Schenker XMG Evo 15 (M24) laptop review - German Ultrabook with bright display and excellent maintenance options
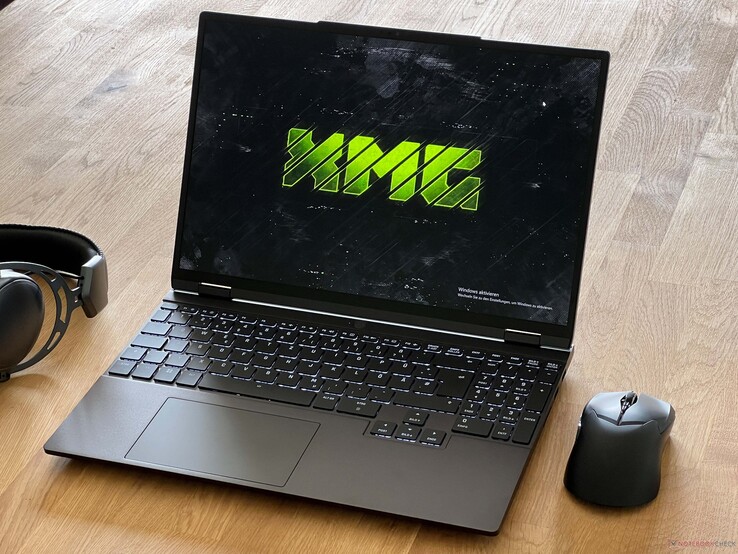
Until now, XMG laptops have primarily been aimed at gamers and customers with a need for fast dedicated graphics cards. With the new XMG Evo models (14 & 15 inch), the German manufacturer is now also launching two ultrabooks without dedicated GPUs. The cases are more compact, but at the same time, you don't have to do without extensive maintenance options. The manufacturer also gives customers a choice between Ryzen 8000 CPUs from AMD (from €1,049) or Meteor Lake chips from Intel (from €1,199), which, according to Schenker, does not lead to any major differences in performance. The display is always a matt WQHD panel (2,560 x 1,600 pixels) with a brightness of 500 nits and a frequency of 240 Hz.
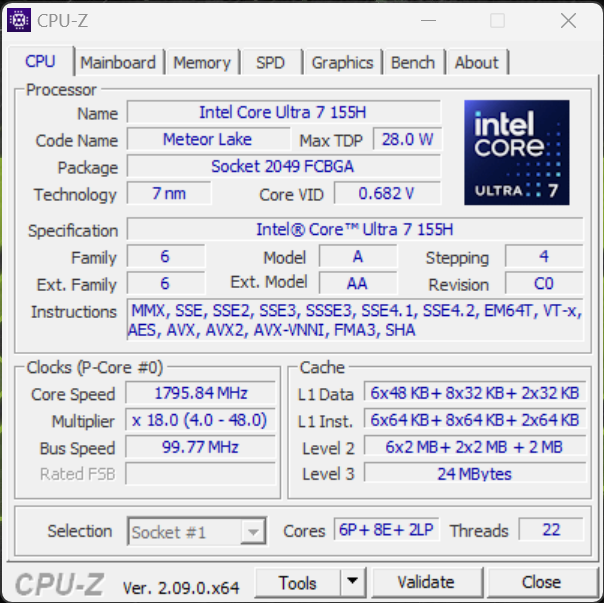
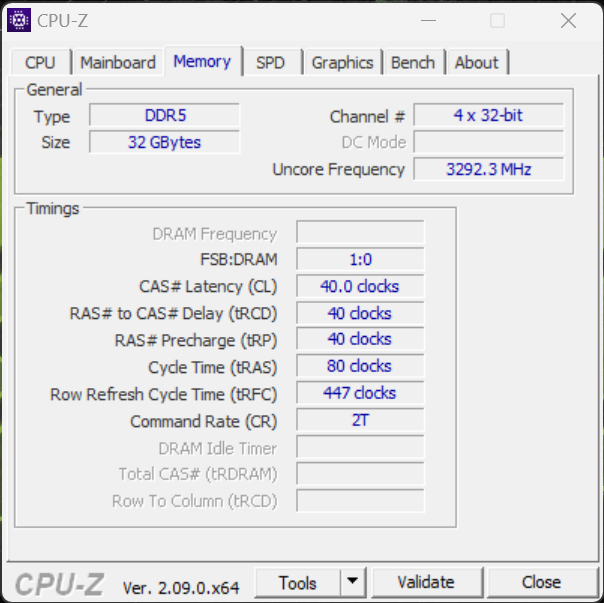
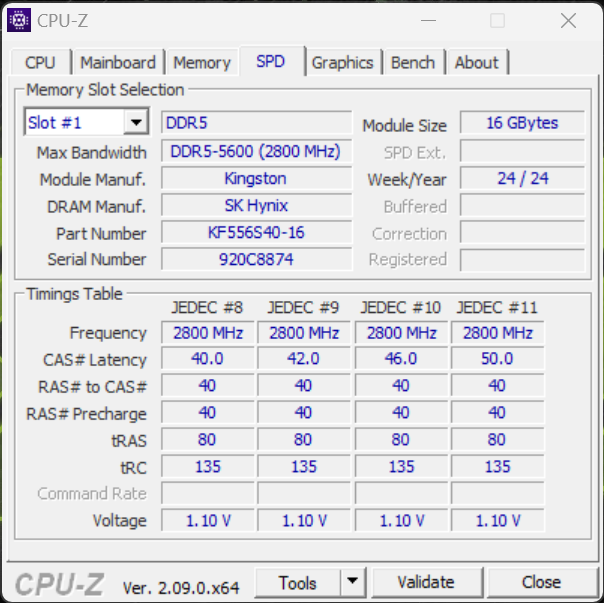
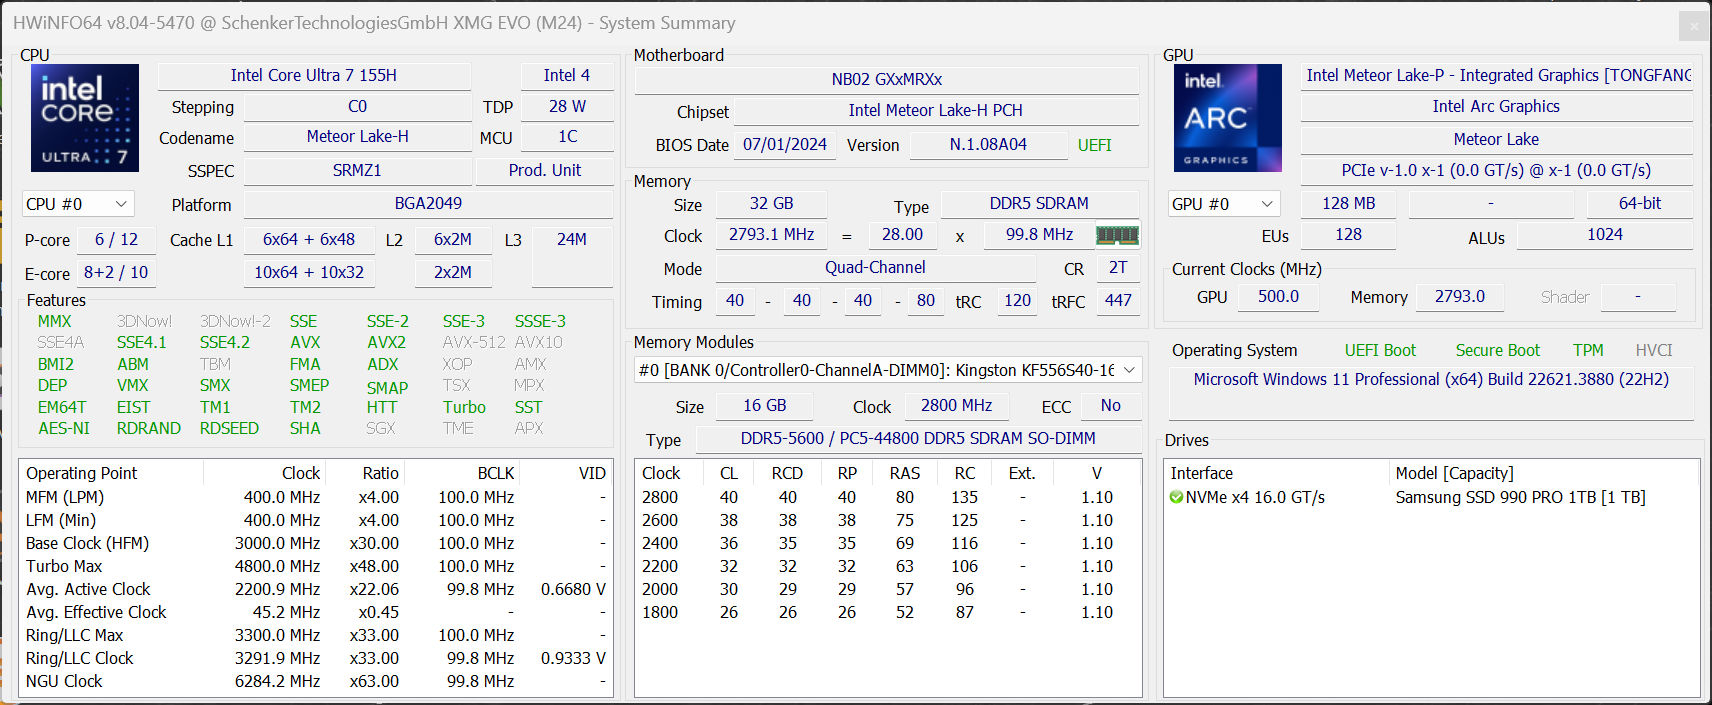
We test the new XMG Evo 15 (M24) with Intel Core Ultra 7 155H including the Arc Graphics iGPU in combination with 32 GB RAM (DDR5-5600) and the 1 TB version of the Samsung 990 Pro. In this configuration (including pre-installation of Windows 11), the price is 1,400 euros.
Possible competitors in comparison
Rating | Version | Date | Model | Weight | Height | Size | Resolution | Price |
|---|---|---|---|---|---|---|---|---|
| 84.7 % | v8 | 08 / 2024 | Schenker XMG Evo 15 (M24) Ultra 7 155H, Arc 8-Core | 1.7 kg | 19.9 mm | 15.30" | 2560x1600 | |
| 82.1 % | v8 | 07 / 2024 | Dell Inspiron 16 7640 2-in-1 Ultra 7 155H, Arc 8-Core | 2.1 kg | 18.99 mm | 16.00" | 2560x1600 | |
| 76.7 % | v8 | 07 / 2024 | Medion S10 OLED Ultra 7 155H, Arc 8-Core | 1.6 kg | 17.8 mm | 16.00" | 3840x2400 | |
| 89.7 % v7 (old) | v7 (old) | 04 / 2024 | Xiaomi RedmiBook Pro 16 2024 Ultra 7 155H, Arc 8-Core | 1.9 kg | 15.9 mm | 16.00" | 3072x1920 | |
| 87.9 % v7 (old) | v7 (old) | 05 / 2024 | Lenovo IdeaPad Pro 5 16IMH G9 Ultra 7 155H, Arc 8-Core | 1.9 kg | 17.5 mm | 16.00" | 2560x1600 | |
| 89.9 % v7 (old) | v7 (old) | 05 / 2024 | Lenovo ThinkPad T16 G2 21K70035GE R7 7840U, Radeon 780M | 1.8 kg | 23.8 mm | 16.00" | 1920x1200 |
Note: We have recently updated our rating system and the results of version 8 are not comparable with the results of version 7. Further information can be found here.
Case - Sturdy aluminum cover

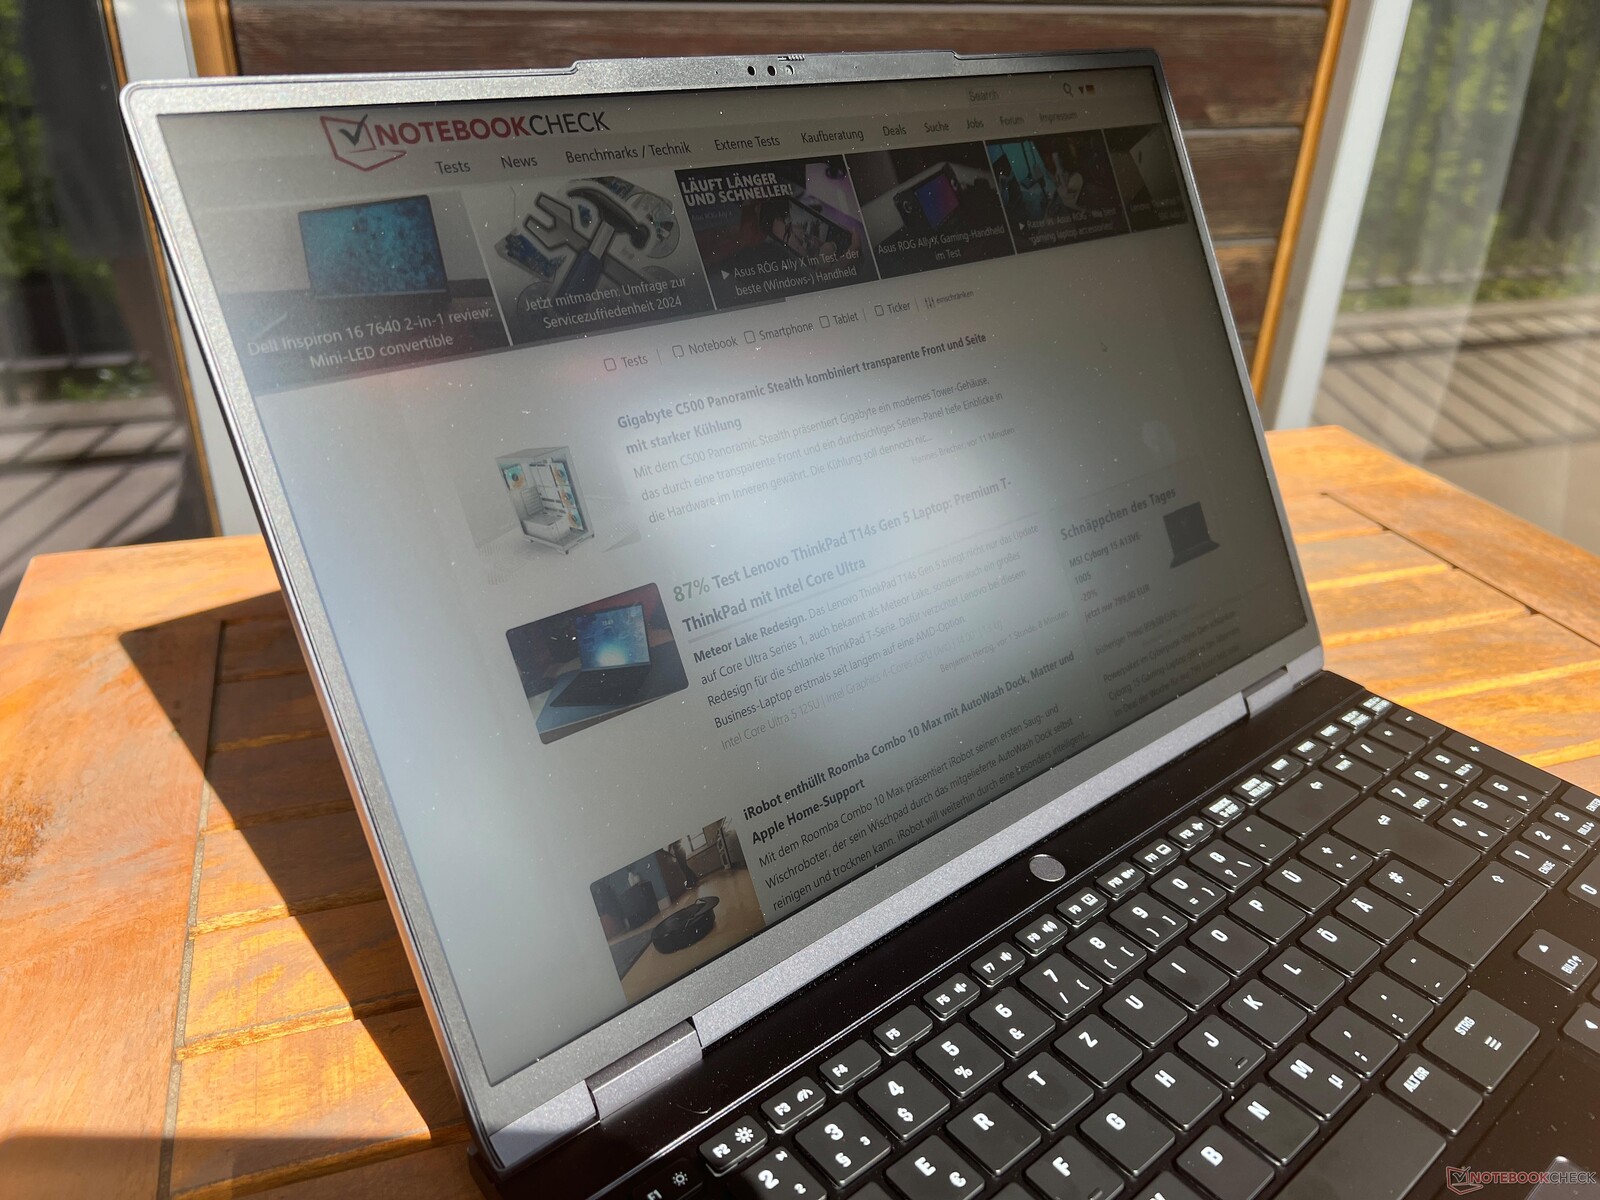
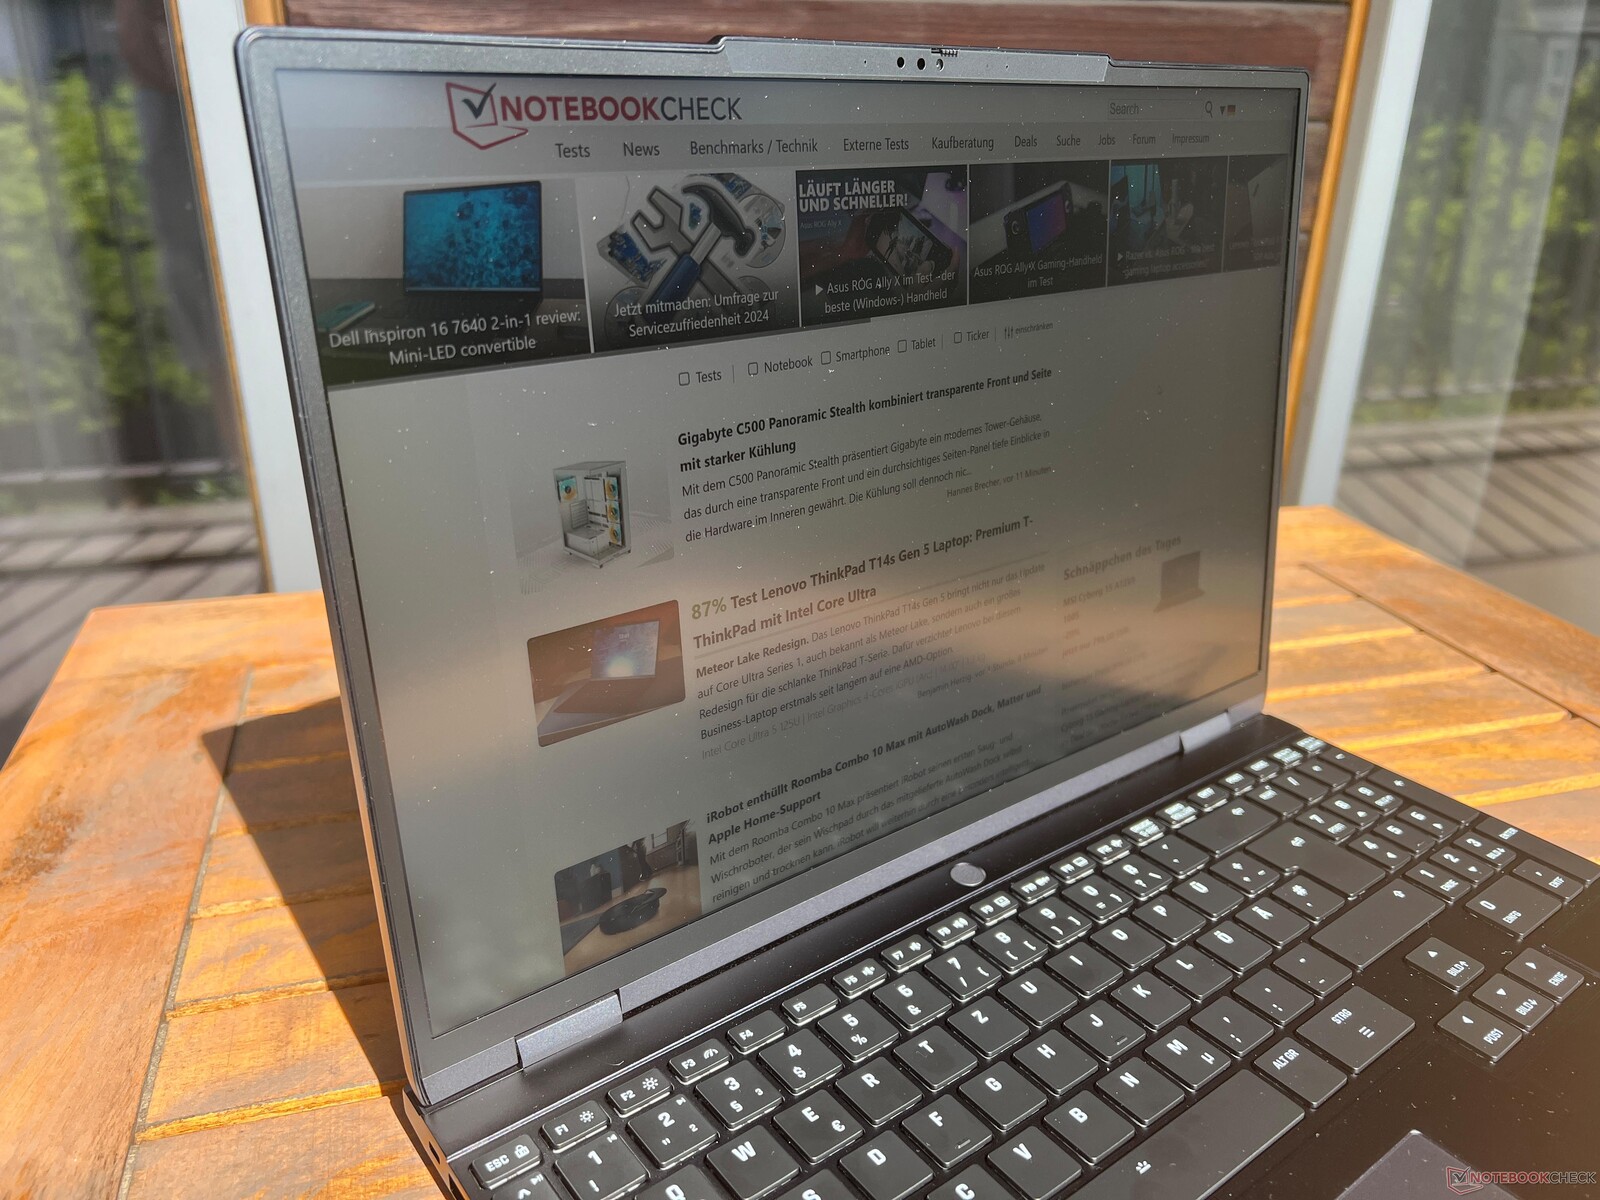
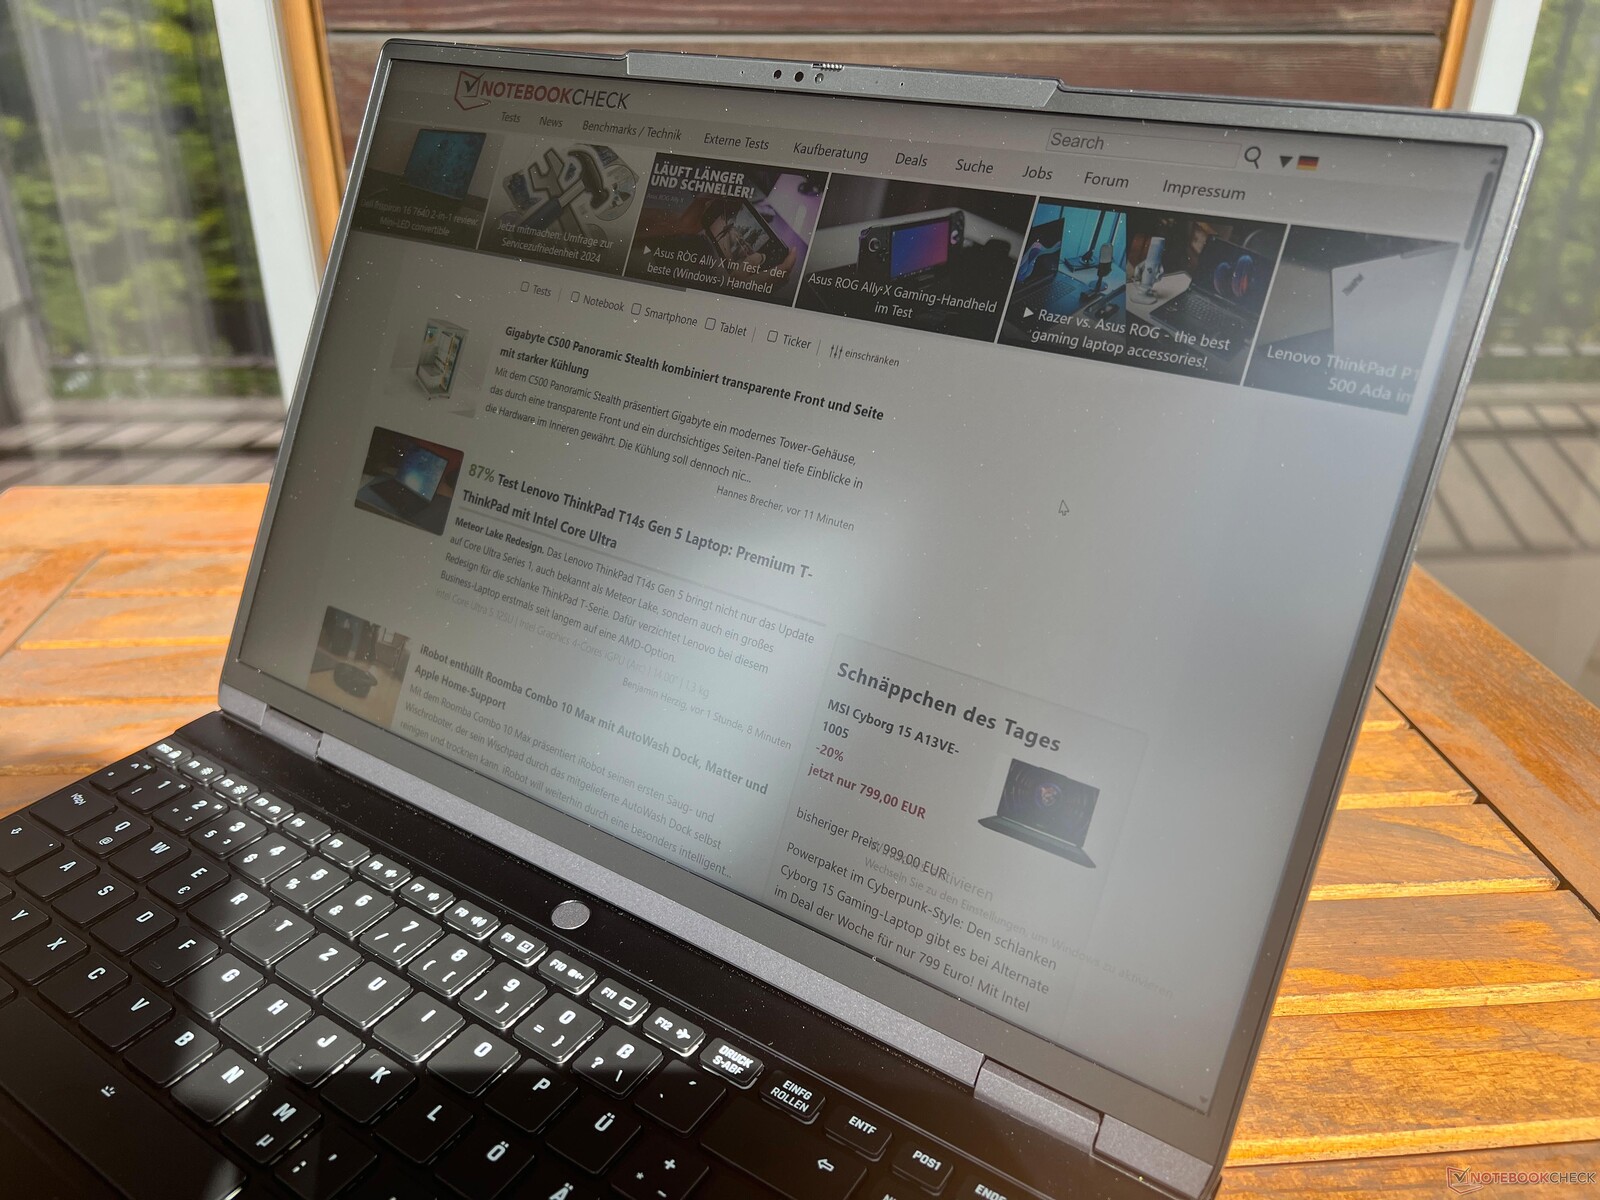
The XMG Evo 15 features a black aluminum chassis, which is somewhat similar to the XMG Fusion 15 gamer. However, the Evo 15 is more compact (especially thinner) and also does without the cooling vents on both sides. Overall, the notebook looks very simple and can also be used in a professional environment without any problems; if required, the laptop can also be ordered without a logo on the display lid. However, the aluminum surfaces are quite sensitive to fingerprints and need to be cleaned regularly.
In terms of quality, the new Evo 15 performs well, as the workmanship is very good and the laptop makes a high-quality impression overall. The base unit is very stable and can only be dented a little in the middle keyboard area if you put your hands on it. The screen lid is also stable and we cannot provoke any image distortions. The maximum opening angle is 180 degrees and the hinges hold the screen securely in position apart from a slight bounce, but opening it with one hand is also possible without any problems thanks to the slight camera hump.

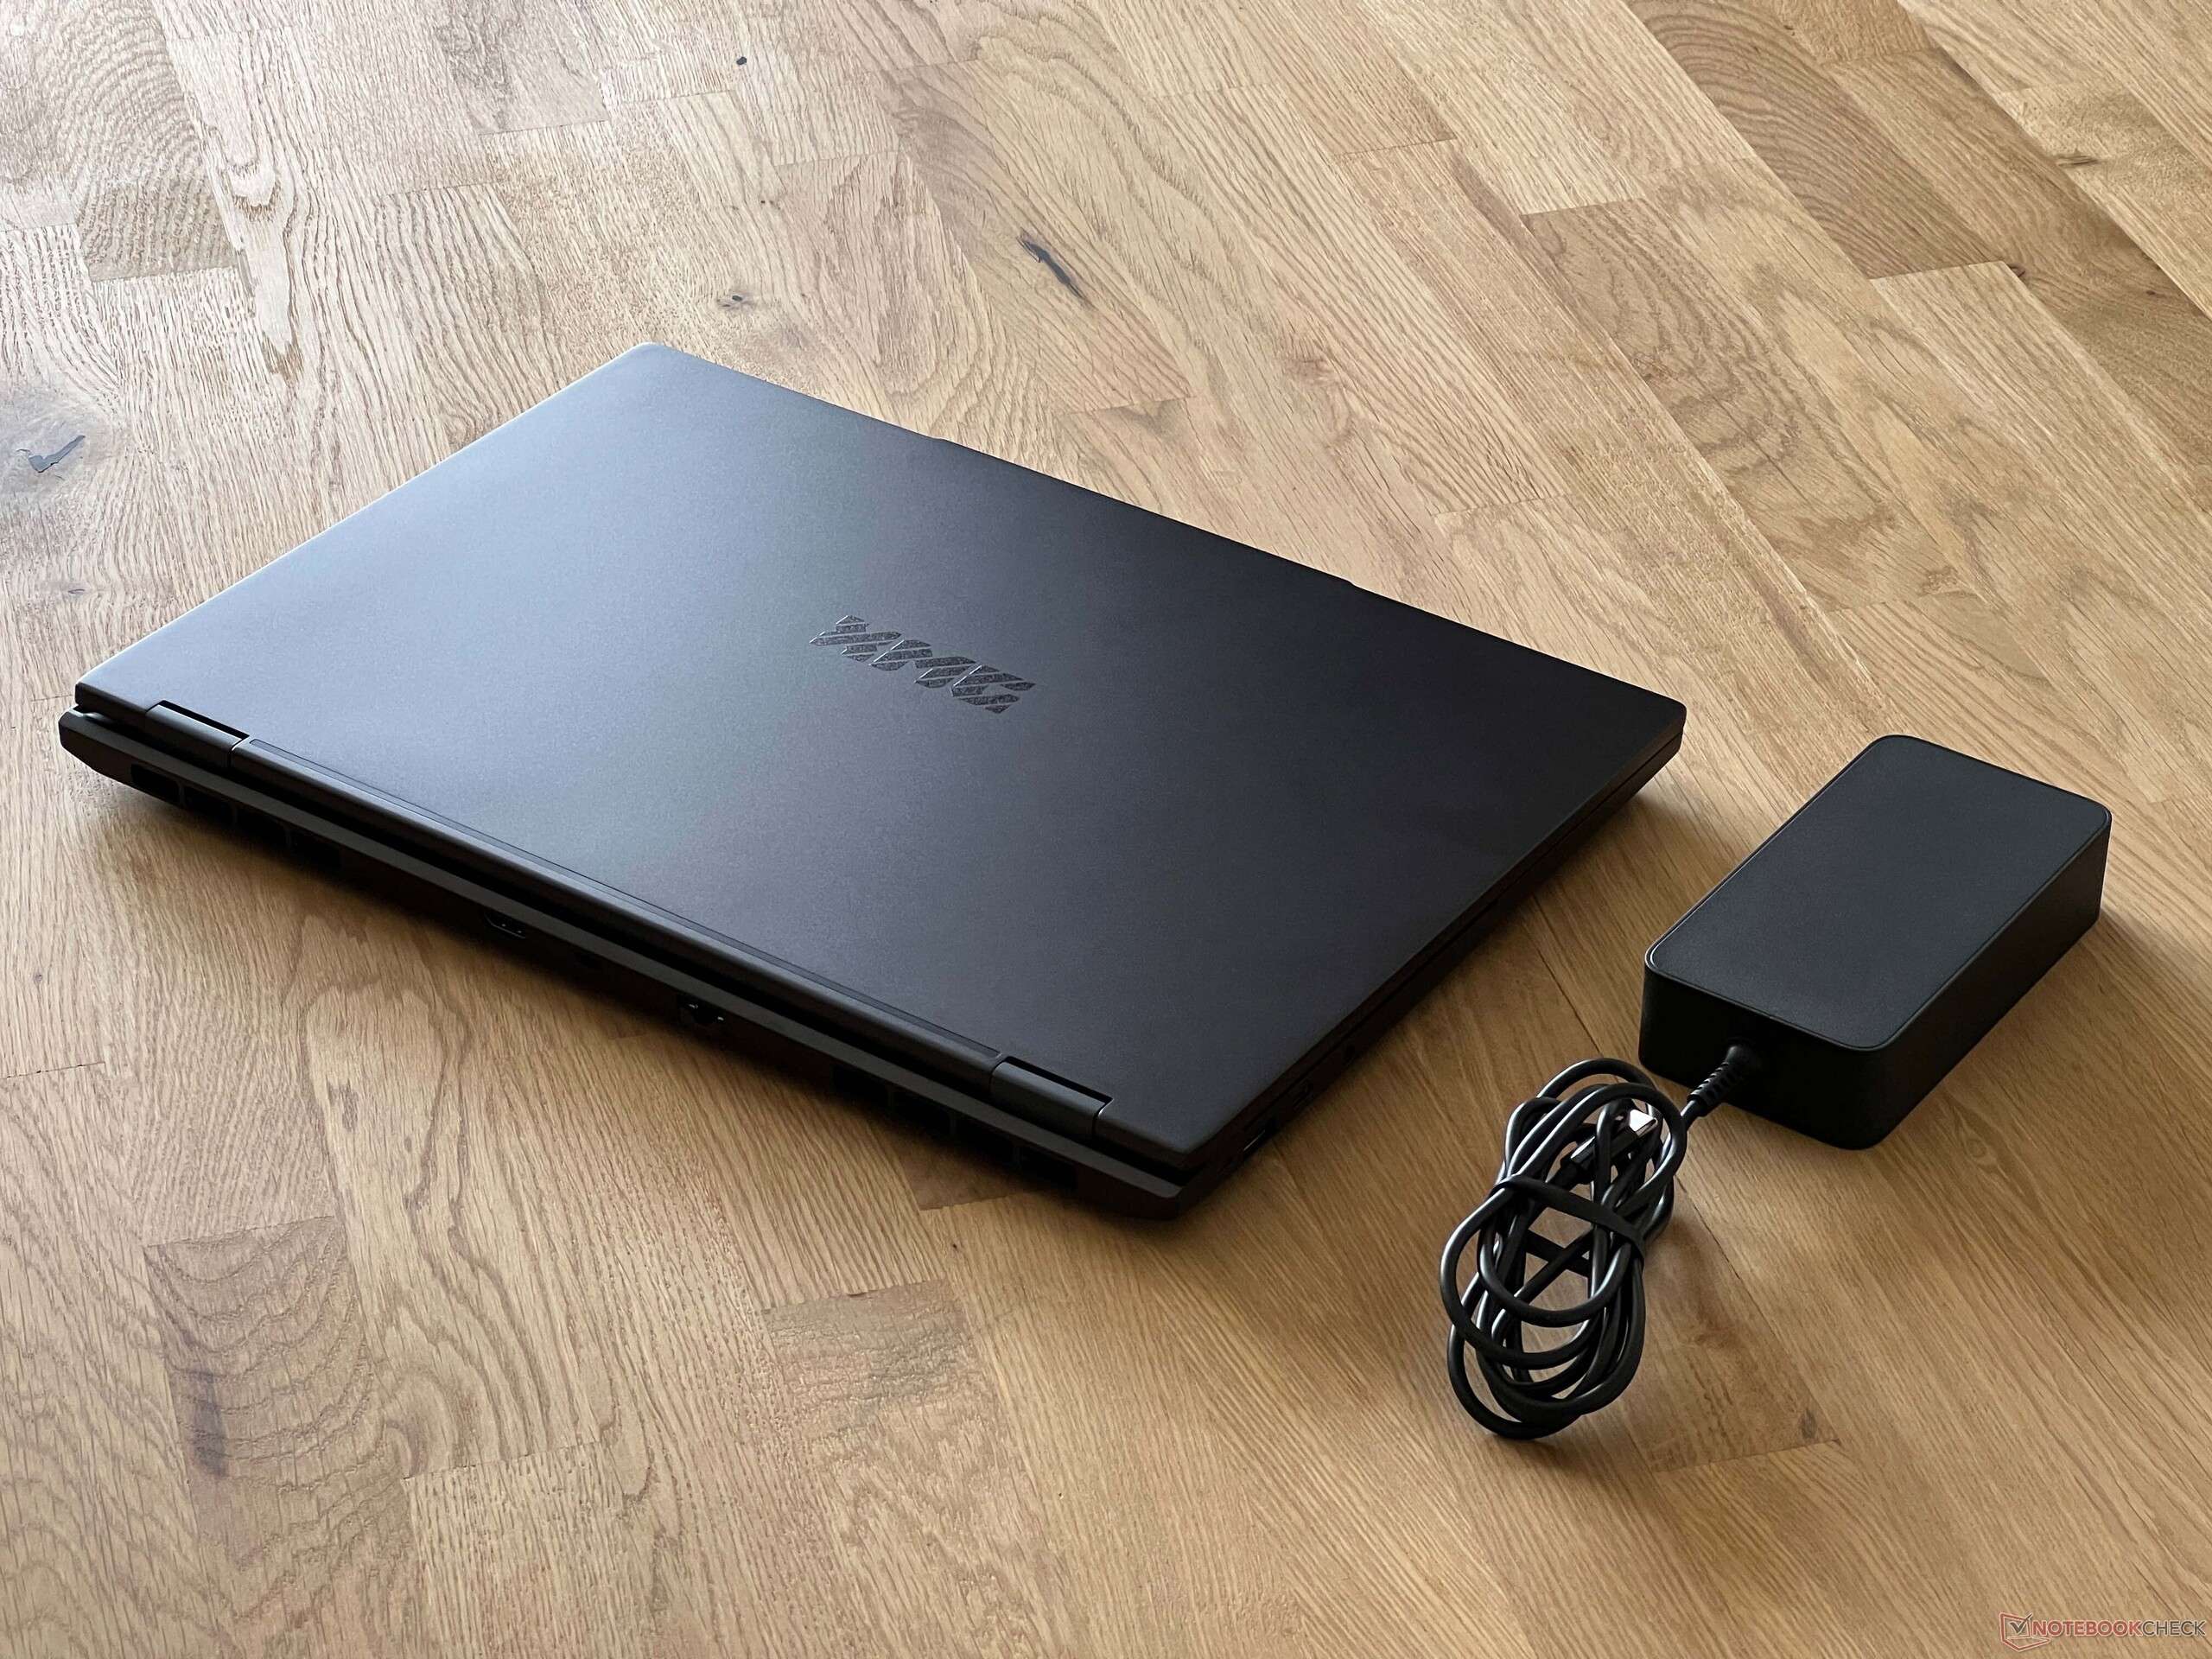
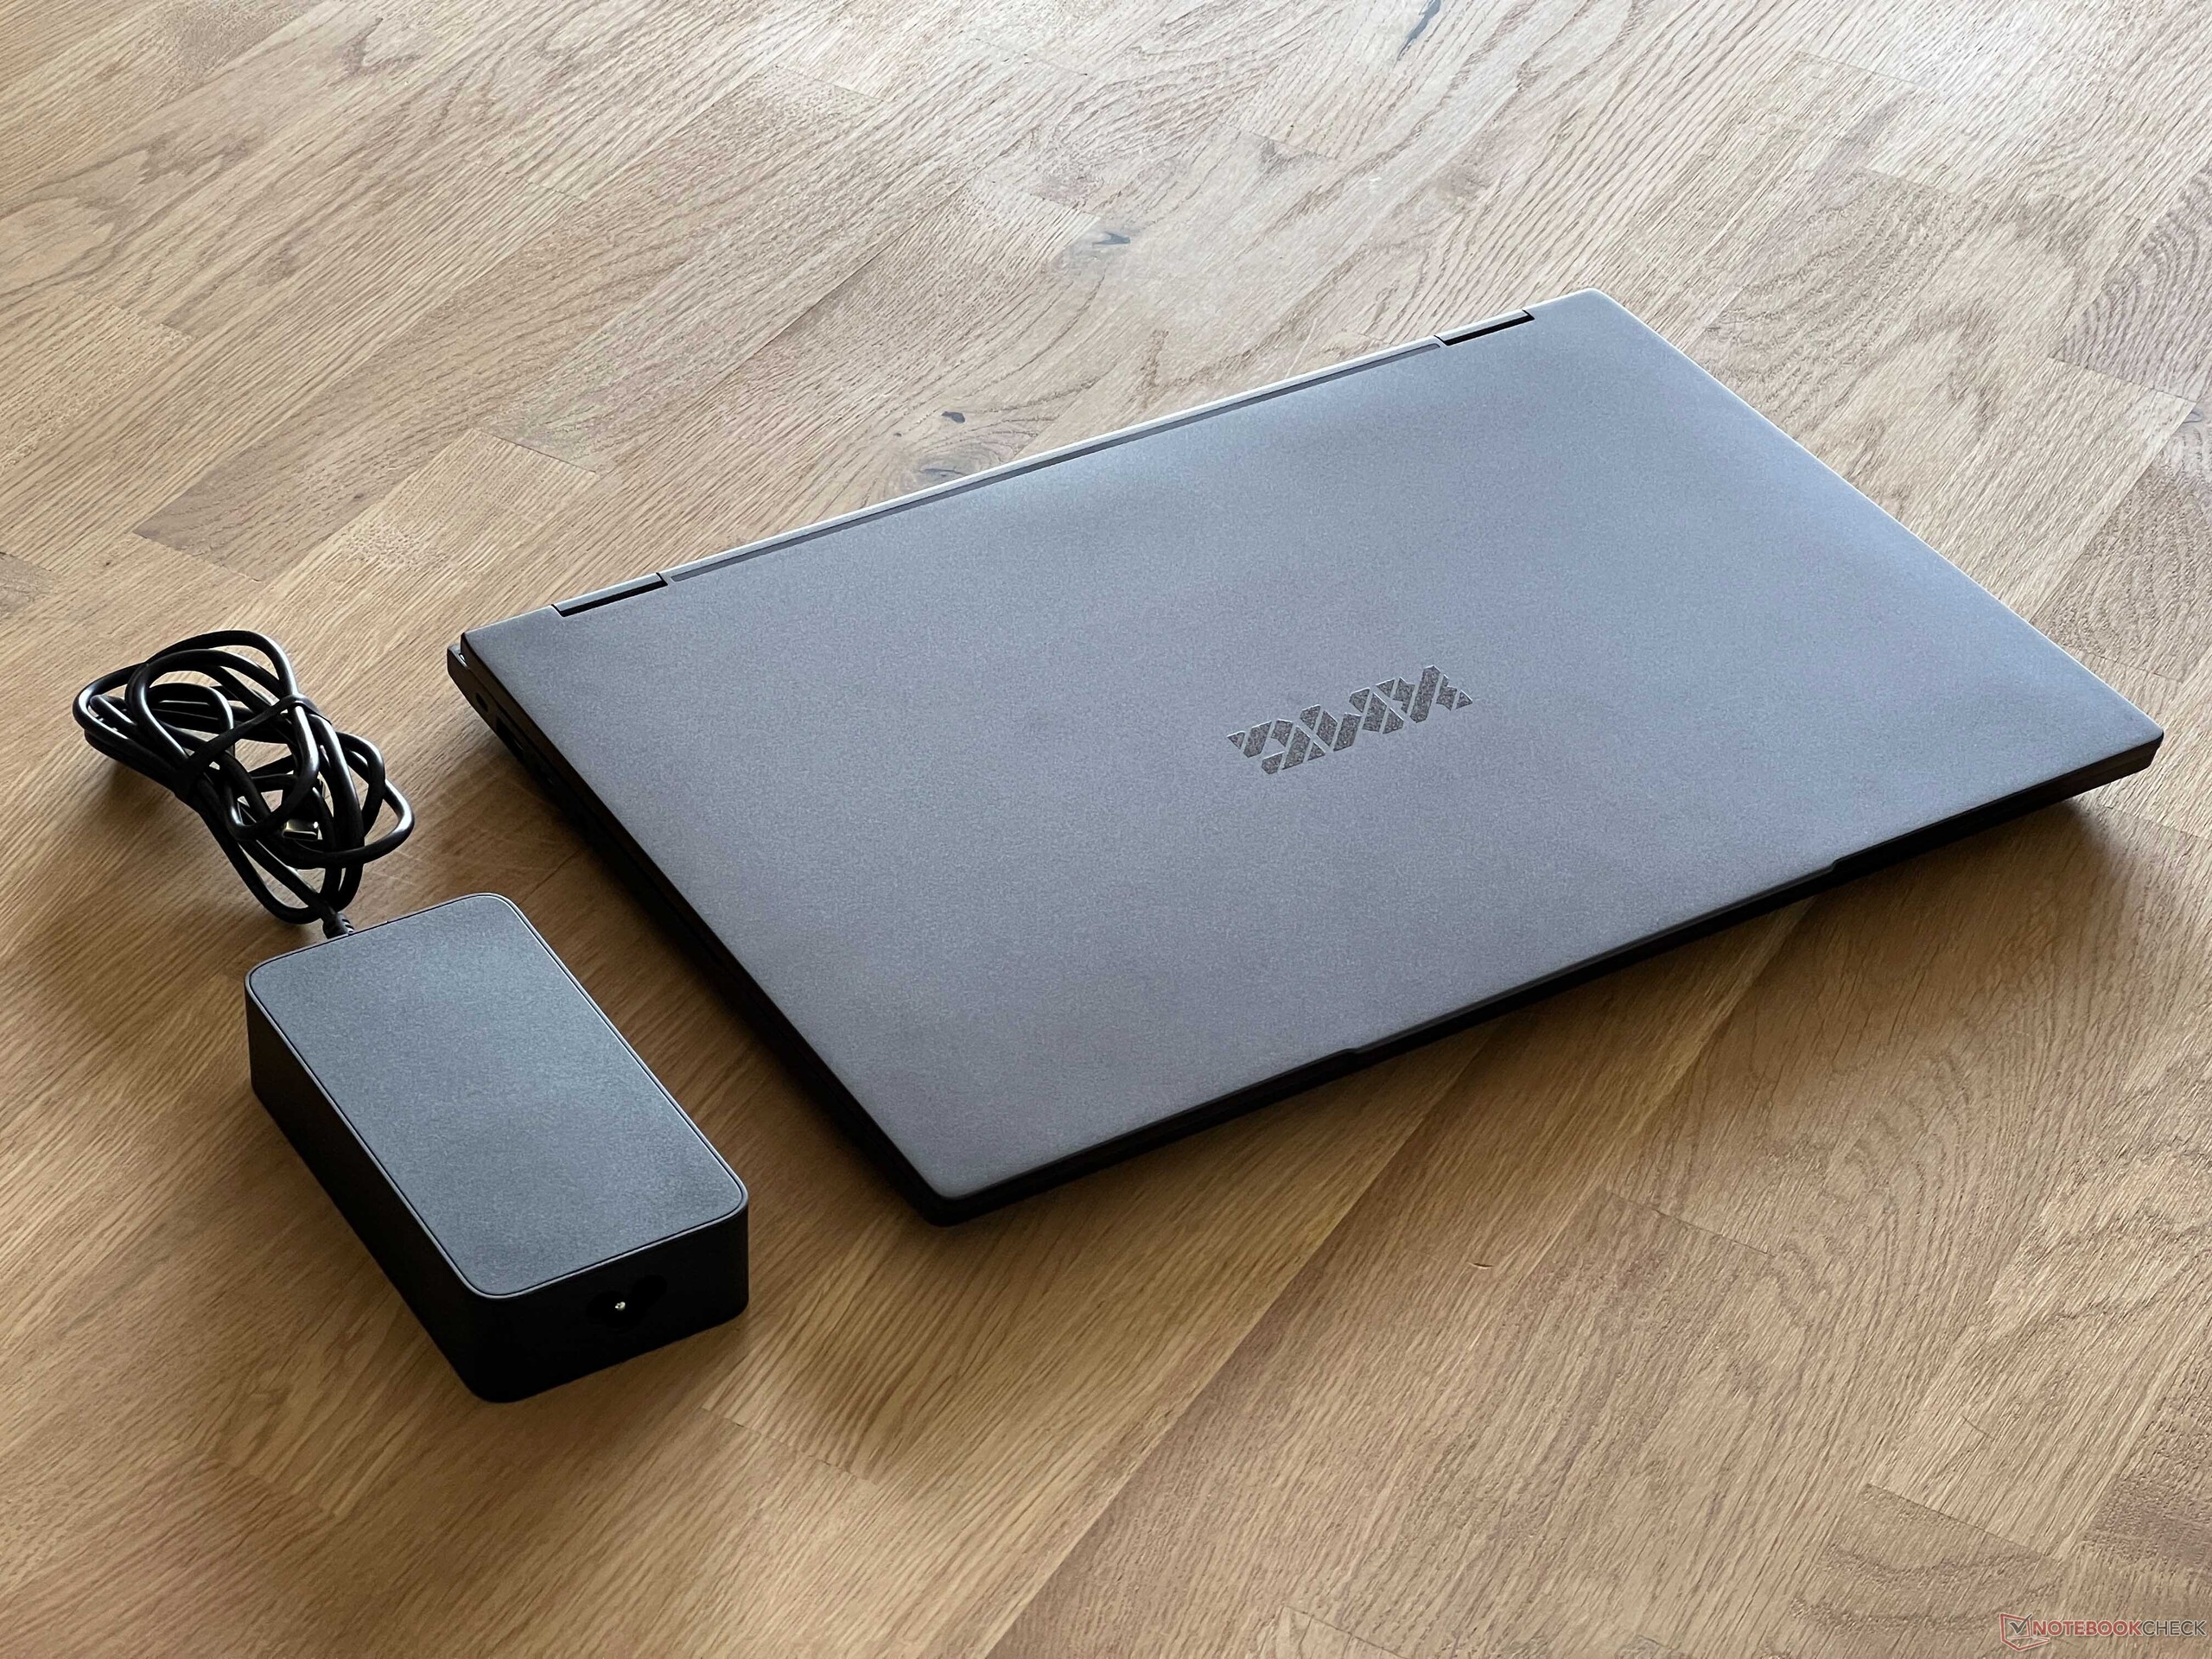
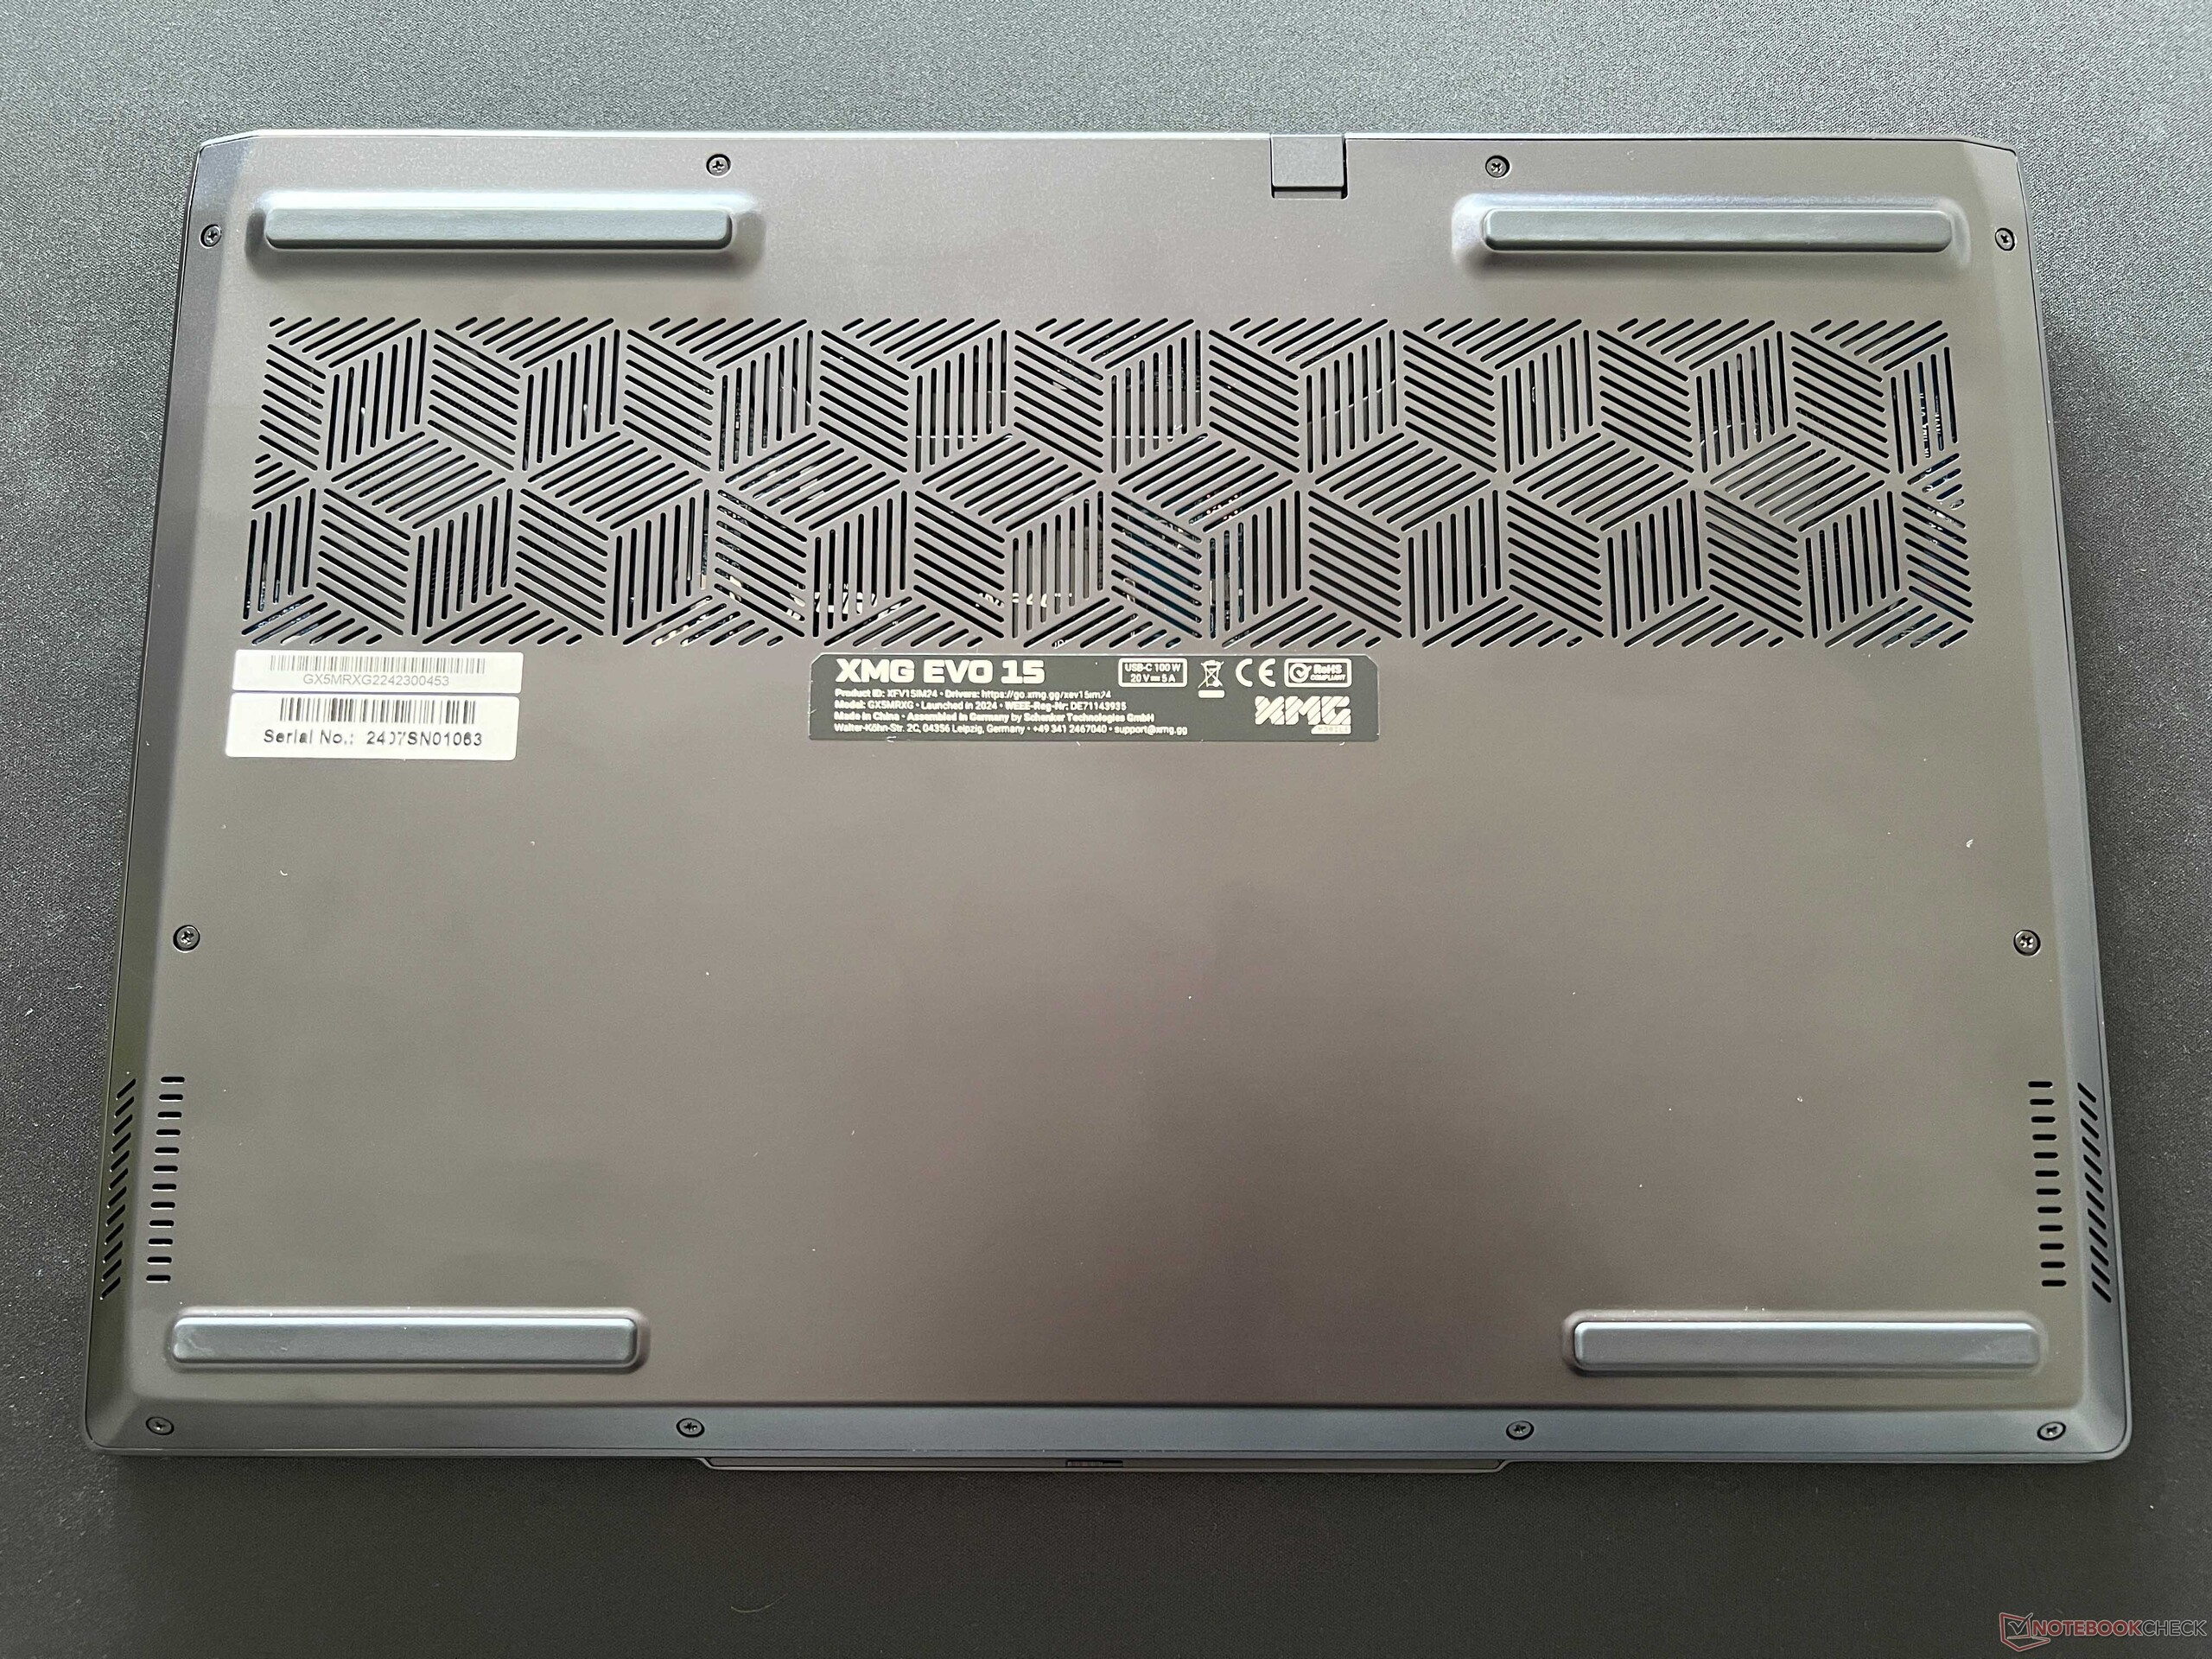
With a thickness of approximately 2 cm, the Evo 15 isn't the thinnest notebook, but it doesn't aspire to be. However, its footprint is noticeably more compact than that of its 16-inch competitors. With a weight of around 1.7 kg, it is also one of the lighter models in our comparison field. The 100-watt power supply weighs in at 513 grams, but this includes the long power cable (1.8 + 1.5 meters).
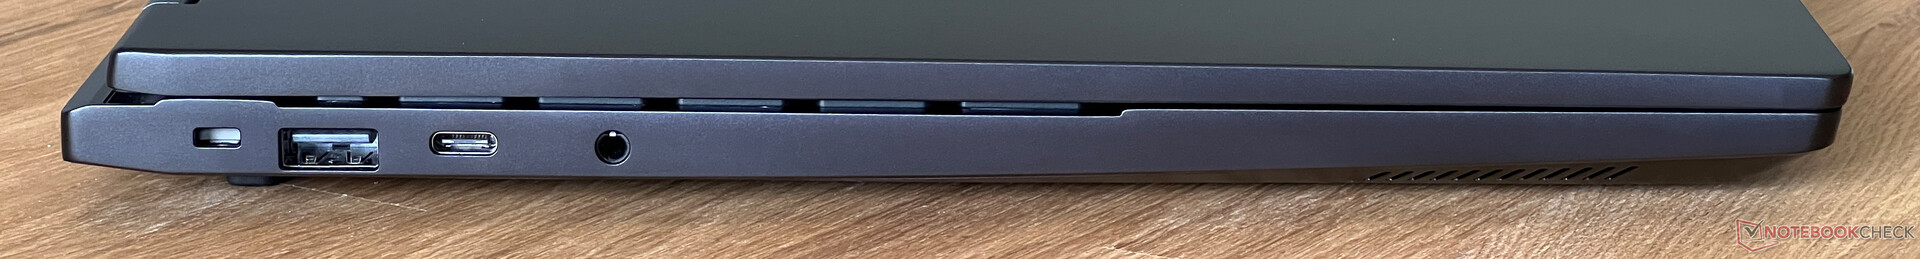
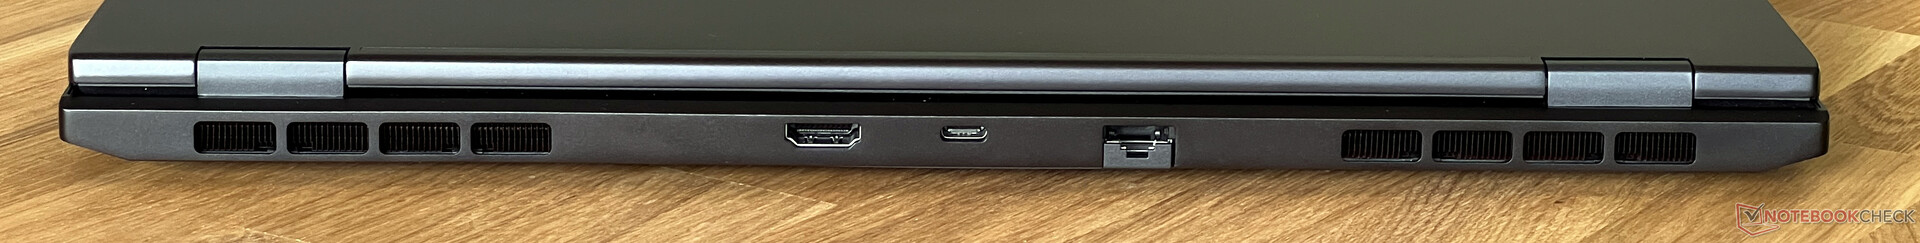
Features - Thunderbolt 4 and USB 2.0
The ports are spread across the two rear side areas and the rear. In principle, all modern standards including Thunderbolt 4 (or USB 4.0 on the AMD model) are available and there are also sufficient USB ports, but we don't know what a USB 2.0 port is doing on a modern laptop. At least there is only one of them, the other two comply with the USB 3.2 Gen1 standard.
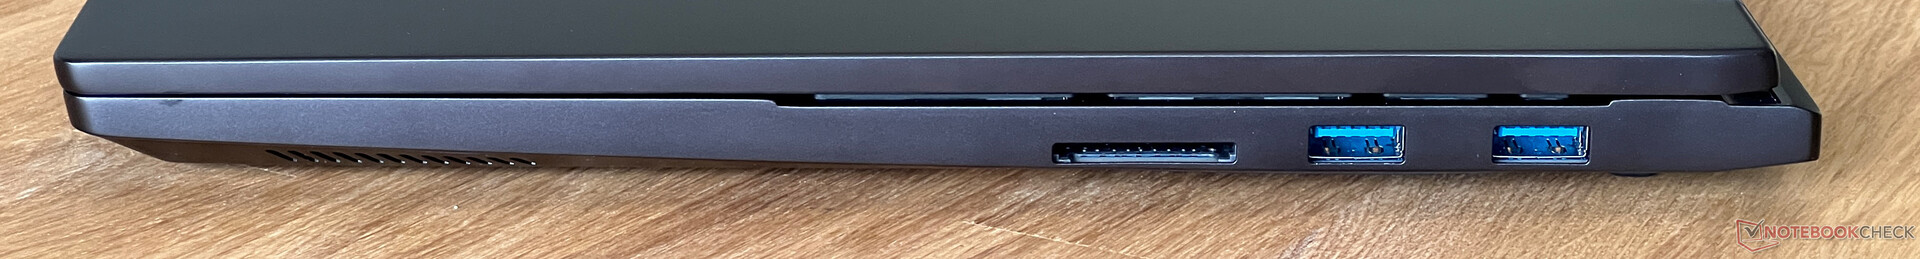
SD Card Reader
In conjunction with our reference card (Angelbird AV Pro V60), the fully-fledged SD card reader achieves transfer rates of up to 90 MB/s and ~50 MB/s when copying data. Overall, these are somewhat below-average results.
| SD Card Reader | |
| average JPG Copy Test (av. of 3 runs) | |
| Schenker XMG Evo 15 (M24) (ADATA V90) | |
| Schenker XMG Evo 15 (M24) (Angelbird AV Pro V60) | |
| Average of class Multimedia (23 - 531, n=36, last 2 years) | |
| Lenovo IdeaPad Pro 5 16IMH G9 (Angelbird AV Pro V60) | |
| Dell Inspiron 16 7640 2-in-1 (Toshiba Exceria Pro SDXC 64 GB UHS-II) | |
| maximum AS SSD Seq Read Test (1GB) | |
| Schenker XMG Evo 15 (M24) (ADATA V90) | |
| Schenker XMG Evo 15 (M24) (Angelbird AV Pro V60) | |
| Average of class Multimedia (37.3 - 1455, n=35, last 2 years) | |
| Lenovo IdeaPad Pro 5 16IMH G9 (Angelbird AV Pro V60) | |
| Dell Inspiron 16 7640 2-in-1 (Toshiba Exceria Pro SDXC 64 GB UHS-II) | |
Communication
The Evo 15 is one of the few modern multimedia notebooks that still has an RJ45 Gigabit network connection. The AX211 module from Intel is also available for wireless networks (Wi-Fi 6E). In conjunction with our reference router from Asus, the transfer rates were good and we had no problems with the Wi-Fi signal during the test.
| Networking | |
| Schenker XMG Evo 15 (M24) | |
| iperf3 transmit AXE11000 | |
| iperf3 receive AXE11000 | |
| Dell Inspiron 16 7640 2-in-1 | |
| iperf3 transmit AXE11000 | |
| iperf3 receive AXE11000 | |
| iperf3 transmit AXE11000 6GHz | |
| iperf3 receive AXE11000 6GHz | |
| Medion S10 OLED | |
| iperf3 transmit AXE11000 | |
| iperf3 receive AXE11000 | |
| Xiaomi RedmiBook Pro 16 2024 | |
| iperf3 transmit AXE11000 | |
| iperf3 receive AXE11000 | |
| Lenovo IdeaPad Pro 5 16IMH G9 | |
| iperf3 transmit AXE11000 | |
| iperf3 receive AXE11000 | |
| Lenovo ThinkPad T16 G2 21K70035GE | |
| iperf3 transmit AXE11000 | |
| iperf3 receive AXE11000 | |
| iperf3 transmit AXE11000 6GHz | |
| iperf3 receive AXE11000 6GHz | |
Webcam
A 2 MP camera with a mechanical shutter is built into the top edge of the screen, which delivers average image quality. Microsoft Studio effects are also supported and the additional IR camera enables facial recognition via Windows Hello.

 Arc 8-Core, Ultra 7 155H, Samsung 990 Pro 1 TB")
 Arc 8-Core, Ultra 7 155H, Samsung 990 Pro 1 TB")
Accessories
In addition to the 100-watt power supply unit, the scope of delivery also includes a USB stick with drivers and a large XMG mouse pad made of fabric.
Maintenance
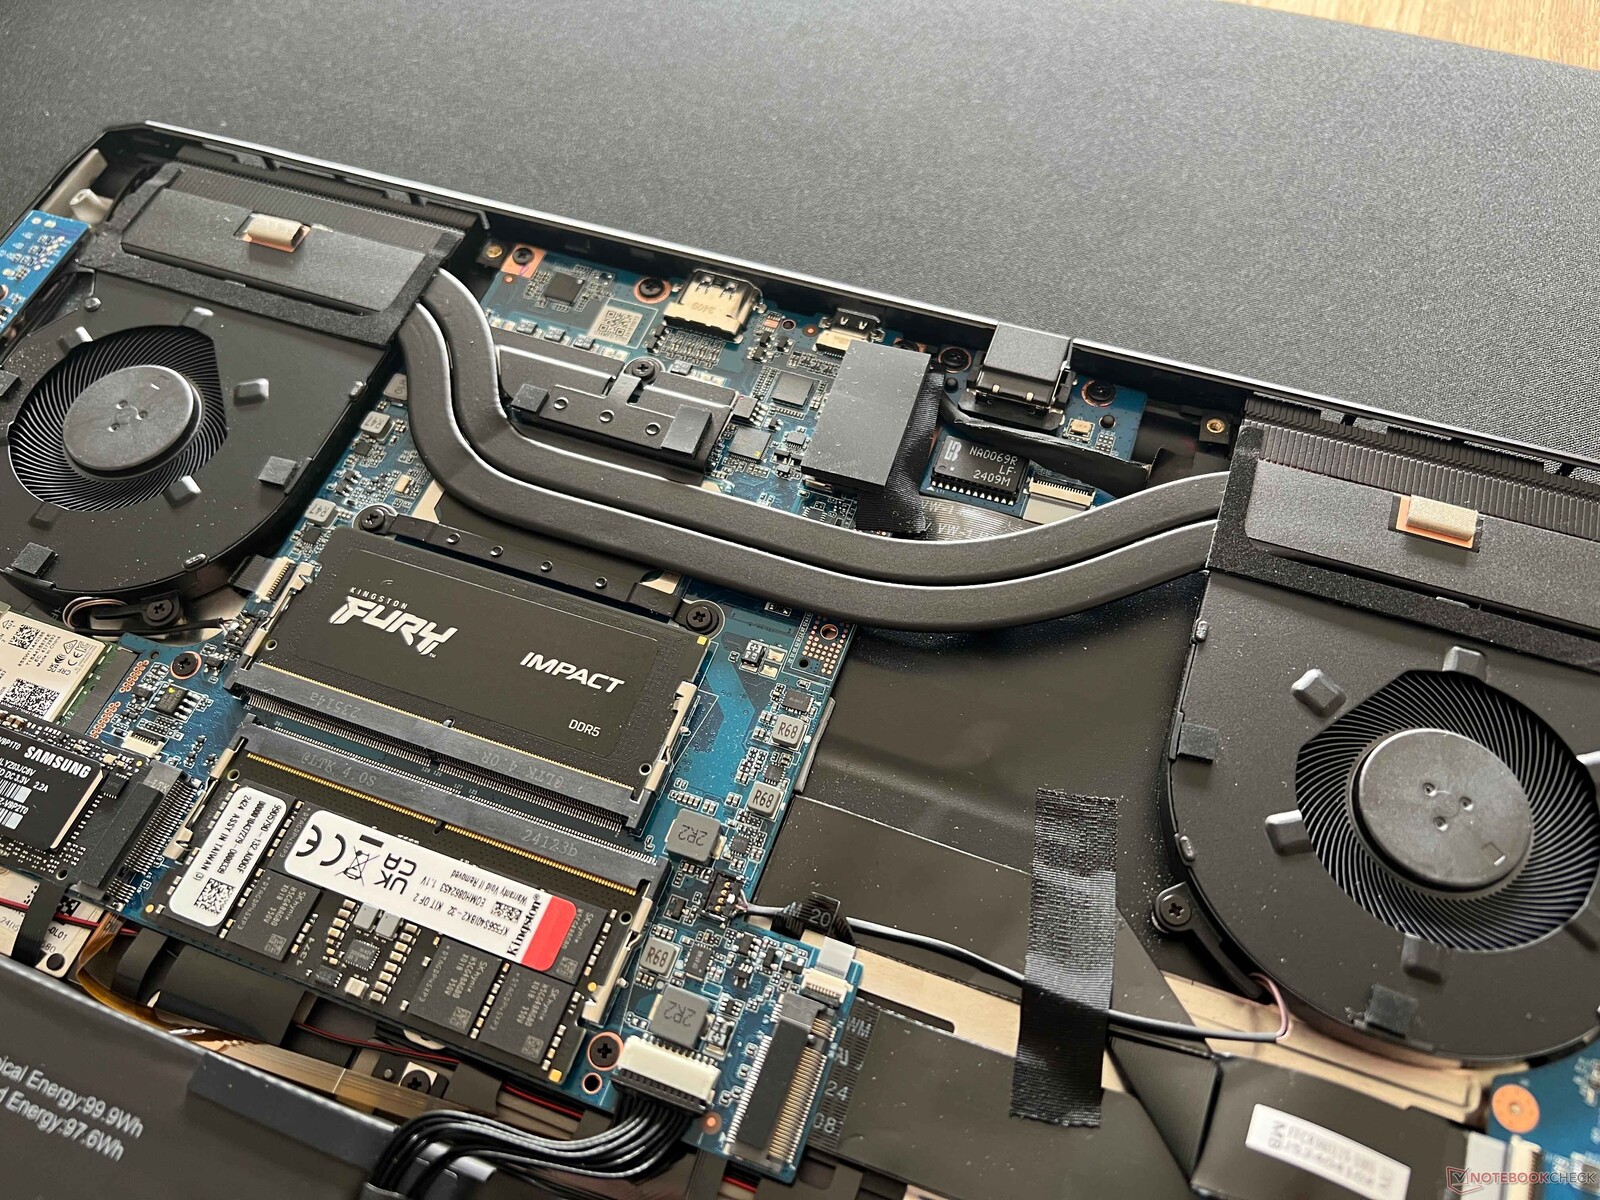
Now we come to a highlight of the Evo 15, the maintenance options. After removing the bottom cover (which is fastened with normal Phillips screws), you can access the fans and the screwed battery, as well as the two SO-DIMM slots for the RAM and two M.2 2280 SSD slots; upgrades are therefore child's play. The WLAN module can also be replaced if necessary.
Sustainability
Schenker's product page lacks any information on CO2 emissions generated during laptop manufacturing. The packaging is largely made of cardboard and plastic. We will talk about the power consumption later, but the standby consumption of 1.4 watts is too high.
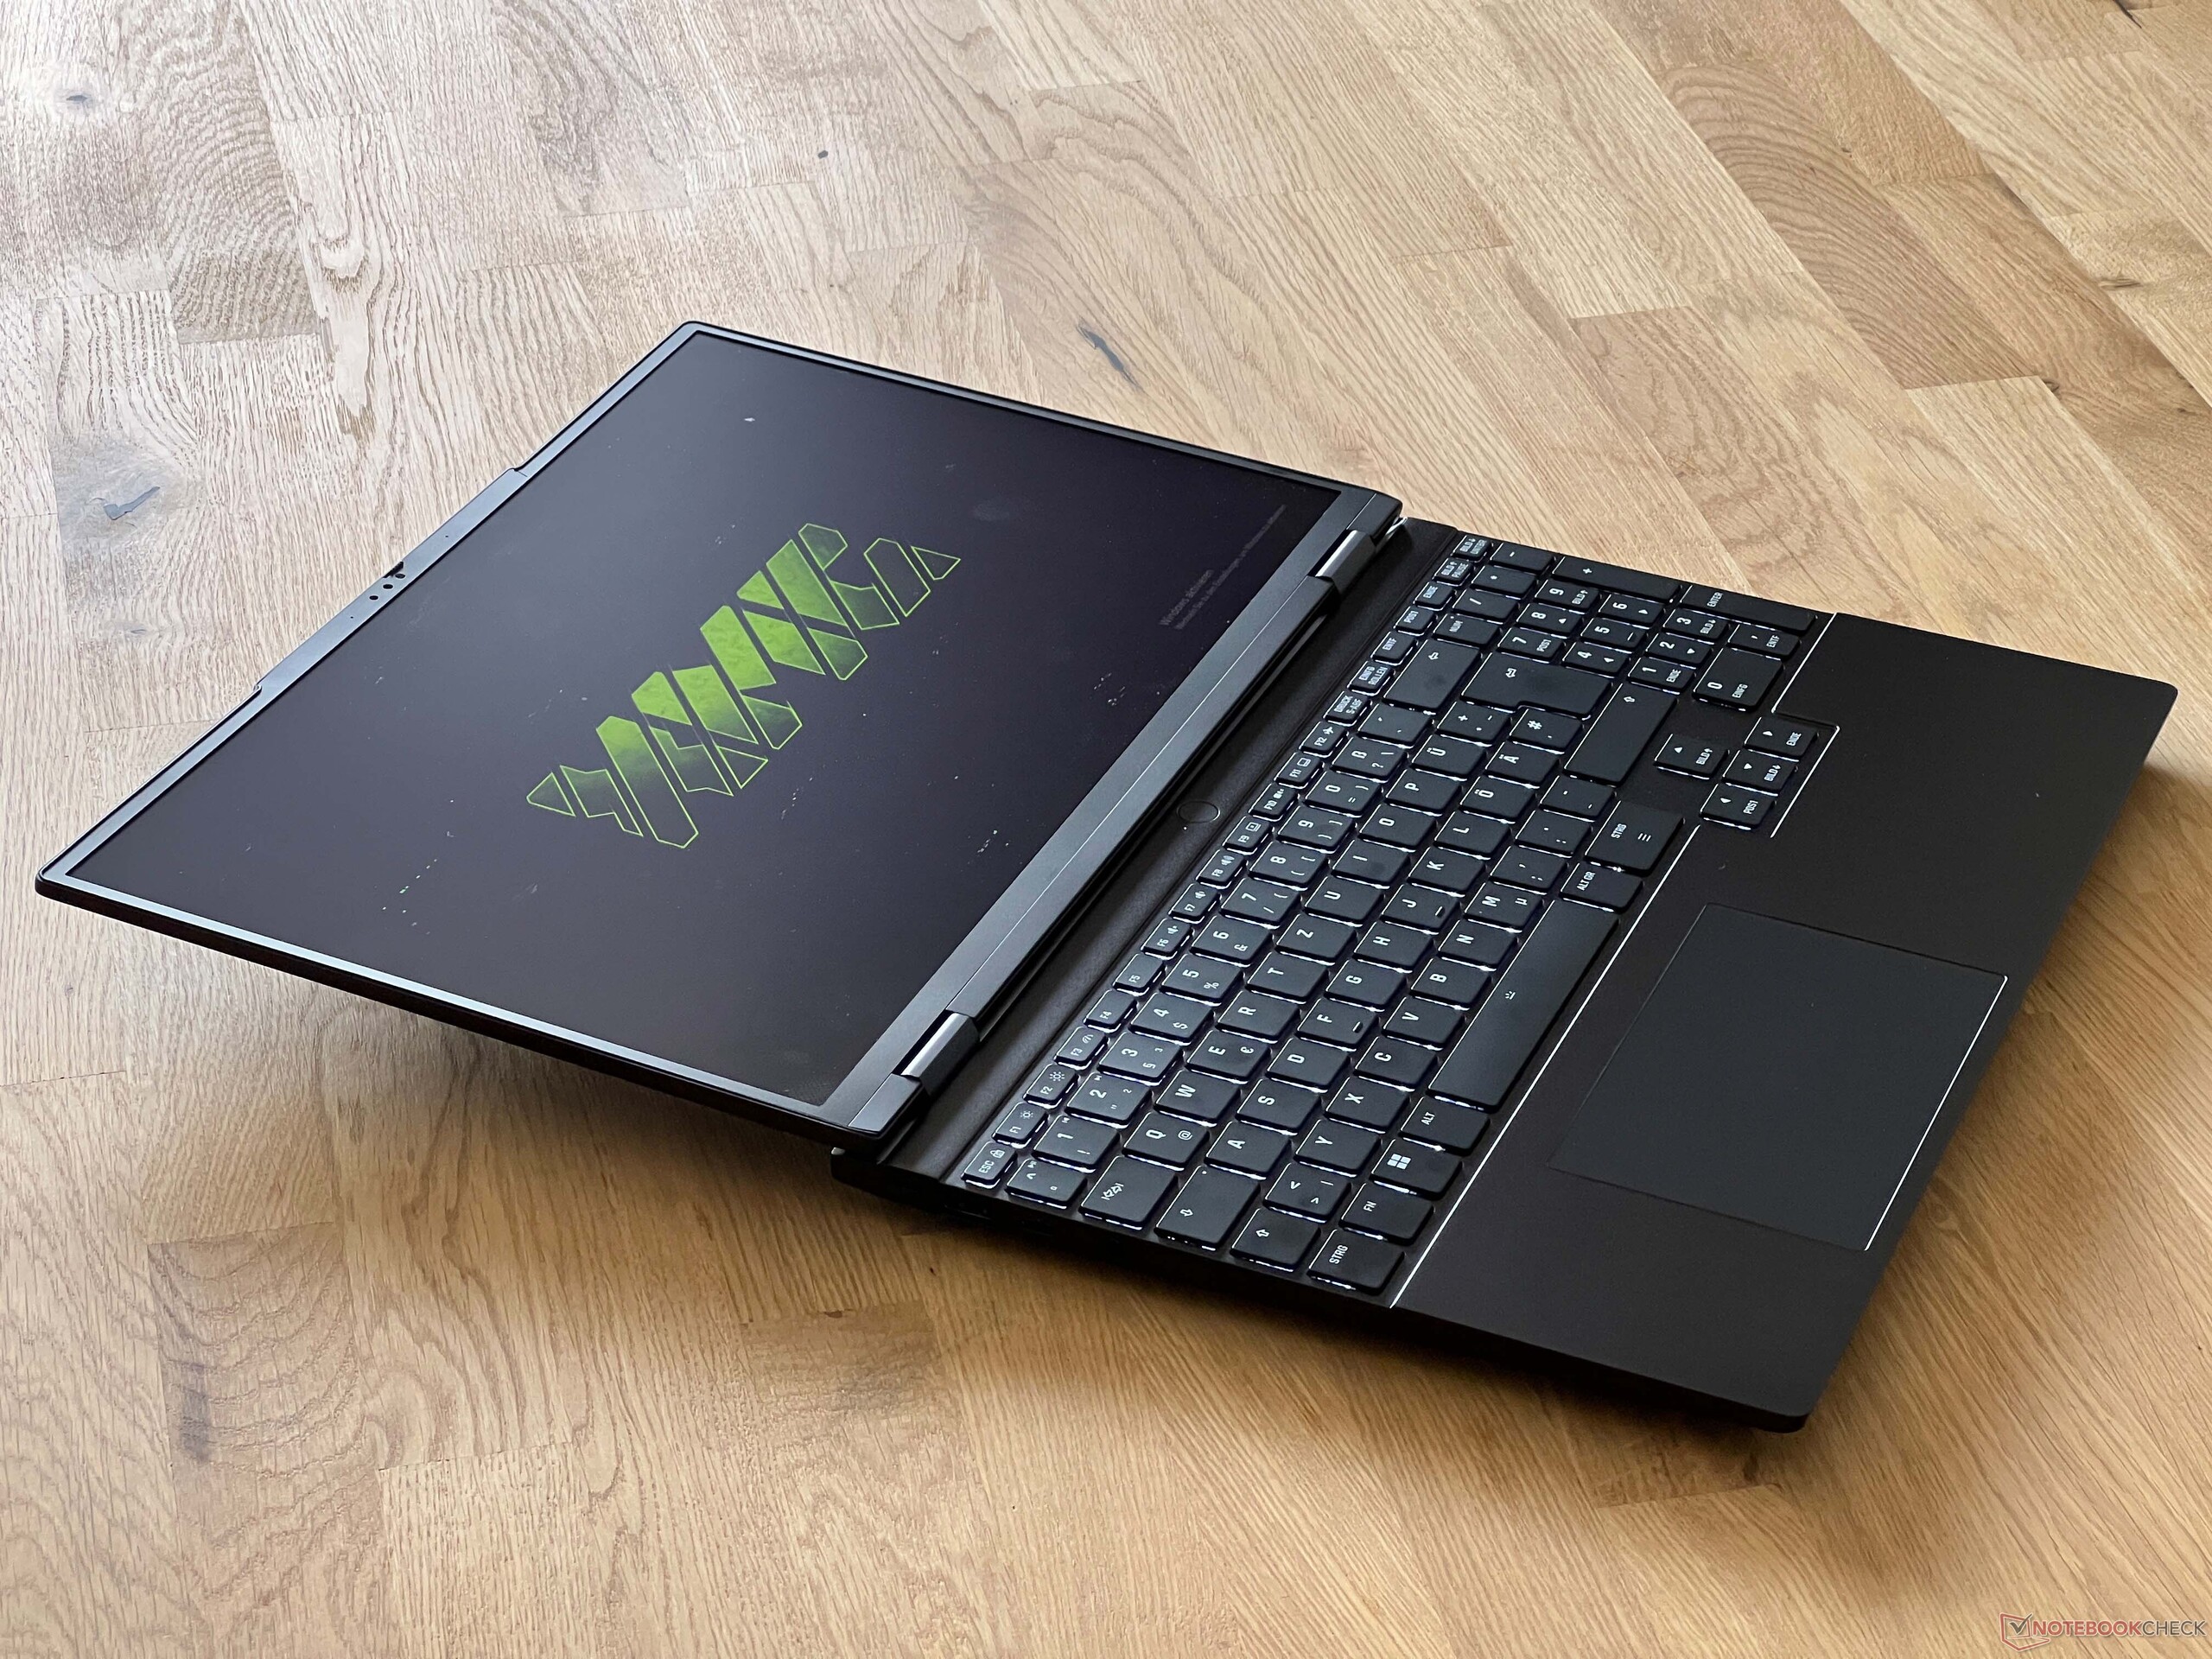
Input devices - Large keyboard with numeric keypad
The keyboard takes up the entire width of the base unit and also offers a dedicated numeric keypad, although these keys are somewhat narrower. However, the arrow keys are not reduced in size. The overall typing experience is comfortable and even long texts are no problem, although business laptops like the ThinkPad T16 still offer advantages here. In addition, the larger keys in particular are quite loud and feel a little rickety. Based on a survey of its customers, Schenker has decided not to install a dedicated co-pilot key. The white backlight currently offers two intensity levels, but an update will be released soon, which will then offer four intensity levels.
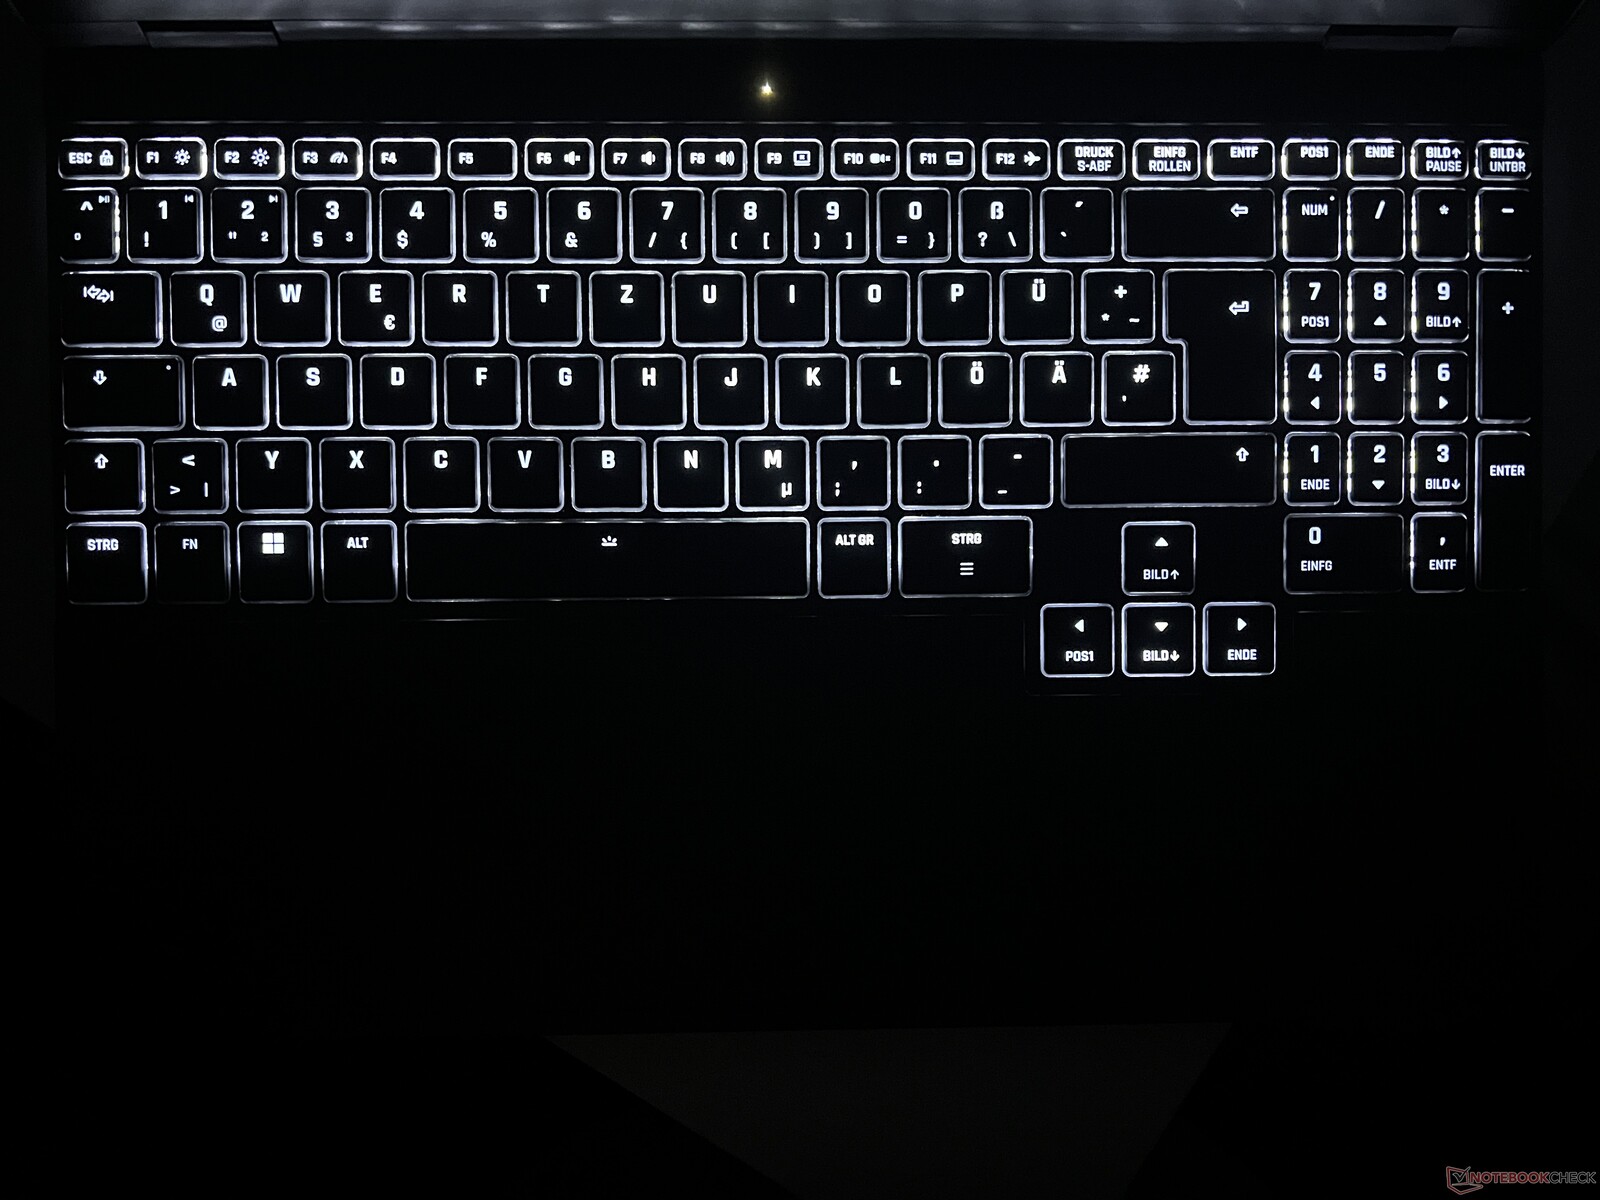
At 12.3 x 7.7 cm, the ClickPad offers sufficient space for inputs and pointer control, but it is clearly shifted to the left, which takes some time to get used to. The pad can be clicked in the lower area, but this results in a loud and cheap sound.
Display - IPS with 240 Hz

Schenker uses the familiar WQHD panel with 240 Hz from the Fusion 15, so it is a matte IPS panel with a resolution of 2,560 x 1,600 pixels. The subjective picture impression is excellent, as all content is very sharp and the color reproduction is also fine, although, of course, you can't expect the bright colors of OLED panels. However, there is also no PWM flickering, but the response times are still very fast. Despite the matte surface, even bright surfaces do not appear grainy and movements are very smooth thanks to the high frequency. Adaptive Sync is also supported, but a brightness sensor is not installed.
The brightness is specified at 500 cd/m², but our test device achieved a significantly better result with an average of 585 cd/m². However, the black value suffers as a result, which is 0.61 cd/m², and makes black content appear rather dark gray. In addition, the maximum contrast ratio is only ~1,000:1.
| |||||||||||||||||||||||||
Brightness Distribution: 93 %
Center on Battery: 608 cd/m²
Contrast: 997:1 (Black: 0.61 cd/m²)
ΔE ColorChecker Calman: 2.1 | ∀{0.5-29.43 Ø4.71}
calibrated: 1.2
ΔE Greyscale Calman: 2.7 | ∀{0.09-98 Ø4.96}
74.2% AdobeRGB 1998 (Argyll 3D)
100% sRGB (Argyll 3D)
73.6% Display P3 (Argyll 3D)
Gamma: 2.2
CCT: 6168 K
| Schenker XMG Evo 15 (M24) NE153QDM-NZ1, IPS, 2560x1600, 15.3", 240 Hz | Dell Inspiron 16 7640 2-in-1 AU Optronics B160QAT, Mini-LED, 2560x1600, 16", 90 Hz | Medion S10 OLED Samsung SDC4174, OLED, 3840x2400, 16", 60 Hz | Xiaomi RedmiBook Pro 16 2024 TL160MDMP03_0, IPS, 3072x1920, 16", 165 Hz | Lenovo IdeaPad Pro 5 16IMH G9 NE160QDM-NY2, IPS, 2560x1600, 16", 120 Hz | Lenovo ThinkPad T16 G2 21K70035GE B160UAN01.K, IPS LED, 1920x1200, 16", Hz | |
|---|---|---|---|---|---|---|
| Display | 20% | 23% | 18% | -10% | 2% | |
| Display P3 Coverage (%) | 73.6 | 99.4 35% | 99.9 36% | 98.8 34% | 63.3 -14% | 75.9 3% |
| sRGB Coverage (%) | 100 | 100 0% | 100 0% | 100 0% | 95.2 -5% | 98.2 -2% |
| AdobeRGB 1998 Coverage (%) | 74.2 | 92.5 25% | 98.6 33% | 89.9 21% | 65.3 -12% | 77.2 4% |
| Response Times | -527% | 71% | -437% | -141% | -548% | |
| Response Time Grey 50% / Grey 80% * (ms) | 4.6 ? | 15.4 ? -235% | 1.7 ? 63% | 39.2 ? -752% | 15 ? -226% | 40.8 ? -787% |
| Response Time Black / White * (ms) | 6.6 ? | 60.6 ? -818% | 1.4 ? 79% | 14.6 ? -121% | 10.3 ? -56% | 26.9 ? -308% |
| PWM Frequency (Hz) | 2753.7 ? | 60 ? | ||||
| PWM Amplitude * (%) | 90 | |||||
| Screen | 3% | 329% | -8% | -12% | -31% | |
| Brightness middle (cd/m²) | 608 | 413 -32% | 307 -50% | 520 -14% | 368 -39% | 446 -27% |
| Brightness (cd/m²) | 585 | 409 -30% | 307 -48% | 510 -13% | 368 -37% | 425 -27% |
| Brightness Distribution (%) | 93 | 97 4% | 96 3% | 93 0% | 91 -2% | 91 -2% |
| Black Level * (cd/m²) | 0.61 | 0.14 77% | 0.01 98% | 0.35 43% | 0.31 49% | 0.28 54% |
| Contrast (:1) | 997 | 2950 196% | 30700 2979% | 1486 49% | 1187 19% | 1593 60% |
| Colorchecker dE 2000 * | 2.1 | 3.48 -66% | 2.1 -0% | 2.9 -38% | 2.4 -14% | 3.7 -76% |
| Colorchecker dE 2000 max. * | 4.3 | 6.97 -62% | 4.87 -13% | 6.2 -44% | 6.5 -51% | 8.8 -105% |
| Colorchecker dE 2000 calibrated * | 1.2 | 2.08 -73% | 1.1 8% | 0.8 33% | 1.6 -33% | |
| Greyscale dE 2000 * | 2.7 | 4.5 -67% | 0.9 67% | 4.3 -59% | 4.5 -67% | 6 -122% |
| Gamma | 2.2 100% | 2.15 102% | 2.197 100% | 2.19 100% | 2.21 100% | 2.2 100% |
| CCT | 6168 105% | 6446 101% | 6513 100% | 7422 88% | 6324 103% | 6499 100% |
| Total Average (Program / Settings) | -168% /
-75% | 141% /
227% | -142% /
-63% | -54% /
-30% | -192% /
-98% |
* ... smaller is better
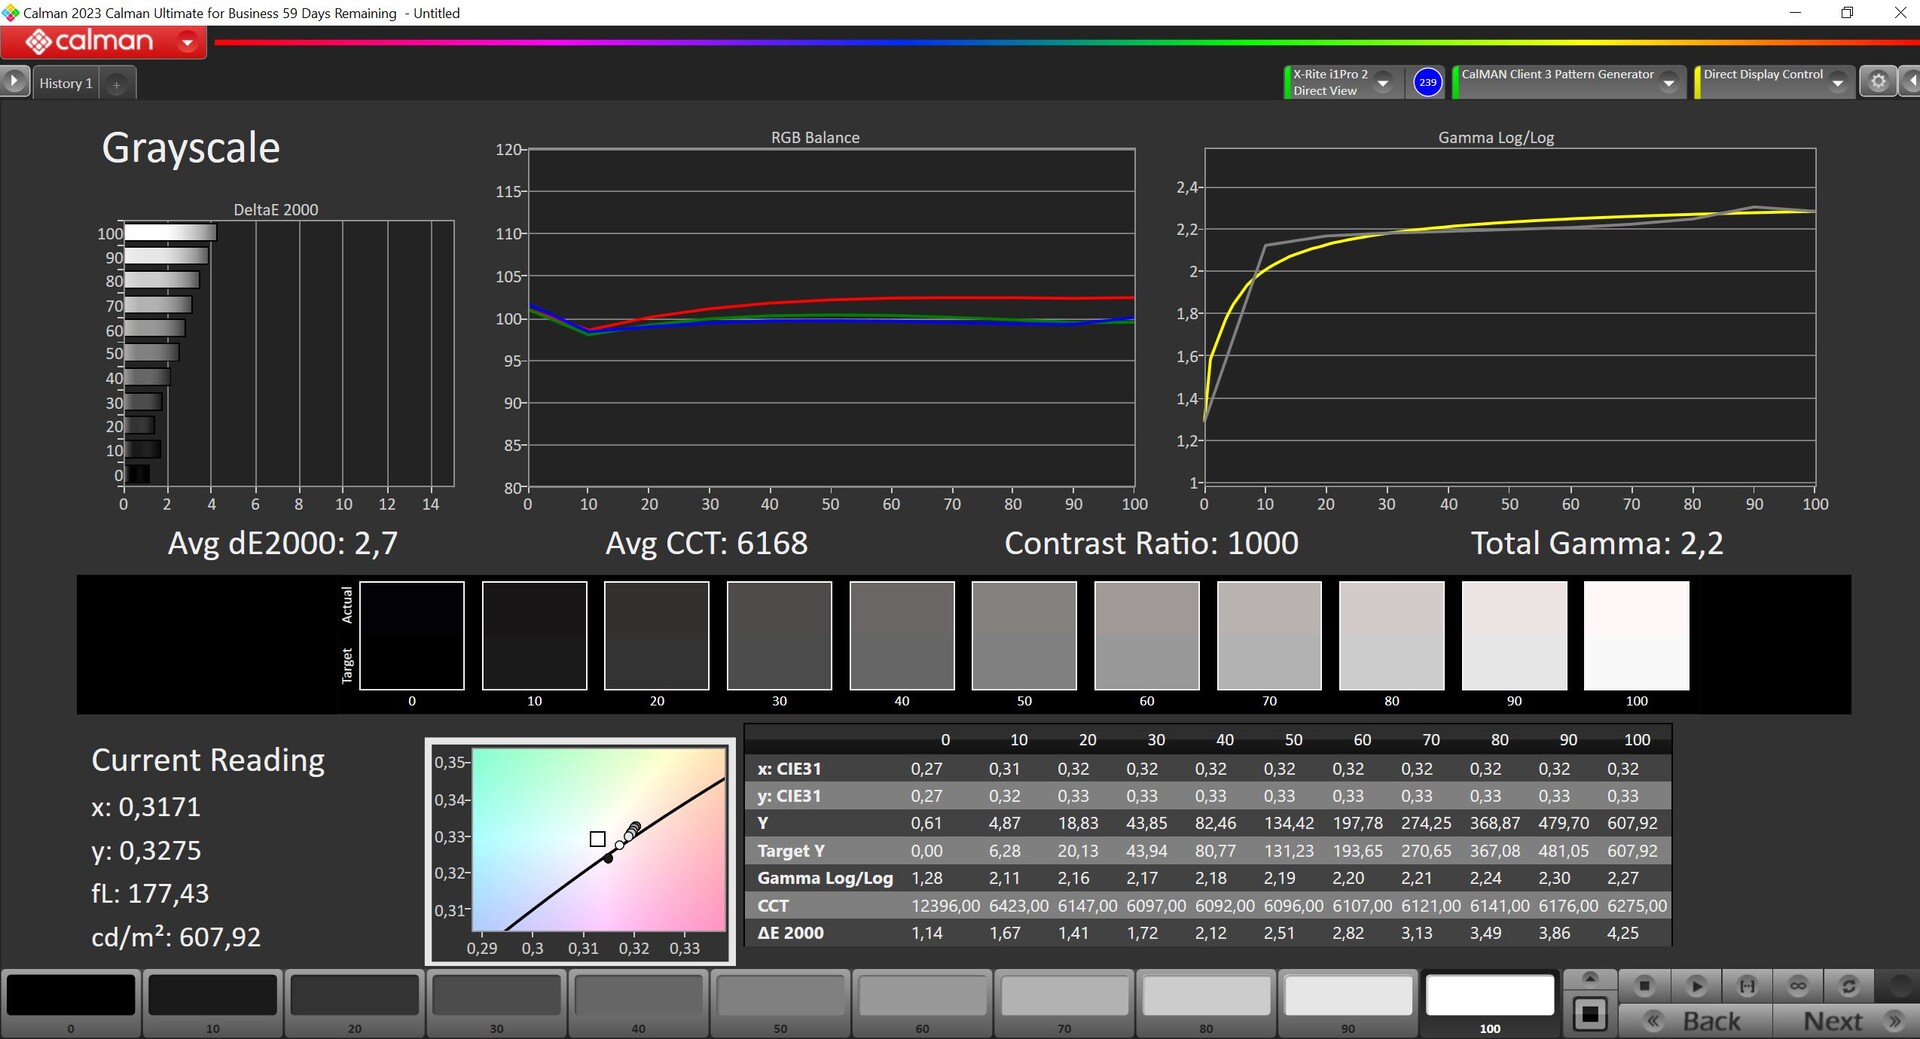
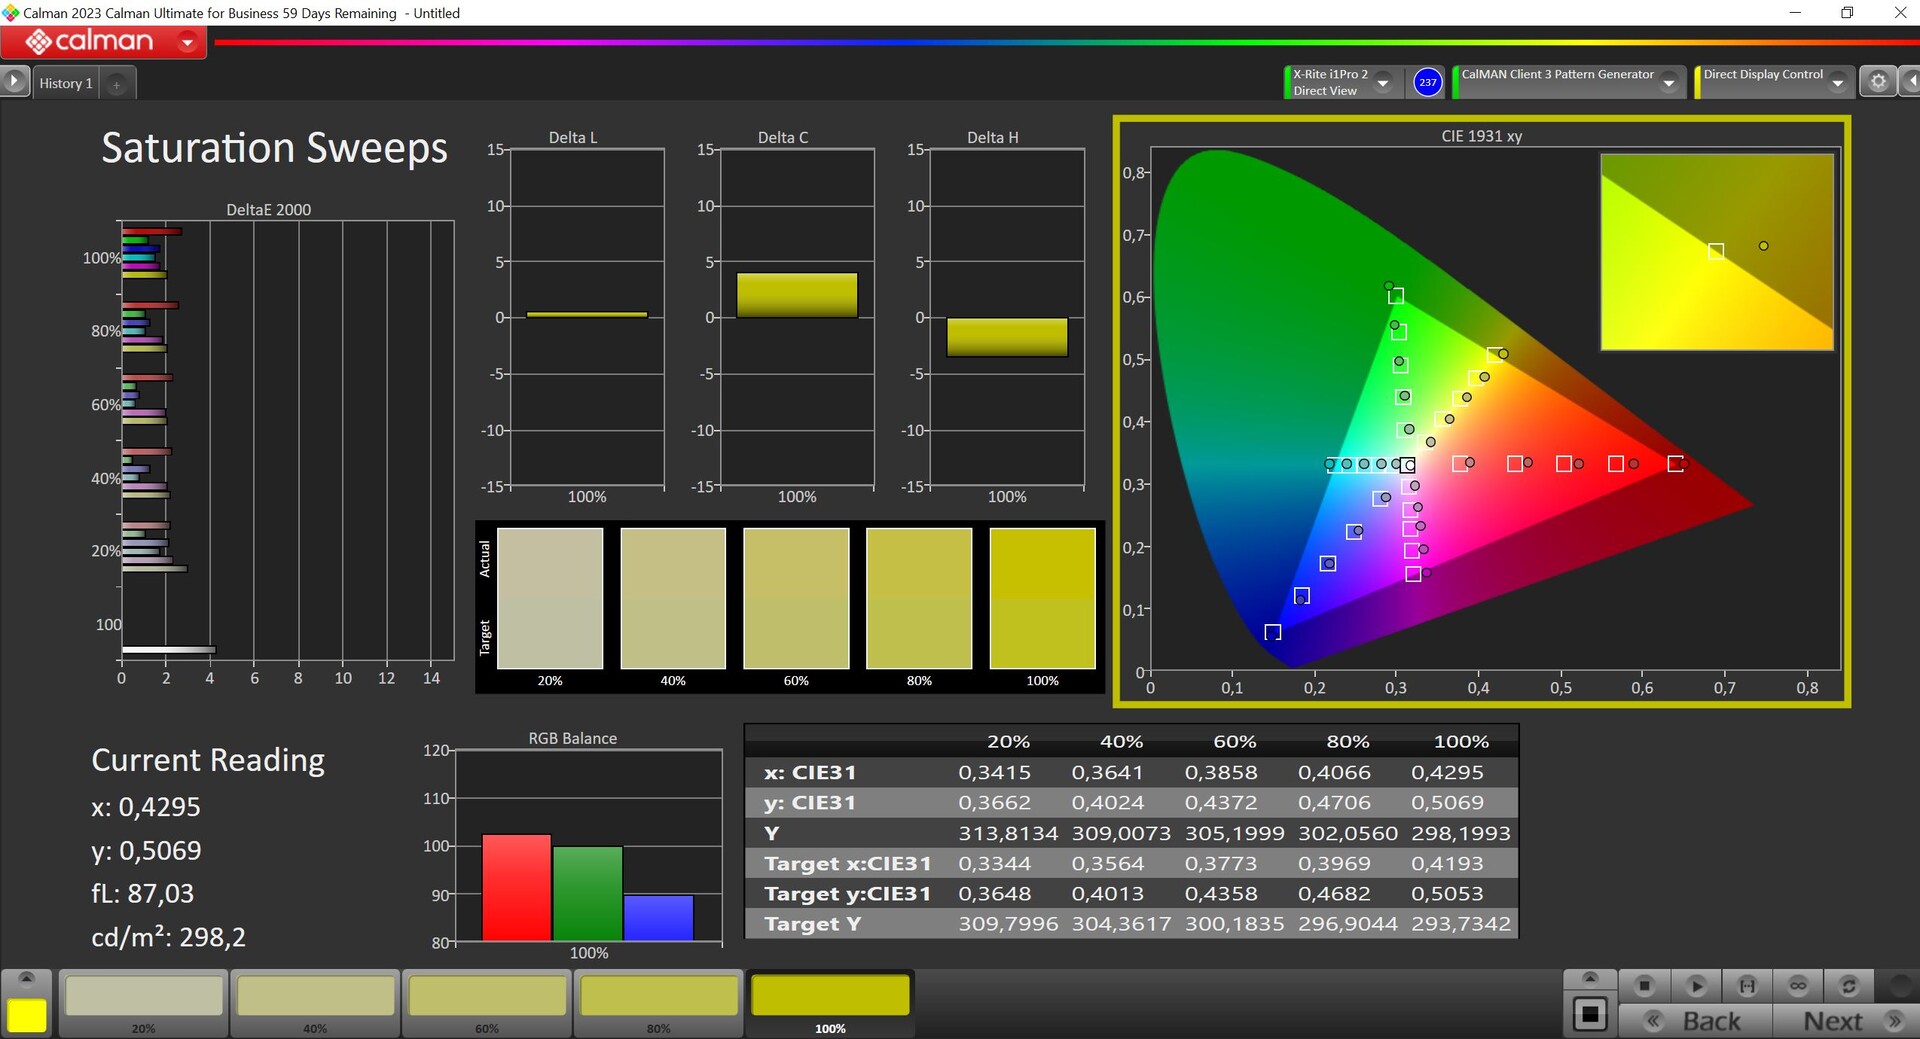
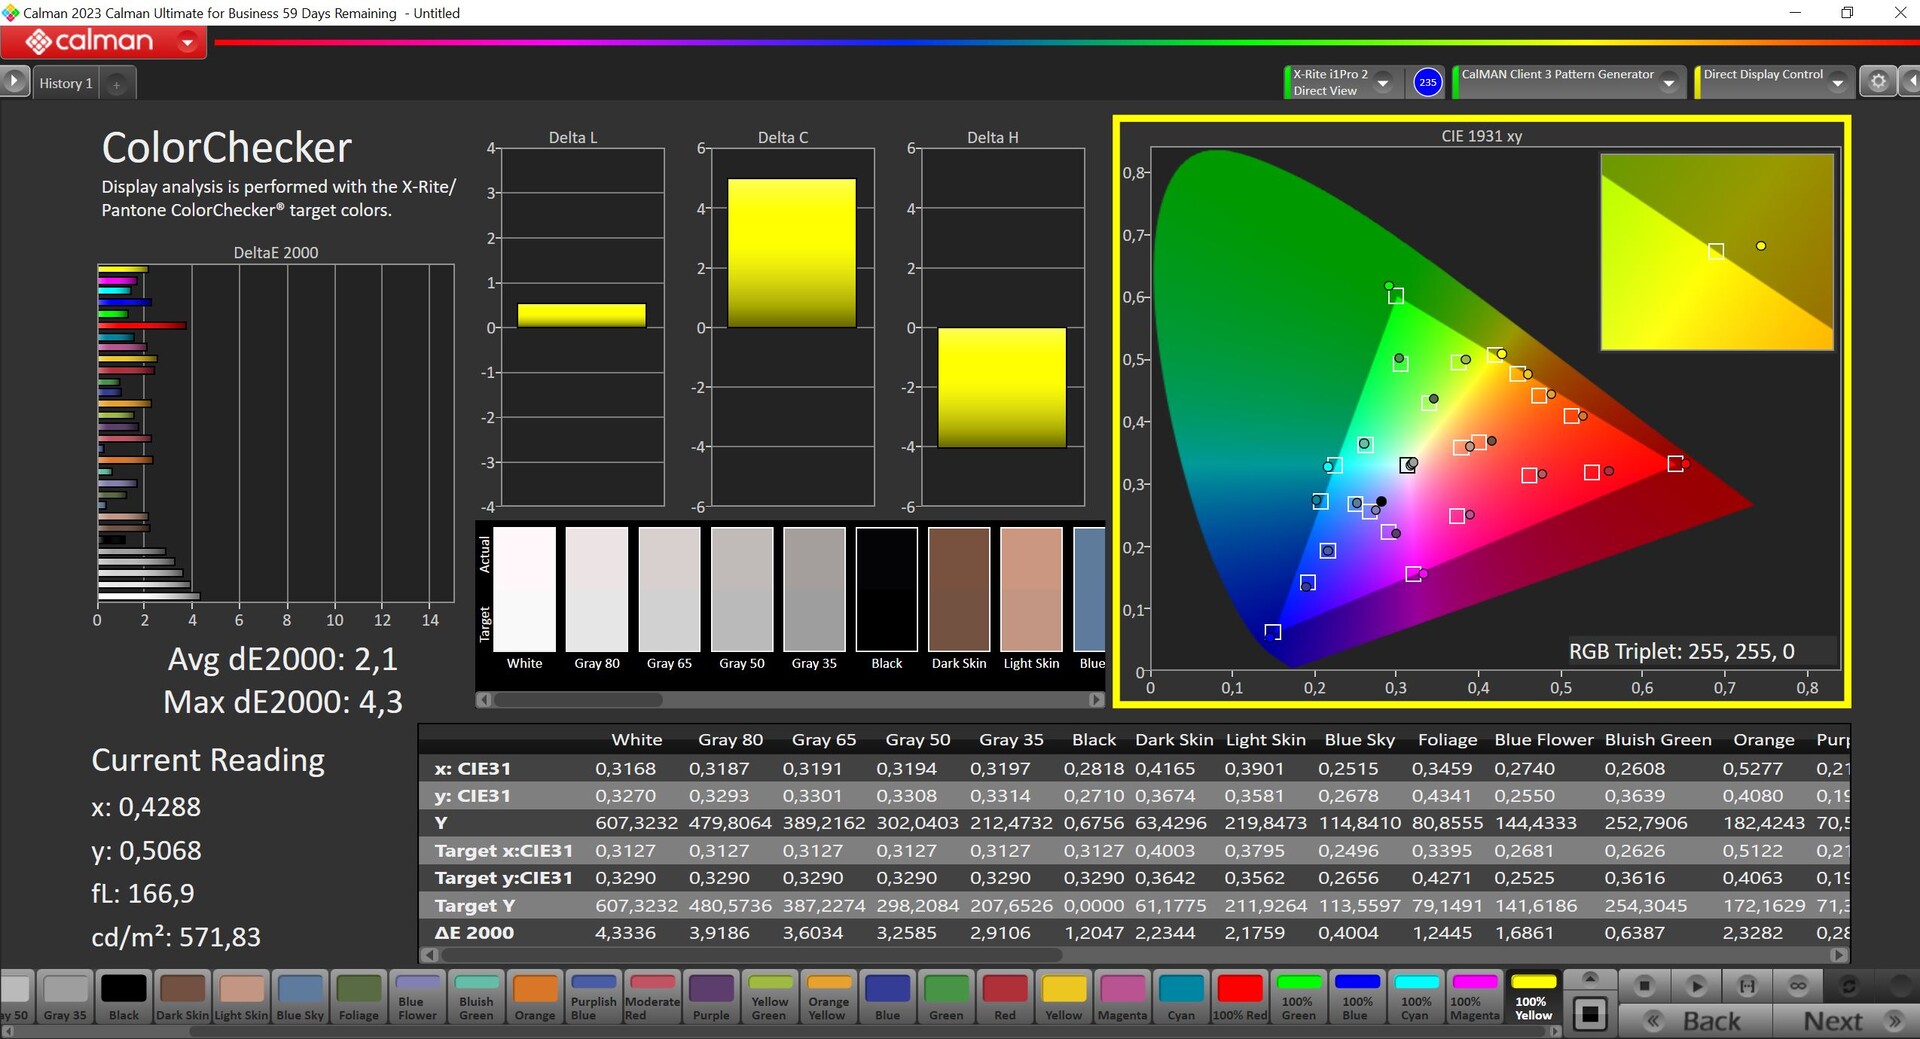
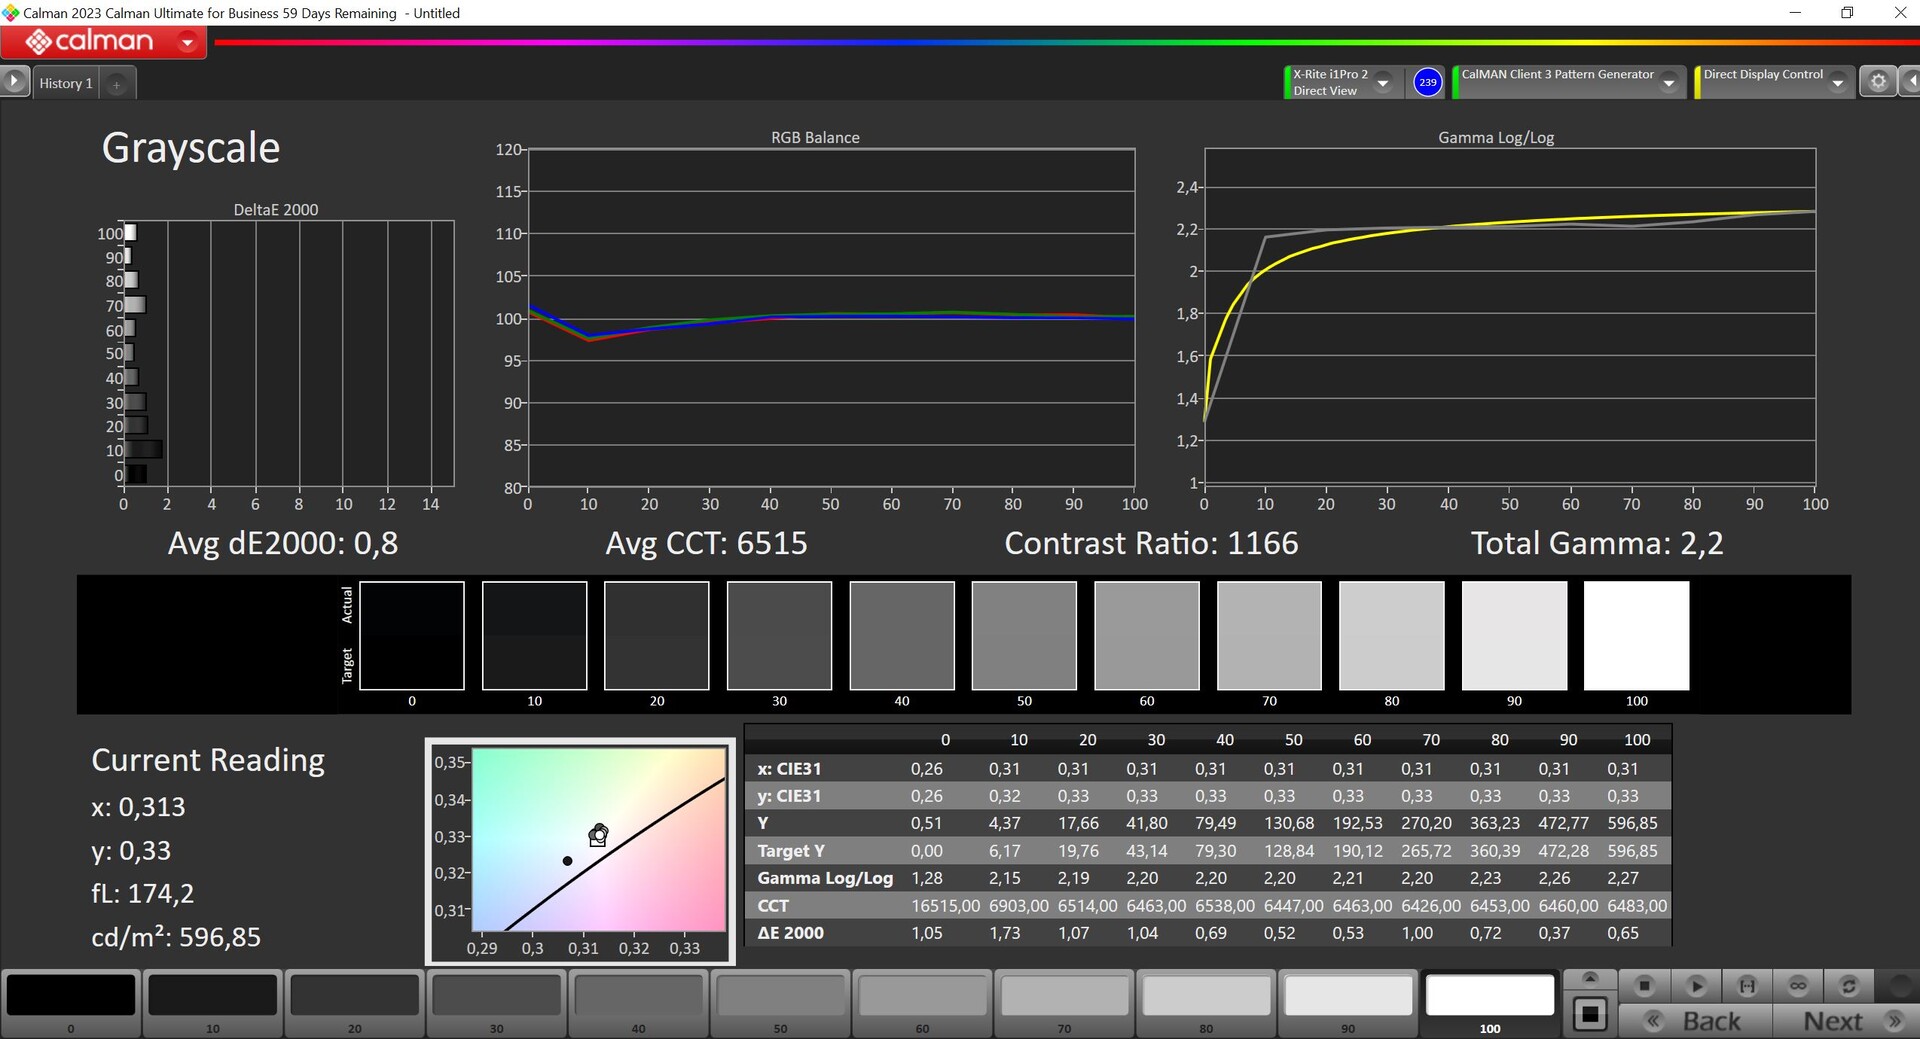
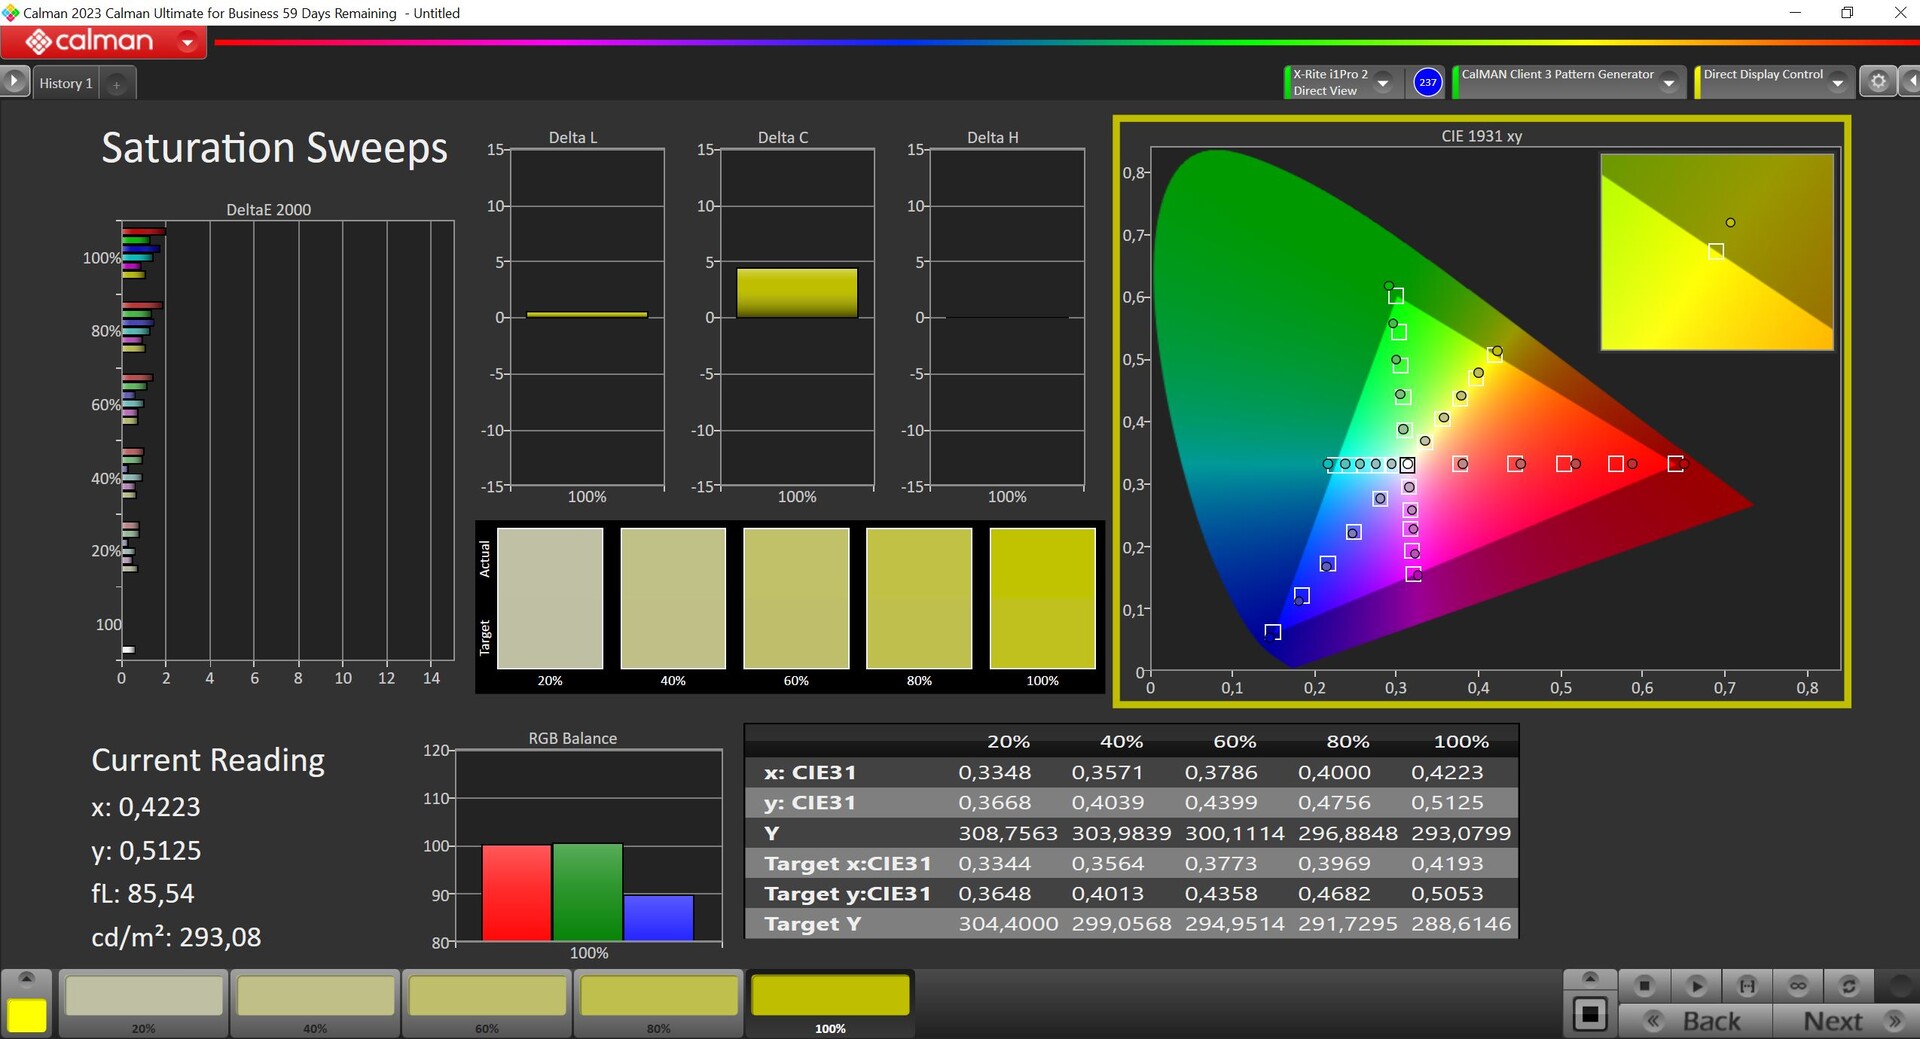

We measured the panel with the professional CalMAN software (X-Rite i1 Pro2) and you can download a pre-calibrated profile from the manufacturer in the Control Center, which we also used for the measurement. However, the color temperature here is a little too warm and there are also some values for colors and grayscale that exceed the target value of 3. With our own calibration (profile is available for free download above), we can significantly improve the display and all values are within the target range. Together with the complete sRGB coverage, the Evo 15 is, therefore, also suitable for editing images/videos without restrictions.
Display Response Times
| ↔ Response Time Black to White | ||
|---|---|---|
| 6.6 ms ... rise ↗ and fall ↘ combined | ↗ 2.8 ms rise |  |
| ↘ 3.8 ms fall | ||
| The screen shows very fast response rates in our tests and should be very well suited for fast-paced gaming. In comparison, all tested devices range from 0.1 (minimum) to 240 (maximum) ms. » 21 % of all devices are better. This means that the measured response time is better than the average of all tested devices (19.8 ms). | ||
| ↔ Response Time 50% Grey to 80% Grey | ||
| 4.6 ms ... rise ↗ and fall ↘ combined | ↗ 1.3 ms rise |  |
| ↘ 2.3 ms fall | ||
| The screen shows very fast response rates in our tests and should be very well suited for fast-paced gaming. In comparison, all tested devices range from 0.165 (minimum) to 636 (maximum) ms. » 16 % of all devices are better. This means that the measured response time is better than the average of all tested devices (31 ms). | ||
Screen Flickering / PWM (Pulse-Width Modulation)
| Screen flickering / PWM not detected | 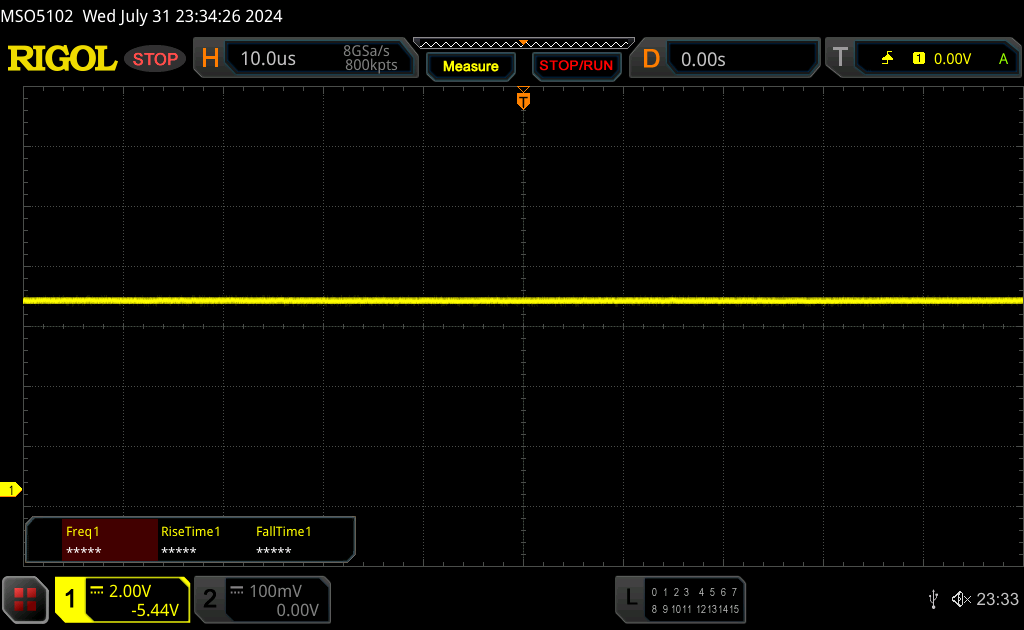 | ||
In comparison: 52 % of all tested devices do not use PWM to dim the display. If PWM was detected, an average of 7751 (minimum: 5 - maximum: 343500) Hz was measured. | |||

The matte panel performs very well outdoors thanks to the high brightness and even on bright days you can still see the content clearly. The viewing angle stability of the IPS panel is very good.

Performance - Meteor Lake and up to 96 GB RAM
The XMG Evo 15 is either equipped with the AMD Ryzen 7 8845HS or the Intel Core Ultra 7 155H in our test device. The two RAM slots allow up to 96 GB of DDR5 RAM, but the frequency is limited from 5600 to 4800 MHz when using 48 GB modules due to thermal restrictions.
Test conditions
The pre-installed Control Center offers three different energy profiles (Balanced, Enthusiast & Overboost), which can also be conveniently switched using the Fn+F3 key combination. We carried out the benchmarks and measurements with the standard Enthusiast profile. We have summarized the performance values of the three profiles in the following table:
| Energy profile | CPU TDP | CPU TDP (battery) | CB R23 Multi | Time Spy Graphics | max. Fan volume |
|---|---|---|---|---|---|
| Balanced | 35 watts | 25 watts | 12,759 points | 2,623 points | 35.4 dB(A) |
| Enthusiast | 45 watts | 35 watts | 14,957 points | 3,690 points | 40.4 dB(A) |
| Overboost | 70 watts | 35 watts | 18,790 points | 3,633 points | 48.1 dB(A) |
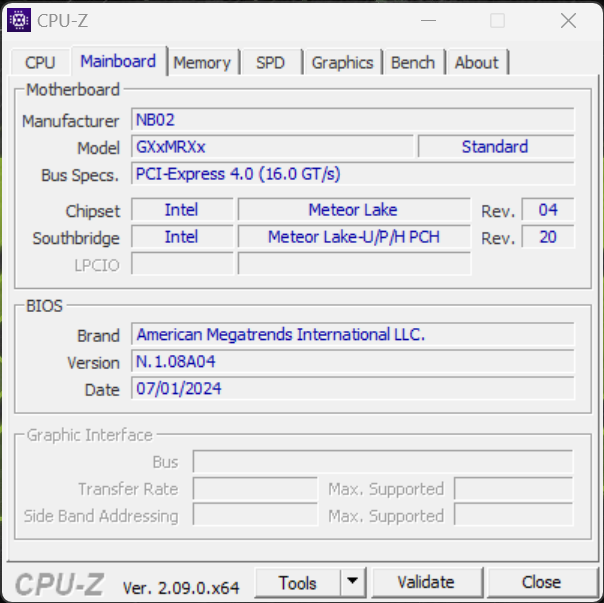
Processor - Core Ultra 7 155H
The Intel Core Ultra 7 155H is currently used in many laptops, but the XMG Evo 15 is one of the few models that does not have an increased short-term power limit. In Enthusiast mode, the consumption is 45 watts and this value is kept constant (this also applies to the other performance profiles with 70 and 35 watts) and there is no loss of performance under continuous load. In enthusiast mode, the performance is already very good, but if you need even more power, you can easily use the overboost mode (+25% multi-core performance). In battery mode, however, the maximum consumption drops to 35 watts, which results in a 15% reduction in performance. Further CPU benchmarks can be found in our technology section.
Cinebench R15 Multi loop
Cinebench R23: Multi Core | Single Core
Cinebench R20: CPU (Multi Core) | CPU (Single Core)
Cinebench R15: CPU Multi 64Bit | CPU Single 64Bit
Blender: v2.79 BMW27 CPU
7-Zip 18.03: 7z b 4 | 7z b 4 -mmt1
Geekbench 6.7: Multi-Core | Single-Core
Geekbench 5.5: Multi-Core | Single-Core
HWBOT x265 Benchmark v2.2: 4k Preset
LibreOffice : 20 Documents To PDF
R Benchmark 2.5: Overall mean
| CPU Performance rating | |
| Lenovo IdeaPad Pro 5 16IMH G9 | |
| Average of class Multimedia | |
| Xiaomi RedmiBook Pro 16 2024 | |
| Dell Inspiron 16 7640 2-in-1 | |
| Schenker XMG Evo 15 (M24) | |
| Medion S10 OLED | |
| Average Intel Core Ultra 7 155H | |
| Lenovo ThinkPad T16 G2 21K70035GE | |
| Cinebench R23 / Multi Core | |
| Lenovo IdeaPad Pro 5 16IMH G9 | |
| Xiaomi RedmiBook Pro 16 2024 | |
| Average of class Multimedia (4861 - 33362, n=65, last 2 years) | |
| Dell Inspiron 16 7640 2-in-1 | |
| Medion S10 OLED | |
| Average Intel Core Ultra 7 155H (9769 - 19007, n=52) | |
| Schenker XMG Evo 15 (M24) | |
| Lenovo ThinkPad T16 G2 21K70035GE | |
| Cinebench R23 / Single Core | |
| Average of class Multimedia (1128 - 2459, n=64, last 2 years) | |
| Medion S10 OLED | |
| Lenovo IdeaPad Pro 5 16IMH G9 | |
| Xiaomi RedmiBook Pro 16 2024 | |
| Dell Inspiron 16 7640 2-in-1 | |
| Schenker XMG Evo 15 (M24) | |
| Average Intel Core Ultra 7 155H (1496 - 1815, n=52) | |
| Lenovo ThinkPad T16 G2 21K70035GE | |
| Cinebench R20 / CPU (Multi Core) | |
| Lenovo IdeaPad Pro 5 16IMH G9 | |
| Xiaomi RedmiBook Pro 16 2024 | |
| Average of class Multimedia (1887 - 12912, n=56, last 2 years) | |
| Dell Inspiron 16 7640 2-in-1 | |
| Medion S10 OLED | |
| Average Intel Core Ultra 7 155H (3798 - 7409, n=50) | |
| Schenker XMG Evo 15 (M24) | |
| Lenovo ThinkPad T16 G2 21K70035GE | |
| Cinebench R20 / CPU (Single Core) | |
| Average of class Multimedia (425 - 853, n=56, last 2 years) | |
| Lenovo IdeaPad Pro 5 16IMH G9 | |
| Medion S10 OLED | |
| Schenker XMG Evo 15 (M24) | |
| Lenovo ThinkPad T16 G2 21K70035GE | |
| Xiaomi RedmiBook Pro 16 2024 | |
| Dell Inspiron 16 7640 2-in-1 | |
| Average Intel Core Ultra 7 155H (601 - 696, n=50) | |
| Cinebench R15 / CPU Multi 64Bit | |
| Xiaomi RedmiBook Pro 16 2024 | |
| Lenovo IdeaPad Pro 5 16IMH G9 | |
| Dell Inspiron 16 7640 2-in-1 | |
| Average of class Multimedia (856 - 5224, n=60, last 2 years) | |
| Average Intel Core Ultra 7 155H (1932 - 2880, n=56) | |
| Medion S10 OLED | |
| Schenker XMG Evo 15 (M24) | |
| Lenovo ThinkPad T16 G2 21K70035GE | |
| Cinebench R15 / CPU Single 64Bit | |
| Average of class Multimedia (184.8 - 326, n=58, last 2 years) | |
| Lenovo IdeaPad Pro 5 16IMH G9 | |
| Lenovo ThinkPad T16 G2 21K70035GE | |
| Schenker XMG Evo 15 (M24) | |
| Medion S10 OLED | |
| Xiaomi RedmiBook Pro 16 2024 | |
| Dell Inspiron 16 7640 2-in-1 | |
| Average Intel Core Ultra 7 155H (99.6 - 268, n=52) | |
| Blender / v2.79 BMW27 CPU | |
| Average of class Multimedia (100 - 557, n=57, last 2 years) | |
| Lenovo ThinkPad T16 G2 21K70035GE | |
| Average Intel Core Ultra 7 155H (175 - 381, n=47) | |
| Dell Inspiron 16 7640 2-in-1 | |
| Schenker XMG Evo 15 (M24) | |
| Medion S10 OLED | |
| Lenovo IdeaPad Pro 5 16IMH G9 | |
| Xiaomi RedmiBook Pro 16 2024 | |
| 7-Zip 18.03 / 7z b 4 | |
| Lenovo IdeaPad Pro 5 16IMH G9 | |
| Xiaomi RedmiBook Pro 16 2024 | |
| Dell Inspiron 16 7640 2-in-1 | |
| Schenker XMG Evo 15 (M24) | |
| Average Intel Core Ultra 7 155H (41739 - 70254, n=50) | |
| Medion S10 OLED | |
| Average of class Multimedia (26062 - 130368, n=54, last 2 years) | |
| Lenovo ThinkPad T16 G2 21K70035GE | |
| 7-Zip 18.03 / 7z b 4 -mmt1 | |
| Lenovo ThinkPad T16 G2 21K70035GE | |
| Average of class Multimedia (3666 - 7545, n=55, last 2 years) | |
| Schenker XMG Evo 15 (M24) | |
| Medion S10 OLED | |
| Xiaomi RedmiBook Pro 16 2024 | |
| Lenovo IdeaPad Pro 5 16IMH G9 | |
| Dell Inspiron 16 7640 2-in-1 | |
| Average Intel Core Ultra 7 155H (4594 - 5621, n=50) | |
| Geekbench 6.7 / Multi-Core | |
| Average of class Multimedia (4983 - 29415, n=67, last 2 years) | |
| Xiaomi RedmiBook Pro 16 2024 | |
| Lenovo IdeaPad Pro 5 16IMH G9 | |
| Schenker XMG Evo 15 (M24) | |
| Average Intel Core Ultra 7 155H (7732 - 13656, n=55) | |
| Dell Inspiron 16 7640 2-in-1 | |
| Medion S10 OLED | |
| Lenovo ThinkPad T16 G2 21K70035GE | |
| Geekbench 6.7 / Single-Core | |
| Average of class Multimedia (1534 - 4335, n=66, last 2 years) | |
| Lenovo ThinkPad T16 G2 21K70035GE | |
| Schenker XMG Evo 15 (M24) | |
| Medion S10 OLED | |
| Lenovo IdeaPad Pro 5 16IMH G9 | |
| Xiaomi RedmiBook Pro 16 2024 | |
| Average Intel Core Ultra 7 155H (1901 - 2473, n=52) | |
| Dell Inspiron 16 7640 2-in-1 | |
| Geekbench 5.5 / Multi-Core | |
| Xiaomi RedmiBook Pro 16 2024 | |
| Average of class Multimedia (4652 - 20422, n=55, last 2 years) | |
| Lenovo IdeaPad Pro 5 16IMH G9 | |
| Dell Inspiron 16 7640 2-in-1 | |
| Average Intel Core Ultra 7 155H (10017 - 13556, n=52) | |
| Schenker XMG Evo 15 (M24) | |
| Medion S10 OLED | |
| Lenovo ThinkPad T16 G2 21K70035GE | |
| Geekbench 5.5 / Single-Core | |
| Average of class Multimedia (805 - 2974, n=55, last 2 years) | |
| Schenker XMG Evo 15 (M24) | |
| Lenovo IdeaPad Pro 5 16IMH G9 | |
| Xiaomi RedmiBook Pro 16 2024 | |
| Medion S10 OLED | |
| Dell Inspiron 16 7640 2-in-1 | |
| Lenovo ThinkPad T16 G2 21K70035GE | |
| Average Intel Core Ultra 7 155H (1462 - 1824, n=52) | |
| HWBOT x265 Benchmark v2.2 / 4k Preset | |
| Lenovo IdeaPad Pro 5 16IMH G9 | |
| Xiaomi RedmiBook Pro 16 2024 | |
| Average of class Multimedia (5.26 - 36.1, n=55, last 2 years) | |
| Dell Inspiron 16 7640 2-in-1 | |
| Schenker XMG Evo 15 (M24) | |
| Medion S10 OLED | |
| Average Intel Core Ultra 7 155H (9.93 - 21.2, n=50) | |
| Lenovo ThinkPad T16 G2 21K70035GE | |
| LibreOffice / 20 Documents To PDF | |
| Average Intel Core Ultra 7 155H (37.5 - 79.2, n=49) | |
| Average of class Multimedia (23.9 - 146.7, n=56, last 2 years) | |
| Medion S10 OLED | |
| Xiaomi RedmiBook Pro 16 2024 | |
| Dell Inspiron 16 7640 2-in-1 | |
| Lenovo ThinkPad T16 G2 21K70035GE | |
| Schenker XMG Evo 15 (M24) | |
| Lenovo IdeaPad Pro 5 16IMH G9 | |
| R Benchmark 2.5 / Overall mean | |
| Dell Inspiron 16 7640 2-in-1 | |
| Average Intel Core Ultra 7 155H (0.4457 - 0.53, n=49) | |
| Lenovo ThinkPad T16 G2 21K70035GE | |
| Xiaomi RedmiBook Pro 16 2024 | |
| Medion S10 OLED | |
| Average of class Multimedia (0.3604 - 0.947, n=55, last 2 years) | |
| Lenovo IdeaPad Pro 5 16IMH G9 | |
| Schenker XMG Evo 15 (M24) | |
* ... smaller is better
AIDA64: FP32 Ray-Trace | FPU Julia | CPU SHA3 | CPU Queen | FPU SinJulia | FPU Mandel | CPU AES | CPU ZLib | FP64 Ray-Trace | CPU PhotoWorxx
| Performance rating | |
| Lenovo ThinkPad T16 G2 21K70035GE | |
| Lenovo IdeaPad Pro 5 16IMH G9 | |
| Average of class Multimedia | |
| Xiaomi RedmiBook Pro 16 2024 | |
| Dell Inspiron 16 7640 2-in-1 | |
| Schenker XMG Evo 15 (M24) | |
| Medion S10 OLED | |
| Average Intel Core Ultra 7 155H | |
| AIDA64 / FP32 Ray-Trace | |
| Lenovo ThinkPad T16 G2 21K70035GE | |
| Average of class Multimedia (2214 - 50388, n=53, last 2 years) | |
| Lenovo IdeaPad Pro 5 16IMH G9 | |
| Medion S10 OLED | |
| Dell Inspiron 16 7640 2-in-1 | |
| Xiaomi RedmiBook Pro 16 2024 | |
| Average Intel Core Ultra 7 155H (6670 - 18470, n=50) | |
| Schenker XMG Evo 15 (M24) | |
| AIDA64 / FPU Julia | |
| Lenovo ThinkPad T16 G2 21K70035GE | |
| Lenovo IdeaPad Pro 5 16IMH G9 | |
| Average of class Multimedia (12867 - 201874, n=53, last 2 years) | |
| Xiaomi RedmiBook Pro 16 2024 | |
| Medion S10 OLED | |
| Dell Inspiron 16 7640 2-in-1 | |
| Schenker XMG Evo 15 (M24) | |
| Average Intel Core Ultra 7 155H (40905 - 93181, n=50) | |
| AIDA64 / CPU SHA3 | |
| Lenovo IdeaPad Pro 5 16IMH G9 | |
| Lenovo ThinkPad T16 G2 21K70035GE | |
| Average of class Multimedia (626 - 8623, n=53, last 2 years) | |
| Xiaomi RedmiBook Pro 16 2024 | |
| Medion S10 OLED | |
| Dell Inspiron 16 7640 2-in-1 | |
| Schenker XMG Evo 15 (M24) | |
| Average Intel Core Ultra 7 155H (1940 - 4436, n=50) | |
| AIDA64 / CPU Queen | |
| Lenovo ThinkPad T16 G2 21K70035GE | |
| Dell Inspiron 16 7640 2-in-1 | |
| Xiaomi RedmiBook Pro 16 2024 | |
| Lenovo IdeaPad Pro 5 16IMH G9 | |
| Average Intel Core Ultra 7 155H (64698 - 94181, n=50) | |
| Schenker XMG Evo 15 (M24) | |
| Medion S10 OLED | |
| Average of class Multimedia (13483 - 181505, n=40, last 2 years) | |
| AIDA64 / FPU SinJulia | |
| Lenovo ThinkPad T16 G2 21K70035GE | |
| Lenovo IdeaPad Pro 5 16IMH G9 | |
| Dell Inspiron 16 7640 2-in-1 | |
| Xiaomi RedmiBook Pro 16 2024 | |
| Schenker XMG Evo 15 (M24) | |
| Average Intel Core Ultra 7 155H (5639 - 10647, n=50) | |
| Medion S10 OLED | |
| Average of class Multimedia (886 - 28794, n=53, last 2 years) | |
| AIDA64 / FPU Mandel | |
| Lenovo ThinkPad T16 G2 21K70035GE | |
| Lenovo IdeaPad Pro 5 16IMH G9 | |
| Average of class Multimedia (6395 - 105740, n=53, last 2 years) | |
| Medion S10 OLED | |
| Xiaomi RedmiBook Pro 16 2024 | |
| Dell Inspiron 16 7640 2-in-1 | |
| Schenker XMG Evo 15 (M24) | |
| Average Intel Core Ultra 7 155H (18236 - 47685, n=50) | |
| AIDA64 / CPU AES | |
| Schenker XMG Evo 15 (M24) | |
| Lenovo IdeaPad Pro 5 16IMH G9 | |
| Average Intel Core Ultra 7 155H (45713 - 152179, n=50) | |
| Lenovo ThinkPad T16 G2 21K70035GE | |
| Dell Inspiron 16 7640 2-in-1 | |
| Xiaomi RedmiBook Pro 16 2024 | |
| Medion S10 OLED | |
| Average of class Multimedia (8171 - 126790, n=53, last 2 years) | |
| AIDA64 / CPU ZLib | |
| Lenovo IdeaPad Pro 5 16IMH G9 | |
| Xiaomi RedmiBook Pro 16 2024 | |
| Dell Inspiron 16 7640 2-in-1 | |
| Medion S10 OLED | |
| Average of class Multimedia (143.8 - 2022, n=53, last 2 years) | |
| Average Intel Core Ultra 7 155H (557 - 1250, n=50) | |
| Schenker XMG Evo 15 (M24) | |
| Lenovo ThinkPad T16 G2 21K70035GE | |
| AIDA64 / FP64 Ray-Trace | |
| Lenovo ThinkPad T16 G2 21K70035GE | |
| Average of class Multimedia (1014 - 26875, n=53, last 2 years) | |
| Lenovo IdeaPad Pro 5 16IMH G9 | |
| Medion S10 OLED | |
| Dell Inspiron 16 7640 2-in-1 | |
| Xiaomi RedmiBook Pro 16 2024 | |
| Schenker XMG Evo 15 (M24) | |
| Average Intel Core Ultra 7 155H (3569 - 9802, n=50) | |
| AIDA64 / CPU PhotoWorxx | |
| Lenovo IdeaPad Pro 5 16IMH G9 | |
| Xiaomi RedmiBook Pro 16 2024 | |
| Average of class Multimedia (8187 - 88154, n=53, last 2 years) | |
| Average Intel Core Ultra 7 155H (32719 - 54223, n=50) | |
| Schenker XMG Evo 15 (M24) | |
| Dell Inspiron 16 7640 2-in-1 | |
| Medion S10 OLED | |
| Lenovo ThinkPad T16 G2 21K70035GE | |
System performance
The overall system performance is excellent and the Evo 15 is a very fast system in everyday use. We also had no problems with system stability during our test period.
CrossMark: Overall | Productivity | Creativity | Responsiveness
WebXPRT 3: Overall
WebXPRT 4: Overall
Mozilla Kraken 1.1: Total
| PCMark 10 / Score | |
| Average of class Multimedia (4325 - 10386, n=51, last 2 years) | |
| Schenker XMG Evo 15 (M24) | |
| Lenovo IdeaPad Pro 5 16IMH G9 | |
| Dell Inspiron 16 7640 2-in-1 | |
| Xiaomi RedmiBook Pro 16 2024 | |
| Average Intel Core Ultra 7 155H, Intel Arc 8-Core iGPU (4809 - 7529, n=34) | |
| Lenovo ThinkPad T16 G2 21K70035GE | |
| Medion S10 OLED | |
| PCMark 10 / Essentials | |
| Lenovo IdeaPad Pro 5 16IMH G9 | |
| Schenker XMG Evo 15 (M24) | |
| Dell Inspiron 16 7640 2-in-1 | |
| Xiaomi RedmiBook Pro 16 2024 | |
| Average of class Multimedia (8025 - 11664, n=50, last 2 years) | |
| Average Intel Core Ultra 7 155H, Intel Arc 8-Core iGPU (7605 - 11289, n=34) | |
| Lenovo ThinkPad T16 G2 21K70035GE | |
| Medion S10 OLED | |
| PCMark 10 / Productivity | |
| Average of class Multimedia (7323 - 18233, n=50, last 2 years) | |
| Lenovo IdeaPad Pro 5 16IMH G9 | |
| Lenovo ThinkPad T16 G2 21K70035GE | |
| Schenker XMG Evo 15 (M24) | |
| Dell Inspiron 16 7640 2-in-1 | |
| Average Intel Core Ultra 7 155H, Intel Arc 8-Core iGPU (6042 - 10591, n=34) | |
| Xiaomi RedmiBook Pro 16 2024 | |
| Medion S10 OLED | |
| PCMark 10 / Digital Content Creation | |
| Schenker XMG Evo 15 (M24) | |
| Average of class Multimedia (3651 - 16240, n=50, last 2 years) | |
| Xiaomi RedmiBook Pro 16 2024 | |
| Lenovo IdeaPad Pro 5 16IMH G9 | |
| Dell Inspiron 16 7640 2-in-1 | |
| Average Intel Core Ultra 7 155H, Intel Arc 8-Core iGPU (4985 - 10709, n=34) | |
| Medion S10 OLED | |
| Lenovo ThinkPad T16 G2 21K70035GE | |
| CrossMark / Overall | |
| Average of class Multimedia (866 - 2728, n=59, last 2 years) | |
| Schenker XMG Evo 15 (M24) | |
| Xiaomi RedmiBook Pro 16 2024 | |
| Dell Inspiron 16 7640 2-in-1 | |
| Medion S10 OLED | |
| Average Intel Core Ultra 7 155H, Intel Arc 8-Core iGPU (1366 - 1903, n=34) | |
| Lenovo ThinkPad T16 G2 21K70035GE | |
| Lenovo IdeaPad Pro 5 16IMH G9 | |
| CrossMark / Productivity | |
| Schenker XMG Evo 15 (M24) | |
| Average of class Multimedia (931 - 2489, n=59, last 2 years) | |
| Xiaomi RedmiBook Pro 16 2024 | |
| Medion S10 OLED | |
| Dell Inspiron 16 7640 2-in-1 | |
| Average Intel Core Ultra 7 155H, Intel Arc 8-Core iGPU (1291 - 1798, n=33) | |
| Lenovo ThinkPad T16 G2 21K70035GE | |
| Lenovo IdeaPad Pro 5 16IMH G9 | |
| CrossMark / Creativity | |
| Average of class Multimedia (907 - 3465, n=59, last 2 years) | |
| Xiaomi RedmiBook Pro 16 2024 | |
| Dell Inspiron 16 7640 2-in-1 | |
| Schenker XMG Evo 15 (M24) | |
| Lenovo IdeaPad Pro 5 16IMH G9 | |
| Average Intel Core Ultra 7 155H, Intel Arc 8-Core iGPU (1519 - 1929, n=33) | |
| Medion S10 OLED | |
| Lenovo ThinkPad T16 G2 21K70035GE | |
| CrossMark / Responsiveness | |
| Schenker XMG Evo 15 (M24) | |
| Xiaomi RedmiBook Pro 16 2024 | |
| Medion S10 OLED | |
| Average of class Multimedia (605 - 2024, n=59, last 2 years) | |
| Average Intel Core Ultra 7 155H, Intel Arc 8-Core iGPU (939 - 1802, n=33) | |
| Dell Inspiron 16 7640 2-in-1 | |
| Lenovo ThinkPad T16 G2 21K70035GE | |
| Lenovo IdeaPad Pro 5 16IMH G9 | |
| WebXPRT 3 / Overall | |
| Average of class Multimedia (136.4 - 596, n=62, last 2 years) | |
| Lenovo IdeaPad Pro 5 16IMH G9 | |
| Dell Inspiron 16 7640 2-in-1 | |
| Schenker XMG Evo 15 (M24) | |
| Xiaomi RedmiBook Pro 16 2024 | |
| Average Intel Core Ultra 7 155H, Intel Arc 8-Core iGPU (252 - 299, n=34) | |
| Lenovo ThinkPad T16 G2 21K70035GE | |
| Medion S10 OLED | |
| WebXPRT 4 / Overall | |
| Average of class Multimedia (167.3 - 402, n=64, last 2 years) | |
| Schenker XMG Evo 15 (M24) | |
| Lenovo IdeaPad Pro 5 16IMH G9 | |
| Dell Inspiron 16 7640 2-in-1 | |
| Xiaomi RedmiBook Pro 16 2024 | |
| Average Intel Core Ultra 7 155H, Intel Arc 8-Core iGPU (166.4 - 309, n=29) | |
| Medion S10 OLED | |
| Lenovo ThinkPad T16 G2 21K70035GE | |
| Mozilla Kraken 1.1 / Total | |
| Medion S10 OLED | |
| Medion S10 OLED | |
| Lenovo ThinkPad T16 G2 21K70035GE | |
| Average Intel Core Ultra 7 155H, Intel Arc 8-Core iGPU (517 - 614, n=35) | |
| Schenker XMG Evo 15 (M24) | |
| Dell Inspiron 16 7640 2-in-1 | |
| Xiaomi RedmiBook Pro 16 2024 | |
| Lenovo IdeaPad Pro 5 16IMH G9 | |
| Average of class Multimedia (228 - 835, n=65, last 2 years) | |
* ... smaller is better
| PCMark 10 Score | 7331 points | |
Help | ||
| AIDA64 / Memory Copy | |
| Lenovo IdeaPad Pro 5 16IMH G9 | |
| Xiaomi RedmiBook Pro 16 2024 | |
| Average Intel Core Ultra 7 155H (62397 - 96791, n=50) | |
| Average of class Multimedia (11299 - 132135, n=53, last 2 years) | |
| Dell Inspiron 16 7640 2-in-1 | |
| Schenker XMG Evo 15 (M24) | |
| Lenovo ThinkPad T16 G2 21K70035GE | |
| Medion S10 OLED | |
| AIDA64 / Memory Read | |
| Lenovo IdeaPad Pro 5 16IMH G9 | |
| Xiaomi RedmiBook Pro 16 2024 | |
| Average of class Multimedia (11624 - 174586, n=53, last 2 years) | |
| Average Intel Core Ultra 7 155H (60544 - 90647, n=50) | |
| Schenker XMG Evo 15 (M24) | |
| Medion S10 OLED | |
| Dell Inspiron 16 7640 2-in-1 | |
| Lenovo ThinkPad T16 G2 21K70035GE | |
| AIDA64 / Memory Write | |
| Lenovo ThinkPad T16 G2 21K70035GE | |
| Average of class Multimedia (11755 - 134998, n=53, last 2 years) | |
| Dell Inspiron 16 7640 2-in-1 | |
| Lenovo IdeaPad Pro 5 16IMH G9 | |
| Average Intel Core Ultra 7 155H (58692 - 93451, n=50) | |
| Schenker XMG Evo 15 (M24) | |
| Xiaomi RedmiBook Pro 16 2024 | |
| Medion S10 OLED | |
| AIDA64 / Memory Latency | |
| Dell Inspiron 16 7640 2-in-1 | |
| Average Intel Core Ultra 7 155H (116.2 - 233, n=50) | |
| Medion S10 OLED | |
| Xiaomi RedmiBook Pro 16 2024 | |
| Lenovo IdeaPad Pro 5 16IMH G9 | |
| Schenker XMG Evo 15 (M24) | |
| Lenovo ThinkPad T16 G2 21K70035GE | |
| Average of class Multimedia (7 - 535, n=52, last 2 years) | |
* ... smaller is better
DPC latencies
In our standardized latency test (surfing the Internet, 4K YouTube playback, CPU load), the test device with the current BIOS version shows slight limitations for the use of real-time audio applications.
| DPC Latencies / LatencyMon - interrupt to process latency (max), Web, Youtube, Prime95 | |
| Medion S10 OLED | |
| Schenker XMG Evo 15 (M24) | |
| Dell Inspiron 16 7640 2-in-1 | |
| Lenovo IdeaPad Pro 5 16IMH G9 | |
| Lenovo ThinkPad T16 G2 21K70035GE | |
| Xiaomi RedmiBook Pro 16 2024 | |
* ... smaller is better
Mass storage
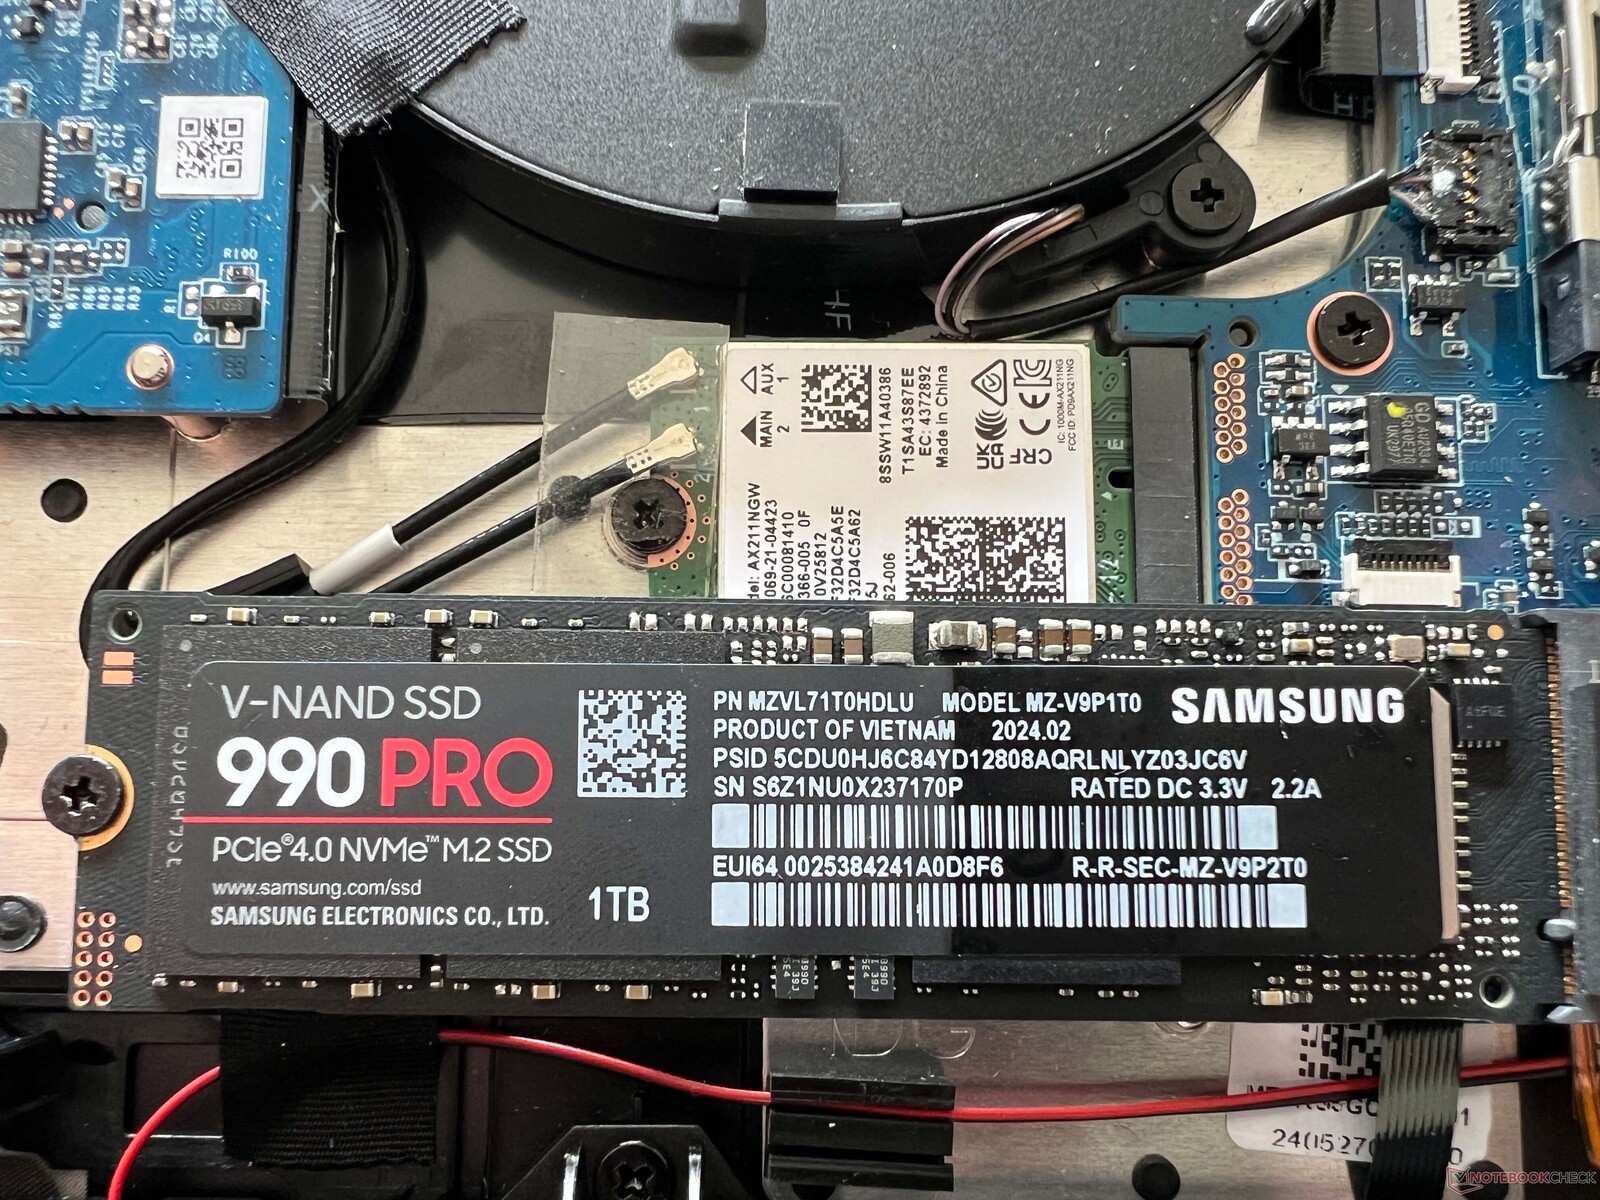
The XMG Evo 15 (M24) offers two M.2-2280 slots, which are connected via PCIe 4.0 and also support a RAID array (0/1). The Evo is equipped with a 500 GB WD Blue SN580 as standard, but our test device is fitted with the 1 TB version of the Samsung 990 Pro, which is an extremely fast SSD with transfer rates of up to 7 GB/s. In addition, the performance remains completely stable even under prolonged load, which is not a matter of course. After the initial start-up, the user has 878 GB at their disposal. Further SSD benchmarks can be found here.

* ... smaller is better
Continuous read: DiskSpd Read Loop, Queue Depth 8
Graphics card - Intel Arc Graphics
The Evo 15 uses the integrated Arc Graphics of the Intel processor, although this is the fast version with 8 Xe cores. The iGPU benefits from the dual-channel RAM configuration, and compared to competitors with faster 7467 RAM (e.g. RedmiBook Pro 16 or IdeaPad Pro 5 16), the graphics performance in the synthetic benchmarks is only marginally lower overall. The Radeon 780M is just overtaken in the benchmarks. In the GPU tables, we have also included the Schenker Via 14 Pro with the Radeon 780M, as it should offer a comparable performance to the XMG Evo 15 with an AMD processor.
The current Intel GPU is a good choice for everyday multimedia and the driver updates in recent months have also improved the gaming performance and overall there are no surprises here. In terms of actual gaming performance, however, Arc Graphics loses its lead and iGPUs are ultimately on the same performance level.
The graphics performance remains constant under constant load, but the performance drops by around 26% in battery mode. Further GPU benchmarks can be found in our technology section.
| 3DMark 11 Performance | 13430 points | |
| 3DMark Fire Strike Score | 7941 points | |
| 3DMark Time Spy Score | 4067 points | |
| 3DMark Steel Nomad Score | 757 points | |
| 3DMark Steel Nomad Light Score | 3248 points | |
Help | ||
| Blender / v3.3 Classroom CPU | |
| Average Intel Arc 8-Core iGPU (294 - 692, n=43) | |
| Lenovo ThinkPad T16 G2 21K70035GE | |
| Average of class Multimedia (134.5 - 1042, n=61, last 2 years) | |
| Dell Inspiron 16 7640 2-in-1 | |
| Schenker XMG Evo 15 (M24) | |
| Medion S10 OLED | |
| Xiaomi RedmiBook Pro 16 2024 | |
| Lenovo IdeaPad Pro 5 16IMH G9 | |
| Blender / v3.3 Classroom oneAPI/Intel | |
| Average of class Multimedia (105 - 492, n=17, last 2 years) | |
| Average Intel Arc 8-Core iGPU (208 - 309, n=17) | |
| Dell Inspiron 16 7640 2-in-1 | |
* ... smaller is better
| The Witcher 3 - 1920x1080 Ultra Graphics & Postprocessing (HBAO+) | |
| Average of class Multimedia (11 - 107, n=5, last 2 years) | |
| Schenker XMG Evo 15 (M24) | |
| Lenovo IdeaPad Pro 5 16IMH G9 | |
| Xiaomi RedmiBook Pro 16 2024 | |
| Lenovo ThinkPad T16 G2 21K70035GE | |
| Dell Inspiron 16 7640 2-in-1 | |
Cyberpunk 2077 Ultra FPS chart
| low | med. | high | ultra | |
|---|---|---|---|---|
| GTA V (2015) | 169.3 | 160.2 | 44.7 | 17.8 |
| The Witcher 3 (2015) | 152 | 93 | 49 | 26 |
| Dota 2 Reborn (2015) | 107.4 | 90.8 | 83.3 | 80.5 |
| Final Fantasy XV Benchmark (2018) | 77 | 40.3 | 29.2 | |
| X-Plane 11.11 (2018) | 54 | 40.4 | 35.8 | |
| Far Cry 5 (2018) | 77 | 43 | 41 | 38 |
| Strange Brigade (2018) | 171 | 73 | 62 | 52 |
| F1 22 (2022) | 96.1 | 87 | 65.2 | 16.9 |
| Baldur's Gate 3 (2023) | 40.3 | 31.1 | 27.5 | 26.2 |
| Cyberpunk 2077 (2023) | 37.9 | 31.4 | 26.7 | 23.7 |
| Total War Pharaoh (2023) | 101.4 | 77.6 | 58.9 | 52 |
Emissions - Quiet in everyday life
Noise emissions
The cooling of the Evo 15 is often deactivated or very quiet when idling or under low load. If you put the laptop under more load, it depends on the active energy profile. In Enthusiast mode, the maximum is 40.4 dB(A), and in Balanced mode and Battery mode, the maximum is 35.4 dB(A). If you want to use the full power of the processor in Overboost mode, the cooling becomes significantly louder with a maximum of 48.1 dB(A). Once the load phase has ended, the fans reduce their speed again very quickly (in every profile). There were no other electronic noises in our Evo 15 test device.
Noise level
| Idle |
| 24.7 / 24.7 / 28.9 dB(A) |
| Load |
| 32.7 / 40.4 dB(A) |
 | ||
30 dB silent 40 dB(A) audible 50 dB(A) loud |
||
min: | ||
| Schenker XMG Evo 15 (M24) Arc 8-Core, Ultra 7 155H, Samsung 990 Pro 1 TB | Dell Inspiron 16 7640 2-in-1 Arc 8-Core, Ultra 7 155H, Micron 2550 1TB | Medion S10 OLED Arc 8-Core, Ultra 7 155H, Phison PS5019-E19 SSO1TBITC4-E19-V7 | Xiaomi RedmiBook Pro 16 2024 Arc 8-Core, Ultra 7 155H, YMTC PC300-1TB | Lenovo IdeaPad Pro 5 16IMH G9 Arc 8-Core, Ultra 7 155H, Samsung PM9C1a MZAL81T0HDLB | Lenovo ThinkPad T16 G2 21K70035GE Radeon 780M, R7 7840U, SK hynix PC801 HFS001TEJ9X162N | |
|---|---|---|---|---|---|---|
| Noise | -4% | -9% | 4% | -6% | 8% | |
| off / environment * (dB) | 24.7 | 22.9 7% | 25 -1% | 24.4 1% | 24.1 2% | 24.5 1% |
| Idle Minimum * (dB) | 24.7 | 22.9 7% | 26 -5% | 24.4 1% | 24.1 2% | 24.5 1% |
| Idle Average * (dB) | 24.7 | 22.9 7% | 27 -9% | 24.4 1% | 24.1 2% | 24.5 1% |
| Idle Maximum * (dB) | 28.9 | 25 13% | 28 3% | 24.4 16% | 28.2 2% | 24.5 15% |
| Load Average * (dB) | 32.7 | 45.1 -38% | 43 -31% | 32 2% | 44.4 -36% | 26.6 19% |
| Cyberpunk 2077 ultra * (dB) | 40.4 | 44.9 -11% | 42 -4% | |||
| Load Maximum * (dB) | 40.4 | 44.9 -11% | 48 -19% | 39.7 2% | 44.4 -10% | 35.5 12% |
| Witcher 3 ultra * (dB) | 30.6 | 36.5 | 37.2 |
* ... smaller is better
Temperature
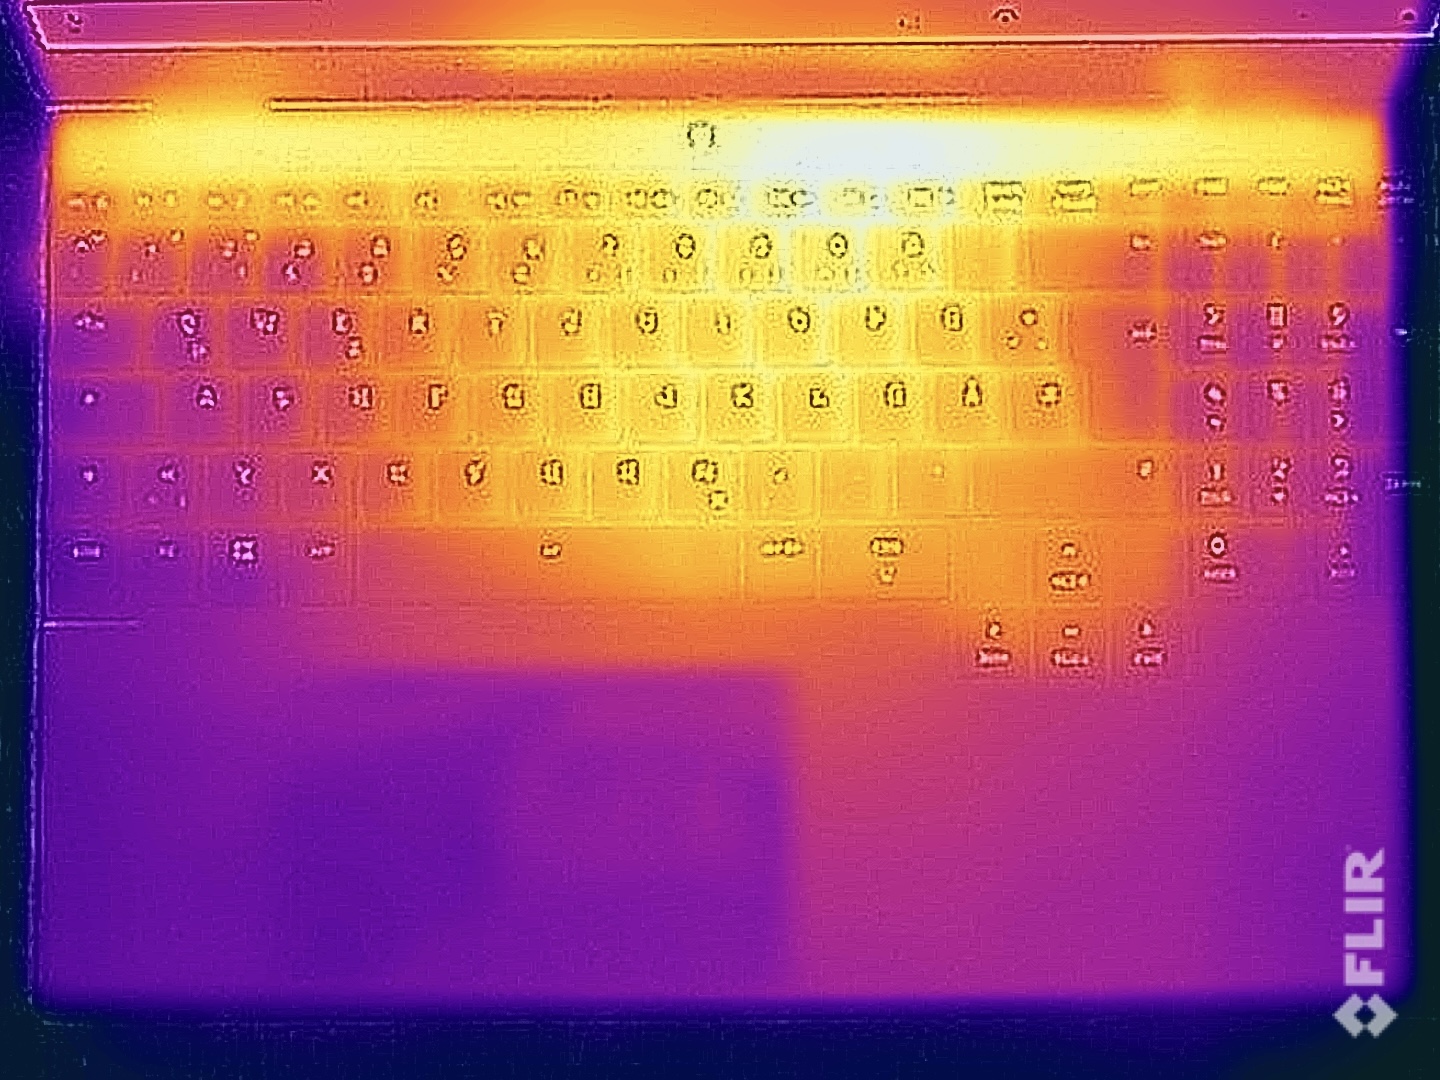
The aluminum casing of the Evo 15 remains very cool under low load and there are no problems even under load. The underside can reach almost 50 °C in extreme cases, but the hotspot is on the underside in the middle rear area. The device can even be used on the thighs. The keyboard area remains significantly cooler overall, even under load, and there are no restrictions when typing. In the stress test, the processor remains constant at its specified TDP value.

(±) The maximum temperature on the upper side is 41.7 °C / 107 F, compared to the average of 36.8 °C / 98 F, ranging from 21 to 71 °C for the class Multimedia.
(-) The bottom heats up to a maximum of 49.6 °C / 121 F, compared to the average of 39.1 °C / 102 F
(+) In idle usage, the average temperature for the upper side is 29.5 °C / 85 F, compared to the device average of 31.3 °C / 88 F.
(±) 3: The average temperature for the upper side is 34.3 °C / 94 F, compared to the average of 31.3 °C / 88 F for the class Multimedia.
(+) The palmrests and touchpad are reaching skin temperature as a maximum (32 °C / 89.6 F) and are therefore not hot.
(-) The average temperature of the palmrest area of similar devices was 28.7 °C / 83.7 F (-3.3 °C / -5.9 F).

| Schenker XMG Evo 15 (M24) Intel Core Ultra 7 155H, Intel Arc 8-Core iGPU | Dell Inspiron 16 7640 2-in-1 Intel Core Ultra 7 155H, Intel Arc 8-Core iGPU | Medion S10 OLED Intel Core Ultra 7 155H, Intel Arc 8-Core iGPU | Xiaomi RedmiBook Pro 16 2024 Intel Core Ultra 7 155H, Intel Arc 8-Core iGPU | Lenovo IdeaPad Pro 5 16IMH G9 Intel Core Ultra 7 155H, Intel Arc 8-Core iGPU | Lenovo ThinkPad T16 G2 21K70035GE AMD Ryzen 7 7840U, AMD Radeon 780M | |
|---|---|---|---|---|---|---|
| Heat | -1% | -12% | 10% | 19% | 4% | |
| Maximum Upper Side * (°C) | 41.7 | 46.8 -12% | 55 -32% | 40.3 3% | 36.3 13% | 48.7 -17% |
| Maximum Bottom * (°C) | 49.6 | 45.6 8% | 55 -11% | 45.9 7% | 39.1 21% | 52 -5% |
| Idle Upper Side * (°C) | 31.1 | 32.2 -4% | 32 -3% | 26.3 15% | 24.9 20% | 26.4 15% |
| Idle Bottom * (°C) | 33.1 | 31.4 5% | 33 -0% | 27.9 16% | 26.1 21% | 26.3 21% |
* ... smaller is better
Speaker
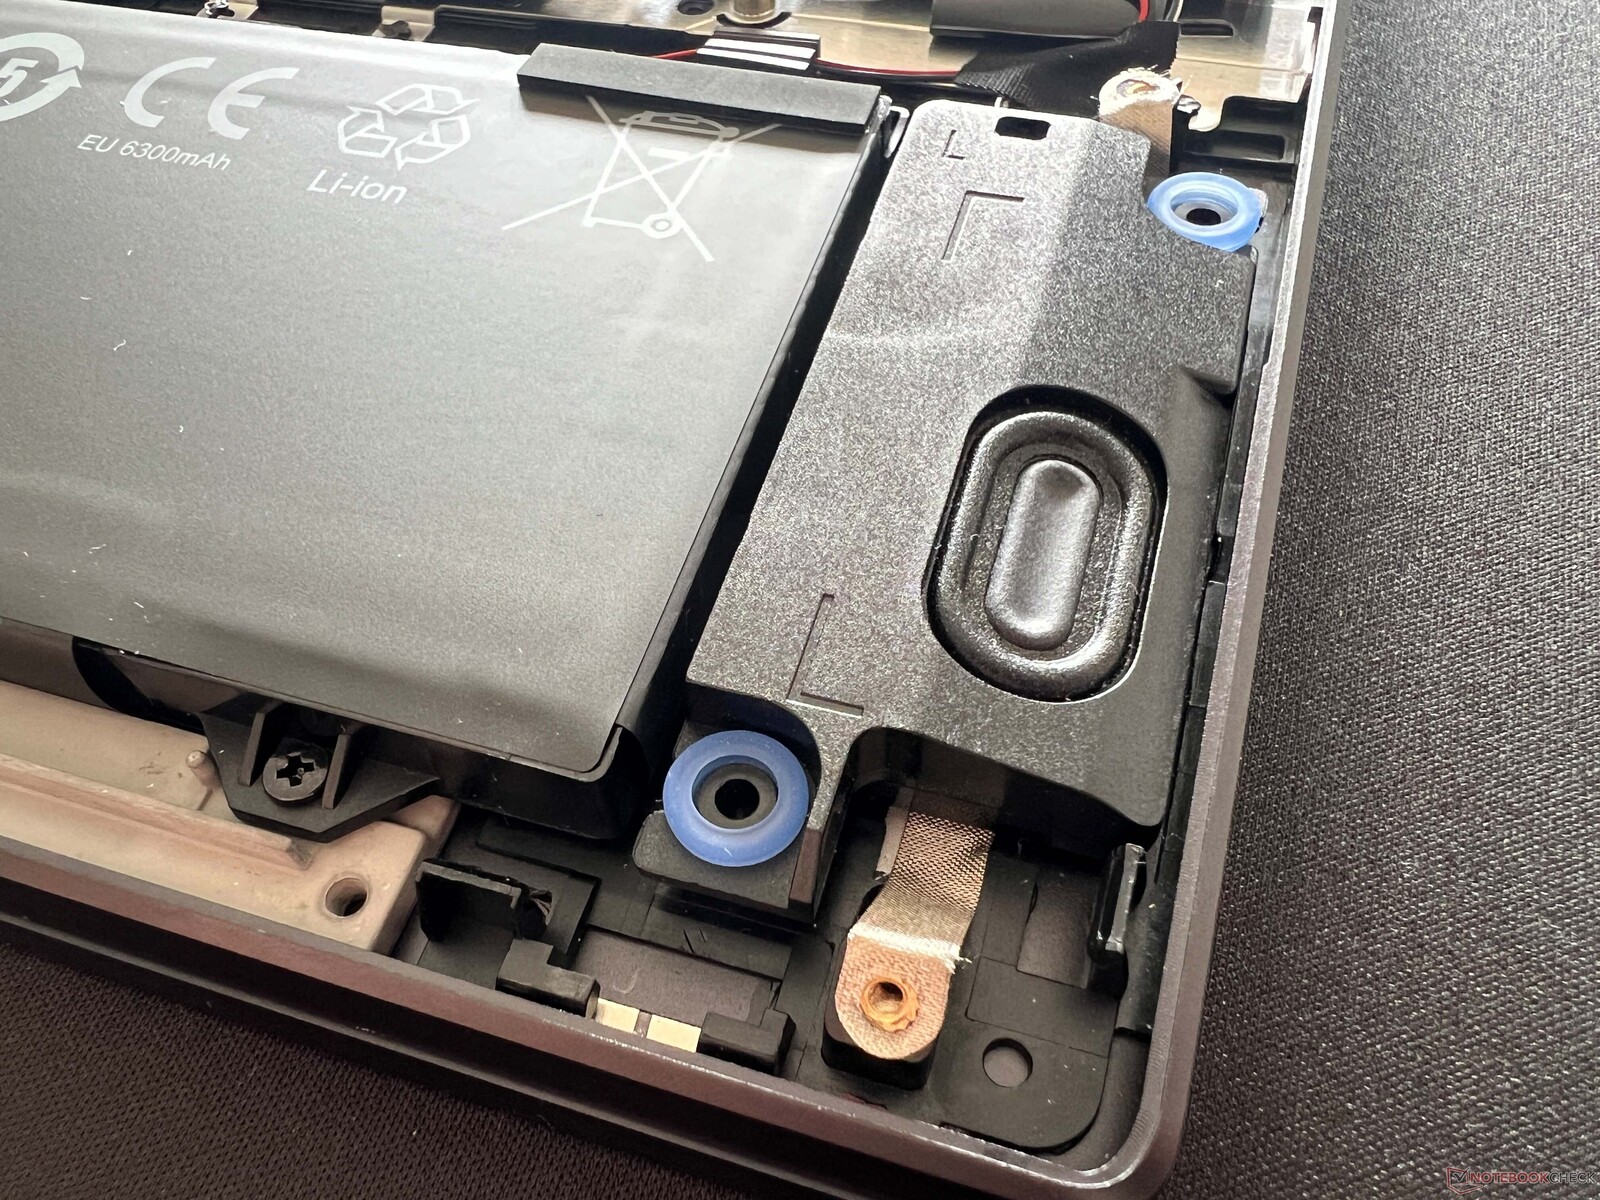
The Evo 15 offers two stereo speakers that provide a decent sound quality. Although there are multimedia laptops with better sound systems (which also have more speakers), the Evo is one of the best models in this discipline within the comparison group. The sound is clear and distinct overall, with the only noticeable drop-off being in the bass.
Schenker XMG Evo 15 (M24) audio analysis
(+) | speakers can play relatively loud (85.6 dB)
Bass 100 - 315 Hz
(-) | nearly no bass - on average 17.9% lower than median
(±) | linearity of bass is average (11.6% delta to prev. frequency)
Mids 400 - 2000 Hz
(+) | balanced mids - only 3.7% away from median
(+) | mids are linear (4.5% delta to prev. frequency)
Highs 2 - 16 kHz
(+) | balanced highs - only 2.2% away from median
(+) | highs are linear (6.5% delta to prev. frequency)
Overall 100 - 16.000 Hz
(+) | overall sound is linear (11.8% difference to median)
Compared to same class
» 19% of all tested devices in this class were better, 4% similar, 76% worse
» The best had a delta of 5%, average was 17%, worst was 45%
Compared to all devices tested
» 9% of all tested devices were better, 3% similar, 89% worse
» The best had a delta of 4%, average was 23%, worst was 134%
Dell Inspiron 16 7640 2-in-1 audio analysis
(+) | speakers can play relatively loud (84 dB)
Bass 100 - 315 Hz
(±) | reduced bass - on average 13.9% lower than median
(±) | linearity of bass is average (14% delta to prev. frequency)
Mids 400 - 2000 Hz
(+) | balanced mids - only 3.6% away from median
(+) | mids are linear (3.6% delta to prev. frequency)
Highs 2 - 16 kHz
(+) | balanced highs - only 4.5% away from median
(+) | highs are linear (2.8% delta to prev. frequency)
Overall 100 - 16.000 Hz
(+) | overall sound is linear (12% difference to median)
Compared to same class
» 12% of all tested devices in this class were better, 4% similar, 84% worse
» The best had a delta of 6%, average was 20%, worst was 57%
Compared to all devices tested
» 9% of all tested devices were better, 2% similar, 88% worse
» The best had a delta of 4%, average was 23%, worst was 134%
Medion S10 OLED audio analysis
(+) | speakers can play relatively loud (85 dB)
Bass 100 - 315 Hz
(-) | nearly no bass - on average 17.3% lower than median
(±) | linearity of bass is average (9.5% delta to prev. frequency)
Mids 400 - 2000 Hz
(+) | balanced mids - only 4.3% away from median
(+) | mids are linear (4.3% delta to prev. frequency)
Highs 2 - 16 kHz
(+) | balanced highs - only 1.2% away from median
(+) | highs are linear (5% delta to prev. frequency)
Overall 100 - 16.000 Hz
(+) | overall sound is linear (12.9% difference to median)
Compared to same class
» 26% of all tested devices in this class were better, 4% similar, 70% worse
» The best had a delta of 5%, average was 17%, worst was 45%
Compared to all devices tested
» 12% of all tested devices were better, 3% similar, 85% worse
» The best had a delta of 4%, average was 23%, worst was 134%
Xiaomi RedmiBook Pro 16 2024 audio analysis
(+) | speakers can play relatively loud (83.8 dB)
Bass 100 - 315 Hz
(±) | reduced bass - on average 13.6% lower than median
(±) | linearity of bass is average (7.9% delta to prev. frequency)
Mids 400 - 2000 Hz
(±) | higher mids - on average 5.3% higher than median
(+) | mids are linear (5% delta to prev. frequency)
Highs 2 - 16 kHz
(+) | balanced highs - only 2.8% away from median
(+) | highs are linear (5.3% delta to prev. frequency)
Overall 100 - 16.000 Hz
(+) | overall sound is linear (13% difference to median)
Compared to same class
» 26% of all tested devices in this class were better, 5% similar, 70% worse
» The best had a delta of 5%, average was 17%, worst was 45%
Compared to all devices tested
» 13% of all tested devices were better, 3% similar, 85% worse
» The best had a delta of 4%, average was 23%, worst was 134%
Lenovo IdeaPad Pro 5 16IMH G9 audio analysis
(±) | speaker loudness is average but good (81.1 dB)
Bass 100 - 315 Hz
(-) | nearly no bass - on average 22.3% lower than median
(±) | linearity of bass is average (10.5% delta to prev. frequency)
Mids 400 - 2000 Hz
(+) | balanced mids - only 2.6% away from median
(+) | mids are linear (4.6% delta to prev. frequency)
Highs 2 - 16 kHz
(+) | balanced highs - only 1.2% away from median
(+) | highs are linear (3.9% delta to prev. frequency)
Overall 100 - 16.000 Hz
(+) | overall sound is linear (13.9% difference to median)
Compared to same class
» 31% of all tested devices in this class were better, 4% similar, 65% worse
» The best had a delta of 5%, average was 17%, worst was 45%
Compared to all devices tested
» 16% of all tested devices were better, 4% similar, 80% worse
» The best had a delta of 4%, average was 23%, worst was 134%
Lenovo ThinkPad T16 G2 21K70035GE audio analysis
(±) | speaker loudness is average but good (75.1 dB)
Bass 100 - 315 Hz
(-) | nearly no bass - on average 23.9% lower than median
(±) | linearity of bass is average (13.8% delta to prev. frequency)
Mids 400 - 2000 Hz
(+) | balanced mids - only 3.9% away from median
(+) | mids are linear (6.9% delta to prev. frequency)
Highs 2 - 16 kHz
(+) | balanced highs - only 2.1% away from median
(+) | highs are linear (4.2% delta to prev. frequency)
Overall 100 - 16.000 Hz
(±) | linearity of overall sound is average (19.9% difference to median)
Compared to same class
» 42% of all tested devices in this class were better, 9% similar, 49% worse
» The best had a delta of 7%, average was 21%, worst was 53%
Compared to all devices tested
» 51% of all tested devices were better, 7% similar, 42% worse
» The best had a delta of 4%, average was 23%, worst was 134%
Energy management
Power consumption
The large and bright display has an effect on the power consumption and we measured a maximum of just under 14 watts in idle mode. Both in gaming and in the stress test, the consumption is 76-78 watts and remains absolutely stable, so the 100-watt power supply is completely sufficient. In the Overboost profile, we measured a maximum of 107.9 watts, so the power supply has no more leeway to charge the battery, for example. However, the battery is not tapped here either. As we have already mentioned, the standby consumption of 1.4 watts is too high.
| Off / Standby | |
| Idle | |
| Load |
|
Key:
min: | |
| Schenker XMG Evo 15 (M24) Ultra 7 155H, Arc 8-Core, Samsung 990 Pro 1 TB, IPS, 2560x1600, 15.3" | Dell Inspiron 16 7640 2-in-1 Ultra 7 155H, Arc 8-Core, Micron 2550 1TB, Mini-LED, 2560x1600, 16" | Medion S10 OLED Ultra 7 155H, Arc 8-Core, Phison PS5019-E19 SSO1TBITC4-E19-V7, OLED, 3840x2400, 16" | Xiaomi RedmiBook Pro 16 2024 Ultra 7 155H, Arc 8-Core, YMTC PC300-1TB, IPS, 3072x1920, 16" | Lenovo IdeaPad Pro 5 16IMH G9 Ultra 7 155H, Arc 8-Core, Samsung PM9C1a MZAL81T0HDLB, IPS, 2560x1600, 16" | Lenovo ThinkPad T16 G2 21K70035GE R7 7840U, Radeon 780M, SK hynix PC801 HFS001TEJ9X162N, IPS LED, 1920x1200, 16" | Average Intel Arc 8-Core iGPU | Average of class Multimedia | |
|---|---|---|---|---|---|---|---|---|
| Power Consumption | 3% | 10% | 1% | 20% | 40% | 20% | 6% | |
| Idle Minimum * (Watt) | 7.7 | 6.1 21% | 7 9% | 4.2 45% | 3.5 55% | 3.7 52% | 5.31 ? 31% | 5.62 ? 27% |
| Idle Average * (Watt) | 13.2 | 13.5 -2% | 10 24% | 11.6 12% | 9.6 27% | 7.2 45% | 8.56 ? 35% | 10.2 ? 23% |
| Idle Maximum * (Watt) | 13.7 | 13.8 -1% | 19 -39% | 12.3 10% | 9.9 28% | 8.7 36% | 11.9 ? 13% | 12.5 ? 9% |
| Load Average * (Watt) | 76.2 | 63.6 17% | 52 32% | 61.9 19% | 62.7 18% | 44.1 42% | 53.6 ? 30% | 65 ? 15% |
| Cyberpunk 2077 ultra * (Watt) | 76.7 | 67 13% | 53.2 31% | |||||
| Cyberpunk 2077 ultra external monitor * (Watt) | 72.7 | 64.6 11% | 49.2 32% | |||||
| Load Maximum * (Watt) | 78.1 | 109.7 -40% | 95 -22% | 140.6 -80% | 101.2 -30% | 58.2 25% | 84.2 ? -8% | 111.9 ? -43% |
| Witcher 3 ultra * (Watt) | 57 | 55.8 | 50.9 |
* ... smaller is better
Powr consumption Cyberpunk / Stress test
Power consumption with the external monitor
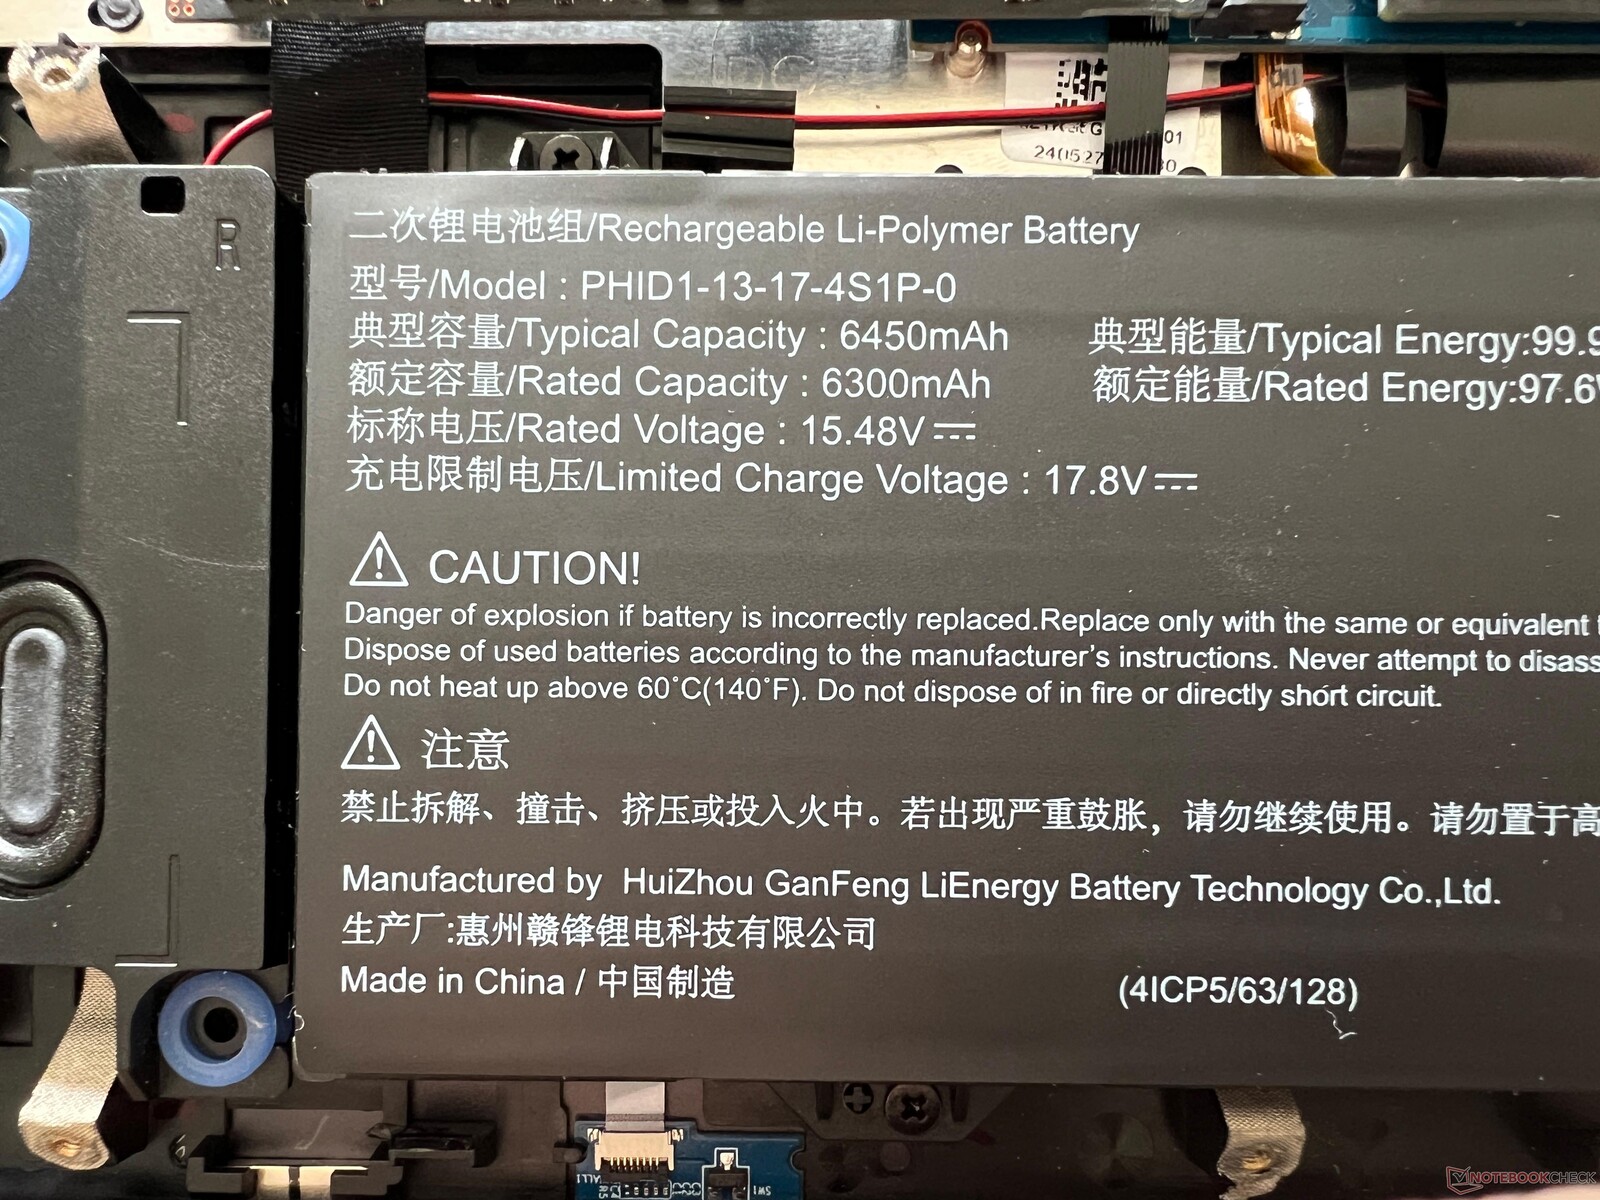
Battery life
Schenker installs a massive 99.8-Wh battery in the Evo 15, which leads to good runtimes overall despite the energy-hungry display, although the Medion S10 offers even more endurance. In the WLAN test with 150 cd/m² (corresponds to 58% of the maximum brightness in the test device), we measured 10:25 hours at 60 Hz and 08:25 hours at 240 Hz. At full brightness, the runtime drops to 8 hours (60 Hz) or 6:39 hours (240 Hz), so you should definitely reduce the frequency in battery mode.
The video test runs for just over 12 hours and under load, the worst-case scenario is 2:14 hours. A full charge takes a long 165 minutes when the device is switched on (80% after 130 minutes) and there is no quick charge function.

| Schenker XMG Evo 15 (M24) Ultra 7 155H, Arc 8-Core, 99.9 Wh | Dell Inspiron 16 7640 2-in-1 Ultra 7 155H, Arc 8-Core, 90 Wh | Medion S10 OLED Ultra 7 155H, Arc 8-Core, 70 Wh | Xiaomi RedmiBook Pro 16 2024 Ultra 7 155H, Arc 8-Core, 99 Wh | Lenovo IdeaPad Pro 5 16IMH G9 Ultra 7 155H, Arc 8-Core, 84 Wh | Lenovo ThinkPad T16 G2 21K70035GE R7 7840U, Radeon 780M, 52.5 Wh | Average of class Multimedia | |
|---|---|---|---|---|---|---|---|
| Battery runtime | -9% | -30% | 44% | 1% | -27% | 10% | |
| H.264 (h) | 12.2 | 21.8 79% | 16 31% | 16.8 ? 38% | |||
| WiFi v1.3 (h) | 10.4 | 11.4 10% | 7.3 -30% | 16.4 58% | 12.6 21% | 11 6% | 12.3 ? 18% |
| Load (h) | 2.2 | 1.6 -27% | 2.1 -5% | 1.1 -50% | 0.9 -59% | 1.645 ? -25% |
Pros
Cons
Verdict - One of the best multimedia notebooks without dGPU

With the new XMG Evo 15 (M24), the German manufacturer Schenker is launching a good multimedia notebook without a dedicated graphics card. It's not the thinnest laptop on the market, but the Evo 15 doesn't aspire to be. On the other hand, you get very good maintenance options and both the RAM (max. 96 GB) and the SSD capacity (2 M.2-2280 slots) can be easily upgraded. There are also enough ports, although we wonder how an old USB 2.0 port managed to find its way into the device. However, as there are plenty of other fast USB ports (Intel with Thunderbolt 4, AMD with USB 4.0), this is not a huge problem. There is also not much to complain about when it comes to the input devices and speakers.
When it comes to the display, you can recognize the gaming roots and the relationship to the XMG Fusion 15 but this is not a disadvantage. The matte IPS panel offers a high resolution and a fast frequency of 240 Hz. In addition, there is no PWM and the response times are also fast. The brightness is very good at almost 600 cd/m², which in turn affects the black level and therefore the contrast ratio. Anyone expecting rich blacks like an OLED panel will definitely be disappointed. After calibration, the color accuracy is excellent and thanks to full sRGB coverage, the panel is also suitable for image editing. The large 99.8 Wh battery can compensate well for the power consumption of the display and overall the endurance away from the socket is decent.
Excellent maintenance options, bright IPS display with accurate colors, and good performance values with coherent energy profiles: The new Schenker XMG Evo 15 is an exciting multimedia laptop without a dedicated graphics card that is available with both AMD and Intel processors and has no real weak points.
The performance of the Evo 15 with the Intel processor is very good overall and above all stable, as there are no absurdly high short-term power limits. If you need higher performance, you can use the Overboost mode, but you will have to put up with louder fans. In general, however, the Evo 15 is a very quiet companion, especially for everyday tasks.
With all these positive aspects, the new Evo 15 is almost unrivaled on the market. The question remains as to whether you should choose the Intel or the AMD model. Although the AMD model only has USB 4.0 instead of Thunderbolt 4, the manufacturer claims that the performance (despite the slightly lower power limits of the Ryzen 7 8845HS) is comparable. We don't expect any huge differences in battery life either, which begs the question of why customers should pay 150 euros more for the Intel processor. The AMD model, which starts at 1,049 euros, definitely offers a better price-performance ratio.
Price and availability
The new Schenker XMG Evo 15 (M24) can now be ordered from Bestware. The AMD model starts at 1,049 euros, the Intel version at 1,199 euros.
Note: We have recently updated our rating system and the results of version 8 are not comparable with the results of version 7. Further information can be found here.
Schenker XMG Evo 15 (M24)
- 07/31/2024 v8
Andreas Osthoff
 Total Sustainability Score:
 Transparency
The selection of devices to be reviewed is made by our editorial team. The test sample was provided to the author as a loan by the manufacturer or retailer for the purpose of this review. The lender had no influence on this review, nor did the manufacturer receive a copy of this review before publication. There was no obligation to publish this review. As an independent media company, Notebookcheck is not subjected to the authority of manufacturers, retailers or publishers.
This is how Notebookcheck is testing
Every year, Notebookcheck independently reviews hundreds of laptops and smartphones using standardized procedures to ensure that all results are comparable. We have continuously developed our test methods for around 20 years and set industry standards in the process. In our test labs, high-quality measuring equipment is utilized by experienced technicians and editors. These tests involve a multi-stage validation process. Our complex rating system is based on hundreds of well-founded measurements and benchmarks, which maintains objectivity. Further information on our test methods can be found here.
Price comparison

