HP Pavilion Gaming 17 laptop review: A good display at a budget price
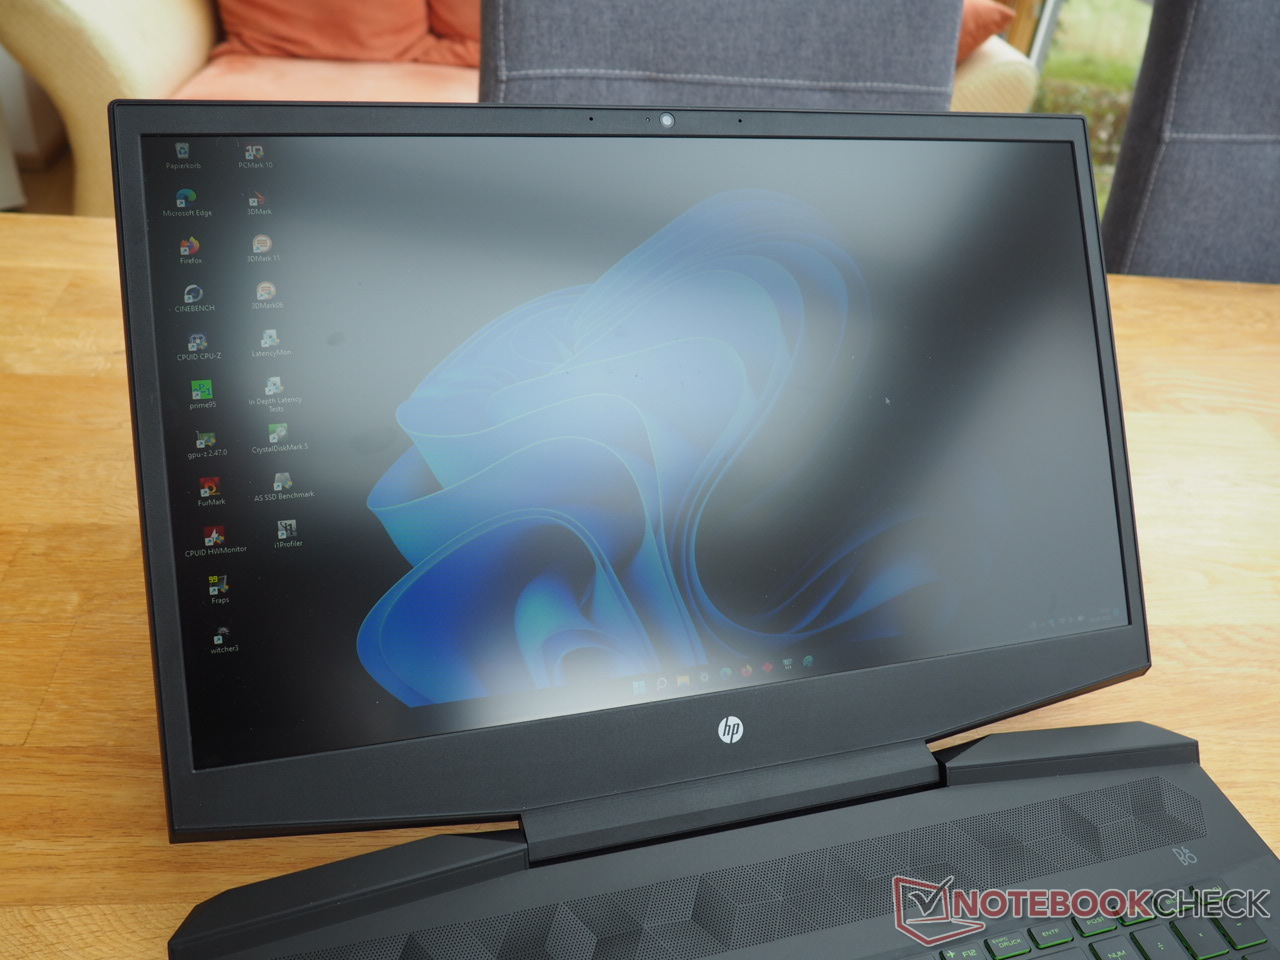
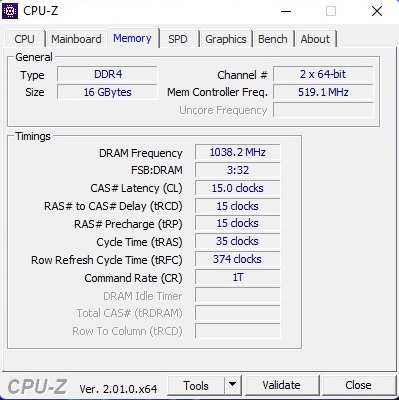
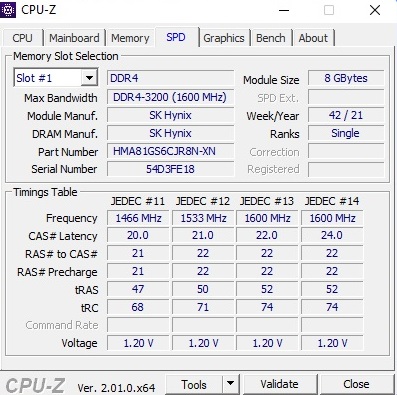
Users looking for a gaming laptop for less than 1,000 Euros (~$1,002) might have already come across the Pavilion Gaming 17. The cd2146ng model that we reviewed is equipped with well-balanced mid-range components, namely a Core i5-11300H and a GeForce RTX 3050 Ti including 4 GB of VRAM. 16 GB of DDR4 RAM (2x 8 GB in dual-channel) and a 512 GB NVMe SSD is also decent in this price range. The display is more than satisfactory: The matte Full HD IPS display supports 144 Hz and is supposed to reach about 300 nits according to HP. We'll analyze whether this claim is true in a moment. Meanwhile, it's a bit of a shame that our review model lacks a "real" operating system (only FreeDOS is on board). However, compatible Windows licenses - such as the one for the 11 Pro version that we installed later - can be bought very cheaply online.
The Pavilion Gaming 17's main competitors include other 15-inch to 17-inch budget laptops equipped with the GeForce RTX 3050 Ti, such as the Dell G15 5510, the Lenovo IdeaPad Gaming 3 15IHU, and the in-house HP Victus 16. Each of the latter laptops appear in the tables as comparison devices.
Possible contenders in comparison
Rating | Date | Model | Weight | Height | Size | Resolution | Price |
|---|---|---|---|---|---|---|---|
| 82.7 % v7 (old) | 09 / 2022 | HP Pavilion Gaming 17-cd2146ng i5-11300H, GeForce RTX 3050 Ti Laptop GPU | 2.8 kg | 25 mm | 17.30" | 1920x1080 | |
| 79.1 % v7 (old) | 05 / 2022 | Dell G15 5510-43NHT i5-10200H, GeForce RTX 3050 Ti Laptop GPU | 2.5 kg | 23.33 mm | 15.60" | 1920x1080 | |
| 79.7 % v7 (old) | 03 / 2022 | Lenovo Ideapad Gaming 3 15IHU-82K1002RGE i5-11300H, GeForce RTX 3050 Ti Laptop GPU | 2 kg | 24.2 mm | 15.60" | 1920x1080 | |
| 82.3 % v7 (old) | 05 / 2022 | HP Victus 16-e0145ng R5 5600H, GeForce RTX 3050 Ti Laptop GPU | 2.4 kg | 23.5 mm | 16.10" | 1920x1080 | |
| 81.6 % v7 (old) | 07 / 2019 | HP Pavilion Gaming 17-cd0085cl i7-9750H, GeForce GTX 1660 Ti Max-Q | 2.8 kg | 25 mm | 17.30" | 1920x1080 |
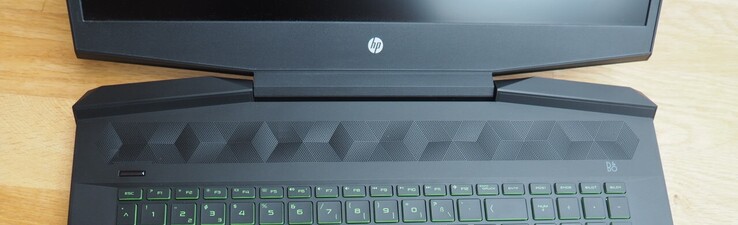
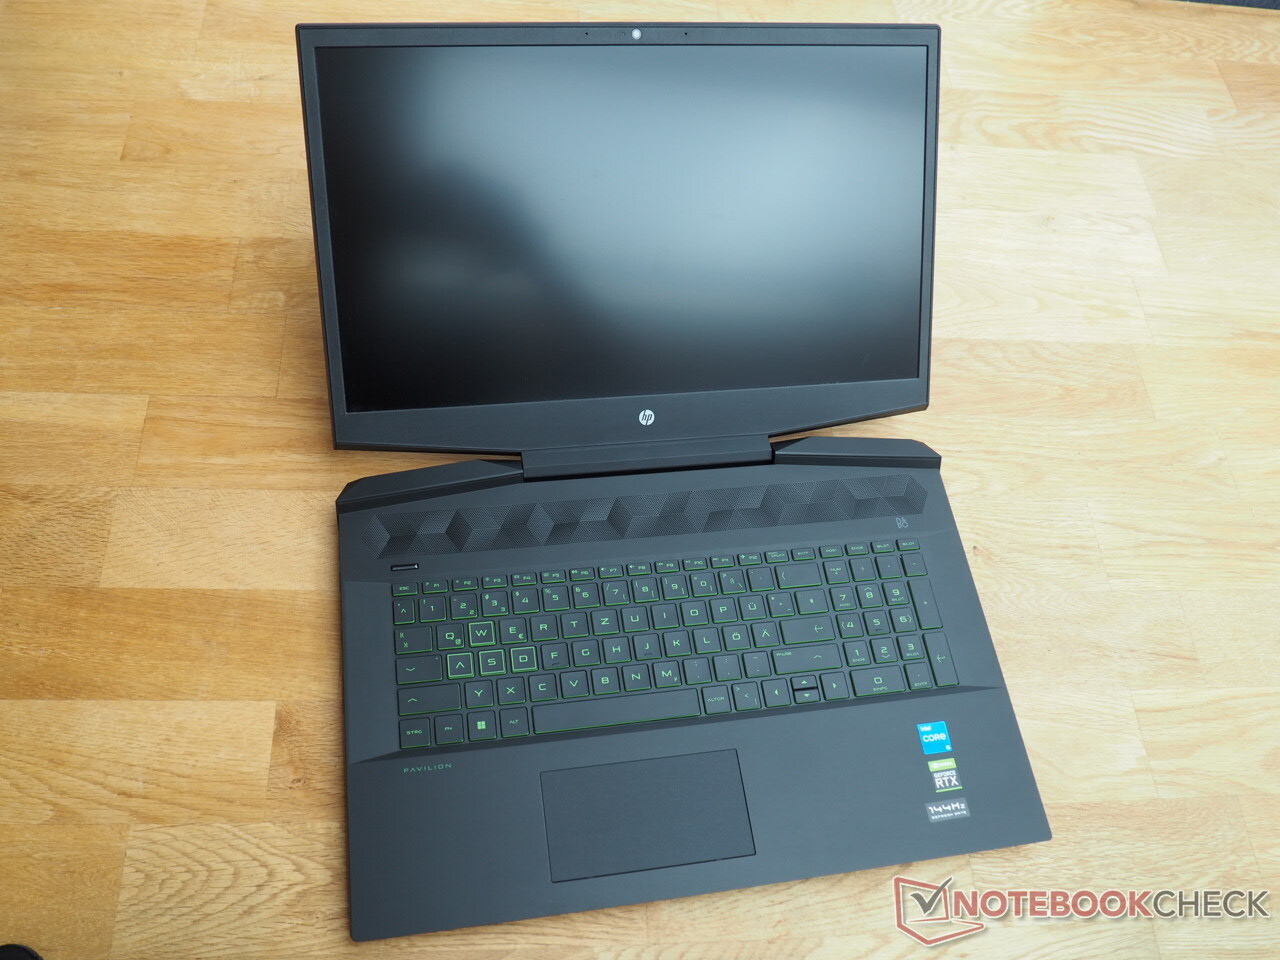
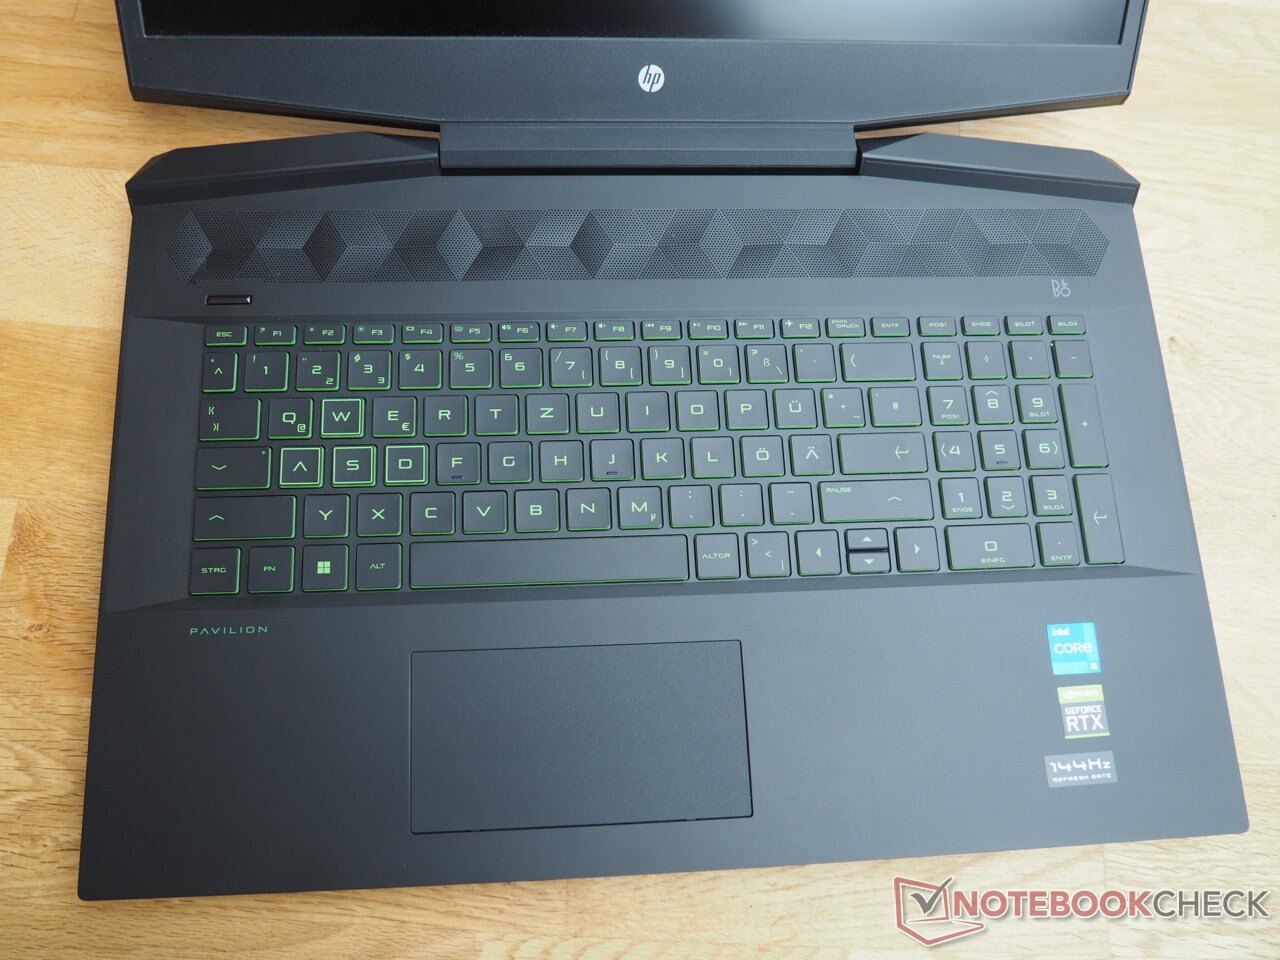
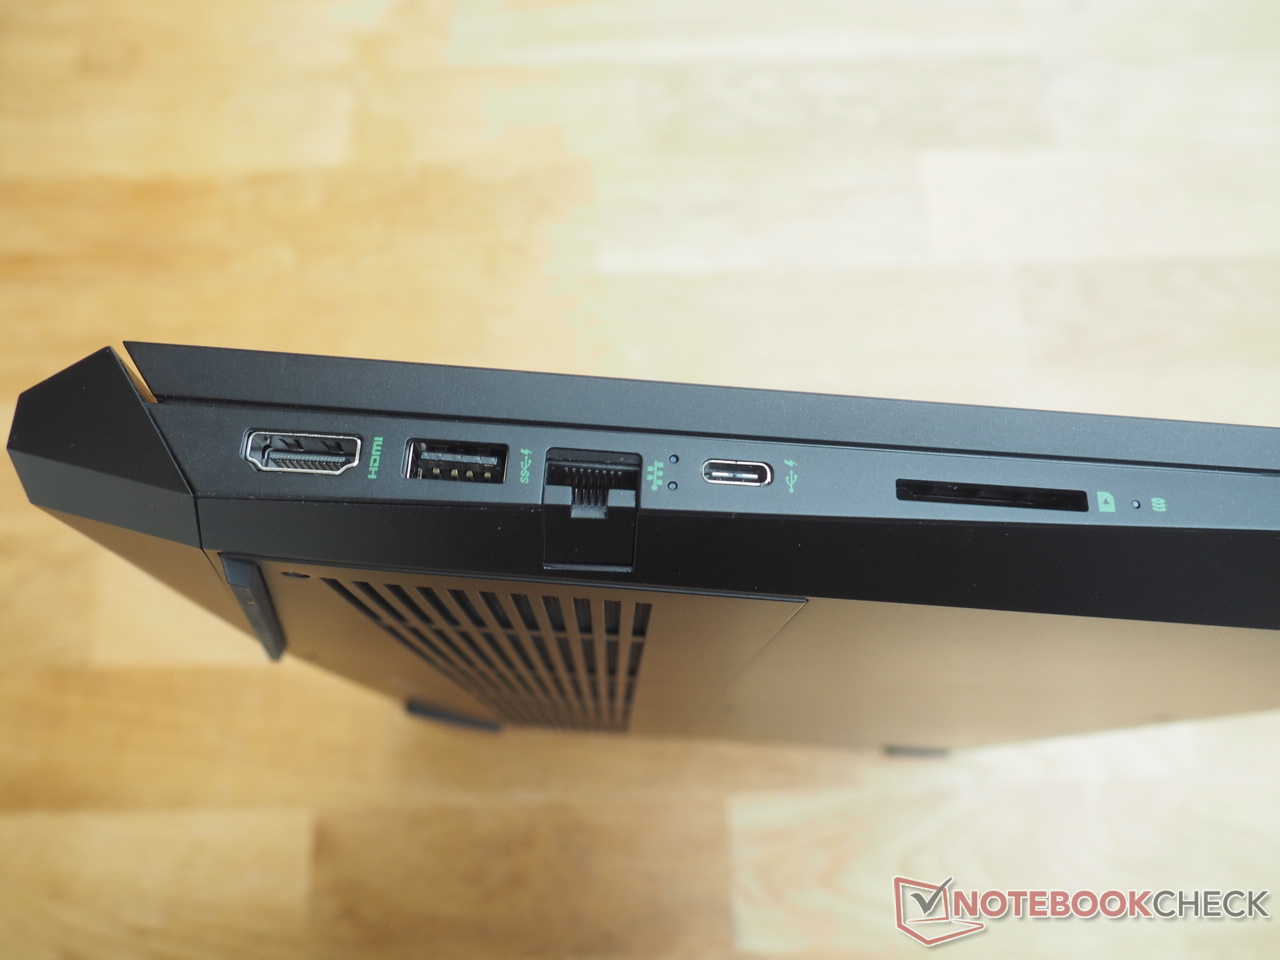
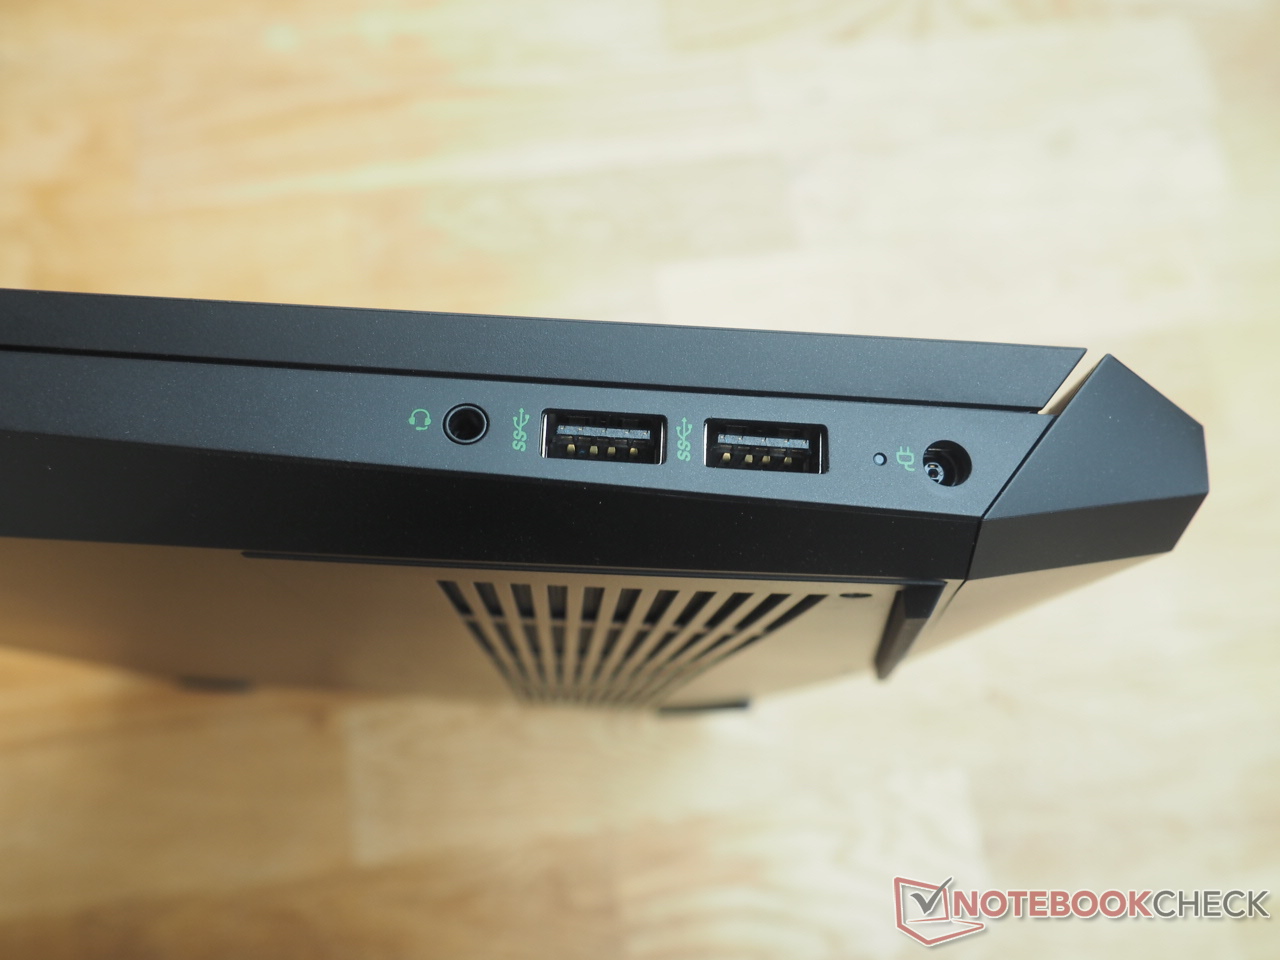
Since the chassis is externally identical to that of the (pre)predecessor, we won't go again into the case, the input devices and connectivity in this article. You can find the corresponding information in our review of the Pavilion Gaming 17-cd0085cl.
SD card reader
| SD Card Reader - average JPG Copy Test (av. of 3 runs) | |
| Average of class Gaming (20.9 - 210, n=54, last 2 years) | |
| HP Pavilion Gaming 17-cd0085cl (Toshiba Exceria Pro SDXC 64 GB UHS-II) | |
| HP Victus 16-e0145ng (AV PRO microSD 128 GB V60) | |
| HP Pavilion Gaming 17-cd2146ng (AV PRO microSD 128 GB V60) | |
Communication
| Networking - iperf3 receive AXE11000 | |
| Average of class Gaming (680 - 1745, n=88, last 2 years) | |
| HP Pavilion Gaming 17-cd2146ng | |
| Average Realtek RTL8852AE (n=1) | |
| HP Victus 16-e0145ng | |
Webcam


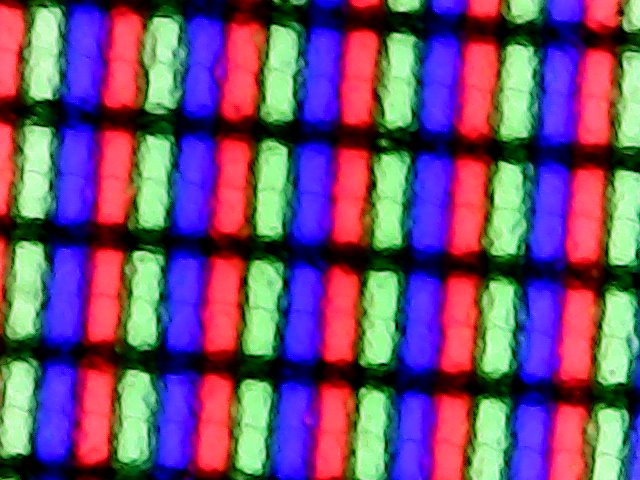
Display
As mentioned before, it's rather uncommon to find good displays in lower-priced gaming laptops. Fortunately, the Pavilion Gaming 17 is one of the few exceptions.
| |||||||||||||||||||||||||
Brightness Distribution: 94 %
Center on Battery: 328 cd/m²
Contrast: 1426:1 (Black: 0.23 cd/m²)
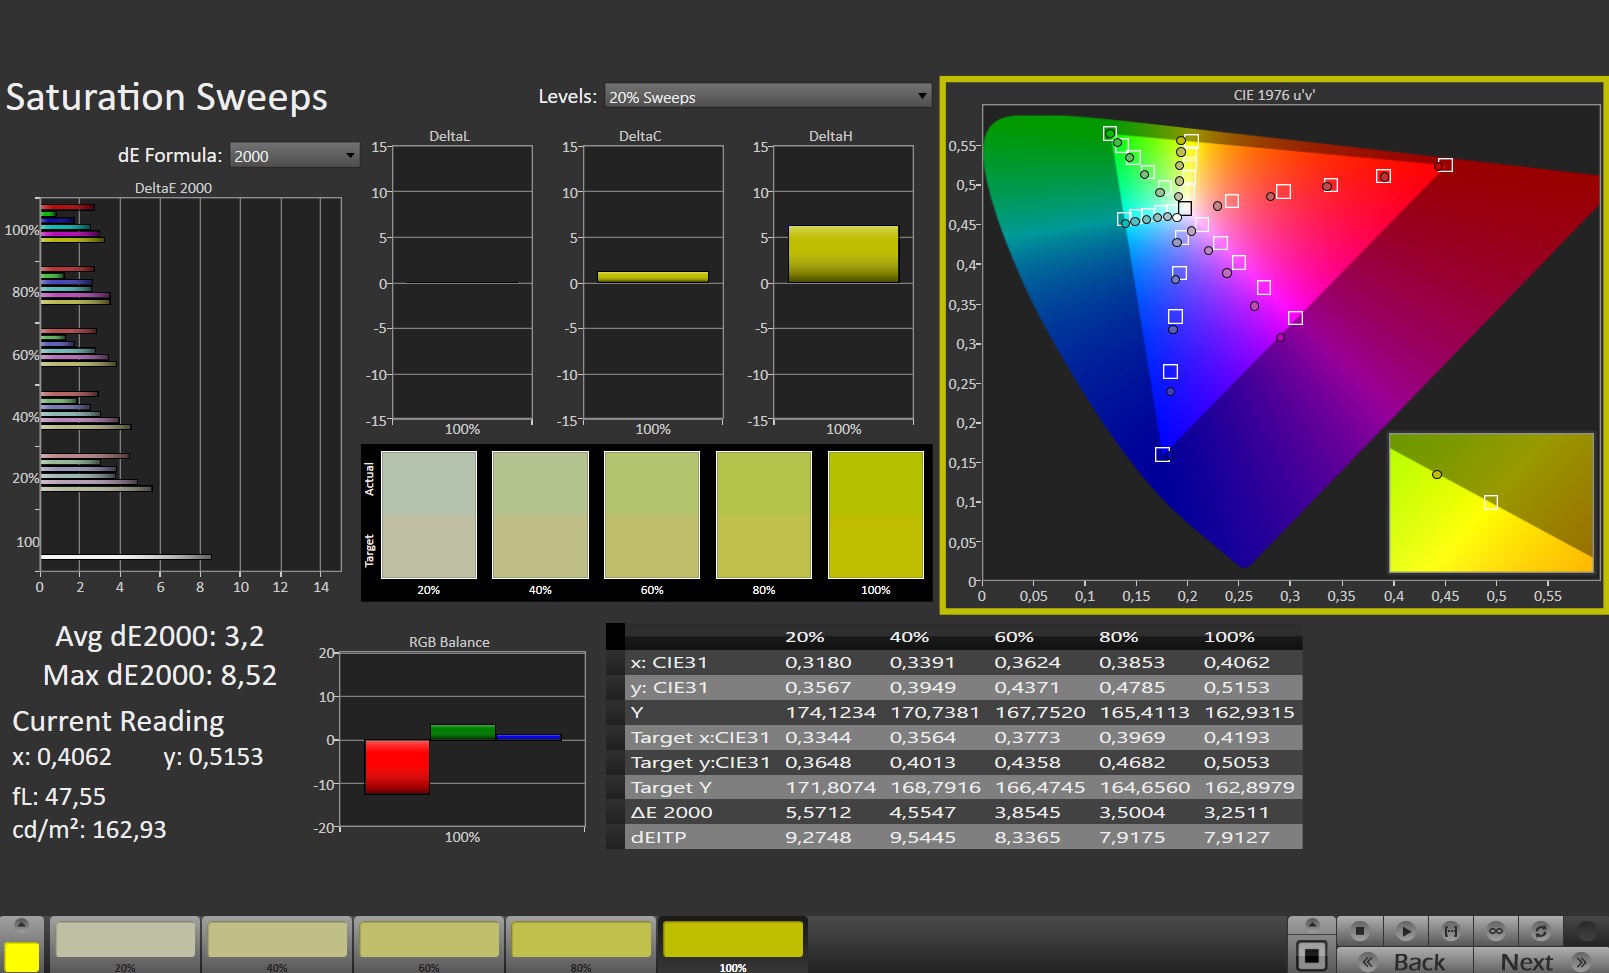
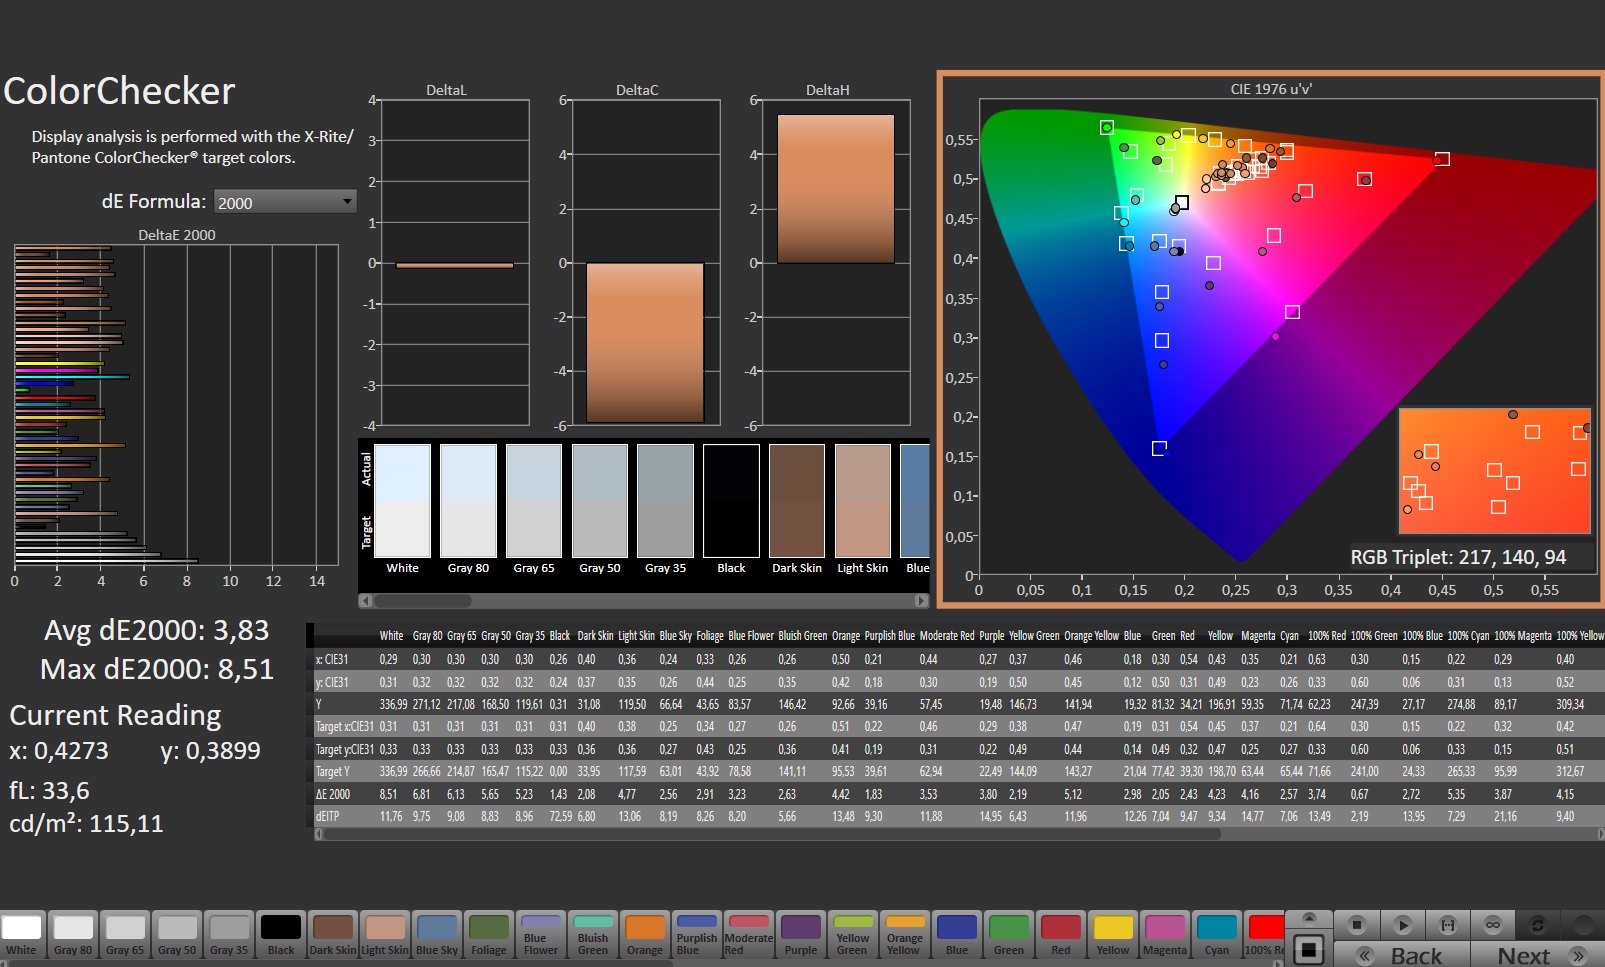
ΔE ColorChecker Calman: 3.83 | ∀{0.5-29.43 Ø4.72}
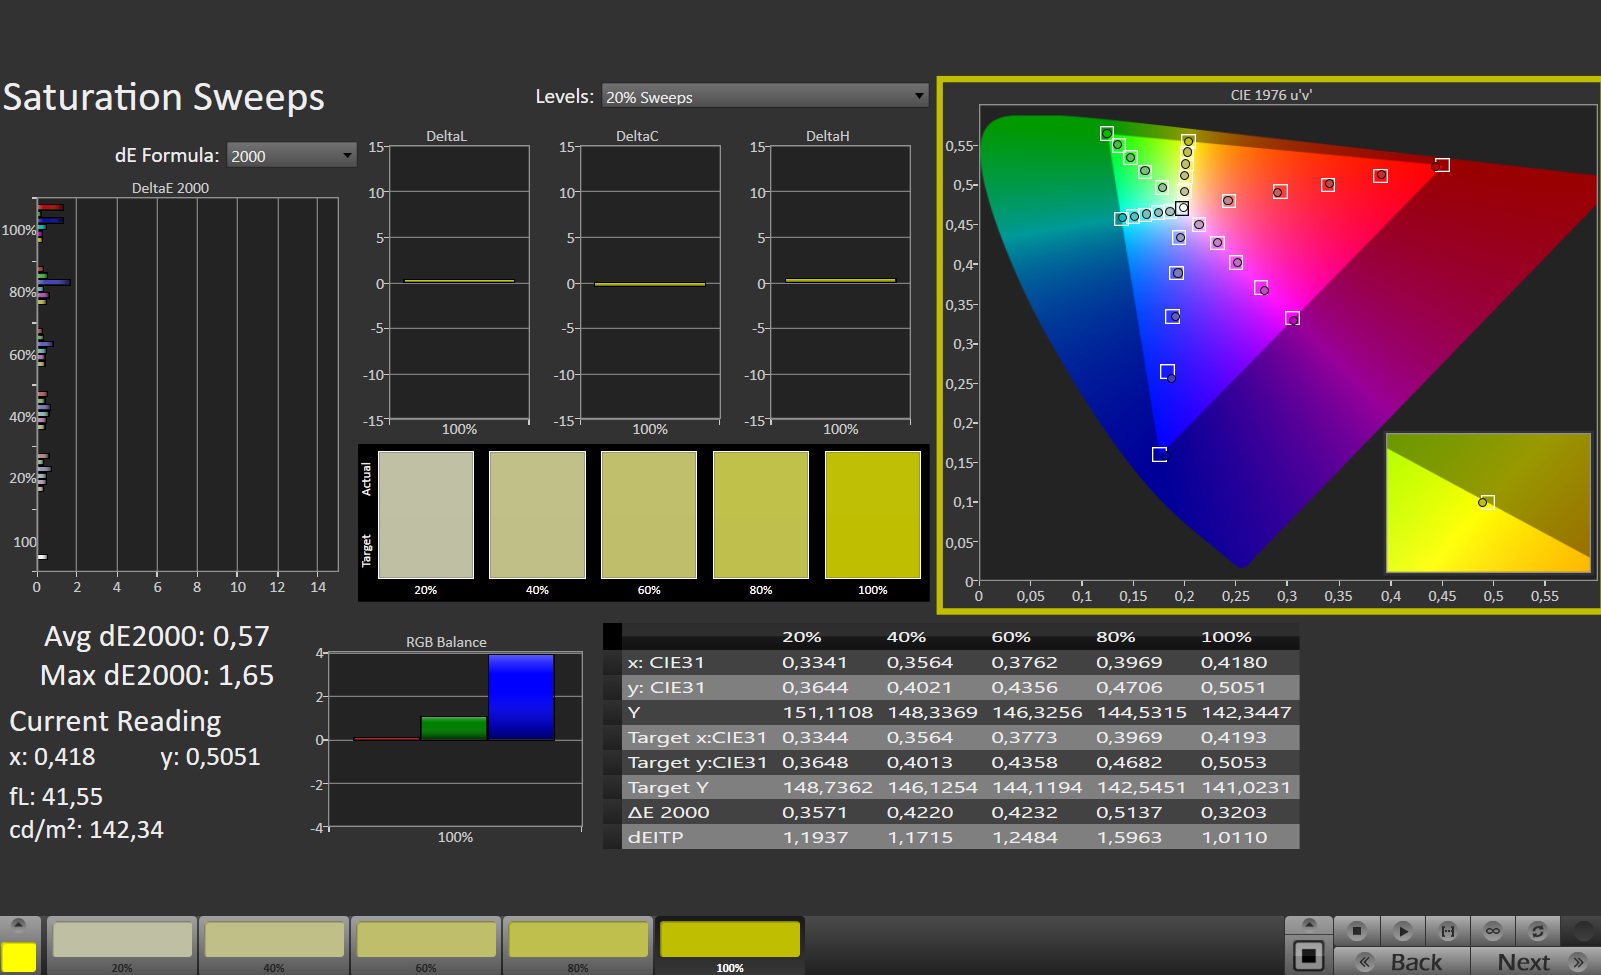
calibrated: 0.83
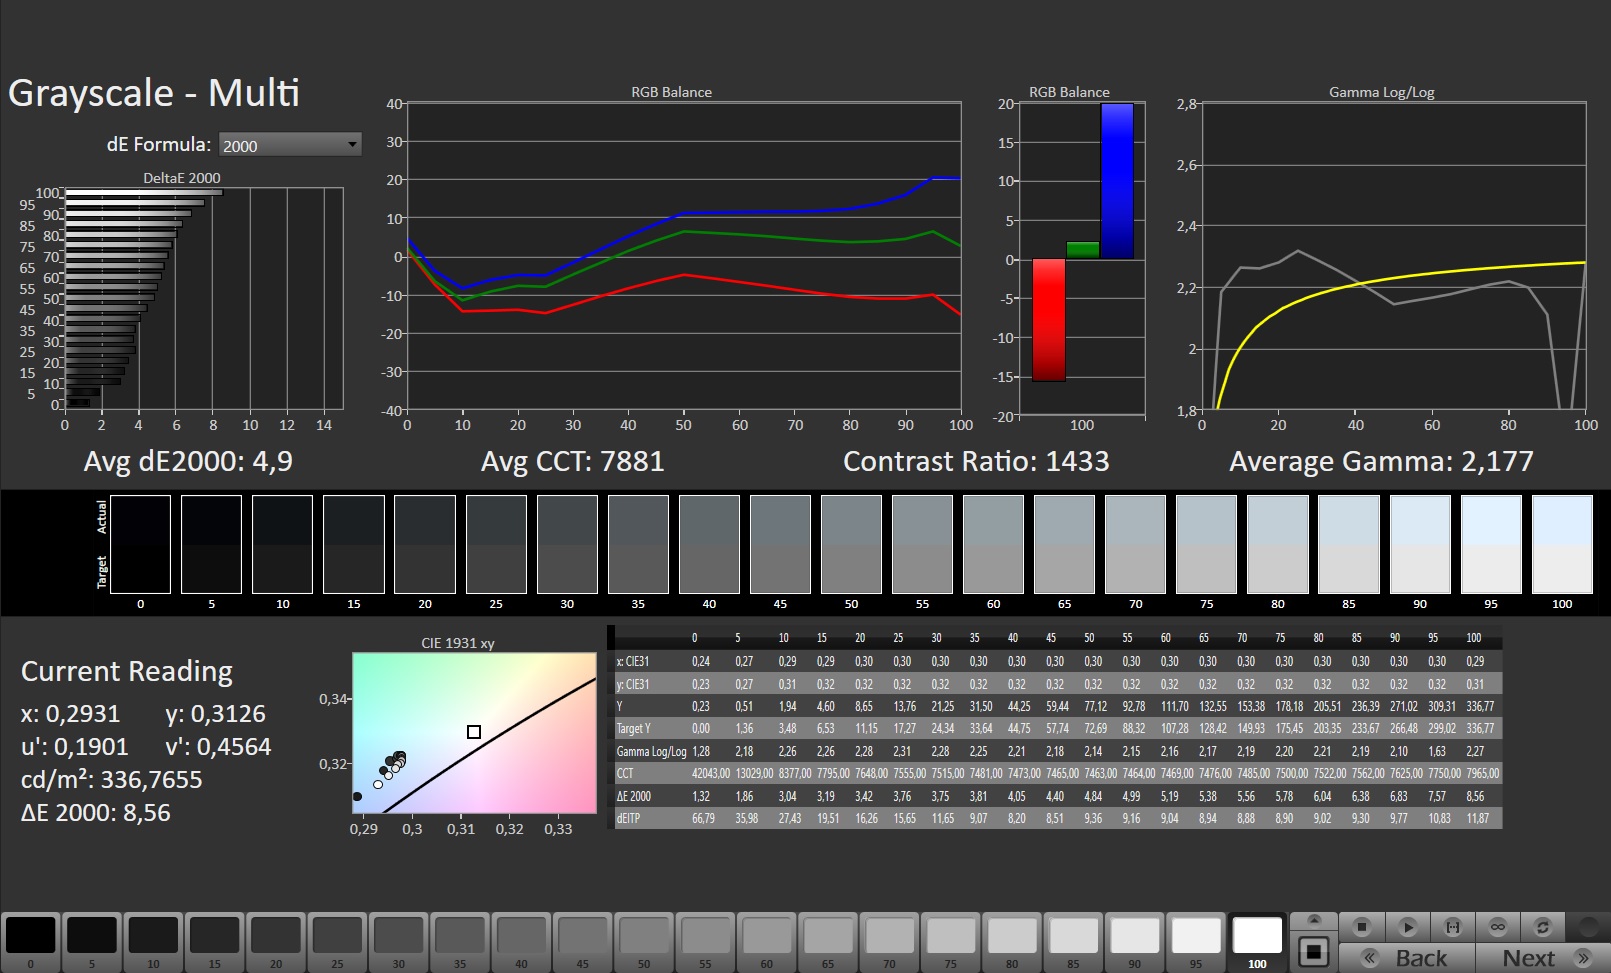
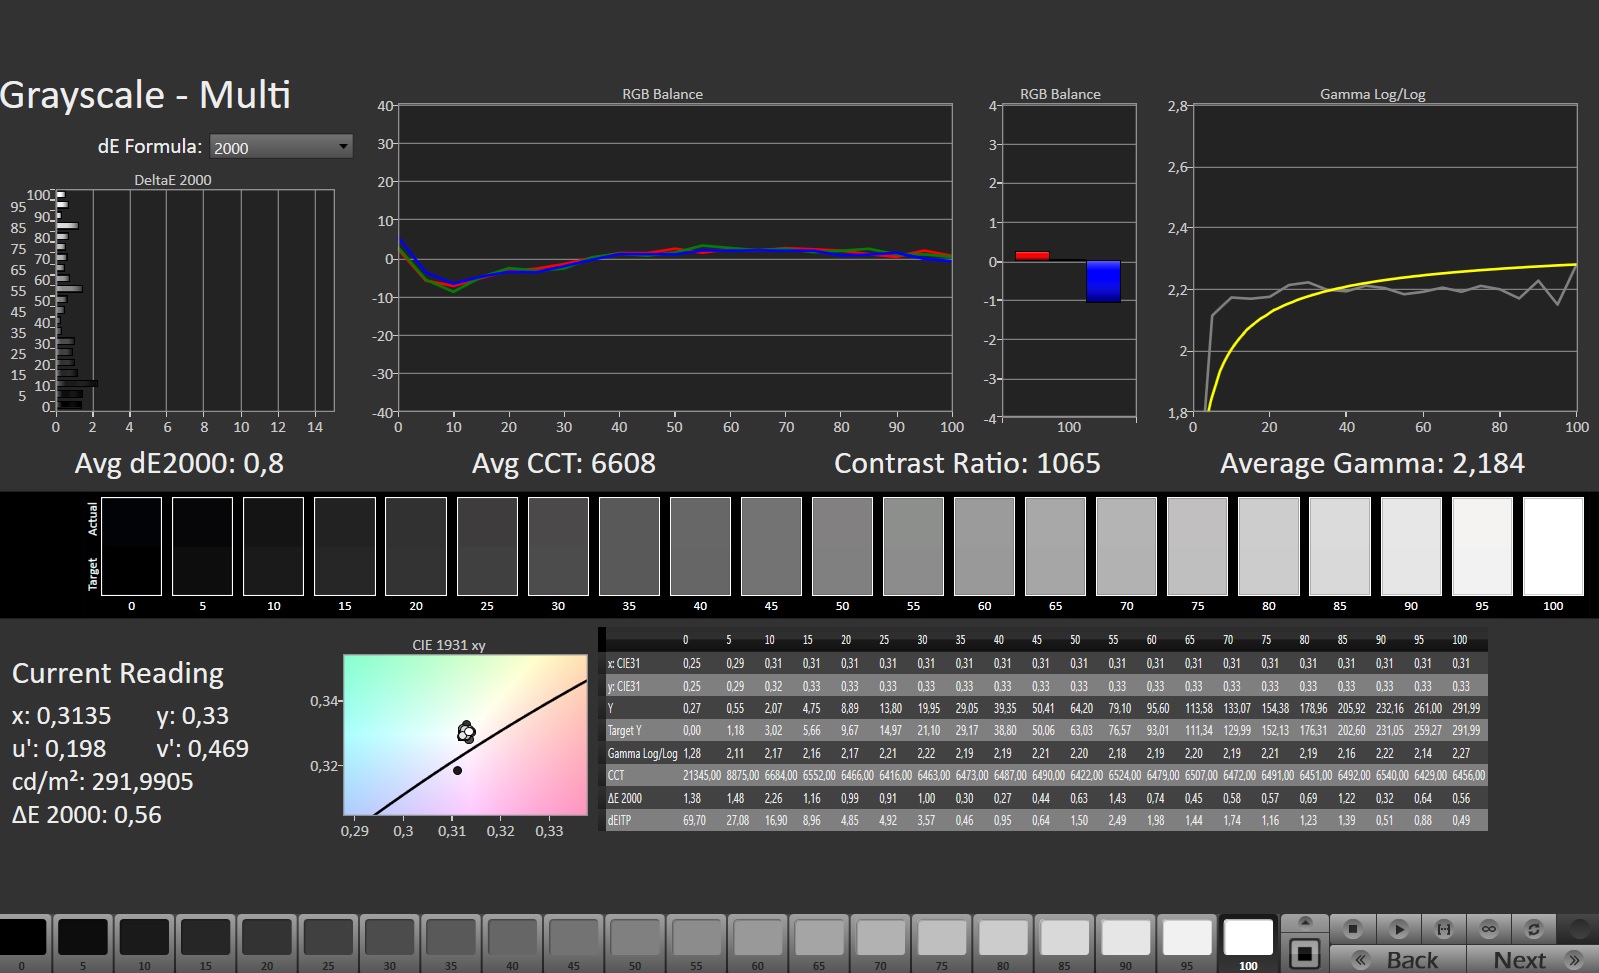
ΔE Greyscale Calman: 4.9 | ∀{0.09-98 Ø4.97}
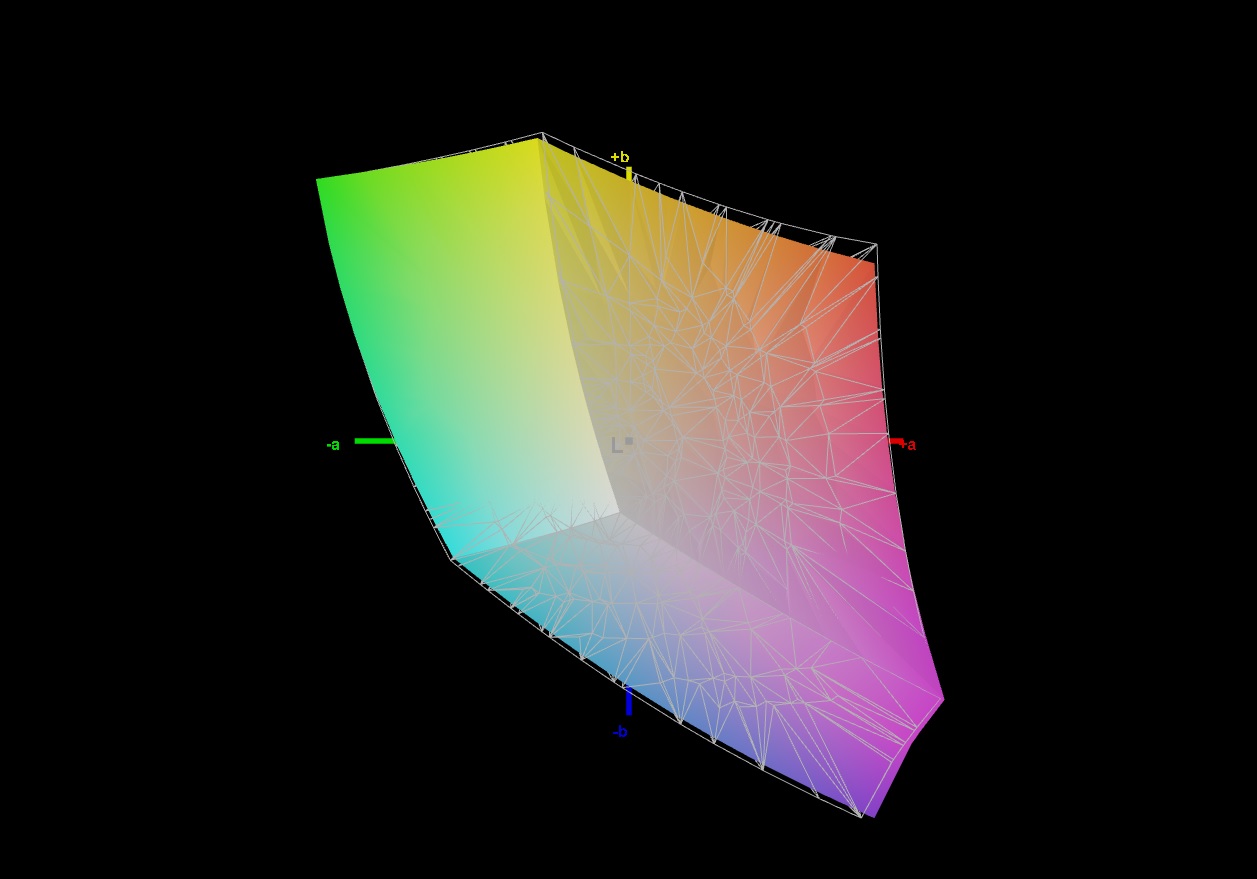
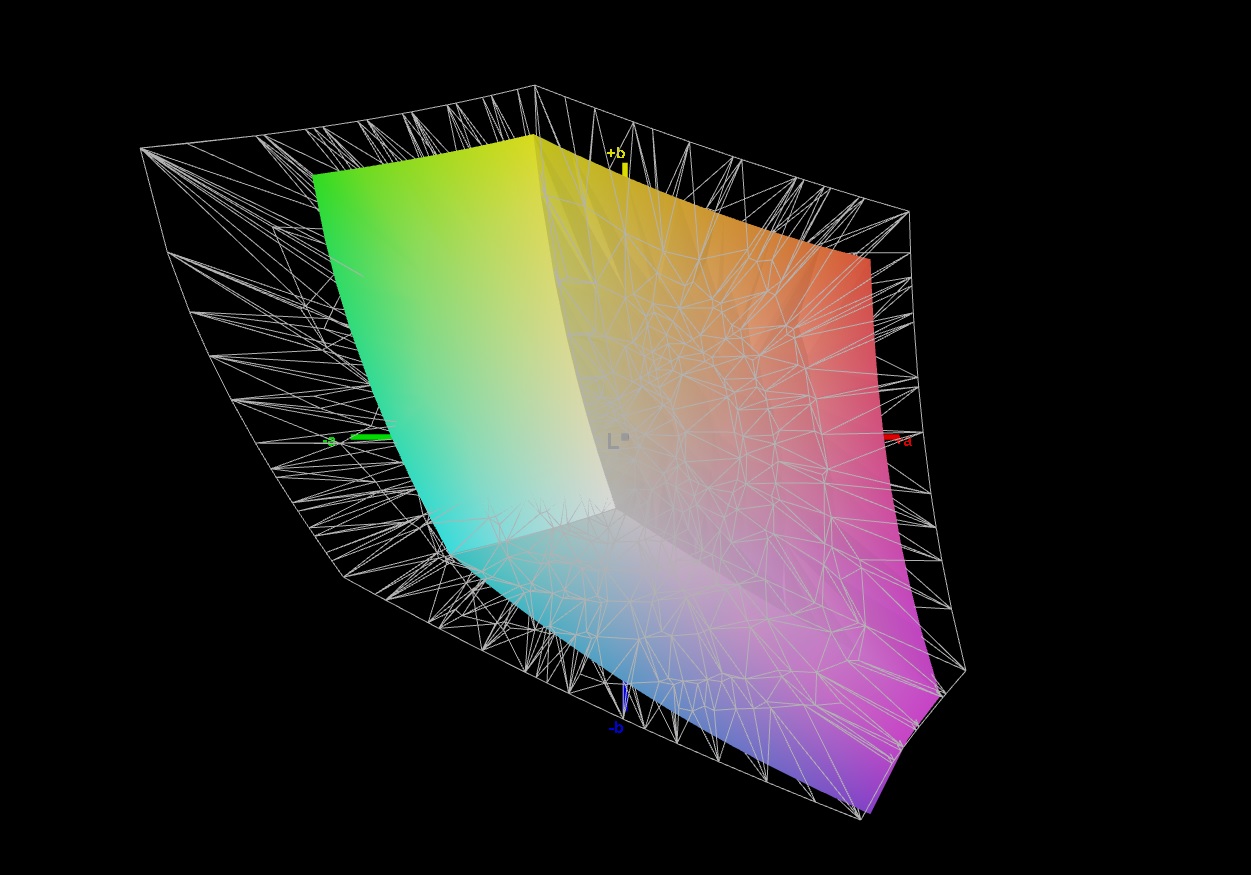
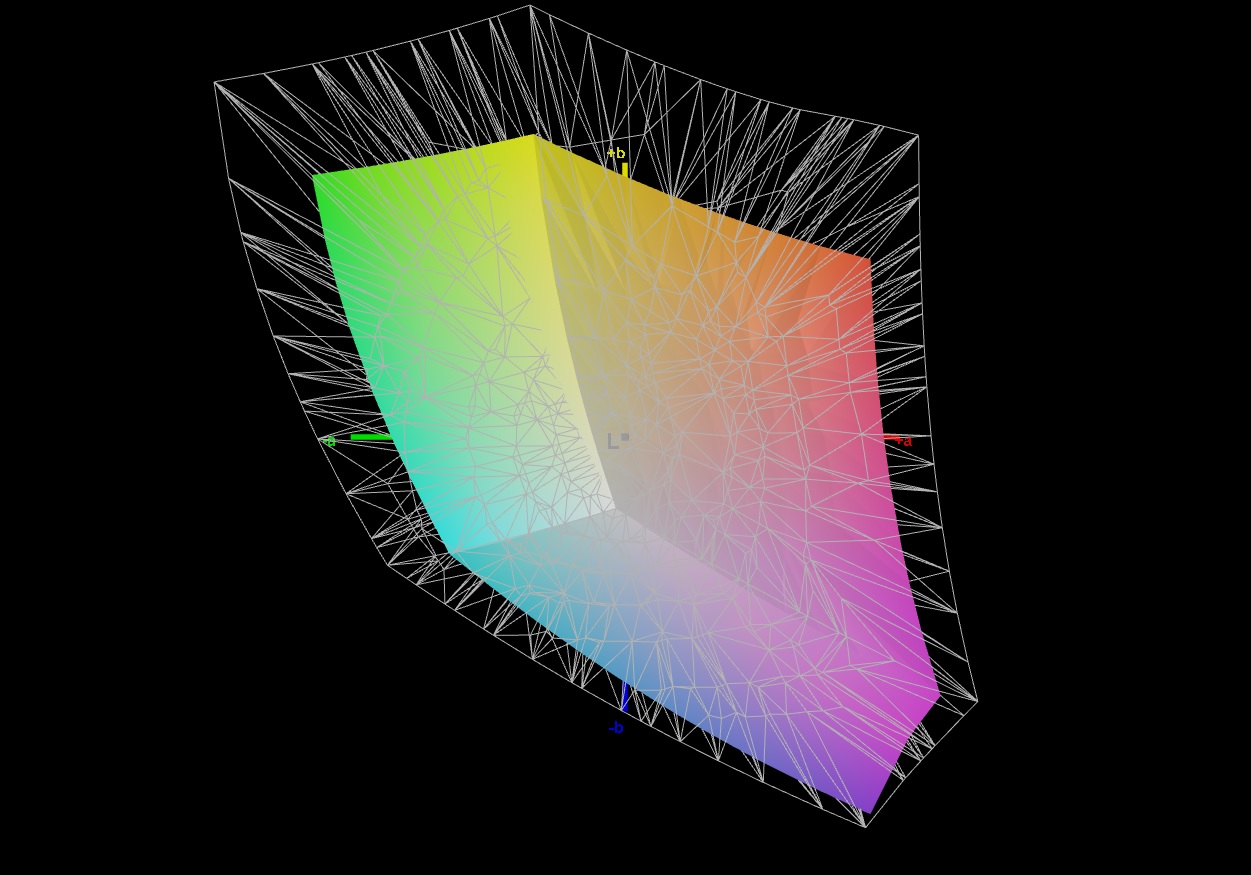
66.5% AdobeRGB 1998 (Argyll 3D)
96.8% sRGB (Argyll 3D)
64.8% Display P3 (Argyll 3D)
Gamma: 2.177
CCT: 7881 K
| HP Pavilion Gaming 17-cd2146ng LGD0611, IPS, 1920x1080, 17.3" | Dell G15 5510-43NHT Dell 156GL05, IPS, 1920x1080, 15.6" | Lenovo Ideapad Gaming 3 15IHU-82K1002RGE LEN156FHD, IPS, 1920x1080, 15.6" | HP Victus 16-e0145ng CMN1609, IPS, 1920x1080, 16.1" | HP Pavilion Gaming 17-cd0085cl BOE0825, IPS, 1920x1080, 17.3" | |
|---|---|---|---|---|---|
| Display | -37% | -38% | -36% | -4% | |
| Display P3 Coverage (%) | 64.8 | 40.8 -37% | 39.7 -39% | 41.6 -36% | 63.3 -2% |
| sRGB Coverage (%) | 96.8 | 61.4 -37% | 59.6 -38% | 61.9 -36% | 90.2 -7% |
| AdobeRGB 1998 Coverage (%) | 66.5 | 42.2 -37% | 41.1 -38% | 43 -35% | 64.3 -3% |
| Response Times | -193% | -285% | -128% | -137% | |
| Response Time Grey 50% / Grey 80% * (ms) | 12.7 ? | 35 ? -176% | 46.4 ? -265% | 29.6 ? -133% | 31.6 ? -149% |
| Response Time Black / White * (ms) | 8.7 ? | 27 ? -210% | 35.2 ? -305% | 19.4 ? -123% | 19.6 ? -125% |
| PWM Frequency (Hz) | |||||
| Screen | -117% | -77% | -80% | -40% | |
| Brightness middle (cd/m²) | 328 | 290 -12% | 307 -6% | 257 -22% | 299.6 -9% |
| Brightness (cd/m²) | 317 | 267 -16% | 292 -8% | 239 -25% | 285 -10% |
| Brightness Distribution (%) | 94 | 87 -7% | 88 -6% | 88 -6% | 86 -9% |
| Black Level * (cd/m²) | 0.23 | 1.085 -372% | 0.21 9% | 0.25 -9% | 0.33 -43% |
| Contrast (:1) | 1426 | 267 -81% | 1462 3% | 1028 -28% | 908 -36% |
| Colorchecker dE 2000 * | 3.83 | 6.5 -70% | 5.9 -54% | 6.91 -80% | 3.68 4% |
| Colorchecker dE 2000 max. * | 8.51 | 16.96 -99% | 21.6 -154% | 22.27 -162% | 8.05 5% |
| Colorchecker dE 2000 calibrated * | 0.83 | 4.11 -395% | 4.8 -478% | 3.61 -335% | 3.15 -280% |
| Greyscale dE 2000 * | 4.9 | 4.85 1% | 4.9 -0% | 7.5 -53% | 3.8 22% |
| Gamma | 2.177 101% | 2.22 99% | 2.26 97% | 2.125 104% | 2.12 104% |
| CCT | 7881 82% | 7401 88% | 6504 100% | 6025 108% | 7240 90% |
| Color Space (Percent of AdobeRGB 1998) (%) | 58.1 | ||||
| Color Space (Percent of sRGB) (%) | 89.8 | ||||
| Total Average (Program / Settings) | -116% /
-111% | -133% /
-99% | -81% /
-77% | -60% /
-46% |
* ... smaller is better
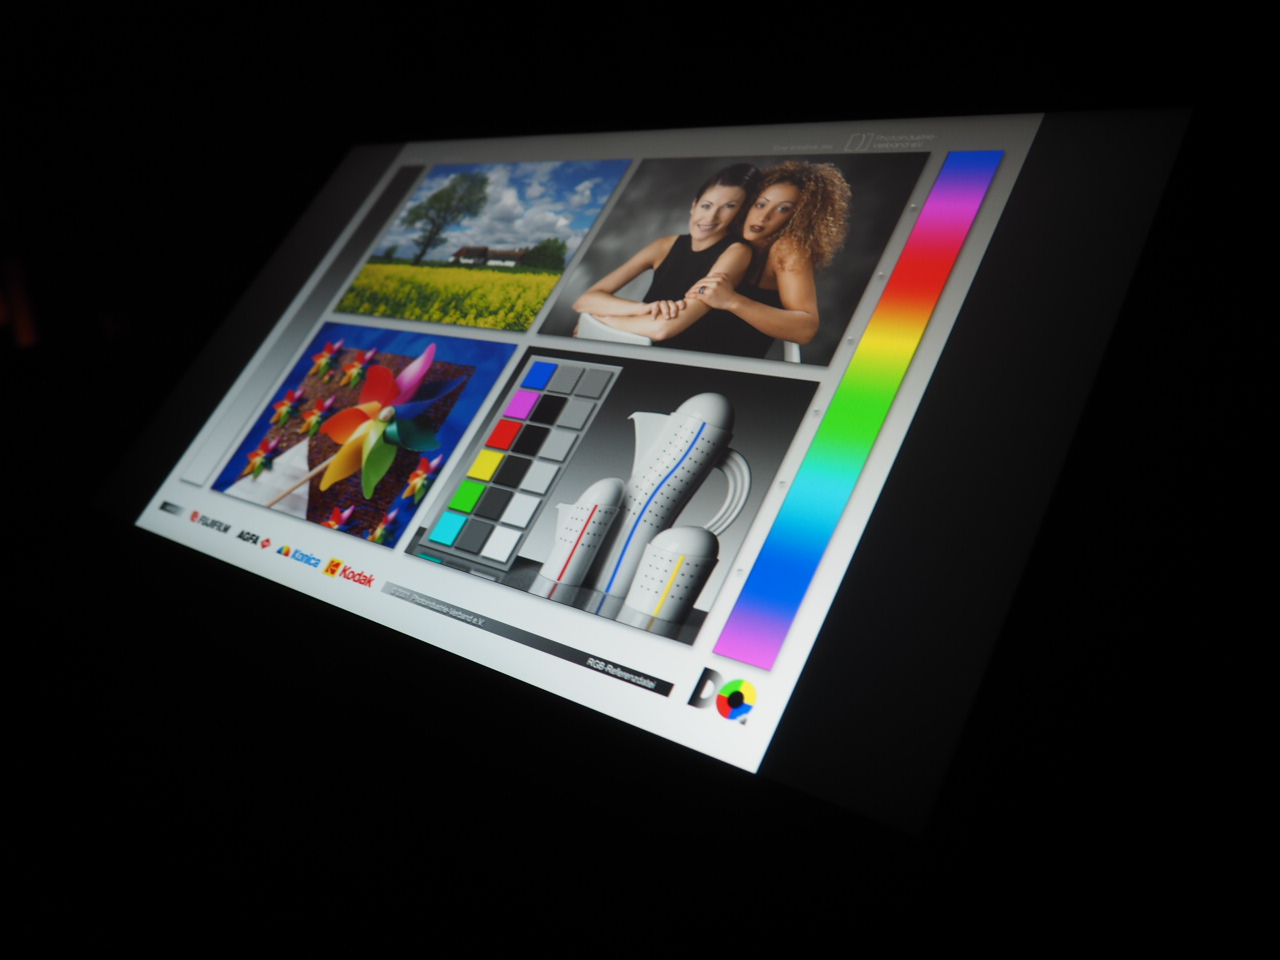
With a registered sRGB coverage of 97%, which is close to the manufacturer's specification, the HP laptop is leaps and bounds ahead of the competition. Both the Dell G15 and the Lenovo IdeaPad Gaming 3 only achieve around 60%, resulting in a much paler image regardless of the contrast, which only tends to be suitable for office and Internet browsing, but not for media consumption (videos, movies, games etc.). In contrast, the Pavilion 17 cuts a fine figure in every application.
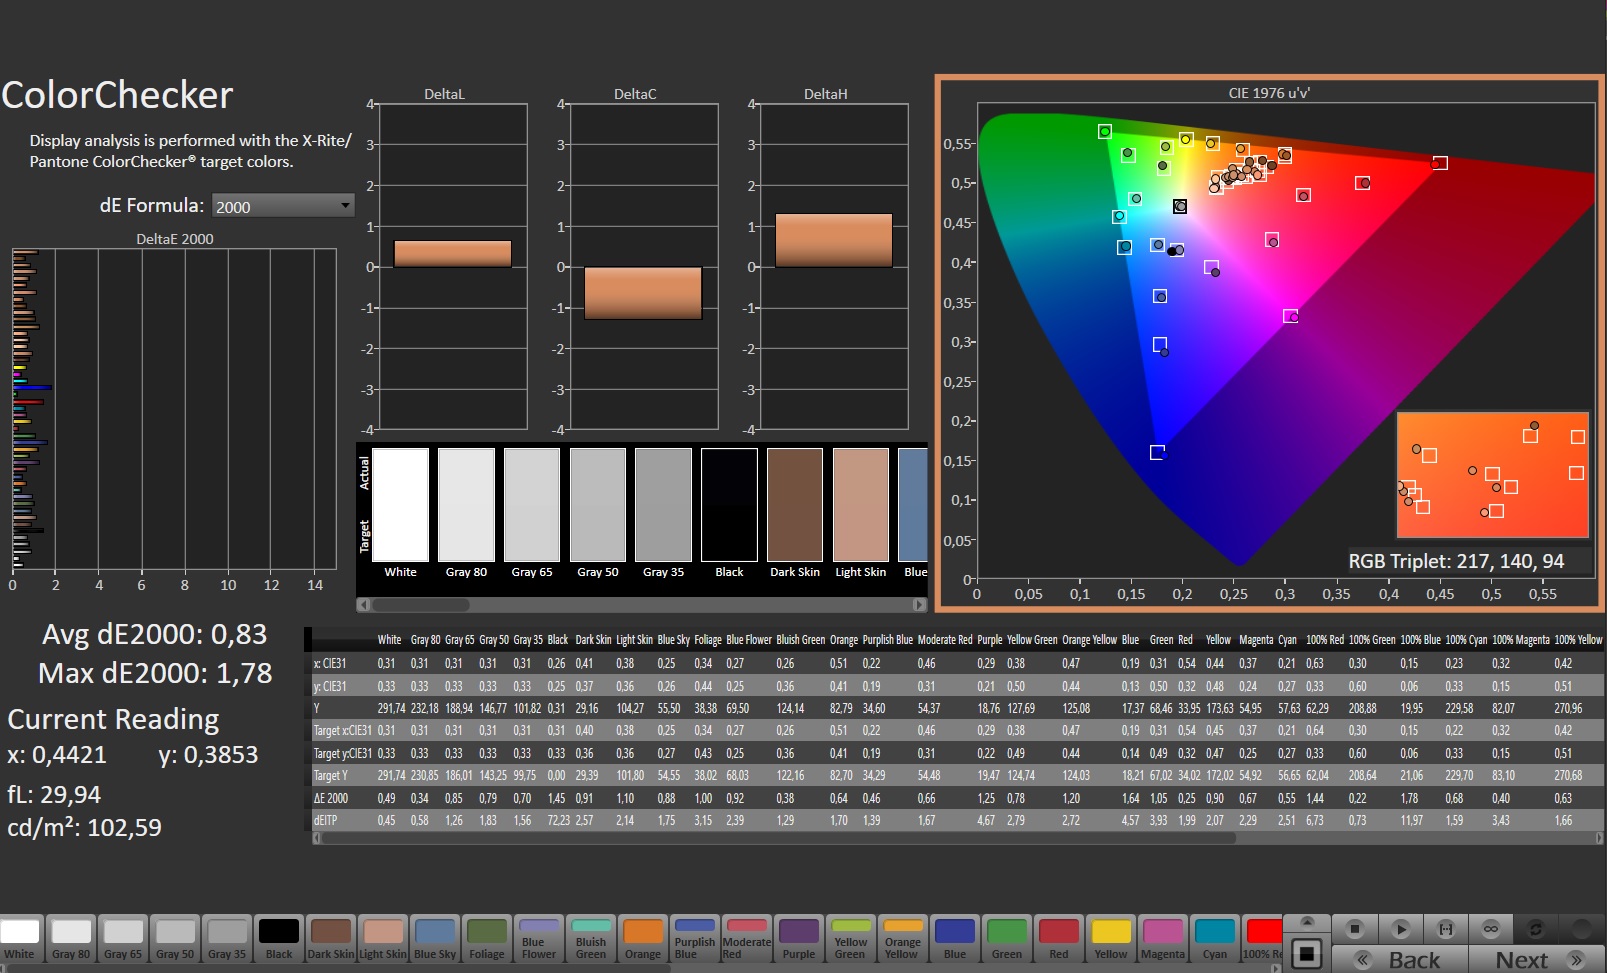
There's nothing to complain about in terms of contrast, either. 1,426:1 is very high by IPS standards, and this value is only just surpassed by the Lenovo laptop. When it comes to brightness, the Pavilion takes the top spot once again. An average of 317 cd/m² isn't a top rate, but it should be sufficient for most needs as long as you avoid particularly bright or sunny locations. For comparison: The competition remains below 300 cd/m² on average.
The HP laptop scores even more points for its fast response times, which no competitor can match. However, the manufacturer could use some improvements in terms of color accuracy. The panel shows a slight blue tint out of the box, which can be corrected by calibration (there's a link to our ICC file in the upper right corner next to the brightness distribution chart). Viewing angles are in line with typical IPS standards. The 17-inch device doesn't suffer from excessive screen bleeding or flickering.
Display Response Times
| ↔ Response Time Black to White | ||
|---|---|---|
| 8.7 ms ... rise ↗ and fall ↘ combined | ↗ 4.4 ms rise | 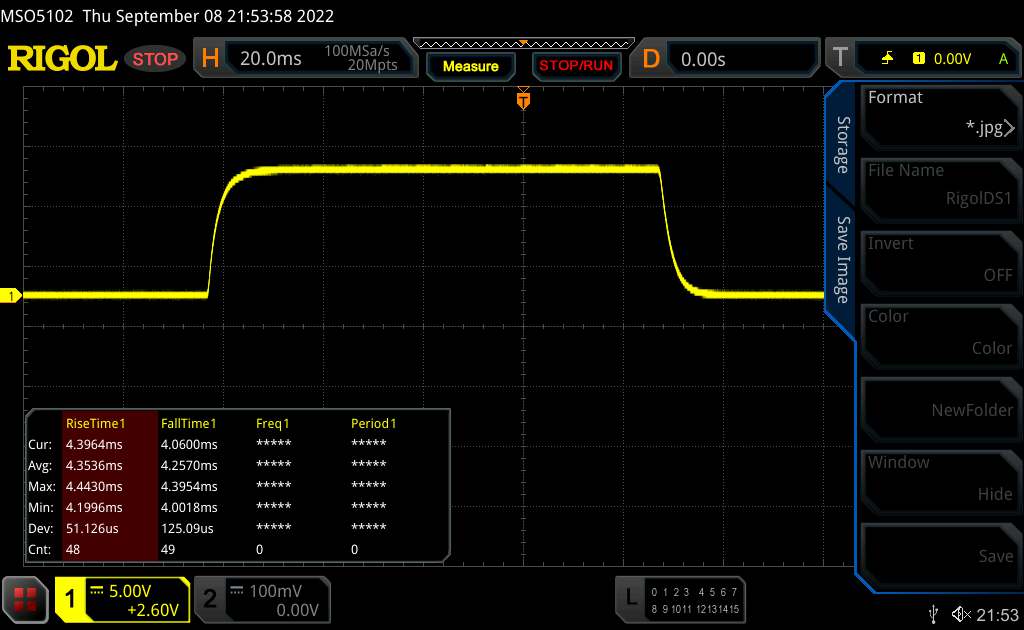 |
| ↘ 4.3 ms fall | ||
| The screen shows fast response rates in our tests and should be suited for gaming. In comparison, all tested devices range from 0.1 (minimum) to 240 (maximum) ms. » 24 % of all devices are better. This means that the measured response time is better than the average of all tested devices (19.8 ms). | ||
| ↔ Response Time 50% Grey to 80% Grey | ||
| 12.7 ms ... rise ↗ and fall ↘ combined | ↗ 6.1 ms rise | 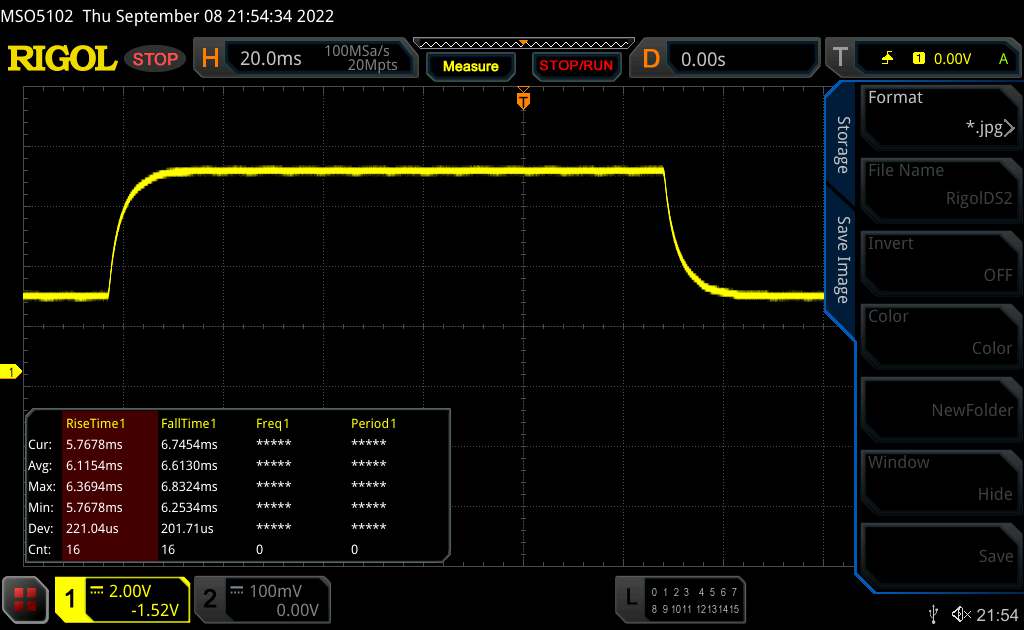 |
| ↘ 6.6 ms fall | ||
| The screen shows good response rates in our tests, but may be too slow for competitive gamers. In comparison, all tested devices range from 0.165 (minimum) to 636 (maximum) ms. » 26 % of all devices are better. This means that the measured response time is better than the average of all tested devices (31 ms). | ||
Screen Flickering / PWM (Pulse-Width Modulation)
| Screen flickering / PWM not detected | 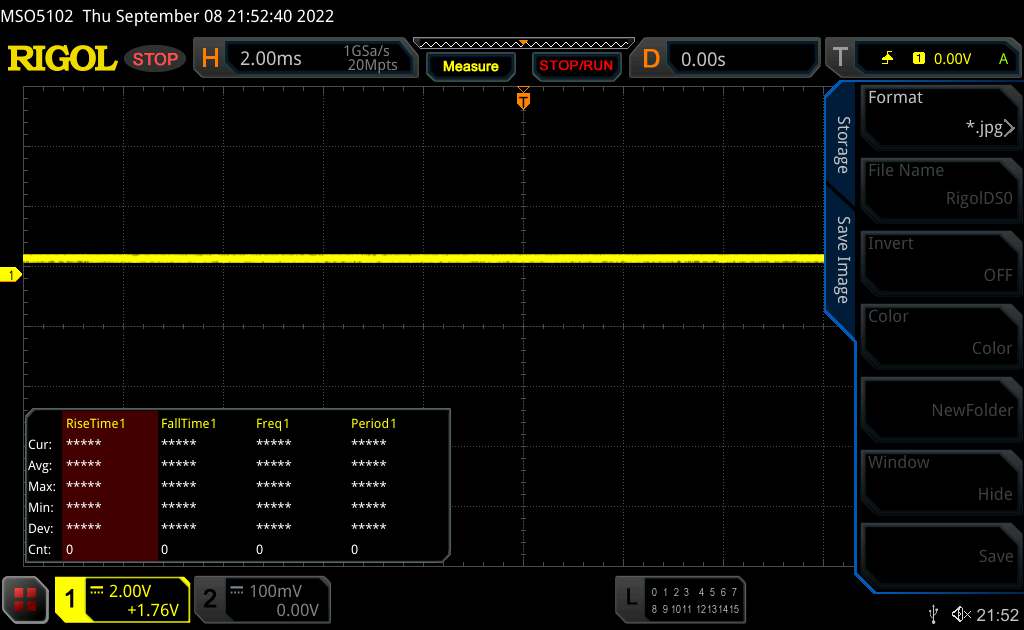 | ||
In comparison: 52 % of all tested devices do not use PWM to dim the display. If PWM was detected, an average of 7747 (minimum: 5 - maximum: 343500) Hz was measured. | |||
Performance
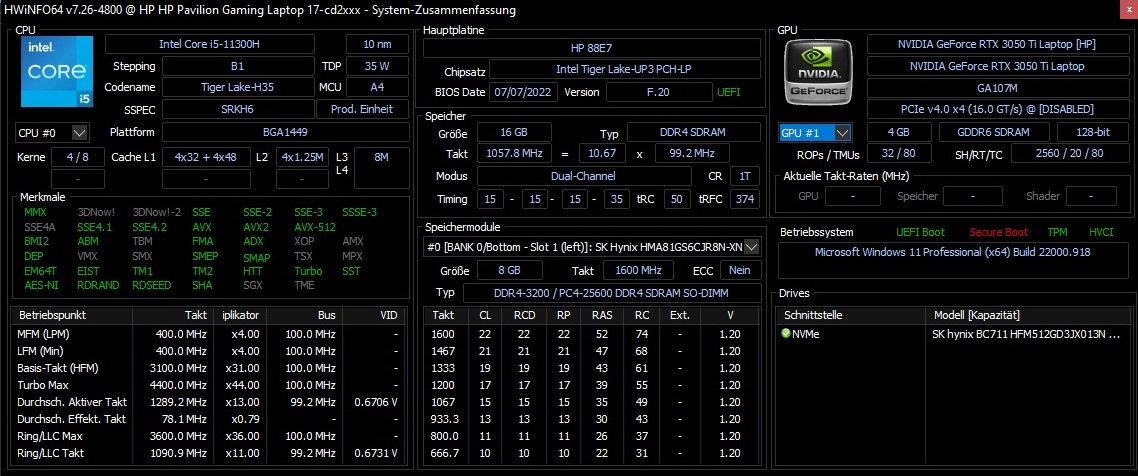
With a quad-core CPU and a 4 GB GPU, the Pavilion Gaming 17 is positioned in the mid-range segment. 16 GB of RAM should be enough for the next few years. Things could get tight with the SSD when several (large) games are installed. Nevertheless, the storage and RAM can be exchanged without any problems.
Test conditions
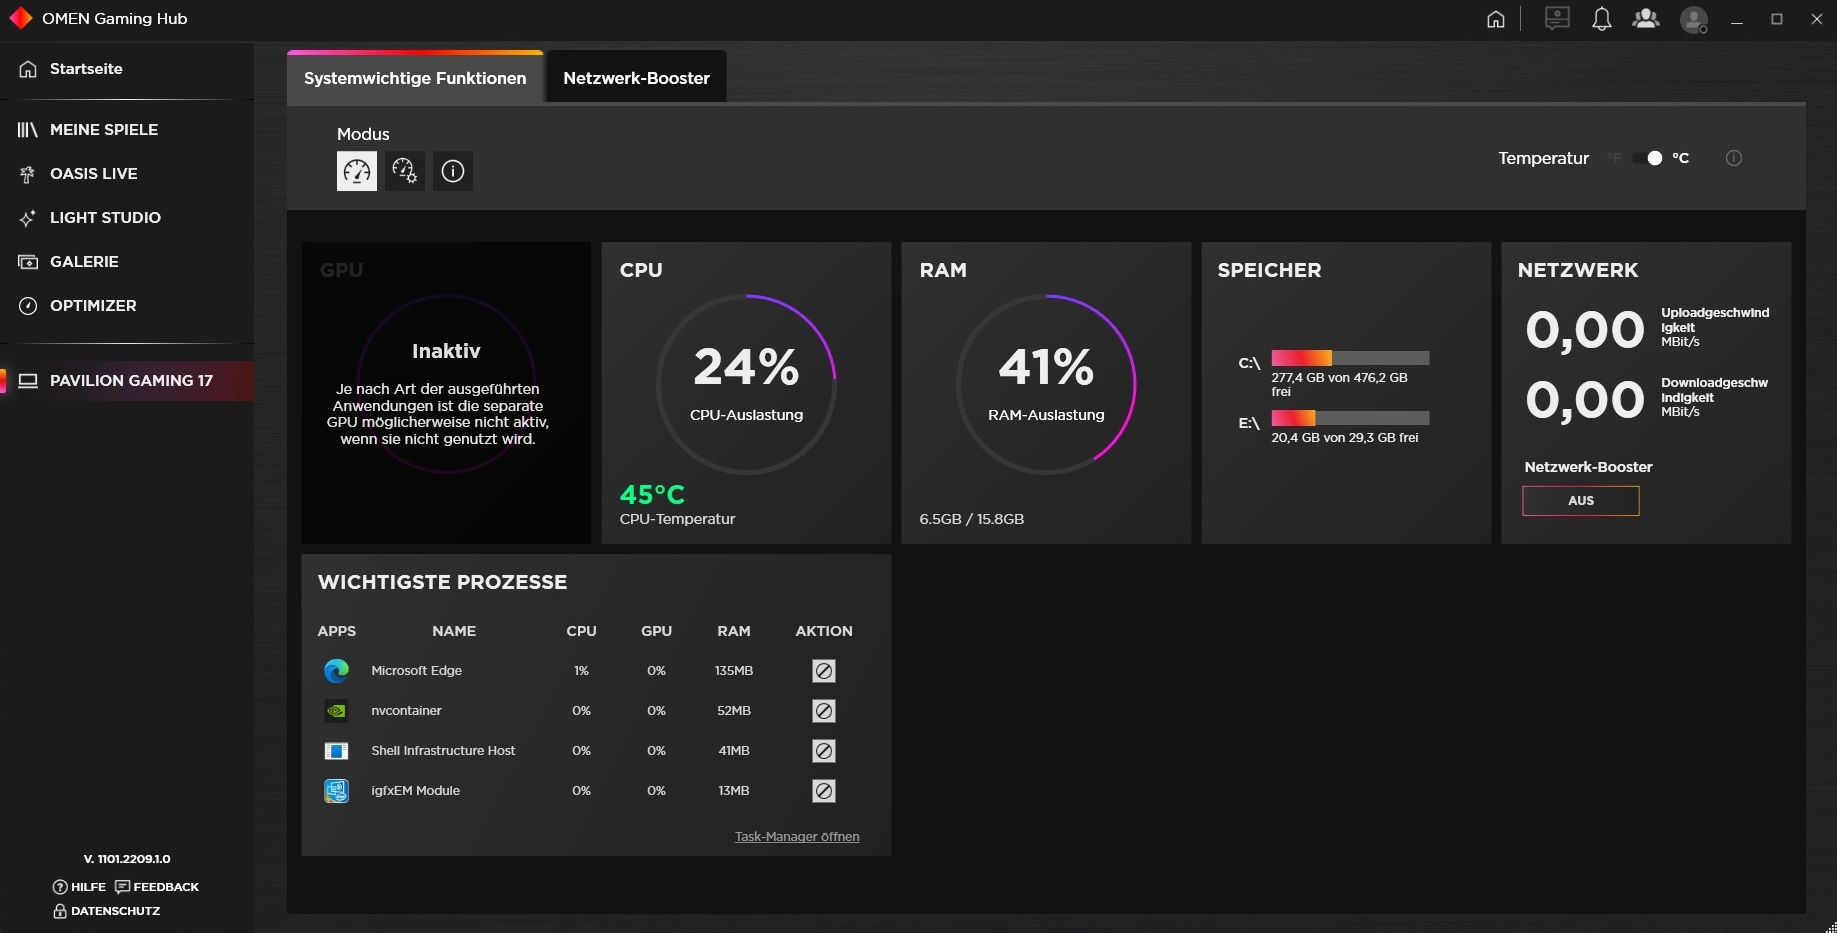
Besides the drivers and updates that are automatically installed by Windows, we only installed the Omen Gaming Hub on the device. However, in the case of the Pavilion Gaming 17, there were no different performance modes available there as is otherwise usual for other laptops.
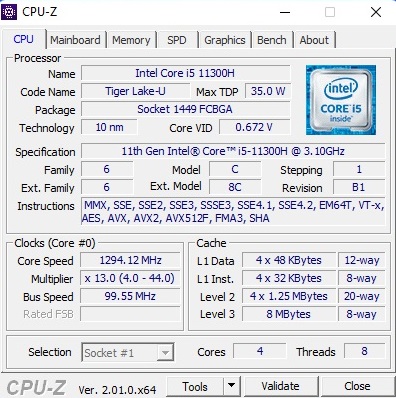
Processor
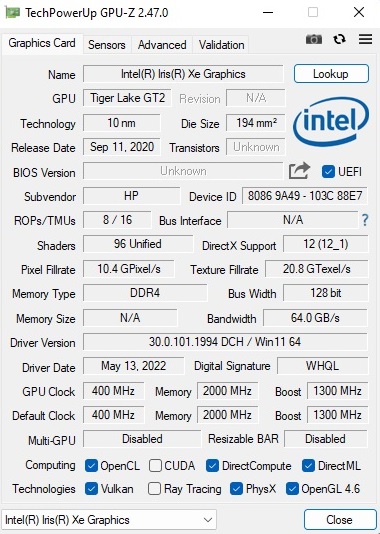
The Core i5-11300H is a powerful quad-core CPU that belongs to Intel's Tiger-Lake generation, which isn't quite as brand-new as it used to be. The 10 nm chip offers 8 MB of L3 cache as well as up to 8 threads that can be processed in parallel via Hyper-Threading. The processor behaved without any issues in our benchmark course. Its performance is similar to that of the Lenovo IdeaPad Gaming 3, which is also equipped with an i5-11300H. However, when it comes to multi-core applications, the CPU doesn't stand a chance against the old Core i7-9750H and the Ryzen 5 5600H (6 cores each) in particular. Nevertheless, the i5-11300H is a good all-round model.
Cinebench R15 Multi endurance test
* ... smaller is better
AIDA64: FP32 Ray-Trace | FPU Julia | CPU SHA3 | CPU Queen | FPU SinJulia | FPU Mandel | CPU AES | CPU ZLib | FP64 Ray-Trace | CPU PhotoWorxx
| Performance rating | |
| Average of class Gaming | |
| HP Victus 16-e0145ng | |
| Lenovo Ideapad Gaming 3 15IHU-82K1002RGE | |
| Average Intel Core i5-11300H | |
| HP Pavilion Gaming 17-cd2146ng | |
| Dell G15 5510-43NHT | |
| AIDA64 / FP32 Ray-Trace | |
| Average of class Gaming (10227 - 85542, n=103, last 2 years) | |
| HP Victus 16-e0145ng | |
| Lenovo Ideapad Gaming 3 15IHU-82K1002RGE | |
| Average Intel Core i5-11300H (6128 - 8440, n=9) | |
| HP Pavilion Gaming 17-cd2146ng | |
| Dell G15 5510-43NHT | |
| AIDA64 / FPU Julia | |
| Average of class Gaming (51376 - 238426, n=103, last 2 years) | |
| HP Victus 16-e0145ng | |
| Lenovo Ideapad Gaming 3 15IHU-82K1002RGE | |
| Dell G15 5510-43NHT | |
| Average Intel Core i5-11300H (25739 - 33986, n=9) | |
| HP Pavilion Gaming 17-cd2146ng | |
| AIDA64 / CPU SHA3 | |
| Average of class Gaming (2180 - 9817, n=103, last 2 years) | |
| HP Victus 16-e0145ng | |
| Lenovo Ideapad Gaming 3 15IHU-82K1002RGE | |
| Average Intel Core i5-11300H (1773 - 2286, n=9) | |
| HP Pavilion Gaming 17-cd2146ng | |
| Dell G15 5510-43NHT | |
| AIDA64 / CPU Queen | |
| Average of class Gaming (49785 - 173351, n=89, last 2 years) | |
| HP Victus 16-e0145ng | |
| Lenovo Ideapad Gaming 3 15IHU-82K1002RGE | |
| Average Intel Core i5-11300H (41257 - 49312, n=9) | |
| Dell G15 5510-43NHT | |
| HP Pavilion Gaming 17-cd2146ng | |
| AIDA64 / FPU SinJulia | |
| Average of class Gaming (4424 - 33636, n=103, last 2 years) | |
| HP Victus 16-e0145ng | |
| Dell G15 5510-43NHT | |
| Lenovo Ideapad Gaming 3 15IHU-82K1002RGE | |
| Average Intel Core i5-11300H (3925 - 4677, n=9) | |
| HP Pavilion Gaming 17-cd2146ng | |
| AIDA64 / FPU Mandel | |
| Average of class Gaming (25115 - 128721, n=103, last 2 years) | |
| HP Victus 16-e0145ng | |
| Lenovo Ideapad Gaming 3 15IHU-82K1002RGE | |
| Average Intel Core i5-11300H (15820 - 20669, n=9) | |
| HP Pavilion Gaming 17-cd2146ng | |
| Dell G15 5510-43NHT | |
| AIDA64 / CPU AES | |
| Average of class Gaming (39258 - 247074, n=103, last 2 years) | |
| Lenovo Ideapad Gaming 3 15IHU-82K1002RGE | |
| Average Intel Core i5-11300H (37694 - 71519, n=9) | |
| HP Victus 16-e0145ng | |
| HP Pavilion Gaming 17-cd2146ng | |
| Dell G15 5510-43NHT | |
| AIDA64 / CPU ZLib | |
| Average of class Gaming (574 - 2531, n=103, last 2 years) | |
| HP Victus 16-e0145ng | |
| Lenovo Ideapad Gaming 3 15IHU-82K1002RGE | |
| Average Intel Core i5-11300H (269 - 390, n=9) | |
| Dell G15 5510-43NHT | |
| HP Pavilion Gaming 17-cd2146ng | |
| AIDA64 / FP64 Ray-Trace | |
| Average of class Gaming (5509 - 45446, n=103, last 2 years) | |
| HP Victus 16-e0145ng | |
| Lenovo Ideapad Gaming 3 15IHU-82K1002RGE | |
| Average Intel Core i5-11300H (3322 - 4613, n=9) | |
| HP Pavilion Gaming 17-cd2146ng | |
| Dell G15 5510-43NHT | |
| AIDA64 / CPU PhotoWorxx | |
| Average of class Gaming (12271 - 89891, n=103, last 2 years) | |
| HP Pavilion Gaming 17-cd2146ng | |
| Average Intel Core i5-11300H (9705 - 38002, n=9) | |
| HP Victus 16-e0145ng | |
| Lenovo Ideapad Gaming 3 15IHU-82K1002RGE | |
| Dell G15 5510-43NHT | |
System performance
In terms of system performance, the 17-inch laptop sits comfortably in the middle of the competition. 5,442 points in PCMark 10 is a solid result and absolutely adequate for the estimated price.
CrossMark: Overall | Productivity | Creativity | Responsiveness
| PCMark 10 / Score | |
| Average of class Gaming (5828 - 11730, n=92, last 2 years) | |
| HP Victus 16-e0145ng | |
| Lenovo Ideapad Gaming 3 15IHU-82K1002RGE | |
| Average Intel Core i5-11300H, NVIDIA GeForce RTX 3050 Ti Laptop GPU (5442 - 5641, n=2) | |
| HP Pavilion Gaming 17-cd2146ng | |
| HP Pavilion Gaming 17-cd0085cl | |
| Dell G15 5510-43NHT | |
| PCMark 10 / Essentials | |
| Average of class Gaming (8810 - 11935, n=96, last 2 years) | |
| HP Victus 16-e0145ng | |
| HP Pavilion Gaming 17-cd0085cl | |
| HP Pavilion Gaming 17-cd2146ng | |
| Average Intel Core i5-11300H, NVIDIA GeForce RTX 3050 Ti Laptop GPU (8524 - 8829, n=2) | |
| Lenovo Ideapad Gaming 3 15IHU-82K1002RGE | |
| Dell G15 5510-43NHT | |
| PCMark 10 / Productivity | |
| Average of class Gaming (6845 - 21327, n=94, last 2 years) | |
| Lenovo Ideapad Gaming 3 15IHU-82K1002RGE | |
| Average Intel Core i5-11300H, NVIDIA GeForce RTX 3050 Ti Laptop GPU (7664 - 9112, n=2) | |
| HP Victus 16-e0145ng | |
| HP Pavilion Gaming 17-cd2146ng | |
| HP Pavilion Gaming 17-cd0085cl | |
| Dell G15 5510-43NHT | |
| PCMark 10 / Digital Content Creation | |
| Average of class Gaming (7602 - 19954, n=94, last 2 years) | |
| HP Victus 16-e0145ng | |
| HP Pavilion Gaming 17-cd0085cl | |
| HP Pavilion Gaming 17-cd2146ng | |
| Average Intel Core i5-11300H, NVIDIA GeForce RTX 3050 Ti Laptop GPU (6271 - 6462, n=2) | |
| Lenovo Ideapad Gaming 3 15IHU-82K1002RGE | |
| Dell G15 5510-43NHT | |
| CrossMark / Overall | |
| Average of class Gaming (1366 - 2409, n=93, last 2 years) | |
| Lenovo Ideapad Gaming 3 15IHU-82K1002RGE | |
| Average Intel Core i5-11300H, NVIDIA GeForce RTX 3050 Ti Laptop GPU (n=1) | |
| CrossMark / Productivity | |
| Average of class Gaming (1386 - 2254, n=93, last 2 years) | |
| Lenovo Ideapad Gaming 3 15IHU-82K1002RGE | |
| Average Intel Core i5-11300H, NVIDIA GeForce RTX 3050 Ti Laptop GPU (n=1) | |
| CrossMark / Creativity | |
| Average of class Gaming (1343 - 2729, n=93, last 2 years) | |
| Lenovo Ideapad Gaming 3 15IHU-82K1002RGE | |
| Average Intel Core i5-11300H, NVIDIA GeForce RTX 3050 Ti Laptop GPU (n=1) | |
| CrossMark / Responsiveness | |
| Average of class Gaming (1226 - 2334, n=93, last 2 years) | |
| Lenovo Ideapad Gaming 3 15IHU-82K1002RGE | |
| Average Intel Core i5-11300H, NVIDIA GeForce RTX 3050 Ti Laptop GPU (n=1) | |
| PCMark 10 Score | 5442 points | |
Help | ||
| AIDA64 / Memory Copy | |
| Average of class Gaming (21750 - 129946, n=103, last 2 years) | |
| HP Victus 16-e0145ng | |
| Average Intel Core i5-11300H (19947 - 60141, n=9) | |
| HP Pavilion Gaming 17-cd2146ng | |
| Lenovo Ideapad Gaming 3 15IHU-82K1002RGE | |
| Dell G15 5510-43NHT | |
| AIDA64 / Memory Read | |
| Average of class Gaming (22956 - 118858, n=103, last 2 years) | |
| HP Victus 16-e0145ng | |
| Average Intel Core i5-11300H (22688 - 62684, n=9) | |
| HP Pavilion Gaming 17-cd2146ng | |
| Lenovo Ideapad Gaming 3 15IHU-82K1002RGE | |
| Dell G15 5510-43NHT | |
| AIDA64 / Memory Write | |
| Average of class Gaming (22297 - 135096, n=103, last 2 years) | |
| HP Victus 16-e0145ng | |
| Average Intel Core i5-11300H (20959 - 65245, n=9) | |
| HP Pavilion Gaming 17-cd2146ng | |
| Lenovo Ideapad Gaming 3 15IHU-82K1002RGE | |
| Dell G15 5510-43NHT | |
| AIDA64 / Memory Latency | |
| Average of class Gaming (75.3 - 259, n=103, last 2 years) | |
| Lenovo Ideapad Gaming 3 15IHU-82K1002RGE | |
| HP Pavilion Gaming 17-cd2146ng | |
| Average Intel Core i5-11300H (76.3 - 93.6, n=9) | |
| HP Victus 16-e0145ng | |
| Dell G15 5510-43NHT | |
* ... smaller is better
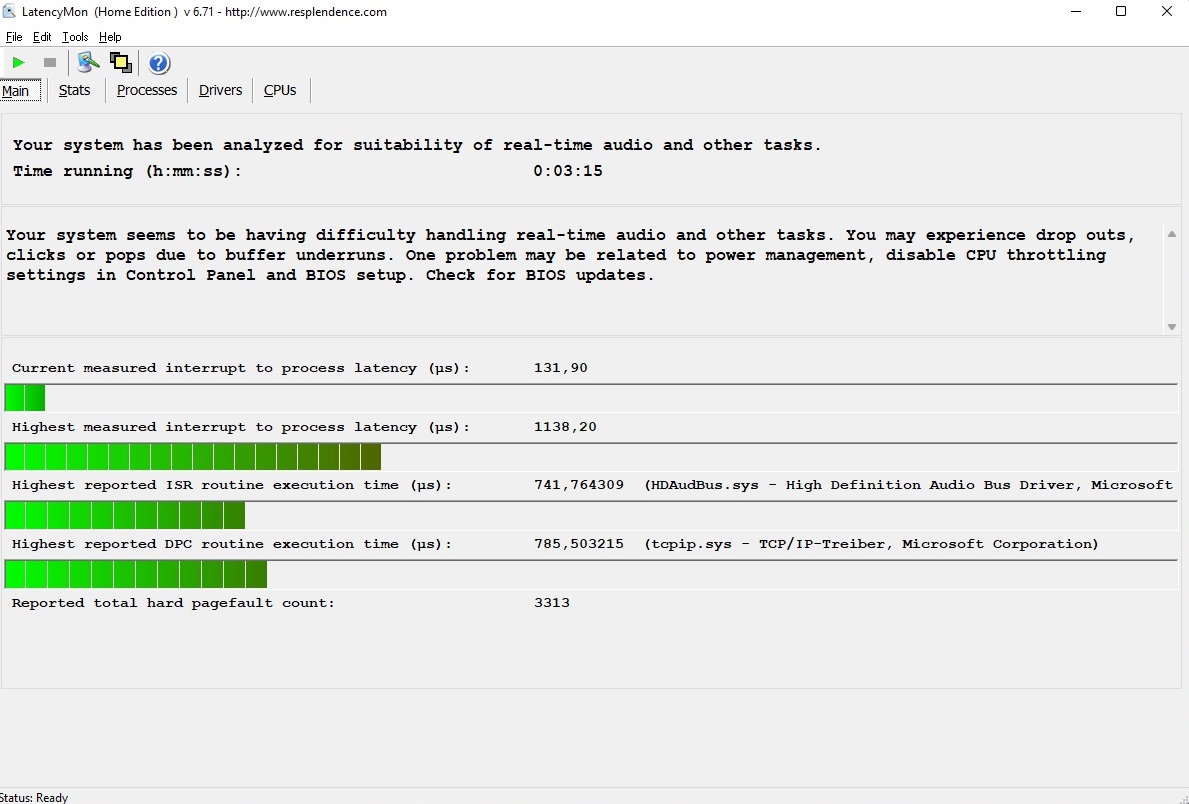
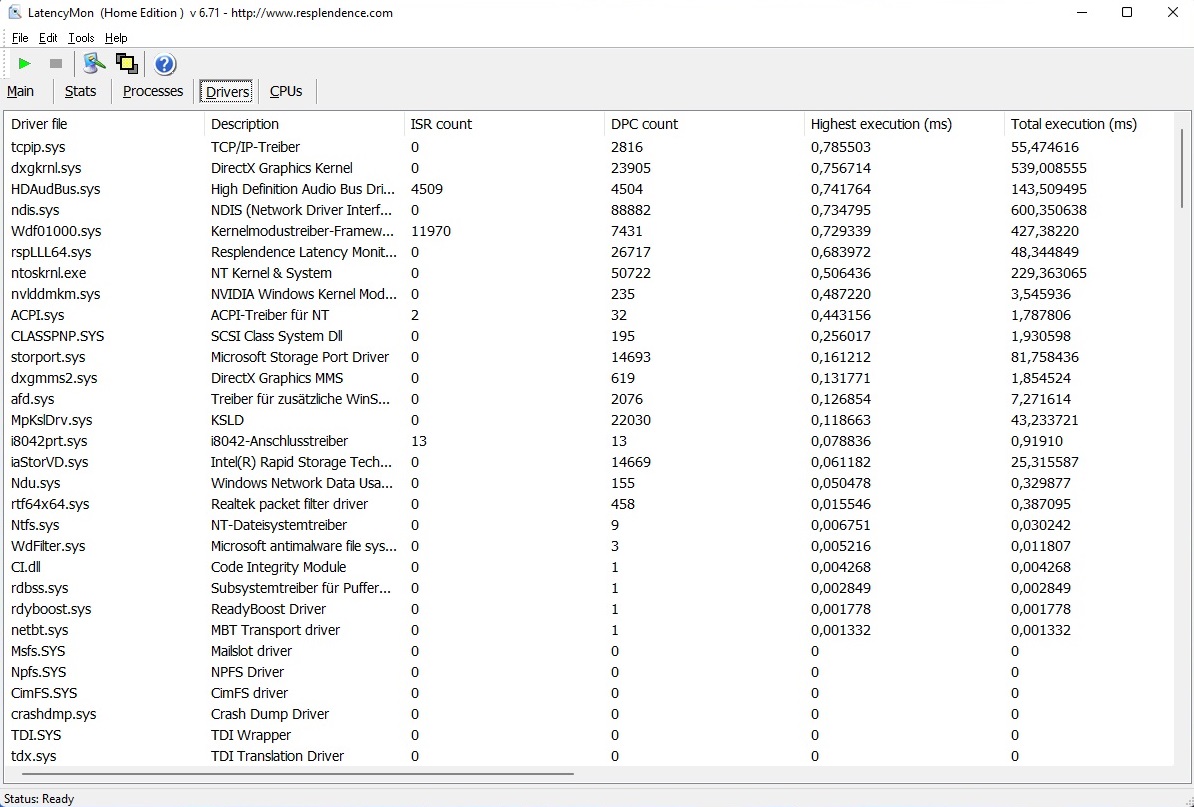
DPC latencies
Things aren't entirely optimal when it comes to latencies. Like numerous other laptops, the Pavilion Gaming 17 isn't particularly suitable for real-time audio and video editing according to the LatencyMon tool.
| DPC Latencies / LatencyMon - interrupt to process latency (max), Web, Youtube, Prime95 | |
| Dell G15 5510-43NHT | |
| HP Pavilion Gaming 17-cd2146ng | |
| Lenovo Ideapad Gaming 3 15IHU-82K1002RGE | |
| HP Victus 16-e0145ng | |
* ... smaller is better
Storage
The fast storage device should be emphasized positively. HP has equipped our review model with a 512 GB PCIe drive (M.2 2280) from SK Hynix (BC711), which achieves sequential read and write speeds of over 2,500 MB/s, something that only the HP Victus 16 can achieve. Annoying: Unfortunately, the existing 2.5-inch slot, which contains an "HDD dummy", can't be used since there's no suitable cable integrated.

* ... smaller is better
Continuous load read: DiskSpd Read Loop, Queue Depth 8
Graphics card
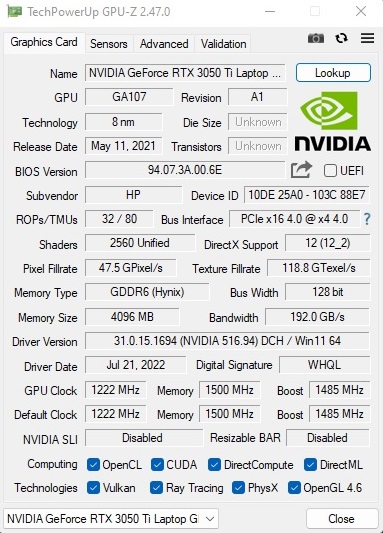
The GeForce RTX 3050 Ti from Nvidia is an ideal graphics card for casual gamers who don't necessarily want to play every new title at maximum details. The 8 nm model is based on the latest Ampere architecture and is equipped with 2,560 shader units. The Nvidia chips' performance depends very much on the specified TGP, which laptop manufacturers can choose freely within a certain range. In this case, HP opted for 60 watts, which corresponds to a medium level for the RTX 3050 Ti. Nevertheless, the Pavilion Gaming 17 performs slightly better in the GPU circuit compared to the 3050 Ti average.
| 3DMark 11 Performance | 15245 points | |
| 3DMark Ice Storm Standard Score | 98555 points | |
| 3DMark Cloud Gate Standard Score | 26005 points | |
| 3DMark Fire Strike Score | 11649 points | |
| 3DMark Time Spy Score | 5155 points | |
Help | ||
Gaming performance
As long as you stick to the native 1920x1080 pixels and don't connect a high-resolution external display, the RTX 3050 Ti offers a solid 3D performance. Apart from very demanding or moderately optimized games like God of War, most current titles run smoothly, even at maximum settings, although the 144 Hz is often far from being fully exploited. The GPU reveals weaknesses in ray tracing in particular, which is shown in F1 22. 4 GB of VRAM isn't optimal for the long term, either. If you're looking for a certain degree of future-proofing, you should buy a graphics card with at least 6 or preferably 8 GB of VRAM.
| The Witcher 3 | |
| 1920x1080 High Graphics & Postprocessing (Nvidia HairWorks Off) | |
| Average of class Gaming (n=1last 2 years) | |
| HP Victus 16-e0145ng | |
| HP Pavilion Gaming 17-cd2146ng | |
| HP Pavilion Gaming 17-cd0085cl | |
| Lenovo Ideapad Gaming 3 15IHU-82K1002RGE | |
| Average NVIDIA GeForce RTX 3050 Ti Laptop GPU (30 - 110, n=26) | |
| Dell G15 5510-43NHT | |
| 1920x1080 Ultra Graphics & Postprocessing (HBAO+) | |
| Average of class Gaming (104.7 - 240, n=6, last 2 years) | |
| HP Victus 16-e0145ng | |
| Dell G15 5510-43NHT | |
| HP Pavilion Gaming 17-cd2146ng | |
| HP Pavilion Gaming 17-cd0085cl | |
| Average NVIDIA GeForce RTX 3050 Ti Laptop GPU (19 - 58.5, n=29) | |
| Lenovo Ideapad Gaming 3 15IHU-82K1002RGE | |
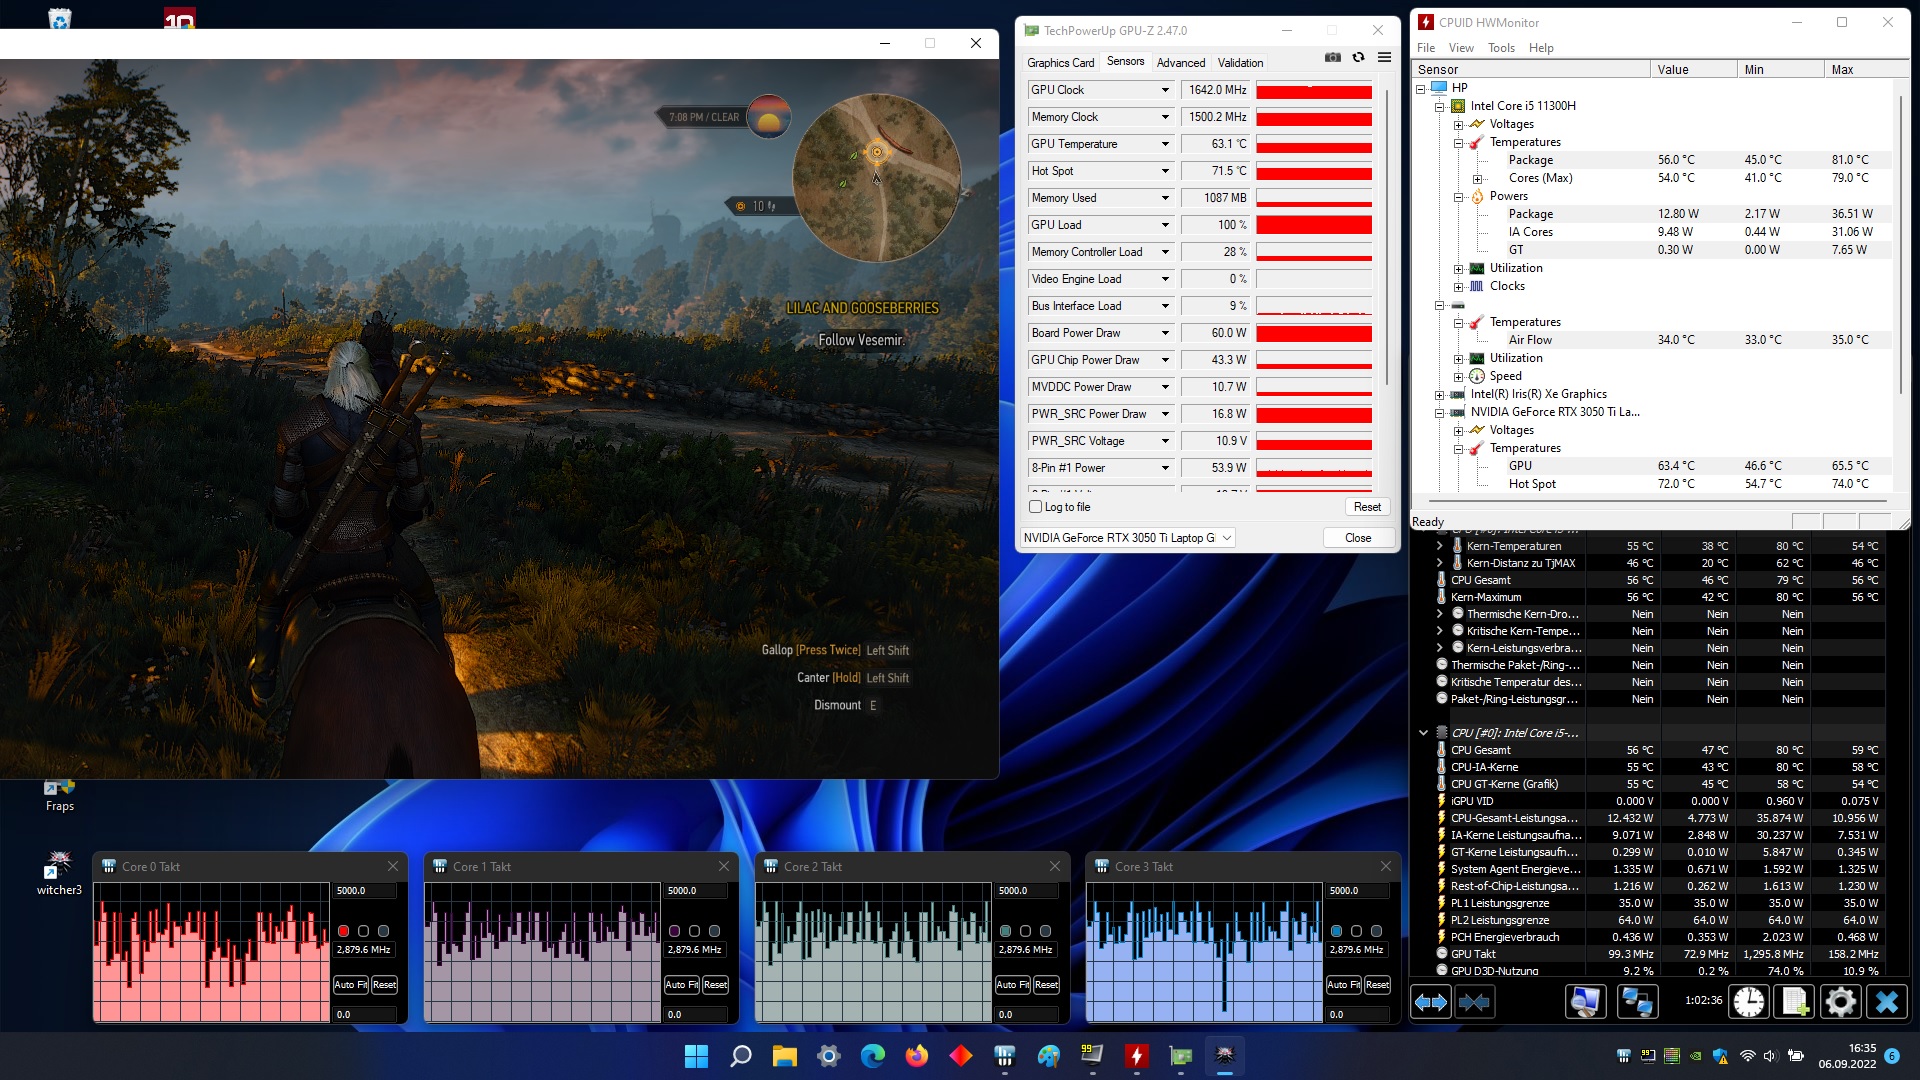
There were no irregularities in our endurance test (one hour of The Witcher 3). The frame rate remained pretty constant over the entire time span.
The Witcher 3 FPS diagram
| low | med. | high | ultra | |
|---|---|---|---|---|
| GTA V (2015) | 156.1 | 119.9 | 66.9 | |
| The Witcher 3 (2015) | 170 | 94.4 | 51.4 | |
| Dota 2 Reborn (2015) | 119.7 | 108.5 | 104.8 | 100.7 |
| Final Fantasy XV Benchmark (2018) | 76 | 53.3 | ||
| X-Plane 11.11 (2018) | 87.5 | 75.3 | 64.3 | |
| Strange Brigade (2018) | 132.8 | 105.8 | 90.3 | |
| God of War (2022) | 60.7 | 48.6 | 30.6 | |
| Rainbow Six Extraction (2022) | 112 | 108 | 83 | |
| Dying Light 2 (2022) | 46.7 | 38.8 | ||
| Elden Ring (2022) | 55.4 | 53.8 | 52.7 | |
| Elex 2 (2022) | 52.2 | 50.9 | 46.1 | |
| F1 22 (2022) | 132 | 93 | 28 | |
| The Quarry (2022) | 63.1 | 51.5 | 39.7 |
Emissions
Noise emissions
When looking at the predecessor with the Core i7-9750H and the GeForce GTX 1660 Ti Max-Q, we praised the lower noise development in particular. While the new Pavilion Gaming 17 is still one of the quieter gaming laptops, the 17-incher is no longer truly quiet. Instead of 34 to 44 dB(A), we measured 39 to 46 dB(A) under load, which is clearly audible, but not annoying. On the other hand, the device is pleasantly quiet with 27 to 30 dB(A) in idle usage, although the fans never turn off completely. However, the latter can be changed in the BIOS by disabling the "always on" option. This results in the fans being disabled during simple tasks at times.
Noise level
| Idle |
| 27 / 28 / 30 dB(A) |
| Load |
| 39 / 46 dB(A) |
 | ||
30 dB silent 40 dB(A) audible 50 dB(A) loud |
||
min: | ||
| HP Pavilion Gaming 17-cd2146ng i5-11300H, GeForce RTX 3050 Ti Laptop GPU | Dell G15 5510-43NHT i5-10200H, GeForce RTX 3050 Ti Laptop GPU | Lenovo Ideapad Gaming 3 15IHU-82K1002RGE i5-11300H, GeForce RTX 3050 Ti Laptop GPU | HP Victus 16-e0145ng R5 5600H, GeForce RTX 3050 Ti Laptop GPU | HP Pavilion Gaming 17-cd0085cl i7-9750H, GeForce GTX 1660 Ti Max-Q | |
|---|---|---|---|---|---|
| Noise | -2% | 1% | -7% | 1% | |
| off / environment * (dB) | 25 | 25 -0% | 23.9 4% | 26 -4% | 28.2 -13% |
| Idle Minimum * (dB) | 27 | 25 7% | 23.9 11% | 26 4% | 30.1 -11% |
| Idle Average * (dB) | 28 | 25 11% | 26.8 4% | 28 -0% | 30.1 -8% |
| Idle Maximum * (dB) | 30 | 25 17% | 26.8 11% | 34 -13% | 30.1 -0% |
| Load Average * (dB) | 39 | 52.2 -34% | 43.5 -12% | 44 -13% | 34.2 12% |
| Witcher 3 ultra * (dB) | 44 | 43.5 1% | 48 -9% | 34.2 22% | |
| Load Maximum * (dB) | 46 | 52.2 -13% | 53.1 -15% | 53 -15% | 43.8 5% |
* ... smaller is better
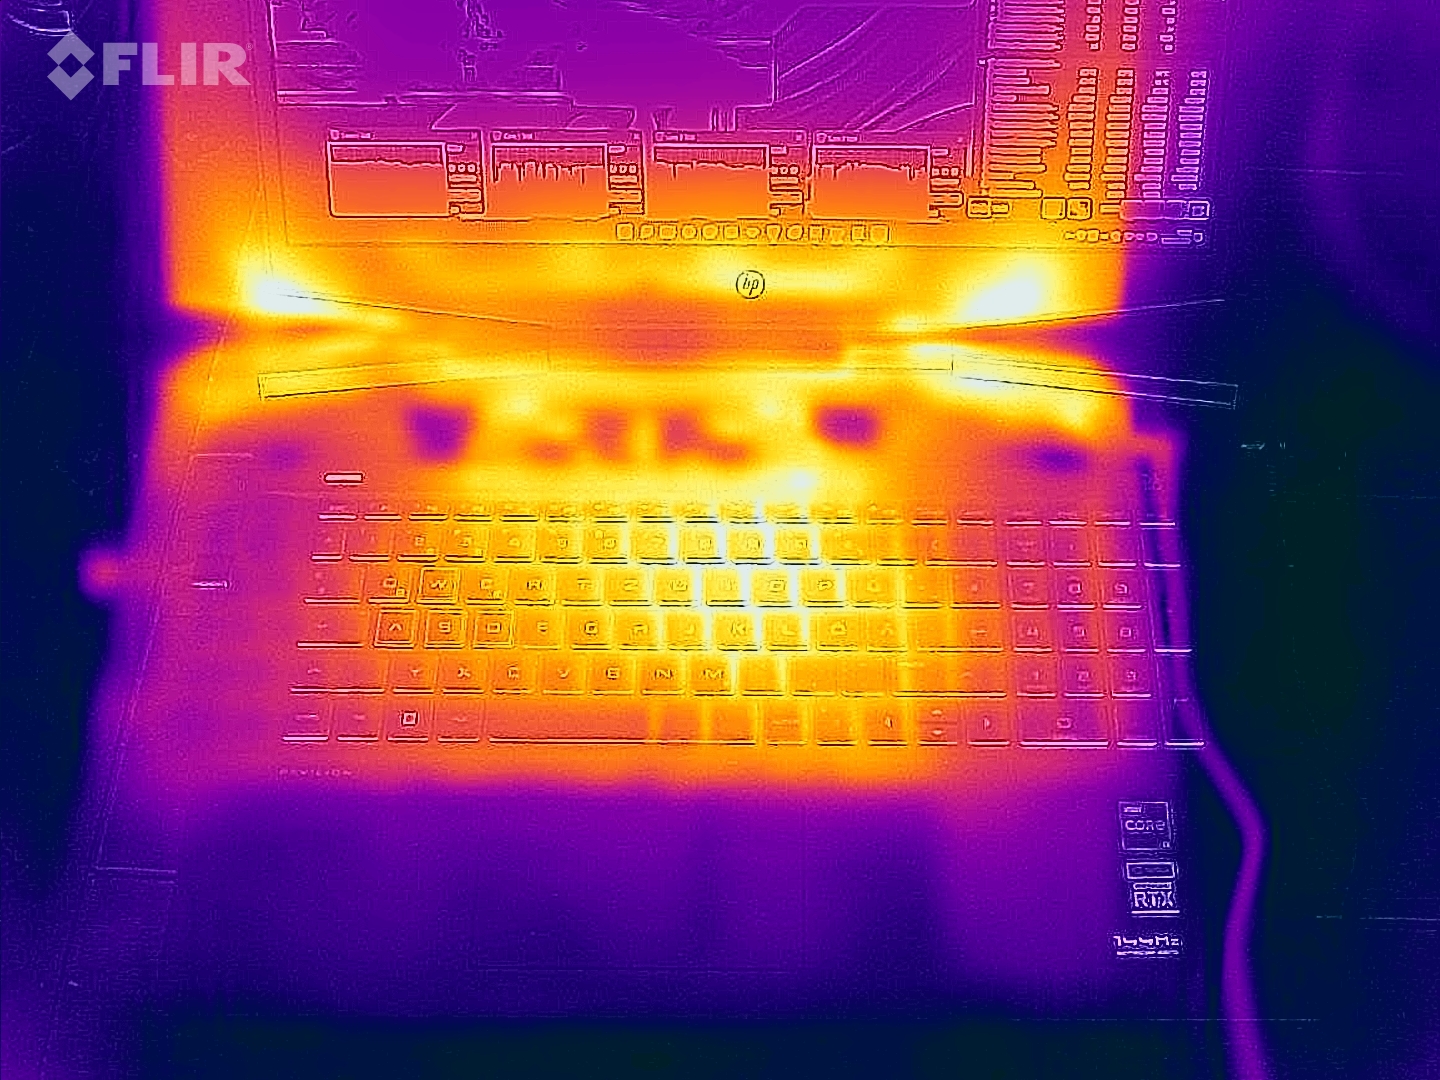
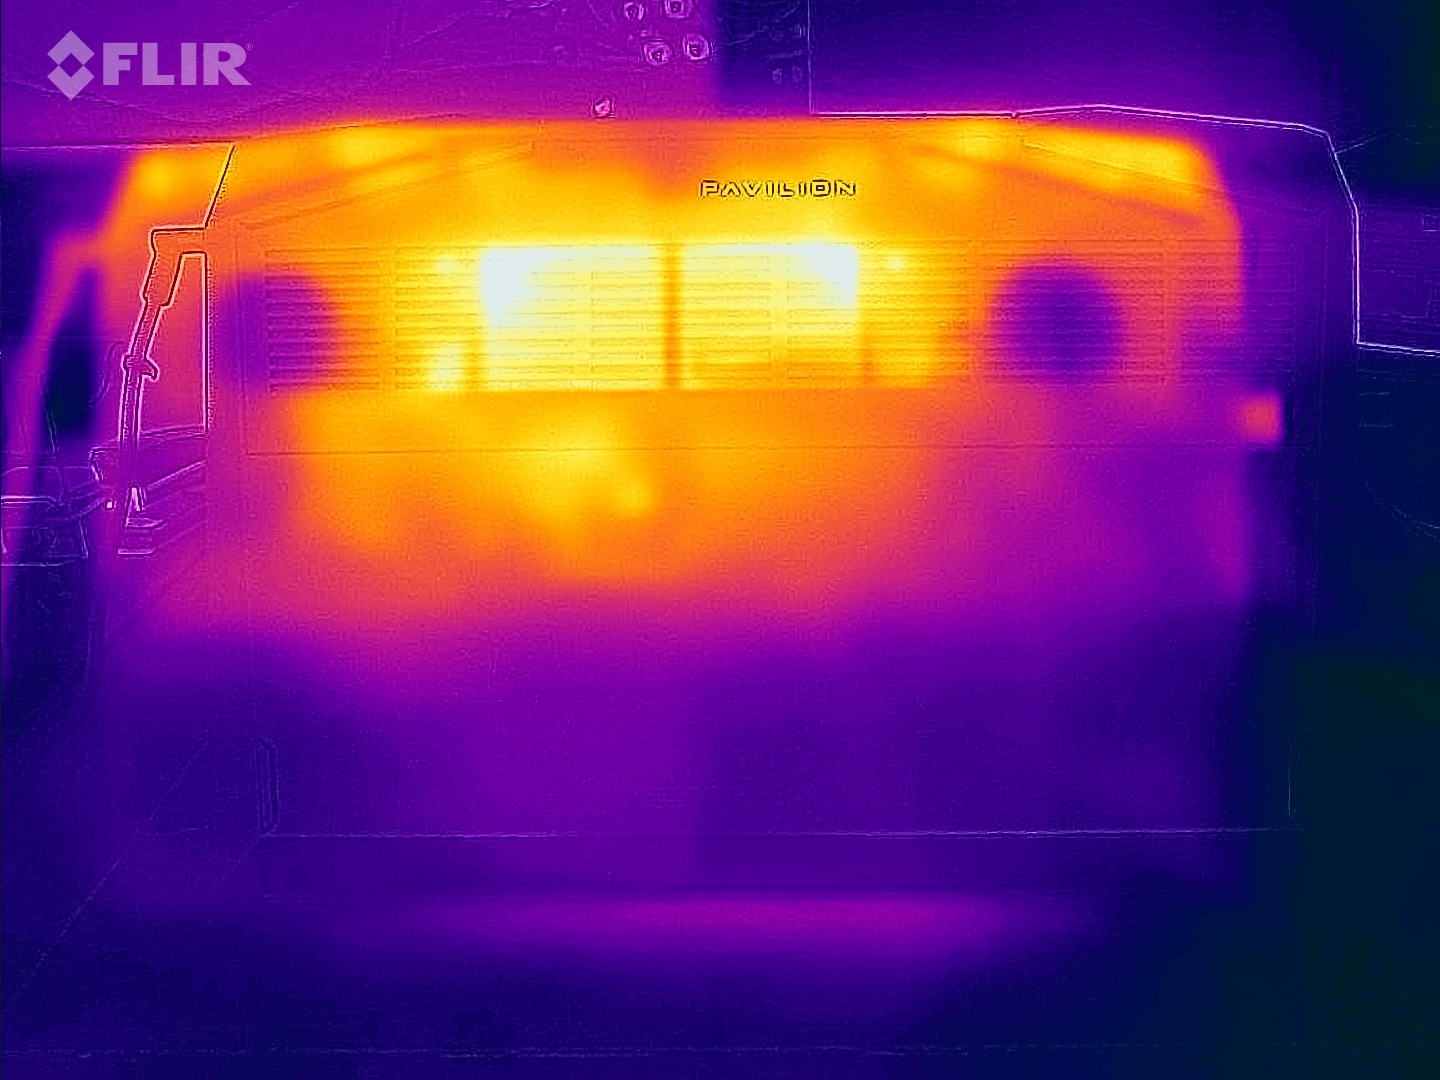
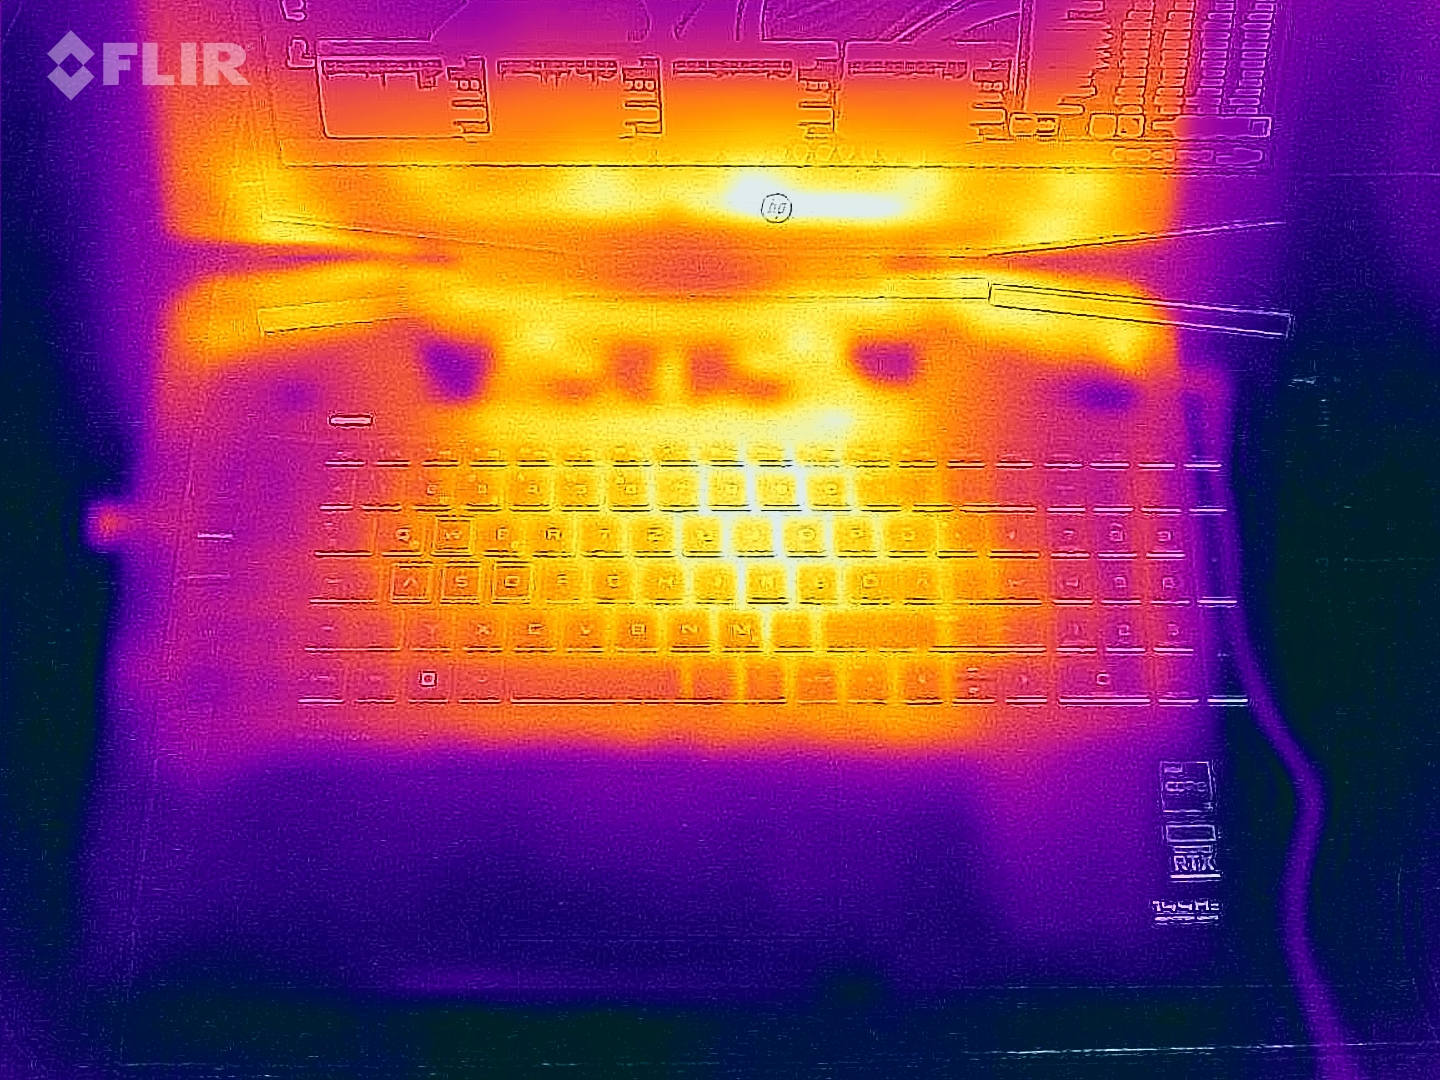
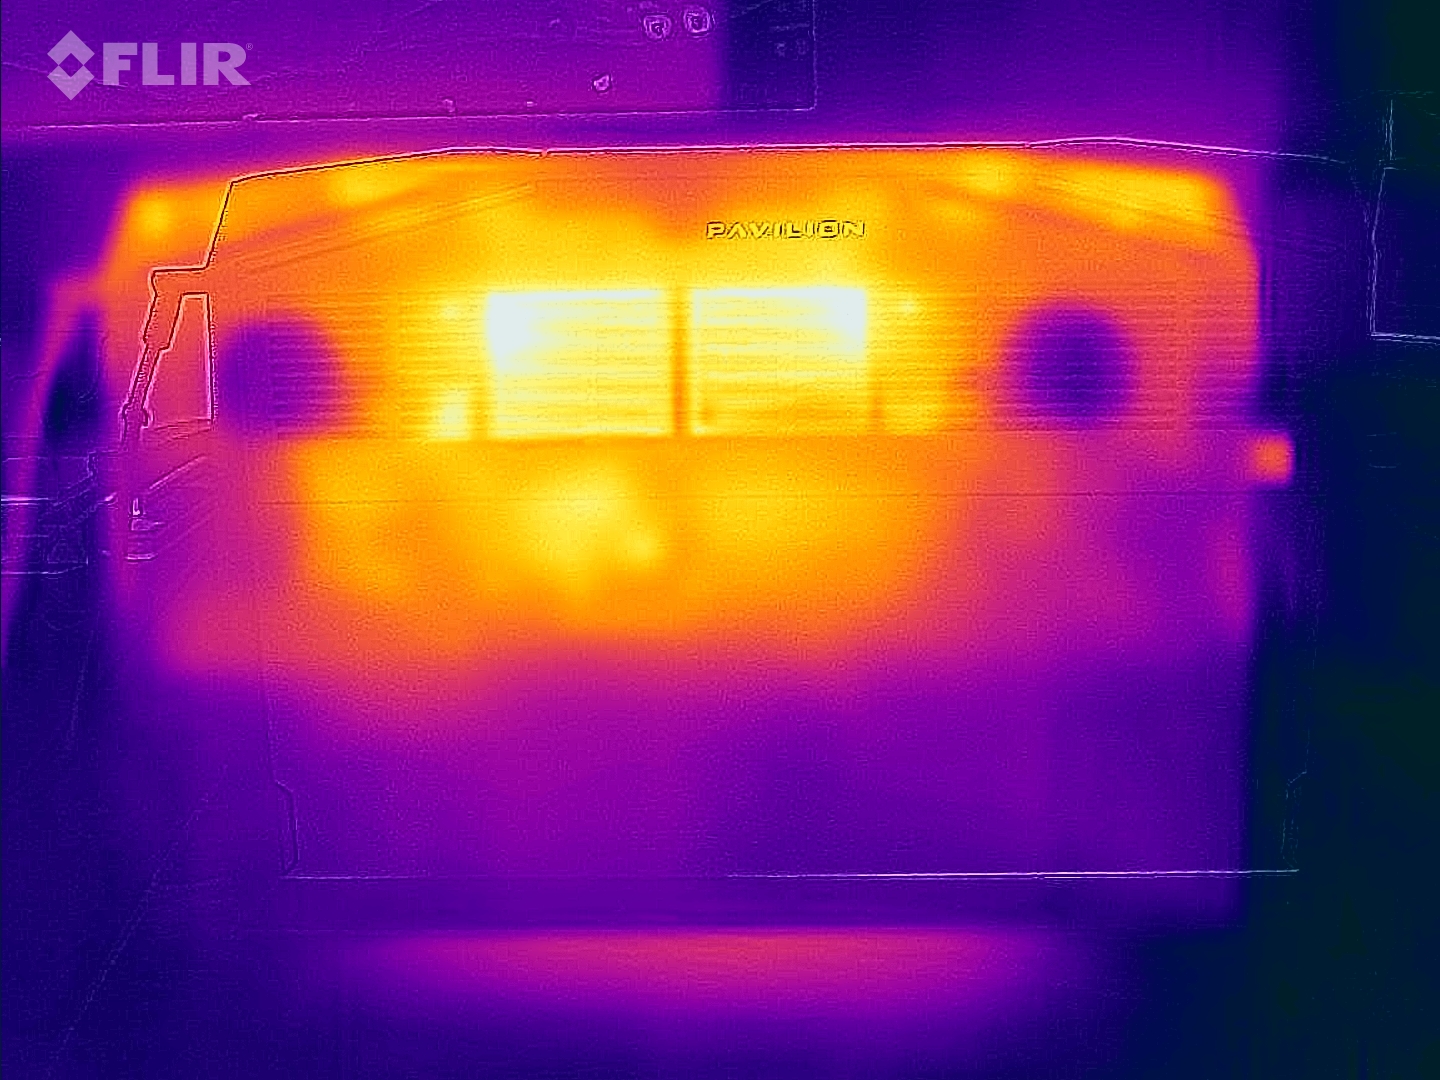
Temperature
The Pavilion Gaming 17's heat development doesn't show anything unusual, either. A maximum of 44 °C (~111 °F) at the top and 48 °C (~115 °F) at the bottom after 60 minutes of stress testing with the FurMark and Prime95 tools are typical for the built-in hardware. The entire chassis remains below the 30 °C (~86 °F) mark in idle usage, which makes it pleasantly cool.
(±) The maximum temperature on the upper side is 44 °C / 111 F, compared to the average of 40.4 °C / 105 F, ranging from 21.2 to 68.8 °C for the class Gaming.
(-) The bottom heats up to a maximum of 48 °C / 118 F, compared to the average of 43.2 °C / 110 F
(+) In idle usage, the average temperature for the upper side is 26.6 °C / 80 F, compared to the device average of 33.9 °C / 93 F.
(±) Playing The Witcher 3, the average temperature for the upper side is 36.2 °C / 97 F, compared to the device average of 33.9 °C / 93 F.
(+) The palmrests and touchpad are reaching skin temperature as a maximum (34 °C / 93.2 F) and are therefore not hot.
(-) The average temperature of the palmrest area of similar devices was 28.8 °C / 83.8 F (-5.2 °C / -9.4 F).
| HP Pavilion Gaming 17-cd2146ng i5-11300H, GeForce RTX 3050 Ti Laptop GPU | Dell G15 5510-43NHT i5-10200H, GeForce RTX 3050 Ti Laptop GPU | Lenovo Ideapad Gaming 3 15IHU-82K1002RGE i5-11300H, GeForce RTX 3050 Ti Laptop GPU | HP Victus 16-e0145ng R5 5600H, GeForce RTX 3050 Ti Laptop GPU | HP Pavilion Gaming 17-cd0085cl i7-9750H, GeForce GTX 1660 Ti Max-Q | |
|---|---|---|---|---|---|
| Heat | -9% | 3% | -22% | -18% | |
| Maximum Upper Side * (°C) | 44 | 45.9 -4% | 43.2 2% | 54 -23% | 42.6 3% |
| Maximum Bottom * (°C) | 48 | 51.9 -8% | 47.9 -0% | 47 2% | 49 -2% |
| Idle Upper Side * (°C) | 27 | 30.1 -11% | 24.9 8% | 41 -52% | 34 -26% |
| Idle Bottom * (°C) | 27 | 30.1 -11% | 27 -0% | 31 -15% | 39.4 -46% |
* ... smaller is better
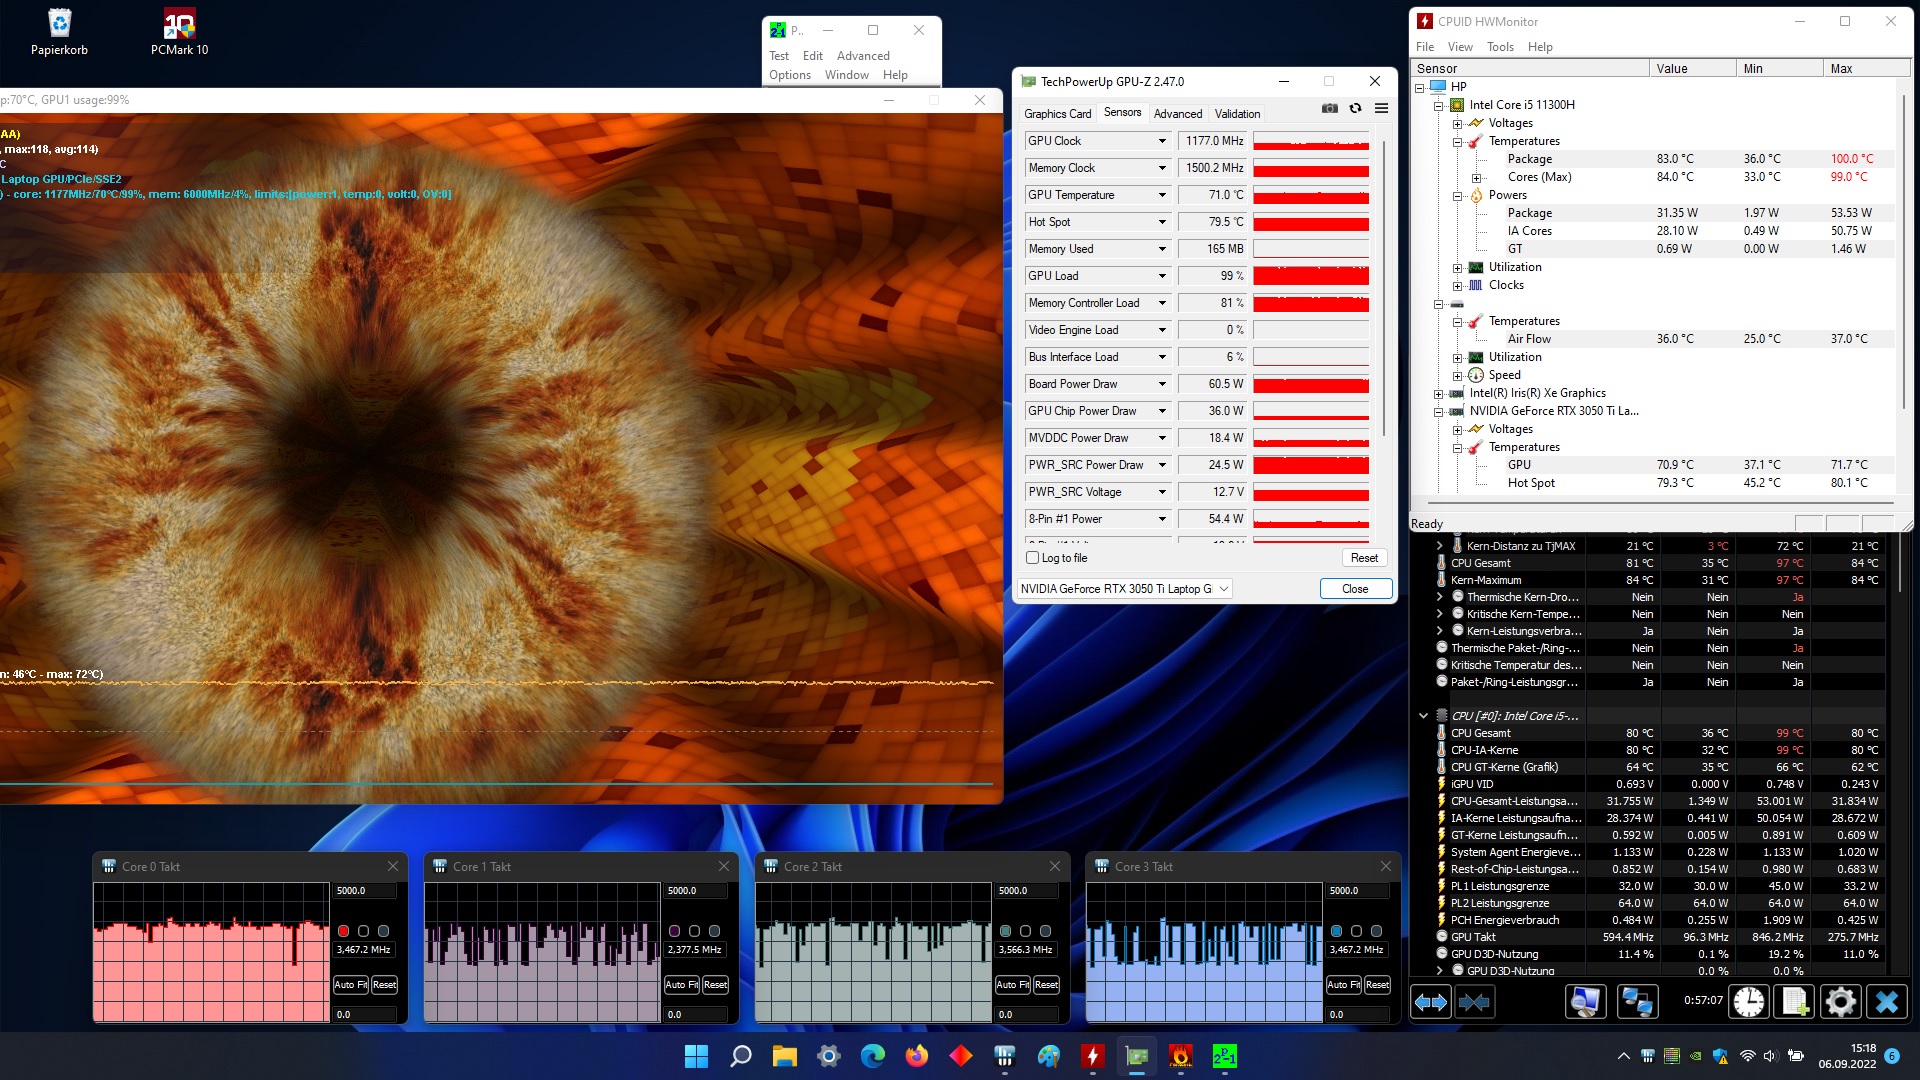
Stress test
The components don't suffer from overheating, either. Although the Core i5-11300H briefly reaches 100 °C (~212 °F) under full load (according to the HWMonitor tool), the temperature settles down to an acceptable 83 °C (~181 °F) after a while (at a decent clock rate). The GeForce RTX 3050 Ti reaches an average temperature of 71 °C (~160 °F), which is also an acceptable and harmless value.
Speakers
HP Pavilion Gaming 17-cd2146ng audio analysis
(±) | speaker loudness is average but good (80 dB)
Bass 100 - 315 Hz
(-) | nearly no bass - on average 19.5% lower than median
(±) | linearity of bass is average (11.5% delta to prev. frequency)
Mids 400 - 2000 Hz
(+) | balanced mids - only 3.2% away from median
(+) | mids are linear (3.8% delta to prev. frequency)
Highs 2 - 16 kHz
(±) | higher highs - on average 8.6% higher than median
(±) | linearity of highs is average (8% delta to prev. frequency)
Overall 100 - 16.000 Hz
(±) | linearity of overall sound is average (20.5% difference to median)
Compared to same class
» 73% of all tested devices in this class were better, 5% similar, 22% worse
» The best had a delta of 6%, average was 18%, worst was 132%
Compared to all devices tested
» 54% of all tested devices were better, 8% similar, 38% worse
» The best had a delta of 4%, average was 23%, worst was 134%
HP Victus 16-e0145ng audio analysis
(±) | speaker loudness is average but good (79 dB)
Bass 100 - 315 Hz
(-) | nearly no bass - on average 21% lower than median
(±) | linearity of bass is average (12.6% delta to prev. frequency)
Mids 400 - 2000 Hz
(+) | balanced mids - only 1.1% away from median
(+) | mids are linear (3.6% delta to prev. frequency)
Highs 2 - 16 kHz
(+) | balanced highs - only 4.2% away from median
(+) | highs are linear (5.3% delta to prev. frequency)
Overall 100 - 16.000 Hz
(±) | linearity of overall sound is average (16.2% difference to median)
Compared to same class
» 40% of all tested devices in this class were better, 7% similar, 53% worse
» The best had a delta of 6%, average was 18%, worst was 132%
Compared to all devices tested
» 26% of all tested devices were better, 6% similar, 68% worse
» The best had a delta of 4%, average was 23%, worst was 134%
Energy management
| Off / Standby | |
| Idle | |
| Load |
|
Key:
min: | |
| HP Pavilion Gaming 17-cd2146ng i5-11300H, GeForce RTX 3050 Ti Laptop GPU | Dell G15 5510-43NHT i5-10200H, GeForce RTX 3050 Ti Laptop GPU | Lenovo Ideapad Gaming 3 15IHU-82K1002RGE i5-11300H, GeForce RTX 3050 Ti Laptop GPU | HP Victus 16-e0145ng R5 5600H, GeForce RTX 3050 Ti Laptop GPU | HP Pavilion Gaming 17-cd0085cl i7-9750H, GeForce GTX 1660 Ti Max-Q | Average of class Gaming | |
|---|---|---|---|---|---|---|
| Power Consumption | -13% | -4% | -28% | -12% | -110% | |
| Idle Minimum * (Watt) | 3 | 4.6 -53% | 4.9 -63% | 7 -133% | 5.4 -80% | 13 ? -333% |
| Idle Average * (Watt) | 8 | 6.5 19% | 8.3 -4% | 9 -13% | 9.2 -15% | 18.7 ? -134% |
| Idle Maximum * (Watt) | 28 | 10.1 64% | 8.9 68% | 15 46% | 13 54% | 24.3 ? 13% |
| Load Average * (Watt) | 88 | 129 -47% | 81 8% | 93 -6% | 85.9 2% | 110.2 ? -25% |
| Witcher 3 ultra * (Watt) | 98.2 | 129 -31% | 119 -21% | 134.5 -37% | 107.9 -10% | |
| Load Maximum * (Watt) | 152 | 195 -28% | 172 -13% | 185 -22% | 182.2 -20% | 258 ? -70% |
* ... smaller is better
Energy consumption during The Witcher 3 / stress test
Energy consumption with an external monitor
Battery life
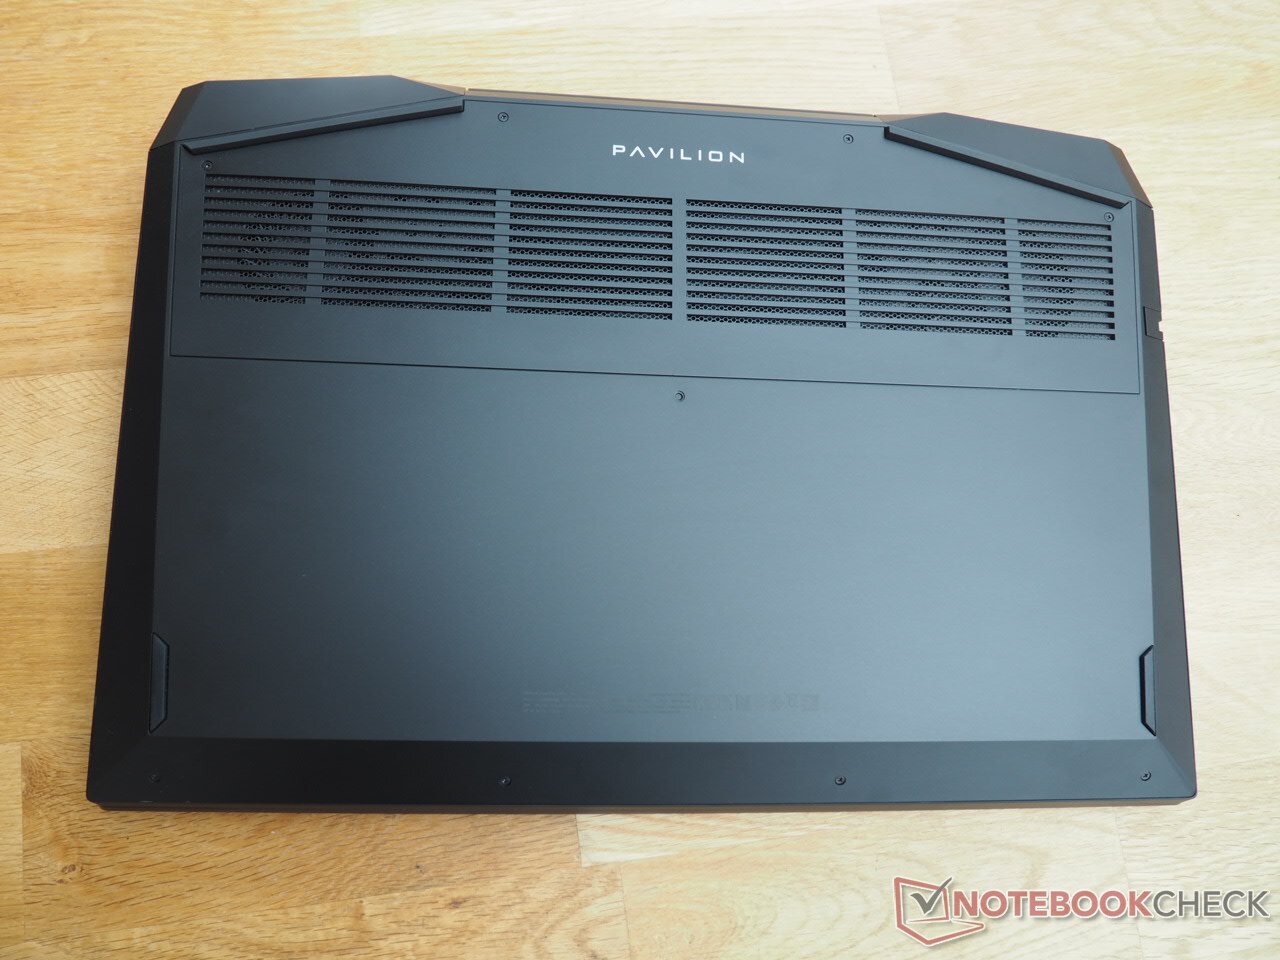
We don't fully comprehend HP's decision to fit a 2.5-inch slot instead of a larger battery. 52.5 Wh is rather modest, which also becomes noticeable in the battery runtimes. Just under 5 hours of Internet browsing over Wi-Fi at medium brightness is no longer a reason to celebrate nowadays. The competition is slightly ahead here.
| HP Pavilion Gaming 17-cd2146ng i5-11300H, GeForce RTX 3050 Ti Laptop GPU, 52.5 Wh | Dell G15 5510-43NHT i5-10200H, GeForce RTX 3050 Ti Laptop GPU, 56 Wh | Lenovo Ideapad Gaming 3 15IHU-82K1002RGE i5-11300H, GeForce RTX 3050 Ti Laptop GPU, 45 Wh | HP Victus 16-e0145ng R5 5600H, GeForce RTX 3050 Ti Laptop GPU, 70 Wh | HP Pavilion Gaming 17-cd0085cl i7-9750H, GeForce GTX 1660 Ti Max-Q, 52.5 Wh | Average of class Gaming | |
|---|---|---|---|---|---|---|
| Battery runtime | 26% | 32% | 42% | 14% | 43% | |
| WiFi v1.3 (h) | 5 | 6.3 26% | 6.6 32% | 7.1 42% | 5.7 14% | 7.15 ? 43% |
| H.264 (h) | 8.6 | 7.7 | 8.64 ? | |||
| Load (h) | 1.1 | 1.1 | 1 | 1.502 ? | ||
| Reader / Idle (h) | 11.6 | 8.71 ? |
Pros
Cons
Verdict
HP offers a good budget laptop for gaming with the Pavilion Gaming 17-cd2146ng.
Unlike most competitors, the 17-inch laptop has a surprisingly good display that doesn't lack contrast or color space. The brightness and response times are also comparatively good.
The 17-incher doesn't stand out positively or negatively from the crowd in the rest of the categories - regardless of whether it's the input devices, the case, the ports, the emissions or the sound quality.
Consequently, you can hardly go wrong with buying the Pavilion Gaming 17. Below 1,000 Euros (~$1,002), the device is a very attractive and advisable option for price-conscious gamers.
Price and availability
At the time of writing, our review configuration doesn't seem to be available in the United States. Nevertheless, you can keep an eye on Amazon and see if the device pops up here.
HP Pavilion Gaming 17-cd2146ng
- 09/10/2022 v7 (old)
Florian Glaser
Price comparison

