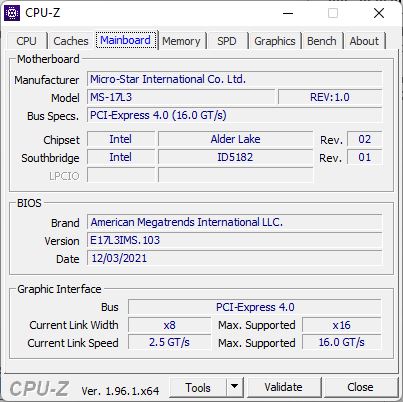
MSI Katana GF76 12UGS review: Is one of the most affordable RTX 3070 Ti gaming laptops worth it?
In the comparison portals, the MSI Katana is listed as one of the most affordable gaming laptops. The first is the 17-inch Alder Lake model for 1199 Euros (~$1249) for the version with an RTX 3050 Ti. The model with an RTX 3060 starts from 1349 Euros (~$1406), and our test configuration with the RTX 3070 Ti will cost you 1949 Euros (~$2031). After the Acer Nitro 5 and the smaller 15-inch sibling, our 17-inch model is the most affordable laptop with an RTX 3070 Ti.
Last year, we tested the predecessor with a Tiger Lake CPU and RTX 3060, and now follows the upgrade to Alder Lake and the Ti GPUs.
Since our database currently lacks affordable 17-inch laptops with RTX 3070 Ti GPUs, we compare the new Katana in addition to its predecessor also with the significantly more expensive Razer Blade 17 top dog, the Aorus 17 XE4, and the 15 and 16-inch Lenovo Legion 5 Pro 16 G7 and MSI Vector GP66 12UGS models.
Possible Competitors for Comparison
Rating | Date | Model | Weight | Height | Size | Resolution | Price |
|---|---|---|---|---|---|---|---|
| 82.6 % v7 (old) | 05 / 2022 | MSI Katana GF76 12UGS i7-12700H, GeForce RTX 3070 Ti Laptop GPU | 2.7 kg | 25.2 mm | 17.30" | 1920x1080 | |
| 80.4 % v7 (old) | 06 / 2021 | MSI Katana GF76 11UE i7-11800H, GeForce RTX 3060 Laptop GPU | 2.7 kg | 25.2 mm | 17.30" | 1920x1080 | |
| 85.2 % v7 (old) | 04 / 2022 | Aorus 17 XE4 i7-12700H, GeForce RTX 3070 Ti Laptop GPU | 2.6 kg | 27 mm | 17.30" | 1920x1080 | |
| 90.1 % v7 (old) | 05 / 2022 | Razer Blade 17 (i7-12800H, RTX 3070 Ti) i7-12800H, GeForce RTX 3070 Ti Laptop GPU | 2.8 kg | 19.9 mm | 17.30" | 2560x1440 | |
| 88 % v7 (old) | 03 / 2022 | Lenovo Legion 5 Pro 16 G7 i7 RTX 3070Ti i7-12700H, GeForce RTX 3070 Ti Laptop GPU | 2.6 kg | 26.6 mm | 16.00" | 2560x1600 | |
| 86.9 % v7 (old) | 03 / 2022 | MSI Vector GP66 12UGS i9-12900H, GeForce RTX 3070 Ti Laptop GPU | 2.3 kg | 23.4 mm | 15.60" | 1920x1080 |
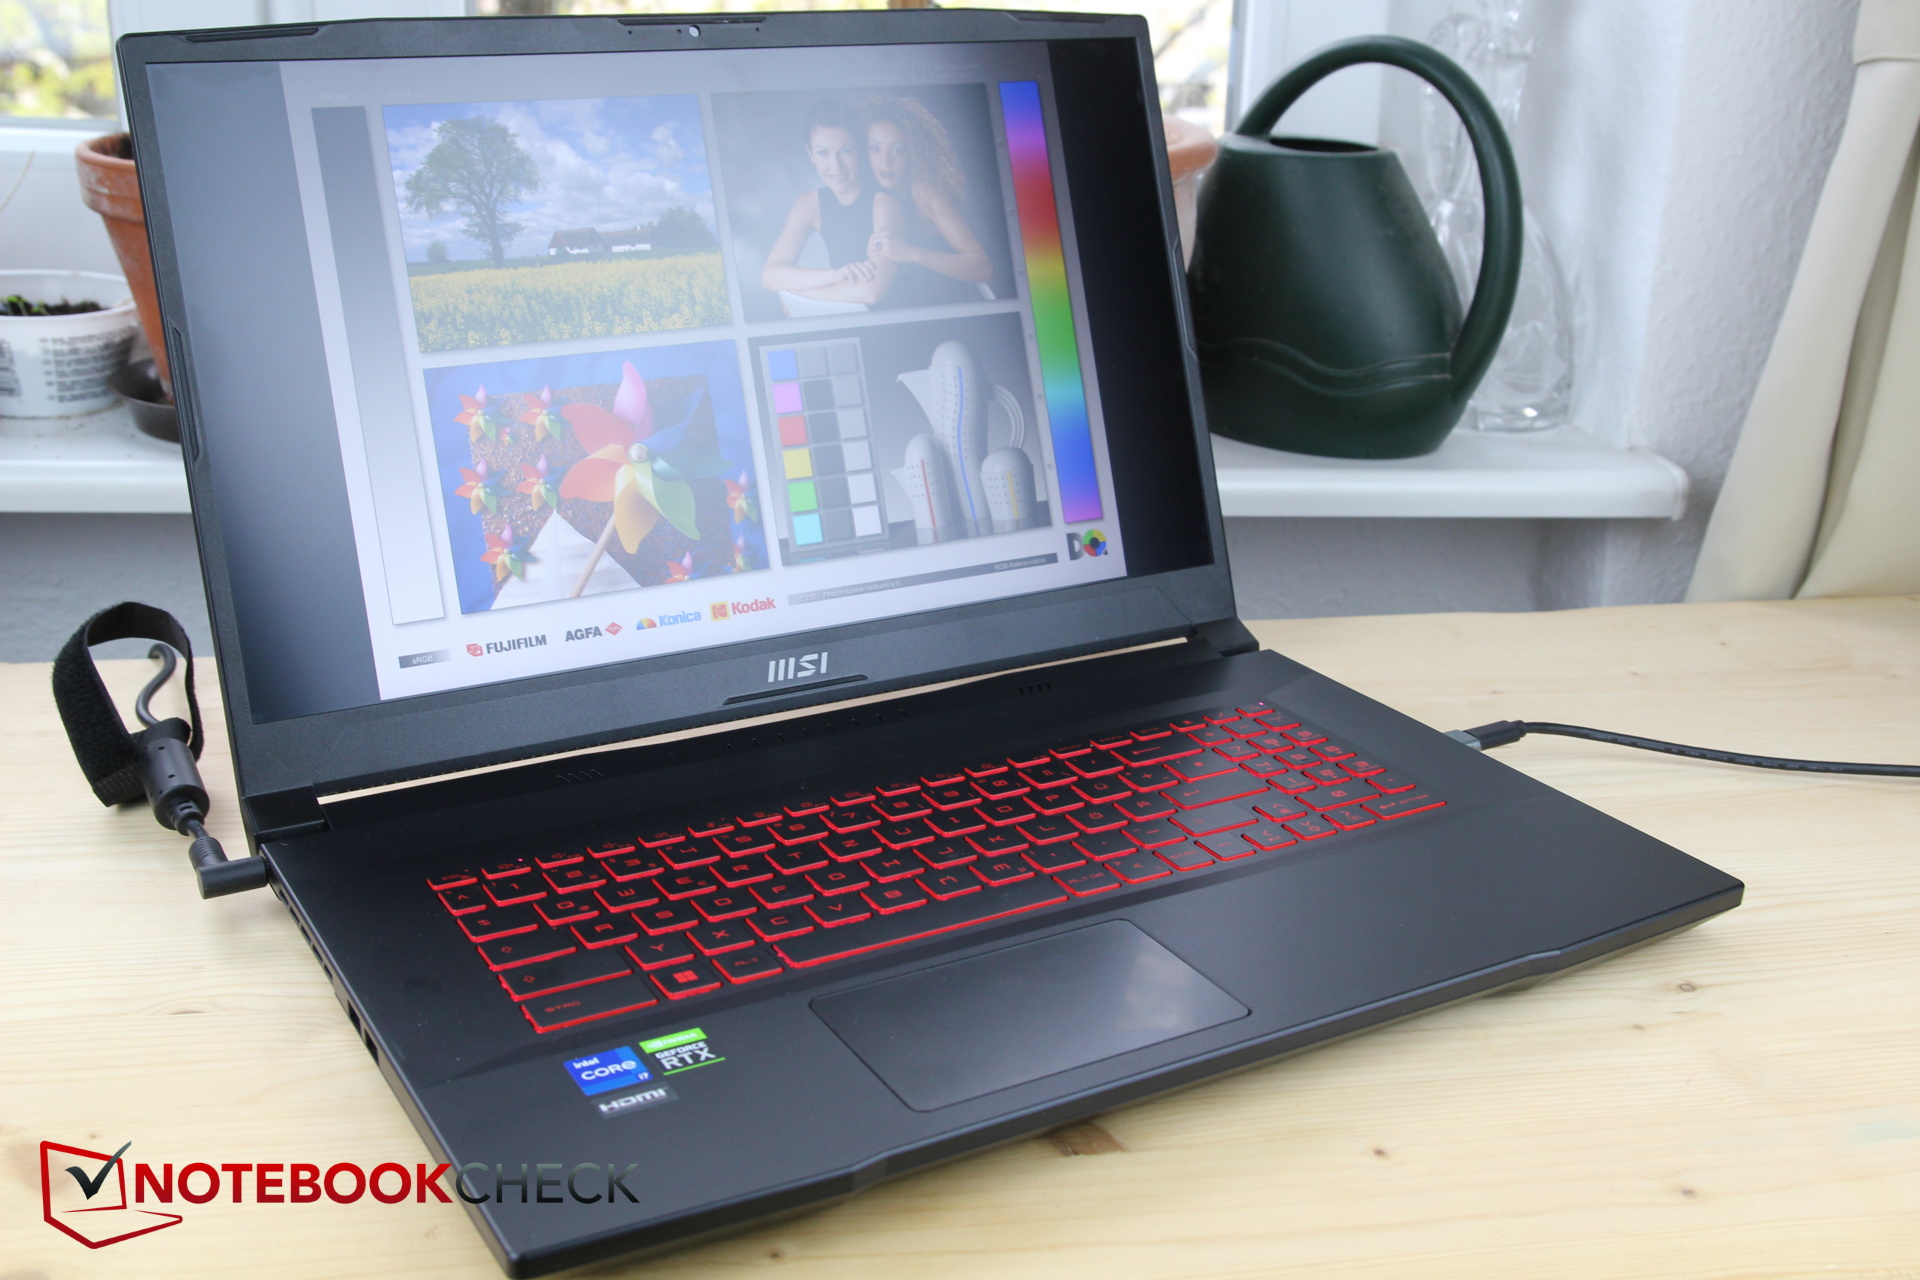
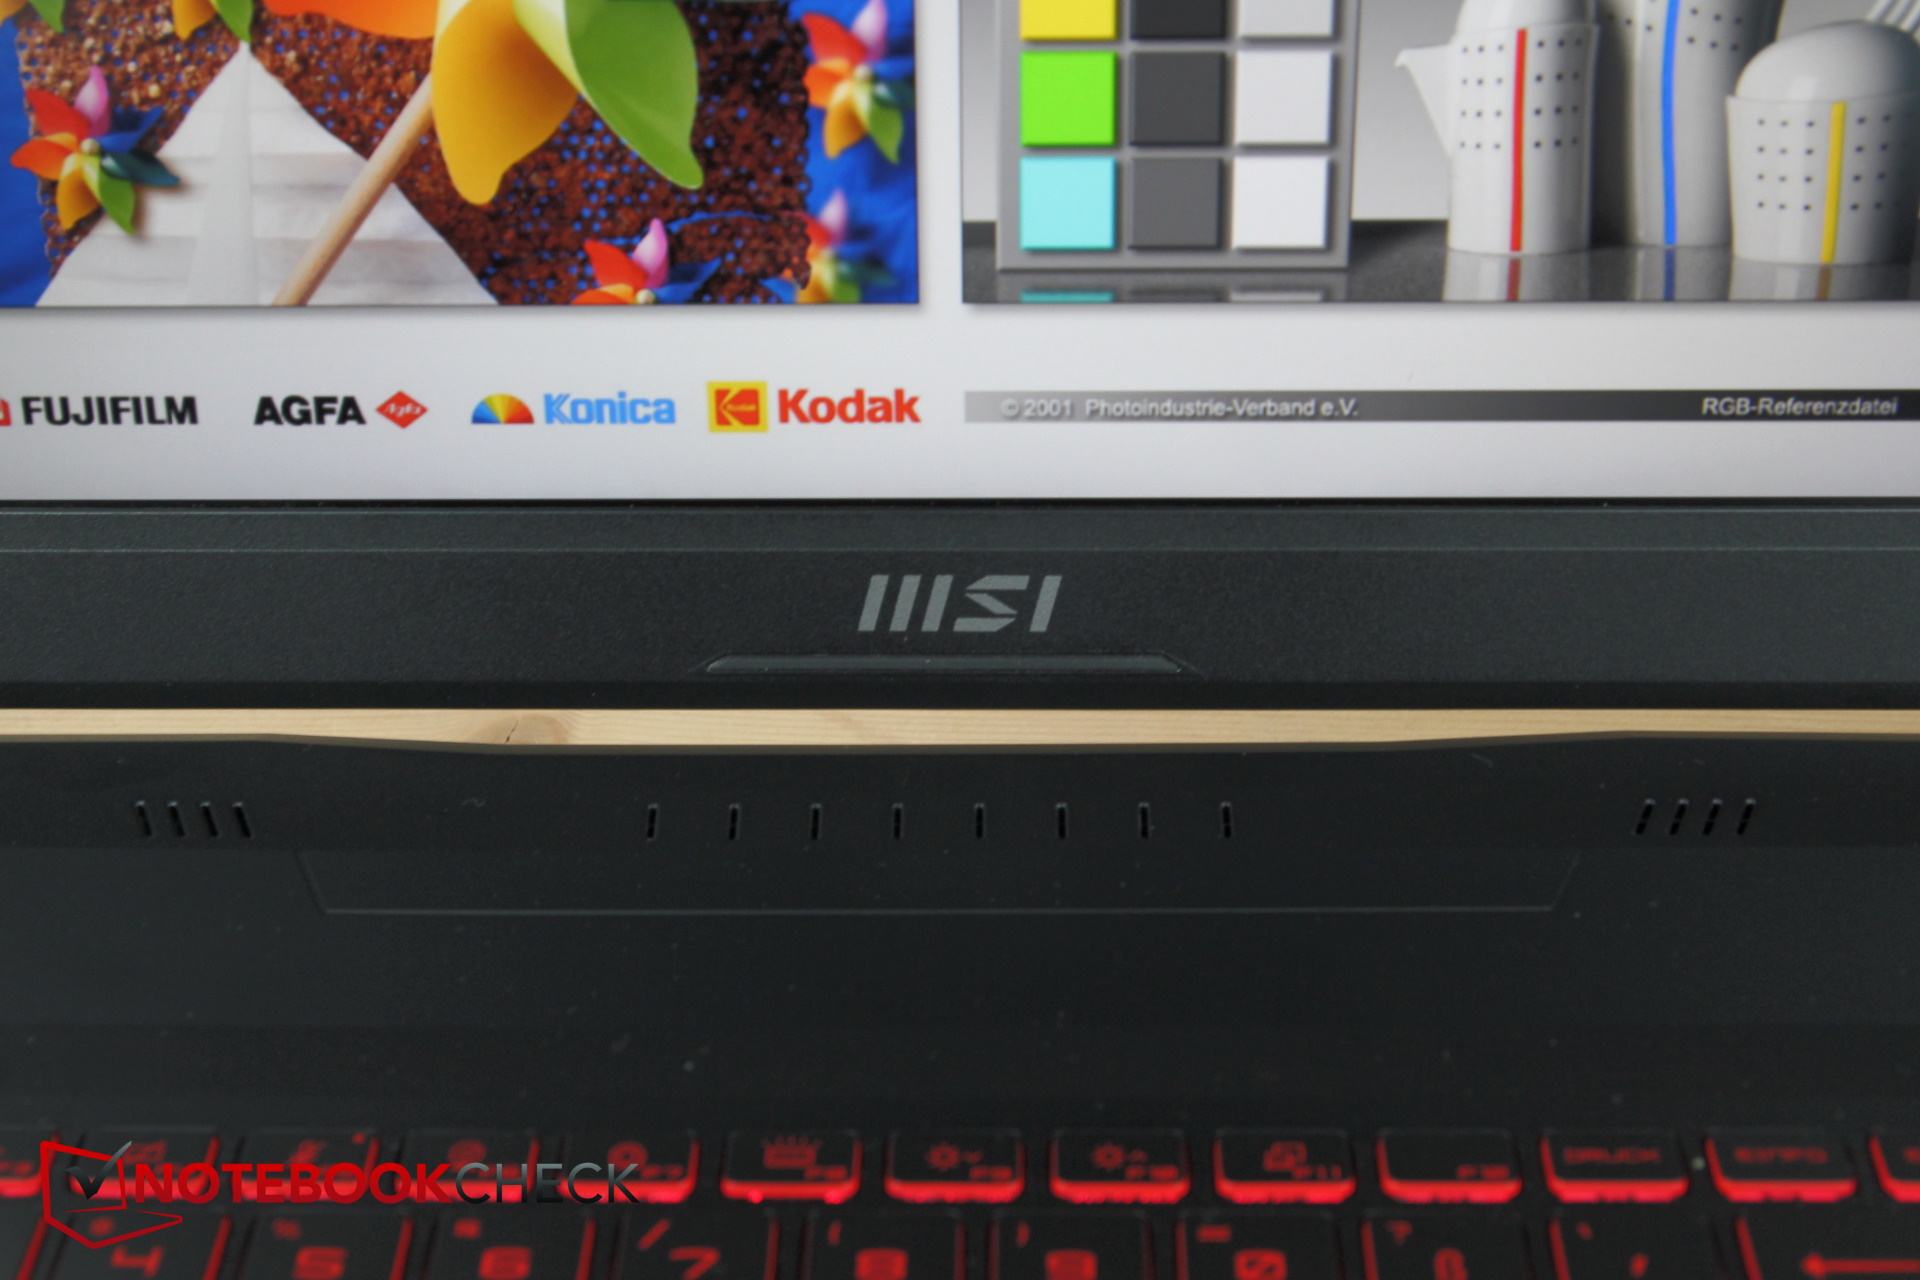
Case - A plastic sword
The materials used in the case of the Katana are solely plastic. The display and its frame produce some powerful creaking noises even if you only warp it slightly, particularly in the top corners, and we immediately start worrying about the panel. The base, on the other hand, gives a robust impression. Otherwise, the workmanship appears to be good, and we do not notice any obvious gaps.
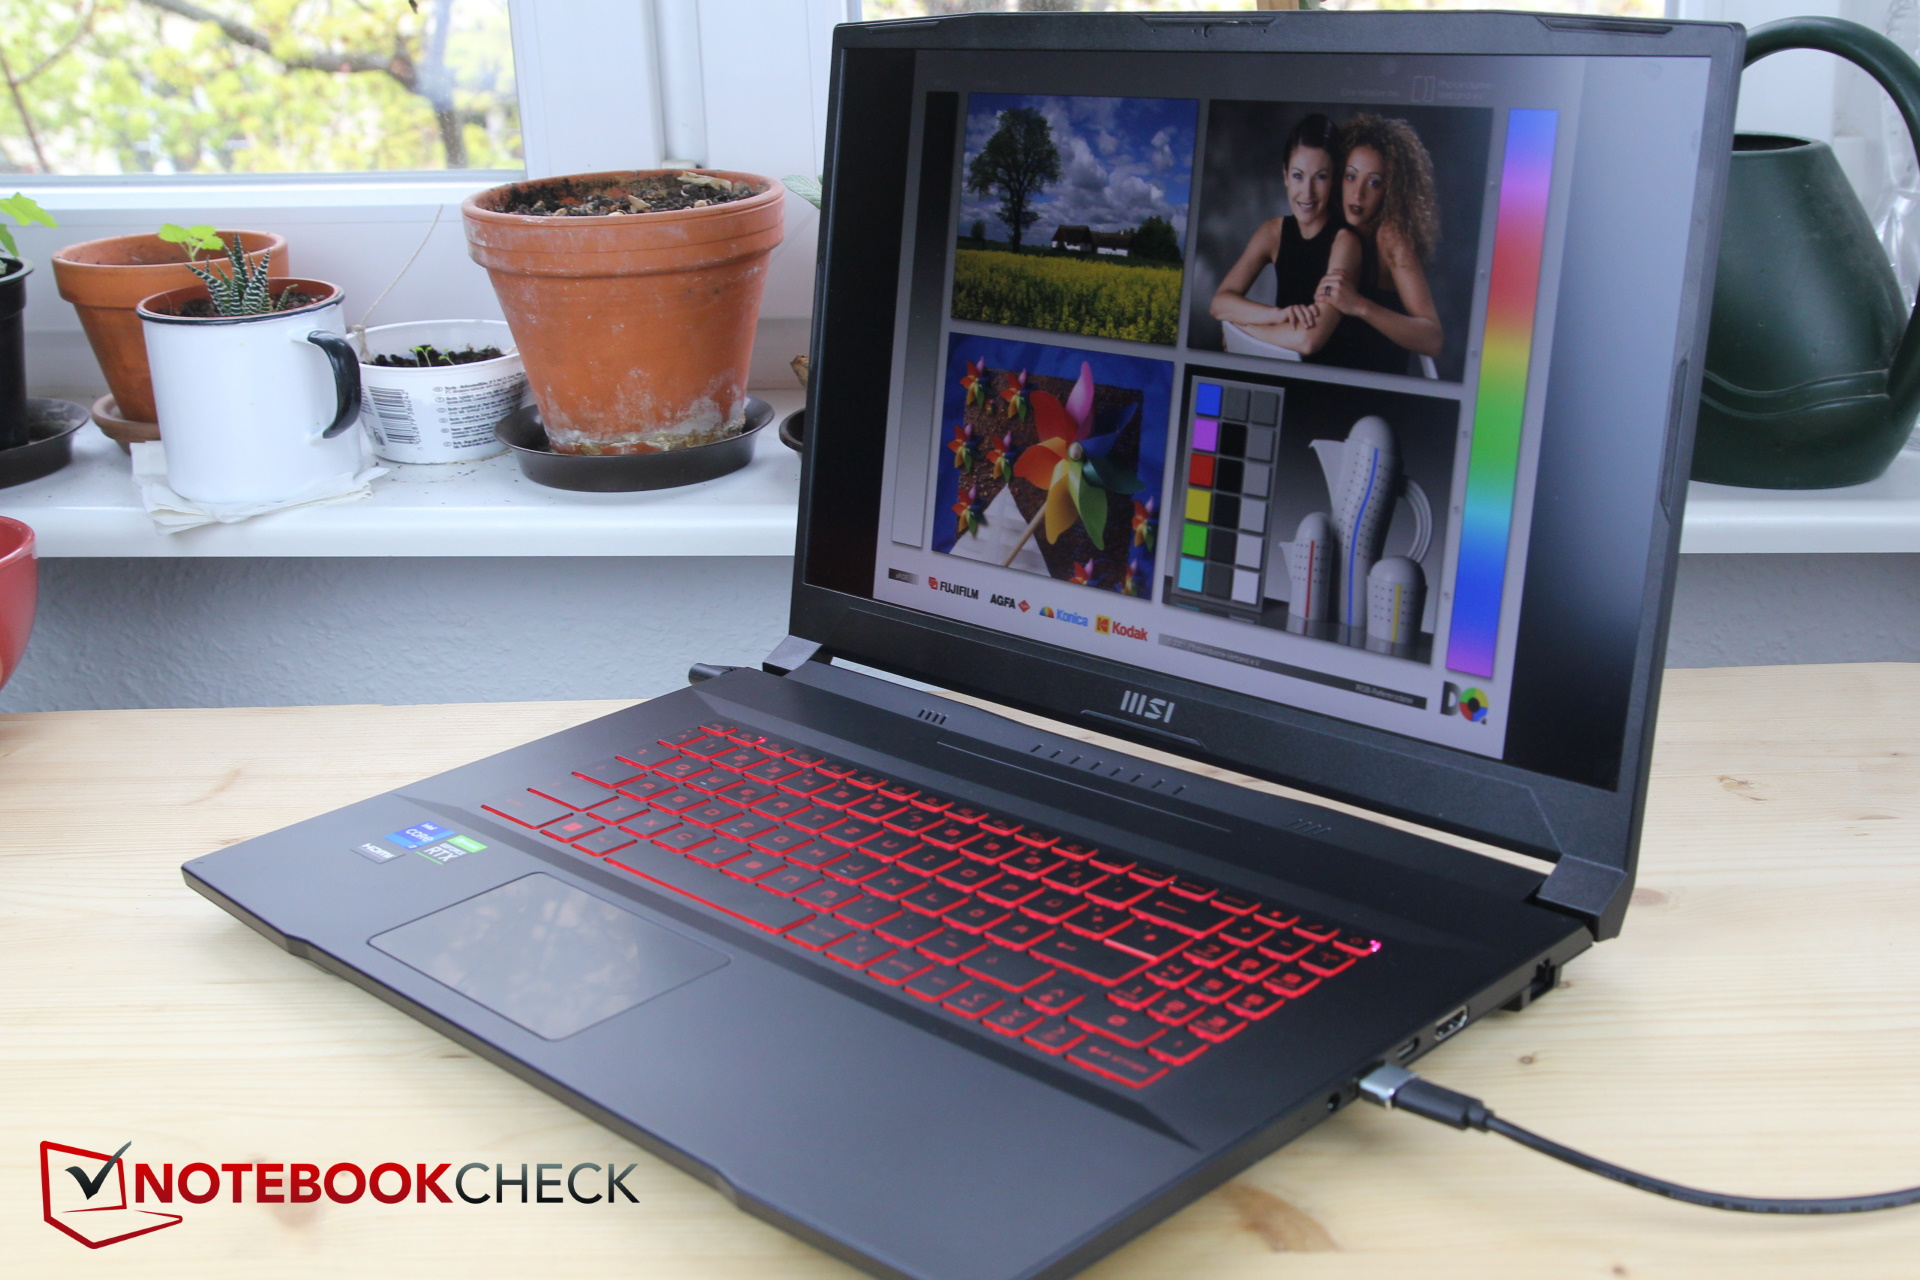
The hinges are able to open the display up to 180 degrees. They are only slightly weak in the last third of the opening range but otherwise hold the display in place fairly well.
The design is kept rather simple, other than the colorful keyboard illumination and the stylized lettering on the keys. There is a large notch in the front of the base, allowing you to easily open the laptop with one hand.
Considering the included hardware, the Katana is fairly compact, and the plastic case also makes it appear lighter than the Blade 17, even though the difference is only about 100 g (~3,5 oz). Although the Aorus is minimally thicker, it is almost 20 mm (~0.8 in) less deep. The Blade 17 is slimmer and also smaller overall. While the Katana is rather one of the larger gaming laptops, it still didn't turn out too thick.
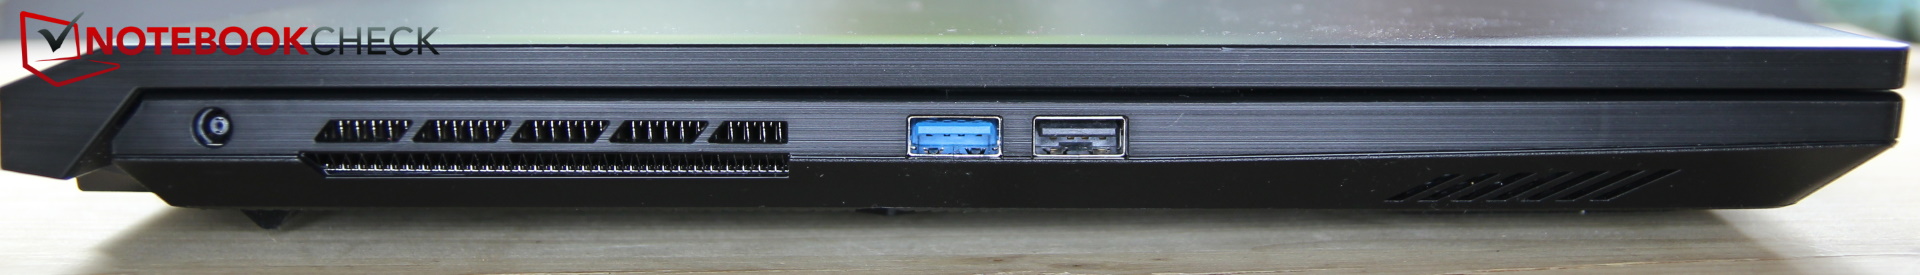
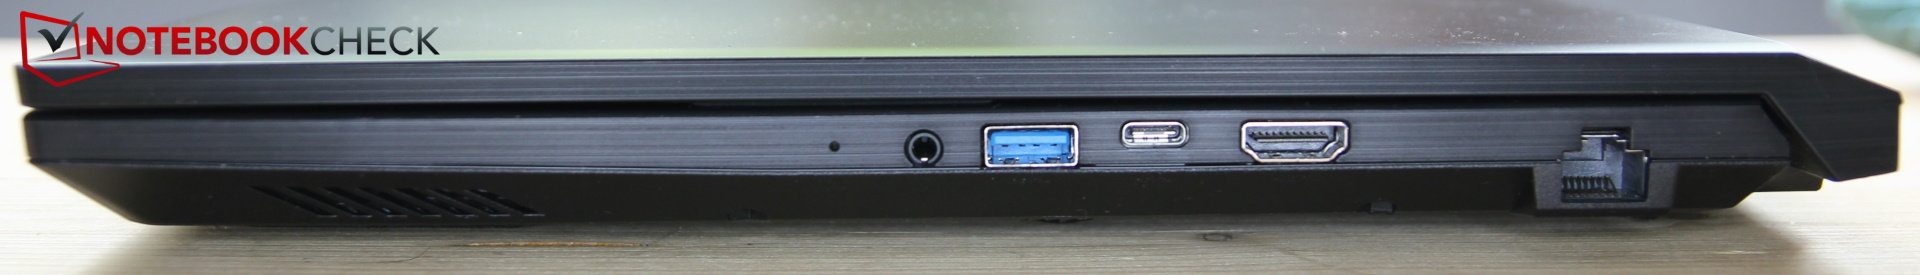
Equipment - Please update
Even in 2022, MSI continues to equip the Katana with a USB-A 2.0 port, and it also continues to forgo Thunderbolt and an SD card reader. The USB-C port only runs at USB-3.0 speed and of course doesn't offer Power Delivery.
The power plug doesn't fit very tightly in our model and can also slip out slowly when moving the laptop. The fit of some USB-C devices is not optimal in the corresponding port.
The external, USB-C connected M.2 case of the author has some problems with several laptops such as the MSI Katana or also the MSI Pulse GL66 but works fine with other laptops. Apparently, some plugs cannot be inserted deep enough into the ports, which leads to the SSD being provided with power but not being recognized reliably by Windows and continuously disconnecting. The author had to use a USB-C-to-A adapter and run the SSD via a USB-A port.
The fact that the ports for potentially thick and stiff cables such as HDMI and LAN are on the right side, where a mouse might also be used, is also less than optimal.
Communication
An Intel Wi-Fi 6 AX201 module is used for WLAN communication. In combination with our Asus ROG GT-AXE11000 test router, the module achieves suitably good transfer rates, and the connection is also fairly stable.
Webcam
As the webcam, a standard 720p camera is used. While the image quality wouldn't help in turning the user into a YouTube star, the color deviations still remain within limits.


Accessories and Warranty
Considering the low price, the lack of any included accessories shouldn't be surprising. As usual with MSI, the warranty period is two years.
Maintenance
The bottom of the case is secured by 13 screws. Since the final one is placed below a sticker seal, we don't want to break it because of our test unit being a loaner. Unfortunately, MSI continues to use sticker seals and thus reserves the option to limit the warranty after improper opening of the device by unqualified users.
However, there shouldn't be too many changes compared to the predecessor, and you can find an image of the opened Katana in the review of the predecessor.
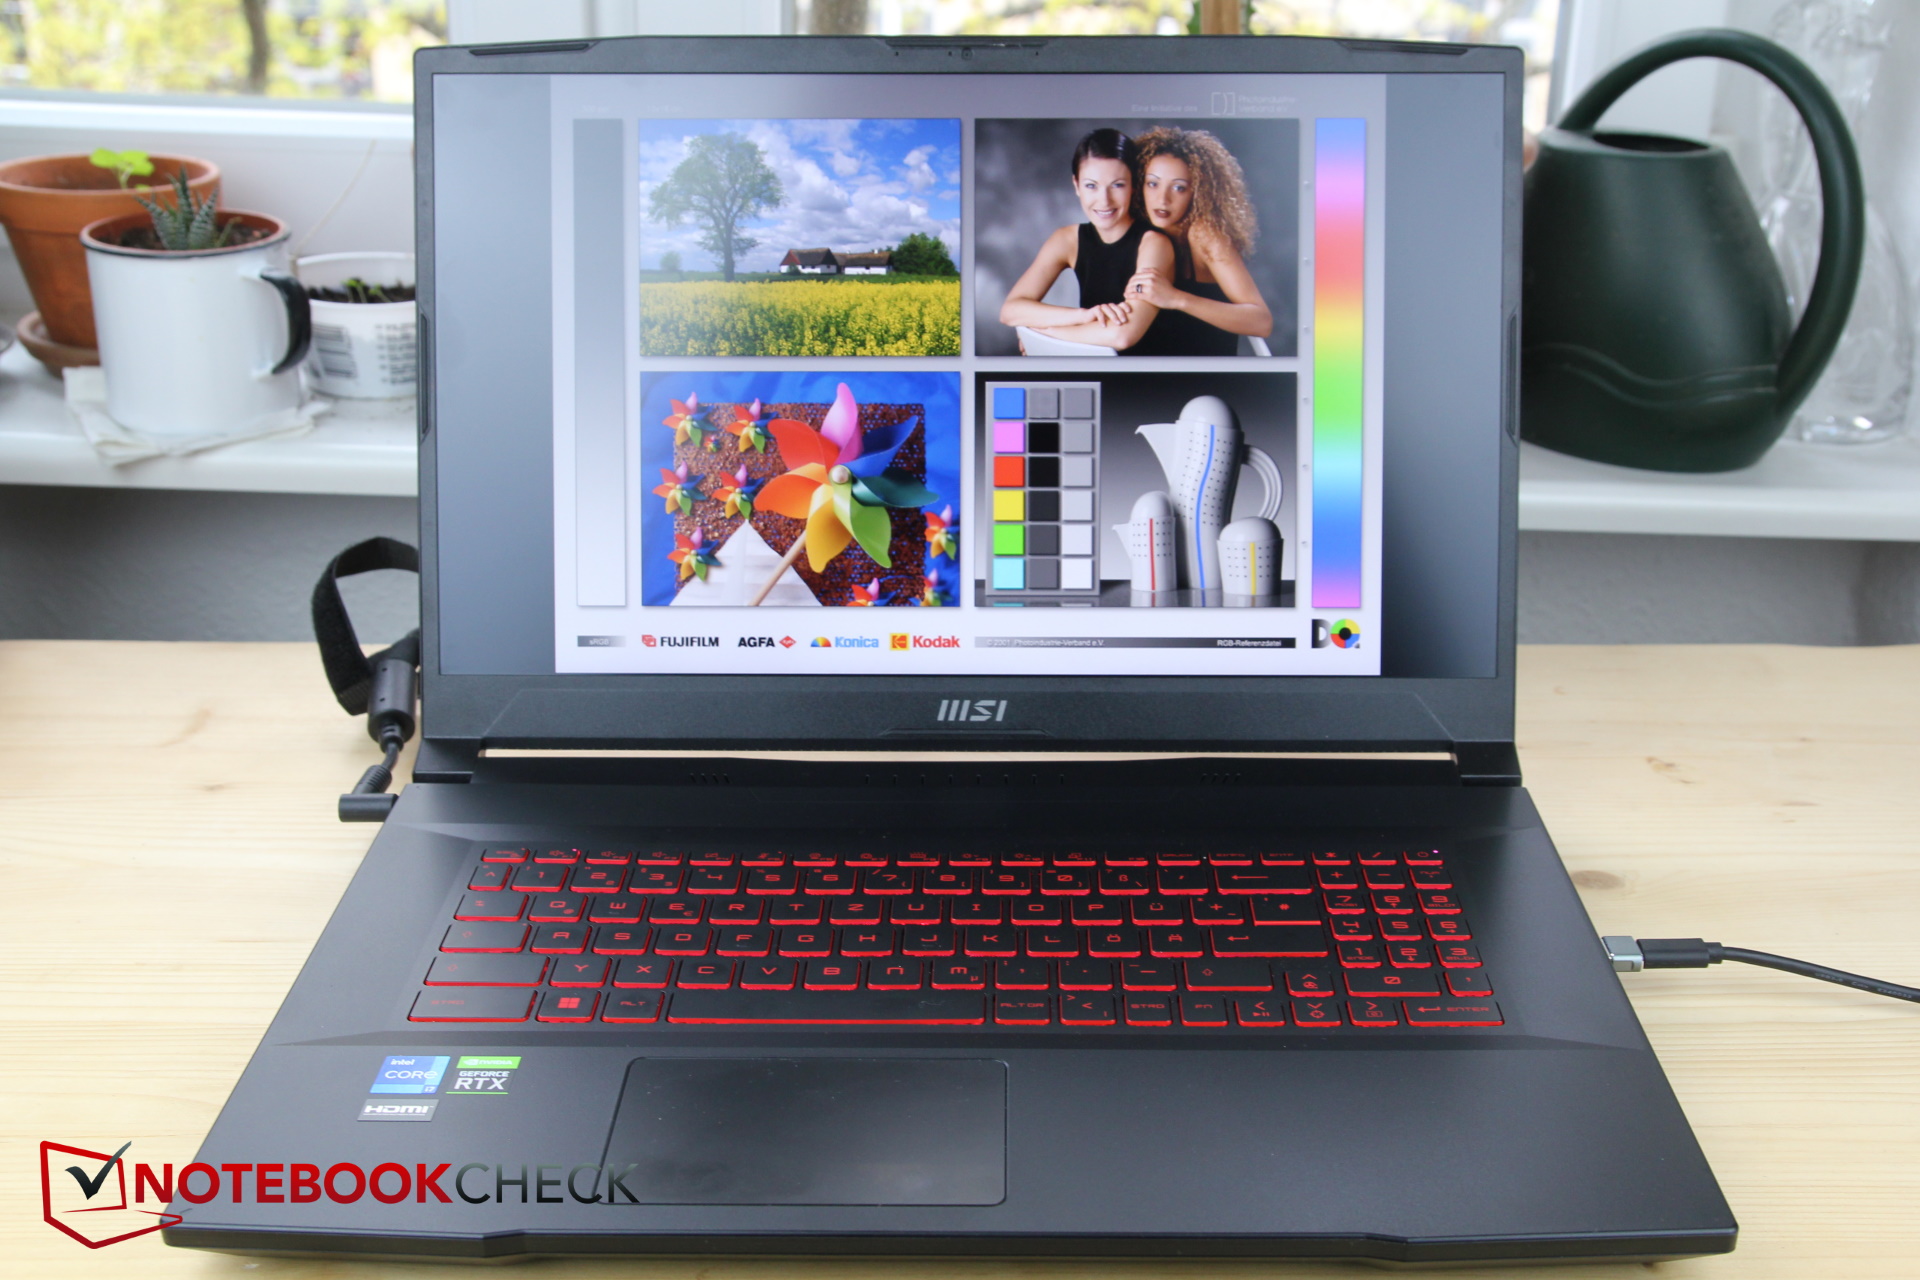
Input Devices - Why is everything so small despite 17 inches?
Keyboard
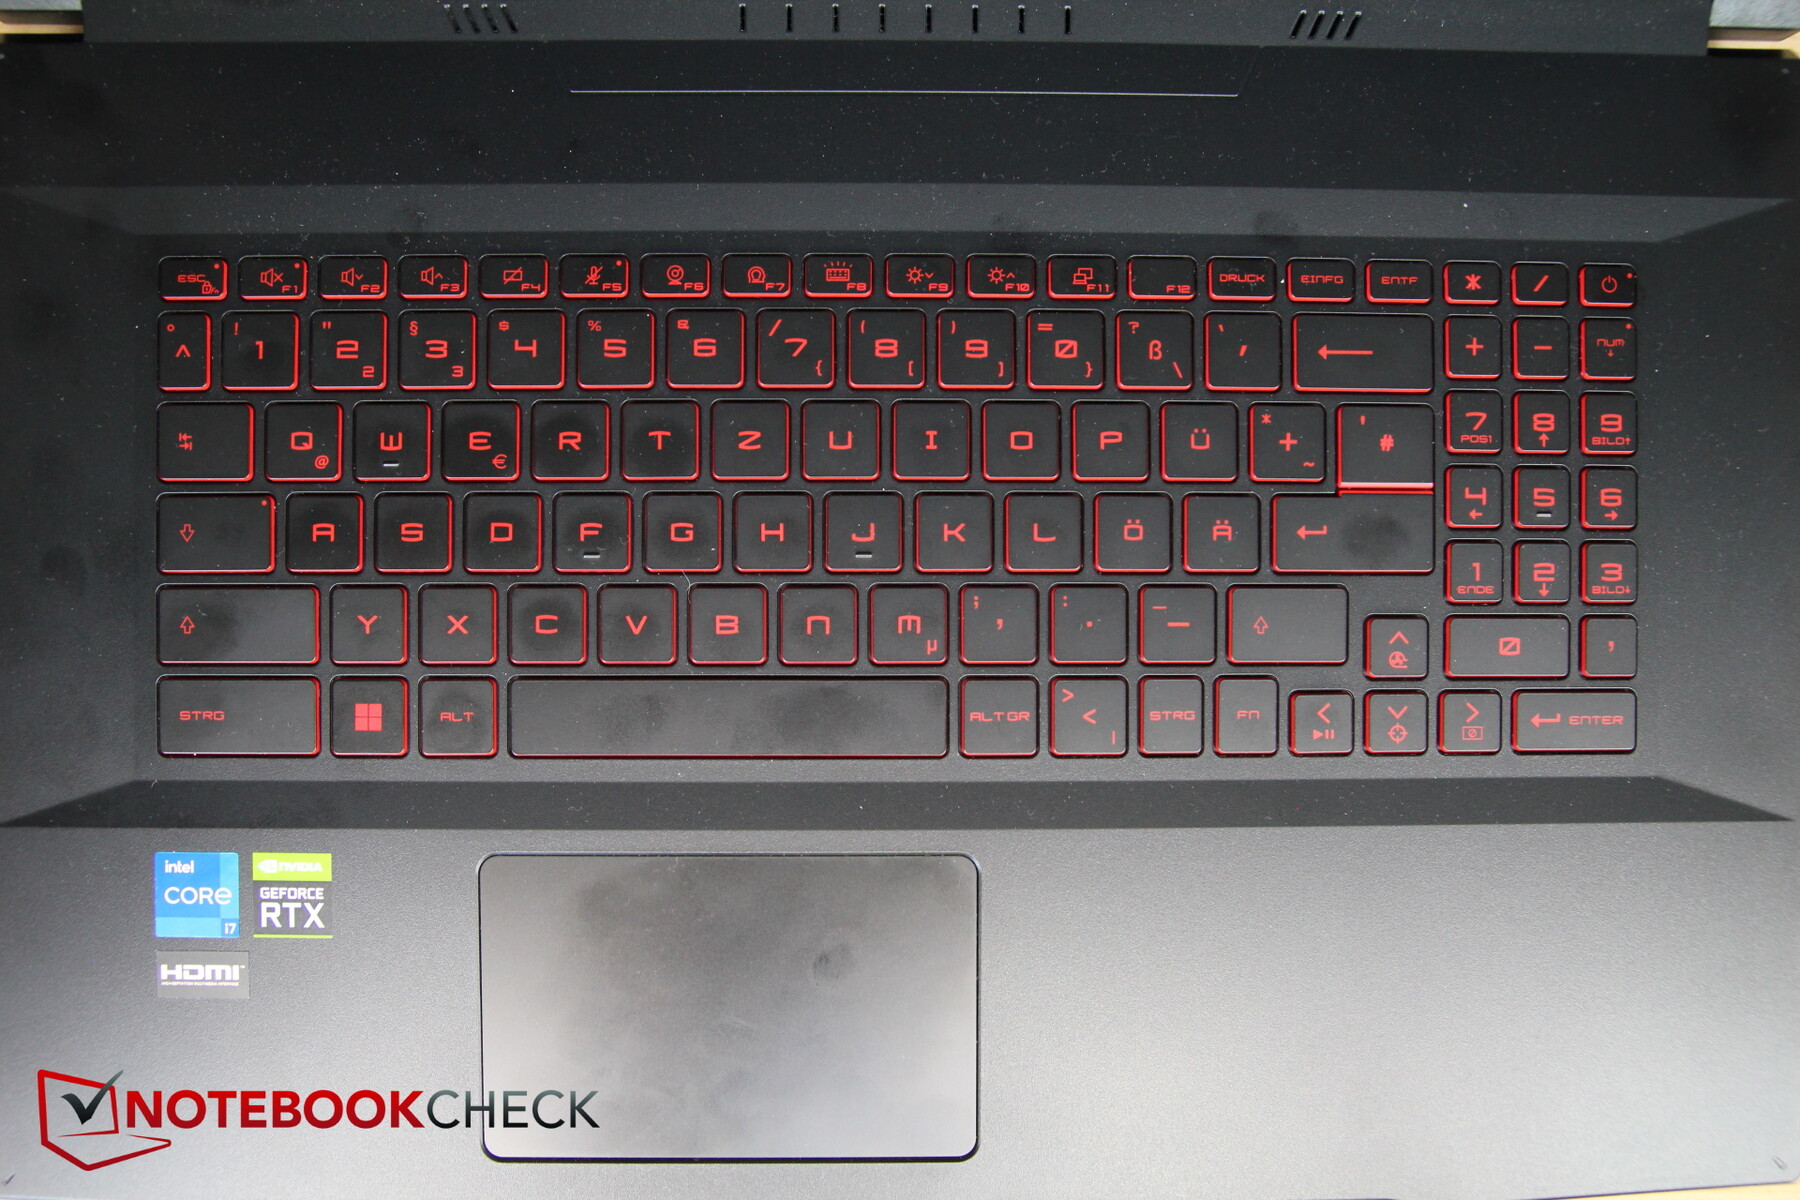
For a 17-inch laptop, the keys turn out rather small, and squeezed on the right side of the base is also a numpad with incredibly tiny keys. Despite the fact that there is still sufficient space on the left and right side of the keyboard, MSI doesn't use this to increase the key size. In the top row of the Function keys, the keys are only half as tall. The Power button is placed as a regular key in the top right corner of the numpad.
As customary for MSI, strangely the Fn key is placed on the right side, but you can switch its function with the Windows key on the left.
The key stroke is relatively short, but the feedback is noticeable. However, the keys still feel slightly spongy, and the user gets the impression that the keys are only really fixed in the middle and can tilt easily towards their sides. On the other hand, typing tasks still succeed fairly quickly and easily. The typing noise is moderate.
The key lettering is easily visible, but their font is a little unusual, which is probably supposed to attract gamers. In dark surroundings, the keyboard illumination helps. While there is only a single zone, the light can be dimmed in three steps. It is only illuminated in red.
Touchpad
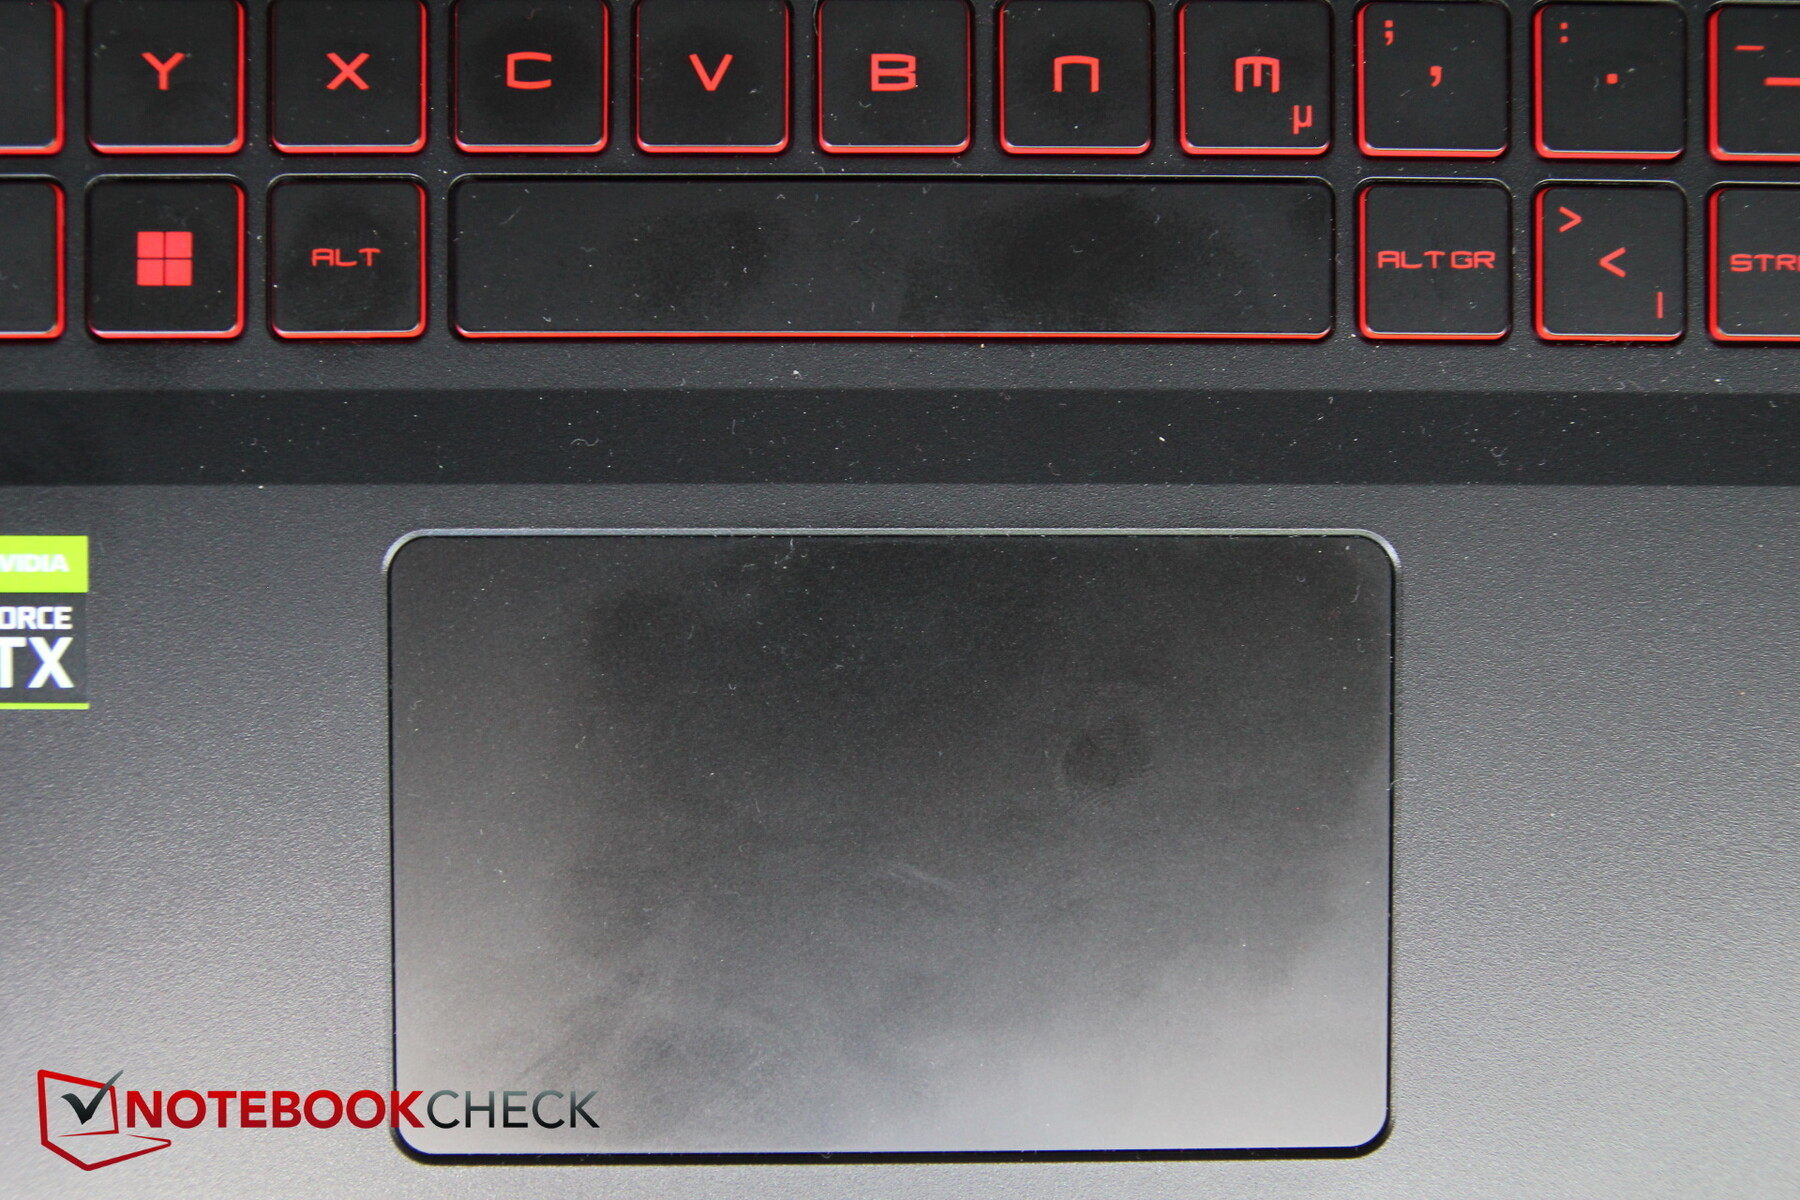
The touchpad is sufficient but not very large for a 17-inch device (~10.5 x 6.5 cm, ~4.1 x 2.6 in). The surface facilitates sliding of the fingers, and they only get stuck with very slow movements or if the fingers are wet.
The integrated keys also work fairly precisely, but they have an extremely short stroke and appear very crisp. The trigger noises aren't really quiet.
Display - 144 Hz but still no gamer
MSI has decided to use the same Full-HD display from AU Optronics as in the predecessor. Even though this can handle 144 Hz, at an average of 264 nits, the brightness isn't very high. The response times are really weak for a gamer, particularly the more than 40 ms from gray to gray. At 88%, the brightness distribution is still relatively even.
At least, the display has a fairly low black value, which leads to a good contrast.
| |||||||||||||||||||||||||
Brightness Distribution: 88 %
Center on Battery: 283 cd/m²
Contrast: 1405:1 (Black: 0.2 cd/m²)
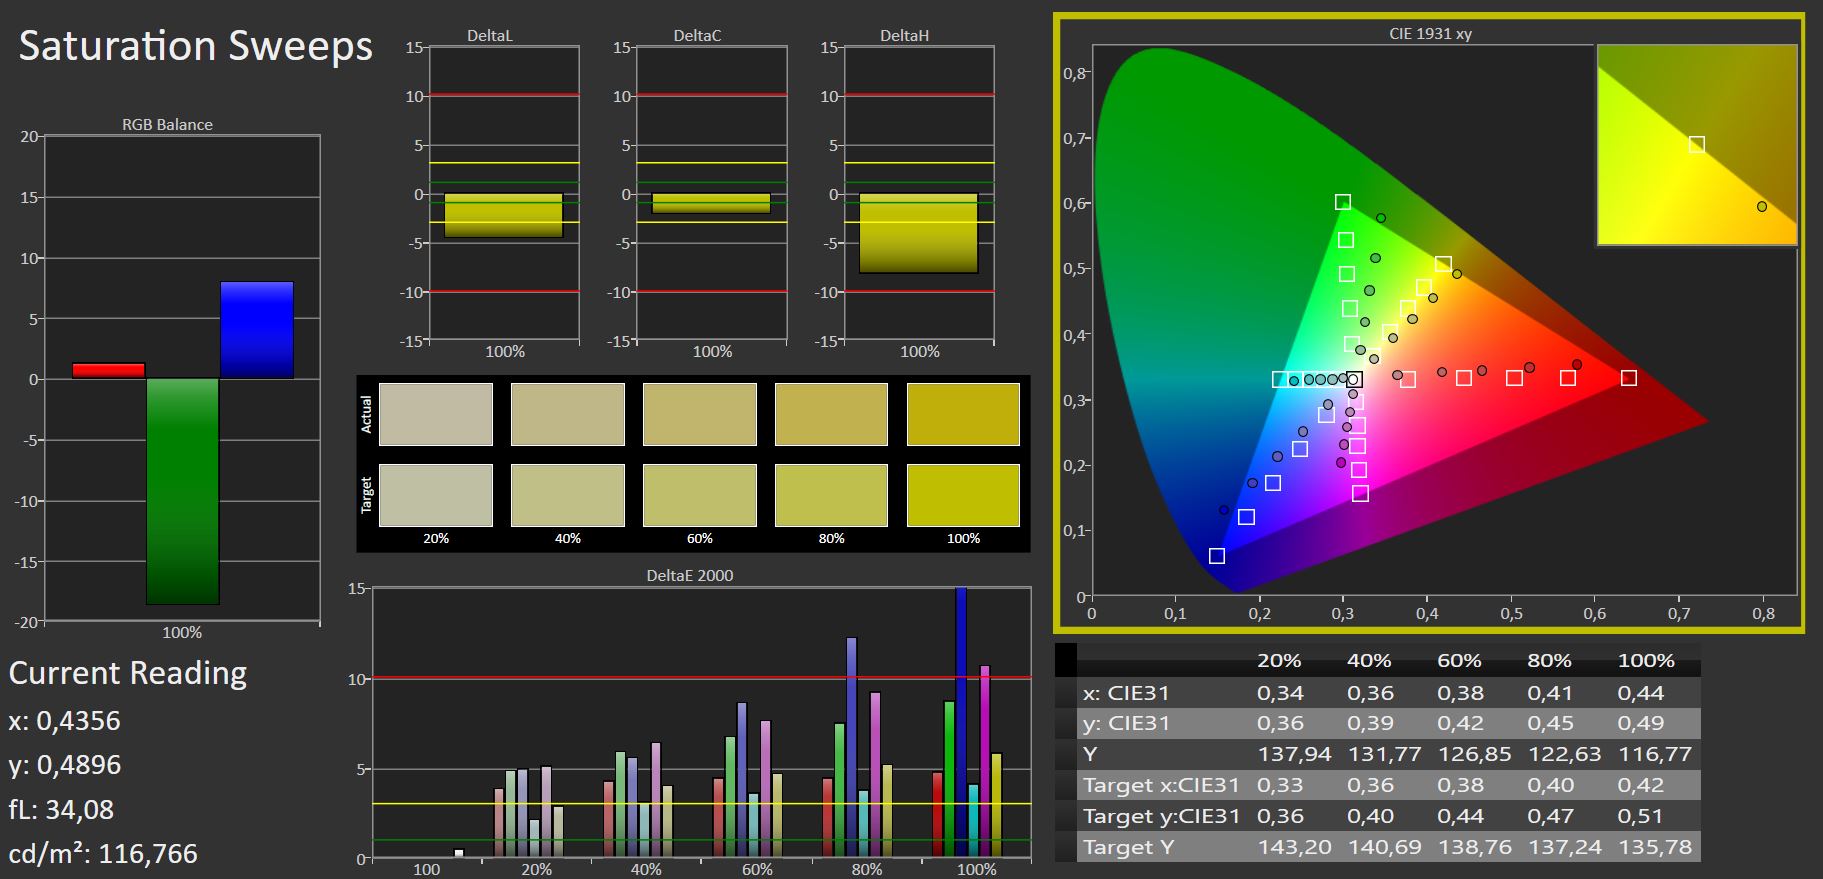
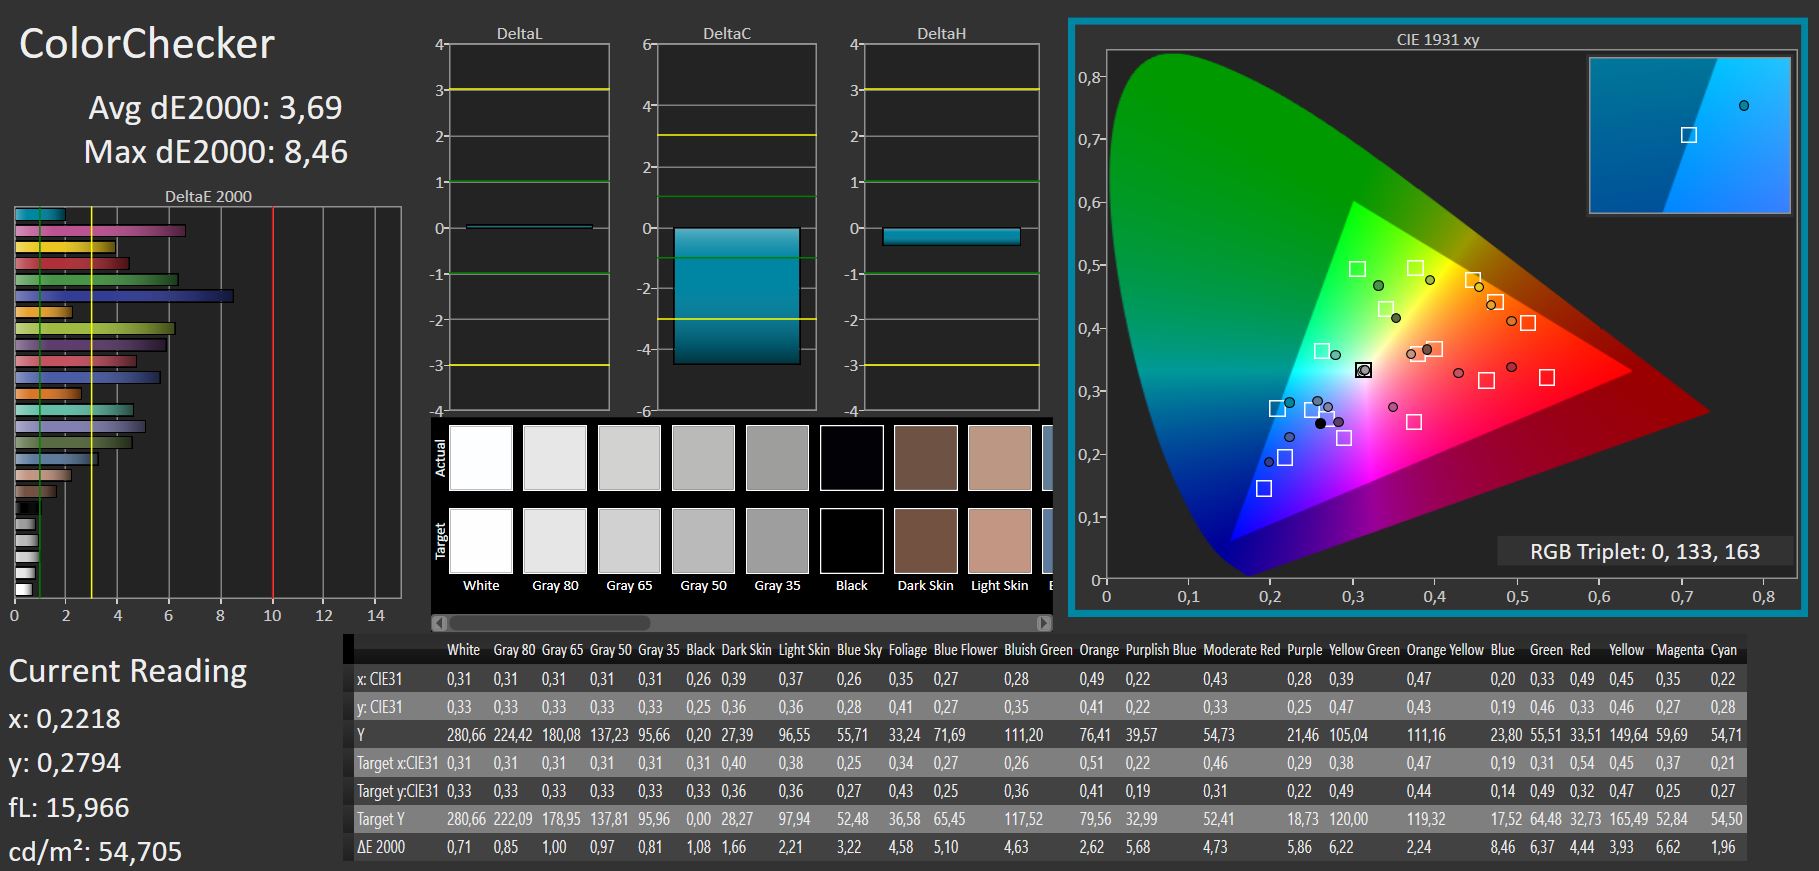
ΔE ColorChecker Calman: 3.69 | ∀{0.5-29.43 Ø4.72}
calibrated: 3.61
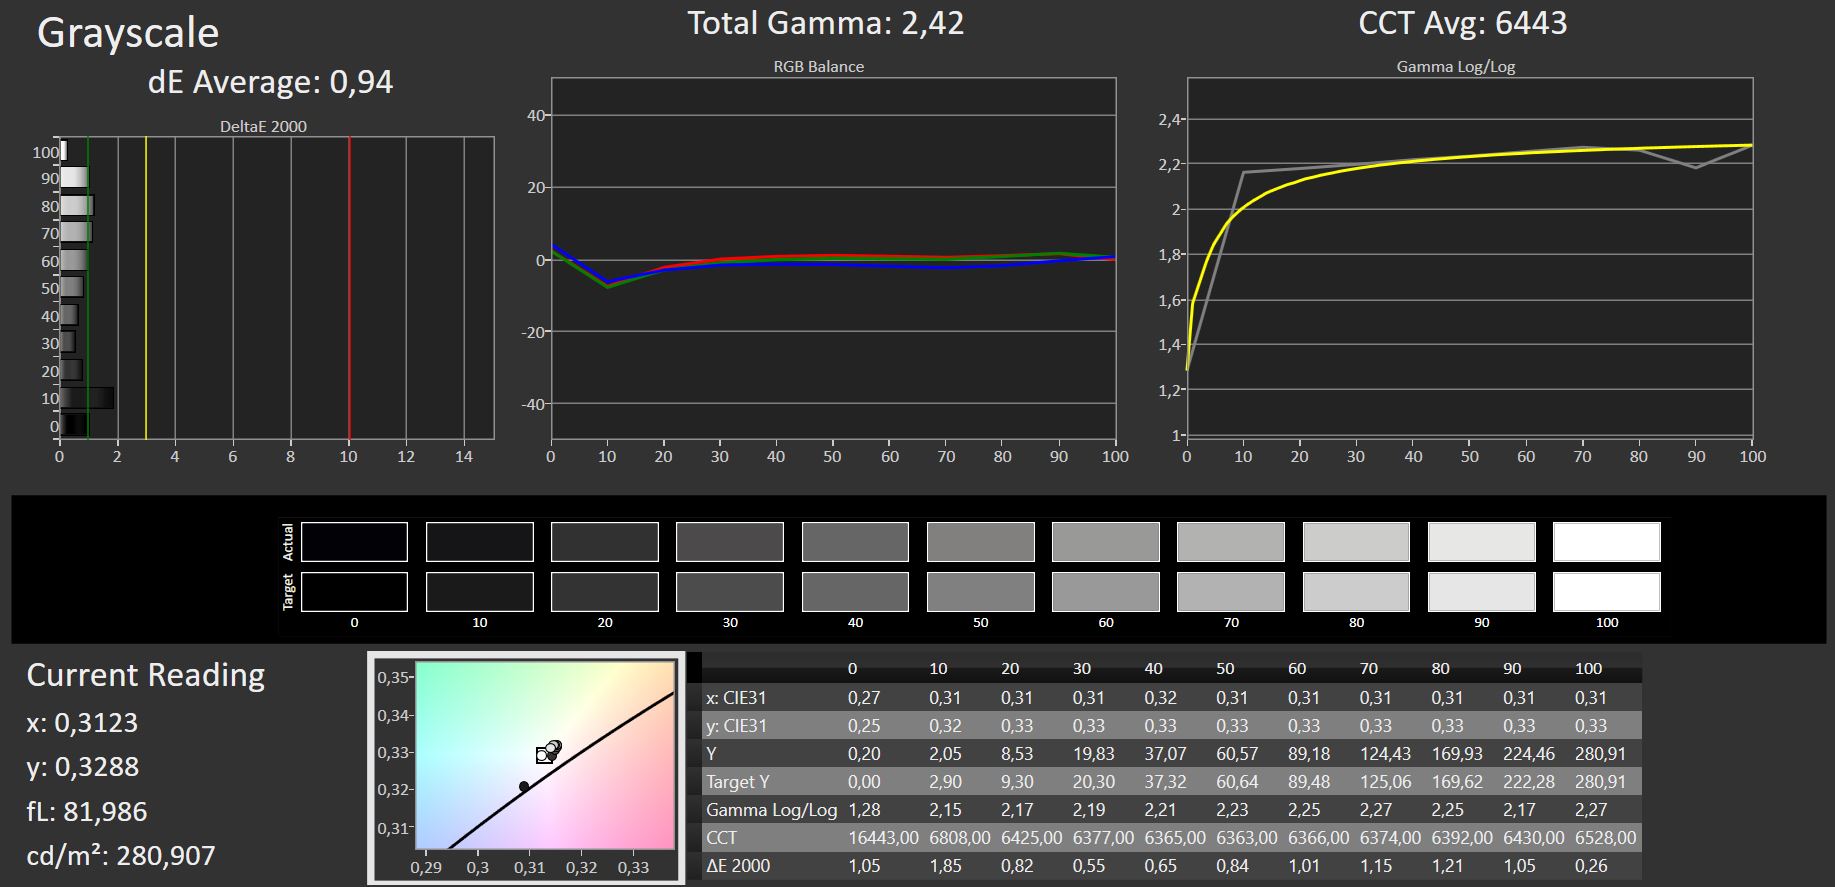
ΔE Greyscale Calman: 0.94 | ∀{0.09-98 Ø4.97}
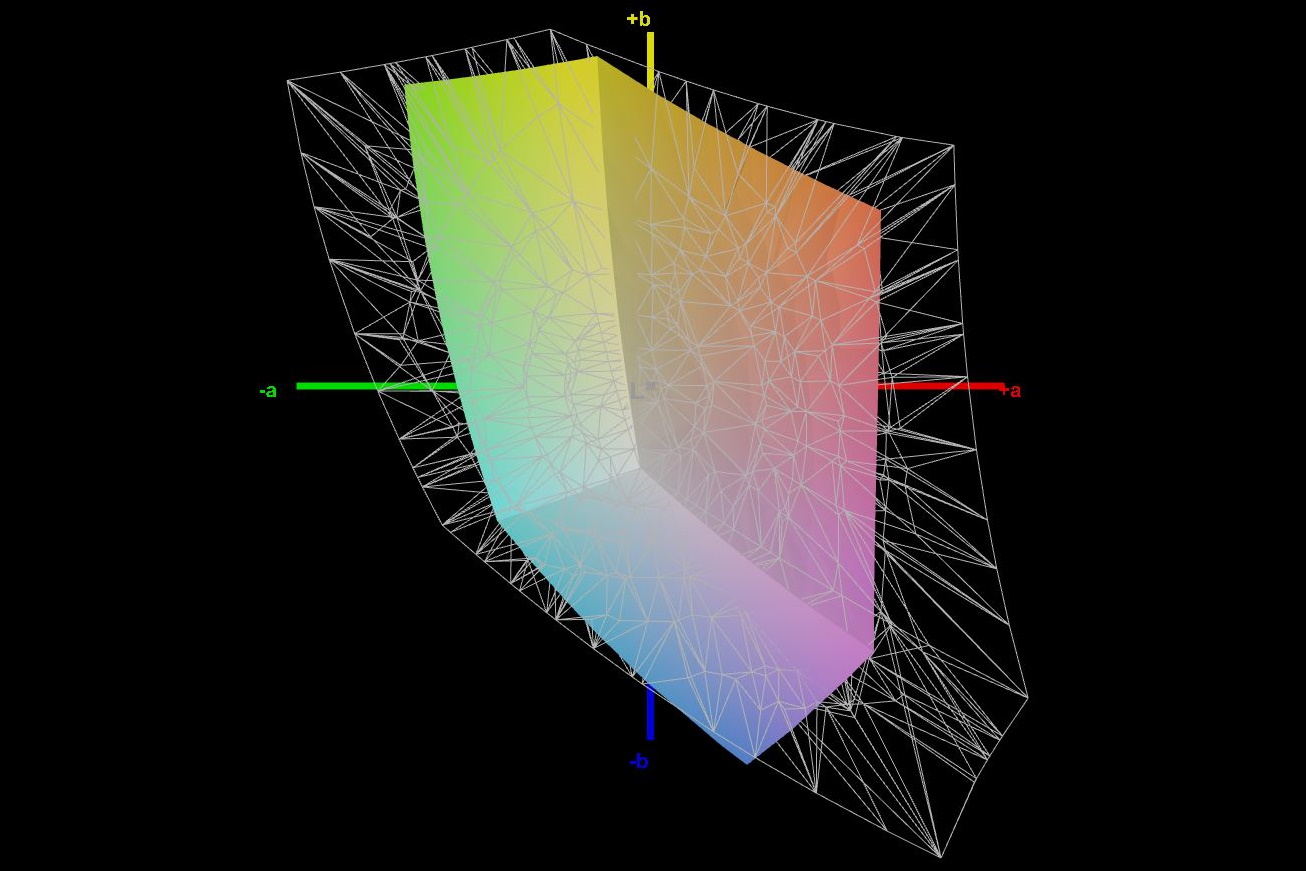
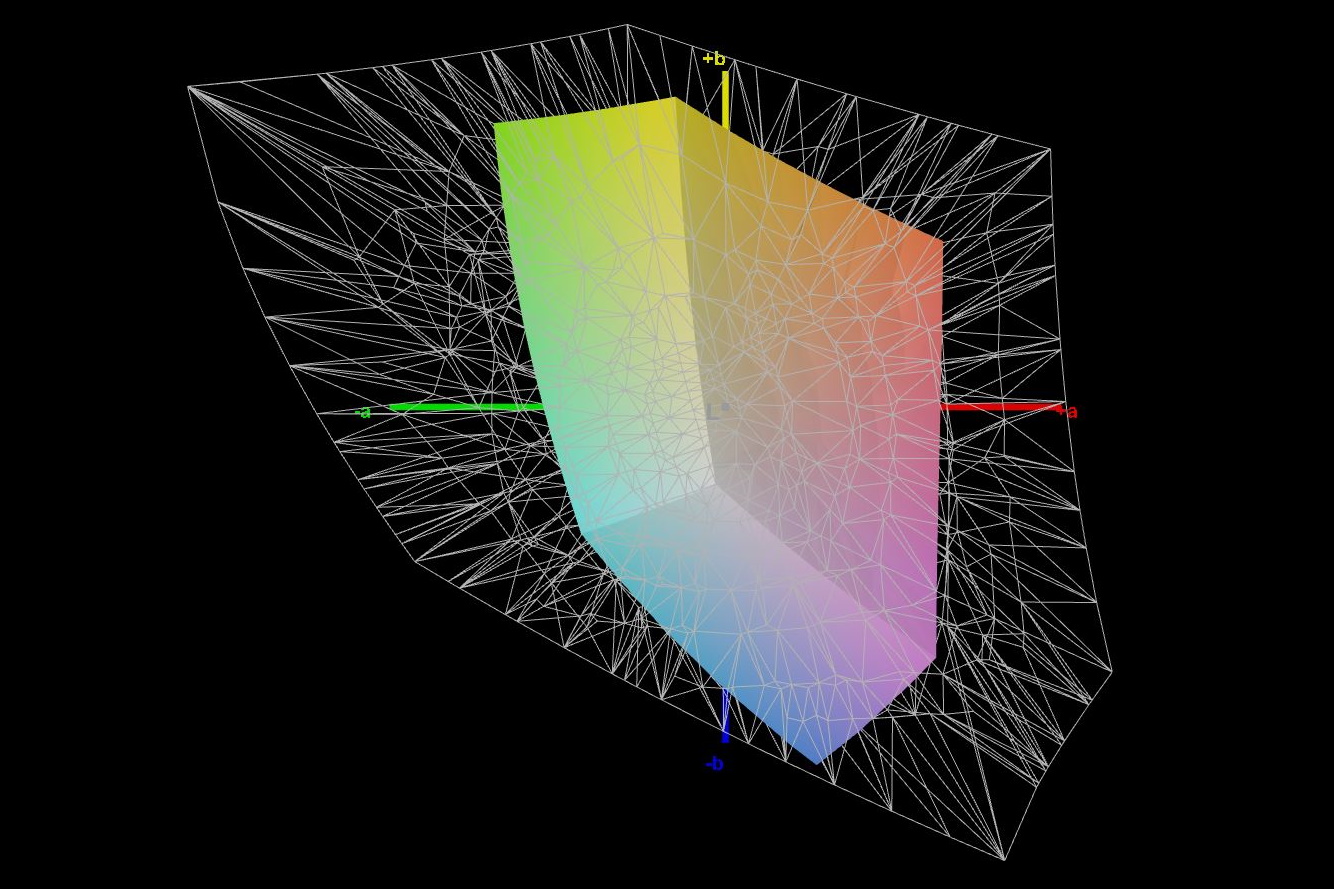
39.8% AdobeRGB 1998 (Argyll 3D)
57.8% sRGB (Argyll 3D)
38.5% Display P3 (Argyll 3D)
Gamma: 2.42
CCT: 6443 K
| MSI Katana GF76 12UGS AU Optronics B173HAN04.9, IPS, 1920x1080, 17.3" | MSI Katana GF76 11UE AU Optronics B173HAN04.9, IPS, 1920x1080, 17.3" | Aorus 17 XE4 Sharp LQ173M1JW12, IPS, 1920x1080, 17.3" | Razer Blade 17 (i7-12800H, RTX 3070 Ti) BOE CQ NE173QHM-NZ1 (BOE09F9), IPS, 2560x1440, 17.3" | Lenovo Legion 5 Pro 16 G7 i7 RTX 3070Ti NE160QDM-NY1, IPS, 2560x1600, 16" | MSI Vector GP66 12UGS BOE NE156FHM-NZ3, IPS, 1920x1080, 15.6" | |
|---|---|---|---|---|---|---|
| Display | 3% | 77% | 114% | 75% | 78% | |
| Display P3 Coverage (%) | 38.5 | 39.8 3% | 69 79% | 97.9 154% | 68.7 78% | 70.1 82% |
| sRGB Coverage (%) | 57.8 | 59.5 3% | 99.4 72% | 99.9 73% | 97.6 69% | 99.5 72% |
| AdobeRGB 1998 Coverage (%) | 39.8 | 41.12 3% | 71.2 79% | 85.5 115% | 70.9 78% | 72.1 81% |
| Response Times | 6% | 61% | 61% | 64% | 75% | |
| Response Time Grey 50% / Grey 80% * (ms) | 40.6 ? | 36.8 ? 9% | 15.2 ? 63% | 15.2 ? 63% | 17.6 ? 57% | 5.8 ? 86% |
| Response Time Black / White * (ms) | 26.4 ? | 26 ? 2% | 11.2 ? 58% | 11.2 ? 58% | 7.6 ? 71% | 9.6 ? 64% |
| PWM Frequency (Hz) | ||||||
| Screen | -33% | -12% | -64% | 3% | -28% | |
| Brightness middle (cd/m²) | 281 | 260 -7% | 274 -2% | 341 21% | 502 79% | 353.1 26% |
| Brightness (cd/m²) | 264 | 251 -5% | 267 1% | 308 17% | 491 86% | 325 23% |
| Brightness Distribution (%) | 88 | 85 -3% | 82 -7% | 82 -7% | 91 3% | 85 -3% |
| Black Level * (cd/m²) | 0.2 | 0.26 -30% | 0.25 -25% | 0.45 -125% | 0.37 -85% | 0.38 -90% |
| Contrast (:1) | 1405 | 1000 -29% | 1096 -22% | 758 -46% | 1357 -3% | 929 -34% |
| Colorchecker dE 2000 * | 3.69 | 3.9 -6% | 2.07 44% | 4.16 -13% | 2.7 27% | 2.24 39% |
| Colorchecker dE 2000 max. * | 8.46 | 20.64 -144% | 4.89 42% | 8.14 4% | 4.5 47% | 5 41% |
| Colorchecker dE 2000 calibrated * | 3.61 | 3.71 -3% | 0.83 77% | 3 17% | 1.4 61% | 1.02 72% |
| Greyscale dE 2000 * | 0.94 | 1.6 -70% | 3 -219% | 5.09 -441% | 2.7 -187% | 4 -326% |
| Gamma | 2.42 91% | 2.068 106% | 2.207 100% | 2.48 89% | 2.44 90% | 2.24 98% |
| CCT | 6443 101% | 6511 100% | 6999 93% | 6884 94% | 6326 103% | 6864 95% |
| Total Average (Program / Settings) | -8% /
-20% | 42% /
17% | 37% /
-8% | 47% /
27% | 42% /
10% |
* ... smaller is better
Professional image and video editors should use an external monitor, since the displayed color space is rather narrow. Only around 40% of AdobeRGB are reproduced, and less than 60% of sRGB.
In the state of delivery, the grayscale deviations are already smaller than 1. However, the color deviations are higher, but unfortunately, they don't improve significantly by a manual calibration using our X-Rite color measurement device (Portrait Displays Calman Color Calibration).
Display Response Times
| ↔ Response Time Black to White | ||
|---|---|---|
| 26.4 ms ... rise ↗ and fall ↘ combined | ↗ 13.8 ms rise | 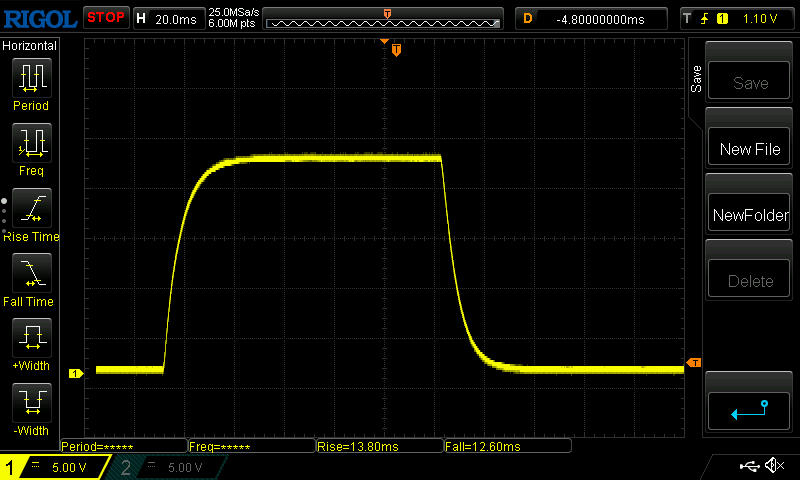 |
| ↘ 12.6 ms fall | ||
| The screen shows relatively slow response rates in our tests and may be too slow for gamers. In comparison, all tested devices range from 0.1 (minimum) to 240 (maximum) ms. » 66 % of all devices are better. This means that the measured response time is worse than the average of all tested devices (19.8 ms). | ||
| ↔ Response Time 50% Grey to 80% Grey | ||
| 40.6 ms ... rise ↗ and fall ↘ combined | ↗ 18.8 ms rise | |
| ↘ 21.8 ms fall | ||
| The screen shows slow response rates in our tests and will be unsatisfactory for gamers. In comparison, all tested devices range from 0.165 (minimum) to 636 (maximum) ms. » 64 % of all devices are better. This means that the measured response time is worse than the average of all tested devices (31 ms). | ||
Screen Flickering / PWM (Pulse-Width Modulation)
| Screen flickering / PWM not detected | 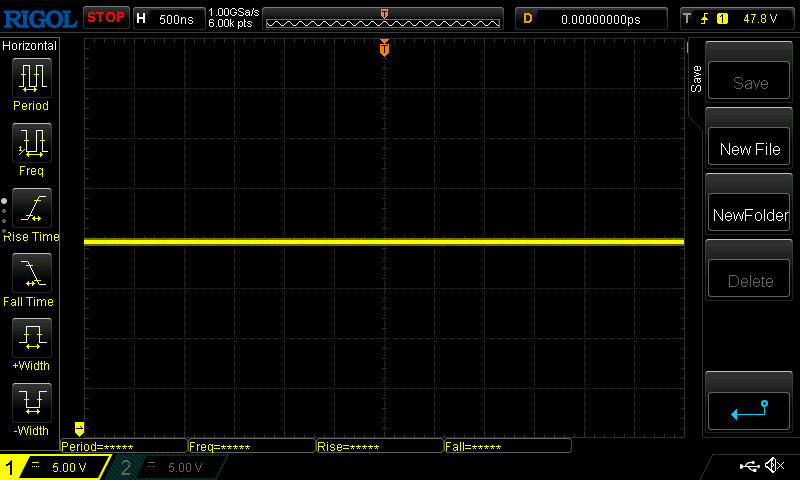 | ||
In comparison: 52 % of all tested devices do not use PWM to dim the display. If PWM was detected, an average of 7747 (minimum: 5 - maximum: 343500) Hz was measured. | |||
While the matte surface prevents many reflections, the low brightness and rather weak viewing angle stability lead to a limited usability outdoors.
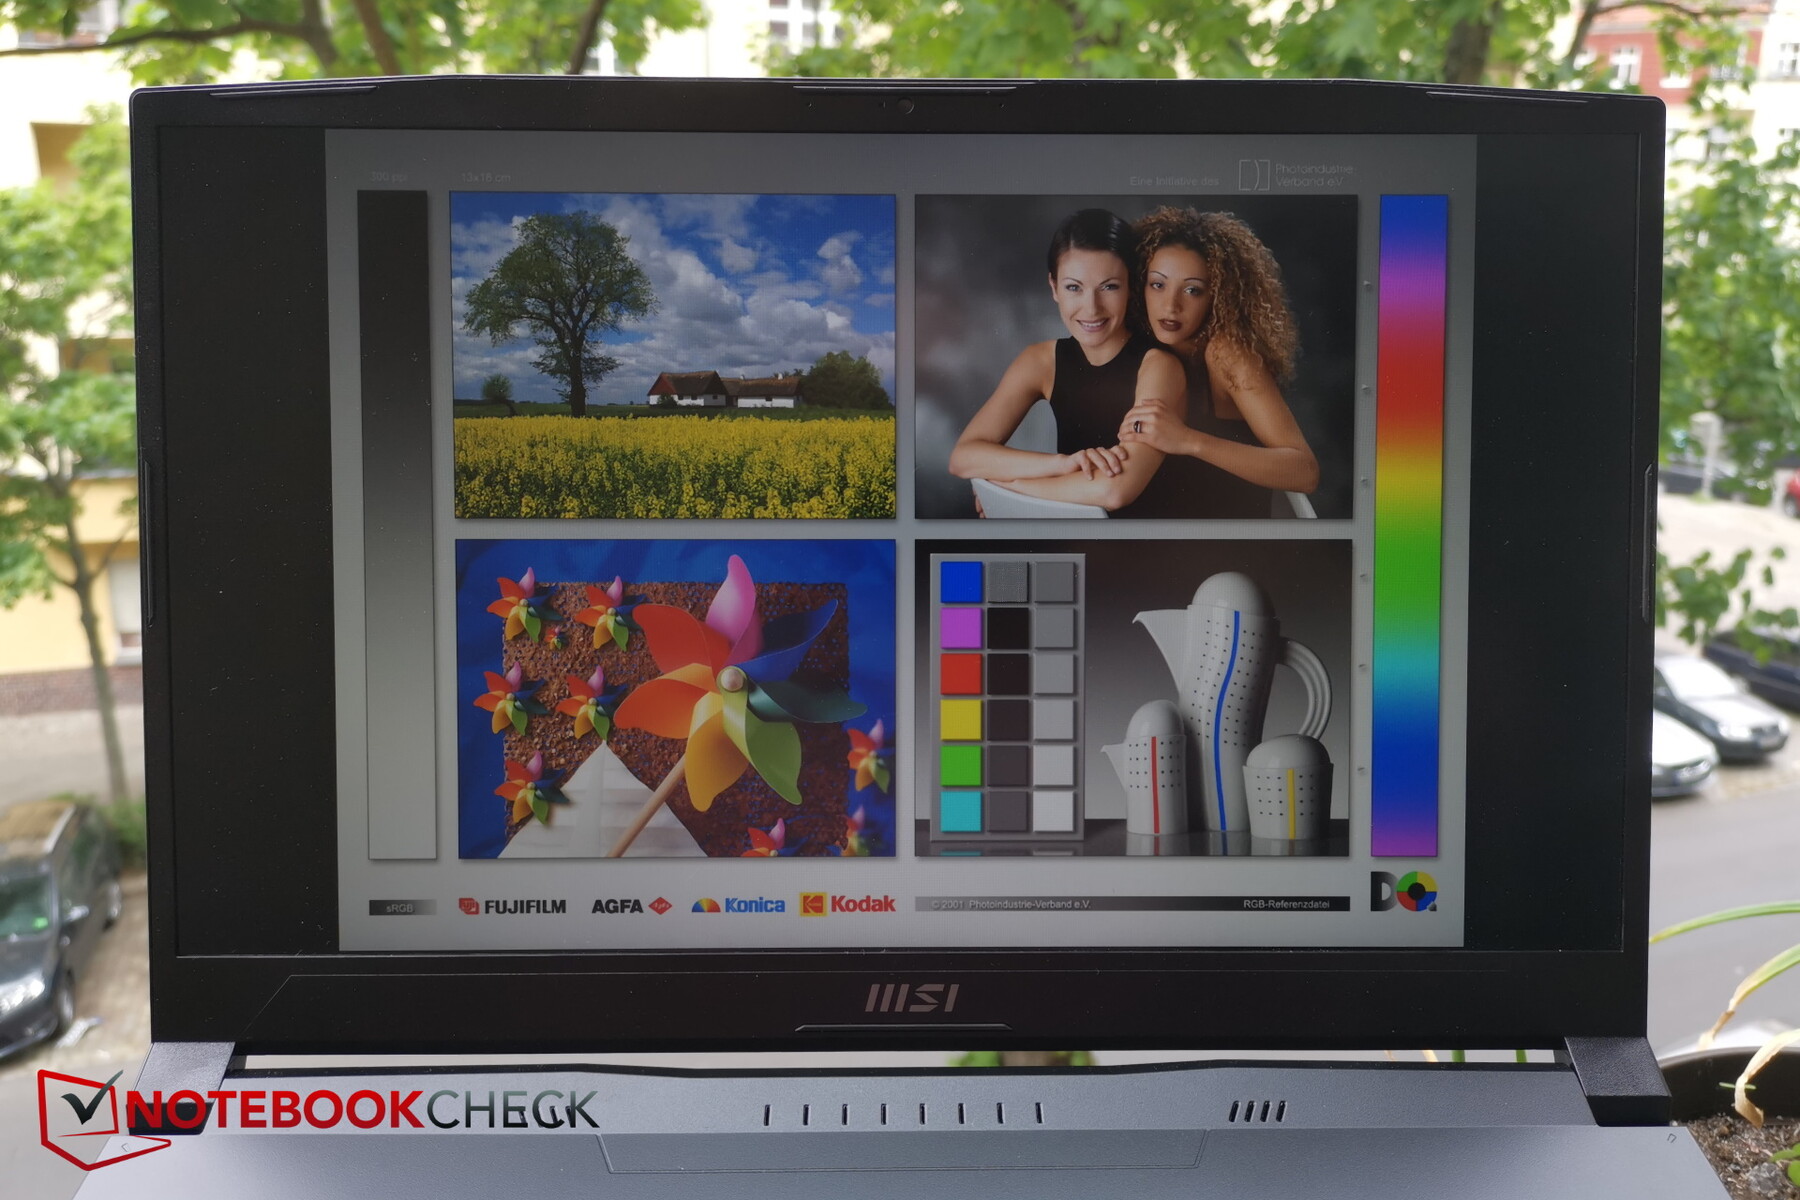
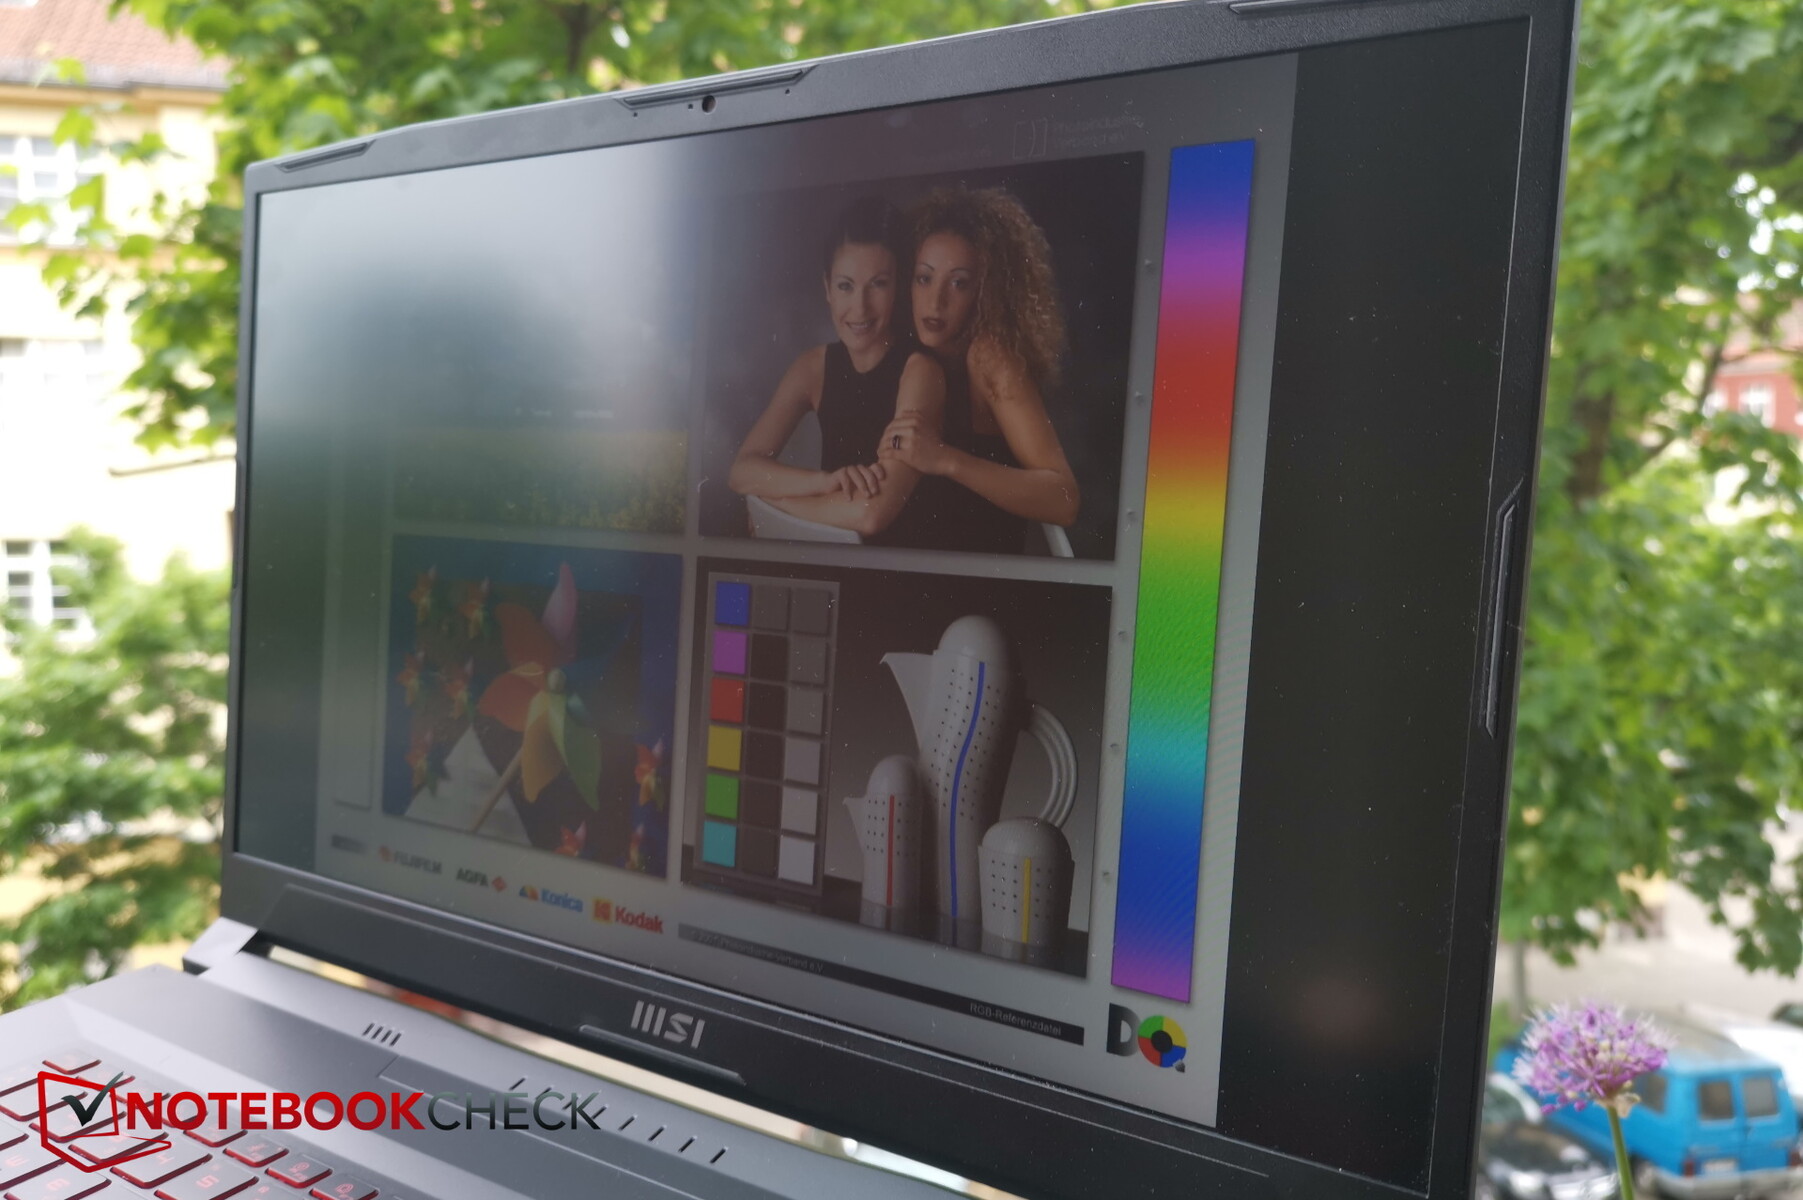
While usually, IPS panels shine in terms of their viewing angle stability, this is less the case for the display of the Katana. From extreme viewing angles, the brightness and colors decrease noticeably in intensity.

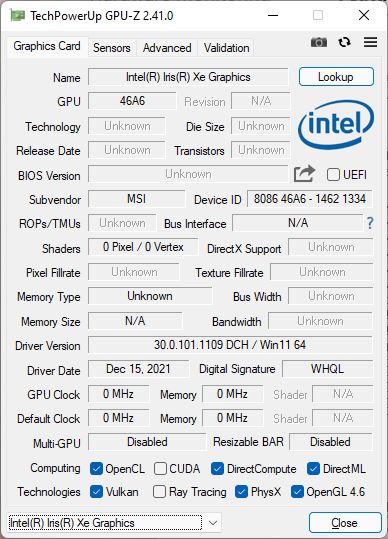
Performance - RTX 3070 Ti with 100-Watt limit
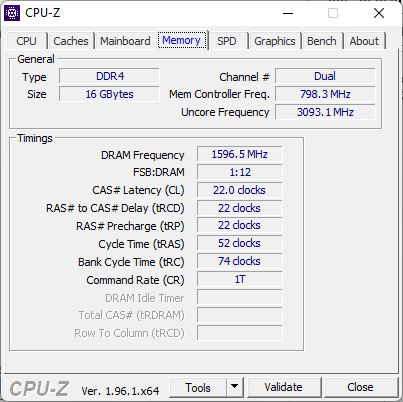
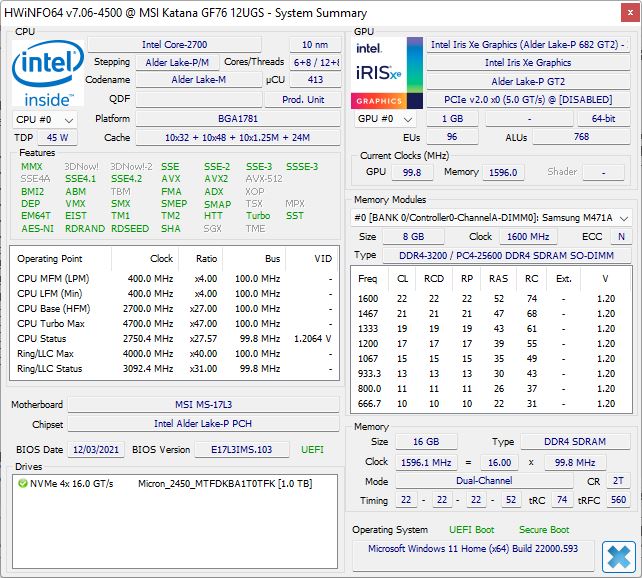
The Katana GF76 12U is available in a total of nine configurations. Eight of those use a Core i7-12700H as CPU and only a single model comes with an i5-12500H. The GPU versions start from the RTX 3050 up to the RTX 3070 Ti, including all the currently available RTX models from Nvidia. The display and RAM (2x 8 GB DDR4, also 16 GB) are the same for all models. As SSD size, either 1 TB or 512 GB are available.
Our configuration represents the top end with an RTX 3070 Ti and 1-TB SSD. It should be able to play all the current games in the native FHD resolution smoothly even at maximum detail level.
Test Conditions
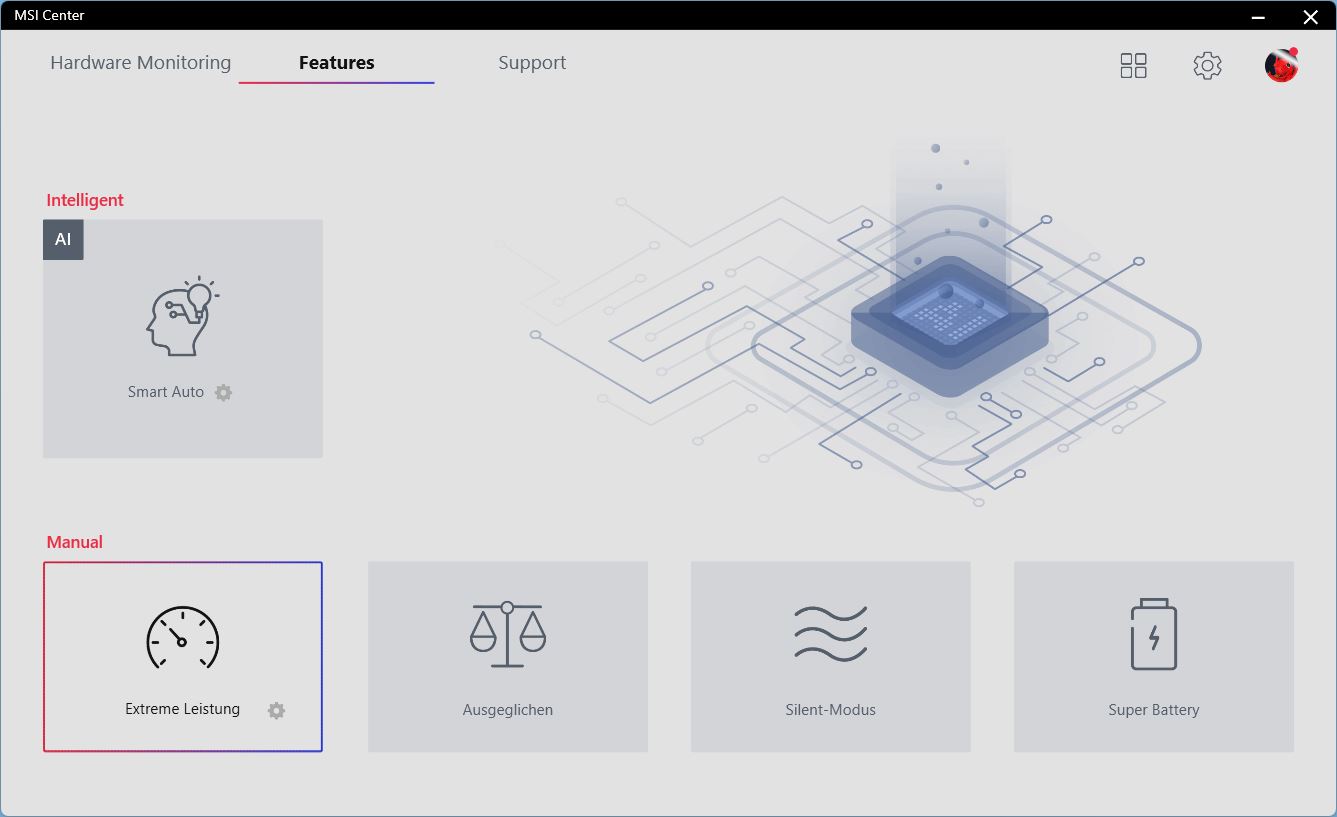
For the best benchmark results, we use the "Extreme Performance" mode in the MSI Center. While this software allows you to adjust various important system settings, at its first startup, you have to agree to a data privacy statement that asks to send anonymous user data. The adjustment settings include the user profiles, fan control modes, and also general settings such as switching the Fn and Windows key. It also allows you to search for driver updates, but unfortunately they don't install automatically after the download.
The MSI Center takes too long to load for our tastes, and it also happened repeatedly that the fan profile switched back to "Balanced" without any discernable reason after the software was restarted.

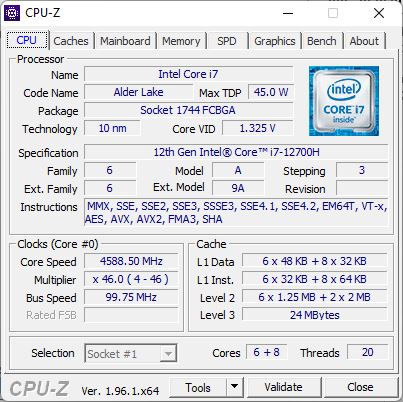
Processor
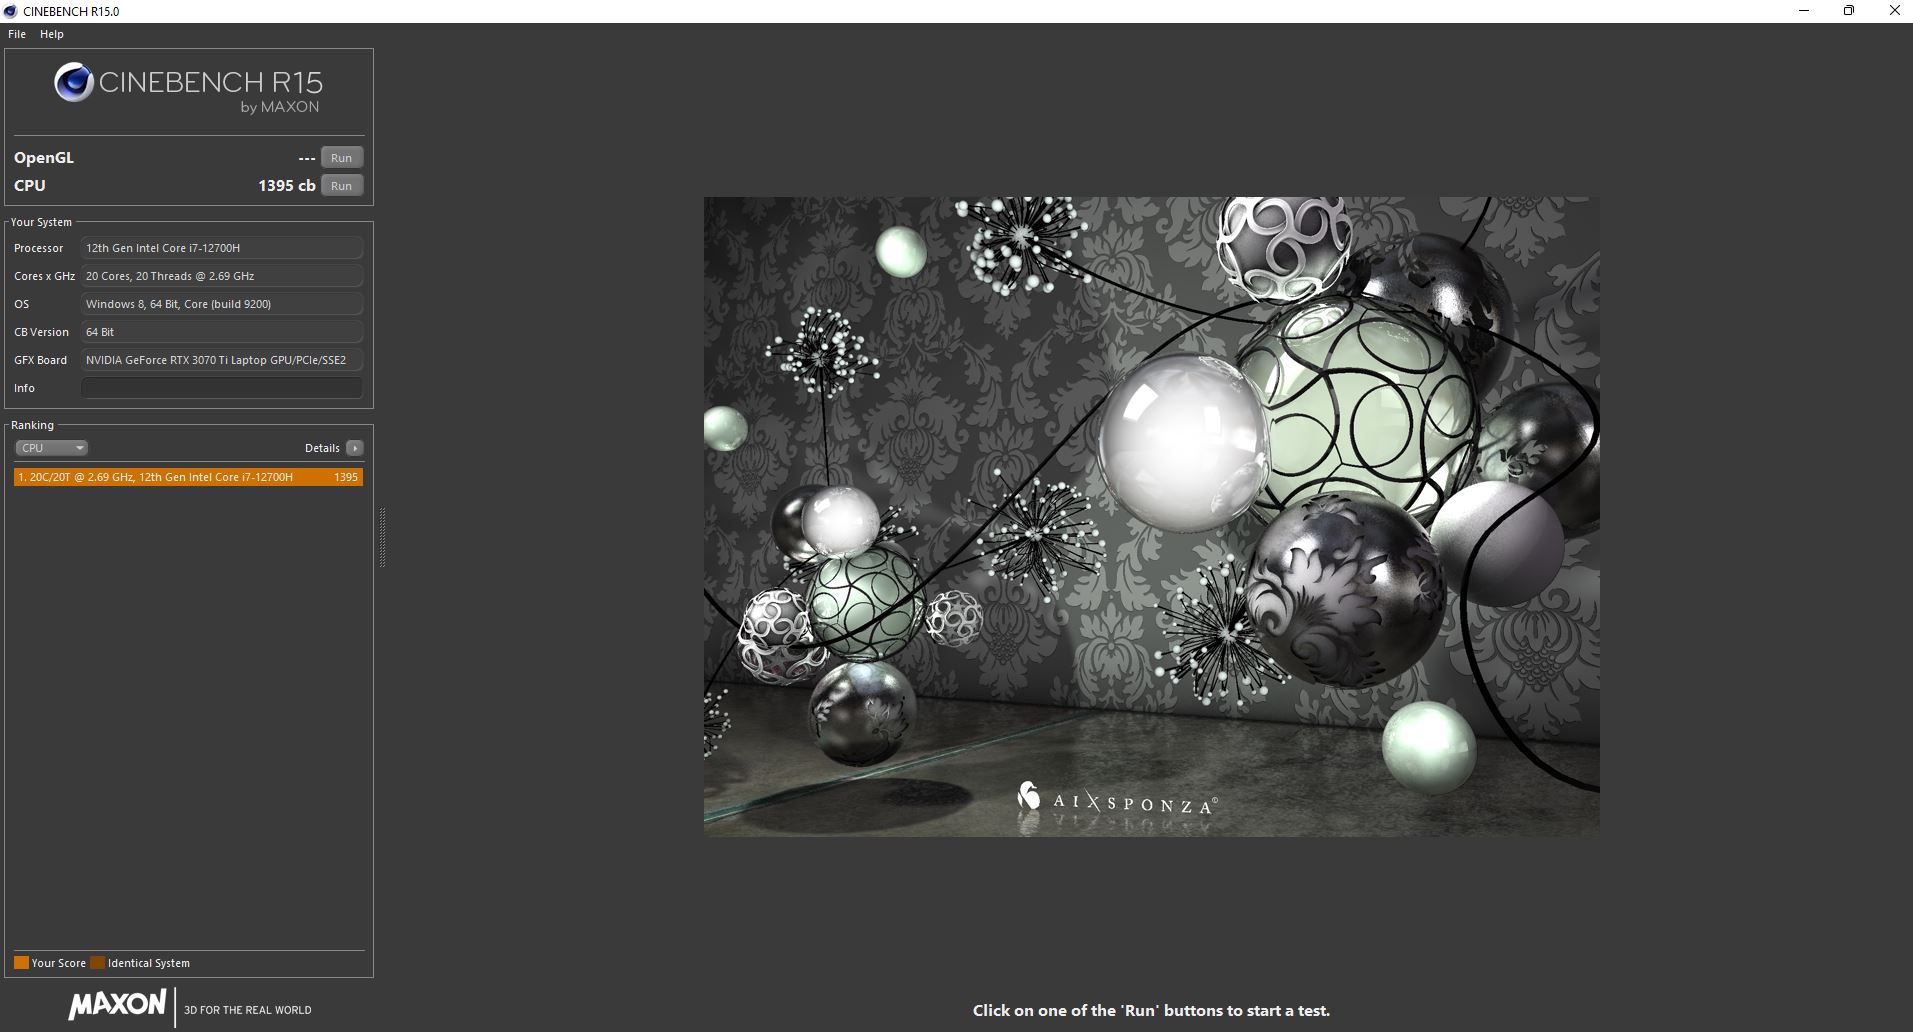
MSI uses an Intel Core i7-12700H, which besides the only minimally better i7-12800H represents one of the standard CPUs for current gaming laptops, as long as you are looking for Intel and not AMD. It possesses a total of 14 cores and is able to operate on 20 threads simultaneously. Each of its six P cores are able to run at up to 4.7 GHz in Turbo Boost, and their basic clock speed is 1.7 (E cores) and 2.4 GHz (P cores).
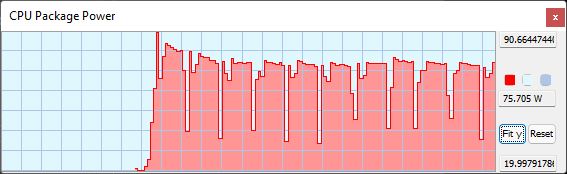
While the 45-Watt CPU should really be able to consume up to 115 watts for a short time period, our test unit only reaches 105 watts for a very short time in the first run. In the following runs, it still reaches 70 to 76 watts, which it is able to maintain relatively well within one run.
With this, the Katane performs at the same level as the competitors, which are also good. The previous Katana is surpassed by about 30%.
In the Cinebench R15 test, the performance is reduced by about 40% in battery operation.
Cinebench R15 Multi Constant Load Test
Cinebench R23: Multi Core | Single Core
Cinebench R20: CPU (Multi Core) | CPU (Single Core)
Cinebench R15: CPU Multi 64Bit | CPU Single 64Bit
Blender: v2.79 BMW27 CPU
7-Zip 18.03: 7z b 4 | 7z b 4 -mmt1
Geekbench 5.5: Multi-Core | Single-Core
HWBOT x265 Benchmark v2.2: 4k Preset
LibreOffice : 20 Documents To PDF
R Benchmark 2.5: Overall mean
| CPU Performance rating | |
| Average of class Gaming | |
| Lenovo Legion 5 Pro 16 G7 i7 RTX 3070Ti | |
| MSI Vector GP66 12UGS | |
| MSI Katana GF76 12UGS | |
| Aorus 17 XE4 | |
| Razer Blade 17 (i7-12800H, RTX 3070 Ti) | |
| Average Intel Core i7-12700H | |
| MSI Katana GF76 11UE | |
| Cinebench R23 / Multi Core | |
| Average of class Gaming (10488 - 40970, n=106, last 2 years) | |
| Lenovo Legion 5 Pro 16 G7 i7 RTX 3070Ti | |
| MSI Katana GF76 12UGS | |
| MSI Vector GP66 12UGS | |
| Aorus 17 XE4 | |
| Average Intel Core i7-12700H (4032 - 19330, n=64) | |
| Razer Blade 17 (i7-12800H, RTX 3070 Ti) | |
| MSI Katana GF76 11UE | |
| Cinebench R23 / Single Core | |
| Average of class Gaming (1166 - 2387, n=106, last 2 years) | |
| MSI Vector GP66 12UGS | |
| Razer Blade 17 (i7-12800H, RTX 3070 Ti) | |
| Lenovo Legion 5 Pro 16 G7 i7 RTX 3070Ti | |
| Aorus 17 XE4 | |
| MSI Katana GF76 12UGS | |
| Average Intel Core i7-12700H (778 - 1826, n=63) | |
| MSI Katana GF76 11UE | |
| Cinebench R20 / CPU (Multi Core) | |
| Average of class Gaming (4029 - 16108, n=105, last 2 years) | |
| Lenovo Legion 5 Pro 16 G7 i7 RTX 3070Ti | |
| MSI Vector GP66 12UGS | |
| Aorus 17 XE4 | |
| MSI Katana GF76 12UGS | |
| Average Intel Core i7-12700H (1576 - 7407, n=64) | |
| Razer Blade 17 (i7-12800H, RTX 3070 Ti) | |
| MSI Katana GF76 11UE | |
| Cinebench R20 / CPU (Single Core) | |
| Average of class Gaming (442 - 904, n=105, last 2 years) | |
| MSI Vector GP66 12UGS | |
| Razer Blade 17 (i7-12800H, RTX 3070 Ti) | |
| MSI Katana GF76 12UGS | |
| Lenovo Legion 5 Pro 16 G7 i7 RTX 3070Ti | |
| Aorus 17 XE4 | |
| Average Intel Core i7-12700H (300 - 704, n=64) | |
| MSI Katana GF76 11UE | |
| Cinebench R15 / CPU Multi 64Bit | |
| Average of class Gaming (1578 - 6271, n=104, last 2 years) | |
| Lenovo Legion 5 Pro 16 G7 i7 RTX 3070Ti | |
| Razer Blade 17 (i7-12800H, RTX 3070 Ti) | |
| MSI Katana GF76 12UGS | |
| Aorus 17 XE4 | |
| Average Intel Core i7-12700H (1379 - 2916, n=70) | |
| MSI Vector GP66 12UGS | |
| MSI Katana GF76 11UE | |
| Cinebench R15 / CPU Single 64Bit | |
| Average of class Gaming (188.8 - 344, n=105, last 2 years) | |
| MSI Vector GP66 12UGS | |
| Razer Blade 17 (i7-12800H, RTX 3070 Ti) | |
| Lenovo Legion 5 Pro 16 G7 i7 RTX 3070Ti | |
| Aorus 17 XE4 | |
| MSI Katana GF76 12UGS | |
| Average Intel Core i7-12700H (113 - 263, n=65) | |
| MSI Katana GF76 11UE | |
| Blender / v2.79 BMW27 CPU | |
| MSI Katana GF76 11UE | |
| Aorus 17 XE4 | |
| Average Intel Core i7-12700H (168 - 732, n=63) | |
| Razer Blade 17 (i7-12800H, RTX 3070 Ti) | |
| MSI Vector GP66 12UGS | |
| MSI Katana GF76 12UGS | |
| Lenovo Legion 5 Pro 16 G7 i7 RTX 3070Ti | |
| Average of class Gaming (80 - 330, n=103, last 2 years) | |
| 7-Zip 18.03 / 7z b 4 | |
| Average of class Gaming (33491 - 148086, n=104, last 2 years) | |
| Lenovo Legion 5 Pro 16 G7 i7 RTX 3070Ti | |
| MSI Vector GP66 12UGS | |
| Razer Blade 17 (i7-12800H, RTX 3070 Ti) | |
| MSI Katana GF76 12UGS | |
| Average Intel Core i7-12700H (22844 - 73067, n=63) | |
| Aorus 17 XE4 | |
| MSI Katana GF76 11UE | |
| 7-Zip 18.03 / 7z b 4 -mmt1 | |
| Average of class Gaming (4199 - 7436, n=104, last 2 years) | |
| MSI Vector GP66 12UGS | |
| Aorus 17 XE4 | |
| Lenovo Legion 5 Pro 16 G7 i7 RTX 3070Ti | |
| MSI Katana GF76 12UGS | |
| Razer Blade 17 (i7-12800H, RTX 3070 Ti) | |
| Average Intel Core i7-12700H (2743 - 5972, n=63) | |
| MSI Katana GF76 11UE | |
| Geekbench 5.5 / Multi-Core | |
| Average of class Gaming (6460 - 27010, n=104, last 2 years) | |
| Lenovo Legion 5 Pro 16 G7 i7 RTX 3070Ti | |
| MSI Vector GP66 12UGS | |
| Aorus 17 XE4 | |
| Razer Blade 17 (i7-12800H, RTX 3070 Ti) | |
| Average Intel Core i7-12700H (5144 - 13745, n=64) | |
| MSI Katana GF76 12UGS | |
| MSI Katana GF76 11UE | |
| Geekbench 5.5 / Single-Core | |
| Average of class Gaming (986 - 2474, n=104, last 2 years) | |
| MSI Vector GP66 12UGS | |
| MSI Katana GF76 12UGS | |
| Aorus 17 XE4 | |
| Razer Blade 17 (i7-12800H, RTX 3070 Ti) | |
| Lenovo Legion 5 Pro 16 G7 i7 RTX 3070Ti | |
| Average Intel Core i7-12700H (803 - 1851, n=64) | |
| MSI Katana GF76 11UE | |
| HWBOT x265 Benchmark v2.2 / 4k Preset | |
| Average of class Gaming (11.5 - 44.3, n=104, last 2 years) | |
| Lenovo Legion 5 Pro 16 G7 i7 RTX 3070Ti | |
| MSI Vector GP66 12UGS | |
| Average Intel Core i7-12700H (4.67 - 21.8, n=64) | |
| Aorus 17 XE4 | |
| Razer Blade 17 (i7-12800H, RTX 3070 Ti) | |
| MSI Katana GF76 12UGS | |
| MSI Katana GF76 11UE | |
| LibreOffice / 20 Documents To PDF | |
| Average of class Gaming (33.2 - 88.8, n=104, last 2 years) | |
| MSI Katana GF76 11UE | |
| Average Intel Core i7-12700H (34.2 - 95.3, n=63) | |
| Lenovo Legion 5 Pro 16 G7 i7 RTX 3070Ti | |
| Razer Blade 17 (i7-12800H, RTX 3070 Ti) | |
| MSI Katana GF76 12UGS | |
| MSI Vector GP66 12UGS | |
| Aorus 17 XE4 | |
| R Benchmark 2.5 / Overall mean | |
| MSI Katana GF76 11UE | |
| Average Intel Core i7-12700H (0.4441 - 1.052, n=63) | |
| Razer Blade 17 (i7-12800H, RTX 3070 Ti) | |
| Aorus 17 XE4 | |
| MSI Katana GF76 12UGS | |
| Lenovo Legion 5 Pro 16 G7 i7 RTX 3070Ti | |
| Average of class Gaming (0.3439 - 0.759, n=105, last 2 years) | |
| MSI Vector GP66 12UGS | |
* ... smaller is better
AIDA64: FP32 Ray-Trace | FPU Julia | CPU SHA3 | CPU Queen | FPU SinJulia | FPU Mandel | CPU AES | CPU ZLib | FP64 Ray-Trace | CPU PhotoWorxx
| Performance rating | |
| Average of class Gaming | |
| Lenovo Legion 5 Pro 16 G7 i7 RTX 3070Ti | |
| Average Intel Core i7-12700H | |
| MSI Vector GP66 12UGS | |
| MSI Katana GF76 12UGS | |
| Razer Blade 17 (i7-12800H, RTX 3070 Ti) | |
| Aorus 17 XE4 | |
| MSI Katana GF76 11UE -9! | |
| AIDA64 / FP32 Ray-Trace | |
| Average of class Gaming (10227 - 85542, n=103, last 2 years) | |
| Average Intel Core i7-12700H (2585 - 17957, n=64) | |
| Lenovo Legion 5 Pro 16 G7 i7 RTX 3070Ti | |
| MSI Katana GF76 12UGS | |
| MSI Vector GP66 12UGS | |
| Razer Blade 17 (i7-12800H, RTX 3070 Ti) | |
| Aorus 17 XE4 | |
| AIDA64 / FPU Julia | |
| Average of class Gaming (51376 - 238426, n=103, last 2 years) | |
| Average Intel Core i7-12700H (12439 - 90760, n=64) | |
| Lenovo Legion 5 Pro 16 G7 i7 RTX 3070Ti | |
| MSI Vector GP66 12UGS | |
| MSI Katana GF76 12UGS | |
| Razer Blade 17 (i7-12800H, RTX 3070 Ti) | |
| Aorus 17 XE4 | |
| AIDA64 / CPU SHA3 | |
| Average of class Gaming (2180 - 9817, n=103, last 2 years) | |
| Lenovo Legion 5 Pro 16 G7 i7 RTX 3070Ti | |
| MSI Katana GF76 12UGS | |
| Average Intel Core i7-12700H (833 - 4242, n=64) | |
| MSI Vector GP66 12UGS | |
| Razer Blade 17 (i7-12800H, RTX 3070 Ti) | |
| Aorus 17 XE4 | |
| AIDA64 / CPU Queen | |
| Average of class Gaming (49785 - 173351, n=89, last 2 years) | |
| MSI Vector GP66 12UGS | |
| Aorus 17 XE4 | |
| Lenovo Legion 5 Pro 16 G7 i7 RTX 3070Ti | |
| MSI Katana GF76 12UGS | |
| Average Intel Core i7-12700H (57923 - 103202, n=63) | |
| Razer Blade 17 (i7-12800H, RTX 3070 Ti) | |
| AIDA64 / FPU SinJulia | |
| Average of class Gaming (4424 - 33636, n=103, last 2 years) | |
| Lenovo Legion 5 Pro 16 G7 i7 RTX 3070Ti | |
| MSI Vector GP66 12UGS | |
| MSI Katana GF76 12UGS | |
| Razer Blade 17 (i7-12800H, RTX 3070 Ti) | |
| Average Intel Core i7-12700H (3249 - 9939, n=64) | |
| Aorus 17 XE4 | |
| AIDA64 / FPU Mandel | |
| Average of class Gaming (25115 - 128721, n=103, last 2 years) | |
| Average Intel Core i7-12700H (7135 - 44760, n=64) | |
| Lenovo Legion 5 Pro 16 G7 i7 RTX 3070Ti | |
| MSI Katana GF76 12UGS | |
| MSI Vector GP66 12UGS | |
| Razer Blade 17 (i7-12800H, RTX 3070 Ti) | |
| Aorus 17 XE4 | |
| AIDA64 / CPU AES | |
| Average of class Gaming (39258 - 247074, n=103, last 2 years) | |
| Lenovo Legion 5 Pro 16 G7 i7 RTX 3070Ti | |
| MSI Vector GP66 12UGS | |
| MSI Katana GF76 12UGS | |
| Average Intel Core i7-12700H (31839 - 144360, n=64) | |
| Aorus 17 XE4 | |
| Razer Blade 17 (i7-12800H, RTX 3070 Ti) | |
| AIDA64 / CPU ZLib | |
| Average of class Gaming (574 - 2531, n=103, last 2 years) | |
| Lenovo Legion 5 Pro 16 G7 i7 RTX 3070Ti | |
| MSI Vector GP66 12UGS | |
| MSI Katana GF76 12UGS | |
| Razer Blade 17 (i7-12800H, RTX 3070 Ti) | |
| Average Intel Core i7-12700H (305 - 1171, n=64) | |
| Aorus 17 XE4 | |
| MSI Katana GF76 11UE | |
| AIDA64 / FP64 Ray-Trace | |
| Average of class Gaming (5509 - 45446, n=103, last 2 years) | |
| Average Intel Core i7-12700H (1437 - 9692, n=64) | |
| Lenovo Legion 5 Pro 16 G7 i7 RTX 3070Ti | |
| MSI Katana GF76 12UGS | |
| MSI Vector GP66 12UGS | |
| Razer Blade 17 (i7-12800H, RTX 3070 Ti) | |
| Aorus 17 XE4 | |
| AIDA64 / CPU PhotoWorxx | |
| Average of class Gaming (12271 - 89891, n=103, last 2 years) | |
| Lenovo Legion 5 Pro 16 G7 i7 RTX 3070Ti | |
| Average Intel Core i7-12700H (12863 - 52207, n=64) | |
| Razer Blade 17 (i7-12800H, RTX 3070 Ti) | |
| MSI Vector GP66 12UGS | |
| MSI Katana GF76 12UGS | |
| Aorus 17 XE4 | |
System Performance
In PCMark 10, the Katana does a good job, placing second most of the time. Only in the Digital Content Creation segment, the performance drops slightly.

CrossMark: Overall | Productivity | Creativity | Responsiveness
| PCMark 10 / Score | |
| Average of class Gaming (5828 - 11730, n=92, last 2 years) | |
| MSI Vector GP66 12UGS | |
| Aorus 17 XE4 | |
| MSI Katana GF76 12UGS | |
| Lenovo Legion 5 Pro 16 G7 i7 RTX 3070Ti | |
| Average Intel Core i7-12700H, NVIDIA GeForce RTX 3070 Ti Laptop GPU (6941 - 7947, n=11) | |
| Razer Blade 17 (i7-12800H, RTX 3070 Ti) | |
| MSI Katana GF76 11UE | |
| PCMark 10 / Essentials | |
| MSI Vector GP66 12UGS | |
| MSI Katana GF76 12UGS | |
| Aorus 17 XE4 | |
| Average of class Gaming (8810 - 11935, n=96, last 2 years) | |
| Average Intel Core i7-12700H, NVIDIA GeForce RTX 3070 Ti Laptop GPU (9892 - 10935, n=11) | |
| Razer Blade 17 (i7-12800H, RTX 3070 Ti) | |
| Lenovo Legion 5 Pro 16 G7 i7 RTX 3070Ti | |
| MSI Katana GF76 11UE | |
| PCMark 10 / Productivity | |
| Average of class Gaming (6845 - 21327, n=94, last 2 years) | |
| MSI Vector GP66 12UGS | |
| MSI Katana GF76 12UGS | |
| Lenovo Legion 5 Pro 16 G7 i7 RTX 3070Ti | |
| Aorus 17 XE4 | |
| Average Intel Core i7-12700H, NVIDIA GeForce RTX 3070 Ti Laptop GPU (9024 - 10638, n=11) | |
| Razer Blade 17 (i7-12800H, RTX 3070 Ti) | |
| MSI Katana GF76 11UE | |
| PCMark 10 / Digital Content Creation | |
| Average of class Gaming (7602 - 19954, n=94, last 2 years) | |
| MSI Vector GP66 12UGS | |
| Lenovo Legion 5 Pro 16 G7 i7 RTX 3070Ti | |
| Aorus 17 XE4 | |
| Average Intel Core i7-12700H, NVIDIA GeForce RTX 3070 Ti Laptop GPU (10165 - 12546, n=11) | |
| Razer Blade 17 (i7-12800H, RTX 3070 Ti) | |
| MSI Katana GF76 12UGS | |
| MSI Katana GF76 11UE | |
| CrossMark / Overall | |
| Aorus 17 XE4 | |
| Average of class Gaming (1366 - 2409, n=93, last 2 years) | |
| Lenovo Legion 5 Pro 16 G7 i7 RTX 3070Ti | |
| MSI Katana GF76 12UGS | |
| Average Intel Core i7-12700H, NVIDIA GeForce RTX 3070 Ti Laptop GPU (974 - 2000, n=12) | |
| Razer Blade 17 (i7-12800H, RTX 3070 Ti) | |
| CrossMark / Productivity | |
| Aorus 17 XE4 | |
| MSI Katana GF76 12UGS | |
| Lenovo Legion 5 Pro 16 G7 i7 RTX 3070Ti | |
| Average of class Gaming (1386 - 2254, n=93, last 2 years) | |
| Average Intel Core i7-12700H, NVIDIA GeForce RTX 3070 Ti Laptop GPU (907 - 1962, n=12) | |
| Razer Blade 17 (i7-12800H, RTX 3070 Ti) | |
| CrossMark / Creativity | |
| Average of class Gaming (1343 - 2729, n=93, last 2 years) | |
| Lenovo Legion 5 Pro 16 G7 i7 RTX 3070Ti | |
| Aorus 17 XE4 | |
| Razer Blade 17 (i7-12800H, RTX 3070 Ti) | |
| Average Intel Core i7-12700H, NVIDIA GeForce RTX 3070 Ti Laptop GPU (1027 - 2057, n=12) | |
| MSI Katana GF76 12UGS | |
| CrossMark / Responsiveness | |
| Aorus 17 XE4 | |
| MSI Katana GF76 12UGS | |
| Lenovo Legion 5 Pro 16 G7 i7 RTX 3070Ti | |
| Average Intel Core i7-12700H, NVIDIA GeForce RTX 3070 Ti Laptop GPU (1029 - 2142, n=12) | |
| Average of class Gaming (1226 - 2334, n=93, last 2 years) | |
| Razer Blade 17 (i7-12800H, RTX 3070 Ti) | |
| PCMark 10 Score | 7637 points | |
Help | ||
| AIDA64 / Memory Copy | |
| Average of class Gaming (21750 - 129946, n=103, last 2 years) | |
| Average Intel Core i7-12700H (25615 - 80511, n=64) | |
| Lenovo Legion 5 Pro 16 G7 i7 RTX 3070Ti | |
| Razer Blade 17 (i7-12800H, RTX 3070 Ti) | |
| MSI Katana GF76 12UGS | |
| MSI Vector GP66 12UGS | |
| Aorus 17 XE4 | |
| AIDA64 / Memory Read | |
| Average of class Gaming (22956 - 118858, n=103, last 2 years) | |
| Lenovo Legion 5 Pro 16 G7 i7 RTX 3070Ti | |
| Average Intel Core i7-12700H (25586 - 79442, n=64) | |
| Razer Blade 17 (i7-12800H, RTX 3070 Ti) | |
| MSI Katana GF76 12UGS | |
| MSI Vector GP66 12UGS | |
| Aorus 17 XE4 | |
| AIDA64 / Memory Write | |
| Average of class Gaming (22297 - 135096, n=103, last 2 years) | |
| Lenovo Legion 5 Pro 16 G7 i7 RTX 3070Ti | |
| Average Intel Core i7-12700H (23679 - 88660, n=64) | |
| Razer Blade 17 (i7-12800H, RTX 3070 Ti) | |
| MSI Katana GF76 12UGS | |
| MSI Vector GP66 12UGS | |
| Aorus 17 XE4 | |
| AIDA64 / Memory Latency | |
| Average of class Gaming (75.3 - 259, n=103, last 2 years) | |
| Lenovo Legion 5 Pro 16 G7 i7 RTX 3070Ti | |
| MSI Katana GF76 12UGS | |
| Aorus 17 XE4 | |
| MSI Vector GP66 12UGS | |
| Average Intel Core i7-12700H (76.2 - 133.9, n=62) | |
| MSI Katana GF76 11UE | |
| Razer Blade 17 (i7-12800H, RTX 3070 Ti) | |
* ... smaller is better
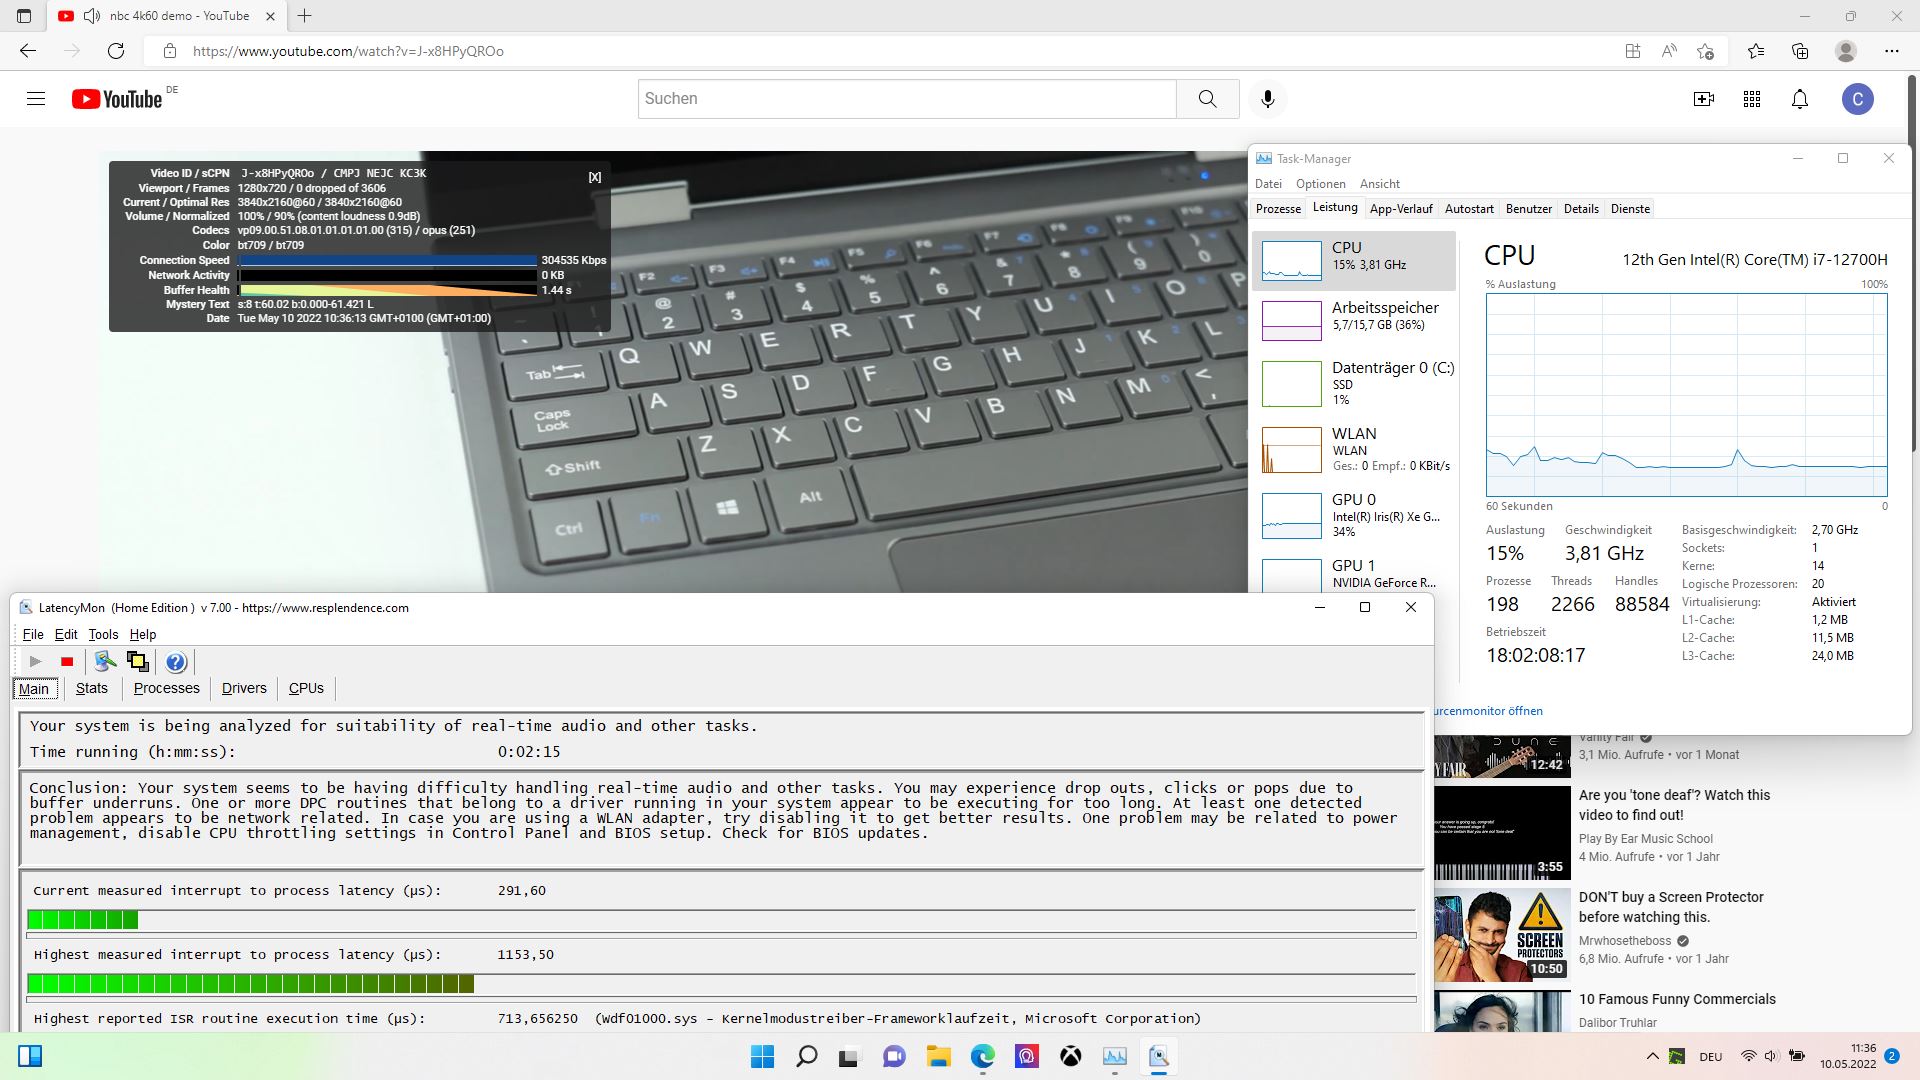
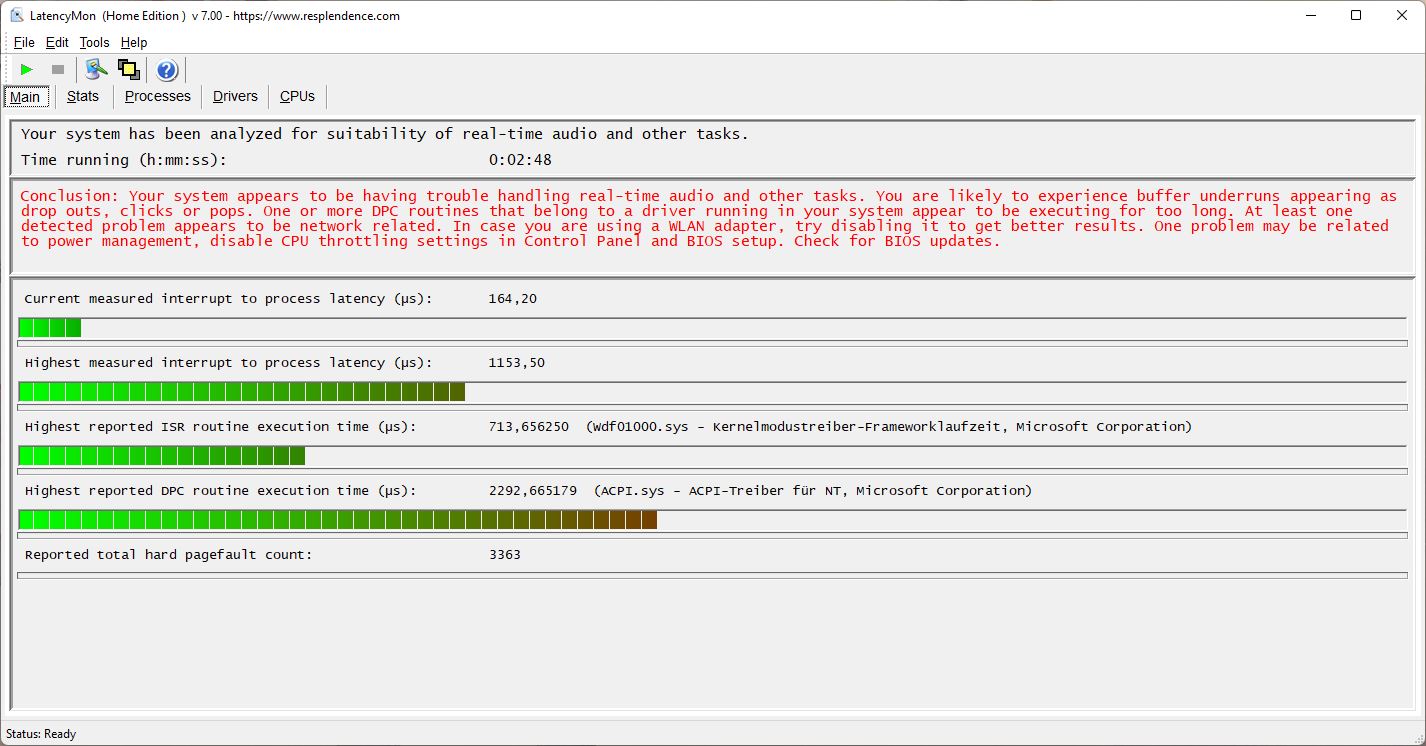
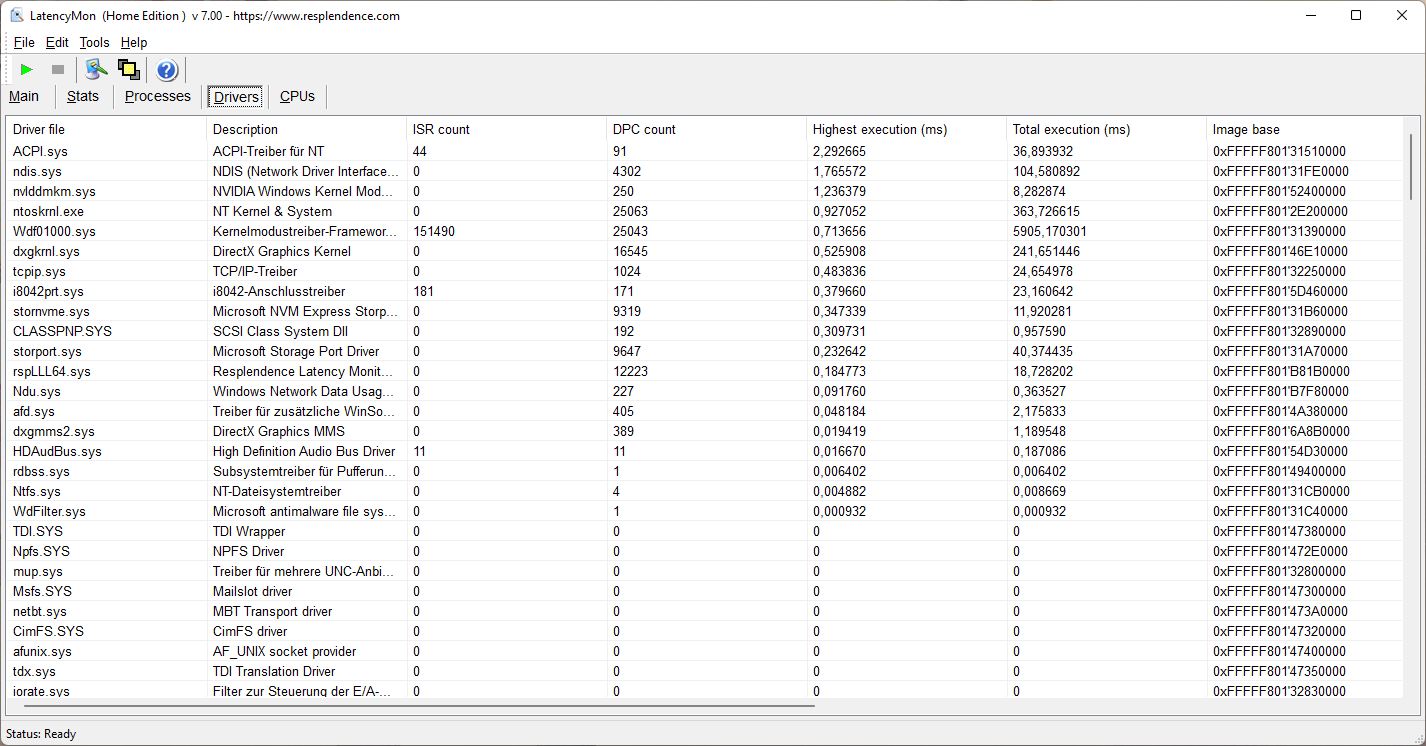
DPC Latencies
Neither opening the browser, nor several open tabs on our Homepage create any problems for the Katana. However, the LatencyMon tool does show some delays when playing our 4K/60-fps YouTube test video, but there are still no dropped frames during the reproduction.
| DPC Latencies / LatencyMon - interrupt to process latency (max), Web, Youtube, Prime95 | |
| MSI Katana GF76 11UE | |
| MSI Vector GP66 12UGS | |
| Aorus 17 XE4 | |
| MSI Katana GF76 12UGS | |
| Razer Blade 17 (i7-12800H, RTX 3070 Ti) | |
| Lenovo Legion 5 Pro 16 G7 i7 RTX 3070Ti | |
* ... smaller is better
Storage Solution
MSI uses an NVMe SSD from Micron with 1 TB. While the storage is already connected via PCIe 4.0, the speed is still more at a high PCIe 3.0 level, so that the models in the more expensive competitors are often faster. On the other hand, the constant performance is very good, ending up on a good 12th place in our list of best storage devices.

* ... smaller is better
Constant Performance Reading: DiskSpd Read Loop, Queue Depth 8
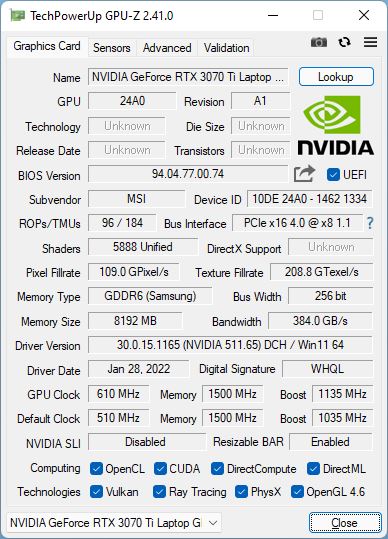
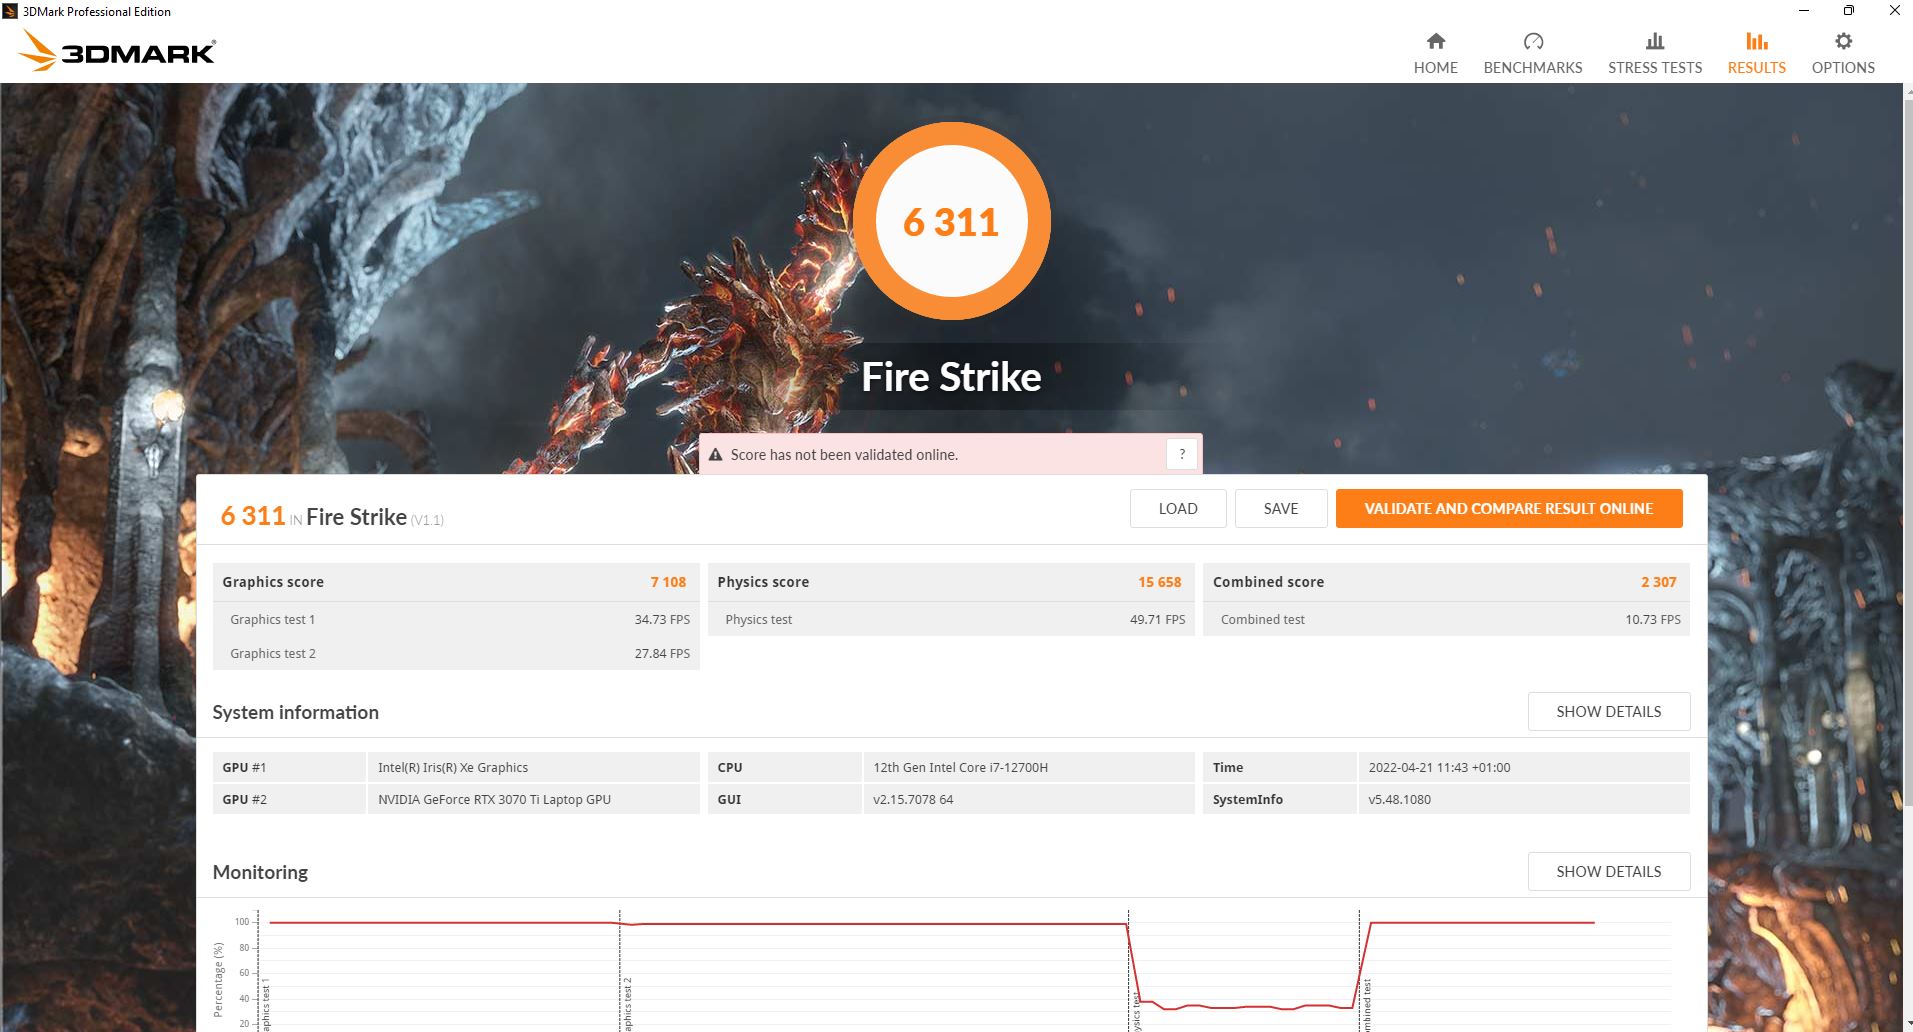
Graphics Card
The Nvidia Geforce RTX 3070 Ti is one of the most powerful mobile GPUs and should really be able to play all the current games smoothly. However, in the Katana its TGP is limited to only 100 watts, while some of the competitors reach 150 watts here. The graphics performance should end up correspondingly lower.
In the synthetic 3DMark tests, the Katana finishes slightly below average, ending up about 7 to 10% behind an average RTX 3070 Ti, which should be due to the lower TGP.
In battery operation, the 3D performance is reduced by more than 70%, as another Fire Strike run shows.


| 3DMark 11 Performance | 14168 points | |
| 3DMark Cloud Gate Standard Score | 28010 points | |
| 3DMark Fire Strike Score | 22545 points | |
| 3DMark Time Spy Score | 9712 points | |
Help | ||
Gaming Performance
In the native FHD resolution, almost all the games are also reproduced smoothly at maximum detail settings. However, in "Cyberpunk 2077 1.5" things can already become tight at times for raytracing effects, and the frame rate drops from about 48.5 fps to only 28.5 fps with activated Raytracing Ultra.
Overall, the RTX 3070 Ti in the Katana performs about 10% lower than the average of all laptops with the same GPU in our database. Considering the performance of an RTX 3070 Ti, most users should be able to live with that, but performance enthusiasts might want to take a look at laptops that don't limit their GPU to 100 watts. In that way, the direct competitors are mostly faster. The predecessor with RTX 3060 is beat by "only" 15 to 20%. Most of the time, the MSI Vector places first in terms of the 3D performance.
The frame rate while running "The Witcher 3" for one hour remains fairly constant. The CPU cores reach a clock speed of 3.8 GHz (76 °C, ~169 °F) on average, and the GPU, of about 1.3 GHz (~70 °C, ~158 °F).
The Witcher 3 FPS Chart


| low | med. | high | ultra | |
|---|---|---|---|---|
| GTA V (2015) | 184.6 | 174.4 | 156 | 97.7 |
| The Witcher 3 (2015) | 388 | 267 | 165 | 91.5 |
| Dota 2 Reborn (2015) | 172.1 | 153.6 | 142.6 | 135.8 |
| Final Fantasy XV Benchmark (2018) | 141.1 | 119.2 | 89.7 | |
| X-Plane 11.11 (2018) | 135.9 | 115.2 | 95 | |
| Far Cry 5 (2018) | 154 | 123 | 118 | 112 |
| Strange Brigade (2018) | 425 | 224 | 183.1 | 159.5 |
| Cyberpunk 2077 1.6 (2022) | 117.5 | 98.9 | 65 | 48.5 |
Emissions - The fans also run during idle operation
Noise Emissions
The cooling system isn't optimally adjusted in terms of the noise level. The fans turn on even during idle operation without any load and in the Balanced or even the Silent Mode. They are active almost constantly, also varying their speeds. This seems unnecessary and is annoying. Even the slimmer Blade 17, for example, remains mostly silent during idle operation even in the highest performance mode.
The rather suboptimal cooling system is probably also the reason for the GPU being limited to 100 watts. In 3DMark06, the Katana is the noisiest model in our comparison, and while gaming and in terms of the maximum volume, it is only surpassed by the Vector, which also comes from MSI.
Noise level
| Idle |
| 28.41 / 28.41 / 36.71 dB(A) |
| Load |
| 53.04 / 54.38 dB(A) |
 | ||
30 dB silent 40 dB(A) audible 50 dB(A) loud |
||
min: | ||
| MSI Katana GF76 12UGS GeForce RTX 3070 Ti Laptop GPU, i7-12700H, Micron 2450 1TB MTFDKBK1T0TFK | MSI Katana GF76 11UE GeForce RTX 3060 Laptop GPU, i7-11800H, Kingston OM8PCP3512F-AB | Aorus 17 XE4 GeForce RTX 3070 Ti Laptop GPU, i7-12700H, Gigabyte AG470S1TB-SI B10 | Razer Blade 17 (i7-12800H, RTX 3070 Ti) GeForce RTX 3070 Ti Laptop GPU, i7-12800H, Samsung PM9A1 MZVL21T0HCLR | Lenovo Legion 5 Pro 16 G7 i7 RTX 3070Ti GeForce RTX 3070 Ti Laptop GPU, i7-12700H, Samsung PM9A1 MZVL21T0HCLR | MSI Vector GP66 12UGS GeForce RTX 3070 Ti Laptop GPU, i9-12900H | |
|---|---|---|---|---|---|---|
| Noise | -5% | 3% | 17% | 4% | 11% | |
| off / environment * (dB) | 23 | 25 -9% | 24 -4% | 23 -0% | 24.6 -7% | 22.9 -0% |
| Idle Minimum * (dB) | 28.41 | 33 -16% | 30 -6% | 23 19% | 28.4 -0% | 23.4 18% |
| Idle Average * (dB) | 28.41 | 34 -20% | 31 -9% | 23 19% | 28.4 -0% | 23.4 18% |
| Idle Maximum * (dB) | 36.71 | 35 5% | 34 7% | 23 37% | 28.4 23% | 27.4 25% |
| Load Average * (dB) | 53.04 | 53 -0% | 44 17% | 36.92 30% | 49.4 7% | 36 32% |
| Witcher 3 ultra * (dB) | 54.22 | 49 10% | 51 6% | 50 8% | 49.4 9% | 58.2 -7% |
| Load Maximum * (dB) | 54.38 | 57 -5% | 49 10% | 50 8% | 54.7 -1% | 58 -7% |
* ... smaller is better
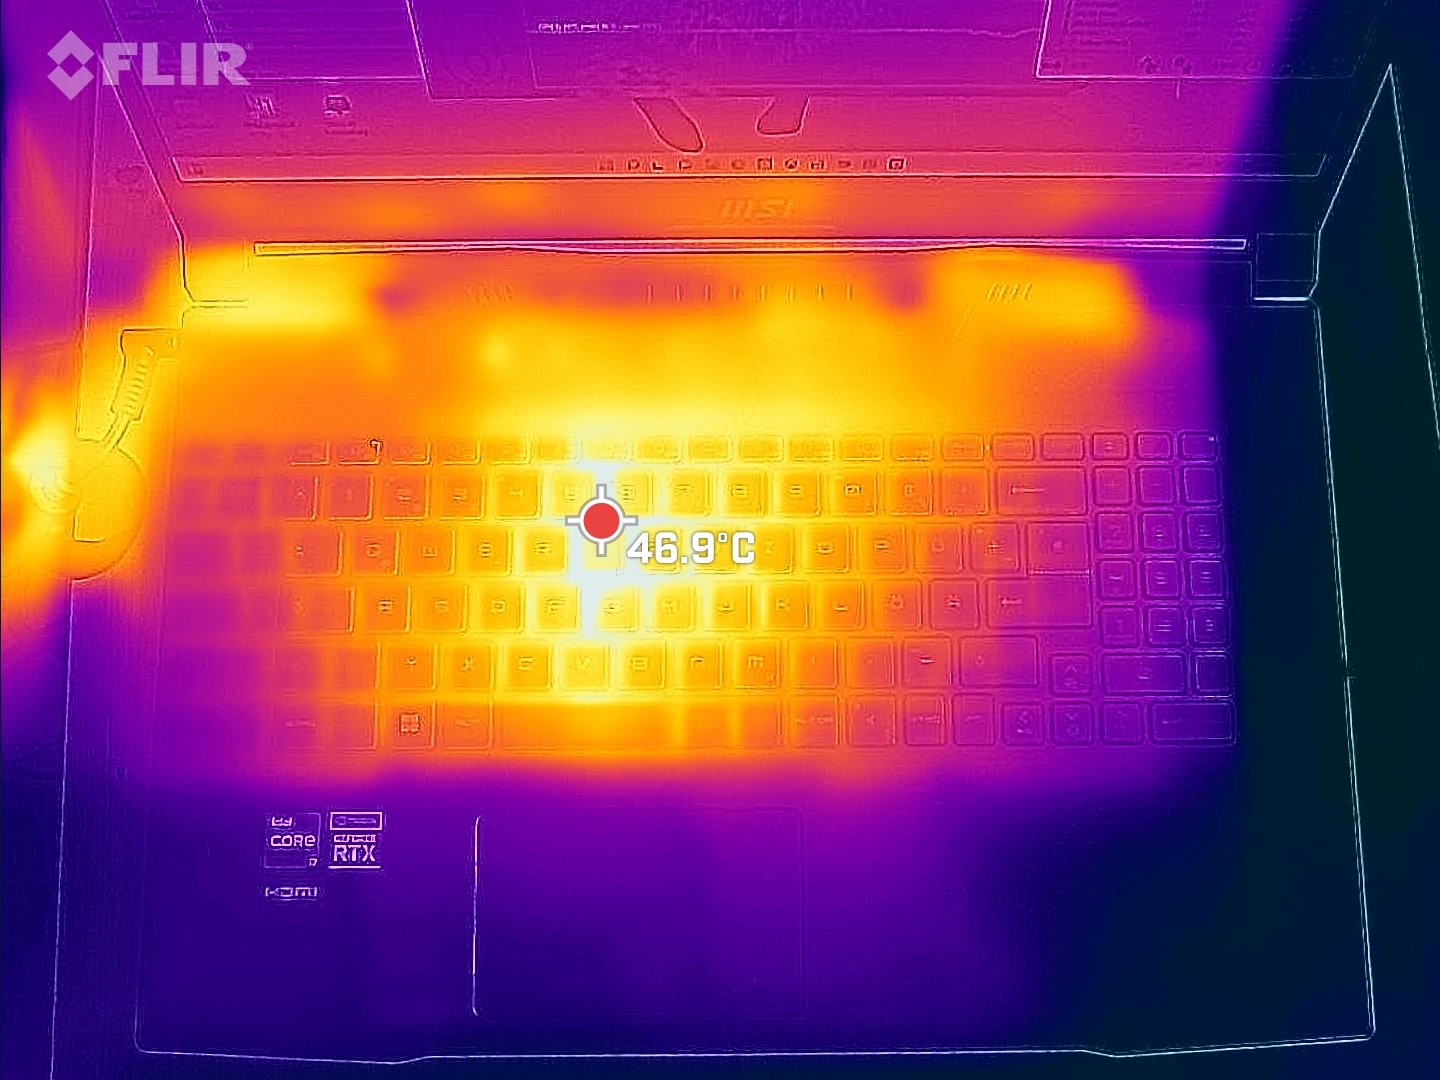
Temperature
Despite the fans turning on sporadically, at up to 37 °C (~99 °F) the Katana is already warmer during idle operation than the competitors. Under load, the Blade 17 and the MSI Vector remain cooler than the Katana, despite their higher performance. The Aorus and the Legion get similarly warm.
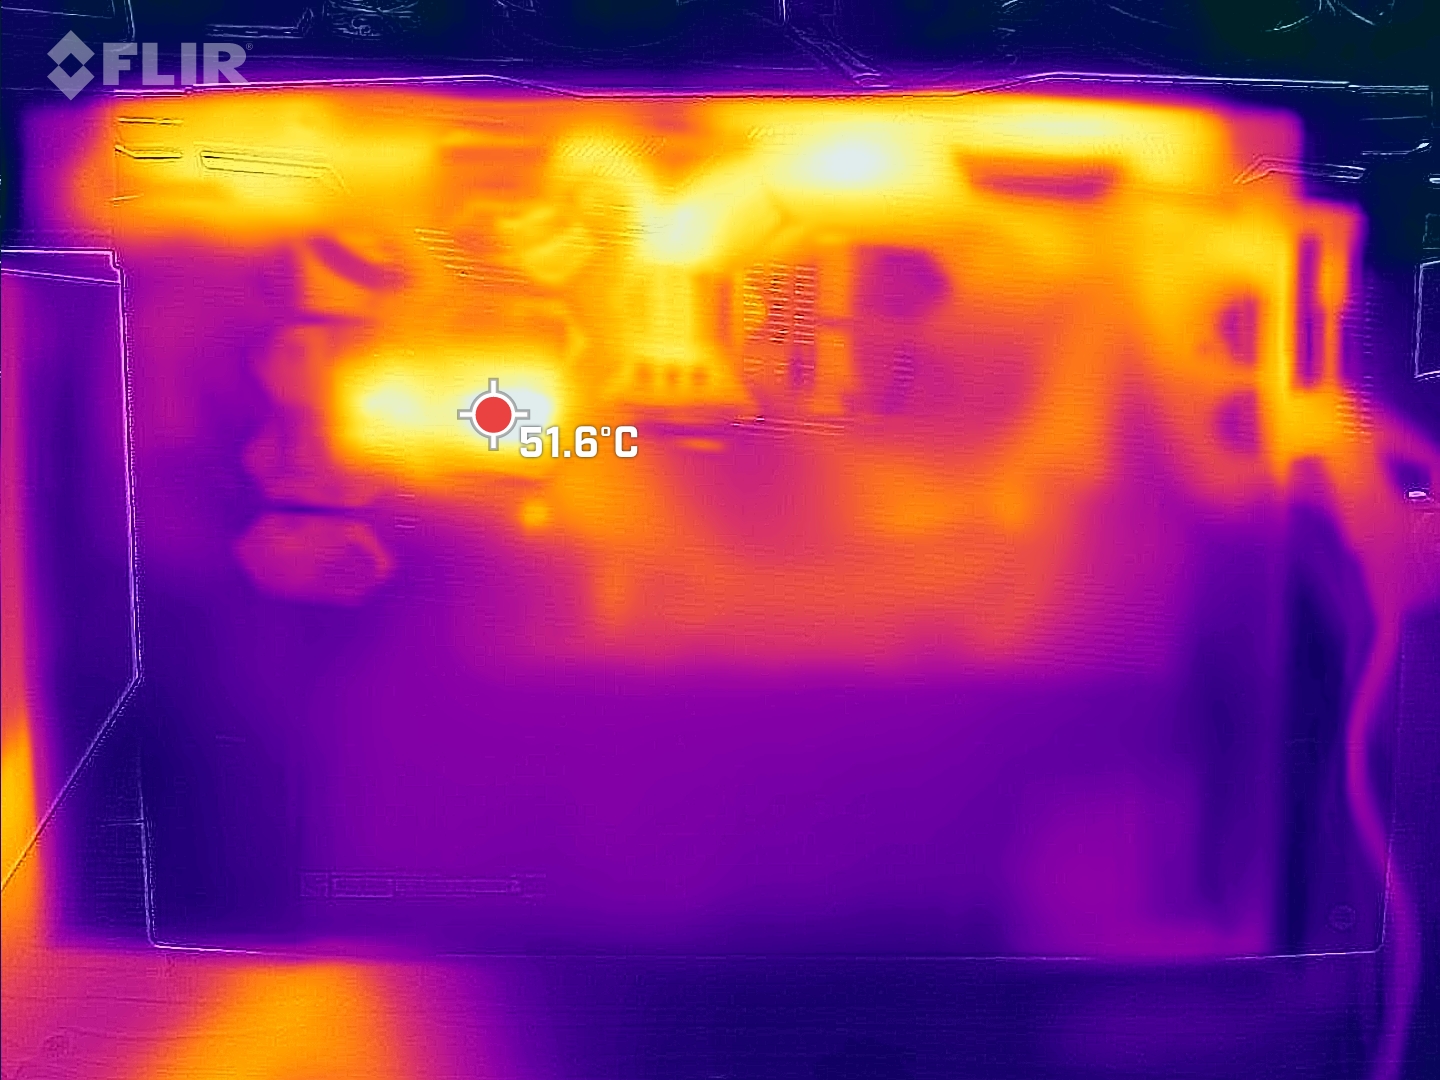
Hot spots, which are located in the center as well as toward the display, can reach up to 55 °C (131 °F).
(-) The maximum temperature on the upper side is 51 °C / 124 F, compared to the average of 40.4 °C / 105 F, ranging from 21.2 to 68.8 °C for the class Gaming.
(-) The bottom heats up to a maximum of 55 °C / 131 F, compared to the average of 43.2 °C / 110 F
(+) In idle usage, the average temperature for the upper side is 30.7 °C / 87 F, compared to the device average of 33.9 °C / 93 F.
(+) The palmrests and touchpad are cooler than skin temperature with a maximum of 26 °C / 78.8 F and are therefore cool to the touch.
(+) The average temperature of the palmrest area of similar devices was 28.8 °C / 83.8 F (+2.8 °C / 5 F).
| MSI Katana GF76 12UGS Intel Core i7-12700H, NVIDIA GeForce RTX 3070 Ti Laptop GPU | MSI Katana GF76 11UE Intel Core i7-11800H, NVIDIA GeForce RTX 3060 Laptop GPU | Aorus 17 XE4 Intel Core i7-12700H, NVIDIA GeForce RTX 3070 Ti Laptop GPU | Razer Blade 17 (i7-12800H, RTX 3070 Ti) Intel Core i7-12800H, NVIDIA GeForce RTX 3070 Ti Laptop GPU | Lenovo Legion 5 Pro 16 G7 i7 RTX 3070Ti Intel Core i7-12700H, NVIDIA GeForce RTX 3070 Ti Laptop GPU | MSI Vector GP66 12UGS Intel Core i9-12900H, NVIDIA GeForce RTX 3070 Ti Laptop GPU | |
|---|---|---|---|---|---|---|
| Heat | 11% | 8% | 15% | 10% | 13% | |
| Maximum Upper Side * (°C) | 51 | 51 -0% | 50 2% | 43 16% | 45.3 11% | 40.2 21% |
| Maximum Bottom * (°C) | 55 | 52 5% | 58 -5% | 44 20% | 61.2 -11% | 43.8 20% |
| Idle Upper Side * (°C) | 37 | 32 14% | 30 19% | 32 14% | 28.6 23% | 34.8 6% |
| Idle Bottom * (°C) | 38 | 29 24% | 32 16% | 34 11% | 31.4 17% | 37 3% |
* ... smaller is better
Stress Test
The CPU cores start off our stress test at about 4 GHz. However, they only maintain this very briefly, since after a few seconds the cores already surpass the thermal limit at more than 90 °C (194 °F), causing the clock speeds to drop afterwards, and finally leveling out between 2 and 2.4 GHz. The temperatures are around 81 °C (178 °F) on average.
On the other hand, during the whole test period, the GPU clock speed varies continuously between 800 and 1600 MHz, and the storage speed, only between 1.4 and 1.5 GHz. The core temperatures range around 70 °C (158 °F). The graphics card consumes about 71 watts on average, only reaching the specified 100 watts sporadically at best.


| CPU Clock (GHz) | GPU Clock (MHz) | Average CPU Temperature (°C) | Average GPU Temperature (°C) | |
| Prime95 + FurMark Stress | 2.3 | 1.254 | 81 | 70 |
| Witcher 3 Stress | 3,8 | 1.332 | 76 | 70 |
Speakers
The speakers don't get very loud and clearly lack in bass. But at least, the mids are fairly balanced. We recommend connecting external audio devices. To do this, a combined 3.5-mm headset port is available.
MSI Katana GF76 12UGS audio analysis
(±) | speaker loudness is average but good (81.81 dB)
Bass 100 - 315 Hz
(-) | nearly no bass - on average 18.2% lower than median
(±) | linearity of bass is average (11% delta to prev. frequency)
Mids 400 - 2000 Hz
(+) | balanced mids - only 3.8% away from median
(+) | mids are linear (4.8% delta to prev. frequency)
Highs 2 - 16 kHz
(+) | balanced highs - only 4.1% away from median
(±) | linearity of highs is average (7.1% delta to prev. frequency)
Overall 100 - 16.000 Hz
(±) | linearity of overall sound is average (15.2% difference to median)
Compared to same class
» 33% of all tested devices in this class were better, 6% similar, 61% worse
» The best had a delta of 6%, average was 18%, worst was 132%
Compared to all devices tested
» 22% of all tested devices were better, 4% similar, 74% worse
» The best had a delta of 4%, average was 23%, worst was 134%
Aorus 17 XE4 audio analysis
(+) | speakers can play relatively loud (84 dB)
Bass 100 - 315 Hz
(-) | nearly no bass - on average 25.3% lower than median
(±) | linearity of bass is average (12.5% delta to prev. frequency)
Mids 400 - 2000 Hz
(+) | balanced mids - only 3.9% away from median
(+) | mids are linear (4.8% delta to prev. frequency)
Highs 2 - 16 kHz
(+) | balanced highs - only 4.4% away from median
(±) | linearity of highs is average (7.3% delta to prev. frequency)
Overall 100 - 16.000 Hz
(±) | linearity of overall sound is average (17.5% difference to median)
Compared to same class
» 49% of all tested devices in this class were better, 12% similar, 40% worse
» The best had a delta of 6%, average was 18%, worst was 132%
Compared to all devices tested
» 34% of all tested devices were better, 8% similar, 58% worse
» The best had a delta of 4%, average was 23%, worst was 134%
Power Management - Relatively efficient
Power Consumption
During idle operation, the Katana consumes about as much or little power as the Razer Blade 17. Under load such as gaming, it then becomes one of the most efficient devices in our comparison, due to its limited GPU power consumption. For example, in "The Witcher 3," it consumes only 6% more power than its predecessor with the RTX 3060, while offering a performance that is up to 26% higher.
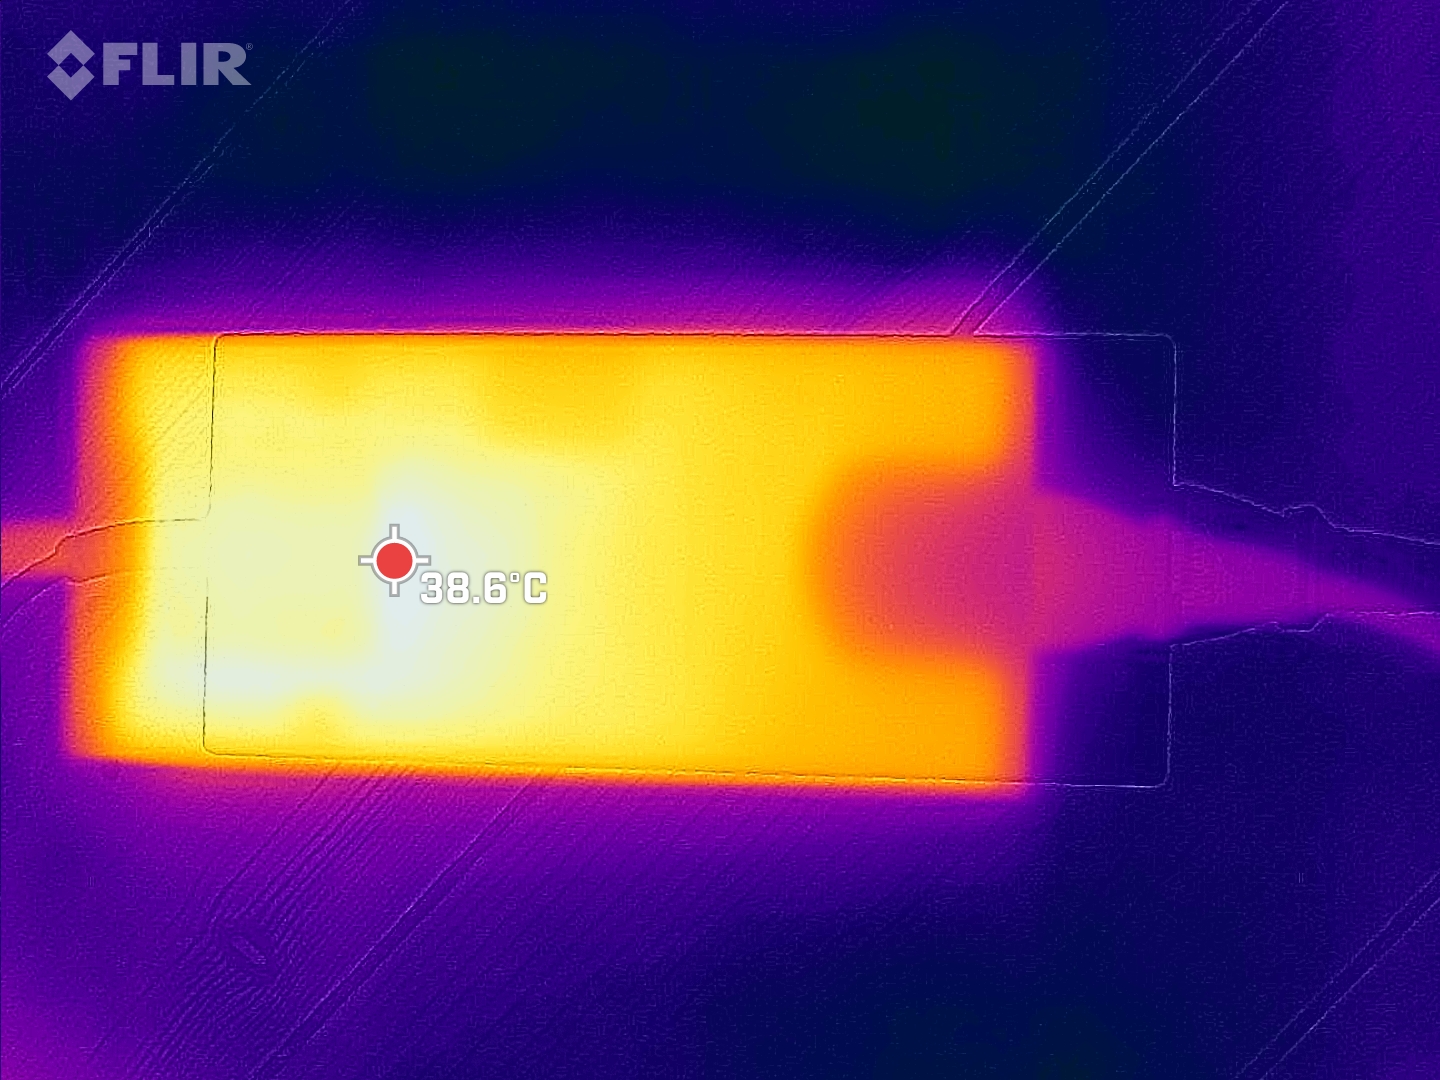
We measure a brief maximum power consumption of 219 watts, which the 240-Watt power supply should be able to handle without any trouble.
| Idle | |
| Load |
|
Key:
min: | |
| MSI Katana GF76 12UGS i7-12700H, GeForce RTX 3070 Ti Laptop GPU, Micron 2450 1TB MTFDKBK1T0TFK, IPS, 1920x1080, 17.3" | MSI Katana GF76 11UE i7-11800H, GeForce RTX 3060 Laptop GPU, Kingston OM8PCP3512F-AB, IPS, 1920x1080, 17.3" | Aorus 17 XE4 i7-12700H, GeForce RTX 3070 Ti Laptop GPU, Gigabyte AG470S1TB-SI B10, IPS, 1920x1080, 17.3" | Razer Blade 17 (i7-12800H, RTX 3070 Ti) i7-12800H, GeForce RTX 3070 Ti Laptop GPU, Samsung PM9A1 MZVL21T0HCLR, IPS, 2560x1440, 17.3" | Lenovo Legion 5 Pro 16 G7 i7 RTX 3070Ti i7-12700H, GeForce RTX 3070 Ti Laptop GPU, Samsung PM9A1 MZVL21T0HCLR, IPS, 2560x1600, 16" | MSI Vector GP66 12UGS i9-12900H, GeForce RTX 3070 Ti Laptop GPU, , IPS, 1920x1080, 15.6" | Average NVIDIA GeForce RTX 3070 Ti Laptop GPU | Average of class Gaming | |
|---|---|---|---|---|---|---|---|---|
| Power Consumption | 15% | -26% | -14% | -6% | -38% | -14% | -7% | |
| Idle Minimum * (Watt) | 14.2 | 9 37% | 20 -41% | 14.4 -1% | 8.6 39% | 17.5 -23% | 14.2 ? -0% | 13 ? 8% |
| Idle Average * (Watt) | 18 | 13 28% | 23 -28% | 20 -11% | 17.6 2% | 20.1 -12% | 19.9 ? -11% | 18.7 ? -4% |
| Idle Maximum * (Watt) | 22 | 20 9% | 28 -27% | 21.5 2% | 18.5 16% | 47.3 -115% | 26.2 ? -19% | 24.3 ? -10% |
| Load Average * (Watt) | 98 | 102 -4% | 120 -22% | 119 -21% | 110 -12% | 107.3 -9% | 125.8 ? -28% | 110.2 ? -12% |
| Witcher 3 ultra * (Watt) | 159 | 149 6% | 196 -23% | 218 -37% | 227 -43% | 225 -42% | ||
| Load Maximum * (Watt) | 219 | 187 15% | 257 -17% | 248 -13% | 294.6 -35% | 277.7 -27% | 248 ? -13% | 258 ? -18% |
* ... smaller is better
Power Consumption The Witcher 3 / Stress Test
Power Consumption with External Monitor
Battery Life
The Katana has a 53.5-Wh battery. While this is no different than the predecessor, it is also significantly smaller than that of the competitors, some of which offer almost twice the capacity (Aorus 17). Correspondingly, the battery life doesn't turn out to be very impressive, particularly under load.
In our video test, the laptop only lasts less than 3 hours. Depending on the adjusted brightness, you can surf away from the outlet between 1:47 hours and 3:47 hours.
| MSI Katana GF76 12UGS i7-12700H, GeForce RTX 3070 Ti Laptop GPU, 53.5 Wh | MSI Katana GF76 11UE i7-11800H, GeForce RTX 3060 Laptop GPU, 53 Wh | Aorus 17 XE4 i7-12700H, GeForce RTX 3070 Ti Laptop GPU, 99 Wh | Razer Blade 17 (i7-12800H, RTX 3070 Ti) i7-12800H, GeForce RTX 3070 Ti Laptop GPU, 82 Wh | Lenovo Legion 5 Pro 16 G7 i7 RTX 3070Ti i7-12700H, GeForce RTX 3070 Ti Laptop GPU, 80 Wh | MSI Vector GP66 12UGS i9-12900H, GeForce RTX 3070 Ti Laptop GPU, 65 Wh | Average of class Gaming | |
|---|---|---|---|---|---|---|---|
| Battery runtime | -0% | 41% | 40% | 25% | 9% | 83% | |
| H.264 (h) | 3.3 | 3.9 18% | 6.1 85% | 4.9 48% | 6.3 91% | 8.64 ? 162% | |
| WiFi v1.3 (h) | 3.7 | 3.7 0% | 5.1 38% | 5.9 59% | 5.4 46% | 5.7 54% | 7.15 ? 93% |
| Load (h) | 1.6 | 1.3 -19% | 1.6 0% | 1.8 13% | 0.6 -63% | 1 -37% | 1.502 ? -6% |
| Reader / Idle (h) | 4.8 | 8.6 | 7.9 | 8.71 ? | |||
| Witcher 3 ultra (h) | 0.8 |
Pros
Cons
Verdict - An affordable gamer
The MSI Katana GF76 12U is one of the most affordable gaming laptops with all the advantages and disadvantages this brings. The positive part is that the Katana is able to reproduce almost all the modern games smoothly even at maximum detail settings. Those for whom this is sufficient will get an affordable gaming laptop with the Katana, whose operation is also relatively efficient.
Of course, the low price also brings some disadvantages. The display forms rather the lowest IPS quality level, the battery is small, and the battery life, short. The connections are not very modern, the cooling system needs some urgent optimization, and the RTX 3070 Ti is limited to 100 watts, which means that its performance isn't even able to come close to its potential.
The MSI Katana GF76 is one of the most affordable gaming laptops. While interested buyers with a limited budget should be able to play all the current games smoothly, the many smaller disadvantages call for a higher budget.
Among the competitors, the Gigabyte Aorus 17, which also offers Thunderbolt and a higher performance while only being slightly more expensive than the Katana, is worth taking a look. The Asus TUF Gaming F17 might also be worth your consideration with its higher performance, but its most affordable version has a display that is even worse in parts. Due to the significant TGP limitation, checking out a model with an RTX 3060 and higher TGP might also be worthwhile.
Price and Availability
The 2022 MSI Katana GF76 is available for example from Amazon starting from $1499.
MSI Katana GF76 12UGS
- 05/13/2022 v7 (old)
Christian Hintze
Price comparison

