MSI Prestige 15 laptop review: Dazzling 4K image quality, solid performance

The MSI Prestige 15 A12UD-093 seems made for graphically demanding tasks. Its 4K display with AdobeRGB delivers detailed imagery with the most lifelike colors possible, so that high-quality digital photographs can be viewed, modified and optimized without the need for an external monitor. An Intel Alder Lake processor from the "P" series, an i7-1280P in this case, provides enough computing power for all tasks. Graphically intensive tasks are handled by the Nvidia GeForce RTX 3050 Ti.
At the same time, MSI has made sure that the typical problems associated with an overly powerful configuration with a separate graphics chip do not occur. Power consumption has been limited, which results in long battery runtimes, minimal fan noise and limited heating. Quiet and concentrated work takes precedence over pure performance values.
In addition to the model under review, there are also other variants that only offer a Full HD display with a smaller color space. In this case, an external monitor would indeed be necessary for professional image editing. Furthermore, the weaker and even more economical Intel Core i5-1240P can be chosen in place of the i7-1280P.
Regarding content creation, media editing and more, competition is fierce. The Acer Swift X SFX16 with the Intel Arc A370M, the Asus Vivobook Pro 16X OLED or the Schenker Vision 14 all deliver either lesser or greater performance values, but also aim to offer quick video and image editing.
Possible Competitors in Comparison
Rating | Date | Model | Weight | Height | Size | Resolution | Price |
|---|---|---|---|---|---|---|---|
| 85.4 % v7 (old) | 12 / 2022 | MSI Prestige 15 A12UD-093 i7-1280P, GeForce RTX 3050 Ti Laptop GPU | 1.8 kg | 20.1 mm | 15.60" | 3840x2160 | |
| 89.5 % v7 (old) | 05 / 2022 | Dell XPS 15 9520 RTX 3050 Ti i7-12700H, GeForce RTX 3050 Ti Laptop GPU | 1.9 kg | 18 mm | 15.60" | 3456x2160 | |
| 88.8 % v7 (old) | 10 / 2022 | Schenker Vision 14 2022 RTX 3050 Ti i7-12700H, GeForce RTX 3050 Ti Laptop GPU | 1.3 kg | 16.6 mm | 14.00" | 2880x1800 | |
| 86.4 % v7 (old) | 11 / 2022 | Acer Swift X SFX16-52G-77RX i7-1260P, A370M | 1.8 kg | 21.2 mm | 16.00" | 2560x1600 | |
| 83.7 % v7 (old) | 11 / 2022 | Asus VivoBook Pro 16X OLED N7600PC-L2026X i7-11370H, GeForce RTX 3050 4GB Laptop GPU | 2 kg | 18.9 mm | 16.00" | 3840x2400 | |
| 79.8 % v7 (old) | 08 / 2022 | Samsung Galaxy Book2 15 i7-1260P, A350M | 1.6 kg | 15 mm | 15.60" | 1920x1080 |
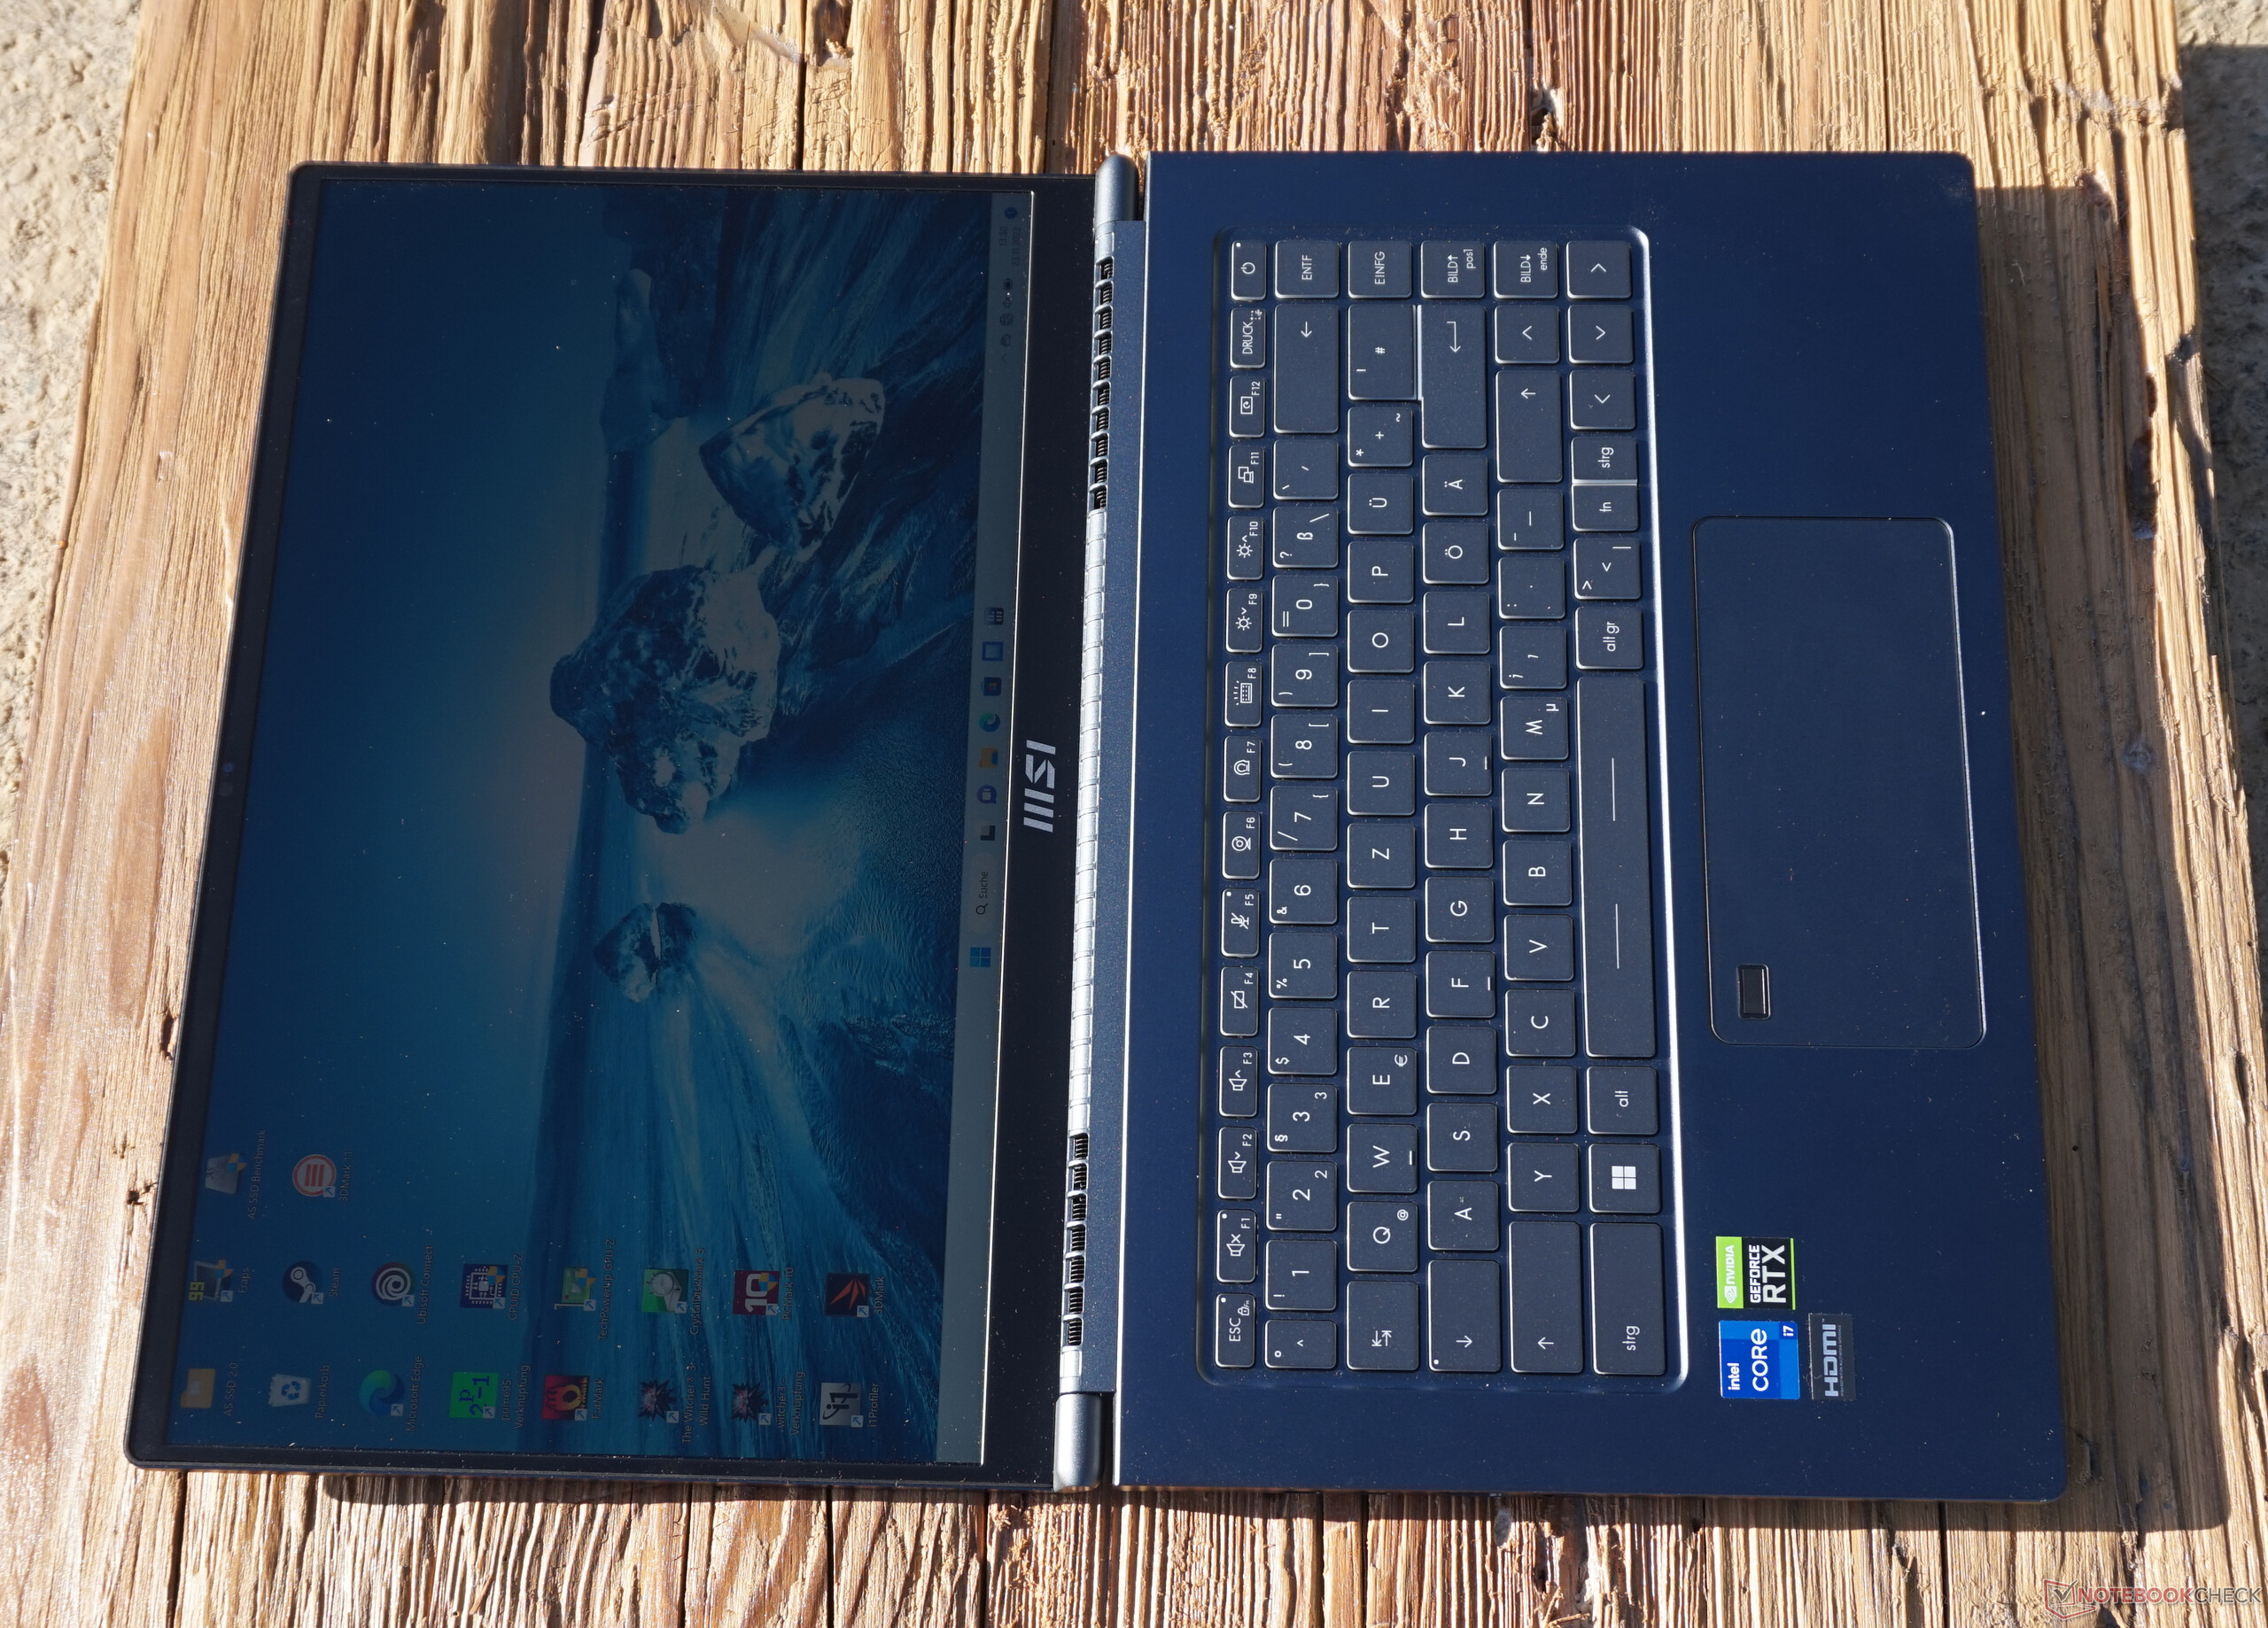
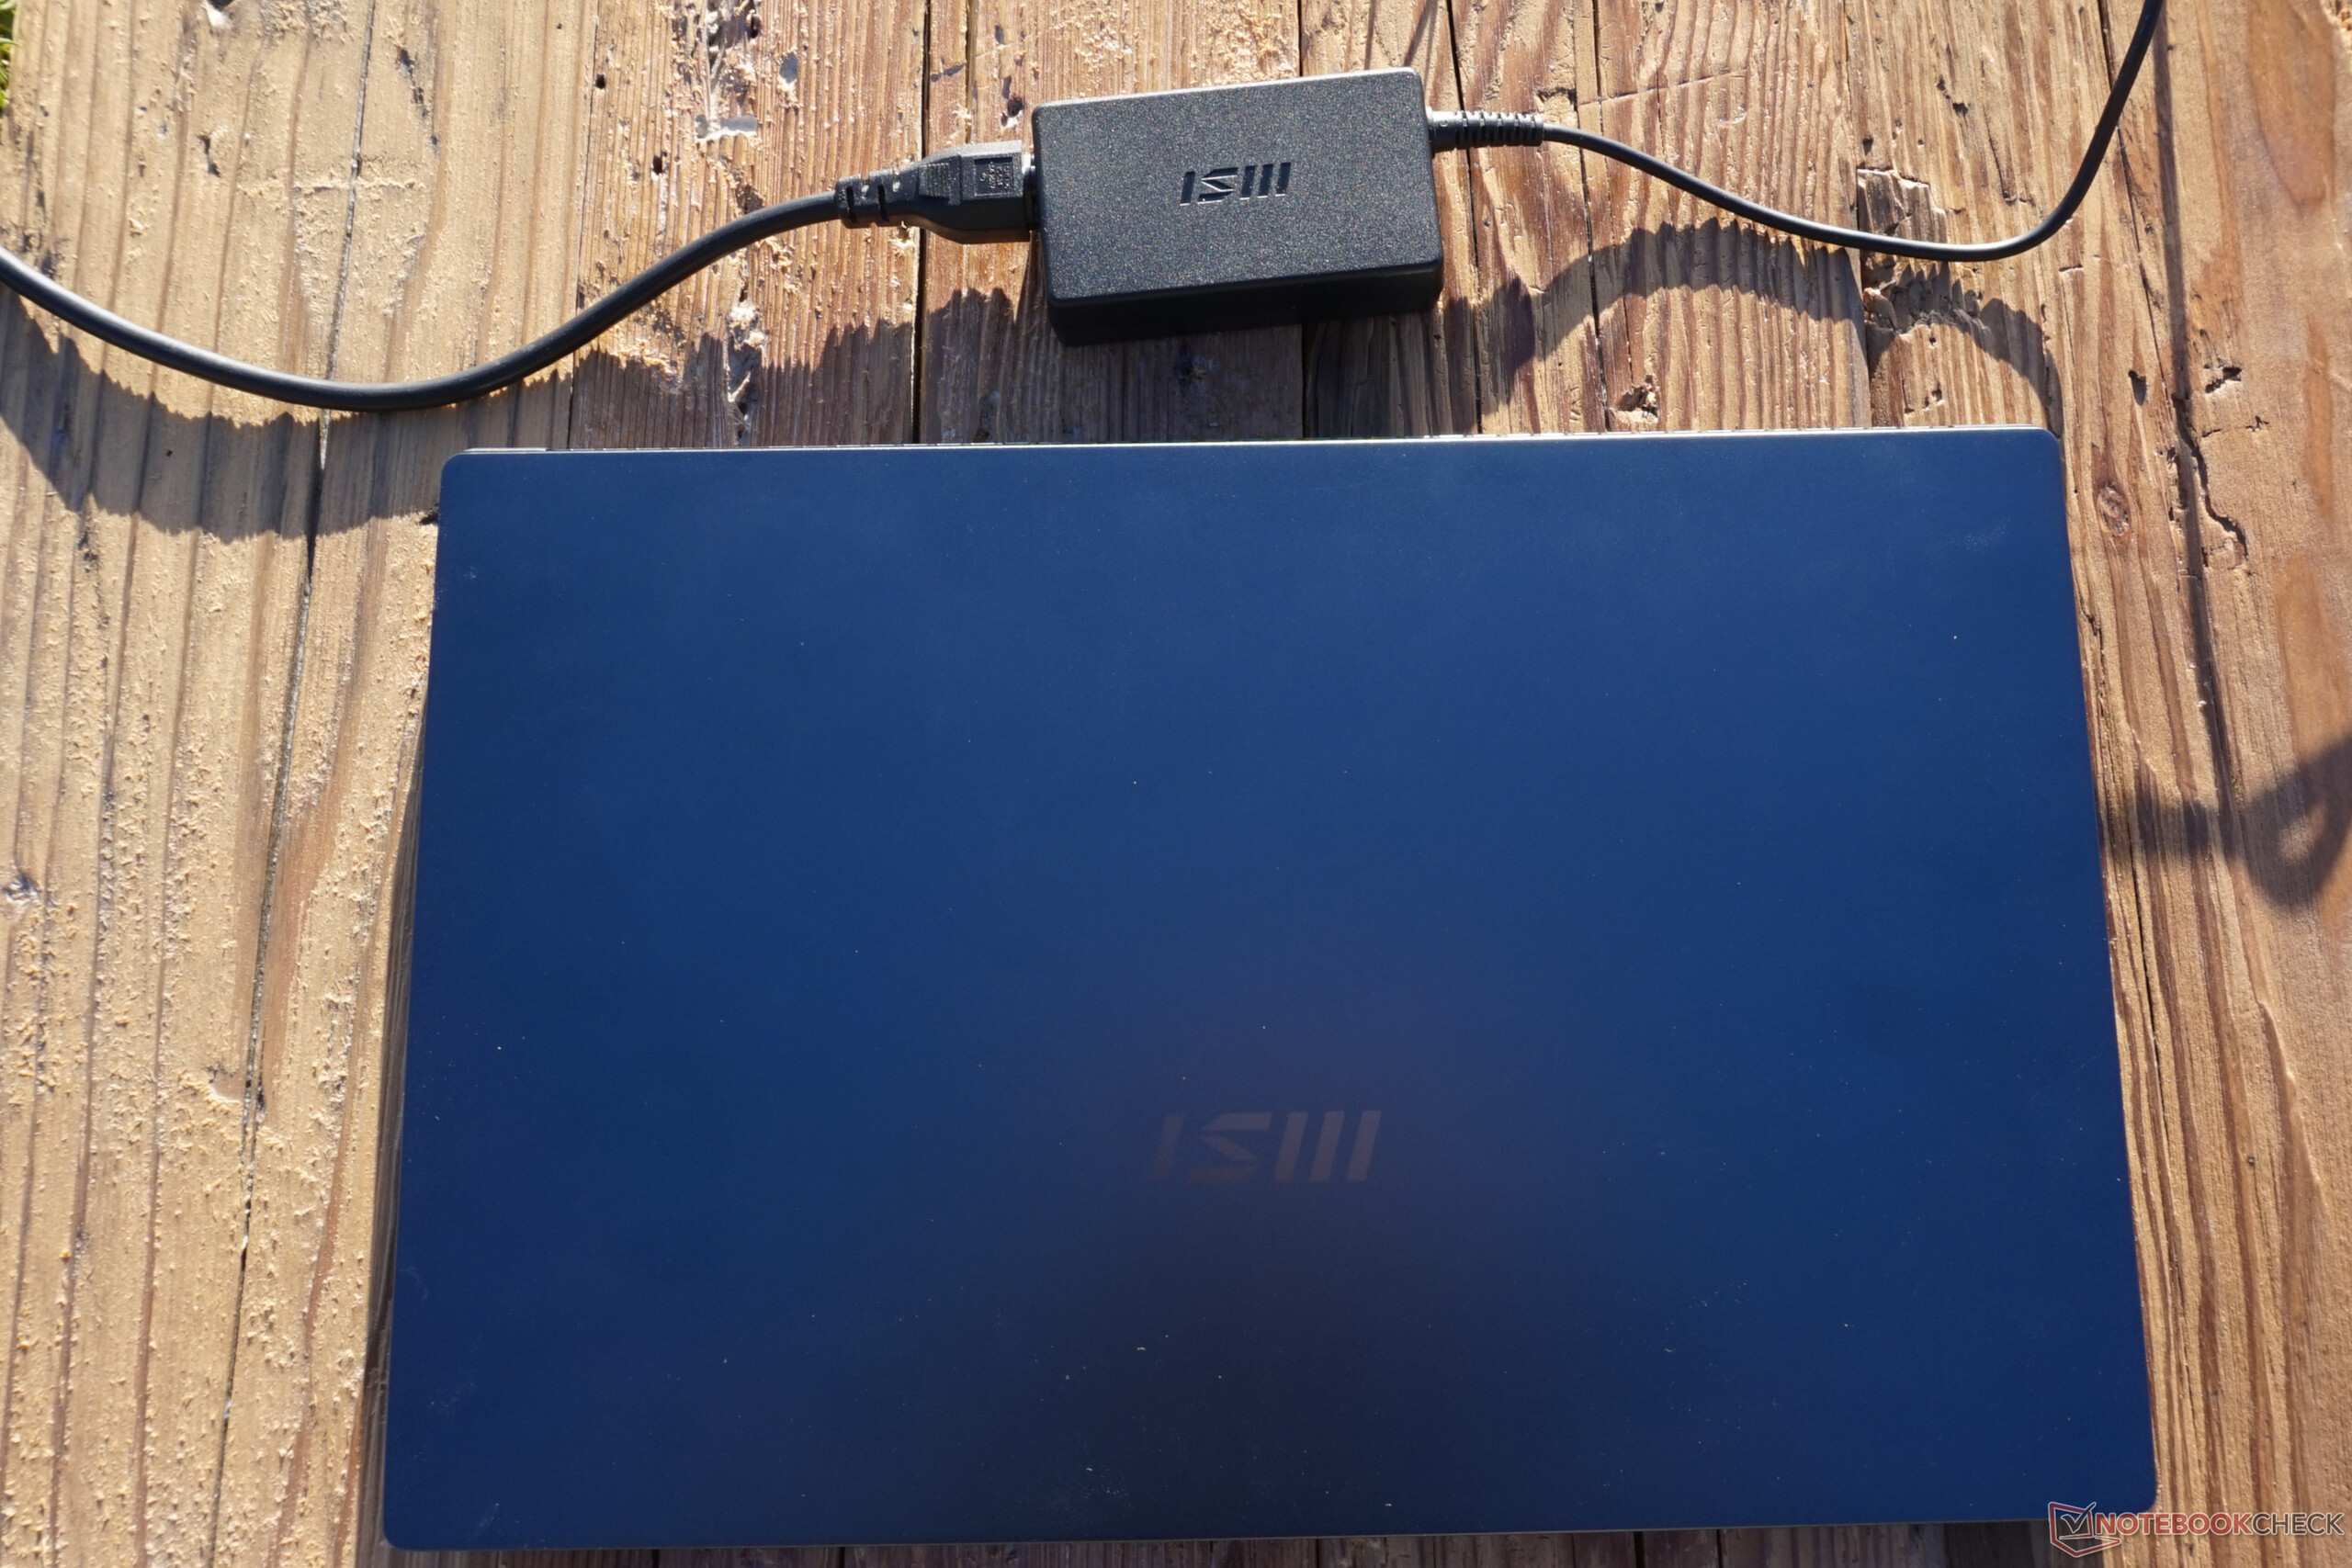
Case - The Prestige 15 makes a serious impression
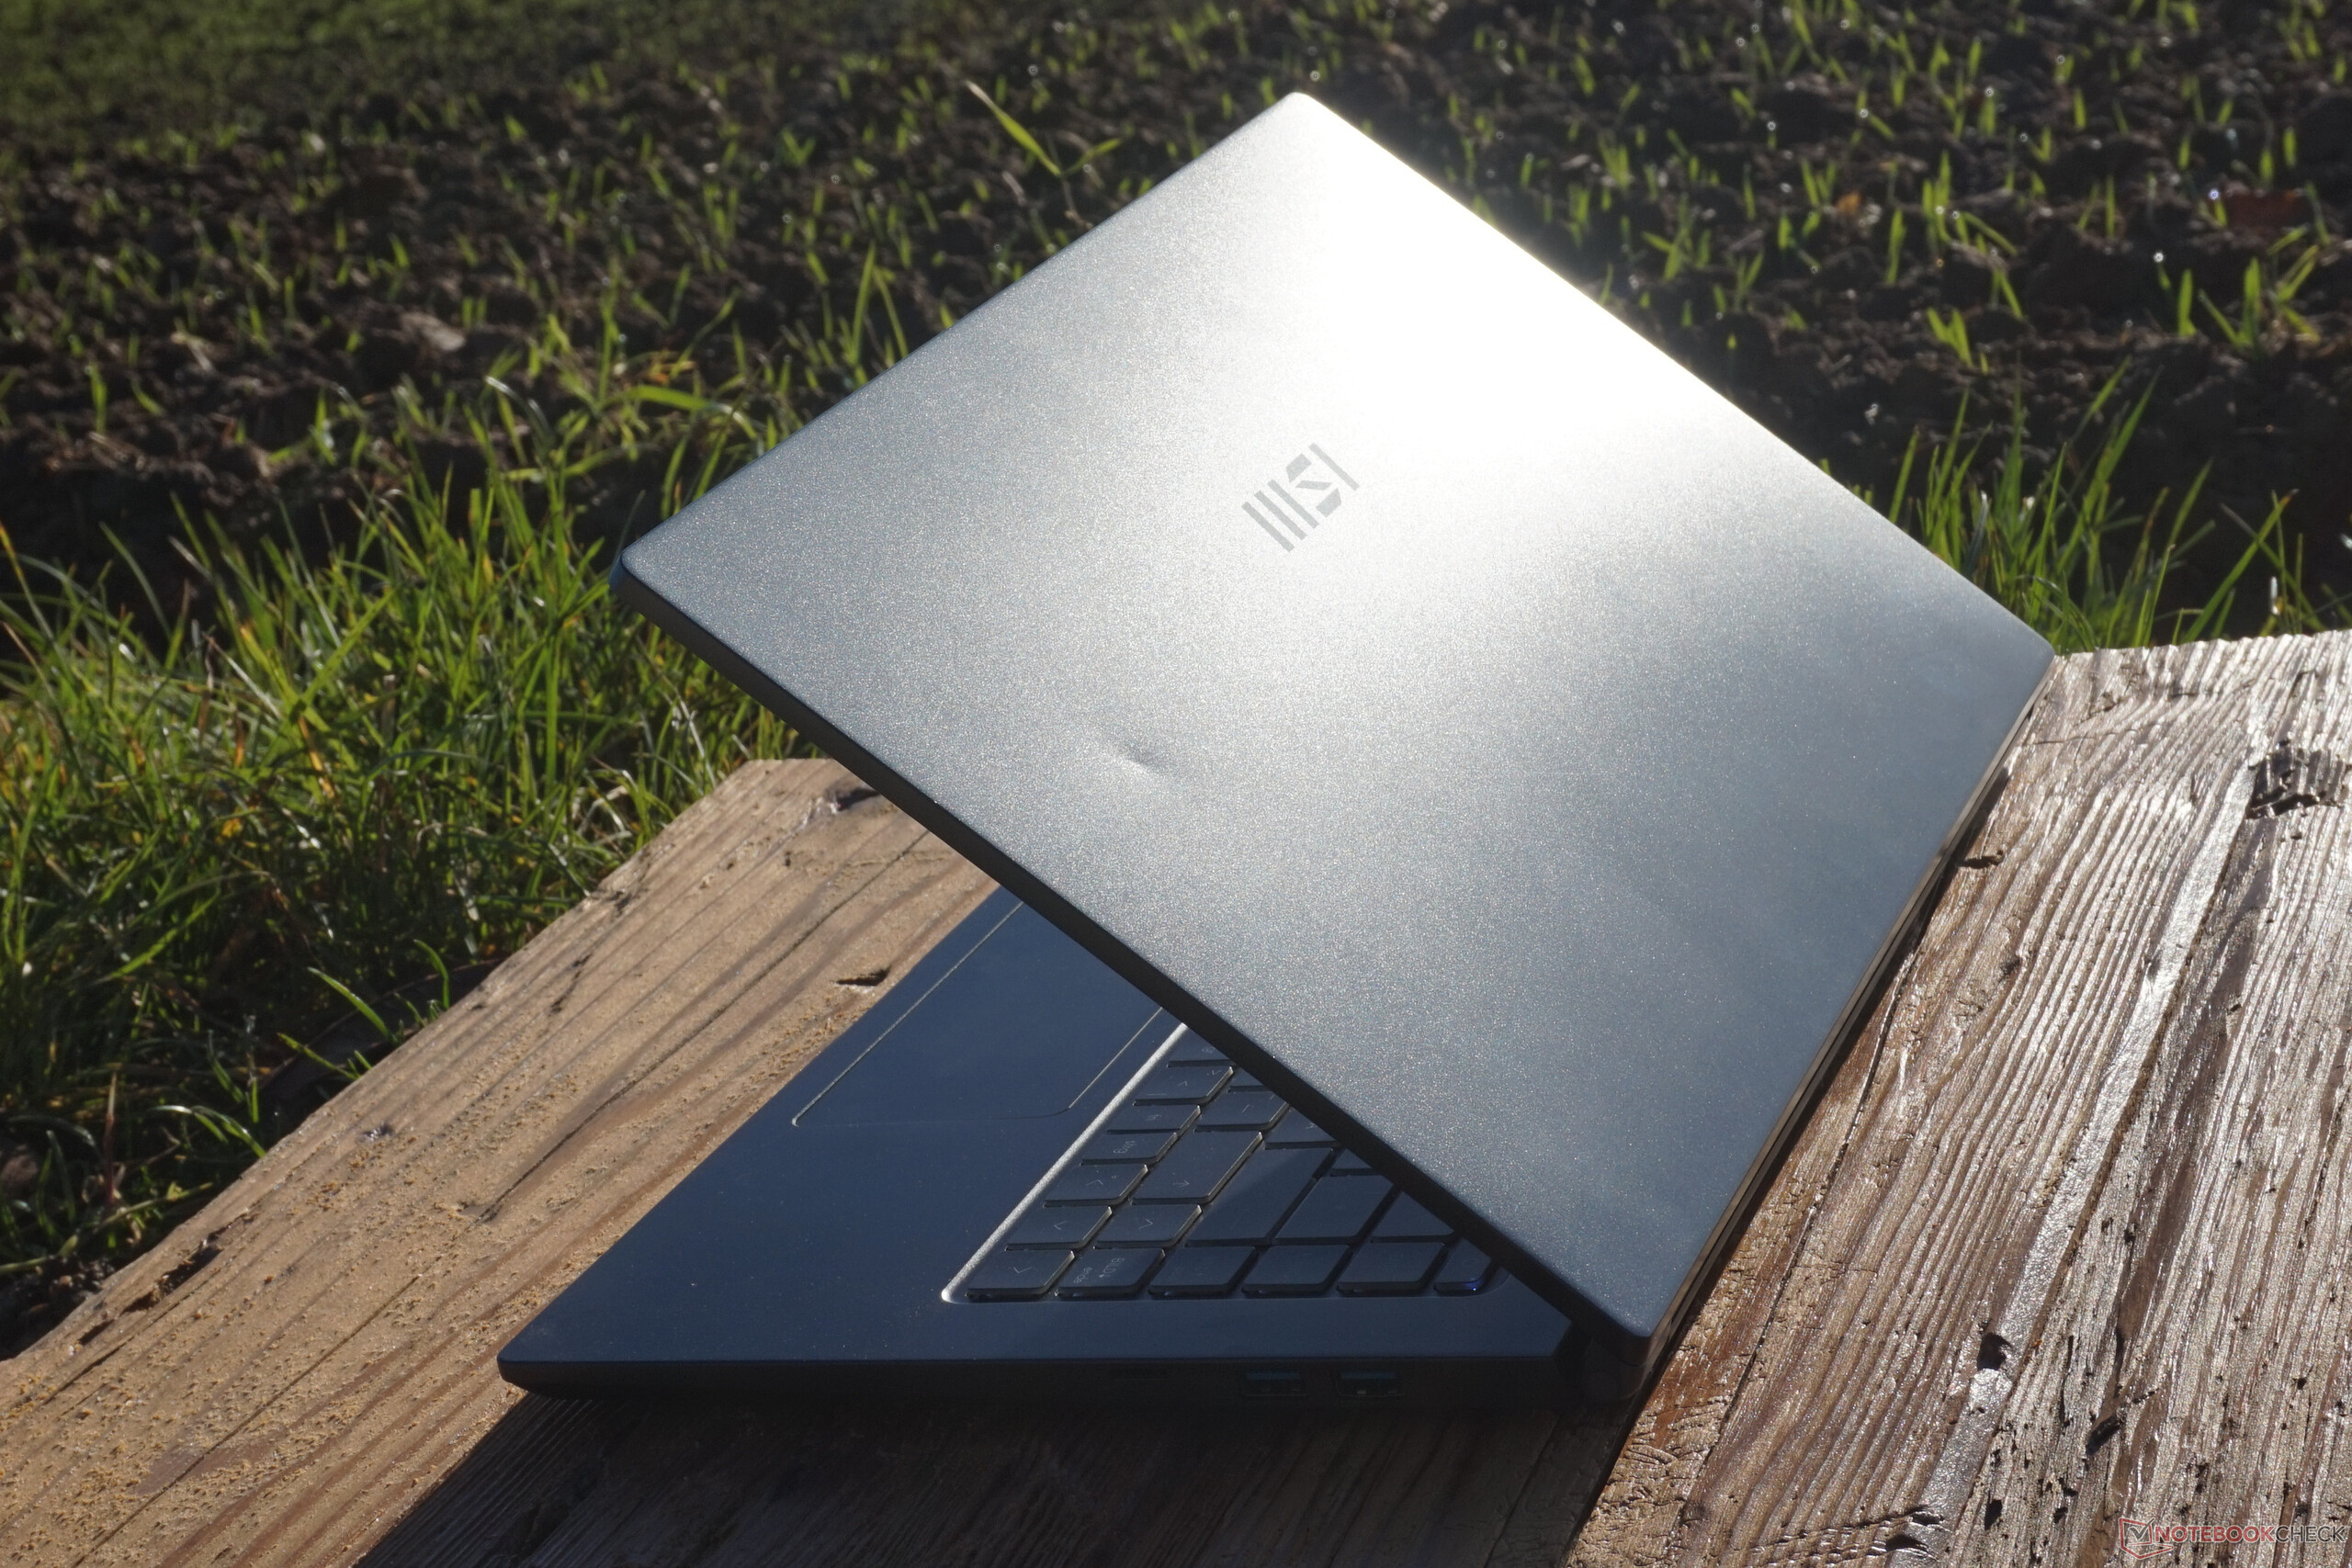
With a deep dark gray, almost black, and the barely recognizable "MSI" logo on the back, the chassis can be described as sober and discreet. The metal display lid and keyboard frame look high-quality, but are very sensitive to fingerprints. That the display frame and base plate are made of plastic is clearly noticeable.
At least this does not affect stability. Display teetering is only minimal and one-handed opening poses no issue, at least up to 180 degrees. Nothing can be twisted here either. The bottom remains flat at all times, and the screen can only be bent minimally.
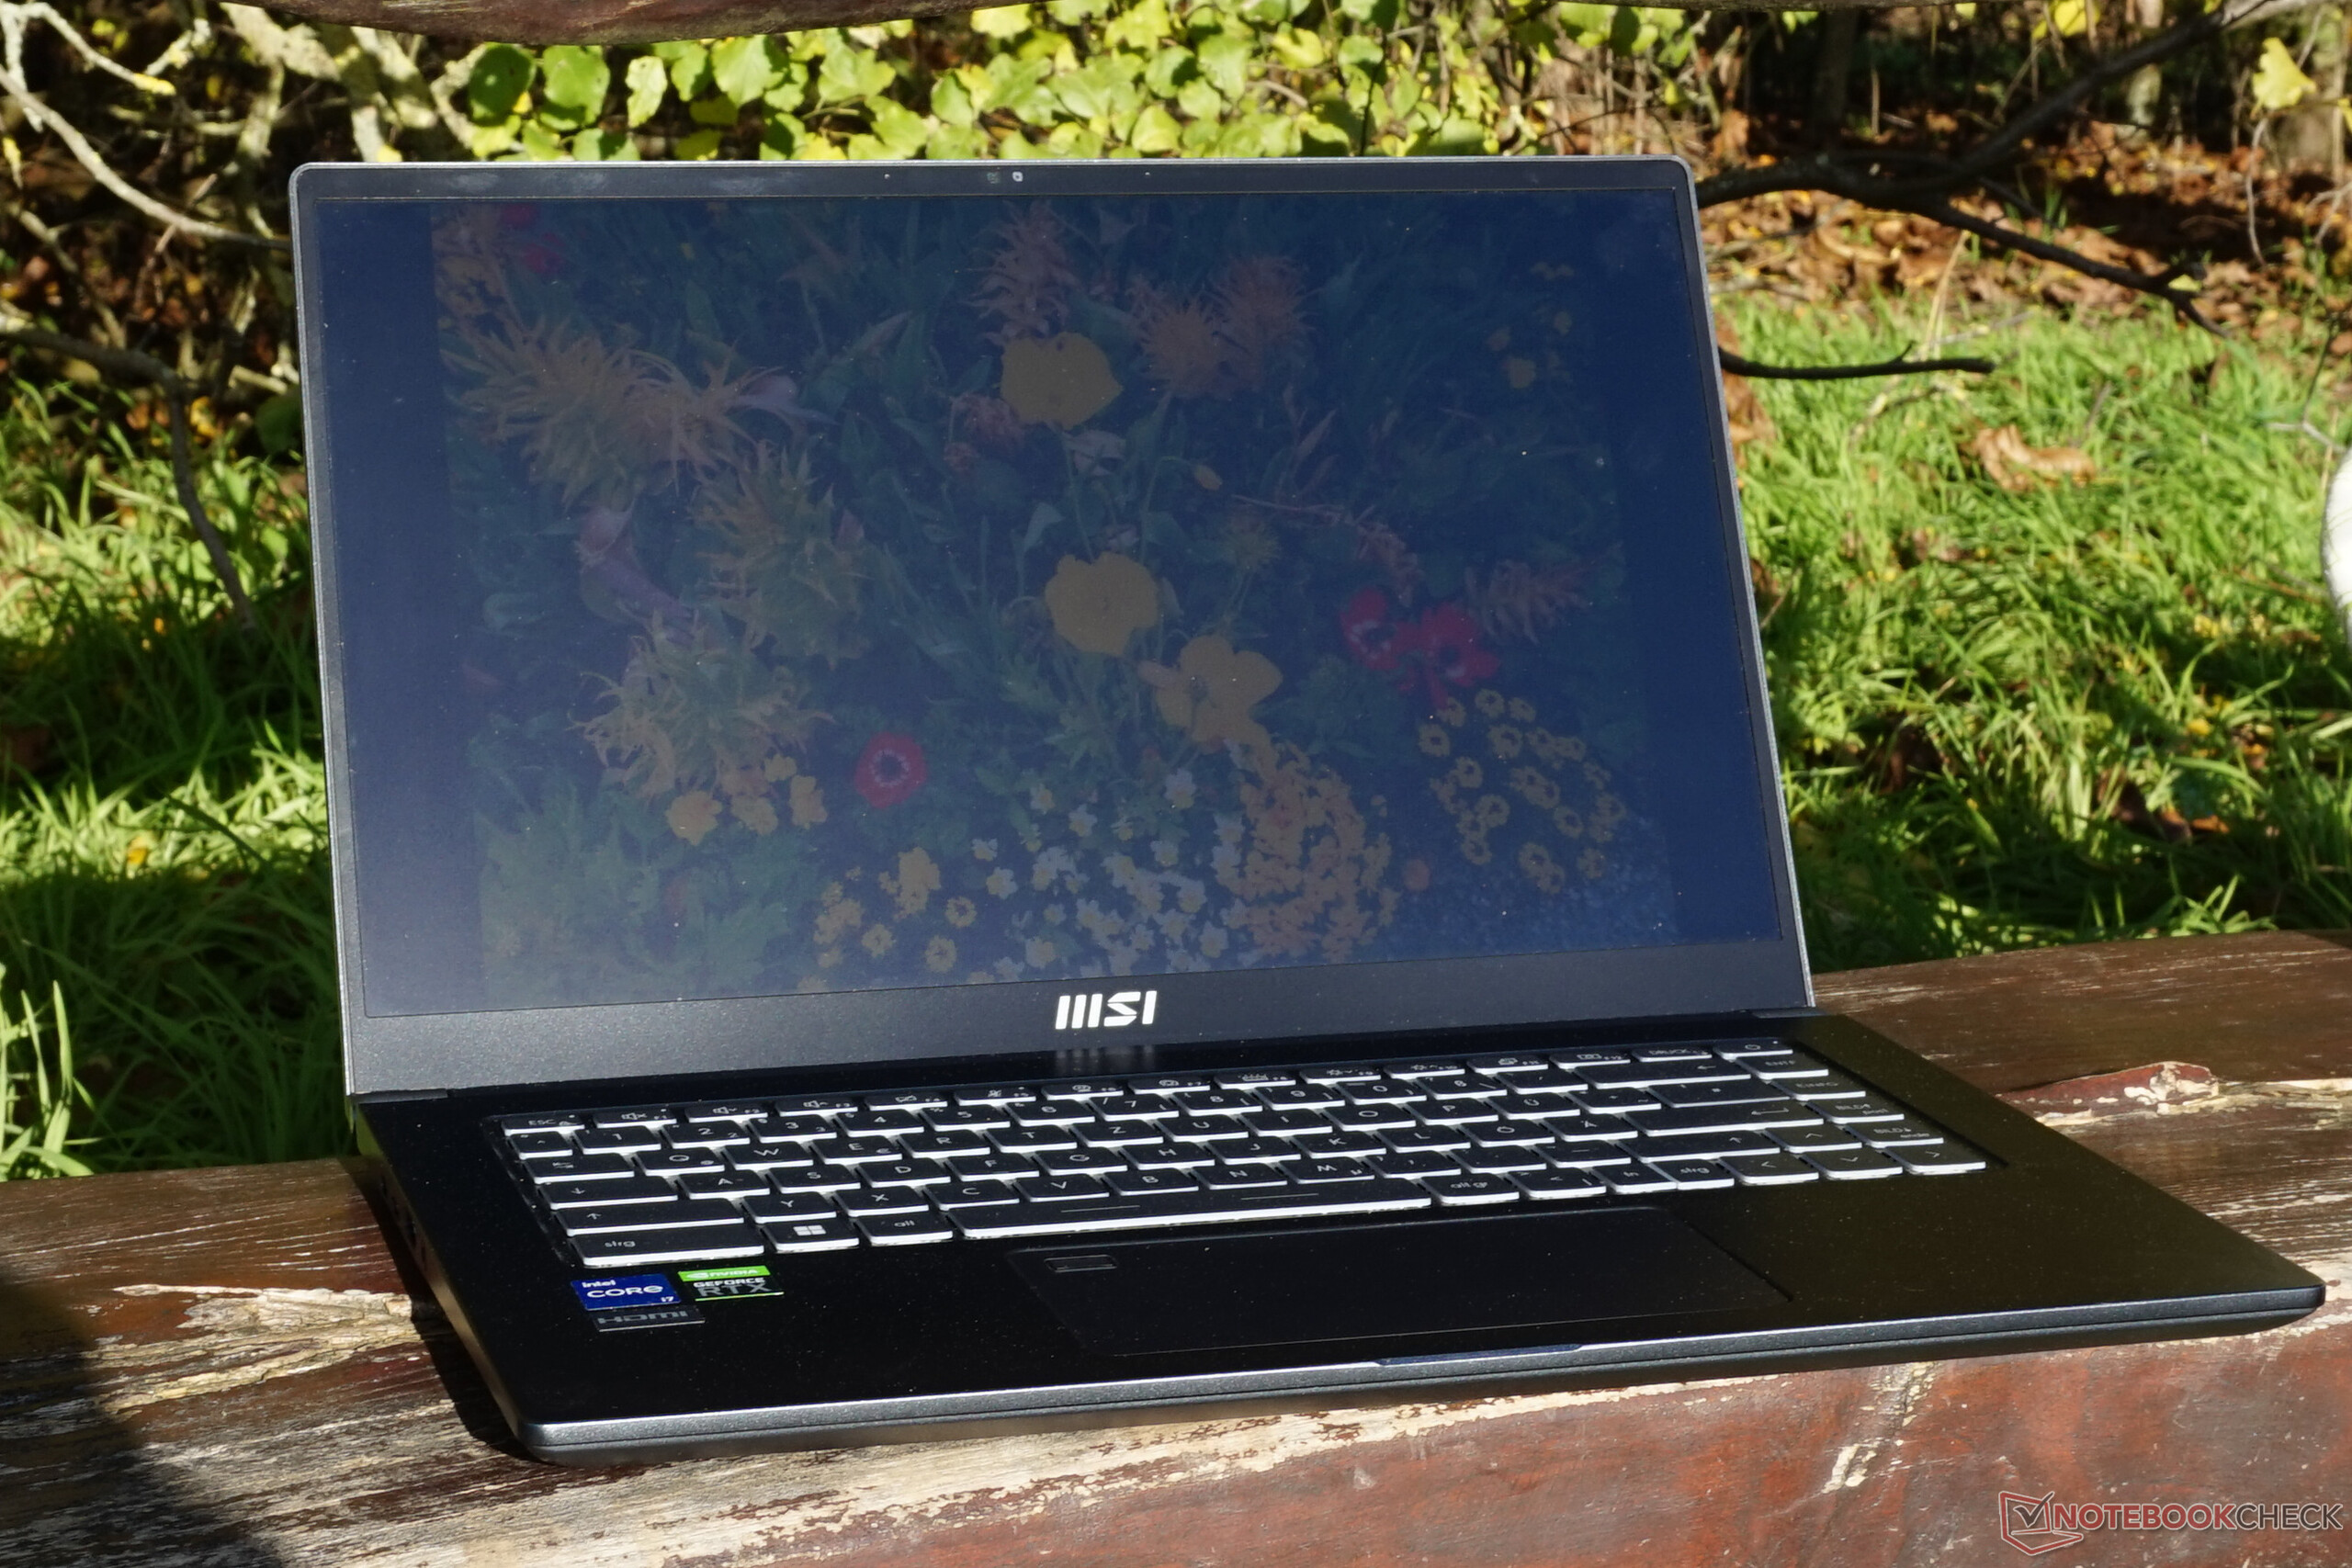
Looking at the built-in components, there are no surprises in terms of weight and size. 1.8 kg is appropriate for the display and the hardware and correspond to the values of rival laptops. The same also applies to the dimensions, which, considering the display and its 5 mm-wide screen edges, are quite compact overall. The case could have been a bit slimmer.
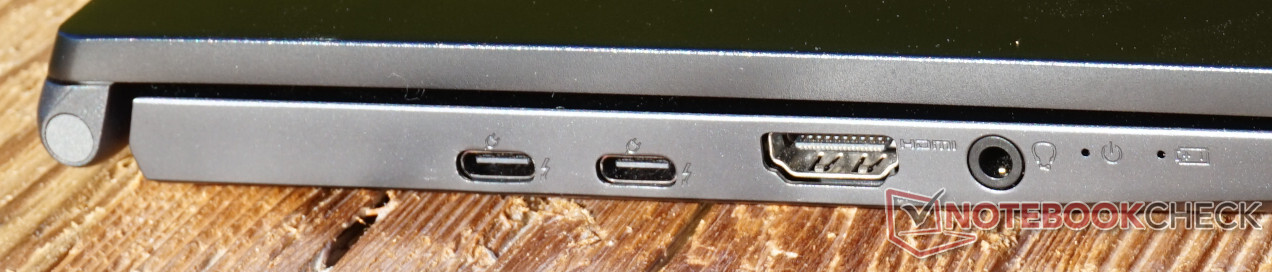
Equipment - Creator notebook with a fast connection
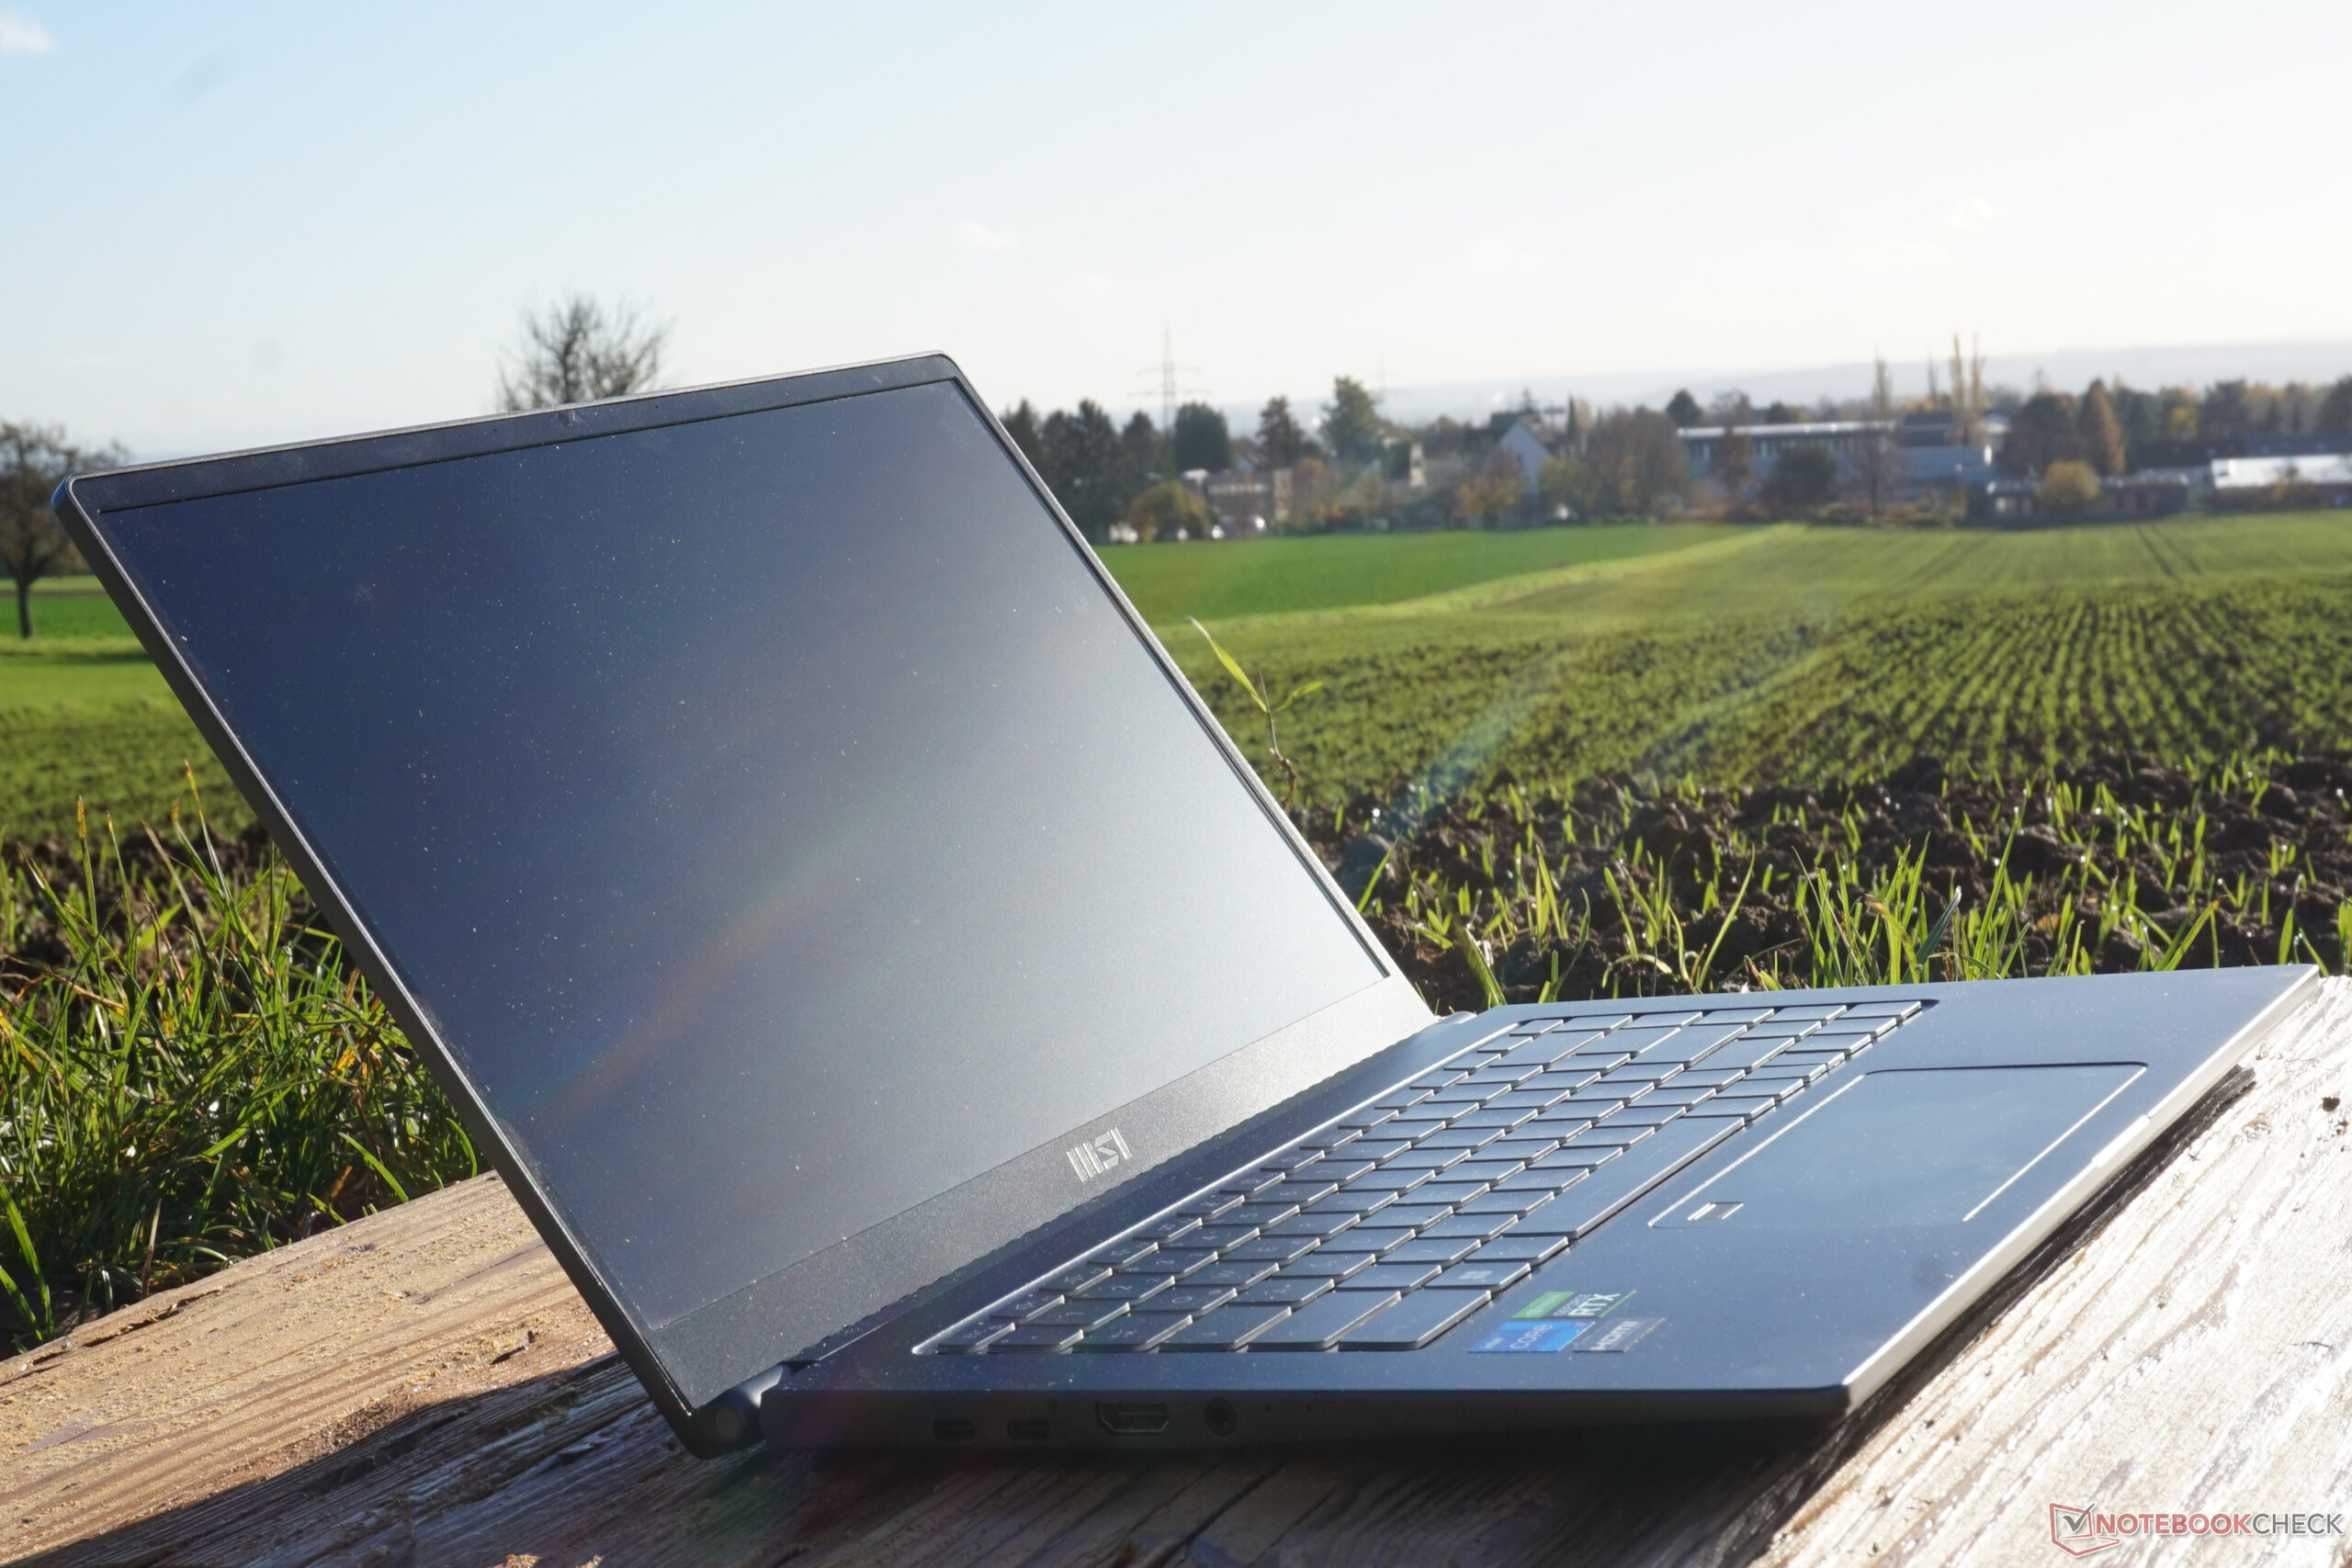
The number and speed of the ports are impressive. In particular, two Thunderbolt 4 ports on the left offer variable use and high transfer rates. The battery is also recharged via this port, but because there are two ports next to each other, one is always free. Fortunately, the two normal USB-A ports reach 10 Gbit/s, which should be sufficient for an external SSD in many cases.
A few other essential connections include the card slot, HDMI and headset. However, the selection is a little scarce overall. A LAN port or the typical Kensington lock are missing. There is also no real argument against a full SD card slot, for which there would have been plenty of room.

SD CardReader
The values measured values with the AV PRO microSD 128 GB V60 reference card are average. This means that the speed of transferring photos and videos is acceptable overall, meaning that large amounts of data can be moved onto the Prestige 15 in just a few minutes.
| SD Card Reader | |
| average JPG Copy Test (av. of 3 runs) | |
| Dell XPS 15 9520 RTX 3050 Ti (Toshiba Exceria Pro SDXC 64 GB UHS-II) | |
| Average of class Multimedia (23 - 531, n=43, last 2 years) | |
| MSI Prestige 15 A12UD-093 (AV Pro SD microSD 128 GB V60) | |
| Schenker Vision 14 2022 RTX 3050 Ti | |
| Asus VivoBook Pro 16X OLED N7600PC-L2026X | |
| maximum AS SSD Seq Read Test (1GB) | |
| Average of class Multimedia (27.9 - 1455, n=42, last 2 years) | |
| Dell XPS 15 9520 RTX 3050 Ti (Toshiba Exceria Pro SDXC 64 GB UHS-II) | |
| MSI Prestige 15 A12UD-093 (AV Pro SD microSD 128 GB V60) | |
| Schenker Vision 14 2022 RTX 3050 Ti | |
| Asus VivoBook Pro 16X OLED N7600PC-L2026X | |
Communication
At least when receiving data, the Intel AX211 WLAN module achieves above-average values. When sending, the values are a little too low, although just under 1,000 Mbit/s is still impressive. The measurement of the maximum transmission speed was prone to errors in our tests, but we can confidently assume that this functions well enough in practice in view of the good reception rates.
Webcam
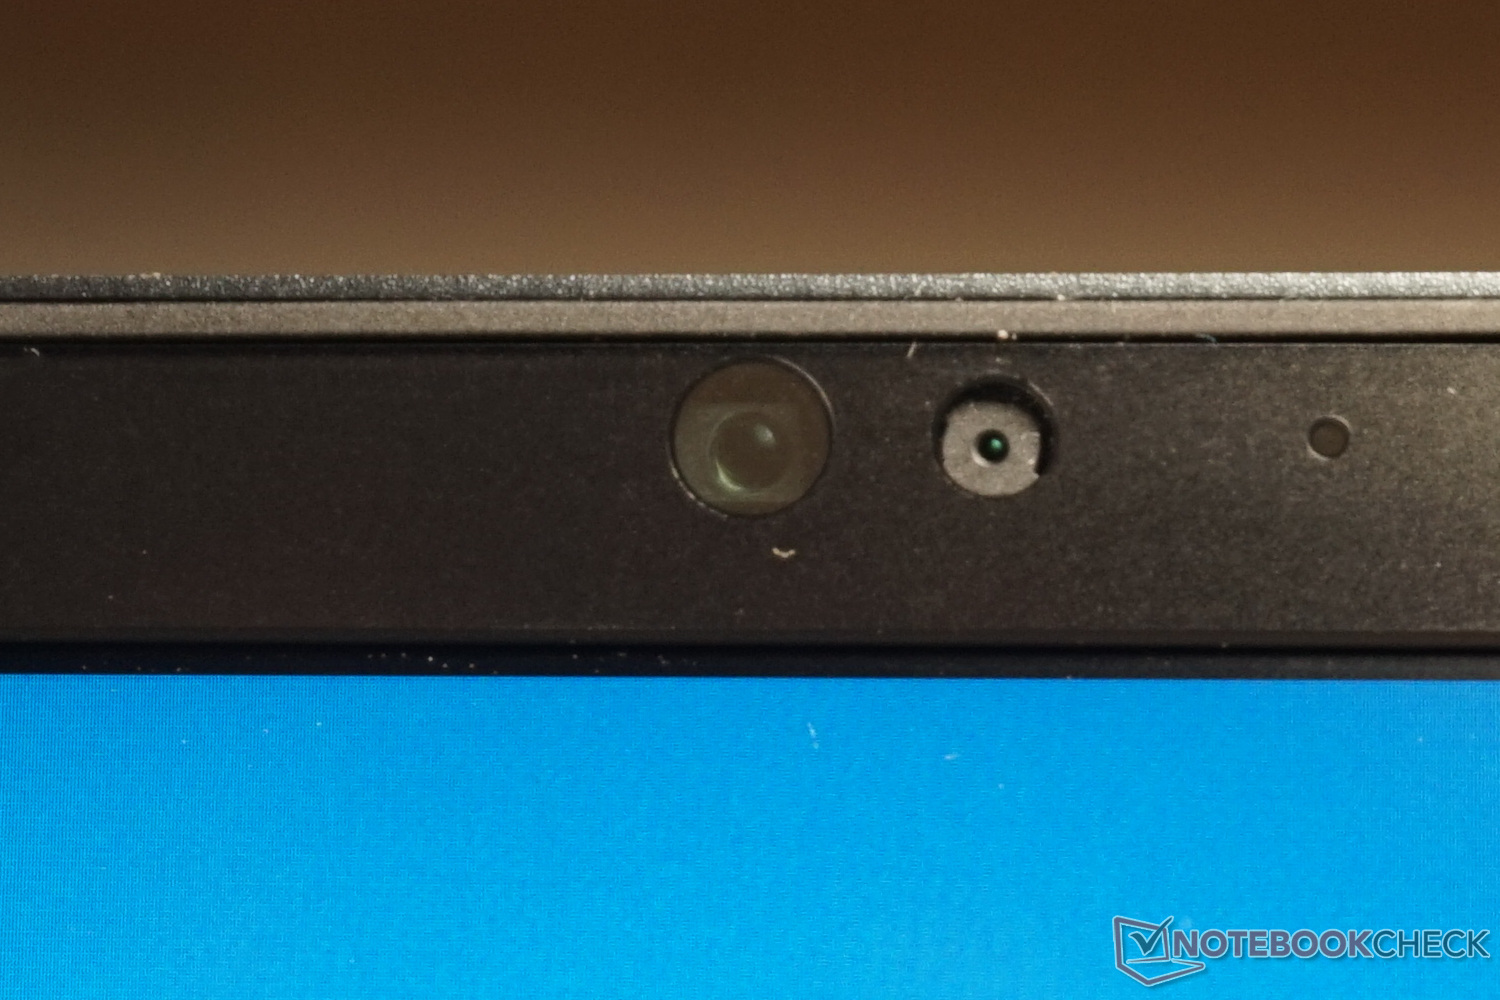
The webcam of the MSI Prestige 15 is not very impressive: merely HD quality, which does not work well during video calls, is actually too little for a multimedia notebook. On the other hand, recognition in low light is convincing. Even the glow of the display is sufficient so that the laptop can be used for video telephony at any time.
The two microphones do not compensate for the weak video quality. Voices sound tinny, and what is said can only be understood when speaking directly in front of the laptop.
At least facial recognition with infrared works reliably. Overall, the webcam is usable, but the resolution and the microphones meet the minimum requirements only.


Security

Although there is no Kensington lock for securing the device at the desk or workplace, at least the login can be made secure via facial recognition and the fingerprint sensor.
Somewhat unusual is the position of the sensor in the touchpad, but its generous design ensures that this does not leave a negative impression during use. Left-handed users may view this differently, however. The build and operation scored very well in our functional tests. The technology appears to be significantly more robust than many keyboard-inbuilt fingerprint sensors.
Facial recognition on the Prestige 15 also ran free of error. Regardless of lighting conditions, the infrared camera recognized the user correctly.
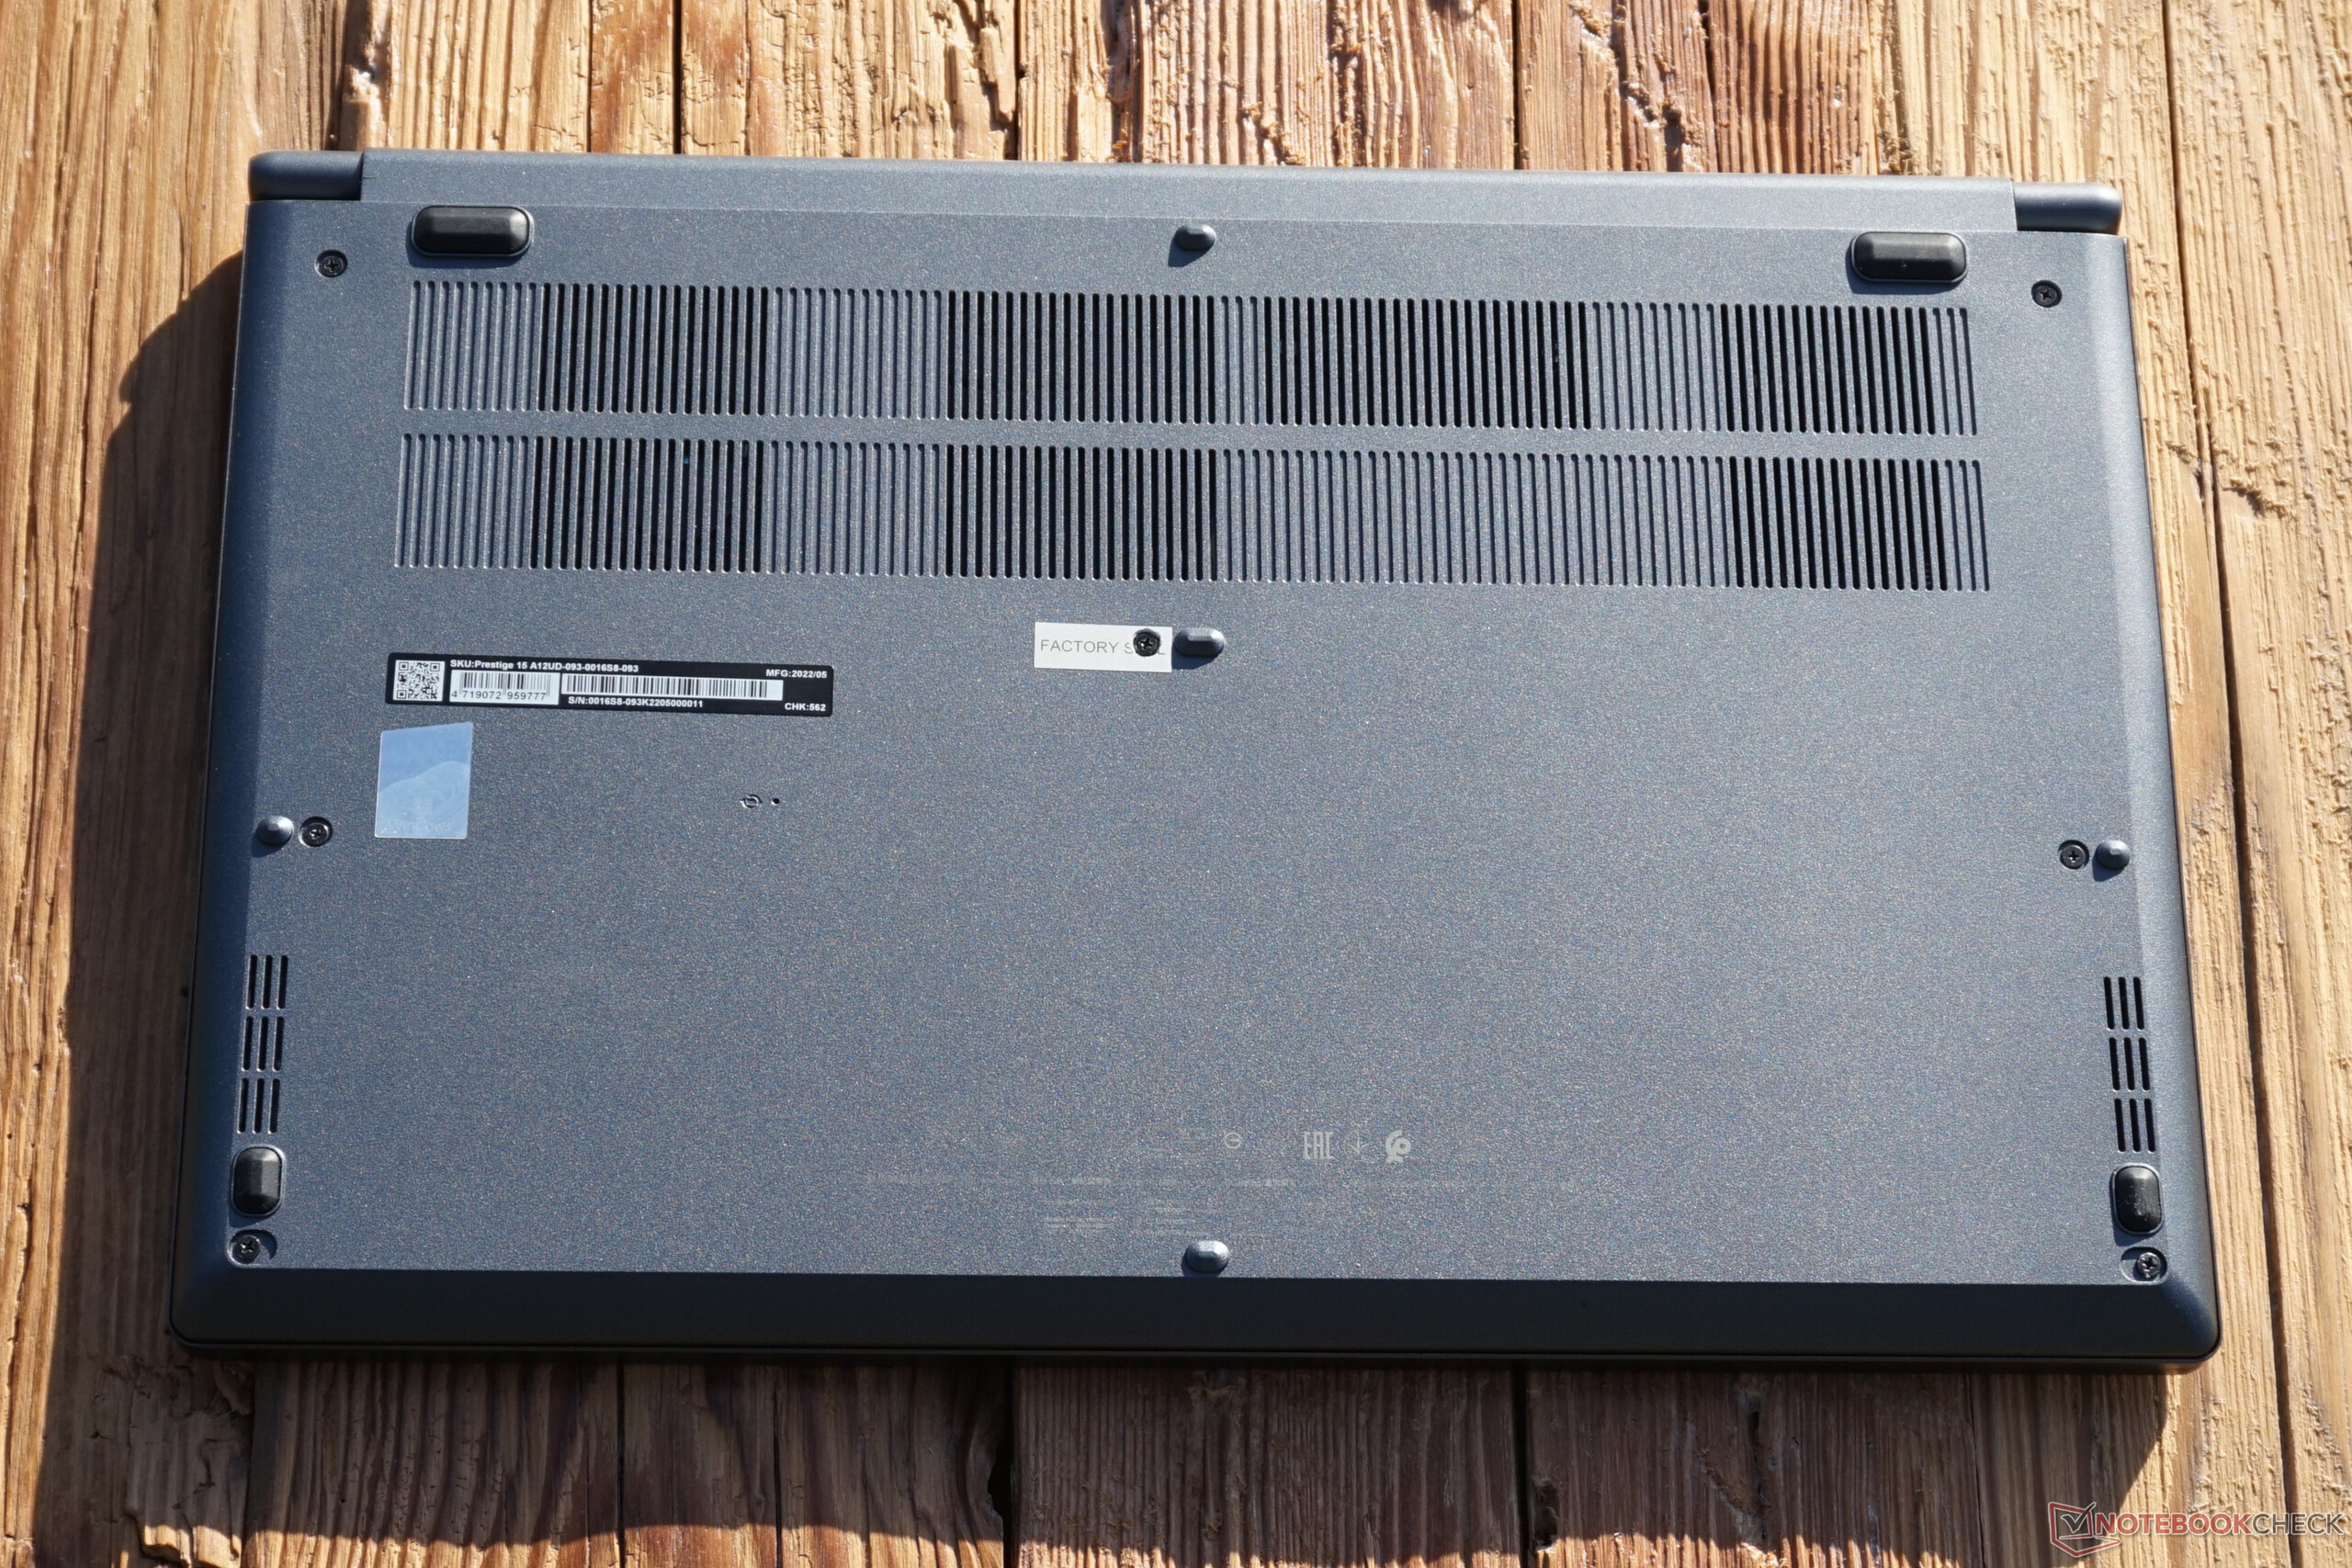
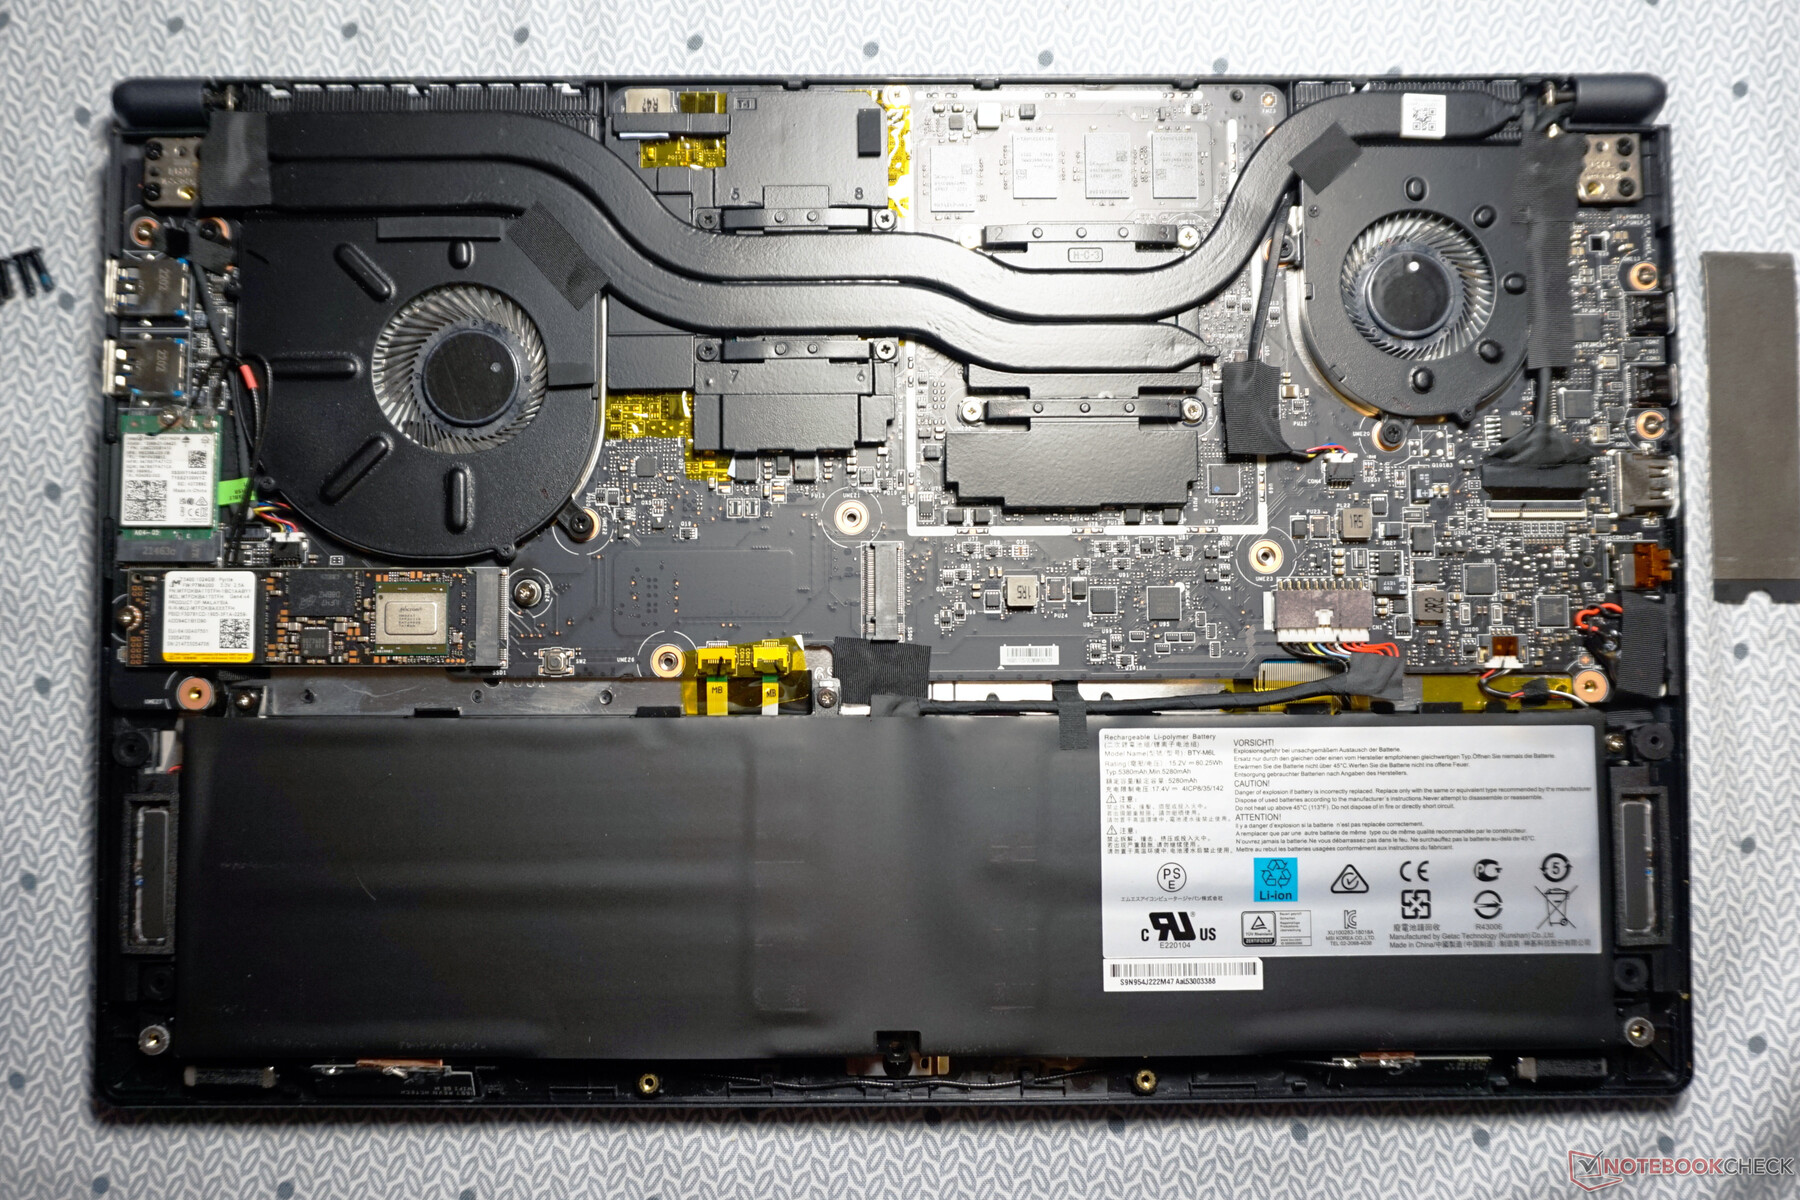
Maintenance

The MSI laptop was easy to open. Only seven Phillips screws have to be loosened in order to detach the baseplate with little effort. Unfortunately, the middle screw is covered with a seal. After contacting MSI, we were assured that breaking the seal does not void the warranty. Nevertheless, this may have a deterrent effect on some users.
Otherwise, a look inside reveals a well thought-out internal design. Only the battery is screwed in. The WLAN module can also be swapped if necessary.
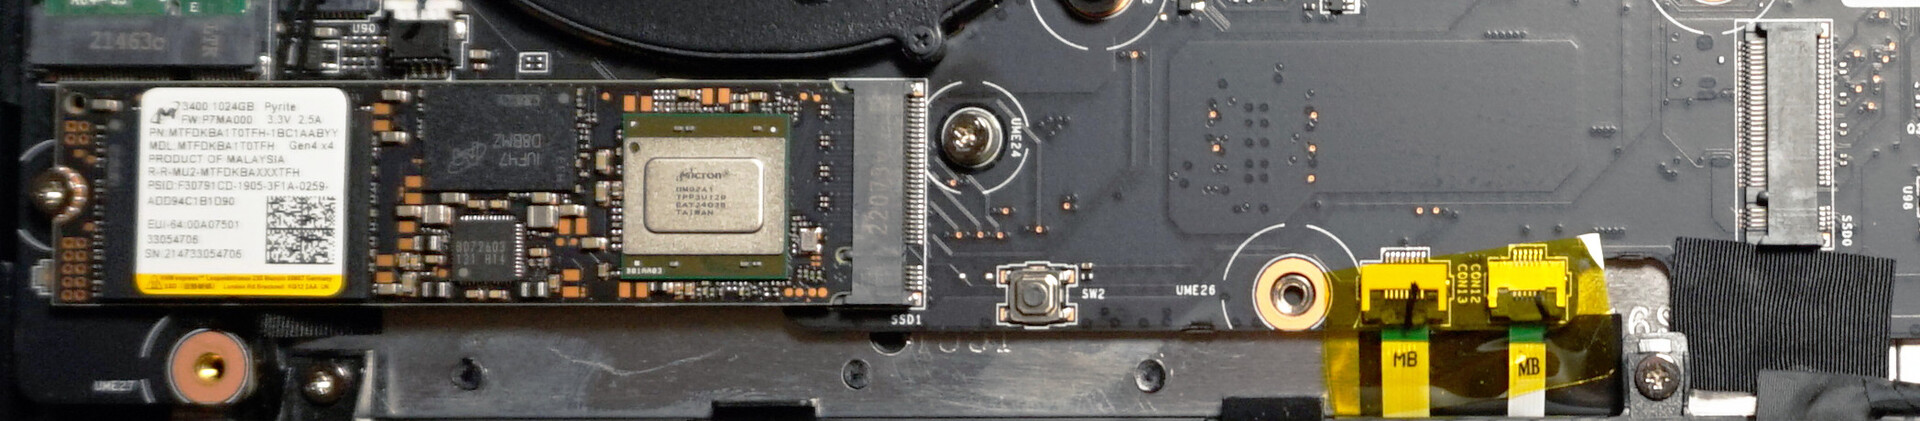
Moreover, expanding the storage space is designed to be completely straightforward, which makes the seal even less comprehensible. In addition to the already installed SSD, an additional SSD can be inserted into a second M.2 slot in the standard 2280 format. This makes perfect sense for video editing.
Only the RAM is permanently soldered. At most, this could prove problematic in the notebook variant with 16 GB at some point in the future. The 32 GB configuration, on the other hand, should be completely sufficient in the long run.
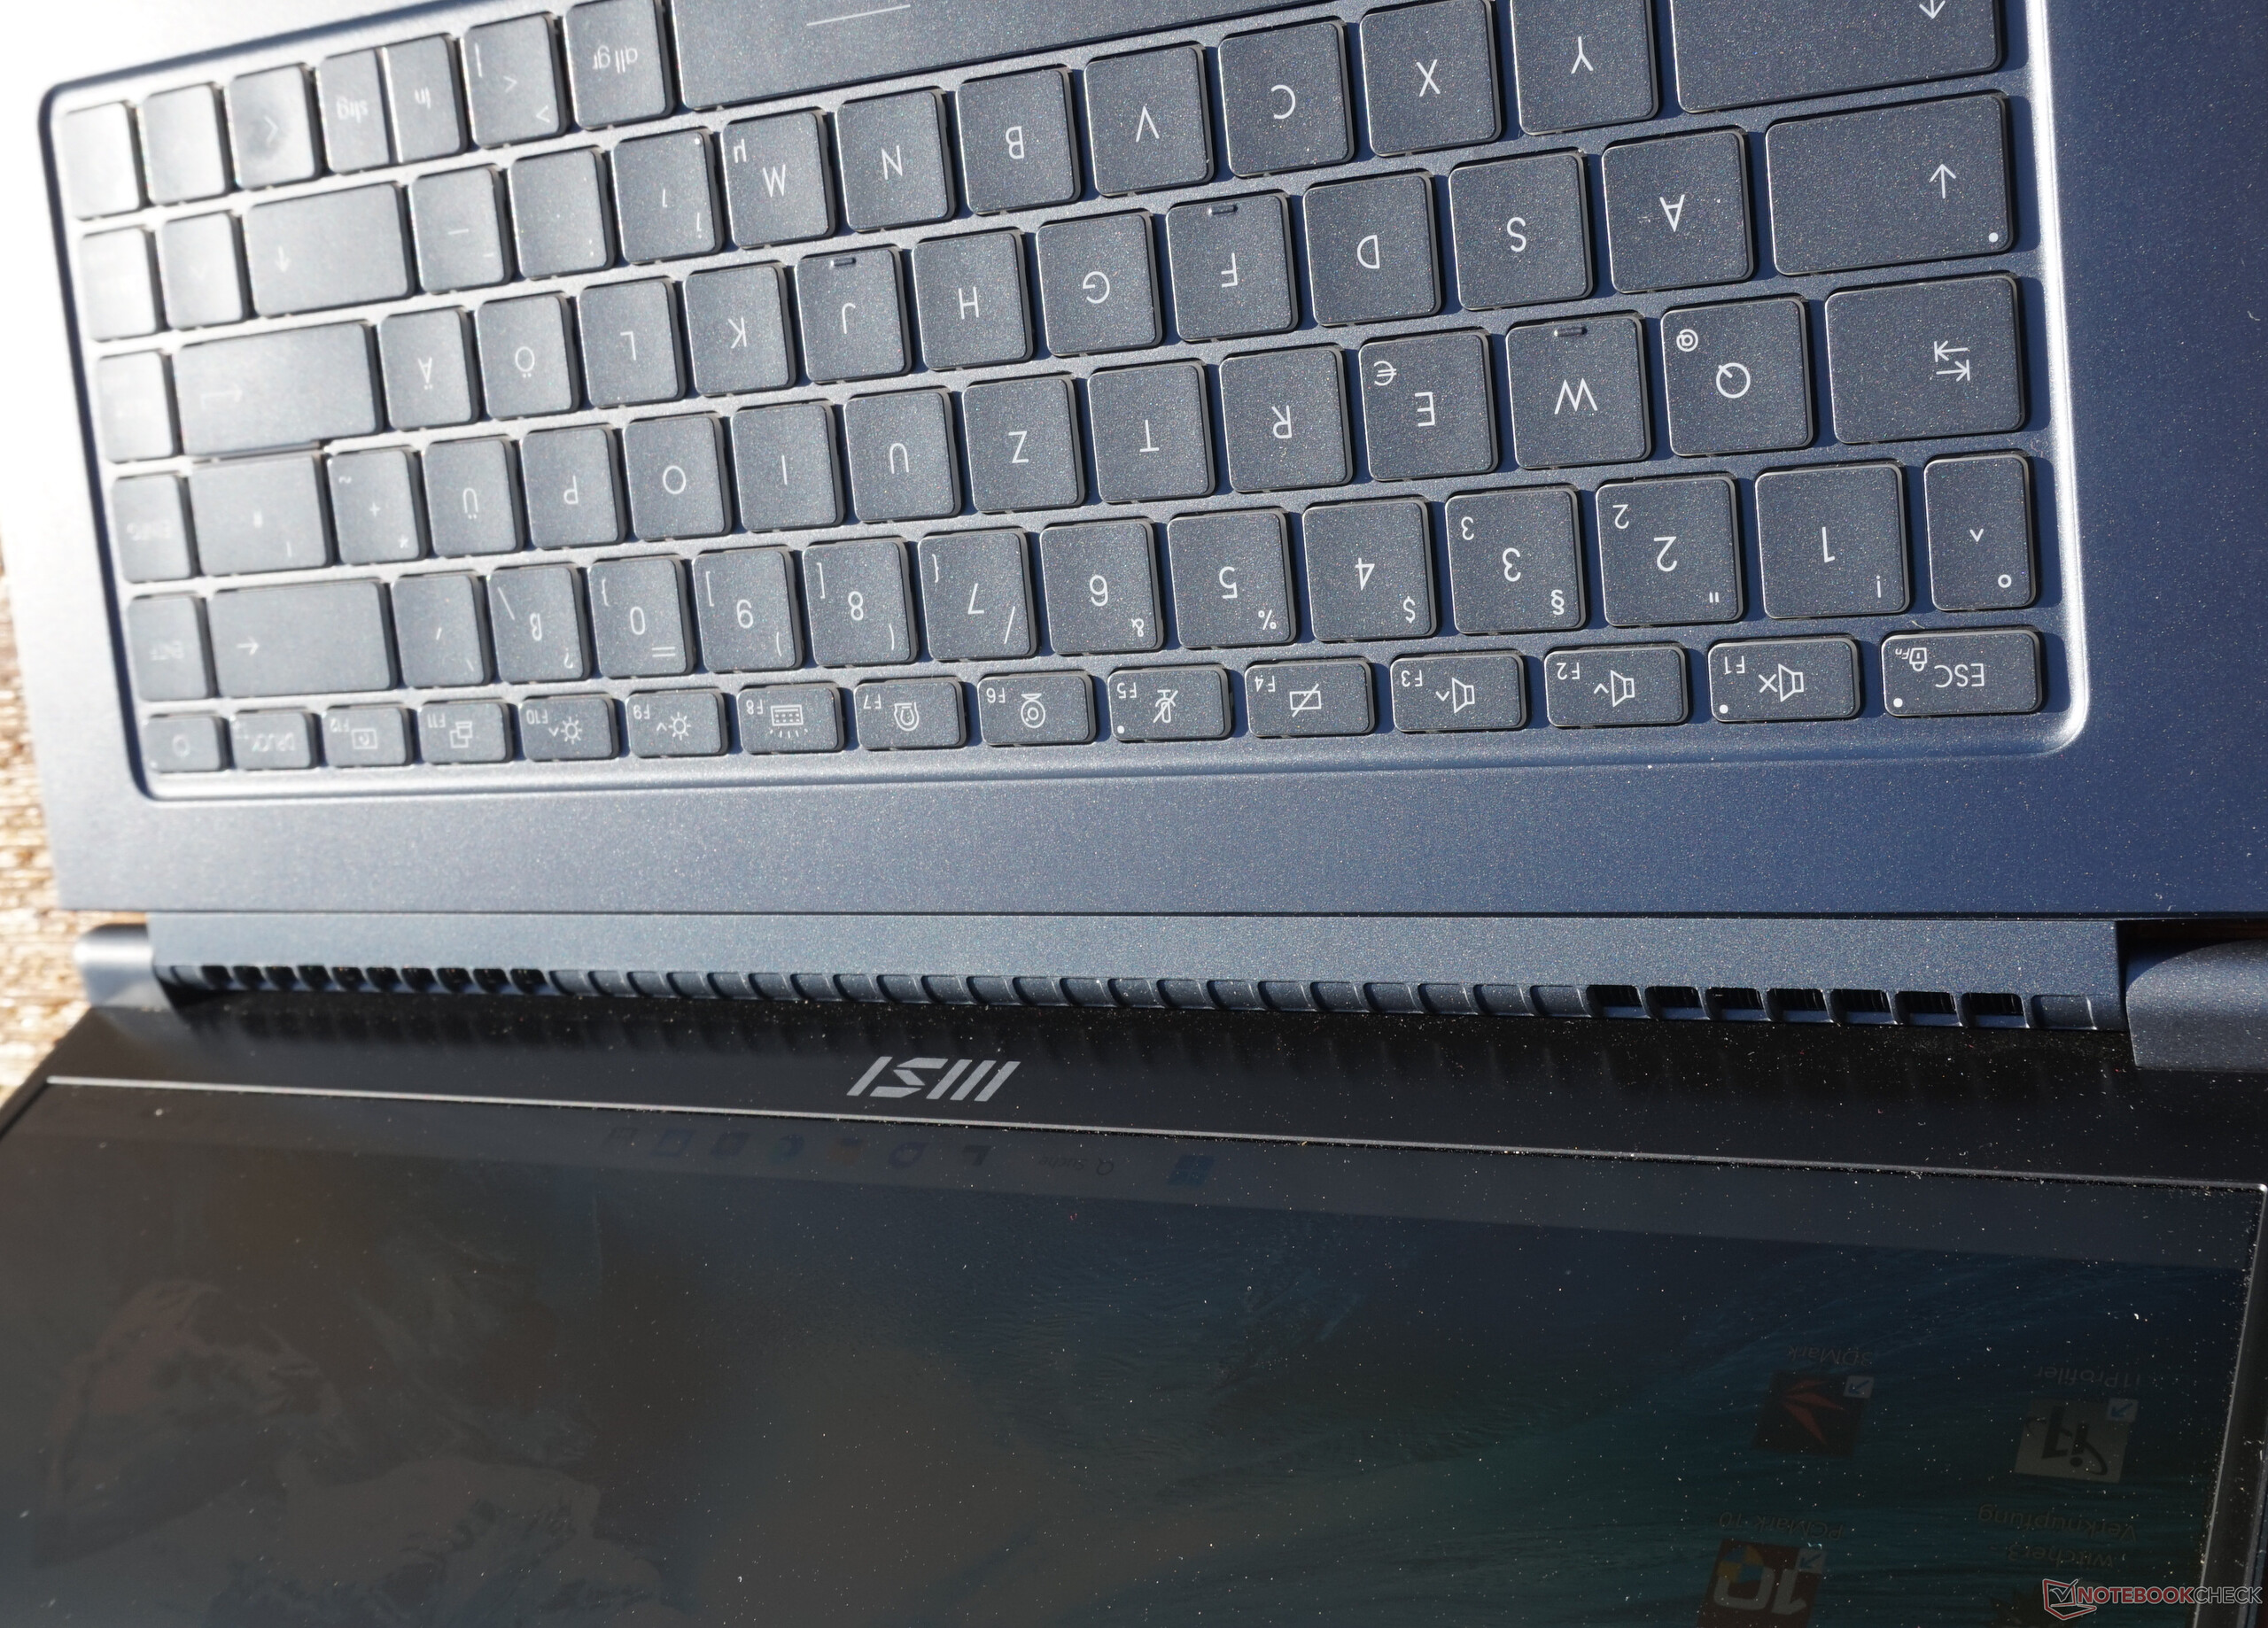
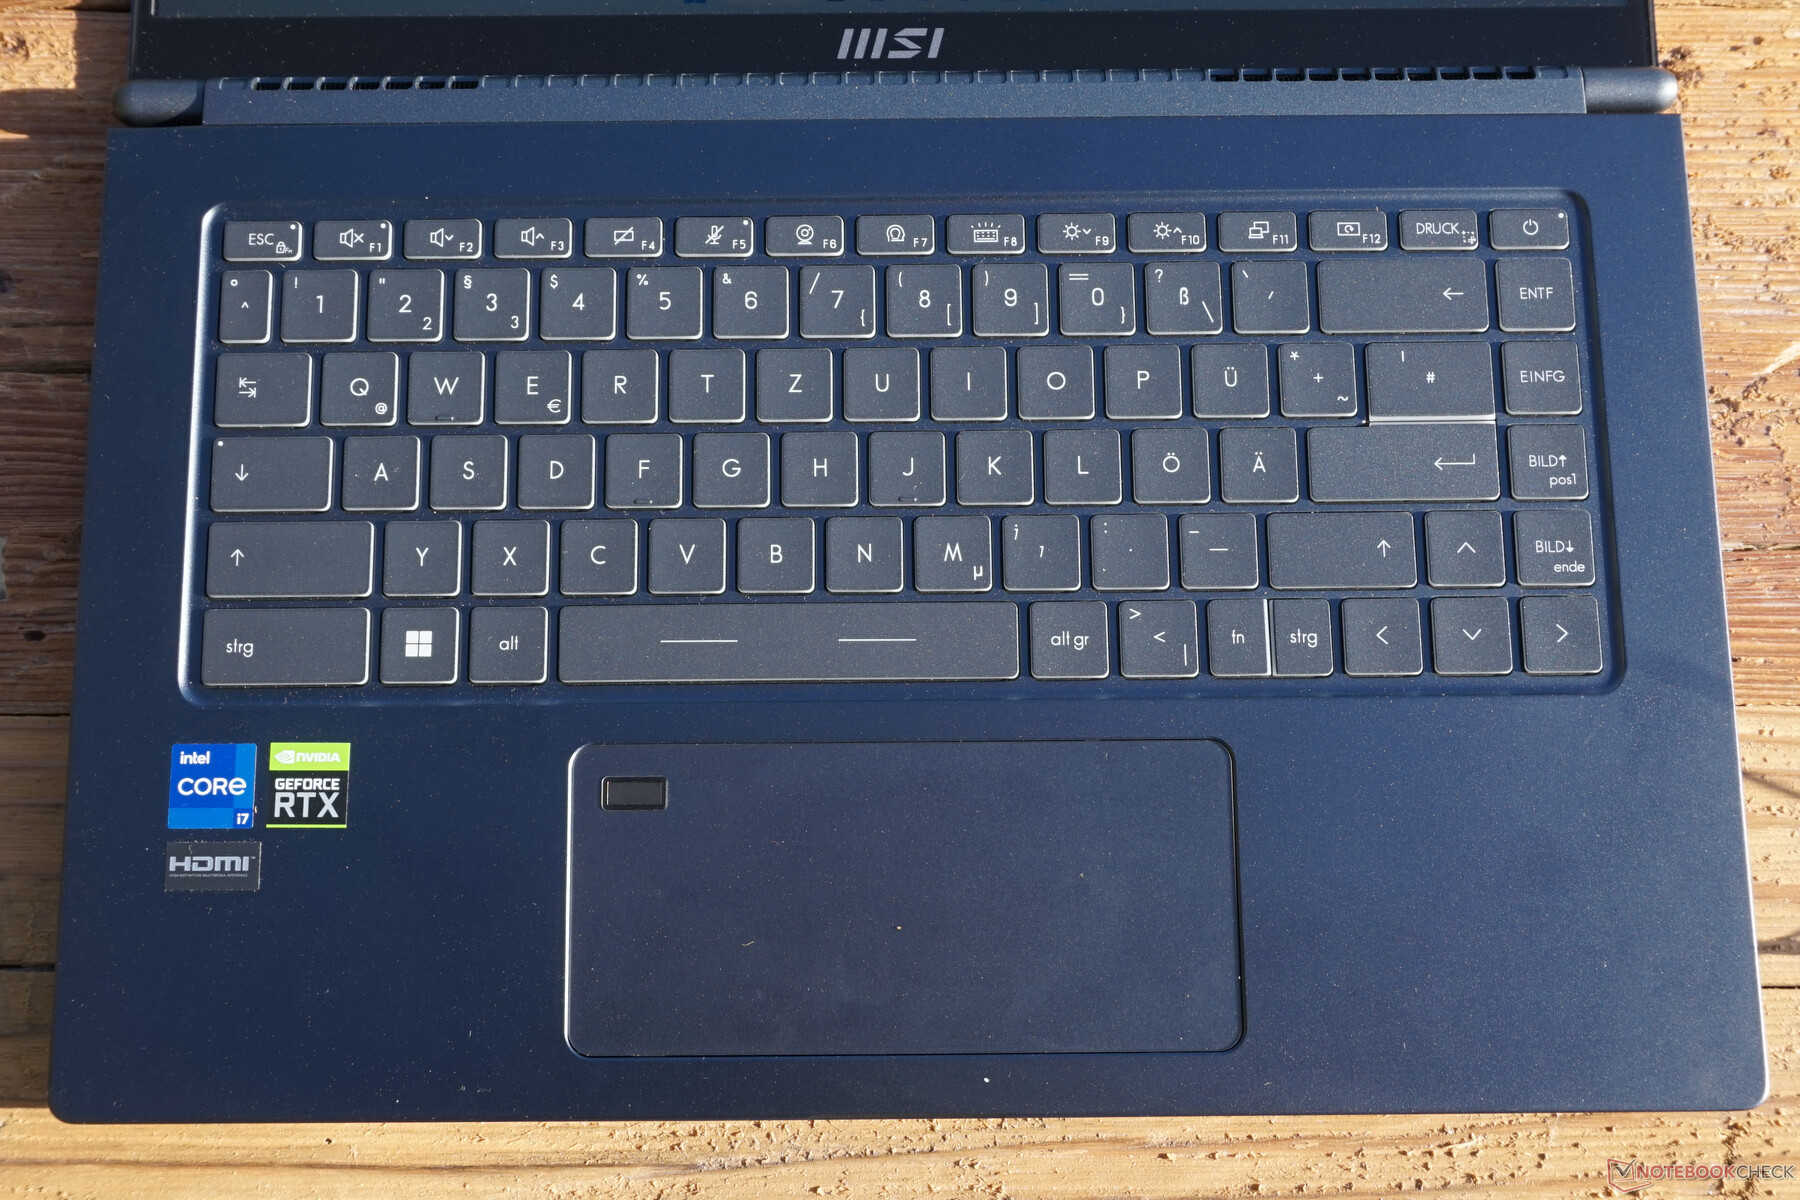
Input Devices - Creator laptop with simple standard
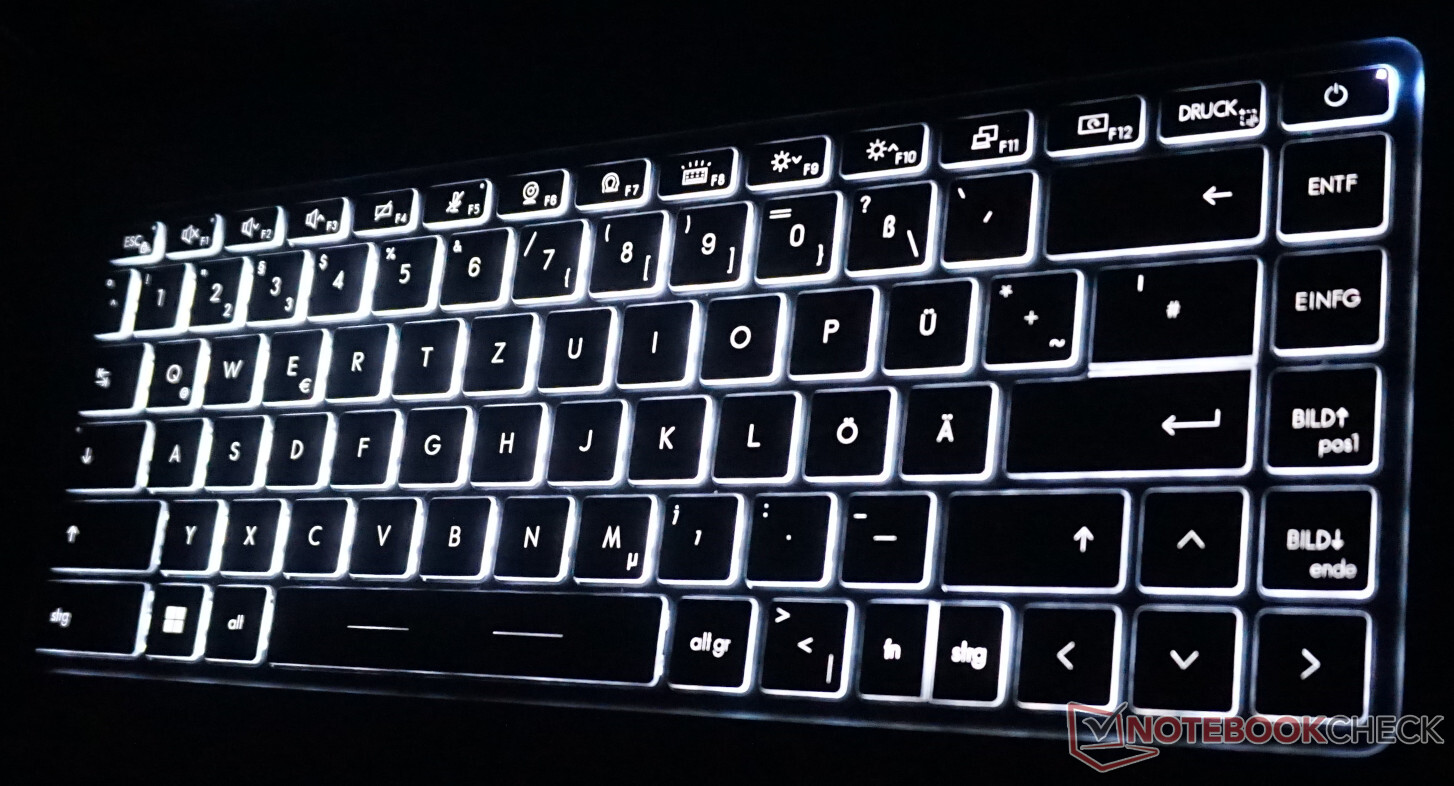
The clearly recognizable lettering and, above all, the familiar size and standardized spacing save any getting used to. Typing on the keyboard of the MSI Prestige 15 is fast and precise. It is neither particularly loud nor very quiet.
Key resistance is well dosed and should also be well suited for long periods of work. However, a little more than just 1 mm travel would have been desirable, especially with intensive use.
The backlighting also leaves no room for criticism. Three different brightness levels are available, and no irregularities were observed. In addition, the illuminated frame of every single key ensures excellent orientation in dark environments.
The touchpad also leaves a positive impression overall. Inputs with one or more fingers are implemented precisely. The glass surface feels very good, and the covered keys in the lower area also function smoothly.
We couldn't see any real advantage in the particularly wide design at first glance, especially since the fingerprint sensor is also installed here. The length of only 65 mm, on the other hand, seems a bit tight. Here, one quickly glides beyond the touchpad.
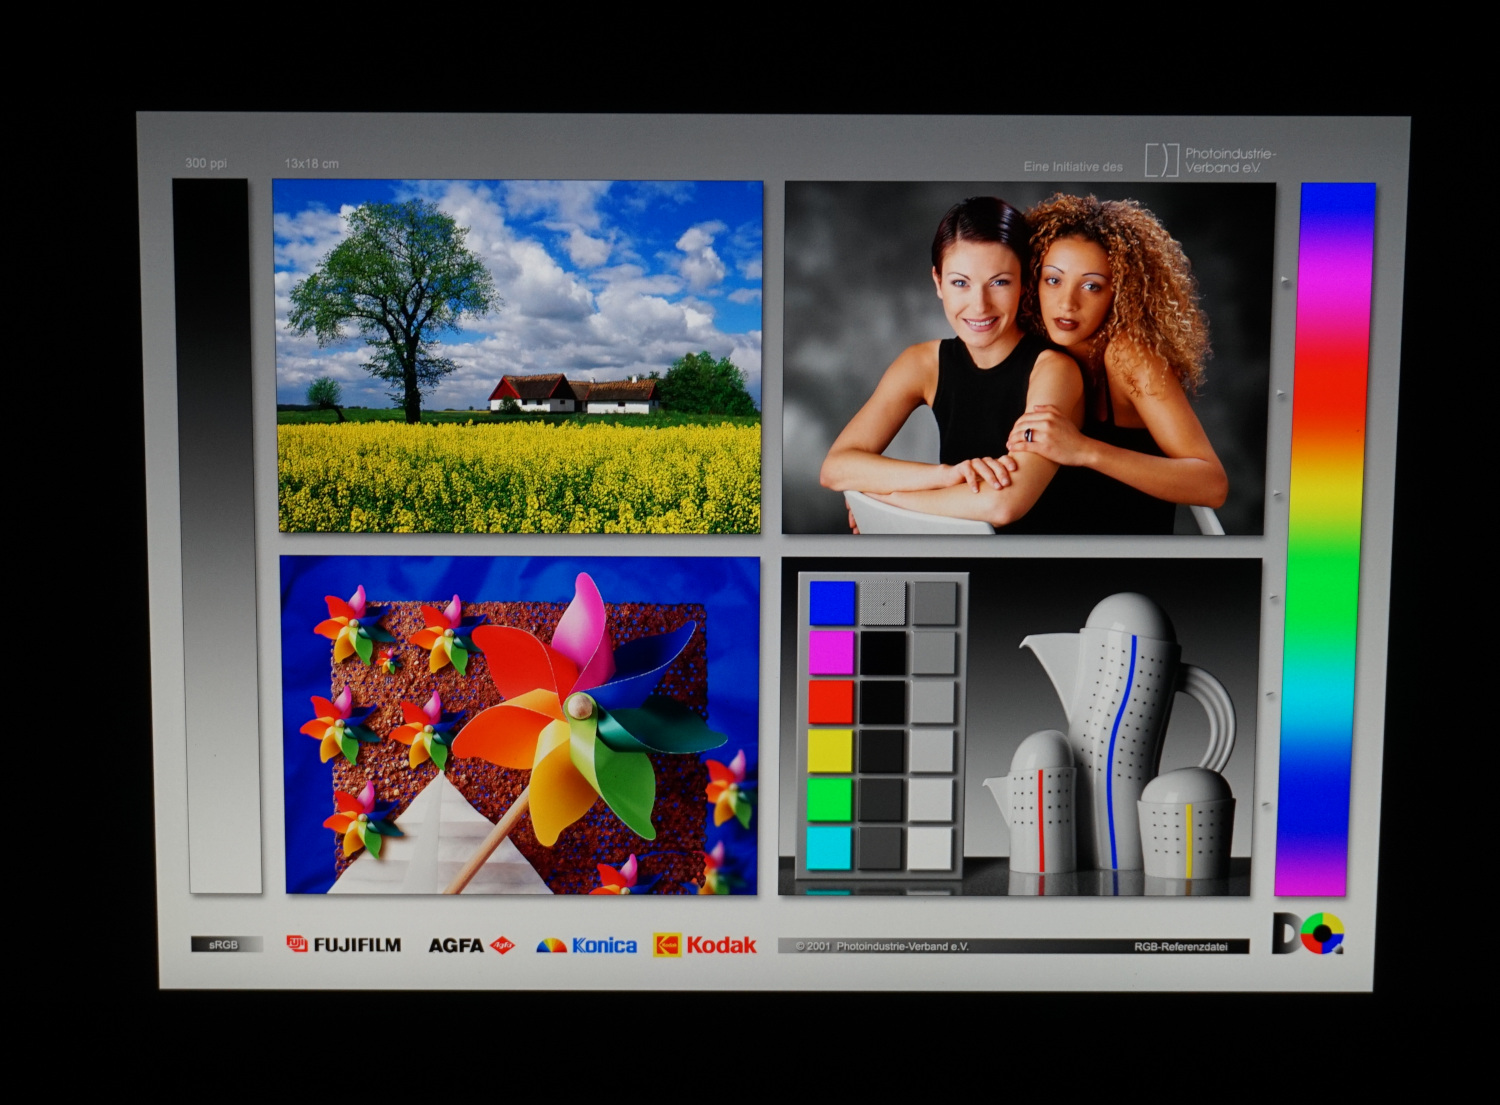
Display - The Prestige 15 offers 4K and more


The display values clearly indicate that MSI is very serious about positioning itself as a creator laptop. At a diagonal of 15.6 inches, the 4K resolution ensures an extremely high pixel density. Individual pixels are not discernible, even at close range. Alternatively, a Full HD display can be used, which unfortunately performs a little worse in terms of color reproduction.
The contrast is impressive and is supported by a very low black value, among other things. Brightness is slightly above average at an average of 420 cd/m², which does not decrease in battery mode.
We observed minimal screen bleeding at the bottom edge. However, this only occurs during full screen brightness, a completely black picture and long exposure times. This also should not be visible to the naked eye. Response times are acceptable for a multimedia laptop. Flickering was not detected at various brightness levels.
However, 4K resolution on an area that is hardly larger than a DIN A4 sheet does not seem really practical. Windows recommends a magnification of 250%, which seems realistic. Even 200% makes reading on the screen difficult. A full-size display makes working on the Prestige 15 almost impossible. Moreover, very few are likely be able to tell the difference whether the displayed image is in FullHD or 4K because the details are simply too small.
In any case, the display is made for photo editing. But your own eyes may have trouble recognizing this level of detail. Connecting an adequate monitor in combination with a built-in Full HD screen seems more practical.
| |||||||||||||||||||||||||
Brightness Distribution: 85 %
Center on Battery: 441 cd/m²
Contrast: 2845:1 (Black: 0.155 cd/m²)
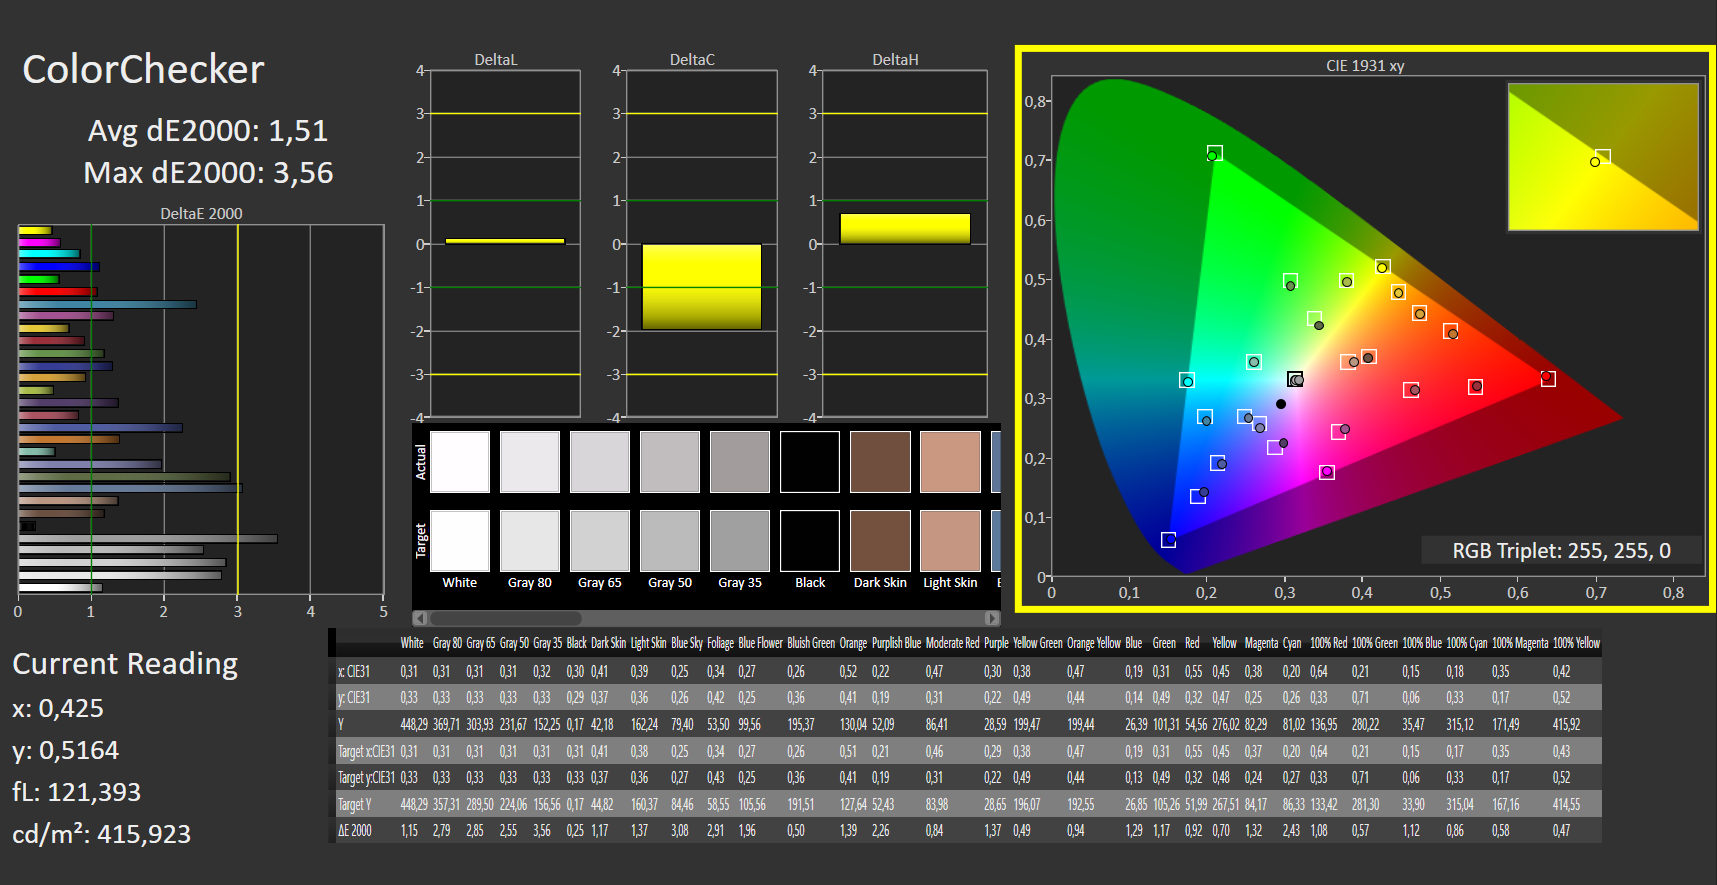
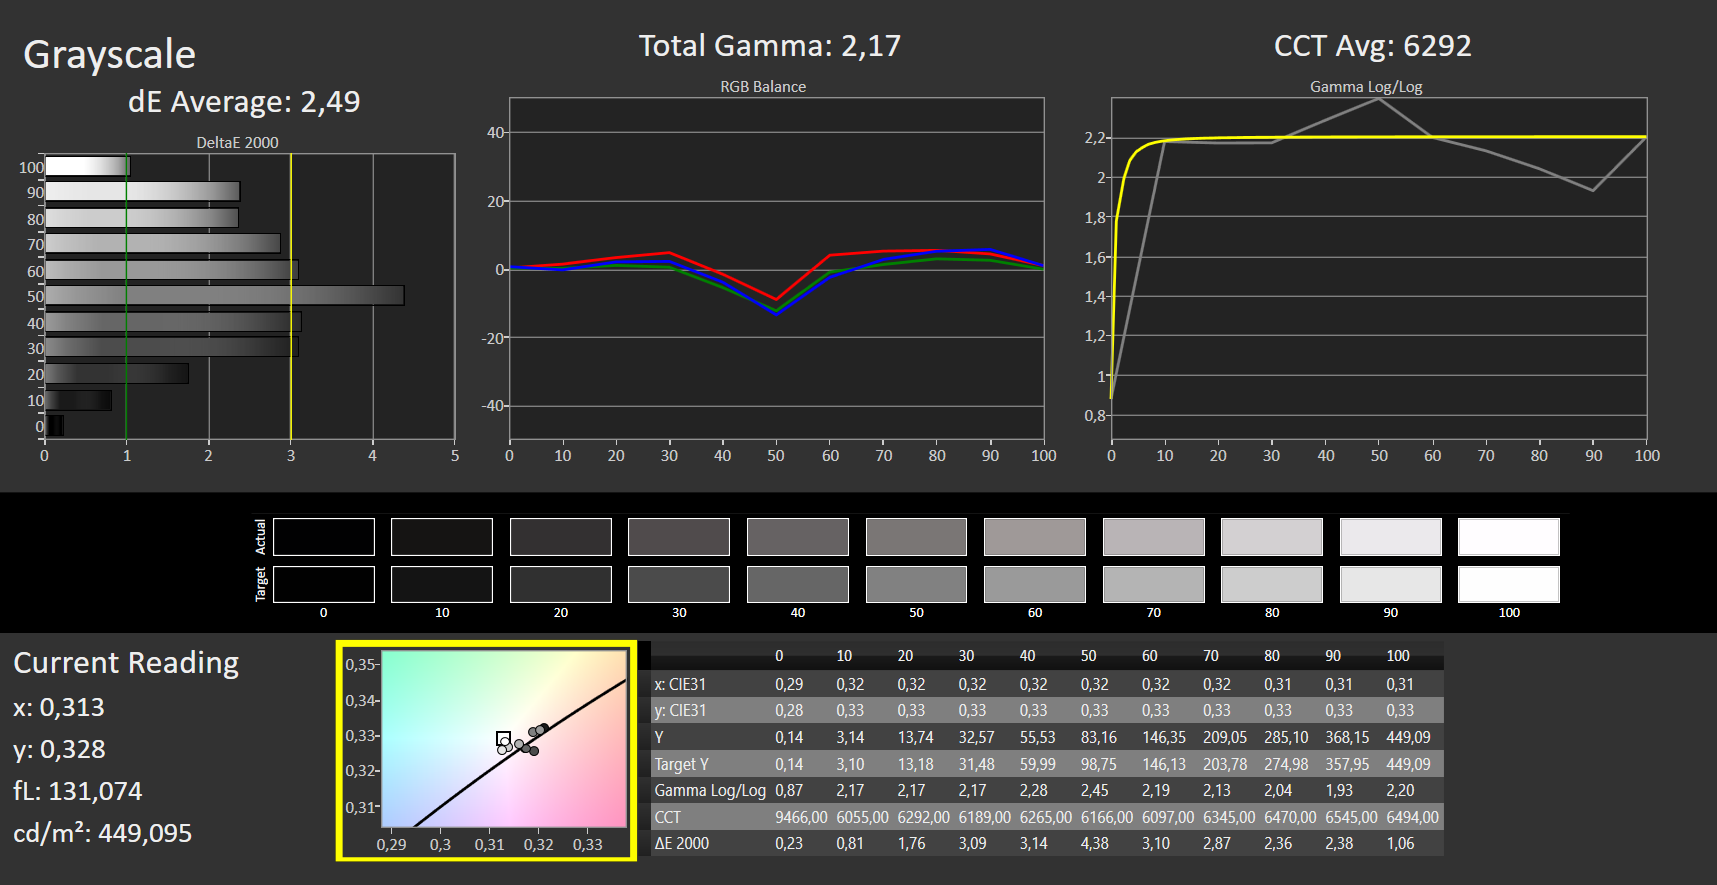
ΔE ColorChecker Calman: 1.51 | ∀{0.5-29.43 Ø4.73}
ΔE Greyscale Calman: 2.49 | ∀{0.09-98 Ø4.97}
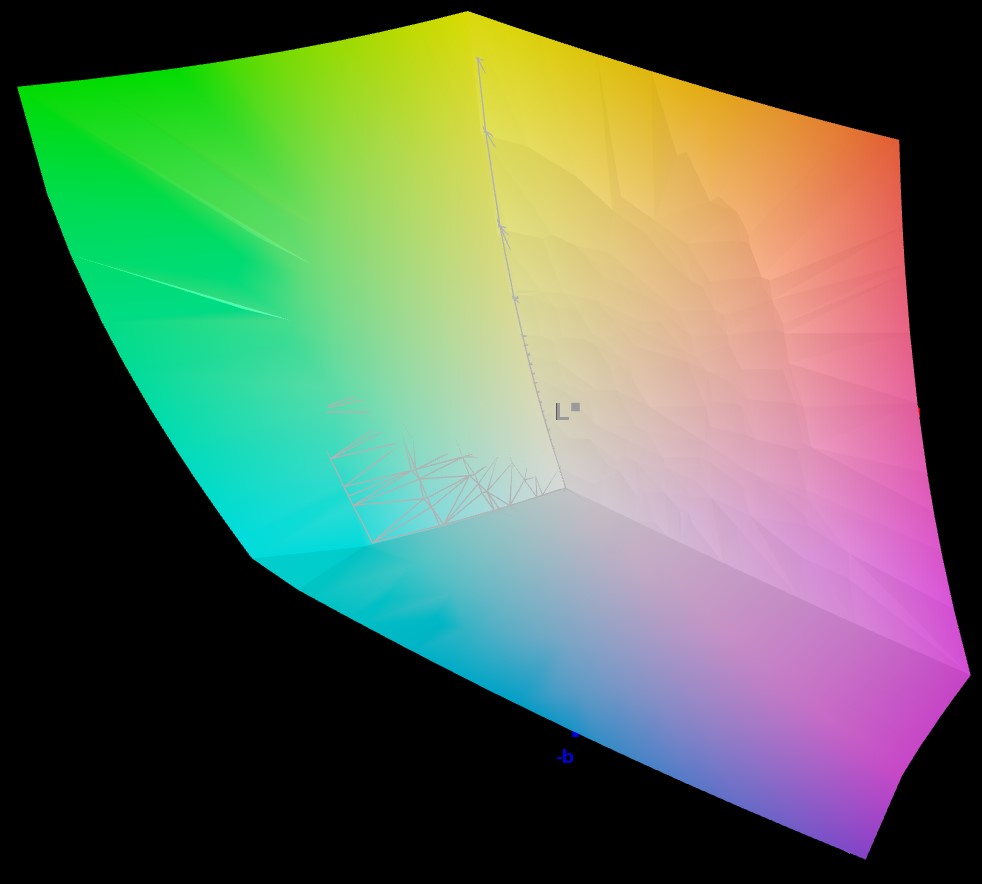
94.02% AdobeRGB 1998 (Argyll 3D)
96.95% sRGB (Argyll 3D)
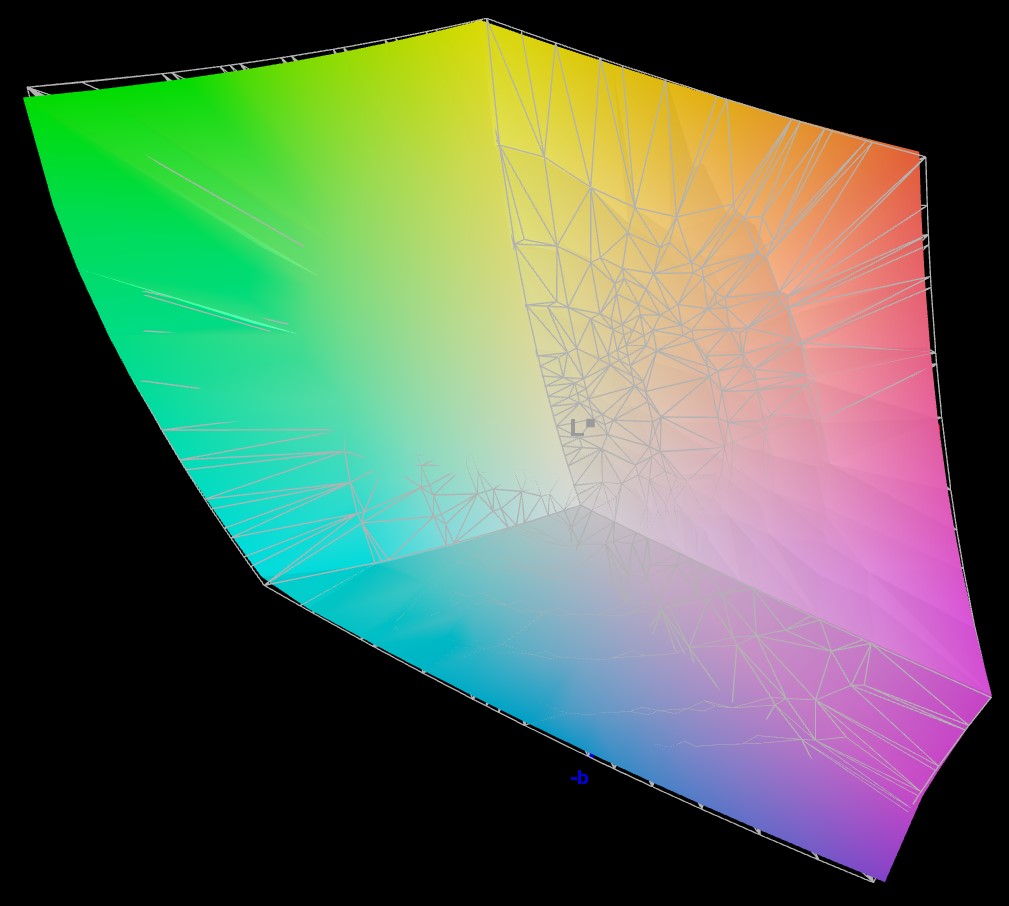
80.48% Display P3 (Argyll 3D)
Gamma: 2.17
CCT: 6292 K
| MSI Prestige 15 A12UD-093 Sharp LQ156D1JW42, IPS, 3840x2160, 15.6" | Acer Swift X SFX16-52G-77RX B160QAN02.M, IPS-LED, 2560x1600, 16" | Schenker Vision 14 2022 RTX 3050 Ti MNE007ZA1-1, IPS, 2880x1800, 14" | Asus VivoBook Pro 16X OLED N7600PC-L2026X Samsung ATNA60YV02-0, OLED, 3840x2400, 16" | Lenovo IdeaPad Gaming 3 15ARH7 LEN156FHD, IPS, 1920x1080, 15.6" | Dell XPS 15 9520 RTX 3050 Ti Samsung 156XG01, OLED, 3456x2160, 15.6" | |
|---|---|---|---|---|---|---|
| Display | -7% | -9% | 10% | -49% | 5% | |
| Display P3 Coverage (%) | 80.48 | 76.4 -5% | 74.1 -8% | 99.9 24% | 39.4 -51% | 97.8 22% |
| sRGB Coverage (%) | 96.95 | 100 3% | 97.4 0% | 100 3% | 58 -40% | 99.9 3% |
| AdobeRGB 1998 Coverage (%) | 94.02 | 76.6 -19% | 75.3 -20% | 98.05 4% | 40.7 -57% | 86 -9% |
| Response Times | 39% | 41% | 95% | 44% | 95% | |
| Response Time Grey 50% / Grey 80% * (ms) | 51 ? | 33 ? 35% | 31.5 ? 38% | 1 98% | 20.8 ? 59% | 1.9 ? 96% |
| Response Time Black / White * (ms) | 26 ? | 15 ? 42% | 14.5 ? 44% | 2 ? 92% | 18.4 ? 29% | 1.9 ? 93% |
| PWM Frequency (Hz) | 247 ? | 59.52 ? | ||||
| Screen | -30% | -46% | 57% | -138% | -56% | |
| Brightness middle (cd/m²) | 441 | 411 -7% | 421 -5% | 383 -13% | 287.8 -35% | 381.4 -14% |
| Brightness (cd/m²) | 416 | 378 -9% | 416 0% | 390 -6% | 268 -36% | 384 -8% |
| Brightness Distribution (%) | 85 | 83 -2% | 89 5% | 96 13% | 86 1% | 95 12% |
| Black Level * (cd/m²) | 0.155 | 0.29 -87% | 0.28 -81% | 0.027 83% | 0.3 -94% | |
| Contrast (:1) | 2845 | 1417 -50% | 1504 -47% | 14185 399% | 959 -66% | |
| Colorchecker dE 2000 * | 1.51 | 2.18 -44% | 3.2 -112% | 2.29 -52% | 6.3 -317% | 4.34 -187% |
| Colorchecker dE 2000 max. * | 3.56 | 4.84 -36% | 5.5 -54% | 3.47 3% | 21.32 -499% | 9.24 -160% |
| Greyscale dE 2000 * | 2.49 | 2.68 -8% | 4.4 -77% | 1.84 26% | 4 -61% | 2 20% |
| Gamma | 2.17 101% | 2.43 91% | 2.22 99% | 2.32 95% | 2.21 100% | 2.13 103% |
| CCT | 6292 103% | 6717 97% | 6384 102% | 6308 103% | 6762 96% | 6210 105% |
| Colorchecker dE 2000 calibrated * | 1.48 | 2 | 2.53 | |||
| Total Average (Program / Settings) | 1% /
-14% | -5% /
-24% | 54% /
52% | -48% /
-90% | 15% /
-12% |
* ... smaller is better
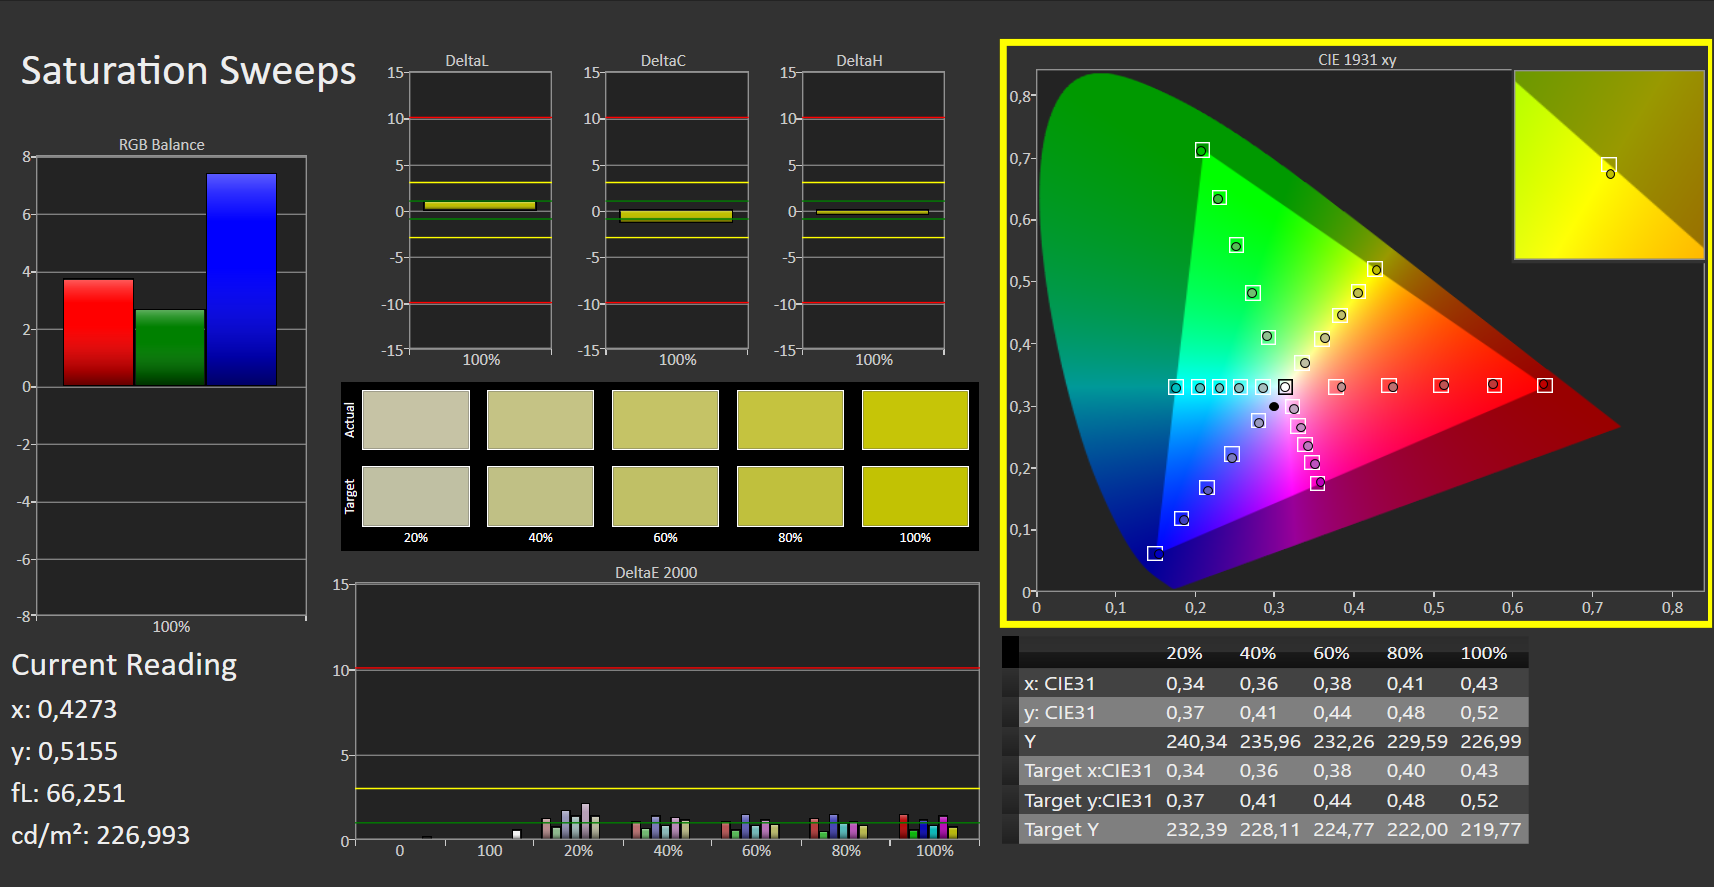
MSI promises 100% coverage of the AdobeRGB color space on the Prestige 15. Rather, it bluntly states that this should typically be the case. The measured 94% is a little off-target, but is still suitable for displaying and editing photos at a high level.
The display is much worse at covering the DCI-P3 color space, which is often used for video content and has larger green and yellow ranges. This is not surprising, since the focus is on image editing.

The specified factory calibration is slightly off the mark in our review sample with a maximum DeltaE of 2. To be fair, color deviations are only perceptible from a value of 3, so the average value remains well below that.
Accordingly, the screen of the Prestige 15 will display almost lifelike colors without any further adjustments.
Display Response Times
| ↔ Response Time Black to White | ||
|---|---|---|
| 26 ms ... rise ↗ and fall ↘ combined | ↗ 11 ms rise |  |
| ↘ 15 ms fall | ||
| The screen shows relatively slow response rates in our tests and may be too slow for gamers. In comparison, all tested devices range from 0.1 (minimum) to 240 (maximum) ms. » 62 % of all devices are better. This means that the measured response time is worse than the average of all tested devices (19.9 ms). | ||
| ↔ Response Time 50% Grey to 80% Grey | ||
| 51 ms ... rise ↗ and fall ↘ combined | ↗ 23 ms rise |  |
| ↘ 28 ms fall | ||
| The screen shows slow response rates in our tests and will be unsatisfactory for gamers. In comparison, all tested devices range from 0.165 (minimum) to 636 (maximum) ms. » 87 % of all devices are better. This means that the measured response time is worse than the average of all tested devices (31.1 ms). | ||
Screen Flickering / PWM (Pulse-Width Modulation)
| Screen flickering / PWM not detected |  | ||
In comparison: 52 % of all tested devices do not use PWM to dim the display. If PWM was detected, an average of 7798 (minimum: 5 - maximum: 343500) Hz was measured. | |||


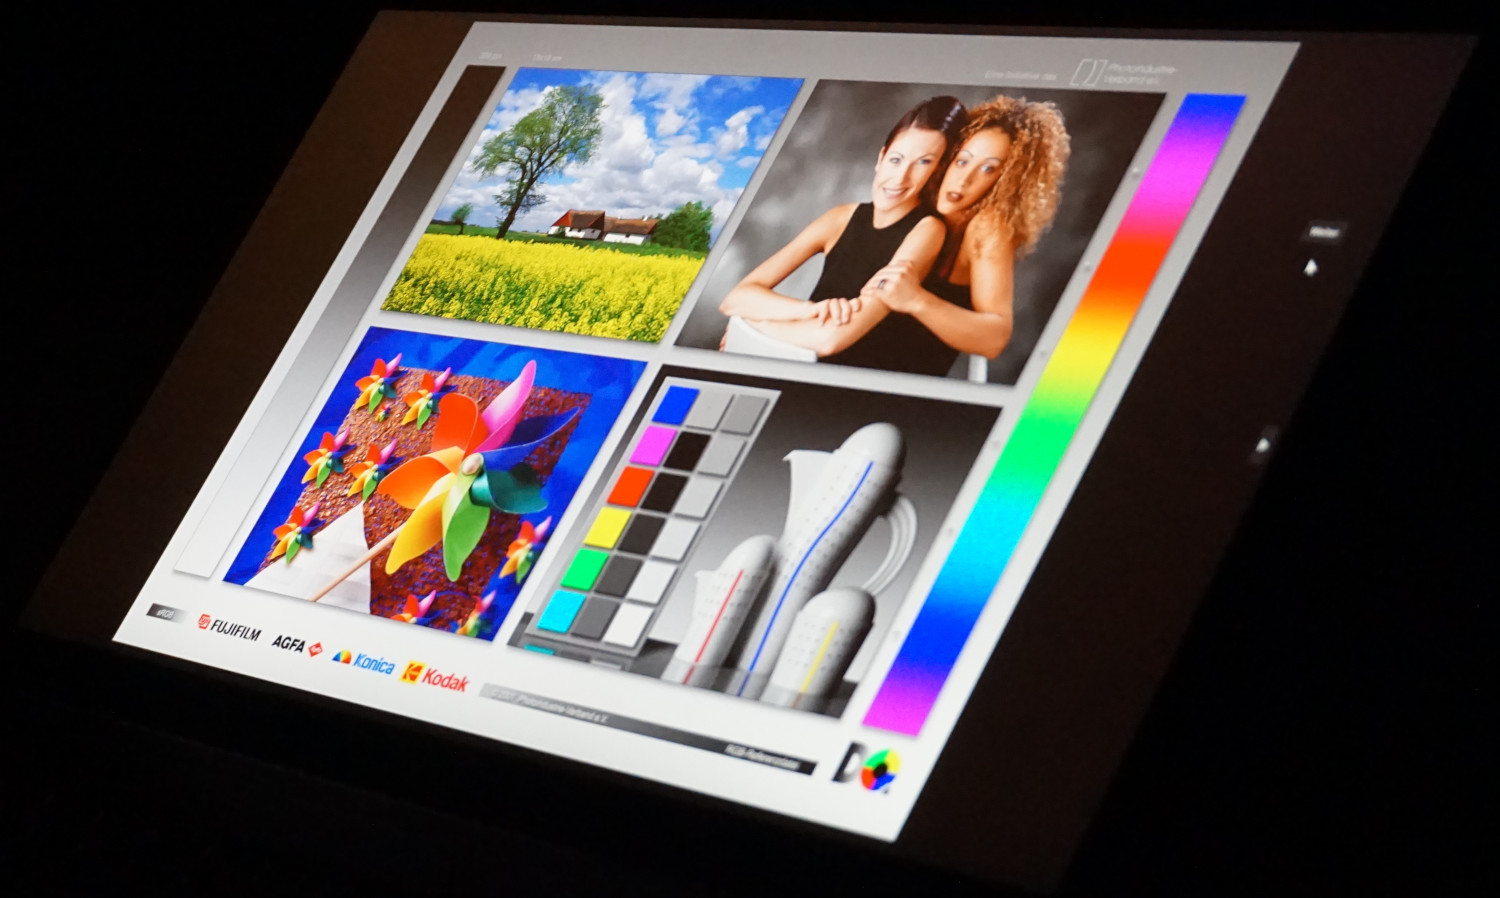
Texts are legible outdoors and even in direct sunlight. On the other hand, you should look for a shady spot for colorful screen content, otherwise color reproduction will suffer.
Overall, the brightness allows the Prestige 15 to be used outdoors, even if only just.
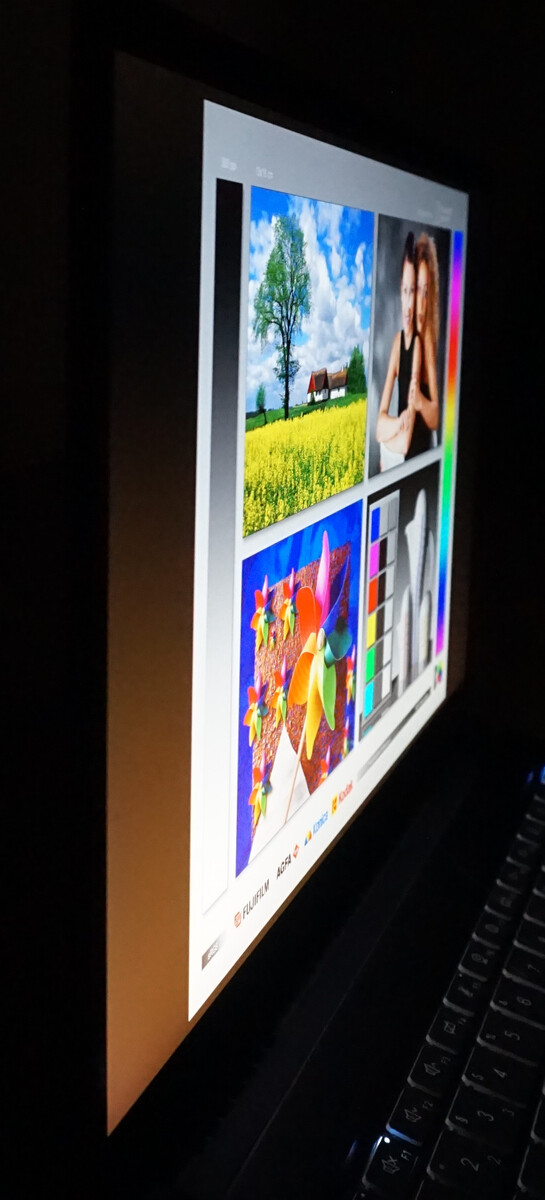
As usual, IPS panels should ensure almost perfect viewing angle stability, but this is not the case with the Prestige 15. Colors and brightness remain unchanged only up to about 30 degrees. Beyond that, a brownish discoloration can be seen, especially on black surfaces.
We suspect an interference effect due to the high pixel density, as can be seen in double slit experiments. Another point that speaks in favor of the models with Full HD screens.

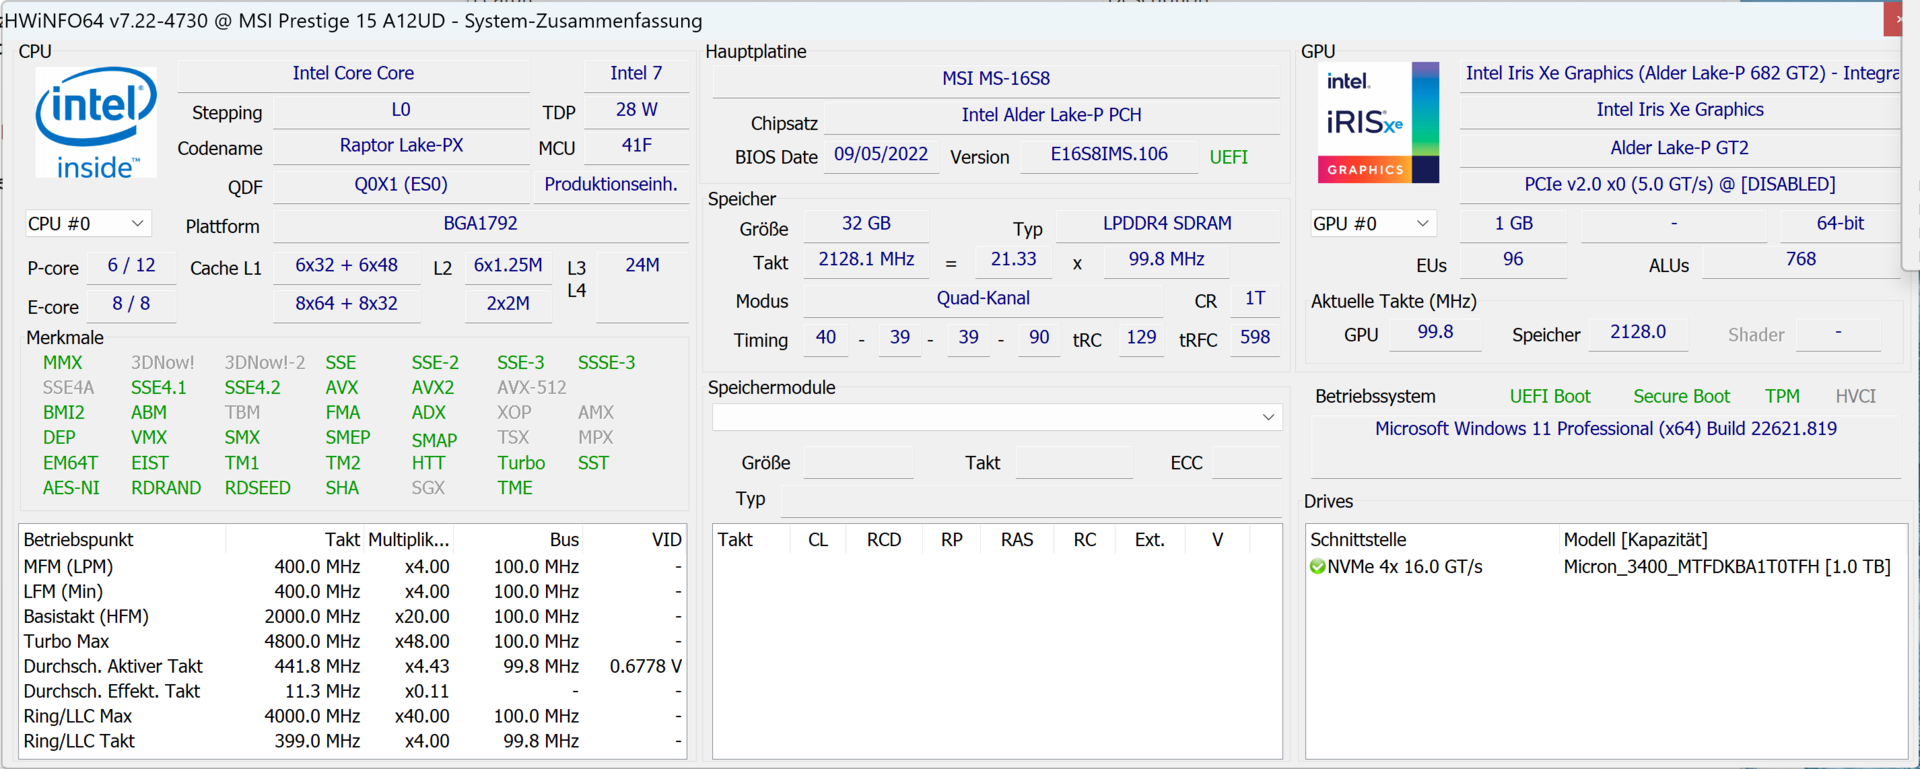
Performance - Quick & quiet creator notebook
The combination of a very efficient, yet powerful Intel Core i7-1280P and a Nvidia GeForce RTX 3050 Ti graphics processor ensures minimal waiting times during system and program starts. With 14 cores and 20 threads, the MSI Prestige 15 doesn't let itself get fazed by multiple programs running simultaneously. Of course, 32 GB of RAM also helps.
Like the large desktop variant, the mobile RTX 3050 Ti is primarily suitable for image and video editing. Complex tasks such as video rendering and photo optimization are correspondingly fast. However, games reveal the GPU's limits. A smooth gaming experience is only realistic at a limited resolution and restricted details.
If the shortest processing times aren't so important for media editing, nothing speaks against the Prestige 15 A12UC-099 with the Intel Core i5-1240P and 16 GB RAM. At most, the limitations only really come to fore in multitasking.

Testing Conditions
"Smart Auto" was set in the MSI Center Pro for all tests. This mode is intended to ensure that the most desirable settings for the processor are selected according to the running programs and the environment.
The extended mode with dynamic fan noise, which is supposed to be lower in quiet environments than in loud ones, still seems to be in the experimental stage. Apart from error messages, there were no noticeable changes.
On the other hand, those who want to select the performance mode themselves have the following options:
| High Performance | Balanced | Quiet | Super Battery | |
|---|---|---|---|---|
| PL1 | 50 watts | 35 watts | 20 watts | 12 watts |
| PL2 | 64 watts | 40 watts | 35 watts | 15 watts |
Processor
The Intel Core i7-1280P has 6 performance and 8 efficiency cores, amounting to a total of 20 threads (only the P-cores support 2 threads). The configuration is thus strongly reminiscent of the Intel Core i7-12700H, which is, however, designed for a continuous load of 45 watts and not just 28 watts like the i7-1280P.
At the beginning of our endurance tests with Cinebench R15, they are at least on par because of the comparable configuration. However, the Prestige 15 has to restrict the power very quickly, which leads to significant performance reduction. Nevertheless, the CPU remains above an Intel Core i7-11370H and at the level of the AMD Ryzen 5 6600H, even with the handbrake on.
The i7-1280P can thus utilize its strengths exactly in the way that MSI intended. An extremely high amount of performance is available in the first few seconds, which is required when running programs or installations. Image processing also rarely takes more than 30 seconds, even in large files.
The i7-1280P can therefore keep up with the much bigger i7-12700H in all typical scenarios. Only more demanding programs such as video editing software and games experience drops in performance. But these are less dramatic than the power consumption suggests: While the i7-12700H delivers around 40% better rates, it consumes almost twice as much power.
The processor installed here is still on the level of not quite up-to-date CPUs that are found in gaming notebooks. Because of its significantly lower power consumption, the ventilation remains quiet and the case heats up less.
More benchmarks for different processors can be found in our CPU benchmark list.
Cinebench R15 Multi Sustained Load
Cinebench R23: Multi Core | Single Core
Cinebench R20: CPU (Multi Core) | CPU (Single Core)
Cinebench R15: CPU Multi 64Bit | CPU Single 64Bit
Blender: v2.79 BMW27 CPU
7-Zip 18.03: 7z b 4 | 7z b 4 -mmt1
Geekbench 5.5: Multi-Core | Single-Core
HWBOT x265 Benchmark v2.2: 4k Preset
LibreOffice : 20 Documents To PDF
R Benchmark 2.5: Overall mean
| CPU Performance rating | |
| Average of class Multimedia | |
| Dell XPS 15 9520 RTX 3050 Ti | |
| Schenker Vision 14 2022 RTX 3050 Ti | |
| MSI Prestige 15 A12UD-093 -1! | |
| Average Intel Core i7-1280P | |
| Acer Swift X SFX16-52G-77RX | |
| Lenovo IdeaPad Gaming 3 15ARH7 | |
| Asus VivoBook Pro 16X OLED N7600PC-L2026X | |
| Cinebench R23 / Multi Core | |
| Average of class Multimedia (4861 - 33362, n=81, last 2 years) | |
| Schenker Vision 14 2022 RTX 3050 Ti | |
| Dell XPS 15 9520 RTX 3050 Ti | |
| MSI Prestige 15 A12UD-093 | |
| Average Intel Core i7-1280P (8632 - 14803, n=8) | |
| Acer Swift X SFX16-52G-77RX | |
| Lenovo IdeaPad Gaming 3 15ARH7 | |
| Asus VivoBook Pro 16X OLED N7600PC-L2026X | |
| Cinebench R23 / Single Core | |
| Average of class Multimedia (1128 - 2459, n=73, last 2 years) | |
| Dell XPS 15 9520 RTX 3050 Ti | |
| Acer Swift X SFX16-52G-77RX | |
| Schenker Vision 14 2022 RTX 3050 Ti | |
| Average Intel Core i7-1280P (1609 - 1787, n=7) | |
| MSI Prestige 15 A12UD-093 | |
| Asus VivoBook Pro 16X OLED N7600PC-L2026X | |
| Lenovo IdeaPad Gaming 3 15ARH7 | |
| Cinebench R20 / CPU (Multi Core) | |
| Average of class Multimedia (1887 - 12912, n=64, last 2 years) | |
| Schenker Vision 14 2022 RTX 3050 Ti | |
| Dell XPS 15 9520 RTX 3050 Ti | |
| Average Intel Core i7-1280P (3283 - 5415, n=8) | |
| MSI Prestige 15 A12UD-093 | |
| Acer Swift X SFX16-52G-77RX | |
| Lenovo IdeaPad Gaming 3 15ARH7 | |
| Asus VivoBook Pro 16X OLED N7600PC-L2026X | |
| Cinebench R20 / CPU (Single Core) | |
| Average of class Multimedia (425 - 853, n=64, last 2 years) | |
| Schenker Vision 14 2022 RTX 3050 Ti | |
| Dell XPS 15 9520 RTX 3050 Ti | |
| MSI Prestige 15 A12UD-093 | |
| Acer Swift X SFX16-52G-77RX | |
| Average Intel Core i7-1280P (615 - 701, n=8) | |
| Asus VivoBook Pro 16X OLED N7600PC-L2026X | |
| Lenovo IdeaPad Gaming 3 15ARH7 | |
| Cinebench R15 / CPU Multi 64Bit | |
| Average of class Multimedia (856 - 5224, n=68, last 2 years) | |
| MSI Prestige 15 A12UD-093 | |
| Dell XPS 15 9520 RTX 3050 Ti | |
| Schenker Vision 14 2022 RTX 3050 Ti | |
| Average Intel Core i7-1280P (1905 - 2332, n=7) | |
| Acer Swift X SFX16-52G-77RX | |
| Lenovo IdeaPad Gaming 3 15ARH7 | |
| Asus VivoBook Pro 16X OLED N7600PC-L2026X | |
| Cinebench R15 / CPU Single 64Bit | |
| Average of class Multimedia (184.8 - 326, n=66, last 2 years) | |
| Schenker Vision 14 2022 RTX 3050 Ti | |
| Dell XPS 15 9520 RTX 3050 Ti | |
| Acer Swift X SFX16-52G-77RX | |
| Average Intel Core i7-1280P (203 - 258, n=7) | |
| Lenovo IdeaPad Gaming 3 15ARH7 | |
| Asus VivoBook Pro 16X OLED N7600PC-L2026X | |
| Asus VivoBook Pro 16X OLED N7600PC-L2026X | |
| MSI Prestige 15 A12UD-093 | |
| Blender / v2.79 BMW27 CPU | |
| Asus VivoBook Pro 16X OLED N7600PC-L2026X | |
| Lenovo IdeaPad Gaming 3 15ARH7 | |
| Acer Swift X SFX16-52G-77RX | |
| MSI Prestige 15 A12UD-093 | |
| Average Intel Core i7-1280P (259 - 309, n=7) | |
| Schenker Vision 14 2022 RTX 3050 Ti | |
| Average of class Multimedia (100 - 557, n=65, last 2 years) | |
| Dell XPS 15 9520 RTX 3050 Ti | |
| 7-Zip 18.03 / 7z b 4 | |
| Dell XPS 15 9520 RTX 3050 Ti | |
| Average of class Multimedia (29095 - 130368, n=62, last 2 years) | |
| MSI Prestige 15 A12UD-093 | |
| Schenker Vision 14 2022 RTX 3050 Ti | |
| Average Intel Core i7-1280P (45292 - 53710, n=7) | |
| Acer Swift X SFX16-52G-77RX | |
| Lenovo IdeaPad Gaming 3 15ARH7 | |
| Asus VivoBook Pro 16X OLED N7600PC-L2026X | |
| 7-Zip 18.03 / 7z b 4 -mmt1 | |
| Average of class Multimedia (3666 - 7545, n=63, last 2 years) | |
| Schenker Vision 14 2022 RTX 3050 Ti | |
| Dell XPS 15 9520 RTX 3050 Ti | |
| MSI Prestige 15 A12UD-093 | |
| Average Intel Core i7-1280P (4995 - 5874, n=7) | |
| Lenovo IdeaPad Gaming 3 15ARH7 | |
| Asus VivoBook Pro 16X OLED N7600PC-L2026X | |
| Acer Swift X SFX16-52G-77RX | |
| Geekbench 5.5 / Multi-Core | |
| Average of class Multimedia (4652 - 20422, n=62, last 2 years) | |
| Dell XPS 15 9520 RTX 3050 Ti | |
| MSI Prestige 15 A12UD-093 | |
| Schenker Vision 14 2022 RTX 3050 Ti | |
| Average Intel Core i7-1280P (9623 - 11811, n=7) | |
| Acer Swift X SFX16-52G-77RX | |
| Lenovo IdeaPad Gaming 3 15ARH7 | |
| Asus VivoBook Pro 16X OLED N7600PC-L2026X | |
| Geekbench 5.5 / Single-Core | |
| Average of class Multimedia (805 - 2974, n=62, last 2 years) | |
| Acer Swift X SFX16-52G-77RX | |
| Schenker Vision 14 2022 RTX 3050 Ti | |
| Dell XPS 15 9520 RTX 3050 Ti | |
| Average Intel Core i7-1280P (1571 - 1802, n=7) | |
| MSI Prestige 15 A12UD-093 | |
| Asus VivoBook Pro 16X OLED N7600PC-L2026X | |
| Lenovo IdeaPad Gaming 3 15ARH7 | |
| HWBOT x265 Benchmark v2.2 / 4k Preset | |
| Average of class Multimedia (5.26 - 36.1, n=63, last 2 years) | |
| Dell XPS 15 9520 RTX 3050 Ti | |
| Schenker Vision 14 2022 RTX 3050 Ti | |
| Acer Swift X SFX16-52G-77RX | |
| Average Intel Core i7-1280P (9.62 - 14.5, n=5) | |
| Lenovo IdeaPad Gaming 3 15ARH7 | |
| Asus VivoBook Pro 16X OLED N7600PC-L2026X | |
| LibreOffice / 20 Documents To PDF | |
| MSI Prestige 15 A12UD-093 | |
| MSI Prestige 15 A12UD-093 | |
| Lenovo IdeaPad Gaming 3 15ARH7 | |
| Acer Swift X SFX16-52G-77RX | |
| Asus VivoBook Pro 16X OLED N7600PC-L2026X | |
| Average Intel Core i7-1280P (41 - 61.6, n=8) | |
| Average of class Multimedia (23.9 - 146.7, n=64, last 2 years) | |
| Schenker Vision 14 2022 RTX 3050 Ti | |
| Dell XPS 15 9520 RTX 3050 Ti | |
| R Benchmark 2.5 / Overall mean | |
| Asus VivoBook Pro 16X OLED N7600PC-L2026X | |
| Lenovo IdeaPad Gaming 3 15ARH7 | |
| Average Intel Core i7-1280P (0.4505 - 0.512, n=7) | |
| Acer Swift X SFX16-52G-77RX | |
| Average of class Multimedia (0.3604 - 0.947, n=63, last 2 years) | |
| Schenker Vision 14 2022 RTX 3050 Ti | |
| Dell XPS 15 9520 RTX 3050 Ti | |
| MSI Prestige 15 A12UD-093 | |
* ... smaller is better
AIDA64: FP32 Ray-Trace | FPU Julia | CPU SHA3 | CPU Queen | FPU SinJulia | FPU Mandel | CPU AES | CPU ZLib | FP64 Ray-Trace | CPU PhotoWorxx
| Performance rating | |
| Average of class Multimedia | |
| Lenovo IdeaPad Gaming 3 15ARH7 | |
| Schenker Vision 14 2022 RTX 3050 Ti | |
| MSI Prestige 15 A12UD-093 | |
| Average Intel Core i7-1280P | |
| Dell XPS 15 9520 RTX 3050 Ti | |
| Acer Swift X SFX16-52G-77RX | |
| Asus VivoBook Pro 16X OLED N7600PC-L2026X | |
| AIDA64 / FP32 Ray-Trace | |
| Average of class Multimedia (2214 - 50388, n=60, last 2 years) | |
| Schenker Vision 14 2022 RTX 3050 Ti | |
| Lenovo IdeaPad Gaming 3 15ARH7 | |
| MSI Prestige 15 A12UD-093 | |
| Average Intel Core i7-1280P (7466 - 13068, n=6) | |
| Acer Swift X SFX16-52G-77RX | |
| Dell XPS 15 9520 RTX 3050 Ti | |
| Asus VivoBook Pro 16X OLED N7600PC-L2026X | |
| AIDA64 / FPU Julia | |
| Average of class Multimedia (12867 - 201874, n=61, last 2 years) | |
| Lenovo IdeaPad Gaming 3 15ARH7 | |
| Schenker Vision 14 2022 RTX 3050 Ti | |
| MSI Prestige 15 A12UD-093 | |
| Average Intel Core i7-1280P (38904 - 66081, n=6) | |
| Acer Swift X SFX16-52G-77RX | |
| Dell XPS 15 9520 RTX 3050 Ti | |
| Asus VivoBook Pro 16X OLED N7600PC-L2026X | |
| AIDA64 / CPU SHA3 | |
| Average of class Multimedia (653 - 8623, n=61, last 2 years) | |
| Schenker Vision 14 2022 RTX 3050 Ti | |
| Dell XPS 15 9520 RTX 3050 Ti | |
| MSI Prestige 15 A12UD-093 | |
| Lenovo IdeaPad Gaming 3 15ARH7 | |
| Average Intel Core i7-1280P (1826 - 2992, n=6) | |
| Acer Swift X SFX16-52G-77RX | |
| Asus VivoBook Pro 16X OLED N7600PC-L2026X | |
| AIDA64 / CPU Queen | |
| Dell XPS 15 9520 RTX 3050 Ti | |
| Average Intel Core i7-1280P (80180 - 100358, n=6) | |
| Schenker Vision 14 2022 RTX 3050 Ti | |
| Acer Swift X SFX16-52G-77RX | |
| MSI Prestige 15 A12UD-093 | |
| Lenovo IdeaPad Gaming 3 15ARH7 | |
| Average of class Multimedia (13483 - 181505, n=49, last 2 years) | |
| Asus VivoBook Pro 16X OLED N7600PC-L2026X | |
| AIDA64 / FPU SinJulia | |
| Lenovo IdeaPad Gaming 3 15ARH7 | |
| Average of class Multimedia (1240 - 28794, n=61, last 2 years) | |
| Dell XPS 15 9520 RTX 3050 Ti | |
| Schenker Vision 14 2022 RTX 3050 Ti | |
| MSI Prestige 15 A12UD-093 | |
| Average Intel Core i7-1280P (5880 - 8571, n=6) | |
| Acer Swift X SFX16-52G-77RX | |
| Asus VivoBook Pro 16X OLED N7600PC-L2026X | |
| AIDA64 / FPU Mandel | |
| Average of class Multimedia (6395 - 105740, n=60, last 2 years) | |
| Lenovo IdeaPad Gaming 3 15ARH7 | |
| Schenker Vision 14 2022 RTX 3050 Ti | |
| MSI Prestige 15 A12UD-093 | |
| Average Intel Core i7-1280P (18907 - 32766, n=6) | |
| Acer Swift X SFX16-52G-77RX | |
| Dell XPS 15 9520 RTX 3050 Ti | |
| Asus VivoBook Pro 16X OLED N7600PC-L2026X | |
| AIDA64 / CPU AES | |
| Lenovo IdeaPad Gaming 3 15ARH7 | |
| MSI Prestige 15 A12UD-093 | |
| Dell XPS 15 9520 RTX 3050 Ti | |
| Schenker Vision 14 2022 RTX 3050 Ti | |
| Average of class Multimedia (13243 - 126790, n=61, last 2 years) | |
| Asus VivoBook Pro 16X OLED N7600PC-L2026X | |
| Average Intel Core i7-1280P (40691 - 99367, n=6) | |
| Acer Swift X SFX16-52G-77RX | |
| AIDA64 / CPU ZLib | |
| Average of class Multimedia (167.2 - 2022, n=61, last 2 years) | |
| Schenker Vision 14 2022 RTX 3050 Ti | |
| Dell XPS 15 9520 RTX 3050 Ti | |
| Average Intel Core i7-1280P (540 - 880, n=6) | |
| MSI Prestige 15 A12UD-093 | |
| Acer Swift X SFX16-52G-77RX | |
| Lenovo IdeaPad Gaming 3 15ARH7 | |
| Asus VivoBook Pro 16X OLED N7600PC-L2026X | |
| AIDA64 / FP64 Ray-Trace | |
| Average of class Multimedia (1014 - 26875, n=61, last 2 years) | |
| Schenker Vision 14 2022 RTX 3050 Ti | |
| Lenovo IdeaPad Gaming 3 15ARH7 | |
| Average Intel Core i7-1280P (4006 - 7184, n=6) | |
| MSI Prestige 15 A12UD-093 | |
| Acer Swift X SFX16-52G-77RX | |
| Dell XPS 15 9520 RTX 3050 Ti | |
| Asus VivoBook Pro 16X OLED N7600PC-L2026X | |
| AIDA64 / CPU PhotoWorxx | |
| Average of class Multimedia (12860 - 88154, n=61, last 2 years) | |
| MSI Prestige 15 A12UD-093 | |
| Acer Swift X SFX16-52G-77RX | |
| Average Intel Core i7-1280P (36663 - 48416, n=6) | |
| Dell XPS 15 9520 RTX 3050 Ti | |
| Schenker Vision 14 2022 RTX 3050 Ti | |
| Lenovo IdeaPad Gaming 3 15ARH7 | |
| Asus VivoBook Pro 16X OLED N7600PC-L2026X | |
System Performance
Our good, albeit subjective, impression is reflected in the PCMark scores. The standardized and relatively realistic test places the MSI Prestige 15 high in the rankings. The processor and graphics card, which are very powerful for short periods of time, never have any difficulties.
One reason for this is also the frugality under sustained load. The system doesn't heat up as much here. Maximum performance is therefore always available when needed, such as when a program has to be started, which is then only for brief moments.
The high computing power can always be felt when browsing, installing and starting games.
CrossMark: Overall | Productivity | Creativity | Responsiveness
| PCMark 10 / Score | |
| Average of class Multimedia (4325 - 10386, n=58, last 2 years) | |
| Dell XPS 15 9520 RTX 3050 Ti | |
| Schenker Vision 14 2022 RTX 3050 Ti | |
| MSI Prestige 15 A12UD-093 | |
| Average Intel Core i7-1280P, NVIDIA GeForce RTX 3050 Ti Laptop GPU (5984 - 6379, n=2) | |
| Lenovo IdeaPad Gaming 3 15ARH7 | |
| Acer Swift X SFX16-52G-77RX | |
| Asus VivoBook Pro 16X OLED N7600PC-L2026X | |
| PCMark 10 / Essentials | |
| Dell XPS 15 9520 RTX 3050 Ti | |
| Acer Swift X SFX16-52G-77RX | |
| Average of class Multimedia (8025 - 11664, n=57, last 2 years) | |
| Schenker Vision 14 2022 RTX 3050 Ti | |
| MSI Prestige 15 A12UD-093 | |
| Average Intel Core i7-1280P, NVIDIA GeForce RTX 3050 Ti Laptop GPU (9687 - 10227, n=2) | |
| Lenovo IdeaPad Gaming 3 15ARH7 | |
| Asus VivoBook Pro 16X OLED N7600PC-L2026X | |
| PCMark 10 / Productivity | |
| Average of class Multimedia (7323 - 18233, n=57, last 2 years) | |
| Dell XPS 15 9520 RTX 3050 Ti | |
| MSI Prestige 15 A12UD-093 | |
| Lenovo IdeaPad Gaming 3 15ARH7 | |
| Schenker Vision 14 2022 RTX 3050 Ti | |
| Asus VivoBook Pro 16X OLED N7600PC-L2026X | |
| Average Intel Core i7-1280P, NVIDIA GeForce RTX 3050 Ti Laptop GPU (7521 - 9165, n=2) | |
| Acer Swift X SFX16-52G-77RX | |
| PCMark 10 / Digital Content Creation | |
| Average of class Multimedia (3651 - 16240, n=57, last 2 years) | |
| Dell XPS 15 9520 RTX 3050 Ti | |
| Schenker Vision 14 2022 RTX 3050 Ti | |
| Average Intel Core i7-1280P, NVIDIA GeForce RTX 3050 Ti Laptop GPU (7518 - 7980, n=2) | |
| Acer Swift X SFX16-52G-77RX | |
| MSI Prestige 15 A12UD-093 | |
| Lenovo IdeaPad Gaming 3 15ARH7 | |
| Asus VivoBook Pro 16X OLED N7600PC-L2026X | |
| CrossMark / Overall | |
| Dell XPS 15 9520 RTX 3050 Ti | |
| Average of class Multimedia (866 - 2728, n=67, last 2 years) | |
| Acer Swift X SFX16-52G-77RX | |
| MSI Prestige 15 A12UD-093 | |
| Average Intel Core i7-1280P, NVIDIA GeForce RTX 3050 Ti Laptop GPU (1652 - 1671, n=2) | |
| Schenker Vision 14 2022 RTX 3050 Ti | |
| Lenovo IdeaPad Gaming 3 15ARH7 | |
| Asus VivoBook Pro 16X OLED N7600PC-L2026X | |
| CrossMark / Productivity | |
| Dell XPS 15 9520 RTX 3050 Ti | |
| Average of class Multimedia (931 - 2489, n=67, last 2 years) | |
| Acer Swift X SFX16-52G-77RX | |
| Schenker Vision 14 2022 RTX 3050 Ti | |
| MSI Prestige 15 A12UD-093 | |
| Average Intel Core i7-1280P, NVIDIA GeForce RTX 3050 Ti Laptop GPU (1583 - 1618, n=2) | |
| Lenovo IdeaPad Gaming 3 15ARH7 | |
| Asus VivoBook Pro 16X OLED N7600PC-L2026X | |
| CrossMark / Creativity | |
| Average of class Multimedia (907 - 3465, n=67, last 2 years) | |
| Dell XPS 15 9520 RTX 3050 Ti | |
| Acer Swift X SFX16-52G-77RX | |
| Average Intel Core i7-1280P, NVIDIA GeForce RTX 3050 Ti Laptop GPU (1752 - 1761, n=2) | |
| MSI Prestige 15 A12UD-093 | |
| Schenker Vision 14 2022 RTX 3050 Ti | |
| Lenovo IdeaPad Gaming 3 15ARH7 | |
| Asus VivoBook Pro 16X OLED N7600PC-L2026X | |
| CrossMark / Responsiveness | |
| Dell XPS 15 9520 RTX 3050 Ti | |
| Acer Swift X SFX16-52G-77RX | |
| MSI Prestige 15 A12UD-093 | |
| Average Intel Core i7-1280P, NVIDIA GeForce RTX 3050 Ti Laptop GPU (1550 - 1594, n=2) | |
| Schenker Vision 14 2022 RTX 3050 Ti | |
| Average of class Multimedia (605 - 2024, n=67, last 2 years) | |
| Lenovo IdeaPad Gaming 3 15ARH7 | |
| Asus VivoBook Pro 16X OLED N7600PC-L2026X | |
| PCMark 10 Score | 6379 points | |
Help | ||
| AIDA64 / Memory Copy | |
| Average of class Multimedia (21158 - 132135, n=61, last 2 years) | |
| Average Intel Core i7-1280P (56337 - 73486, n=6) | |
| Acer Swift X SFX16-52G-77RX | |
| MSI Prestige 15 A12UD-093 | |
| Dell XPS 15 9520 RTX 3050 Ti | |
| Schenker Vision 14 2022 RTX 3050 Ti | |
| Asus VivoBook Pro 16X OLED N7600PC-L2026X | |
| Lenovo IdeaPad Gaming 3 15ARH7 | |
| AIDA64 / Memory Read | |
| Average of class Multimedia (19699 - 174586, n=61, last 2 years) | |
| Average Intel Core i7-1280P (63221 - 73719, n=6) | |
| Acer Swift X SFX16-52G-77RX | |
| MSI Prestige 15 A12UD-093 | |
| Dell XPS 15 9520 RTX 3050 Ti | |
| Schenker Vision 14 2022 RTX 3050 Ti | |
| Asus VivoBook Pro 16X OLED N7600PC-L2026X | |
| Lenovo IdeaPad Gaming 3 15ARH7 | |
| AIDA64 / Memory Write | |
| Average of class Multimedia (17733 - 134998, n=61, last 2 years) | |
| MSI Prestige 15 A12UD-093 | |
| Average Intel Core i7-1280P (58729 - 68247, n=6) | |
| Acer Swift X SFX16-52G-77RX | |
| Dell XPS 15 9520 RTX 3050 Ti | |
| Schenker Vision 14 2022 RTX 3050 Ti | |
| Asus VivoBook Pro 16X OLED N7600PC-L2026X | |
| Lenovo IdeaPad Gaming 3 15ARH7 | |
| AIDA64 / Memory Latency | |
| Average of class Multimedia (7 - 535, n=60, last 2 years) | |
| Acer Swift X SFX16-52G-77RX | |
| Average Intel Core i7-1280P (93.1 - 153.3, n=6) | |
| Dell XPS 15 9520 RTX 3050 Ti | |
| MSI Prestige 15 A12UD-093 | |
| Schenker Vision 14 2022 RTX 3050 Ti | |
| Asus VivoBook Pro 16X OLED N7600PC-L2026X | |
| Lenovo IdeaPad Gaming 3 15ARH7 | |
* ... smaller is better
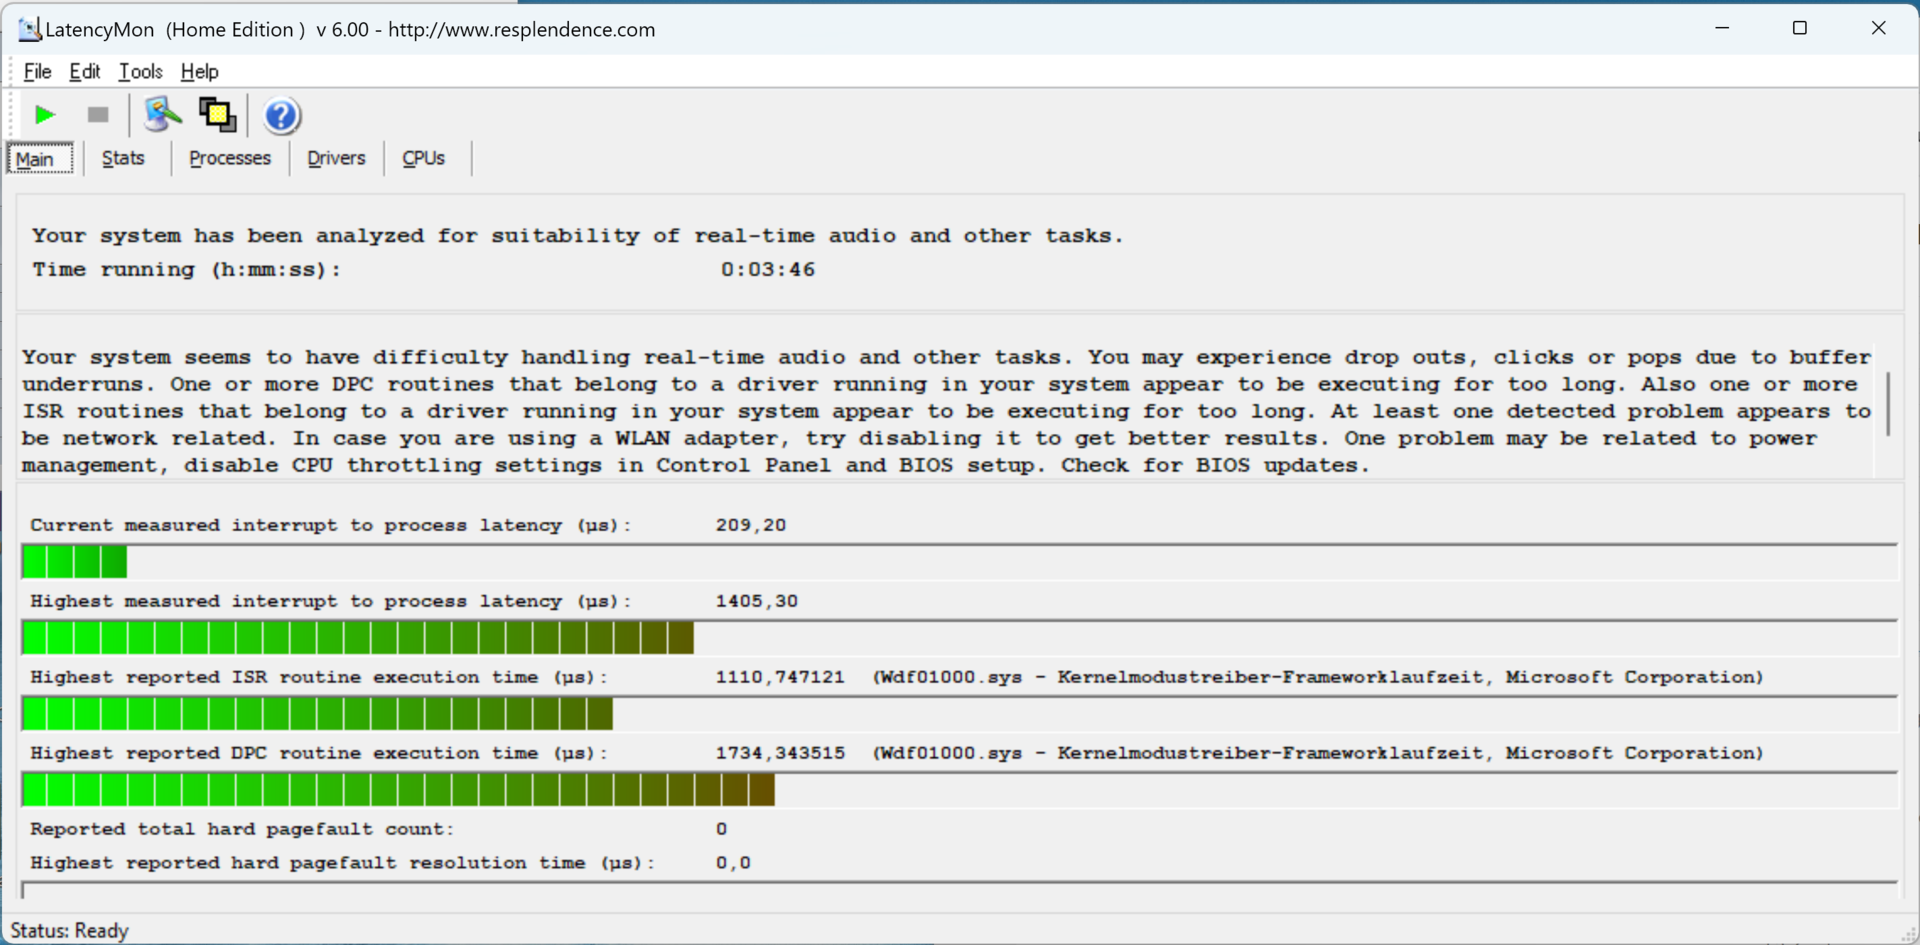
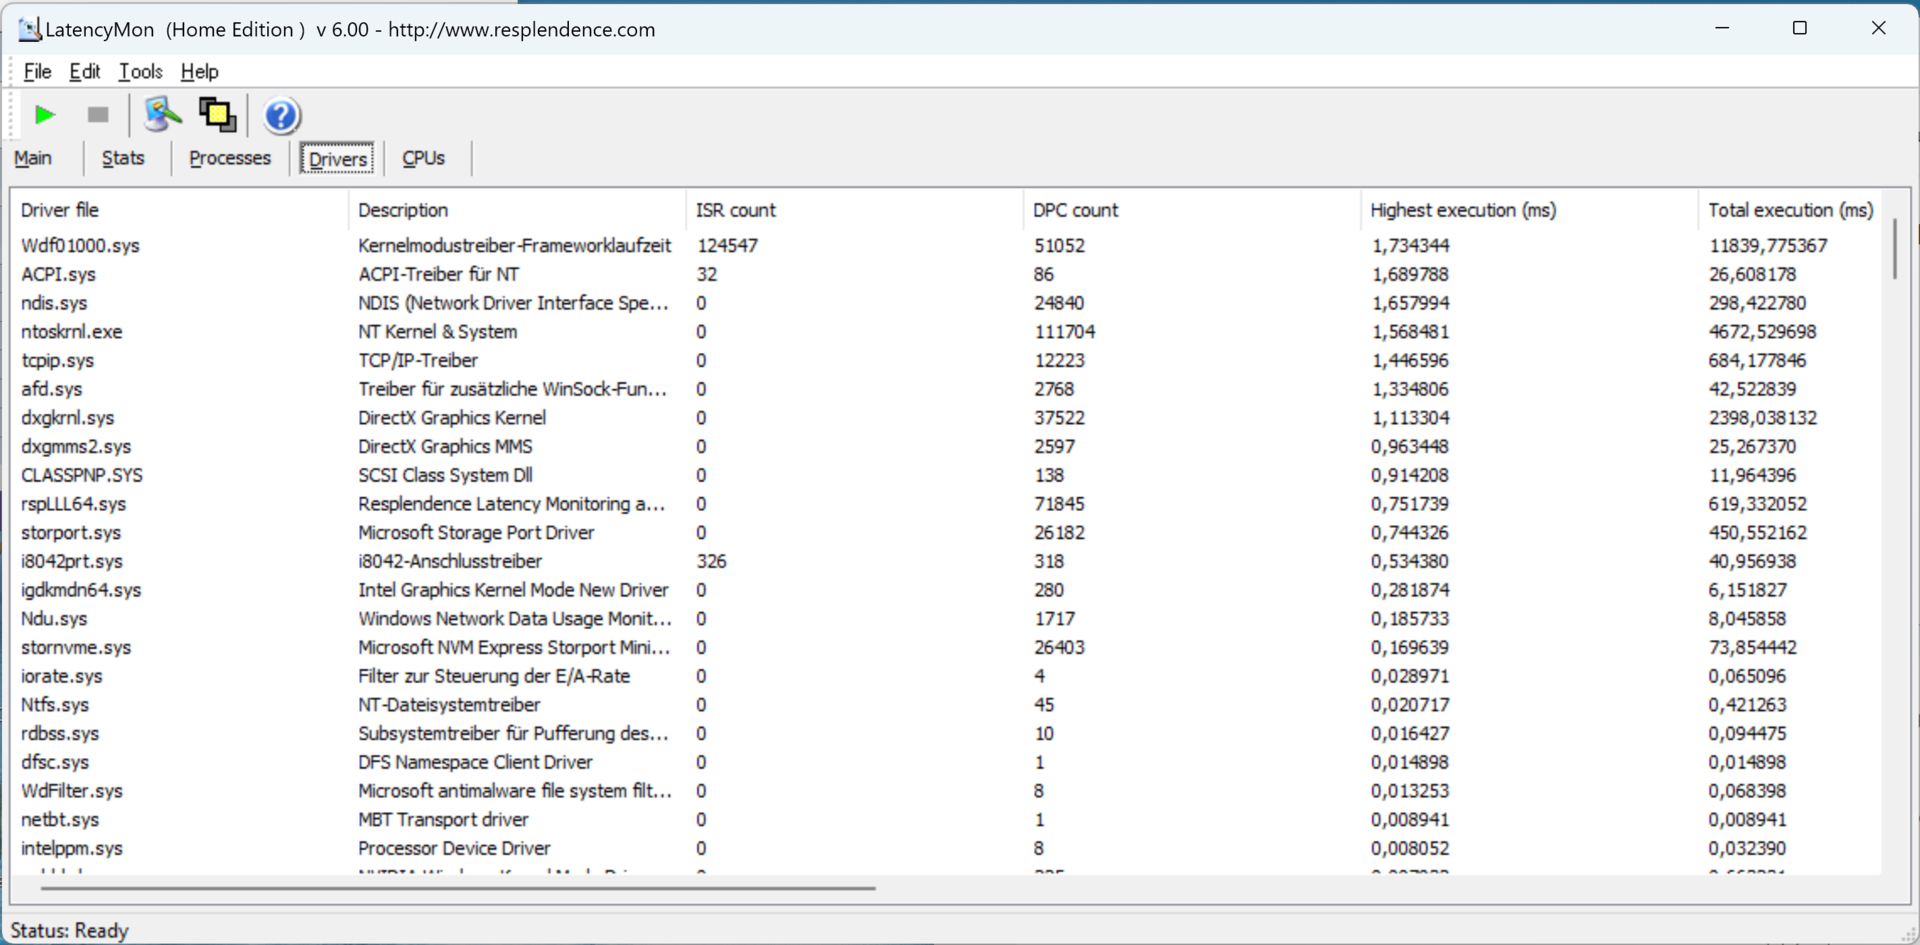
DPC Latency
The Prestige 15 is not suitable for real-time audio and video editing. It has the highest latency in the field of competitors.
The kernel mode driver framework is mainly responsible for this. An adjustment of the driver configuration, updates and more may remedy the problem.
| DPC Latencies / LatencyMon - interrupt to process latency (max), Web, Youtube, Prime95 | |
| MSI Prestige 15 A12UD-093 | |
| Dell XPS 15 9520 RTX 3050 Ti | |
| Schenker Vision 14 2022 RTX 3050 Ti | |
| Acer Swift X SFX16-52G-77RX | |
| Lenovo IdeaPad Gaming 3 15ARH7 | |
| Asus VivoBook Pro 16X OLED N7600PC-L2026X | |
* ... smaller is better
Storage Devices
The Micron SSD achieves more than 6,000 MB/s in sequential reading. This rate also remains stable over longer periods of time, which speaks for the adequate cooling of the hardware.
This means that the PCIe 4.0 interface can be used well with the M.2 SSD. However, the other rates are not quite on par with the best hard drives. But this does not have any negative effects for a fast, albeit not outstanding creator notebook.
On the other hand, the size of 1 TB is fitting. Raw data, whether videos or images, take up a lot of space. So the second SSD slot makes sense, which is easily accessible regardless of the seal.

* ... smaller is better
Sustained Read Performance: DiskSpd Read Loop, Queue Depth 8
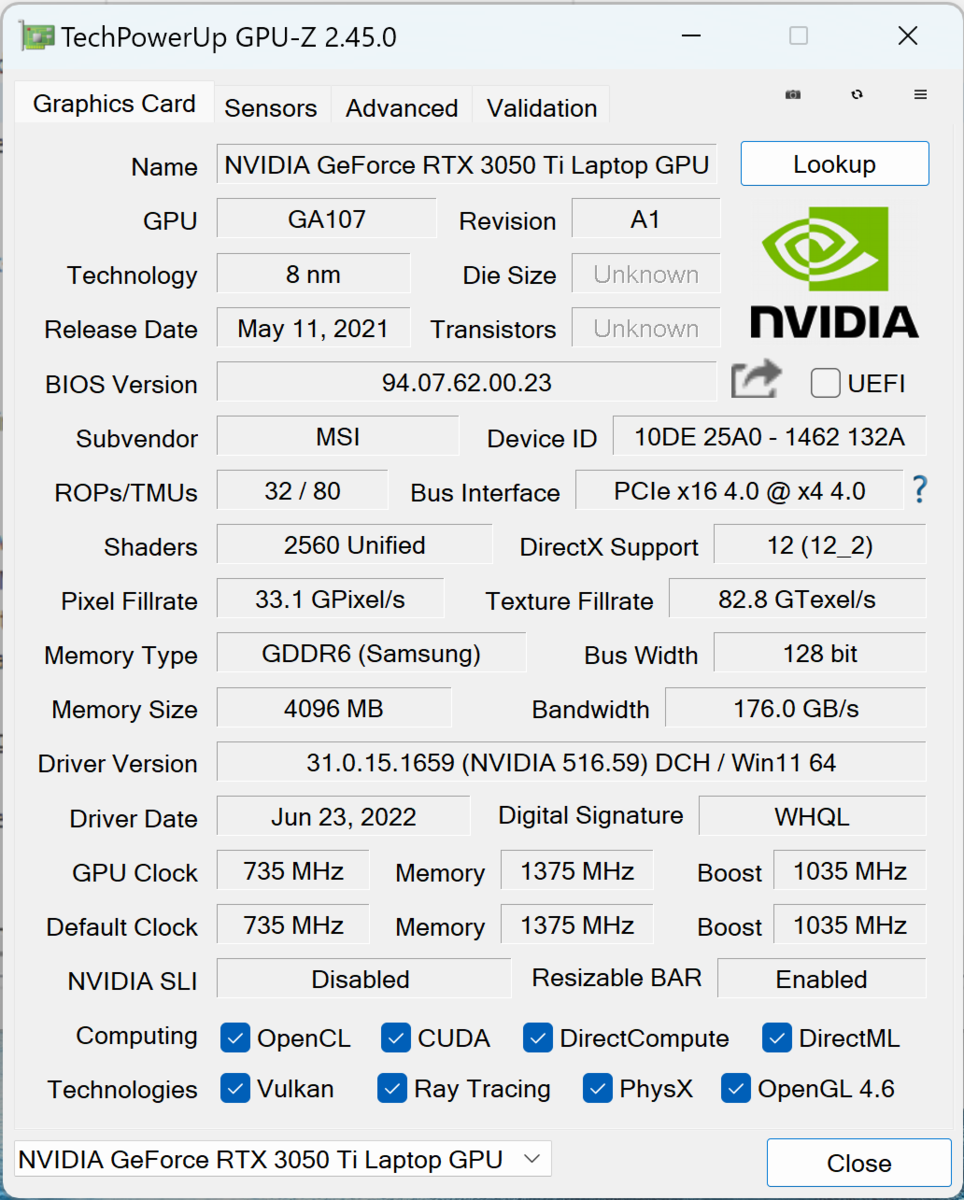
Graphics Card
The Nvidia GeForce RTX 3050 Ti is not the most solid recommendation for gaming, even when free of limitations. Here it is limited to a maximum of 40 watts in the MSI Prestige 15, which further reduces performance in continuous operation. In theory at least, operation of up to 80 watts is possible.
This is of course not necessary here. Like the processor, the graphics chip is only intended to provide powerful performance bursts to accelerate program processes. This succeeds very convincingly in comparison to a GeForce MX450. On the other hand, the Intel Arc A370M, which is actually somewhat weaker on average in our measurements, is able to outperform the throttled RTX 3050 Ti.
This limited power consumption ensures that there is no drop in performance even under sustained load. Even in battery mode, graphics performance remains at approximately the same level. This decision seems only logical, as multimedia notebooks shouldn't take longer for image editing just because there isn't a power outlet nearby.
However, the fact that the best performance rates are achieved in battery mode could be due to the MSI Center Pro software not being configured correctly. The system then receives more power than with the power adapter connected.
More GPU benchmarks can be found here.
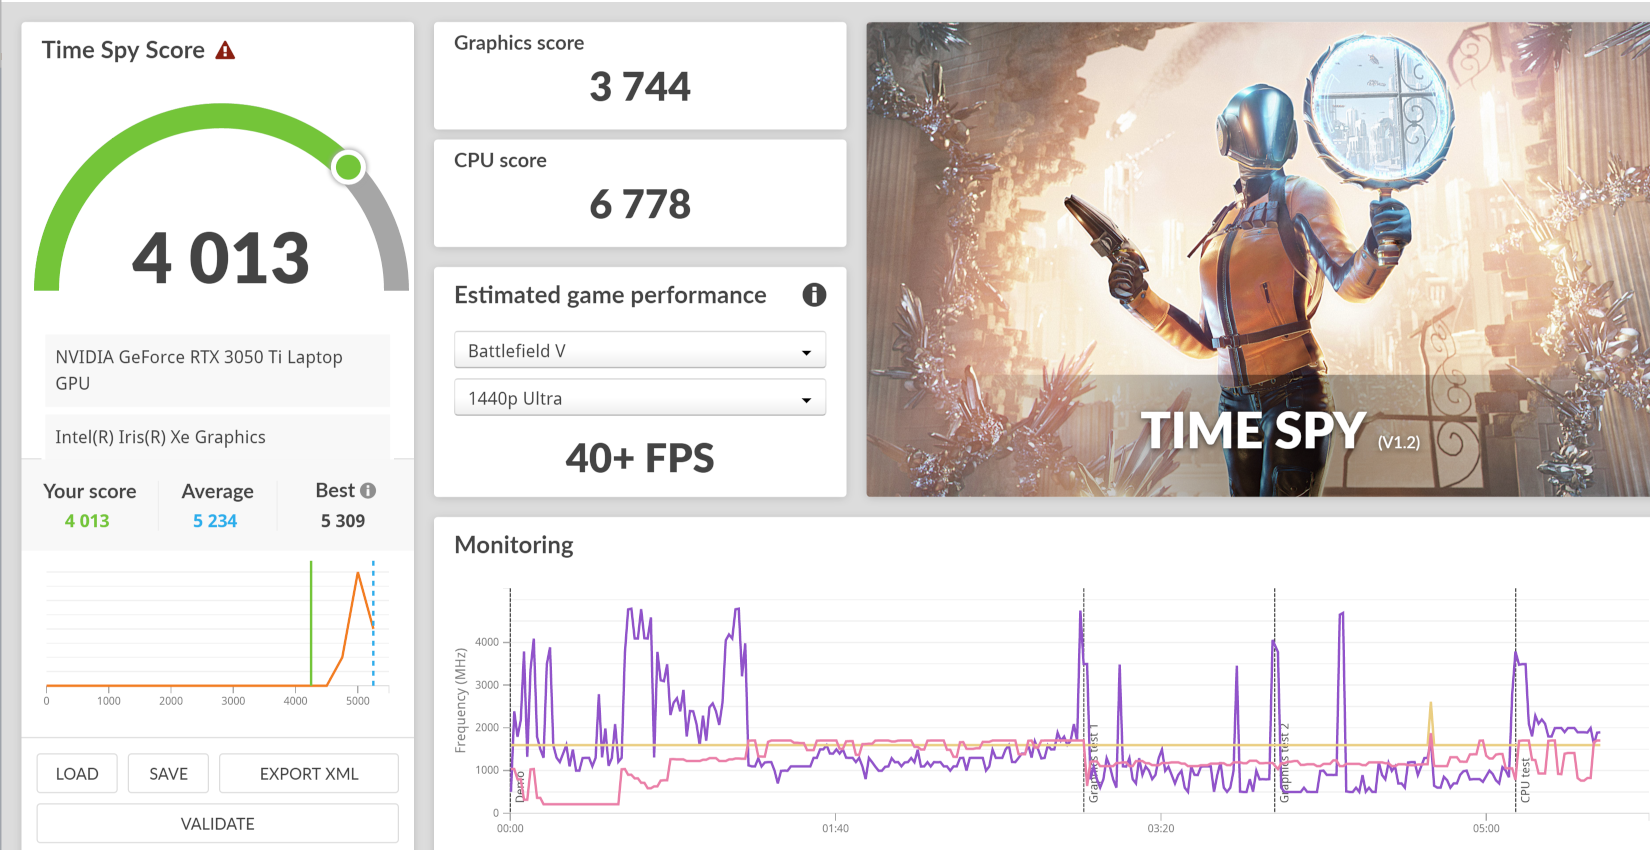
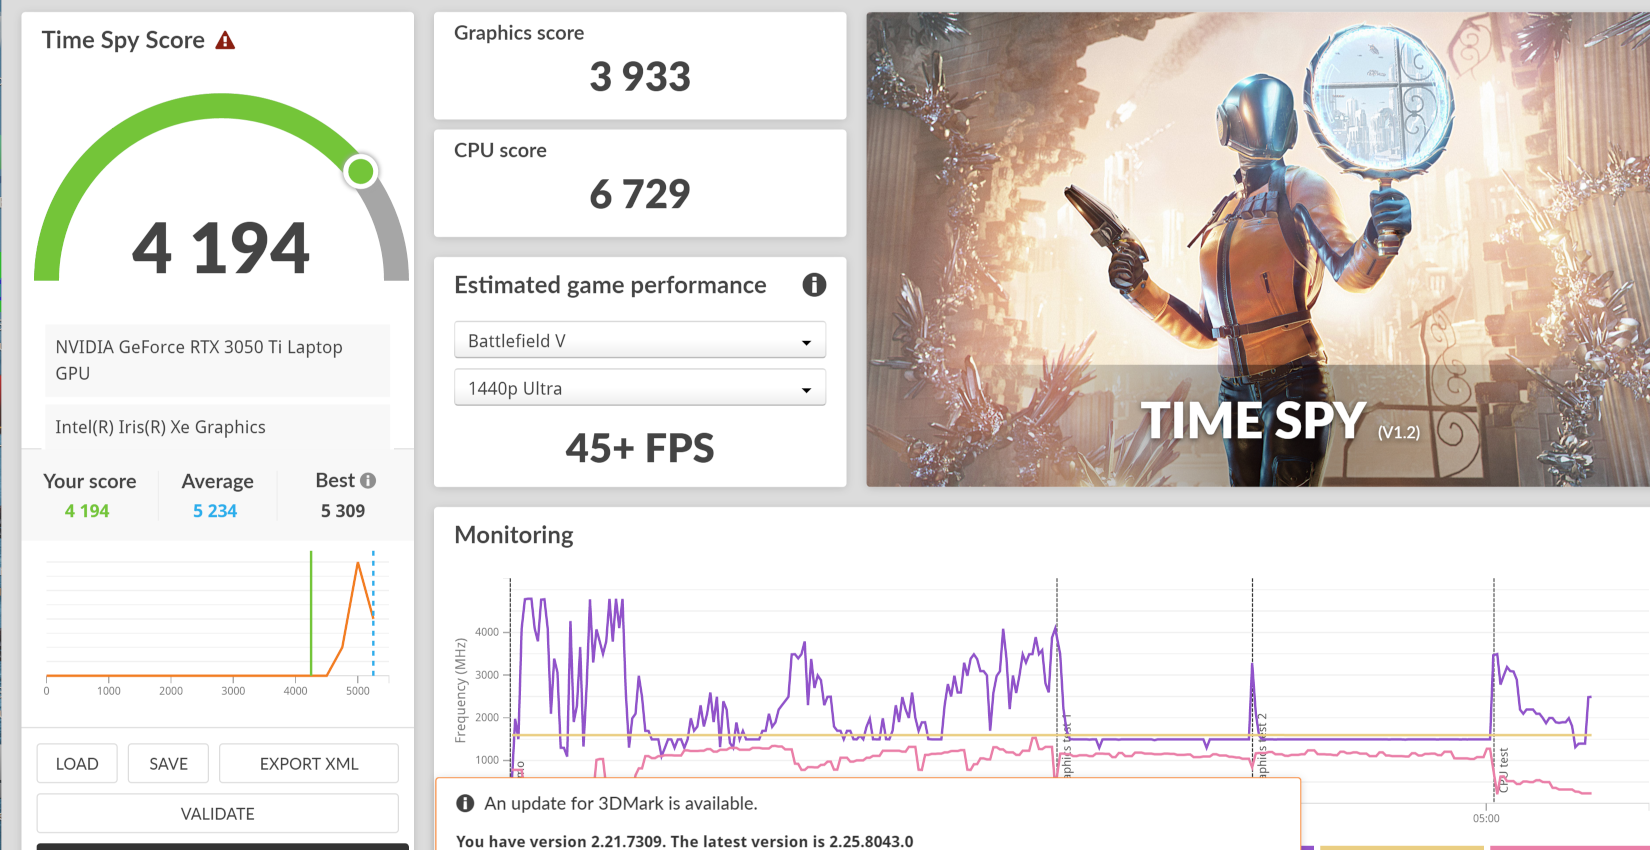
| 3DMark 11 Performance | 8322 points | |
| 3DMark Cloud Gate Standard Score | 21679 points | |
| 3DMark Fire Strike Score | 6670 points | |
| 3DMark Time Spy Score | 4013 points | |
Help | ||
* ... smaller is better
Gaming Performance
The limitation of the graphics card to 35 watts or 40 watts in turbo mode and the general configuration of the system for quiet operations consistently depress the values measured in gaming. Even the Acer Swift X SFX16 with the nominally weaker Intel Arc A370M delivers better frame rates in some games.
Again, the Prestige 15 can be credited with the fact that it is simply not designed for sustained CPU and GPU load and that its strengths lie elsewhere. Still, we feel that the system could also do with a "High Performance mode". The hardware for it is there, but always runs in economy mode.
| The Witcher 3 - 1920x1080 Ultra Graphics & Postprocessing (HBAO+) | |
| Lenovo IdeaPad Gaming 3 15ARH7 | |
| Average of class Multimedia (11 - 121, n=13, last 2 years) | |
| Asus VivoBook Pro 16X OLED N7600PC-L2026X | |
| Schenker Vision 14 2022 RTX 3050 Ti | |
| Dell XPS 15 9520 RTX 3050 Ti | |
| Acer Swift X SFX16-52G-77RX | |
| MSI Prestige 15 A12UD-093 | |
| F1 22 | |
| 1920x1080 Ultra High Preset AA:T AF:16x | |
| Schenker Vision 14 2022 RTX 3050 Ti | |
| Average NVIDIA GeForce RTX 3050 Ti Laptop GPU (16 - 35, n=7) | |
| Average of class Multimedia (11 - 54.1, n=12, last 2 years) | |
| Asus VivoBook Pro 16X OLED N7600PC-L2026X | |
| MSI Prestige 15 A12UD-093 | |
| 3840x2160 Ultra High Preset AA:T AF:16x | |
| MSI Prestige 15 A12UD-093 | |
| Average NVIDIA GeForce RTX 3050 Ti Laptop GPU (n=1) | |
The difference becomes clear when we compare a small gaming notebook with an identical GPU. The Lenovo IdeaPad Gaming 3 15IAH7 delivers double the frame rate and this appears to be even more consistent than in the MSI Prestige 15.
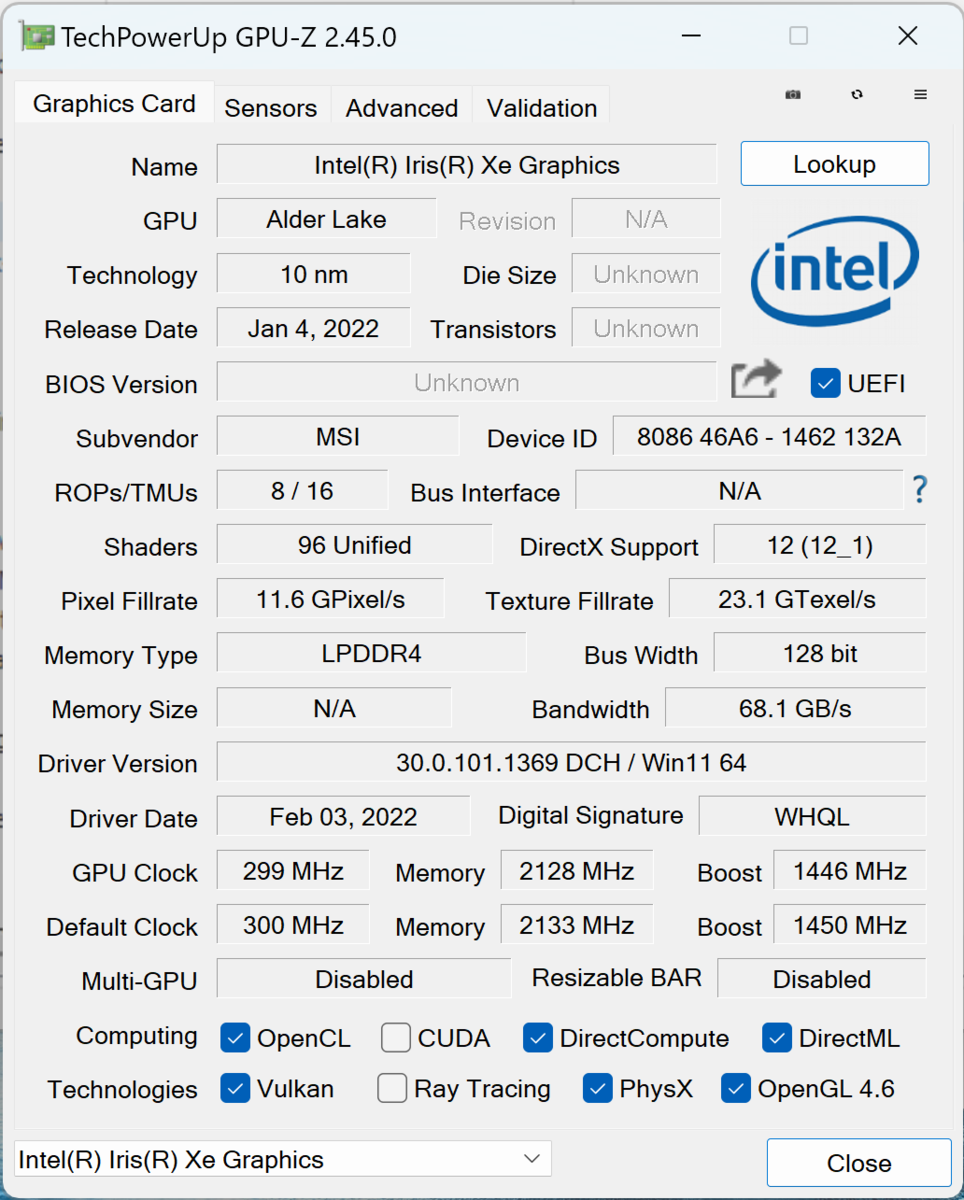
Laptops with an iGPU are nonetheless a good deal weaker, as can be seen in the example of the Asus ExpertBook Flip 2 with its Iris Xe G7. The Intel Arc A350M in the Samsung Galaxy Book 2 15 is on par.
Witcher 3 FPS Chart
| low | med. | high | ultra | QHD | 4K | |
|---|---|---|---|---|---|---|
| GTA V (2015) | 144 | 136 | 53.8 | 27.8 | 22.8 | |
| The Witcher 3 (2015) | 75 | 48 | 30 | 19 | 10 | |
| Dota 2 Reborn (2015) | 153.8 | 111.9 | 74.8 | 67.3 | 31.9 | |
| Final Fantasy XV Benchmark (2018) | 55.9 | 33.4 | 23.5 | 18.4 | 12.8 | |
| X-Plane 11.11 (2018) | 100.8 | 72.7 | 62 | 32.8 | ||
| Far Cry 5 (2018) | 56 | 44 | 36 | 30 | 19 | 13 |
| Strange Brigade (2018) | 103.3 | 53 | 34.8 | 28.1 | 18.9 | |
| F1 22 (2022) | 70 | 63 | 48 | 16 | 10 | 4 |
Emissions - Notebook from MSI remains quiet and cool
Noise
The fans are almost never completely still. They are always audible in the background during normal use, but by no means uncomfortable when they change speed or briefly rev up.
Under load, the cooling is particularly efficient compared to many rivals. It gets a little louder, but remains discreet and noticeably quieter than in many similar notebooks.
Noise level
| Idle |
| 26 / 30.7 / 30.7 dB(A) |
| Load |
| 41.9 / 40.7 dB(A) |
 | ||
30 dB silent 40 dB(A) audible 50 dB(A) loud |
||
min: | ||
| MSI Prestige 15 A12UD-093 GeForce RTX 3050 Ti Laptop GPU, i7-1280P, Micron 3400 1TB MTFDKBA1T0TFH | Acer Swift X SFX16-52G-77RX A370M, i7-1260P, WDC PC SN810 1TB | Schenker Vision 14 2022 RTX 3050 Ti GeForce RTX 3050 Ti Laptop GPU, i7-12700H, Samsung SSD 980 Pro 1TB MZ-V8P1T0BW | Asus VivoBook Pro 16X OLED N7600PC-L2026X GeForce RTX 3050 4GB Laptop GPU, i7-11370H, Intel Optane Memory H10 with Solid State Storage 32GB + 512GB HBRPEKNX0202A(L/H) | Lenovo IdeaPad Gaming 3 15ARH7 GeForce RTX 3050 4GB Laptop GPU, R5 6600H, Lenovo UMIS AM630 RPJTJ256MGE1QDY | Dell XPS 15 9520 RTX 3050 Ti GeForce RTX 3050 Ti Laptop GPU, i7-12700H, WDC PC SN810 512GB | |
|---|---|---|---|---|---|---|
| Noise | 5% | 3% | -17% | 8% | 15% | |
| off / environment * (dB) | 26 | 25 4% | 24.4 6% | 25.15 3% | 23.3 10% | 22.8 12% |
| Idle Minimum * (dB) | 26 | 25 4% | 24.4 6% | 30 -15% | 23.8 8% | 22.9 12% |
| Idle Average * (dB) | 30.7 | 25 19% | 24.4 21% | 30 2% | 23.8 22% | 22.9 25% |
| Idle Maximum * (dB) | 30.7 | 25 19% | 27.8 9% | 30 2% | 27.2 11% | 22.9 25% |
| Load Average * (dB) | 41.9 | 44.7 -7% | 43.3 -3% | 57.6 -37% | 34.8 17% | 30.9 26% |
| Load Maximum * (dB) | 40.7 | 45.6 -12% | 48.8 -20% | 62.9 -55% | 49.4 -21% | 44.7 -10% |
| Witcher 3 ultra * (dB) | 48.2 | 49.3 | 37.8 |
* ... smaller is better
Temperature
The Creator notebook is not only quiet, but also cool. The temperatures only rise to over 50 °C in extreme cases at the upper edge, which also accommodates the ventilation slots. On the other hand, if you use the laptop normally and not for stress tests, you are unlikely to feel anything more than a slight warming.
The heat distribution is particularly successful. High temperatures are completely absent in the palm rest area, and the increased case temperature is only noticeable in the upper area of the keyboard.
(-) The maximum temperature on the upper side is 49 °C / 120 F, compared to the average of 36.8 °C / 98 F, ranging from 21 to 71 °C for the class Multimedia.
(-) The bottom heats up to a maximum of 52.6 °C / 127 F, compared to the average of 39.1 °C / 102 F
(+) In idle usage, the average temperature for the upper side is 27.7 °C / 82 F, compared to the device average of 31.3 °C / 88 F.
(±) Playing The Witcher 3, the average temperature for the upper side is 34.9 °C / 95 F, compared to the device average of 31.3 °C / 88 F.
(+) The palmrests and touchpad are cooler than skin temperature with a maximum of 29.5 °C / 85.1 F and are therefore cool to the touch.
(±) The average temperature of the palmrest area of similar devices was 28.7 °C / 83.7 F (-0.8 °C / -1.4 F).
| MSI Prestige 15 A12UD-093 Intel Core i7-1280P, NVIDIA GeForce RTX 3050 Ti Laptop GPU | Acer Swift X SFX16-52G-77RX Intel Core i7-1260P, Intel Arc A370M | Schenker Vision 14 2022 RTX 3050 Ti Intel Core i7-12700H, NVIDIA GeForce RTX 3050 Ti Laptop GPU | Asus VivoBook Pro 16X OLED N7600PC-L2026X Intel Core i7-11370H, NVIDIA GeForce RTX 3050 4GB Laptop GPU | Lenovo IdeaPad Gaming 3 15ARH7 AMD Ryzen 5 6600H, NVIDIA GeForce RTX 3050 4GB Laptop GPU | Dell XPS 15 9520 RTX 3050 Ti Intel Core i7-12700H, NVIDIA GeForce RTX 3050 Ti Laptop GPU | |
|---|---|---|---|---|---|---|
| Heat | -2% | 1% | 7% | 8% | -3% | |
| Maximum Upper Side * (°C) | 49 | 49.4 -1% | 48.4 1% | 40.6 17% | 47.6 3% | 51.4 -5% |
| Maximum Bottom * (°C) | 52.6 | 55.5 -6% | 57.1 -9% | 53 -1% | 46.6 11% | 51 3% |
| Idle Upper Side * (°C) | 29.7 | 28.4 4% | 28.1 5% | 29 2% | 27.2 8% | 30 -1% |
| Idle Bottom * (°C) | 30.7 | 32.6 -6% | 29 6% | 28.3 8% | 27.2 11% | 33 -7% |
* ... smaller is better
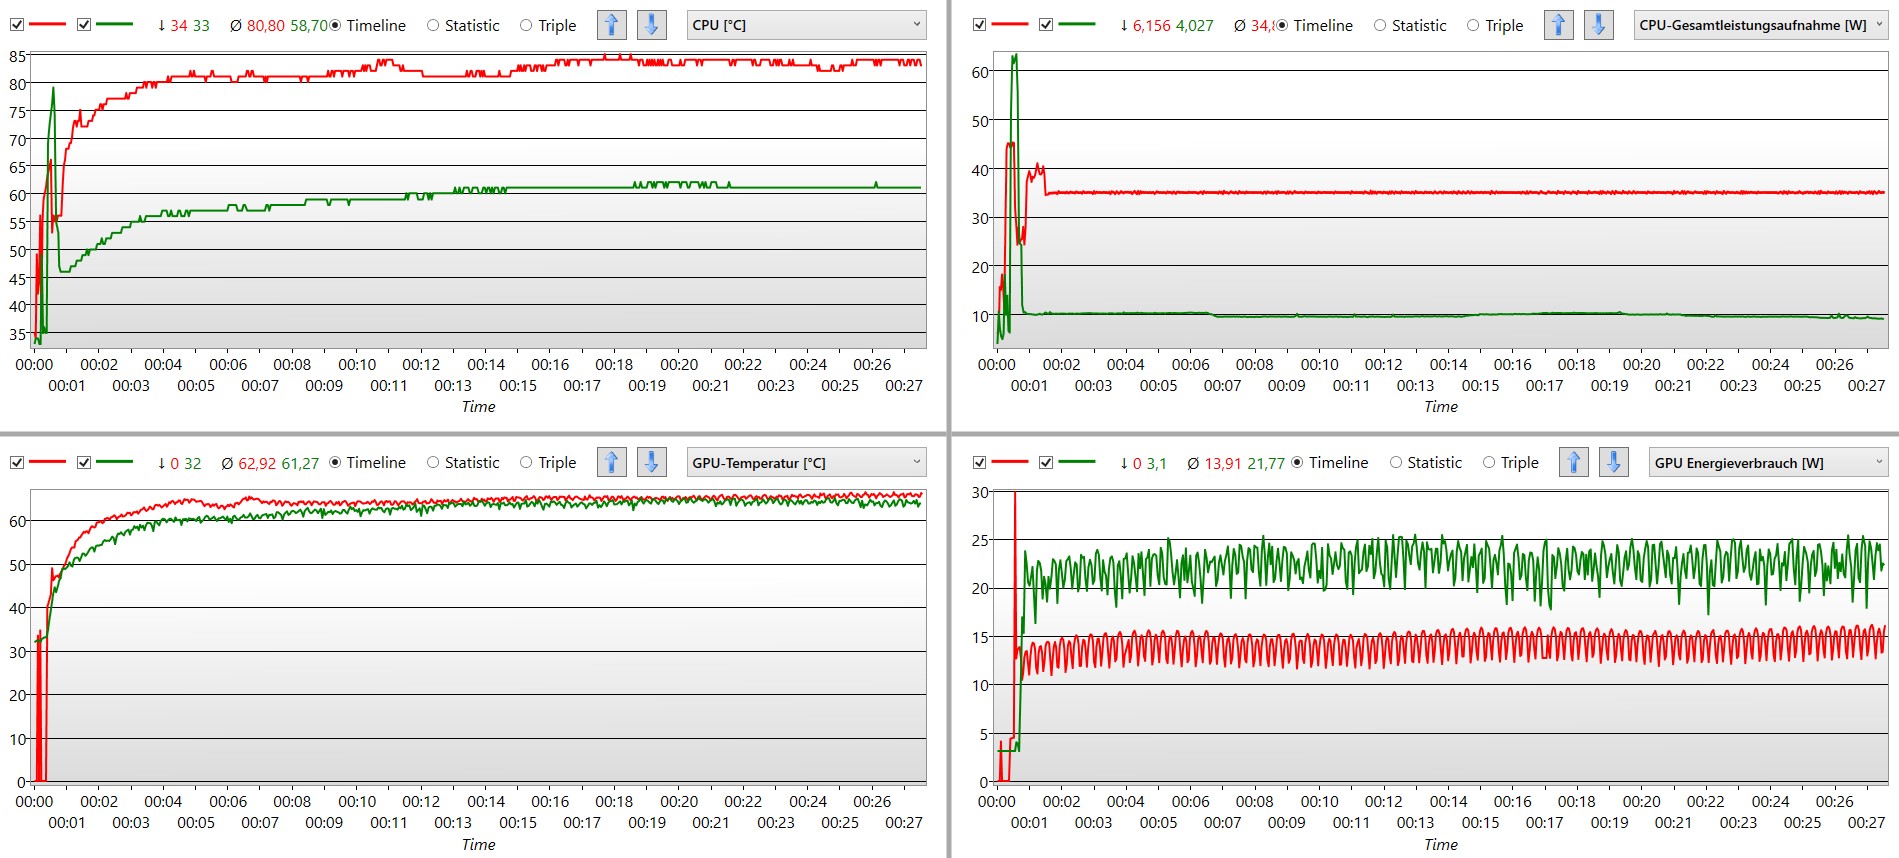
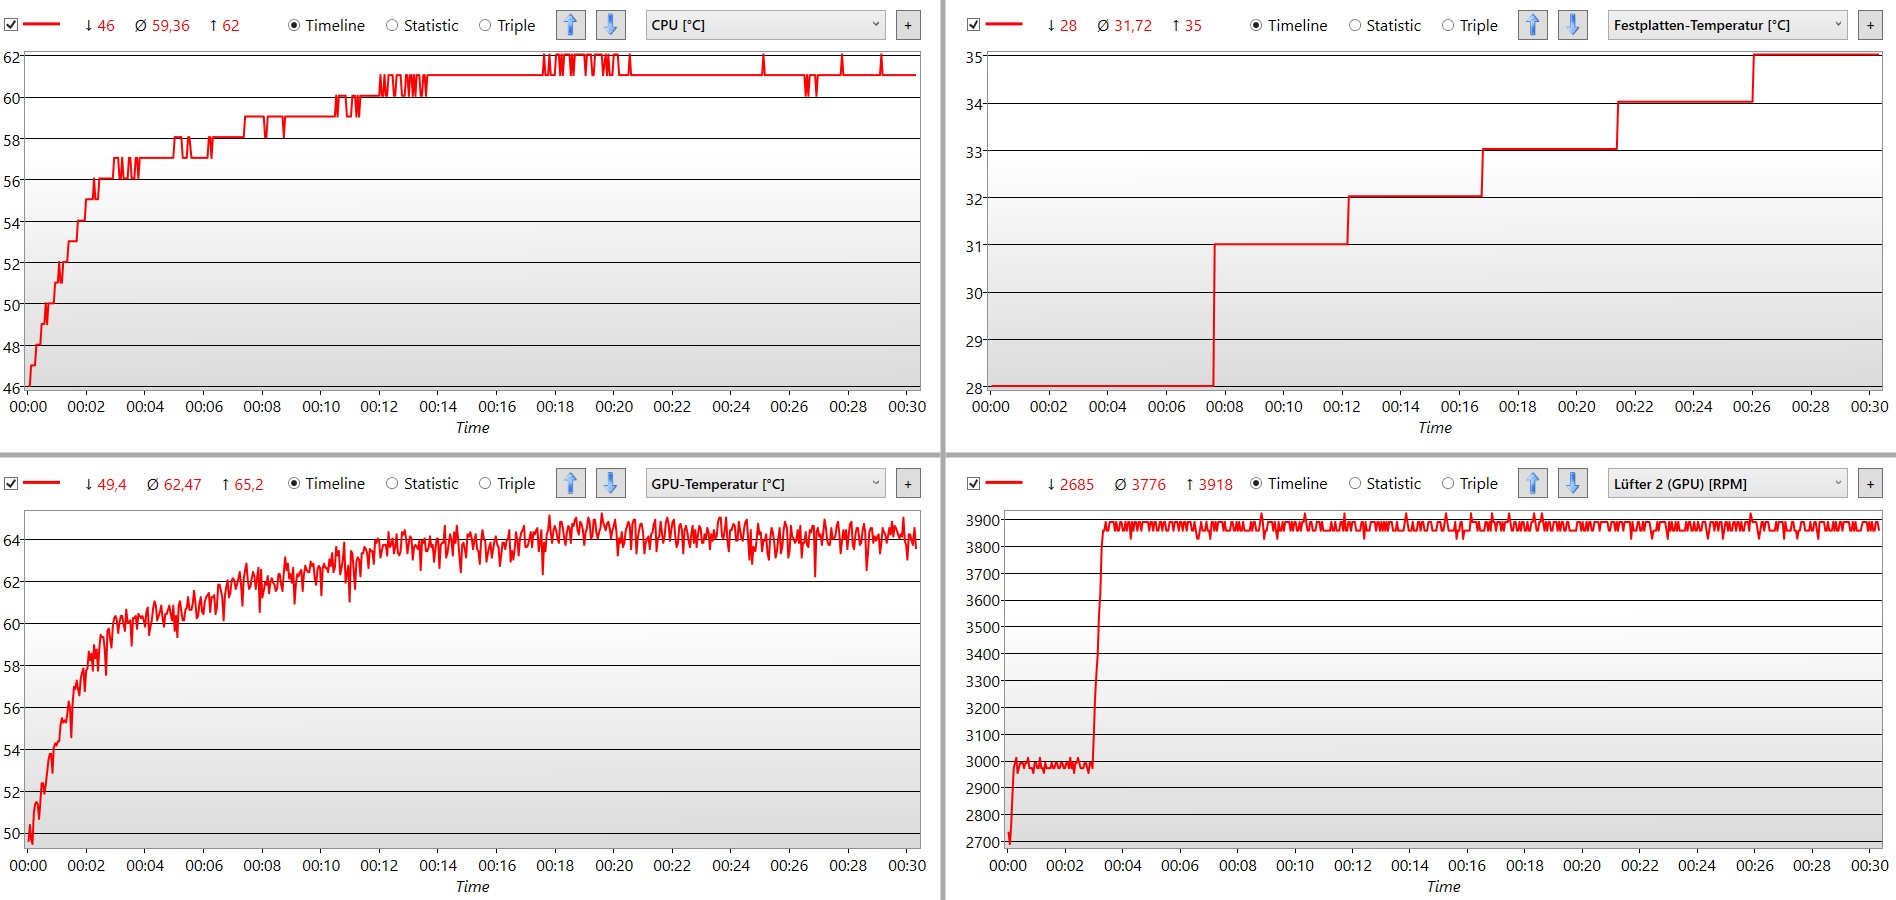
Stress Test
Even full load in Prime95 and Furmark does not lead to unhealthy temperatures. The CPU climbs a little over 60 °C, while the sensors for the GPU indicate just under 65 °C. The fan rotates at a consistently high speed. Maximum values are reached after 10 minutes at the latest, and the laptop stays on the same level.
Here, the "Smart Auto" setting with its power consumption limit always ensures tolerable temperatures. Maximum performance is thus available immediately after such loads because the system does not have to cool down from 80 or 90 °C.
Speakers
A comparison with the Apple MacBook Pro 16 2021 reveals an unfortunate shortcoming: The speakers of the Prestige 15 start to overmodulate at high volumes. For example, basses and the lower mids, in which electric guitars can be heard, are very weak.
Voices sound decent and detailed. Overall, this is sufficient for checking the sound of videos, for streaming movies, or for making video calls. However, as soon as music begins to play, the speakers' weaknesses become clearly audible.
MSI Prestige 15 A12UD-093 audio analysis
(+) | speakers can play relatively loud (89.3 dB)
Bass 100 - 315 Hz
(-) | nearly no bass - on average 34.4% lower than median
(±) | linearity of bass is average (10.7% delta to prev. frequency)
Mids 400 - 2000 Hz
(±) | reduced mids - on average 10.8% lower than median
(±) | linearity of mids is average (11.1% delta to prev. frequency)
Highs 2 - 16 kHz
(±) | higher highs - on average 9% higher than median
(+) | highs are linear (3.7% delta to prev. frequency)
Overall 100 - 16.000 Hz
(±) | linearity of overall sound is average (28.1% difference to median)
Compared to same class
» 94% of all tested devices in this class were better, 1% similar, 5% worse
» The best had a delta of 5%, average was 17%, worst was 45%
Compared to all devices tested
» 85% of all tested devices were better, 3% similar, 12% worse
» The best had a delta of 4%, average was 24%, worst was 134%
Apple MacBook Pro 16 2021 M1 Pro audio analysis
(+) | speakers can play relatively loud (84.7 dB)
Bass 100 - 315 Hz
(+) | good bass - only 3.8% away from median
(+) | bass is linear (5.2% delta to prev. frequency)
Mids 400 - 2000 Hz
(+) | balanced mids - only 1.3% away from median
(+) | mids are linear (2.1% delta to prev. frequency)
Highs 2 - 16 kHz
(+) | balanced highs - only 1.9% away from median
(+) | highs are linear (2.7% delta to prev. frequency)
Overall 100 - 16.000 Hz
(+) | overall sound is linear (4.6% difference to median)
Compared to same class
» 0% of all tested devices in this class were better, 0% similar, 100% worse
» The best had a delta of 5%, average was 17%, worst was 45%
Compared to all devices tested
» 0% of all tested devices were better, 0% similar, 100% worse
» The best had a delta of 4%, average was 24%, worst was 134%
Power Management - Prestige 15 scores with efficiency
Power Consumption
The i7-1280P shows that it can function energy-efficiently. A minimum of 5 watts testify to its economical operation. However, it does not need to power an OLED display like the Asus VivoBook Pro 16X, but rather a 4K monitor.
The difference in maximum power consumption is particularly striking. The fact that MSI throttles the CPU and GPU considerably in order to achieve the quietest possible behavior results in around half of the usual maximum rates.
The power supply is a bit tight. Recharging is done with a standard 60 watts via one of the Thunderbolt ports. Under load, this is only just enough to supply the laptop with power. During intensive and lengthy computing operations, we observed that the battery was only charged at minimum speed or not at all. On the other hand, we did not notice a discharge despite a connected power adapter.
| Off / Standby | |
| Idle | |
| Load |
|
Key:
min: | |
| MSI Prestige 15 A12UD-093 i7-1280P, GeForce RTX 3050 Ti Laptop GPU, Micron 3400 1TB MTFDKBA1T0TFH, IPS, 3840x2160, 15.6" | Acer Swift X SFX16-52G-77RX i7-1260P, A370M, WDC PC SN810 1TB, IPS-LED, 2560x1600, 16" | Schenker Vision 14 2022 RTX 3050 Ti i7-12700H, GeForce RTX 3050 Ti Laptop GPU, Samsung SSD 980 Pro 1TB MZ-V8P1T0BW, IPS, 2880x1800, 14" | Asus VivoBook Pro 16X OLED N7600PC-L2026X i7-11370H, GeForce RTX 3050 4GB Laptop GPU, Intel Optane Memory H10 with Solid State Storage 32GB + 512GB HBRPEKNX0202A(L/H), OLED, 3840x2400, 16" | Lenovo IdeaPad Gaming 3 15ARH7 R5 6600H, GeForce RTX 3050 4GB Laptop GPU, Lenovo UMIS AM630 RPJTJ256MGE1QDY, IPS, 1920x1080, 15.6" | Dell XPS 15 9520 RTX 3050 Ti i7-12700H, GeForce RTX 3050 Ti Laptop GPU, WDC PC SN810 512GB, OLED, 3456x2160, 15.6" | Average NVIDIA GeForce RTX 3050 Ti Laptop GPU | Average of class Multimedia | |
|---|---|---|---|---|---|---|---|---|
| Power Consumption | -16% | -46% | -55% | -76% | -44% | -63% | -22% | |
| Idle Minimum * (Watt) | 5.4 | 3.7 31% | 7.5 -39% | 8.9 -65% | 7.7 -43% | 5.5 -2% | 8.2 ? -52% | 5.71 ? -6% |
| Idle Average * (Watt) | 11.8 | 7.6 36% | 10.4 12% | 10.2 14% | 9.1 23% | 7.2 39% | 12.6 ? -7% | 10.1 ? 14% |
| Idle Maximum * (Watt) | 12.7 | 11.1 13% | 11.4 10% | 12 6% | 15.6 -23% | 16 -26% | 17.2 ? -35% | 12.4 ? 2% |
| Load Average * (Watt) | 45.9 | 70 -53% | 83.3 -81% | 94 -105% | 90.7 -98% | 91.8 -100% | 92 ? -100% | 65 ? -42% |
| Witcher 3 ultra * (Watt) | 45.7 | 68.8 -51% | 92.7 -103% | 93.1 -104% | 122.9 -169% | 74.6 -63% | ||
| Load Maximum * (Watt) | 63 | 108 -71% | 110.3 -75% | 112 -78% | 155.2 -146% | 134.7 -114% | 139.1 ? -121% | 112.2 ? -78% |
* ... smaller is better
Power Consumption Witcher 3 / Stresstest
Power Consumption with an External Monitor
Battery Life
With an impressive 80 Wh, good runtimes are almost guaranteed. If the brightness is reduced, the MSI Prestige 15 achieves almost 9 hours in our web surfing test. The variant with a Full HD display should thus be able to crack the 10-hour mark relatively easily.
The figures are not quite as impressive in full brightness or during the playback of a Full HD video in a continuous loop. Nevertheless, at 7 hours, the laptop should suffice for most operations.
Under full load, the lack of throttling pushes the battery life down to the expected low value. A consumption of 60 watts and an 80 Wh battery result in 80 minutes. After all, full performance is available even without an external power supply.
| MSI Prestige 15 A12UD-093 i7-1280P, GeForce RTX 3050 Ti Laptop GPU, 80 Wh | Acer Swift X SFX16-52G-77RX i7-1260P, A370M, 56 Wh | Schenker Vision 14 2022 RTX 3050 Ti i7-12700H, GeForce RTX 3050 Ti Laptop GPU, 99.8 Wh | Asus VivoBook Pro 16X OLED N7600PC-L2026X i7-11370H, GeForce RTX 3050 4GB Laptop GPU, 96 Wh | Lenovo IdeaPad Gaming 3 15ARH7 R5 6600H, GeForce RTX 3050 4GB Laptop GPU, 45 Wh | Dell XPS 15 9520 RTX 3050 Ti i7-12700H, GeForce RTX 3050 Ti Laptop GPU, 86 Wh | Average of class Multimedia | |
|---|---|---|---|---|---|---|---|
| Battery runtime | 9% | 40% | 39% | -32% | 64% | 62% | |
| H.264 (h) | 7.1 | 10.4 46% | 11.1 56% | 16.4 ? 131% | |||
| WiFi v1.3 (h) | 8.9 | 9.1 2% | 10.1 13% | 8.7 -2% | 6.5 -27% | 8.8 -1% | 12 ? 35% |
| Load (h) | 1.4 | 1.1 -21% | 2.1 50% | 2.5 79% | 0.9 -36% | 3.2 129% | 1.675 ? 20% |
Pros
Cons
Verdict: A well-balanced combination of components in the Prestige 15
The MSI Prestige 15 appears to consistently implement the guiding principle of throttling the solid and efficient hardware to such an extent that content creation succeeds perfectly. Performance-hungry tasks, on the other hand, are slowed down a little by the reduced power consumption.
Conversely, this means that the case remains relatively cool and the dual fan subdued. The battery life also benefits somewhat. So the losses aren't really dramatic because full performance is still available for short bursts.
This also sets the Prestige apart from a laptop with an iGPU despite the relatively low graphics performance. Although performance is weak in games, it is still sufficient and well-tuned for image and video editing software and is clearly above what integrated graphics chips can do.
Quiet, mobile and powerful - the perfect choice for creative people.
In addition, there is the optimally tuned display. 4K and the AdobeRGB color space prove to be worthy of such a professional display. On 15.6 inches, however, the many pixels cannot fully maximize their potential. Instead they consume more power and occupy more computing capacity than a FullHD display, which would be even brighter with the same light output.
The Prestige 15 convinces in other aspects, perhaps not with top performance, but with a good range of hardware features. These include two Thunderbolt ports and two reasonably fast USB-A ports. The keyboard and touchpad make a solid impression and we liked them even without the fancy highlights.
If the focus is on image and video editing, the Prestige offers an almost perfect mix that is designed to function pleasantly. Only the display is perhaps a bit too much of a good thing.
In terms of alternatives, the Dell XPS 15 9520 has fewer weaknesses in certain areas, ranging from the webcam, the keyboard and to the speakers. The Schenker Vision 14 2022 impresses with high performance from similar components. However, both models cost more and do not quite reach the efficiency of the Prestige 15.
Price and Availability
Regional variations of the Prestige 15 A12UD are still being rolled out internationally. In the US, for example, only the Prestige 15 A12UD-010 model (with an Intel Core i7-1260P instead of an i7-1280P) appears to be on sale for US$1,899.00 (currently out of stock at all applicable retailers).
Users are advised to check directly via MSI (where applicable) and type Prestige 15 A12UD in the search bar.
MSI Prestige 15 A12UD-093
- 11/30/2022 v7 (old)
Mario Petzold
Price comparison

