Schenker Compact 17 (Clevo PB71DF2-G) in review: A lot of performance with little heat development

Schenker's 17.3-inch gaming laptop is powered by a Core i7-10875H octa-core processor and a GeForce RTX 2070 Super graphics core. It's the identically built sibling model of the XMG Pro 17. Competitors include devices like the Aorus 17G XB, the Asus Strix G17 G712LWS, the Razer Blade Pro 17, and the Gigabyte Aero 17 XB. Both of the latter devices have a 4K display on board like the Compact 17.
Rating | Date | Model | Weight | Height | Size | Resolution | Price |
|---|---|---|---|---|---|---|---|
| 84 % v7 (old) | 12 / 2020 | Schenker Compact 17 i7-10875H, GeForce RTX 2070 Super Mobile | 2.9 kg | 29.9 mm | 17.30" | 3840x2160 | |
| 87 % v7 (old) | 04 / 2020 | Gigabyte Aero 17 HDR XB i7-10875H, GeForce RTX 2070 Super Max-Q | 2.7 kg | 21 mm | 17.30" | 3840x2160 | |
| 86.7 % v7 (old) | 10 / 2019 | Razer Blade Pro 17 4K UHD 120 Hz i7-9750H, GeForce RTX 2080 Max-Q | 2.8 kg | 19.9 mm | 17.30" | 3840x2160 | |
| 83.1 % v7 (old) | 10 / 2020 | Asus Strix G17 G712LWS i7-10750H, GeForce RTX 2070 Super Mobile | 2.8 kg | 26.5 mm | 17.30" | 1920x1080 | |
| 86.5 % v7 (old) | 05 / 2020 | Aorus 17G XB i7-10875H, GeForce RTX 2070 Super Max-Q | 2.7 kg | 26 mm | 17.30" | 1920x1080 |
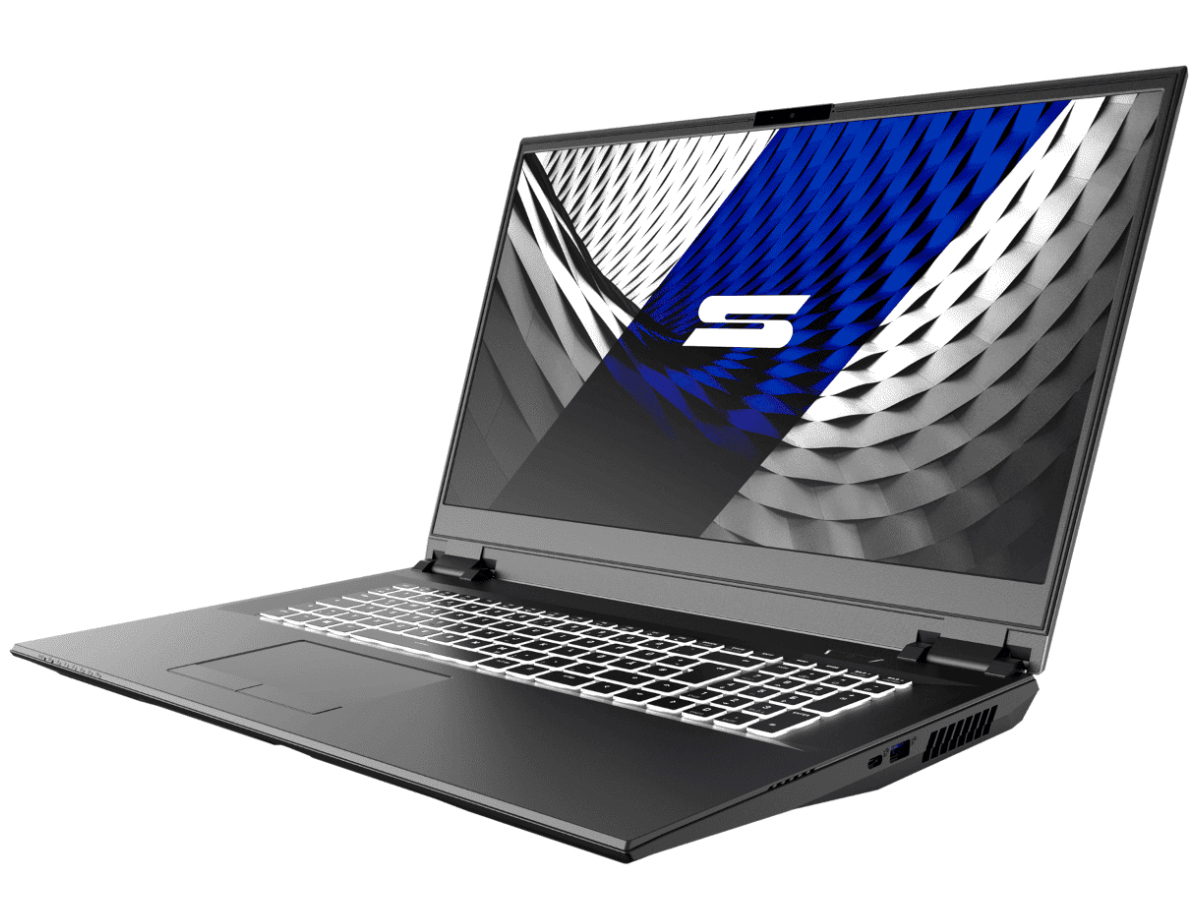
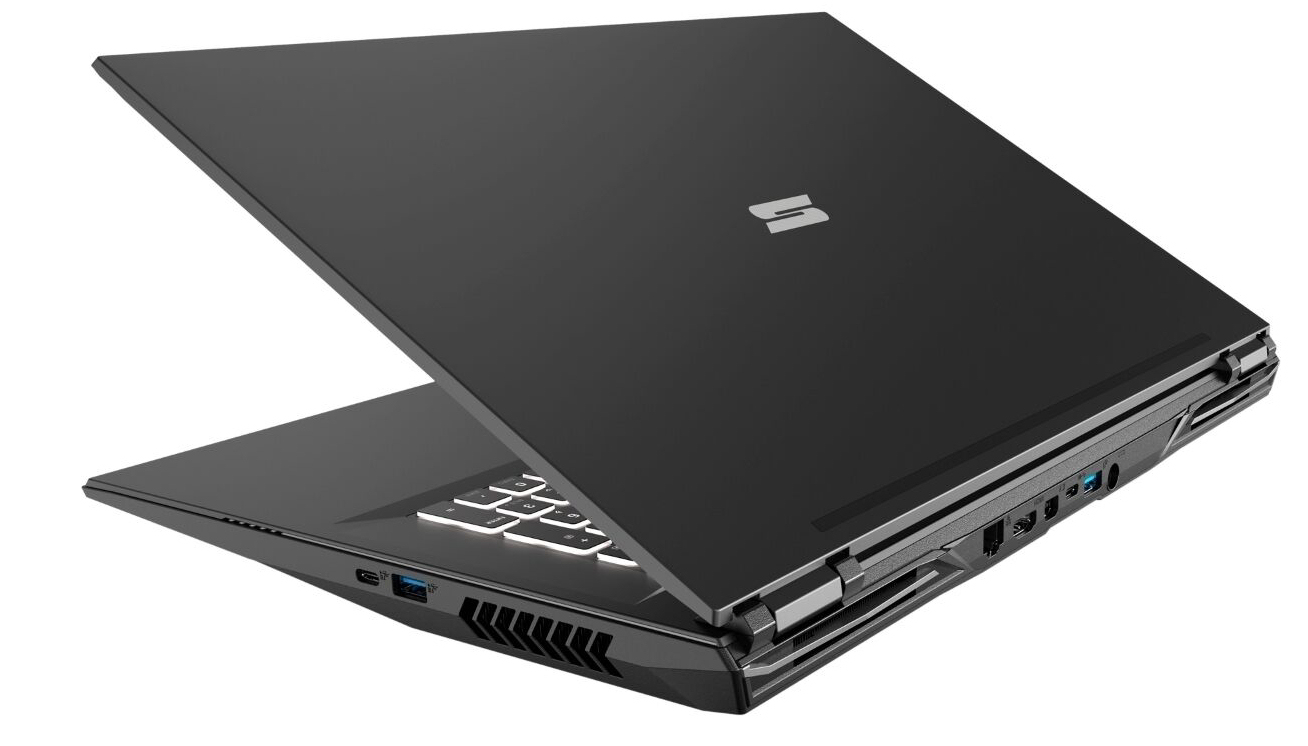
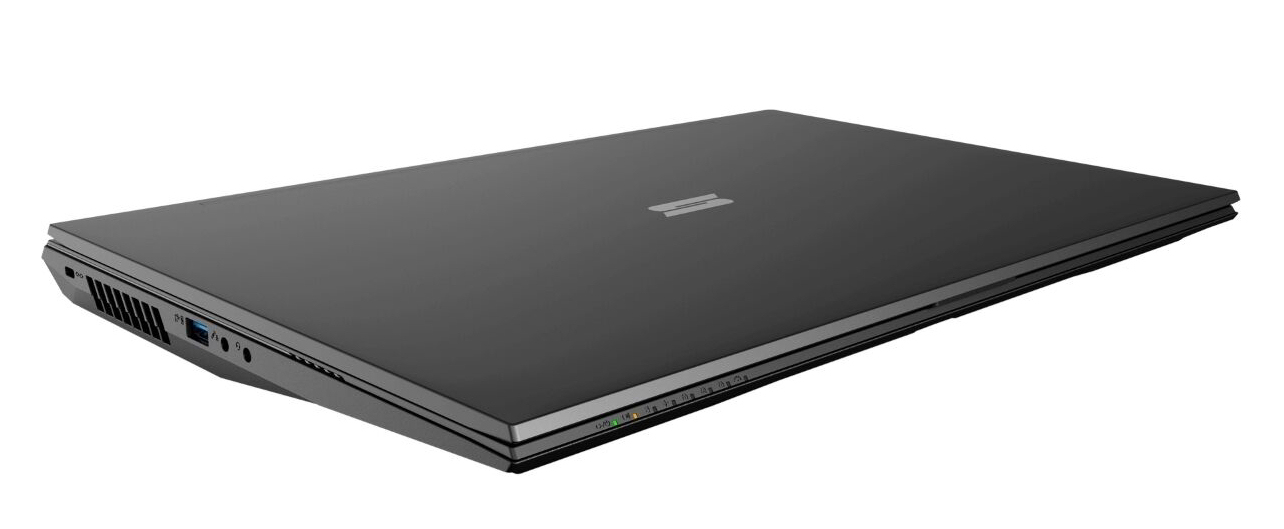
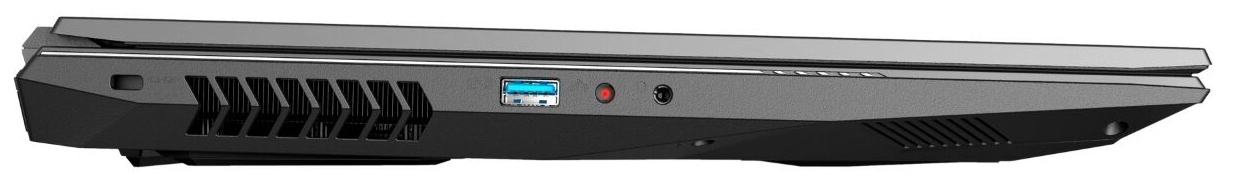
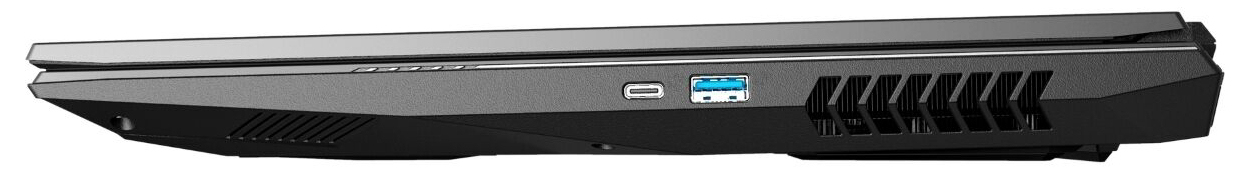
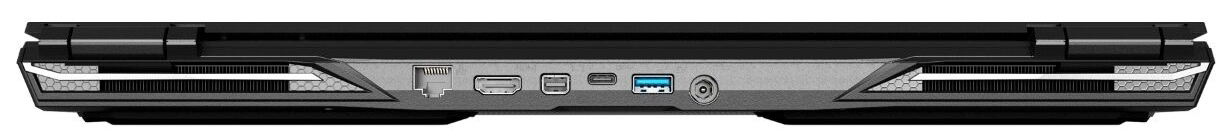
Case and connectivity - The Schenker laptop offers many ports
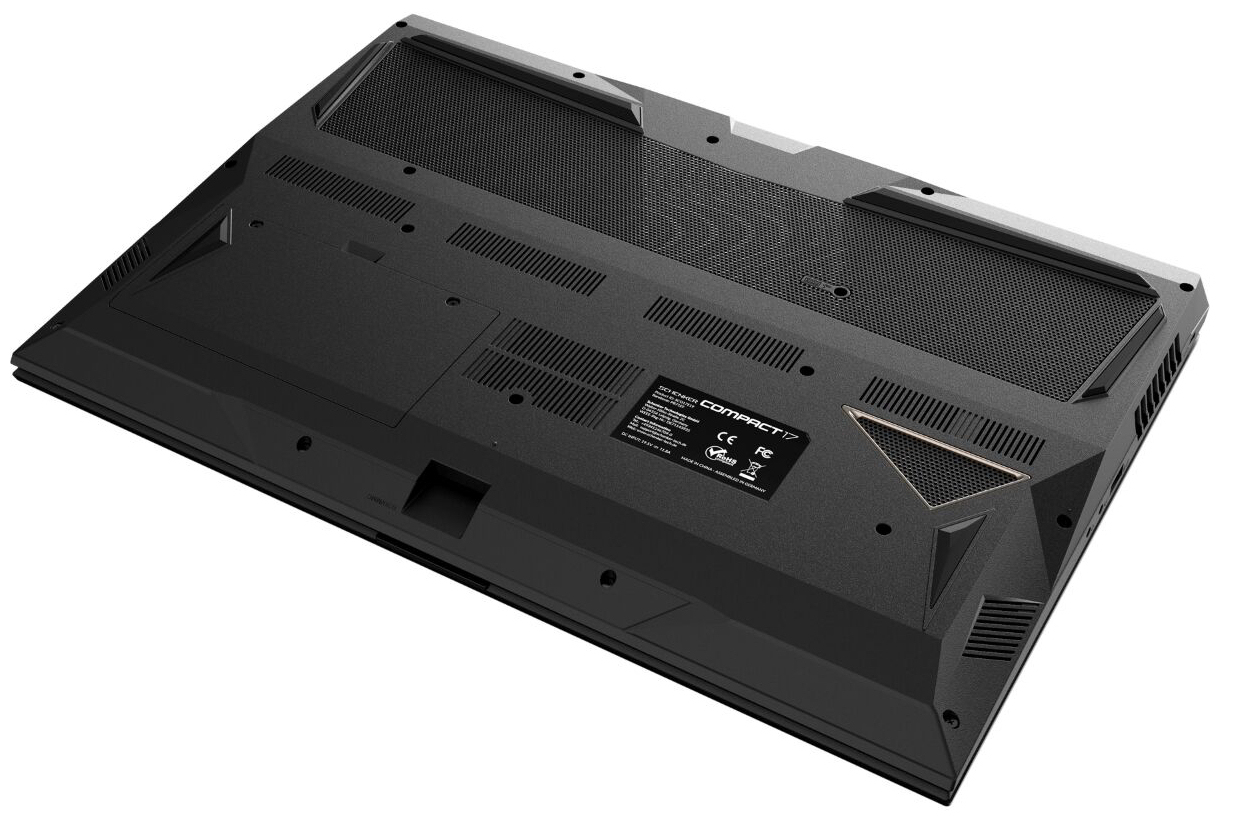
The matte black, soberly designed chassis is made of metal (back of the lid, top of the base unit) and plastic (display frame, bottom cover). The battery is removable (it's secured by two screws). The hardware of the laptop can be accessed after removing the base cover. The case is mostly well manufactured - with one exception: The tapered corners of the lid (metal) are not optimally chamfered. A risk of injury can't be ruled out here.
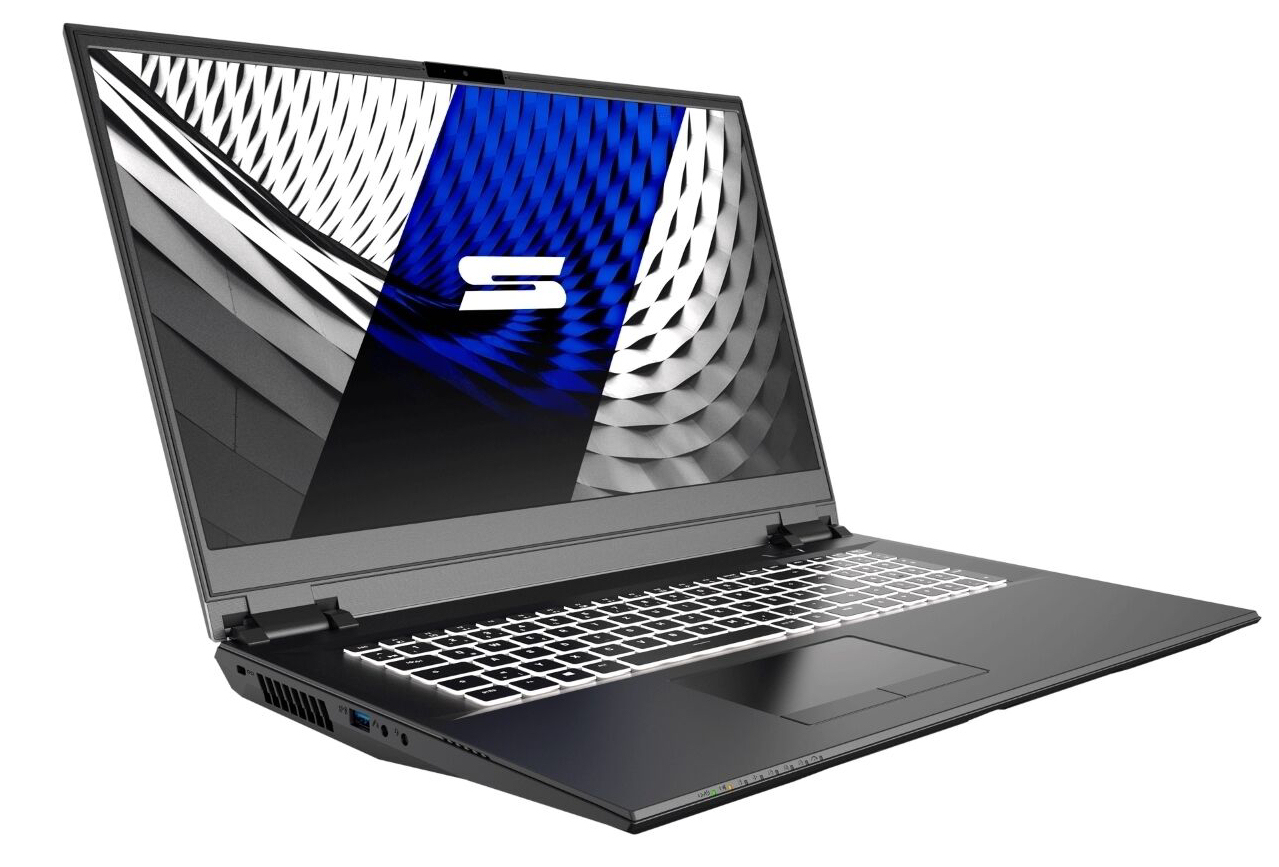
The Compact 17 has three USB Type-A ports (USB 3.2 Gen 1) and two USB Type-C ports (1x Thunderbolt 3, 1x USB 3.2 Gen 2). The latter support DisplayPort via USB-C. Therefore, the laptop has a total of four video outputs together with the HDMI port and the Mini DisplayPort. The three DisplayPorts offer G-Sync functionality.
The SD memory card reader (reference card: 64 GB Toshiba Exceria Pro UHS-II SDXC) belongs to the faster representatives of its kind with maximum transfer rates of 156.6 MB/s (transferring 250 jpg image files of 5 MB each) and 192.2 MB/s (copying large data blocks).
The WLAN chip (Intel AX200) supports the 802.11a/b/g/n/ac/ax standards and provides Bluetooth 5 functionality. The data rates determined under optimal conditions (no other WLAN devices nearby, short distance between laptop and server PC; router: Netgear Nighthawk AX12) are very good.
Port configuration

| SD Card Reader | |
| average JPG Copy Test (av. of 3 runs) | |
| Aorus 17G XB (Toshiba Exceria Pro SDXC 64 GB UHS-II) | |
| Gigabyte Aero 17 HDR XB (Toshiba Exceria Pro SDXC 64 GB UHS-II) | |
| Schenker XMG Pro 17 PB71RD-G (Toshiba Exceria Pro SDXC 64 GB UHS-II) | |
| Razer Blade Pro 17 4K UHD 120 Hz (Toshiba Exceria Pro SDXC 64 GB UHS-II) | |
| Schenker Compact 17 (Toshiba Exceria Pro SDXC 64 GB UHS-II) | |
| Average of class Gaming (20.9 - 210, n=54, last 2 years) | |
| maximum AS SSD Seq Read Test (1GB) | |
| Aorus 17G XB (Toshiba Exceria Pro SDXC 64 GB UHS-II) | |
| Gigabyte Aero 17 HDR XB (Toshiba Exceria Pro SDXC 64 GB UHS-II) | |
| Schenker XMG Pro 17 PB71RD-G (Toshiba Exceria Pro SDXC 64 GB UHS-II) | |
| Razer Blade Pro 17 4K UHD 120 Hz (Toshiba Exceria Pro SDXC 64 GB UHS-II) | |
| Schenker Compact 17 (Toshiba Exceria Pro SDXC 64 GB UHS-II) | |
| Average of class Gaming (25.5 - 261, n=51, last 2 years) | |
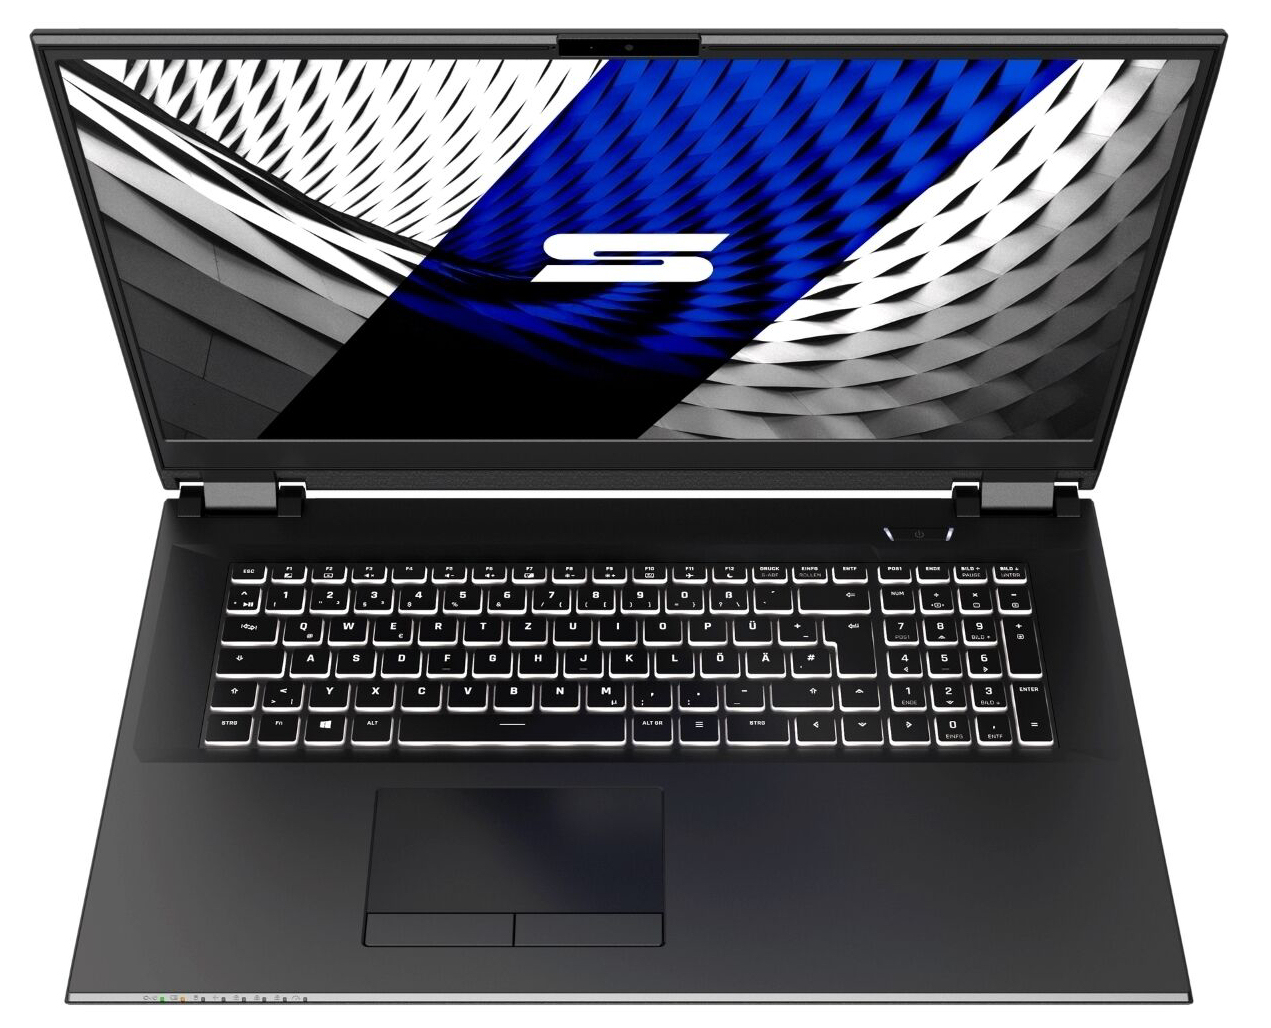
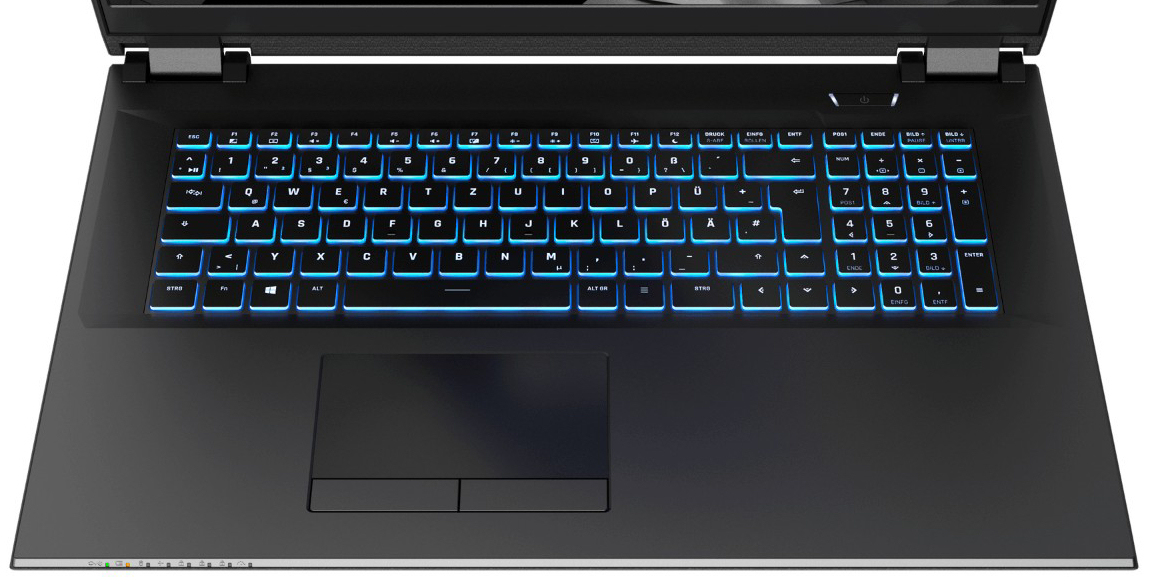
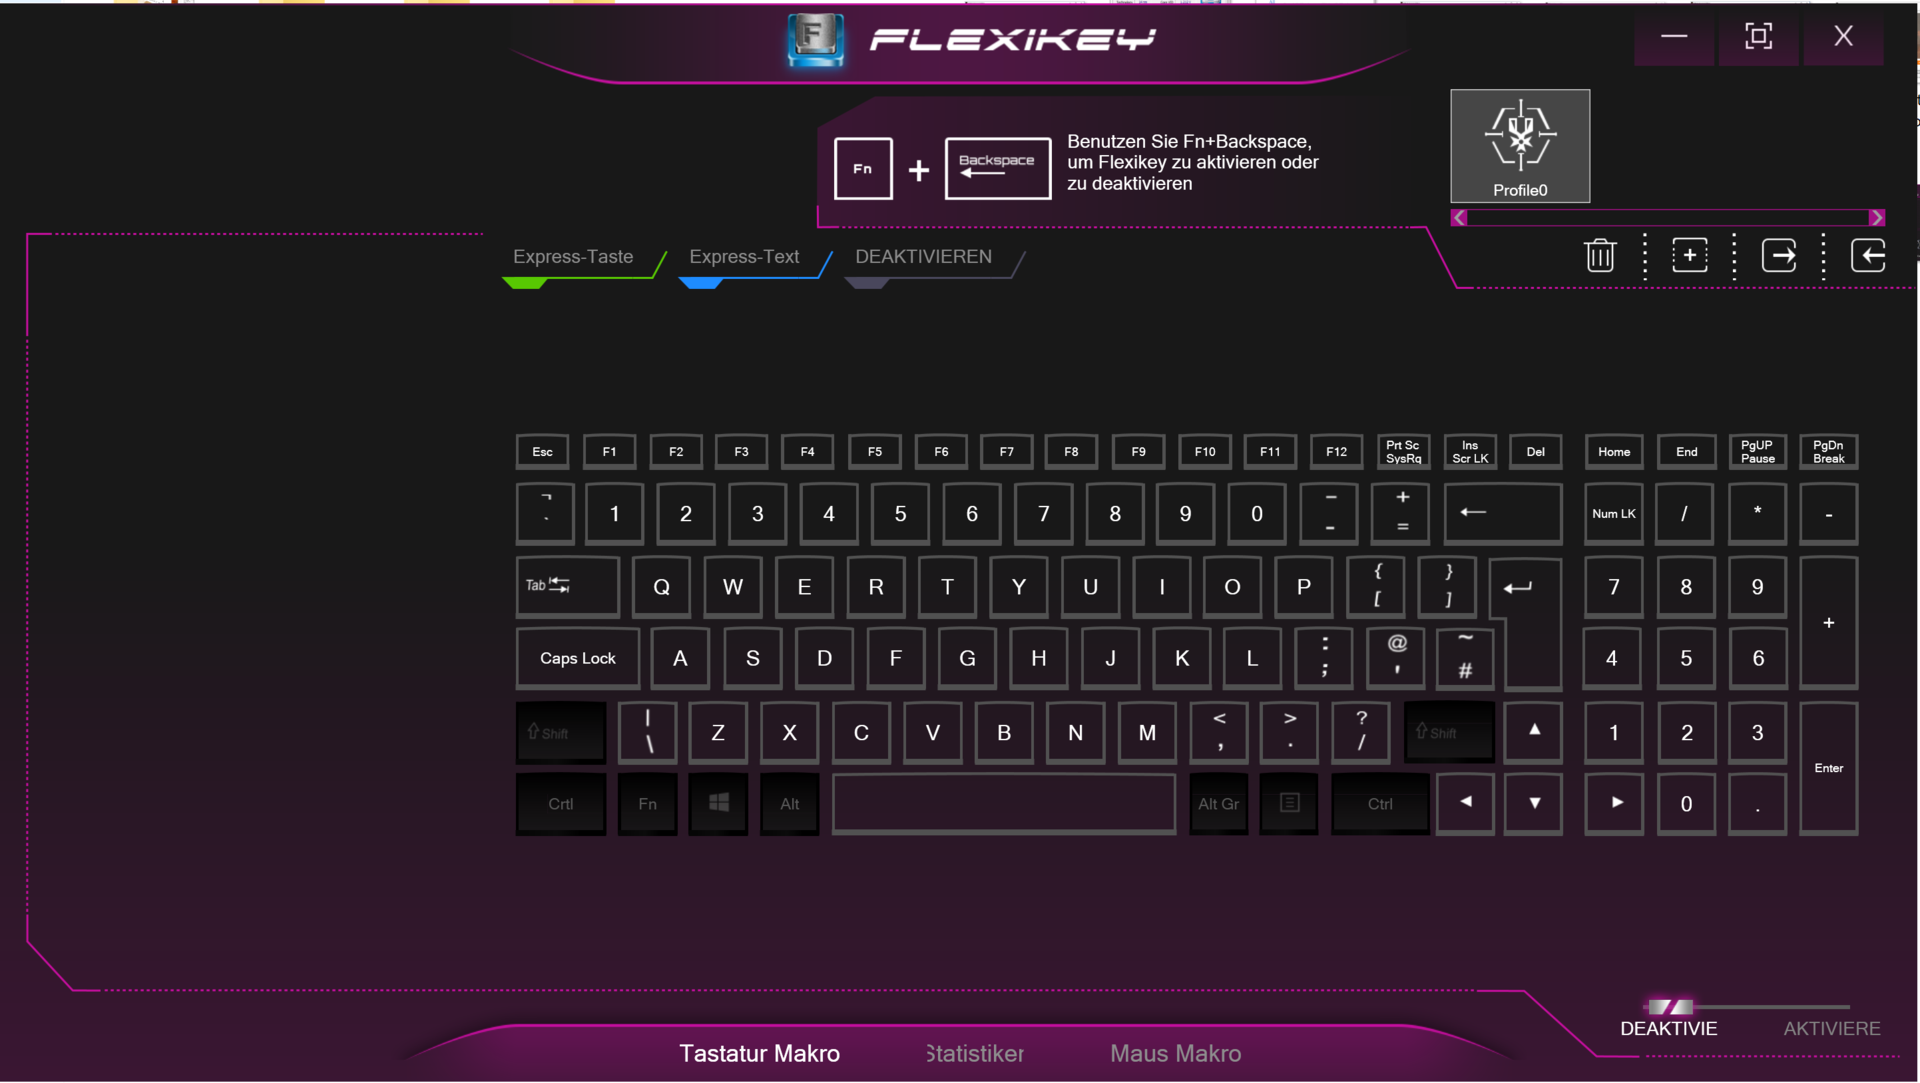
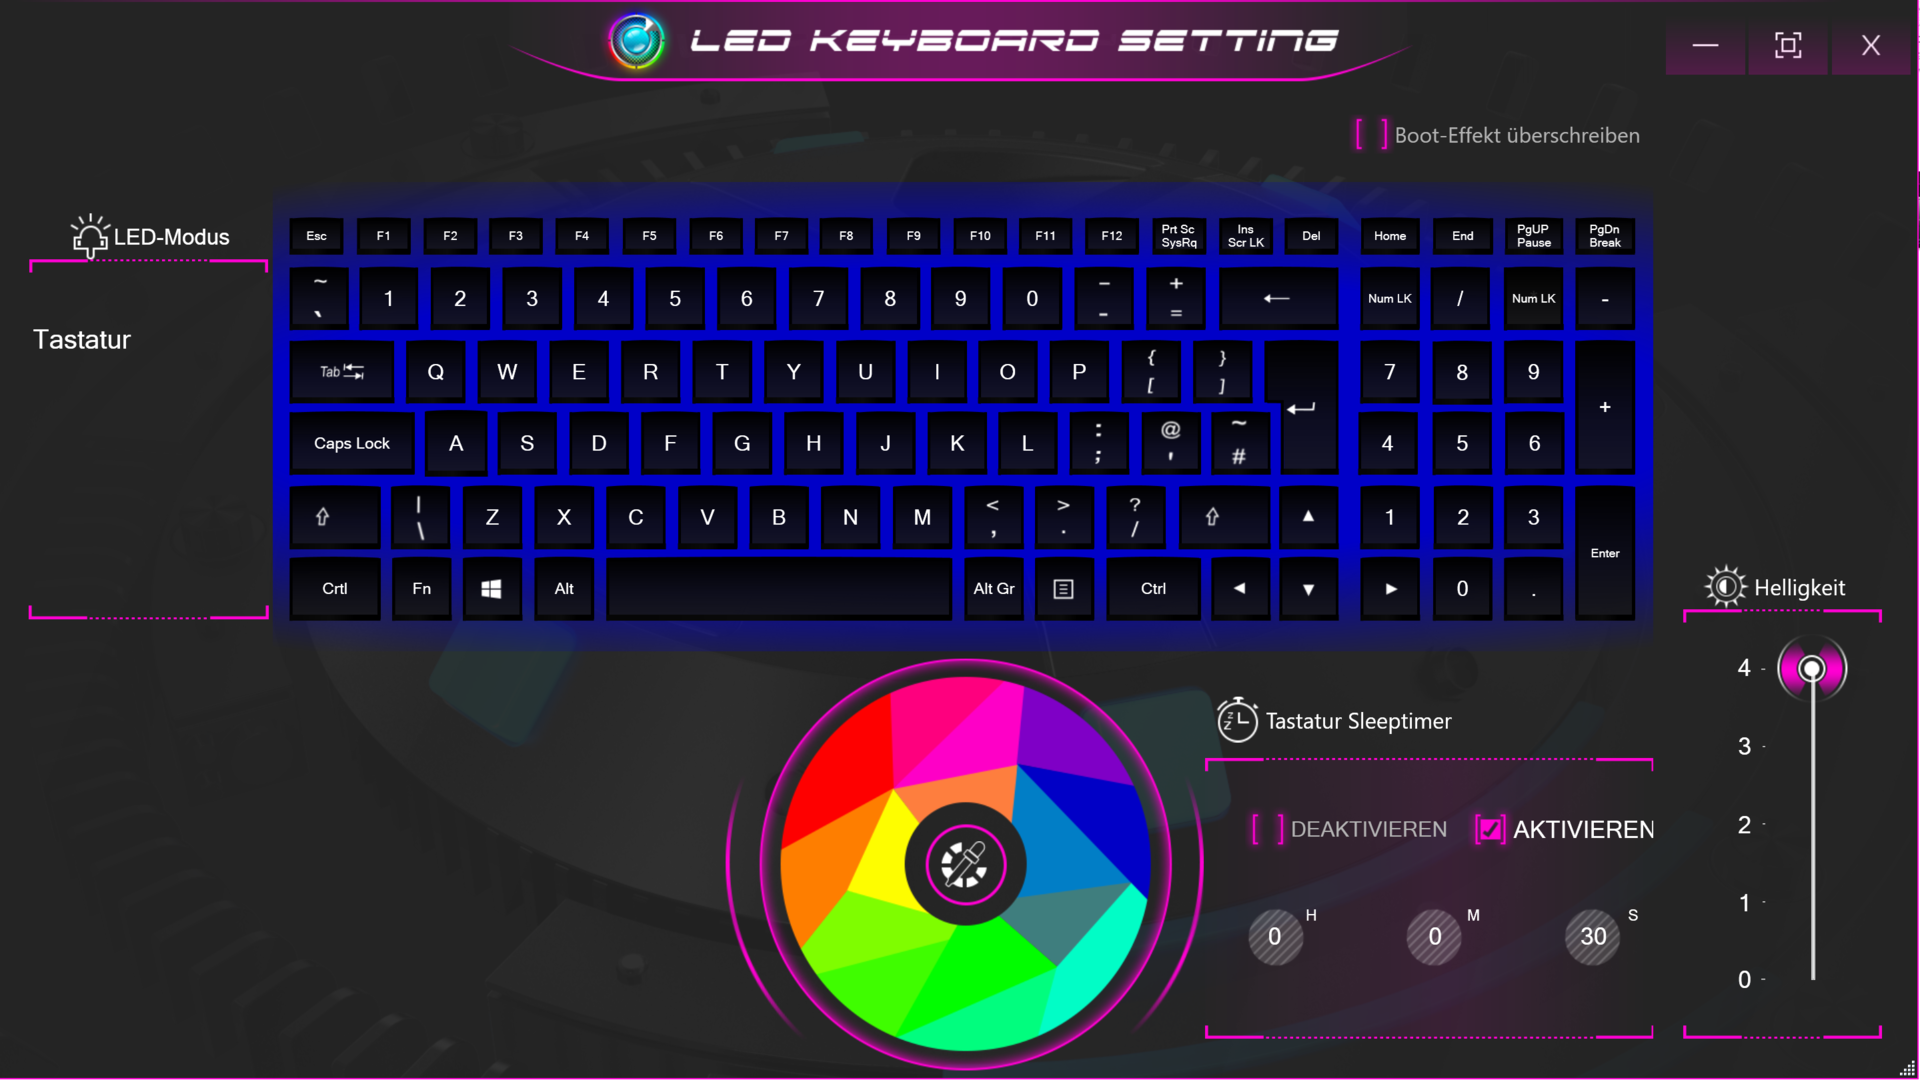
Input devices - Chiclet keyboard with RGB backlighting
The flat, smooth keys of the backlit chiclet keyboard (RGB lighting) have a medium travel and a clear pressure point. The keyboard visibly bounces during typing. All in all, Schenker delivers a keyboard suitable for everyday use here. The surface of the multi-touch capable touchpad (about 10.8 x 6.1 cm) makes it easy for fingers to glide on it. The pad responds to input in the corners as well. The two separate mouse buttons offer a short travel and a clear pressure point.
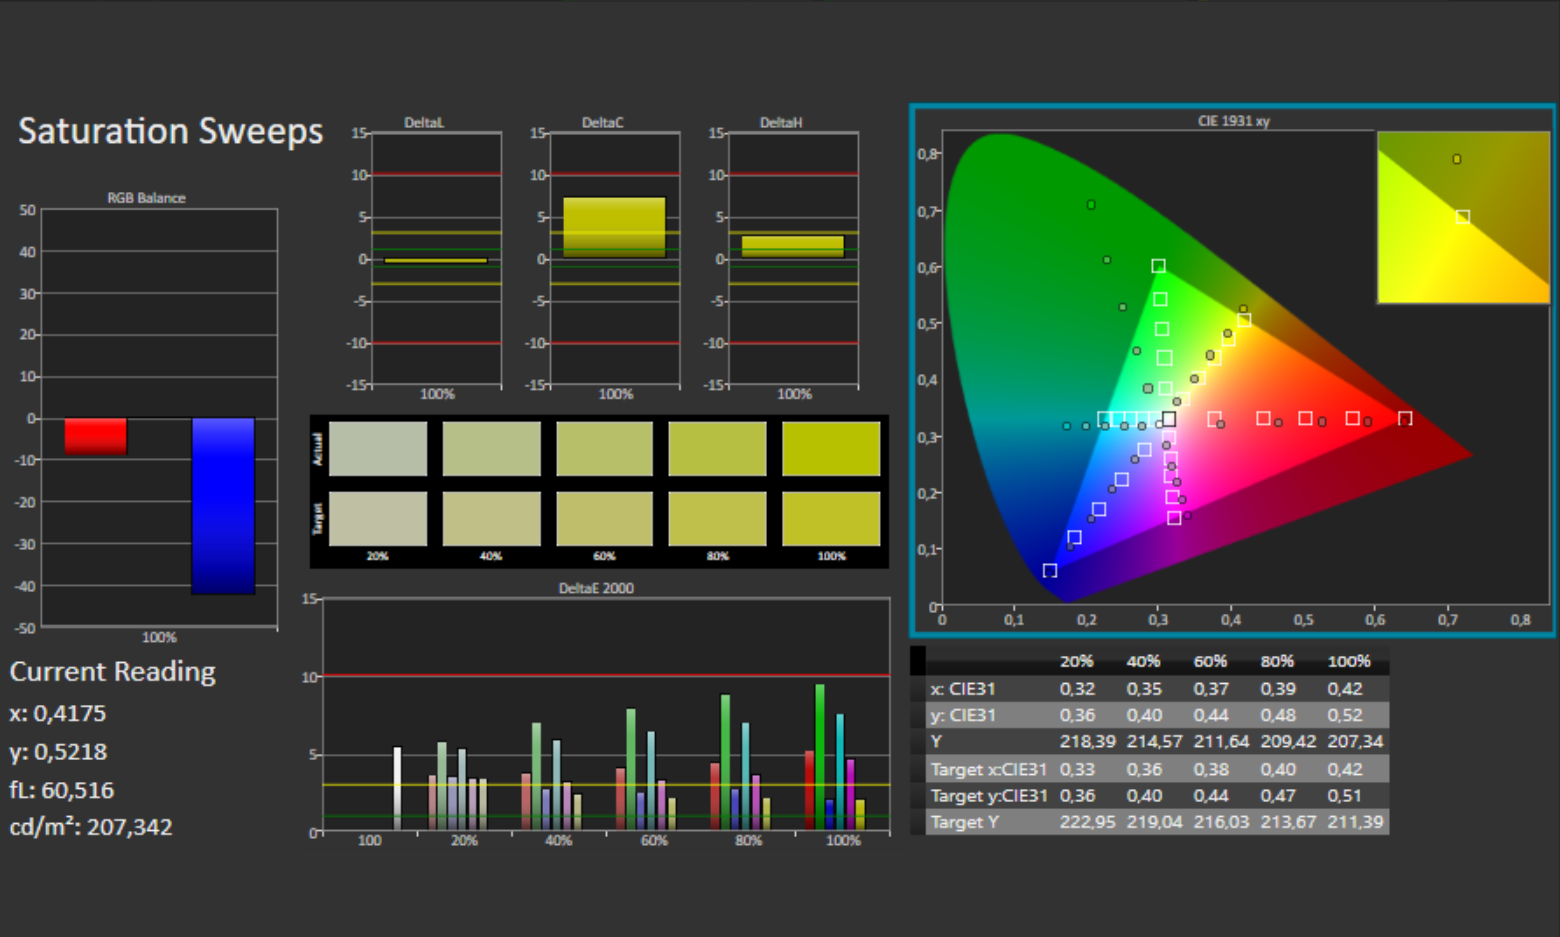
Display - 4K IPS

While the matte 17.3-inch display (3840x2160 pixels, 60 Hz) delivers a good brightness value (412.8 cd/m²), there's a lot of room for improvement in terms of contrast (728:1). We consider values beyond 1,000:1 to be good. Positive: The display doesn't show any PWM flickering.
| |||||||||||||||||||||||||
Brightness Distribution: 88 %
Center on Battery: 444 cd/m²
Contrast: 728:1 (Black: 0.6 cd/m²)
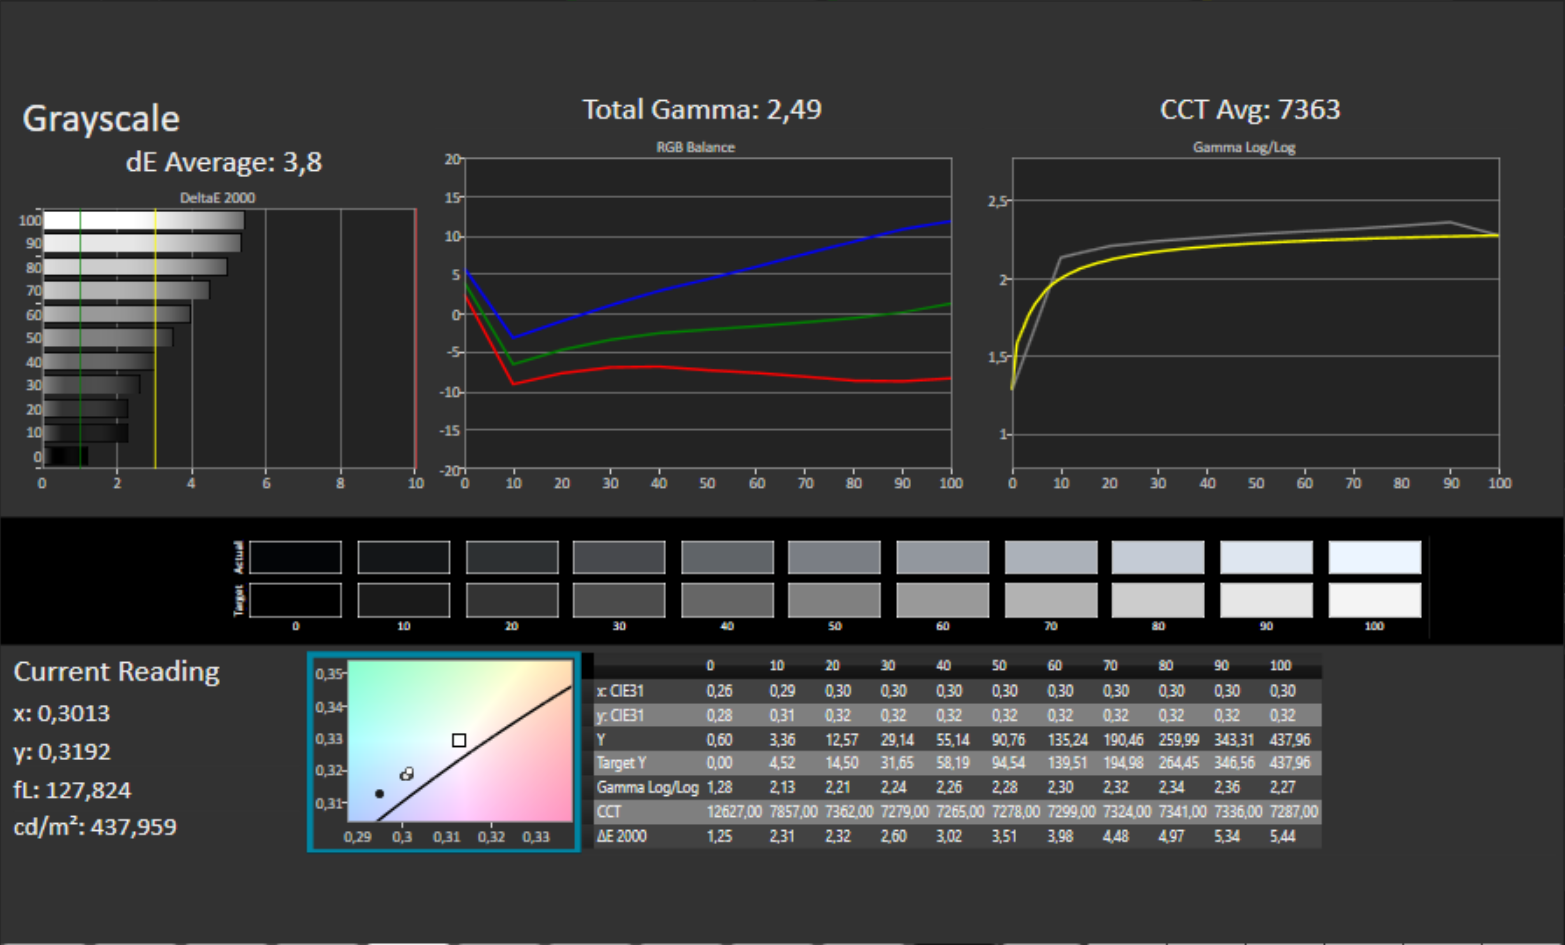
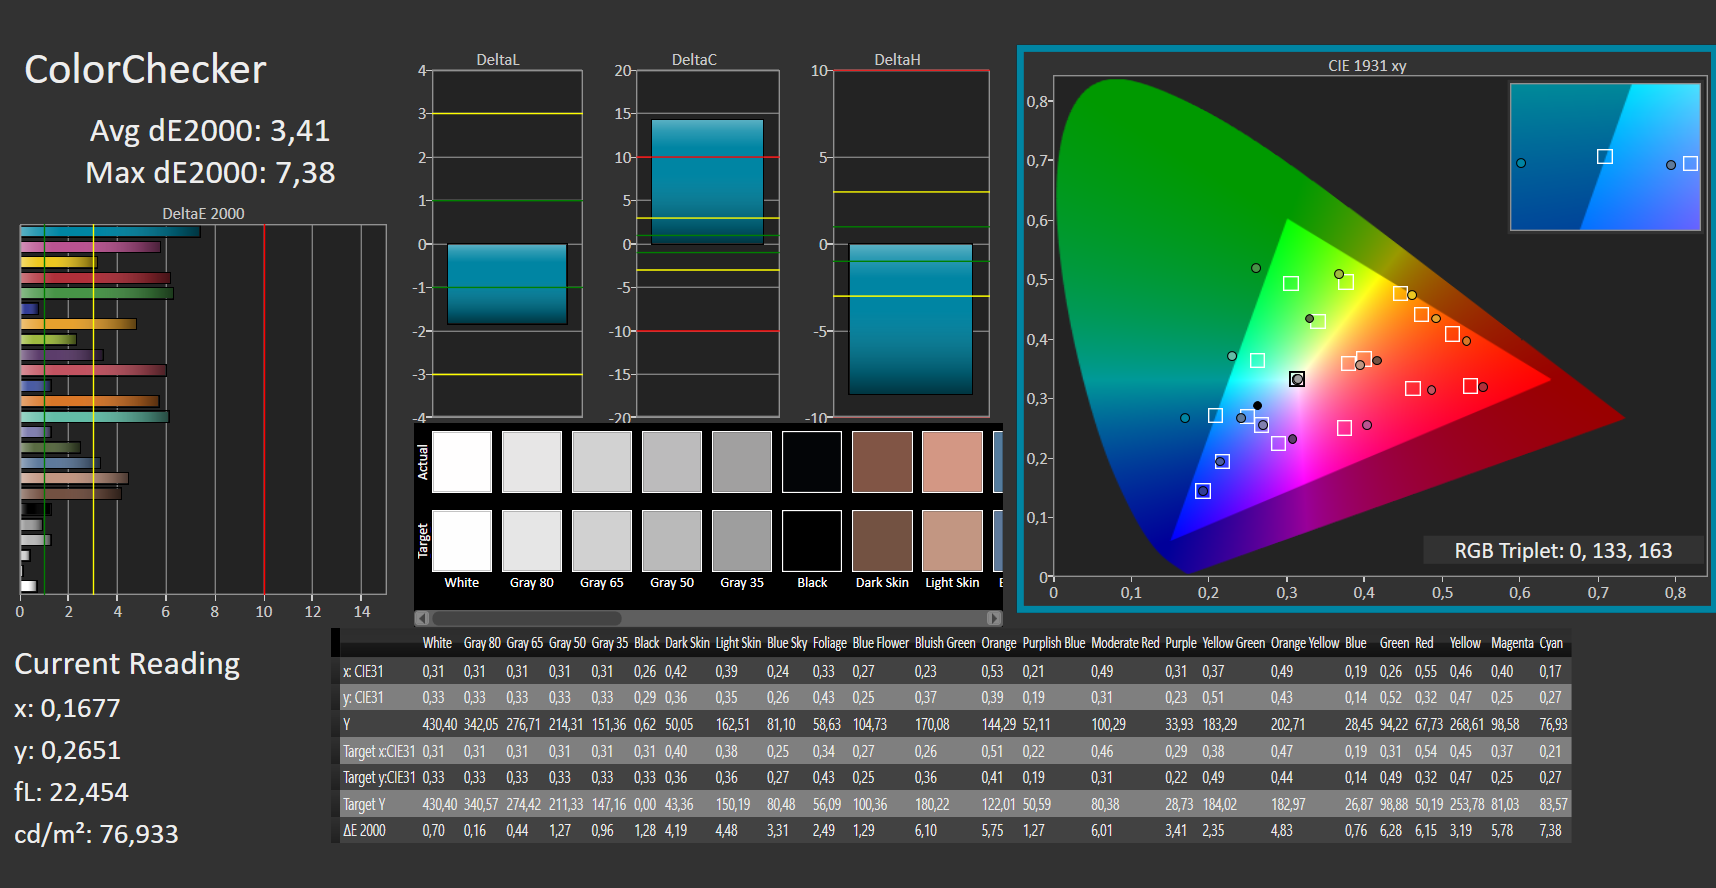
ΔE ColorChecker Calman: 4.28 | ∀{0.5-29.43 Ø4.73}
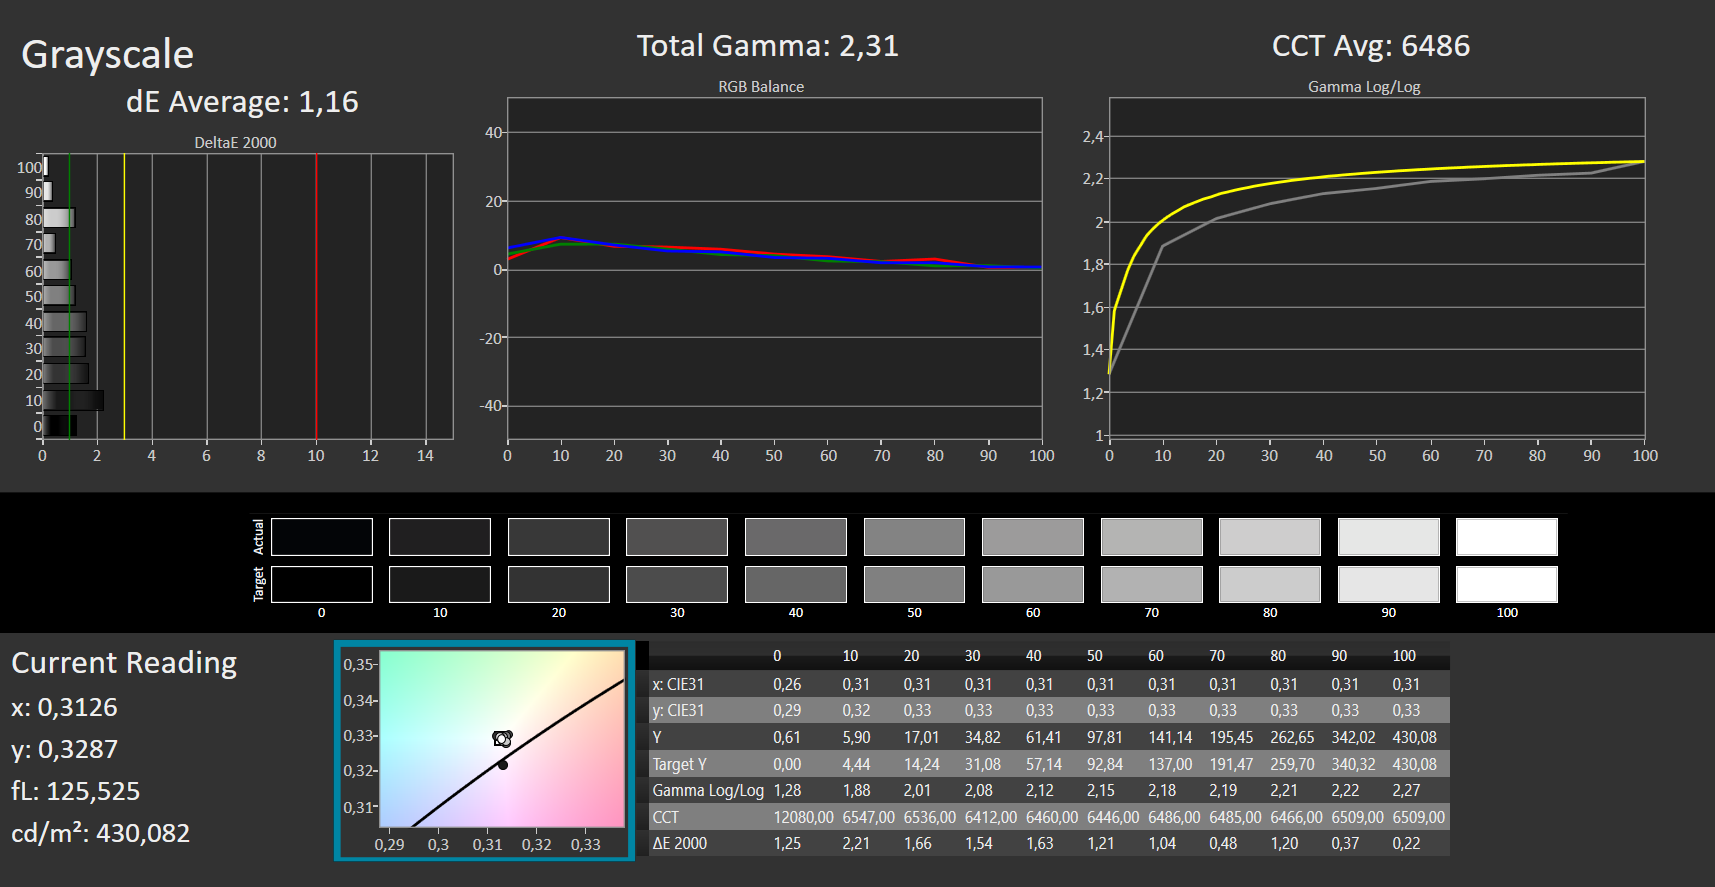
calibrated: 3.41
ΔE Greyscale Calman: 3.8 | ∀{0.09-98 Ø4.97}
100% sRGB (Argyll 1.6.3 3D)
87% AdobeRGB 1998 (Argyll 1.6.3 3D)
98% AdobeRGB 1998 (Argyll 3D)
99.9% sRGB (Argyll 3D)
84.4% Display P3 (Argyll 3D)
Gamma: 2.49
CCT: 7363 K
| Schenker Compact 17 AU Optronics B173ZAN03.0, IPS, 3840x2160, 17.3" | Gigabyte Aero 17 HDR XB AUO B173ZAN03.2 (AUO329B), IPS, 3840x2160, 17.3" | Razer Blade Pro 17 4K UHD 120 Hz AU Optronics B173ZAN03.3, IPS, 3840x2160, 17.3" | Asus Strix G17 G712LWS LG Philips LP173WFG-SPB3, IPS, 1920x1080, 17.3" | Aorus 17G XB AU Optronics B173HAN05.0 (AUO509D), IPS, 1920x1080, 17.3" | Schenker XMG Pro 17 PB71RD-G AU Optronics B173HAN04.0 (AUO409D), IPS, 1920x1080, 17.3" | |
|---|---|---|---|---|---|---|
| Display | 1% | 0% | -19% | -15% | -23% | |
| Display P3 Coverage (%) | 84.4 | 86.5 2% | 84.8 0% | 65.2 -23% | 70.6 -16% | 62.8 -26% |
| sRGB Coverage (%) | 99.9 | 100 0% | 99.9 0% | 96.8 -3% | 97.2 -3% | 89.8 -10% |
| AdobeRGB 1998 Coverage (%) | 98 | 100 2% | 98.6 1% | 66.4 -32% | 72.8 -26% | 64.2 -34% |
| Response Times | 6% | 69% | 70% | 66% | 65% | |
| Response Time Grey 50% / Grey 80% * (ms) | 51 ? | 55.2 ? -8% | 15.2 ? 70% | 14.4 ? 72% | 16 ? 69% | 16.8 ? 67% |
| Response Time Black / White * (ms) | 32 ? | 26 ? 19% | 10.4 ? 67% | 10.4 ? 67% | 12 ? 62% | 12 ? 62% |
| PWM Frequency (Hz) | ||||||
| Screen | 40% | -2% | 10% | 30% | -1% | |
| Brightness middle (cd/m²) | 437 | 487 11% | 346.7 -21% | 323 -26% | 293 -33% | 274 -37% |
| Brightness (cd/m²) | 413 | 475 15% | 332 -20% | 300 -27% | 285 -31% | 273 -34% |
| Brightness Distribution (%) | 88 | 95 8% | 91 3% | 89 1% | 95 8% | 95 8% |
| Black Level * (cd/m²) | 0.6 | 0.38 37% | 0.27 55% | 0.31 48% | 0.24 60% | 0.26 57% |
| Contrast (:1) | 728 | 1282 76% | 1284 76% | 1042 43% | 1221 68% | 1054 45% |
| Colorchecker dE 2000 * | 4.28 | 1.19 72% | 5.62 -31% | 3.01 30% | 1.27 70% | 4.62 -8% |
| Colorchecker dE 2000 max. * | 7.65 | 2.43 68% | 9.36 -22% | 7.65 -0% | 2.24 71% | 7.66 -0% |
| Colorchecker dE 2000 calibrated * | 3.41 | 0.5 85% | 3.81 -12% | 1 71% | 1.06 69% | 1.93 43% |
| Greyscale dE 2000 * | 3.8 | 1.45 62% | 5.5 -45% | 3.8 -0% | 1.34 65% | 5.3 -39% |
| Gamma | 2.49 88% | 2.21 100% | 2.25 98% | 2.154 102% | 2.38 92% | 2.34 94% |
| CCT | 7363 88% | 6557 99% | 6175 105% | 7507 87% | 6542 99% | 7619 85% |
| Color Space (Percent of AdobeRGB 1998) (%) | 87 | 88 1% | 87.2 0% | 66 -24% | 73 -16% | 58 -33% |
| Color Space (Percent of sRGB) (%) | 100 | 100 0% | 100 0% | 90 -10% | 94 -6% | 90 -10% |
| Total Average (Program / Settings) | 16% /
28% | 22% /
8% | 20% /
12% | 27% /
26% | 14% /
3% |
* ... smaller is better
Display Response Times
| ↔ Response Time Black to White | ||
|---|---|---|
| 32 ms ... rise ↗ and fall ↘ combined | ↗ 18 ms rise | 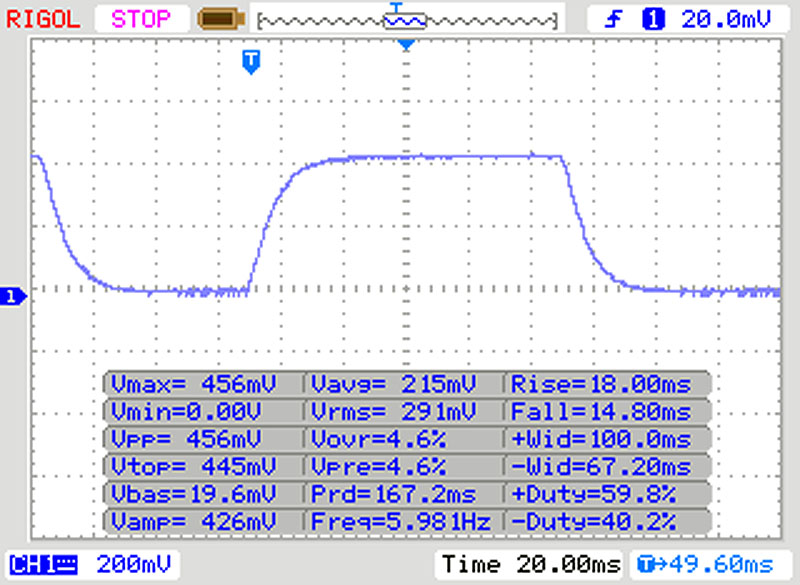 |
| ↘ 14 ms fall | ||
| The screen shows slow response rates in our tests and will be unsatisfactory for gamers. In comparison, all tested devices range from 0.1 (minimum) to 240 (maximum) ms. » 86 % of all devices are better. This means that the measured response time is worse than the average of all tested devices (19.9 ms). | ||
| ↔ Response Time 50% Grey to 80% Grey | ||
| 51 ms ... rise ↗ and fall ↘ combined | ↗ 25 ms rise | 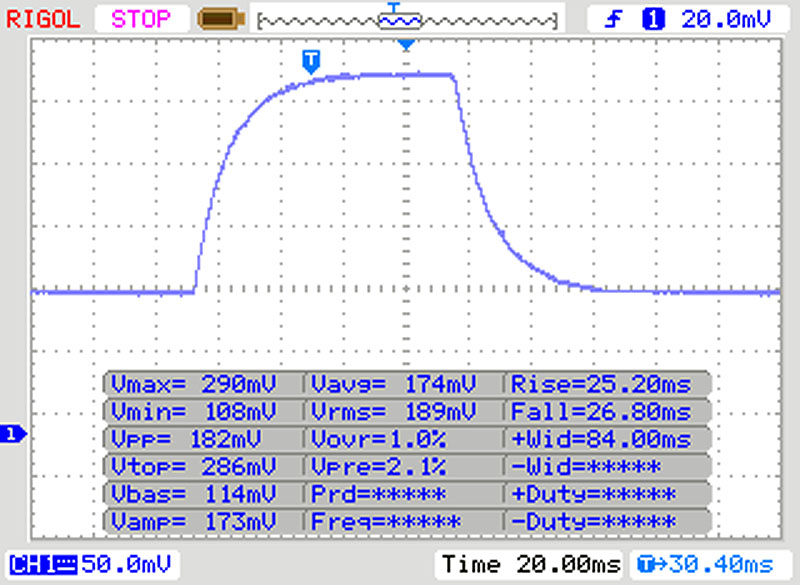 |
| ↘ 26 ms fall | ||
| The screen shows slow response rates in our tests and will be unsatisfactory for gamers. In comparison, all tested devices range from 0.165 (minimum) to 636 (maximum) ms. » 87 % of all devices are better. This means that the measured response time is worse than the average of all tested devices (31.1 ms). | ||
Screen Flickering / PWM (Pulse-Width Modulation)
| Screen flickering / PWM not detected | 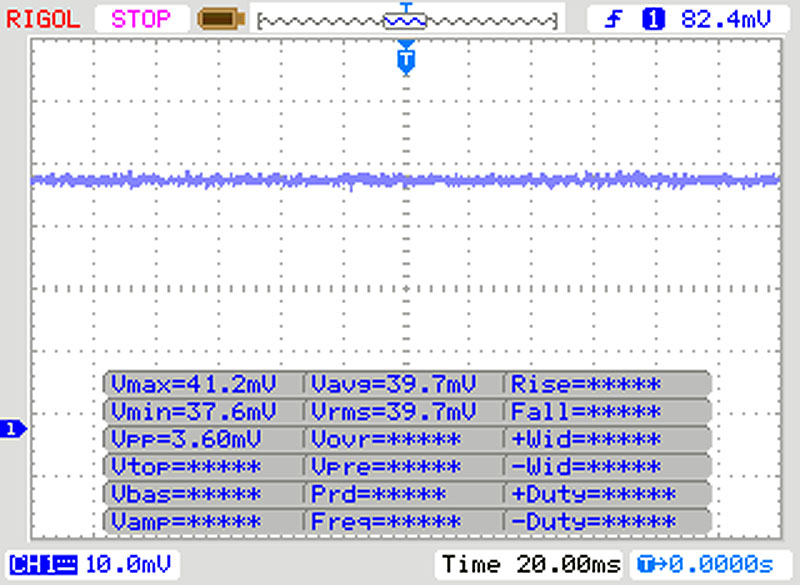 | ||
In comparison: 52 % of all tested devices do not use PWM to dim the display. If PWM was detected, an average of 7798 (minimum: 5 - maximum: 343500) Hz was measured. | |||
Out of the box, the display shows a decent color reproduction. However, the target (Delta E less than 3) isn't met with a color deviation of almost 4.3. The display doesn't suffer from a blue tint. Furthermore, calibration reduces the color deviation to 3.41 and provides a more balanced representation of grayscales. Good: The display covers 100% of the sRGB color space.
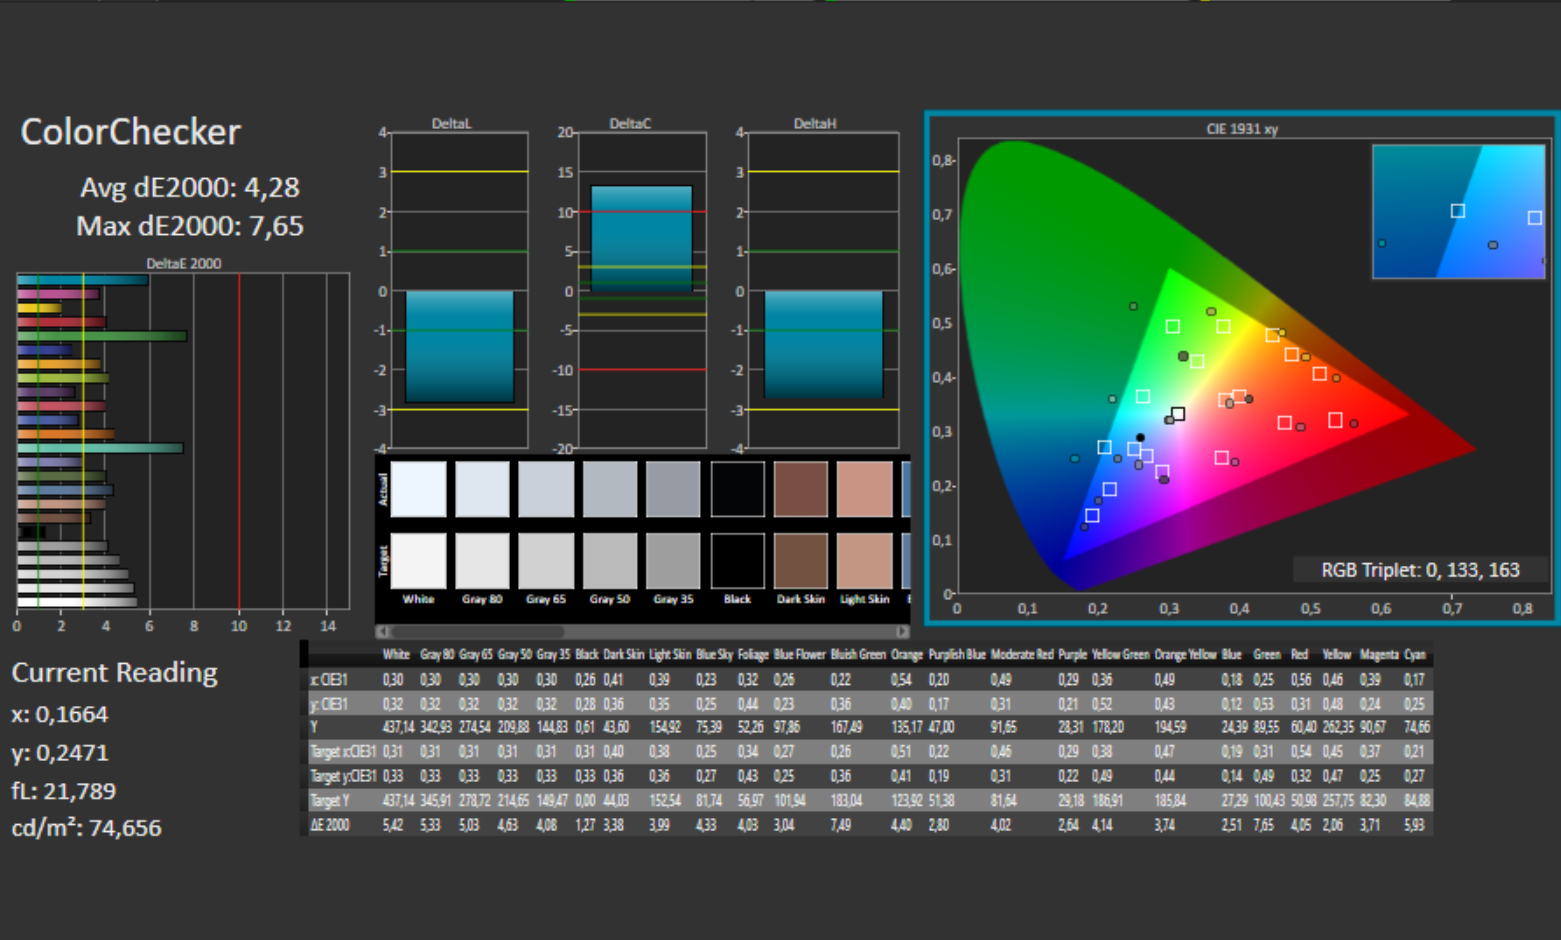
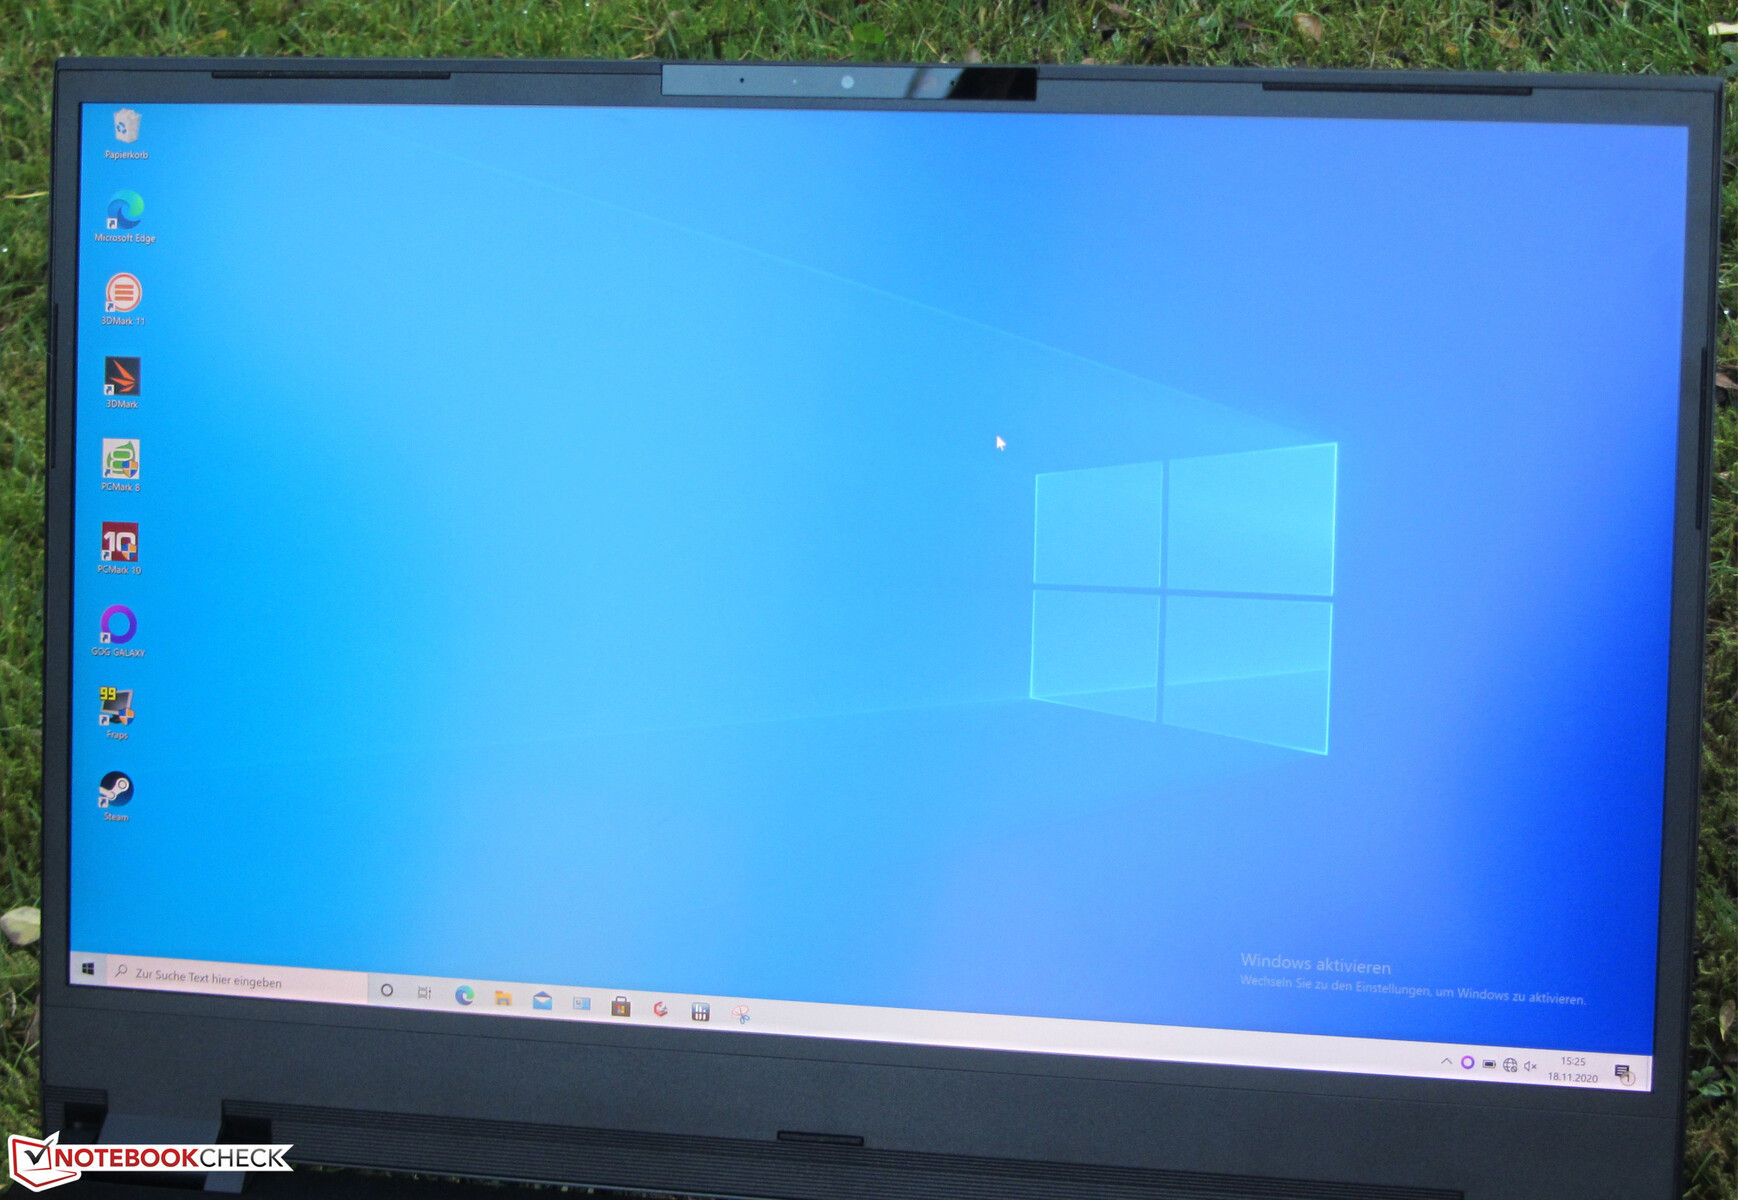
The viewing-angle stable IPS panel can be read from any position. Moreover, it's certainly possible to read the display outdoors.
Performance - Sufficient for all application areas
Schenker's 17.3-inch gaming laptop brings every modern game smoothly onto the screen and also cuts a fine figure in all other application areas. Our test device costs about 3,000 Euros (~$3,636). The device can be individually customized in Schenker's online store.
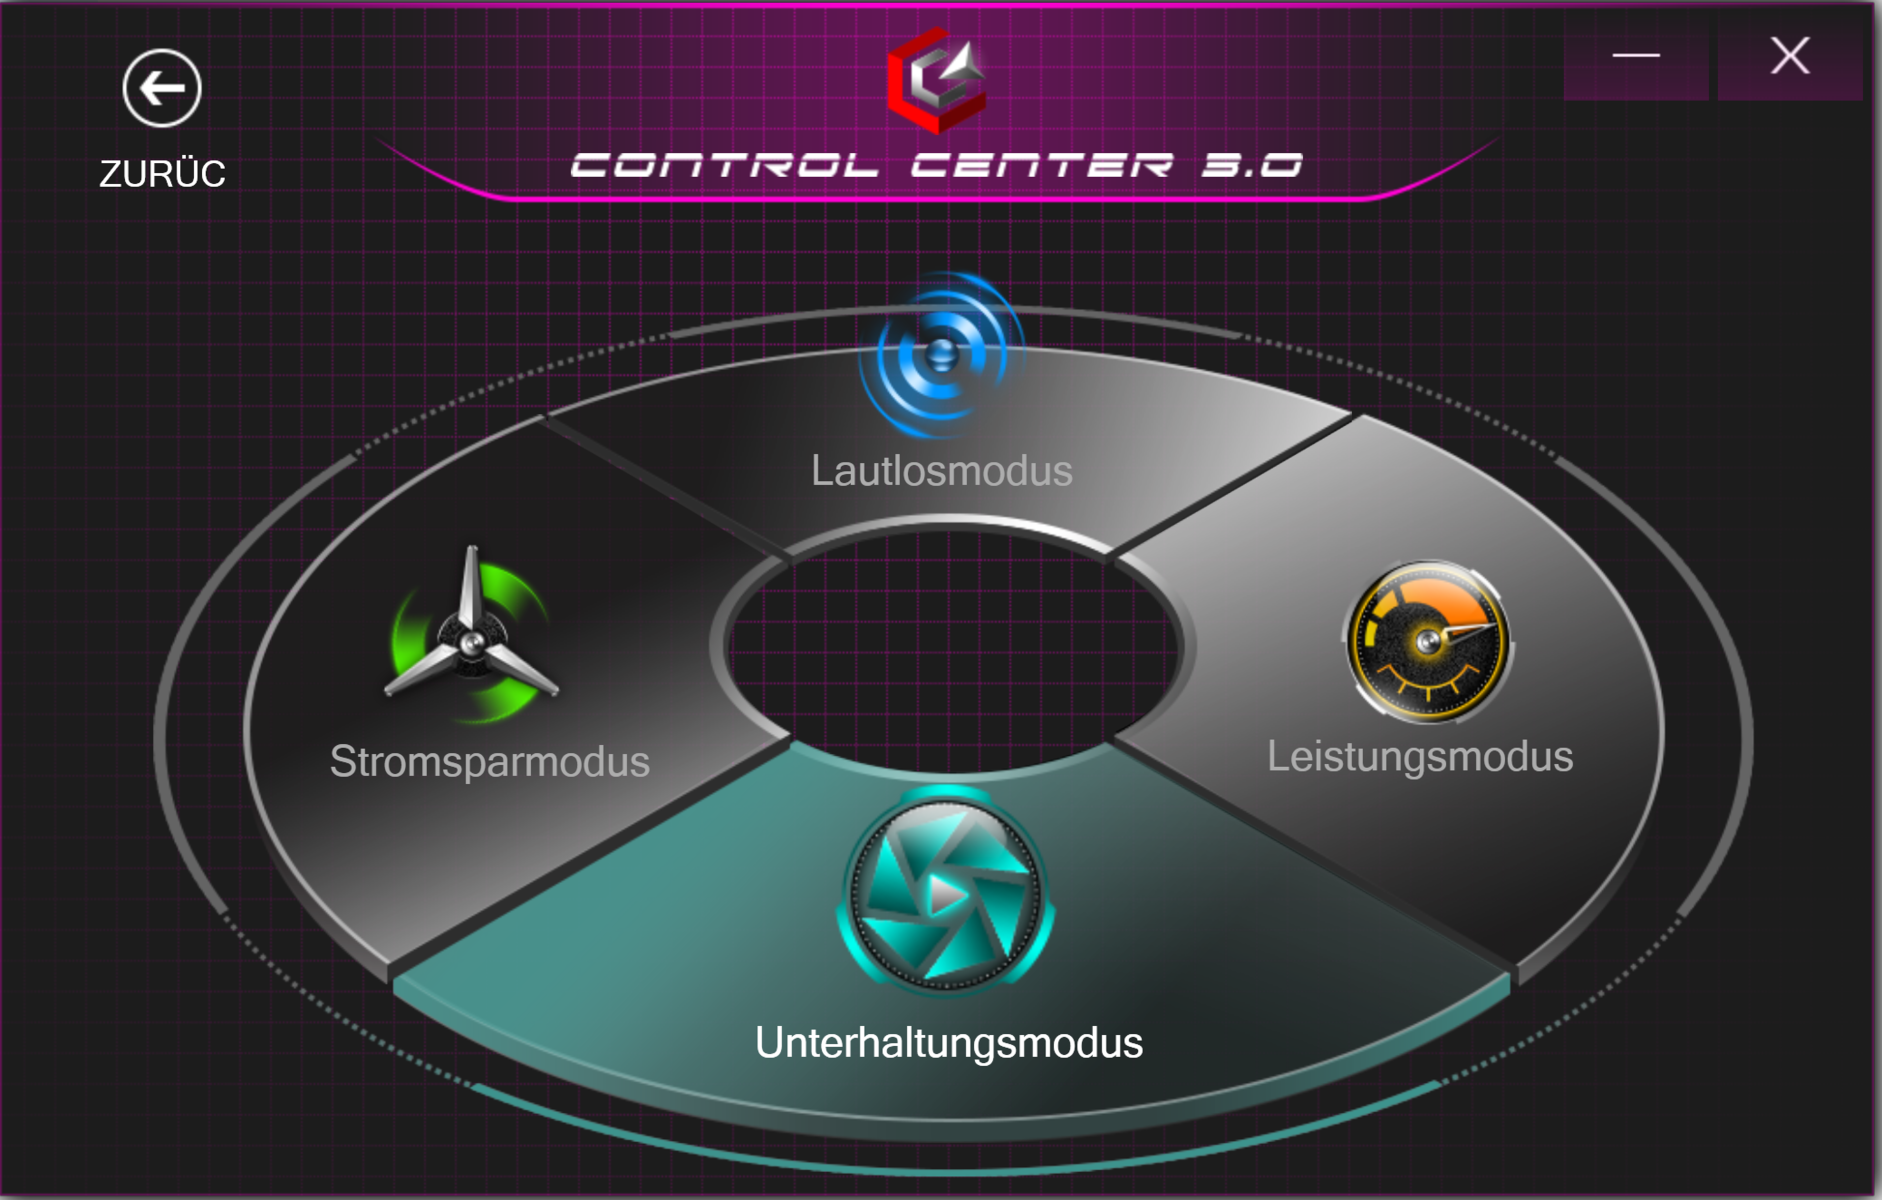
Test conditions
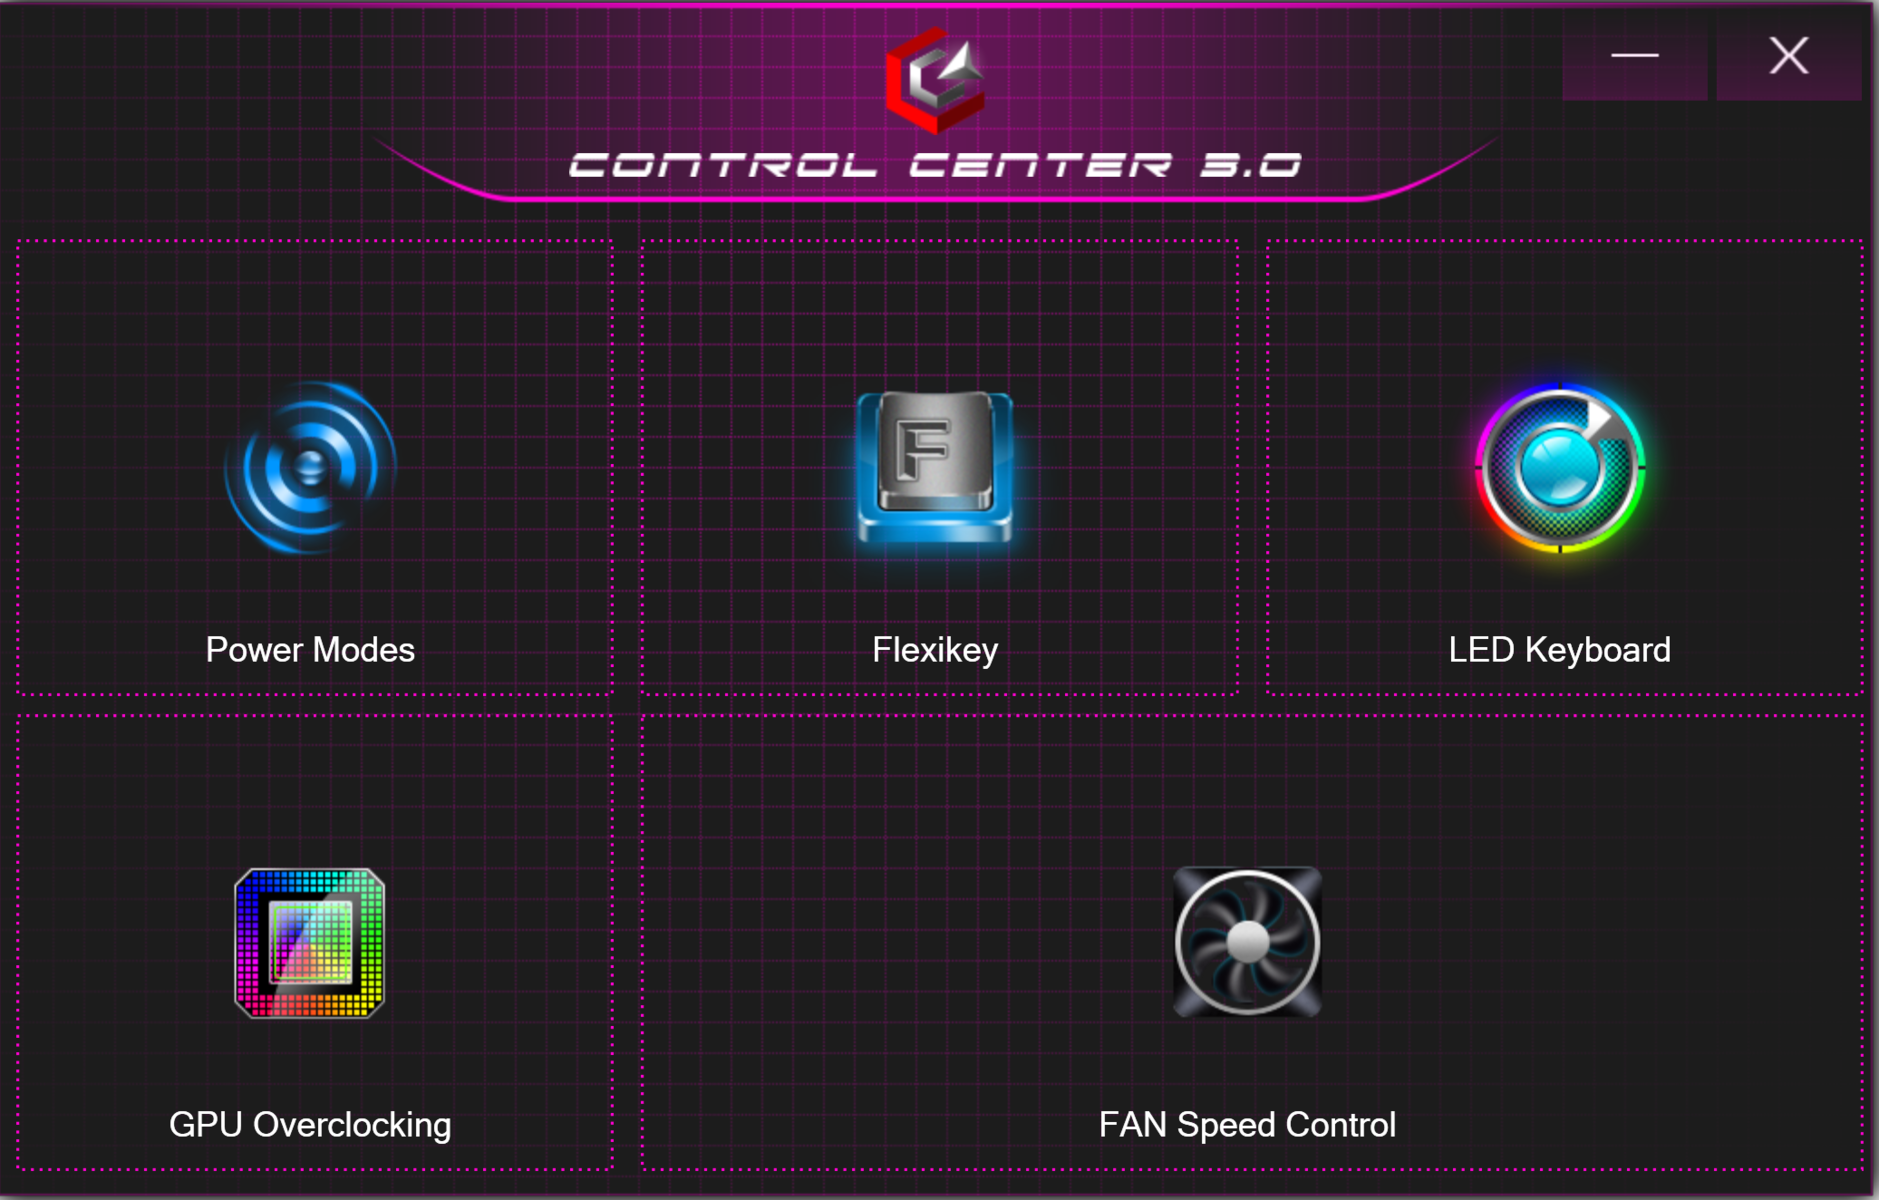
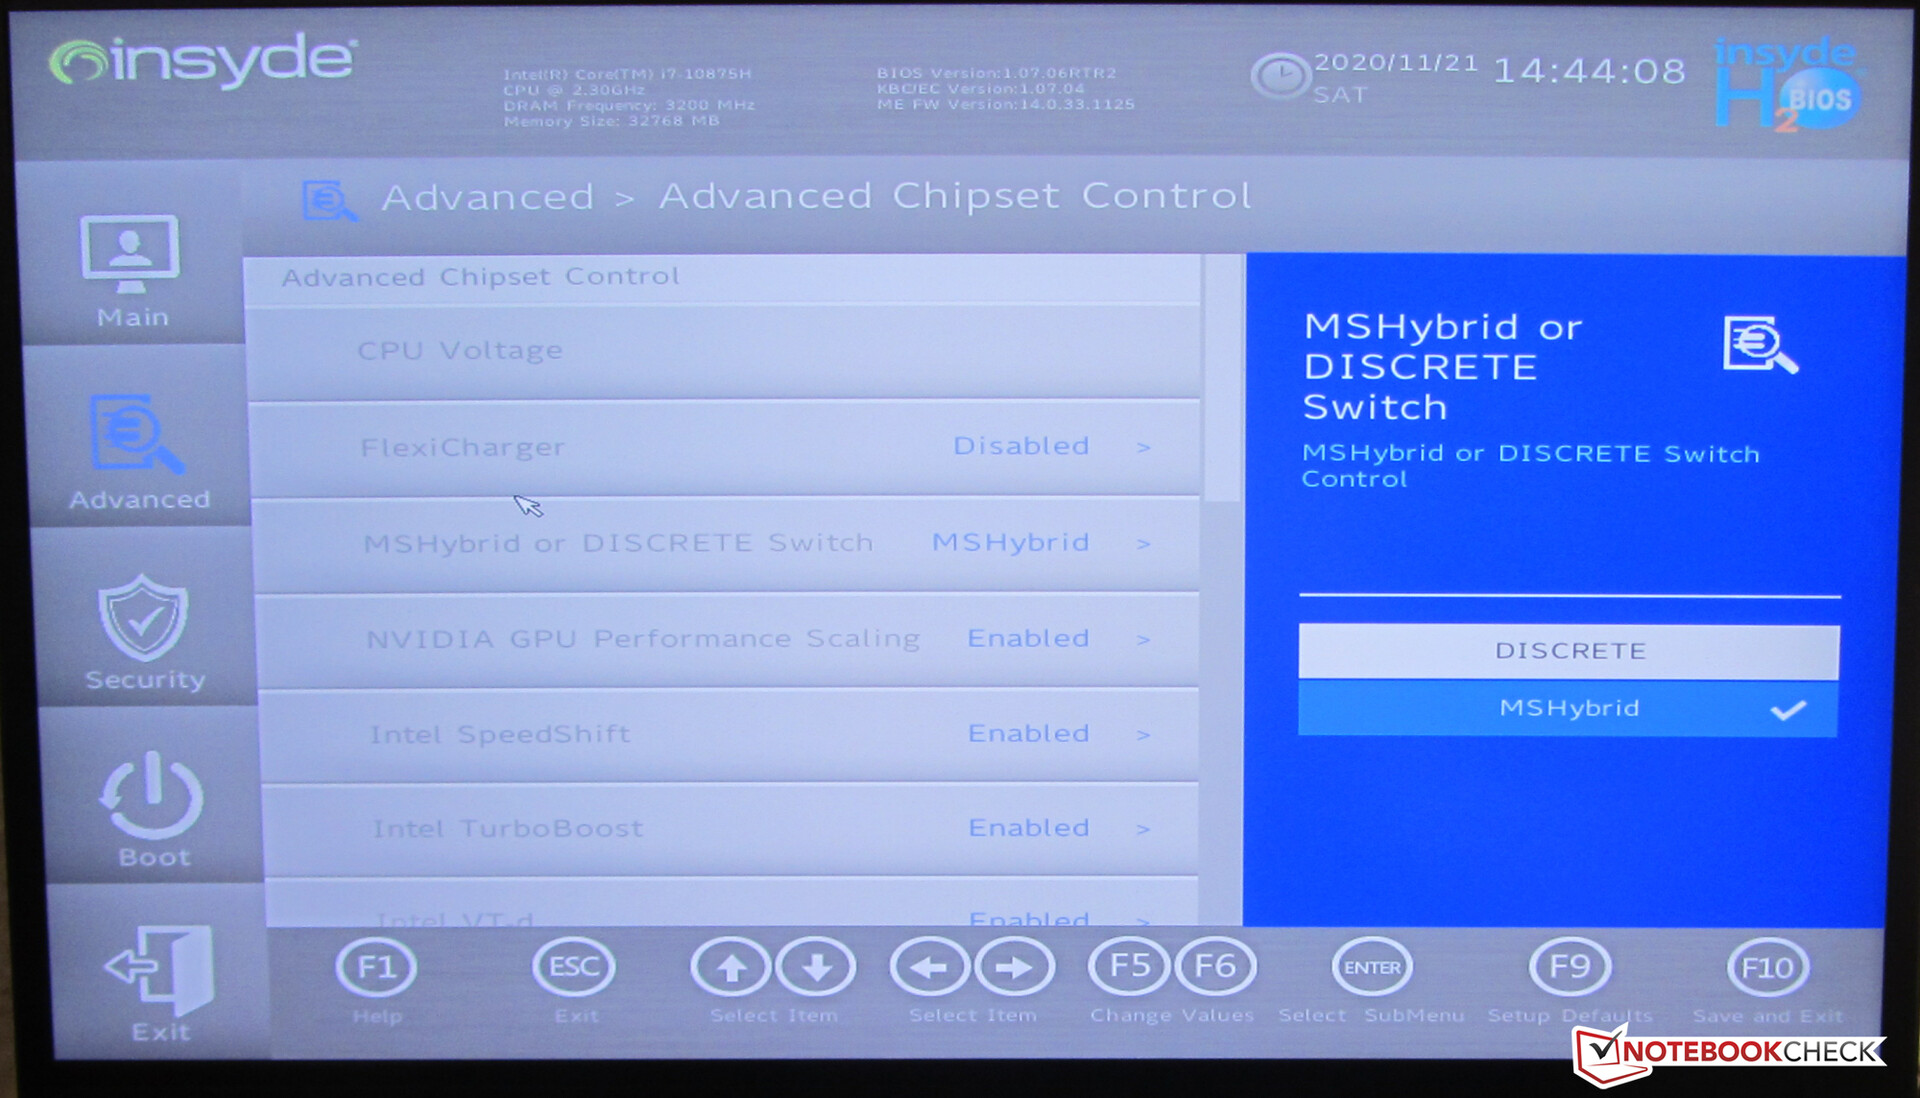
The preinstalled Control Center allows adjusting the fan control and selecting a performance profile, among other things. We performed all tests with automatic fan control and under the "Entertainment Mode" performance profile. We also ran some benchmarks under the "Performance Mode" profile. The "GPU Overclocking" function is only available when Optimus is disabled.
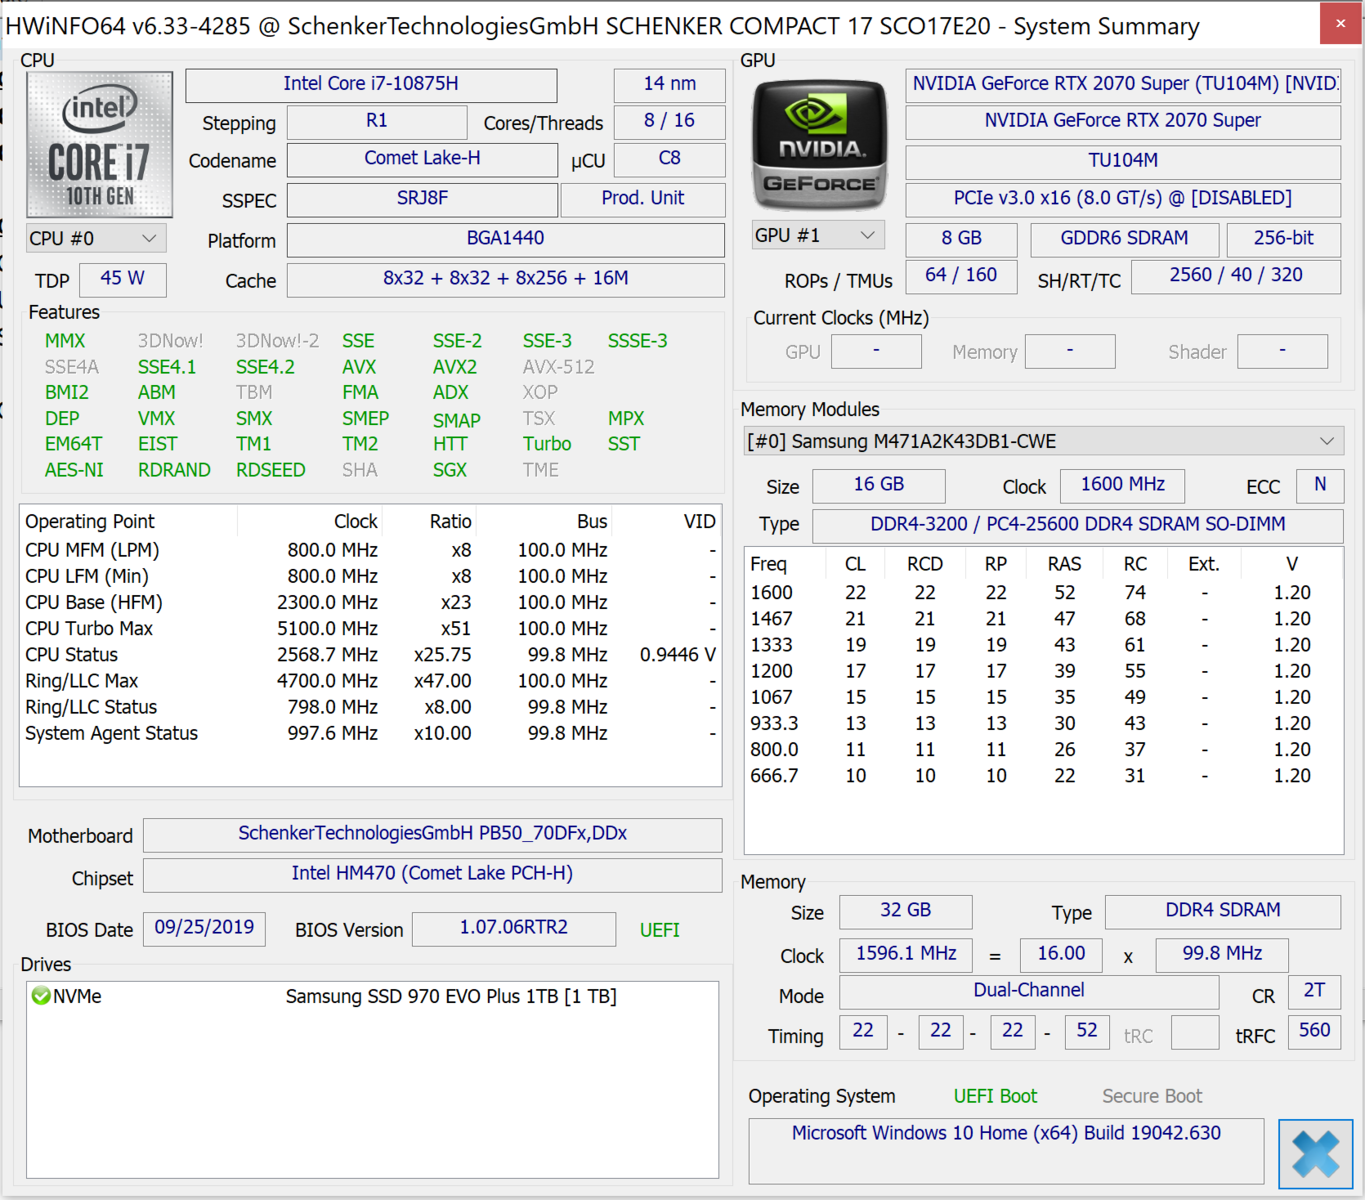
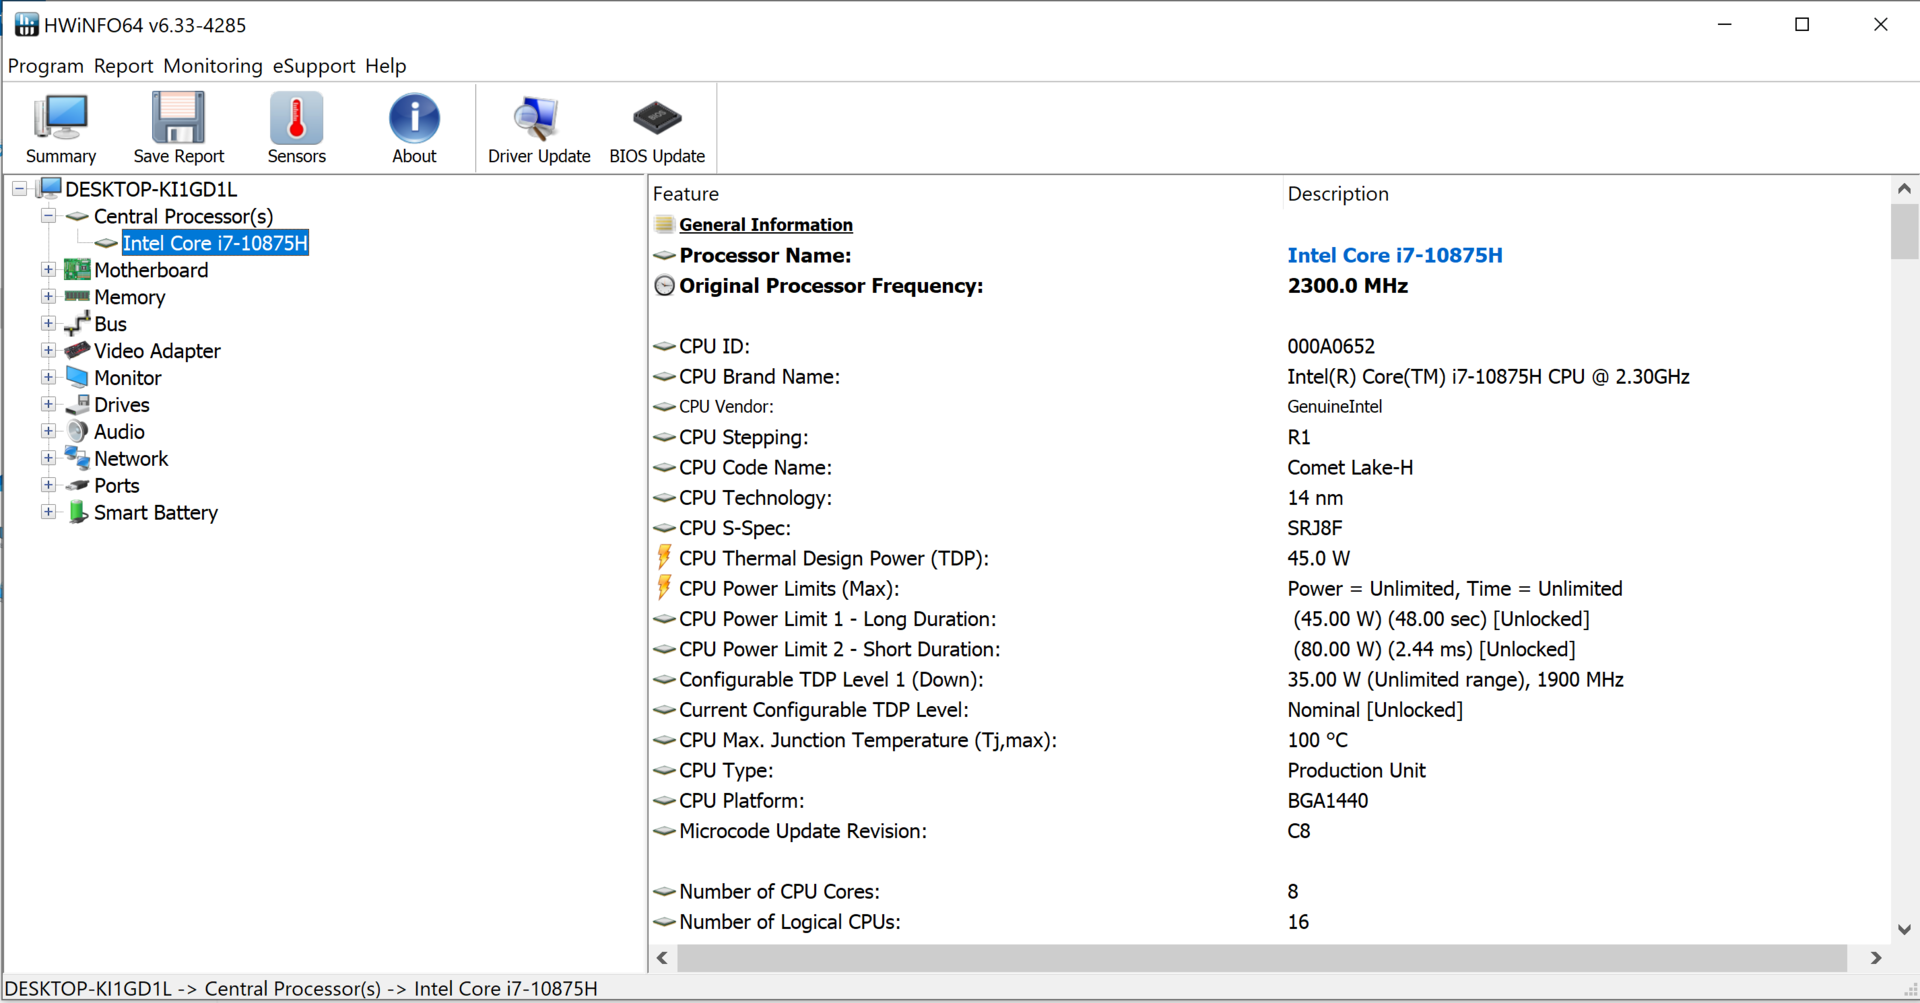
Processor
The Core i7-10875H octa-core processor (Comet Lake) operates at a base clock speed of 2.3 GHz. An increase to 4.3 GHz (eight cores) or 5.1 GHz (one core) is possible via Turbo. Hyper-Threading (two threads per core) is supported.
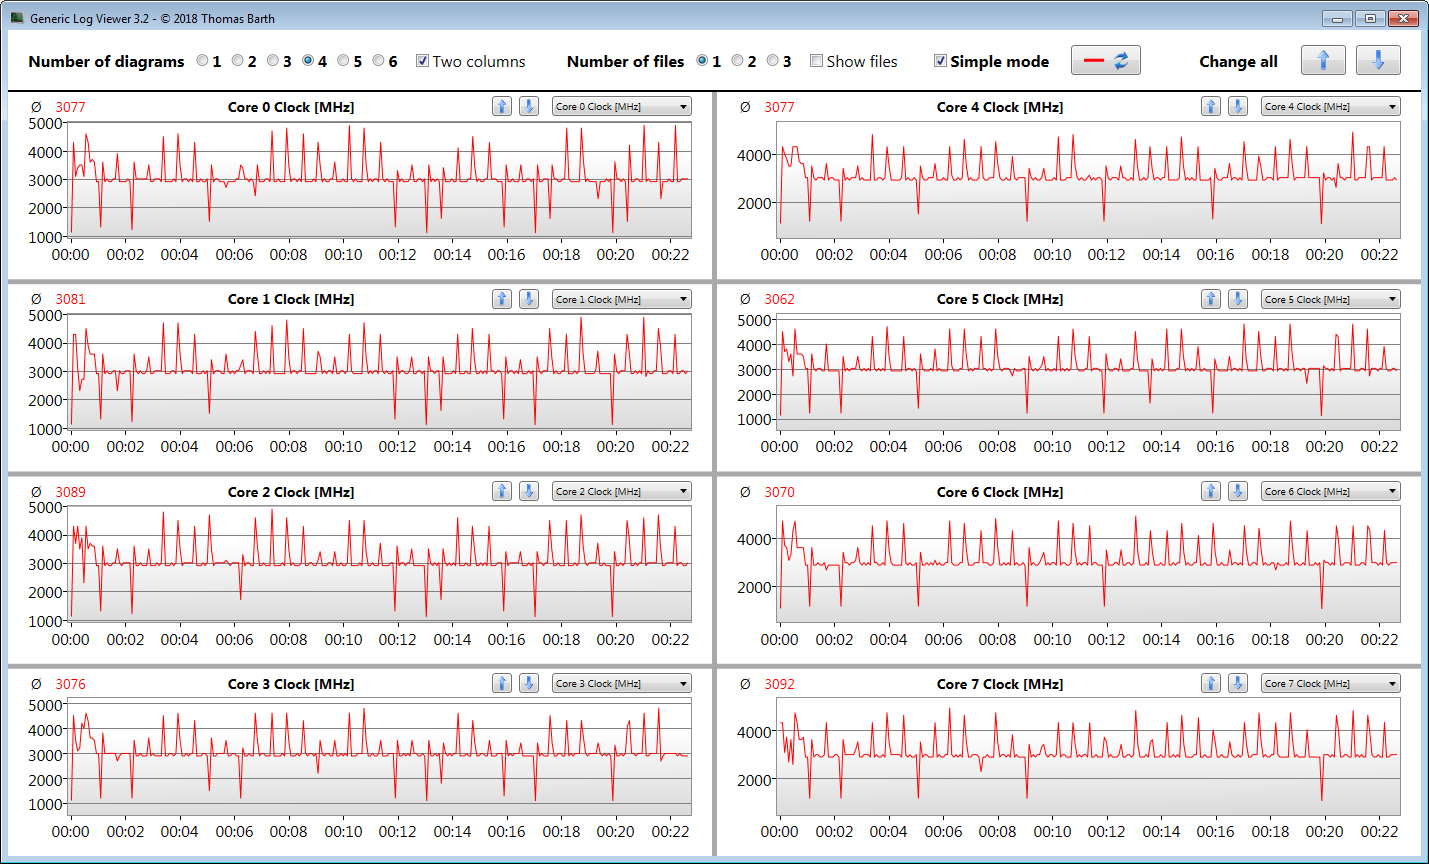
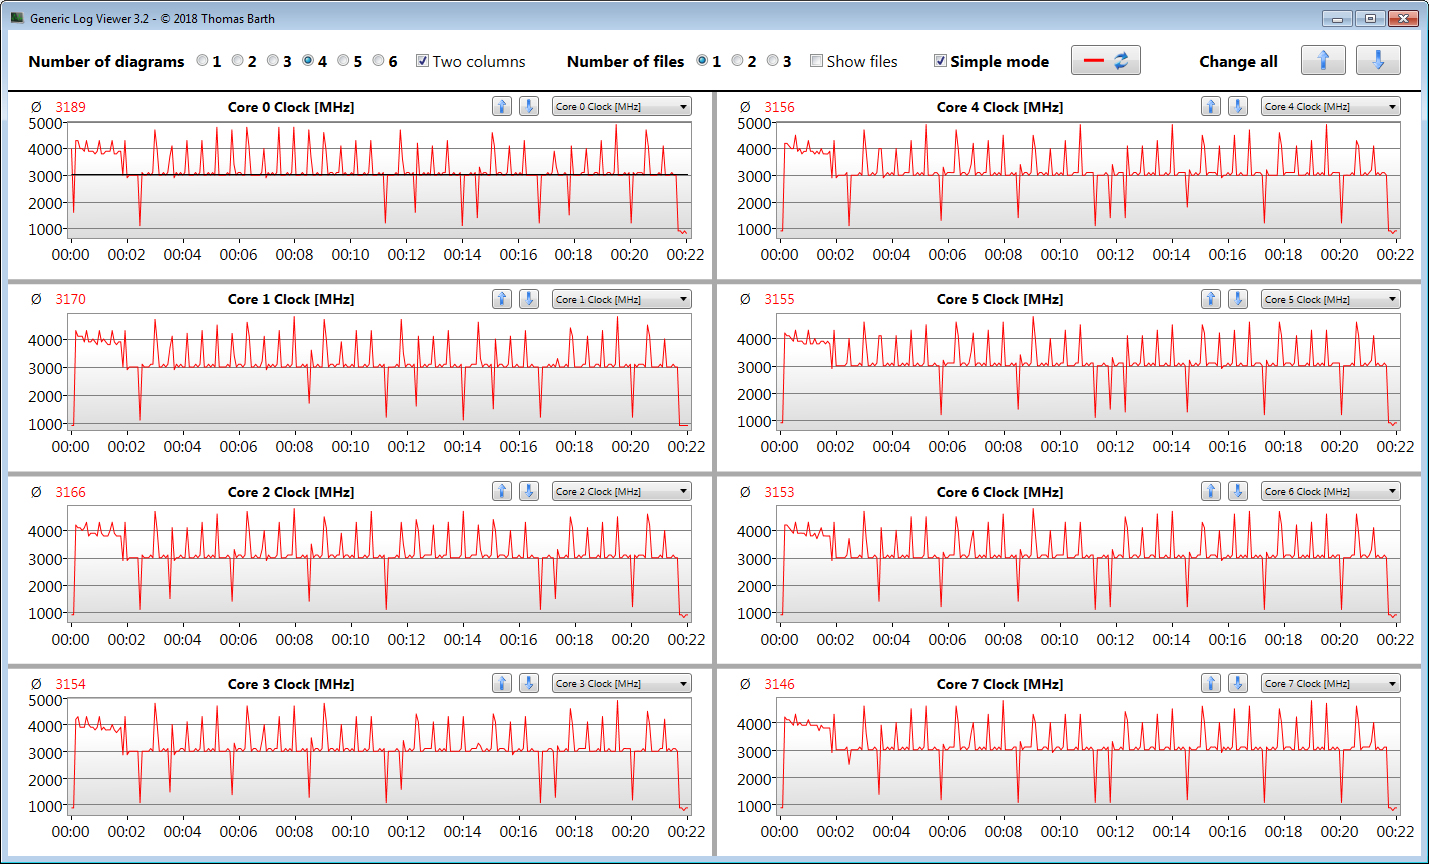
The CPU tests of the Cinebench R15 benchmark are processed at 2.6 to 4.2 GHz (multithread) and 4.2 to 5.1 GHz (single-thread), respectively. On battery power, the speeds are 1.8 to 1.9 GHz (multithread) and 1.8 to 3.9 GHz (single-thread), respectively.

We verify if the CPU Turbo is also consistently used when plugged in by running the Cinebench R15 benchmark's multithread test in a continuous loop for at least 30 minutes. Turbo is used.
"Performance Mode" lets the Turbo clock rates increase significantly for a short time. Under prolonged load, the speeds are only just above those of the "Entertainment Mode".
| Cinebench R15 | |
| CPU Single 64Bit | |
| Average of class Gaming (188.8 - 343, n=111, last 2 years) | |
| Schenker Compact 17 (Leistungsmodus) | |
| Schenker Compact 17 | |
| Gigabyte Aero 17 HDR XB | |
| Average Intel Core i7-10875H (190 - 220, n=37) | |
| Aorus 17G XB | |
| Asus Strix G17 G712LWS | |
| Razer Blade Pro 17 4K UHD 120 Hz | |
| Schenker XMG Pro 17 PB71RD-G | |
| CPU Multi 64Bit | |
| Average of class Gaming (1578 - 6271, n=111, last 2 years) | |
| Aorus 17G XB | |
| Schenker Compact 17 (Leistungsmodus) | |
| Gigabyte Aero 17 HDR XB | |
| Average Intel Core i7-10875H (1003 - 1833, n=38) | |
| Schenker Compact 17 | |
| Asus Strix G17 G712LWS | |
| Schenker XMG Pro 17 PB71RD-G | |
| Razer Blade Pro 17 4K UHD 120 Hz | |
| Blender - v2.79 BMW27 CPU | |
| Schenker XMG Pro 17 PB71RD-G | |
| Asus Strix G17 G712LWS | |
| Schenker Compact 17 | |
| Average Intel Core i7-10875H (259 - 535, n=30) | |
| Gigabyte Aero 17 HDR XB | |
| Schenker Compact 17 (Leistungsmodus) | |
| Aorus 17G XB | |
| Average of class Gaming (80 - 330, n=109, last 2 years) | |
| 7-Zip 18.03 | |
| 7z b 4 -mmt1 | |
| Average of class Gaming (4199 - 7436, n=110, last 2 years) | |
| Schenker Compact 17 | |
| Schenker Compact 17 (Leistungsmodus) | |
| Gigabyte Aero 17 HDR XB | |
| Average Intel Core i7-10875H (5071 - 5780, n=31) | |
| Aorus 17G XB | |
| Asus Strix G17 G712LWS | |
| Schenker XMG Pro 17 PB71RD-G | |
| 7z b 4 | |
| Average of class Gaming (33491 - 148086, n=110, last 2 years) | |
| Schenker Compact 17 (Leistungsmodus) | |
| Aorus 17G XB | |
| Gigabyte Aero 17 HDR XB | |
| Average Intel Core i7-10875H (29844 - 49562, n=31) | |
| Schenker Compact 17 | |
| Asus Strix G17 G712LWS | |
| Schenker XMG Pro 17 PB71RD-G | |
| Cinebench R20 | |
| CPU (Single Core) | |
| Average of class Gaming (442 - 895, n=111, last 2 years) | |
| Schenker Compact 17 (Leistungsmodus) | |
| Gigabyte Aero 17 HDR XB | |
| Asus Strix G17 G712LWS | |
| Aorus 17G XB | |
| Average Intel Core i7-10875H (430 - 524, n=32) | |
| Schenker Compact 17 | |
| Razer Blade Pro 17 4K UHD 120 Hz | |
| Schenker XMG Pro 17 PB71RD-G | |
| CPU (Multi Core) | |
| Average of class Gaming (4029 - 16108, n=111, last 2 years) | |
| Schenker Compact 17 (Leistungsmodus) | |
| Aorus 17G XB | |
| Average Intel Core i7-10875H (1986 - 4176, n=32) | |
| Gigabyte Aero 17 HDR XB | |
| Schenker Compact 17 | |
| Asus Strix G17 G712LWS | |
| Razer Blade Pro 17 4K UHD 120 Hz | |
| Schenker XMG Pro 17 PB71RD-G | |
| Geekbench 5.5 | |
| Single-Core | |
| Average of class Gaming (986 - 2474, n=110, last 2 years) | |
| Schenker Compact 17 (Leistungsmodus) | |
| Schenker Compact 17 | |
| Average Intel Core i7-10875H (1233 - 1371, n=29) | |
| Aorus 17G XB | |
| Asus Strix G17 G712LWS | |
| Gigabyte Aero 17 HDR XB | |
| Schenker XMG Pro 17 PB71RD-G | |
| Multi-Core | |
| Average of class Gaming (6460 - 27010, n=110, last 2 years) | |
| Schenker Compact 17 (Leistungsmodus) | |
| Aorus 17G XB | |
| Average Intel Core i7-10875H (5715 - 8620, n=29) | |
| Schenker Compact 17 | |
| Gigabyte Aero 17 HDR XB | |
| Asus Strix G17 G712LWS | |
| Schenker XMG Pro 17 PB71RD-G | |
| HWBOT x265 Benchmark v2.2 - 4k Preset | |
| Average of class Gaming (11.5 - 44.3, n=110, last 2 years) | |
| Aorus 17G XB | |
| Schenker Compact 17 (Leistungsmodus) | |
| Gigabyte Aero 17 HDR XB | |
| Average Intel Core i7-10875H (7.27 - 14.1, n=27) | |
| Schenker Compact 17 | |
| Asus Strix G17 G712LWS | |
| Schenker XMG Pro 17 PB71RD-G | |
| LibreOffice - 20 Documents To PDF | |
| Gigabyte Aero 17 HDR XB | |
| Asus Strix G17 G712LWS | |
| Schenker Compact 17 | |
| Aorus 17G XB | |
| Average Intel Core i7-10875H (30.2 - 84.3, n=30) | |
| Average of class Gaming (19 - 88.8, n=110, last 2 years) | |
| Schenker Compact 17 (Leistungsmodus) | |
| R Benchmark 2.5 - Overall mean | |
| Schenker XMG Pro 17 PB71RD-G | |
| Asus Strix G17 G712LWS | |
| Aorus 17G XB | |
| Average Intel Core i7-10875H (0.546 - 0.662, n=29) | |
| Gigabyte Aero 17 HDR XB | |
| Schenker Compact 17 | |
| Schenker Compact 17 (Leistungsmodus) | |
| Average of class Gaming (0.3439 - 0.759, n=111, last 2 years) | |
* ... smaller is better
System performance
The system works fast and smoothly. The installed hardware provides more than enough computing power for all common application areas - gaming, video-editing, and image-processing don't pose a big challenge for the laptop. This is accompanied by good PCMark results.
| PCMark 8 Home Score Accelerated v2 | 3561 points | |
| PCMark 8 Creative Score Accelerated v2 | 6034 points | |
| PCMark 8 Work Score Accelerated v2 | 4380 points | |
| PCMark 10 Score | 6364 points | |
Help | ||
DPC latencies
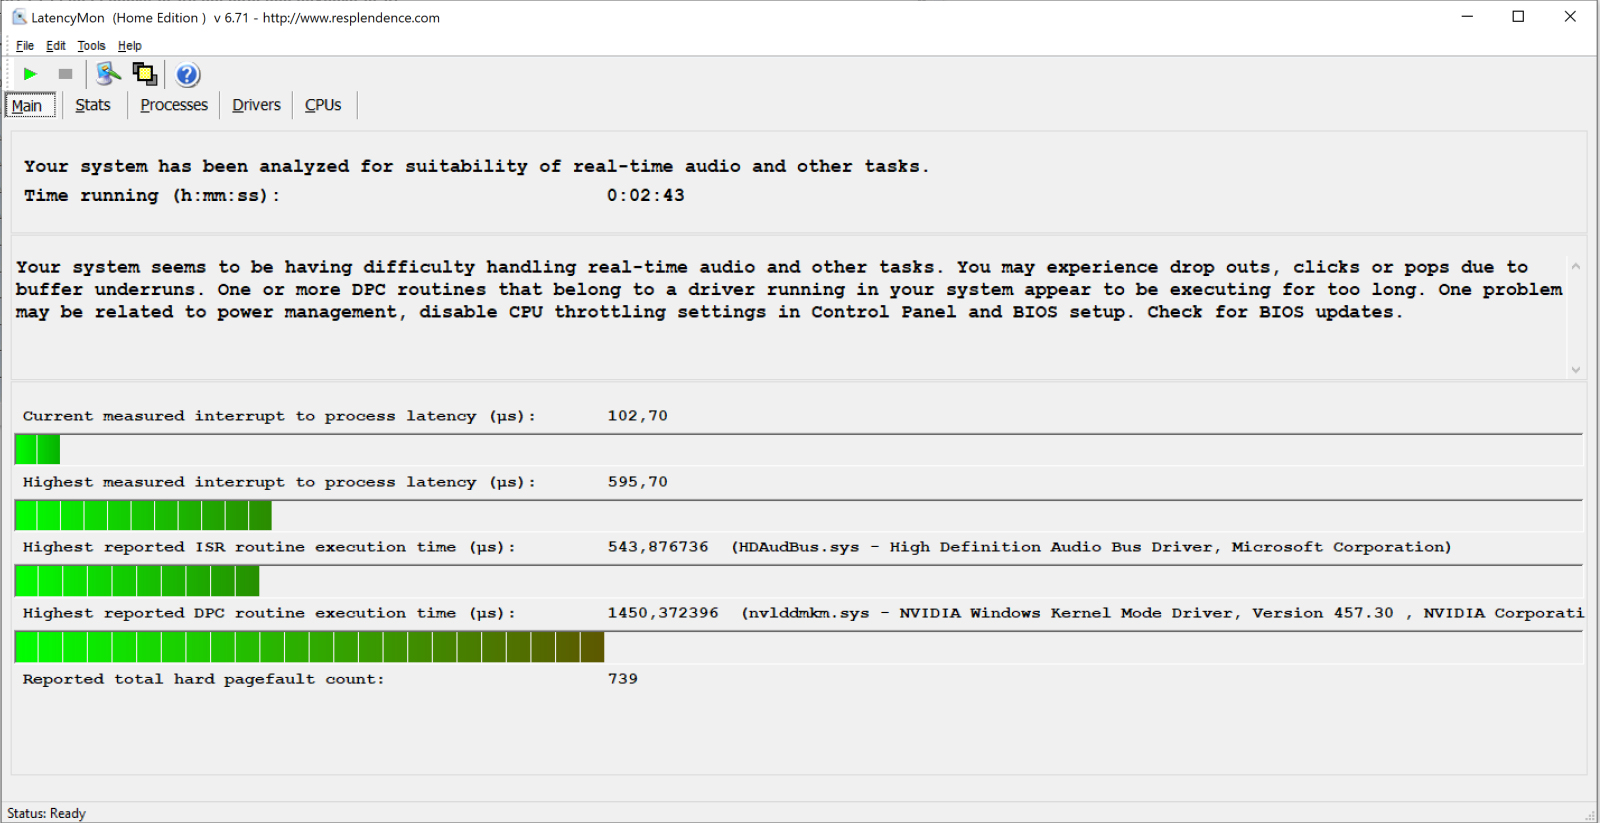
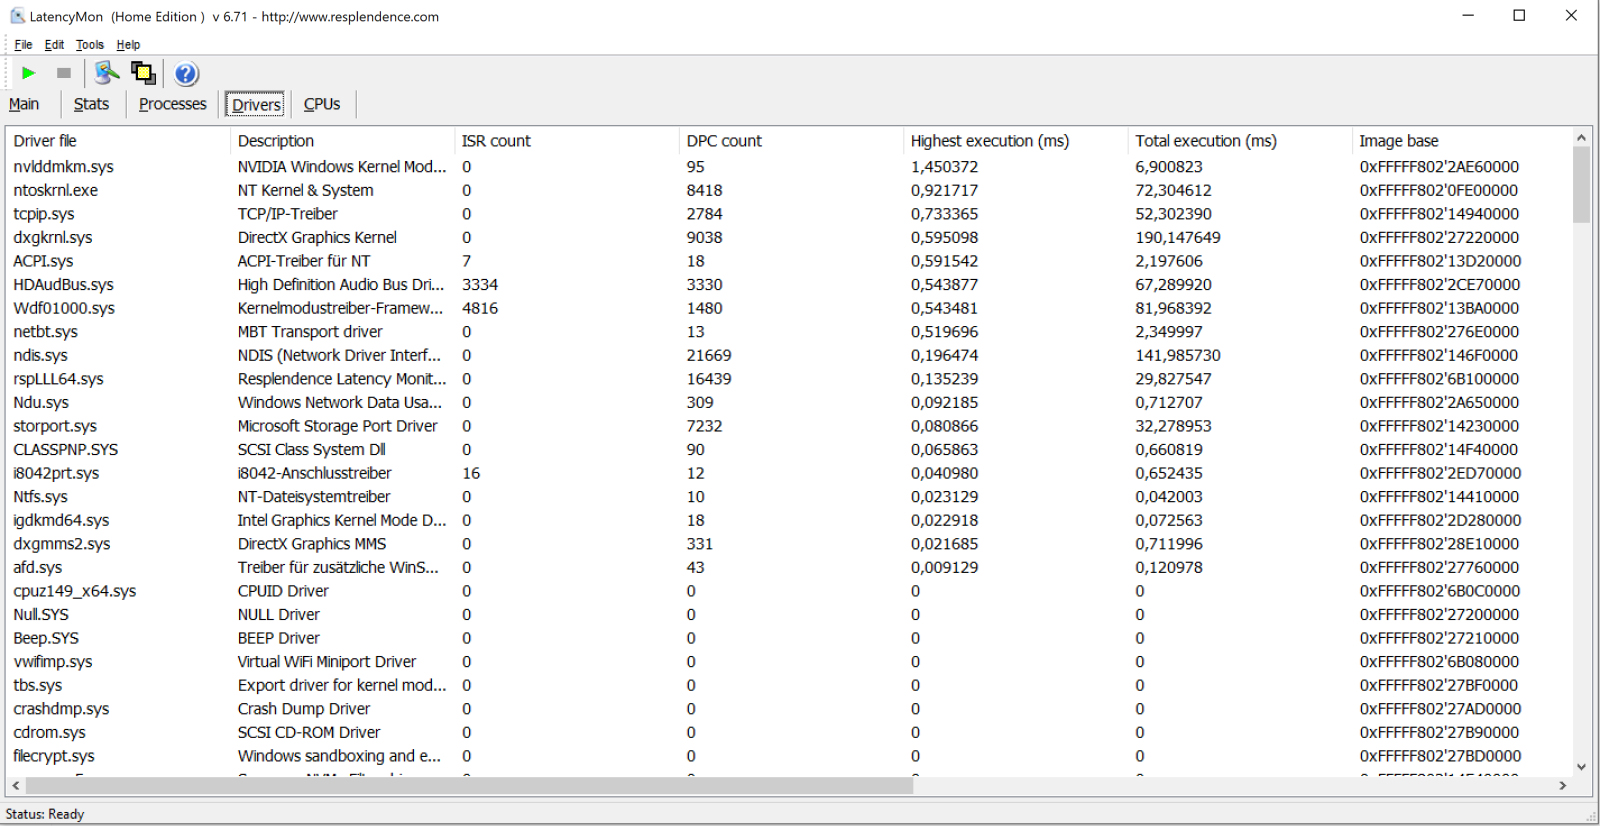
| DPC Latencies / LatencyMon - interrupt to process latency (max), Web, Youtube, Prime95 | |
| Aorus 17G XB | |
| Asus Strix G17 G712LWS | |
| Gigabyte Aero 17 HDR XB | |
| Schenker Compact 17 | |
* ... smaller is better
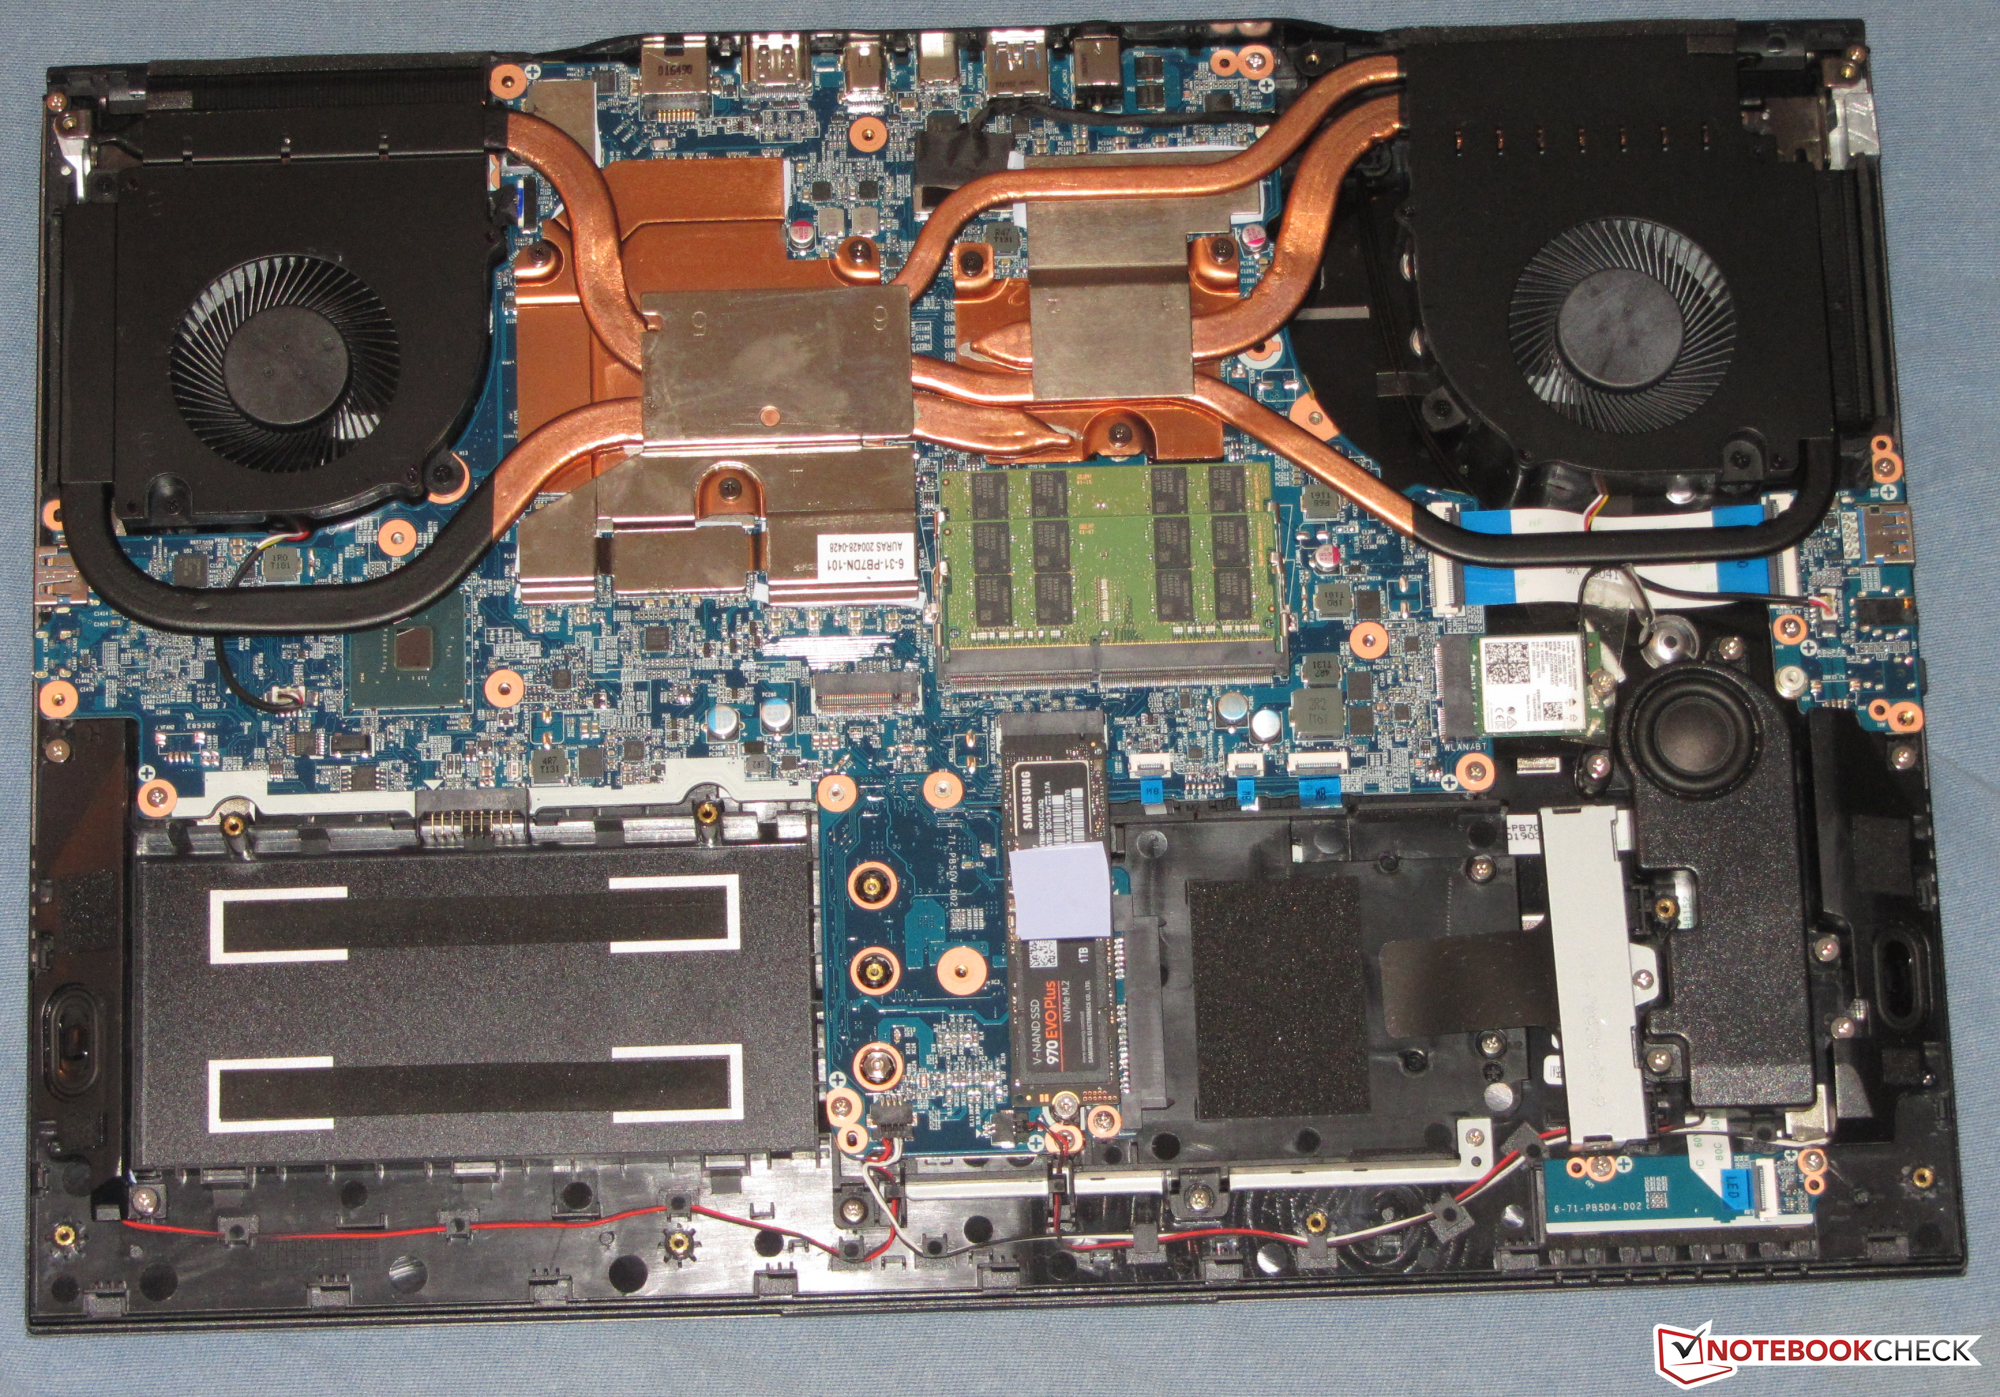
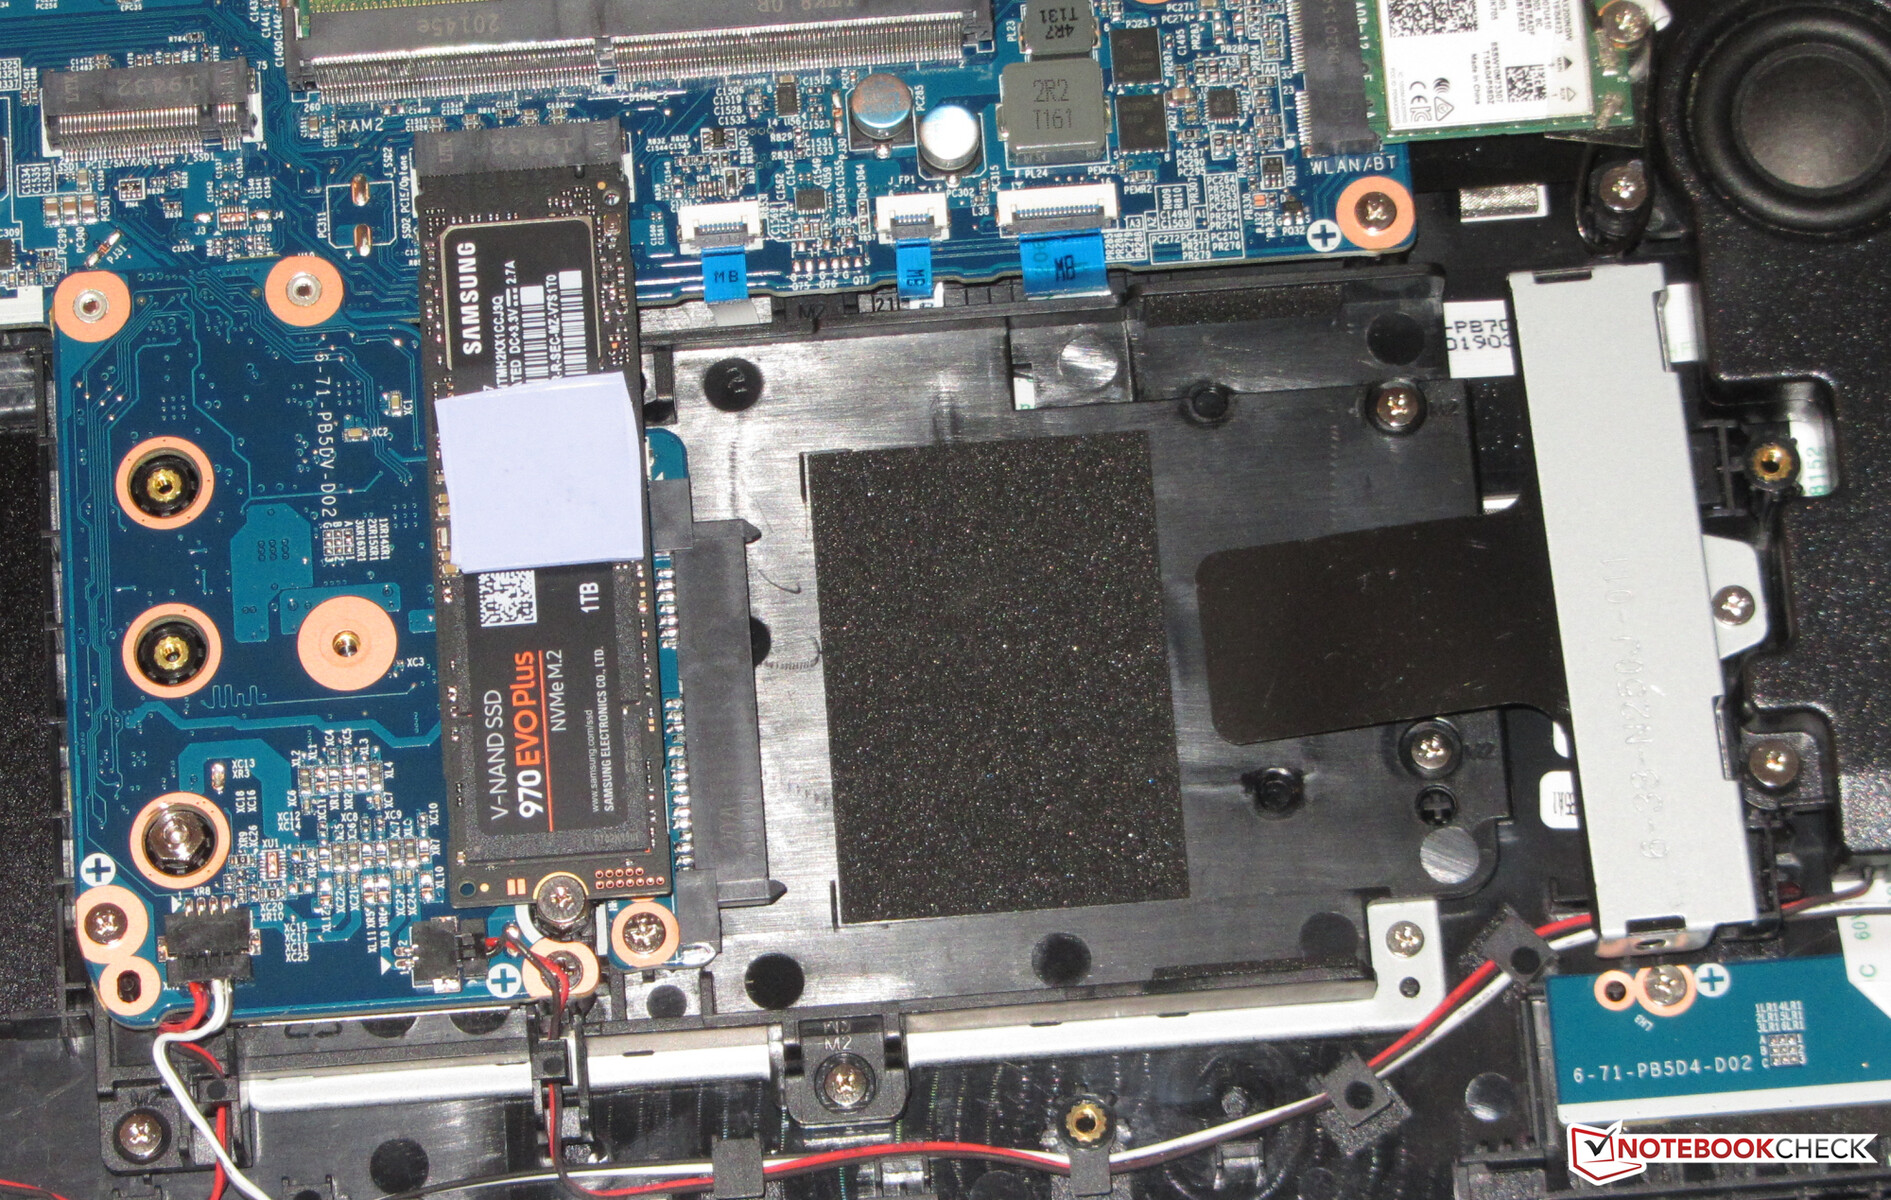
Storage
The laptop can accommodate two SSDs (1x NVMe, 1x NVMe/SATA; RAID 0/1) in the M.2 format. Our test device is equipped with an NVMe SSD that provides 1 TB of storage space. The transfer rates are very good. Moreover, the Schenker laptop still has room for a 2.5-inch storage medium. A mounting frame and SATA slot are available.

| Schenker Compact 17 Samsung SSD 970 EVO Plus 1TB | Gigabyte Aero 17 HDR XB Samsung SSD PM981a MZVLB512HBJQ | Razer Blade Pro 17 4K UHD 120 Hz Samsung SSD PM981 MZVLB1T0HALR | Asus Strix G17 G712LWS Intel SSD 660p 1TB SSDPEKNW010T8 | Aorus 17G XB Samsung SSD PM981a MZVLB512HBJQ | Schenker XMG Pro 17 PB71RD-G Samsung SSD 970 EVO Plus 500GB | Average Samsung SSD 970 EVO Plus 1TB | Average of class Gaming | |
|---|---|---|---|---|---|---|---|---|
| CrystalDiskMark 5.2 / 6 | -14% | -24% | -27% | -12% | -19% | -7% | 40% | |
| Write 4K (MB/s) | 167.8 | 123.4 -26% | 121.7 -27% | 141.1 -16% | 123.4 -26% | 117.5 -30% | 155.5 ? -7% | 202 ? 20% |
| Read 4K (MB/s) | 53.5 | 45.59 -15% | 43.81 -18% | 60.9 14% | 45.02 -16% | 46.47 -13% | 51.6 ? -4% | 78.1 ? 46% |
| Write Seq (MB/s) | 3073 | 2320 -25% | 1276 -58% | 1681 -45% | 2526 -18% | 1345 -56% | 2660 ? -13% | 3703 ? 21% |
| Read Seq (MB/s) | 2488 | 2013 -19% | 1183 -52% | 1602 -36% | 2062 -17% | 2804 13% | 2390 ? -4% | 3592 ? 44% |
| Write 4K Q32T1 (MB/s) | 524 | 489.3 -7% | 527 1% | 406.6 -22% | 497.9 -5% | 368.2 -30% | 447 ? -15% | 611 ? 17% |
| Read 4K Q32T1 (MB/s) | 595 | 559 -6% | 592 -1% | 470.2 -21% | 579 -3% | 412.9 -31% | 544 ? -9% | 715 ? 20% |
| Write Seq Q32T1 (MB/s) | 3324 | 2979 -10% | 2379 -28% | 1759 -47% | 2982 -10% | 3248 -2% | 3296 ? -1% | 5192 ? 56% |
| Read Seq Q32T1 (MB/s) | 3564 | 3432 -4% | 3213 -10% | 1932 -46% | 3440 -3% | 3559 0% | 3551 ? 0% | 6958 ? 95% |
| AS SSD | -29% | -32% | -49% | -25% | -7% | 1% | 27% | |
| Seq Read (MB/s) | 2879 | 1762 -39% | 1881 -35% | 1778 -38% | 1791 -38% | 2946 2% | 2800 ? -3% | 5490 ? 91% |
| Seq Write (MB/s) | 2842 | 2309 -19% | 2354 -17% | 1478 -48% | 2193 -23% | 2627 -8% | 2633 ? -7% | 3914 ? 38% |
| 4K Read (MB/s) | 51.6 | 49.45 -4% | 43.42 -16% | 49.76 -4% | 50.7 -2% | 56.9 10% | 51.2 ? -1% | 70 ? 36% |
| 4K Write (MB/s) | 142.5 | 117.1 -18% | 104.1 -27% | 117.9 -17% | 116.8 -18% | 151.7 6% | 131.2 ? -8% | 215 ? 51% |
| 4K-64 Read (MB/s) | 1672 | 1237 -26% | 1805 8% | 591 -65% | 1525 -9% | 1222 -27% | 1839 ? 10% | 1633 ? -2% |
| 4K-64 Write (MB/s) | 2293 | 1986 -13% | 1775 -23% | 875 -62% | 1958 -15% | 2444 7% | 2144 ? -6% | 2875 ? 25% |
| Access Time Read * (ms) | 0.034 | 0.076 -124% | 0.049 -44% | 0.082 -141% | 0.07 -106% | 0.051 -50% | 0.04528 ? -33% | 0.06415 ? -89% |
| Access Time Write * (ms) | 0.027 | 0.032 -19% | 0.106 -293% | 0.041 -52% | 0.032 -19% | 0.025 7% | 0.03128 ? -16% | 0.03953 ? -46% |
| Score Read (Points) | 2012 | 1463 -27% | 2037 1% | 818 -59% | 1755 -13% | 1574 -22% | 2171 ? 8% | 2252 ? 12% |
| Score Write (Points) | 2719 | 2334 -14% | 2115 -22% | 1140 -58% | 2294 -16% | 2859 5% | 2539 ? -7% | 3481 ? 28% |
| Score Total (Points) | 5760 | 4581 -20% | 5215 -9% | 2377 -59% | 4972 -14% | 5232 -9% | 5812 ? 1% | 6815 ? 18% |
| Copy ISO MB/s (MB/s) | 2383 | 1877 -21% | 1495 -37% | 2133 ? -10% | 3074 ? 29% | |||
| Copy Program MB/s (MB/s) | 603 | 539 -11% | 446 -26% | 698 ? 16% | 951 ? 58% | |||
| Copy Game MB/s (MB/s) | 873 | 1368 57% | 697 -20% | 1521 ? 74% | 2035 ? 133% | |||
| Total Average (Program / Settings) | -22% /
-23% | -28% /
-29% | -38% /
-41% | -19% /
-20% | -13% /
-12% | -3% /
-2% | 34% /
32% |
* ... smaller is better
Continuous load read: DiskSpd Read Loop, Queue Depth 8
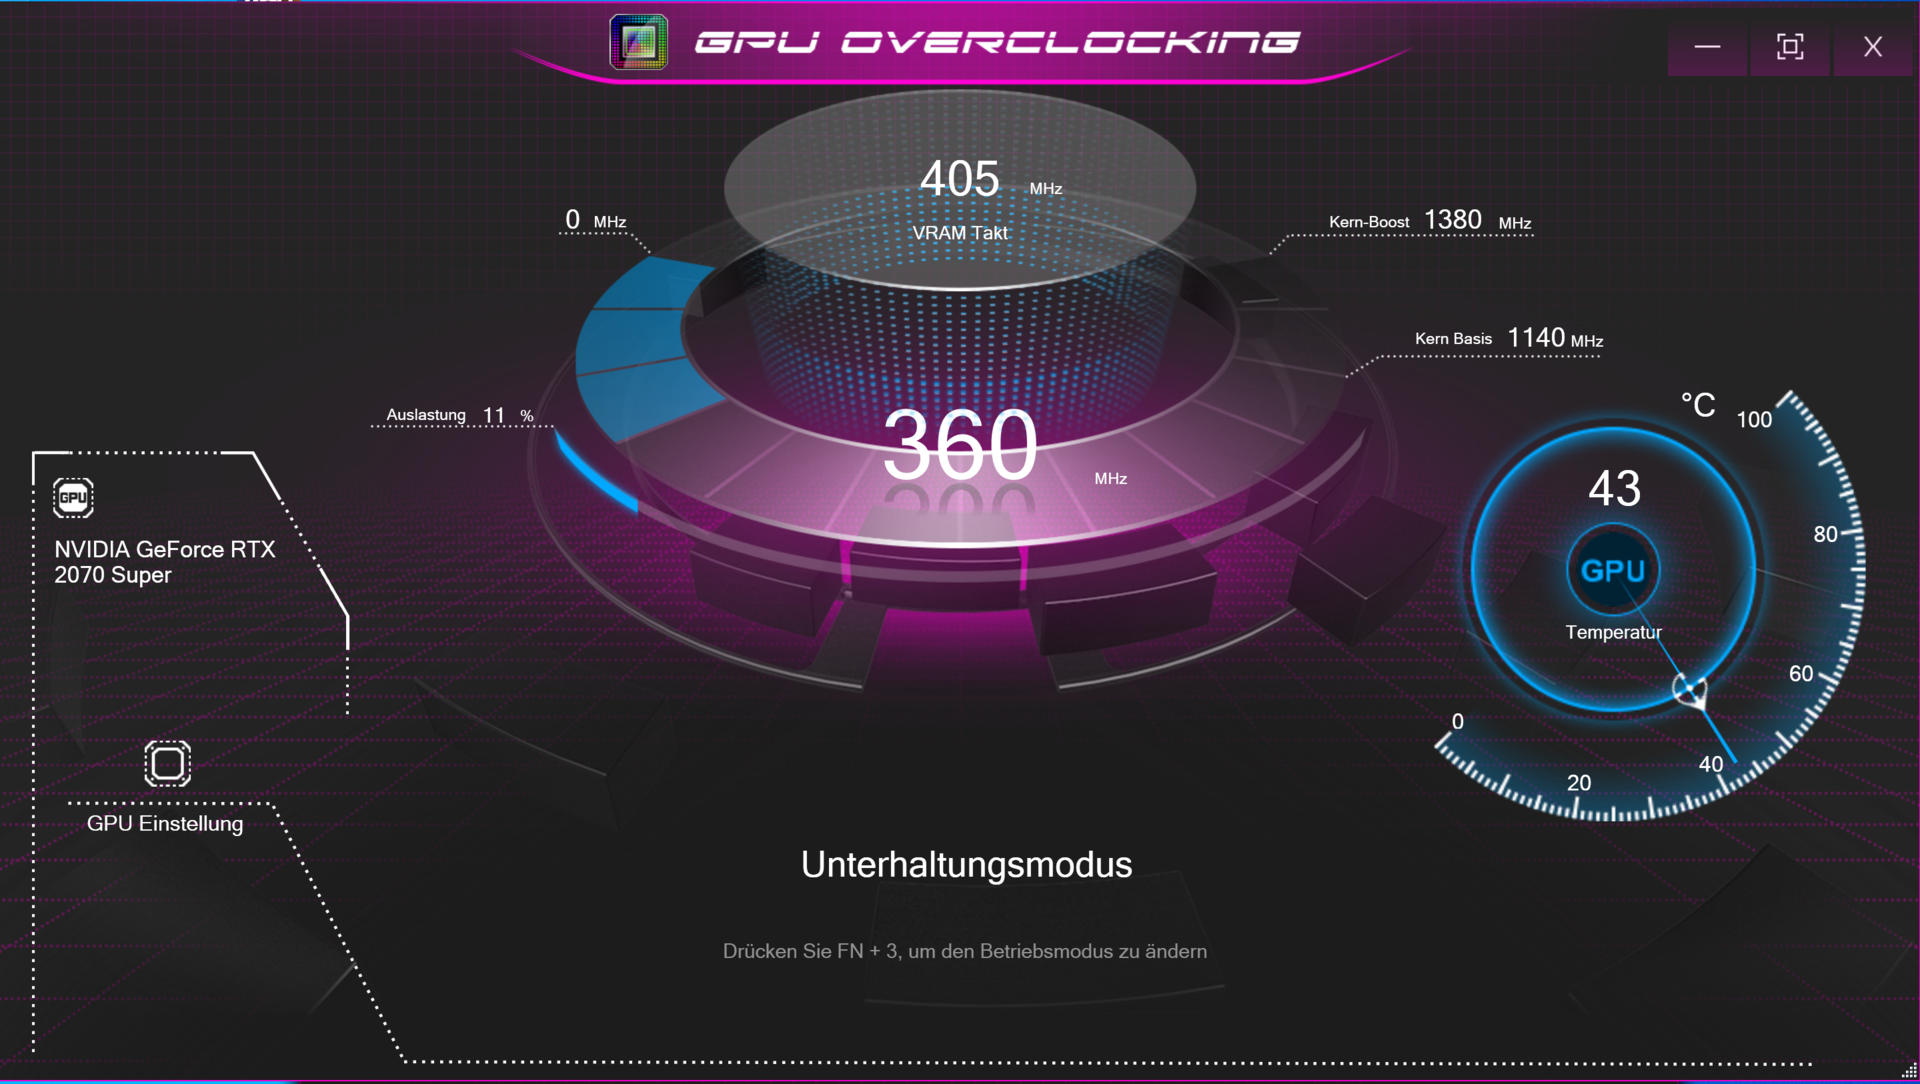
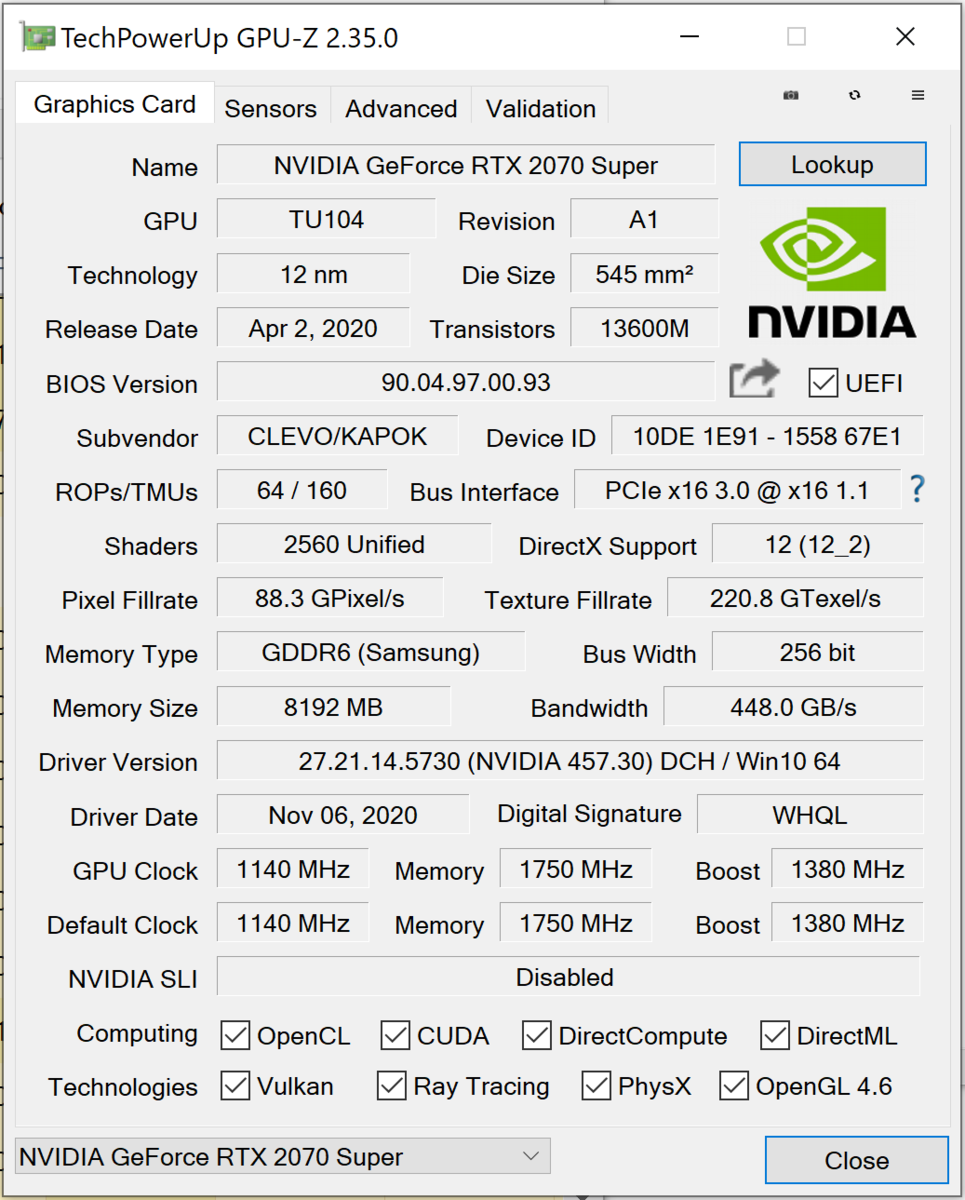
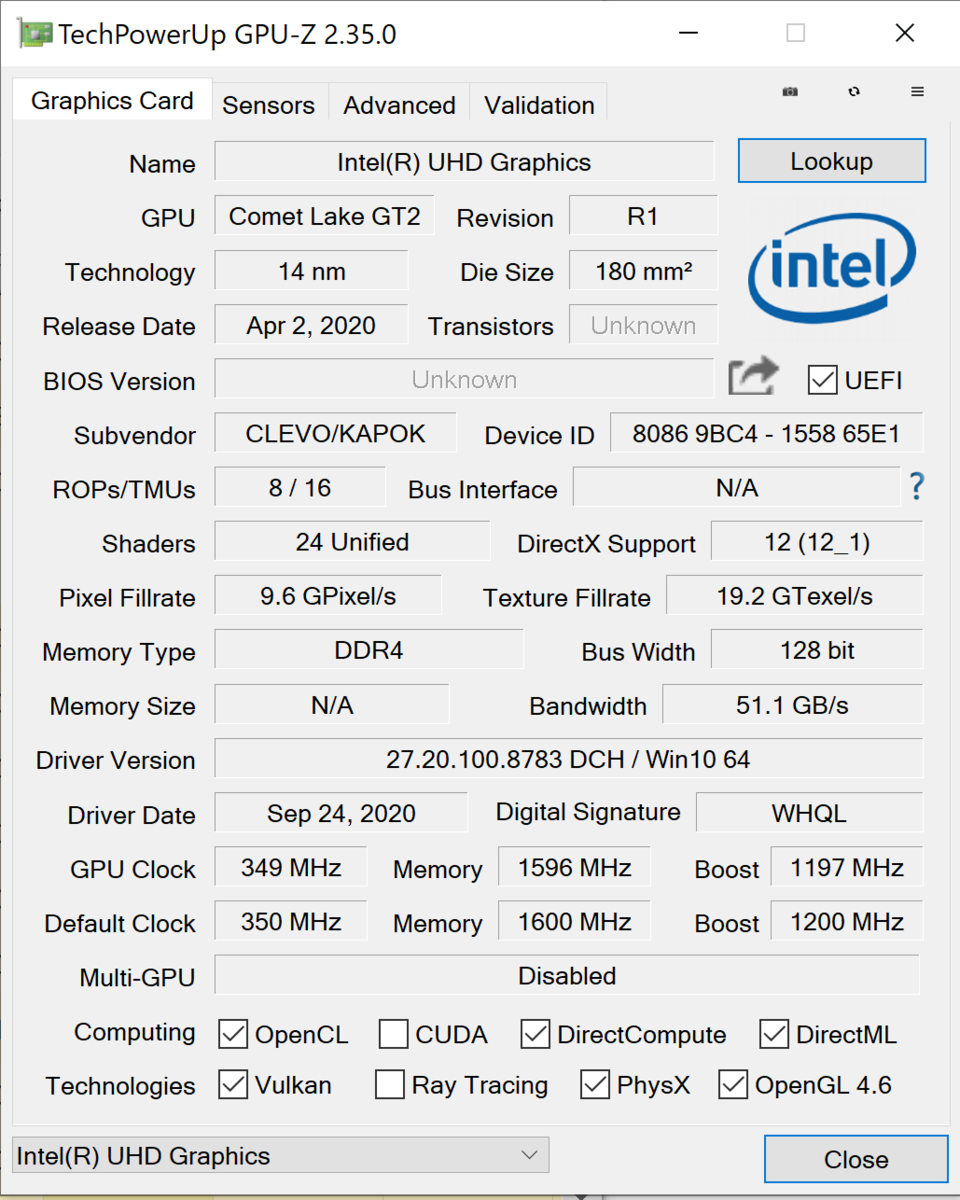
Graphics card
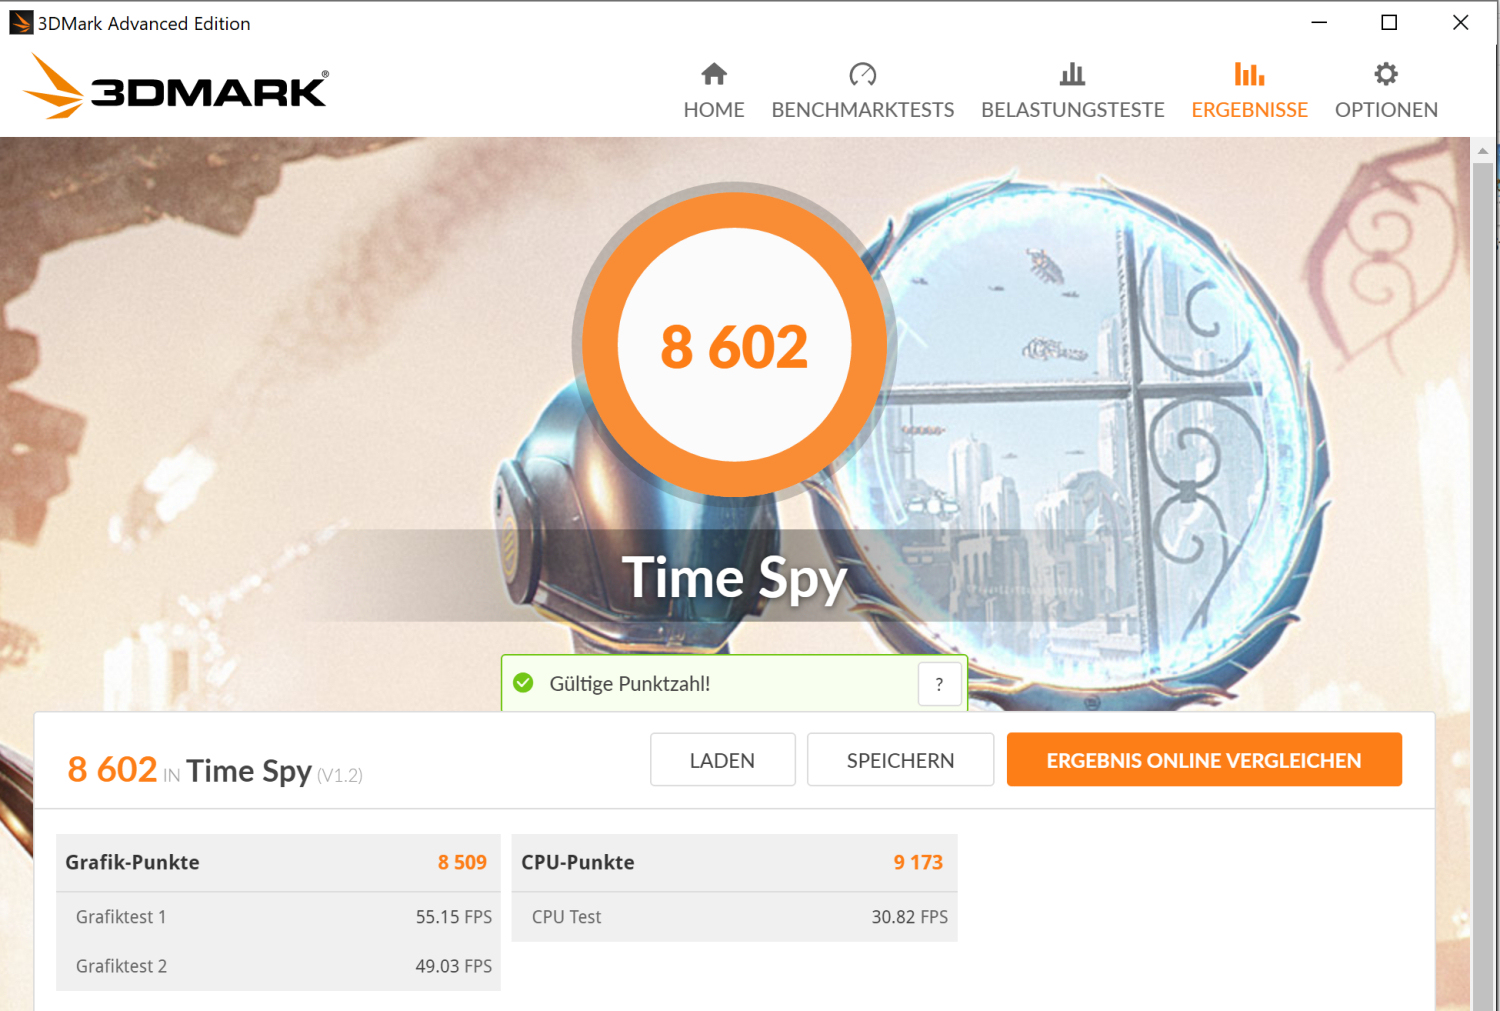
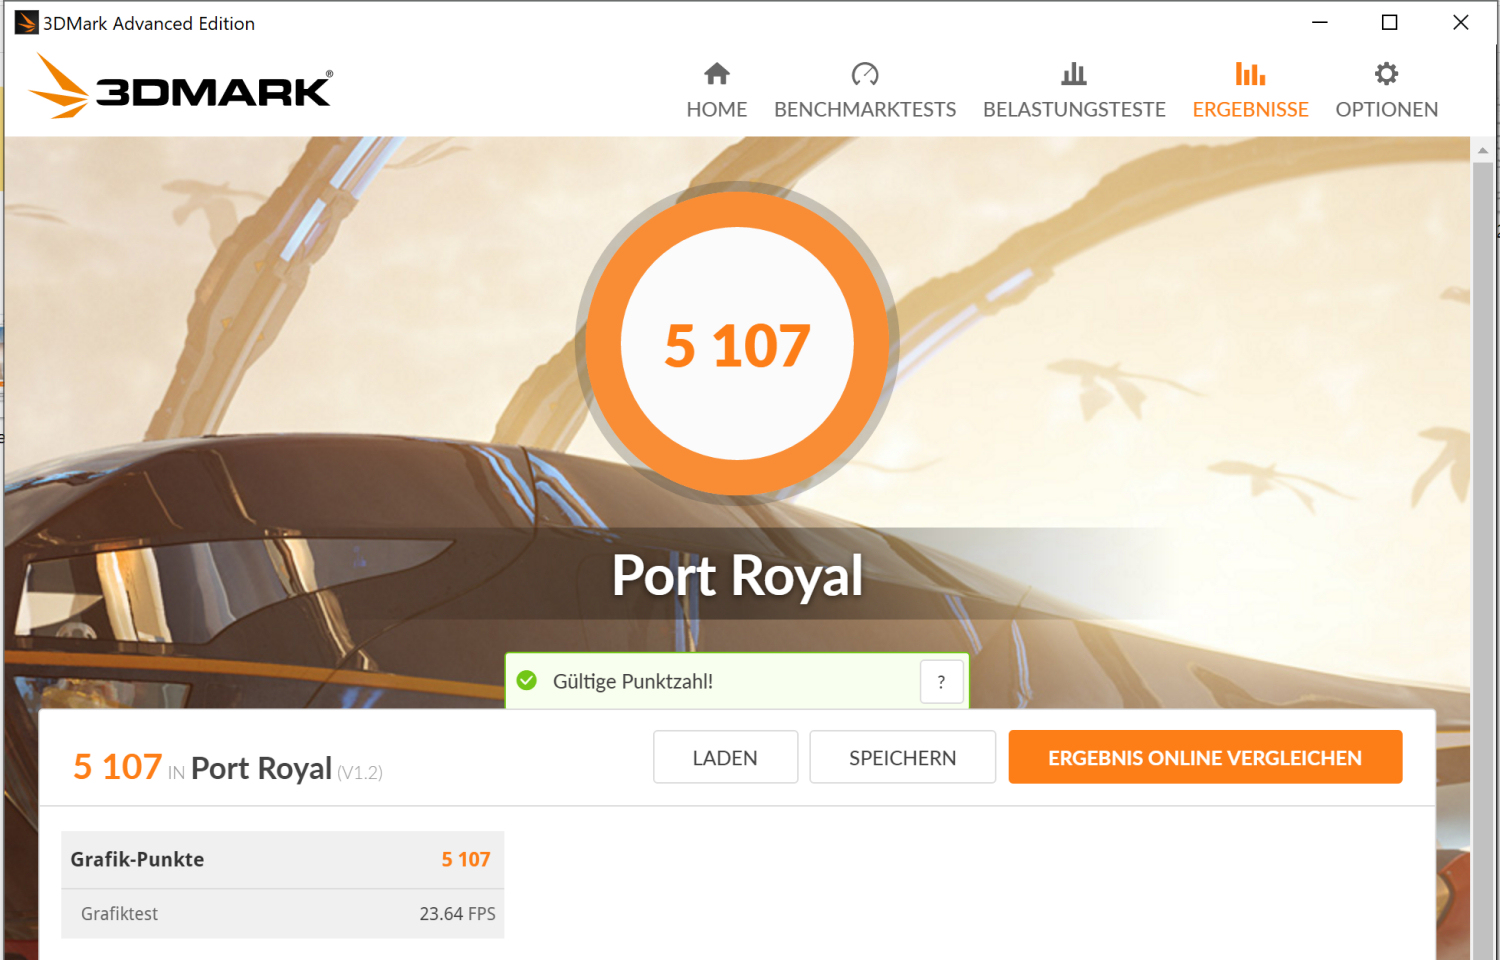
The GeForce RTX 2070 Super graphics core (Turing) is a top-of-the-line GPU. It's supported by fast GDDR6 memory (8,192 MB). The 3DMark results are at a normal level for the GPU installed here. "Performance Mode" causes a very slight increase in graphics performance. Furthermore, the UHD Graphics 630 GPU that's integrated into the processor is active, and the laptop works with Nvidia's Optimus graphics-switching solution. Optimus can be disabled in the BIOS.
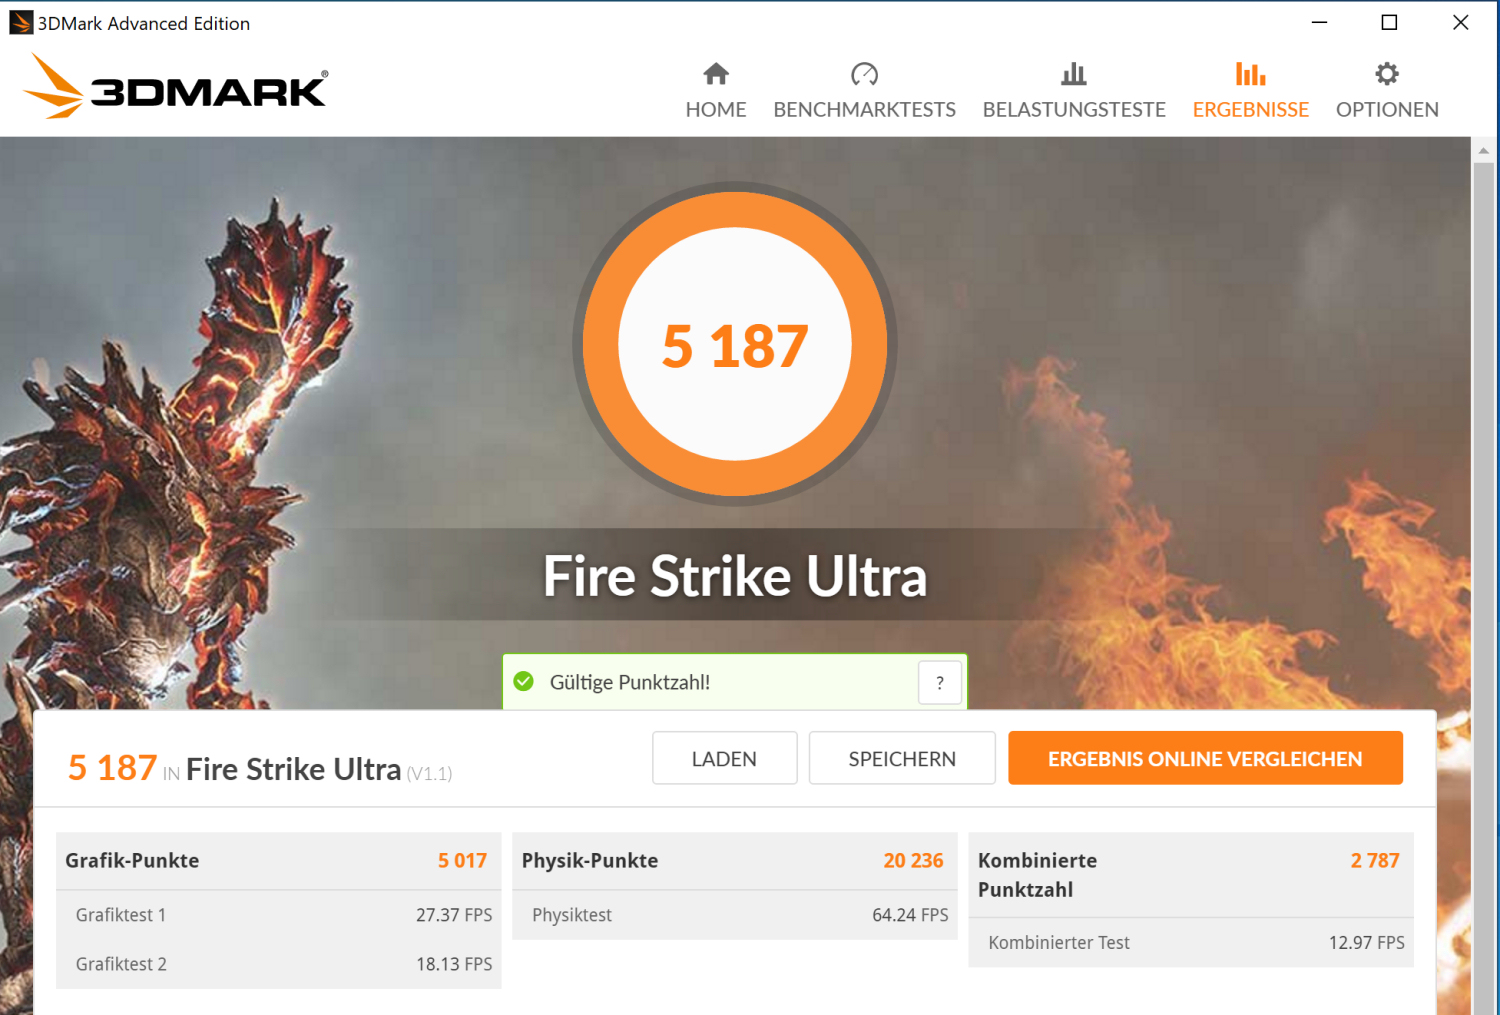


| 3DMark 11 Performance | 24026 points | |
| 3DMark Cloud Gate Standard Score | 40127 points | |
| 3DMark Fire Strike Score | 18624 points | |
| 3DMark Time Spy Score | 8338 points | |
Help | ||
Gaming performance
The Compact 17 brings all the latest games onto the screen smoothly at Full HD resolution and maximum quality settings. The hardware also handles higher resolutions. However, the quality level has to be set more conservatively in some cases. "Performance Mode" leads to a slight increase in frame rates.
| The Witcher 3 - 1920x1080 Ultra Graphics & Postprocessing (HBAO+) | |
| Average of class Gaming (95 - 240, n=8, last 2 years) | |
| Schenker Compact 17 | |
| Razer Blade Pro 17 4K UHD 120 Hz | |
| Asus Strix G17 G712LWS | |
| Average NVIDIA GeForce RTX 2070 Super Mobile (76.3 - 94.6, n=8) | |
| Gigabyte Aero 17 HDR XB | |
| Aorus 17G XB | |
| Schenker XMG Pro 17 PB71RD-G | |
| Death Stranding - 1920x1080 Very High Preset | |
| Schenker Compact 17 (Leistungsmodus) | |
| Average NVIDIA GeForce RTX 2070 Super Mobile (116.2 - 123.8, n=4) | |
| Schenker Compact 17 | |
| Asus Strix G17 G712LWS | |
| Serious Sam 4 - 1920x1080 Ultra (DX12) AA:2xMS | |
| Schenker Compact 17 (Leistungsmodus) | |
| Schenker Compact 17 | |
| Average NVIDIA GeForce RTX 2070 Super Mobile (71.1 - 82.1, n=4) | |
| Asus Strix G17 G712LWS | |
| Watch Dogs Legion - 1920x1080 Ultra Preset (DX12) | |
| Schenker Compact 17 (Leistungsmodus) | |
| Average NVIDIA GeForce RTX 2070 Super Mobile (59.3 - 64, n=4) | |
| Schenker Compact 17 | |
| Assassin´s Creed Valhalla - 1920x1080 Ultra High Preset | |
| Schenker Compact 17 (Leistungsmodus) | |
| Average NVIDIA GeForce RTX 2070 Super Mobile (60 - 93, n=3) | |
| Call of Duty Black Ops Cold War - 1920x1080 Highest Settings | |
| Schenker Compact 17 | |
| Average NVIDIA GeForce RTX 2070 Super Mobile (n=1) | |
| Yakuza Like a Dragon - 1920x1080 Ultra Preset | |
| Schenker Compact 17 | |
| Average NVIDIA GeForce RTX 2070 Super Mobile (n=1) | |
| Dirt 5 - 1920x1080 Ultra High Preset | |
| Schenker Compact 17 (Leistungsmodus) | |
| Schenker Compact 17 | |
| Average NVIDIA GeForce RTX 2070 Super Mobile (45.5 - 68.6, n=3) | |
In order to verify whether the frame rates remain largely constant over a prolonged period of time, we let the game The Witcher 3 run for about 60 minutes at Full HD resolution and maximum quality settings. The character is not moved. A drop in frame rates wasn't found.
| low | med. | high | ultra | QHD | 4K | |
|---|---|---|---|---|---|---|
| The Witcher 3 (2015) | 381.2 | 268.1 | 170.2 | 94.6 | 59.8 | |
| Death Stranding (2020) | 137.5 | 129.2 | 119.1 | 116.8 | 81.3 | 46.9 |
| Serious Sam 4 (2020) | 143 | 102 | 86.6 | 78 | 63.7 | 39.8 |
| Watch Dogs Legion (2020) | 112 | 105 | 92 | 61 | 44 | 25 |
| Dirt 5 (2020) | 165 | 95.5 | 78 | 63.8 | 52.3 | 34.9 |
| Call of Duty Black Ops Cold War (2020) | 191 | 100.5 | 93.8 | 85.1 | 60.6 | 35.3 |
| Yakuza Like a Dragon (2020) | 156 | 105.4 | 104.1 | 92.2 | 61 | 31.4 |
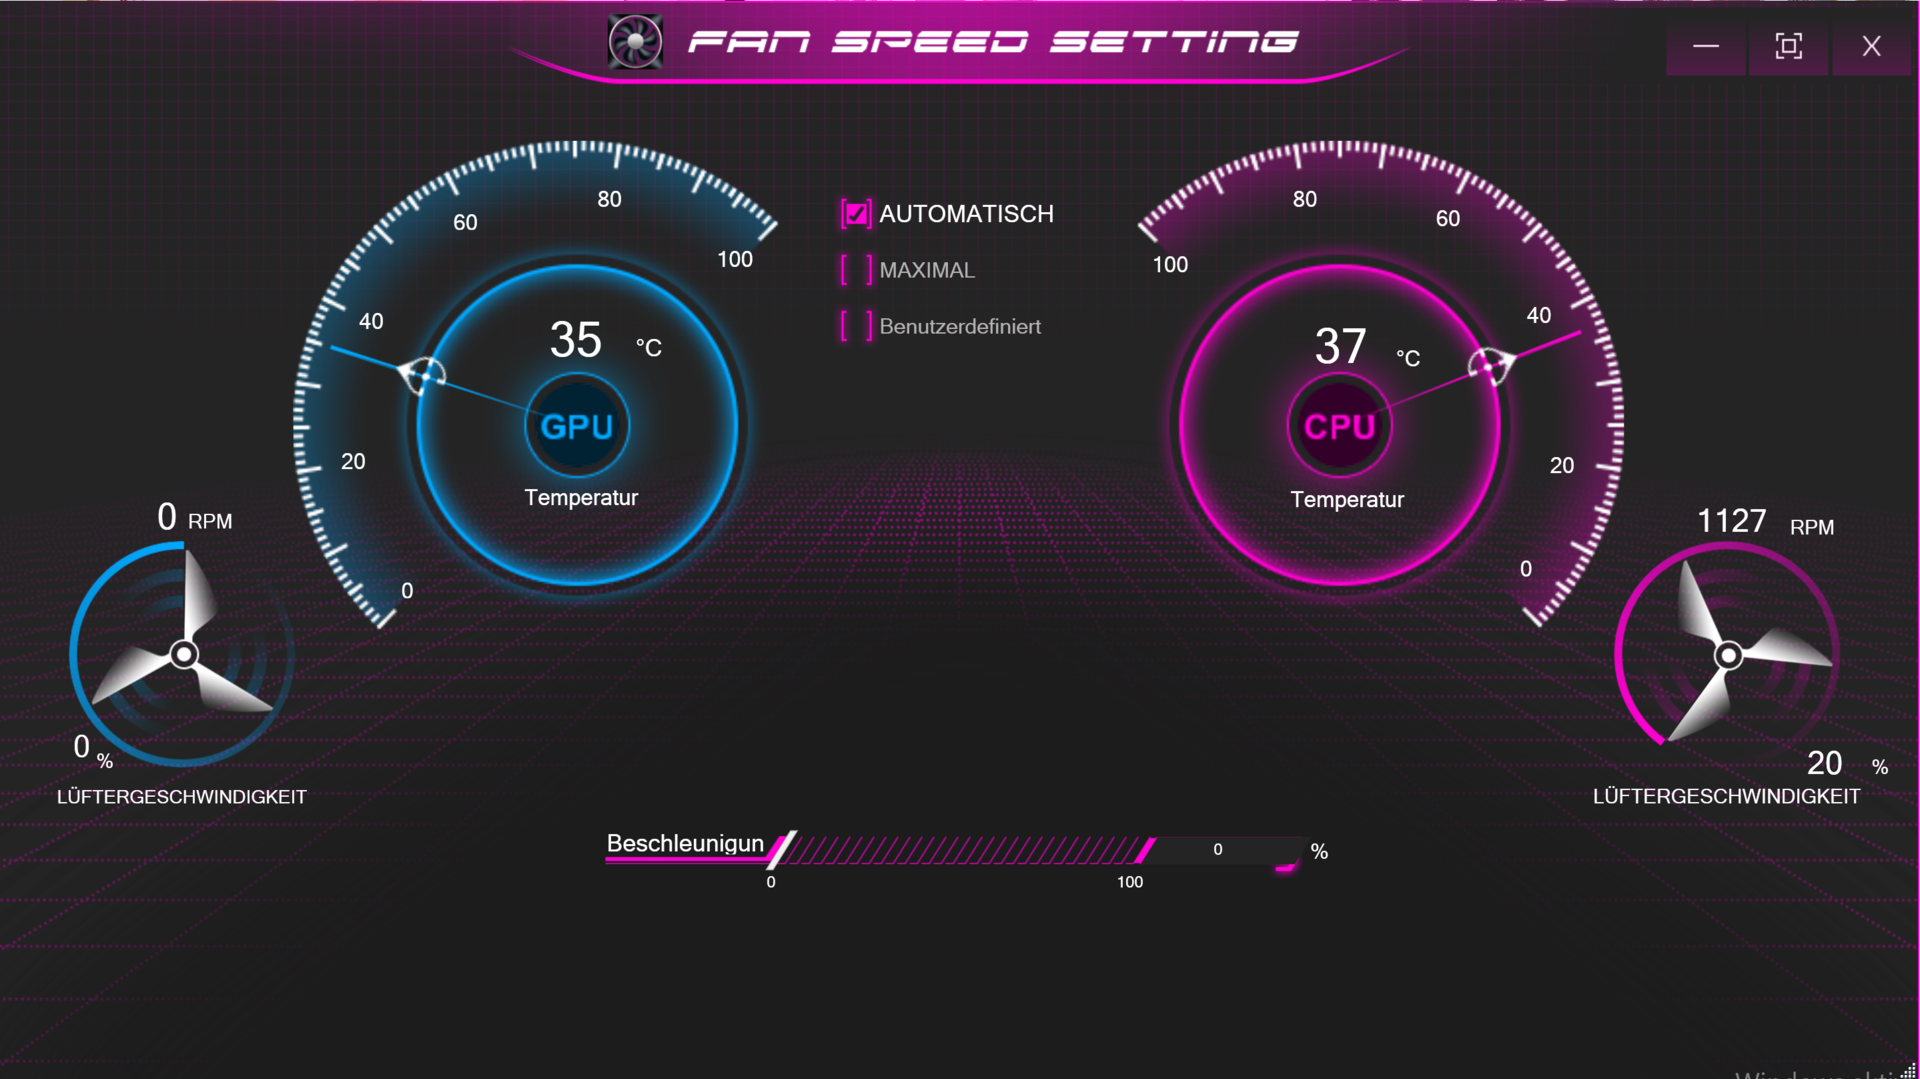
Emissions and energy - Loud under load
Noise emissions
The fans mainly work at low rotational speeds in idle usage, but they repeatedly turn up strongly for a short time - we measured sound pressure levels of up to 40 dB(A). Occasionally, they stand still. The fans produce considerably more noise under load. The maximum sound pressure level is 54.6 dB(A). Gaming is no fun here without a headset.
Noise level
| Idle |
| 25.4 / 25.4 / 40 dB(A) |
| Load |
| 54.6 / 54.6 dB(A) |
 | ||
30 dB silent 40 dB(A) audible 50 dB(A) loud |
||
min: | ||
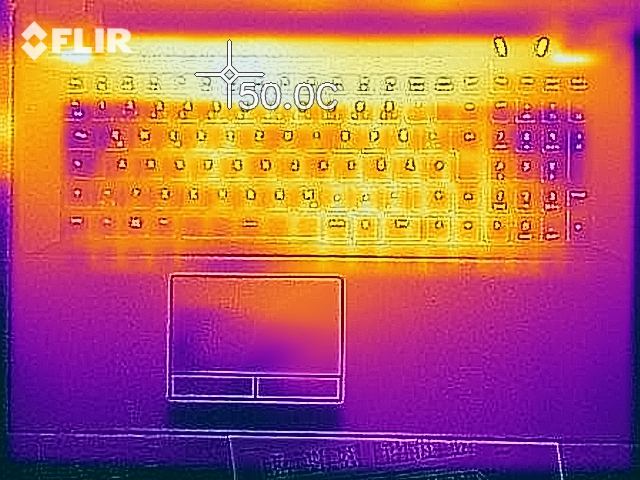
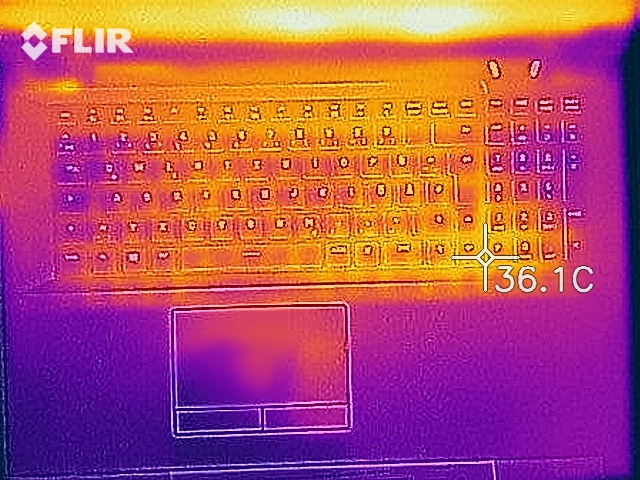
Temperature
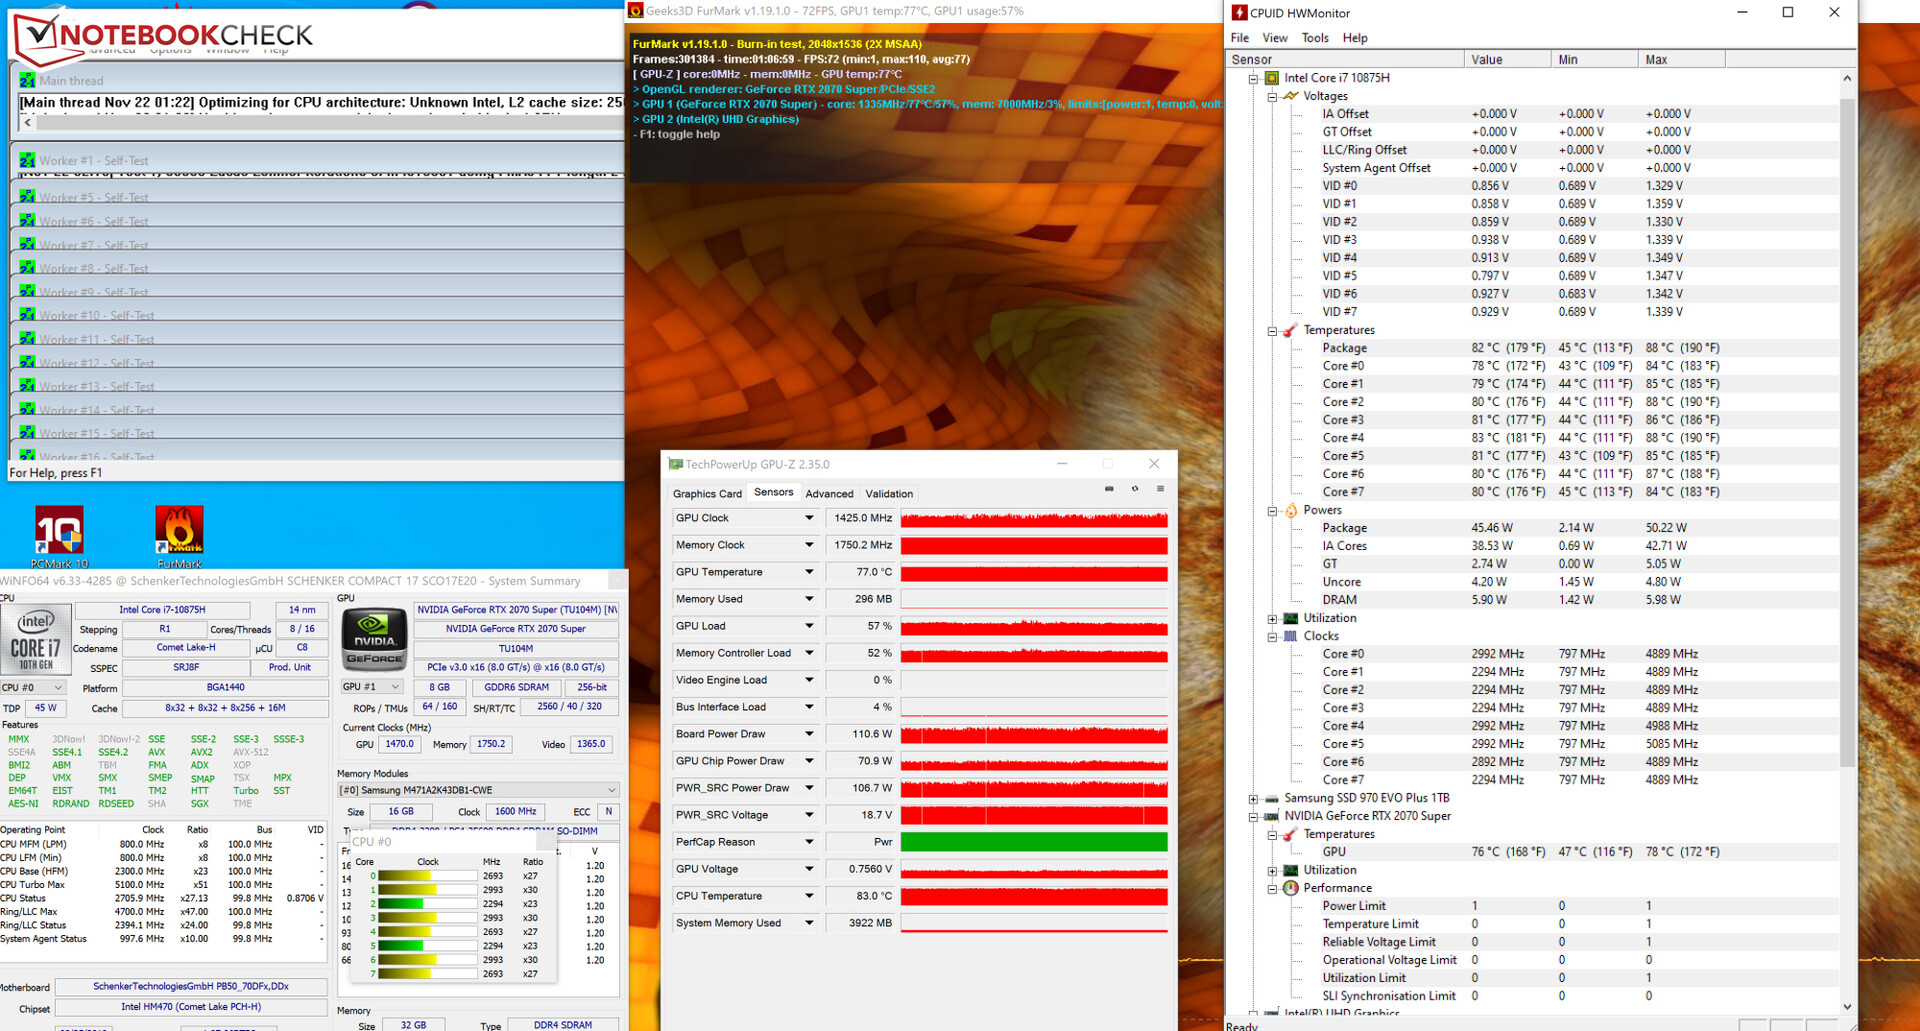
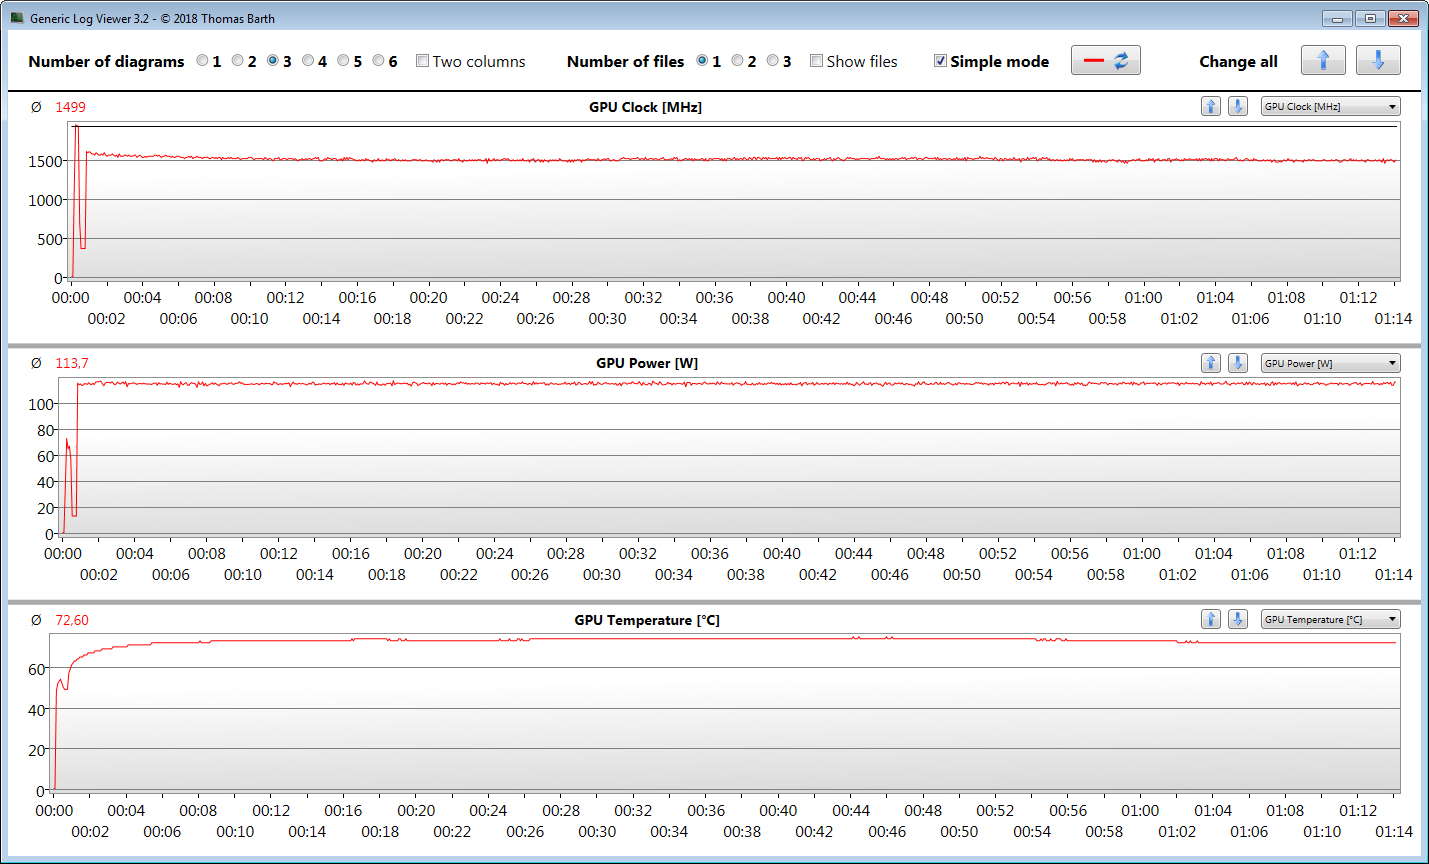
In our stress test (Prime95 and FurMark run for at least an hour), the CPU and GPU run at 2.3 to 3 GHz and 1,100 to 1,600 MHz, respectively. Significantly lower speeds are achieved on battery power. The stress test represents an extreme scenario, though. We use this test to check whether the system remains stable under full load.
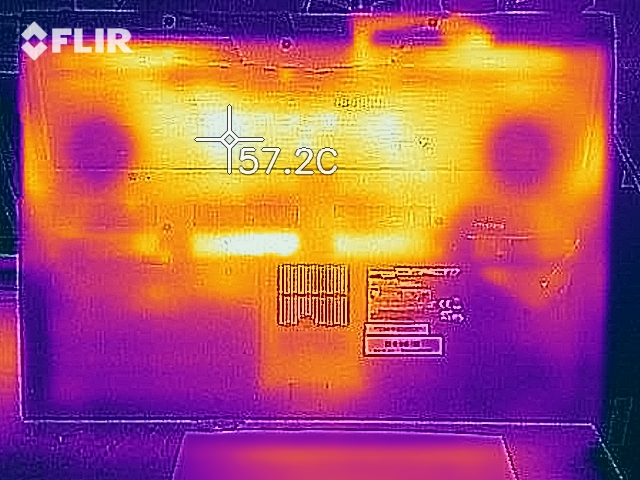
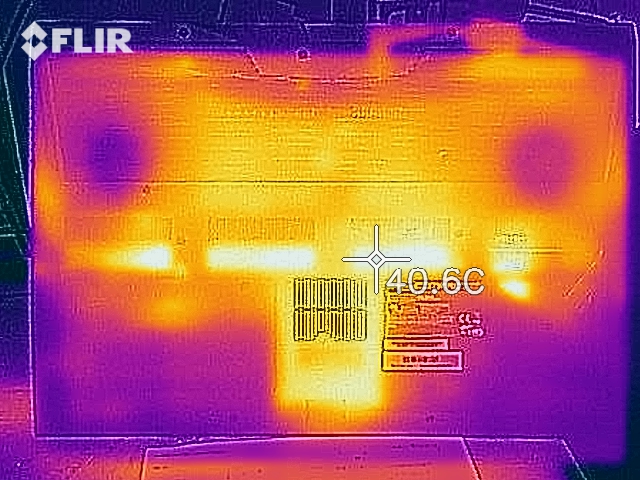
The laptop doesn't get particularly warm. During the stress test, we register temperatures in the lower to mid 40-°C range (~104 °F) at some measuring points. The values are within the green area in everyday use.
(±) The maximum temperature on the upper side is 40.5 °C / 105 F, compared to the average of 40.4 °C / 105 F, ranging from 21.2 to 68.8 °C for the class Gaming.
(±) The bottom heats up to a maximum of 44.9 °C / 113 F, compared to the average of 43.2 °C / 110 F
(+) In idle usage, the average temperature for the upper side is 25.5 °C / 78 F, compared to the device average of 33.9 °C / 93 F.
(+) The palmrests and touchpad are cooler than skin temperature with a maximum of 28.4 °C / 83.1 F and are therefore cool to the touch.
(±) The average temperature of the palmrest area of similar devices was 28.8 °C / 83.8 F (+0.4 °C / 0.7 F).
Speakers
The Compact 17 is equipped with a 2.1 speaker system that produces a very decent sound. However, it lacks bass - despite having a subwoofer.
Schenker Compact 17 audio analysis
(±) | speaker loudness is average but good (80.9 dB)
Bass 100 - 315 Hz
(-) | nearly no bass - on average 15.9% lower than median
(±) | linearity of bass is average (8.1% delta to prev. frequency)
Mids 400 - 2000 Hz
(±) | higher mids - on average 7.9% higher than median
(+) | mids are linear (5.6% delta to prev. frequency)
Highs 2 - 16 kHz
(+) | balanced highs - only 2.1% away from median
(+) | highs are linear (5.4% delta to prev. frequency)
Overall 100 - 16.000 Hz
(+) | overall sound is linear (14.2% difference to median)
Compared to same class
» 25% of all tested devices in this class were better, 7% similar, 68% worse
» The best had a delta of 6%, average was 18%, worst was 132%
Compared to all devices tested
» 17% of all tested devices were better, 4% similar, 79% worse
» The best had a delta of 4%, average was 24%, worst was 134%
Energy consumption
Energy consumption is at a normal level for the hardware installed here. The power adapter's output is 230 watts.
| Off / Standby | |
| Idle | |
| Load |
|
Key:
min: | |
Battery life
The 17.3-incher completed our WLAN test (accessing websites using a script; display brightness at about 150 cd/m²) after 4:40 hours. The value is perfectly acceptable for a powerful laptop with a 4K display.
Pros
Cons
Verdict
The Compact 17 doesn't follow the trend towards increasingly thinner cases - which leads to good heat dissipation. Our measurements confirm this: Under load, the device warms up moderately at best. The fan control needs attention: The fans sometimes turn up too much in idle usage. The problem can't be solved by using a different performance scheme.
The well-equipped Schenker Compact 17 offers many upgrade options.
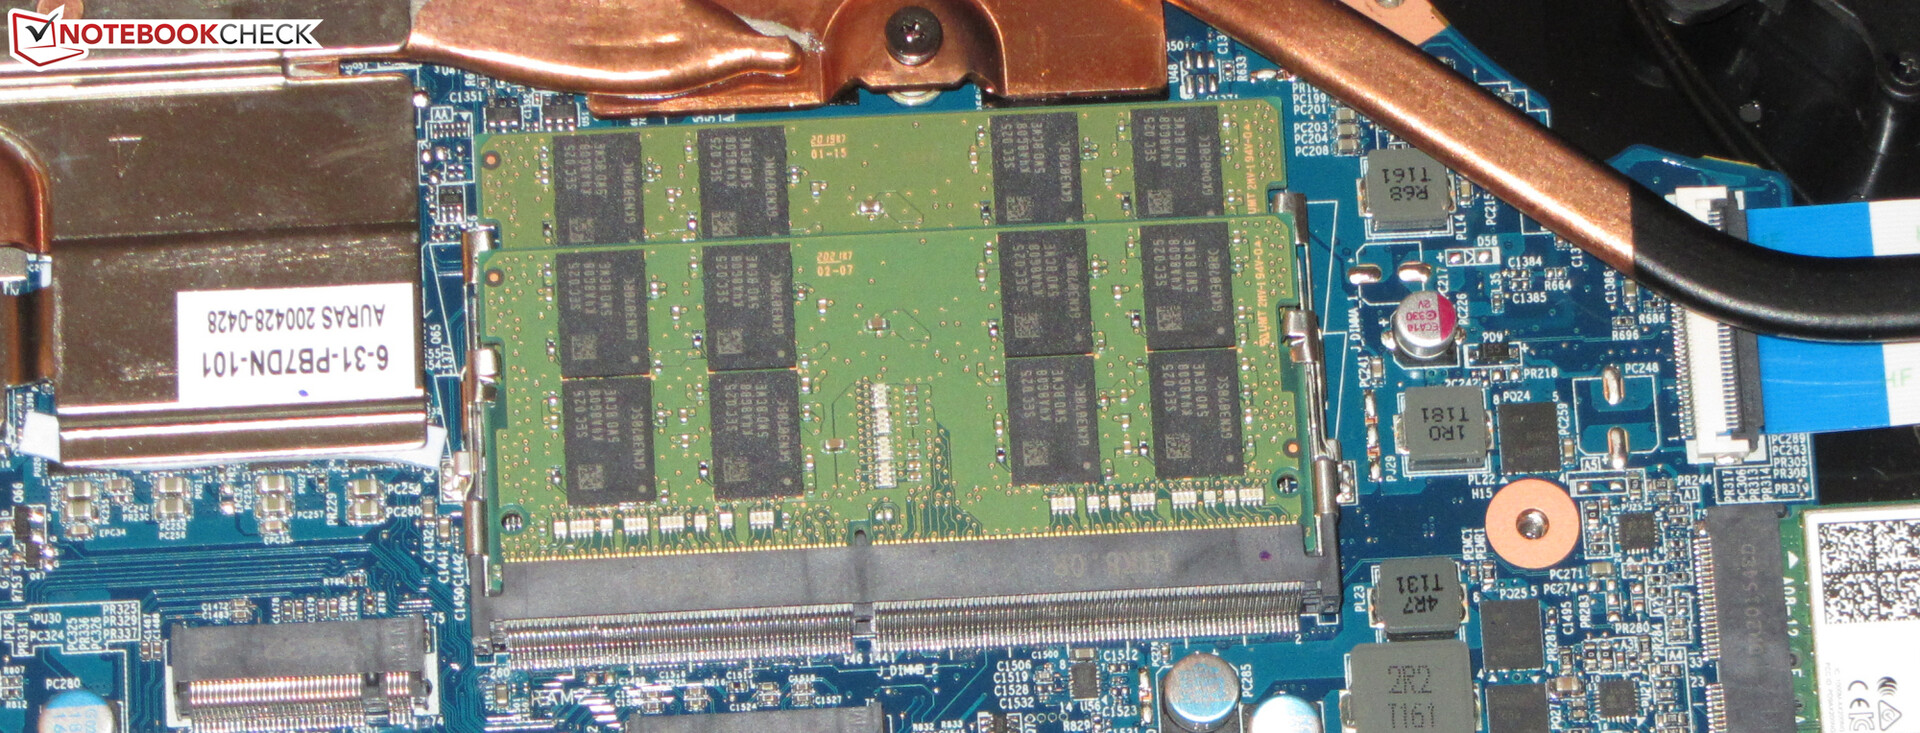
There are no problems in terms of performance. The Core i7-10875H processor and the GeForce RTX 2070 Super graphics core bring all modern computer games smoothly onto the screen. 32 GB of memory (dual-channel mode; max. 64 GB) and a 1 TB NVMe SSD represent an adequate storage configuration. Expanding storage wouldn't be a problem if necessary.
The display (4K, IPS, 60 Hz) scores points with a matte surface, stable viewing angles, high brightness, decent color reproduction, and good color-space coverage. Contrast should be higher, though. Battery life is alright. The chiclet keyboard (RGB lighting) proved to be suitable for everyday use. Moreover, the laptop's ample range of connections includes, among other things, four video outputs - three of which support G-Sync. Finally, the build quality deserves criticism: The lid's tapered corners (metal) are poorly chamfered.
Schenker Compact 17
- 12/08/2020 v7 (old)
Sascha Mölck
Price comparison

