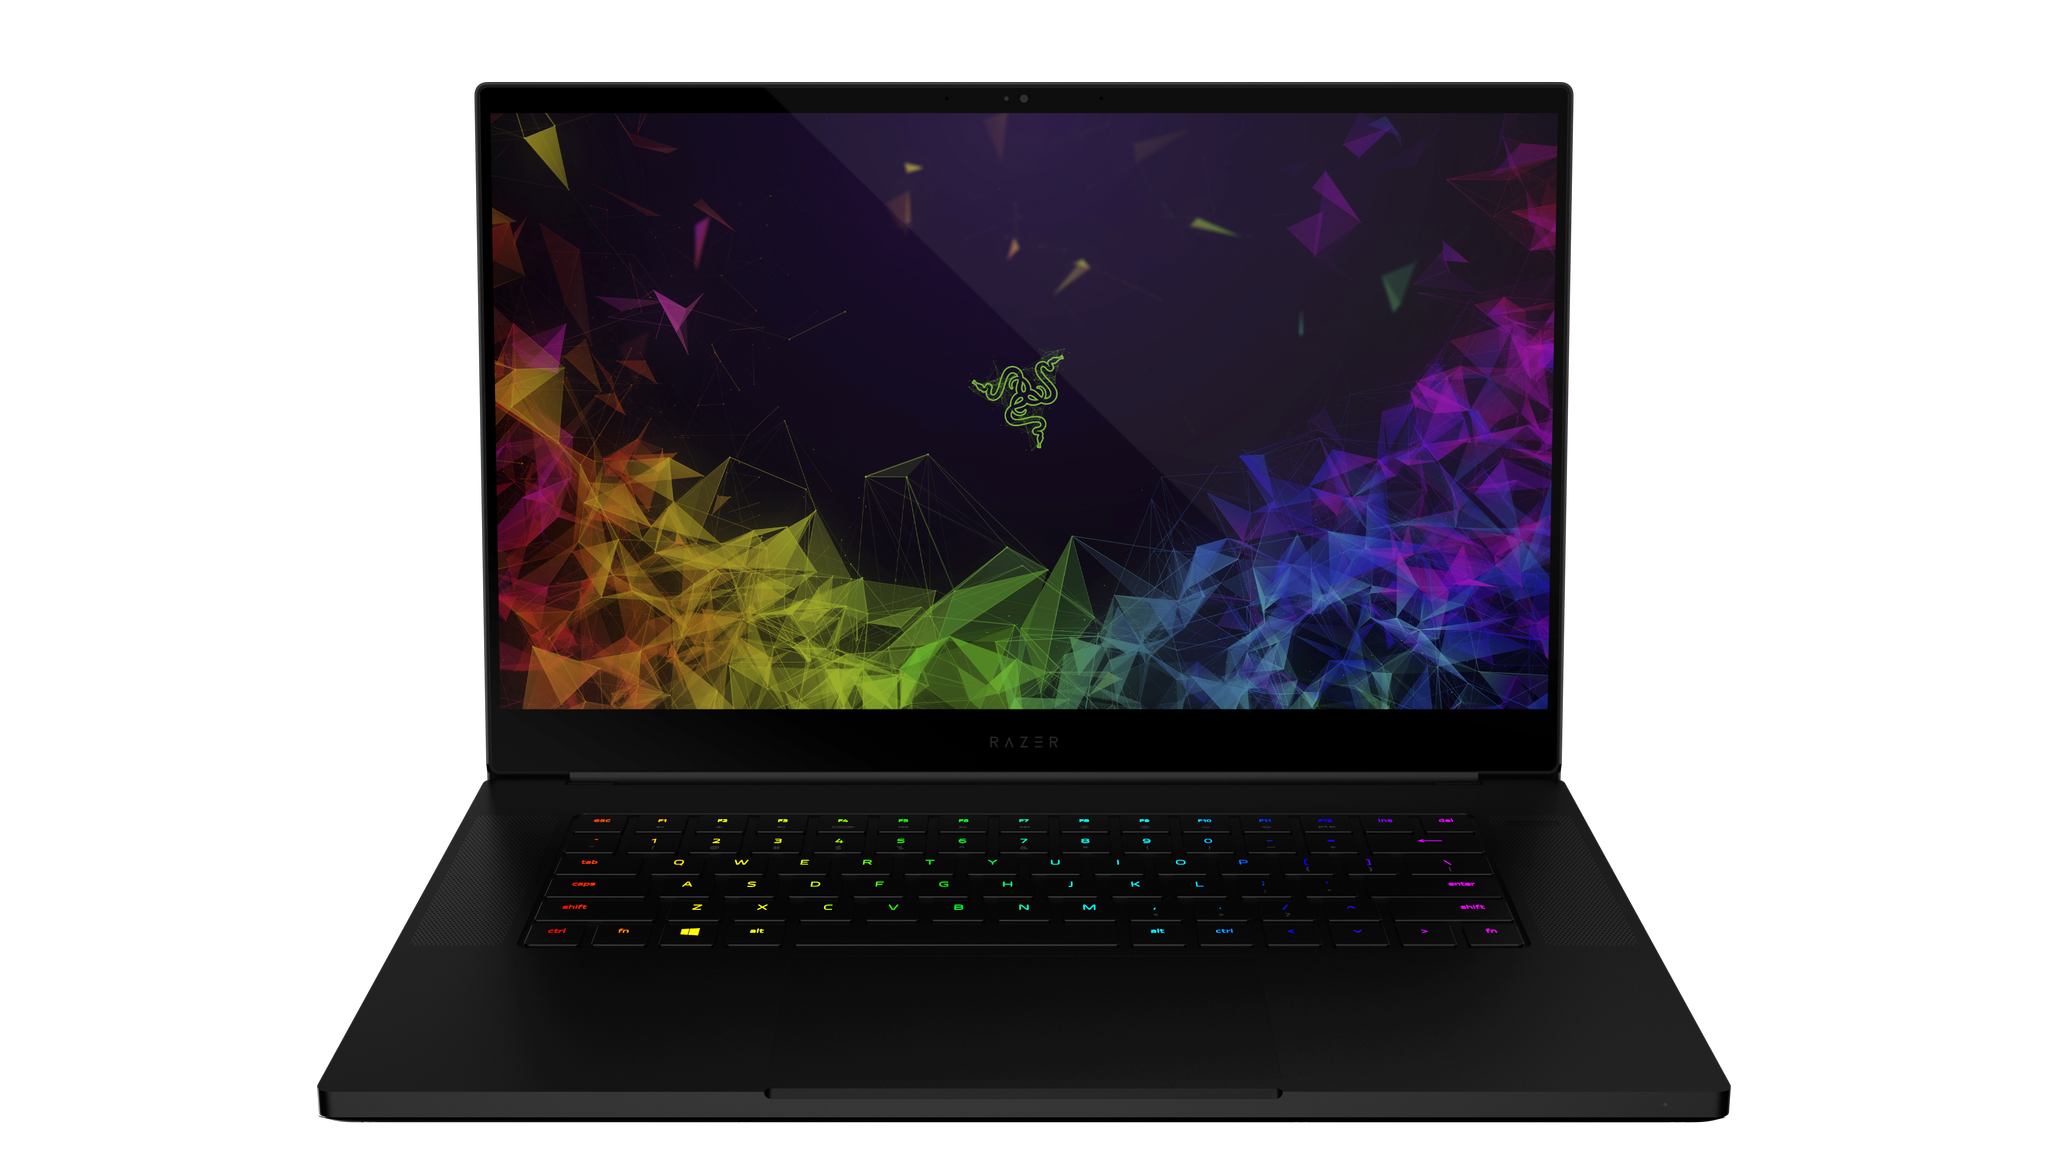
Razer Blade 15 (i7-8750H, GTX 1060 Max-Q, FHD) Laptop Review
We've seen what the new Razer Blade 15 GTX 1070 Max-Q SKU can do, but what about the Blade 15 GTX 1060 Max-Q?
For this review, we'll be focusing on what the Blade 15 1060 Max-Q can offer and how it may differ from the Blade 15 1070 Max-Q in performance, battery life, temperatures, and noise. We recommend checking out our original review on the Blade 15 1070 Max-Q for more information on chassis features and quality since both configurations share the same design.
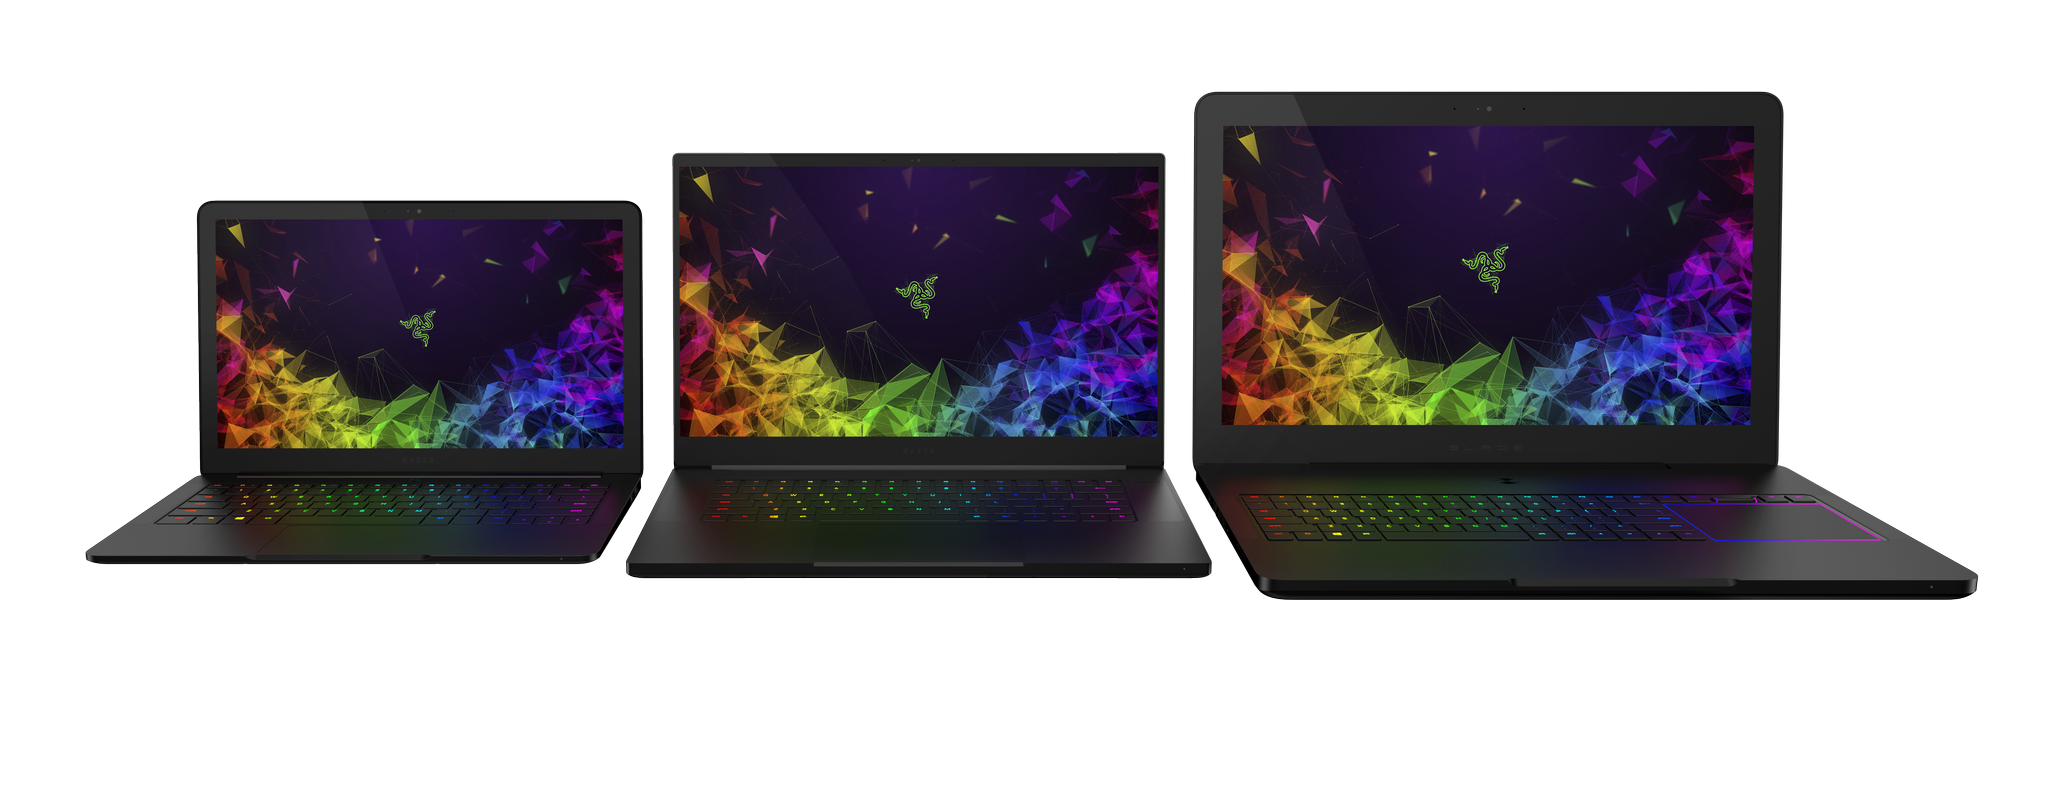
As the very handy table below shows, the Blade 15 1060 Max-Q SKU can be configured with either 256 GB of storage and a 60 Hz 1080p display for $1900 USD or 512 GB of storage and a 144 Hz 1080p display for $2200 USD. This is Razer's first 15-inch gaming laptop to compete directly with other 15-inch alternatives like the MSI GS65, Gigabyte Aero 15X, HP Pavilion Gaming, Asus Zephyrus M, Aorus X5, Lenovo Legion Y530, and the Eurocom Q5. The price range of the new Razer is also comparable to 15-inch multimedia flagships like the Dell XPS 15, HP Spectre x360 15, Asus ZenBook Pro 15 UX580, and the MacBook Pro 15.
More Razer reviews:

Case
Much like how the Razer Blade Pro GTX 1060 is slightly different from the Razer Blade Pro GTX 1080, expect the Blade 15 GTX 1060 Max-Q to have some small changes when compared to the Blade 15 GTX 1070 Max-Q. This includes the following:
- The GTX 1060 Max-Q SKU is slightly thinner (16.8 mm vs. 17.3 mm) and lighter (2.07 kg vs. 2.1 kg) due to internal alterations
- A less powerful 200 W AC adapter is included in the packaging whereas the GTX 1070 Max-Q SKU uses a 230 W adapter
- The system lacks a 4K UHD panel which is reserved only for the GTX 1070 Max-Q configuration
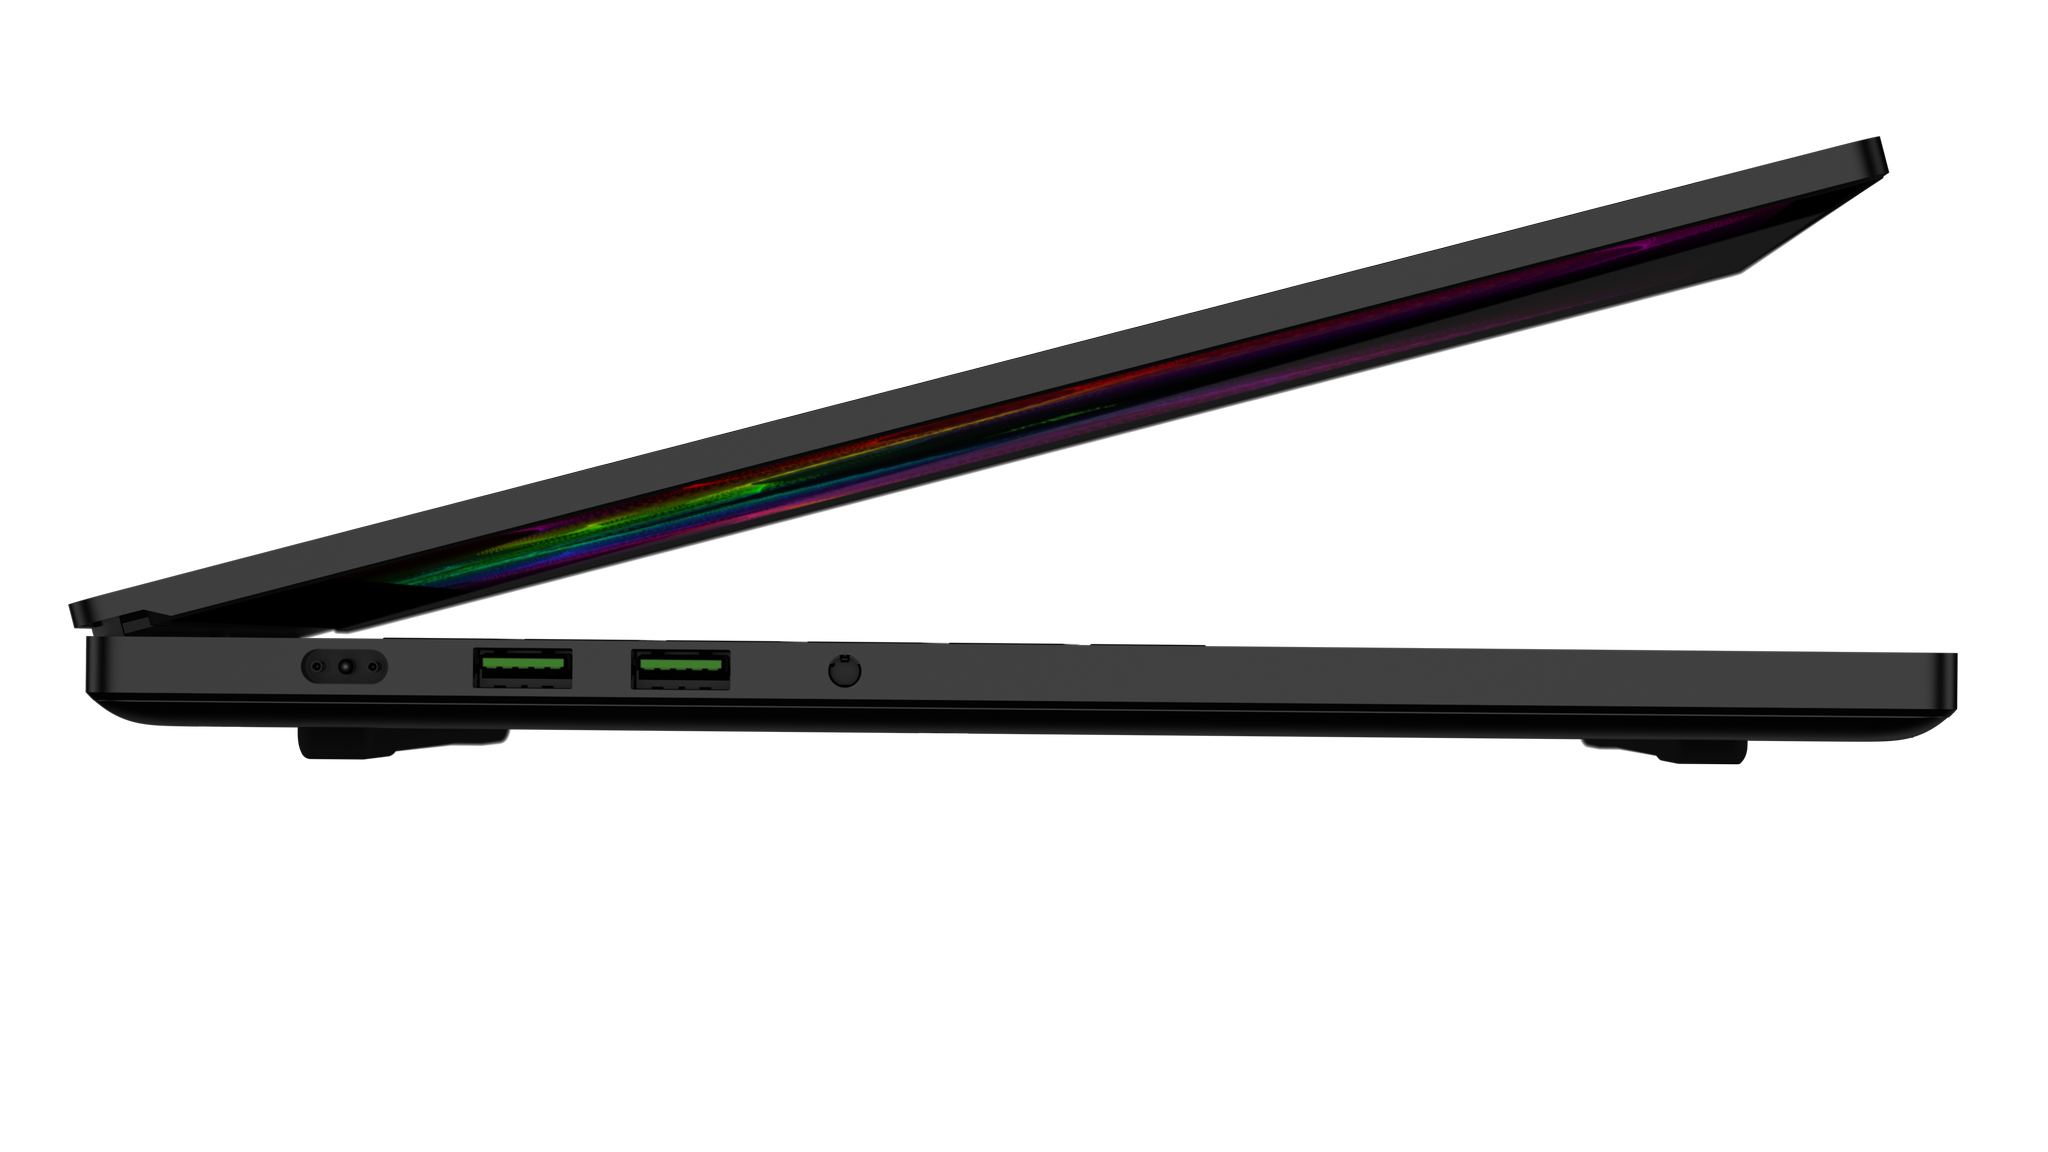
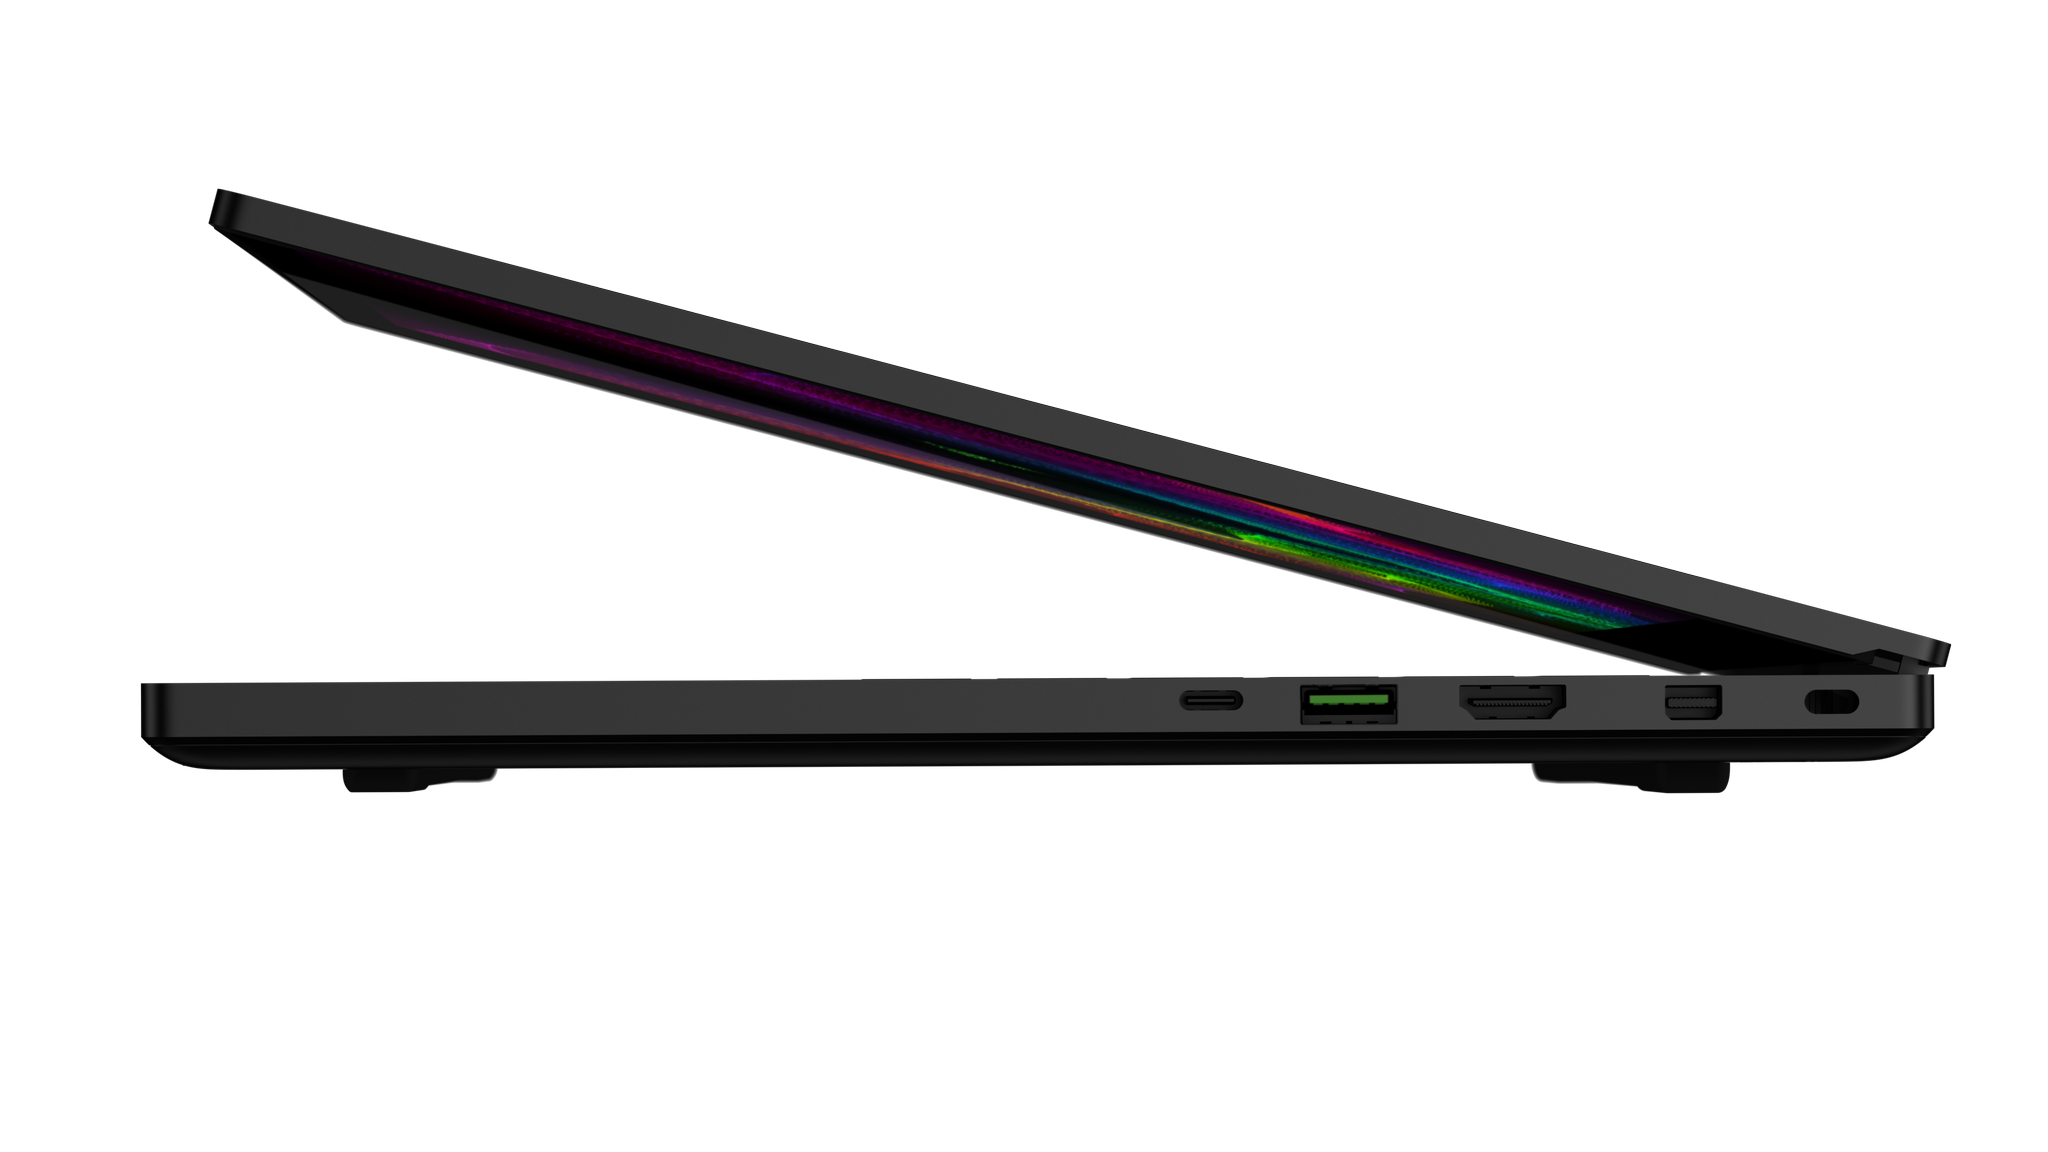
Otherwise, the all-aluminum matte surfaces, connectivity features, and build quality remain identical including the maximum lid angle of 140 degrees.
Communication
The Intel 8260 is capable of theoretical transfer rates of up to 1.73 Gbps. Our current test conditions are limited to 1 Gbps and so the system can be even faster than what we've recorded below. This is particularly important for the Blade 15 compared to most other gaming laptops since it lacks a traditional RJ-45 port.
| Networking | |
| iperf3 transmit AX12 | |
| MSI GS65 8RF-019DE Stealth Thin | |
| Razer Blade 15 GTX 1060 | |
| Dell XPS 15 2018 i5 FHD 97Wh | |
| iperf3 receive AX12 | |
| Razer Blade 15 GTX 1060 | |
| MSI GS65 8RF-019DE Stealth Thin | |
| Dell XPS 15 2018 i5 FHD 97Wh | |
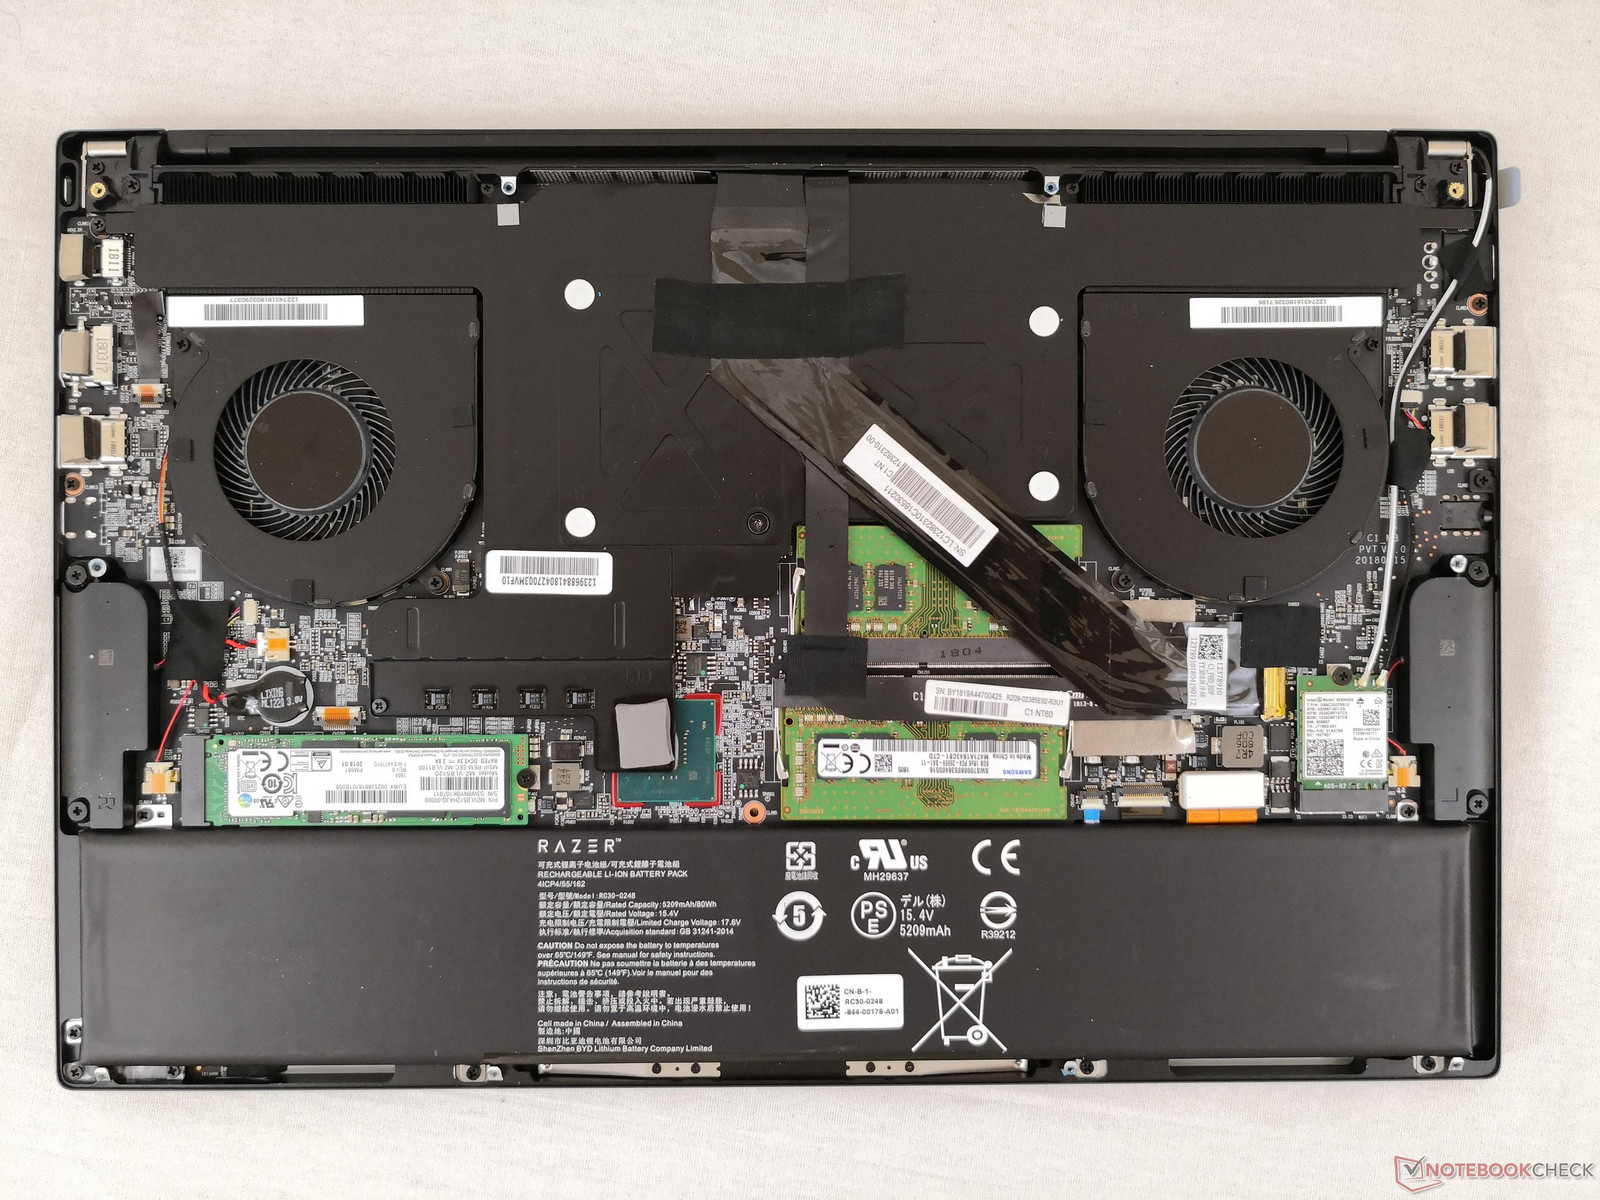
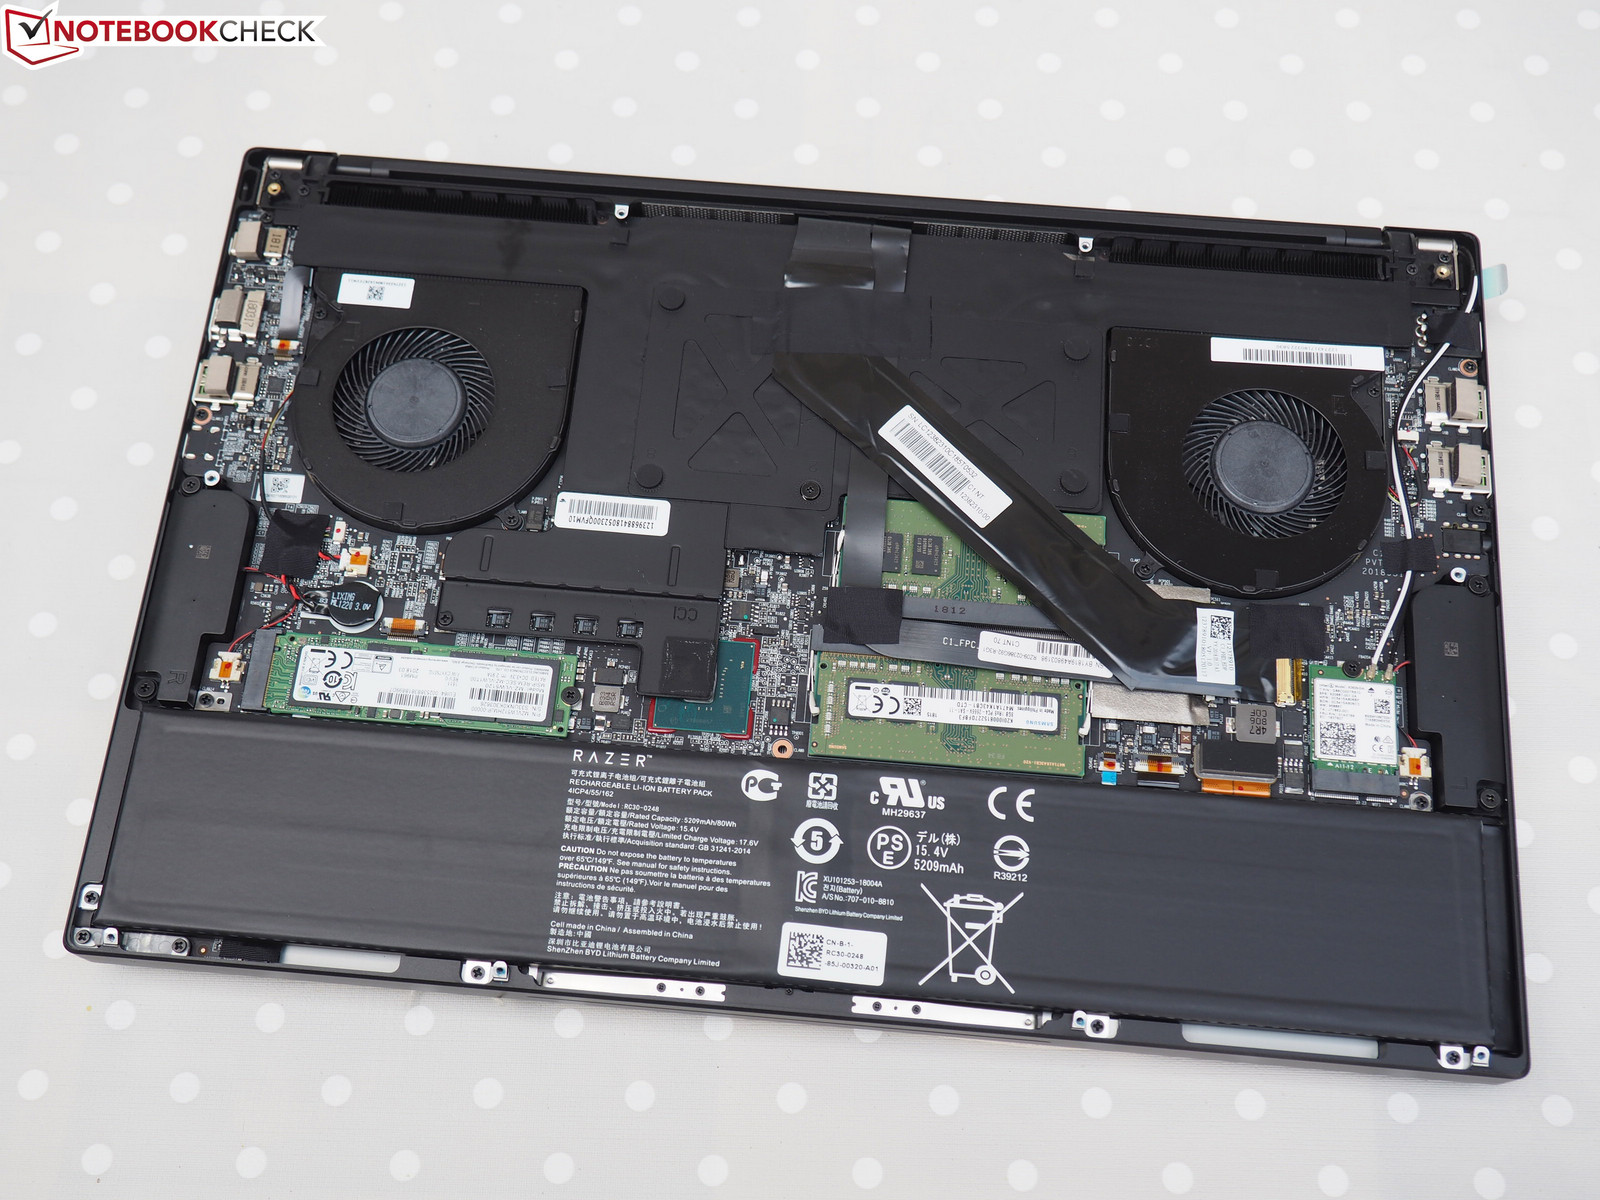
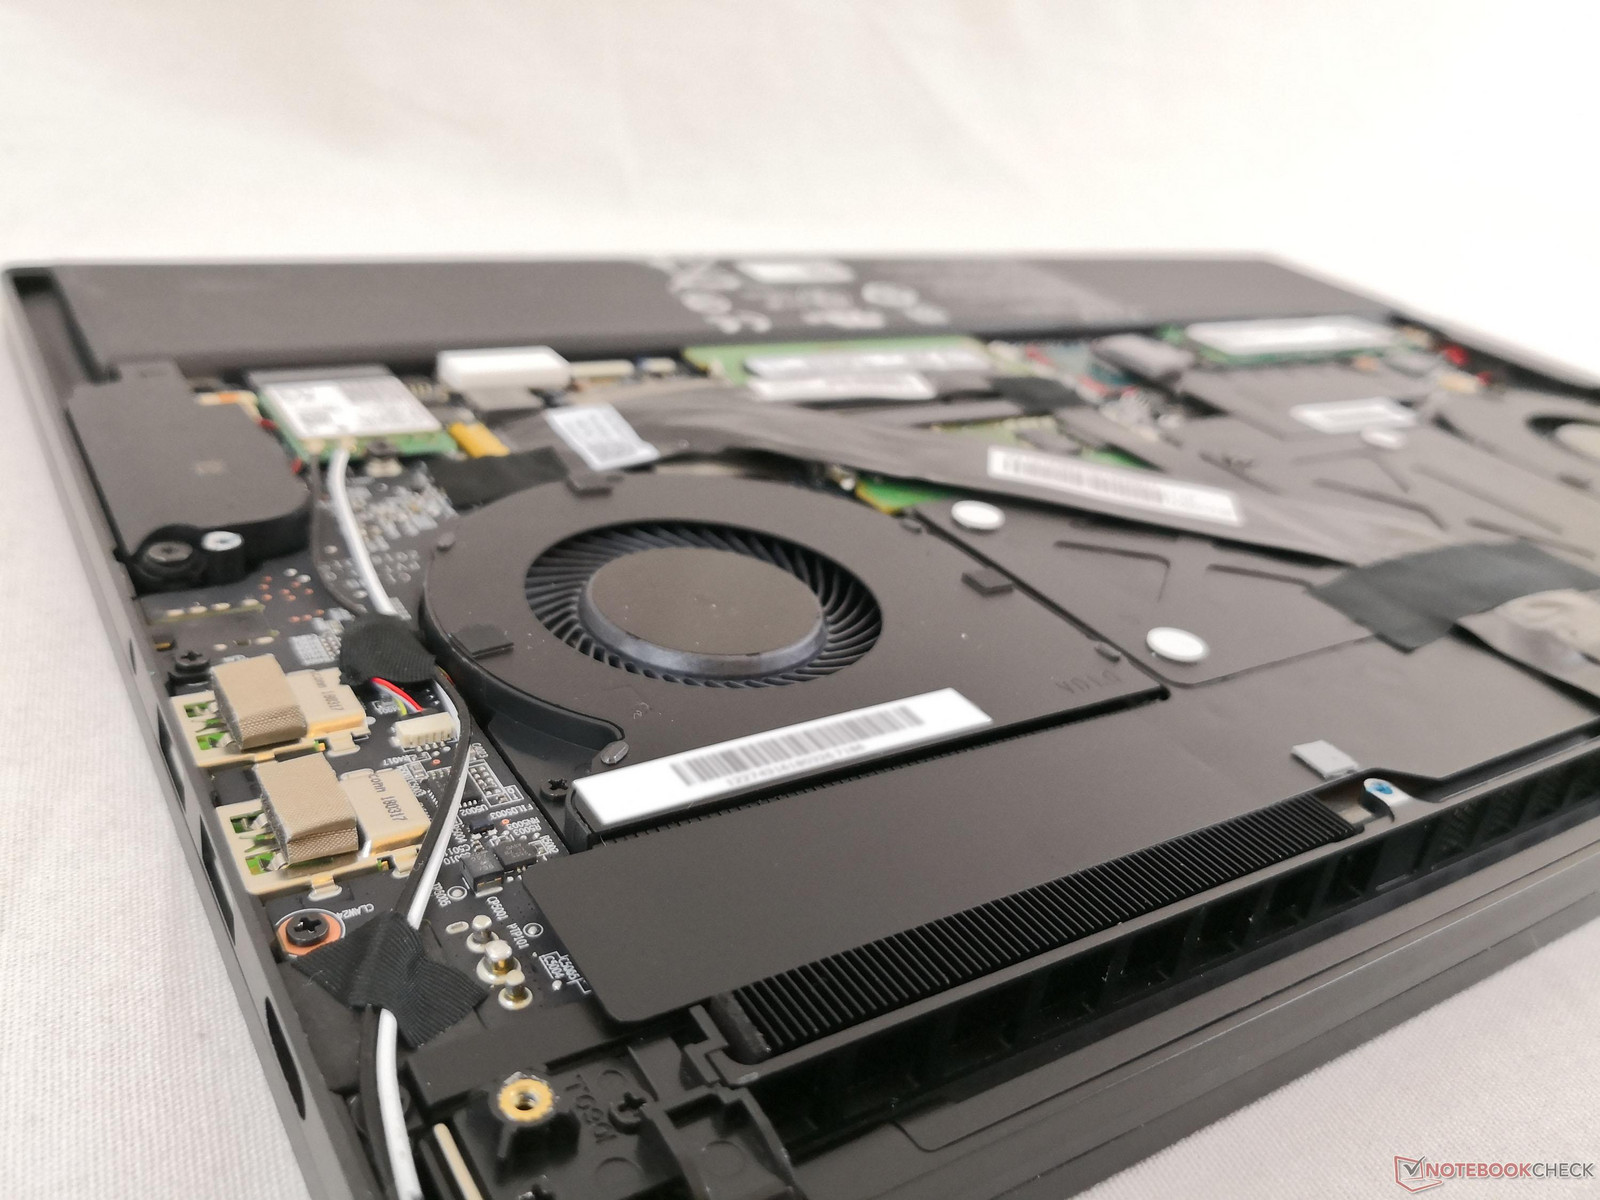
Maintenance
Input Devices
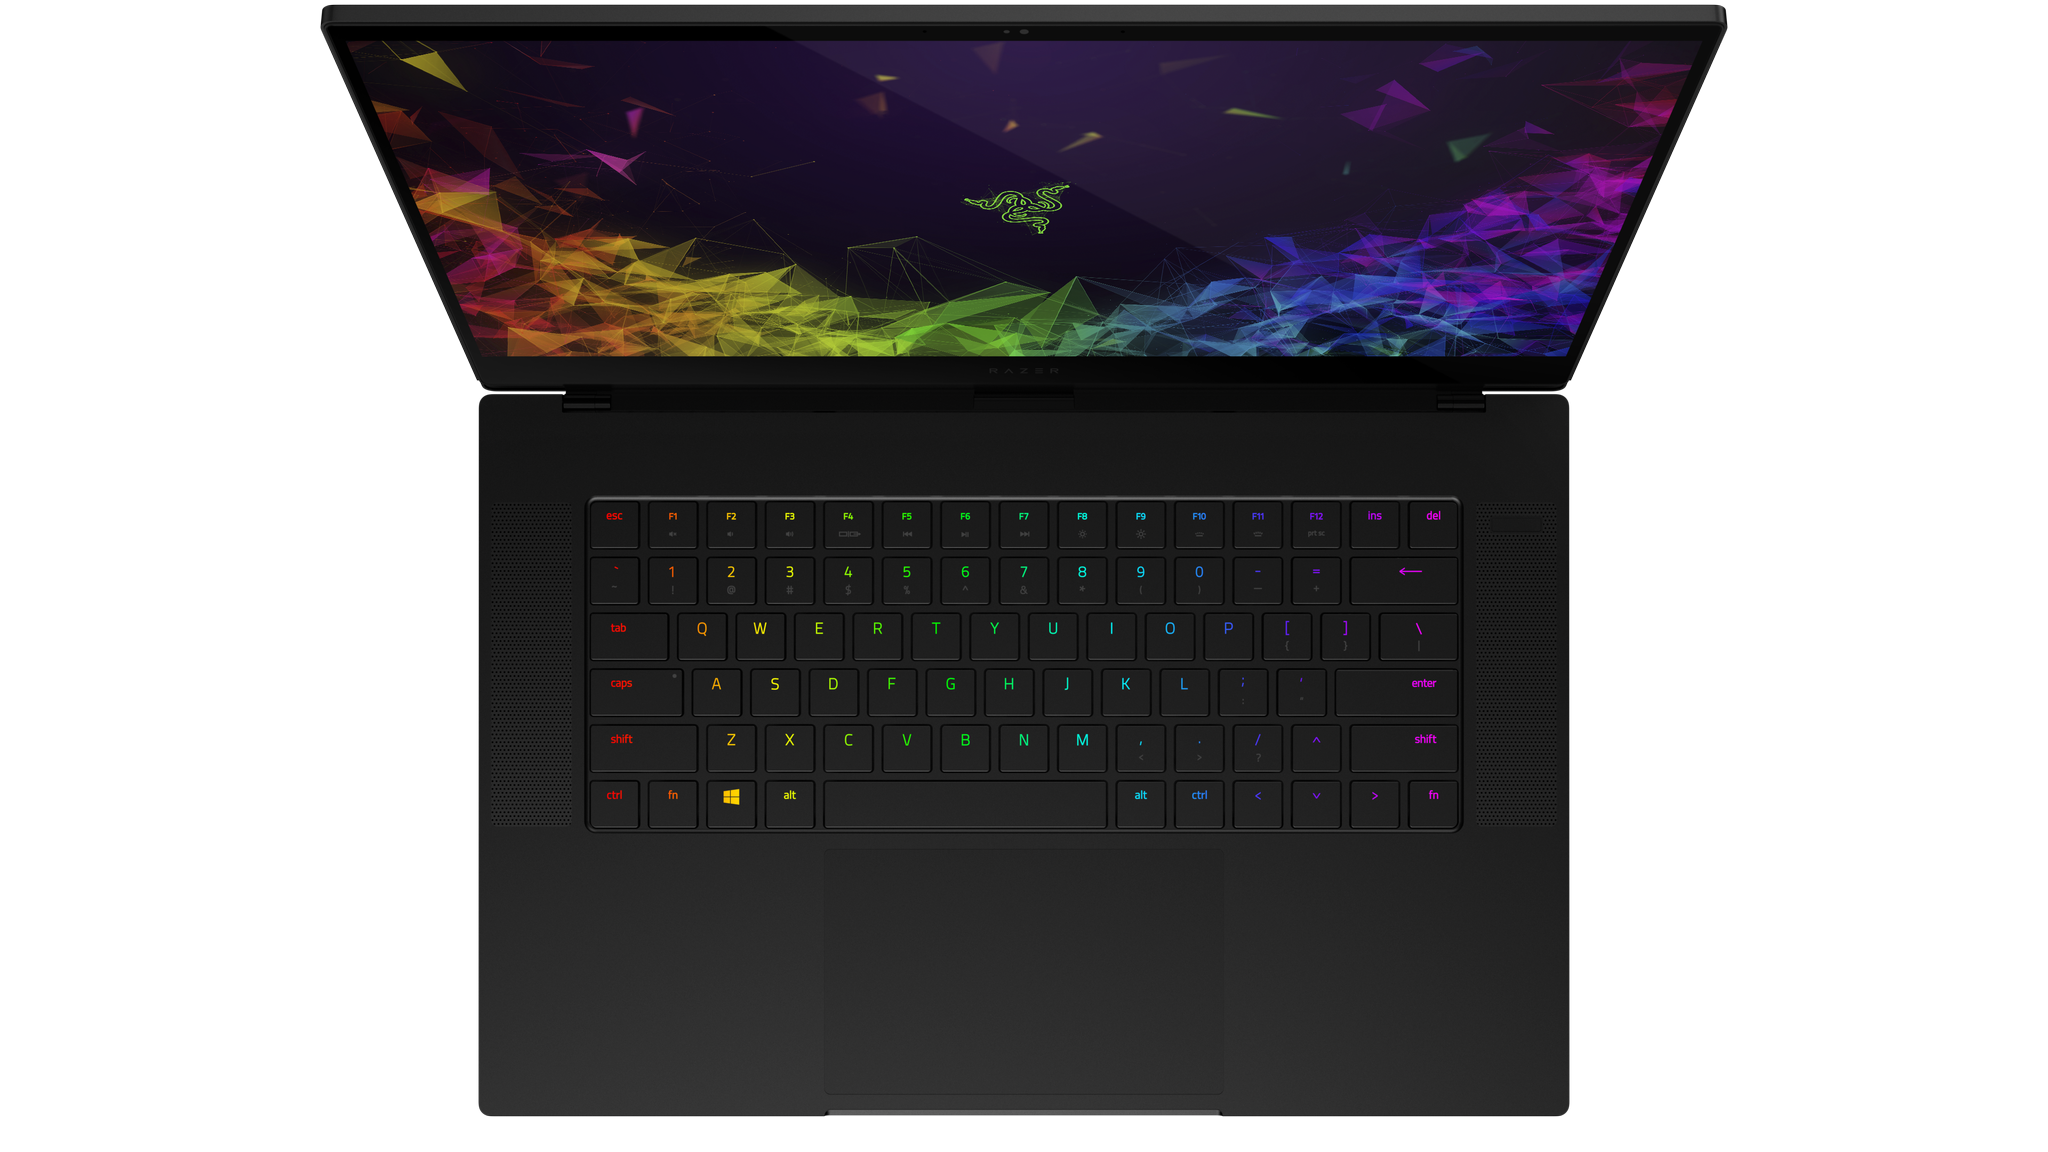
Keyboard and Touchpad
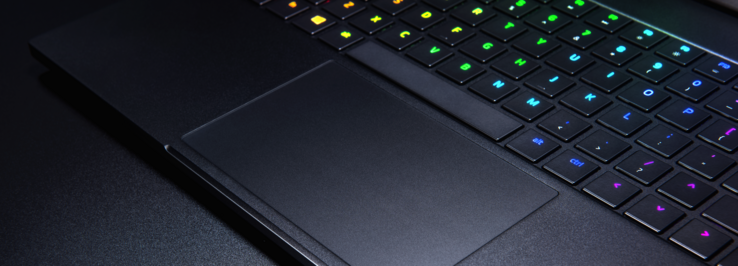
The keys on the Blade 15 offer shorter travel and lighter feedback when compared to the keys on the MSI GS65, XPS 15, or Asus Zephyrus GM501. Ultrabook users will feel right at home with the Chroma keyboard, but desktop gamers will likely need some time to adjust to these softer keys.
The per-key RGB lighting from the Blade 14 and Blade Pro has carried over to the Blade 15 series. Owners must login to Razer Central or Synapse to take full advantage of its features. The lighting can be very bright at maximum setting, but it unfortunately does not light up the secondary symbols (i.e., !, @, #, $, etc.) or multimedia shortcuts printed onto some keys.
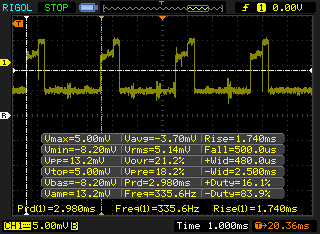
It's worth noting that the RGB lighting exhibits pulse-width modulation at a frequency of about 335 Hz. Users sensitive to onscreen flickering may want to adjust the RGB brightness level accordingly when gaming.
Meanwhile, the large (13 x 8 cm) trackpad is smooth in glide with excellent multi-touch responsiveness. The integrated mouse clicks are shallow and quiet and could have benefited from being a bit firmer.
Display
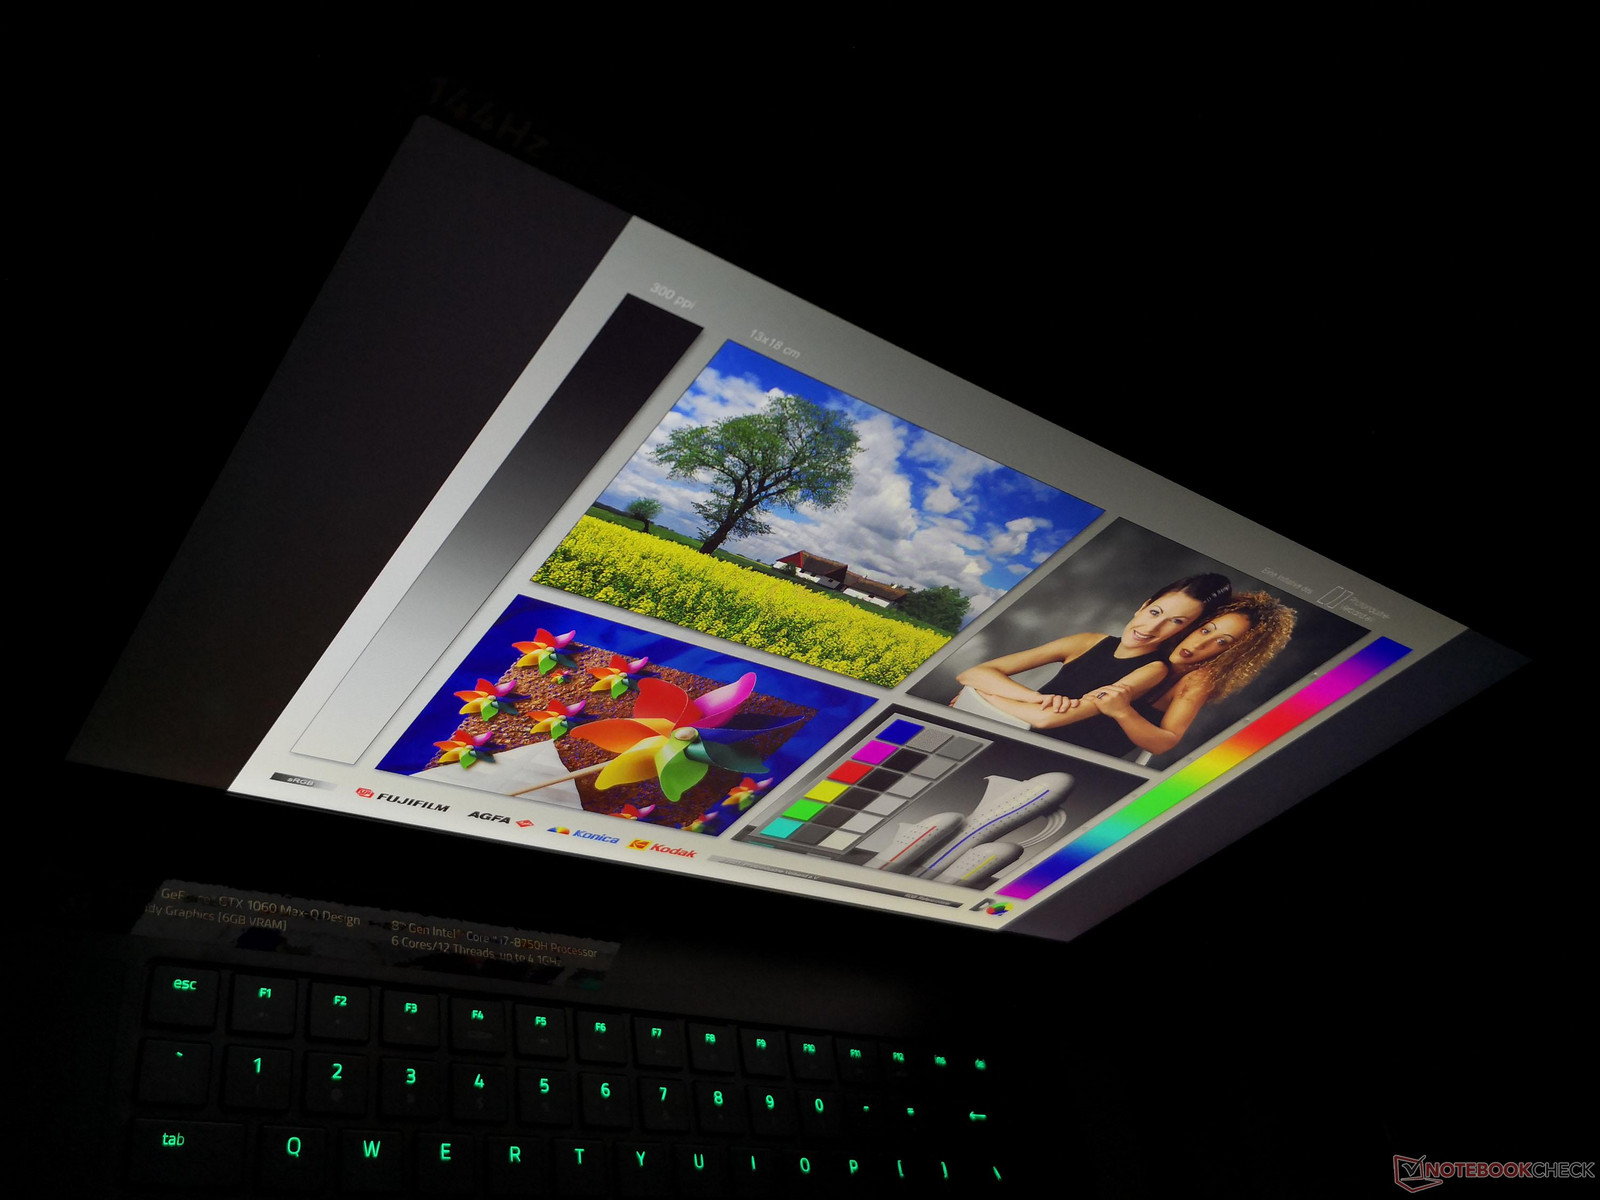
Our GTX 1060 Max-Q configuration utilizes the same matte 1080p 144 Hz panel as on our GTX 1070 Max-Q unit and so we refer to our existing review for more information. The two other panel options include the less expensive 1080p 60 Hz panel and the pricier 4K UHD 60 Hz glossy touchscreen. These panels will likely exhibit different contrast ratios, gamuts, response times, and even brightness levels between them. Thus, our measurements below reflect only the 1080p 144 Hz configuration.
Note that the Blade 15 utilizes the same LGD05C0 1080p 144 Hz panel from LG as does the competing Gigabyte Aero 15X. Both systems share very similar display qualities as a result.
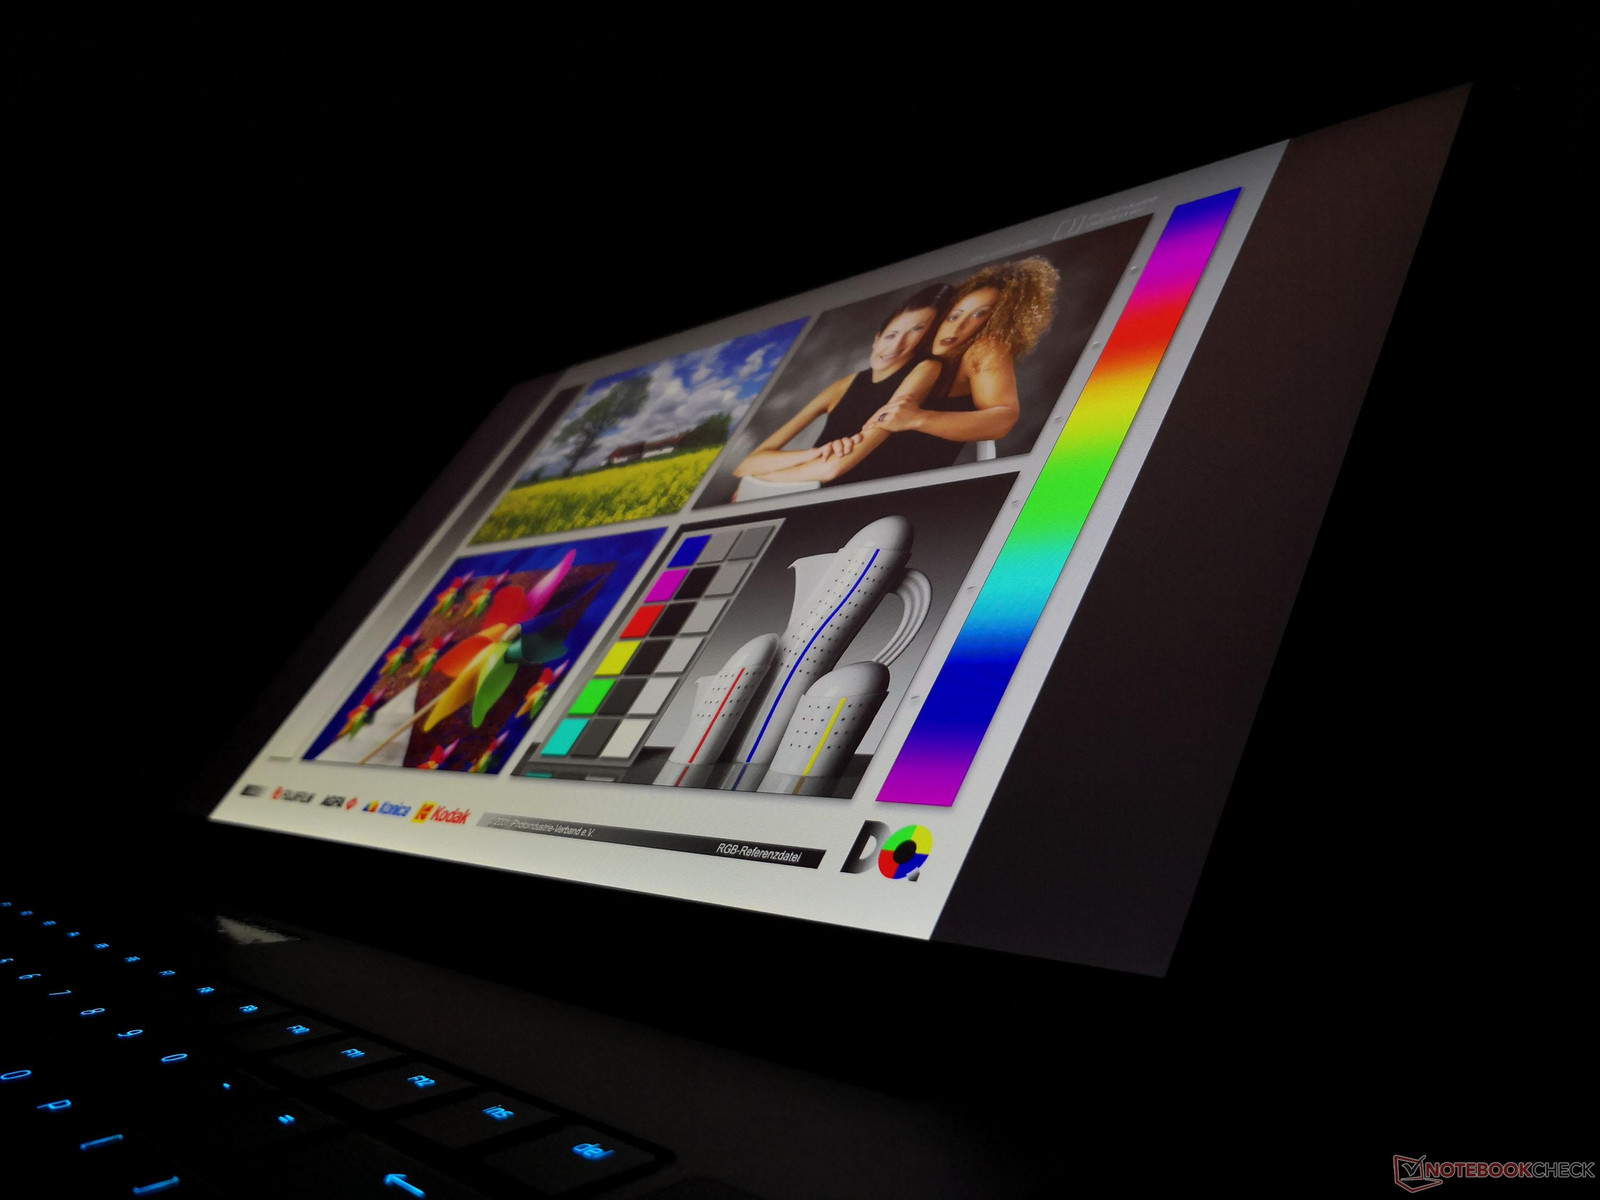
Our GTX 1070 Max-Q unit exhibited uneven backlight bleeding and we can unfortunately observe the same on today's GTX 1060 Max-Q system. The bleeding around the edges and corners is noticeable when gaming or during video playback where darkened scenes can be common.


| |||||||||||||||||||||||||
Brightness Distribution: 80 %
Center on Battery: 304.3 cd/m²
Contrast: 801:1 (Black: 0.38 cd/m²)
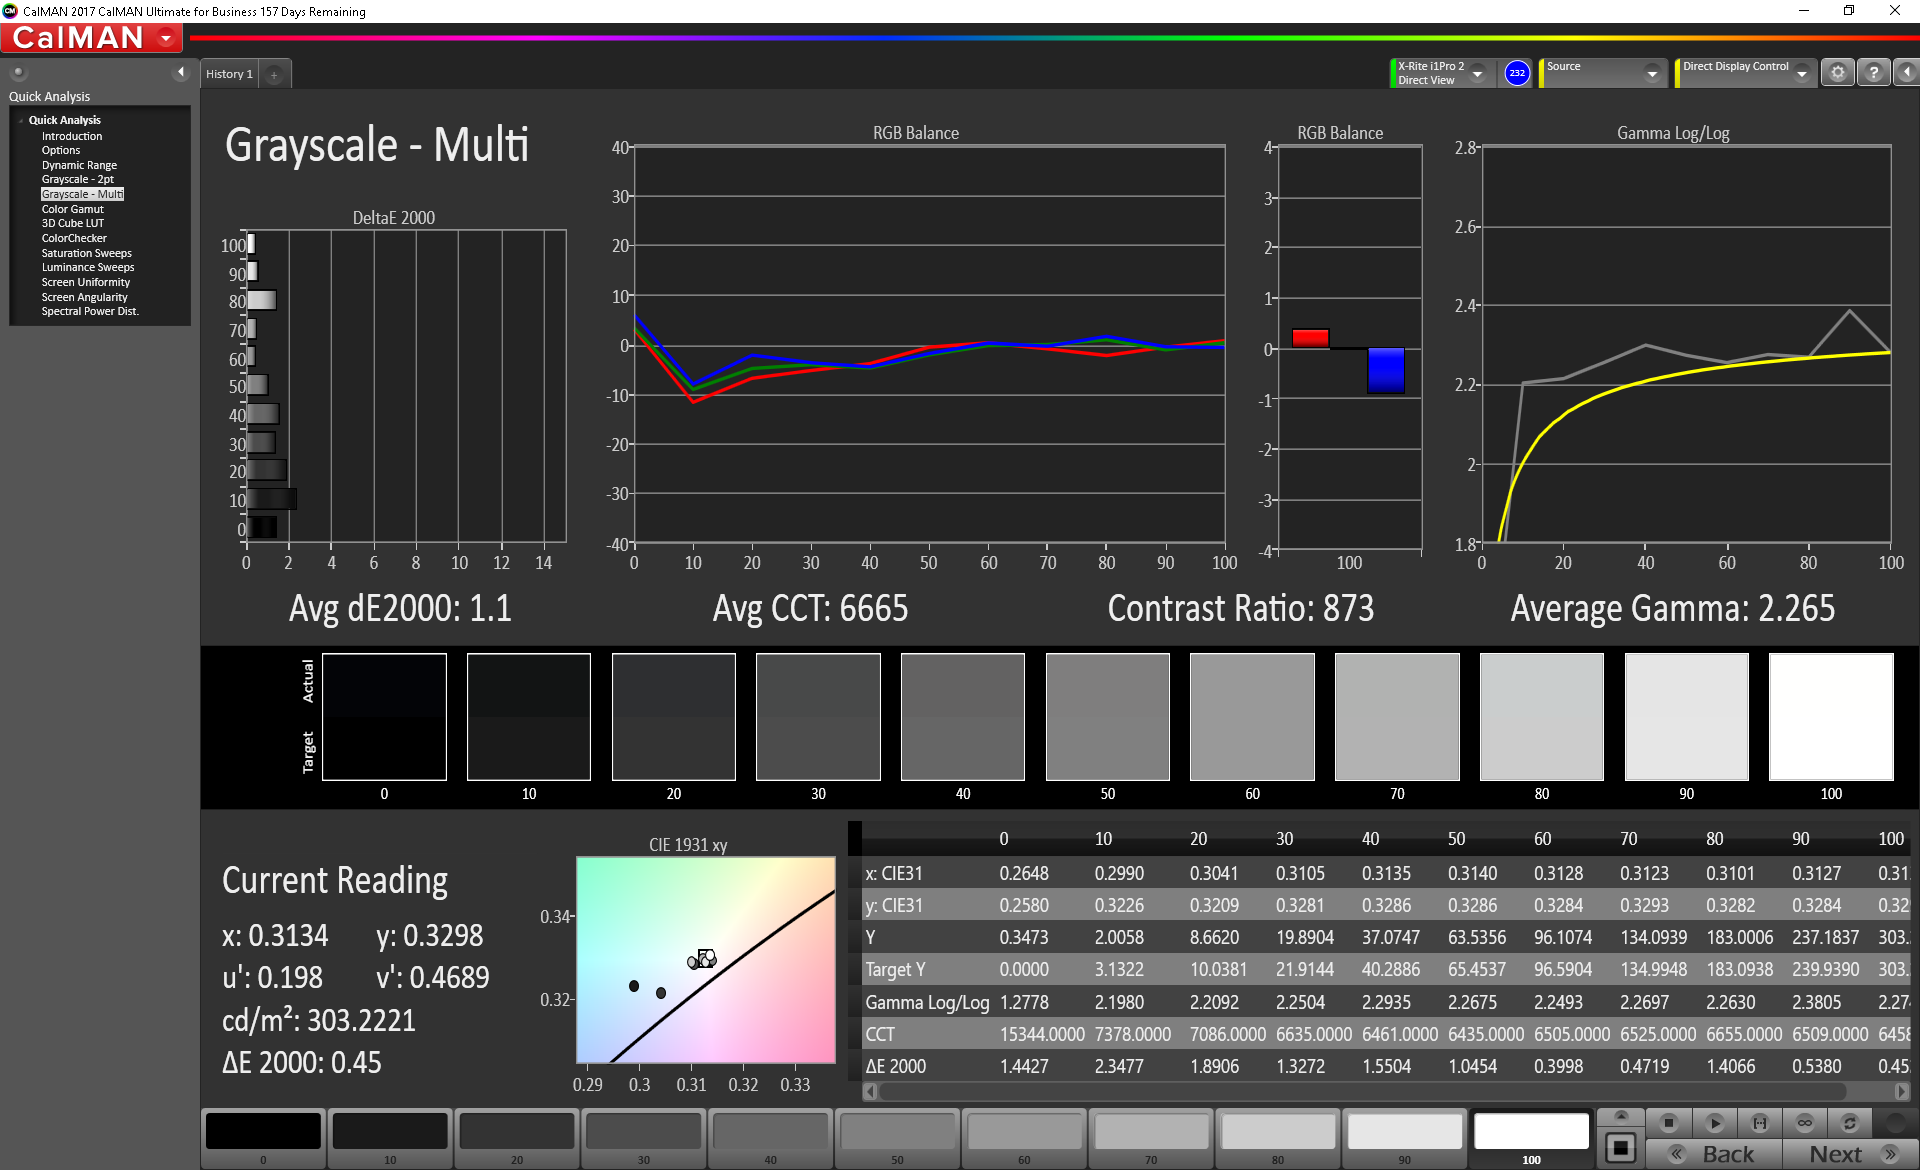
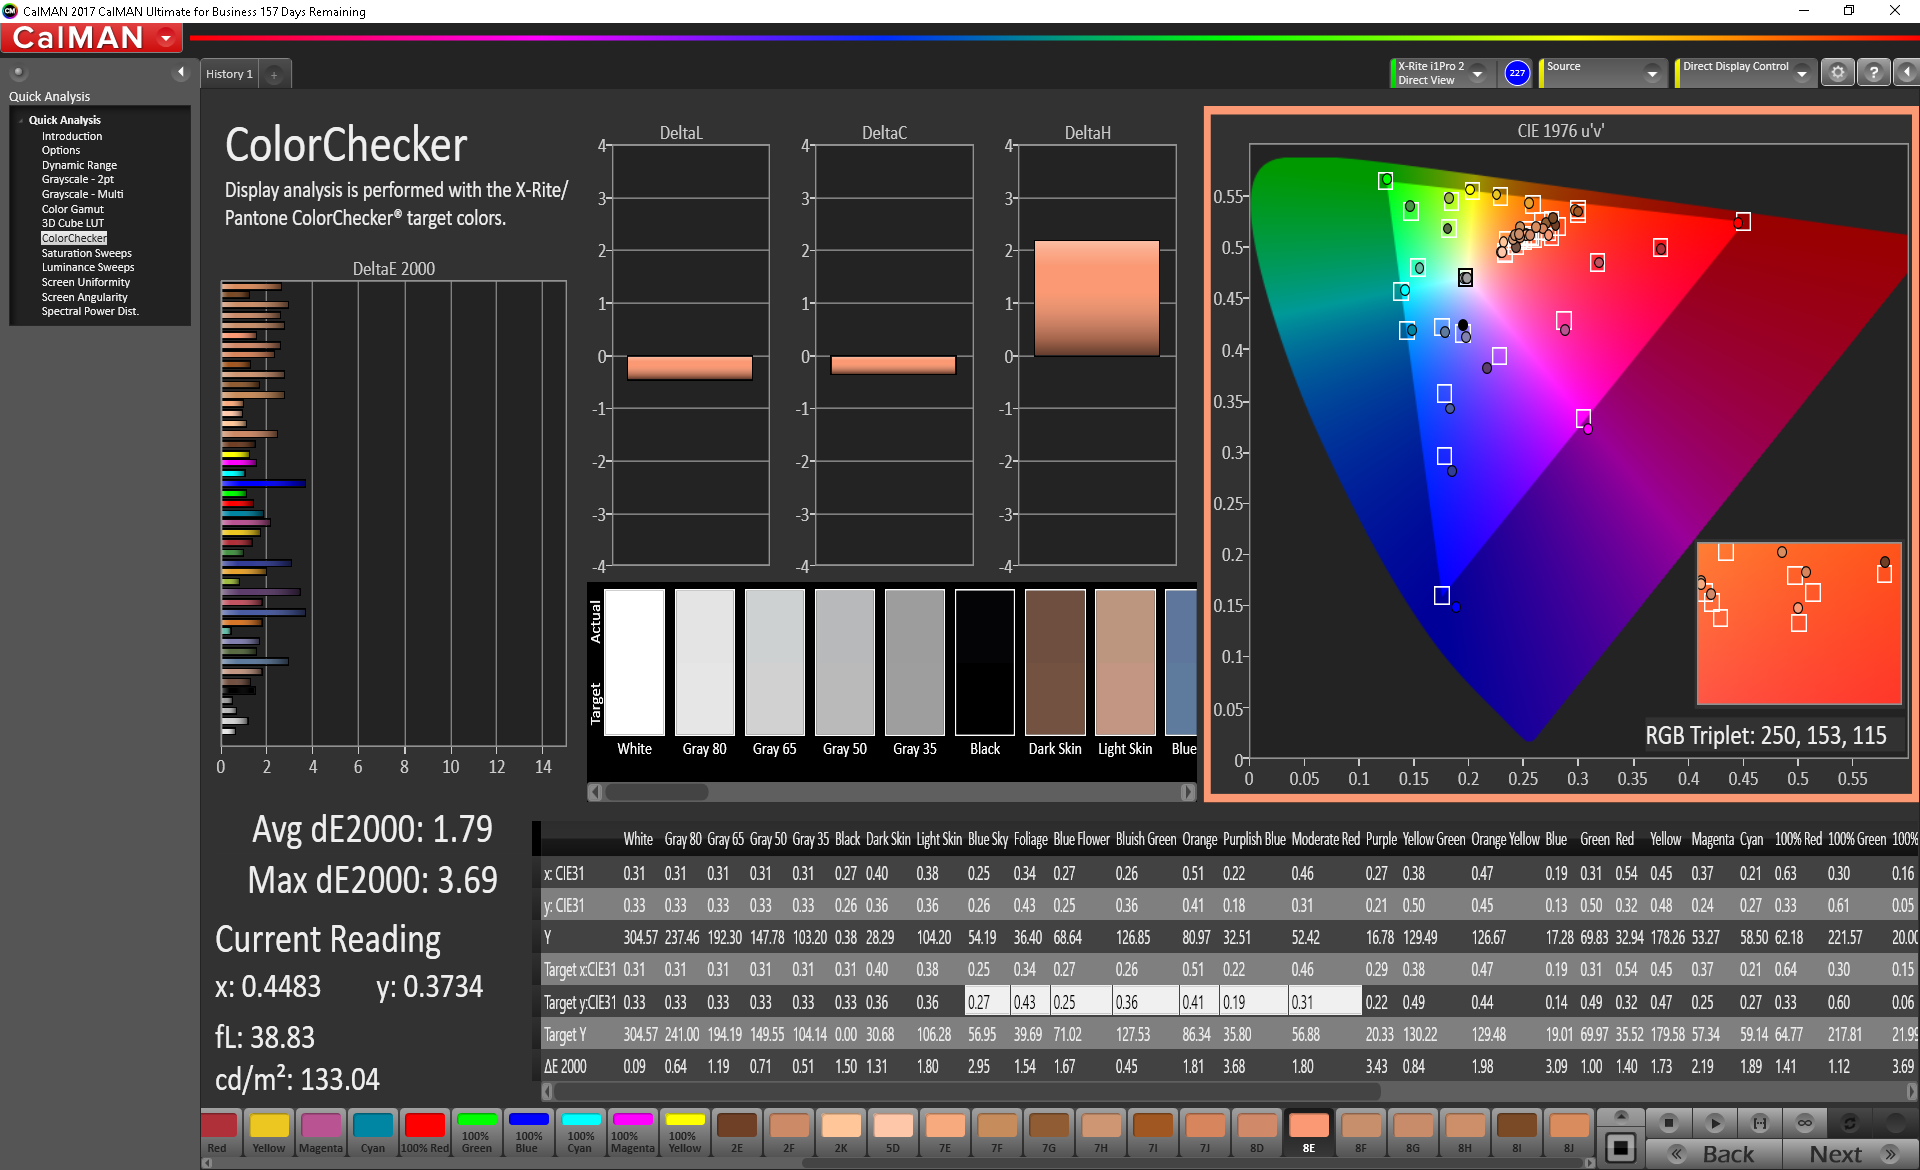
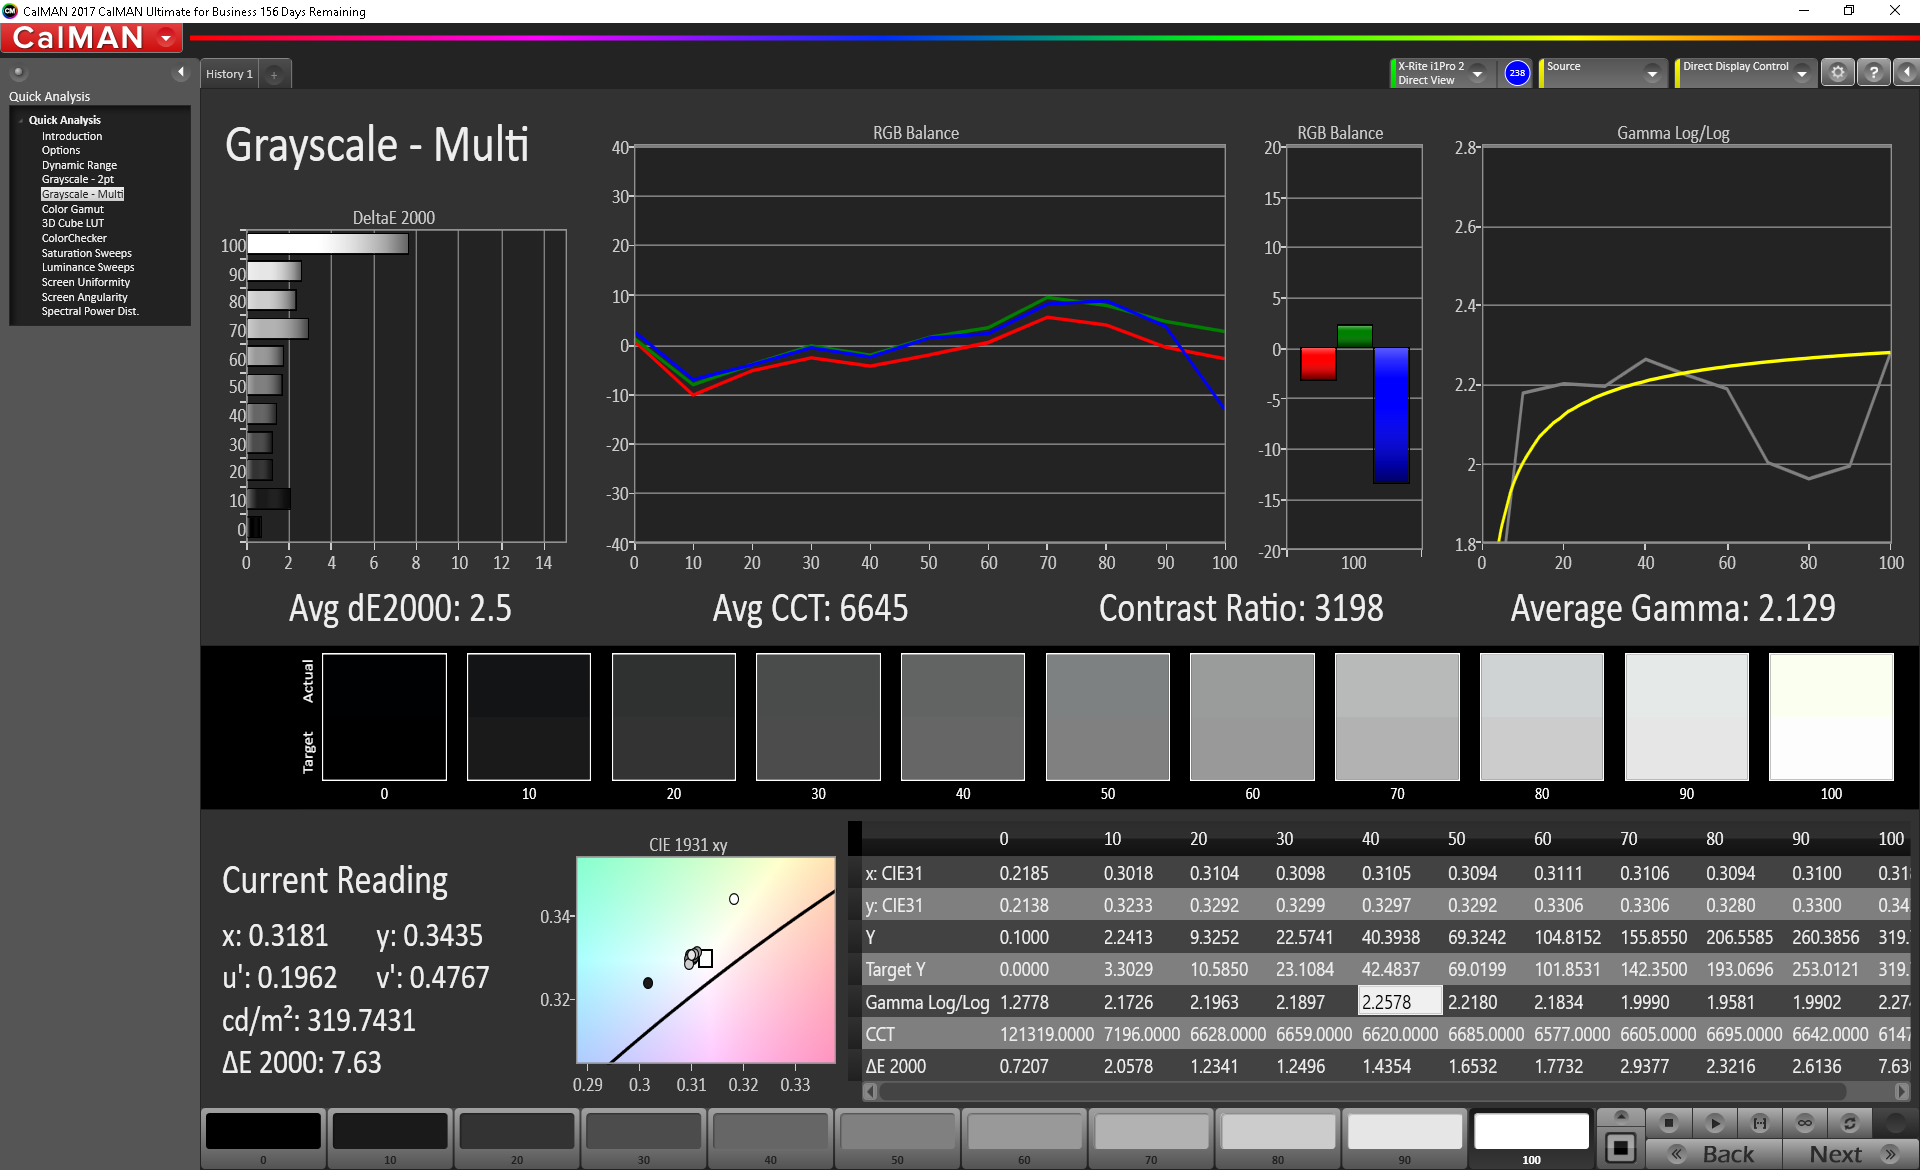
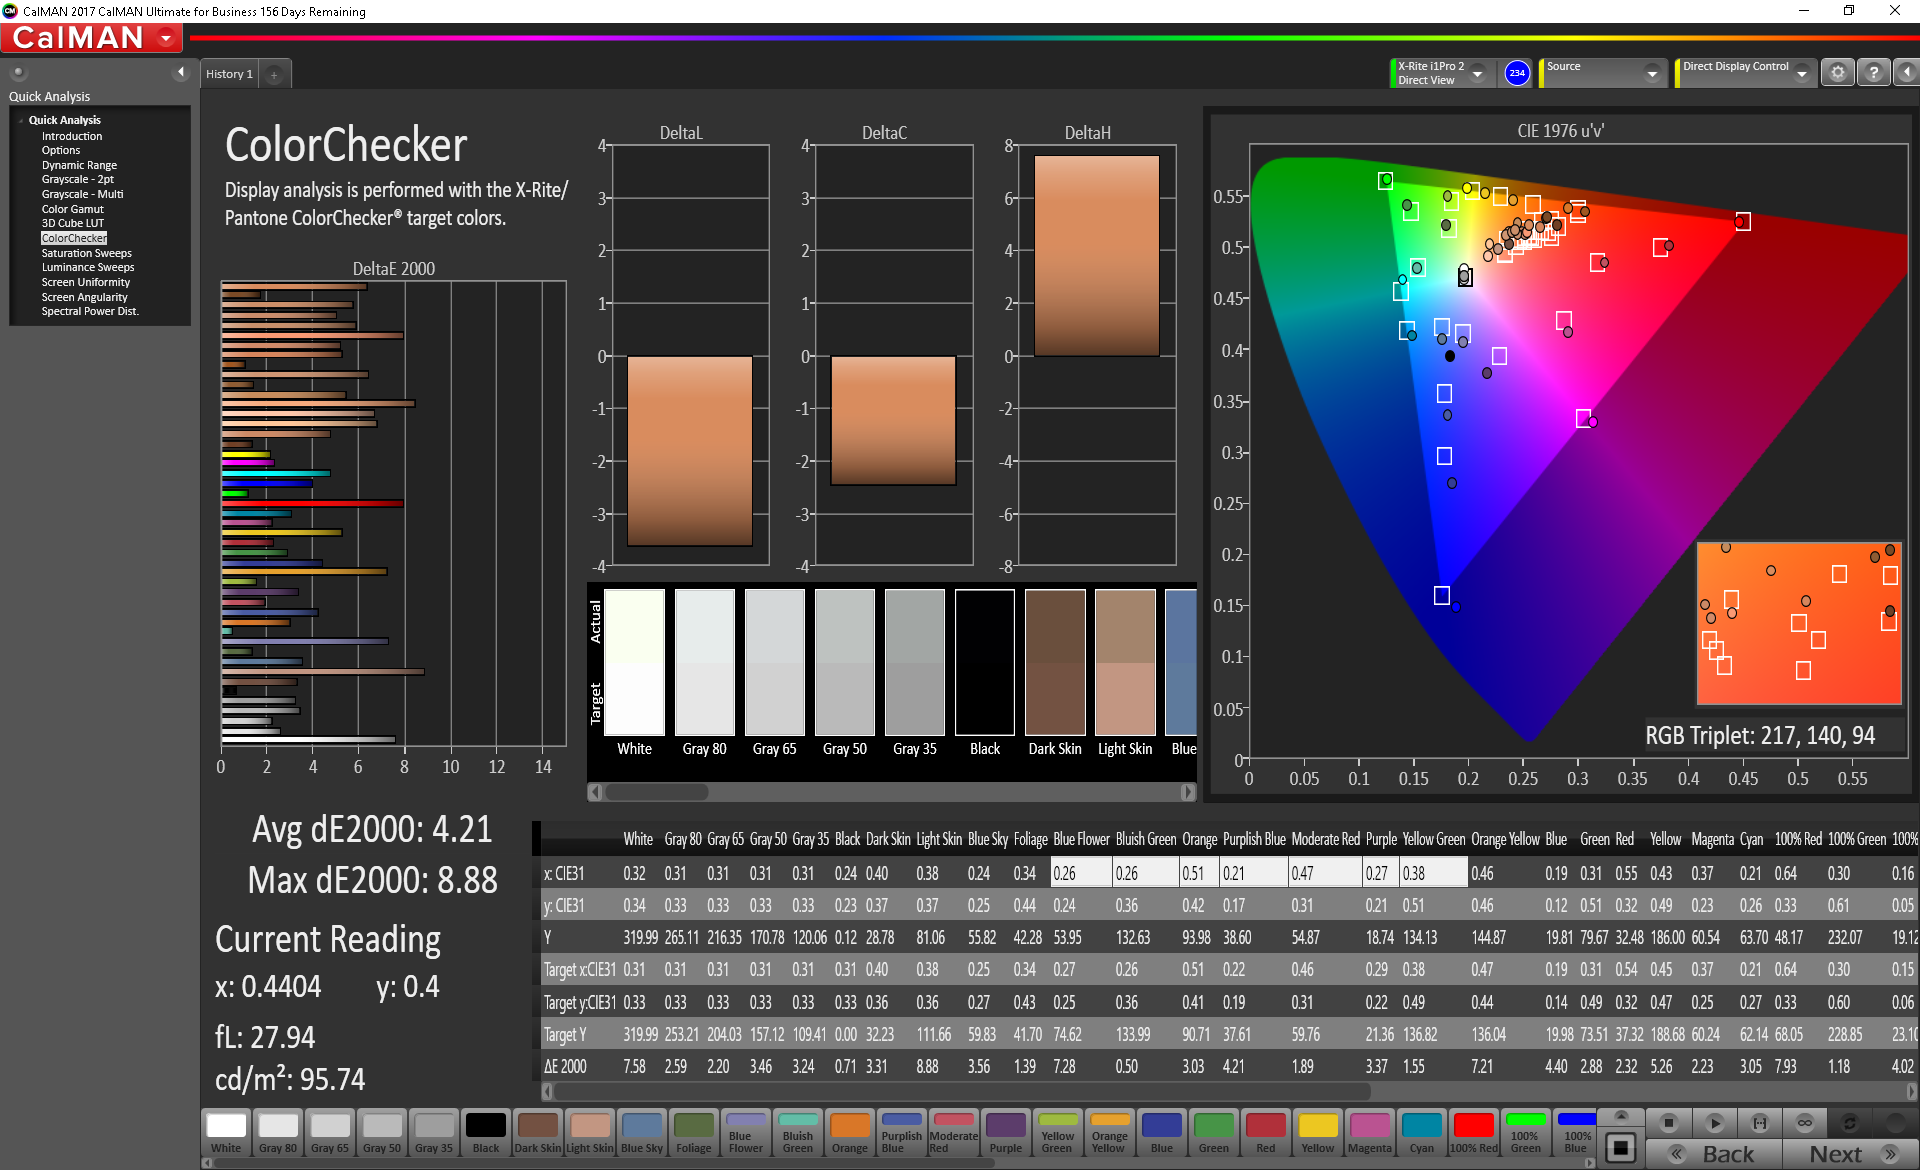
ΔE ColorChecker Calman: 1.79 | ∀{0.5-29.43 Ø4.73}
ΔE Greyscale Calman: 1.1 | ∀{0.09-98 Ø4.97}
92.8% sRGB (Argyll 1.6.3 3D)
59.8% AdobeRGB 1998 (Argyll 1.6.3 3D)
65.5% AdobeRGB 1998 (Argyll 3D)
93.4% sRGB (Argyll 3D)
64.4% Display P3 (Argyll 3D)
Gamma: 2.27
CCT: 6665 K
| Razer Blade 15 GTX 1060 LGD05C0, IPS, 15.6", 1920x1080 | Razer Blade 15 2018 LGD05C0, IPS, 15.6", 1920x1080 | MSI GS65 8RF-019DE Stealth Thin AU Optronics B156HAN08.0 (AUO80ED), IPS, 15.6", 1920x1080 | Gigabyte Aero 15X v8 LGD05C0, IPS, 15.6", 1920x1080 | Apple MacBook Pro 15 2017 (2.9 GHz, 560) 15.4", 2880x1800 | Dell XPS 15 2018 i5 FHD 97Wh Sharp SHP149A LQ156M1, LED IGZO IPS InfinityEdge, 15.6", 1920x1080 | |
|---|---|---|---|---|---|---|
| Display | 0% | 2% | -1% | 2% | ||
| Display P3 Coverage (%) | 64.4 | 64.3 0% | 66.2 3% | 63.6 -1% | 66 2% | |
| sRGB Coverage (%) | 93.4 | 93.7 0% | 92.1 -1% | 93.8 0% | 96.5 3% | |
| AdobeRGB 1998 Coverage (%) | 65.5 | 65.5 0% | 67.2 3% | 64.9 -1% | 66.7 2% | |
| Response Times | -13% | -18% | -9% | -173% | -205% | |
| Response Time Grey 50% / Grey 80% * (ms) | 13.6 ? | 17.2 ? -26% | 17.6 ? -29% | 16.8 ? -24% | 42.4 ? -212% | 49 ? -260% |
| Response Time Black / White * (ms) | 12 ? | 12 ? -0% | 12.8 ? -7% | 11.2 ? 7% | 28 ? -133% | 30 ? -150% |
| PWM Frequency (Hz) | 961 ? | |||||
| Screen | -21% | -4% | 15% | 20% | 0% | |
| Brightness middle (cd/m²) | 304.3 | 290 -5% | 254 -17% | 313 3% | 534 75% | 413 36% |
| Brightness (cd/m²) | 293 | 281 -4% | 262 -11% | 300 2% | 502 71% | 378 29% |
| Brightness Distribution (%) | 80 | 82 2% | 89 11% | 78 -2% | 86 8% | 86 8% |
| Black Level * (cd/m²) | 0.38 | 0.3 21% | 0.22 42% | 0.33 13% | 0.31 18% | 0.29 24% |
| Contrast (:1) | 801 | 967 21% | 1155 44% | 948 18% | 1723 115% | 1424 78% |
| Colorchecker dE 2000 * | 1.79 | 2.85 -59% | 2.37 -32% | 1.29 28% | 1.8 -1% | 2.44 -36% |
| Colorchecker dE 2000 max. * | 3.69 | 6.27 -70% | 4.71 -28% | 2.04 45% | 3.8 -3% | 4.46 -21% |
| Greyscale dE 2000 * | 1.1 | 2.4 -118% | 1.58 -44% | 0.69 37% | 2.4 -118% | 2.48 -125% |
| Gamma | 2.27 97% | 2.34 94% | 2.48 89% | 2.43 91% | 2.27 97% | 2.43 91% |
| CCT | 6665 98% | 6718 97% | 6785 96% | 6550 99% | 6563 99% | 7006 93% |
| Color Space (Percent of AdobeRGB 1998) (%) | 59.8 | 60 0% | 60 0% | 60 0% | 77.92 30% | 62 4% |
| Color Space (Percent of sRGB) (%) | 92.8 | 94 1% | 92 -1% | 94 1% | 99.94 8% | 96 3% |
| Colorchecker dE 2000 calibrated * | 1.39 | 1.84 | 2.48 | |||
| Total Average (Program / Settings) | -11% /
-16% | -7% /
-4% | 2% /
8% | -77% /
-12% | -68% /
-27% |
* ... smaller is better
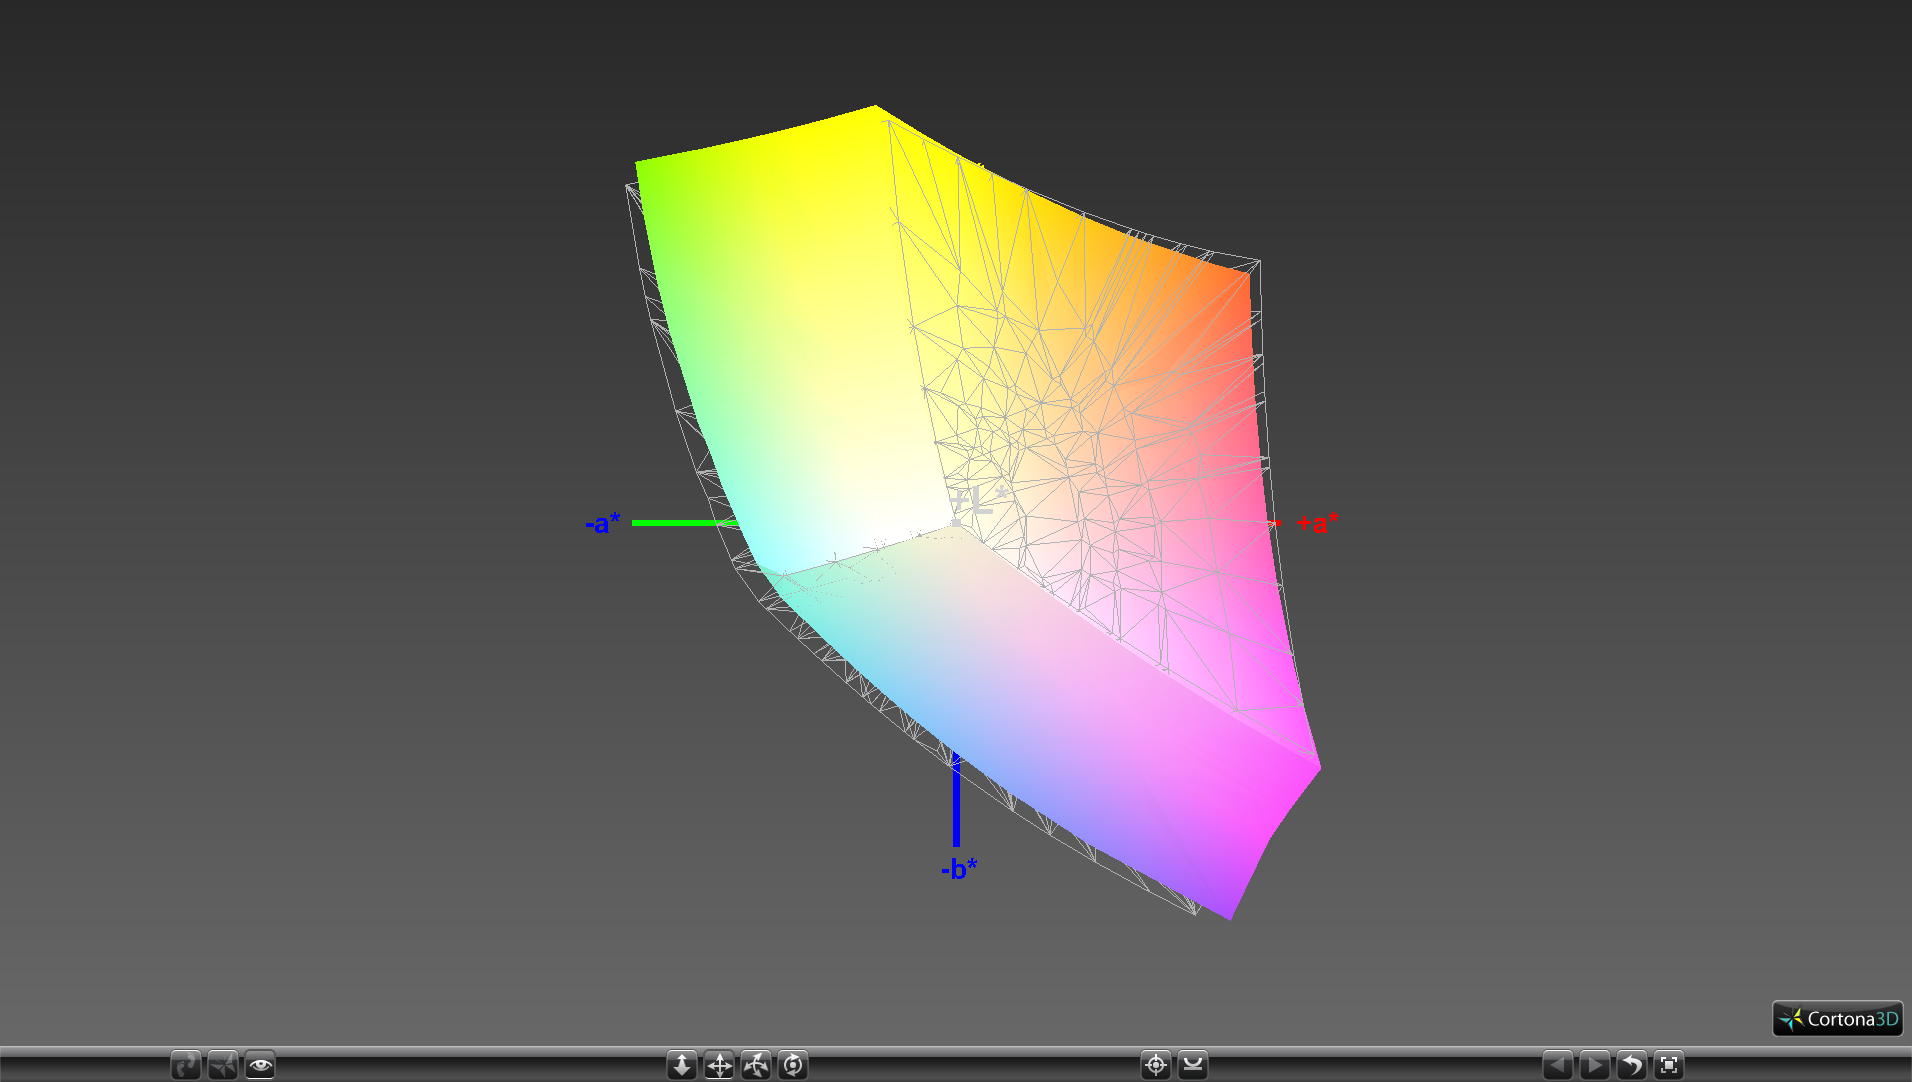
Color space is approximately 93 percent and 60 percent of the sRGB and AdobeRGB standards, respectively. This is unsurprisingly similar to our results from the Blade 15 GTX 1070 Max-Q unit and Aero 15X. Graphics artists can get near-complete sRGB coverage from the Razer while the MacBook Pro 15 has an even wider gamut that encompasses more of AdobeRGB.
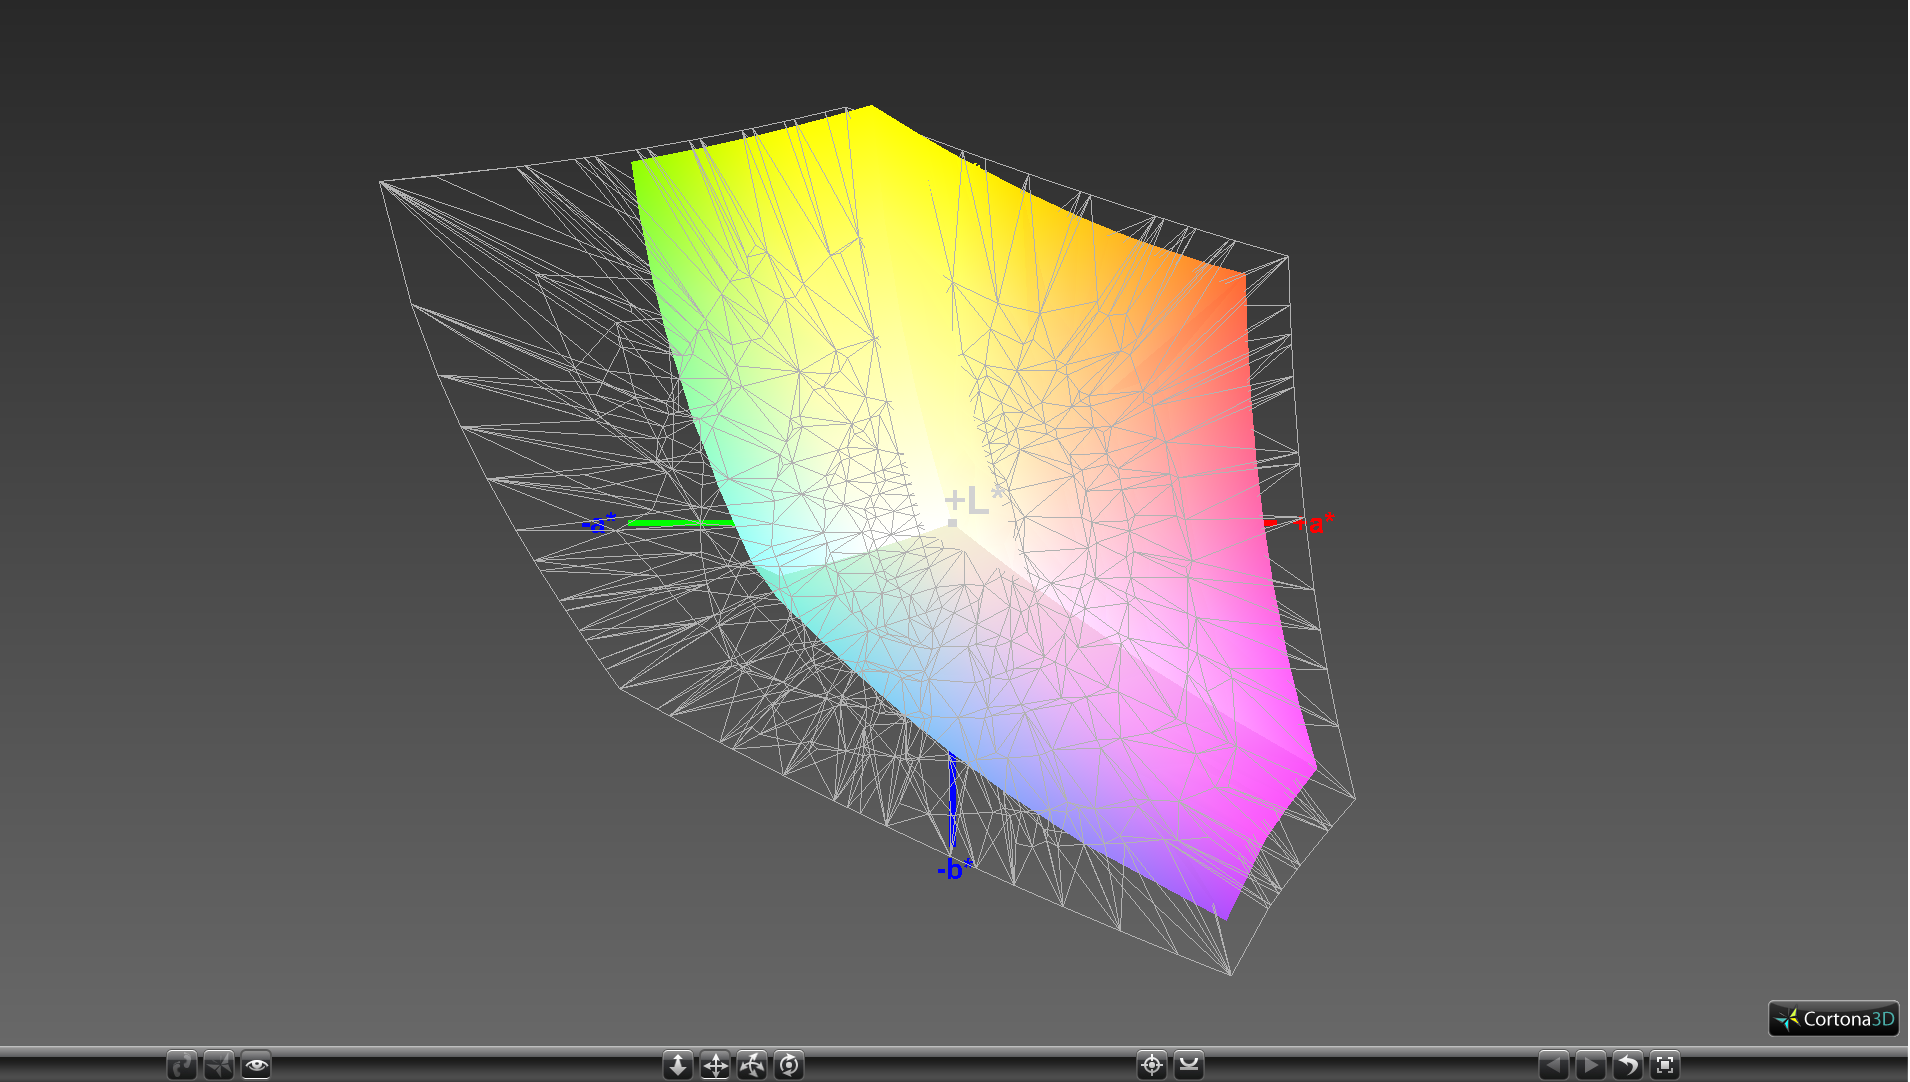
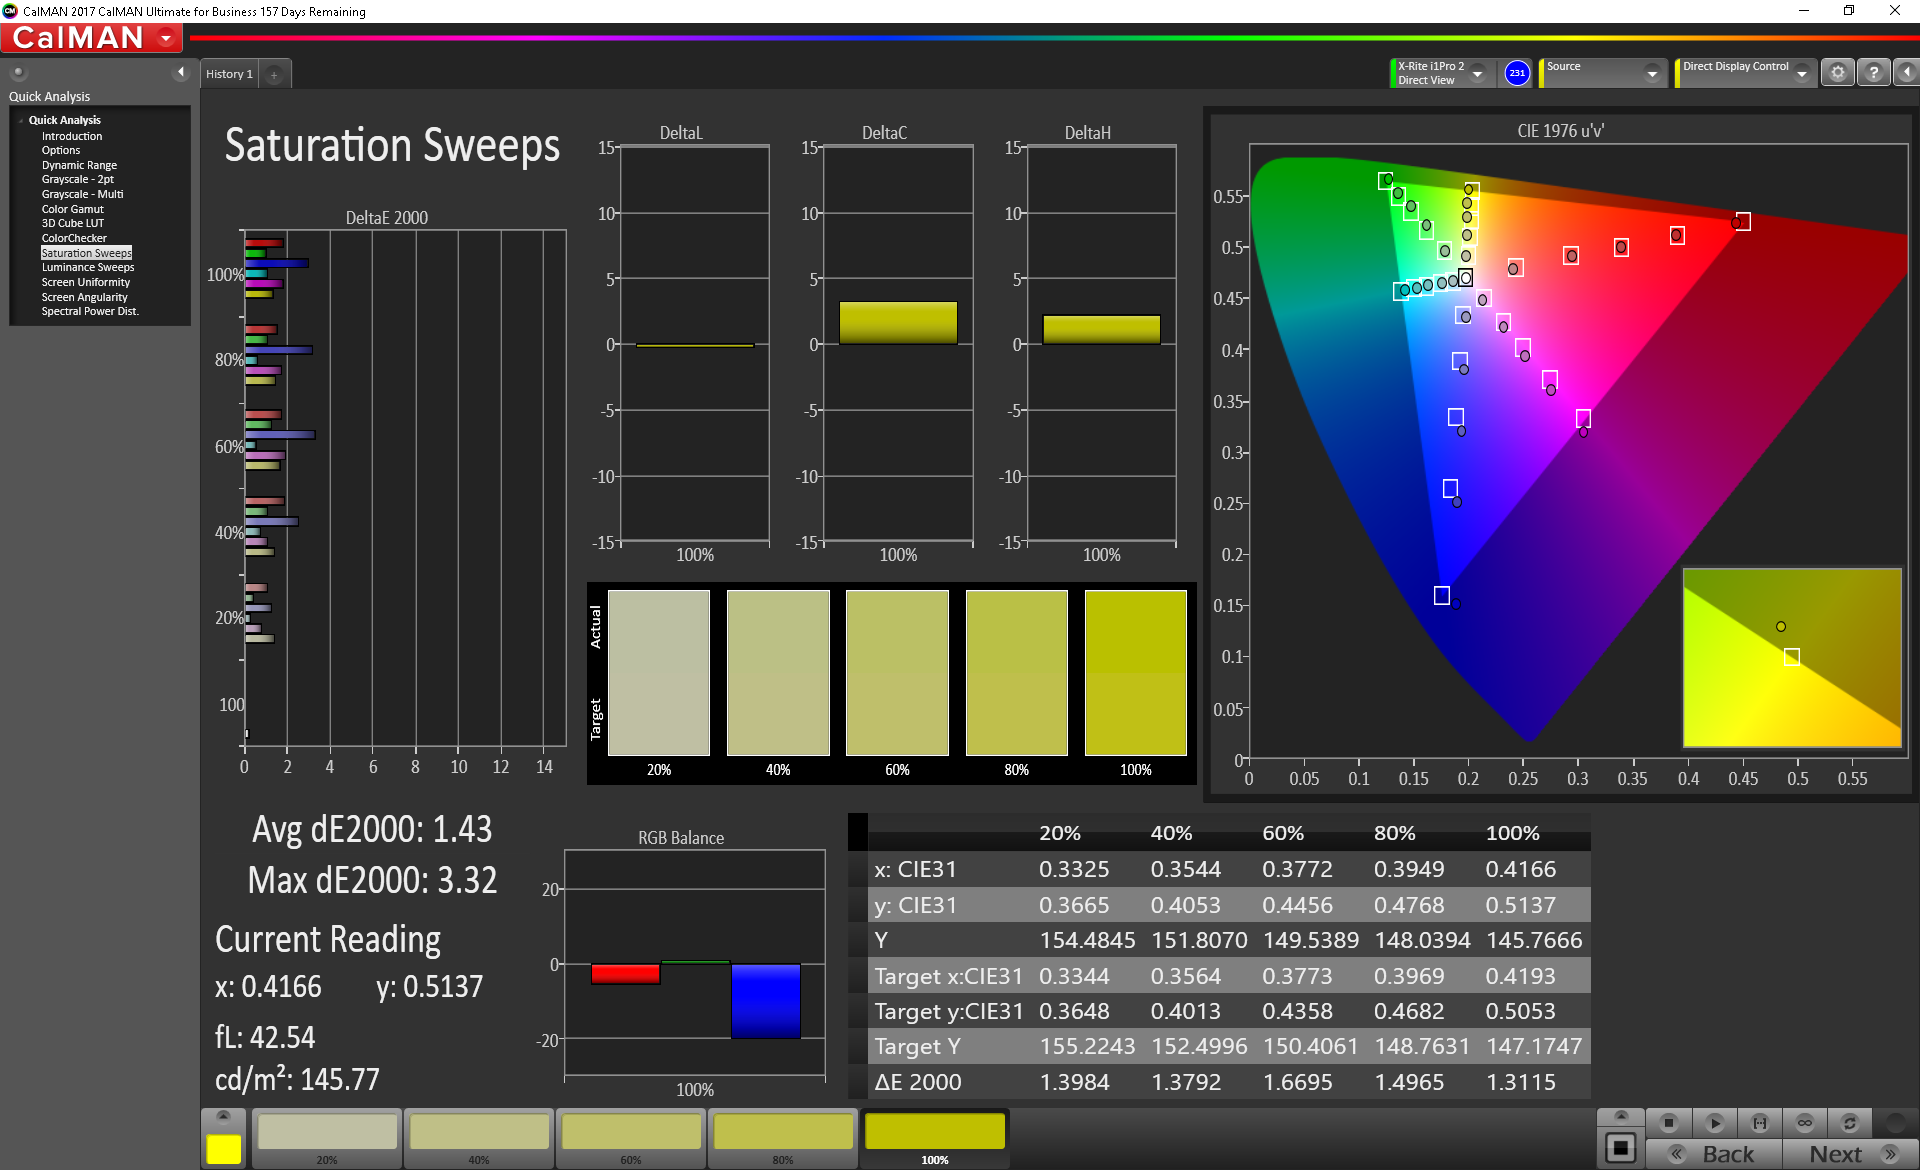
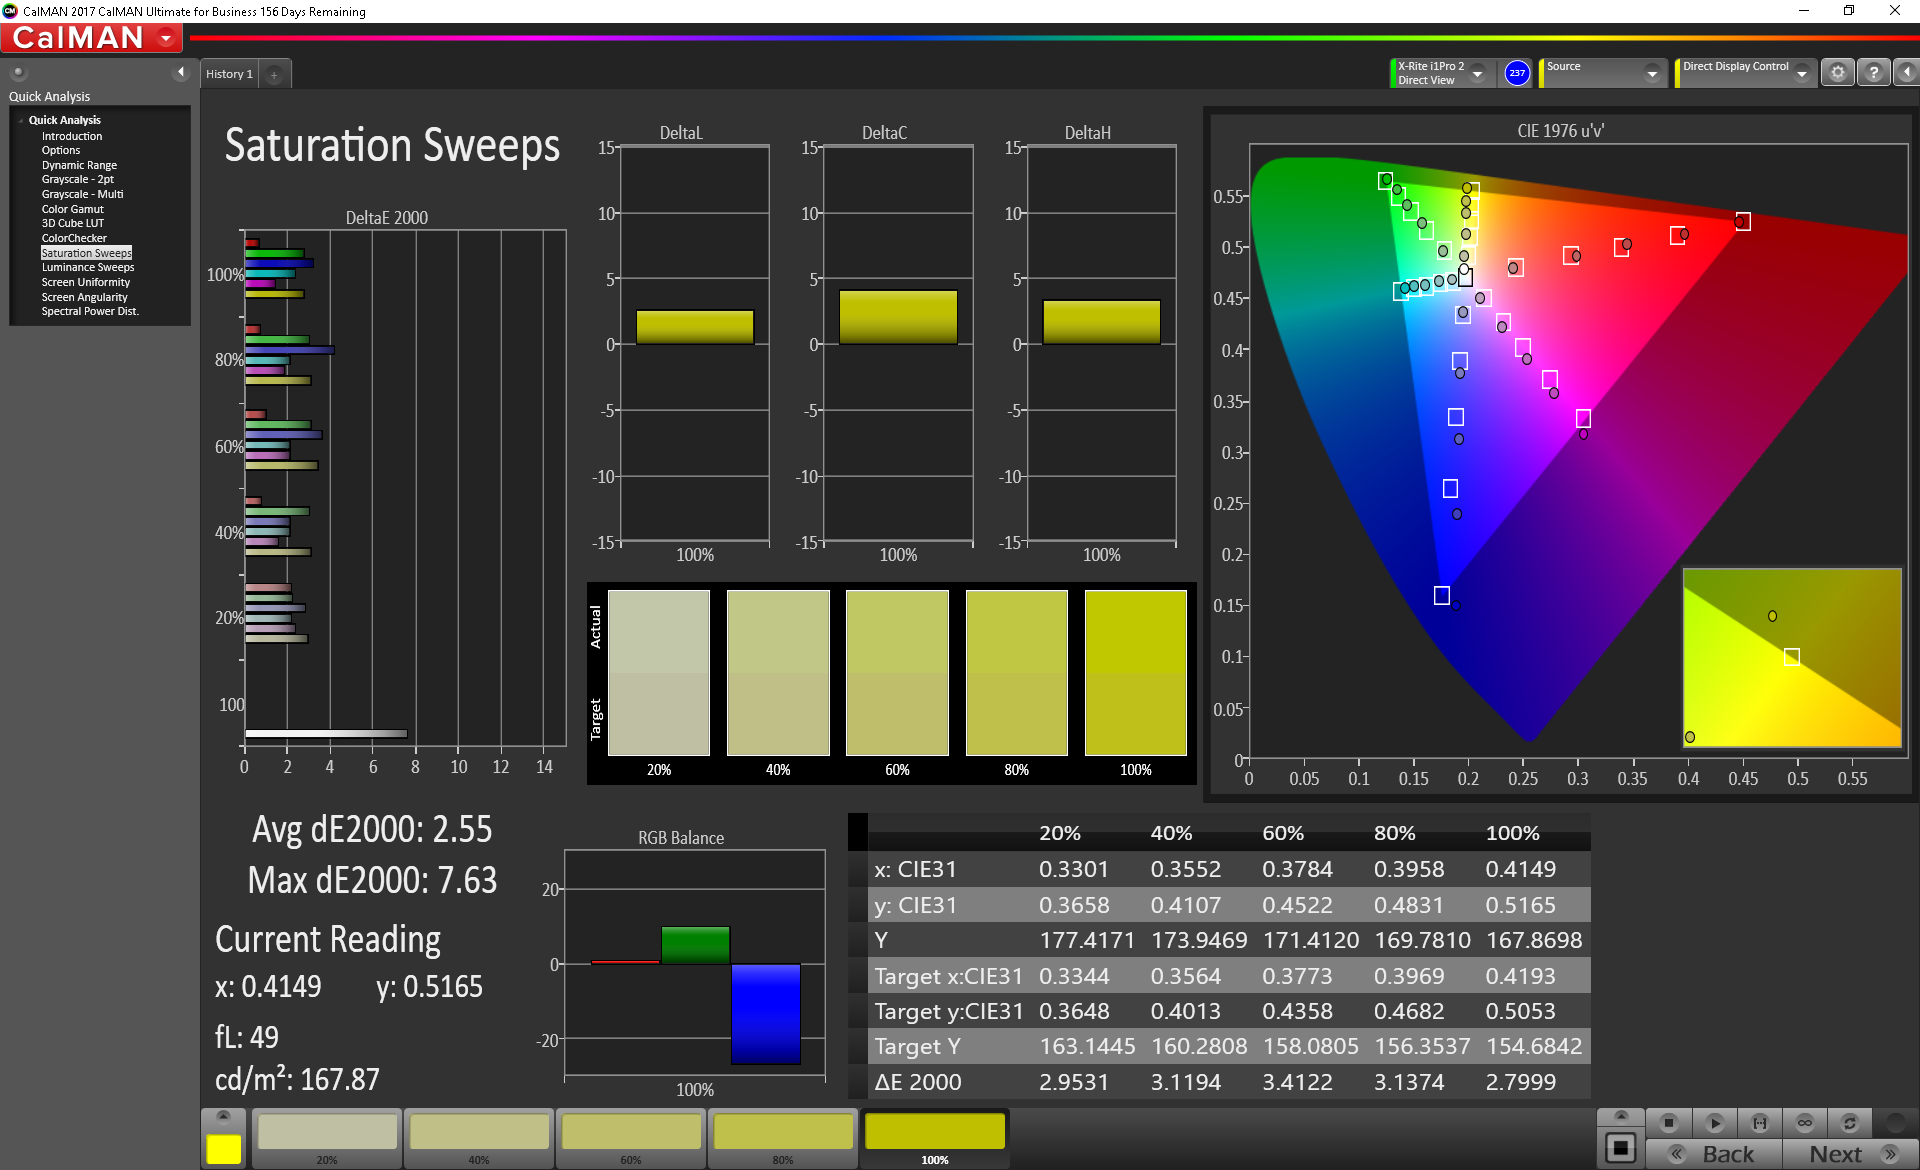
Razer promises "Custom calibrated" displays at factory for every Razer 15 unit similar to how Gigabyte promises Pantone-certified calibration for every Aero 15X v8 unit. Our independent spectrophotometer results do indeed show very accurate grayscale and colors across all saturation levels. Unlike other flagships like the XPS 15 or Spectre x360 15, owners need not perform any additional calibration to get the most accurate colors possible from the Razer. In fact, our own attempts to calibrate the already-calibrated display resulted in slightly worse colors and grays.
Display Response Times
| ↔ Response Time Black to White | ||
|---|---|---|
| 12 ms ... rise ↗ and fall ↘ combined | ↗ 7.6 ms rise | 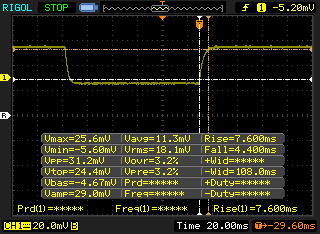 |
| ↘ 4.4 ms fall | ||
| The screen shows good response rates in our tests, but may be too slow for competitive gamers. In comparison, all tested devices range from 0.1 (minimum) to 240 (maximum) ms. » 31 % of all devices are better. This means that the measured response time is better than the average of all tested devices (19.9 ms). | ||
| ↔ Response Time 50% Grey to 80% Grey | ||
| 13.6 ms ... rise ↗ and fall ↘ combined | ↗ 7.6 ms rise | 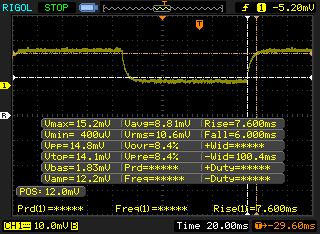 |
| ↘ 6 ms fall | ||
| The screen shows good response rates in our tests, but may be too slow for competitive gamers. In comparison, all tested devices range from 0.165 (minimum) to 636 (maximum) ms. » 27 % of all devices are better. This means that the measured response time is better than the average of all tested devices (31.1 ms). | ||
Screen Flickering / PWM (Pulse-Width Modulation)
| Screen flickering / PWM not detected | 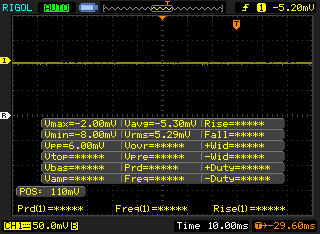 | ||
In comparison: 52 % of all tested devices do not use PWM to dim the display. If PWM was detected, an average of 7798 (minimum: 5 - maximum: 343500) Hz was measured. | |||
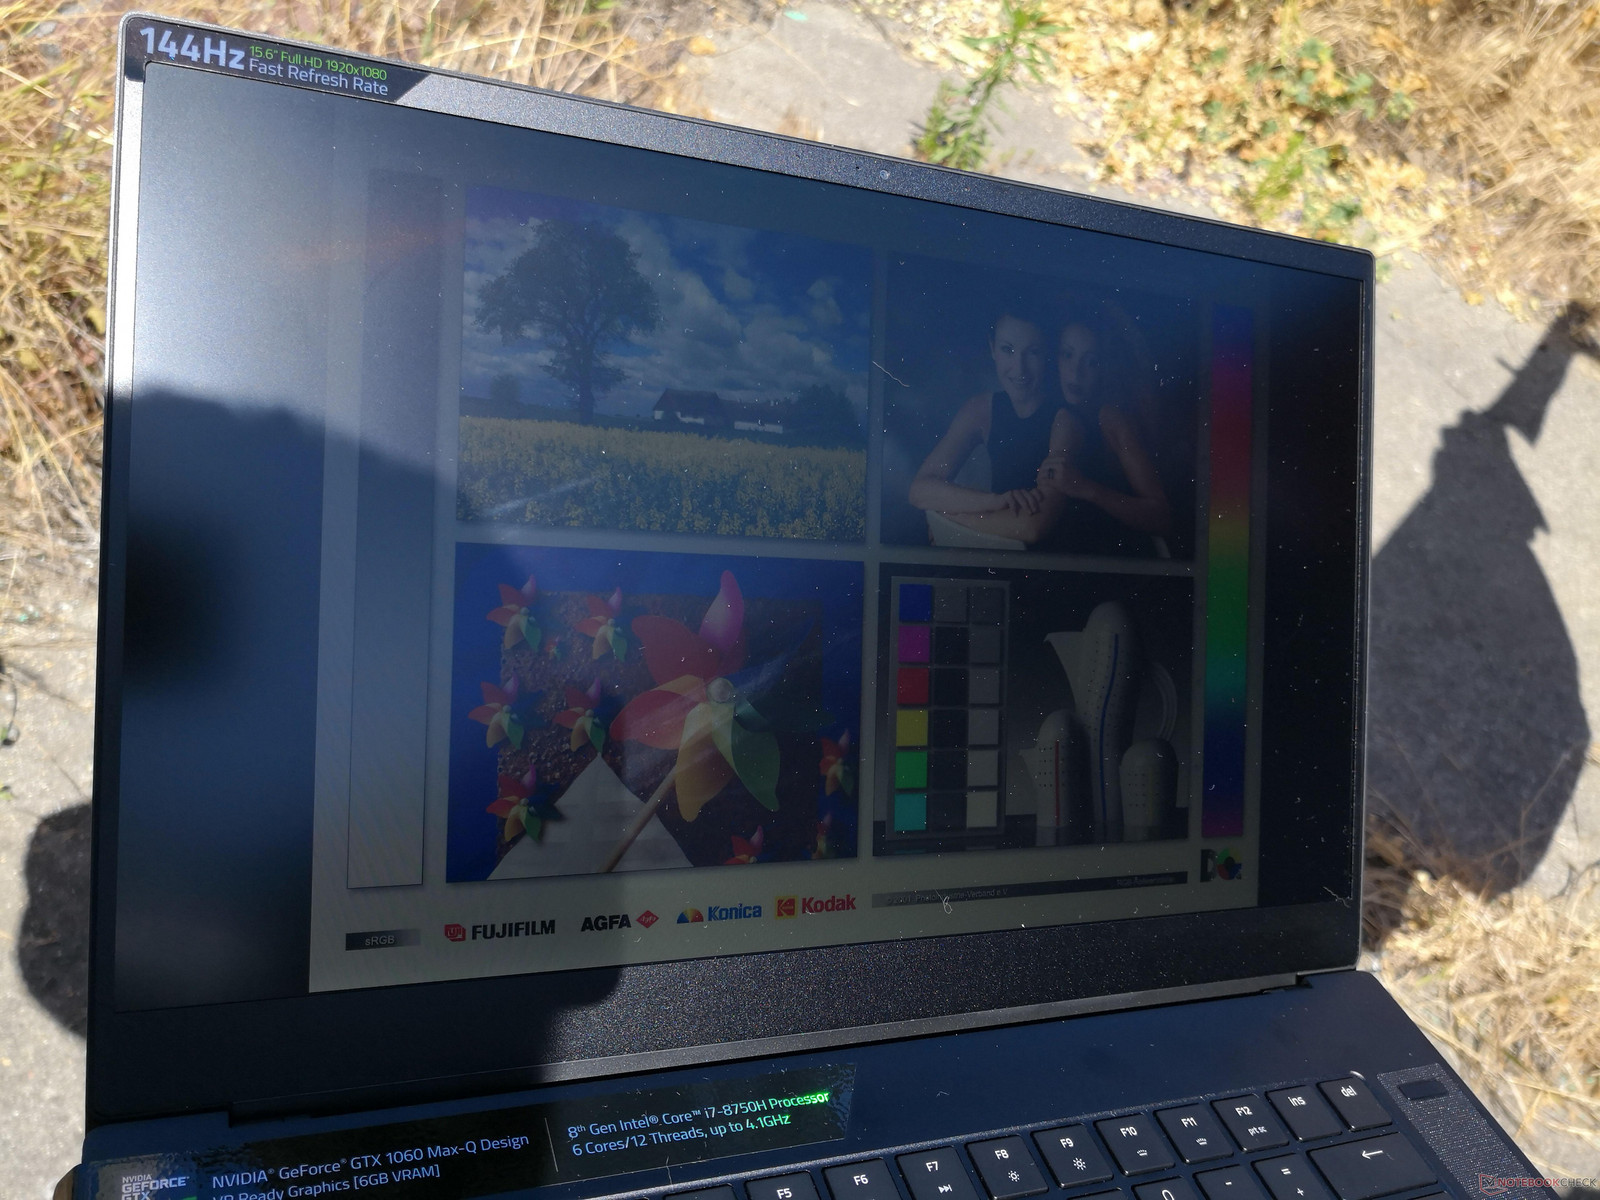
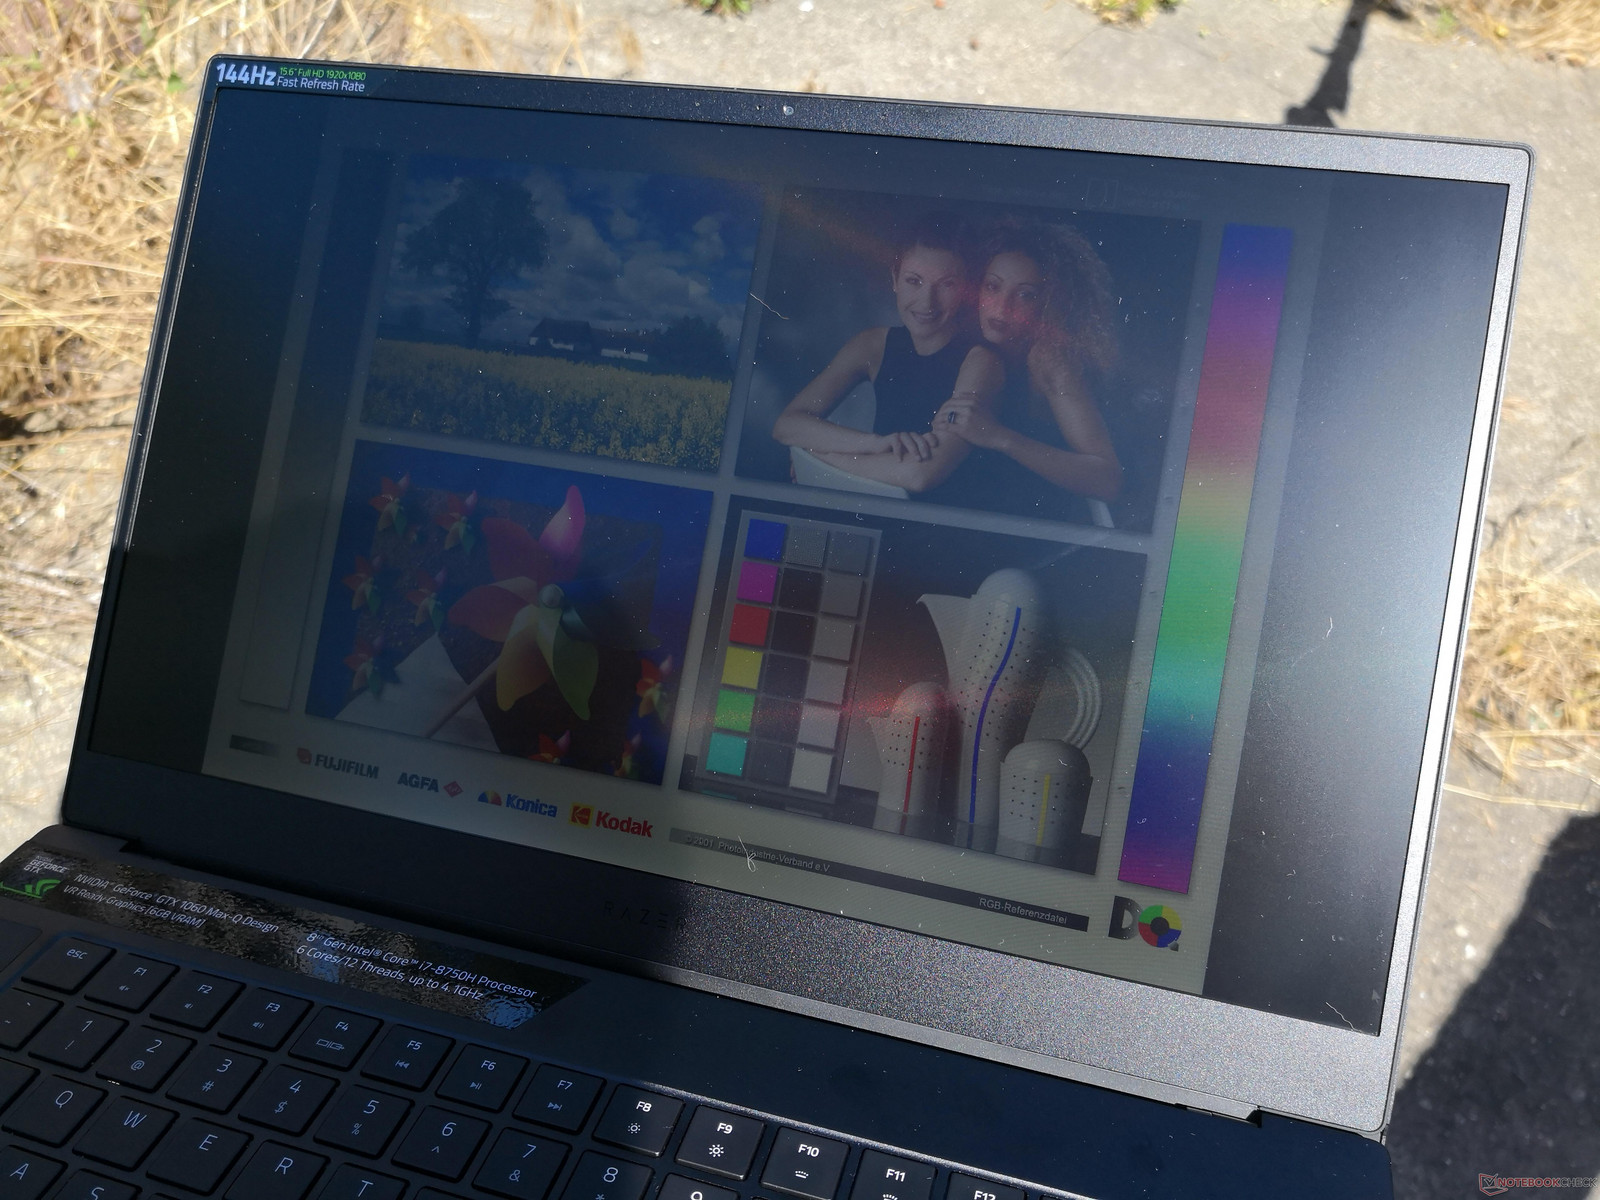
Outdoor visibility is average for a gaming notebook. The system is certainly easier to carry around compared to other gaming laptops, but Ultrabooks with brighter displays exist if visibility is of utmost importance. The XPS 15, MacBook Pro 15, and Samsung NP900X5N are popular examples with brighter screens.


Performance
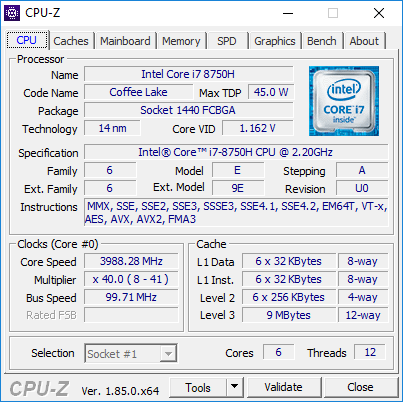
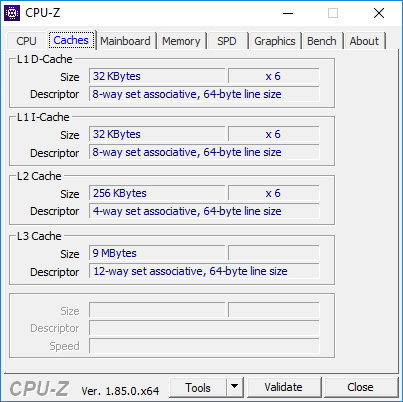
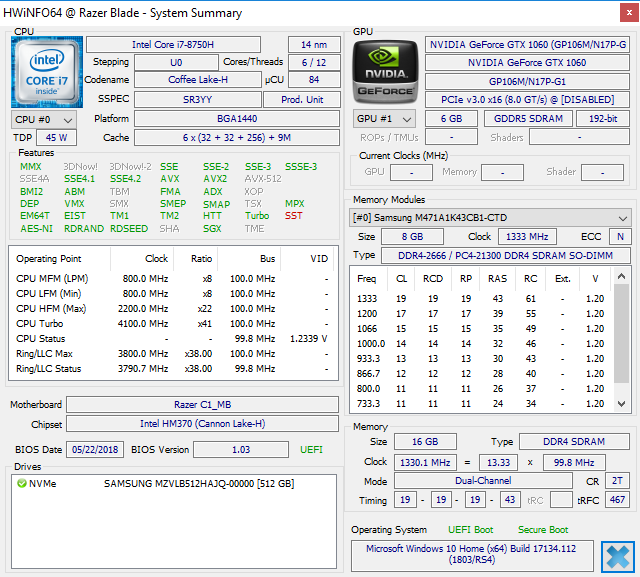
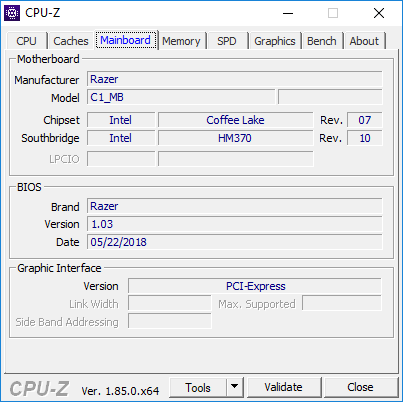
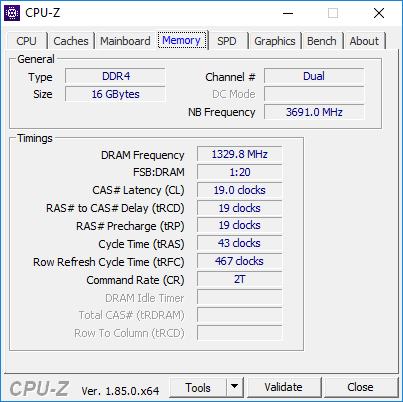
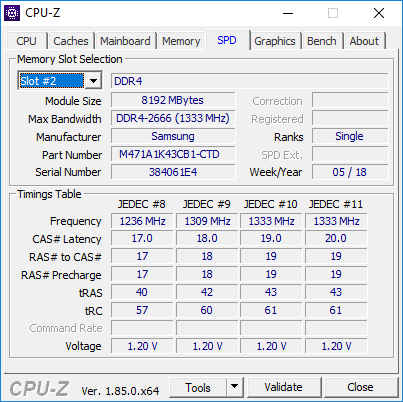
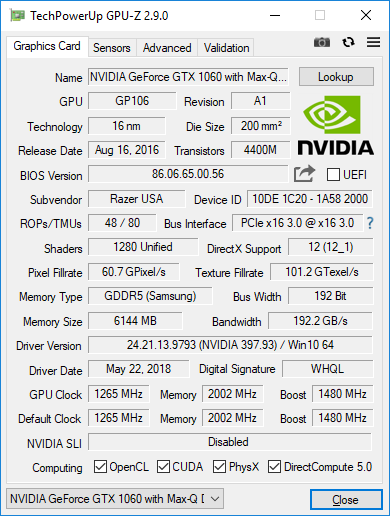
All current Razer Blade 15 SKUs come with the same hexa-core Core i7-8750H CPU and 16 GB of expandable DDR4 2667 MHz RAM. Nvidia Optimus is included across the lineup which sadly means no G-Sync technology to make better use of the high panel refresh rate.
Processor
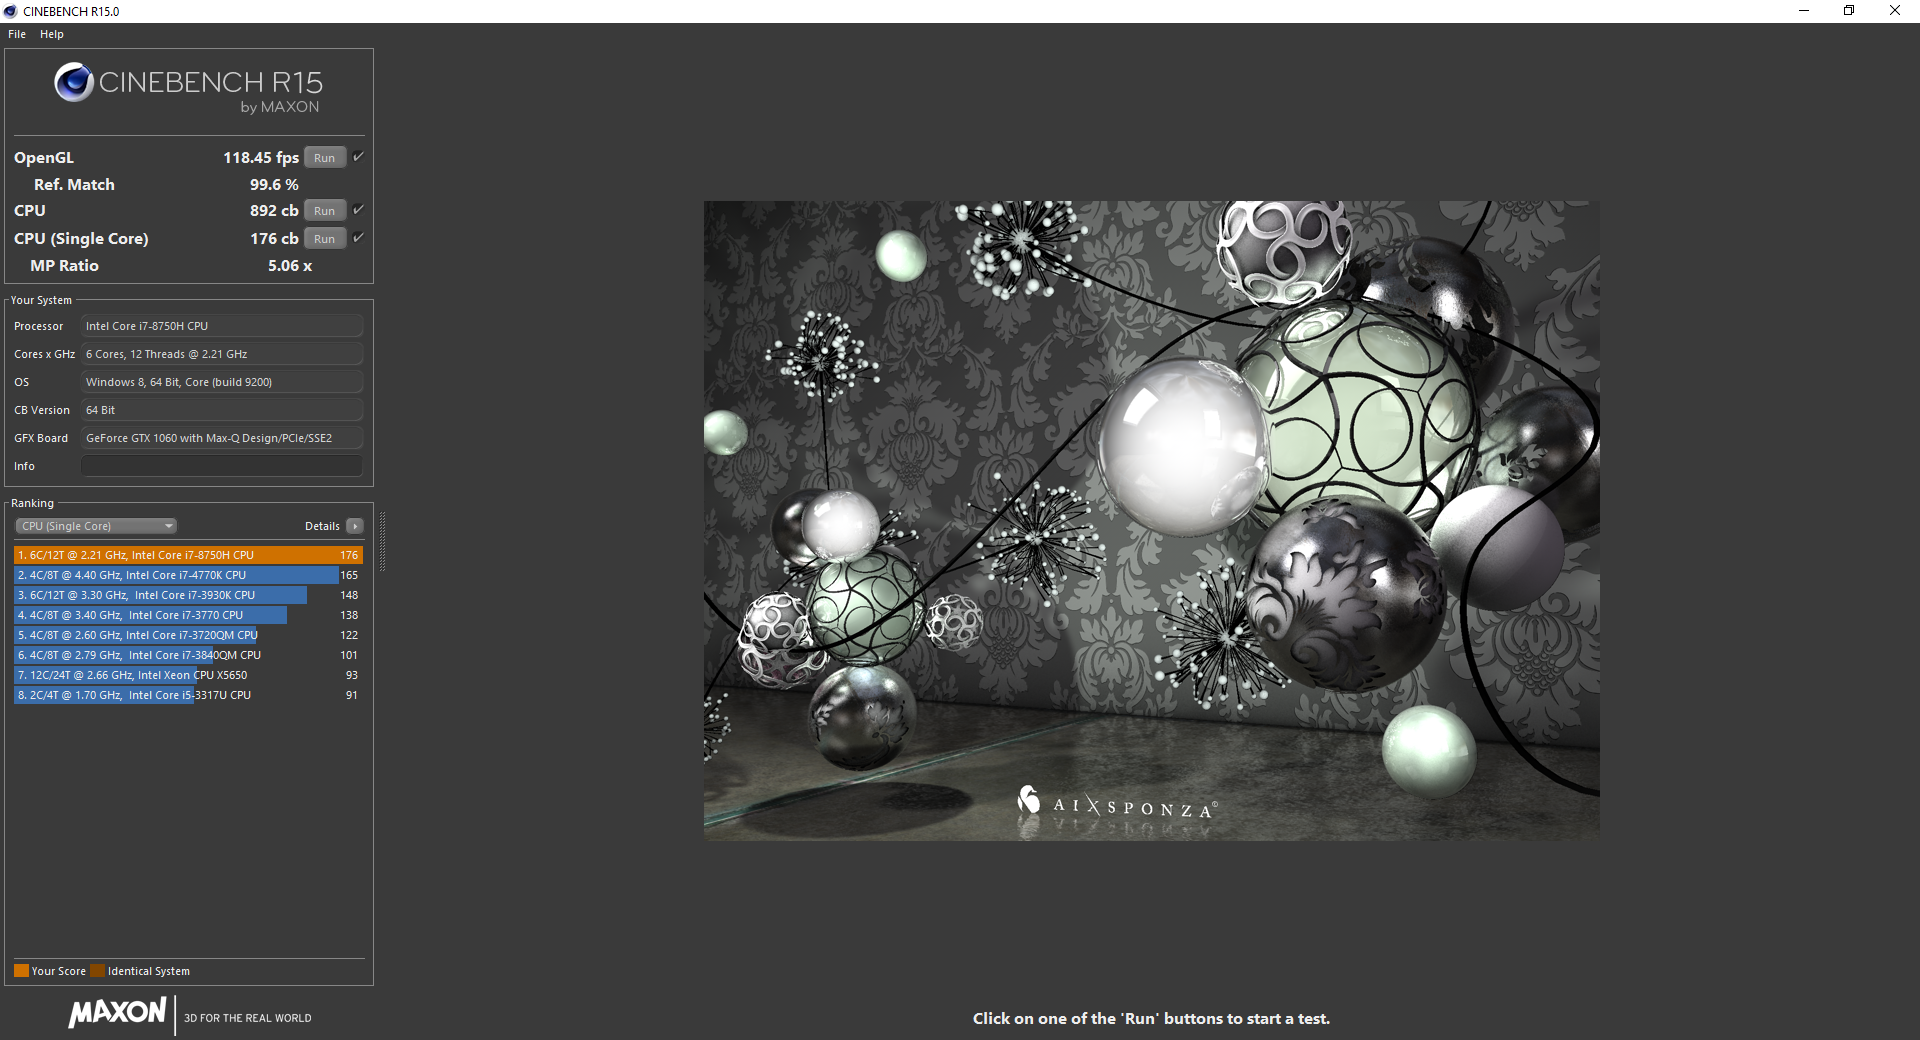
CPU performance is on par with the average Core i7-8750H in our database. Users can expect a 25 to 30 percent raw performance boost when moving up from the i5-8300H or common i7-7700HQ. The Core i7-8550U in the Blade Stealth and most newer Ultrabooks is roughly 40 percent slower than the Blade 15 in multi-threaded workloads.
Performance sustainability, however, is a different story. Running CineBench R15 Multi-Thread in a loop results in a notable drop in score from 1051 points to 915 points to represent a deficit of 13 percent. The drop occurs immediately after the first loop to suggest that CPU Turbo Boost is very short-lived on the Blade 15 even when the High Performance and Gaming profiles are selected. While this does not significantly impact gaming potential, it shows that a small CPU performance hit was likely necessary given the small form factor.
See our CPU page on the Core i7-8750H for more technical information and benchmark comparisons.
System Performance
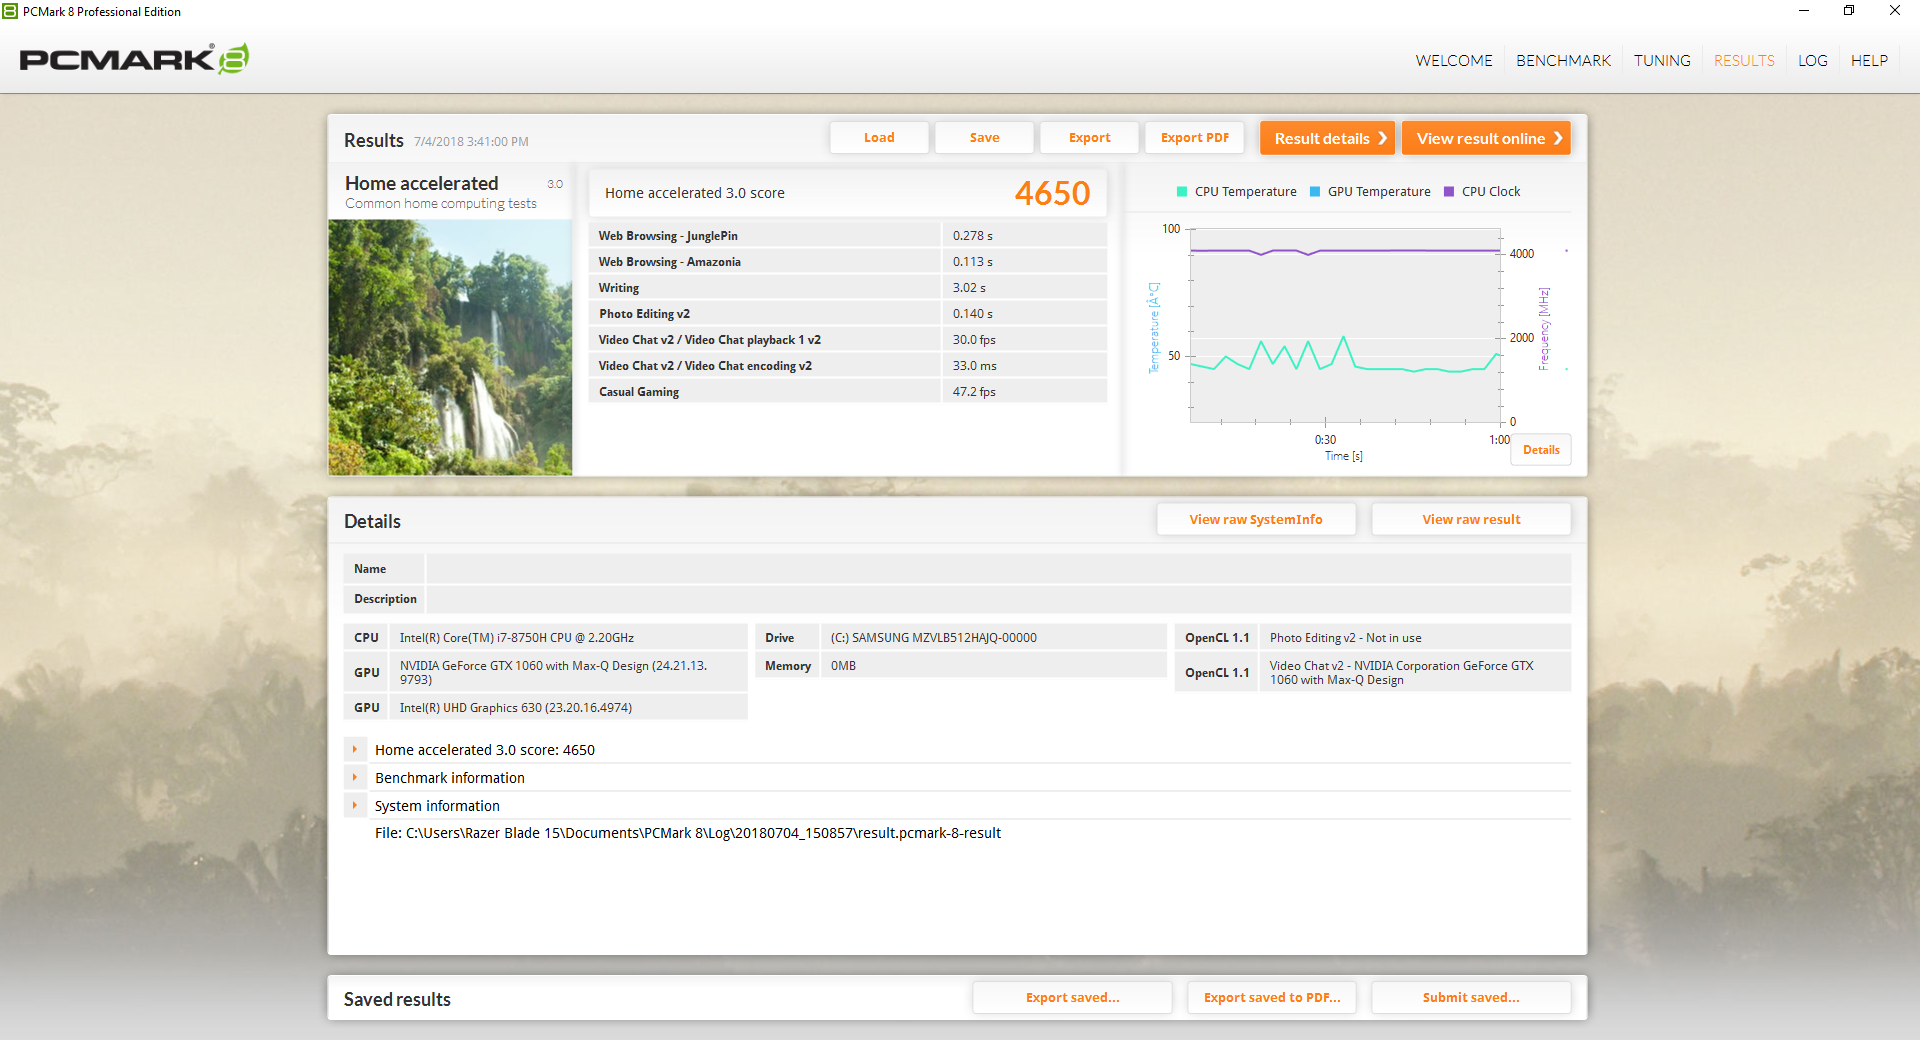
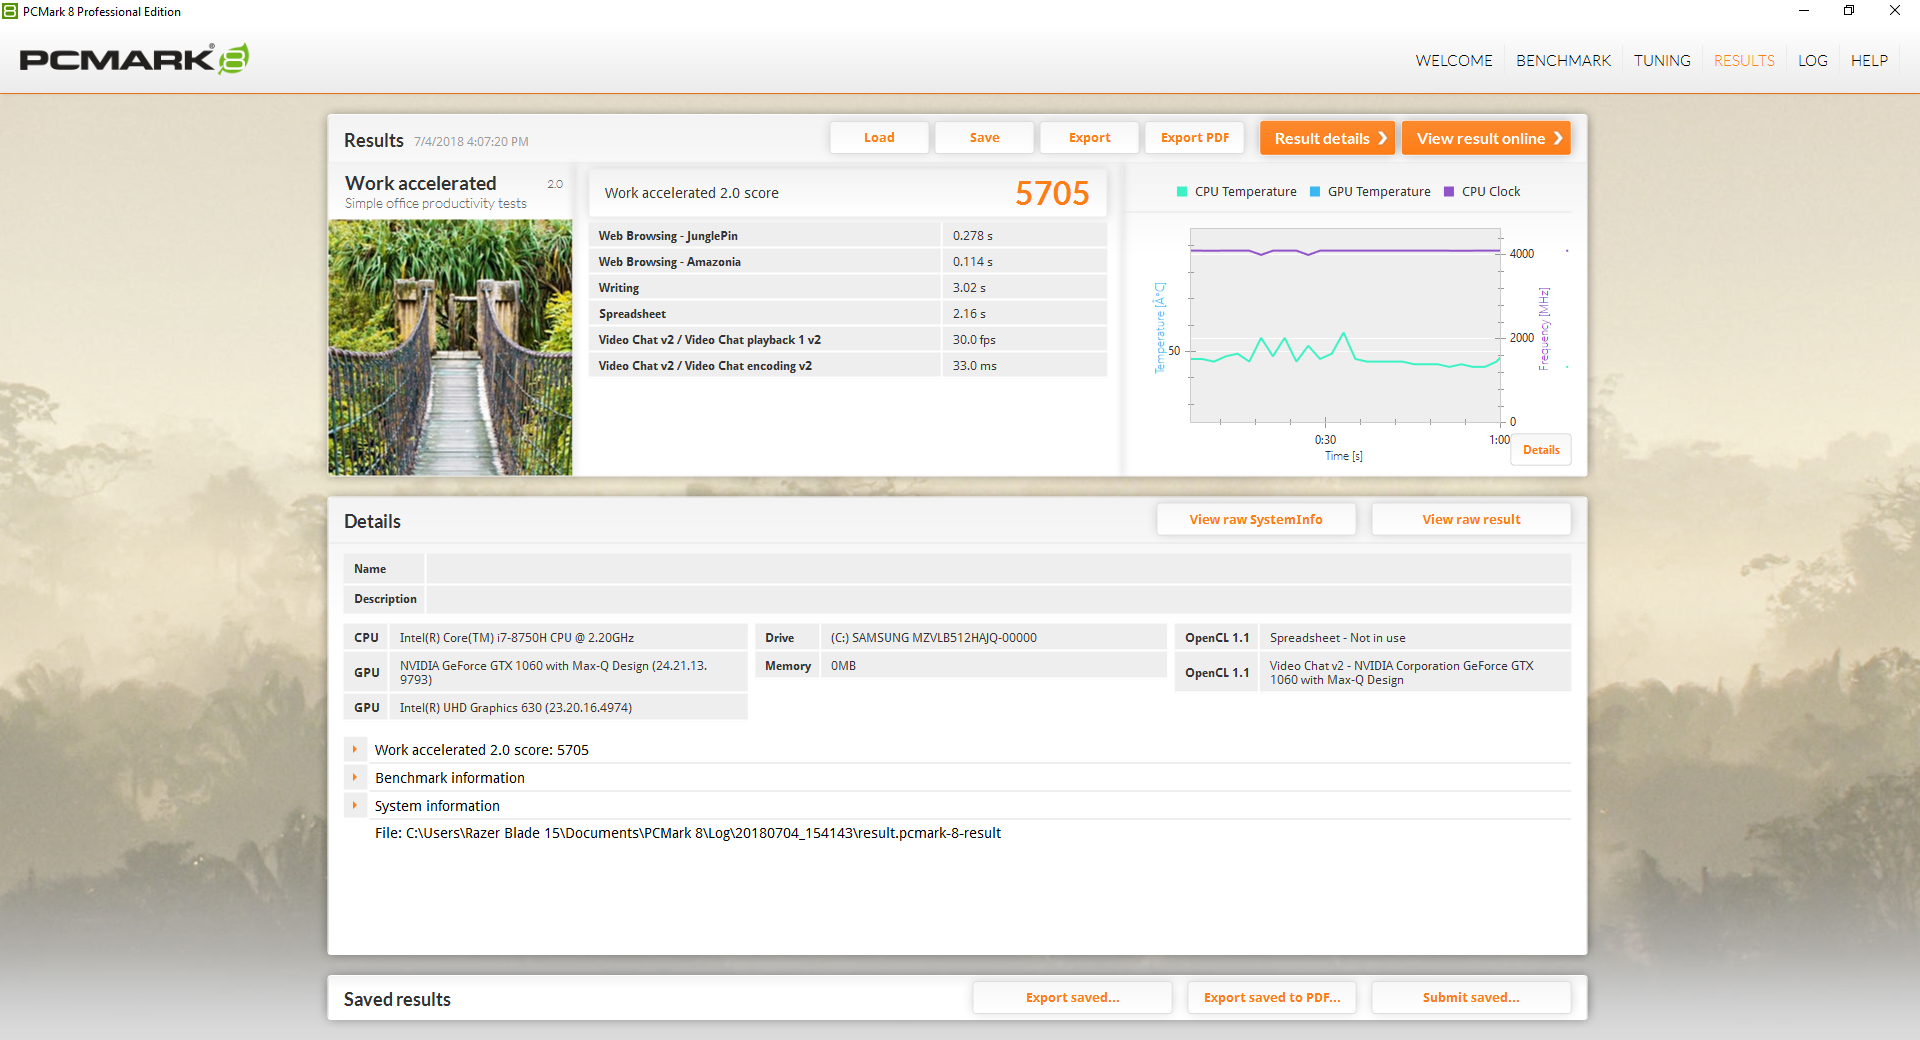
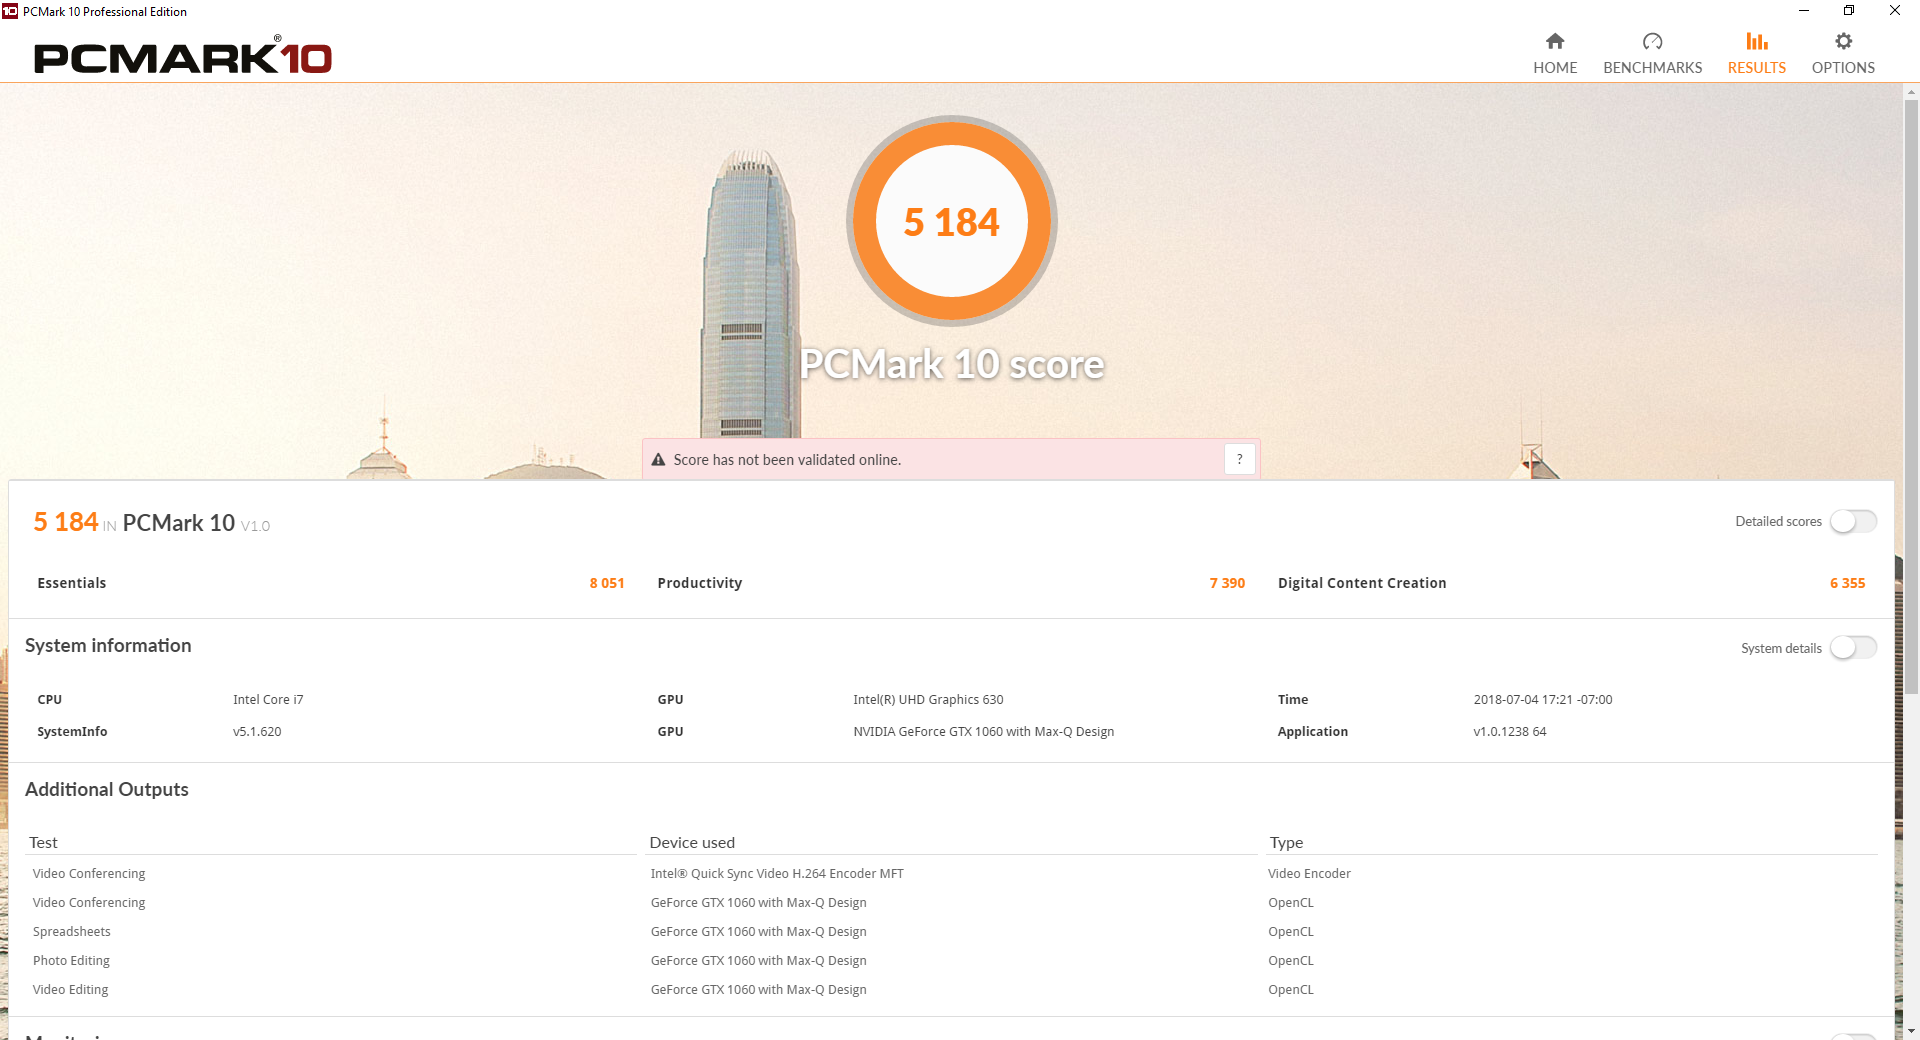
PCMark benchmarks are essentially identical to the GTX 1070 Max-Q configuration despite the GPU performance differences.
| PCMark 10 - Score | |
| Razer Blade 15 GTX 1060 | |
| MSI GS65 8RF-019DE Stealth Thin | |
| Gigabyte Aero 15X v8 | |
| Razer Blade 15 2018 | |
| Dell XPS 15 2018 i5 FHD 97Wh | |
| PCMark 8 Home Score Accelerated v2 | 4650 points | |
| PCMark 8 Work Score Accelerated v2 | 5705 points | |
| PCMark 10 Score | 5184 points | |
Help | ||
Storage Devices
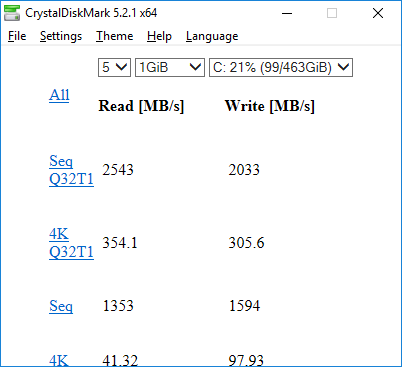
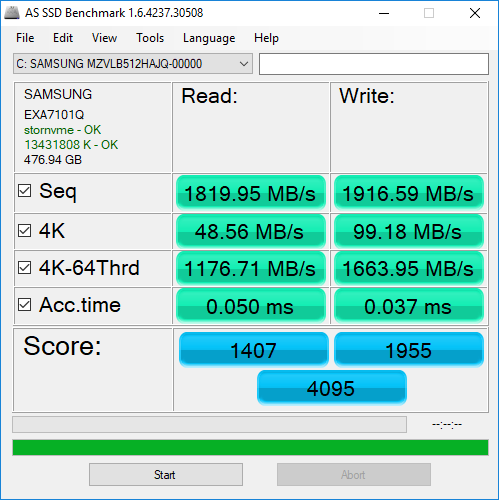
Whereas our GTX 1070 Max-Q configuration utilizes a 512 GB Samsung PM961 M.2 NVMe SSD, our GTX 1060 Max-Q configuration utilizes the newer 512 GB Samsung PM981 with faster theoretical sequential write rates (1800 MB/s vs. 1150 MB/s). We're not sure how Razer decides which SKUs or regions will have which SSD, but consider yourself lucky if your unit ships with the faster PM981 NVMe SSD. This exact same SSD can also be found on the competing MSI GS65.
See our table of HDDs and SSDs for more benchmark comparisons.
| Razer Blade 15 GTX 1060 Samsung SSD PM981 MZVLB512HAJQ | Razer Blade 15 2018 Samsung PM961 NVMe MZVLW512HMJP | MSI GS65 8RF-019DE Stealth Thin Samsung SSD PM981 MZVLB512HAJQ | Gigabyte Aero 15X v8 Toshiba NVMe THNSN5512GPU7 | Dell XPS 15 9575 i5-8305G Toshiba XG5 KXG50ZNV256G | Apple MacBook Pro 15 2017 (2.9 GHz, 560) | |
|---|---|---|---|---|---|---|
| CrystalDiskMark 5.2 / 6 | -2% | 0% | -9% | -19% | 18% | |
| Write 4K (MB/s) | 97.9 | 94.2 -4% | 95.3 -3% | 94.4 -4% | 118.3 21% | 142.5 46% |
| Read 4K (MB/s) | 41.32 | 39.23 -5% | 40.13 -3% | 37.65 -9% | 26.93 -35% | 29.32 -29% |
| Write Seq (MB/s) | 1594 | 1483 -7% | 1883 18% | 1335 -16% | 350.2 -78% | 2078 30% |
| Read Seq (MB/s) | 1353 | 1371 1% | 1322 -2% | 1404 4% | 2125 57% | 1309 -3% |
| Write 4K Q32T1 (MB/s) | 305.6 | 296.2 -3% | 309.9 1% | 268.6 -12% | 243.4 -20% | 362.6 19% |
| Read 4K Q32T1 (MB/s) | 354.1 | 342.5 -3% | 353.7 0% | 332.8 -6% | 275.8 -22% | 472.8 34% |
| Write Seq Q32T1 (MB/s) | 2033 | 1527 -25% | 1919 -6% | 1375 -32% | 349 -83% | 2208 9% |
| Read Seq Q32T1 (MB/s) | 2543 | 3280 29% | 2466 -3% | 2627 3% | 2732 7% | 3474 37% |

GPU Performance
Raw graphics performance is about 15 percent and nearly 30 percent slower than the GTX 980M and GTX 1070 Max-Q, respectively. Thus, the graphics leap from the Blade 15 1060 Max-Q to the Blade 15 1070 Max-Q is significant for gaming purposes. Gamers who want to make the most out of the 144 Hz panel may want to consider the faster GTX 1070 Max-Q SKU while the GTX 1060 Max-Q should suffice for targeting 1080p60. Newer and more demanding titles, however, will have a difficult time maintaining 1080p60 on very high settings since the GTX 1060 Max-Q is about 10 to 15 percent slower than our desktop GTX 1060 reference.
See our GPU page on the GeForce GTX 1060 Max-Q for more technical information and benchmark comparisons.
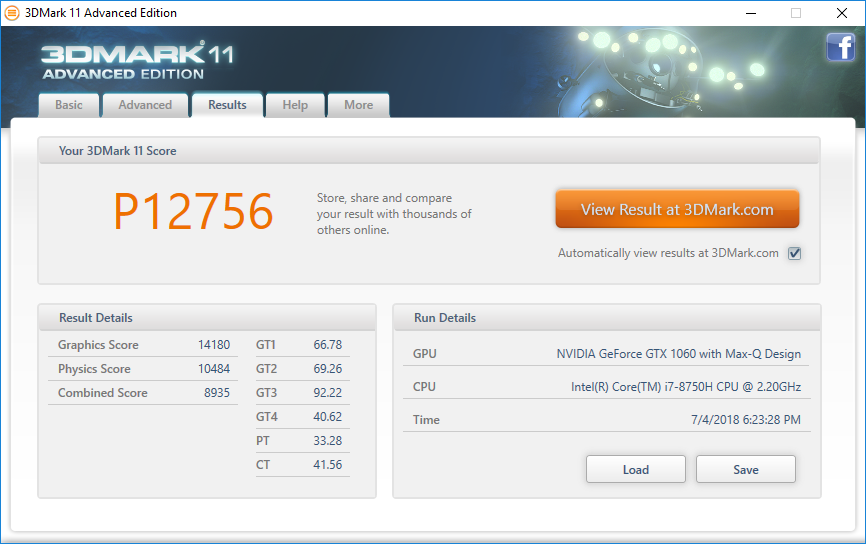
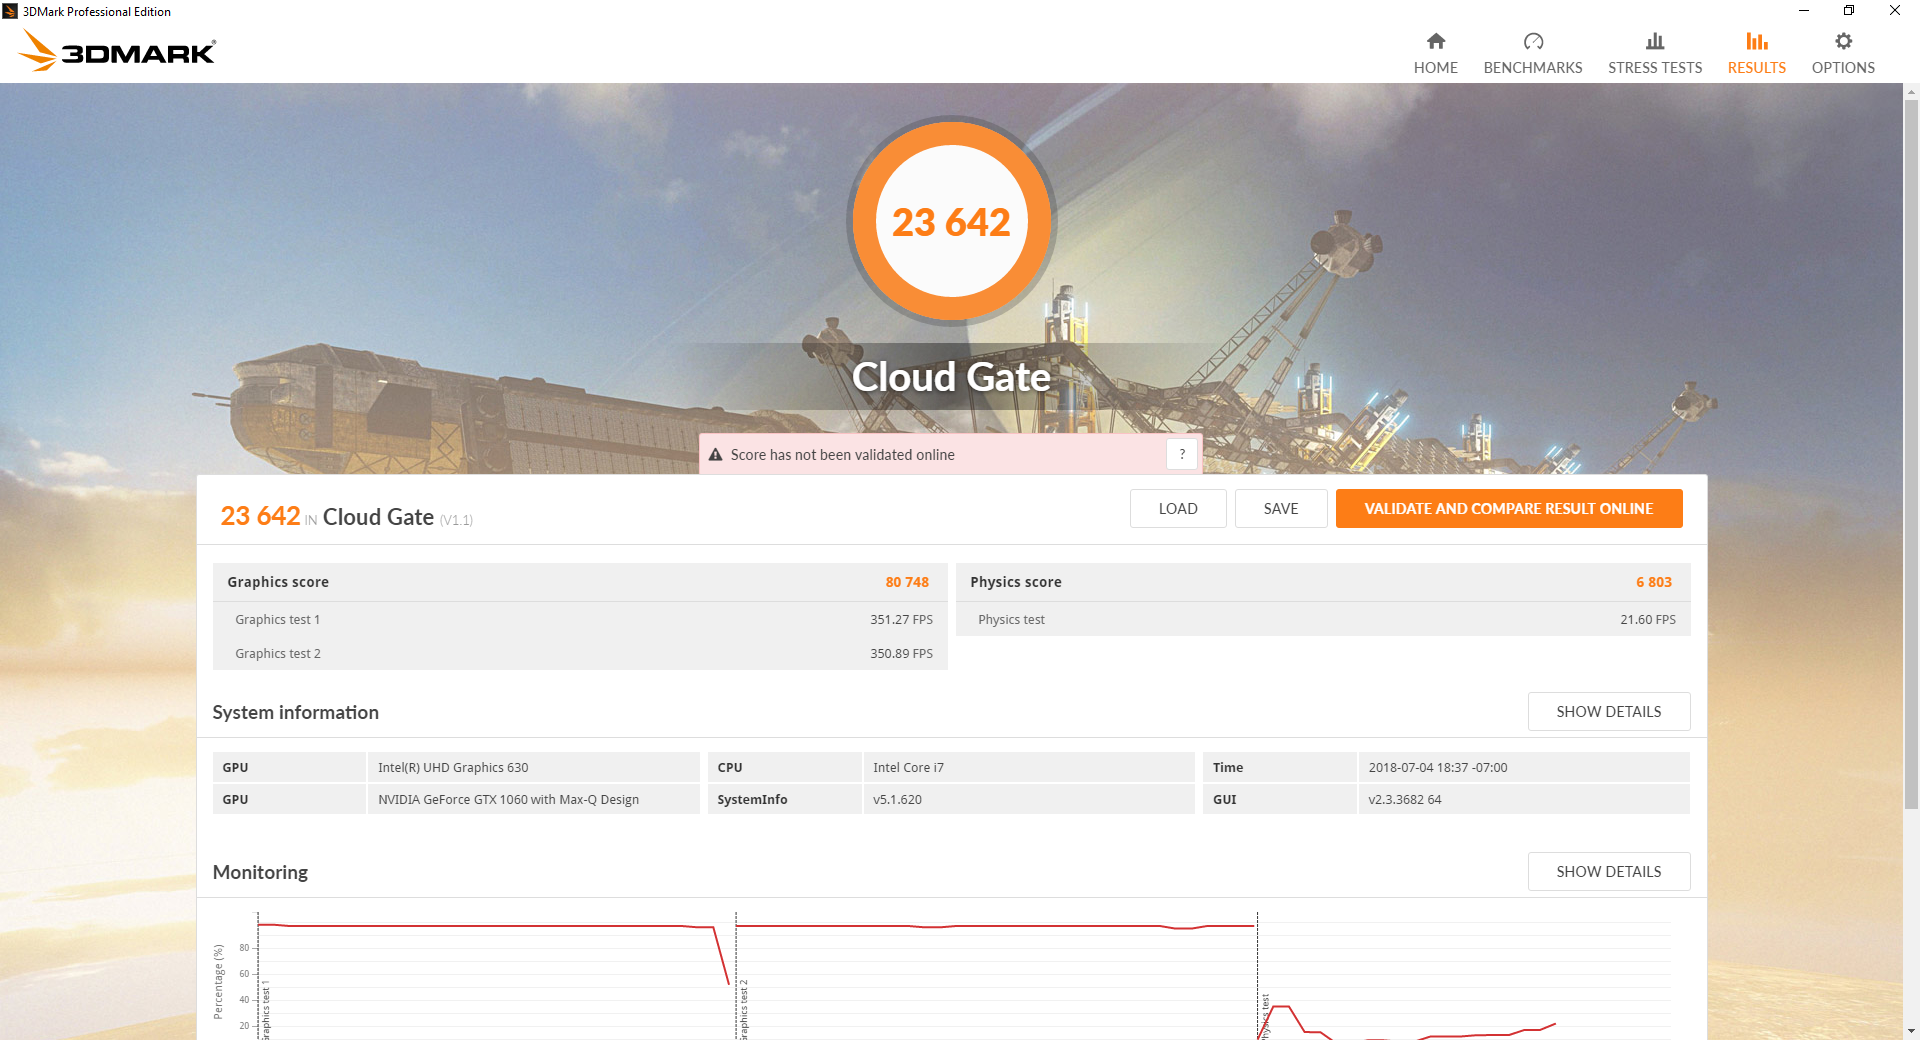
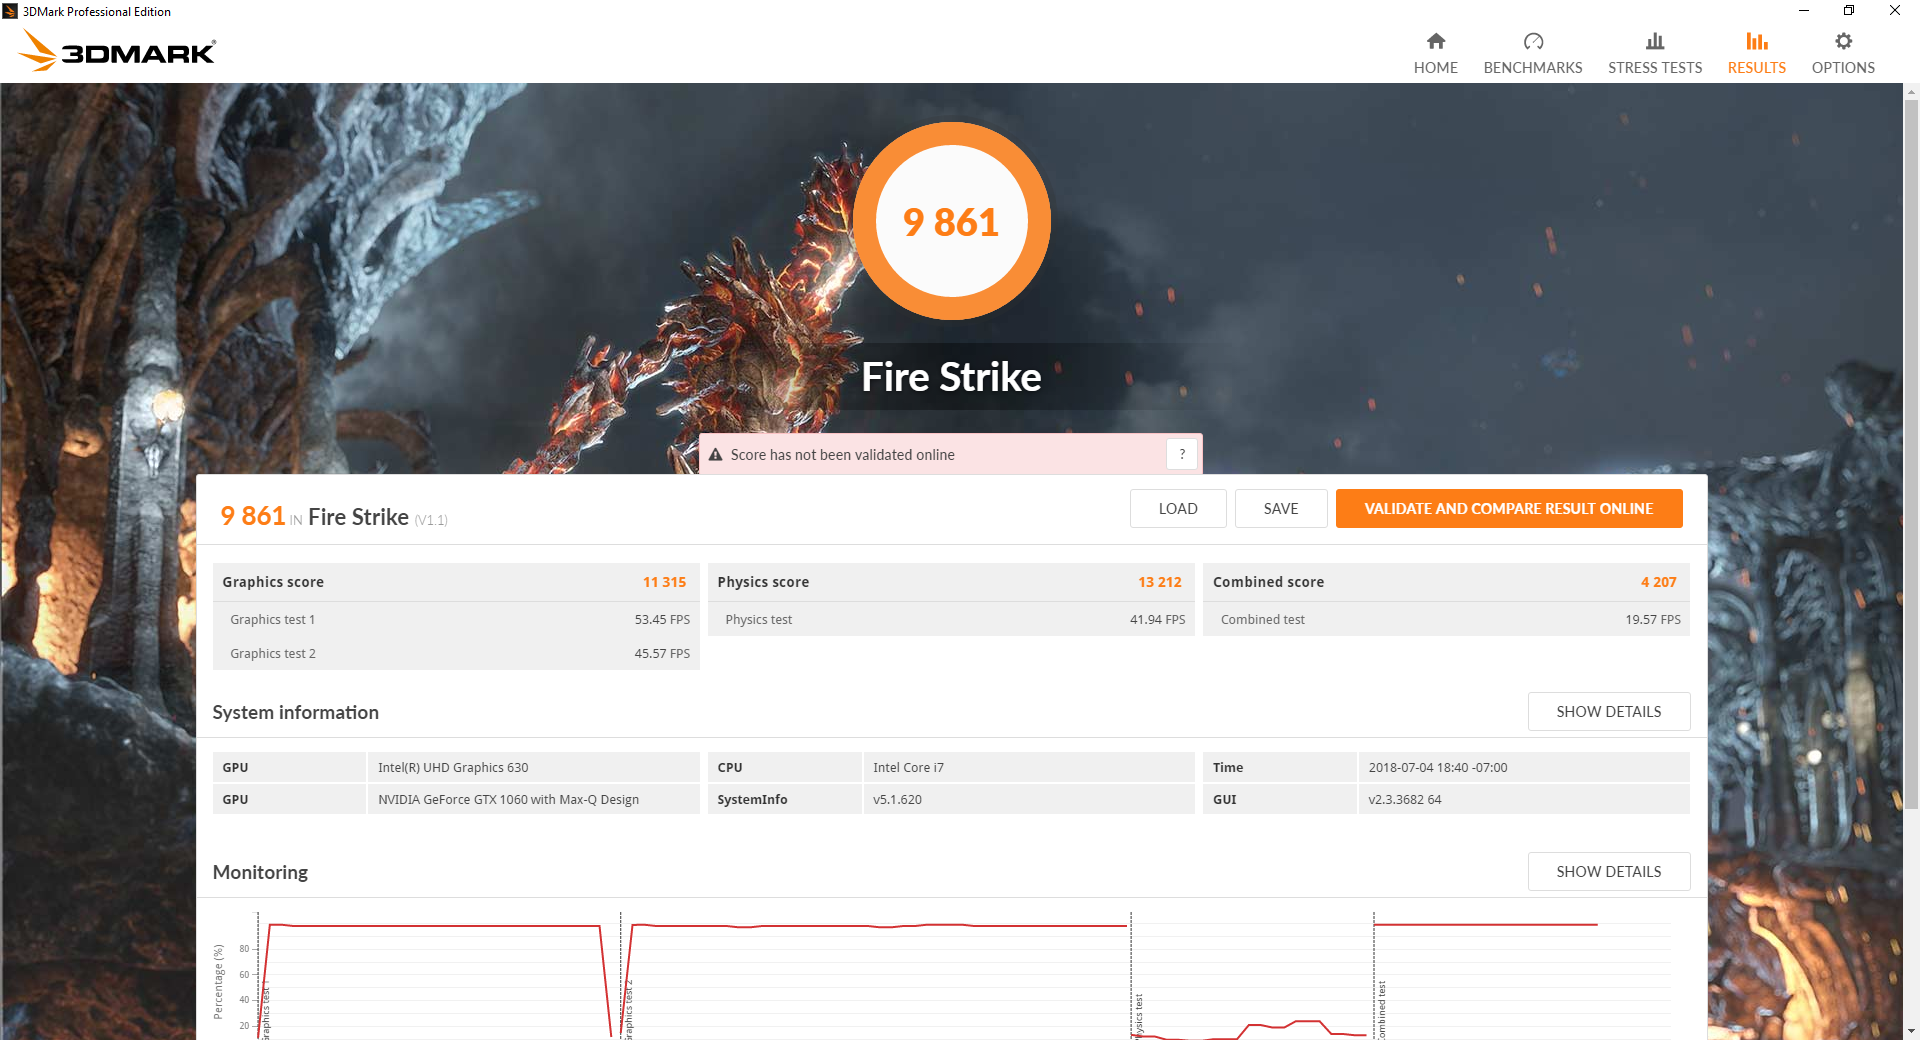
| 3DMark 11 Performance | 12756 points | |
| 3DMark Cloud Gate Standard Score | 23642 points | |
| 3DMark Fire Strike Score | 9861 points | |
Help | ||
| low | med. | high | ultra | |
|---|---|---|---|---|
| BioShock Infinite (2013) | 274.4 | 226.1 | 211.6 | 109.8 |
| The Witcher 3 (2015) | 210.7 | 133.2 | 74.2 | 37 |
| Overwatch (2016) | 299.2 | 266.2 | 165 | 107.3 |
Stress Test
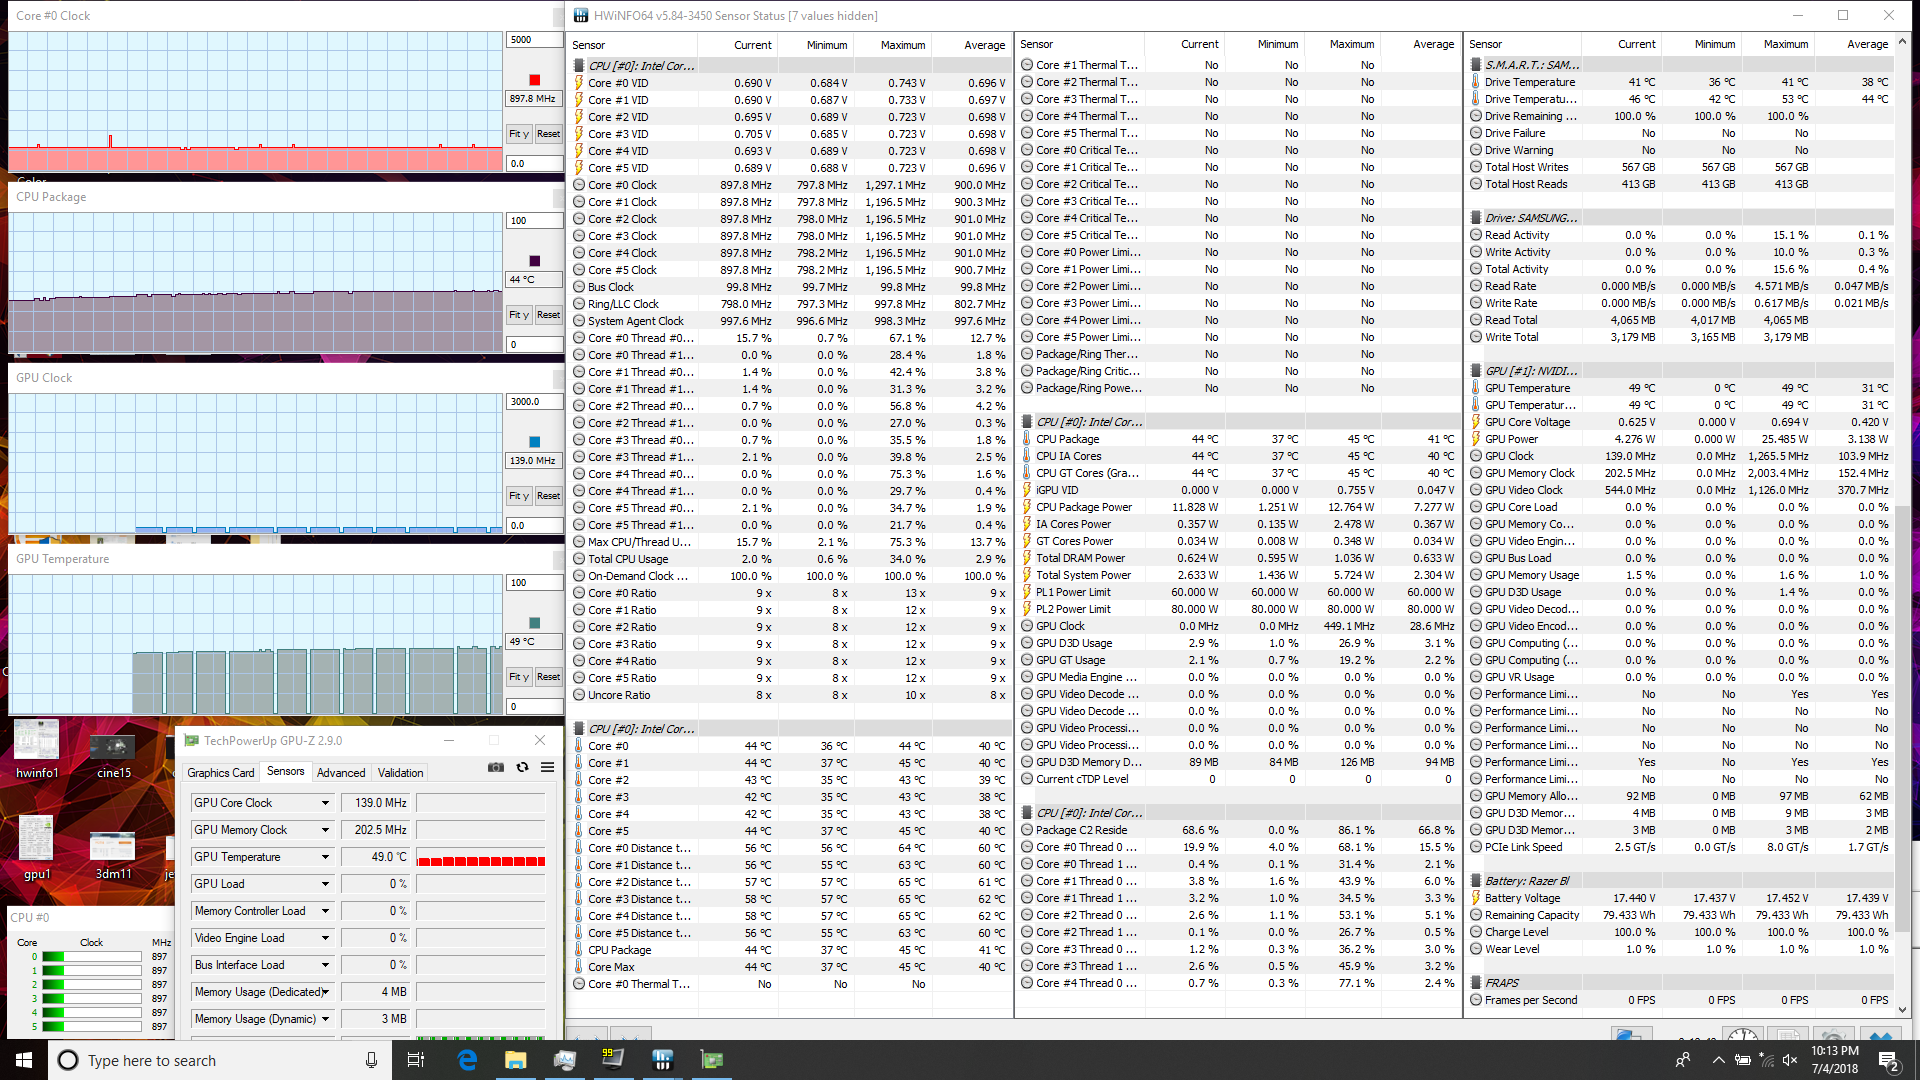
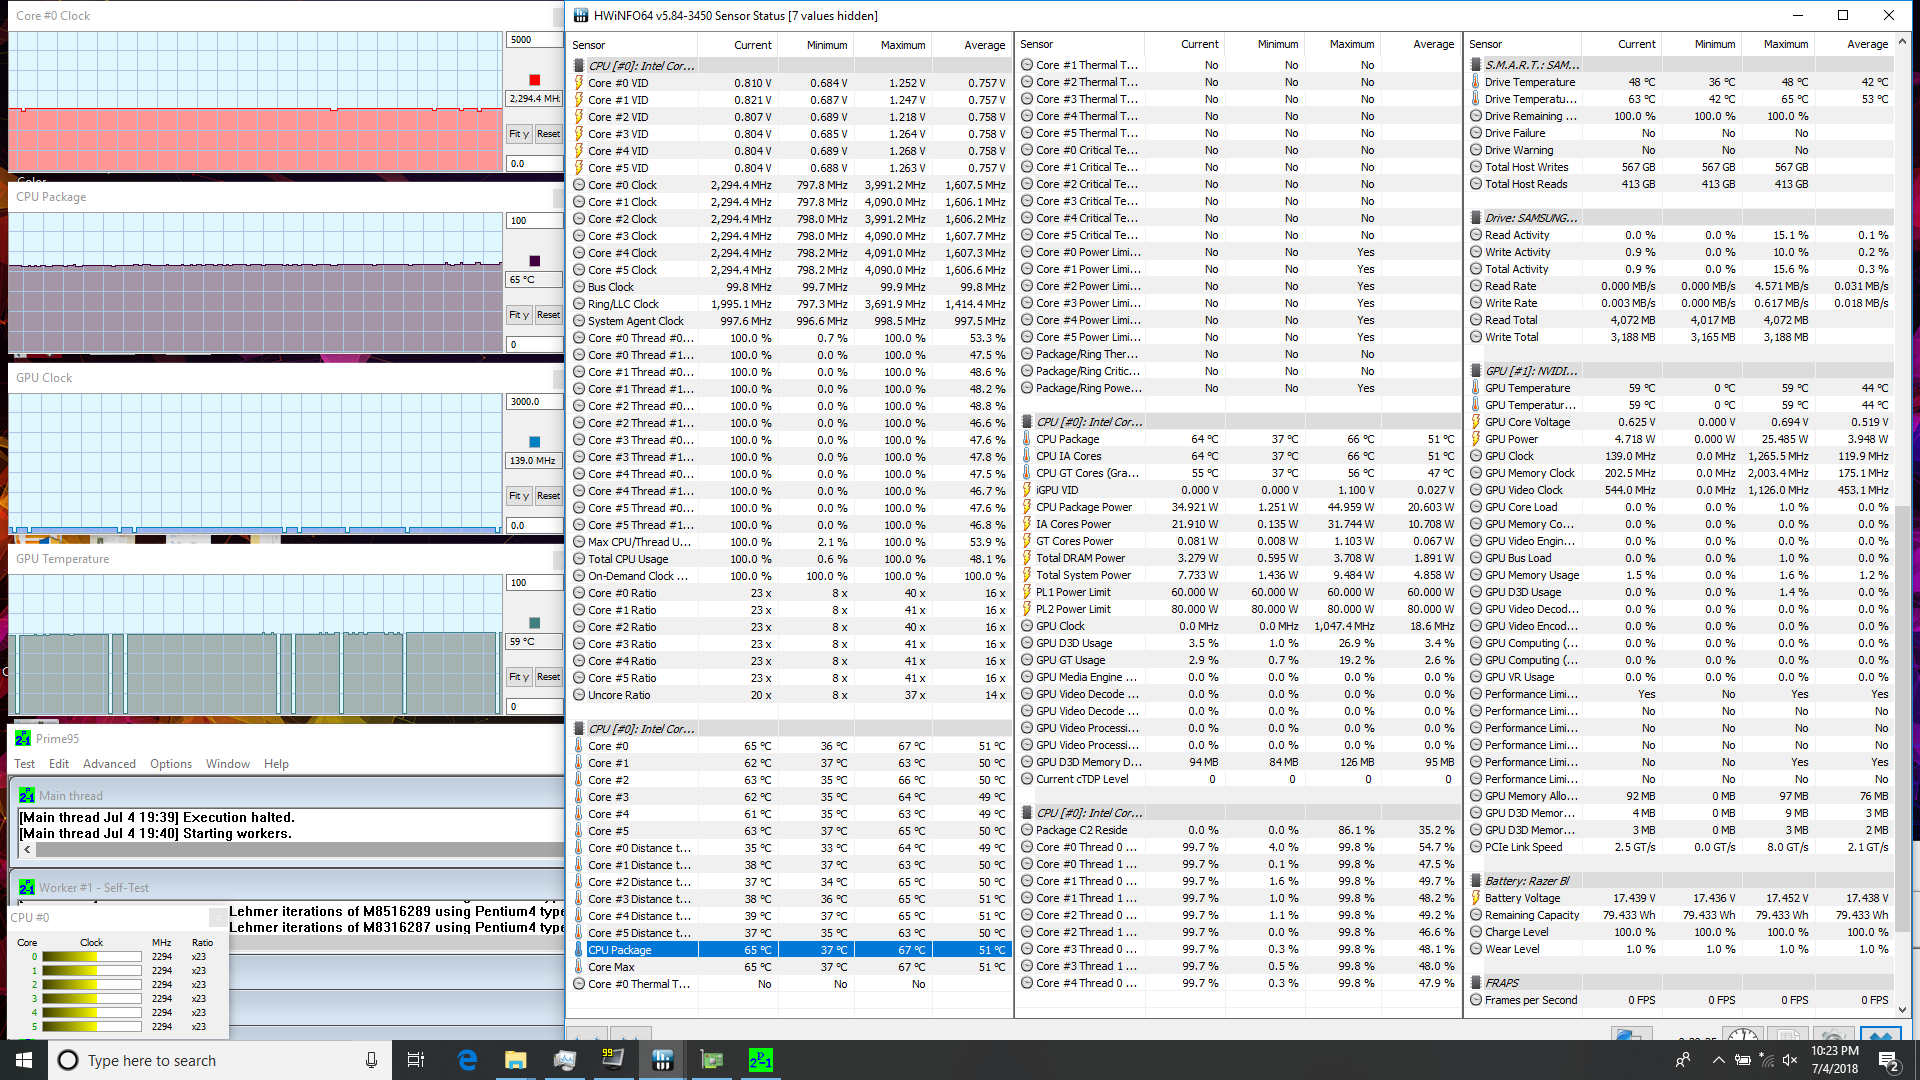
We stress the notebook to identify for any potential throttling or stability issues. When subjected to Prime95 load, the CPU can be observed running at 2.9 GHz for the first few seconds before falling and stabilizing at 2.2 or 2.3 GHz. Since the base clock rate of the i7-8750H is 2.2 GHz, this means that Turbo Boost is unsustainable when under extreme stress. In return, core temperature is quite cool for a laptop under heavy CPU load at just 65 C. Running both Prime95 and FurMark to stress the CPU and GPU simultaneously will cause temperatures to rise up to the high 70 C range each. Meanwhile, the GTX 1070 Max-Q SKU can run even warmer at up to 83 C and 88 C for the GPU and CPU, respectively, when subjected to similar extreme loads.
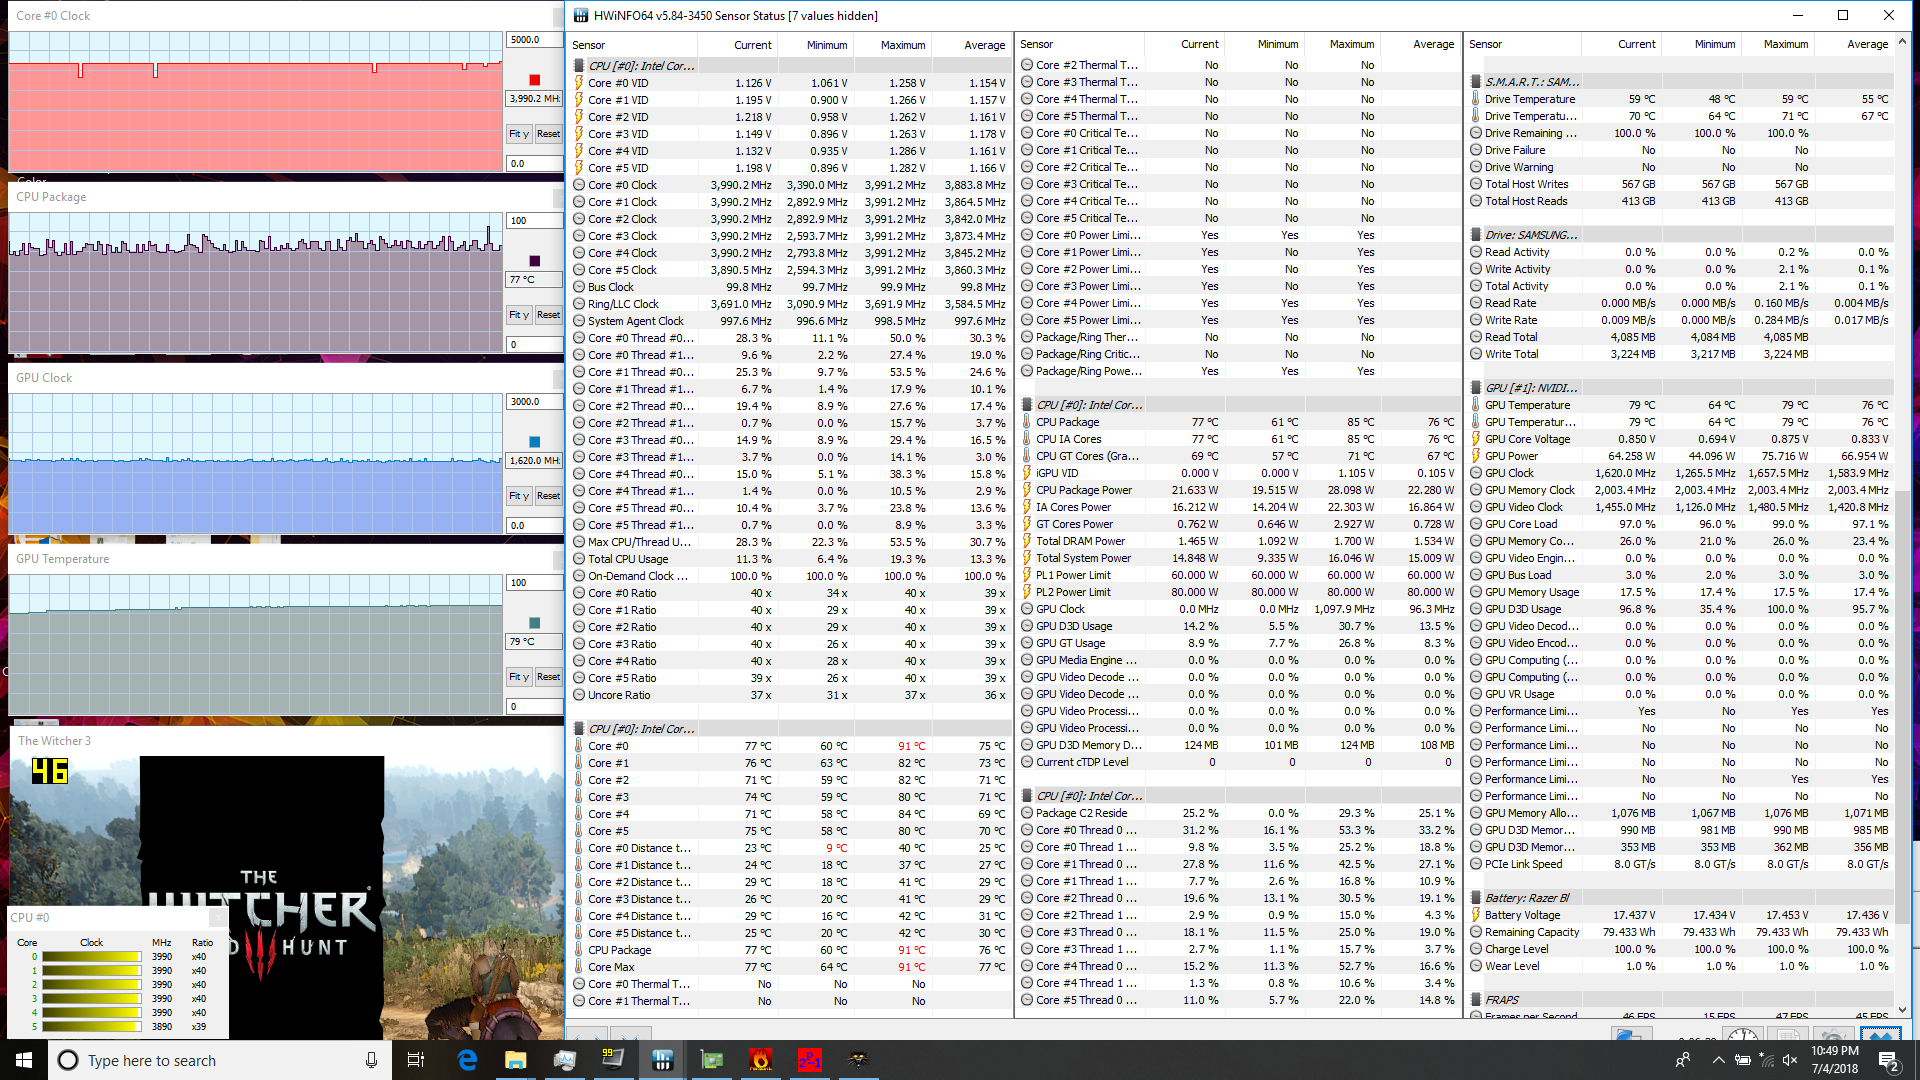
Running Witcher 3 is more representative of real-world gaming load. The CPU and GPU can be observed running stably at 4.0 GHz and 1620 MHz, respectively, with core temperatures again reaching high 70s. Temperatures when gaming are actually very similar to the GTX 1070 Max-Q SKU.
Performance is throttled when on battery power especially for the CPU. 3DMark 11 Physics and Graphics scores on batteries are at 5580 and 13132 points, respectively, compared to 10484 and 14180 points when on mains.
| CPU Clock (GHz) | GPU Clock (MHz) | Average CPU Temperature (°C) | Average GPU Temperature (°C) | |
| Prime95 Stress | 2.3 | -- | 65 | -- |
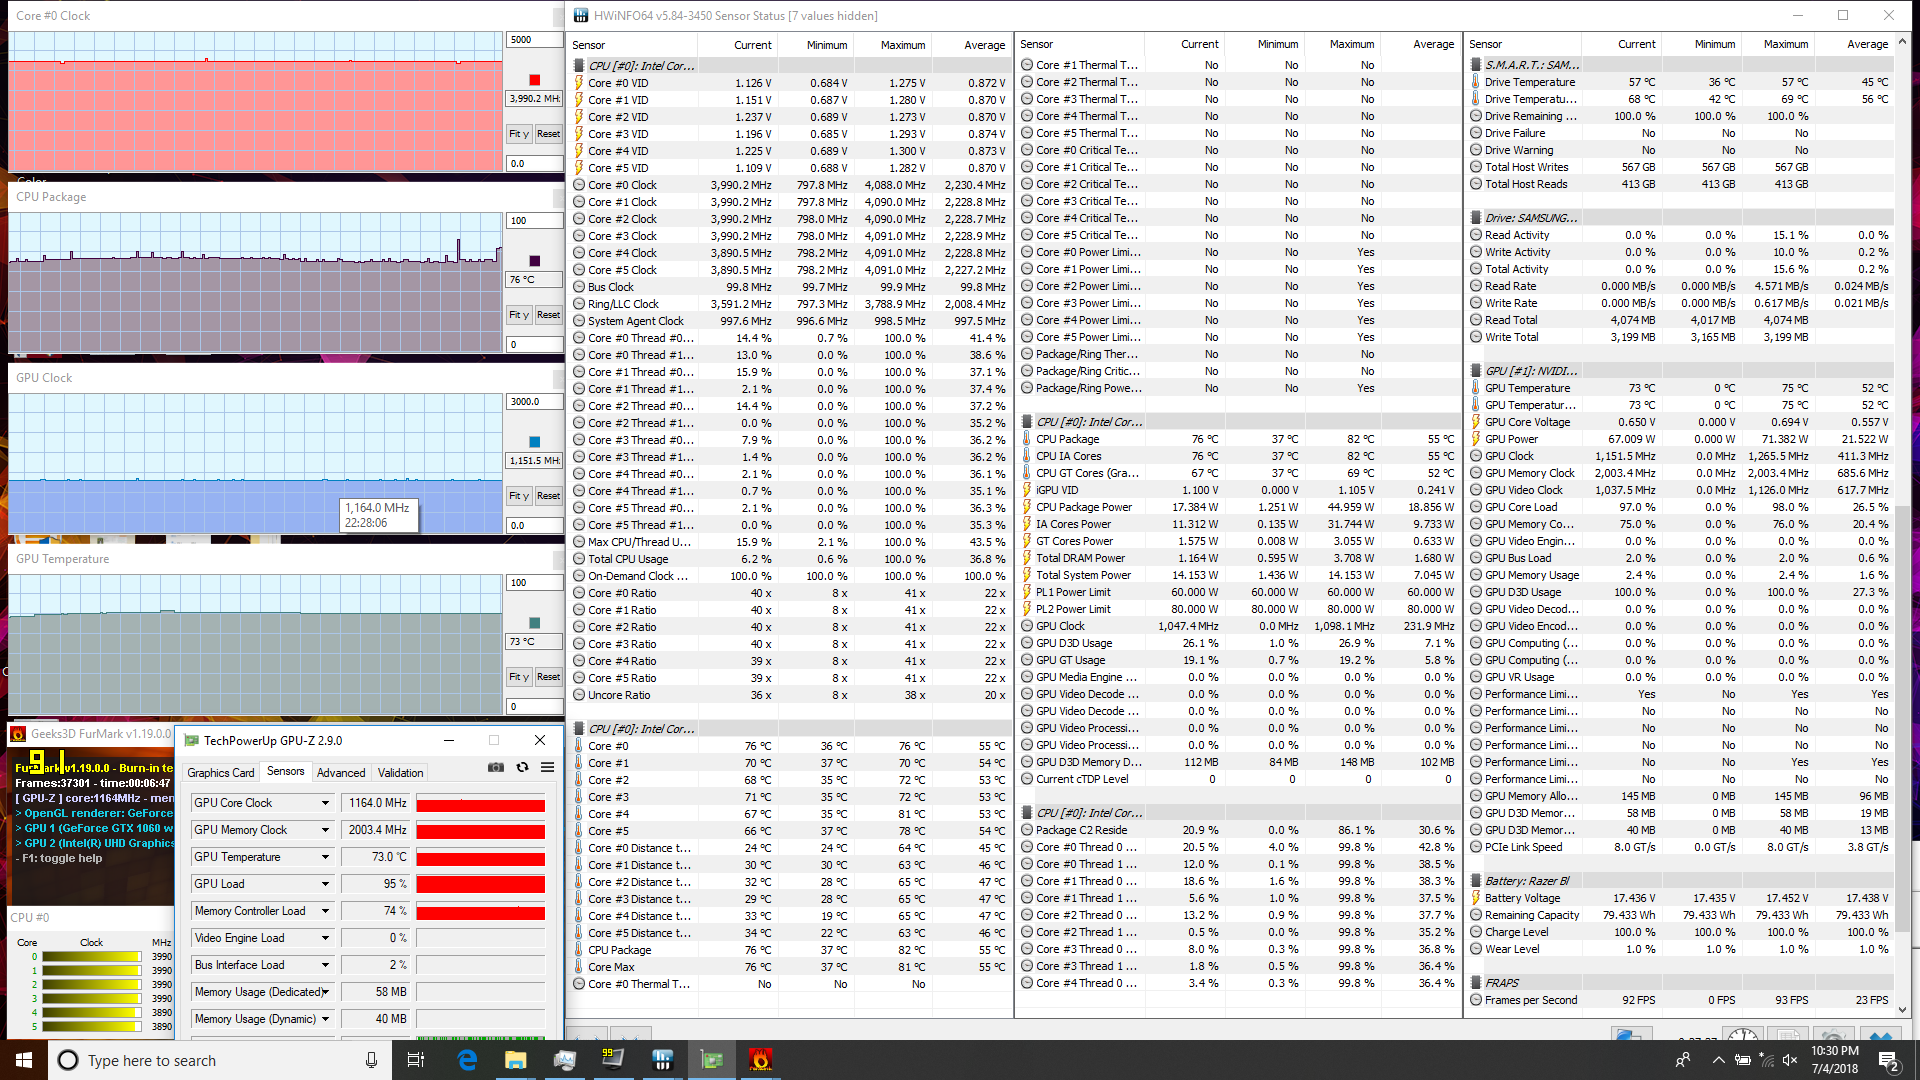
| FurMark Stress | -- | 1152 | -- | 73 |
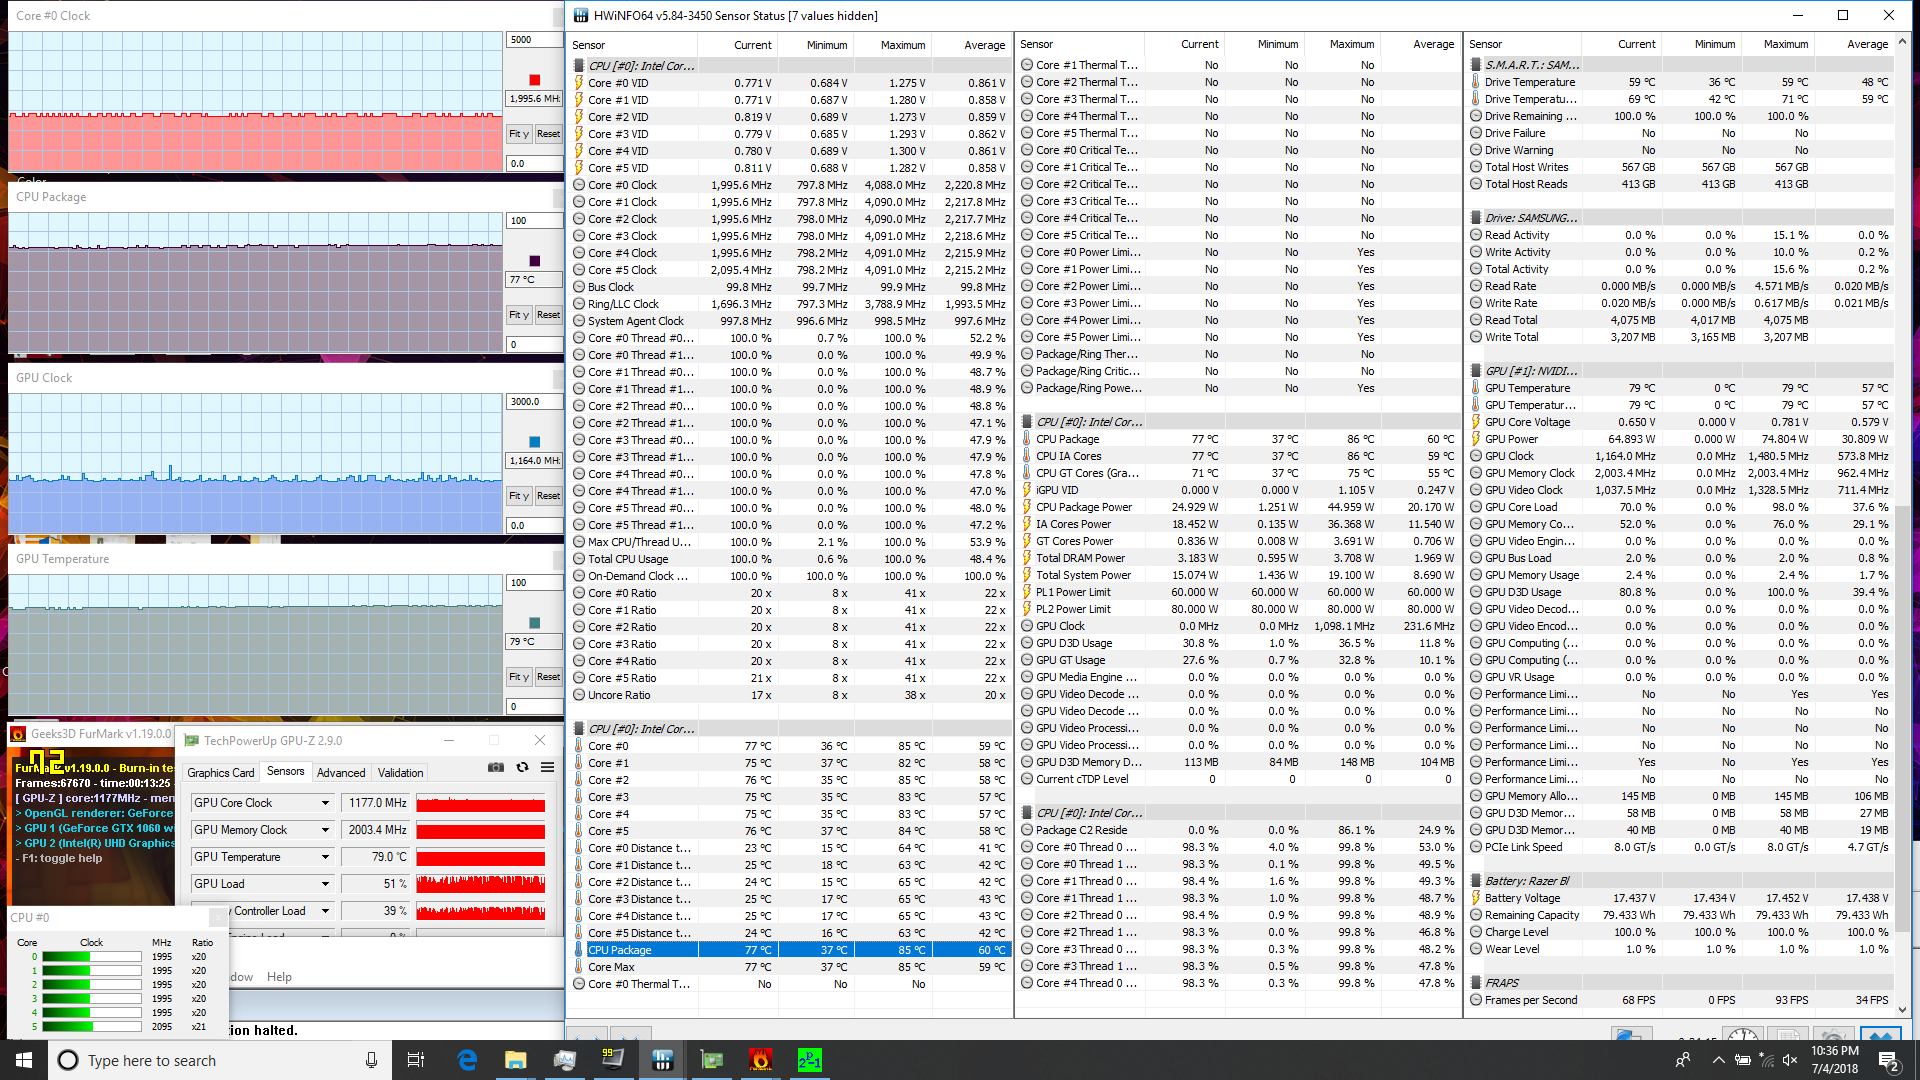
| Prime95 + FurMark Stress | 1.9 - 2.0 | 1164 | 77 | 79 |
| Witcher 3 Stress | 4.0 | 1620 | 77 | 79 |
Emissions
System Noise
Fan noise is notably quieter than on the GTX 1070 Max-Q SKU when under load. Running Witcher 3, for example, will induce a steady fan noise of about 45 dB(A) compared to 49 dB(A) on the more powerful Blade 15 configuration. Fans will remain silent for low processing loads when on the Power Saver profile with only infrequent pulsing.
Unfortunately, our test unit suffers from light coil whine or electronic noise that is noticeable when idling on desktop. It's not loud enough to overcome typical ambient conditions, but it's disappointing nonetheless considering the asking price of the system.
Noise level
| Idle |
| 28.1 / 33 / 33.5 dB(A) |
| Load |
| 42.2 / 45.7 dB(A) |
 | ||
30 dB silent 40 dB(A) audible 50 dB(A) loud |
||
min: | ||
| Razer Blade 15 GTX 1060 GeForce GTX 1060 Max-Q, i7-8750H, Samsung SSD PM981 MZVLB512HAJQ | Razer Blade 15 2018 GeForce GTX 1070 Max-Q, i7-8750H, Samsung PM961 NVMe MZVLW512HMJP | MSI GS65 8RF-019DE Stealth Thin GeForce GTX 1070 Max-Q, i7-8750H, Samsung SSD PM981 MZVLB512HAJQ | Gigabyte Aero 15X v8 GeForce GTX 1070 Max-Q, i7-8750H, Toshiba NVMe THNSN5512GPU7 | Razer Blade Pro 2017 GeForce GTX 1080 Mobile, i7-7820HK, 2x Samsung SSD PM951 MZVLV256HCHP (RAID 0) | Asus Zephyrus M GM501 GeForce GTX 1070 Mobile, i7-8750H, Samsung SM961 MZVKW512HMJP m.2 PCI-e | |
|---|---|---|---|---|---|---|
| Noise | -4% | 0% | -8% | -8% | -6% | |
| off / environment * (dB) | 28.1 | 29 -3% | 30 -7% | 29 -3% | 30 -7% | 29 -3% |
| Idle Minimum * (dB) | 28.1 | 29 -3% | 30 -7% | 30 -7% | 30 -7% | 30 -7% |
| Idle Average * (dB) | 33 | 30 9% | 31 6% | 31 6% | 31 6% | 31 6% |
| Idle Maximum * (dB) | 33.5 | 38 -13% | 34 -1% | 35 -4% | 33 1% | 33 1% |
| Load Average * (dB) | 42.2 | 46 -9% | 43 -2% | 49 -16% | 43 -2% | 49 -16% |
| Witcher 3 ultra * (dB) | 45.3 | 49 -8% | 42 7% | 51 -13% | 55 -21% | 50 -10% |
| Load Maximum * (dB) | 45.7 | 46 -1% | 44 4% | 54 -18% | 58 -27% | 52 -14% |
* ... smaller is better
Temperature
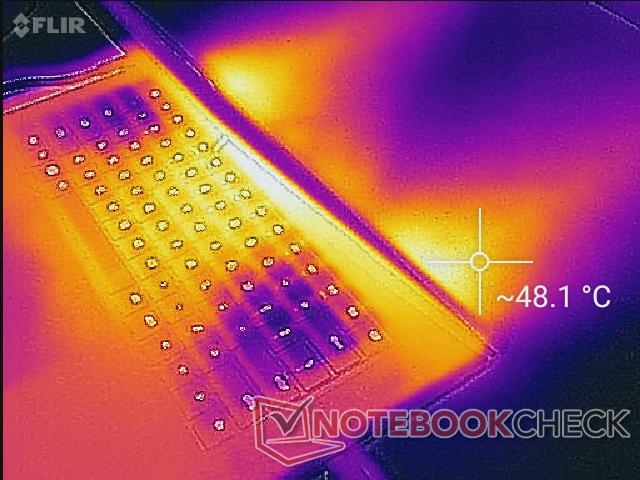
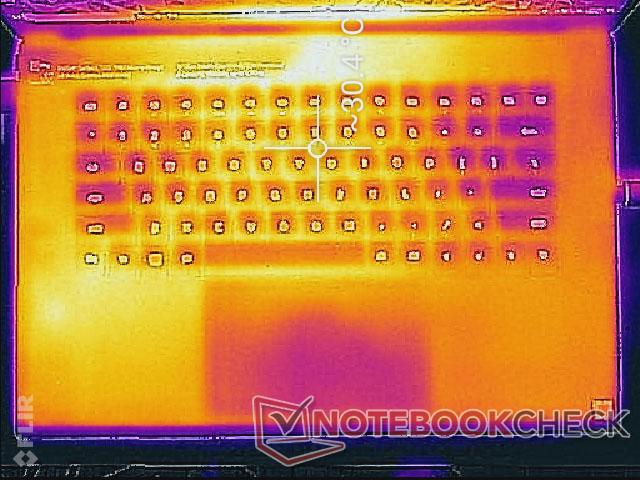
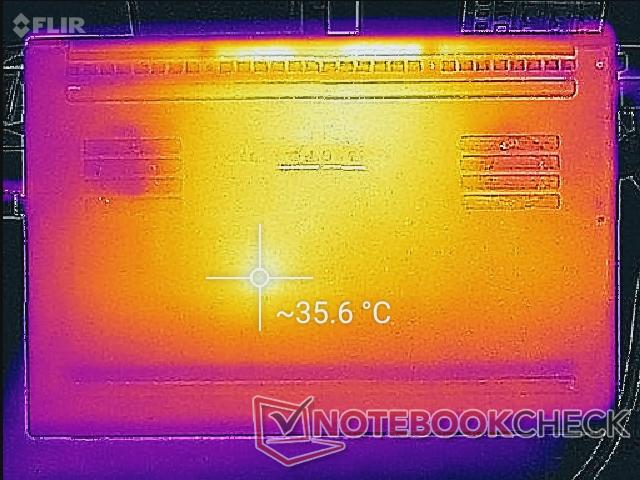
Are surface temperatures any cooler when compared to the more powerful GTX 1070 Max-Q SKU? Their differences are marginal at best when idling, video streaming, or word processing. Higher loads like gaming, however, will indeed run slightly cooler on the GTX 1060 Max-Q SKU. The palm rests and center keyboard keys in particular are notably cooler albeit still a bit too warm for our liking when compared to thicker gaming laptops like the MSI GT63 or Asus Strix GL503. A flat desk is definitely recommend when gaming because the bottom hot spot can reach over 50 C quite quickly.
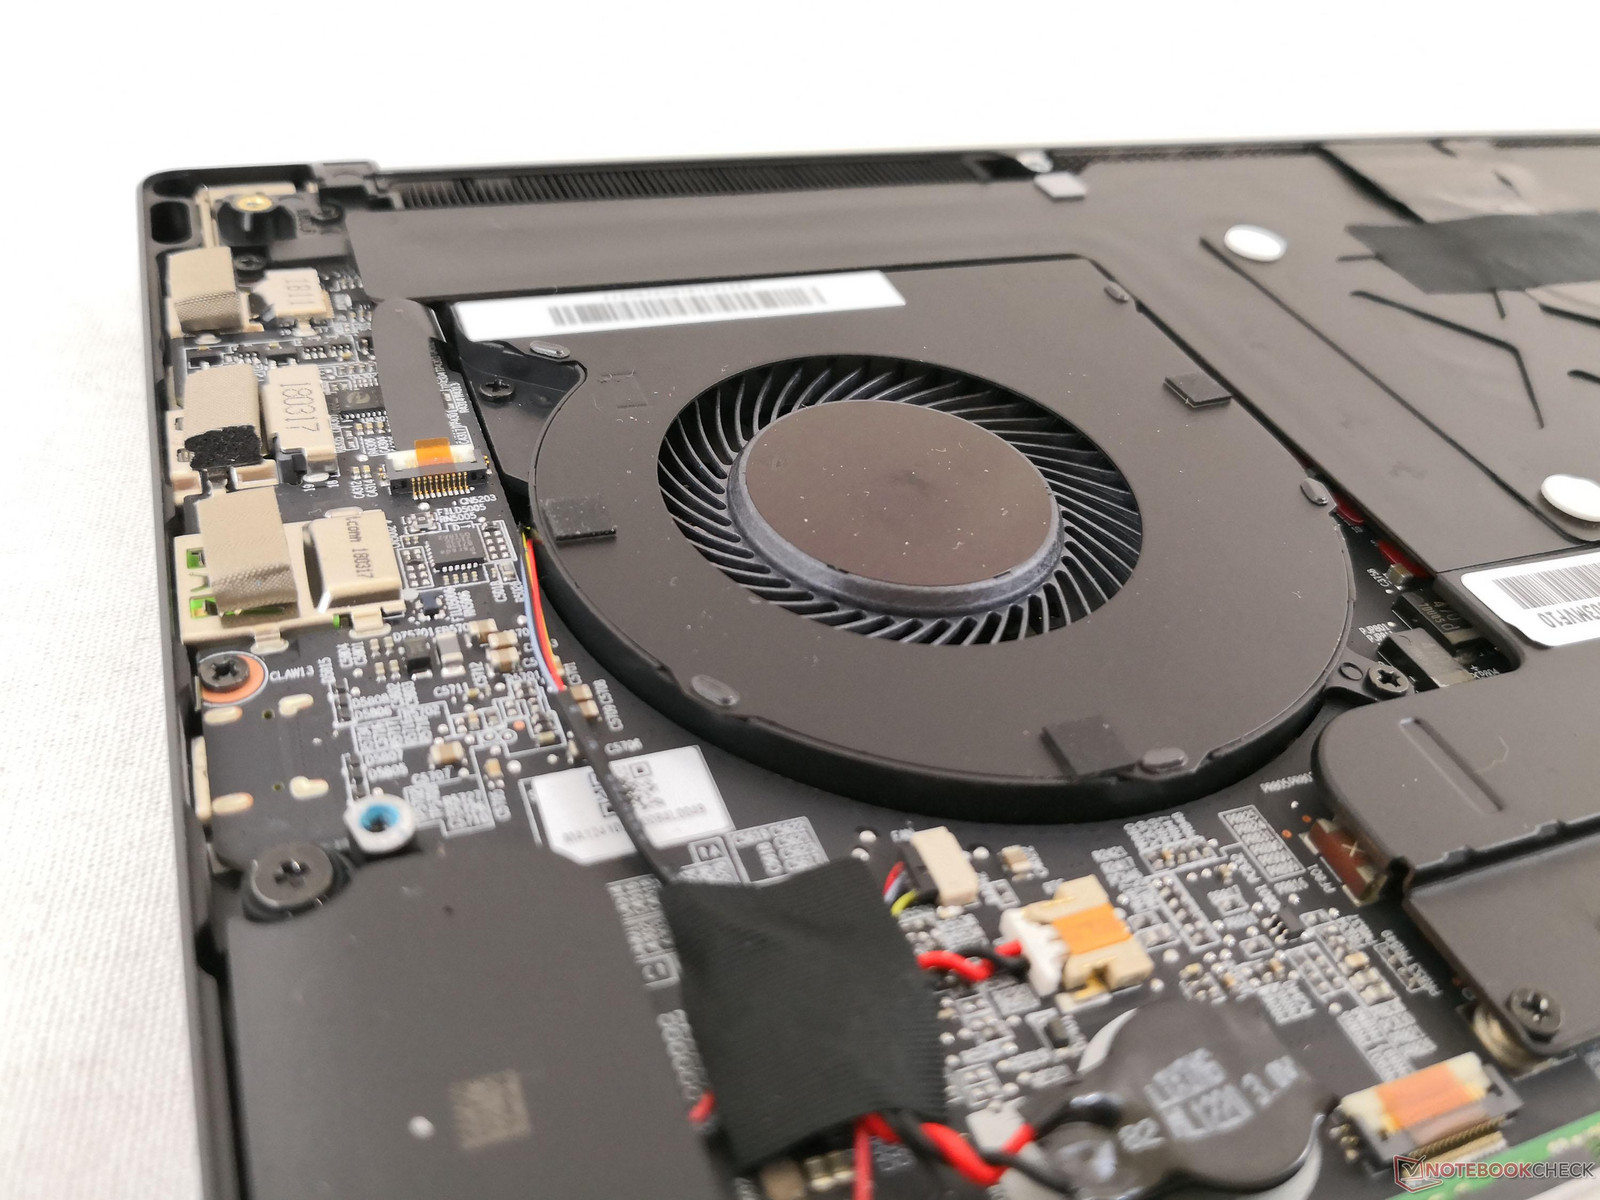
While much of the notebook surface is warm, the important WASD keys remain comparatively cooler no matter the load as shown by the temperature maps below. The system fan underneath draws cool air directly through these keys to prevent gamers' fingers from sweating.
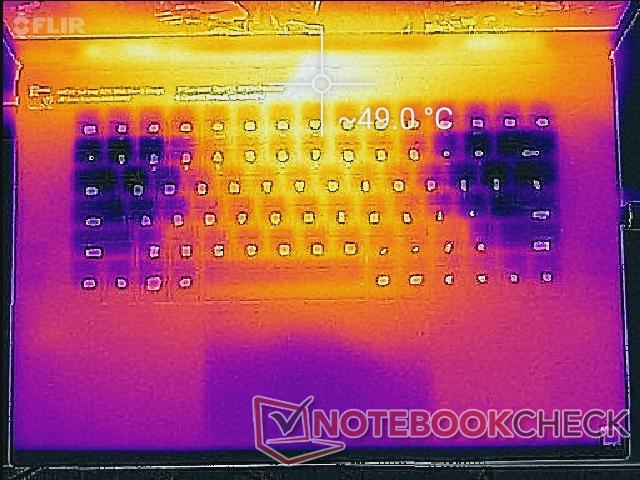

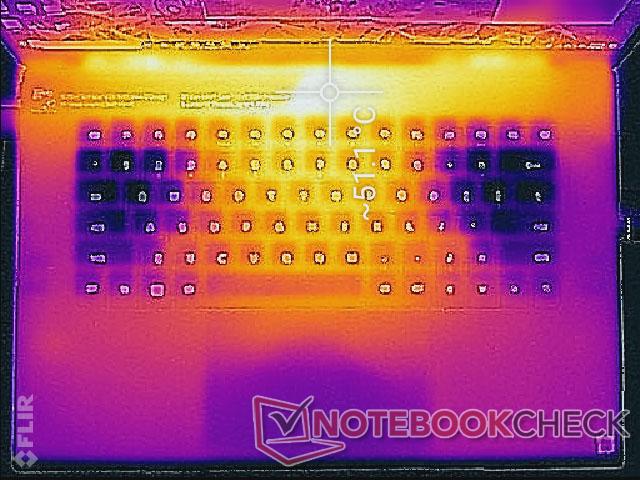

(-) The maximum temperature on the upper side is 51.2 °C / 124 F, compared to the average of 40.4 °C / 105 F, ranging from 21.2 to 68.8 °C for the class Gaming.
(-) The bottom heats up to a maximum of 55.2 °C / 131 F, compared to the average of 43.2 °C / 110 F
(+) In idle usage, the average temperature for the upper side is 29.7 °C / 85 F, compared to the device average of 33.9 °C / 93 F.
(-) Playing The Witcher 3, the average temperature for the upper side is 39.2 °C / 103 F, compared to the device average of 33.9 °C / 93 F.
(±) The palmrests and touchpad can get very hot to the touch with a maximum of 36.2 °C / 97.2 F.
(-) The average temperature of the palmrest area of similar devices was 28.8 °C / 83.8 F (-7.4 °C / -13.4 F).
Energy Management
Power Consumption
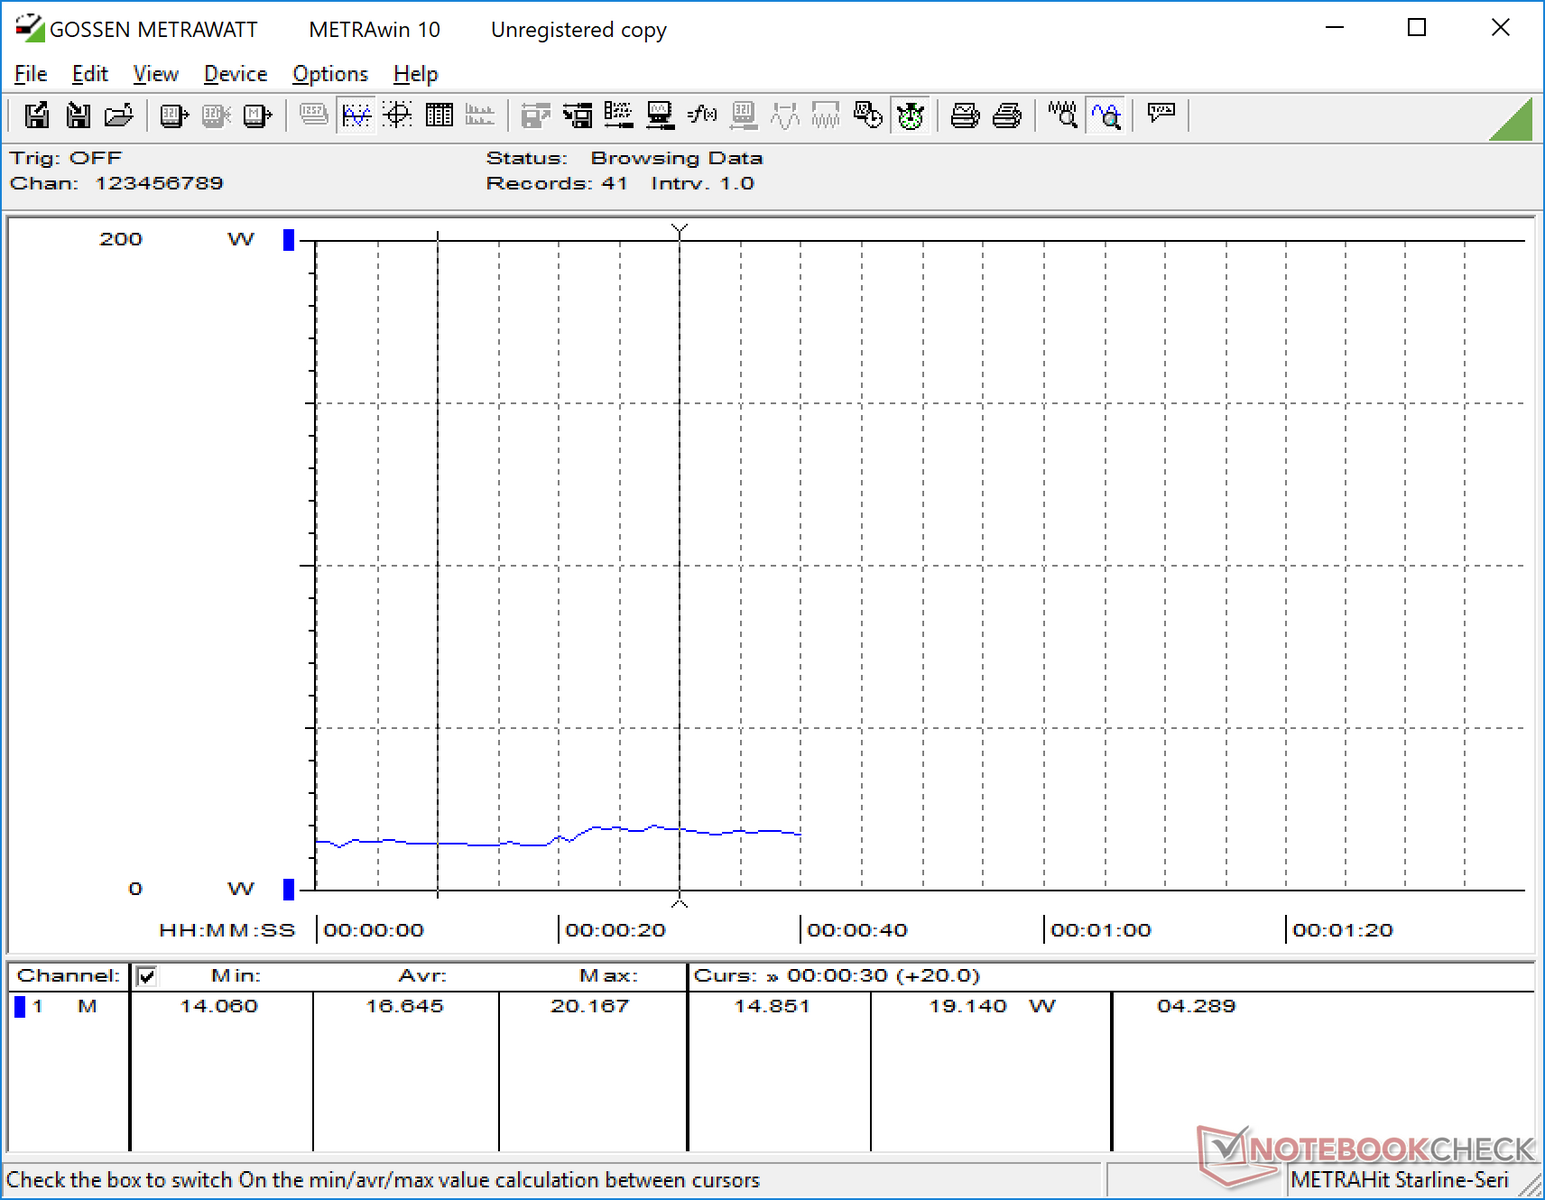
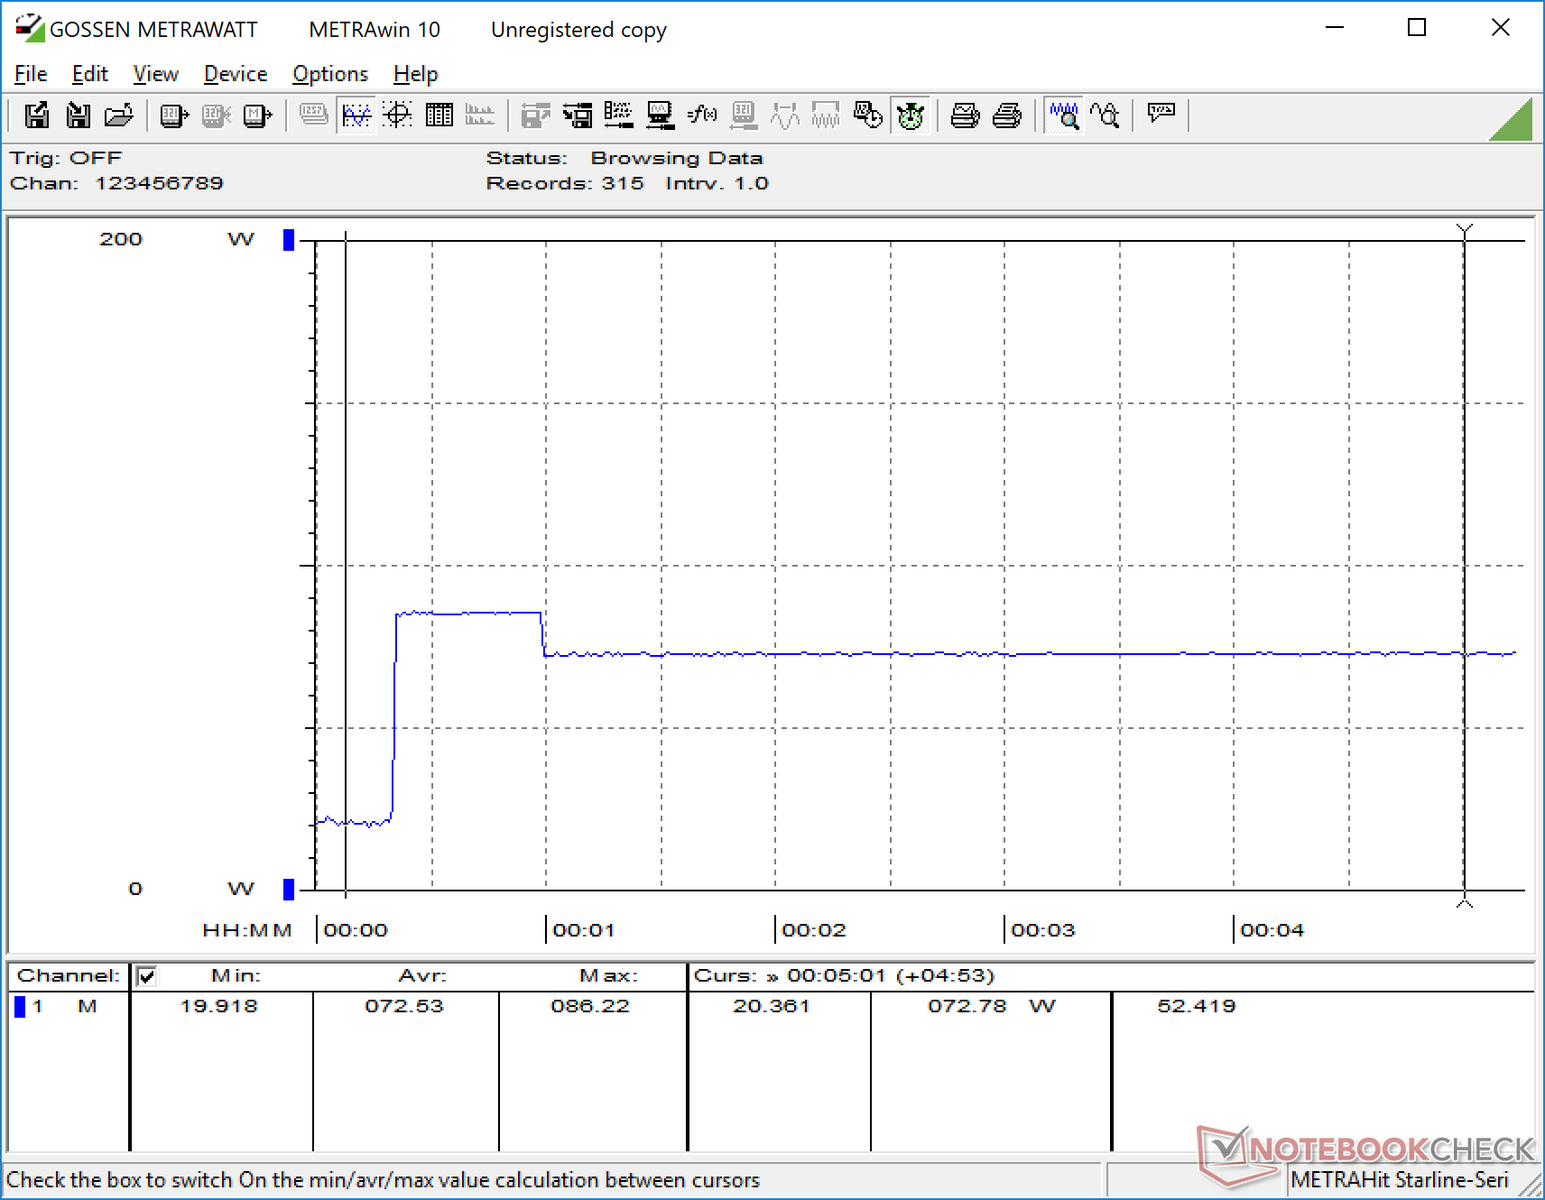
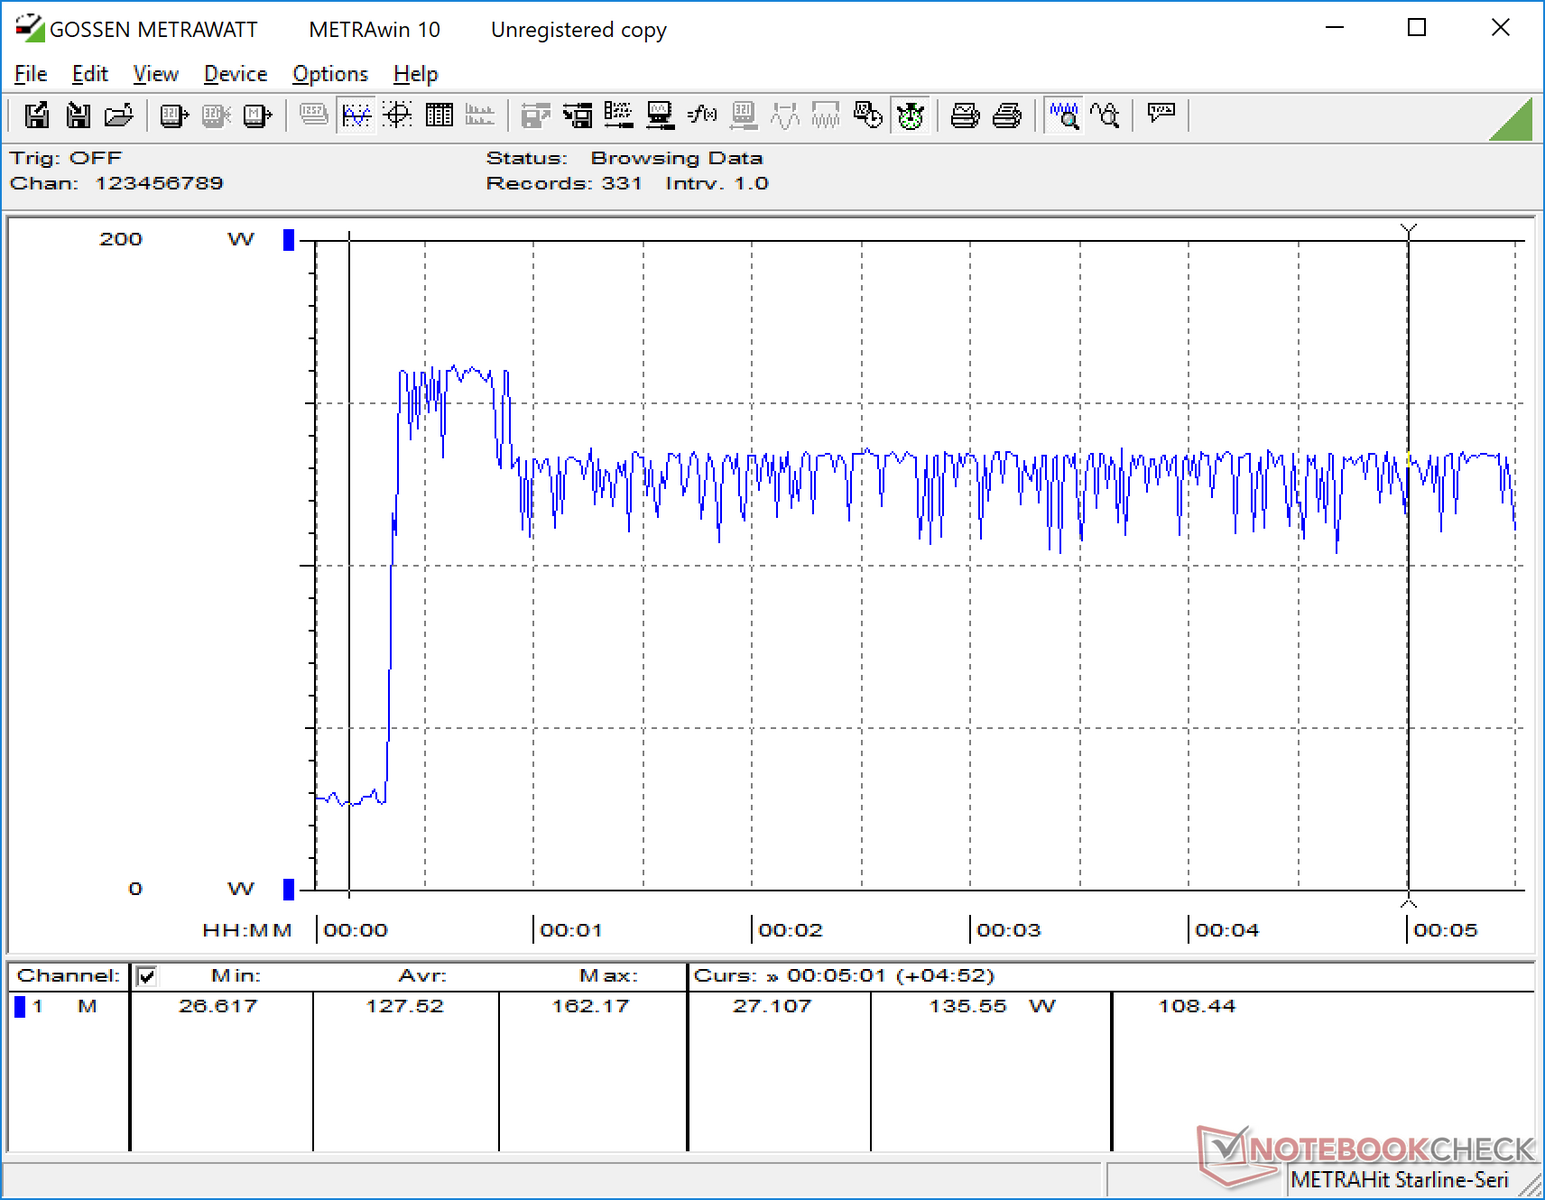
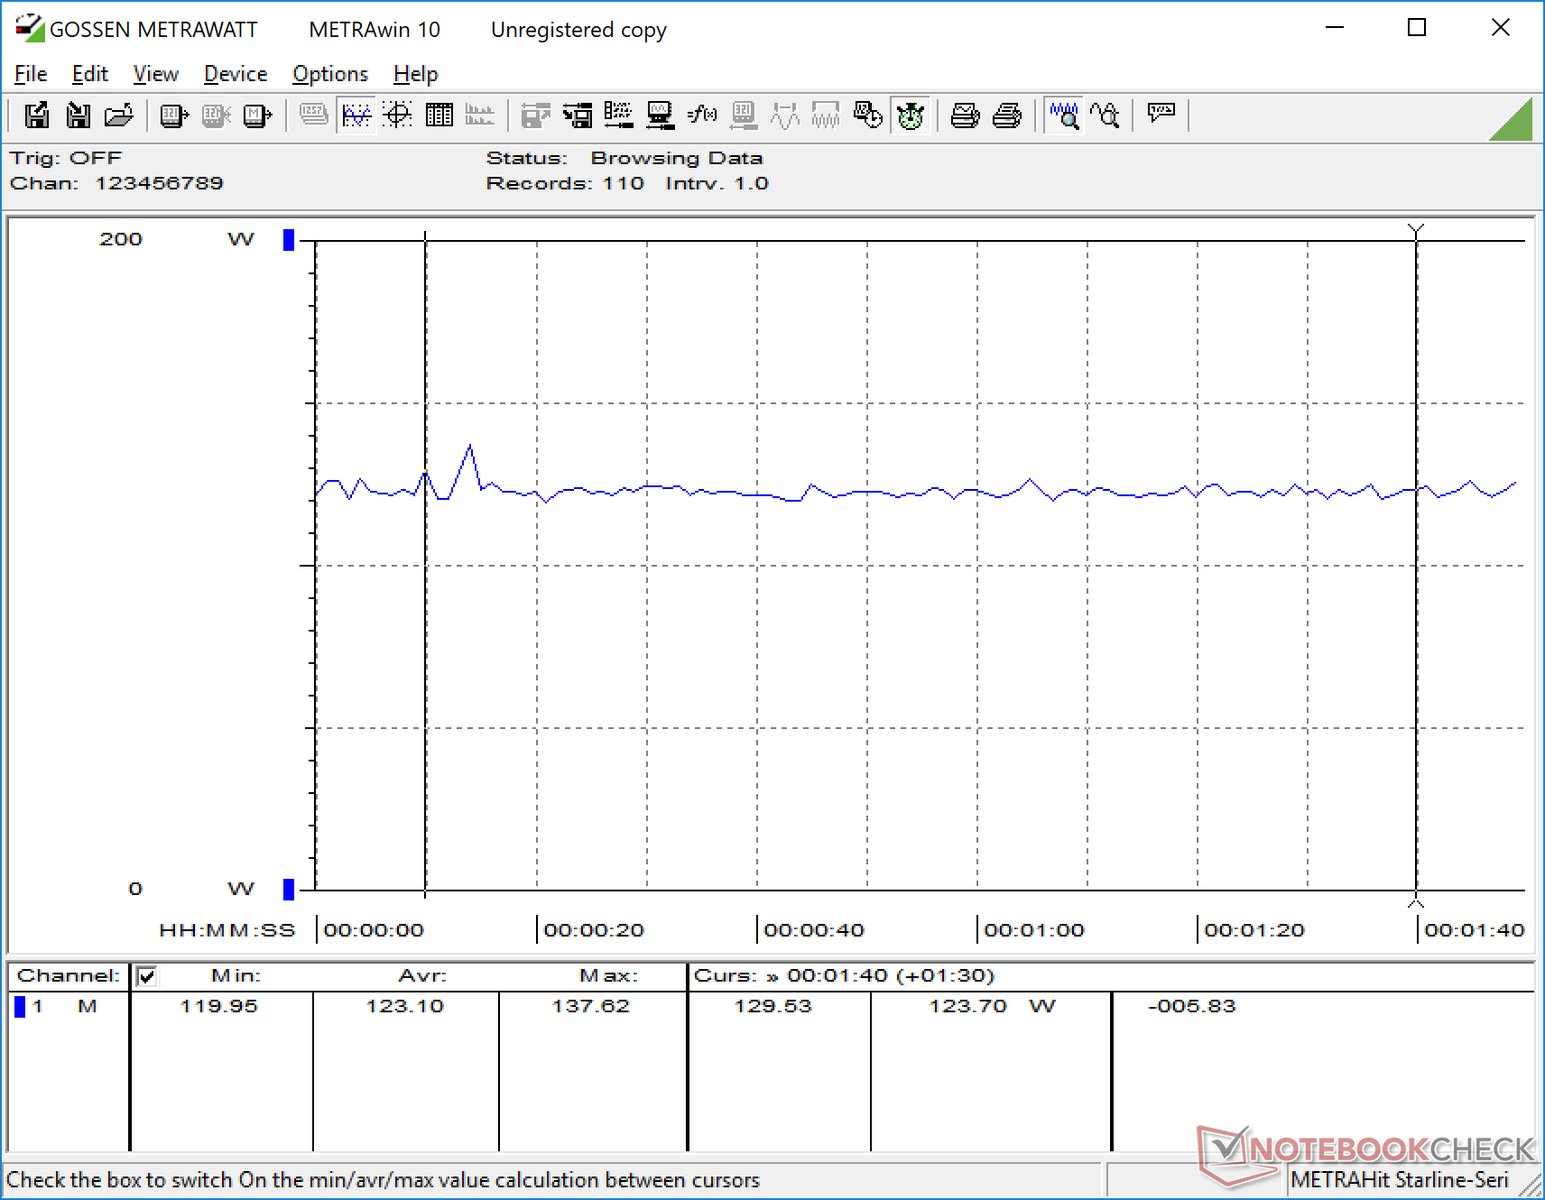
Power consumption when idling is about 15 W to 19 W depending on the screen brightness and power profile. Results are similar to the GTX 1070 Max-Q configuration despite having the slower GTX 1060 Max-Q GPU. Differences begin to show when the two systems are subjected to higher levels of stress. When running Witcher 3, for example, the GTX 1060 Max-Q SKU draws about 15 percent less power and this delta increases even further up to 35 percent when running extreme loads like Prime95 and FurMark. Perhaps not coincidentally, the GTX 1070 Max-Q is also about 30 to 35 percent faster than the GTX 1060 Max-Q according to 3DMark benchmarks.
The medium-sized (~15.5 x 6.5 x 2.5 cm) 200 W adapter is more than enough for the Blade 15 as the maximum draw we can record is only 162 W when the system is under extreme stress.
| Off / Standby | |
| Idle | |
| Load |
|
Key:
min: | |
| Razer Blade 15 GTX 1060 i7-8750H, GeForce GTX 1060 Max-Q, Samsung SSD PM981 MZVLB512HAJQ, IPS, 1920x1080, 15.6" | Razer Blade 15 2018 i7-8750H, GeForce GTX 1070 Max-Q, Samsung PM961 NVMe MZVLW512HMJP, IPS, 1920x1080, 15.6" | MSI GS65 8RF-019DE Stealth Thin i7-8750H, GeForce GTX 1070 Max-Q, Samsung SSD PM981 MZVLB512HAJQ, IPS, 1920x1080, 15.6" | Gigabyte Aero 15X v8 i7-8750H, GeForce GTX 1070 Max-Q, Toshiba NVMe THNSN5512GPU7, IPS, 1920x1080, 15.6" | Asus Zephyrus M GM501 i7-8750H, GeForce GTX 1070 Mobile, Samsung SM961 MZVKW512HMJP m.2 PCI-e, IPS, 1920x1080, 15.6" | Dell XPS 15 9575 i7-8705G i7-8705G, Vega M GL / 870, SK hynix PC401 NVMe 500 GB, IPS, 3840x2160, 15.6" | |
|---|---|---|---|---|---|---|
| Power Consumption | -7% | 8% | -8% | -25% | 33% | |
| Idle Minimum * (Watt) | 14.9 | 14 6% | 7 53% | 14 6% | 16 -7% | 6.2 58% |
| Idle Average * (Watt) | 17.5 | 17 3% | 11 37% | 18 -3% | 19 -9% | 12.9 26% |
| Idle Maximum * (Watt) | 19.2 | 21 -9% | 20 -4% | 22 -15% | 26 -35% | 13.6 29% |
| Load Average * (Watt) | 103.2 | 95 8% | 98 5% | 91 12% | 103 -0% | 76.1 26% |
| Witcher 3 ultra * (Watt) | 123.1 | 141 -15% | 132 -7% | 142 -15% | 164 -33% | 84.3 32% |
| Load Maximum * (Watt) | 132.7 | 179 -35% | 182 -37% | 173 -30% | 223 -68% | 99.4 25% |
* ... smaller is better
Battery Life
Runtimes from our GTX 1060 Max-Q unit is notably longer than on our GTX 1070 Max-Q unit. WLAN loads will last over 6.5 hours compared to 5 to 5.5 hours on the faster Blade 15 configuration. Results are comparable to the GS65 albeit still a couple of hours shorter than the Aero 15X and MacBook Pro 15 when subjected to similar conditions.
Charging from near empty to full capacity will take just under 1.5 hours.
| Razer Blade 15 GTX 1060 i7-8750H, GeForce GTX 1060 Max-Q, 80 Wh | Razer Blade 15 2018 i7-8750H, GeForce GTX 1070 Max-Q, 80 Wh | MSI GS65 8RF-019DE Stealth Thin i7-8750H, GeForce GTX 1070 Max-Q, 82 Wh | Gigabyte Aero 15X v8 i7-8750H, GeForce GTX 1070 Max-Q, 94.24 Wh | Apple MacBook Pro 15 2017 (2.9 GHz, 560) i7-7820HQ, Radeon Pro 560, Wh | Dell XPS 15 2018 i5 FHD 97Wh i5-8300H, GeForce GTX 1050 Mobile, 97 Wh | |
|---|---|---|---|---|---|---|
| Battery runtime | -19% | -10% | 28% | 69% | 134% | |
| WiFi v1.3 (h) | 6.7 | 5.4 -19% | 6 -10% | 8.6 28% | 11.3 69% | 15.7 134% |
| Reader / Idle (h) | 6.4 | 8.5 | 12.7 | |||
| Load (h) | 1.2 | 1.4 | 2.6 | 1.1 | 1.9 | |
| Witcher 3 ultra (h) | 1.3 | 1 |
Pros
Cons
Verdict
At the end of the day, the Blade 15 GTX 1060 Max-Q SKU is about 30 percent slower in GPU power than the Blade 15 1070 Max-Q SKU. The result is a configuration that actually runs longer, cooler, and quieter by noticeable margins. It is therefore arguable that the GTX 1060 Max-Q SKU offers a more balanced experience for mainstream gamers and on-the-go students while the powerful GTX 1070 Max-Q SKU can be seen as the "performance at all cost" enthusiast option.
The elephant in the room is the asking price of the Blade 15 GTX 1060 Max-Q SKU. Users are paying a premium for the design, brand, aesthetics, and features of the chassis. Because of this, even the smallest nitpicks can be disappointing. Our particular unit suffers from both moderate backlight bleeding and electronic noise which we feel should have no place on a notebook in this price range. The use of PWM for its per-key RGB backlight and the limited CPU Turbo Boost are other minor setbacks enthusiasts might lament. Other than that, it's hard not to be impressed by the rigidity of the minimalist chassis especially when compared to the MSI GS65 or Aorus X5 series.
Razer Blade 15 GTX 1060
- 07/08/2018 v6 (old)
Allen Ngo
Price comparison
