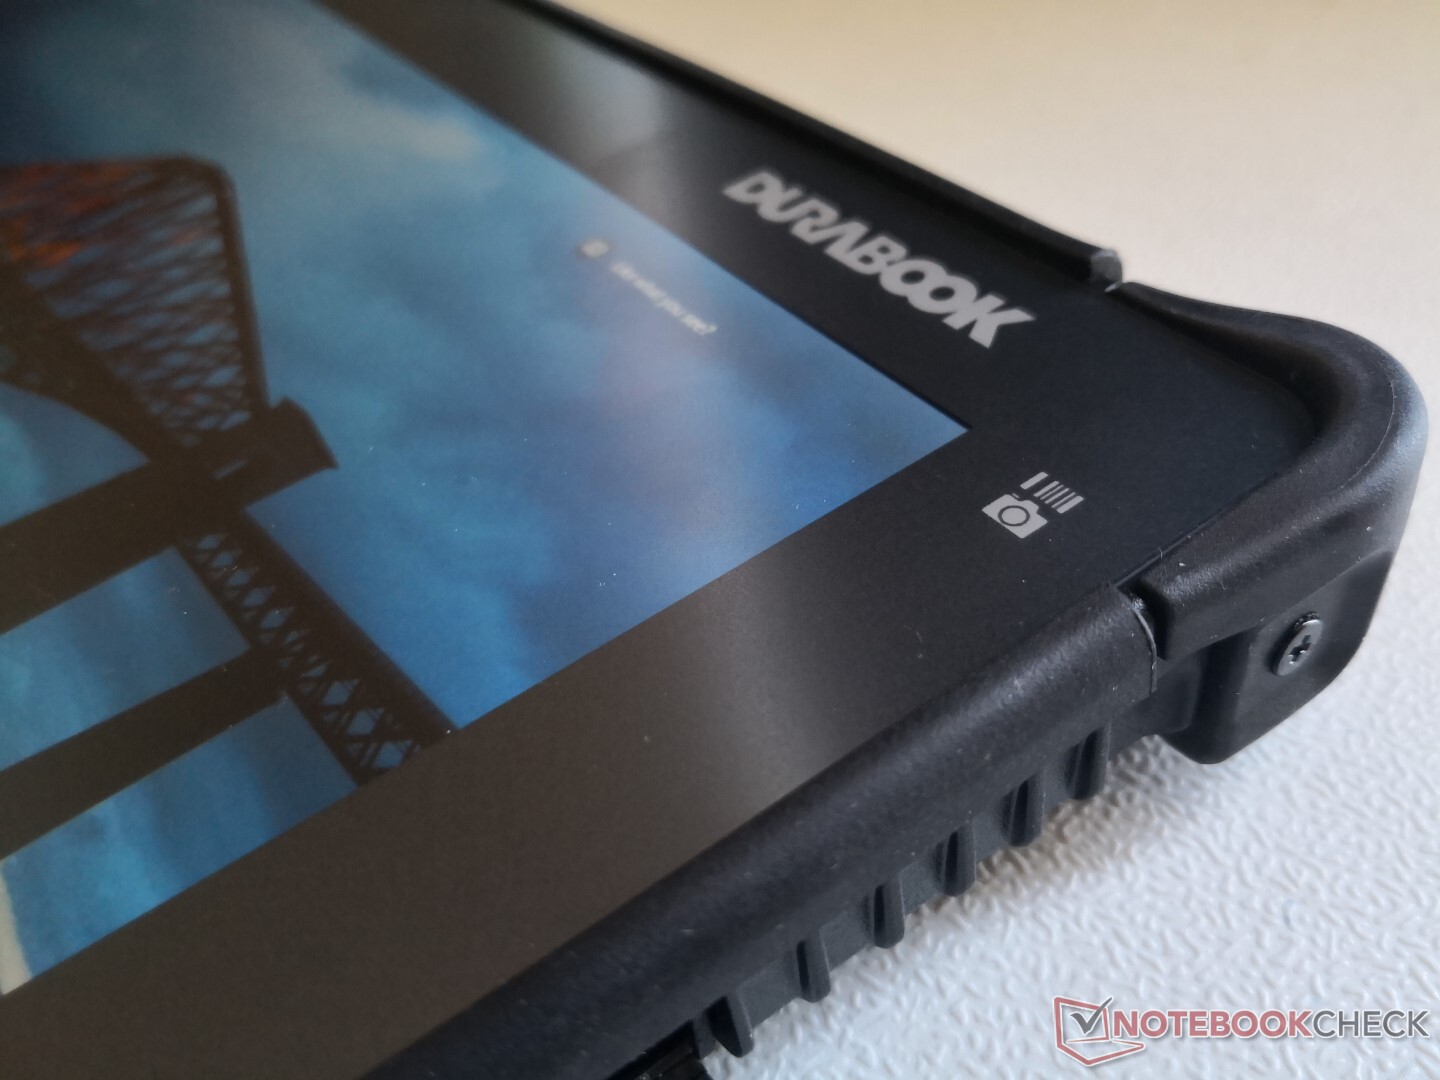
Durabook R11 Rugged Tablet Review: A Tough Cookie
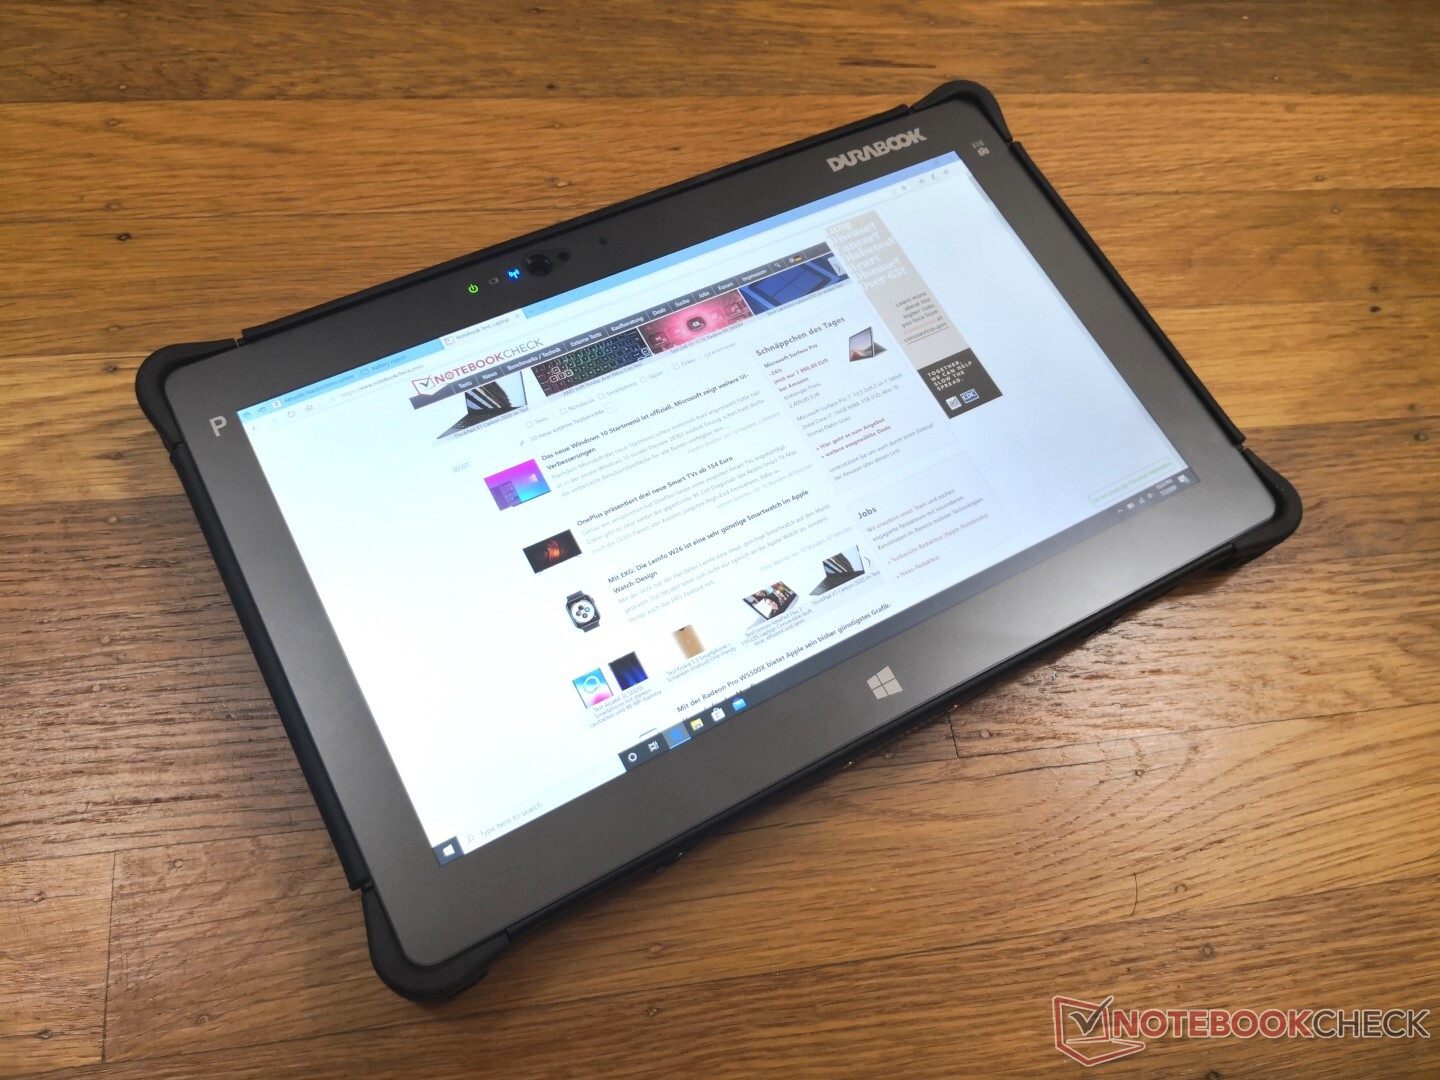
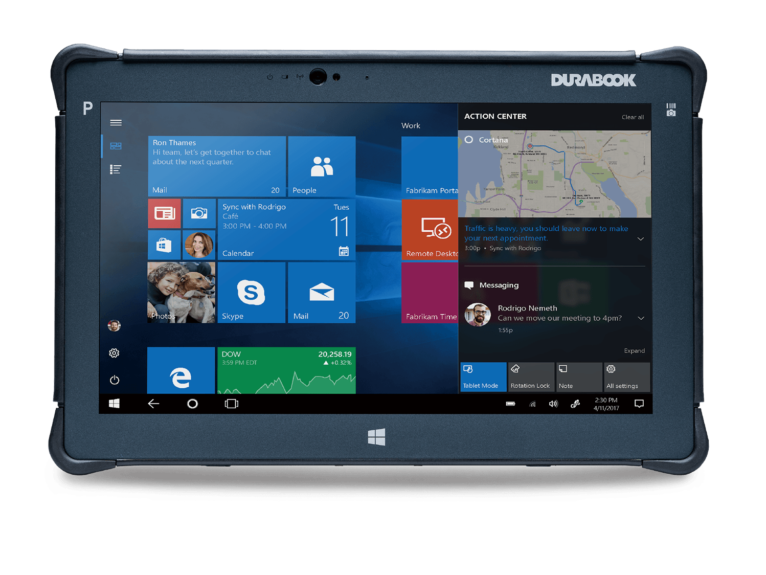
The 11.6-inch Durabook R11 is fully-rugged enterprise-class tablet designed for professionals and field workers. It's able to take quite the beating while integrating respectable hardware features like Bluetooth 5.0, dual-band WLAN, quad-core Core U-series CPUs with optional vPro, front and rear cameras, and a high contrast touchscreen.
Its long list of features and specifications can be found on the official product page here. This review page will cover the major pros and cons of the rugged device.
More rugged laptop and tablet reviews:

Rating | Date | Model | Weight | Height | Size | Resolution | Price |
|---|---|---|---|---|---|---|---|
v (old) | 07 / 2020 | Durabook R11 i5-8250U, UHD Graphics 620 | 1.2 kg | 20 mm | 11.60" | 1920x1080 | |
| 84.3 % v6 (old) | 03 / 2019 | Dell Latitude 7424 Rugged Extreme i7-8650U, Radeon RX 540 | 3.5 kg | 59.3 mm | 14.00" | 1920x1080 | |
| 89.2 % v6 (old) | 03 / 2019 | Dell Latitude 5420 Rugged-P85G i7-8650U, Radeon RX 540 | 2.8 kg | 32.9 mm | 14.00" | 1920x1080 | |
| 77.3 % v6 (old) | 07 / 2018 | Fujitsu Stylistic Q738 i5-8350U, UHD Graphics 620 | 1.4 kg | 18 mm | 13.30" | 1920x1080 | |
| 89.1 % v7 (old) | 09 / 2019 | Dell Latitude 7200 i5-8365U, UHD Graphics 620 | 1.2 kg | 9.35 mm | 12.30" | 1920x1280 |
Case
Like many rugged devices, the Durabook R11 is MIL-STD 810G certified to withstand a variety of environmental dangers.
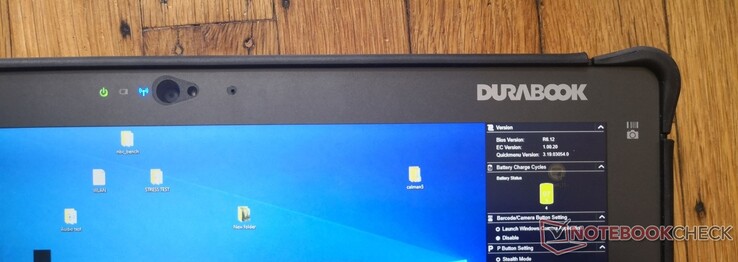
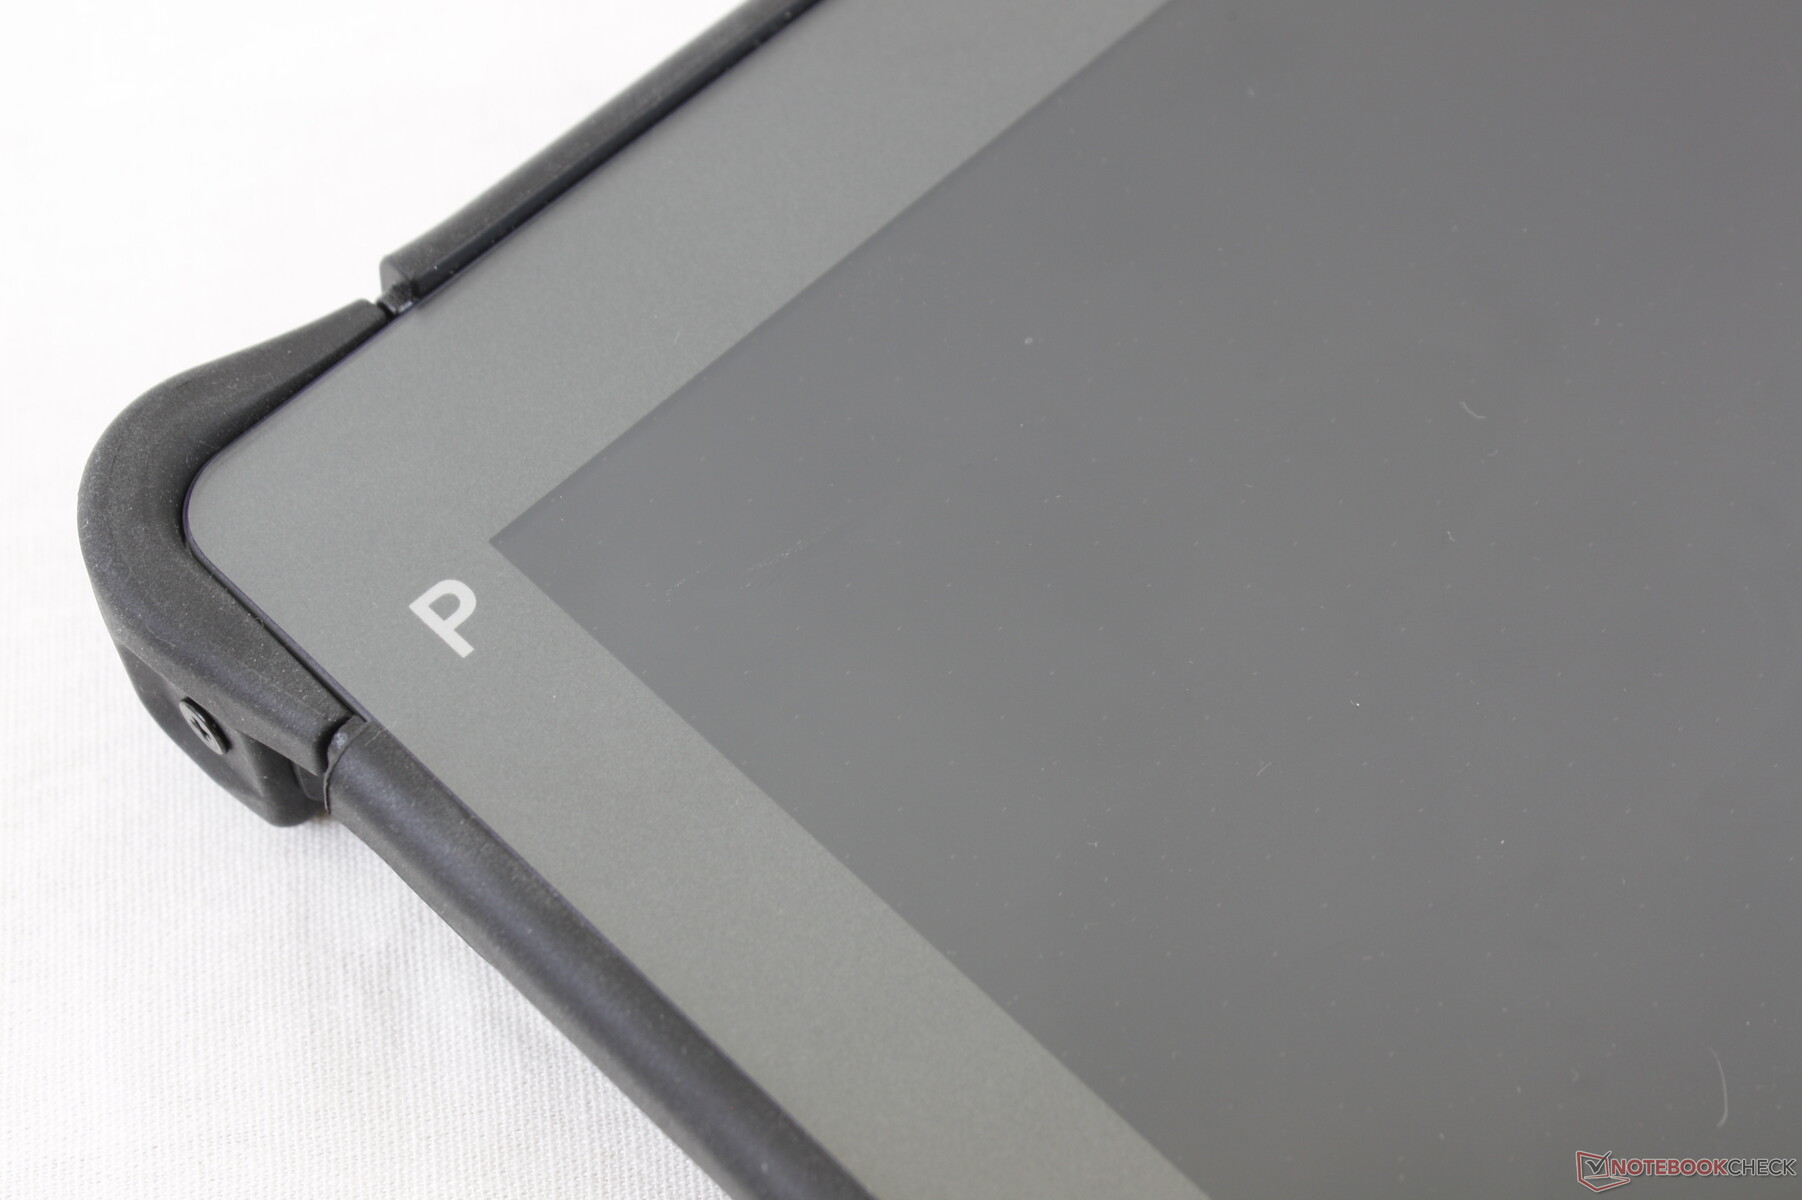
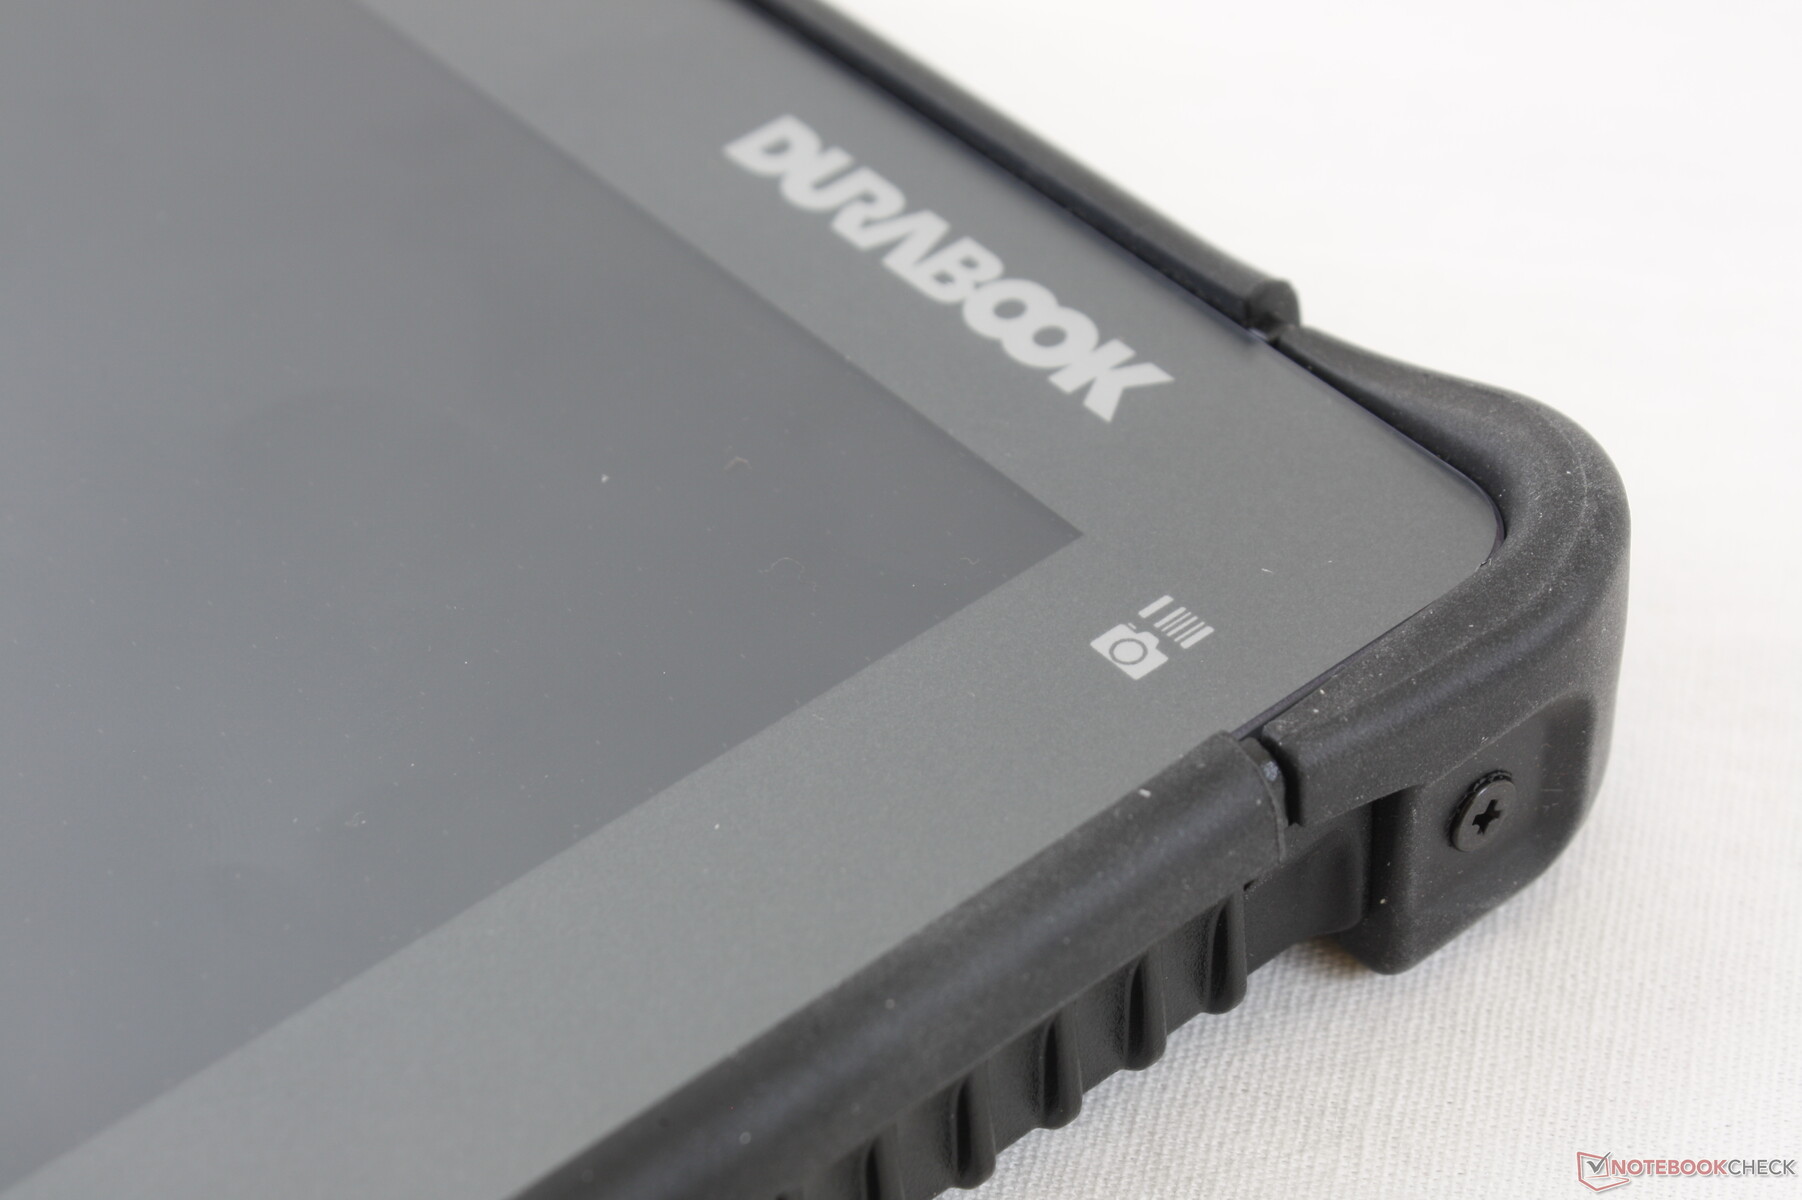
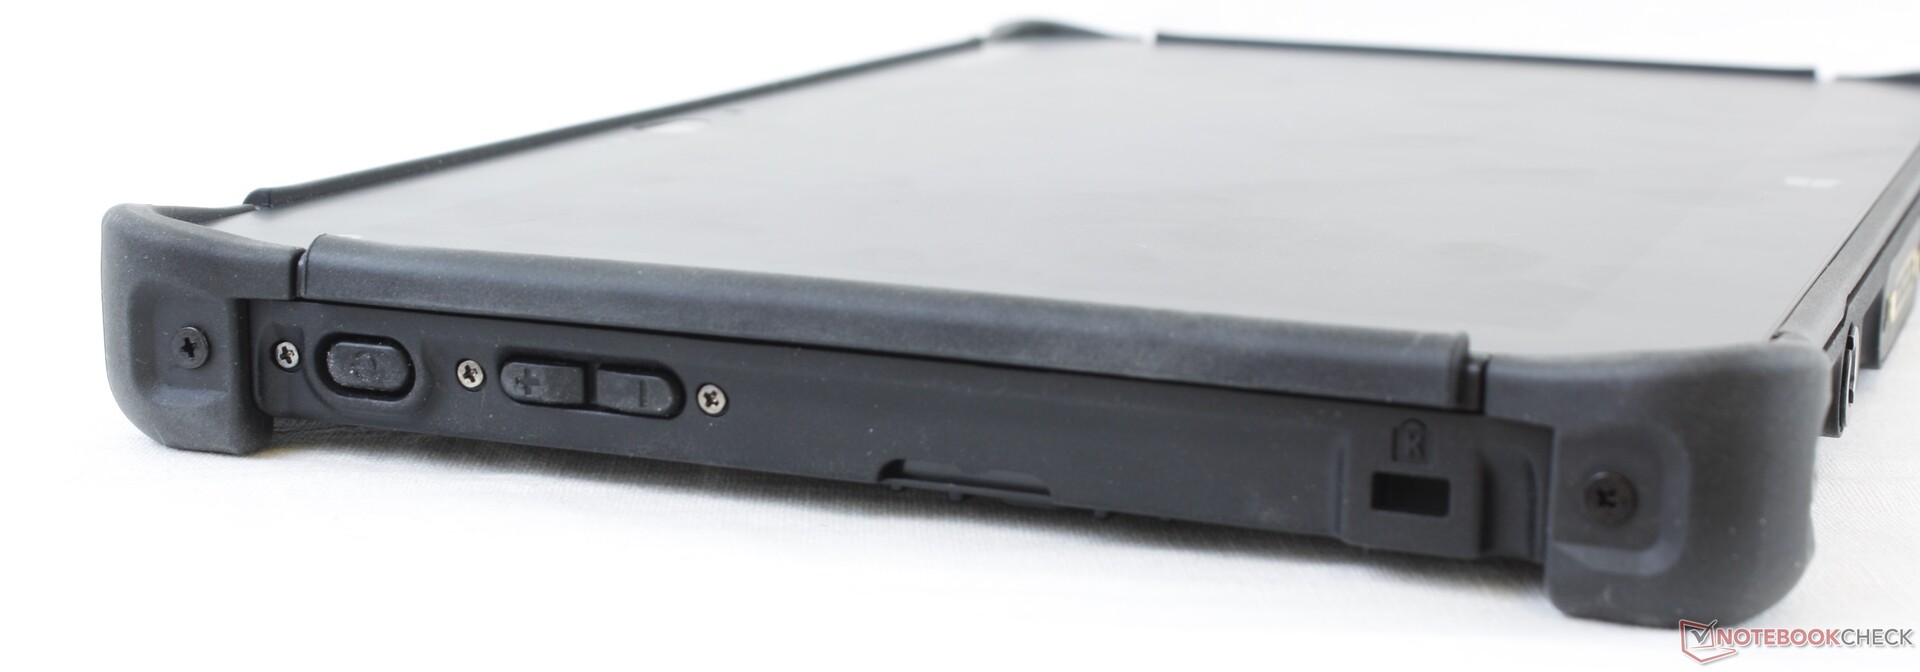
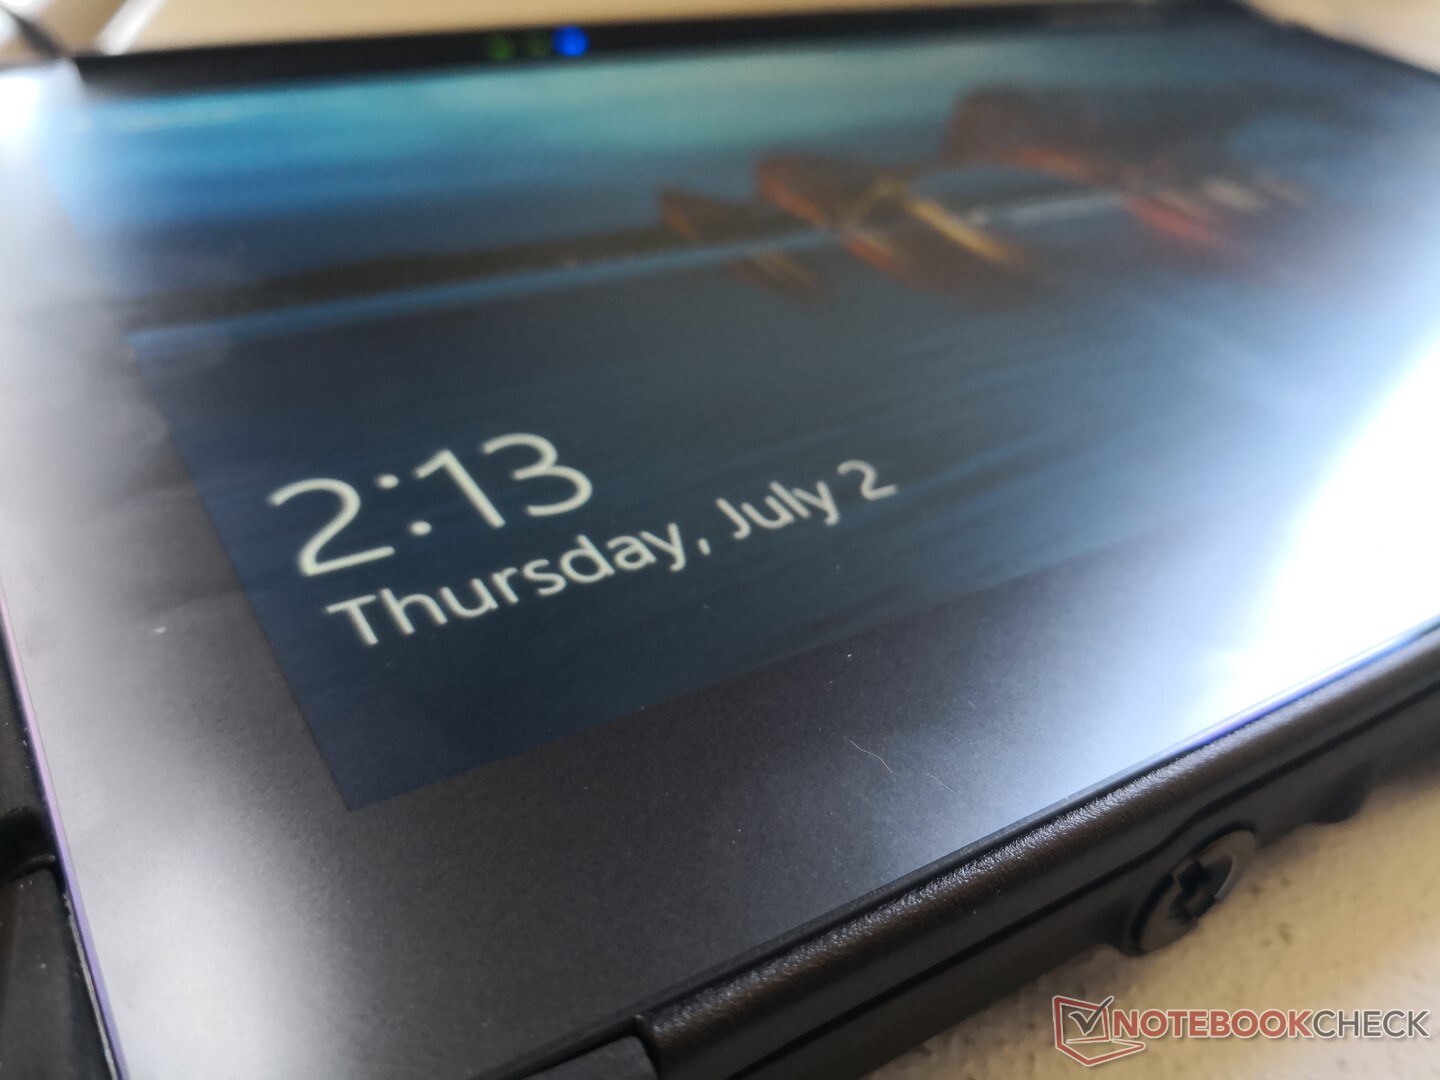
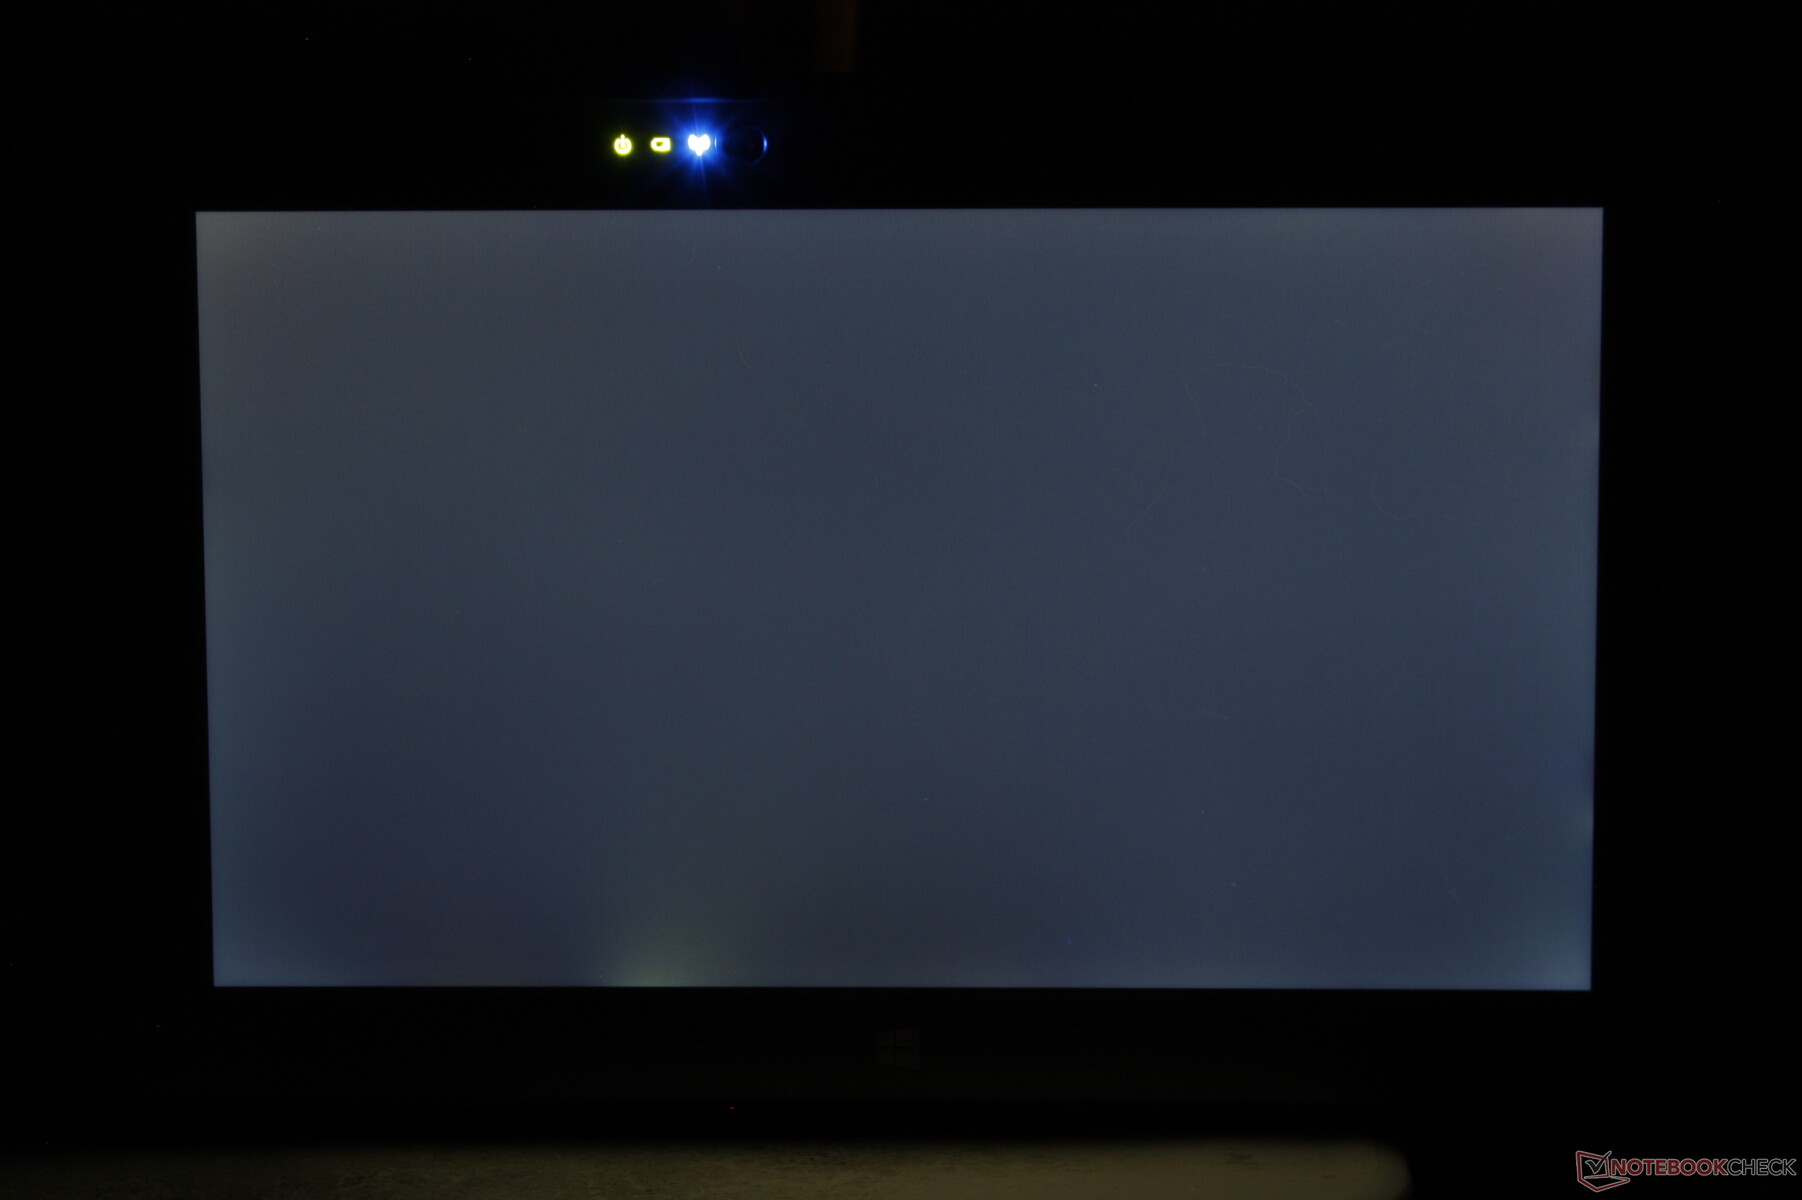
A notable feature of the tablet is the touch-sensitive "P" button on the top left edge of the screen. Tapping it will turn the screen on or off as a faux sleep mode or it can be customized to launch applications as well. However, it suffers from a couple of major problems. Firstly, the touch-sensitive button is far too easy to hit by accident and secondly, it only toggles the screen on or off while leaving Windows logged in and running. This means that the blank screen will still respond to your touch inputs which can be frustrating because it's possible to have accidentally dragged icons around or launched applications while the screen was dark.

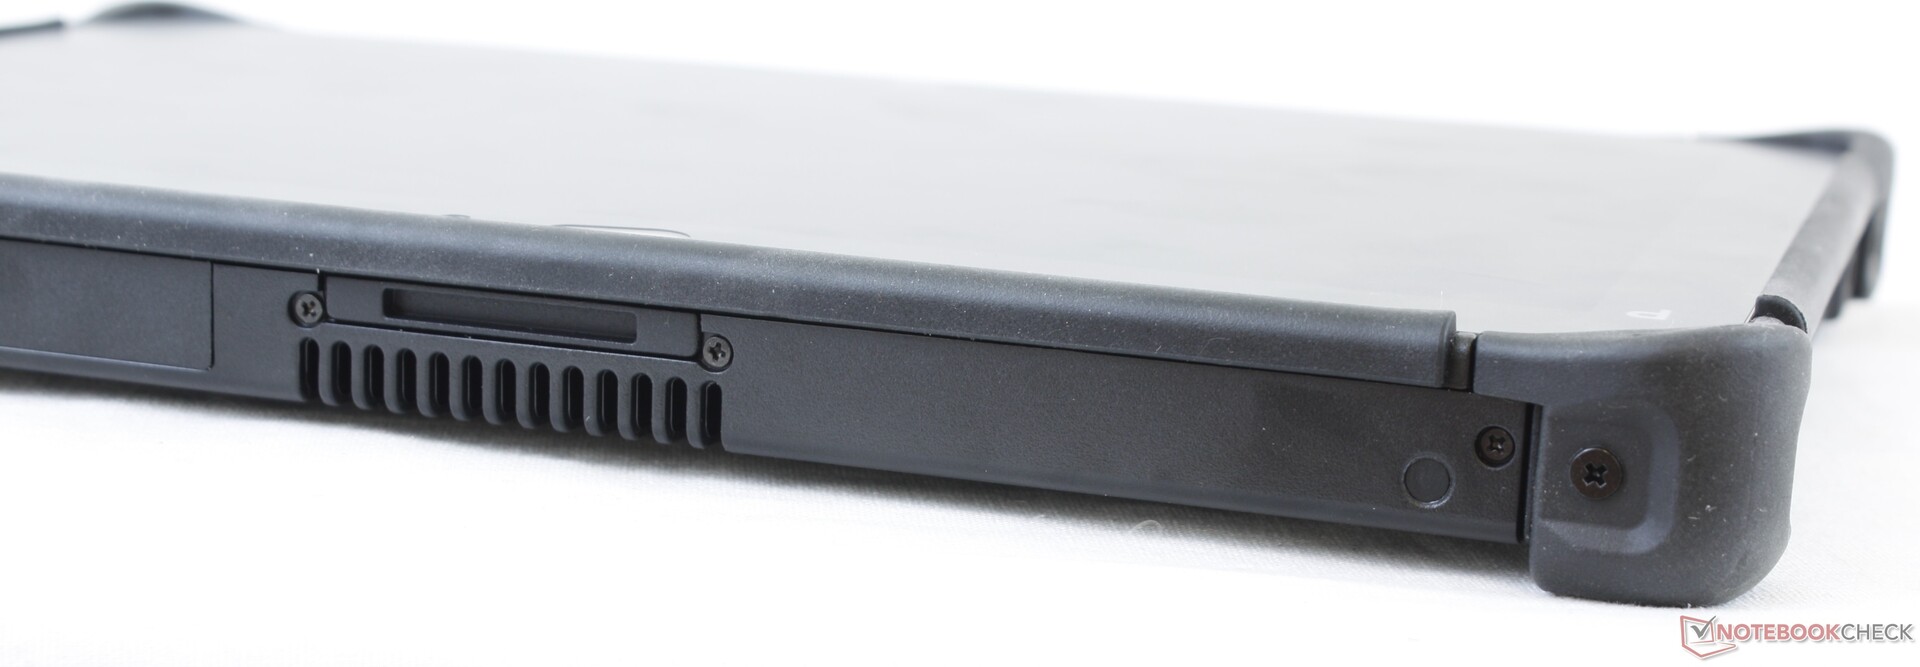
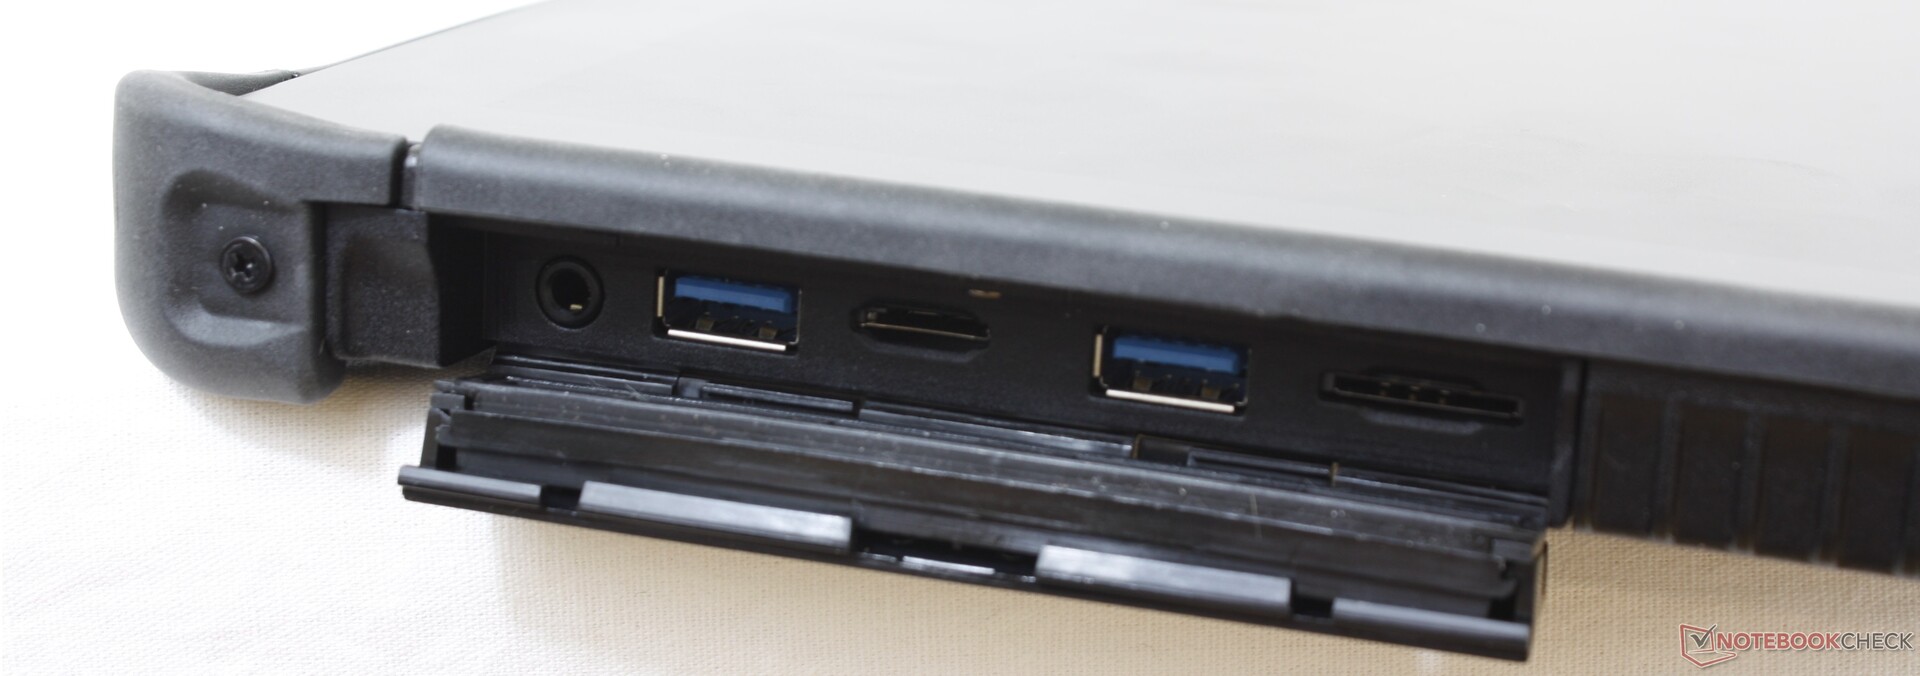
Connectivity
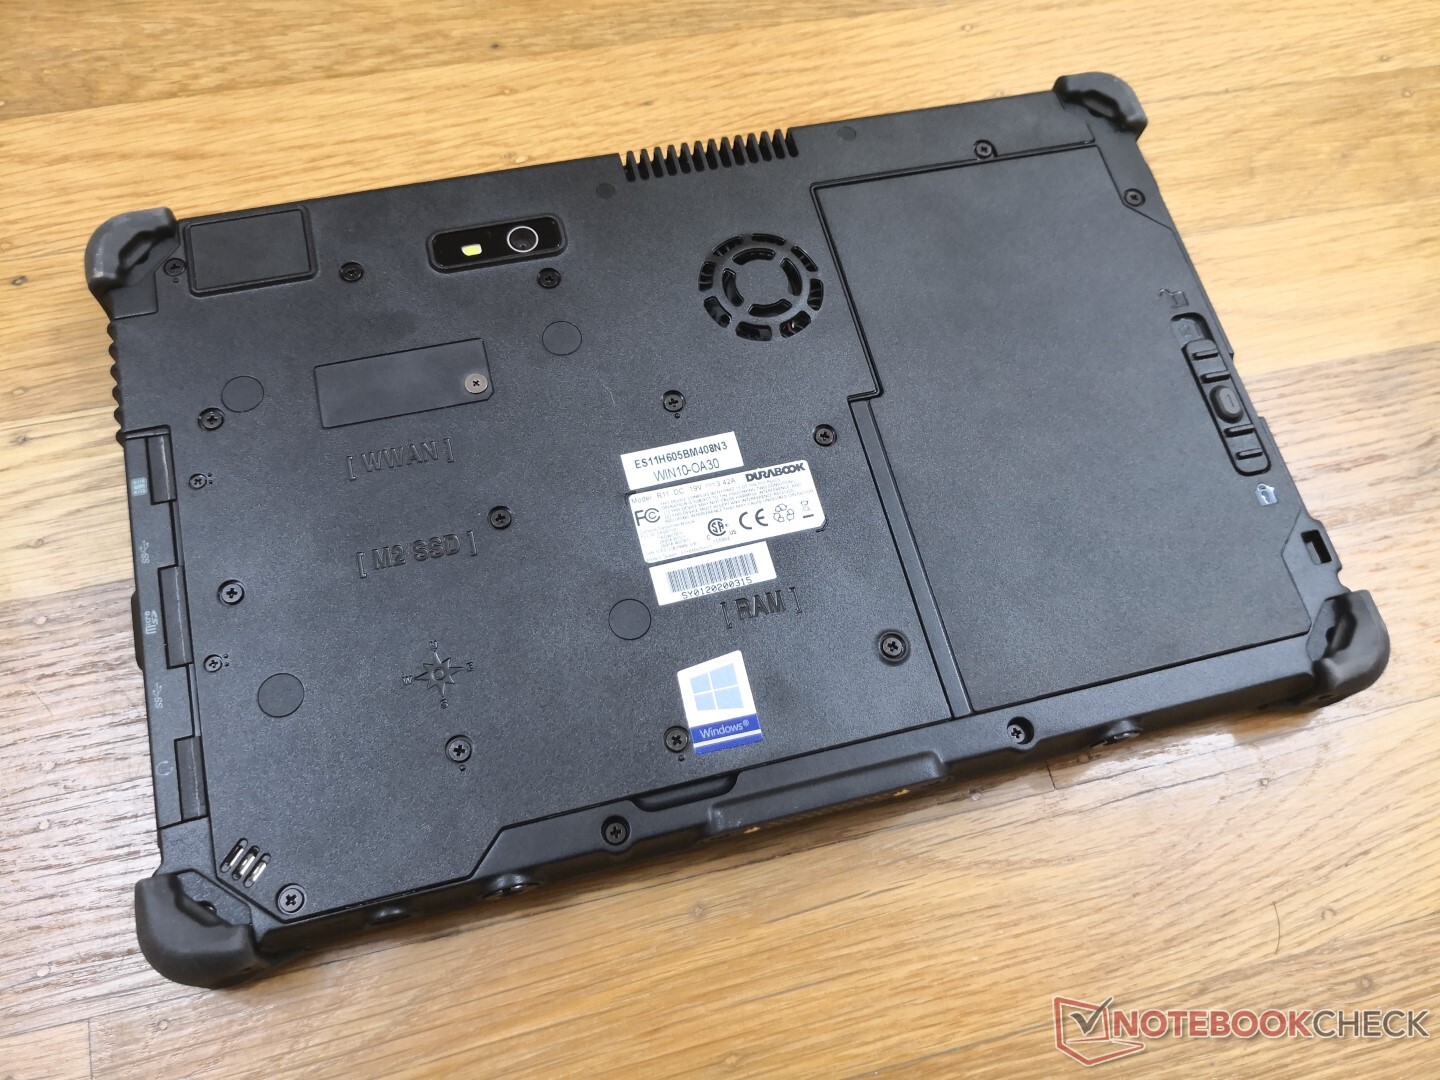
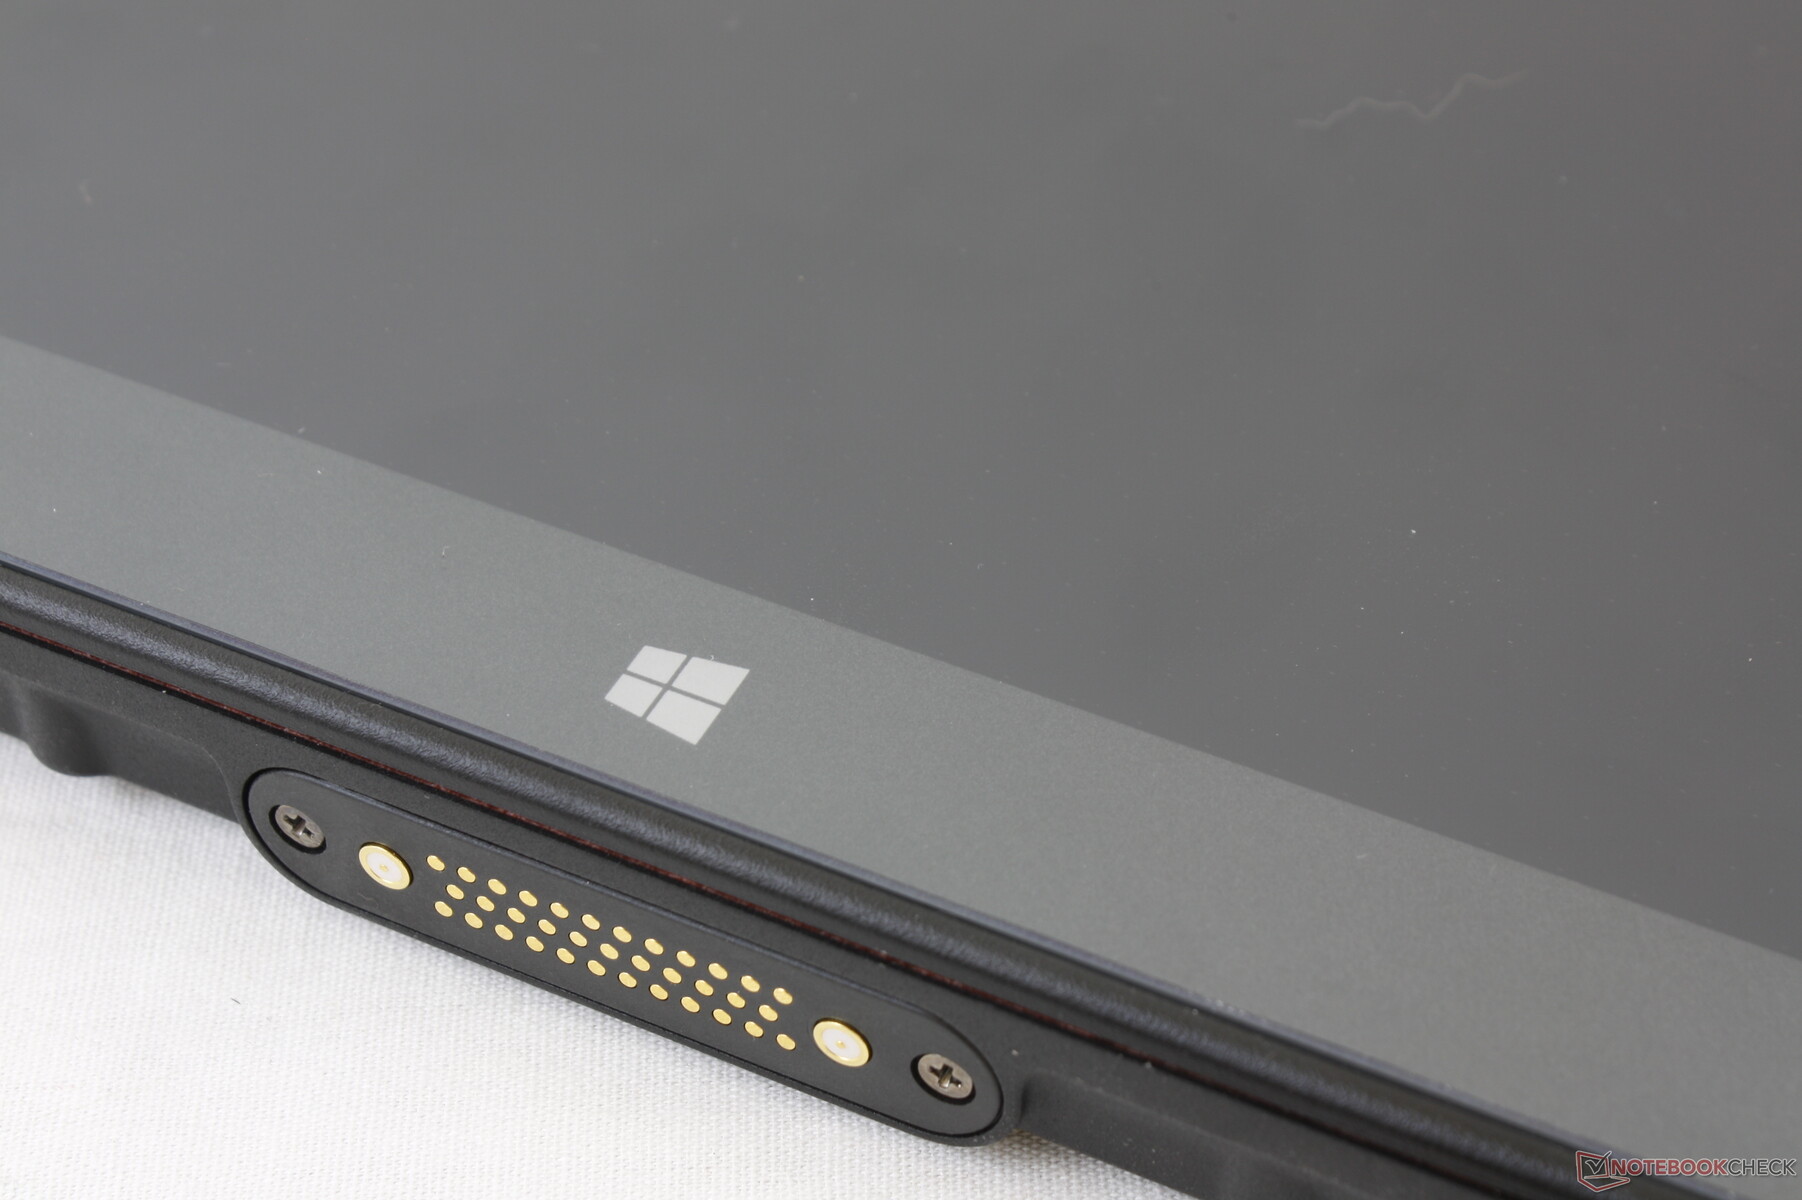
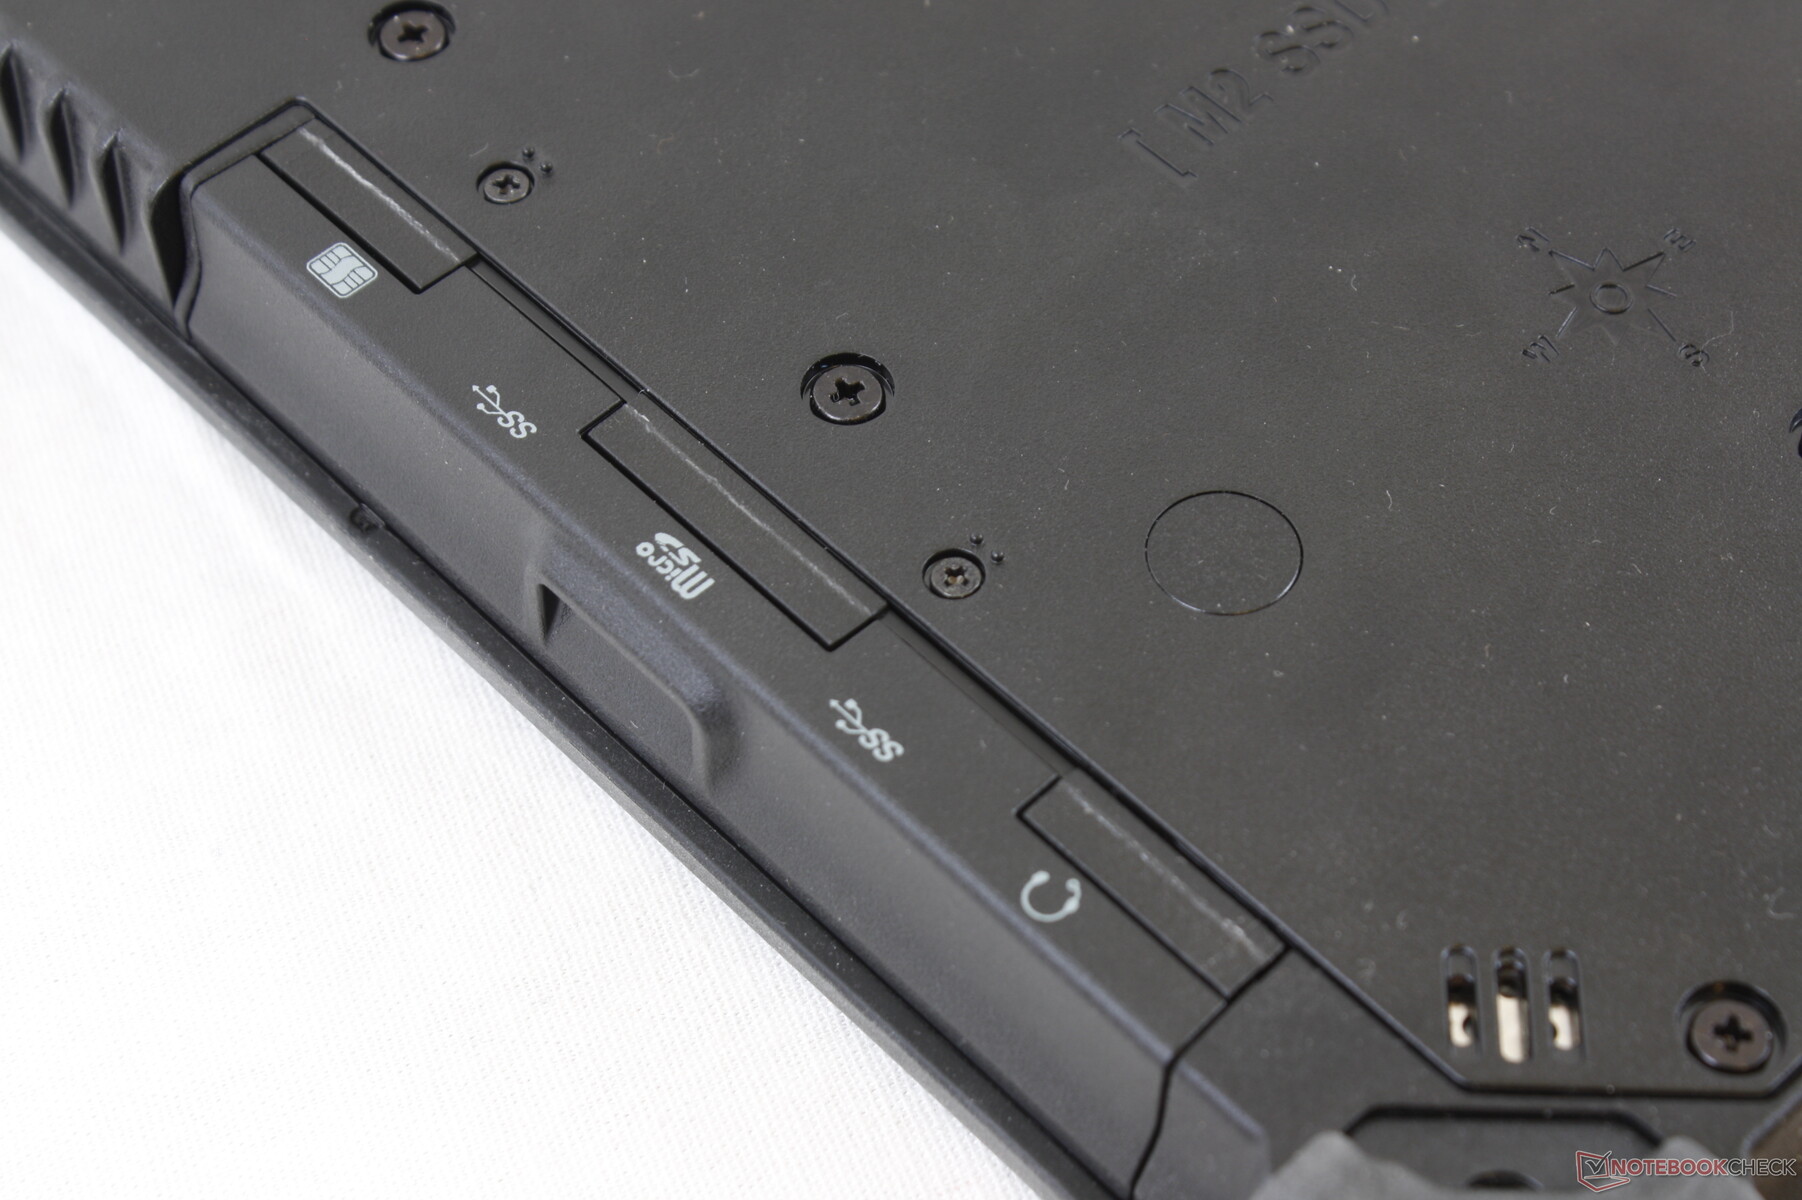
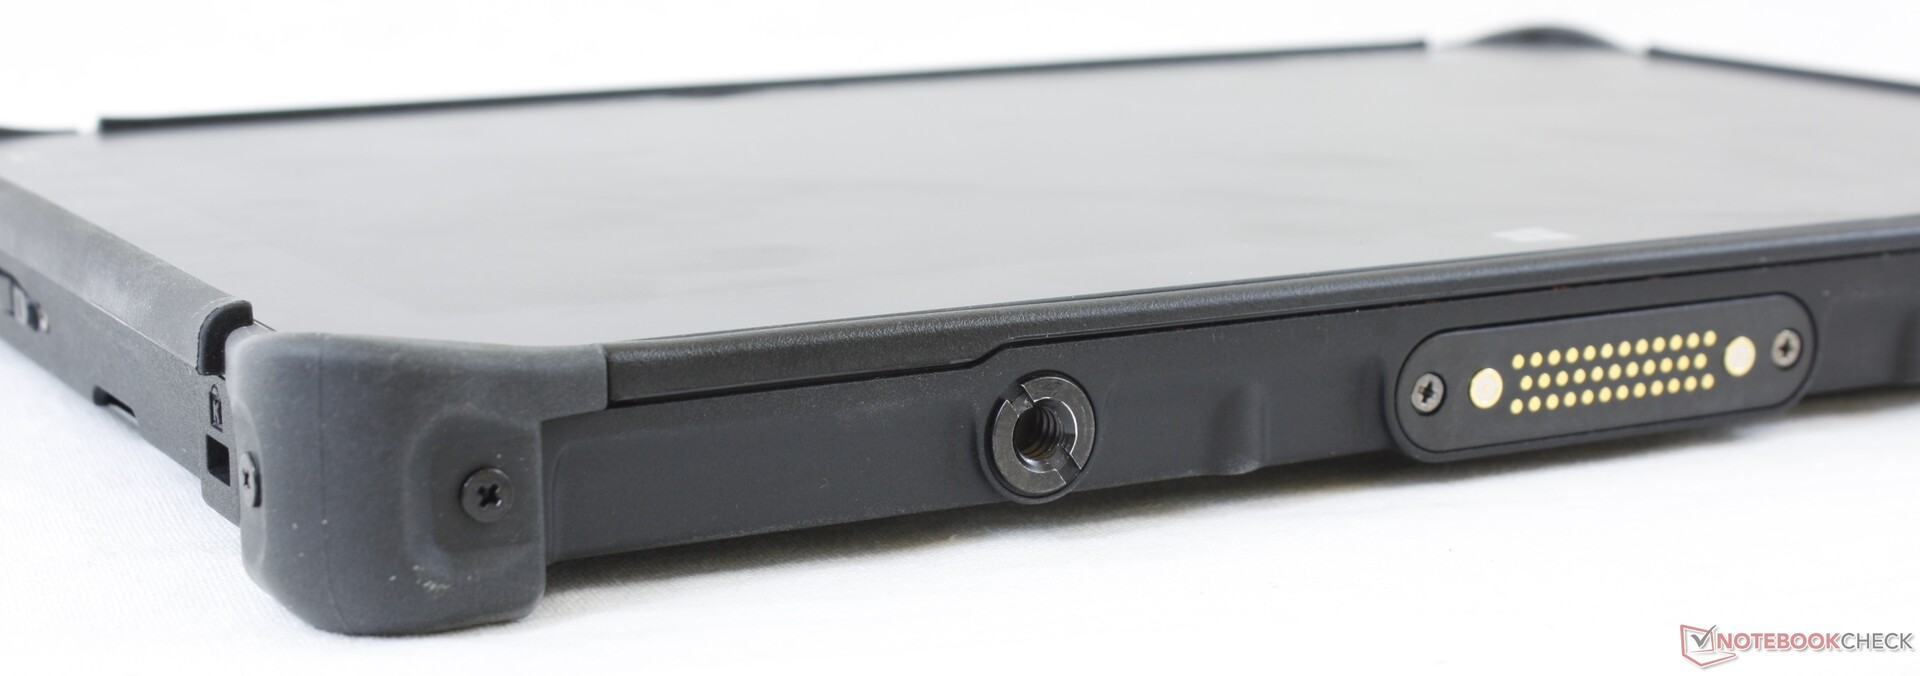
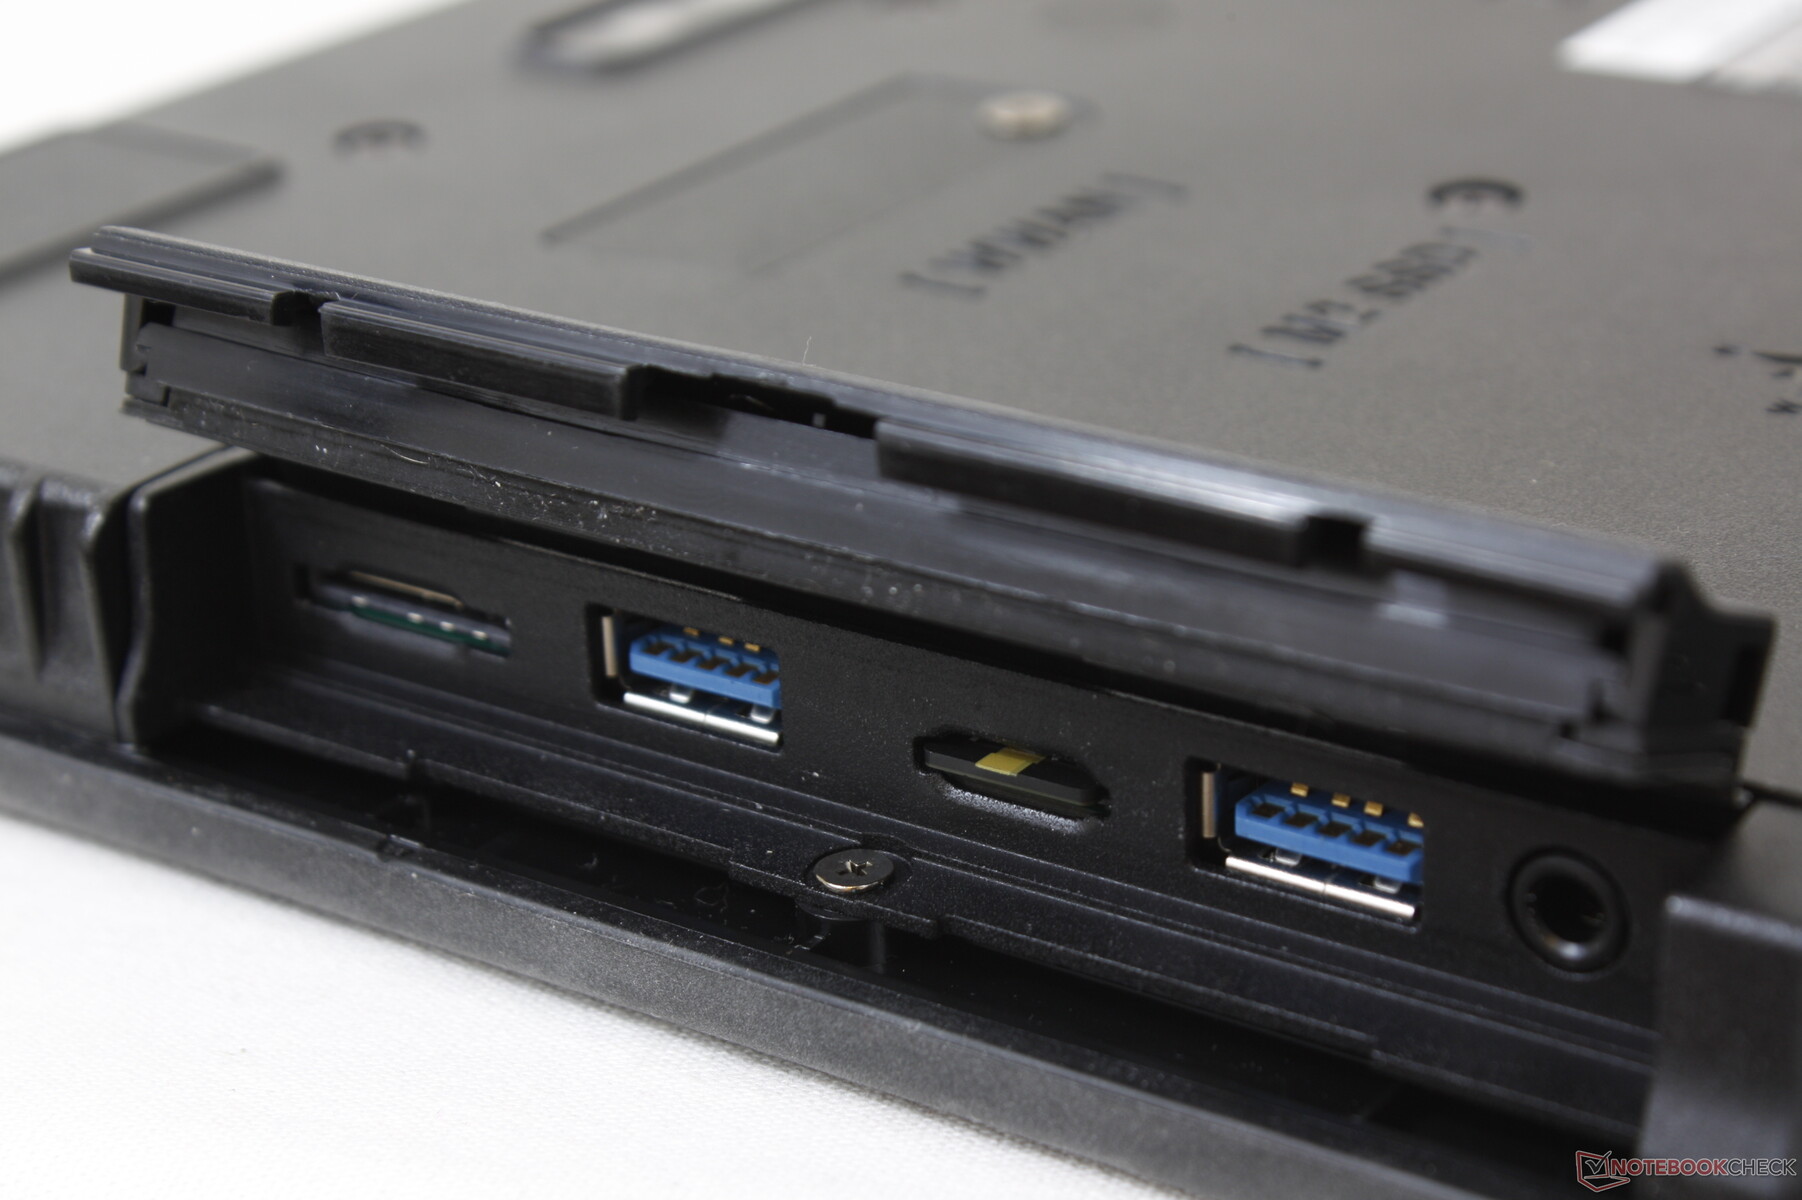
Proprietary docking stations connect along the bottom of the tablet while the right side houses most of the ports including the Mini SIM slot. The cover protecting the ports can be difficult to open.
SD Card Reader
Transfer rates from the SD card reader are slow. Moving 1 GB of pictures from our UHS-II test card to desktop takes almost 40 seconds.
| SD Card Reader | |
| average JPG Copy Test (av. of 3 runs) | |
| Dell Latitude 5420 Rugged-P85G (Toshiba Exceria Pro SDXC 64 GB UHS-II) | |
| Dell Latitude 7200 (Toshiba Exceria Pro M501 64 GB UHS-II) | |
| Dell Latitude 7424 Rugged Extreme (Toshiba Exceria Pro SDXC 64 GB UHS-II) | |
| Fujitsu Stylistic Q738 (Toshiba Exceria Pro M501 microSDXC 64GB) | |
| Durabook R11 (Toshiba Exceria Pro M501 microSDXC 64GB) | |
| maximum AS SSD Seq Read Test (1GB) | |
| Dell Latitude 5420 Rugged-P85G (Toshiba Exceria Pro SDXC 64 GB UHS-II) | |
| Dell Latitude 7424 Rugged Extreme (Toshiba Exceria Pro SDXC 64 GB UHS-II) | |
| Dell Latitude 7200 (Toshiba Exceria Pro M501 64 GB UHS-II) | |
| Fujitsu Stylistic Q738 (Toshiba Exceria Pro M501 microSDXC 64GB) | |
| Durabook R11 (Toshiba Exceria Pro M501 microSDXC 64GB) | |
Communication
The Intel 9260 comes standard for Wi-Fi 5 and Bluetooth 5 connectivity. An optional 4G LTE M.2 module may be installed by the end-user as the antenna are included.
| Networking | |
| iperf3 transmit AX12 | |
| HP Envy x360 13-ay0010nr | |
| Microsoft Surface Book 3 15 | |
| Acer Swift 3 SF314-42-R27B | |
| Durabook R11 | |
| iperf3 receive AX12 | |
| HP Envy x360 13-ay0010nr | |
| Acer Swift 3 SF314-42-R27B | |
| Microsoft Surface Book 3 15 | |
| Durabook R11 | |
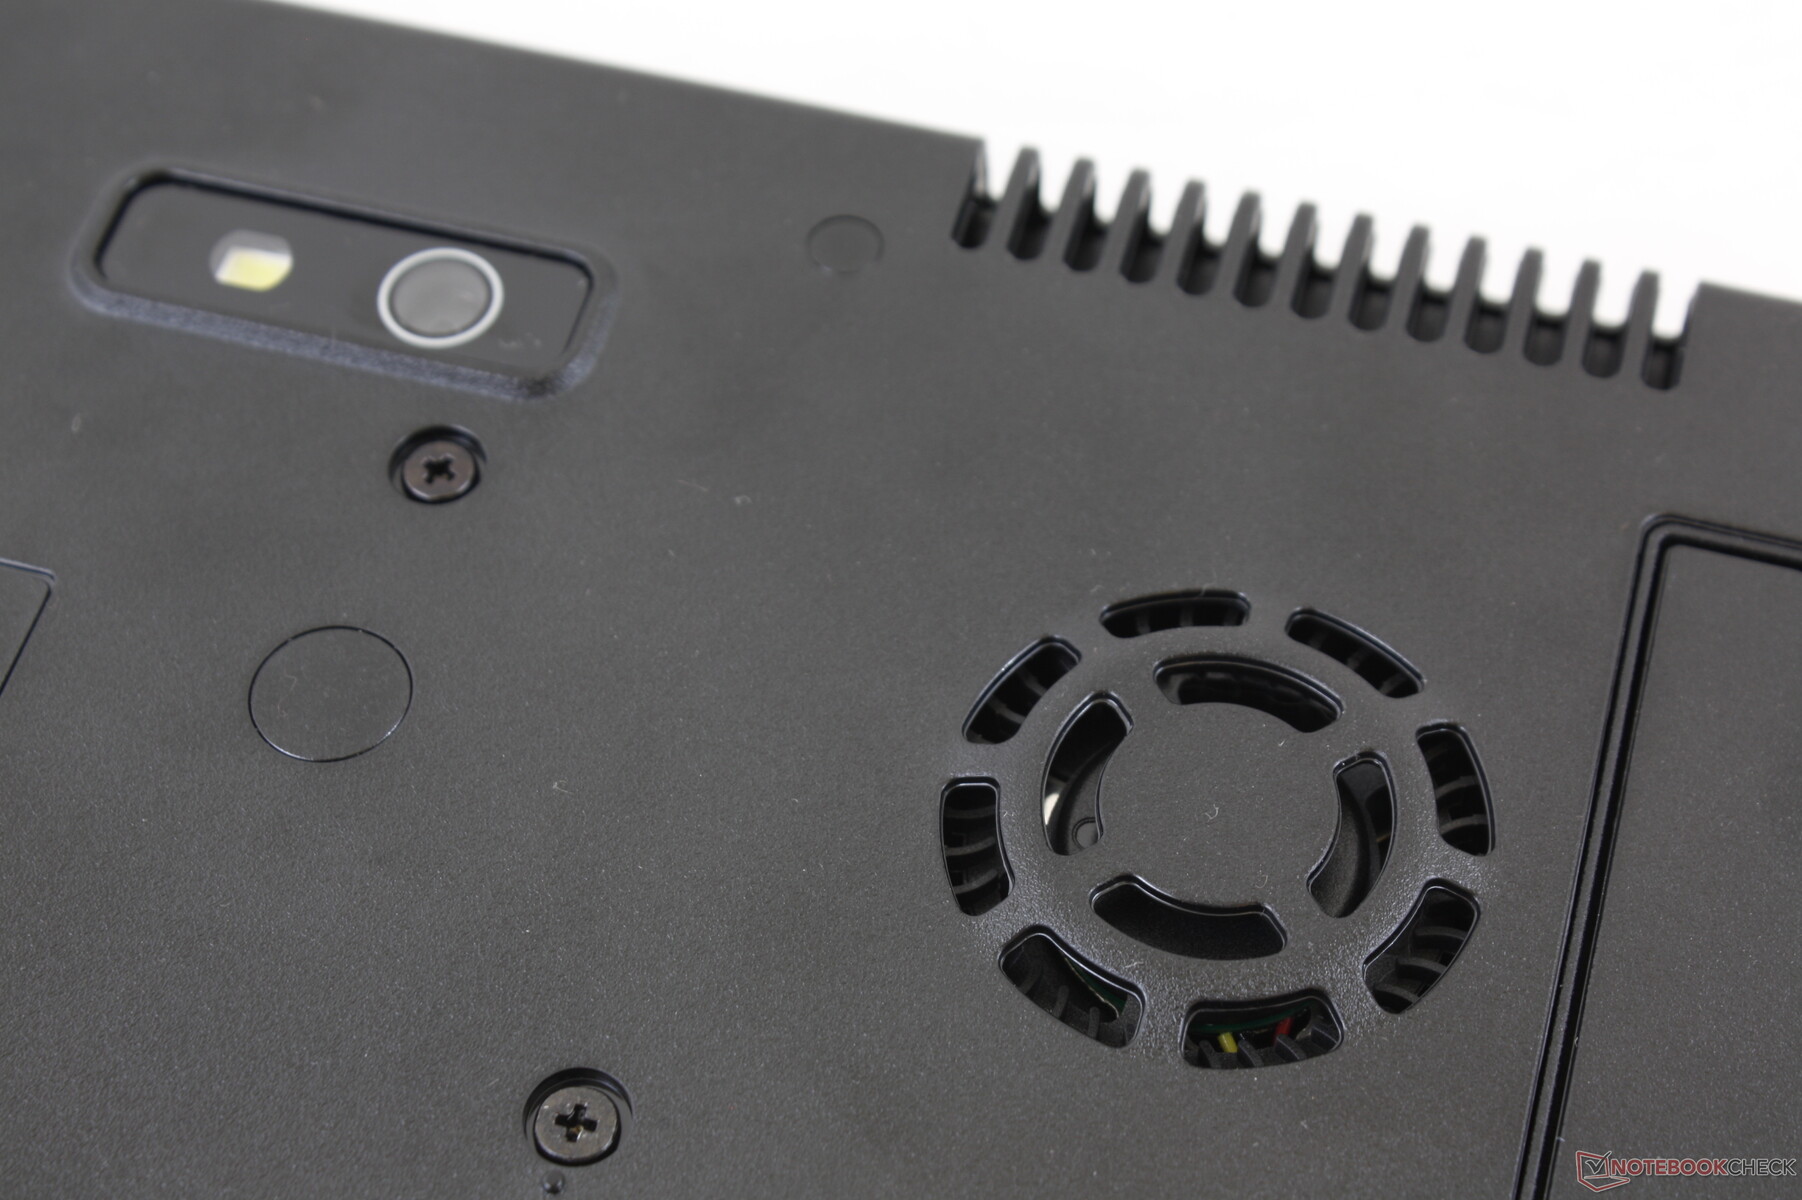
Webcam


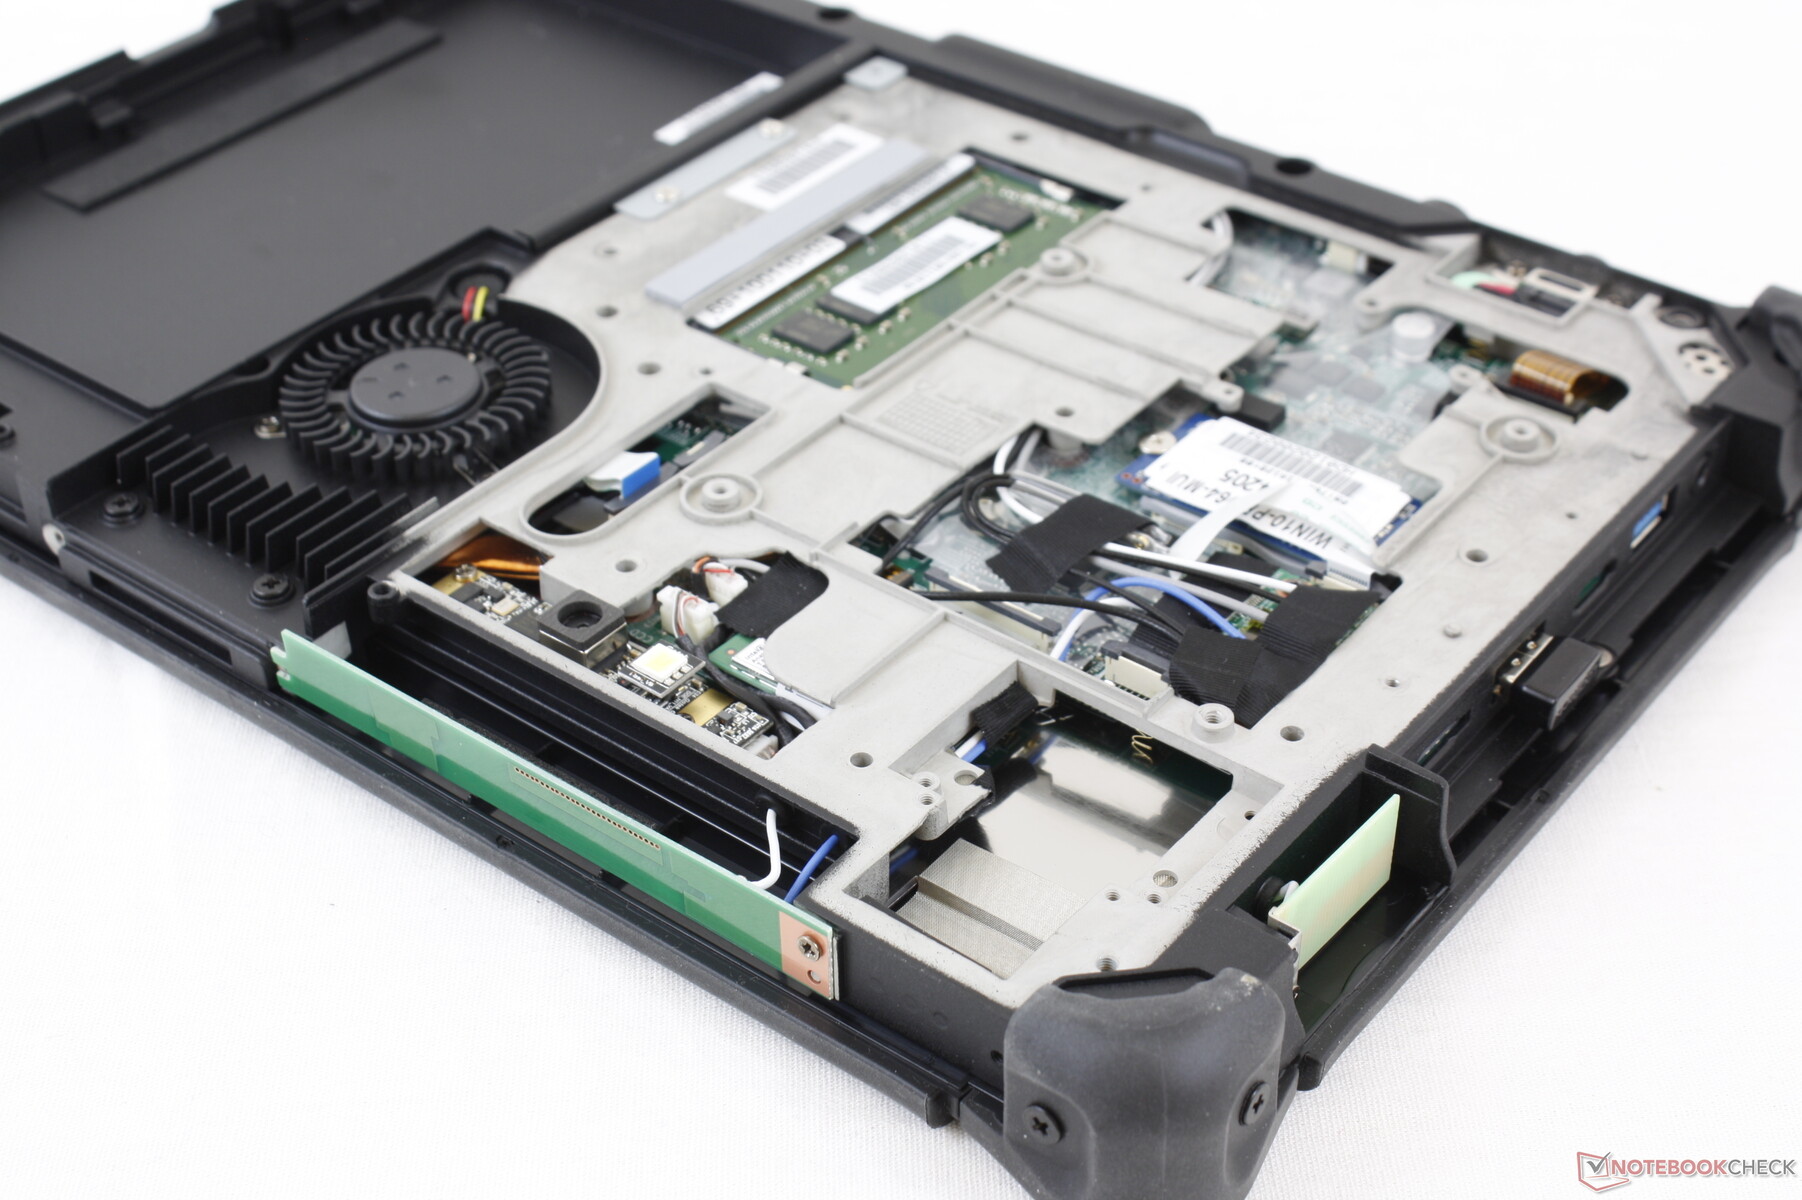
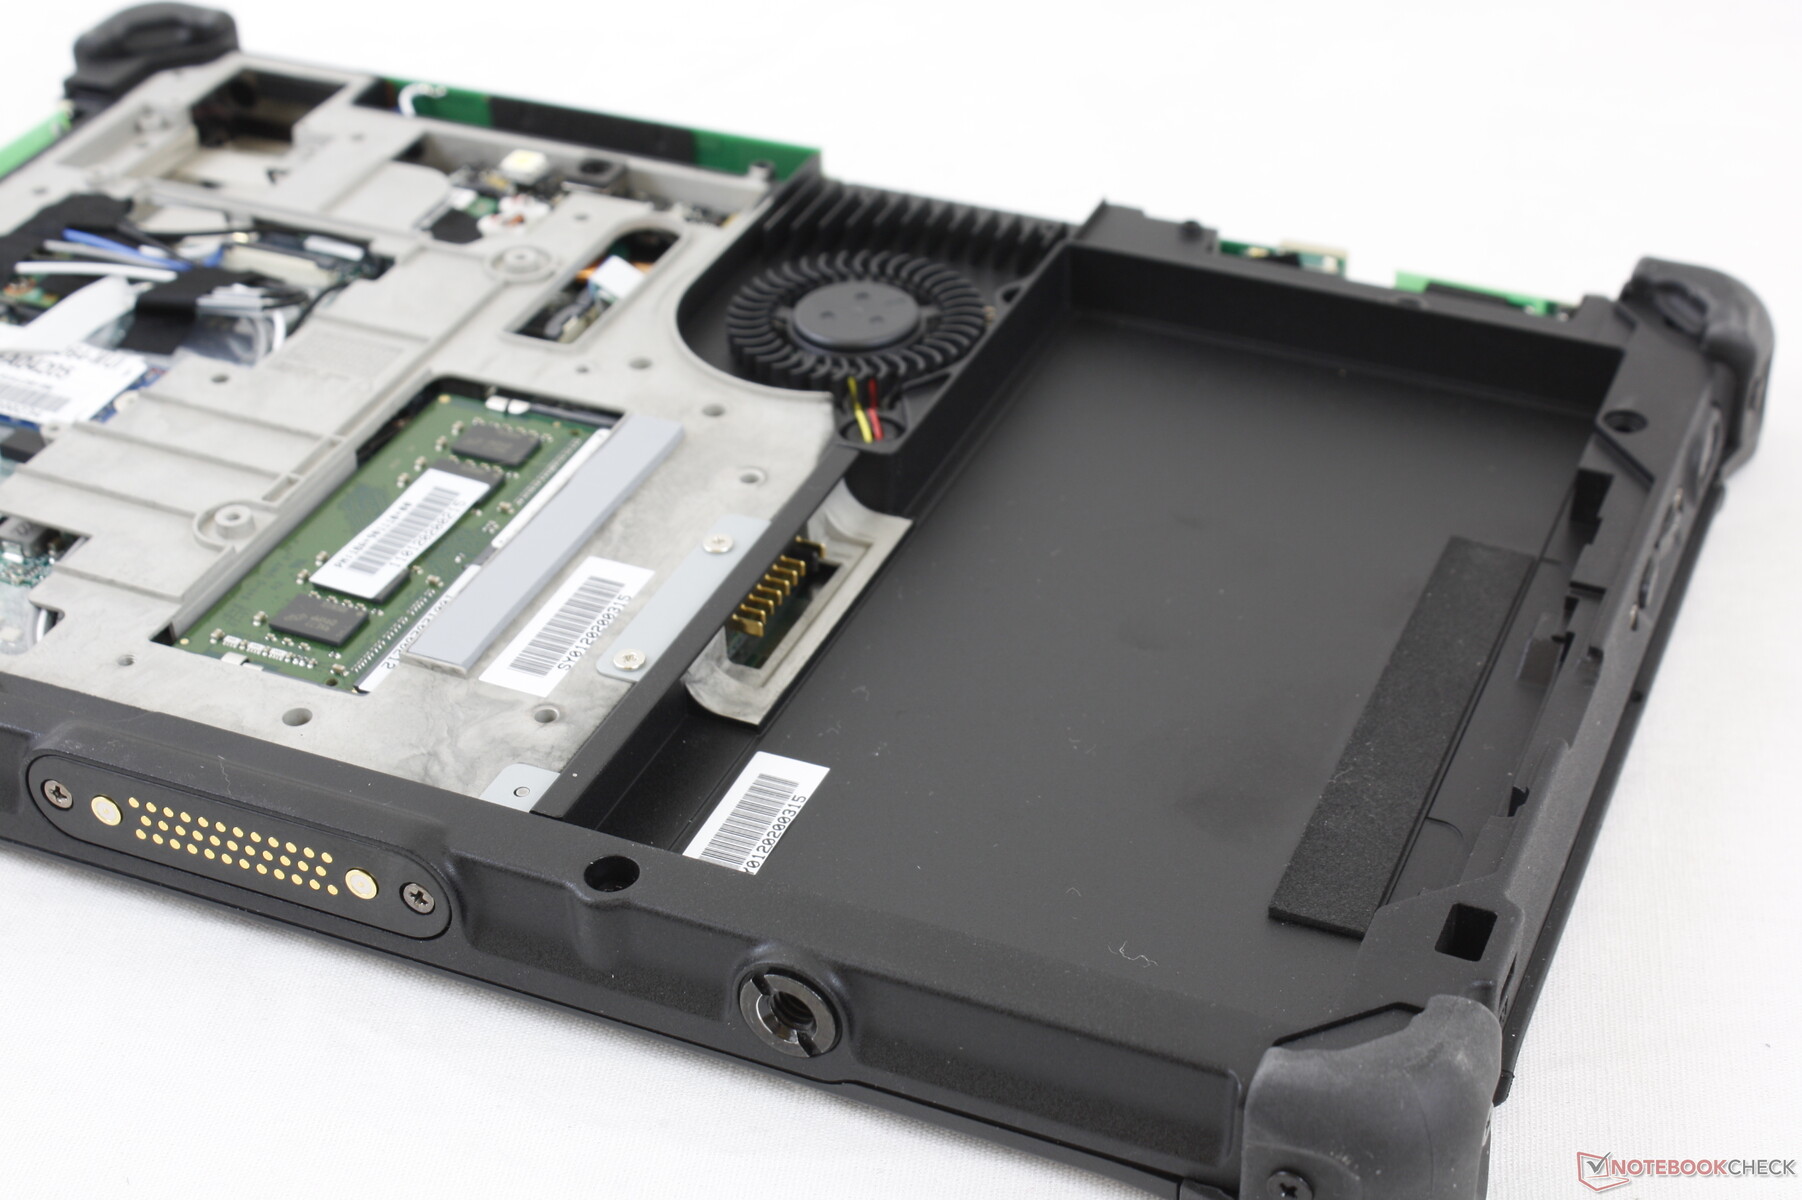
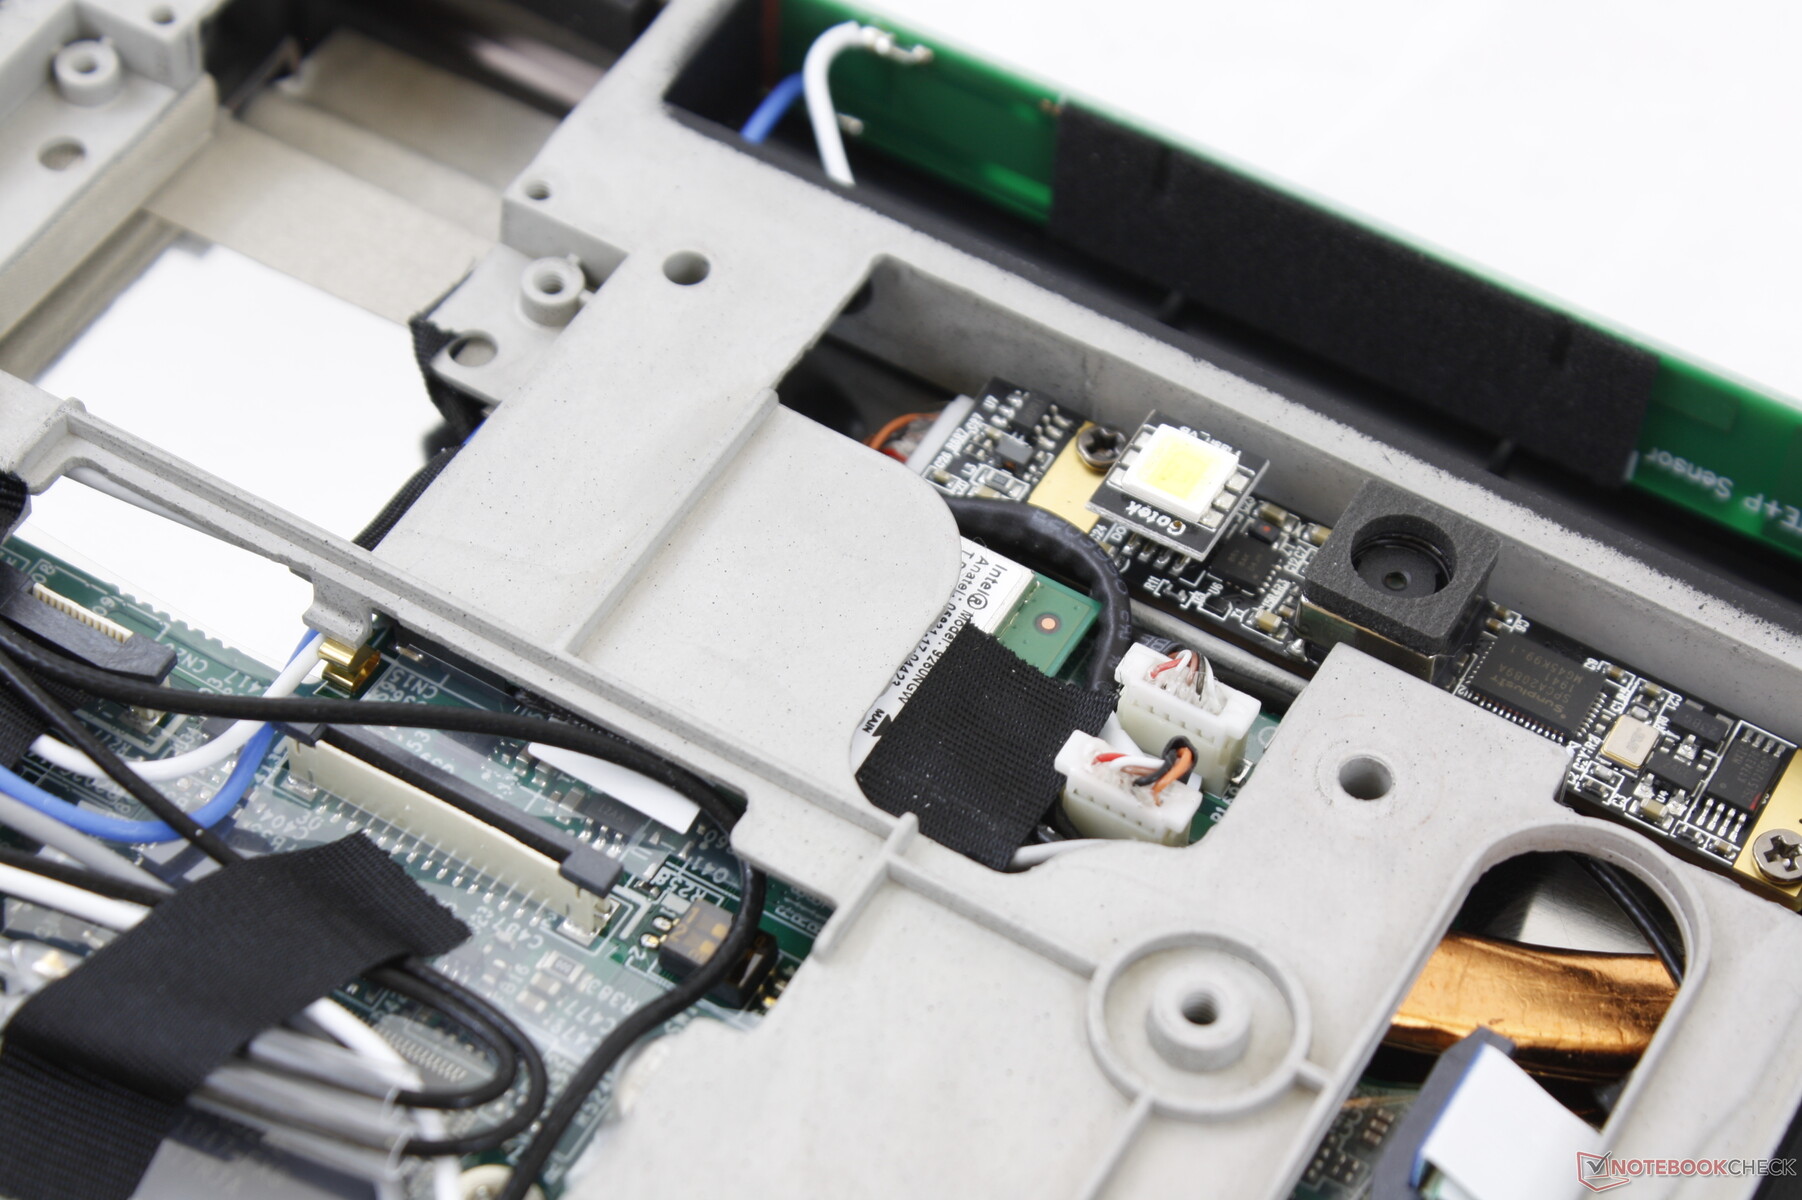
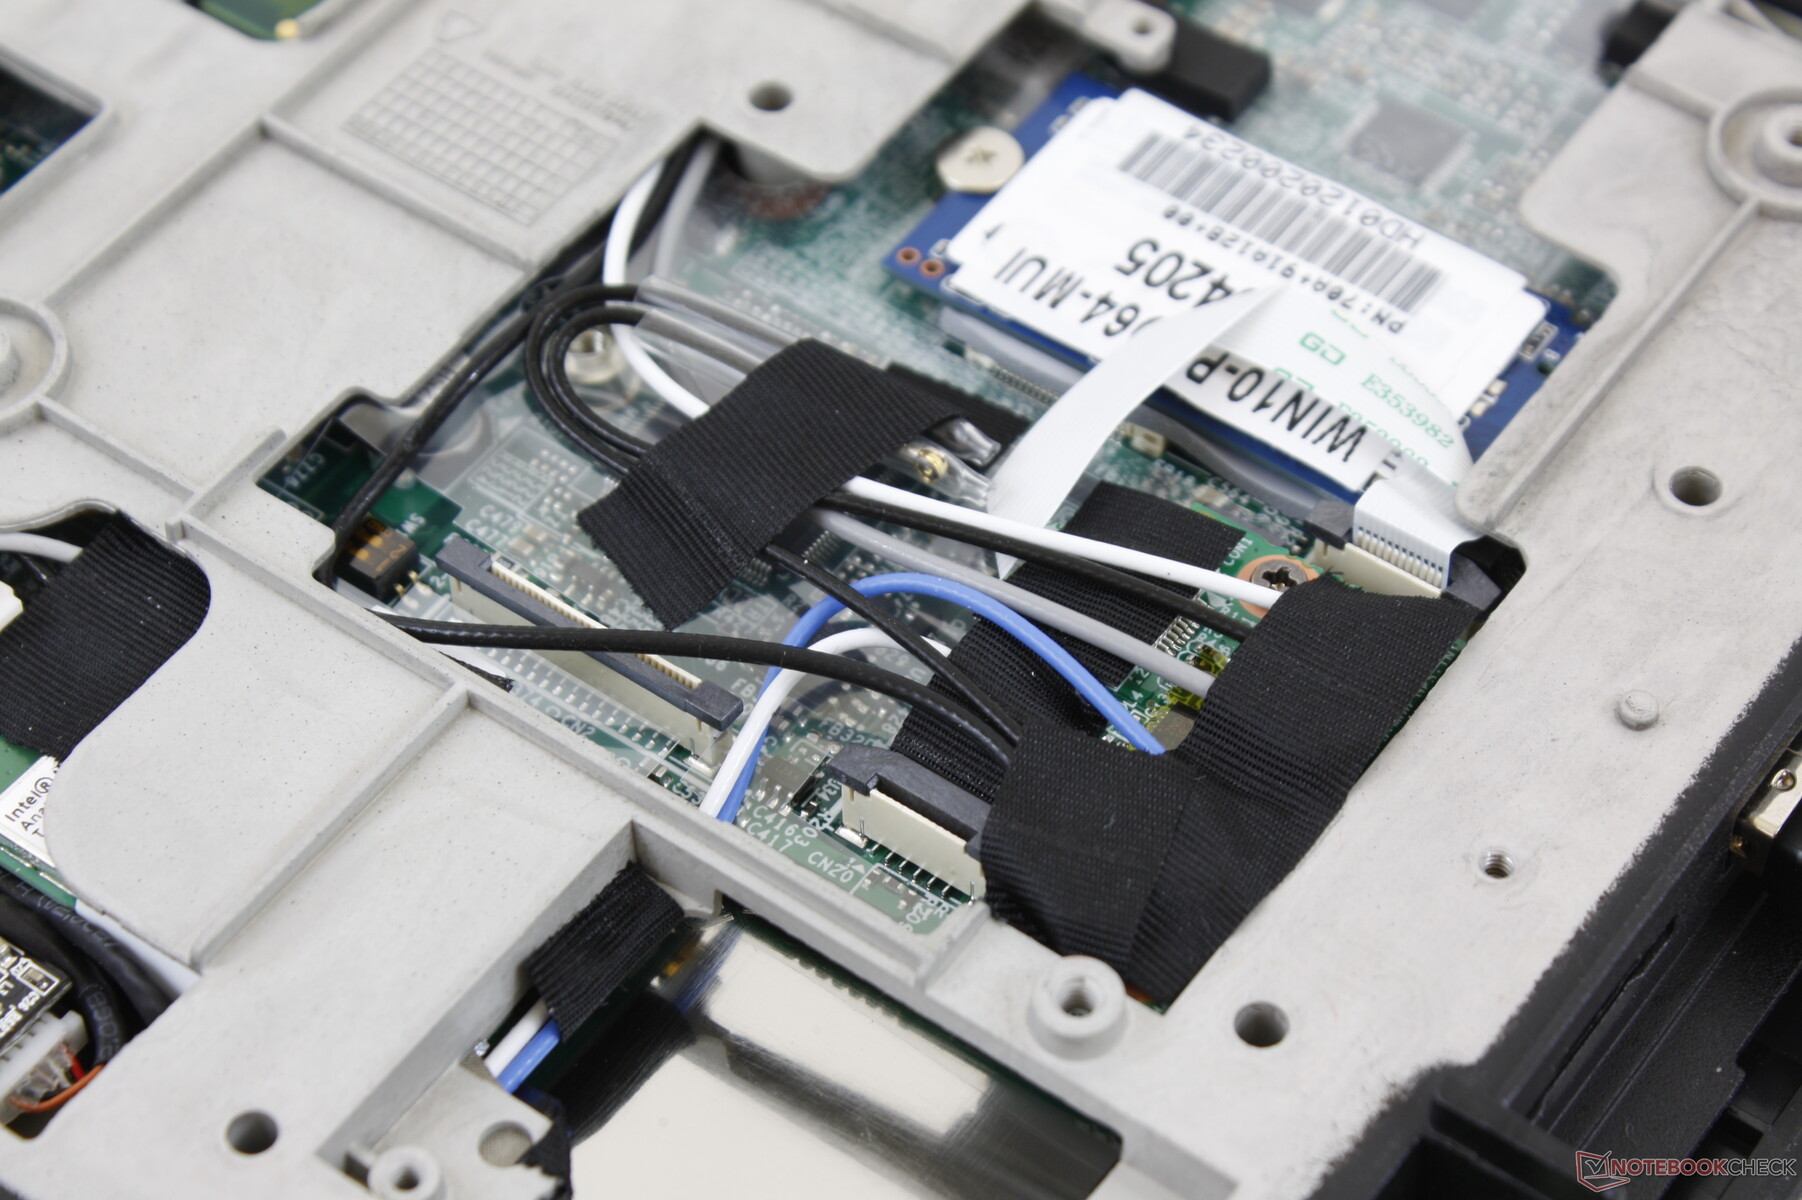
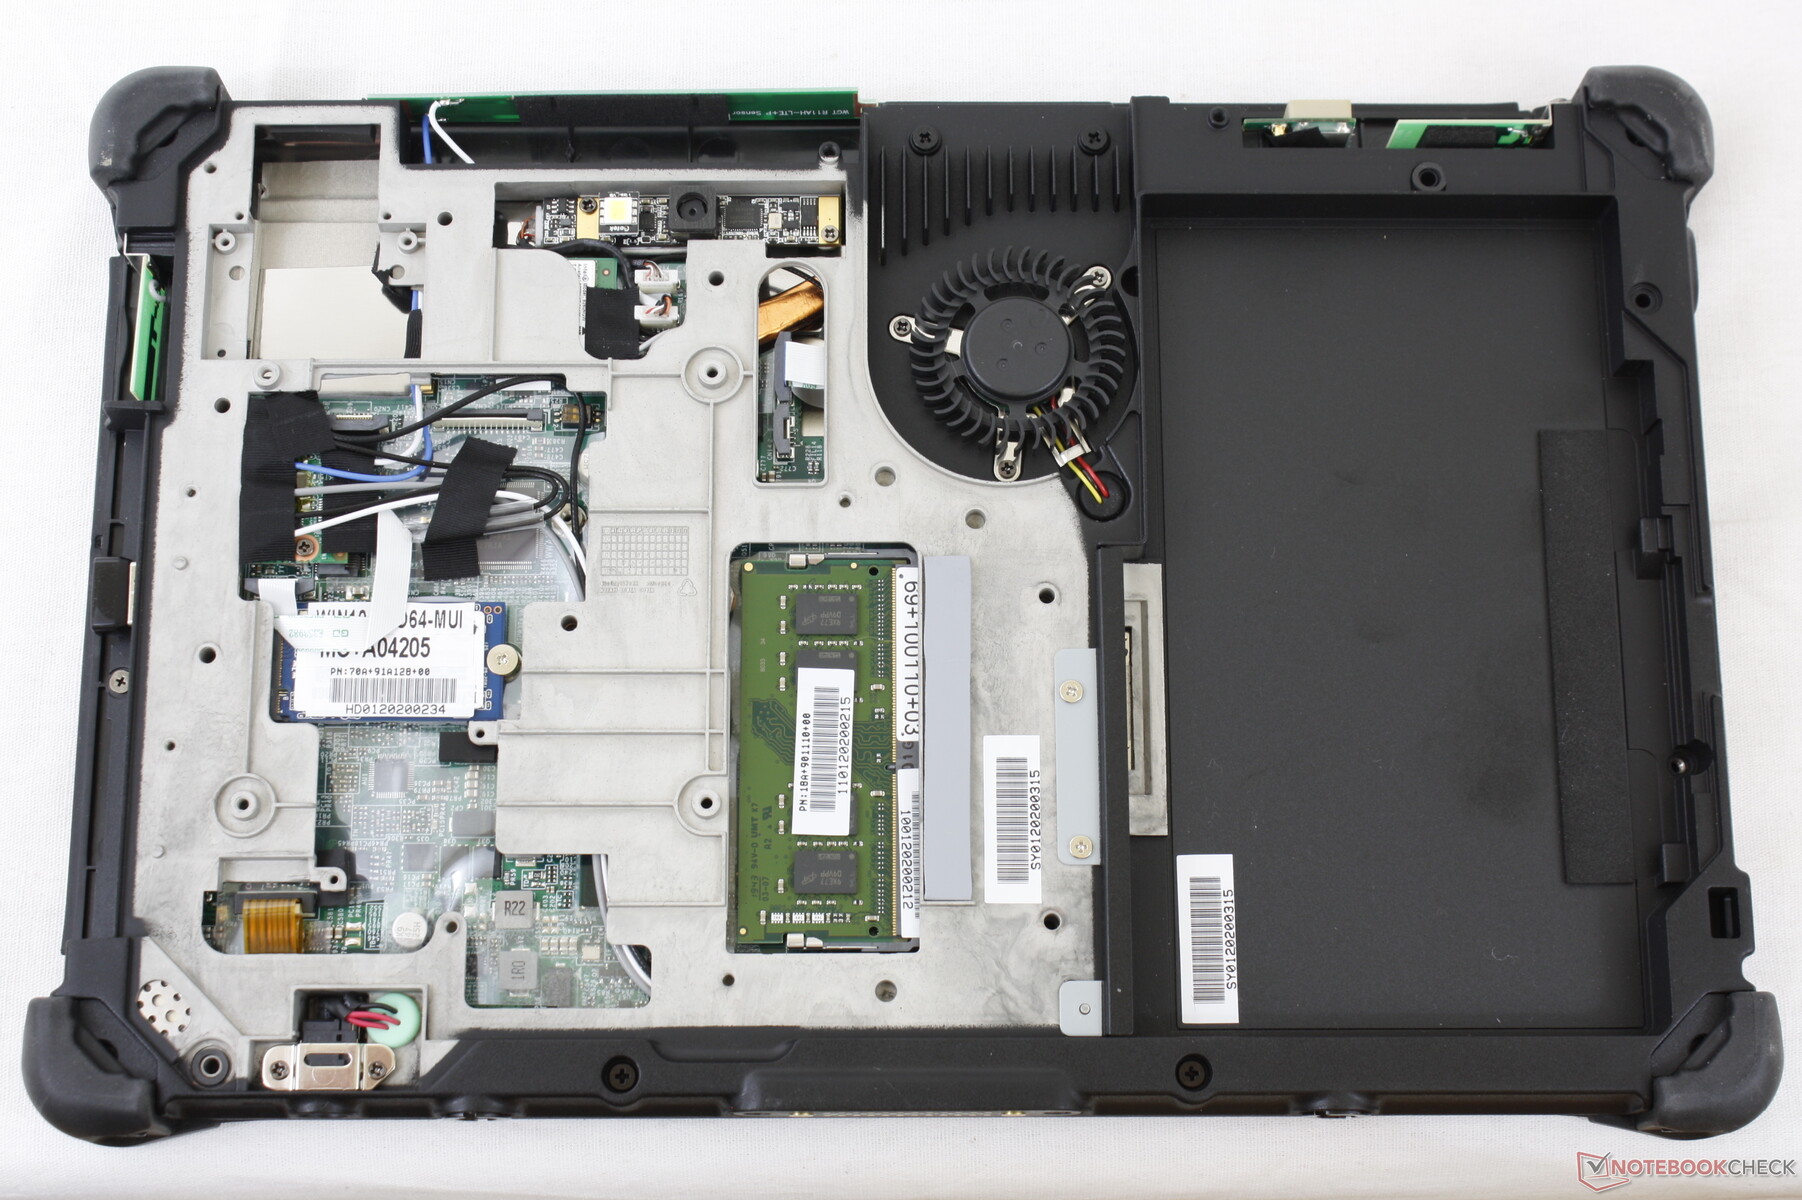
Maintenance
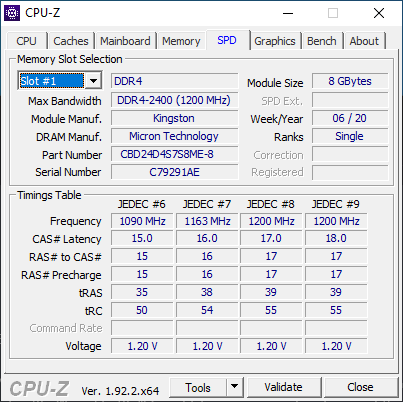
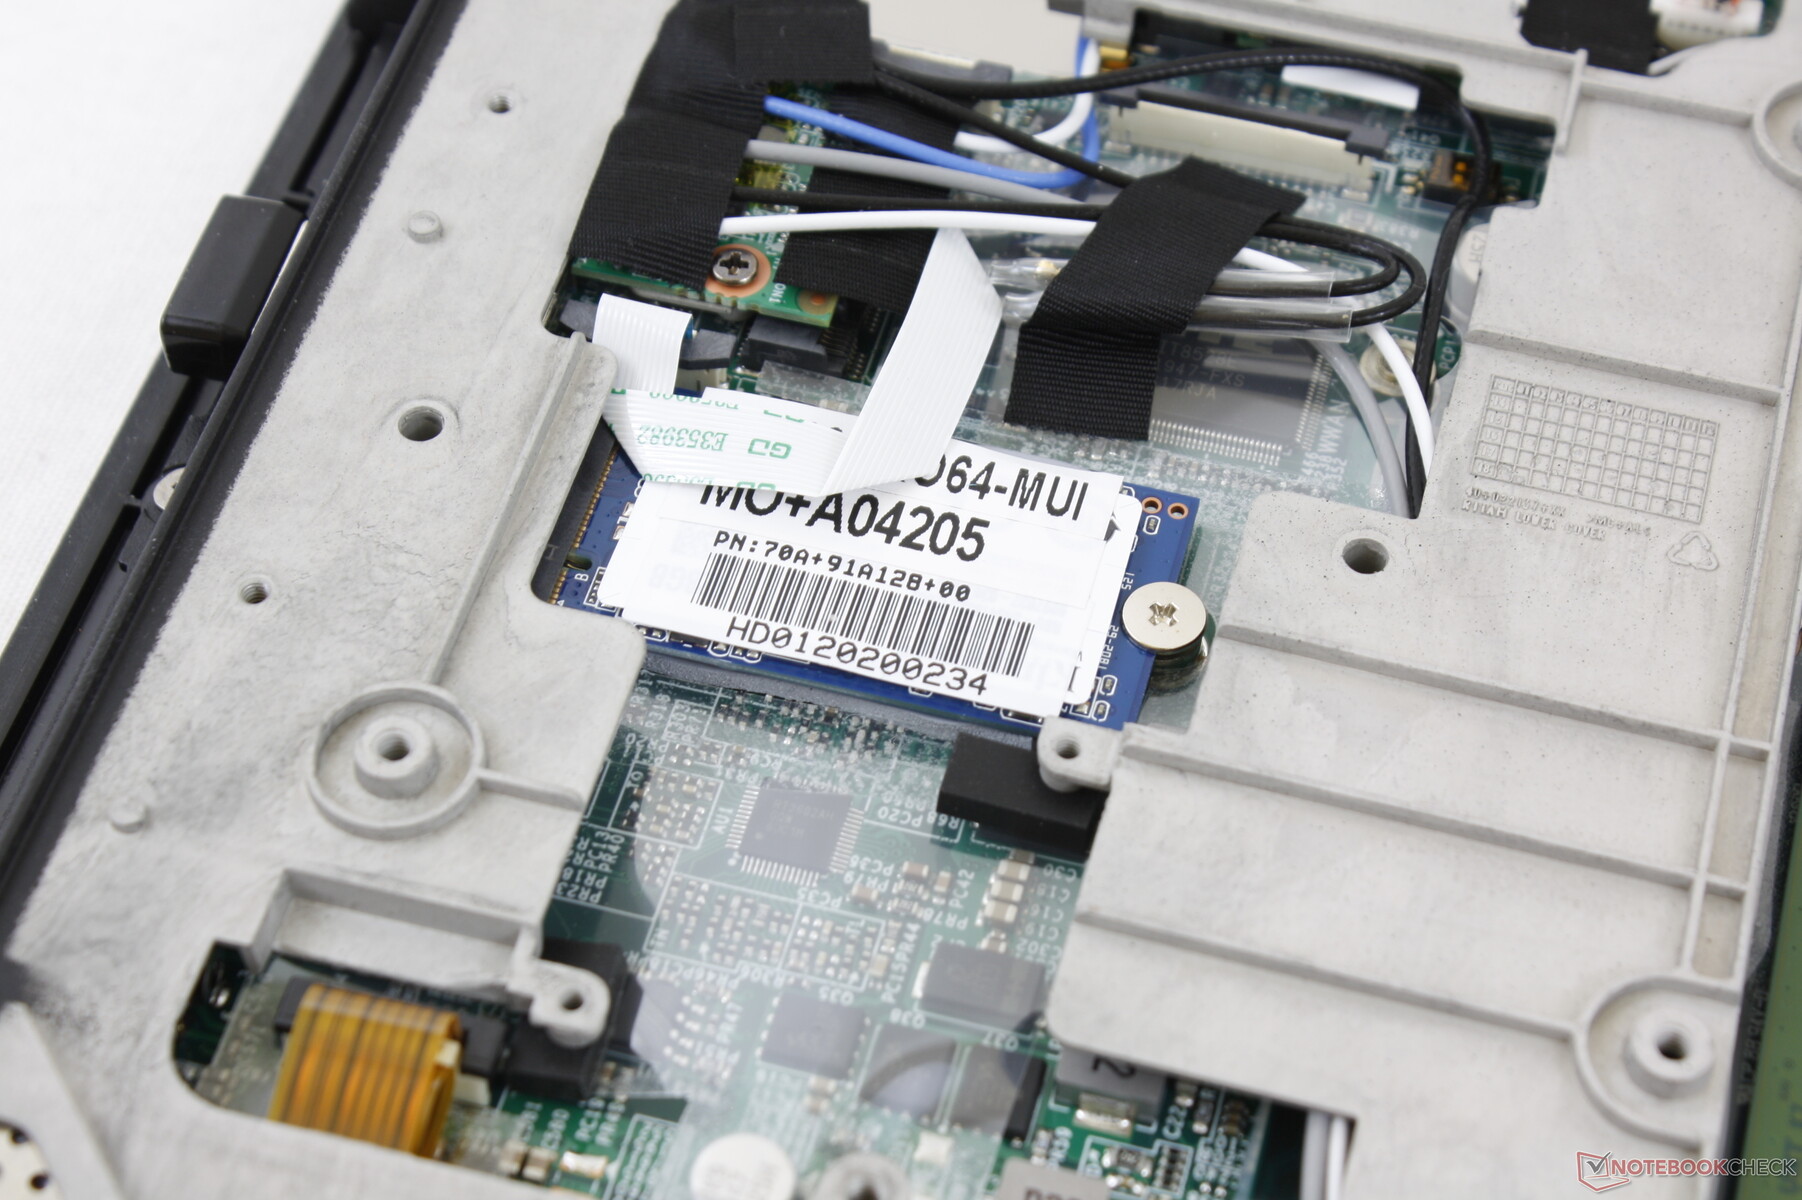
The back panel is a pain to remove since it is held in place by 19 Philips screws of different lengths and sizes. RAM, storage, WWAN, and WLAN can be serviced. Note that RAM is single-channel only.
Accessories and Warranty
Durabook offers plenty of extras including a backlit keyboard, higher capacity battery, car adapters, chargers, RFID readers, and more. The standard retail box includes a cloth for wiping the screen. A three-year warranty comes standard.
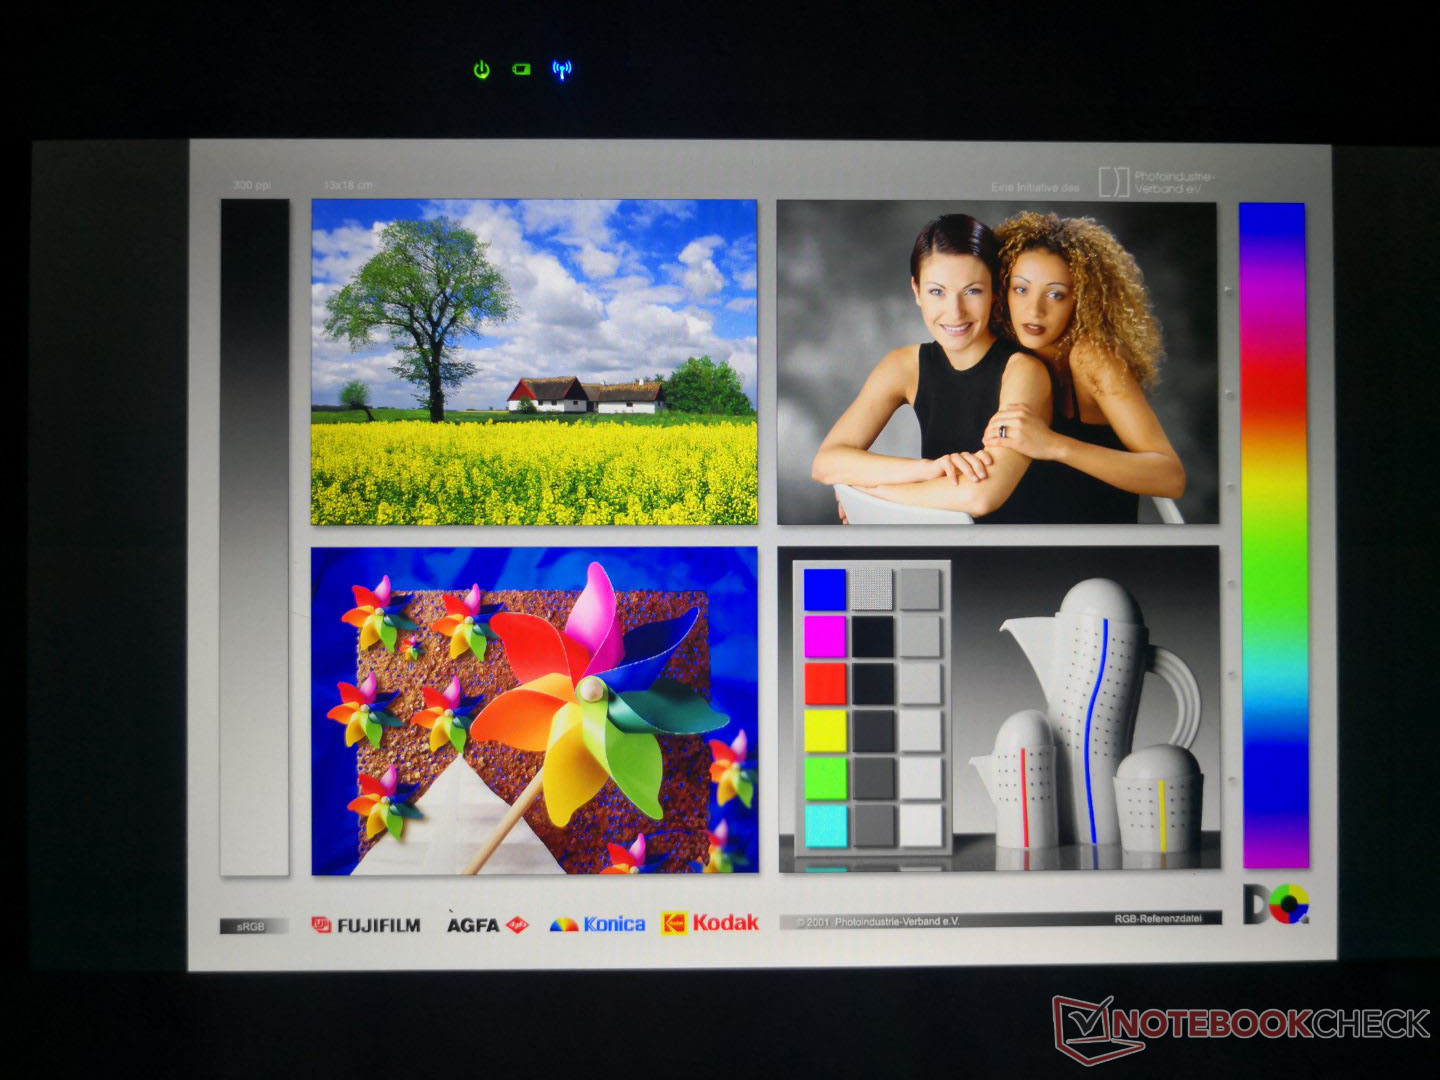
Display
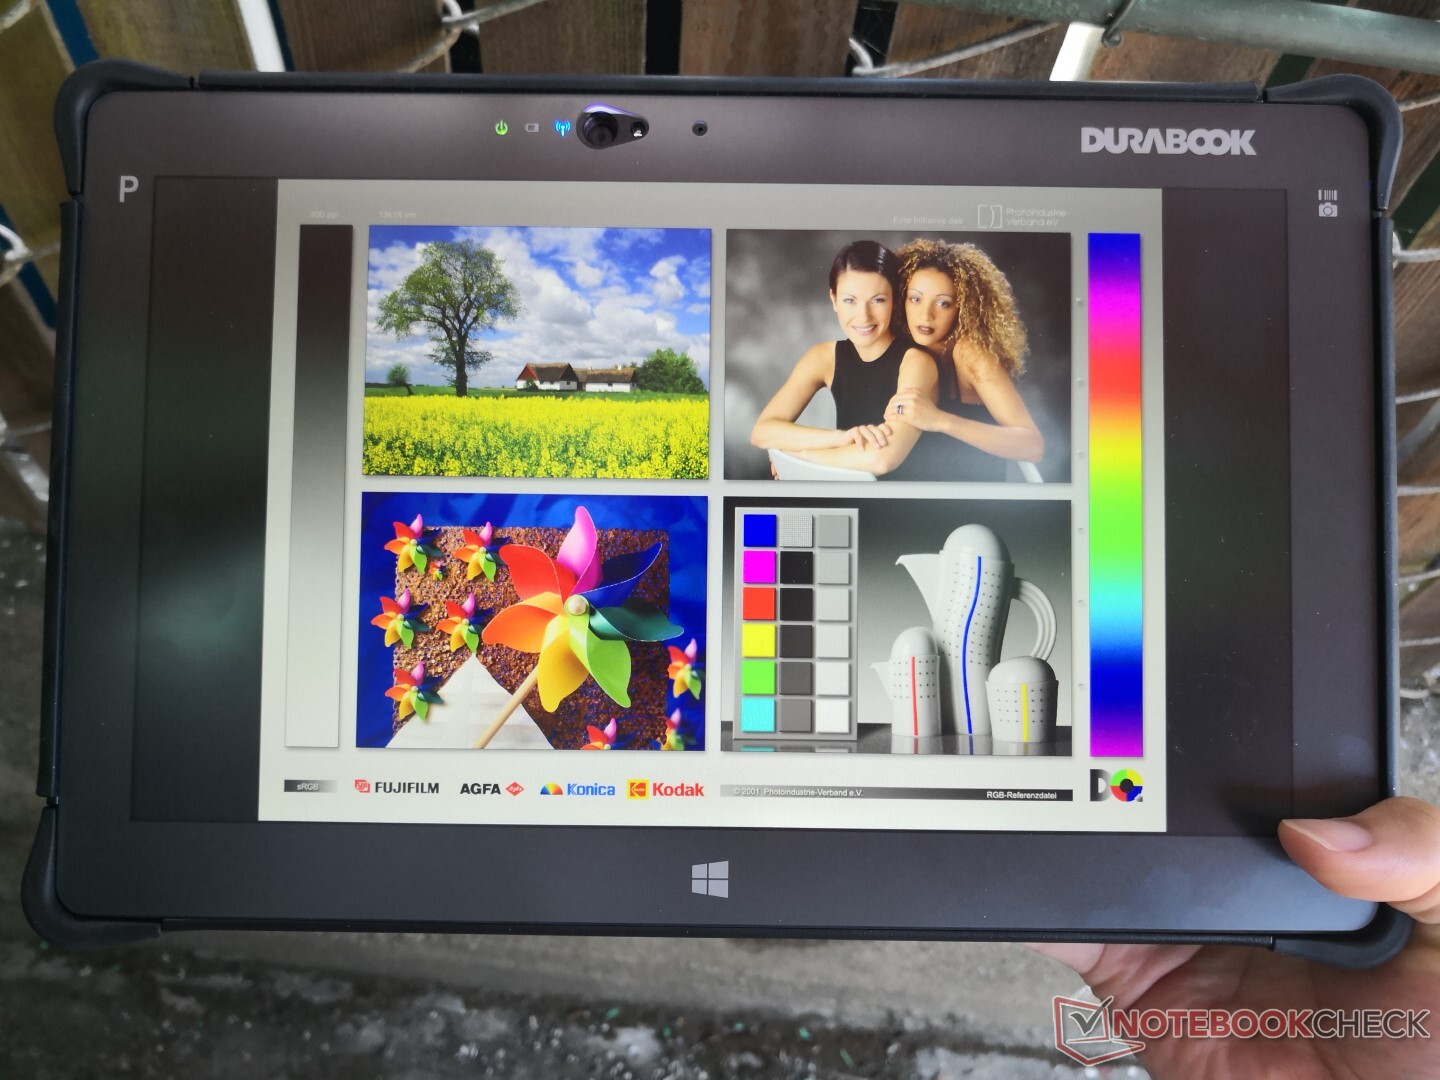
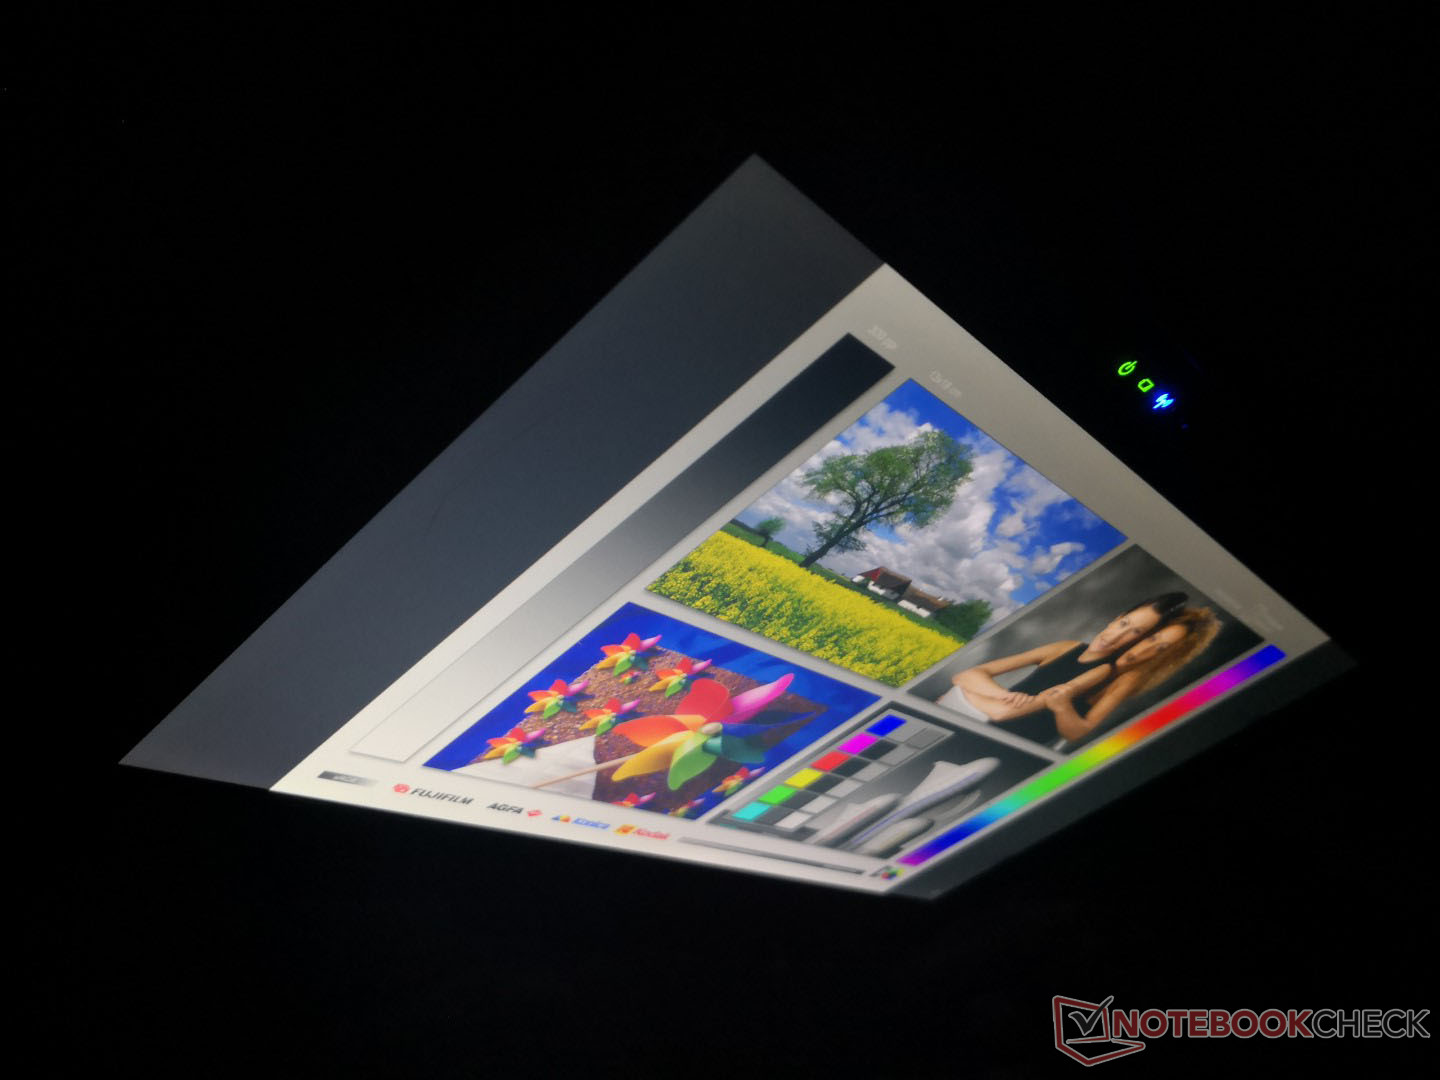
The 500-nit IPS panel on our unit is advertised as being "sunlight readable" and it is indeed brighter than many consumer tablets. However, it's far from being readable in direct sunlight as competing portables like the HP EliteBook or the Dell Latitude Rugged series offer 1000-nit options that can literally be twice as bright as our Durabook.
Outside of brightness, black-white and gray-gray response times are faster than average for the rugged category meaning reduced ghosting and a smoother visual experience. The most disappointing aspect of the display, however, is that pulse-width modulation is present on all brightness levels up to 99 percent. If your eyes are sensitive to onscreen flickering, then it may be best to avoid the Durabook R11.

| |||||||||||||||||||||||||
Brightness Distribution: 79 %
Center on Battery: 584.2 cd/m²
Contrast: 1123:1 (Black: 0.52 cd/m²)
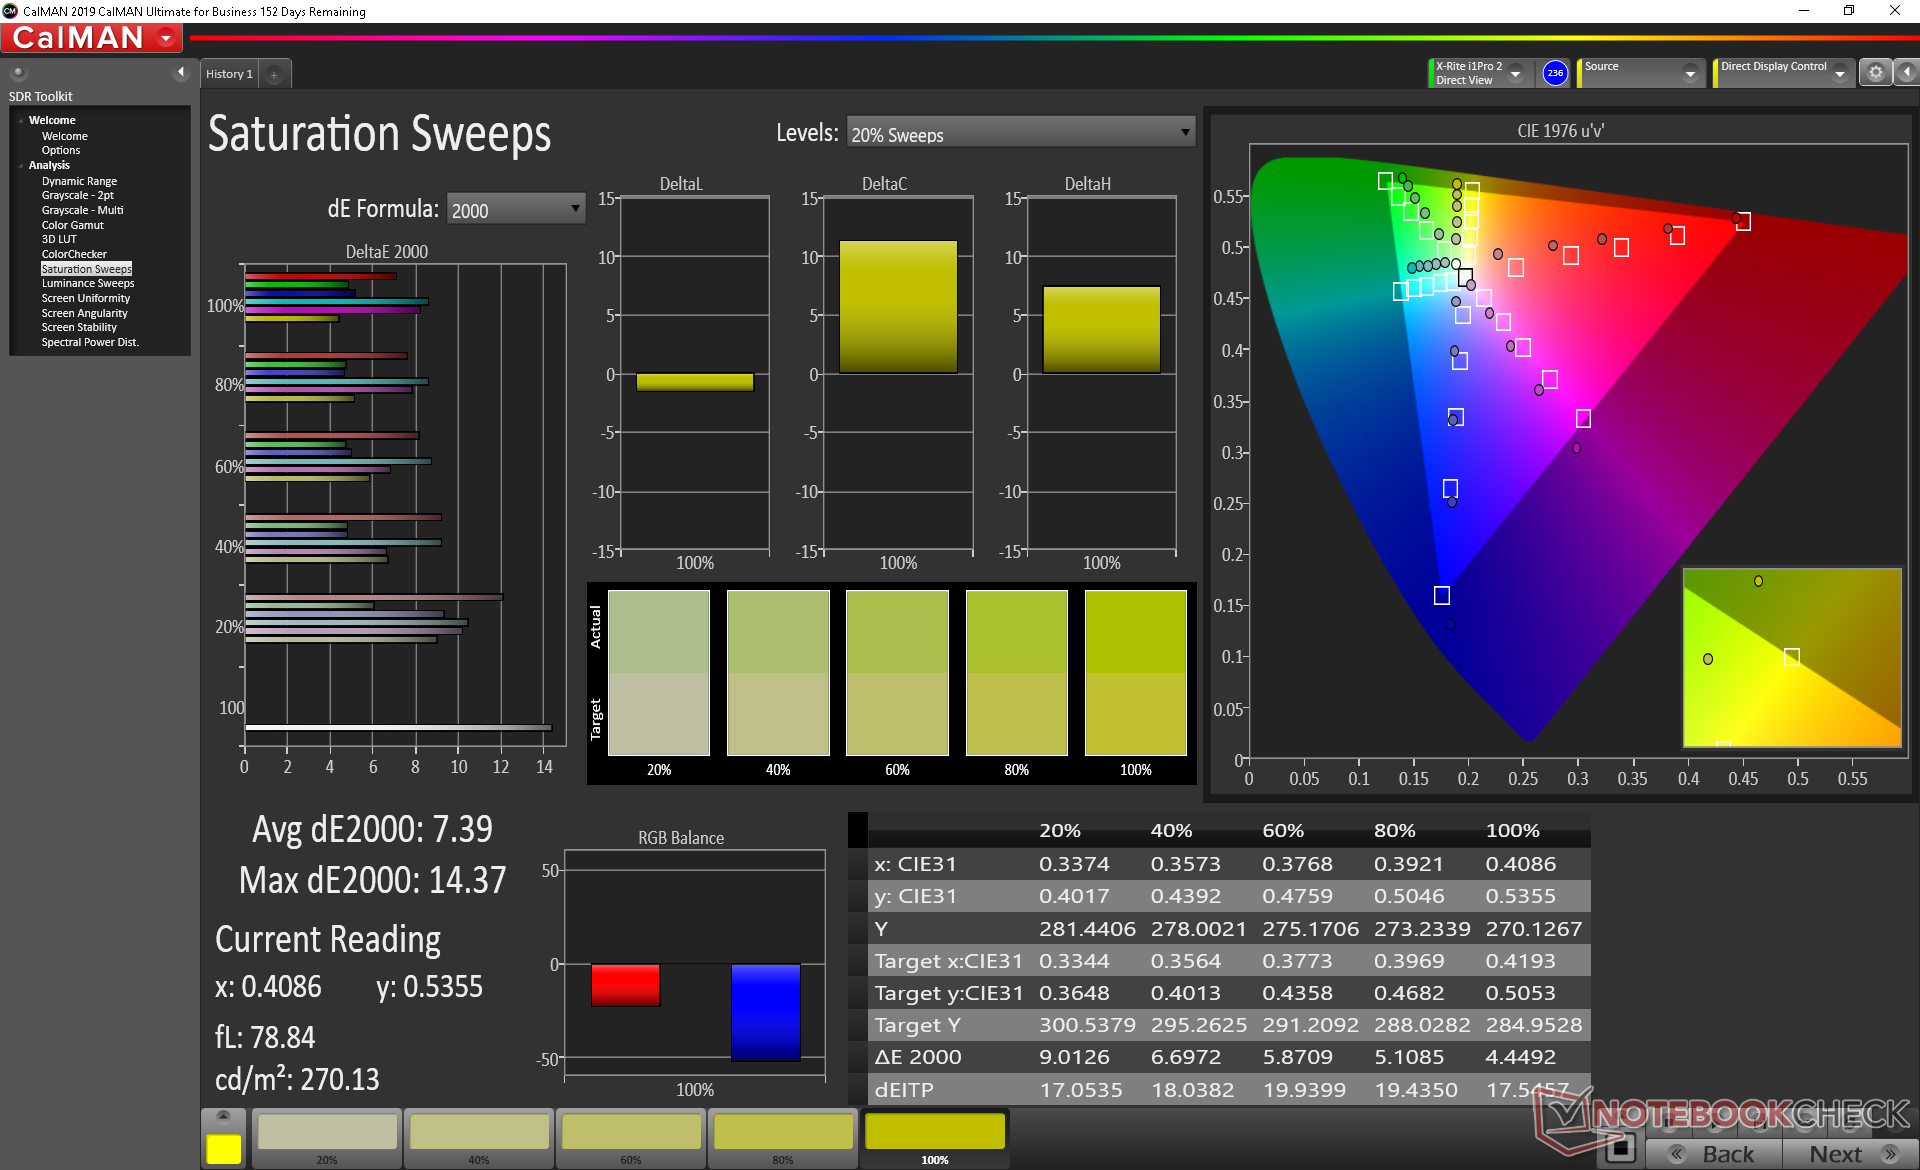
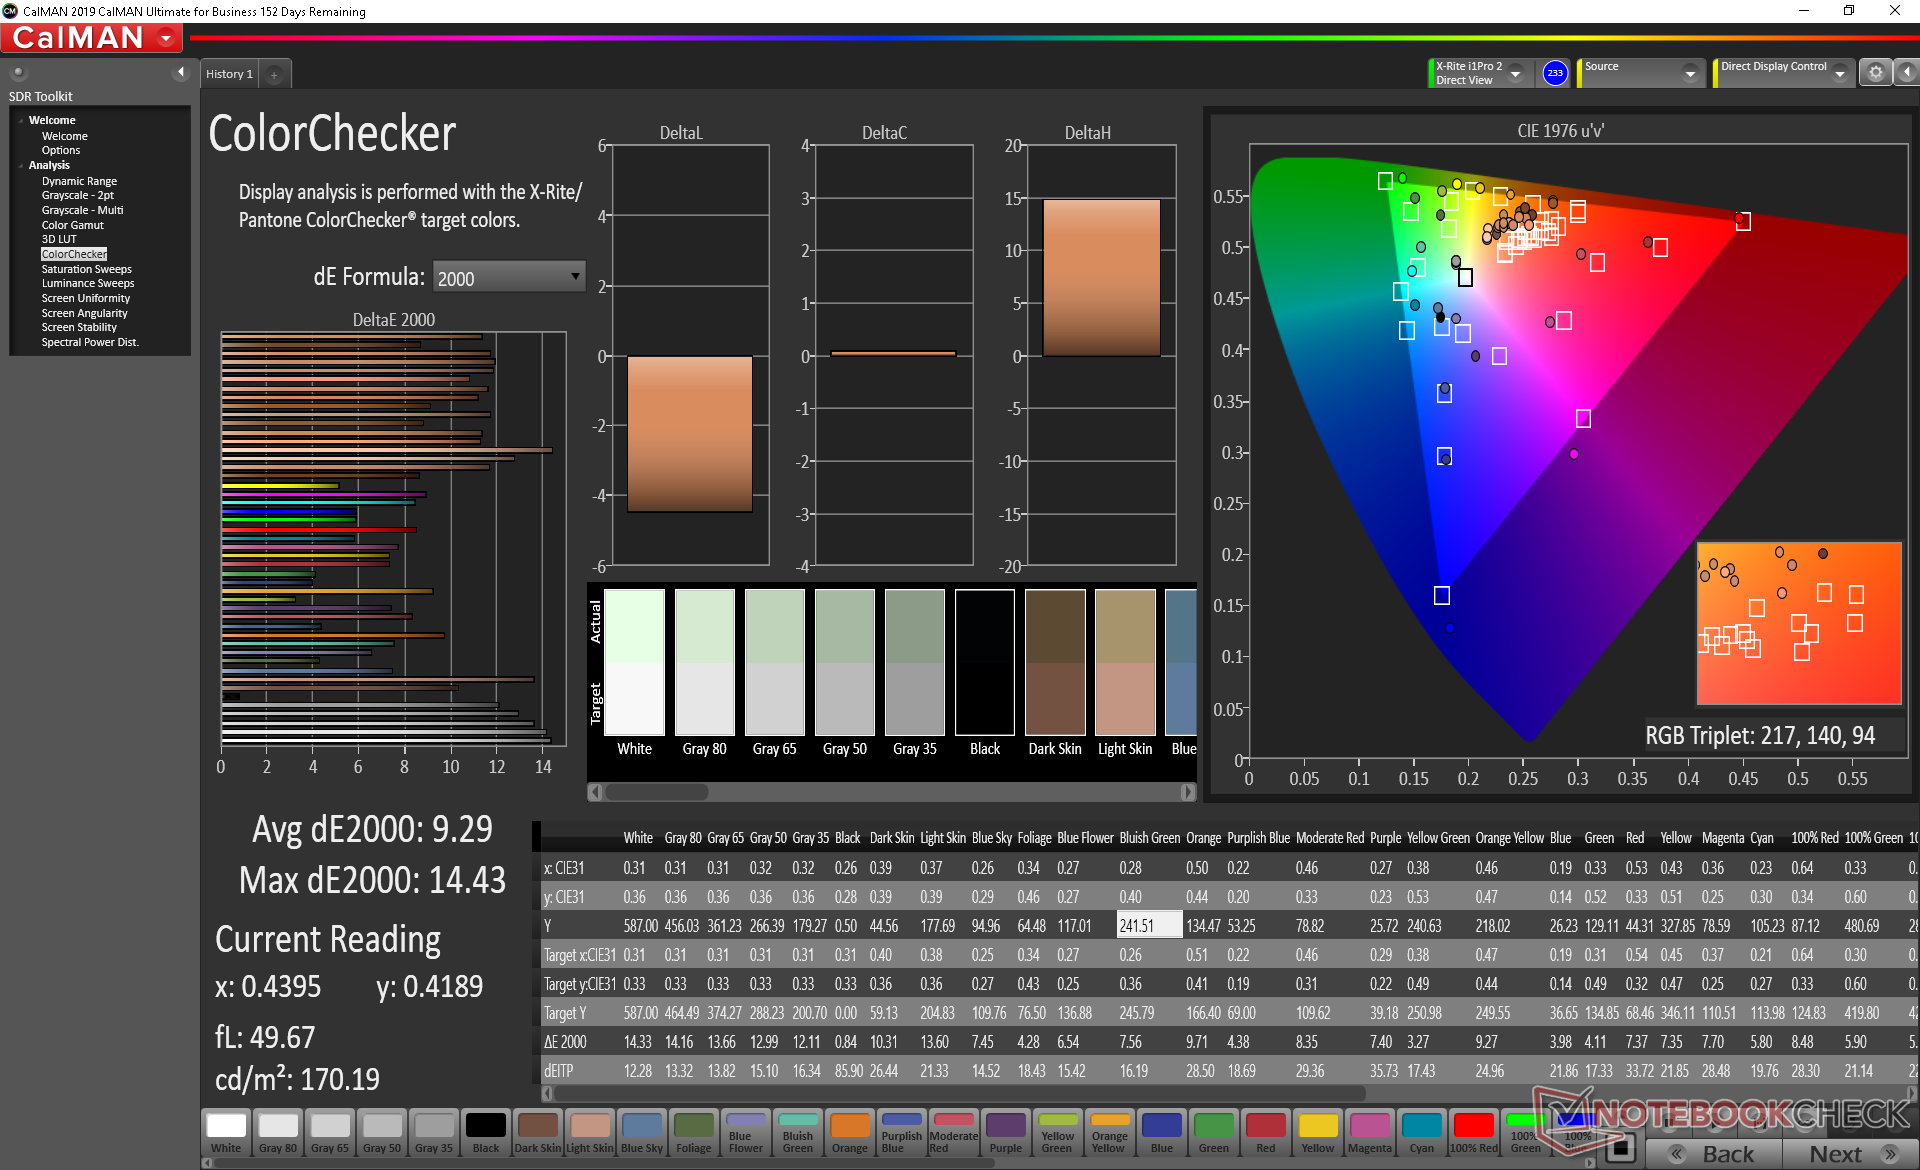
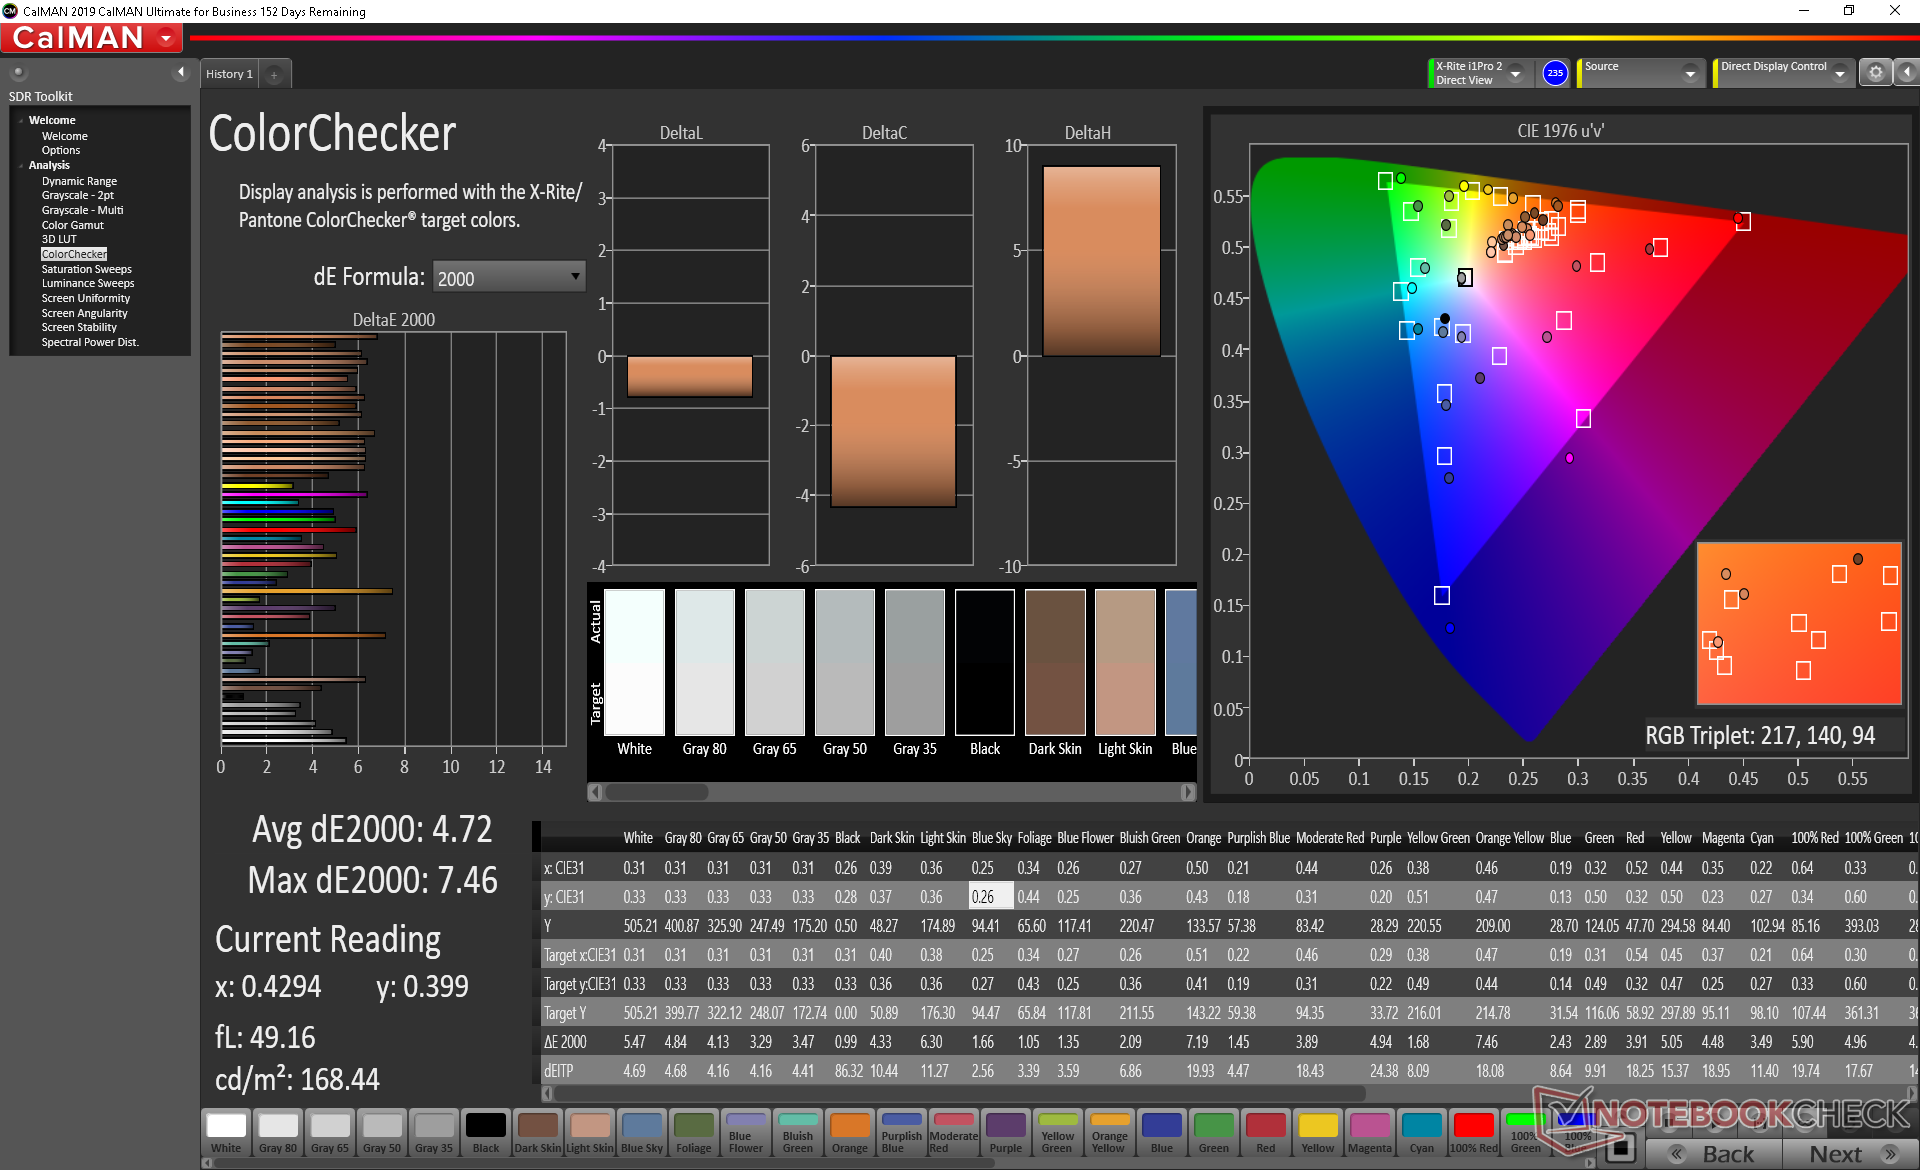
ΔE ColorChecker Calman: 9.29 | ∀{0.5-29.43 Ø4.73}
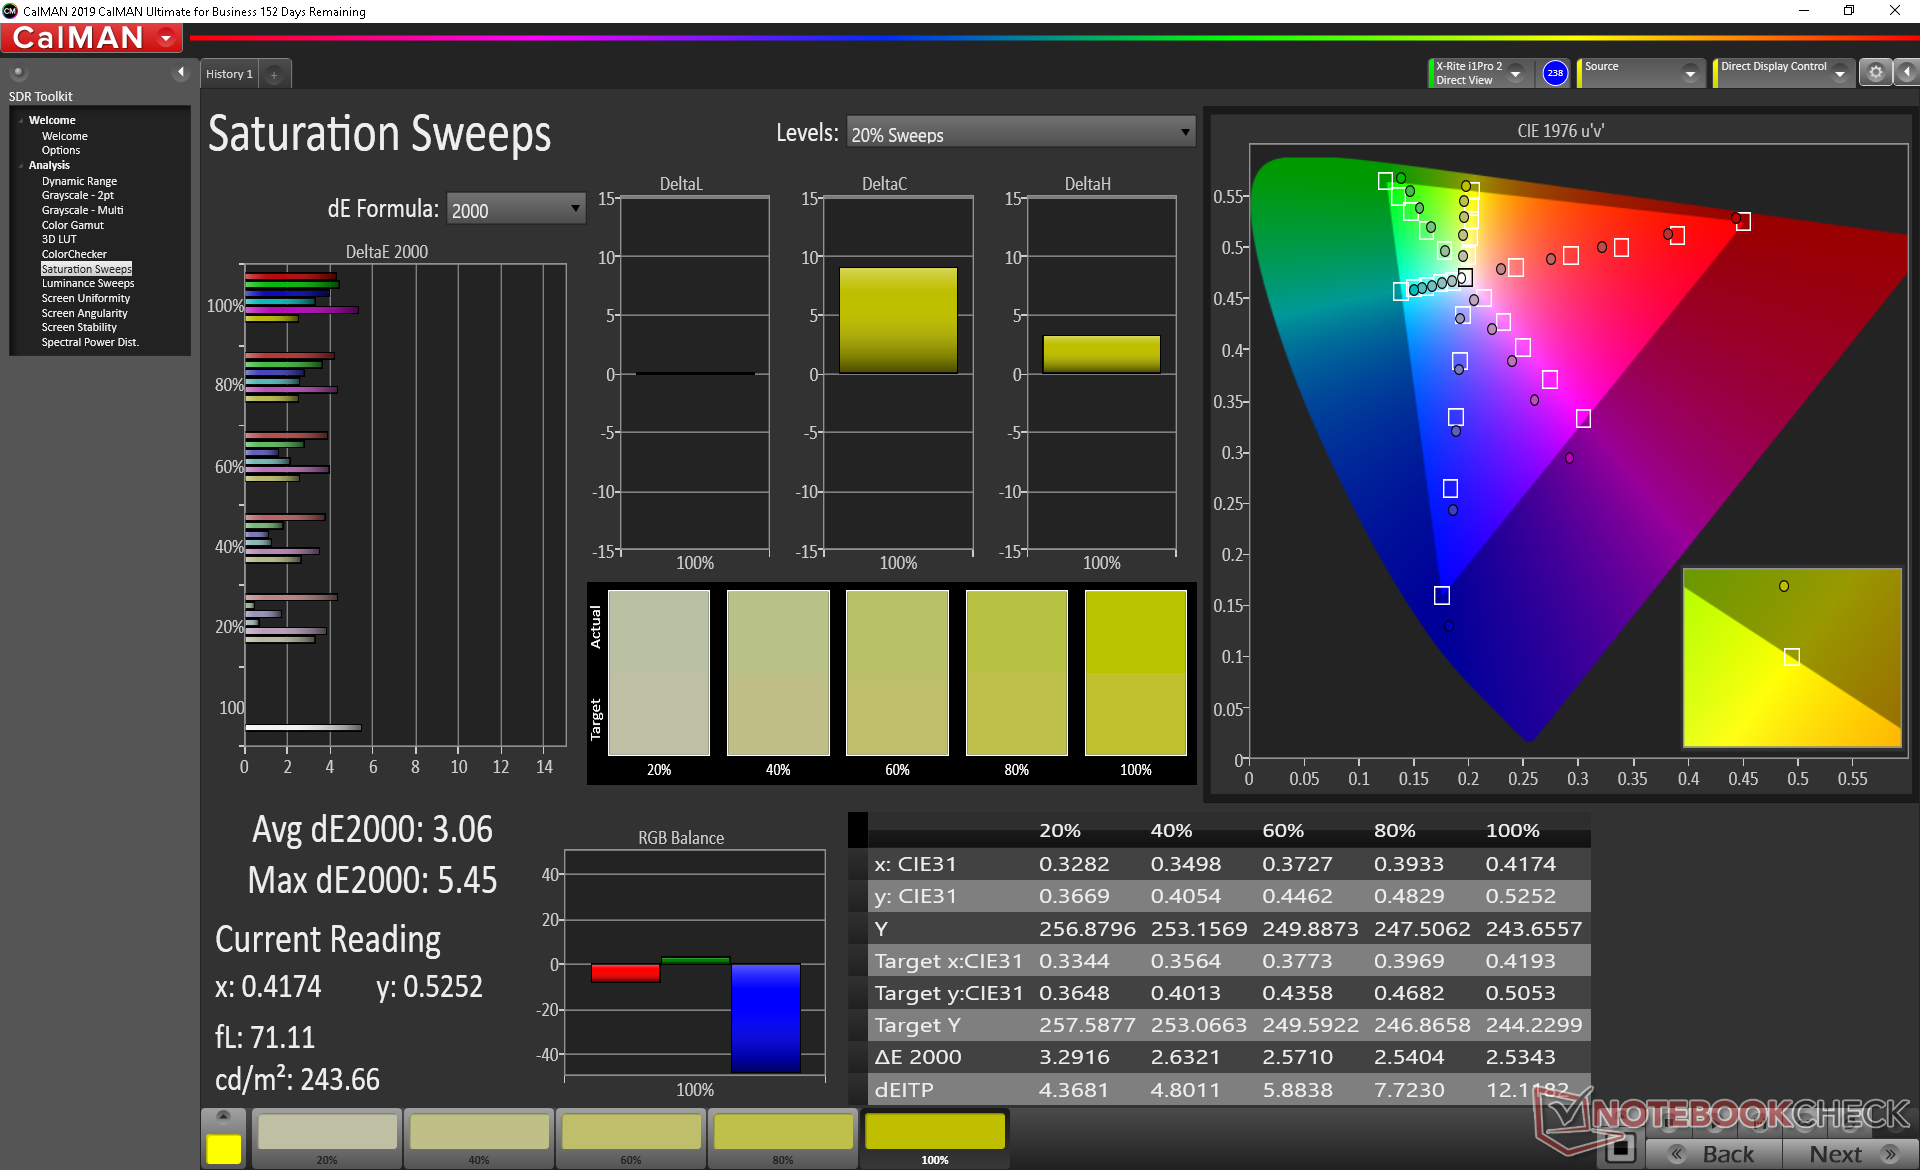
calibrated: 4.72
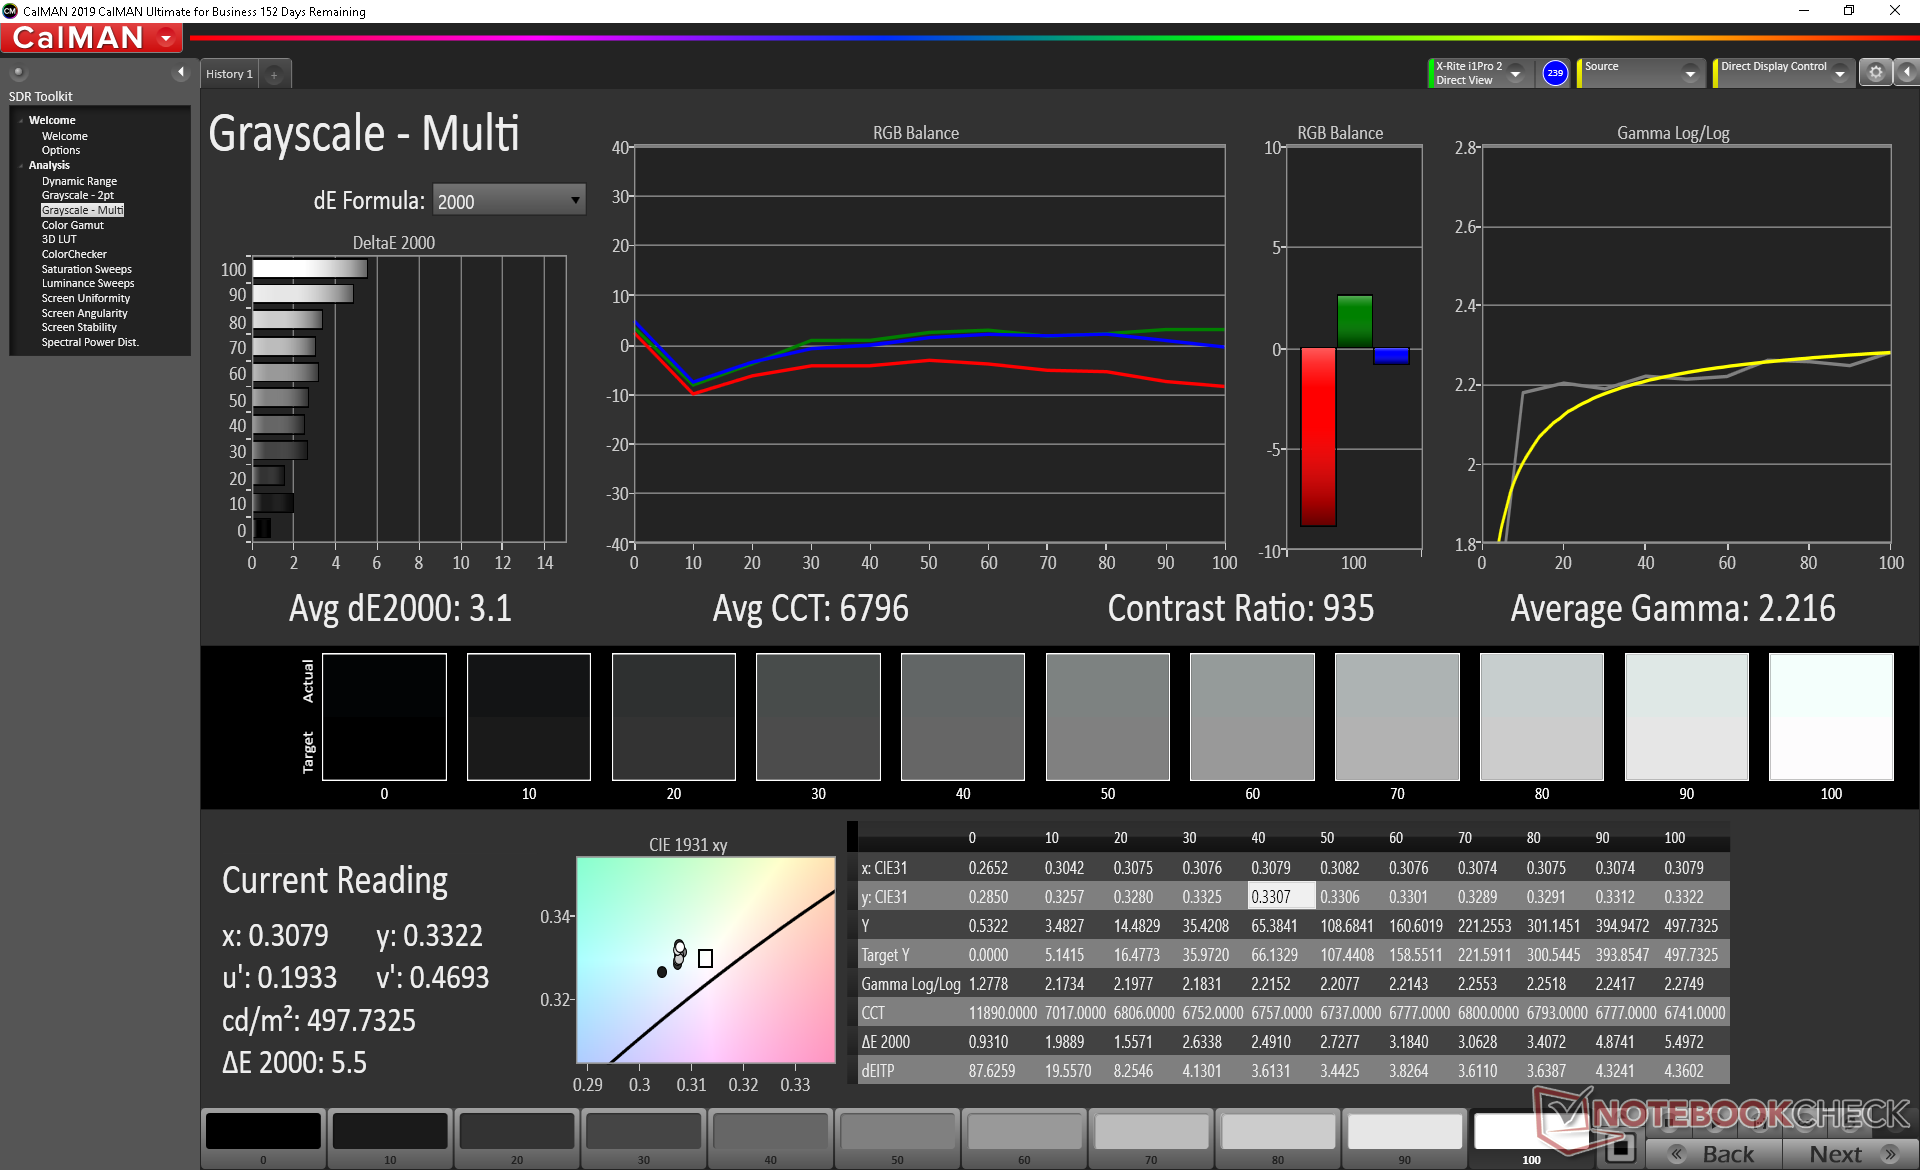
ΔE Greyscale Calman: 10.6 | ∀{0.09-98 Ø4.97}
82.2% sRGB (Argyll 1.6.3 3D)
53.4% AdobeRGB 1998 (Argyll 1.6.3 3D)
60% AdobeRGB 1998 (Argyll 3D)
82.9% sRGB (Argyll 3D)
59.3% Display P3 (Argyll 3D)
Gamma: 2.41
CCT: 6230 K
| Durabook R11 BOE5F9, IPS, 11.6", 1920x1080 | Dell Latitude 7424 Rugged Extreme AU Optronics AUO523D, IPS, 14", 1920x1080 | Dell Latitude 5420 Rugged-P85G AU Optronics AUO523D, IPS, 14", 1920x1080 | Fujitsu Stylistic Q738 Sharp SHP149B, IPS, 13.3", 1920x1080 | Dell Latitude 7200 SHP14A3 LQ123N1, IPS LED, 12.3", 1920x1280 | |
|---|---|---|---|---|---|
| Display | 13% | 8% | 16% | 21% | |
| Display P3 Coverage (%) | 59.3 | 65.3 10% | 62.5 5% | 67.8 14% | 71.6 21% |
| sRGB Coverage (%) | 82.9 | 96.9 17% | 92.4 11% | 96.6 17% | 99.5 20% |
| AdobeRGB 1998 Coverage (%) | 60 | 67.3 12% | 64.2 7% | 69.4 16% | 72.6 21% |
| Response Times | -130% | -123% | -28% | -95% | |
| Response Time Grey 50% / Grey 80% * (ms) | 26 ? | 62.8 ? -142% | 68 ? -162% | 35 ? -35% | 52 ? -100% |
| Response Time Black / White * (ms) | 18.4 ? | 40 ? -117% | 33.6 ? -83% | 22 ? -20% | 34.8 ? -89% |
| PWM Frequency (Hz) | 198.4 ? | 763 | 735 ? | 208 ? | 1645 ? |
| Screen | 31% | 32% | 14% | 35% | |
| Brightness middle (cd/m²) | 584.2 | 844 44% | 1111.7 90% | 292 -50% | 401 -31% |
| Brightness (cd/m²) | 560 | 793 42% | 1026 83% | 277 -51% | 385 -31% |
| Brightness Distribution (%) | 79 | 88 11% | 80 1% | 90 14% | 88 11% |
| Black Level * (cd/m²) | 0.52 | 0.54 -4% | 0.81 -56% | 0.32 38% | 0.28 46% |
| Contrast (:1) | 1123 | 1563 39% | 1372 22% | 913 -19% | 1432 28% |
| Colorchecker dE 2000 * | 9.29 | 4.8 48% | 3.83 59% | 3.69 60% | 1.8 81% |
| Colorchecker dE 2000 max. * | 14.43 | 11.88 18% | 7.85 46% | 6.9 52% | 3.4 76% |
| Colorchecker dE 2000 calibrated * | 4.72 | 1.15 76% | 2.98 37% | 1.1 77% | |
| Greyscale dE 2000 * | 10.6 | 7.6 28% | 5.6 47% | 4.11 61% | 1.6 85% |
| Gamma | 2.41 91% | 2.334 94% | 2.306 95% | 2.3 96% | 2.14 103% |
| CCT | 6230 104% | 6546 99% | 7676 85% | 7140 91% | 6702 97% |
| Color Space (Percent of AdobeRGB 1998) (%) | 53.4 | 62 16% | 59 10% | 63 18% | 66.6 25% |
| Color Space (Percent of sRGB) (%) | 82.2 | 97 18% | 93 13% | 97 18% | 99.4 21% |
| Total Average (Program / Settings) | -29% /
7% | -28% /
8% | 1% /
9% | -13% /
16% |
* ... smaller is better
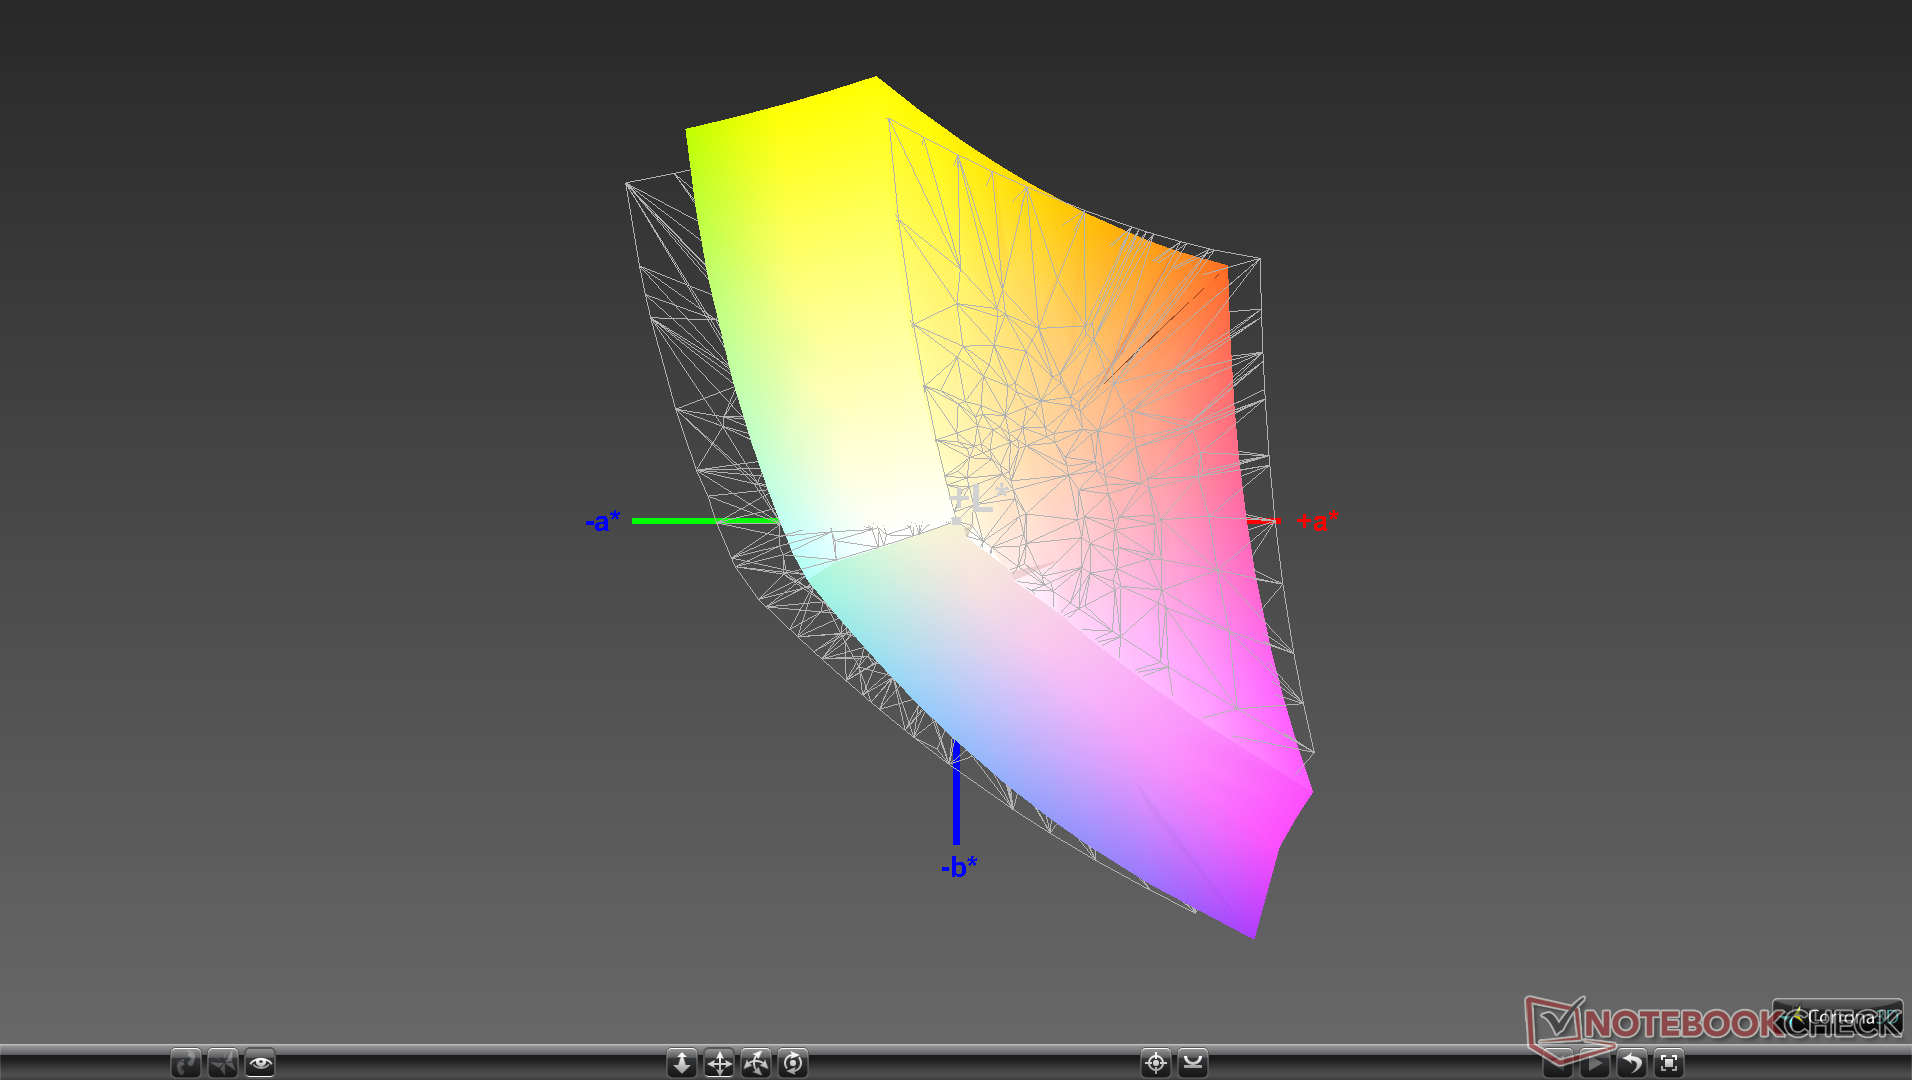
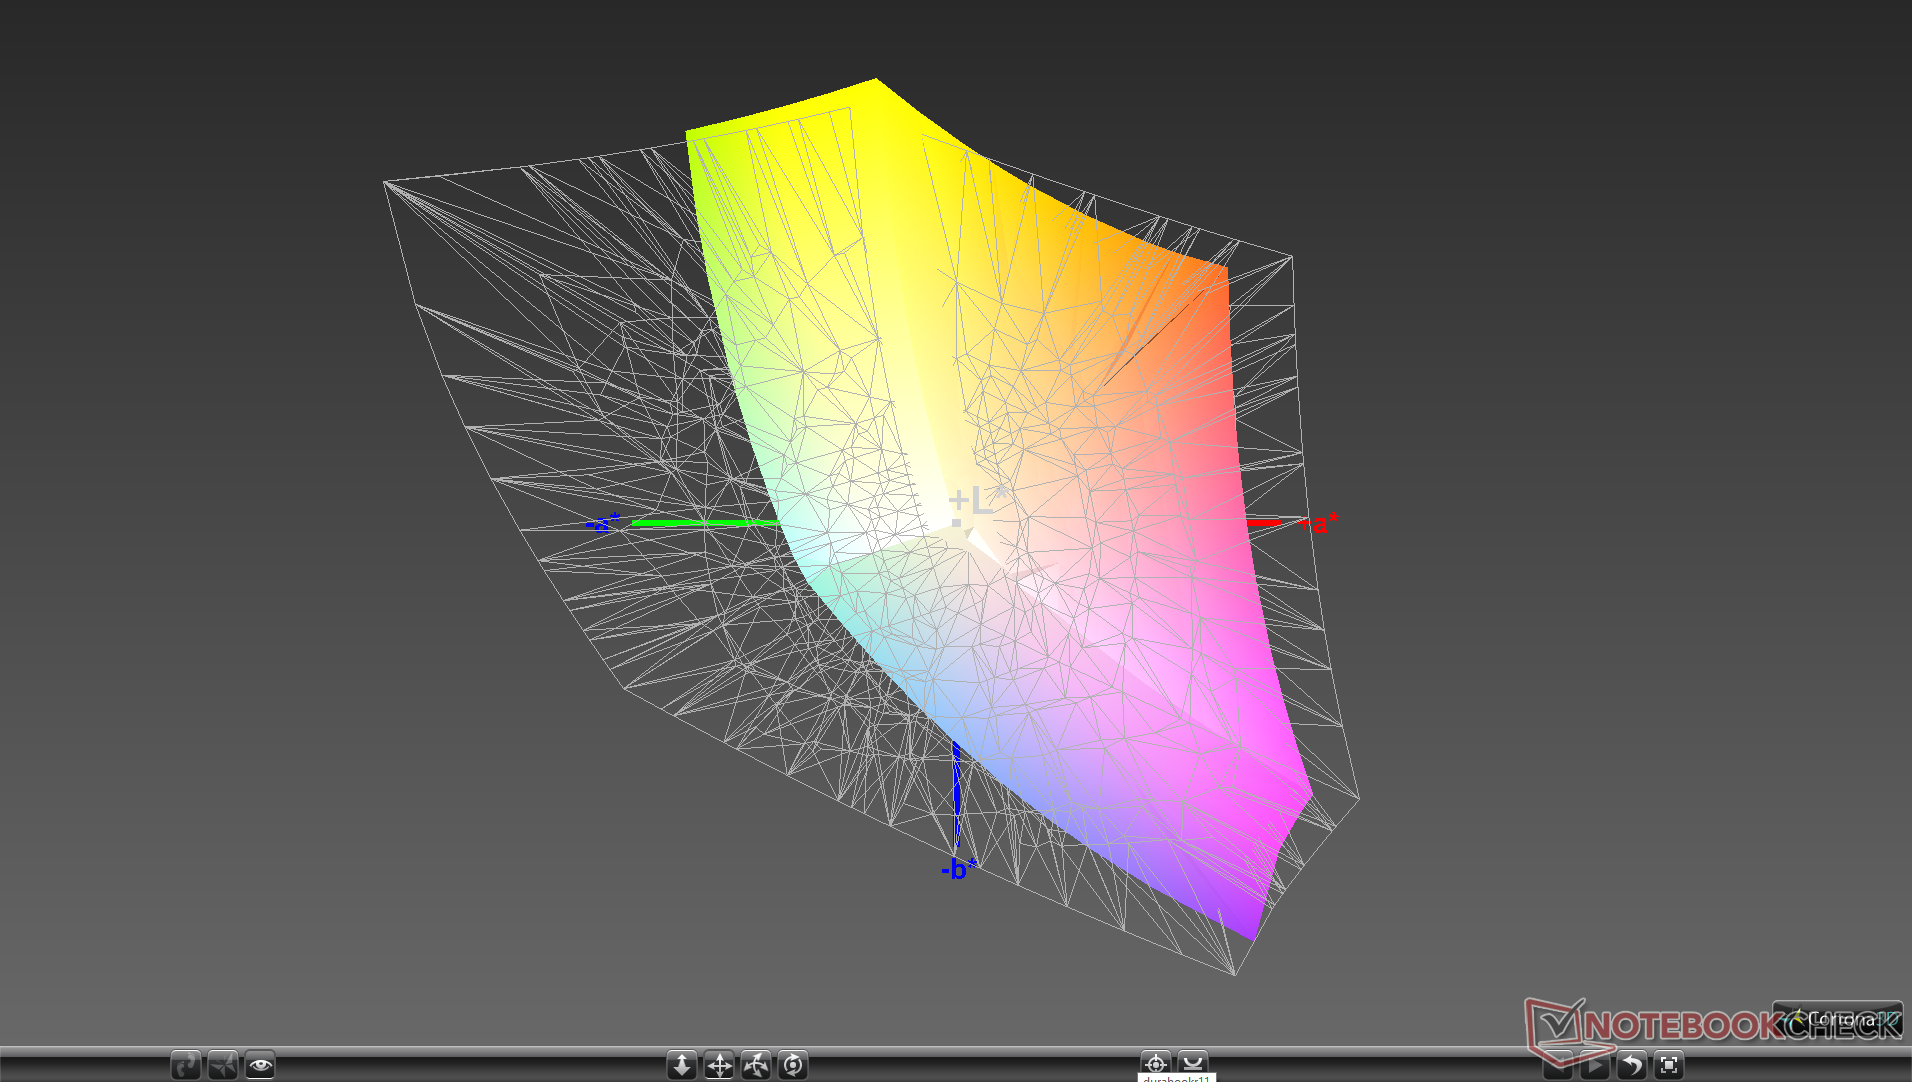
Color space covers approximately 82 percent of sRGB to be better than expected for a rugged device where color accuracy isn't usually a major selling point. Though still not as good as most Ultrabook displays, the deeper colors aid in visibility when outdoors.
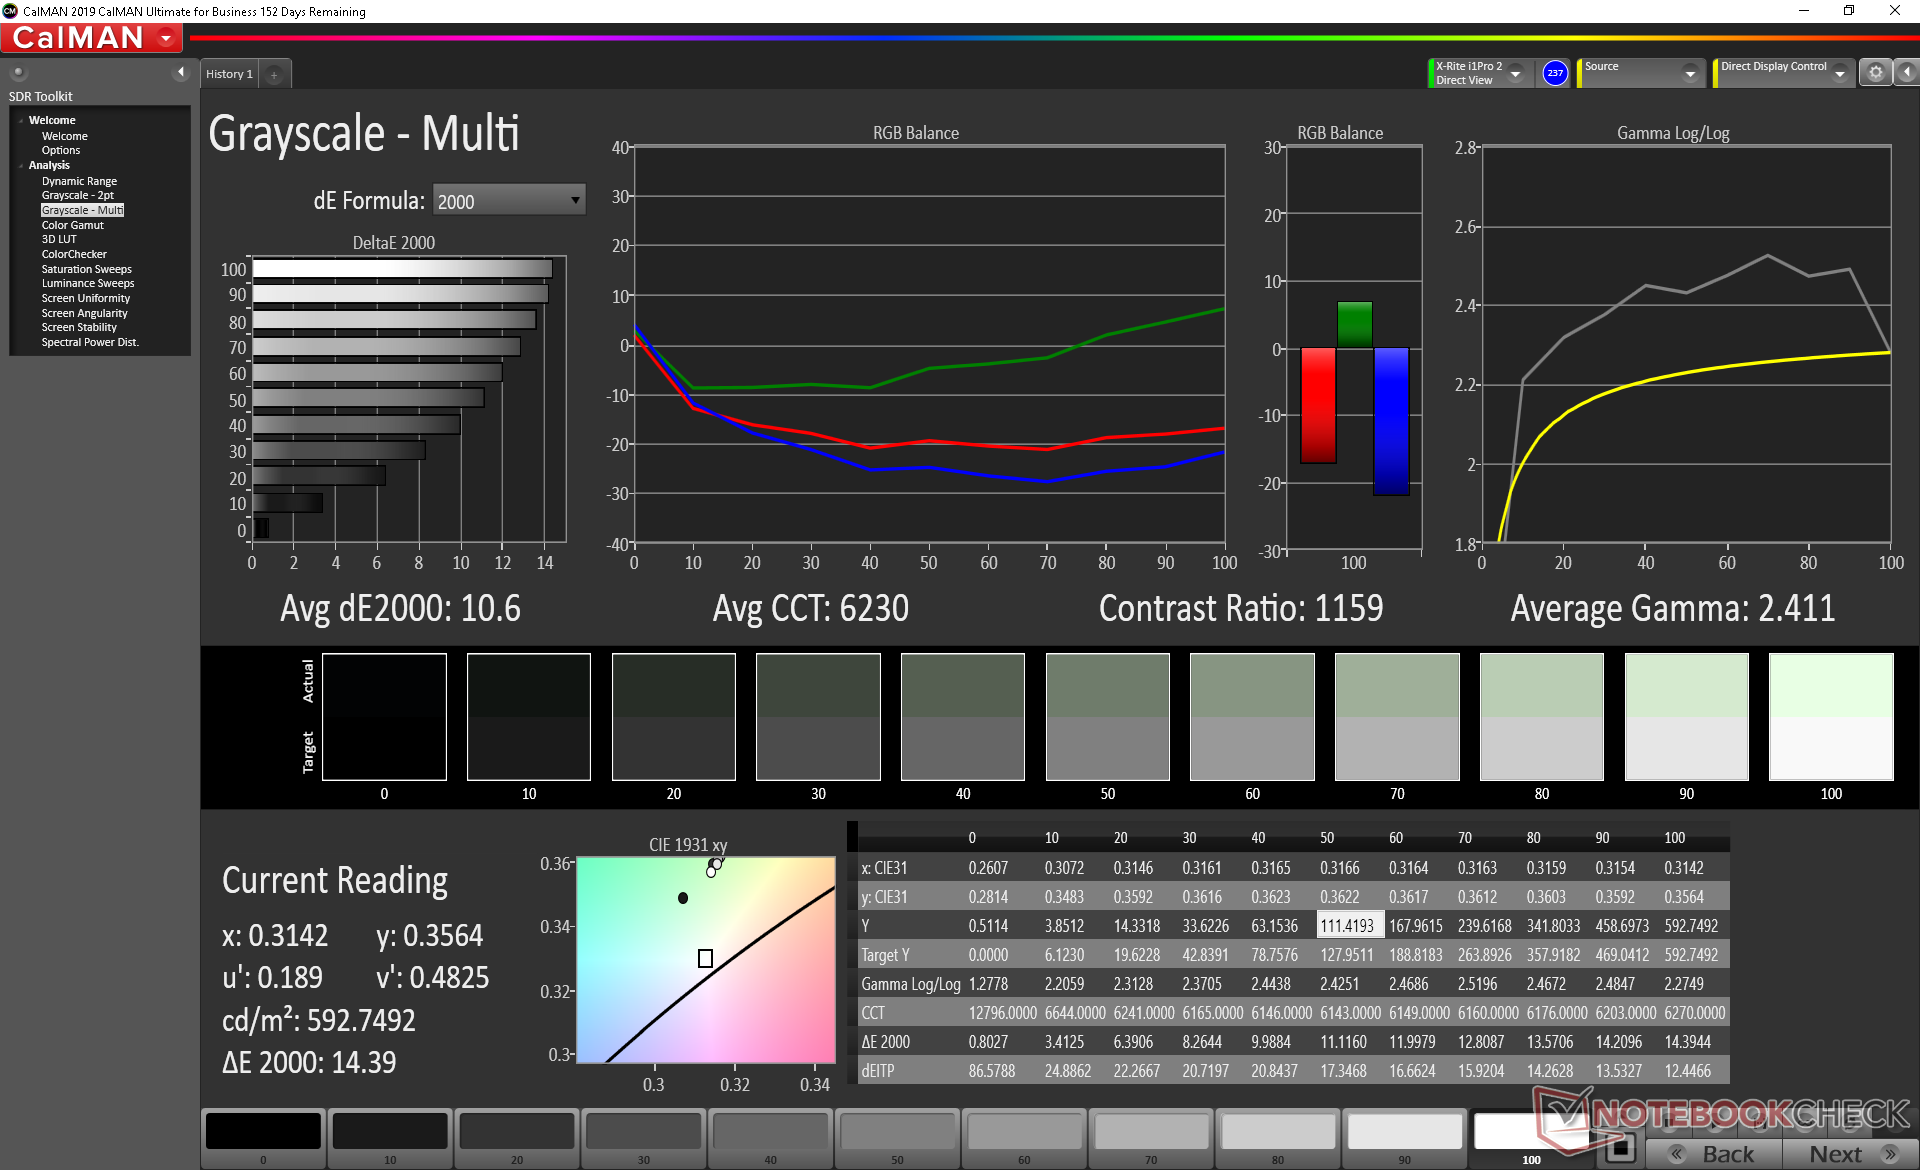
Color temperature is very warm out of the box with poor grayscale as a result. Calibrating the panel ourselves would significantly improve the average grayscale DeltaE from 10.6 to just 3.1. We recommend applying our calibrated ICM profile above to get the most out of the screen.
Display Response Times
| ↔ Response Time Black to White | ||
|---|---|---|
| 18.4 ms ... rise ↗ and fall ↘ combined | ↗ 10 ms rise |  |
| ↘ 8.4 ms fall | ||
| The screen shows good response rates in our tests, but may be too slow for competitive gamers. In comparison, all tested devices range from 0.1 (minimum) to 240 (maximum) ms. » 41 % of all devices are better. This means that the measured response time is similar to the average of all tested devices (19.9 ms). | ||
| ↔ Response Time 50% Grey to 80% Grey | ||
| 26 ms ... rise ↗ and fall ↘ combined | ↗ 14 ms rise |  |
| ↘ 12 ms fall | ||
| The screen shows relatively slow response rates in our tests and may be too slow for gamers. In comparison, all tested devices range from 0.165 (minimum) to 636 (maximum) ms. » 36 % of all devices are better. This means that the measured response time is better than the average of all tested devices (31.1 ms). | ||
Screen Flickering / PWM (Pulse-Width Modulation)
| Screen flickering / PWM detected | 198.4 Hz | ≤ 99 % brightness setting | 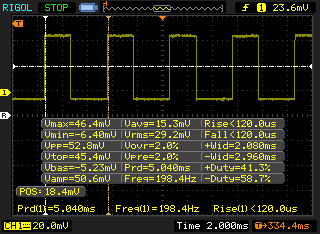 |
The display backlight flickers at 198.4 Hz (worst case, e.g., utilizing PWM) Flickering detected at a brightness setting of 99 % and below. There should be no flickering or PWM above this brightness setting. The frequency of 198.4 Hz is relatively low, so sensitive users will likely notice flickering and experience eyestrain at the stated brightness setting and below. In comparison: 52 % of all tested devices do not use PWM to dim the display. If PWM was detected, an average of 7794 (minimum: 5 - maximum: 343500) Hz was measured. | |||
Outdoor visibility is good only when under shade or a cloudy day. Sunlight will still overwhelm the matte screen and wash out colors even when set to maximum brightness.


Performance
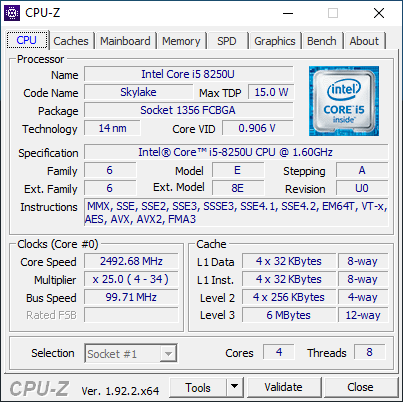
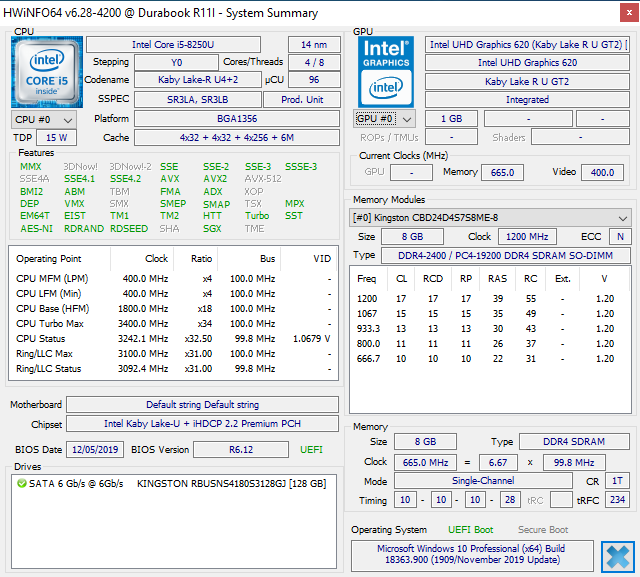
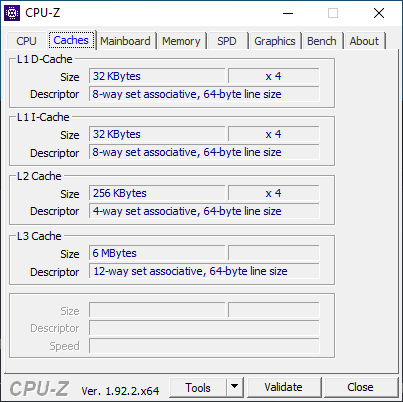

Processor
Multi-thread performance is disappointing as it is 25 to 35 percent slower than the average Core i5-8250U in our database taken from almost 100 other laptops. Single-thread performance, however, is where we expect it to be. Users who decide to upgrade to the Core i5-8350U or Core i7-8650U SKUs should see a multi-thread performance boost of about 25 to 40 percent.
See our dedicated page on the Core i5-8250U for more technical information and benchmark comparisons.
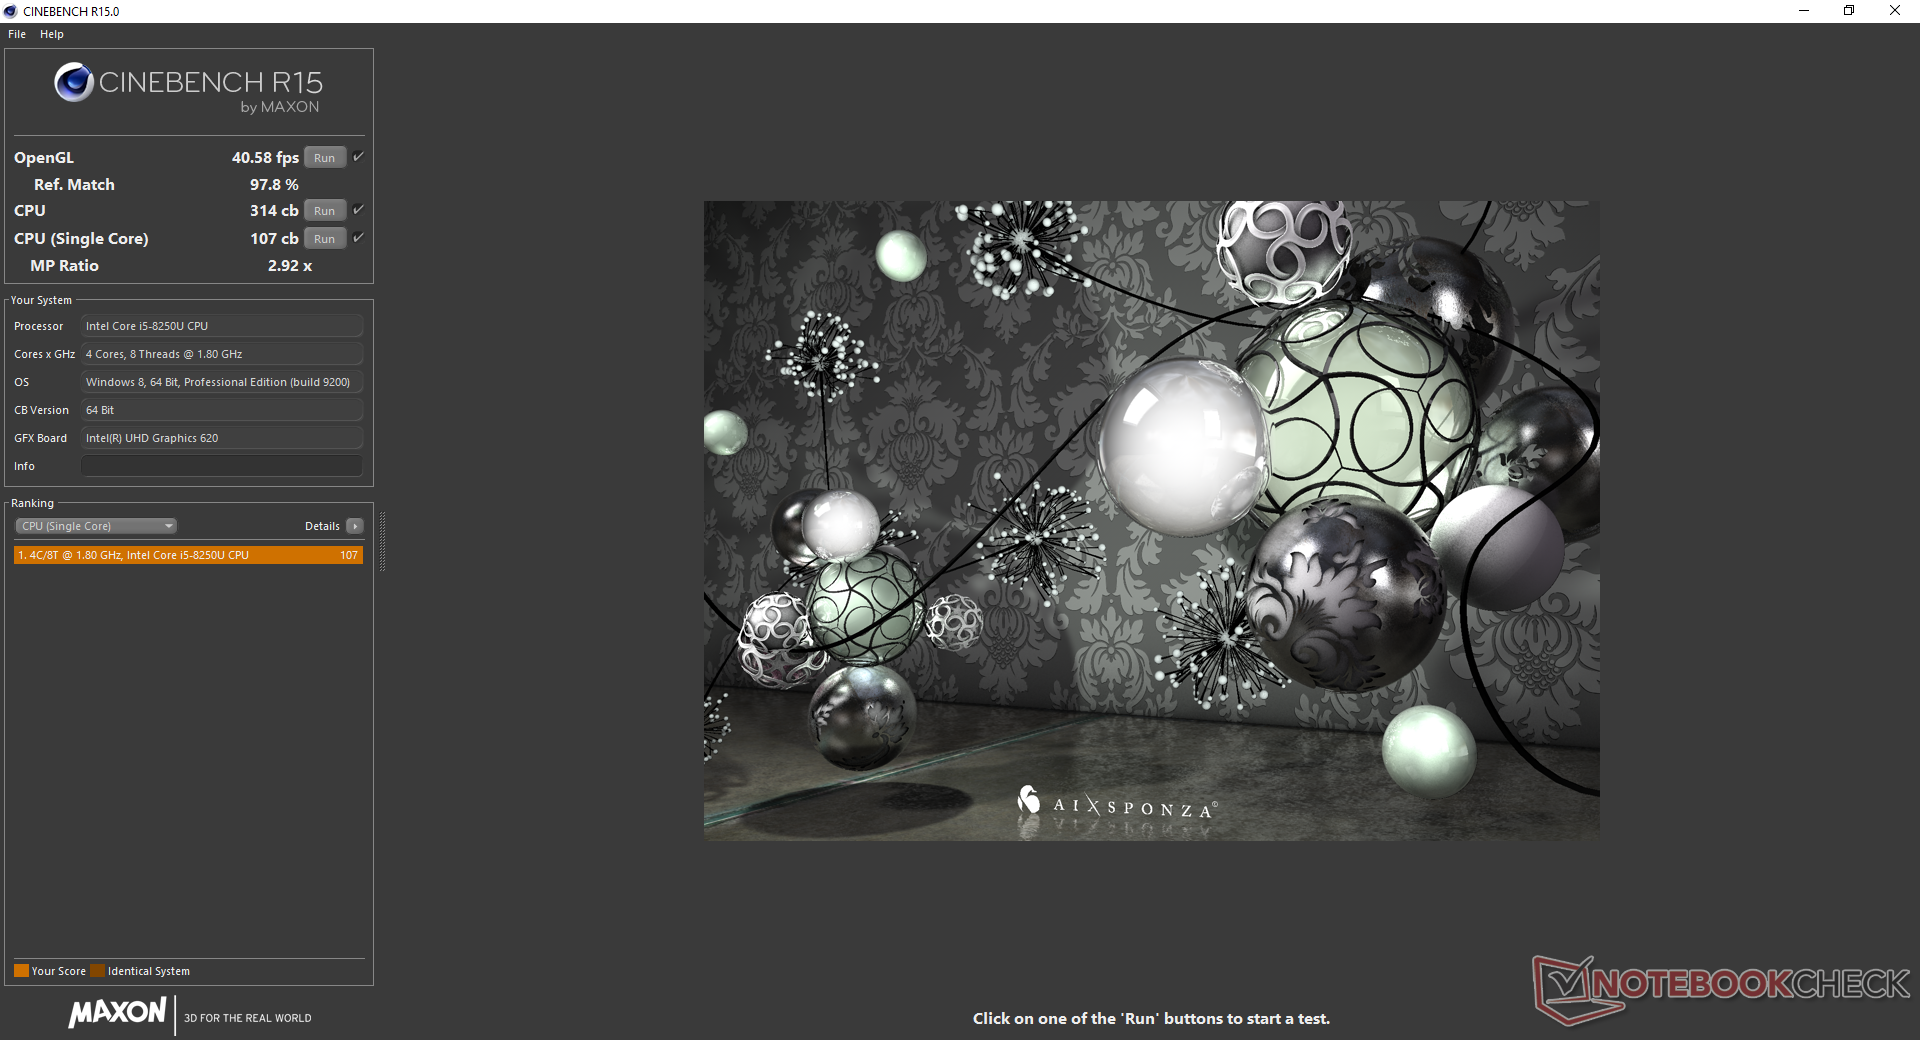

Cinebench R15: CPU Multi 64Bit | CPU Single 64Bit
Blender: v2.79 BMW27 CPU
7-Zip 18.03: 7z b 4 -mmt1 | 7z b 4
Geekbench 5.5: Single-Core | Multi-Core
HWBOT x265 Benchmark v2.2: 4k Preset
LibreOffice : 20 Documents To PDF
R Benchmark 2.5: Overall mean
| Cinebench R20 / CPU (Multi Core) | |
| Dell XPS 13 9300 i5 FHD | |
| Lenovo ThinkPad X1 Carbon 2020-20UAS04T00 | |
| Huawei MateBook 13 2020 AMD | |
| Average Intel Core i5-8250U (846 - 1325, n=5) | |
| Dynabook Portege A30-E-174 | |
| Dynabook Portege X30L-G1331 | |
| Lenovo ThinkPad P43s-20RH001FGE | |
| Durabook S15ABG2 | |
| HP Pavilion 15-cw1212ng | |
| Durabook R11 | |
| Apple MacBook Air 2020 i3 | |
| Lenovo IdeaPad Flex 3 11IGL05 | |
| Teclast Tbook 16 Power | |
| Cinebench R20 / CPU (Single Core) | |
| Lenovo ThinkPad X1 Carbon 2020-20UAS04T00 | |
| Dell XPS 13 9300 i5 FHD | |
| Dynabook Portege X30L-G1331 | |
| Durabook S15ABG2 | |
| Dynabook Portege A30-E-174 | |
| Lenovo ThinkPad P43s-20RH001FGE | |
| Huawei MateBook 13 2020 AMD | |
| Average Intel Core i5-8250U (332 - 355, n=5) | |
| Apple MacBook Air 2020 i3 | |
| HP Pavilion 15-cw1212ng | |
| Durabook R11 | |
| Lenovo IdeaPad Flex 3 11IGL05 | |
| Teclast Tbook 16 Power | |
| Blender / v2.79 BMW27 CPU | |
| Teclast Tbook 16 Power | |
| Lenovo IdeaPad Flex 3 11IGL05 | |
| Apple MacBook Air 2020 i3 | |
| HP Pavilion 15-cw1212ng | |
| Durabook R11 | |
| Durabook S15ABG2 | |
| Average Intel Core i5-8250U (813 - 1209, n=8) | |
| Dynabook Portege X30L-G1331 | |
| Huawei MateBook 13 2020 AMD | |
| Lenovo ThinkPad X1 Carbon 2020-20UAS04T00 | |
| Dell XPS 13 9300 i5 FHD | |
| Lenovo ThinkPad P43s-20RH001FGE | |
| 7-Zip 18.03 / 7z b 4 -mmt1 | |
| Lenovo ThinkPad P43s-20RH001FGE | |
| Lenovo ThinkPad X1 Carbon 2020-20UAS04T00 | |
| Dynabook Portege X30L-G1331 | |
| Durabook S15ABG2 | |
| Dell XPS 13 9300 i5 FHD | |
| Average Intel Core i5-8250U (3641 - 3925, n=6) | |
| Durabook R11 | |
| Huawei MateBook 13 2020 AMD | |
| Apple MacBook Air 2020 i3 | |
| HP Pavilion 15-cw1212ng | |
| Lenovo IdeaPad Flex 3 11IGL05 | |
| 7-Zip 18.03 / 7z b 4 | |
| Lenovo ThinkPad P43s-20RH001FGE | |
| Dell XPS 13 9300 i5 FHD | |
| Lenovo ThinkPad X1 Carbon 2020-20UAS04T00 | |
| Huawei MateBook 13 2020 AMD | |
| Dynabook Portege X30L-G1331 | |
| Average Intel Core i5-8250U (11546 - 17405, n=6) | |
| Durabook S15ABG2 | |
| HP Pavilion 15-cw1212ng | |
| Durabook R11 | |
| Apple MacBook Air 2020 i3 | |
| Lenovo IdeaPad Flex 3 11IGL05 | |
| HWBOT x265 Benchmark v2.2 / 4k Preset | |
| Lenovo ThinkPad P43s-20RH001FGE | |
| Lenovo ThinkPad X1 Carbon 2020-20UAS04T00 | |
| Dell XPS 13 9300 i5 FHD | |
| Average Intel Core i5-8250U (3.02 - 4.78, n=8) | |
| Dynabook Portege X30L-G1331 | |
| Durabook S15ABG2 | |
| Huawei MateBook 13 2020 AMD | |
| Durabook R11 | |
| HP Pavilion 15-cw1212ng | |
| Apple MacBook Air 2020 i3 | |
| Lenovo IdeaPad Flex 3 11IGL05 | |
| Teclast Tbook 16 Power | |
| LibreOffice / 20 Documents To PDF | |
| Teclast Tbook 16 Power | |
| Lenovo IdeaPad Flex 3 11IGL05 | |
| Apple MacBook Air 2020 i3 | |
| Huawei MateBook 13 2020 AMD | |
| HP Pavilion 15-cw1212ng | |
| Durabook R11 | |
| Average Intel Core i5-8250U (63.8 - 78.9, n=4) | |
| Durabook S15ABG2 | |
| Dynabook Portege X30L-G1331 | |
| Lenovo ThinkPad X1 Carbon 2020-20UAS04T00 | |
| R Benchmark 2.5 / Overall mean | |
| Teclast Tbook 16 Power | |
| Lenovo IdeaPad Flex 3 11IGL05 | |
| Apple MacBook Air 2020 i3 | |
| Durabook R11 | |
| Average Intel Core i5-8250U (0.818 - 0.843, n=4) | |
| Huawei MateBook 13 2020 AMD | |
| HP Pavilion 15-cw1212ng | |
| Dell XPS 13 9300 i5 FHD | |
| Durabook S15ABG2 | |
| Dynabook Portege X30L-G1331 | |
| Lenovo ThinkPad X1 Carbon 2020-20UAS04T00 | |
Cinebench R15: CPU Multi 64Bit | CPU Single 64Bit
Blender: v2.79 BMW27 CPU
7-Zip 18.03: 7z b 4 -mmt1 | 7z b 4
Geekbench 5.5: Single-Core | Multi-Core
HWBOT x265 Benchmark v2.2: 4k Preset
LibreOffice : 20 Documents To PDF
R Benchmark 2.5: Overall mean
* ... smaller is better
System Performance
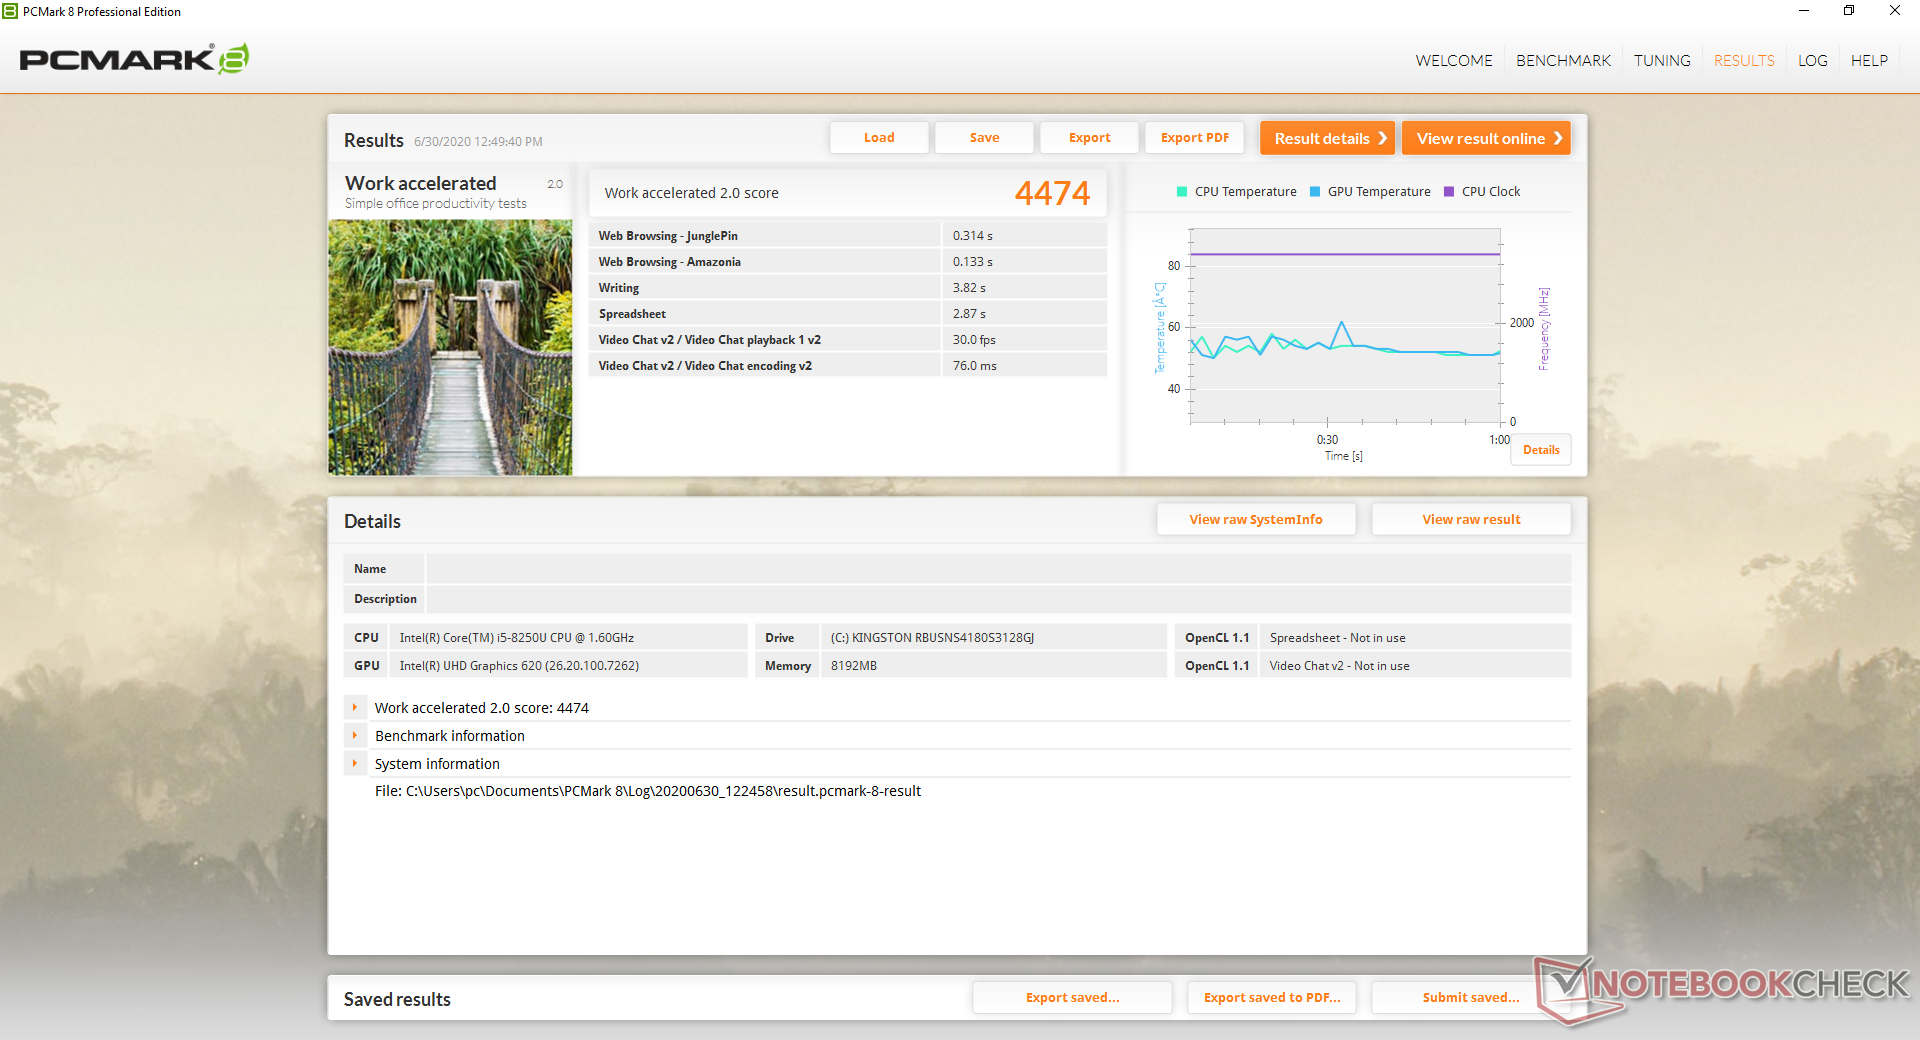
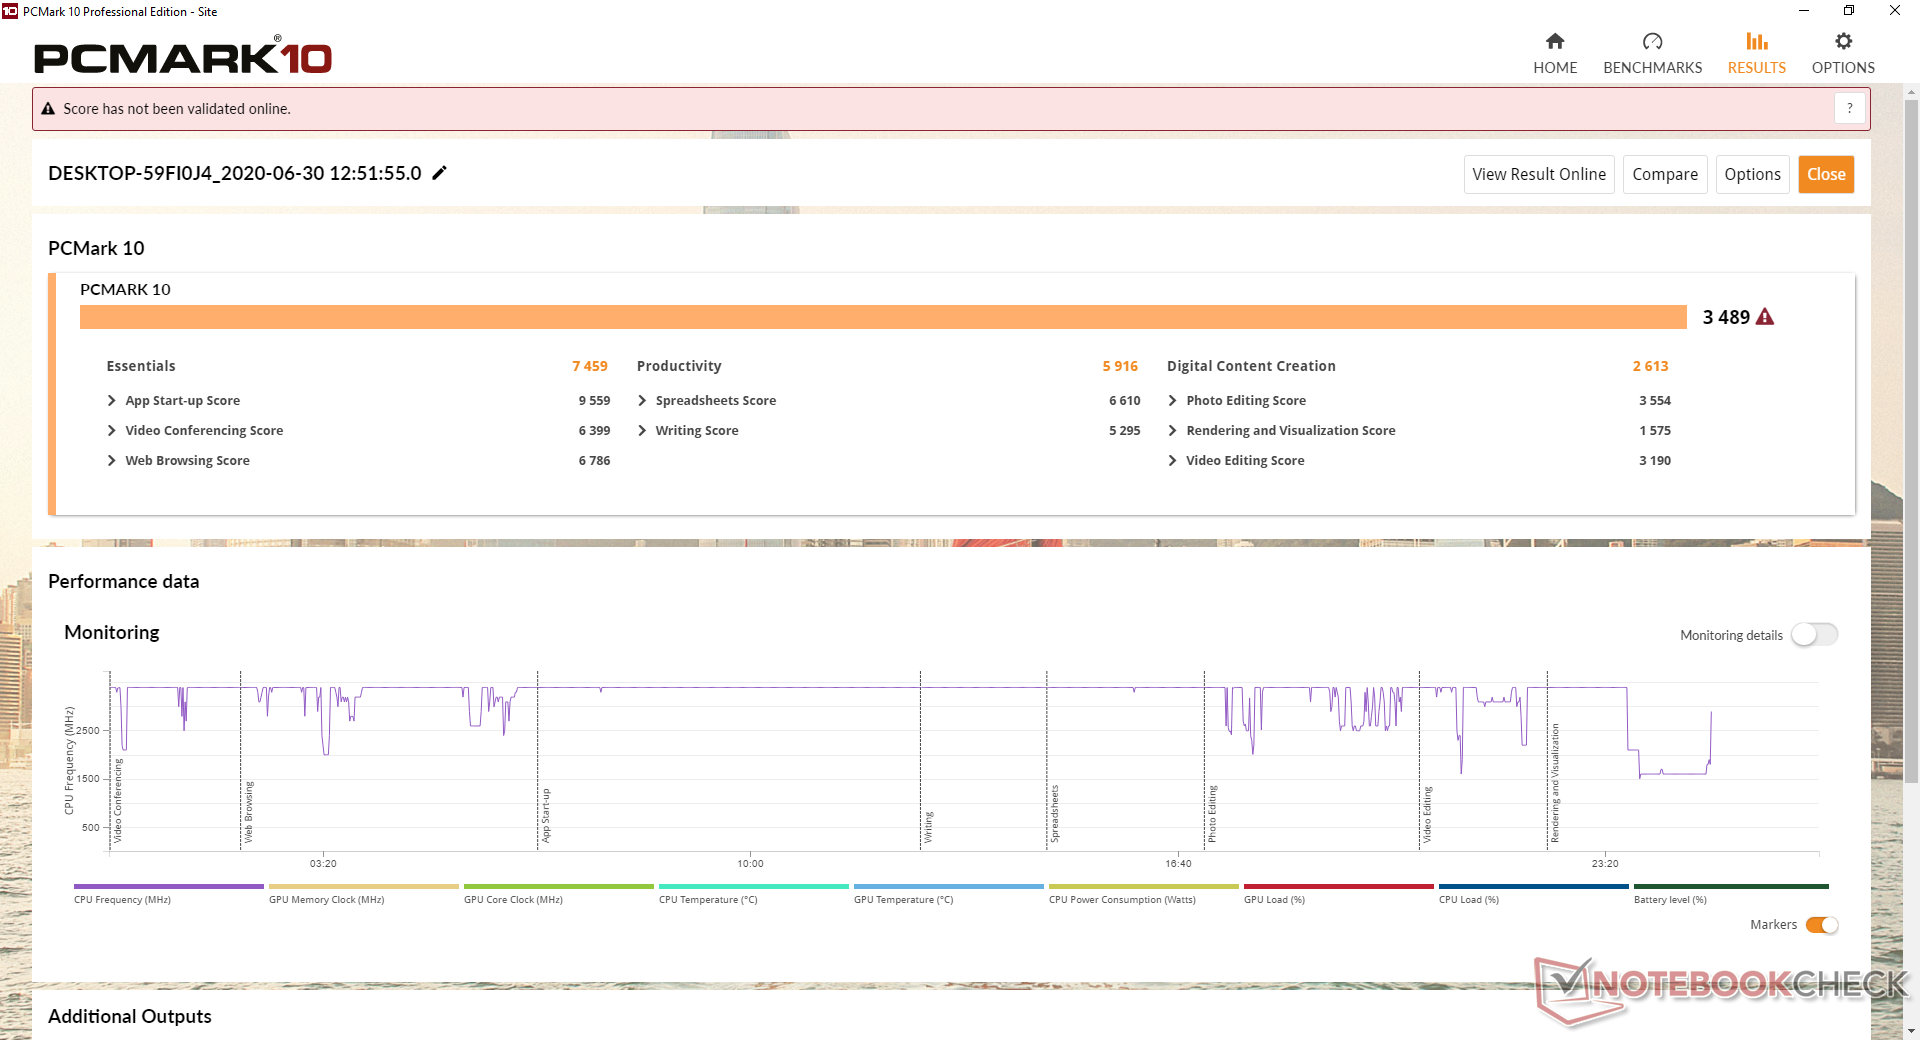
PCMark results are within a few percentage points of the average laptop with the same Core i5-8250U CPU despite the slower-than-average processor performance recorded above. We experienced no software or hardware issues during our time with the unit.
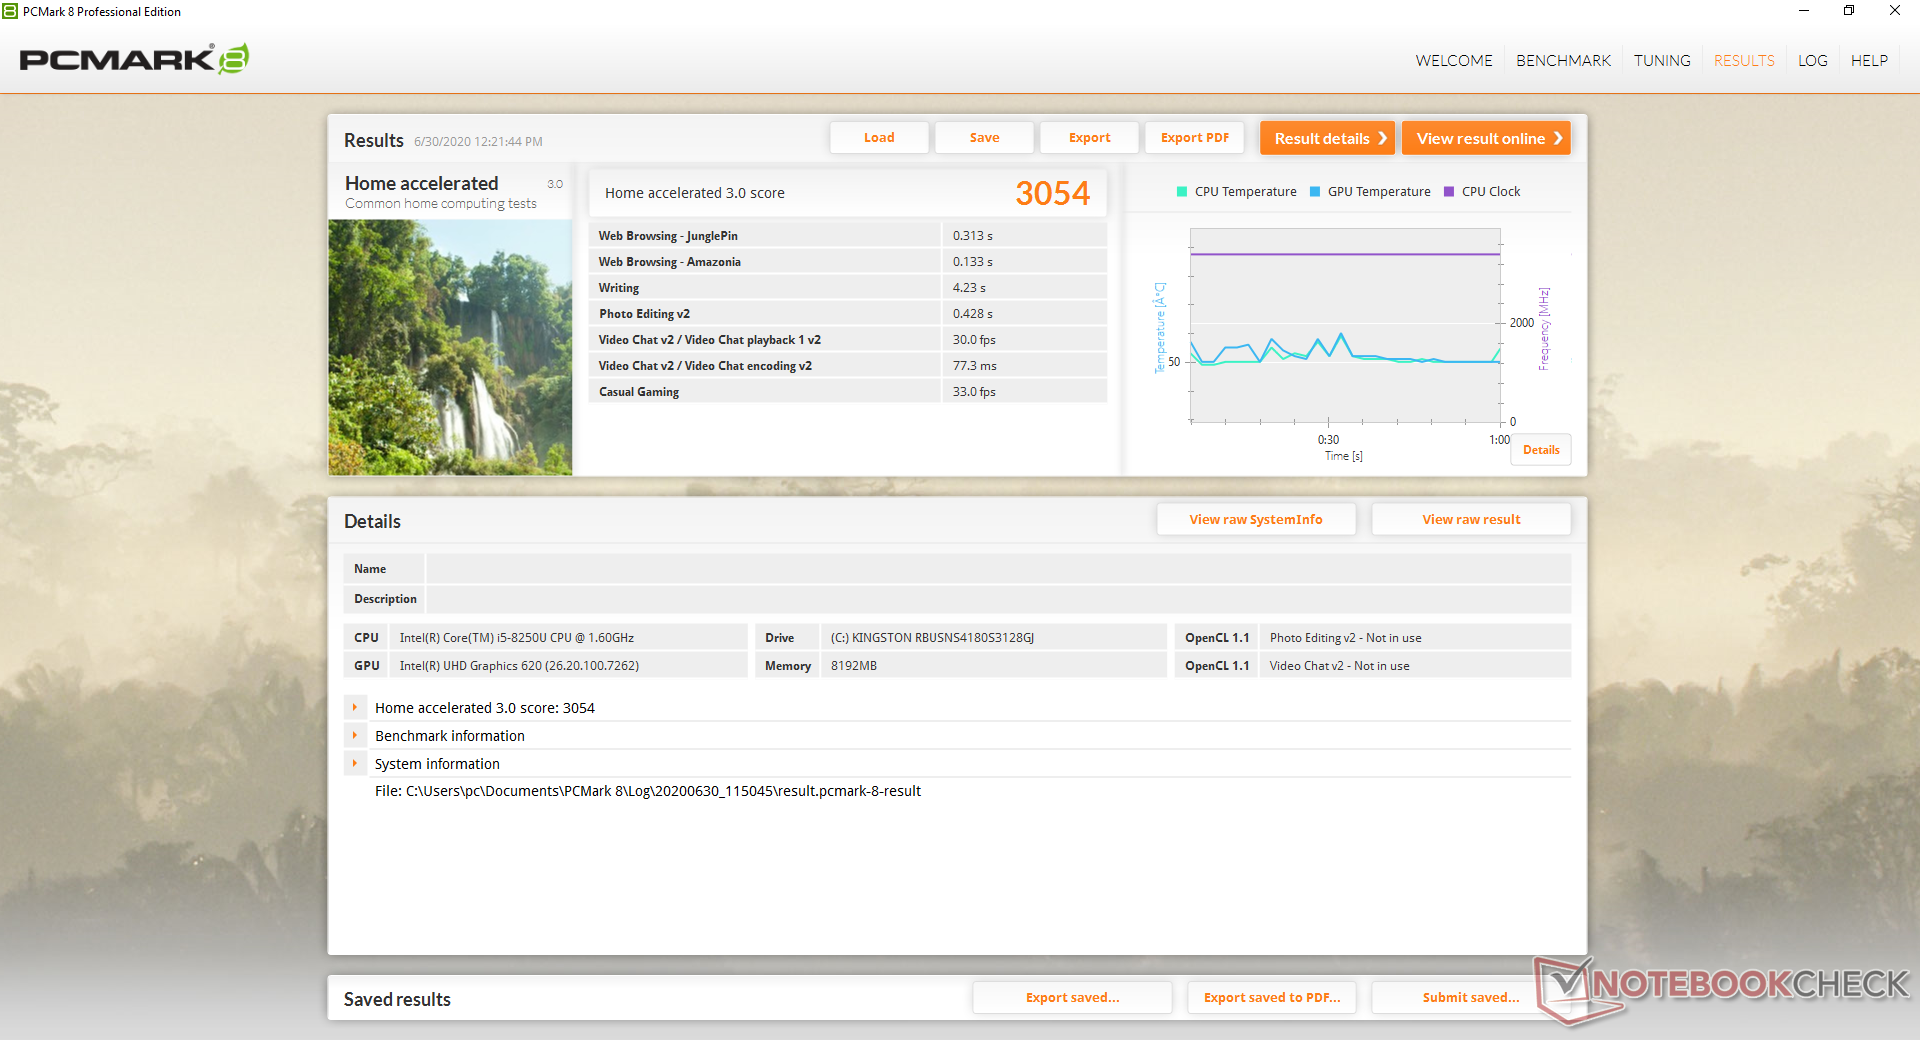
| PCMark 8 Home Score Accelerated v2 | 3054 points | |
| PCMark 8 Work Score Accelerated v2 | 4474 points | |
| PCMark 10 Score | 3489 points | |
Help | ||
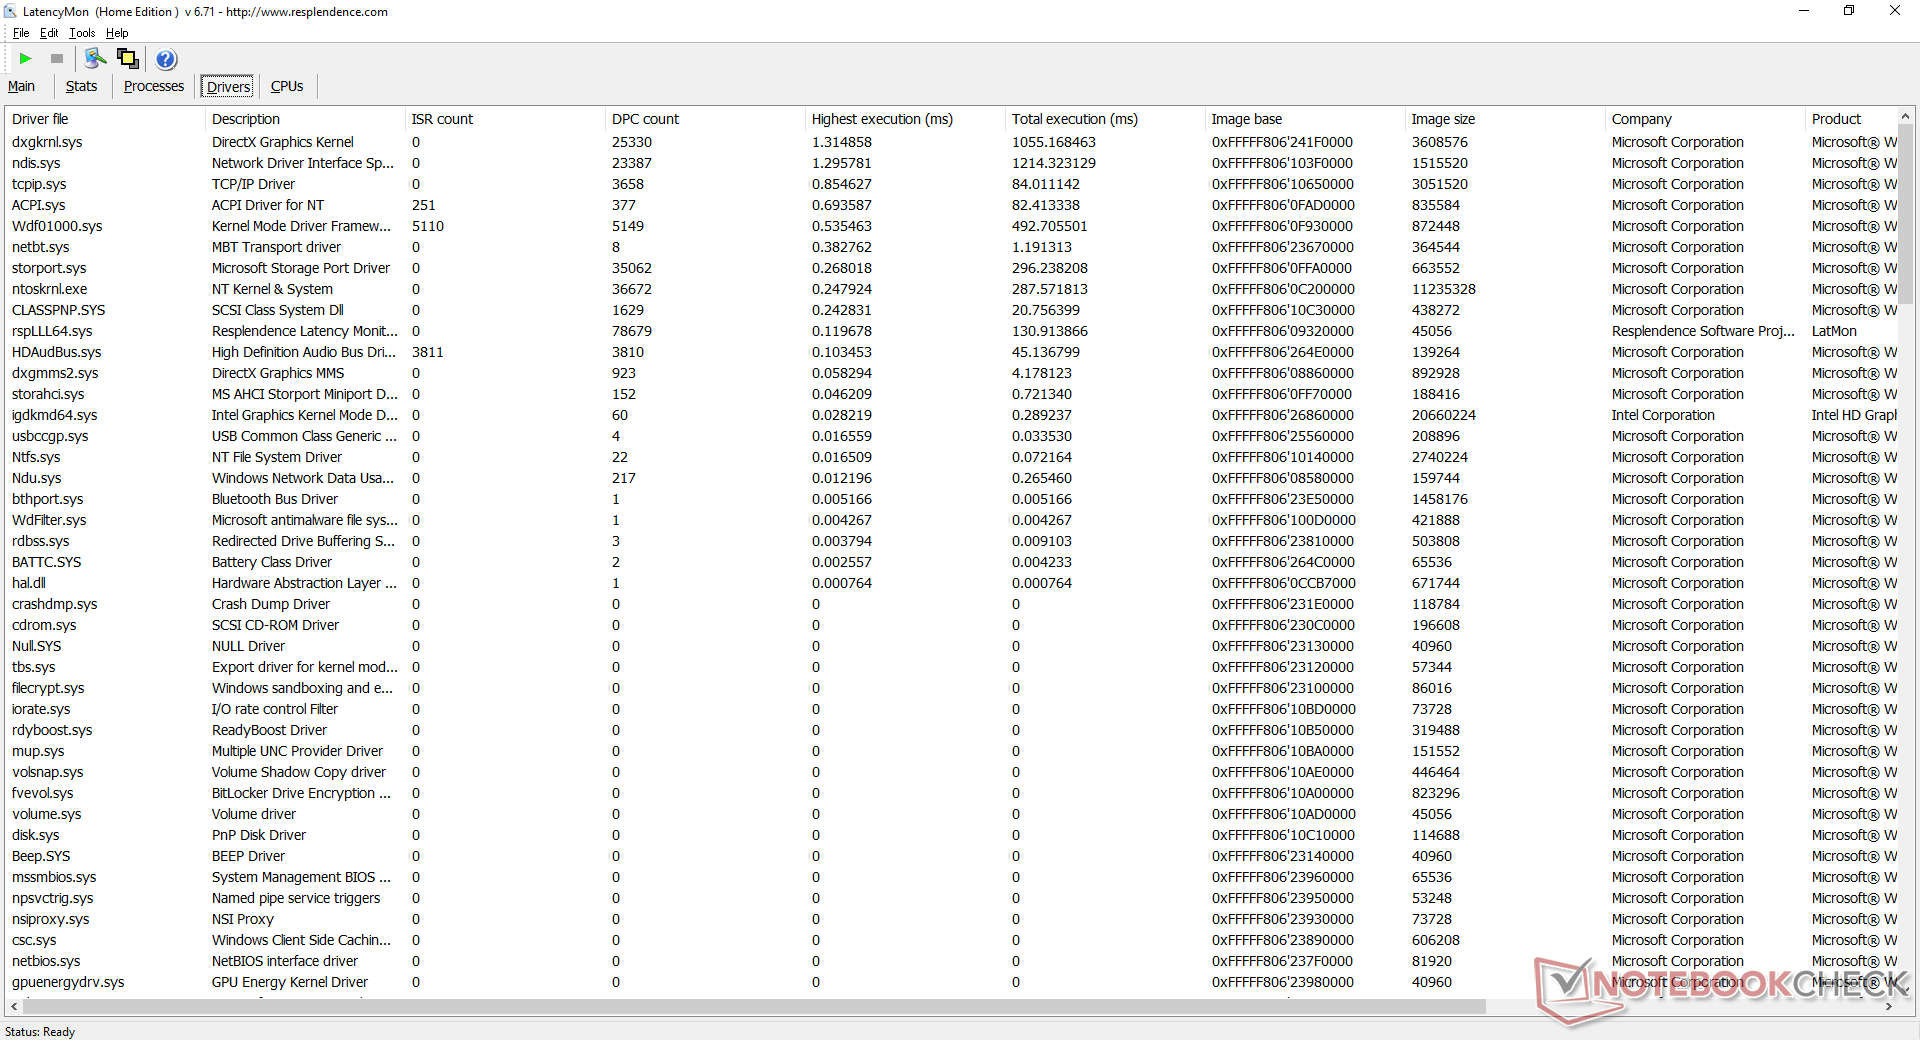
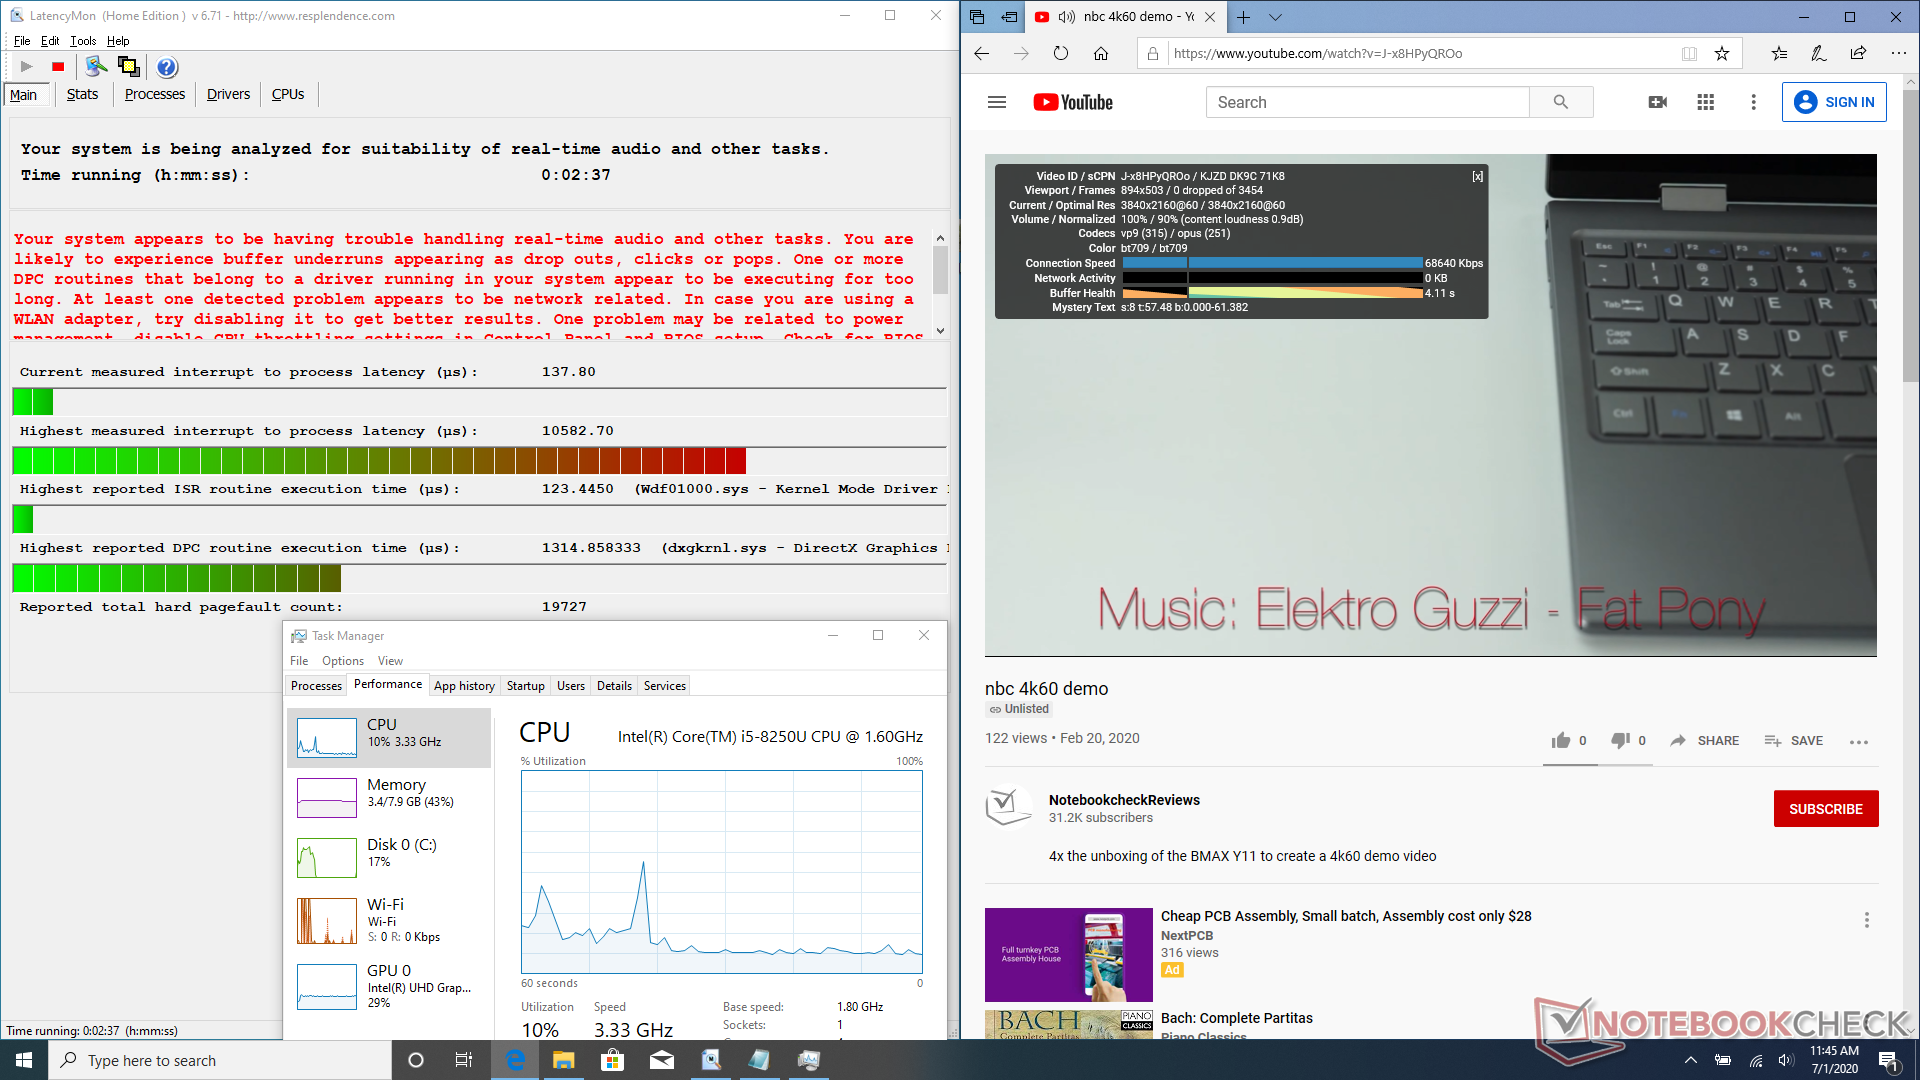
DPC Latency
LatencyMon reveals heavy DPC latency issues when opening multiple browser tabs on our homepage. Nonetheless, 4K video playback is smooth and without any issues.
| DPC Latencies / LatencyMon - interrupt to process latency (max), Web, Youtube, Prime95 | |
| Durabook R11 | |
| Dell XPS 13 9300 i5 FHD | |
| HP Envy x360 13-ay0010nr | |
| Durabook S15ABG2 | |
| Acer Swift 3 SF314-42-R27B | |
* ... smaller is better
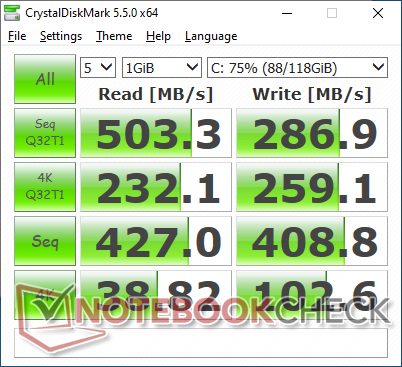
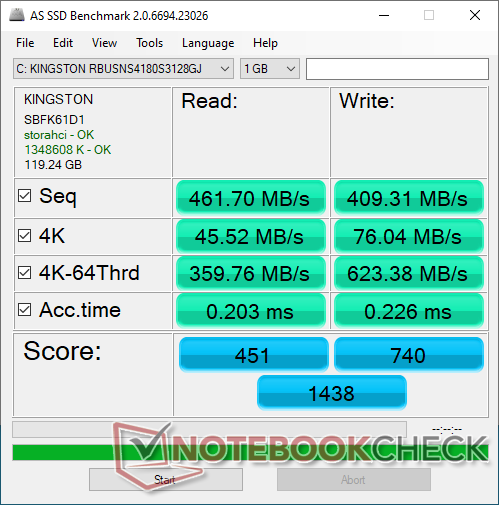
Storage Devices
A single internal M.2 SATA III bay is available with options ranging from 128 GB to 1 TB. The Kingston RBUSNS4180S3128GJ drive in our unit returns good sequential read and write rates of about 400 MB/s each which are not not uncommon results for SATA III SSDs.
| Durabook R11 Kingston RBUSNS4180S3128GJ | Dell Latitude 7424 Rugged Extreme SK Hynix PC401 512GB M.2 (HFS512GD9TNG) | Dell Latitude 5420 Rugged-P85G SK hynix PC401 NVMe 500 GB | Fujitsu Stylistic Q738 Samsung SSD PM871b MZNLN256HAJQ | Dell Latitude 7200 WDC PC SN520 SDAPNUW-512G | |
|---|---|---|---|---|---|
| AS SSD | 82% | 126% | -10% | 151% | |
| Seq Read (MB/s) | 461.7 | 2096 354% | 2054 345% | 432.9 -6% | 1294 180% |
| Seq Write (MB/s) | 409.3 | 1016 148% | 653 60% | 253.6 -38% | 856 109% |
| 4K Read (MB/s) | 45.52 | 39.91 -12% | 39.34 -14% | 22.47 -51% | 42.52 -7% |
| 4K Write (MB/s) | 76 | 97.9 29% | 96.4 27% | 76.7 1% | 141 86% |
| 4K-64 Read (MB/s) | 359.8 | 636 77% | 677 88% | 377.8 5% | 983 173% |
| 4K-64 Write (MB/s) | 623 | 604 -3% | 982 58% | 282.1 -55% | 1183 90% |
| Access Time Read * (ms) | 0.203 | 0.044 78% | 0.044 78% | 0.148 27% | 0.057 72% |
| Access Time Write * (ms) | 0.226 | 0.051 77% | 0.051 77% | 0.046 80% | 0.026 88% |
| Score Read (Points) | 451 | 886 96% | 921 104% | 444 -2% | 1155 156% |
| Score Write (Points) | 740 | 804 9% | 1143 54% | 384 -48% | 1410 91% |
| Score Total (Points) | 1438 | 2099 46% | 2475 72% | 1052 -27% | 3142 118% |
| Copy ISO MB/s (MB/s) | 454.8 | 1622 257% | 1387 205% | ||
| Copy Program MB/s (MB/s) | 114.7 | 378.1 230% | 449.5 292% | ||
| Copy Game MB/s (MB/s) | 188.1 | 793 322% | 1059 463% | ||
| CrystalDiskMark 5.2 / 6 | 176% | 118% | -1% | 139% | |
| Write 4K (MB/s) | 102.6 | 114.4 12% | 98.8 -4% | 79.5 -23% | 131.9 29% |
| Read 4K (MB/s) | 38.82 | 43.86 13% | 38.51 -1% | 19.71 -49% | 45.47 17% |
| Write Seq (MB/s) | 408.8 | 1281 213% | 843 106% | 385.2 -6% | 1021 150% |
| Read Seq (MB/s) | 427 | 1918 349% | 1282 200% | 435.9 2% | 1085 154% |
| Write 4K Q32T1 (MB/s) | 259.1 | 422.5 63% | 355.5 37% | 222.4 -14% | 444.9 72% |
| Read 4K Q32T1 (MB/s) | 232.1 | 260.6 12% | 241.4 4% | 212.8 -8% | 366.6 58% |
| Write Seq Q32T1 (MB/s) | 286.9 | 1282 347% | 893 211% | 534 86% | 1458 408% |
| Read Seq Q32T1 (MB/s) | 503 | 2515 400% | 2478 393% | 544 8% | 1640 226% |
| Write 4K Q8T8 (MB/s) | 437.2 | ||||
| Read 4K Q8T8 (MB/s) | 988 | ||||
| Total Average (Program / Settings) | 129% /
121% | 122% /
123% | -6% /
-6% | 145% /
147% |
* ... smaller is better

Disk Throttling: DiskSpd Read Loop, Queue Depth 8
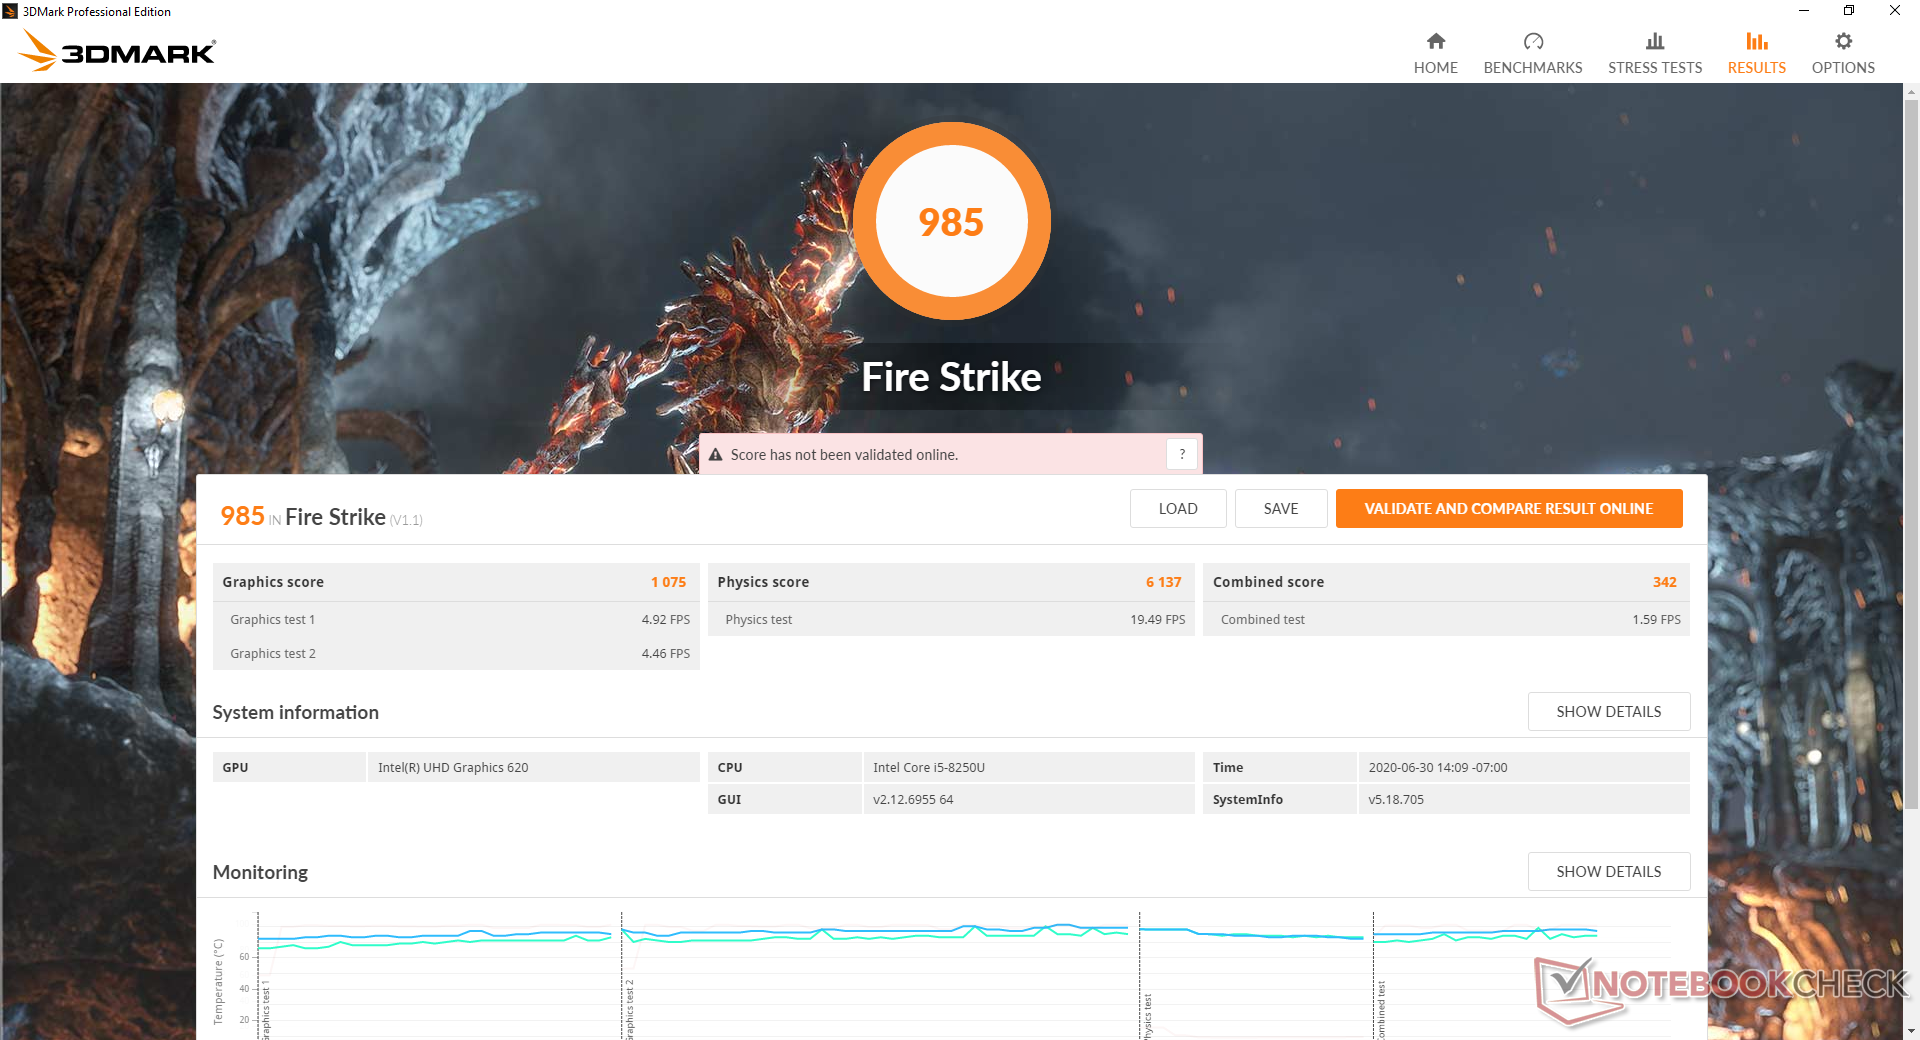
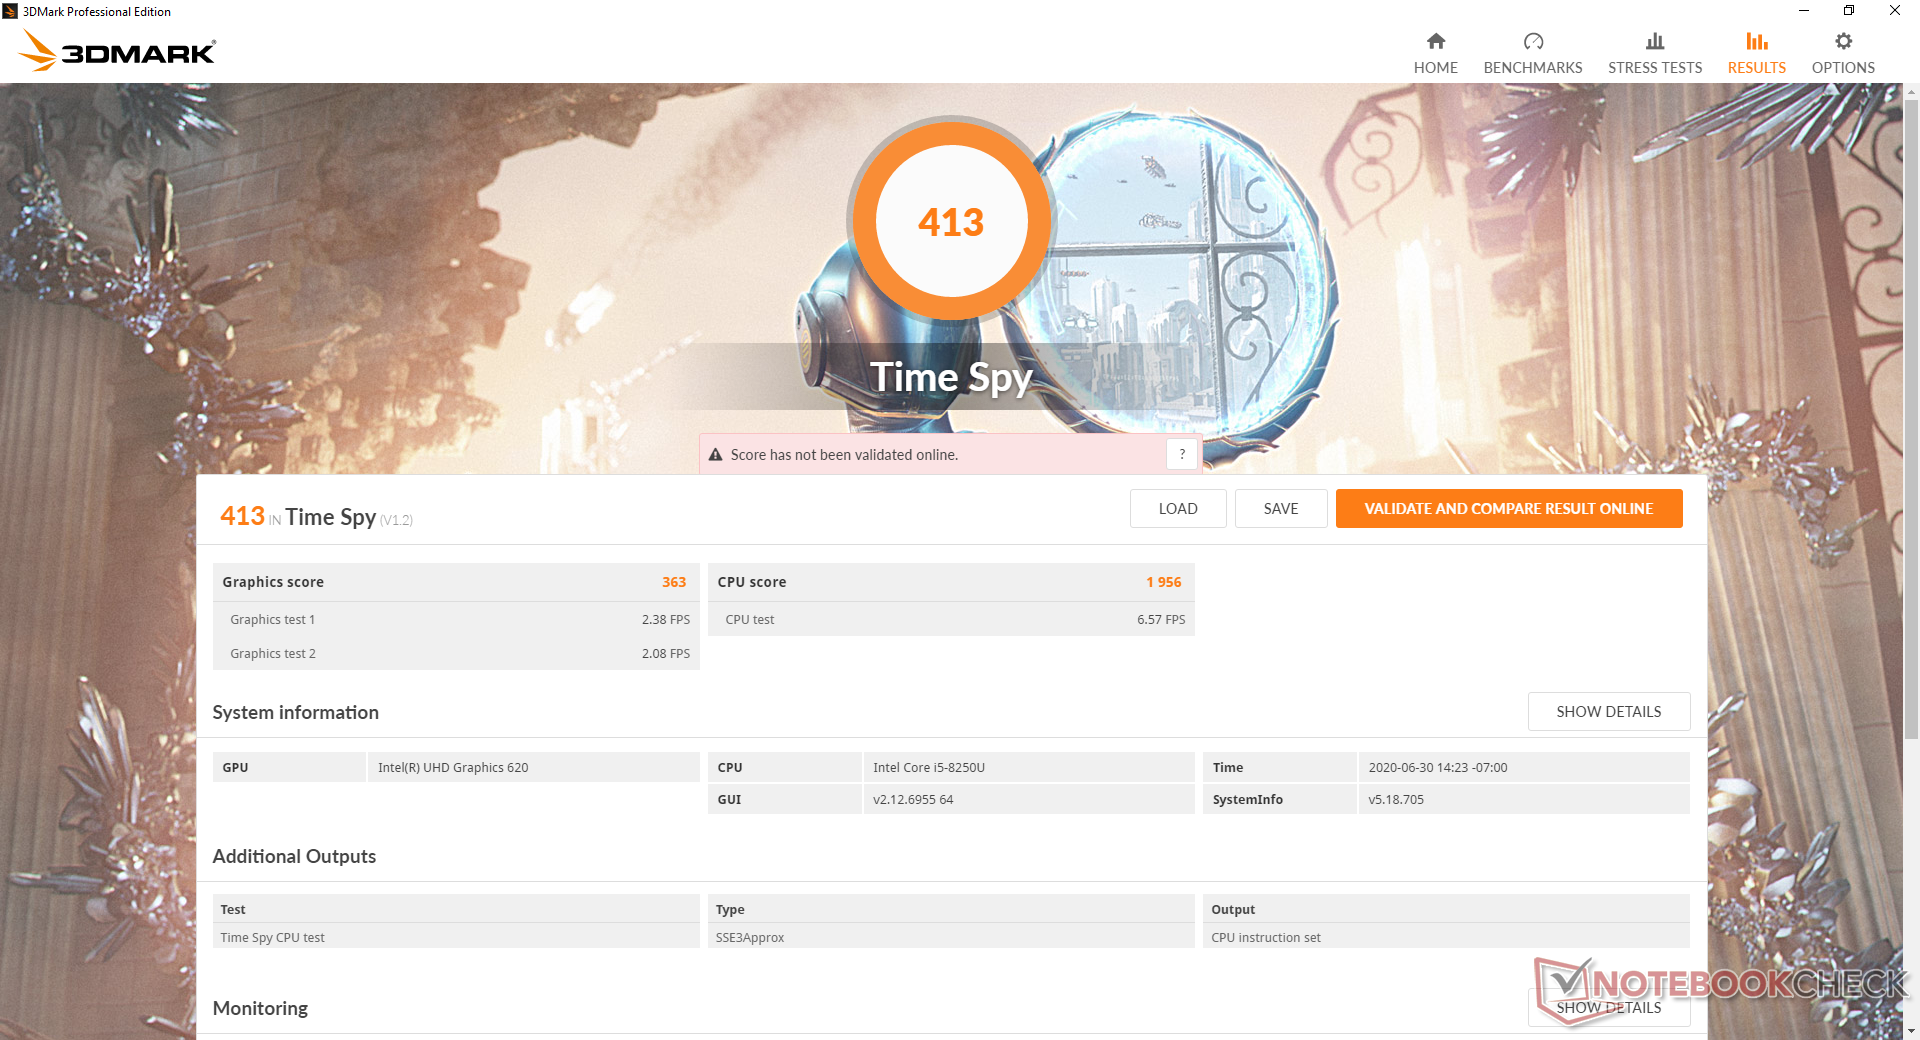
GPU Performance
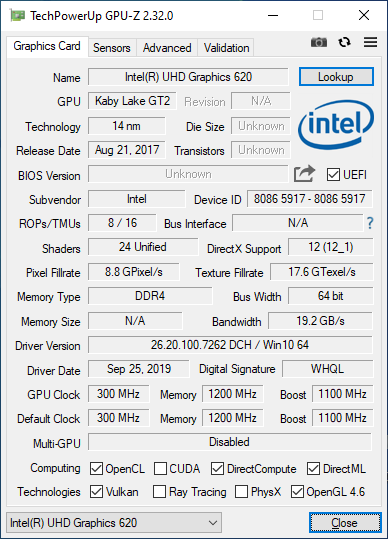
The integrated UHD Graphics 620 is years old and so it holds no surprises here. Graphics performance is where we expect it to be relative to other systems equipped with the same GPU including those with the newer 10th gen Comet Lake-U CPUs.
See our page on the UHD Graphics 620 for more technical information and benchmark comparisons.
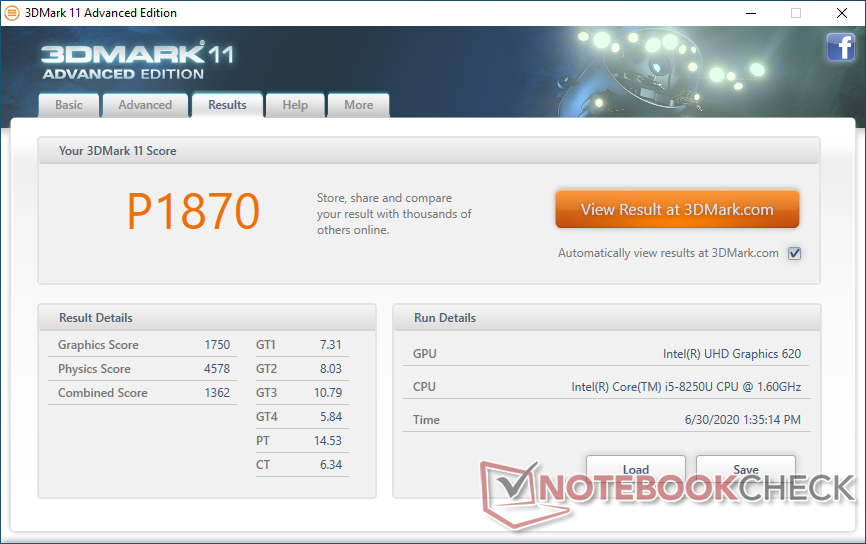
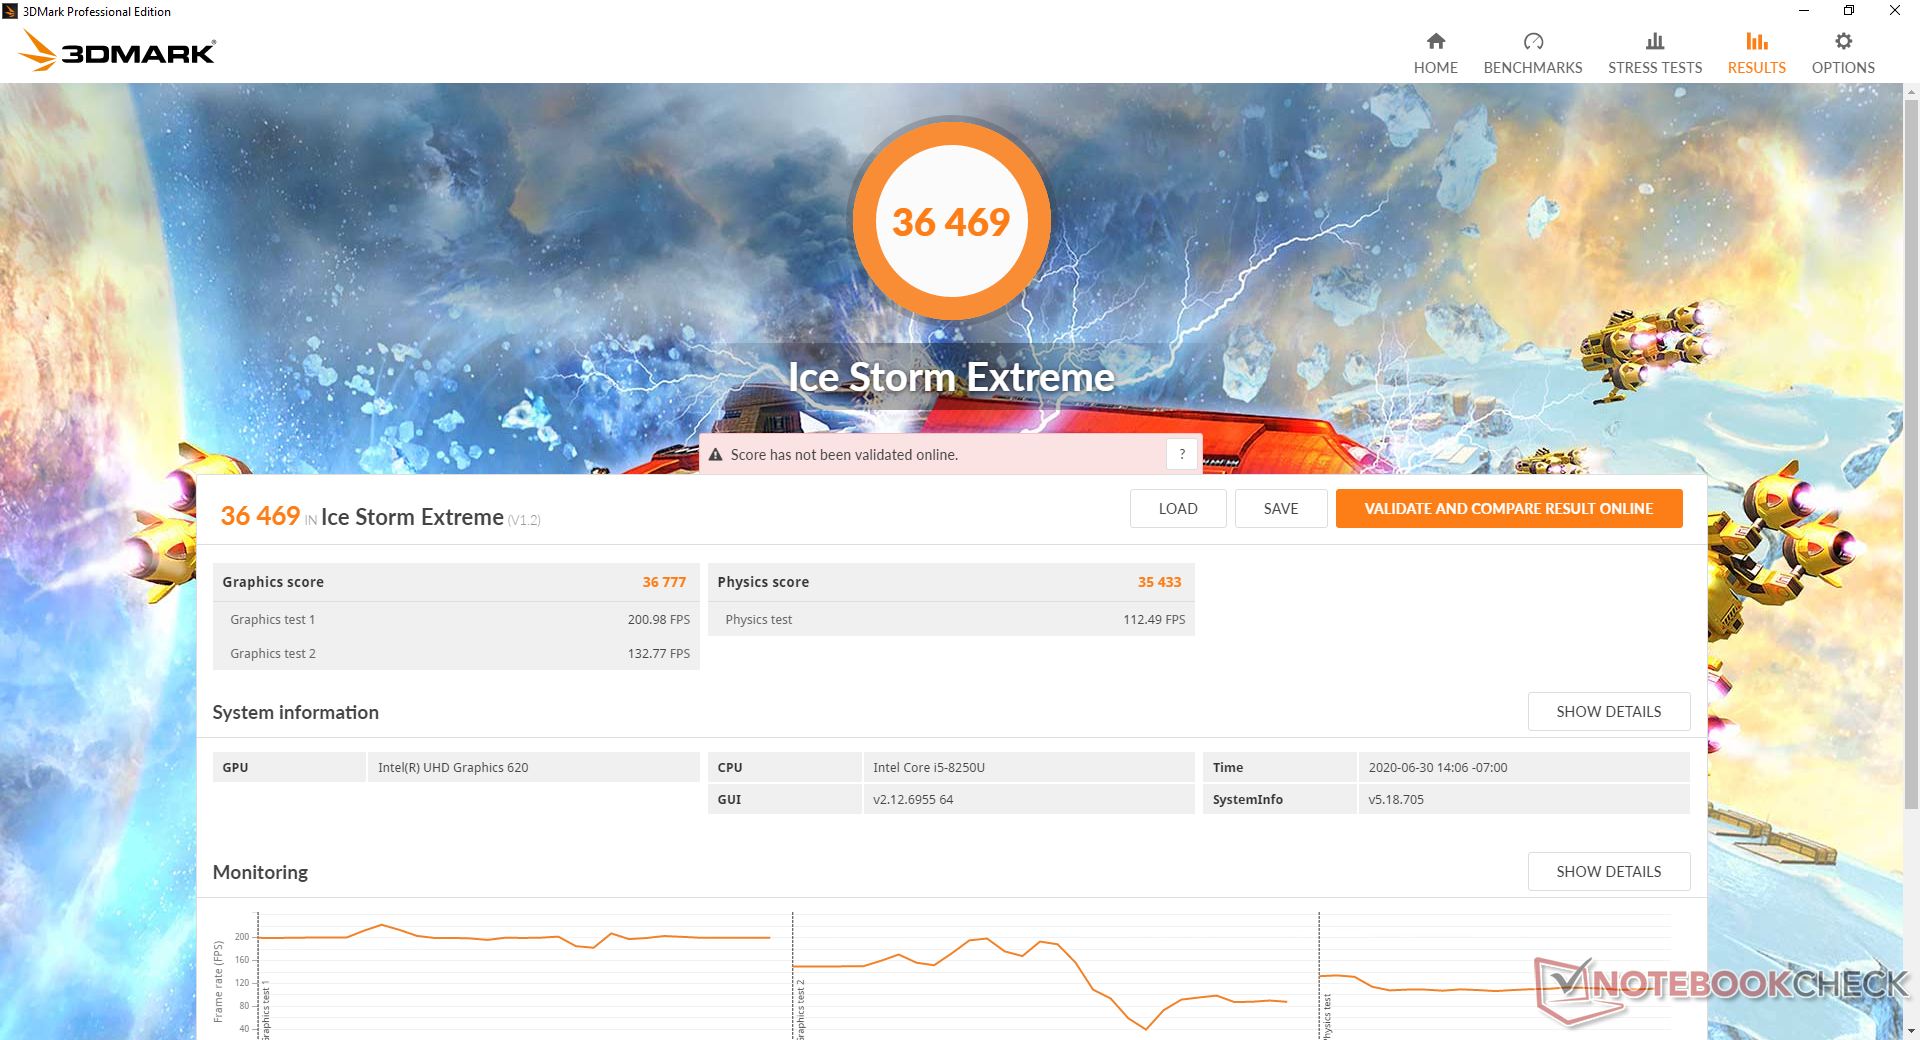
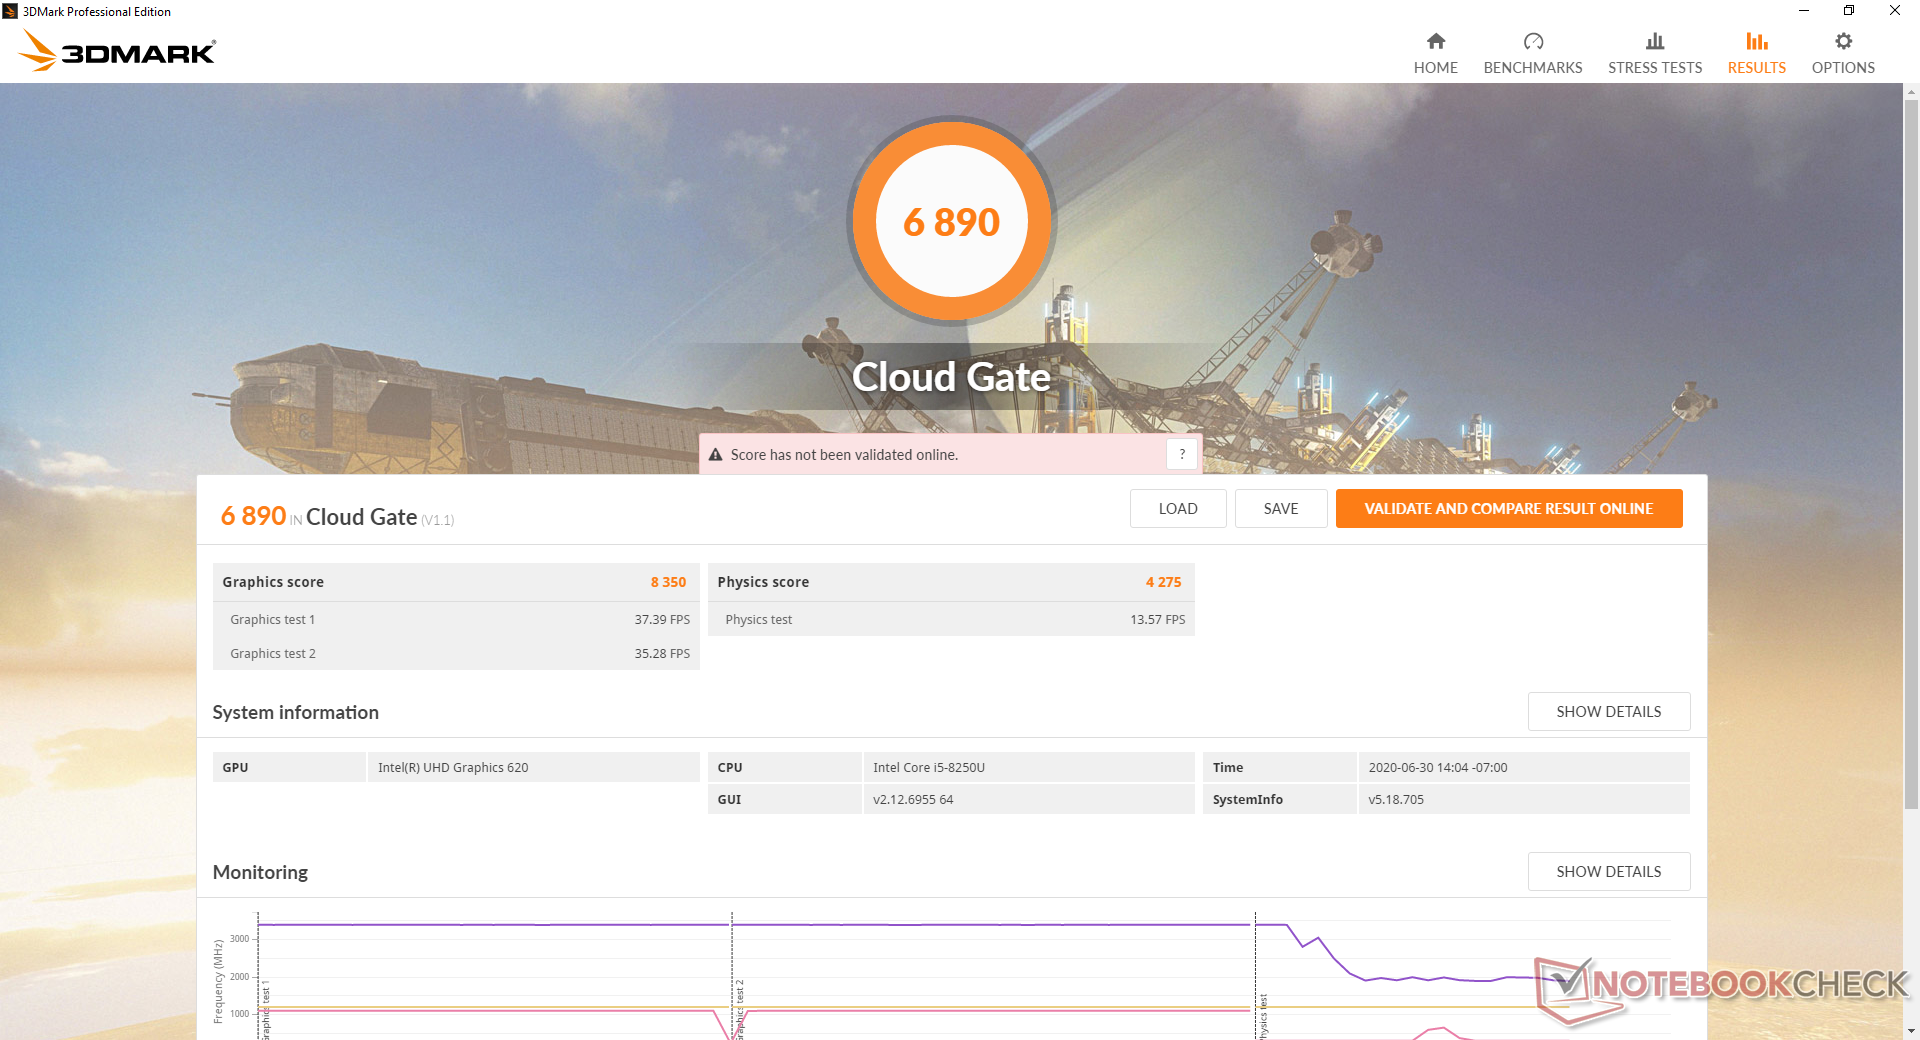
| 3DMark 11 Performance | 1870 points | |
| 3DMark Cloud Gate Standard Score | 6890 points | |
| 3DMark Fire Strike Score | 985 points | |
| 3DMark Time Spy Score | 413 points | |
Help | ||
| low | med. | high | ultra | |
|---|---|---|---|---|
| Dota 2 Reborn (2015) | 59.8 | 33.7 | 17.8 | 14.9 |
| X-Plane 11.11 (2018) | 19.1 | 13.2 | 11.9 |
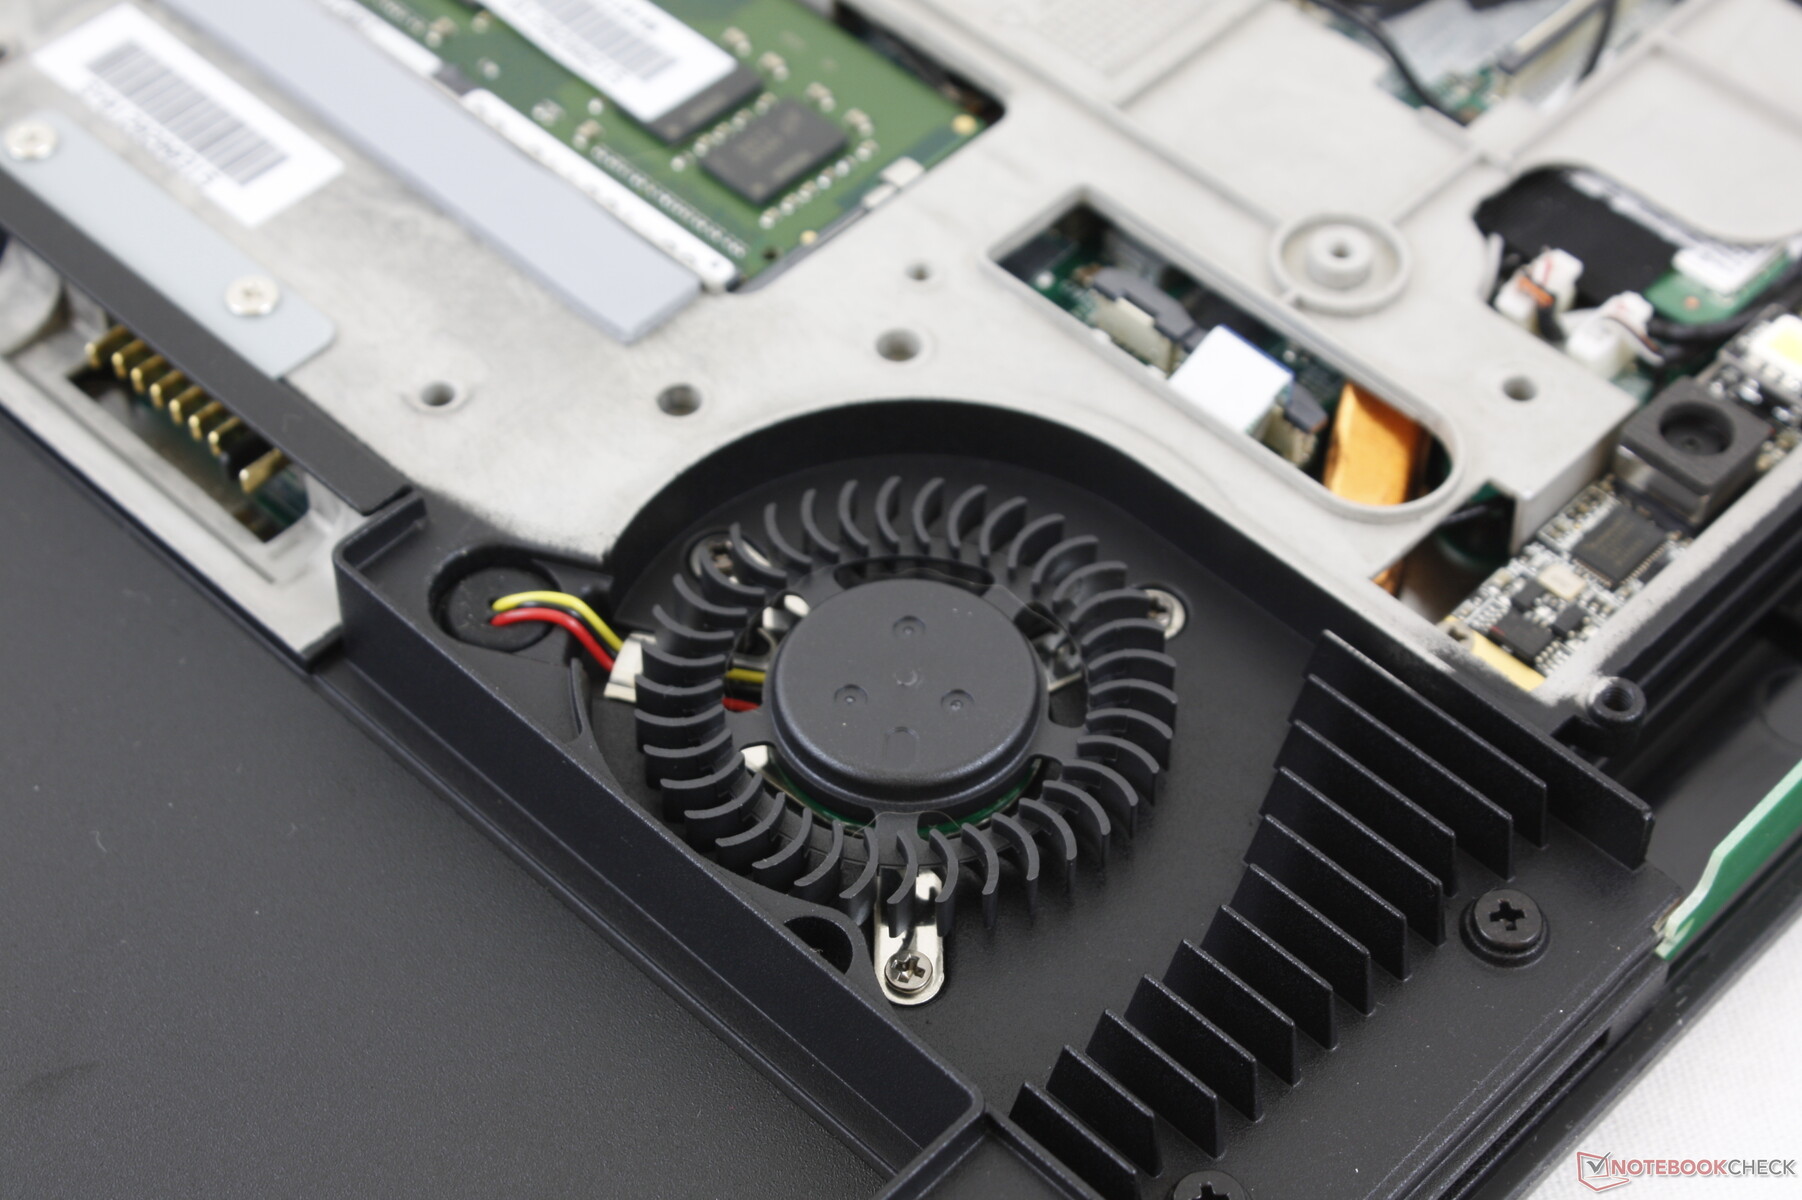
Emissions
System Noise
The tablet is not passively cooled since it uses a faster 15 W Core U-series CPU instead of a 4.5 W Core Y or Atom variety. Even so, the fan remains idle during most loads for a silent experience. Fan noise jumps abruptly to almost 40 dB(A) when running sustained higher loads to be louder than we expected. The 40 dB(A) range is audible in a typical office environment, but it's much more acceptable and difficult to hear when outdoors.
| Durabook R11 UHD Graphics 620, i5-8250U, Kingston RBUSNS4180S3128GJ | Dell Latitude 7424 Rugged Extreme Radeon RX 540, i7-8650U, SK Hynix PC401 512GB M.2 (HFS512GD9TNG) | Dell Latitude 5420 Rugged-P85G Radeon RX 540, i7-8650U, SK hynix PC401 NVMe 500 GB | Fujitsu Stylistic Q738 UHD Graphics 620, i5-8350U, Samsung SSD PM871b MZNLN256HAJQ | Dell Latitude 7200 UHD Graphics 620, i5-8365U, WDC PC SN520 SDAPNUW-512G | |
|---|---|---|---|---|---|
| Noise | 2% | 4% | -1% | 6% | |
| off / environment * (dB) | 28 | 28.6 -2% | 28.3 -1% | 30.5 -9% | 28.8 -3% |
| Idle Minimum * (dB) | 28 | 28.6 -2% | 28.3 -1% | 30.5 -9% | 28.8 -3% |
| Idle Average * (dB) | 28 | 28.6 -2% | 28.3 -1% | 30.5 -9% | 28.8 -3% |
| Idle Maximum * (dB) | 28 | 28.6 -2% | 28.3 -1% | 30.5 -9% | 28.8 -3% |
| Load Average * (dB) | 39.3 | 32.9 16% | 29.9 24% | 33.3 15% | 30.1 23% |
| Load Maximum * (dB) | 39.3 | 39 1% | 38 3% | 33.6 15% | 30.1 23% |
* ... smaller is better
Noise level
| Idle |
| 28 / 28 / 28 dB(A) |
| Load |
| 39.3 / 39.3 dB(A) |
 | ||
30 dB silent 40 dB(A) audible 50 dB(A) loud |
||
min: | ||
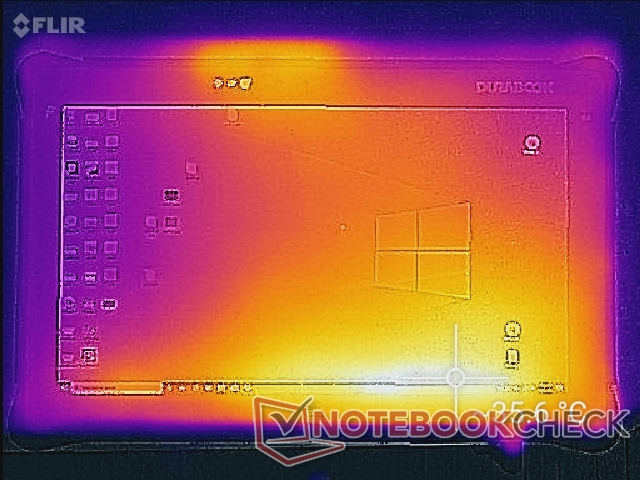
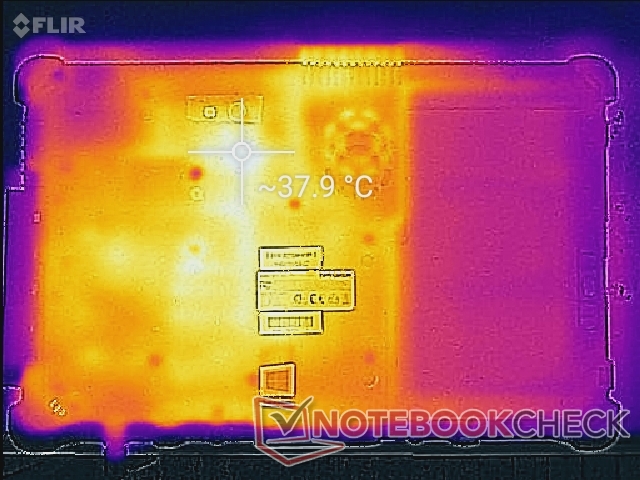
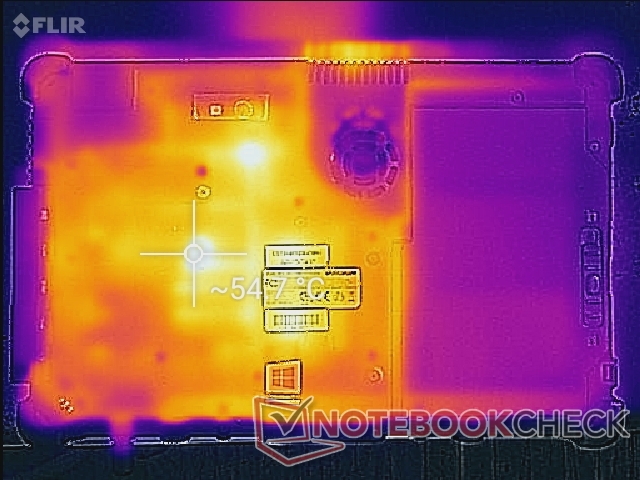
Temperature
Surface temperatures are warm when under load despite the thick profile and active fan. The front and back hot spots can be as warm as 35 C to 38 C, respectively, even when simply idling on desktop. These same hot spots can reach over 50 C when under high processing stress. Thankfully, the edges and corners of the tablet remain cool to the touch which is how most users will be handling the device.

(-) The maximum temperature on the upper side is 53.2 °C / 128 F, compared to the average of 33.6 °C / 92 F, ranging from 20.7 to 53.2 °C for the class Tablet.
(-) The bottom heats up to a maximum of 55.2 °C / 131 F, compared to the average of 33.2 °C / 92 F
(+) In idle usage, the average temperature for the upper side is 30.7 °C / 87 F, compared to the device average of 30 °C / 86 F.

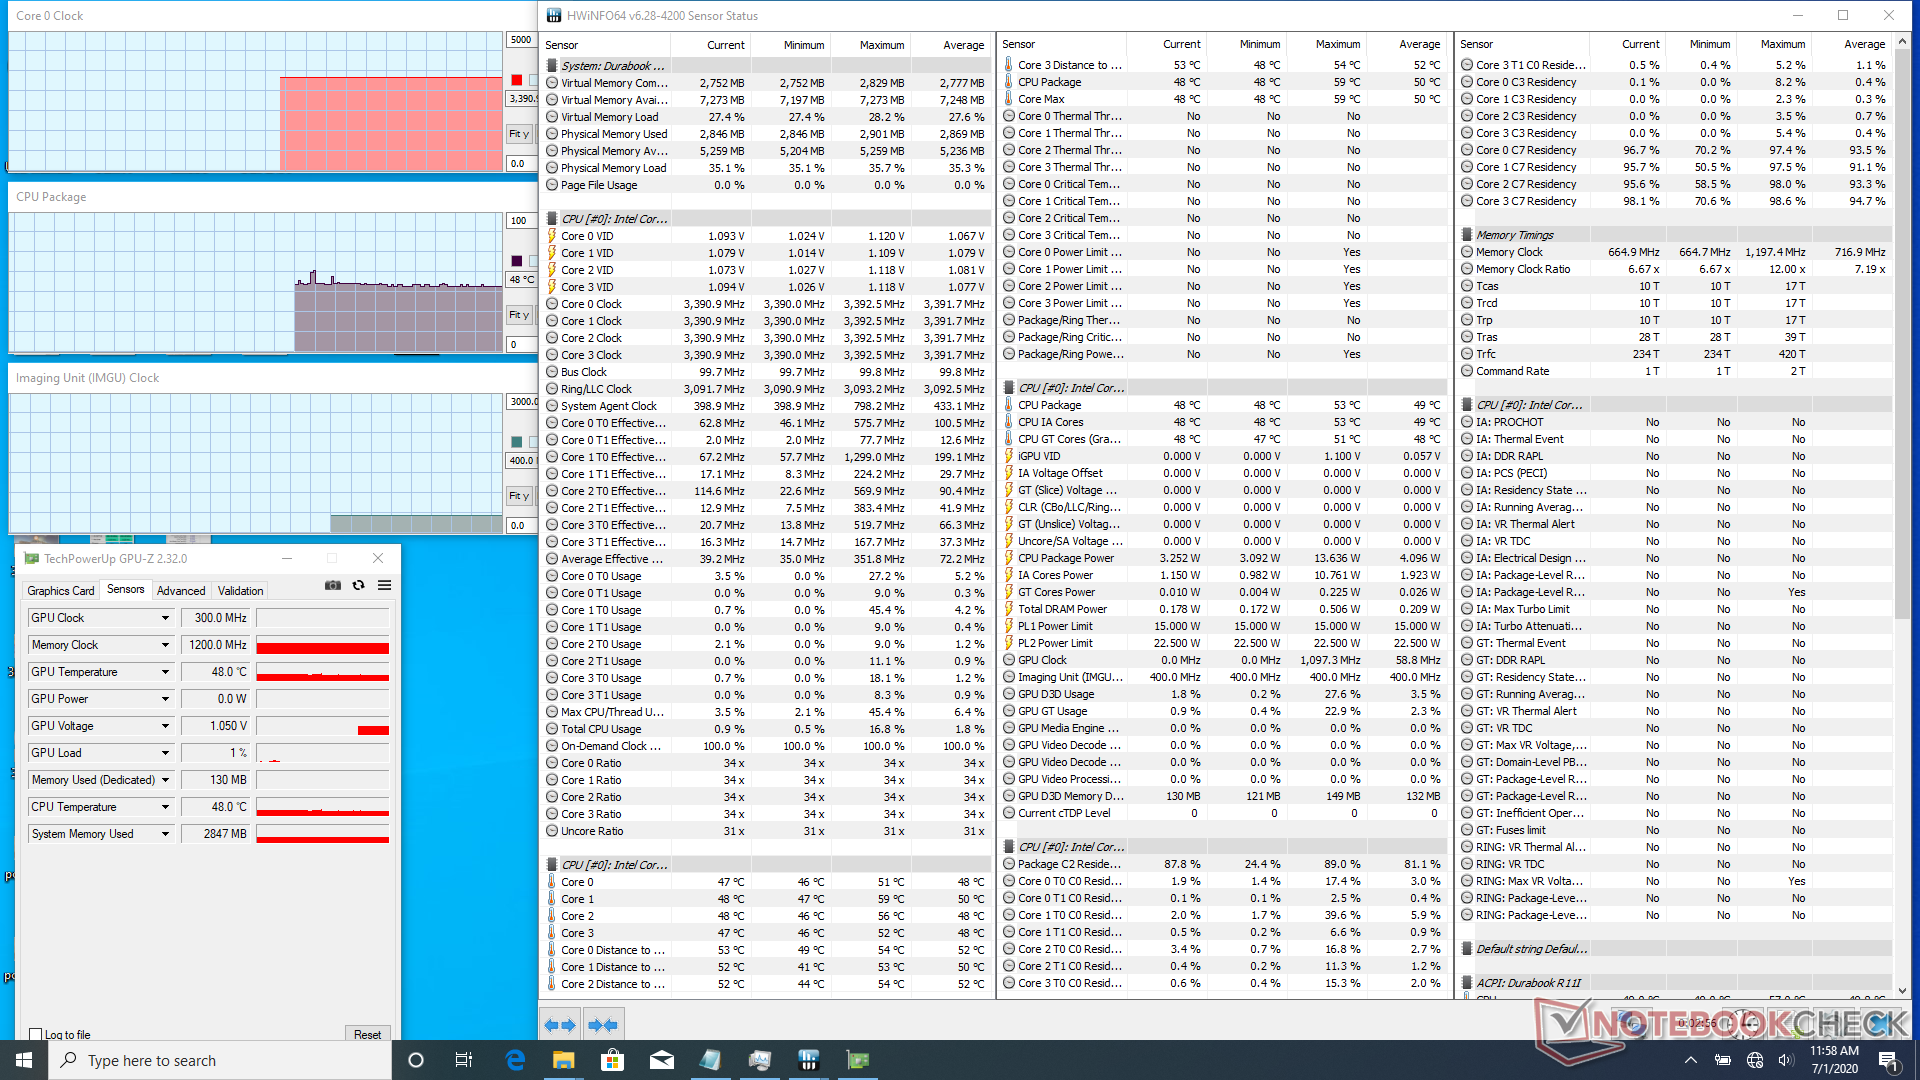
Stress Test
When running Prime95 to stress the processor, clock rates can be observed boosting up to 2.1 GHz for about 20 seconds until hitting a core temperature of 65 C. Clock rates would then throttle and settle at 1.5 GHz in order to maintain the 65 C core temperature. When both the CPU and integrated GPU are stressed to maximum utilization, core temperature would stabilize at a toasty 85 C.
Running on battery will limit graphics performance. A 3DMark test on batteries returns Physics and Graphics scores of 4273 and 881 points, respectively, compared to 4578 and 1750 points when on mains.
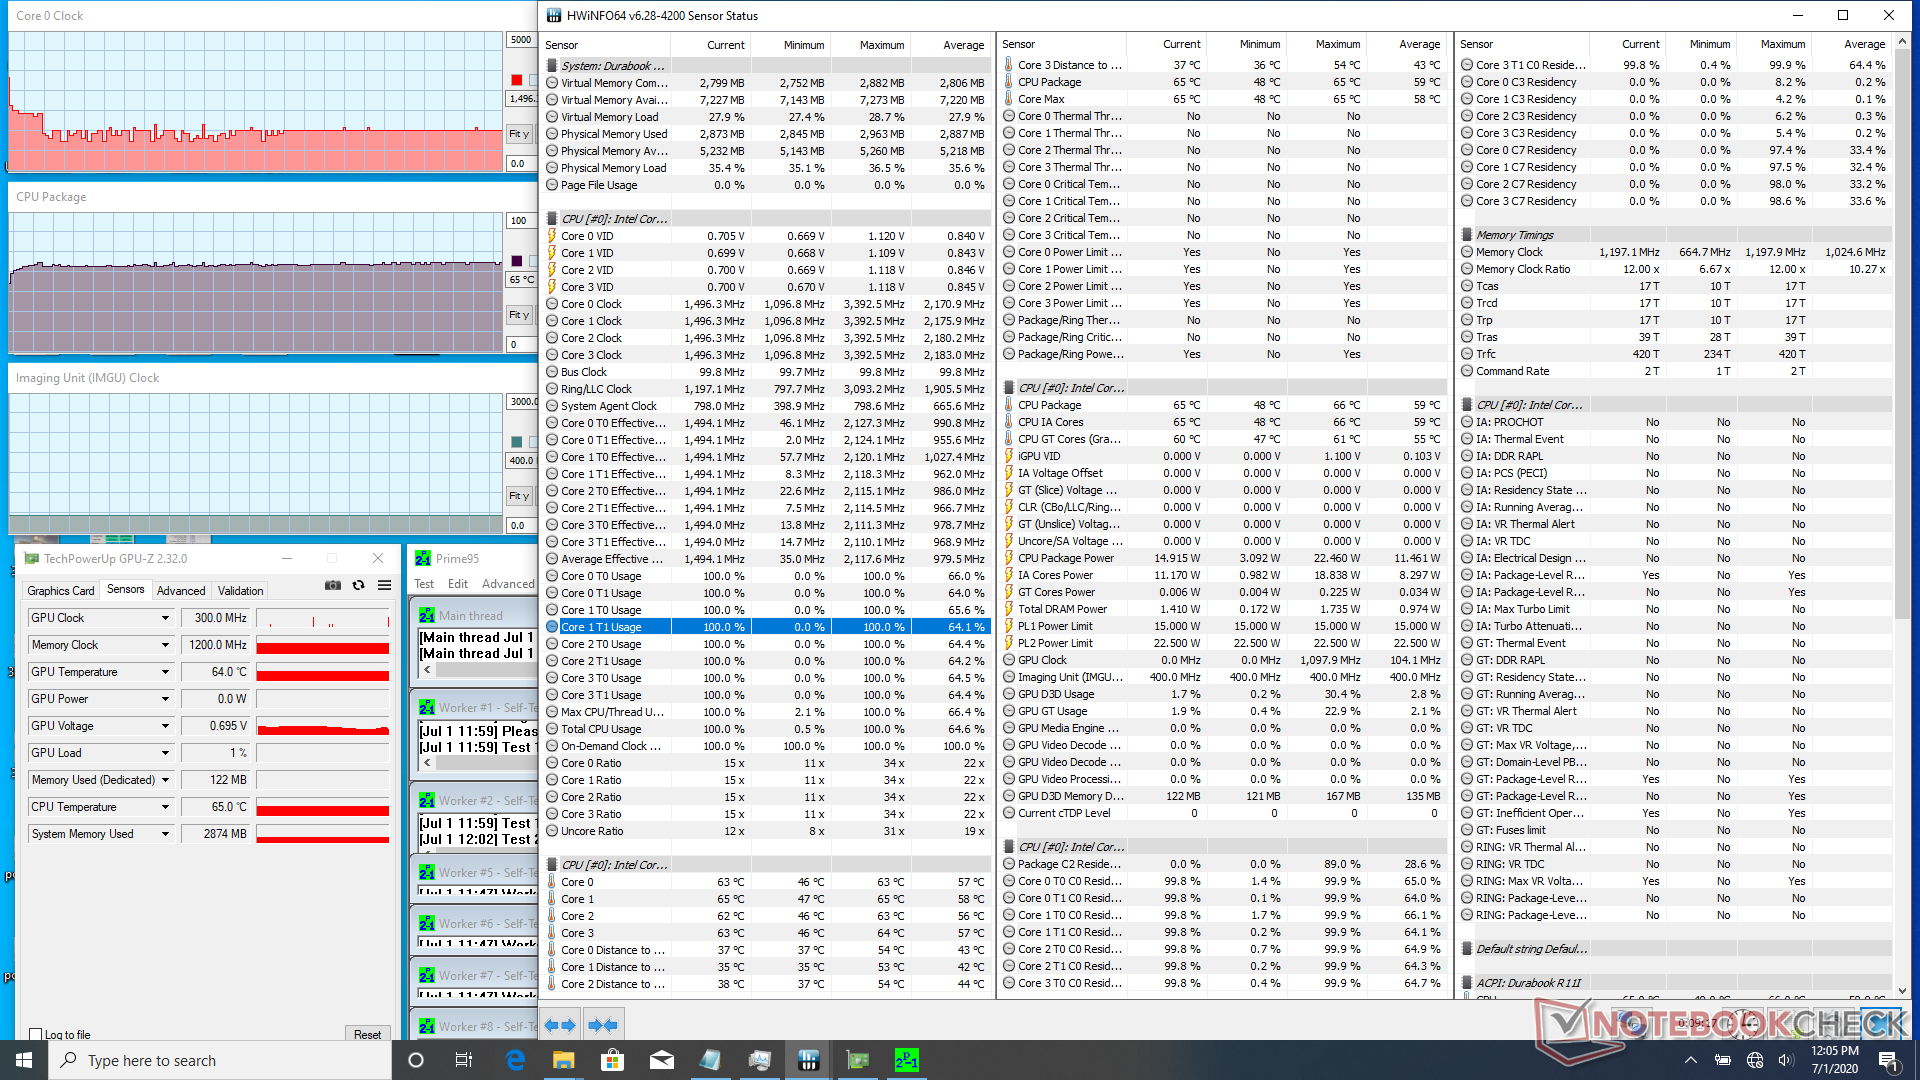

| CPU Clock (GHz) | GPU Clock (MHz) | Average CPU Temperature (°C) | |
| System Idle | -- | -- | 48 |
| Prime95 Stress | 1.5 | -- | 65 |
| Prime95 + FurMark Stress | 1.1 | 850 | 85 |
Speakers

Durabook R11 audio analysis
(±) | speaker loudness is average but good (76.8 dB)
Bass 100 - 315 Hz
(-) | nearly no bass - on average 38.7% lower than median
(±) | linearity of bass is average (7.8% delta to prev. frequency)
Mids 400 - 2000 Hz
(±) | reduced mids - on average 12.1% lower than median
(±) | linearity of mids is average (9.5% delta to prev. frequency)
Highs 2 - 16 kHz
(+) | balanced highs - only 3.2% away from median
(+) | highs are linear (6.8% delta to prev. frequency)
Overall 100 - 16.000 Hz
(-) | overall sound is not linear (33.8% difference to median)
Compared to same class
» 93% of all tested devices in this class were better, 3% similar, 4% worse
» The best had a delta of 7%, average was 20%, worst was 129%
Compared to all devices tested
» 93% of all tested devices were better, 1% similar, 6% worse
» The best had a delta of 4%, average was 24%, worst was 134%
Apple MacBook 12 (Early 2016) 1.1 GHz audio analysis
(+) | speakers can play relatively loud (83.6 dB)
Bass 100 - 315 Hz
(±) | reduced bass - on average 11.3% lower than median
(±) | linearity of bass is average (14.2% delta to prev. frequency)
Mids 400 - 2000 Hz
(+) | balanced mids - only 2.4% away from median
(+) | mids are linear (5.5% delta to prev. frequency)
Highs 2 - 16 kHz
(+) | balanced highs - only 2% away from median
(+) | highs are linear (4.5% delta to prev. frequency)
Overall 100 - 16.000 Hz
(+) | overall sound is linear (10.2% difference to median)
Compared to same class
» 7% of all tested devices in this class were better, 2% similar, 91% worse
» The best had a delta of 5%, average was 18%, worst was 53%
Compared to all devices tested
» 5% of all tested devices were better, 1% similar, 94% worse
» The best had a delta of 4%, average was 24%, worst was 134%
Energy Management
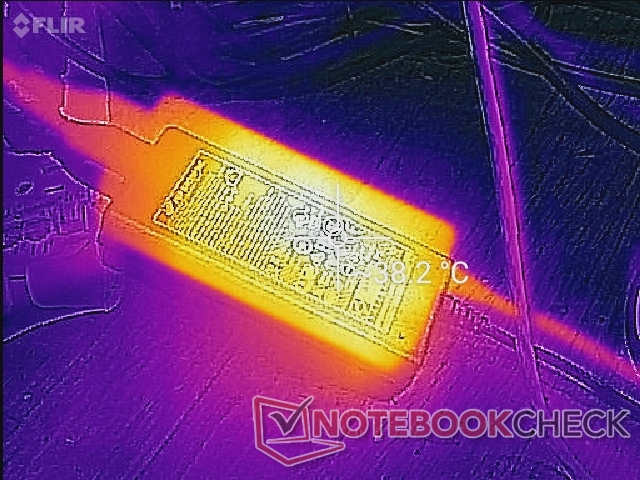
Power Consumption
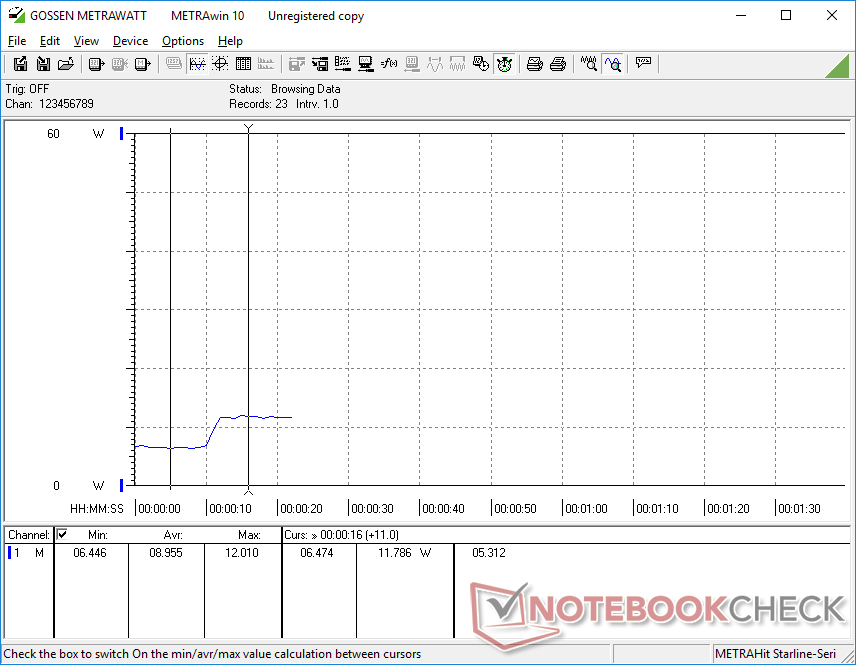
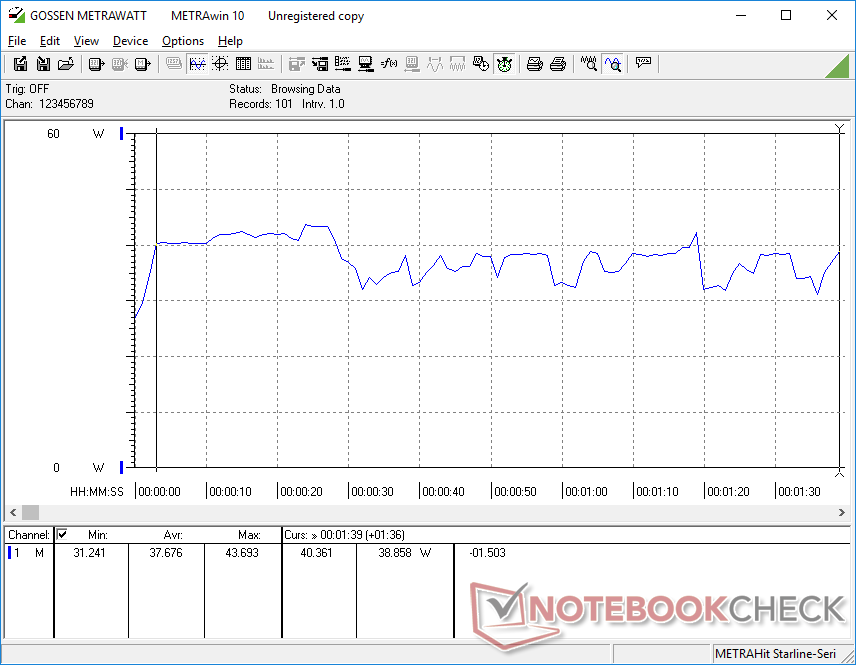
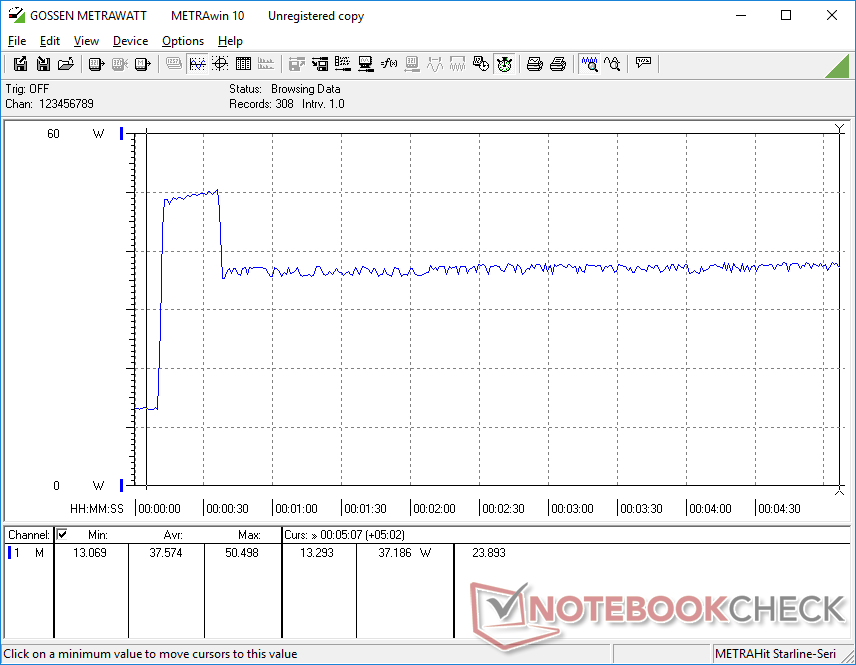
Power consumption is relatively high due in part to the very bright display. Jumping from the minimum brightness setting to the maximum will draw almost 5 watts more on average.
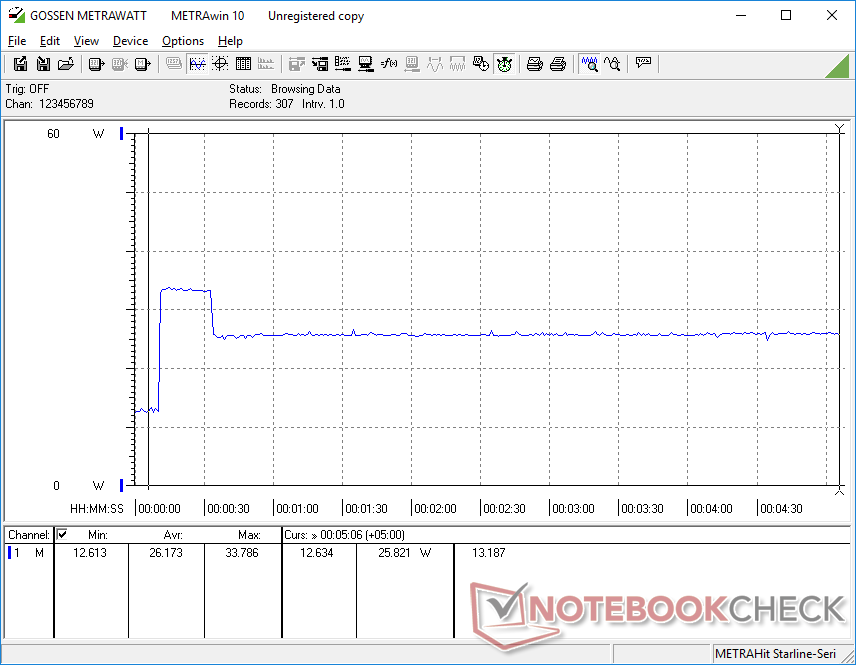
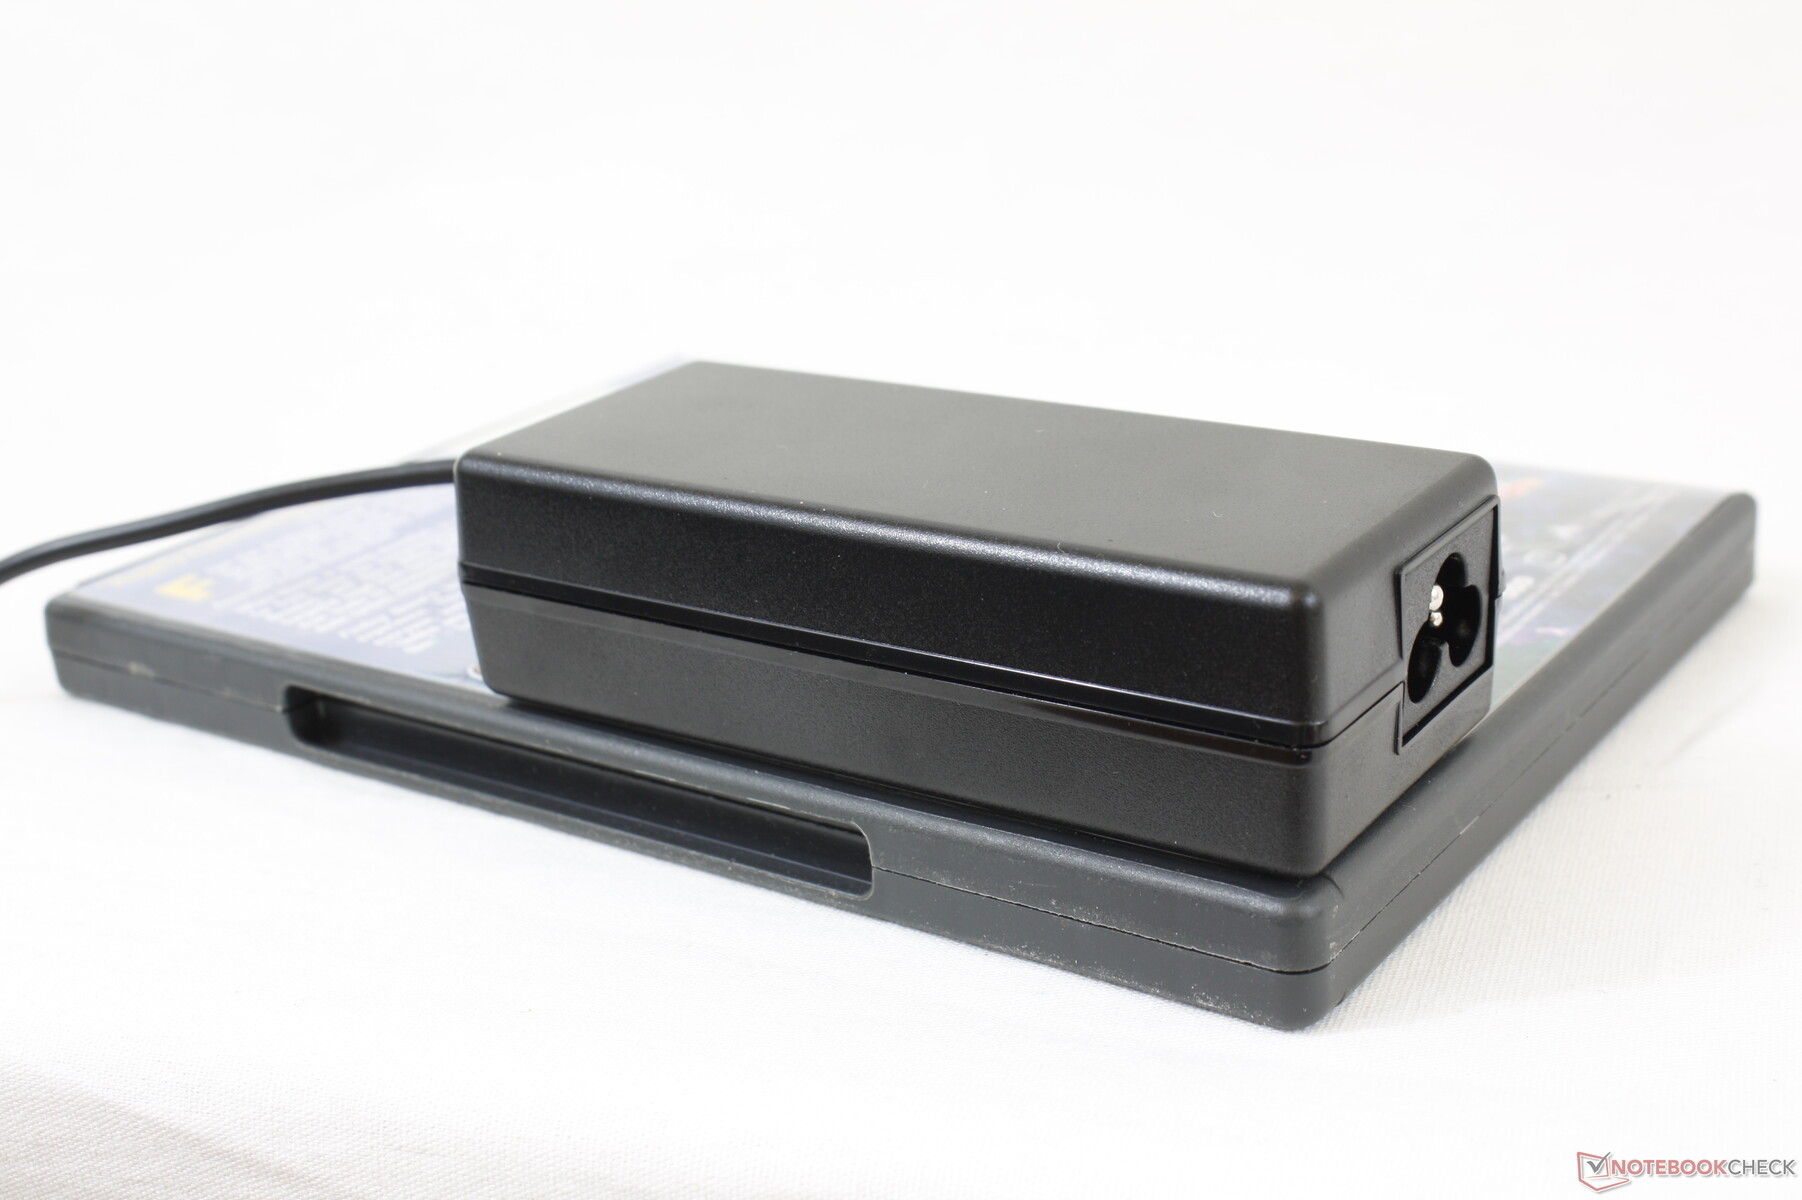
We're able to measure a maximum draw of 50.7 W from the small (~10.8 4.6 3.1 cm) 65 W AC adapter when running extreme processing loads. However, this lasts for only about 20 seconds due to thermal limits as shown by our graphs below.
| Off / Standby | |
| Idle | |
| Load |
|
Key:
min: | |
| Durabook R11 i5-8250U, UHD Graphics 620, Kingston RBUSNS4180S3128GJ, IPS, 1920x1080, 11.6" | Dell Latitude 7424 Rugged Extreme i7-8650U, Radeon RX 540, SK Hynix PC401 512GB M.2 (HFS512GD9TNG), IPS, 1920x1080, 14" | Dell Latitude 5420 Rugged-P85G i7-8650U, Radeon RX 540, SK hynix PC401 NVMe 500 GB, IPS, 1920x1080, 14" | Fujitsu Stylistic Q738 i5-8350U, UHD Graphics 620, Samsung SSD PM871b MZNLN256HAJQ, IPS, 1920x1080, 13.3" | Dell Latitude 7200 i5-8365U, UHD Graphics 620, WDC PC SN520 SDAPNUW-512G, IPS LED, 1920x1280, 12.3" | |
|---|---|---|---|---|---|
| Power Consumption | -49% | -35% | 42% | 28% | |
| Idle Minimum * (Watt) | 6.1 | 6.5 -7% | 4.8 21% | 4.2 31% | 3.3 46% |
| Idle Average * (Watt) | 11.7 | 15.1 -29% | 13.6 -16% | 7 40% | 5.8 50% |
| Idle Maximum * (Watt) | 11.9 | 16.1 -35% | 13.8 -16% | 7.9 34% | 6.5 45% |
| Load Average * (Watt) | 37.7 | 70.5 -87% | 67.8 -80% | 19.8 47% | 37 2% |
| Load Maximum * (Watt) | 50.5 | 95.2 -89% | 93.5 -85% | 22 56% | 51.3 -2% |
| Witcher 3 ultra * (Watt) | 68.1 | 69.1 |
* ... smaller is better
Battery Life
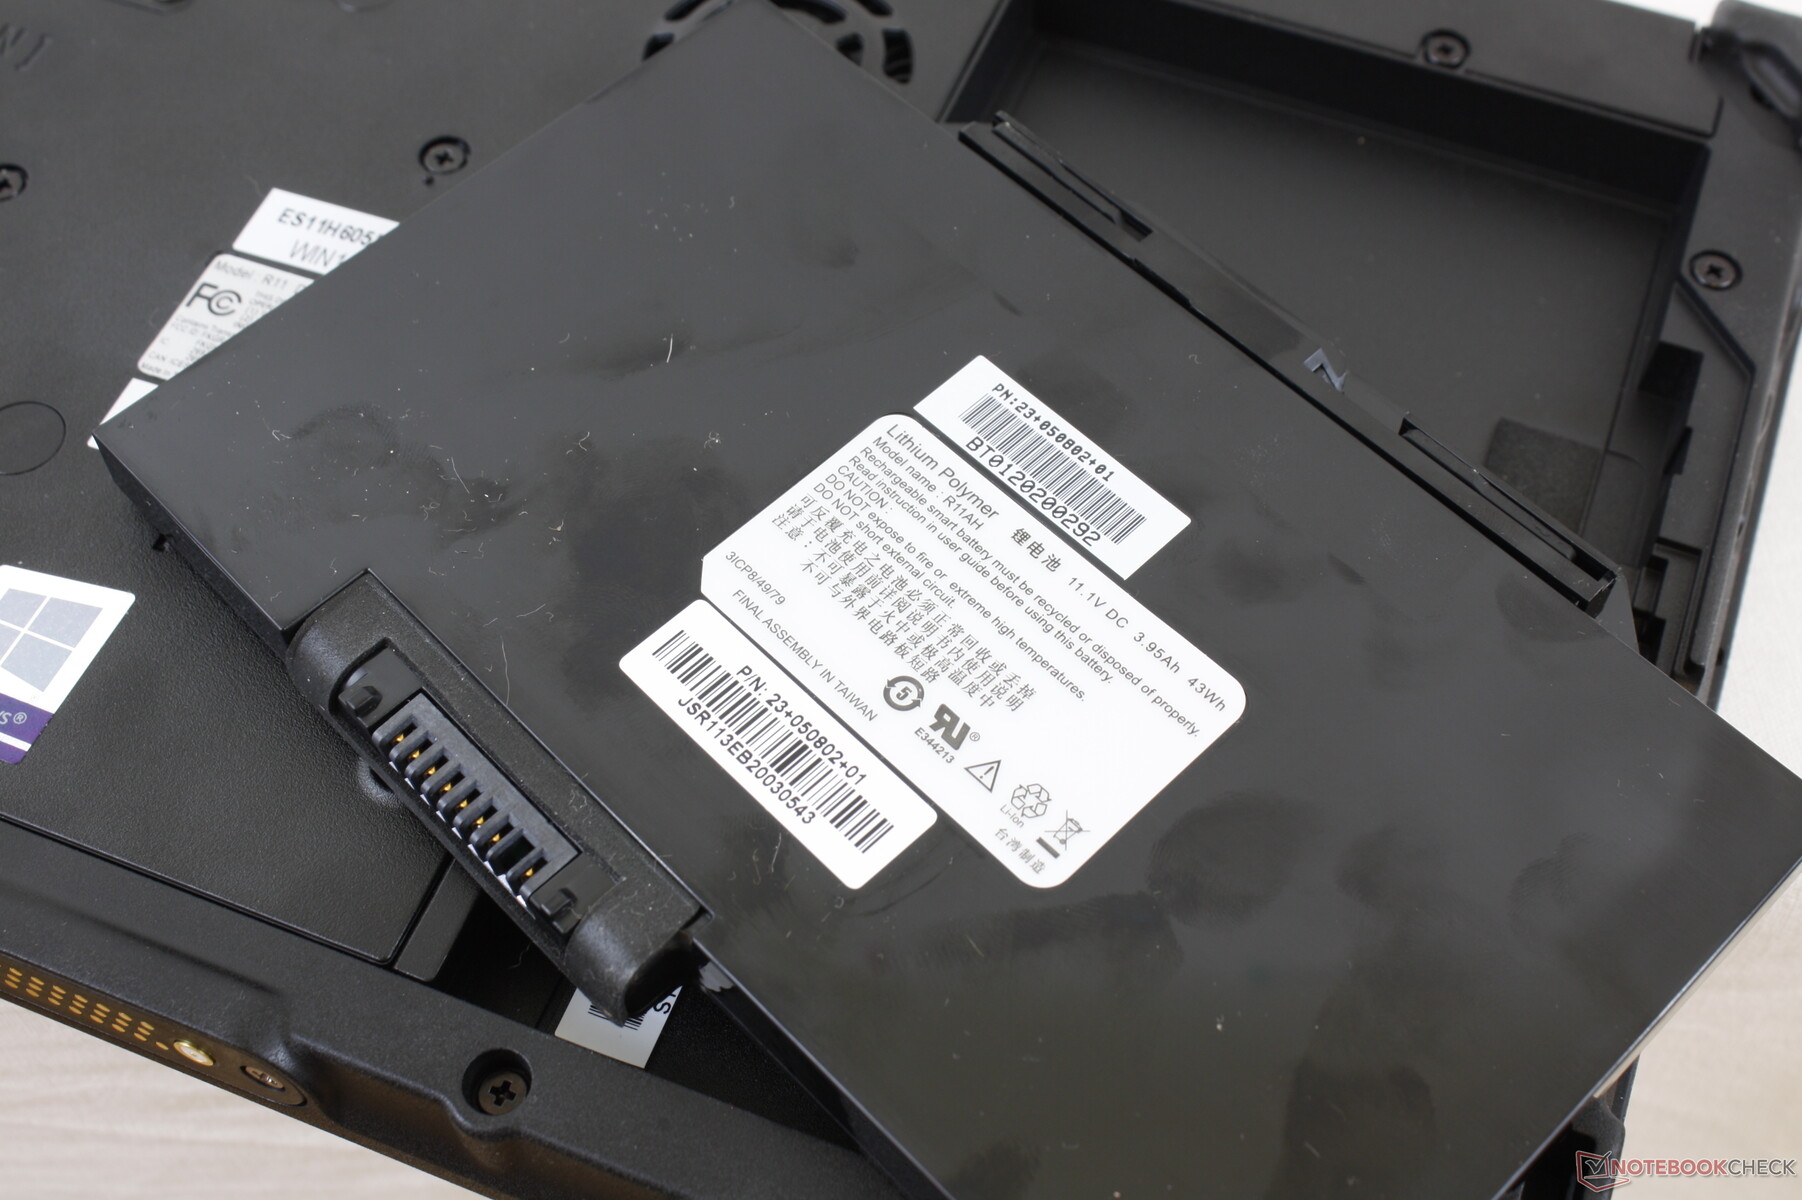
Expect just over 5.5 hours of real-world WLAN use when set to the Balanced power profile at a brightness of 150 nits. Charging the removable 43 Wh battery from empty to full capacity takes about 2 hours.
| Durabook R11 i5-8250U, UHD Graphics 620, 43 Wh | Dell Latitude 7424 Rugged Extreme i7-8650U, Radeon RX 540, 102 Wh | Dell Latitude 5420 Rugged-P85G i7-8650U, Radeon RX 540, 102 Wh | Fujitsu Stylistic Q738 i5-8350U, UHD Graphics 620, Wh | Dell Latitude 7200 i5-8365U, UHD Graphics 620, 38 Wh | |
|---|---|---|---|---|---|
| Battery runtime | 105% | 184% | 12% | 23% | |
| WiFi v1.3 (h) | 5.7 | 11.7 105% | 16.2 184% | 6.4 12% | 7 23% |
| Load (h) | 2.7 | 3.2 | 1.8 | ||
| Reader / Idle (h) | 31.4 |
Pros
Cons
Verdict
Having a modern Core U-series CPU instead of a weaker Celeron or Atom variant helps tremendously in system responsiveness. Despite being marketed as a more affordable rugged tablet, the Durabook R11 doesn't sacrifice display quality or processor options by all that much.
There is room for improvement. A brighter 1000-nit panel option would have helped a lot for outdoor users as 500 nits is usually not enough. Furthermore, hot spots on the tablet can get quite warm despite the thick profile and active fan. Thirdly, the touch-sensitive buttons and bright LEDs along the edges of the screen are more distracting than helpful especially since the buttons are easy to hit by accident. These buttons can fortunately be disabled, but it's a missed opportunity for other potentially more helpful features.
Perhaps the most notable drawback is the use of pulse-width modulation for brightness control at almost all brightness levels. If your eyes are sensitive to flickering, then don't plan on using this tablet in the dark too often.
A rugged tablet with an impressive display for its category. However, its finicky touch-sensitive buttons and display PWM should definitely be addressed in future iterations.
Price comparison
