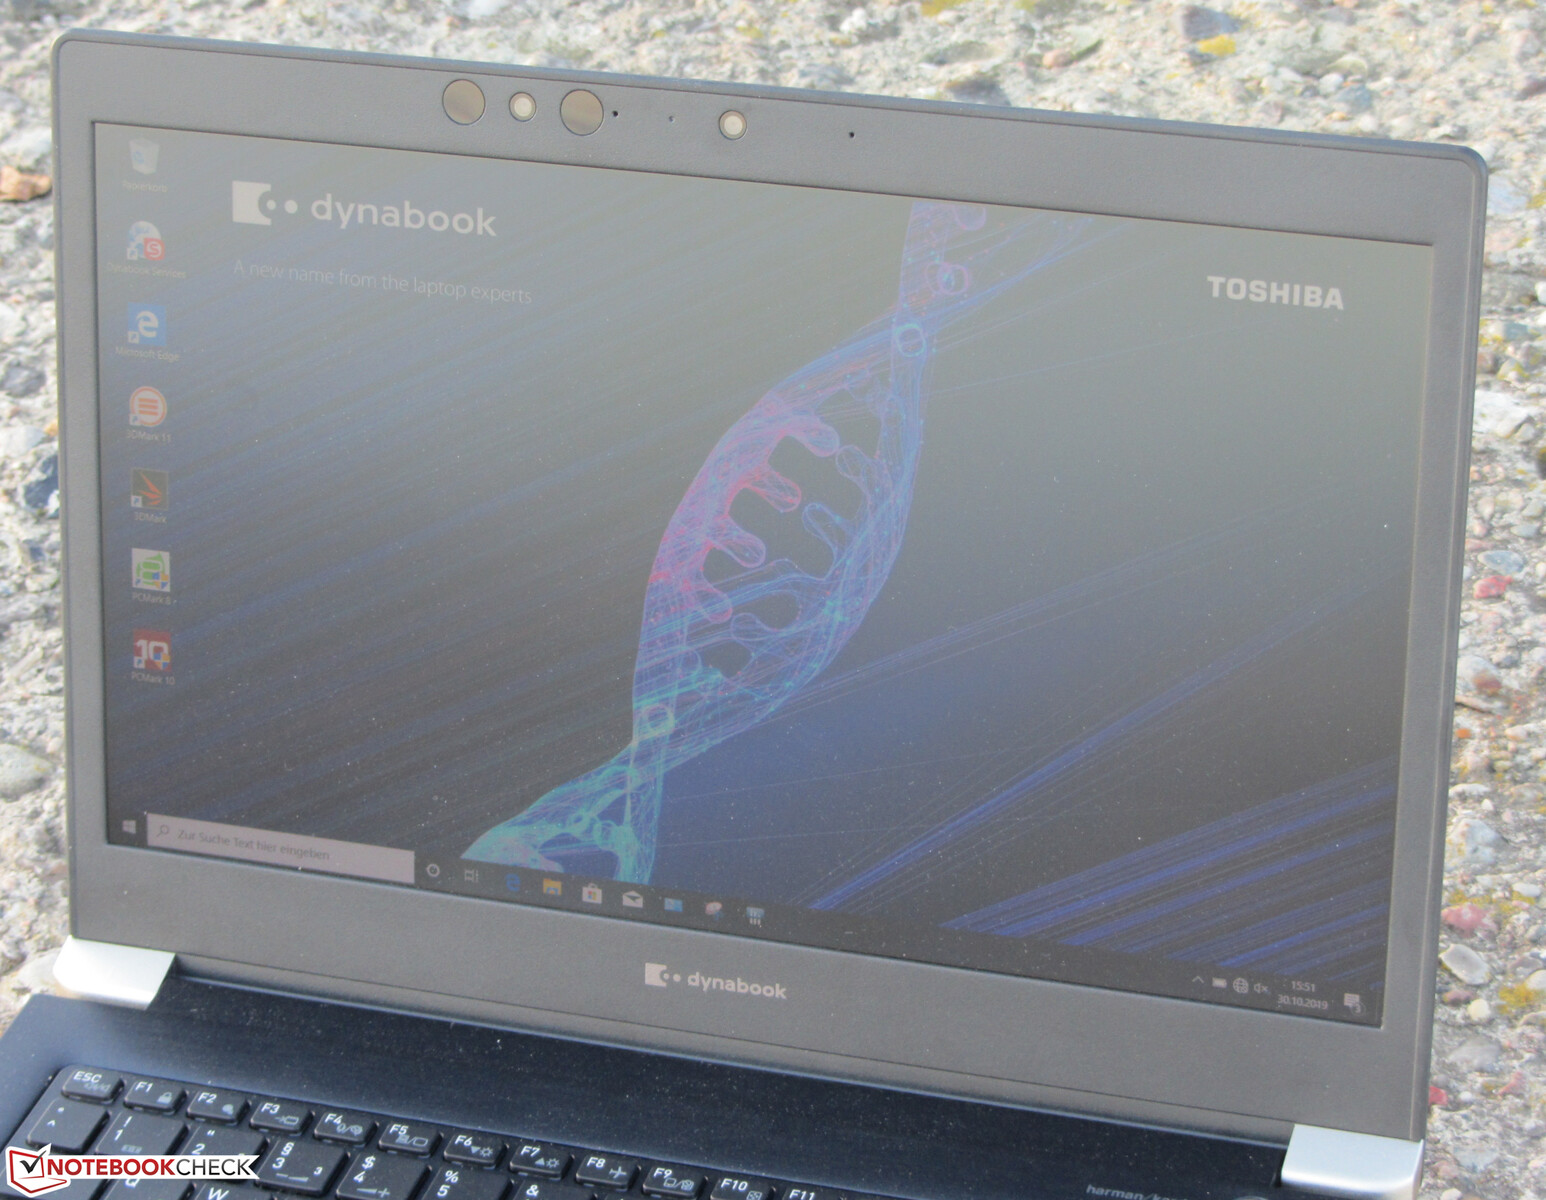
Dynabook Portégé X30-F laptop review: Light, slim, enduring

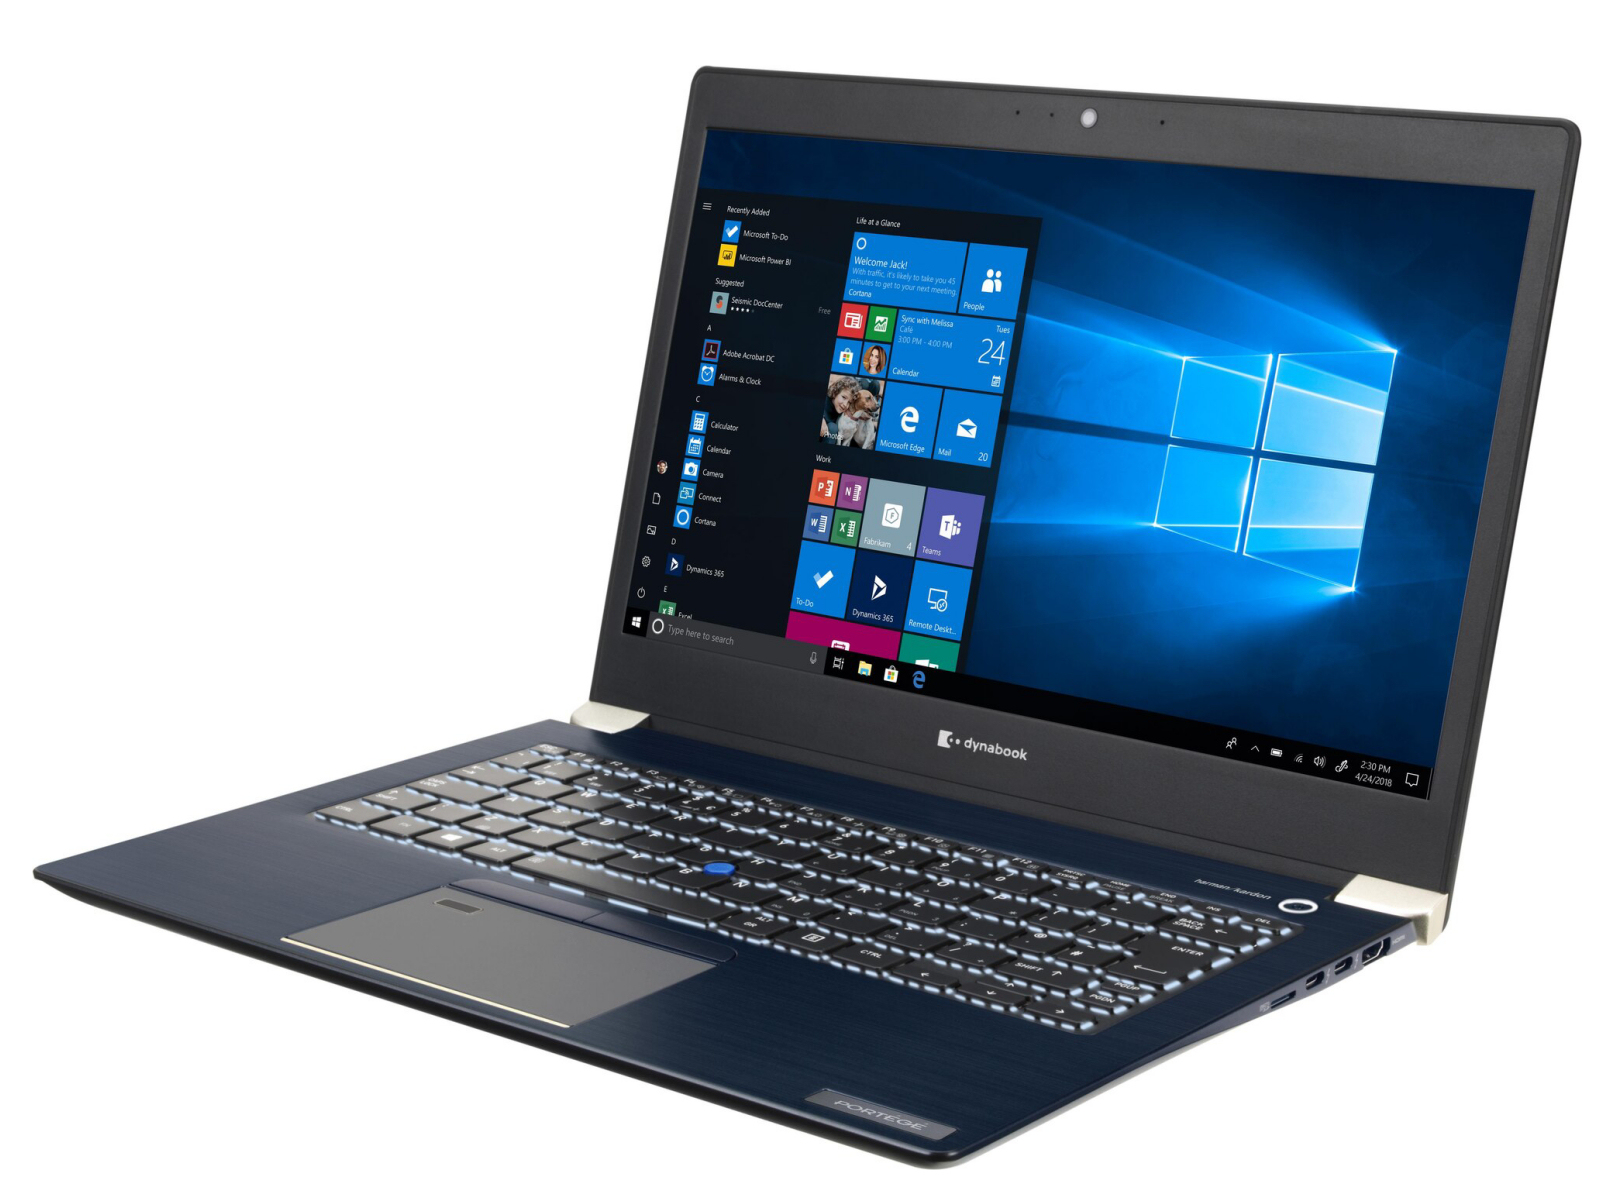
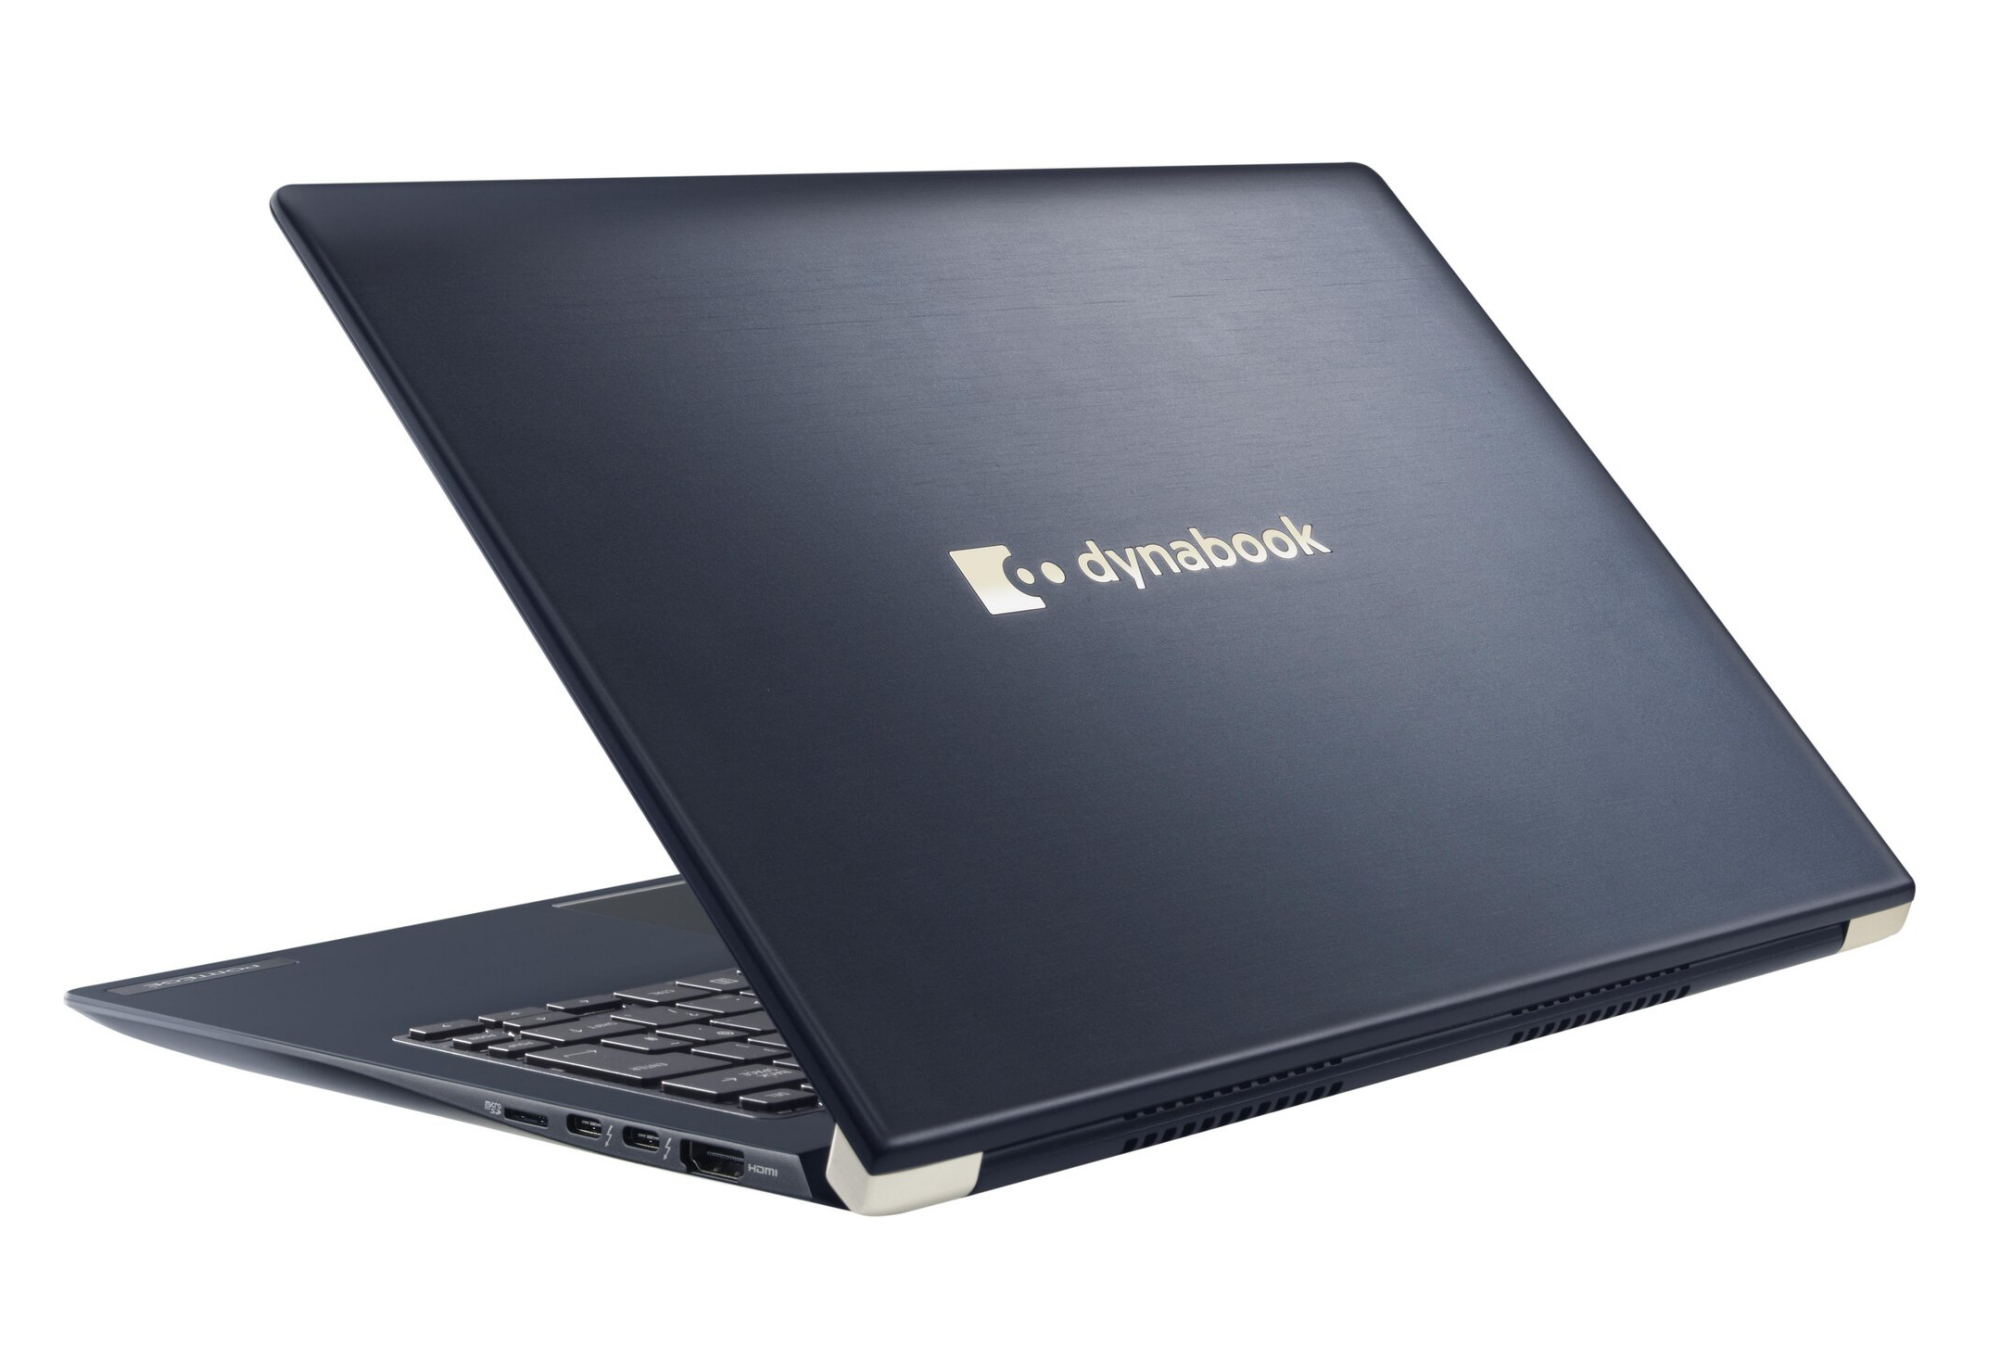
The Dynabook Portégé X30-F is among the high-end 13.3-inch business laptops. In contrast to the recently reviewed Portégé A30-E, Dynabook hasn't opted for a completely new chassis here but continues to use the slim, lightweight case that was also used in its predecessors. There are changes inside: The current model uses Whiskey Lake processors. Competitors include devices such as the Lenovo ThinkPad X390 and X395, the Dell Latitude 7300, the HP EliteBook 735 G5 and 830 G5.
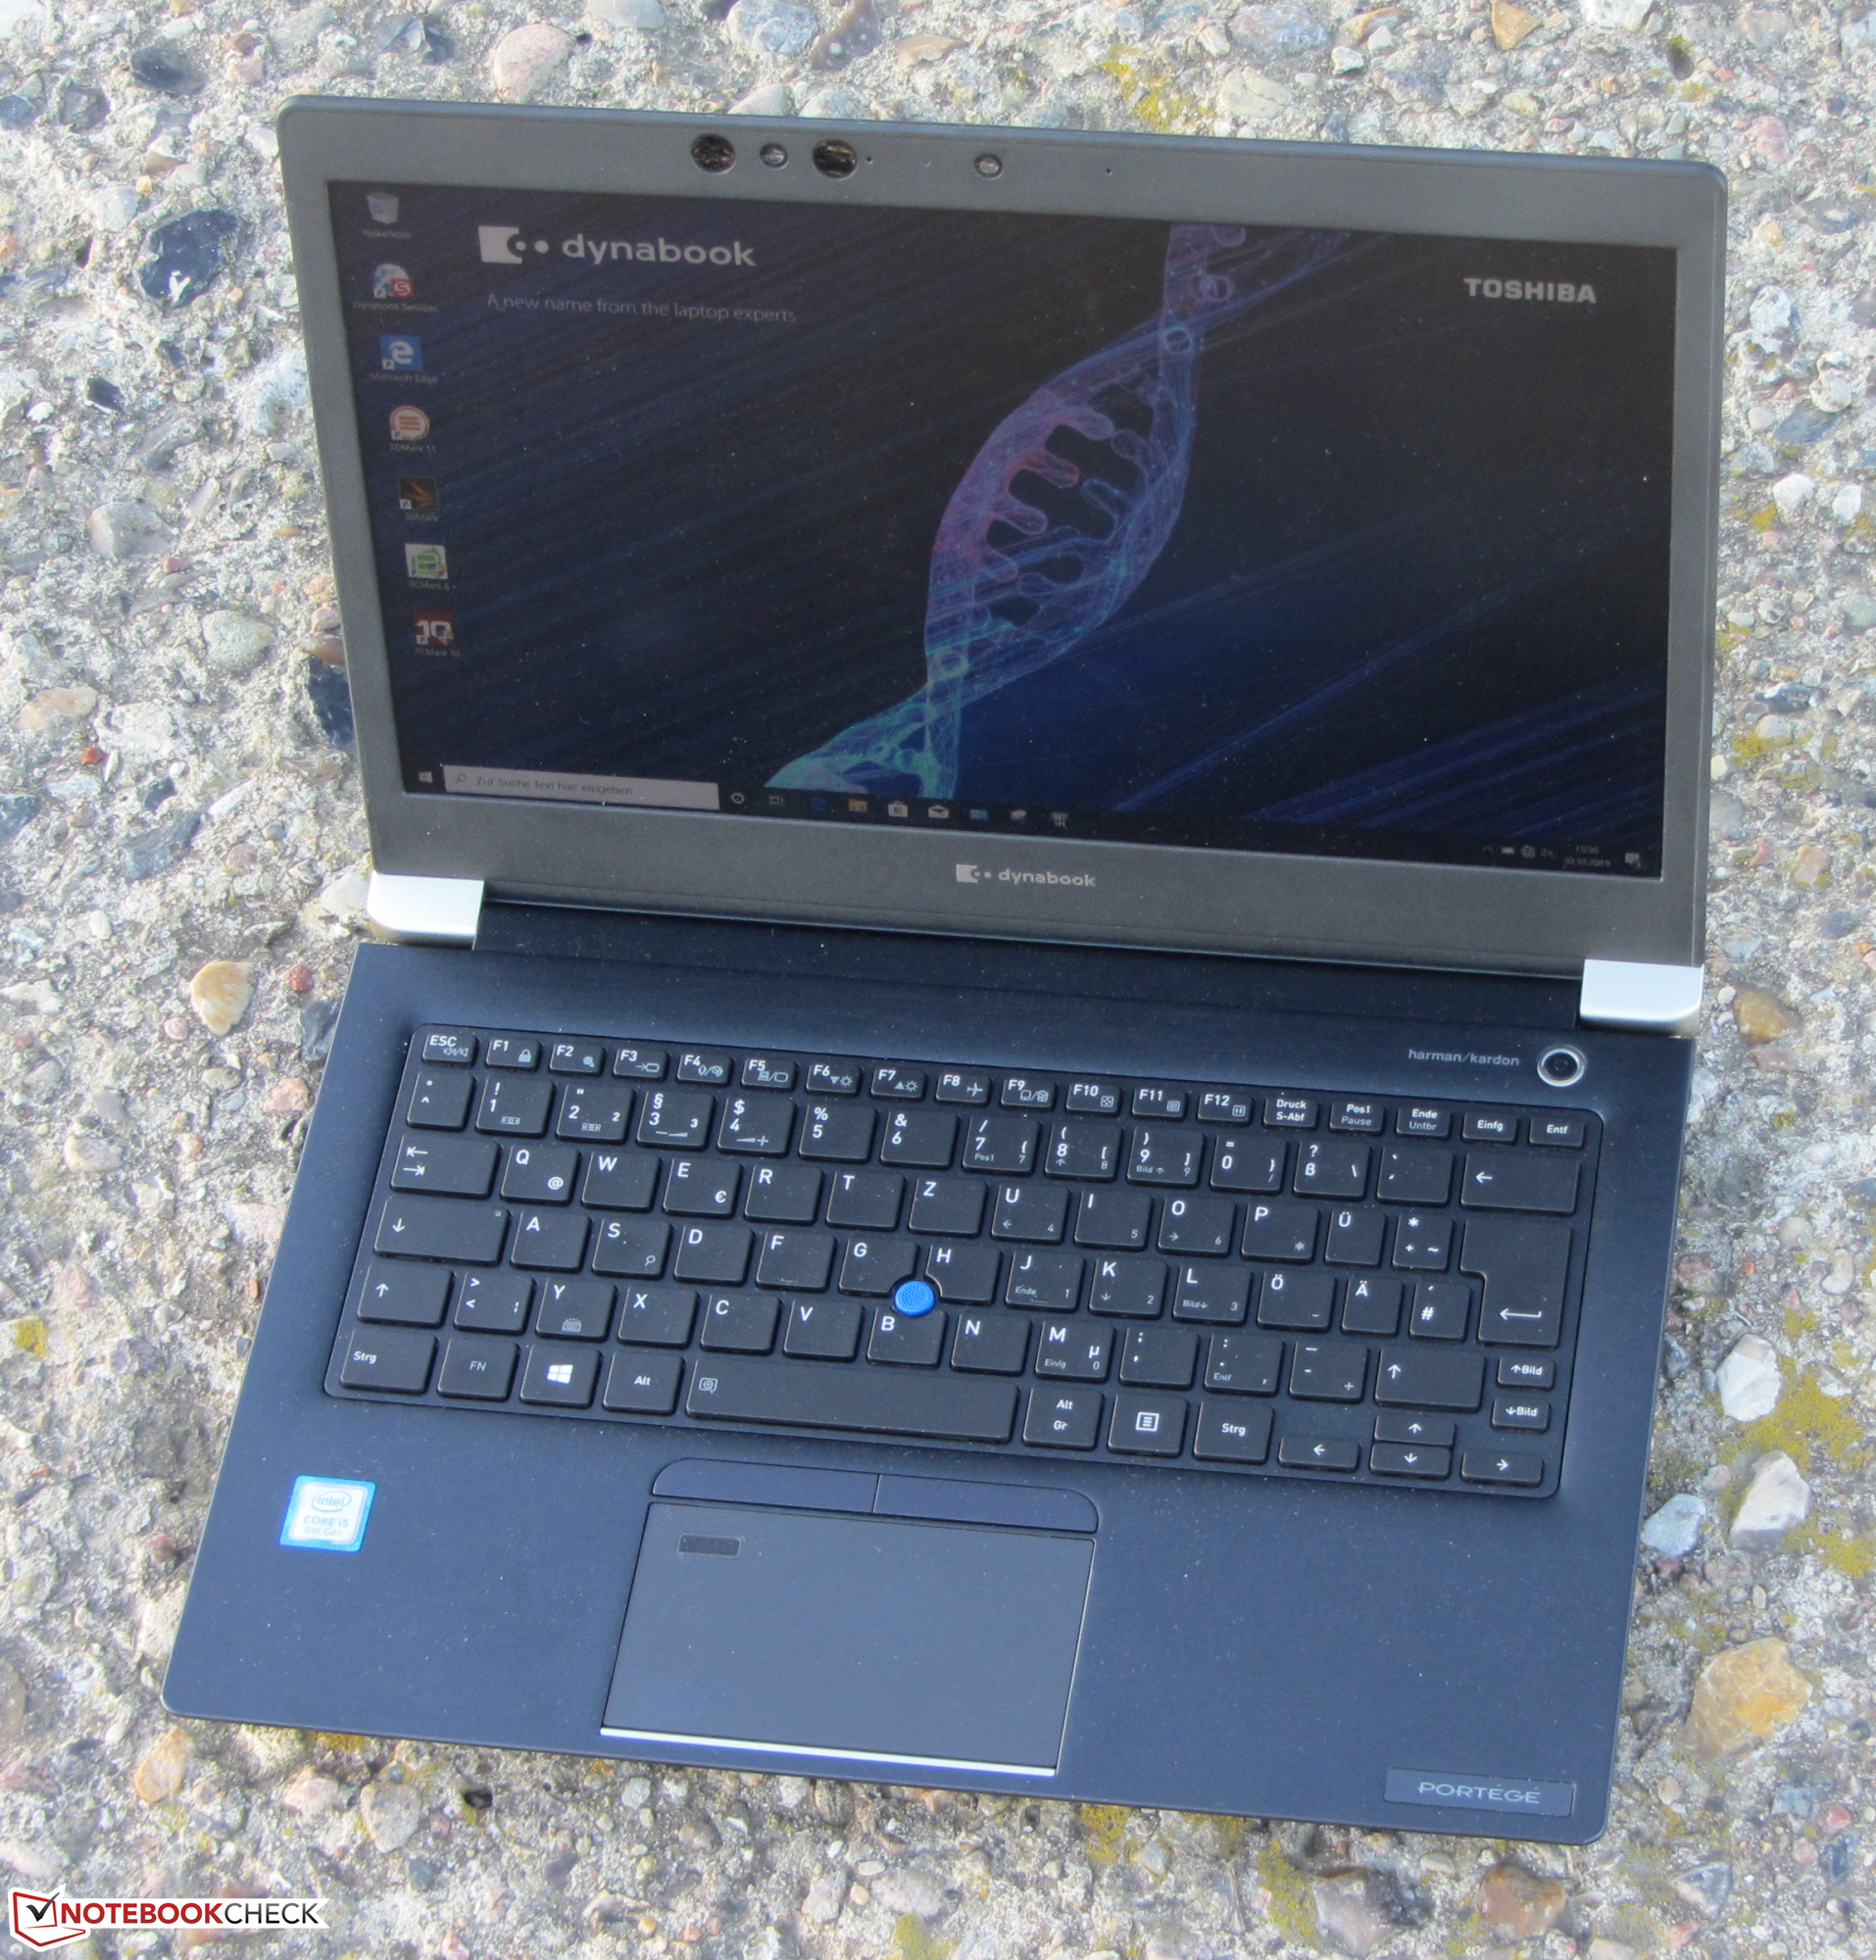
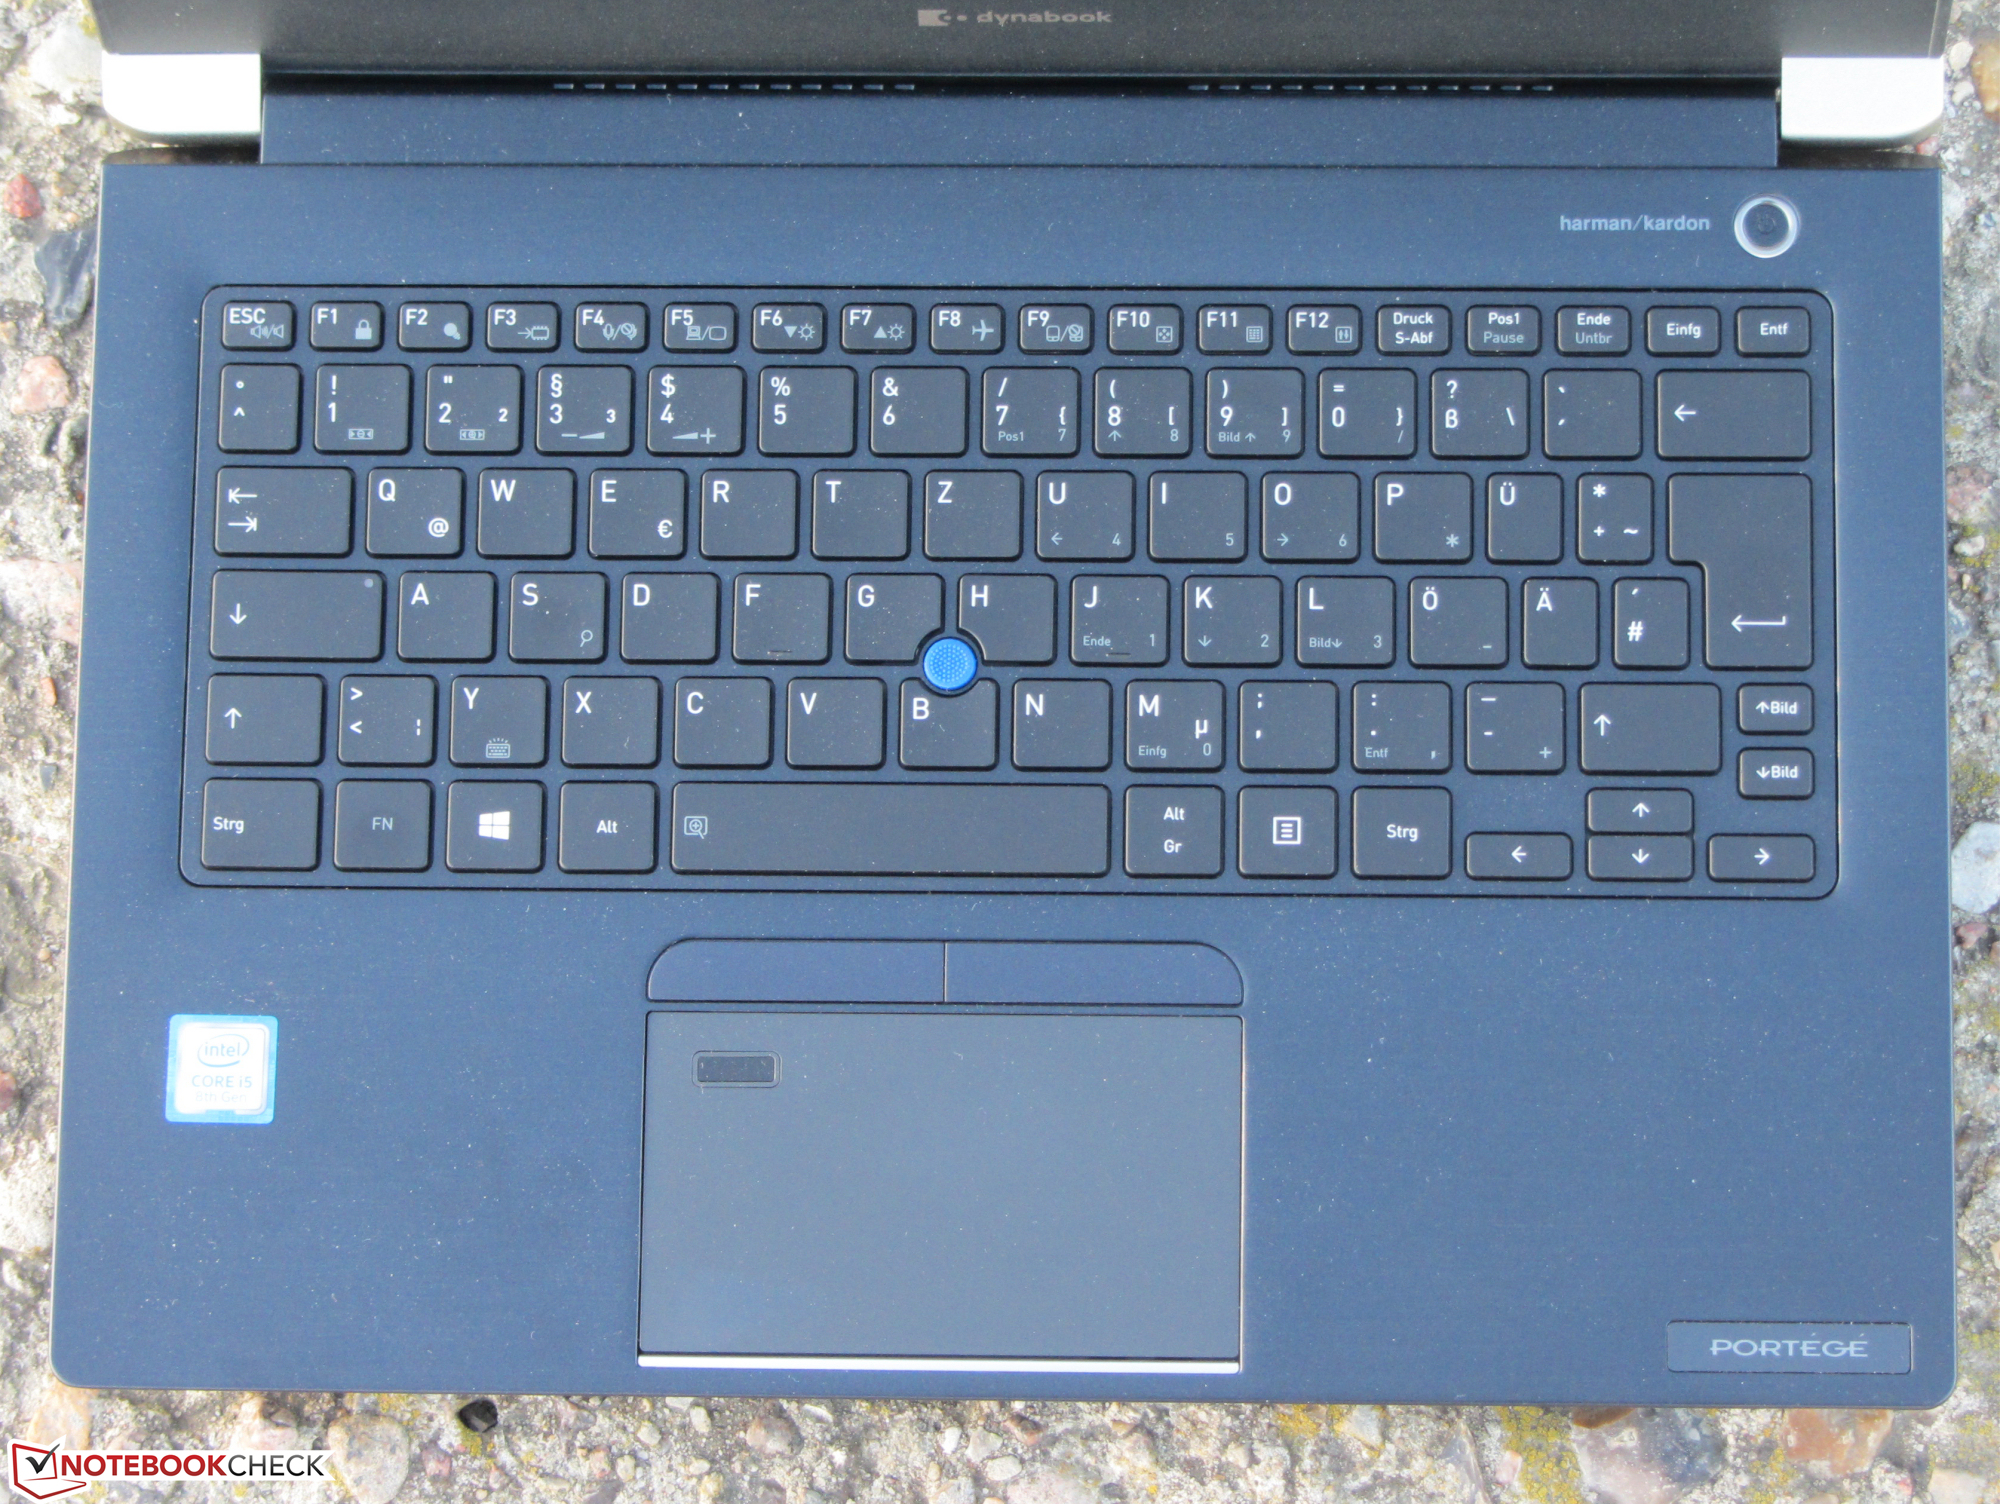
Since the Dynabook Portégé X30-F and the Toshiba Portégé X30-D are identical in construction, we won't go into the case, connectivity, input devices and speakers. The corresponding information can be found in our review of the Toshiba Portégé X30-D.
Rating | Date | Model | Weight | Height | Size | Resolution | Price |
|---|---|---|---|---|---|---|---|
| 87 % v7 (old) | 11 / 2019 | Dynabook Portégé X30-F-10N i5-8265U, UHD Graphics 620 | 1.1 kg | 16.4 mm | 13.30" | 1920x1080 | |
| 88.2 % v6 (old) | 06 / 2017 | Toshiba Portege X30-D (PT274U-01N001) i7-7600U, HD Graphics 620 | 1 kg | 15.9 mm | 13.30" | 1920x1080 | |
| 90.3 % v6 (old) | 05 / 2019 | Lenovo ThinkPad X390-20Q1S02M00 i5-8265U, UHD Graphics 620 | 1.3 kg | 16.9 mm | 13.30" | 1920x1080 | |
| 88.8 % v7 (old) | 10 / 2019 | Lenovo ThinkPad X395 R3 PRO 3300U, Vega 6 | 1.3 kg | 16.9 mm | 13.30" | 1920x1080 | |
| 86.8 % v7 (old) | 09 / 2019 | Dell Latitude 7300-P99G i7-8665U, UHD Graphics 620 | 1.4 kg | 18.45 mm | 13.30" | 1920x1080 | |
| 86.4 % v6 (old) | 09 / 2018 | HP EliteBook 735 G5 3UN62EA R7 2700U, Vega 10 | 1.3 kg | 17 mm | 13.30" | 1920x1080 | |
| 88.2 % v6 (old) | 05 / 2018 | HP EliteBook 830 G5-3JX74EA i5-8550U, UHD Graphics 620 | 1.3 kg | 17.7 mm | 13.30" | 1920x1080 |
| SD Card Reader | |
| average JPG Copy Test (av. of 3 runs) | |
| Dell Latitude 7300-P99G (Toshiba Exceria Pro M501 microSDXC 64GB) | |
| Lenovo ThinkPad X390-20Q1S02M00 (Toshiba Exceria Pro M501) | |
| Average of class Subnotebook (23.7 - 188, n=9, last 2 years) | |
| Lenovo ThinkPad X395 | |
| Dynabook Portégé X30-F-10N (Toshiba Exceria Pro M501 microSDXC 64GB) | |
| Toshiba Portege X30-D (PT274U-01N001) (Toshiba Exceria Pro M401) | |
| maximum AS SSD Seq Read Test (1GB) | |
| Dell Latitude 7300-P99G (Toshiba Exceria Pro M501 microSDXC 64GB) | |
| Average of class Subnotebook (24.9 - 195, n=8, last 2 years) | |
| Toshiba Portege X30-D (PT274U-01N001) (Toshiba Exceria Pro M401) | |
| Lenovo ThinkPad X390-20Q1S02M00 (Toshiba Exceria Pro M501) | |
| Lenovo ThinkPad X395 | |
| Dynabook Portégé X30-F-10N (Toshiba Exceria Pro M501 microSDXC 64GB) | |
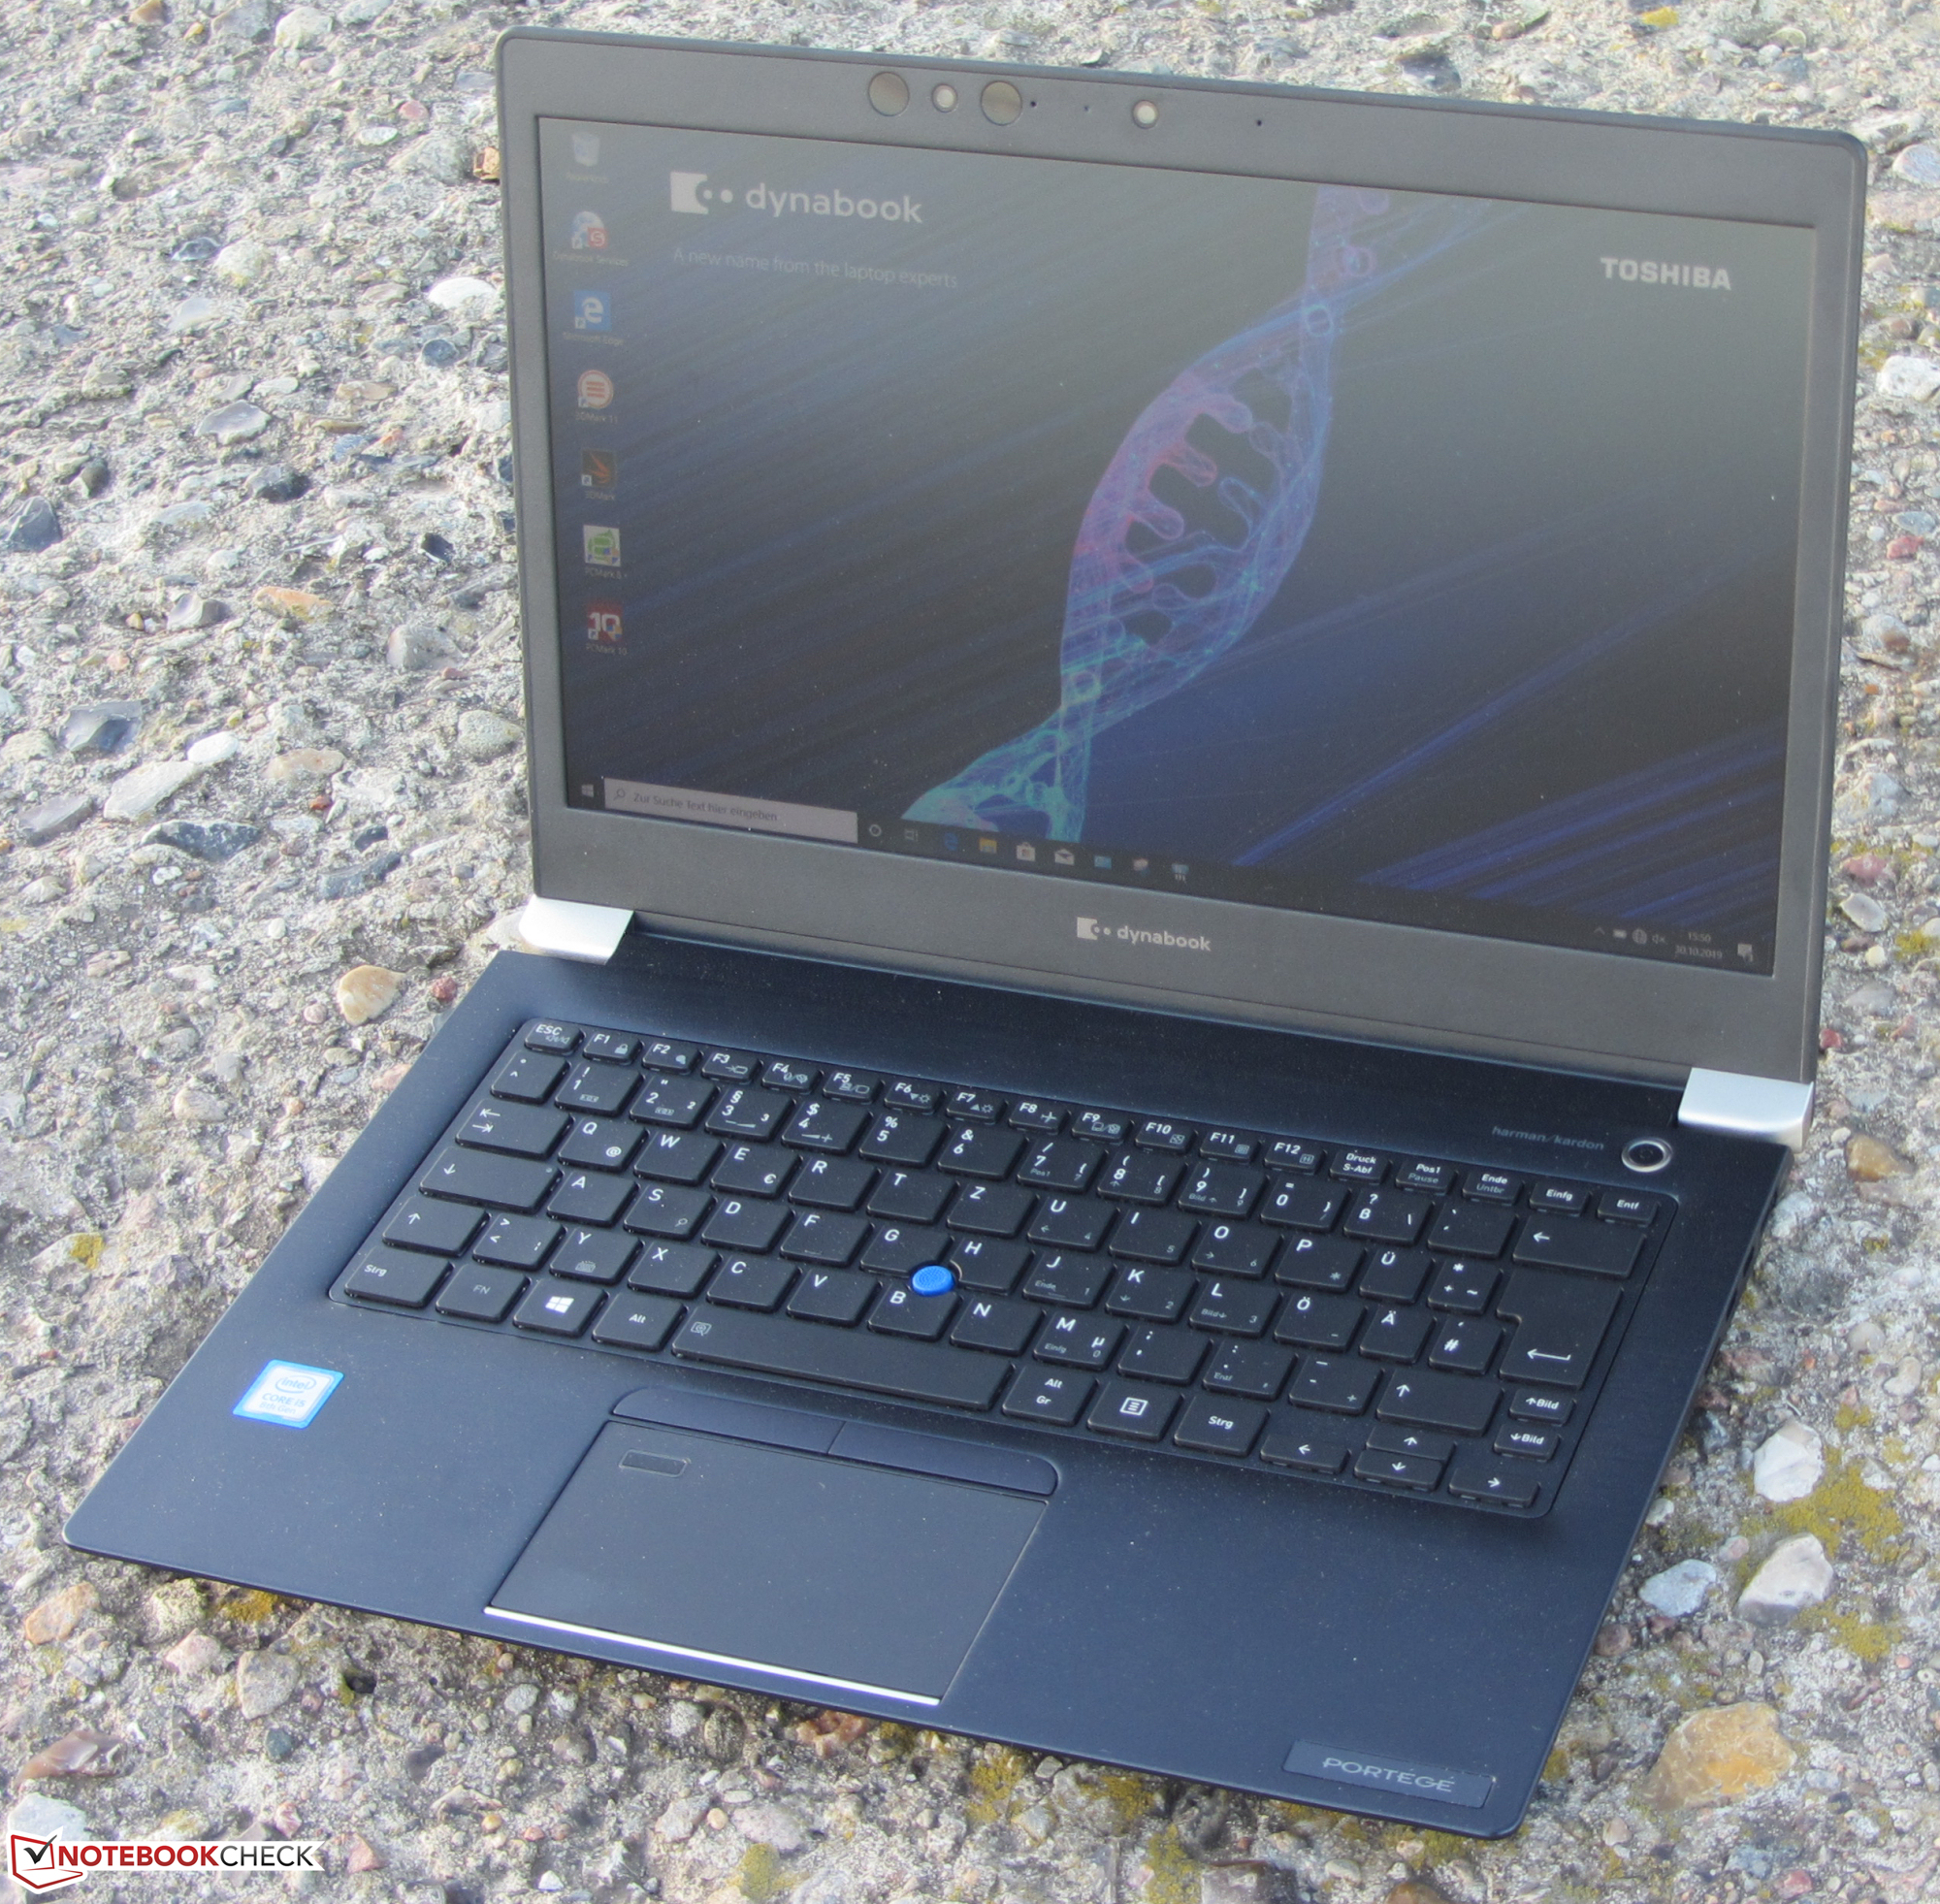
Display - X30-F with bright IPS screen

The X30-F's matte 13.3-inch screen works at a native resolution of 1920x1080 pixels. Contrast (1,319:1) and brightness (390.3 cd/m²) are good. Only the EliteBook 735 G5 offers a brighter display within our comparison field.
The display flickers at a frequency of 250 Hz at brightness levels of 20% and below. Due to the low frequency, headaches and/or eye problems may occur in sensitive users.
| |||||||||||||||||||||||||
Brightness Distribution: 86 %
Center on Battery: 428 cd/m²
Contrast: 1319:1 (Black: 0.31 cd/m²)
ΔE ColorChecker Calman: 3.2 | ∀{0.5-29.43 Ø4.72}
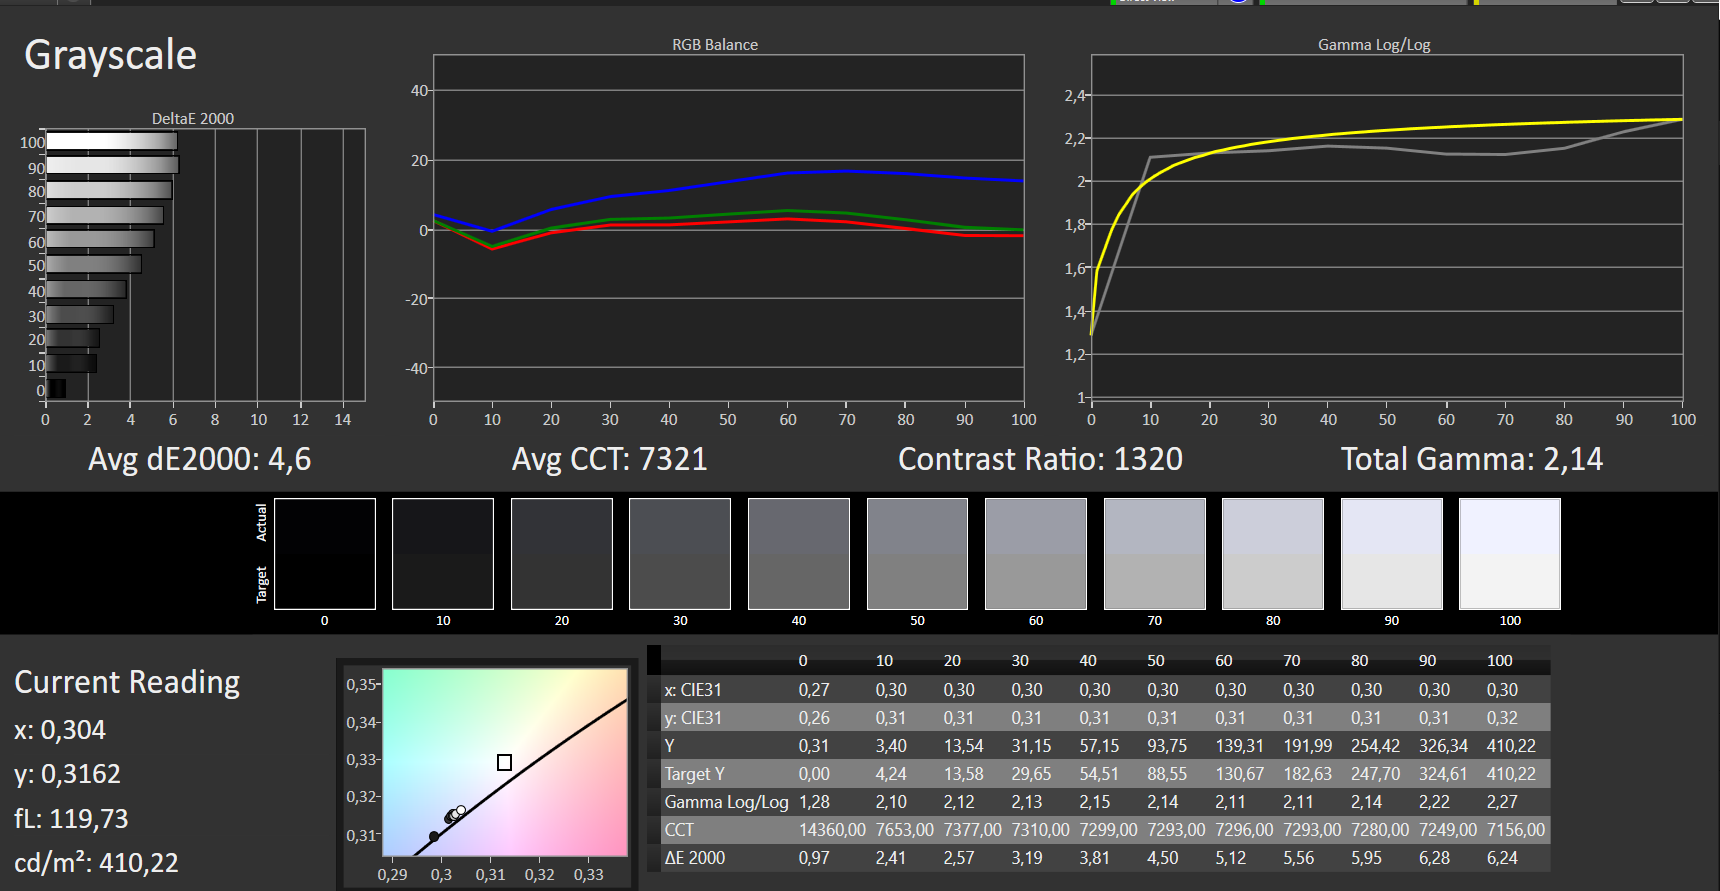
ΔE Greyscale Calman: 4.6 | ∀{0.09-98 Ø4.97}
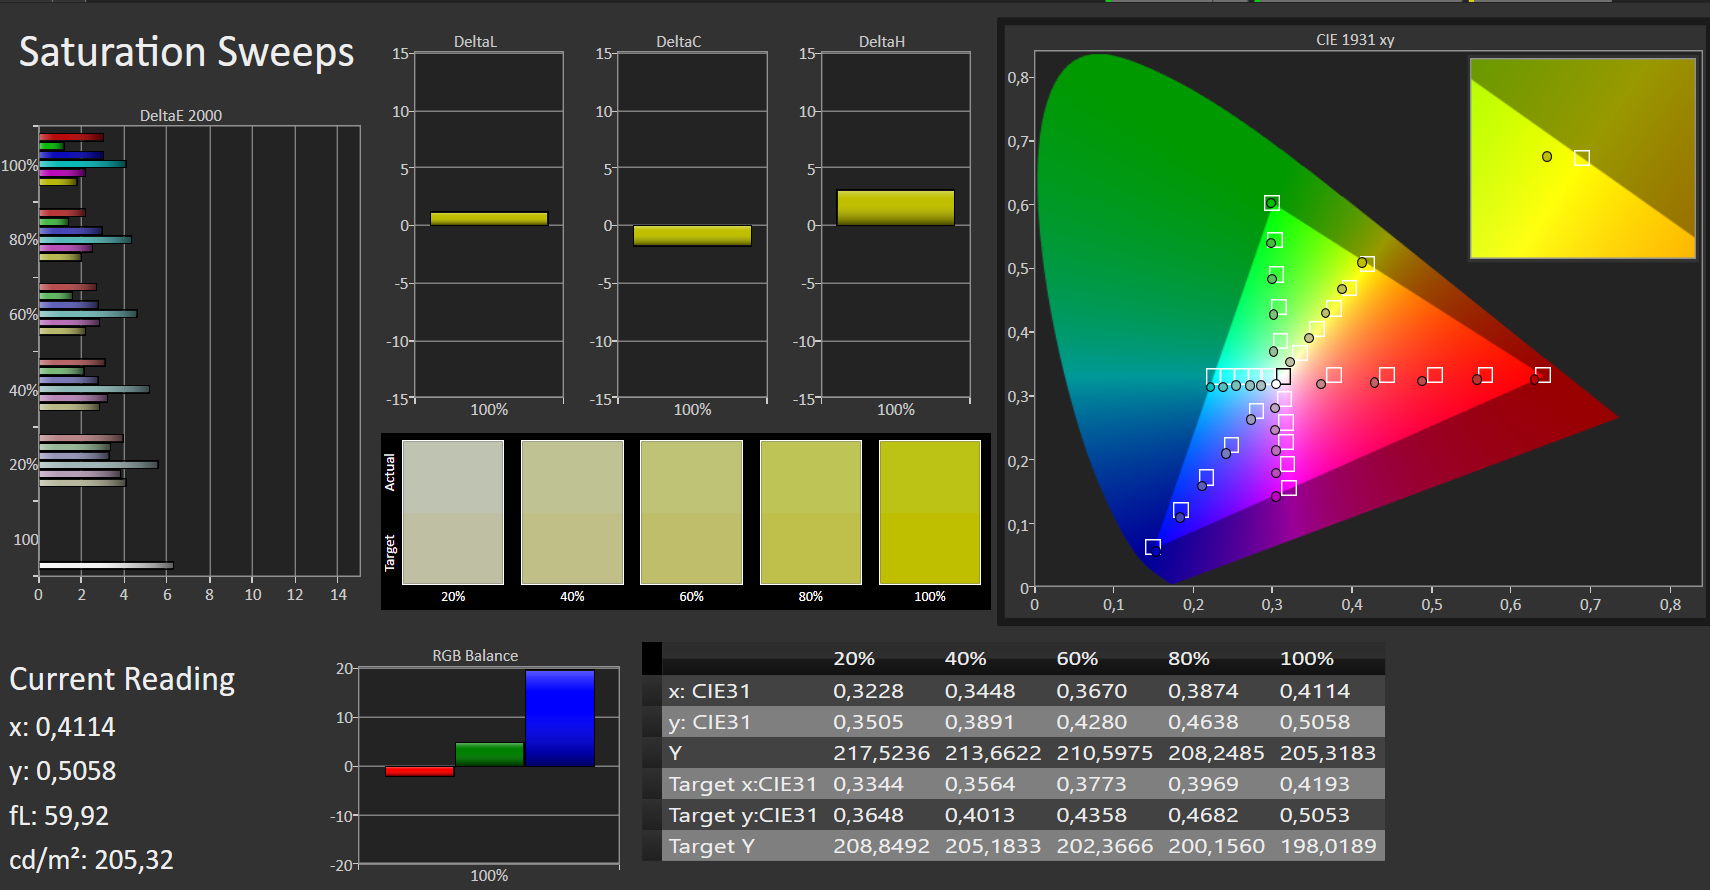
95% sRGB (Argyll 1.6.3 3D)
60% AdobeRGB 1998 (Argyll 1.6.3 3D)
65.2% AdobeRGB 1998 (Argyll 3D)
95% sRGB (Argyll 3D)
64.3% Display P3 (Argyll 3D)
Gamma: 2.14
CCT: 7321 K
| Dynabook Portégé X30-F-10N IPS, 1920x1080, 13.3" | Toshiba Portege X30-D (PT274U-01N001) IPS, 1920x1080, 13.3" | Lenovo ThinkPad X390-20Q1S02M00 IPS LED, 1920x1080, 13.3" | Lenovo ThinkPad X395 IPS, 1920x1080, 13.3" | Dell Latitude 7300-P99G IPS LED, 1920x1080, 13.3" | HP EliteBook 735 G5 3UN62EA IPS, 1920x1080, 13.3" | HP EliteBook 830 G5-3JX74EA IPS LED, 1920x1080, 13.3" | |
|---|---|---|---|---|---|---|---|
| Display | 1% | 2% | 0% | -1% | 7% | -2% | |
| Display P3 Coverage (%) | 64.3 | 66.4 3% | 65.3 2% | 64.1 0% | 64.6 0% | 71.1 11% | 64.2 0% |
| sRGB Coverage (%) | 95 | 93.5 -2% | 95.9 1% | 95.2 0% | 91.5 -4% | 96.3 1% | 89.2 -6% |
| AdobeRGB 1998 Coverage (%) | 65.2 | 66.6 2% | 66.6 2% | 65.8 1% | 65.5 0% | 71.4 10% | 65.2 0% |
| Response Times | 24% | -2% | 4% | 26% | 22% | 32% | |
| Response Time Grey 50% / Grey 80% * (ms) | 56 ? | 36.8 ? 34% | 57.6 ? -3% | 55 ? 2% | 39 ? 30% | 42 ? 25% | 36 ? 36% |
| Response Time Black / White * (ms) | 34 ? | 29.6 ? 13% | 34 ? -0% | 32 ? 6% | 27 ? 21% | 28 ? 18% | 24.8 ? 27% |
| PWM Frequency (Hz) | 250 ? | 20500 ? | 1020 ? | ||||
| Screen | 3% | 9% | 9% | -28% | -14% | -13% | |
| Brightness middle (cd/m²) | 409 | 332.6 -19% | 356 -13% | 356 -13% | 341 -17% | 464 13% | 316 -23% |
| Brightness (cd/m²) | 390 | 323 -17% | 336 -14% | 336 -14% | 306 -22% | 426 9% | 326 -16% |
| Brightness Distribution (%) | 86 | 86 0% | 88 2% | 88 2% | 79 -8% | 85 -1% | 85 -1% |
| Black Level * (cd/m²) | 0.31 | 0.28 10% | 0.16 48% | 0.16 48% | 0.31 -0% | 0.42 -35% | 0.19 39% |
| Contrast (:1) | 1319 | 1188 -10% | 2225 69% | 2225 69% | 1100 -17% | 1105 -16% | 1663 26% |
| Colorchecker dE 2000 * | 3.2 | 2.6 19% | 3.6 -13% | 3.6 -13% | 6.43 -101% | 4.49 -40% | 4.5 -41% |
| Colorchecker dE 2000 max. * | 6.4 | 6.7 -5% | 5.5 14% | 5.5 14% | 10.33 -61% | 8.77 -37% | 12.1 -89% |
| Greyscale dE 2000 * | 4.6 | 2.5 46% | 4.7 -2% | 4.7 -2% | 6.9 -50% | 6.44 -40% | 5 -9% |
| Gamma | 2.14 103% | 2.12 104% | 2.48 89% | 2.92 75% | 2.23 99% | 2.41 91% | 2.22 99% |
| CCT | 7321 89% | 6720 97% | 6374 102% | 6222 104% | 8338 78% | 6922 94% | 6018 108% |
| Color Space (Percent of AdobeRGB 1998) (%) | 60 | 62 3% | 61.3 2% | 61 2% | 59 -2% | 63 5% | 57.9 -3% |
| Color Space (Percent of sRGB) (%) | 95 | 94 -1% | 95.7 1% | 96 1% | 91 -4% | 96 1% | 87.3 -8% |
| Colorchecker dE 2000 calibrated * | 1.1 | 1.11 | 2.36 | 1.27 | 2.9 | ||
| Total Average (Program / Settings) | 9% /
5% | 3% /
6% | 4% /
7% | -1% /
-16% | 5% /
-5% | 6% /
-5% |
* ... smaller is better
Display Response Times
| ↔ Response Time Black to White | ||
|---|---|---|
| 34 ms ... rise ↗ and fall ↘ combined | ↗ 18 ms rise | 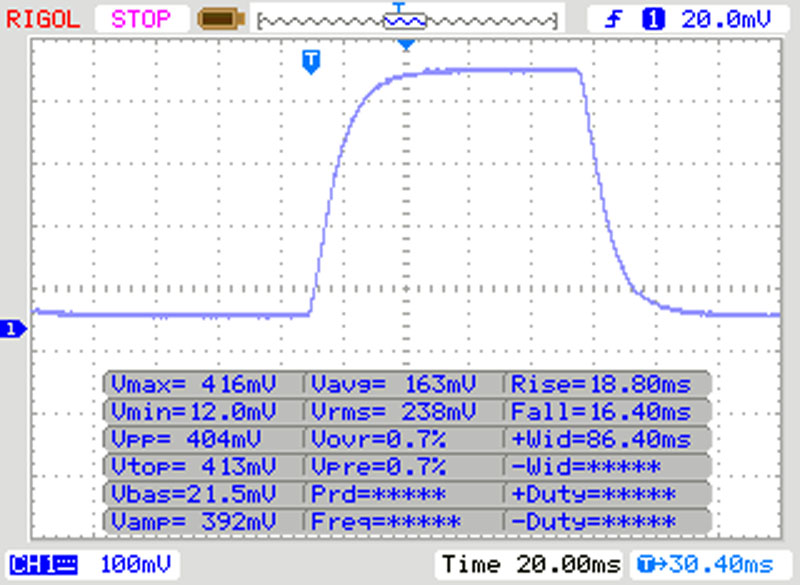 |
| ↘ 16 ms fall | ||
| The screen shows slow response rates in our tests and will be unsatisfactory for gamers. In comparison, all tested devices range from 0.1 (minimum) to 240 (maximum) ms. » 91 % of all devices are better. This means that the measured response time is worse than the average of all tested devices (19.8 ms). | ||
| ↔ Response Time 50% Grey to 80% Grey | ||
| 56 ms ... rise ↗ and fall ↘ combined | ↗ 26 ms rise | 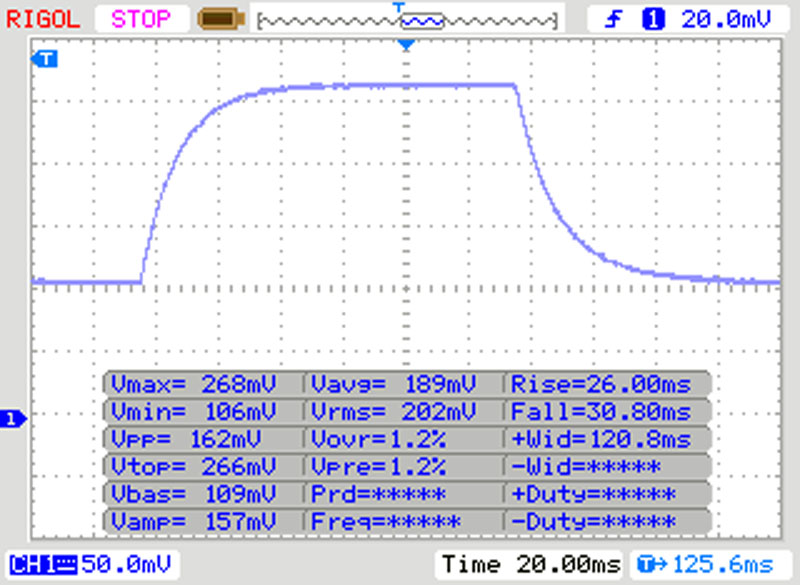 |
| ↘ 30 ms fall | ||
| The screen shows slow response rates in our tests and will be unsatisfactory for gamers. In comparison, all tested devices range from 0.165 (minimum) to 636 (maximum) ms. » 93 % of all devices are better. This means that the measured response time is worse than the average of all tested devices (31 ms). | ||
Screen Flickering / PWM (Pulse-Width Modulation)
| Screen flickering / PWM detected | 250 Hz | ≤ 20 % brightness setting | 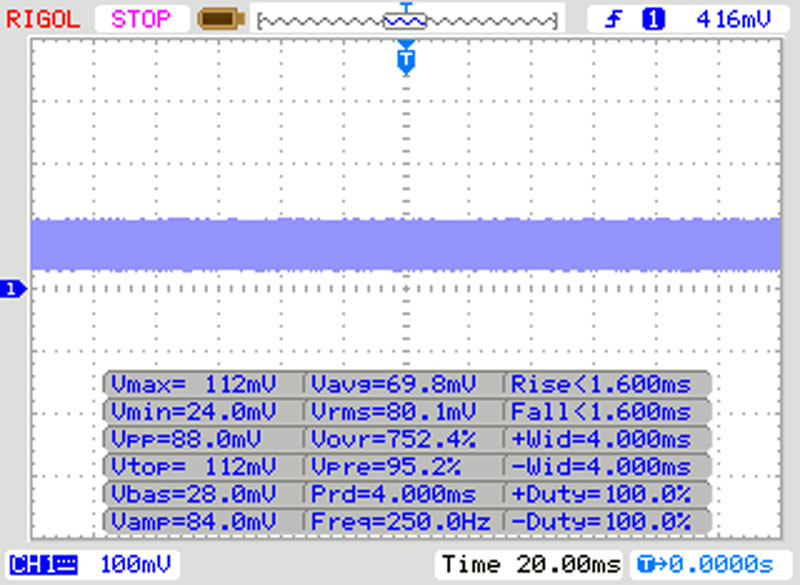 |
The display backlight flickers at 250 Hz (worst case, e.g., utilizing PWM) Flickering detected at a brightness setting of 20 % and below. There should be no flickering or PWM above this brightness setting. The frequency of 250 Hz is relatively low, so sensitive users will likely notice flickering and experience eyestrain at the stated brightness setting and below. In comparison: 52 % of all tested devices do not use PWM to dim the display. If PWM was detected, an average of 7747 (minimum: 5 - maximum: 343500) Hz was measured. | |||
Already out of the box, the screen has a very decent color reproduction. With a DeltaE 2000 color deviation of 3.2, it barely scrapes past the target (DeltaE smaller than 3). In addition, the display suffers from a very light blue tint. The display isn't able to fully map the AdobeRGB (60%) and the sRGB (95%) color spaces.
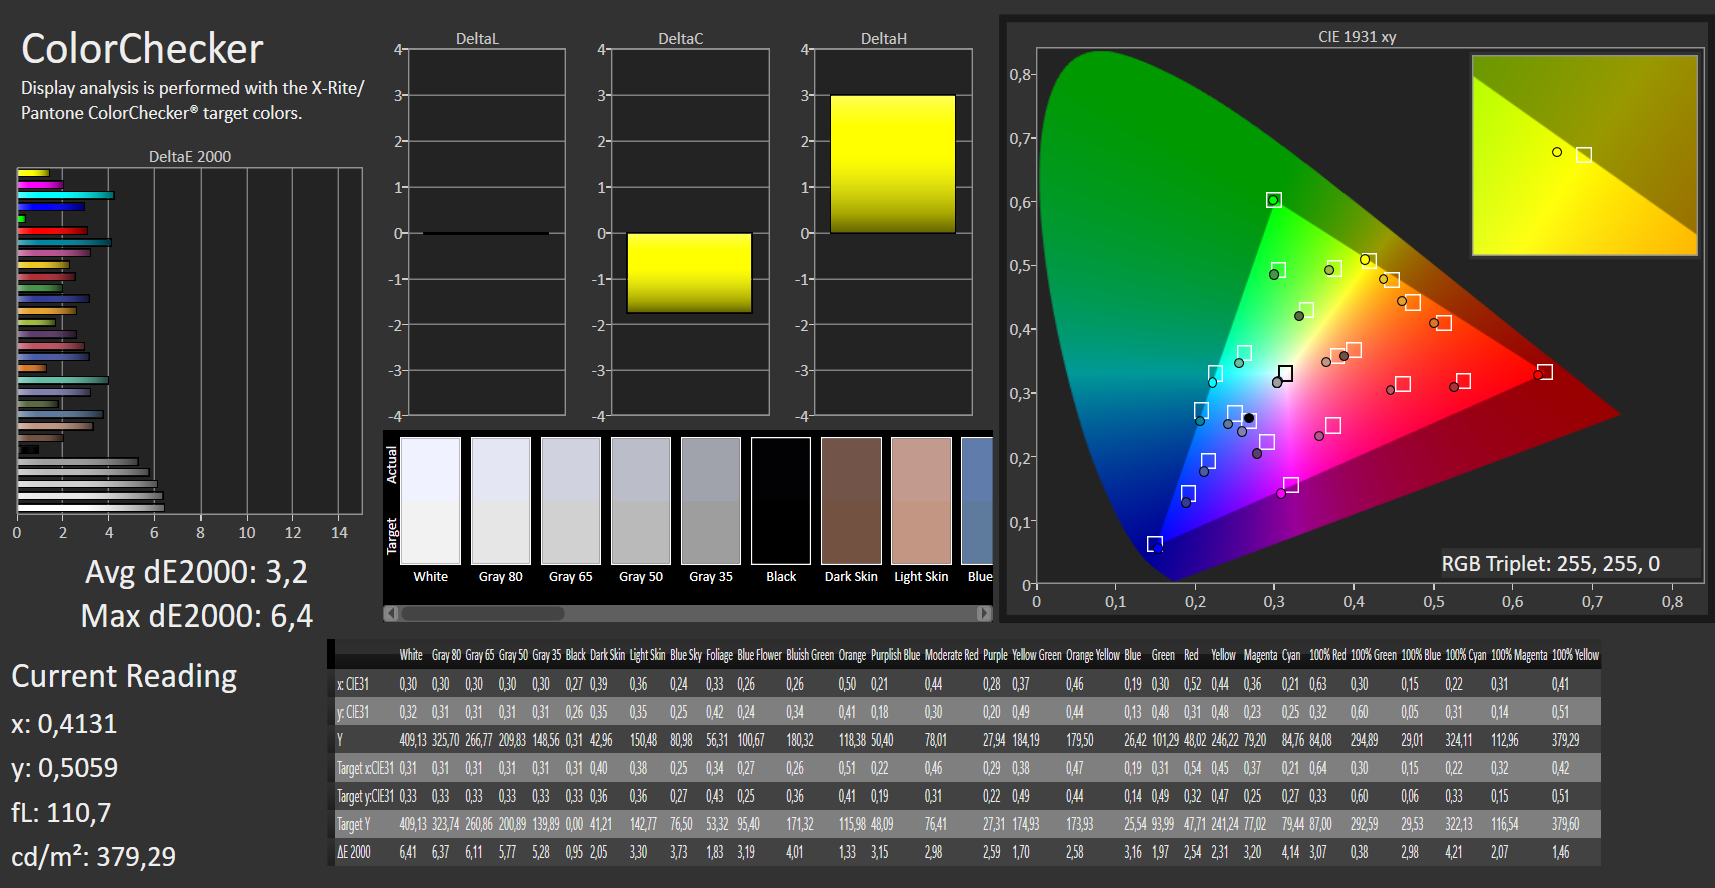
Dynabook has equipped the Portégé with a viewing-angle-stable IPS panel. Therefore, the screen can be read from any position. As long as the sun doesn't shine too brightly, this is also possible outdoors.
Performance - Portégé provides enough performance for office and Internet
With the Portégé X30-F, Dynabook has a 13.3-inch high-end business laptop in its range. The device provides enough computing power for office and Internet applications. Our test device is available from about 1,150 Euros (~$1,270) and is therefore currently the cheapest representative in the series. Other configuration variants are available.
Processor
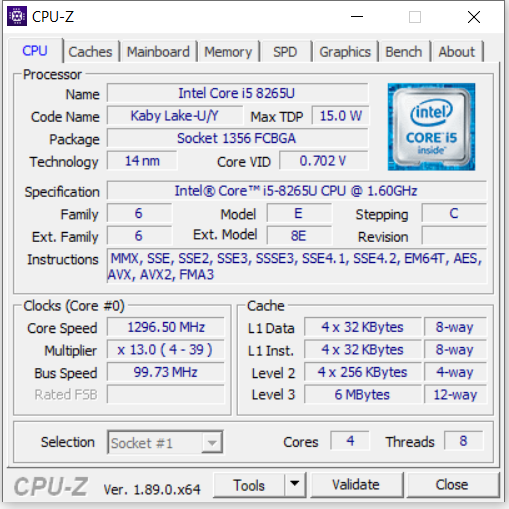
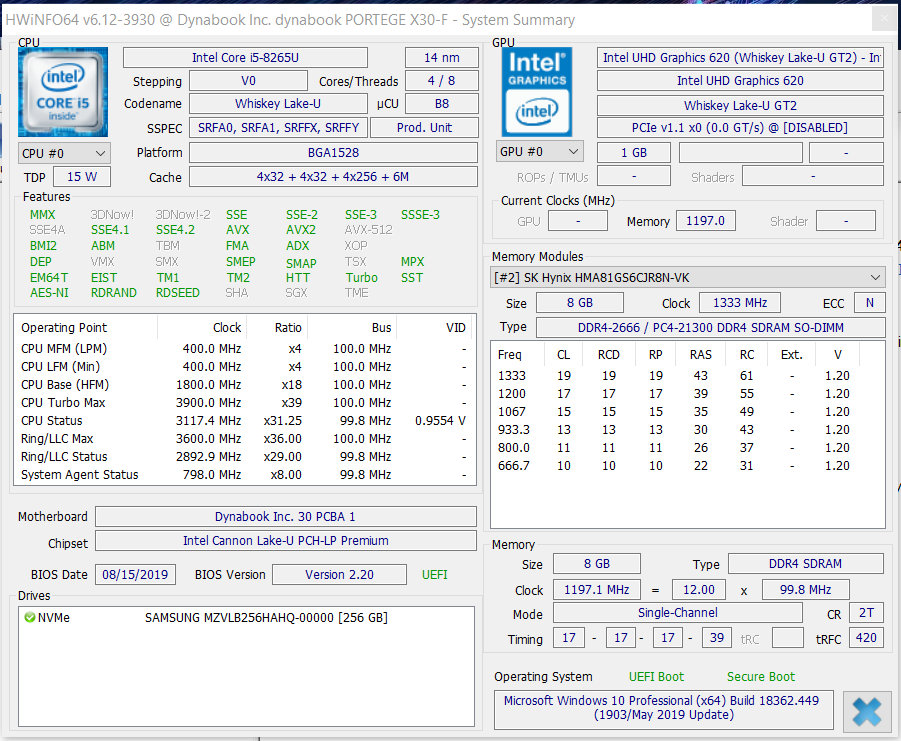
The Portégé is powered by an Intel Core i5-8265U quad-core processor. This is a ULV model (TDP: 15 watts) based on Intel's Whiskey Lake architecture. The processor operates at a base speed of 1.6 GHz. Turbo can be used to increase it to 3.7 GHz (all four cores), 3.8 GHz (two cores) and 3.9 GHz (one core), respectively.
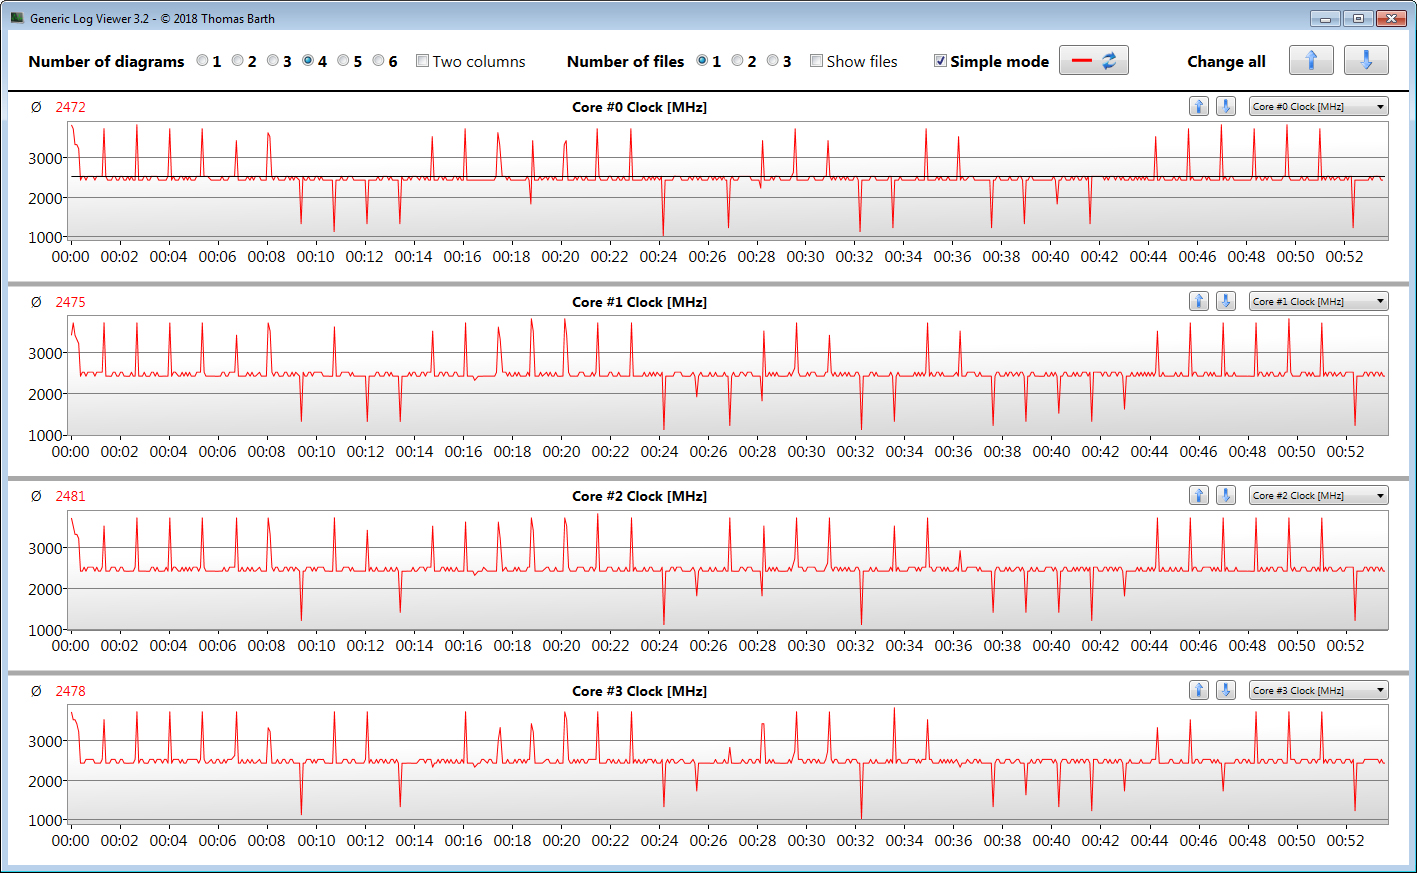
The processor briefly works through the multithread tests of the Cinebench benchmarks at 3.3 to 3.7 GHz. The clock speed then drops to 2.3 to 2.5 GHz. The single-thread tests are run at 3.7 to 3.9 GHz. This is the behavior when plugged in. On battery power, the clock speeds range from 1.8 to 2.2 GHz (multithread) and 1.8 GHz (single-thread), respectively.
We test whether the CPU Turbo is used consistently when plugged in by running the multithread test of the Cinebench R15 benchmark in a continuous loop for at least 30 minutes. The results drop slightly from the first to the second run and then remain at a constant level. The CPU Turbo is used to a small extent.
| Geekbench 4.4 | |
| 64 Bit Multi-Core Score | |
| Average of class Subnotebook (27854 - 45023, n=7, last 2 years) | |
| Average Intel Core i5-8265U (7144 - 16249, n=19) | |
| Dynabook Portégé X30-F-10N | |
| 64 Bit Single-Core Score | |
| Average of class Subnotebook (5976 - 8929, n=7, last 2 years) | |
| Average Intel Core i5-8265U (2106 - 4830, n=19) | |
| Dynabook Portégé X30-F-10N | |
| Mozilla Kraken 1.1 - Total | |
| HP EliteBook 735 G5 3UN62EA | |
| Dynabook Portégé X30-F-10N (Edge 44) | |
| Average Intel Core i5-8265U (851 - 1245, n=25) | |
| Lenovo ThinkPad X390-20Q1S02M00 (Edge) | |
| HP EliteBook 830 G5-3JX74EA (Edge) | |
| Dell Latitude 7300-P99G (Edge) | |
| Average of class Subnotebook (234 - 1104, n=61, last 2 years) | |
| Octane V2 - Total Score | |
| Average of class Subnotebook (35801 - 142020, n=29, last 2 years) | |
| Dell Latitude 7300-P99G (Edge) | |
| Dynabook Portégé X30-F-10N (Edge 44) | |
| Lenovo ThinkPad X390-20Q1S02M00 (Edge) | |
| HP EliteBook 830 G5-3JX74EA (Edge) | |
| Average Intel Core i5-8265U (12842 - 35563, n=23) | |
| HP EliteBook 735 G5 3UN62EA | |
| JetStream 1.1 - 1.1 Total | |
| HP EliteBook 830 G5-3JX74EA (Edge) | |
| Dynabook Portégé X30-F-10N (Edge 44) | |
| Average Intel Core i5-8265U (193.7 - 244, n=19) | |
| Average of class Subnotebook (n=1last 2 years) | |
| HP EliteBook 735 G5 3UN62EA | |
* ... smaller is better
System performance
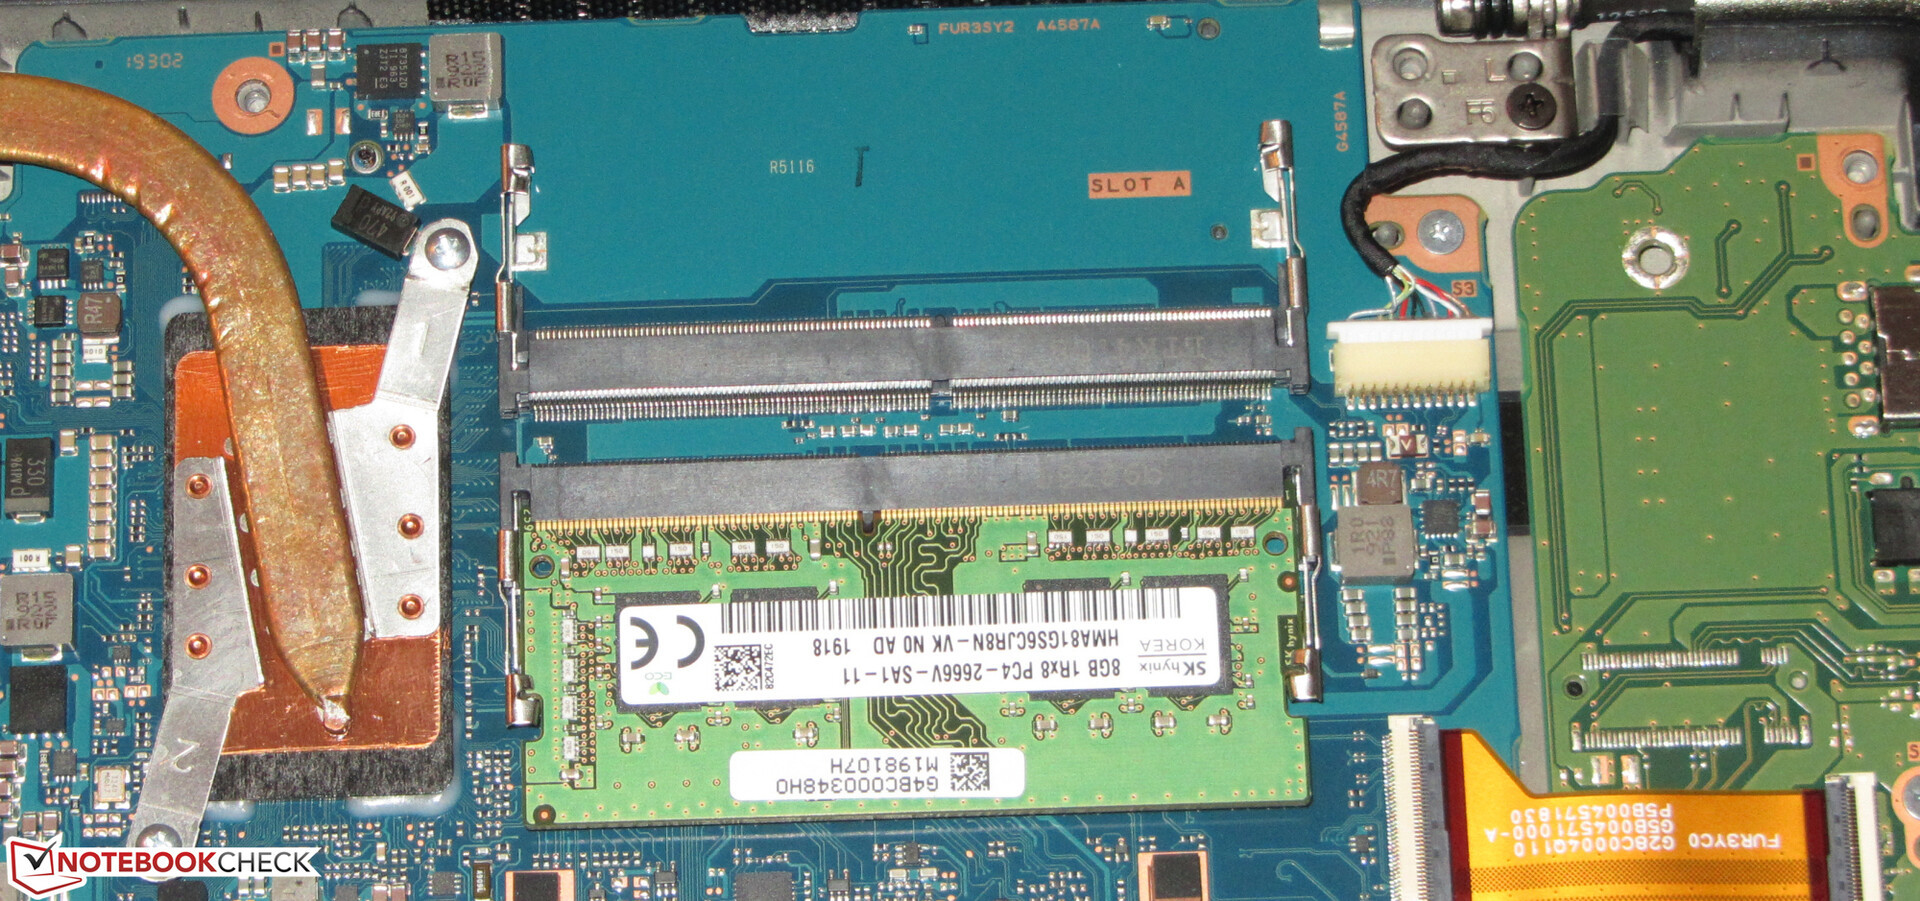
The good results in the PCMark benchmarks demonstrate that the laptop has enough computing power for office and Internet applications. We haven't encountered any problems. The system is fast and smooth. A slight increase in overall performance would be possible by activating dual-channel mode. For this, a second memory module would have to be added to the laptop.
| PCMark 8 Home Score Accelerated v2 | 3298 points | |
| PCMark 8 Creative Score Accelerated v2 | 3473 points | |
| PCMark 8 Work Score Accelerated v2 | 4735 points | |
| PCMark 10 Score | 3595 points | |
Help | ||
Storage
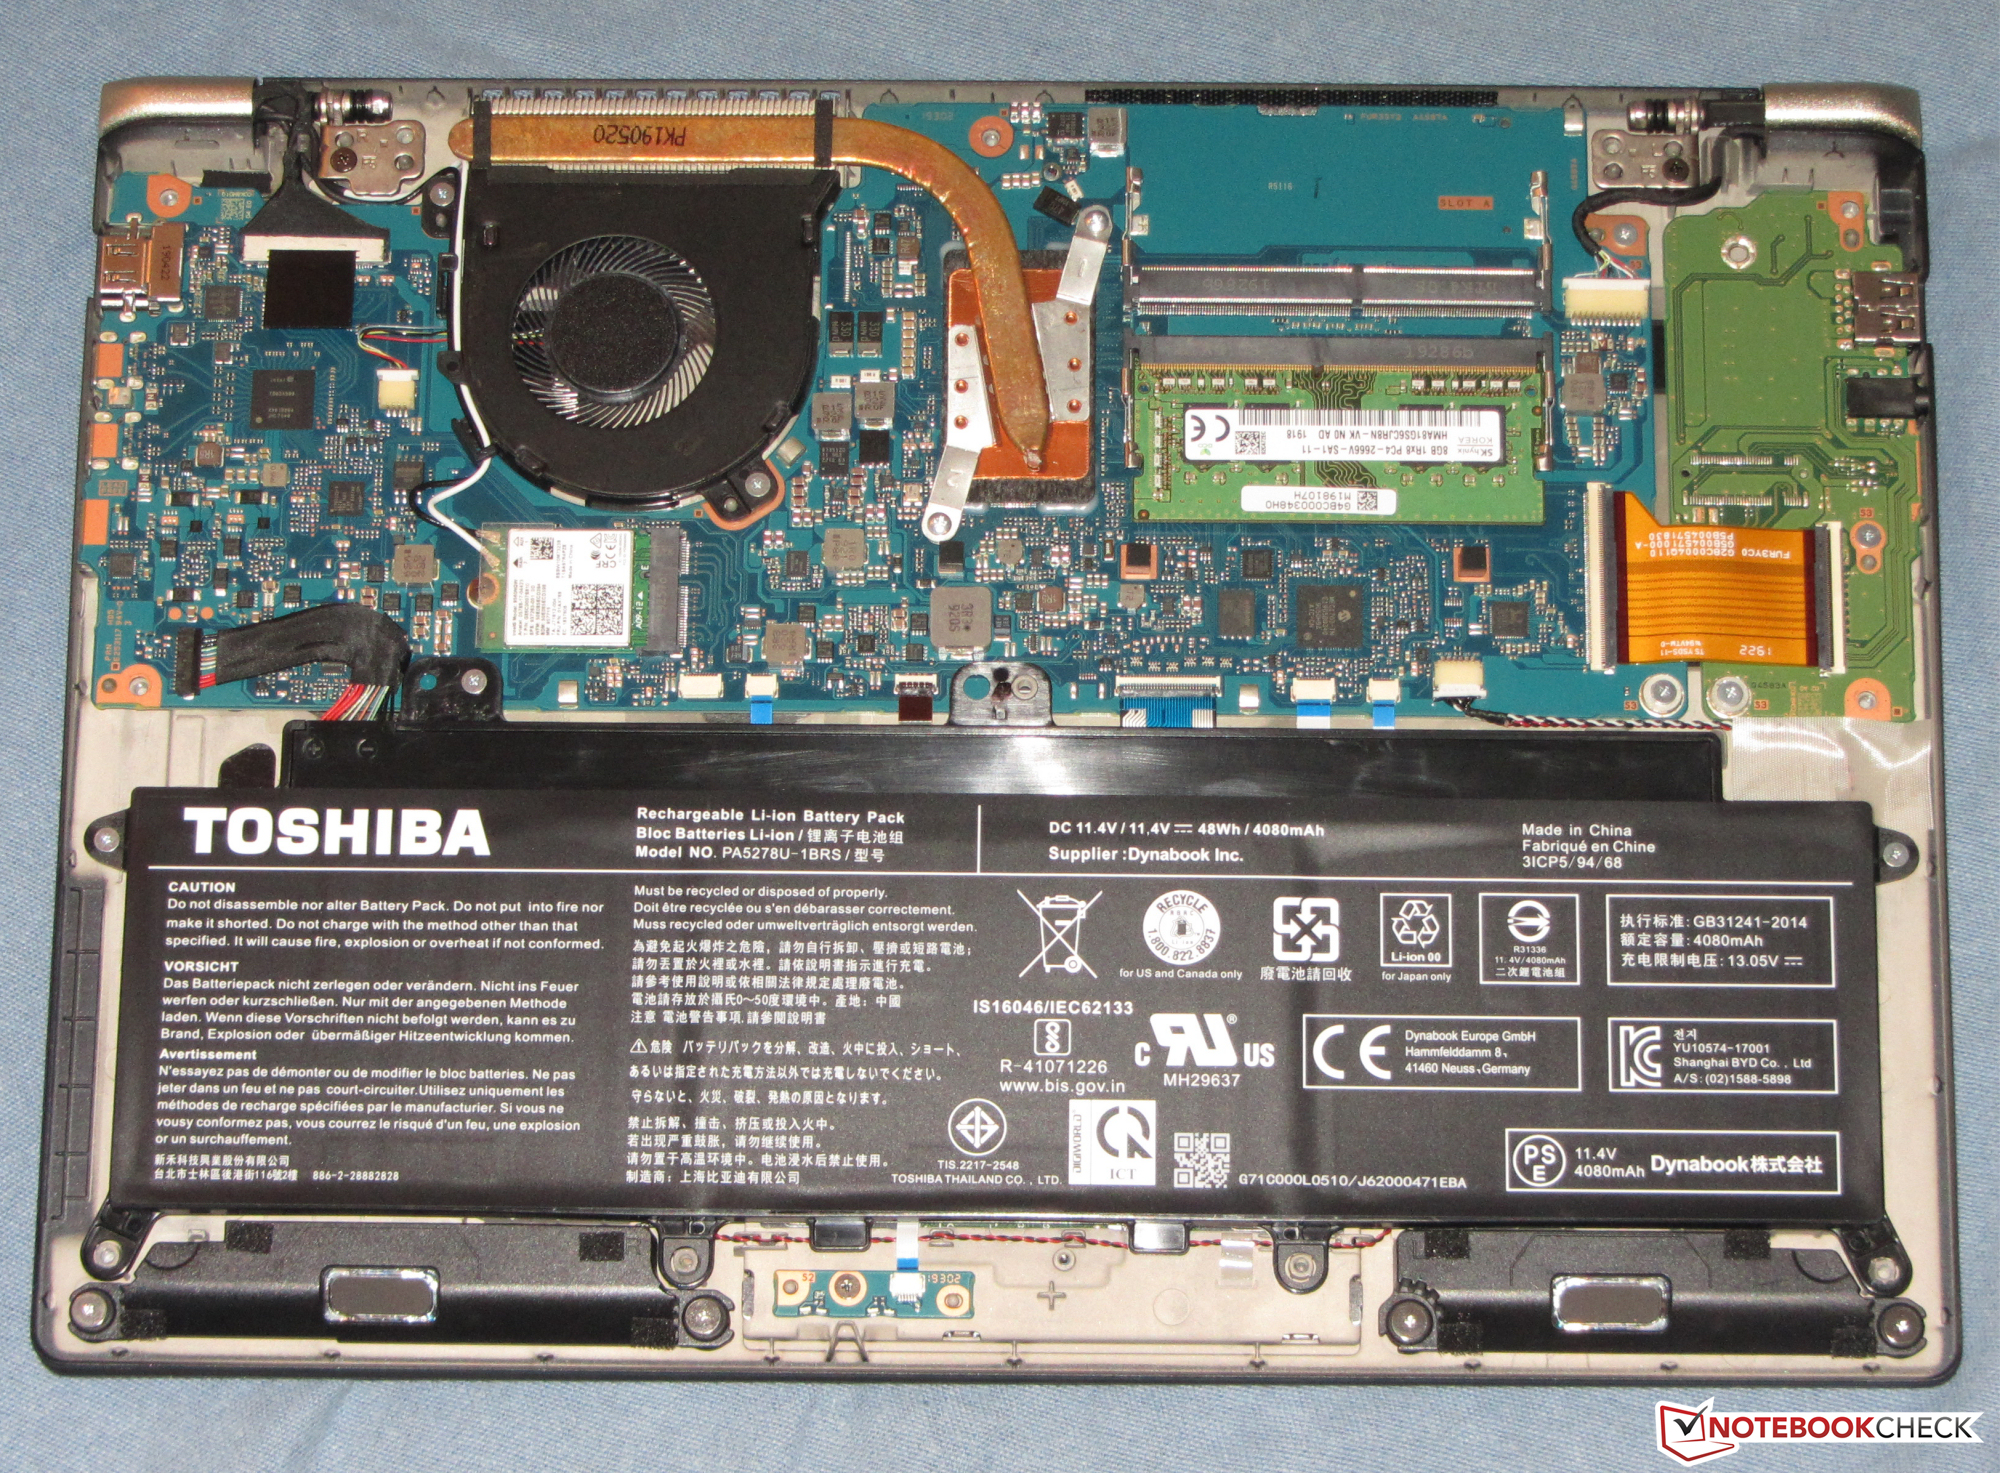
The system drive is an NVMe SSD (M.2 2280 format) from Samsung, which has a total capacity of 256 GB. Of this, approximately 191 GB is usable out of the box. Transfer speeds are very good. NVMe SSDs achieve higher transfer rates than SATA III models because they're connected via PCI Express.

| Dynabook Portégé X30-F-10N Samsung SSD PM981 MZVLB256HAHQ | Lenovo ThinkPad X390-20Q1S02M00 Intel SSD Pro 7600p SSDPEKKF512G8L | Lenovo ThinkPad X395 Samsung SSD PM981a MZVLB256HBHQ | Dell Latitude 7300-P99G Samsung SSD PM981 MZVLB512HAJQ | HP EliteBook 735 G5 3UN62EA Toshiba KBG30ZMV256G | HP EliteBook 830 G5-3JX74EA Samsung SSD PM961 1TB M.2 PCIe 3.0 x4 NVMe (MZVLW1T0) | Average Samsung SSD PM981 MZVLB256HAHQ | Average of class Subnotebook | |
|---|---|---|---|---|---|---|---|---|
| CrystalDiskMark 5.2 / 6 | -3% | 9% | 29% | -38% | -5% | -4% | 68% | |
| Write 4K (MB/s) | 102.1 | 120.7 18% | 129.4 27% | 141.1 38% | 97.3 -5% | 108.5 6% | 116.1 ? 14% | 150.3 ? 47% |
| Read 4K (MB/s) | 3738 | 58.5 -98% | 41.6 -99% | 46.37 -99% | 44.58 -99% | 40.53 -99% | 189.5 ? -95% | 63.8 ? -98% |
| Write Seq (MB/s) | 1507 | 1491 -1% | 2334 55% | 1994 32% | 883 -41% | 1026 -32% | 1409 ? -7% | 2795 ? 85% |
| Read Seq (MB/s) | 1723 | 2760 60% | 2151 25% | 2275 32% | 1050 -39% | 2080 21% | 1624 ? -6% | 3303 ? 92% |
| Write 4K Q32T1 (MB/s) | 300.9 | 237.5 -21% | 234 -22% | 493.3 64% | 167.3 -44% | 451 50% | 360 ? 20% | 433 ? 44% |
| Read 4K Q32T1 (MB/s) | 273.7 | 336.1 23% | 325.7 19% | 429 57% | 337.4 23% | 269.7 -1% | 396 ? 45% | 498 ? 82% |
| Write Seq Q32T1 (MB/s) | 1494 | 1512 1% | 2348 57% | 2992 100% | 789 -47% | 1770 18% | 1492 ? 0% | 4677 ? 213% |
| Read Seq Q32T1 (MB/s) | 3309 | 3154 -5% | 3563 8% | 3562 8% | 1606 -51% | 3214 -3% | 3313 ? 0% | 5850 ? 77% |
Graphics card
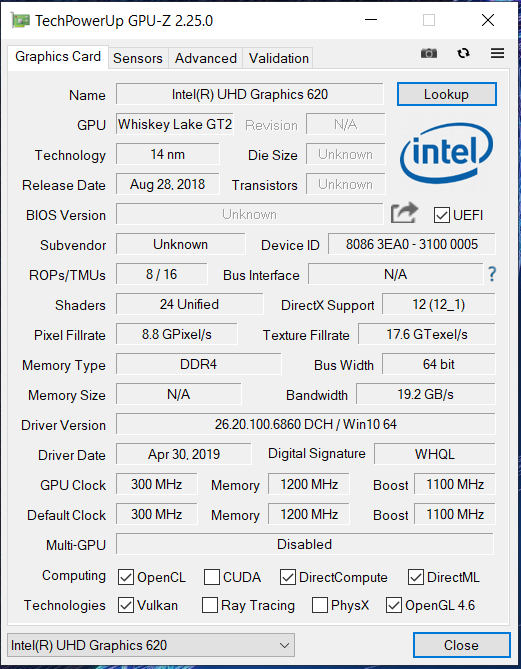
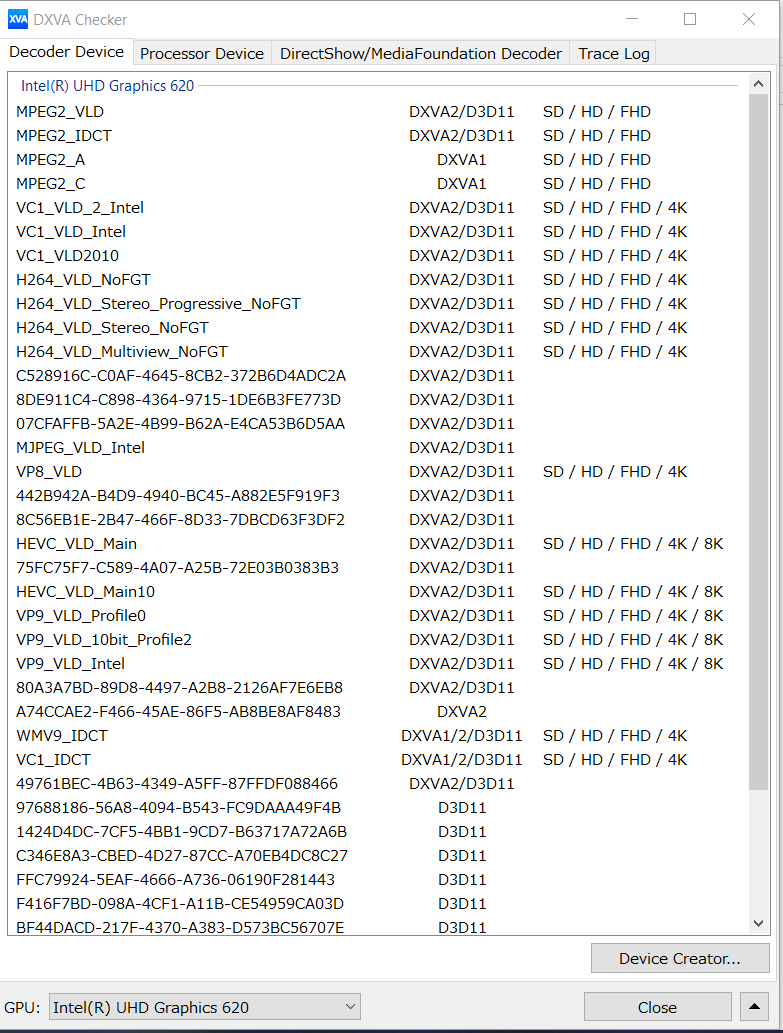
Intel's UHD Graphics 620 graphics core takes care of graphics output. The GPU supports DirectX 12 and reaches working speeds of up to 1,100 MHz. The results in the 3DMark benchmarks are at a normal level for this GPU. An increase in performance would be achieved by activating dual-channel mode. The decoder integrated into the GPU can unload the processor when playing videos. Therefore, using streaming services isn't a problem.
| 3DMark 11 Performance | 1882 points | |
| 3DMark Cloud Gate Standard Score | 7837 points | |
| 3DMark Fire Strike Score | 997 points | |
Help | ||
Gaming performance
The hardware of the Portégé X30 allows playing some of the games that are in our database smoothly - at low resolutions and low quality settings. This includes games that only have moderate hardware requirements. By installing a second memory module (= dual-channel mode active), an increase in frame rates would be achieved. But even then, most of the games of the last three to four years wouldn't be playable.
| low | med. | high | ultra | |
|---|---|---|---|---|
| BioShock Infinite (2013) | 48.4 | 30 | 23.4 | 7.5 |
Emissions and energy - The 13.3-incher has a lot of endurance
Noise emissions
When idle, the fan is often turned off and silence prevails. It turns up under full load. In this way, we measure a sound pressure level of 40.1 dB(A) during the stress test.
Noise level
| Idle |
| 30.4 / 30.4 / 30.4 dB(A) |
| Load |
| 37.8 / 40.1 dB(A) |
 | ||
30 dB silent 40 dB(A) audible 50 dB(A) loud |
||
min: | ||
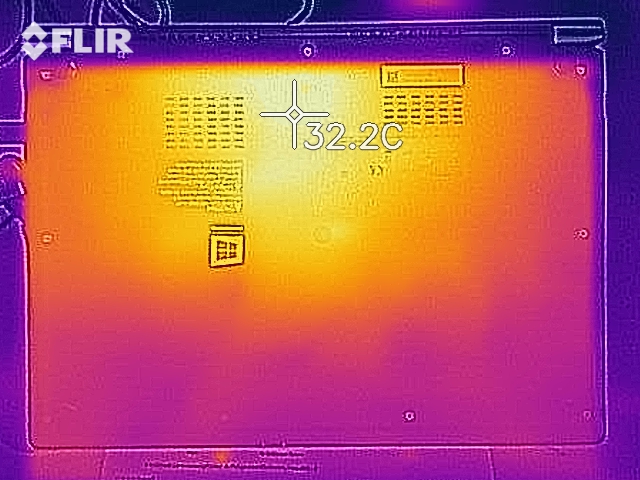
Temperature
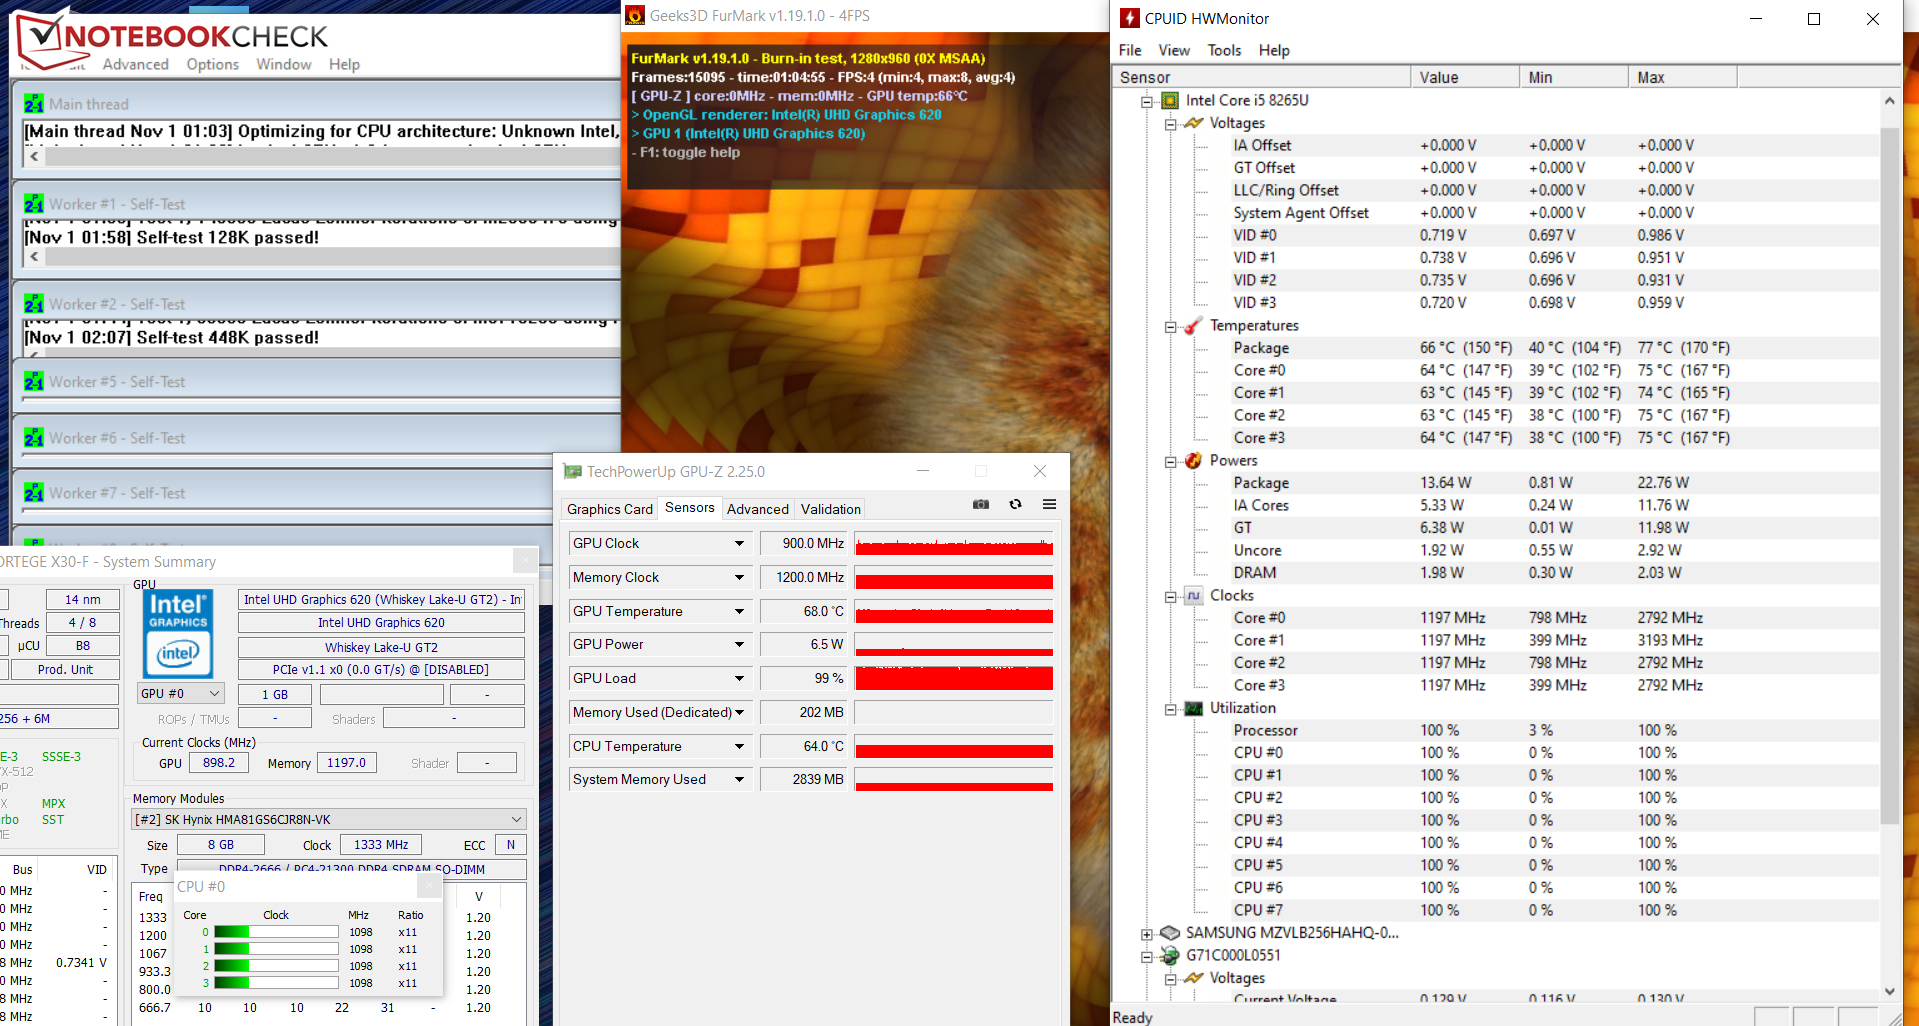
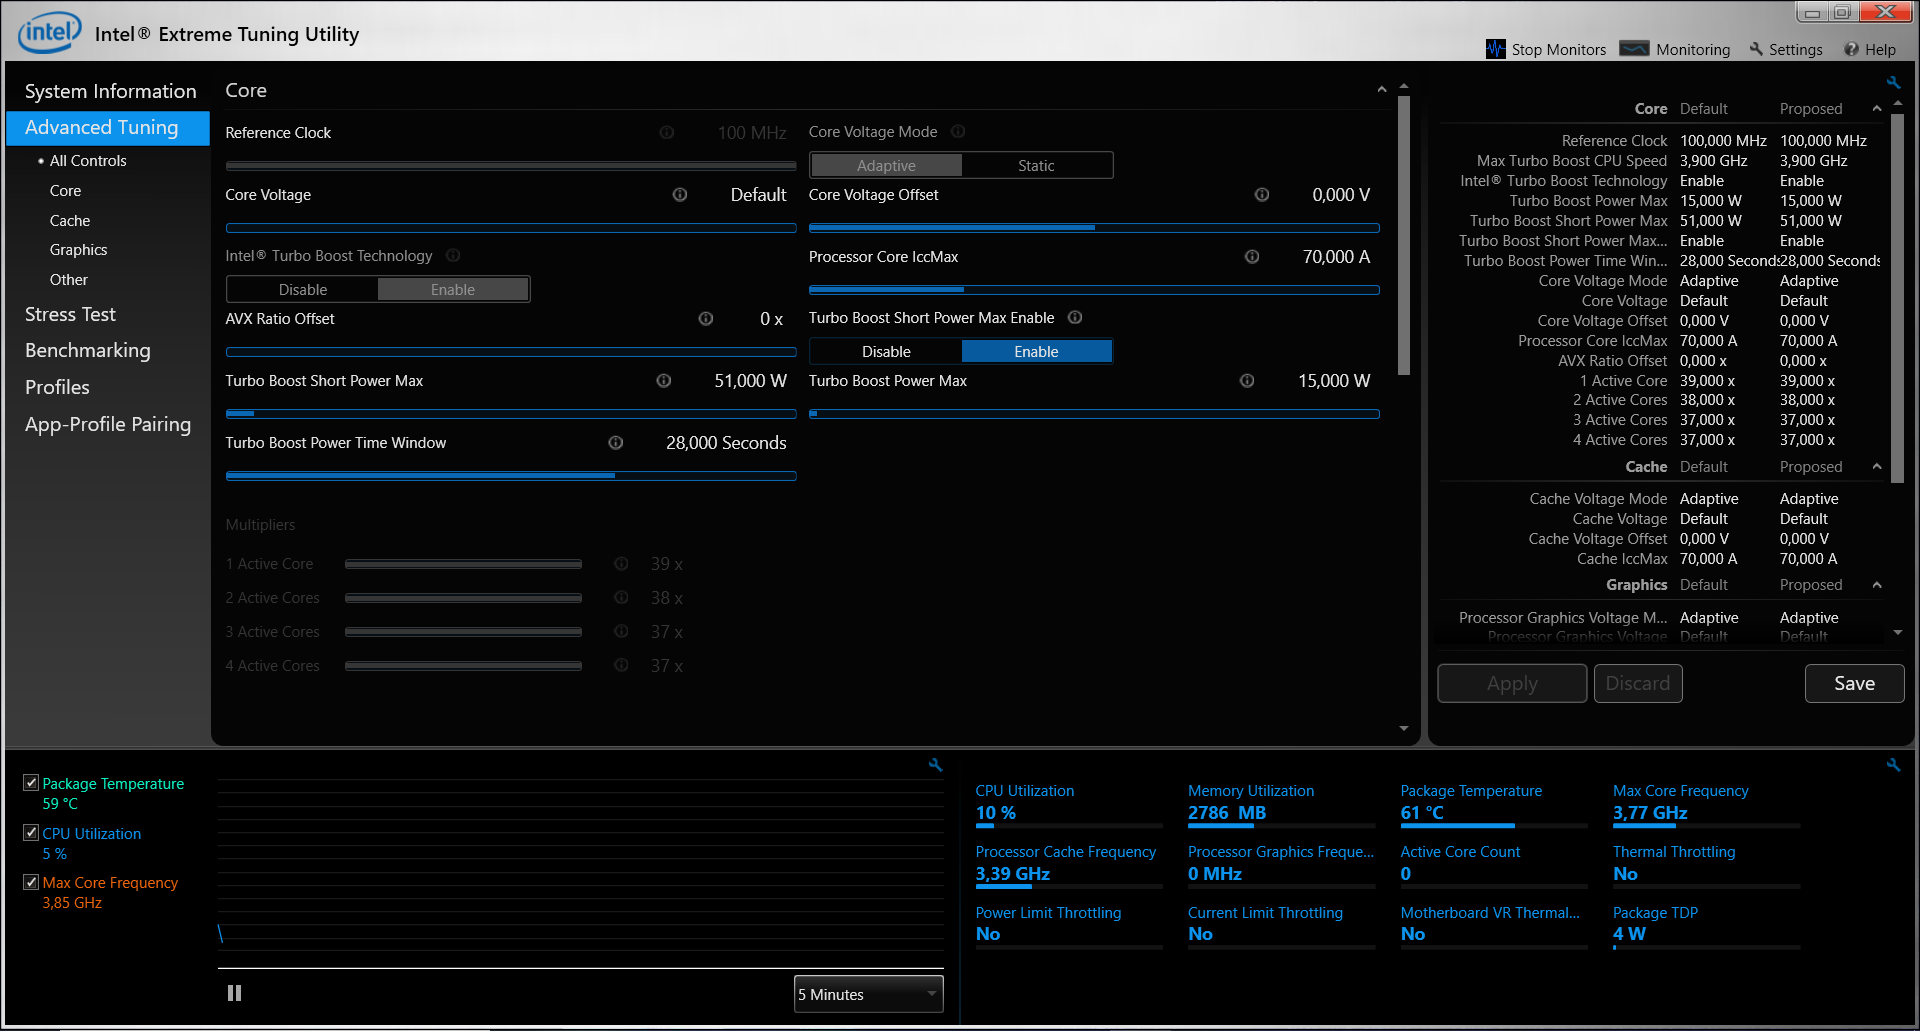
The Dynabook laptop completes our stress test (Prime95 and FurMark run for at least an hour) on battery power and plugged-in in the same way. The CPU operates at 1.6 to 1.7 GHz at the beginning of the test. The clock speed then drops to 1.3 to 1.5 GHz, then later to 1.1 to 1.2 GHz and it remains at this level. The clock speed of the graphics core increases from the initial 550 MHz to 900 MHz. The stress test represents an extreme scenario that doesn't occur in everyday life. With this test, we check whether the system remains stable even under full load.
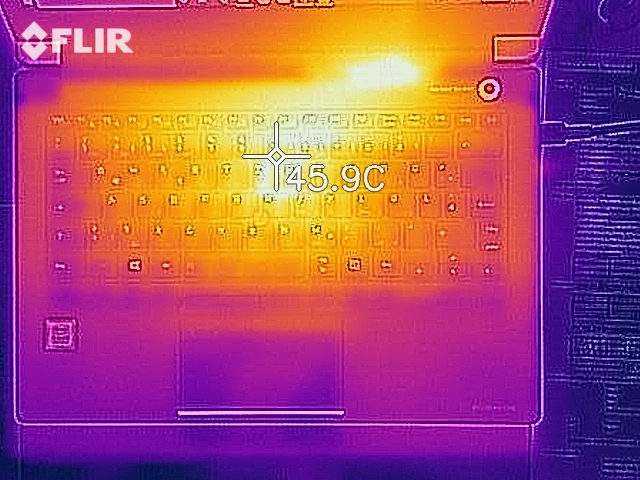
The Portégé doesn't get excessively warm. During the stress test, we only register a temperature of 40 °C (~104 °F) at one measuring point. In everyday use, the values are consistently in the green range.
(±) The maximum temperature on the upper side is 40 °C / 104 F, compared to the average of 35.9 °C / 97 F, ranging from 21.4 to 59 °C for the class Subnotebook.
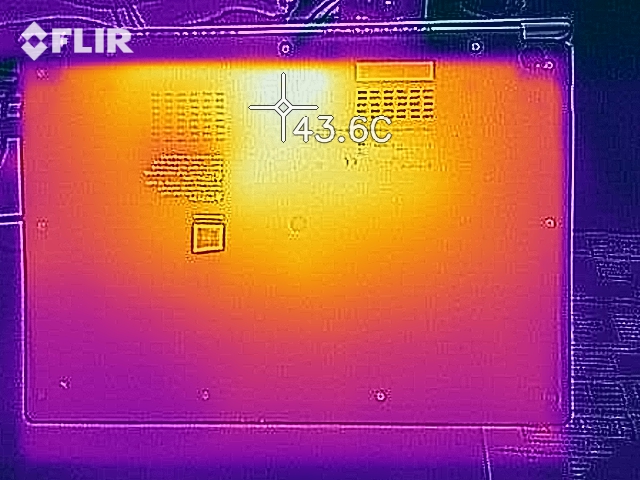
(+) The bottom heats up to a maximum of 38 °C / 100 F, compared to the average of 39.2 °C / 103 F
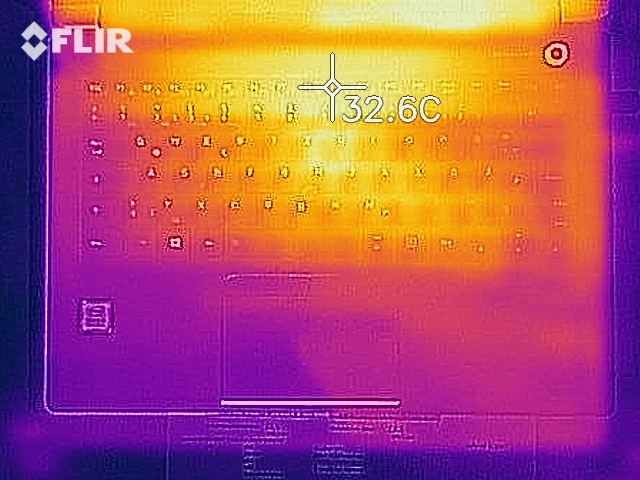
(+) In idle usage, the average temperature for the upper side is 24.6 °C / 76 F, compared to the device average of 30.8 °C / 87 F.
(+) The palmrests and touchpad are cooler than skin temperature with a maximum of 24.9 °C / 76.8 F and are therefore cool to the touch.
(+) The average temperature of the palmrest area of similar devices was 28.2 °C / 82.8 F (+3.3 °C / 6 F).
Speakers
Dynabook Portégé X30-F-10N audio analysis
(-) | not very loud speakers (69.9 dB)
Bass 100 - 315 Hz
(-) | nearly no bass - on average 20.4% lower than median
(±) | linearity of bass is average (12.8% delta to prev. frequency)
Mids 400 - 2000 Hz
(+) | balanced mids - only 1.4% away from median
(+) | mids are linear (4.5% delta to prev. frequency)
Highs 2 - 16 kHz
(+) | balanced highs - only 4% away from median
(+) | highs are linear (6.3% delta to prev. frequency)
Overall 100 - 16.000 Hz
(±) | linearity of overall sound is average (18.3% difference to median)
Compared to same class
» 53% of all tested devices in this class were better, 7% similar, 40% worse
» The best had a delta of 5%, average was 18%, worst was 53%
Compared to all devices tested
» 40% of all tested devices were better, 8% similar, 52% worse
» The best had a delta of 4%, average was 23%, worst was 134%
Energy consumption
The energy demand remains at a normal level over the entire load range for the hardware platform installed here. In idle usage, we measure a maximum power consumption of 5 watts - a good value. During the stress test (Prime95 and FurMark run for at least an hour), the demand briefly increases to up to 39 watts. The output of the USB Type-C power adapter is 45 watts.
| Off / Standby | |
| Idle | |
| Load |
|
Key:
min: | |
Battery life
Our practical Wi-Fi test uses a script to simulate the load caused by accessing websites. The "Balanced" profile is active, the power-saving functions are deactivated, and the display brightness is adjusted to about 150 cd/m². The Portégé X30-F reaches a runtime of 11:36 h.
Pros
Cons
Verdict

With the Portégé X30-F, Dynabook is mainly doing a model update. The same chassis is used here as with its predecessors - for example, the Toshiba Portégé X30-D. Therefore, the new model inherits many advantages and disadvantages of its predecessors. A low weight, a stable base unit and easy maintainability are the pros. The weaknesses can be found in the mediocre keyboard, the susceptibility to fingerprints and the lid that's easy to twist.
The newest incarnation of the Portégé X30 is also made for users who are often on the move.
The Whiskey Lake quad-core processor provides enough computing power for office and Internet applications. However, the CPU uses its Turbo only to a very small extent on battery power. Positive consequence: The X30-F delivers excellent battery life.
An NVMe SSD (M.2 2280 format) makes for a fast system. A replacement of the SSD is possible but involves effort. The SSD is mounted on the inaccessible side of the motherboard; this means that the motherboard would have to be removed in order to replace the storage device.
The matte IPS screen scores points with stable viewing angles, a good contrast, sufficient brightness and decent color reproduction out of the box. Our test device doesn't have an LTE modem. Furthermore, one can't be retrofitted. If necessary, a different configuration variant of the X30-F would have to be chosen.
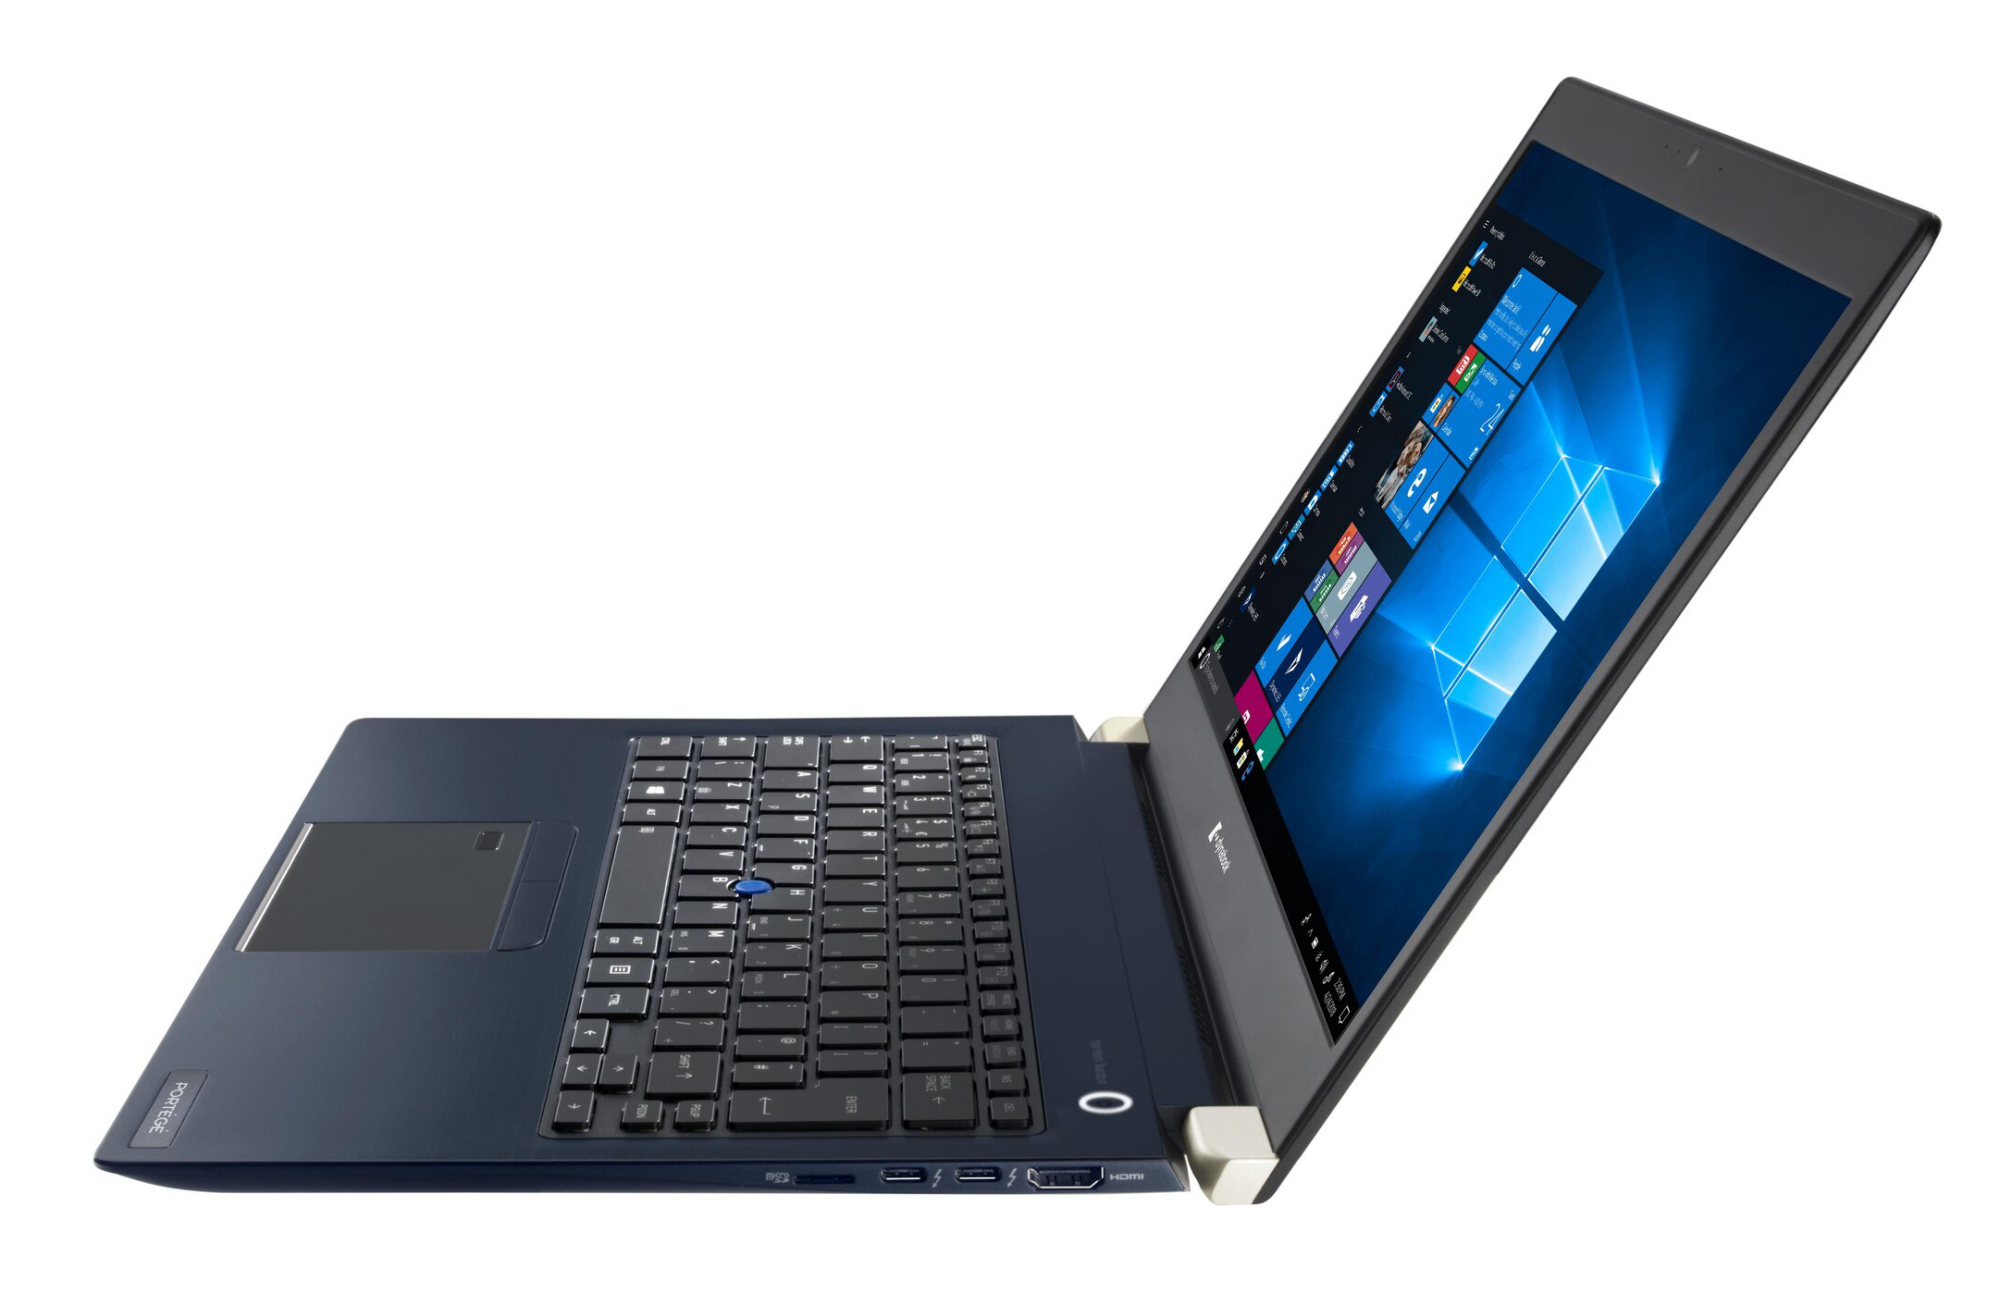
The two Thunderbolt 3 ports allow the connection of docking solutions and/or an external, powerful GPU. The ports naturally support both Power Delivery 3.0 and DisplayPort via USB-C (this requires an adapter that needs to be obtained separately).
Dynabook Portégé X30-F-10N
- 11/04/2019 v7 (old)
Sascha Mölck
Price comparison
