Dell Latitude 5490 (Core i7-8650U, Touchscreen) Laptop Review
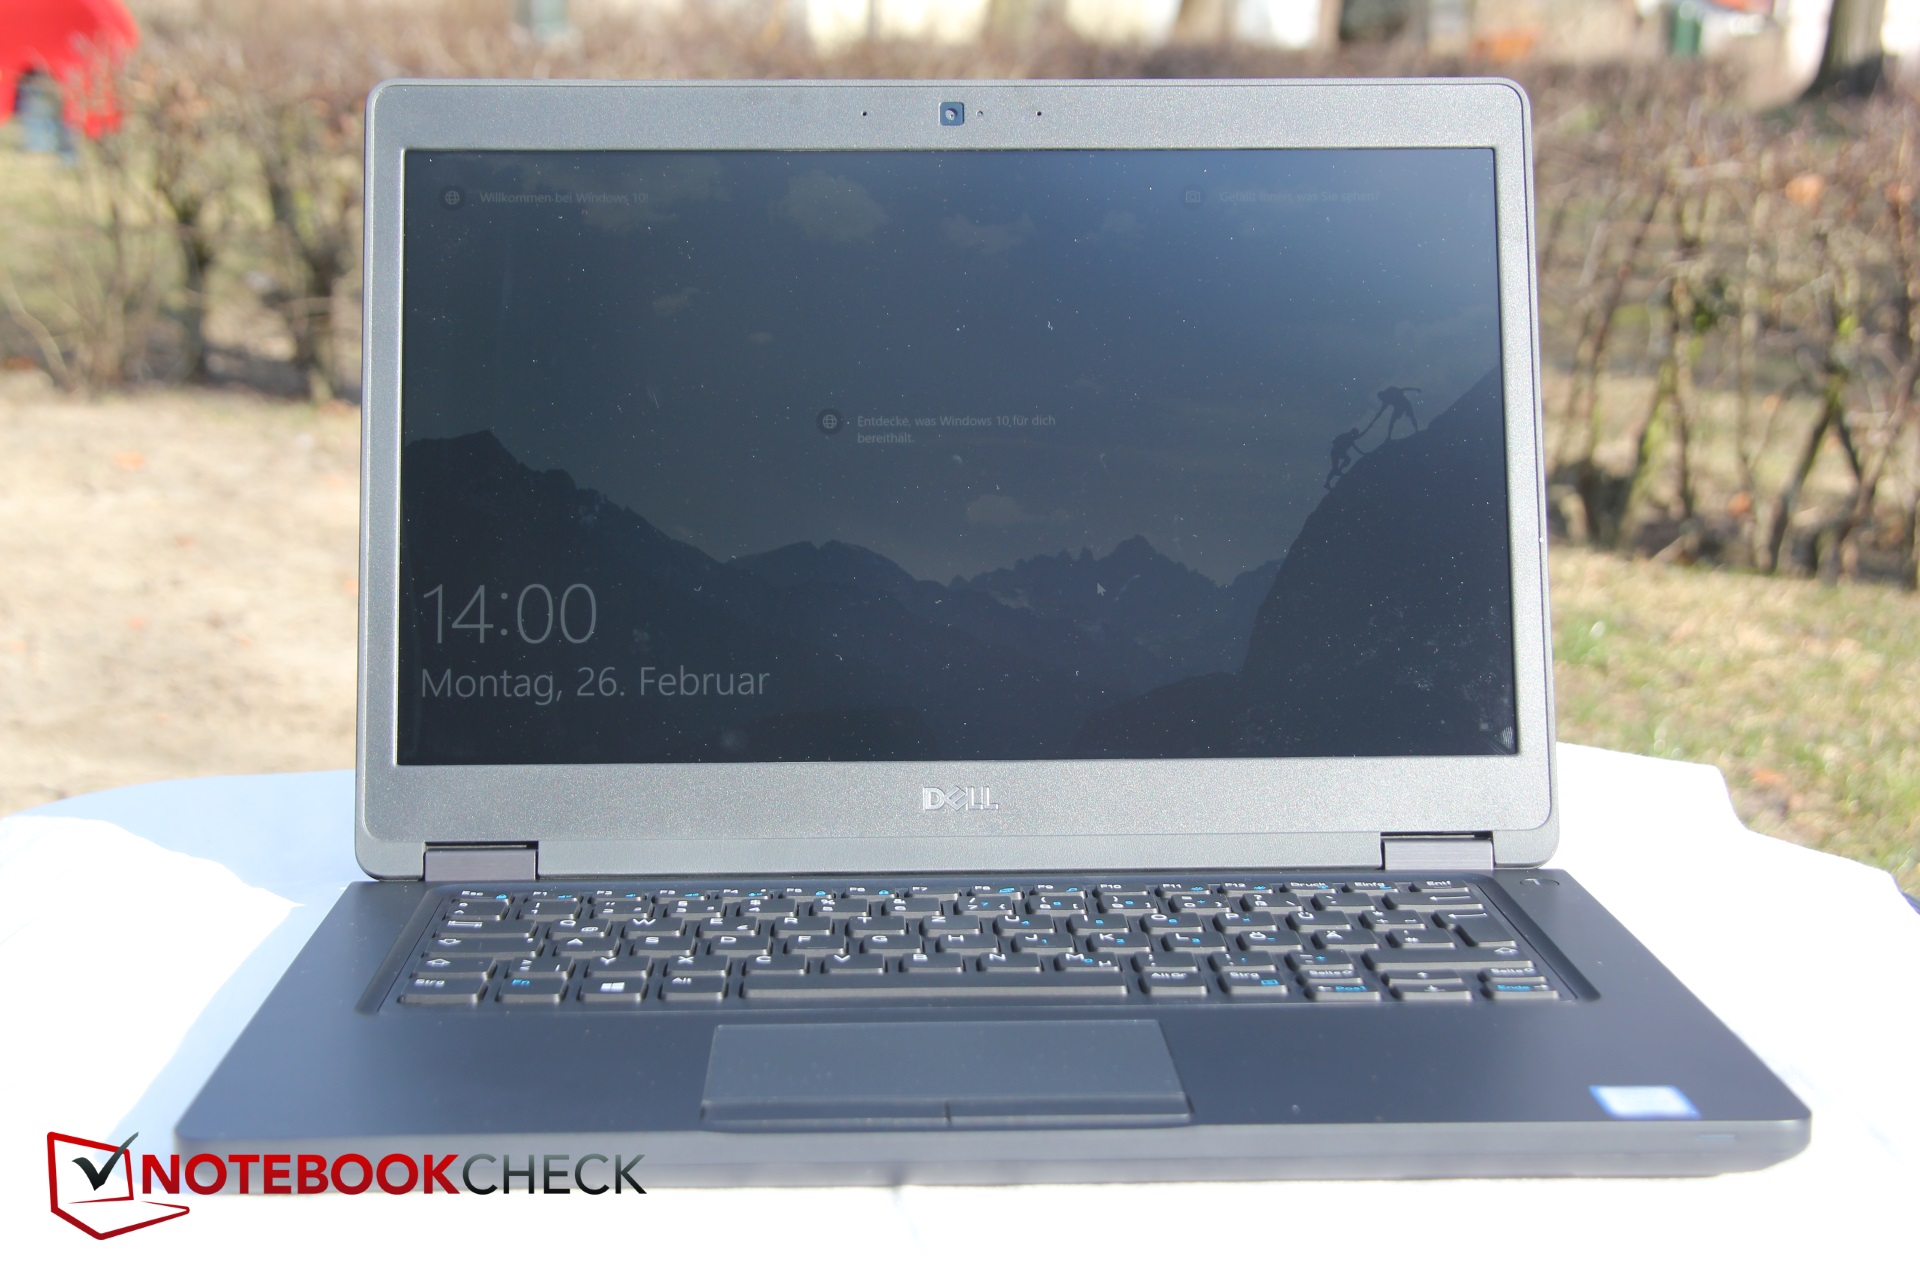
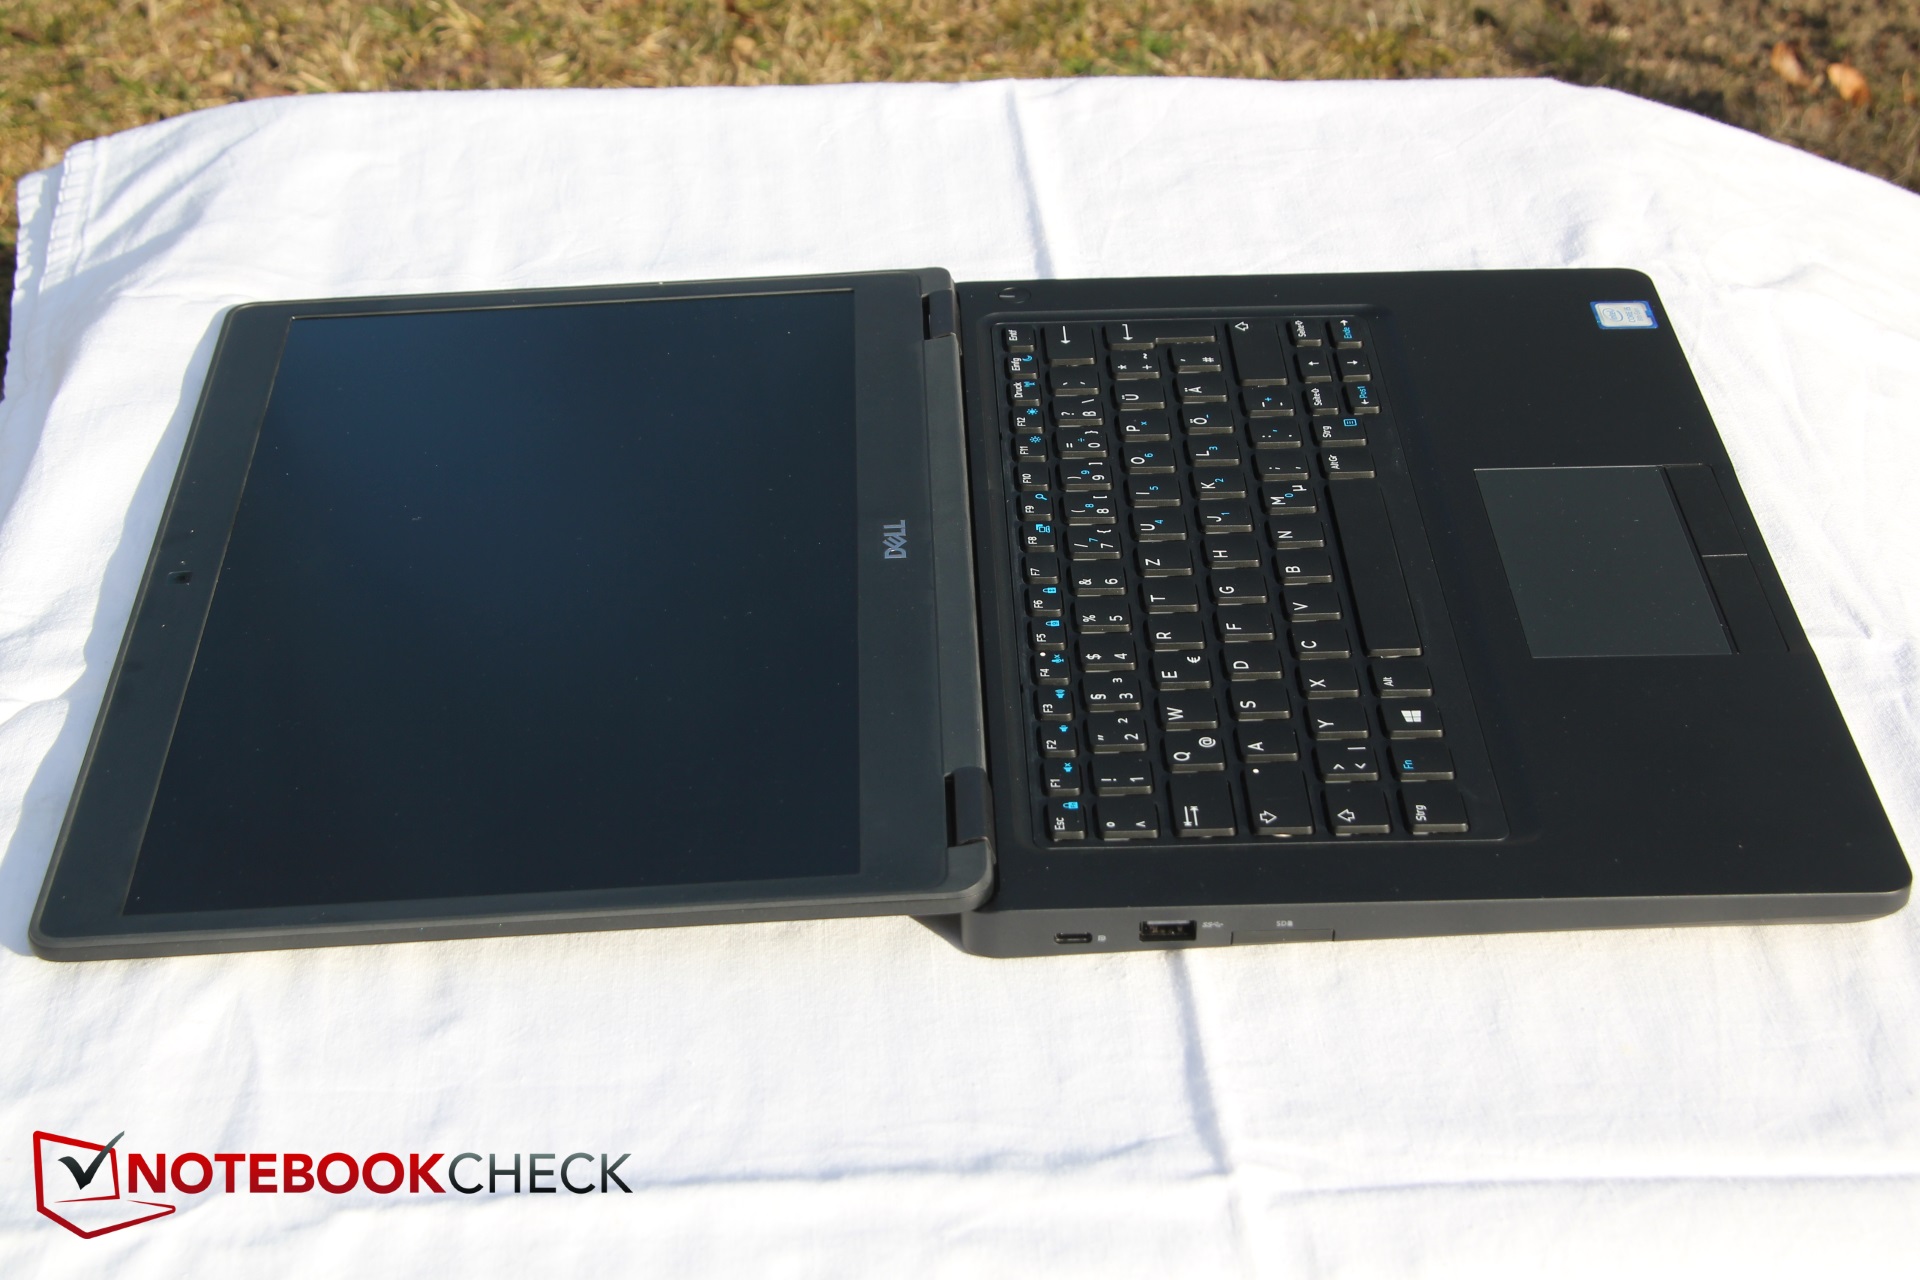
A couple of months back, we reviewed the Dell Latitude 5490, which is the 14-inch mid-range business laptop from the manufacturer. Compared with the magnesium/carbon fiber 7000 series, 5000 series machines are constructed from predominantly heavy-duty plastic and are a bit larger and more conventional in terms of their form factor and port selection. They’re the most common fit for employees at many organizations, not least because they are simple to maintain and provide powerful security options.
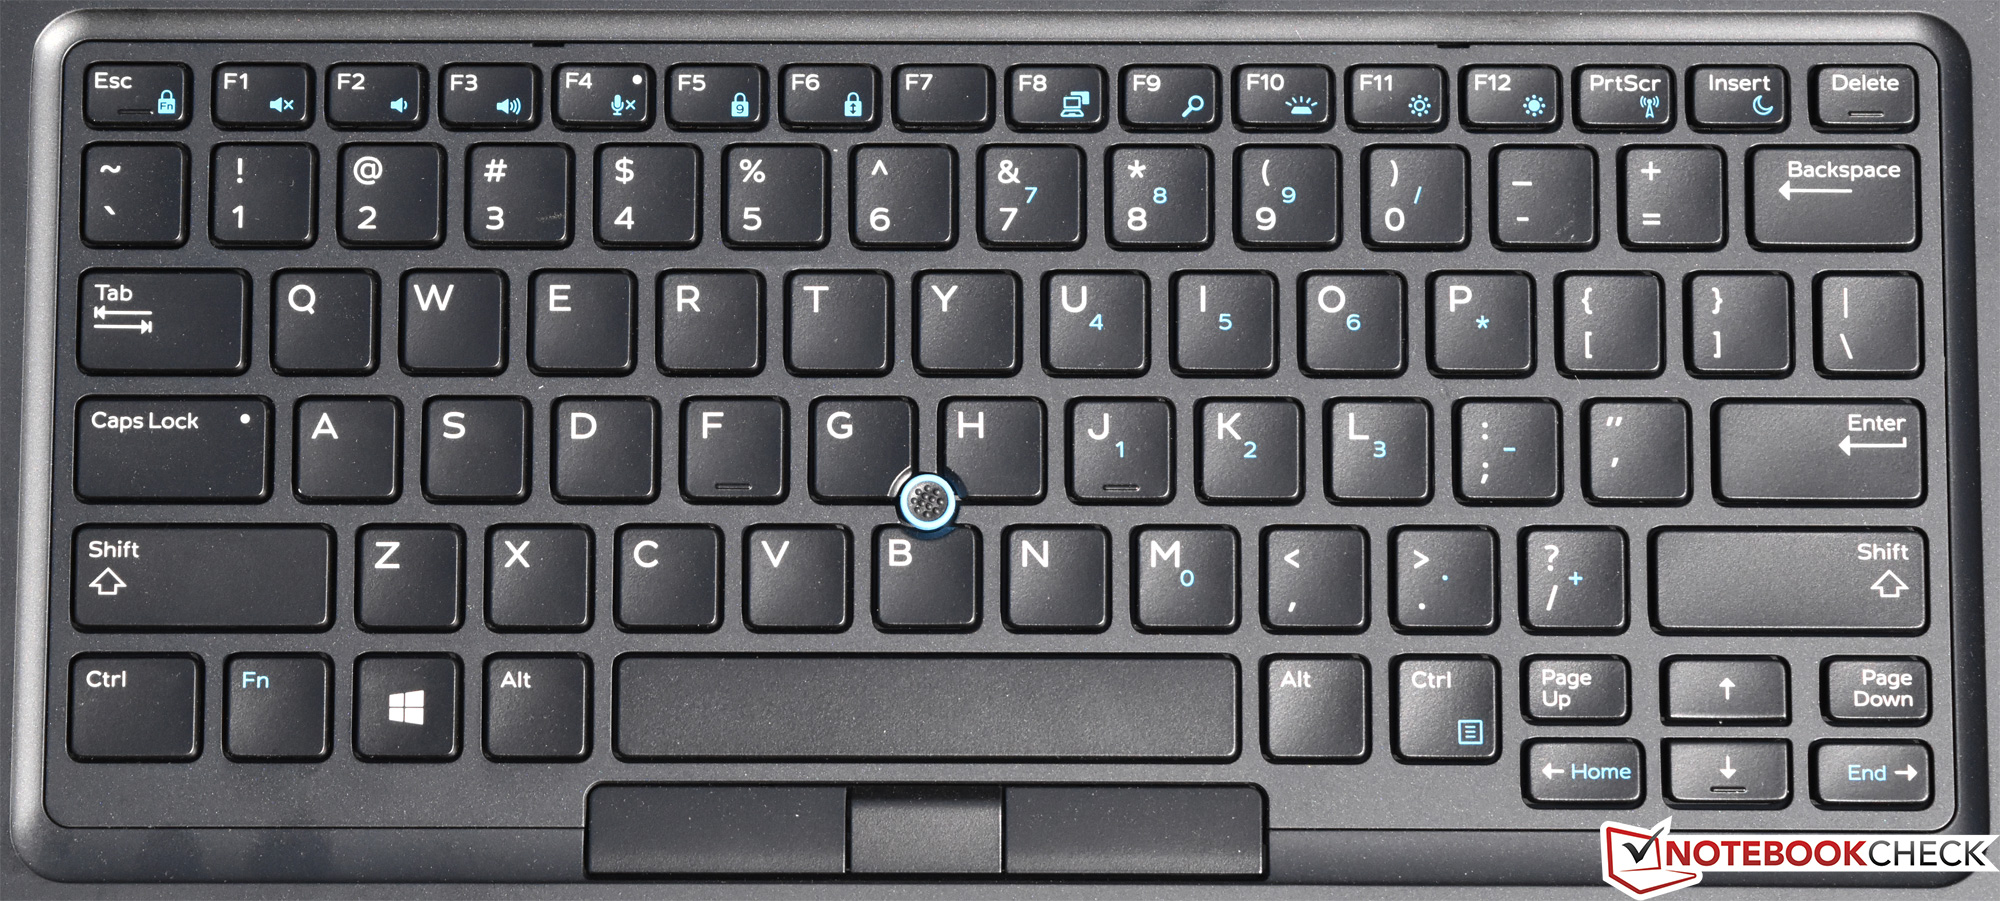
In our previous review, we praised the device’s stable build, great input devices, quiet and efficient operation, and long battery life. However, we also relented that it was a bit on the heavy side, lacked Thunderbolt 3, possessed no keyboard backlighting, and was saddled by a merely average SSD and an unfortunately dim display. Today’s alternate configuration sees a few notable changes: a faster Core i7 CPU, an NVMe solid-state drive, a backlit keyboard, new security features (fingerprint reader, smart card reader, and IR camera), and a (glossy) touchscreen. At $1,788, this is no inexpensive device—so can these changes help to further justify the asking price, or will this remain merely another “good” choice for businesses equipping their workforce?
Preliminary Notes
As mentioned above, there are just a few differences between this month’s configuration and the one we reviewed back in March. The rest of the specifications and design remain consistent with the previous unit—and as such, our existing impressions still apply. For a much more detailed breakdown of the initial topics, please reference our previous review.
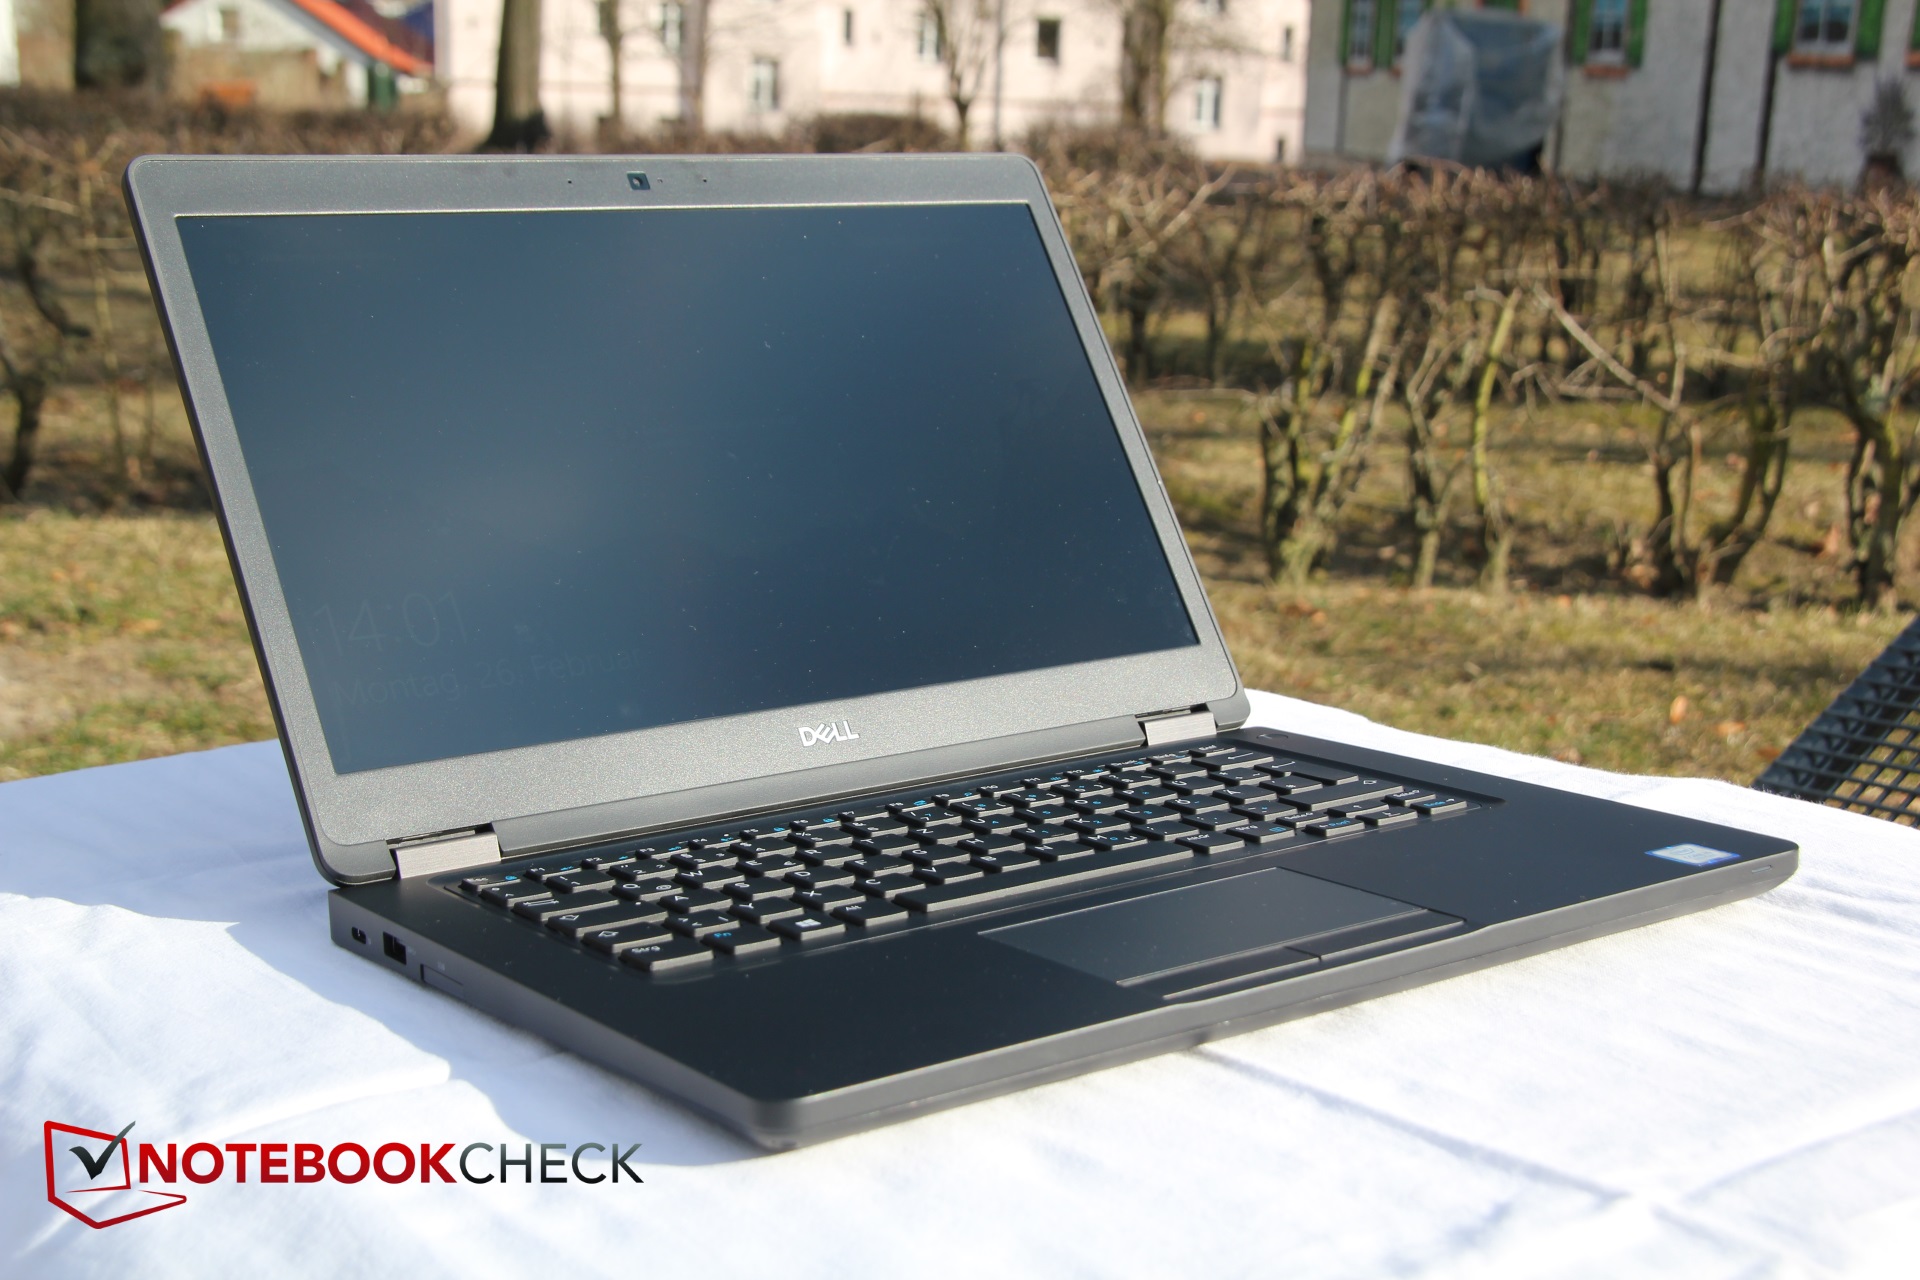
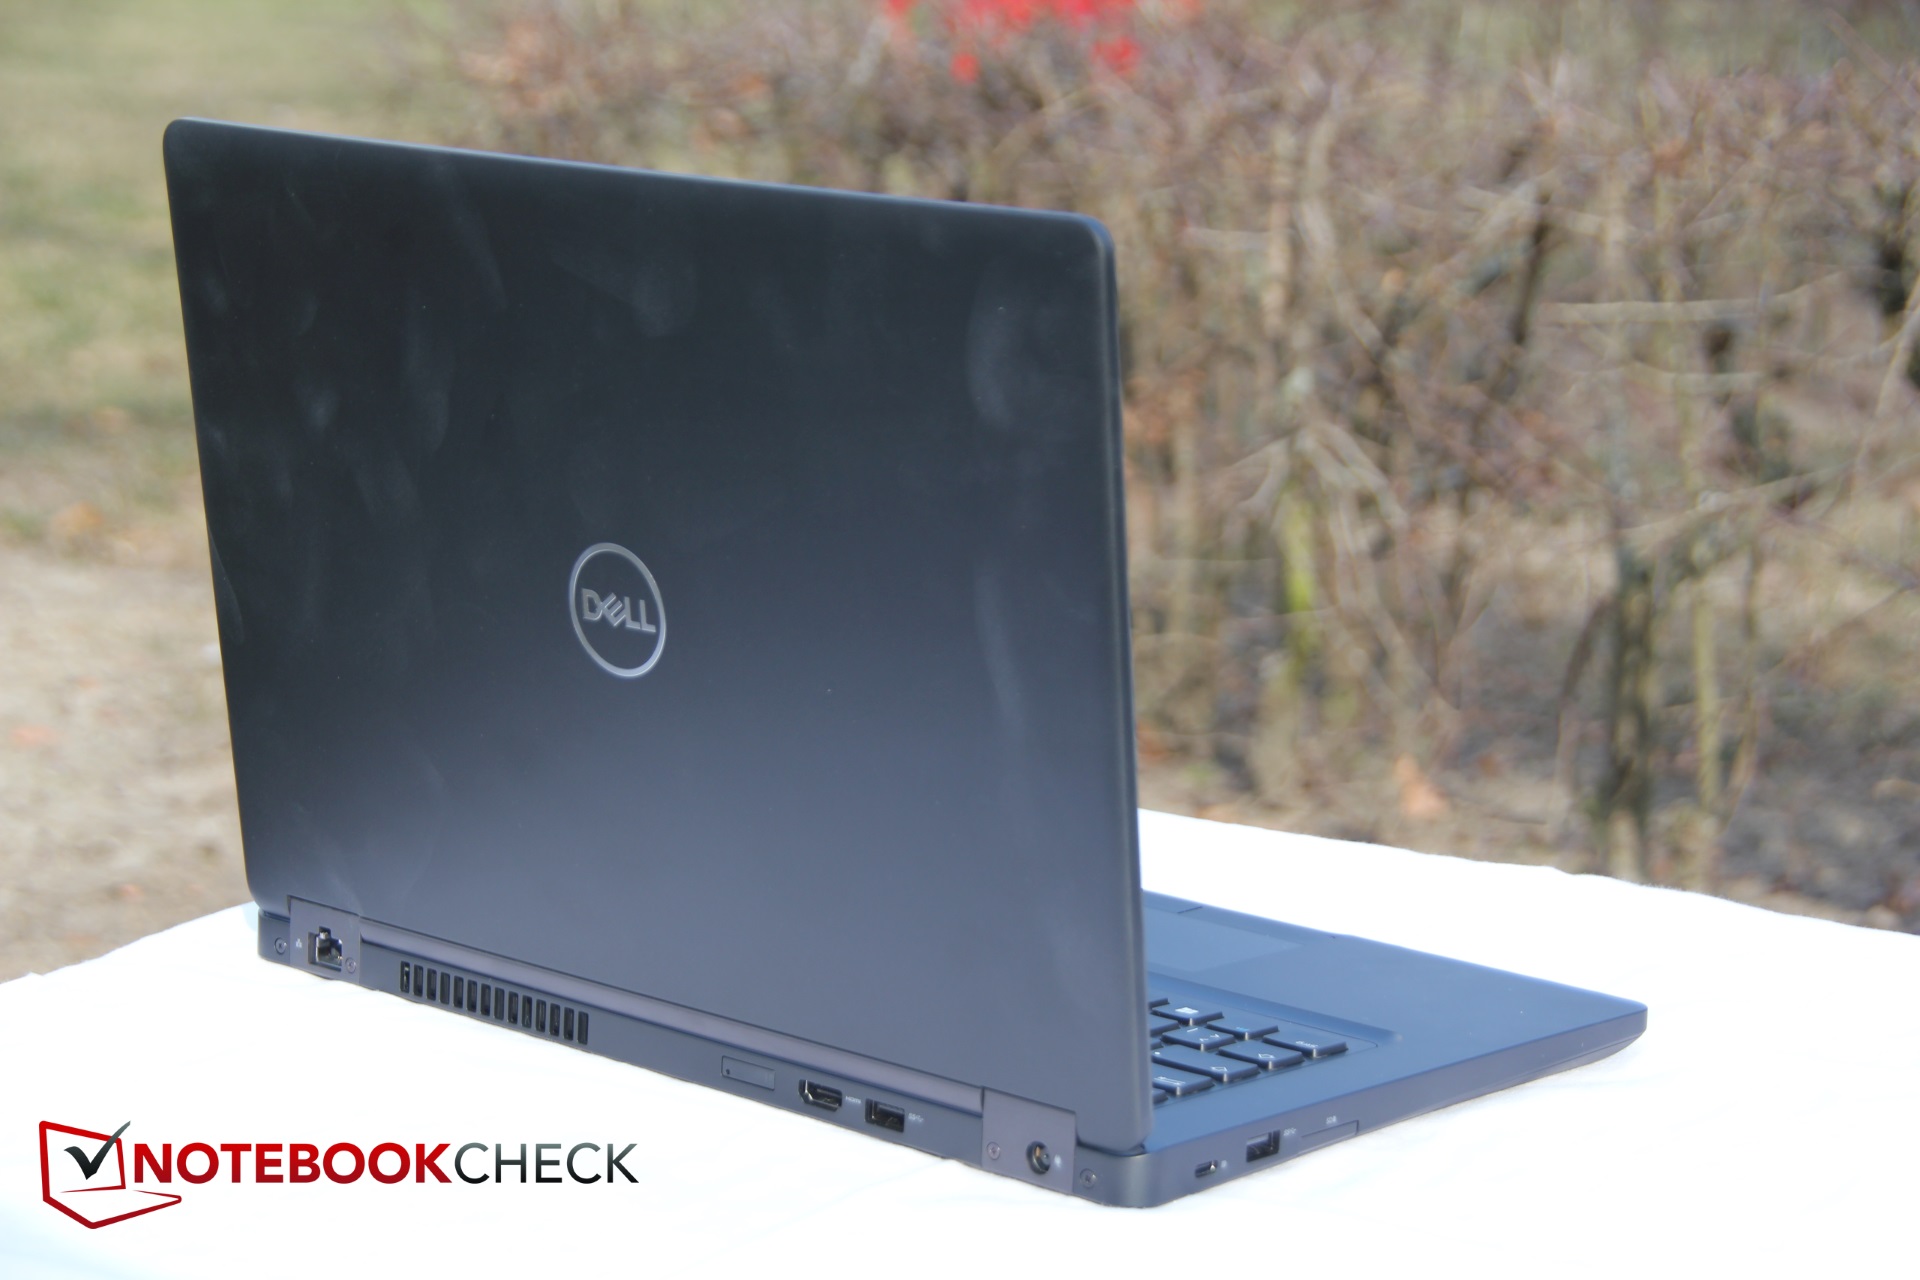
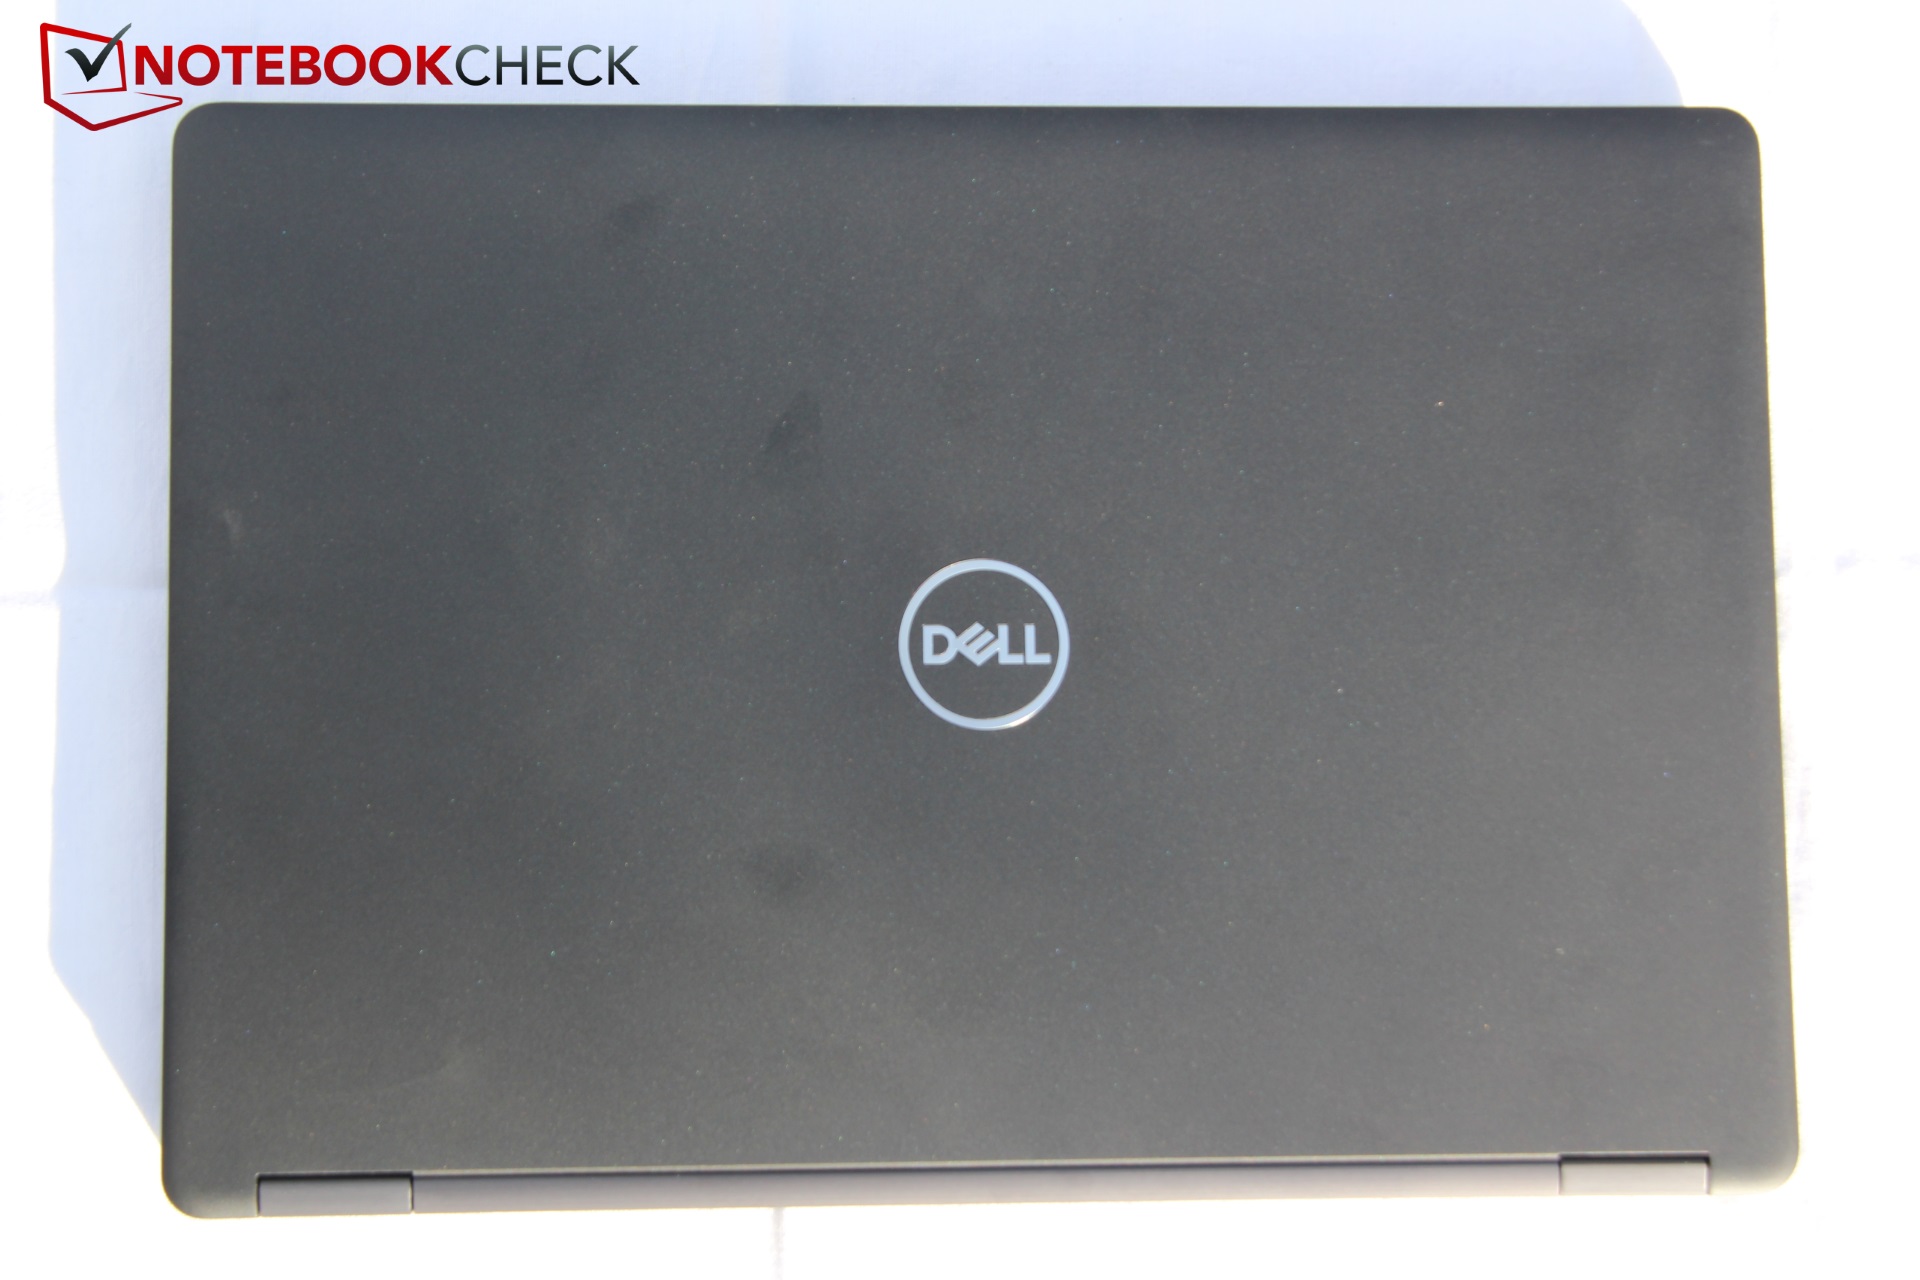
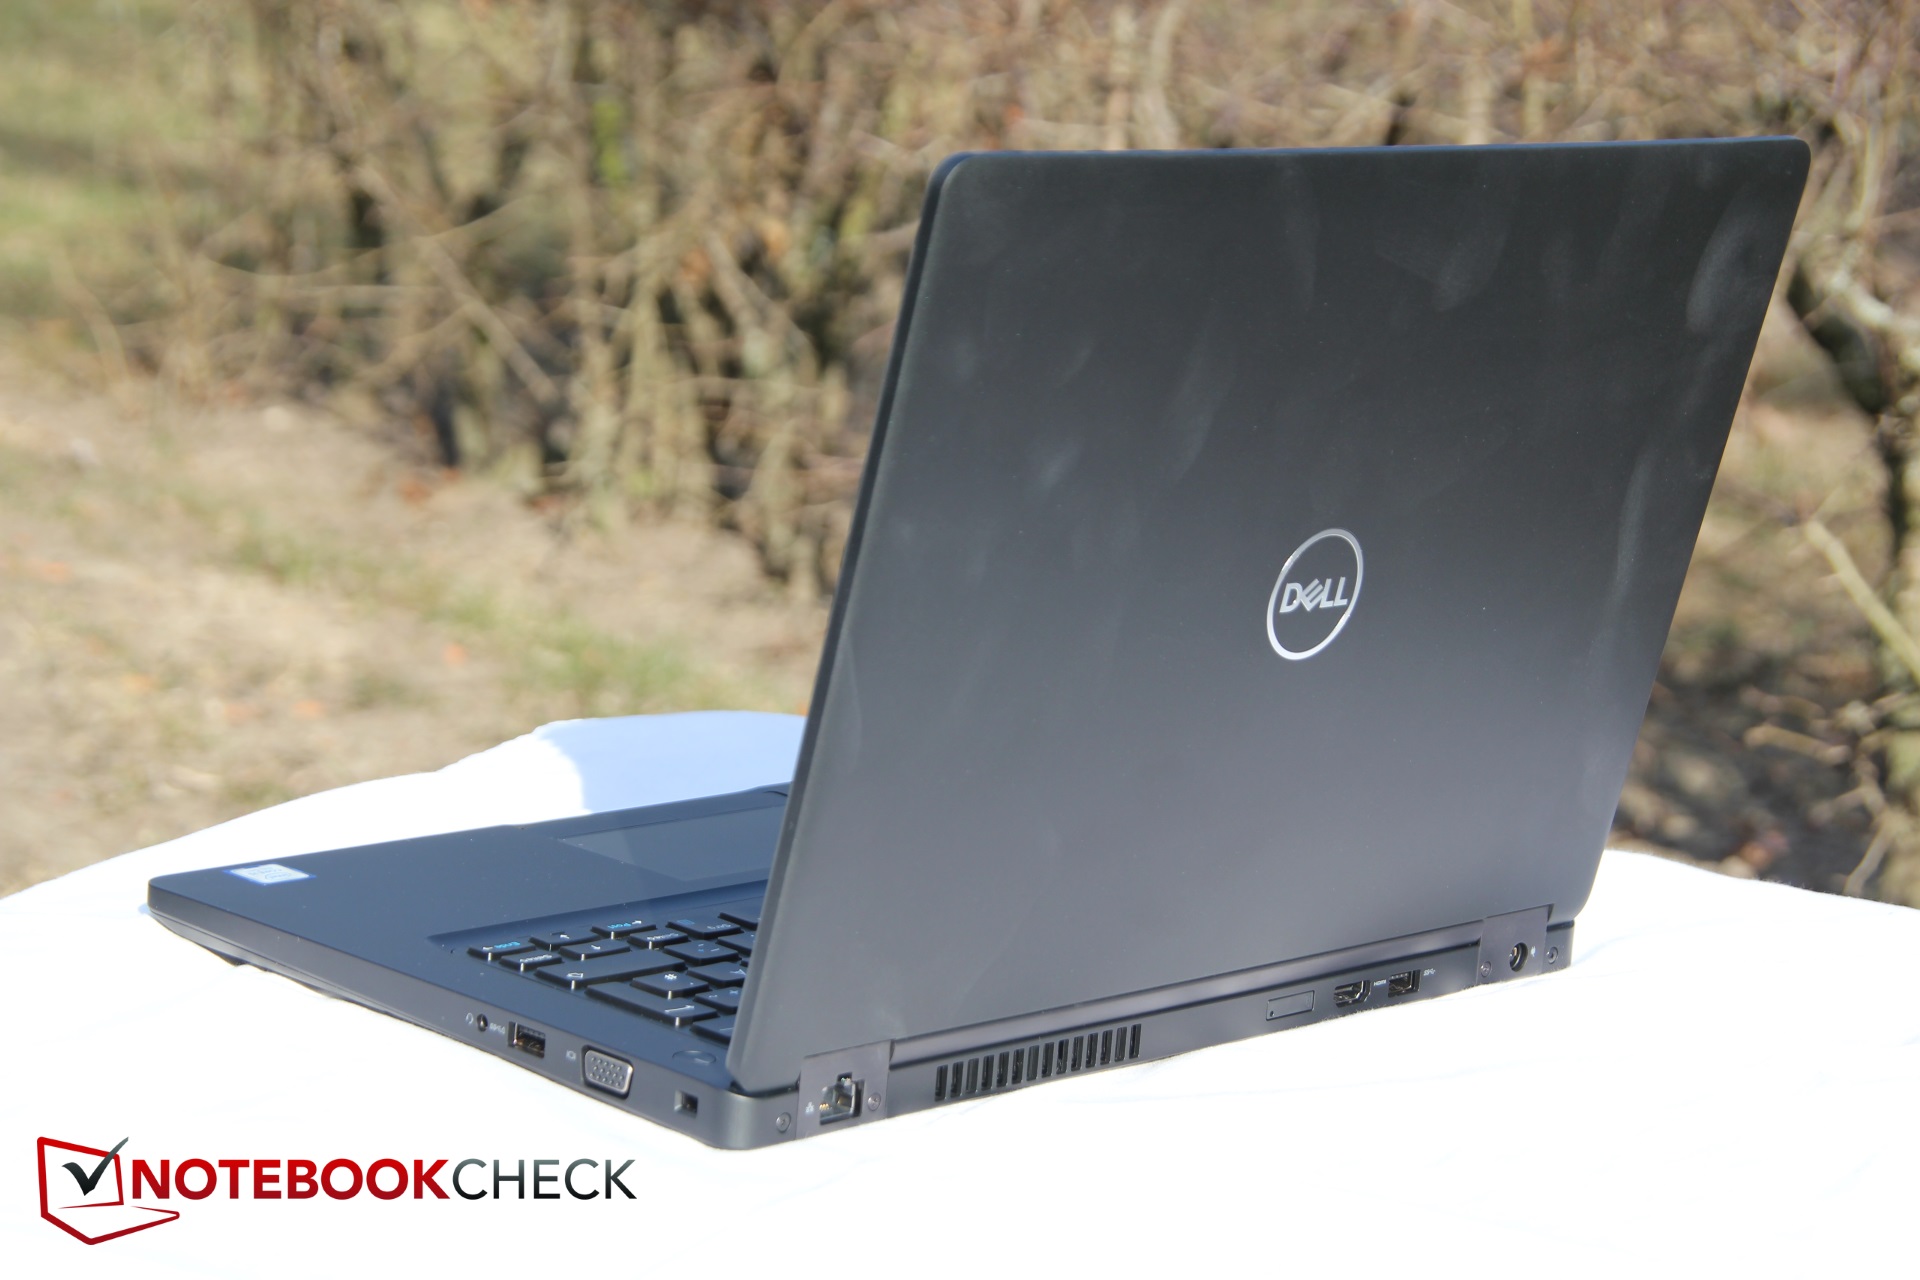
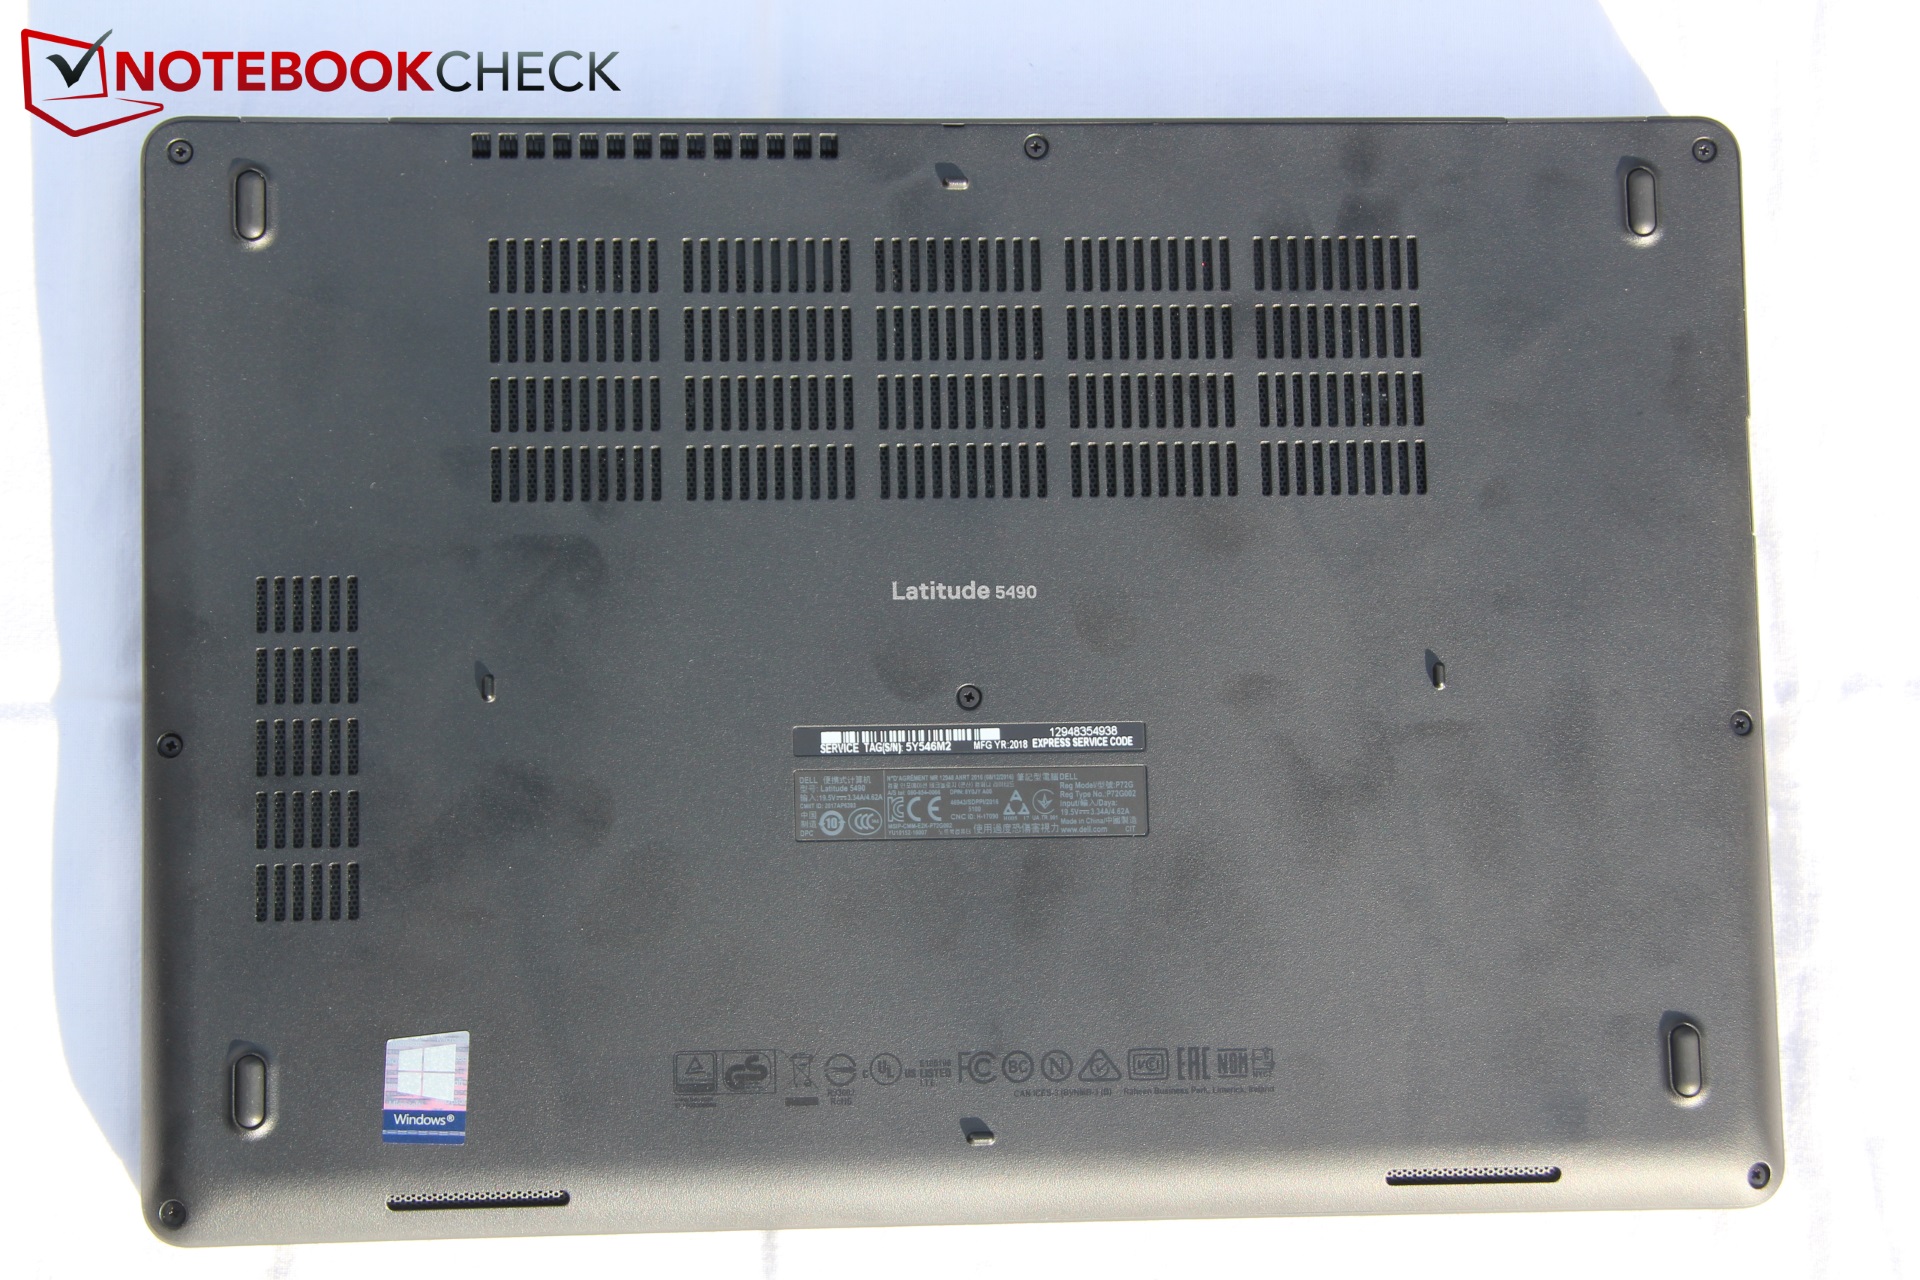
However, to quickly summarize, although the case is plastic, it is indeed very sturdy nevertheless. We appreciate the basic, no-frills design, but we do regret the prevalence of fingerprints and oils on the matte black material coating the surfaces. The machine is also a bit heavy for its class. Connectivity is good overall, with a solid number of ports to choose from and a subjectively good organization. The missing security options from our previous review unit are present in today’s, including a fingerprint reader, a smart card reader, and an IR camera. Maintenance is easy thanks to the removable bottom cover. Finally, both the keyboard and touchpad are excellent overall.
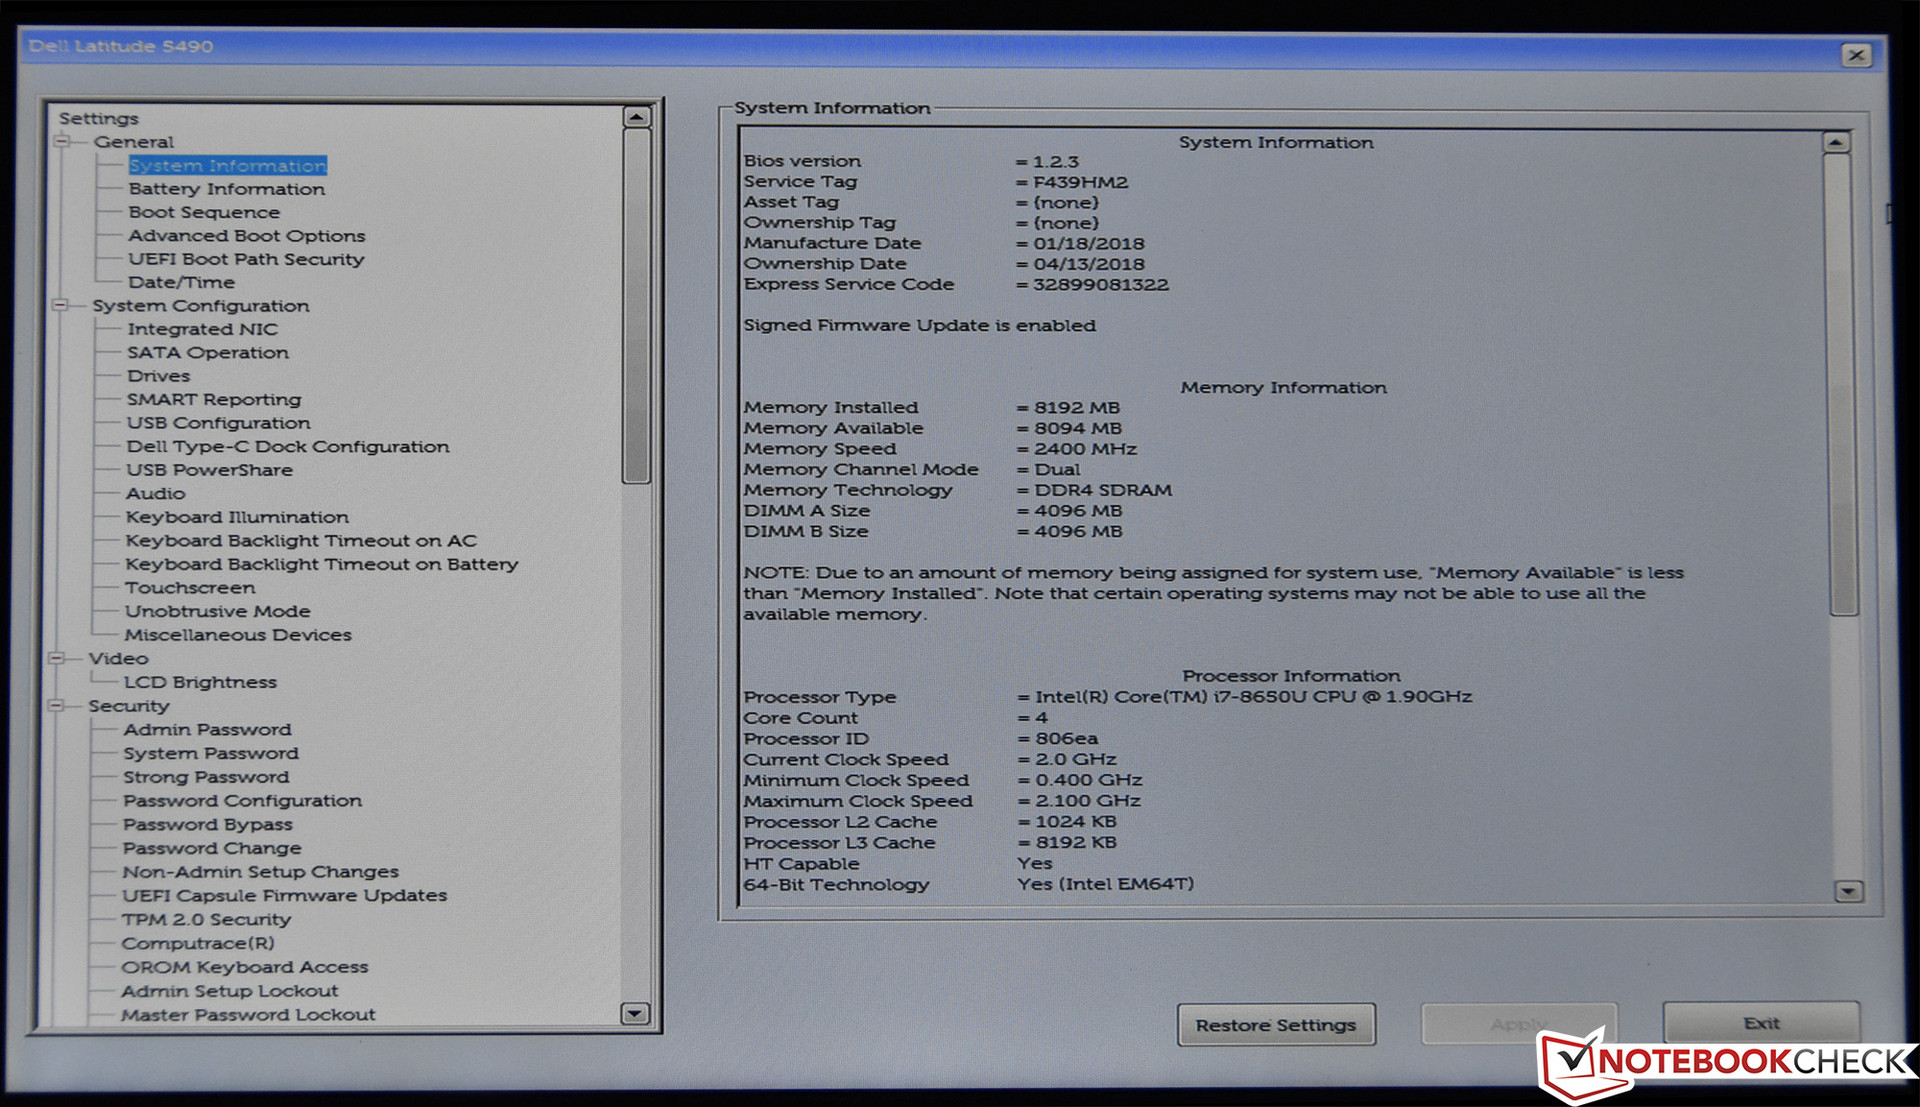
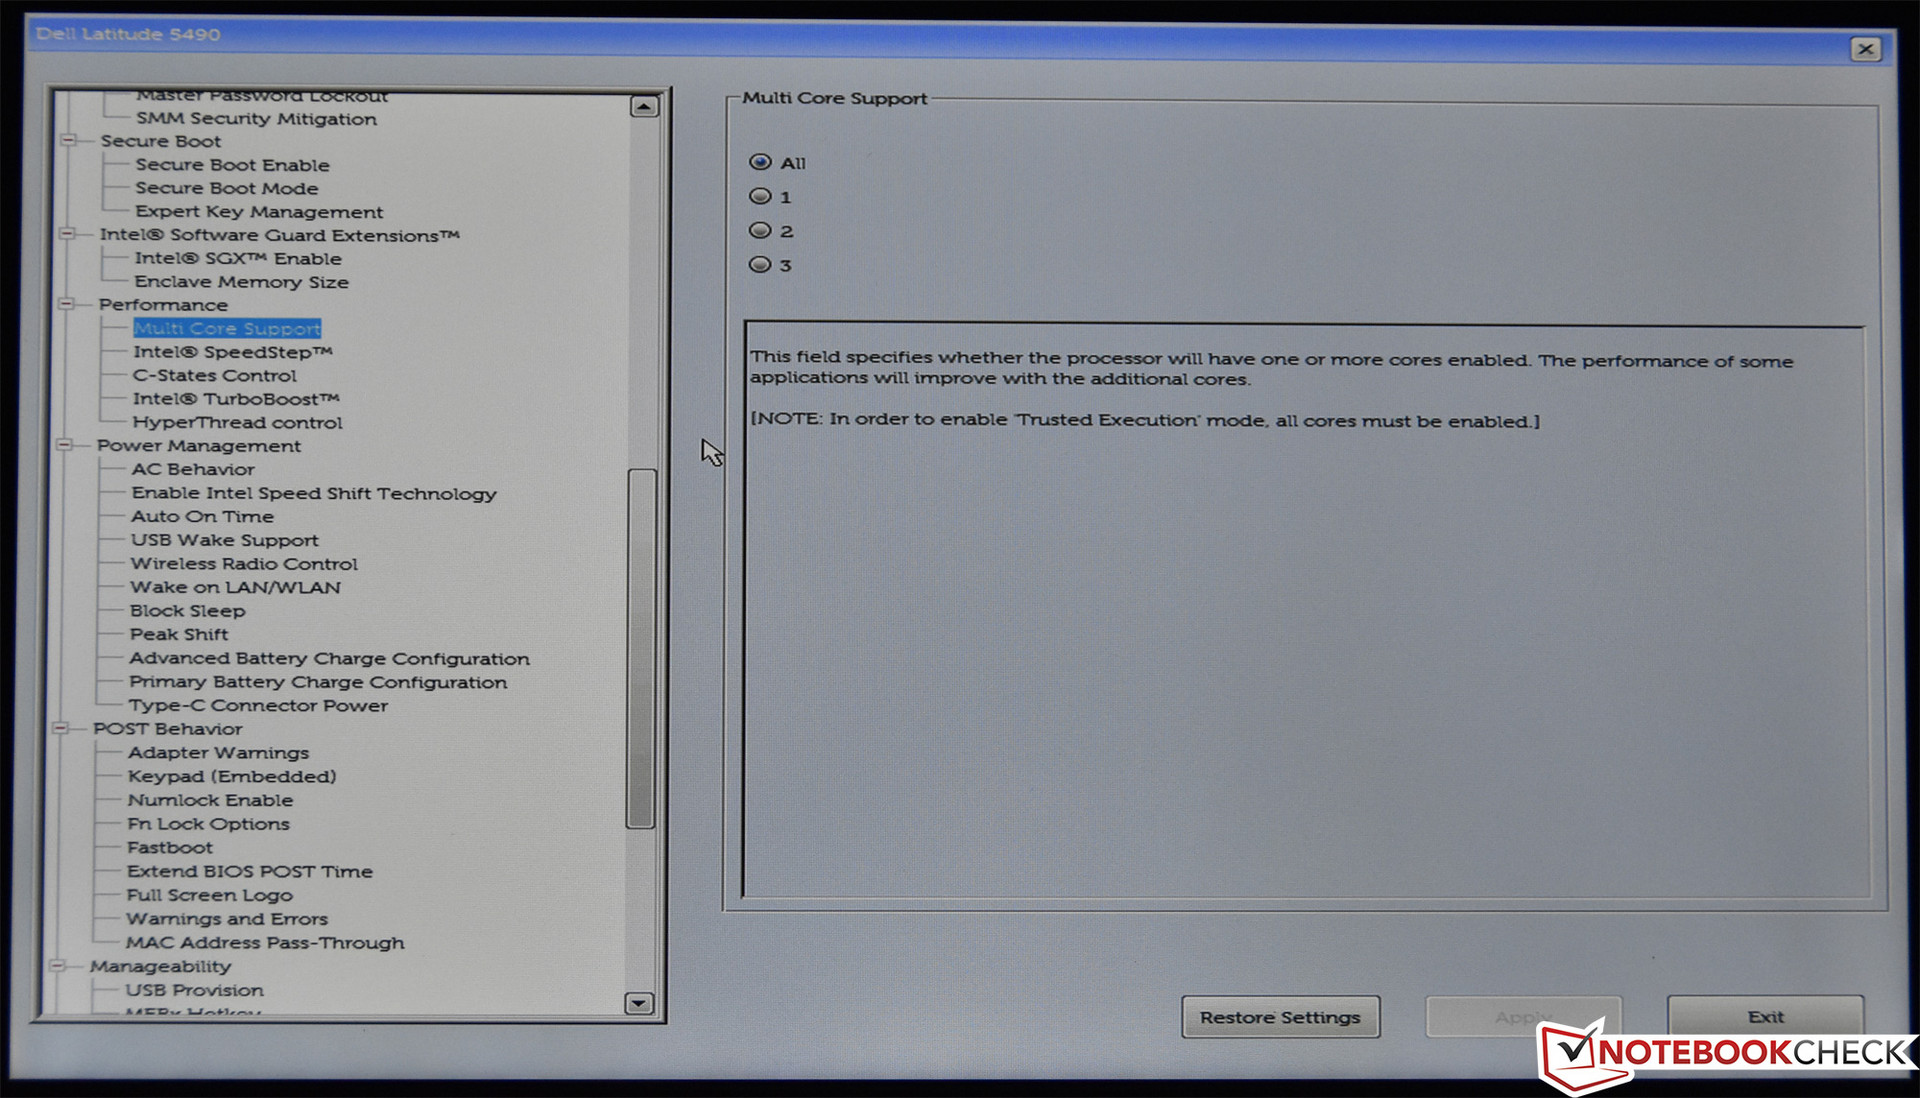
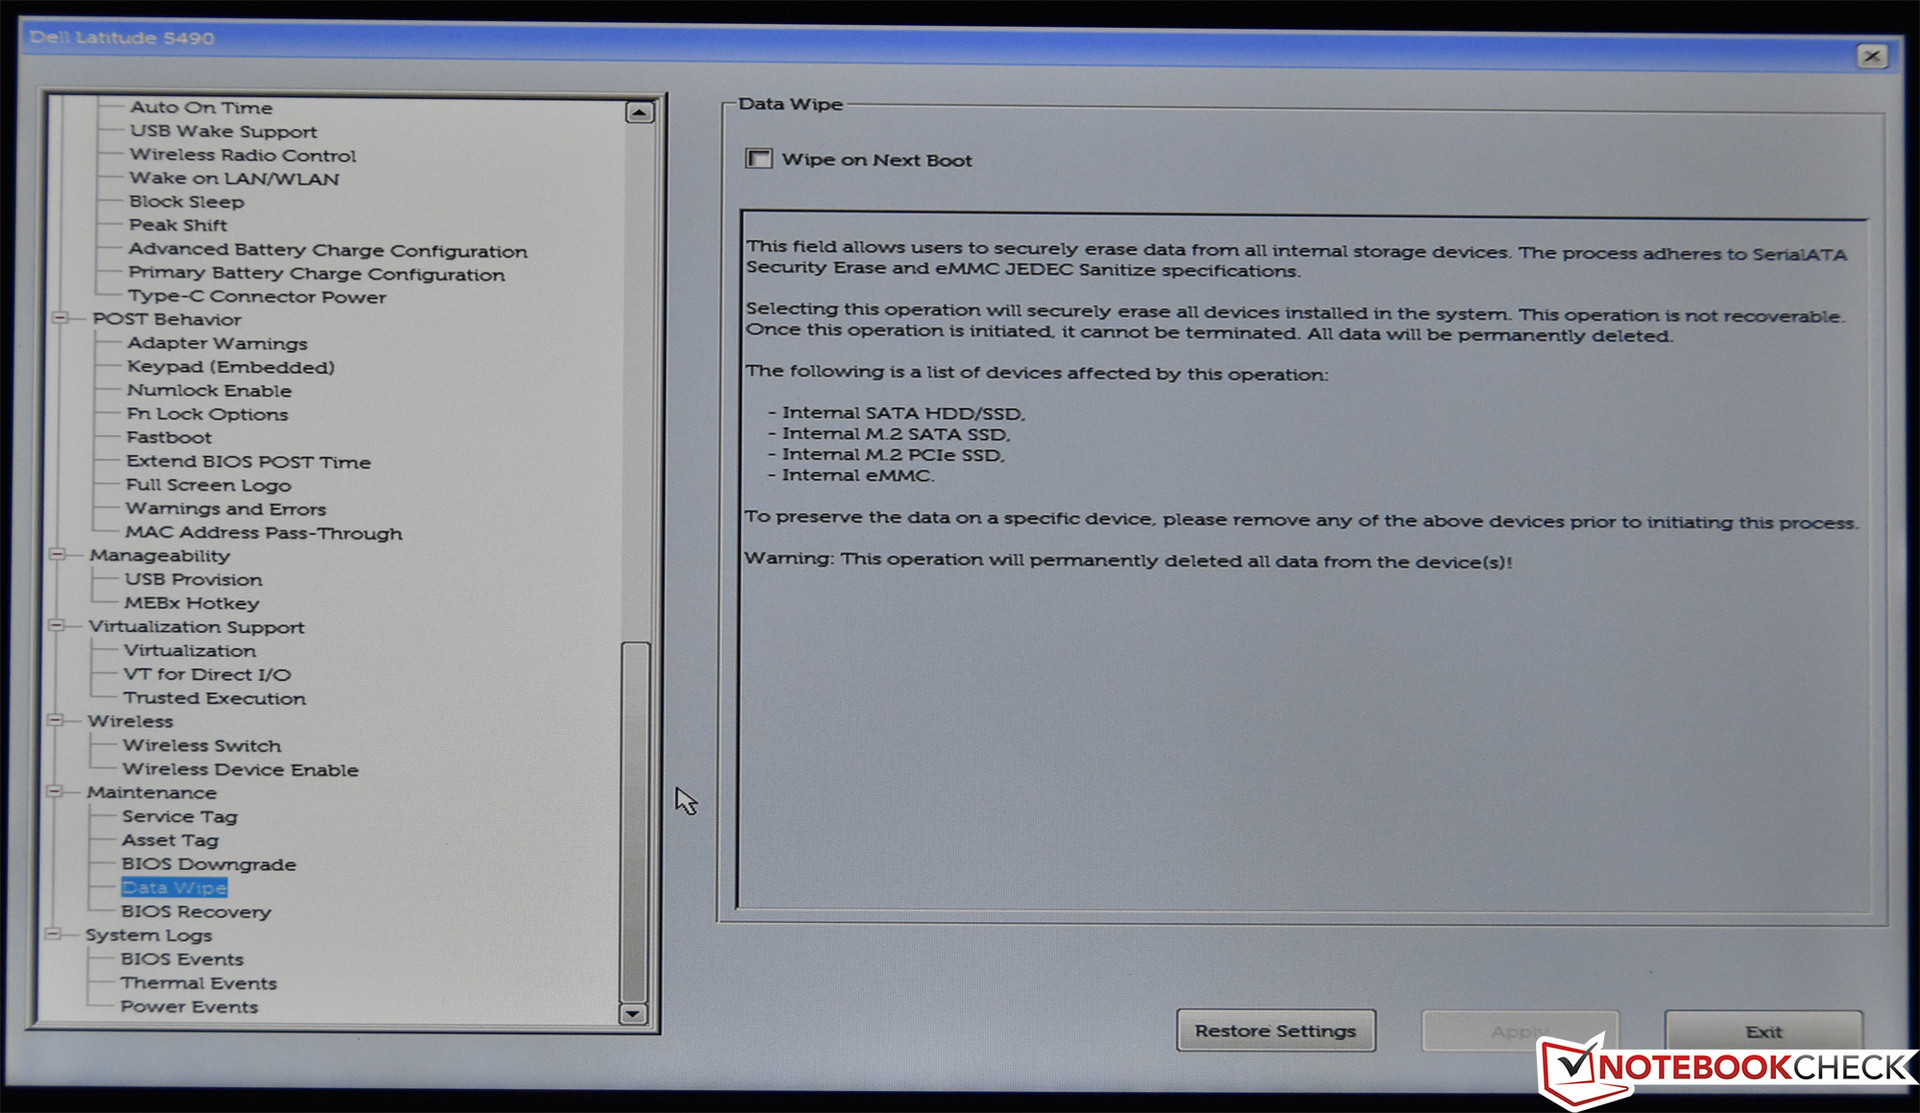
One other item we’d like to mention that we didn’t cover in our previous article is that the Latitude 5490 BIOS Setup remains one of the most elaborate and feature-rich of any laptop around. Within, you’ll find practically every option you could imagine, along with a host of other extras—such as the ability to force a BIOS downgrade or schedule an automatic wipe of the internal storage drive upon the next boot.
Next, let’s dive into what separates this device from the previous configuration.
| BioShock Infinite | |
| 1280x720 Very Low Preset (sort by value) | |
| Dell Latitude 5490 | |
| HP EliteBook 840 G4-Z2V49ET ABD | |
| Lenovo ThinkPad T470-20HD002HGE | |
| 1366x768 Medium Preset (sort by value) | |
| Dell Latitude 5490 | |
| HP EliteBook 840 G4-Z2V49ET ABD | |
| Lenovo ThinkPad T470-20HD002HGE | |
| 1366x768 High Preset (sort by value) | |
| Dell Latitude 5490 | |
| HP EliteBook 840 G4-Z2V49ET ABD | |
| Lenovo ThinkPad T470-20HD002HGE | |
| 1920x1080 Ultra Preset, DX11 (DDOF) (sort by value) | |
| Dell Latitude 5490 | |
| HP EliteBook 840 G4-Z2V49ET ABD | |
| Lenovo ThinkPad T470-20HD002HGE | |
| SD Card Reader | |
| average JPG Copy Test (av. of 3 runs) | |
| Dell Latitude 5490-TD70X (Toshiba Exceria Pro SDXC 64 GB UHS-II) | |
| Dell Latitude 5490 (Toshiba Exceria Pro SDXC 64 GB UHS-II) | |
| Dell Latitude 5480 (Toshiba Exceria Pro SDXC 64 GB UHS-II) | |
| Lenovo ThinkPad T470-20HD002HGE (Toshiba Exceria Pro SDXC 64 GB UHS-II) | |
| HP EliteBook 840 G4-Z2V49ET ABD (Toshiba Exceria Pro SDXC 64 GB UHS-II) | |
| Average of class Office (19.8 - 198.5, n=22, last 2 years) | |
| maximum AS SSD Seq Read Test (1GB) | |
| Dell Latitude 5480 (Toshiba Exceria Pro SDXC 64 GB UHS-II) | |
| Dell Latitude 5490-TD70X (Toshiba Exceria Pro SDXC 64 GB UHS-II) | |
| Dell Latitude 5490 (Toshiba Exceria Pro SDXC 64 GB UHS-II) | |
| Lenovo ThinkPad T470-20HD002HGE (Toshiba Exceria Pro SDXC 64 GB UHS-II) | |
| HP EliteBook 840 G4-Z2V49ET ABD (Toshiba Exceria Pro SDXC 64 GB UHS-II) | |
| Average of class Office (27.4 - 249, n=21, last 2 years) | |
| Networking | |
| iperf3 transmit AX12 | |
| Dell Latitude 5490 | |
| Lenovo ThinkPad T470-20HD002HGE | |
| Dell Latitude 5490-TD70X | |
| HP EliteBook 840 G4-Z2V49ET ABD (jseb) | |
| Dell Latitude 5480 | |
| iperf3 receive AX12 | |
| Lenovo ThinkPad T470-20HD002HGE | |
| Dell Latitude 5490 | |
| Dell Latitude 5480 | |
| Dell Latitude 5490-TD70X | |
| HP EliteBook 840 G4-Z2V49ET ABD (jseb) | |
Display
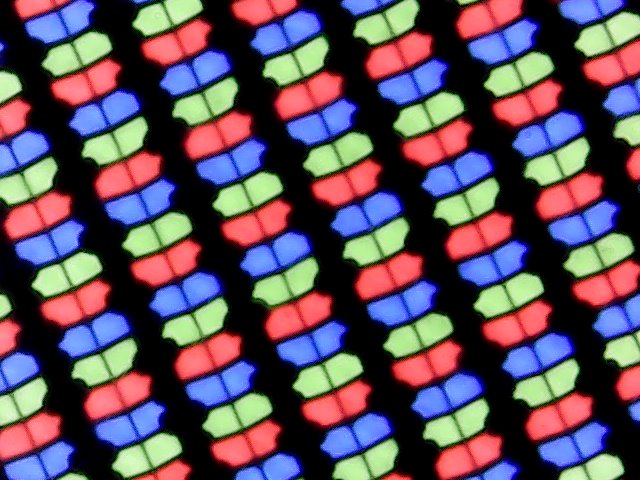
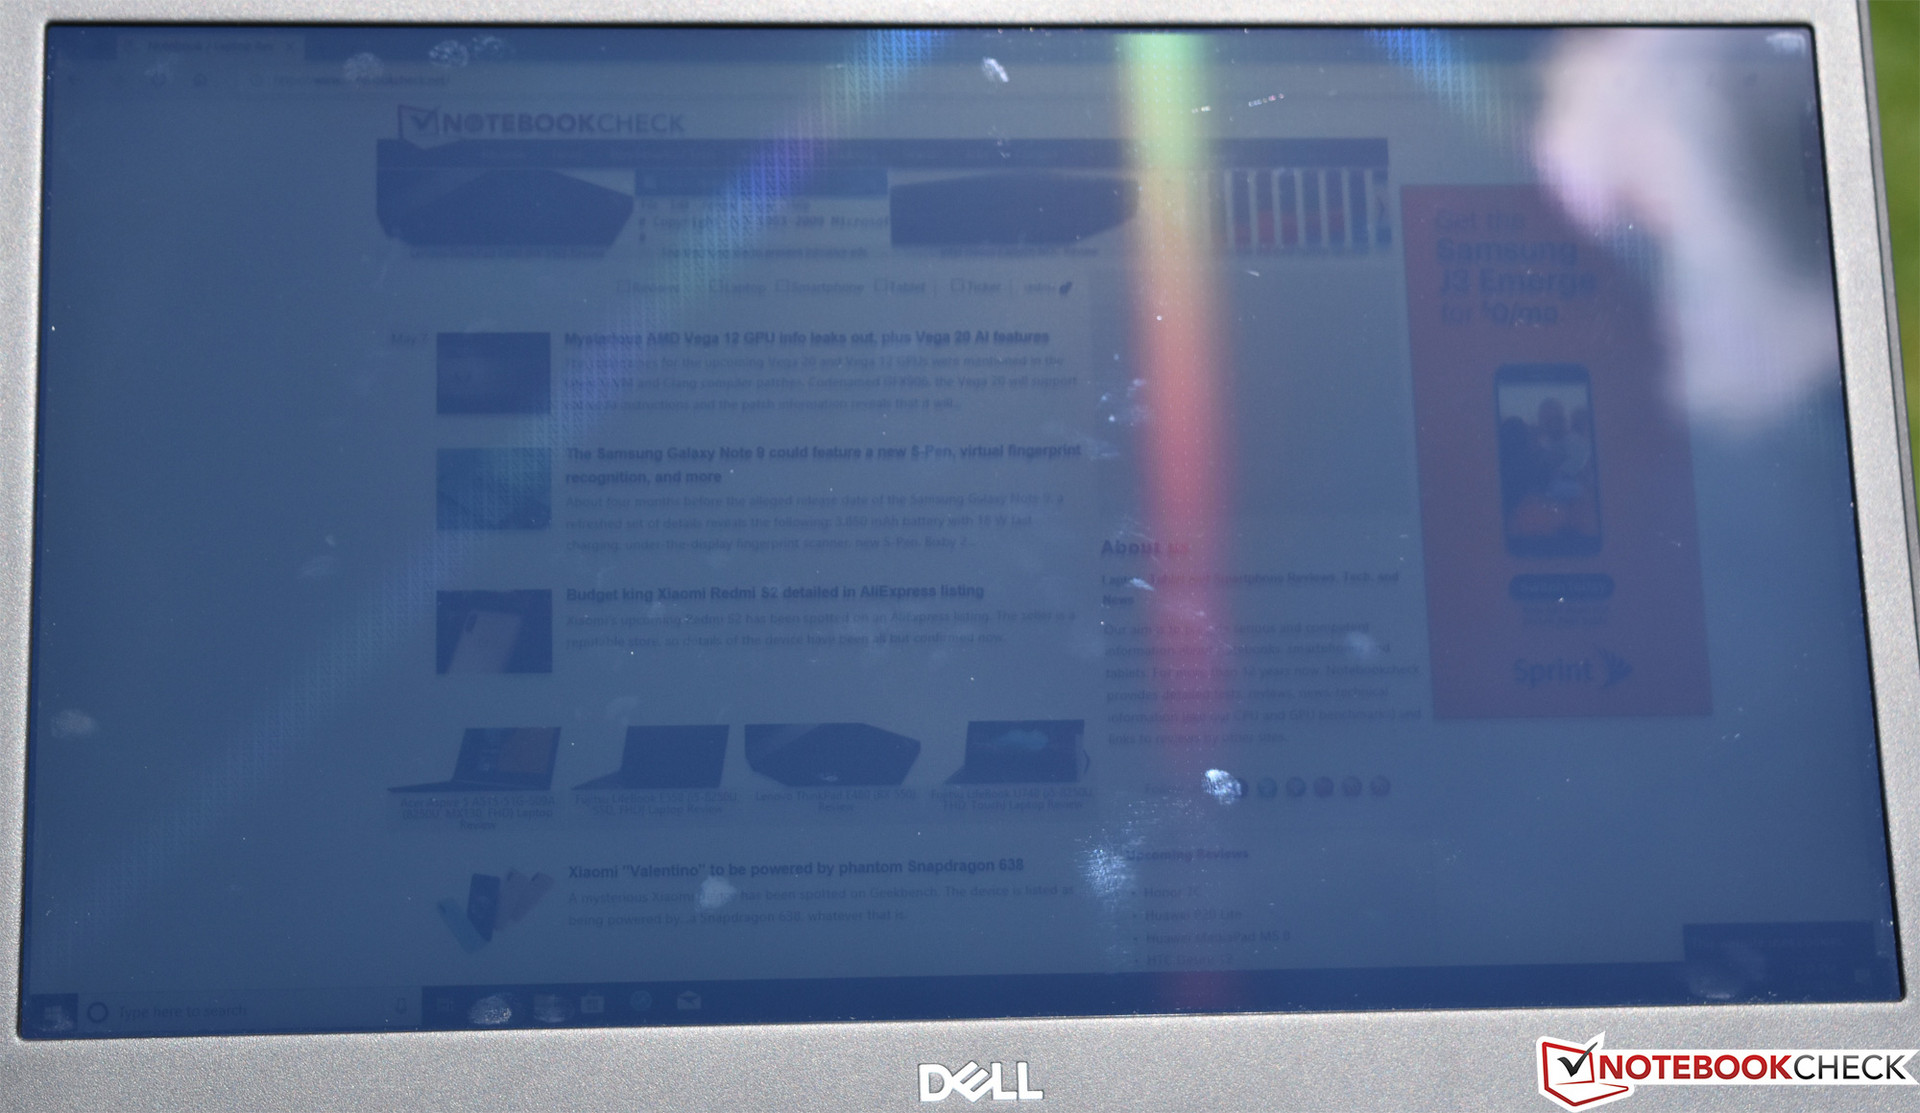
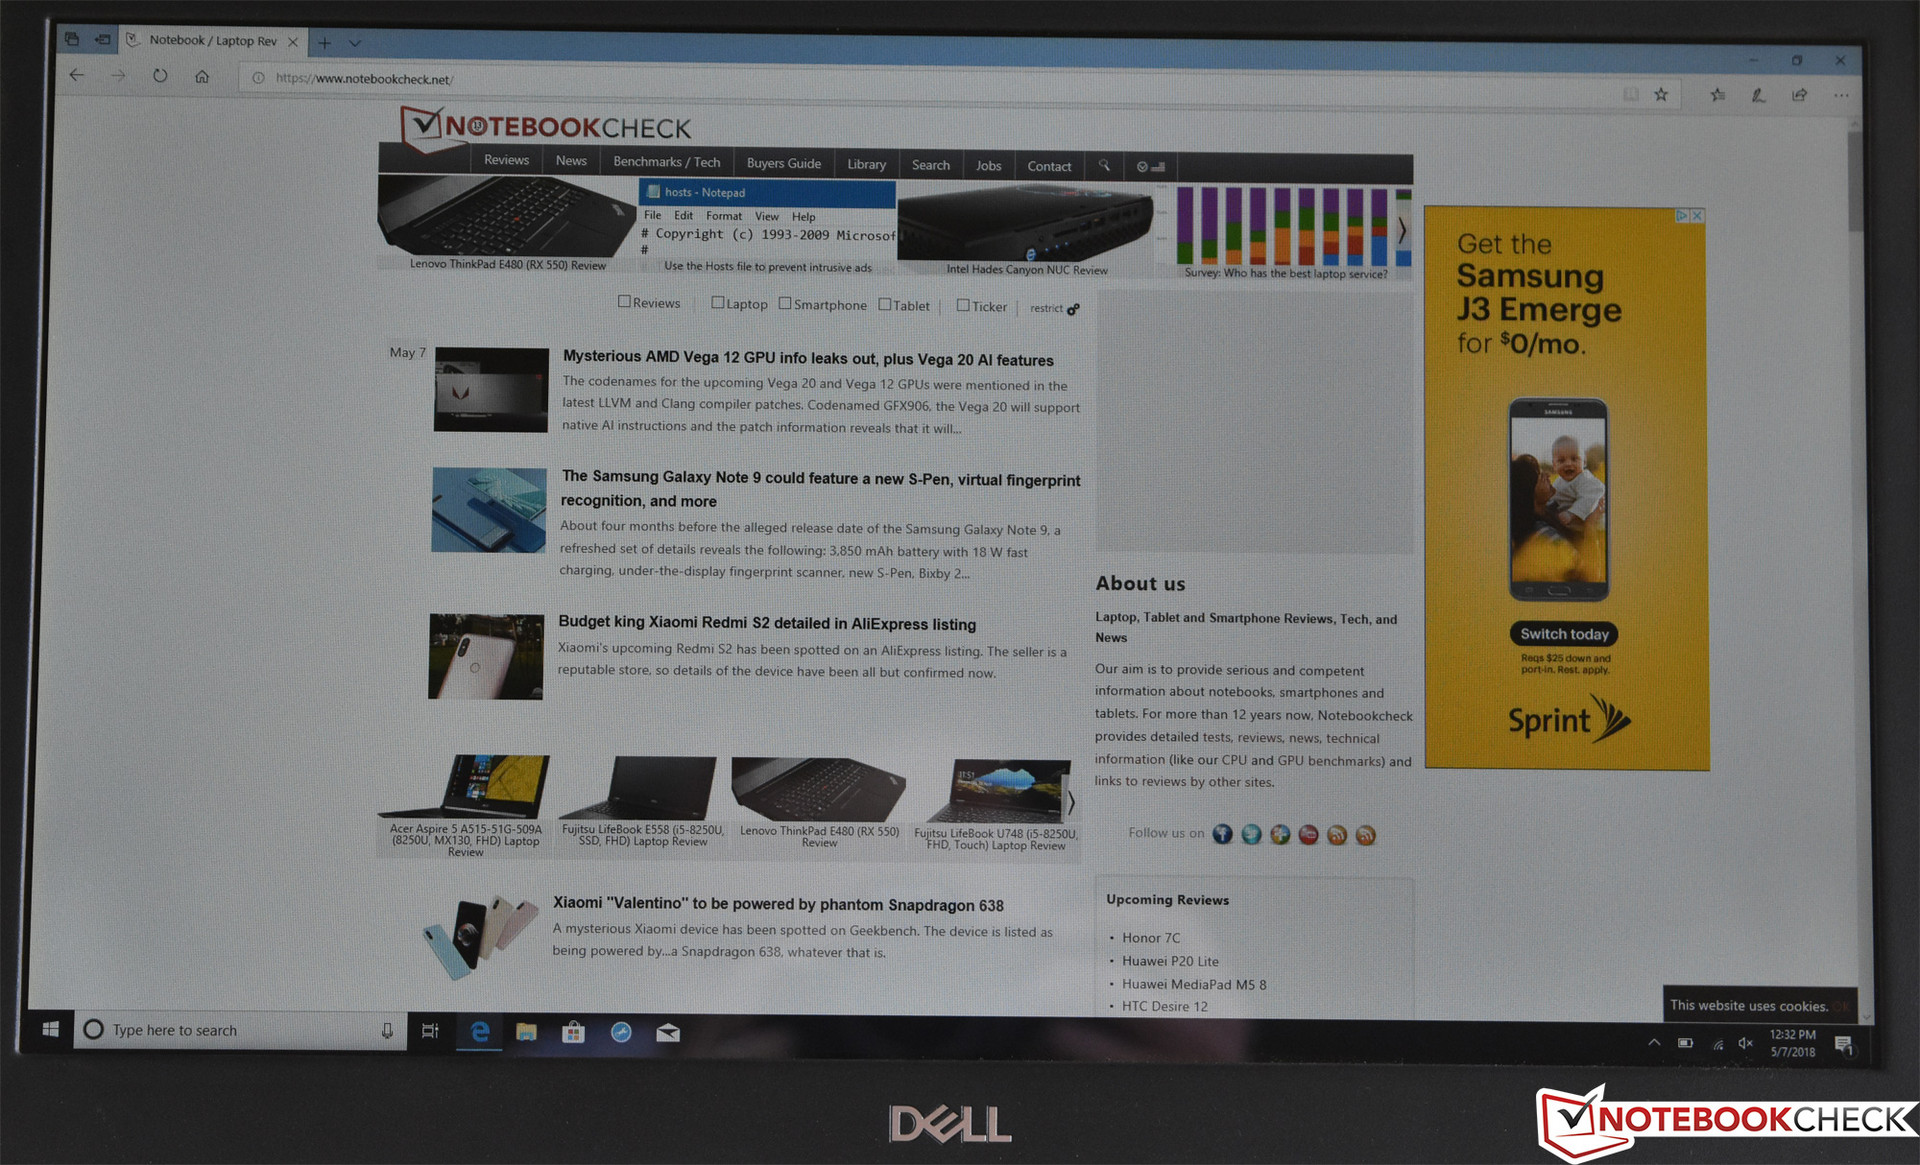
As compared with the model we reviewed in March, today’s unit features a very similar display, identical in resolution (1920x1080) and obviously still 14 inches in size. However, there is one major difference: it’s now a touchscreen, and unlike the impressive panel we encountered in our 7390 review unit a few days ago, it’s fully glossy. Since the 5490 display brightness was never great to begin with, the transition from matte to glossy isn’t a positive move—but we’ll come back to that in a moment.

| |||||||||||||||||||||||||
Brightness Distribution: 87 %
Center on Battery: 200.6 cd/m²
Contrast: 1254:1 (Black: 0.16 cd/m²)
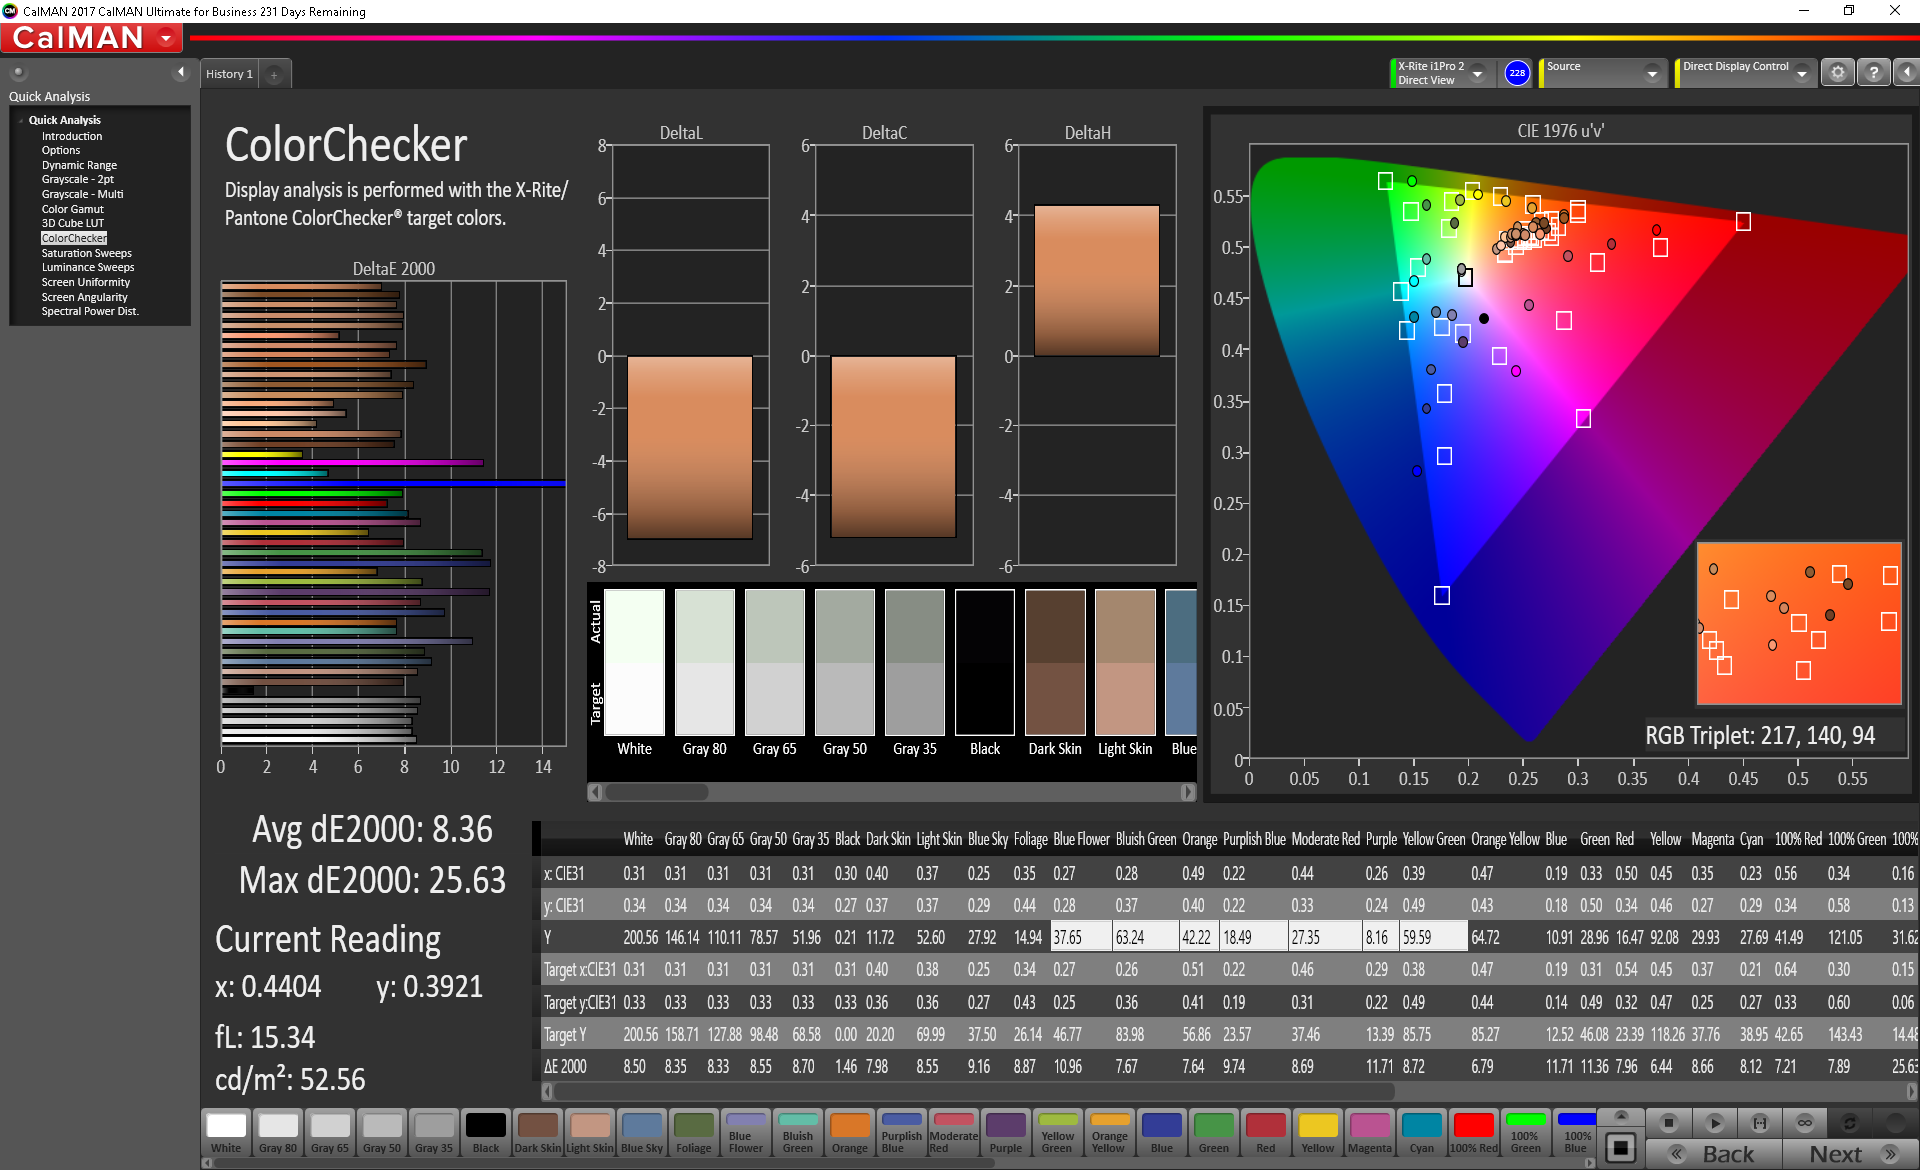
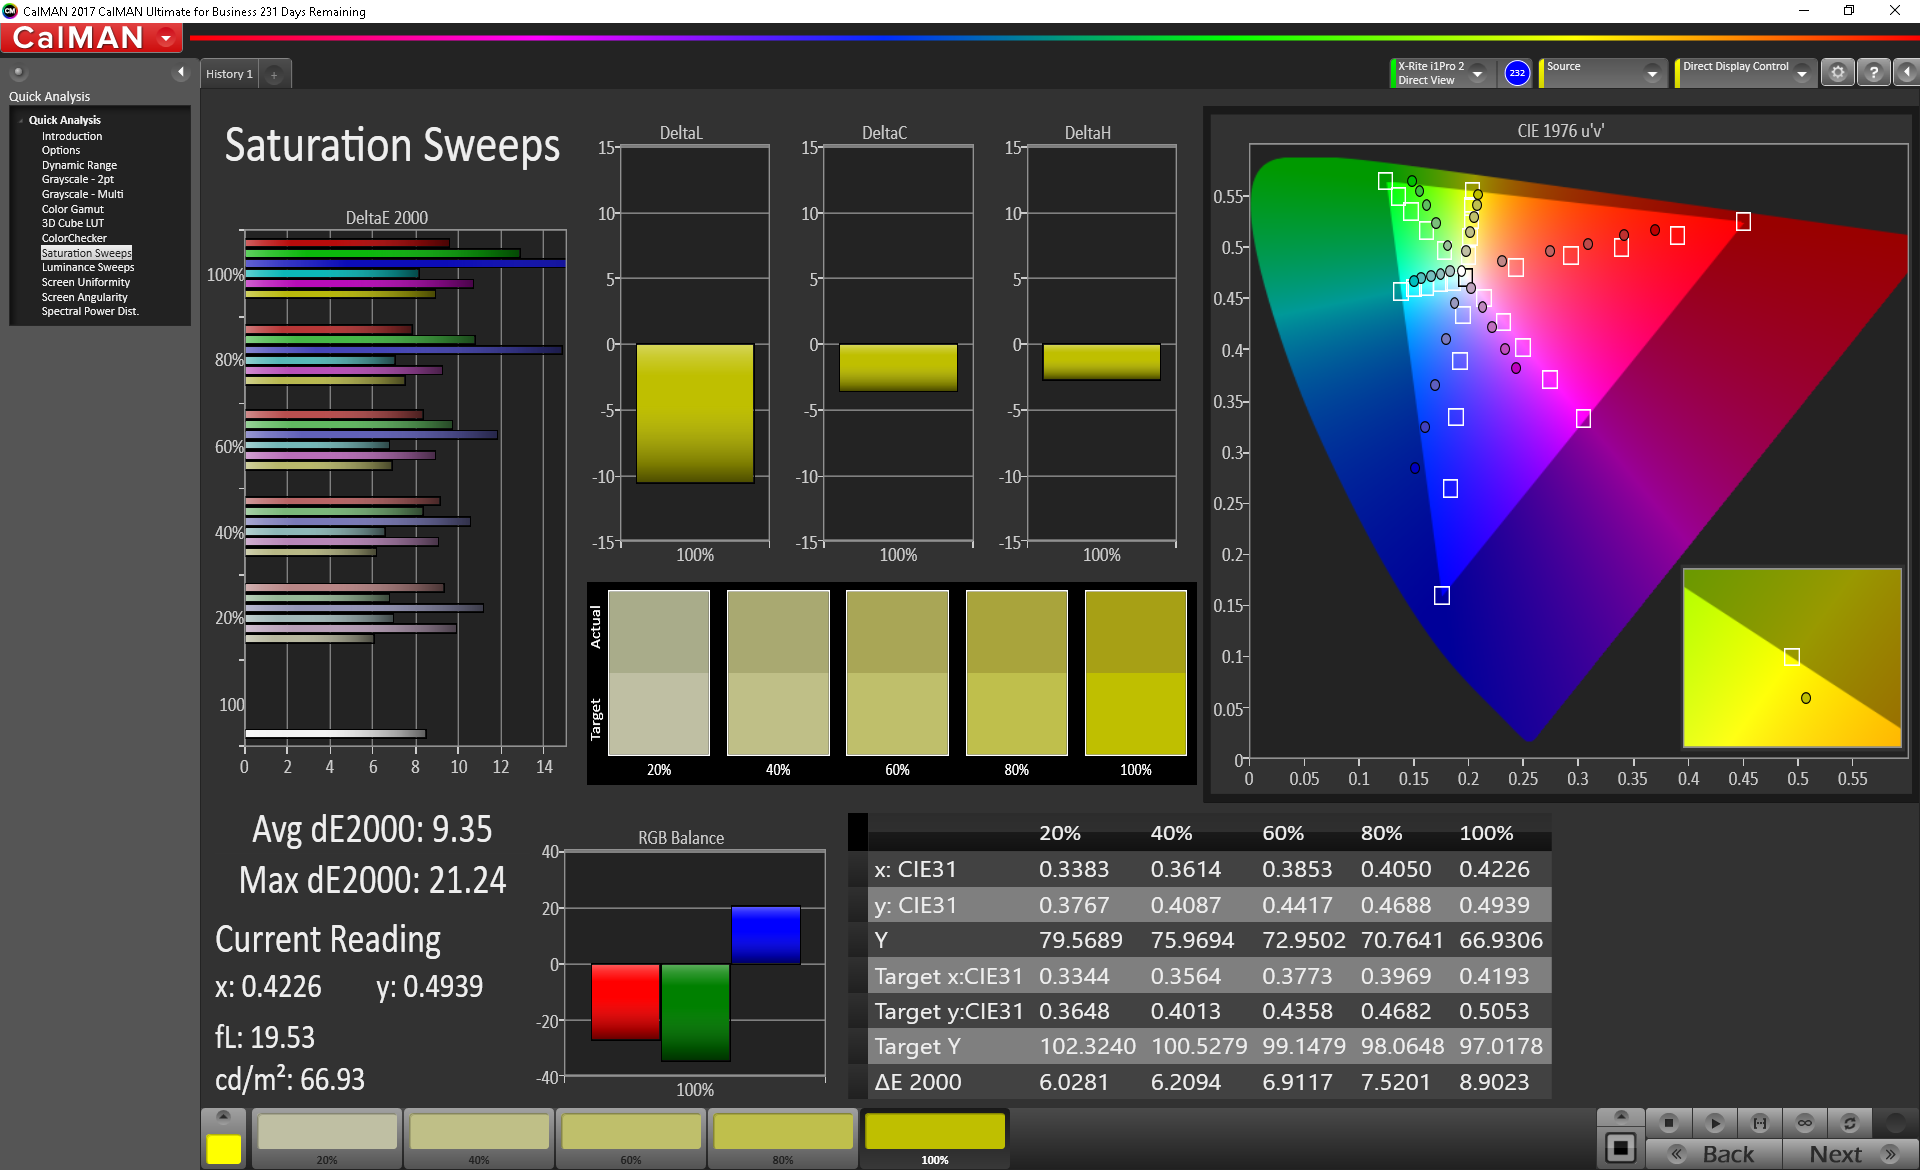
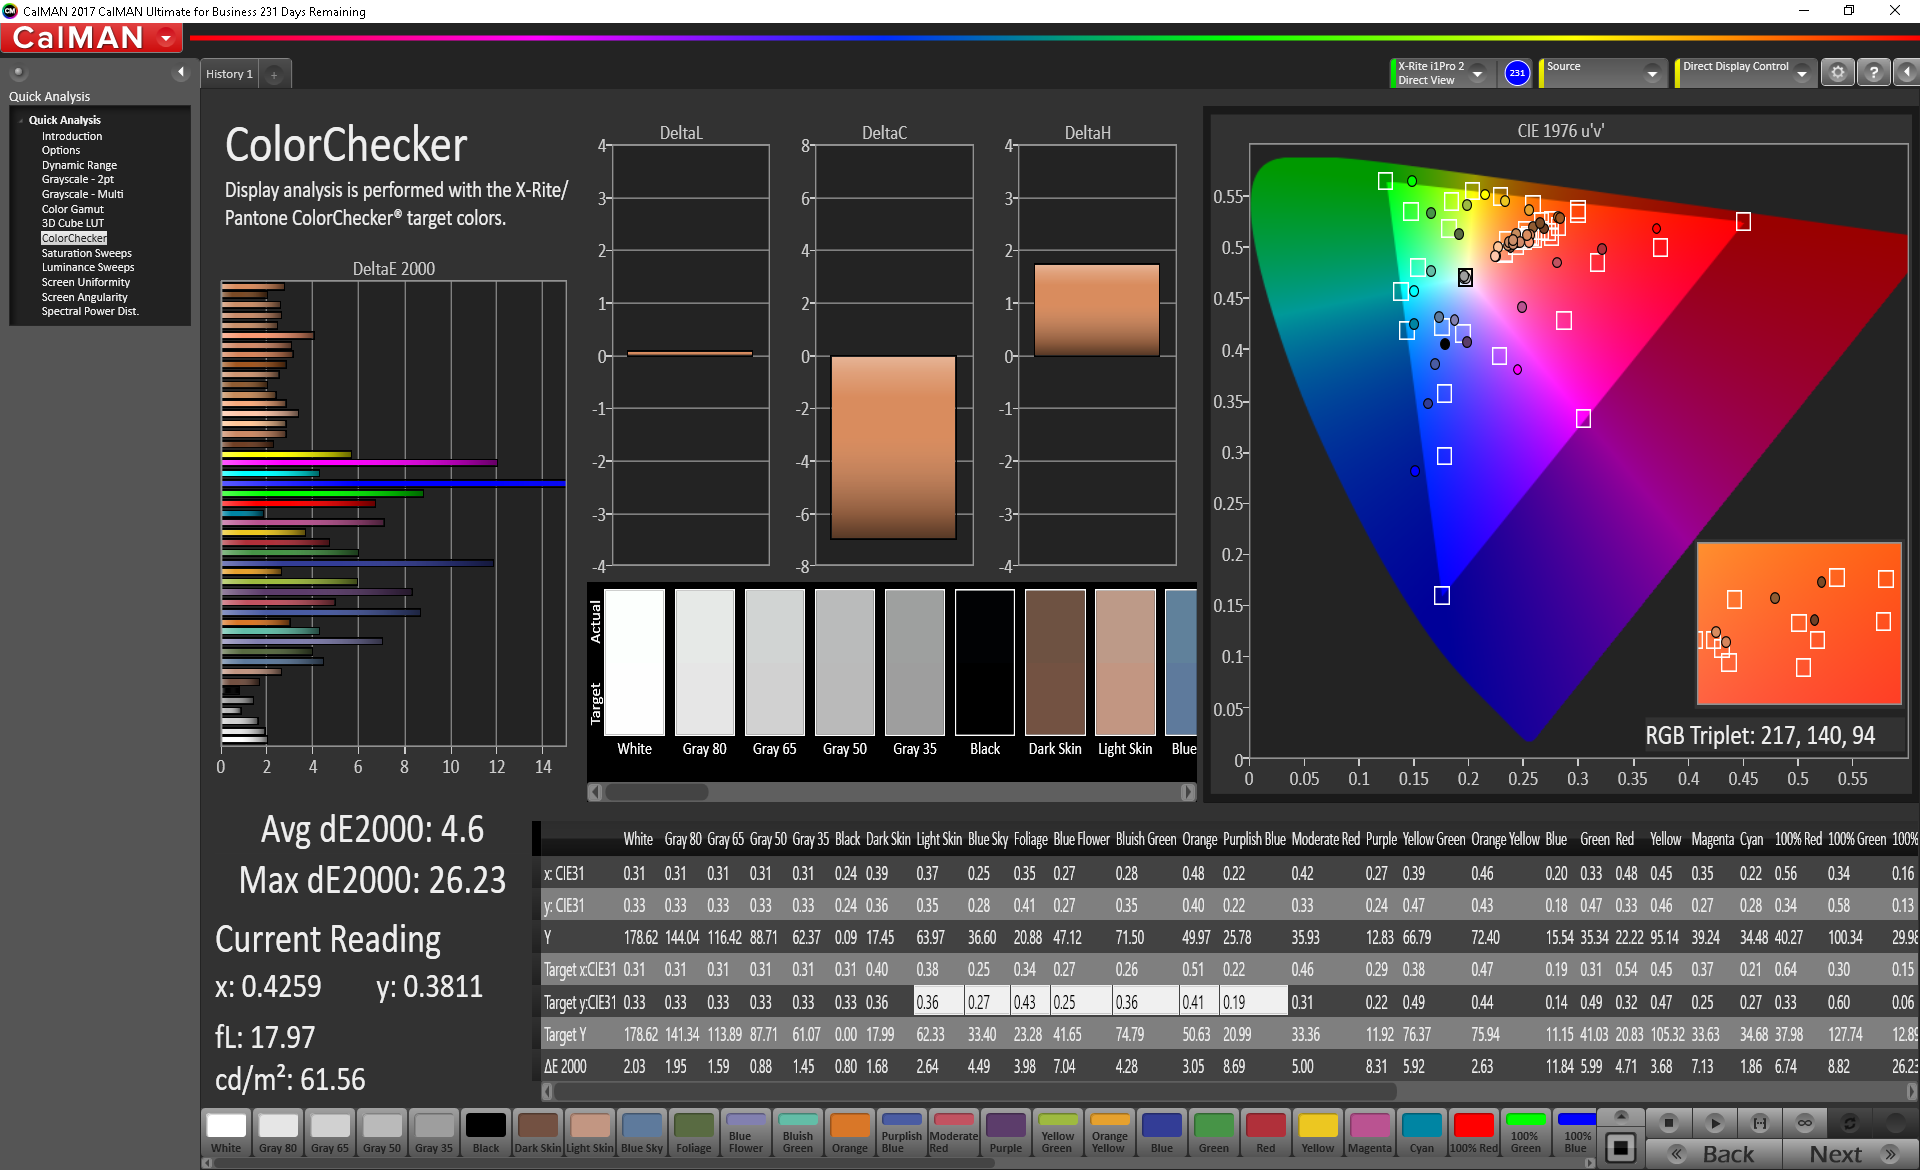
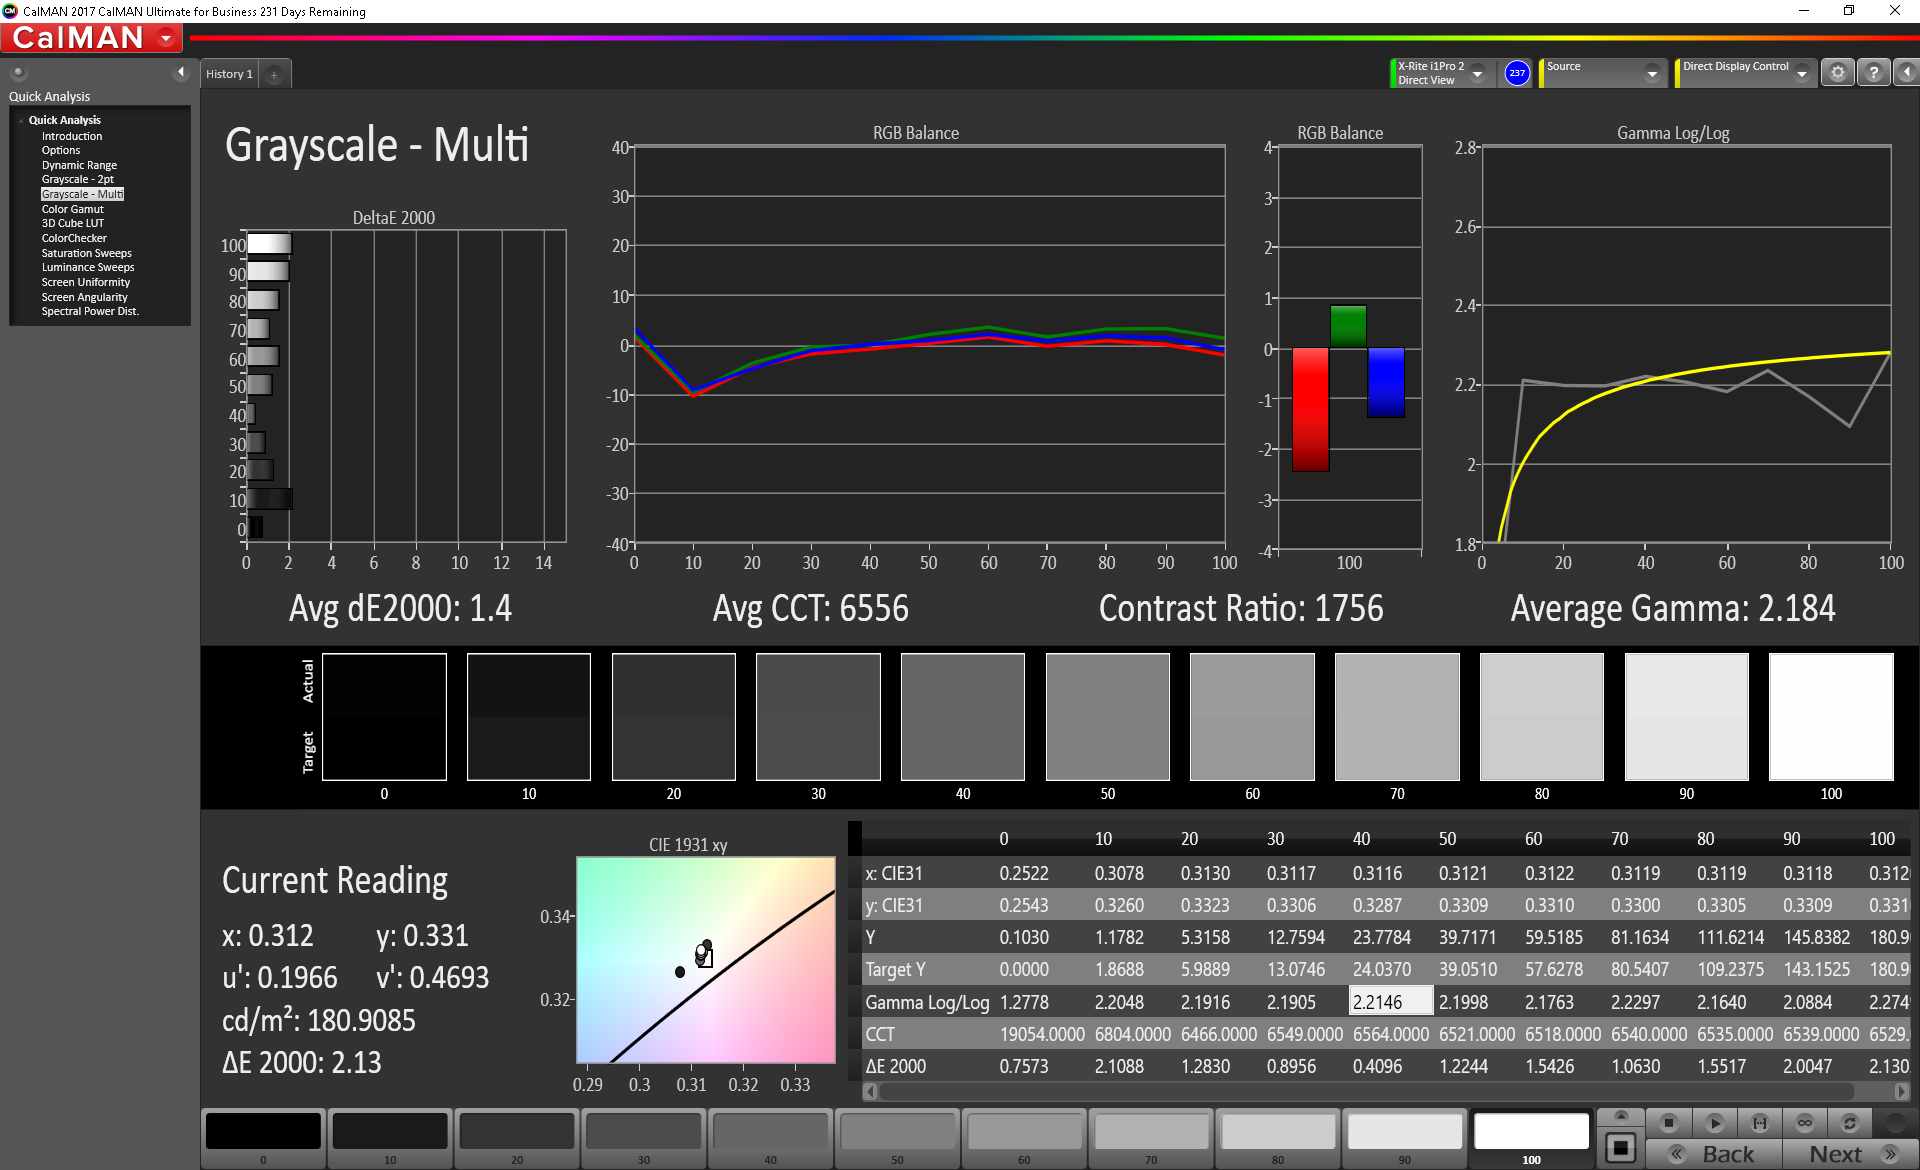
ΔE ColorChecker Calman: 8.36 | ∀{0.5-29.43 Ø4.71}
calibrated: 4.6
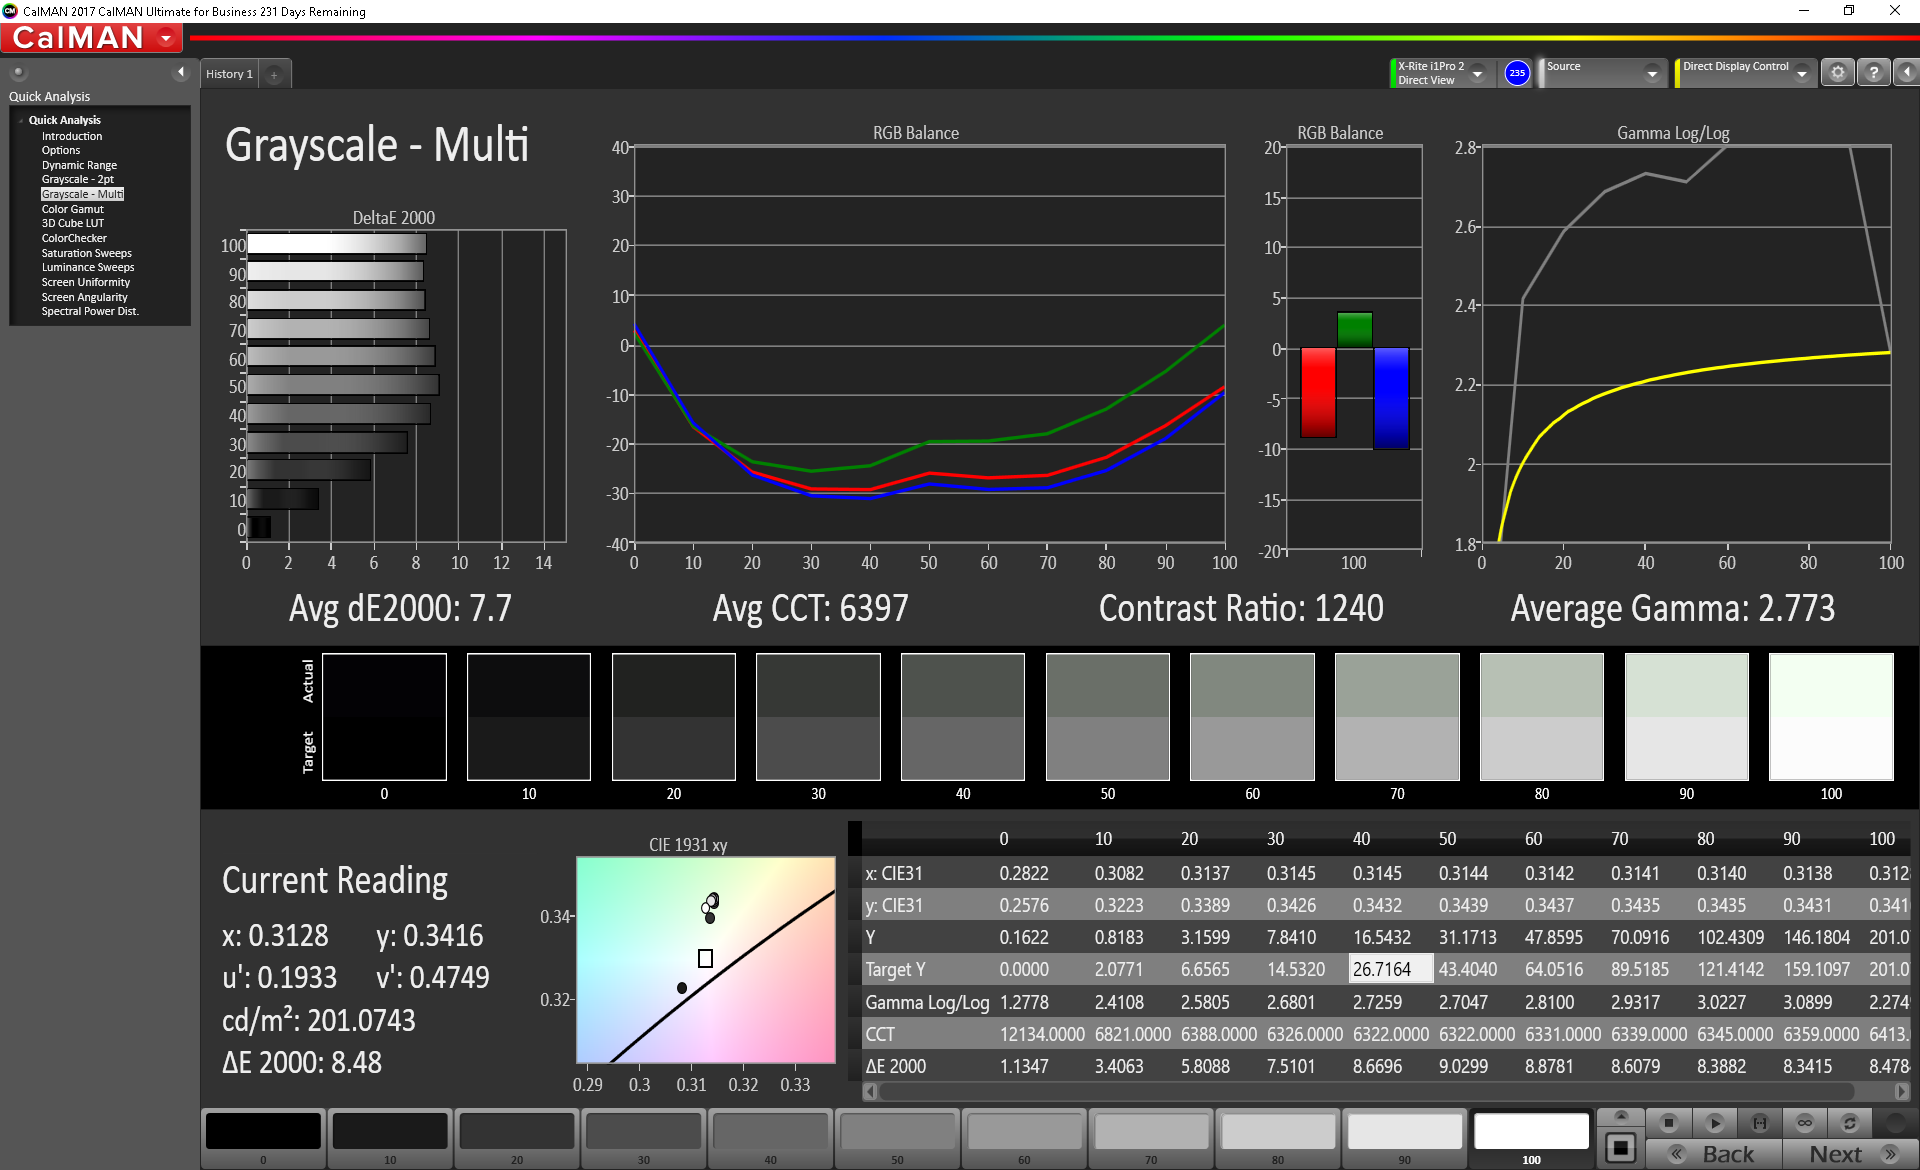
ΔE Greyscale Calman: 7.7 | ∀{0.09-98 Ø4.96}
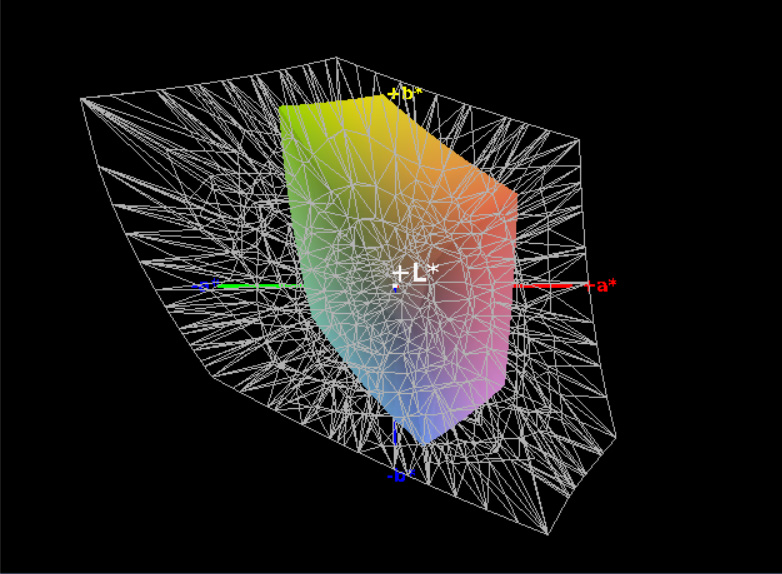
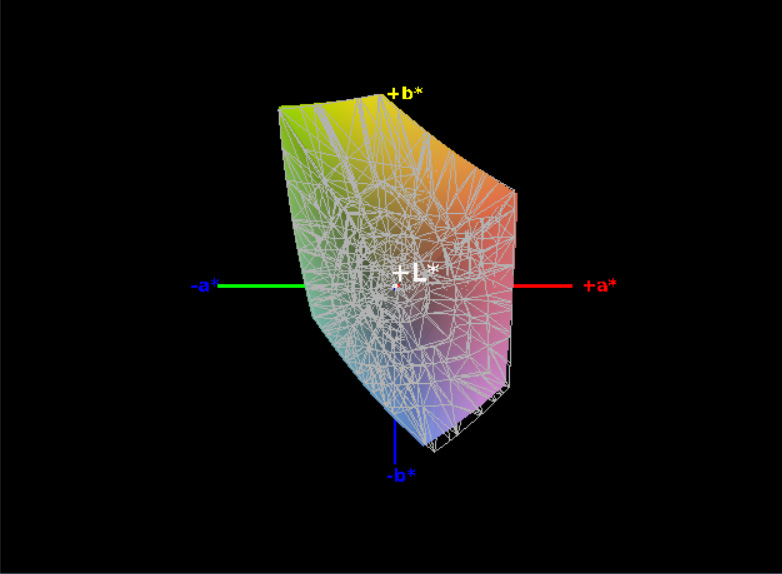
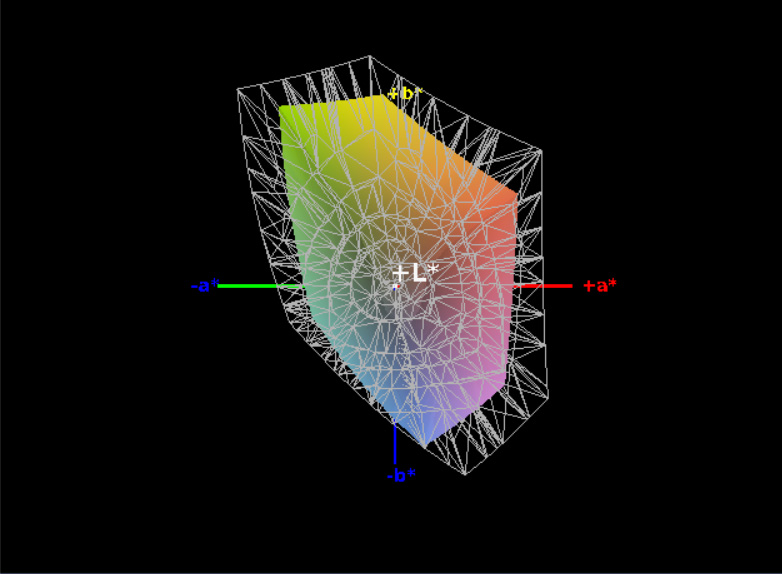
54.2% sRGB (Argyll 1.6.3 3D)
34.5% AdobeRGB 1998 (Argyll 1.6.3 3D)
37.62% AdobeRGB 1998 (Argyll 3D)
54.6% sRGB (Argyll 3D)
36.42% Display P3 (Argyll 3D)
Gamma: 2.773
CCT: 6397 K
| Dell Latitude 5490 AUO133D, IPS, 14", 1920x1080 | Dell Latitude 5490-TD70X AU Optronics AUO263D, IPS, 14", 1920x1080 | Dell Latitude 5480 LG Philips LGD0553, IPS, 14", 1920x1080 | HP EliteBook 840 G4-Z2V49ET ABD AUO123D, TN, 14", 1920x1080 | Lenovo ThinkPad T480-20L6S01V00 Lenovo LP140WF6-SPB7, IPS, 14", 1920x1080 | Lenovo ThinkPad T470-20HD002HGE N140HCA-EAB, IPS, 14", 1920x1080 | |
|---|---|---|---|---|---|---|
| Display | 0% | 12% | 51% | 8% | 14% | |
| Display P3 Coverage (%) | 36.42 | 36.28 0% | 40.62 12% | 55.8 53% | 39.24 8% | 41.6 14% |
| sRGB Coverage (%) | 54.6 | 54.6 0% | 61.2 12% | 80.7 48% | 58.8 8% | 61.9 13% |
| AdobeRGB 1998 Coverage (%) | 37.62 | 37.48 0% | 41.96 12% | 57.7 53% | 40.56 8% | 43.06 14% |
| Response Times | -35% | -3% | -7% | -4% | -31% | |
| Response Time Grey 50% / Grey 80% * (ms) | 30.4 ? | 46.9 ? -54% | 32.8 ? -8% | 39 ? -28% | 35.6 ? -17% | 41.6 ? -37% |
| Response Time Black / White * (ms) | 27.2 ? | 31.2 ? -15% | 26.4 ? 3% | 23 ? 15% | 24.8 ? 9% | 34 ? -25% |
| PWM Frequency (Hz) | ||||||
| Screen | 11% | 11% | -28% | 14% | 11% | |
| Brightness middle (cd/m²) | 200.6 | 227 13% | 215.9 8% | 346 72% | 307 53% | 306 53% |
| Brightness (cd/m²) | 204 | 211 3% | 205 0% | 317 55% | 295 45% | 287 41% |
| Brightness Distribution (%) | 87 | 88 1% | 90 3% | 86 -1% | 90 3% | 88 1% |
| Black Level * (cd/m²) | 0.16 | 0.19 -19% | 0.22 -38% | 0.86 -438% | 0.25 -56% | 0.3 -88% |
| Contrast (:1) | 1254 | 1195 -5% | 981 -22% | 402 -68% | 1228 -2% | 1020 -19% |
| Colorchecker dE 2000 * | 8.36 | 5.6 33% | 5.1 39% | 8.64 -3% | 5.7 32% | 6.2 26% |
| Colorchecker dE 2000 max. * | 25.63 | 22.4 13% | 15.6 39% | 13.58 47% | 21.3 17% | 13.6 47% |
| Colorchecker dE 2000 calibrated * | 4.6 | 4.7 -2% | ||||
| Greyscale dE 2000 * | 7.7 | 2.4 69% | 4 48% | 11.24 -46% | 3.7 52% | 5.8 25% |
| Gamma | 2.773 79% | 2.44 90% | 2.41 91% | 2.62 84% | 2.11 104% | 2.04 108% |
| CCT | 6397 102% | 6506 100% | 6856 95% | 12530 52% | 7353 88% | 6277 104% |
| Color Space (Percent of AdobeRGB 1998) (%) | 34.5 | 34.5 0% | 41.96 22% | 52 51% | 37.4 8% | 39.62 15% |
| Color Space (Percent of sRGB) (%) | 54.2 | 54.4 0% | 61.15 13% | 80 48% | 58.7 8% | 61.44 13% |
| Total Average (Program / Settings) | -8% /
3% | 7% /
10% | 5% /
-9% | 6% /
11% | -2% /
6% |
* ... smaller is better
We measured a brightness of just 204.3 cd/m², which is really quite low, especially for a glossy display. In spite of the 1254:1 contrast ratio, the screen appears dim and dreary in comparison to almost any other competitor; the HP EliteBook 840 G4 and ThinkPad T480 don’t exactly pack bright panels, either, but at (give or take) 300 cd/m², they’re far more palatable than the 5490’s subpar display.
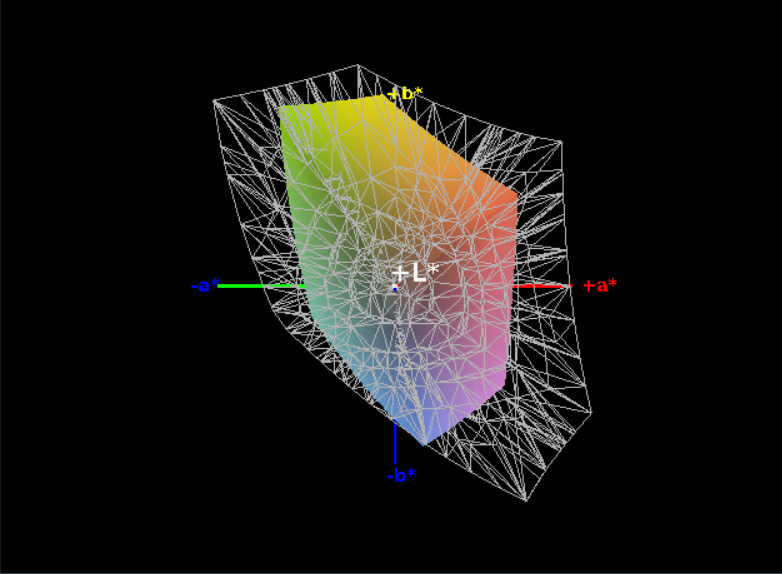
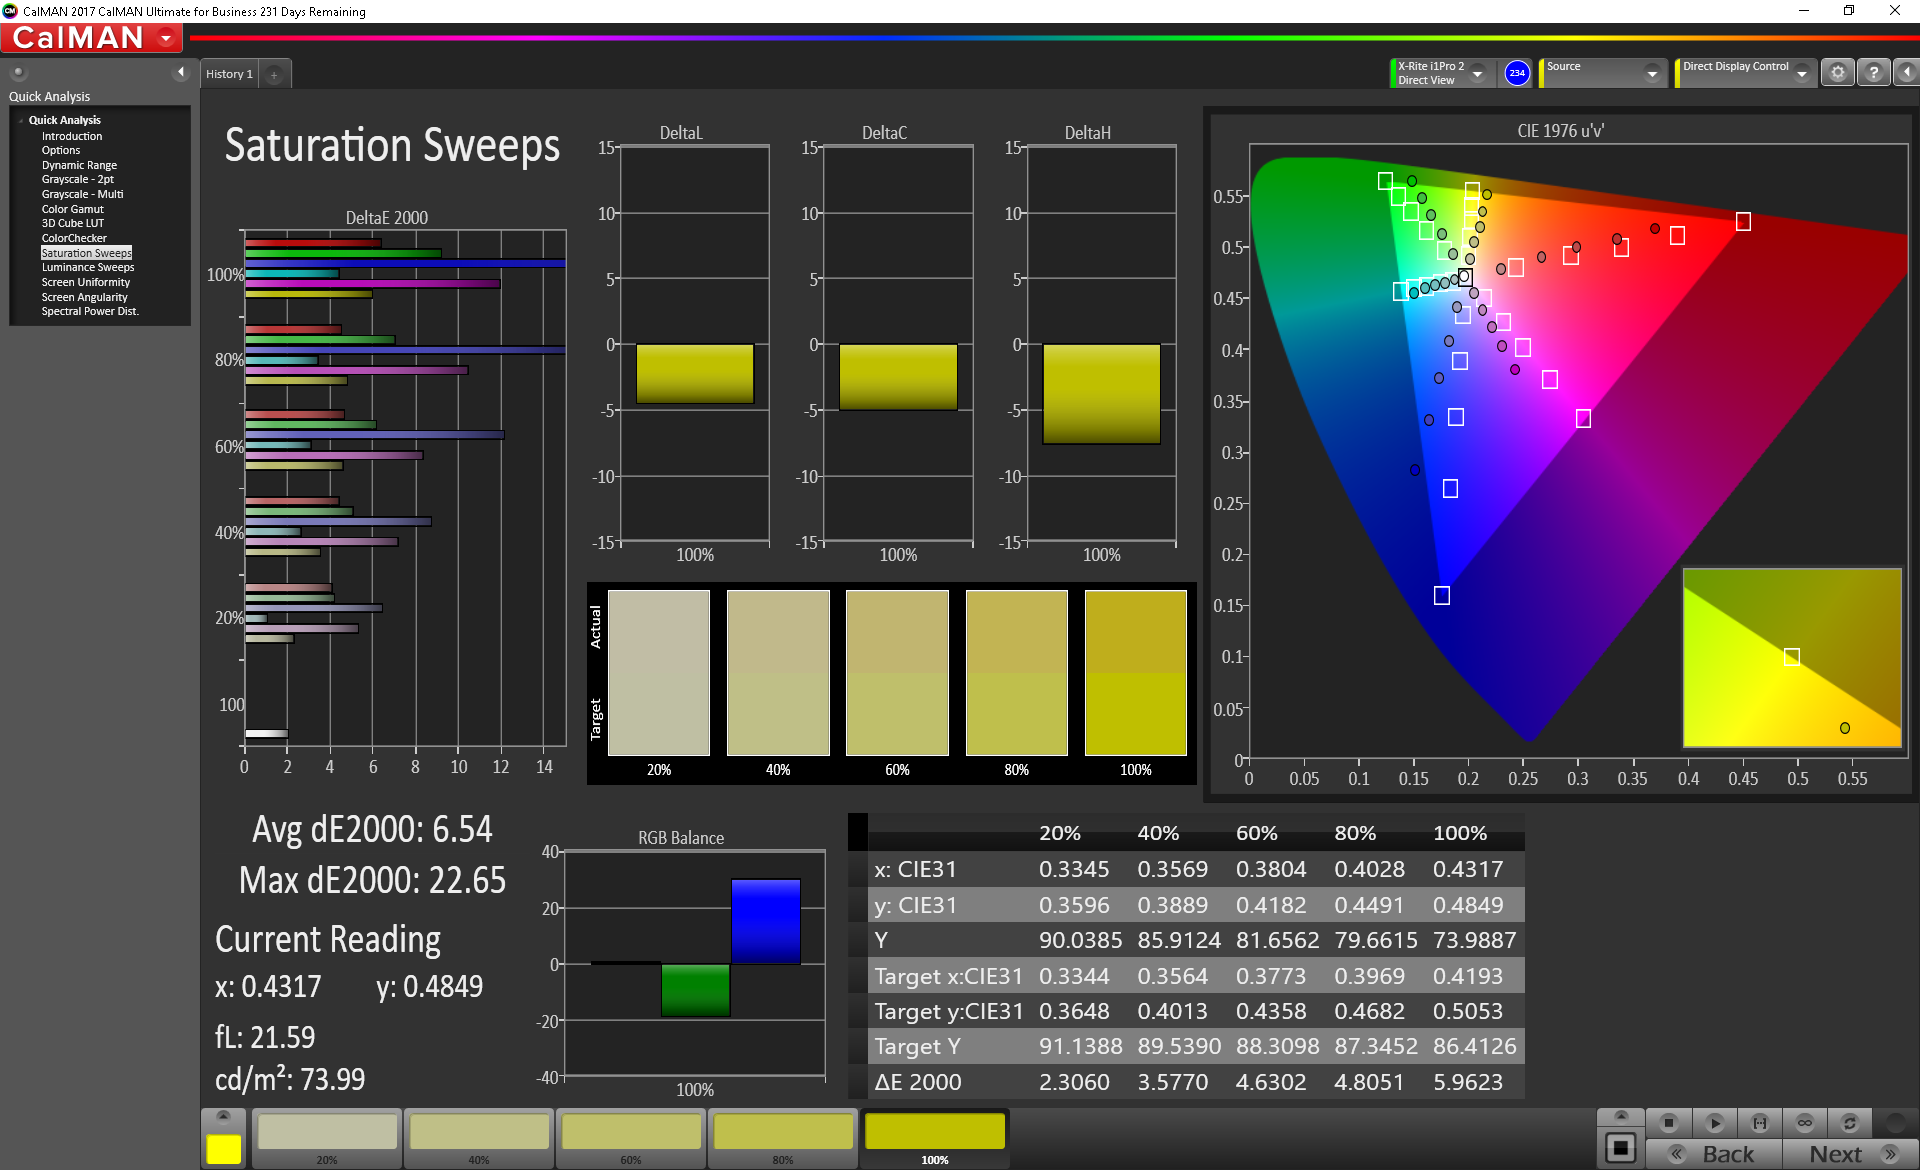
The topic of color coverage is no kinder to the 5490: we measured a measly 54.2% and 34.5% of sRGB and AdobeRGB respectively, which is vastly inferior to the Elitebook’s 80%/52%, but only marginally worse than the ThinkPad T470’s 58.7%/37.4%.
Our CalMAN measurements reveal that the panel is also quite a bit less accurate than even the one we evaluated previously: a Greyscale DeltaE of 7.7 and Colorchecker DeltaE of 8.36 are not great numbers. Still, it’s fine for office work or anything where color accuracy isn’t mission-critical. Last year’s model with the LG panel fared considerably better here.
Display Response Times
| ↔ Response Time Black to White | ||
|---|---|---|
| 27.2 ms ... rise ↗ and fall ↘ combined | ↗ 16.4 ms rise | 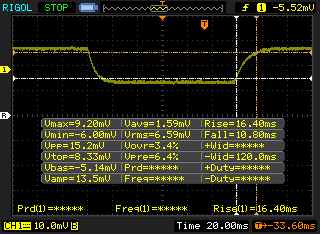 |
| ↘ 10.8 ms fall | ||
| The screen shows relatively slow response rates in our tests and may be too slow for gamers. In comparison, all tested devices range from 0.1 (minimum) to 240 (maximum) ms. » 69 % of all devices are better. This means that the measured response time is worse than the average of all tested devices (19.8 ms). | ||
| ↔ Response Time 50% Grey to 80% Grey | ||
| 30.4 ms ... rise ↗ and fall ↘ combined | ↗ 16.8 ms rise | 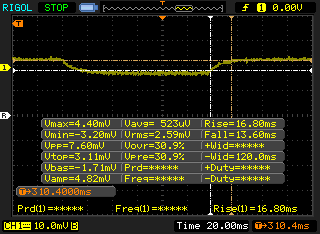 |
| ↘ 13.6 ms fall | ||
| The screen shows slow response rates in our tests and will be unsatisfactory for gamers. In comparison, all tested devices range from 0.165 (minimum) to 636 (maximum) ms. » 41 % of all devices are better. This means that the measured response time is similar to the average of all tested devices (30.9 ms). | ||
Screen Flickering / PWM (Pulse-Width Modulation)
| Screen flickering / PWM not detected | 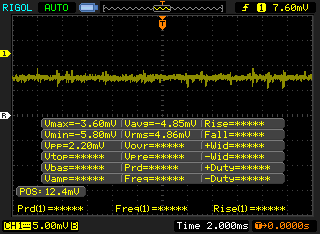 | ||
In comparison: 52 % of all tested devices do not use PWM to dim the display. If PWM was detected, an average of 7748 (minimum: 5 - maximum: 343500) Hz was measured. | |||
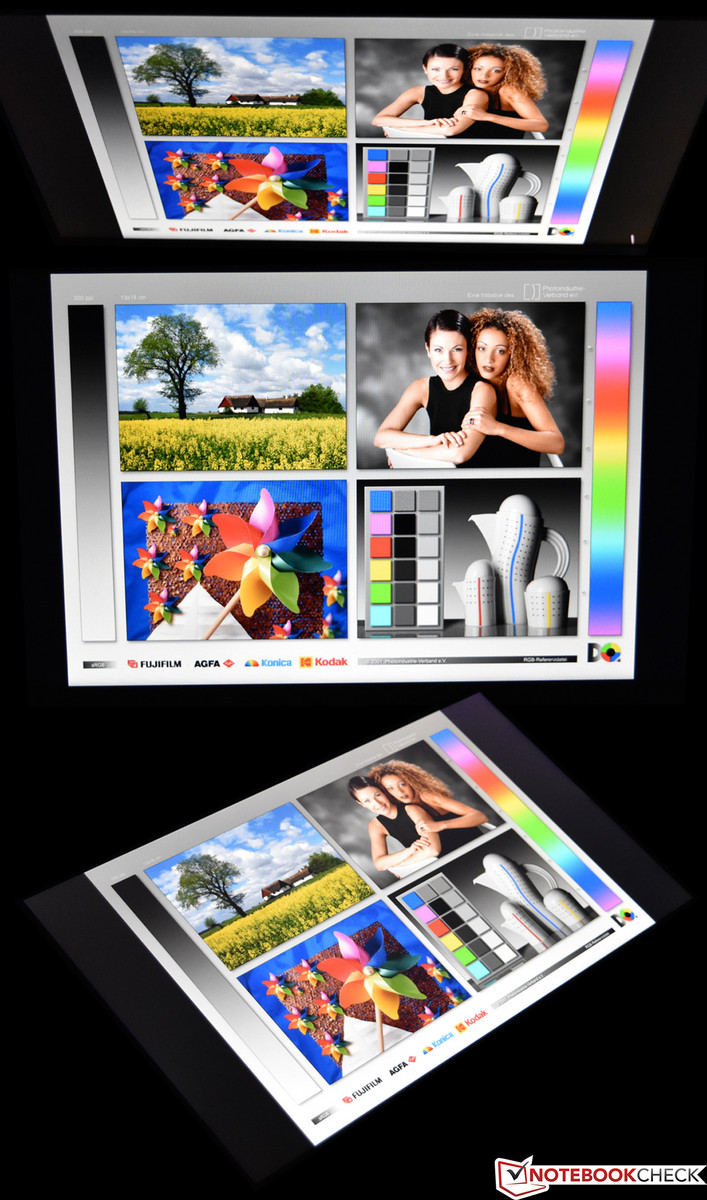
We measured no PWM from the display. Response times are on the slower side, but this is no surprise for a machine of this class. Viewing angles are good, forgiving any ancillary reflections that might apply. Outdoors, the machine is unfortunately largely unusable, crippled by the combination of the display’s woefully inadequate luminosity and highly reflective finish.
Performance
The model we evaluated in March was powered by a Core i5-8350U, 8 GB of DDR4 RAM, and a 512 GB M.2 SATA SSD. Today’s review unit notches the processor up to an i7-8650U and swaps the storage drive for a faster NVMe model of smaller capacity. While we didn’t have any major complaints about performance to begin with, how will these adjustments affect the overall capability of the laptop?
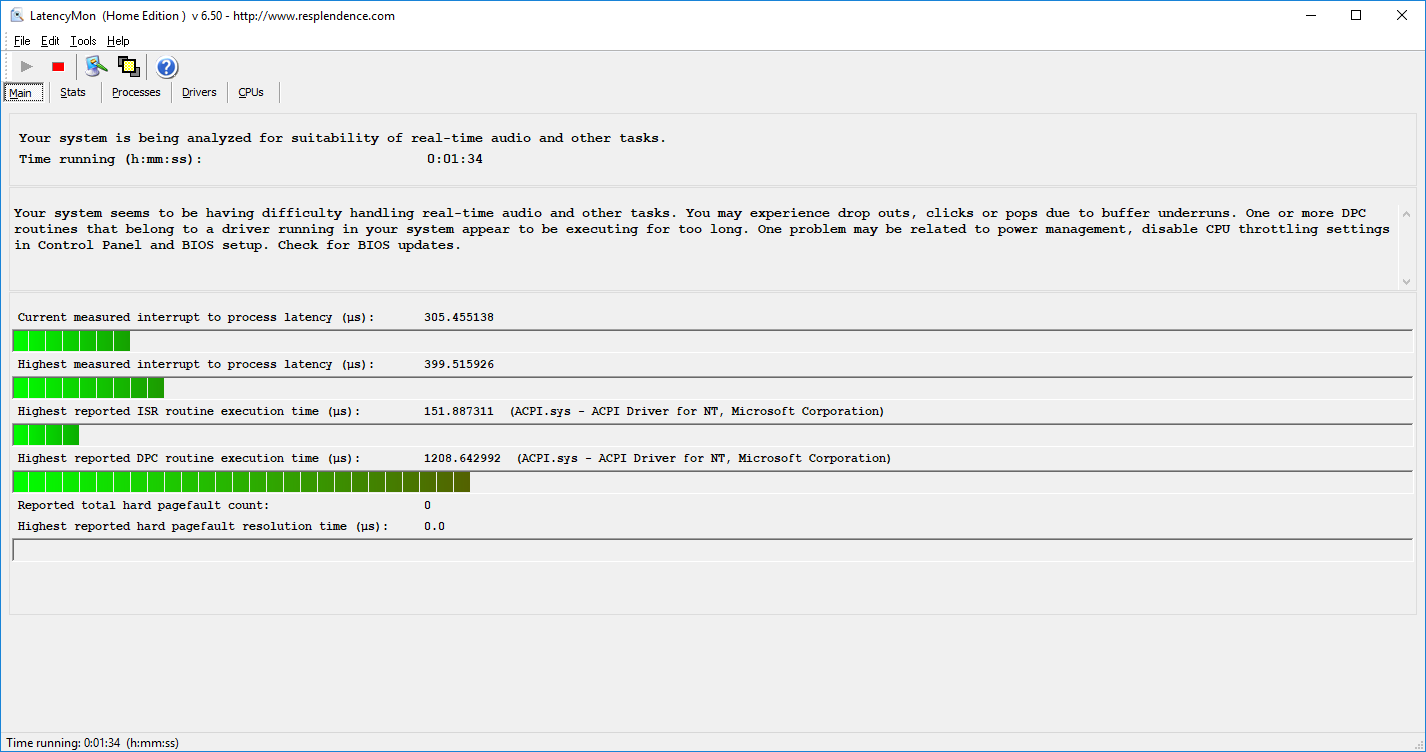
LatencyMon once again reported some minor issues with driver-level DPC Latencies.
Processor
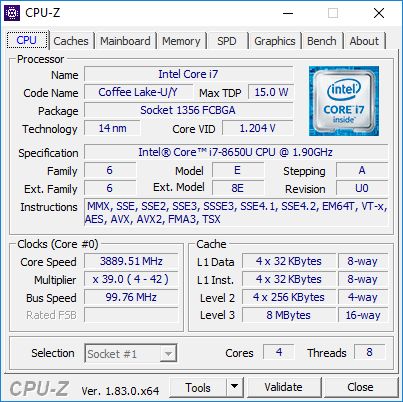
The quad-core Core i7-8650U that powers today’s configuration is certainly faster on paper than the Core i5-8350U that resided in our previous test machine, but as we’ve seen time and time again, just how much faster is directly dependent upon how well the machine handles the significant thermal developments that accompany these latest-gen Intel SoCs. Under ideal conditions, the i7-8650U can theoretically reach 4.2 GHz; it carries a 1.9 GHz base clock rate and maintains a 15 W TDP with capability of cTDP Up/Down to further adjust the power requirements.
Throughout our tests, the Core i7 Latitude 5490 is anywhere from 6 to 49% faster than its Core i5 counterpart. Multi-threaded applications only see premiums on the lower end of the spectrum (around 6 to 8%), whereas single-threaded applications tend to benefit much more heavily (closer to 40 to 50%). Performance is consistently above the Core i7-8650U total average (6 total samples as of this writing) by a few percentage points.
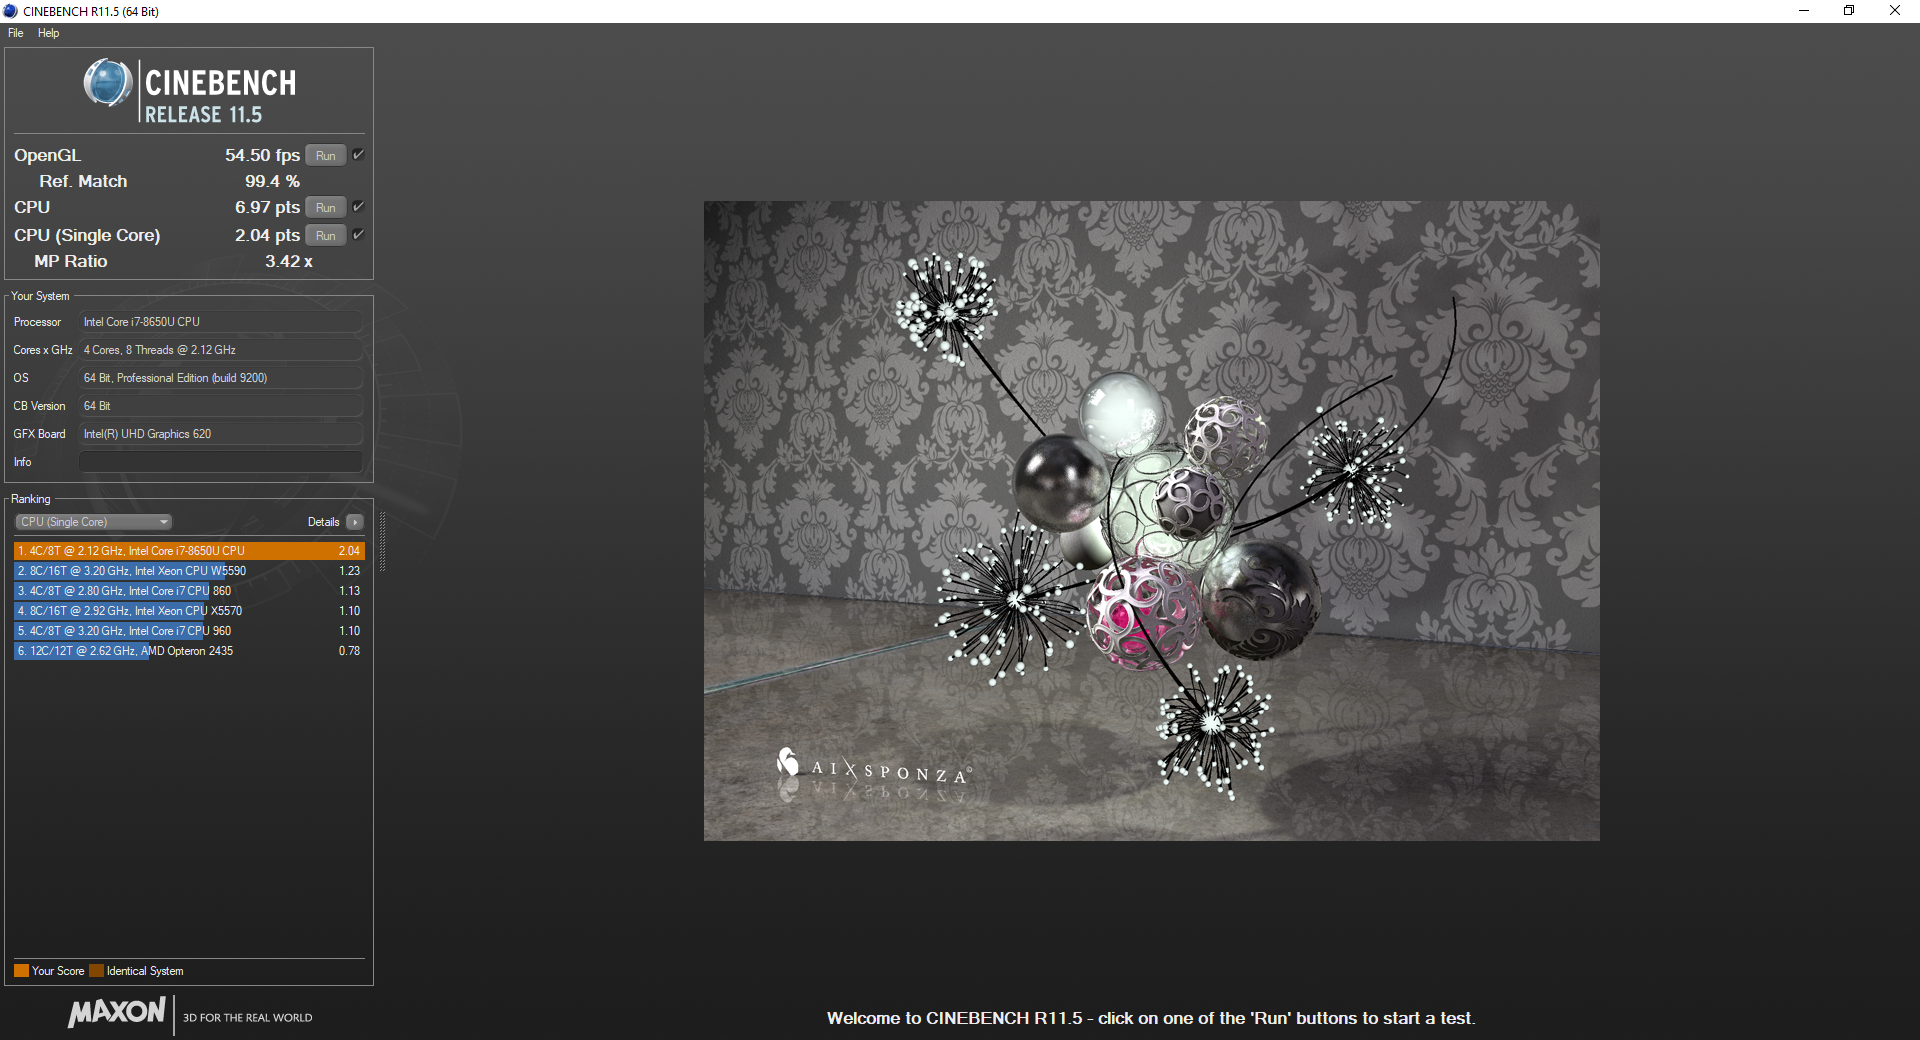
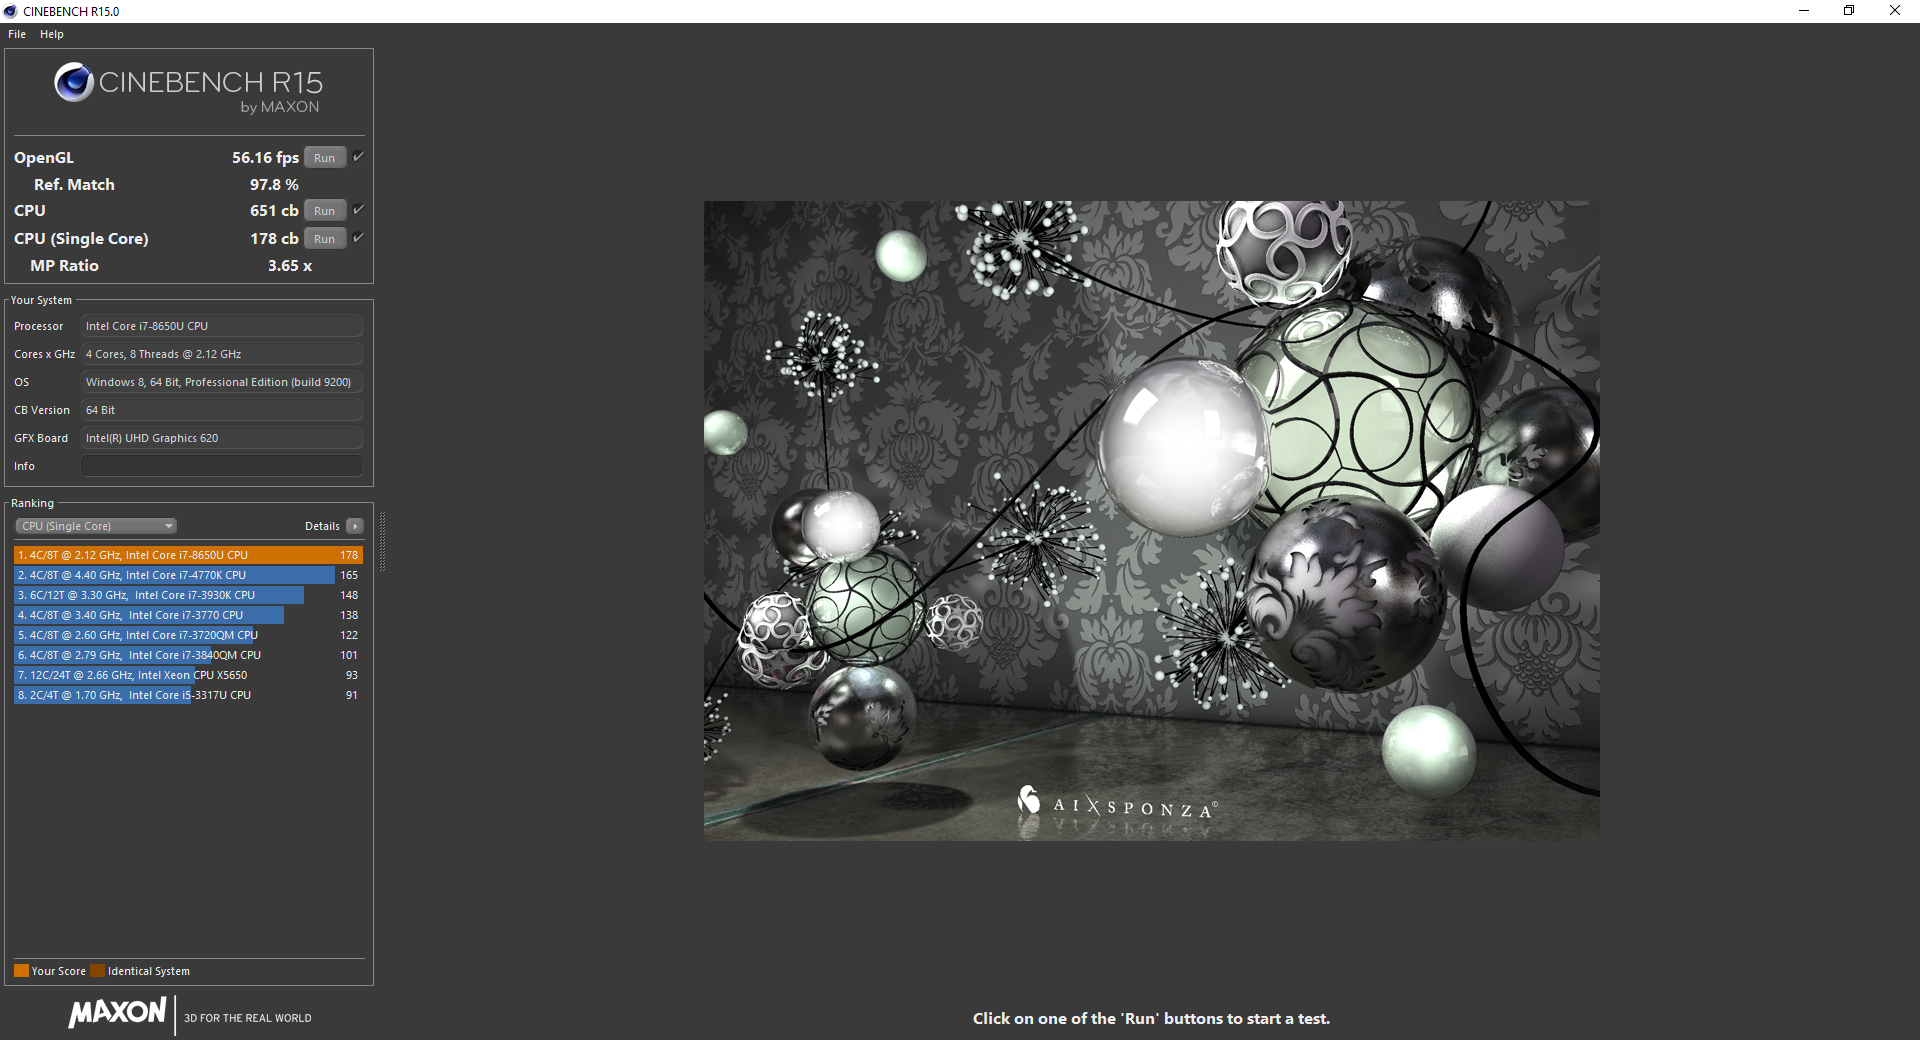
Our Cinebench R15 multi-CPU loop test showed relatively stable performance throughout its duration. The first (and highest) result we received was 660, after which the machine hovered near the 650 mark for the next dozen or so runs before eventually retreating a bit further into the low 640s where (barring a couple of outliers, the lowest of which came in at 629) it effectively remains for the rest of the testing period. This is only around a 5 percent drop in performance, which is a very good result for an 8th-generation Core i7 CPU.
Is it worth the extra cost to upgrade from the Core i5? In this case, if the primary use is single-threaded applications, the answer is a resounding yes. A 40%+ performance premium is absolutely substantial, so even for $170 it’s probably worth it. On the other hand, if it’s multi-threaded applications, the case is harder to make for the Core i7, since our testing shows a much smaller performance advantage over the already very capable i5-8350U. As we’ll see in a bit, apart from cost, there are some other drawbacks associated with the faster CPU as well.
| wPrime 2.10 - 1024m | |
| Dell Latitude 5480 | |
| Dell Latitude 5490-TD70X | |
| Average of class Office (208 - 675, n=8, last 2 years) | |
| Dell Latitude 5490 | |
| Average Intel Core i7-8650U (268 - 335, n=3) | |
* ... smaller is better
System Performance
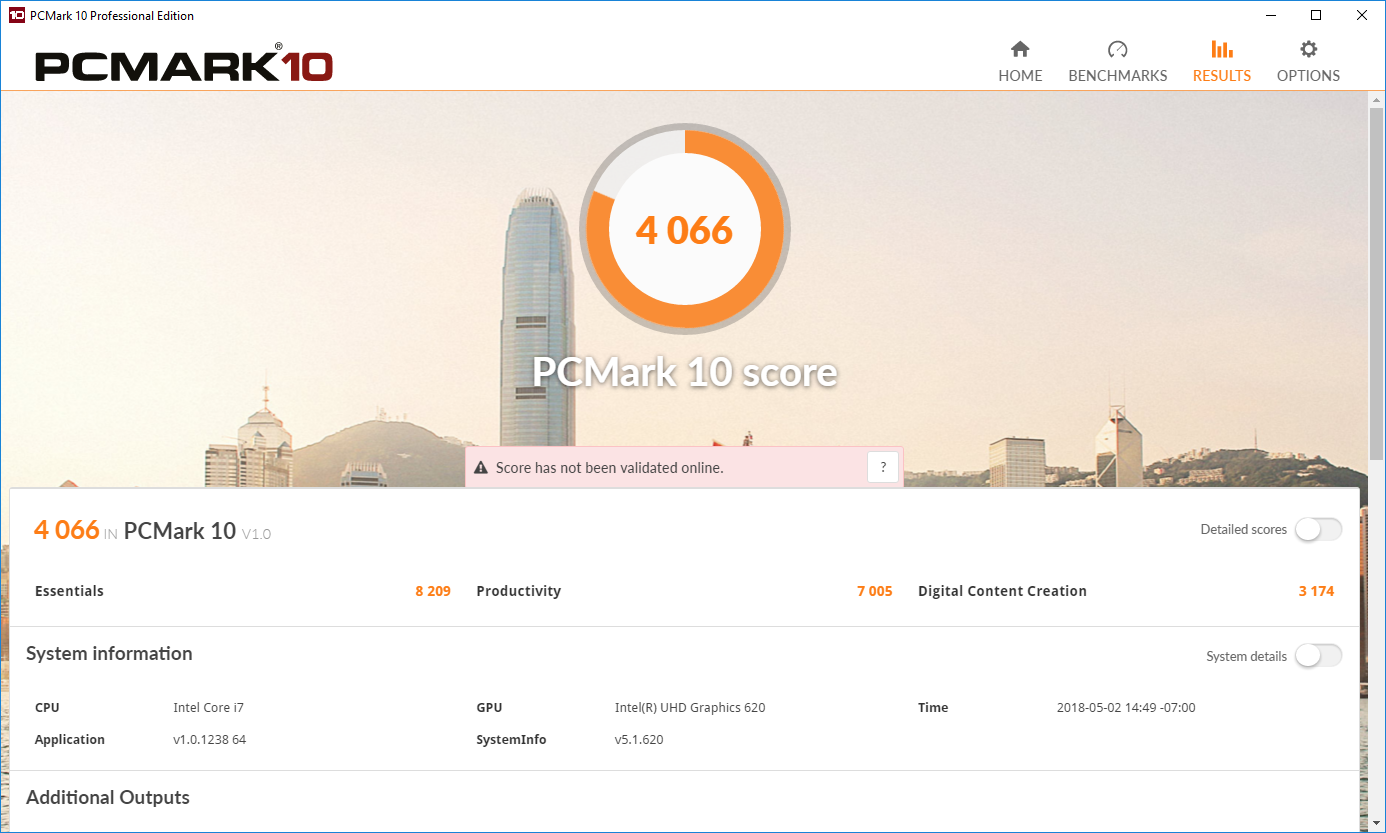
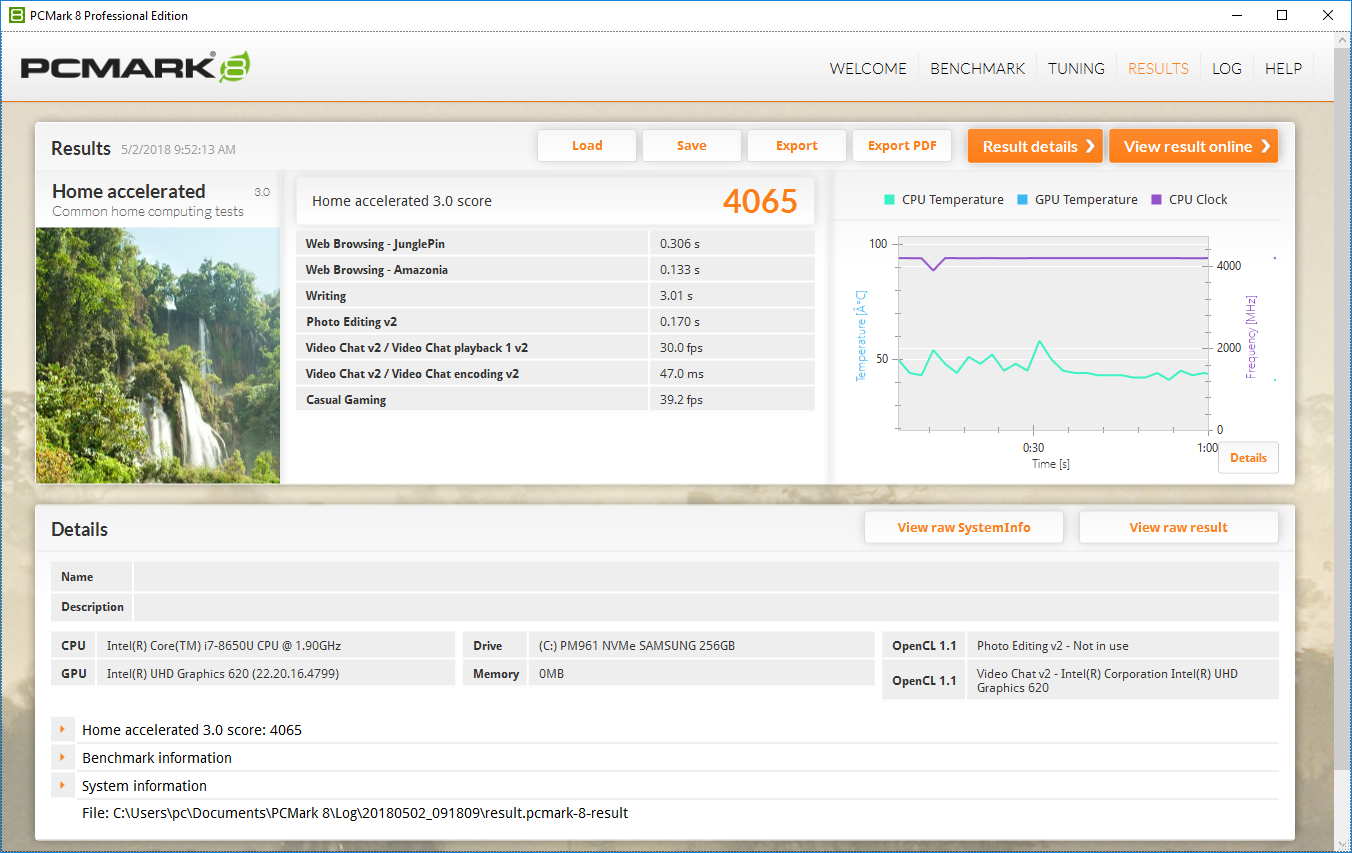
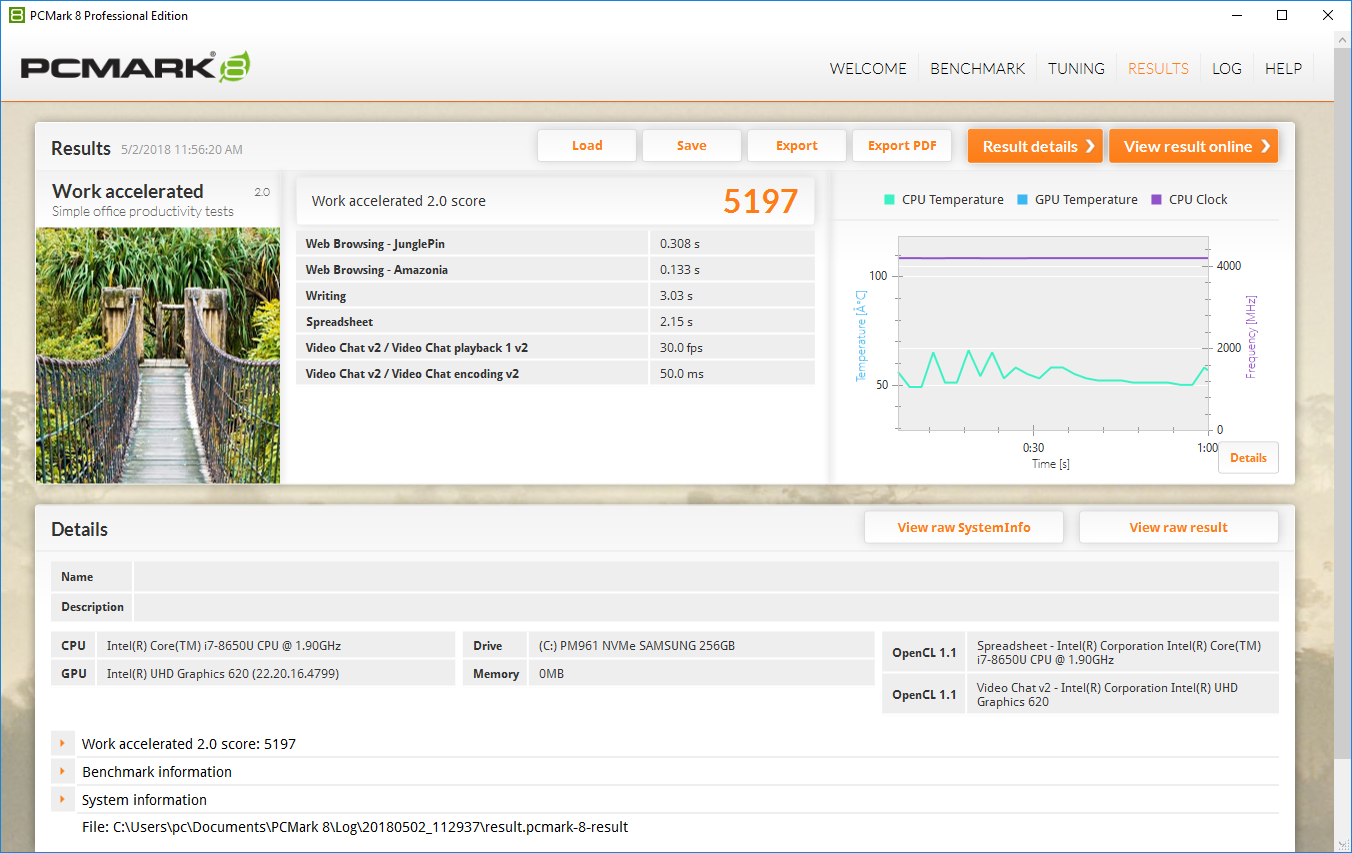
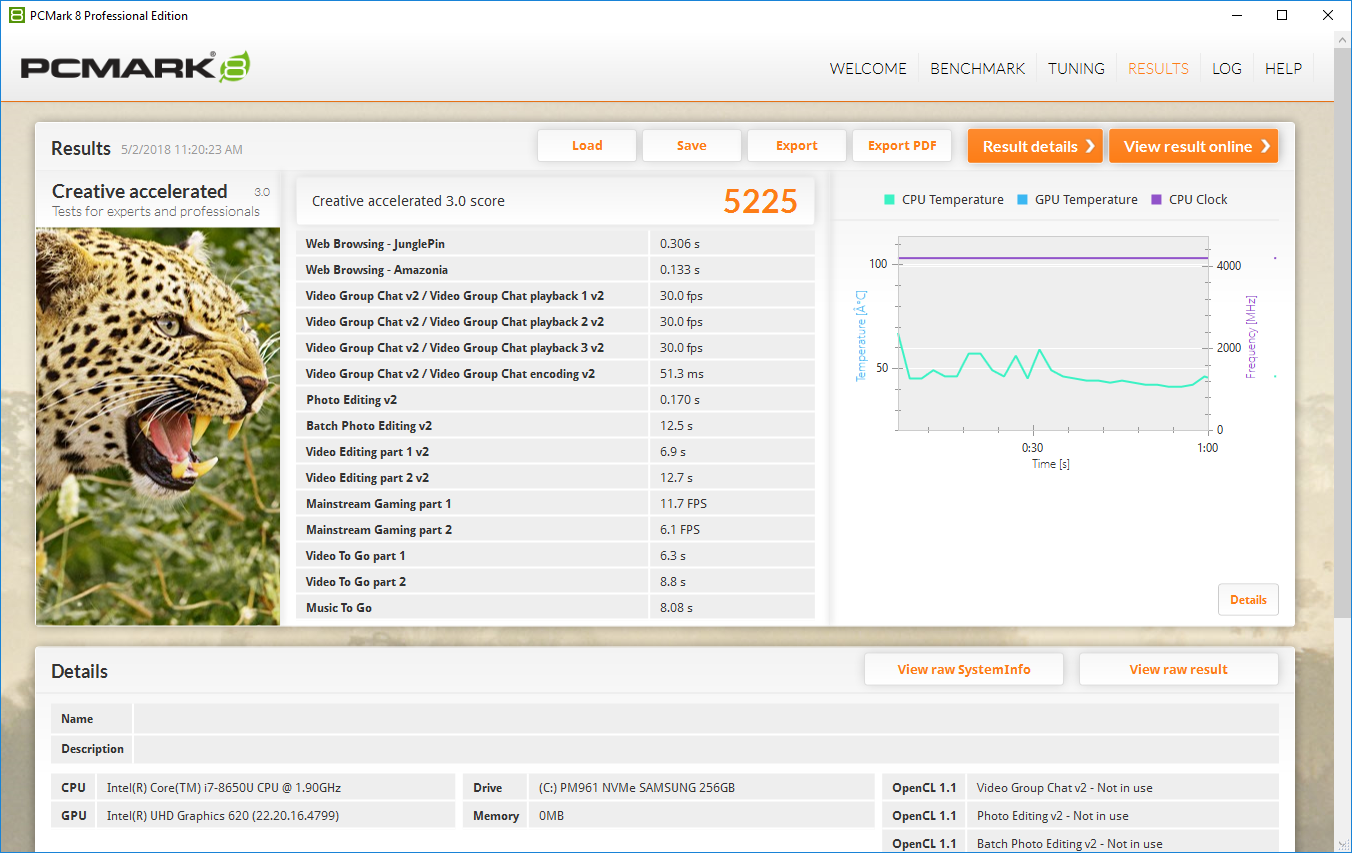
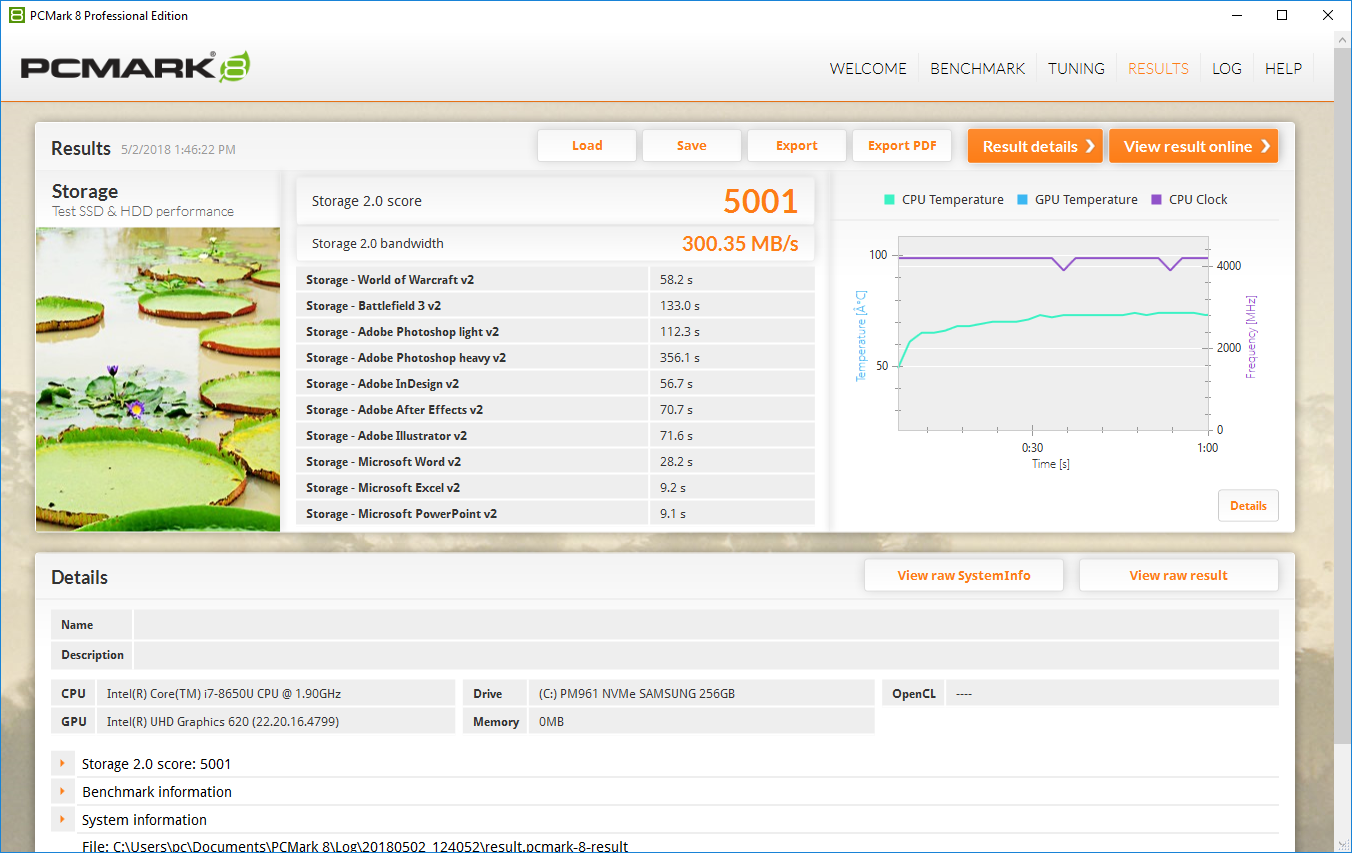
Today’s Latitude 5490 configuration offers absolutely blistering general application performance. In PCMark 10, we received a very good result of 4066. PCMark 8, meanwhile, placed our test machine at the top of the comparison field, some 8 to 10% faster than March’s 5490 Core i5 configuration and about 4 to 6% faster than the Latitude 5480 from last generation. We’re certainly at the point where diminishing returns are in play, so suffice it to say that any of these machines in today’s test field is more than enough to meet the needs of the modern businessperson.
| PCMark 10 - Score | |
| Average of class Office (2601 - 9298, n=68, last 2 years) | |
| Dell Latitude 5490 | |
| Lenovo ThinkPad T480-20L6S01V00 | |
| Average Intel Core i7-8650U, Intel UHD Graphics 620 (2403 - 4078, n=10) | |
| PCMark 8 Home Score Accelerated v2 | 4065 points | |
| PCMark 8 Creative Score Accelerated v2 | 5225 points | |
| PCMark 8 Work Score Accelerated v2 | 5200 points | |
| PCMark 10 Score | 4066 points | |
Help | ||
Storage Devices
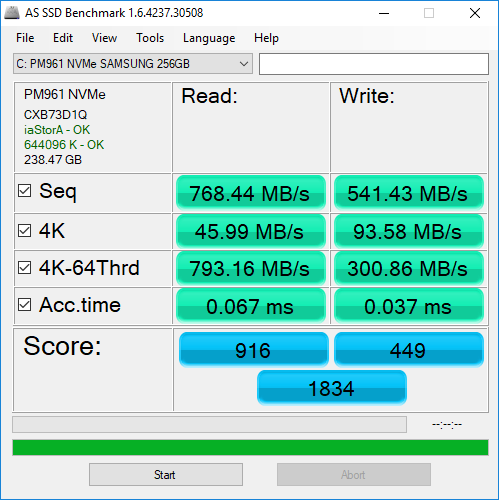
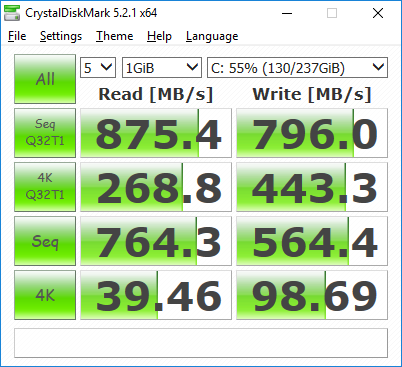
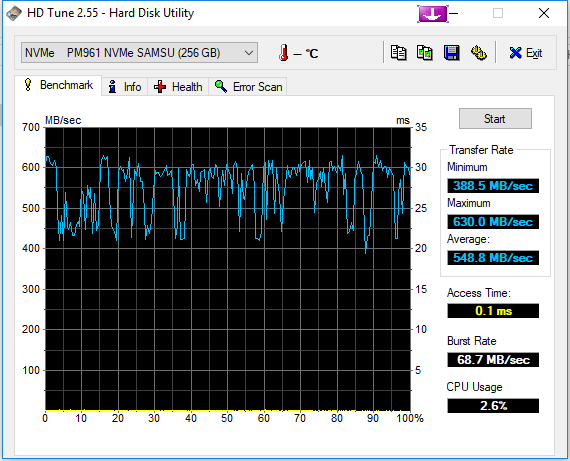
While the storage capacity of our test machine is only half of the Core i5 unit we evaluated previously, the type of solid-state drive has been upgraded to an NVMe/PCIe SSD (from the M.2 SATA drive before). This move carries obvious performance implications, though the PM961 isn’t nearly as fast as, say, the newest-gen PM981 that we recently encountered in our ThinkPad X1 review machine. Still, sequential read/write speeds of 768.44 MB/s and 541.43 MB/s are perfectly acceptable, and for most uses they will prove more than quick enough.
As always, swapping out the drive is a cinch thanks to the removable bottom cover. With the proper adapters, a standard 2.5-inch SATA drive is also supported.
| Dell Latitude 5490 Samsung PM961 MZVLW256HEHP | Dell Latitude 5490-TD70X Toshiba KSG60ZMV512G | HP EliteBook 840 G4-Z2V49ET ABD Samsung PM961 MZVLW256HEHP | Lenovo ThinkPad T480-20L6S01V00 Samsung SSD PM981 MZVLB512HAJQ | Average Samsung PM961 MZVLW256HEHP | |
|---|---|---|---|---|---|
| AS SSD | -20% | 64% | -457% | -33% | |
| Copy Game MB/s (MB/s) | 273.6 | 505 85% | 355.1 30% | 676 147% | 537 ? 96% |
| Copy Program MB/s (MB/s) | 214 | 213 0% | 269.7 26% | 254.8 19% | 343 ? 60% |
| Copy ISO MB/s (MB/s) | 514 | 426.6 -17% | 735 43% | 921 79% | 1004 ? 95% |
| Score Total (Points) | 1834 | 1067 -42% | 3006 64% | 2348 28% | 2565 ? 40% |
| Score Write (Points) | 449 | 381 -15% | 767 71% | 147 -67% | 587 ? 31% |
| Score Read (Points) | 916 | 455 -50% | 1524 66% | 1480 62% | 1378 ? 50% |
| Access Time Write * (ms) | 0.037 | 0.052 -41% | 0.027 27% | 2.515 -6697% | 0.4637 ? -1153% |
| Access Time Read * (ms) | 0.067 | 0.07 -4% | 0.044 34% | 0.041 39% | 0.06777 ? -1% |
| 4K-64 Write (MB/s) | 300.9 | 259.5 -14% | 510 69% | 96.2 -68% | 419 ? 39% |
| 4K-64 Read (MB/s) | 793 | 383.6 -52% | 1215 53% | 1278 61% | 1112 ? 40% |
| 4K Write (MB/s) | 93.6 | 91.7 -2% | 140.2 50% | 1.76 -98% | 91.6 ? -2% |
| 4K Read (MB/s) | 45.99 | 23.75 -48% | 49.21 7% | 58 26% | 45.1 ? -2% |
| Seq Write (MB/s) | 541 | 300.6 -44% | 1167 116% | 487.1 -10% | 960 ? 77% |
| Seq Read (MB/s) | 768 | 473.1 -38% | 2603 239% | 1441 88% | 2019 ? 163% |
* ... smaller is better

GPU Performance
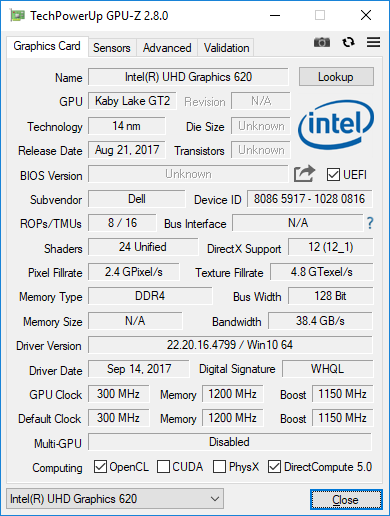
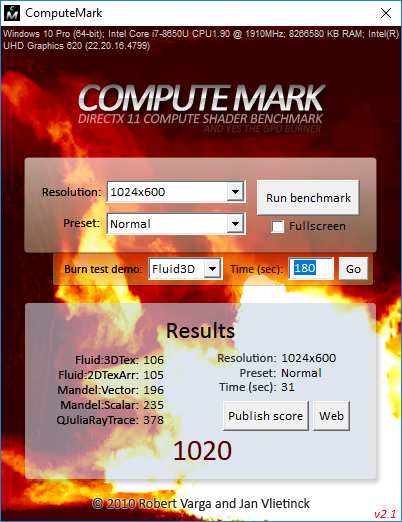
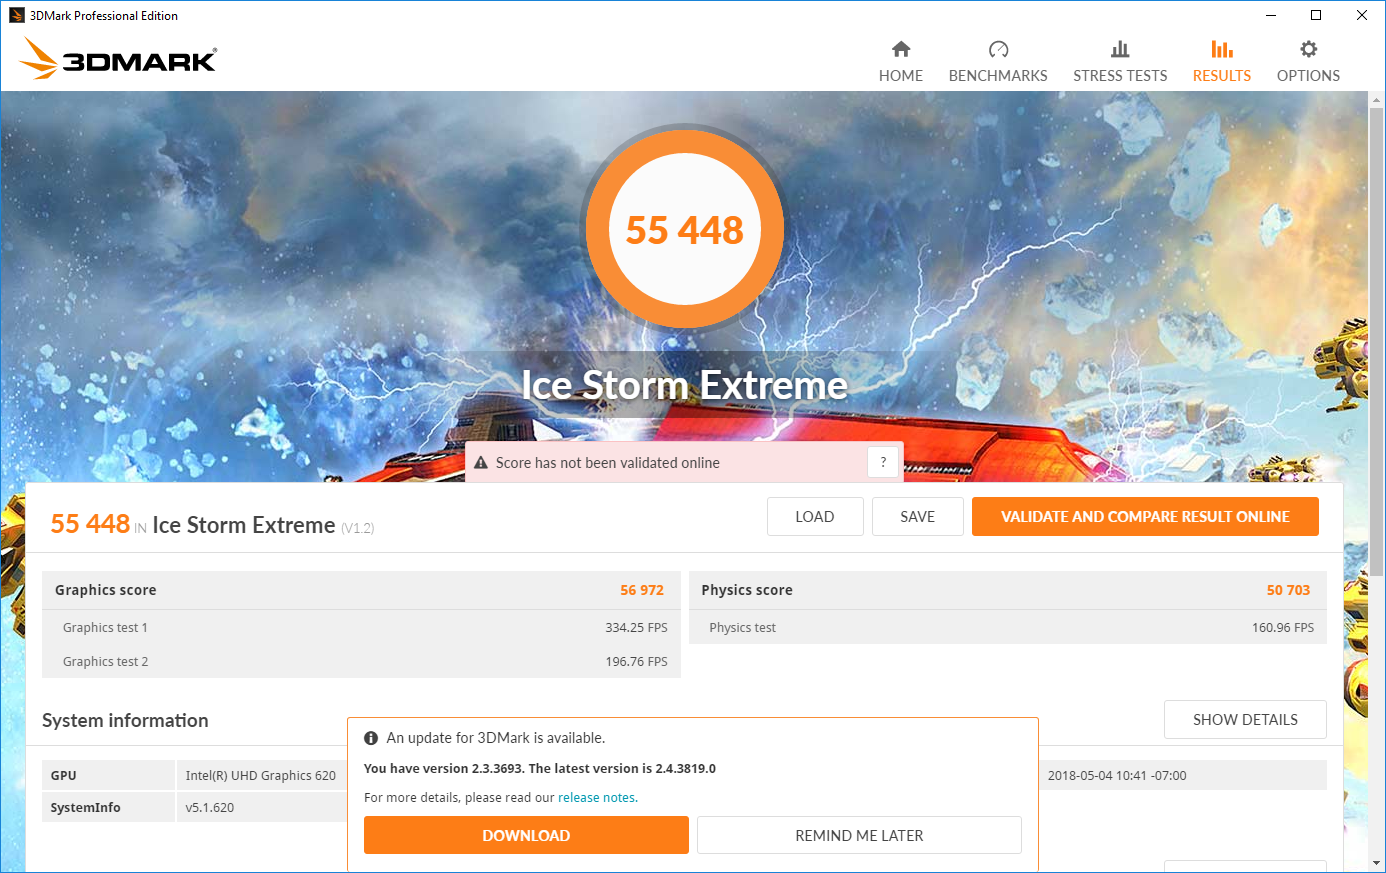
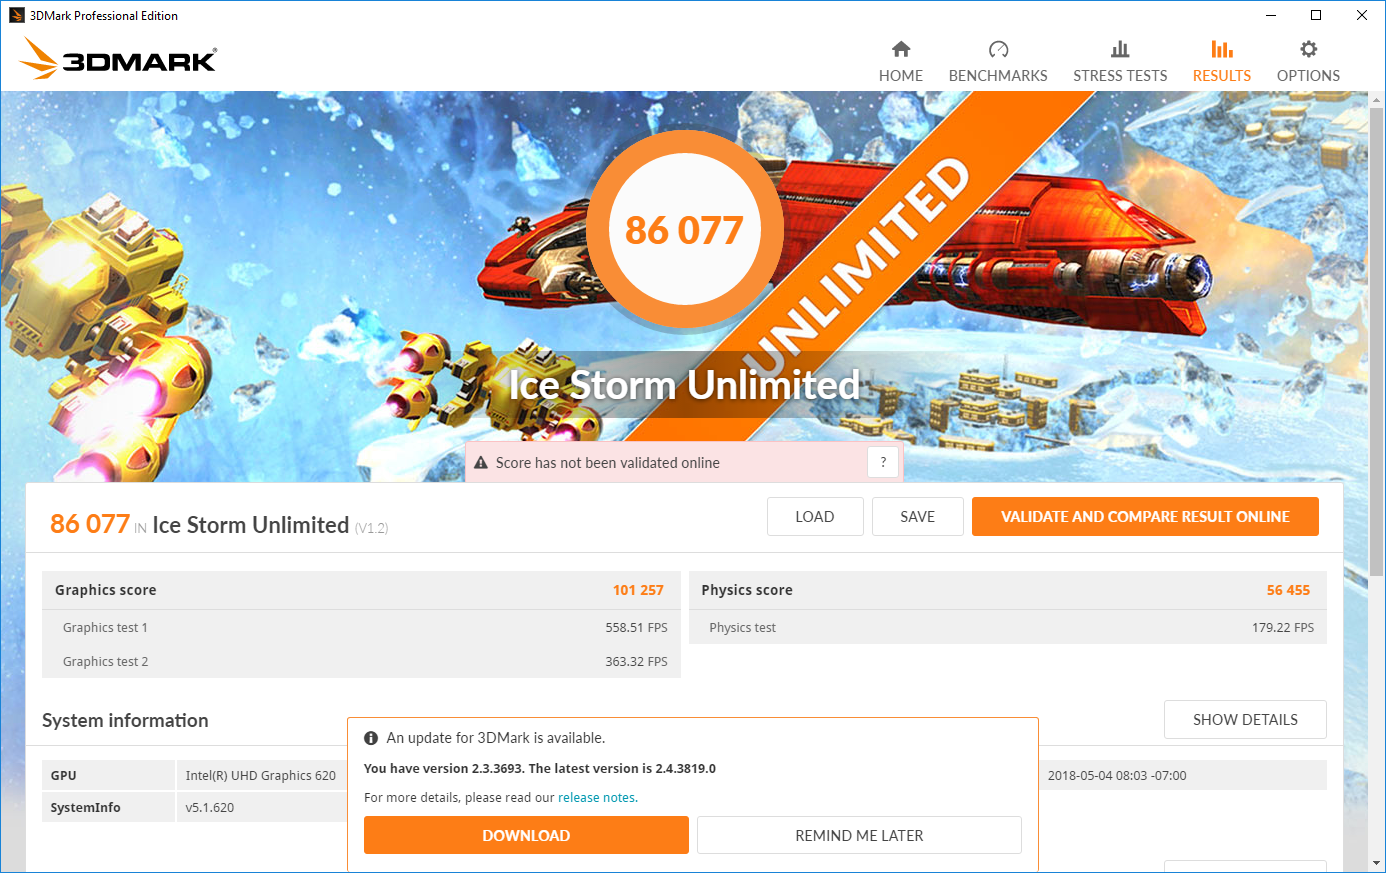
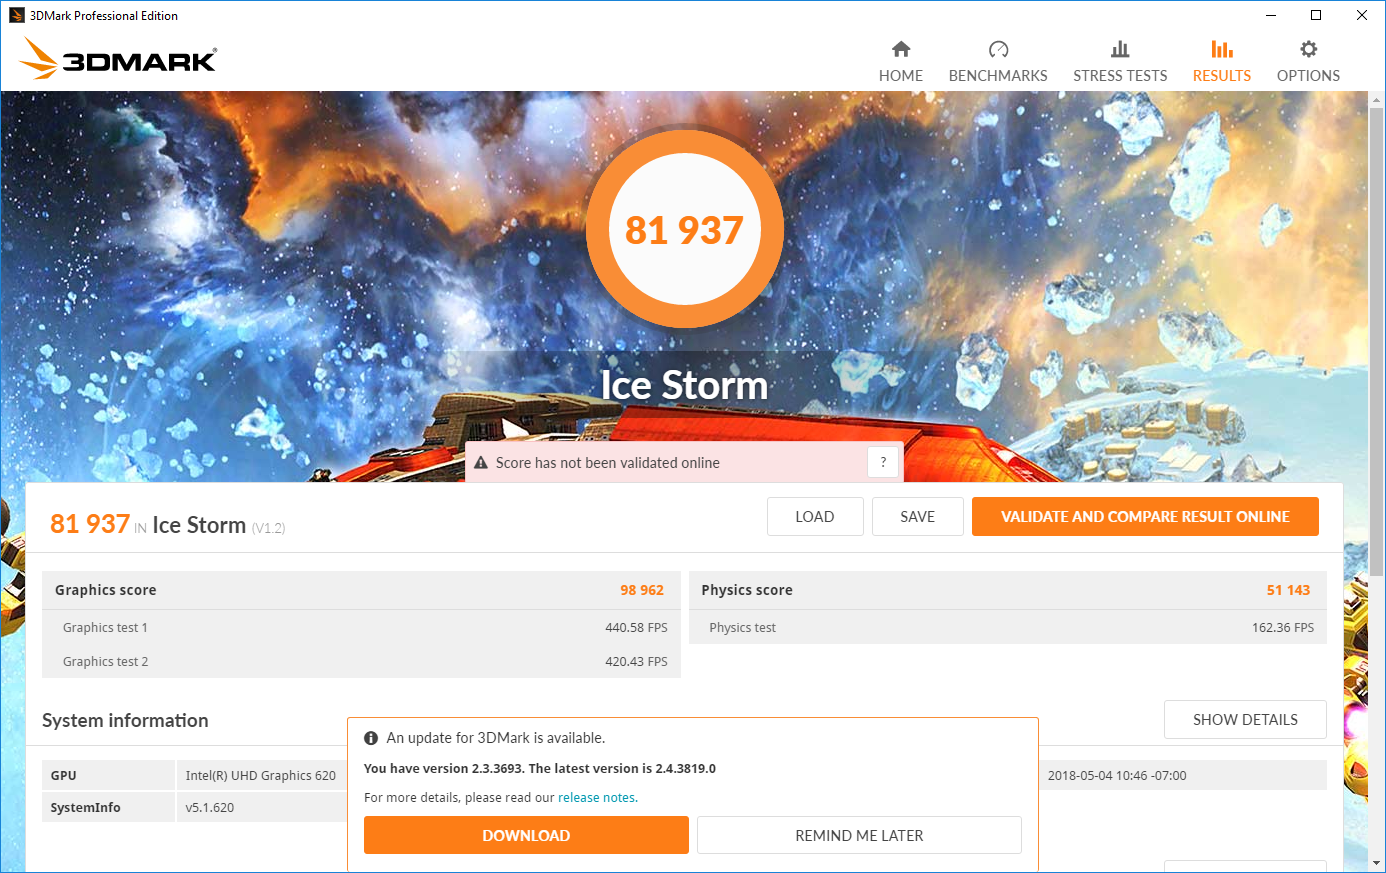
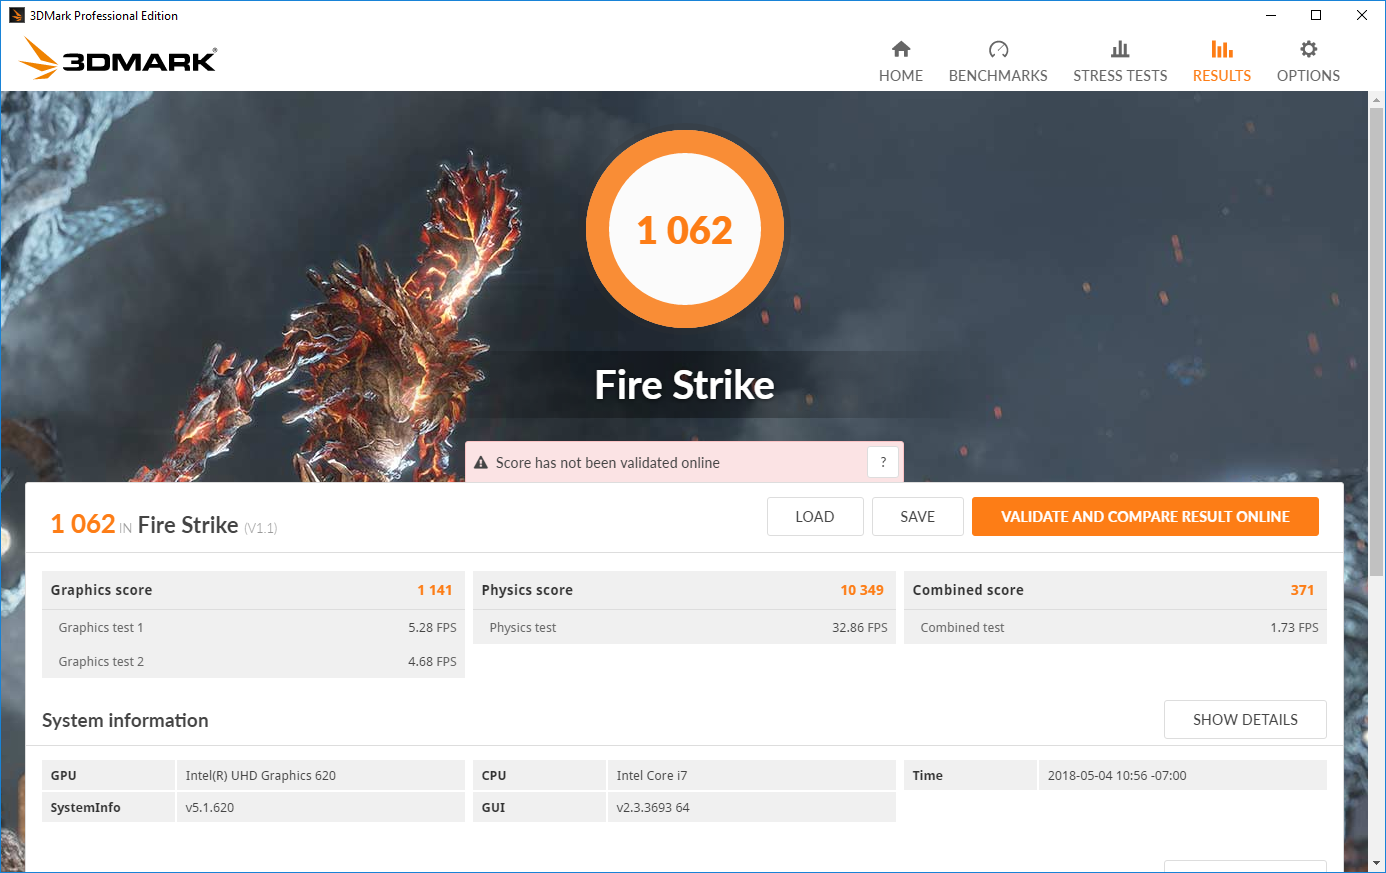
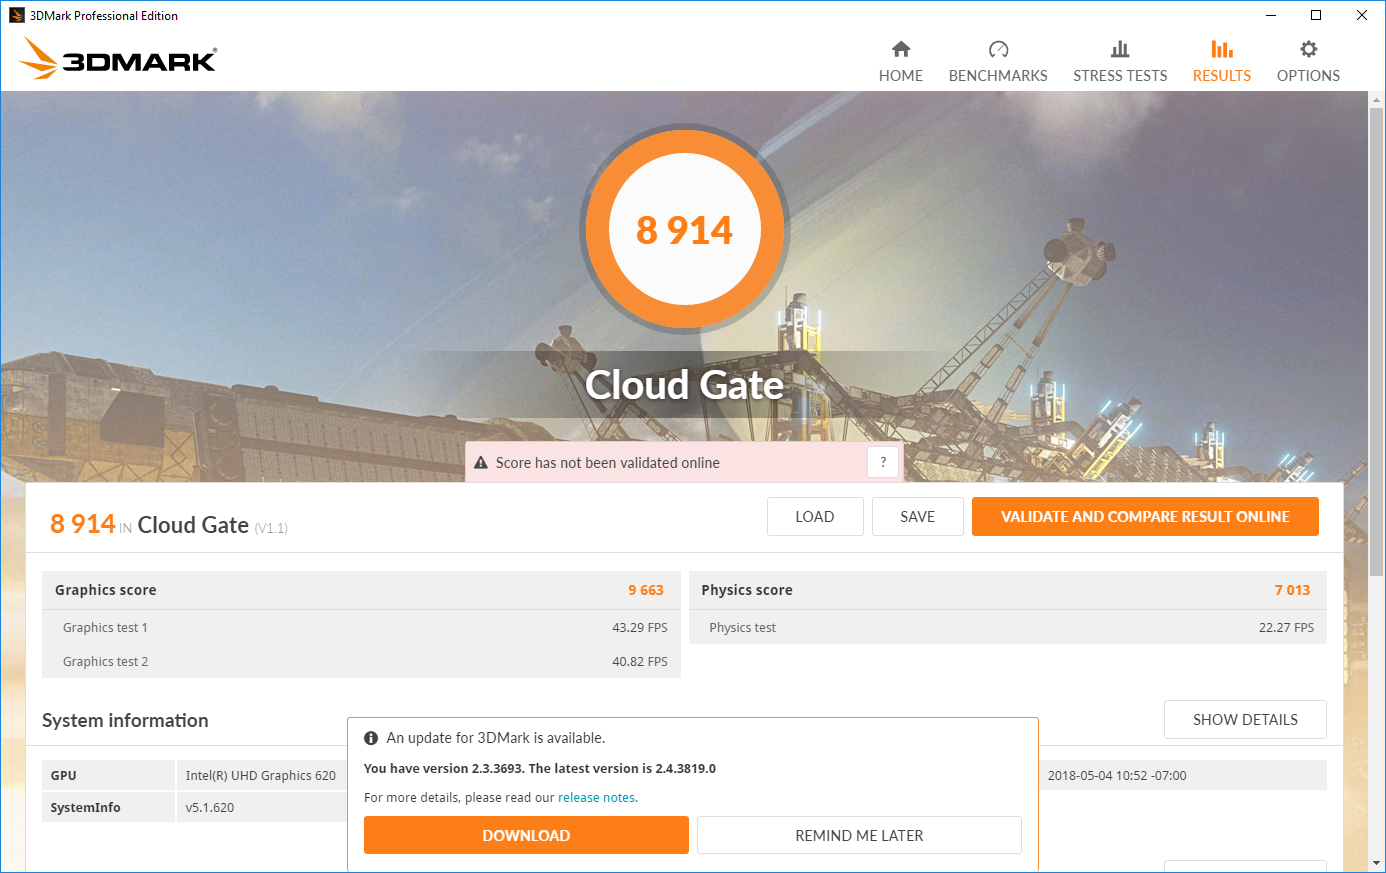
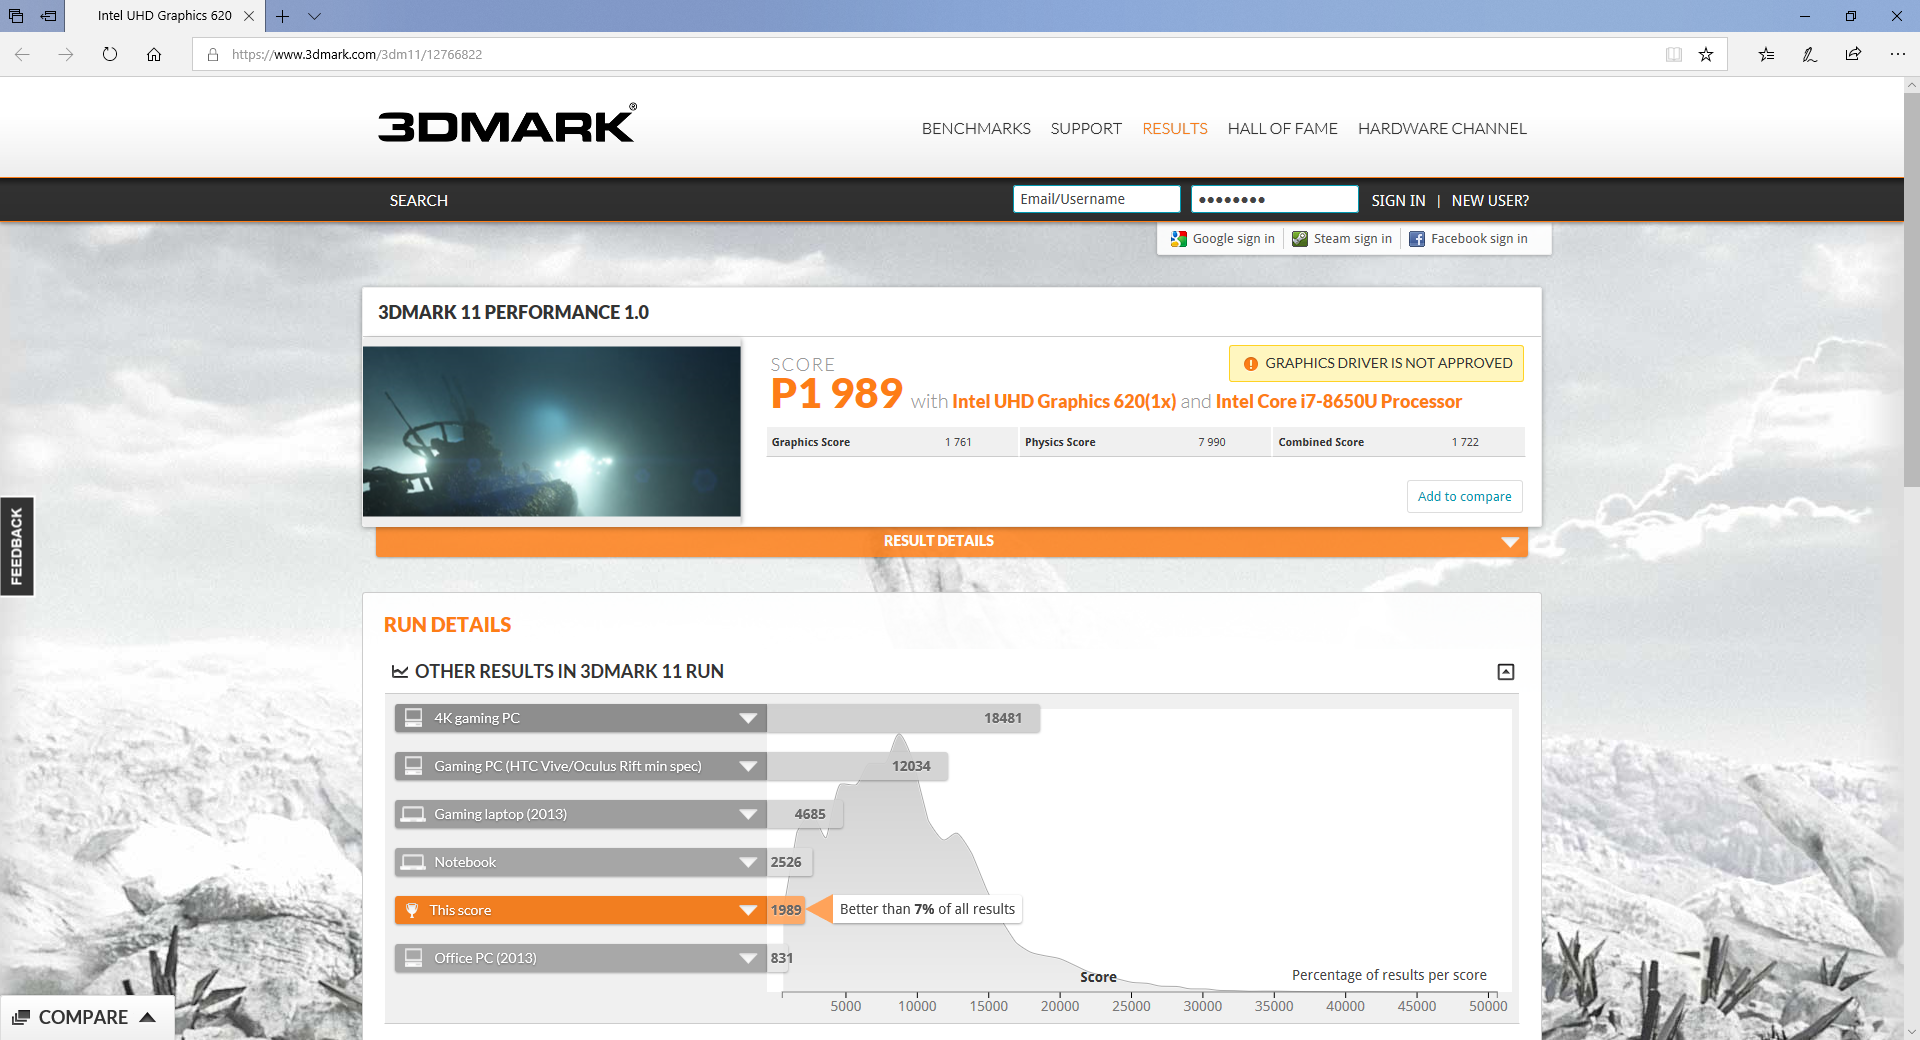
GPU performance from the integrated Intel UHD Graphics 620 (clocked at 300 – 1150 MHz when paired with this CPU) sees a sizable boost in performance by anywhere from 8 to 15 percent over the Core i5 configuration. We received a score of 1062 in 3DMark Fire Strike and 1989 in 3DMark 11; both of these are quite decent for a machine lacking a dedicated graphics adapter. Regardless, the Latitude 5490 is hardly a gaming machine; only older games would be possible to play at lower settings.
| 3DMark 06 Standard Score | 11732 points | |
| 3DMark 11 Performance | 1989 points | |
| 3DMark Cloud Gate Standard Score | 8914 points | |
| 3DMark Fire Strike Score | 1062 points | |
Help | ||
| low | med. | high | ultra | |
|---|---|---|---|---|
| BioShock Infinite (2013) | 64 | 35 | 29 | 10 |
Stress Test
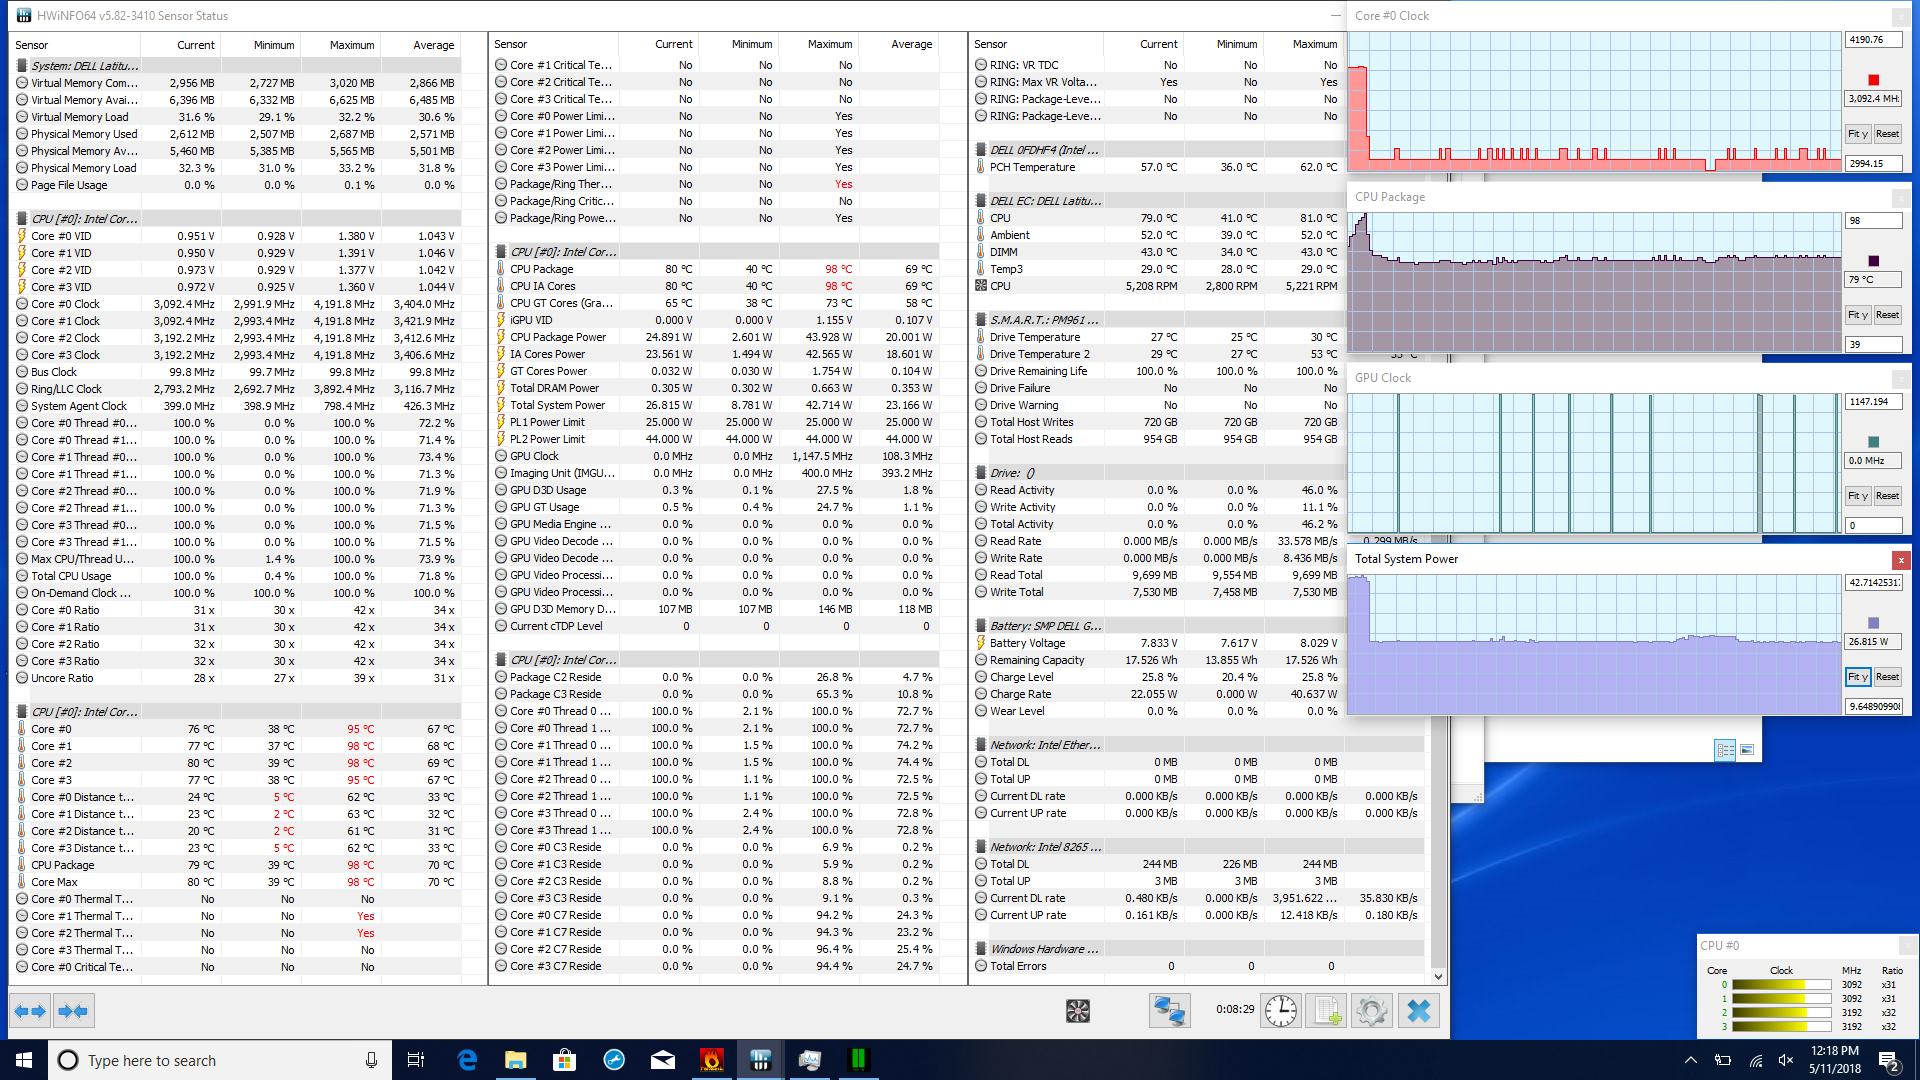
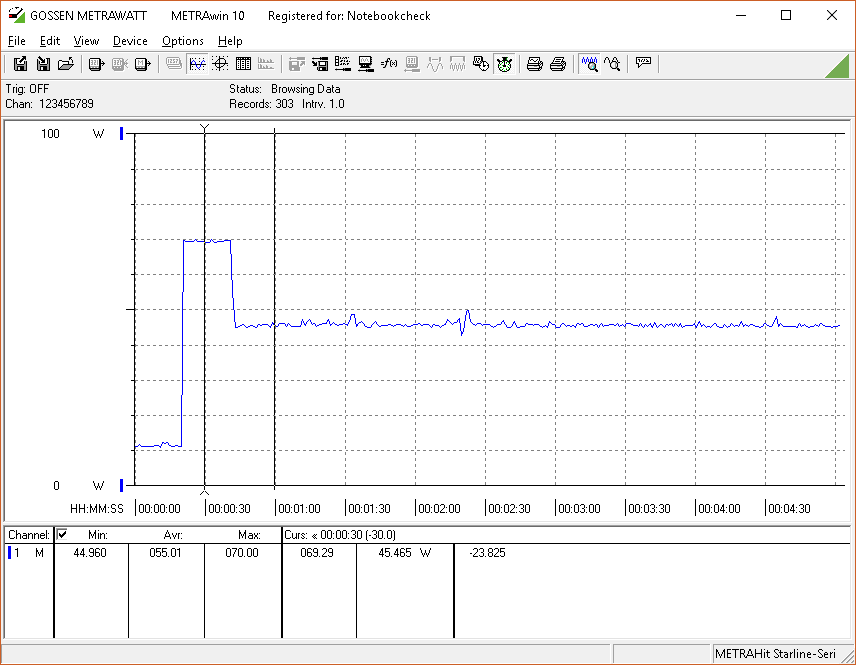
When full CPU stress is applied to the machine, clock rates initially begin at 3.9 GHz, but within seconds, core temperatures have rocketed to 98 °C, and performance correspondingly is reduced to a near-permanent 3.1 GHz instead (and temperatures drop to 79 °C). Full GPU stress, on the other hand, proves to be no problem for the Latitude 5490; it consistently pumps out 1150 MHz clock rates from the GPU with average temperatures hovering around the 77 °C mark.
Combined CPU and GPU stress sees frequencies of 1.8 GHz for CPU and 1150 for GPU, with occasional drops of the GPU to 0 MHz on our graph (represented by hiccups in actual performance). Core temperatures are stable at 72 °C.
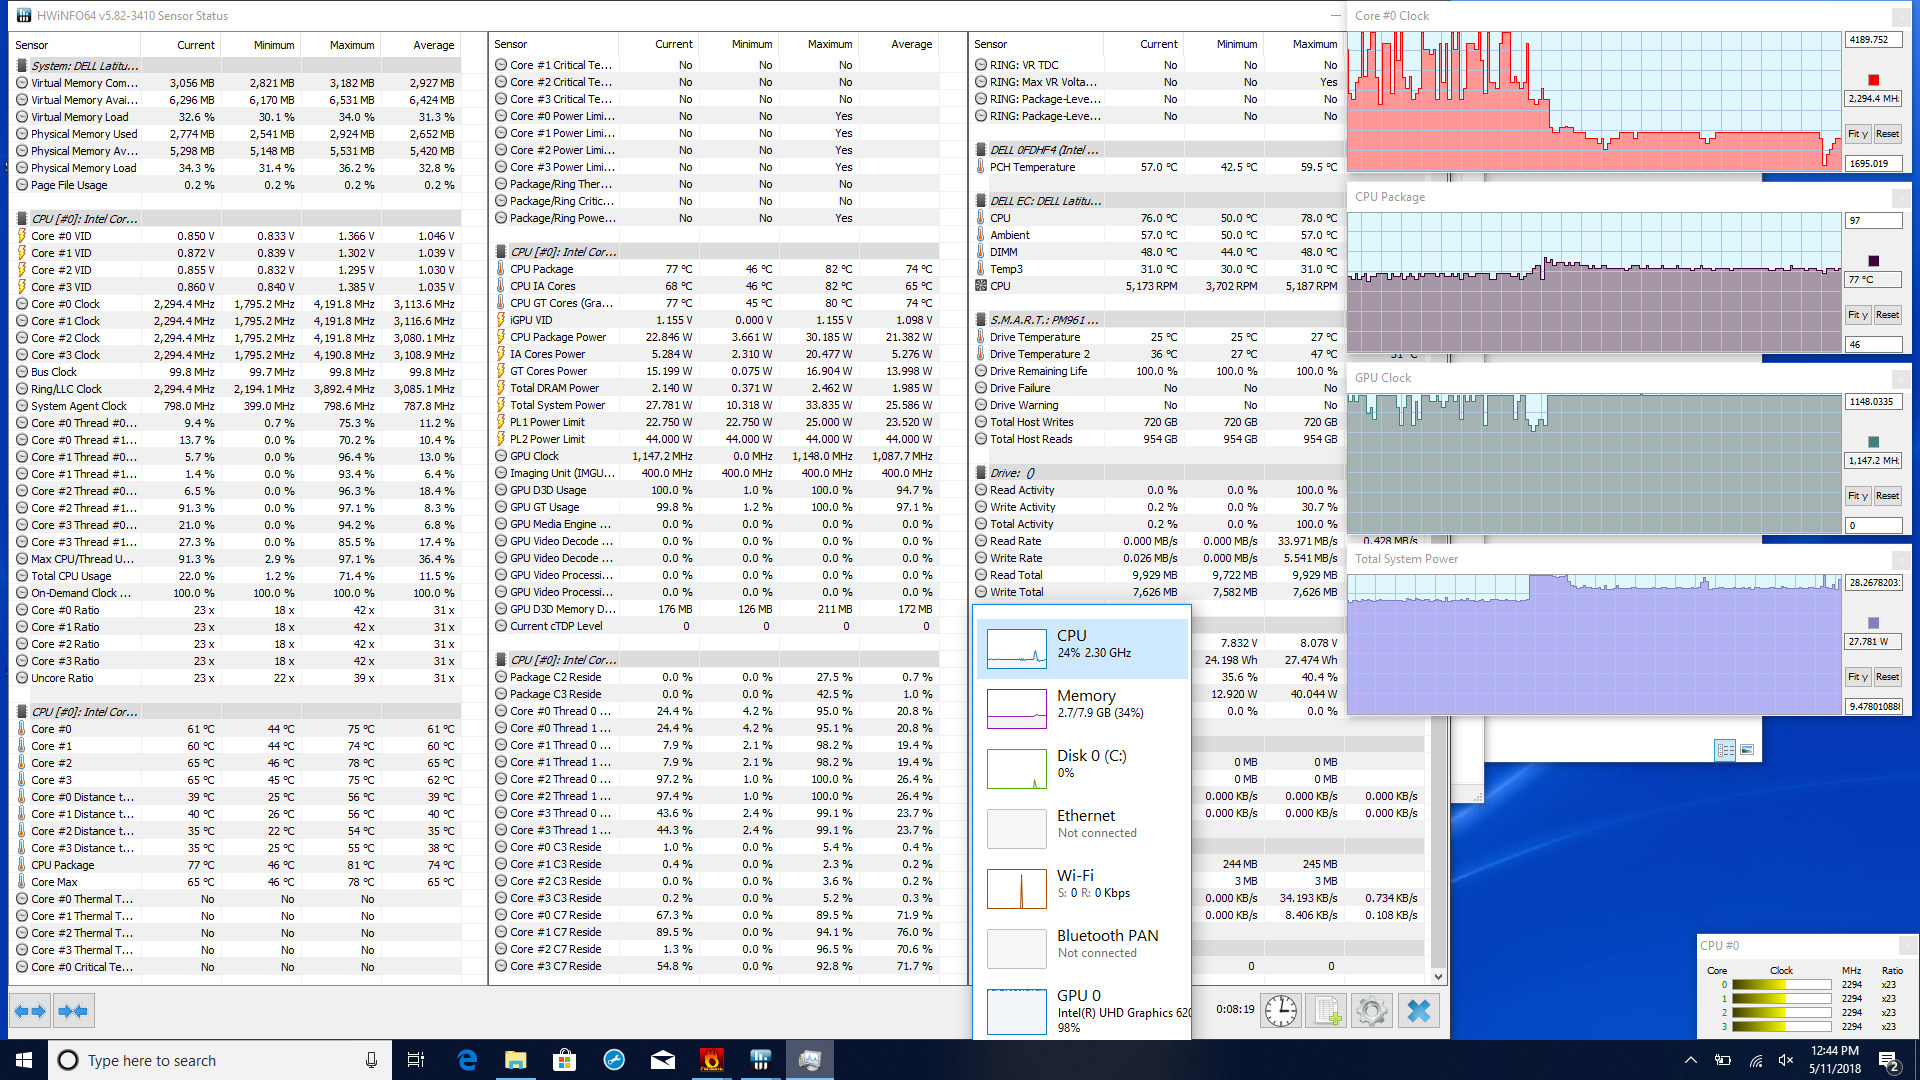
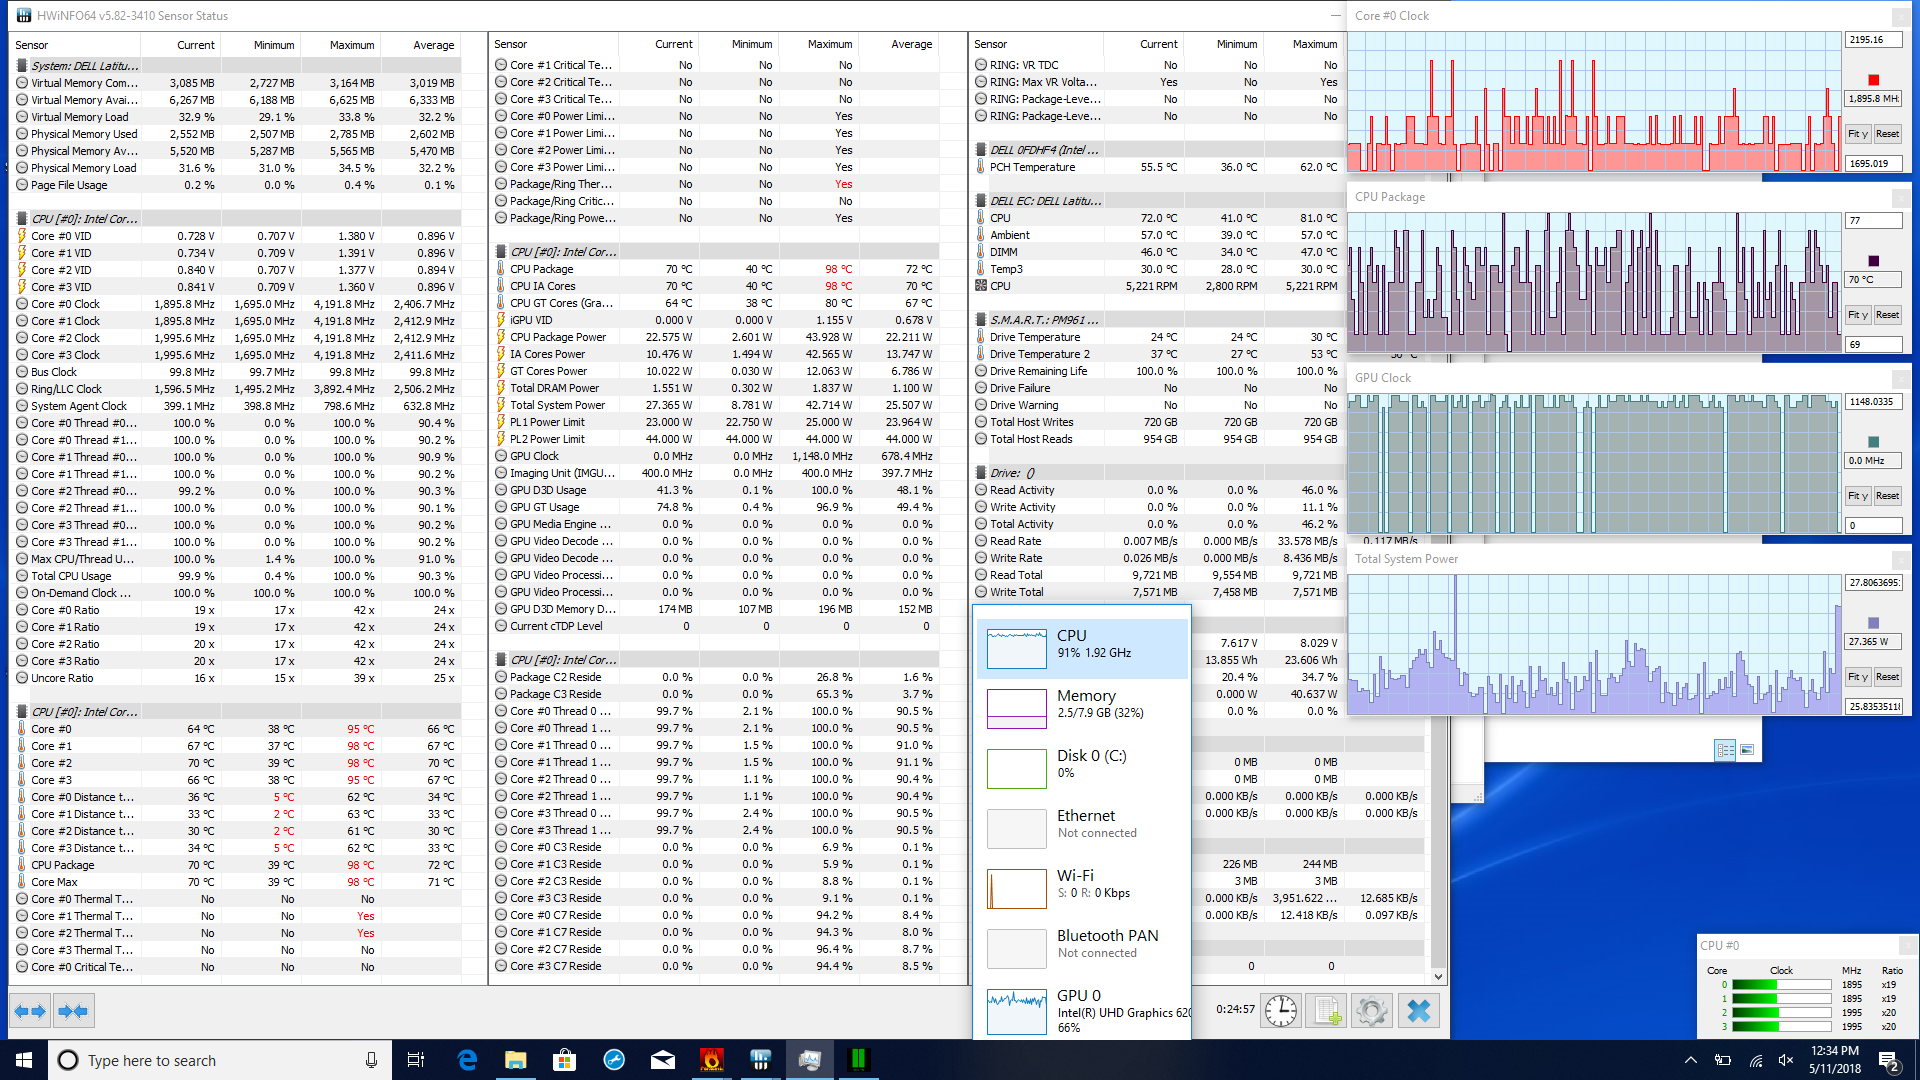
| CPU Clock (GHz) | GPU Clock (MHz) | Average CPU Temperature (°C) | Average GPU Temperature (°C) | |
| Prime95 Stress | 3.1 | - | 79 | - |
| FurMark Stress | - | 1150 | - | 77 |
| Prime95 + FurMark Stress | 1.8 | 1150 | 72 | 72 |
Emissions
System Noise
Like many modern laptops, the Latitude 5490’s fan doesn’t even run most of the time while idling. It’s consequently completely silent except for rare circumstances where we measured just a couple of decibels above environmental noise levels. Under load, the device is not much louder than its predecessor; at the very worst, we recorded 42.7 dB(A), which (after adjusting for discrepancies in ambient noise) is just 2.3 dB(A) louder than the i5 model. Compared with its competition, these are acceptable levels, though the load noise level is quite a bit higher at the top end of the spectrum (some 20% or so versus the HP Elitebook and Lenovo ThinkPad T480).
Noise level
| Idle |
| 27.8 / 27.8 / 31 dB(A) |
| Load |
| 34.2 / 42.7 dB(A) |
 | ||
30 dB silent 40 dB(A) audible 50 dB(A) loud |
||
min: | ||
| Dell Latitude 5490 UHD Graphics 620, i7-8650U, Samsung PM961 MZVLW256HEHP | Dell Latitude 5490-TD70X UHD Graphics 620, i5-8350U, Toshiba KSG60ZMV512G | Dell Latitude 5480 HD Graphics 620, i7-7600U, Toshiba SG5 256GB THNSNK256GVN8 | HP EliteBook 840 G4-Z2V49ET ABD HD Graphics 620, i5-7200U, Samsung PM961 MZVLW256HEHP | Lenovo ThinkPad T480-20L6S01V00 GeForce MX150, i5-8550U, Samsung SSD PM981 MZVLB512HAJQ | Lenovo ThinkPad T470-20HD002HGE HD Graphics 620, i5-7200U, Samsung PM961 NVMe MZVLW512HMJP | |
|---|---|---|---|---|---|---|
| Noise | -2% | -8% | -2% | 1% | 5% | |
| off / environment * (dB) | 27.8 | 28.8 -4% | 31 -12% | 29 -4% | 28 -1% | |
| Idle Minimum * (dB) | 27.8 | 28.8 -4% | 29.6 -6% | 31 -12% | 29 -4% | 28 -1% |
| Idle Average * (dB) | 27.8 | 28.8 -4% | 29.6 -6% | 31 -12% | 29 -4% | 28 -1% |
| Idle Maximum * (dB) | 31 | 30.9 -0% | 29.6 5% | 31 -0% | 29 6% | 29.4 5% |
| Load Average * (dB) | 34.2 | 35.6 -4% | 42 -23% | 33.5 2% | 35.6 -4% | 31.4 8% |
| Load Maximum * (dB) | 42.7 | 41.4 3% | 47.1 -10% | 33.7 21% | 35.6 17% | 34.6 19% |
| Witcher 3 ultra * (dB) | 32.5 |
* ... smaller is better
Temperature
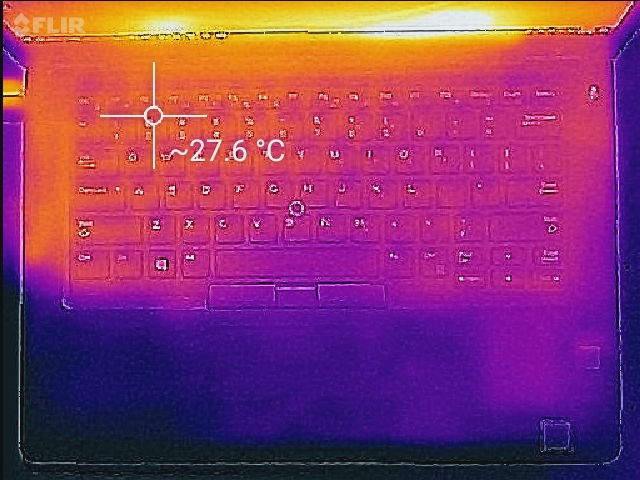
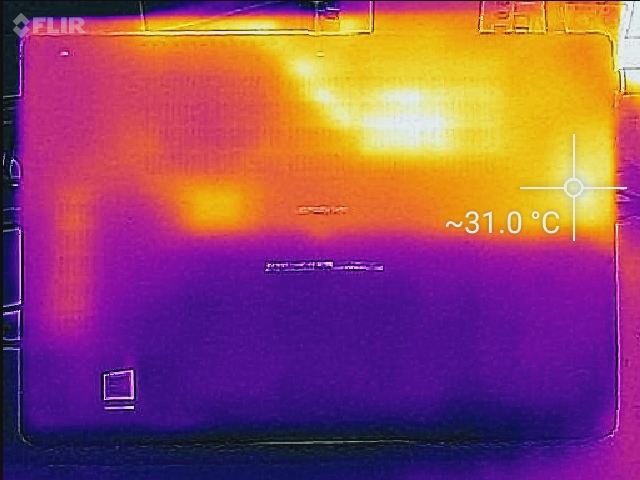
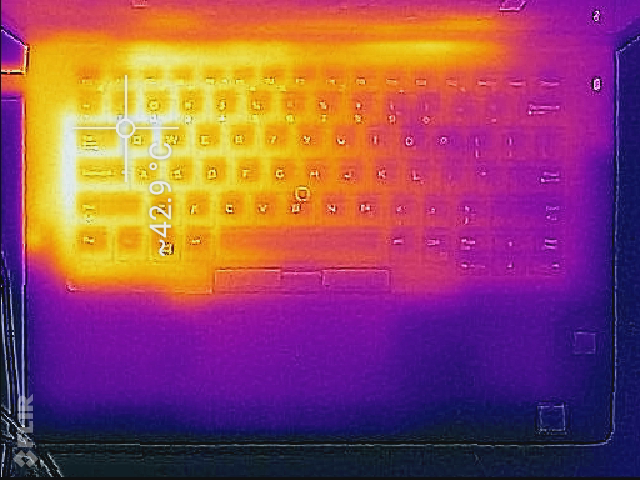
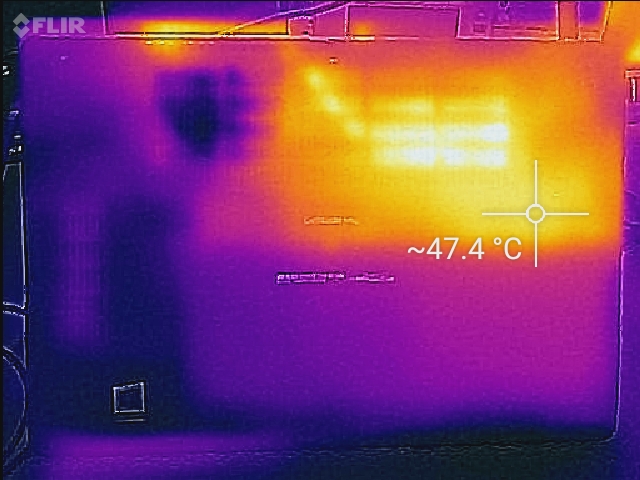
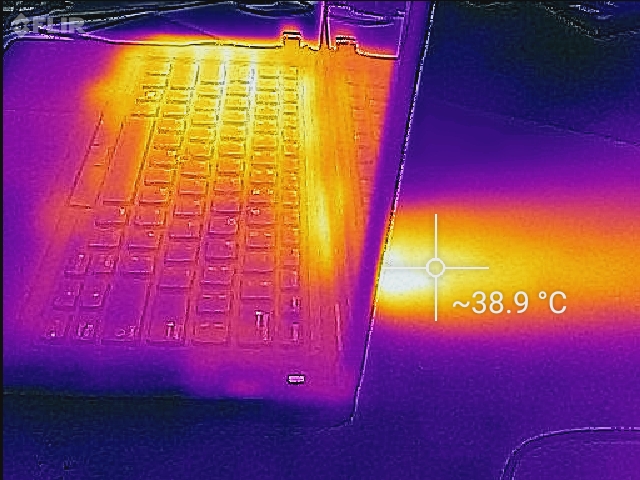
Under load, temperature development of the Core i7 Latitude 5490 configuration is hardly any more than its Core i5 predecessor. Discrepancies in measurements between the two units are entirely attributable to differences in ambient air temperatures of nearly 3 °C. The top left side of the machine (bottom-left underside) still rises to a rather significant 43.4 / 47.8 °C under heavy load, but yet again, these conditions are unrealistic in practice, and the machine would likely be resting on a surface anyway to help facilitate airflow under such circumstances.
There are notable differences while idling, however. Even after adjusting for ambient temperature discrepancies, the top and underside averages of 26.3 °C and 28.4 °C (respectively) are a few degrees higher than the Core i5 model, and some regions (such as the bottom-right center quadrant) are several degrees above room temperature. This is sure to become irritating during lap-based usage to anyone with temperature sensitivities.
(±) The maximum temperature on the upper side is 43.4 °C / 110 F, compared to the average of 34.3 °C / 94 F, ranging from 21.2 to 62.5 °C for the class Office.
(-) The bottom heats up to a maximum of 47.8 °C / 118 F, compared to the average of 36.8 °C / 98 F
(+) In idle usage, the average temperature for the upper side is 26.3 °C / 79 F, compared to the device average of 29.5 °C / 85 F.
(+) The palmrests and touchpad are cooler than skin temperature with a maximum of 28.2 °C / 82.8 F and are therefore cool to the touch.
(±) The average temperature of the palmrest area of similar devices was 27.5 °C / 81.5 F (-0.7 °C / -1.3 F).
Speakers
The speakers have not changed since our previous review of the notebook; that is to say, they remain quite decent across the spectrum at most volume levels, excepting low frequencies, which are (of course) mostly absent—hardly a surprise given the machine’s size and class.

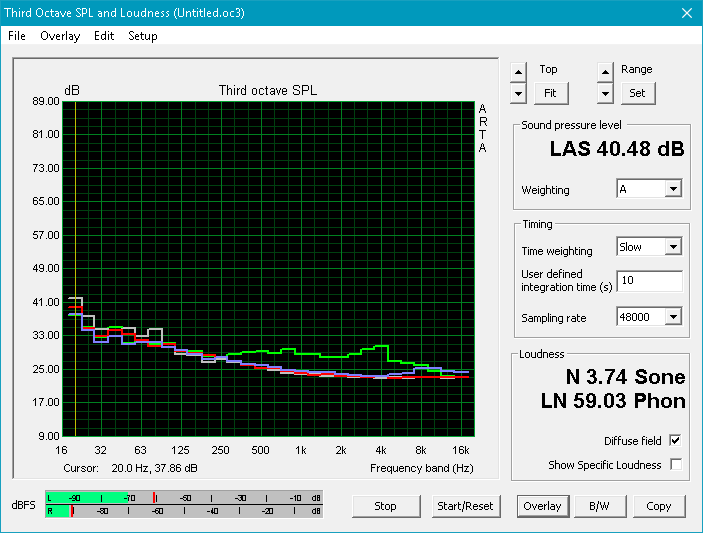
Dell Latitude 5490 audio analysis
(±) | speaker loudness is average but good (78.3 dB)
Bass 100 - 315 Hz
(-) | nearly no bass - on average 15.5% lower than median
(±) | linearity of bass is average (9.3% delta to prev. frequency)
Mids 400 - 2000 Hz
(+) | balanced mids - only 3.9% away from median
(±) | linearity of mids is average (9.5% delta to prev. frequency)
Highs 2 - 16 kHz
(+) | balanced highs - only 1.5% away from median
(+) | highs are linear (1.7% delta to prev. frequency)
Overall 100 - 16.000 Hz
(±) | linearity of overall sound is average (17.4% difference to median)
Compared to same class
» 27% of all tested devices in this class were better, 7% similar, 66% worse
» The best had a delta of 7%, average was 21%, worst was 53%
Compared to all devices tested
» 33% of all tested devices were better, 8% similar, 58% worse
» The best had a delta of 4%, average was 23%, worst was 134%
Lenovo ThinkPad T470-20HD002HGE audio analysis
(±) | speaker loudness is average but good (80.4 dB)
Bass 100 - 315 Hz
(-) | nearly no bass - on average 16.6% lower than median
(±) | linearity of bass is average (8.8% delta to prev. frequency)
Mids 400 - 2000 Hz
(+) | balanced mids - only 4.3% away from median
(+) | mids are linear (6.7% delta to prev. frequency)
Highs 2 - 16 kHz
(±) | higher highs - on average 5.4% higher than median
(±) | linearity of highs is average (13.3% delta to prev. frequency)
Overall 100 - 16.000 Hz
(±) | linearity of overall sound is average (18.7% difference to median)
Compared to same class
» 35% of all tested devices in this class were better, 6% similar, 59% worse
» The best had a delta of 7%, average was 21%, worst was 53%
Compared to all devices tested
» 43% of all tested devices were better, 8% similar, 49% worse
» The best had a delta of 4%, average was 23%, worst was 134%
Energy Management
Power Consumption
Average power consumption has only climbed slightly over the Core i5-8350U Latitude 5490 model; we measured 6.2 W average while idling and 43.9 W under max load (versus 5.54 W / 42.4 W previously). The load differences are absolutely insignificant, but the idle numbers calculate to a nearly 12 percent increase in power consumption—which will likely affect the battery life results in our next section somewhat.
| Off / Standby | |
| Idle | |
| Load |
|
Key:
min: | |
| Dell Latitude 5490 i7-8650U, UHD Graphics 620, Samsung PM961 MZVLW256HEHP, IPS, 1920x1080, 14" | Dell Latitude 5490-TD70X i5-8350U, UHD Graphics 620, Toshiba KSG60ZMV512G, IPS, 1920x1080, 14" | Dell Latitude 5480 i7-7600U, HD Graphics 620, Toshiba SG5 256GB THNSNK256GVN8, IPS, 1920x1080, 14" | HP EliteBook 840 G4-Z2V49ET ABD i5-7200U, HD Graphics 620, Samsung PM961 MZVLW256HEHP, TN, 1920x1080, 14" | Lenovo ThinkPad T470-20HD002HGE i5-7200U, HD Graphics 620, Samsung PM961 NVMe MZVLW512HMJP, IPS, 1920x1080, 14" | |
|---|---|---|---|---|---|
| Power Consumption | 0% | -3% | 19% | 19% | |
| Idle Minimum * (Watt) | 3.9 | 3.3 15% | 6.64 -70% | 2.9 26% | 3.21 18% |
| Idle Average * (Watt) | 6.2 | 5.54 11% | 6.67 -8% | 5.6 10% | 6.15 1% |
| Idle Maximum * (Watt) | 7.7 | 6.59 14% | 7.78 -1% | 8.15 -6% | 6.82 11% |
| Load Average * (Watt) | 43.9 | 42.4 3% | 30.83 30% | 30.6 30% | 28.5 35% |
| Load Maximum * (Watt) | 47.7 | 67.6 -42% | 31.7 34% | 31 35% | 34.5 28% |
* ... smaller is better
Battery Life
As we anticipated, we do see lower battery life numbers as a result of the marginally higher power consumption we measured in the previous section—though the results are still extremely positive overall. We recorded a battery life of 11 hours and 35 minutes during our standardized websurfing battery benchmark, some 3 hours and 22 minutes below that of the Core i5 configuration. Still, a result in excess of 10 hours is a very long runtime, and it’s extremely unlikely that anyone will be truly bothered by this shortfall.
| Dell Latitude 5490 i7-8650U, UHD Graphics 620, 68 Wh | Dell Latitude 5490-TD70X i5-8350U, UHD Graphics 620, 68 Wh | Dell Latitude 5480 i7-7600U, HD Graphics 620, 68 Wh | HP EliteBook 840 G4-Z2V49ET ABD i5-7200U, HD Graphics 620, 51 Wh | Lenovo ThinkPad T470-20HD002HGE i5-7200U, HD Graphics 620, 48 Wh | |
|---|---|---|---|---|---|
| Battery runtime | 29% | 39% | -18% | -37% | |
| WiFi v1.3 (h) | 11.6 | 15 29% | 16.1 39% | 9.5 -18% | 7.3 -37% |
| Reader / Idle (h) | 25.9 | 24.1 | 19.3 | ||
| Load (h) | 1.6 | 2.7 | 3.1 | 1.8 |
Pros
Cons
Verdict

For a no-frills productivity-centered machine, the Latitude 5490 certainly meets most requirements. It features strong application performance, a sturdy, well-built case, wide port selection, excellent input devices, and exceptionally long battery life. It’s also largely quiet and unobtrusive during typical use—so it’s well-suited to an office environment. The advantages that this $1,788 configuration brings over the one we evaluated in March are much faster single-core and marginally faster multi-core performance, a better-performing NVMe SSD, more security features, a backlit keyboard, and a touchscreen. All of these are welcomed (cost notwithstanding—which we’ll discuss in a moment) except for the touchscreen, which makes a bad screen even worse by converting it from a dim, dreary anti-glare panel to a dim, dreary, sometimes nigh-unusable highly-reflective glossy panel. We’ve said it before, but the 5490 desperately needs a much brighter display with an anti-glare finish.
No machine is perfect, and at least in terms of performance and battery life, the Latitude 5490 has few competitors in its class. If only the display were better, we could wholeheartedly recommend it.
Apart from this primary complaint, there are a few other issues: the machine is fairly heavy, it lacks Thunderbolt 3, and the power consumption and surface temperatures are less than ideal. Some competitors—such as both the HP EliteBook 840 G4 and Lenovo ThinkPad T480—handle these items more effectively. Dell’s own Latitude 7490 and 7390 are also excellent (albeit pricier) alternatives to this device which possess very few shortcomings indeed. However, no machine is perfect, and at least in terms of performance and battery life, the Latitude 5490 has few competitors in its class. If only the display were better, we could wholeheartedly recommend it.
Dell Latitude 5490
- 05/12/2018 v6 (old)
Steve Schardein
Price comparison
