Dell XPS 13 9380 2019 (i5-8265U, 256GB, UHD) Subnotebook Review

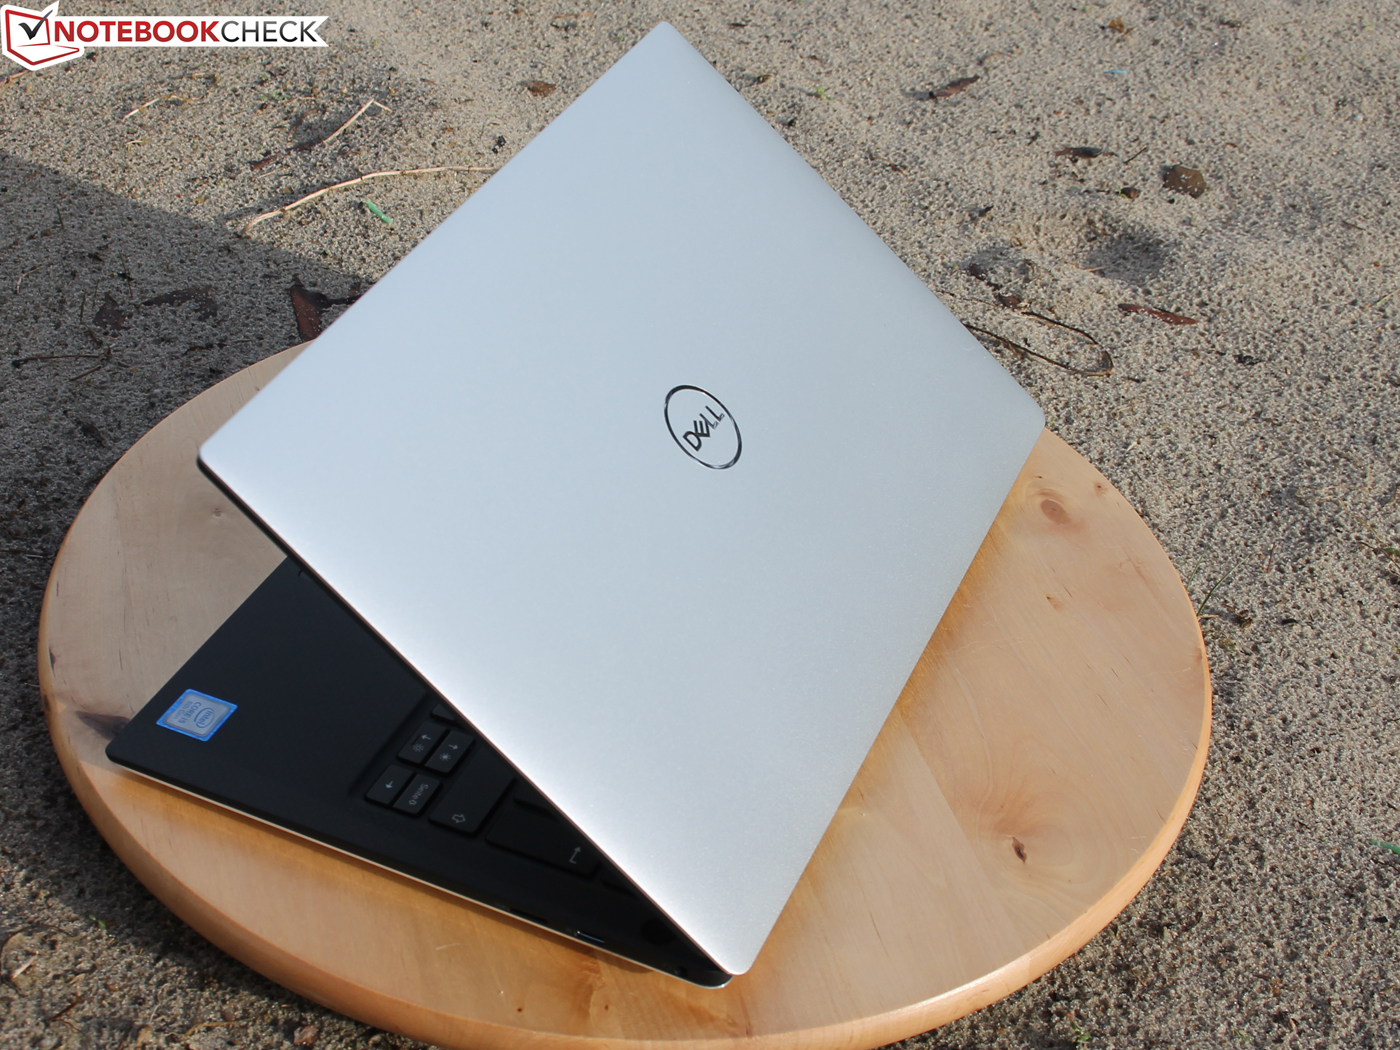
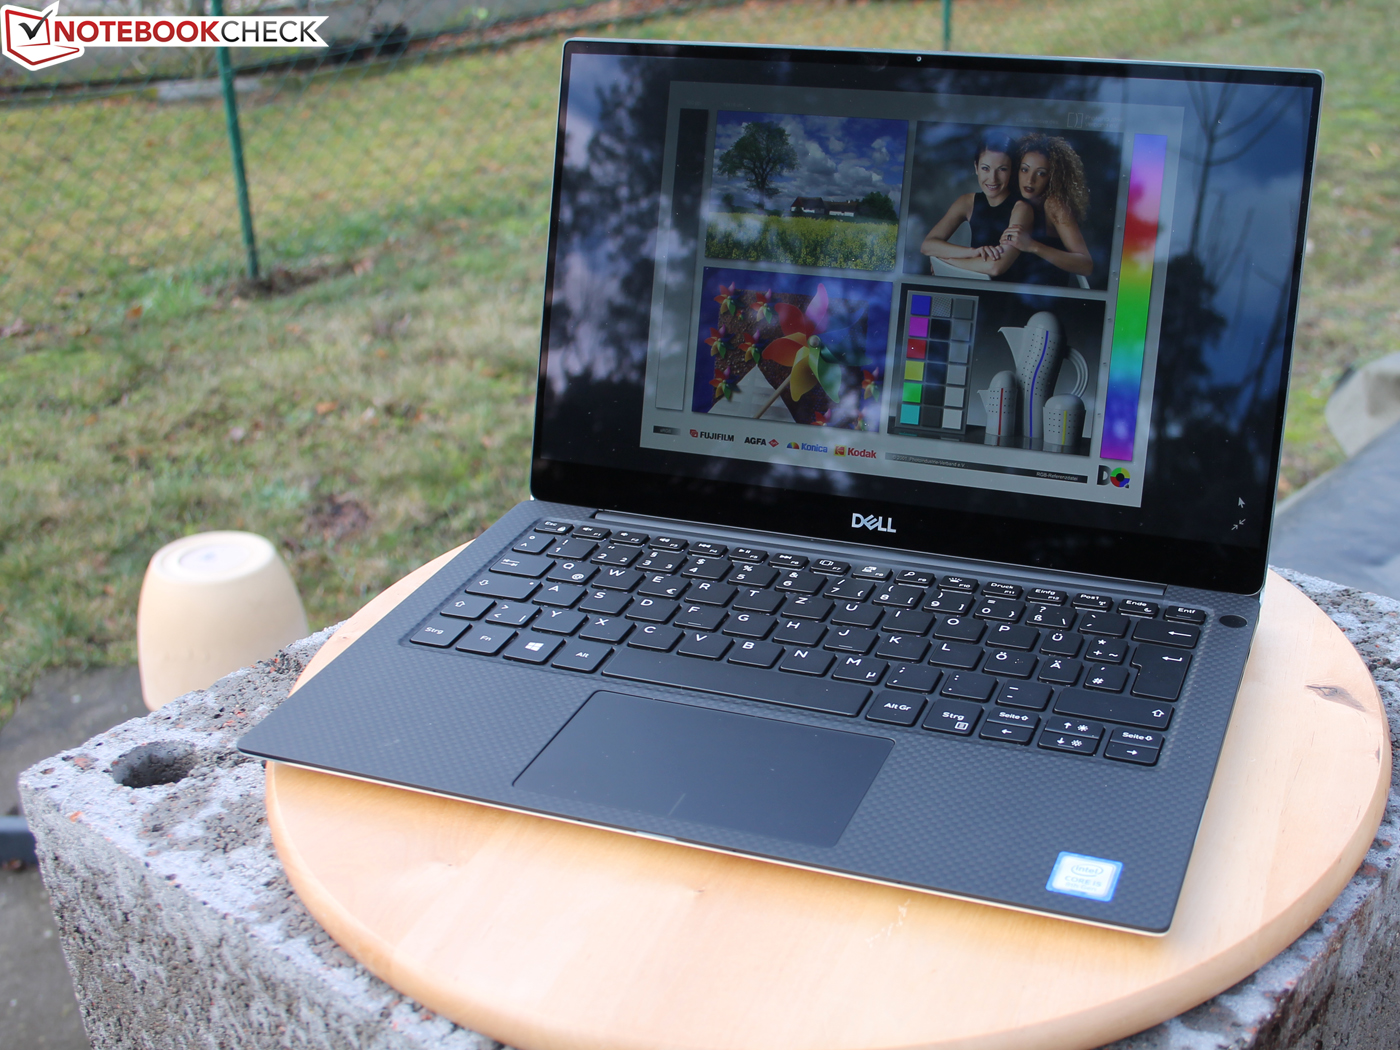
There is a new version of Dell's popular XPS 13. The 13.3-inch device with the footprint of a 12-inch laptop from a few years ago is still one of the thinnest, lightest, and most mobile working devices you can currently get. Dell targets mobile power users and enthusiasts with its XPS lineup, and there is no shortage of competitors from Apple, Lenovo, HP, Huawei, or Fujitsu. The air has become thin in the subnotebook market.
We check the mainstream SKU of the new XPS 13 9380 with a Whiskey Lake Core i5-8265U, 8 GB RAM, 265 GB SSD storage (SK Hynix, NVMe), and a touch panel with 3840x2160 pixels. Dell currently offers this spec for 1600 Euros (~$1829).
We will update this live review over the next couple of days. We are looking forward to your feedback and you can tell us specific aspects you would like us to check. What do you want to know and what should we test in addition to our standard benchmark suite?
Changelog:
- 01/30/2019: CPU performance: Whiskey Lake comes out on top, but only under sustained workloads!
- 01/31/2019: Case, build quality, rating, ports, communication, webcam, input devices
- 02/01/2019: Display
- 02/04/2019: Power consumption, speakers, emissions, GPU, verdict
Dell still sells the predecessor 9370 and some retailers still have the older 9360 in stock, so we also recommend checking out our previous reviews of the XPS 13:
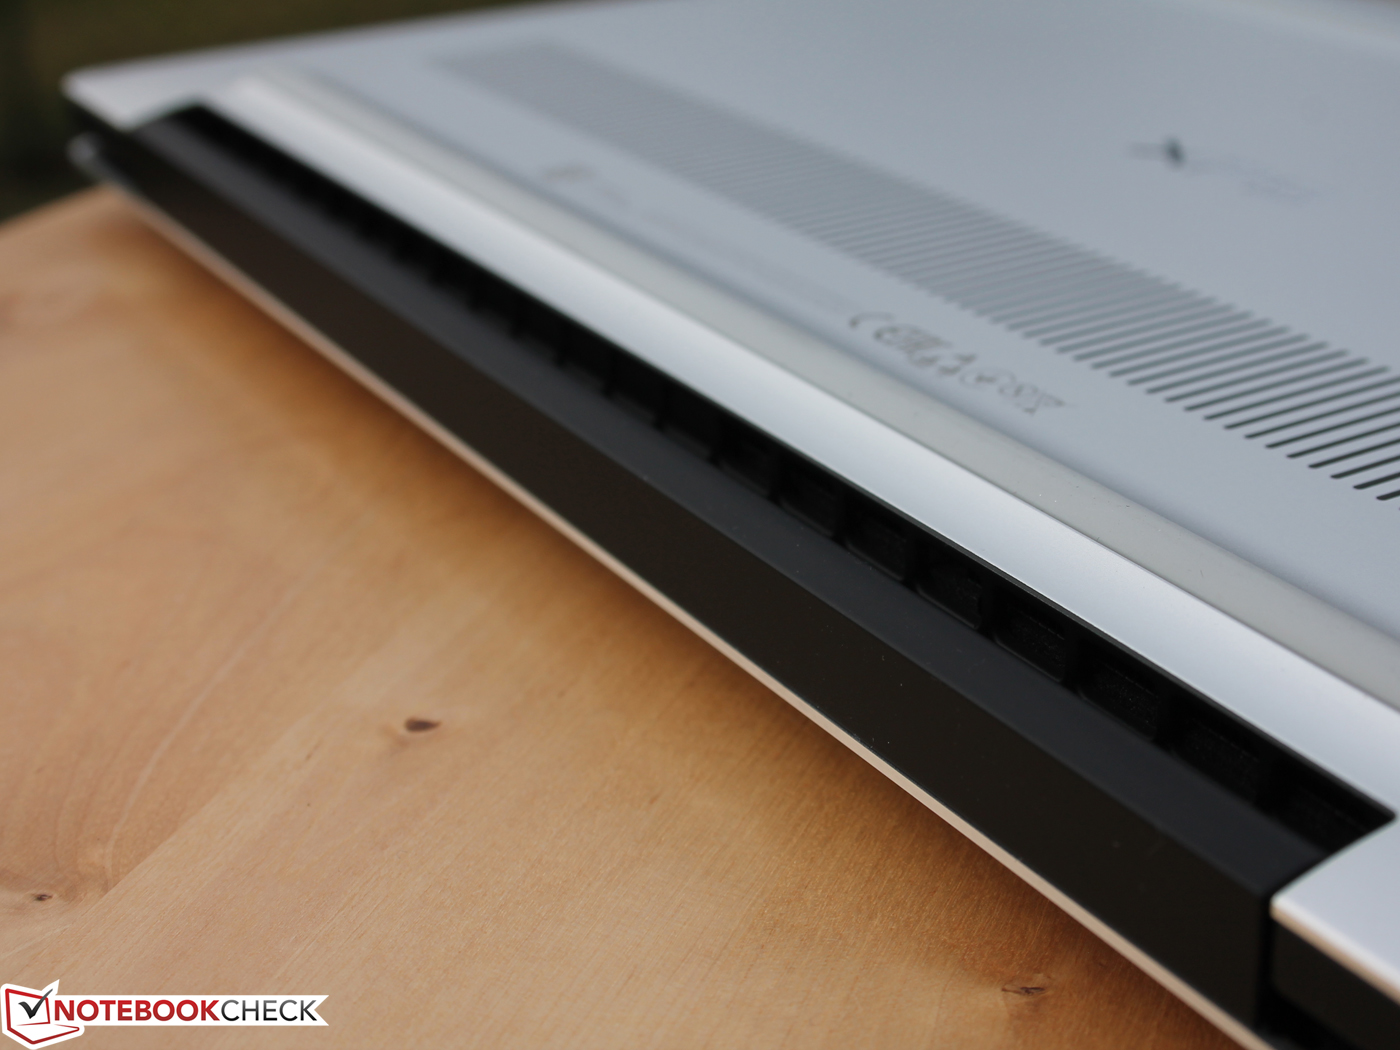
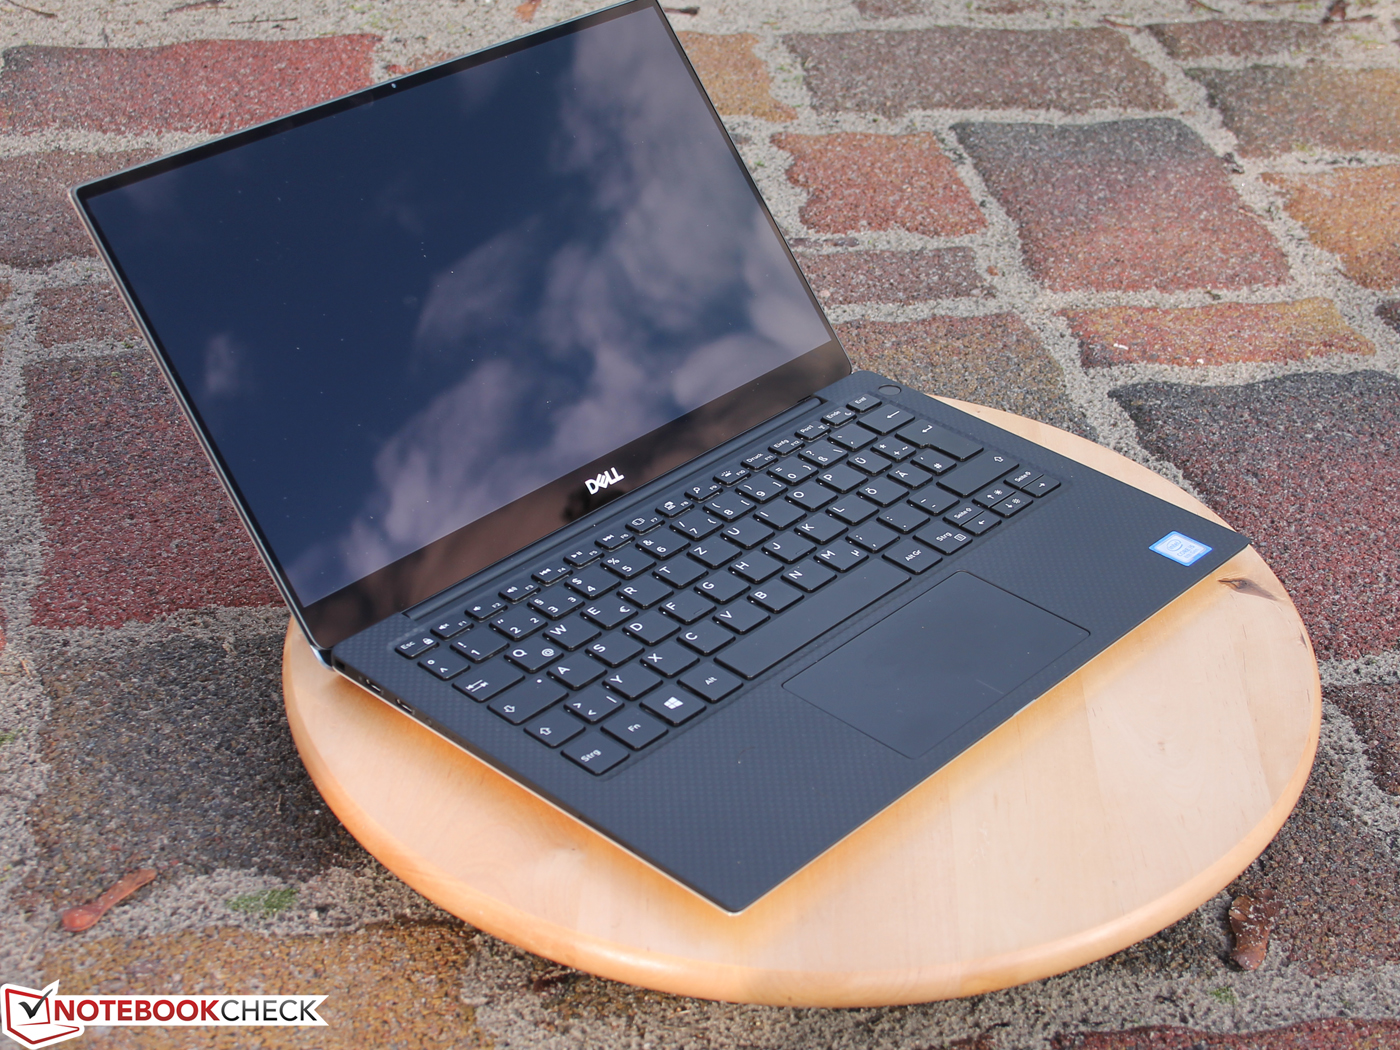
Case – Webcam is back at the top of the XPS 13
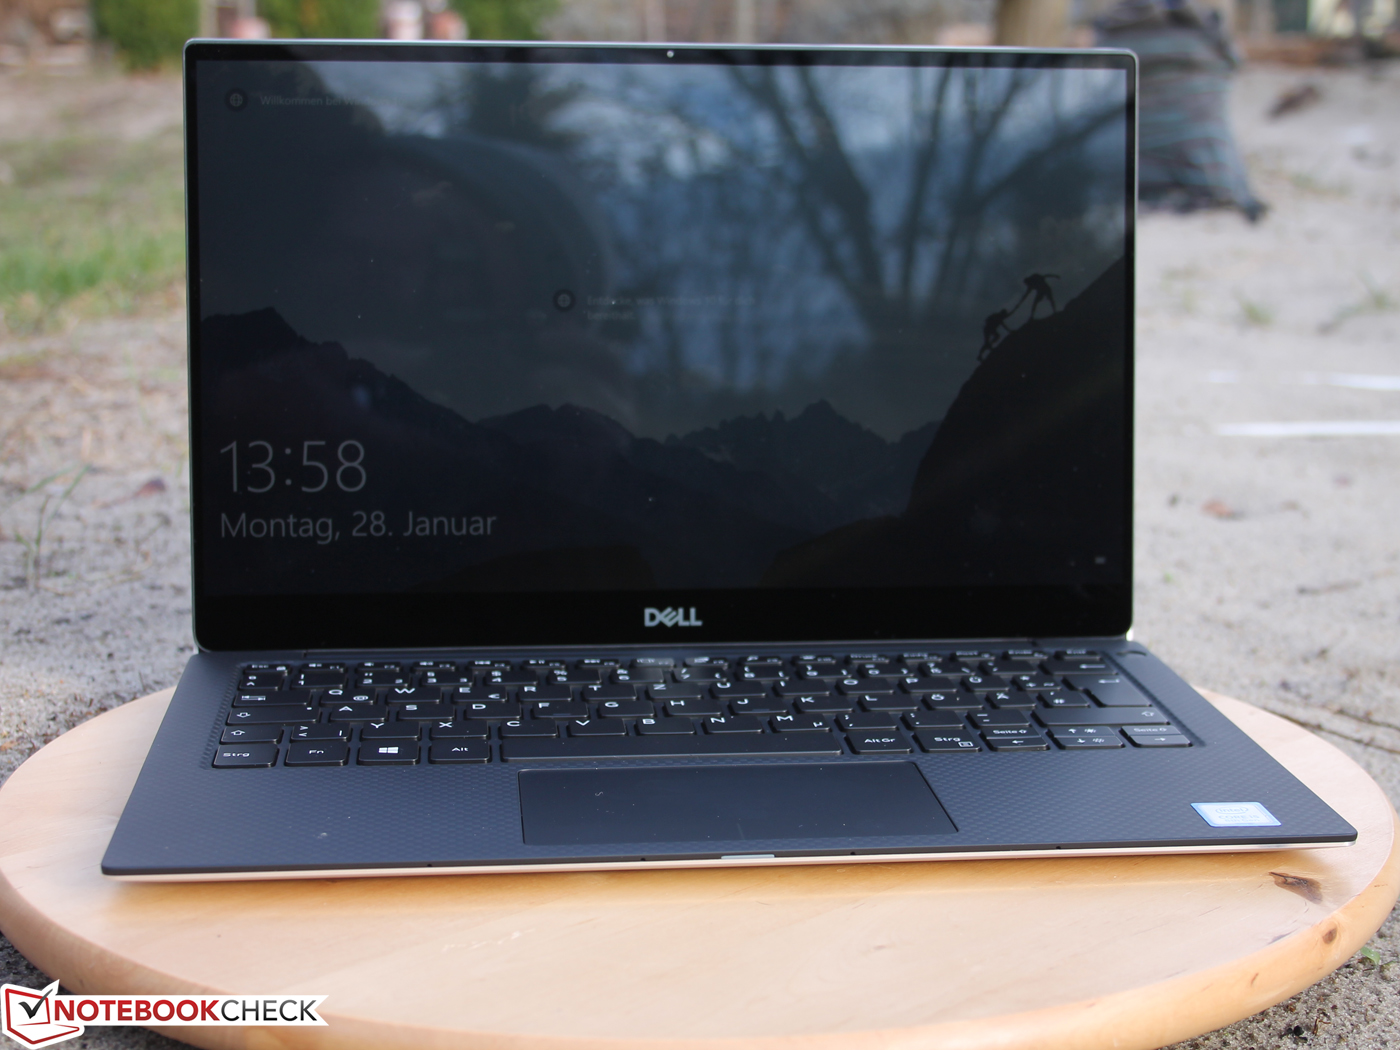
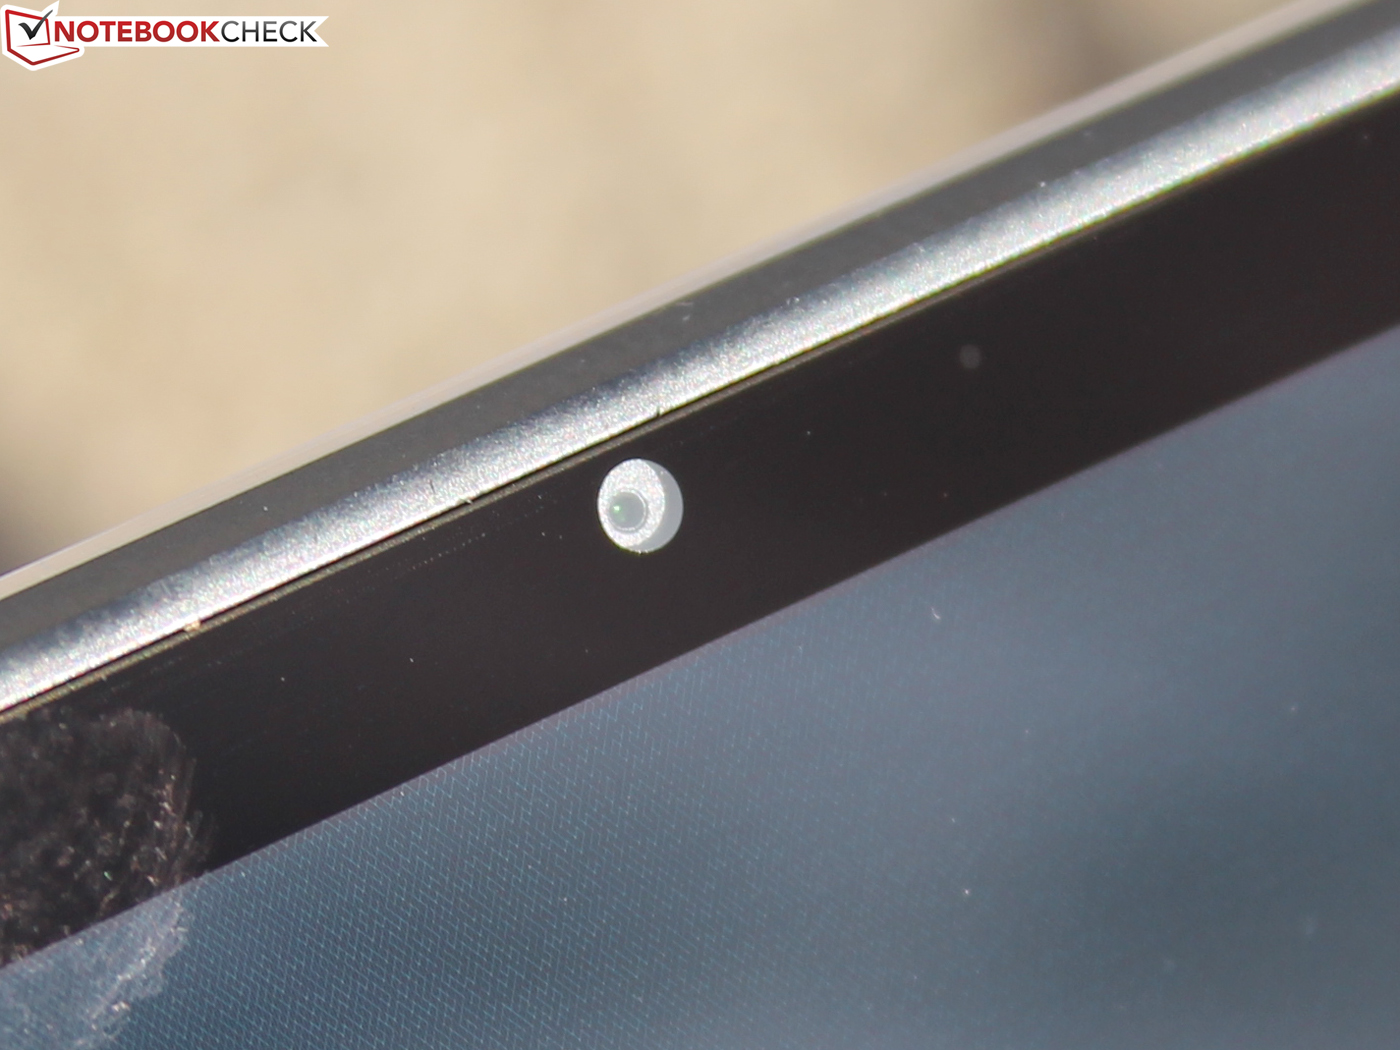
Dell put the webcam back at the top of the screen, which will be good news for many users. The manufacturer used an extremely small webcam module, which is hardly visible. Right next to the webcam is a tiny white LED that lights up when the webcam is active.
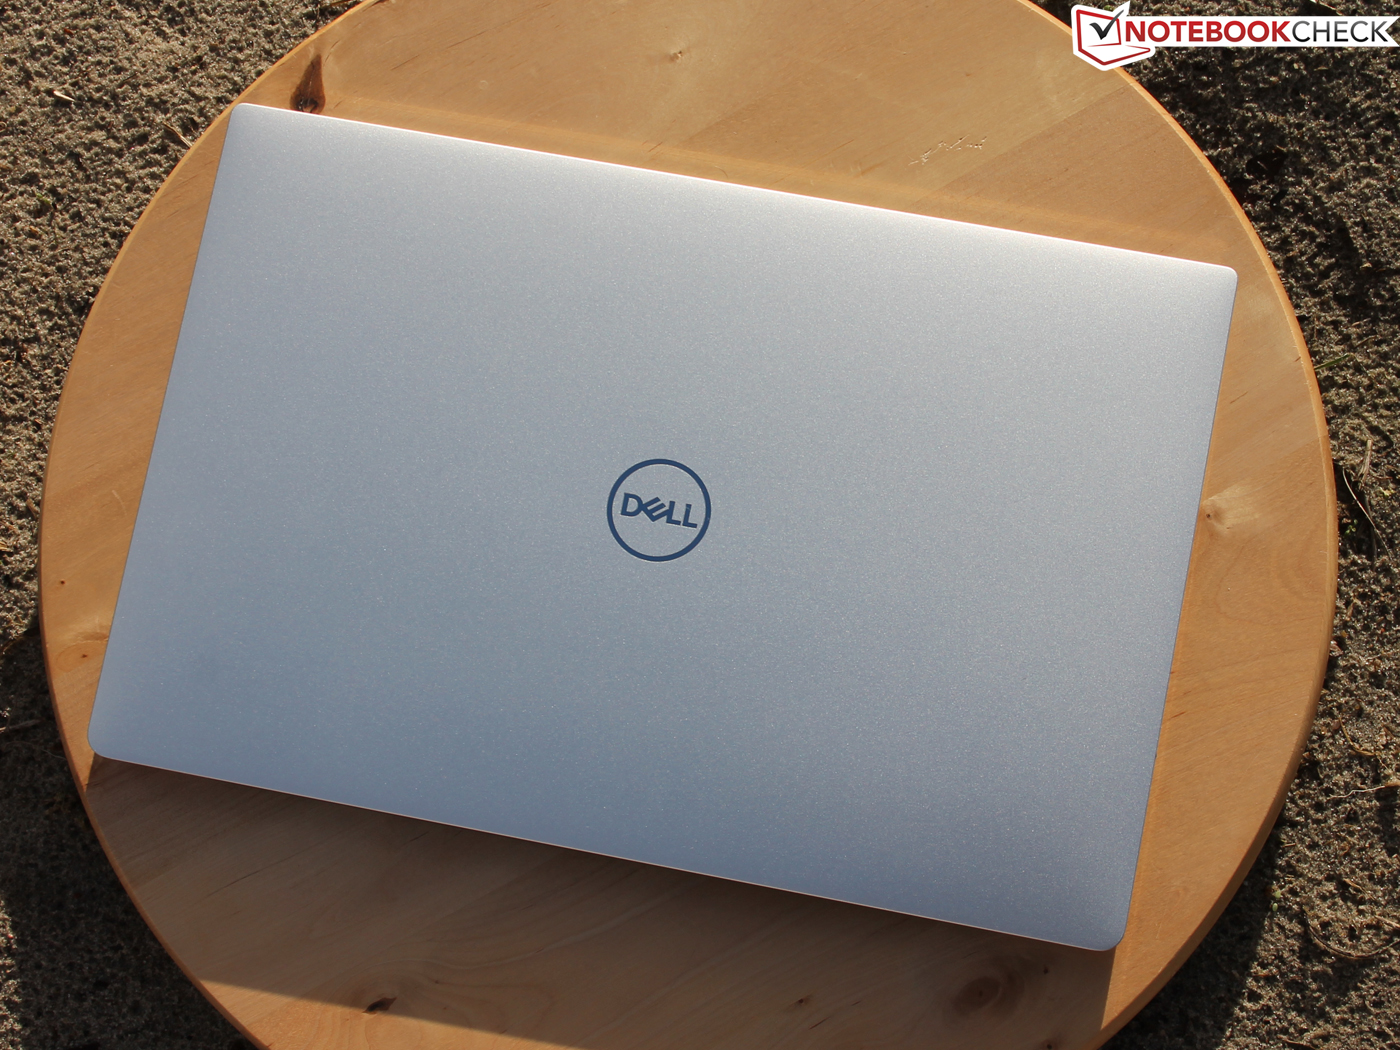
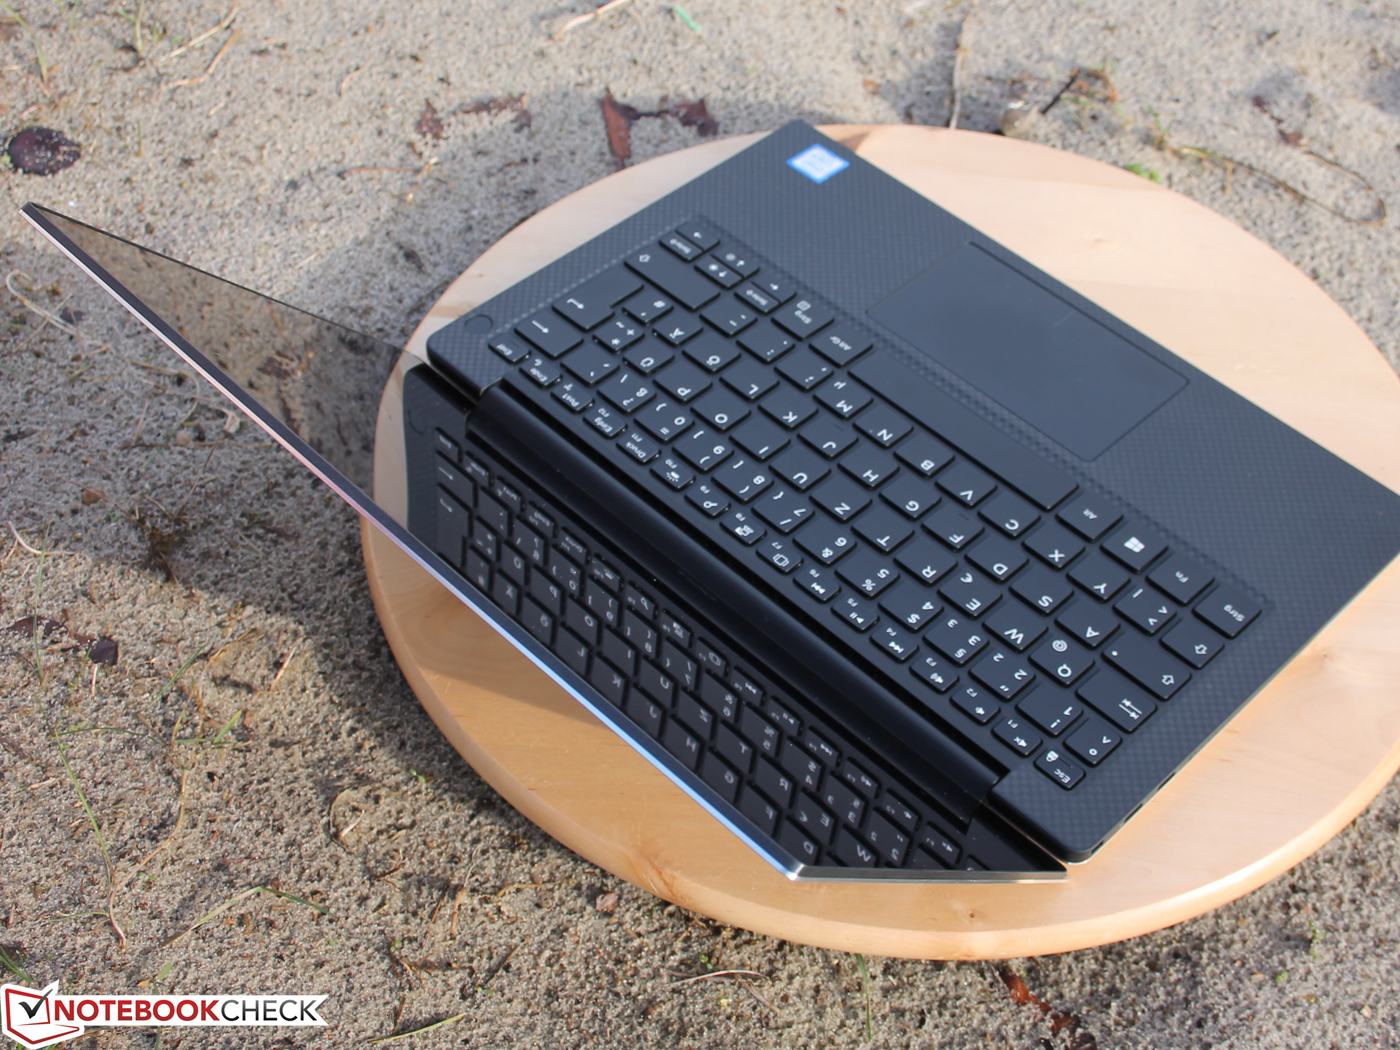
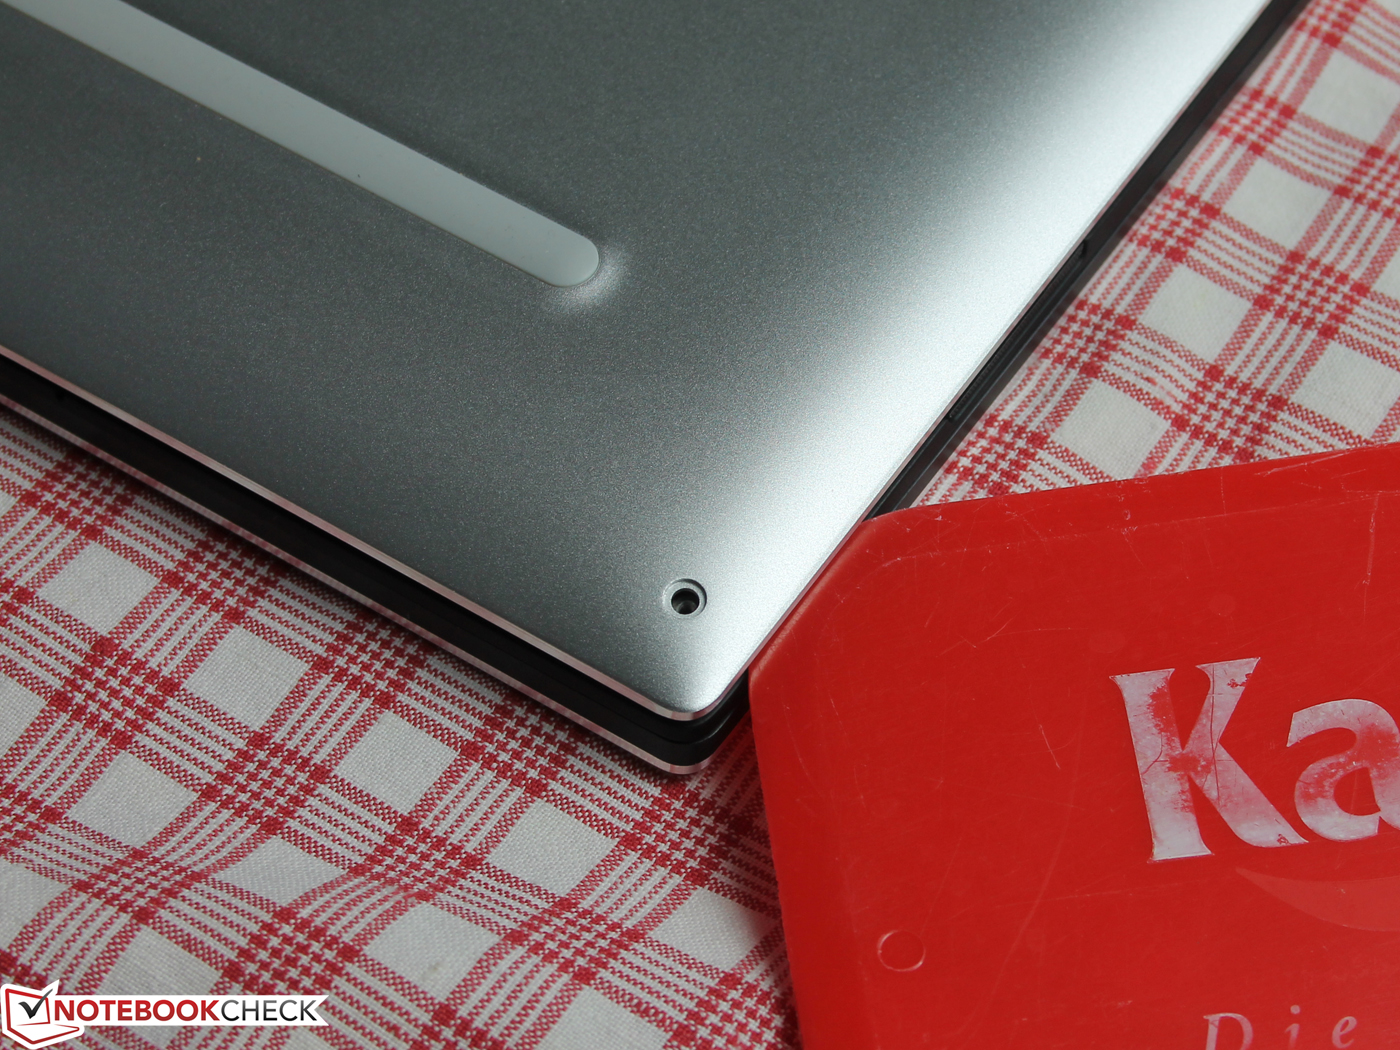
Dell introduced a new color for the 2018 XPS 13: rose gold. It is still available, while the more common choice is the silver version (our test unit). The lid is matte and made of magnesium. The palm rests have a carbon-fiber finish. It is smooth to touch but is still velvety and provides good grip. The advantage of this dark surface is that fingerprints are only an issue when you have very greasy fingers.
The optional color version differs a bit, because it has an aluminum lid in this color and palm rests made of woven glass fiber in Arctic White. We used a 9370 in this color and know that it does not attract dirt any worse than the black model, but the dirt is more visible. This model definitely requires more cleaning.
You will have to clean the white gaps between the keys on the rose-gold SKU from time to time. This is no problem, though, since pressed keys are flush with the keyboard frame.
Dell does not offer any other colors for the XPS 13, only silver and rose-gold (in combination with white surfaces).
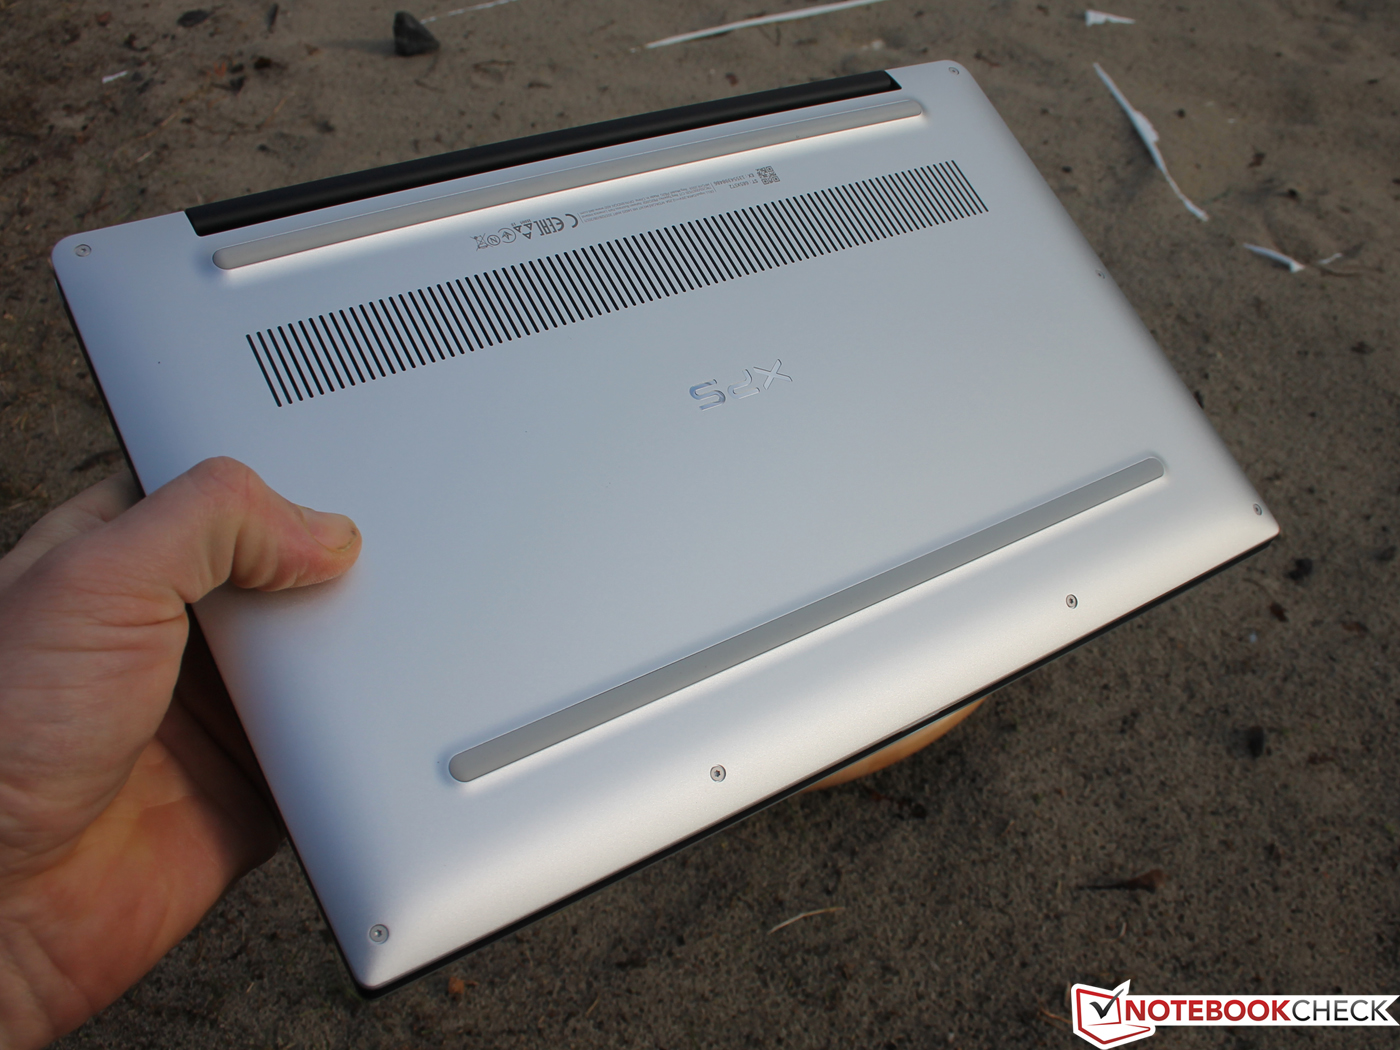
The stability of the base unit and the screen is excellent. Pressure from behind is no problem for the screen and even concentrated pressure at the center does not result in a distorted picture. There is only minor twisting when we try really hard, while the base unit itself is extremely sturdy. We did not hear any creaking sounds when we tried to twist it. We cannot even dent the bottom cover, which is secured by Torx screws. All in all, Dell delivers a very sturdy and well-built device.
The competitors are pretty even in terms of weight, the only exception is the Fujitsu LifeBook U930 at just 930 grams. However, the latter has a more flexible lid in return, but the base is very sturdy and well-built. If you want an extremely light device: The LG Gram 13 (0.939 kg) and the Samsung Notebook 9 (0.817 kg) are comparable to the Fujitsu.
It looks like Dell did not try to make the XPS 13 as light as possible but preferred stability and the resulting high-quality impression instead. This is also the case for Apple's MacBook Pro 13 2018 at 1.4 kg, even though our XPS 13 is a bit lighter at 1.22 kg. The weight did not change compared to last year's model. You can see why when you open the chassis, because the internal layout of the two devices, including the motherboard, battery, and cooling, is identical.
The XPS 13 with the 1080p screen is slightly lighter at 1.21 kg due to the lack of a touchscreen.
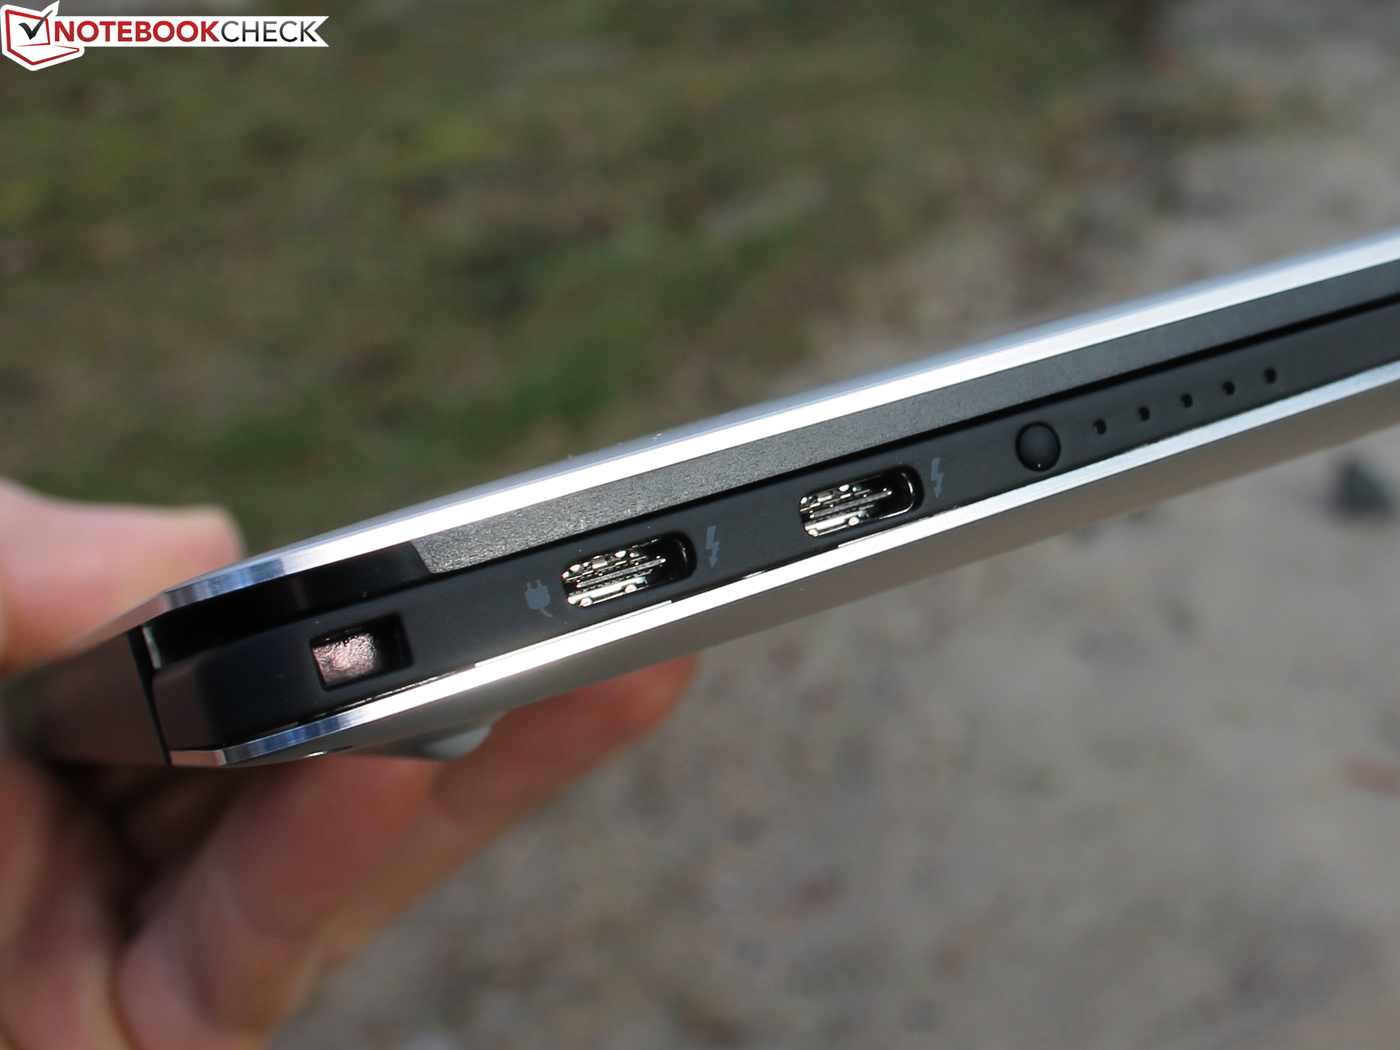
Connectivity – XPS Ultrabook with Thunderbolt 3
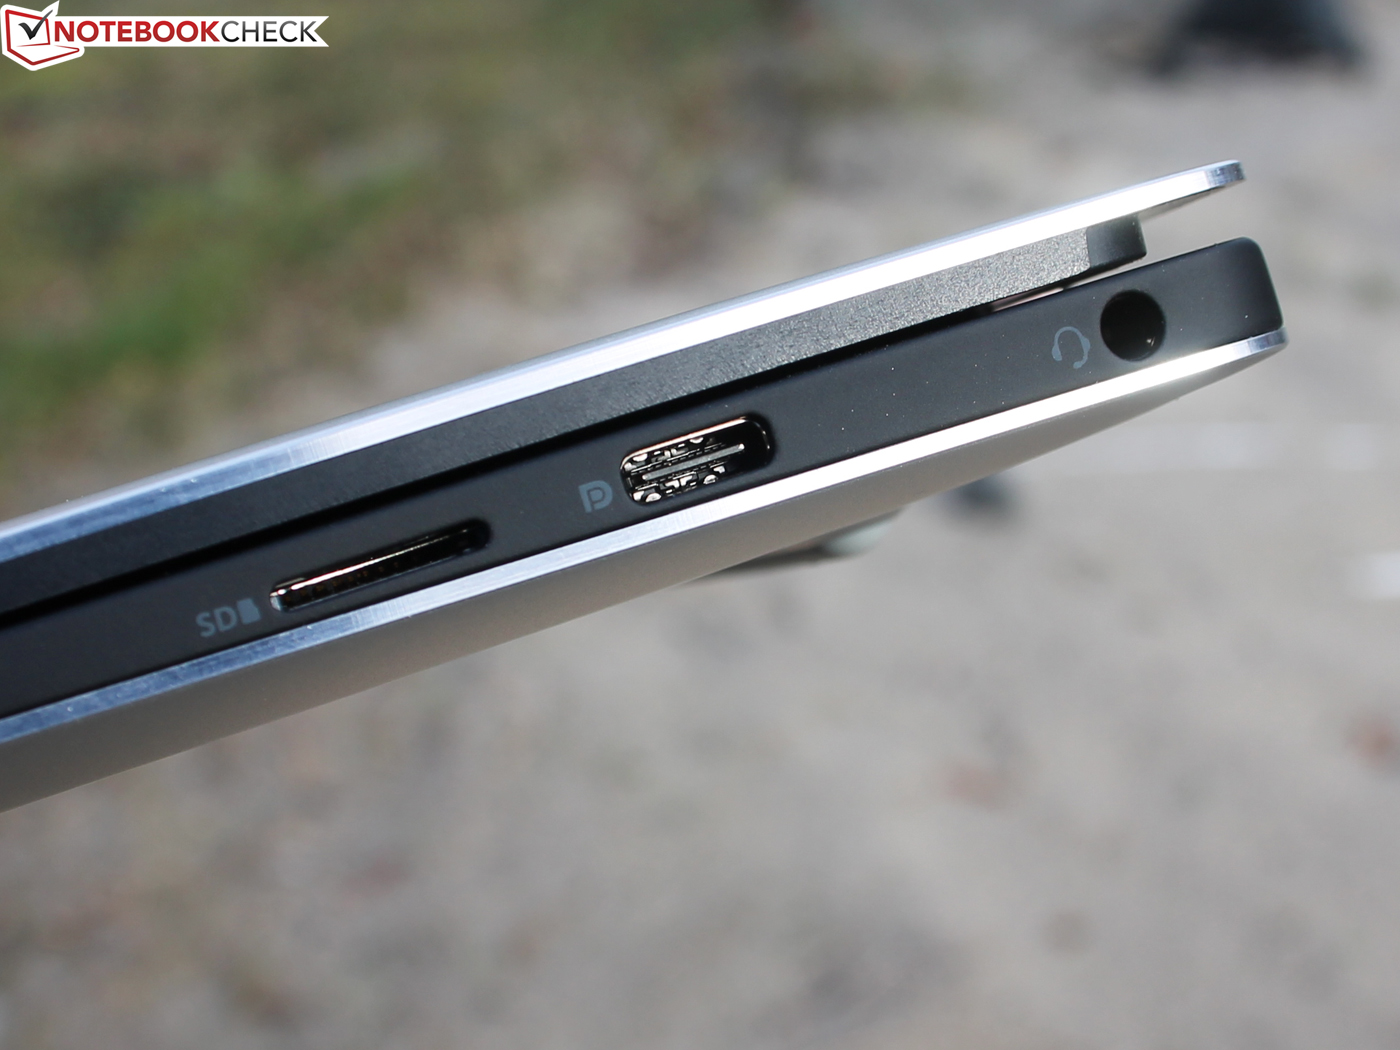
We are already familiar with the situation from the 9370: The standard USB ports as well as the full-size SD reader have been replaced by three USB-C ports and a microSD reader. This is not uncommon for slim laptops, including the MateBook 13 (15 mm) or the Apple MacBook Pro 13 2018 (15.5 mm).
If you prefer a wider selection of ports, you have to get a laptop with a thicker case. Models like the HP EliteBook 830 G5 as well as the Envy 13 and the ThinkPad X280 offer ports like USB Type-A, HDMI, and even Ethernet, but at the cost of thicker cases at 18, 15, and 17 mm, respectively, compared to 12 mm for the XPS 13.
Fujitsu's LifeBook U938 offers a pretty good compromise between slim chassis (15.5 mm) and older ports (HDMI, USB Type-A, RJ45).
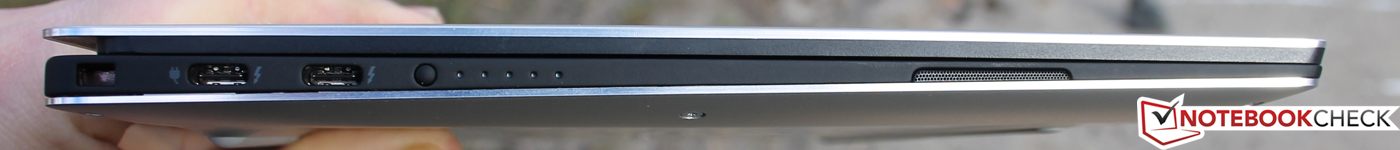
The two Thunderbolt 3 ports share a single PCIe-x4 connection (3rd gen 4-lane PCI-Express). All three USB ports can be used for charging, and the two Thunderbolt 3 connectors can double as video outputs (DisplayPort via adapter), so you can attach two external screens.
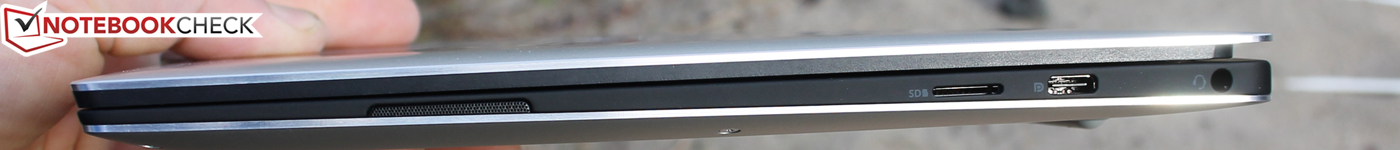
SD Card Reader
We use our reference card from Toshiba (Exceria Pro SDXC 64 GB UHS-II) to test the performance of the microSD reader. The maximum transfer rate is 192 MB/s when we copy large files, while typical jpeg images (about 5 MB each) are transferred at 184 MB/s.
These are excellent results and easily beat the competition (if they have a card reader) and is similar to the predecessor, while laptops like the Huawei MateBook 13 or Apple MacBook Pro 13 2018 do not have a card reader at all.
The microSD card is not completely flush with the chassis and protrudes by ~1 mm, which is no problem when you transport the device.
| SD Card Reader | |
| average JPG Copy Test (av. of 3 runs) | |
| Dell XPS 13 9380 2019 (Toshiba Exceria Pro SDXC 64 GB UHS-II) | |
| Dell XPS 13 9370 FHD i5 (Toshiba Exceria Pro M501 64 GB UHS-II) | |
| Dell XPS 13 9370 i7 UHD (Toshiba Exceria Pro UHS-II) | |
| Fujitsu Lifebook U938 (Toshiba Exceria Pro SDXC 64 GB UHS-II) | |
| HP Envy 13-ah0003ng (Toshiba Exceria Pro M501 microSDXC 64GB) | |
| Lenovo ThinkPad X280-20KES01S00 (Toshiba Excerie Pro M501) | |
| Average of class Subnotebook (23.7 - 188, n=9, last 2 years) | |
| maximum AS SSD Seq Read Test (1GB) | |
| Dell XPS 13 9370 i7 UHD (Toshiba Exceria Pro UHS-II) | |
| Dell XPS 13 9370 FHD i5 (Toshiba Exceria Pro M501 64 GB UHS-II) | |
| Dell XPS 13 9380 2019 (Toshiba Exceria Pro SDXC 64 GB UHS-II) | |
| Fujitsu Lifebook U938 (Toshiba Exceria Pro SDXC 64 GB UHS-II) | |
| Average of class Subnotebook (24.9 - 195, n=8, last 2 years) | |
| Lenovo ThinkPad X280-20KES01S00 (Toshiba Excerie Pro M501) | |
| HP Envy 13-ah0003ng (Toshiba Exceria Pro M501 microSDXC 64GB) | |
Communication
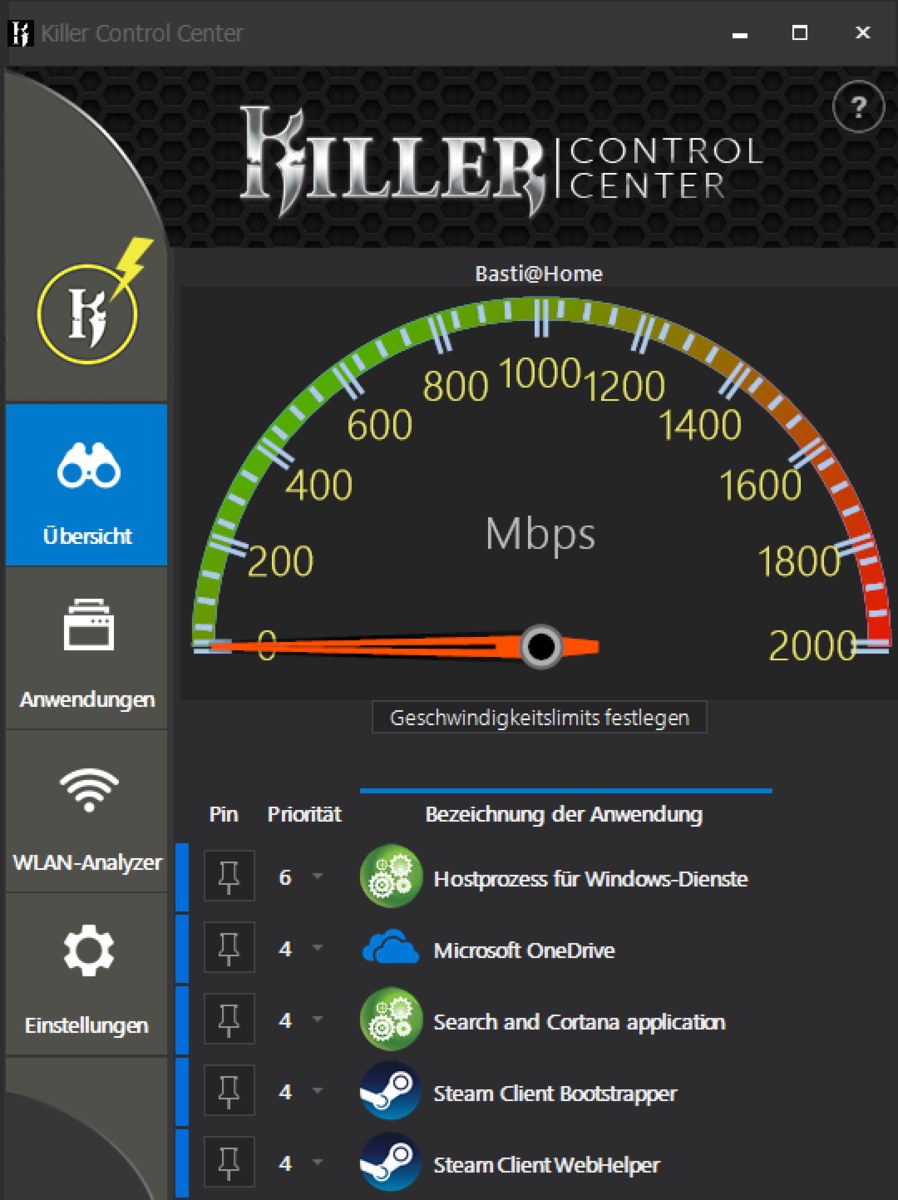
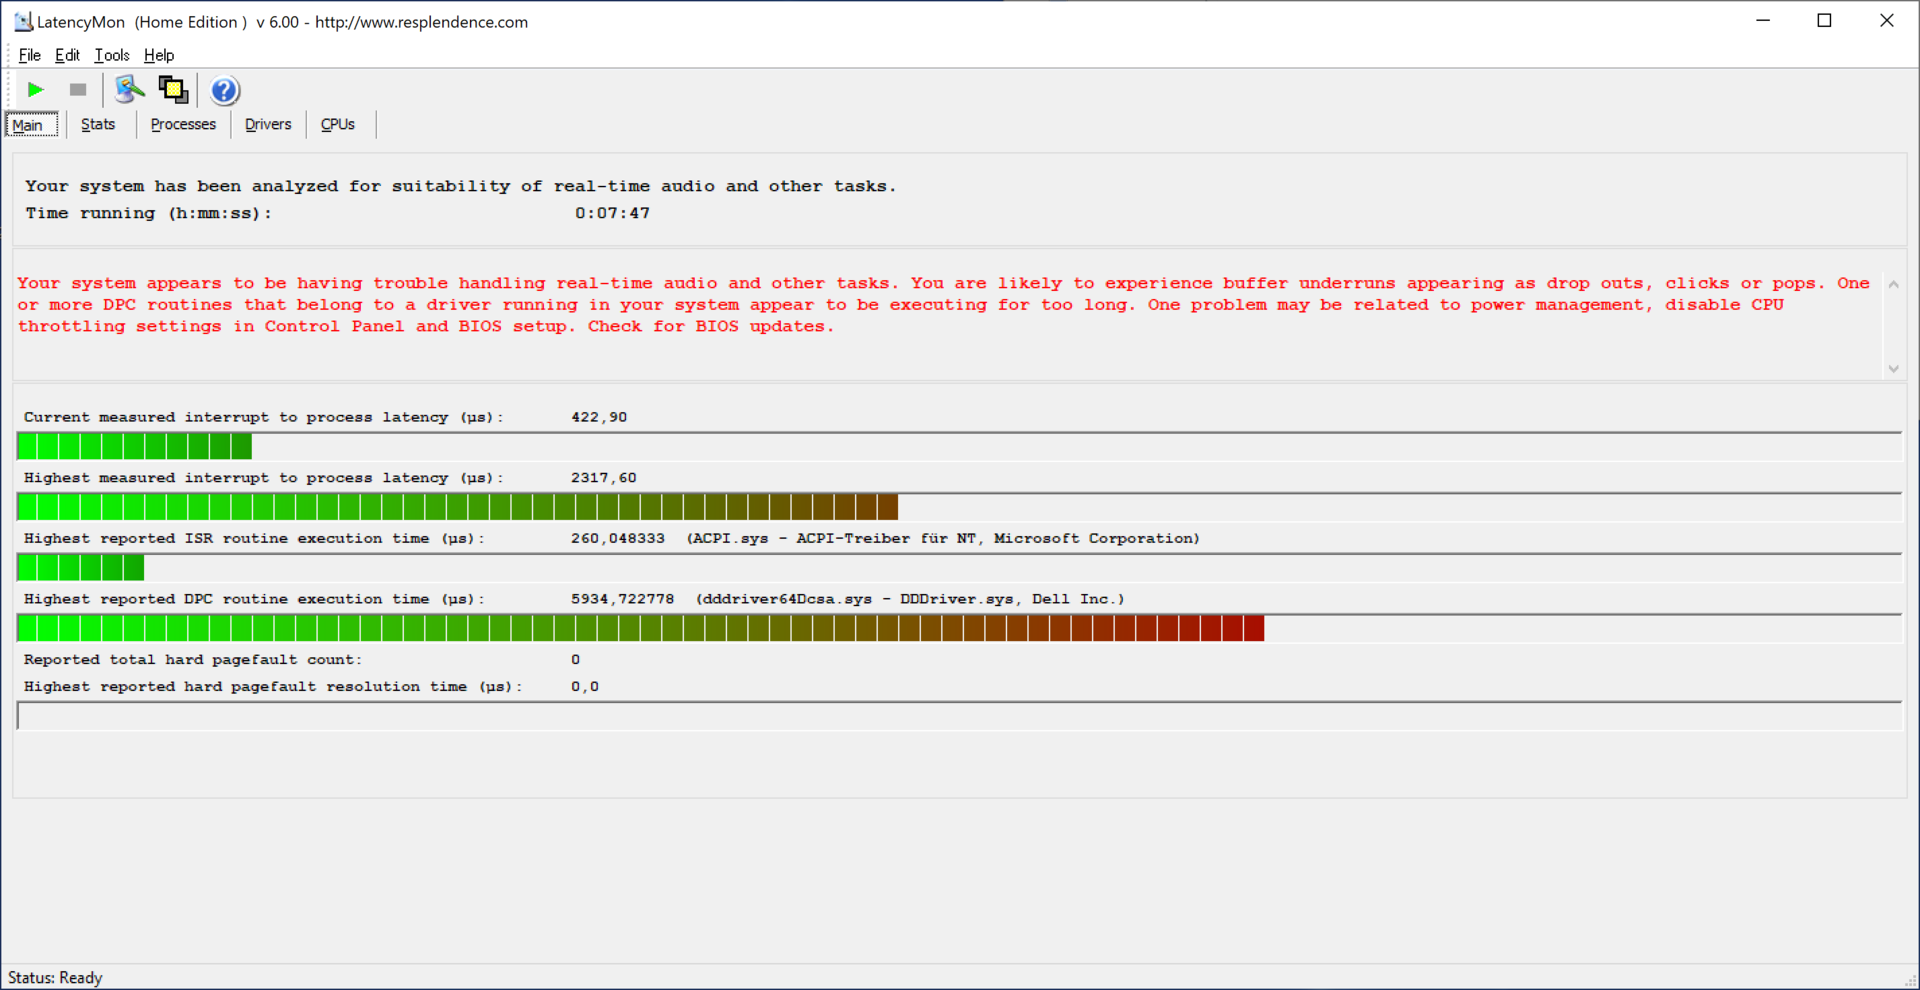
Dell ships its new XPS 13 with the Wi-Fi module Killer 1435 by default. HWiNFO shows the Atheros/Qualcomm QCA6174 (ac), which supports Bluetooth 4.2 + HS according to the spec sheet. The chip supports MU-MIMO technology with 2x2 antennas. The transfer rates are lower compared to the Apple MacBook Pro 13 2018 or the Lenovo ThinkPad X280. Otherwise, we did not have any issues in combination with our test router Linksys EA8500.

Webcam
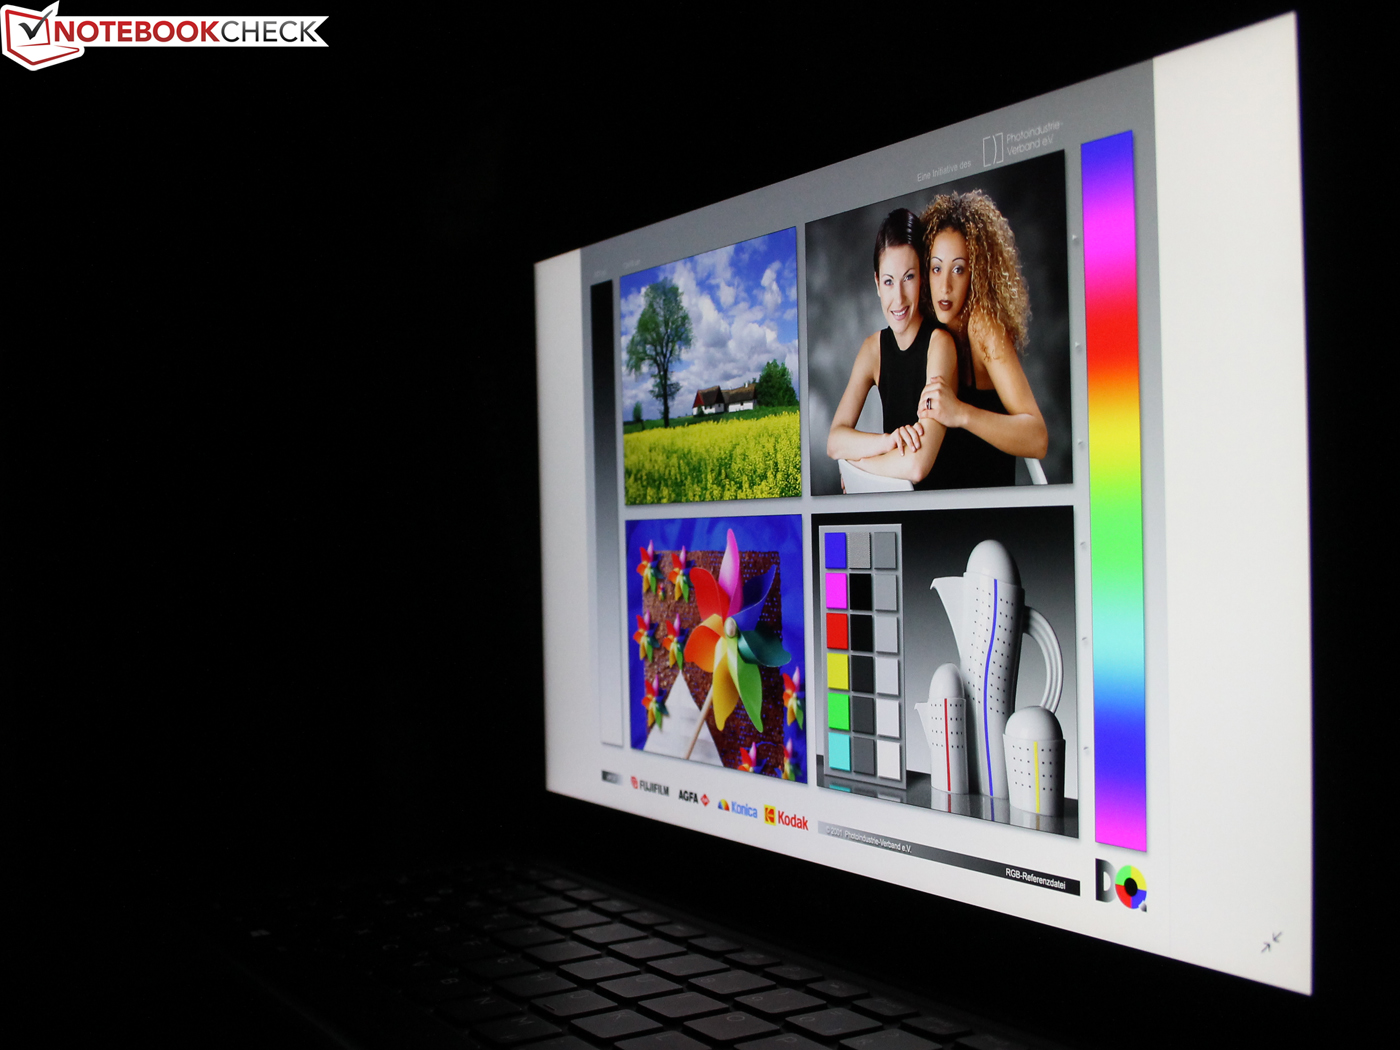
After many complaints from users, Dell put the webcam back on top of the screen. However, the quality of the tiny module did not improve, and the resolution is still stuck at 1280x720 pixels. Images are washed-out and the quality is only sufficient for basic video chats. Colors look pretty real, but the camera has problems with edges and surface structures, they look washed-out and lack any form of structure (see wooden flower).


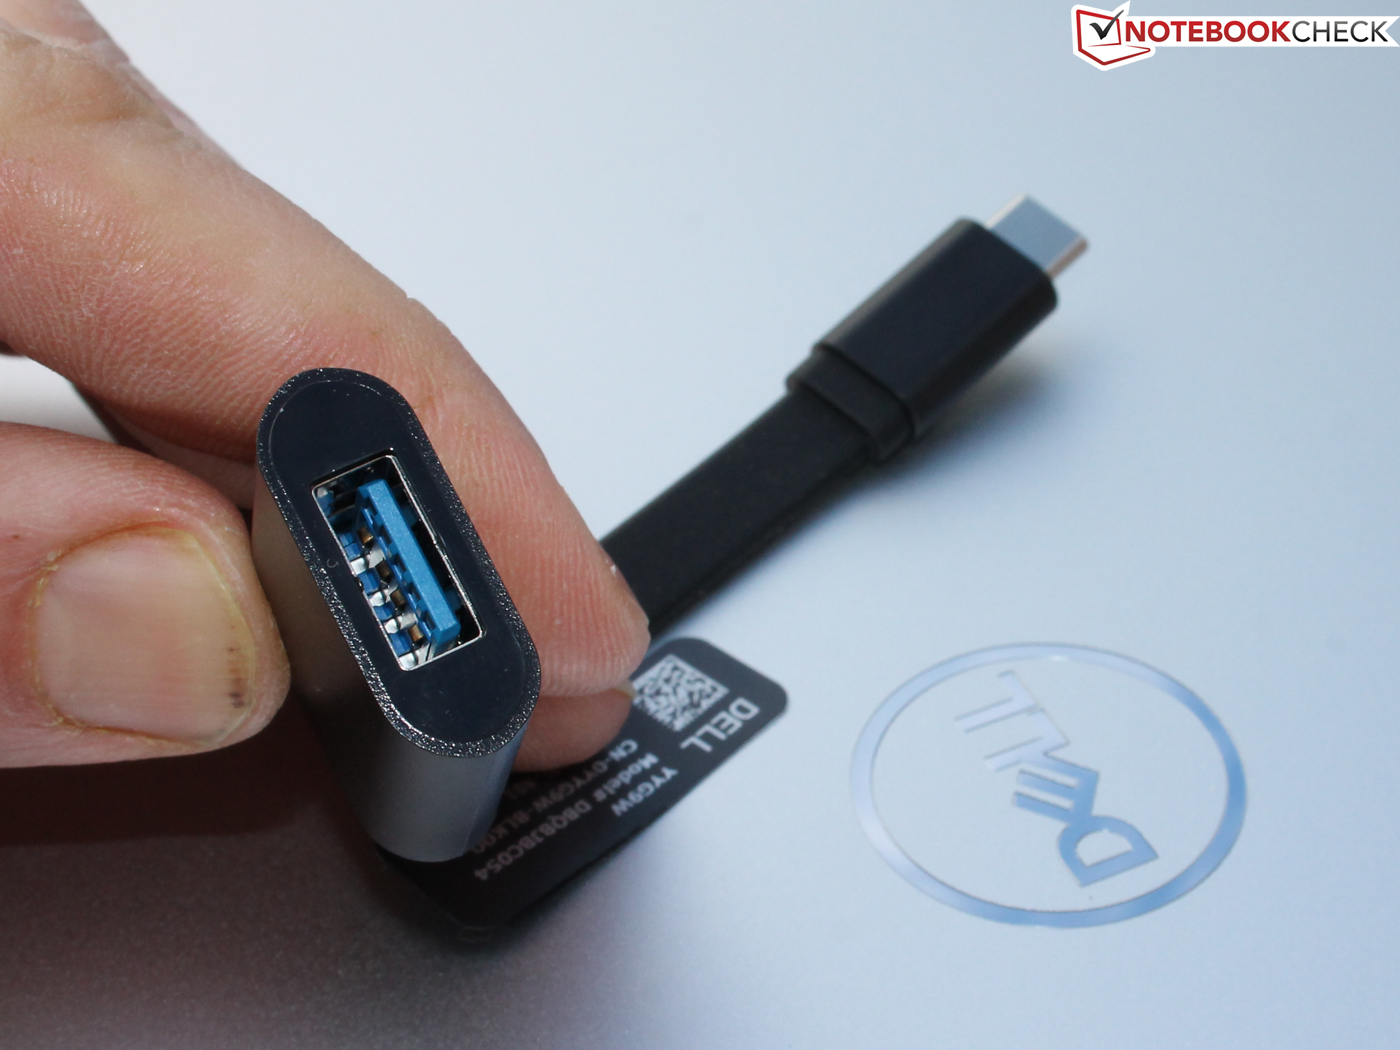
Accessories
The box includes a small USB-C/USB-A adapter as well as a quick-start guide. Dell does not include a protective sleeve or a cleaning cloth.
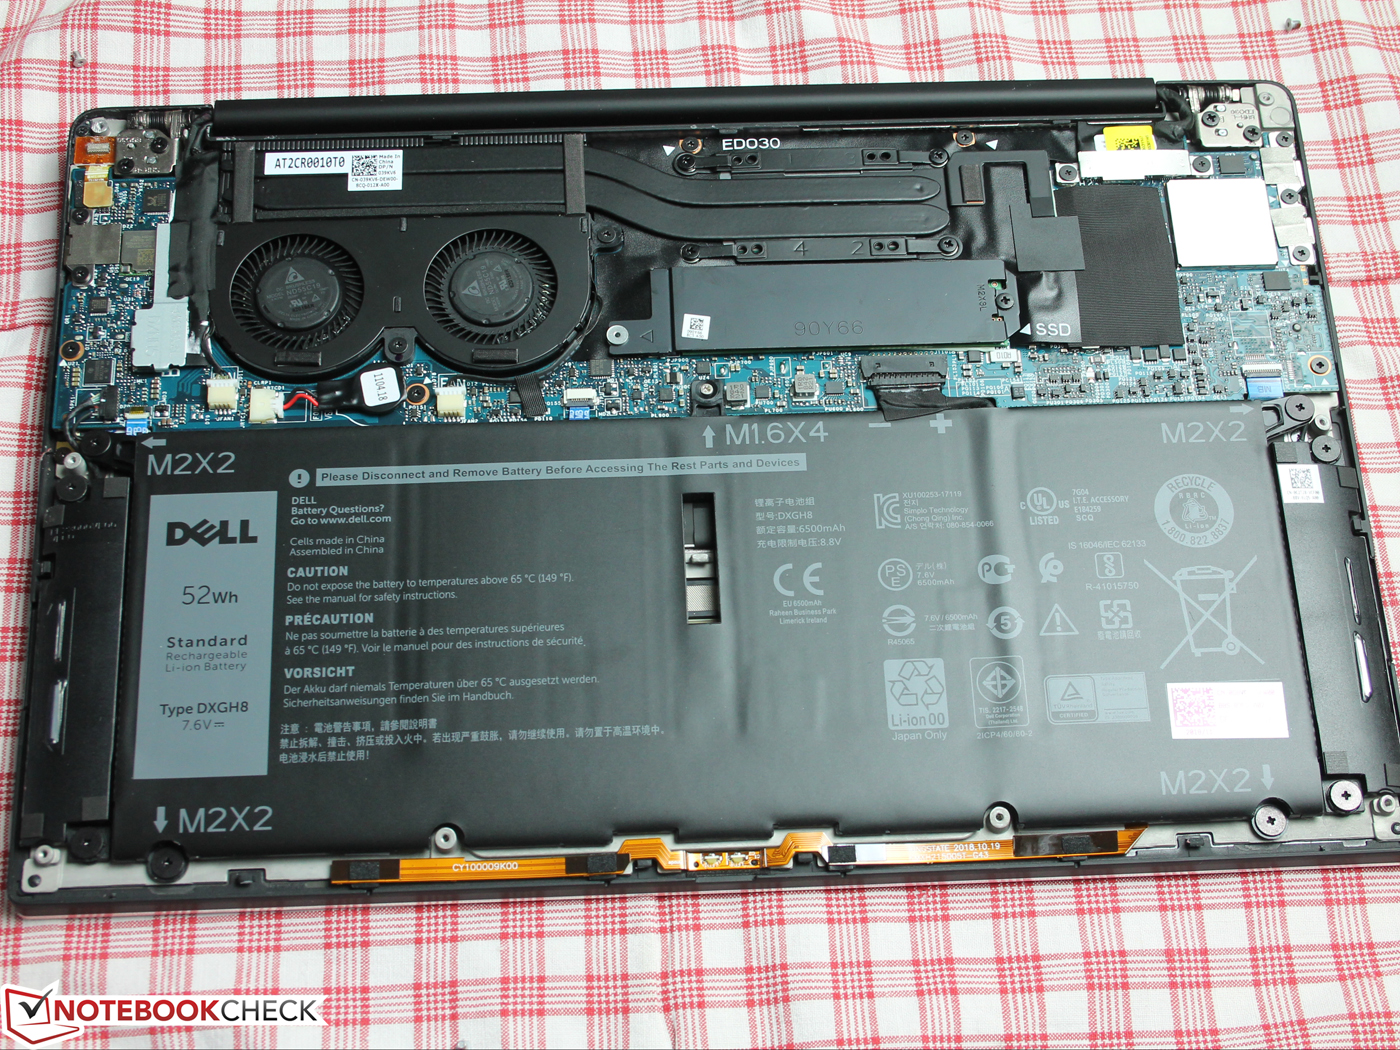
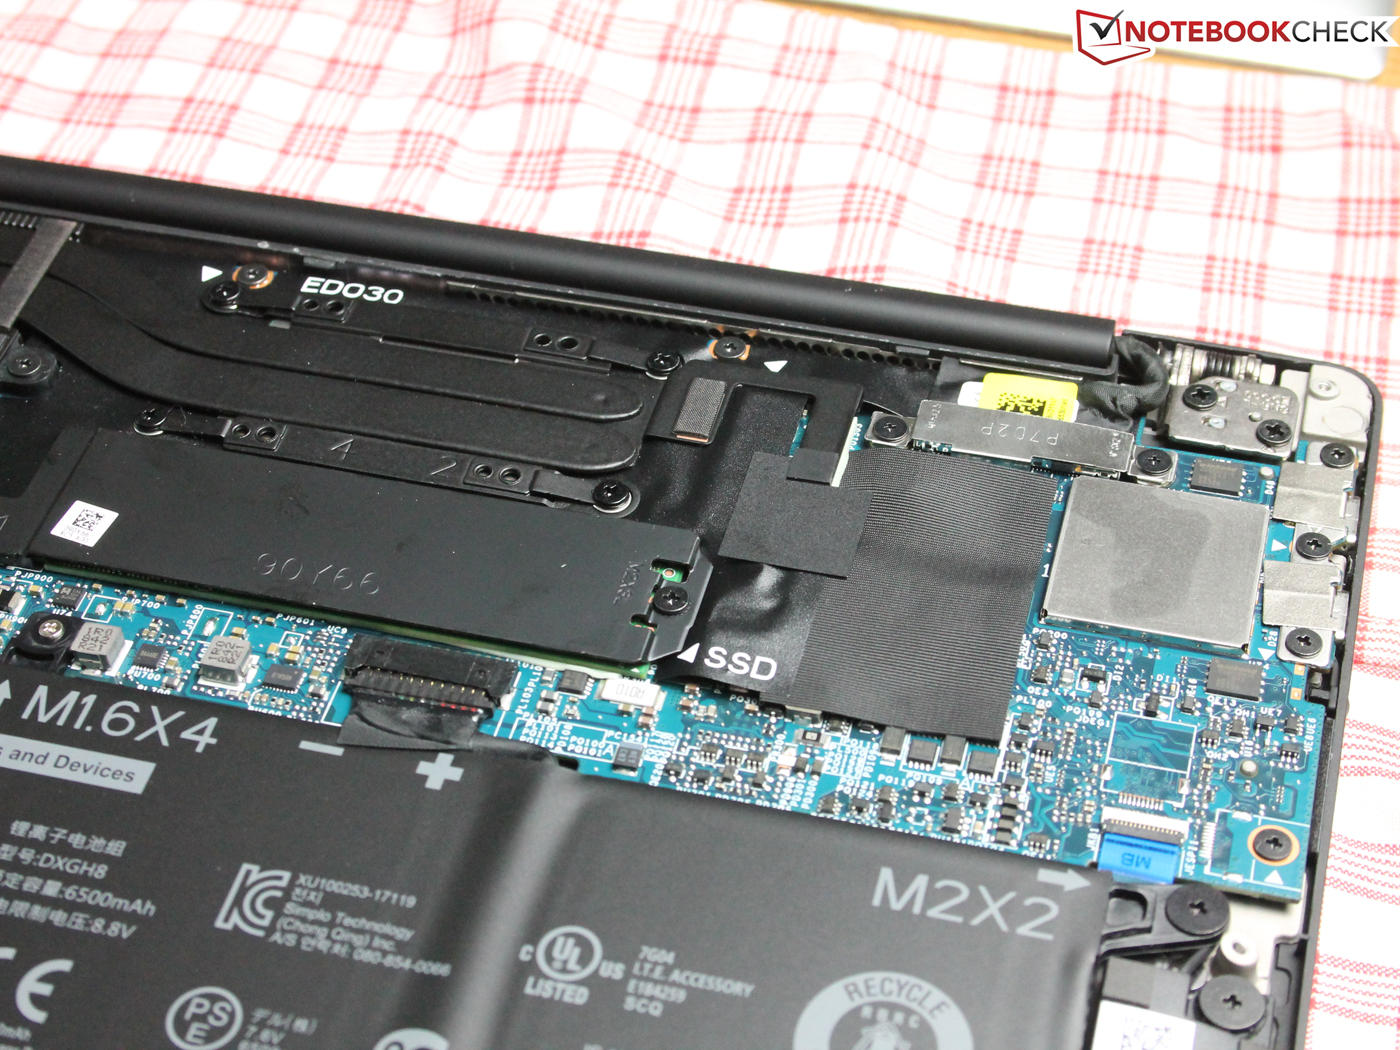
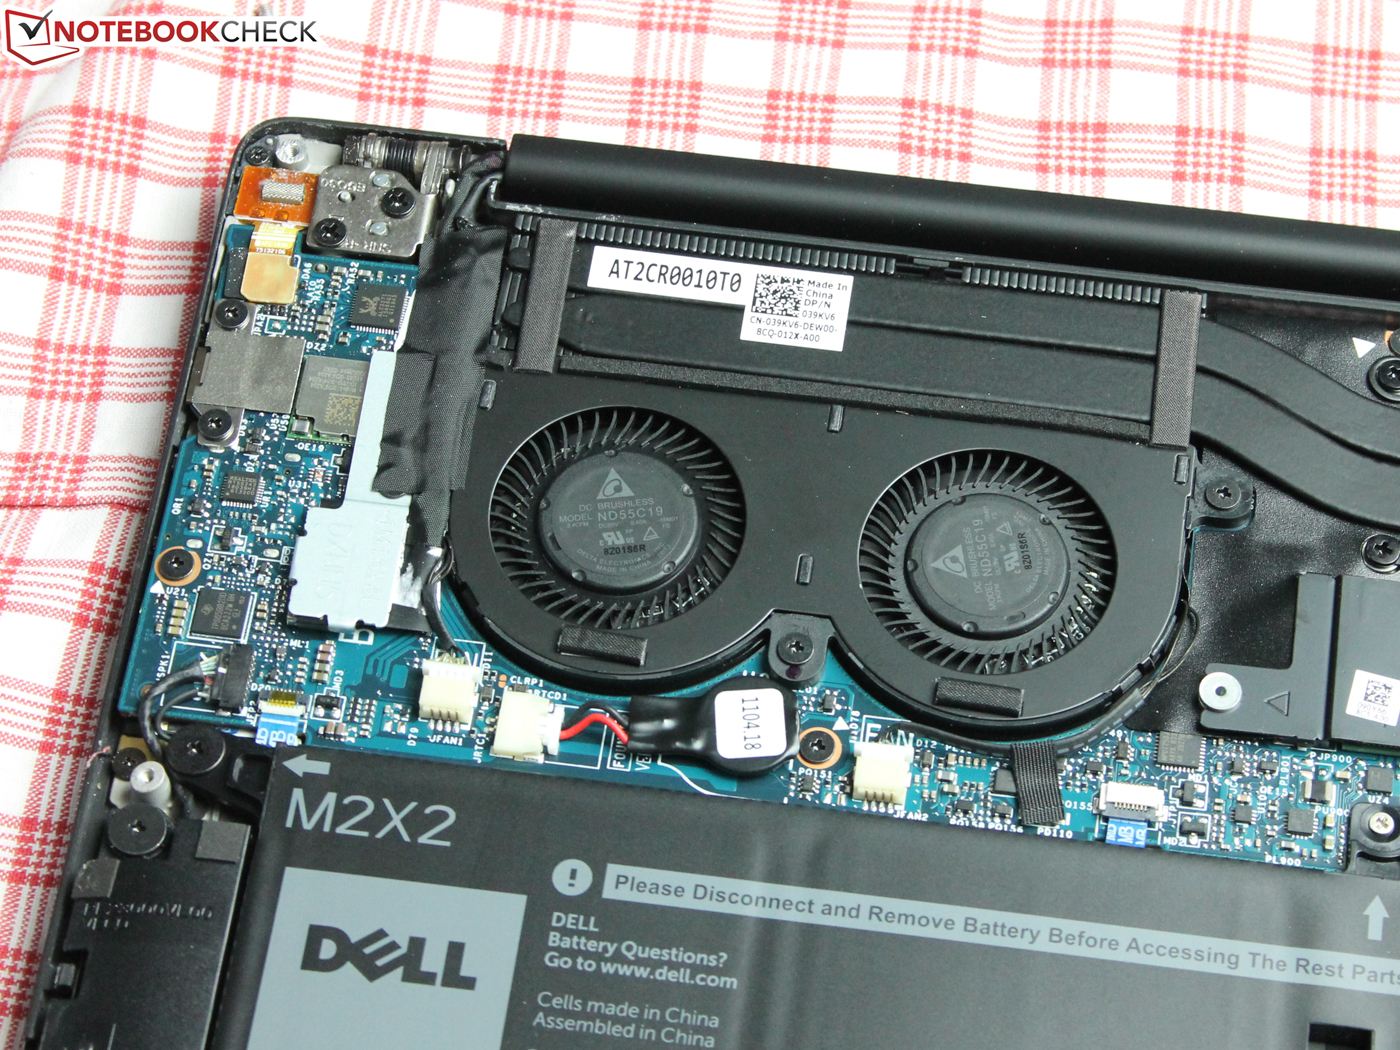
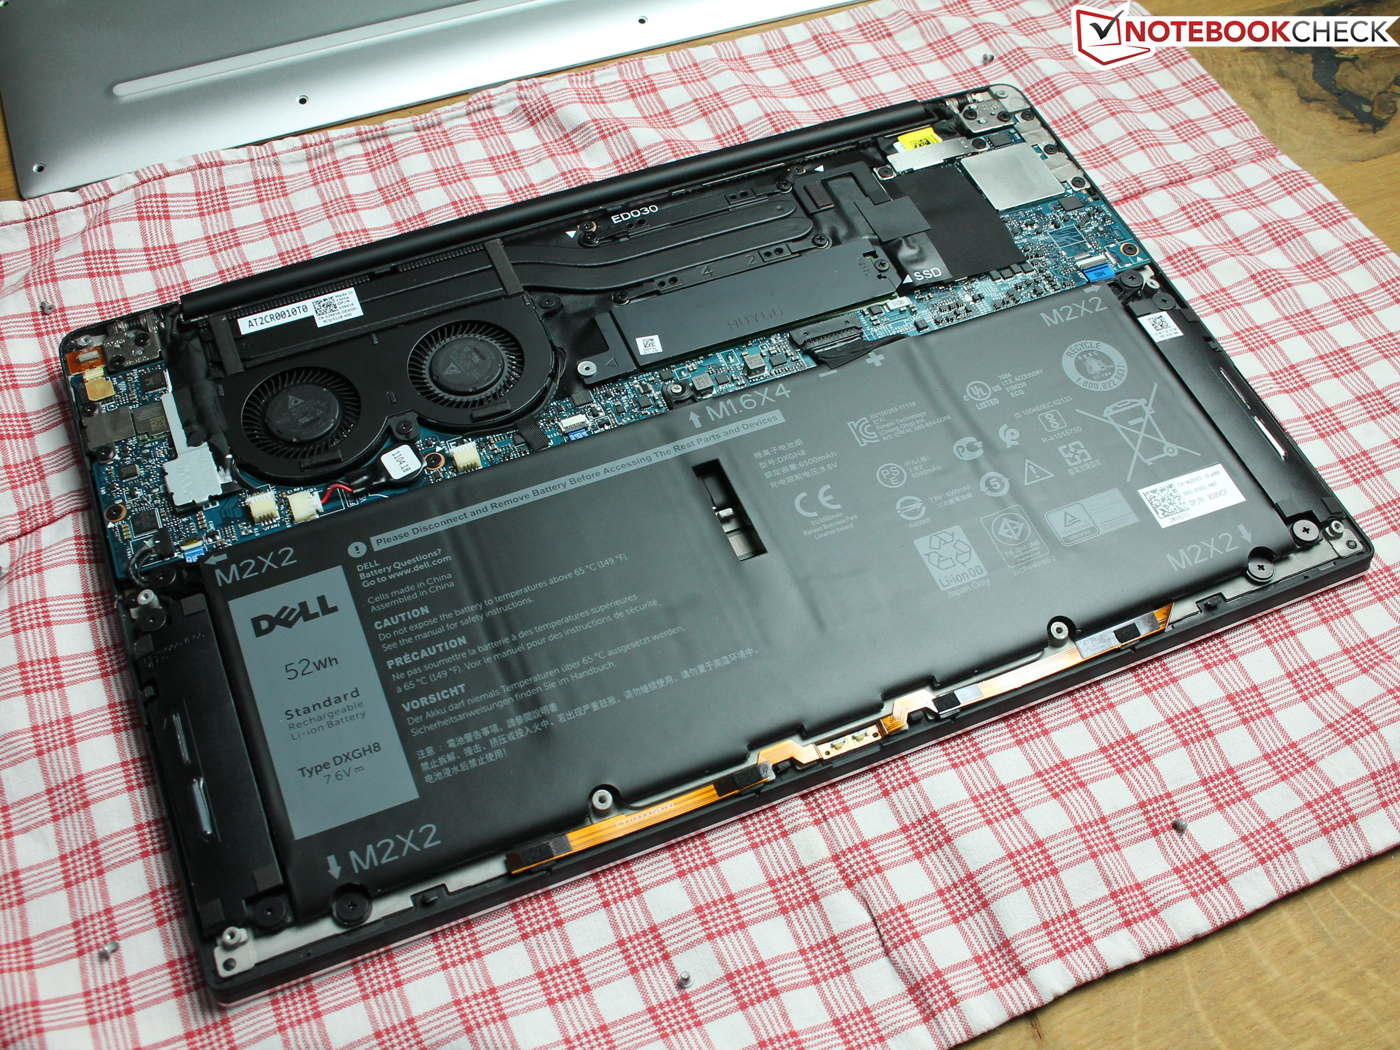
Maintenance
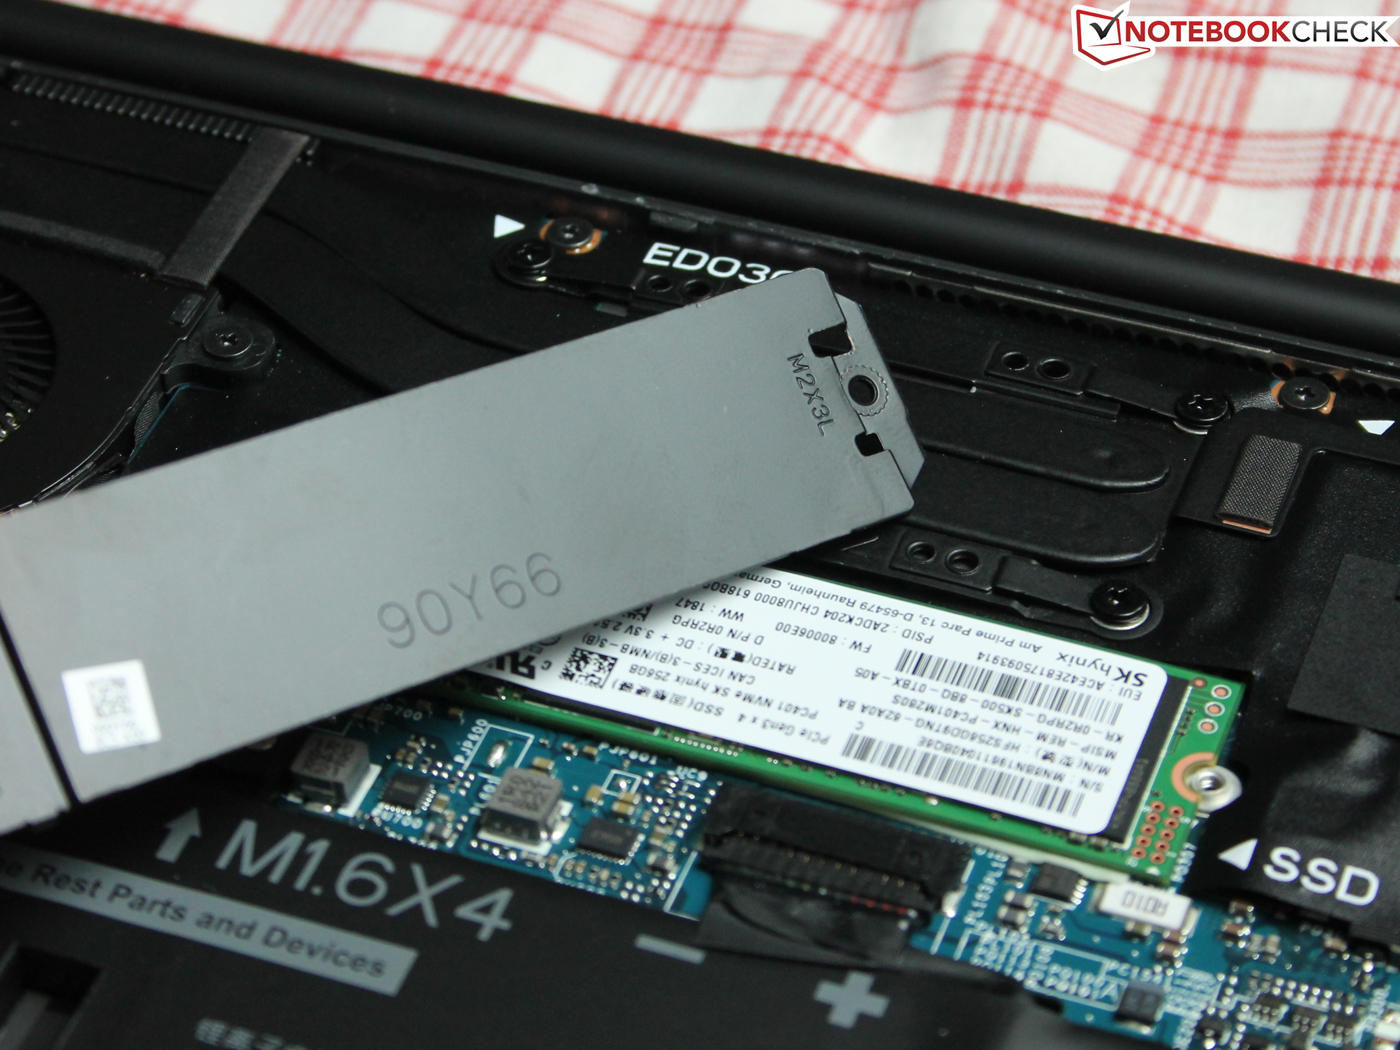
The bottom cover is once again secured by eight Torx T5 screws. It is pretty easy to remove it, but you should be careful not to damage the small plastic hooks. We recommend using a sharp object to remove the bottom cover.
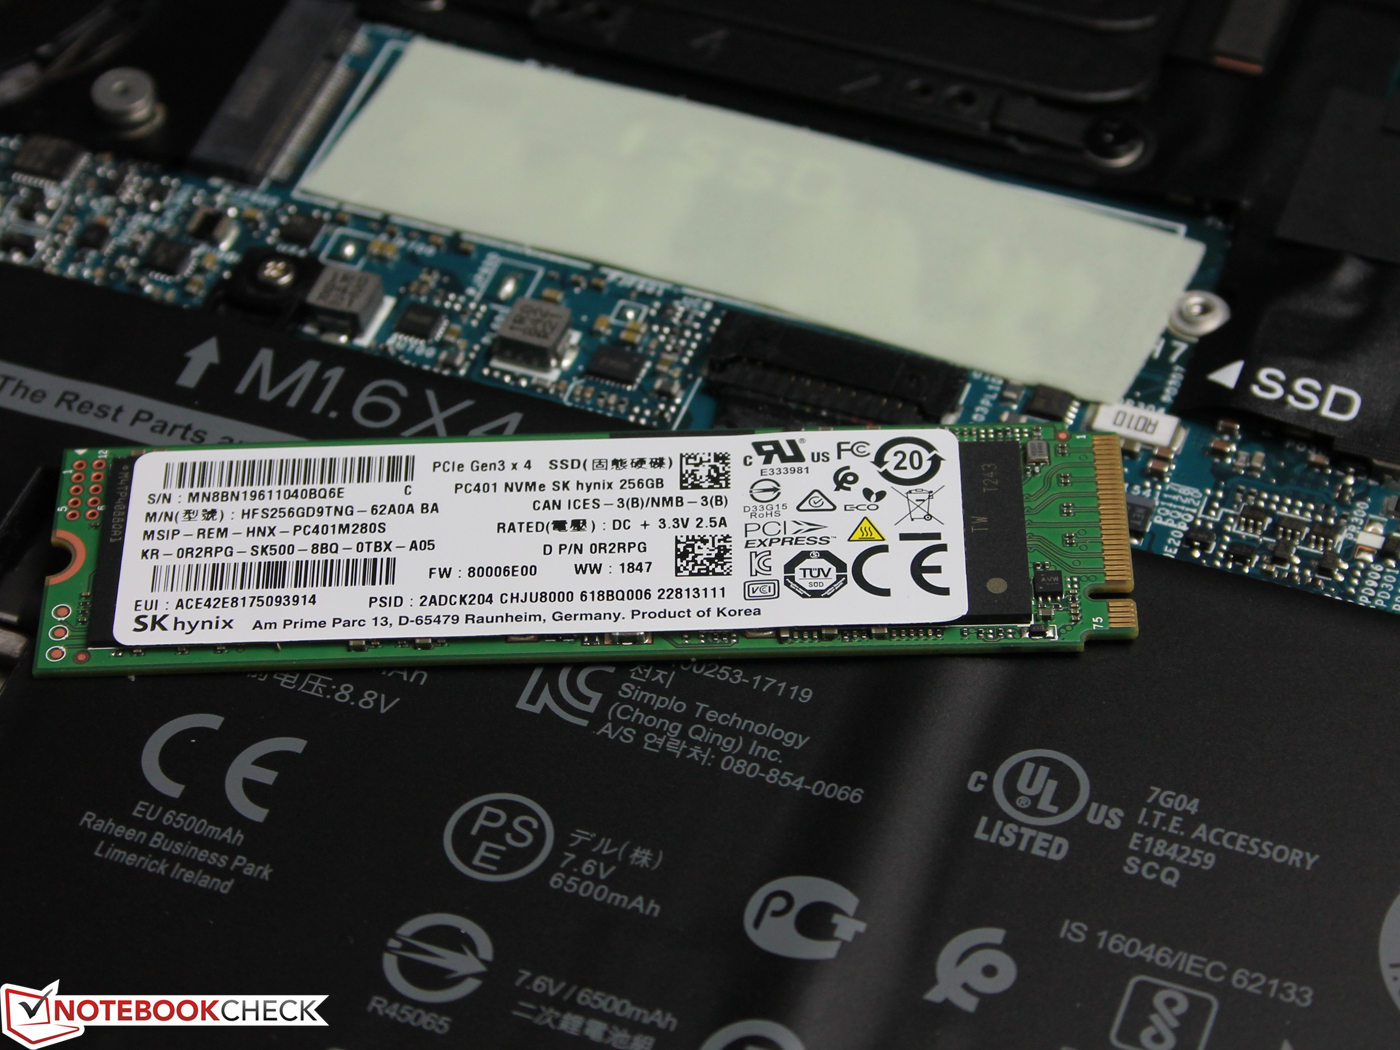
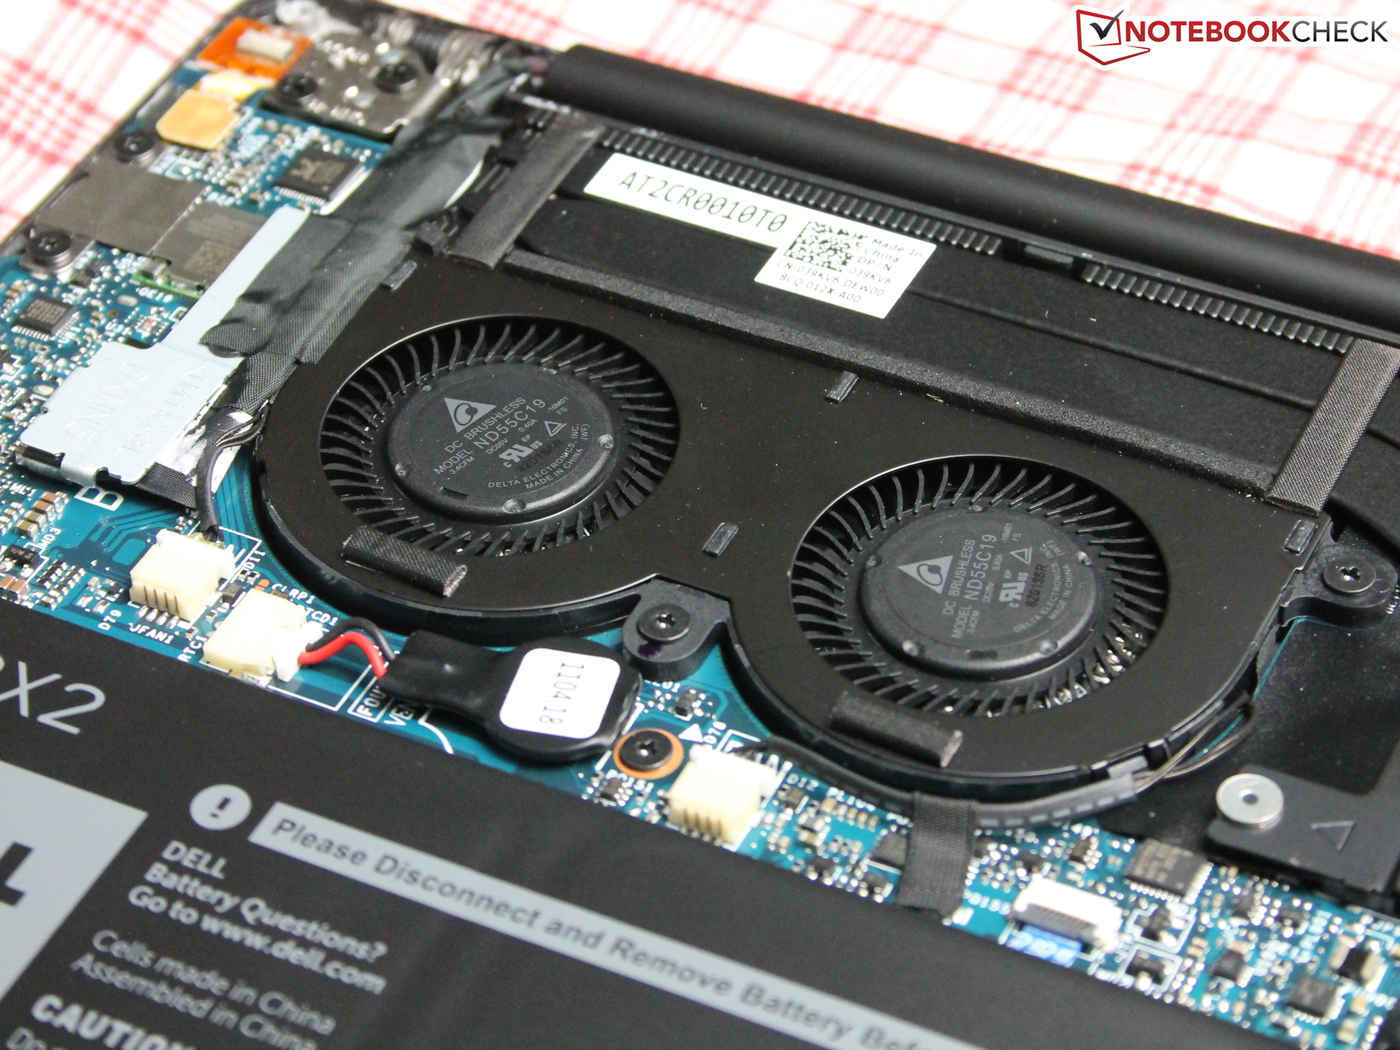
You get access to the two fans, the CMOS battery, the battery as well as the replaceable M.2-2280 SSD. The Wi-Fi module on the other hand is soldered onto the motherboard.
Warranty
Dell offers comprehensive service options. The base warranty of 12 months can be expanded all the way up to four years. Please see our Guarantees, Return policies and Warranties article for country-specific information.
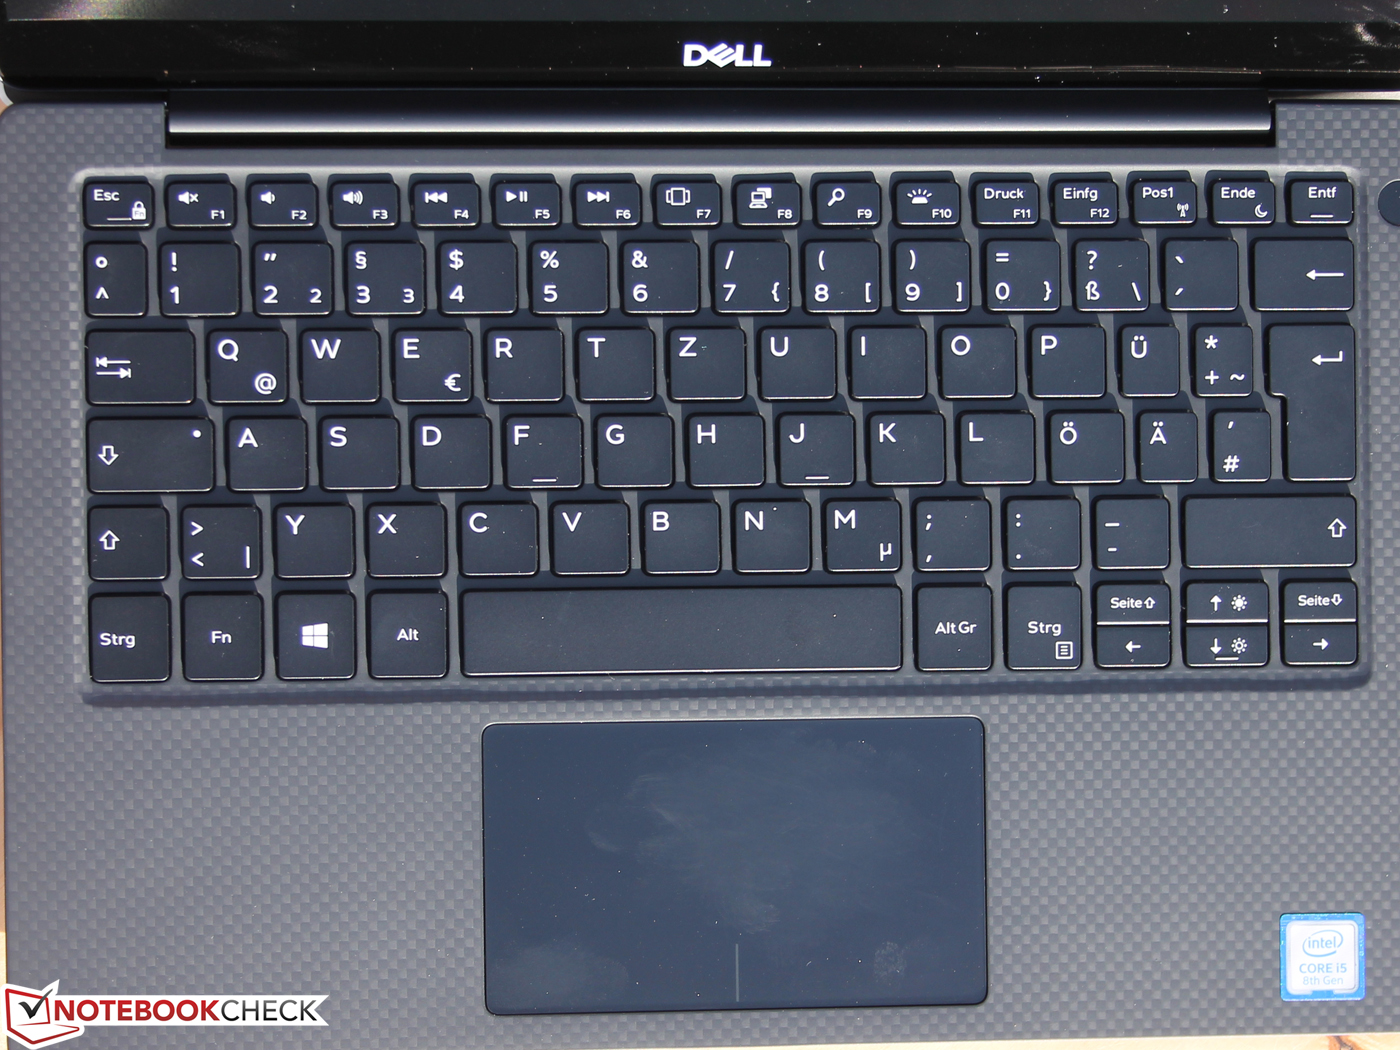
Input Devices
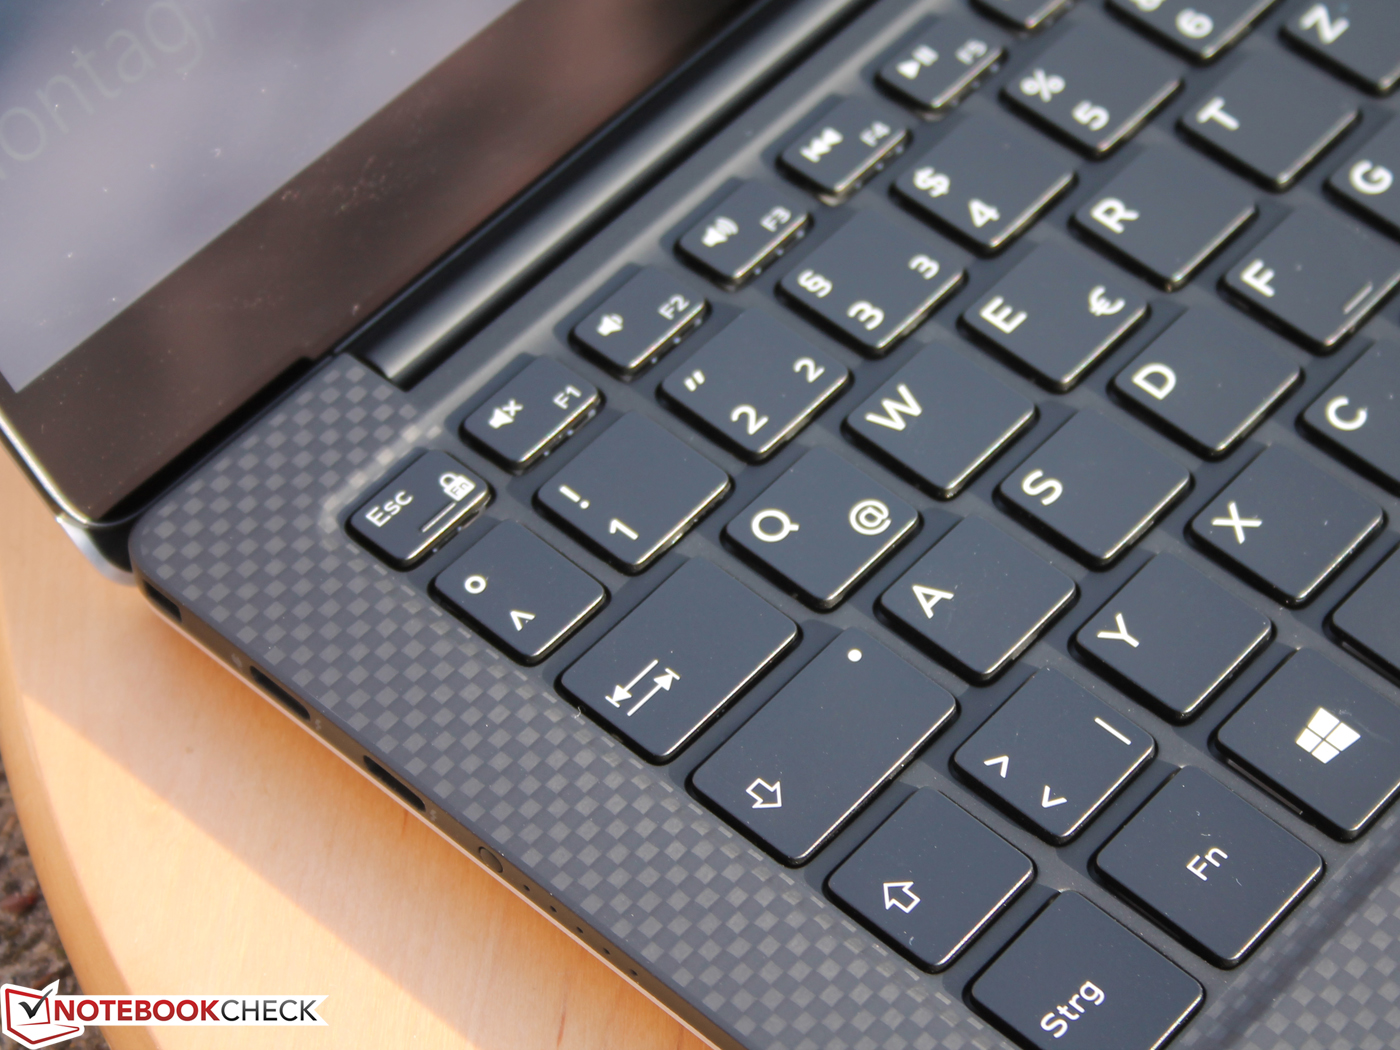
Keyboard
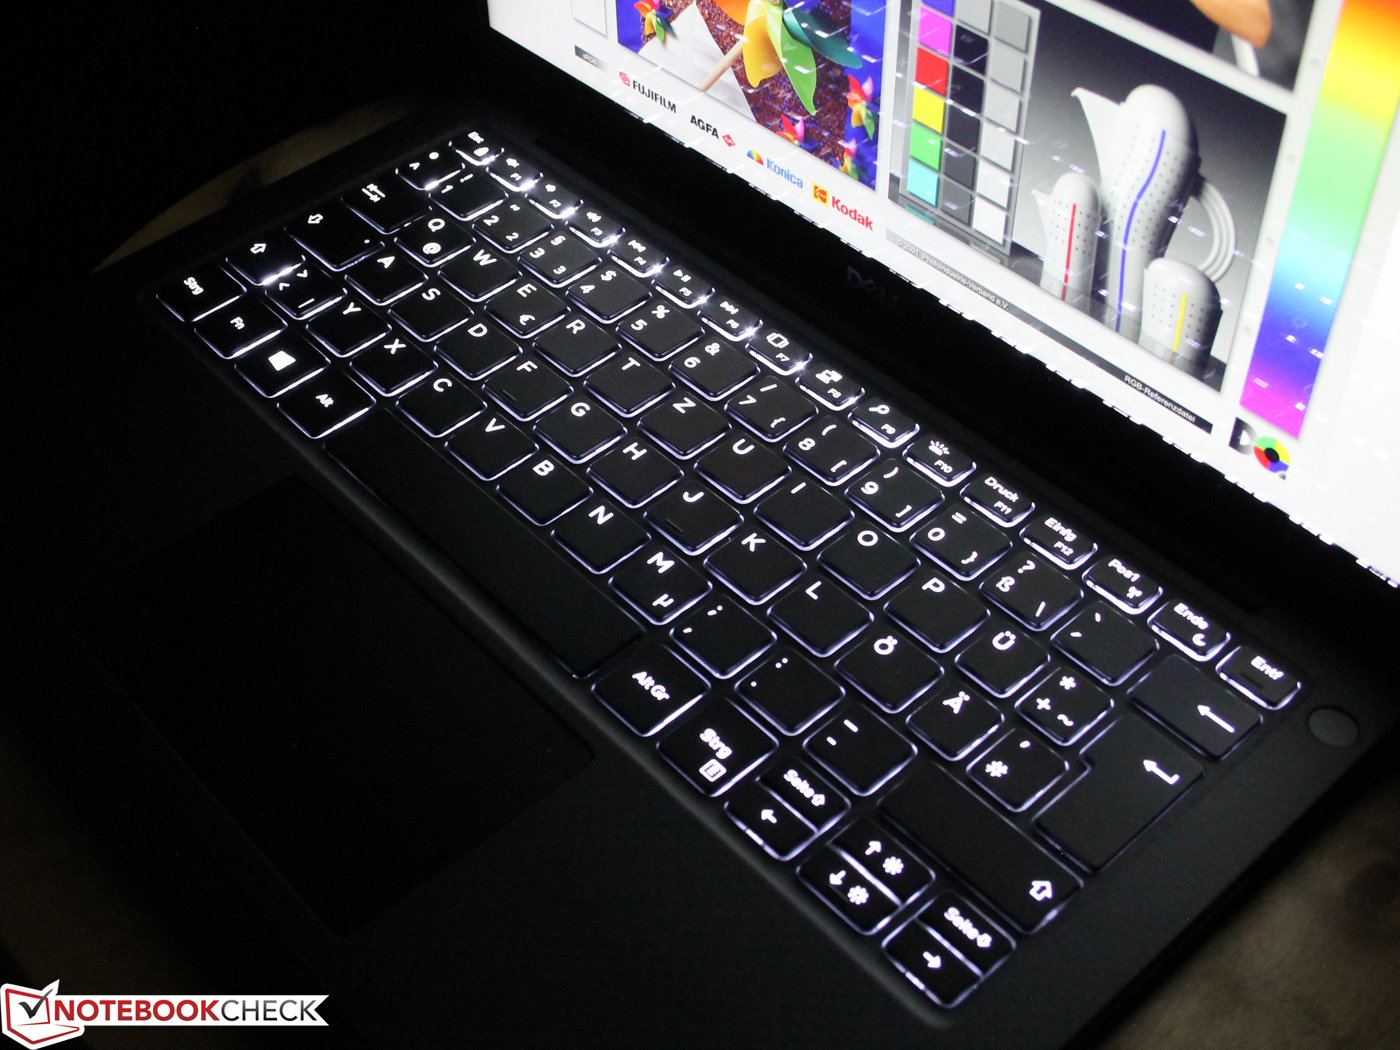
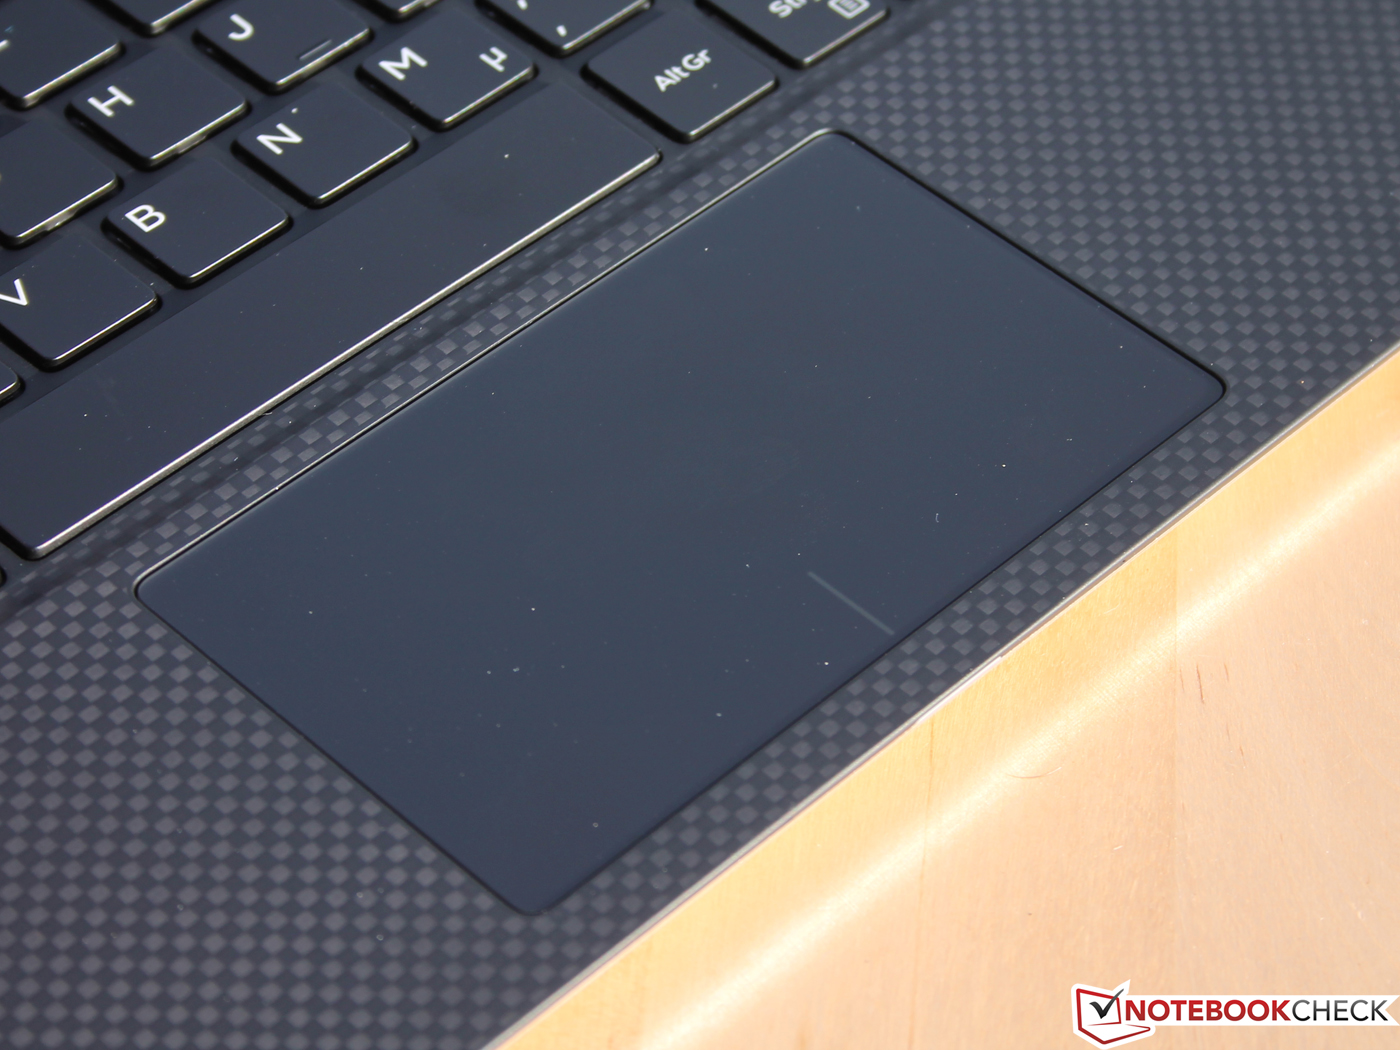
Both the illuminated keyboard and the trackpad are identical to the previous model. However, the keys of the rose-gold SKU have smooth and transparent plastic caps (9370). The size of the trackpad (~10.5 x 5 cm) as well as the individual keys (~1.6 x 1.6 mm) and the key travel (1.3 mm) are identical as well.
The key stroke is on the firm side and only the center of the keyboard gives in, but this requires some force. It is no problem to type quickly and the well-defined pressure point ensures good feedback. You might even think the keys are too soft if you are used to desktop keyboards, maybe even mechanical models. Still, it is pretty firm for a laptop keyboard.
The keys have a matte surface and can be a bit too slippery. They are not rubberized.
You cannot activate the illumination permanently, but you can deactivate it permanently. It automatically turns on when you use the keyboard or the touchpad.
Touchpad
The trackpad has a limited travel from the bottom up to the center, but the feedback is still good thanks to the well-adjusted and audible pressure point. The surface is smooth and fingers glide easily across.
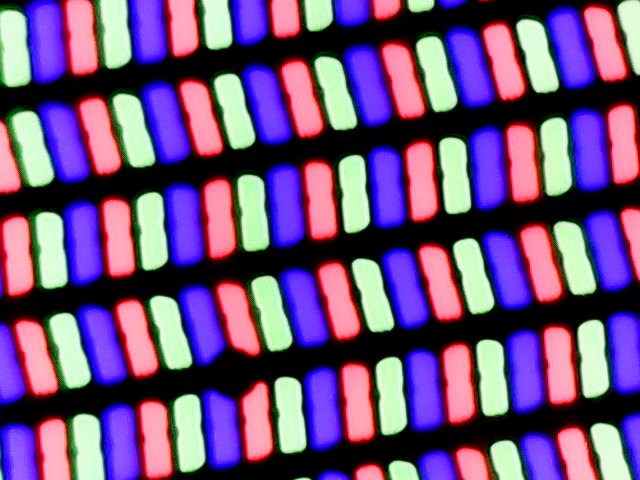
Touchscreen
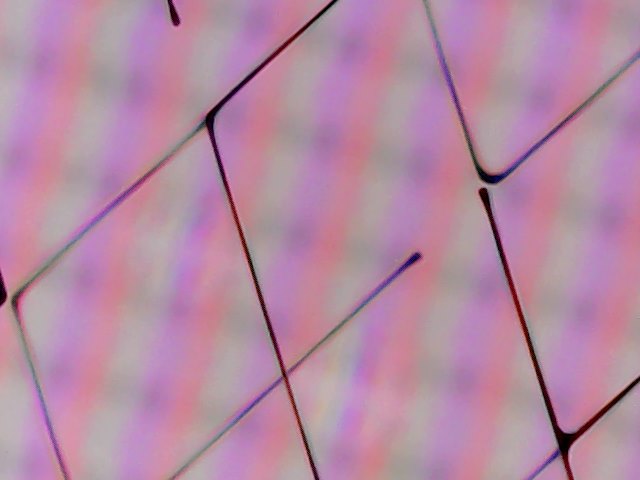
The 2019 XPS 13 does not use the IGZO touchscreen (SHP144A) from Sharp but uses an IPS screen from AUO (B133ZAN). The panel sits behind a layer of glass, which creates a visible gap between the surface and the pixels. We did not experience any issues with touch inputs (up to 10 inputs are recognized simultaneously). Fingers easily glide across the surface and the screen is very responsive. The glossy surface is obviously prone to fingerprints and has to be cleaned on a regular basis.
Display - Dell Ultrabook now with AUO panel
Something changed: The Dell Ultrabook does not use a 13.3-inch panel from Sharp (4K SKU 2018: SHP148B, LQ1331D1), but it uses one from AUO (B133ZAN Dell: 90NTH) instead. The specs are identical, and you still get a resolution of 3840x2160 pixels.
The 10-finger touchscreen of the XPS 13 4K (capacitive) uses an IPS screen with a glossy surface, is illuminated by LEDs (WLED) and it has a luminance of 340 nits and a contrast ratio of 1800:1 according to panelook.com. Dell advertises different numbers with a 1500:1 contrast ratio and a luminance of 400 nits.
Our measurements show a lower contrast ratio. The black value is a bit high at 0.37, which results in a contrast ratio of "just" 1092:1. This is almost identical to the XPS 13 9370 i7 UHD with the Sharp panel (113:1). The 1080p screen manages a higher contrast ratio of 1646:1 (9370).
The good news: The AUO panel does not use pulse-width modulation (PWM) for brightness control. This was still the case for the 2018 Sharp panel, albeit at a comparatively high frequency.
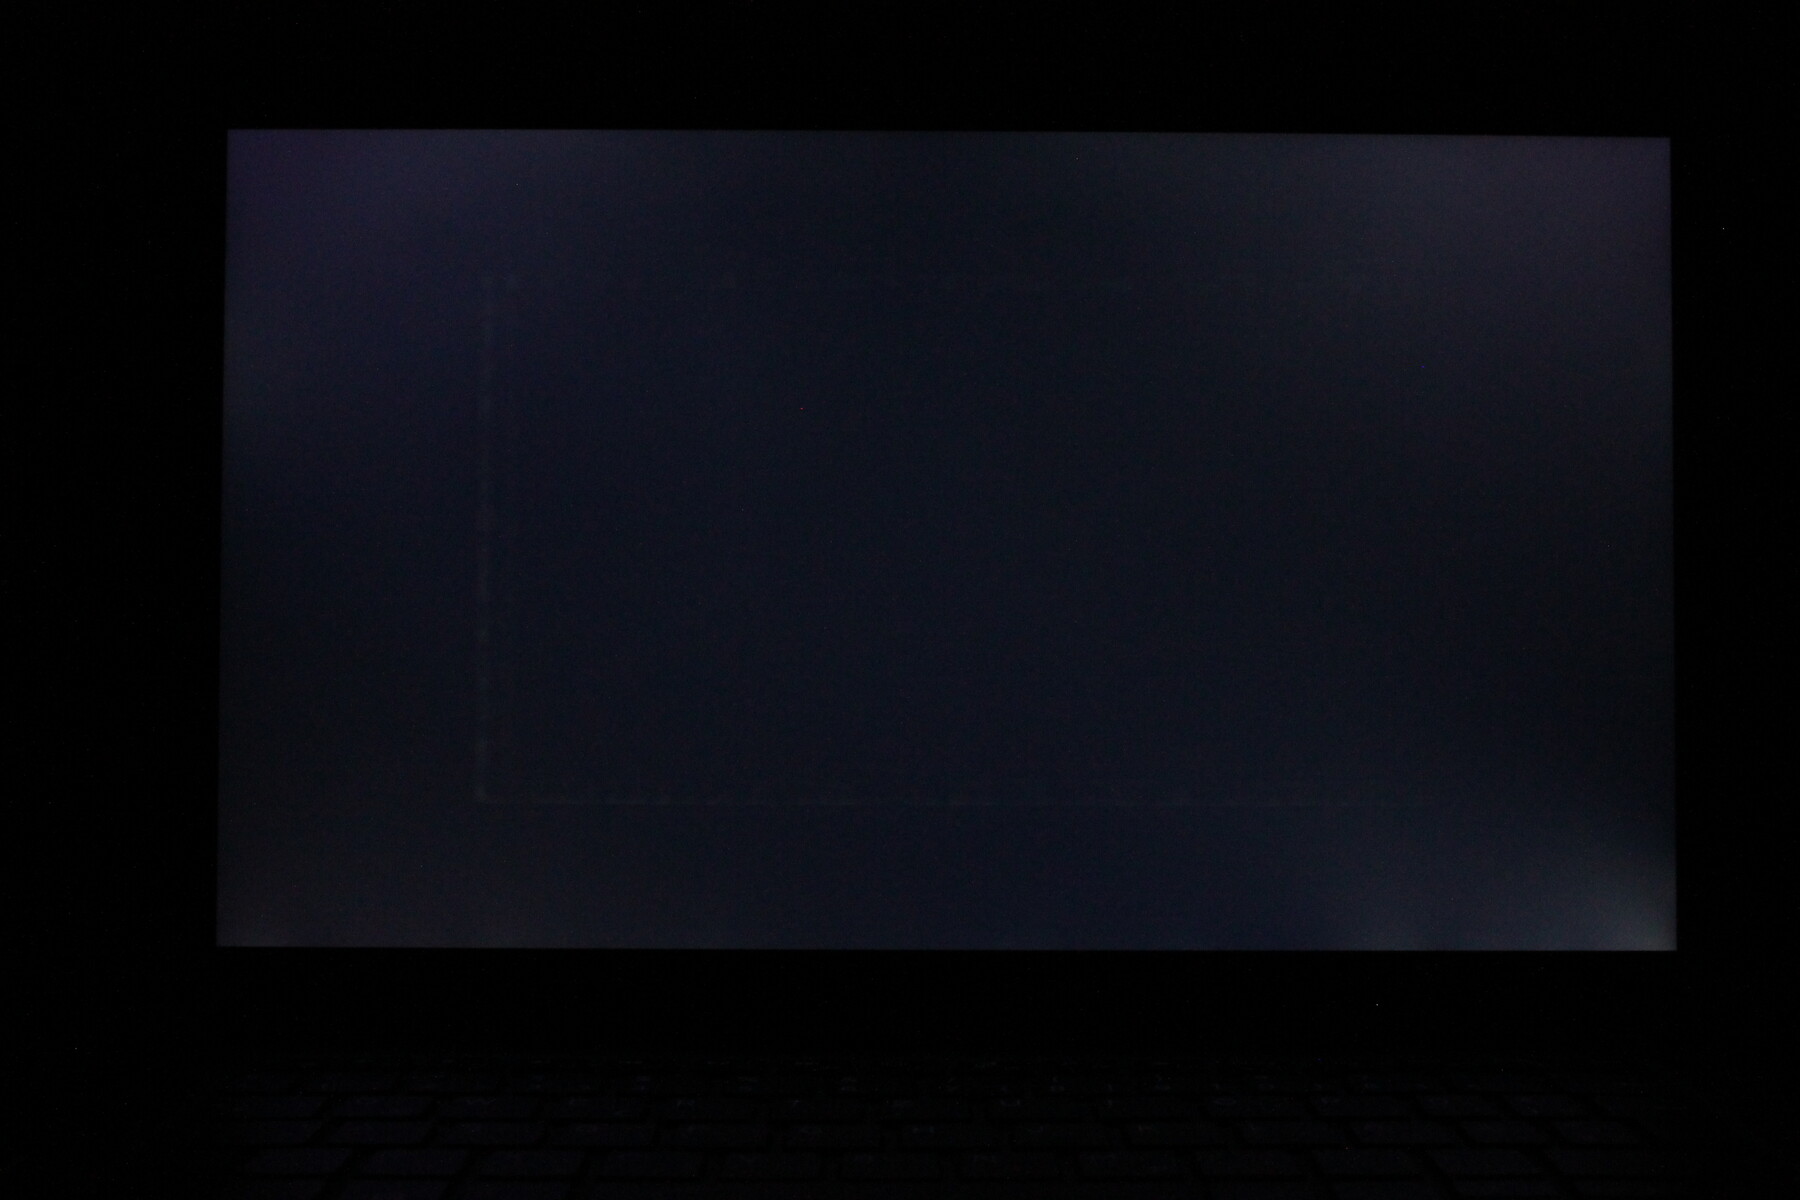
The luminance is a bit lower; the XPS 13 9370 i7 UHD was 20% brighter on average. We measure 404 nits at the center of the screen of our 9380 with an average result of 389 nits. Backlight bleeding is slightly visible at the lower right corner, but it is only visible at the maximum luminance on a dark image. We increased the exposure time significantly for the picture below.
| |||||||||||||||||||||||||
Brightness Distribution: 85 %
Center on Battery: 404 cd/m²
Contrast: 1092:1 (Black: 0.37 cd/m²)
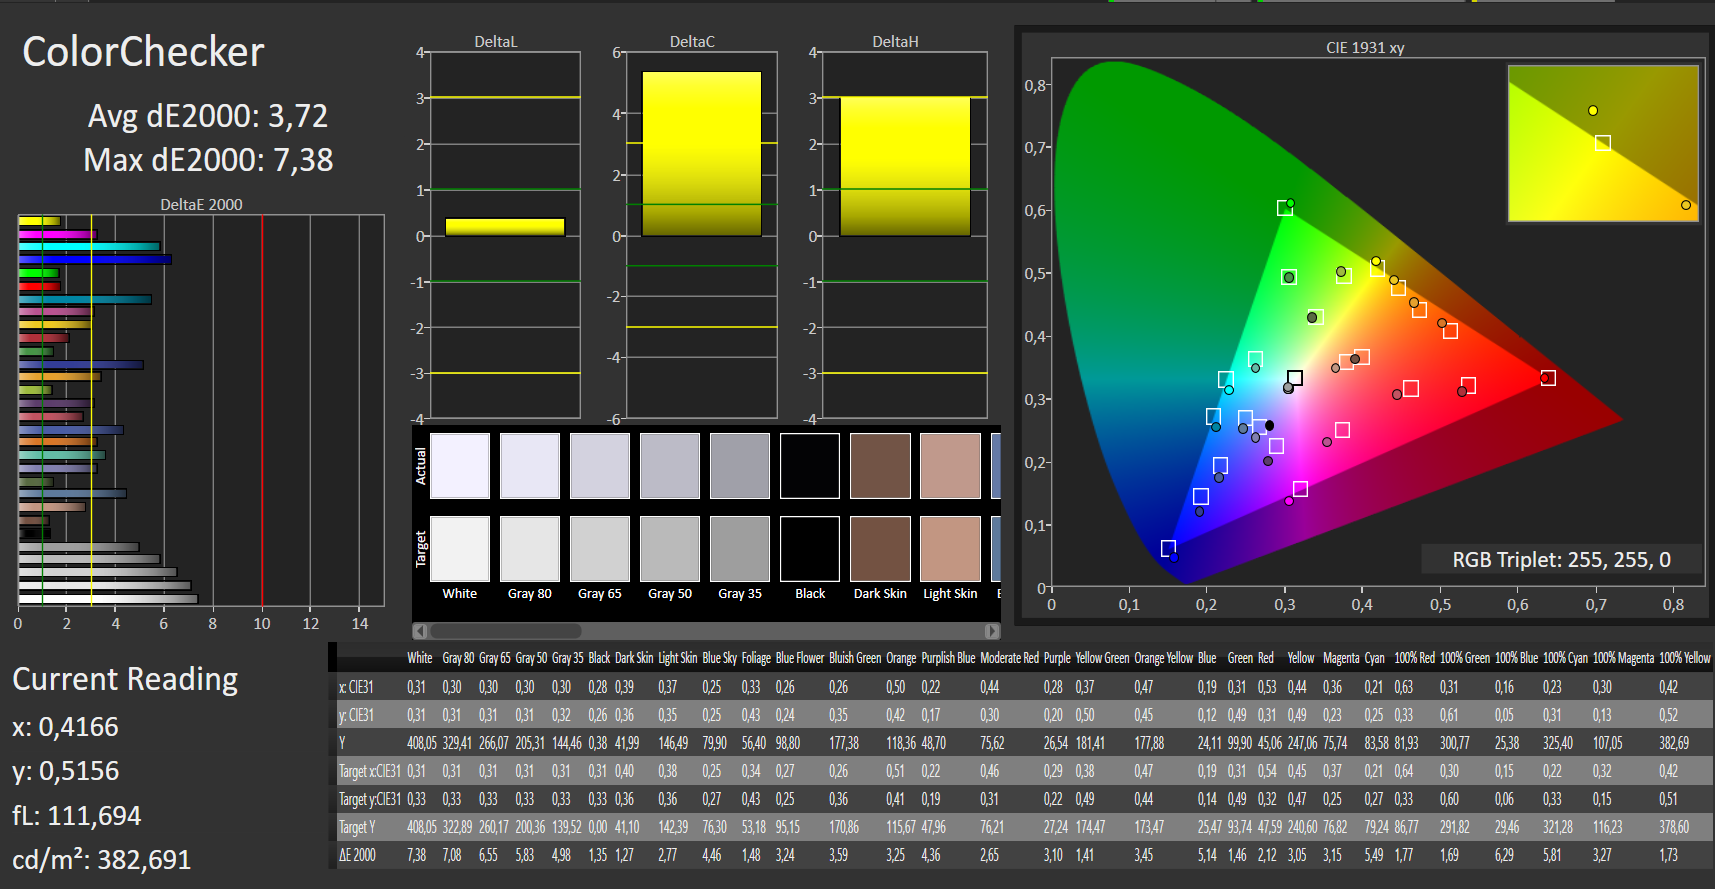
ΔE ColorChecker Calman: 3.72 | ∀{0.5-29.43 Ø4.72}
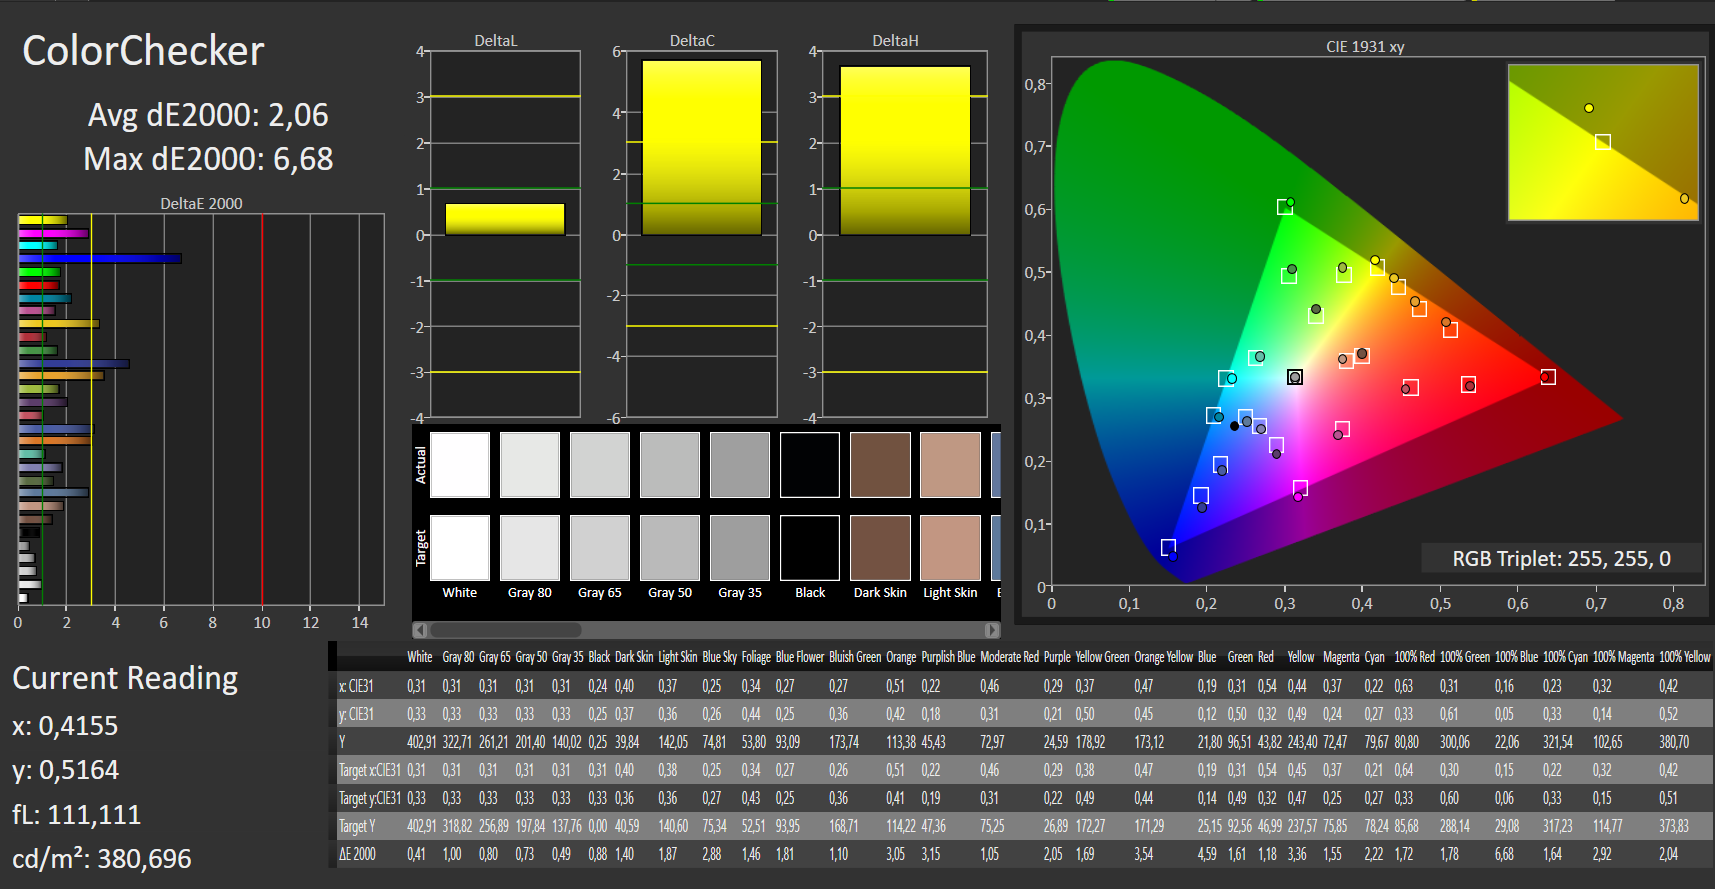
calibrated: 2.06
ΔE Greyscale Calman: 4.44 | ∀{0.09-98 Ø4.97}
93% sRGB (Argyll 1.6.3 3D)
60% AdobeRGB 1998 (Argyll 1.6.3 3D)
65.3% AdobeRGB 1998 (Argyll 3D)
93.1% sRGB (Argyll 3D)
64.7% Display P3 (Argyll 3D)
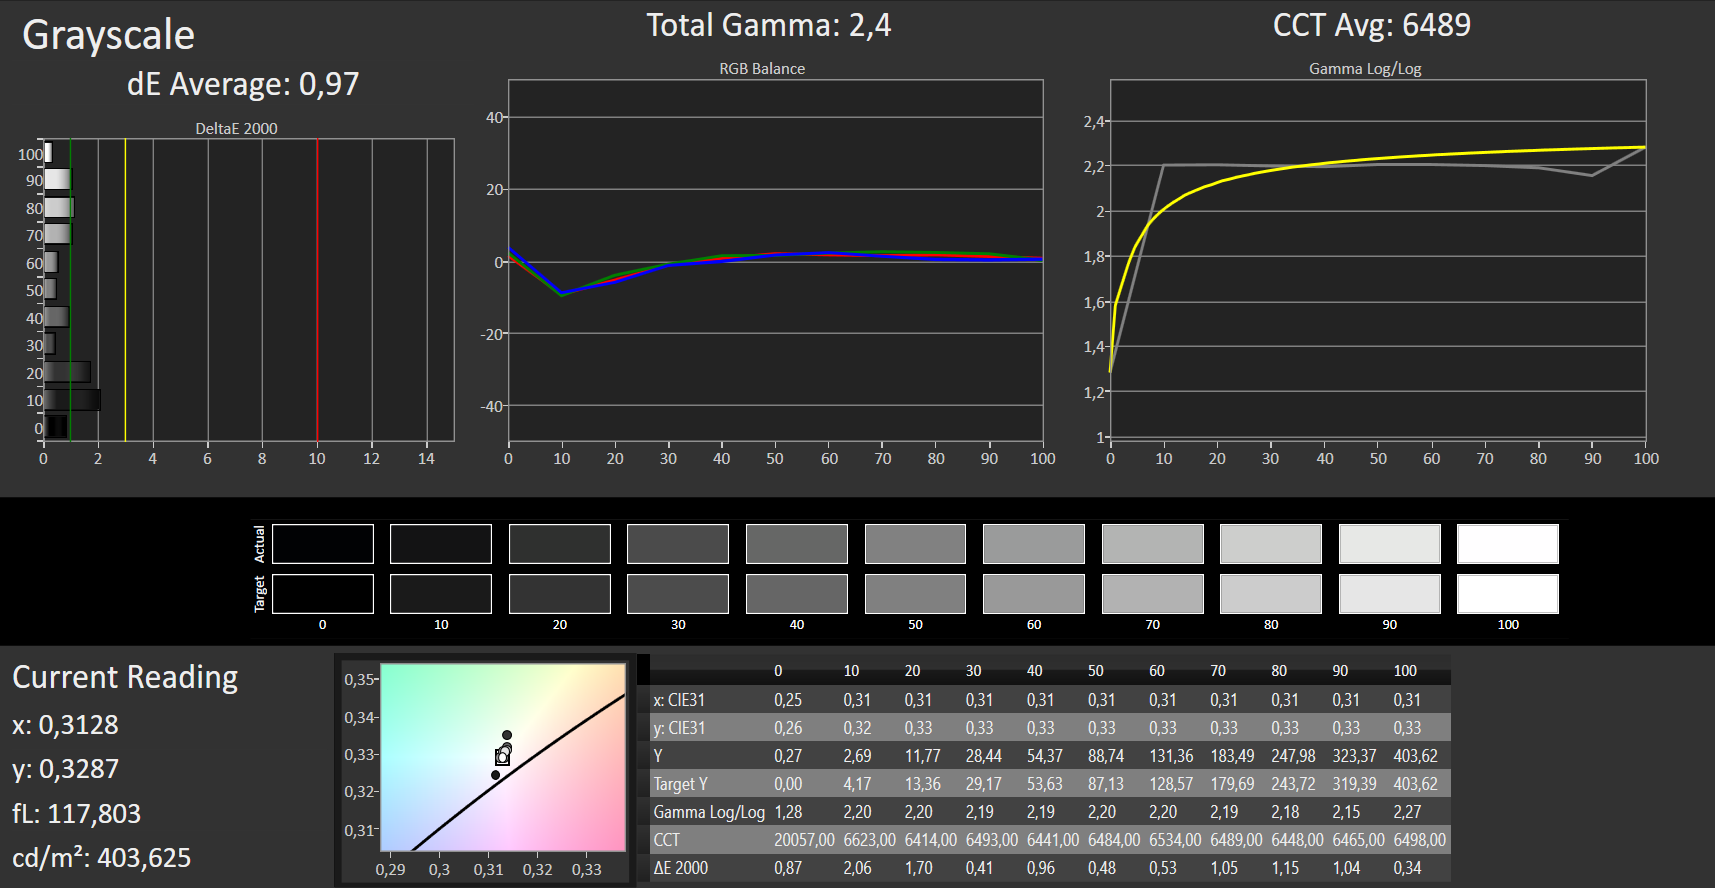
Gamma: 2.34
CCT: 7095 K
| Dell XPS 13 9380 2019 ID: AUO 282B B133ZAN Dell: 90NTH, , 3840x2160, 13.3" | Dell XPS 13 9370 i7 UHD ID: Sharp SHP148B, Name: LQ133D1, Dell P/N: 8XDHY, , 3840x2160, 13.3" | Dell XPS 13 9370 FHD i5 SHP1484, , 1920x1080, 13.3" | Apple MacBook Pro 13 2018 Touchbar i5 APPA03E, , 2560x1600, 13.3" | Lenovo ThinkPad X280-20KES01S00 B125HAN02.2, , 1920x1080, 12.5" | Fujitsu Lifebook U938 Sharp LQ133M1JW28, , 1920x1080, 13.3" | HP EliteBook 830 G5-3JX74EA IVO M133NVF3-R0, , 1920x1080, 13.3" | HP Envy 13-ah0003ng M133NVF3 R0, , 1920x1080, 13.3" | Huawei MateBook 13 i7 Chi Mei CMN8201, , 2160x1440, 13" | |
|---|---|---|---|---|---|---|---|---|---|
| Display | 6% | 6% | 31% | -31% | 4% | -2% | -13% | 5% | |
| Display P3 Coverage (%) | 64.7 | 68.9 6% | 68.9 6% | 98.5 52% | 44 -32% | 67.5 4% | 64.2 -1% | 54.8 -15% | 68.1 5% |
| sRGB Coverage (%) | 93.1 | 98.4 6% | 96.6 4% | 99.9 7% | 64.5 -31% | 94.5 2% | 89.2 -4% | 82.5 -11% | 97.7 5% |
| AdobeRGB 1998 Coverage (%) | 65.3 | 69.5 6% | 69.6 7% | 87.3 34% | 45.45 -30% | 68.7 5% | 65.2 0% | 56.6 -13% | 69.2 6% |
| Response Times | -21% | -18% | 16% | 25% | 23% | 35% | 40% | 19% | |
| Response Time Grey 50% / Grey 80% * (ms) | 58 ? | 69.6 ? -20% | 62.4 ? -8% | 46 ? 21% | 40 ? 31% | 43 ? 26% | 36 ? 38% | 31 ? 47% | 43.2 ? 26% |
| Response Time Black / White * (ms) | 36 ? | 44 ? -22% | 45.6 ? -27% | 32 ? 11% | 29.6 ? 18% | 29 ? 19% | 24.8 ? 31% | 24 ? 33% | 32 ? 11% |
| PWM Frequency (Hz) | 3759 ? | 1008 ? | 118000 ? | 217 ? | 1020 ? | 1000 ? | |||
| Screen | 12% | 10% | 34% | -18% | 6% | -8% | 19% | 5% | |
| Brightness middle (cd/m²) | 404 | 478.5 18% | 428 6% | 519 28% | 344 -15% | 344 -15% | 316 -22% | 289 -28% | 366.6 -9% |
| Brightness (cd/m²) | 389 | 466 20% | 405 4% | 504 30% | 313 -20% | 320 -18% | 326 -16% | 310 -20% | 360 -7% |
| Brightness Distribution (%) | 85 | 86 1% | 87 2% | 95 12% | 82 -4% | 77 -9% | 85 0% | 85 0% | 93 9% |
| Black Level * (cd/m²) | 0.37 | 0.43 -16% | 0.26 30% | 0.33 11% | 0.25 32% | 0.31 16% | 0.19 49% | 0.23 38% | 0.39 -5% |
| Contrast (:1) | 1092 | 1113 2% | 1646 51% | 1573 44% | 1376 26% | 1110 2% | 1663 52% | 1257 15% | 940 -14% |
| Colorchecker dE 2000 * | 3.72 | 3.09 17% | 3.8 -2% | 1.4 62% | 4.7 -26% | 2.72 27% | 4.5 -21% | 1.64 56% | 2.76 26% |
| Colorchecker dE 2000 max. * | 7.38 | 5.94 20% | 7.2 2% | 2.8 62% | 19.4 -163% | 5.92 20% | 12.1 -64% | 3.31 55% | 6.19 16% |
| Colorchecker dE 2000 calibrated * | 2.06 | 2.06 -0% | 2.9 -41% | 0.99 52% | 1.53 26% | ||||
| Greyscale dE 2000 * | 4.44 | 2.4 46% | 4.4 1% | 2.2 50% | 2.2 50% | 2.74 38% | 5 -13% | 1.71 61% | 4.2 5% |
| Gamma | 2.34 94% | 2.063 107% | 2.21 100% | 2.22 99% | 2.16 102% | 2.38 92% | 2.22 99% | 2.32 95% | 2.22 99% |
| CCT | 7095 92% | 6883 94% | 7067 92% | 6908 94% | 6252 104% | 6794 96% | 6018 108% | 6291 103% | 6271 104% |
| Color Space (Percent of AdobeRGB 1998) (%) | 60 | 69.47 16% | 62.8 5% | 77.3 29% | 41.2 -31% | 61 2% | 57.9 -3% | 52 -13% | 63.2 5% |
| Color Space (Percent of sRGB) (%) | 93 | 98.36 6% | 96.4 4% | 99.99 8% | 64.1 -31% | 94 1% | 87.3 -6% | 82 -12% | 97.6 5% |
| Total Average (Program / Settings) | -1% /
7% | -1% /
6% | 27% /
31% | -8% /
-15% | 11% /
8% | 8% /
-1% | 15% /
15% | 10% /
7% |
* ... smaller is better
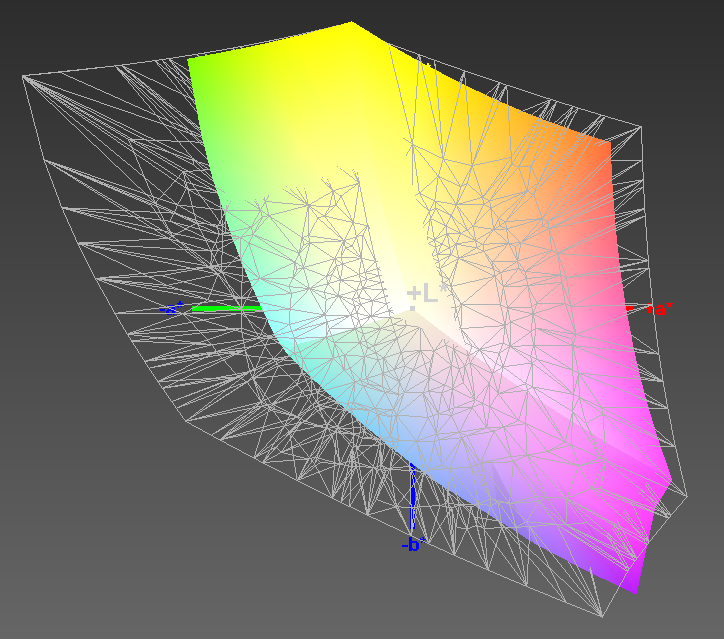
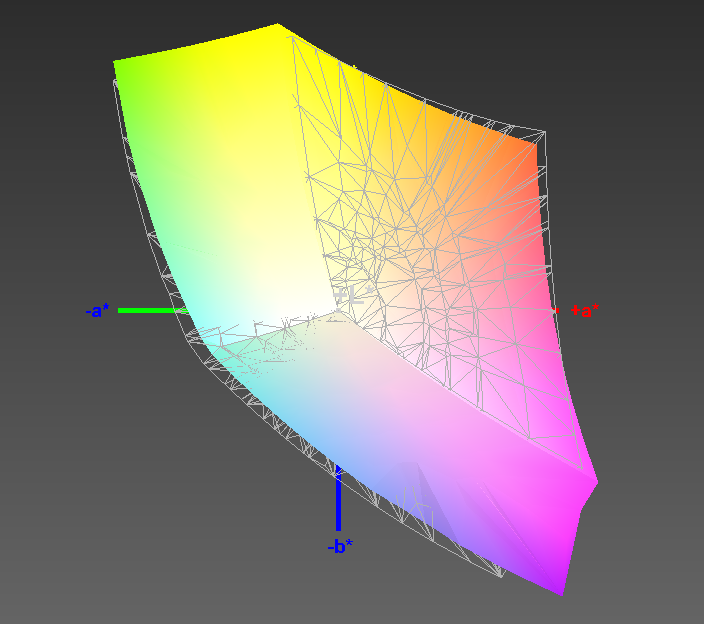
The color gamut is pretty much identical at 60% AdobeRGB and 93% sRGB; the Sharp SKU from 2018 still managed 98% sRGB.
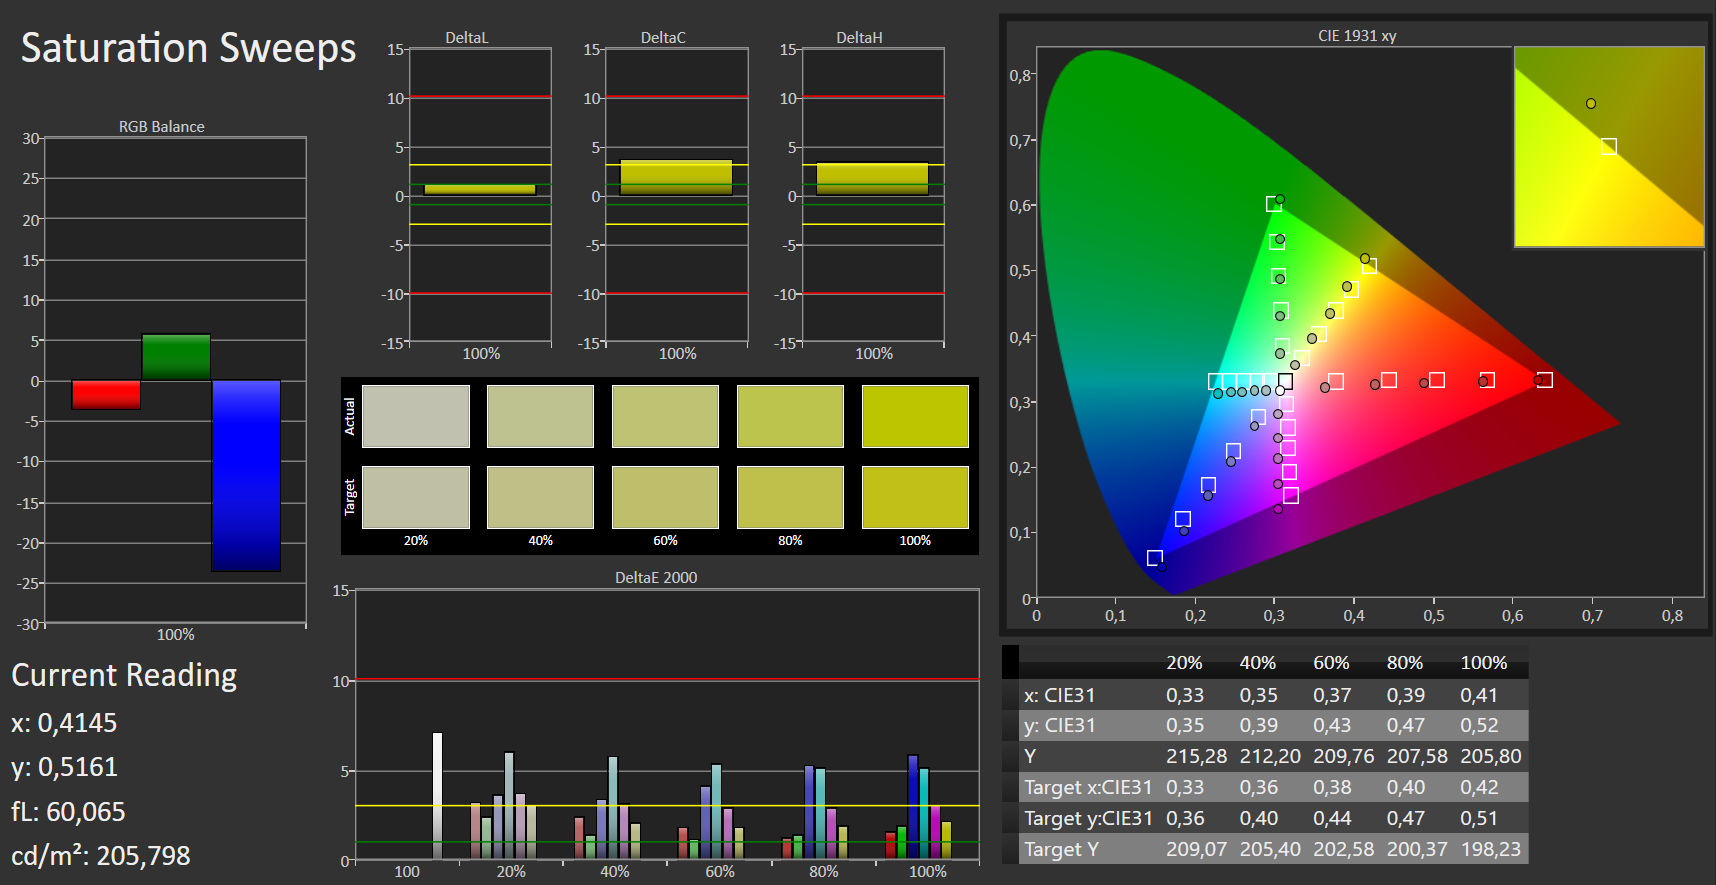
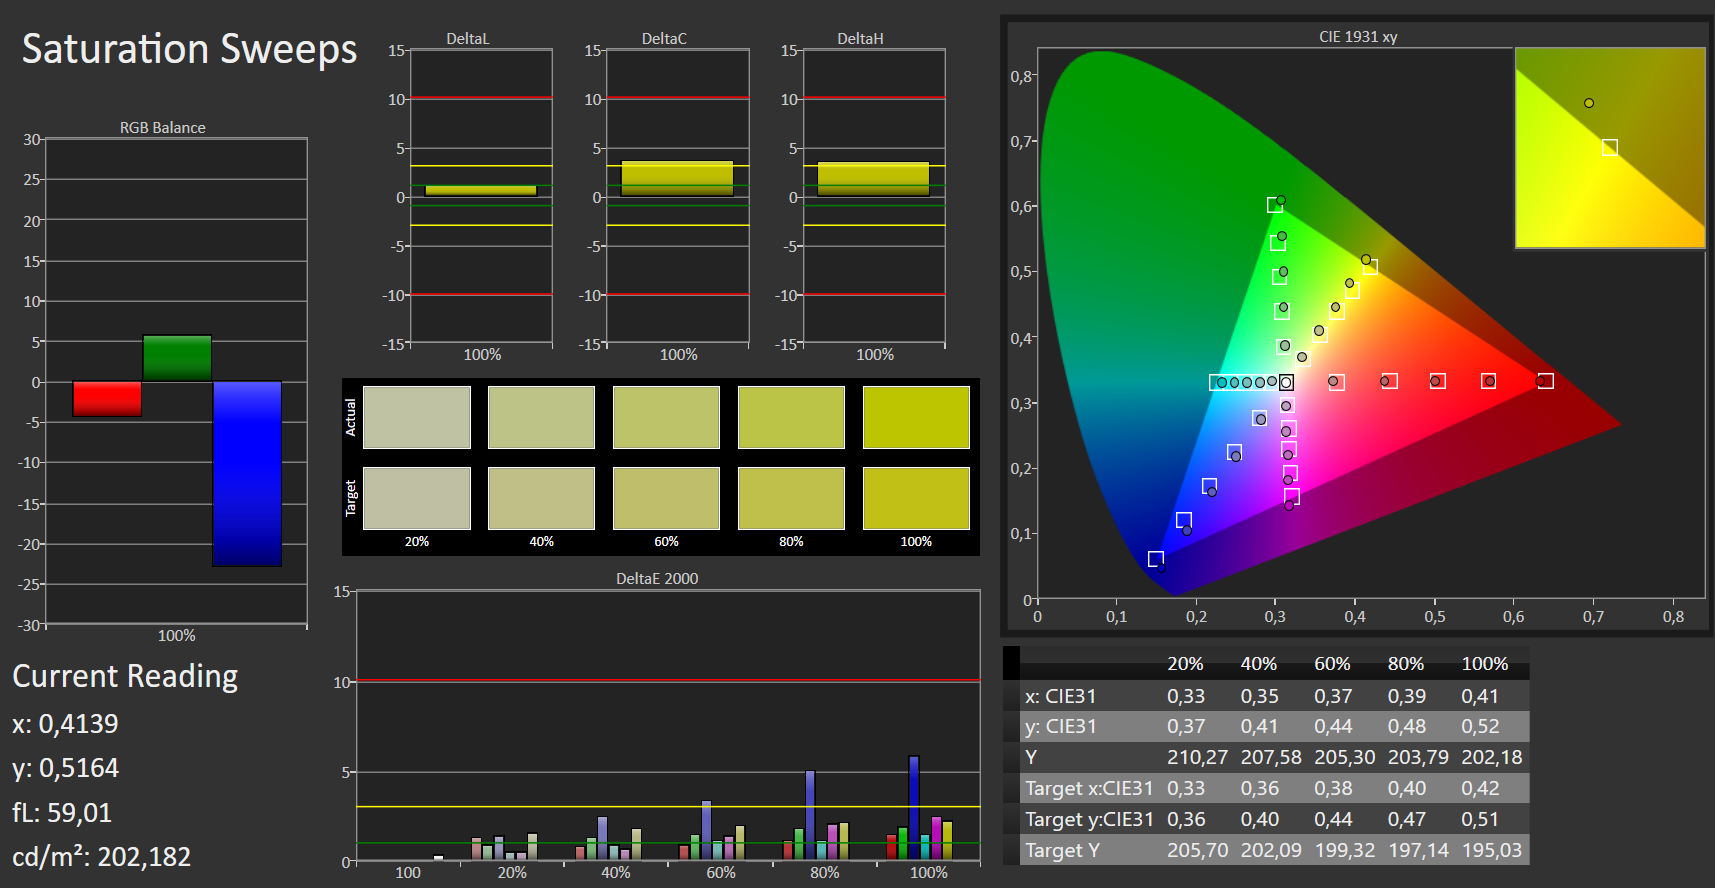
The color accuracy ex-works is a bit worse, more precisely the grayscale performance. The DeltaE deviation increased to 4.4, while the Sharp panel managed 2.4 out of the box. However, this problem can be solved by calibration (photospectrometer), and the DeltaE value (grayscale) was reduced to 1.0.
Calibration also helps to improve the high color deviation of 3.7. We determine 2.0 after calibration, which means the color accuracy is almost perfect (target color space sRGB).
As always, we linked the color profile (ICC file X-Rite i1Pro 2) of our XPS 13 9380 with the 4K panel in the box above. Please make sure that your device uses the same panel (AUO B133ZAN). Otherwise, the color accuracy will probably be worse.

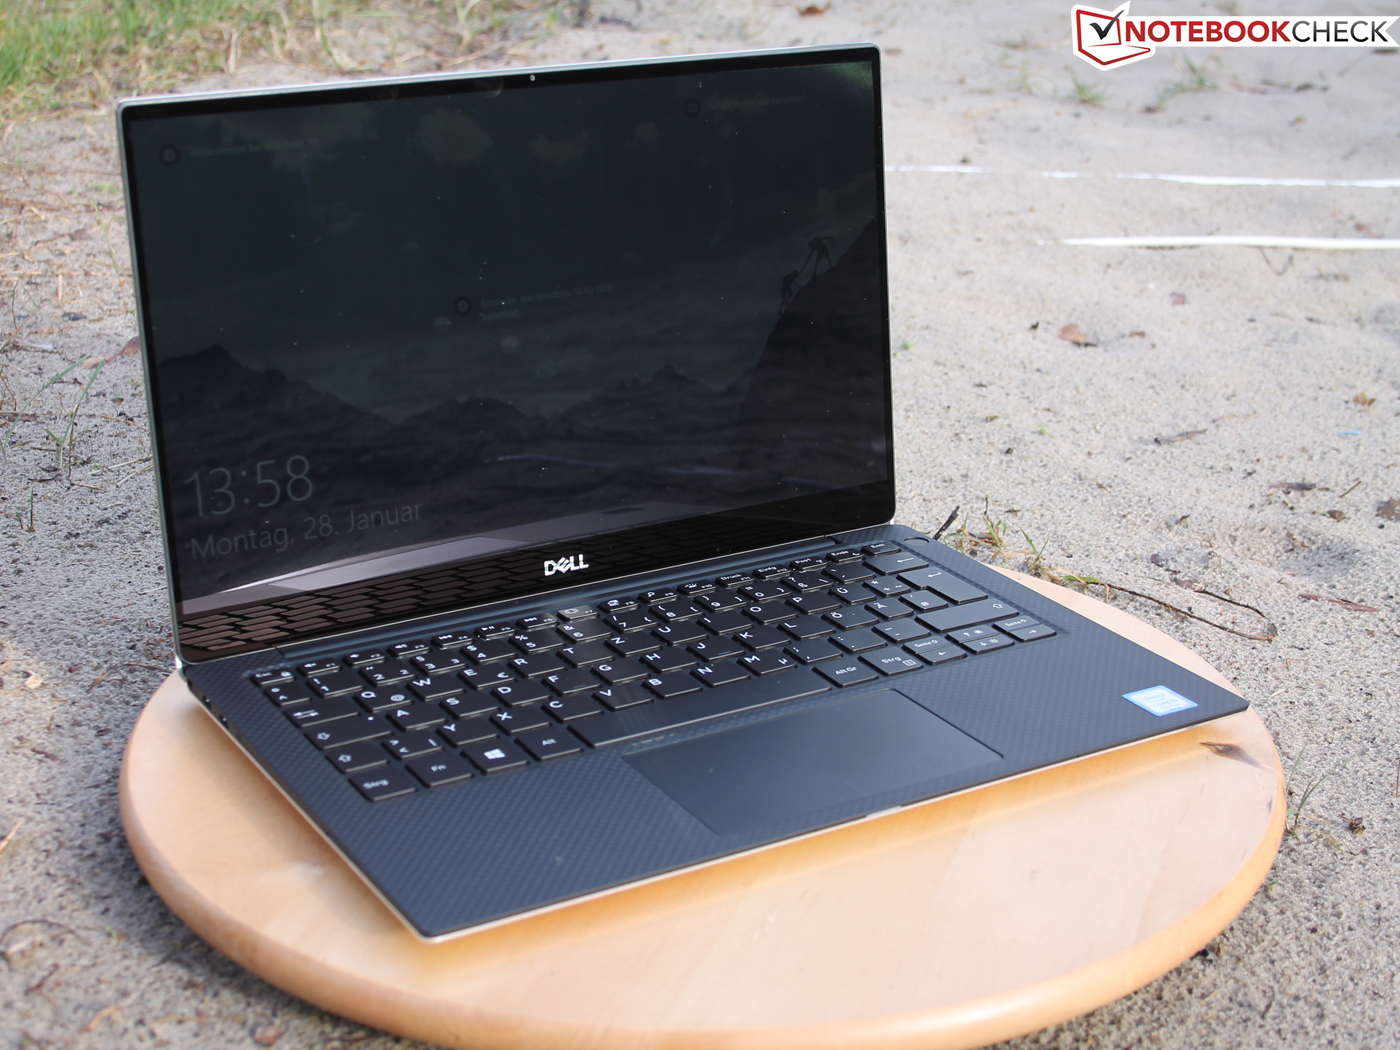
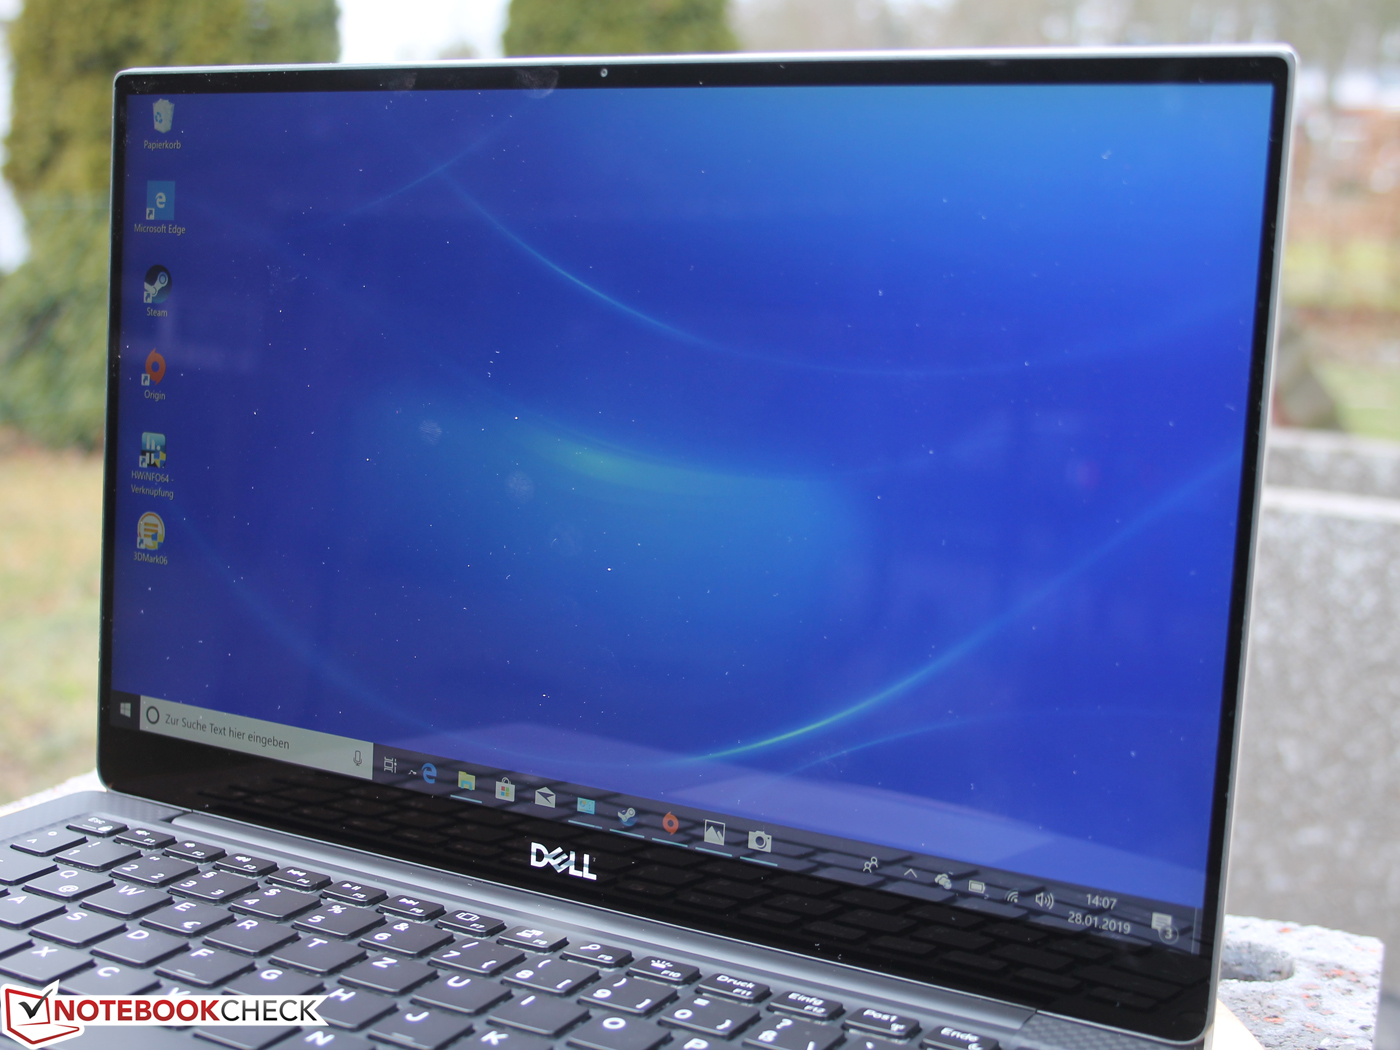
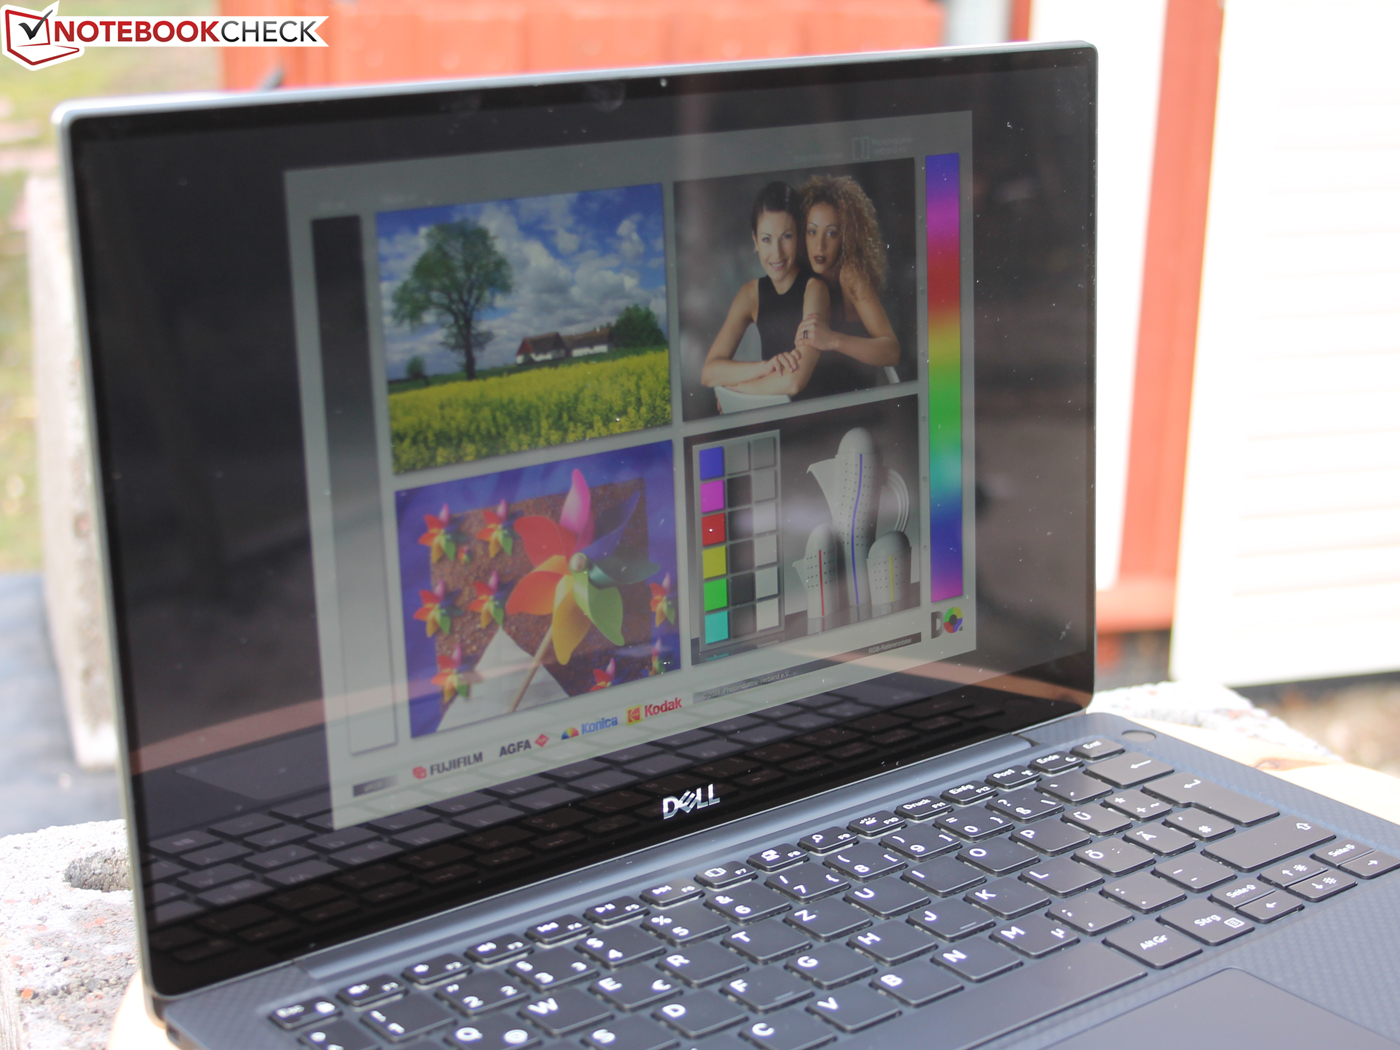
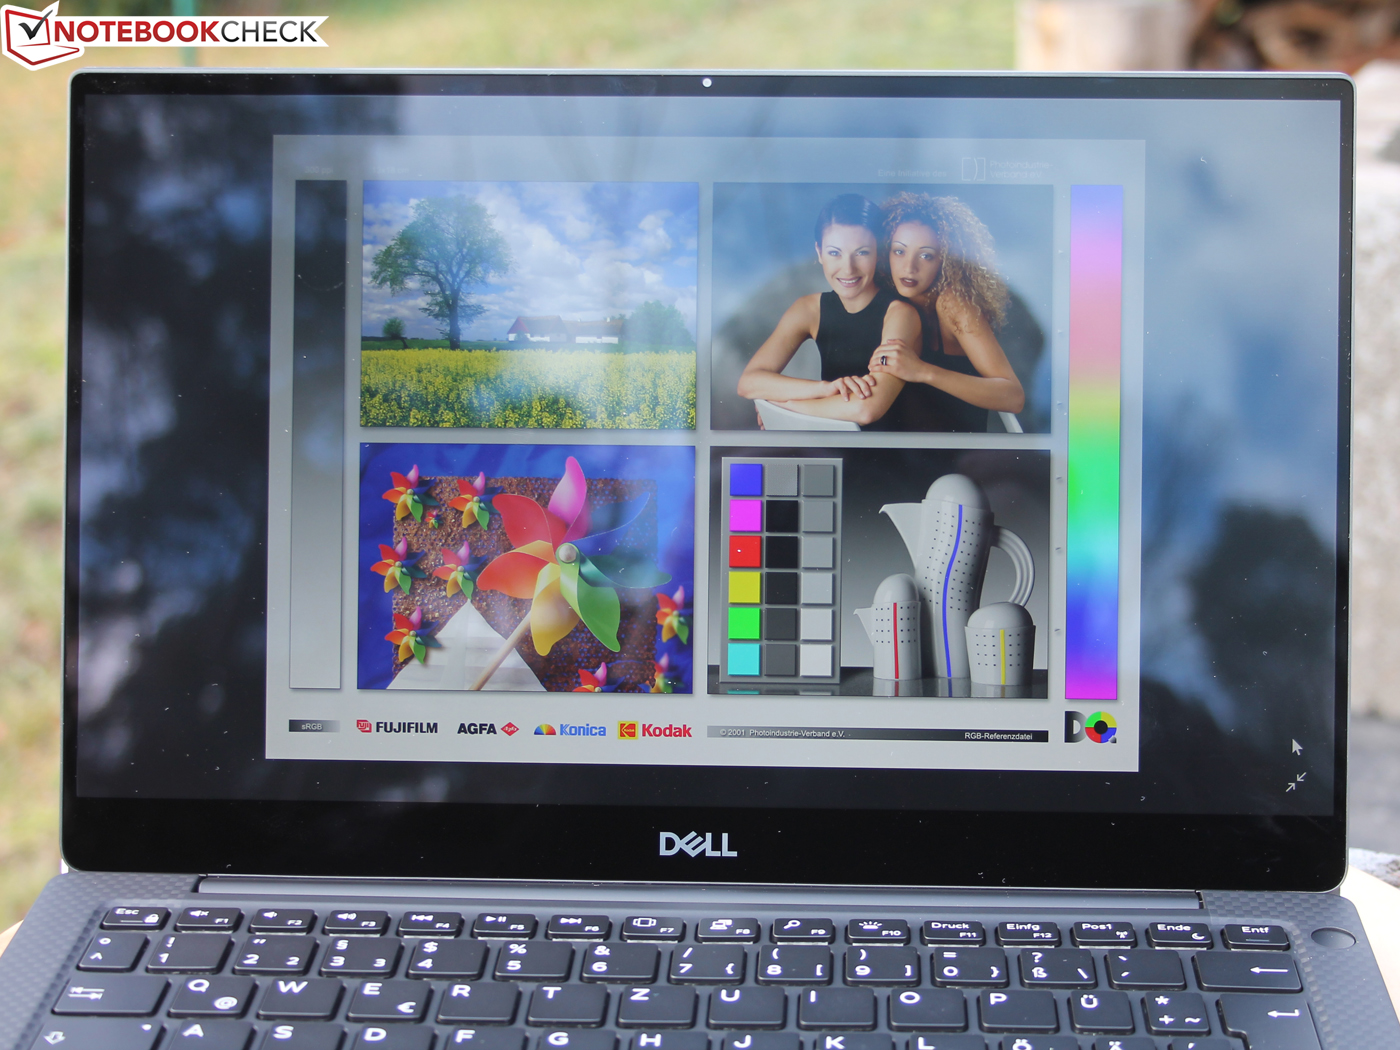
You can use the Dell XPS 13 with the touch panel in the sun, but there are limitations. The maximum luminance of ~400 nits (which is reduced to 363 nits on battery) is certainly sufficient, but the glossy screen surface quickly becomes an issue. You will have to search for a place in the shade to see the display content comfortably. The 1080p screen also has a glossy screen, but at least our 2018 SKU was a bit brighter, so it might be favorable outdoors.
The luminance is reduced to 363 nits on battery power. It is the default setting in the BIOS (F2: Video/LCD Brightness) and can be deactivated, so the brightness is identical on mains and battery.
Dynamic Backlight Control is once again included and was formerly known as Content Adaptive Brightness Control (CABC). This feature, which helps to save power by dynamically adapting the brightness based on the screen content, was a big annoyance in the past. Users reported flickering screens and Dell had to deploy a tool to deactivate CABC.
Now, you can just deactivate DBC (CABC) in the BIOS, both on battery as well as mains. The BIOS shows the note "if the panel supports it". So far, we did not find out whether our UHD screen supports CABC in the first place.
We deactivated DBC for our battery runtime test to ensure a fixed luminance of 150 nits (Wi-Fi test), which corresponds with 35% of the maximum luminance on our test unit.
Display Response Times
| ↔ Response Time Black to White | ||
|---|---|---|
| 36 ms ... rise ↗ and fall ↘ combined | ↗ 20 ms rise | 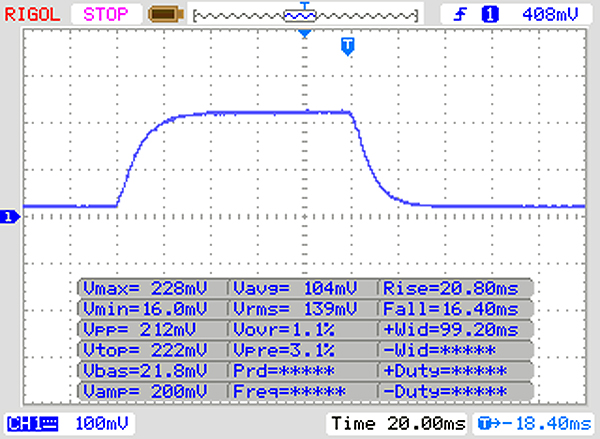 |
| ↘ 16 ms fall | ||
| The screen shows slow response rates in our tests and will be unsatisfactory for gamers. In comparison, all tested devices range from 0.1 (minimum) to 240 (maximum) ms. » 94 % of all devices are better. This means that the measured response time is worse than the average of all tested devices (19.8 ms). | ||
| ↔ Response Time 50% Grey to 80% Grey | ||
| 58 ms ... rise ↗ and fall ↘ combined | ↗ 26 ms rise | 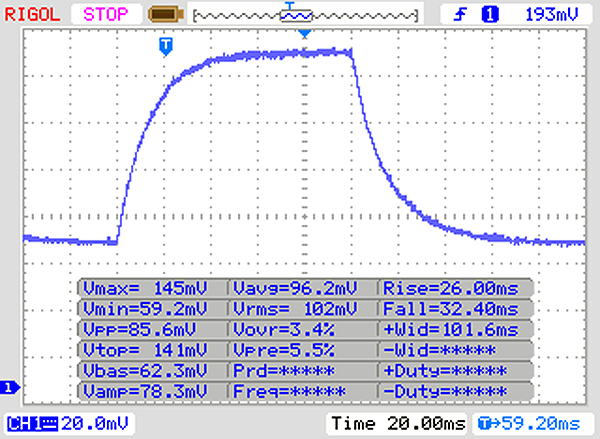 |
| ↘ 32 ms fall | ||
| The screen shows slow response rates in our tests and will be unsatisfactory for gamers. In comparison, all tested devices range from 0.165 (minimum) to 636 (maximum) ms. » 94 % of all devices are better. This means that the measured response time is worse than the average of all tested devices (31 ms). | ||
Screen Flickering / PWM (Pulse-Width Modulation)
| Screen flickering / PWM not detected | 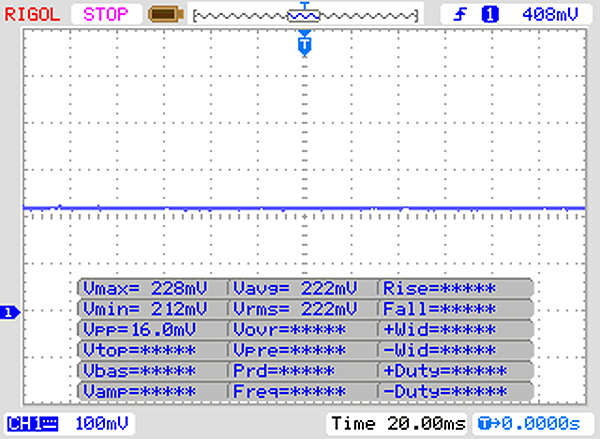 | ||
In comparison: 52 % of all tested devices do not use PWM to dim the display. If PWM was detected, an average of 7747 (minimum: 5 - maximum: 343500) Hz was measured. | |||
The viewing angles are on the expected level for an IPS screen. The brightness drops a bit from wider angles, but there are no noteworthy color shifts, even from extreme viewing positions.

Performance – Whiskey Lake in the 2019 XPS

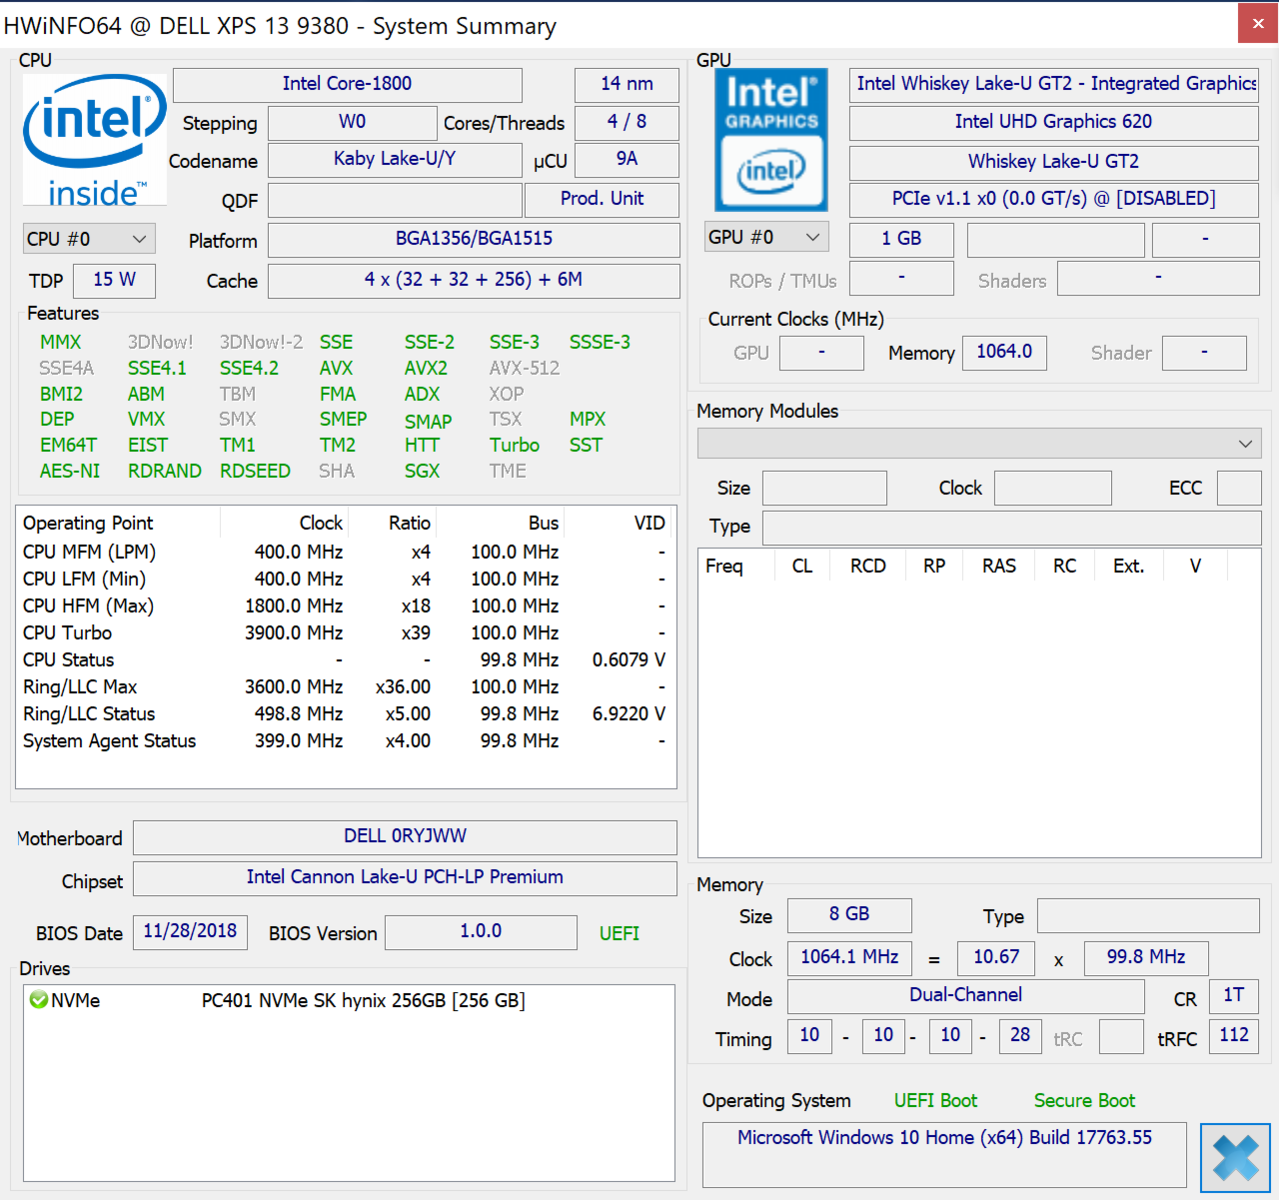
Dell ships its XPS with a powerful processor. The quad-core Intel Core i5-8265U based on the Whiskey Lake architecture is supported by 8 GB RAM and a 256 GB SSD from SK Hynix. Our test unit is equipped with the UHD touchscreen, which has a native resolution of 3840x2160 pixels.
It is the mainstream SKU of the Dell XPS 13 that costs about 1600 Euros (~$1829). Dell also offers the XPS 13 with a Core i3 for the first time, with the Intel Core i3-8145U. The entry-level spec with 128 GB SSD storage, 1080p screen (non-touch) and only 4 GB RAM currently starts at 1100 Euros (~$1257). The most-expensive SKU is available for 1950 Euros (~$2229) and comes with a Core i7-8565U, 16 GB RAM and 512 GB SSD storage. This model uses the same 4K UHD (3840x2160) InfinityEdge touchscreen from our test unit.
Our SKU with the high-resolution display and the Core i5 should be a popular choice for many customers, and the system performance is more than sufficient for most common (and even professional) tasks.
Processor
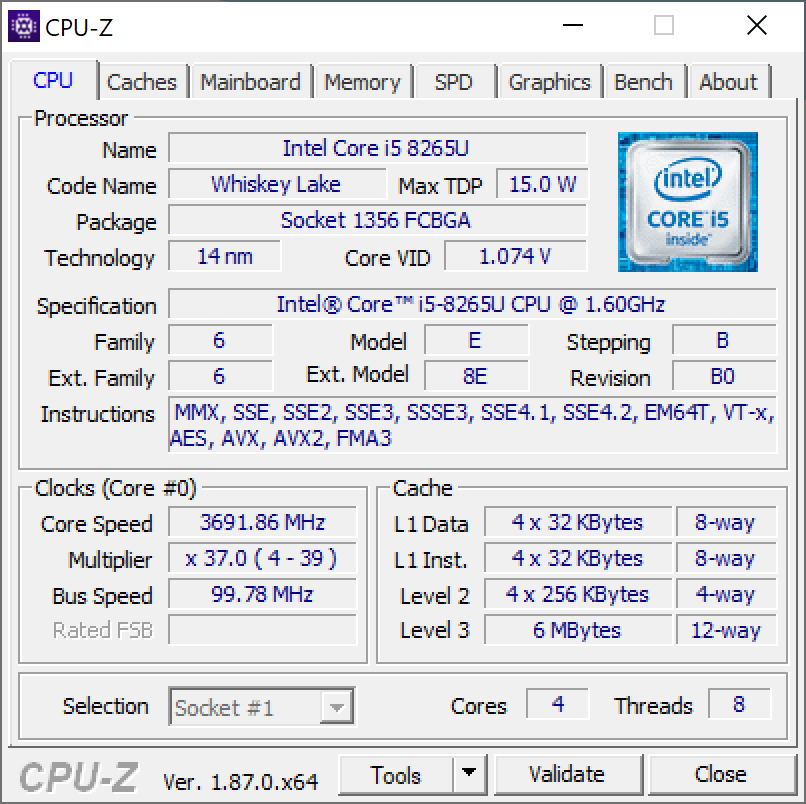
The Intel Core i5-8265U quad-core processor is a ULV chip (TDP 15W) based on Intel's Whiskey Lake architecture. The processor runs at a base frequency of 1.6 GHz, but it can reach up to 3.7 GHz (all four cores), 3.8 GHz (two cores), or 3.9 GHz (one core) via Turbo Boost.
The Whiskey Lake architecture of the Core i5-8265U processor does not differ much from the previous Kaby Lake architecture used for the 2018 XPS 13. The per-MHz performance is identical, but the improved manufacturing process of Whiskey Lake allows higher clock rates. In theory, the higher frequency of the 8265U should be faster than the previous Core i5-8250U processor in our CPU benchmarks. However, this is not the case: The Cinebench R15 Multi test shows both CPUs are similarly fast, and the new chip is only 3% ahead in the Single test. This is the case for one benchmark run, but the Whiskey Lake chip is ahead under sustained workloads.
As always, the interesting question is whether the cooling solution can maintain the performance when the load period is longer. Slim subnotebooks often struggle with this task, and the initial high performance (Turbo Boost) often drops by 15-30%, which results in lower benchmark scores compared to the initial run. So what about the 2019 XPS 13?
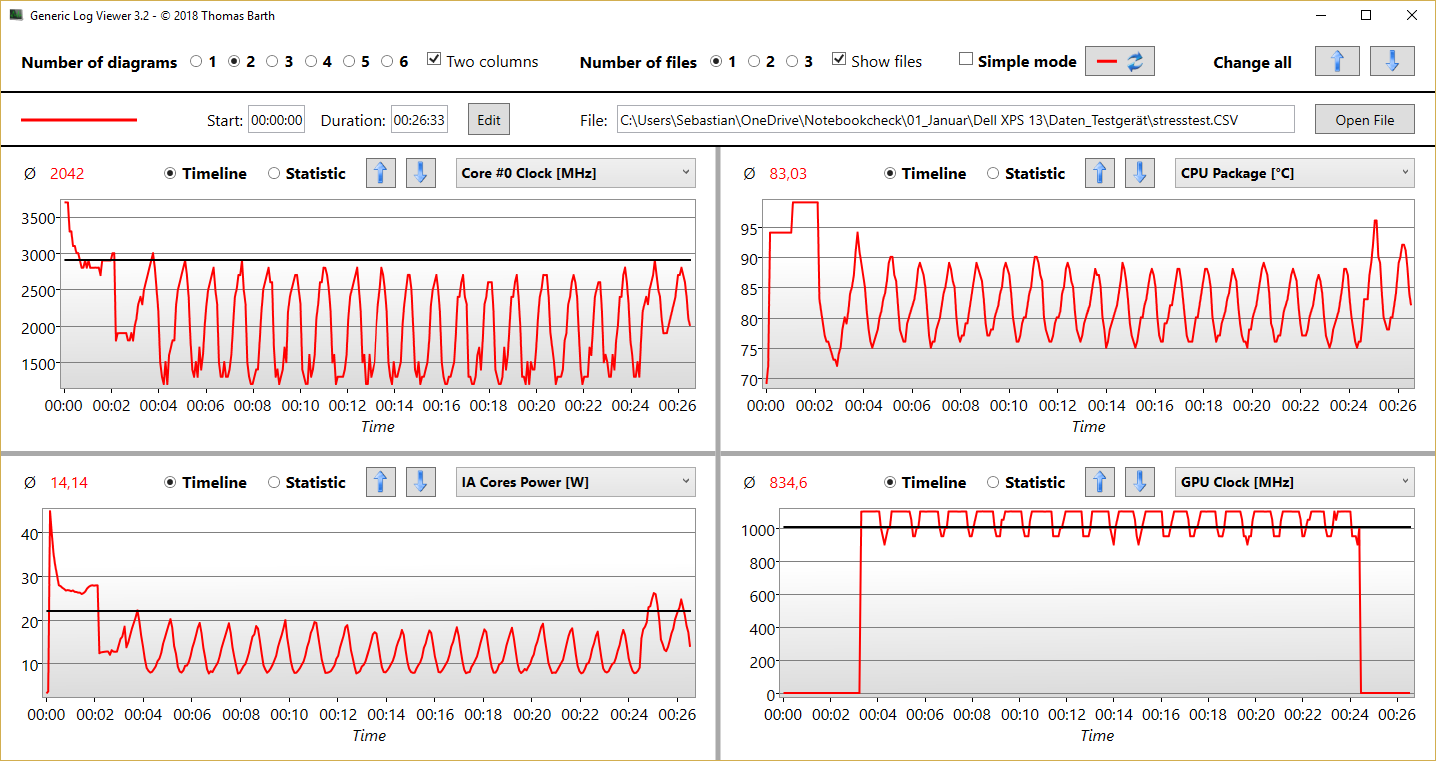
The processor starts with 3.7 GHz in the Cinebench R15 Multithread, but it drops to 3.3-3.4 GHz after a couple of seconds. This level can be maintained for the first four minutes, because the chip warms up to 99 °C and occasionally has to reduce the clocks down to 2.5 GHz. The CPU cools down to 80 °C in these periods, before it increases the clock and warms up to almost 100 °C again.
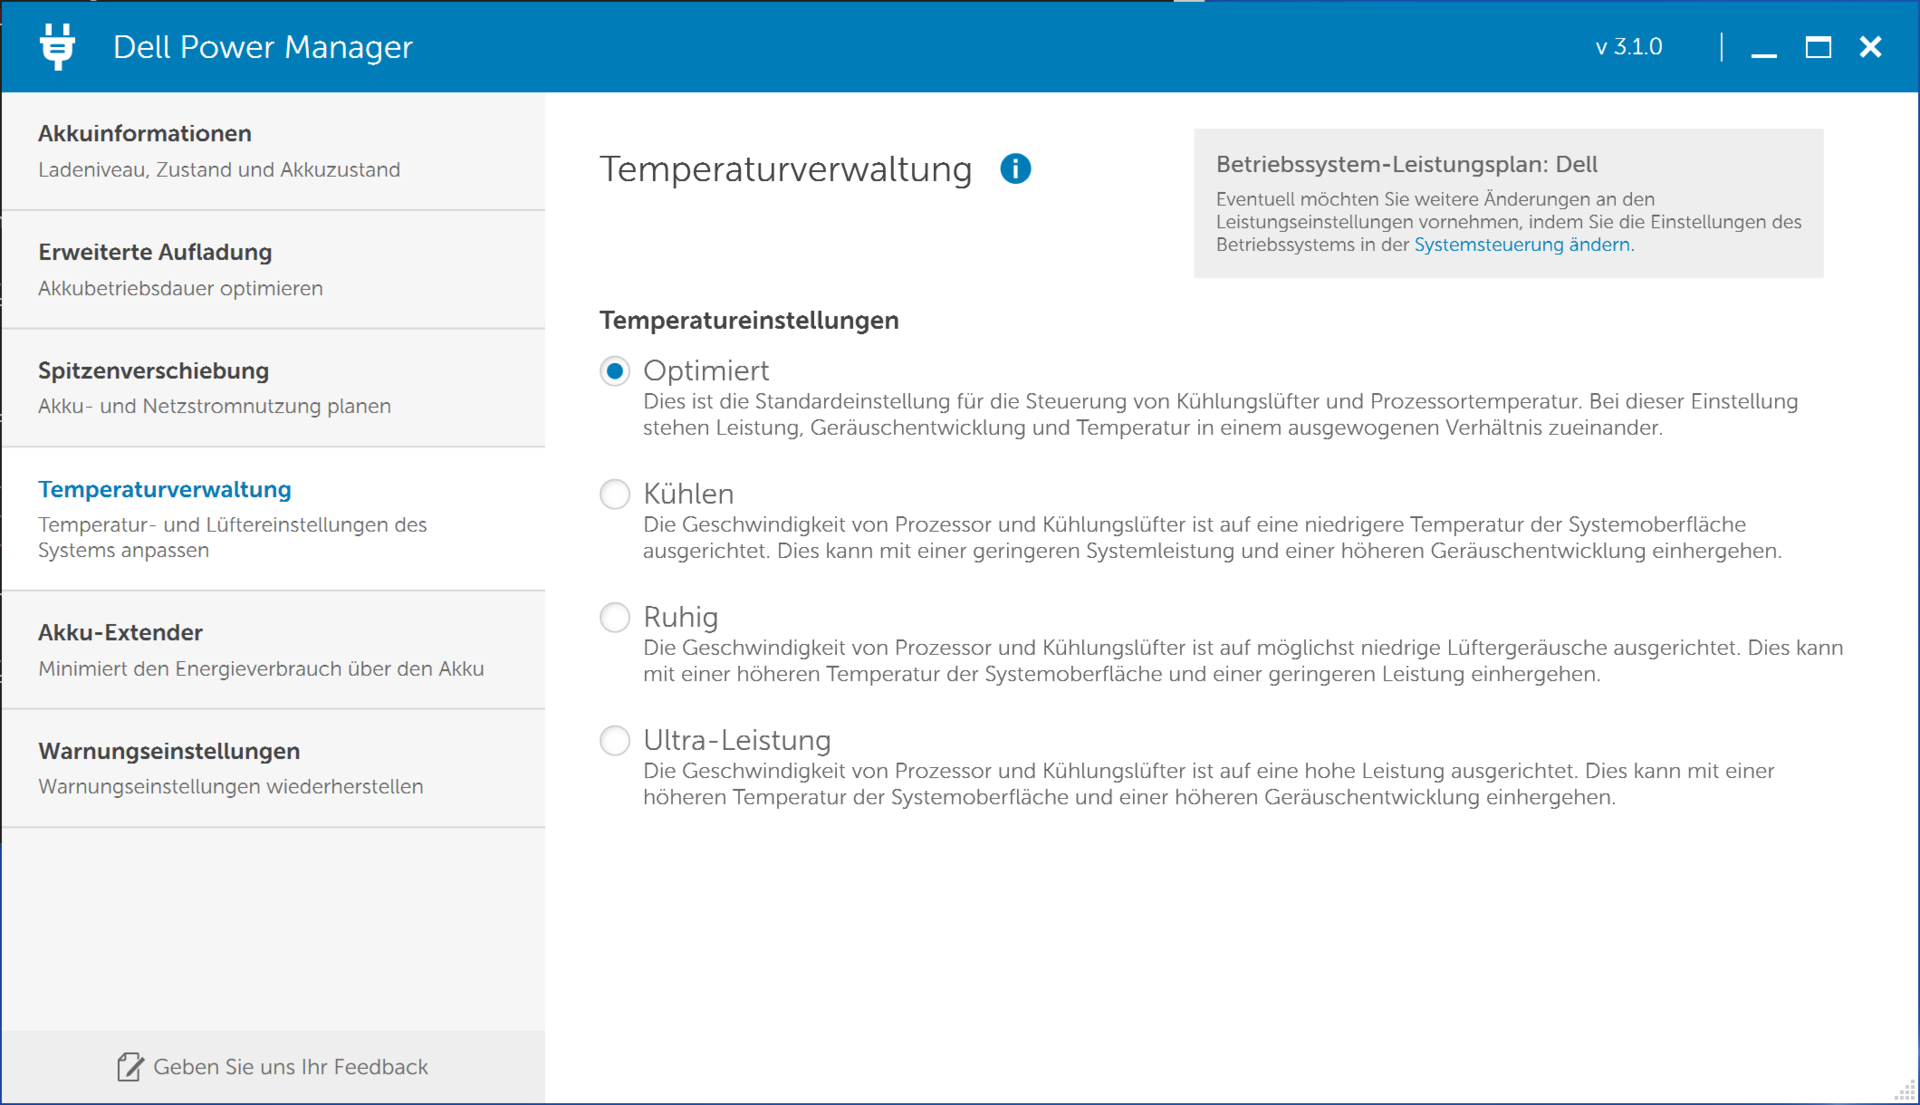
The first picture shows the development of the temperature and the processor frequency with the Optimized performance mode. The second picture shows the same data with the performance mode Ultra. The average clock is pretty much identical, but the behavior changes: The periods with higher clocks than 2.5 GHz are longer, but the clock climbs slower in return.
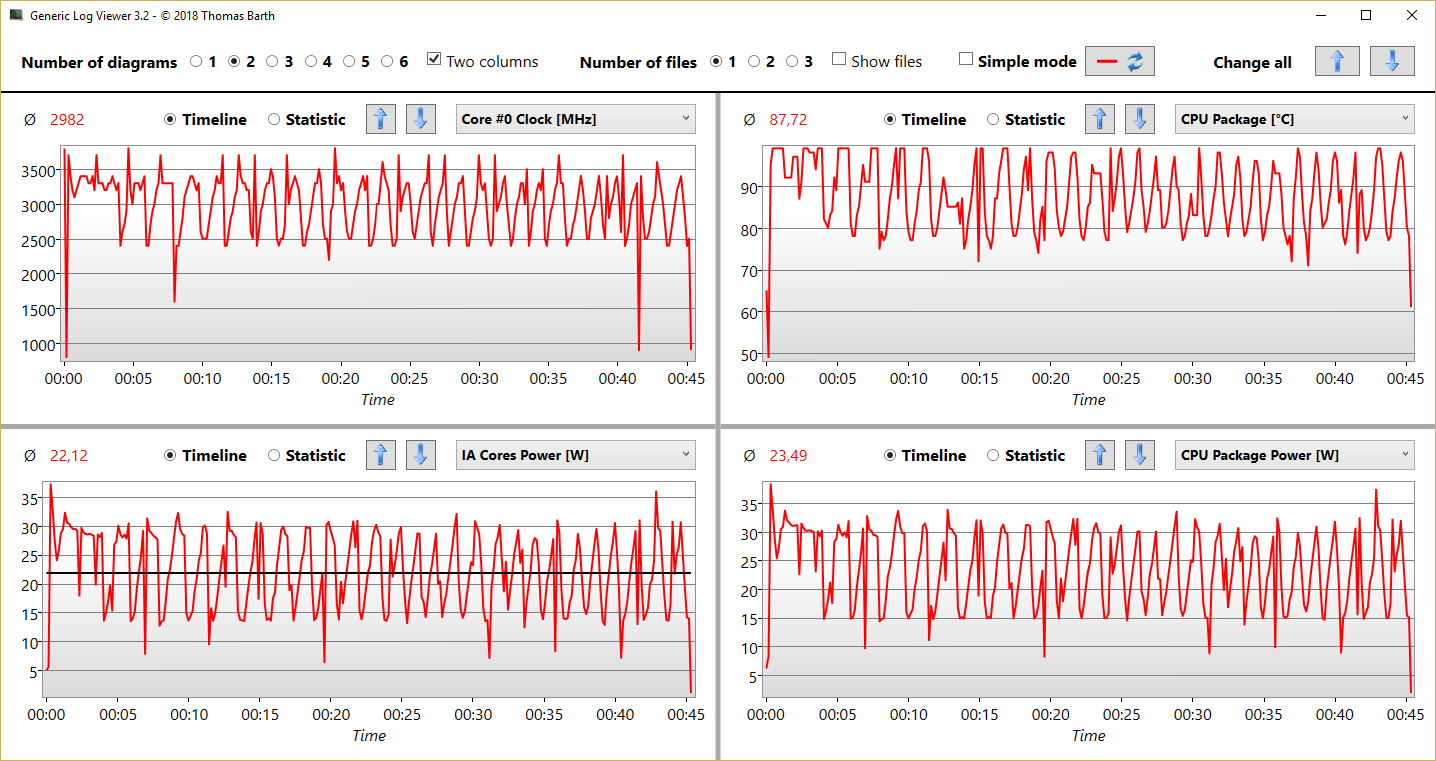

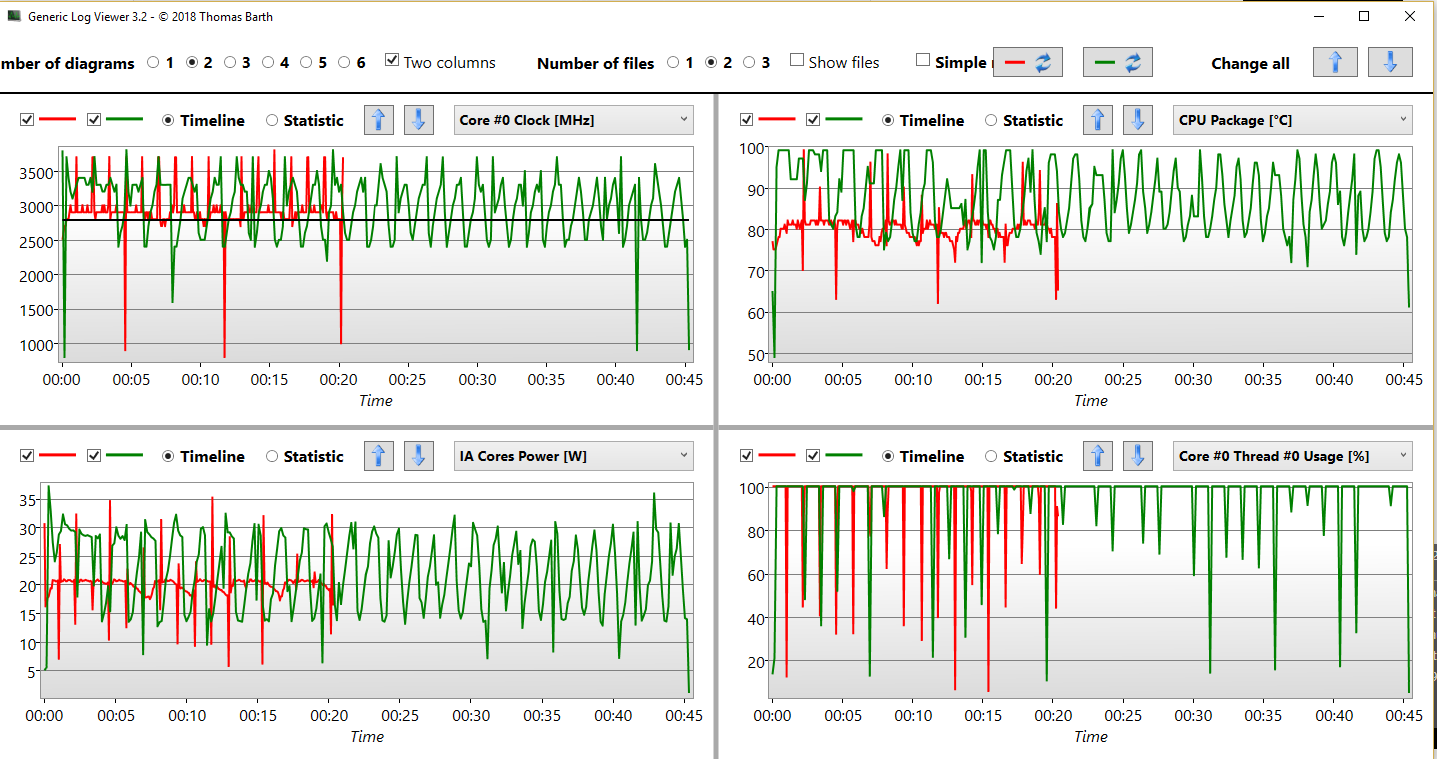
The results of the Cinebench R15 loop show an advantage for the Ultra mode, but the difference is small: 574 up to 666 points (Optimized, 597 on average) vs. 518 up to 672 points (Ultra mode, 614 on average). The Ultra mode also has bigger fluctuations.
All in all, Dell is able to utilize the performance of the Whiskey Lake i5 very well, but the high clocks often result in core temperatures close to 100 °C. The previous model 8250U behaved differently and the performance in the CB loop was lower. We have already seen more conservative CPU settings, which lost between 15-30% percent after the first iterations. Our XPS 13 only loses 8% of its original performance (~14% for the previous 9370).
A quick look at the competitors in the subnotebook segment also shows that the XPS 13 i5 performs very well and is only beaten by the Apple MacBook Pro 13 (i5-8259U).
Our results were determined on mains, but the CPU frequency is much lower on battery power. 1.8-2.6 GHz in the Multi test and 1.4-1.8 GHz in the Single test only results in 535 or 114 points, respectively, which is a deficit of 20 (Multi) and 23% (Single).
System Performance
The combination of solid state drive, quad-core processor, and dual-channel memory ensures a responsive user experience. The integrated GPU is powerful enough for older or less-demanding games.
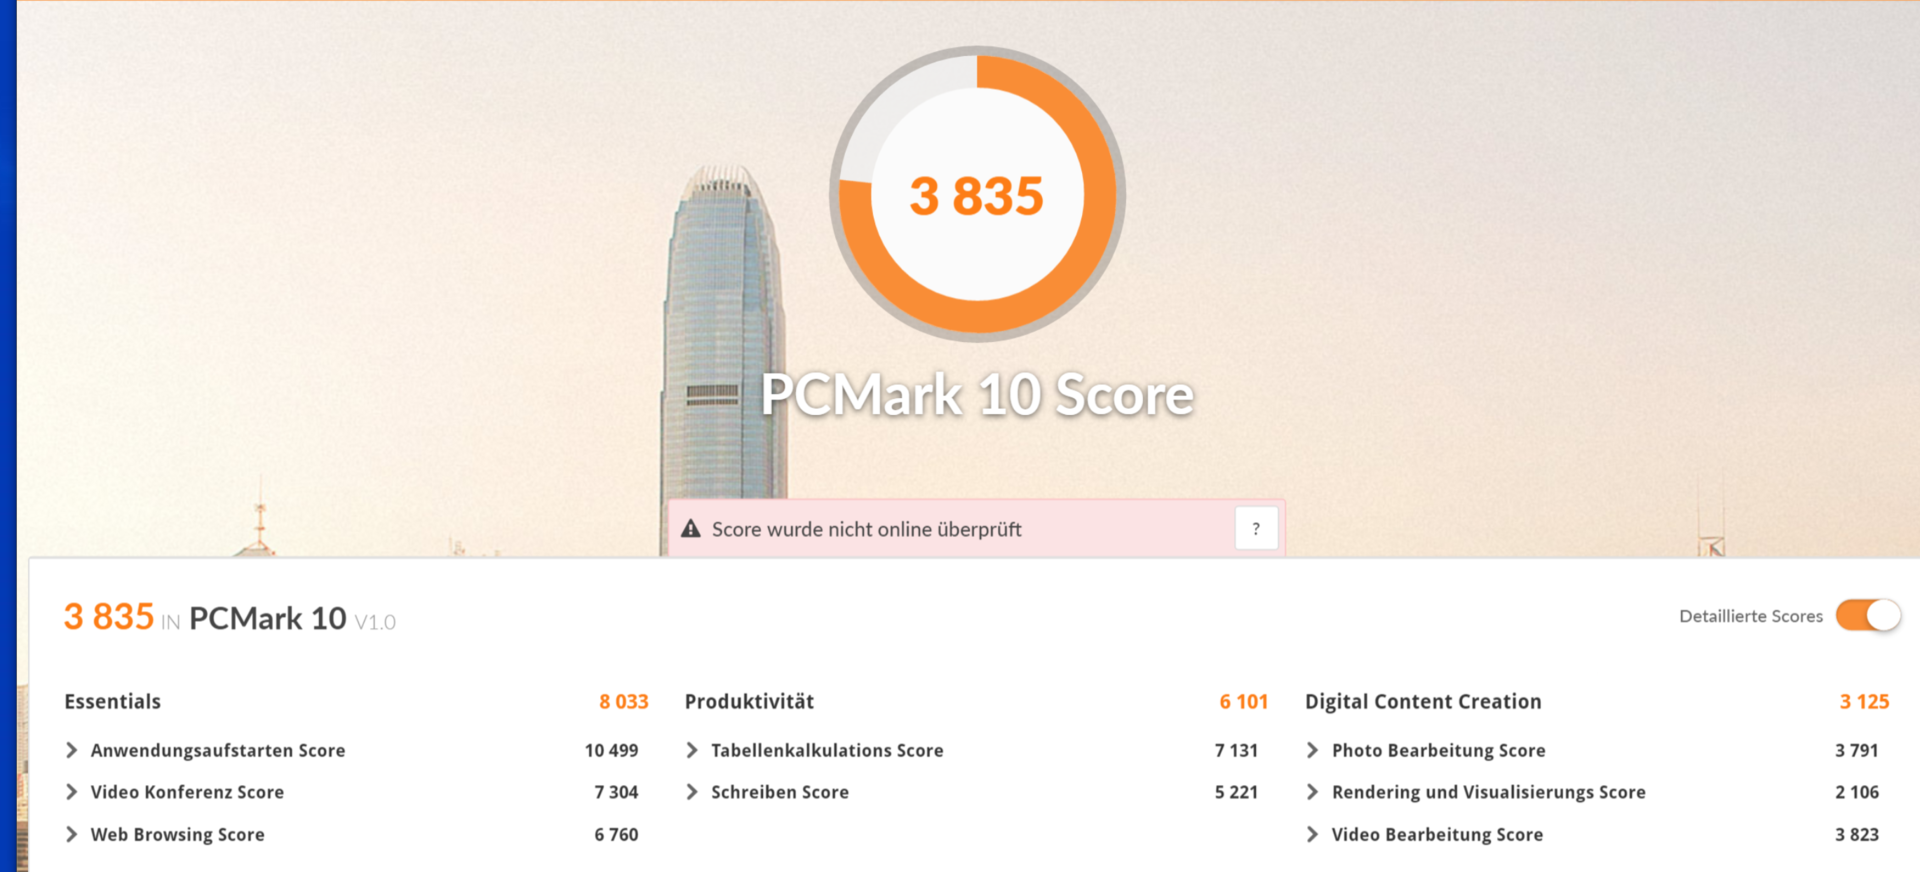
We determine very good results in the synthetic PCMark benchmarks, but we did not expect anything else. Our XPS 13 is only beaten by the Huawei MateBook 13 (Whiskey Lake i7), which has an advantage thanks to its dedicated MX150 GPU (PCMark 10 score +13%).
Interesting: The 2019 XPS 13 is just slightly (if at all) faster than the XPS 13 9370 FHD i5. Potential buyers should keep that in mind before they spend their money, it's possible that a 2018 XPS 13 could be the better choice. We will pick this topic up in the final verdict and give our recommendation.
| PCMark 8 Home Score Accelerated v2 | 3519 points | |
| PCMark 8 Work Score Accelerated v2 | 4302 points | |
| PCMark 10 Score | 3835 points | |
Help | ||
Storage Devices
The 256 GB SSD from SK Hynix carries the designation PC401 HFS256GD9TNG, which is an NVMe-PCIe M.2 drive. You can use 159 GB for your own files after the initial setup.
The SSD manages pretty high transfer rates but cannot quite compete with the Samsung SSD PM981 and PM961 (ThinkPad X280 / HP EliteBook 830 G5-3JX74EA; +56%). Even the Toshiba XG5 (XPS 13 9370) from 2018 was faster overall (+47%), which is caused by the comparatively low sequential read/write results.
| Dell XPS 13 9380 2019 SK hynix PC401 HFS256GD9TNG | Dell XPS 13 9370 FHD i5 Toshiba XG5 KXG50ZNV256G | Apple MacBook Pro 13 2018 Touchbar i5 | Lenovo ThinkPad X280-20KES01S00 Samsung SSD PM981 MZVLB512HAJQ | Fujitsu Lifebook U938 Micron 1100 MTFDDAV256TBN | HP EliteBook 830 G5-3JX74EA Samsung SSD PM961 1TB M.2 PCIe 3.0 x4 NVMe (MZVLW1T0) | HP Envy 13-ah0003ng SK Hynix BC501 HFM512GDJTNG | Huawei MateBook 13 i7 Samsung SSD PM981 MZVLB512HAJQ | Average SK hynix PC401 HFS256GD9TNG | |
|---|---|---|---|---|---|---|---|---|---|
| CrystalDiskMark 5.2 / 6 | 47% | 3% | 58% | -32% | 56% | 6% | 100% | 12% | |
| Write 4K (MB/s) | 84.6 | 128.2 52% | 43.24 -49% | 125.3 48% | 80.5 -5% | 108.5 28% | 112.9 33% | 159.4 88% | 101.8 ? 20% |
| Read 4K (MB/s) | 38.52 | 48.09 25% | 14.07 -63% | 43.5 13% | 26.14 -32% | 40.53 5% | 38.69 0% | 47.31 23% | 40.9 ? 6% |
| Write Seq (MB/s) | 557 | 1088 95% | 887 59% | 112 -80% | 396.8 -29% | 1026 84% | 654 17% | 1899 241% | 673 ? 21% |
| Read Seq (MB/s) | 1393 | 1877 35% | 1515 9% | 2273 63% | 473.1 -66% | 2080 49% | 642 -54% | 2173 56% | 1464 ? 5% |
| Write 4K Q32T1 (MB/s) | 339.5 | 367.1 8% | 225.3 -34% | 641 89% | 264.2 -22% | 451 33% | 305.9 -10% | 368.1 8% | 294 ? -13% |
| Read 4K Q32T1 (MB/s) | 255.4 | 411.9 61% | 346.5 36% | 392 53% | 244 -4% | 269.7 6% | 351.6 38% | 526 106% | 302 ? 18% |
| Write Seq Q32T1 (MB/s) | 558 | 1078 93% | 859 54% | 1903 241% | 464.6 -17% | 1770 217% | 869 56% | 1914 243% | 760 ? 36% |
| Read Seq Q32T1 (MB/s) | 2541 | 2771 9% | 2915 15% | 3398 34% | 525 -79% | 3214 26% | 1683 -34% | 3487 37% | 2561 ? 1% |
| AS SSD | 6% | 90% | -41% | 114% | 12% | 119% | -19% | ||
| Seq Read (MB/s) | 2035 | 1442 -29% | 2316 14% | 455.5 -78% | 2423 19% | 494.3 -76% | 1889 -7% | 1882 ? -8% | |
| Seq Write (MB/s) | 658 | 1694 157% | 1385 110% | 364.5 -45% | 1141 73% | 720 9% | 1812 175% | 593 ? -10% | |
| 4K Read (MB/s) | 39.74 | 9.7 -76% | 47.2 19% | 24.41 -39% | 47.17 19% | 38.35 -3% | 55.5 40% | 38.9 ? -2% | |
| 4K Write (MB/s) | 105.7 | 20 -81% | 105.3 0% | 73.8 -30% | 115.6 9% | 98.4 -7% | 118.4 12% | 100.2 ? -5% | |
| 4K-64 Read (MB/s) | 461 | 957 108% | 1218 164% | 235.7 -49% | 1144 148% | 611 33% | 1257 173% | 452 ? -2% | |
| 4K-64 Write (MB/s) | 300.1 | 162 -46% | 1309 336% | 308.8 3% | 1571 423% | 712 137% | 1571 423% | 290 ? -3% | |
| Access Time Read * (ms) | 0.061 | 0.041 33% | 0.099 -62% | 0.04 34% | 0.061 -0% | 0.041 33% | 0.1118 ? -83% | ||
| Access Time Write * (ms) | 0.051 | 0.036 29% | 0.057 -12% | 0.031 39% | 0.037 27% | 0.032 37% | 0.1111 ? -118% | ||
| Score Read (Points) | 704 | 1497 113% | 306 -57% | 1433 104% | 698 -1% | 1502 113% | 679 ? -4% | ||
| Score Write (Points) | 471 | 1553 230% | 419 -11% | 1801 282% | 883 87% | 1871 297% | 450 ? -4% | ||
| Score Total (Points) | 1479 | 3774 155% | 885 -40% | 3910 164% | 1961 33% | 4147 180% | 1423 ? -4% | ||
| Copy ISO MB/s (MB/s) | 893 | 1068 20% | 442.4 -50% | 2452 175% | 860 -4% | 1800 102% | 748 ? -16% | ||
| Copy Program MB/s (MB/s) | 287.9 | 327.5 14% | 163.9 -43% | 421.9 47% | 244 -15% | 385.6 34% | 358 ? 24% | ||
| Copy Game MB/s (MB/s) | 618 | 717 16% | 275.8 -55% | 991 60% | 282 -54% | 982 59% | 423 ? -32% | ||
| Total Average (Program / Settings) | 47% /
47% | 5% /
4% | 74% /
78% | -37% /
-37% | 85% /
93% | 9% /
10% | 110% /
112% | -4% /
-8% |
* ... smaller is better

GPU Performance
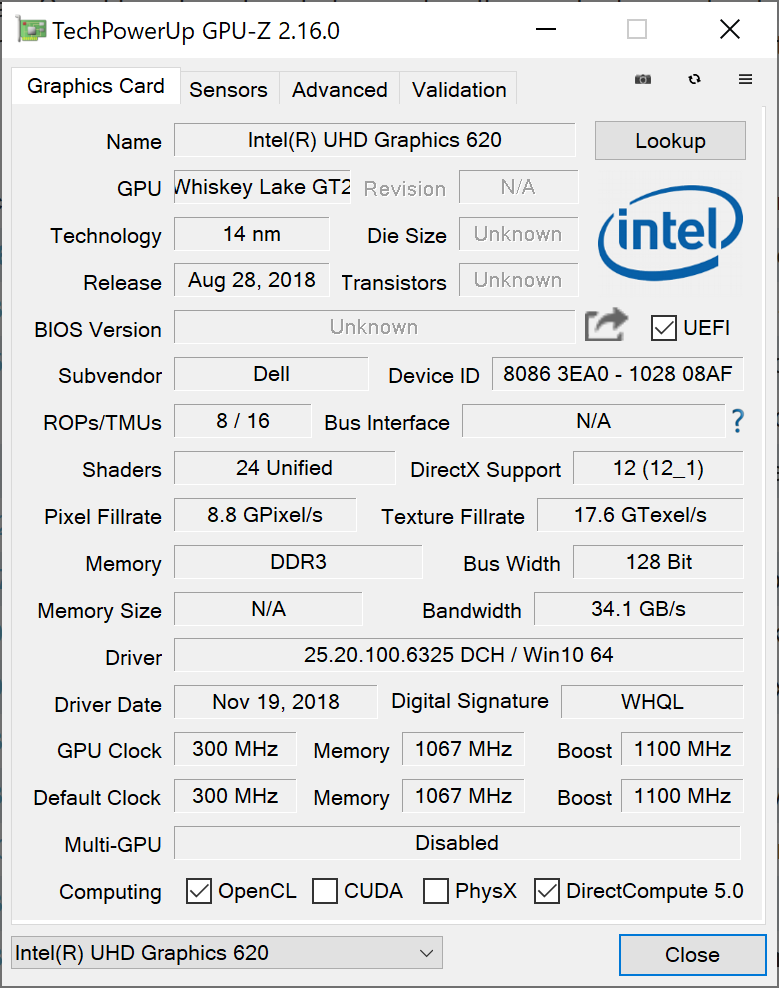
The performance of the familiar UHD Graphics 620 is above average in the synthetic benchmarks, and 3DMark Cloud Gate score is higher compared to the similar iGPU in the Lenovo ThinkPad X280, HP EliteBook 830 G5 or Fujitsu LifeBook U938.
Still, the overall performance level is low; we have to take a look at the GeForce MX150 from the Huawei MateBook 13 to see how much GPU performance a subnotebook can offer (+110%).
| 3DMark 11 Performance | 2053 points | |
| 3DMark Cloud Gate Standard Score | 9514 points | |
Help | ||
Gaming Performance
We have a look at some modern and older standard titles to evaluate the gaming performance of the XPS 13 with the UHD Graphics 620. It can confirm the good synthetic results, but other devices are sometimes a bit faster. Overall, however, all the comparison devices are pretty much on par, and the UHD Graphics 620 is no graphics adapter for gaming.
This is also supported by our colorful benchmark table below. Games with high and medium hardware requirements are not playable on the XPS laptop. The Huawei MateBook 13 with the discrete MX150 would be the better for choice for this scenario (compare BioShock Infinite).
| Thief - 1024x768 Very Low Preset | |
| Average Intel UHD Graphics 620 (16.3 - 34.3, n=10) | |
| Dell XPS 13 9380 2019 | |
| Rise of the Tomb Raider - 1024x768 Lowest Preset | |
| Apple MacBook Pro 13 2018 Touchbar i5 | |
| HP EliteBook 830 G5-3JX74EA | |
| Dell XPS 13 9370 i7 UHD | |
| Lenovo ThinkPad X280-20KES01S00 | |
| Average Intel UHD Graphics 620 (10.4 - 110.7, n=82) | |
| Dell XPS 13 9380 2019 | |
| Fujitsu Lifebook U938 | |
| F1 2018 - 1280x720 Ultra Low Preset | |
| HP Envy 13-ah0003ng | |
| Apple MacBook Pro 13 2018 Touchbar i5 | |
| Dell XPS 13 9380 2019 | |
| Average Intel UHD Graphics 620 (31 - 35.8, n=5) | |
| Shadow of the Tomb Raider - 1280x720 Lowest Preset | |
| Average of class Subnotebook (41 - 109, n=7, last 2 years) | |
| HP Envy 13-ah0003ng | |
| Apple MacBook Pro 13 2018 Touchbar i5 | |
| Dell XPS 13 9380 2019 | |
| Average Intel UHD Graphics 620 (12 - 21.7, n=13) | |
| FIFA 19 - 1920x1080 High Preset AA:2x MS | |
| Dell XPS 13 9380 2019 | |
| HP Envy 13-ah0003ng | |
| Average Intel UHD Graphics 620 (20.7 - 51, n=2) | |
| Darksiders III - 1280x720 Low | |
| Dell XPS 13 9380 2019 | |
| Average Intel UHD Graphics 620 (16.5 - 30.4, n=4) | |
| low | med. | high | ultra | |
|---|---|---|---|---|
| BioShock Infinite (2013) | 71.3 | 37.4 | 31.2 | 9.8 |
| Thief (2014) | 23.9 | 12.8 | ||
| Rise of the Tomb Raider (2016) | 20.5 | 17.4 | 6.9 | |
| F1 2018 (2018) | 33 | 15 | 14 | |
| Shadow of the Tomb Raider (2018) | 15 | 10 | ||
| FIFA 19 (2018) | 48 | 53.4 | 51 | |
| Darksiders III (2018) | 26.3 | 7.3 |
Emissions – 13-inch laptop with long stamina
System Noise
The XPS 13 9380 is not a noisy system and the fans are usually turned off. This obviously changes as soon as you stress the device with heavier workloads. We did not hear any noises while idling, and this includes coil whine, which was often an issue with XPS laptops in the past.
Short-term load (like copying files) can turn the fan on, but we only measure a noise of 31.7 dB(A). The maximum noise was 38.1 dB(A) at the beginning of our stress test, which is a noticeable murmur. However, this value is not steady and drops to 33.3 dB(A) every 2-3 minutes. This corresponds with a reduced CPU clock to 1.4 GHz, which can last for up to 60 seconds.
Noise level
| Idle |
| 30.4 / 30.4 / 30.4 dB(A) |
| Load |
| 31.7 / 38.1 dB(A) |
 | ||
30 dB silent 40 dB(A) audible 50 dB(A) loud |
||
min: | ||
Temperature
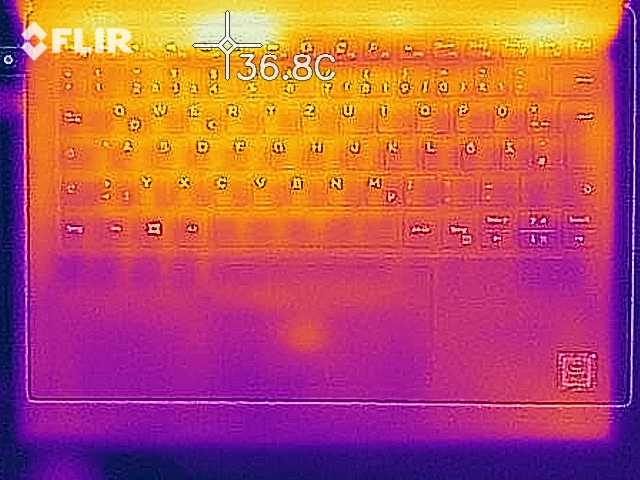
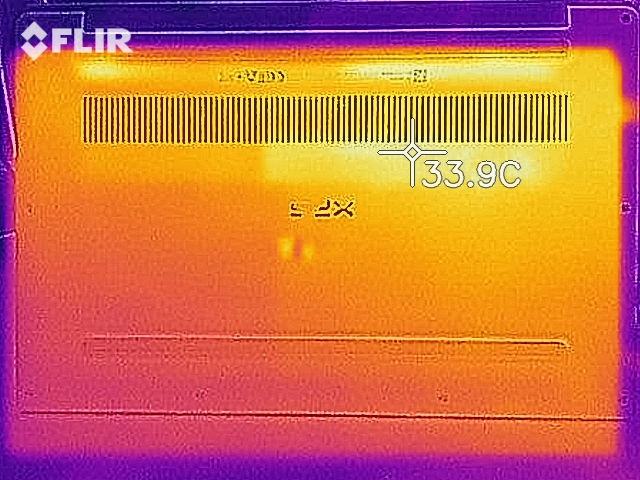
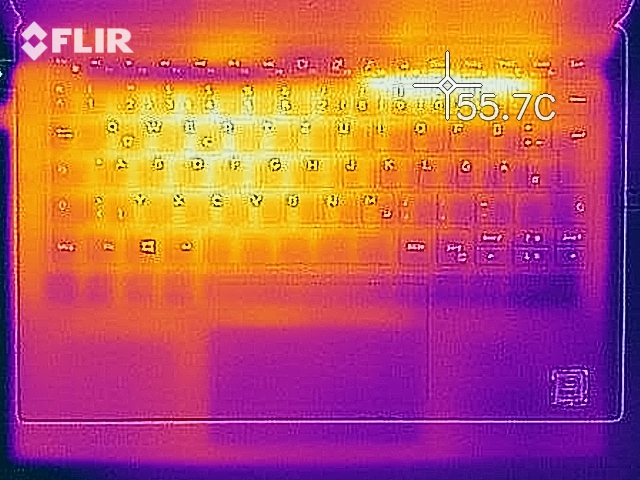
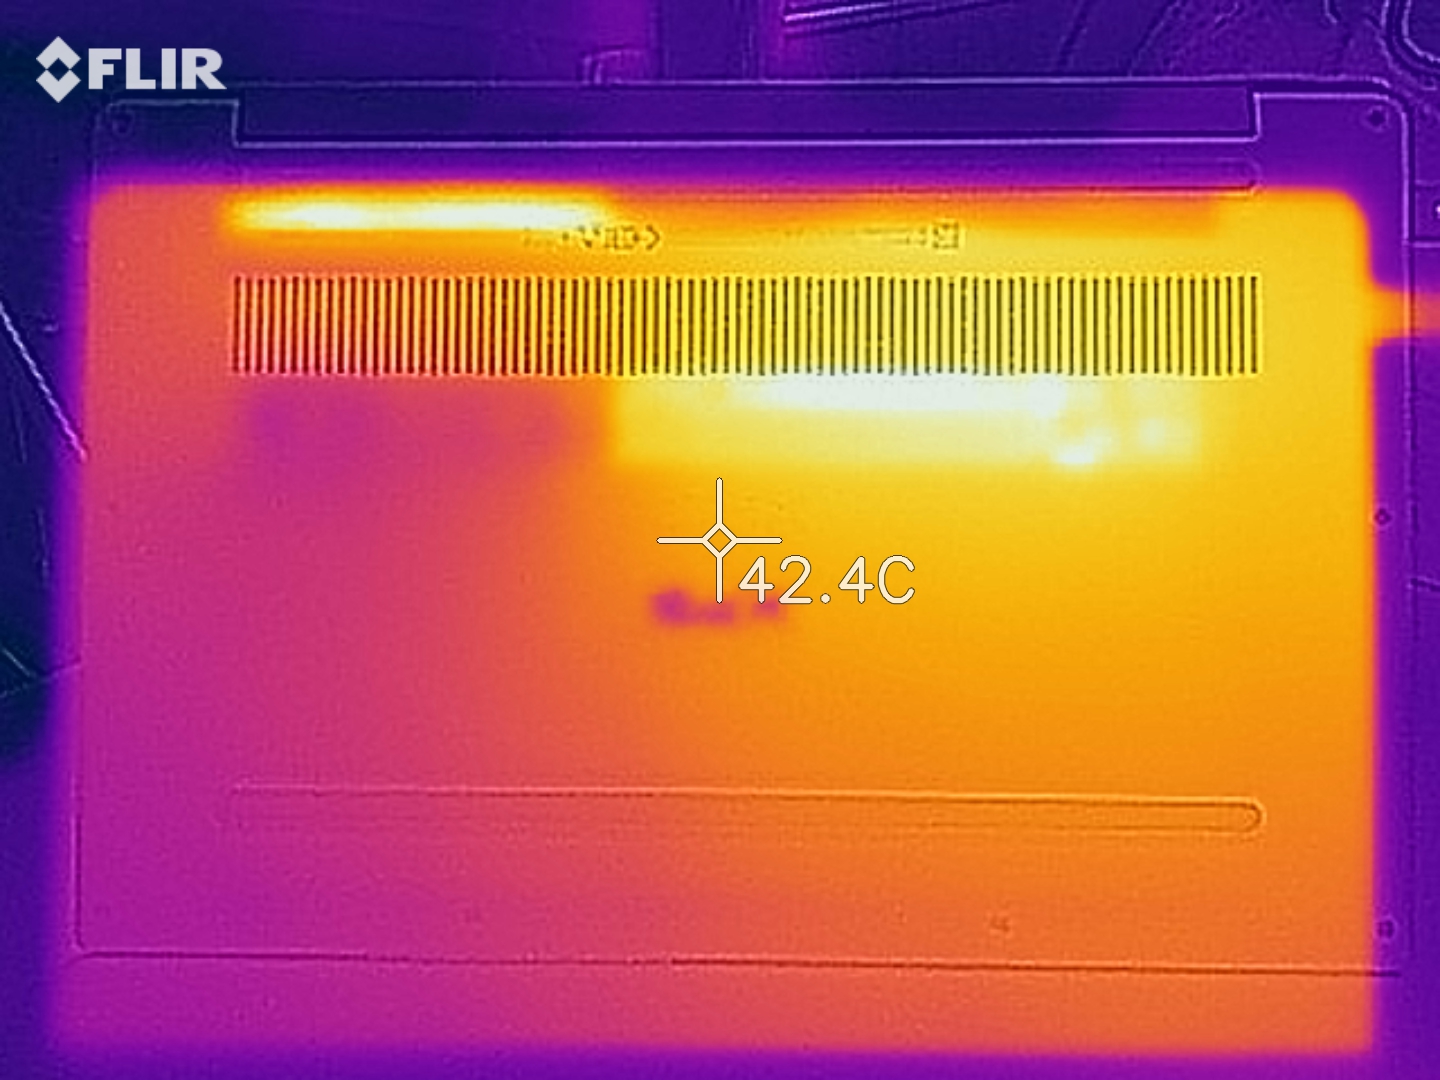
Dell's XPS 13 only warms up moderately, and we only measure average surface temperatures of 26-27 °C while idling. This obviously changes under load, which is represented by our stress test here. We measured up to 47 °C with the power mode Optimized (Dell Power Manager). This means you can still use Dell's Ultrabook on your lap, even when you stress it.
Our stress test also reveals massive fluctuations of the processor clock (1.4-3.0 GHz), but the GPU frequency is pretty stable with values between 950 and 1050 MHz. The CPU frequently raises its clock to 2.8-3.0 GHz, which results in chip temperatures of up to 90 °C. As soon as the CPU hits this value, it starts to throttle the clock again.
We ran our stress test with two different Power Manager settings: Optimized and Ultra Performance, but this has no effect on the clocks or the fan behavior.

(-) The maximum temperature on the upper side is 47.2 °C / 117 F, compared to the average of 35.9 °C / 97 F, ranging from 21.4 to 59 °C for the class Subnotebook.
(±) The bottom heats up to a maximum of 43.3 °C / 110 F, compared to the average of 39.2 °C / 103 F
(+) In idle usage, the average temperature for the upper side is 26.4 °C / 80 F, compared to the device average of 30.8 °C / 87 F.
(+) The palmrests and touchpad are reaching skin temperature as a maximum (32.4 °C / 90.3 F) and are therefore not hot.
(-) The average temperature of the palmrest area of similar devices was 28.2 °C / 82.8 F (-4.2 °C / -7.5 F).
Speaker
The speakers of the Dell XPS 13 9380 did not change and are still located underneath the palm rests on the left and right sides. You can see small speaker grilles at both sides.
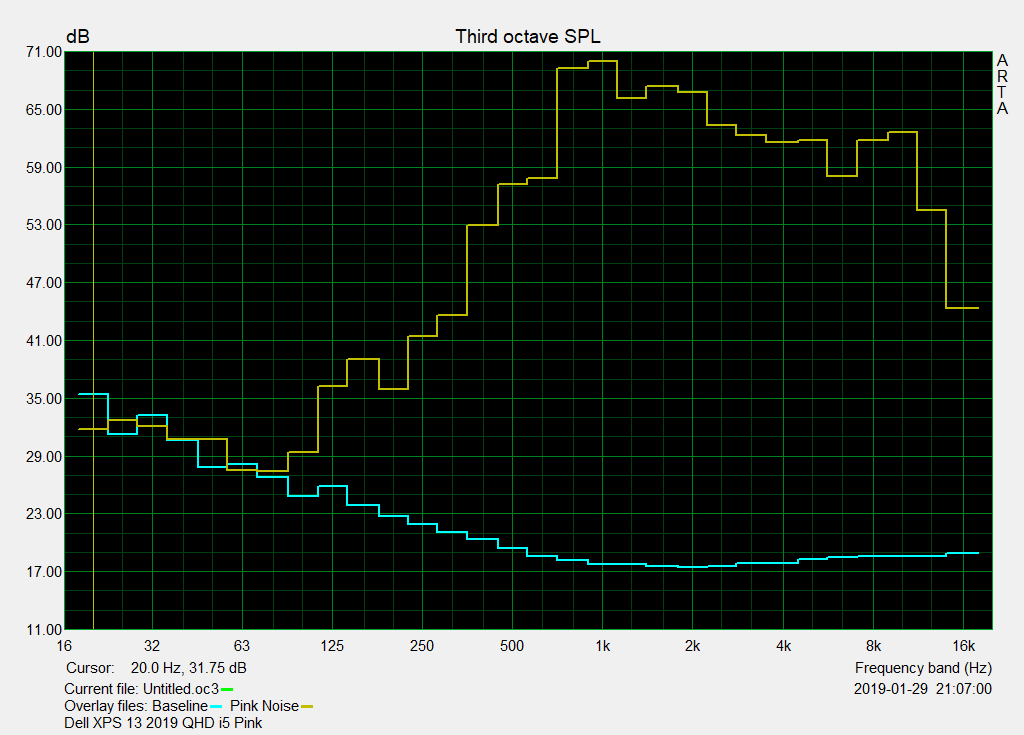
The mids and high tones are well represented, and they are also comparatively balanced. However, the resulting sound completely lacks bass. More is not possible with the small speaker setup.
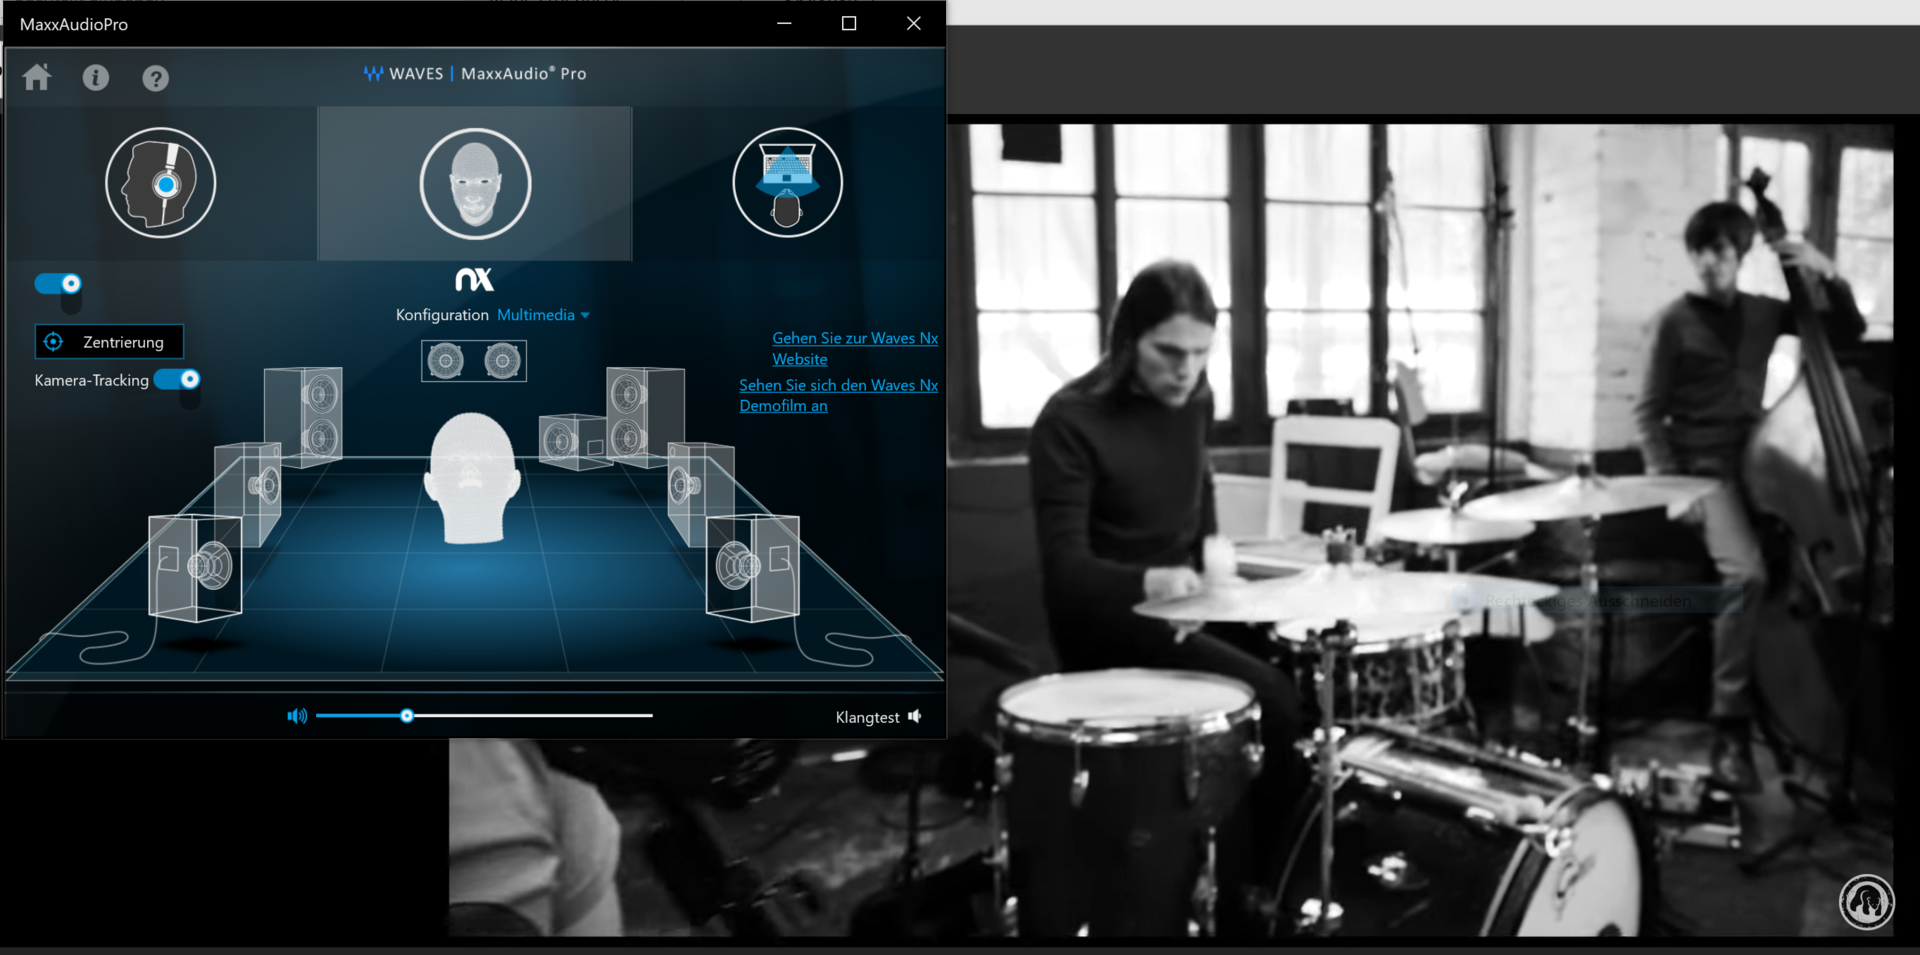
Dell also installs the Maxx Audio Pro tool including several audio enhancements, but this does not change the weak bass. You can also simulate surround sound with the Waves nX features. The webcam scans the position of your head, and voices or sounds will be louder or quieter on the headset depending on the position of your head relative to the webcam.
However, there is no "wow" effect, and it looks like the feature requires a better speaker setup (tweeters, subwoofers).
Contrary to the usual setup, the microphone does not sit next to the webcam but is placed at the front edge of the palm rests. Voice recordings were mostly clear and without any surrounding noises in our test. However, you should not be too far away from the laptop, otherwise the recording will be quieter, but the ambient sounds are still no problem.
One example of a better performance is with the MSI P63, which we reviewed simultaneously. We can move around in the whole room, while the voice is recorded at the same volume.
Dell XPS 13 9380 2019 audio analysis
(-) | not very loud speakers (70 dB)
Bass 100 - 315 Hz
(-) | nearly no bass - on average 20.4% lower than median
(±) | linearity of bass is average (9.4% delta to prev. frequency)
Mids 400 - 2000 Hz
(±) | higher mids - on average 6.9% higher than median
(±) | linearity of mids is average (10.2% delta to prev. frequency)
Highs 2 - 16 kHz
(+) | balanced highs - only 3.6% away from median
(+) | highs are linear (5% delta to prev. frequency)
Overall 100 - 16.000 Hz
(±) | linearity of overall sound is average (26.6% difference to median)
Compared to same class
» 88% of all tested devices in this class were better, 1% similar, 10% worse
» The best had a delta of 5%, average was 18%, worst was 53%
Compared to all devices tested
» 82% of all tested devices were better, 3% similar, 15% worse
» The best had a delta of 4%, average was 23%, worst was 134%
Apple MacBook Pro 13 2018 Touchbar i5 audio analysis
(+) | speakers can play relatively loud (83.4 dB)
Bass 100 - 315 Hz
(±) | reduced bass - on average 6.9% lower than median
(+) | bass is linear (6.7% delta to prev. frequency)
Mids 400 - 2000 Hz
(+) | balanced mids - only 1.9% away from median
(+) | mids are linear (3.8% delta to prev. frequency)
Highs 2 - 16 kHz
(+) | balanced highs - only 3.6% away from median
(+) | highs are linear (6.3% delta to prev. frequency)
Overall 100 - 16.000 Hz
(+) | overall sound is linear (9.5% difference to median)
Compared to same class
» 5% of all tested devices in this class were better, 2% similar, 93% worse
» The best had a delta of 5%, average was 18%, worst was 53%
Compared to all devices tested
» 4% of all tested devices were better, 1% similar, 95% worse
» The best had a delta of 4%, average was 23%, worst was 134%
HP Envy 13-ah0003ng audio analysis
(-) | not very loud speakers (71.9 dB)
Bass 100 - 315 Hz
(-) | nearly no bass - on average 23.3% lower than median
(±) | linearity of bass is average (12.4% delta to prev. frequency)
Mids 400 - 2000 Hz
(+) | balanced mids - only 2.2% away from median
(+) | mids are linear (4.8% delta to prev. frequency)
Highs 2 - 16 kHz
(+) | balanced highs - only 1.3% away from median
(+) | highs are linear (4.4% delta to prev. frequency)
Overall 100 - 16.000 Hz
(±) | linearity of overall sound is average (16.8% difference to median)
Compared to same class
» 43% of all tested devices in this class were better, 8% similar, 49% worse
» The best had a delta of 5%, average was 18%, worst was 53%
Compared to all devices tested
» 30% of all tested devices were better, 8% similar, 63% worse
» The best had a delta of 4%, average was 23%, worst was 134%
Energy Management – XPS 13 1080p lasts longer
Power Consumption
The power consumption of the XPS 13 9380 is basically identical to the predecessor 9370. The 4K SKU needs a bit more power than the 2018 1080p SKU while idling. Depending on the brightness and the wireless features, we measure 5-10 W.
The consumption jumps to 48 W when we stress the processor via Prime95. This is also the level when we add GPU load (FurMark), and we can still measure 48 W after one minute. This suggests a good Turbo utilization, and many slim laptops already consume 5-10 W less after one minute.
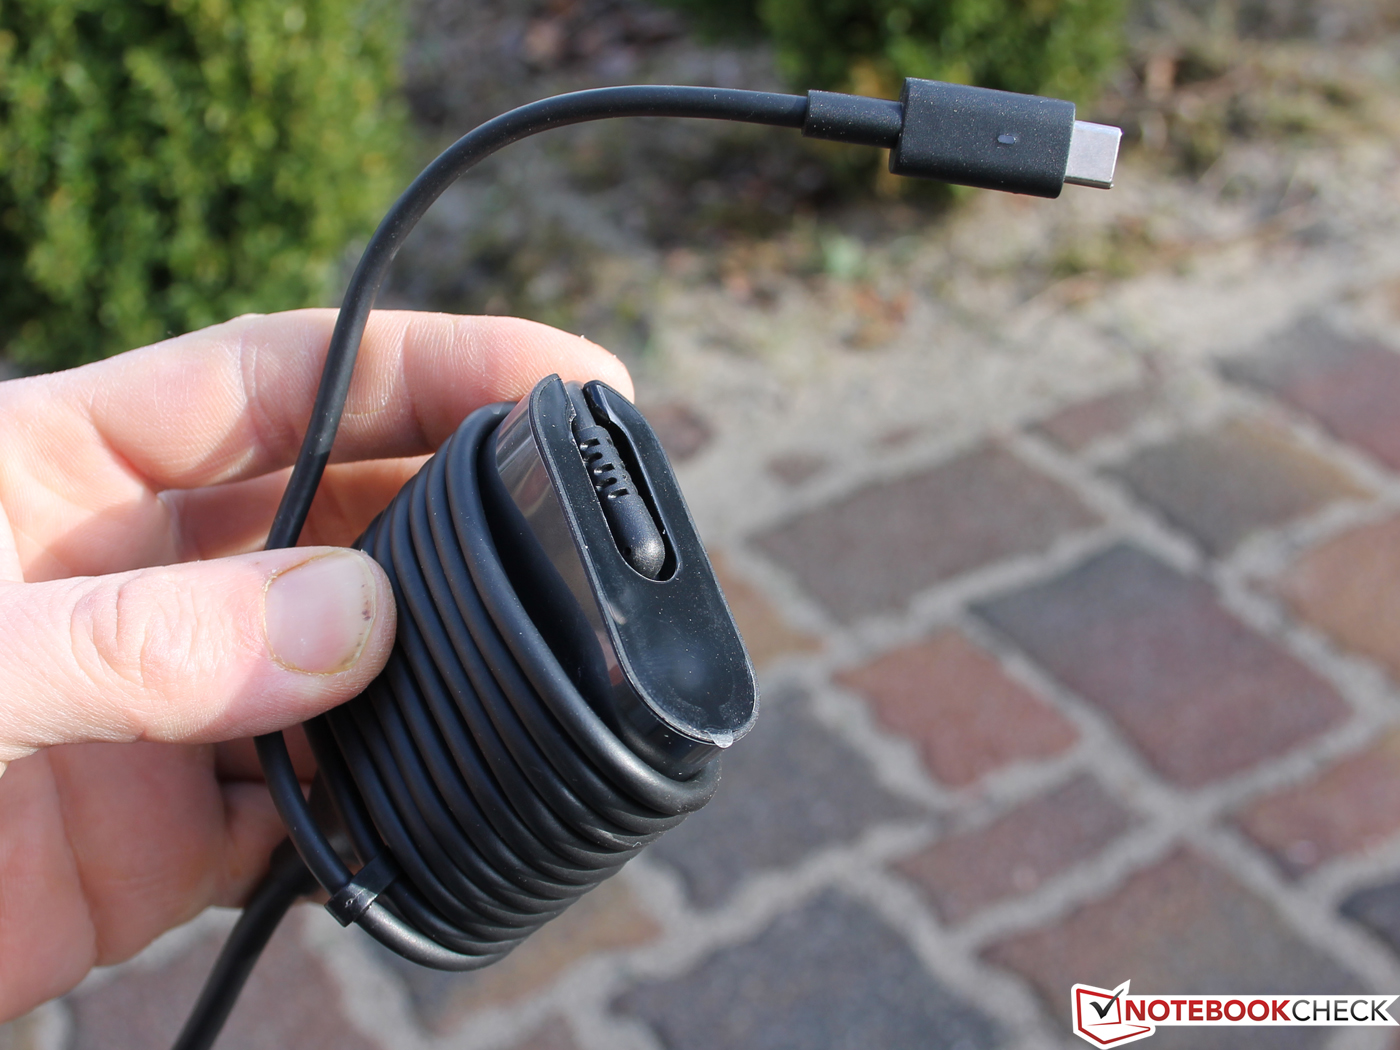
The small 45 W power adapter is therefore not perfect. It works, but it also gets very warm during the stress test at 54 °C.
All the competitors are on a similar level under load, only the subnotebooks with dGPUs are the exception. Huawei's MateBook 13 i7 with the MX150, for example, consumes 65 W under load.
| Off / Standby | |
| Idle | |
| Load |
|
Key:
min: | |
| Dell XPS 13 9380 2019 i5-8265U, UHD Graphics 620, SK hynix PC401 HFS256GD9TNG, IPS, 3840x2160, 13.3" | Dell XPS 13 9370 FHD i5 i5-8250U, UHD Graphics 620, Toshiba XG5 KXG50ZNV256G, IPS, 1920x1080, 13.3" | Dell XPS 13 9370 i7 UHD i5-8550U, UHD Graphics 620, Toshiba XG5 KXG50ZNV512G, IPS, 3840x2160, 13.3" | Apple MacBook Pro 13 2018 Touchbar i5 i5-8259U, Iris Plus Graphics 655, , IPS, 2560x1600, 13.3" | Lenovo ThinkPad X280-20KES01S00 i5-8250U, UHD Graphics 620, Samsung SSD PM981 MZVLB512HAJQ, IPS LED, 1920x1080, 12.5" | Fujitsu Lifebook U938 i5-8250U, UHD Graphics 620, Micron 1100 MTFDDAV256TBN, IPS, 1920x1080, 13.3" | HP EliteBook 830 G5-3JX74EA i5-8550U, UHD Graphics 620, Samsung SSD PM961 1TB M.2 PCIe 3.0 x4 NVMe (MZVLW1T0), IPS LED, 1920x1080, 13.3" | HP Envy 13-ah0003ng i5-8550U, GeForce MX150, SK Hynix BC501 HFM512GDJTNG, IPS, 1920x1080, 13.3" | Huawei MateBook 13 i7 i7-8565U, GeForce MX150, Samsung SSD PM981 MZVLB512HAJQ, IPS, 2160x1440, 13" | Average Intel UHD Graphics 620 | Average of class Subnotebook | |
|---|---|---|---|---|---|---|---|---|---|---|---|
| Power Consumption | 22% | -2% | -8% | 15% | 36% | 3% | 4% | -17% | 13% | 5% | |
| Idle Minimum * (Watt) | 4.8 | 3.14 35% | 5 -4% | 2.3 52% | 3.11 35% | 2.4 50% | 4.5 6% | 5.3 -10% | 3.5 27% | 3.81 ? 21% | 3.76 ? 22% |
| Idle Average * (Watt) | 8.6 | 5.22 39% | 8.3 3% | 8.7 -1% | 5.01 42% | 5.5 36% | 6.4 26% | 7.3 15% | 7.5 13% | 6.94 ? 19% | 6.54 ? 24% |
| Idle Maximum * (Watt) | 10.4 | 6 42% | 8.8 15% | 12.2 -17% | 8.11 22% | 6 42% | 9.2 12% | 9.3 11% | 12.4 -19% | 8.75 ? 16% | 7.89 ? 24% |
| Load Average * (Watt) | 37.9 | 38.5 -2% | 46.4 -22% | 53.3 -41% | 44.6 -18% | 31 18% | 35.7 6% | 39 -3% | 64.2 -69% | 35 ? 8% | 42 ? -11% |
| Load Maximum * (Watt) | 48.5 | 50.4 -4% | 48.6 -0% | 64 -32% | 51.7 -7% | 32.6 33% | 65.4 -35% | 46 5% | 65.7 -35% | 47.5 ? 2% | 64.8 ? -34% |
| Witcher 3 ultra * (Watt) | 52.5 |
* ... smaller is better
Battery Runtime
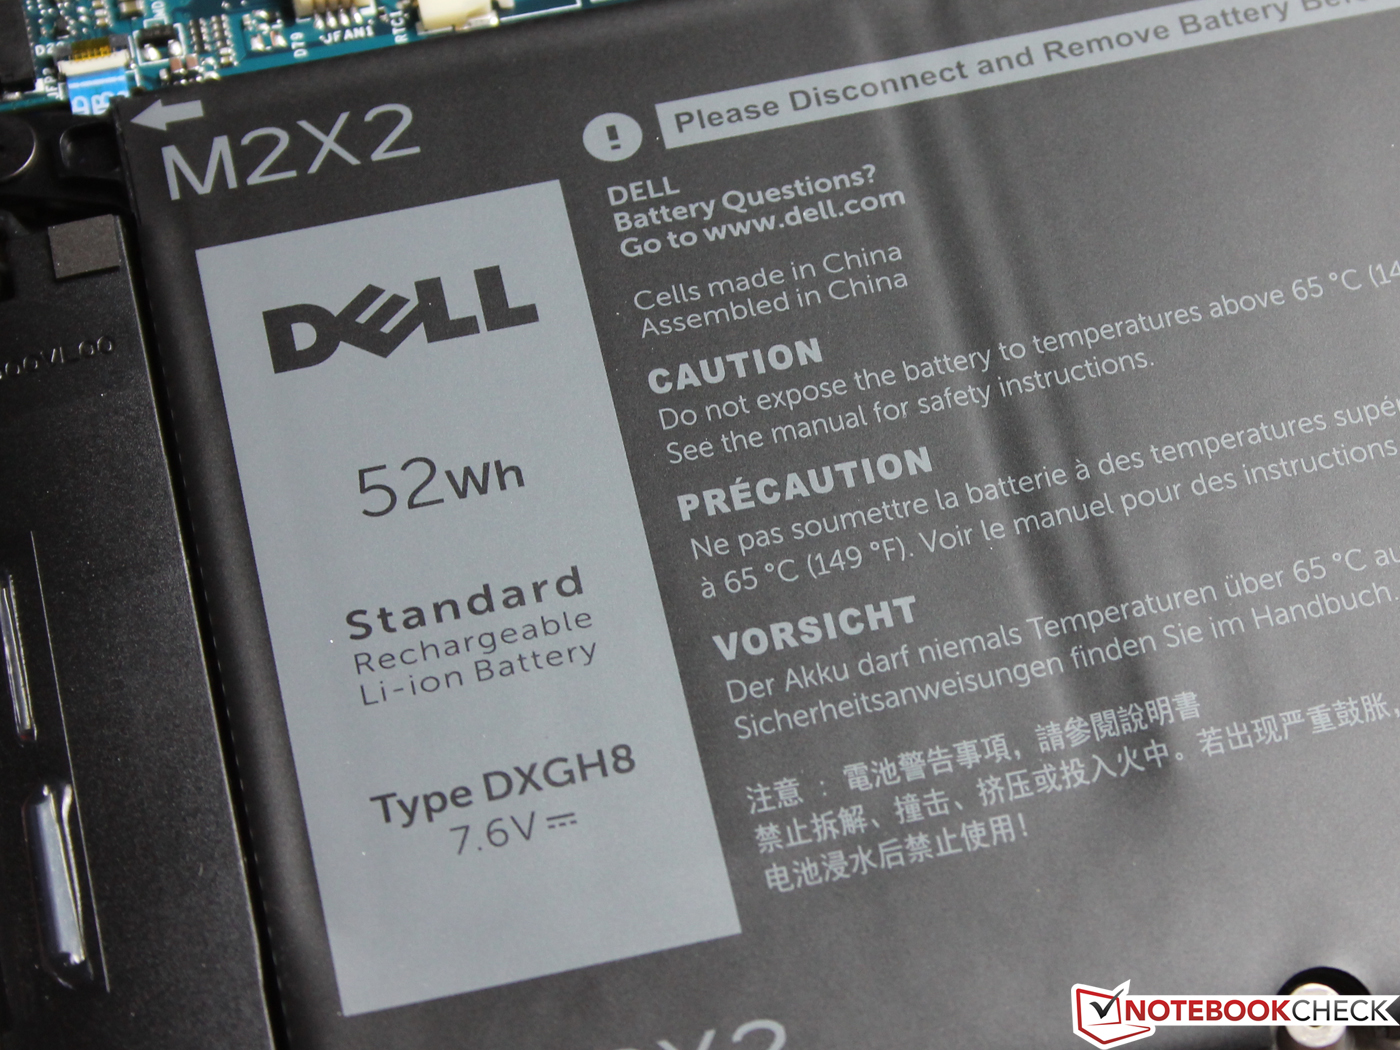
The XPS 13 9380 is equipped with a 52 Wh lithium-polymer battery, which is integrated into the case and cannot be replaced quickly.
We determine an idle runtime of about 17 hours for the XPS laptop. However, this is only possible with the minimum luminance (CABC off), the deactivation of the reduced luminance on battery (BIOS) and the flight mode. But these settings are not really suitable for everyday use.
Our Wi-Fi test is a more realistic scenario for the runtime of the 13-inch laptop. One charge lasted 8:18 hours on the 2019 XPS 13 before the system shut down. We reduced the luminance to 150 nits (35% on our test model).
This runtime is not among the best, and its own sibling XPS 13 9370 FHD i5 raised the bar by quite a bit with almost 11 hours and therefore ~30% longer. The competition is not bad, either, and all of the rivals lasted at least 7 hours.
It takes almost 3 hours before the battery of the XPS 13 is fully recharged. However, 80% of the charge is available after just one hour (Express Charge). You can adjust more details about the battery charge in the BIOS or Dell's Power Manager.
The default setting for the charge is 100%, but you can also choose if the machine is primarily used on mains (increases the lifespan of the battery by not charging it to 100%). You can also set manual limits for the charge, like start charging when the battery drops below 20%.
You can expect at least 2:21 hours under load from the XPS 13 with one charge. The Huawei MateBook 13 i7 (42 Wh) only lasts 53 minutes, while the HP Envy 13 and ThinkPad X280 manage 116 or 119 minutes, respectively. The two latter devices have batteries with very similar capacities (53 and 50 Wh).
| Dell XPS 13 9380 2019 i5-8265U, UHD Graphics 620, 52 Wh | Dell XPS 13 9370 FHD i5 i5-8250U, UHD Graphics 620, 52 Wh | Apple MacBook Pro 13 2018 Touchbar i5 i5-8259U, Iris Plus Graphics 655, 58 Wh | Lenovo ThinkPad X280-20KES01S00 i5-8250U, UHD Graphics 620, 50 Wh | Fujitsu Lifebook U938 i5-8250U, UHD Graphics 620, 50 Wh | HP EliteBook 830 G5-3JX74EA i5-8550U, UHD Graphics 620, 49 Wh | HP Envy 13-ah0003ng i5-8550U, GeForce MX150, 53.2 Wh | Huawei MateBook 13 i7 i7-8565U, GeForce MX150, 41.7 Wh | Average of class Subnotebook | |
|---|---|---|---|---|---|---|---|---|---|
| Battery runtime | 16% | 17% | 2% | 1% | -15% | -12% | -27% | 39% | |
| Reader / Idle (h) | 17.2 | 23.6 37% | 20.2 17% | 19.5 13% | 12.8 -26% | 15.5 -10% | 15.4 -10% | 28.6 ? 66% | |
| WiFi v1.3 (h) | 8.3 | 10.7 29% | 9.7 17% | 8.9 7% | 8.4 1% | 7.1 -14% | 8 -4% | 7.6 -8% | 14 ? 69% |
| Load (h) | 2.4 | 2 -17% | 2 -17% | 2.1 -12% | 2.3 -4% | 1.9 -21% | 0.9 -62% | 1.969 ? -18% | |
| H.264 (h) | 13.9 | 10.9 | 9.5 | 7.2 | 8 | 6.3 | 15.4 ? | ||
| Witcher 3 ultra (h) | 1.6 |
Verdict
Pros
Cons
Dell launches the next update of the XPS 13, but the changes are small and do not justify an upgrade from the predecessor XPS 13 9370 (2018), but certainly do justify an upgrade from the 9360 (2016). Its Kaby Lake dual-core CPU is noticeably slower than the current quad-cores.
Dell obviously reworked the temperature control. Compared to the quad-core processor from 2018, the performance is better, but only under sustained workloads. Many Ultrabooks have to reduce the CPU speed under sustained load to reduce the temperatures; the XPS continues to run at high speeds. The 2019 XPS 13 only reduces its CPU frequency by 8% on average (compared to the maximum Turbo clock!) and is faster than the Kaby Lake-R quad-core in the 2018 XPS 13 9370.
The 2019 XPS 13 only reduces its CPU frequency by 8% under sustained workloads and is faster than the Kaby Lake-R quad-core in the 2018 XPS 13.
The case design is still very attractive with its slim bezels. The changed webcam position (back at the top) is definitely a welcome change. Dell now uses 4K panels from AUO instead of Sharp. We determine similar luminance values, but the contrast is lower and the sRGB coverage is smaller.
The ports remain unchanged: Two Thunderbolt 3 ports and the USB-C port (with DisplayPort) are good for professional peripherals.
We are happy with the runtime: 8 hours is very similar to the 2018 XPS 13 9370 UHD. We are already eager to see whether the 1080p SKU of the XPS 13 9380 will last longer. The 9370 FHD managed 11 hours instead of 8 hours (Wi-Fi test, +29%).
Any user disappointed by the low GPU performance of the XPS 13 – but also other popular 13-inch Ultrabooks like the Spectre 13, Gram 13 or ZenBook 13 – should have a look at the Huawei MateBook 13 i7 and HP Envy 13-ah0003ng with the GeForce MX150, which is much more powerful than the integrated UHD Graphics 620 and can also handle games.
This means the XPS 13 is for users without the need for a powerful GPU and who prefer perfect input devices as well as a large number of ports. The UHD touch version of our test unit suffers from shorter battery runtimes and lower contrast. If you want the best mobility possible, we recommend the 1080p SKU. We will review this version as well in the near future.
Dell XPS 13 9380 2019
- 02/02/2019 v6 (old)
Sebastian Jentsch
Price comparison

