Fujitsu LifeBook U938 (i5-8250U, LTE, SSD, FHD) Subnotebook Review
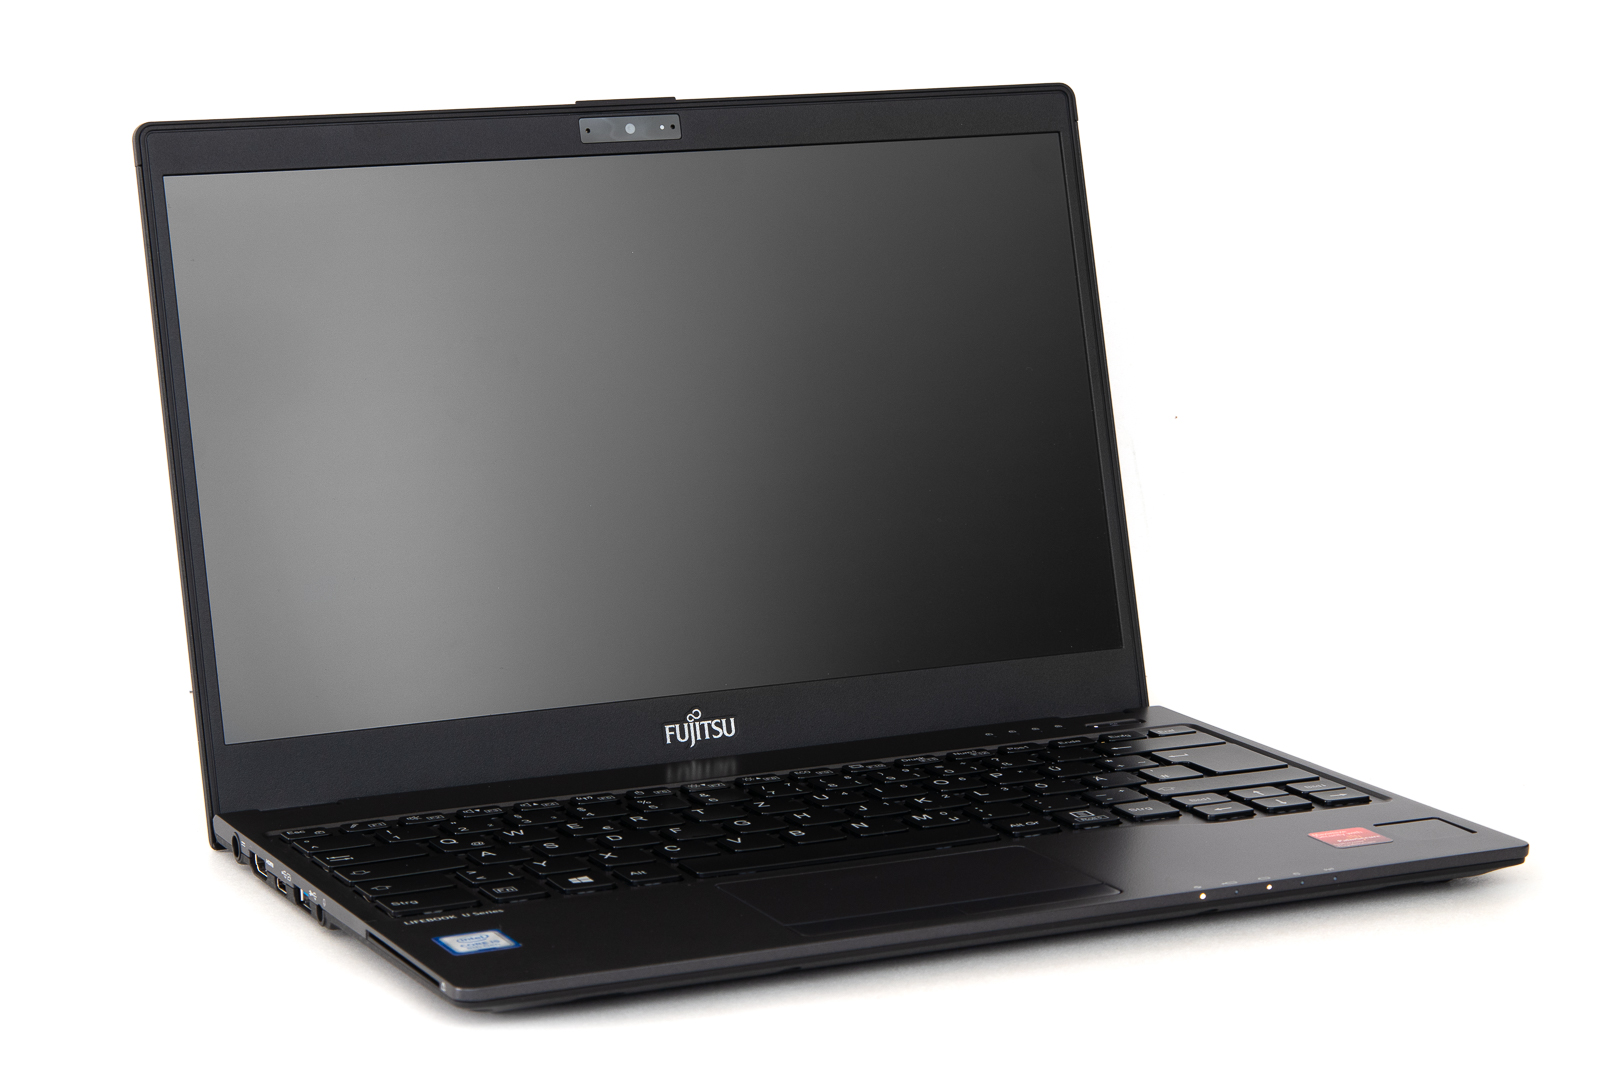
Fujitsu’s latest LifeBook U938 is a 13-inch business notebook that weighs just 920 g (2.03 lbs), and has been optimized for mobility and security as much as humanly possible. It includes special features like the touch-free palm vein sensor for secure authentication, and sold for around $1,500 at the time of writing. The U938 is the successor to last year’s U937, which at around 30 g (1.06 oz) more, was already one of the most lightweight 13-inch notebooks available.
Fujitsu is very clearly targeting business users with this particular notebook. In addition to the exclusive palm vein sensor the laptop also features a 4G/LTE modem with GPS, TPM 2.0, a smart card reader, and Windows 10 Pro with support for Bitlocker. Our test unit (U9380MP580DE) was equipped with Intel’s Core i5-8250U, 12 GB of RAM, a matte FHD IPS display, and a 256 GB large SSD. Those last items are flexible and the LTE modem is optional, otherwise all models are identical.
Its main competitors can be found in the land of lightweight premium business notebooks, and we focused mainly on format, target audience, and price. Some of these competitors lack the palm vein sensor, others the smart card reader or the WWAN modem. These are, however, either available on other SKUs, or can be retrofitted in some cases. Thus, we have picked the following business notebooks:
- Lenovo ThinkPad X280 (i5-8250U, FHD, 12.5-inch)
- Dell XPS 13 9370 (Core i5, FHD, 13.3-inch)
- Huawei MateBook X Pro (i5-8250U, MX150, 13.9-inch)
- Lenovo ThinkPad X1 Carbon 2018 (WQHD HDR, i7, 14-inch)
Case
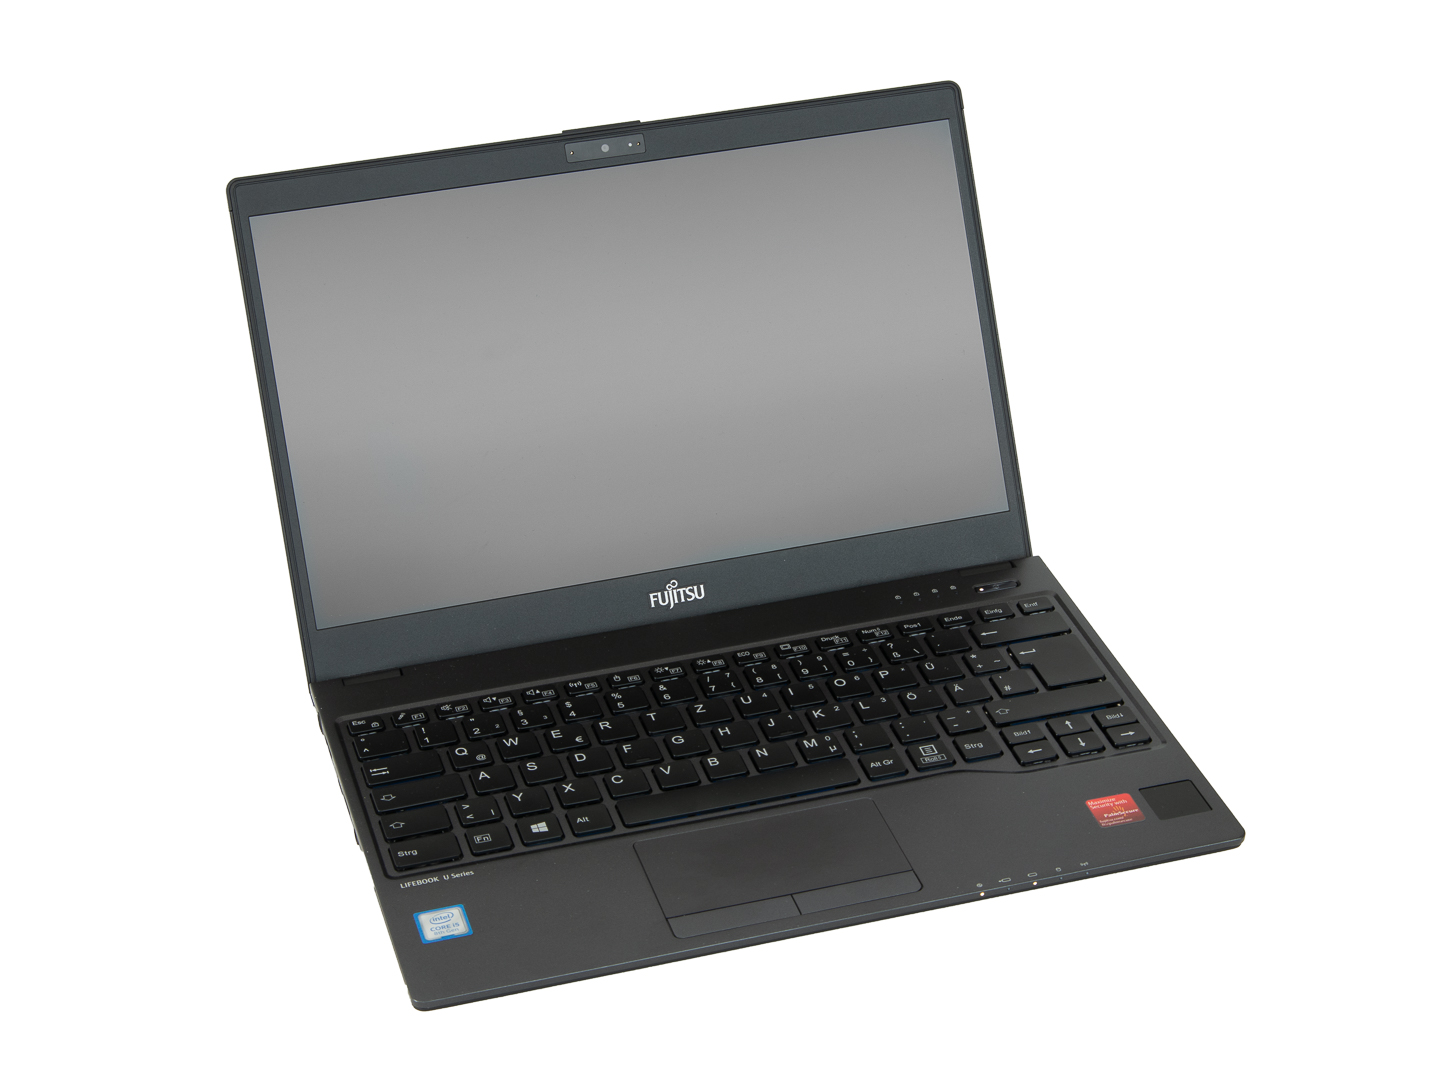
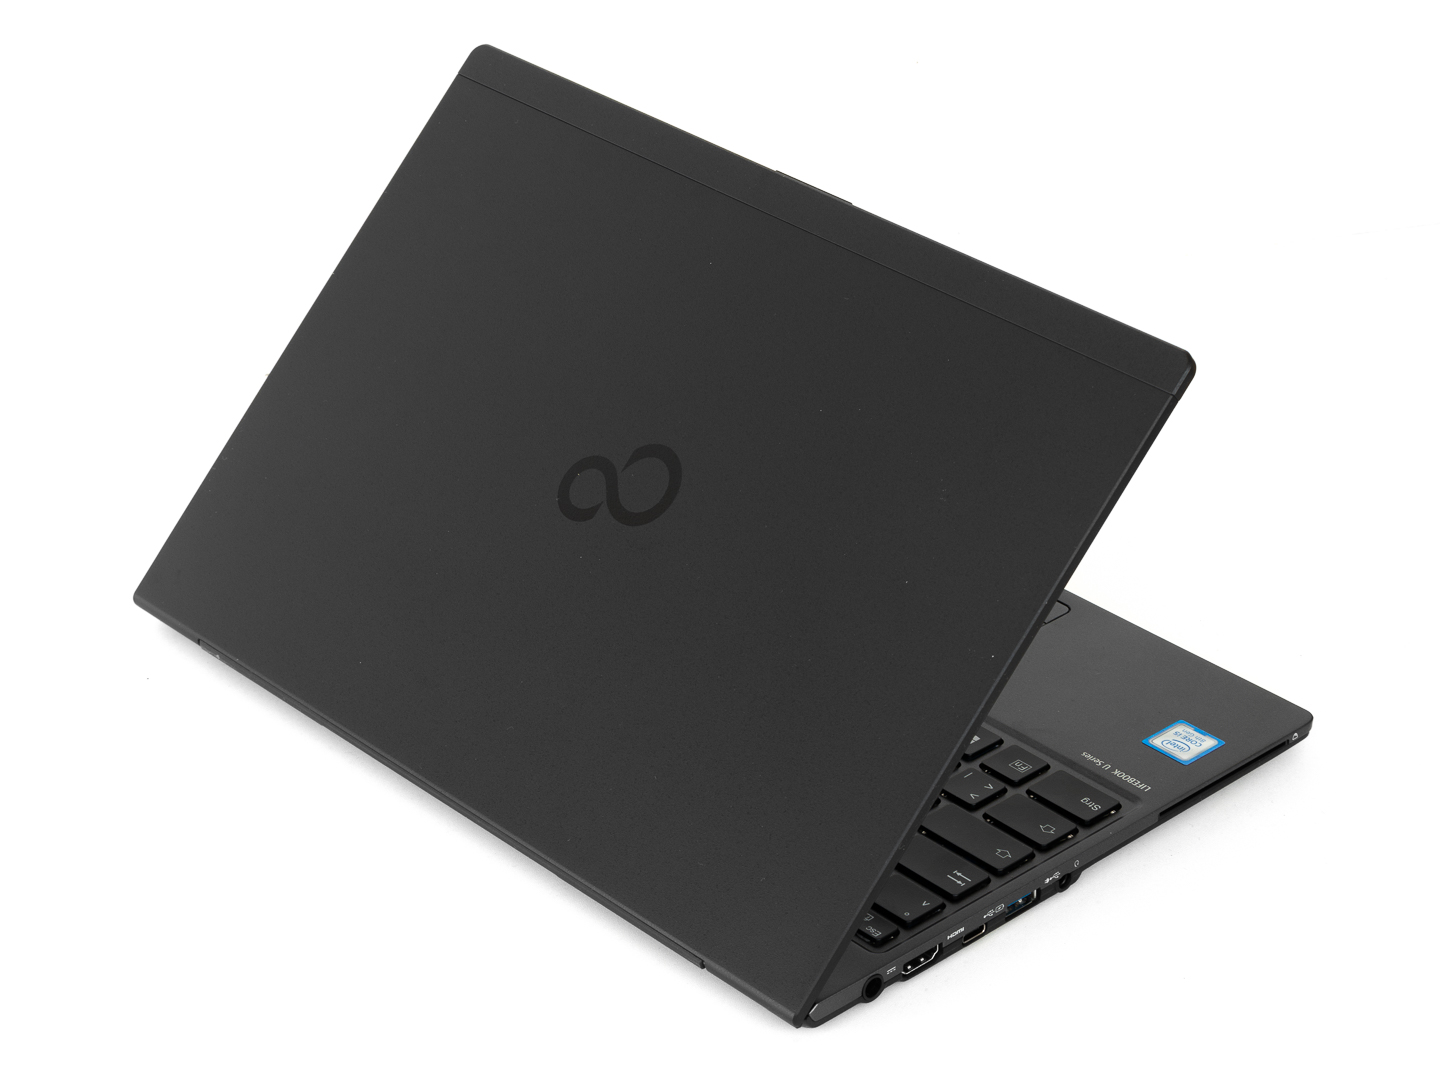
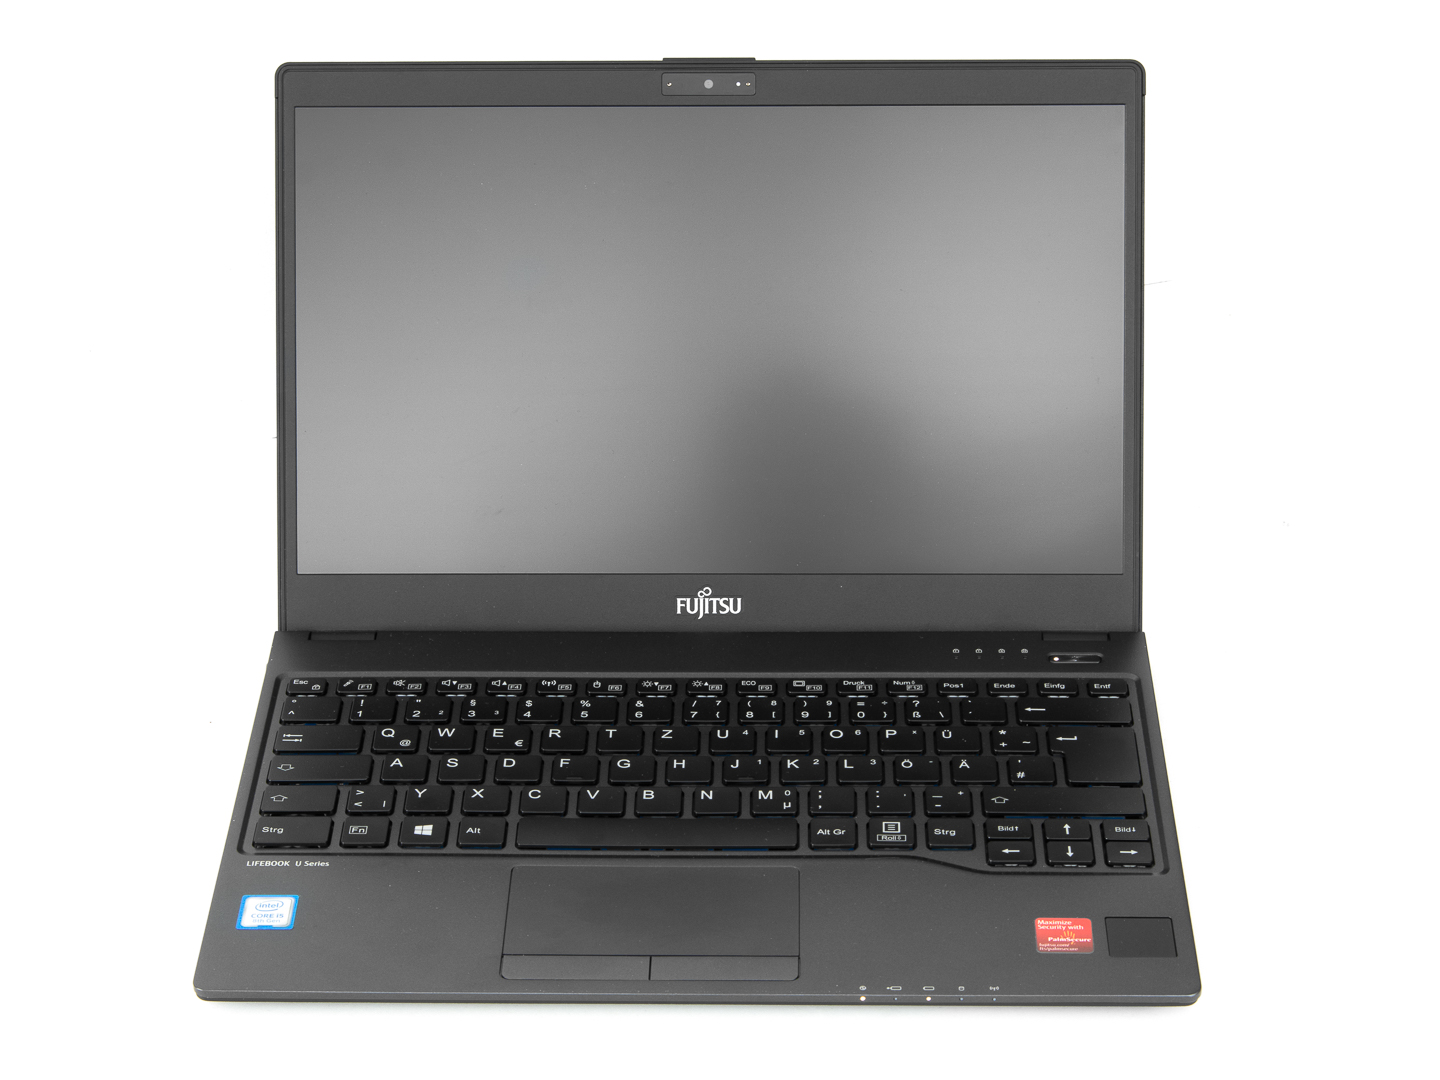
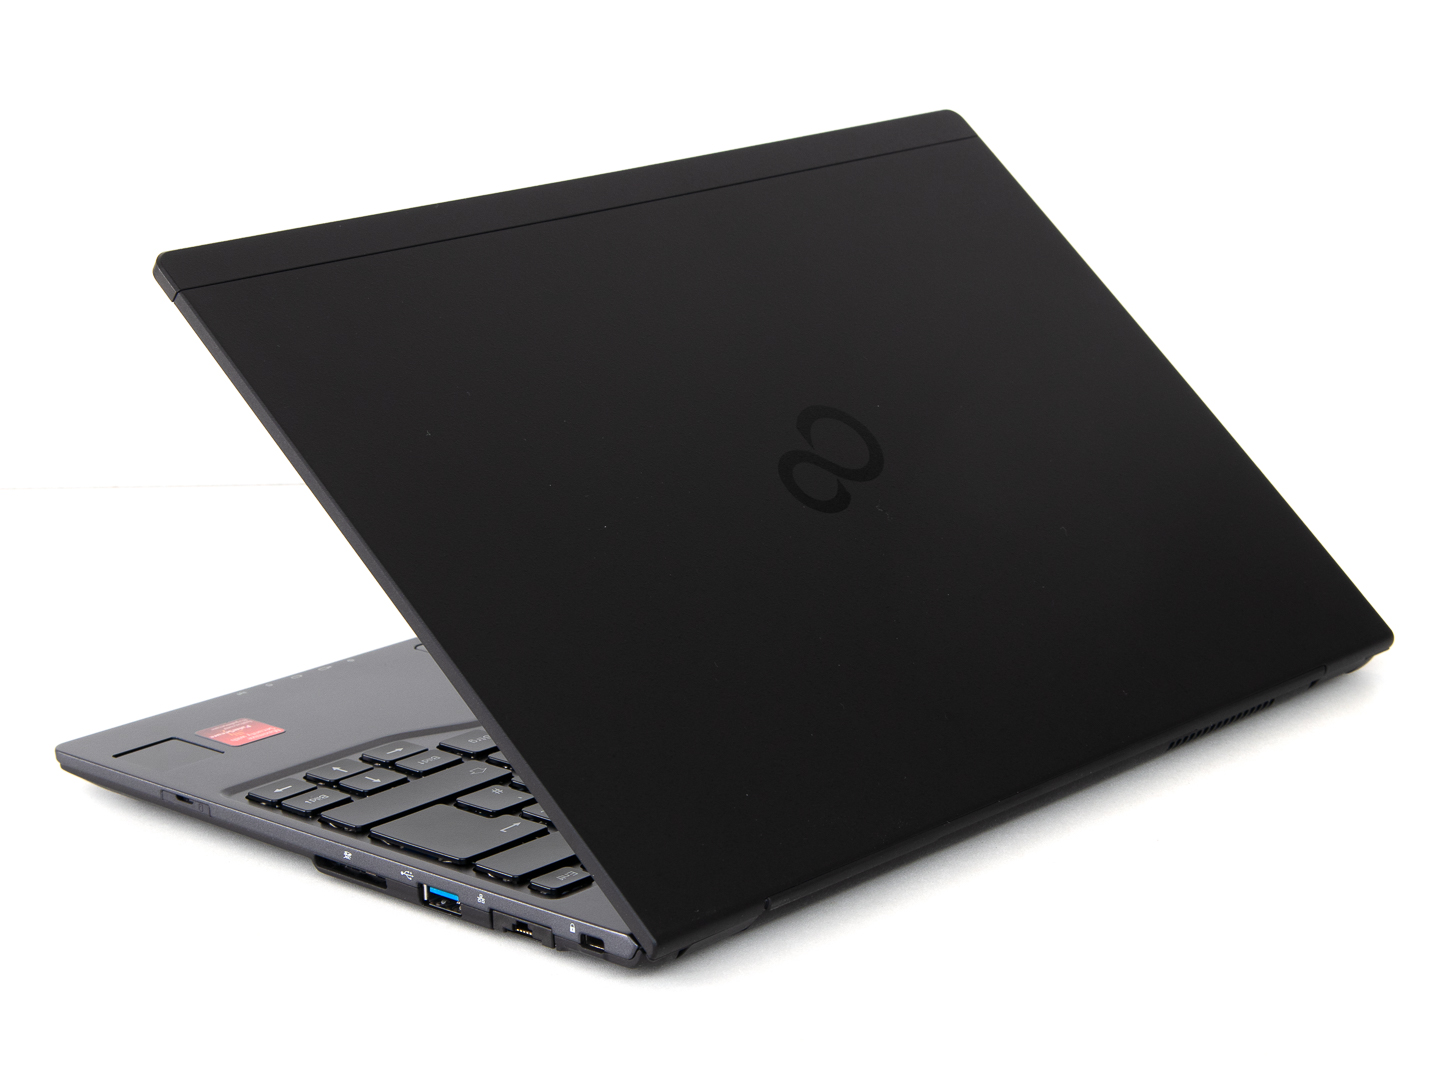
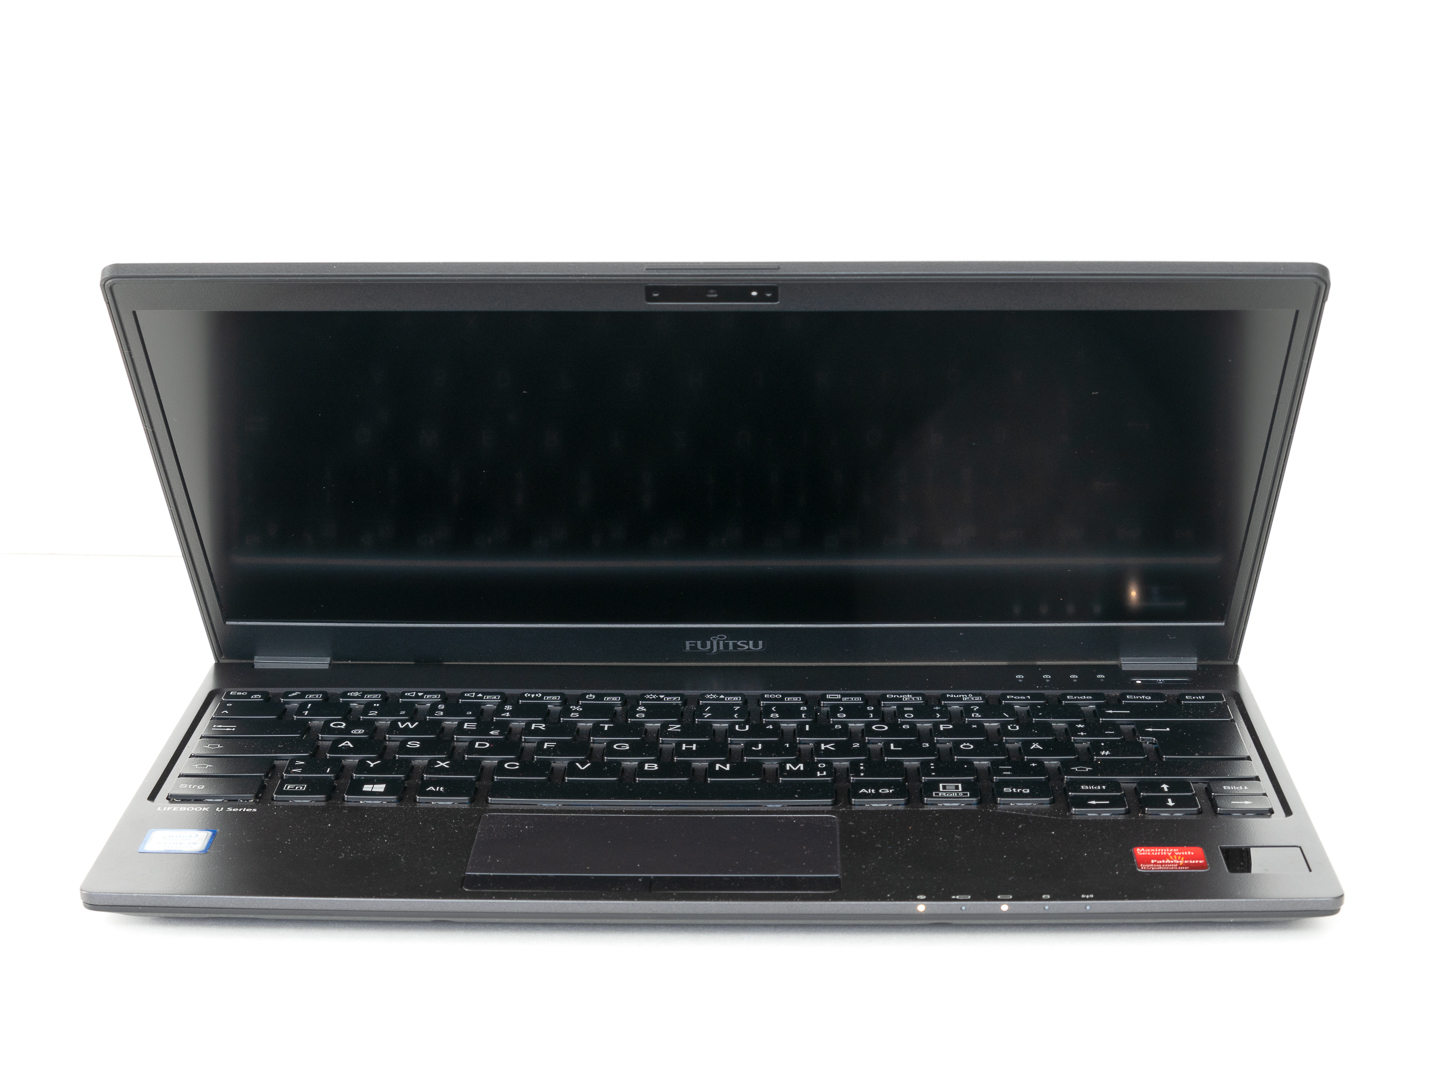
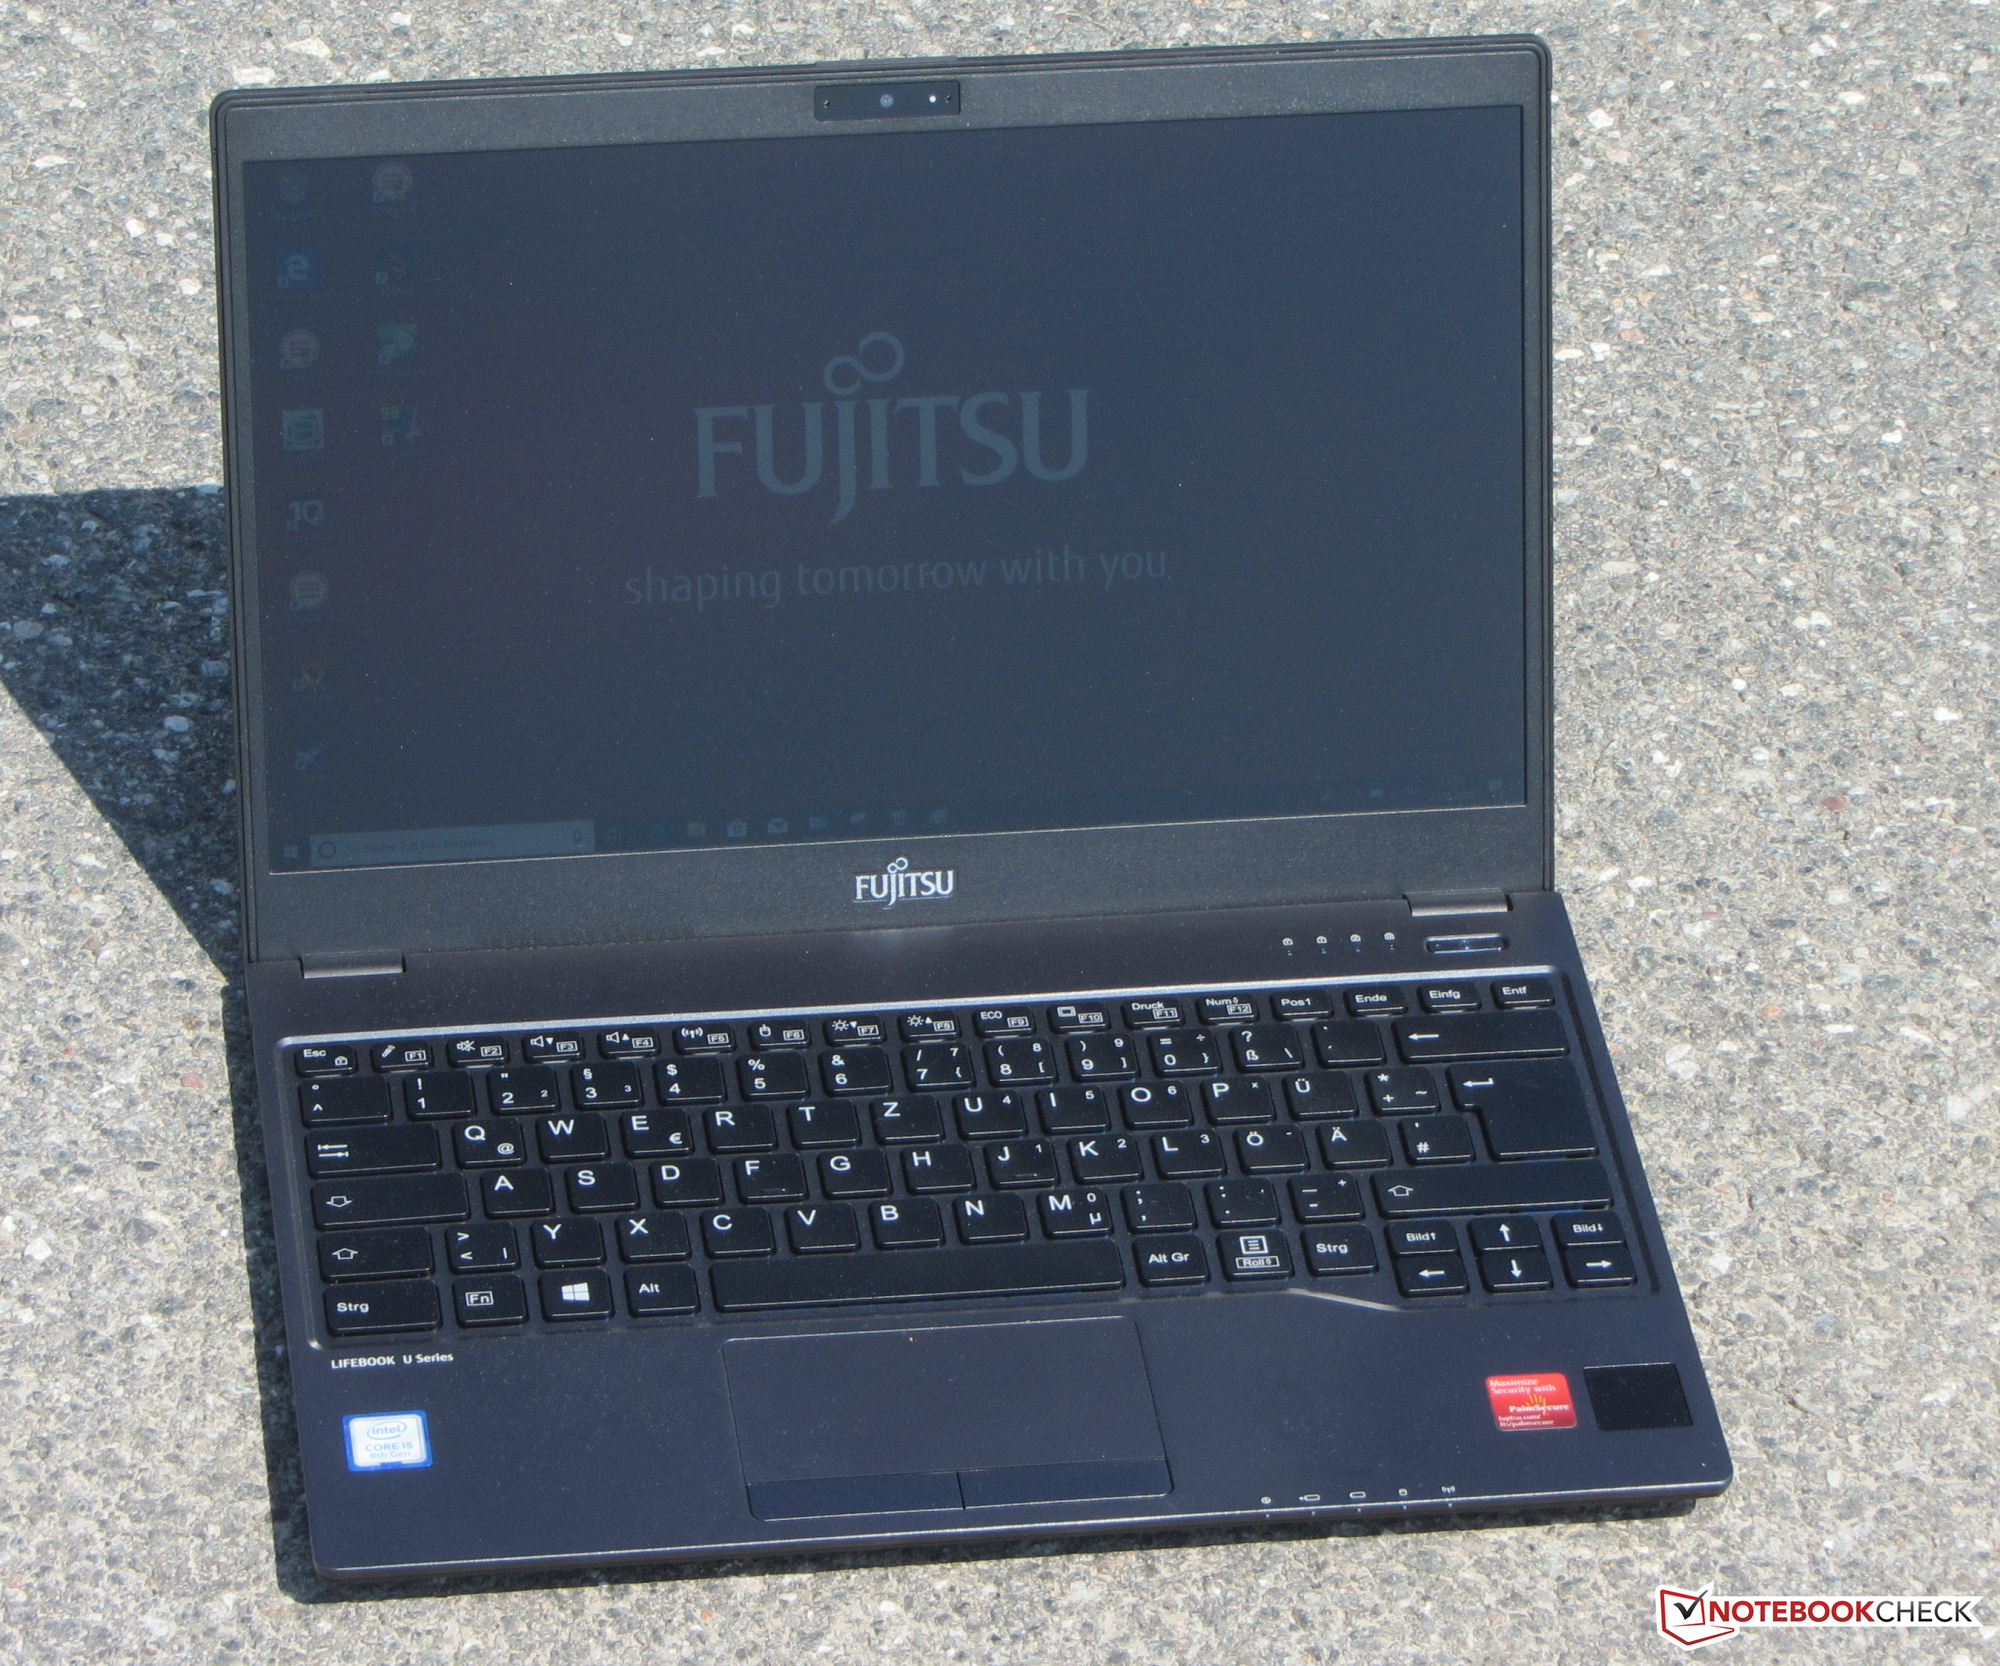
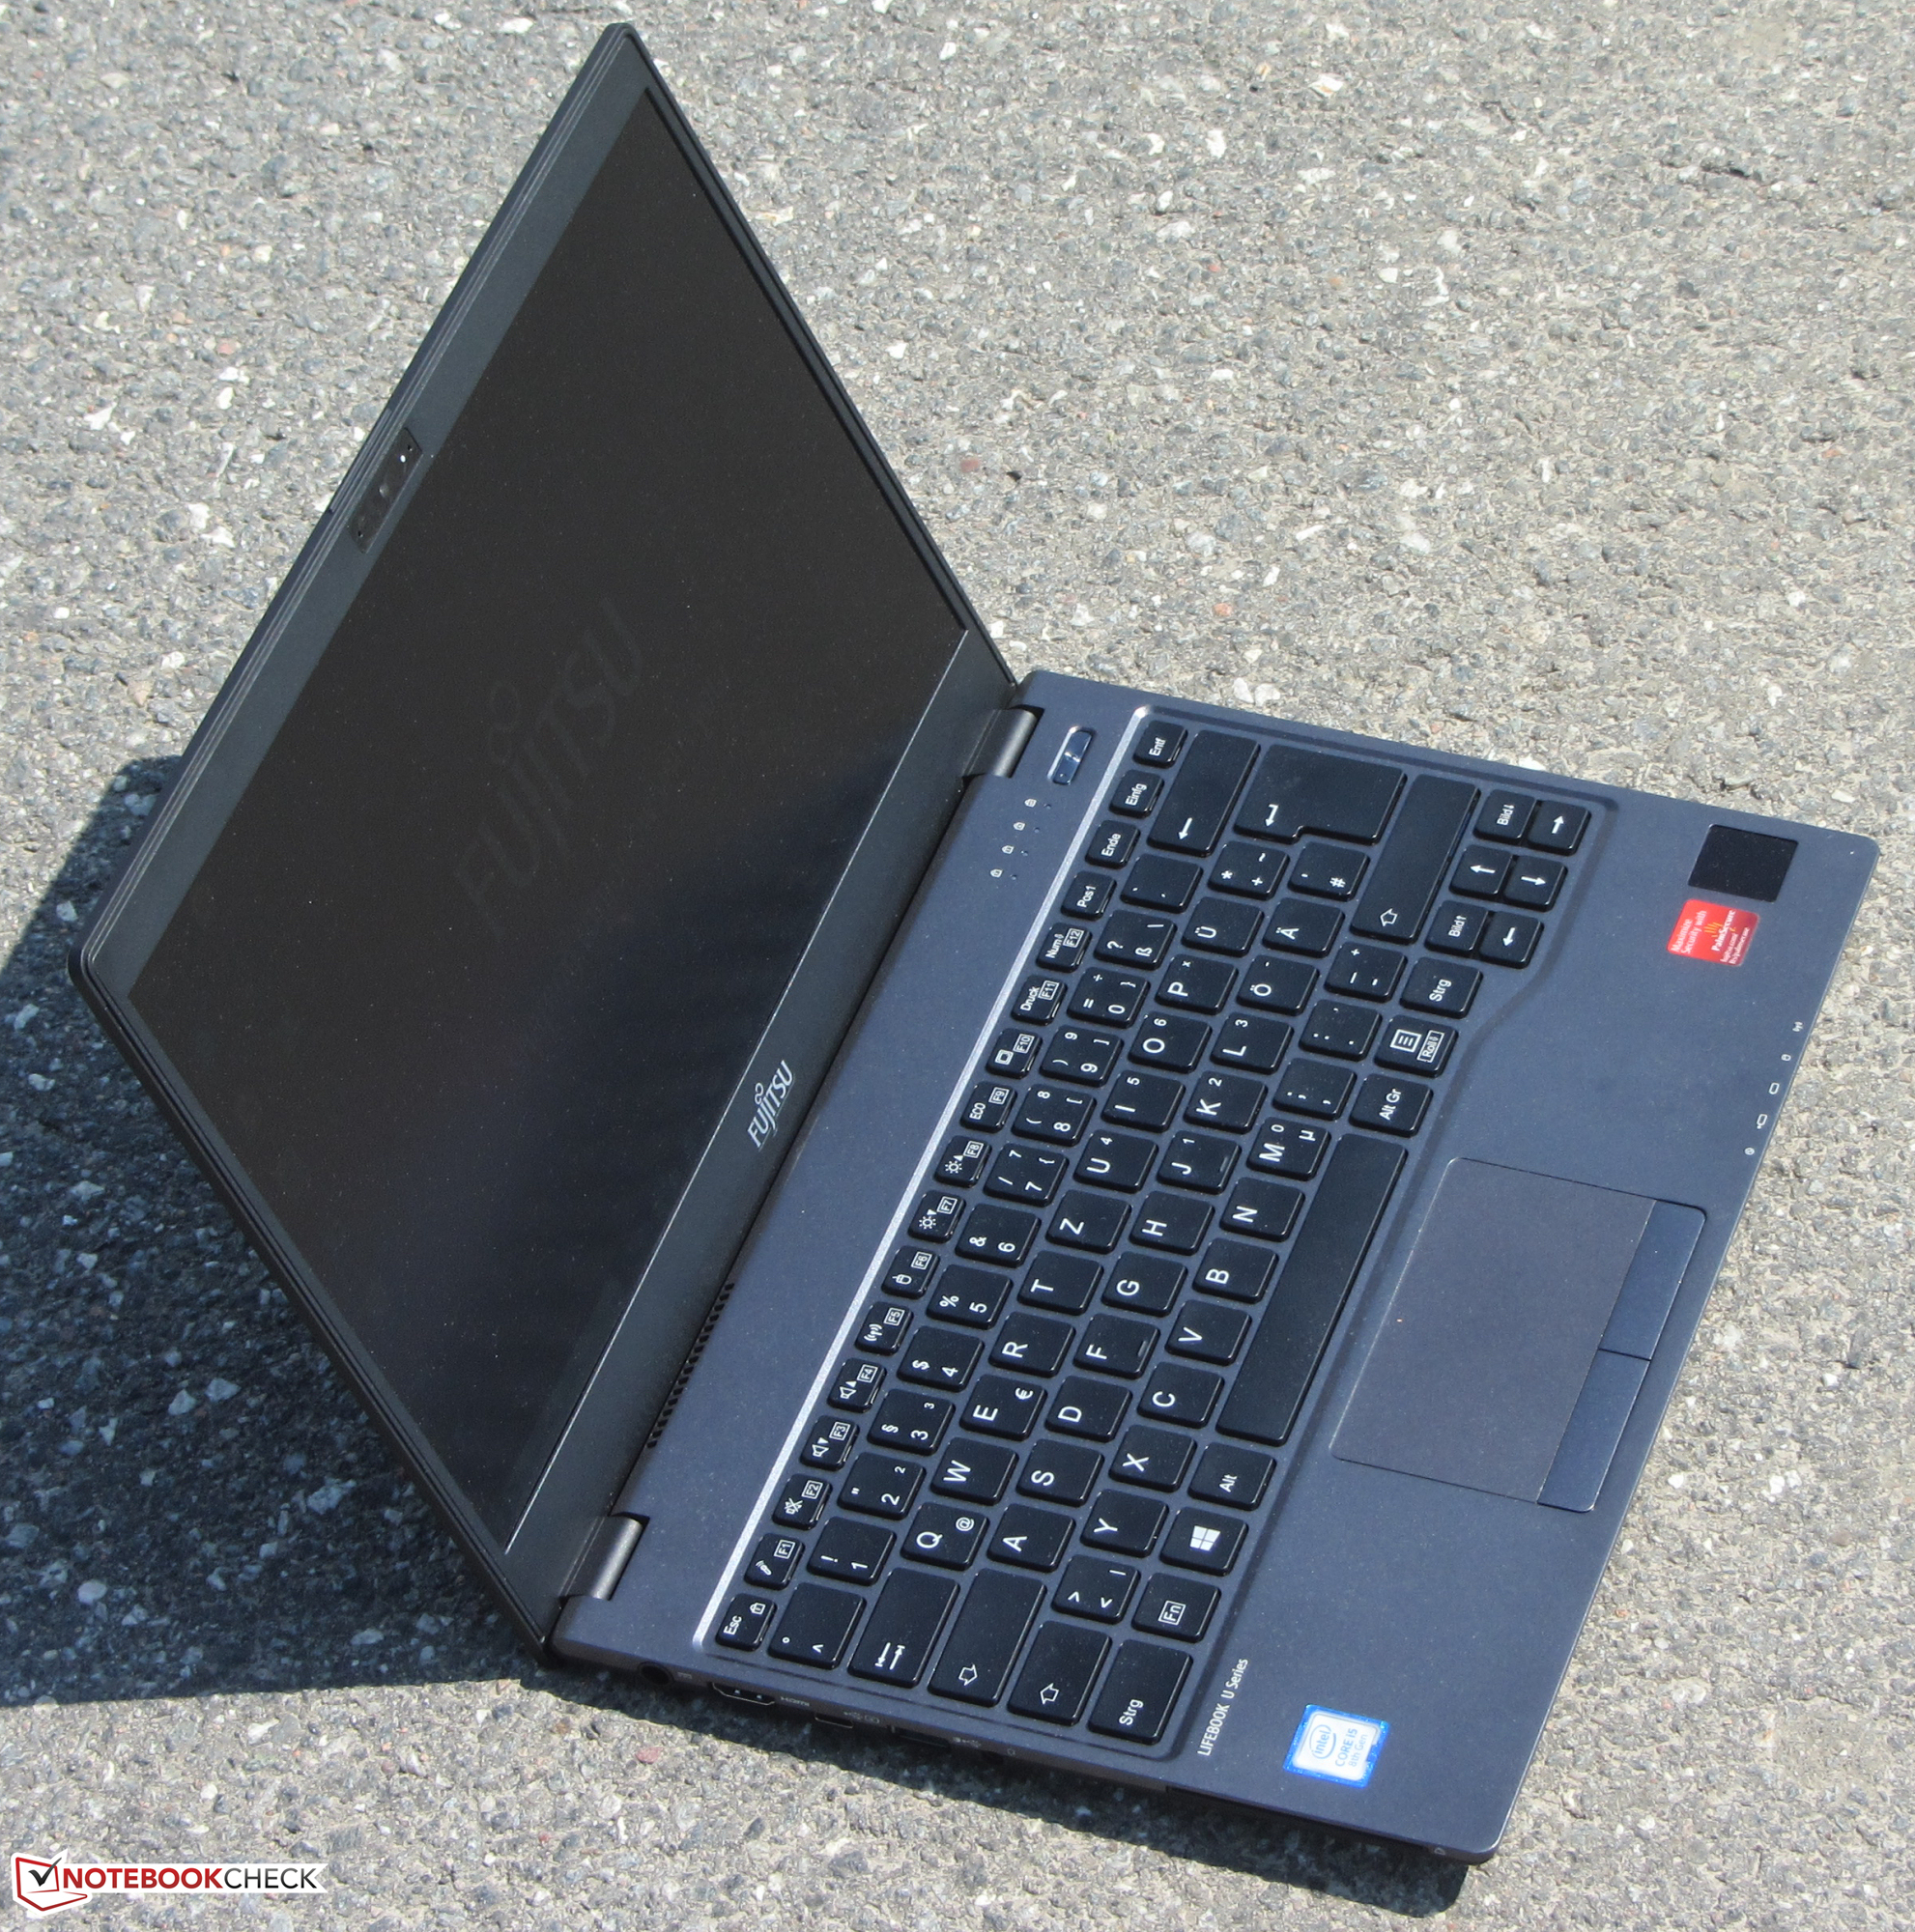
The very functional nonslip case features various status LEDs, and is mostly clad in a matte dotted Black. The only blur of color, so to speak, is the slightly roughened Gray (or Anthrazit) top case. According to Fujitsu, the case is made of aluminum, and the designers did not even bother to make it look like a unibody case. The only decorative elements on the entire case are the palm vein sensor, the status LEDs, a fine line that goes across the display lid at the top, and an asymmetric keyboard that is stretched further down on the right-hand side to accommodate the arrow keys.
Accordingly, it is impossible to guess the device’s high price based on looks alone. It becomes more obvious when one tries to warp the incredibly lightweight base - it was as stiff as a wooden plank and sizzled ever so slightly when we tried our best to warp and bend it. The very thin display lid, on the other hand, tells a very different story, and it turned out to be rather flexible and flimsy. That said, even our most violent attempts never led to distortions worth mentioning. While the display lid’s build quality was impeccable, the base unit’s was not - the gaps between the bottom tray and the top case were uneven, and even slightly protruding here and there.
We have removed Lenovo’s 14-inch candidate from our size comparison and are only including 12.5, 13.3, and 13.9-inch notebooks. The Fujitsu LifeBook U938’s very low weight is one of the most distinct features - even the incredibly lightweight ThinkPad X280 is significantly heavier. The MateBook X is the deepest of the pack, and at 14.6 mm (~.6 in) it is not particularly slim. Its footprint more or less equals our slightly wider yet also slightly less deep review unit, and the thickness was almost identical as well. The Lenovo ThinkPad’s footprint was slightly smaller, but it at 17.4 mm (~0.7 in) it was pretty thick. The smallest device was Dell’s XPS 13, however at 1.2 kg (~2.6 lb) it was on the heavier side.
Connectivity
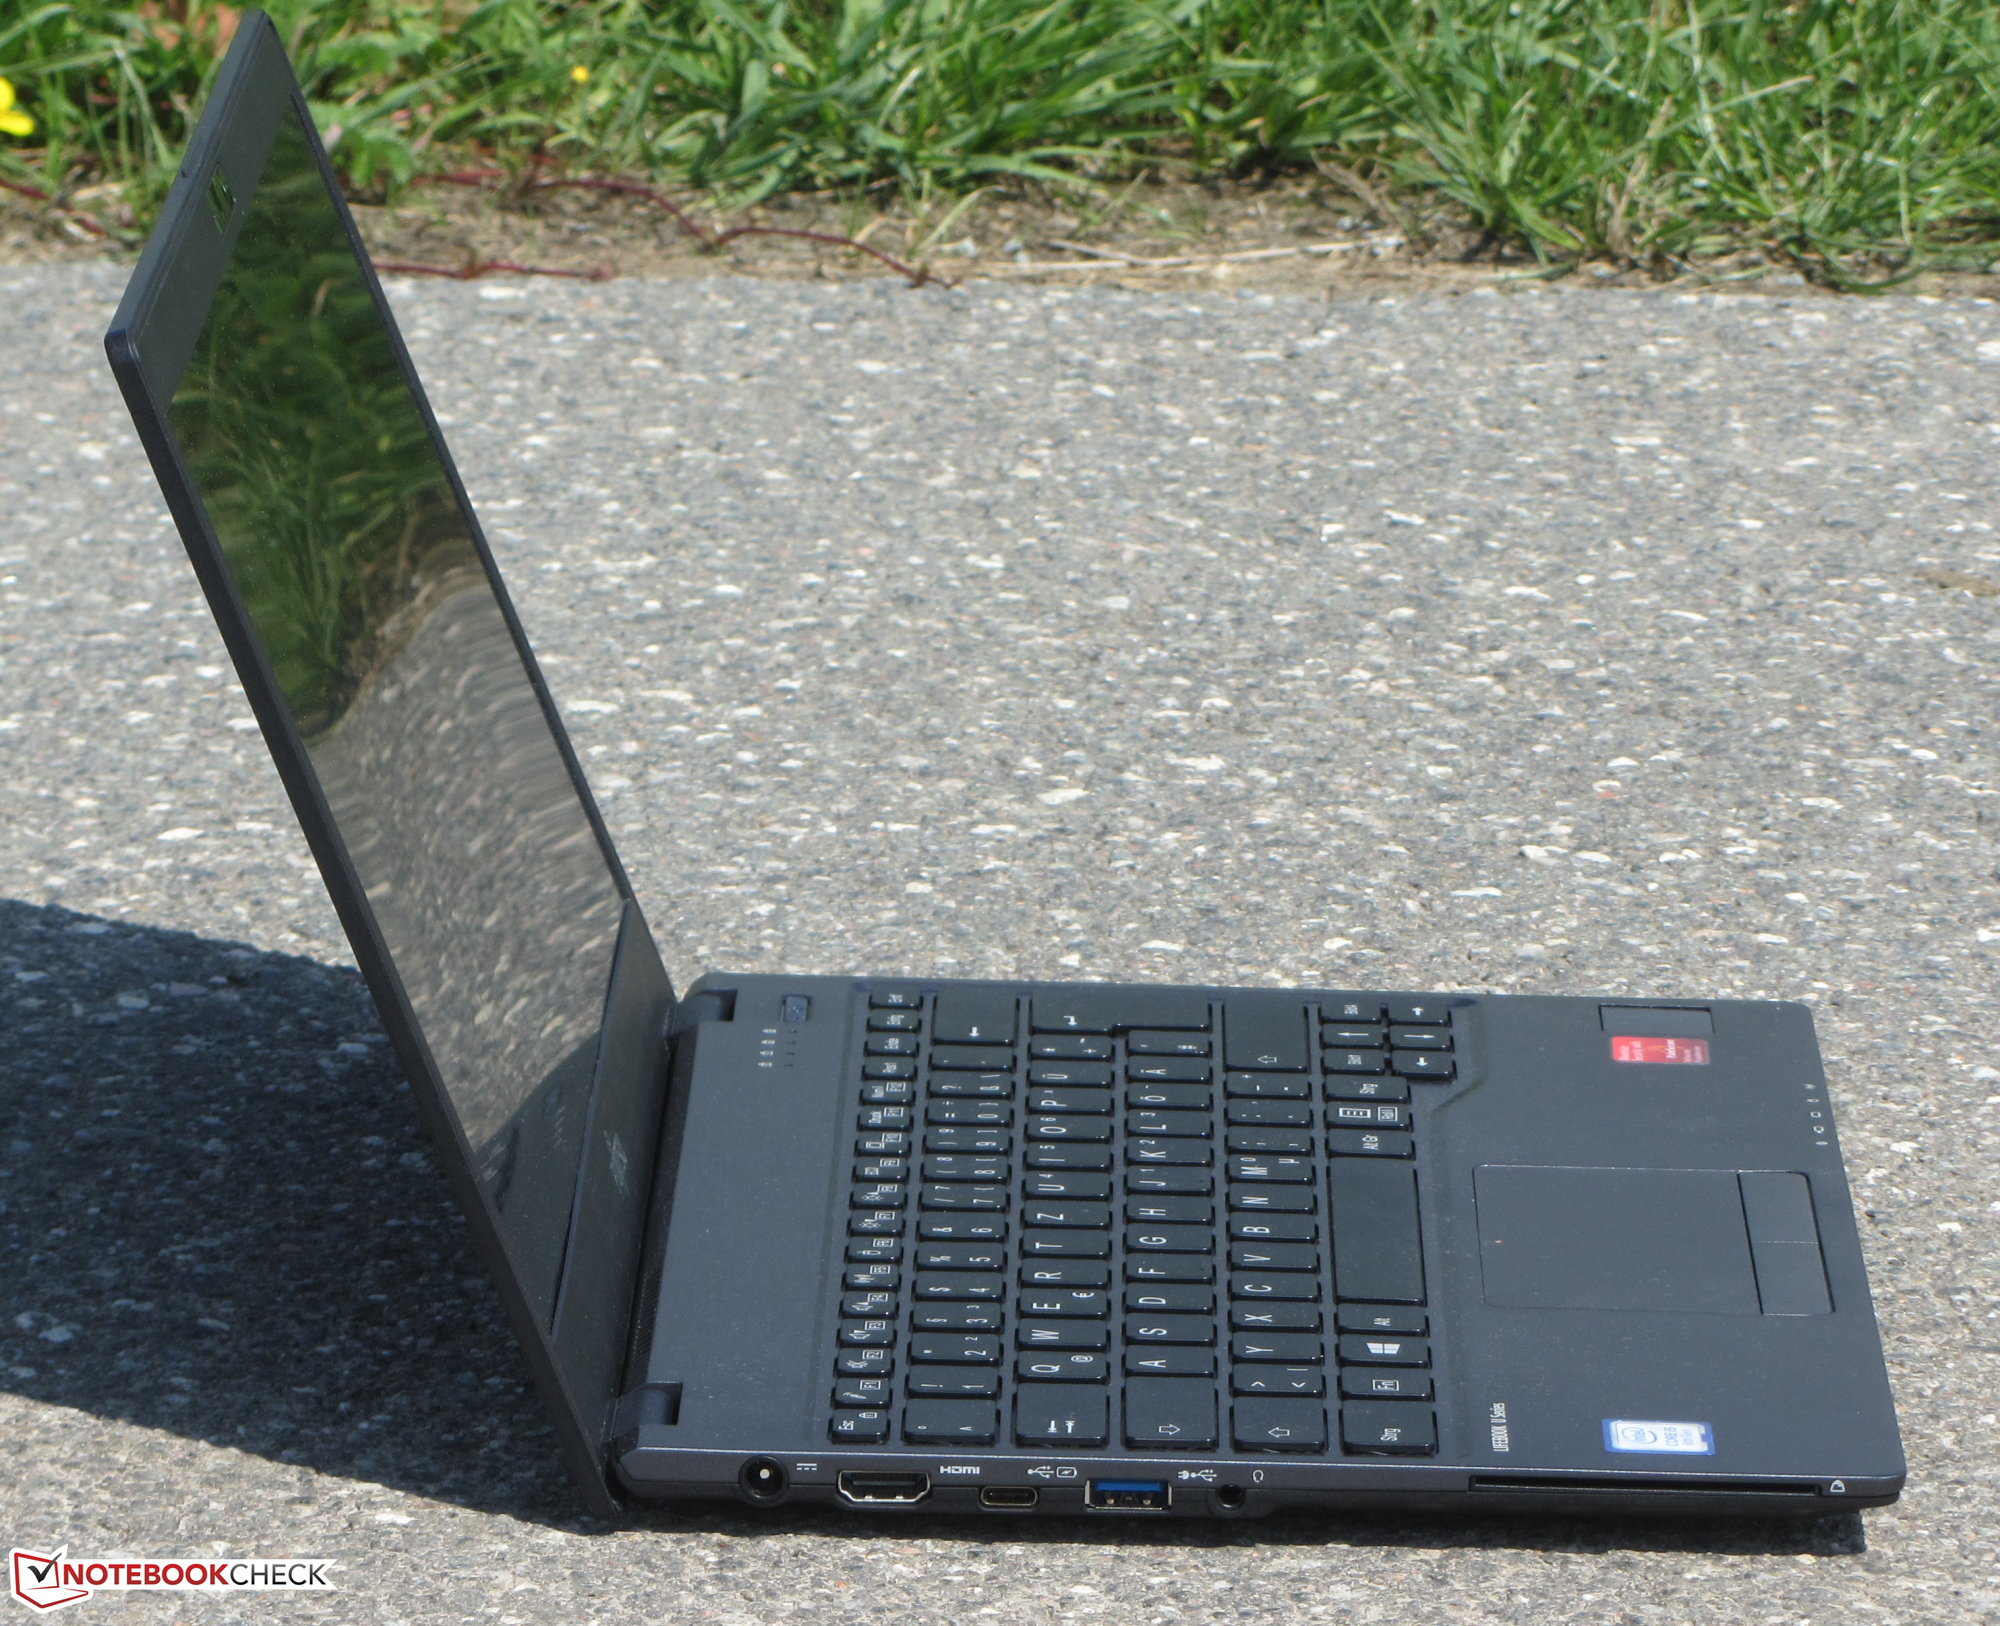
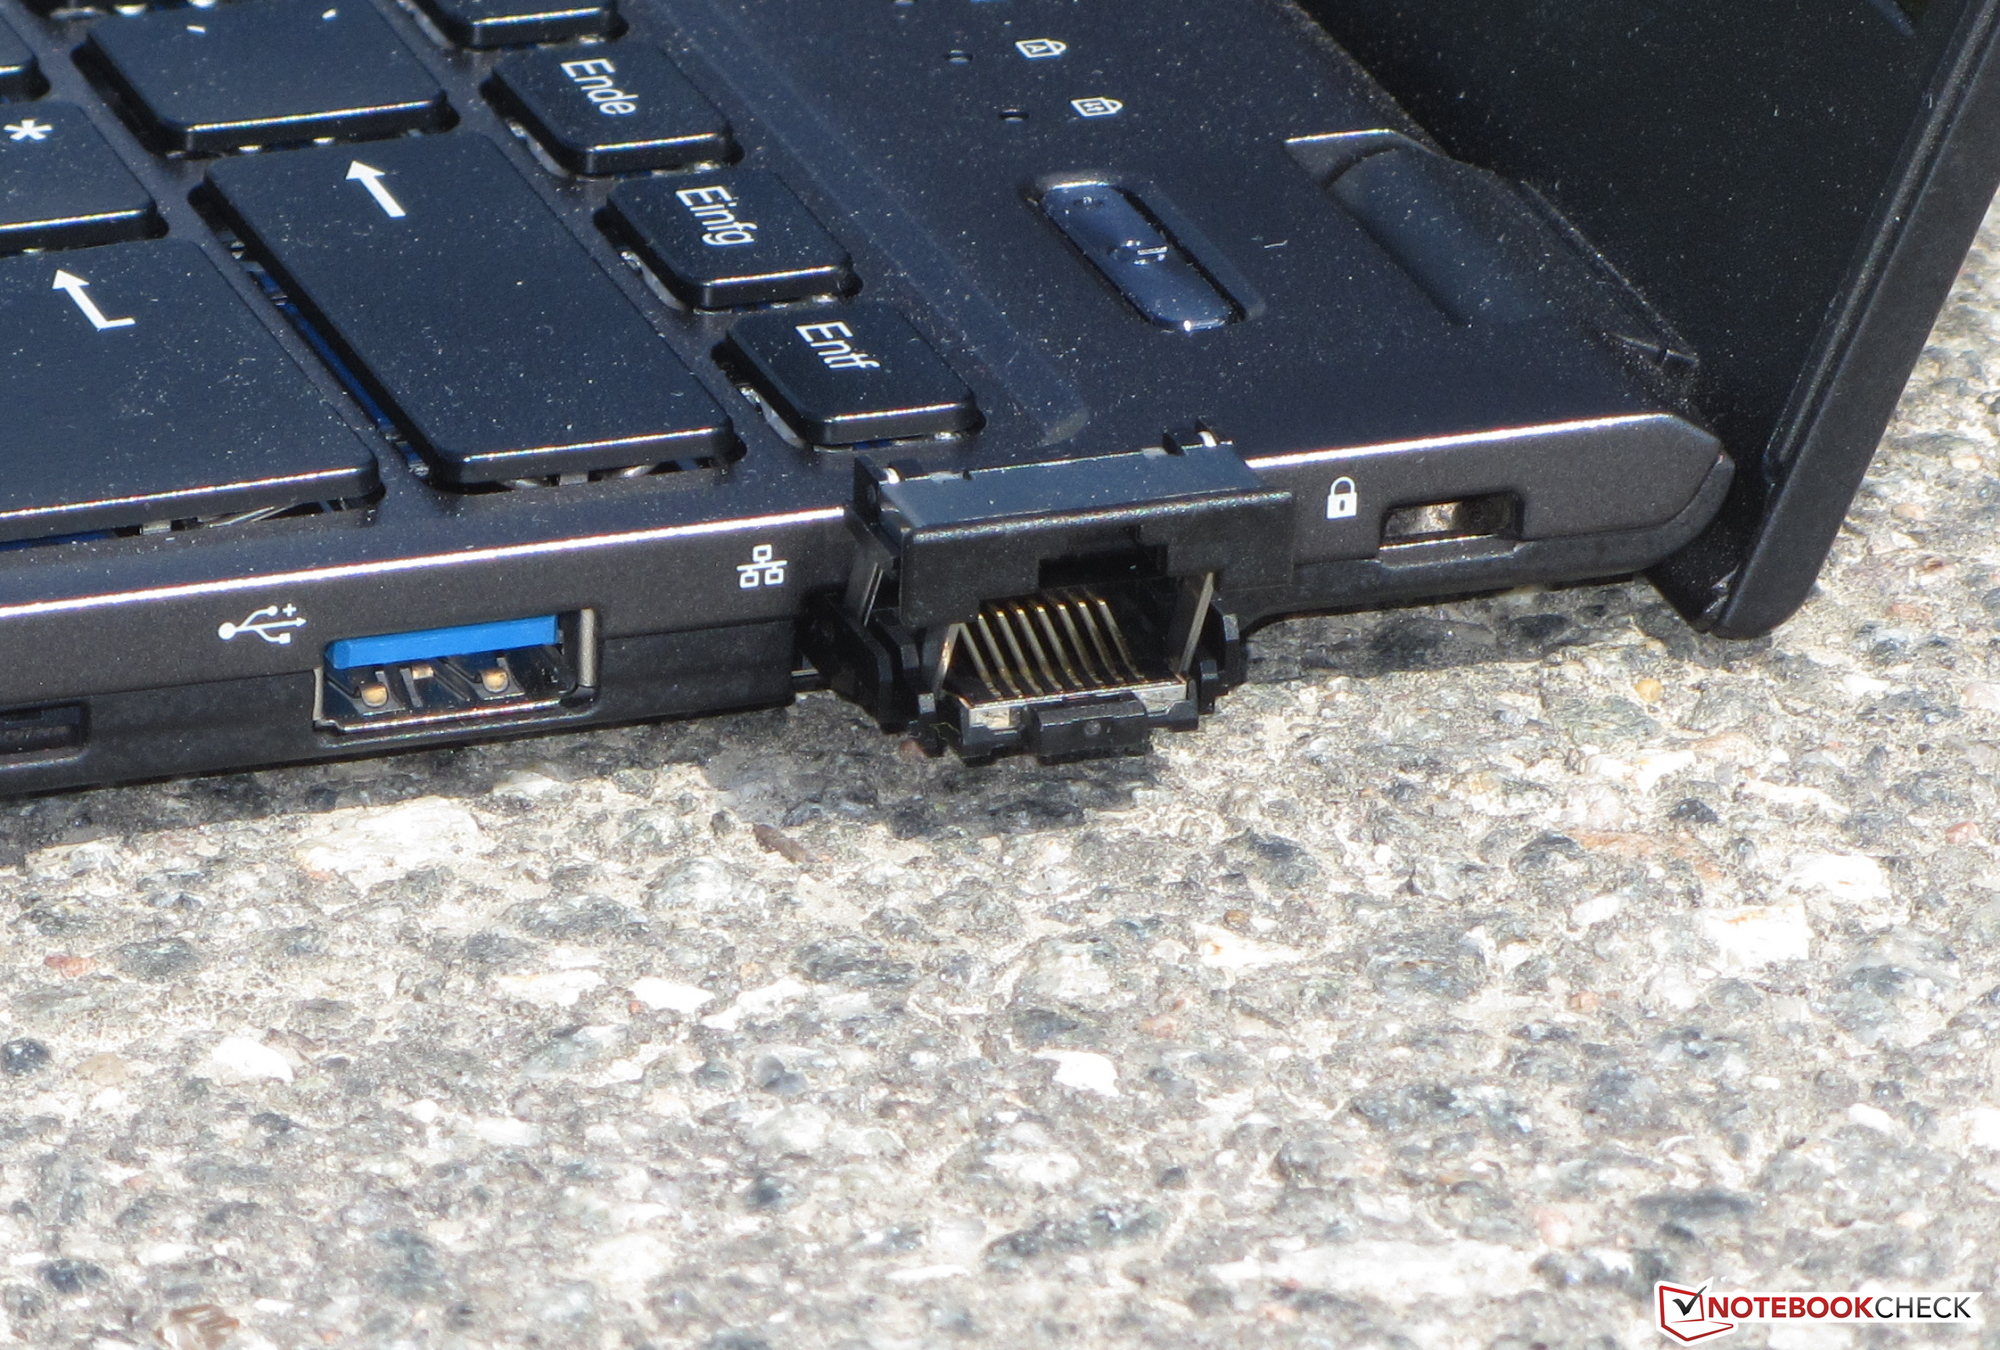
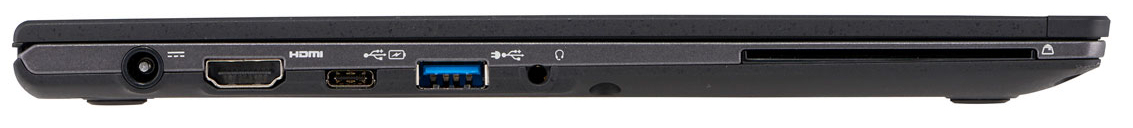
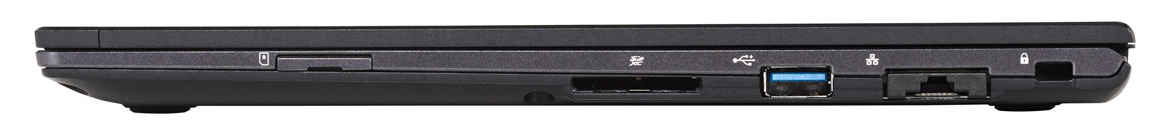
Despite its high price, the notebook lacks modern connectivity features such as Thunderbolt 3 or DisplayPort, but business users will most probably be content with what it has to offer. Three USB 3.1 Gen1 ports, one of which is USB Type-C, are available. One of the two remaining USB Type-A ports is equipped with Power Rate. External displays can be connected via HDMI, and an Ethernet port that needs to be pulled out and then flipped open is available as well. Given the slim case this was most probably the only way for Fujitsu to include one. All ports are strategically located towards the rear of the device on both sides.
SD Card Reader
An SD card reader’s performance depends mostly on the way it is connected, and fortunately none of the notebooks in our test group jangled our nerves with a slow USB 2.0 connection. The ThinkPad’s card reader is most probably connected via USB 3.0, the other competitors seem to feature PCIe-connected card readers. Our review unit’s card reader was unable to keep up with its PCIe-connected brethren, but was still fast enough for everyday use and more than twice as fast as the subnotebook average. As always, our benchmarks were performed using our 64 GB Toshiba Exceria Pro SDXC UHS-II reference card.
| SD Card Reader | |
| average JPG Copy Test (av. of 3 runs) | |
| Lenovo ThinkPad X1 Carbon 2018-20KGS03900 (Toshiba Exceria Pro M501) | |
| Dell XPS 13 9370 FHD i5 (Toshiba Exceria Pro M501 64 GB UHS-II) | |
| Fujitsu LifeBook U937 (Toshiba Exceria Pro SDXC 64 GB UHS-II) | |
| Fujitsu Lifebook U938 (Toshiba Exceria Pro SDXC 64 GB UHS-II) | |
| Lenovo ThinkPad X280-20KES01S00 (Toshiba Excerie Pro M501) | |
| Average of class Subnotebook (23.7 - 188, n=9, last 2 years) | |
| maximum AS SSD Seq Read Test (1GB) | |
| Lenovo ThinkPad X1 Carbon 2018-20KGS03900 (Toshiba Exceria Pro M501) | |
| Dell XPS 13 9370 FHD i5 (Toshiba Exceria Pro M501 64 GB UHS-II) | |
| Fujitsu LifeBook U937 (Toshiba Exceria Pro SDXC 64 GB UHS-II) | |
| Fujitsu Lifebook U938 (Toshiba Exceria Pro SDXC 64 GB UHS-II) | |
| Average of class Subnotebook (24.9 - 195, n=8, last 2 years) | |
| Lenovo ThinkPad X280-20KES01S00 (Toshiba Excerie Pro M501) | |
Communication
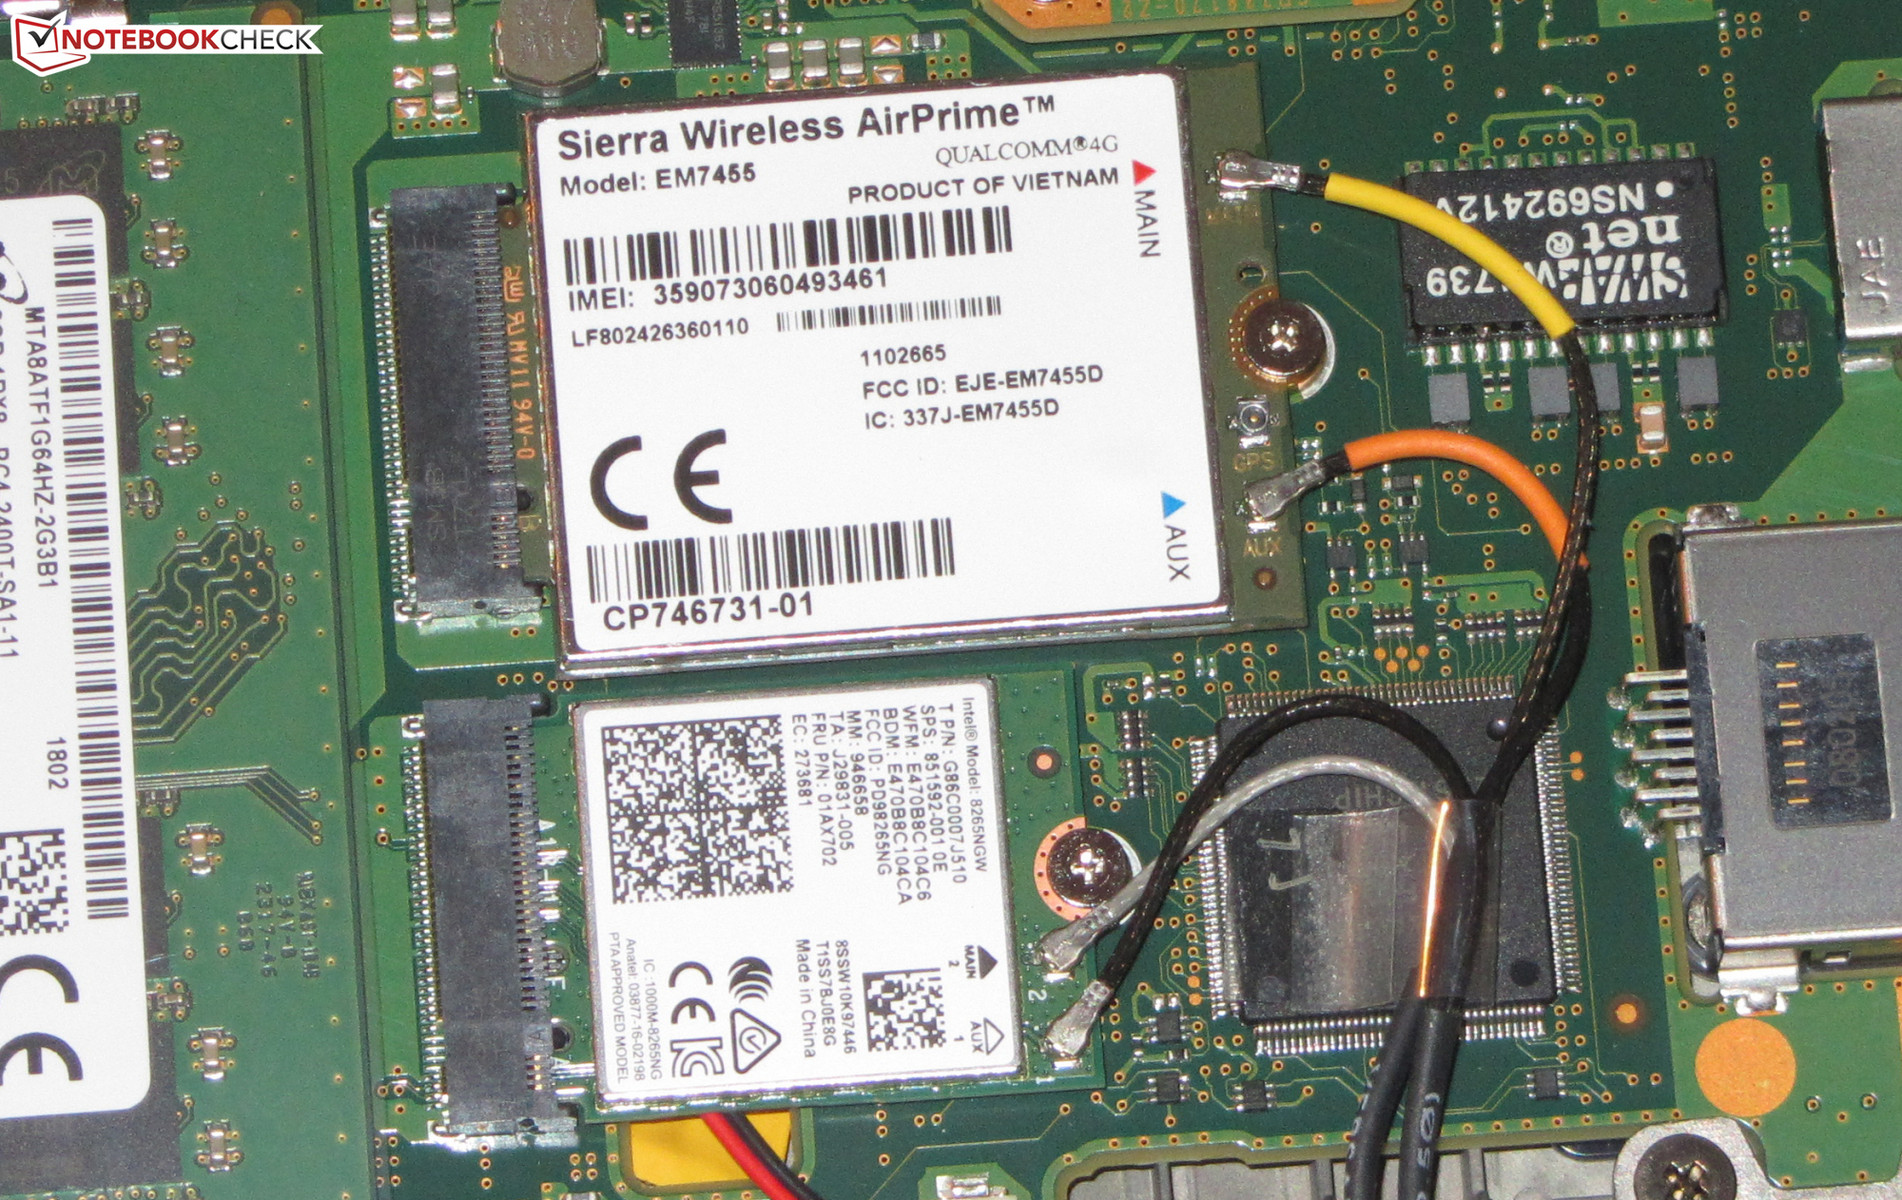
The Wireless communication modules match Fujitsu’s claims of high mobility and portability. All things Wi-Fi are handled by the slightly aged yet tried and tested Intel Wireless-AC 8265 with 2x2 MIMO technology and Bluetooth 4.2. Its theoretical maximum bandwidth is 867 Mbps, and taking an overhead of roughly 200 Mbps into account, the LifeBook failed to meet our expectations (as did the Dell, by the way) when receiving data. When transmitting data, on the other hand, it turned out to be the fastest contender in our test group.
The optional 4G/LTE modem is a Sierra Wireless EM7455 (Cat. 6) card with GPS. Further information can be found here.
Security
Security features include a smart card reader, a TPM 2.0 chip, and the Bitlocker hard disk encryption included in Windows 10 Pro.
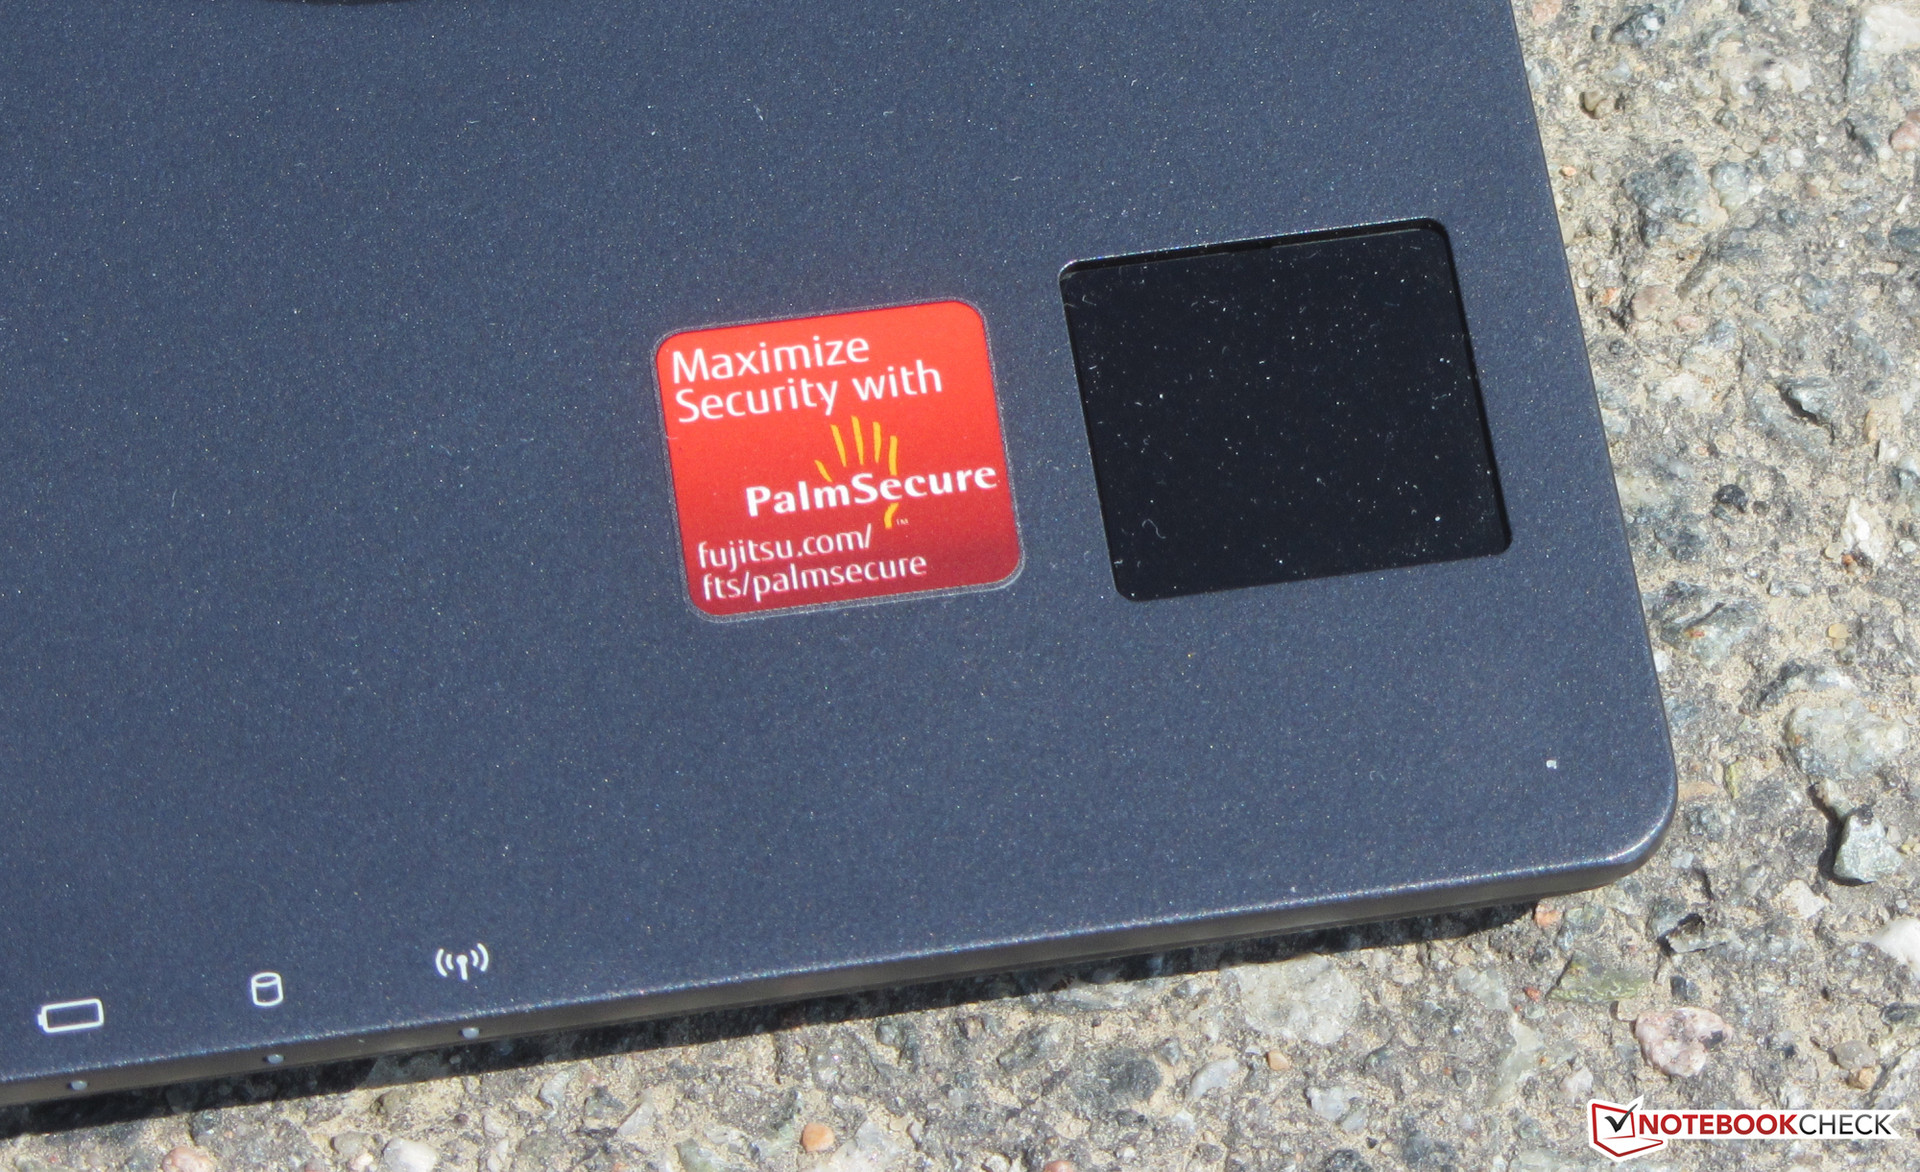
Fujitsu’s touch-free palm secure authentication system deserves special attention. Instead of using biometric features such as face detection or a person’s fingerprint, it relies on vein detection. According to Fujitsu, a false positive is practically impossible. Further information can be found here.
Accessories
The box includes a quick start poster and a Windows 10 Pro Recovery DVD.
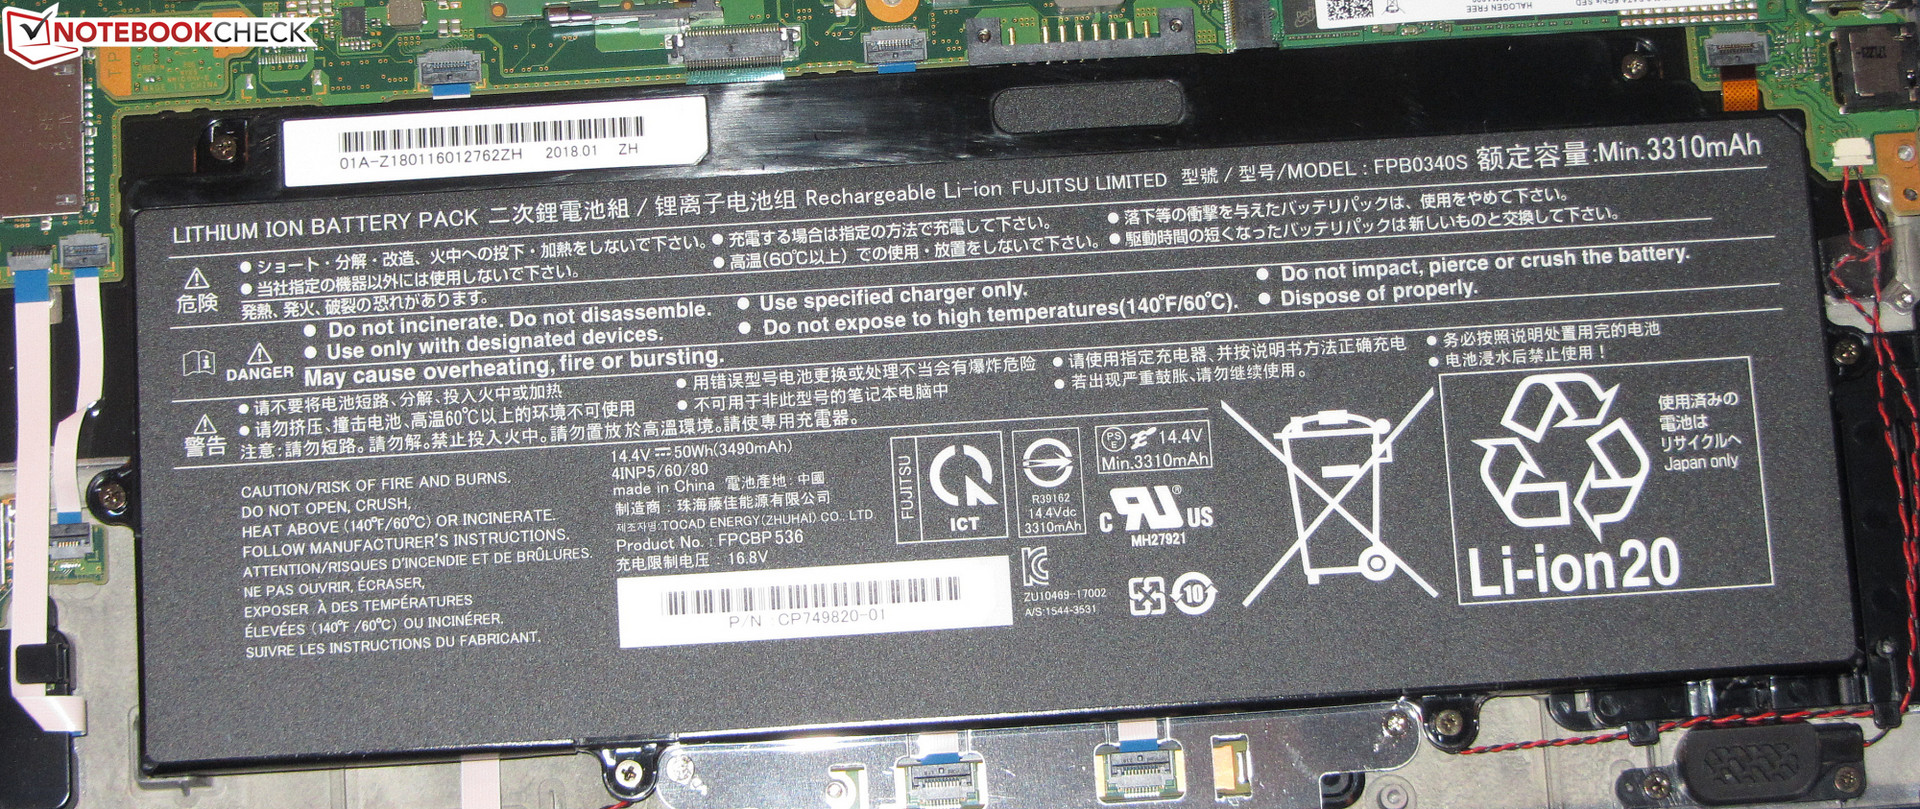
Maintenance
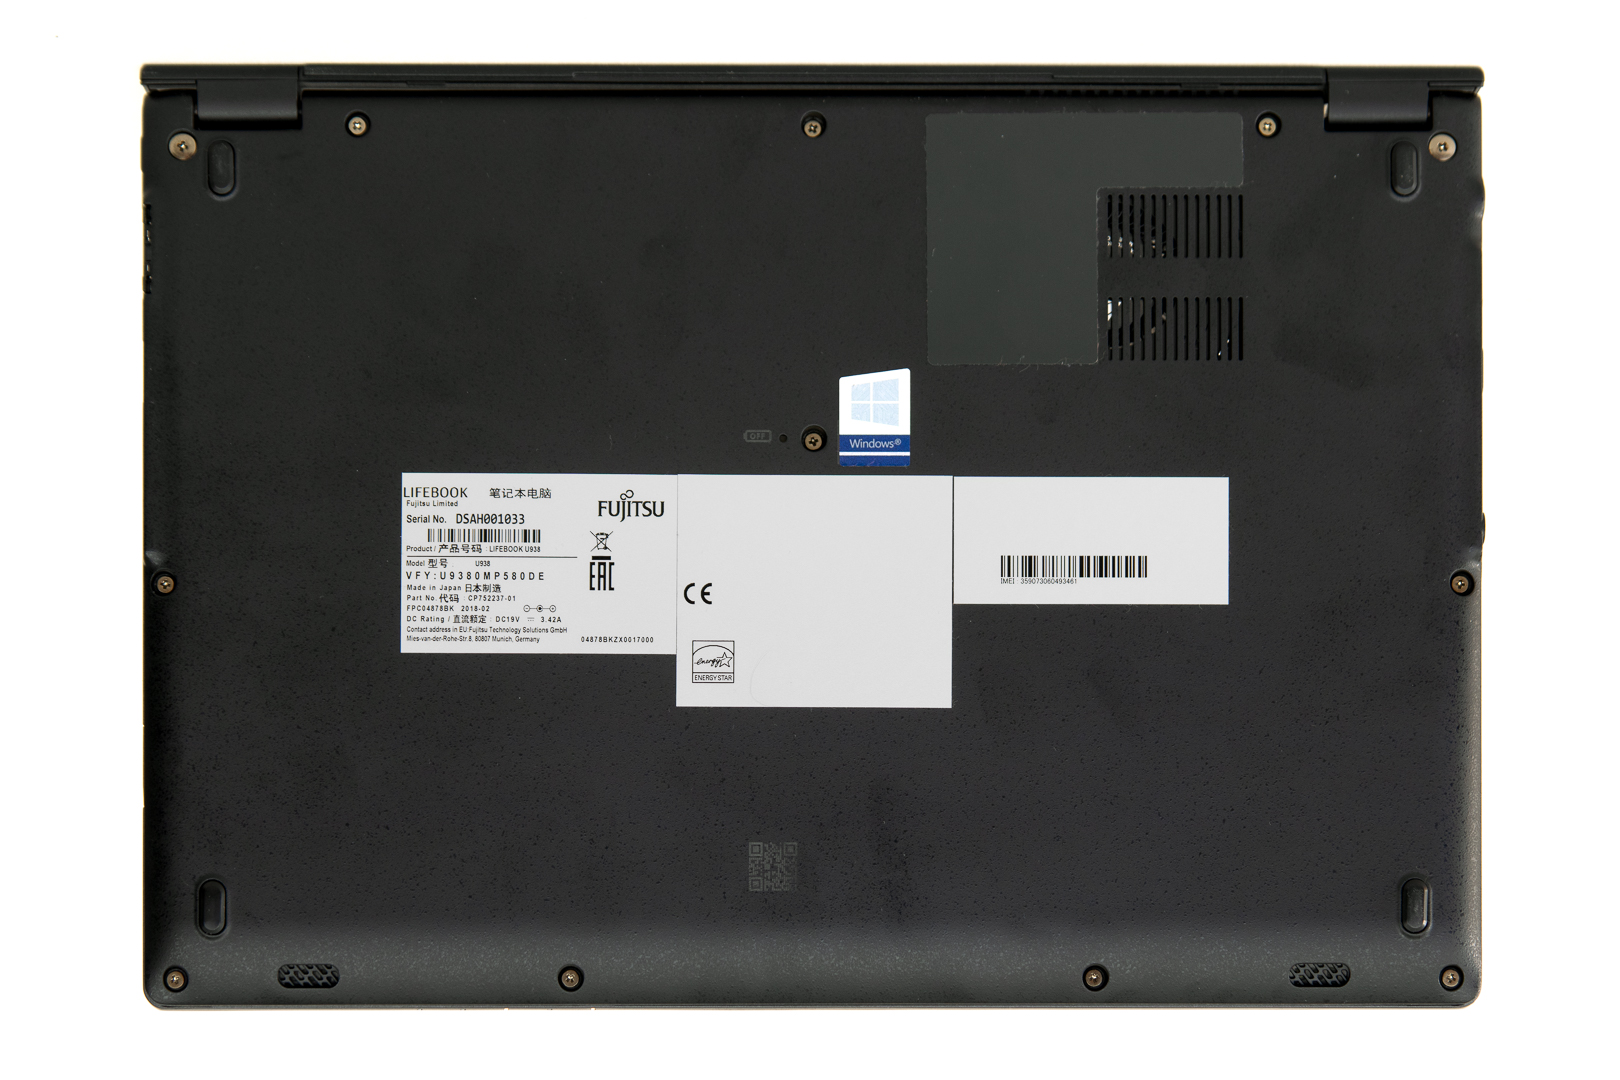
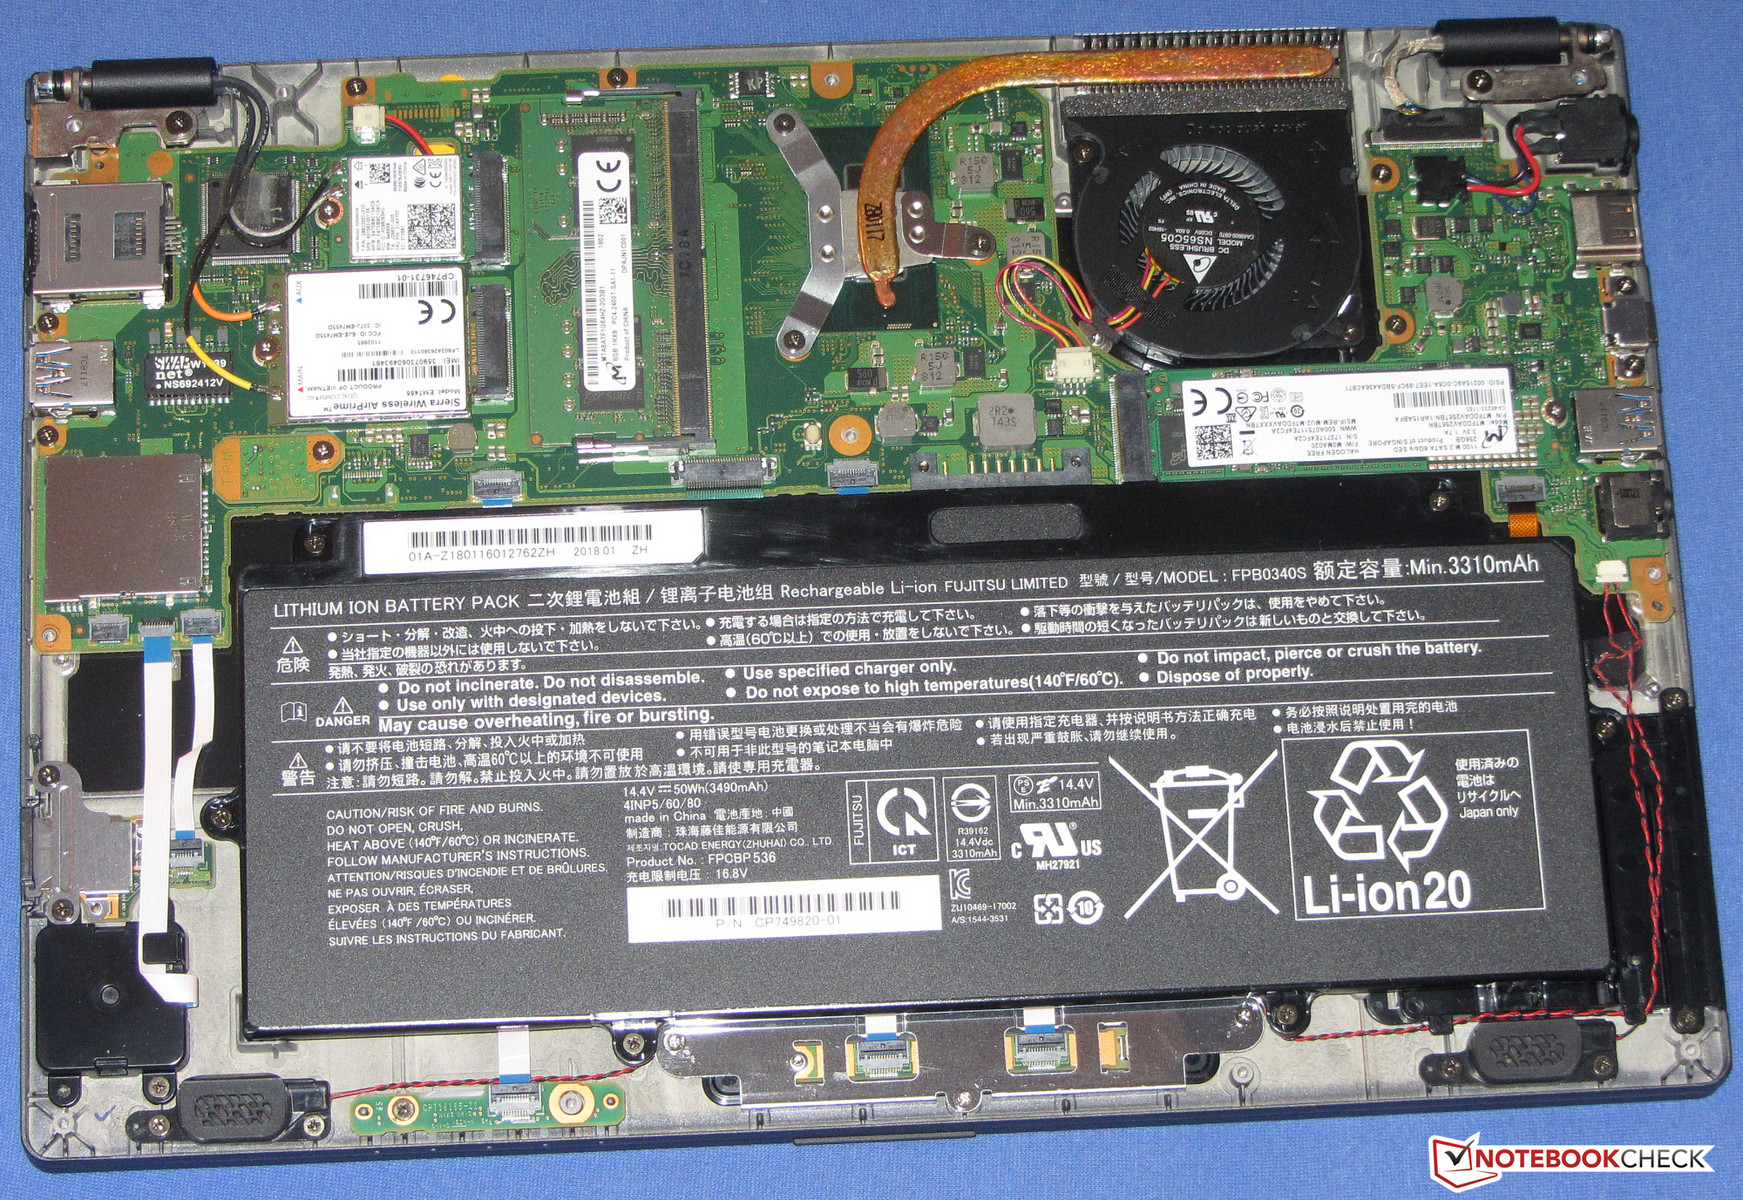
The notebook lacks a dedicated maintenance flap, and accordingly the entire bottom shell has to be removed in order to access the internals. Fortunately, this process is very straightforward: after undoing a total of 12 screws the bottom cover pops right off.
Warranty
Despite the U938’s high price and its business ambitions, warranty is limited to just one year. Warranty extensions are obviously available at a premium. Please see our Guarantees, Return policies and Warranties FAQ for country-specific information.
Input Devices
Keyboard
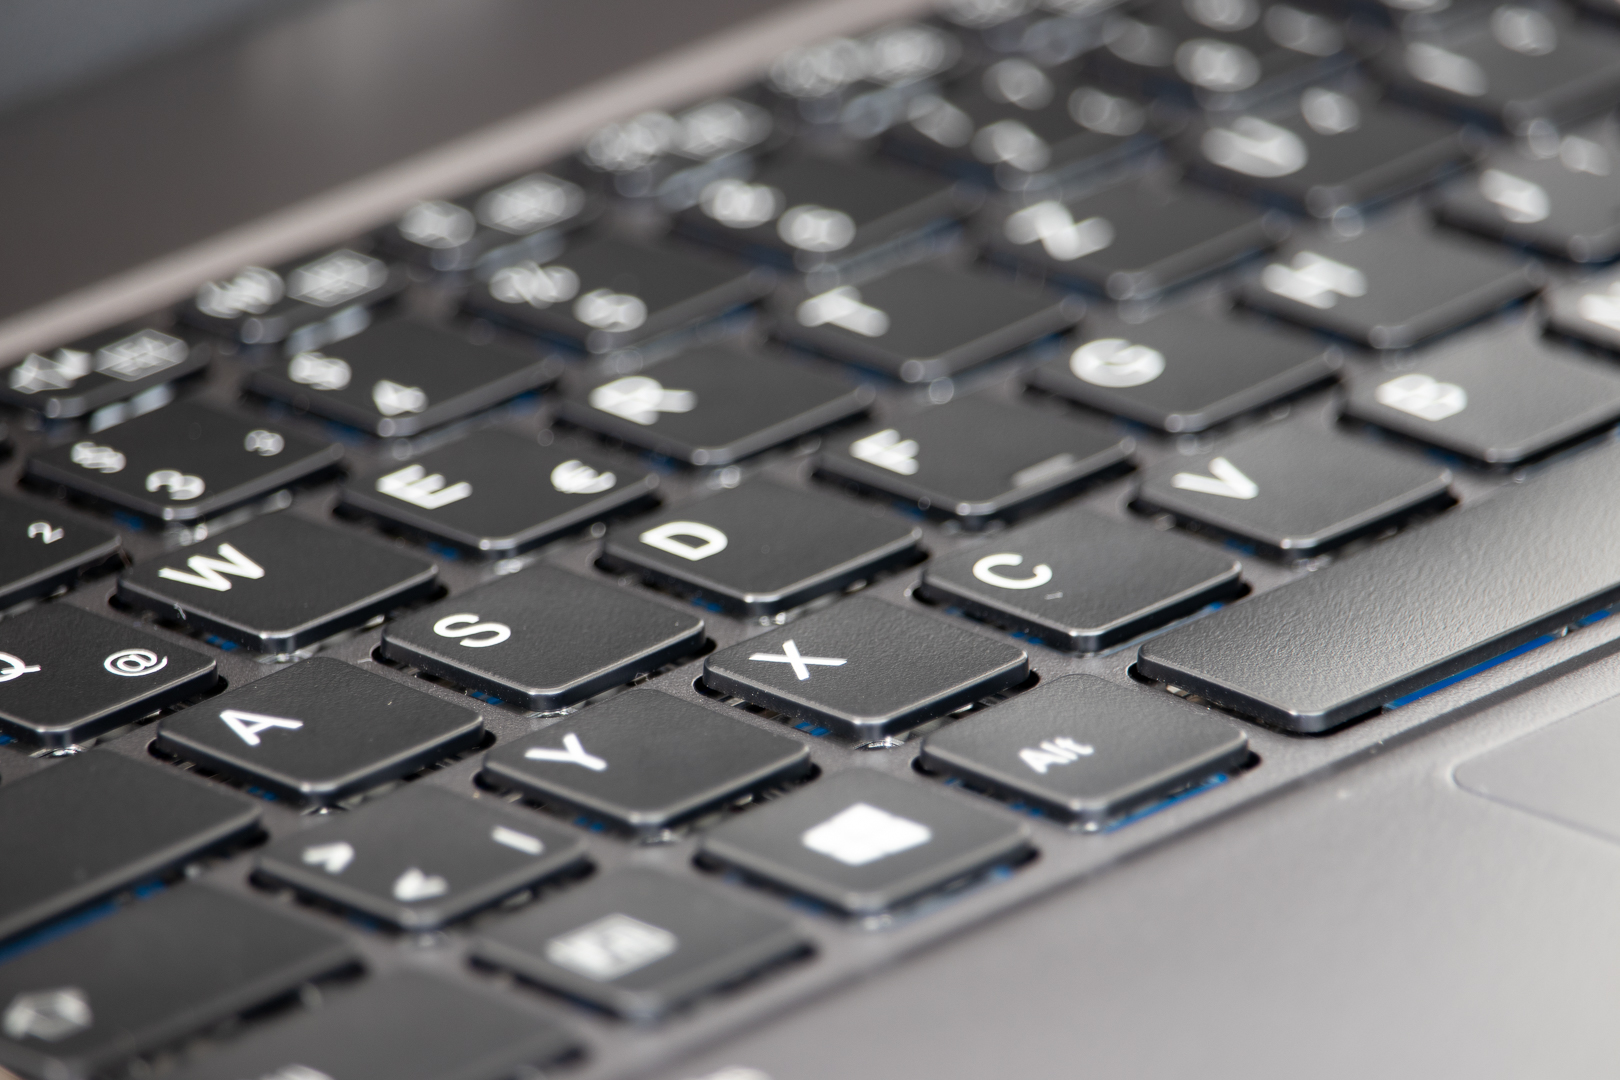
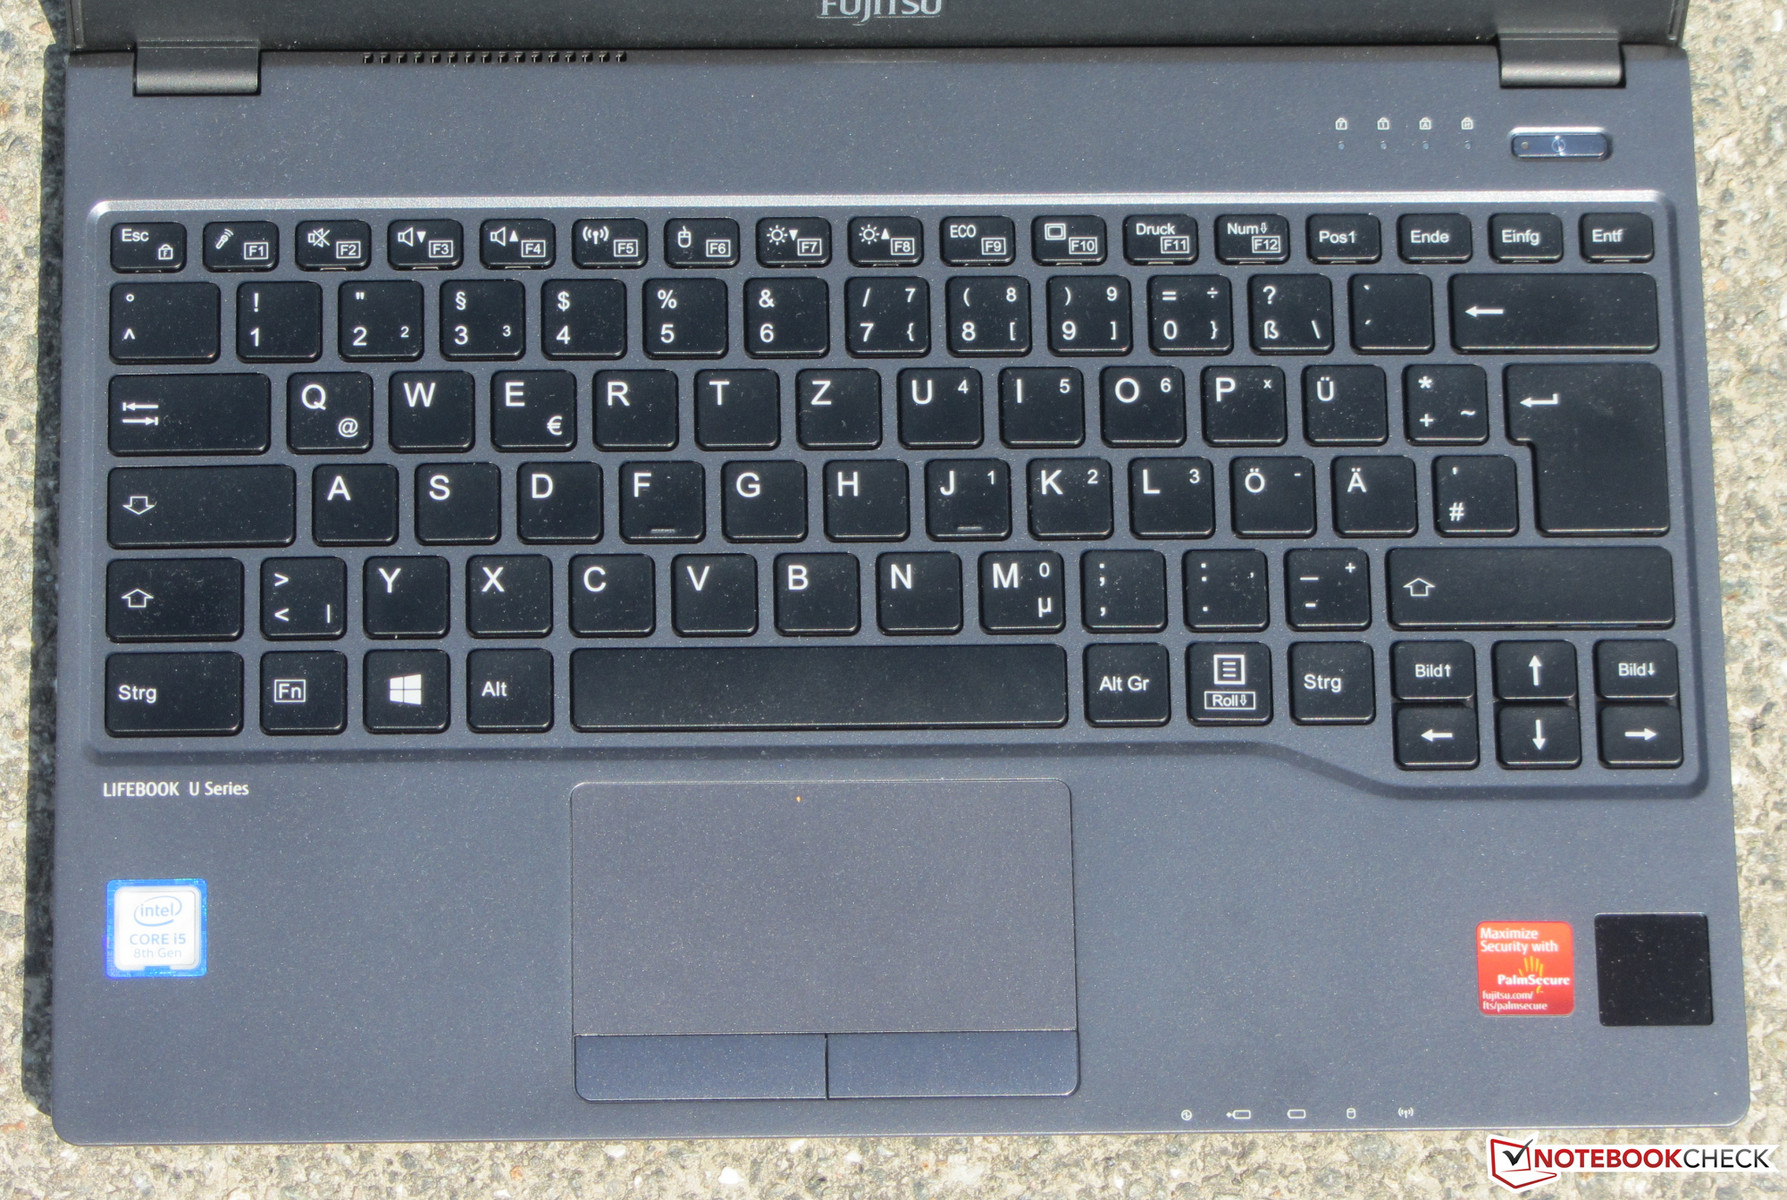
The LifeBook’s chiclet keyboard features concave and slightly roughened keys with decent key travel and a very clear and precise accentuation point. We would have preferred a higher resistance, though. It is a mystery to us why Fujitsu has decided not to include a backlight at all - for us, a device such as this LifeBook should always come with keyboard backlight by default. All things considered the keyboard was more than decent.
Touchpad
At 9.2 x 4.7 cm (3.6 x 1.85 inches) the touchpad is large enough for gestures, which can be configured and enabled/disabled in the touchpad’s settings. The surface was very smooth and easy to use. Two dedicated mouse buttons are located underneath the touchpad. Their travel is rather short, but their accentuation point is very firm in return.
Display
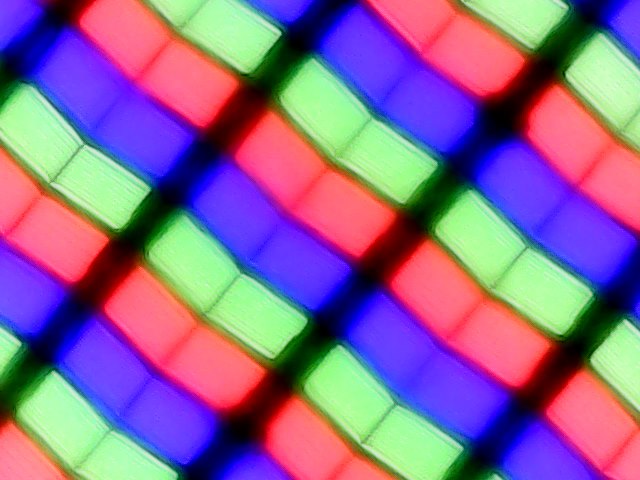
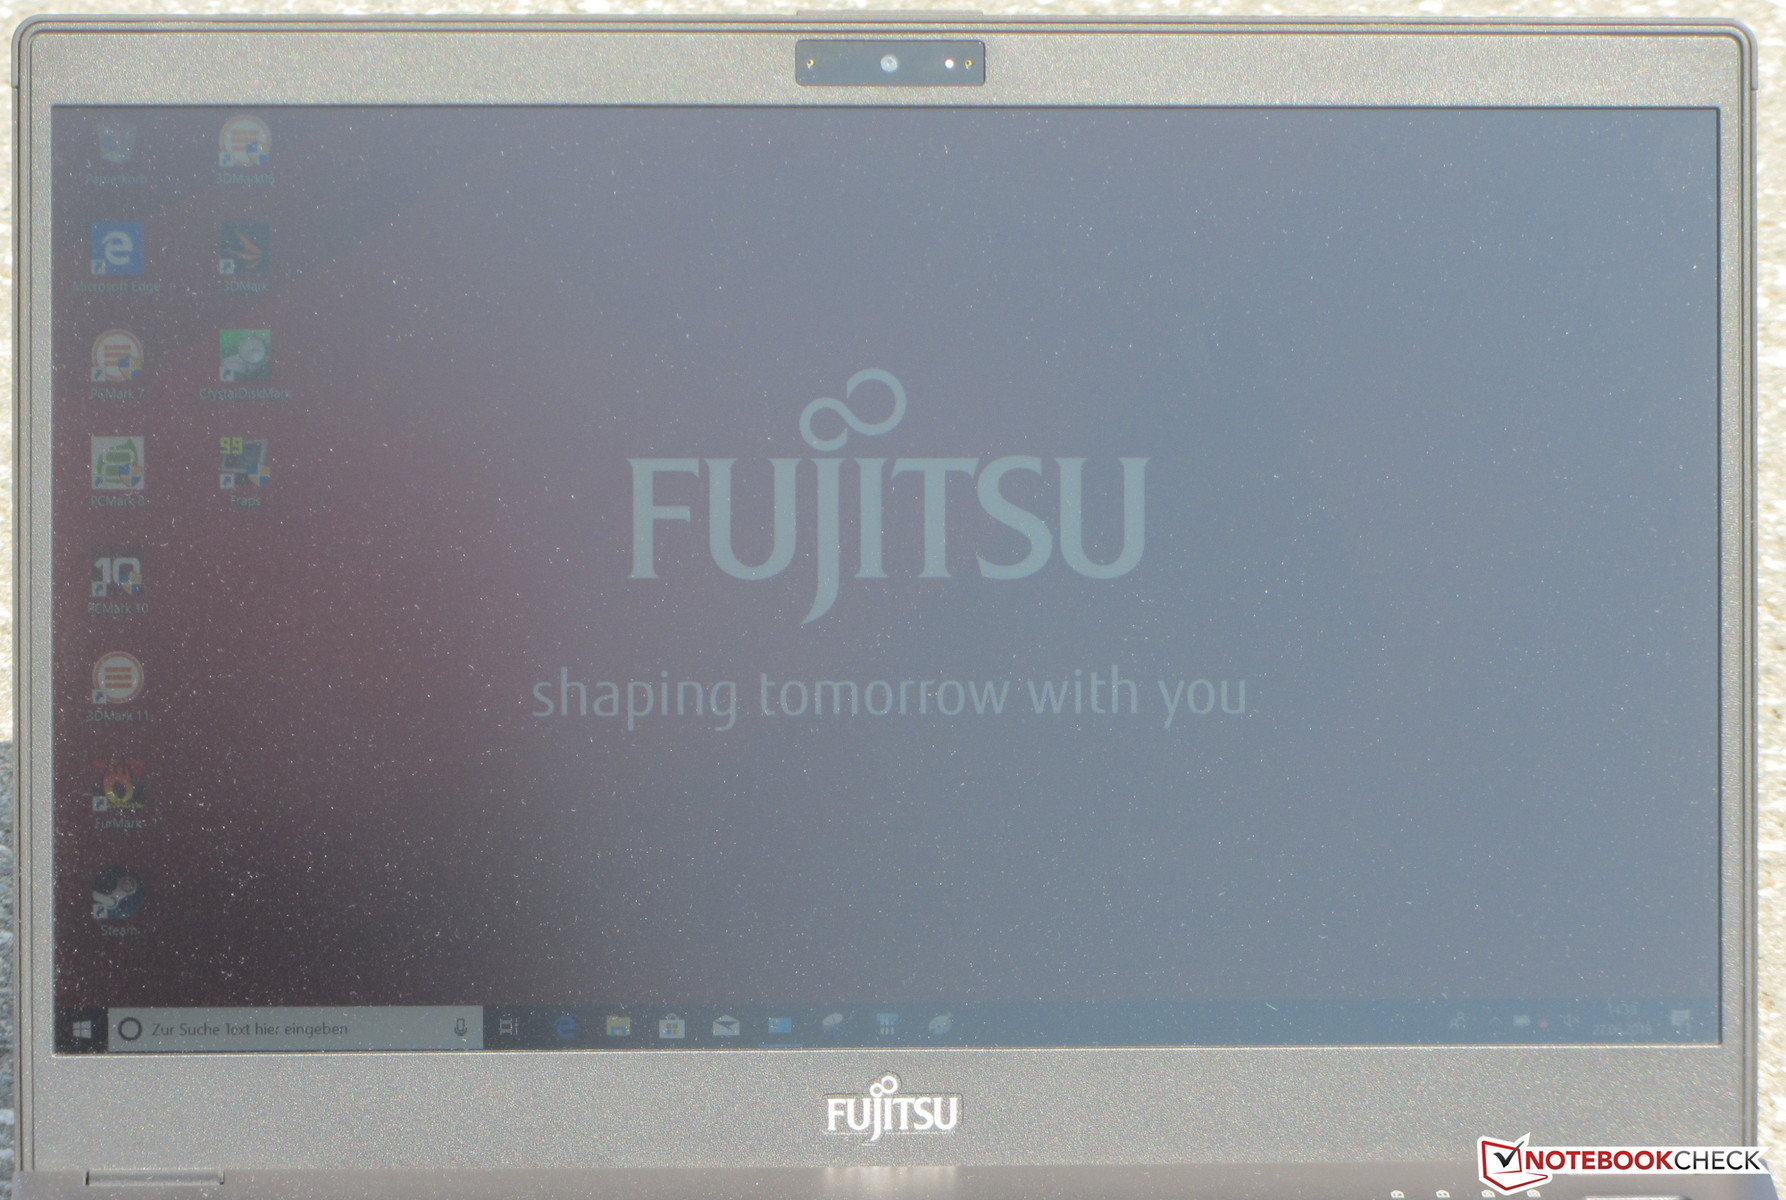
Even though the LifeBook’s 13.3-inch FHD IPS display’s average maximum brightness is a very good 320 nits, most competitors are even brighter; especially the X1 Carbon with its Dolby Vision HDR display. Brightness distribution turned out to be below average but just barely so. Subjectively, the image seemed fine. Blacks were very uniform and homogenous, and we only noticed some minor screen bleeding along the bottom edge. An alternative to our review unit’s matte FHD panel is a glossy FHD touchscreen.
At brightness levels of 20% and below, the display exhibited PWM flickering at a frequency of just 217 Hz. Accordingly, it could cause headaches and eye strain for some people.
| |||||||||||||||||||||||||
Brightness Distribution: 77 %
Center on Battery: 350 cd/m²
Contrast: 1110:1 (Black: 0.31 cd/m²)
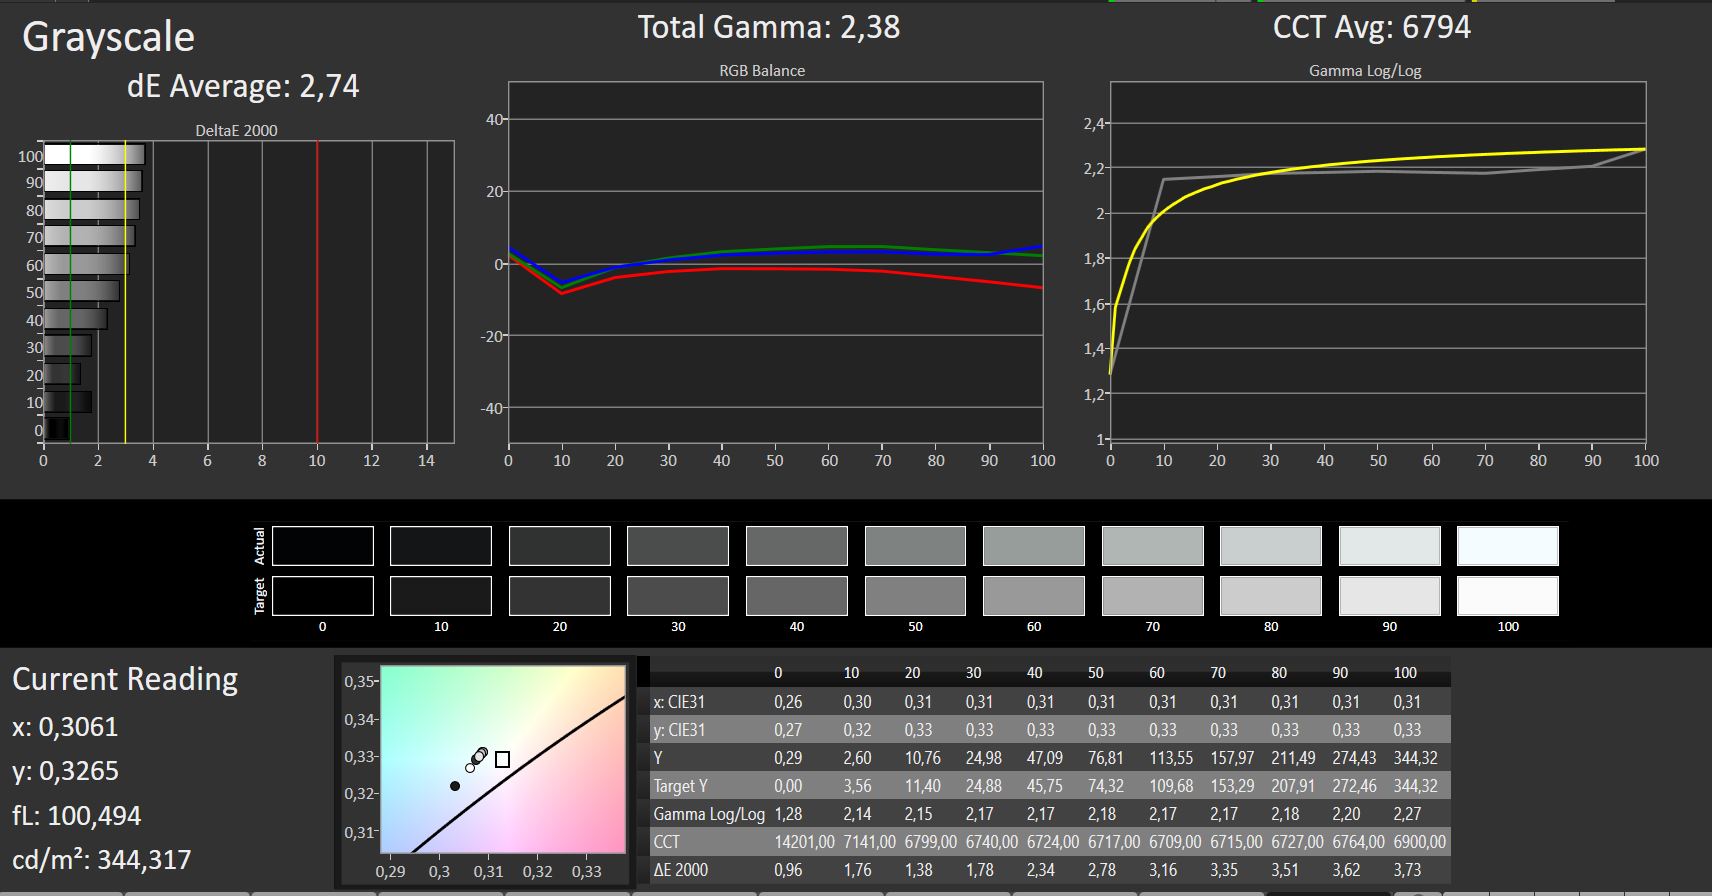
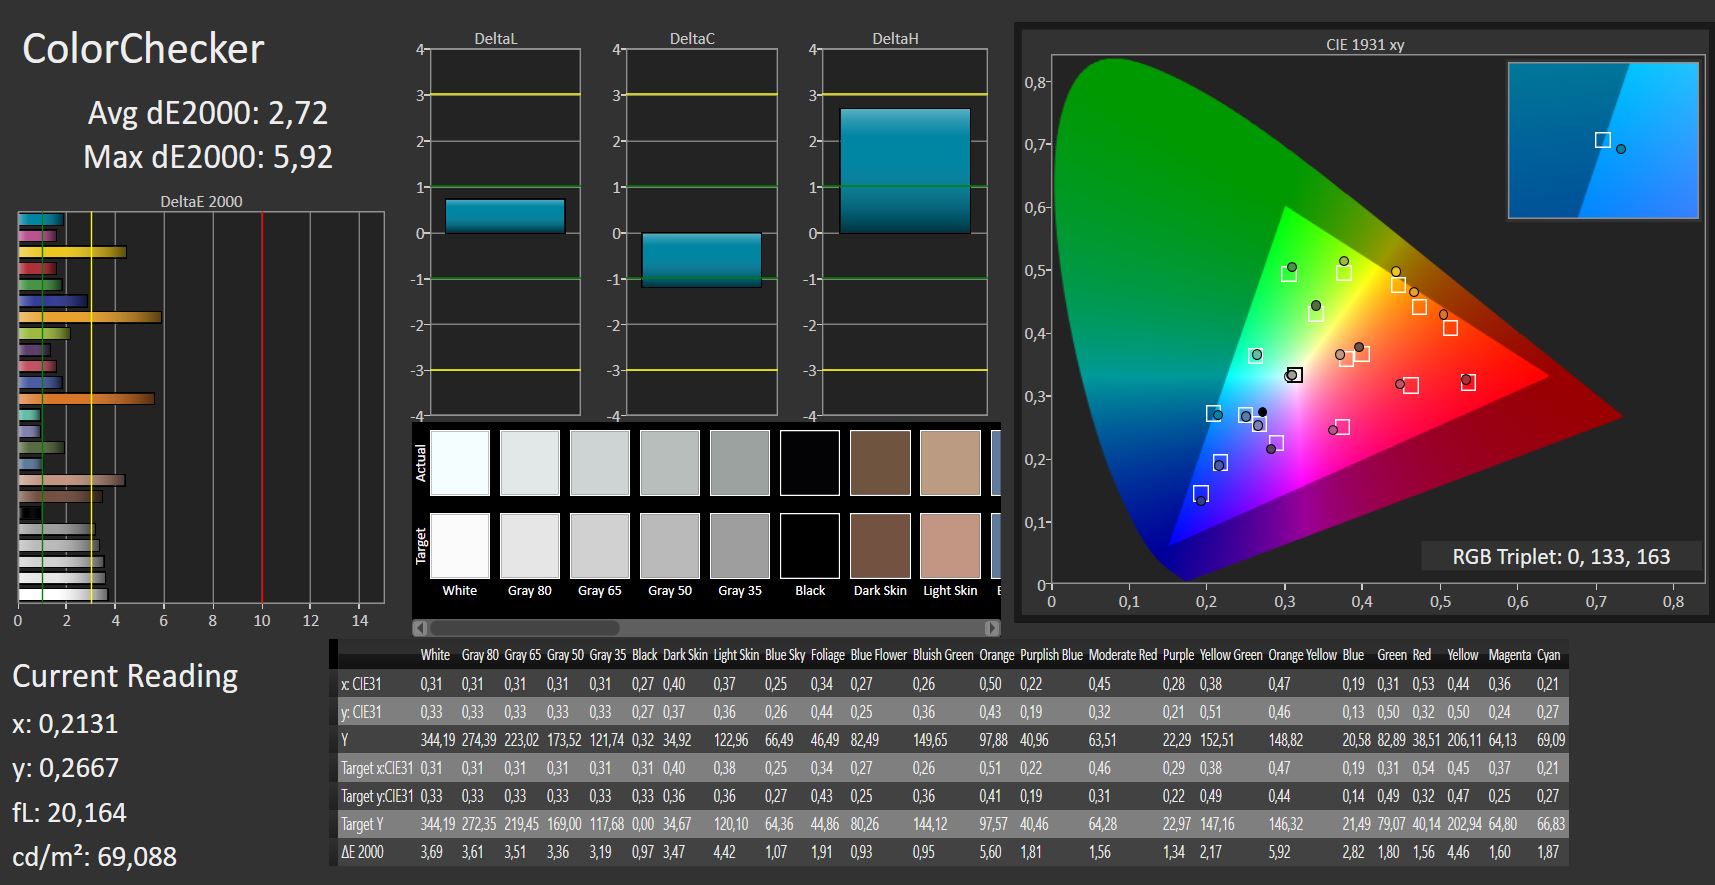
ΔE ColorChecker Calman: 2.72 | ∀{0.5-29.43 Ø4.73}
ΔE Greyscale Calman: 2.74 | ∀{0.09-98 Ø4.97}
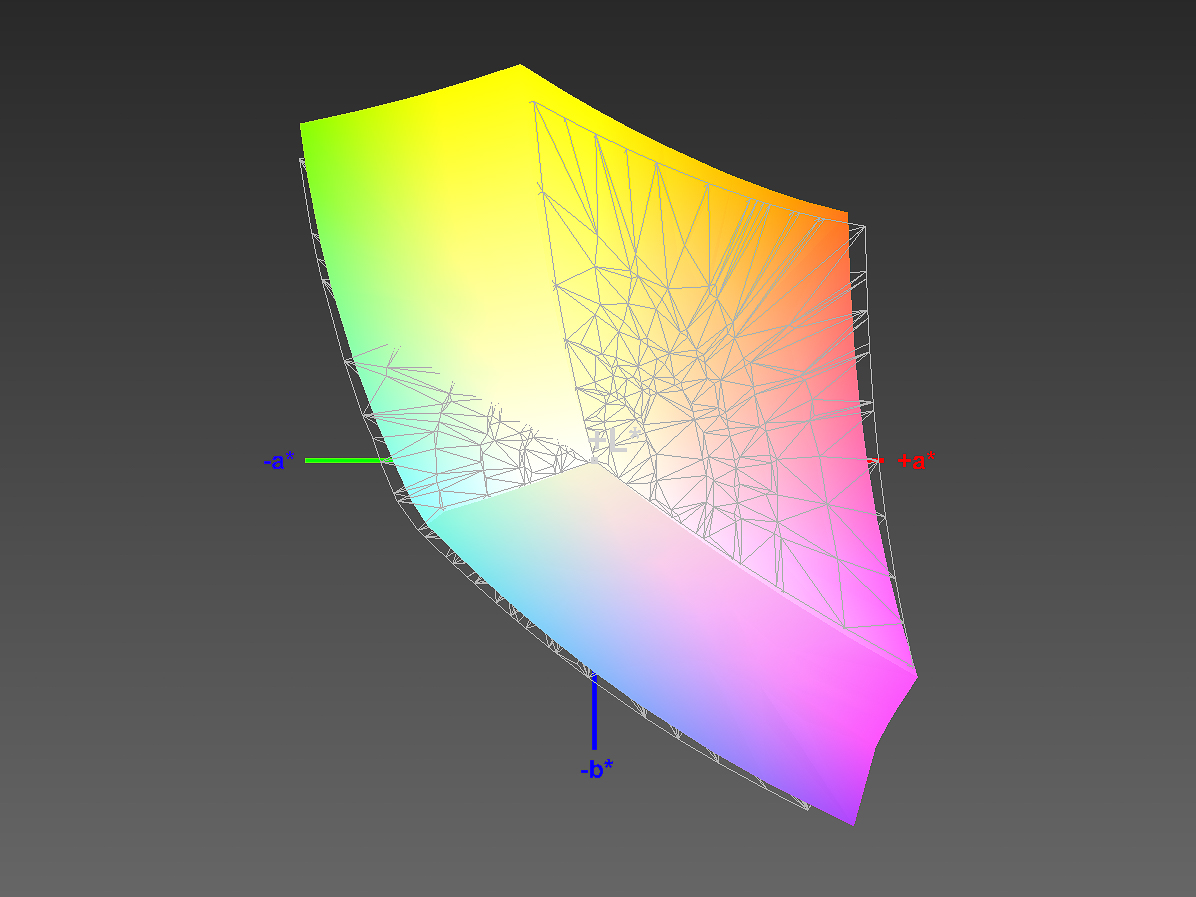
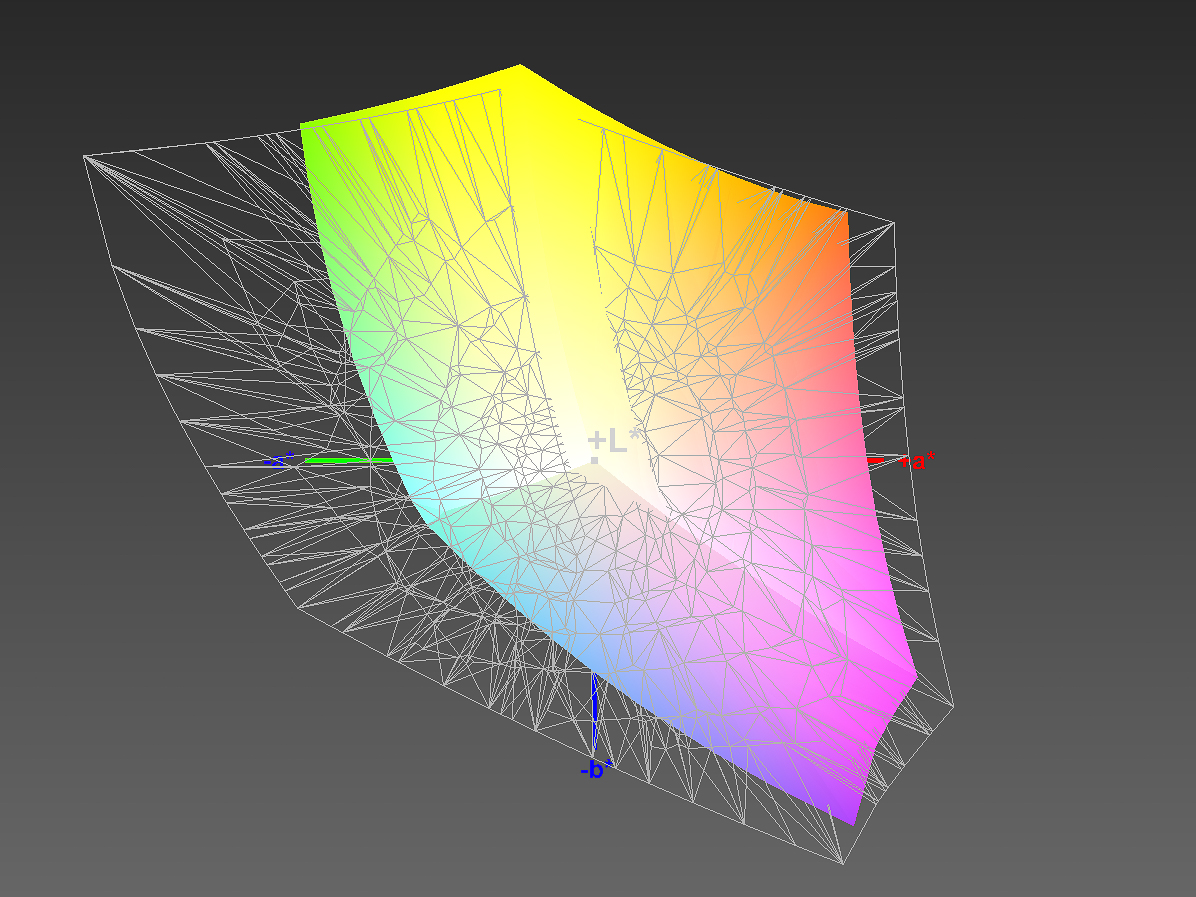
94% sRGB (Argyll 1.6.3 3D)
61% AdobeRGB 1998 (Argyll 1.6.3 3D)
68.7% AdobeRGB 1998 (Argyll 3D)
94.5% sRGB (Argyll 3D)
67.5% Display P3 (Argyll 3D)
Gamma: 2.38
CCT: 6794 K
| Fujitsu Lifebook U938 IPS, 1920x1080, 13.3" | Lenovo ThinkPad X280-20KES01S00 IPS LED, 1920x1080, 12.5" | Dell XPS 13 9370 FHD i5 IPS, 1920x1080, 13.3" | Huawei Matebook X Pro i5 IPS, 3000x2000, 13.9" | Lenovo ThinkPad X1 Carbon 2018-20KGS03900 IPS, 2560x1440, 14" | Fujitsu LifeBook U937 IPS, 1920x1080, 13.3" | |
|---|---|---|---|---|---|---|
| Display | -34% | 2% | -1% | 27% | 3% | |
| Display P3 Coverage (%) | 67.5 | 44 -35% | 68.9 2% | 65.9 -2% | 87.7 30% | 68.6 2% |
| sRGB Coverage (%) | 94.5 | 64.5 -32% | 96.6 2% | 95.2 1% | 100 6% | 98 4% |
| AdobeRGB 1998 Coverage (%) | 68.7 | 45.45 -34% | 69.6 1% | 67.6 -2% | 99.9 45% | 70.4 2% |
| Response Times | 3% | -51% | 9% | -29% | 20% | |
| Response Time Grey 50% / Grey 80% * (ms) | 43 ? | 40 ? 7% | 62.4 ? -45% | 40.4 ? 6% | 59.2 ? -38% | 39.2 ? 9% |
| Response Time Black / White * (ms) | 29 ? | 29.6 ? -2% | 45.6 ? -57% | 25.6 ? 12% | 34.4 ? -19% | 20 ? 31% |
| PWM Frequency (Hz) | 217 ? | 1008 ? | 211.9 ? | |||
| Screen | -30% | 1% | -15% | 27% | -11% | |
| Brightness middle (cd/m²) | 344 | 344 0% | 428 24% | 442.7 29% | 578 68% | 353 3% |
| Brightness (cd/m²) | 320 | 313 -2% | 405 27% | 428 34% | 533 67% | 347 8% |
| Brightness Distribution (%) | 77 | 82 6% | 87 13% | 84 9% | 84 9% | 81 5% |
| Black Level * (cd/m²) | 0.31 | 0.25 19% | 0.26 16% | 0.31 -0% | 0.38 -23% | 0.33 -6% |
| Contrast (:1) | 1110 | 1376 24% | 1646 48% | 1428 29% | 1521 37% | 1070 -4% |
| Colorchecker dE 2000 * | 2.72 | 4.7 -73% | 3.8 -40% | 2.24 18% | 1.9 30% | 3.5 -29% |
| Colorchecker dE 2000 max. * | 5.92 | 19.4 -228% | 7.2 -22% | 7.19 -21% | 3.8 36% | 6.9 -17% |
| Greyscale dE 2000 * | 2.74 | 2.2 20% | 4.4 -61% | 9.7 -254% | 3 -9% | 4.9 -79% |
| Gamma | 2.38 92% | 2.16 102% | 2.21 100% | 1.42 155% | 2.14 103% | 2.21 100% |
| CCT | 6794 96% | 6252 104% | 7067 92% | 6227 104% | 6377 102% | 7136 91% |
| Color Space (Percent of AdobeRGB 1998) (%) | 61 | 41.2 -32% | 62.8 3% | 61.6 1% | 88.8 46% | 63.5 4% |
| Color Space (Percent of sRGB) (%) | 94 | 64.1 -32% | 96.4 3% | 95 1% | 100 6% | 98.1 4% |
| Colorchecker dE 2000 calibrated * | 1.11 | 0.8 | ||||
| Total Average (Program / Settings) | -20% /
-26% | -16% /
-6% | -2% /
-9% | 8% /
19% | 4% /
-4% |
* ... smaller is better
Screen Flickering / PWM (Pulse-Width Modulation)
| Screen flickering / PWM detected | 217 Hz | ≤ 20 % brightness setting | 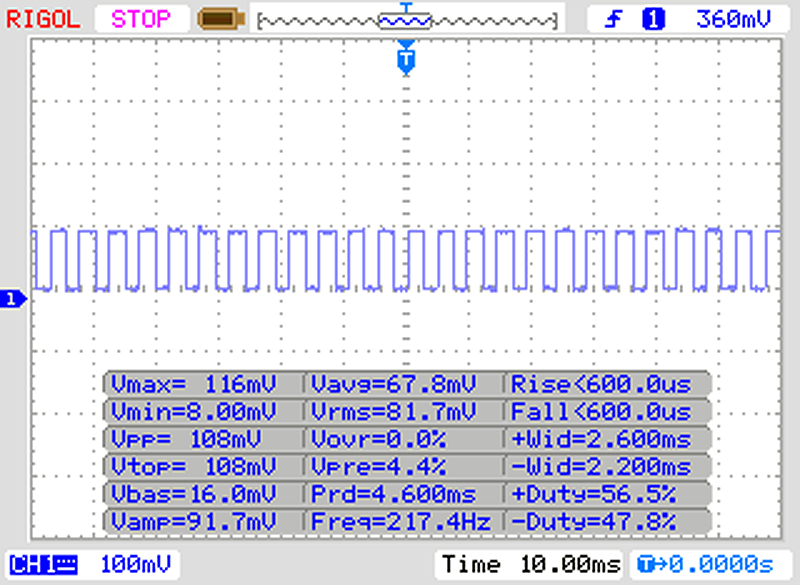 |
The display backlight flickers at 217 Hz (worst case, e.g., utilizing PWM) Flickering detected at a brightness setting of 20 % and below. There should be no flickering or PWM above this brightness setting. The frequency of 217 Hz is relatively low, so sensitive users will likely notice flickering and experience eyestrain at the stated brightness setting and below. In comparison: 52 % of all tested devices do not use PWM to dim the display. If PWM was detected, an average of 7798 (minimum: 5 - maximum: 343500) Hz was measured. | |||
A black level of 0.31 nits is nothing out of the ordinary in 2018, and two of its competitors were up to 19% darker while the X1 Carbon had the highest black level in our test group. Despite a very good contrast ratio of 1,110:1 the LifeBook ended up in the last place in this category. After all, contrast ratio is the ratio between black level and maximum brightness, and the competition was stronger in both respects.
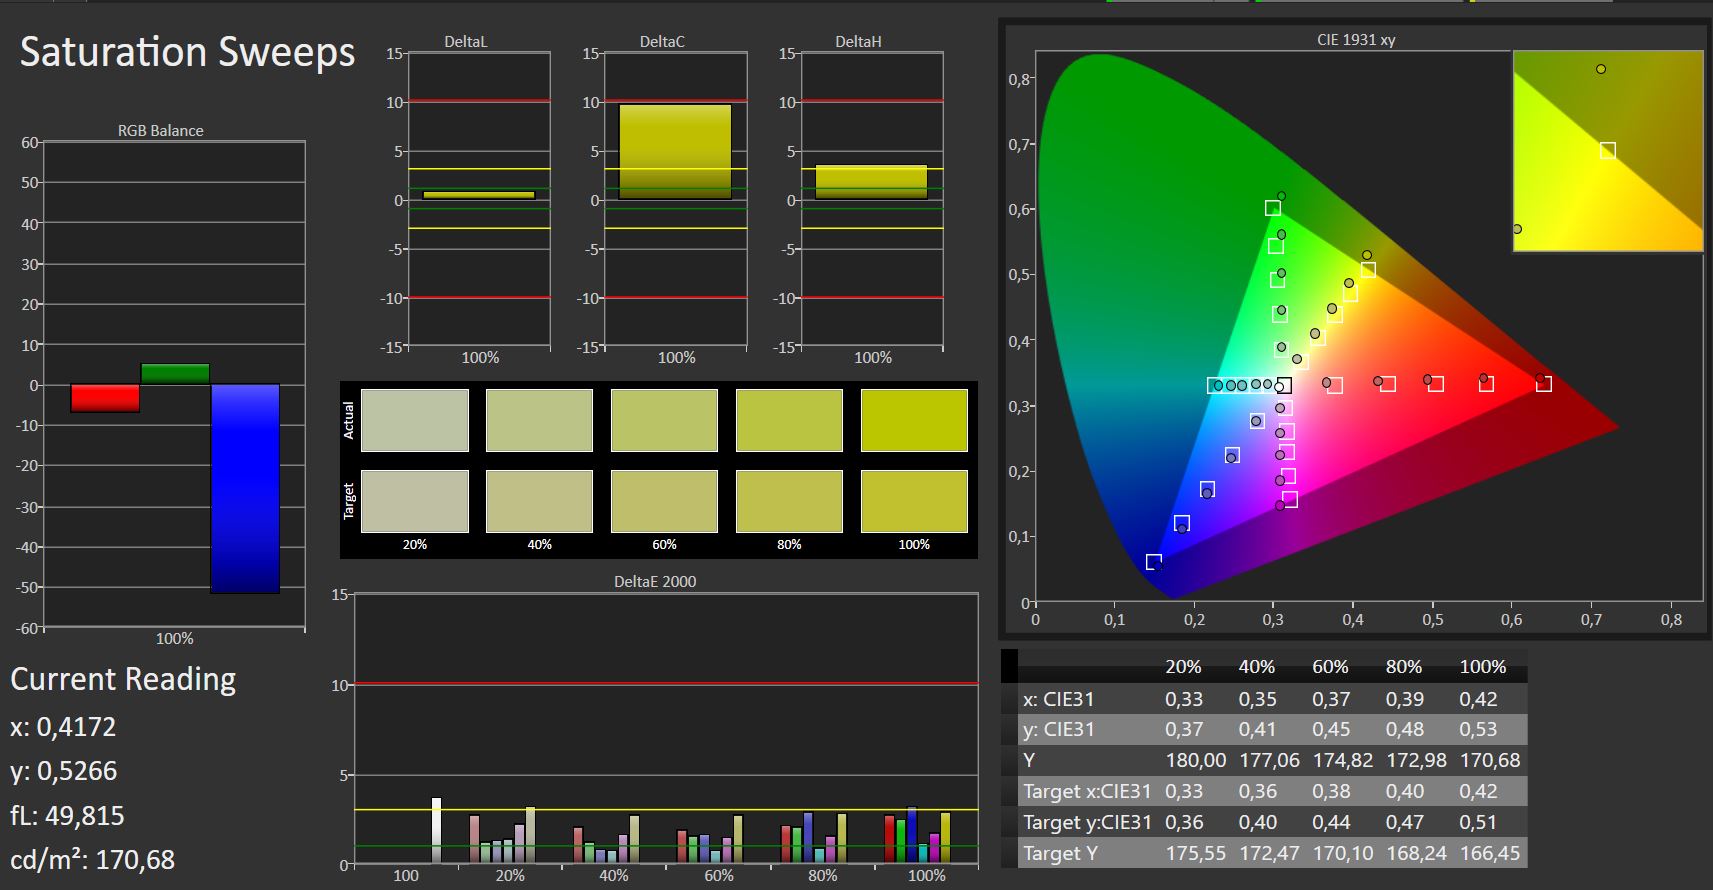
When looking at professional photo editing, the most important characteristics of any display are color space coverage and color accuracy. The latter is measured as the so-called DeltaE deviation in comparison with a reference color, and DeltaE values of up to 3 are considered to be very accurate. When talking about color space coverage, one is usually looking at the smaller sRGB color space. And just like the Huawei and the Dell the LifeBook barely misses a full coverage thereof. The unchallenged king of the hill in this category is Lenovo’s X1 Carbon 2018, which covers 89% of the much bigger professional AdobeRGB color space. To compensate, the other Lenovo laptop did very poorly in this test. Thanks to the LifeBook’s almost ideal color temperature of close to 6,500K we failed to notice any tint whatsoever.
Display Response Times
| ↔ Response Time Black to White | ||
|---|---|---|
| 29 ms ... rise ↗ and fall ↘ combined | ↗ 16 ms rise | 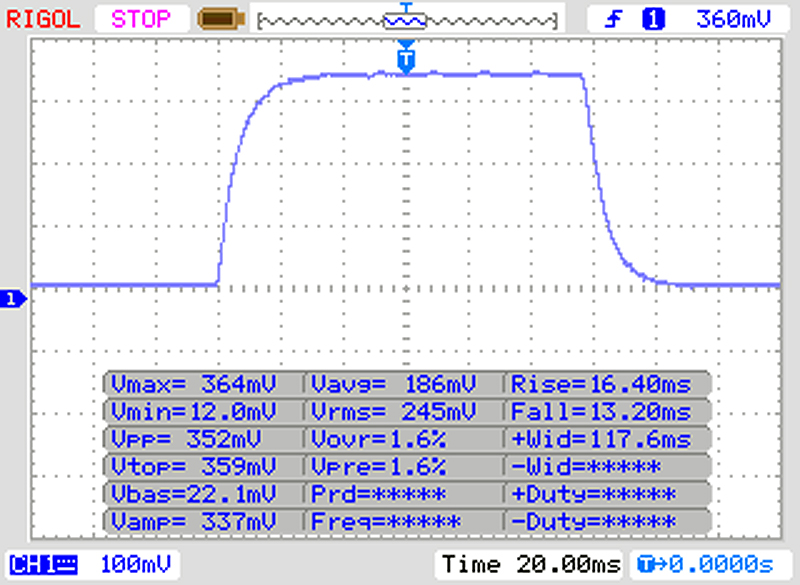 |
| ↘ 13 ms fall | ||
| The screen shows relatively slow response rates in our tests and may be too slow for gamers. In comparison, all tested devices range from 0.1 (minimum) to 240 (maximum) ms. » 77 % of all devices are better. This means that the measured response time is worse than the average of all tested devices (19.9 ms). | ||
| ↔ Response Time 50% Grey to 80% Grey | ||
| 43 ms ... rise ↗ and fall ↘ combined | ↗ 21 ms rise | 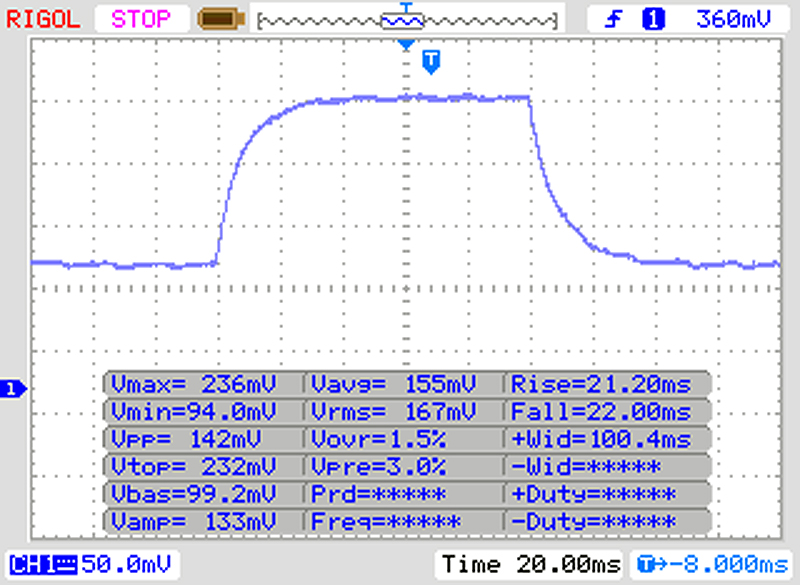 |
| ↘ 22 ms fall | ||
| The screen shows slow response rates in our tests and will be unsatisfactory for gamers. In comparison, all tested devices range from 0.165 (minimum) to 636 (maximum) ms. » 71 % of all devices are better. This means that the measured response time is worse than the average of all tested devices (31.1 ms). | ||
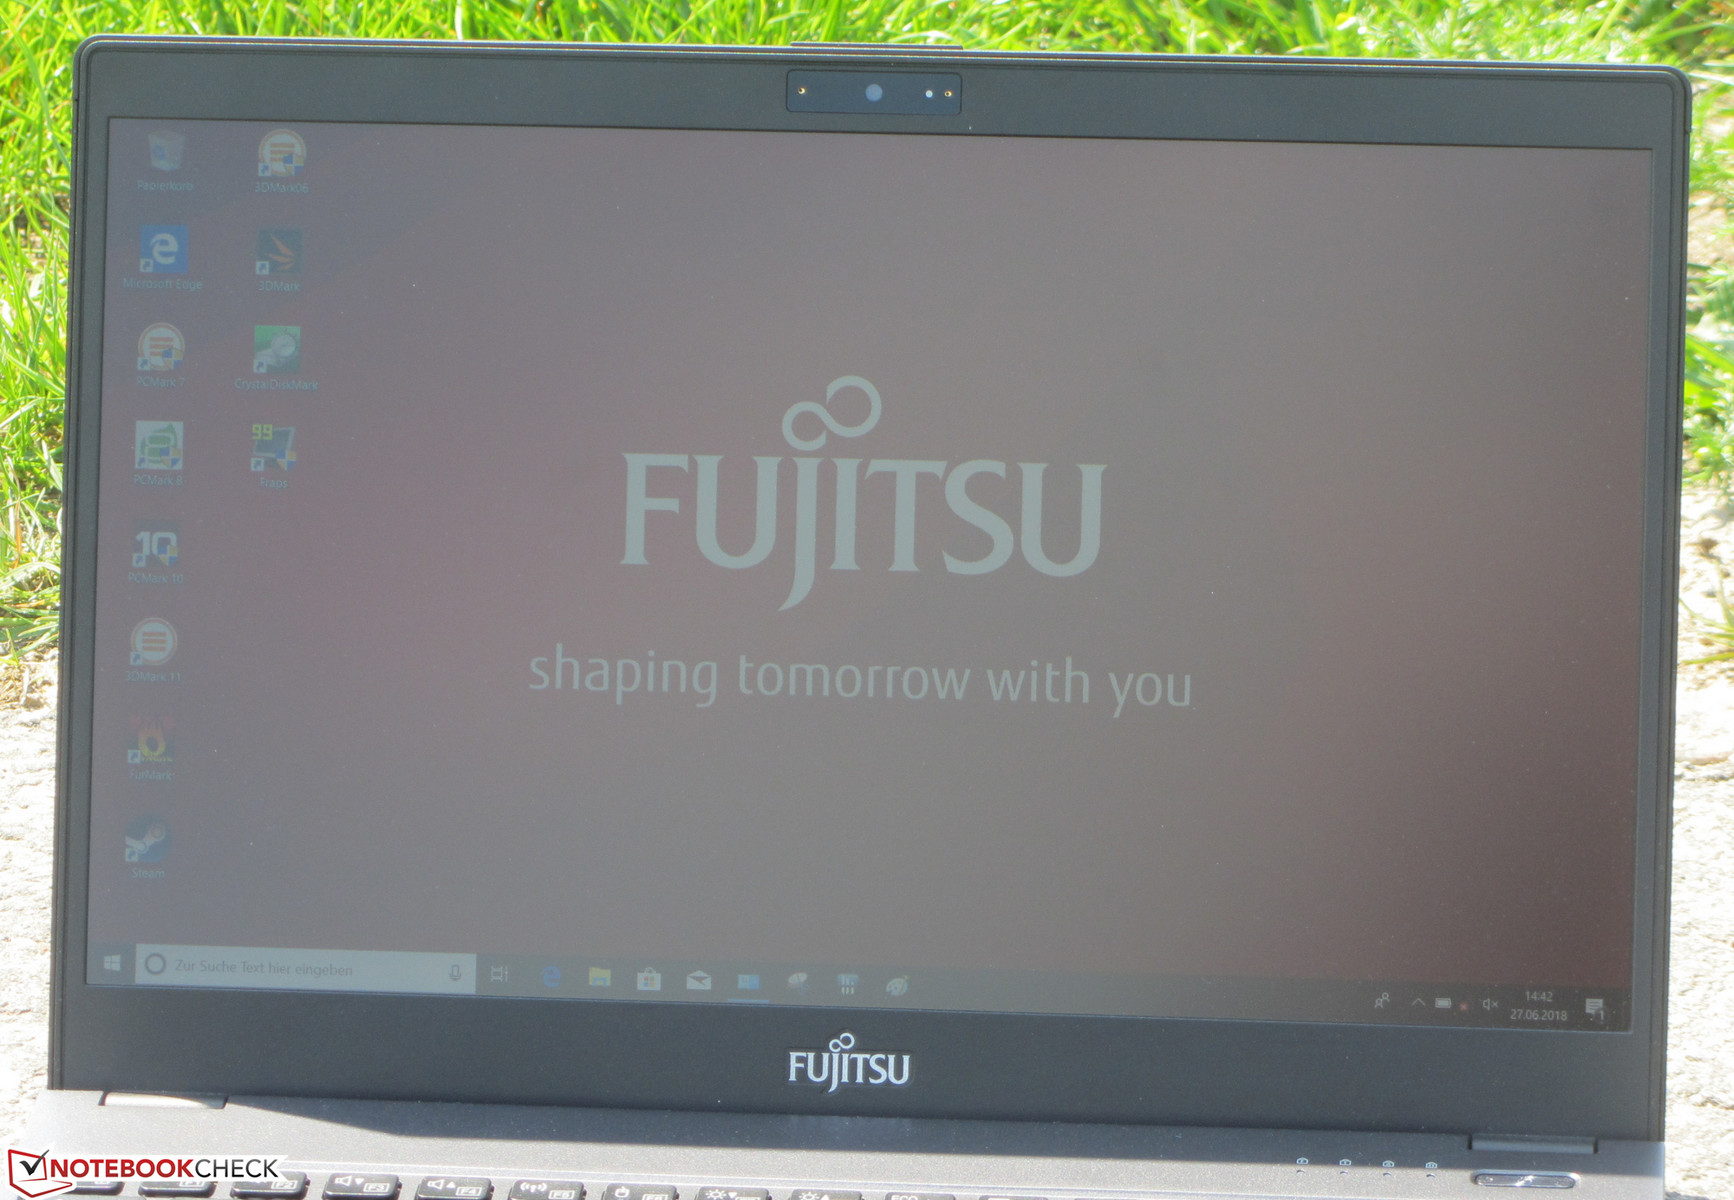
The LifeBook is equipped with an IPS panel with very wide viewing angles. Accordingly, the display can be read from even the most acute angles. Outdoor usability was somewhat limited, and we suggest staying out of the sun and in the shade.

Performance
The LifeBook U938 is a highly portable 13.3-inch business notebook with sufficient computing power for everyday office and internet tasks. At the time of writing, our review unit sold for around $1,500, and other SKUs were available as well.
Processor
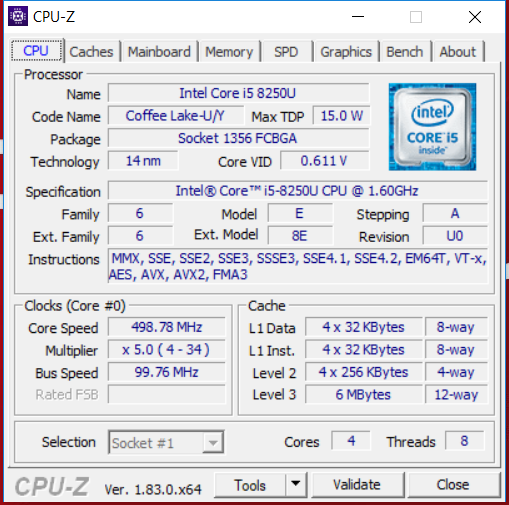
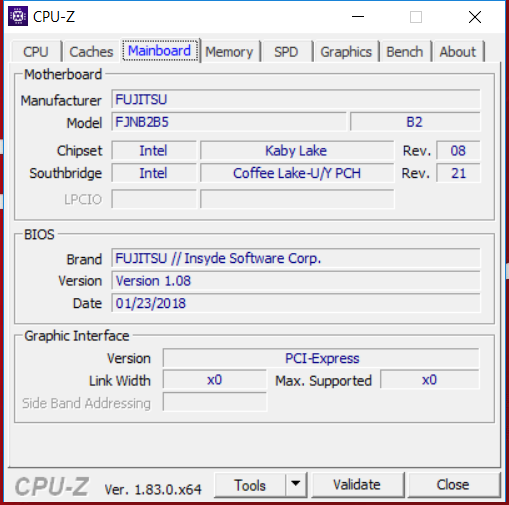
The microprocessor that Fujitsu has chosen is Intel’s Core i5-8250U (4x 1.6 - 3.4 GHz) ULV quad-core CPU with support for Hyper-Threading (two simultaneous threads per core) and a TDP of 15 W. It is a member of Intel’s Kaby Lake Refresh family first introduced in August of 2017, and its immediate Kaby Lake predecessor is the very widely used Core i5-7200U dual-core (2x 2.5 - 3.1 GHz, Hyper-Threading, 15 W TDP).
Thanks to double the amount of cores and higher turbo boost rates the new processor is up to 40% faster. However, its benefits are somewhat limited in mere office workloads. Whether or not turbo boost can be applied for prolonged periods of time as well as the actual turbo boost frequency depends much more on the cooling solution than it did with the more consistent previous generation dual-cores. In an ideal world, applications such as Lightroom CC Classic should be running noticeably smoother on four cores than on two.
In our Cinebench R15 multi-thread benchmark the processor starts out at between 2.5 - 2.7 GHz for a few seconds but quickly drops to 2.3 - 2.4 GHz. Our single-thread benchmarks were completed at between 2.9 and 3.4 GHz. The notebook behaved exactly the same on battery and on mains.
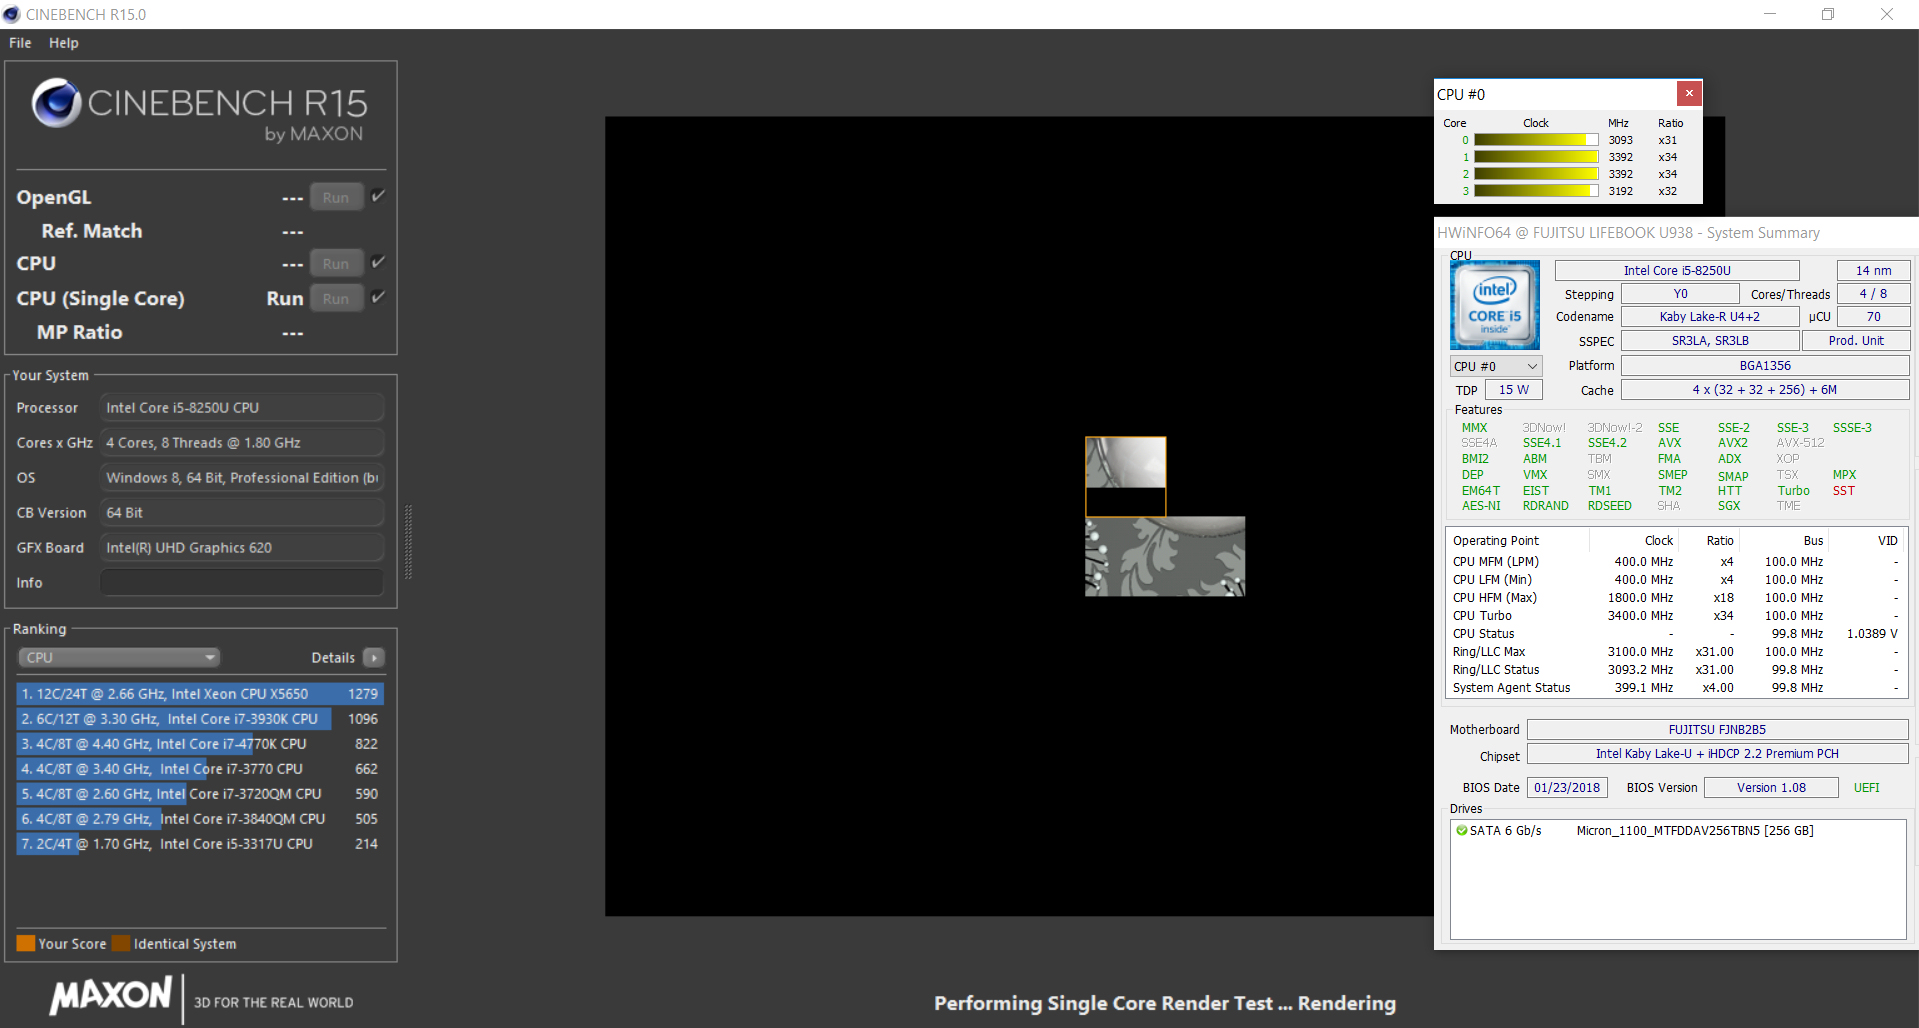
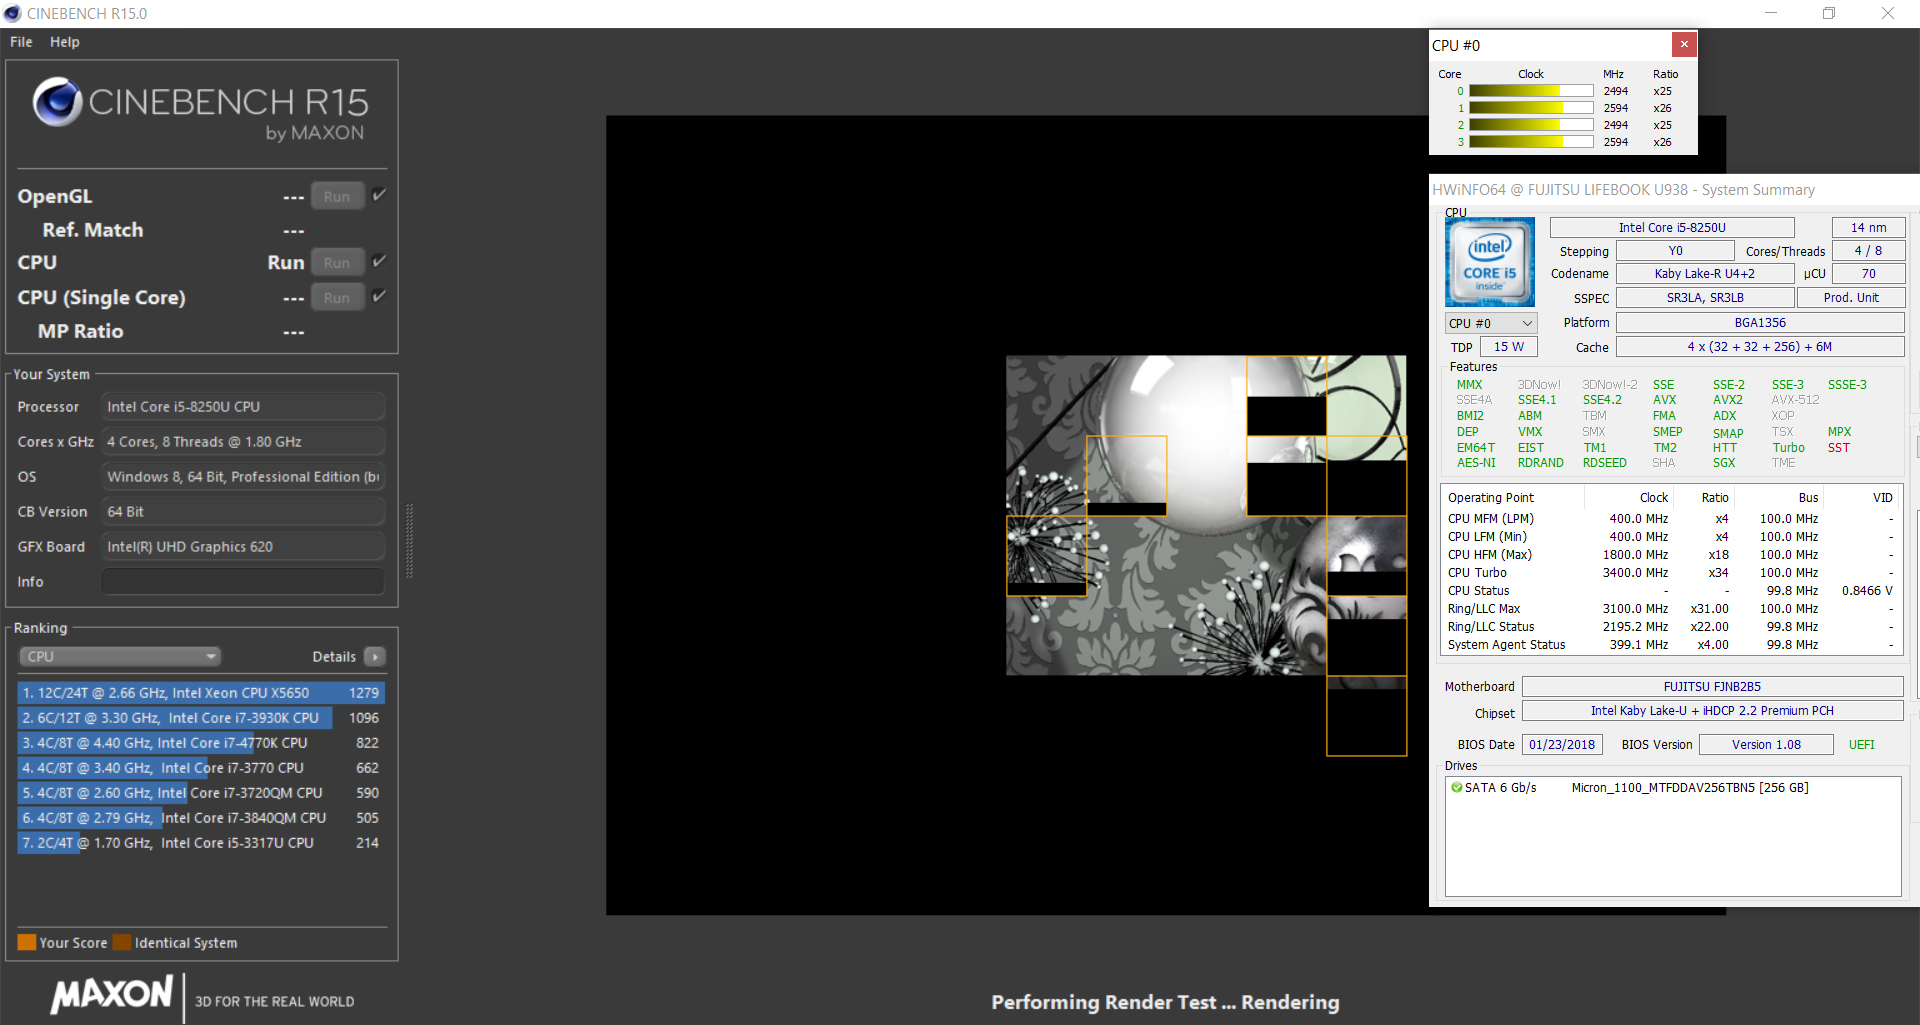
We run Cinebench’s multi-thread test in a 30-minute loop in order to determine a device’s turbo boost capabilities. Scores drop after the first iteration already, but remain very consistent afterwards. While turbo boost is applied throughout the entire duration of the test, it is not applied to its full extent.
Looking at the data in our database, we can see that Fujitsu certainly was not trying to push the processor to new record highs. Even the first run of Cinebench R15 remained slightly below the overall CPU average of 577 points, and identically equipped competitors like the Dell XPS 13 9370 or the Lenovo ThinkPad X1 Carbon performed much better. The same could be observed for long-term load. In other words: the Dell and the Lenovo offer more performance than the LifeBook over long periods of time.
| Cinebench R10 | |
| Rendering Single 32Bit | |
| Average of class Subnotebook (2299 - 10697, n=13, last 2 years) | |
| Average Intel Core i5-8250U (5349 - 8356, n=42) | |
| Huawei Matebook X Pro i5 | |
| Fujitsu Lifebook U938 | |
| Rendering Multiple CPUs 32Bit | |
| Average of class Subnotebook (14395 - 51868, n=13, last 2 years) | |
| Average Intel Core i5-8250U (14148 - 22097, n=42) | |
| Huawei Matebook X Pro i5 | |
| Fujitsu Lifebook U938 | |
| Geekbench 3 | |
| 32 Bit Multi-Core Score | |
| Average of class Subnotebook (n=1last 2 years) | |
| Average Intel Core i5-8250U (10893 - 13553, n=18) | |
| Fujitsu Lifebook U938 | |
| 32 Bit Single-Core Score | |
| Average of class Subnotebook (n=1last 2 years) | |
| Average Intel Core i5-8250U (3148 - 3503, n=18) | |
| Fujitsu Lifebook U938 | |
| Geekbench 4.0 | |
| 64 Bit Multi-Core Score | |
| Average of class Subnotebook (n=1last 2 years) | |
| Average Intel Core i5-8250U (10751 - 13486, n=19) | |
| Fujitsu Lifebook U938 | |
| 64 Bit Single-Core Score | |
| Average of class Subnotebook (n=1last 2 years) | |
| Average Intel Core i5-8250U (3924 - 4243, n=19) | |
| Fujitsu Lifebook U938 | |
| Geekbench 4.4 | |
| 64 Bit Multi-Core Score | |
| Average of class Subnotebook (27854 - 45023, n=7, last 2 years) | |
| Average Intel Core i5-8250U (11269 - 14228, n=25) | |
| Fujitsu Lifebook U938 | |
| 64 Bit Single-Core Score | |
| Average of class Subnotebook (5976 - 8929, n=7, last 2 years) | |
| Fujitsu Lifebook U938 | |
| Average Intel Core i5-8250U (3453 - 4330, n=25) | |
| Mozilla Kraken 1.1 - Total | |
| Huawei Matebook X Pro i5 (Edge 41.16299.402.0) | |
| Fujitsu Lifebook U938 (Edge 42) | |
| Lenovo ThinkPad X280-20KES01S00 (Edge) | |
| Average Intel Core i5-8250U (986 - 1532, n=59) | |
| Dell XPS 13 9370 FHD i5 (Edge 41.15399.15.0) | |
| Average of class Subnotebook (234 - 1104, n=62, last 2 years) | |
| Octane V2 - Total Score | |
| Average of class Subnotebook (35801 - 142020, n=29, last 2 years) | |
| Dell XPS 13 9370 FHD i5 (Edge 41.15399.15.0) | |
| Fujitsu Lifebook U938 (Edge 42) | |
| Lenovo ThinkPad X280-20KES01S00 (Edge) | |
| Average Intel Core i5-8250U (22772 - 35817, n=54) | |
| Huawei Matebook X Pro i5 (Edge 41.16299.402.0) | |
| JetStream 1.1 - 1.1 Total | |
| Average of class Subnotebook (215 - 476, n=2, last 2 years) | |
| Dell XPS 13 9370 FHD i5 (Edge 41.15399.15.0) | |
| Fujitsu Lifebook U938 (Edge 42) | |
| Lenovo ThinkPad X280-20KES01S00 (Edge) | |
| Average Intel Core i5-8250U (151.5 - 256, n=78) | |
| Huawei Matebook X Pro i5 (Edge 41.16299.402.0) | |
* ... smaller is better
System Performance
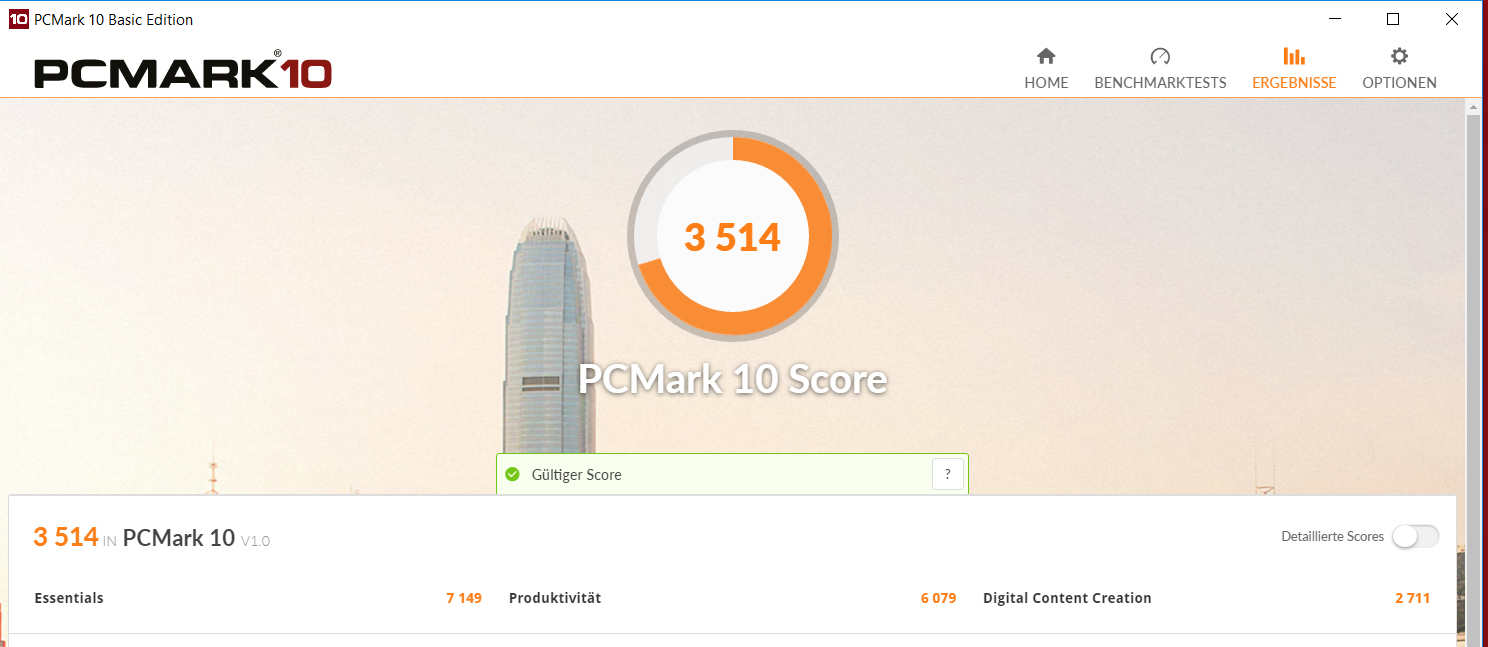
By and large, the system was very smooth and fast, and we did not encounter any problems. The notebook offered more than enough processing power for the most common use cases. Our PCMark benchmark results were very high, however they were trailing behind the identically equipped Dell XPS 13 9370 and Lenovo ThinkPad X280 for two reasons: first, the CPUs in these two ran faster; and second, both were equipped with fast NVMe SSDs.
| PCMark 7 Score | 5479 points | |
| PCMark 8 Home Score Accelerated v2 | 3676 points | |
| PCMark 8 Creative Score Accelerated v2 | 4427 points | |
| PCMark 8 Work Score Accelerated v2 | 4747 points | |
| PCMark 10 Score | 3514 points | |
Help | ||
Storage Devices
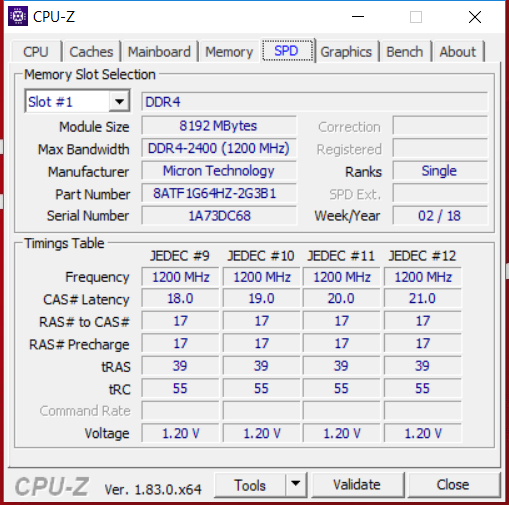
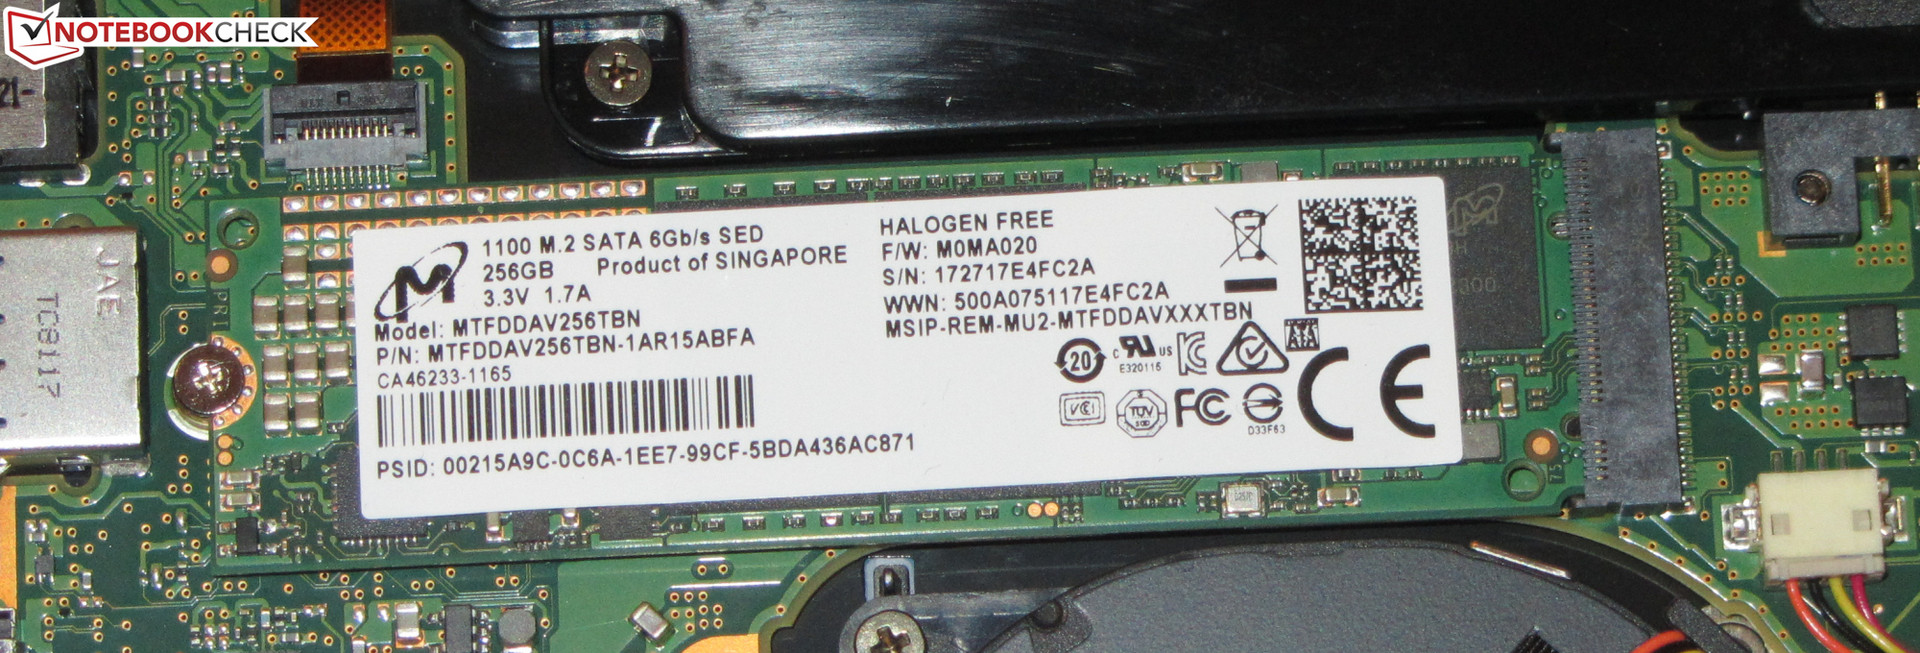
The 256 GB large M.2-2280 SATA III SSD is made by Micron, and it offered 196 GB of usable space out of the box with the rest shared between the recovery partition and the Windows installation. Transfer rates were solid. Alternatively, the LifeBook can also be purchased with an NVMe SSD, which should allow for much higher transfer rates than a SATA III SSD thanks to its PCIe 3.0 x4 connection.

| Fujitsu Lifebook U938 Micron 1100 MTFDDAV256TBN | Lenovo ThinkPad X280-20KES01S00 Samsung SSD PM981 MZVLB512HAJQ | Dell XPS 13 9370 FHD i5 Toshiba XG5 KXG50ZNV256G | Lenovo ThinkPad X1 Carbon 2018-20KGS03900 Samsung SSD PM981 MZVLB512HAJQ | Fujitsu LifeBook U937 Samsung CM871a MZNTY256HDHP | Average Micron 1100 MTFDDAV256TBN | |
|---|---|---|---|---|---|---|
| CrystalDiskMark 3.0 | 242% | 78% | 169% | 13% | -5% | |
| Read Seq (MB/s) | 464.9 | 2535 445% | 1875 303% | 2327 401% | 509 9% | 465 ? 0% |
| Write Seq (MB/s) | 401 | 1236 208% | 352.7 -12% | 1808 351% | 462.3 15% | 379 ? -5% |
| Read 512 (MB/s) | 320.2 | 1751 447% | 840 162% | 419.3 31% | 385.1 20% | 315 ? -2% |
| Write 512 (MB/s) | 335.2 | 1864 456% | 353.9 6% | 1272 279% | 228.5 -32% | 315 ? -6% |
| Read 4k (MB/s) | 26.45 | 59.3 124% | 34.18 29% | 60.6 129% | 34.85 32% | 24.6 ? -7% |
| Write 4k (MB/s) | 79.8 | 129.4 62% | 127.5 60% | 132.9 67% | 90.5 13% | 80.8 ? 1% |
| Read 4k QD32 (MB/s) | 246.5 | 387.9 57% | 381.8 55% | 340.7 38% | 392.8 59% | 227 ? -8% |
| Write 4k QD32 (MB/s) | 277.2 | 646 133% | 339.9 23% | 439.7 59% | 253.6 -9% | 233 ? -16% |
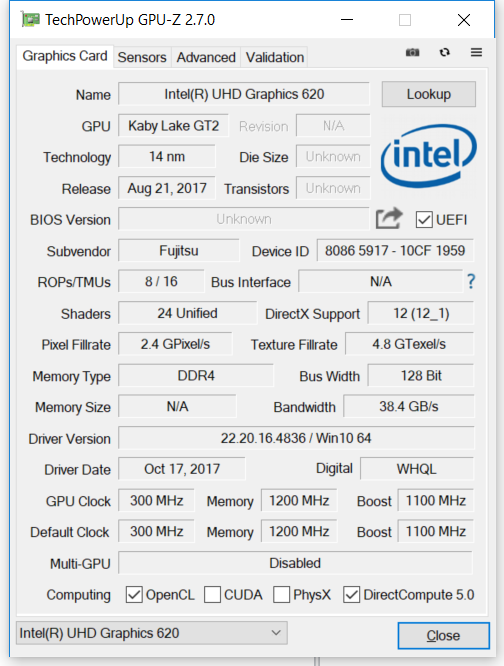
GPU Performance
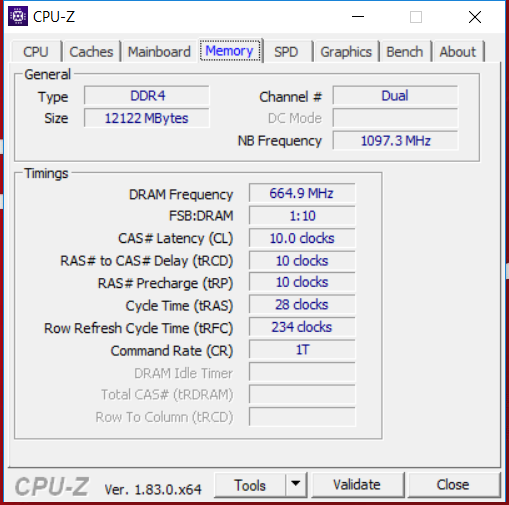
Intel’s integrated UHD Graphics 620 GPU is in charge of display output. It supports DirectX 12 and runs at between 300 and 1,100 MHz. 3DMark benchmark scores were at a level expected of this particular GPU. Nevertheless, they were slightly slower than competitors equipped with the same CPU/GPU combo. The GPU benefitted from the fact that the laptop’s RAM was running in dual-channel mode, which allowed for a slightly higher GPU performance.
| 3DMark 06 Standard Score | 9851 points | |
| 3DMark 11 Performance | 1795 points | |
| 3DMark Cloud Gate Standard Score | 8143 points | |
| 3DMark Fire Strike Score | 1073 points | |
Help | ||
Gaming Performance
The LifeBook U938 is certainly capable of running a few games smoothly. However, these are limited to less demanding games and require reduced resolutions and details. Thanks to dual-channel mode, frame rates were higher than on competitors that were running in single-channel mode. That said, demanding games like “Far Cry 5” are still a no-go.
| low | med. | high | ultra | |
|---|---|---|---|---|
| Tomb Raider (2013) | 89.9 | 45 | 26.8 | 12.3 |
| BioShock Infinite (2013) | 57.9 | 29.8 | 25.2 | 8.6 |
| Rainbow Six Siege (2015) | 28.2 | 16.1 | ||
| Rise of the Tomb Raider (2016) | 18.9 | 12.2 | 6.5 | 3.9 |
| Farming Simulator 17 (2016) | 54.4 | 18.8 |
Emissions
System Noise
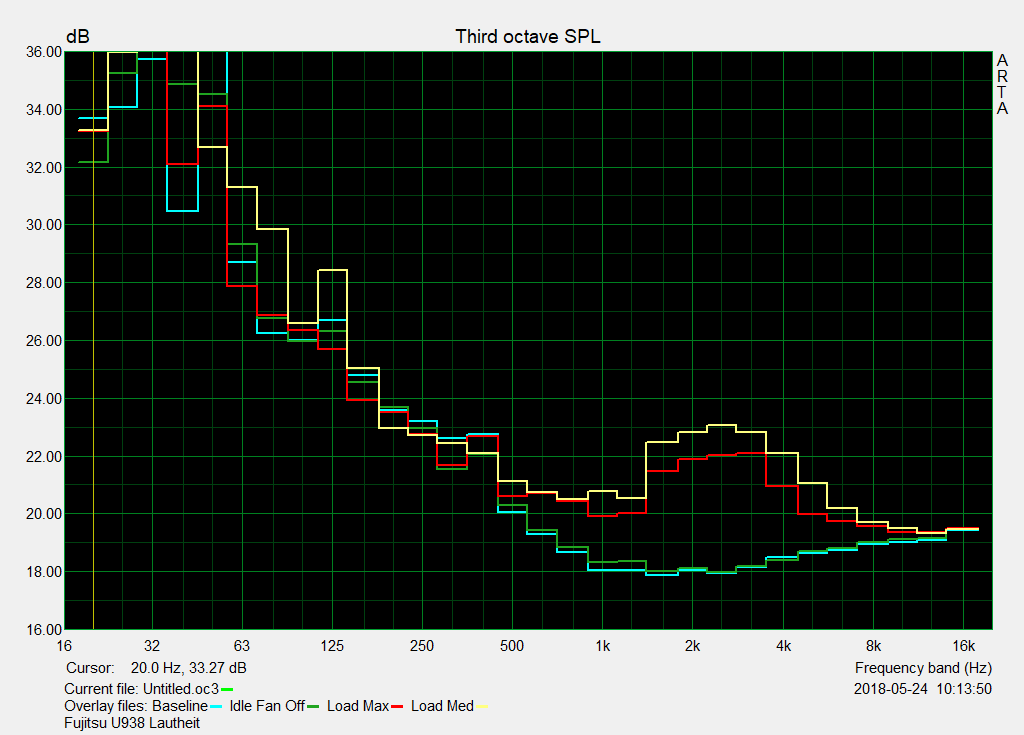
When idle, the fan was off most of the time and thus the system was completely silent. It revved up moderately under load, and reached a sound pressure level of 33 dB(A) during our stress test and 33.7 dB(A) under medium load.
Unfortunately, the fan emitted a whistling noise when active. It was certainly bearable yet it is unacceptable for a notebook at this price point, especially considering that its predecessor, the LifeBook U937, was plagued by the very same issue.
Noise level
| Idle |
| 30.4 / 30.4 / 30.4 dB(A) |
| Load |
| 33.7 / 33 dB(A) |
 | ||
30 dB silent 40 dB(A) audible 50 dB(A) loud |
||
min: | ||
| Fujitsu Lifebook U938 i5-8250U, UHD Graphics 620 | Lenovo ThinkPad X280-20KES01S00 i5-8250U, UHD Graphics 620 | Dell XPS 13 9370 FHD i5 i5-8250U, UHD Graphics 620 | Huawei Matebook X Pro i5 i5-8250U, GeForce MX150 | Lenovo ThinkPad X1 Carbon 2018-20KGS03900 i5-8550U, UHD Graphics 620 | Fujitsu LifeBook U937 i5-7200U, HD Graphics 620 | Average Intel UHD Graphics 620 | Average of class Subnotebook | |
|---|---|---|---|---|---|---|---|---|
| Noise | -4% | 1% | -2% | -0% | -2% | 1% | 8% | |
| off / environment * (dB) | 30.4 | 29.2 4% | 29.1 4% | 27.9 8% | 28.9 5% | 30.8 -1% | 29 ? 5% | 24.1 ? 21% |
| Idle Minimum * (dB) | 30.4 | 29.2 4% | 29.1 4% | 27.9 8% | 28.9 5% | 30.8 -1% | 29.1 ? 4% | 24.2 ? 20% |
| Idle Average * (dB) | 30.4 | 29.2 4% | 29.1 4% | 27.9 8% | 28.9 5% | 30.8 -1% | 29.1 ? 4% | 24.5 ? 19% |
| Idle Maximum * (dB) | 30.4 | 29.2 4% | 29.1 4% | 27.9 8% | 32.5 -7% | 31.1 -2% | 29.7 ? 2% | 25.1 ? 17% |
| Load Average * (dB) | 33.7 | 39.7 -18% | 32.2 4% | 36.2 -7% | 35.1 -4% | 32.3 4% | 33.5 ? 1% | 34.1 ? -1% |
| Load Maximum * (dB) | 33 | 39.7 -20% | 37.3 -13% | 45.2 -37% | 35.1 -6% | 35.7 -8% | 36.1 ? -9% | 42 ? -27% |
| Witcher 3 ultra * (dB) | 45 |
* ... smaller is better
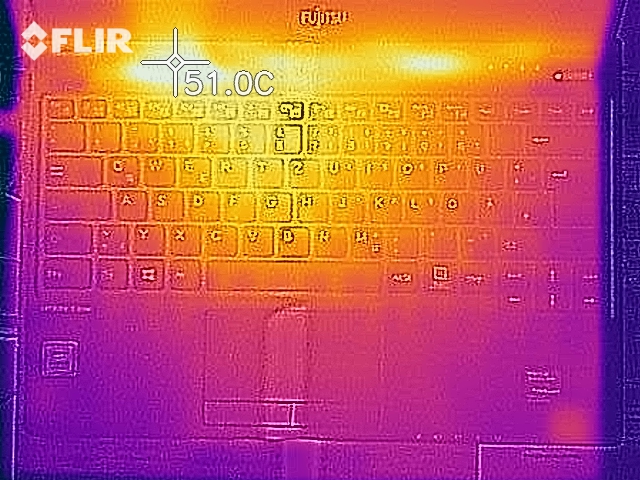
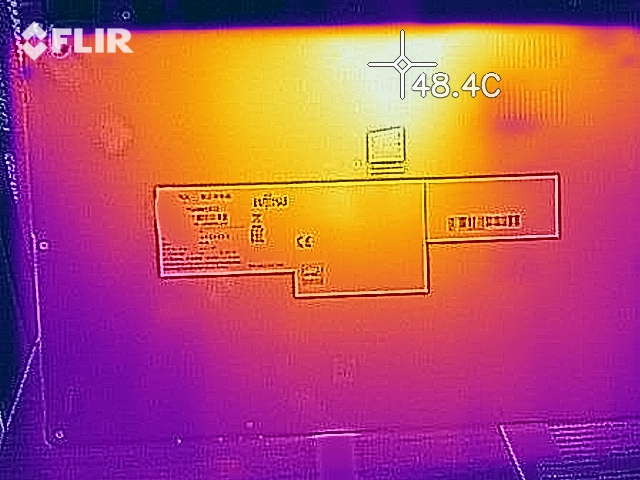
Temperature
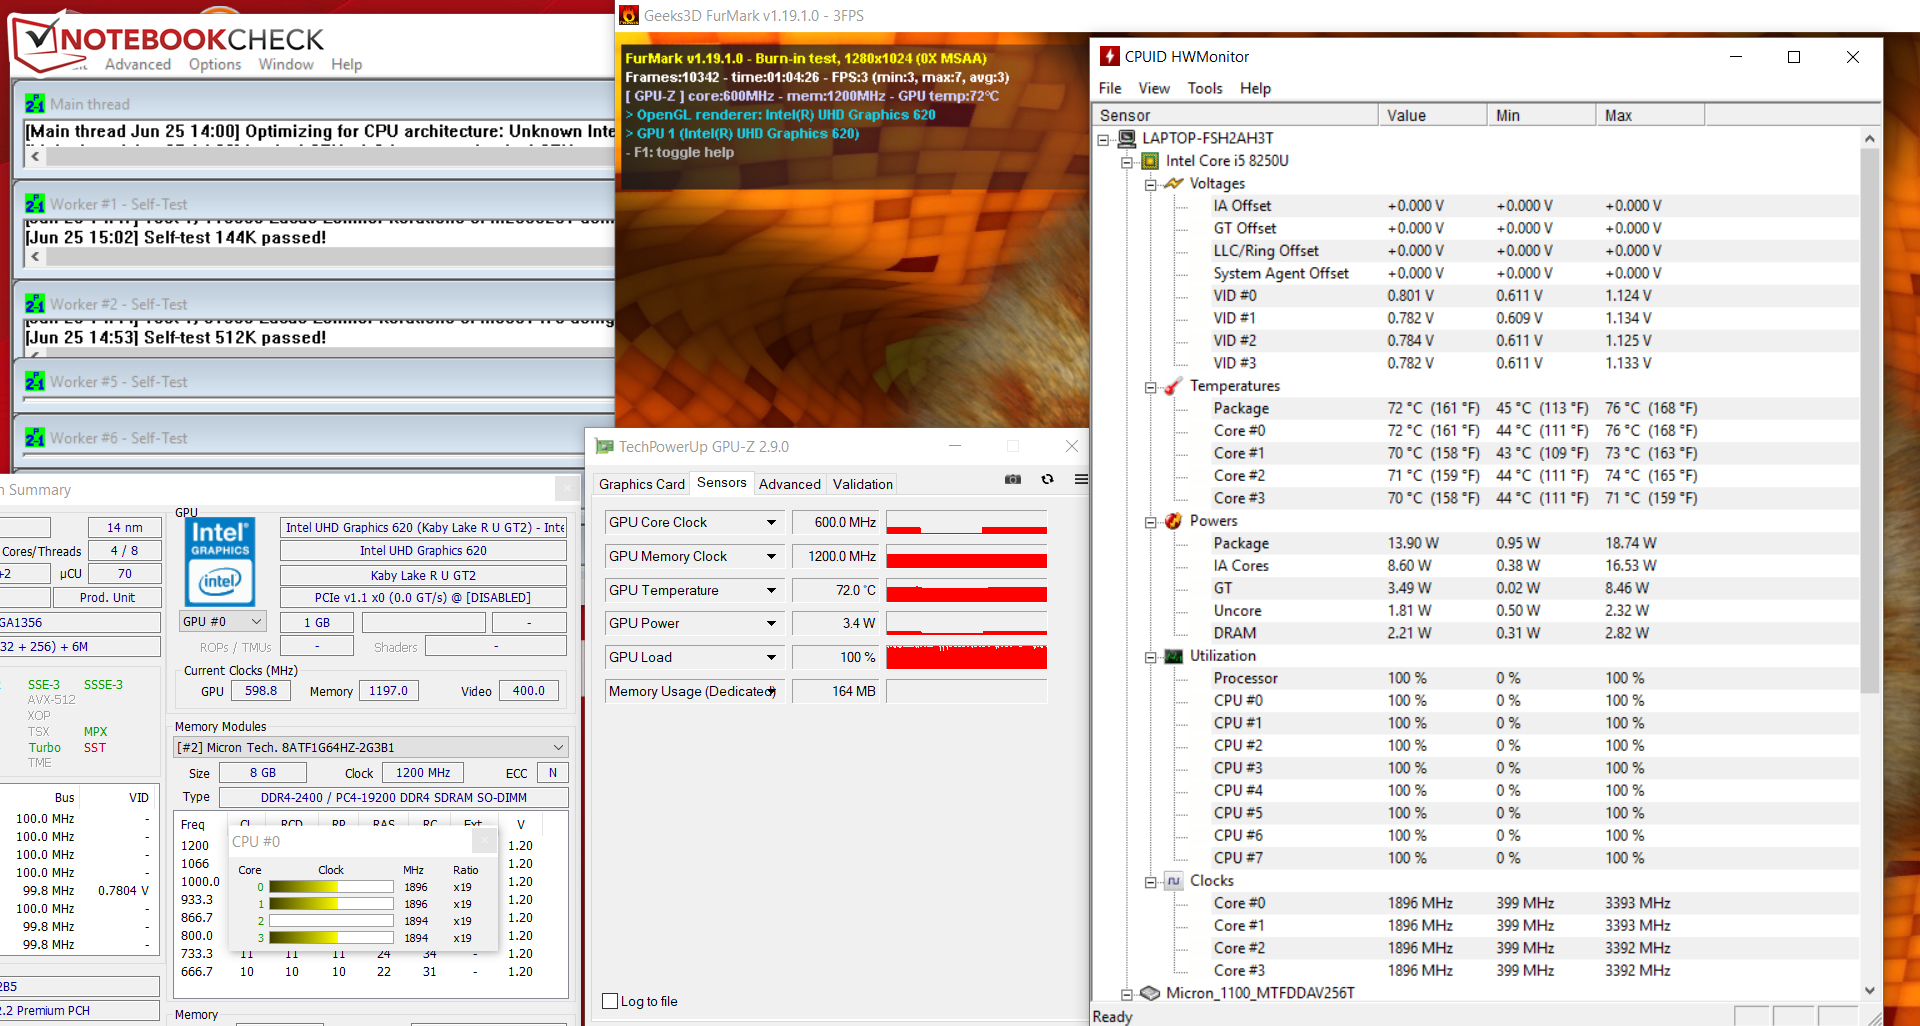
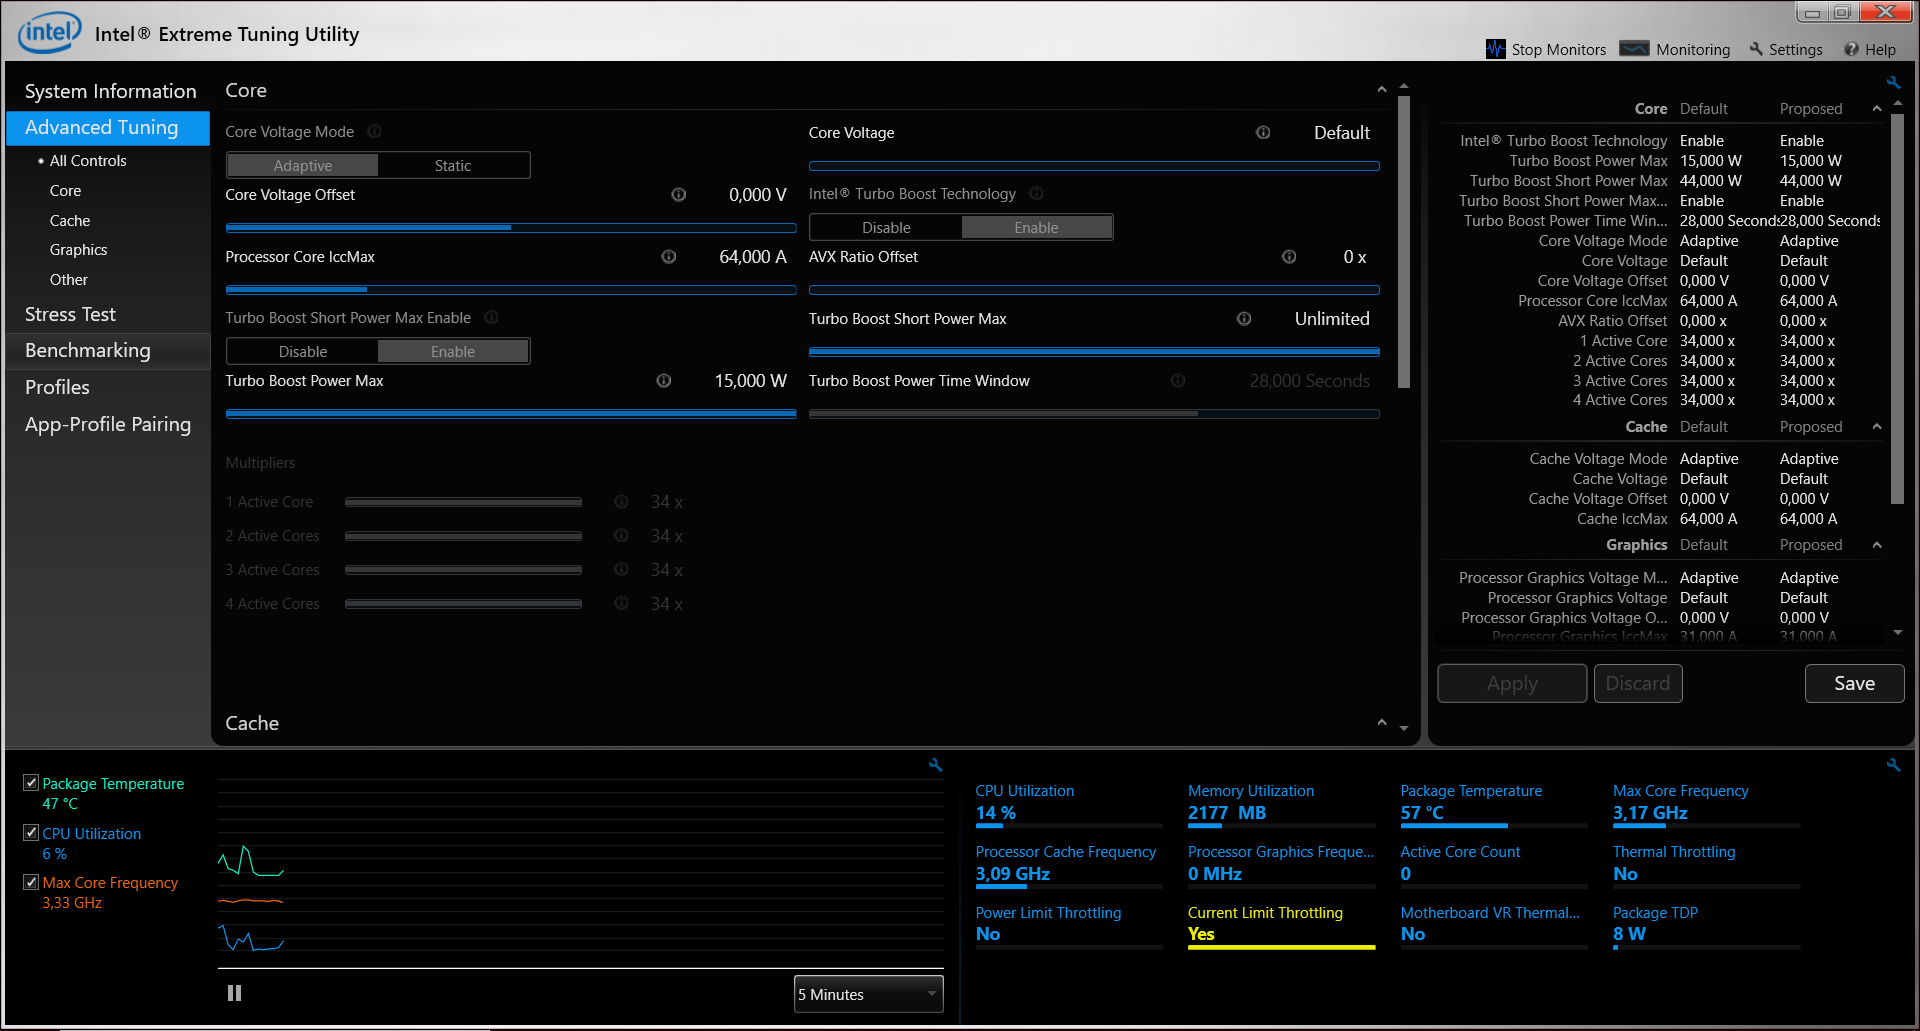
Our stress test (at least one hour of Prime95 and FurMark simultaneously) was completed the same on both battery and mains. For the first 10 minutes of the test, CPU and GPU ran at 1.9 - 2.0 and 600 MHz, respectively. After that, the CPU was throttled down to 1.3 GHz, and the GPU actually accelerated to 800 MHz. Later on, the system returned to its initial clock speeds.
The system remained comparatively cool by and large. We found just one single hot spot of more than 40 °C (~104 °F) during our stress test, and most competitors got somewhat warmer in this test. Keep in mind that our stress test is an unrealistic extreme load scenario which rarely ever occurs in everyday use. We run it in order to detect bottlenecks and test a system’s stability under maximum load.
(+) The maximum temperature on the upper side is 39.3 °C / 103 F, compared to the average of 35.9 °C / 97 F, ranging from 21.4 to 59 °C for the class Subnotebook.
(±) The bottom heats up to a maximum of 43.1 °C / 110 F, compared to the average of 39.2 °C / 103 F
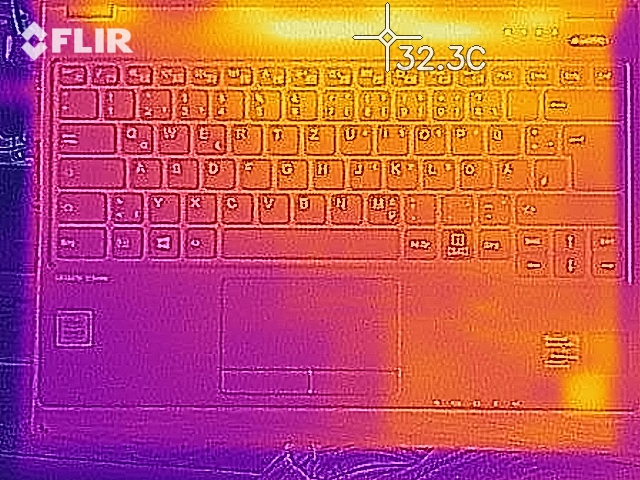
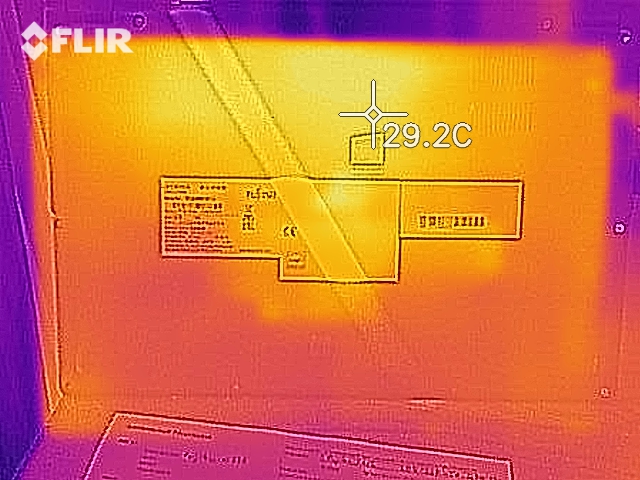
(+) In idle usage, the average temperature for the upper side is 24 °C / 75 F, compared to the device average of 30.8 °C / 87 F.
(+) The palmrests and touchpad are cooler than skin temperature with a maximum of 26.1 °C / 79 F and are therefore cool to the touch.
(+) The average temperature of the palmrest area of similar devices was 28.2 °C / 82.8 F (+2.1 °C / 3.8 F).
| Fujitsu Lifebook U938 i5-8250U, UHD Graphics 620 | Lenovo ThinkPad X280-20KES01S00 i5-8250U, UHD Graphics 620 | Dell XPS 13 9370 FHD i5 i5-8250U, UHD Graphics 620 | Huawei Matebook X Pro i5 i5-8250U, GeForce MX150 | Lenovo ThinkPad X1 Carbon 2018-20KGS03900 i5-8550U, UHD Graphics 620 | Fujitsu LifeBook U937 i5-7200U, HD Graphics 620 | Average Intel UHD Graphics 620 | Average of class Subnotebook | |
|---|---|---|---|---|---|---|---|---|
| Heat | -1% | -1% | -17% | -7% | -3% | -6% | -5% | |
| Maximum Upper Side * (°C) | 39.3 | 43.2 -10% | 44.2 -12% | 48.6 -24% | 52.6 -34% | 43.4 -10% | 41.1 ? -5% | 41.7 ? -6% |
| Maximum Bottom * (°C) | 43.1 | 43.1 -0% | 45.5 -6% | 47 -9% | 48.2 -12% | 41.6 3% | 44.3 ? -3% | 43.6 ? -1% |
| Idle Upper Side * (°C) | 25.4 | 24.8 2% | 24.1 5% | 28.6 -13% | 23.6 7% | 26.5 -4% | 26.8 ? -6% | 26.9 ? -6% |
| Idle Bottom * (°C) | 25.6 | 24.1 6% | 23.2 9% | 30.8 -20% | 23 10% | 26 -2% | 27.7 ? -8% | 27.5 ? -7% |
* ... smaller is better
Speakers
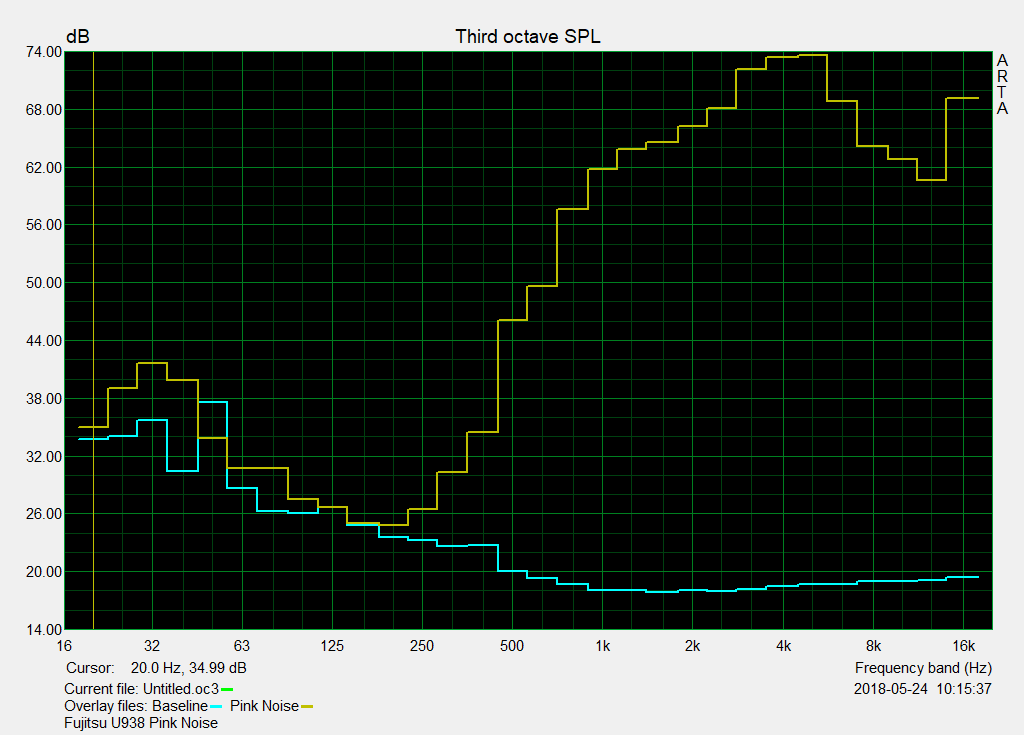
The downward-firing stereo speakers are located at the front of the device. They sounded very tinny and lacked bass, and we highly recommend using headphones or external speakers instead.
Fujitsu Lifebook U938 audio analysis
(±) | speaker loudness is average but good (73.6 dB)
Bass 100 - 315 Hz
(-) | nearly no bass - on average 35% lower than median
(+) | bass is linear (4.4% delta to prev. frequency)
Mids 400 - 2000 Hz
(±) | reduced mids - on average 8.6% lower than median
(±) | linearity of mids is average (10.5% delta to prev. frequency)
Highs 2 - 16 kHz
(±) | higher highs - on average 7.2% higher than median
(+) | highs are linear (6.1% delta to prev. frequency)
Overall 100 - 16.000 Hz
(-) | overall sound is not linear (35.4% difference to median)
Compared to same class
» 97% of all tested devices in this class were better, 1% similar, 2% worse
» The best had a delta of 5%, average was 18%, worst was 53%
Compared to all devices tested
» 94% of all tested devices were better, 1% similar, 6% worse
» The best had a delta of 4%, average was 24%, worst was 134%
Lenovo ThinkPad X280-20KES01S00 audio analysis
(±) | speaker loudness is average but good (76.8 dB)
Bass 100 - 315 Hz
(-) | nearly no bass - on average 17% lower than median
(±) | linearity of bass is average (11.8% delta to prev. frequency)
Mids 400 - 2000 Hz
(+) | balanced mids - only 4.1% away from median
(±) | linearity of mids is average (9.9% delta to prev. frequency)
Highs 2 - 16 kHz
(+) | balanced highs - only 1.9% away from median
(+) | highs are linear (4.7% delta to prev. frequency)
Overall 100 - 16.000 Hz
(±) | linearity of overall sound is average (17.7% difference to median)
Compared to same class
» 49% of all tested devices in this class were better, 7% similar, 44% worse
» The best had a delta of 5%, average was 18%, worst was 53%
Compared to all devices tested
» 35% of all tested devices were better, 8% similar, 57% worse
» The best had a delta of 4%, average was 24%, worst was 134%
Dell XPS 13 9370 FHD i5 audio analysis
(+) | speakers can play relatively loud (82.8 dB)
Bass 100 - 315 Hz
(-) | nearly no bass - on average 18.6% lower than median
(±) | linearity of bass is average (11.1% delta to prev. frequency)
Mids 400 - 2000 Hz
(±) | higher mids - on average 5.3% higher than median
(+) | mids are linear (3.8% delta to prev. frequency)
Highs 2 - 16 kHz
(+) | balanced highs - only 3.9% away from median
(+) | highs are linear (6.4% delta to prev. frequency)
Overall 100 - 16.000 Hz
(±) | linearity of overall sound is average (18.2% difference to median)
Compared to same class
» 52% of all tested devices in this class were better, 7% similar, 41% worse
» The best had a delta of 5%, average was 18%, worst was 53%
Compared to all devices tested
» 39% of all tested devices were better, 8% similar, 53% worse
» The best had a delta of 4%, average was 24%, worst was 134%
Huawei Matebook X Pro i5 audio analysis
(±) | speaker loudness is average but good (73.3 dB)
Bass 100 - 315 Hz
(±) | reduced bass - on average 9.7% lower than median
(±) | linearity of bass is average (13.3% delta to prev. frequency)
Mids 400 - 2000 Hz
(+) | balanced mids - only 4.7% away from median
(±) | linearity of mids is average (7.4% delta to prev. frequency)
Highs 2 - 16 kHz
(+) | balanced highs - only 3% away from median
(±) | linearity of highs is average (9.2% delta to prev. frequency)
Overall 100 - 16.000 Hz
(±) | linearity of overall sound is average (17.7% difference to median)
Compared to same class
» 49% of all tested devices in this class were better, 7% similar, 44% worse
» The best had a delta of 5%, average was 18%, worst was 53%
Compared to all devices tested
» 35% of all tested devices were better, 8% similar, 57% worse
» The best had a delta of 4%, average was 24%, worst was 134%
Lenovo ThinkPad X1 Carbon 2018-20KGS03900 audio analysis
(+) | speakers can play relatively loud (83.6 dB)
Bass 100 - 315 Hz
(-) | nearly no bass - on average 25.9% lower than median
(±) | linearity of bass is average (9.8% delta to prev. frequency)
Mids 400 - 2000 Hz
(+) | balanced mids - only 3.8% away from median
(±) | linearity of mids is average (9% delta to prev. frequency)
Highs 2 - 16 kHz
(+) | balanced highs - only 2.1% away from median
(+) | highs are linear (4% delta to prev. frequency)
Overall 100 - 16.000 Hz
(±) | linearity of overall sound is average (18.7% difference to median)
Compared to same class
» 34% of all tested devices in this class were better, 7% similar, 59% worse
» The best had a delta of 7%, average was 21%, worst was 53%
Compared to all devices tested
» 43% of all tested devices were better, 8% similar, 50% worse
» The best had a delta of 4%, average was 24%, worst was 134%
Energy Management
Power Consumption
Power consumption was inconspicuous. When idle, the U938’s maximum power consumption was measured at 6 W, and the only competitor capable of keeping up was Dell's XPS 13 9370. Lenovo’s ThinkPads required more energy. Under medium and full load the U938 remained more efficient than its competitors, mainly because their respective CPUs and GPUs were running faster. The power supply is rated at 65 W.
| Off / Standby | |
| Idle | |
| Load |
|
Key:
min: | |
| Fujitsu Lifebook U938 i5-8250U, UHD Graphics 620 | Lenovo ThinkPad X280-20KES01S00 i5-8250U, UHD Graphics 620 | Dell XPS 13 9370 FHD i5 i5-8250U, UHD Graphics 620 | Huawei Matebook X Pro i5 i5-8250U, GeForce MX150 | Lenovo ThinkPad X1 Carbon 2018-20KGS03900 i5-8550U, UHD Graphics 620 | Fujitsu LifeBook U937 i5-7200U, HD Graphics 620 | Average Intel UHD Graphics 620 | Average of class Subnotebook | |
|---|---|---|---|---|---|---|---|---|
| Power Consumption | -32% | -21% | -70% | -66% | -10% | -38% | -48% | |
| Idle Minimum * (Watt) | 2.4 | 3.11 -30% | 3.14 -31% | 3.5 -46% | 3.8 -58% | 3.11 -30% | 3.81 ? -59% | 3.79 ? -58% |
| Idle Average * (Watt) | 5.5 | 5.01 9% | 5.22 5% | 8.9 -62% | 8.9 -62% | 6.1 -11% | 6.94 ? -26% | 6.57 ? -19% |
| Idle Maximum * (Watt) | 6 | 8.11 -35% | 6 -0% | 12.3 -105% | 11.9 -98% | 6.75 -13% | 8.75 ? -46% | 7.94 ? -32% |
| Load Average * (Watt) | 31 | 44.6 -44% | 38.5 -24% | 54.2 -75% | 47.5 -53% | 28.9 7% | 35 ? -13% | 41.8 ? -35% |
| Load Maximum * (Watt) | 32.6 | 51.7 -59% | 50.4 -55% | 52.1 -60% | 52.5 -61% | 33.3 -2% | 47.5 ? -46% | 64.1 ? -97% |
| Witcher 3 ultra * (Watt) | 42.4 |
* ... smaller is better
Battery Life
In our real-world Wi-Fi test, the LifeBook lasted for 8:26 hours. We simulate typical load while browsing the web. The energy plan is set to “Balanced”, and display brightness is normalized to 150 nits. In our video test, it lasted for 7:13 hours. In this test, we evaluate video playback by running the short film Big Buck Bunny (H.265, 1920x1080) in a loop with all communication modules disabled, energy saving features enabled, and display brightness normalized at 150 nits.
All in all, the LifeBook’s battery life was decent. However, it did significantly worse than its own predecessor with the exact same battery. Even the Lenovo ThinkPad X280 and the Lenovo ThinkPad X1 Carbon 2018 ran longer than the LifeBook. The device with the longest battery life by far was Dell's XPS 13 9370.
| Fujitsu Lifebook U938 i5-8250U, UHD Graphics 620, 50 Wh | Lenovo ThinkPad X280-20KES01S00 i5-8250U, UHD Graphics 620, 50 Wh | Dell XPS 13 9370 FHD i5 i5-8250U, UHD Graphics 620, 52 Wh | Huawei Matebook X Pro i5 i5-8250U, GeForce MX150, 57.4 Wh | Lenovo ThinkPad X1 Carbon 2018-20KGS03900 i5-8550U, UHD Graphics 620, 57 Wh | Fujitsu LifeBook U937 i5-7200U, HD Graphics 620, 50 Wh | Average of class Subnotebook | |
|---|---|---|---|---|---|---|---|
| Battery runtime | 9% | 34% | 7% | 9% | 31% | 56% | |
| Reader / Idle (h) | 19.5 | 20.2 4% | 23.6 21% | 20.7 6% | 22.1 13% | 19.2 -2% | 28.6 ? 47% |
| H.264 (h) | 7.2 | 9.5 32% | 13.9 93% | 9.4 31% | 11.9 65% | 15.6 ? 117% | |
| WiFi v1.3 (h) | 8.4 | 8.9 6% | 10.7 27% | 9.3 11% | 8.7 4% | 10.9 30% | 14 ? 67% |
| Load (h) | 2.1 | 2 -5% | 2 -5% | 2.2 5% | 1.8 -14% | 2.7 29% | 1.946 ? -7% |
Verdict
Pros
Cons
The LifeBook U938’s main selling point is certainly its tiny and lightweight case. At just slightly under 1 kg (~2.2 lb) it practically outclasses its Dell and Lenovo competition. The Core i5-8250U that the LifeBook is equipped with offers plenty of oomph for all common use cases. However, just like many of its identically equipped competitors, it is incapable of fully utilizing the processor’s theoretical potential. At least the competition offers slightly higher clock speeds and thus also an overall higher level of performance.
The system was fast and responsive thanks to its SSD, which can be swapped for a larger or faster model by disassembling the device and removing the bottom cover. Considering the laptop’s price point we would have expected an NVMe SSD instead of the SATA III SSD Fujitsu has opted for.
The LifeBook U938 is a very lightweight and compact subnotebook. However, we find it immensely hard to process why Fujitsu has decided to ignore its critics and carried the predecessor’s weaknesses over instead of fixing them once and for all.
The keyboard was pretty solid by and large, but we mourn the lack of a keyboard backlight. Battery life was decent yet shorter than on most competitors. At least the integrated 4G/LTE modem allowed for mobile connectivity on the road.
The matte IPS display was very bright, offered a decent contrast ratio, wide viewing angles, and a fairly decent color accuracy out of the box. Nevertheless, the display is one of the LifeBook’s biggest weaknesses. It flexes and warps very easily, and is thus always at risk of accidental damage. We also did not like the U938’s fan as it emitted a whistling sound every time it was spinning. This should not happen on a notebook at the LifeBook’s price point.
Fujitsu Lifebook U938
- 10/22/2019 v7 (old)
Sven Kloevekorn / Sascha Mölck
Price comparison

