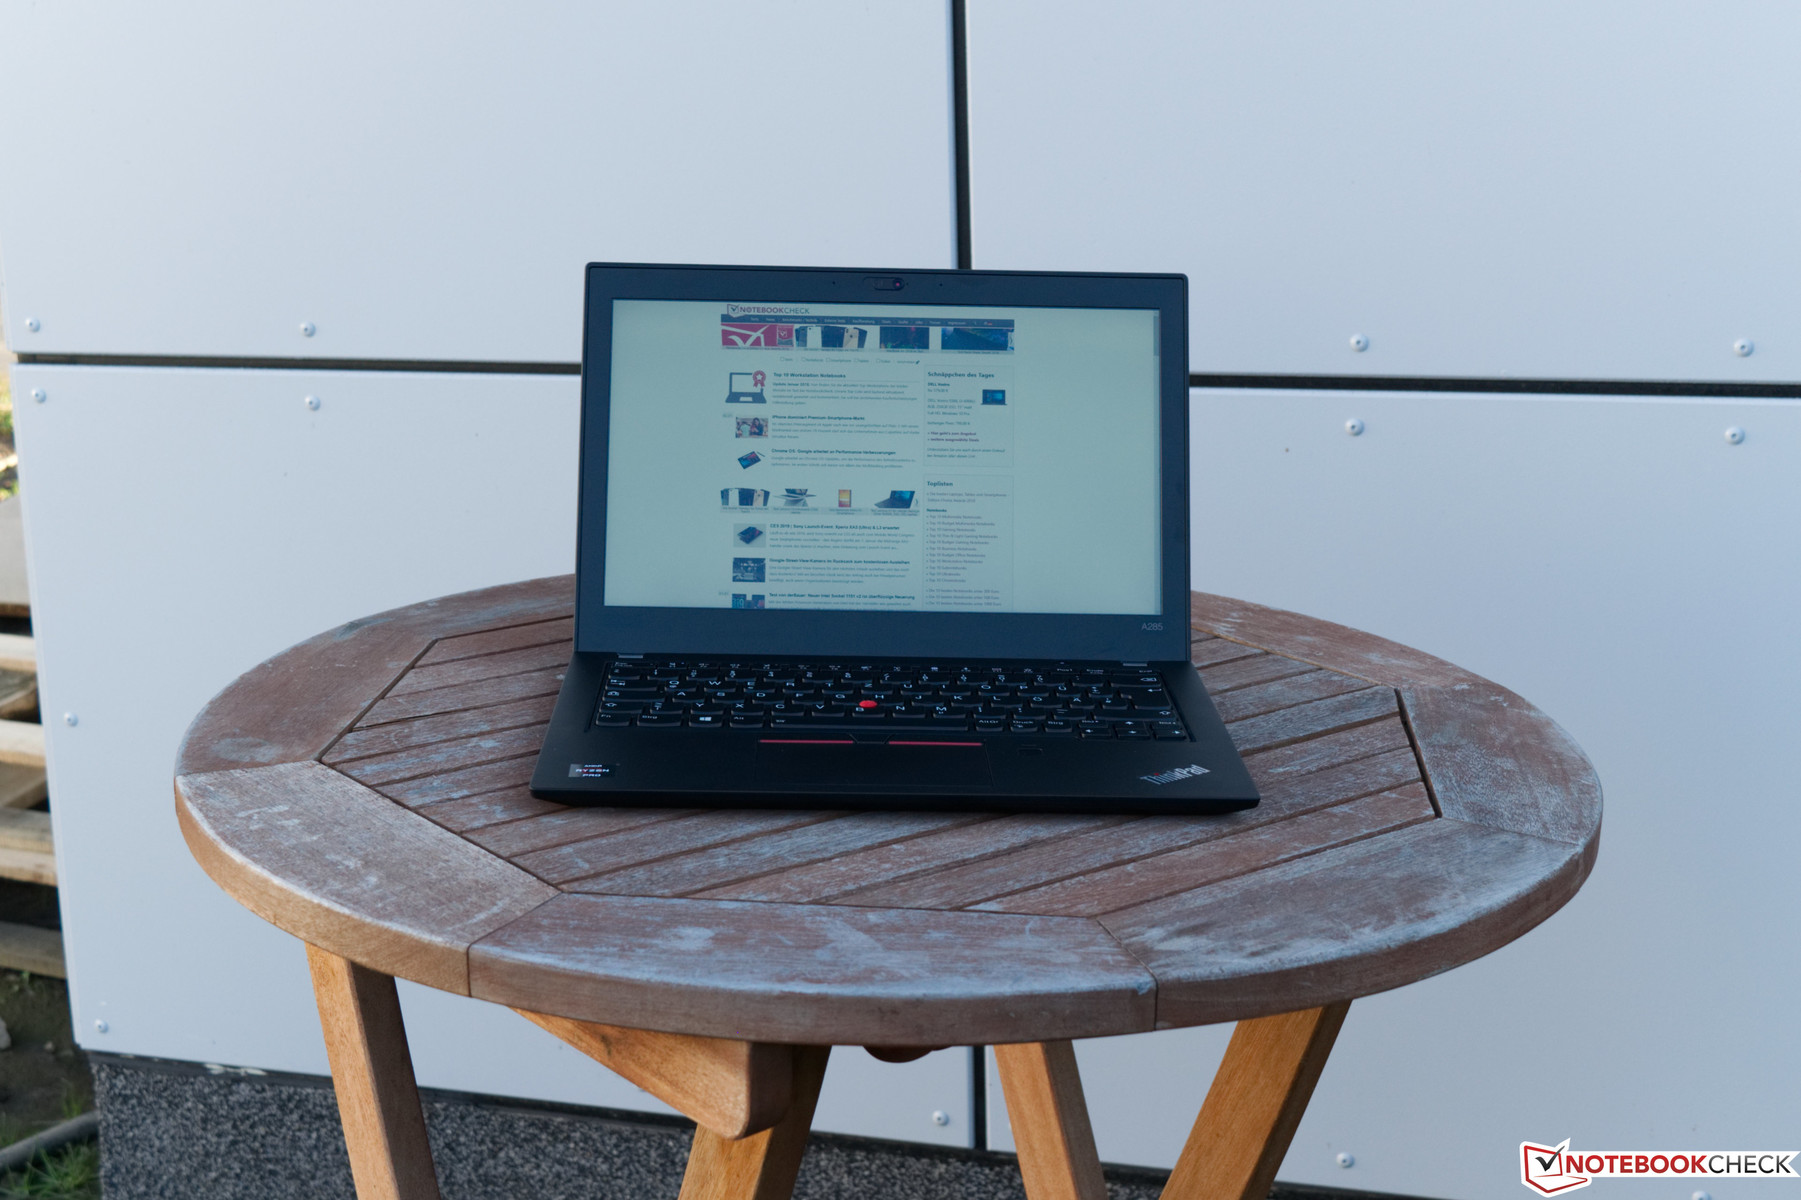
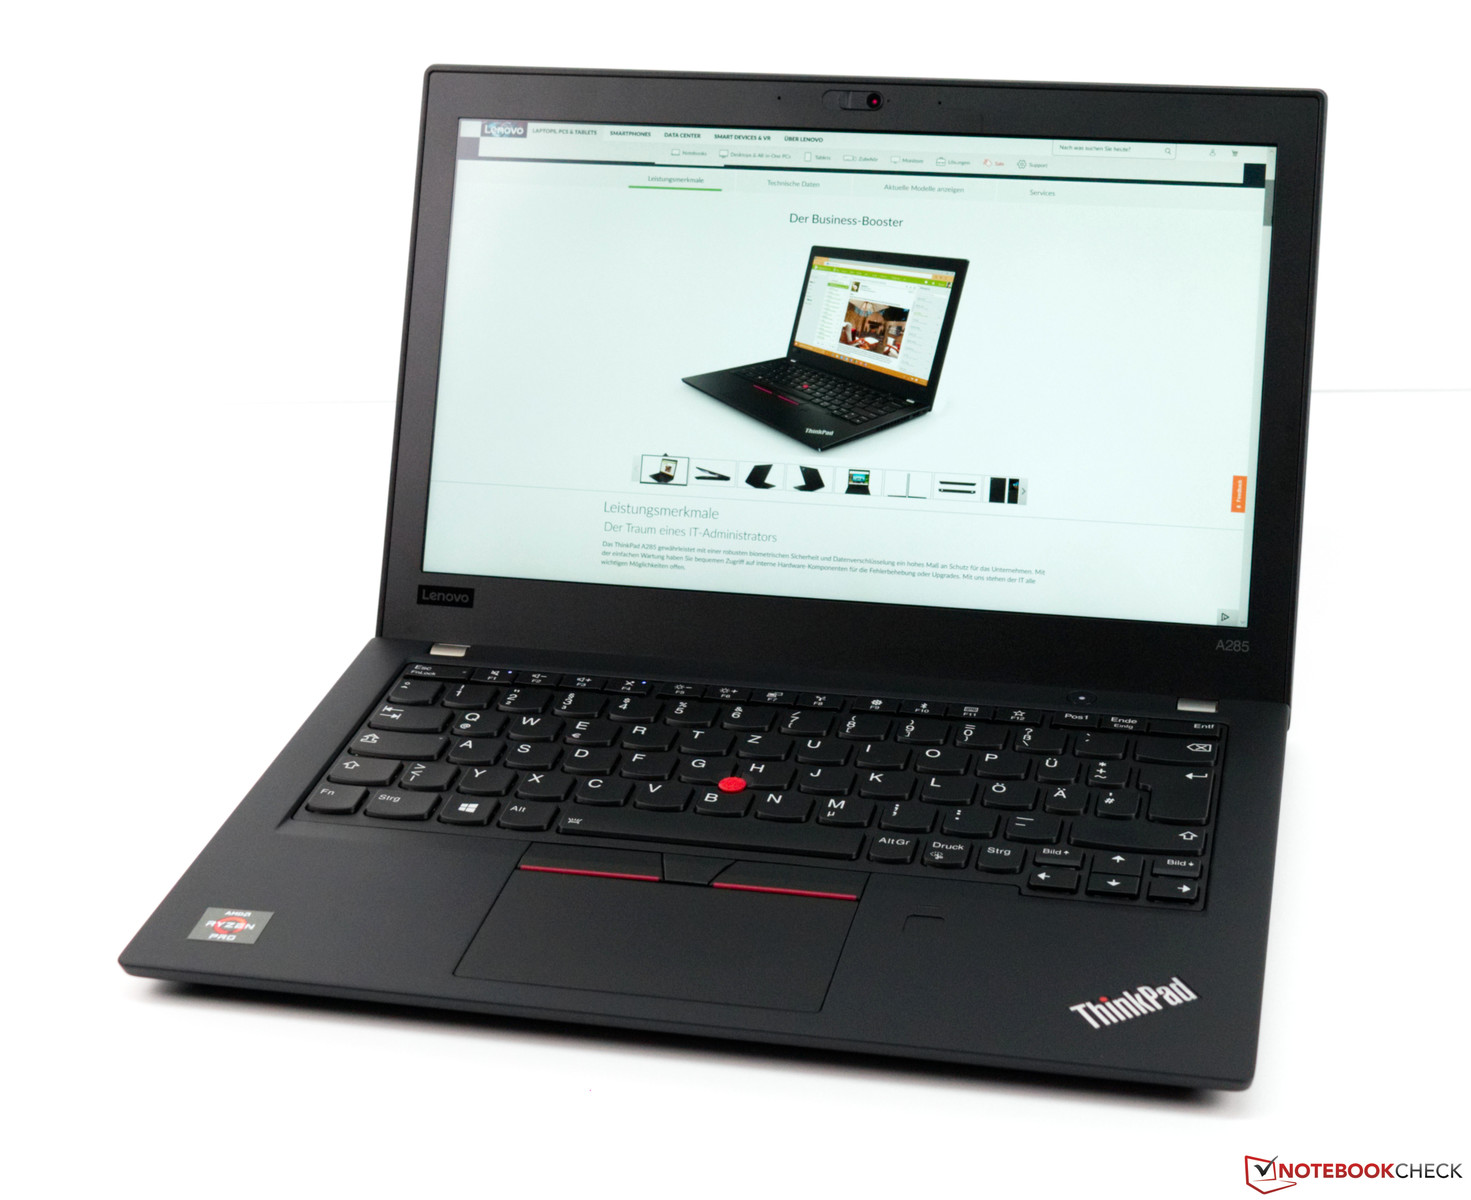
Lenovo ThinkPad A285 (Ryzen 5 Pro, Vega 8, FHD) Laptop Review
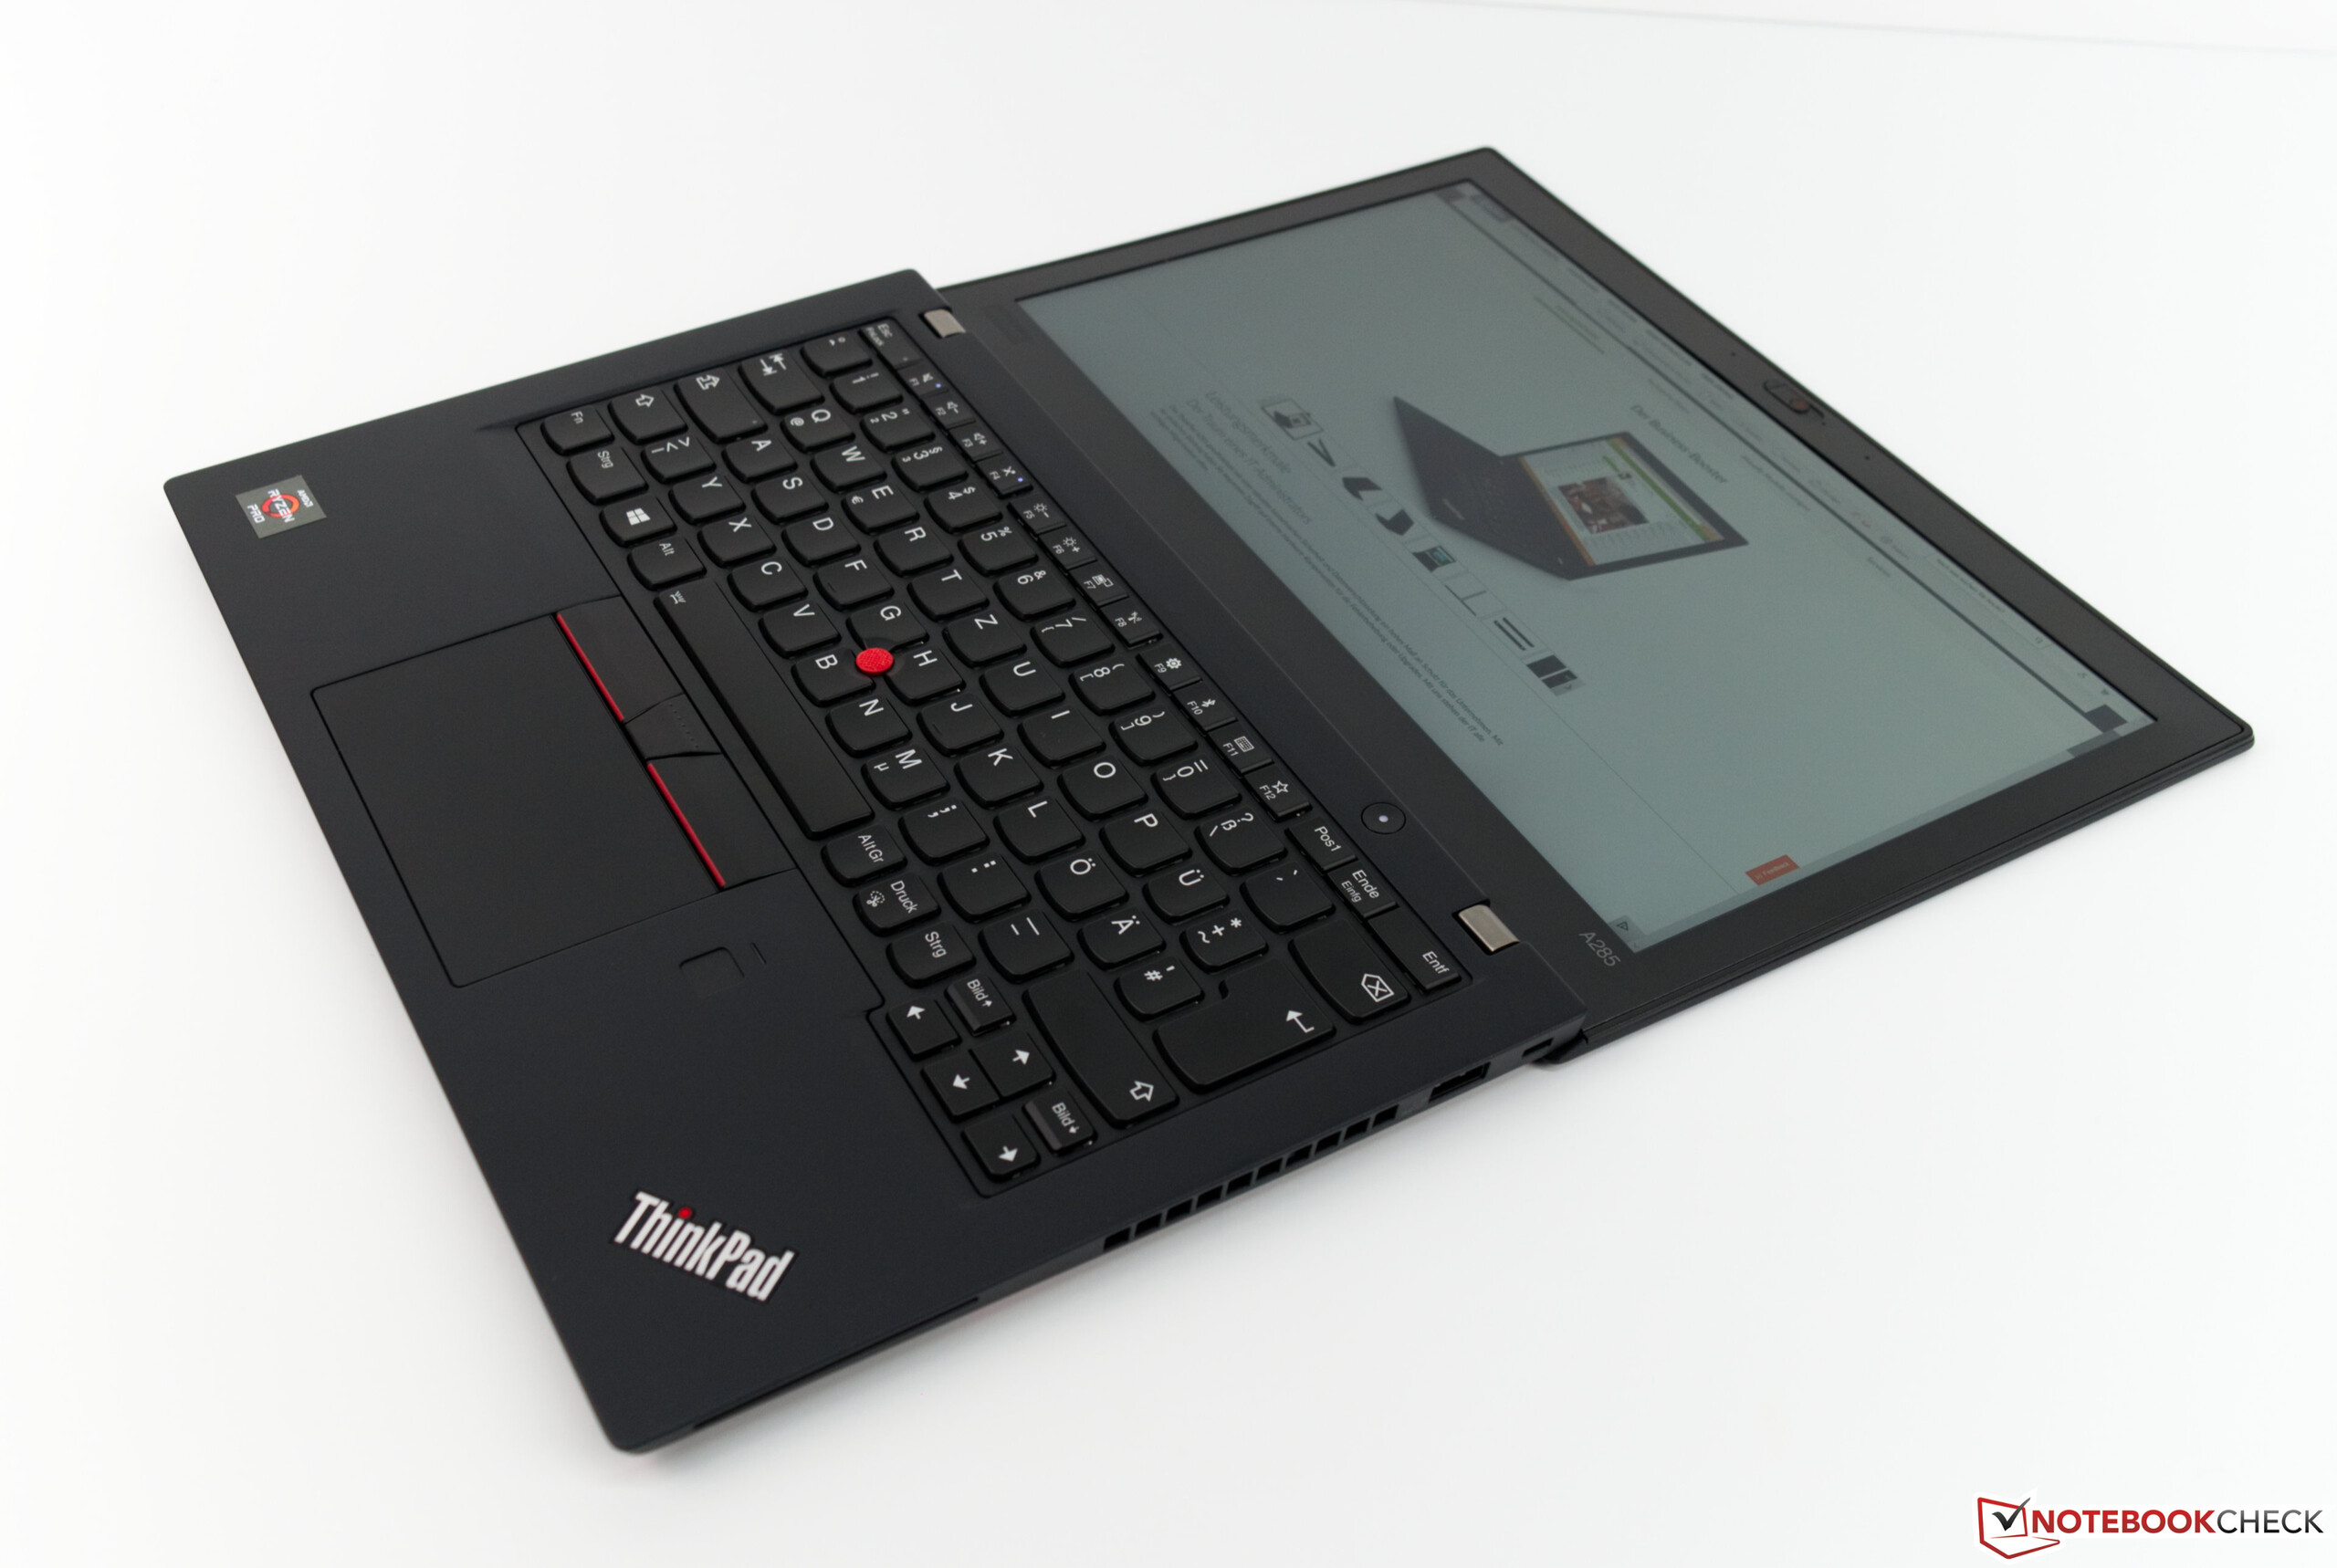
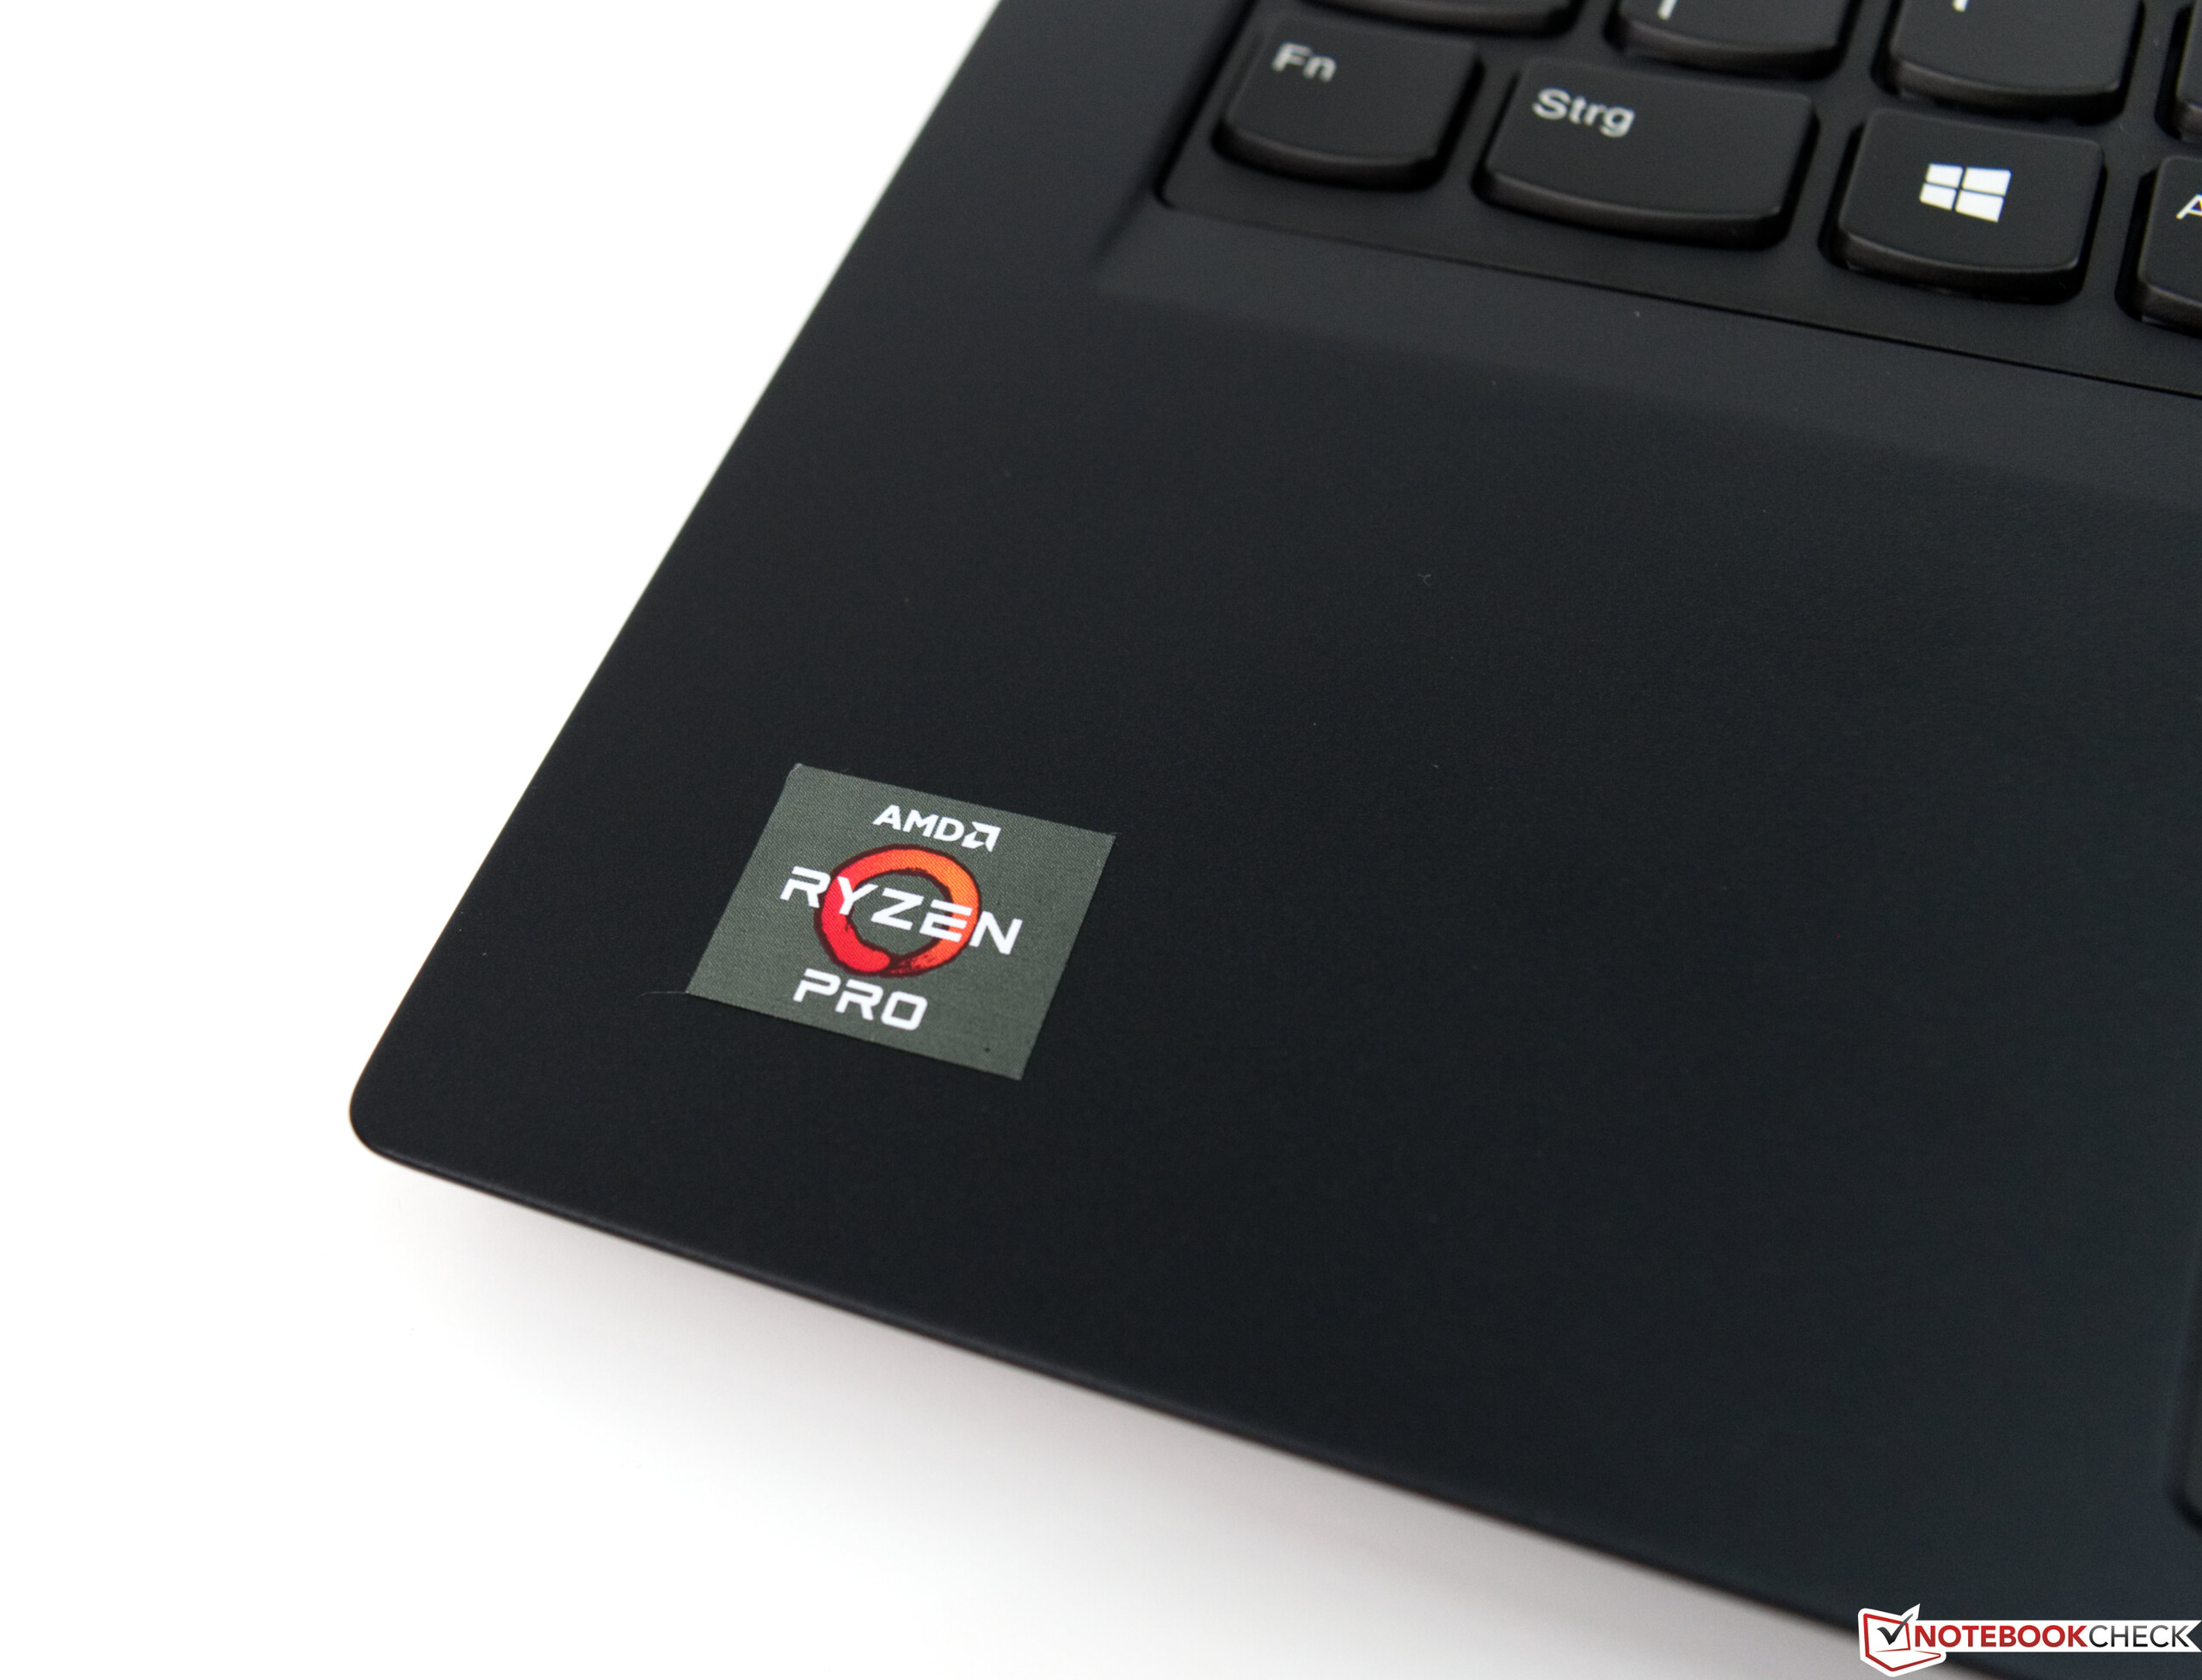
Lenovo already sells a very compact subnotebook called ThinkPad X280, and it is a desired business device thanks to its small case. The manufacturer now offers the ThinkPad A285 based on the same chassis, but powered by an AMD Ryzen APU with much more 3D performance compared to Intel's iGPU.
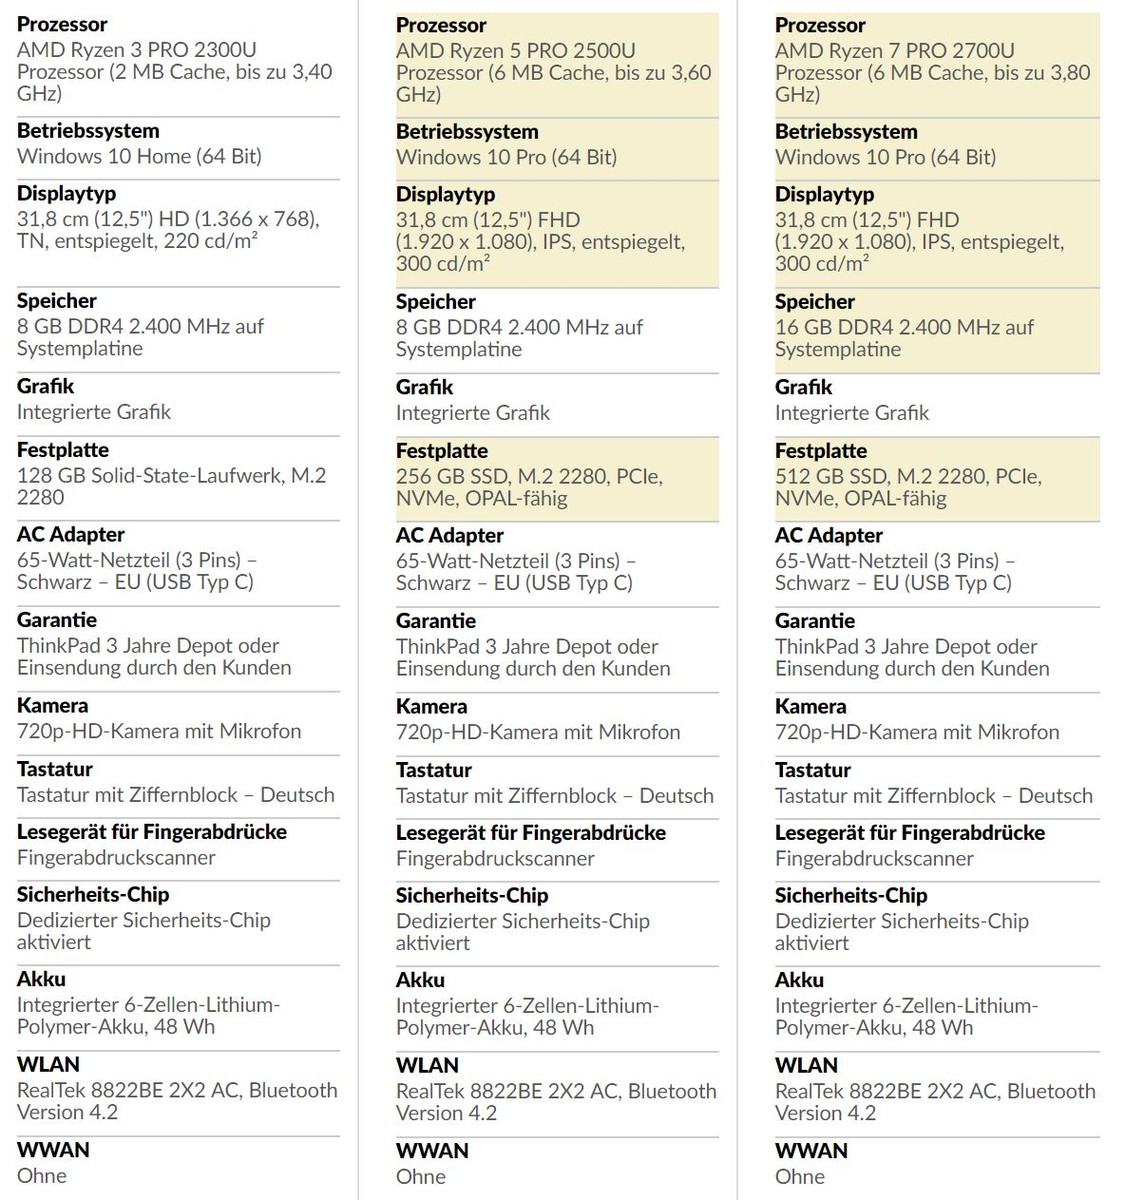
Lenovo Germany currently offers three base models, but they can be configured during the ordering process. The entry-level SKU is based on the AMD Ryzen 3 Pro 2300U, 8 GB of RAM and 128 GB SSD storage starting at 1129 Euros (~$1286), so the A285 is 150 Euros (~$170) less expensive than the Intel counterpart X280. However, this entry-level SKU is equipped with an HD panel. The SKU with Ryzen 7 Pro 2700U, 16 GB of RAM and a 512 GB SSD costs 1919 Euros (~$2187), so the 12.5-inch subnotebook is no bargain. Other features such as multi-touch panels cost even more.
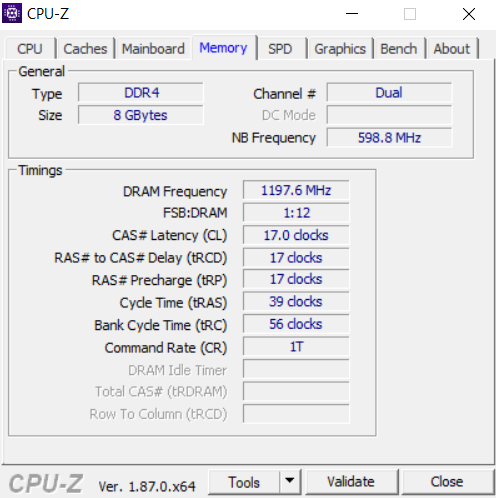
Our test model uses the Ryzen 5 Pro 2500U with 8 GB of RAM and a 256 GB SSD for 1439 Euros (~$1640) in Lenovo's online shop. The RAM is soldered onto the mainboard and cannot be upgraded, so you should carefully consider the choice between the default 8 GB or the 16 GB option. You also get the integrated graphics adapter AMD Radeon Vega 8.
We want to find out whether the AMD-powered business device can compete with the rivals. We will obviously compare the A285 with Lenovo's own X280, but Dell, Fujitsu, and HP also offer compact subnotebooks with similar price tags. We have summarized the specs of the comparison devices in the table below.
| Lenovo ThinkPad X280 | Dell Latitude 7390 | Fujitsu Lifebook U938 | HP Envy 13 | |
| CPU | Intel Core i5-8250U | Intel Core i5-8350U | Intel Core i5-8250U | Intel Core i7-8550U |
| GPU | Intel UHD Graphics 620 | Intel UHD Graphics 620 | Intel UHD Graphics 620 | GeForce MX150 |
| Display | 12.5" 1920 x 1080 (IPS) | 13.3" 1920 x 1080 (IPS) | 13.3" 1920 x 1080 (IPS) | 13.3" 1920 x 1080 (IPS) |
| RAM | 8 GB DDR4 | 8 GB DDR4 | 12 GB DDR4 | 16 GB DDR4 |
| Storage | 512 GB SSD | 256 GB SSD | 256 GB SSD | 512 GB SSD |
| Rating | 90% | 89% | 89% | 87% |
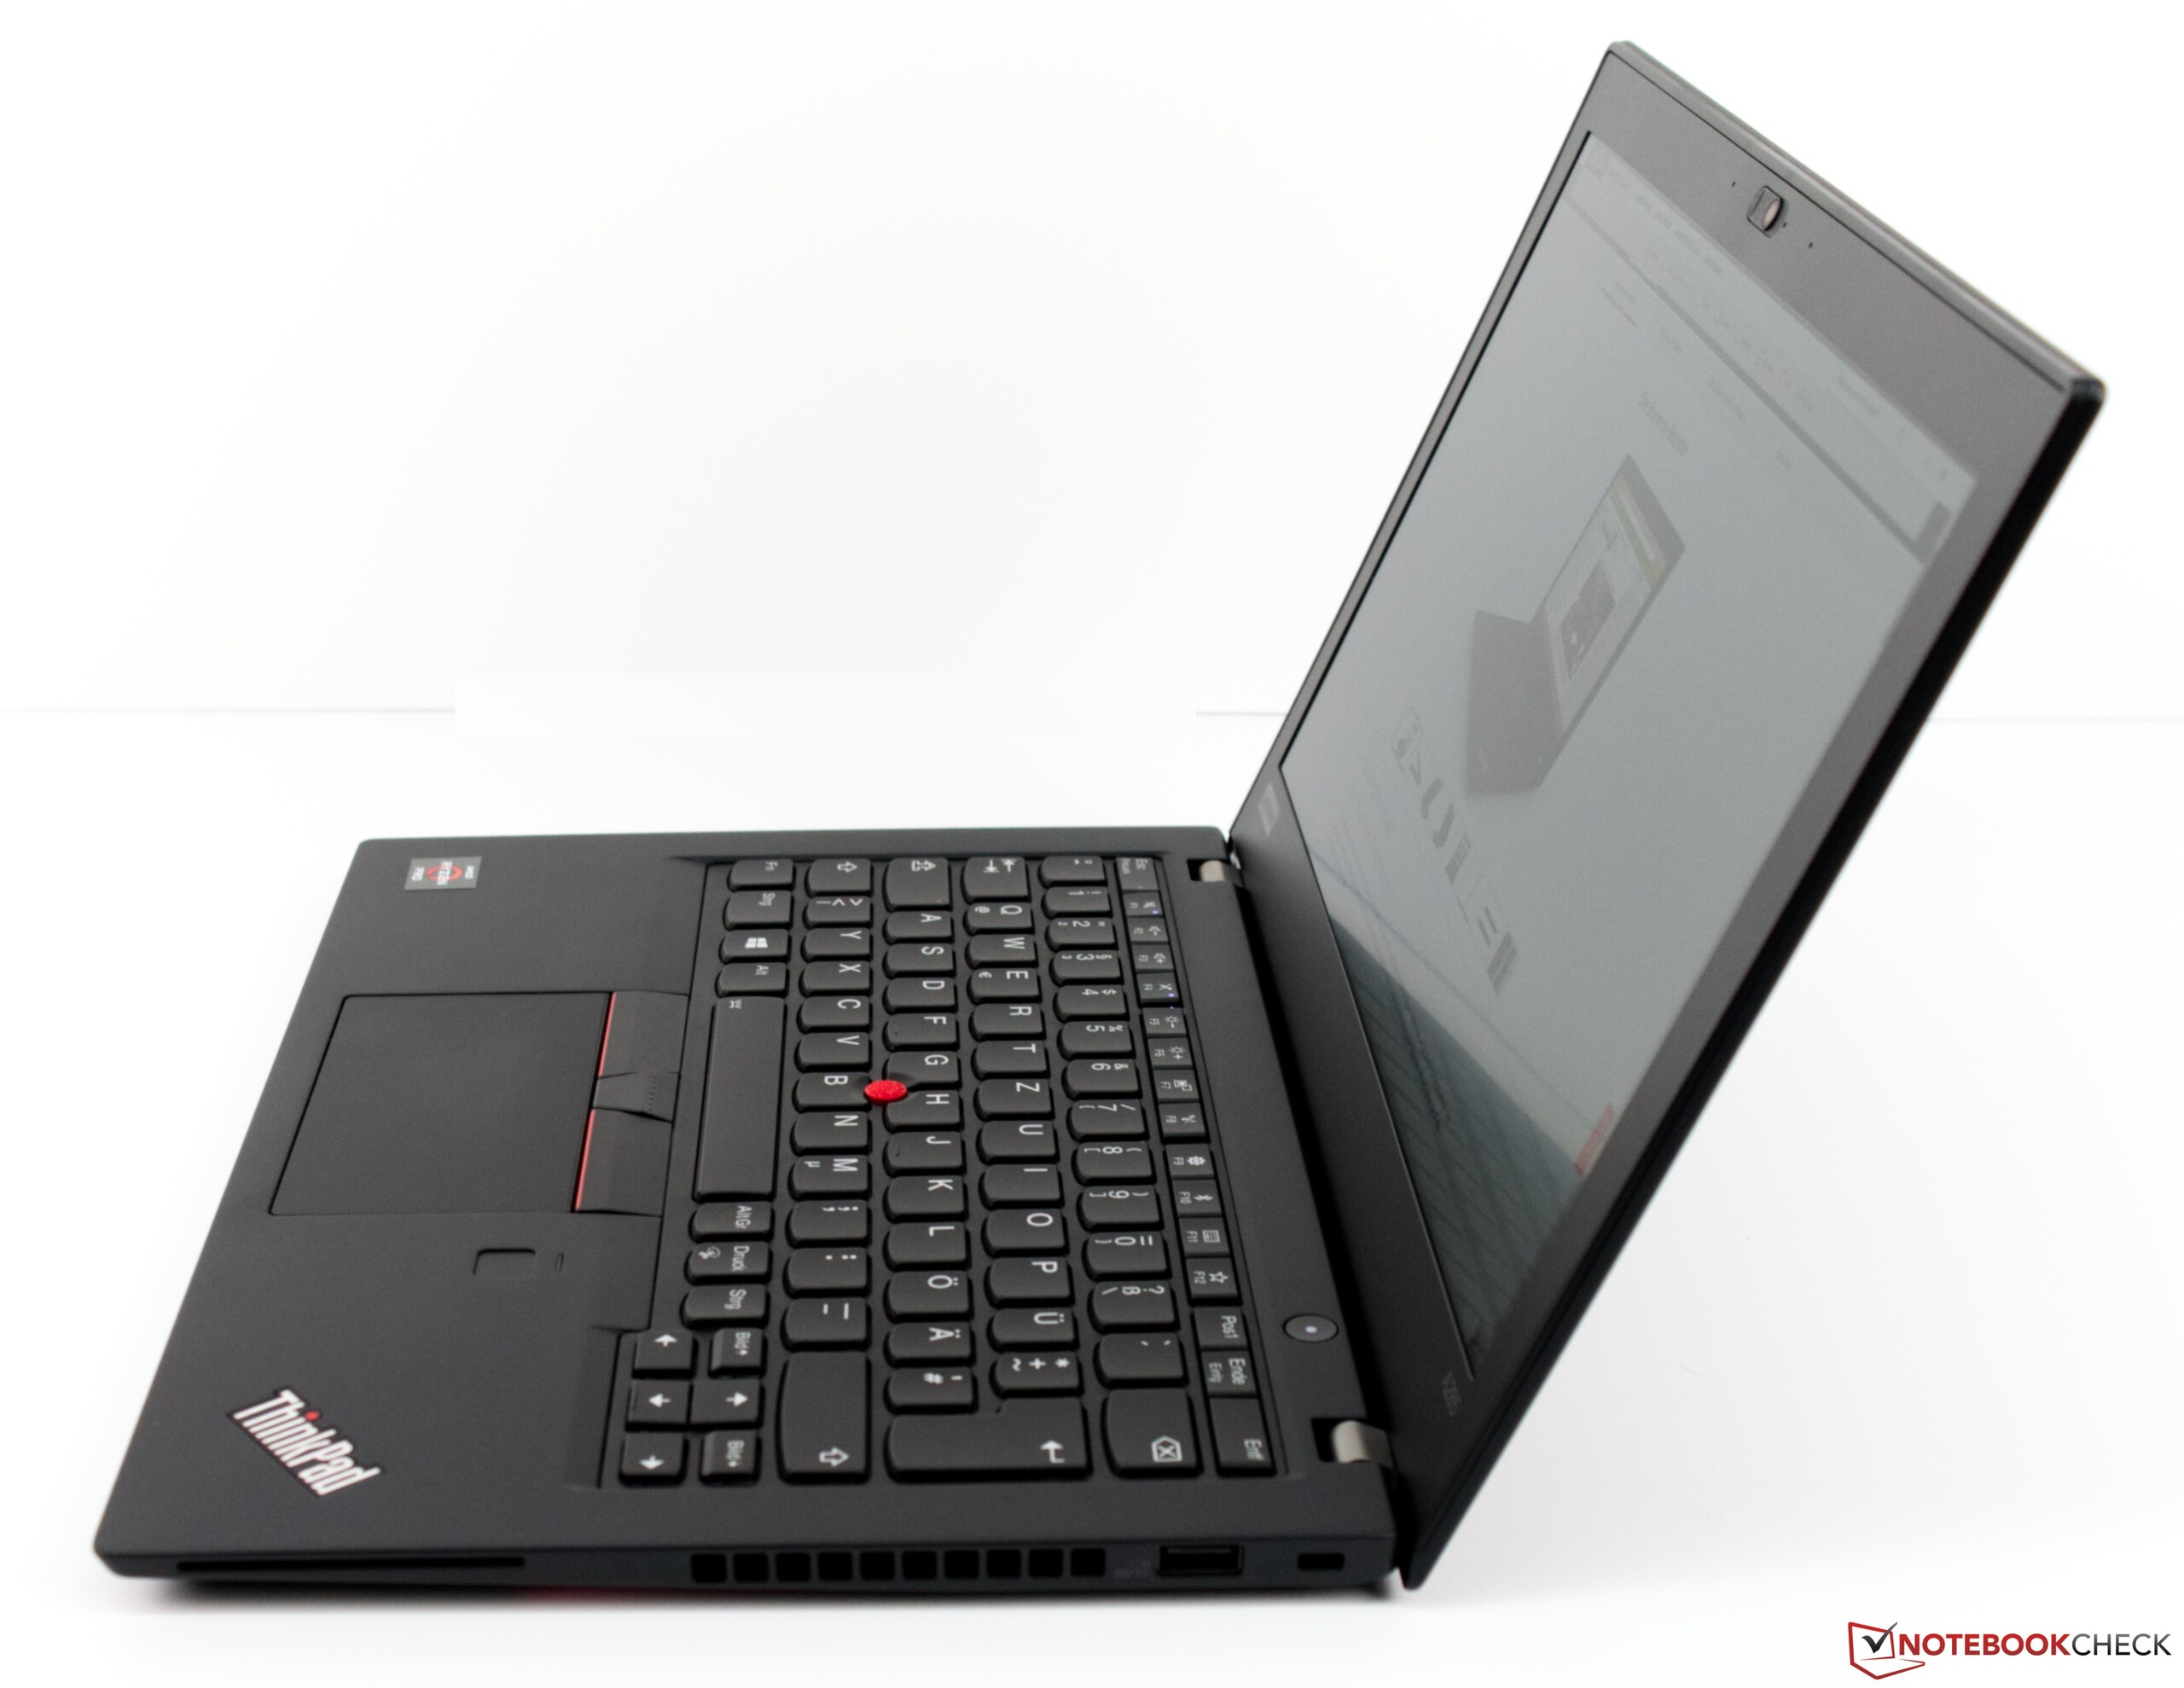
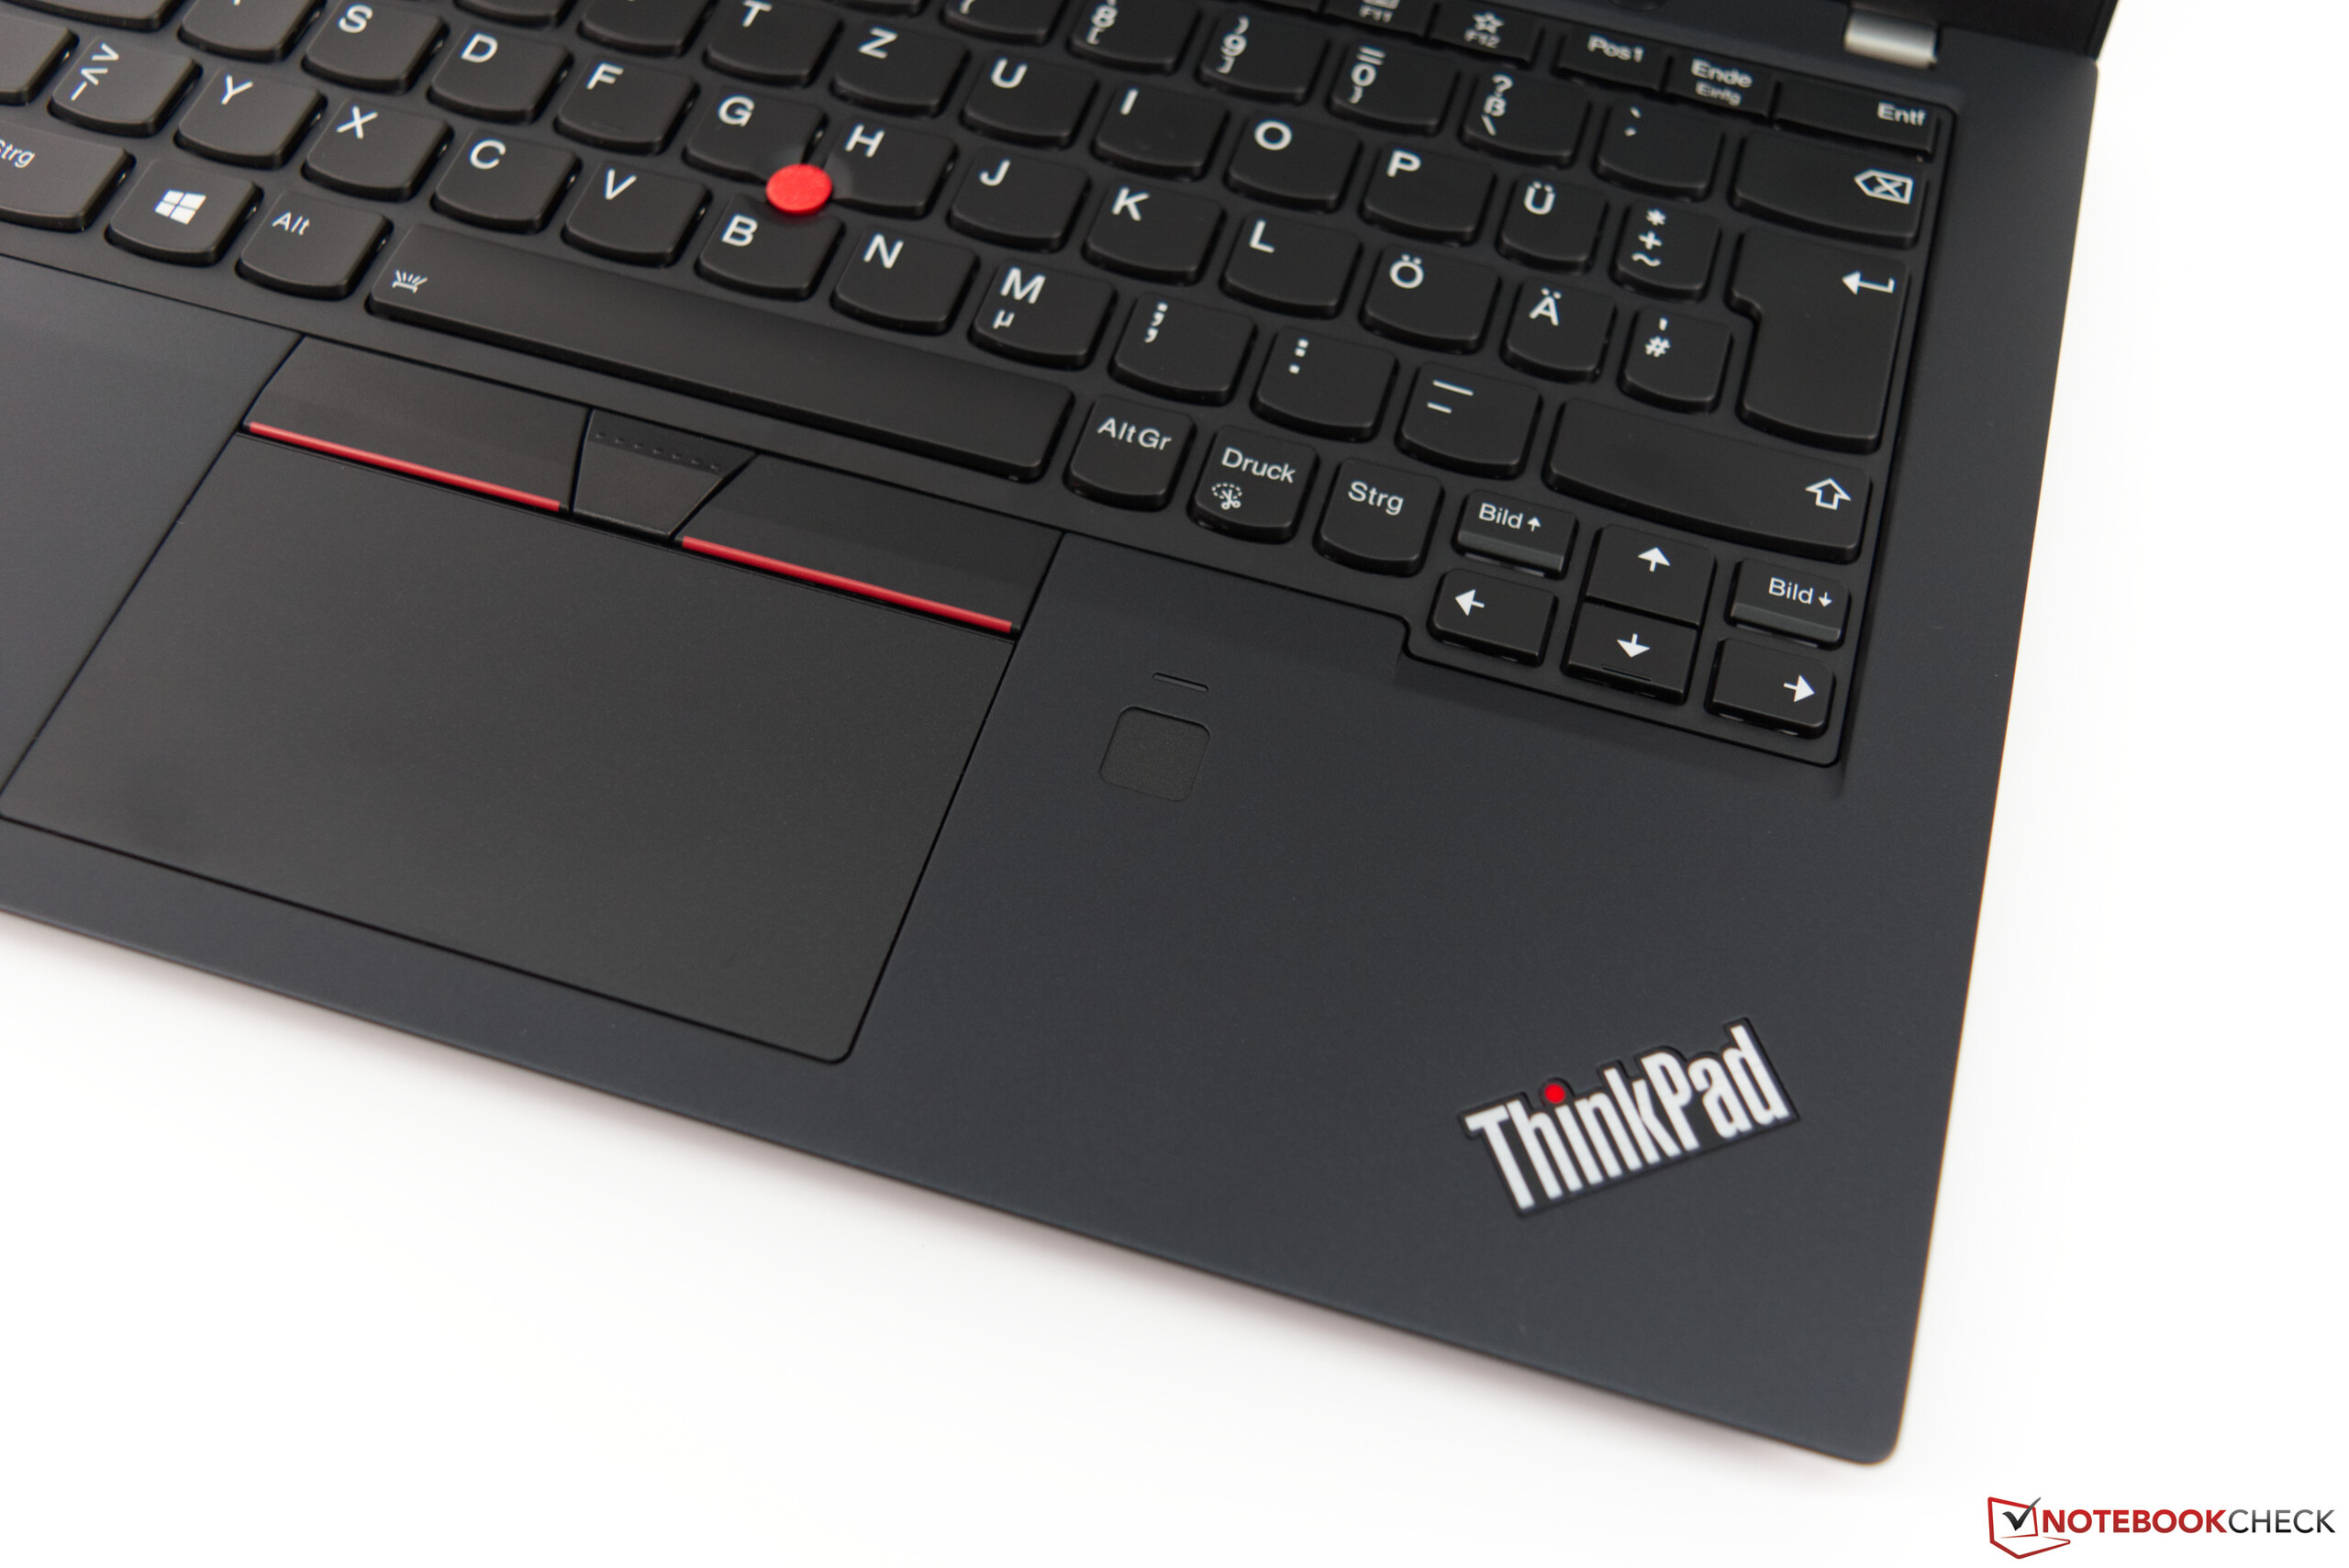
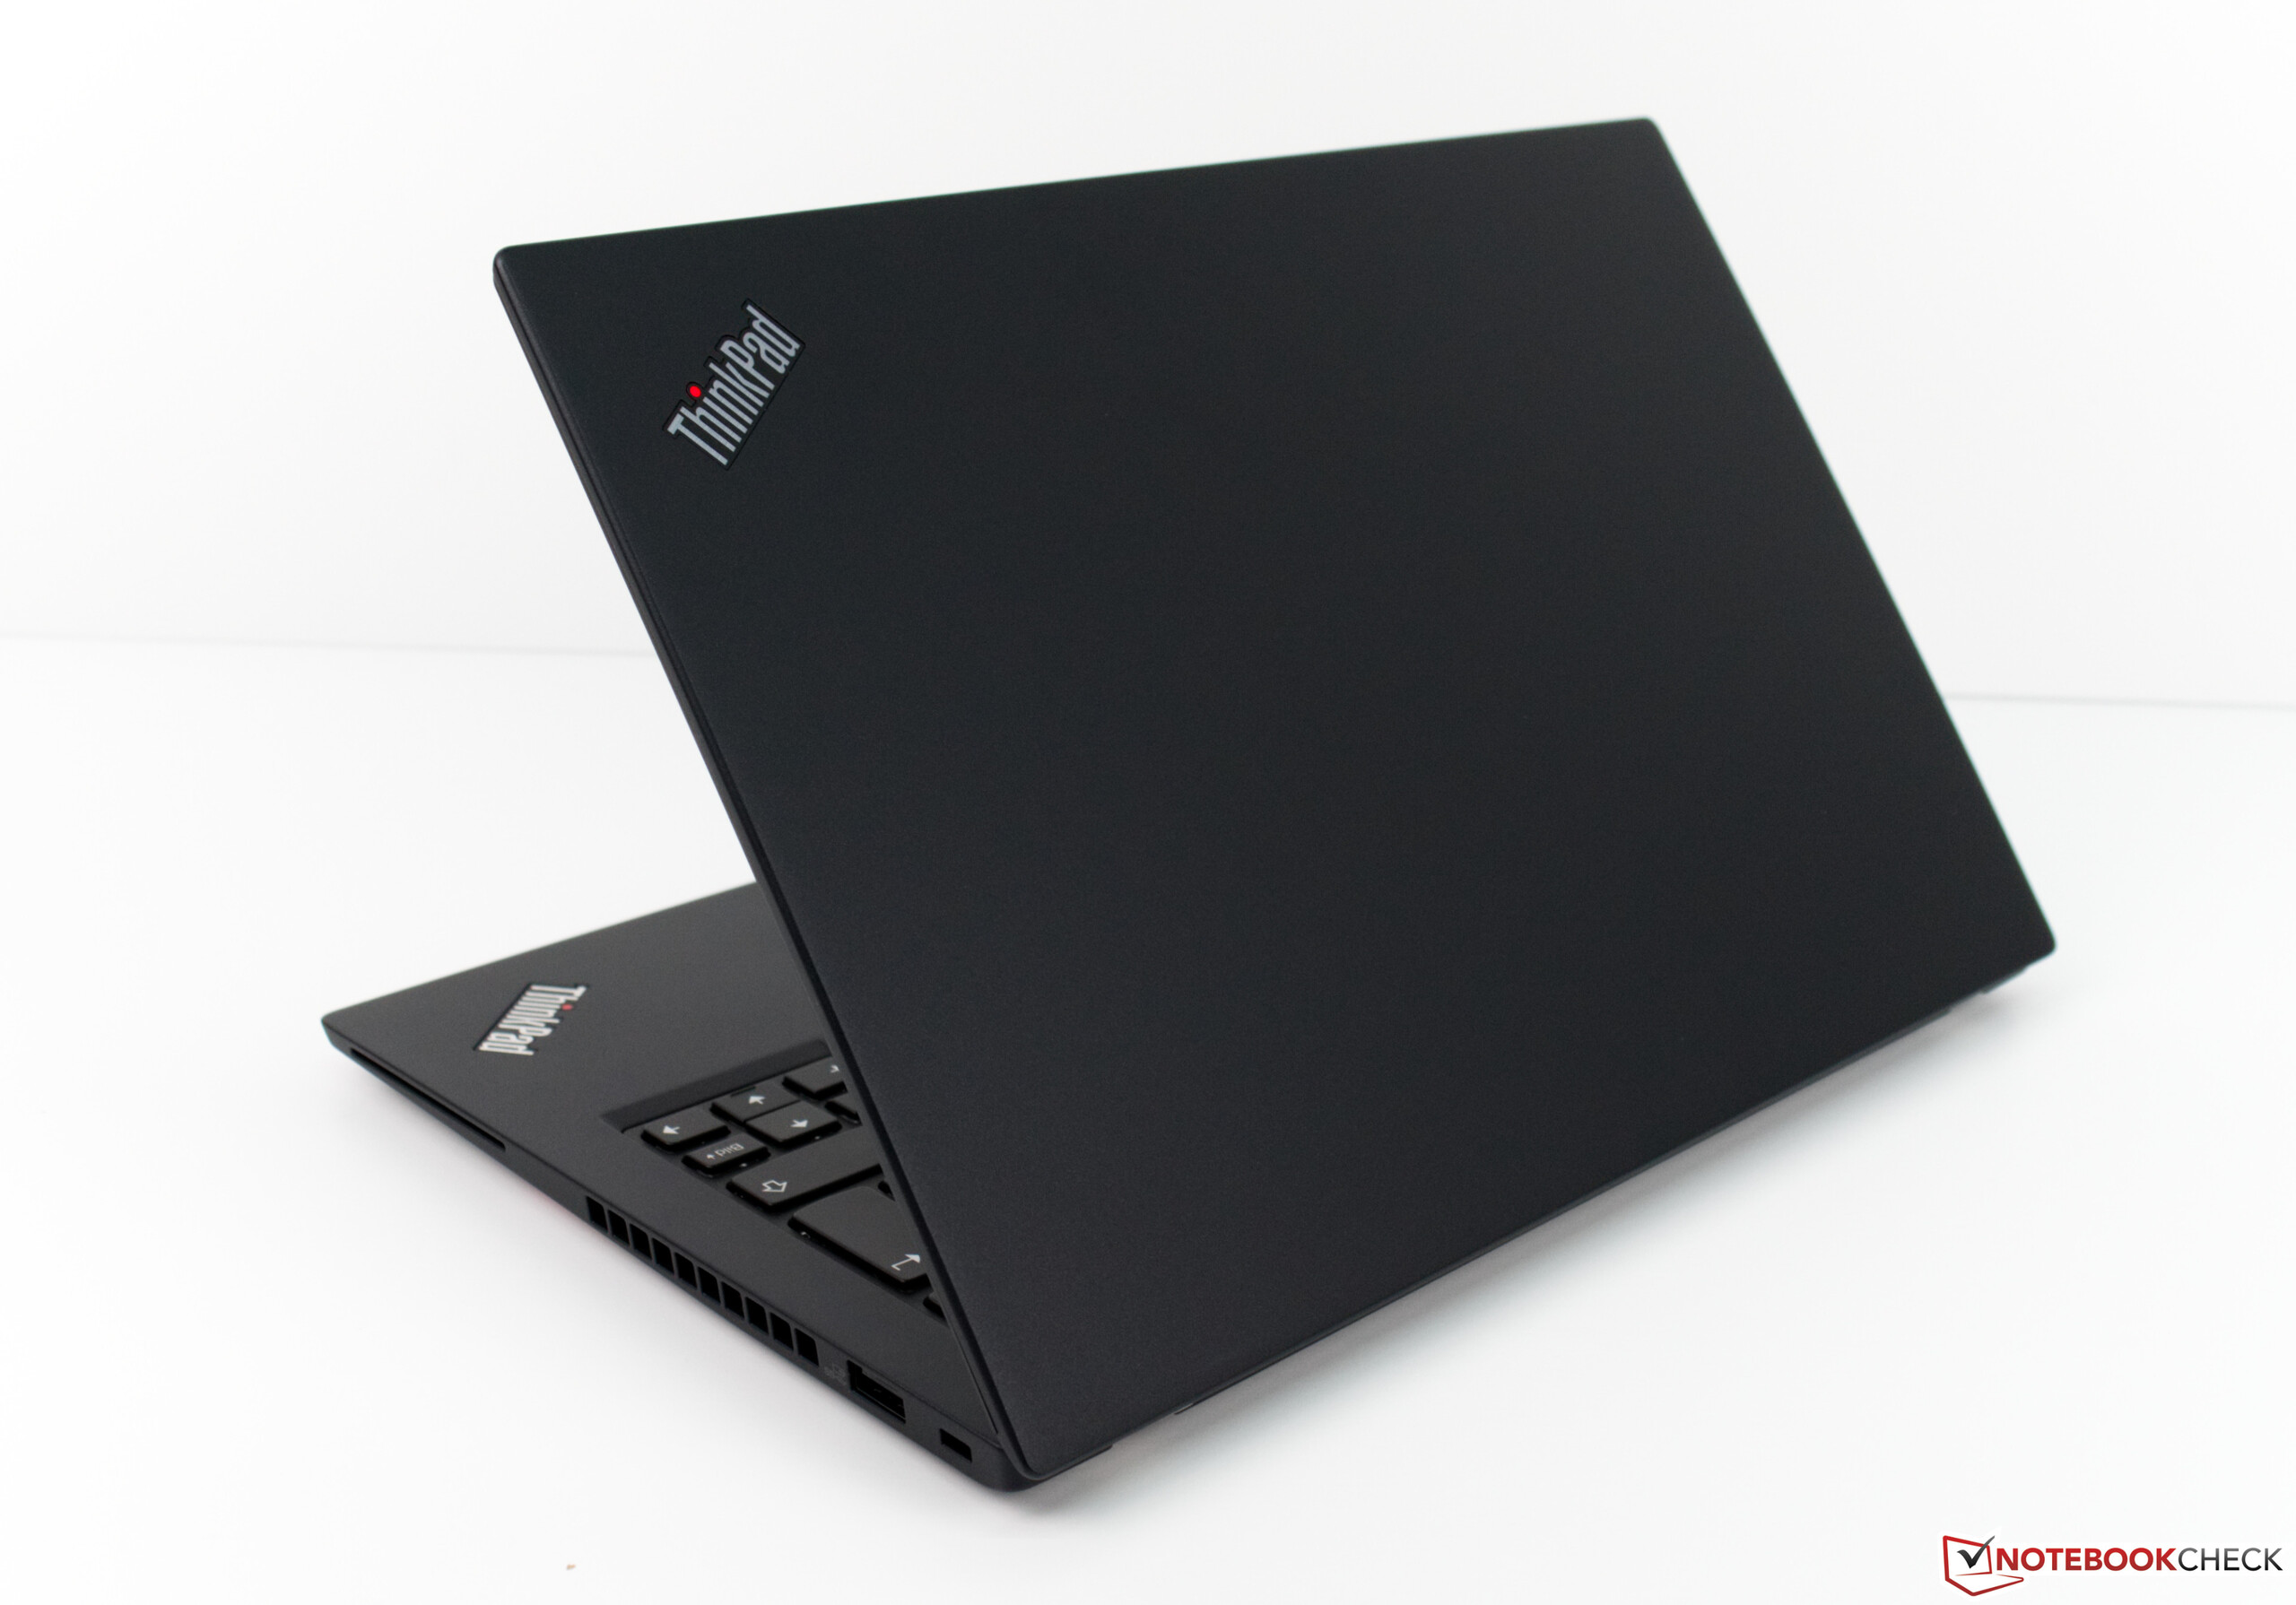
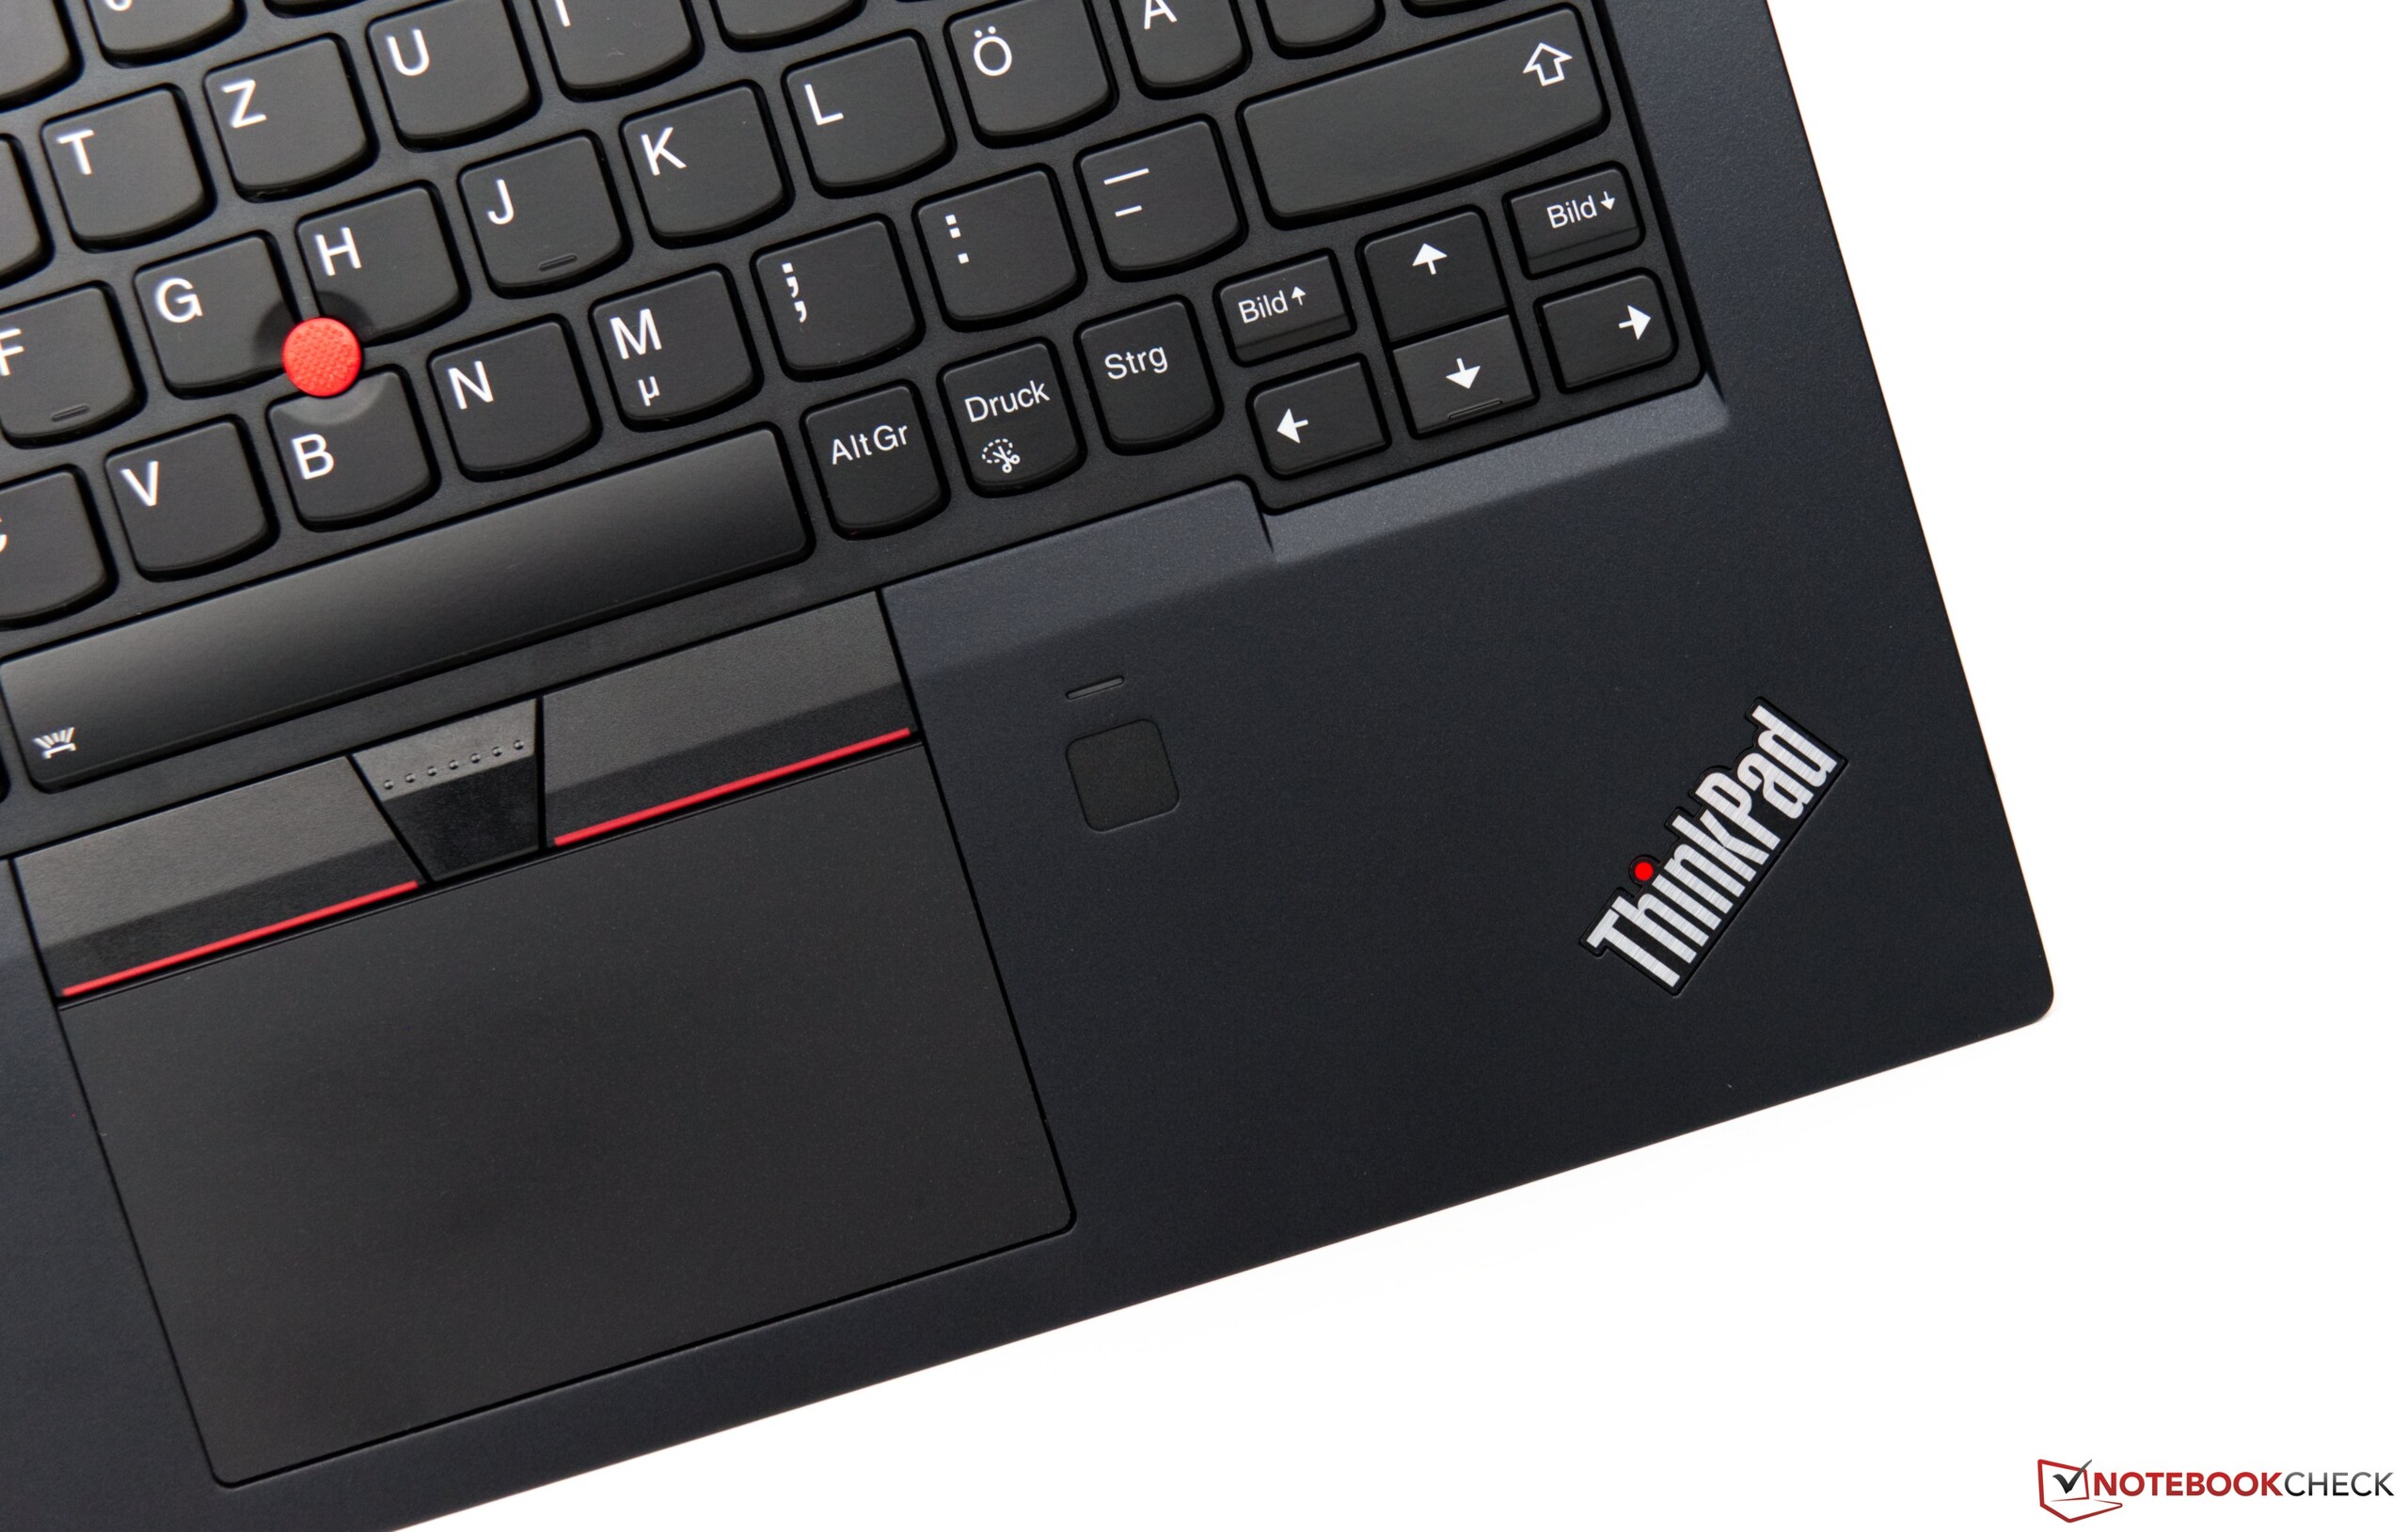
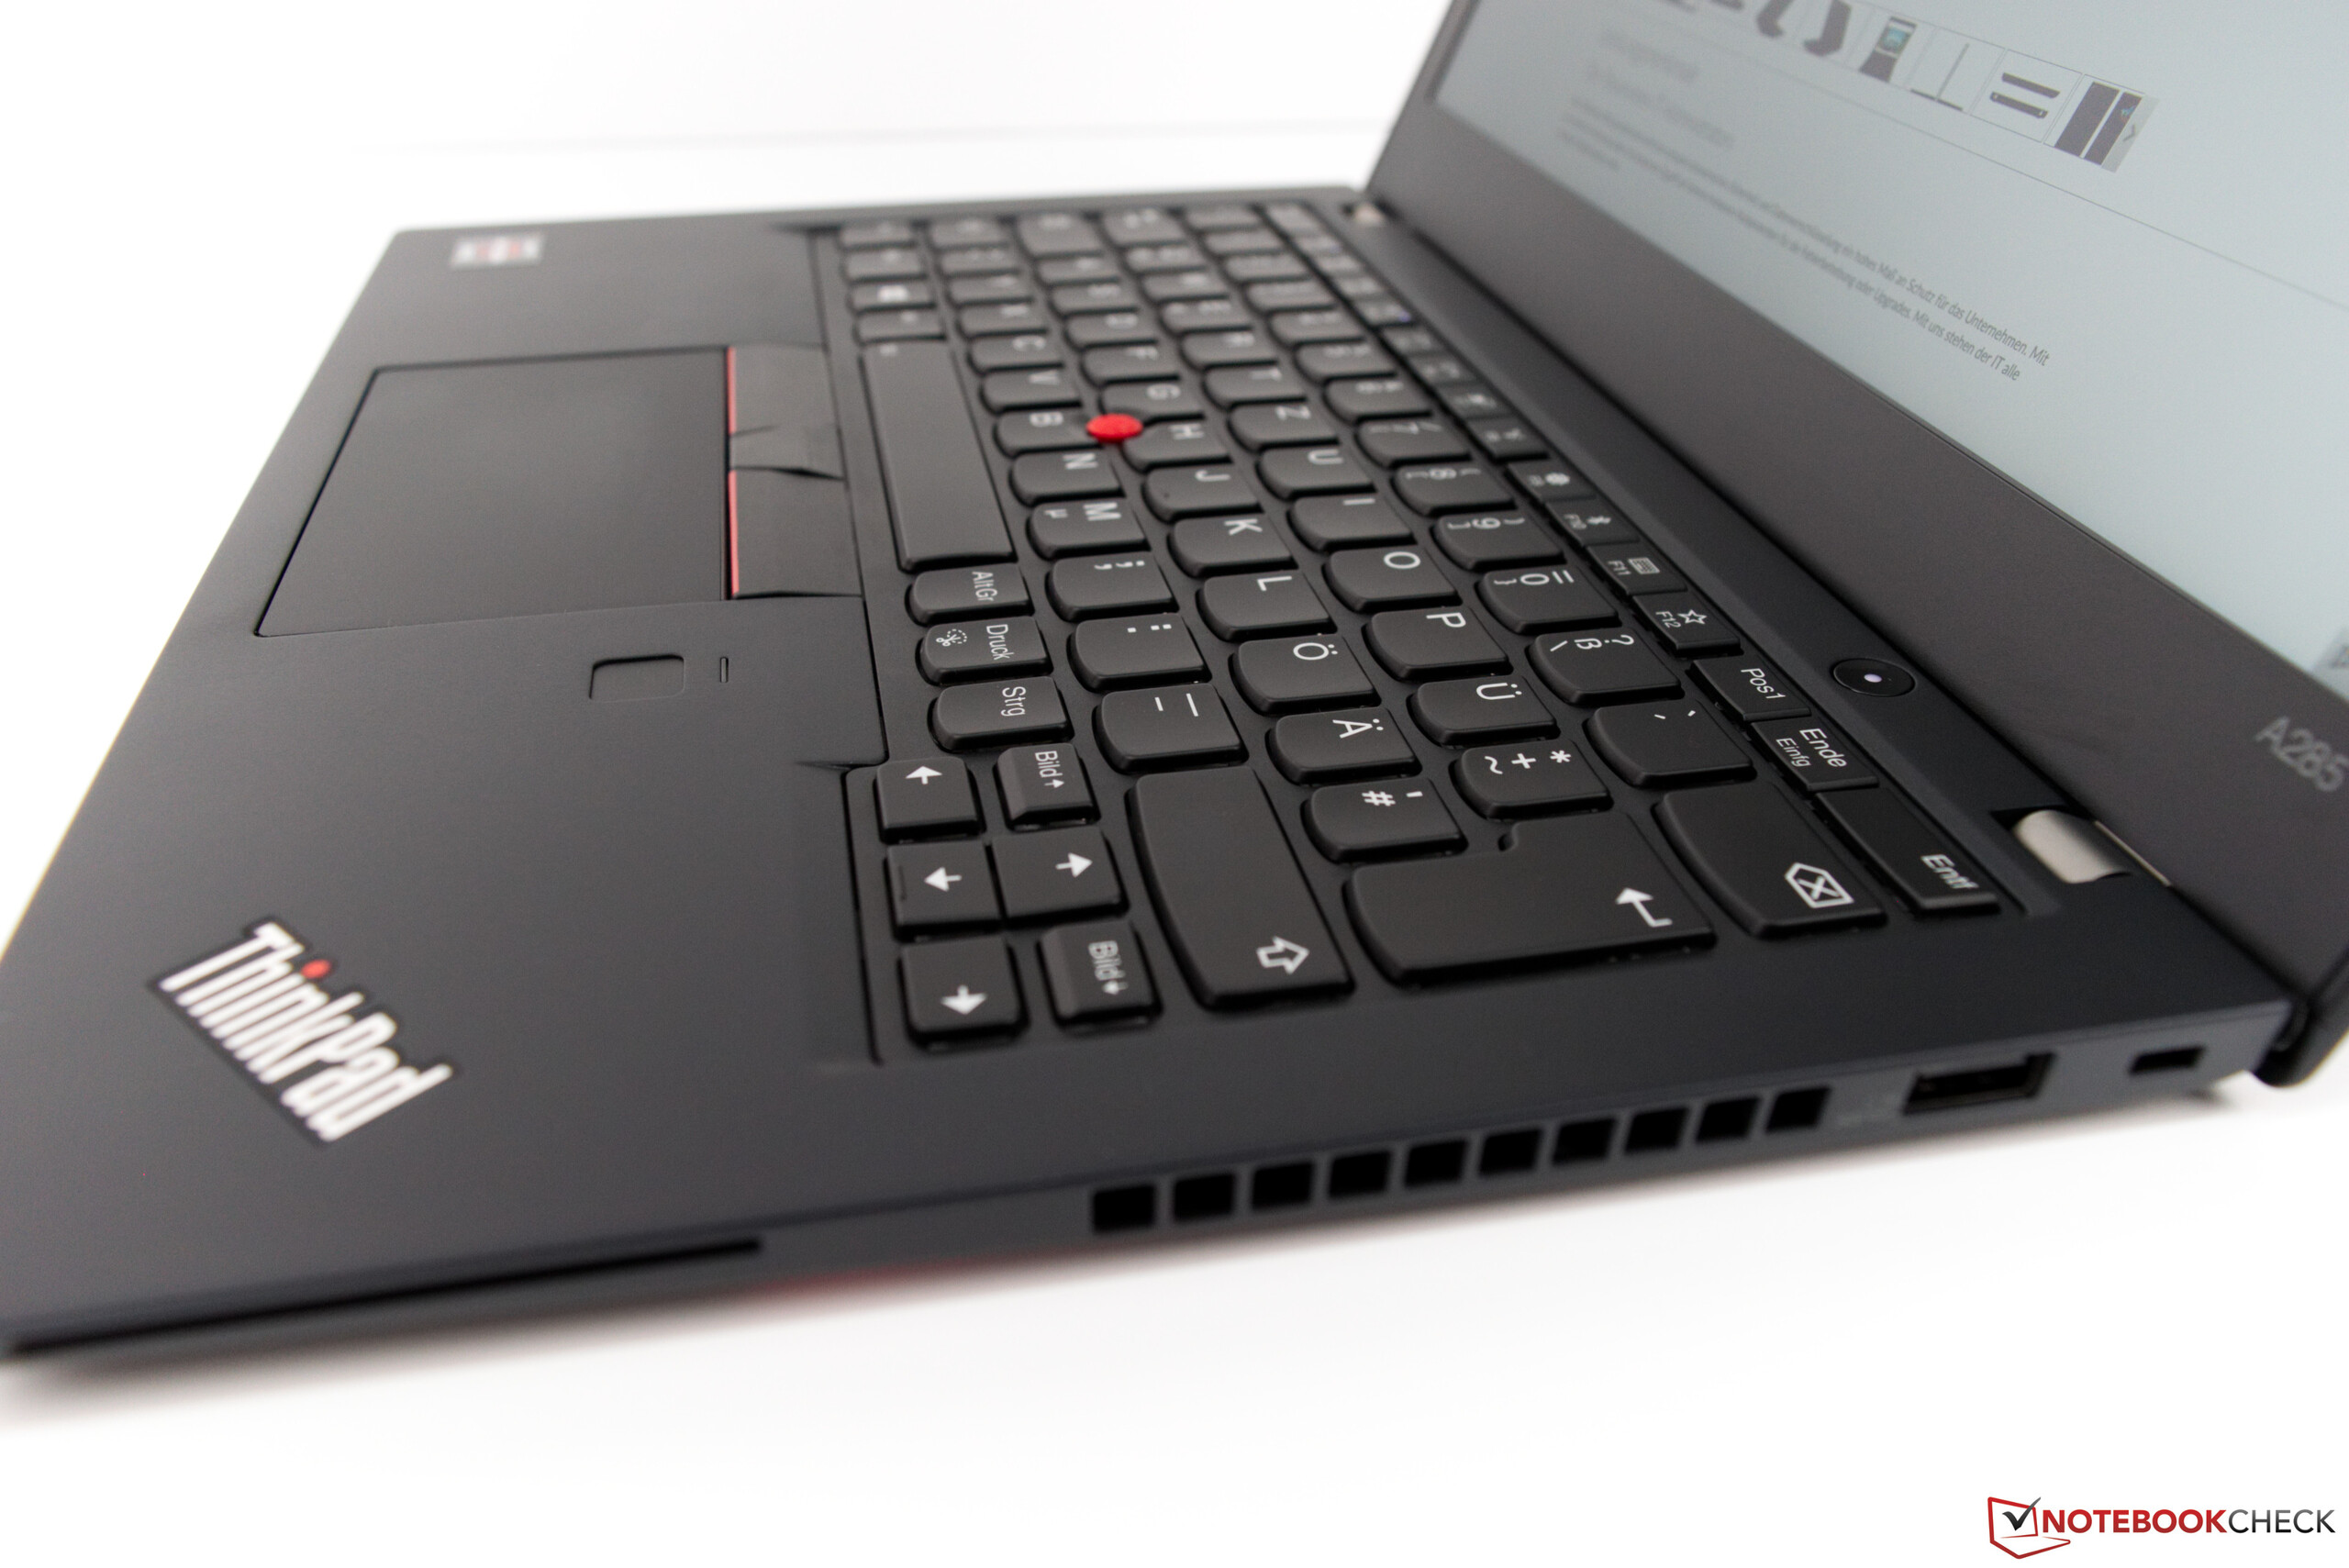
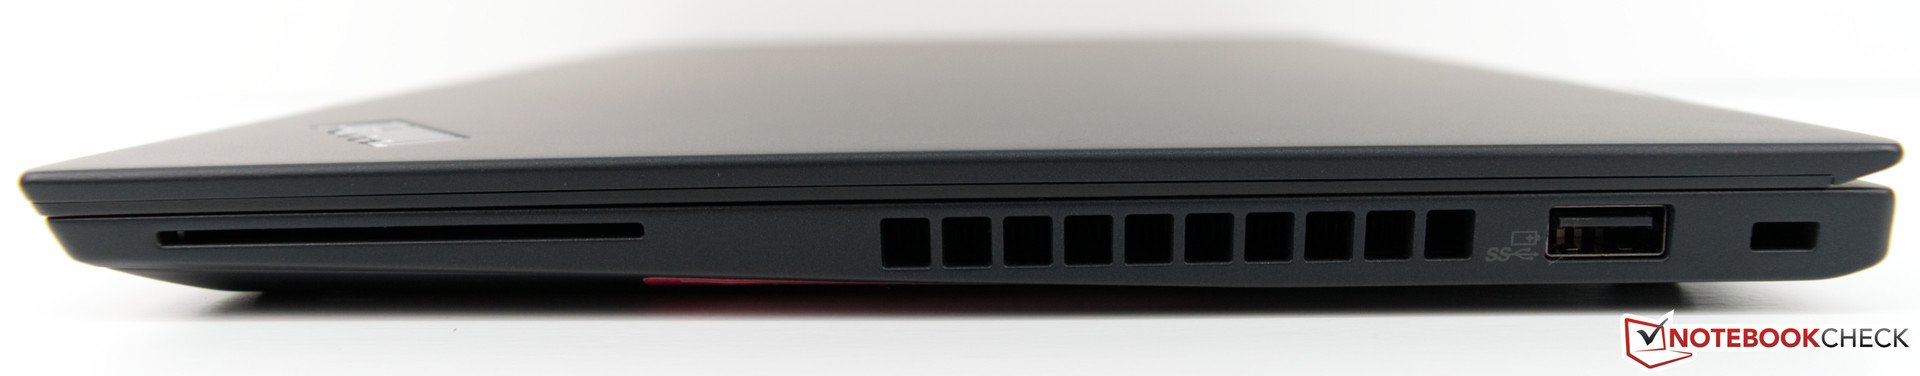
The chassis is identical to that of the ThinkPad X280 we have already reviewed. This means that we will not cover the sections Case, Connectivity or Input Devices in this review. All the corresponding information is available in our comprehensive review of the X280.
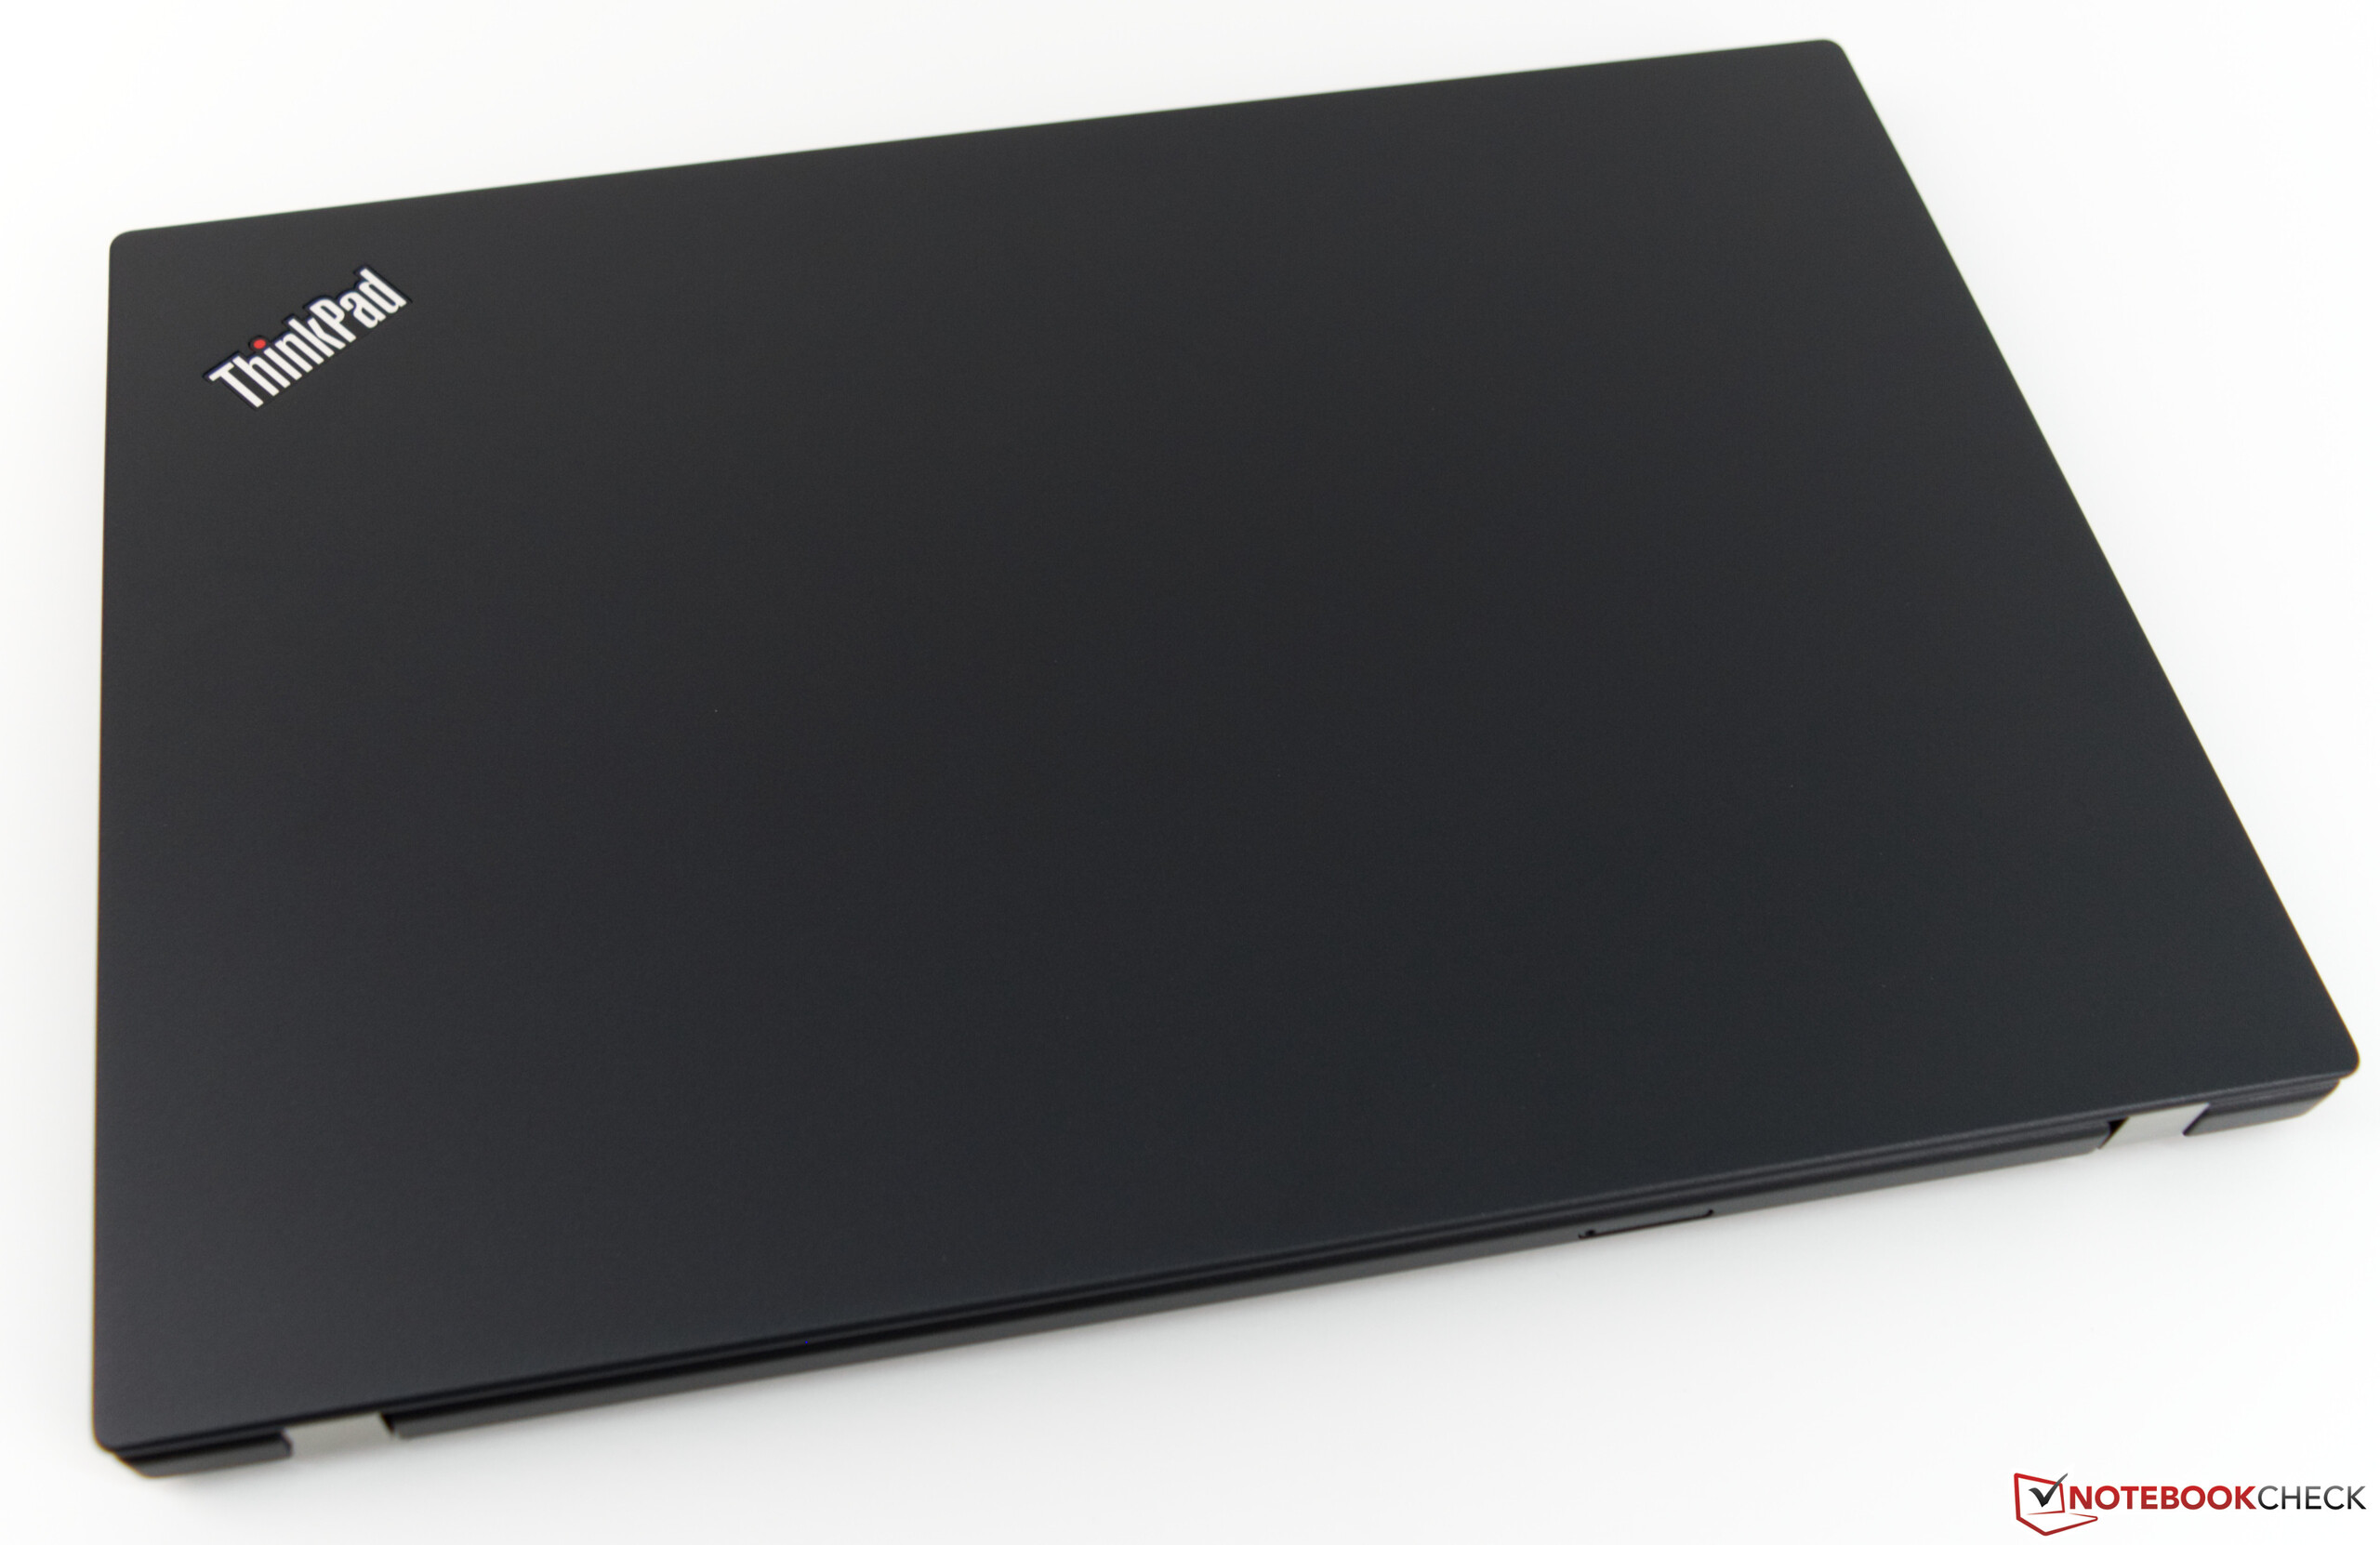
Case - Magnesium and Carbon ensure stability


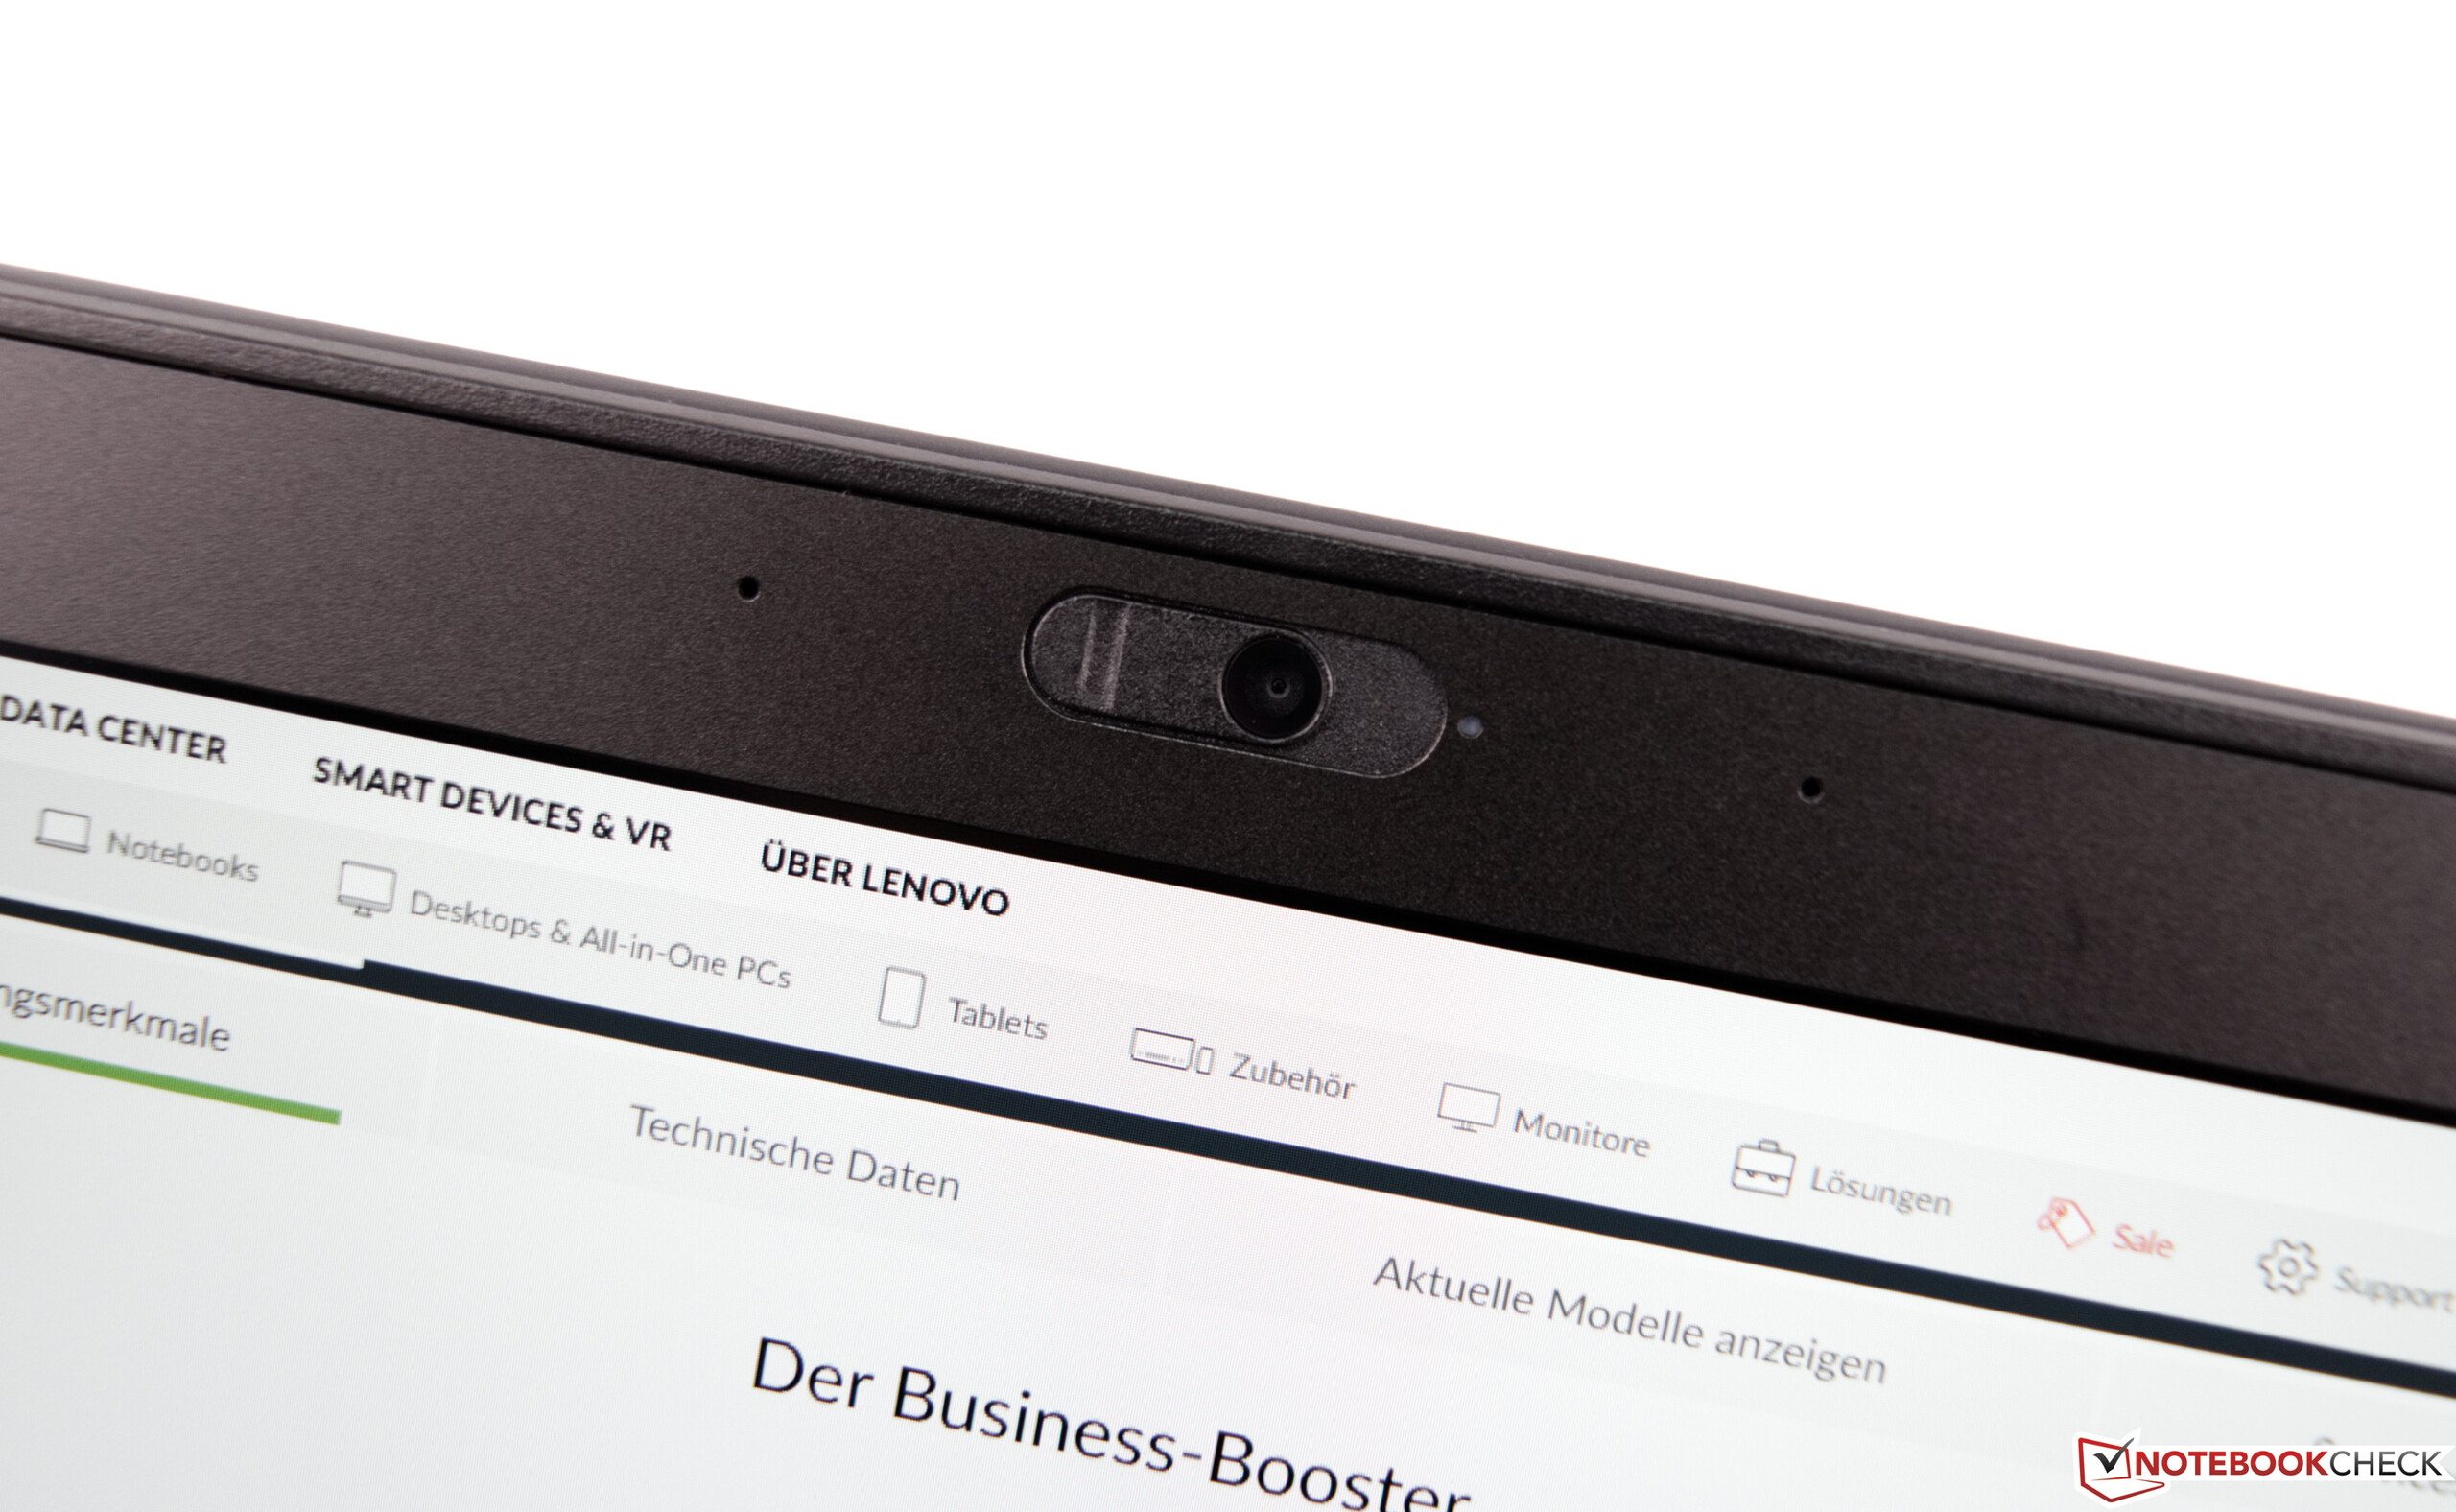
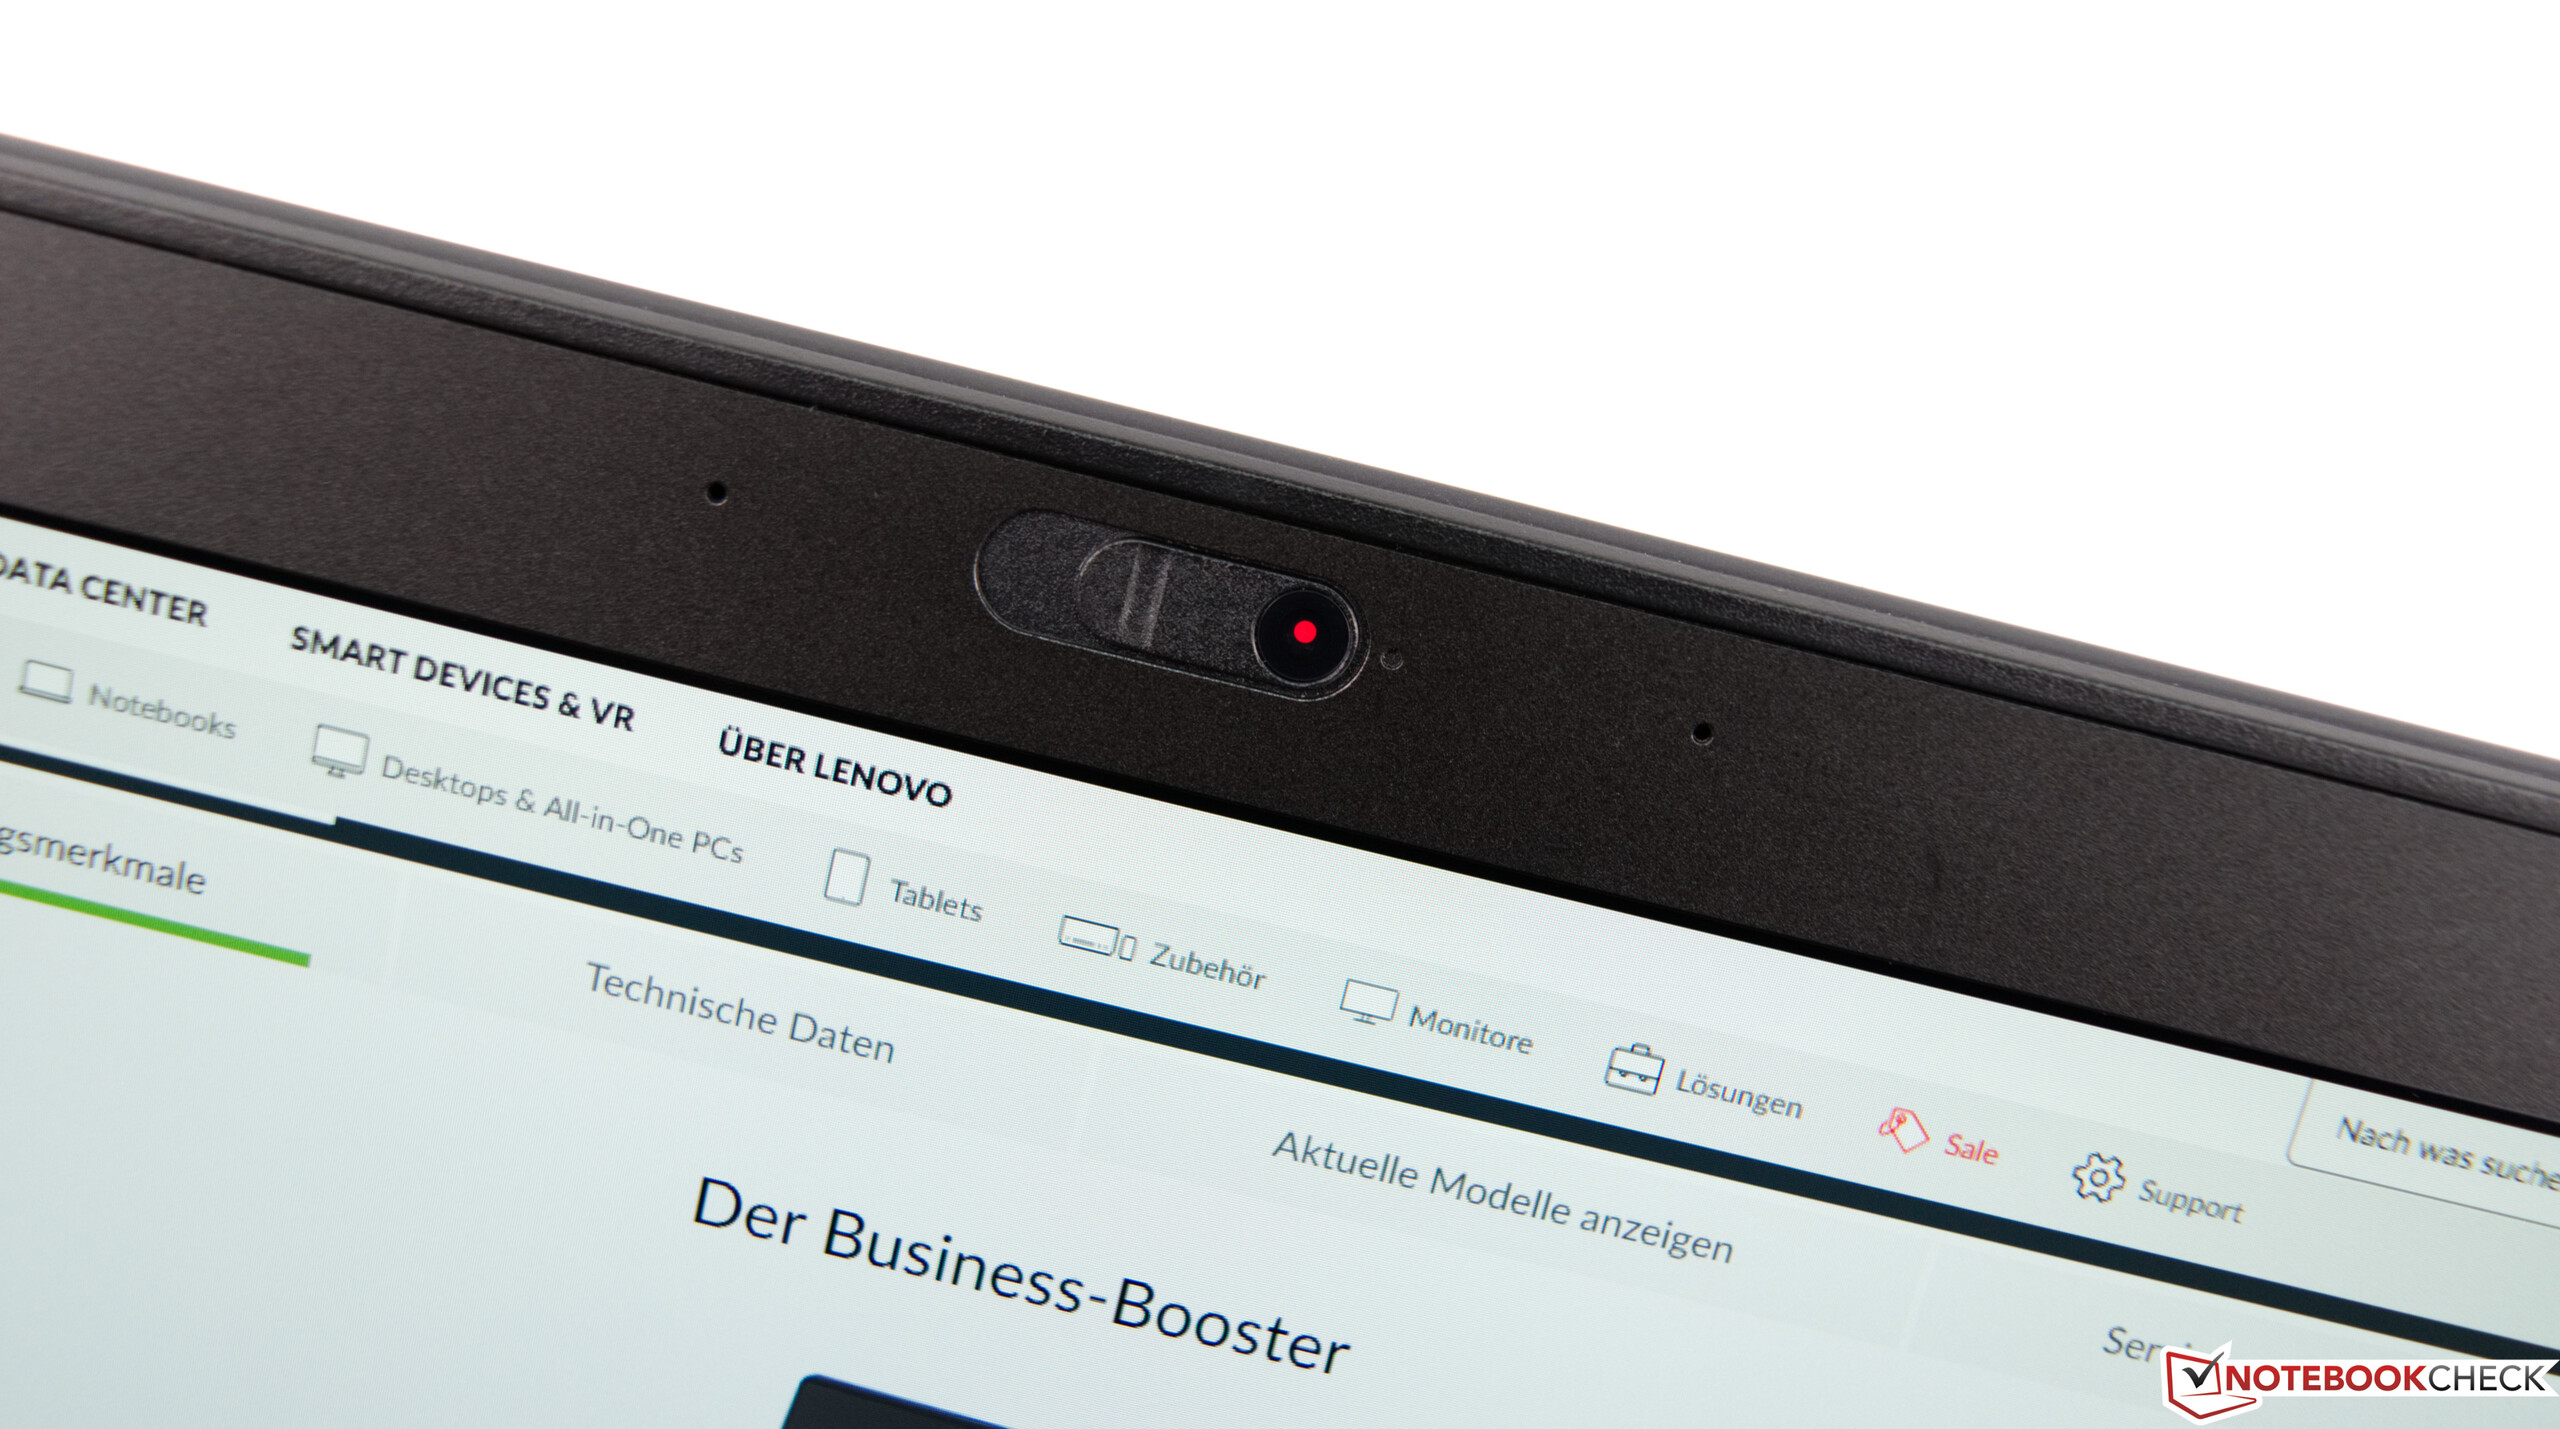
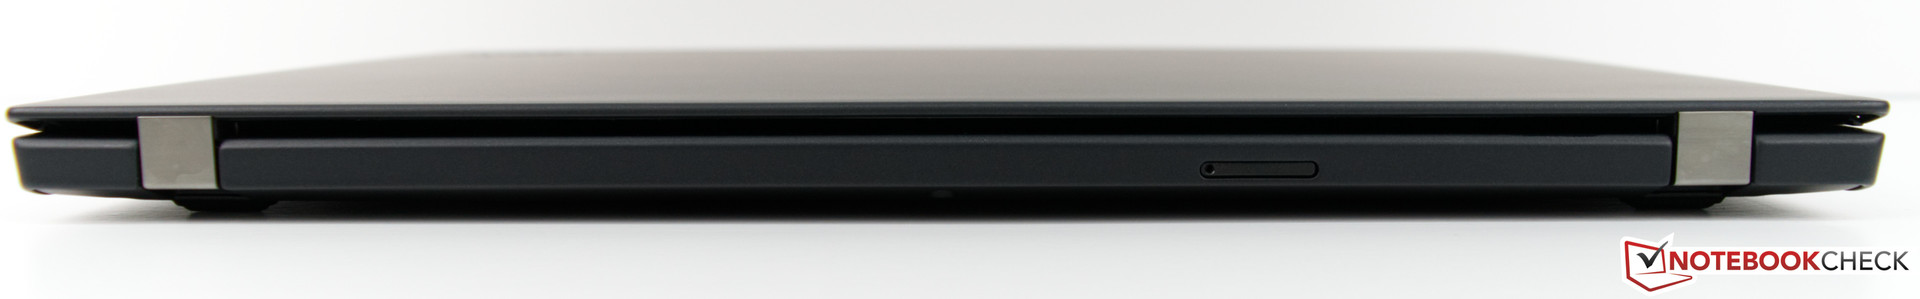
Connectivity - no Thunderbolt 3
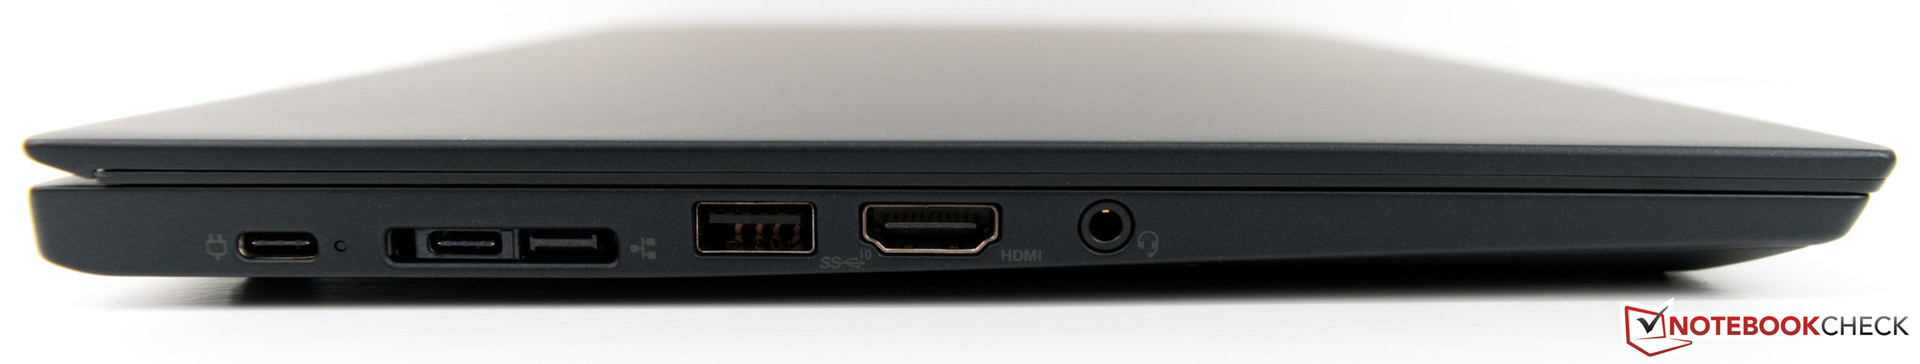
The ports lock identical on the ThinkPad A285 and the X280, but there is one major difference. The A285 has two USB Type-C ports (Gen.2) at the left side, but they lack the Thunderbolt 3 support of the X280. The current mechanical docking stations from Lenovo, like the ThinkPad Pro Dock, are still compatible with the A285, but you cannot attach external GPUs.
The video output is another difference. While the X280 can drive up to three independent display, the A285 supports four at higher resolutions. The HDMI port is now HDMI 2.0 and not 1.4b, so it supports 4K signals at 60 Hz. The maximum resolution via USB-C (via adapter) also increased from 4096x2304 to 5120x2880 pixels (60 Hz).
| SD Card Reader | |
| average JPG Copy Test (av. of 3 runs) | |
| Dell Latitude 7390 (Toshiba Exceria Pro M501) | |
| Fujitsu Lifebook U938 (Toshiba Exceria Pro SDXC 64 GB UHS-II) | |
| HP Envy 13-ah0003ng (Toshiba Exceria Pro M501 microSDXC 64GB) | |
| Lenovo ThinkPad X280-20KES01S00 (Toshiba Excerie Pro M501) | |
| Average of class Subnotebook (23.7 - 188, n=9, last 2 years) | |
| Lenovo ThinkPad A285-20MX0002GE (Toshiba Exceria Pro M501 64 GB UHS-II) | |
| maximum AS SSD Seq Read Test (1GB) | |
| Dell Latitude 7390 (Toshiba Exceria Pro M501) | |
| Fujitsu Lifebook U938 (Toshiba Exceria Pro SDXC 64 GB UHS-II) | |
| Average of class Subnotebook (24.9 - 195, n=8, last 2 years) | |
| Lenovo ThinkPad A285-20MX0002GE (Toshiba Exceria Pro M501 64 GB UHS-II) | |
| Lenovo ThinkPad X280-20KES01S00 (Toshiba Excerie Pro M501) | |
| HP Envy 13-ah0003ng (Toshiba Exceria Pro M501 microSDXC 64GB) | |
Display - matte and bright, but still not perfect
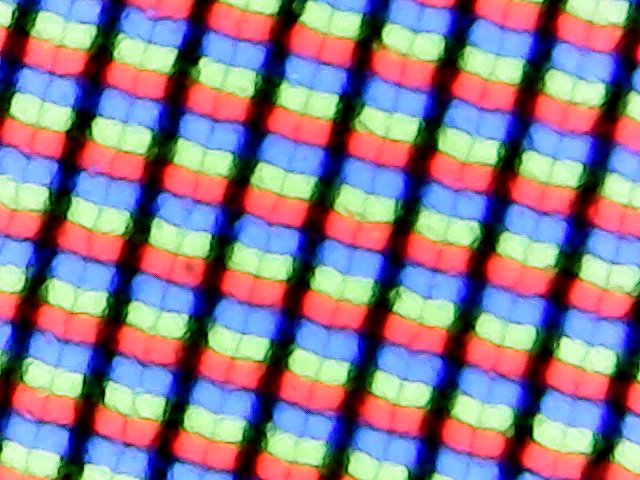

Lenovo offers a total of three different display for the Lenovo ThinkPad A285. We cannot recommend the base TN panel with the low HD resolution. Its luminance is rated at just 220 nits and therefore significantly lower compared to the IPS screen in our test model. We also measure more than the advertised 300 nits on our unit with an average value of 321 nits. The HP Envy 13 (289 nits) is a bit darker, but the other comparison devices are very similar. The brightness distribution is good at 89% and only the Dell Latitude 7390 is superior in this respect. The resolution of 1920x1080 pixels results in a pixel density of 176 PPI on the 12.5-inch screen. We also like the matte surface, which prevents reflections very effectively.
Lenovo uses another panel for the A285 (Innolux) compared to the tested X280 (AUO), which is evident when you look at the much higher black value (0.37). In combination with the measured brightness values, this results in a lower contrast ratio of 938:1. Lenovo uses different suppliers for the panels, so you never know the exact panel ahead of the purchase.
The A285 uses PWM to regulate the background illumination, but there should not be any limitations even during longer work sessions thanks to the high frequency. Our test unit suffered from slight backlight bleeding on dark contents in the lower corners, but it was no problem in everyday scenarios.
| |||||||||||||||||||||||||
Brightness Distribution: 88 %
Center on Battery: 349 cd/m²
Contrast: 938:1 (Black: 0.37 cd/m²)
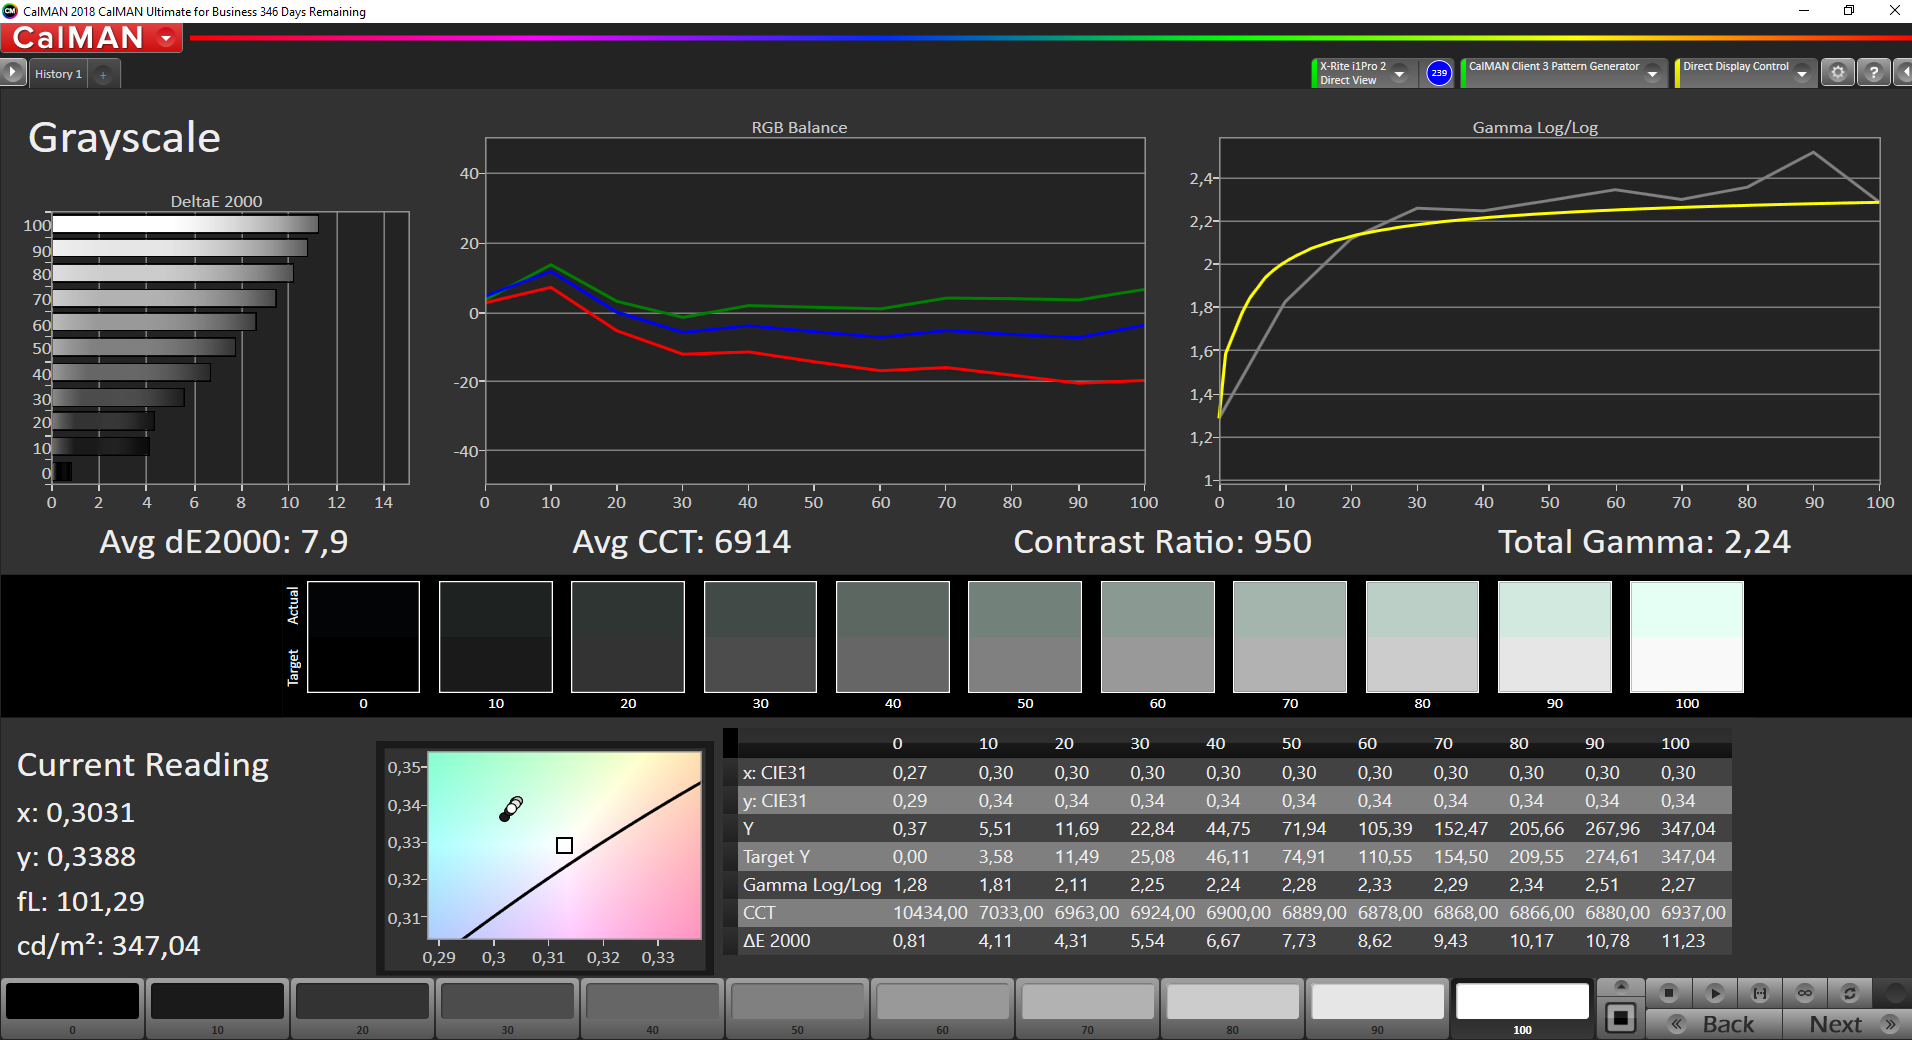
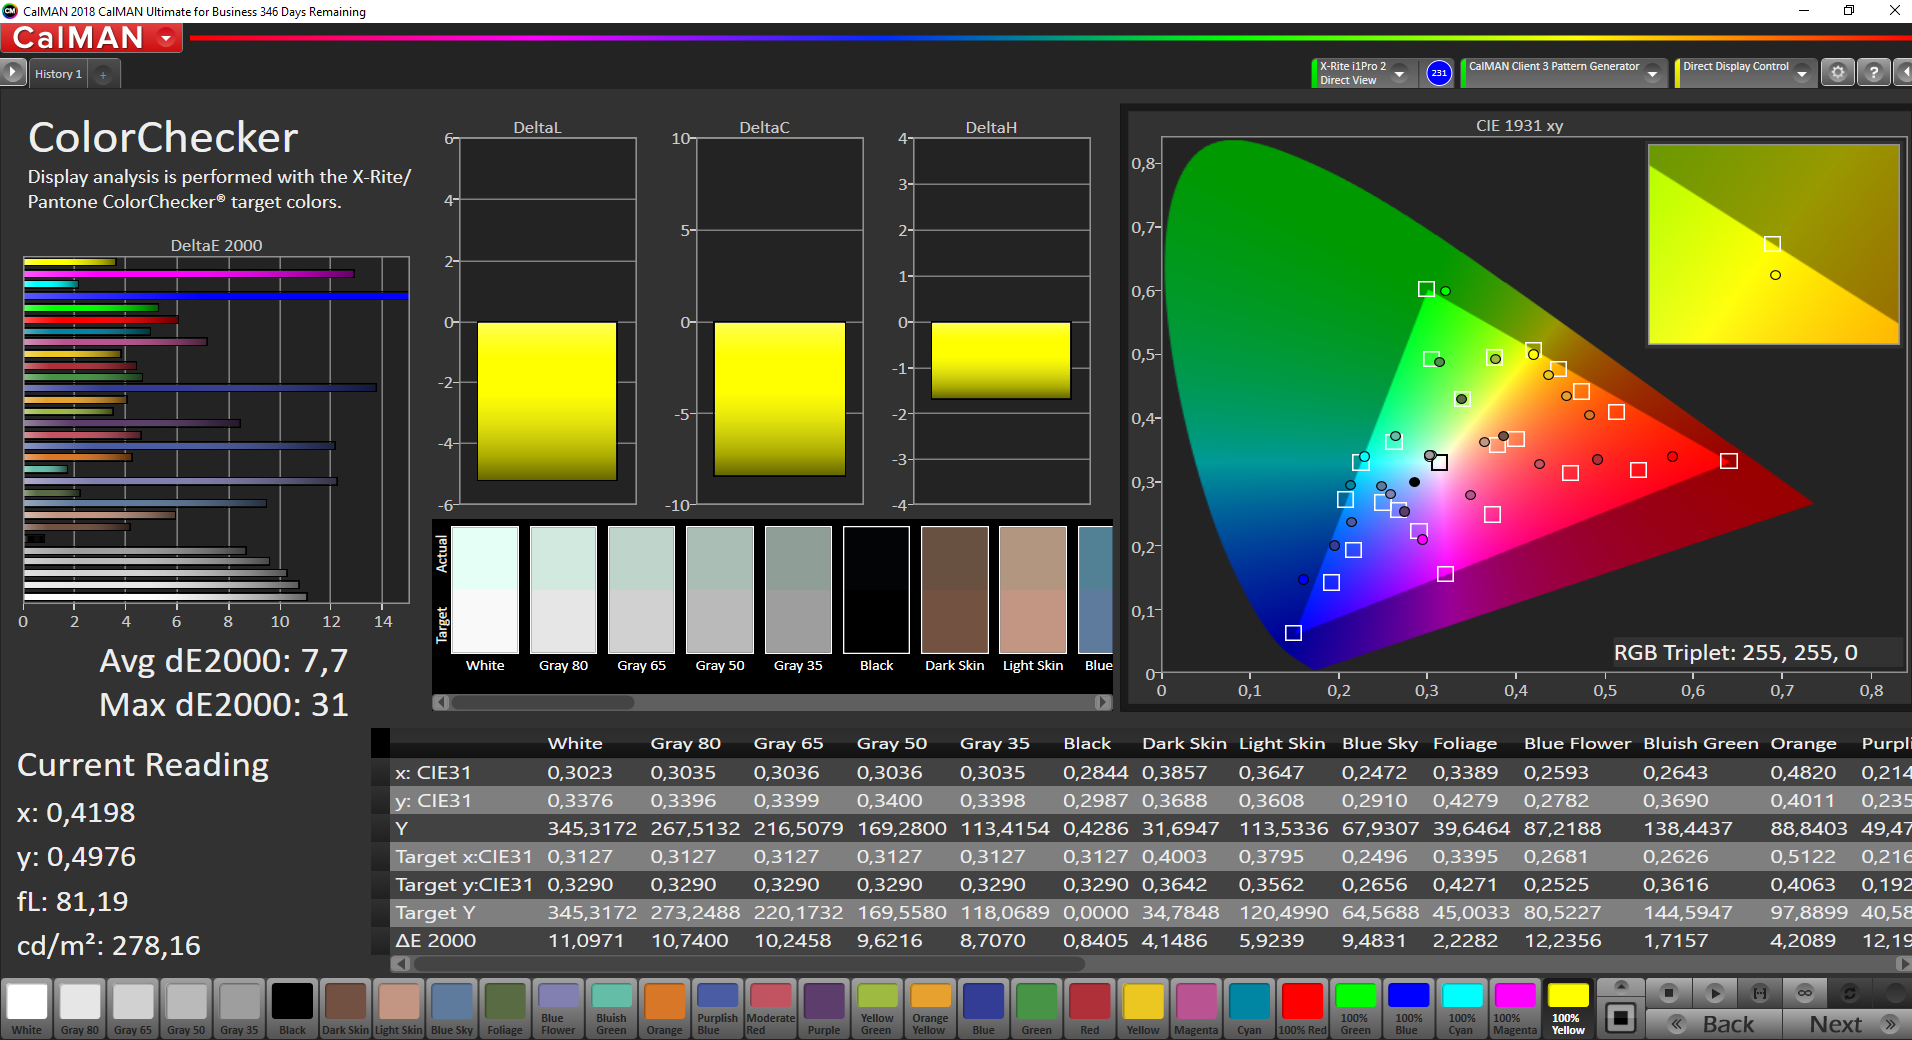
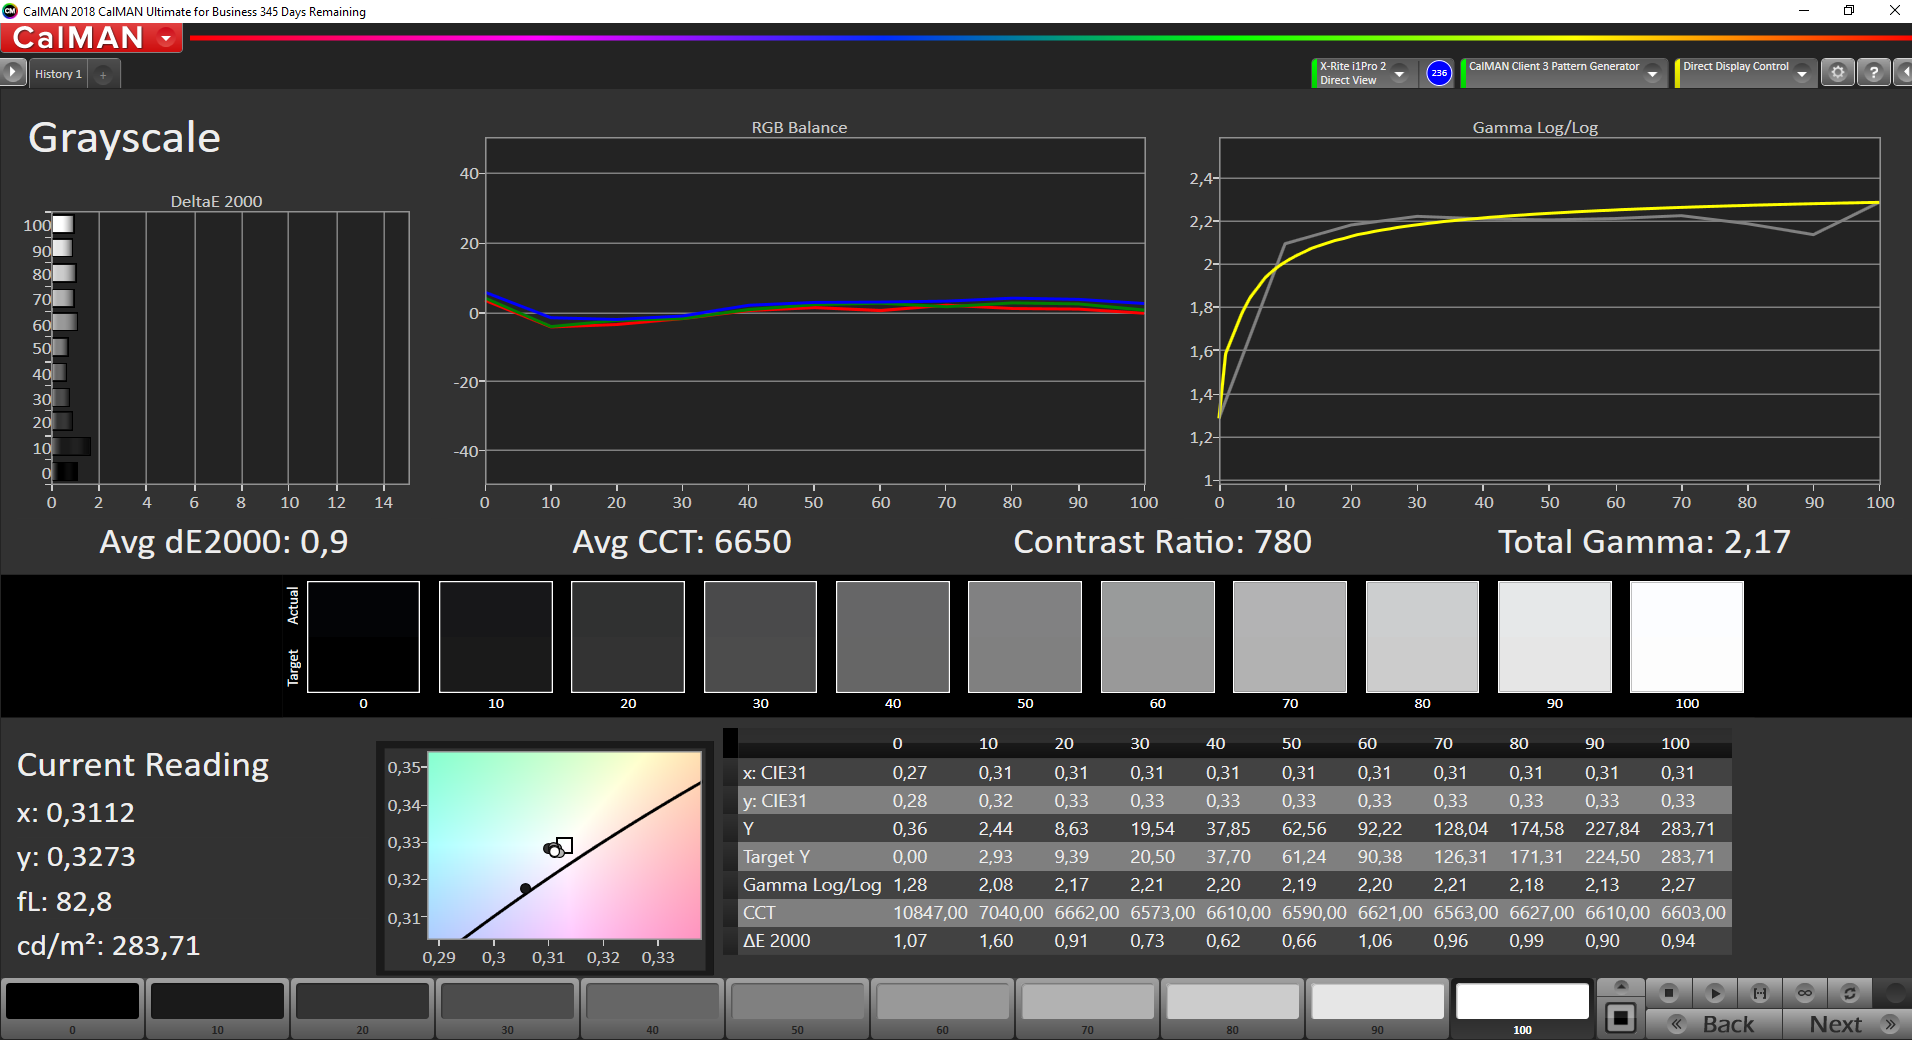
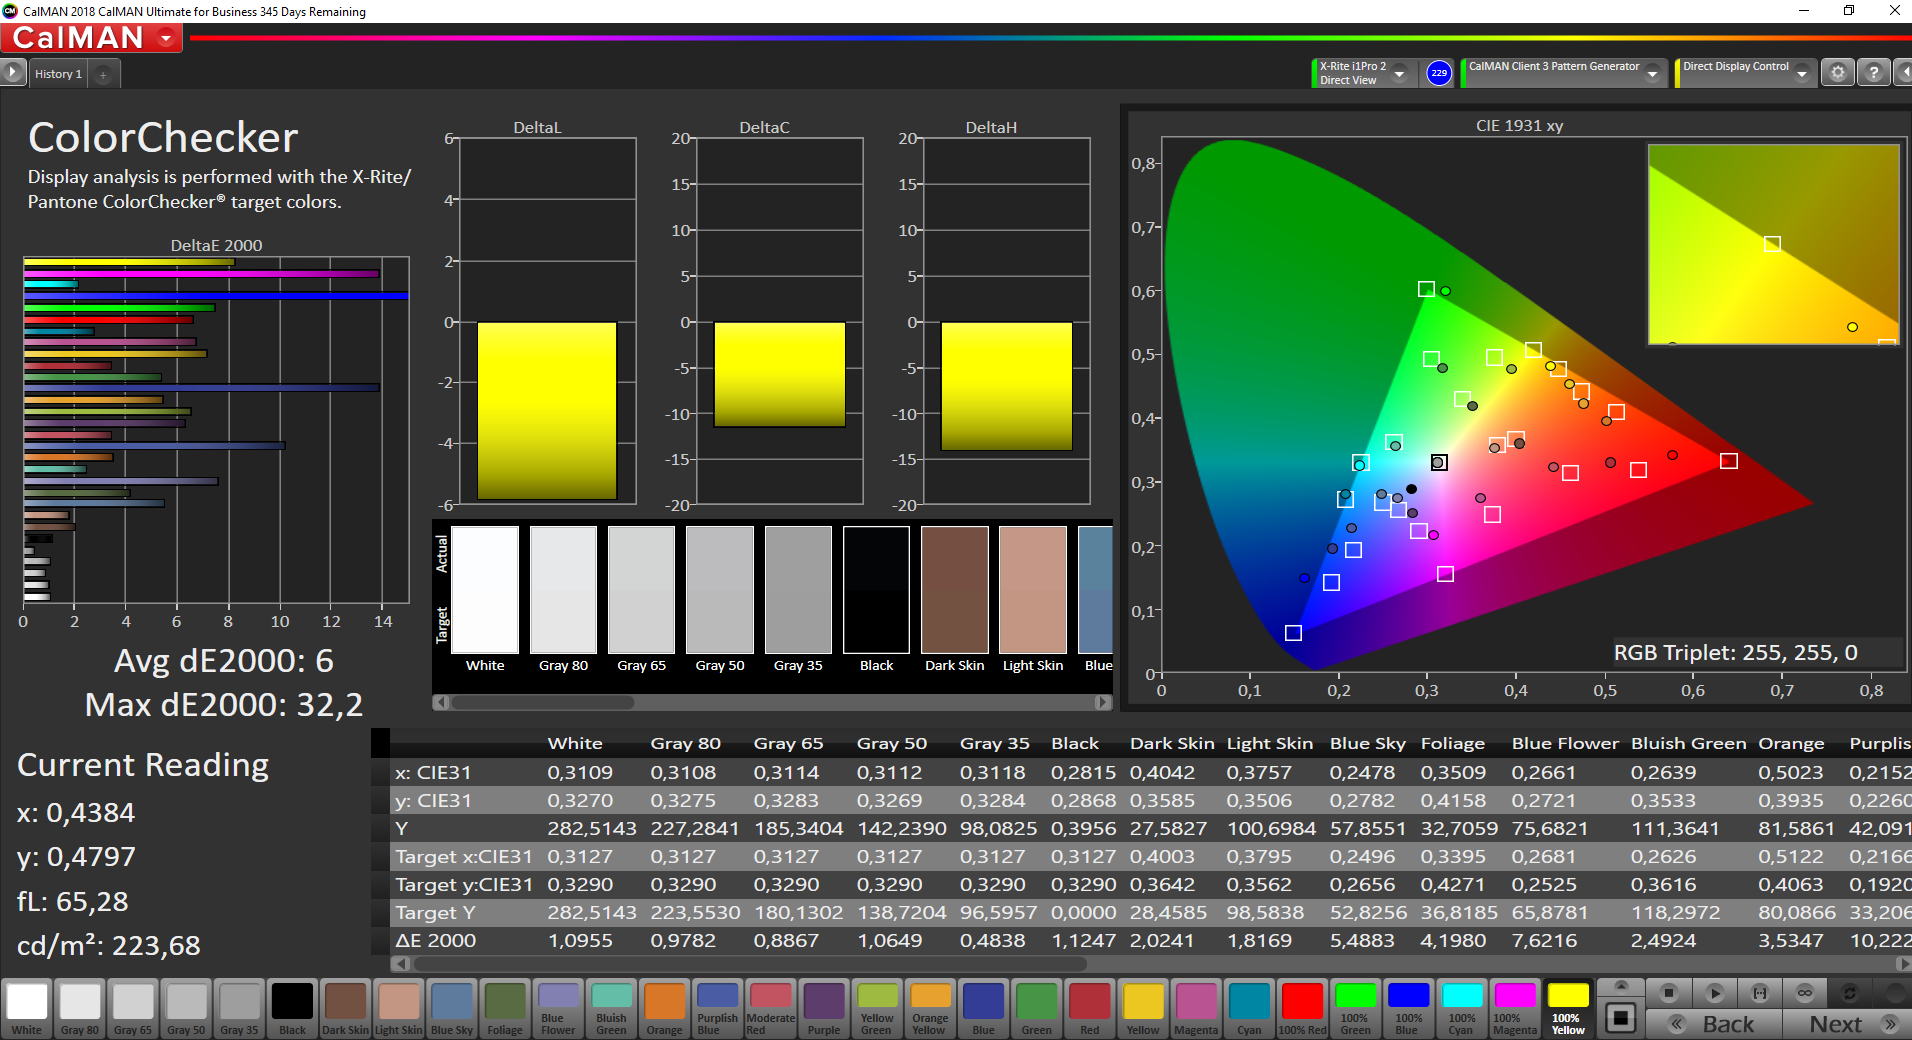
ΔE ColorChecker Calman: 7.7 | ∀{0.5-29.43 Ø4.72}
calibrated: 6
ΔE Greyscale Calman: 7.9 | ∀{0.09-98 Ø4.97}
64.9% sRGB (Argyll 1.6.3 3D)
42.2% AdobeRGB 1998 (Argyll 1.6.3 3D)
46.03% AdobeRGB 1998 (Argyll 3D)
65.4% sRGB (Argyll 3D)
44.51% Display P3 (Argyll 3D)
Gamma: 2.24
CCT: 6914 K
| Lenovo ThinkPad A285-20MX0002GE N125HCE-GN1, IPS LED, 1920x1080, 12.5" | Lenovo ThinkPad X280-20KES01S00 B125HAN02.2, IPS LED, 1920x1080, 12.5" | Dell Latitude 7390 AU Optronics AUO462D / B133HAN [DELL P/N:F7VDJ], IPS, 1920x1080, 13.3" | Fujitsu Lifebook U938 Sharp LQ133M1JW28, IPS, 1920x1080, 13.3" | HP Envy 13-ah0003ng M133NVF3 R0, IPS, 1920x1080, 13.3" | |
|---|---|---|---|---|---|
| Display | -1% | 43% | 48% | 24% | |
| Display P3 Coverage (%) | 44.51 | 44 -1% | 65.1 46% | 67.5 52% | 54.8 23% |
| sRGB Coverage (%) | 65.4 | 64.5 -1% | 90.8 39% | 94.5 44% | 82.5 26% |
| AdobeRGB 1998 Coverage (%) | 46.03 | 45.45 -1% | 65.9 43% | 68.7 49% | 56.6 23% |
| Response Times | 4% | -17% | 1% | 24% | |
| Response Time Grey 50% / Grey 80% * (ms) | 41 ? | 40 ? 2% | 48.8 ? -19% | 43 ? -5% | 31 ? 24% |
| Response Time Black / White * (ms) | 31 ? | 29.6 ? 5% | 35.2 ? -14% | 29 ? 6% | 24 ? 23% |
| PWM Frequency (Hz) | 25510 ? | 217 ? | 1000 ? | ||
| Screen | 21% | 35% | 32% | 39% | |
| Brightness middle (cd/m²) | 347 | 344 -1% | 329 -5% | 344 -1% | 289 -17% |
| Brightness (cd/m²) | 321 | 313 -2% | 316 -2% | 320 0% | 310 -3% |
| Brightness Distribution (%) | 88 | 82 -7% | 92 5% | 77 -12% | 85 -3% |
| Black Level * (cd/m²) | 0.37 | 0.25 32% | 0.25 32% | 0.31 16% | 0.23 38% |
| Contrast (:1) | 938 | 1376 47% | 1316 40% | 1110 18% | 1257 34% |
| Colorchecker dE 2000 * | 7.7 | 4.7 39% | 4.3 44% | 2.72 65% | 1.64 79% |
| Colorchecker dE 2000 max. * | 31 | 19.4 37% | 7.8 75% | 5.92 81% | 3.31 89% |
| Colorchecker dE 2000 calibrated * | 6 | 2.5 58% | 0.99 83% | ||
| Greyscale dE 2000 * | 7.9 | 2.2 72% | 3.6 54% | 2.74 65% | 1.71 78% |
| Gamma | 2.24 98% | 2.16 102% | 2.43 91% | 2.38 92% | 2.32 95% |
| CCT | 6914 94% | 6252 104% | 6928 94% | 6794 96% | 6291 103% |
| Color Space (Percent of AdobeRGB 1998) (%) | 42.2 | 41.2 -2% | 59.1 40% | 61 45% | 52 23% |
| Color Space (Percent of sRGB) (%) | 64.9 | 64.1 -1% | 90.6 40% | 94 45% | 82 26% |
| Total Average (Program / Settings) | 8% /
15% | 20% /
30% | 27% /
31% | 29% /
34% |
* ... smaller is better
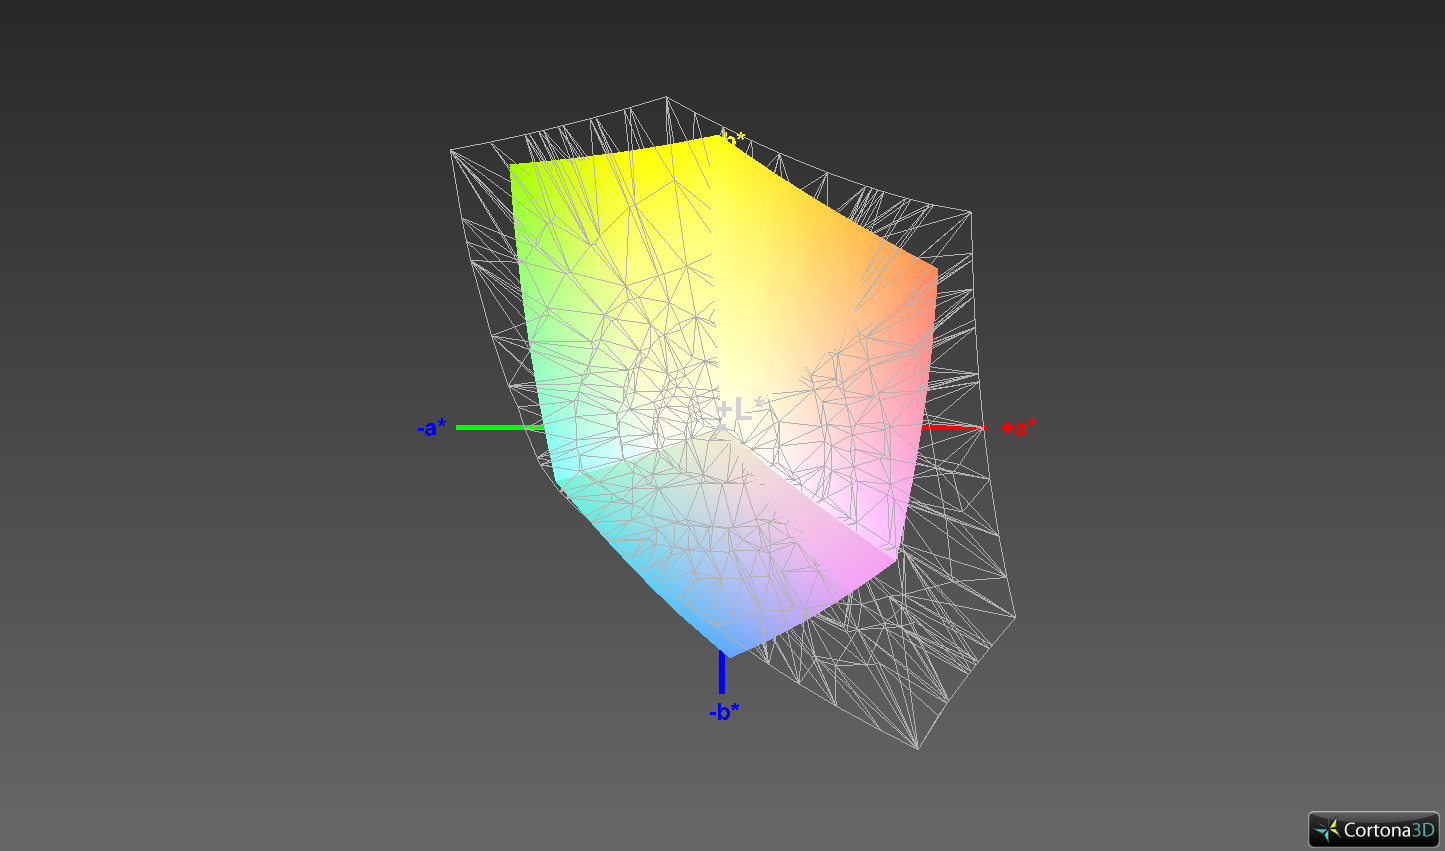
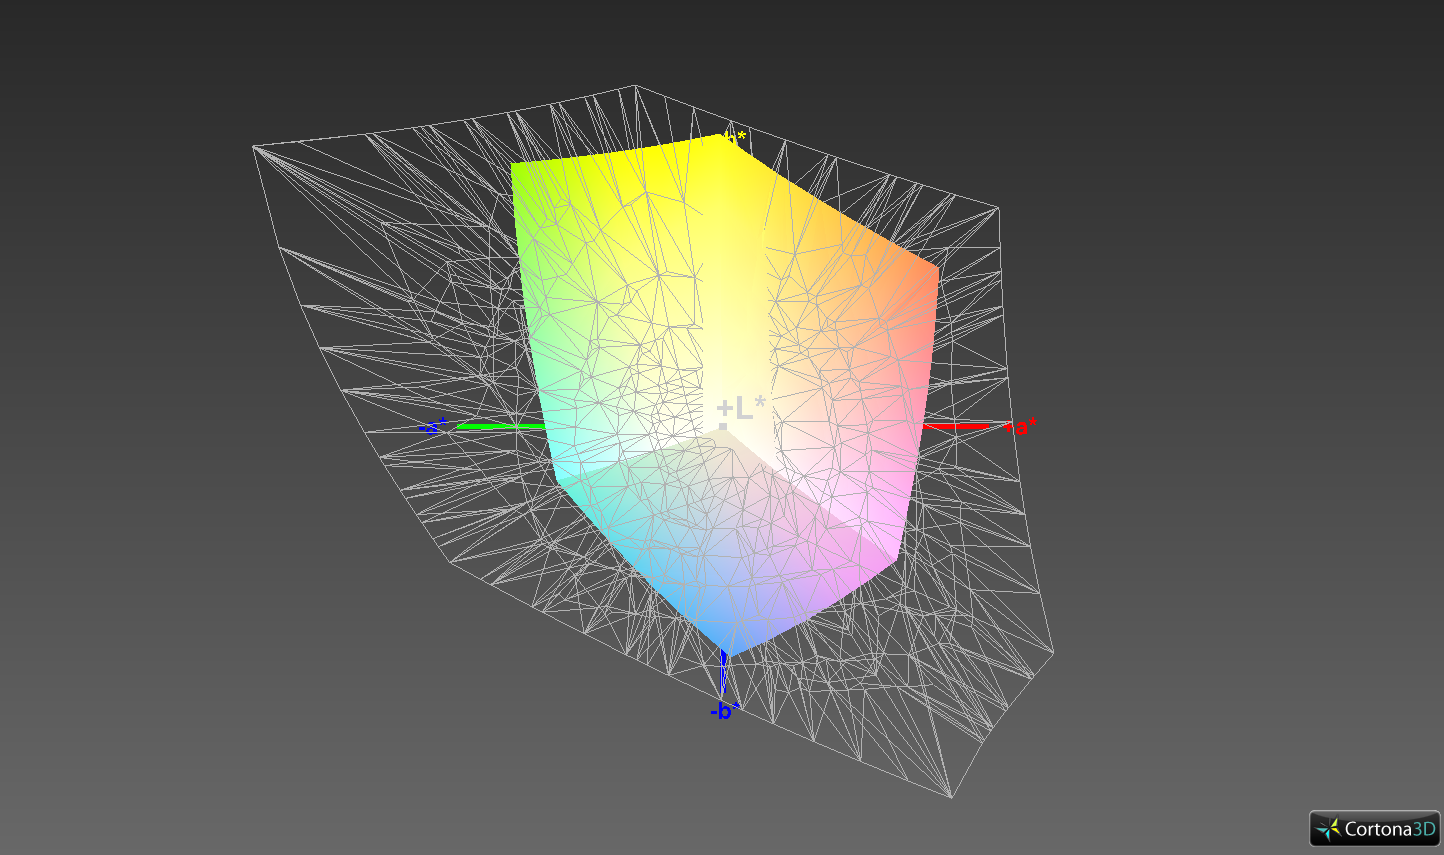
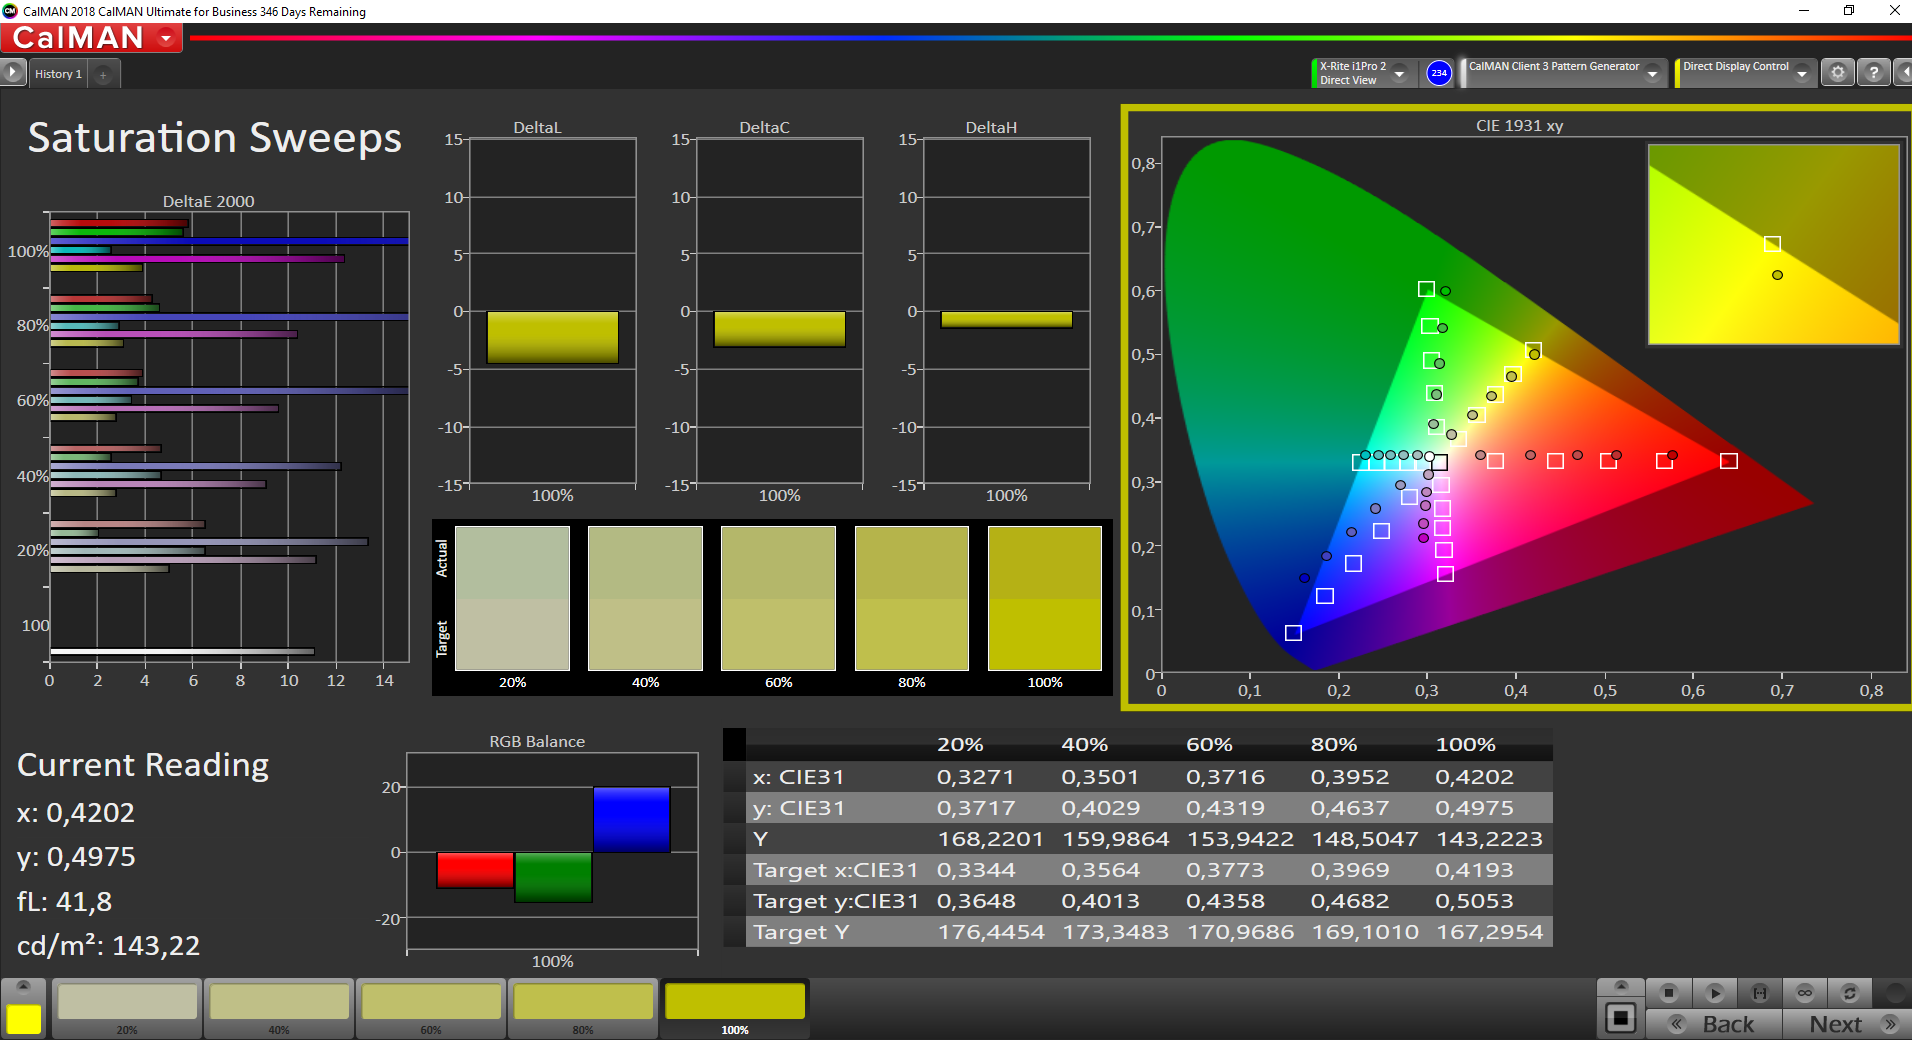
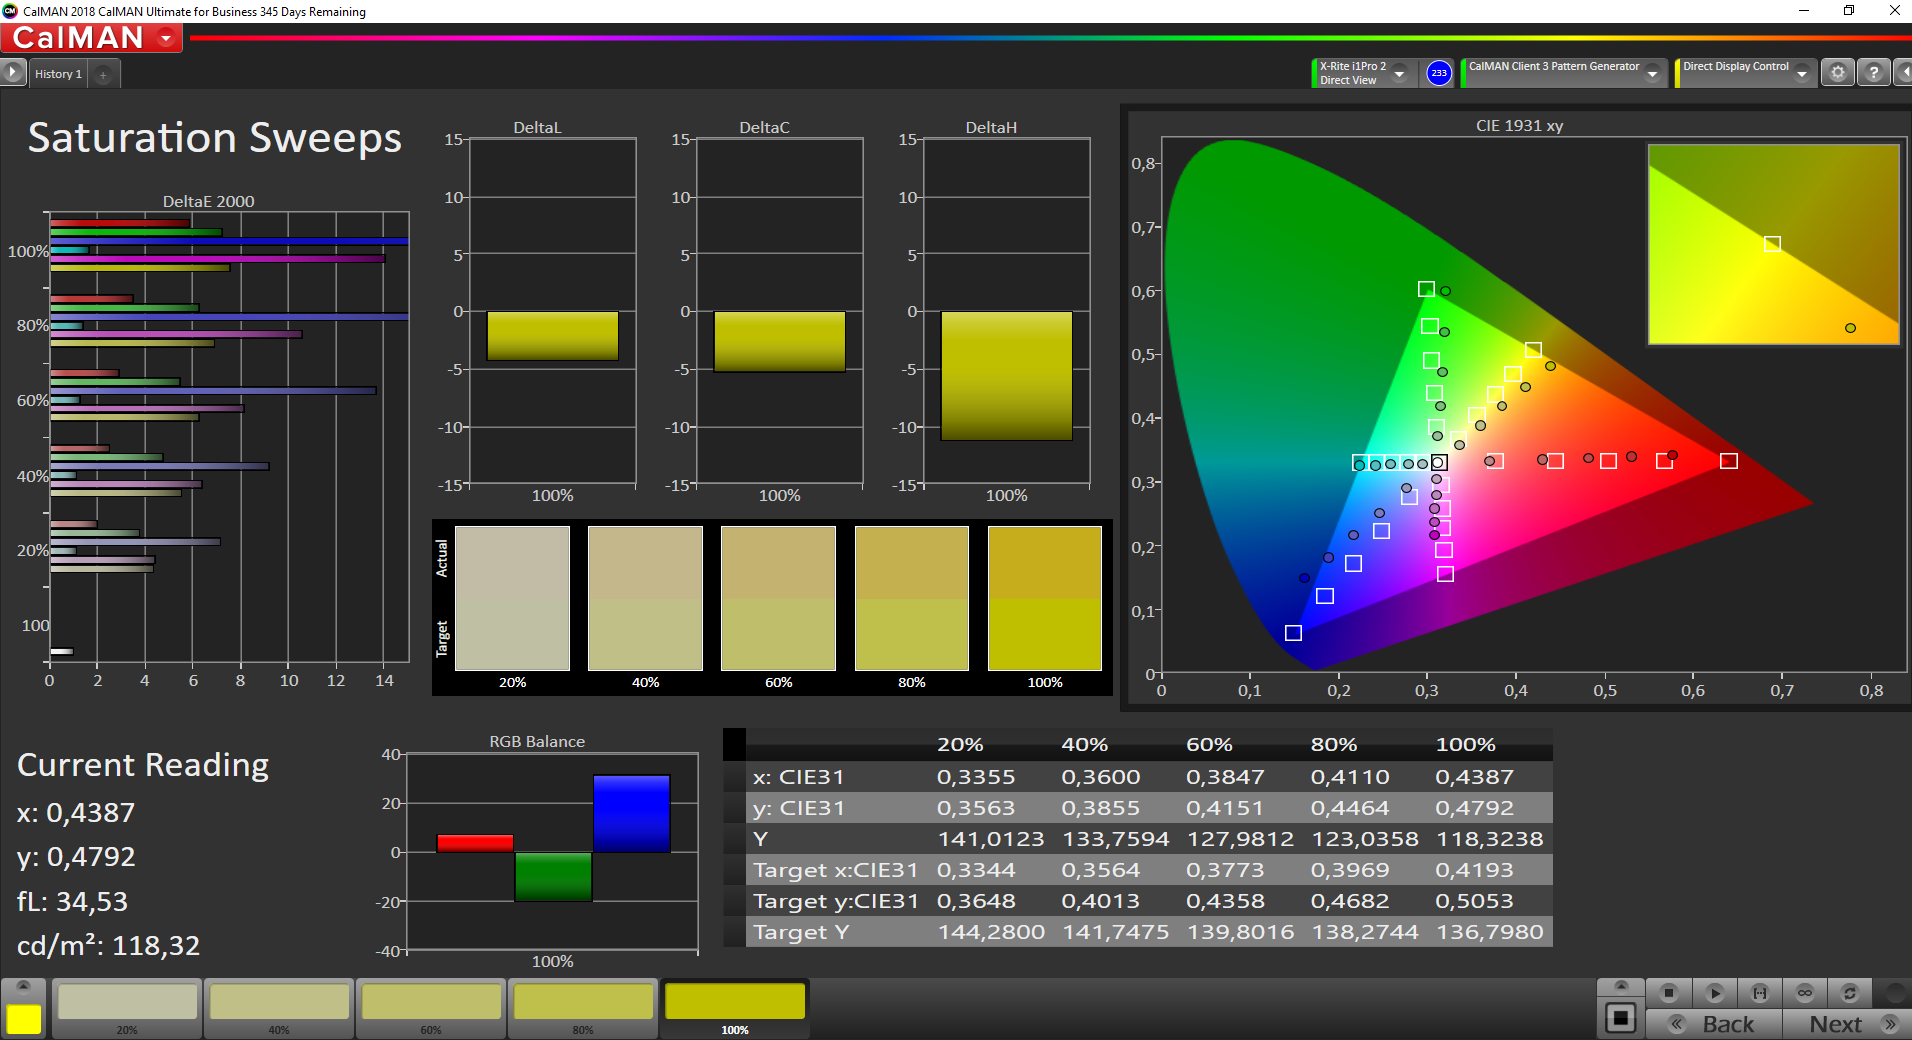
Our test model shows increased DeltaE-2000 deviations ex-works. The comparison devices are superior thanks to pre-calibrated units. Our A285 also shows a slight color cast (blue-green), but it is fortunately not too strong. Our calibration improves the grayscale performance significantly and the color cast is gone, even though the color deviations do not change that much. The corresponding icc profile is linked in the box above and can be downloaded for free. Both 12.5-inch displays are similar in terms of color gamut and are therefore not suited for (semi) professional picture editing. It is still a decent panel for an office device.
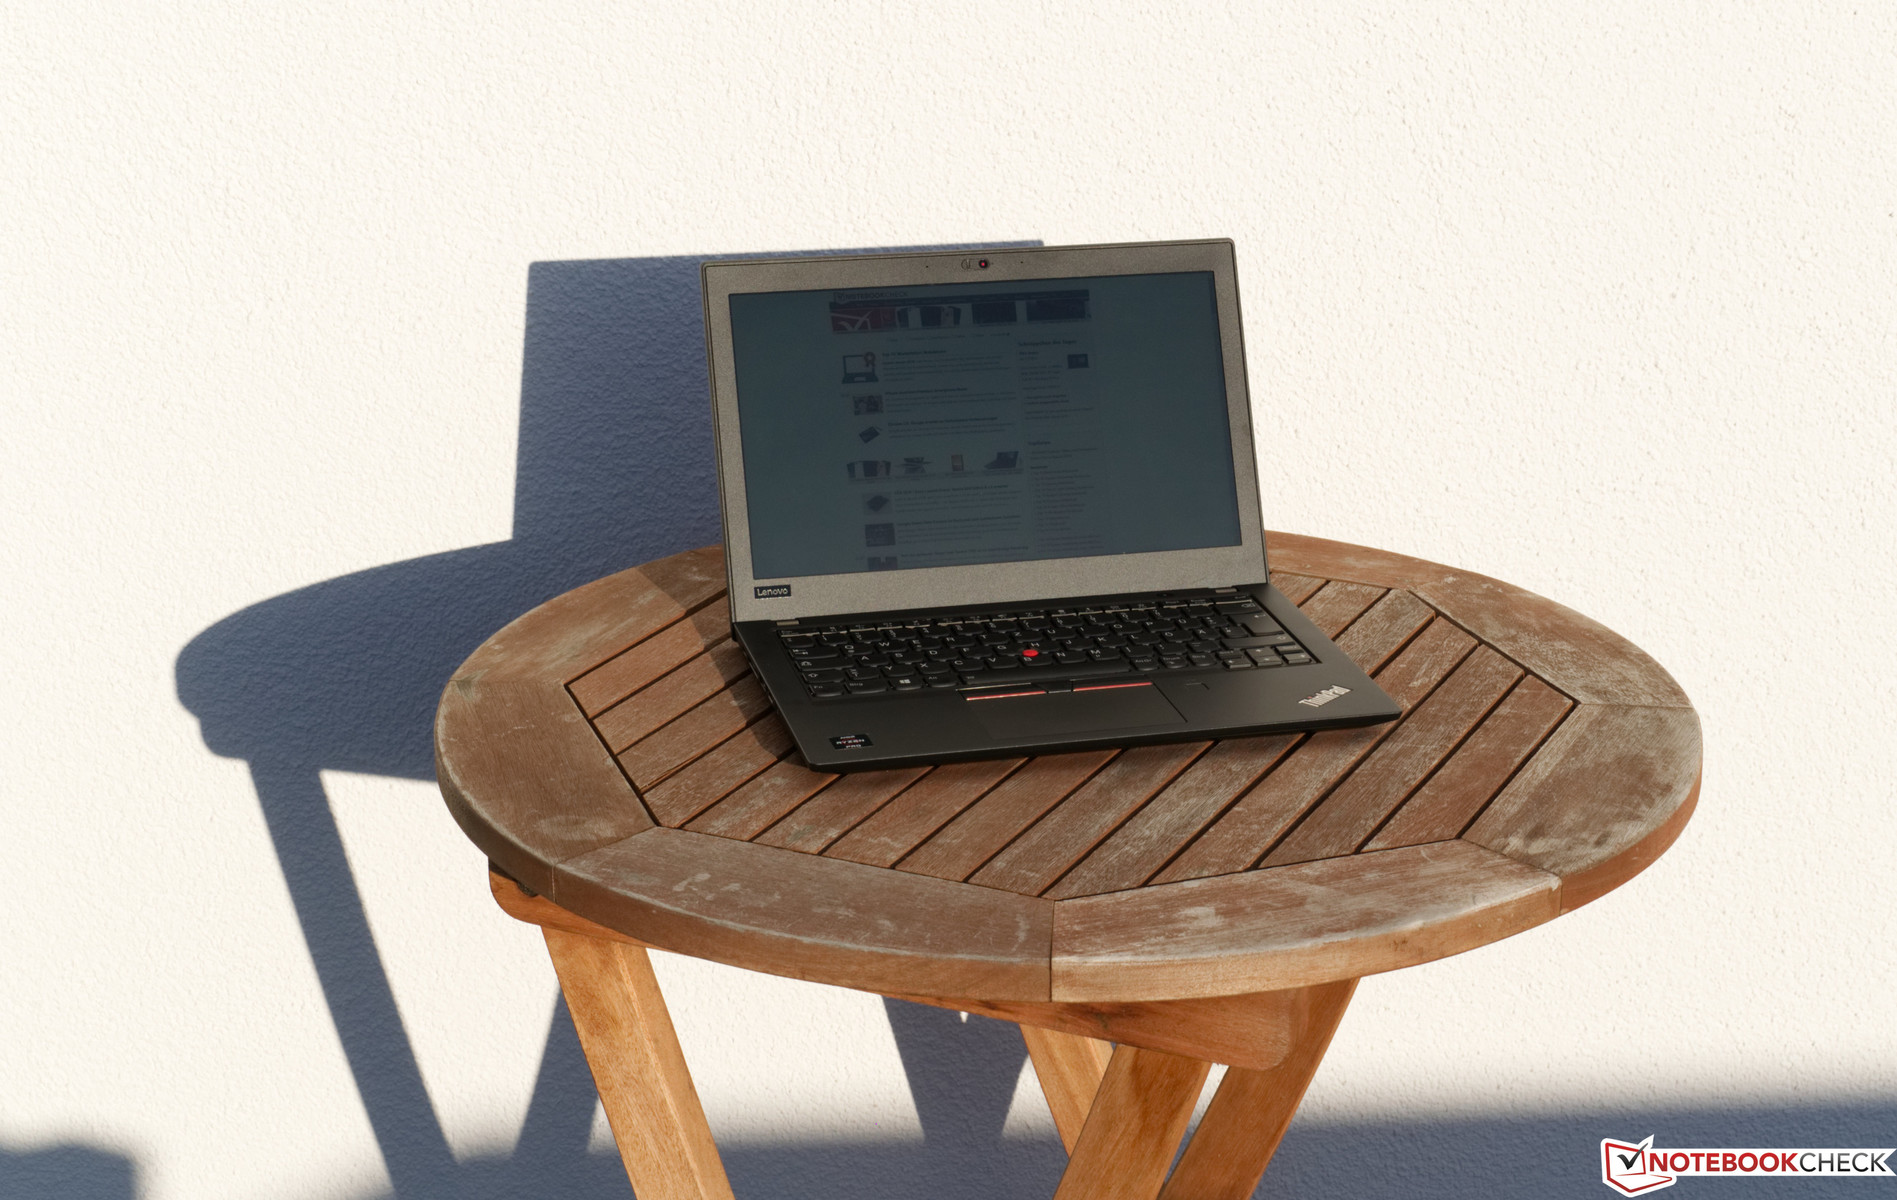
Thanks to the matte panel surface, there are no major limitations when you use it outdoors. The luminance is also good and sufficient, but you should still avoid direct sunlight and prefer a place in the shade.
Display Response Times
| ↔ Response Time Black to White | ||
|---|---|---|
| 31 ms ... rise ↗ and fall ↘ combined | ↗ 16 ms rise | 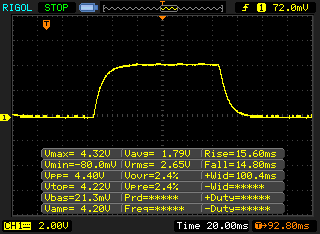 |
| ↘ 15 ms fall | ||
| The screen shows slow response rates in our tests and will be unsatisfactory for gamers. In comparison, all tested devices range from 0.1 (minimum) to 240 (maximum) ms. » 84 % of all devices are better. This means that the measured response time is worse than the average of all tested devices (19.8 ms). | ||
| ↔ Response Time 50% Grey to 80% Grey | ||
| 41 ms ... rise ↗ and fall ↘ combined | ↗ 22 ms rise | 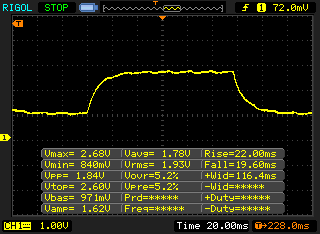 |
| ↘ 19 ms fall | ||
| The screen shows slow response rates in our tests and will be unsatisfactory for gamers. In comparison, all tested devices range from 0.165 (minimum) to 636 (maximum) ms. » 65 % of all devices are better. This means that the measured response time is worse than the average of all tested devices (31 ms). | ||
Screen Flickering / PWM (Pulse-Width Modulation)
| Screen flickering / PWM detected | 25510 Hz | ≤ 50 % brightness setting | 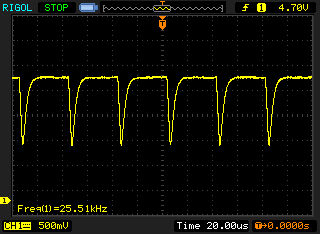 |
The display backlight flickers at 25510 Hz (worst case, e.g., utilizing PWM) Flickering detected at a brightness setting of 50 % and below. There should be no flickering or PWM above this brightness setting. The frequency of 25510 Hz is quite high, so most users sensitive to PWM should not notice any flickering. In comparison: 52 % of all tested devices do not use PWM to dim the display. If PWM was detected, an average of 7747 (minimum: 5 - maximum: 343500) Hz was measured. | |||
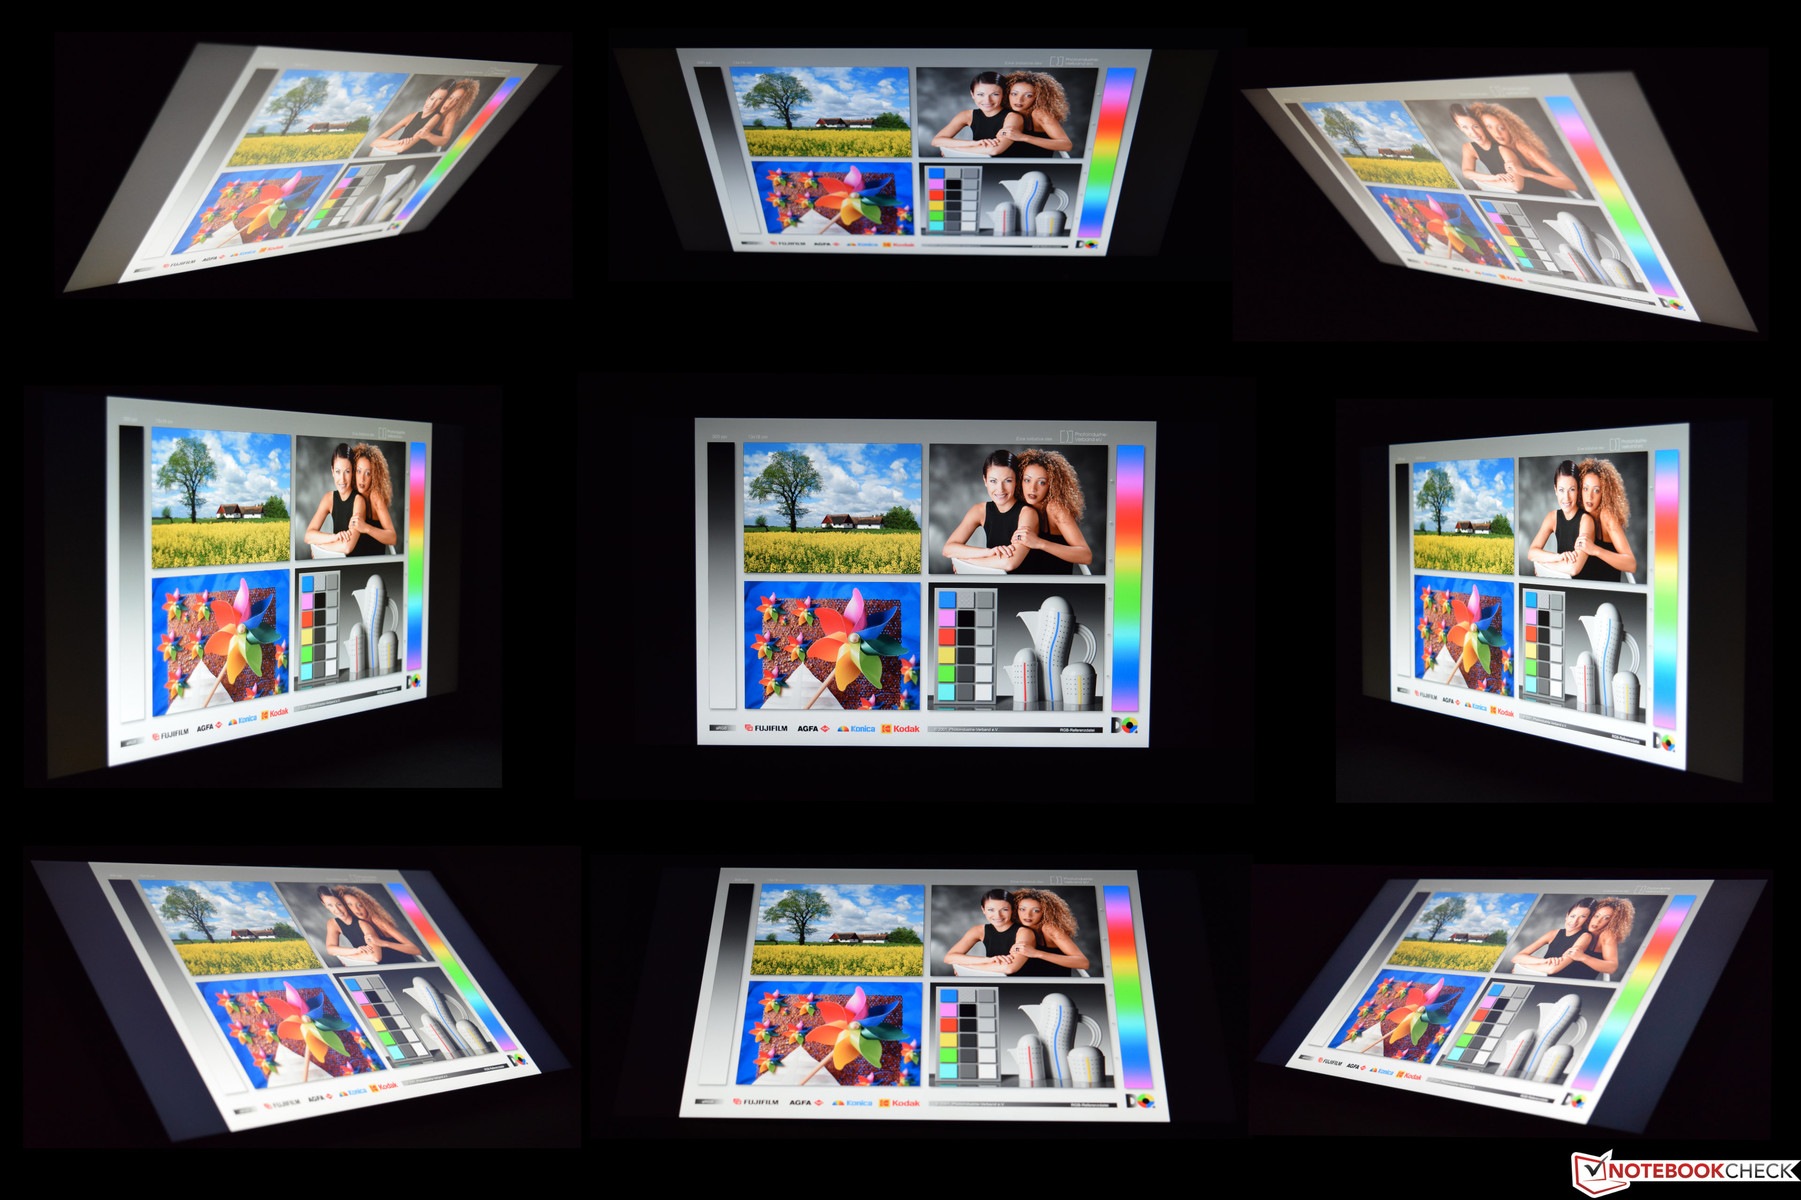
The IPS screen ensures wide viewing angles and we only noticed a slight loss of contrast and color deviations from extreme angles. However, this is no problem in practice since those angles are rare in everyday use.
Performance - Quad-core Ryzen 5 Pro
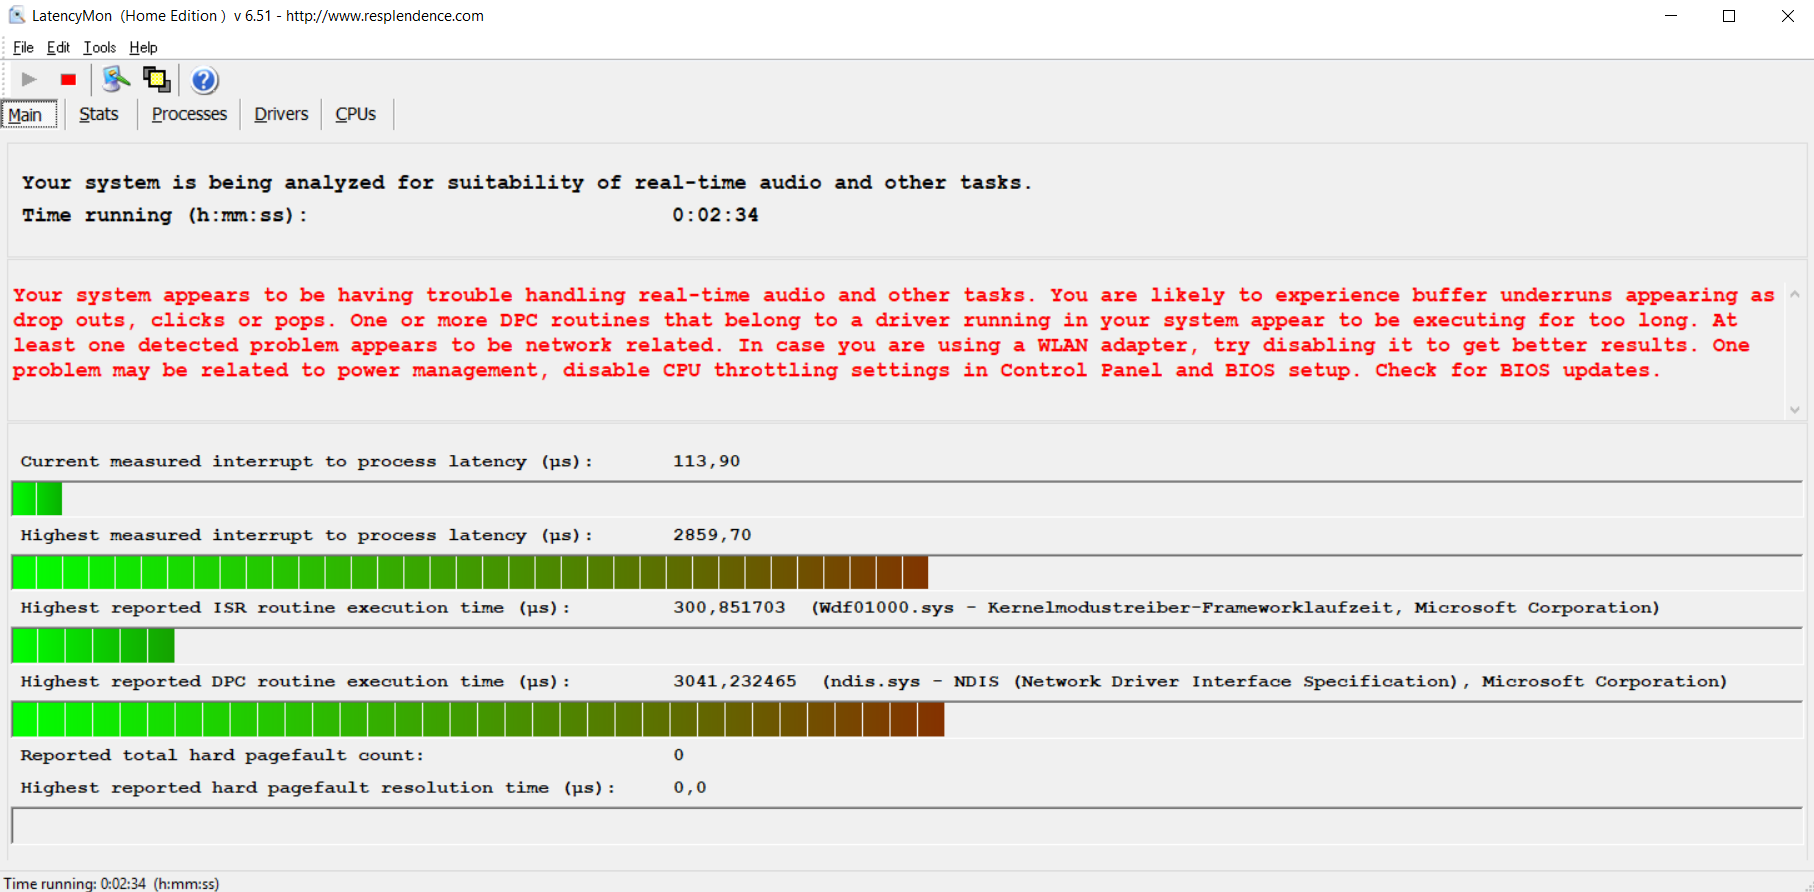
The performance of the AMD Ryzen 5 Pro 2500U is more than sufficient for common office tasks. You should take into the account the iGPU (AMD Radeon Vega 8), which occupies a part of the memory (shared memory), so you cannot use the full amount. If you want to use the device for virtual machines, we recommend you select an SKU with 16 GB of RAM. LatencyMon also detected increased latencies, so the drivers are not working perfectly yet and we hope this will improve with future updates. During our review, we could not detect dropouts during the playback of multimedia contents.

Processor
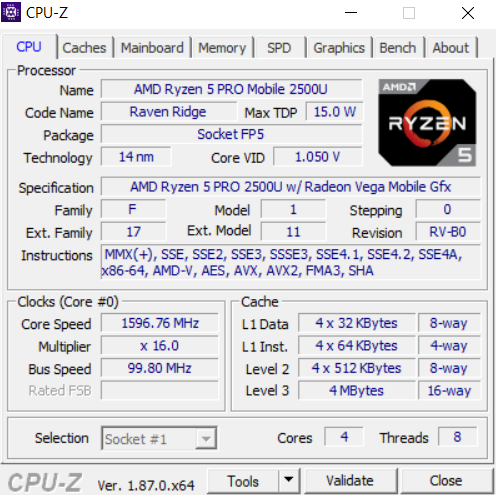
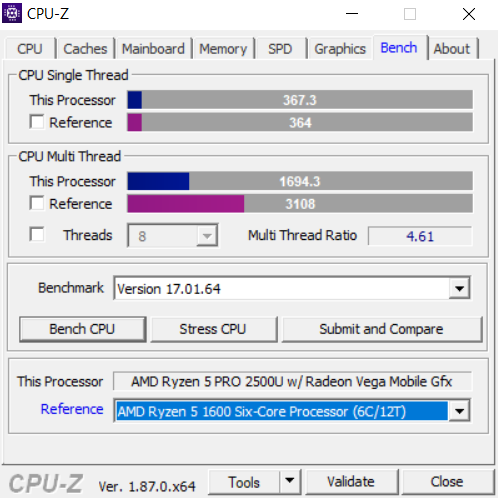
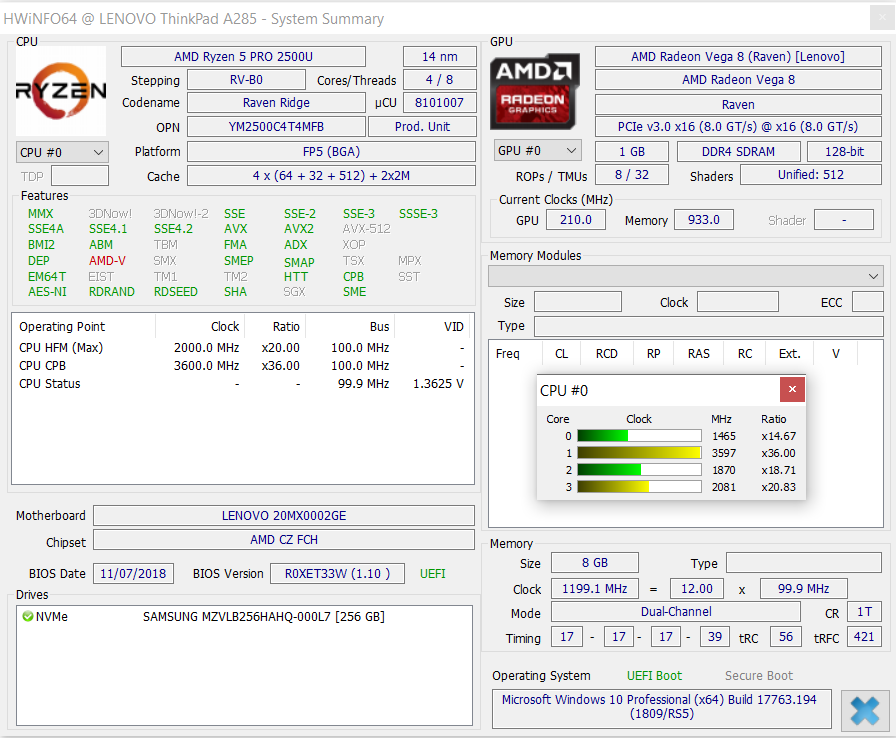
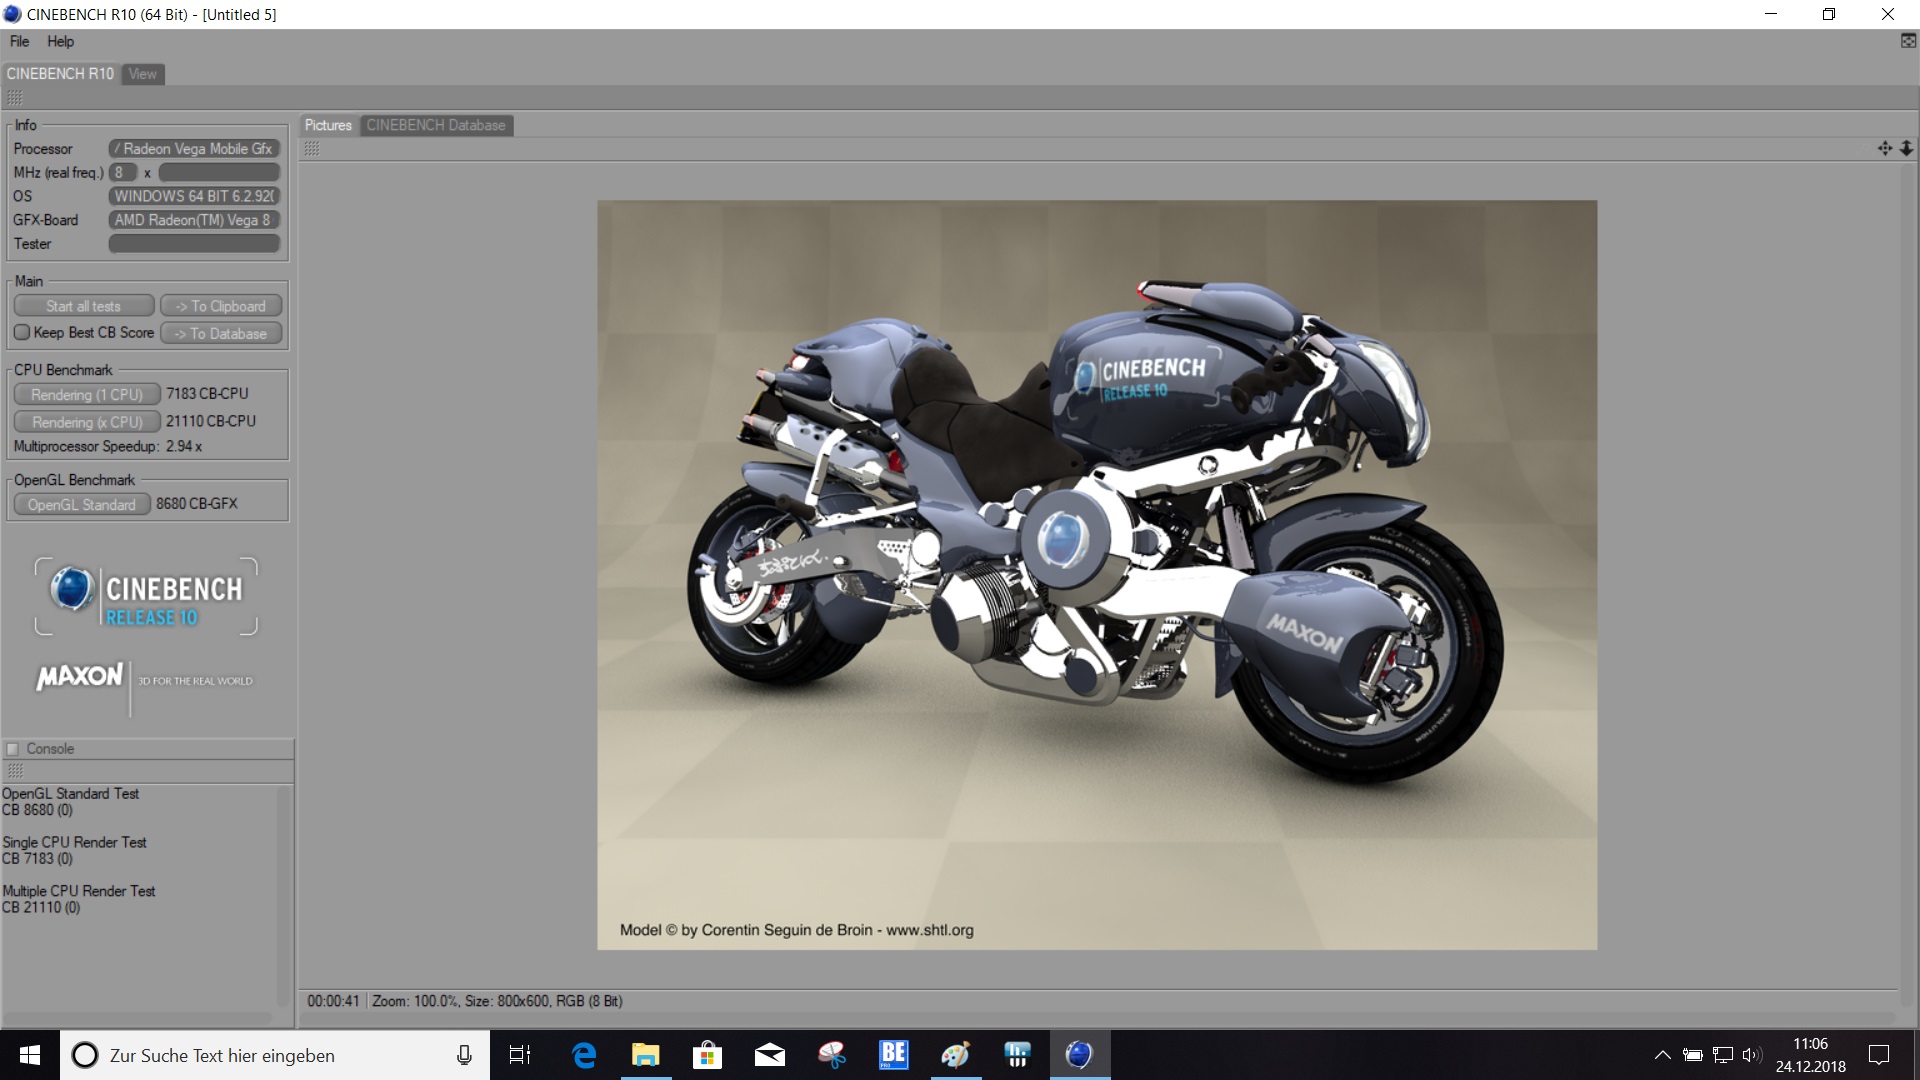
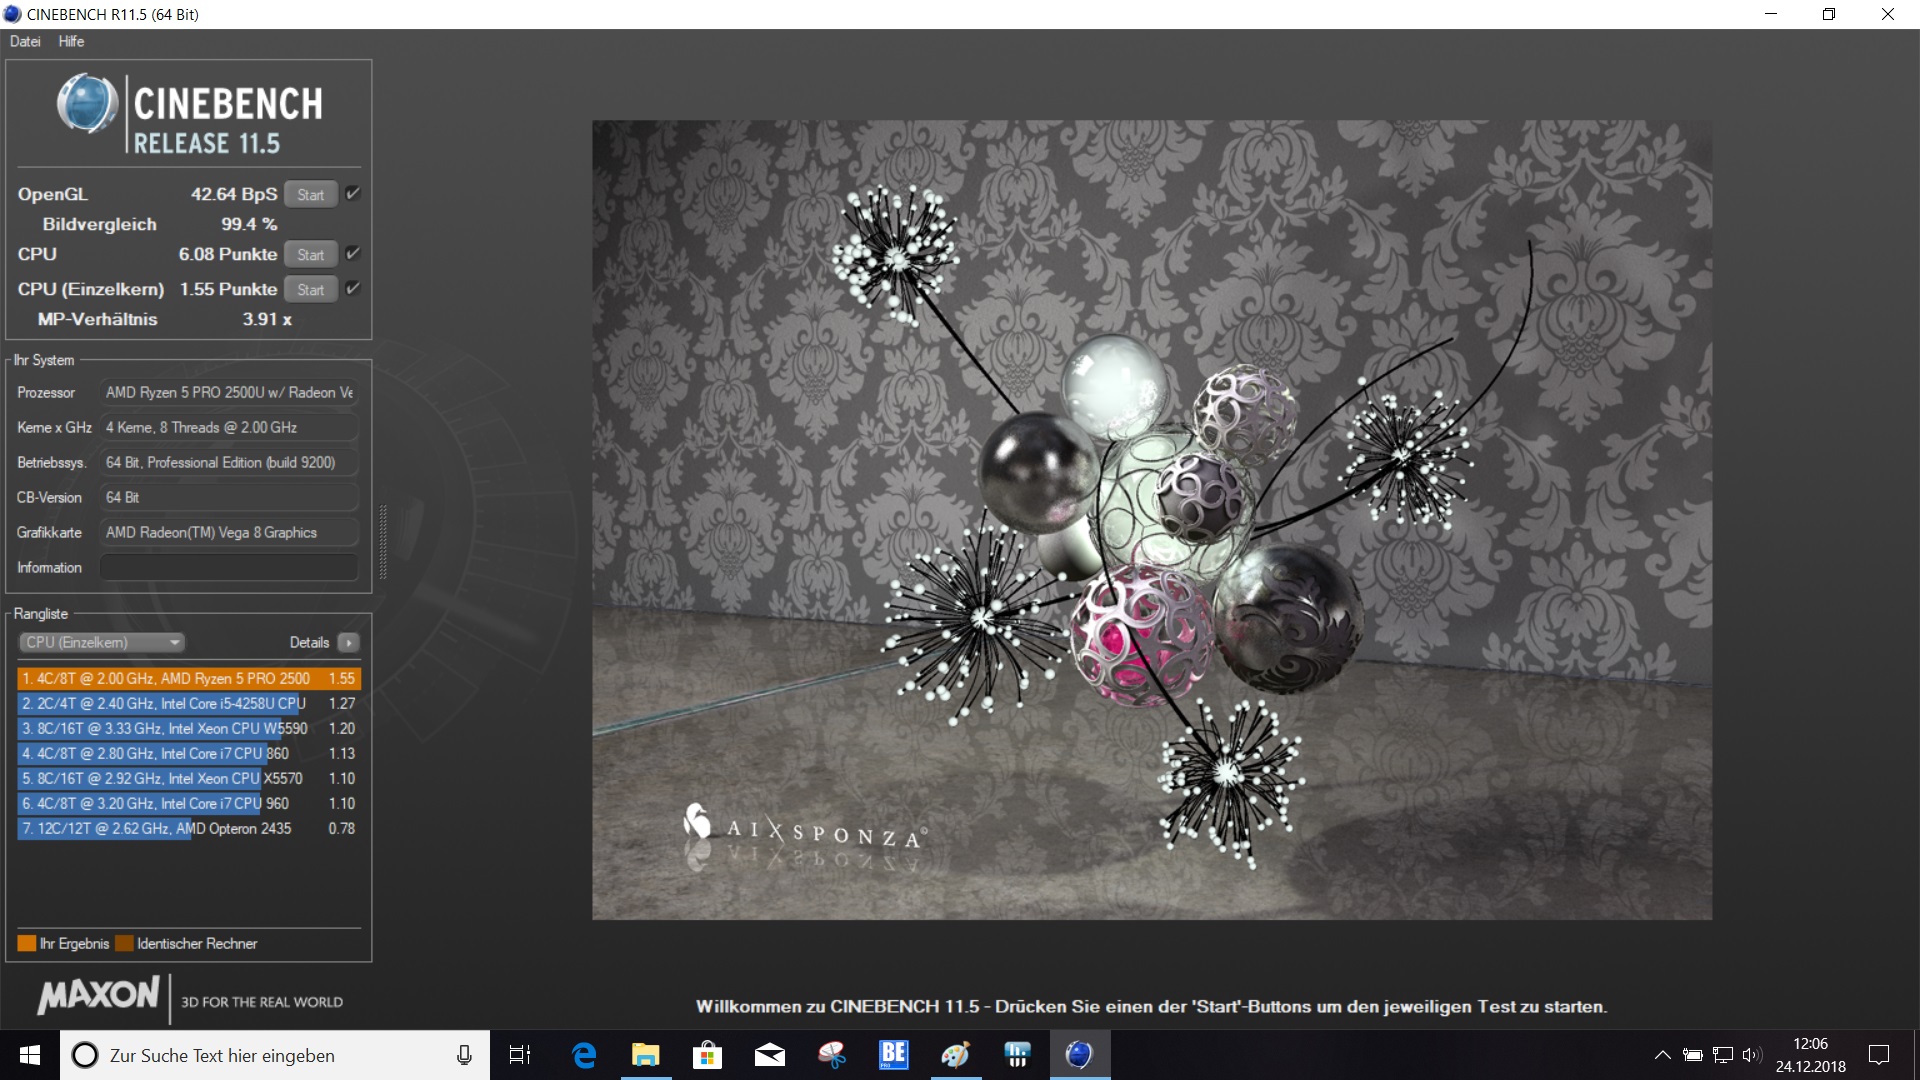
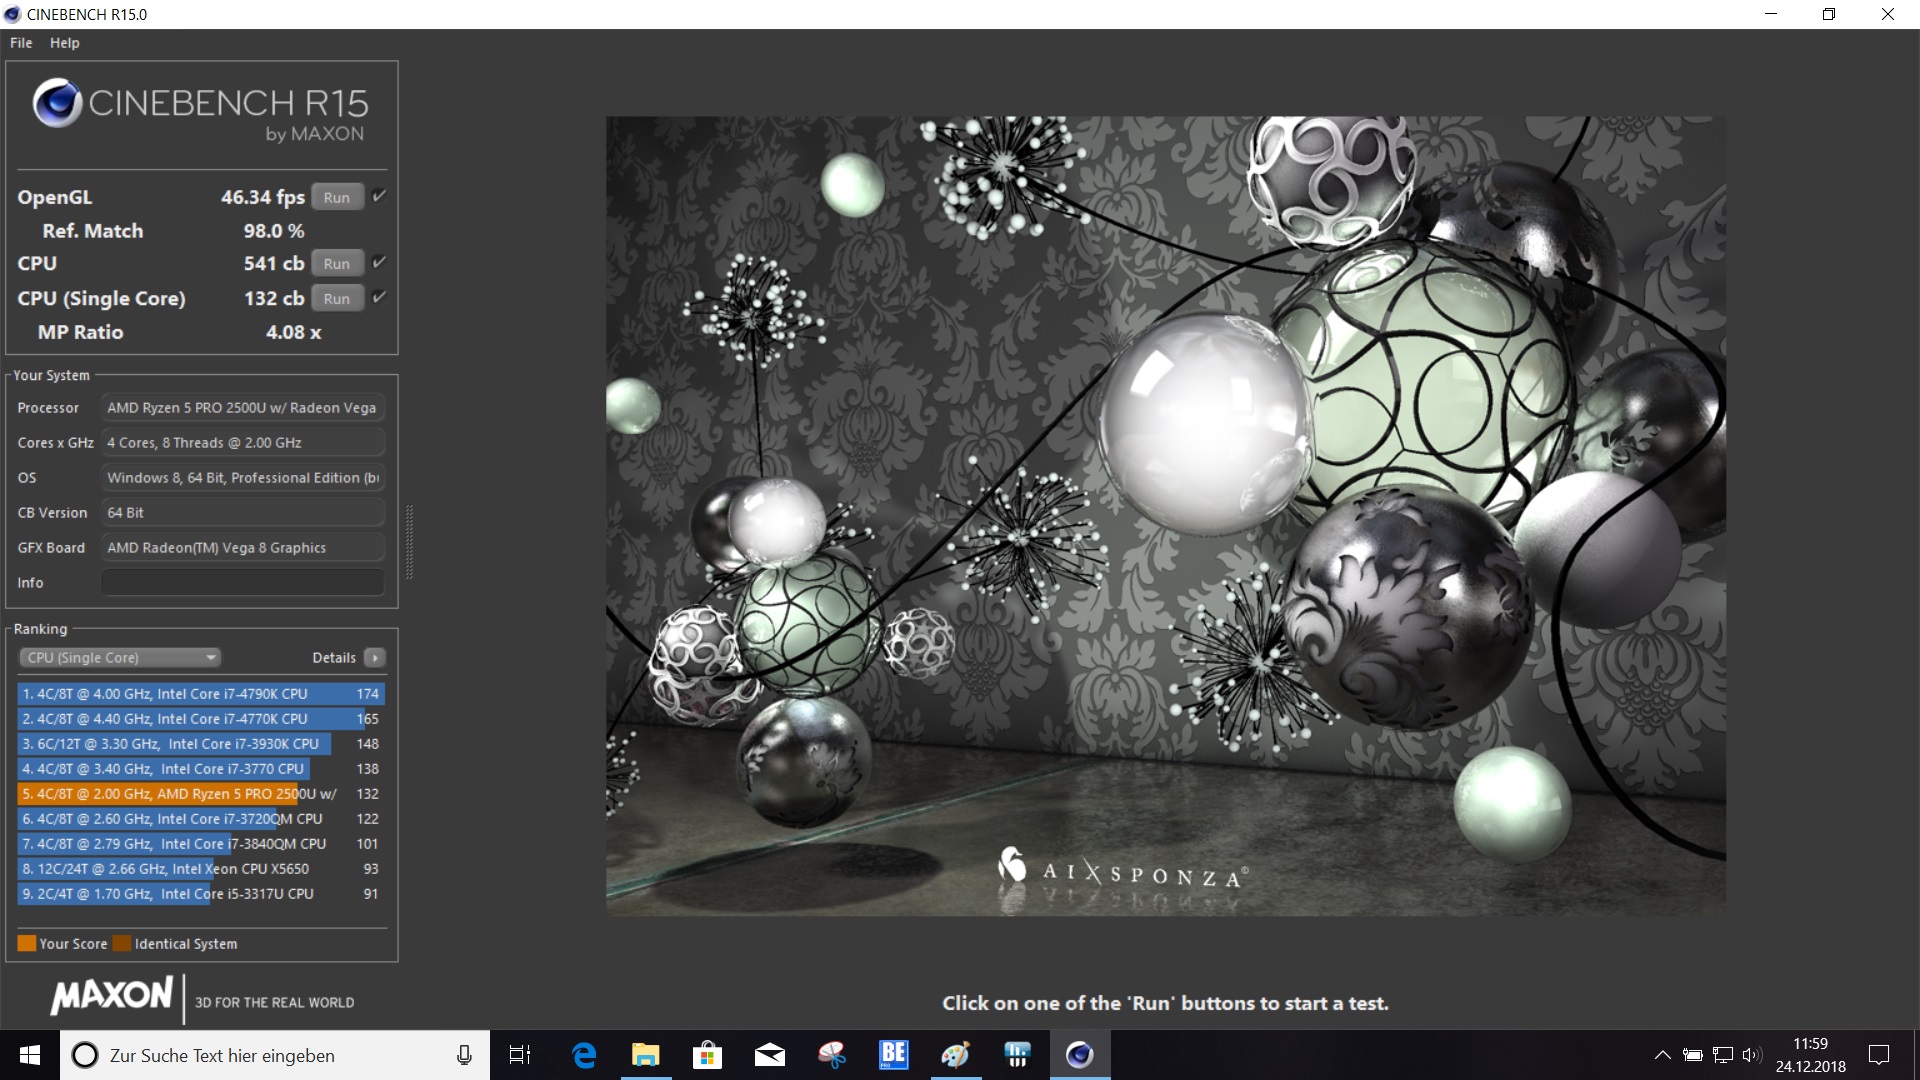
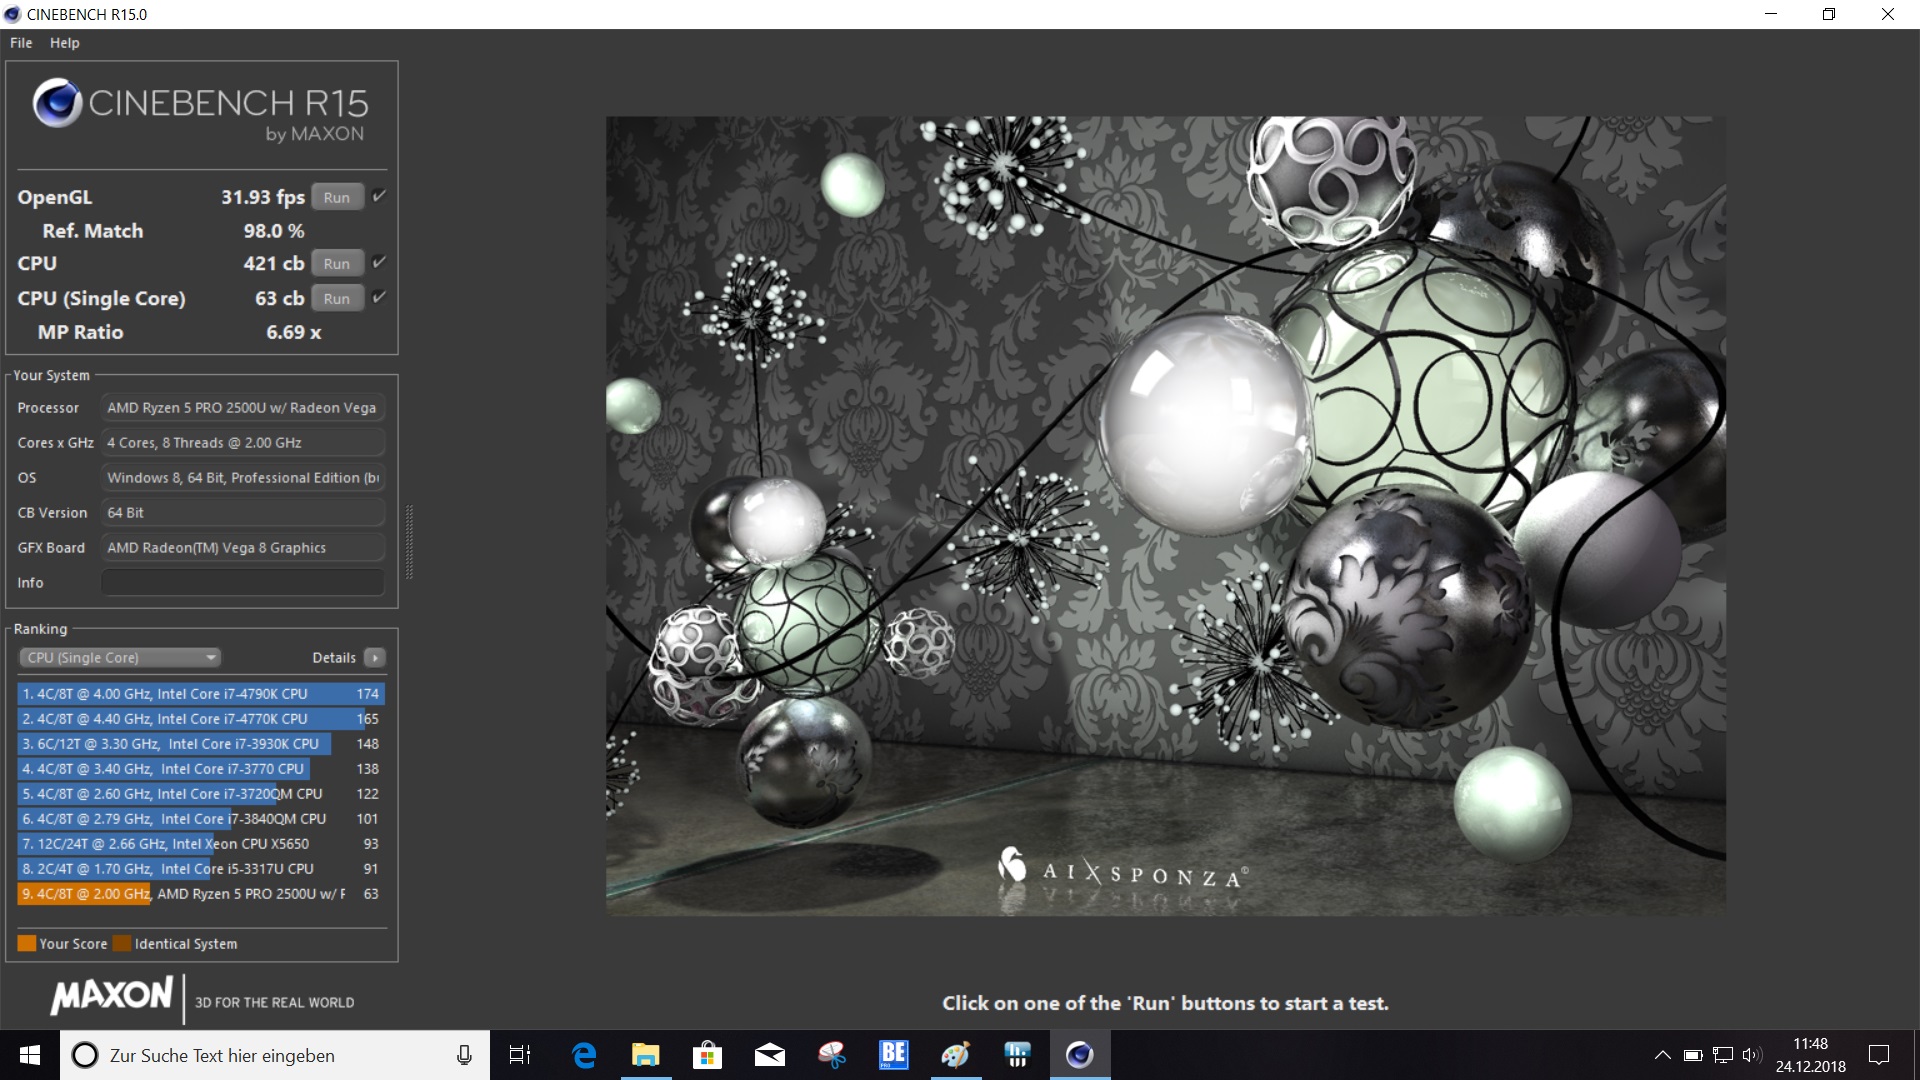
The AMD Ryzen 5 Pro 2500U is a quad-core processor and can execute up to 8 threads simultaneously at a base frequency of 2 GHz. The maximum turbo clock is 3.6 GHz. The standard power consumption is rated at 15 watts and therefore identical to the Intel competition. The performance comparison shows that the Ryzen 5 Pro 2500U can keep up with the Intel-powered rivals at first, but the single-core performance of the AMD processor is still lower.
Our Cinebench R15 Multi loop shows a performance drop after the first iteration to 438 points and the score levels off at 438 points with the third run.
A direct comparison shows that the Intel CPU in the X280 is faster under sustained workloads. However, you also have to consider the power consumption, because the processor in the X280 is allowed to consume slightly more power. The difference between the two models would be smaller if the TDP configuration would be identical.
* ... smaller is better
System Performance
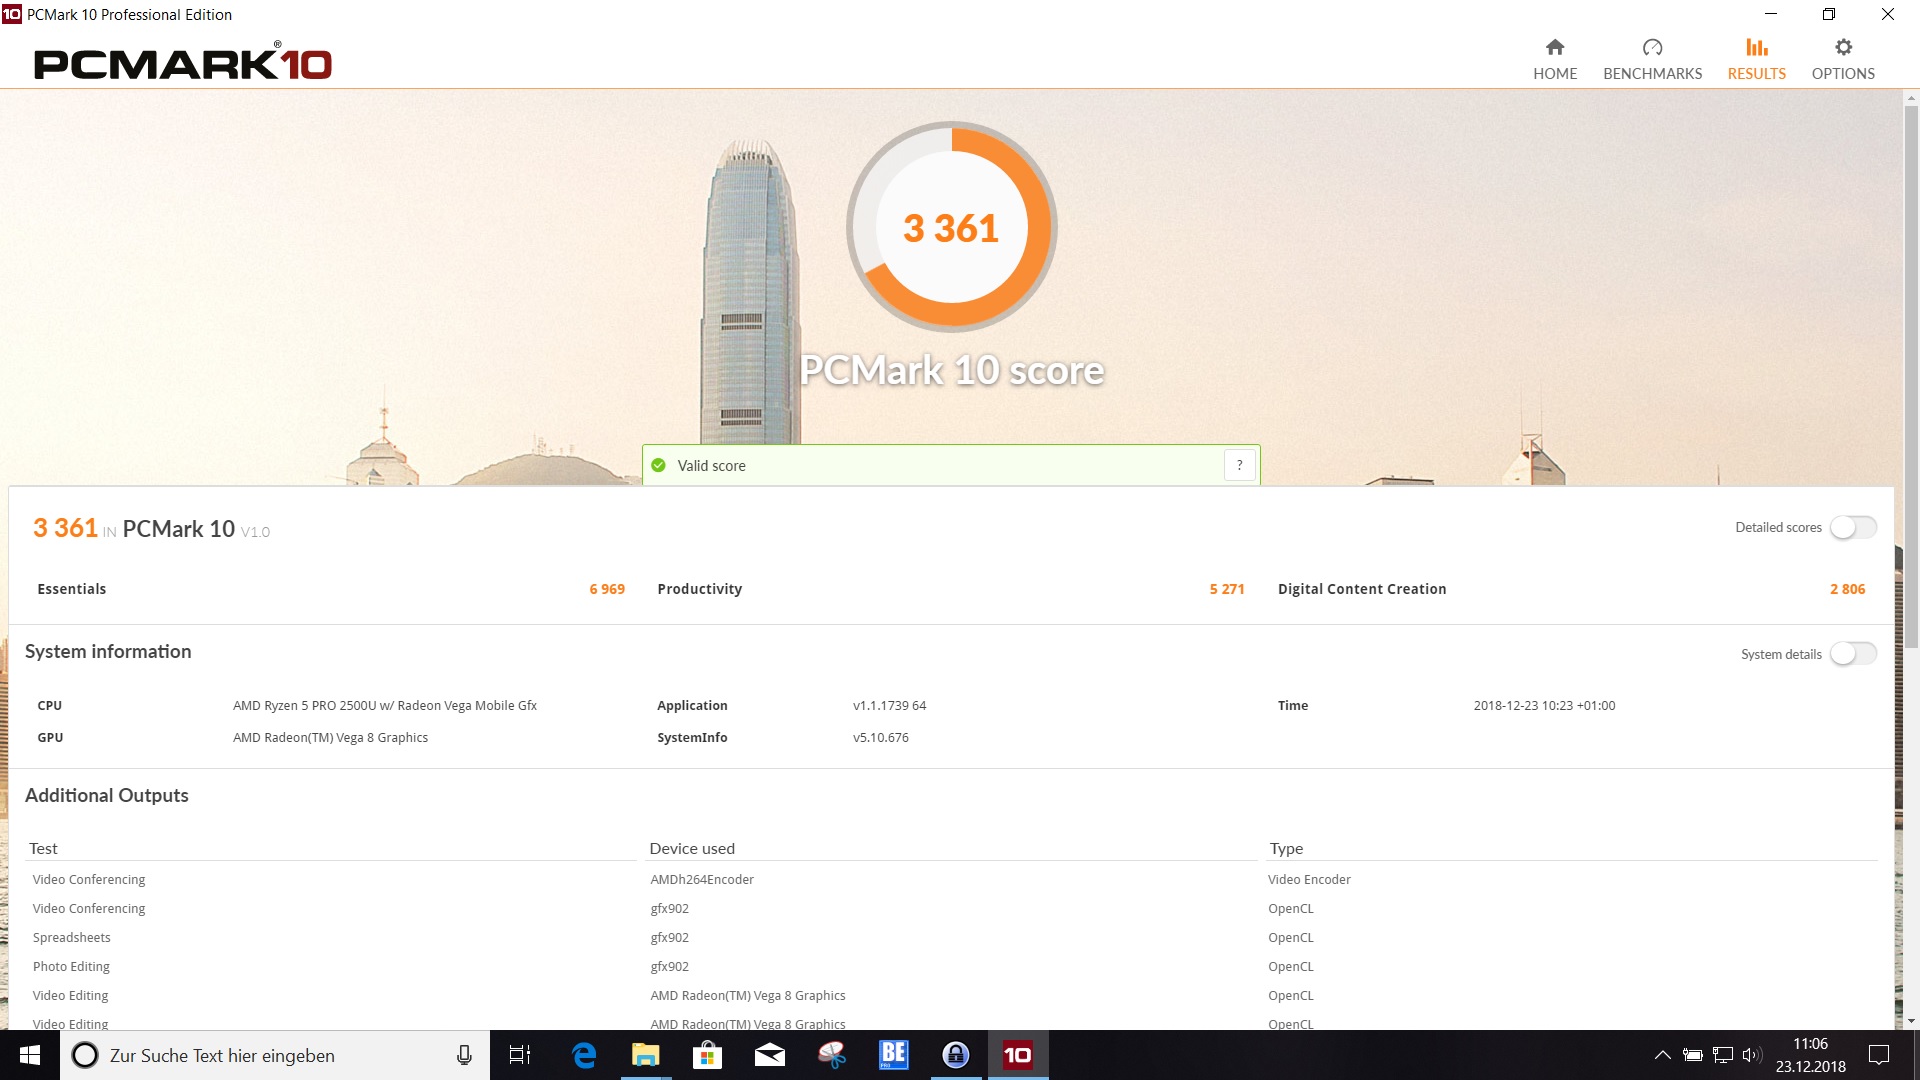
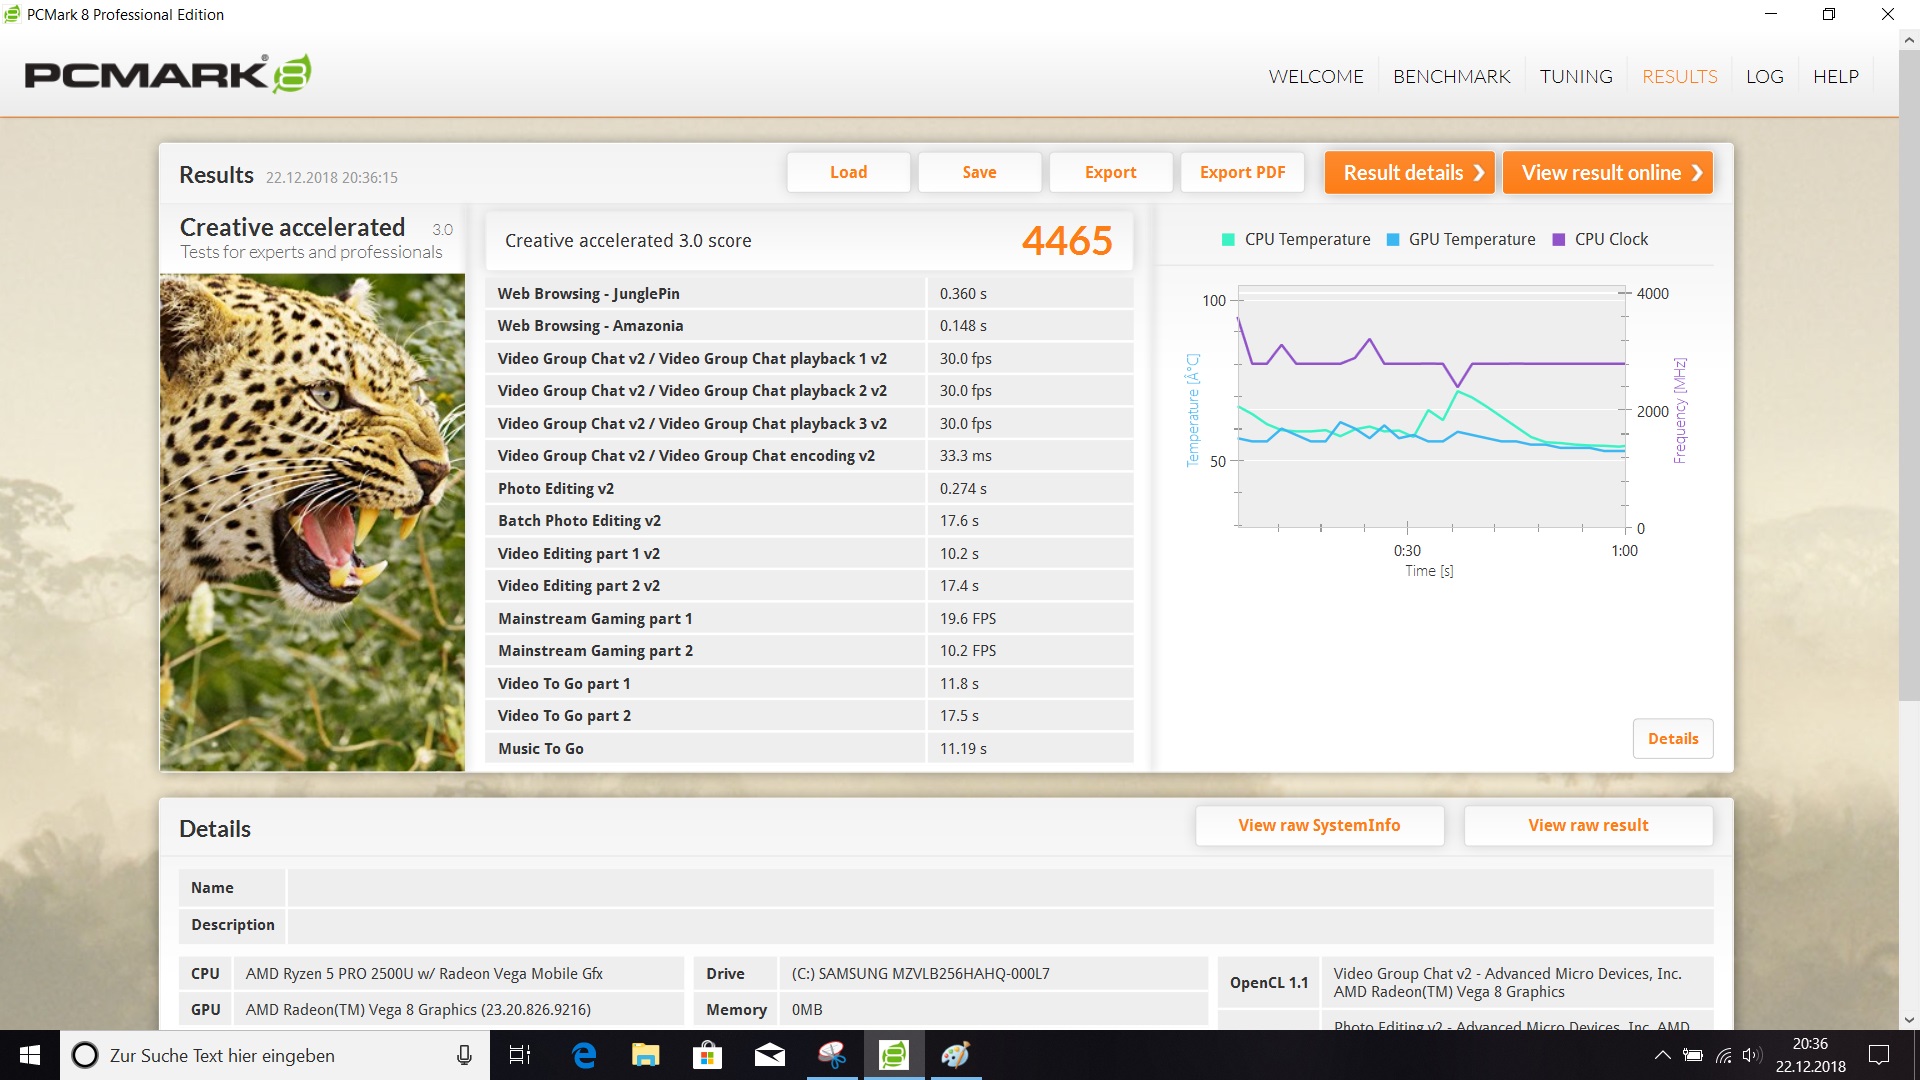
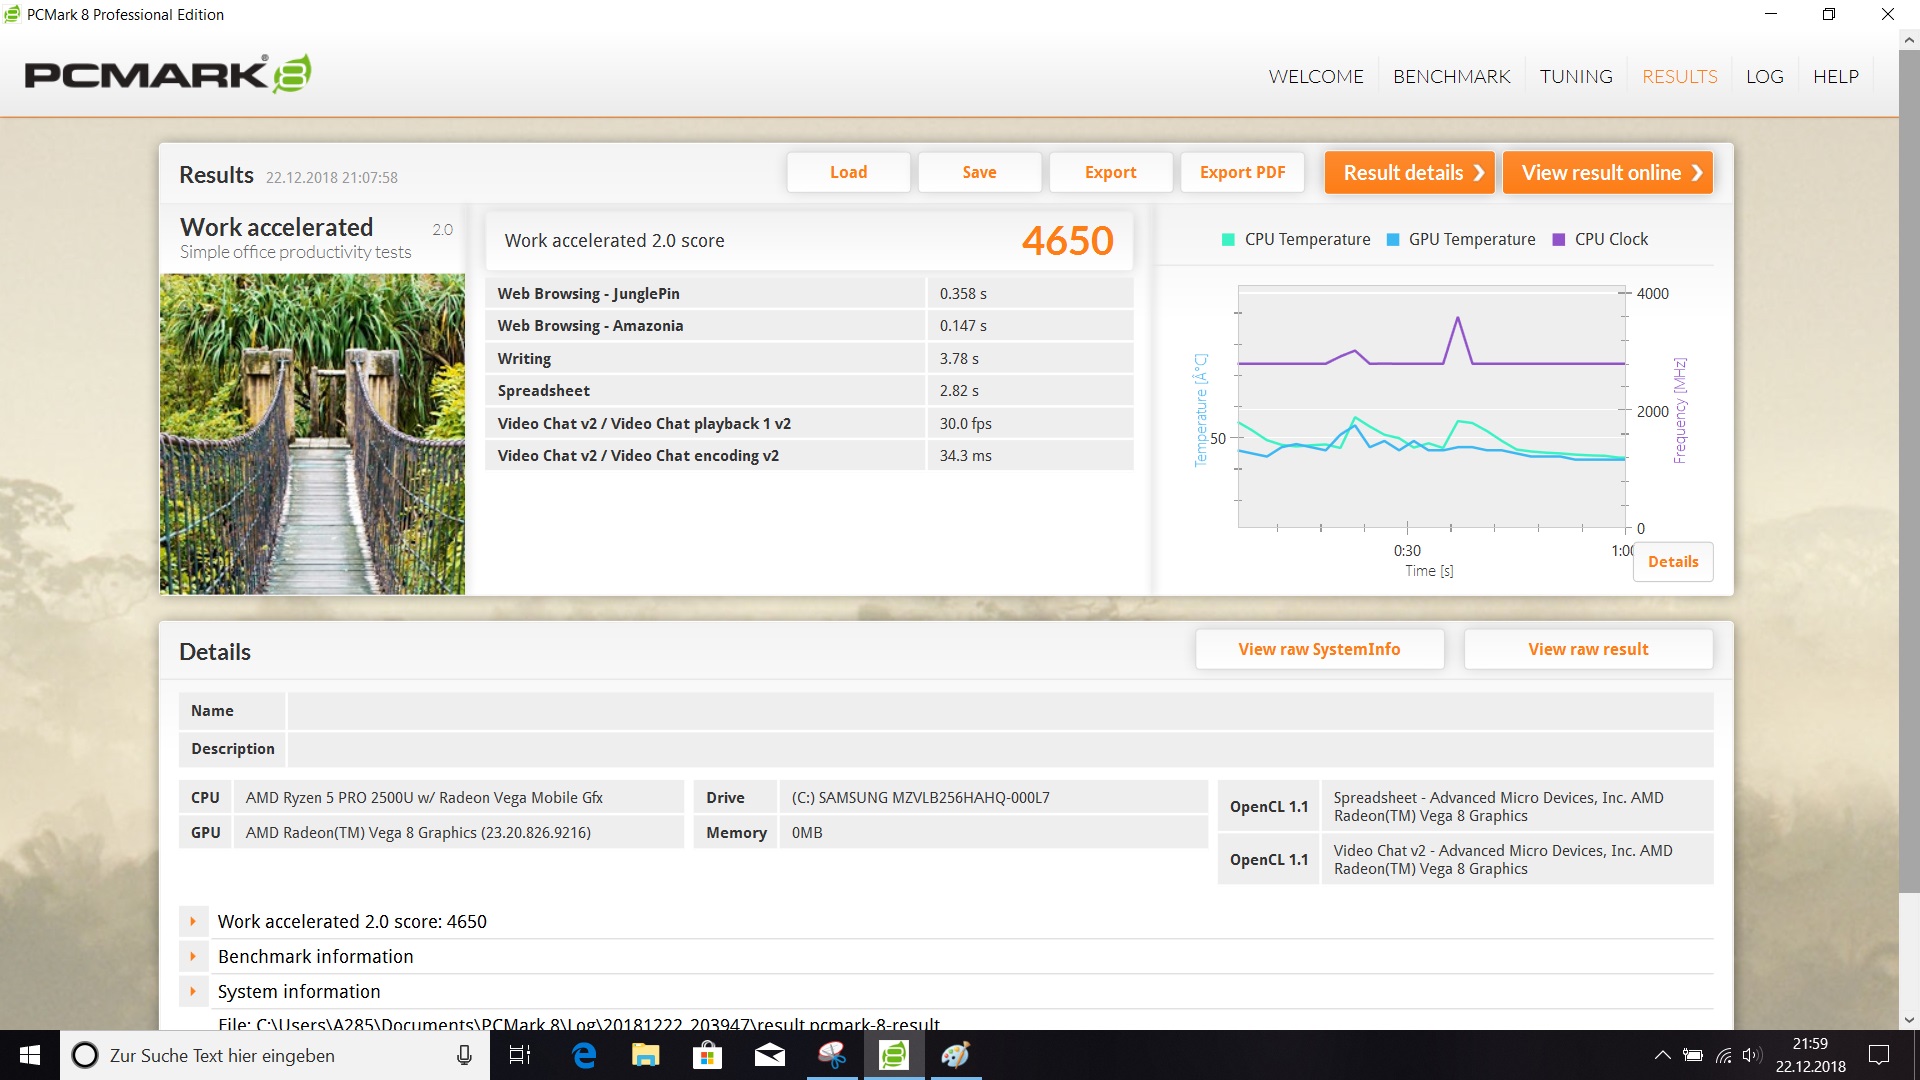
The synthetic PCMark benchmarks show a similar picture. The Intel-powered rivals manage higher scores, even though the difference is just measurable, but subjectively not noticeable. We cannot say that the AMD system felt any slower.
The subjective performance of the ThinkPad A285 is very good, which is also a result of the fast SSD.
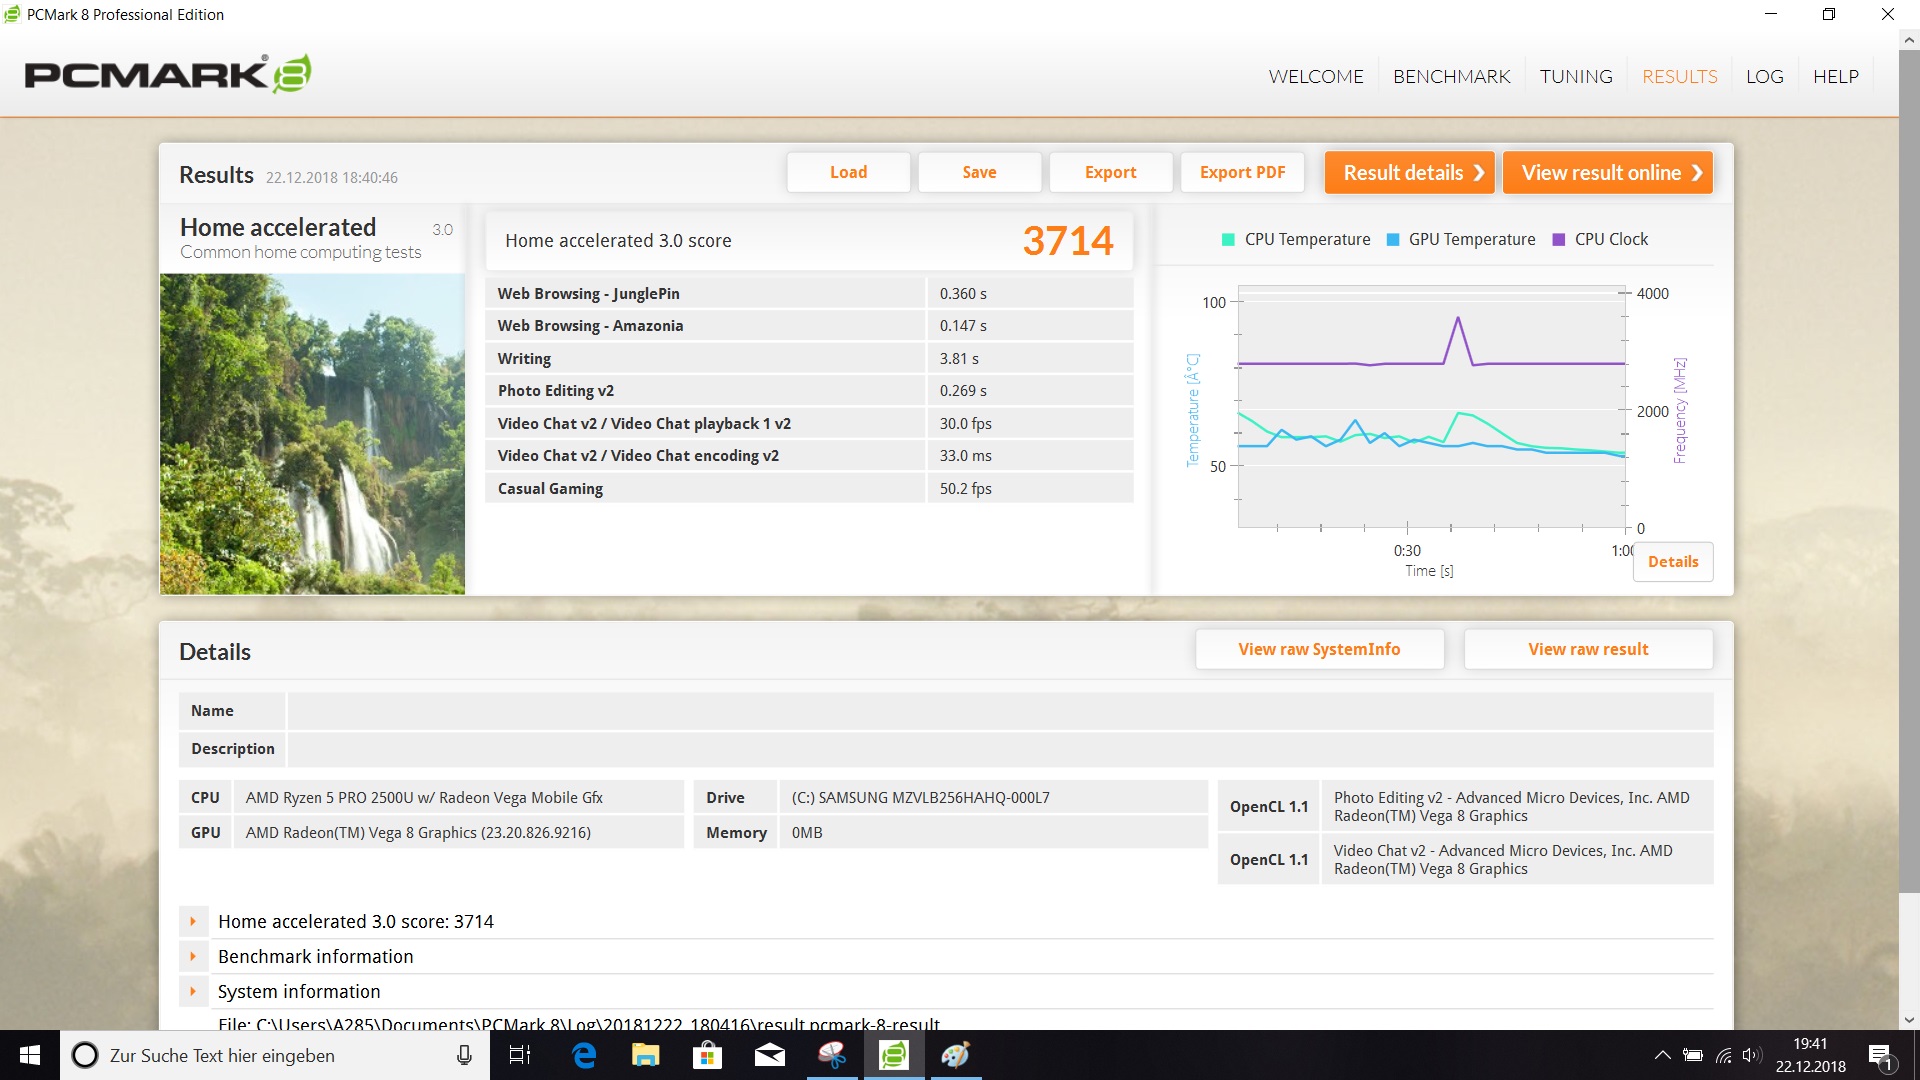
| PCMark 8 Home Score Accelerated v2 | 3714 points | |
| PCMark 8 Creative Score Accelerated v2 | 4465 points | |
| PCMark 8 Work Score Accelerated v2 | 4650 points | |
| PCMark 10 Score | 3361 points | |
Help | ||
Storage Devices
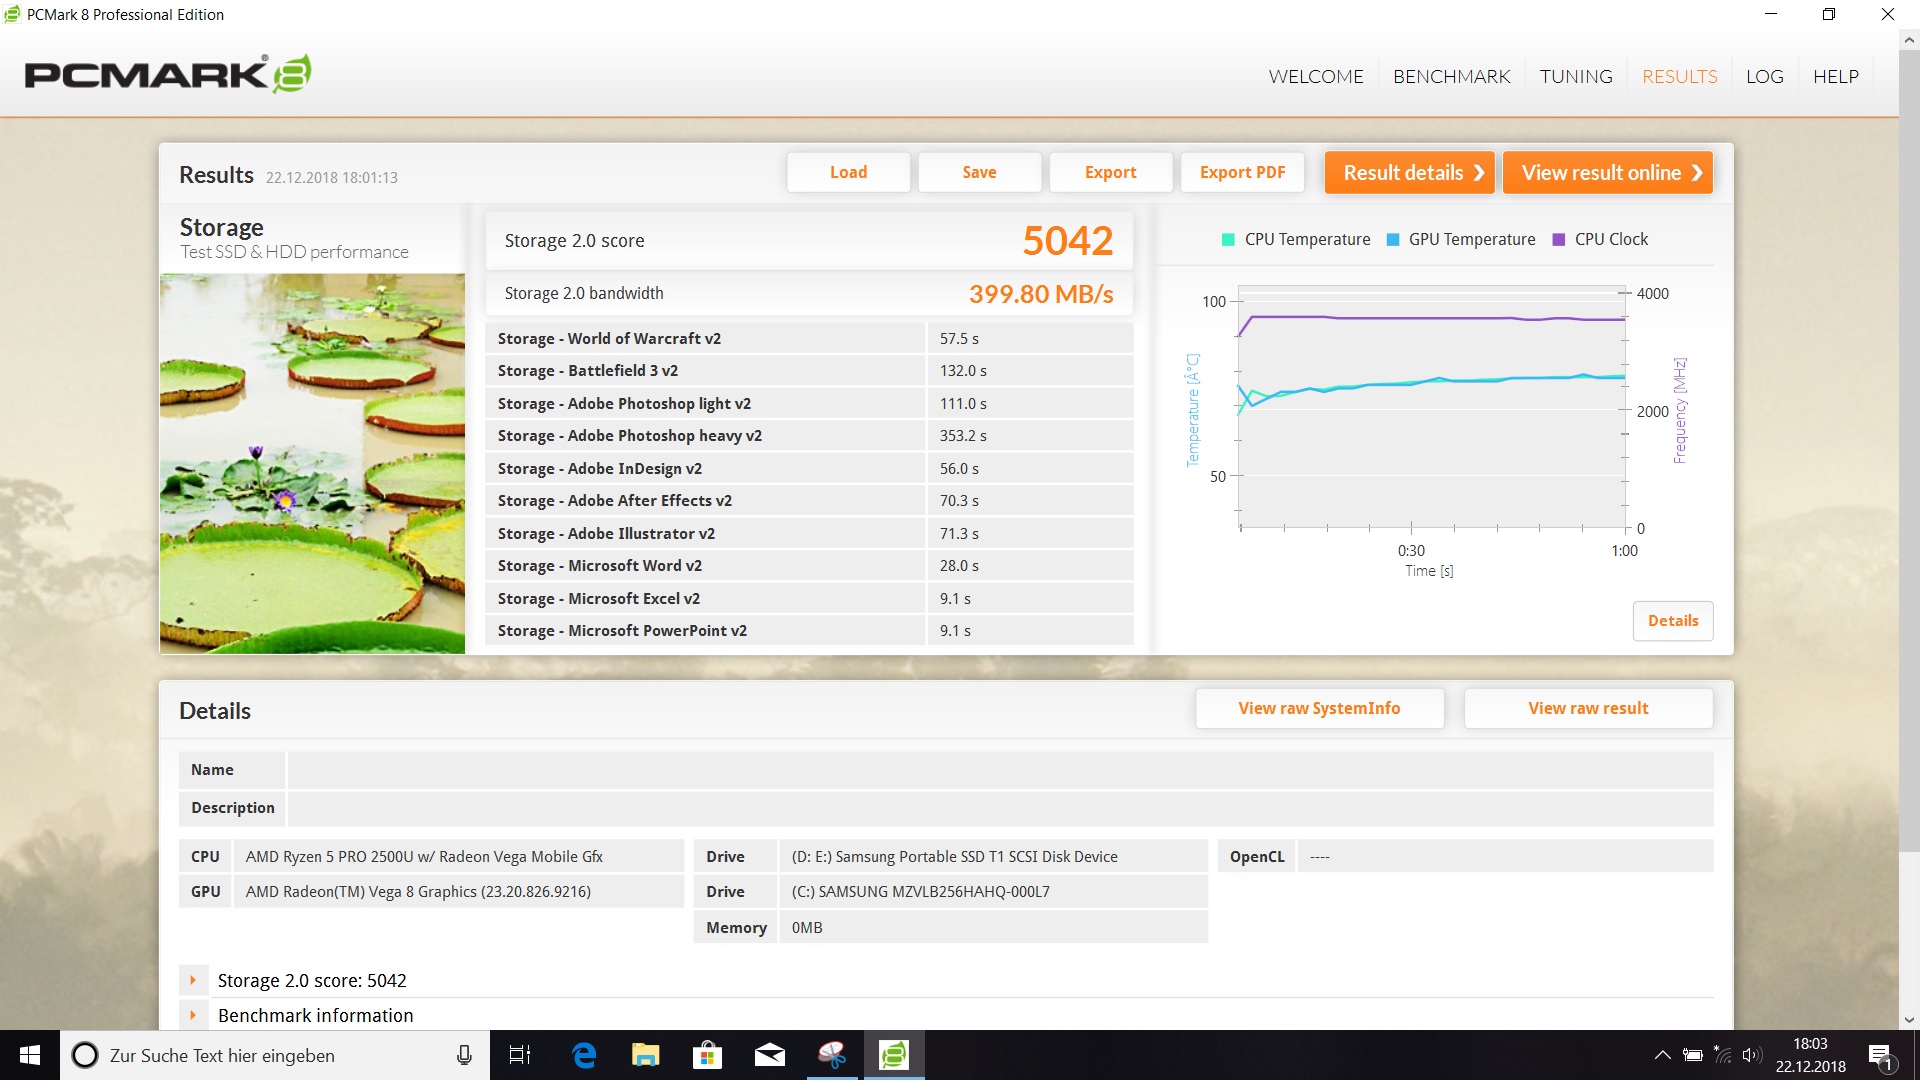
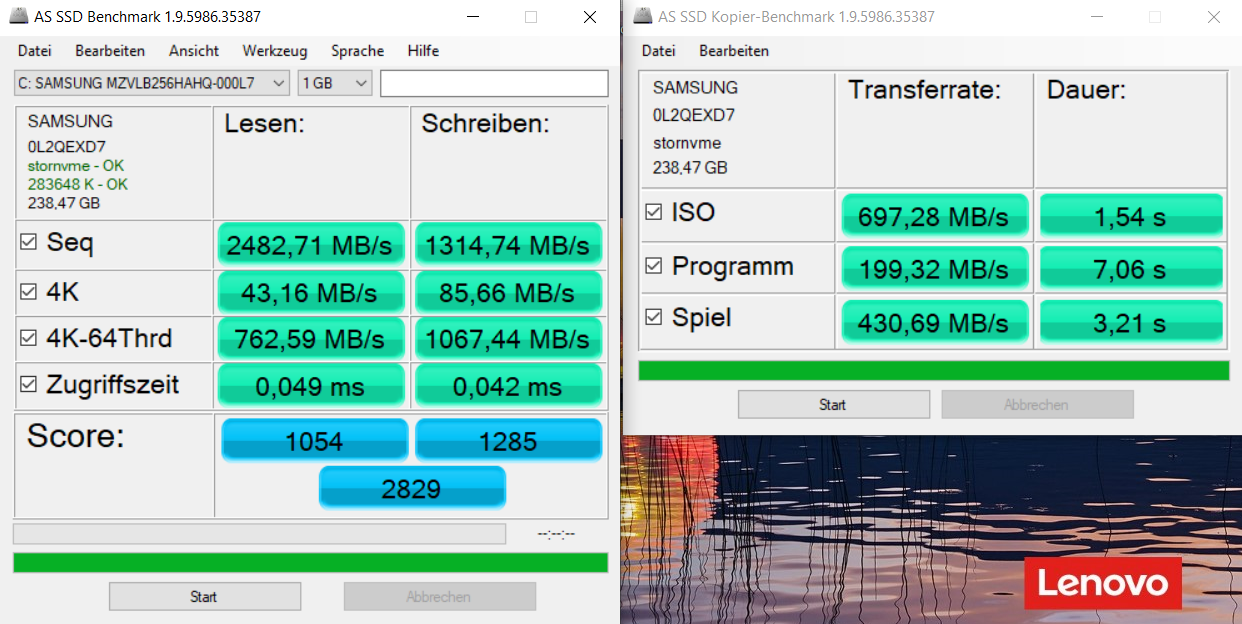
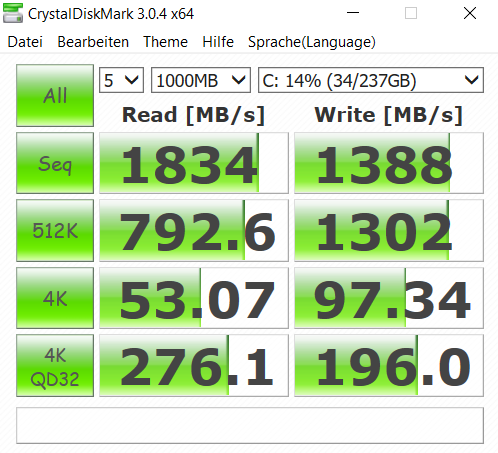
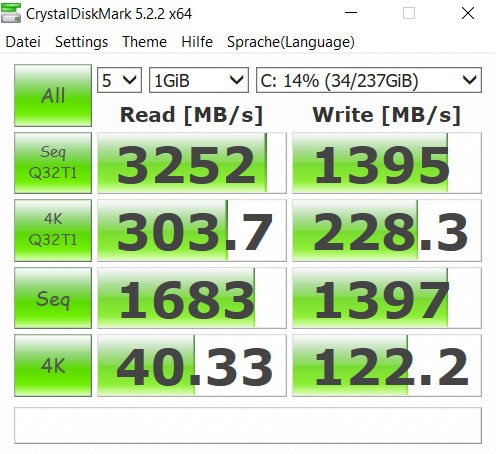
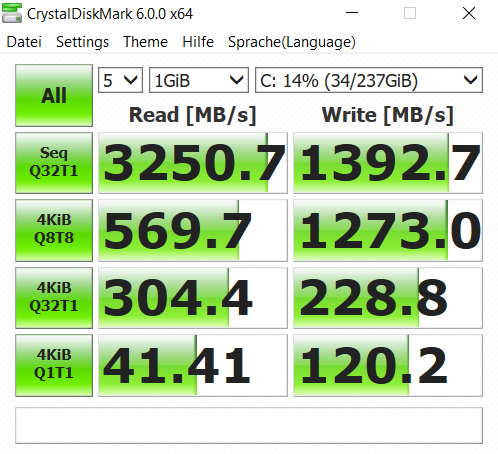
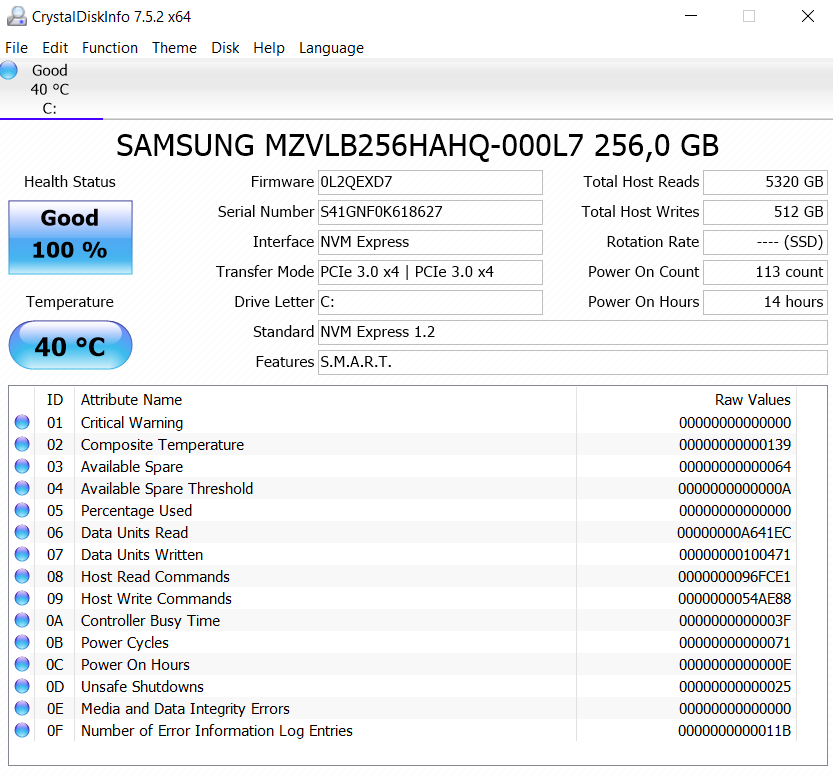
Similar to the ThinkPad X280, Lenovo also equips the A285 with a fast SSD from Samsung. It uses the NVMe protocol and manages very high transfer rates thanks to the PCIe interface. All in all, the performance is still a bit lower compared to the X280 depending on the benchmark. Still, our test sample does not have to hide and beats all the other rivals.
We especially like the excellent 4K read performance, which improves the boot process and application launches. The SSD also supports OPAL, but this is only the case for the 256 and 512 GB drives. The entry-level A285 is only equipped with a 128 GB M.2-SSD via SATA interface.
| Lenovo ThinkPad A285-20MX0002GE Samsung SSD PM981 MZVLB256HAHQ | Lenovo ThinkPad X280-20KES01S00 Samsung SSD PM981 MZVLB512HAJQ | Dell Latitude 7390 SK hynix SC311 M.2 | Fujitsu Lifebook U938 Micron 1100 MTFDDAV256TBN | HP Envy 13-ah0003ng SK Hynix BC501 HFM512GDJTNG | Average Samsung SSD PM981 MZVLB256HAHQ | |
|---|---|---|---|---|---|---|
| AS SSD | 22% | -60% | -63% | -26% | -6% | |
| Seq Read (MB/s) | 2483 | 2316 -7% | 485.5 -80% | 455.5 -82% | 494.3 -80% | 2032 ? -18% |
| Seq Write (MB/s) | 1315 | 1385 5% | 369.9 -72% | 364.5 -72% | 720 -45% | 1339 ? 2% |
| 4K Read (MB/s) | 43.16 | 47.2 9% | 27.31 -37% | 24.41 -43% | 38.35 -11% | 46.1 ? 7% |
| 4K Write (MB/s) | 85.7 | 105.3 23% | 63.6 -26% | 73.8 -14% | 98.4 15% | 107.4 ? 25% |
| 4K-64 Read (MB/s) | 763 | 1218 60% | 282.8 -63% | 235.7 -69% | 611 -20% | 712 ? -7% |
| 4K-64 Write (MB/s) | 1067 | 1309 23% | 210.3 -80% | 308.8 -71% | 712 -33% | 999 ? -6% |
| Access Time Read * (ms) | 0.049 | 0.041 16% | 0.075 -53% | 0.099 -102% | 0.061 -24% | 0.07076 ? -44% |
| Access Time Write * (ms) | 0.042 | 0.036 14% | 0.056 -33% | 0.057 -36% | 0.037 12% | 0.04352 ? -4% |
| Score Read (Points) | 1052 | 1497 42% | 359 -66% | 306 -71% | 698 -34% | 961 ? -9% |
| Score Write (Points) | 1285 | 1553 21% | 311 -76% | 419 -67% | 883 -31% | 1240 ? -4% |
| Score Total (Points) | 2829 | 3774 33% | 857 -70% | 885 -69% | 1961 -31% | 2671 ? -6% |
* ... smaller is better

GPU Performance
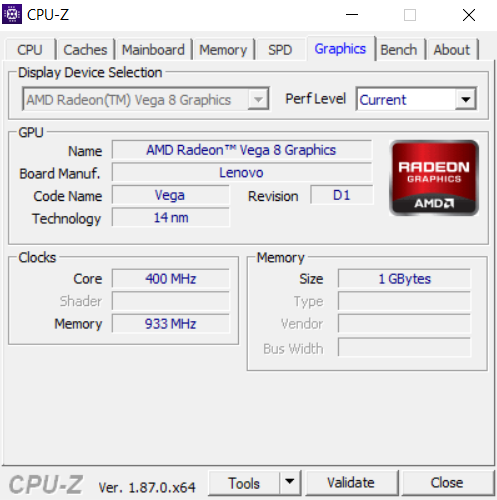
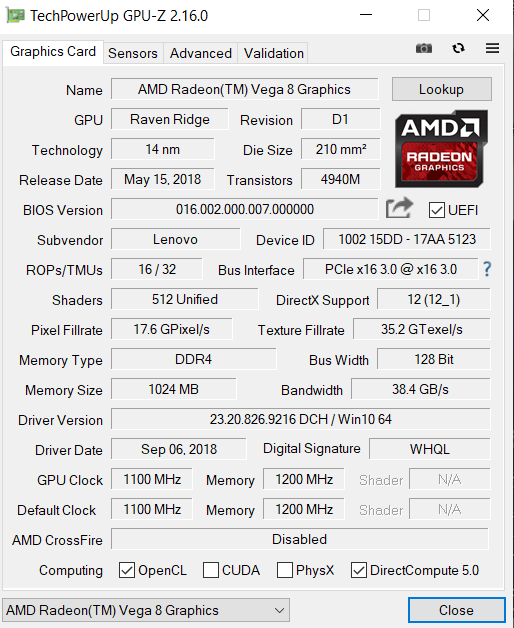
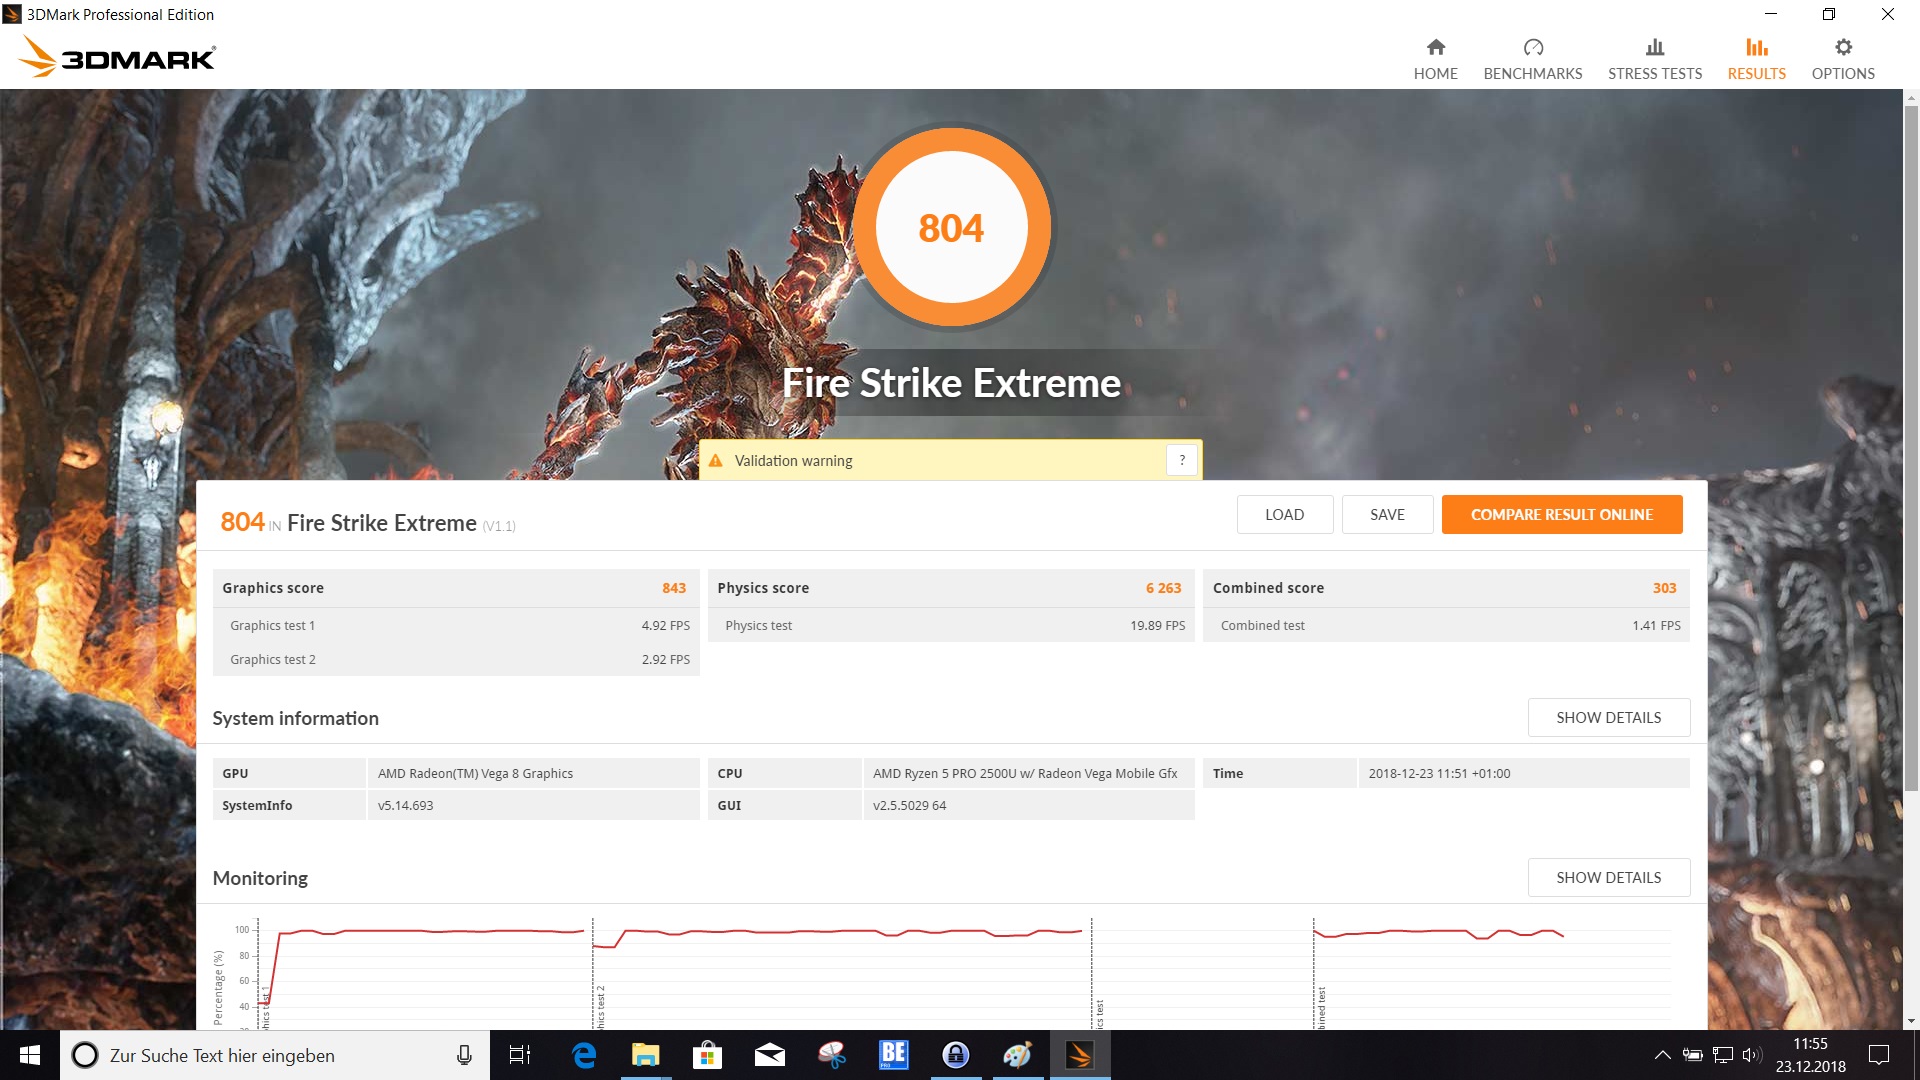
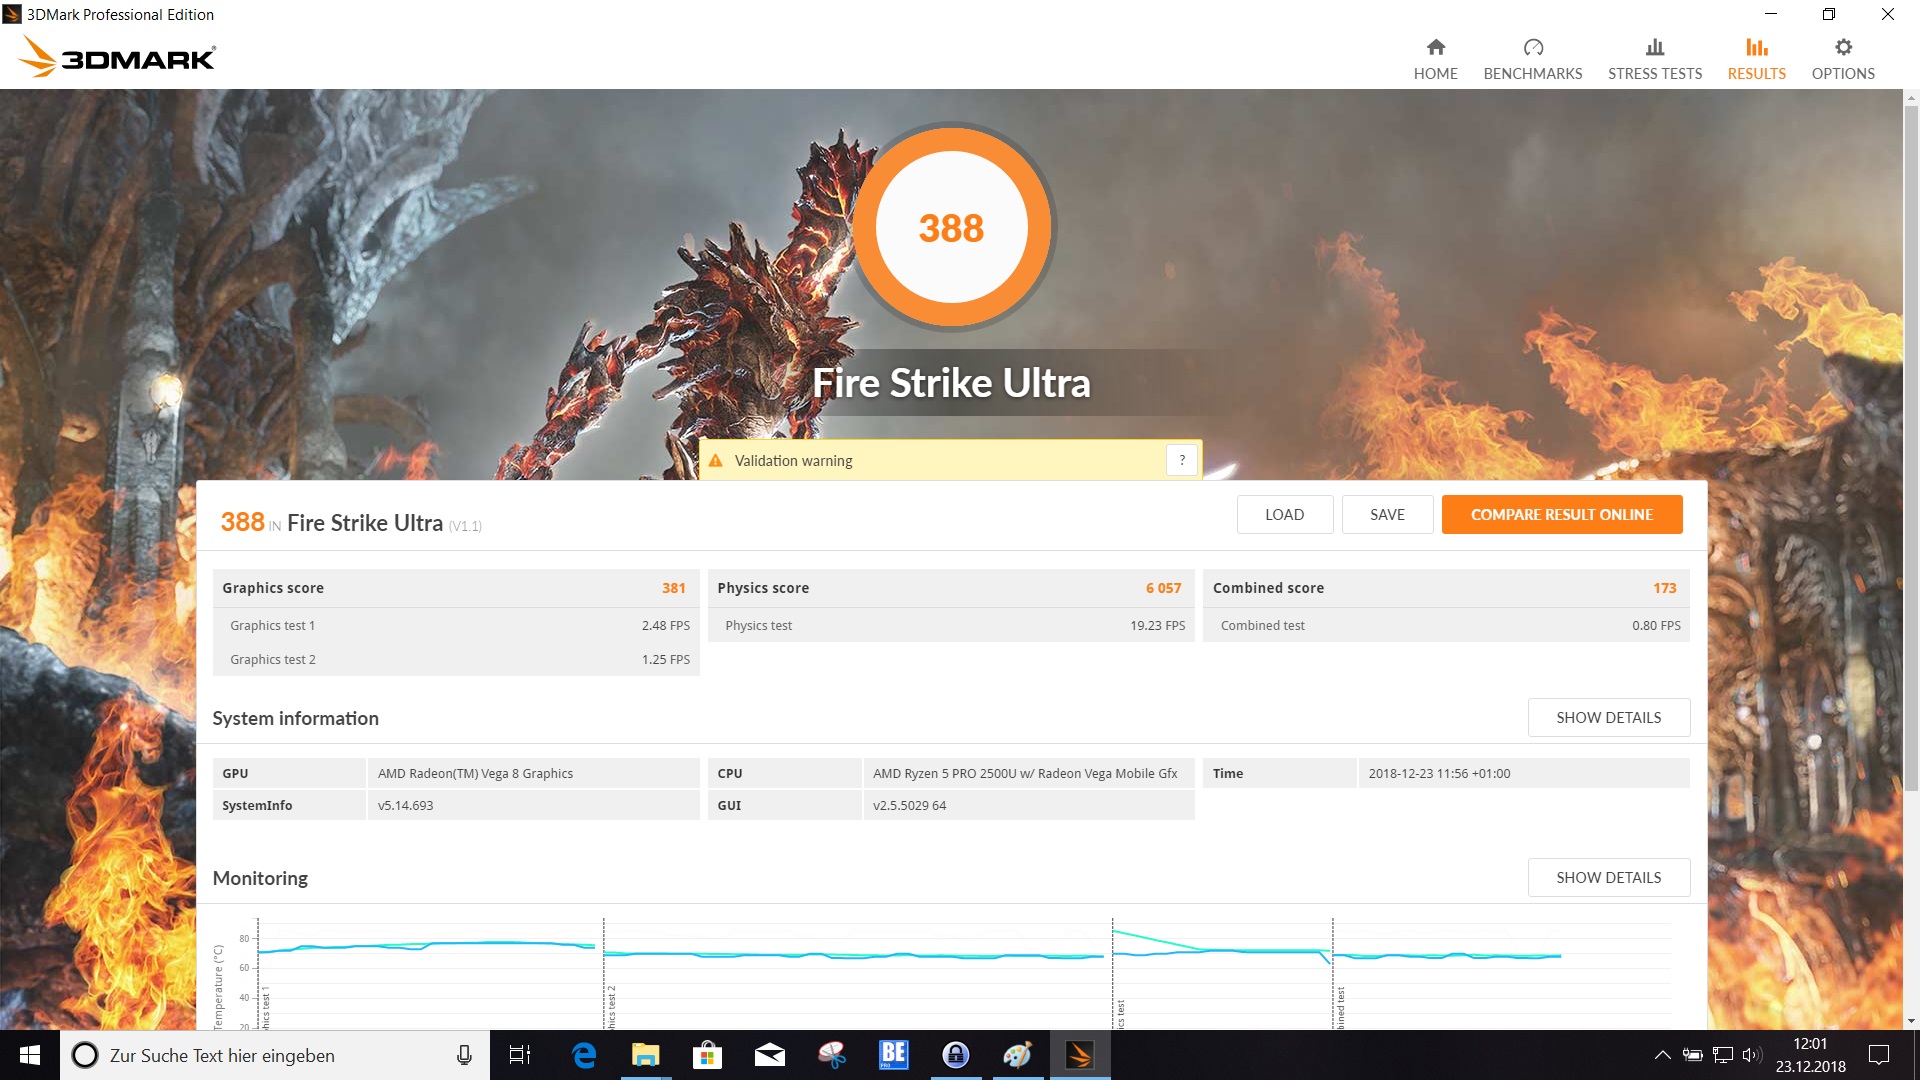
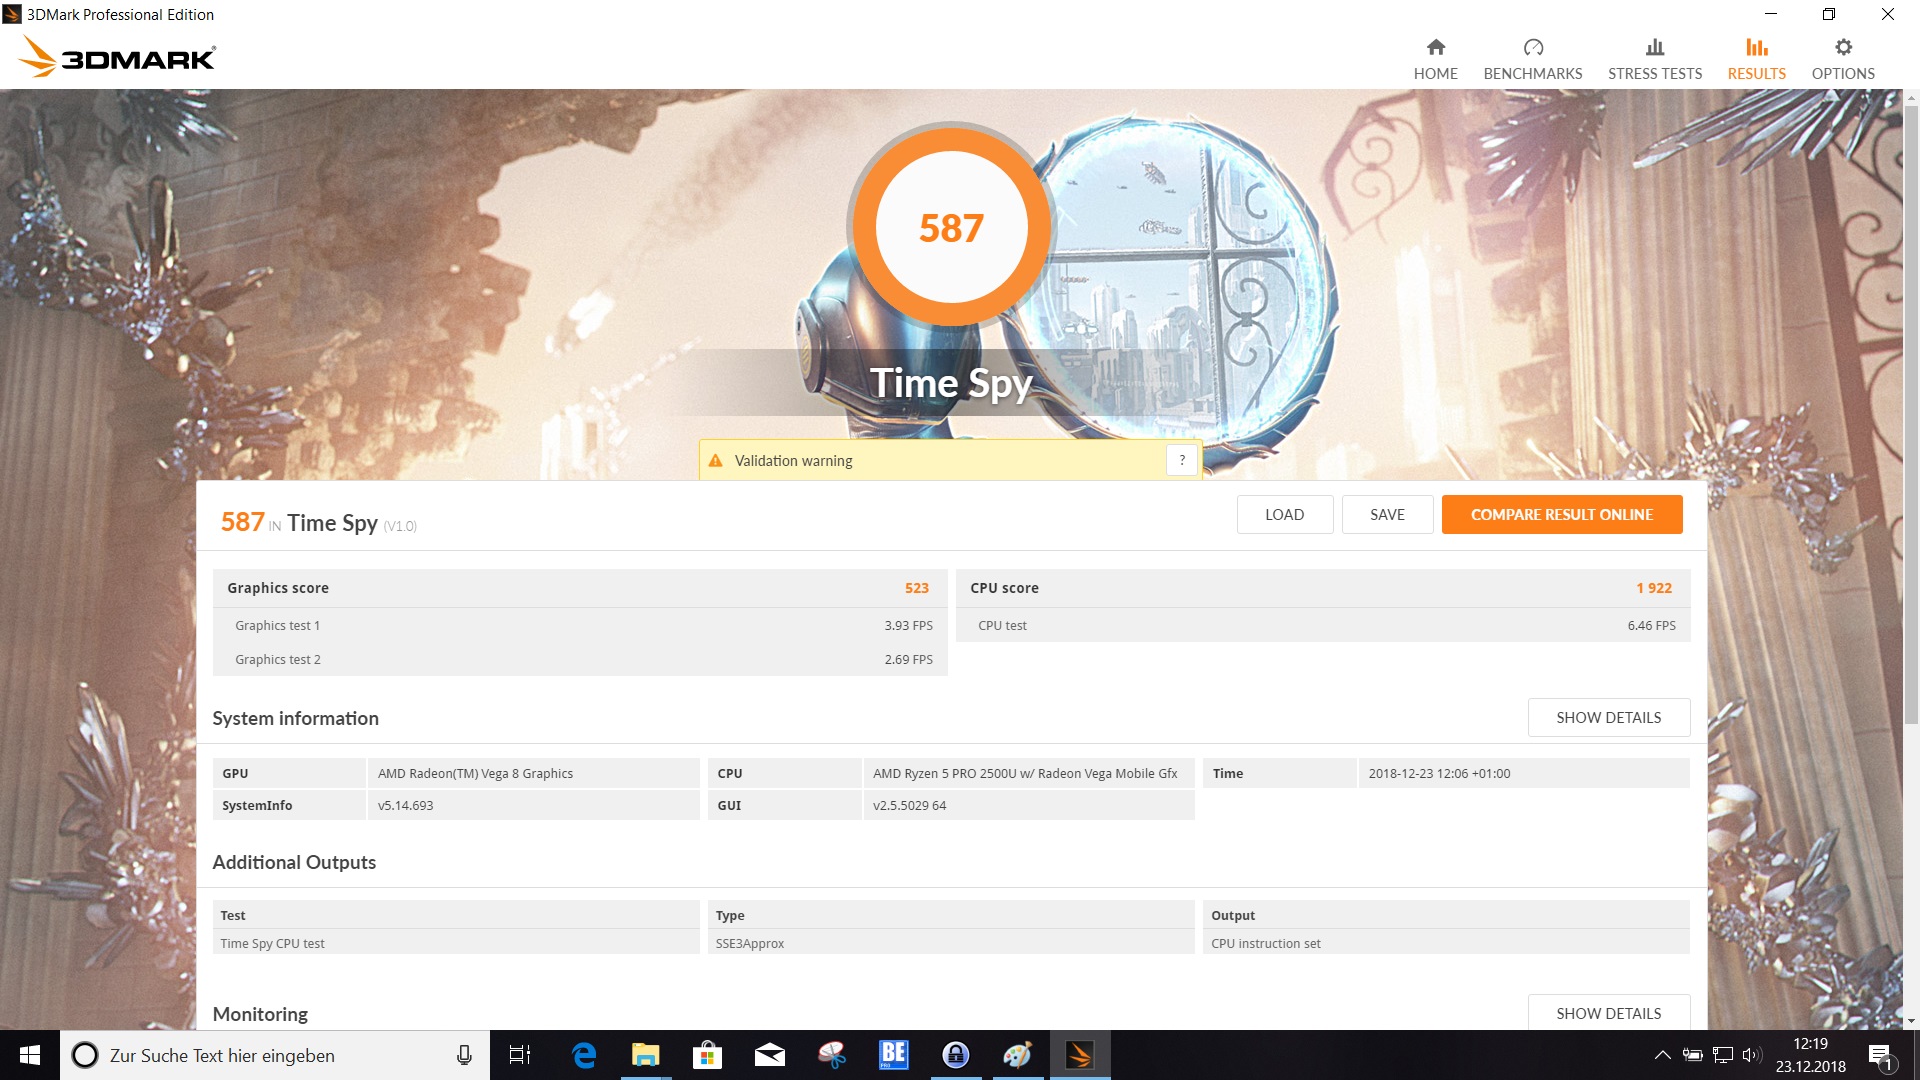
The AMD Ryzen 5 Pro 2500U is an APU and features the integrated graphics adapter AMD Radeon Vega 8. It is much faster compared to the Intel UHD Graphics 620 as shown by the synthetic 3DMarks. The iGPU is equipped with 512 shader units and runs at up to 1100 MHz. There is no dedicated memory, so the Vega 8 iGPU uses 1 GB from the system. The performance of the Radeon Vega 8 is 71% better compared to the ThinkPad X280 with the Intel UHD Graphics 620. The HP Envy 13 on the other hand is even faster thanks to the dedicated GeForce MX150 GPU.
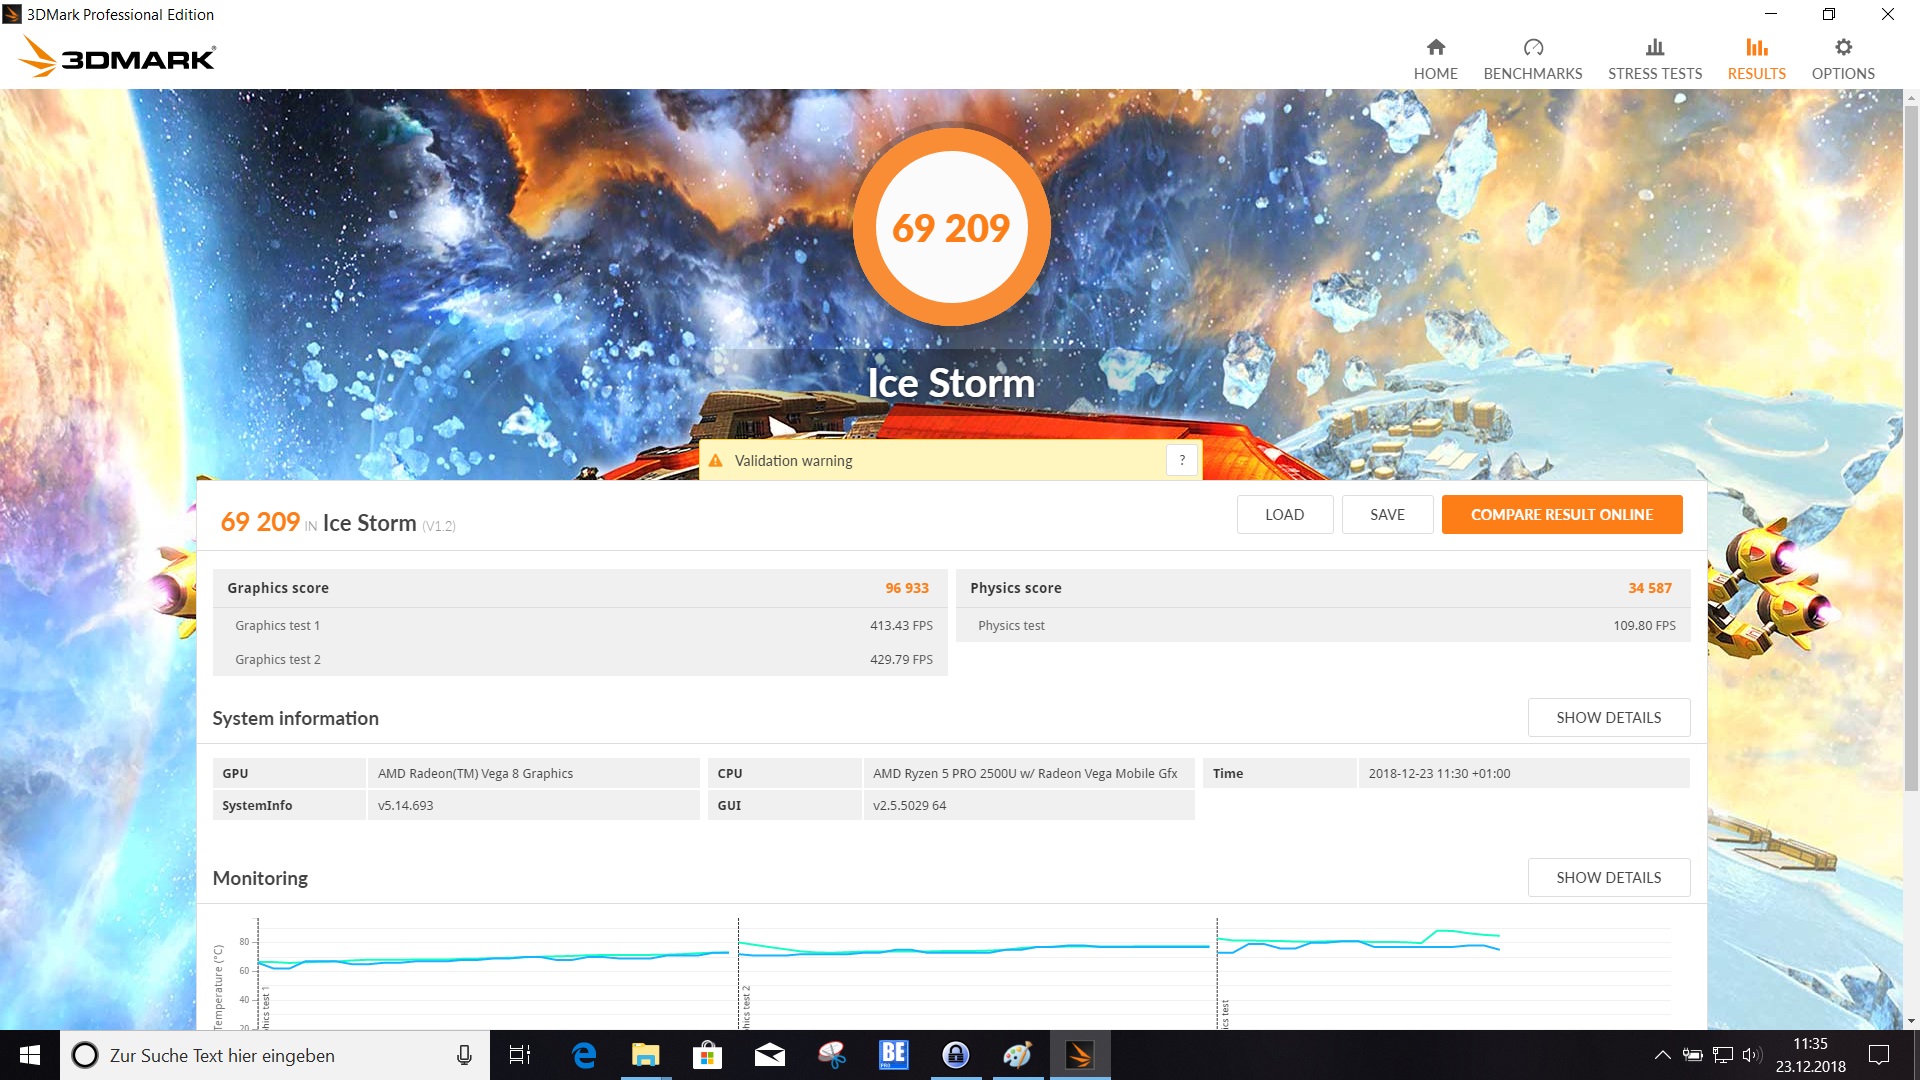
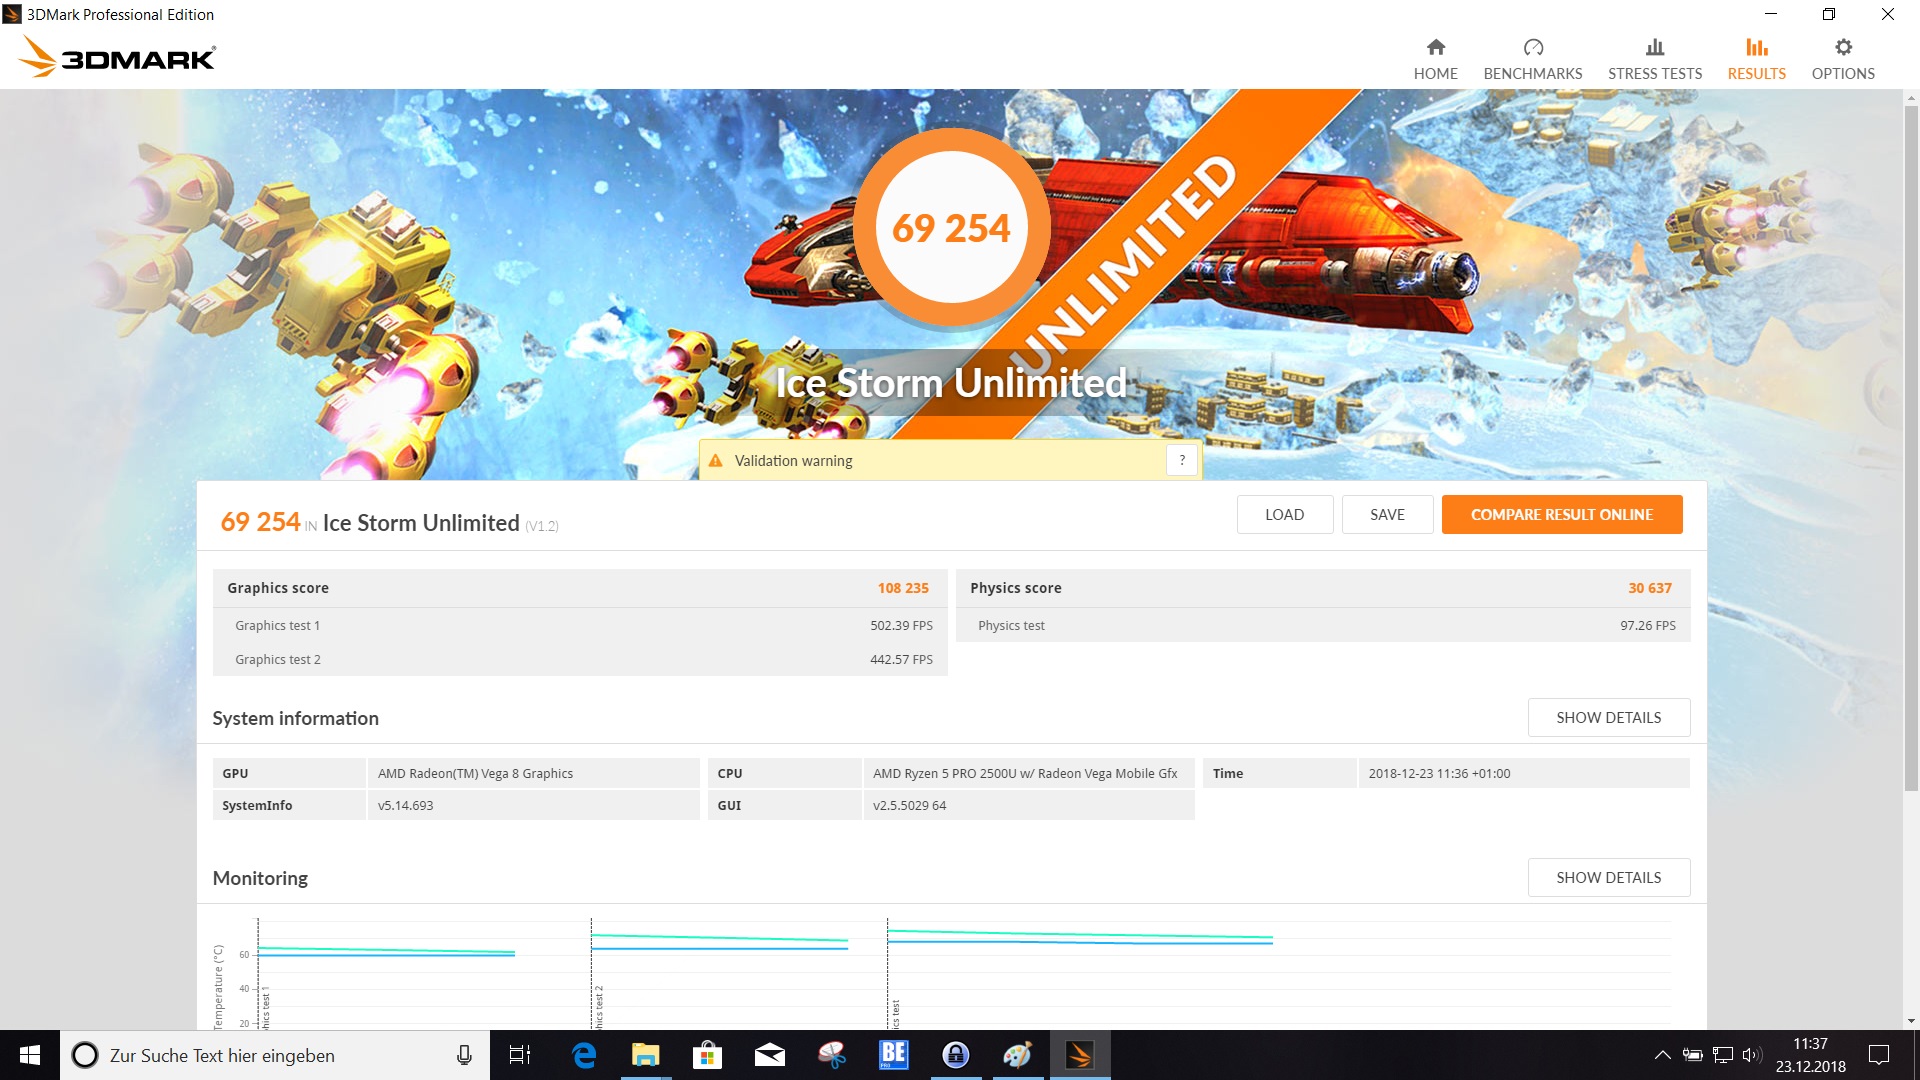
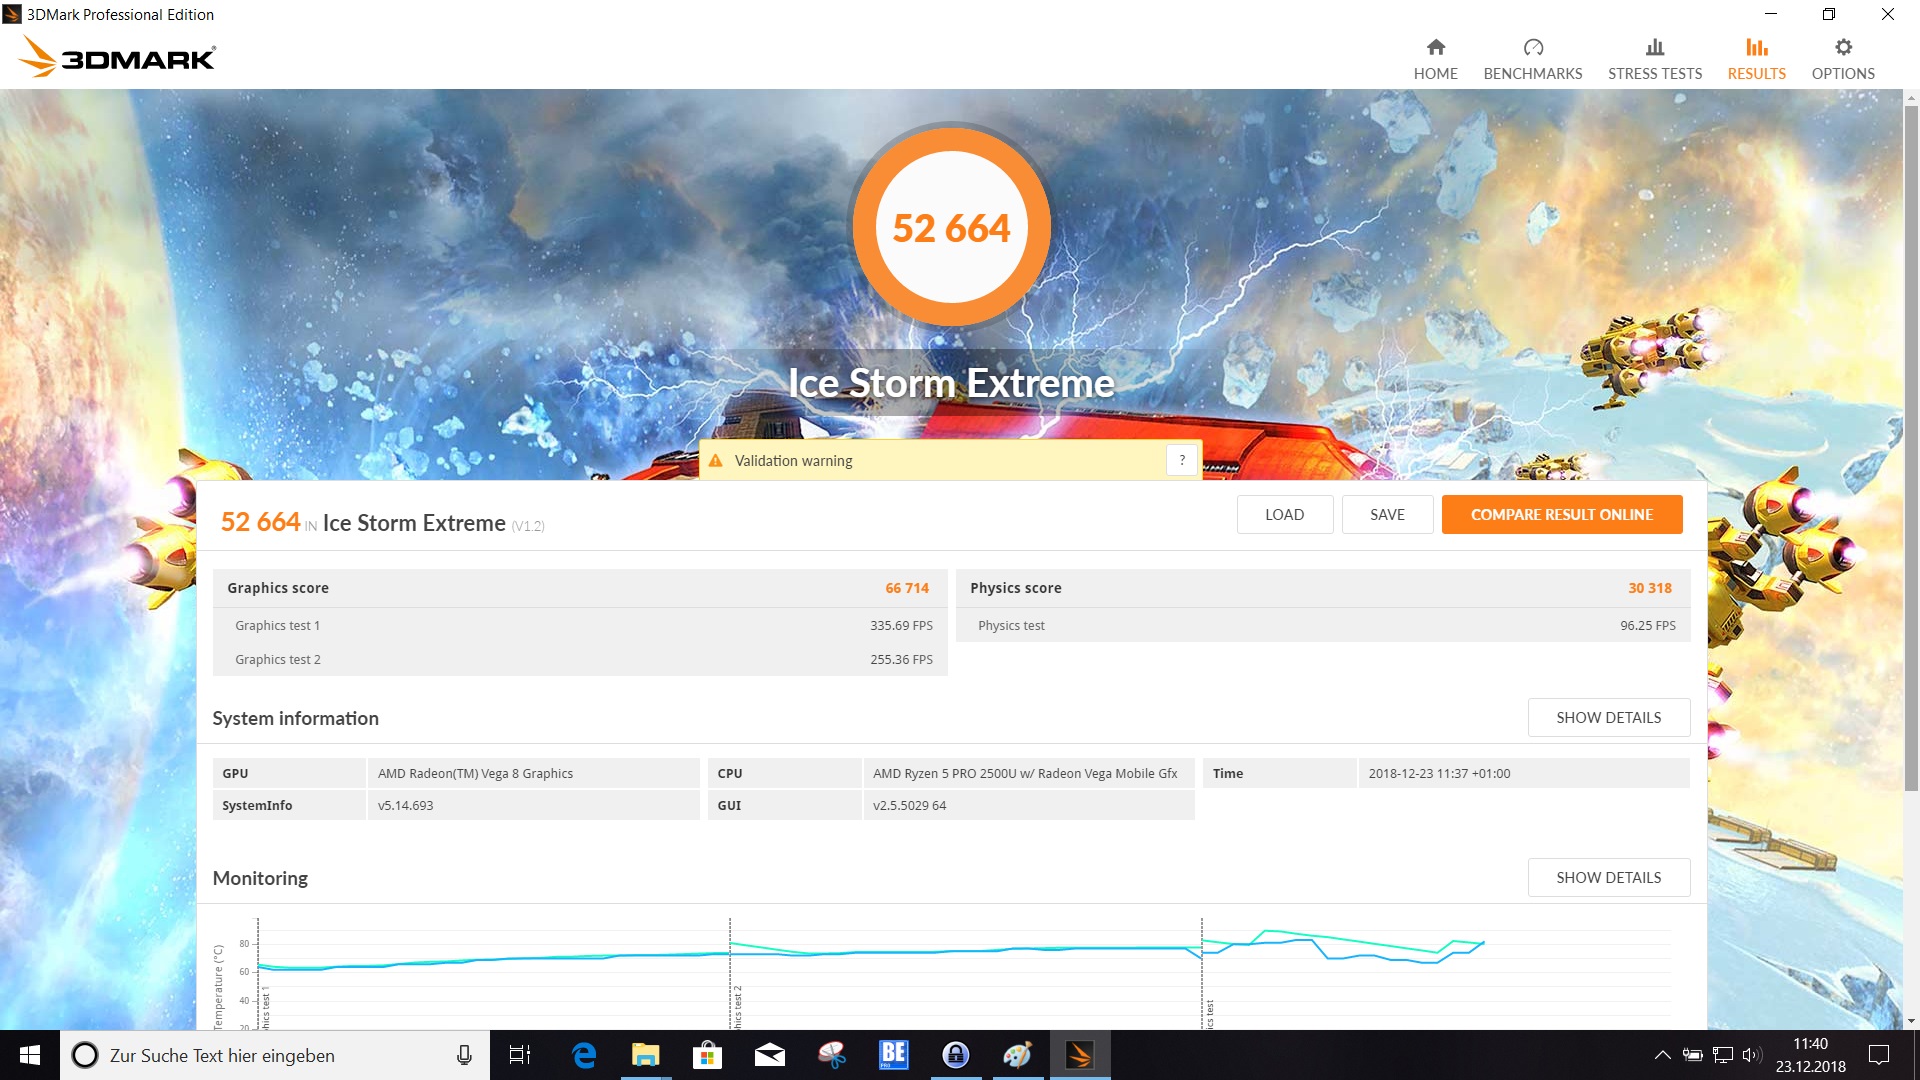
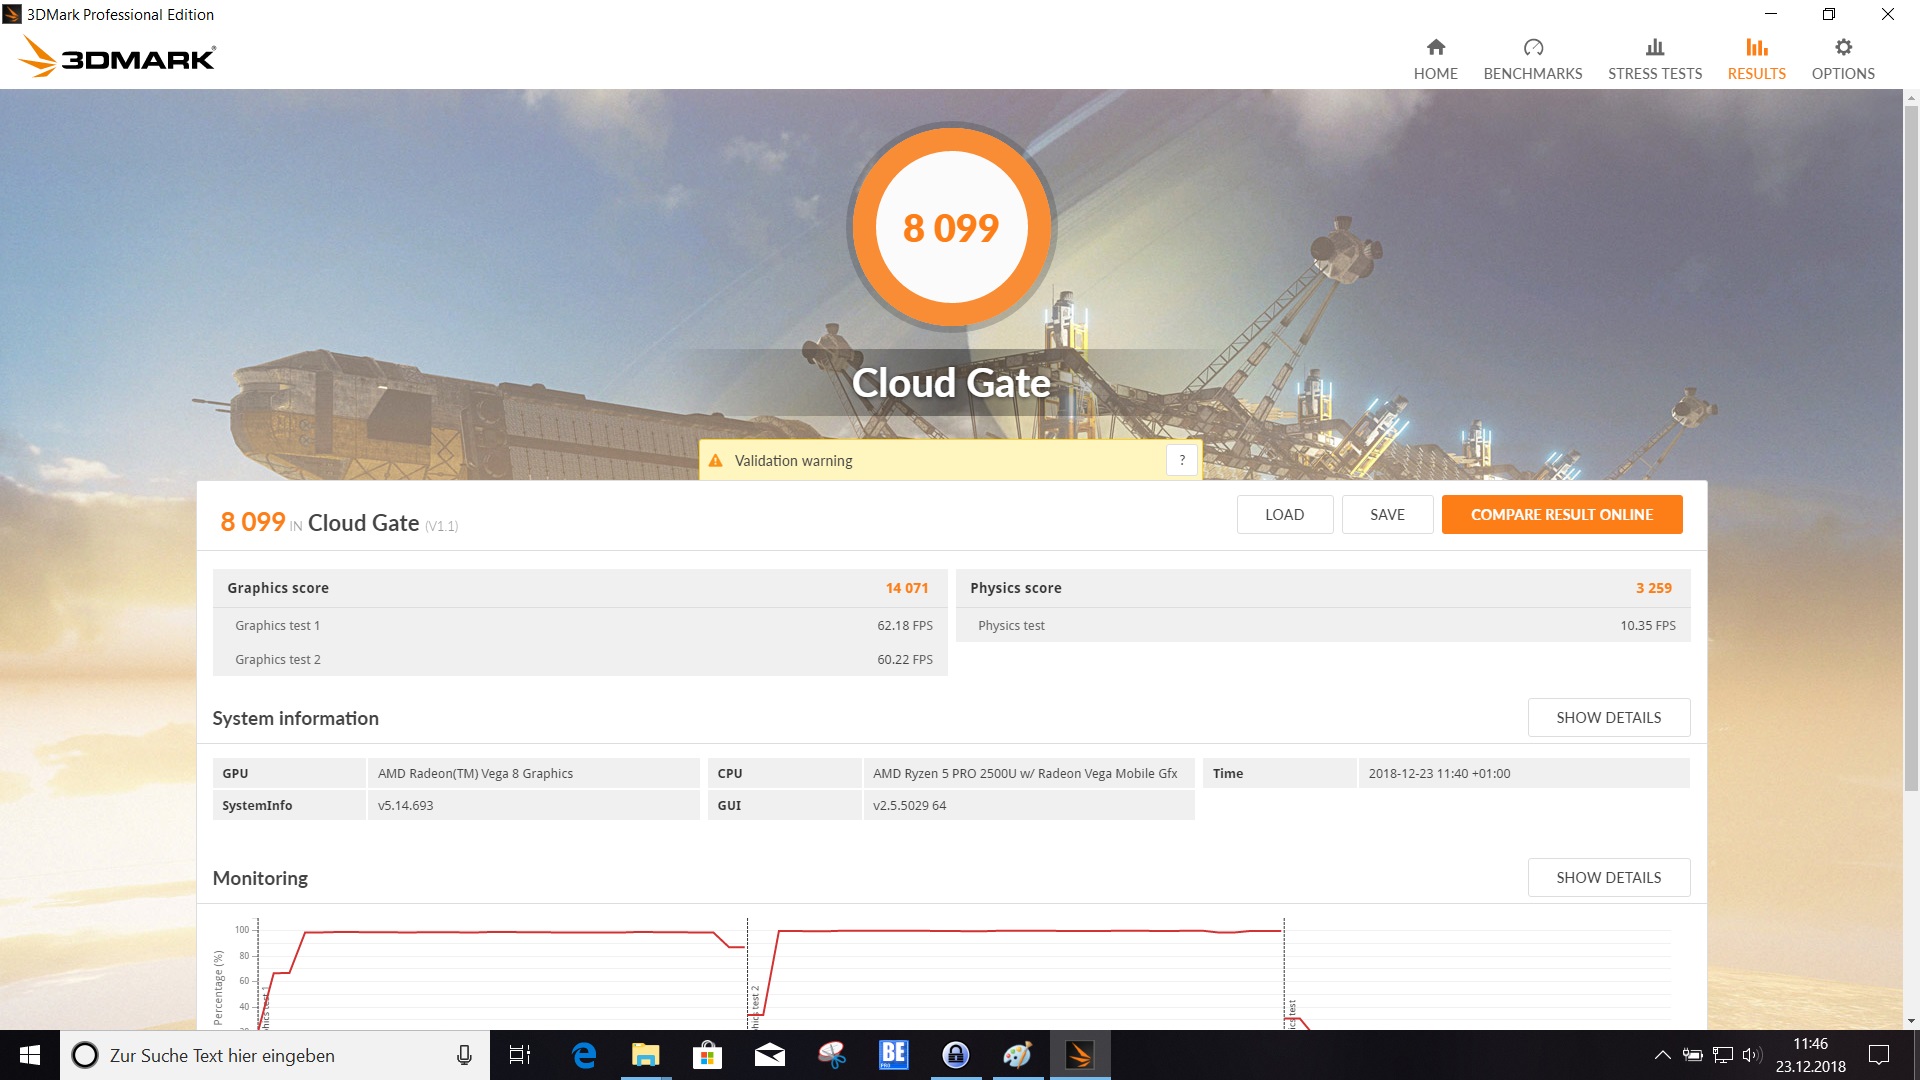
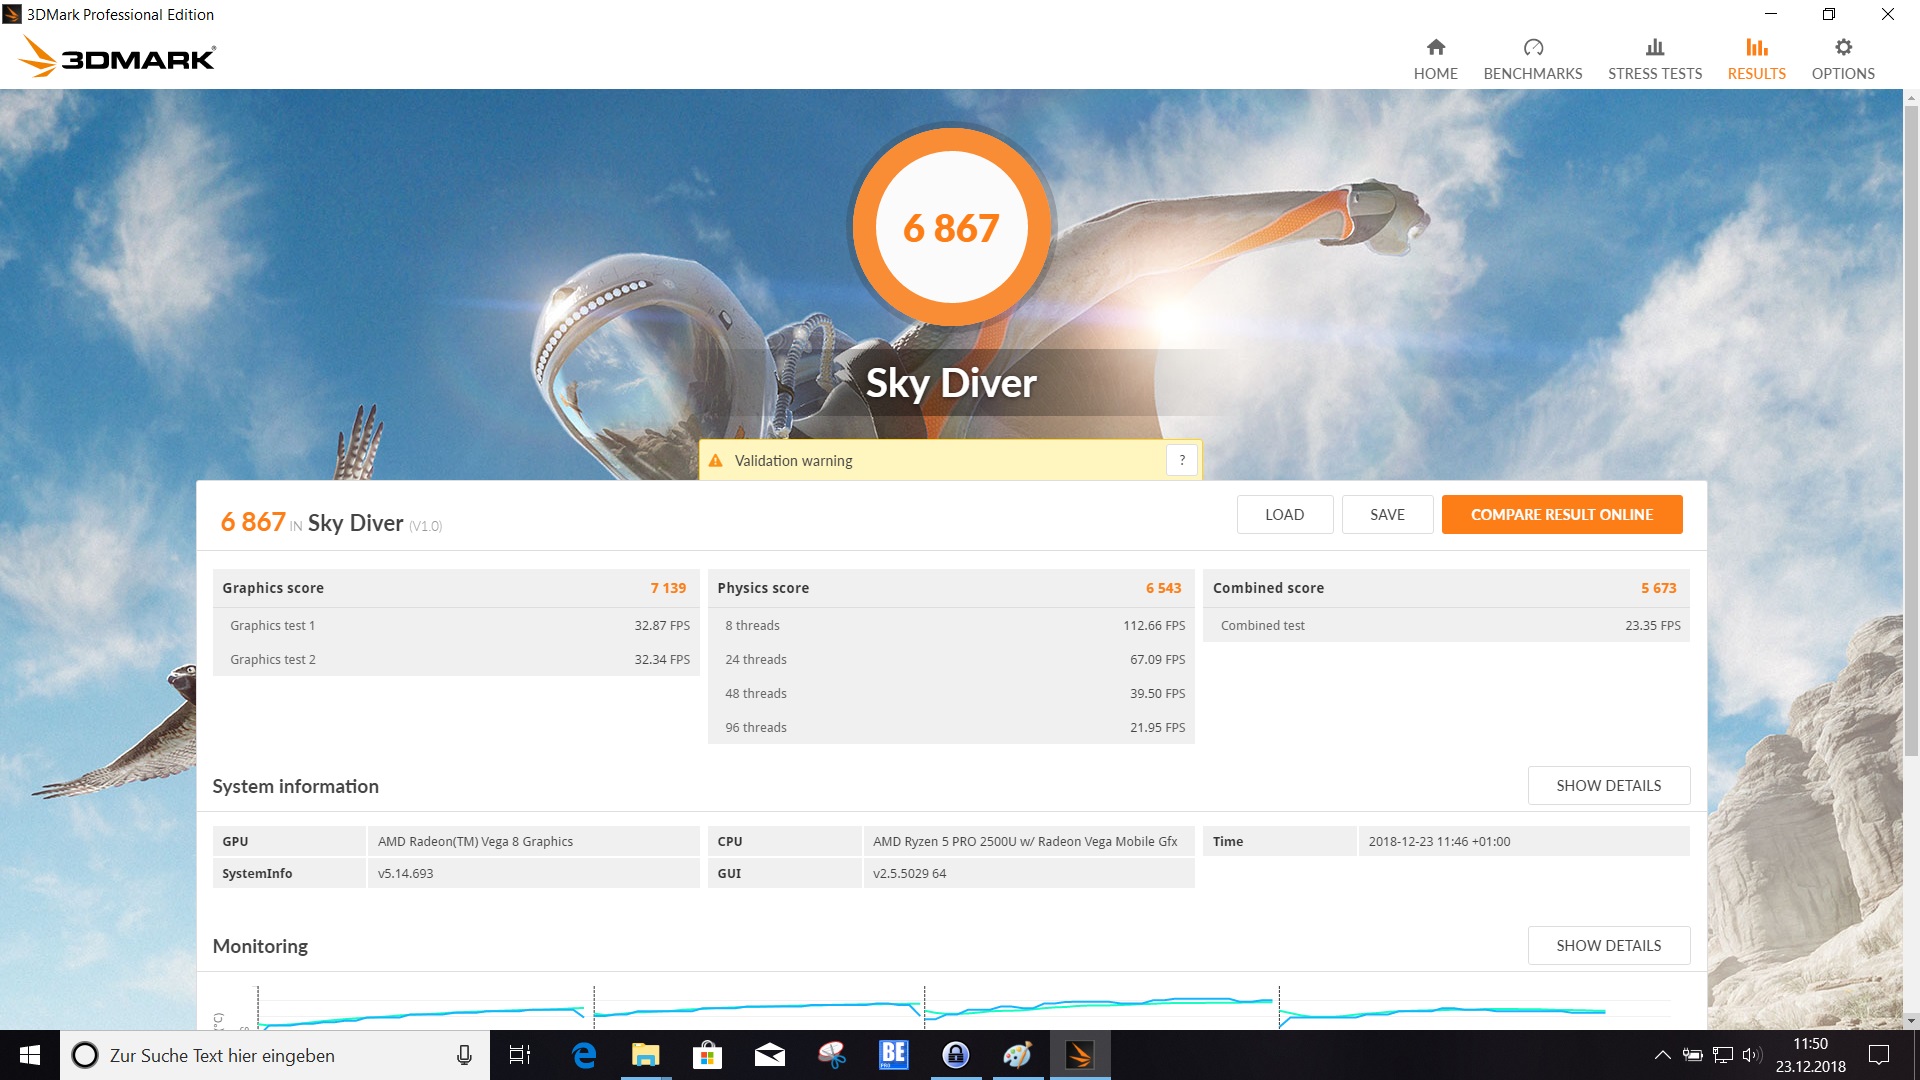
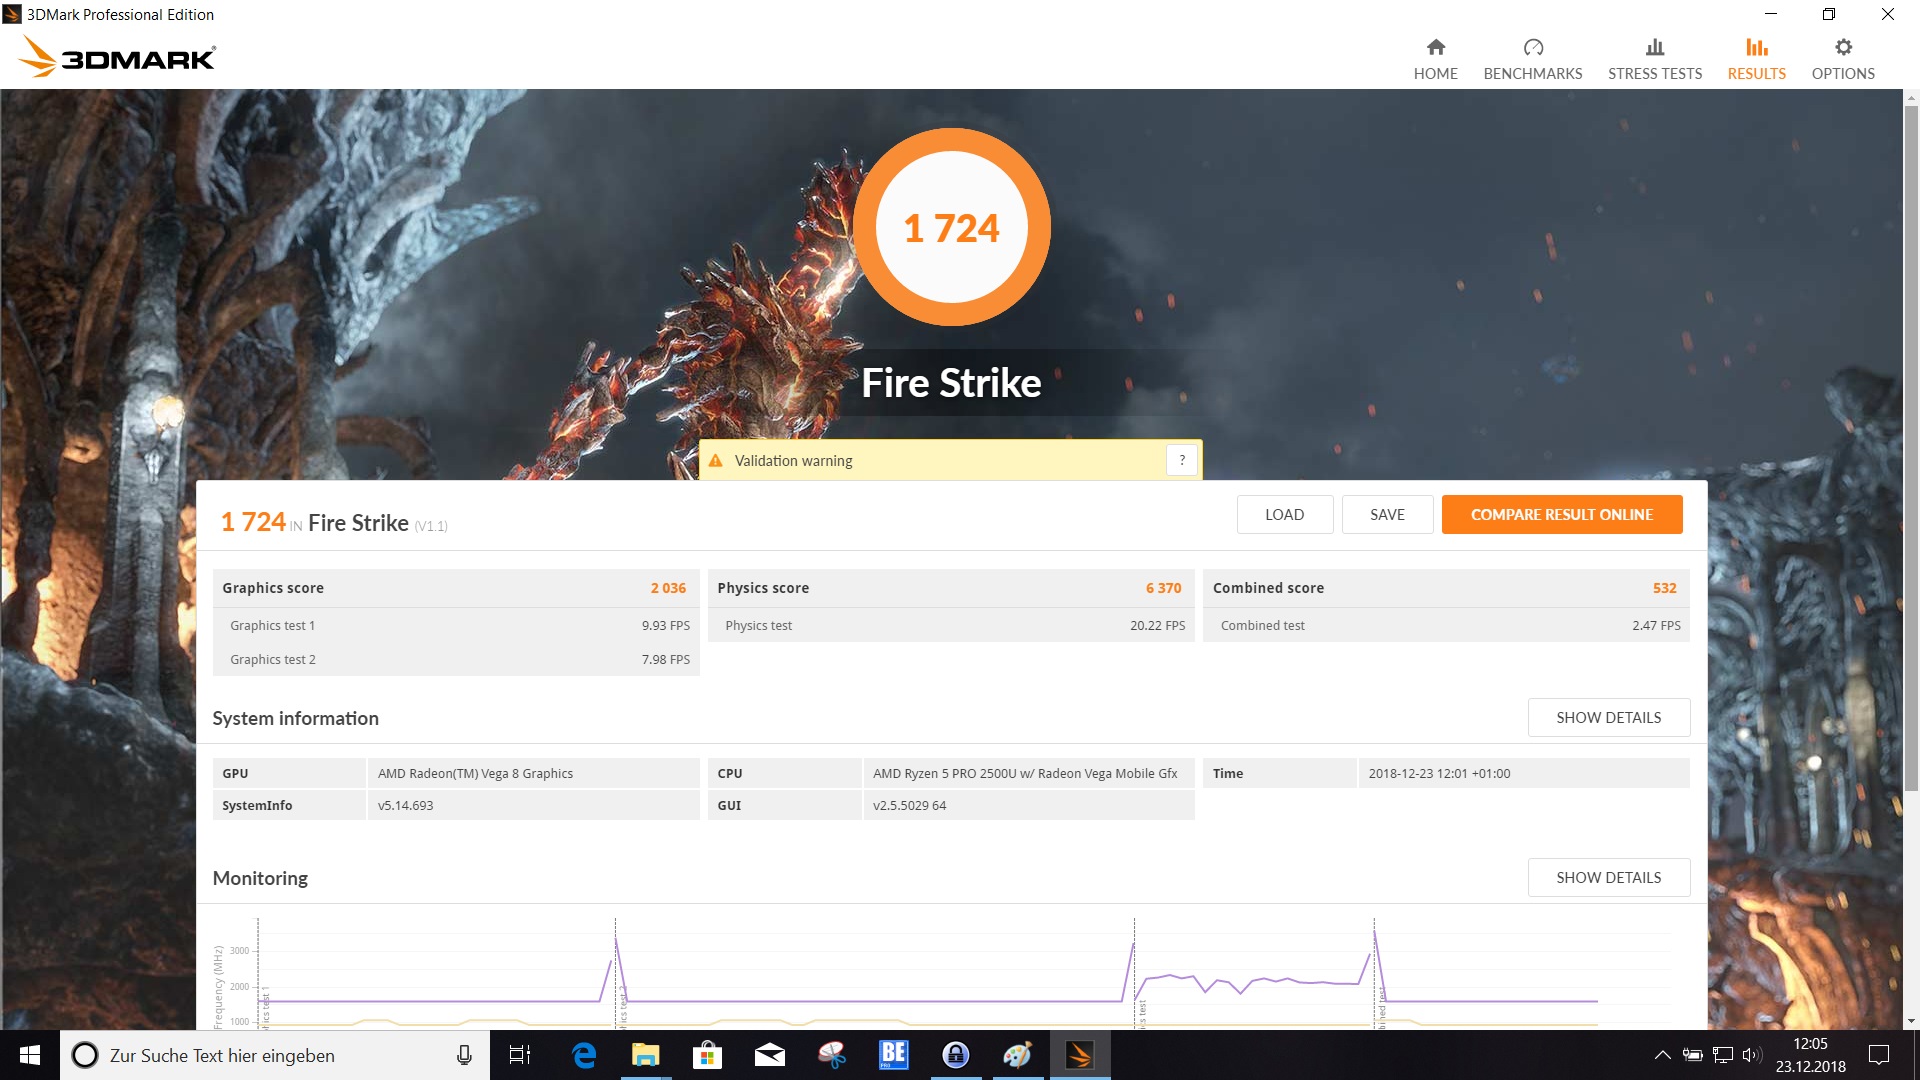
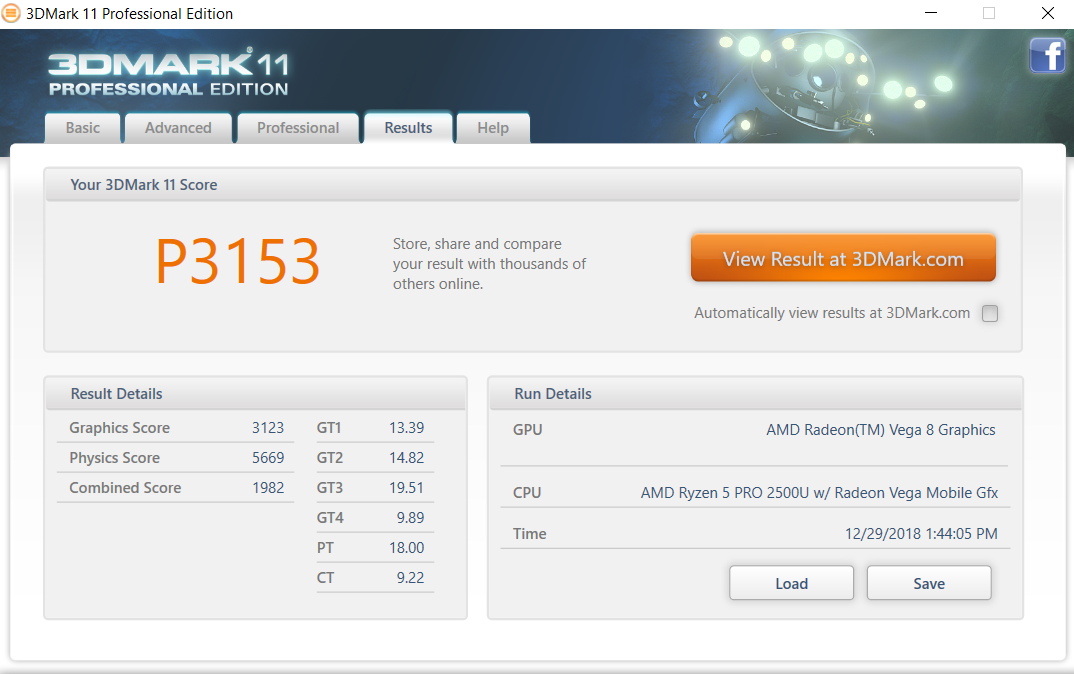
| 3DMark 11 Performance | 3153 points | |
| 3DMark Ice Storm Standard Score | 69209 points | |
| 3DMark Cloud Gate Standard Score | 8099 points | |
| 3DMark Fire Strike Score | 1724 points | |
| 3DMark Fire Strike Extreme Score | 807 points | |
| 3DMark Time Spy Score | 587 points | |
Help | ||
Gaming Performance
Gaming benchmarks turned out to be challenging on the Lenovo A285, because the device often did not support our standard resolution. For example, we could only test Rise of the "Tomb Raider" at 1080p, even though the resolution was not available in "Rocket League". We hope that future GPU drivers will improve the situation. The 3D performance of the Vega 8 is sufficient for less demanding titles in general.
| low | med. | high | ultra | |
|---|---|---|---|---|
| BioShock Infinite (2013) | 103.1 | 17.2 | ||
| Rise of the Tomb Raider (2016) | 12.3 | |||
| Rocket League (2017) | 52.9 |
Emissions - Quiet companion
System Noise
The behavior of the fan in the ThinkPad A285 is very similar to the X280, but the maximum fan noise under load is much lower at 31.2 dB(A) for the new model. The Intel counterpart could be much louder at up to 39.7 dB(A). The fan is not spinning while idling and only starts spinning under load. Otherwise, it is a silent system, and the test model is much quieter than some of the rivals. Only the Fujitsu LifeBook U938 is similarly quiet.
Noise level
| Idle |
| 28.9 / 28.9 / 28.9 dB(A) |
| Load |
| 31.2 / 31.2 dB(A) |
 | ||
30 dB silent 40 dB(A) audible 50 dB(A) loud |
||
min: | ||
| Lenovo ThinkPad A285-20MX0002GE Vega 8, R5 PRO 2500U, Samsung SSD PM981 MZVLB256HAHQ | Lenovo ThinkPad X280-20KES01S00 UHD Graphics 620, i5-8250U, Samsung SSD PM981 MZVLB512HAJQ | Dell Latitude 7390 UHD Graphics 620, i5-8350U, SK hynix SC311 M.2 | Fujitsu Lifebook U938 UHD Graphics 620, i5-8250U, Micron 1100 MTFDDAV256TBN | HP Envy 13-ah0003ng GeForce MX150, i5-8550U, SK Hynix BC501 HFM512GDJTNG | |
|---|---|---|---|---|---|
| Noise | -10% | -7% | -6% | -12% | |
| off / environment * (dB) | 28.9 | 29.2 -1% | 29.5 -2% | 30.4 -5% | 30.3 -5% |
| Idle Minimum * (dB) | 28.9 | 29.2 -1% | 29.5 -2% | 30.4 -5% | 30.3 -5% |
| Idle Average * (dB) | 28.9 | 29.2 -1% | 29.5 -2% | 30.4 -5% | 30.3 -5% |
| Idle Maximum * (dB) | 28.9 | 29.2 -1% | 29.5 -2% | 30.4 -5% | 30.3 -5% |
| Load Average * (dB) | 31.2 | 39.7 -27% | 32.4 -4% | 33.7 -8% | 38.9 -25% |
| Load Maximum * (dB) | 31.2 | 39.7 -27% | 39.9 -28% | 33 -6% | 39 -25% |
* ... smaller is better
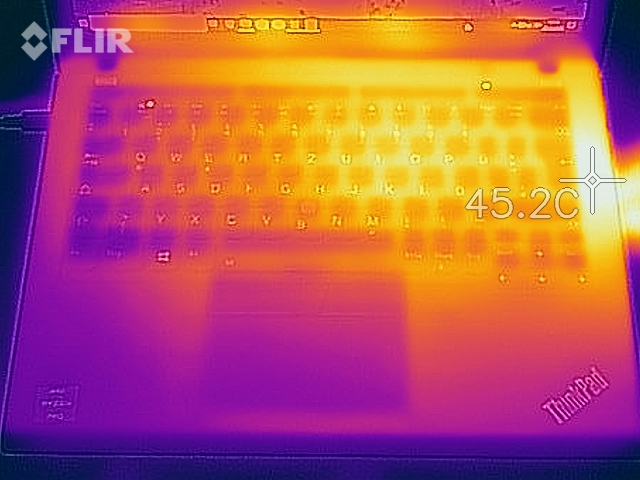
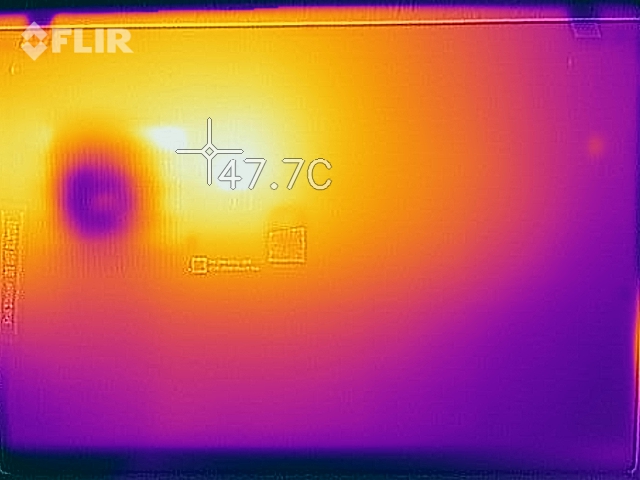
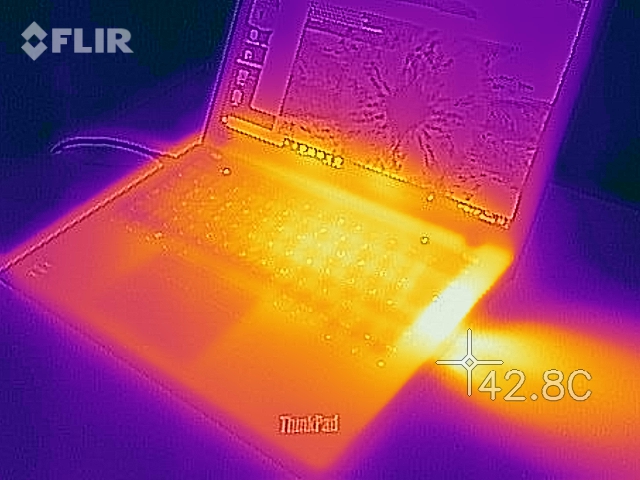
Temperature
Both the ThinkPad X280 and the ThinkPad A285 use the same chassis, so we are not surprised about similar hot spot locations. There are only minor differences between the two subnotebooks with a small advantage for the X280. The A285 is a bit warmer at 46 °C (~115 °F), but this is not uncomfortable. Dell's Latitude 7390 gets much warmer at up to 55.2 °C (~131 °F).
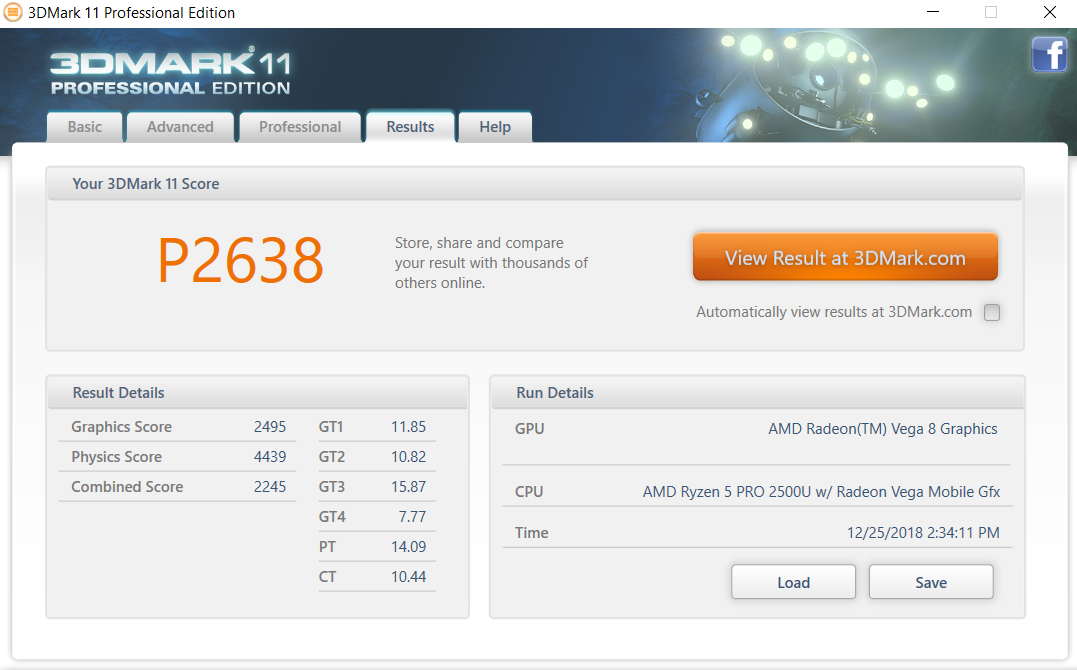
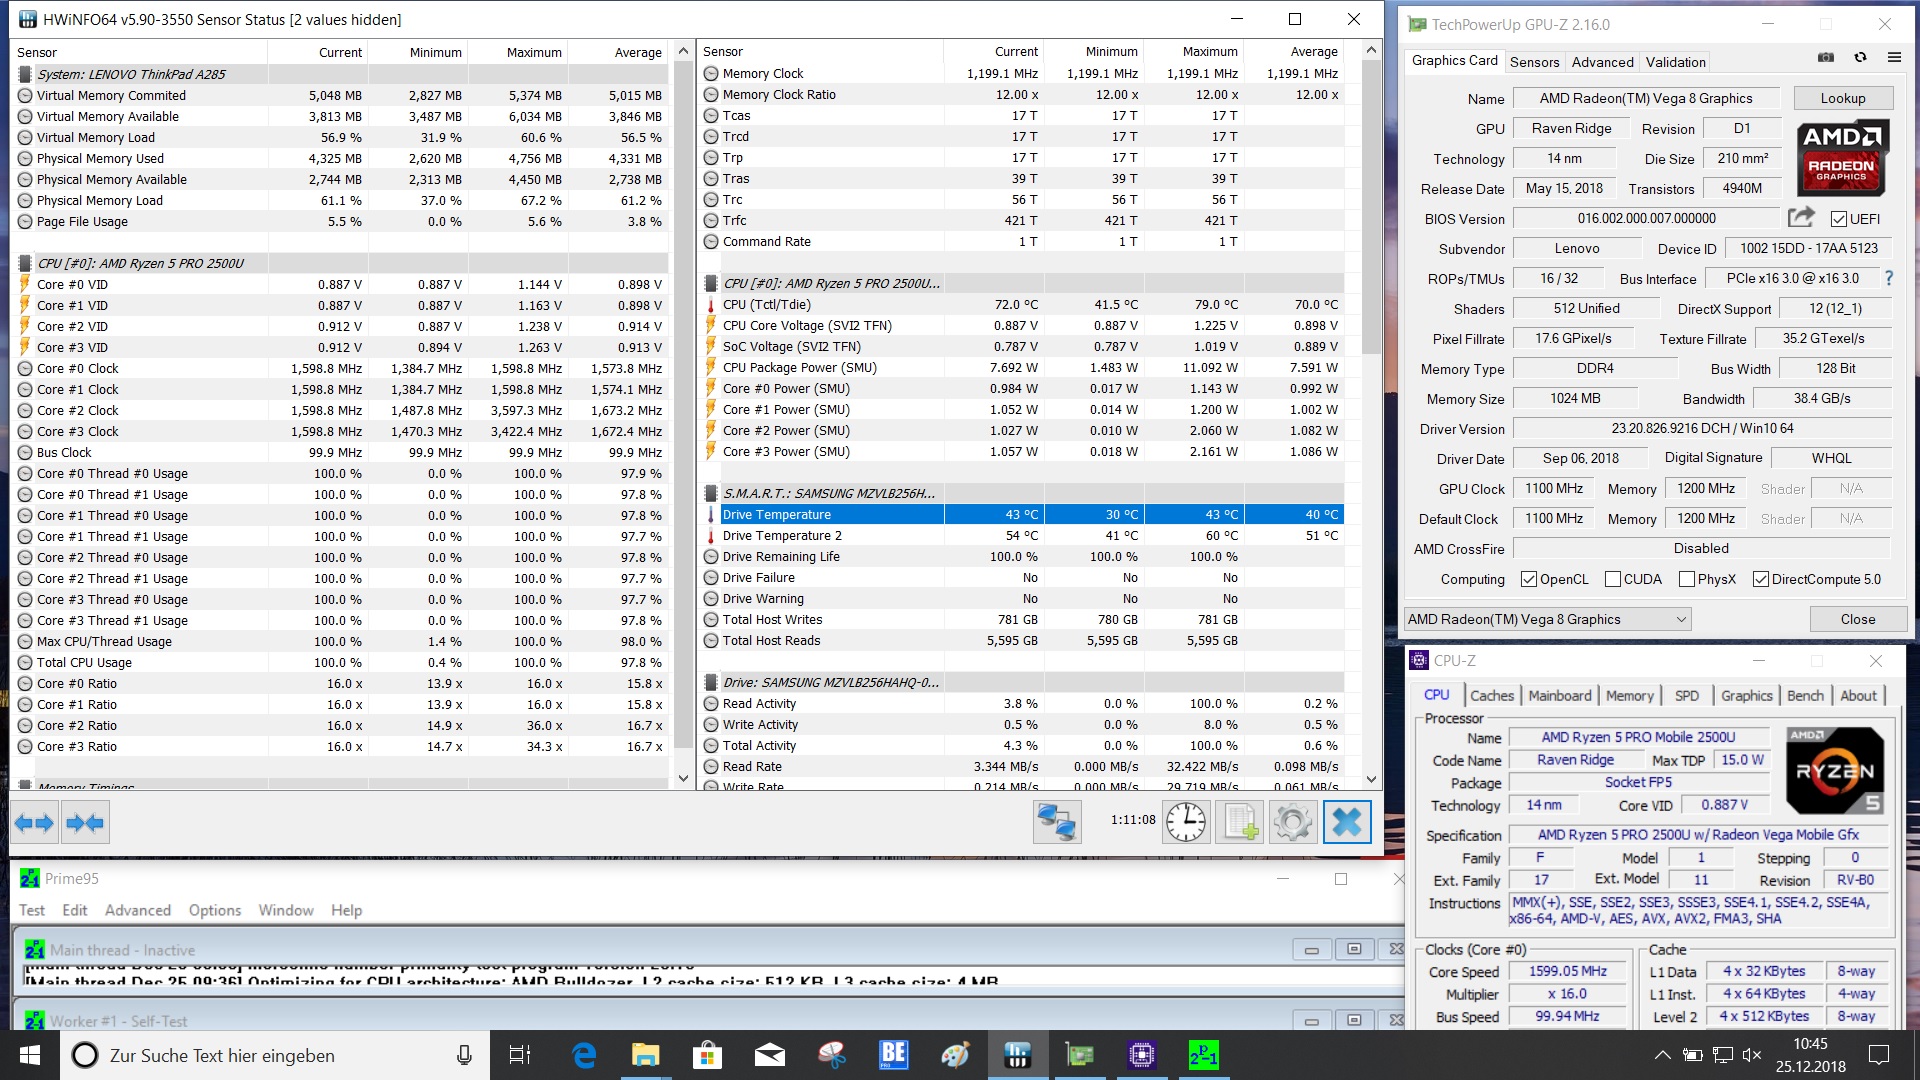
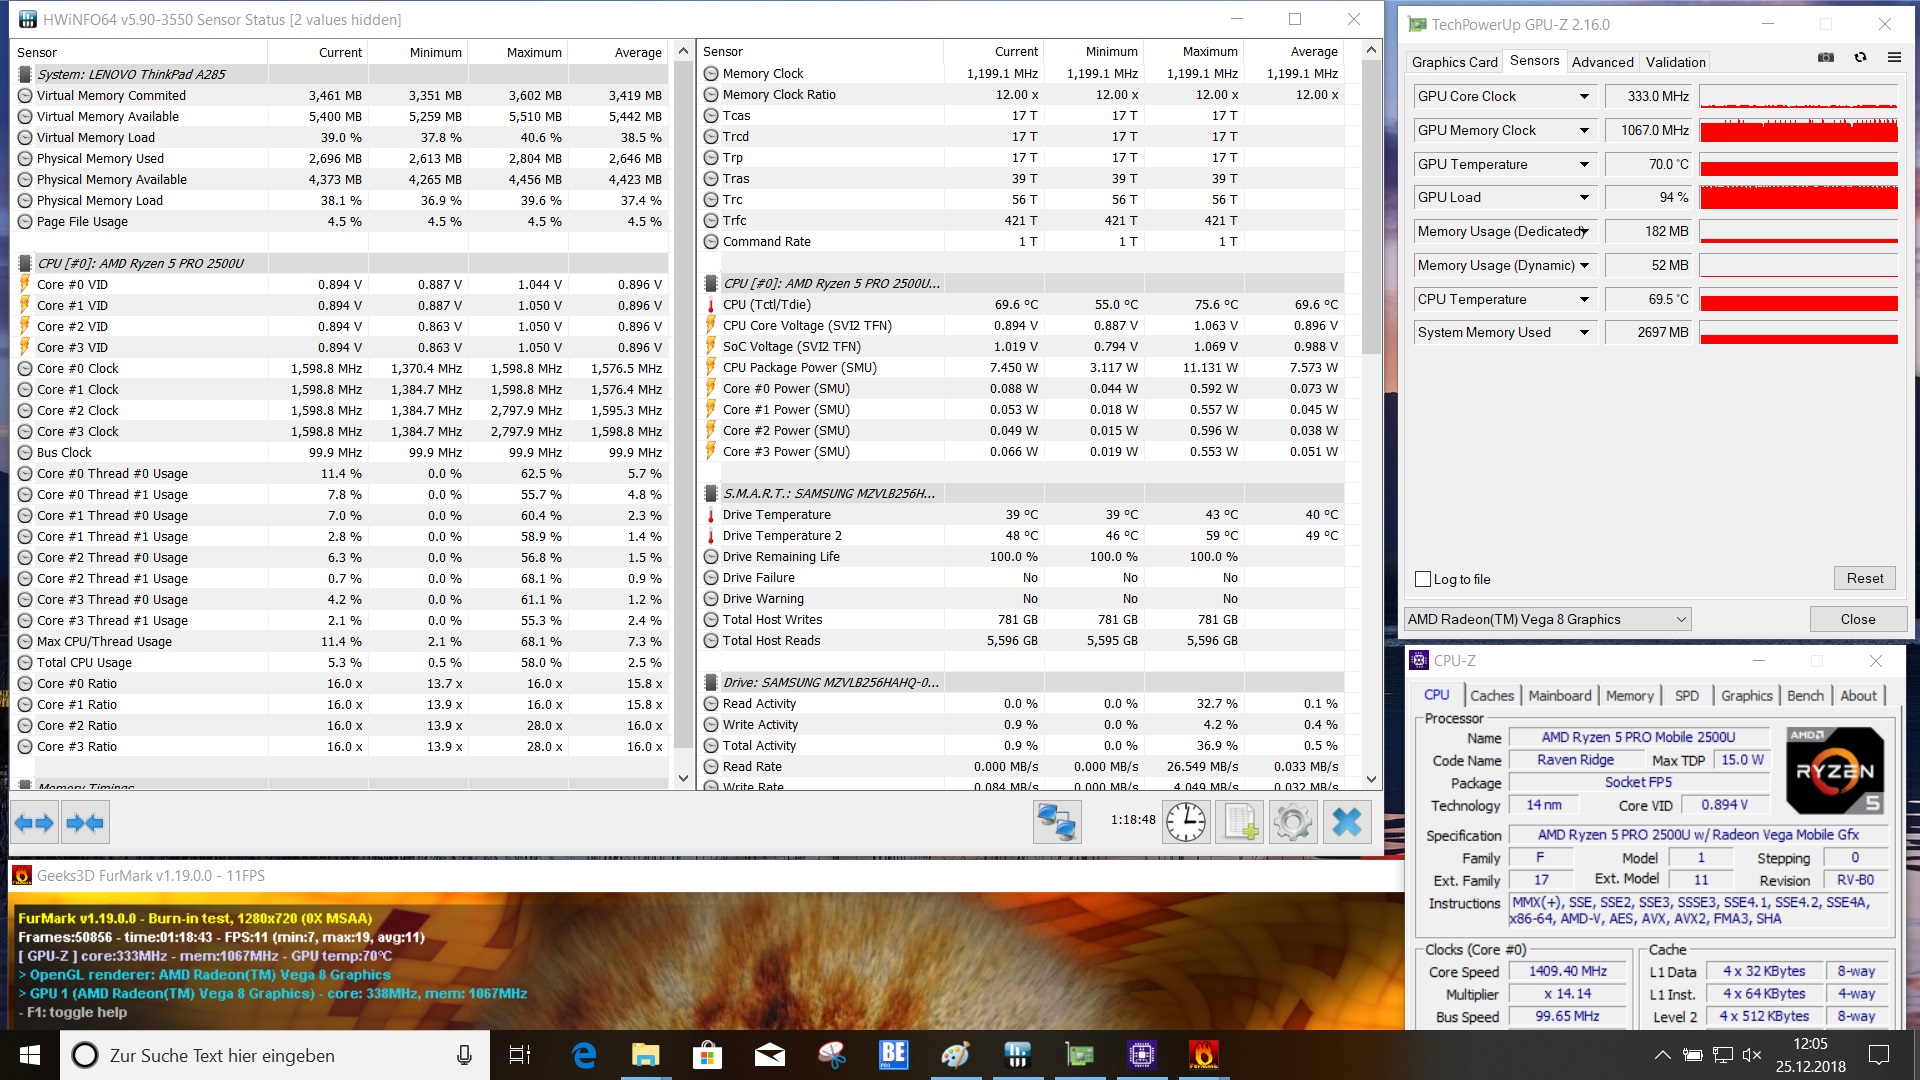
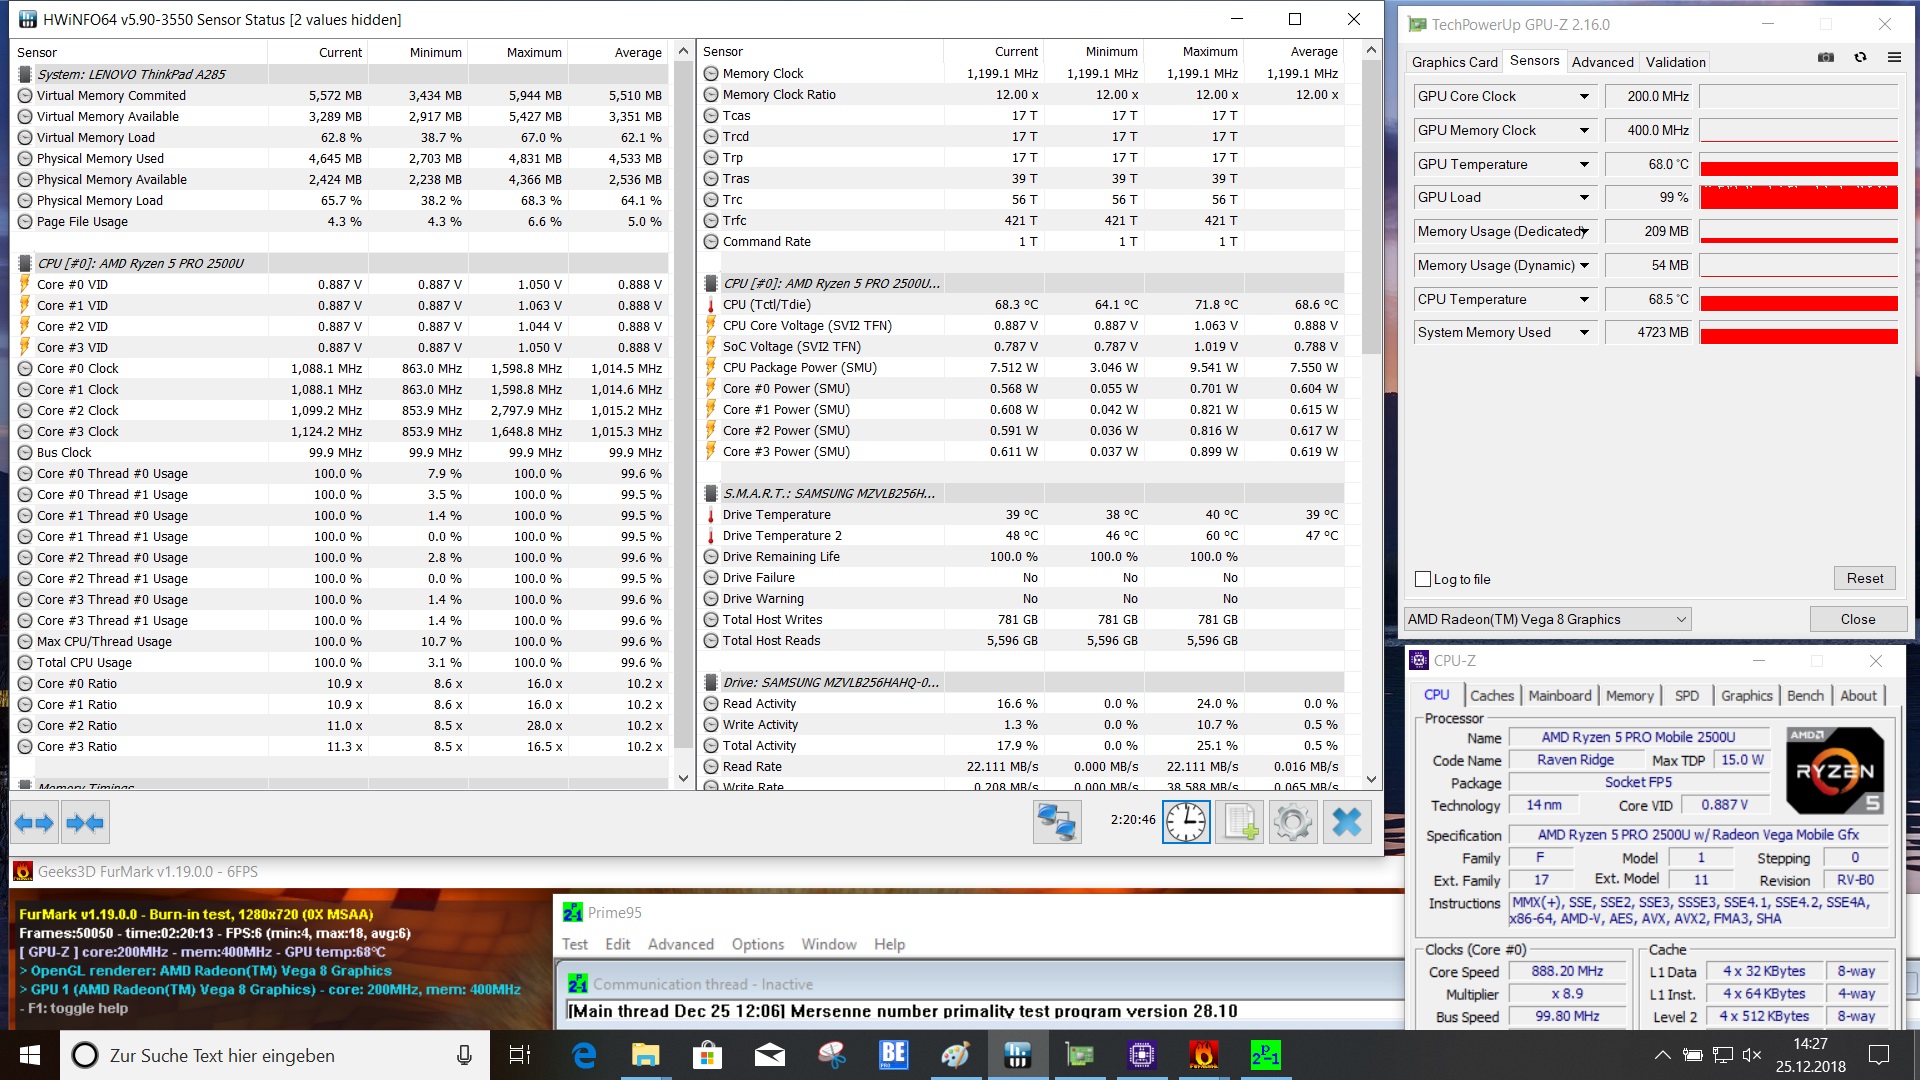
The AMD Ryzen 5 Pro 2500U has a configurable TDP between 12-25 watts, and it looks as if Lenovo limits it to just 12 watts in the compact chassis. We see a maximum CPU temperature of 79 °C (~174 °F) during the stress test with Prime95 with an average frequency of 1.6 GHz. The chip stays cooler when we add GPU load at 71.8 (~161 °F) or 68 °C (~154 °F), respectively. Both the CPU and GPU have to share the limited TDP envelope of 12 watts, so the Ryzen 5 Pro only runs at 1 GHz and the Radeon Vega 8 is limited to just 200 MHz.
This sustained workload also affects the 3D performance, because the 3DMark 11 run immediately after the stress test only determined 2638 points, a deficit of ~500 points compared to a regular run.
(±) The maximum temperature on the upper side is 43 °C / 109 F, compared to the average of 35.9 °C / 97 F, ranging from 21.4 to 59 °C for the class Subnotebook.
(-) The bottom heats up to a maximum of 46 °C / 115 F, compared to the average of 39.2 °C / 103 F
(+) In idle usage, the average temperature for the upper side is 23.8 °C / 75 F, compared to the device average of 30.8 °C / 87 F.
(+) The palmrests and touchpad are reaching skin temperature as a maximum (34.7 °C / 94.5 F) and are therefore not hot.
(-) The average temperature of the palmrest area of similar devices was 28.2 °C / 82.8 F (-6.5 °C / -11.7 F).
| Lenovo ThinkPad A285-20MX0002GE Vega 8, R5 PRO 2500U, Samsung SSD PM981 MZVLB256HAHQ | Lenovo ThinkPad X280-20KES01S00 UHD Graphics 620, i5-8250U, Samsung SSD PM981 MZVLB512HAJQ | Dell Latitude 7390 UHD Graphics 620, i5-8350U, SK hynix SC311 M.2 | Fujitsu Lifebook U938 UHD Graphics 620, i5-8250U, Micron 1100 MTFDDAV256TBN | HP Envy 13-ah0003ng GeForce MX150, i5-8550U, SK Hynix BC501 HFM512GDJTNG | |
|---|---|---|---|---|---|
| Heat | 3% | -2% | 3% | -14% | |
| Maximum Upper Side * (°C) | 43 | 43.2 -0% | 43.1 -0% | 39.3 9% | 43.1 -0% |
| Maximum Bottom * (°C) | 46 | 43.1 6% | 55.2 -20% | 43.1 6% | 45.9 -0% |
| Idle Upper Side * (°C) | 24.5 | 24.8 -1% | 23.7 3% | 25.4 -4% | 32.4 -32% |
| Idle Bottom * (°C) | 25.9 | 24.1 7% | 23.6 9% | 25.6 1% | 32.2 -24% |
* ... smaller is better
Speakers
The speakers of the ThinkPad A285 are located at the bottom and only manage mediocre sound quality. They are pretty loud at up to 71 dB(A), but there is an emphasis on the high tones and there is no bass at all. All in all, the sound is very tinny.
The combined stereo jack on the left side provides a noise-free sound for external speakers or headphones.
Lenovo ThinkPad A285-20MX0002GE audio analysis
(-) | not very loud speakers (71 dB)
Bass 100 - 315 Hz
(-) | nearly no bass - on average 25.9% lower than median
(±) | linearity of bass is average (10.3% delta to prev. frequency)
Mids 400 - 2000 Hz
(+) | balanced mids - only 2.7% away from median
(+) | mids are linear (6.1% delta to prev. frequency)
Highs 2 - 16 kHz
(+) | balanced highs - only 2.3% away from median
(+) | highs are linear (5.1% delta to prev. frequency)
Overall 100 - 16.000 Hz
(±) | linearity of overall sound is average (24% difference to median)
Compared to same class
» 82% of all tested devices in this class were better, 4% similar, 14% worse
» The best had a delta of 5%, average was 18%, worst was 53%
Compared to all devices tested
» 72% of all tested devices were better, 6% similar, 22% worse
» The best had a delta of 4%, average was 23%, worst was 134%
Dell Latitude 7390 audio analysis
(+) | speakers can play relatively loud (83.1 dB)
Bass 100 - 315 Hz
(-) | nearly no bass - on average 22.5% lower than median
(±) | linearity of bass is average (10.7% delta to prev. frequency)
Mids 400 - 2000 Hz
(±) | higher mids - on average 5% higher than median
(+) | mids are linear (4.7% delta to prev. frequency)
Highs 2 - 16 kHz
(±) | higher highs - on average 5.8% higher than median
(+) | highs are linear (6% delta to prev. frequency)
Overall 100 - 16.000 Hz
(±) | linearity of overall sound is average (20.7% difference to median)
Compared to same class
» 48% of all tested devices in this class were better, 10% similar, 43% worse
» The best had a delta of 7%, average was 21%, worst was 53%
Compared to all devices tested
» 56% of all tested devices were better, 8% similar, 36% worse
» The best had a delta of 4%, average was 23%, worst was 134%
Energy Management
Power Consumption
The ThinkPad A285 is unfortunately beaten by the rivals in terms of power consumption. The maximum consumption of the subnotebook is lower at 40.5W, but it is not as efficient while idling. We measure between 5.8 and 9.96 watts for the A285 while idling depending on the power settings and the luminance, which is just too much compared to the other devices.
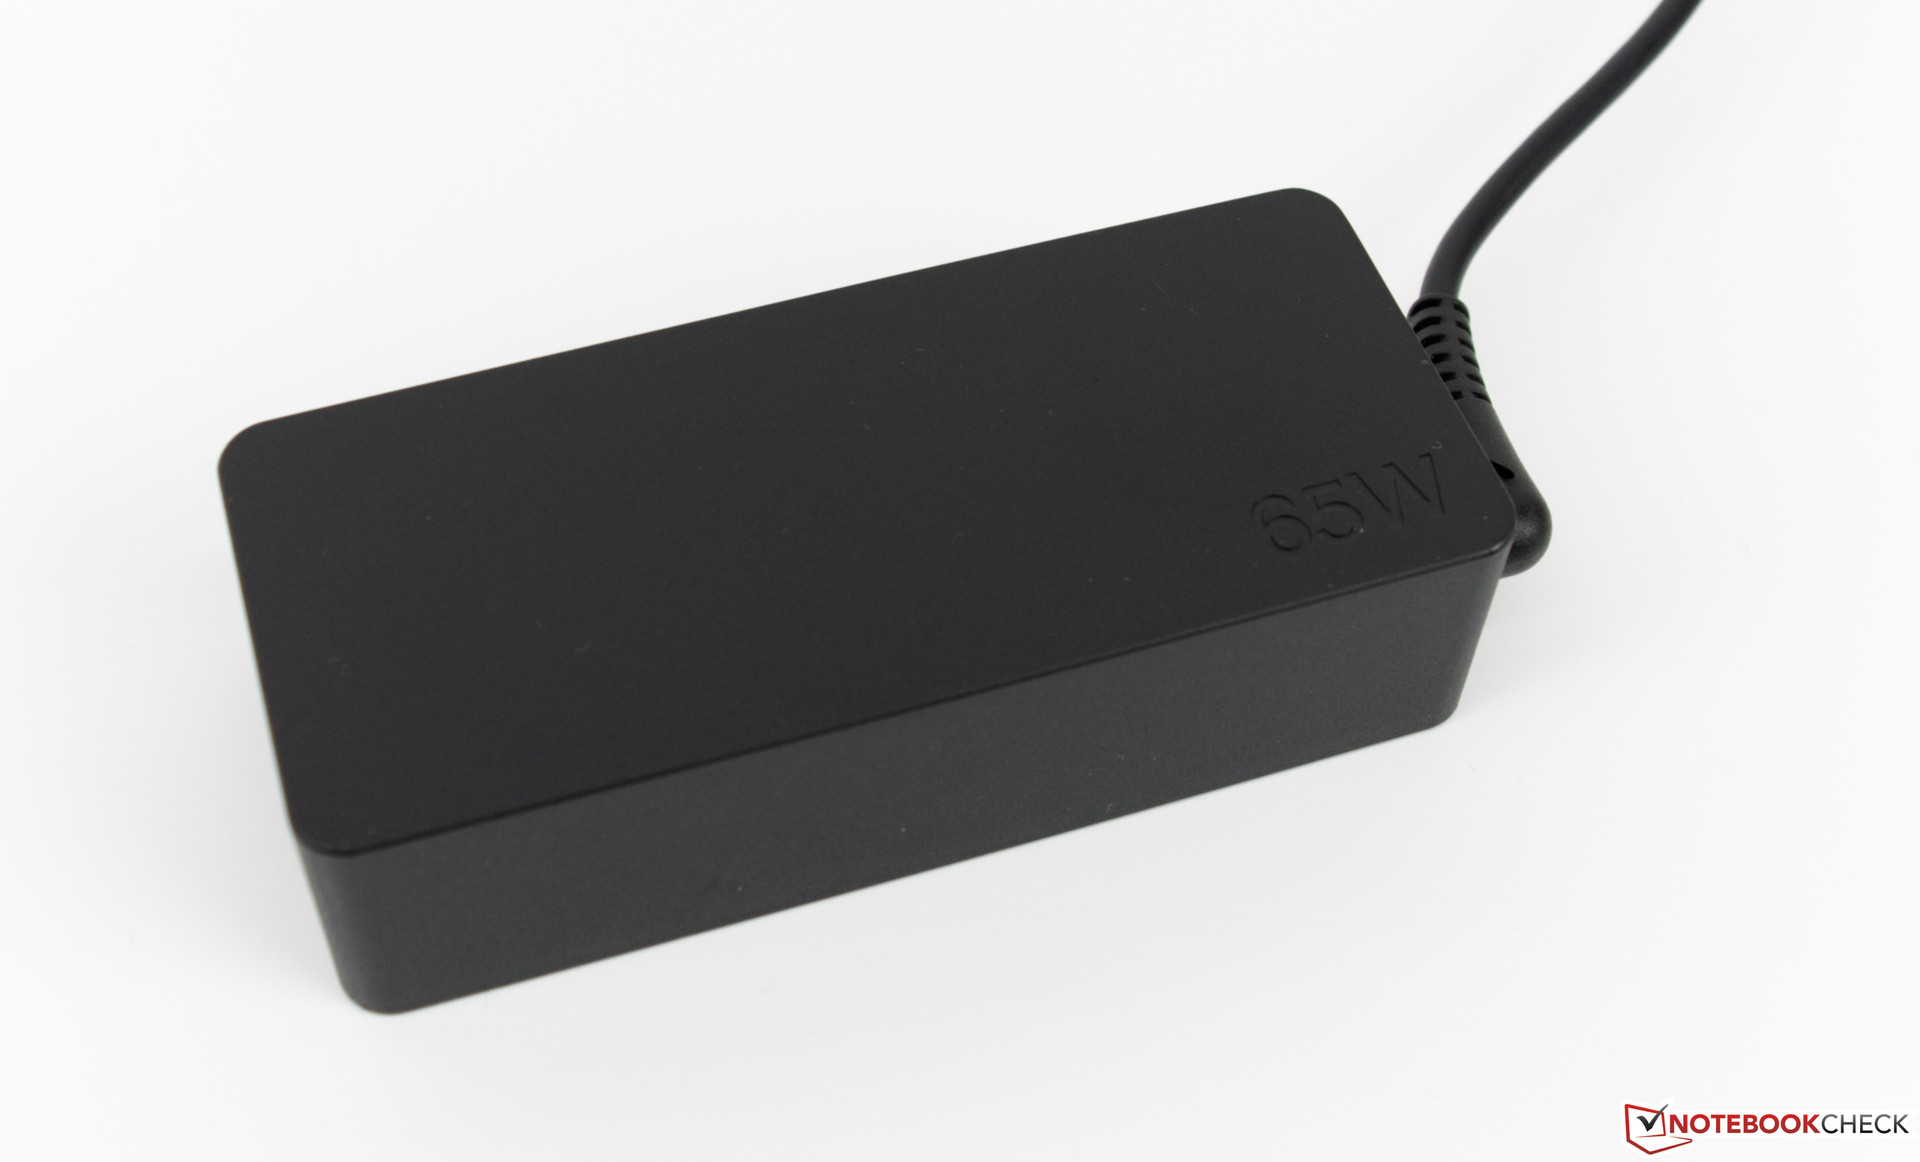
The power adapter is rated at 65 watts and is more than sufficient for the A285. You can use both USB Type-C ports on the ThinkPad to charge the battery.
| Off / Standby | |
| Idle | |
| Load |
|
Key:
min: | |
| Lenovo ThinkPad A285-20MX0002GE R5 PRO 2500U, Vega 8, Samsung SSD PM981 MZVLB256HAHQ, IPS LED, 1920x1080, 12.5" | Lenovo ThinkPad X280-20KES01S00 i5-8250U, UHD Graphics 620, Samsung SSD PM981 MZVLB512HAJQ, IPS LED, 1920x1080, 12.5" | Dell Latitude 7390 i5-8350U, UHD Graphics 620, SK hynix SC311 M.2, IPS, 1920x1080, 13.3" | Fujitsu Lifebook U938 i5-8250U, UHD Graphics 620, Micron 1100 MTFDDAV256TBN, IPS, 1920x1080, 13.3" | HP Envy 13-ah0003ng i5-8550U, GeForce MX150, SK Hynix BC501 HFM512GDJTNG, IPS, 1920x1080, 13.3" | Average AMD Radeon RX Vega 8 (Ryzen 2000/3000) | Average of class Subnotebook | |
|---|---|---|---|---|---|---|---|
| Power Consumption | 12% | 10% | 34% | 2% | -4% | 1% | |
| Idle Minimum * (Watt) | 5.8 | 3.11 46% | 2.34 60% | 2.4 59% | 5.3 9% | 5.68 ? 2% | 3.76 ? 35% |
| Idle Average * (Watt) | 8.2 | 5.01 39% | 5.6 32% | 5.5 33% | 7.3 11% | 8.75 ? -7% | 6.54 ? 20% |
| Idle Maximum * (Watt) | 9.96 | 8.11 19% | 6.5 35% | 6 40% | 9.3 7% | 10.1 ? -1% | 7.89 ? 21% |
| Load Average * (Watt) | 37.9 | 44.6 -18% | 43 -13% | 31 18% | 39 -3% | 37.8 ? -0% | 42 ? -11% |
| Load Maximum * (Watt) | 40.5 | 51.7 -28% | 67.4 -66% | 32.6 20% | 46 -14% | 46.2 ? -14% | 64.8 ? -60% |
* ... smaller is better
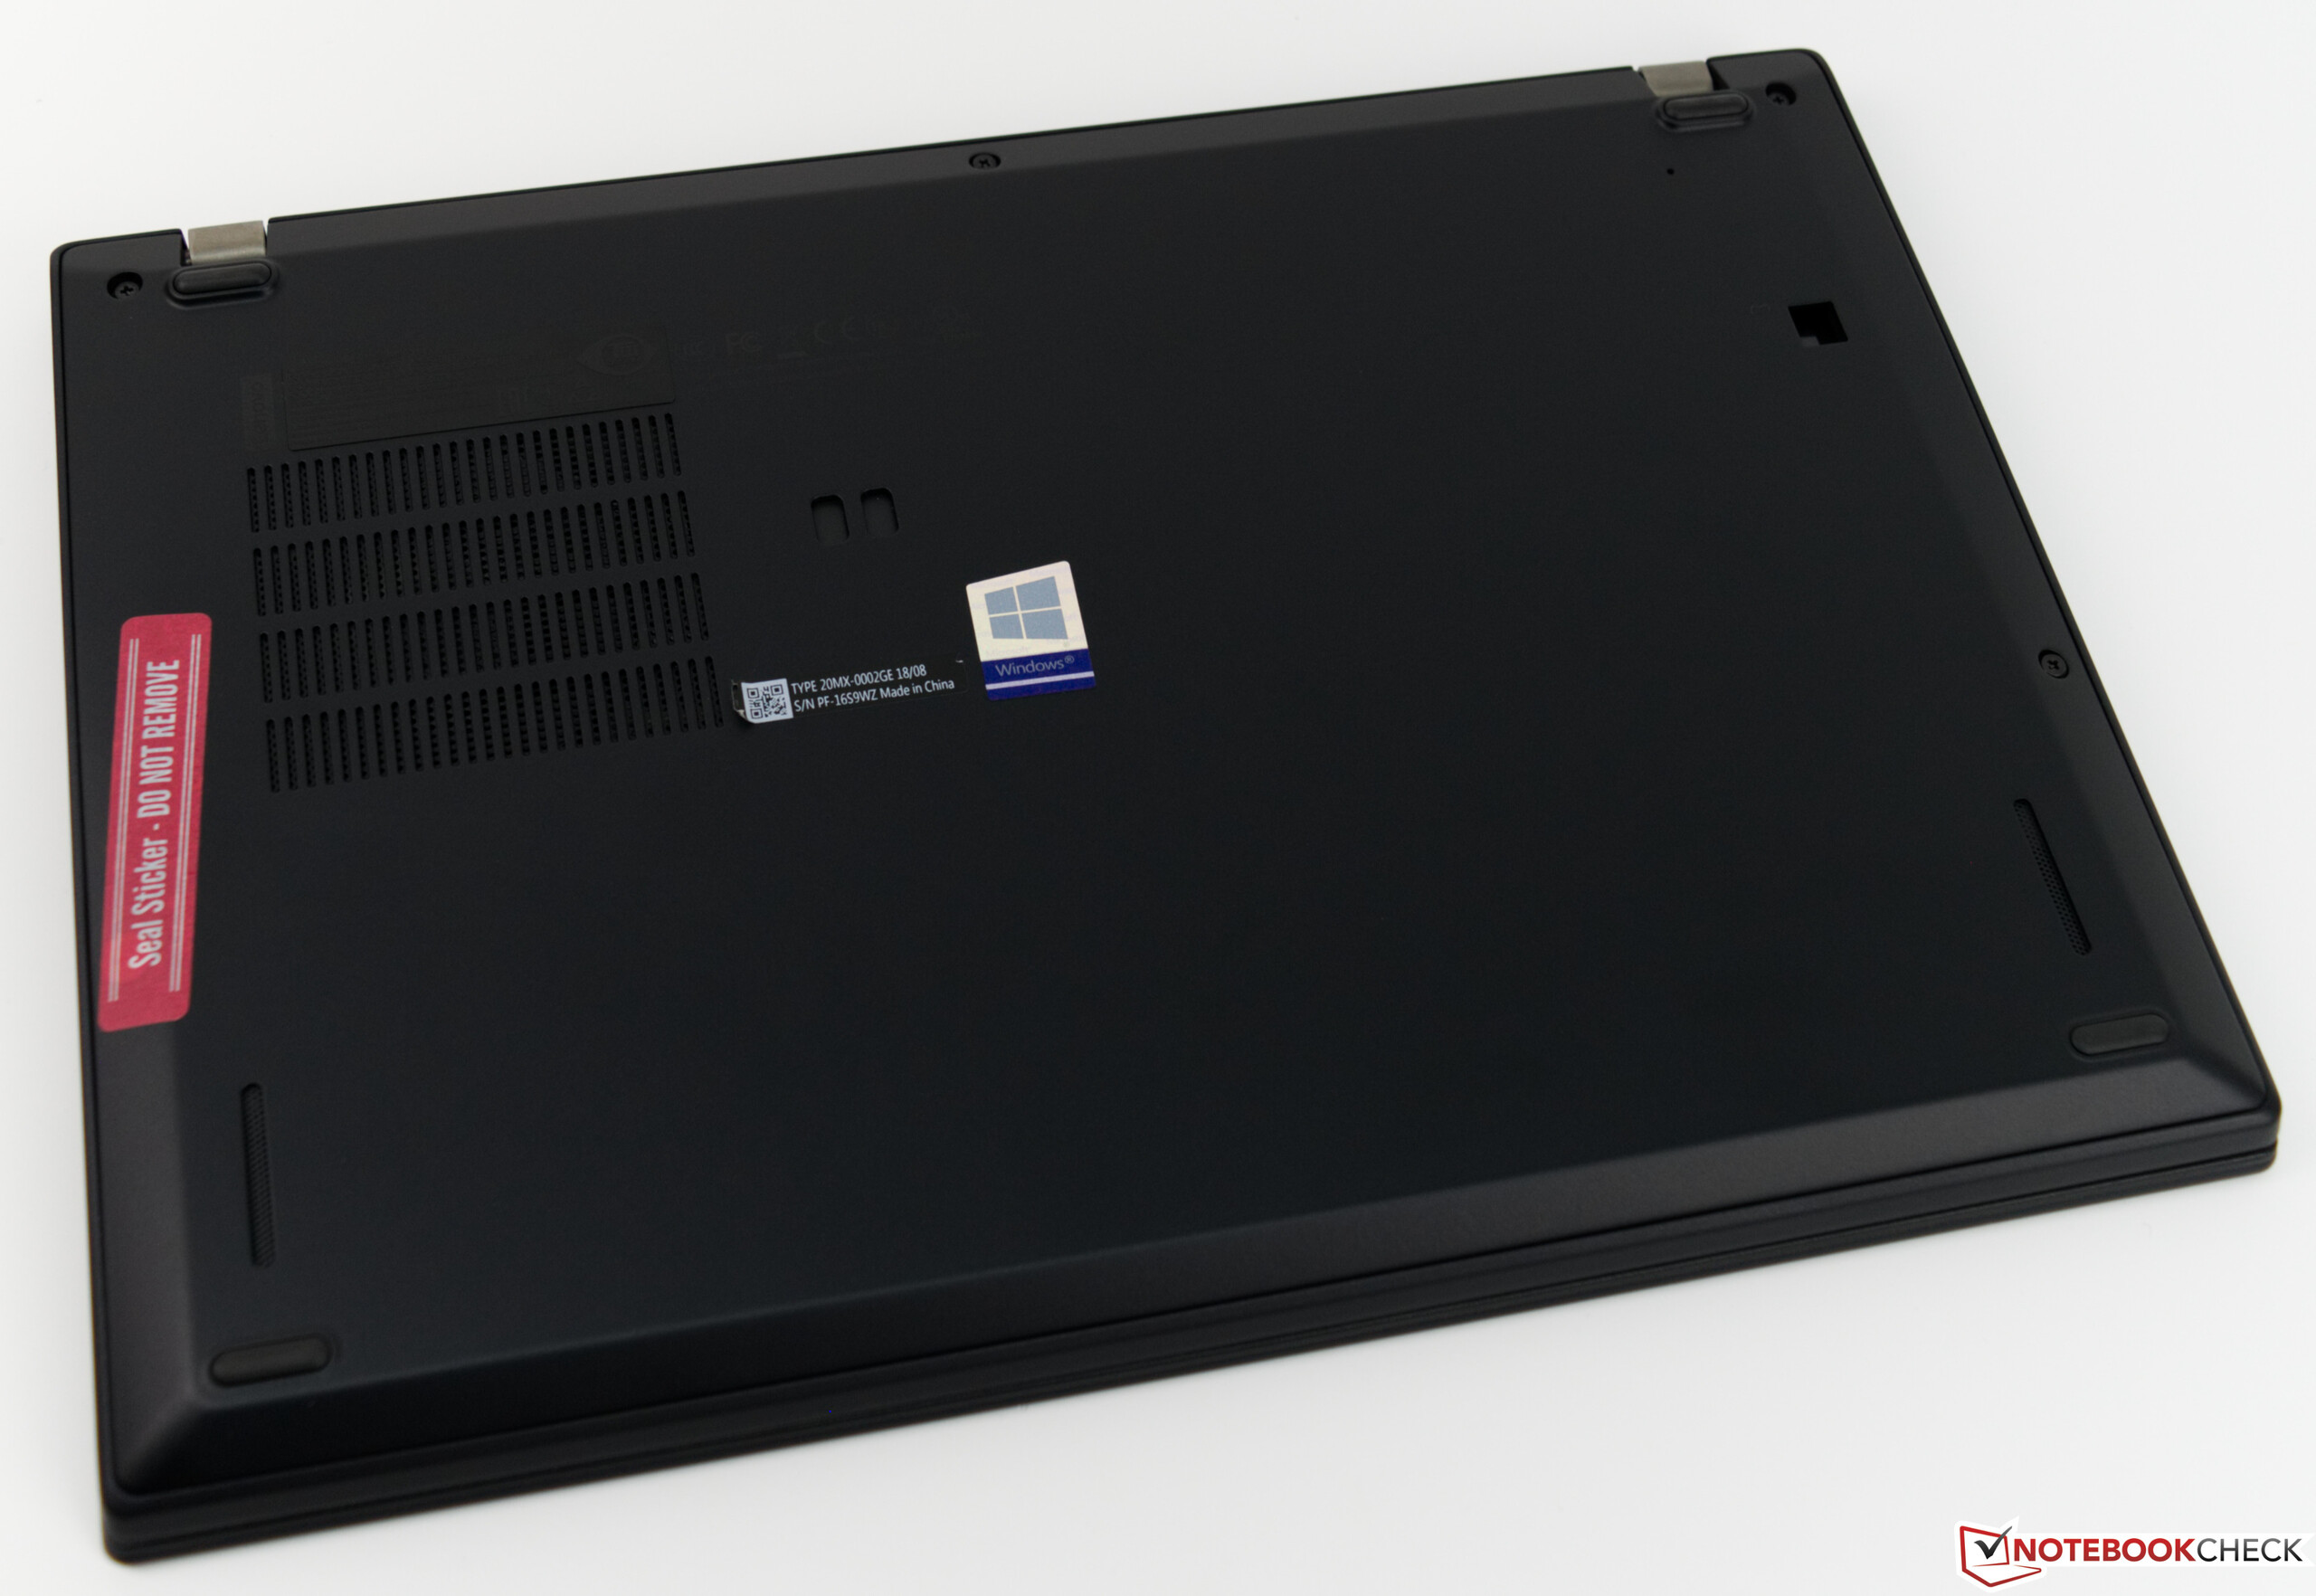
Battery Runtime

Lenovo has equipped the ThinkPad A285 with a 48 Wh battery, which is non-removable inside the case. The increased power consumption compared to the X280 obviously affects the battery runtime and we determine shorter results. Our practical WLAN test runs for 7:49 hours on the ThinkPad A285, which is a decent result, but it might not be enough for a full day in the office without some recharging. We used an adjusted luminance of 150 nits for this test (71% for our test model).
The H.264 test also determines a poorer result compared to the X280, and it looks that the UHD Graphics 620 is more efficient in this scenario. The battery lasts just 4:46 hours before it has to be recharged. It is still enough for two long movies.
The charging time is comparatively short at 1:40 hours and you can use about 80% after just 50 minutes.
We did not detect any GPU performance drops on battery power; only the CPU performance is a bit lower, which is shown by the Cinebench R15 test.


| Lenovo ThinkPad A285-20MX0002GE R5 PRO 2500U, Vega 8, 48 Wh | Lenovo ThinkPad X280-20KES01S00 i5-8250U, UHD Graphics 620, 50 Wh | Dell Latitude 7390 i5-8350U, UHD Graphics 620, 60 Wh | Fujitsu Lifebook U938 i5-8250U, UHD Graphics 620, 50 Wh | HP Envy 13-ah0003ng i5-8550U, GeForce MX150, 53.2 Wh | Average of class Subnotebook | |
|---|---|---|---|---|---|---|
| Battery runtime | 62% | 114% | 48% | 29% | 130% | |
| Reader / Idle (h) | 9.6 | 20.2 110% | 27.7 189% | 19.5 103% | 15.5 61% | 28.6 ? 198% |
| H.264 (h) | 4.8 | 9.5 98% | 12.5 160% | 7.2 50% | 6.3 31% | 15.4 ? 221% |
| WiFi v1.3 (h) | 7.8 | 8.9 14% | 8.4 8% | 8 3% | 14 ? 79% | |
| Load (h) | 1.6 | 2 25% | 1.5 -6% | 2.1 31% | 1.9 19% | 1.969 ? 23% |
Verdict
Pros
Cons
The Lenovo ThinkPad A285 finally gives users the chance to get a compact ThinkPad laptop based on an AMD processor. Besides three base models, the compact 12.5-inch device can be further configured and is available with useful features such as a SmartCard reader or fingerprint scanner. The manufacturer also offers an optional WWAN module, so you can use the Internet on the road.
AMD's Ryzen 5 Pro 2500U is a good CPU for the A285 and offers plenty of performance for common tasks. The processor is comparable to an Intel Core i5-8250U, but not for sustained workloads. The X280 with the Intel CPU is faster, but this is also a result of different TDP configurations, which were set by Lenovo.
The biggest difference between the two chips is the integrated graphics adapter. AMD's Radeon Vega 8 is a much faster unit and can easily beat the Intel UHD Graphics 620 in the benchmarks.
Our test model of the Lenovo ThinkPad A285 retails for 1439 Euros (~$1640). We particularly liked the excellent input devices, and the 256 GB PCIe-SSD ensures high transfer rates for a good system performance. The high-quality and robust chassis completes the package. It tips the scale at just 1.1 kg (~2.4 lb), so you can easily carry it around or just put it in your bag.
The Lenovo ThinkPad A285 is a good office device based on an AMD processor and benefits from the lower price point compared to the X280. The A285 is a good choice if you do not need the additional CPU performance of the X280 or the longer battery runtimes.
There are still some drawbacks such as the increased idle consumption, which affects the battery runtime compared to the X280. The display in our test model is also a bit worse, but this is a result of Lenovo's panel lottery. The manufacturer uses different suppliers and you never know what panel you will get before the purchase.
The soldered memory is definitely a bad development for a business devices and you cannot upgrade it later. The A285 also lacks the Thunderbolt 3 support of the X280. Still, the overall impression of the device is good and we can recommend it. Whether users are willing to switch to an AMD system for their business device remains to be seen, but the lower price is definitely an advantage. A similarly equipped ThinkPad X280 with an Intel CPU is almost 200 Euros (~$228) more expensive and does not perform much better.
Lenovo ThinkPad A285-20MX0002GE
- 01/06/2019 v6 (old)
Sebastian Bade
Price comparison

