HP Envy 13-ad006ng (i7-7500U, MX150) Laptop Review
For the original German review, please click here.
HP attacks the venerable Dell XPS 13 on several fronts at once. First, the company offers high-end and very premium Ultrabooks in form of the Spectre x360 13 and the Spectre 13, which both just received hardware updates and now sport 8th-generation Core i CPUs. Secondly, HP sells the Envy 13, which is decidedly upscale as well and at the same time a more "traditional" Ultrabook design. Back in August we reviewed one of the available configurations - a less expensive version with Core i5-7200U and 128 GB SSD. This time around, we are taking a look at the Envy 13 with Core i7-7500U and 256 GB SSD. The most important difference is the Nvidia GeForce MX150 GPU, which makes the Ultrabook suitable for occasional gaming as well.
The segment is hotly contested and consequently attracts many manufacturers. The most prominent competitor is of course the Dell XPS 13, but there are others, like the Lenovo IdeaPad 710s Plus (we haven't had a chance to review the successor to the IdeaPad 720s yet), the Xiaomi Mi Notebook Air 13 or the Asus ZenBook UX310UA.
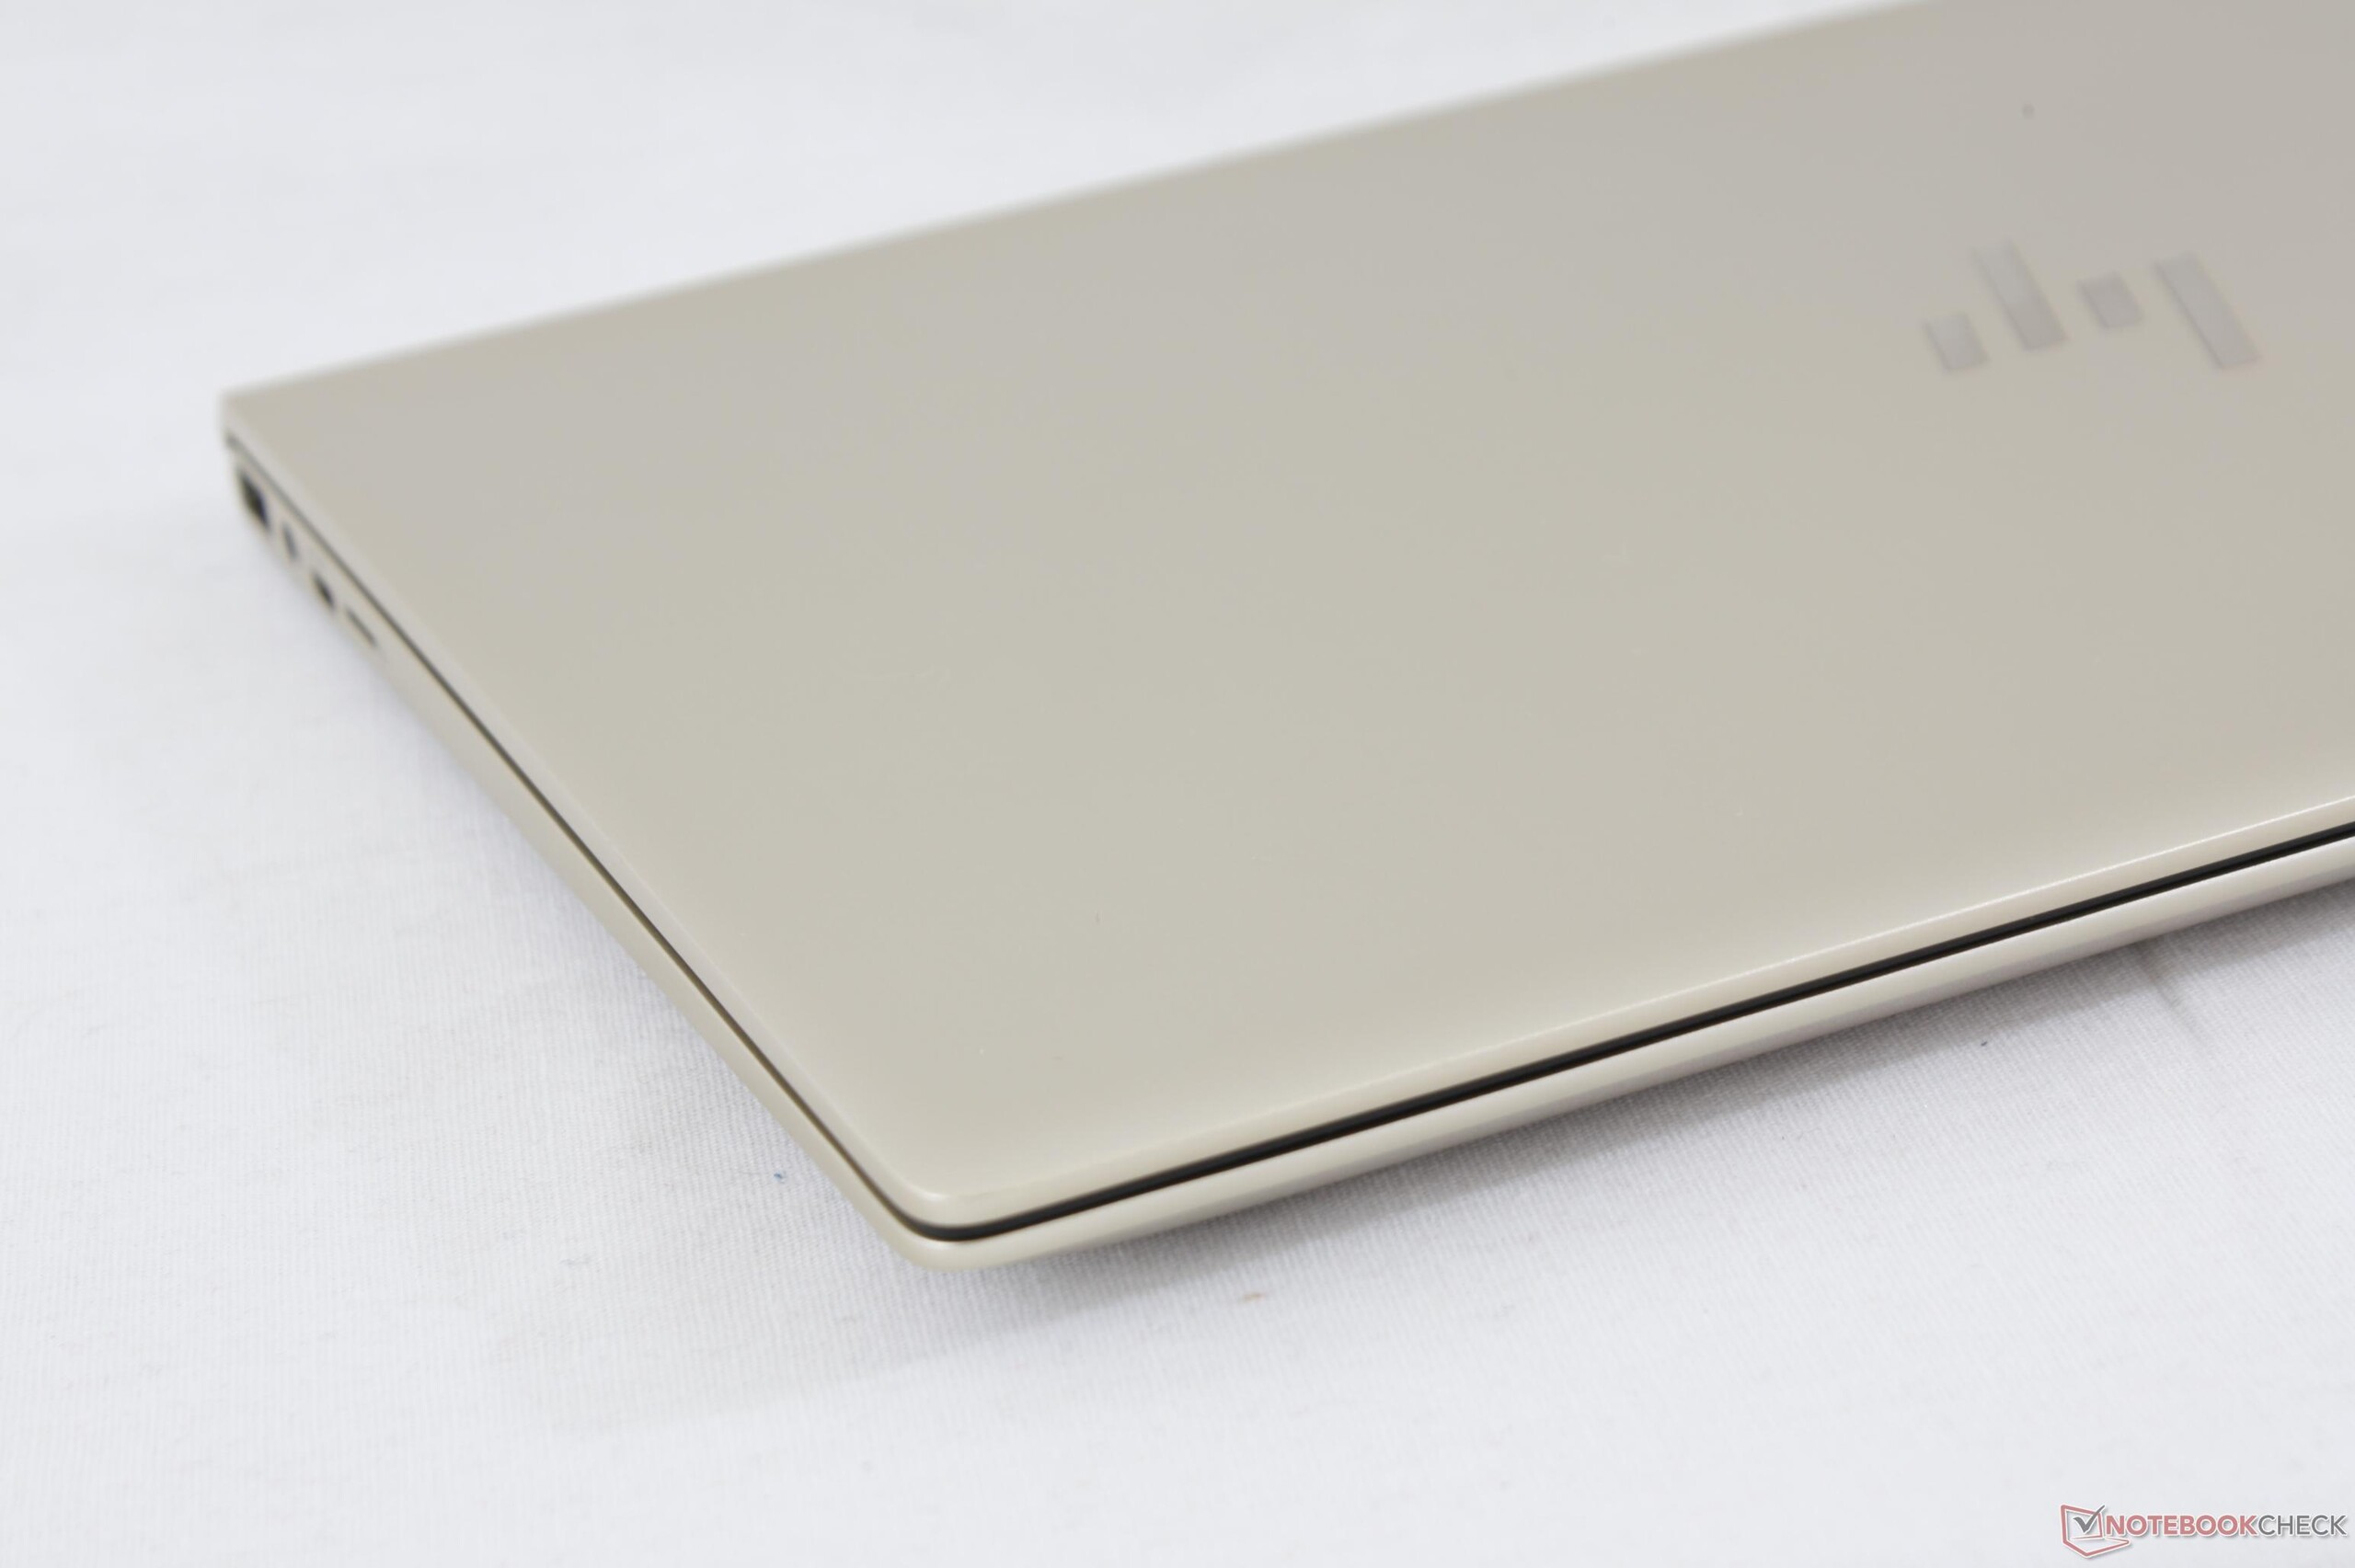
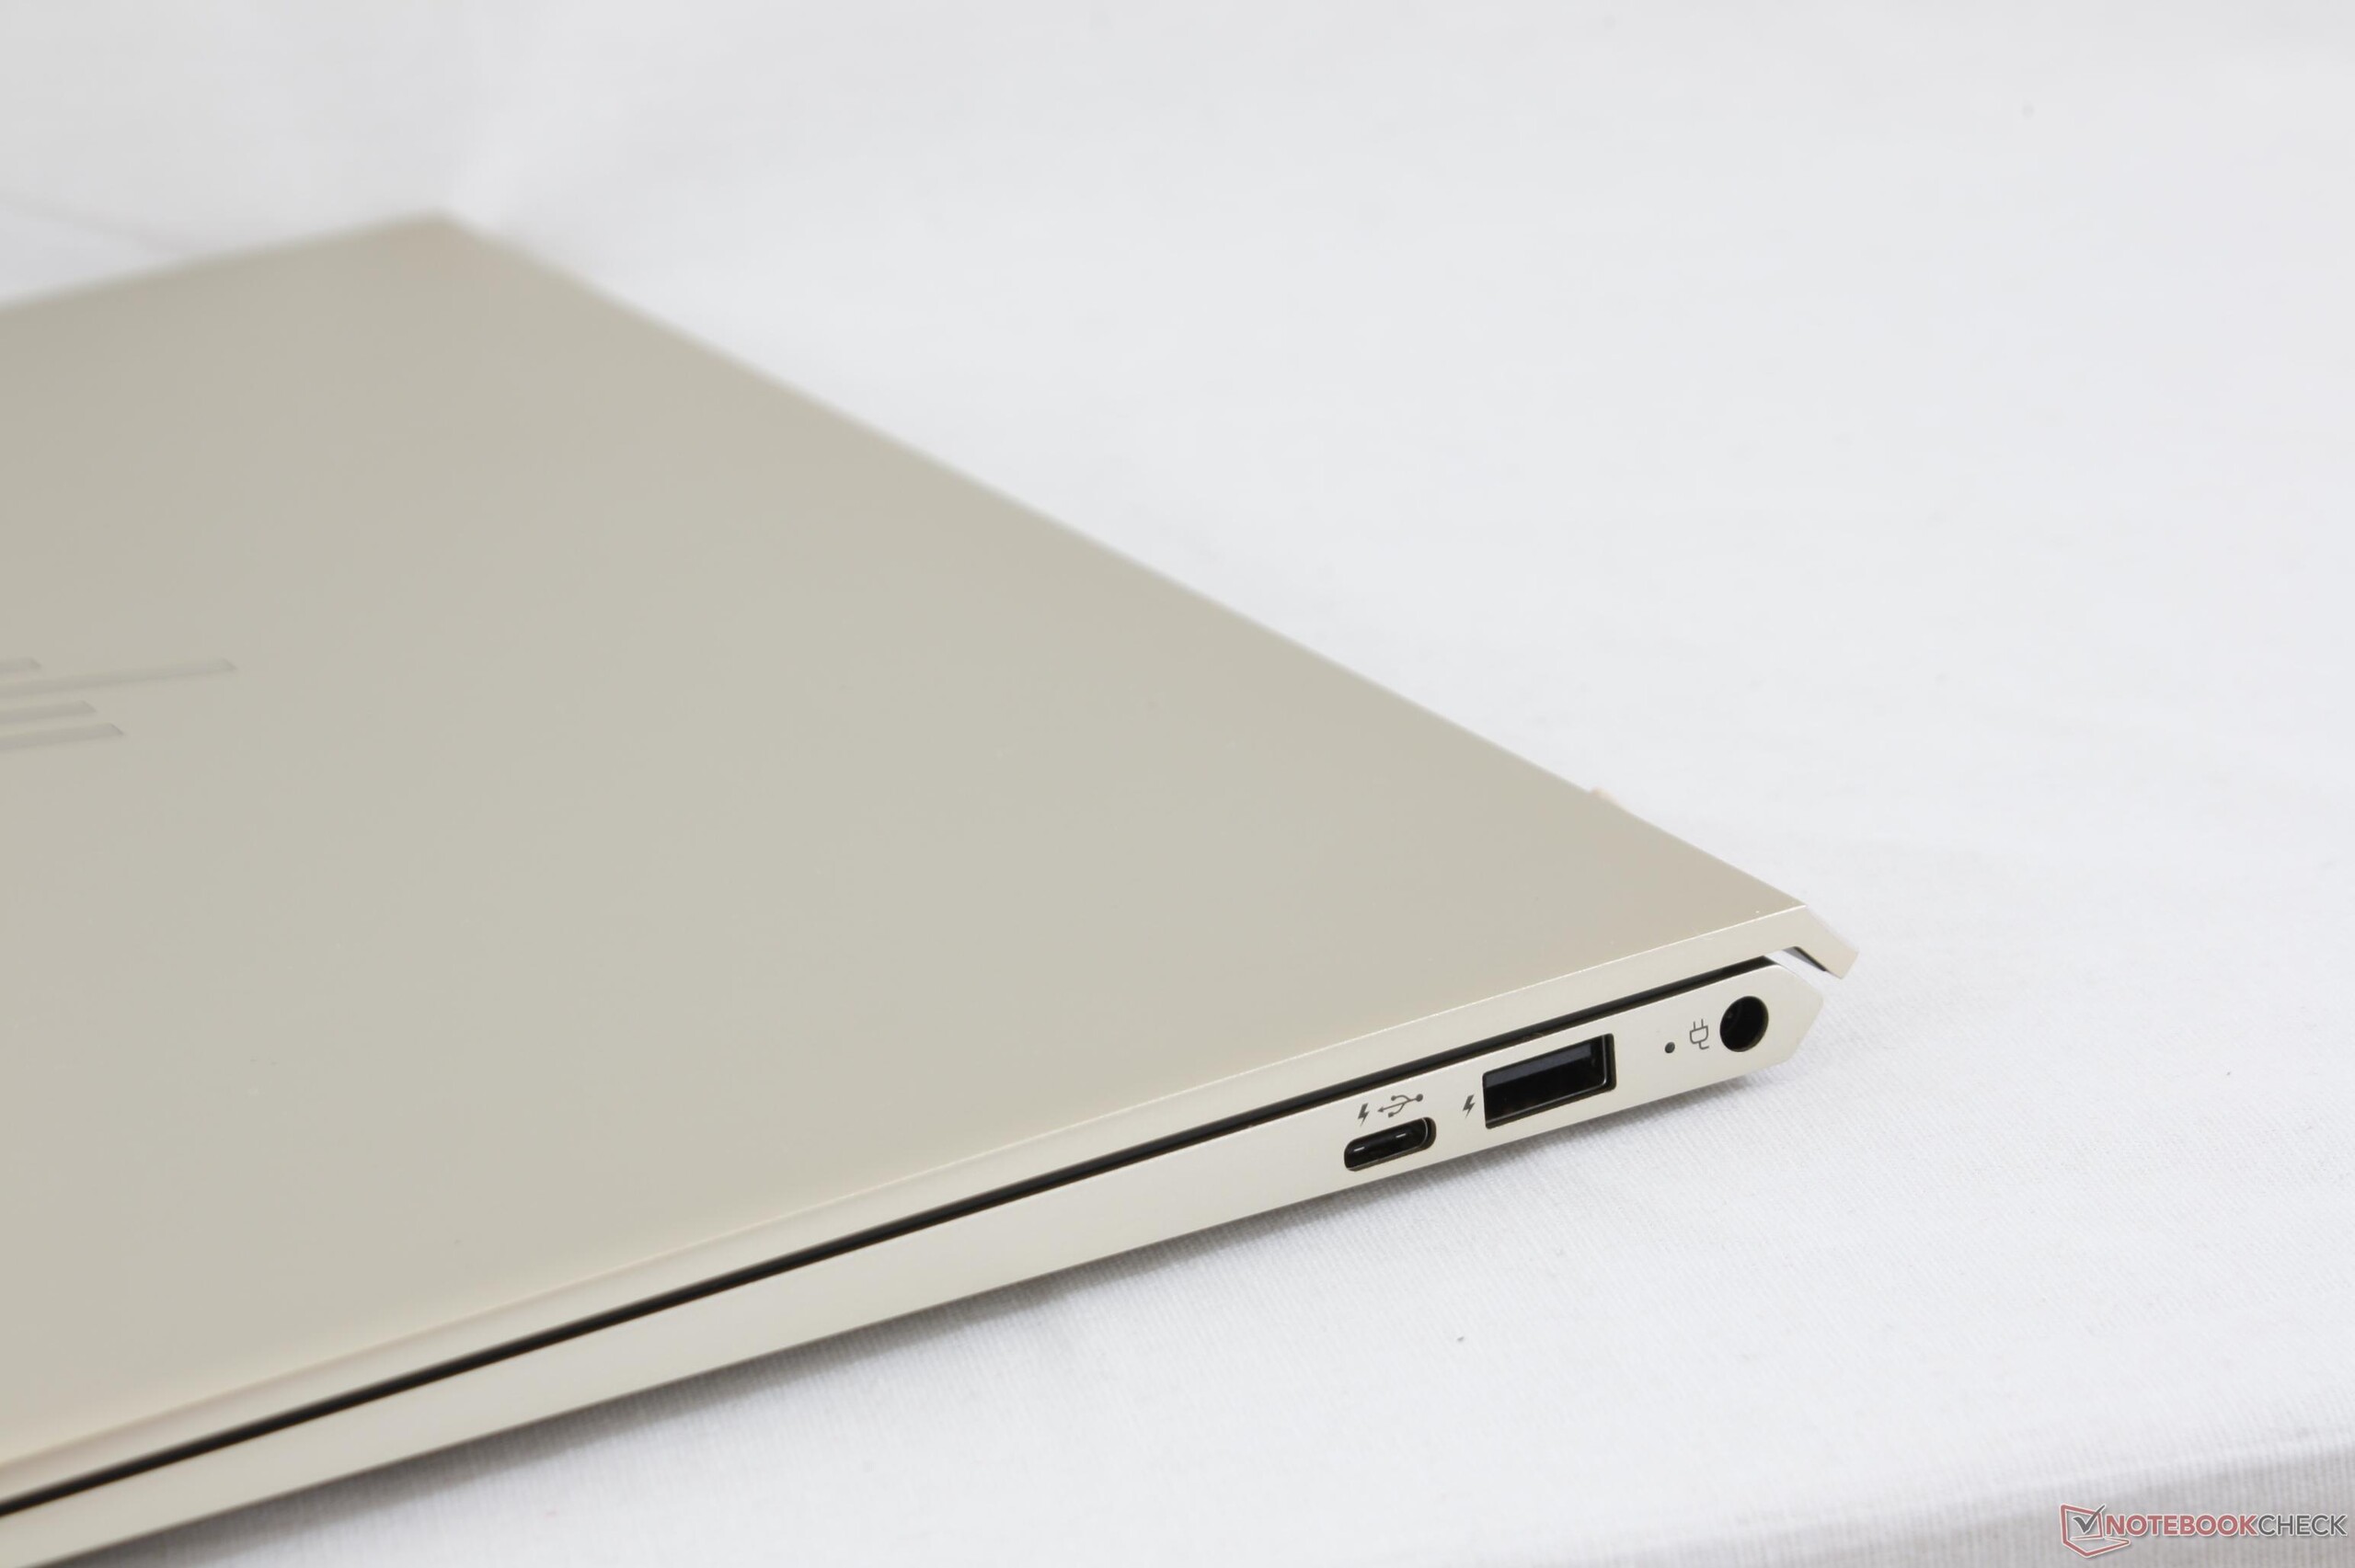
Since the exterior of the Envy 13 with GeForce MX150 mirrors that of the Envy 13 without MX150 and the configuration is very similar as well, we'll skip the sections dealing with connectivity, the chassis, and the input devices.
At the time of writing, HP US offers the Envy 13 with Core i7-8550U, 256 GB SSD, 8 GB of RAM and 13.3-inch Full HD display for $850. The 4K display option costs $150 extra.
| SD Card Reader | |
| average JPG Copy Test (av. of 3 runs) | |
| Dell XPS 13 i7-8550U | |
| HP Envy 13-ad006ng (Toshiba Exceria Pro SDXC 64 GB UHS-II) | |
| Lenovo IdeaPad 710S Plus-13IKB | |
| maximum AS SSD Seq Read Test (1GB) | |
| Dell XPS 13 i7-8550U | |
| Lenovo IdeaPad 710S Plus-13IKB | |
| HP Envy 13-ad006ng (Toshiba Exceria Pro SDXC 64 GB UHS-II) | |
| Networking | |
| iperf3 transmit AX12 | |
| HP Envy 13-ad006ng | |
| Lenovo IdeaPad 710S Plus-13IKB | |
| Dell XPS 13 i7-8550U | |
| iperf3 receive AX12 | |
| Dell XPS 13 i7-8550U | |
| Lenovo IdeaPad 710S Plus-13IKB | |
| HP Envy 13-ad006ng | |
Display
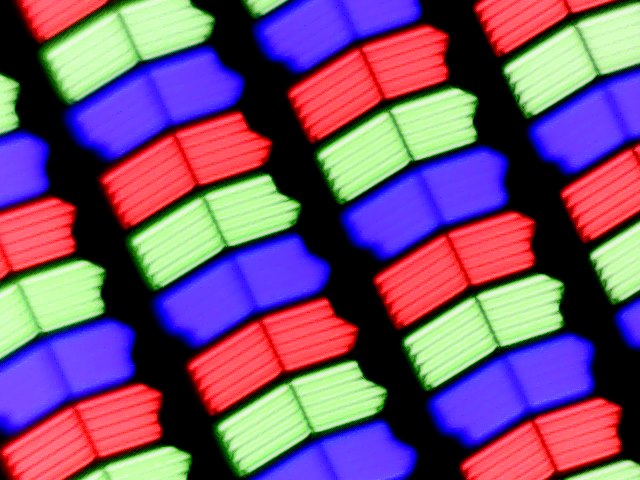
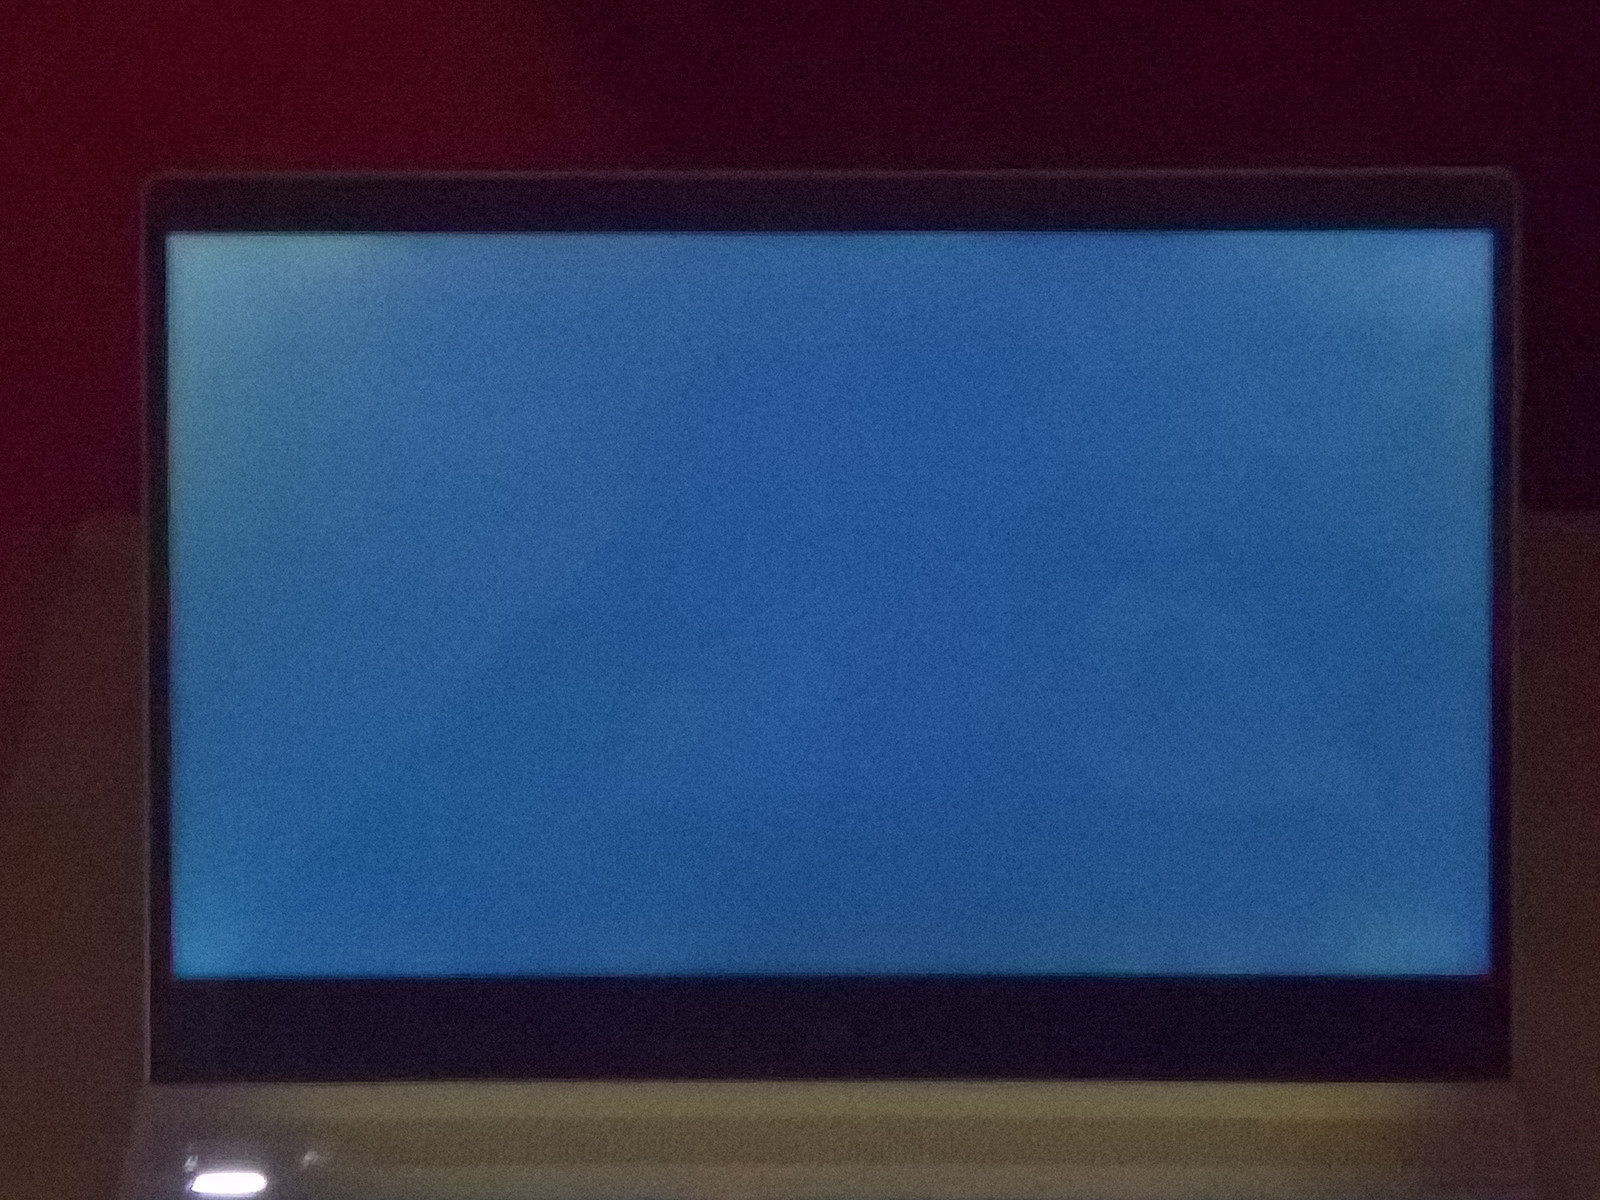
At a first glance, it seems that the review notebook is equipped with the same panel as the Envy 13-ad065nr, since it also features a glossy 13.3-inch Full HD IPS display with a resolution of 1920 x 1080 pixels just like the latter notebook. There's one difference though: the display of the Envy we are reviewing today is protected by a glass panel, whereas the Envy 13-ad065nr features a traditional construction without a glass layer. The panel itself is different as well, as it is sourced from BOE and not LG. There are no other display choices in Germany, but HP's US page also mentions a 4K IPS panel as an alternative.
The difference between the two panels isn't really that significant. The LG panel in the ad065nr is slightly brighter, but its contrast is lower and the brightness distribution isn't that great. The response time of the BOE panel is slower and the PWM frequency is - at 1000 Hz for all brightness levels of less than 90 % - worse as well, although that might not bother most users. The LG panel has a PWM frequency of over 10200 MHz, which definitely shouldn't cause any issues. The BOE display has more noticeable backlight bleeding, but all things considered, it's still extremely minor.
Neither Envy 13 display does well when compared to other notebooks, as all of the competitors feature significantly brighter panels.
| |||||||||||||||||||||||||
Brightness Distribution: 83 %
Center on Battery: 281 cd/m²
Contrast: 1222:1 (Black: 0.23 cd/m²)
ΔE ColorChecker Calman: 4.83 | ∀{0.5-29.43 Ø4.73}
ΔE Greyscale Calman: 6.63 | ∀{0.09-98 Ø4.97}
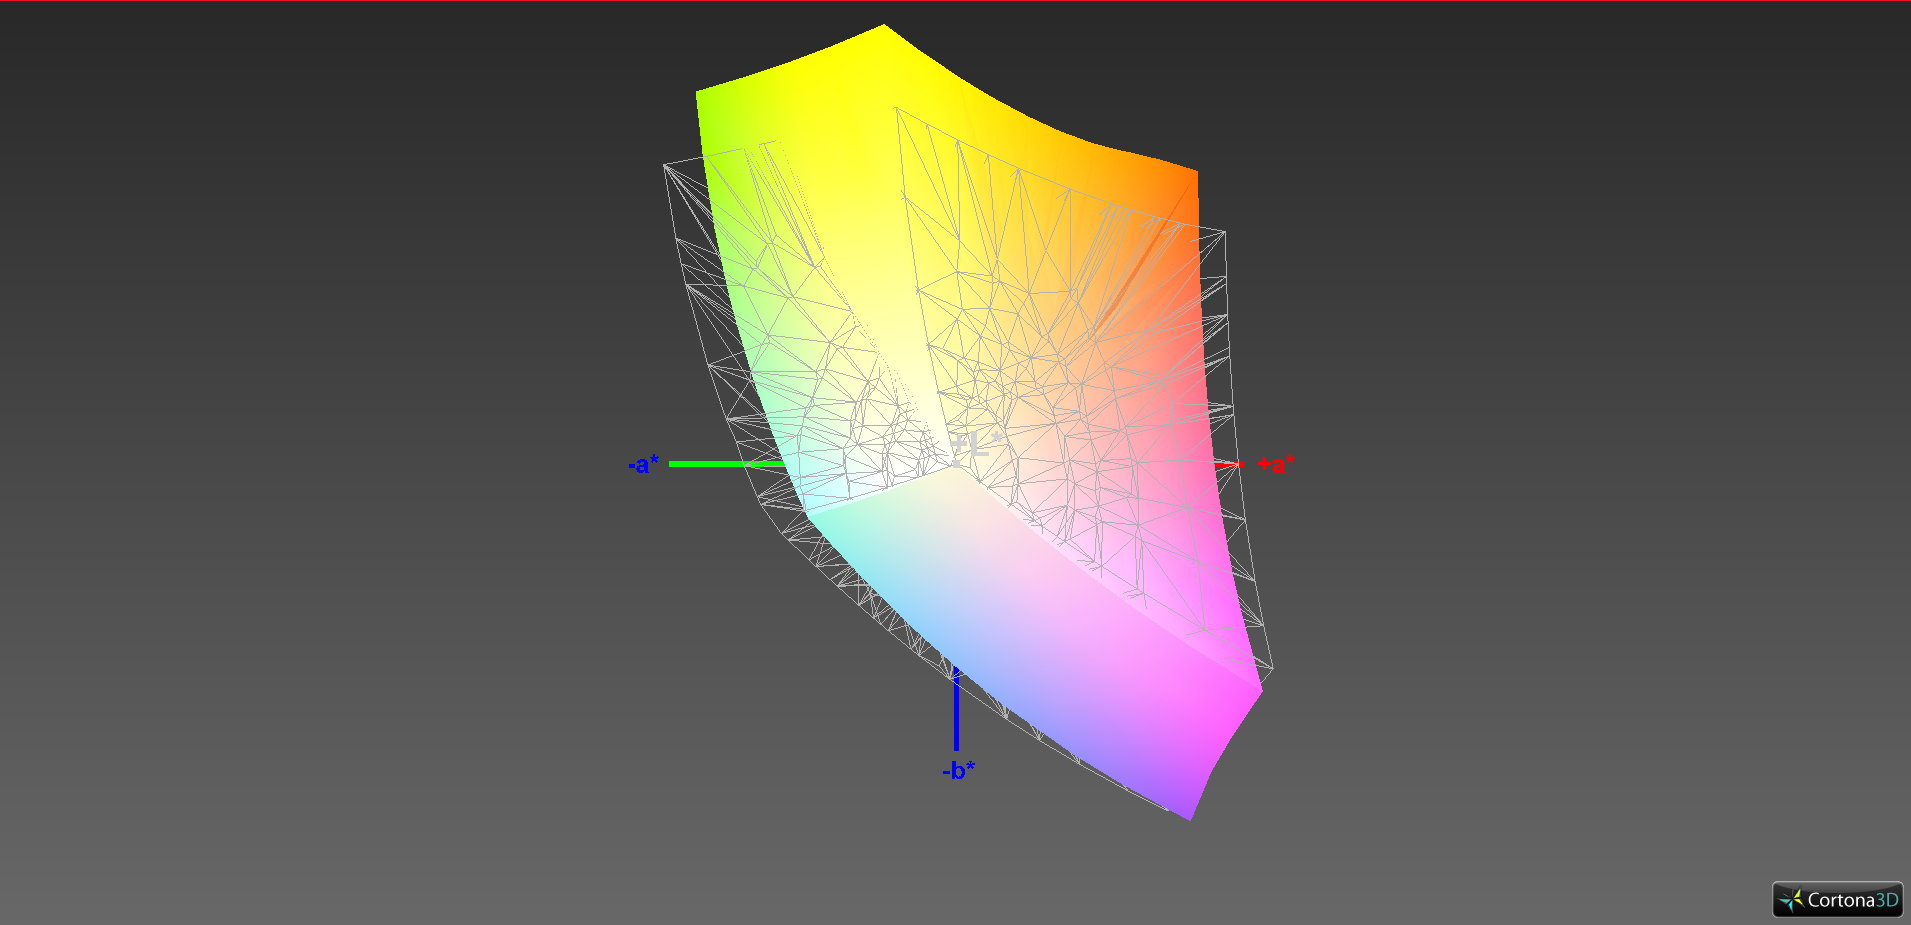
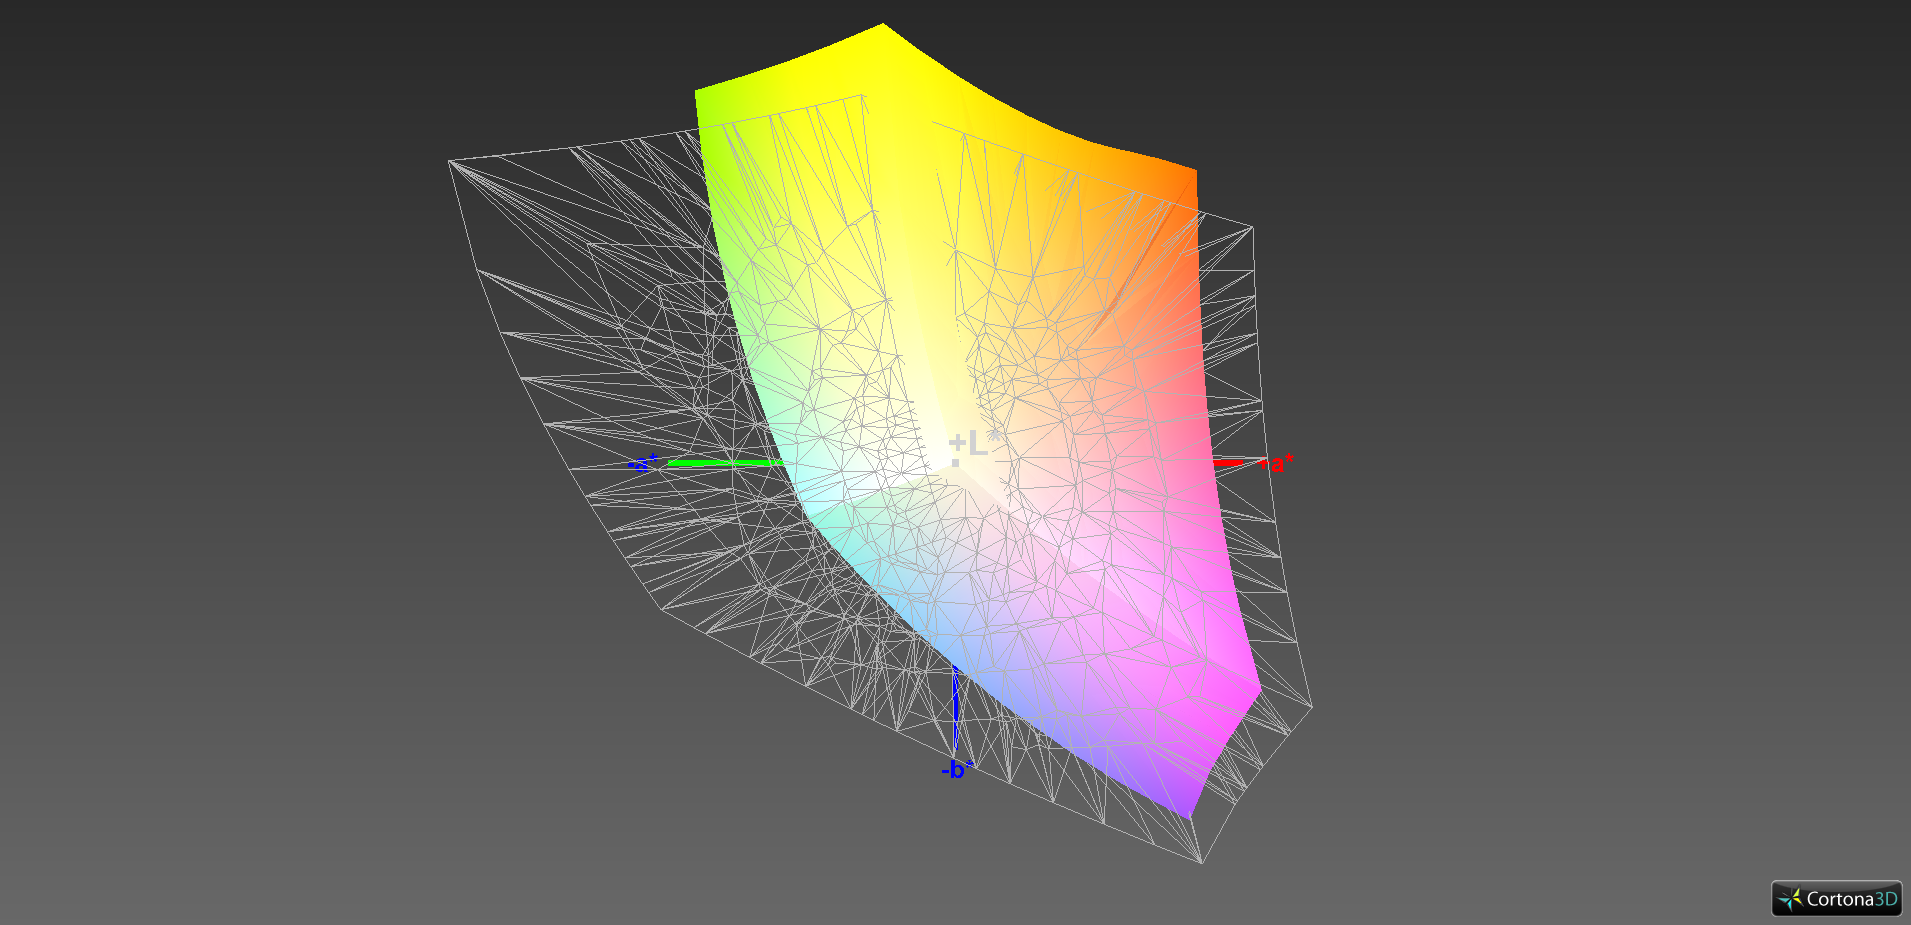
86% sRGB (Argyll 1.6.3 3D)
56% AdobeRGB 1998 (Argyll 1.6.3 3D)
63.1% AdobeRGB 1998 (Argyll 3D)
86.3% sRGB (Argyll 3D)
66.8% Display P3 (Argyll 3D)
Gamma: 1.85
CCT: 6794 K
| HP Envy 13-ad006ng BOE070E, , 1920x1080, 13.3" | HP Envy 13-ad065nr LG Philips LGD0576, , 1920x1080, 13.3" | Dell XPS 13 9360 FHD i5 Sharp SHP1449 LQ133M1, , 1920x1080, 13.3" | Lenovo IdeaPad 710S Plus-13IKB LG Philips LP133WF4-SPB1 (LGD04EF), , 1920x1080, 13.3" | Asus Zenbook UX310UA-FC347T iGP AU Optronics AUO272D, , 1920x1080, 13.3" | Xiaomi Mi Notebook Air 13.3 2016 Samsung LTN133HL09-M01, , 1920x1080, 13.3" | |
|---|---|---|---|---|---|---|
| Display | -3% | -21% | -3% | -8% | 6% | |
| Display P3 Coverage (%) | 66.8 | 65.5 -2% | 48.94 -27% | 65.3 -2% | 64.2 -4% | 66 -1% |
| sRGB Coverage (%) | 86.3 | 83.8 -3% | 73.3 -15% | 82.9 -4% | 65.3 -24% | 95.5 11% |
| AdobeRGB 1998 Coverage (%) | 63.1 | 61.3 -3% | 50.5 -20% | 60.6 -4% | 65.3 3% | 67.8 7% |
| Response Times | 36% | 14% | 8% | 24% | 7% | |
| Response Time Grey 50% / Grey 80% * (ms) | 48 ? | 28 ? 42% | 32.8 ? 32% | 45 ? 6% | 40 ? 17% | 49 ? -2% |
| Response Time Black / White * (ms) | 32 ? | 22.4 ? 30% | 33.2 ? -4% | 29 ? 9% | 22 ? 31% | 27 ? 16% |
| PWM Frequency (Hz) | 1000 ? | 10200 ? | 200 ? | 50 ? | ||
| Screen | -4% | 4% | 4% | 6% | 18% | |
| Brightness middle (cd/m²) | 281 | 290 3% | 351.2 25% | 343 22% | 358 27% | 347 23% |
| Brightness (cd/m²) | 264 | 270 2% | 325 23% | 306 16% | 347 31% | 334 27% |
| Brightness Distribution (%) | 83 | 78 -6% | 89 7% | 81 -2% | 87 5% | 80 -4% |
| Black Level * (cd/m²) | 0.23 | 0.32 -39% | 0.195 15% | 0.3 -30% | 0.26 -13% | 0.27 -17% |
| Contrast (:1) | 1222 | 906 -26% | 1801 47% | 1143 -6% | 1377 13% | 1285 5% |
| Colorchecker dE 2000 * | 4.83 | 4.8 1% | 7.4 -53% | 4.73 2% | 5.22 -8% | 3.29 32% |
| Colorchecker dE 2000 max. * | 8.89 | 11.2 -26% | 9.08 -2% | 9.05 -2% | 9.19 -3% | 4.69 47% |
| Greyscale dE 2000 * | 6.63 | 2.8 58% | 6.71 -1% | 3.29 50% | 6.69 -1% | 3.62 45% |
| Gamma | 1.85 119% | 2.19 100% | 2.74 80% | 2.36 93% | 2.35 94% | 2.23 99% |
| CCT | 6794 96% | 6382 102% | 7222 90% | 6437 101% | 6745 96% | 7307 89% |
| Color Space (Percent of AdobeRGB 1998) (%) | 56 | 54.9 -2% | 50.48 -10% | 54 -4% | 59 5% | 62 11% |
| Color Space (Percent of sRGB) (%) | 86 | 83.5 -3% | 73.31 -15% | 83 -3% | 91 6% | 95 10% |
| Total Average (Program / Settings) | 10% /
2% | -1% /
0% | 3% /
3% | 7% /
6% | 10% /
14% |
* ... smaller is better
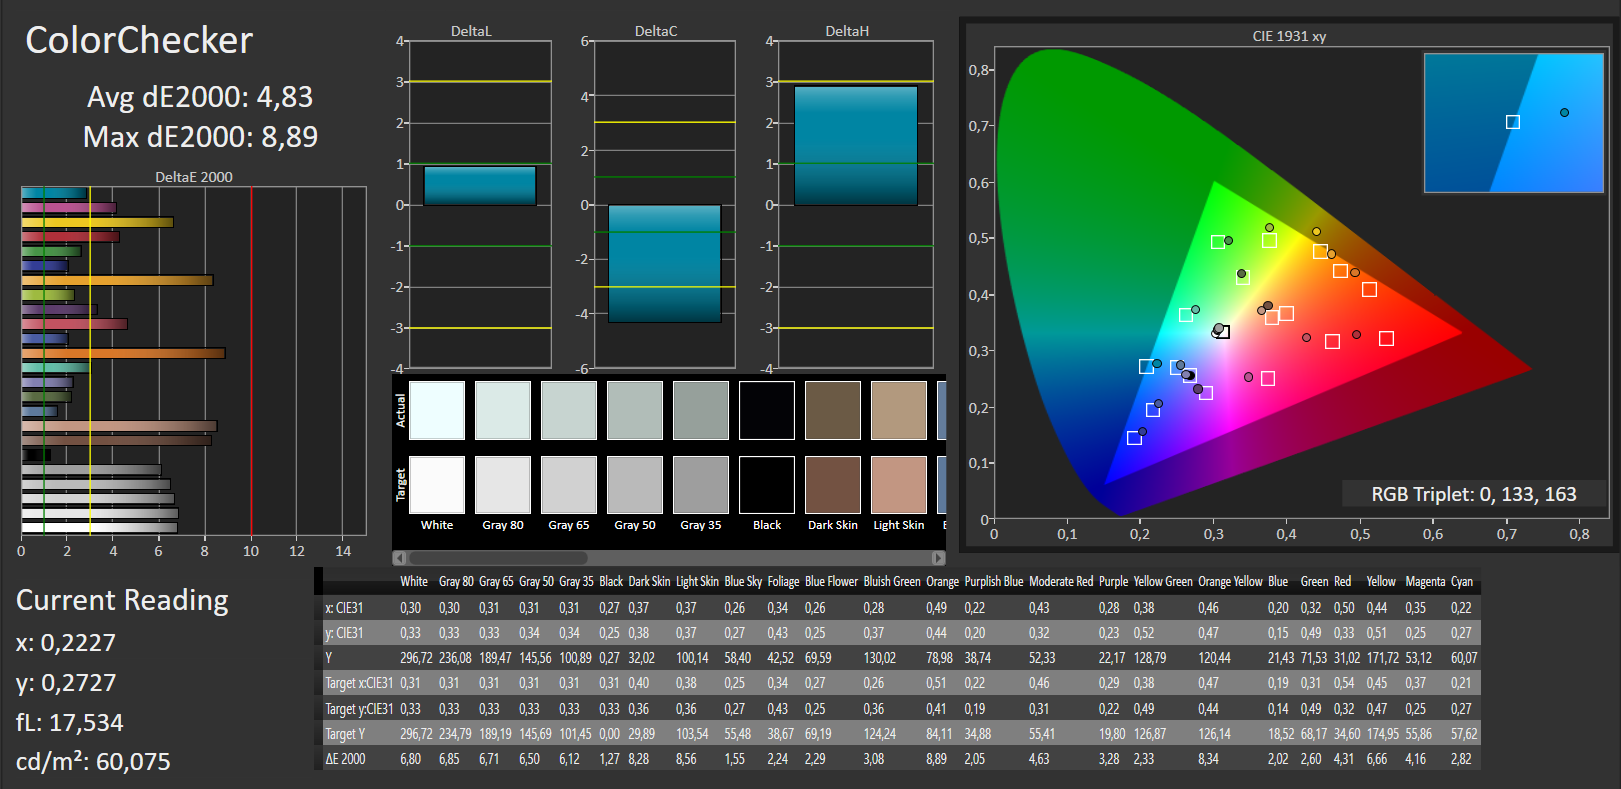
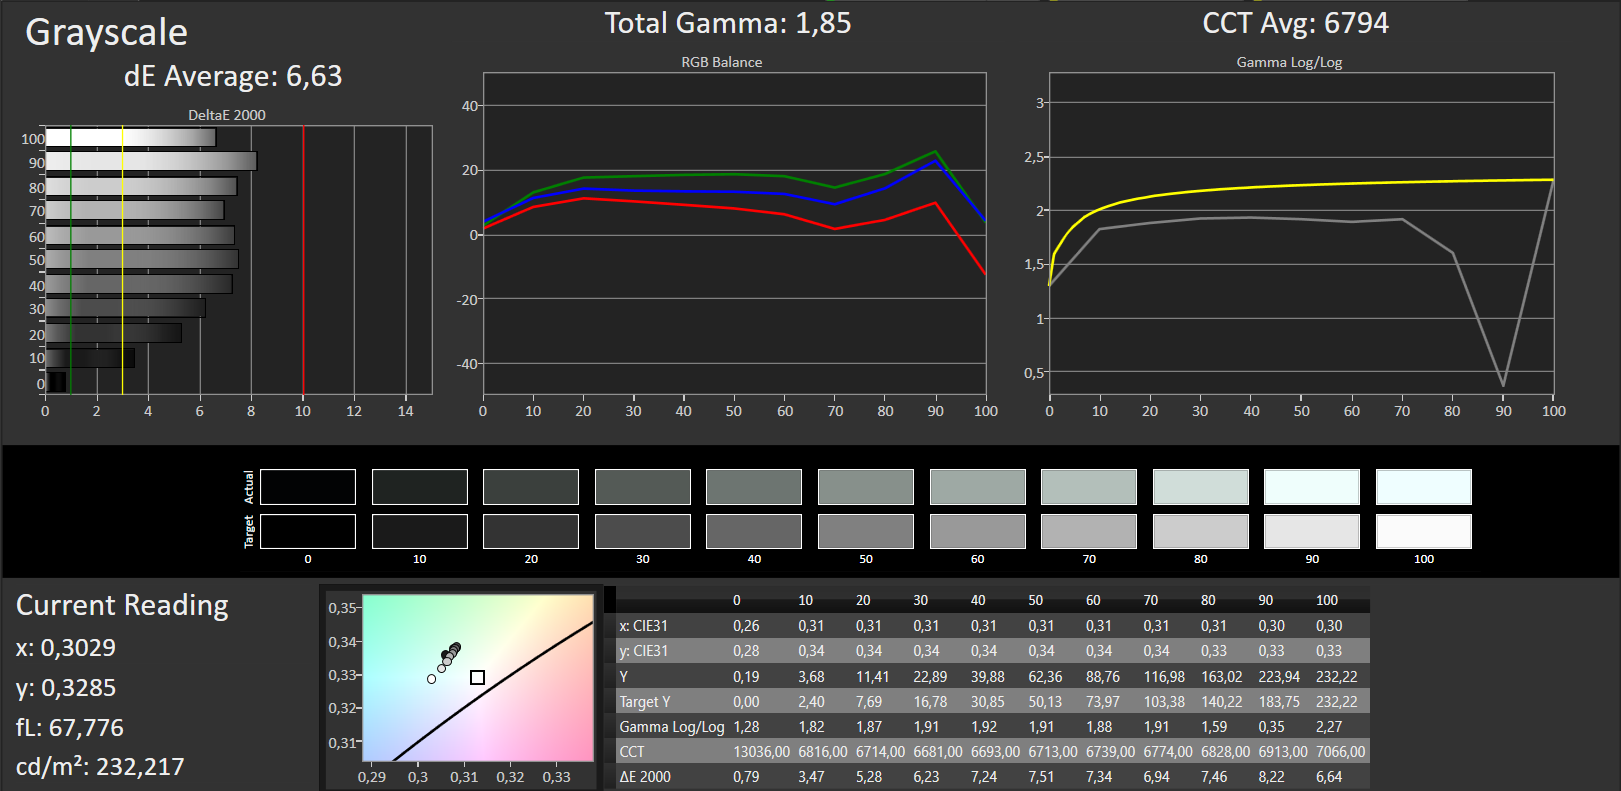
The combination of the fairly low black value (0.23) and decent brightness results in a good contrast ratio of 1222:1. Black actually looks like blacks and the colors are nicely saturated. The resolution of 1920 x 1080 on the 13.3-inch panel translates to a pixel density of 166 ppi, which means that the sharpness is very good - subjectively as well. Unfortunately, we couldn't calibrate the display. As shipped, the panel has a very slight greenish cast.
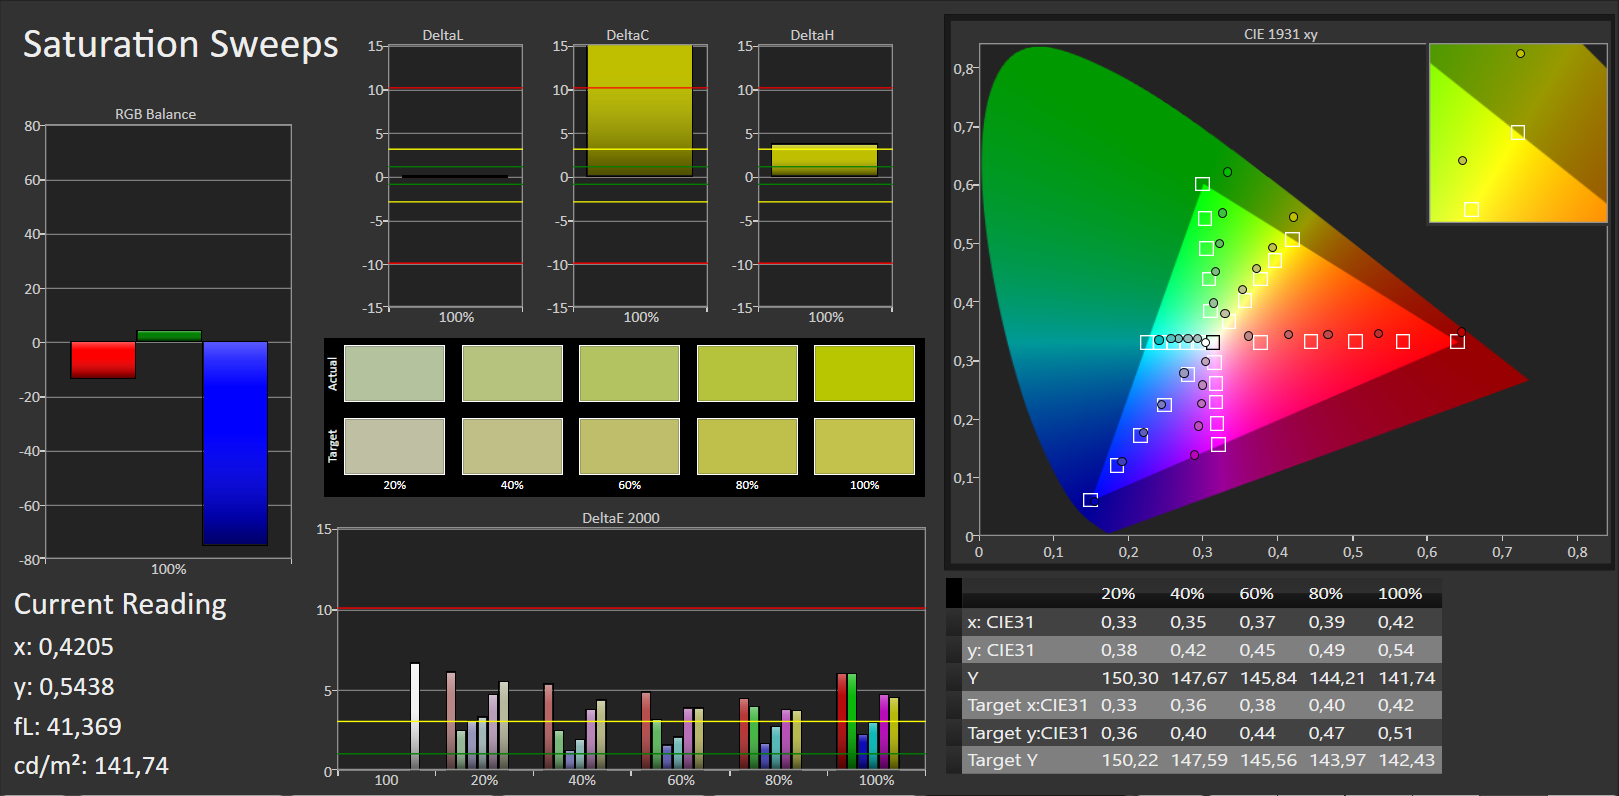
Inexpensive panels normally offer less than 70 % coverage of the sRGB color space; good panels exceed 90 %. The BOE display is decent here with 86 %, although it can't reproduce all the colors needed for professional photo editing. Still, the performance is quite a bit better than what we are used to from true bargain IPS displays.
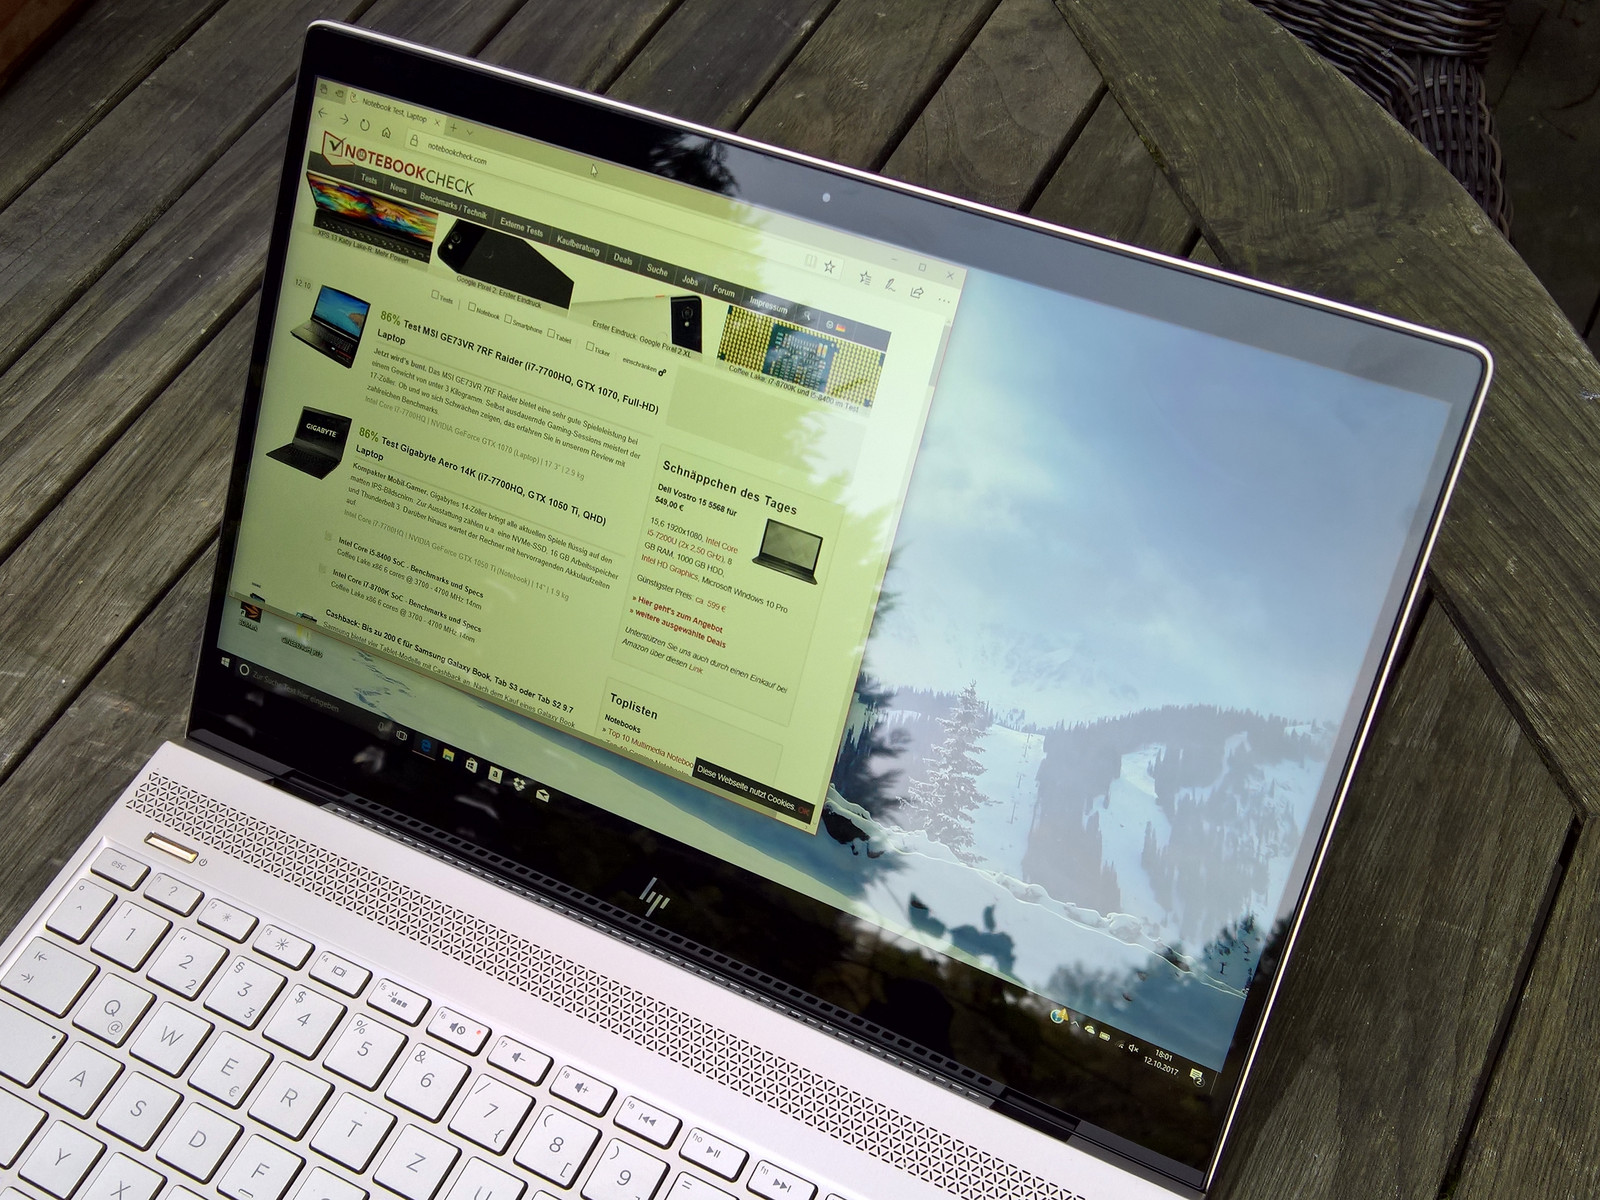
Although the brightness of 260 cd/m² is sufficient for outdoor use in the shade, the glossy display still impacts the experience in a negative fashion. To overpower the reflections better, we'd like to see an average brightness of over 300 cd/m² - something a few of the competitors do offer. Another option would be a matte display, which unfortunately isn't available.
Display Response Times
| ↔ Response Time Black to White | ||
|---|---|---|
| 32 ms ... rise ↗ and fall ↘ combined | ↗ 17 ms rise | 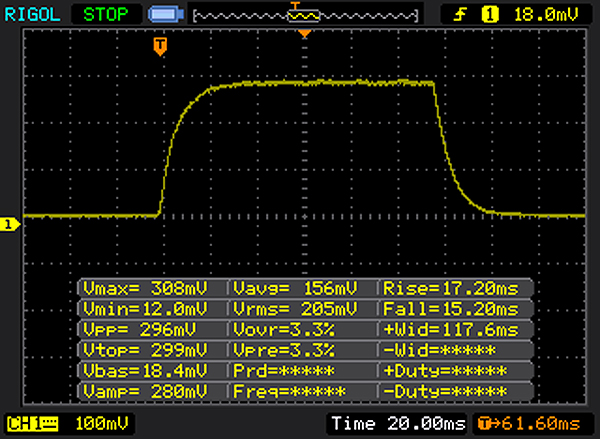 |
| ↘ 15 ms fall | ||
| The screen shows slow response rates in our tests and will be unsatisfactory for gamers. In comparison, all tested devices range from 0.1 (minimum) to 240 (maximum) ms. » 86 % of all devices are better. This means that the measured response time is worse than the average of all tested devices (19.9 ms). | ||
| ↔ Response Time 50% Grey to 80% Grey | ||
| 48 ms ... rise ↗ and fall ↘ combined | ↗ 23 ms rise |  |
| ↘ 25 ms fall | ||
| The screen shows slow response rates in our tests and will be unsatisfactory for gamers. In comparison, all tested devices range from 0.165 (minimum) to 636 (maximum) ms. » 82 % of all devices are better. This means that the measured response time is worse than the average of all tested devices (31.1 ms). | ||
Screen Flickering / PWM (Pulse-Width Modulation)
| Screen flickering / PWM detected | 1000 Hz | ≤ 90 % brightness setting | 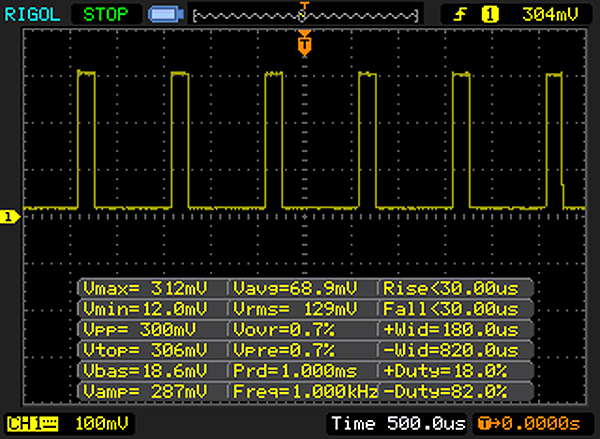 |
The display backlight flickers at 1000 Hz (worst case, e.g., utilizing PWM) Flickering detected at a brightness setting of 90 % and below. There should be no flickering or PWM above this brightness setting. The frequency of 1000 Hz is quite high, so most users sensitive to PWM should not notice any flickering. In comparison: 52 % of all tested devices do not use PWM to dim the display. If PWM was detected, an average of 7798 (minimum: 5 - maximum: 343500) Hz was measured. | |||
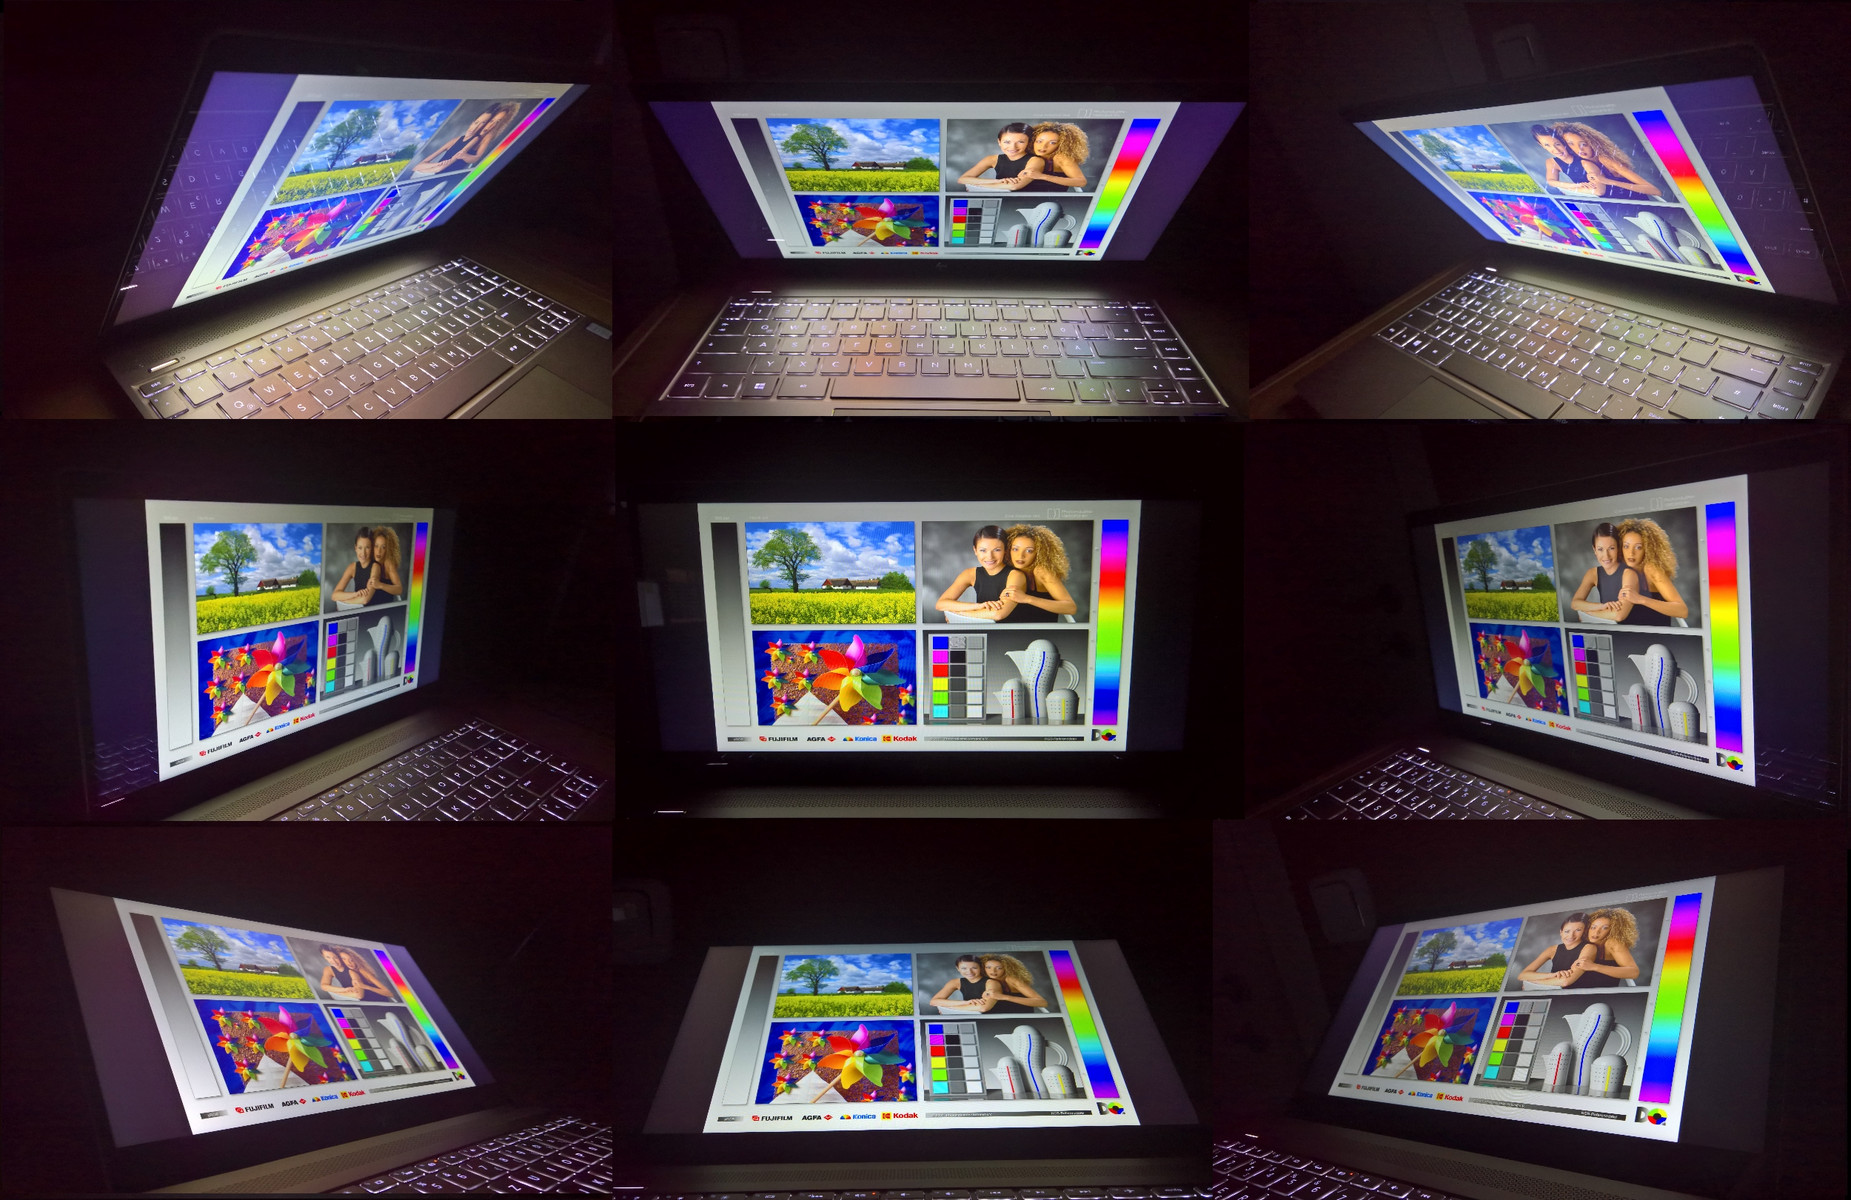
Viewing angles stability for IPS displays is generally great. The Envy is no exception here, although we noticed a bluish cast at very shallow angles - most likely an artifact of the IPS glow effect. Normal daily use remains unaffected, however.
Performance
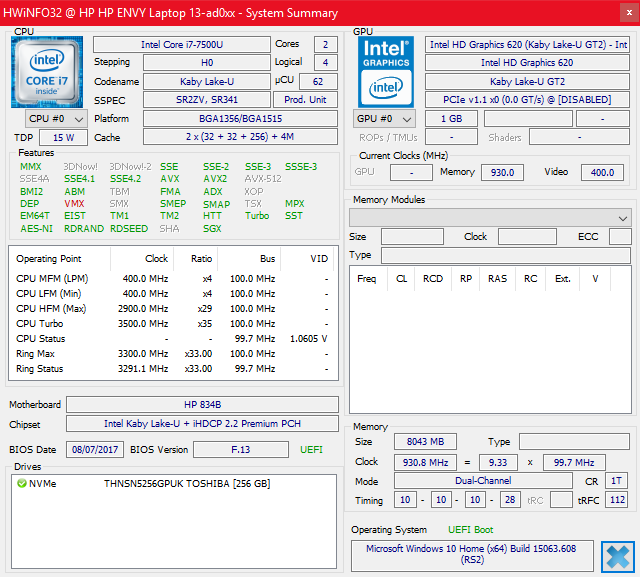
To potential buyers, the sheer number of Envy 13 offerings can be quite confusing. First, it's necessary to differentiate between the different models: there's an older version with the letters "ab" in the model number (for example ab005ng) - which uses a different chassis - as well as a newer version designated by "ad". For the latter, it doesn't matter if the notebook is equipped with a Kaby Lake processor (like our review notebook) or one of the Kaby Lake "refresh" CPUs. At the time of writing, there are two models with the new CPUs Core i5-8250U and i7-8550U.
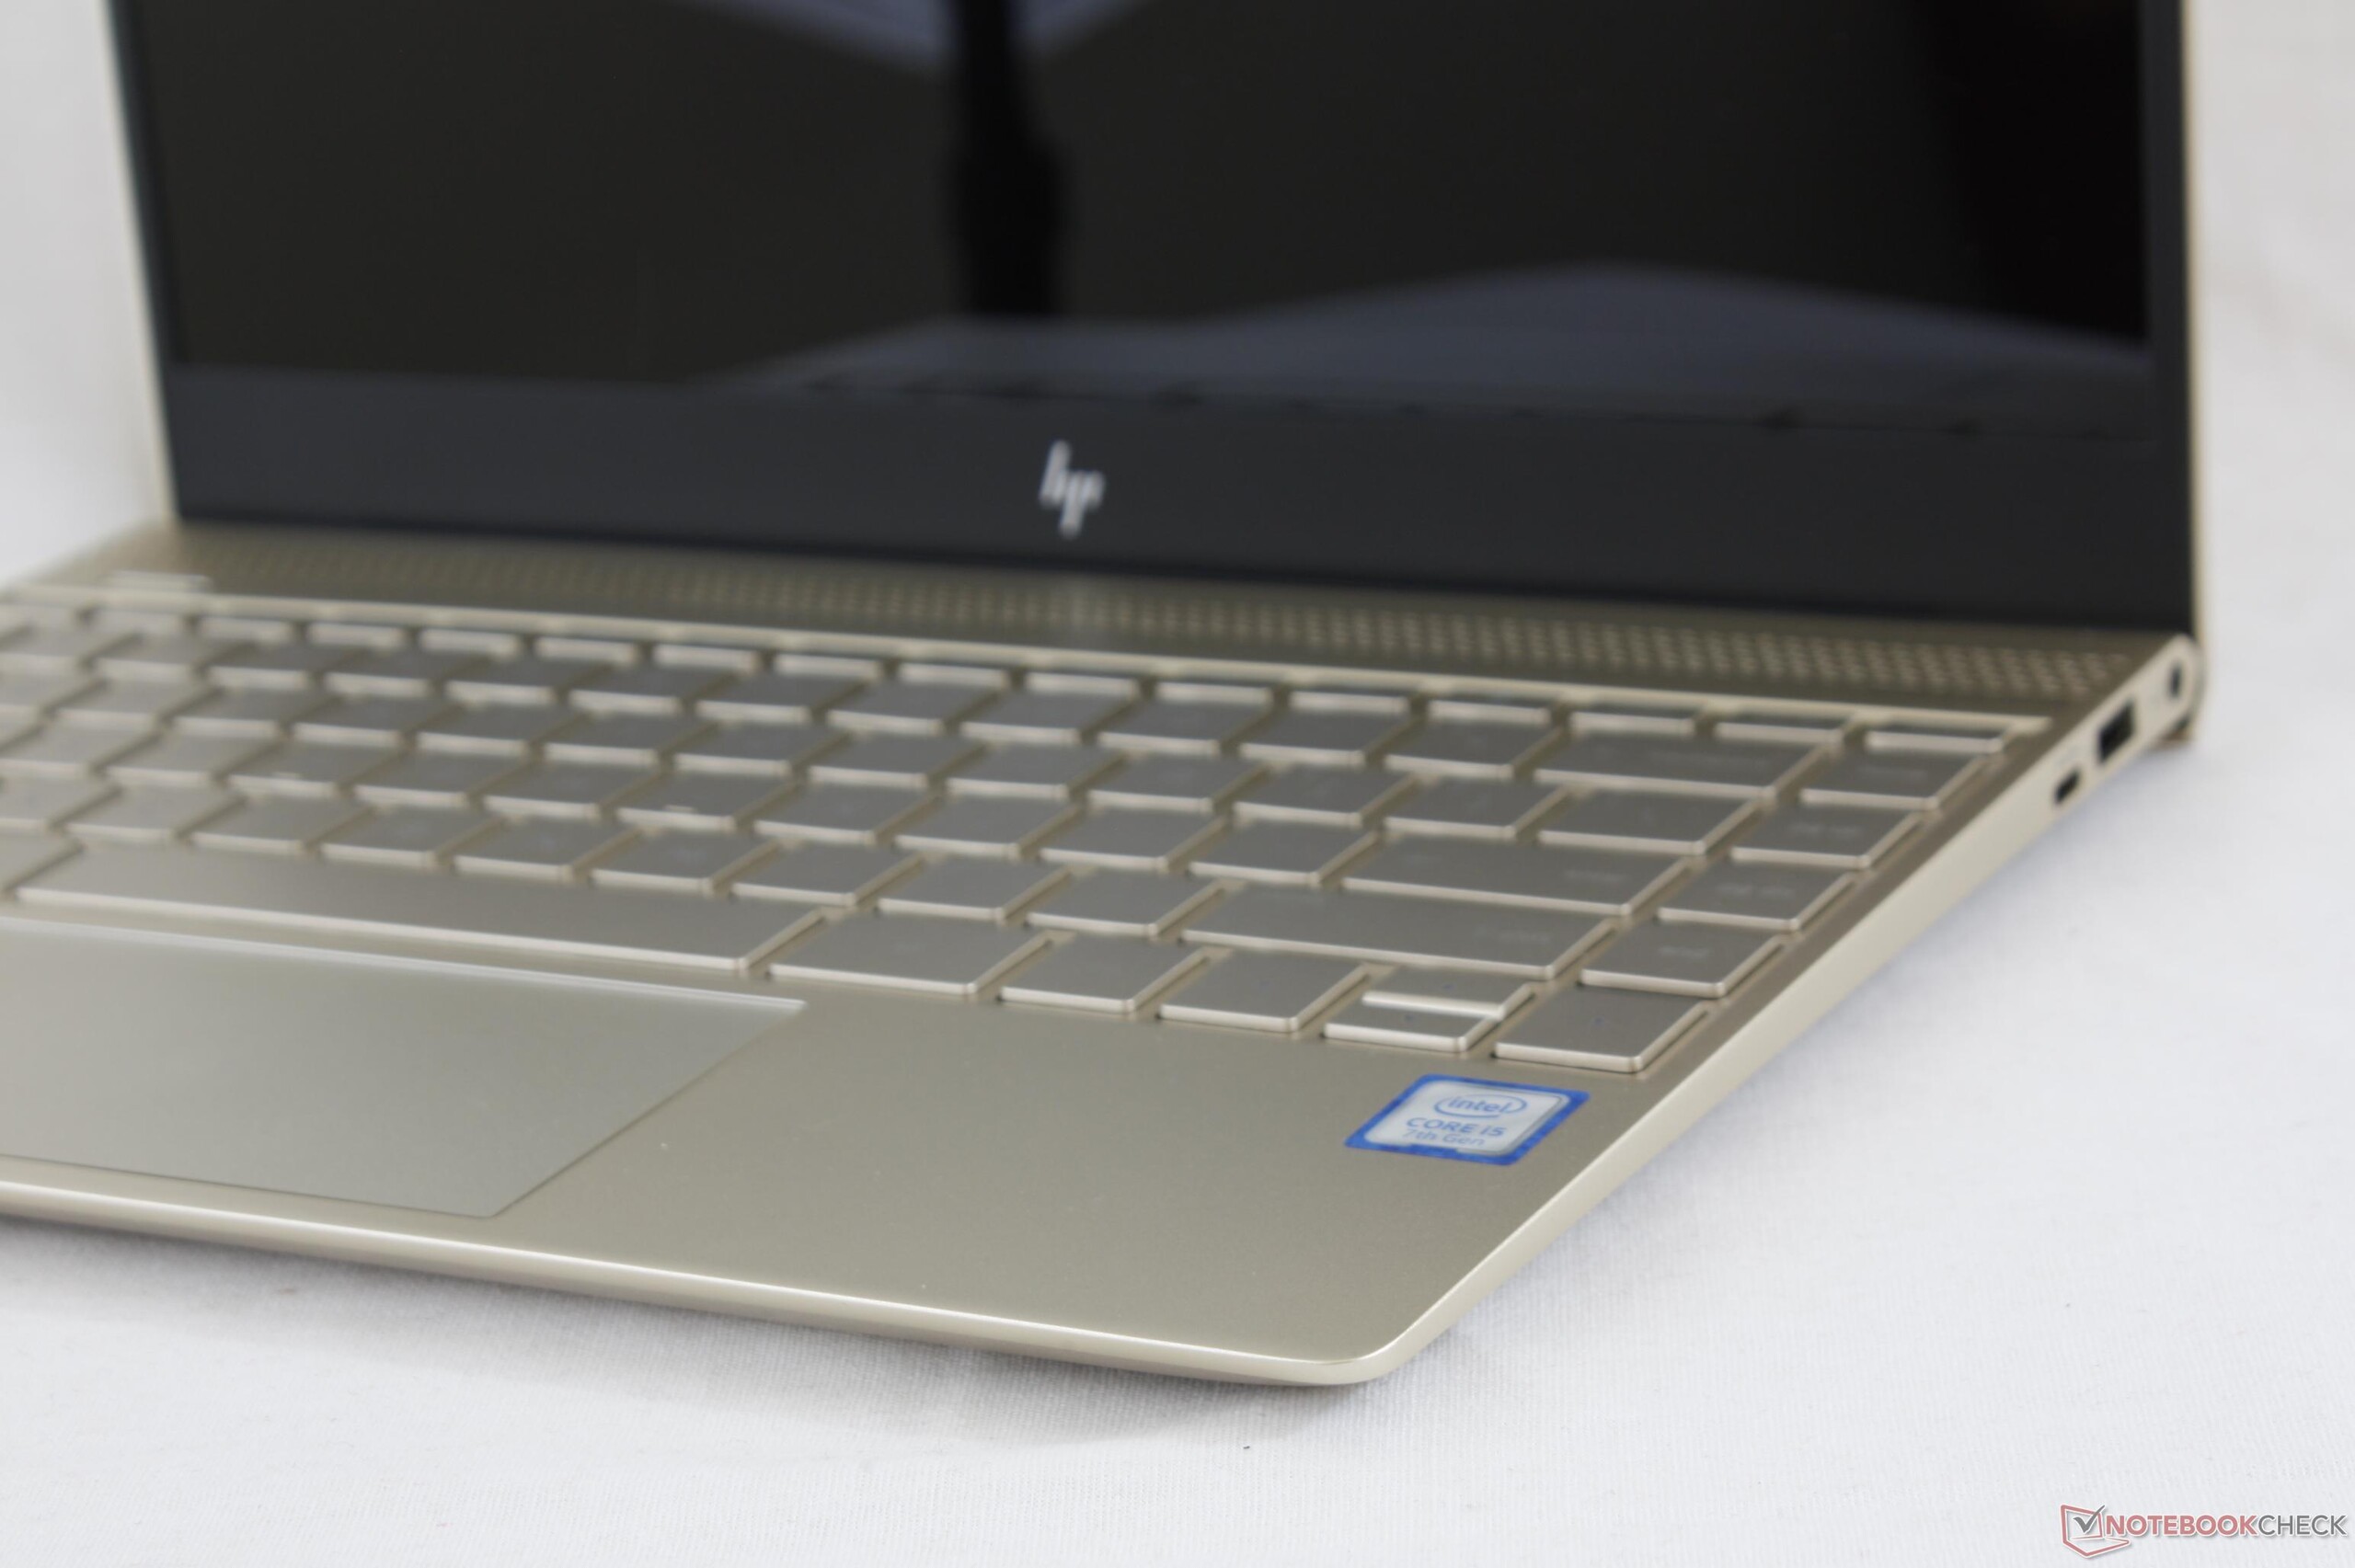
There are quite a few models with the older processors, although there are actual only two choices with either the Core i5-7200U or the Core i7-7500U. Most versions included Intel GPUs, but a few come with the Nvidia GeForce MX150. SSDs can either be 256 or 512 GB in size; the 8 GB of RAM across the current lineup is soldered on. One additional difference: some configurations come in silver, while others are offered in gold like the review notebook.
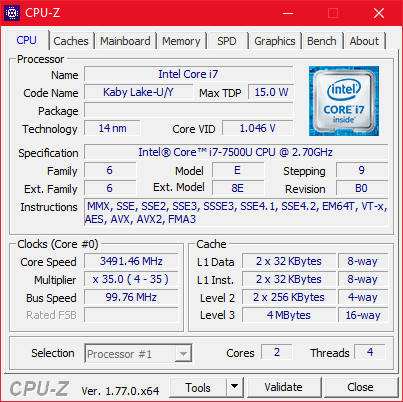
Processor
The Core i7-7500U is the second-fasted ULV dual-core CPU with a TDP of 15 W in Intel's lineup and is outperformed only by the more expensive Core i7-7600U. We have to note that's only true if we look at the now outdated Kaby Lake generation, since the significantly faster successor to the i7-7500U - the Intel Core i7-8550U - is already available. For comparisons between this and other CPUs, please take a look at our benchmark table.
Theoretically, the two cores (4 threads with Hyperthreading) can operate at a maximum clock speed of 3.5 GHz.The CPU does indeed reach the highest Turbo speed - but not for that long, as the Multi-Thread portion of the Cinebench R15 shows. The reason is a built-in TDP limitation: for about one minute, the CPU is allowed to draw about 19 W, but then TDP threshold becomes active and the cores drop to 3.1 GHz. This behavior is also the reason why the first iteration of the Cinebench R15 Multi-Thread loop test ends up with a higher score than the subsequent ones: the temporary performance boost is only available at the beginning.
The results are quite good, but not perfect. The Envy's Core i7-7500U scores 376 points when running the Cinebench-R15 Multi-Thread test. The notebook thus does well when compared to competitors with dual-core Kaby Lake CPUs; the new XPS 13 with Core i7-8550U is in a different league altogether as far as performance is concerned.
There's no noticeable drop in performance when the notebook is running on battery.
System Performance
Es expected for such a well-equipped notebook, the Envy 13 performs impressively and without any delays. There's no stuttering even under heavy load and the PCMark test results are top notch.
| PCMark 10 - Score | |
| HP Envy 13-ad006ng | |
| HP Envy 13-ad065nr | |
| PCMark 8 Home Score Accelerated v2 | 3773 points | |
| PCMark 8 Work Score Accelerated v2 | 4900 points | |
| PCMark 10 Score | 3282 points | |
Help | ||
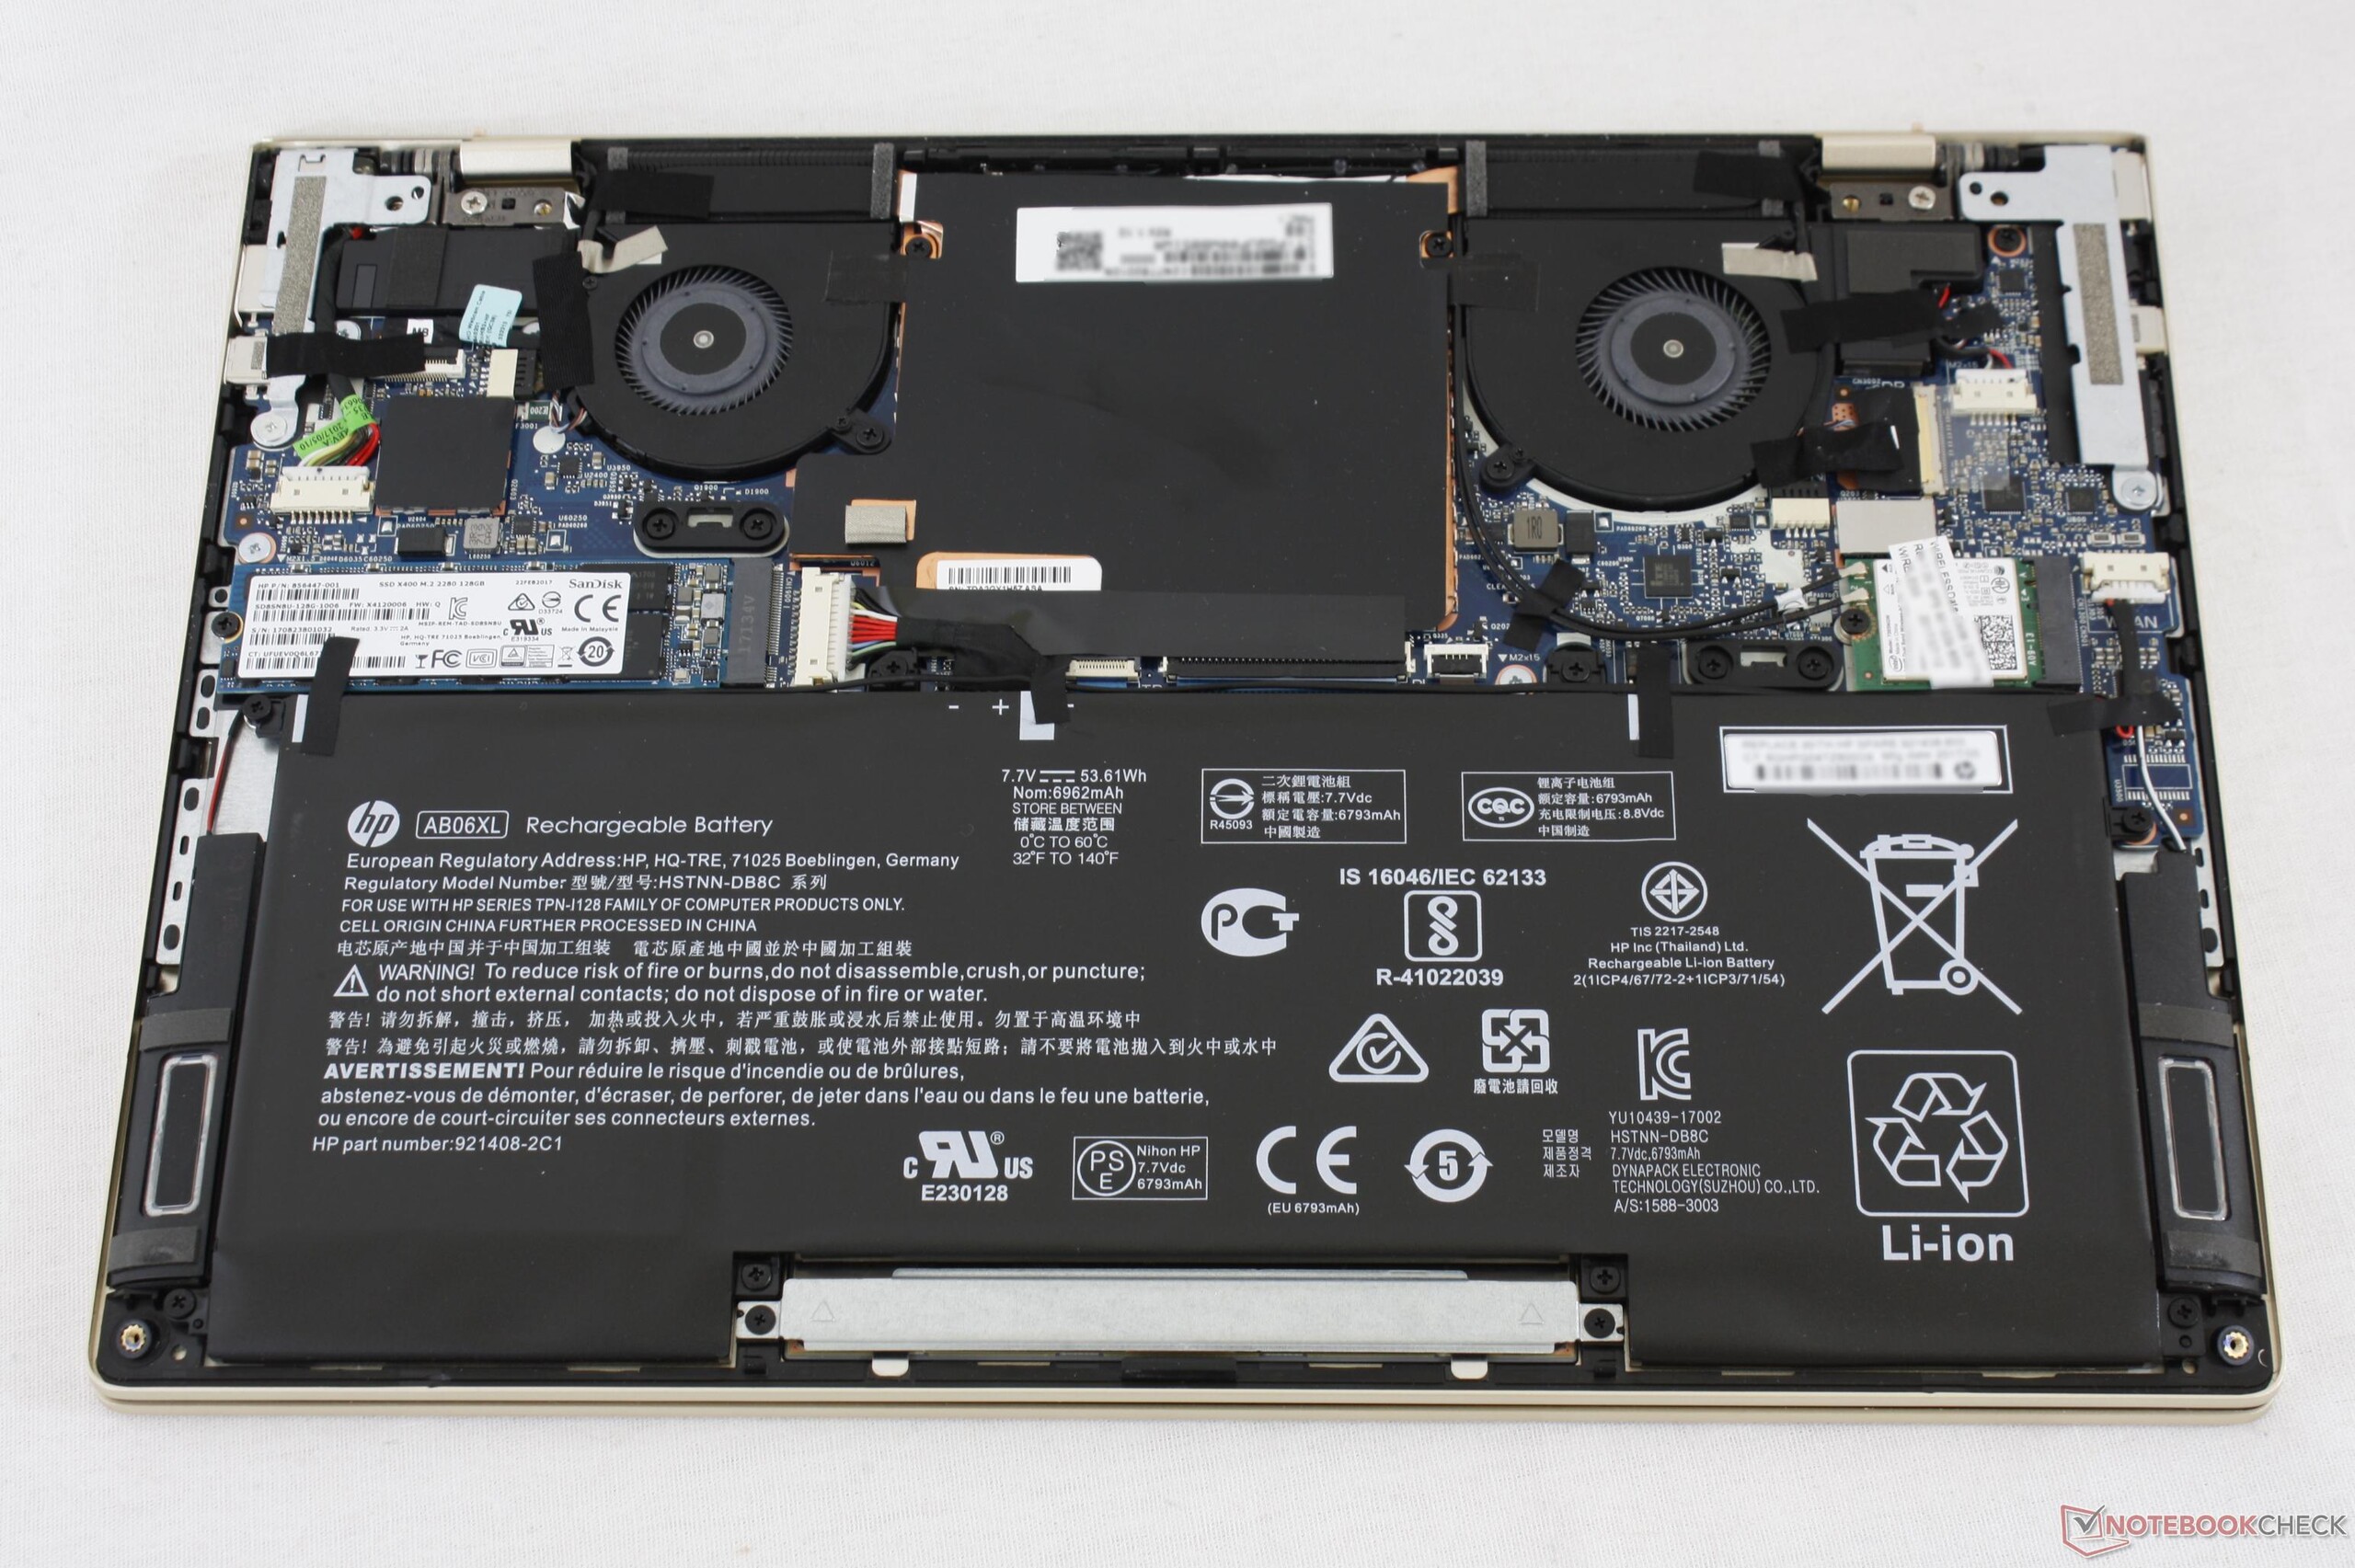
Storage Devices
Our review Ultrabook is equipped with a Toshiba SSD with a very long model name and a capacity of 256 GB. The M.2 NVMe PCIe SSD is much faster than SATA III SSDs like the 128 GB example we encountered in the Envy 13-ad065nr. The Toshiba SSD isn't the fastest of its kind, however: Samsung's PM961 is significantly faster.
To get a better idea about how the Toshiba SSD compares to others, we recommend a look at our SSD benchmark list.
| HP Envy 13-ad006ng Toshiba NVMe THNSN5256GPUK | Lenovo IdeaPad 710S Plus-13IKB Samsung PM961 NVMe MZVLW512HMJP | Xiaomi Mi Notebook Air 13.3 2016 Samsung PM951 NVMe MZVLV256 | Asus Zenbook UX310UA-FC347T iGP Micron SSD 1100 (MTFDDAV256TBN) | HP Envy 13-ad065nr SanDisk X400 SD8SN8U-128G-1006 | Dell XPS 13 i7-8550U Toshiba XG5 KXG50ZNV256G | |
|---|---|---|---|---|---|---|
| CrystalDiskMark 3.0 | 193% | 40% | 14% | |||
| Read Seq (MB/s) | 1019 | 1577 55% | 1209 19% | 489.4 -52% | ||
| Write Seq (MB/s) | 195.4 | 1472 653% | 314 61% | 431.6 121% | ||
| Read 512 (MB/s) | 735 | 1165 59% | 356.7 -51% | |||
| Write 512 (MB/s) | 172.3 | 1244 622% | 389.1 126% | |||
| Read 4k (MB/s) | 34.5 | 54.8 59% | 43.4 26% | 26.68 -23% | ||
| Write 4k (MB/s) | 109.4 | 121.5 11% | 153.4 40% | 88.7 -19% | ||
| Read 4k QD32 (MB/s) | 494.6 | 407.5 -18% | 487.6 -1% | 246.3 -50% | ||
| Write 4k QD32 (MB/s) | 161.3 | 321.4 99% | 312.2 94% | 251.5 56% | ||
| CrystalDiskMark 5.2 / 6 | -26% | 12% | ||||
| Write 4K (MB/s) | 155.7 | 57.5 -63% | 121.5 -22% | |||
| Read 4K (MB/s) | 26.5 | 29.34 11% | 24.92 -6% | |||
| Write Seq (MB/s) | 312.3 | 342.5 10% | 345 10% | |||
| Read Seq (MB/s) | 928 | 503 -46% | 1313 41% | |||
| Write 4K Q32T1 (MB/s) | 208.7 | 160.3 -23% | 346.1 66% | |||
| Read 4K Q32T1 (MB/s) | 478.8 | 285.7 -40% | 389.4 -19% | |||
| Write Seq Q32T1 (MB/s) | 305.1 | 330.8 8% | 334.7 10% | |||
| Read Seq Q32T1 (MB/s) | 1601 | 552 -66% | 1840 15% | |||
| Total Average (Program / Settings) | 193% /
193% | 40% /
40% | 14% /
14% | -26% /
-26% | 12% /
12% |

GPU Performance
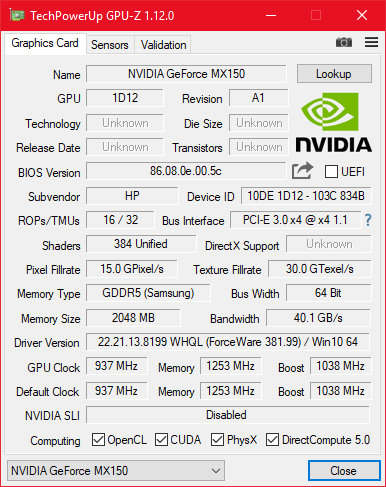
After a long dry spell, Nvidia finally introduced the GeForce MX150 this year as the successor to the outdated notebook-GPU GeForce 940MX. The MX150 is a low-end, Pascal-based GPU with 384 Shaders, 975 MHz clock speed (Turbo ca. 1600 MHz) and 2 GB of dedicated GDDR5 RAM. Our GPU Benchmark Tool allows a comparison of the performance with other dGPUs.
One of the direct competitors, the IdeaPad 710s-Plus, comes with the predecessor-GPU 940MX. A closer look reveals that the MX150 consumes almost the same amount of power, but is roughly 30 % faster. Notebooks in our comparison equipped with Intel HD Graphics 620 or UHD Graphics 620 (in case of the new XPS 13) are 50 to 60 % slower.
Even when the Envy is operated in battery mode, the graphics performance doesn't decline.
| 3DMark 11 - 1280x720 Performance GPU | |
| HP Envy 13-ad006ng | |
| Lenovo IdeaPad 710S Plus-13IKB | |
| Xiaomi Mi Notebook Air 13.3 2016 | |
| Dell XPS 13 i7-8550U | |
| Asus Zenbook UX310UA-FC347T iGP | |
| HP Envy 13-ad065nr | |
| 3DMark 11 Performance | 3588 points | |
| 3DMark Cloud Gate Standard Score | 9800 points | |
| 3DMark Fire Strike Score | 2528 points | |
Help | ||
Gaming Performance
The MX150 is almost the GPU-definition for occasional gaming. Although current games won't be playable at the highest quality settings, most titles should work quite nicely at reduced details.
We conduct our Witcher 3 loop test to see if the GPU can deliver maximum performance over the long haul. During this test, the fps rate fluctuates between 10 - 8, which means that the performance remains comparatively stable with only minor fluctuations.
When playing Witcher 3, the MX150 outperforms the GeForce 940 MX only by about 20 %, which is quite a bit lower than what the synthetic benchmarks predicted. The GeForce GTX 1050, which is used in a lot of entry-level gaming rigs, is about 3x faster than the graphics card in the review notebook. The Envy 13 is well-suited as a mobile gaming companion especially for games that aren't brand-new; users requiring better performance might want to take a look at our list of the Top 10 Gaming Notebooks. Of course, no laptop on that list is as portable as the Envy 13.
| The Witcher 3 - 1366x768 Medium Graphics & Postprocessing | |
| Dell XPS 15 2017 9560 (7300HQ, Full-HD) | |
| HP Envy 13-ad006ng | |
| Lenovo IdeaPad 710S Plus-13IKB | |
| Asus Zenbook UX310UA-FC347T iGP | |
| BioShock Infinite - 1366x768 High Preset | |
| HP Envy 13-ad006ng | |
| Xiaomi Mi Notebook Air 13.3 2016 | |
| Dell XPS 13 i7-8550U | |
| Asus Zenbook UX310UA-FC347T iGP | |
| HP Envy 13-ad065nr | |
| low | med. | high | ultra | |
|---|---|---|---|---|
| BioShock Infinite (2013) | 173.9 | 94 | 79 | 29.72 |
| Company of Heroes 2 (2013) | 46.46 | 38.73 | 27.87 | 9.9 |
| The Witcher 3 (2015) | 45.13 | 27.64 | 14.47 | 9 |
| Rise of the Tomb Raider (2016) | 60 | 34.06 | 17 |
Emissions
System Noise
The HP Envy 13 performs like a typical Ultrabook when it comes to its noise level: during idle, the fan is turned off, but the system is audible at higher load levels. Even so, the Envy 13 never gets very loud.
Unlike the Dell XPS 13, the Envy 13 doesn't suffer from any coil whine.
Noise level
| Idle |
| 30.5 / 30.5 / 30.5 dB(A) |
| Load |
| 37.3 / 34.2 dB(A) |
 | ||
30 dB silent 40 dB(A) audible 50 dB(A) loud |
||
min: | ||
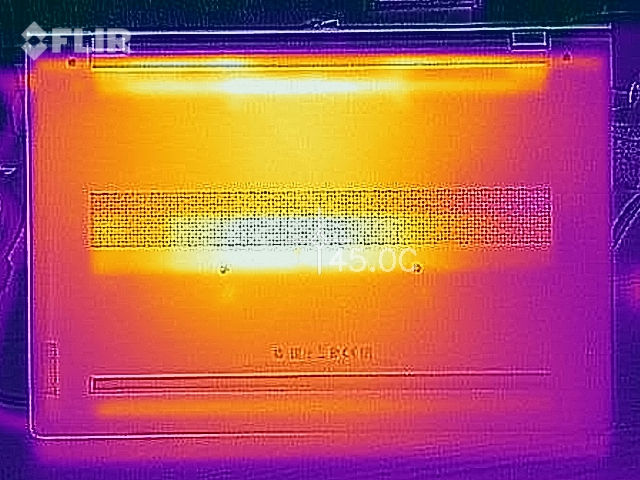
Temperature
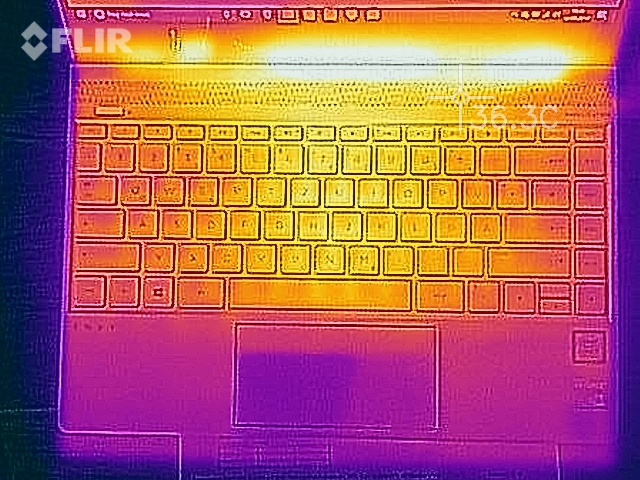
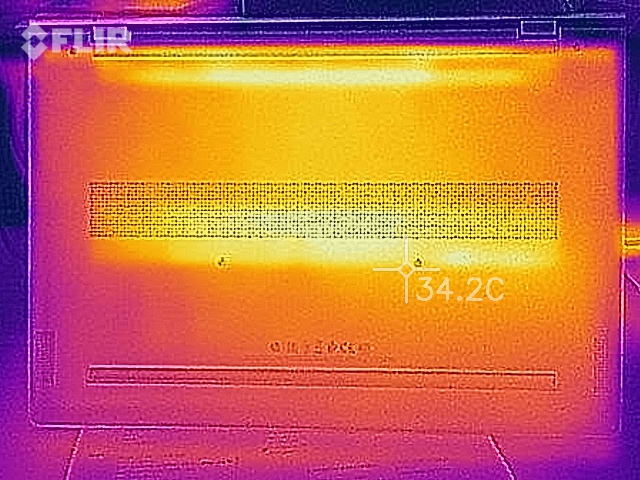
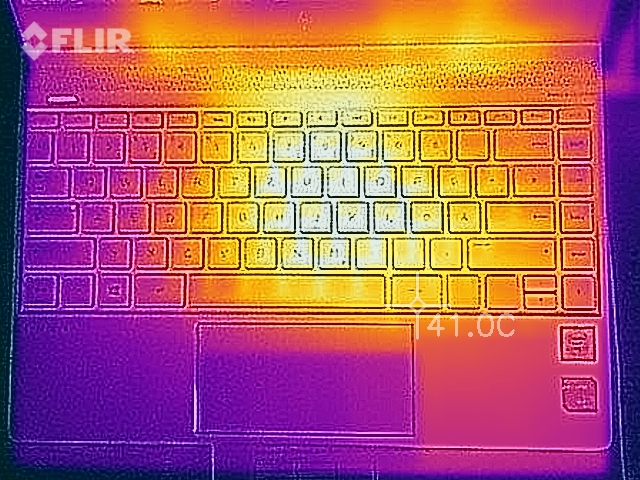
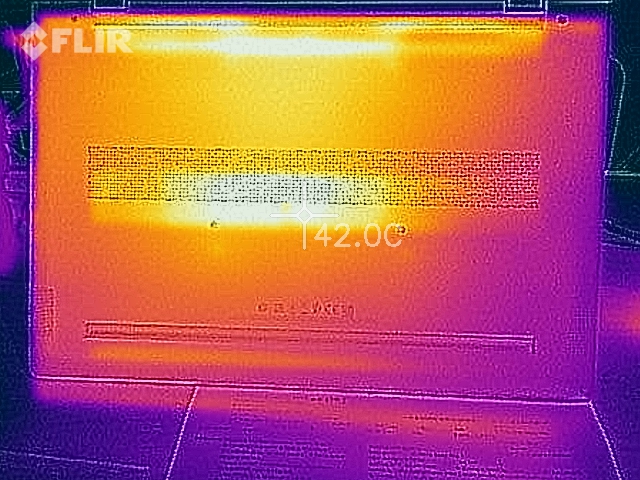
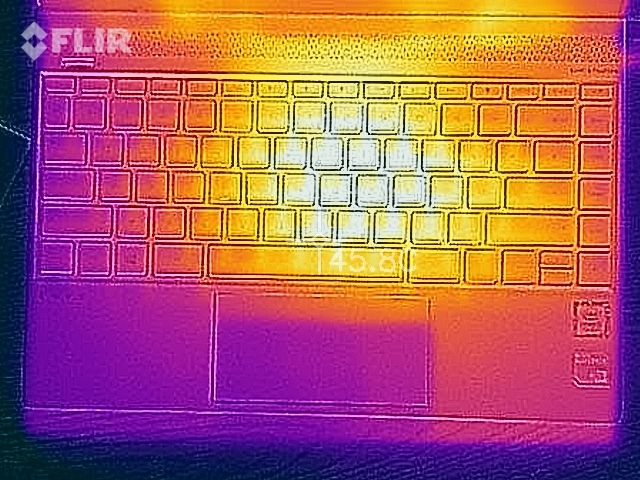
While the idle surface temperatures aren't even worth mentioning, the chassis gets quite warm under load - metal is a good conductor after all. The hotspot is above the keyboard up top; the palm rests and the bottom remain cool to the touch. That's good news, because the Ultrabook is a pleasure to work with even when subjected to load. The chassis gets hotter still during the Witcher 3 test, but the important threshold of 50 °C is never crossed.
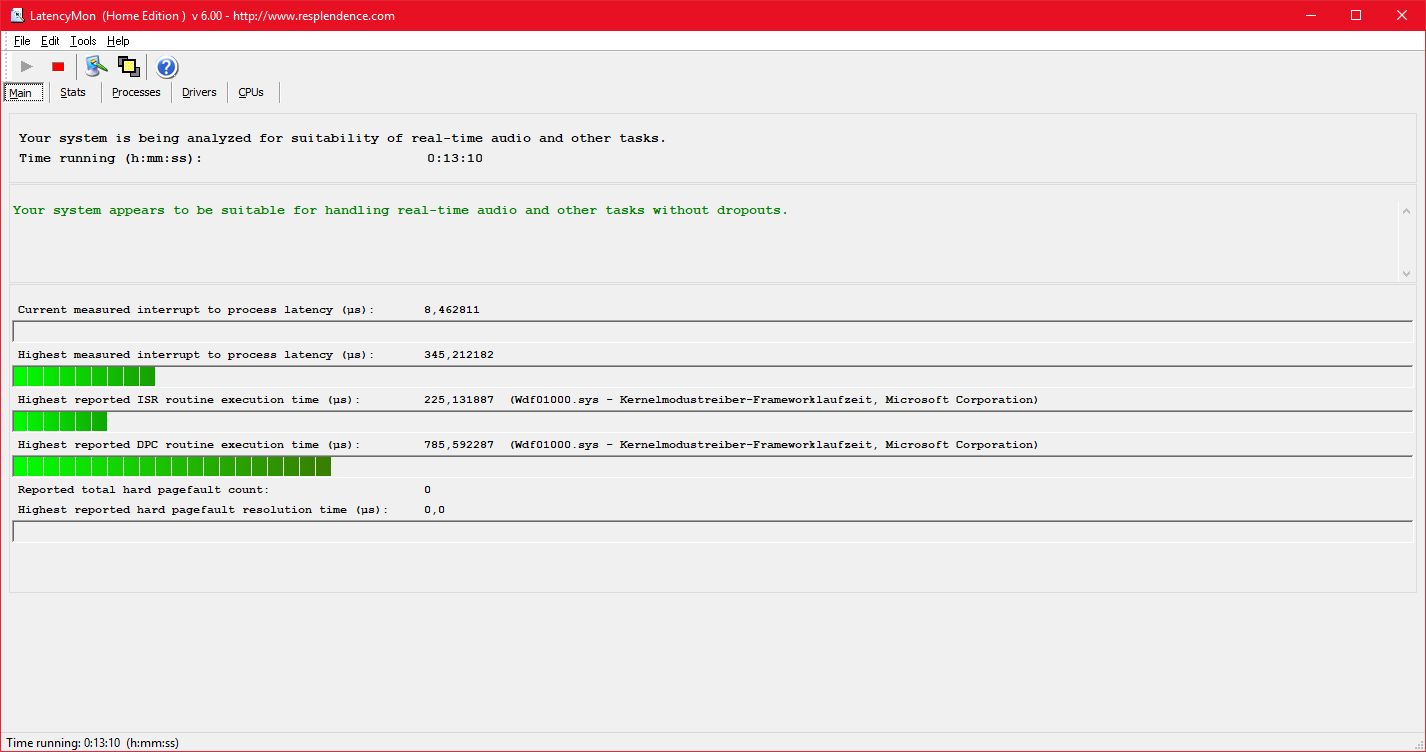
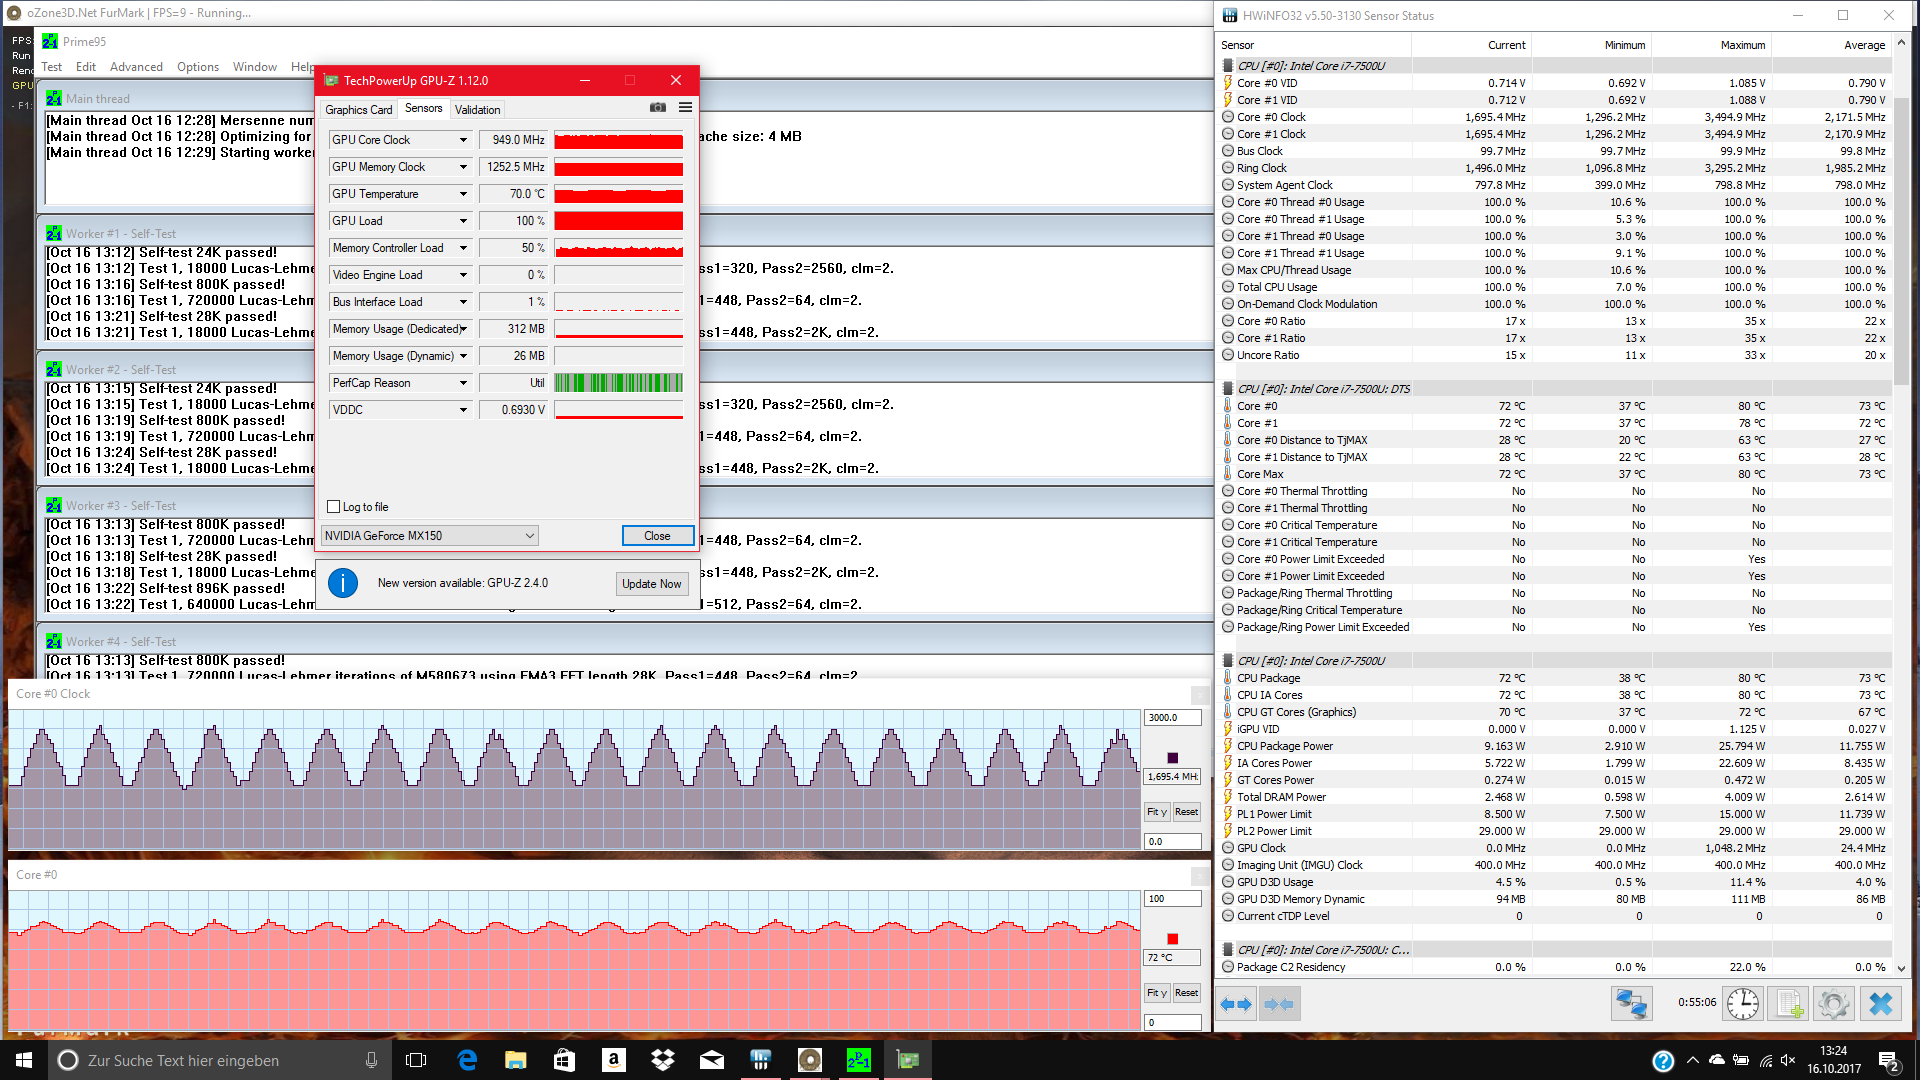
Stress test performance with Prime95 and FurMark in parallel initially mirrors the results of the Cinebench loop test: during the first 30 seconds, the CPU can consume up to 25 W and runs at 3.5 GHz. After that, the TDP threshold of 15 W comes into play and the frequency drops to the nominal clock speed of 2.7 GHz. During the next 10 minutes, the temperature gradually rises and reaches 77 °C, at which point we enter the third stage of the stress test, as the system now hits a temperature limit: once the CPU reaches 77 °C, the clock speed drops to 1.4 GHz in phases, but doesn't remain there for long. Once the temperature has dropped to 70 °C. the clock speed ratchets back up to 2.7 GHz, the temperature once again increases to 77 °C and the cycle repeats. While the CPU is subjected to thermal throttling, the GPU remains at a rock-solid at 975 MHz and 70 °C.
Directly after the stress test, we run 3DMark 11 again. This time around, the score was lower, which means that thermal throttling can also happen during normal use - for example, when playing demanding games - and the temperature reaches 77 °C.
(±) The maximum temperature on the upper side is 41.6 °C / 107 F, compared to the average of 35.9 °C / 97 F, ranging from 21.4 to 59 °C for the class Subnotebook.
(+) The bottom heats up to a maximum of 33.4 °C / 92 F, compared to the average of 39.2 °C / 103 F
(+) In idle usage, the average temperature for the upper side is 22.4 °C / 72 F, compared to the device average of 30.8 °C / 87 F.
(±) Playing The Witcher 3, the average temperature for the upper side is 35 °C / 95 F, compared to the device average of 30.8 °C / 87 F.
(+) The palmrests and touchpad are cooler than skin temperature with a maximum of 30.6 °C / 87.1 F and are therefore cool to the touch.
(-) The average temperature of the palmrest area of similar devices was 28.2 °C / 82.8 F (-2.4 °C / -4.3 F).
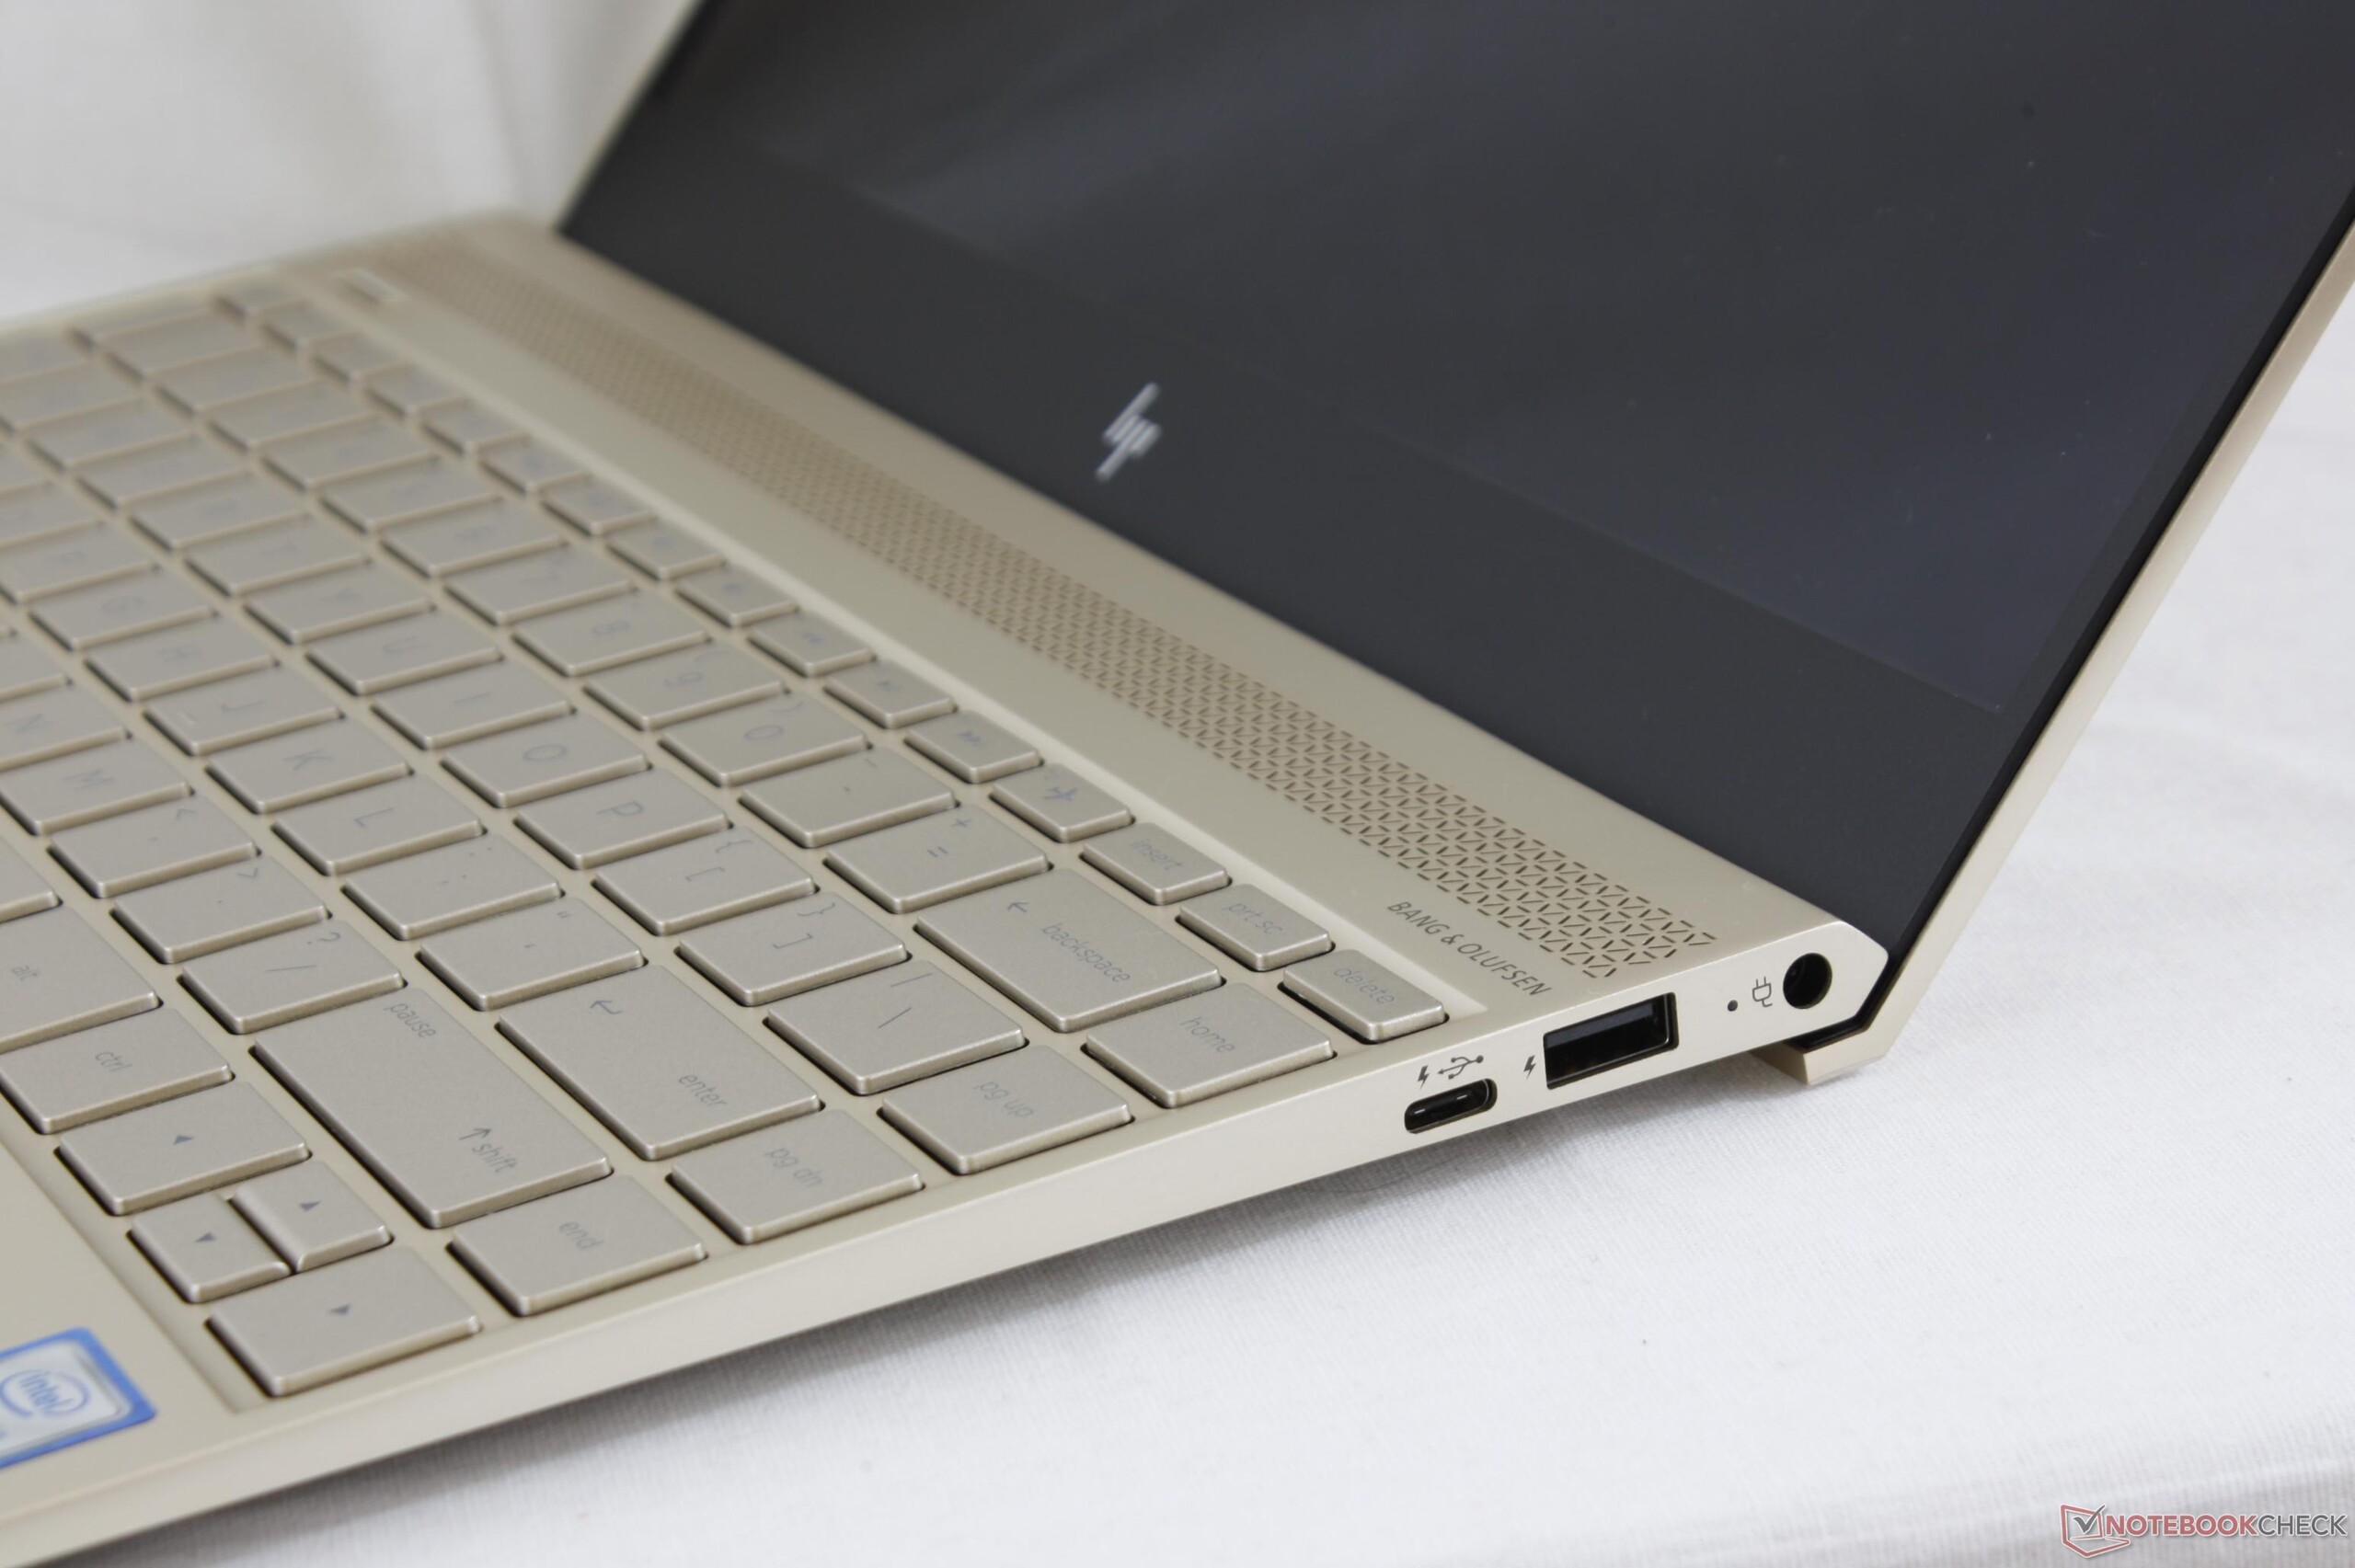
Speakers
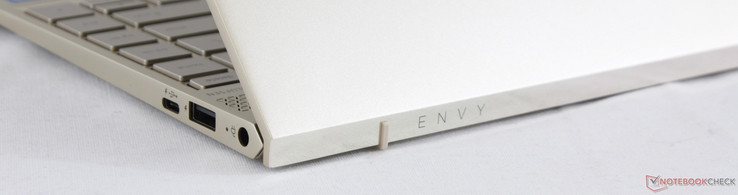
The area above the keyboard is home to the very distinctive speaker grill with its triangular-shaped perforation pattern. Since the Envy 13 emphasizes multimedia as well, we expect the speakers quality to be a notch above those of regular home office notebooks. Unfortunately, that's not the case, since the speakers neither get particularly loud nor do they feature an audible amount of bass. The sound output from the audio comb-jack on the other hand is flawless, however.
HP Envy 13-ad006ng audio analysis
(-) | not very loud speakers (70.1 dB)
Bass 100 - 315 Hz
(-) | nearly no bass - on average 27.6% lower than median
(±) | linearity of bass is average (9.8% delta to prev. frequency)
Mids 400 - 2000 Hz
(+) | balanced mids - only 2.2% away from median
(+) | mids are linear (6.1% delta to prev. frequency)
Highs 2 - 16 kHz
(+) | balanced highs - only 2% away from median
(+) | highs are linear (3.7% delta to prev. frequency)
Overall 100 - 16.000 Hz
(±) | linearity of overall sound is average (20.2% difference to median)
Compared to same class
» 64% of all tested devices in this class were better, 9% similar, 27% worse
» The best had a delta of 5%, average was 18%, worst was 53%
Compared to all devices tested
» 52% of all tested devices were better, 8% similar, 39% worse
» The best had a delta of 4%, average was 24%, worst was 134%
Dell XPS 13 i7-8550U audio analysis
(-) | not very loud speakers (66.8 dB)
Bass 100 - 315 Hz
(+) | good bass - only 4.5% away from median
(±) | linearity of bass is average (8.2% delta to prev. frequency)
Mids 400 - 2000 Hz
(±) | higher mids - on average 5% higher than median
(+) | mids are linear (5.8% delta to prev. frequency)
Highs 2 - 16 kHz
(+) | balanced highs - only 3% away from median
(±) | linearity of highs is average (14.5% delta to prev. frequency)
Overall 100 - 16.000 Hz
(±) | linearity of overall sound is average (17.2% difference to median)
Compared to same class
» 44% of all tested devices in this class were better, 9% similar, 47% worse
» The best had a delta of 5%, average was 18%, worst was 53%
Compared to all devices tested
» 32% of all tested devices were better, 8% similar, 60% worse
» The best had a delta of 4%, average was 24%, worst was 134%
Frequency Comparison (Checkbox selectable!)
Graph 1: Pink Noise 100% Vol.; Graph 2: Audio off
Energy Management
Power Consumption
Just like our other Envy 13, our review notebook also has a slightly lower minimum idle power consumption, although the maximum value has increased a little. The power draw under load is higher as well, but that of course can be attributed to the dedicated GPU.
The power supply is rated for 65 W and has more than enough overhead for the maximum power consumption of 48 W.
| Off / Standby | |
| Idle | |
| Load |
|
Key:
min: | |
| HP Envy 13-ad006ng i7-7500U, GeForce MX150, Toshiba NVMe THNSN5256GPUK, IPS LED, 1920x1080, 13.3" | HP Envy 13-ad065nr i5-7200U, HD Graphics 620, SanDisk X400 SD8SN8U-128G-1006, IPS, 1920x1080, 13.3" | Lenovo IdeaPad 710S Plus-13IKB i7-7500U, GeForce 940MX, Samsung PM961 NVMe MZVLW512HMJP, IPS, 1920x1080, 13.3" | Asus Zenbook UX310UA-FC347T iGP i7-7500U, HD Graphics 620, Micron SSD 1100 (MTFDDAV256TBN), IPS, LED, 1920x1080, 13.3" | Dell XPS 13 i7-8550U i5-8550U, UHD Graphics 620, Toshiba XG5 KXG50ZNV256G, IGZO IPS, 3200x1800, 13.3" | Xiaomi Mi Notebook Air 13.3 2016 6200U, GeForce 940MX, Samsung PM951 NVMe MZVLV256, IPS, 1920x1080, 13.3" | |
|---|---|---|---|---|---|---|
| Power Consumption | 17% | -10% | 2% | 0% | -10% | |
| Idle Minimum * (Watt) | 2.8 | 2.8 -0% | 3.6 -29% | 3.5 -25% | 4.1 -46% | 4 -43% |
| Idle Average * (Watt) | 5.8 | 5.8 -0% | 7.4 -28% | 6.6 -14% | 5.8 -0% | 6.6 -14% |
| Idle Maximum * (Watt) | 7.7 | 6.4 17% | 8.7 -13% | 7.5 3% | 6 22% | 7.4 4% |
| Load Average * (Watt) | 48 | 31.3 35% | 43 10% | 34.7 28% | 42.5 11% | 41.7 13% |
| Witcher 3 ultra * (Watt) | 35 | |||||
| Load Maximum * (Watt) | 48 | 31.7 34% | 42 12% | 39.6 17% | 41.4 14% | 52.4 -9% |
* ... smaller is better
Battery Life
The 51 Wh battery is built-in, which is very common for Ultrabooks. The Dell XPS 13 has a battery with a much higher capacity; the Lenovo IdeaPad 710s-Plus features a slightly smaller power source.
Given the power consumption, we can already expect that our review notebook won't be able to match the other Envy 13 when it comes to the runtimes. The XPS 13 also lasts way longer on a charge, while the IdeaPad trails its competitors by a pretty significant margin. The recorded WLAN runtime of 7 hours 13 minutes is decent enough, but nothing special.
A full charge takes two hours and 15 minutes.
| HP Envy 13-ad006ng i7-7500U, GeForce MX150, 51 Wh | HP Envy 13-ad065nr i5-7200U, HD Graphics 620, 53.6 Wh | Lenovo IdeaPad 710S Plus-13IKB i7-7500U, GeForce 940MX, 46 Wh | Asus Zenbook UX310UA-FC347T iGP i7-7500U, HD Graphics 620, 48 Wh | Dell XPS 13 i7-8550U i5-8550U, UHD Graphics 620, 60 Wh | Xiaomi Mi Notebook Air 13.3 2016 6200U, GeForce 940MX, 40 Wh | |
|---|---|---|---|---|---|---|
| Battery runtime | 21% | -36% | -1% | 17% | -22% | |
| Reader / Idle (h) | 20 | 24.8 24% | 7.8 -61% | 16.1 -19% | 18.5 -7% | 12 -40% |
| H.264 (h) | 7.9 | 6.9 -13% | 7.1 -10% | |||
| WiFi v1.3 (h) | 7.1 | 9.5 34% | 5.6 -21% | 9.6 35% | 9.8 38% | 6.5 -8% |
| Load (h) | 2 | 2.1 5% | 1.5 -25% | 1.9 -5% | 2.4 20% | 1.4 -30% |
Verdict
Pros
Cons
HP's Envy 13 is an attractive 13.3-inch mainstream Ultrabook designed to compete with the Dell XPS 13 - also with its price. As far as that lofty goal is concerned, the Envy falls short.
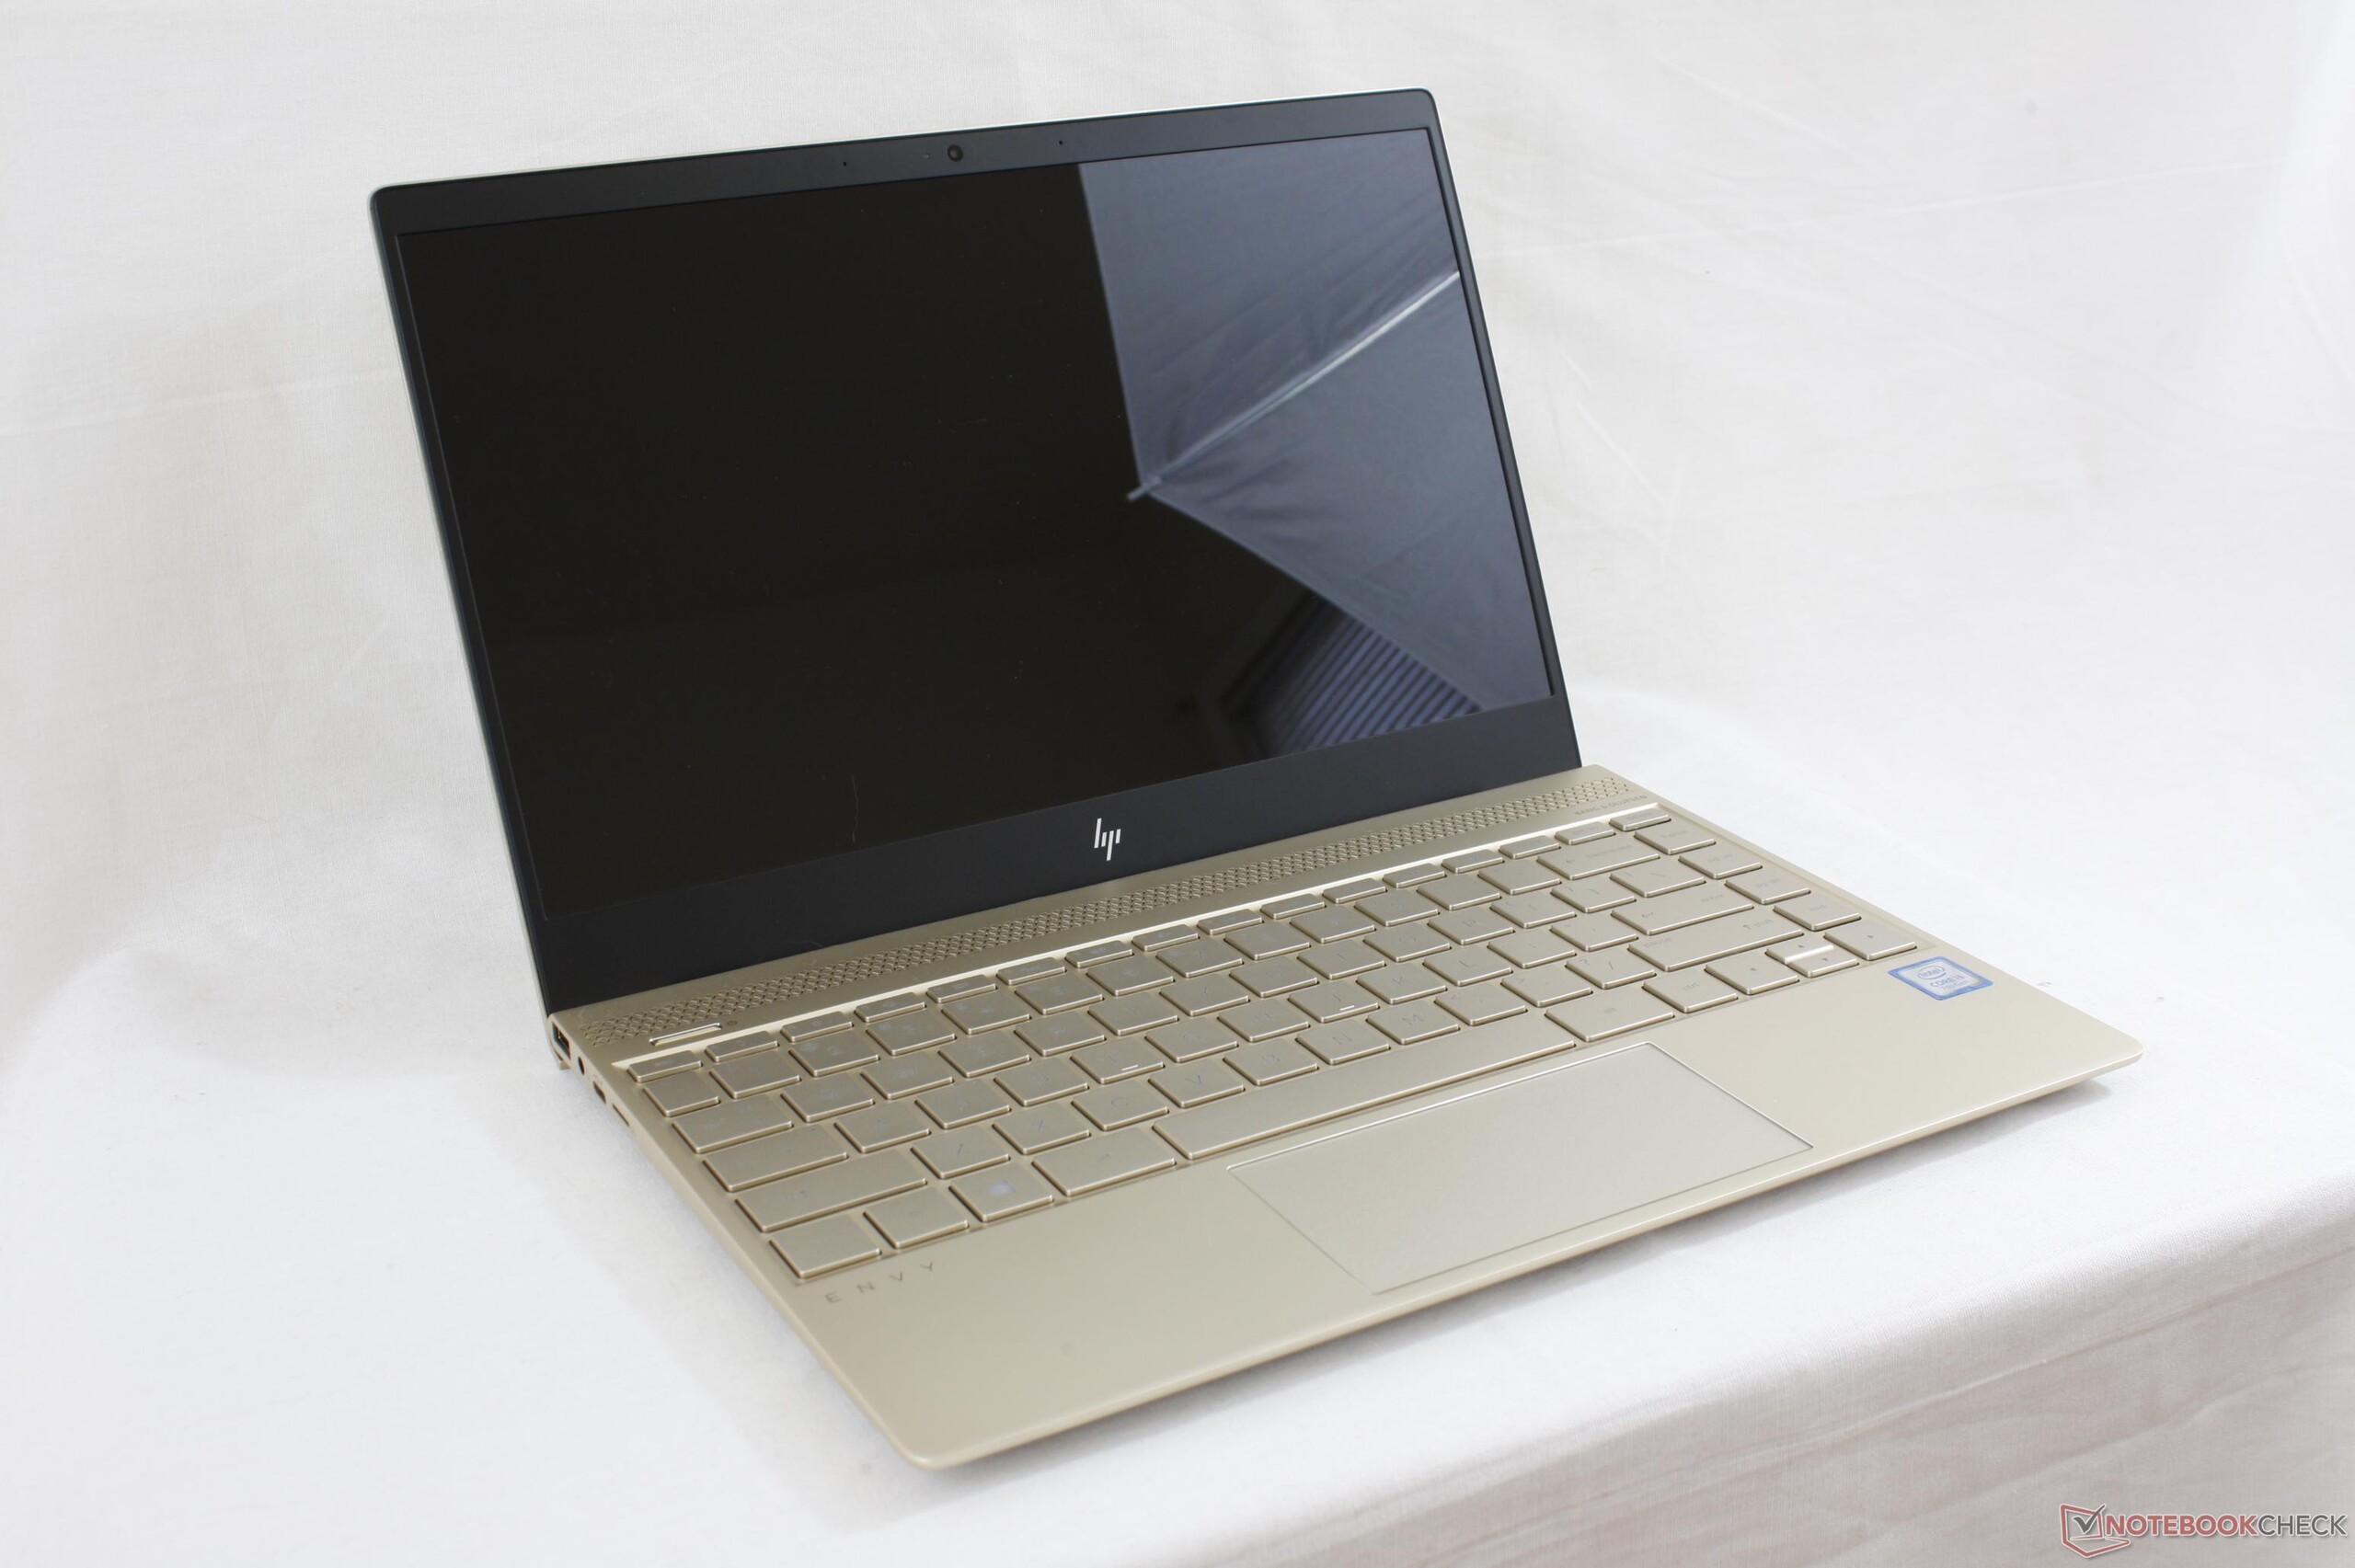
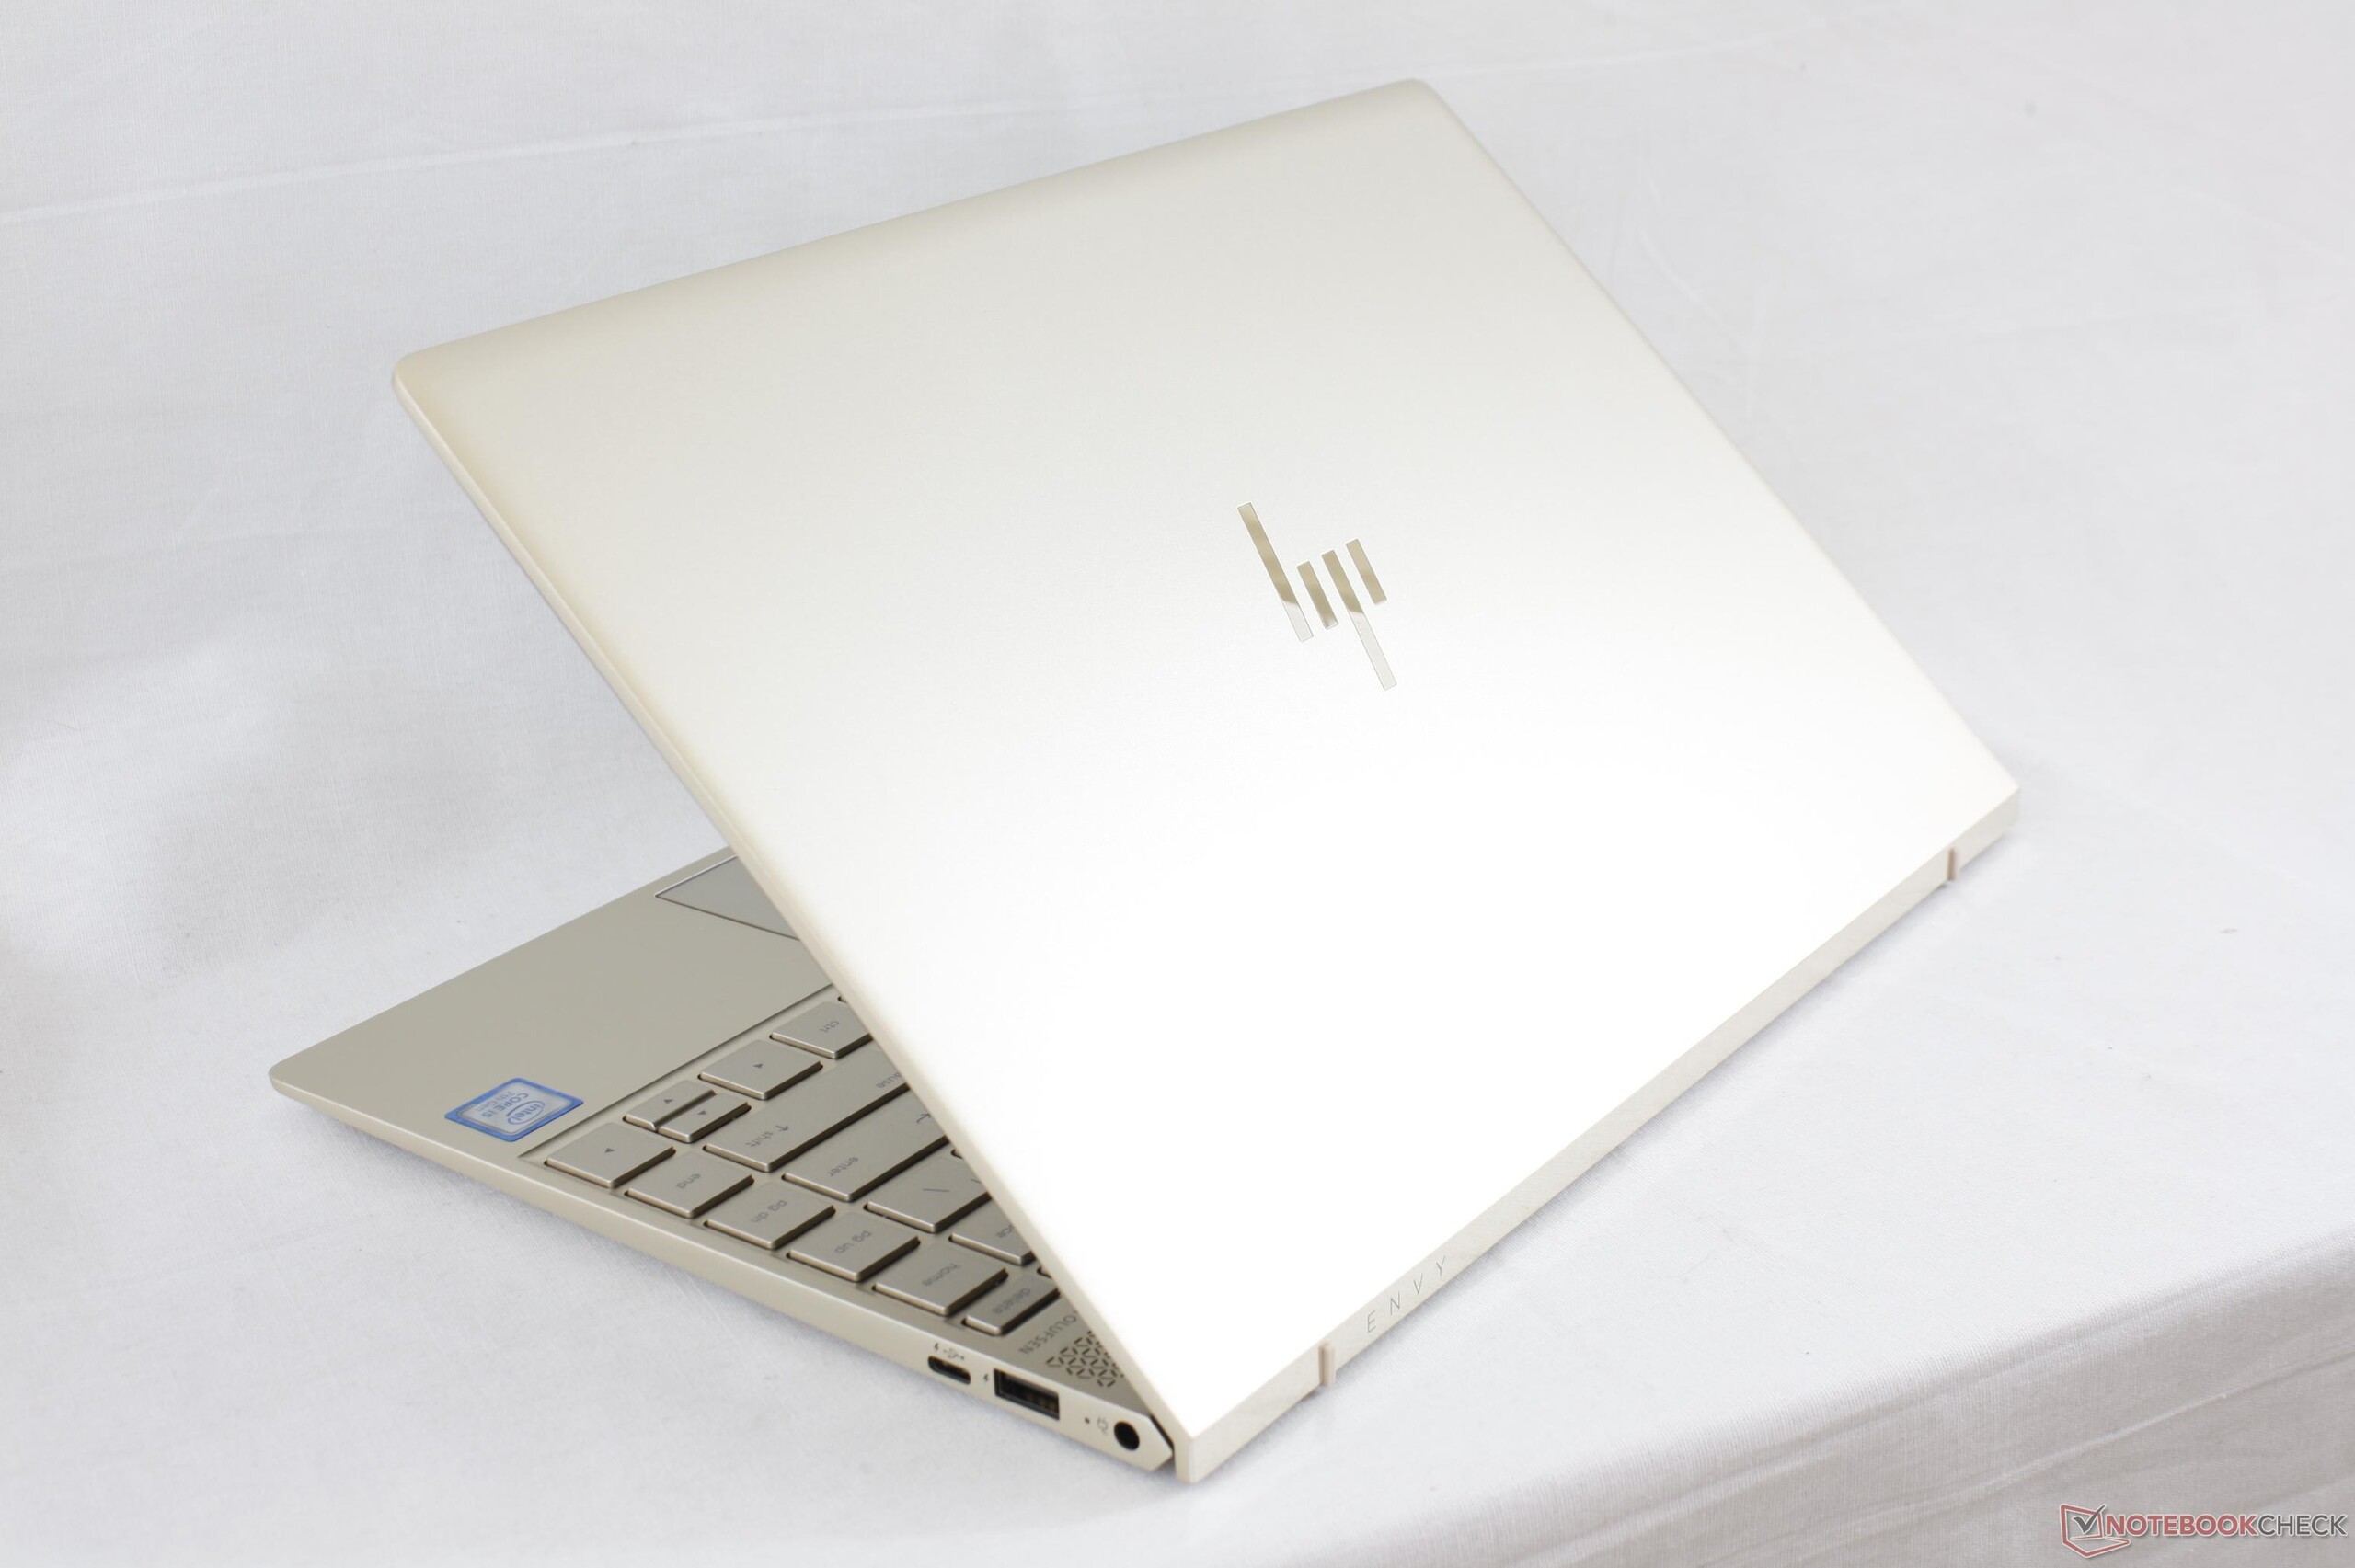
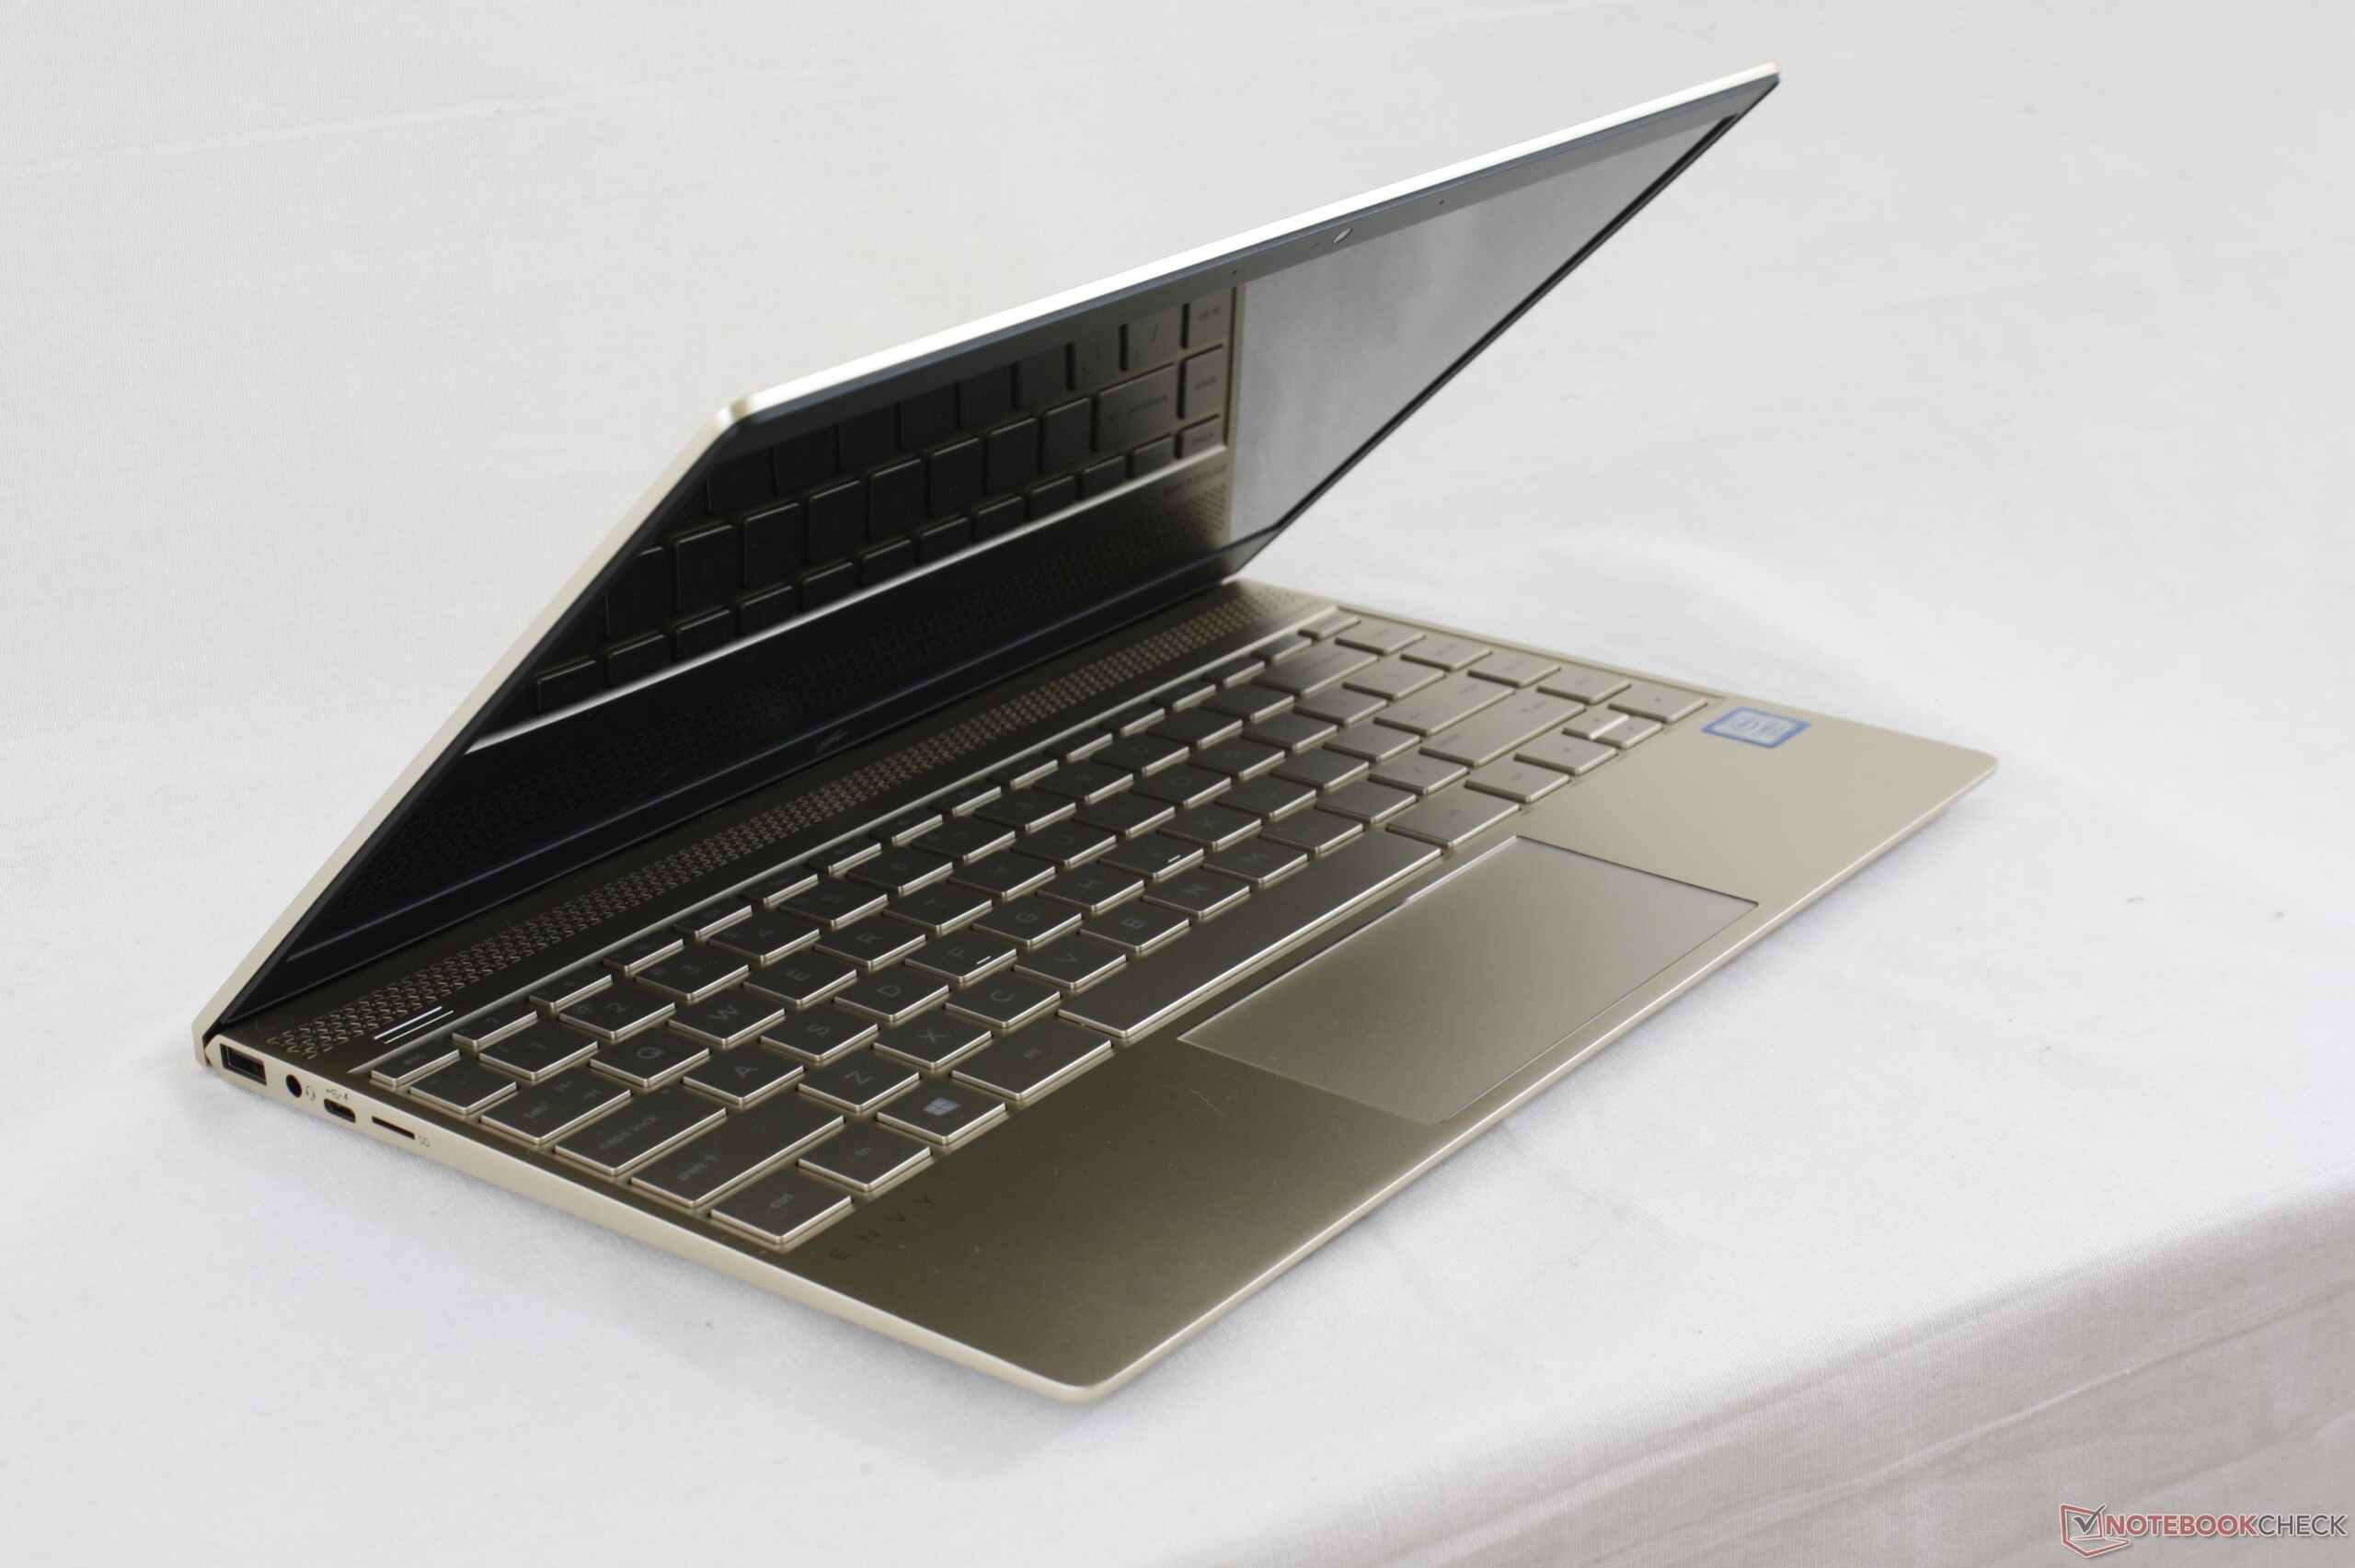
There's one thing the XPS 13 doesn't offer: a dedicated GPU. That's a clear advantage for HP, as the MX150 is going to be a deciding factor for many customers. The Envy does many things very well: the built quality is great and the chassis is - thanks to the thin bezels - very compact as well as attractive. The cooling system is also very capable and all is well when it comes to the noise level and the temperatures. The display has its share of weaknesses, but subjectively, it looks very good, is very sharp and offers good contrast.
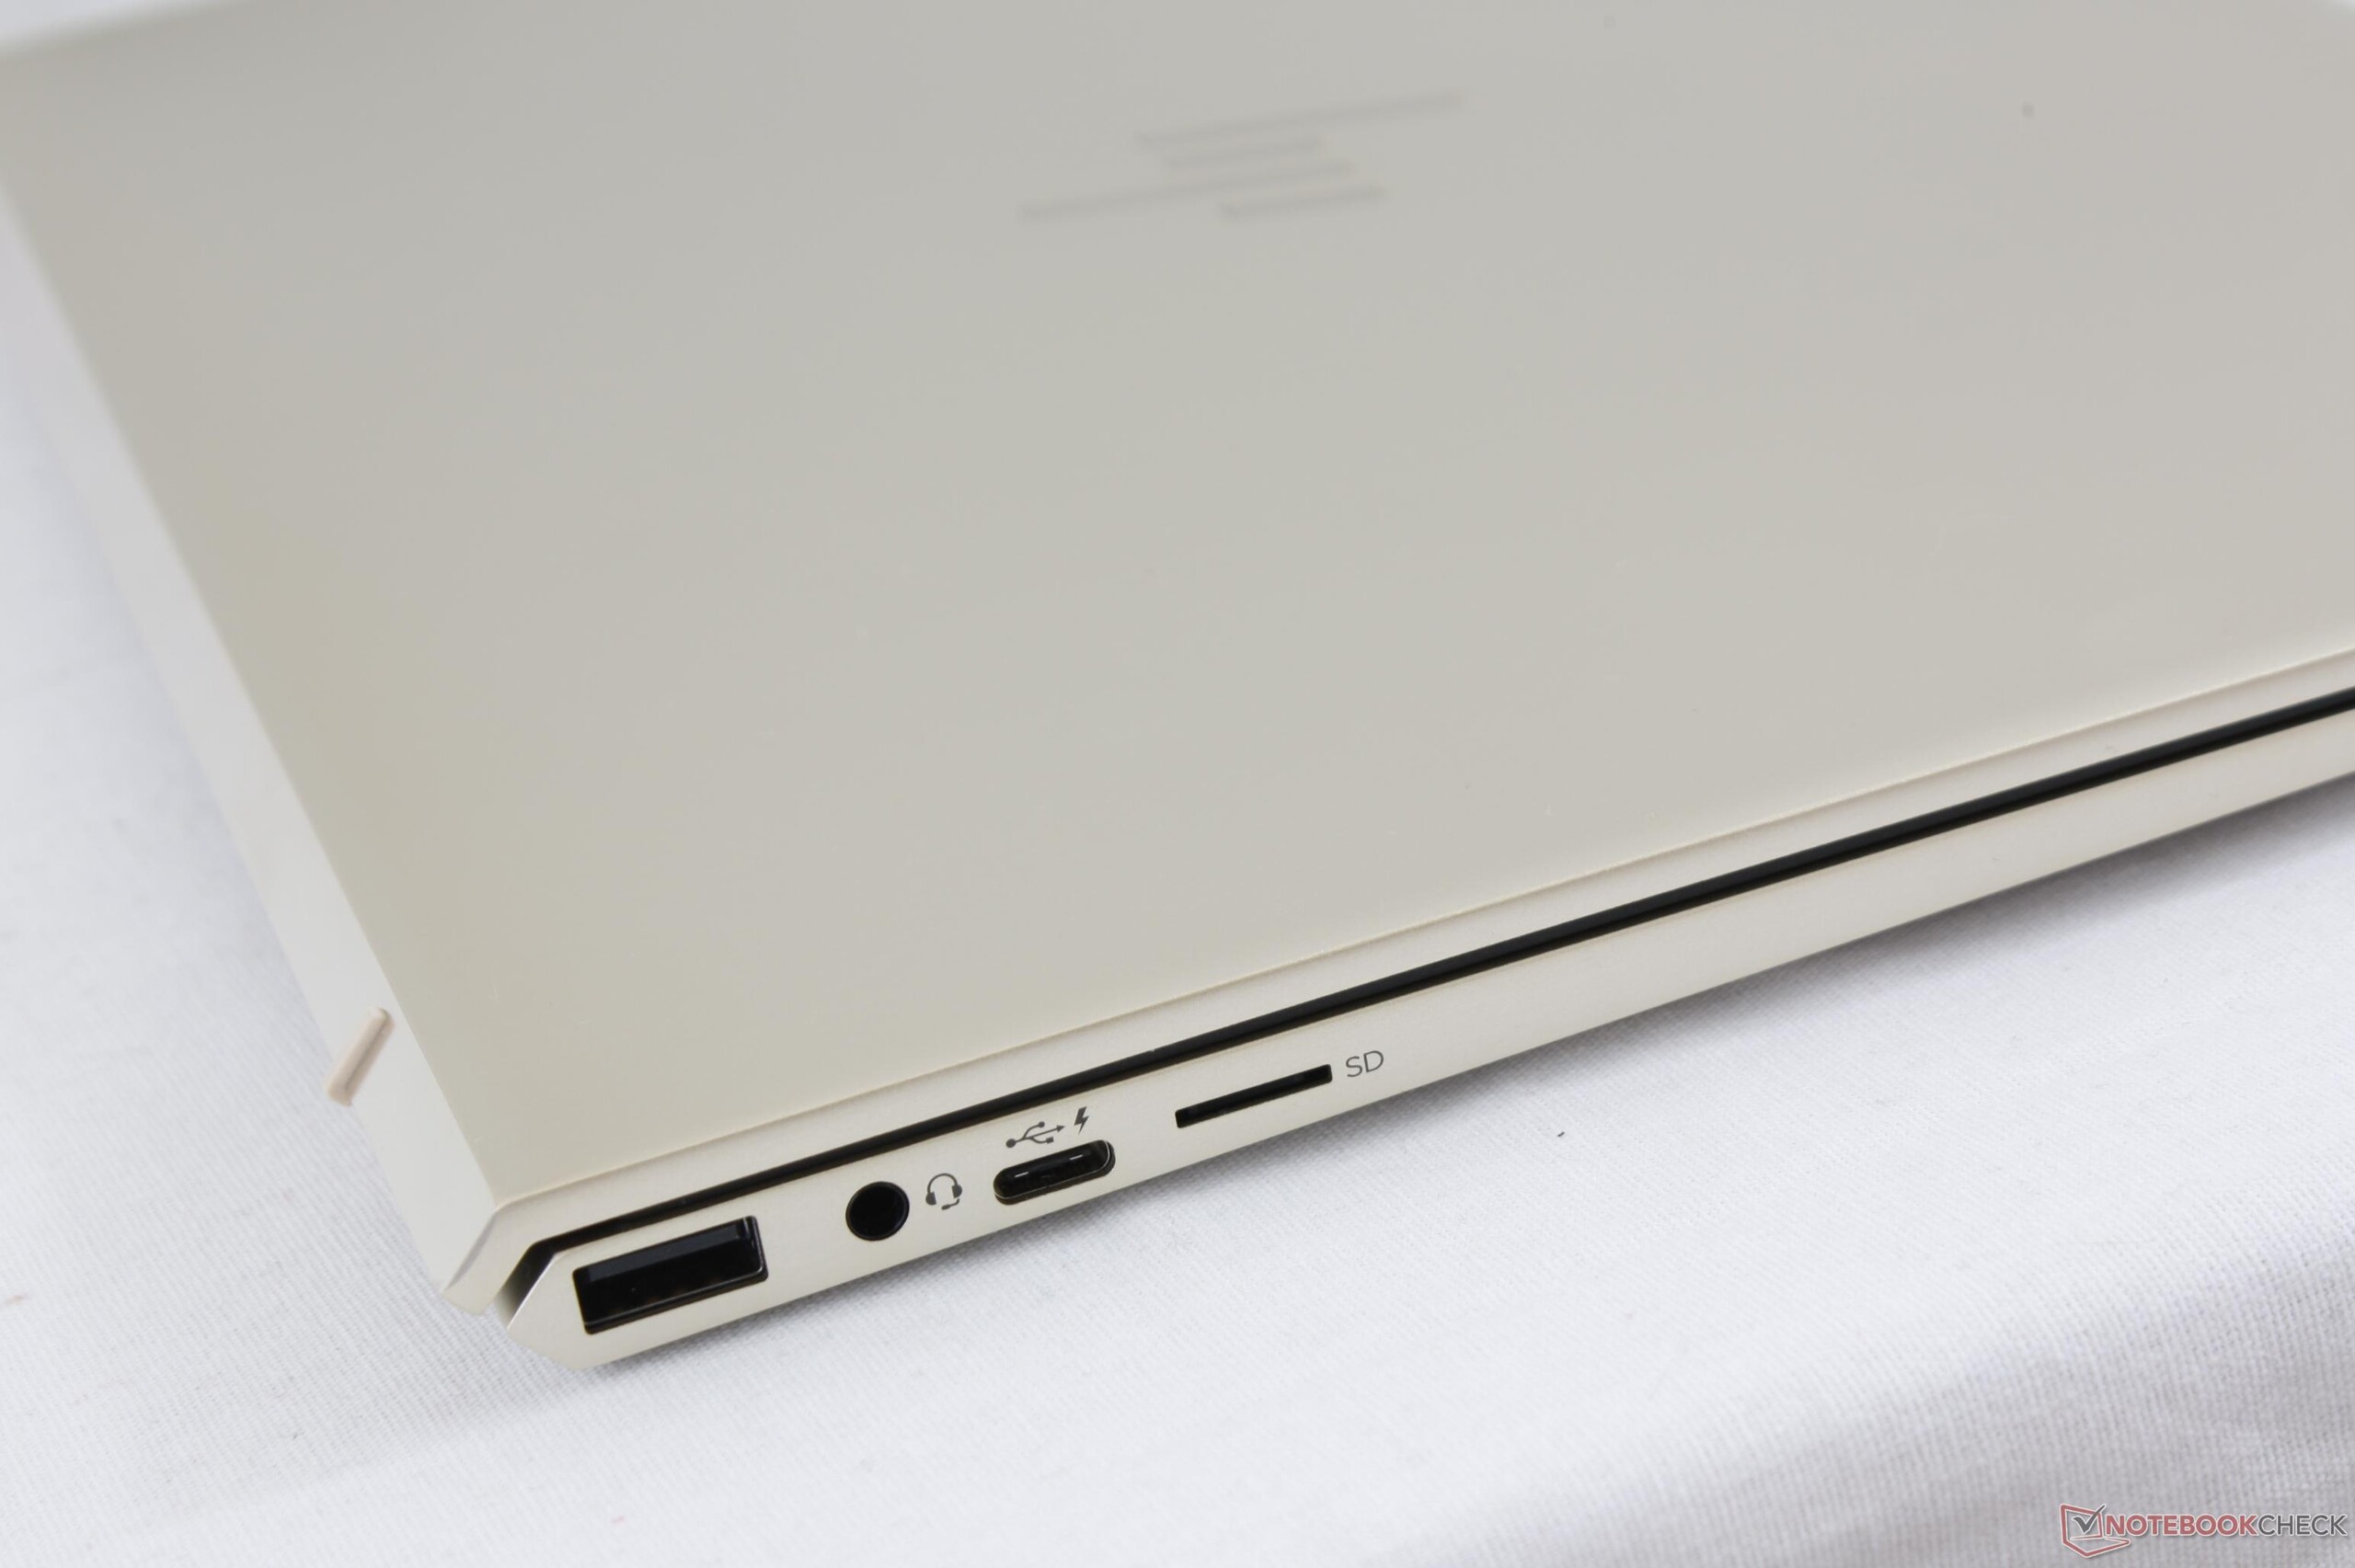
The display brightness though doesn't quite stand up to the competition. What makes matters worse here is the fact that there is no matte panel option, which restricts the suitability for outdoor use somewhat - a real problem considering this is a subnotebook. The port selection is also subpar: we would've appreciated the inclusion of HDMI, a full-sized SD card slot and Thunderbolt 3. We weren't overly pleased with the touchpad of the Envy 13-ad065nr and our displeasure continues here, as the glass clickpad clatters noticeably. Another potential drawback of the high-performing system is the fact that thermal throttling occurs during the stress test. This throttling could potentially occur during regular use as well.
Sometimes, the original is simply better: we can't really come up with sufficient reasons to recommend the HP Envy 13 over the Dell XPS 13.
Despite these shortcomings, the Envy 13 is by no means a bad notebook. Aside from the slightly lower price and the dedicated GPU, we just don't find that many arguments for the Envy. The Dell XPS is higher-end and better when it comes to the physical ports, the display brightness and the battery life. Our configuration is already outdated as well - a successor with Core i7-8550U is available already. For this reason, we can't really recommend our particular version. Users interested in the Envy 13 should look for a model with the newest hardware components.
HP Envy 13-ad006ng
- 10/17/2017 v6 (old)
Benjamin Herzig
Price comparison