HP Pavilion x360 15 2019 Convertible Review: Don't Buy This Configuration
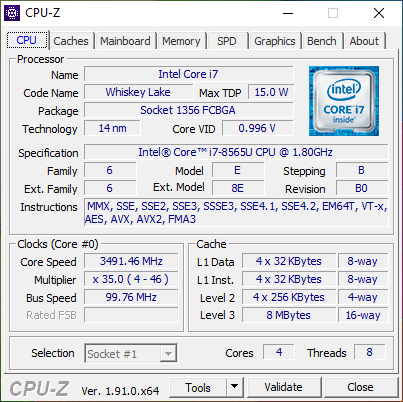
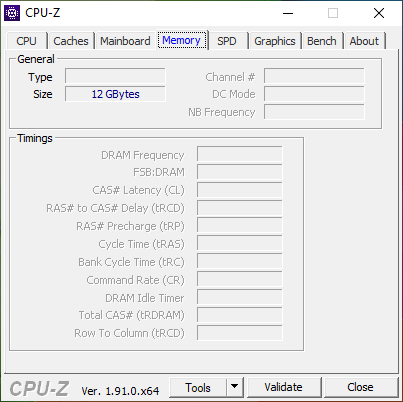
The HP Pavilion x360 15 is the least expensive 15.6-inch convertible laptop you can buy from HP. Even so, some configurations can reach $1000 USD to be on the pricey side for what is supposed to be a budget laptop. The unit we have today is a highly configured SKU with the Whiskey Lake-U Core i7-8565U CPU, 12 GB of RAM, 512 GB NVMe SSD, and 768p touchscreen for $1000 at retail. Newer SKUs with Comet Lake-U CPUs can be found online meaning that various outlets may carry our Whiskey Lake-U unit at discounted prices.
Direct competitors include other budget 15.6-inch convertibles like the Asus VivoBook Flip 15, Lenovo IdeaPad C340 15, Dell Inspiron 15 3585, and the Acer Spin series.
More HP reviews:
Rating | Date | Model | Weight | Height | Size | Resolution | Price |
|---|---|---|---|---|---|---|---|
| 72 % v7 (old) | 02 / 2020 | HP Pavilion x360 15-dq0065cl i7-8565U, UHD Graphics 620 | 1.9 kg | 20.6 mm | 15.60" | 1366x768 | |
| 78.9 % v6 (old) | 02 / 2018 | Asus VivoBook Flip 15 TP510UA-E8073T i5-8250U, UHD Graphics 620 | 2.3 kg | 18 mm | 15.60" | 1920x1080 | |
| 82.6 % v7 (old) | 10 / 2019 | Lenovo Ideapad C340-15IWL-81N5004QGE i5-8265U, GeForce MX230 | 2 kg | 20.5 mm | 15.60" | 1920x1080 | |
| 80.1 % v6 (old) | 03 / 2018 | HP Envy x360 15-bq102ng R5 2500U, Vega 8 | 2.1 kg | 19.6 mm | 15.60" | 1920x1080 | |
| 77.6 % v6 (old) | 06 / 2019 | Dell Inspiron 15 3585 (2300U, Vega 6) R3 2300U, Vega 6 | 1.9 kg | 20 mm | 15.60" | 1920x1080 |
Case
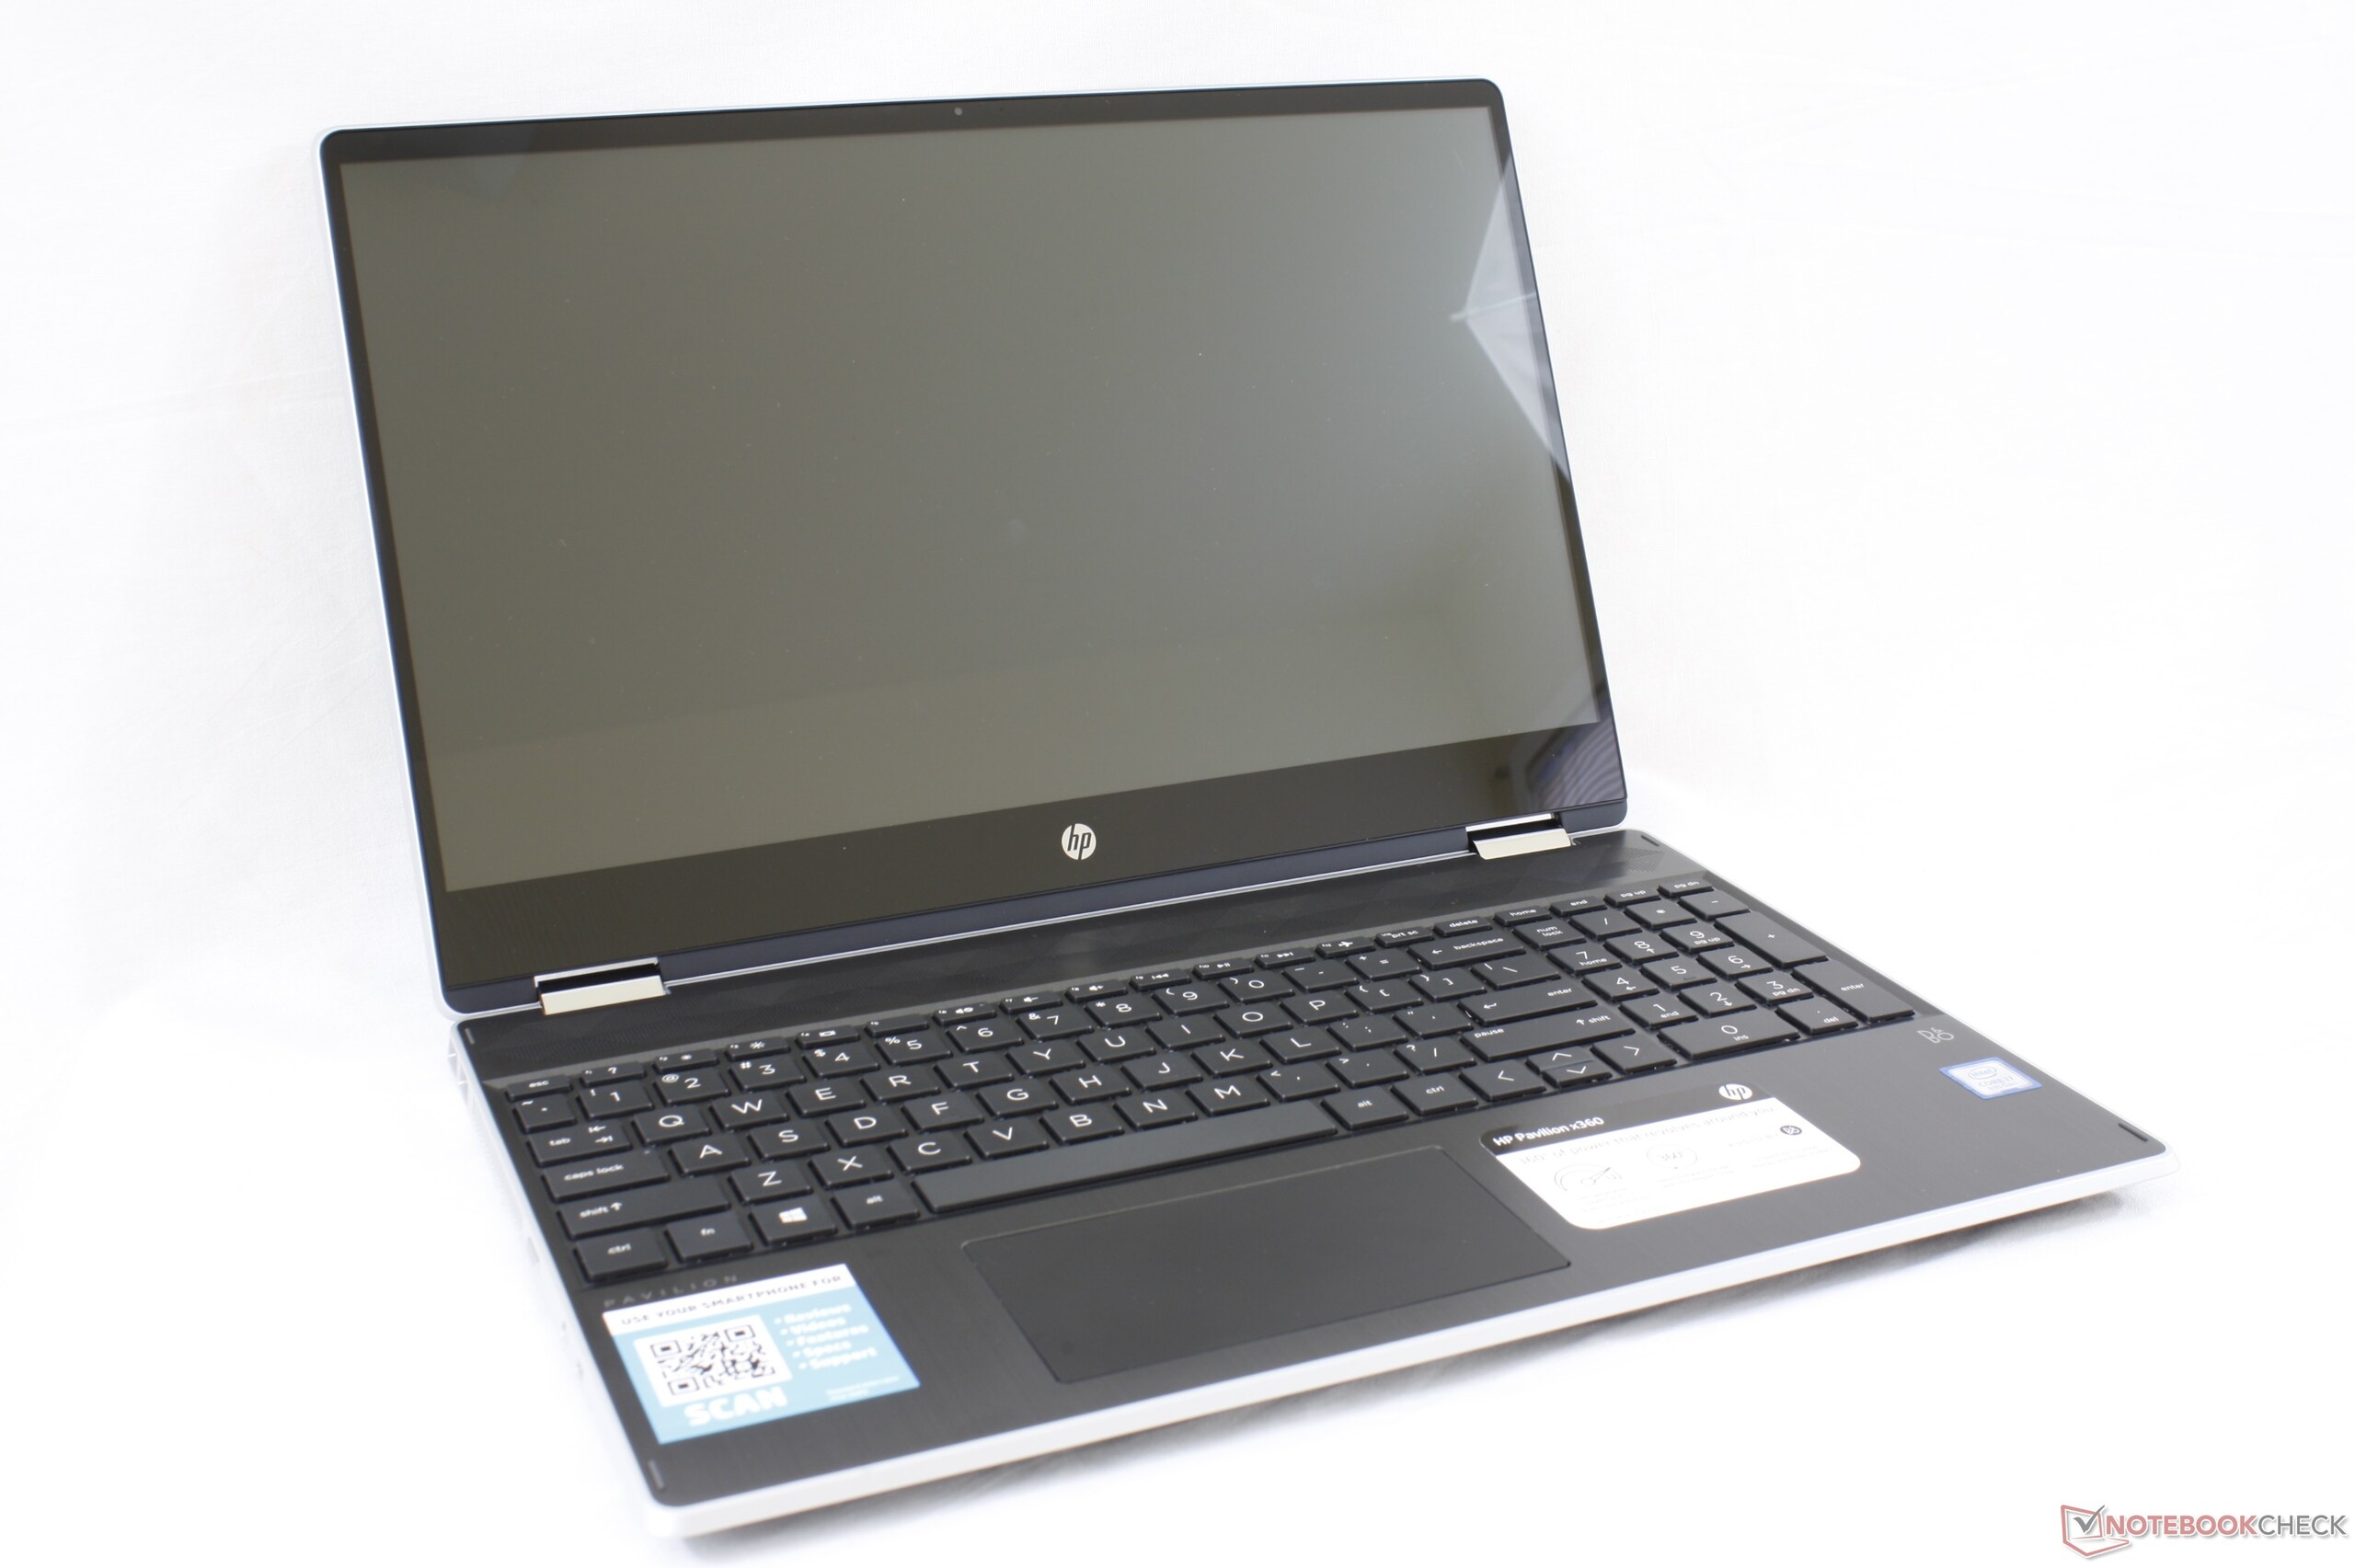
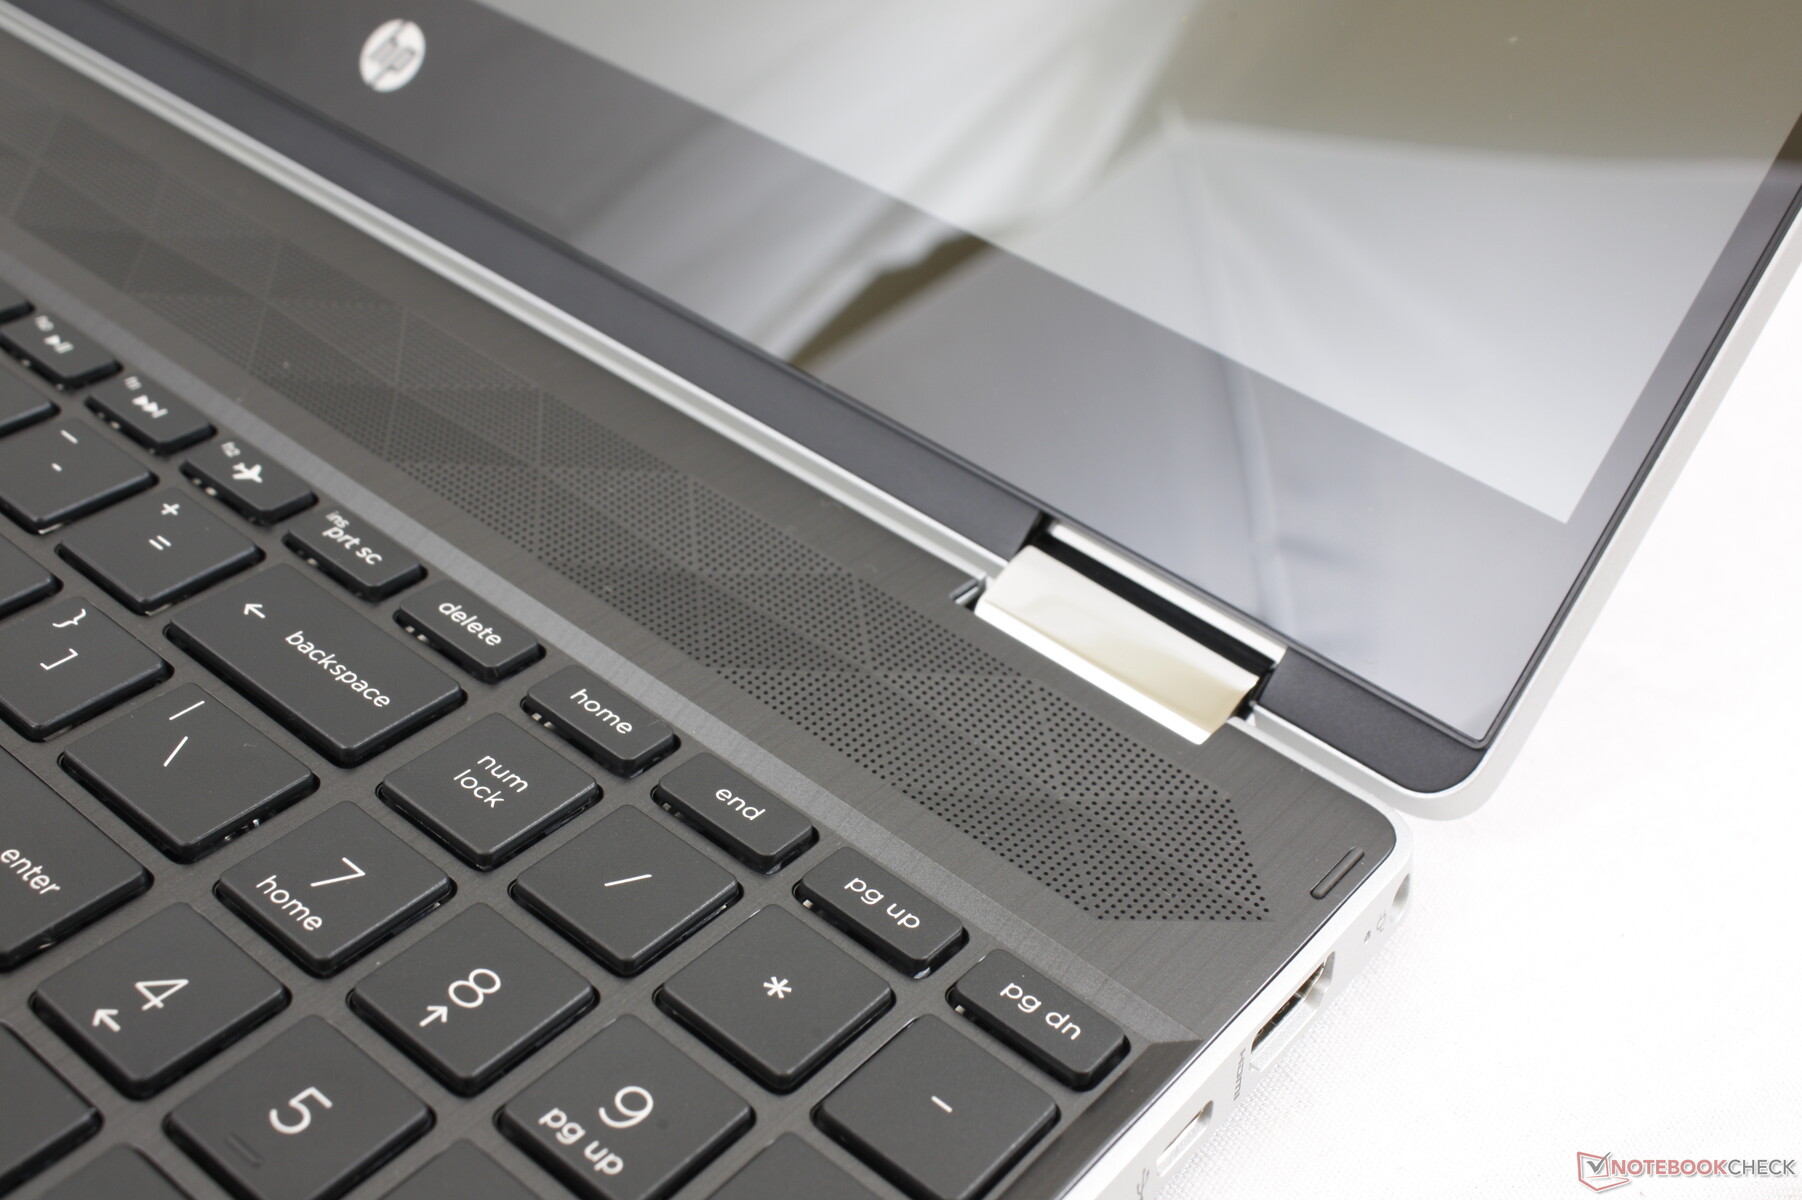
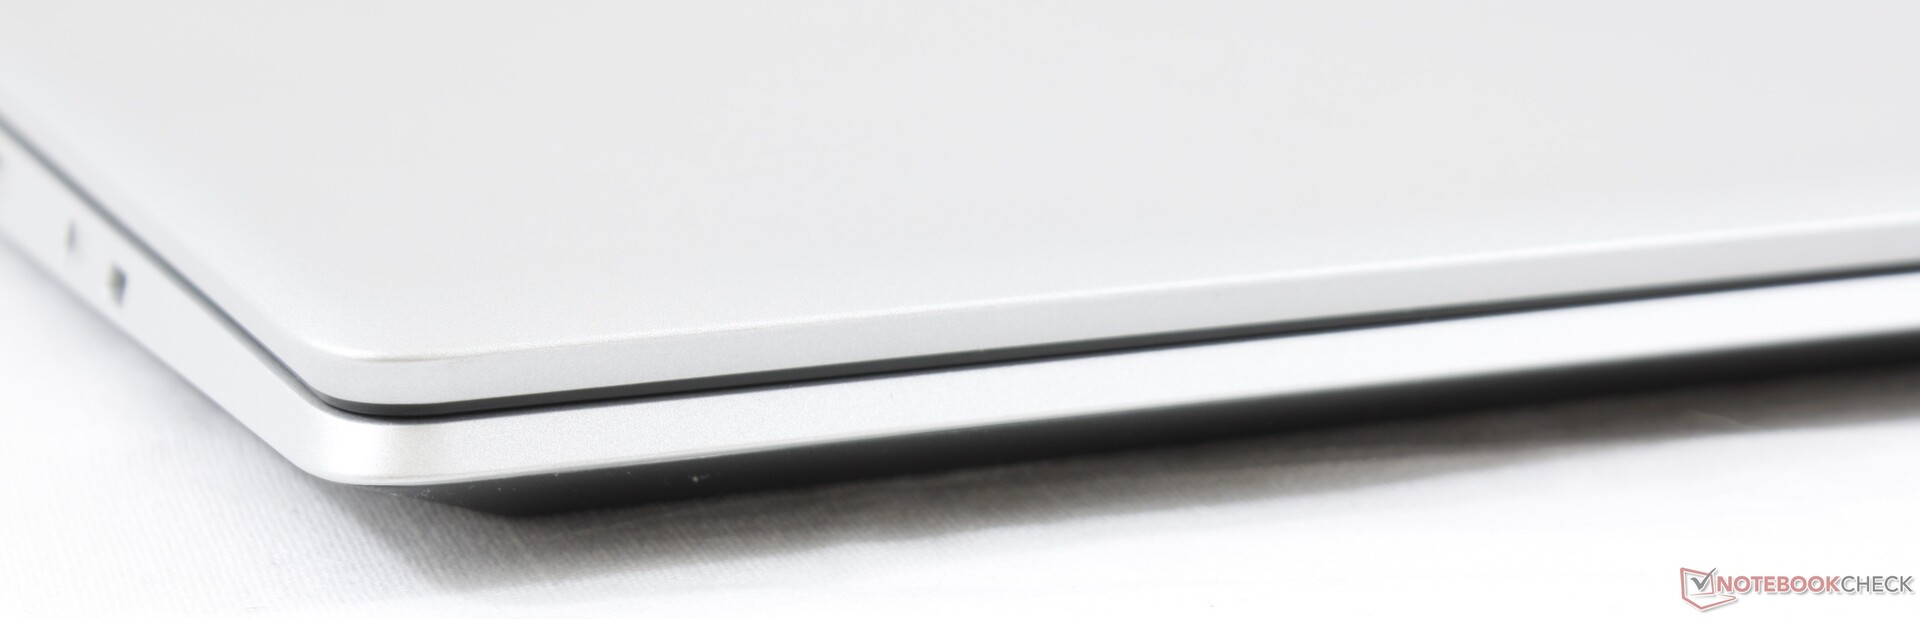
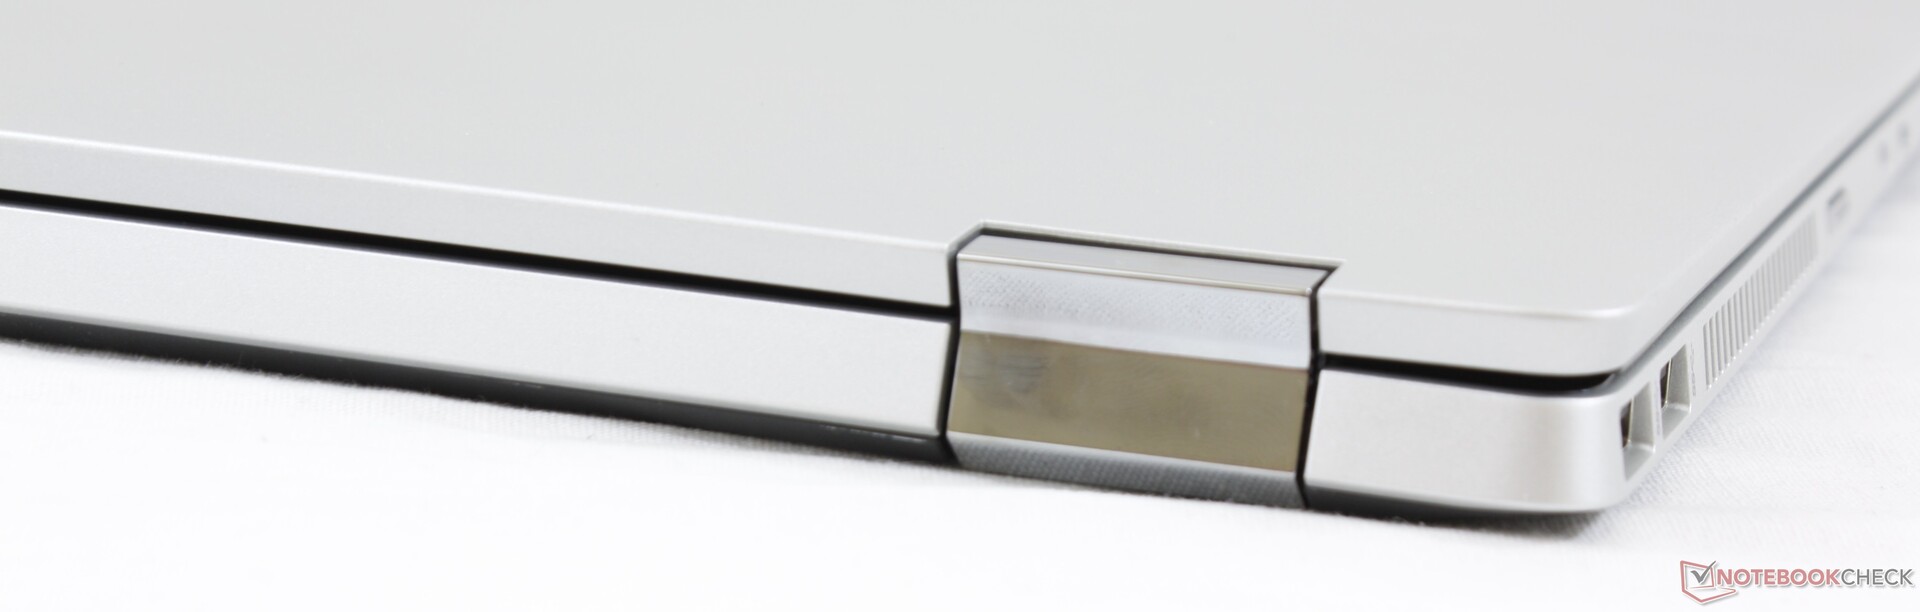
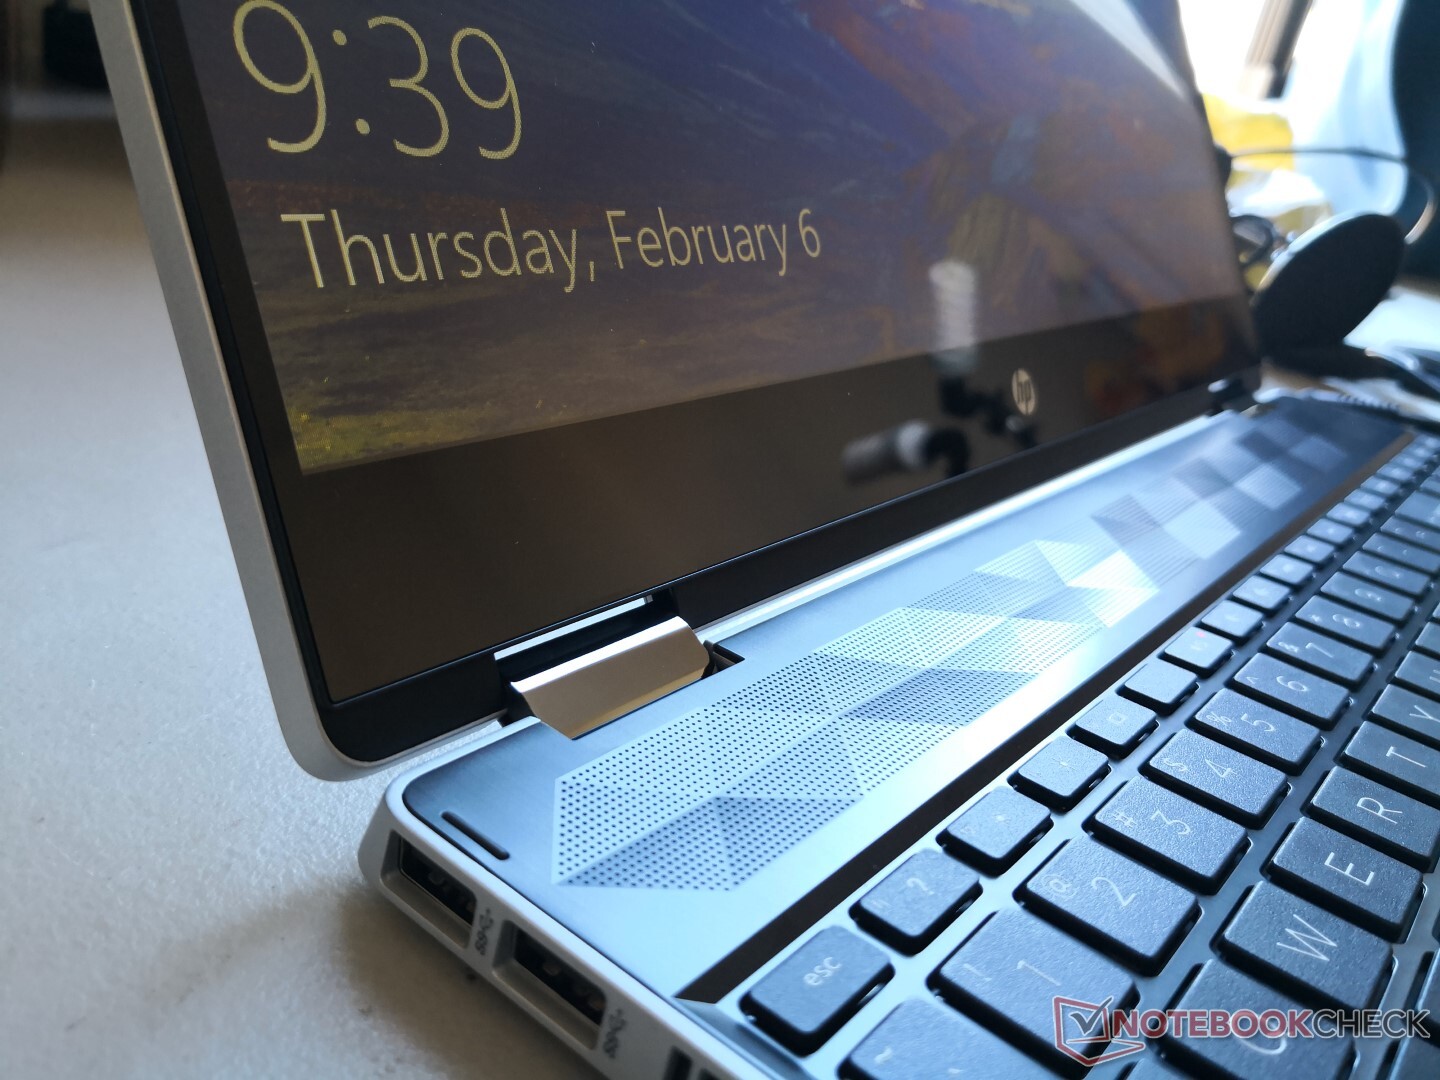
When compared to the last Pavilion x360 15 we tested back in 2017, this 2019 model incorporates narrow bezels for a more modern visual design. The entire chassis is still plastic, however, meaning that it lacks the luxuriousness of the costlier HP Envy or Spectre laptops. The palm rests and keyboard deck have a faux brushed aluminum look to bolster the otherwise plain plastic design.
We like the fact that the edges and corners of the chassis are made of thick plastic to better adsorb accidental bumps. Even so, both the base and lid flex and creak more noticeably than on the pricier Spectre x360 15 while being just slightly more rigid than the competing Asus VivoBook Flip or Lenovo Ideapad C340 15.
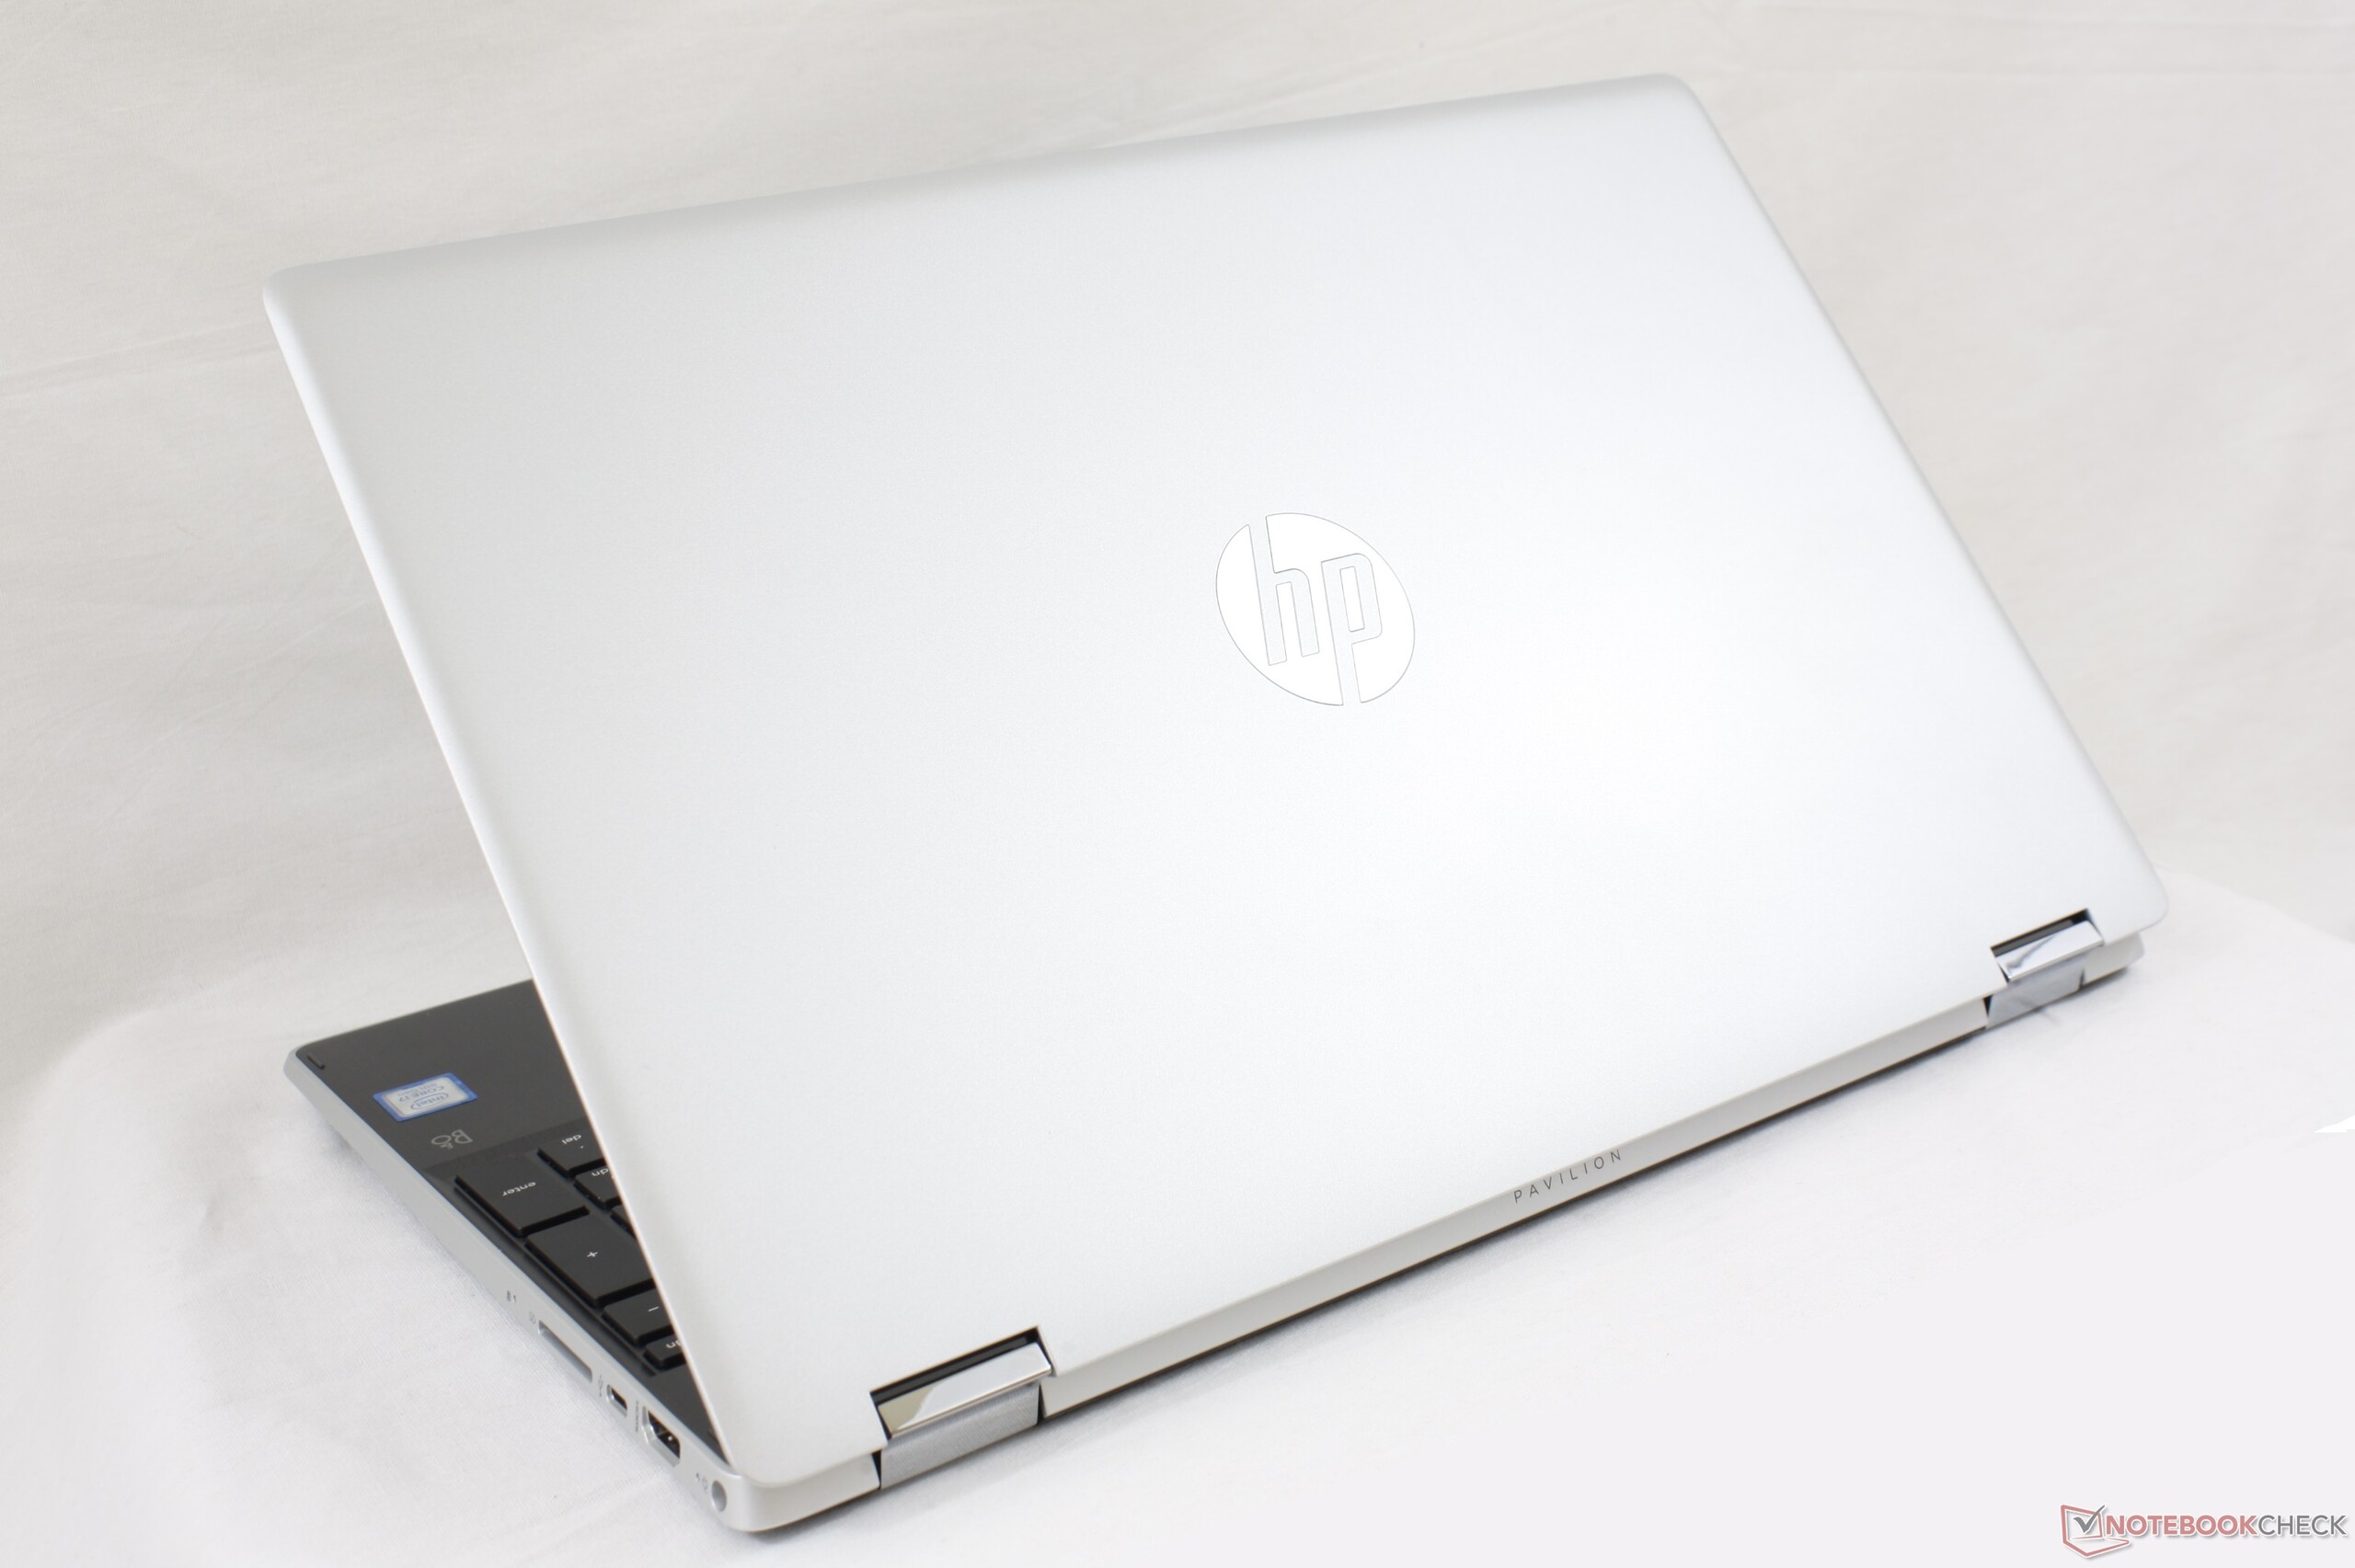
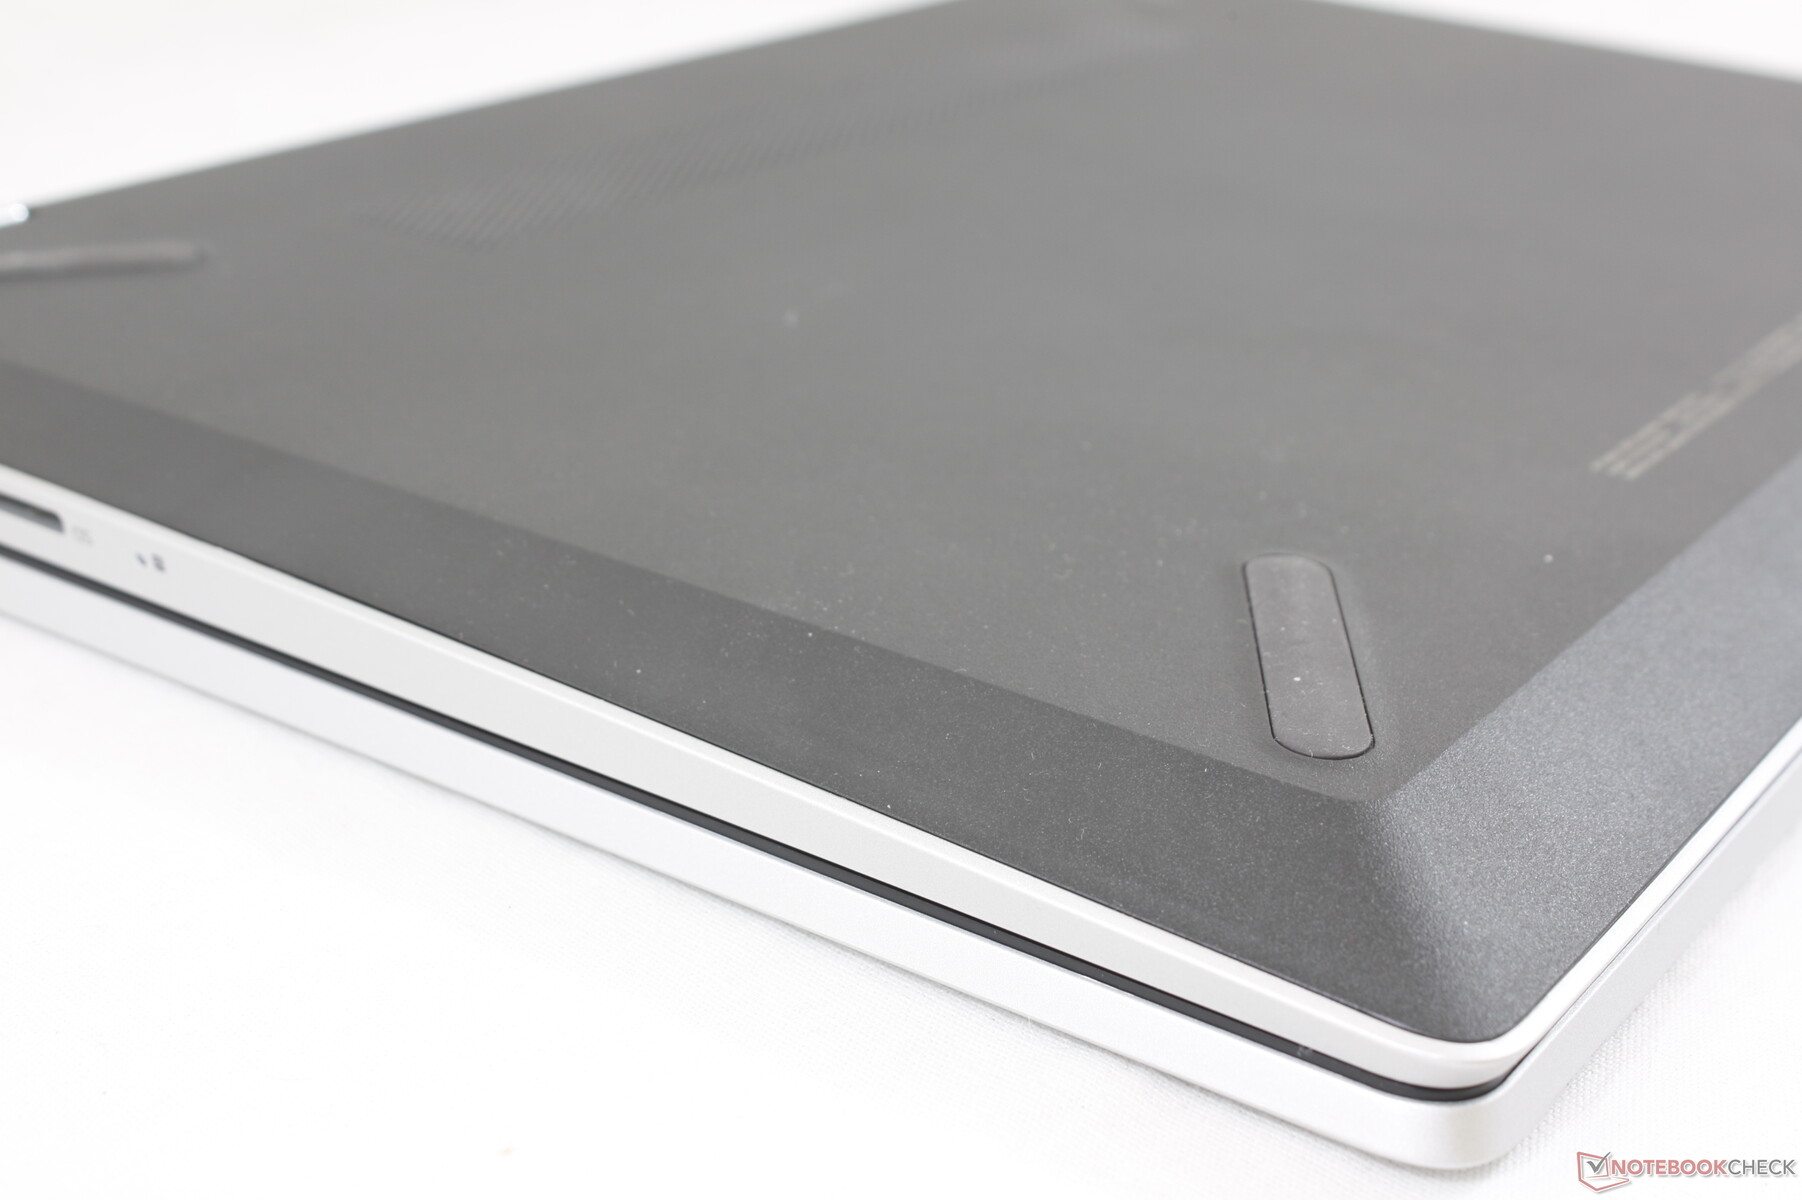
Overall dimensions and weight are slightly smaller and lighter, respectively, than alternatives like the Envy x360 15, Ideapad C340-15, or Asus VivoBook Flip 15. It even has a smaller footprint than the flagship HP Spectre x360 15.
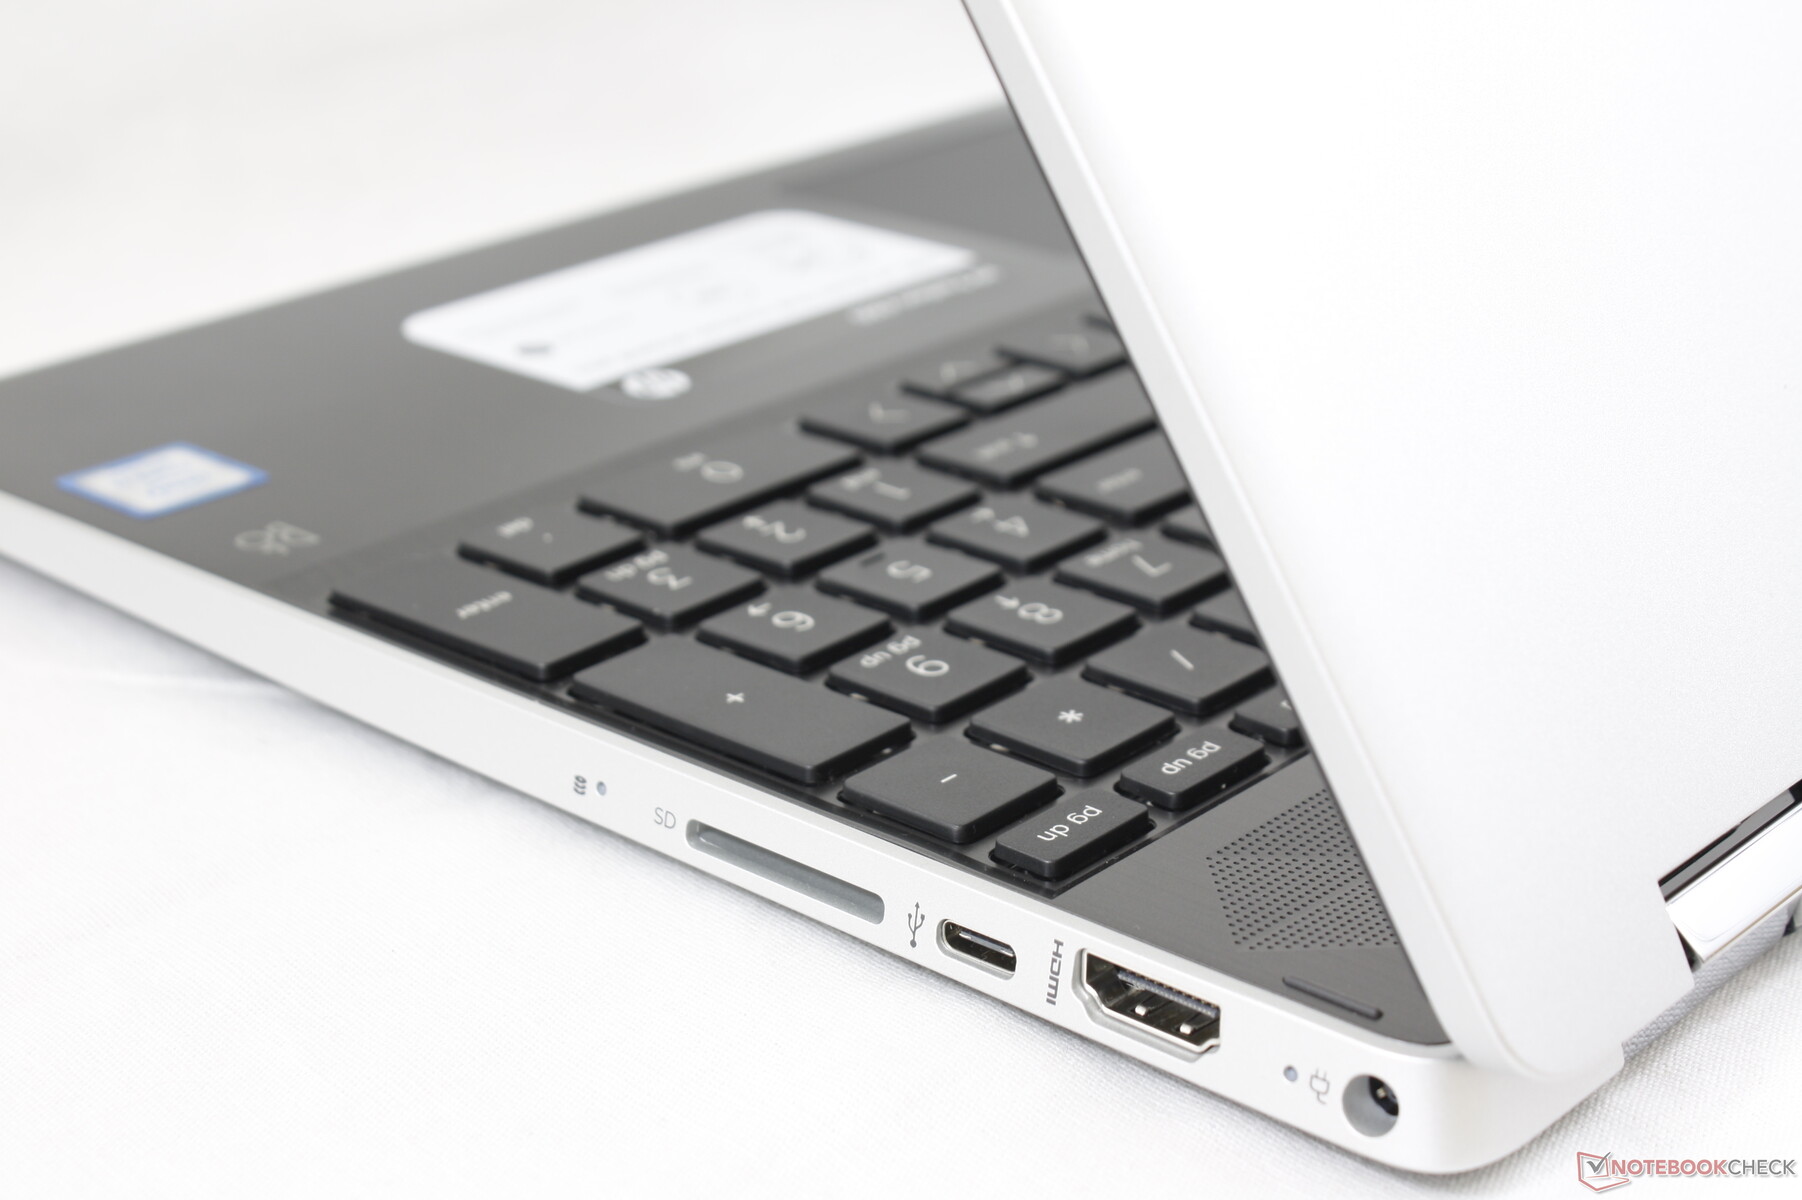
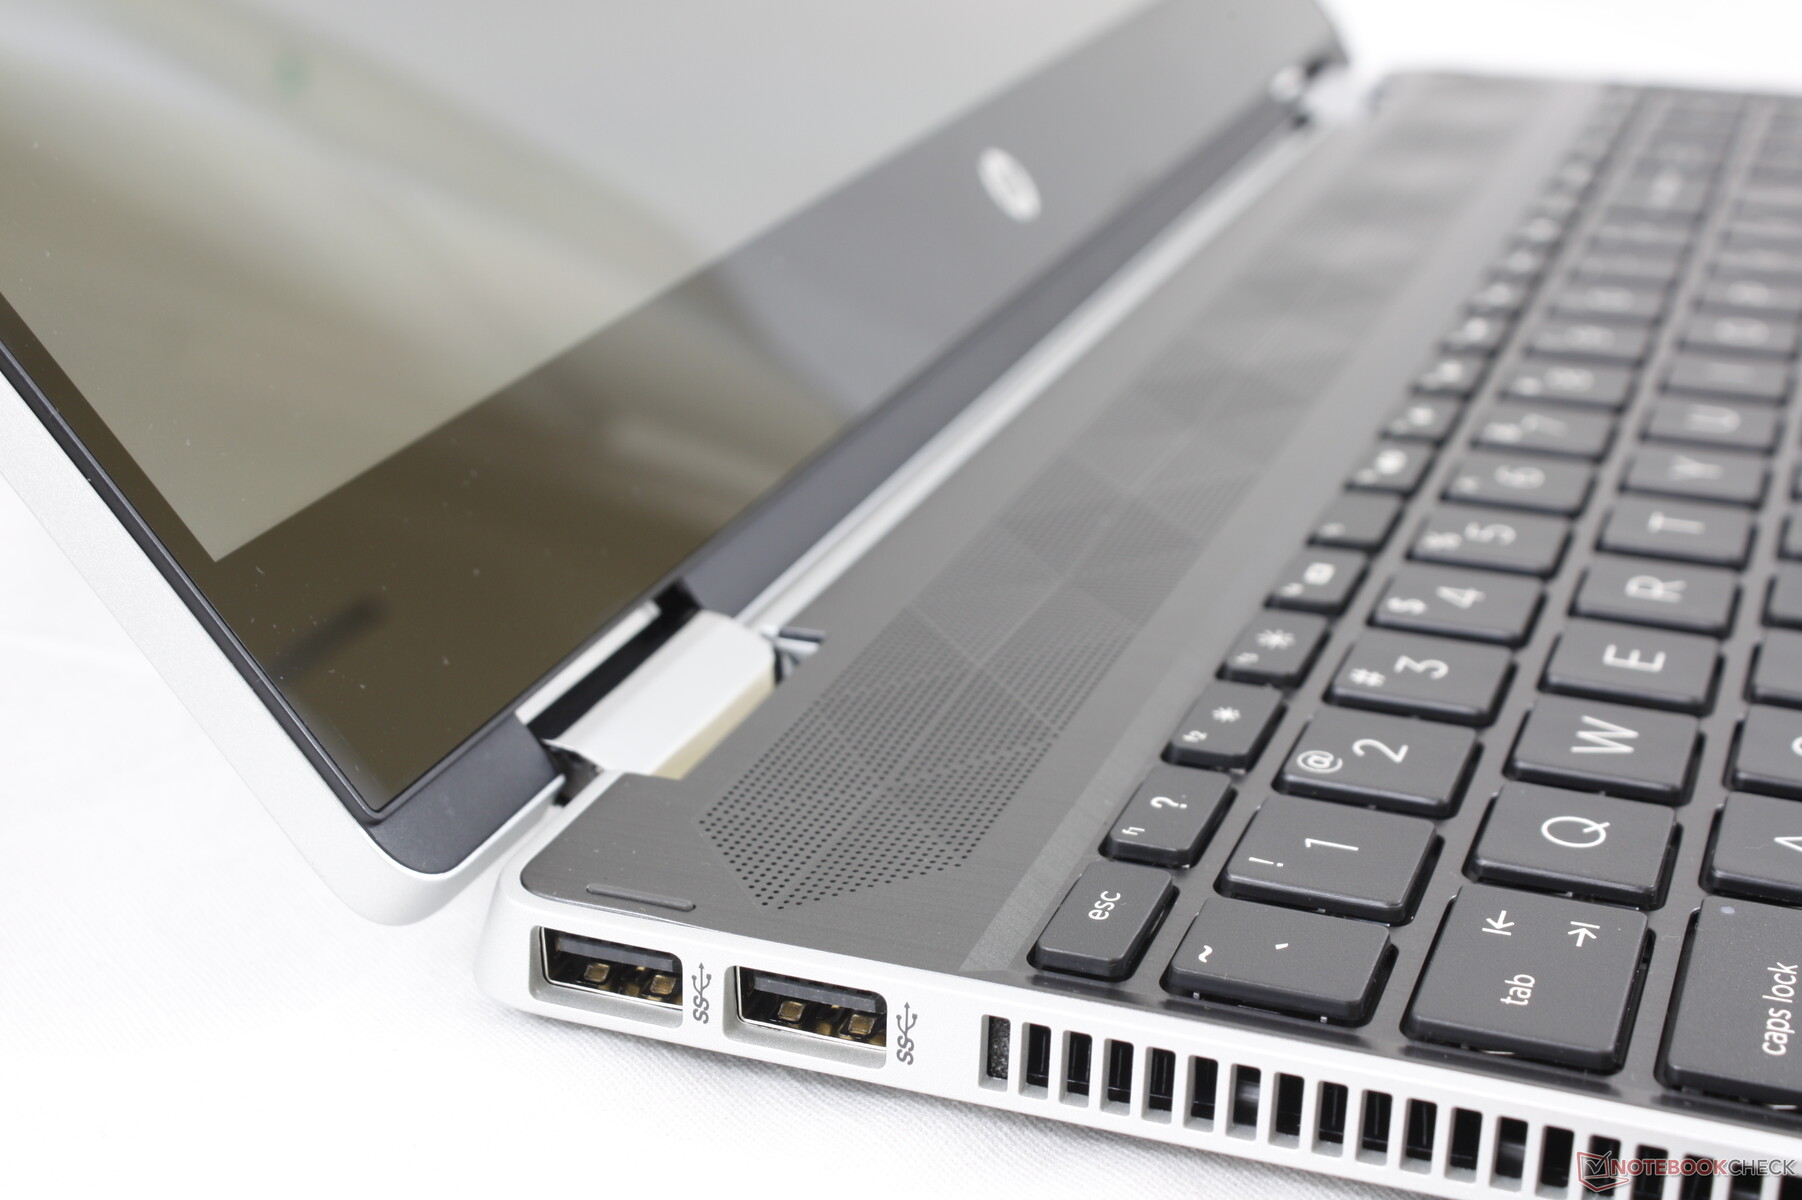
Connectivity
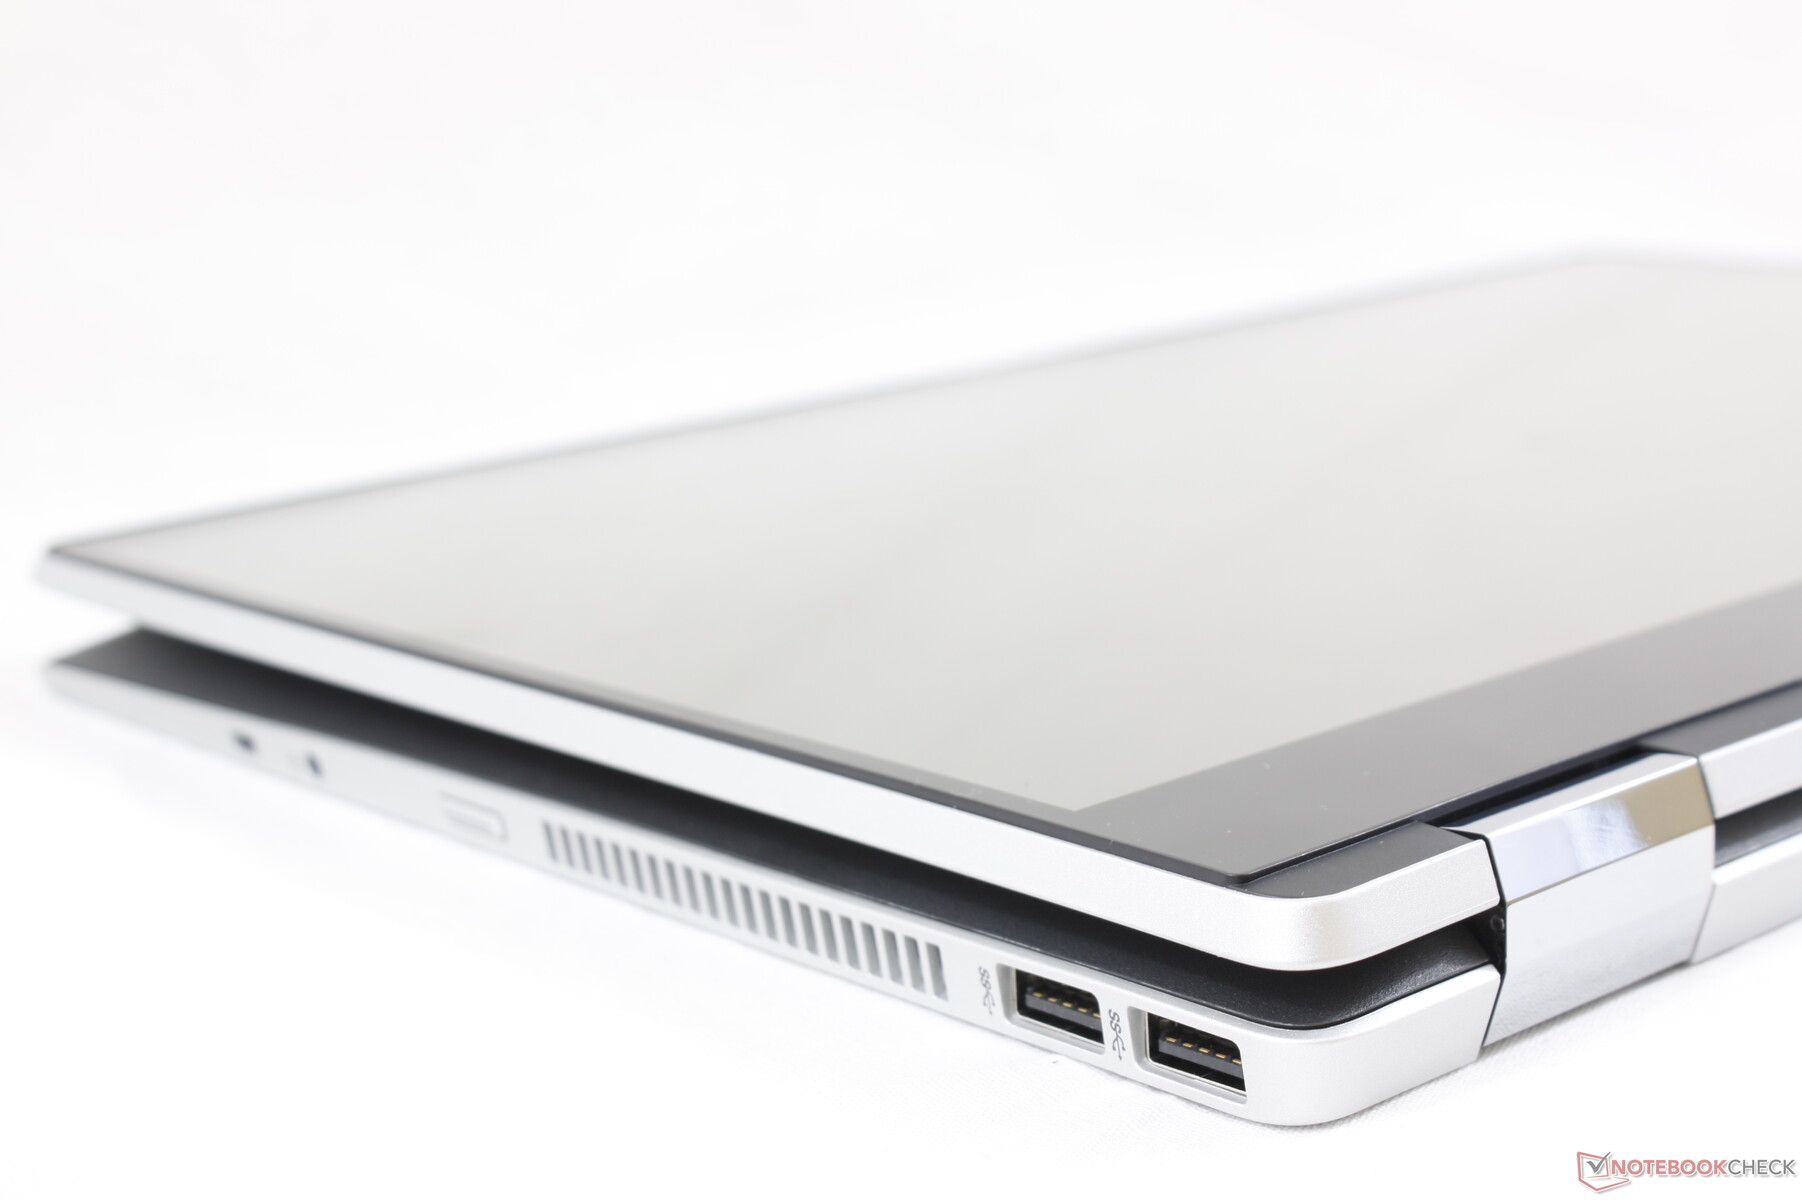
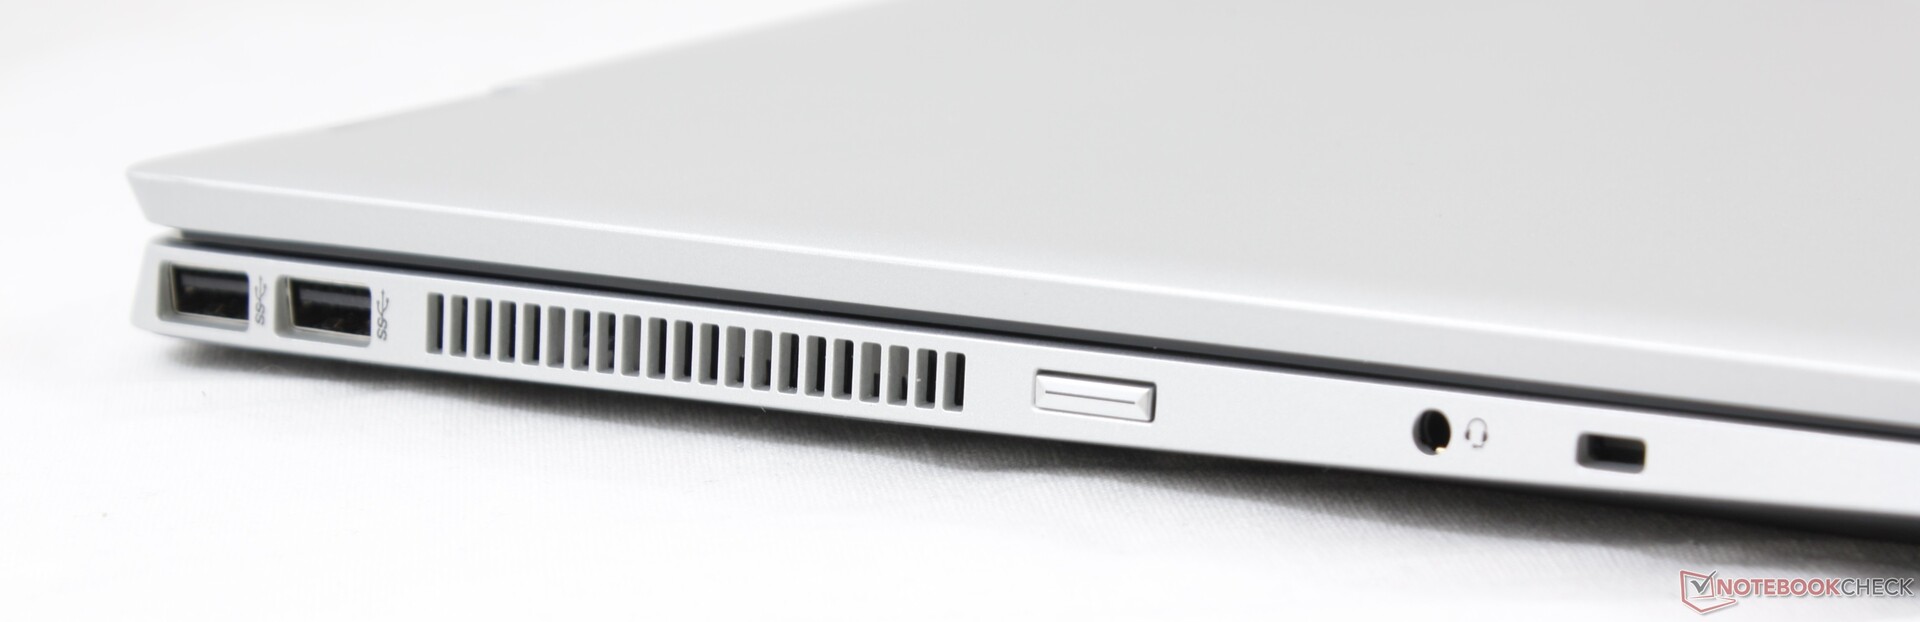
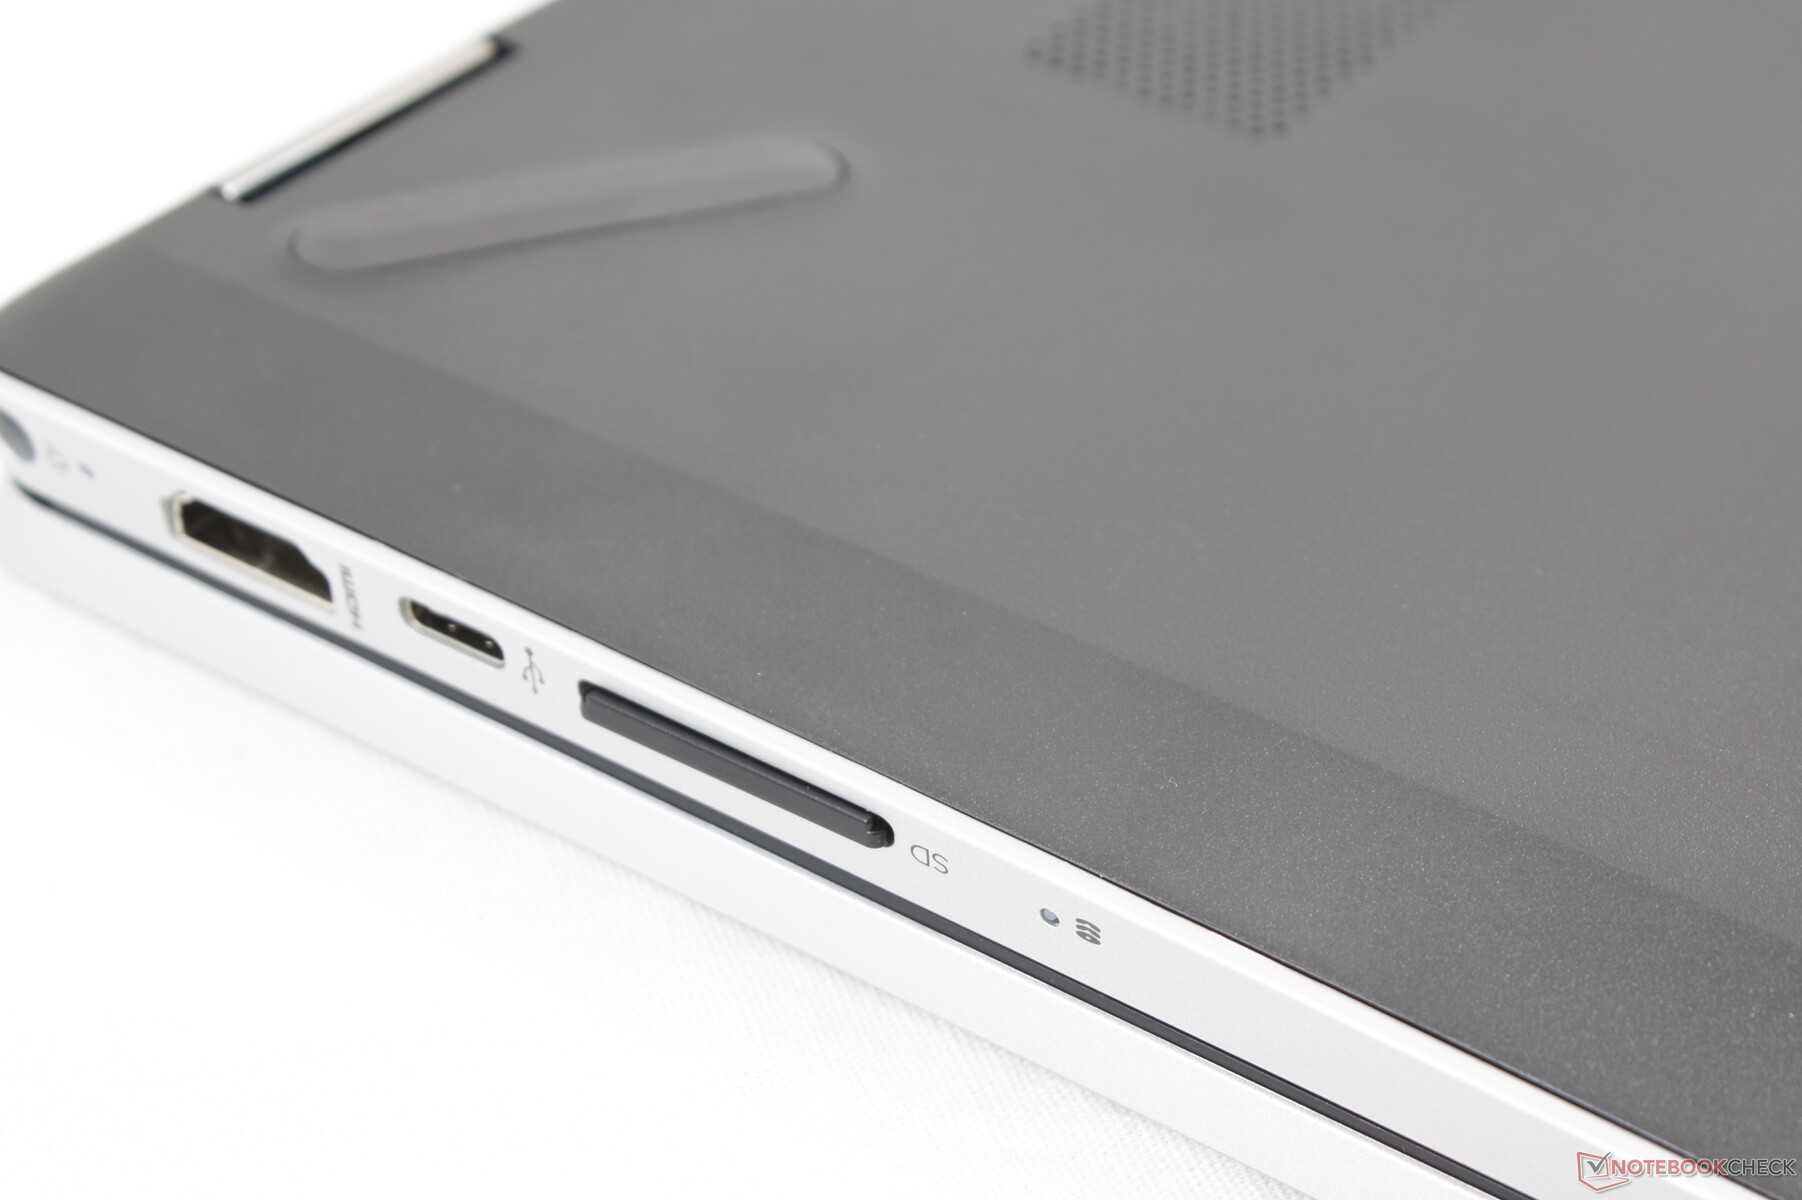
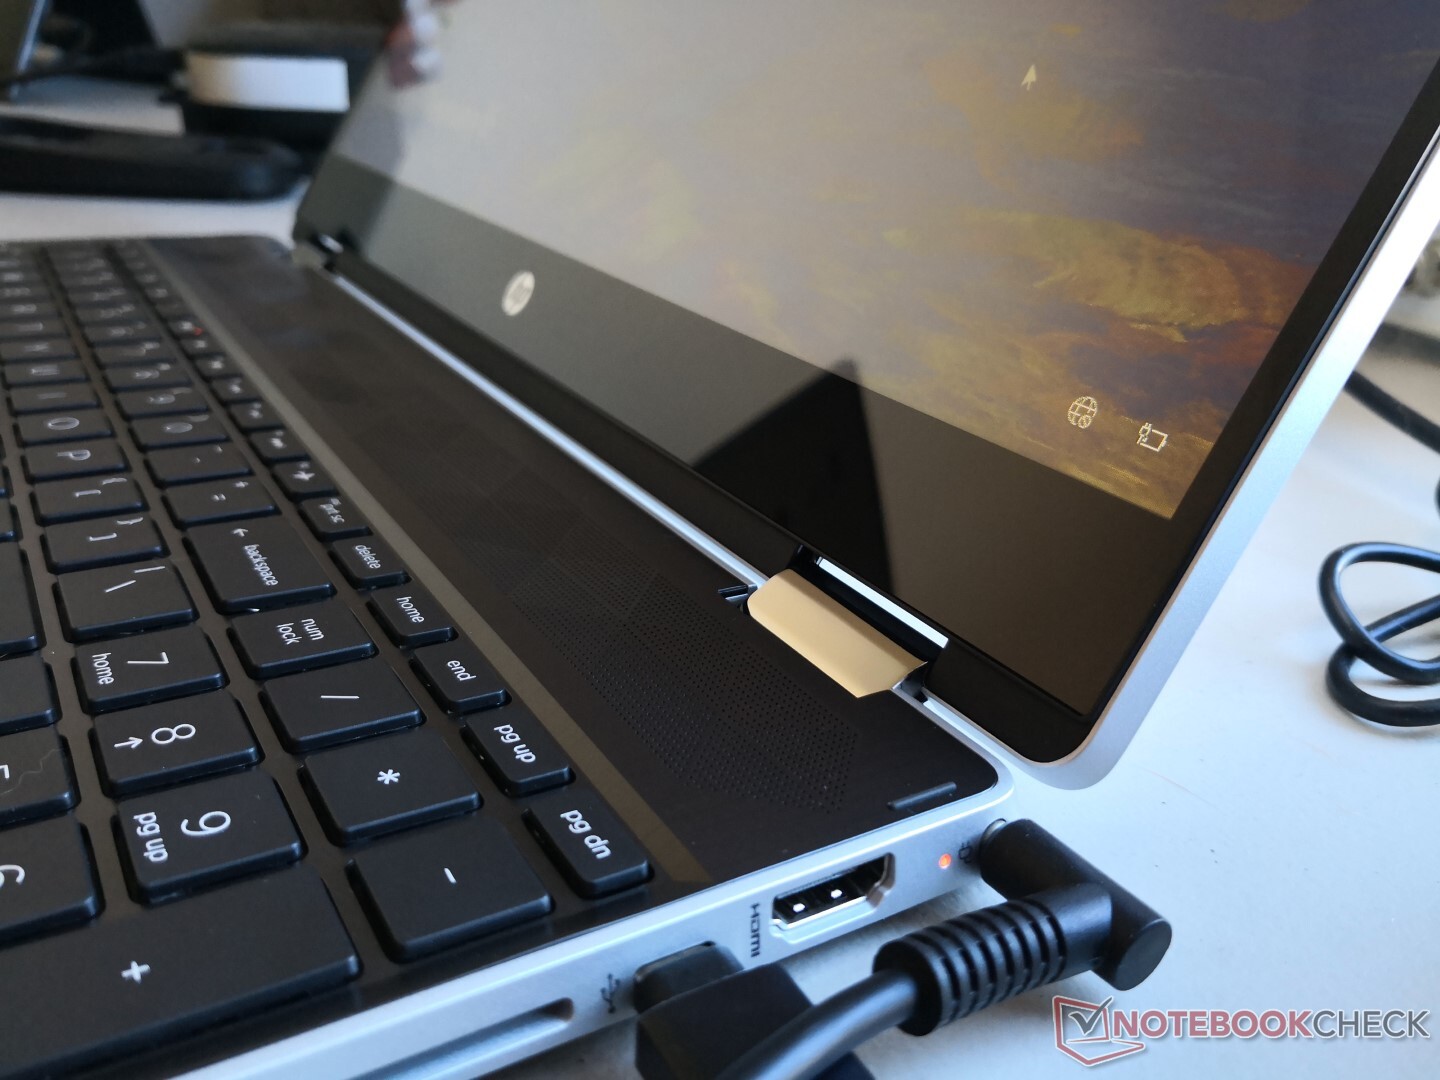
Perhaps by coincidence, port options here are exactly the same as on the Lenovo IdeaPad C340-15 albeit in a different arrangement. USB Type-A ports are along the left edge only while everything else is along the right edge. The ports are easy to reach but tightly packed together in such a way that thick USB devices or cables may block adjacent ports.
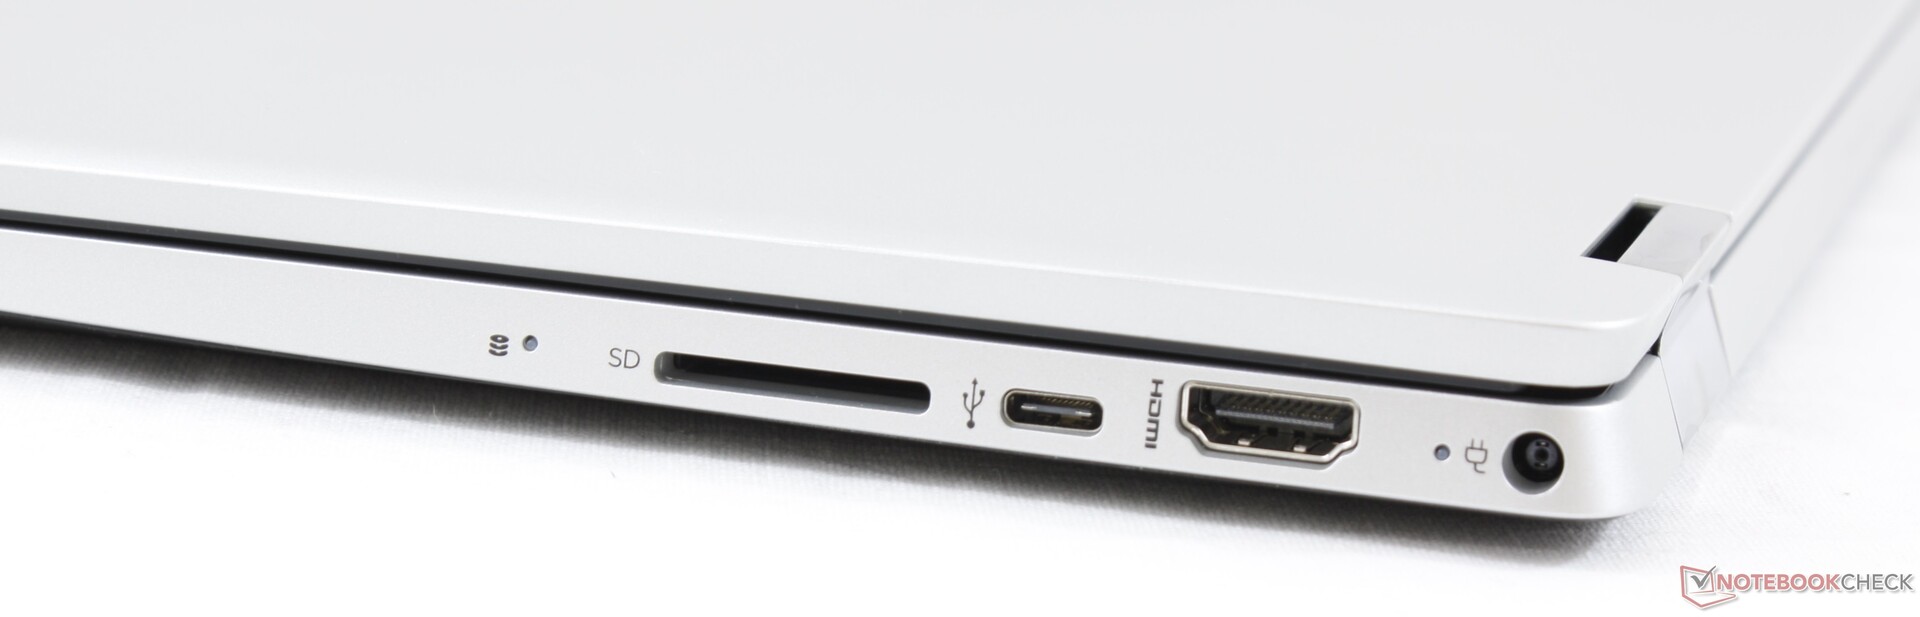
SD Card Reader
The full-size SD card reader offers decent transfer rates. Moving 1 GB of images from our UHS-II test card to desktop takes about 14 seconds compared to 6 or 7 seconds on the Dell XPS 15.
| SD Card Reader | |
| average JPG Copy Test (av. of 3 runs) | |
| Dell XPS 15 7590 i5 iGPU FHD (Toshiba Exceria Pro SDXC 64 GB UHS-II) | |
| HP Pavilion x360 15-dq0065cl (Toshiba Exceria Pro SDXC 64 GB UHS-II) | |
| Lenovo Ideapad C340-15IWL-81N5004QGE (Toshiba Exceria Pro SDXC 64 GB UHS-II) | |
| HP Envy x360 15-bq102ng (Toshiba Exceria Pro SDXC 64 GB UHS-II) | |
| Dell Inspiron 15 3585 (2300U, Vega 6) (Toshiba Exceria Pro SDXC 64 GB UHS-II) | |
| Asus VivoBook Flip 15 TP510UA-E8073T (Toshiba Exceria Pro SDXC 64 GB UHS-II) | |
| maximum AS SSD Seq Read Test (1GB) | |
| Dell XPS 15 7590 i5 iGPU FHD (Toshiba Exceria Pro SDXC 64 GB UHS-II) | |
| Lenovo Ideapad C340-15IWL-81N5004QGE (Toshiba Exceria Pro SDXC 64 GB UHS-II) | |
| HP Envy x360 15-bq102ng (Toshiba Exceria Pro SDXC 64 GB UHS-II) | |
| HP Pavilion x360 15-dq0065cl (Toshiba Exceria Pro SDXC 64 GB UHS-II) | |
| Dell Inspiron 15 3585 (2300U, Vega 6) (Toshiba Exceria Pro SDXC 64 GB UHS-II) | |
| Asus VivoBook Flip 15 TP510UA-E8073T (Toshiba Exceria Pro SDXC 64 GB UHS-II) | |
Communication
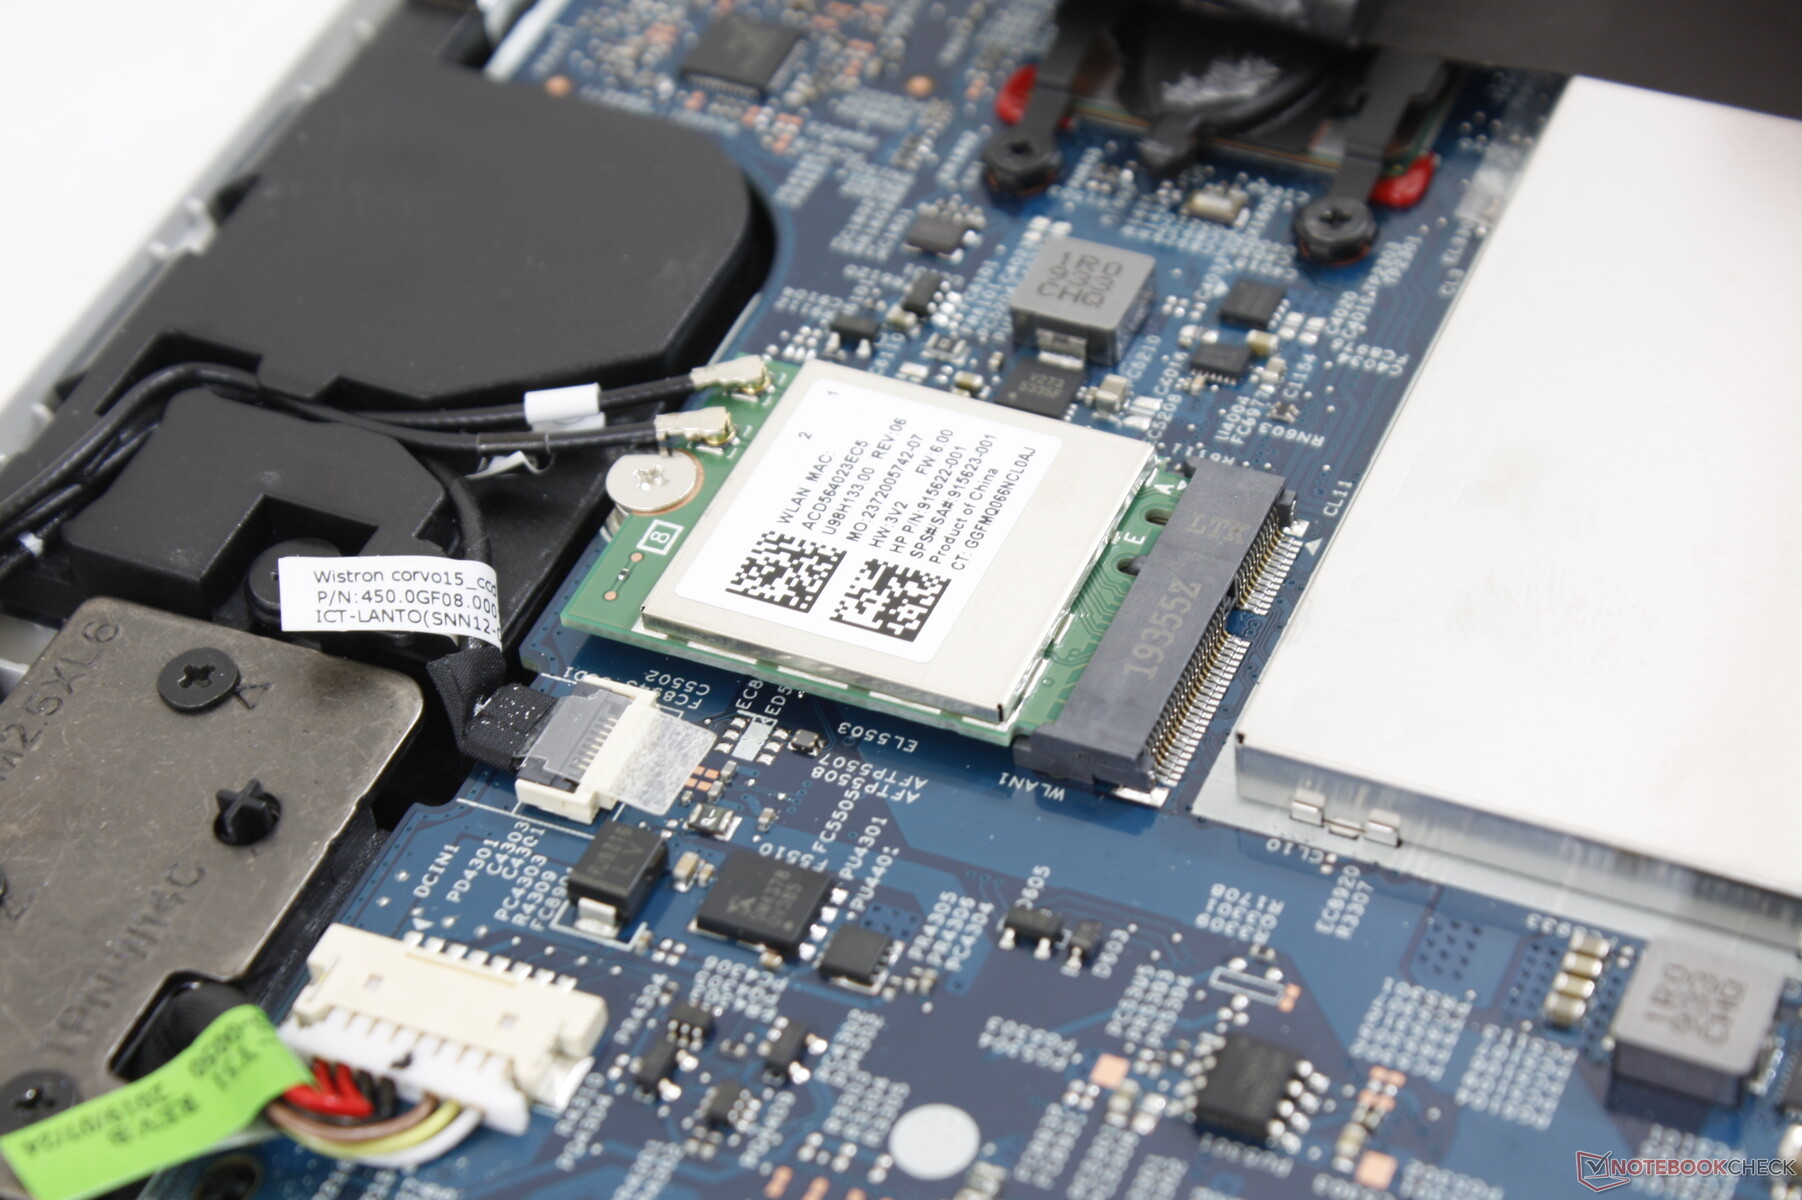
The Realtek RTL8822BE comes standard for 2x2 802.11ac wireless and integrated Bluetooth 4.2. Even with our Netgear RAX200 router and 10 Gbit Ethernet server, however, we're only able to record average transfer rates of around 650 Mbps in contrast to the 1.73 Gbps theoretical.
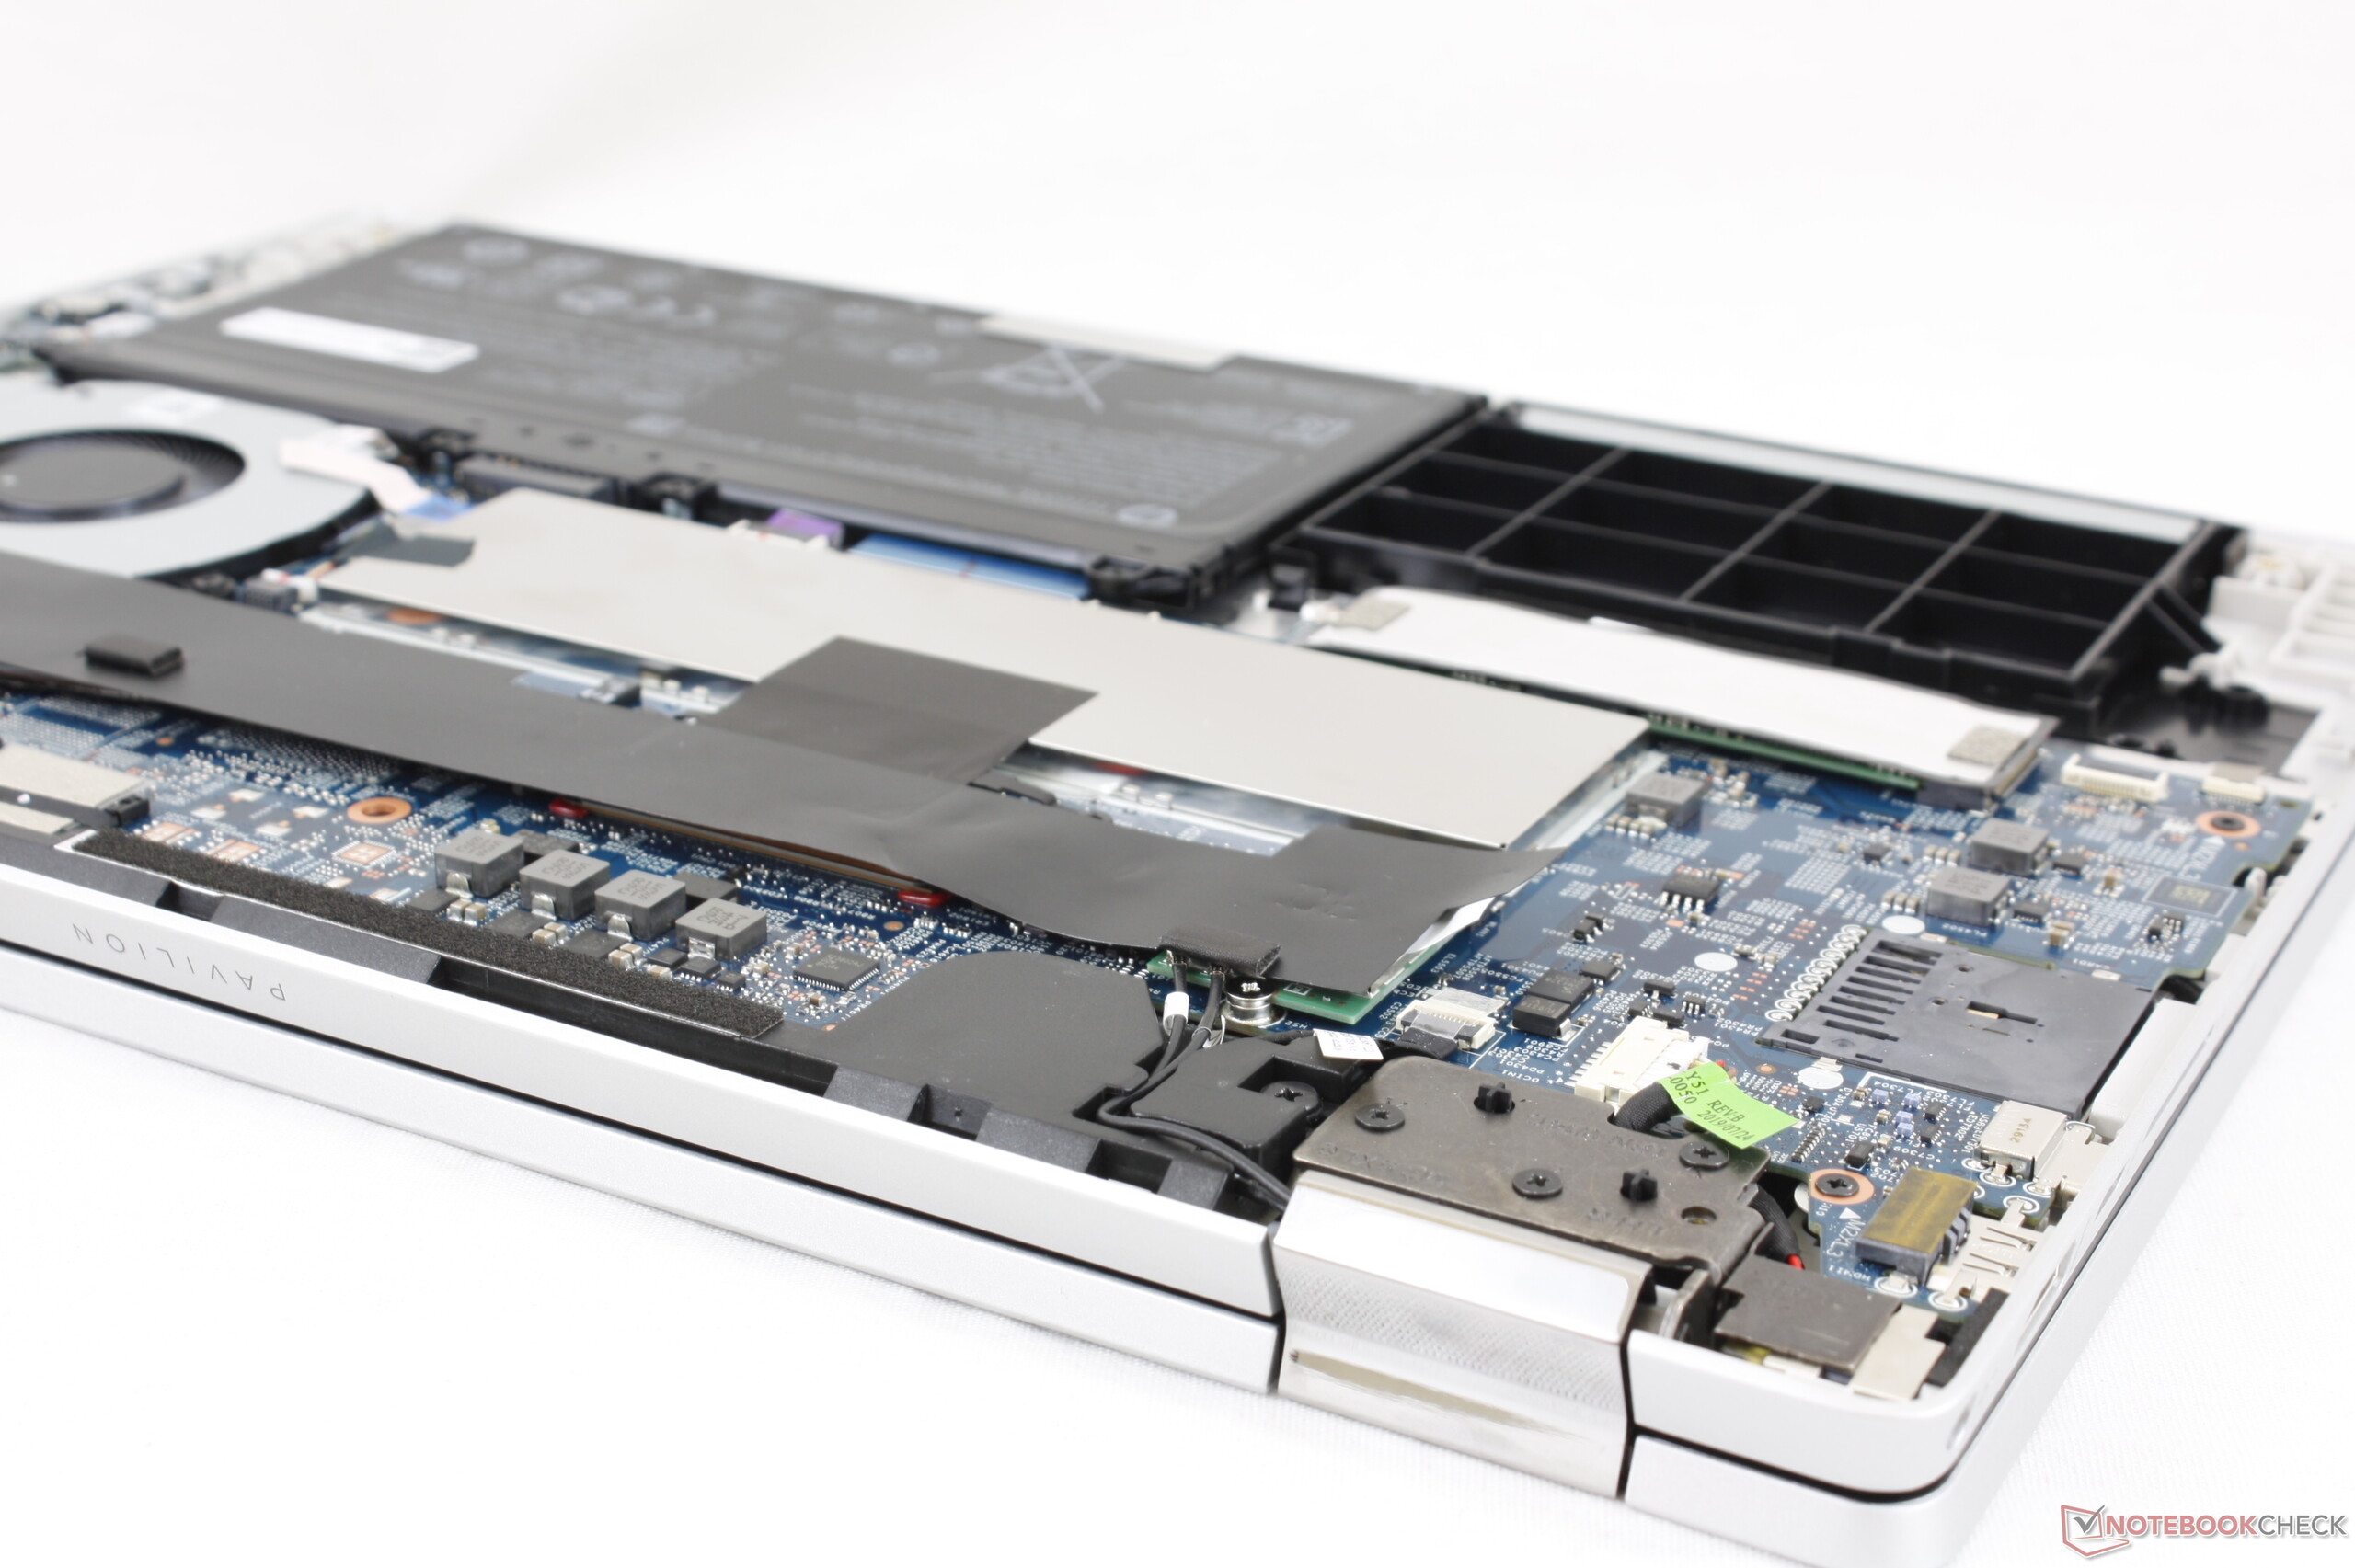
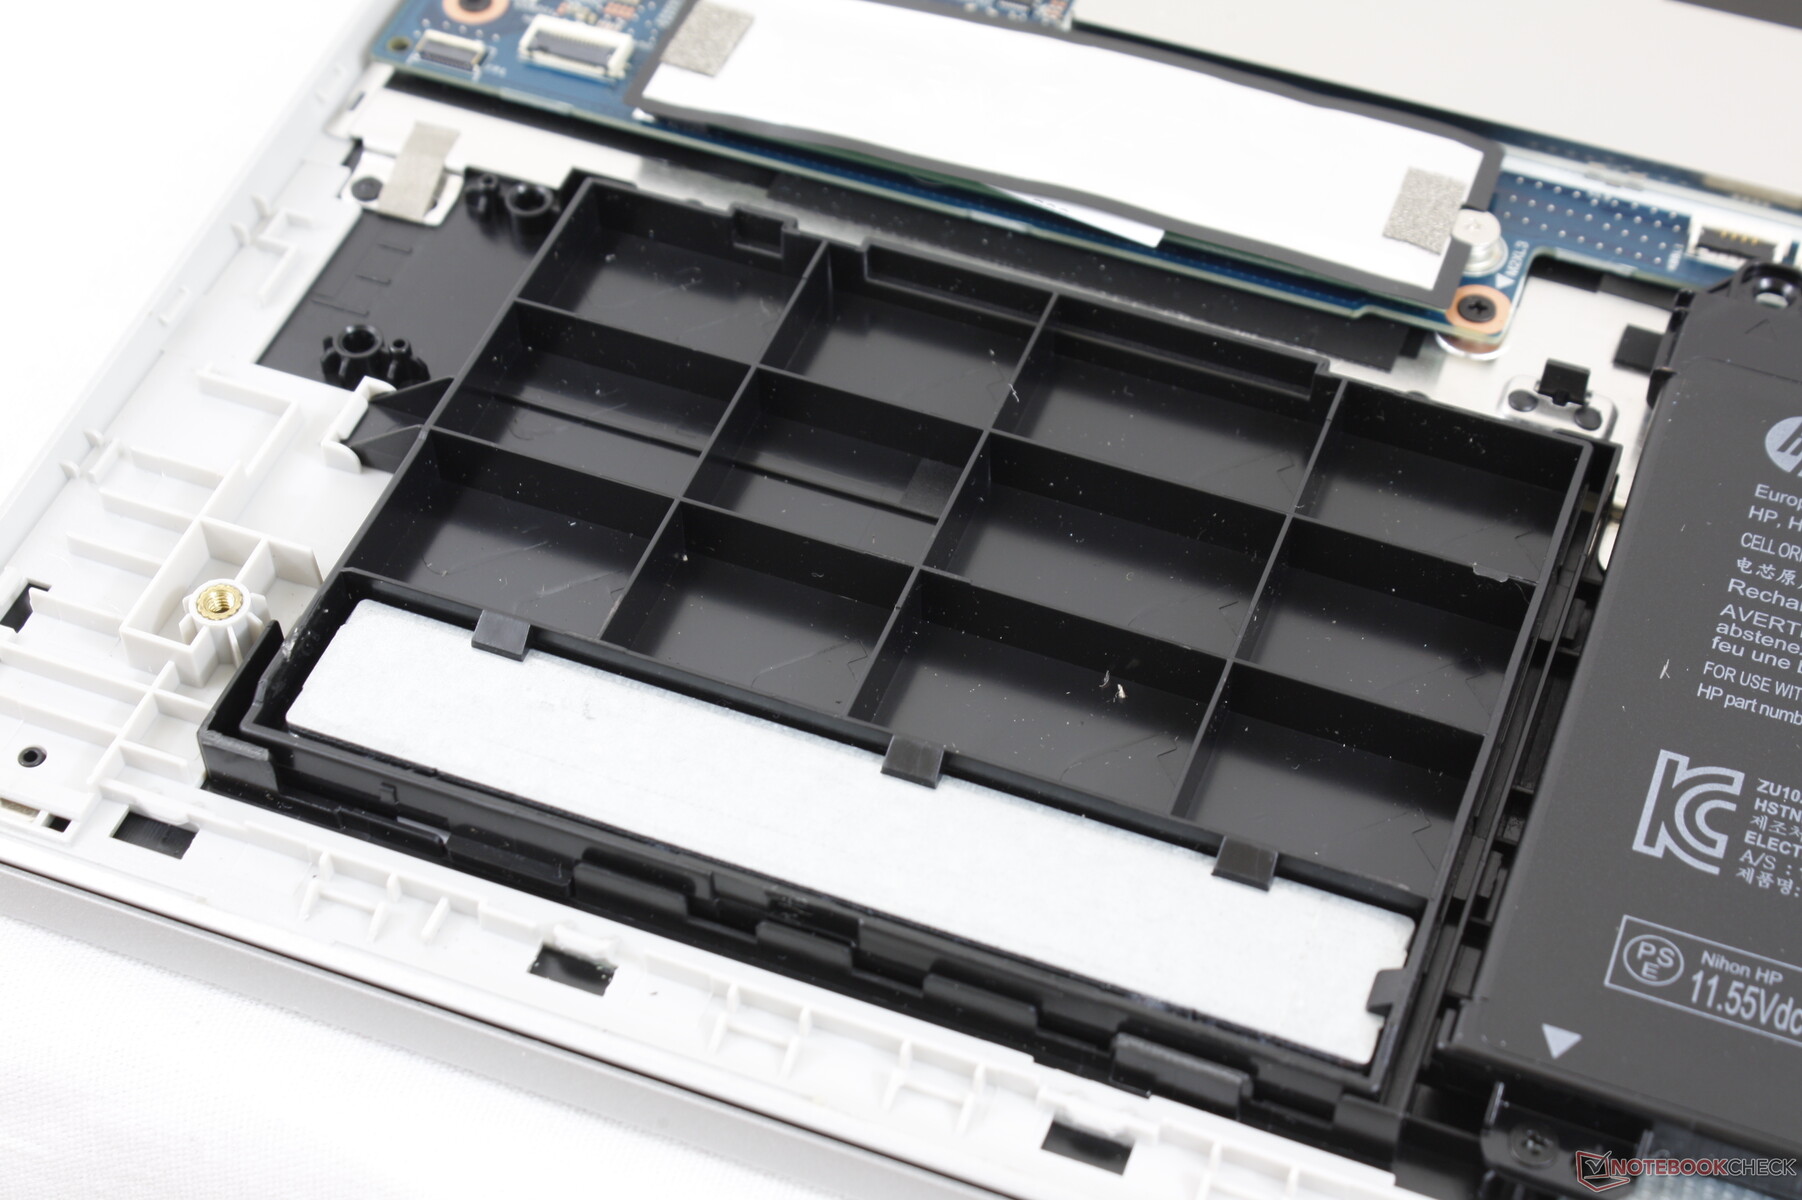
Maintenance
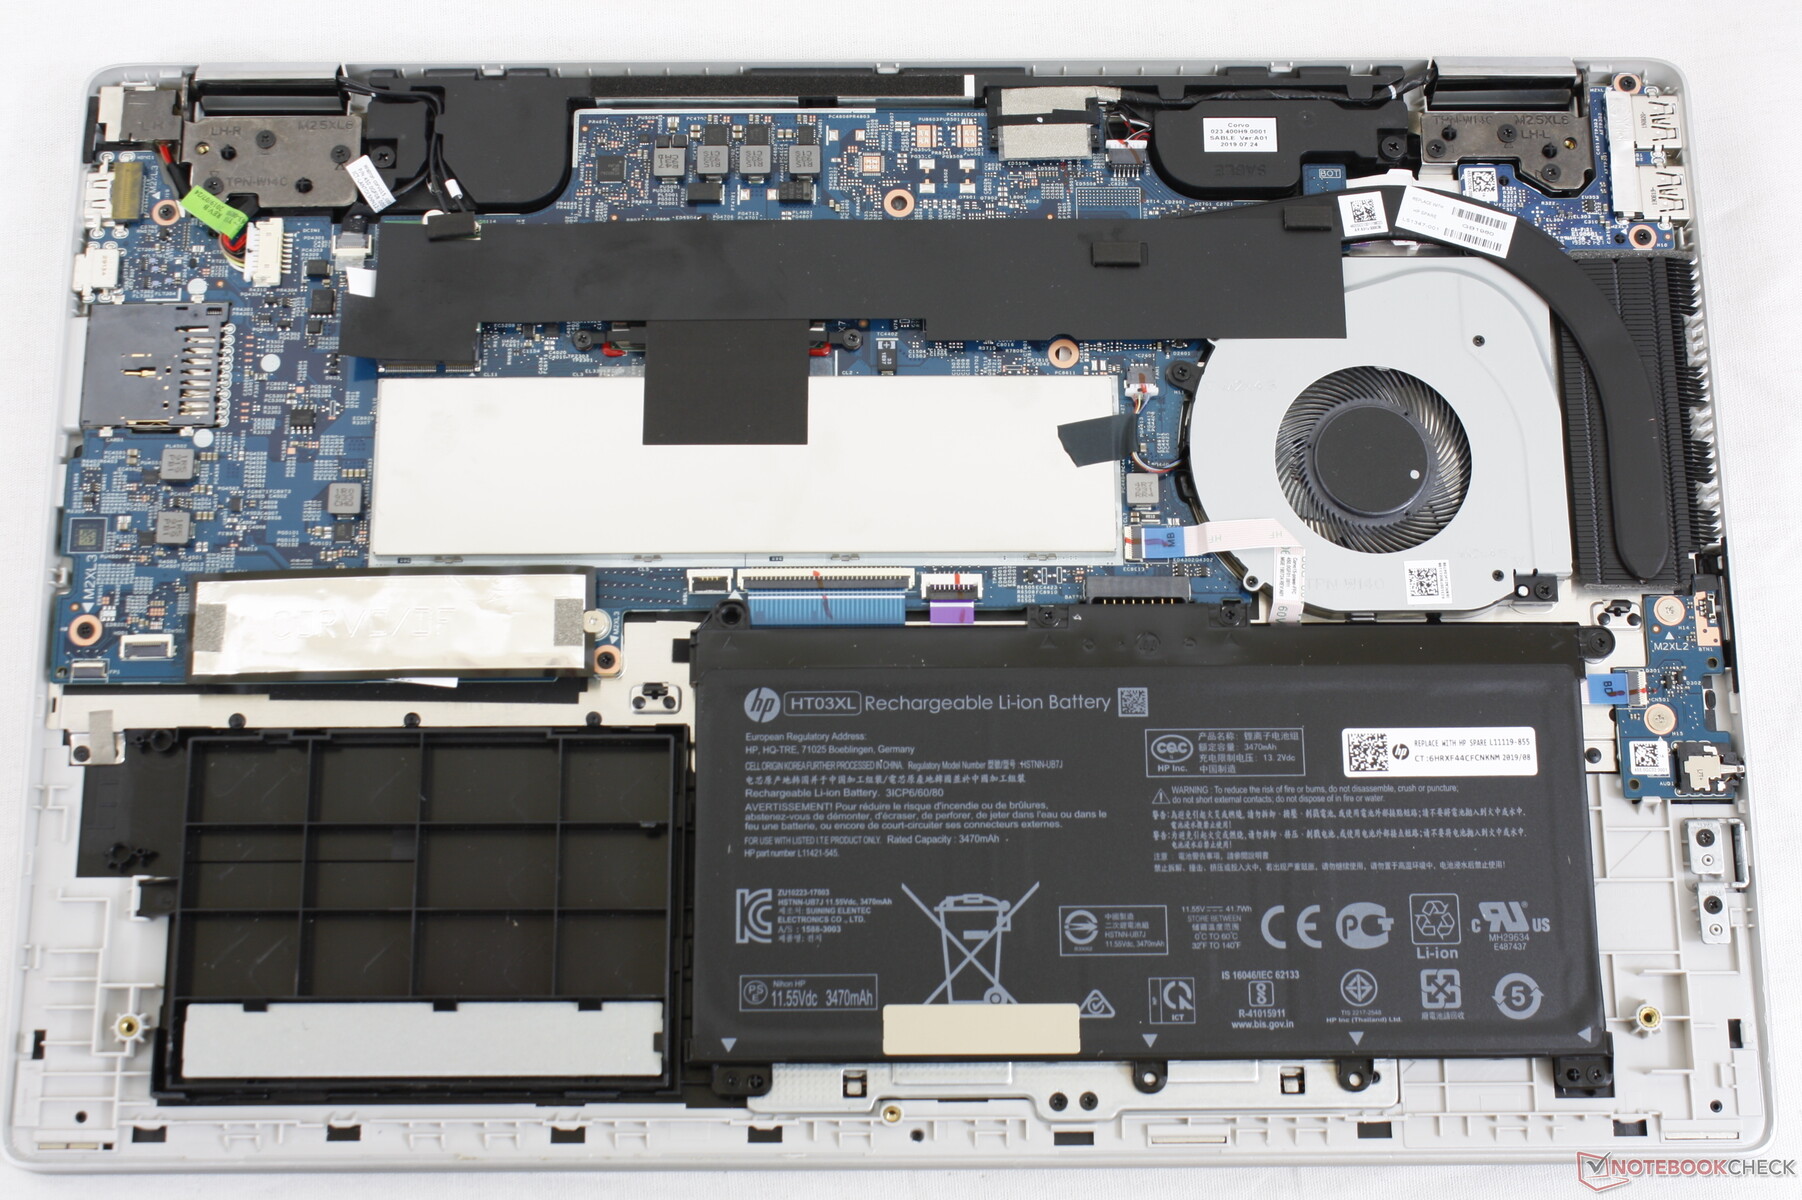
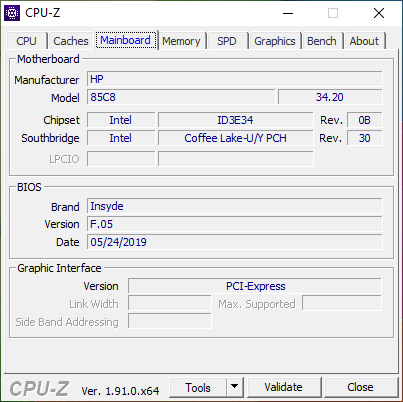
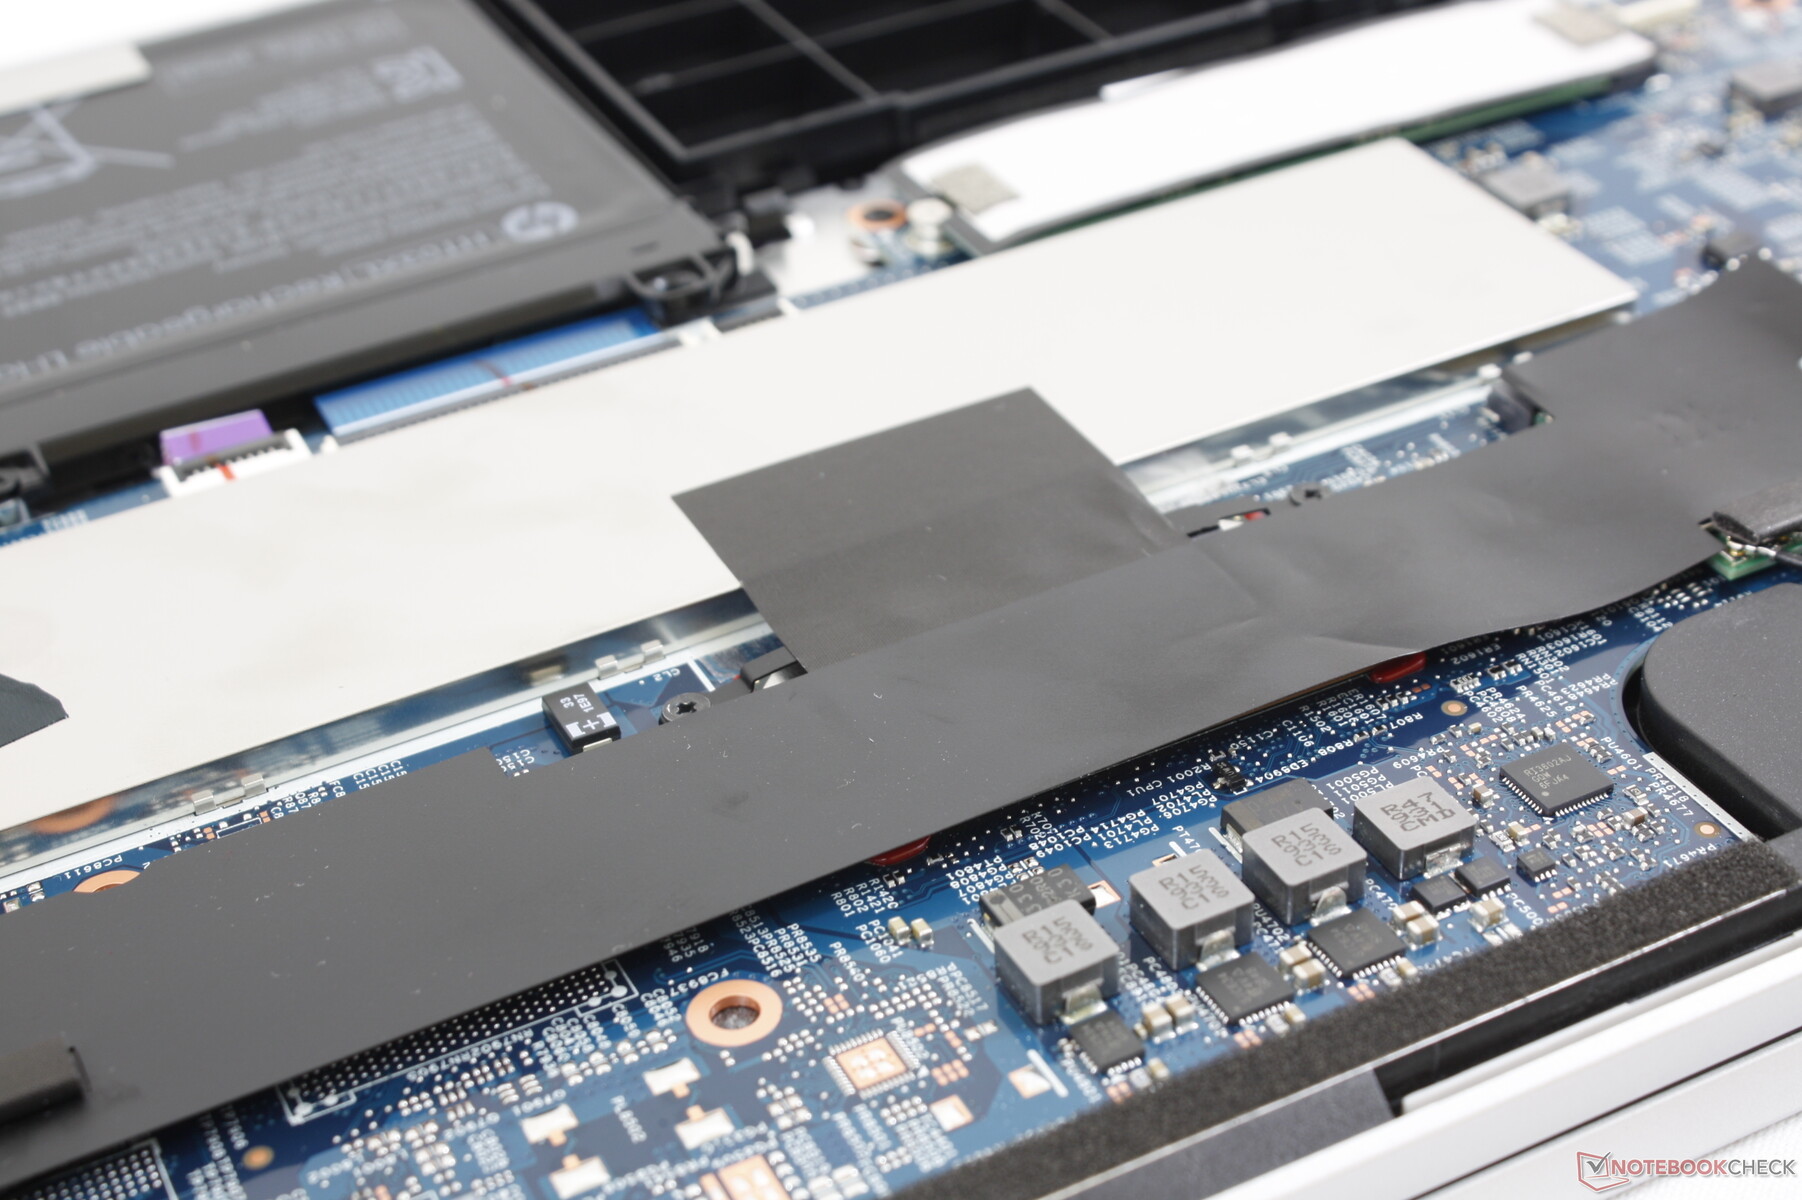
Pavilion laptops are generally difficult to service and the Pavilion x360 15 is no different. The bottom panel is secured by five Philips screws with four of them hidden underneath the rubber footing. Thereafter, a sharp edge is required to separate the plate from the rest of the laptop along the edges and corners. Users will have direct access to the M.2 storage slot, battery, and WLAN module while the 2x SODIMM slots are protected under an aluminum plate.
Accessories and Warranty
There are no extras in the box other than the AC adapter and some small manuals. The standard one-year limited warranty applies with plenty of additional options since HP is one of the largest OEMs in the world.
Input Devices
Keyboard
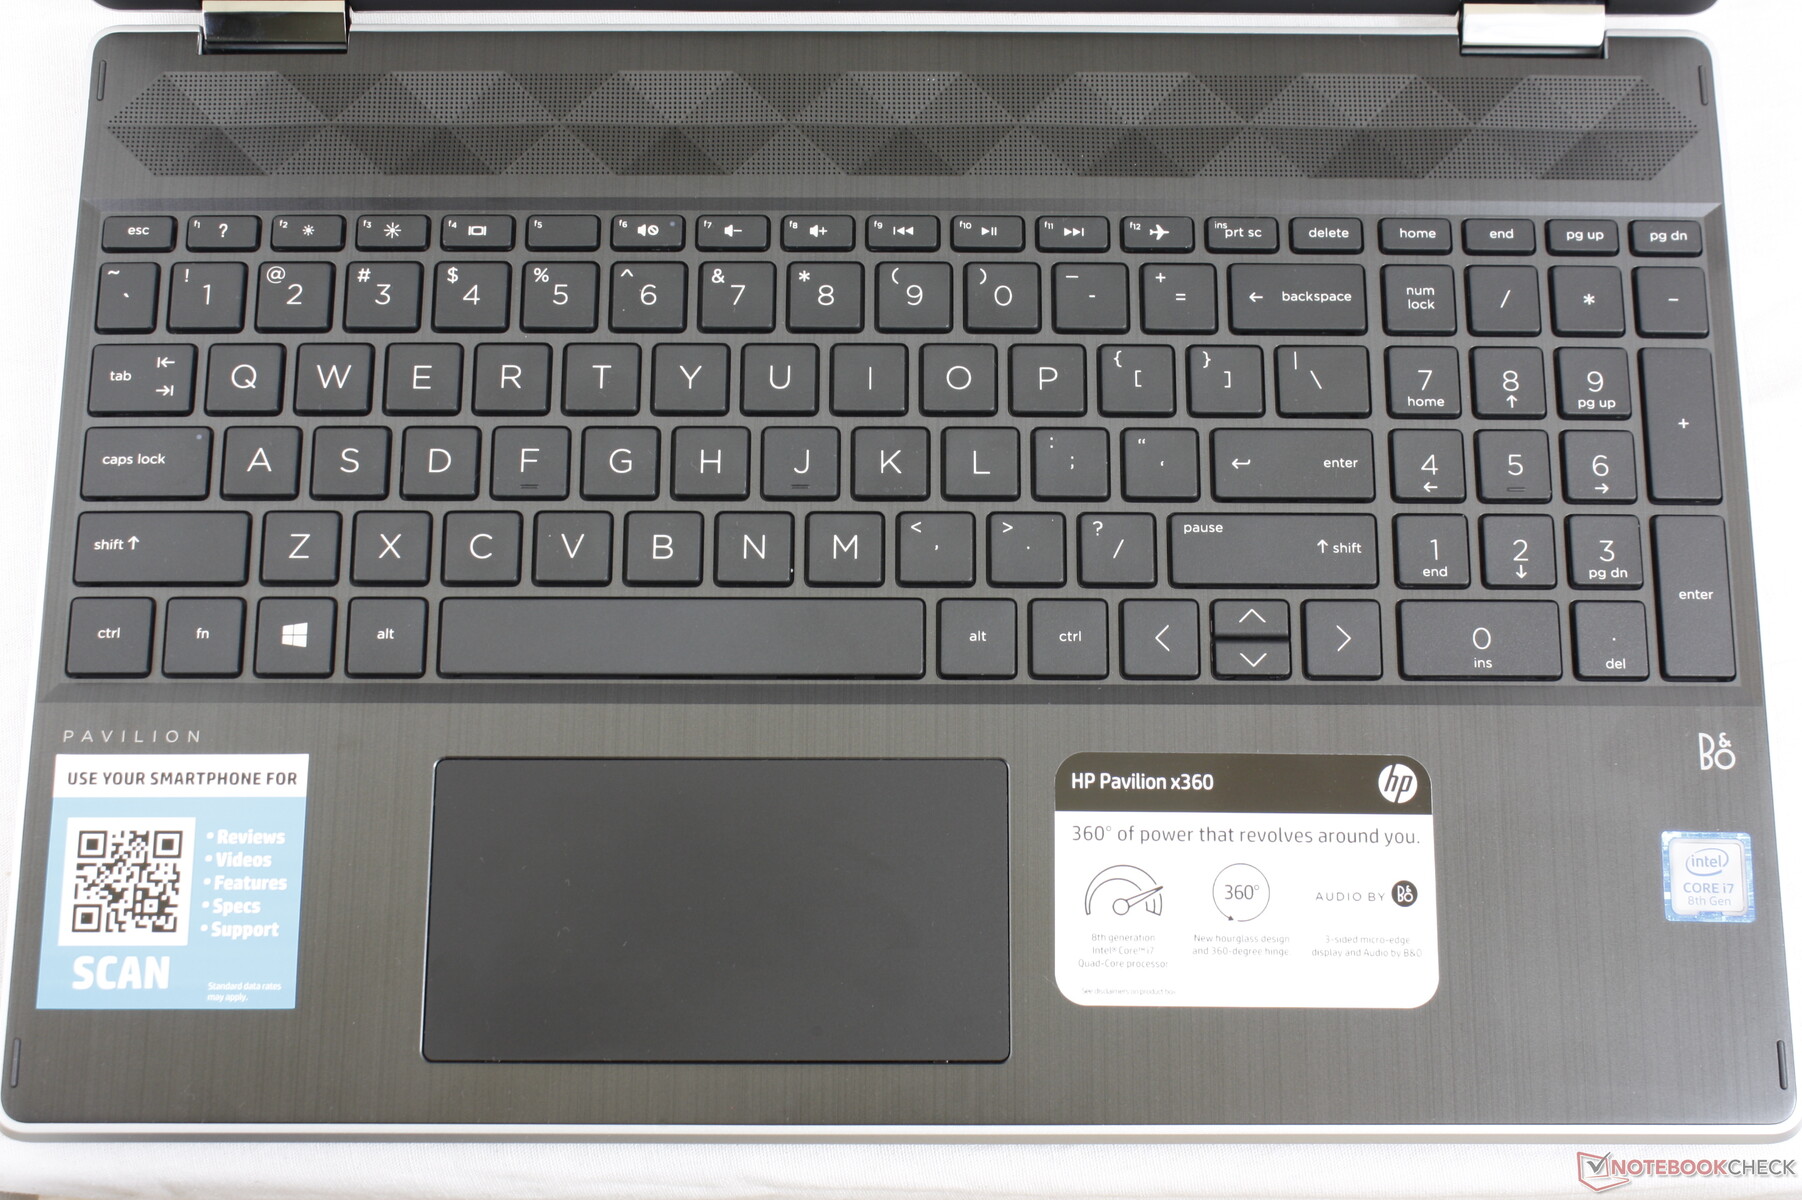
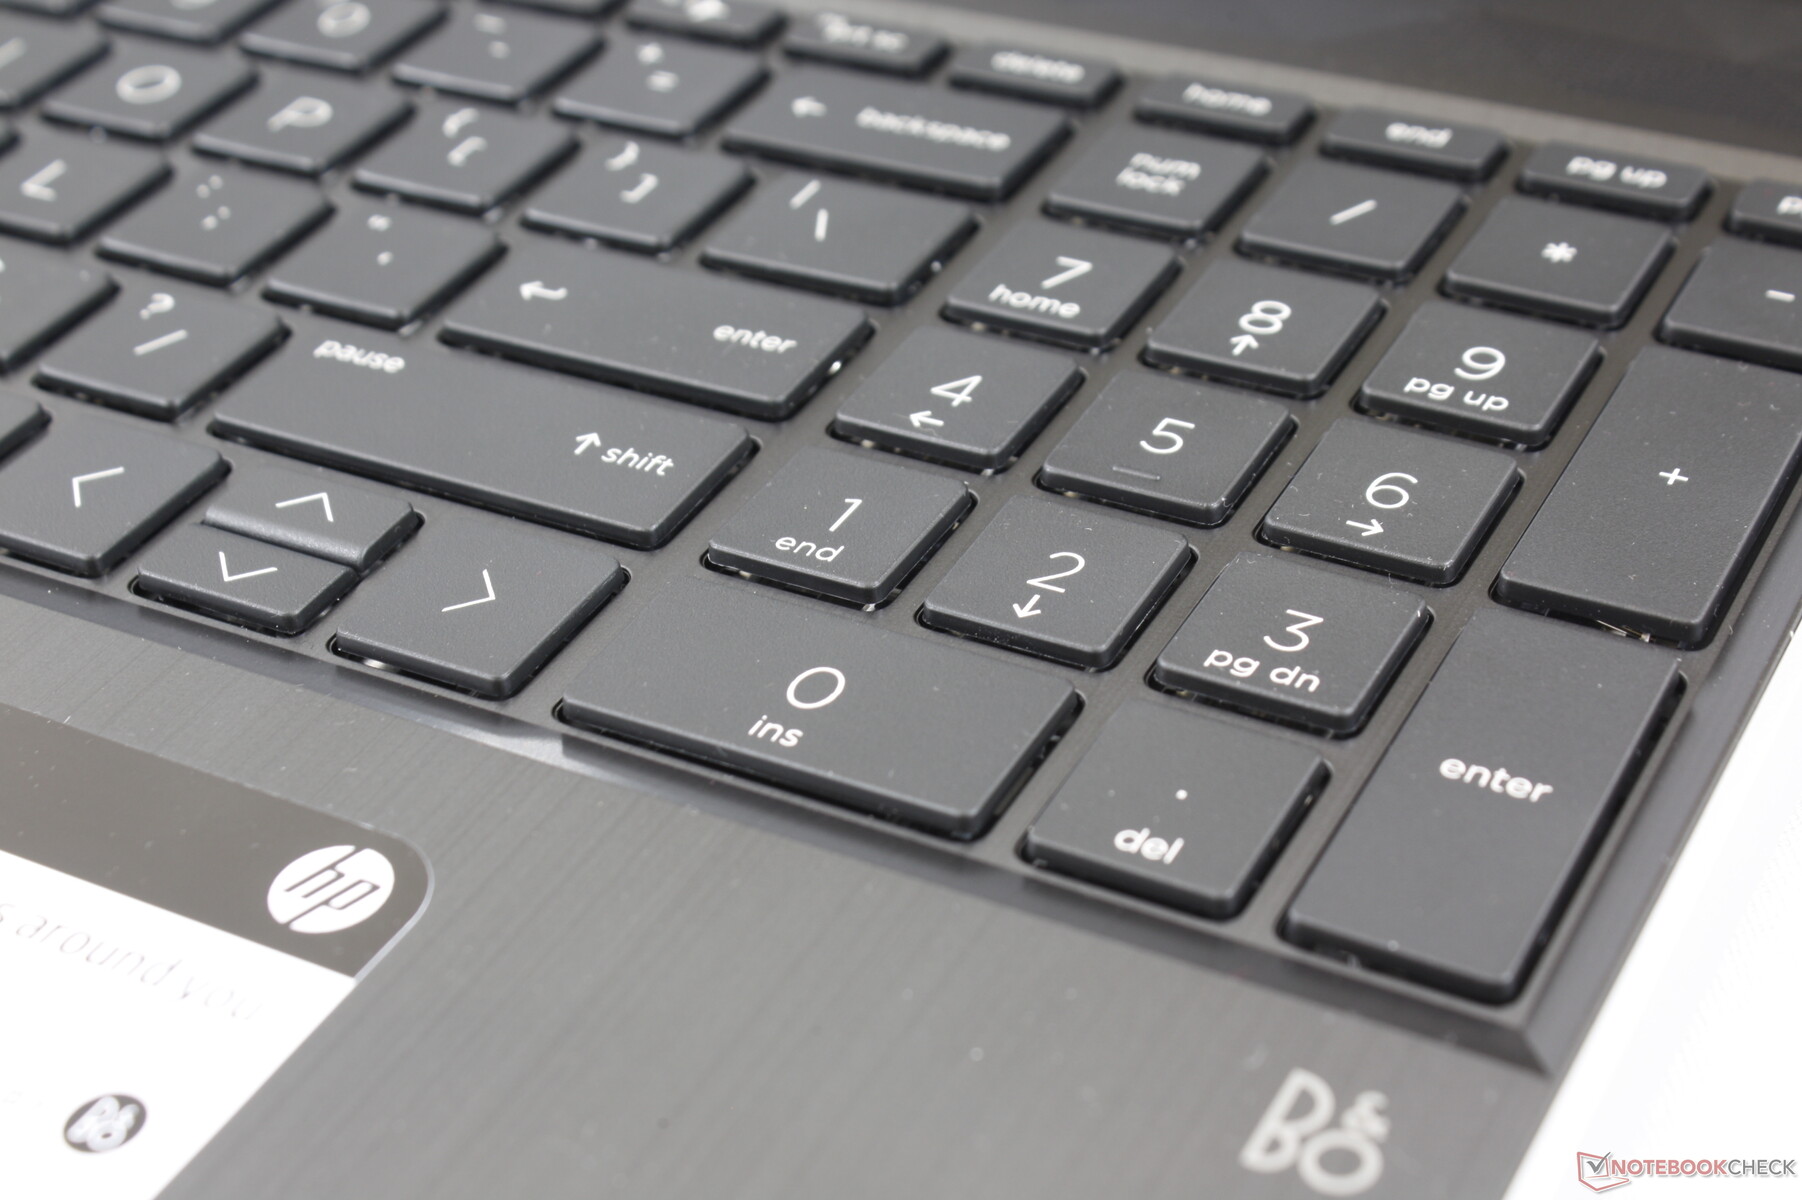
The plastic keyboard keys have no backlight and are smaller in size when compared to the keys on the pricier HP Envy or Spectre series. Individual keys tend to wiggle more as well meaning that feedback is different if hitting a key at one of its corners versus its center. This is undesirable on a keyboard because you would want key feedback to be uniform no matter where your finger will land. If you're accustomed to cheap keyboards on budget laptops, however, then the Pavilion keyboard here shouldn't be a surprise.
The best part of the keyboard is perhaps the integrated NumPad. The number keys are the same size as the main QWERTY keys whereas most other laptops tend to have smaller NumPad keys or none at all.
Touchpad
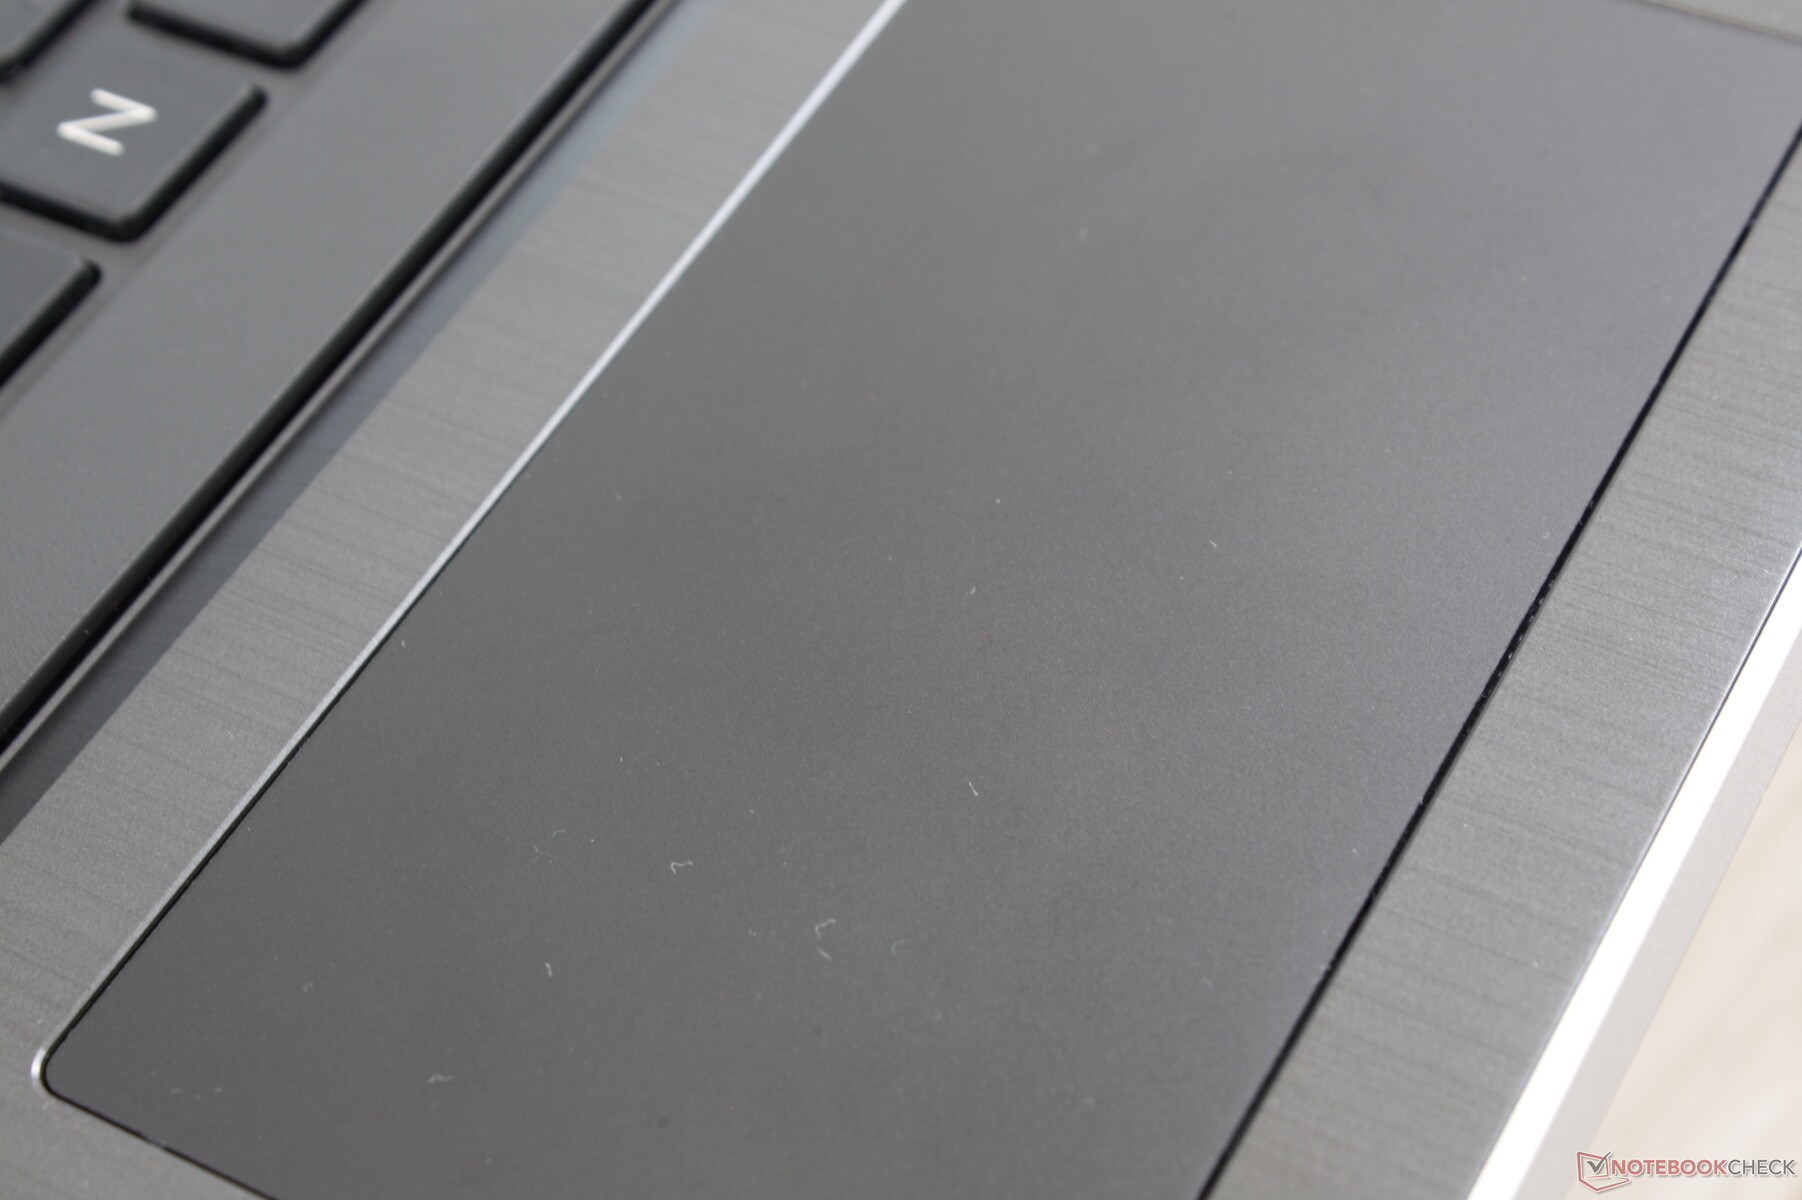
The clickpad (11.5 x 6 cm) is slightly smaller than the clickpad on the 2019 Spectre x360 15 (12 x 6 cm). Traction is otherwise smooth and reliable with just a bit of stickiness when gliding very slowly. The integrated mouse keys are also satisfactory in feedback with a soft but audible click not unlike on the aforementioned Spectre. Vertical scrolling will feel cramped due to the wide aspect ratio of the clickpad surface.

Display
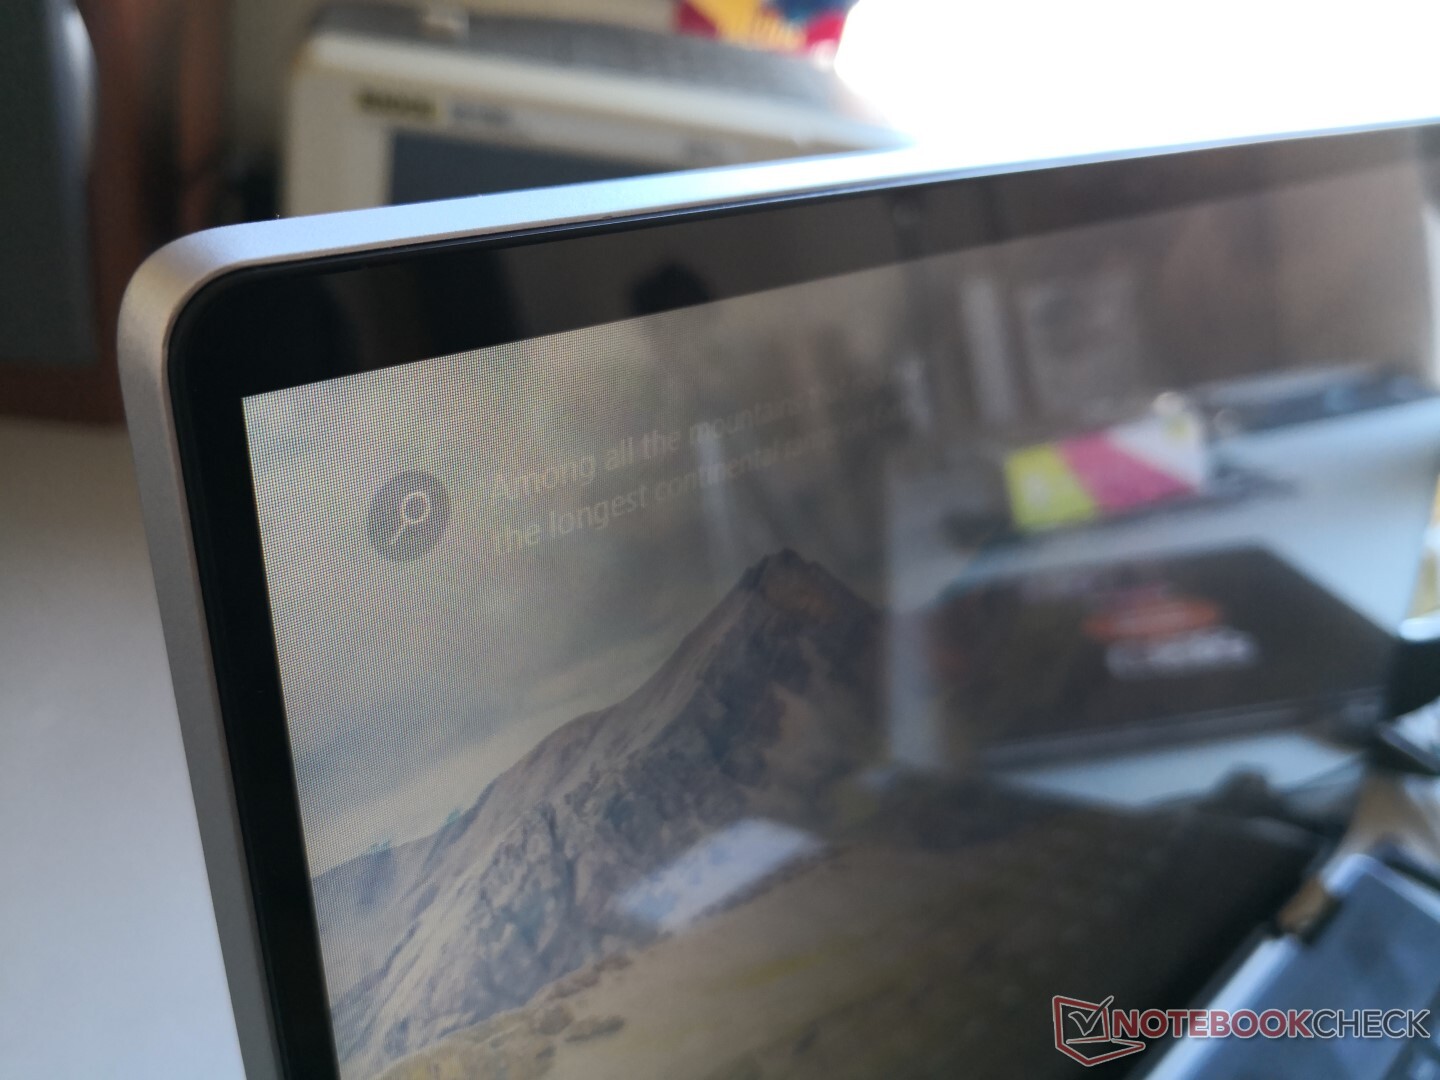
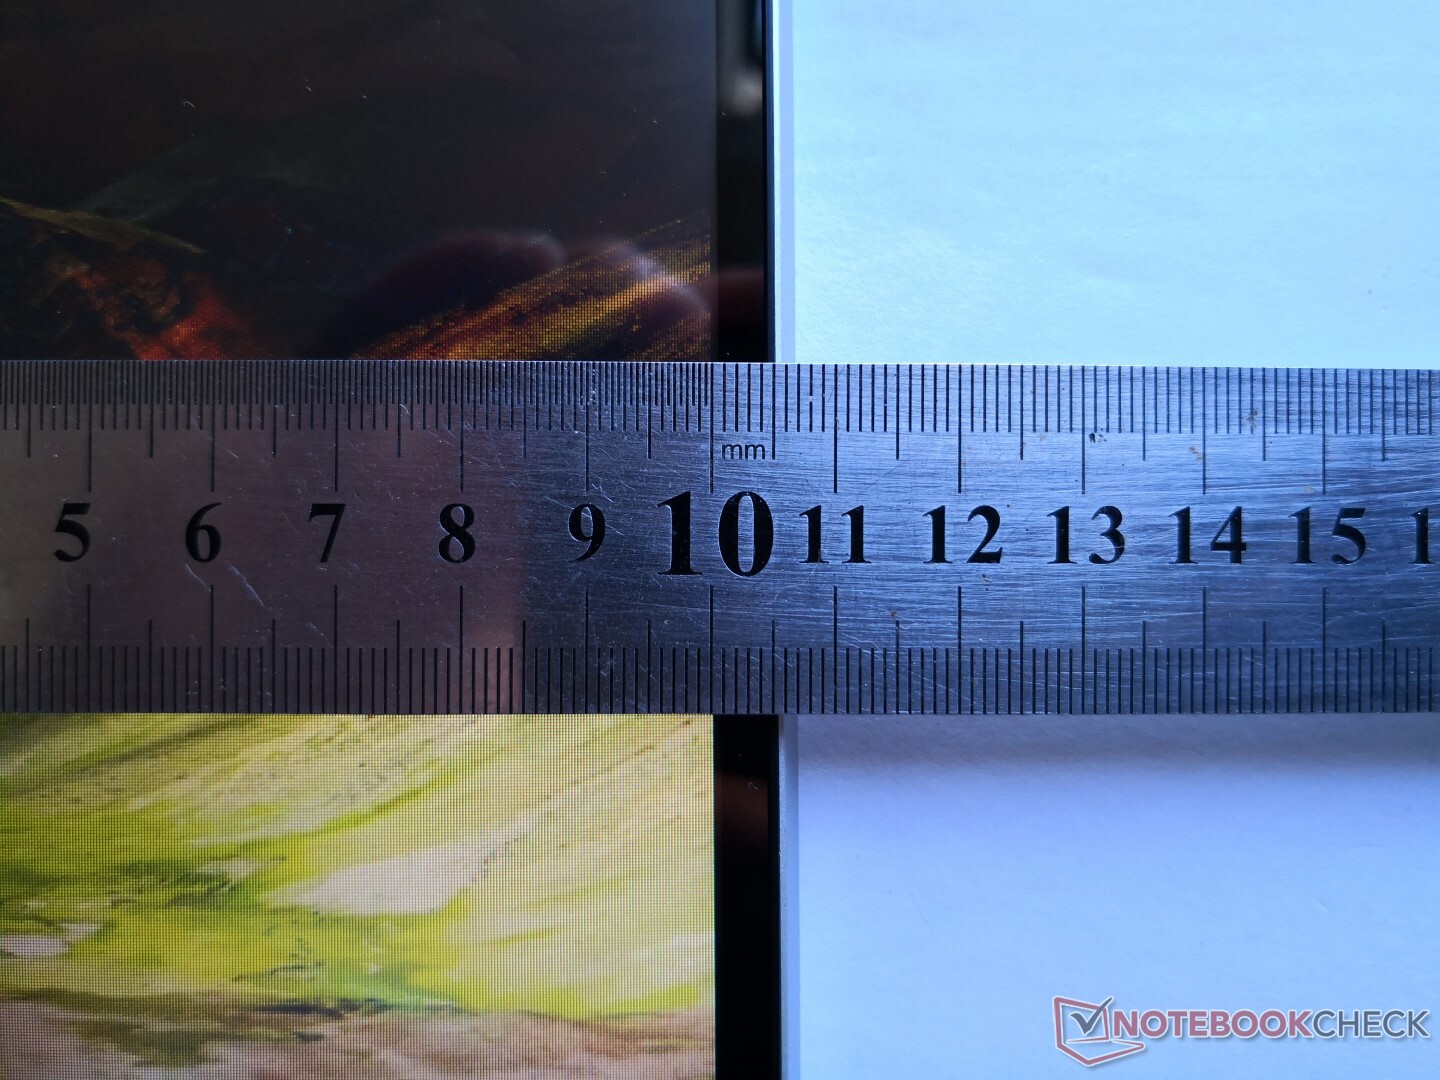
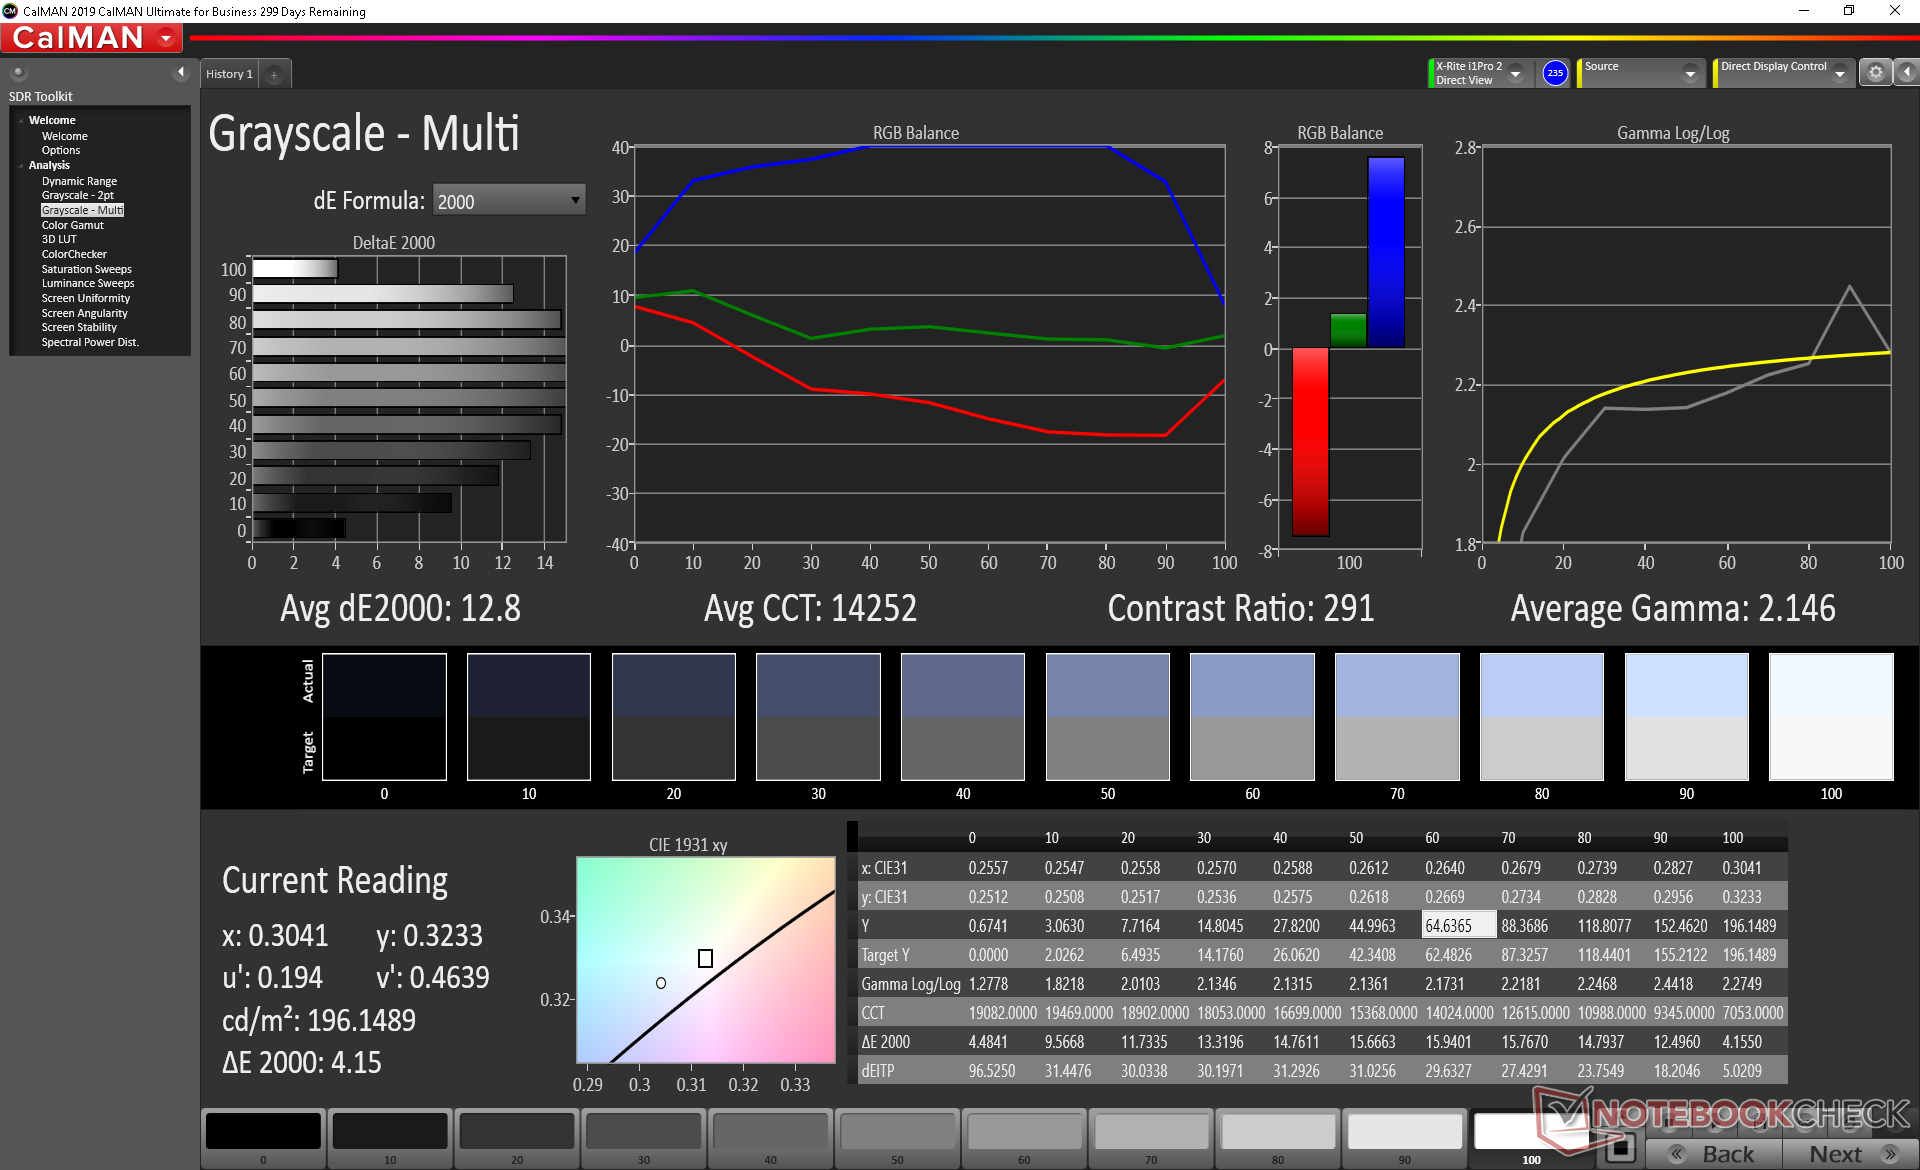
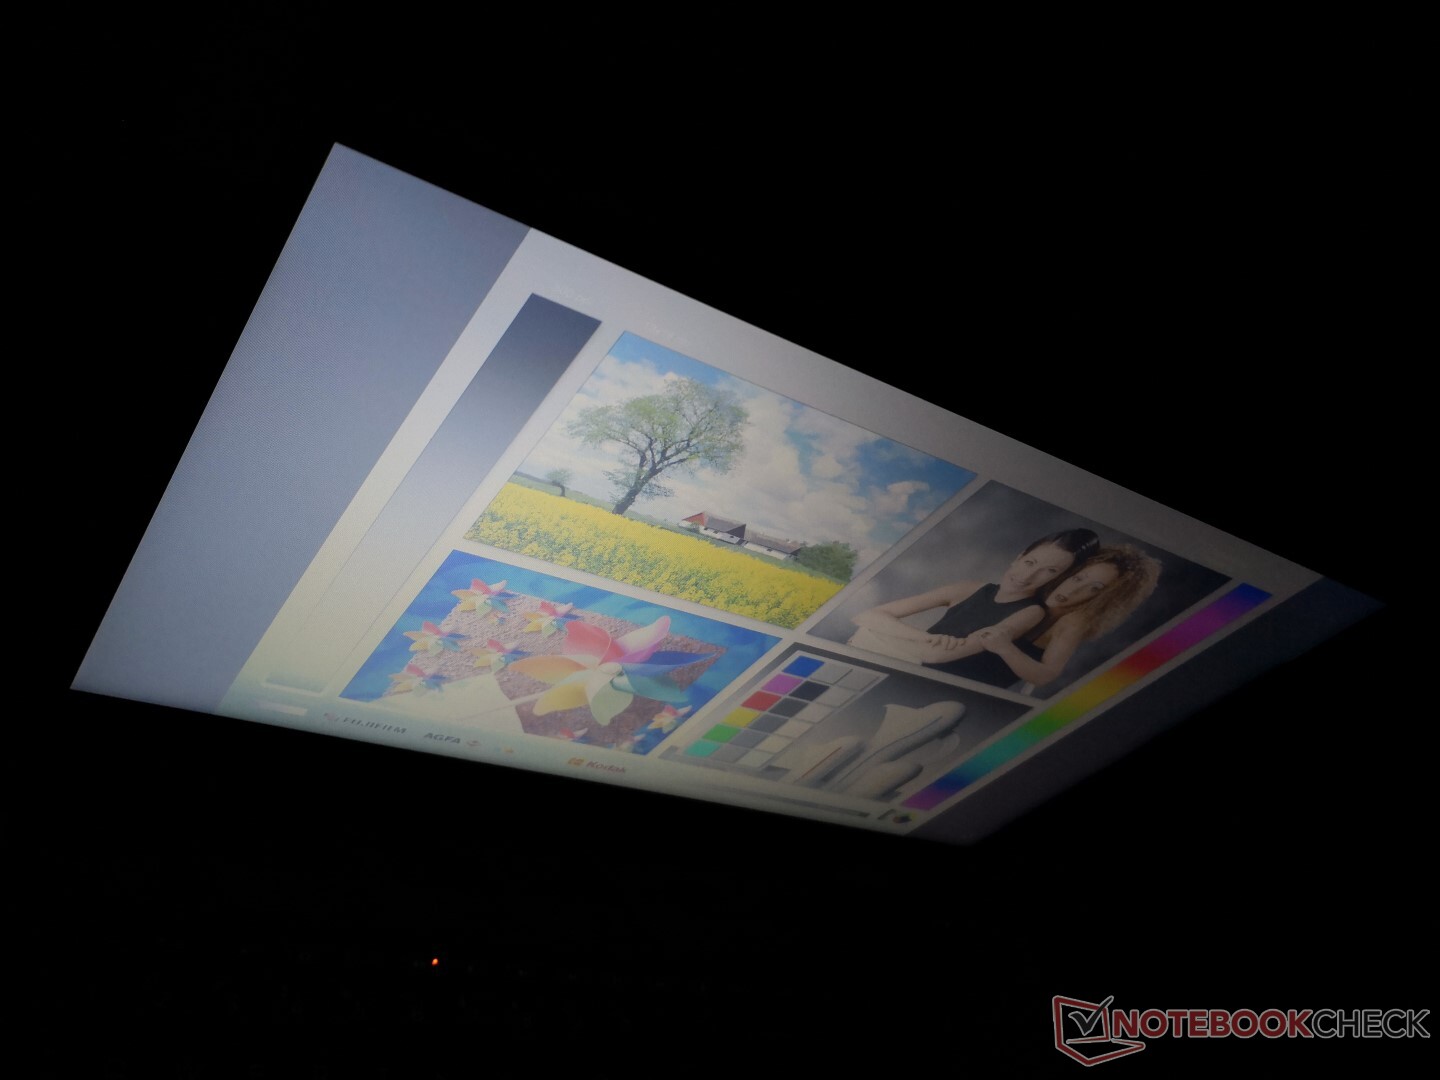
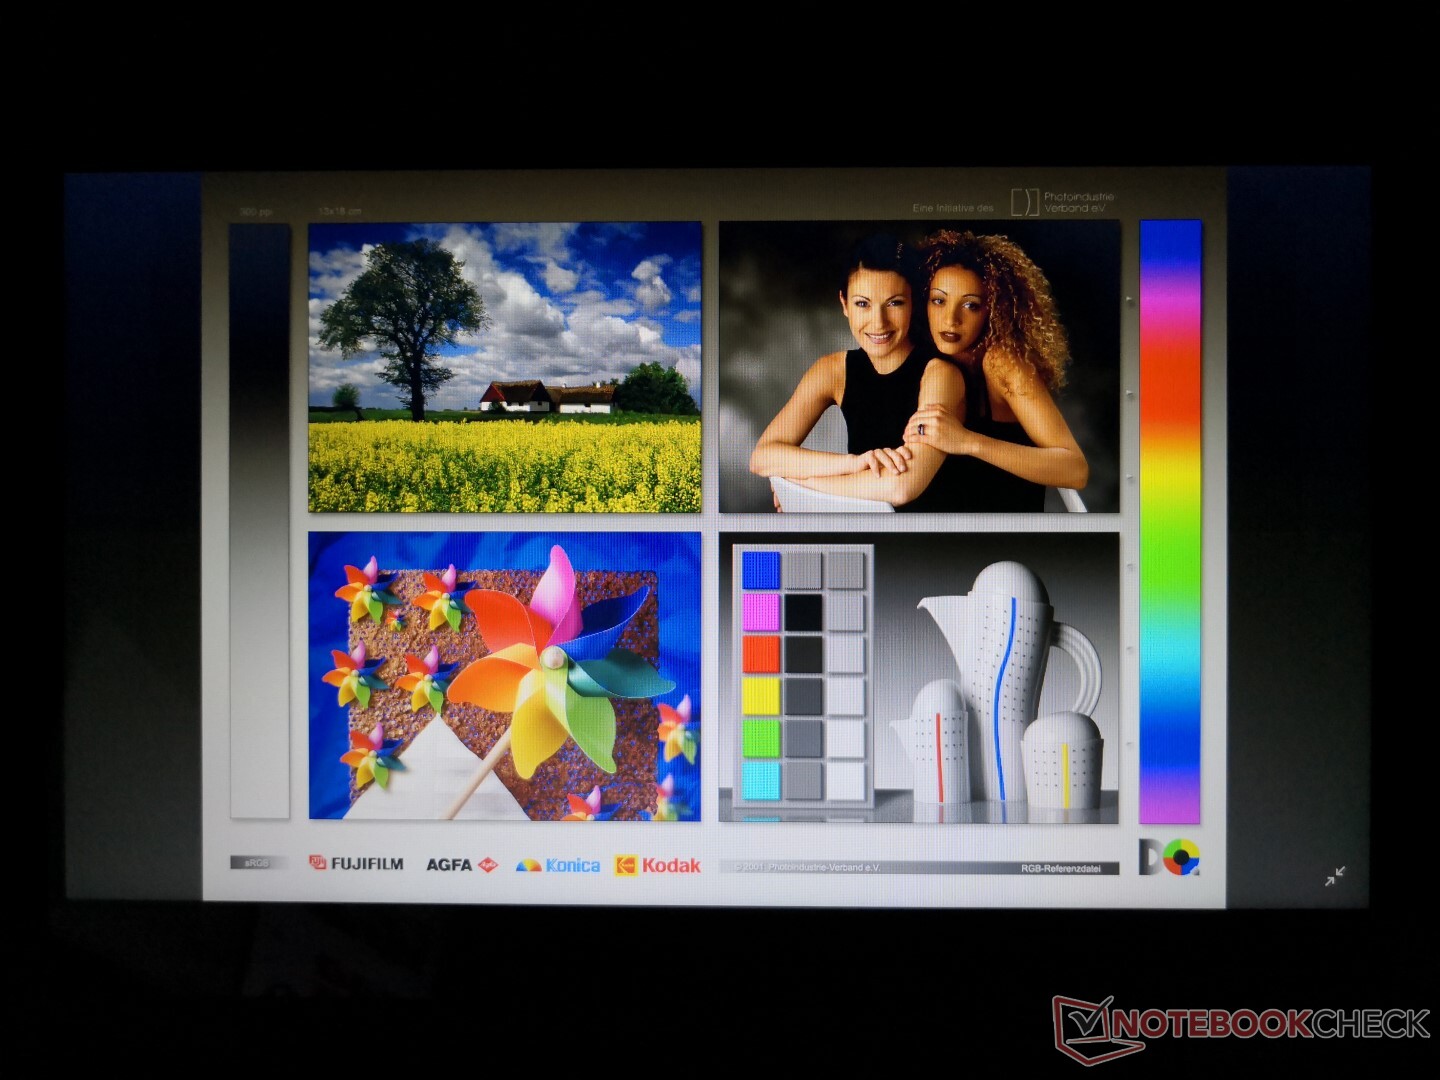
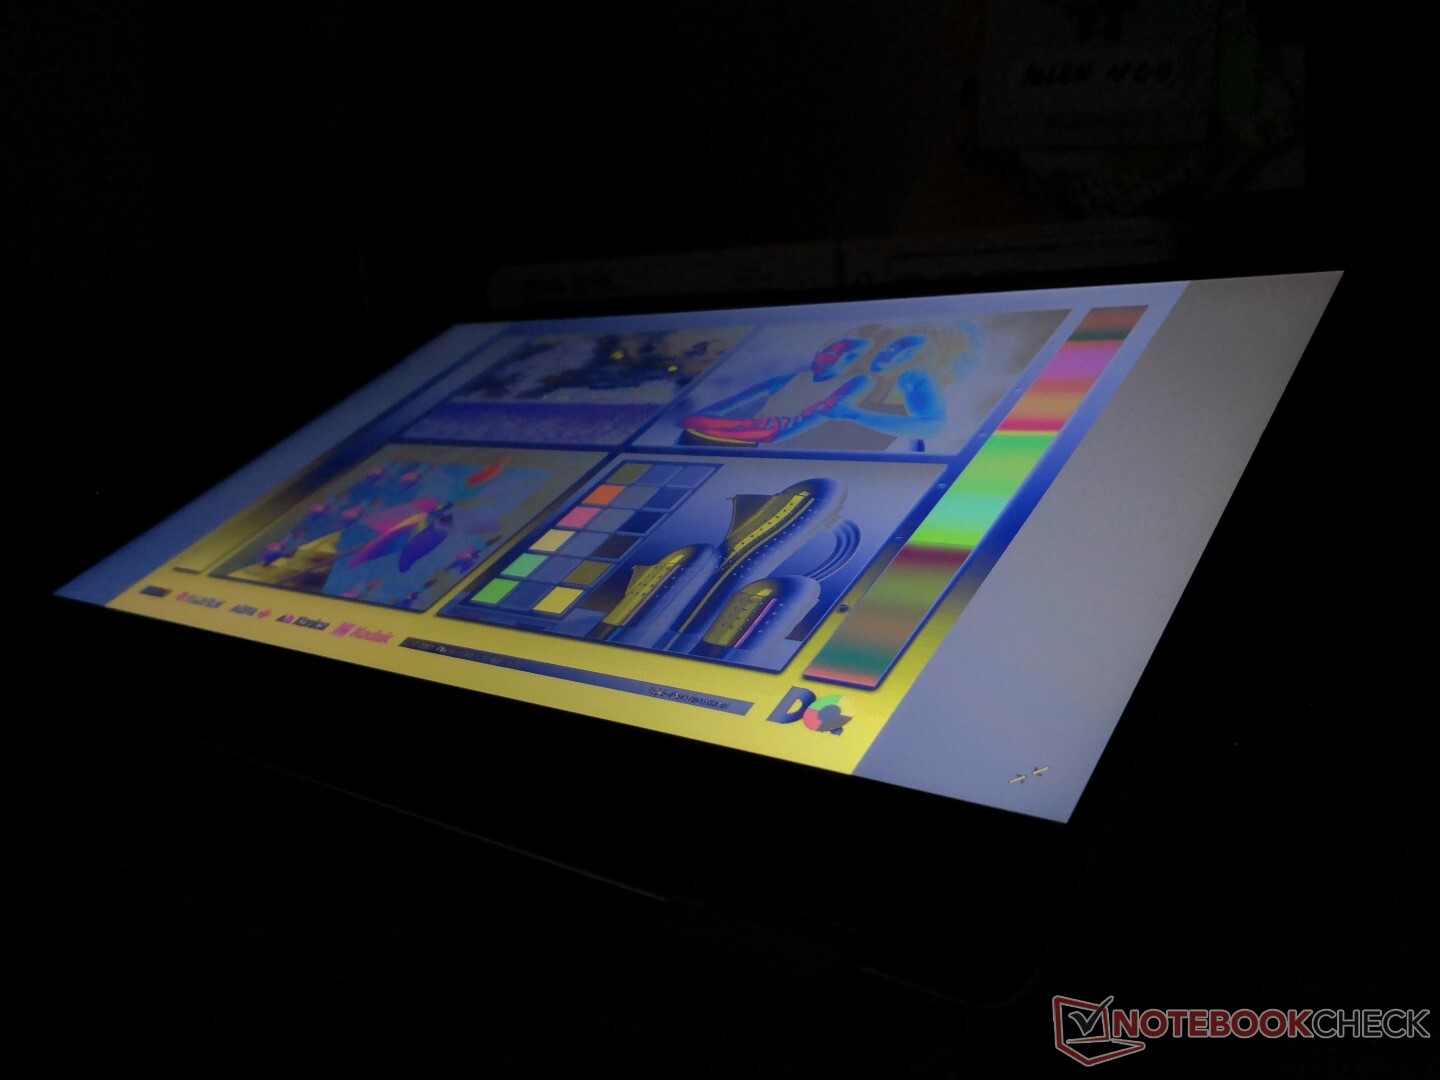
The 768p display here is one of the worst displays you can find on a laptop made in 2019. It's dim at under 200 nits with horrible colors and a very low contrast ratio of under 300:1. Pulse-width modulation is present at all brightness levels up to 99 percent to impact users sensitive to flickering light. Its worst offense is the low native resolution of just 768p for a grainy first impression even for a glossy display where texts and images are normally crisp. If you're looking for a half decent visual experience, you'd be be better off with any other laptop equipped with a 1080p panel instead.
SKUs with 1080p panels are available that will likely have different results than what we've recorded here.
| |||||||||||||||||||||||||
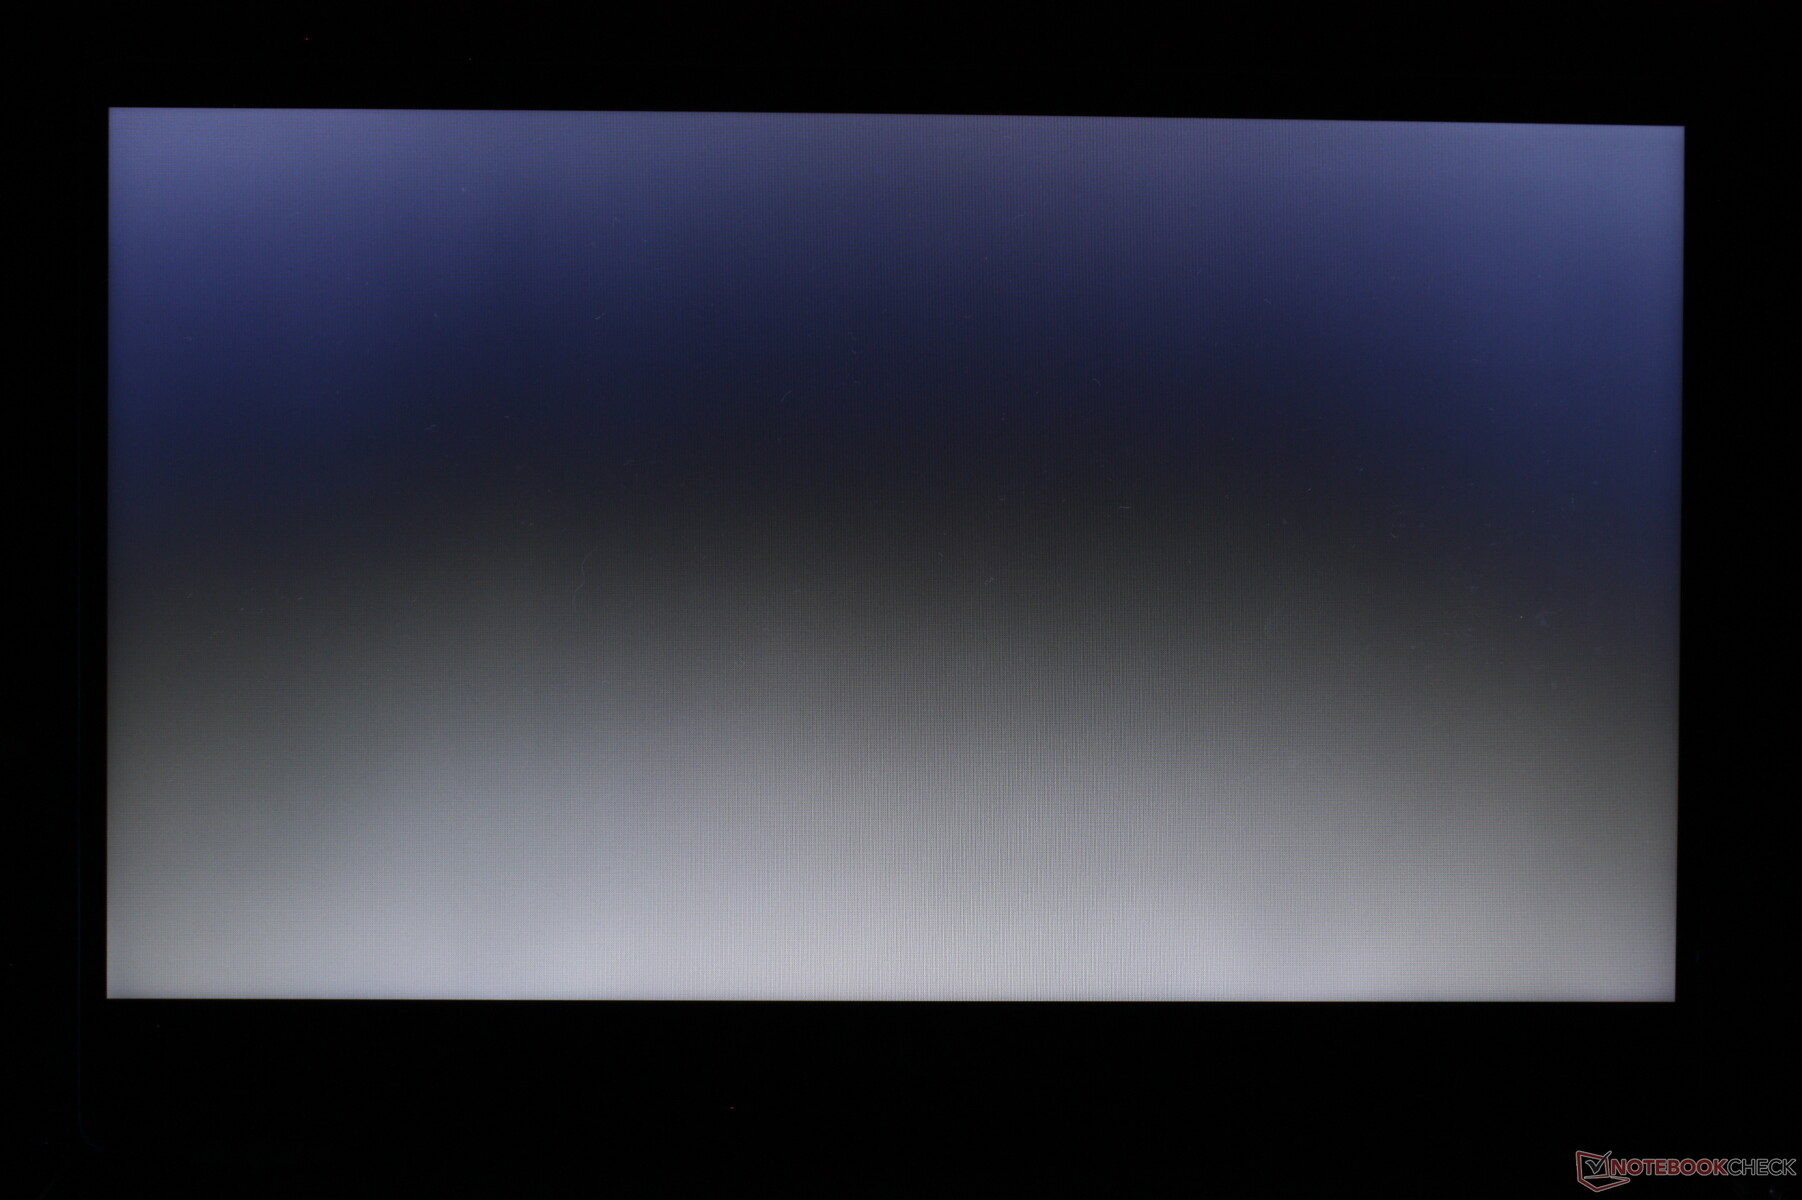
Brightness Distribution: 88 %
Center on Battery: 195.7 cd/m²
Contrast: 288:1 (Black: 0.68 cd/m²)
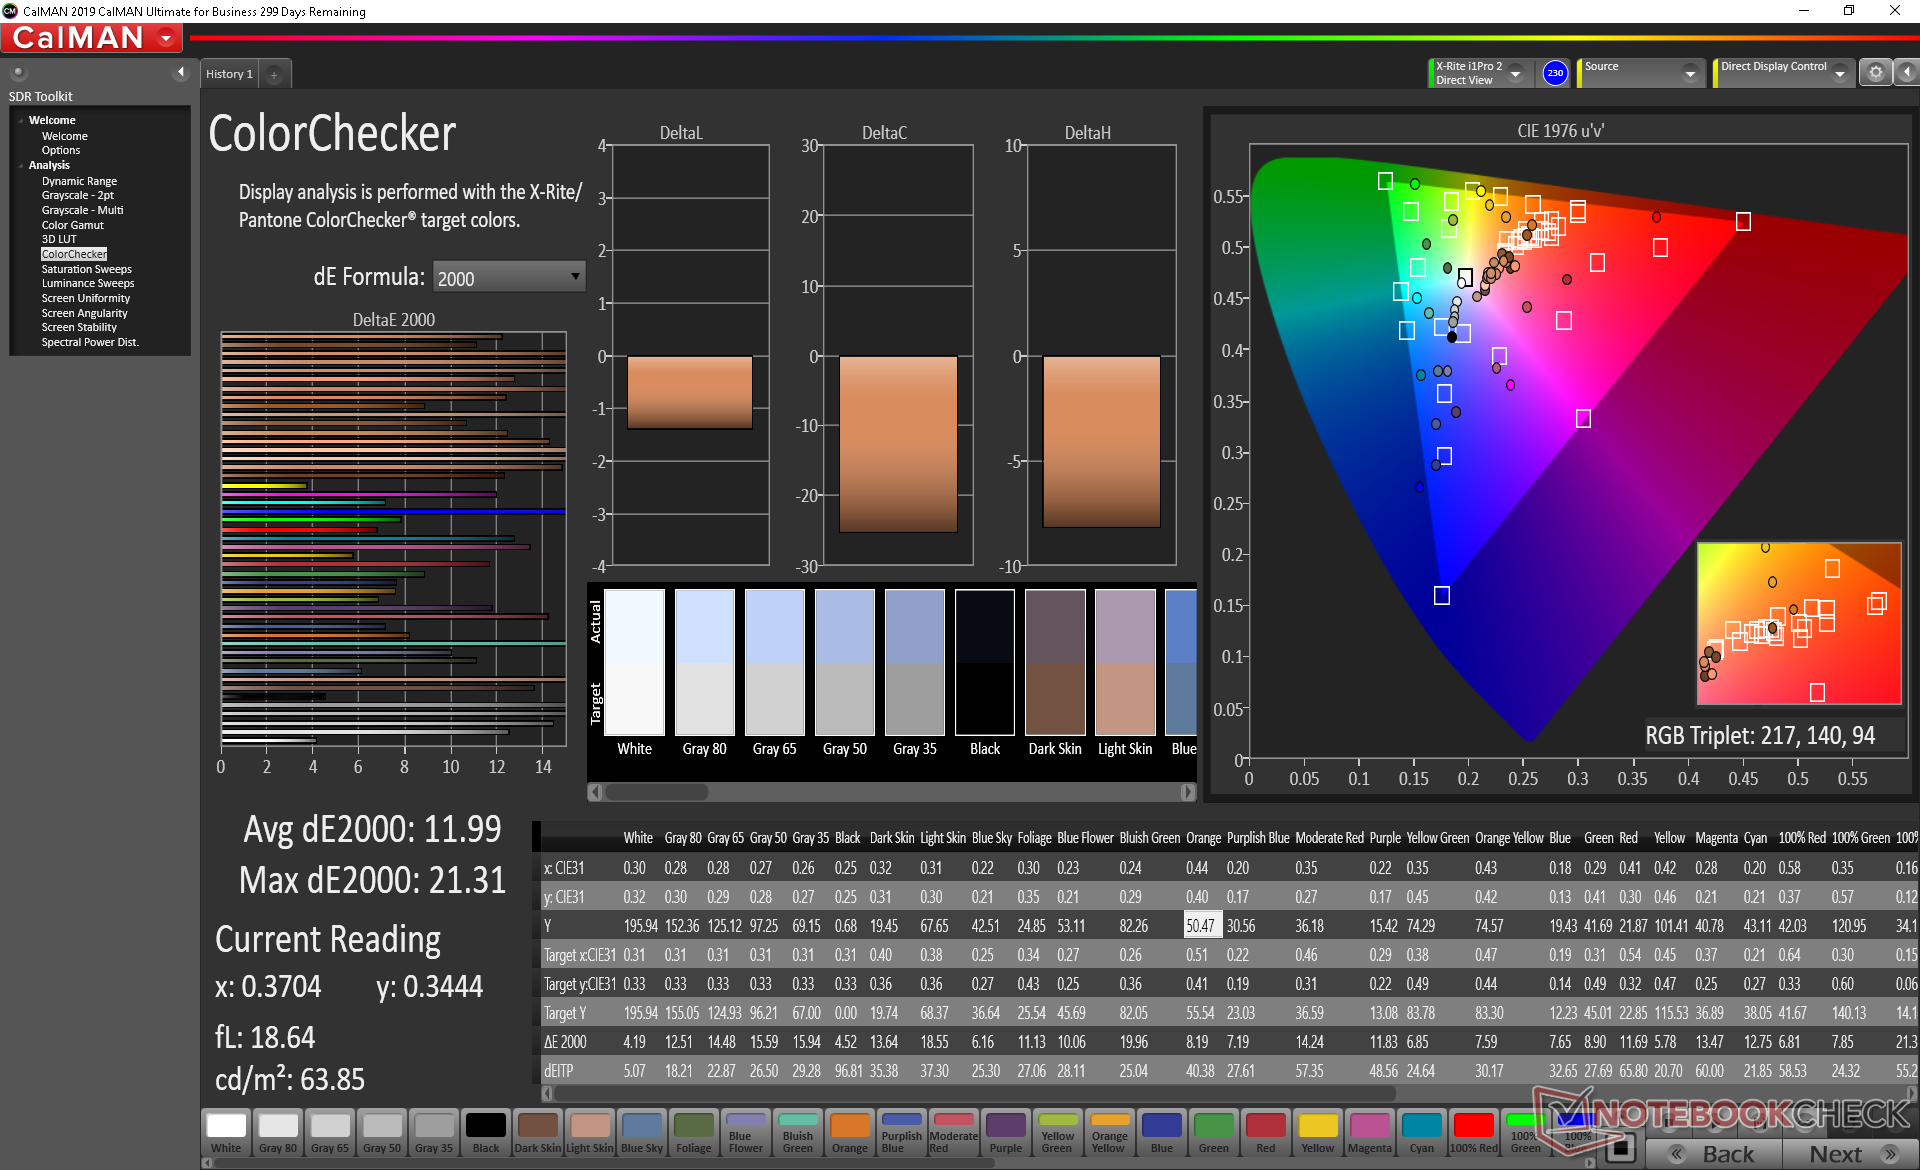
ΔE ColorChecker Calman: 11.99 | ∀{0.5-29.43 Ø4.71}
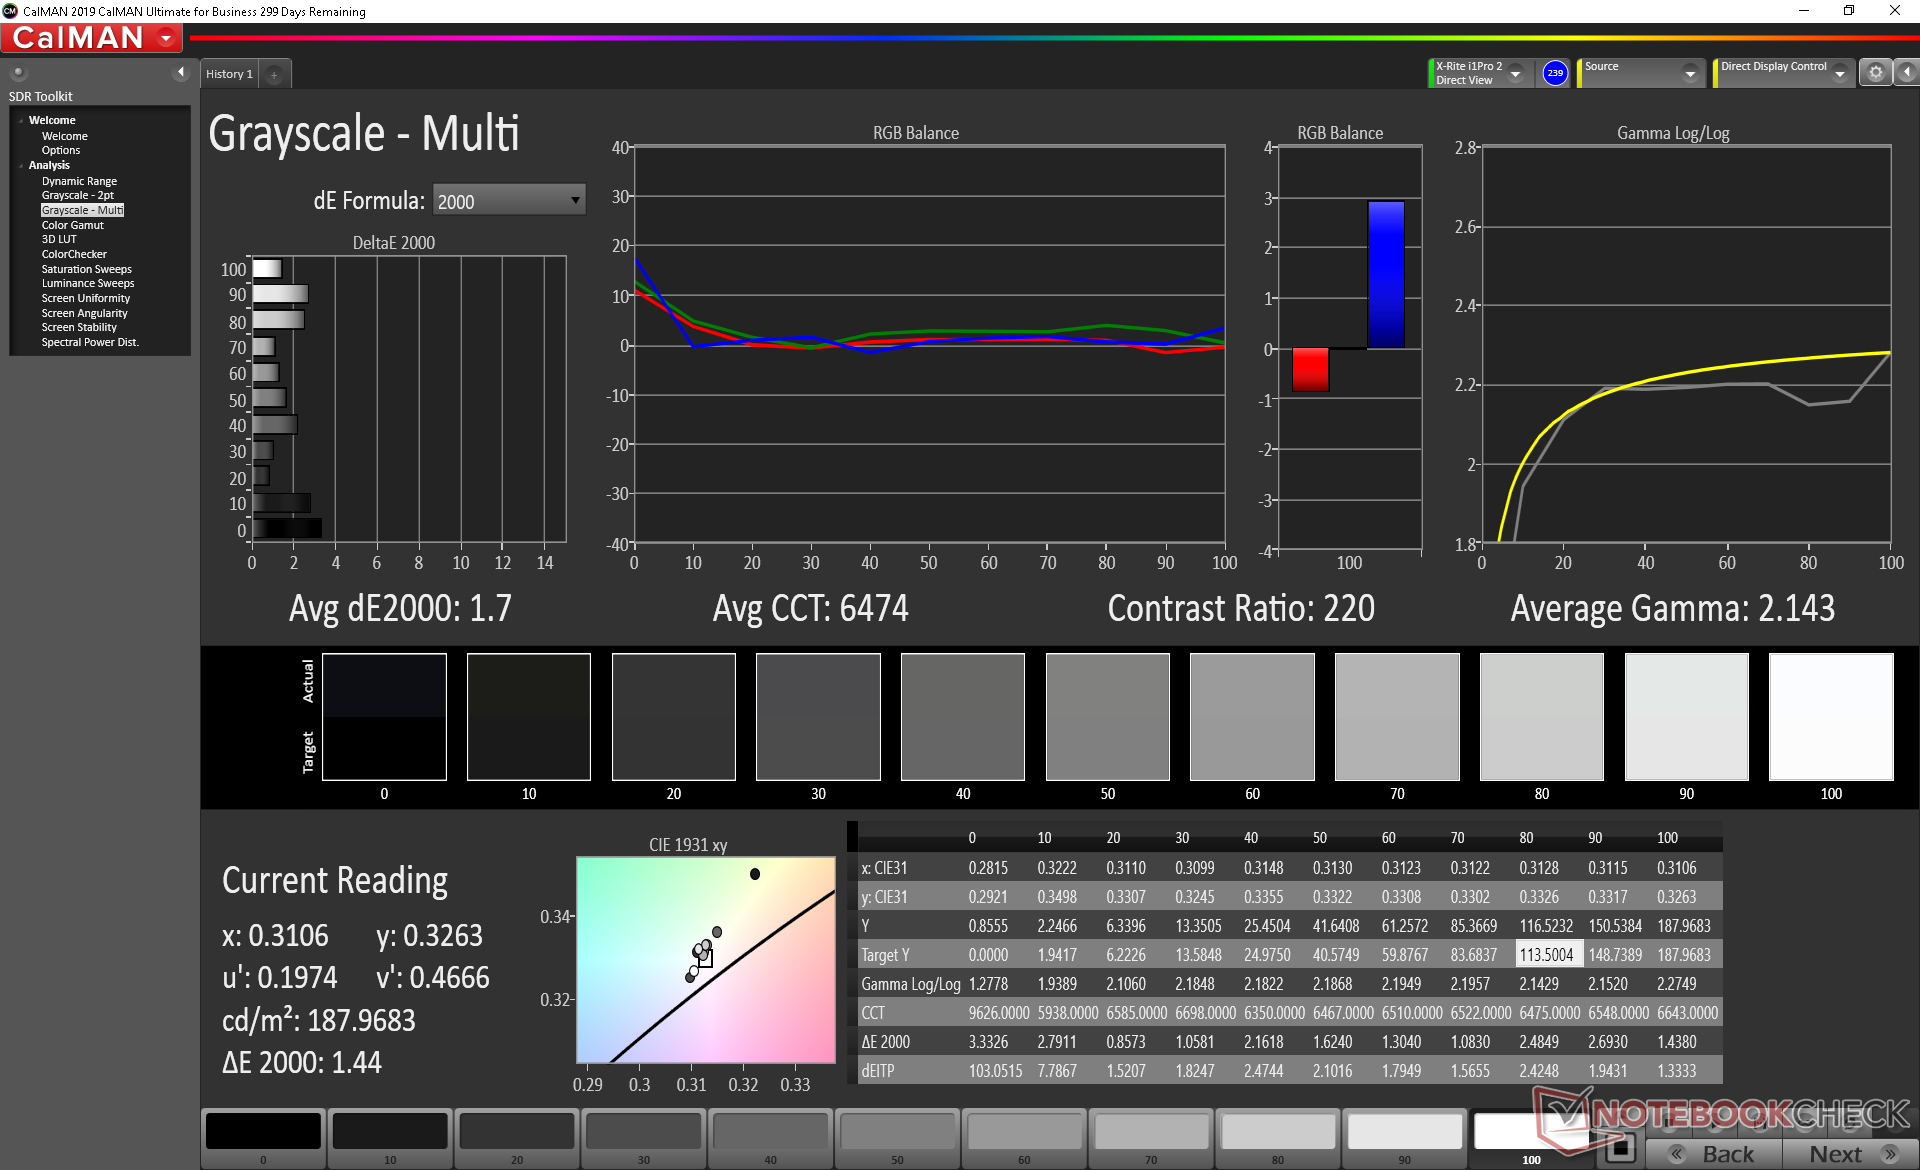
calibrated: 4.63
ΔE Greyscale Calman: 12.8 | ∀{0.09-98 Ø4.96}
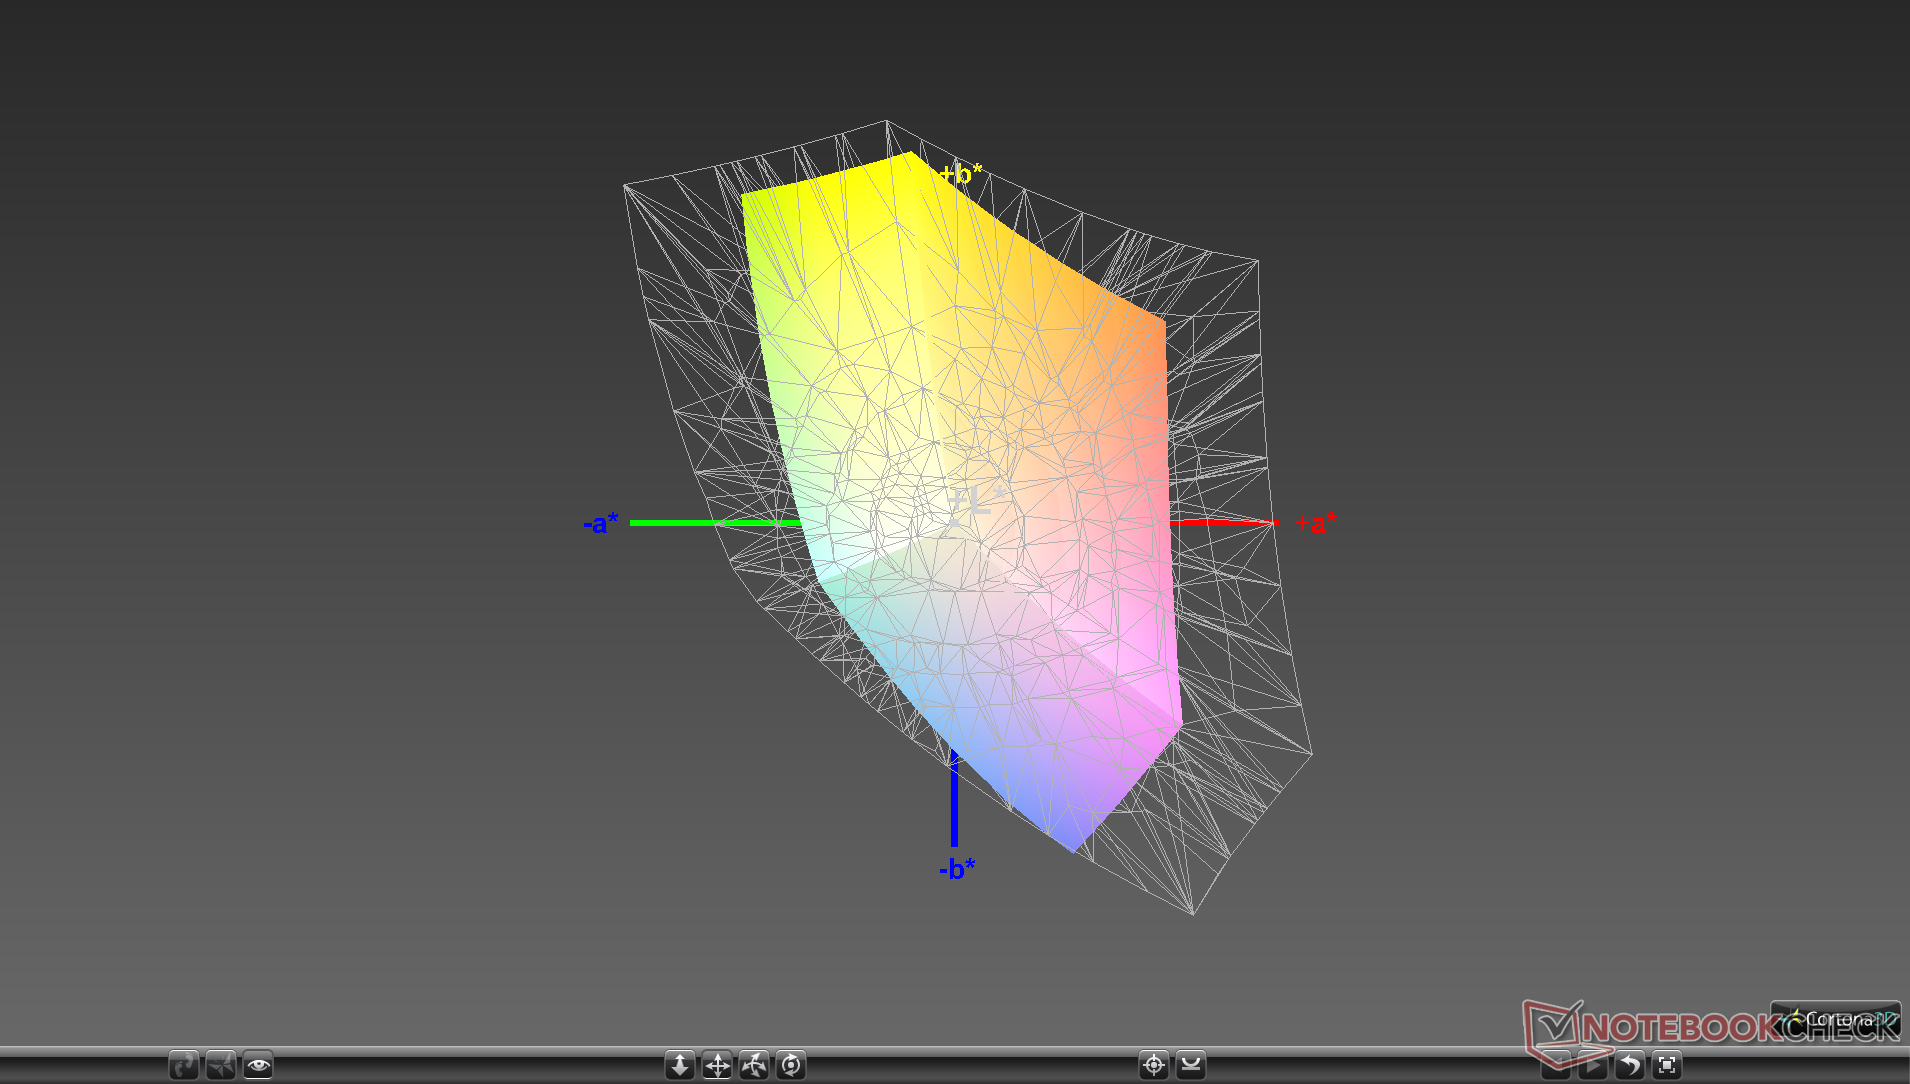
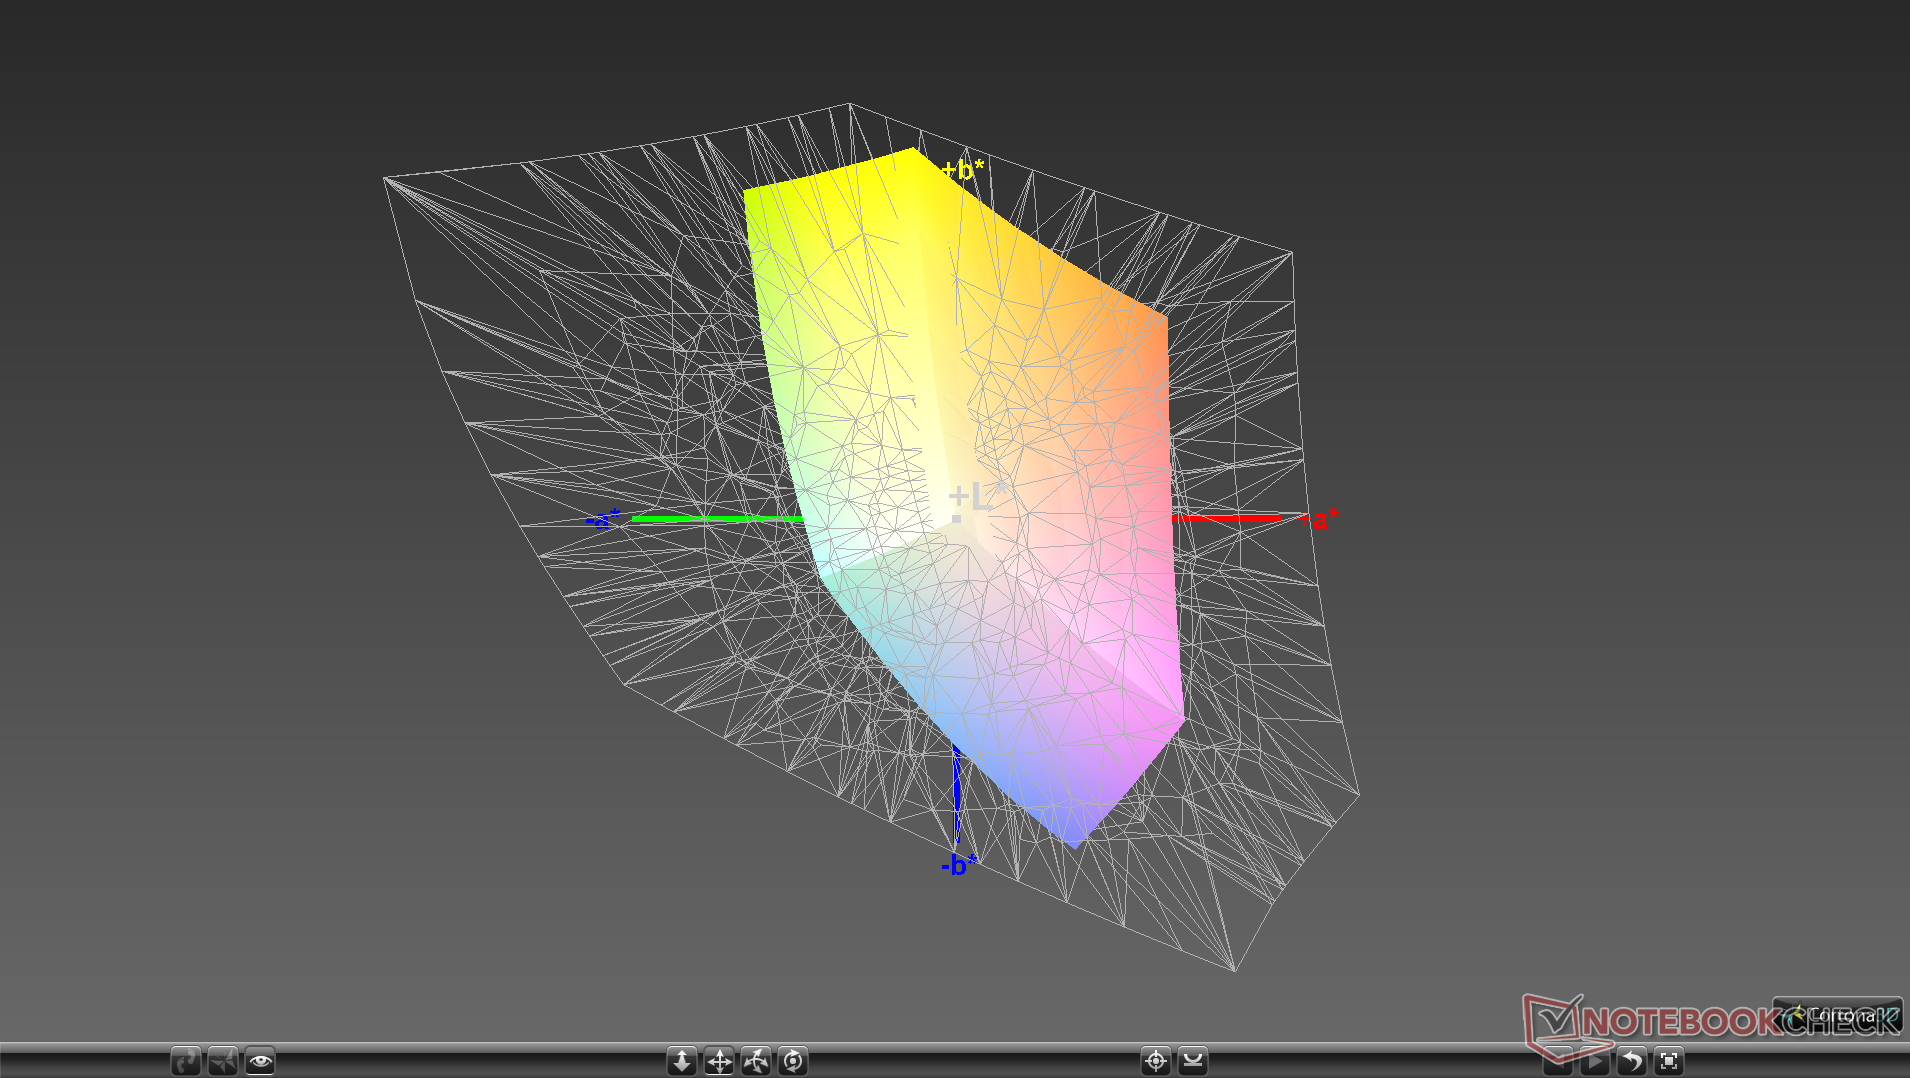
57.8% sRGB (Argyll 1.6.3 3D)
36.7% AdobeRGB 1998 (Argyll 1.6.3 3D)
39.93% AdobeRGB 1998 (Argyll 3D)
58.2% sRGB (Argyll 3D)
38.65% Display P3 (Argyll 3D)
Gamma: 2.15
CCT: 14252 K
| HP Pavilion x360 15-dq0065cl BOE076E, TN LED, 15.6", 1366x768 | Asus VivoBook Flip 15 TP510UA-E8073T AU Optronics B156HAN02.1, IPS, 15.6", 1920x1080 | Lenovo Ideapad C340-15IWL-81N5004QGE BOE CQ NV156FHM-N48, IPS, 15.6", 1920x1080 | HP Envy x360 15-bq102ng Chi Mei CM15E9, IPS, 15.6", 1920x1080 | Dell Inspiron 15 3585 (2300U, Vega 6) BOE0802, TN, 15.6", 1920x1080 | Dell XPS 15 7590 i5 iGPU FHD LQ156M1, IPS, 15.6", 1920x1080 | |
|---|---|---|---|---|---|---|
| Display | 1% | 0% | 7% | 1% | 70% | |
| Display P3 Coverage (%) | 38.65 | 39.19 1% | 39.05 1% | 41.36 7% | 39.22 1% | 66.5 72% |
| sRGB Coverage (%) | 58.2 | 58.9 1% | 57.3 -2% | 62.2 7% | 58.9 1% | 98 68% |
| AdobeRGB 1998 Coverage (%) | 39.93 | 40.49 1% | 40.35 1% | 42.74 7% | 40.52 1% | 68.4 71% |
| Response Times | -25% | -48% | -13% | 33% | -41% | |
| Response Time Grey 50% / Grey 80% * (ms) | 68.8 ? | 44 ? 36% | 57 ? 17% | 40 ? 42% | 39 ? 43% | 52.8 ? 23% |
| Response Time Black / White * (ms) | 15.6 ? | 29 ? -86% | 33 ? -112% | 26 ? -67% | 12 ? 23% | 32 ? -105% |
| PWM Frequency (Hz) | 1000 ? | 352 ? | 25000 ? | 250 ? | 1020 ? | |
| Screen | 71% | 64% | 81% | 13% | 118% | |
| Brightness middle (cd/m²) | 195.7 | 229 17% | 266 36% | 221 13% | 225 15% | 588 200% |
| Brightness (cd/m²) | 186 | 221 19% | 251 35% | 207 11% | 213 15% | 555 198% |
| Brightness Distribution (%) | 88 | 76 -14% | 81 -8% | 87 -1% | 88 0% | 89 1% |
| Black Level * (cd/m²) | 0.68 | 0.15 78% | 0.165 76% | 0.15 78% | 0.535 21% | 0.4 41% |
| Contrast (:1) | 288 | 1527 430% | 1612 460% | 1473 411% | 421 46% | 1470 410% |
| Colorchecker dE 2000 * | 11.99 | 5.03 58% | 6.33 47% | 4.35 64% | 10.37 14% | 2.5 79% |
| Colorchecker dE 2000 max. * | 21.31 | 8.89 58% | 21.03 1% | 8.98 58% | 19.75 7% | 6.3 70% |
| Colorchecker dE 2000 calibrated * | 4.63 | 5.23 -13% | 3.89 16% | 0.6 87% | ||
| Greyscale dE 2000 * | 12.8 | 5.56 57% | 3.81 70% | 3.09 76% | 12.09 6% | 4.5 65% |
| Gamma | 2.15 102% | 2.64 83% | 2.38 92% | 2.23 99% | 2.72 81% | 2.2 100% |
| CCT | 14252 46% | 7015 93% | 6057 107% | 6068 107% | 13335 49% | 6836 95% |
| Color Space (Percent of AdobeRGB 1998) (%) | 36.7 | 37 1% | 37 1% | 56 53% | 37 1% | 63.2 72% |
| Color Space (Percent of sRGB) (%) | 57.8 | 59 2% | 57 -1% | 86 49% | 59 2% | 98 70% |
| Total Average (Program / Settings) | 16% /
44% | 5% /
38% | 25% /
54% | 16% /
13% | 49% /
89% |
* ... smaller is better
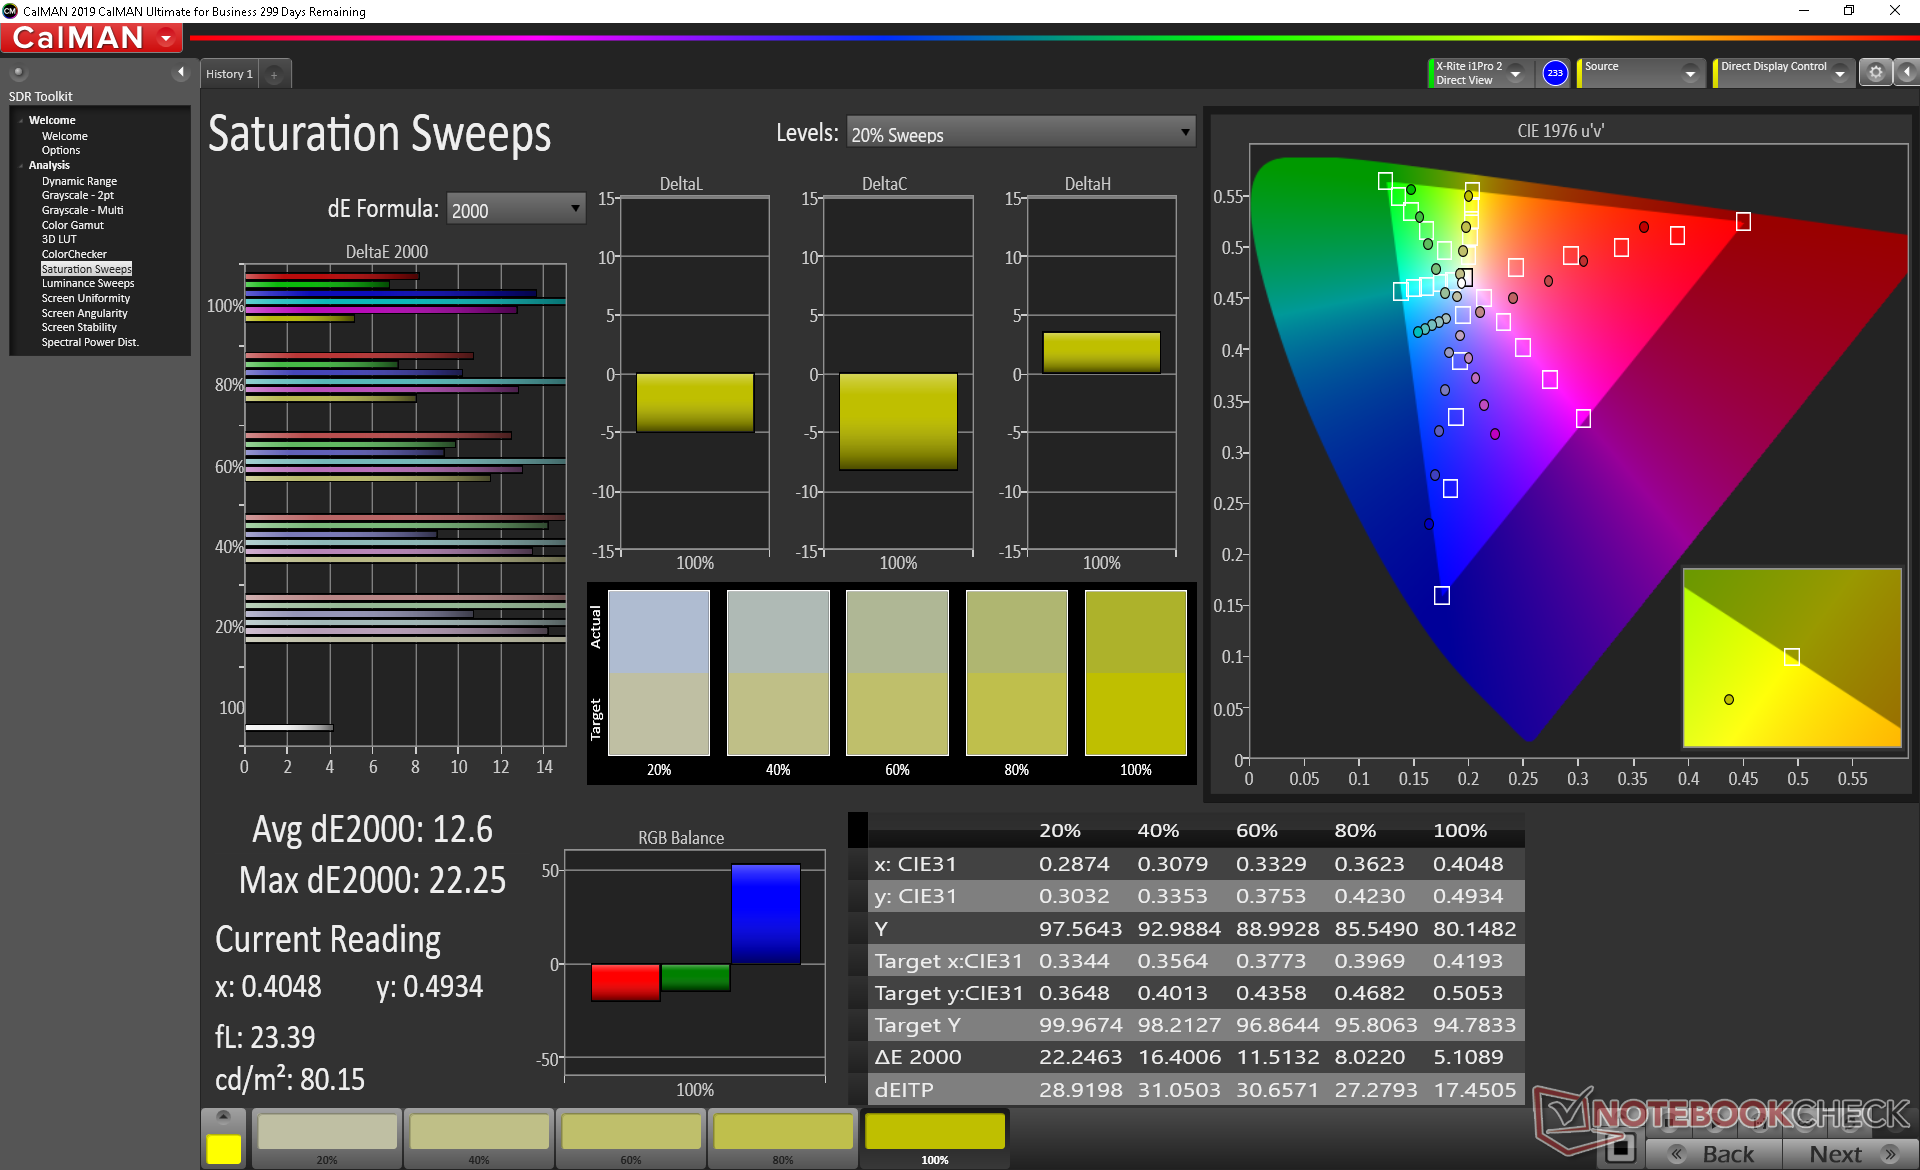
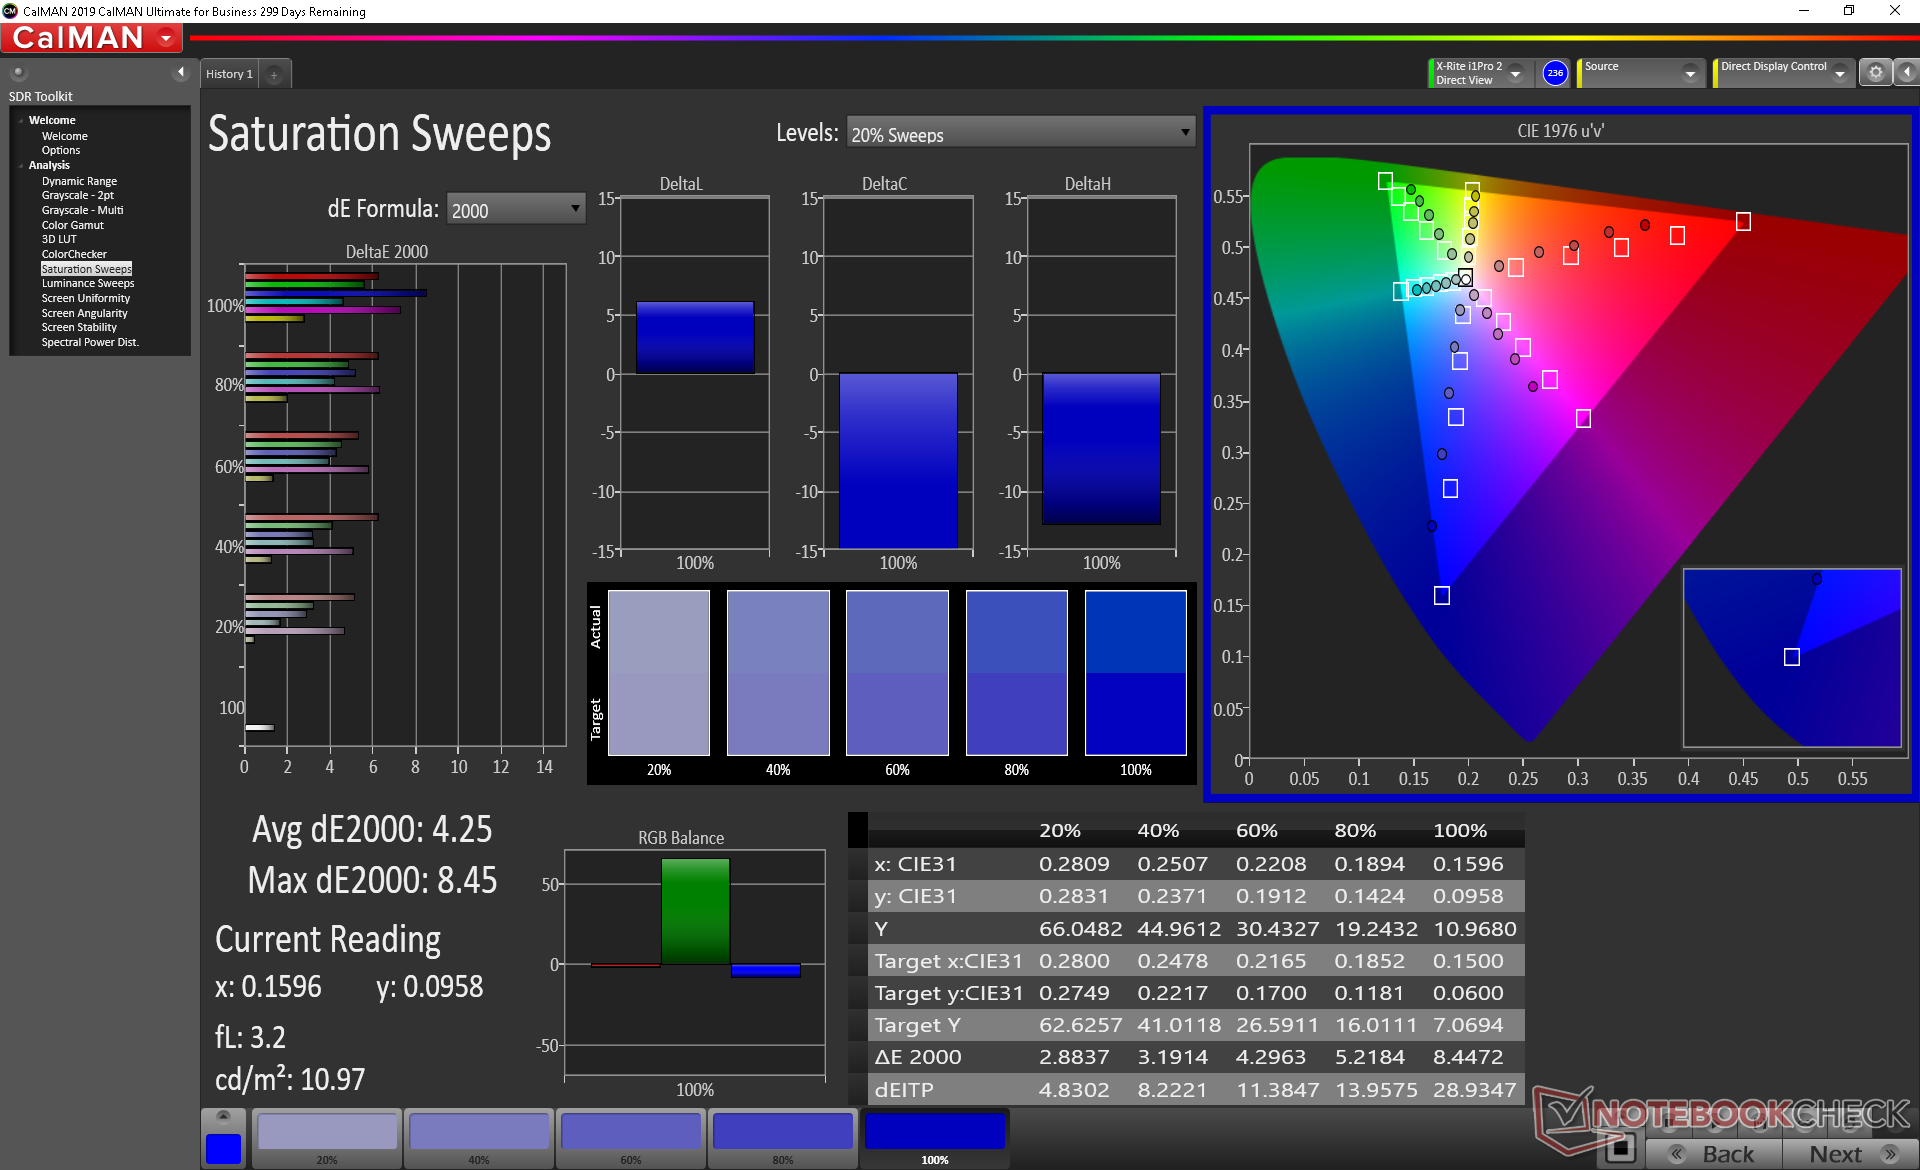
Color space is narrow at just 37 percent and 58 percent of AdobeRGB and sRGB, respectively, to be indicative of a budget panel. These results confirm our subjective analysis above about the shallow colors. In comparison, the displays on nearly all high-end Ultrabooks typically cover over 90 percent of sRGB for deeper and more accurate colors.
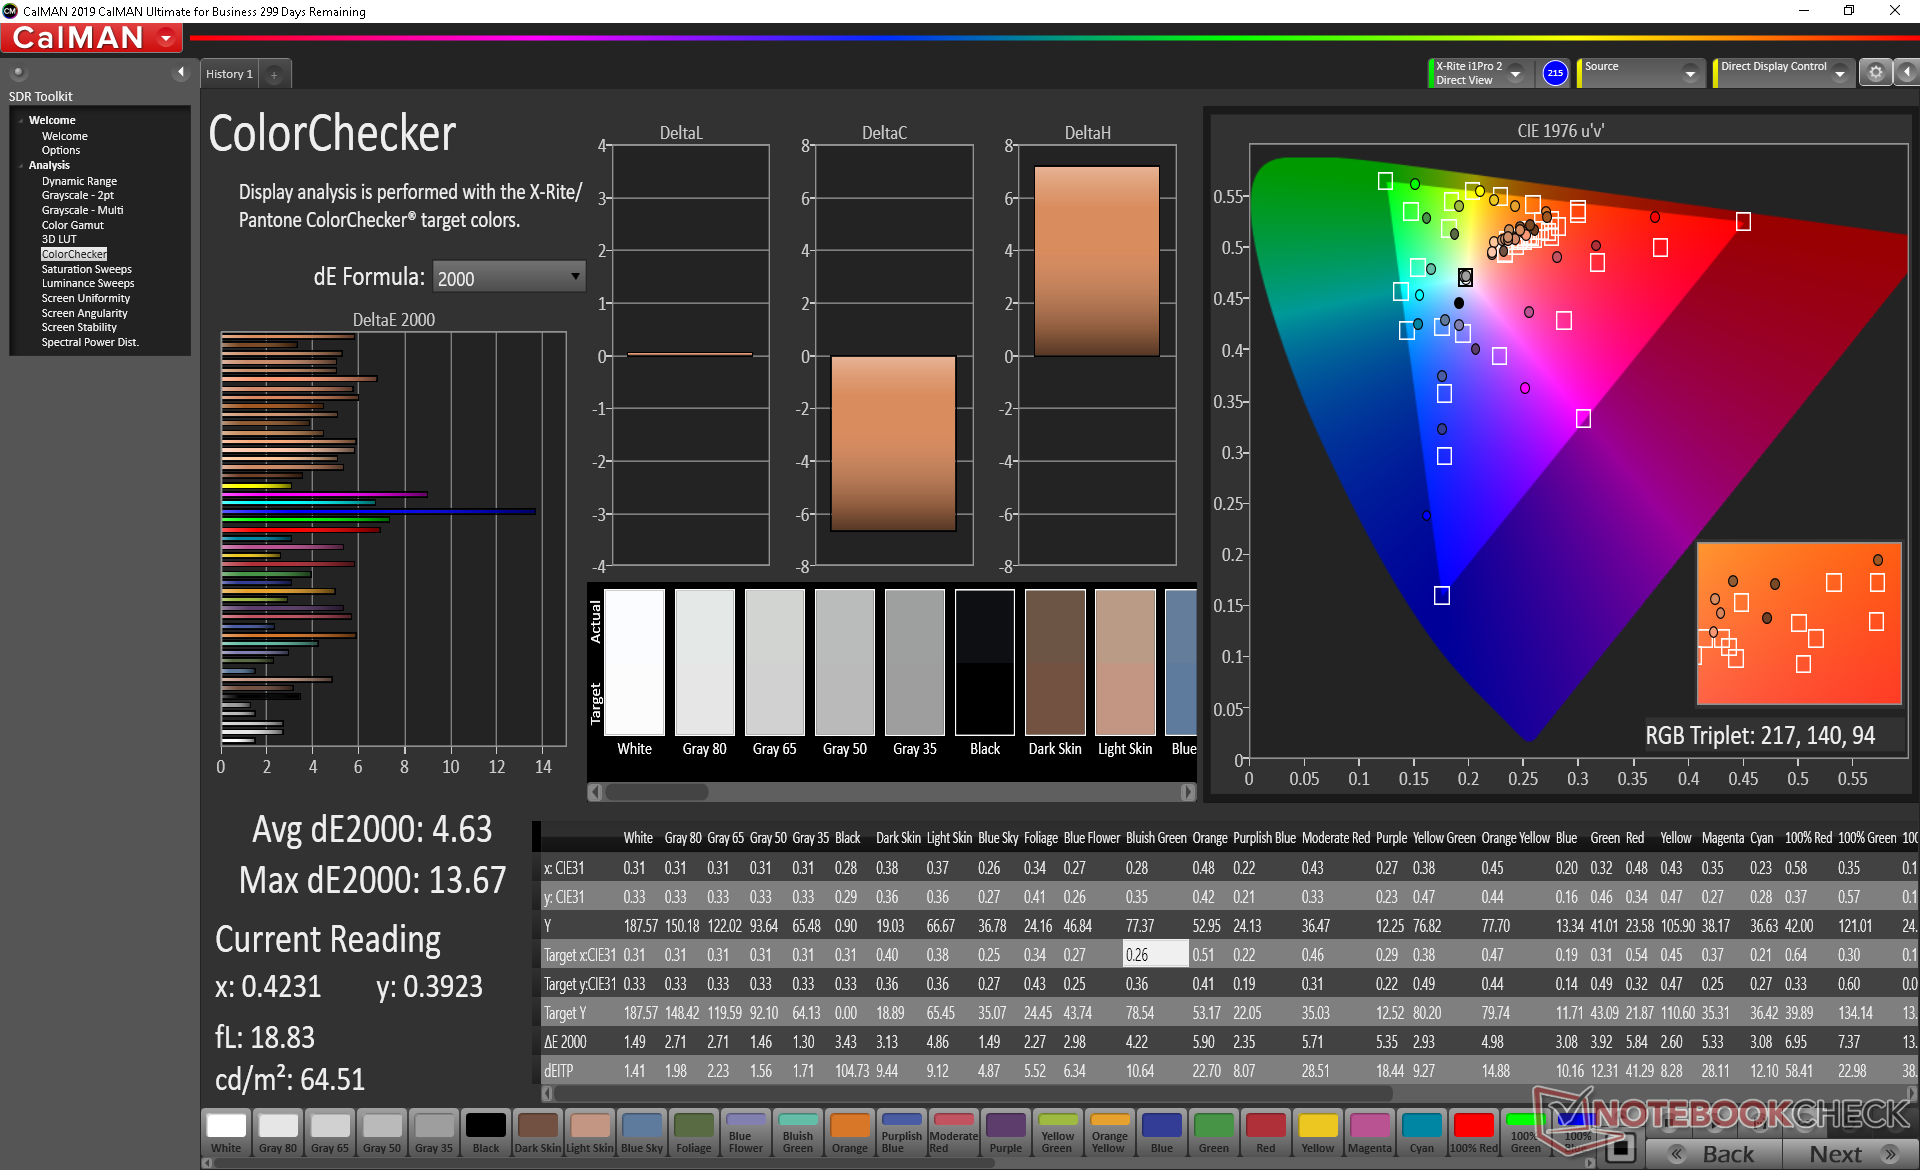
Unsurprisingly, further measurements with an X-Rite colorimeter reveal a very inaccurate panel. Color temperature is far too cool and colors are therefore very off especially at lower saturation levels. Colors improve dramatically after calibrating the panel ourselves, but you can only do so much with such limited black levels and color reproduction.
Display Response Times
| ↔ Response Time Black to White | ||
|---|---|---|
| 15.6 ms ... rise ↗ and fall ↘ combined | ↗ 9.2 ms rise | 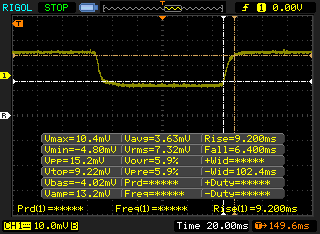 |
| ↘ 6.4 ms fall | ||
| The screen shows good response rates in our tests, but may be too slow for competitive gamers. In comparison, all tested devices range from 0.1 (minimum) to 240 (maximum) ms. » 37 % of all devices are better. This means that the measured response time is better than the average of all tested devices (19.8 ms). | ||
| ↔ Response Time 50% Grey to 80% Grey | ||
| 68.8 ms ... rise ↗ and fall ↘ combined | ↗ 30 ms rise | 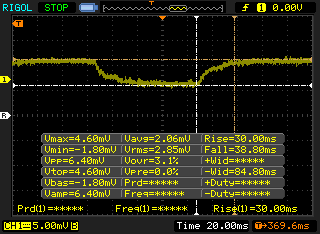 |
| ↘ 38.8 ms fall | ||
| The screen shows slow response rates in our tests and will be unsatisfactory for gamers. In comparison, all tested devices range from 0.165 (minimum) to 636 (maximum) ms. » 98 % of all devices are better. This means that the measured response time is worse than the average of all tested devices (31 ms). | ||
Screen Flickering / PWM (Pulse-Width Modulation)
| Screen flickering / PWM detected | 1000 Hz | ≤ 99 % brightness setting | 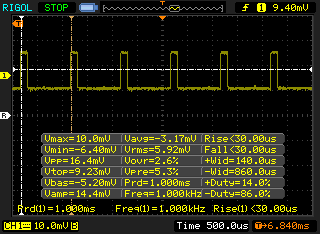 |
The display backlight flickers at 1000 Hz (worst case, e.g., utilizing PWM) Flickering detected at a brightness setting of 99 % and below. There should be no flickering or PWM above this brightness setting. The frequency of 1000 Hz is quite high, so most users sensitive to PWM should not notice any flickering. In comparison: 52 % of all tested devices do not use PWM to dim the display. If PWM was detected, an average of 7757 (minimum: 5 - maximum: 343500) Hz was measured. | |||
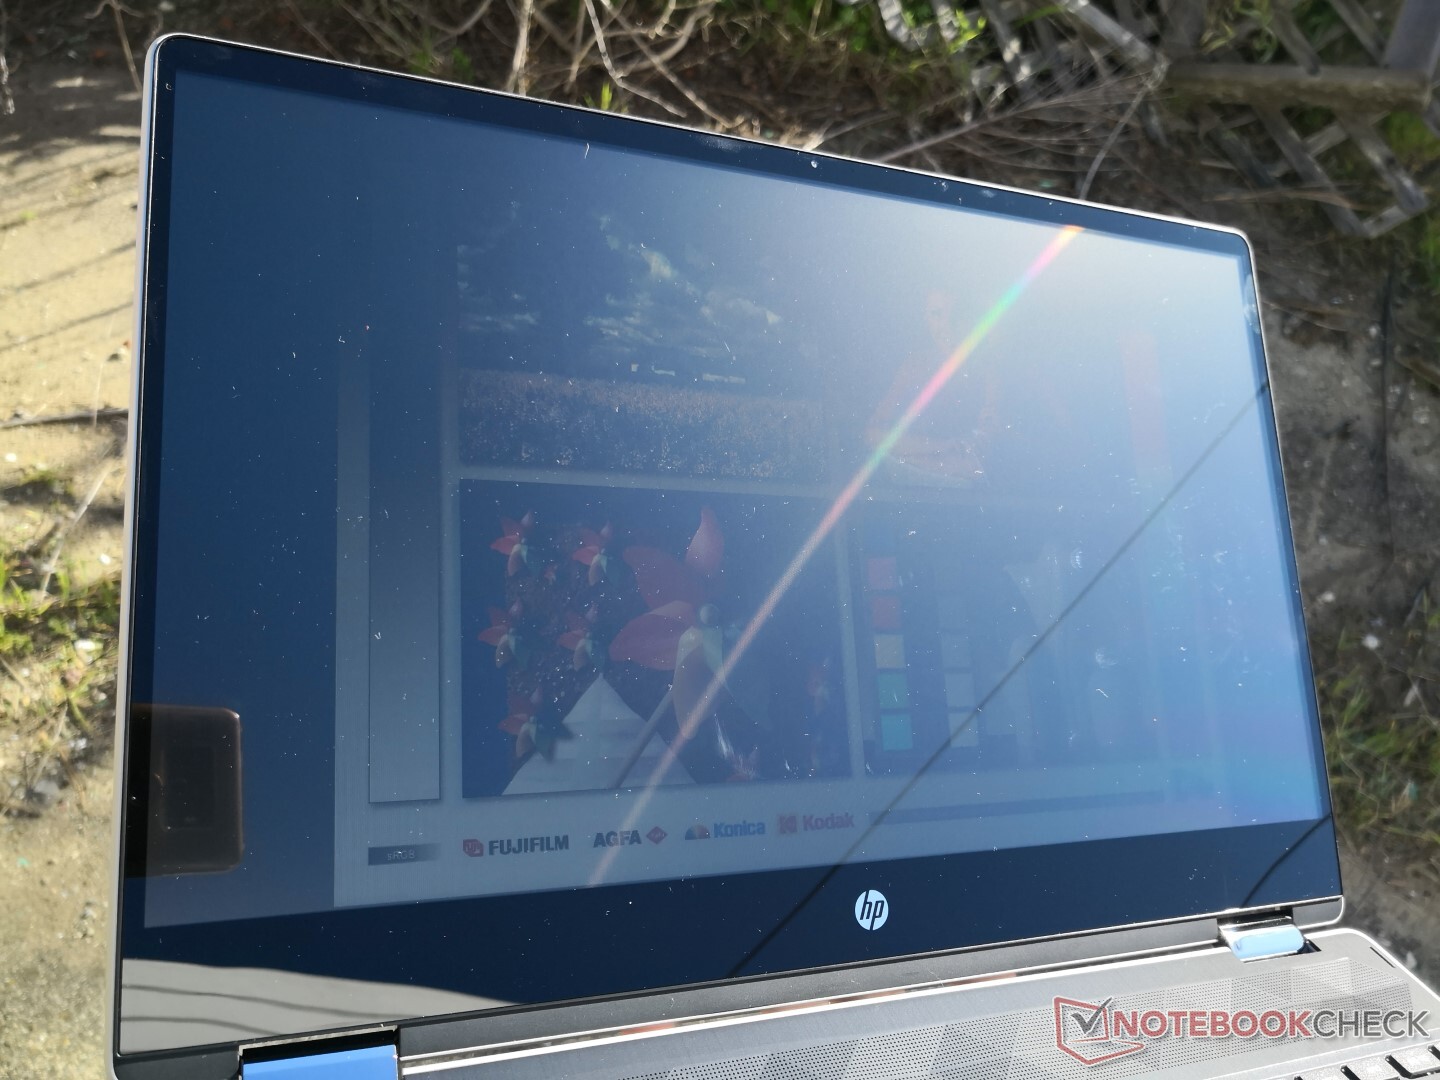
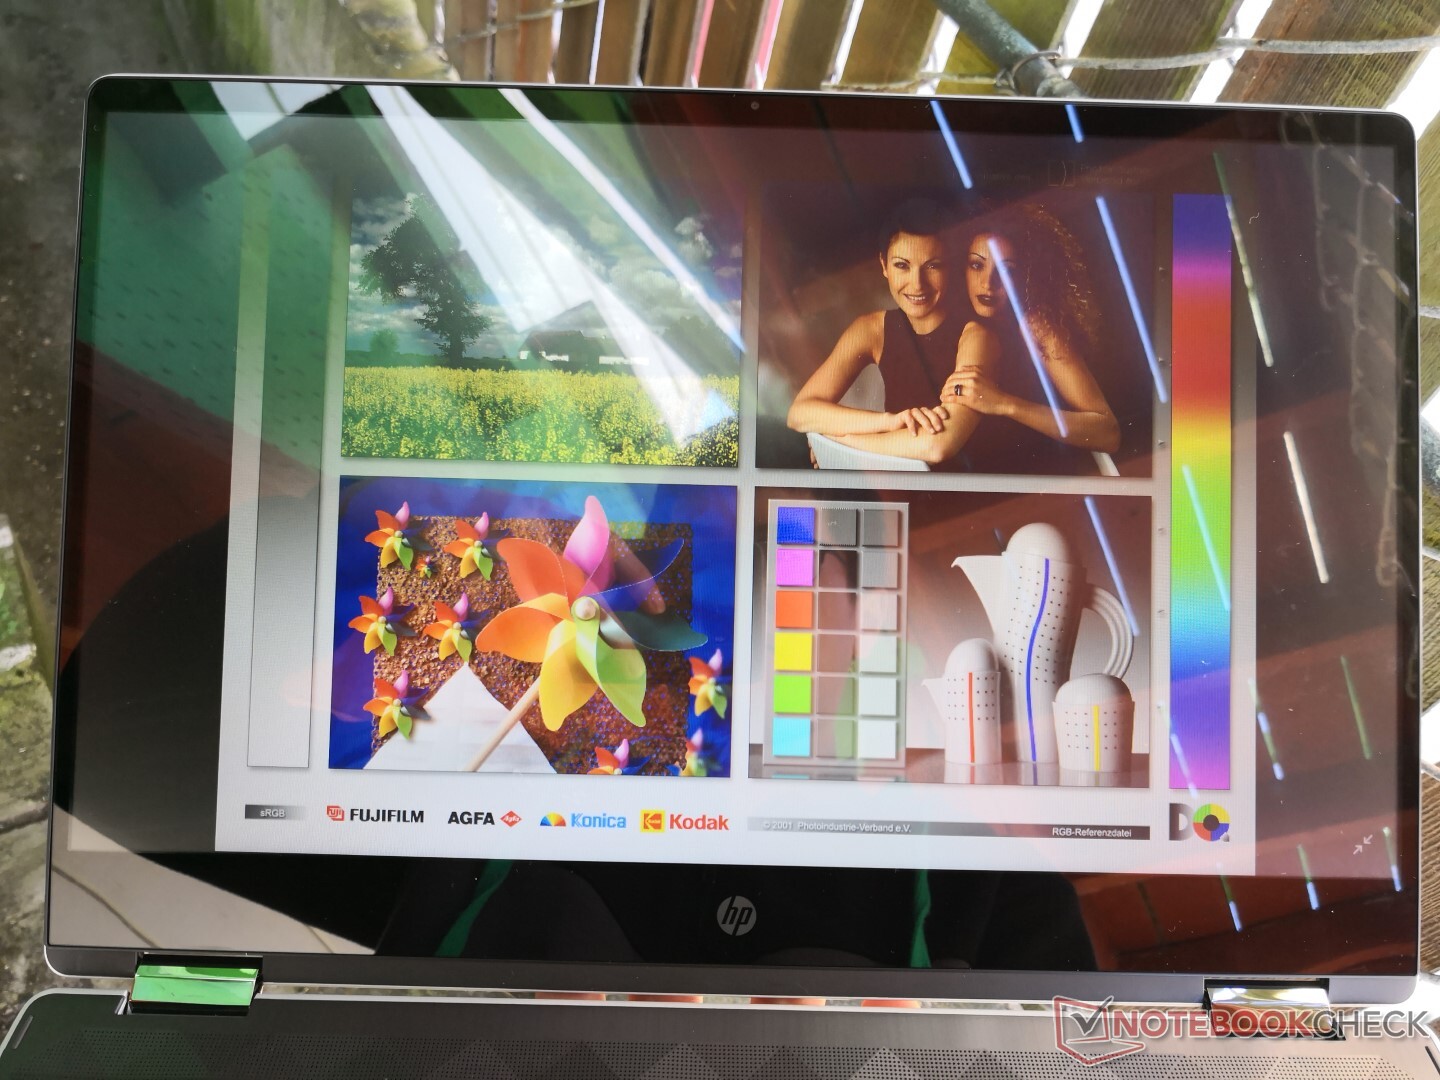
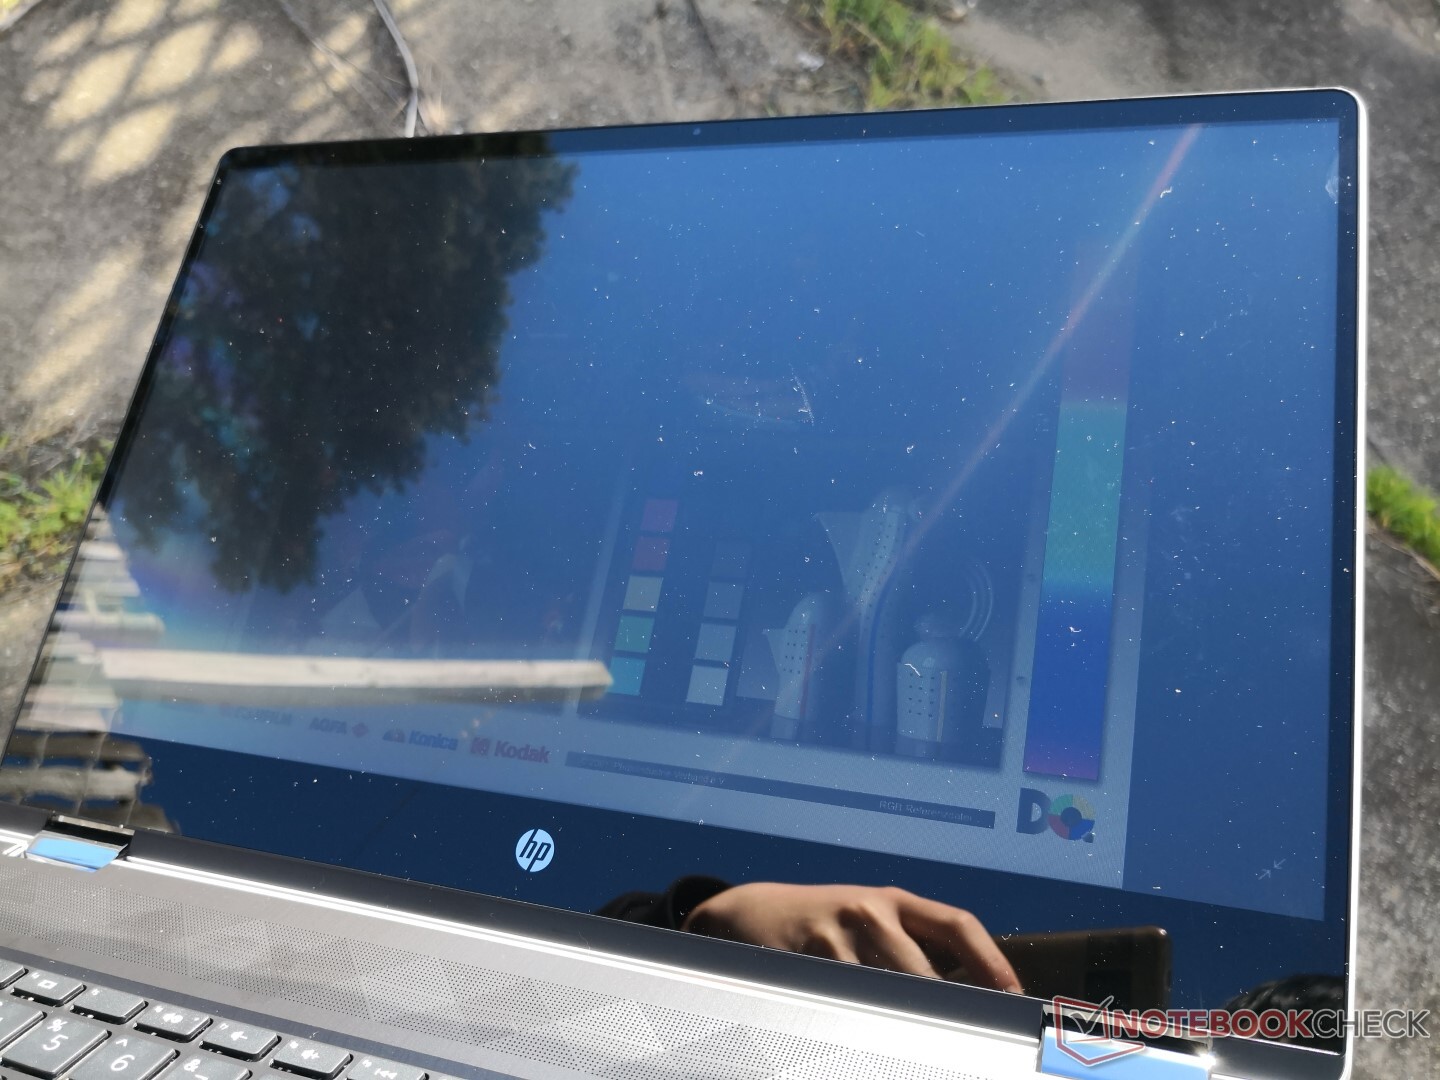
Outdoor visibility is well below average. The combination of a dim backlight, glossy screen, and poor TN viewing angles makes for an unpleasant experience even when under shade. You may be tempted to use this particular convertible outdoors because of its 2-in-1 form factor, but the Pavilion series is designed mostly for indoor conditions.
Performance
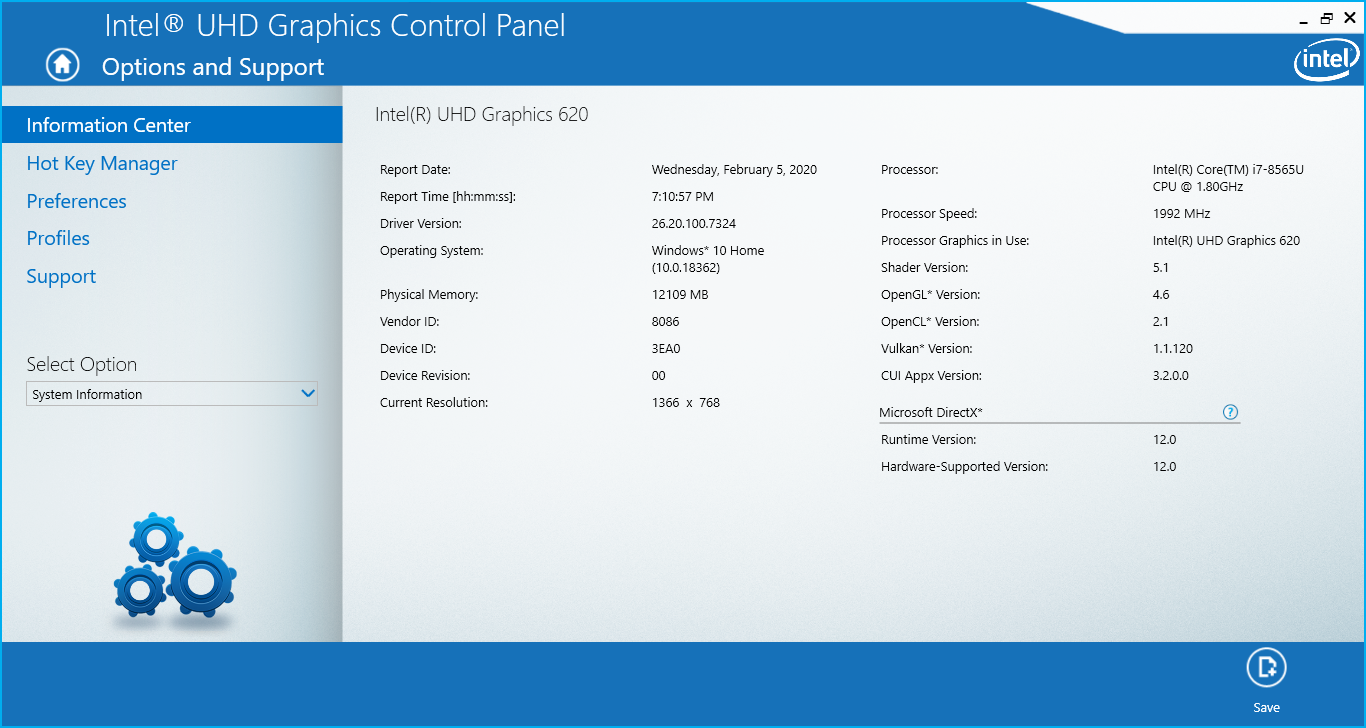
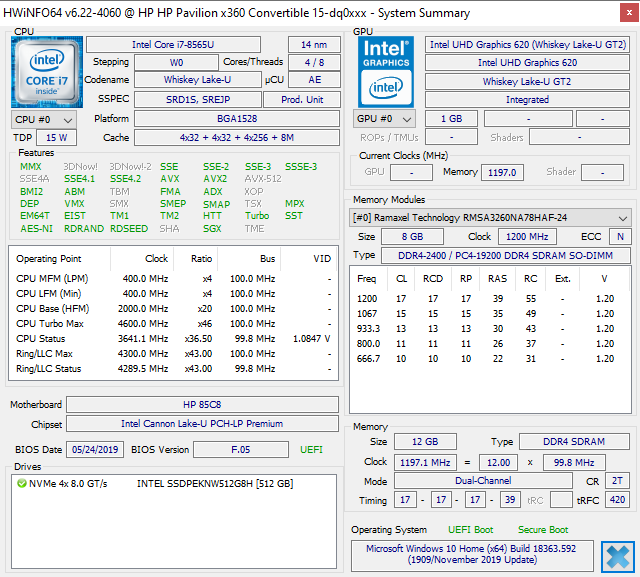
All SKUs come with U-class Core i3 to Core i7 CPUs and some can even be configured with Radeon 535 graphics. Nonetheless, overall performance will target light to light-medium workloads and multi-tasking like web browsing and video streaming. Note that this same Core i7-8565U CPU can also be found on HP's higher-end Spectre series for a roughly similar level of processor performance.
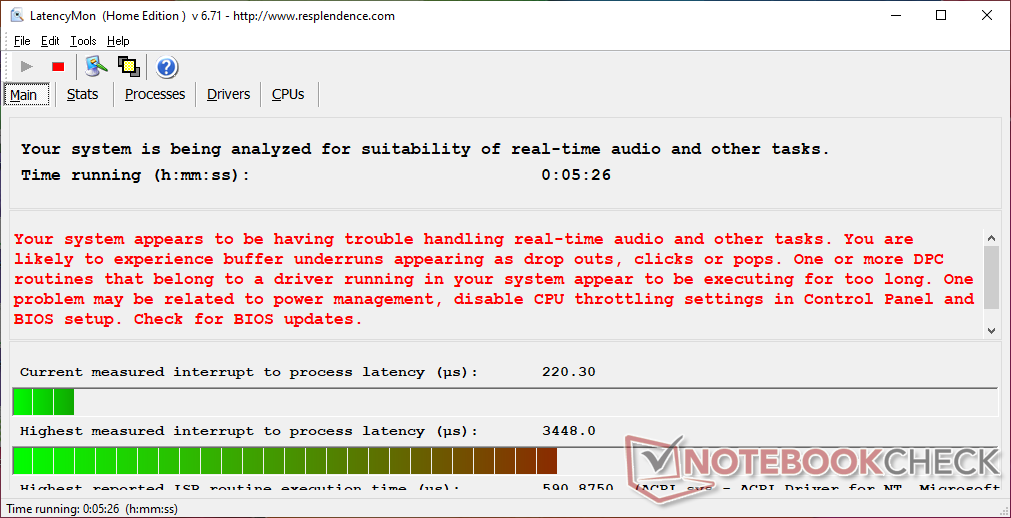
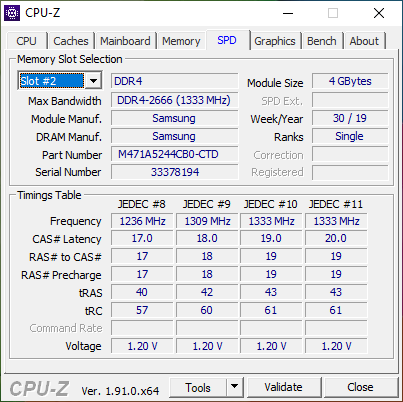
LatencyMon shows DPC latency issues even when wireless is enabled. RAM is expandable up to 16 GB across two SODIMM slots.
Processor
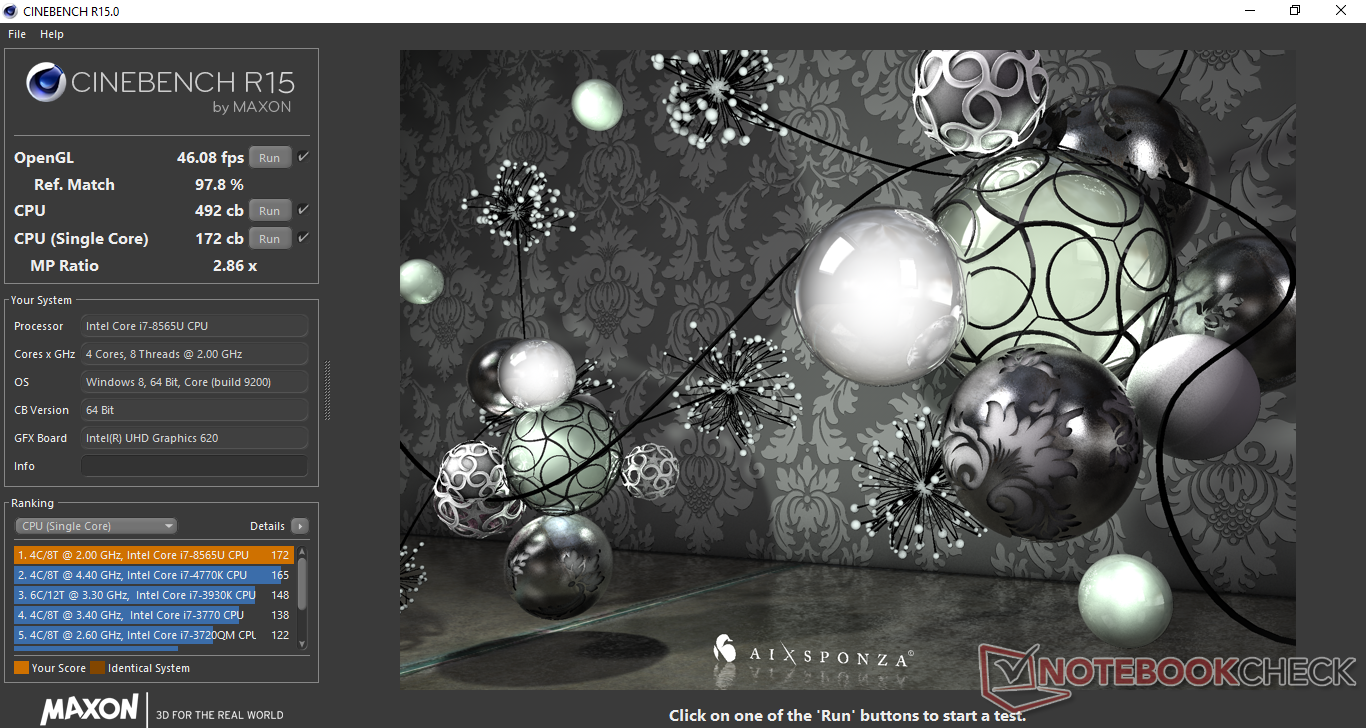
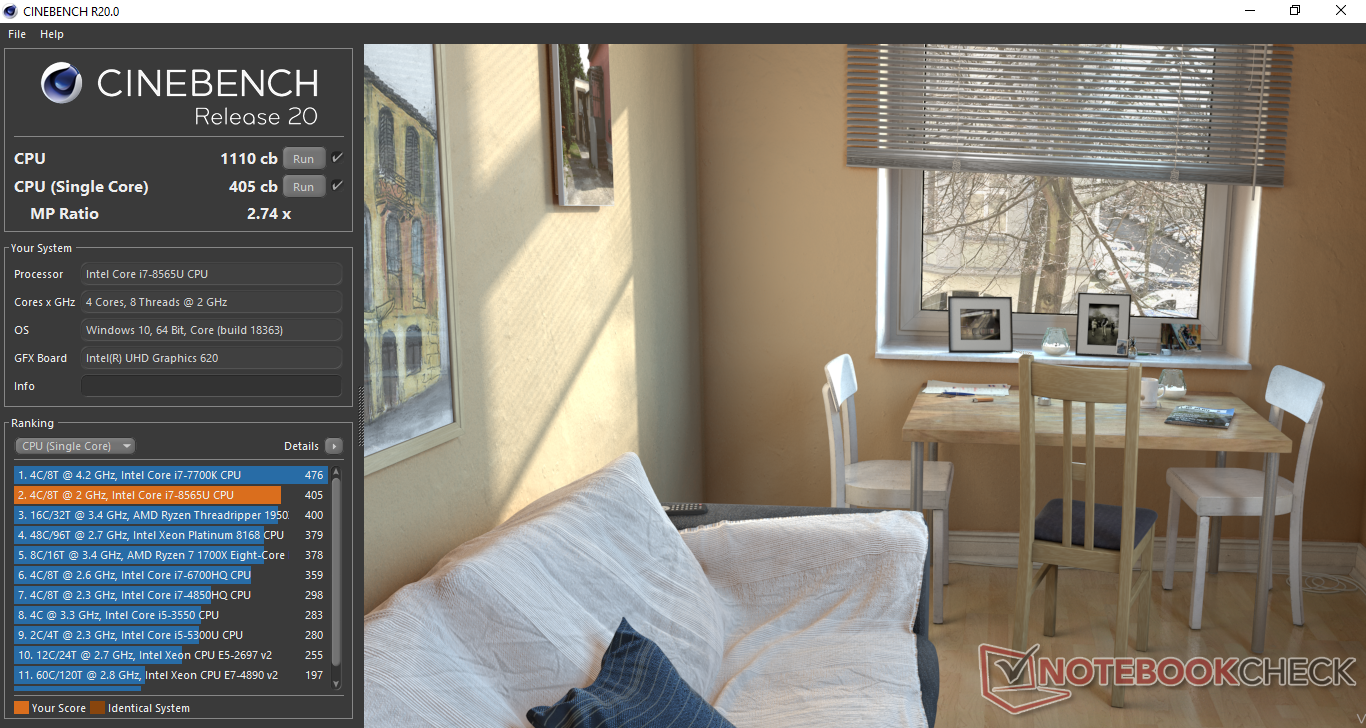
Raw multi-thread performance is about 9 to 16 percent slower than the average Core i7-8565U in our database taken from 50 other laptops with the same processor. The i7-8565U in the Spectre x360 13, for example, runs faster than our Pavilion. The deficit can be partly attributed to the almost non-existent Turbo Boost potential of the CPU in the Pavilion convertible. When running CineBench R15 Multi-Thread in a loop, for example, final scores remain steady throughout the run with no initial spike in clock rate that we would normally see on most other laptops.
Users can expect the same processor performance as the older Kaby Lake-R Core i7-8550U while being slower than the Ryzen 7 2700U in the Dell Latitude 5495.
See our dedicated page on the Core i7-8565U for more technical information and benchmark comparisons.
| Cinebench R10 | |
| Rendering Multiple CPUs 32Bit | |
| Dell XPS 13 7390 Core i7-10710U | |
| Average Intel Core i7-8565U (13806 - 23118, n=16) | |
| Dynabook Portege A30-E-174 | |
| Rendering Single 32Bit | |
| Dell XPS 13 7390 Core i7-10710U | |
| Average Intel Core i7-8565U (2682 - 8906, n=16) | |
| Dynabook Portege A30-E-174 | |
| wPrime 2.10 - 1024m | |
| Average Intel Core i7-8565U (263 - 420, n=7) | |
| Dell XPS 13 7390 Core i7-10710U | |
* ... smaller is better
System Performance
PCMark results are where we expect them to be when compared to other laptops with the same Core i7 CPU and integrated UHD Graphics 620 GPU. Its Digital Content Creation Score is particularly weak since this is most definitely not the laptop to be using for any sort of graphics or editing work.
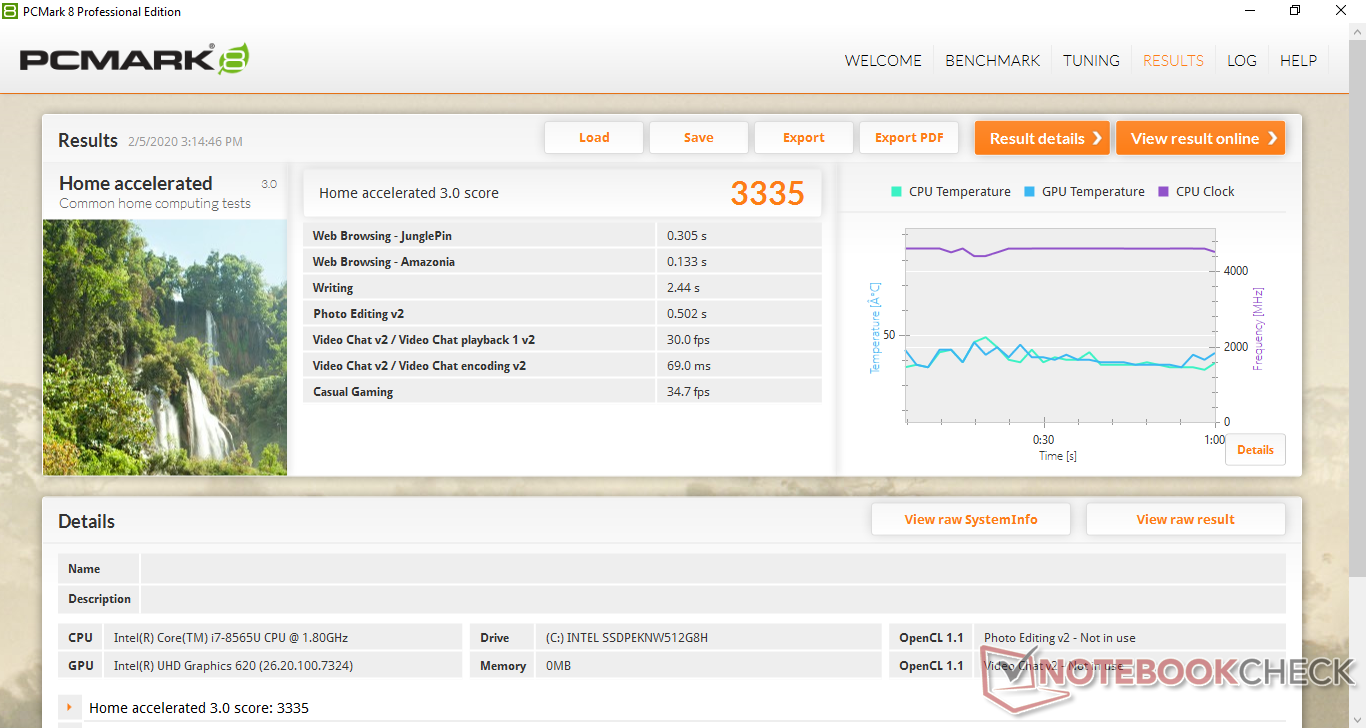
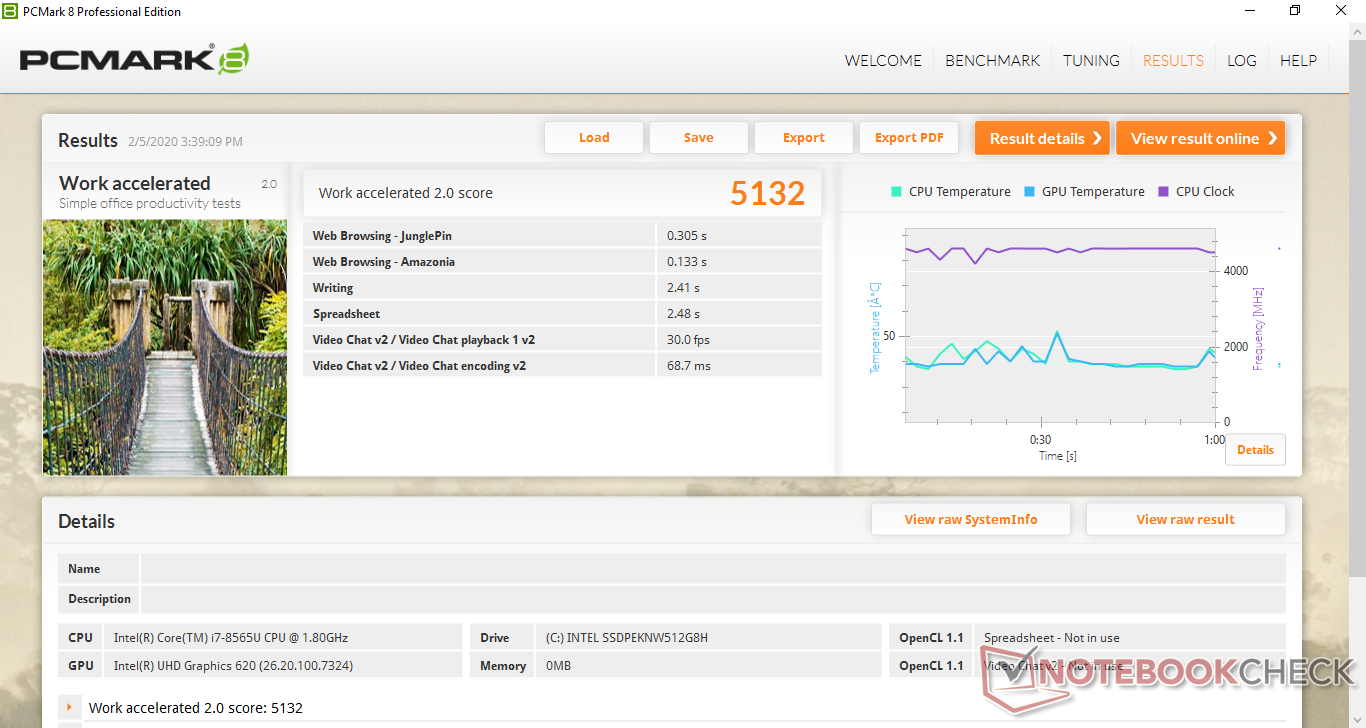
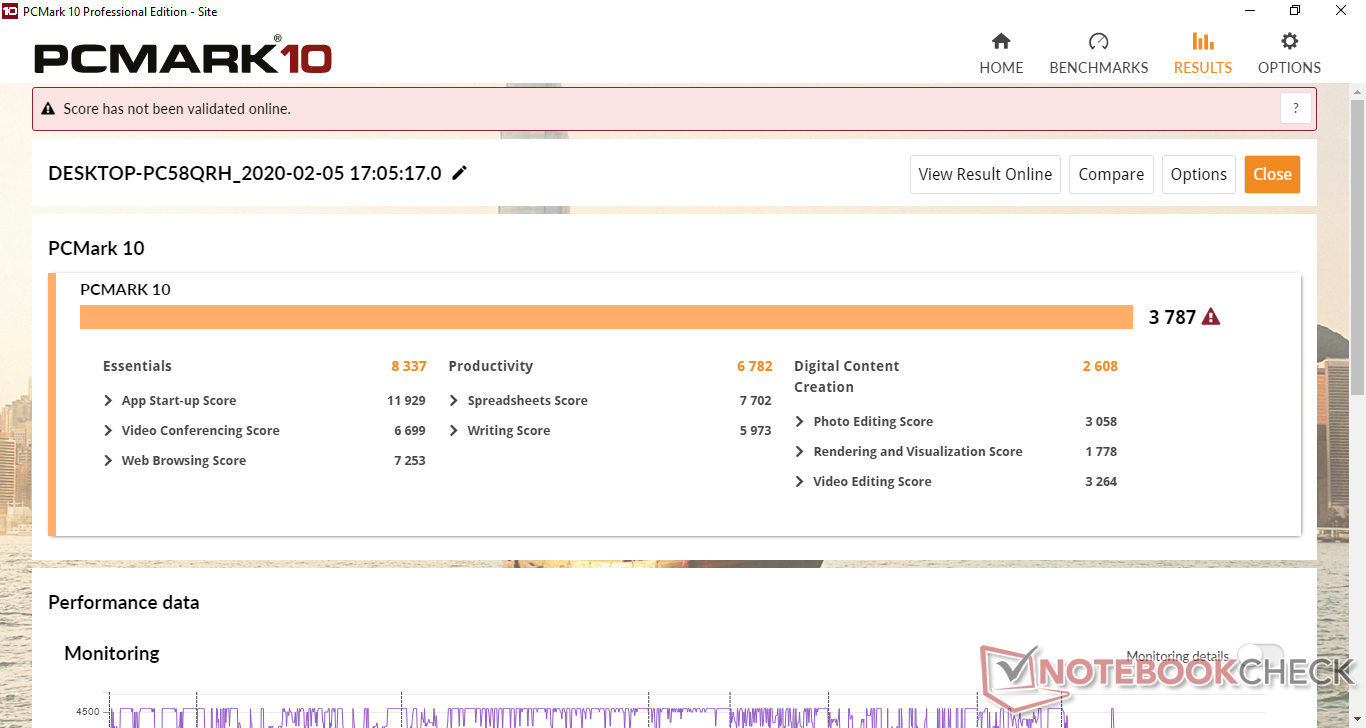
| PCMark 8 Home Score Accelerated v2 | 3335 points | |
| PCMark 8 Work Score Accelerated v2 | 5132 points | |
| PCMark 10 Score | 3787 points | |
Help | ||
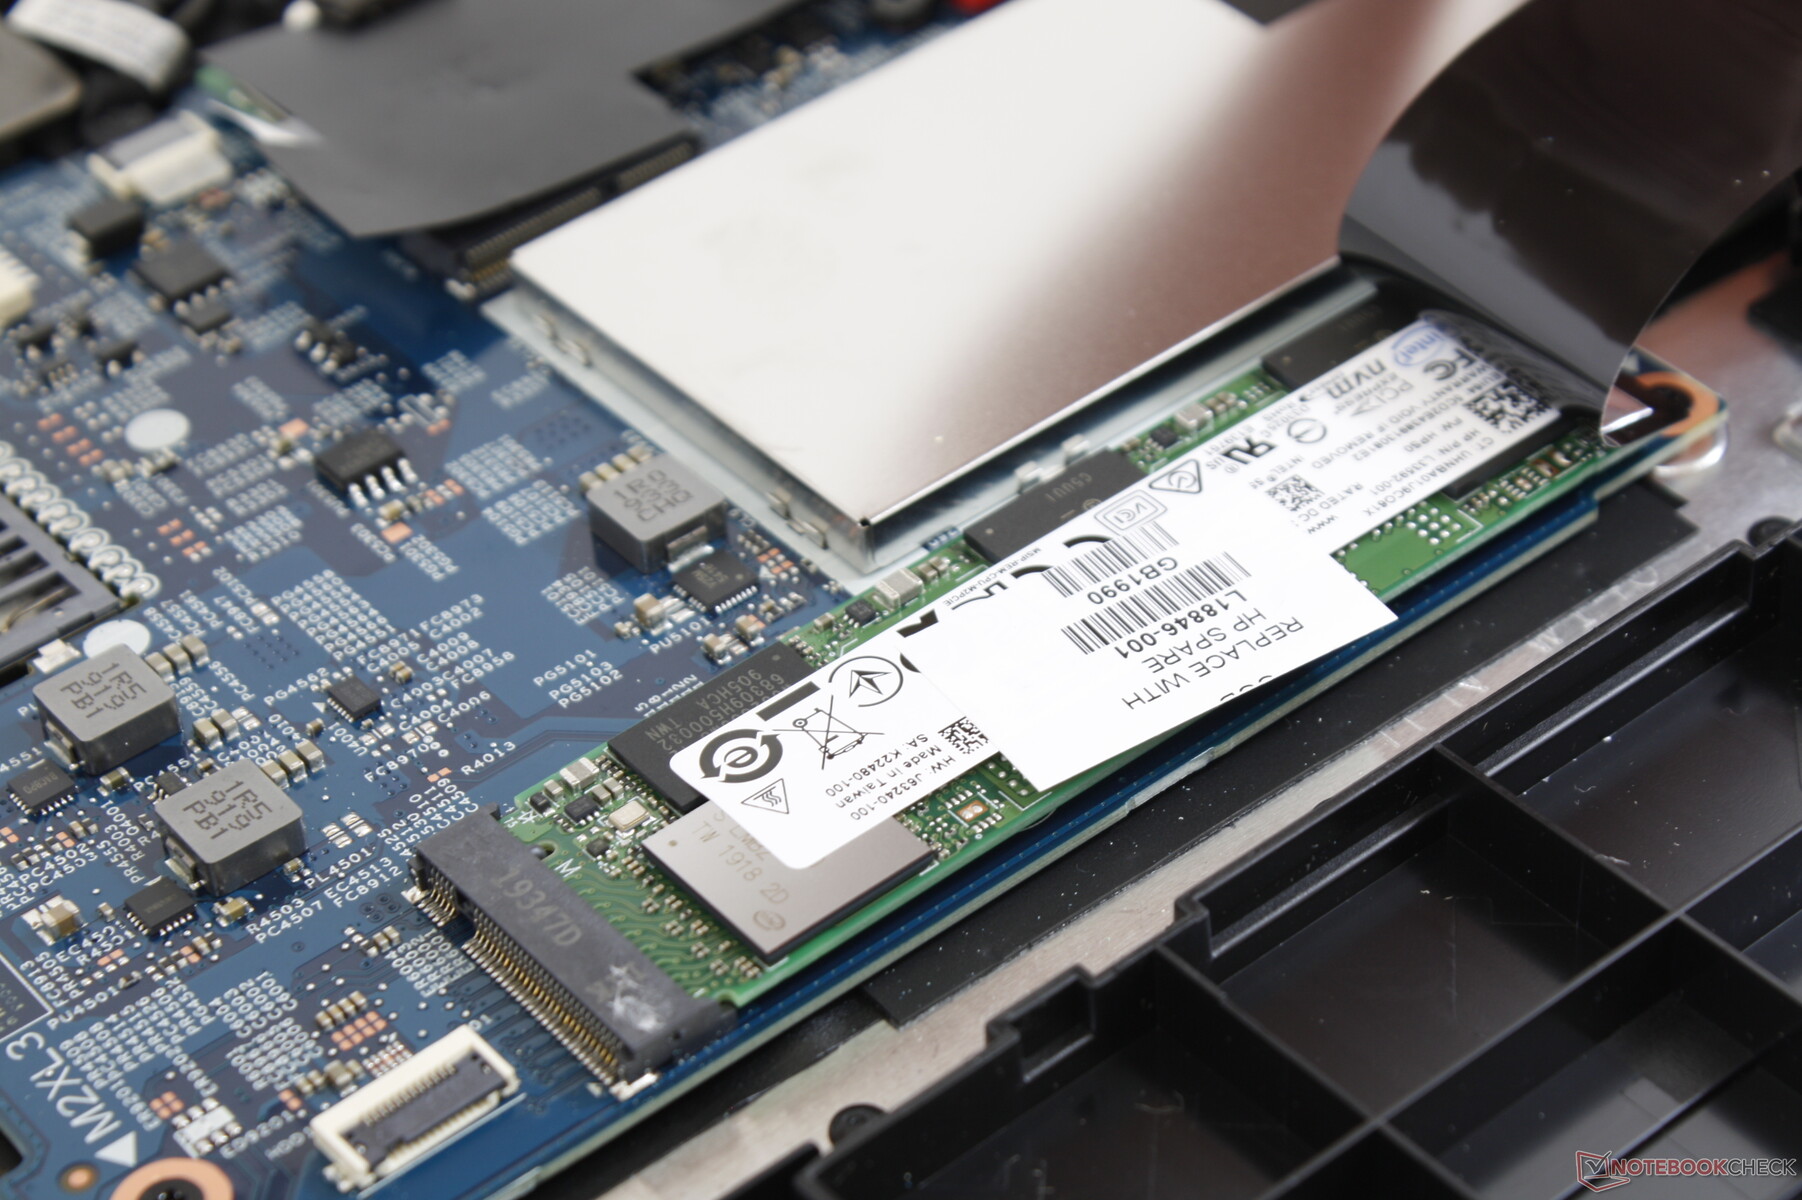
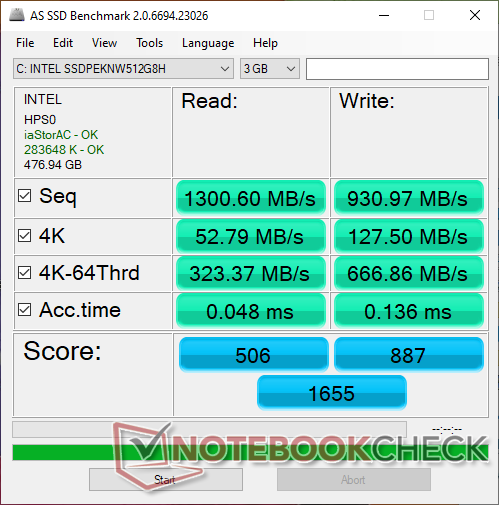
Storage Devices
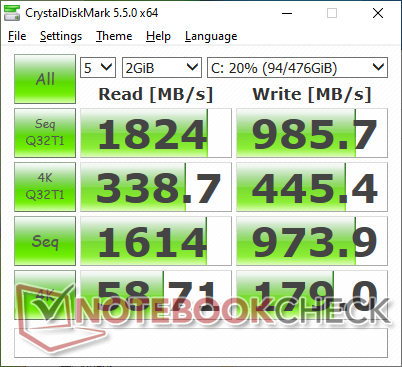
Only a single M.2 2280 storage slot is available. While our test unit comes with a mid-range 512 GB Intel 660p PCIe NVMe SSD, users can expect SSDs from different manufacturers depending on capacity and where the laptop is purchased. Sequential read and write rates hover around 1000 MB/s each compared to 1500 or 2000+ MB/s from the Samsung PM981 series or the Toshiba XG6 series.
See our table of HDDs and SSDs for more benchmark comparisons.
| HP Pavilion x360 15-dq0065cl Intel SSD 660p SSDPEKNW512G8 | Asus VivoBook Flip 15 TP510UA-E8073T SanDisk SD8SN8U128G1002 | Lenovo Ideapad C340-15IWL-81N5004QGE SK hynix BC501 HFM128GDJTNG-831 | HP Envy x360 15-bq102ng Samsung PM961 MZVLW256HEHP | Dell Inspiron 15 3585 (2300U, Vega 6) Toshiba BG3 KBG30ZMS256G | Dell XPS 15 7590 i5 iGPU FHD Toshiba XG6 KXG60ZNV512G | |
|---|---|---|---|---|---|---|
| AS SSD | -60% | -35% | 19% | -73% | 70% | |
| Seq Read (MB/s) | 1301 | 474.8 -64% | 1399 8% | 2465 89% | 1291 -1% | 2357 81% |
| Seq Write (MB/s) | 931 | 229.3 -75% | 369.8 -60% | 1318 42% | 688 -26% | 1235 33% |
| 4K Read (MB/s) | 52.8 | 26.42 -50% | 40 -24% | 42.97 -19% | 21.87 -59% | 43.29 -18% |
| 4K Write (MB/s) | 127.5 | 49.85 -61% | 109.2 -14% | 81.9 -36% | 35.62 -72% | 99.7 -22% |
| 4K-64 Read (MB/s) | 323.4 | 364.5 13% | 264.3 -18% | 1025 217% | 632 95% | 1020 215% |
| 4K-64 Write (MB/s) | 667 | 93.2 -86% | 181.9 -73% | 338.6 -49% | 221.2 -67% | 1502 125% |
| Access Time Read * (ms) | 0.048 | 0.13 -171% | 0.07 -46% | 0.077 -60% | 0.33 -588% | 0.07 -46% |
| Access Time Write * (ms) | 0.136 | 0.088 35% | 0.041 70% | 0.046 66% | 0.234 -72% | 0.039 71% |
| Score Read (Points) | 506 | 438 -13% | 444 -12% | 1314 160% | 783 55% | 1299 157% |
| Score Write (Points) | 887 | 166 -81% | 328 -63% | 552 -38% | 326 -63% | 1726 95% |
| Score Total (Points) | 1655 | 825 -50% | 963 -42% | 2488 50% | 1489 -10% | 3640 120% |
| Copy ISO MB/s (MB/s) | 905 | 317.8 -65% | 265.8 -71% | 700 -23% | 432.6 -52% | 2145 137% |
| Copy Program MB/s (MB/s) | 607 | 80.8 -87% | 158.7 -74% | 167.2 -72% | 95.6 -84% | 565 -7% |
| Copy Game MB/s (MB/s) | 911 | 127.1 -86% | 216.8 -76% | 370.4 -59% | 263.4 -71% | 1320 45% |
| CrystalDiskMark 5.2 / 6 | -39% | 4% | -39% | 32% | ||
| Write 4K (MB/s) | 179 | 105 -41% | 116 -35% | 87.3 -51% | 93.6 -48% | |
| Read 4K (MB/s) | 58.7 | 39.72 -32% | 42.73 -27% | 23.54 -60% | 41.87 -29% | |
| Write Seq (MB/s) | 974 | 326.9 -66% | 1222 25% | 824 -15% | 1698 74% | |
| Read Seq (MB/s) | 1614 | 1033 -36% | 1608 0% | 715 -56% | 1978 23% | |
| Write 4K Q32T1 (MB/s) | 445.4 | 269.1 -40% | 280.1 -37% | 147.8 -67% | 383.1 -14% | |
| Read 4K Q32T1 (MB/s) | 338.7 | 284.8 -16% | 333.6 -2% | 256.1 -24% | 326.9 -3% | |
| Write Seq Q32T1 (MB/s) | 986 | 321 -67% | 1291 31% | 733 -26% | 2778 182% | |
| Read Seq Q32T1 (MB/s) | 1824 | 1606 -12% | 3183 75% | 1525 -16% | 3119 71% | |
| Total Average (Program / Settings) | -60% /
-60% | -37% /
-37% | 12% /
14% | -56% /
-60% | 51% /
56% |
* ... smaller is better

GPU Performance
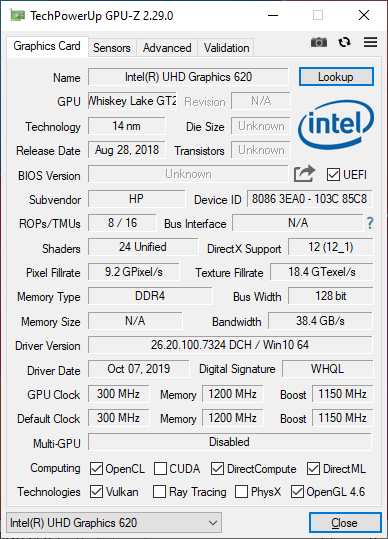
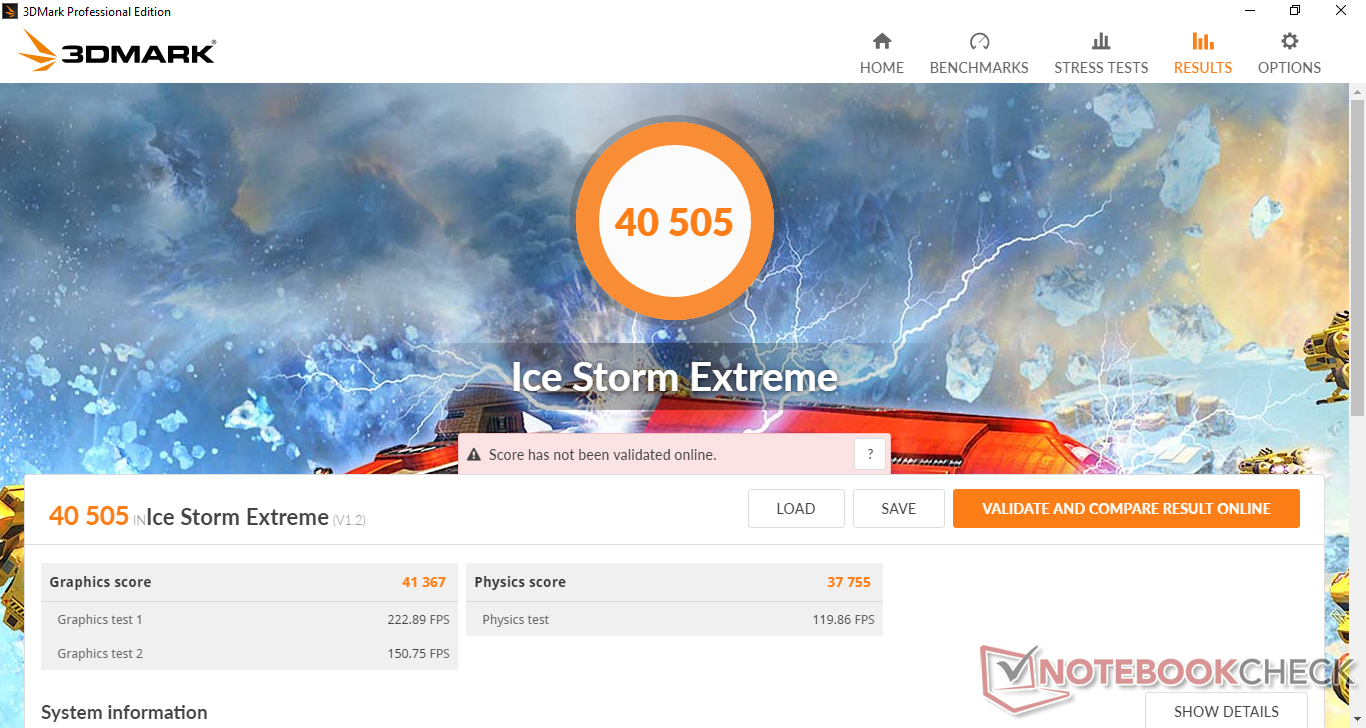
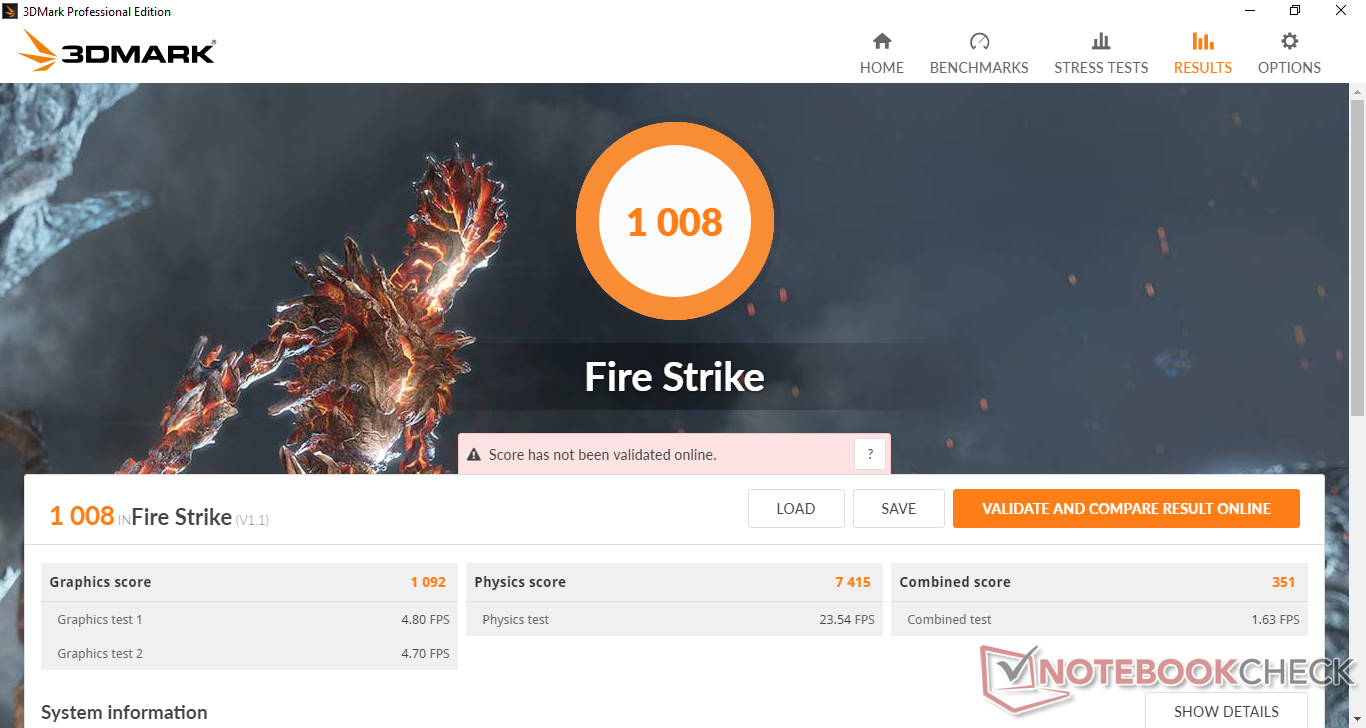
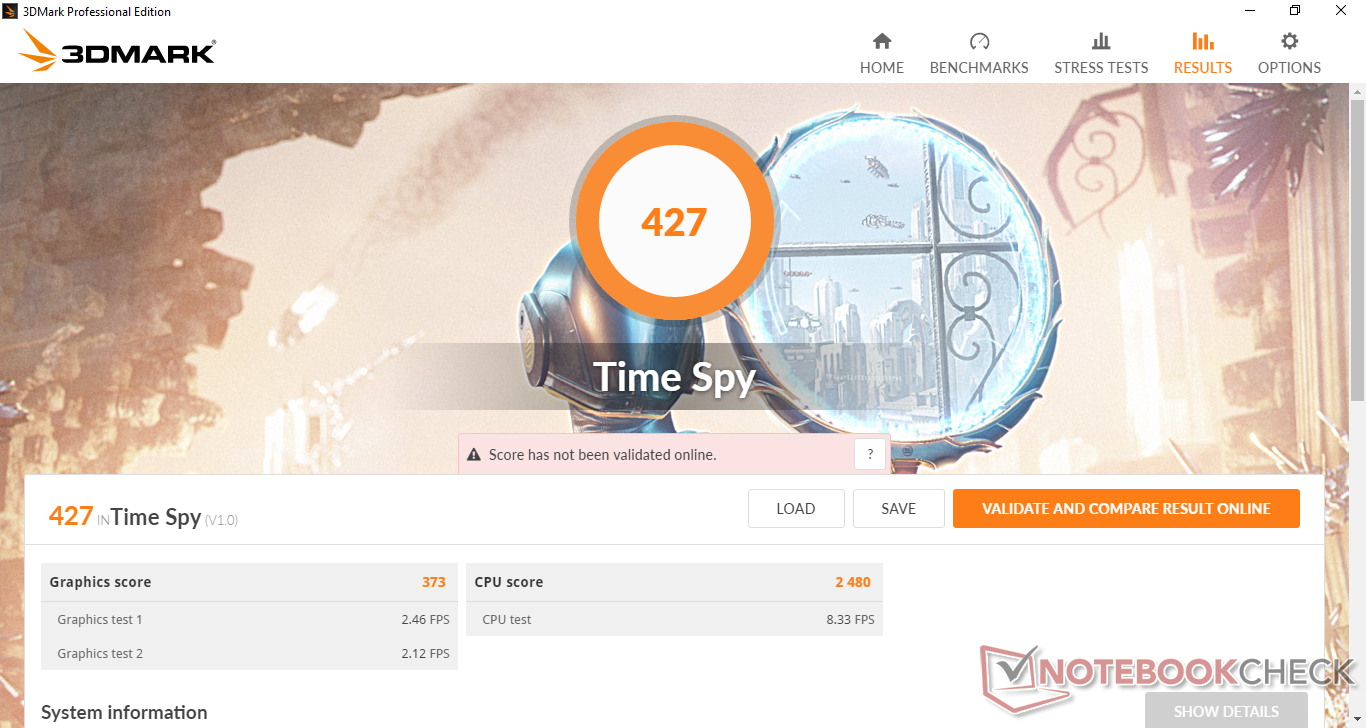
The UHD Graphics 620 is sorely outdated at this point. Don't expect to do very much graphically outside of video streaming and the occasional browser games. 4K30 playback will work without a hitch provided that you have an external monitor.
See our dedicated page on the UHD Graphics 620 for more technical information and benchmark comparisons.
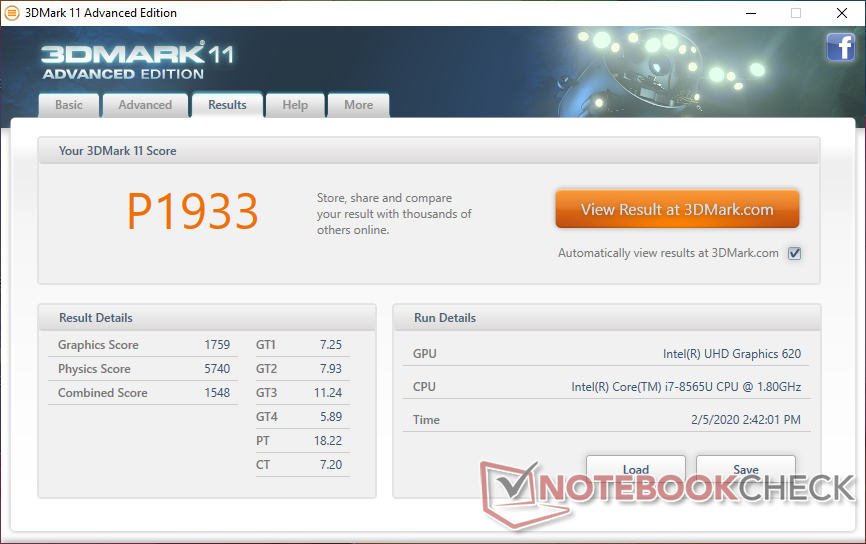
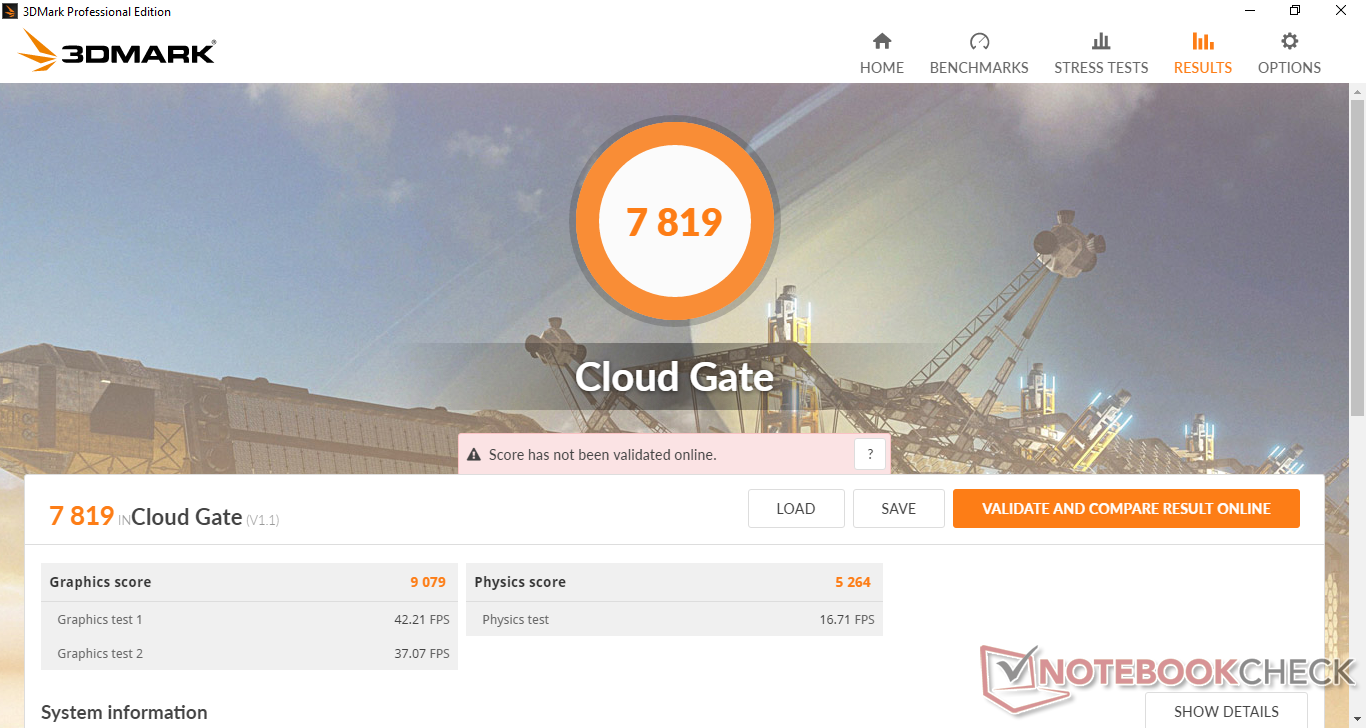
| 3DMark 11 Performance | 1933 points | |
| 3DMark Cloud Gate Standard Score | 7819 points | |
| 3DMark Fire Strike Score | 1008 points | |
| 3DMark Time Spy Score | 427 points | |
Help | ||
| Shadow of the Tomb Raider - 1280x720 Lowest Preset | |
| MSI Modern 14 A10RB-459US | |
| Dell Inspiron 15 5000 5585 | |
| Microsoft Surface Laptop 3 15 i7-1065G7 | |
| Dell Inspiron 15 3585 (2300U, Vega 6) | |
| Dell XPS 13 7390 Core i7-10710U | |
| Average Intel UHD Graphics 620 (12 - 21.7, n=13) | |
| low | med. | high | ultra | |
|---|---|---|---|---|
| BioShock Infinite (2013) | 49.1 | 30.5 | 24.7 | |
| The Witcher 3 (2015) | 16.8 | 10.5 | ||
| Rocket League (2017) | 62.7 |
Emissions
System Noise
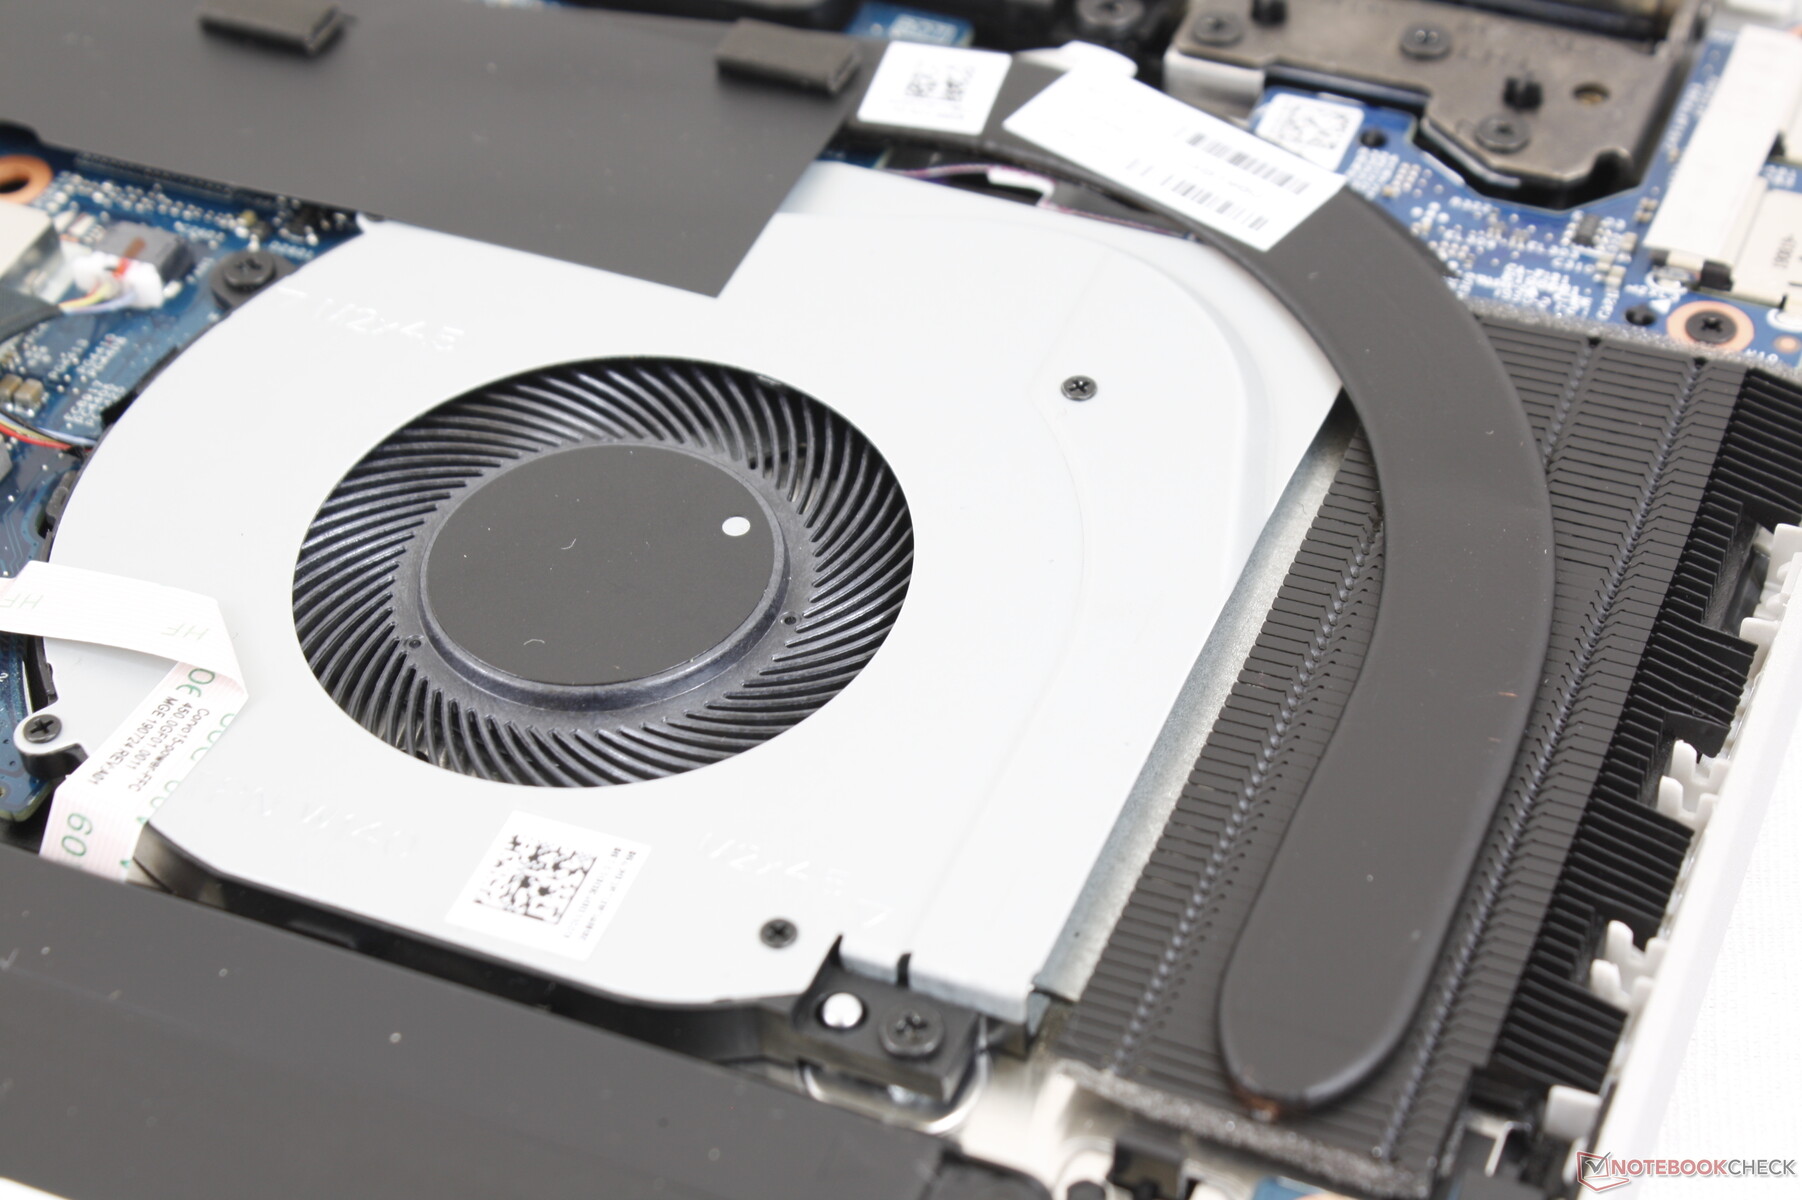
The cooling solution consists of a single fan and one heat pipe. The fan will idle during low loads like web browsing or emailing for a completely silent experience. At worst, we're able to record a fan noise of just 31.5 dB(A) when running 3DMark 06 for about 90 seconds. Running Both Prime95 and FurMark will induce a maximum fan noise of just over 37 dB(A), but this is an extreme case. In general, the Pavilion x360 15 is quieter than many of its competitors.
We experienced no coil whine or electronic noise on our test unit.
| HP Pavilion x360 15-dq0065cl UHD Graphics 620, i7-8565U, Intel SSD 660p SSDPEKNW512G8 | Asus VivoBook Flip 15 TP510UA-E8073T UHD Graphics 620, i5-8250U, SanDisk SD8SN8U128G1002 | Lenovo Ideapad C340-15IWL-81N5004QGE GeForce MX230, i5-8265U, SK hynix BC501 HFM128GDJTNG-831 | HP Envy x360 15-bq102ng Vega 8, R5 2500U, Samsung PM961 MZVLW256HEHP | Dell Inspiron 15 3585 (2300U, Vega 6) Vega 6, R3 2300U, Toshiba BG3 KBG30ZMS256G | Dell XPS 15 7590 i5 iGPU FHD UHD Graphics 630, i5-9300H, Toshiba XG6 KXG60ZNV512G | |
|---|---|---|---|---|---|---|
| Noise | -6% | -8% | -9% | -10% | -3% | |
| off / environment * (dB) | 28.4 | 30.2 -6% | 30.3 -7% | 30.13 -6% | 30.6 -8% | 29.3 -3% |
| Idle Minimum * (dB) | 28.4 | 30.9 -9% | 30.6 -8% | 30.13 -6% | 30.6 -8% | 29.3 -3% |
| Idle Average * (dB) | 28.4 | 30.9 -9% | 30.6 -8% | 30.13 -6% | 30.6 -8% | 29.3 -3% |
| Idle Maximum * (dB) | 28.4 | 30.9 -9% | 30.6 -8% | 30.13 -6% | 30.6 -8% | 29.8 -5% |
| Load Average * (dB) | 31.5 | 34.2 -9% | 36.4 -16% | 38.8 -23% | 36.7 -17% | 32.4 -3% |
| Load Maximum * (dB) | 37.4 | 34.2 9% | 36.8 2% | 38.8 -4% | 41.1 -10% | 37.2 1% |
* ... smaller is better
Noise level
| Idle |
| 28.4 / 28.4 / 28.4 dB(A) |
| Load |
| 31.5 / 37.4 dB(A) |
 | ||
30 dB silent 40 dB(A) audible 50 dB(A) loud |
||
min: | ||
Temperature
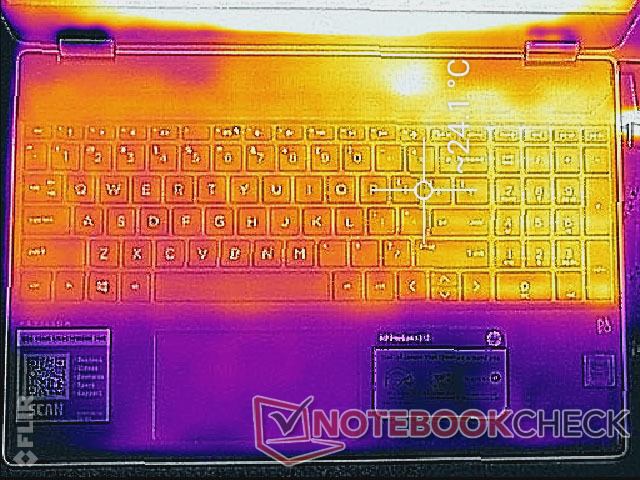
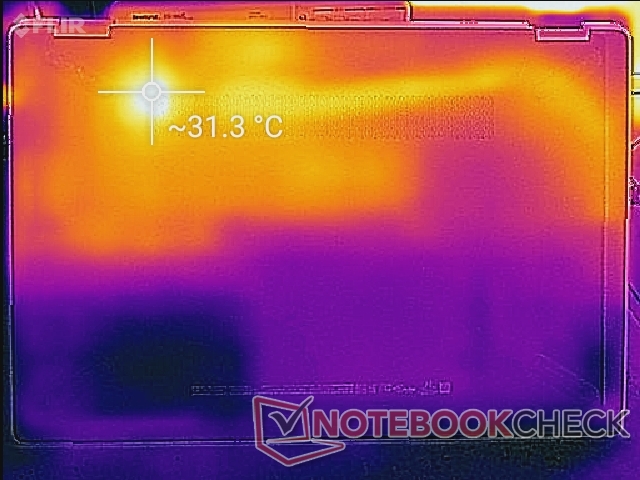
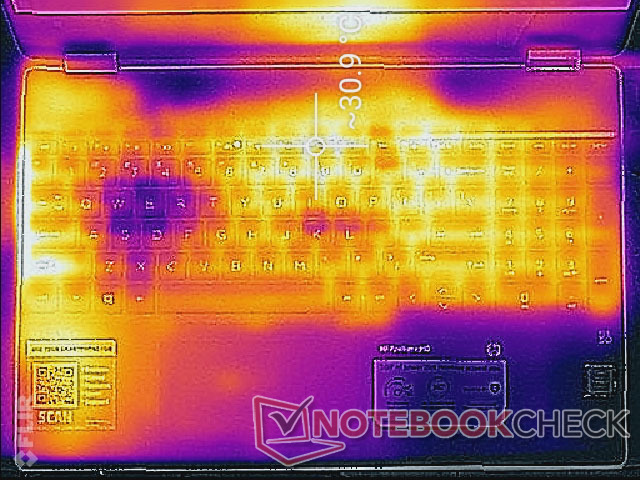
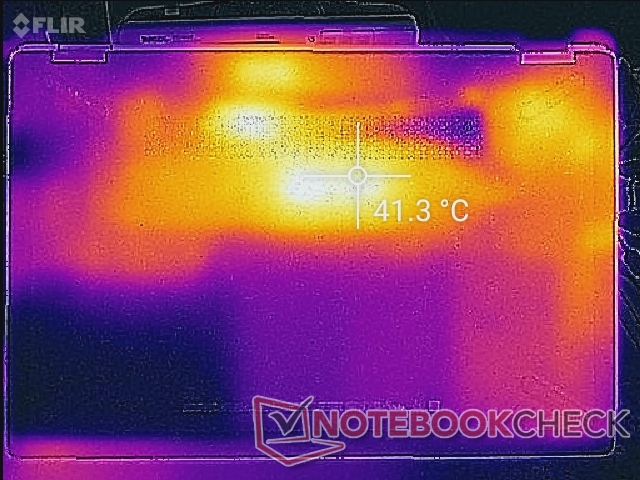
Surface temperatures are never a bother due in part to the relatively low core temperatures and lack of a dedicated GPU. At worst, the warmest spots on the keyboard deck and bottom can reach 31 C and 41 C, respectively, when running very high processing loads. The Pavilion runs cooler than what we recorded on the Envy 15 with the Ryzen 5 2500U.
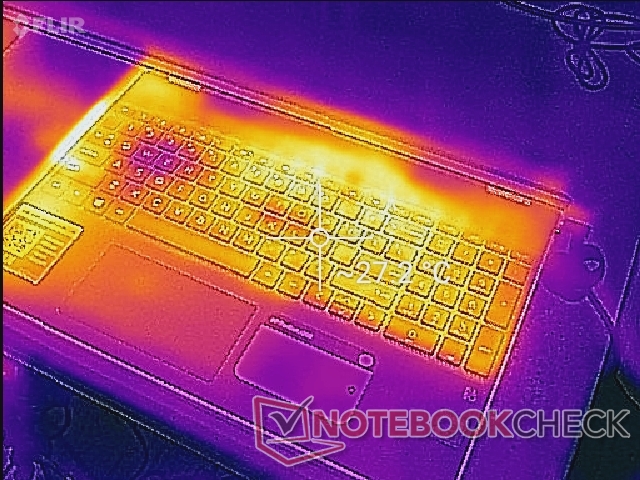
(+) The maximum temperature on the upper side is 31.6 °C / 89 F, compared to the average of 36.8 °C / 98 F, ranging from 21 to 71 °C for the class Multimedia.
(±) The bottom heats up to a maximum of 41.6 °C / 107 F, compared to the average of 39.1 °C / 102 F
(+) In idle usage, the average temperature for the upper side is 22.9 °C / 73 F, compared to the device average of 31.3 °C / 88 F.
(+) The palmrests and touchpad are cooler than skin temperature with a maximum of 29.8 °C / 85.6 F and are therefore cool to the touch.
(±) The average temperature of the palmrest area of similar devices was 28.7 °C / 83.7 F (-1.1 °C / -1.9 F).
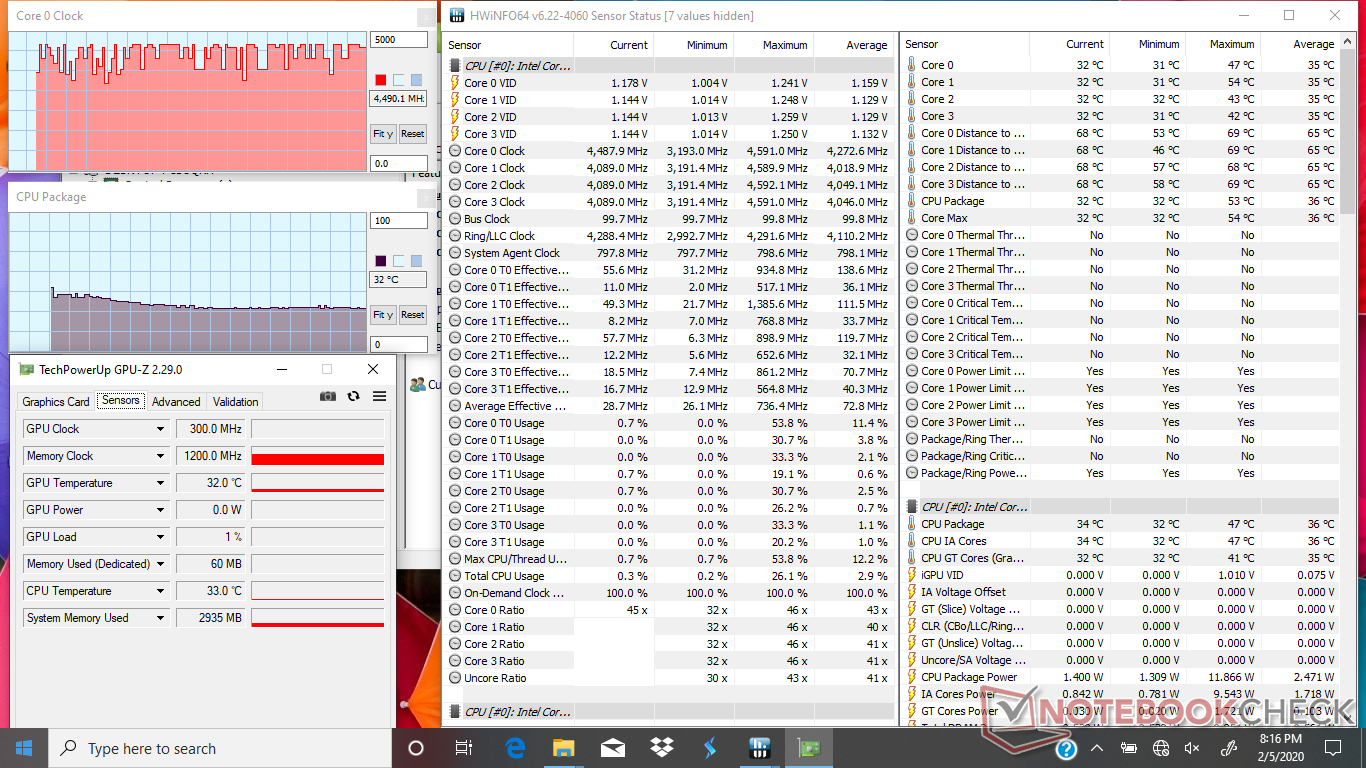
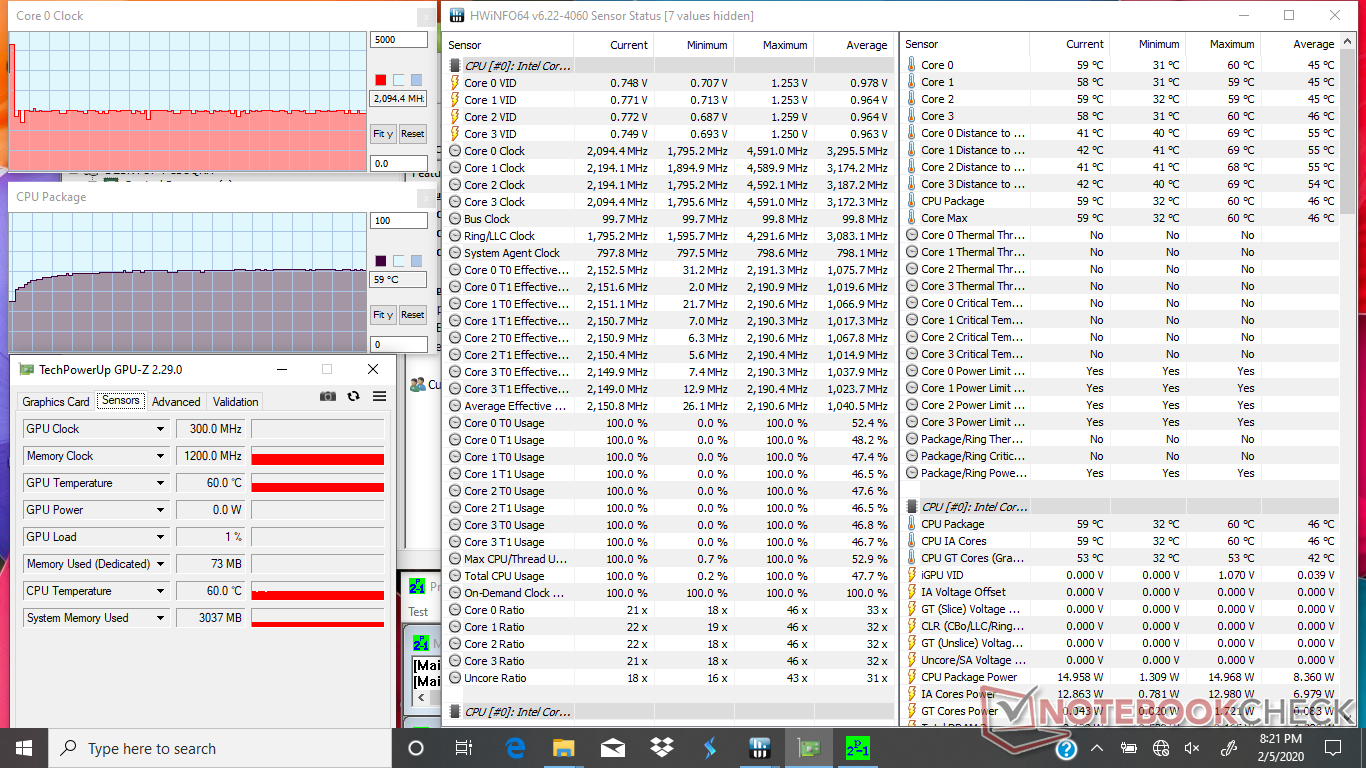
Stress Test
We stress the system with synthetic loads to identify for any potential throttling or stability issues. When running Prime95 to stress the CPU, clock rates would jump to the 2.1 to 2.2 GHz range and then maintain that speed indefinitely at a relatively cool core temperature of 59 C. The Core i7-8565U, however, is rated for a maximum multi-core Turbo Boost of 4.1 GHz meaning that the Pavilion system isn't exploiting the performance potential of the CPU. Results are somewhat similar to the older HP Spectre x360 15 with the Core i7-8550U as that would stabilize at 2.1 GHz and 64 C when under similar Prime95 stress conditions. Running both Prime95 and FurMark simultaneously will throttle the CPU to just 1.0 GHz while maintaining a core temperature of 59 C. There is definitely temperature overhead for faster Turbo Boost clock rates, but that is not exploited here at all.
Running on batteries will not limit performance. A 3DMark 11 run on battery power returns Physics and Graphics scores of 5511 and 1735 points, respectively, compared to 5740 and 1759 points when on mains.
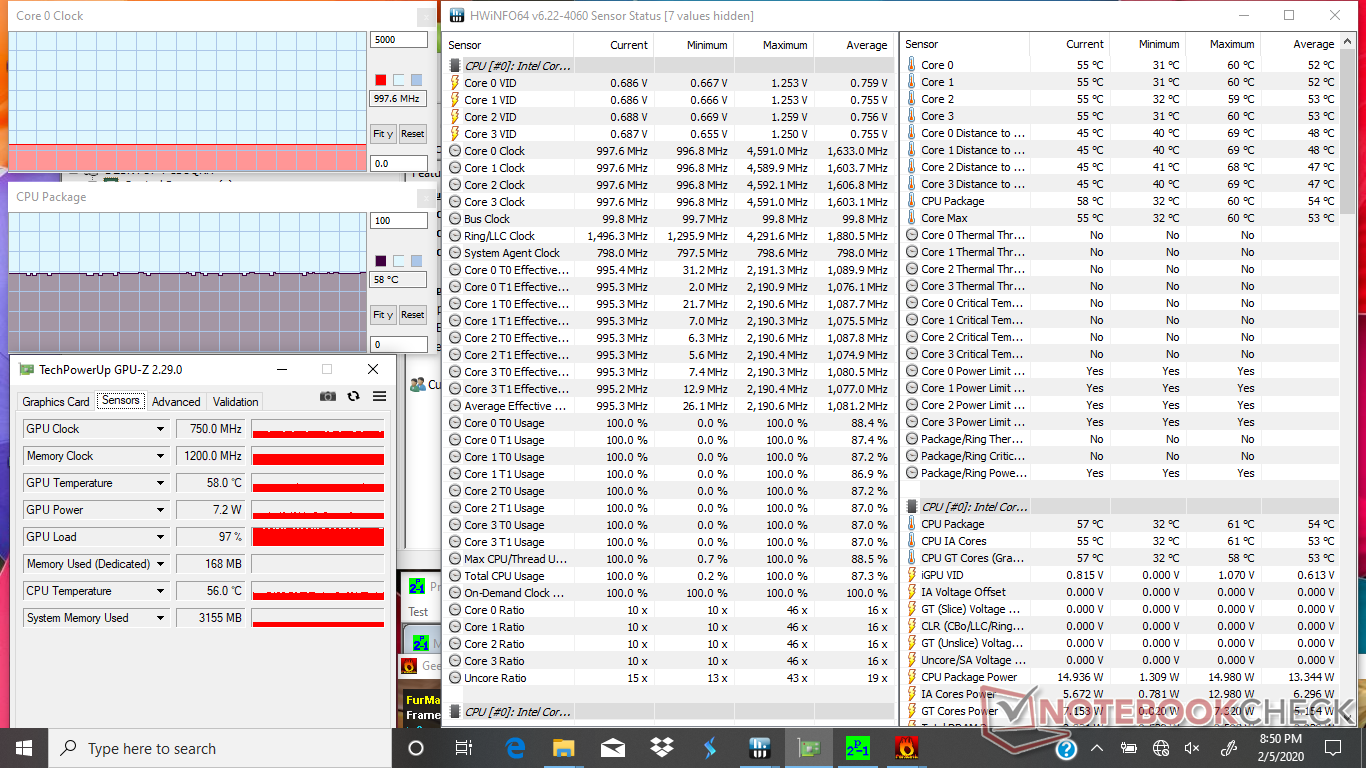
| CPU Clock (GHz) | GPU Clock (MHz) | Average CPU Temperature (°C) | |
| System Idle | -- | -- | 32 |
| Prime95 Stress | 2.1 - 2.2 | -- | 59 |
| Prime95 + FurMark Stress | 1.0 | 750 | 59 |
Speakers
Maximum volume is about the same as on the HP Spectre x360 15 (~80 dB). Pink noise measurements, however, reveal a narrower scope of frequencies and poorer bass reproduction on the Pavilion system. Maximum volume introduces no static or surface vibrations.


HP Pavilion x360 15-dq0065cl audio analysis
(±) | speaker loudness is average but good (80.3 dB)
Bass 100 - 315 Hz
(±) | reduced bass - on average 12.7% lower than median
(-) | bass is not linear (15.3% delta to prev. frequency)
Mids 400 - 2000 Hz
(+) | balanced mids - only 3.6% away from median
(±) | linearity of mids is average (7% delta to prev. frequency)
Highs 2 - 16 kHz
(+) | balanced highs - only 3.6% away from median
(±) | linearity of highs is average (7% delta to prev. frequency)
Overall 100 - 16.000 Hz
(±) | linearity of overall sound is average (20.1% difference to median)
Compared to same class
» 67% of all tested devices in this class were better, 8% similar, 25% worse
» The best had a delta of 5%, average was 17%, worst was 45%
Compared to all devices tested
» 52% of all tested devices were better, 8% similar, 40% worse
» The best had a delta of 4%, average was 23%, worst was 134%
Apple MacBook 12 (Early 2016) 1.1 GHz audio analysis
(+) | speakers can play relatively loud (83.6 dB)
Bass 100 - 315 Hz
(±) | reduced bass - on average 11.3% lower than median
(±) | linearity of bass is average (14.2% delta to prev. frequency)
Mids 400 - 2000 Hz
(+) | balanced mids - only 2.4% away from median
(+) | mids are linear (5.5% delta to prev. frequency)
Highs 2 - 16 kHz
(+) | balanced highs - only 2% away from median
(+) | highs are linear (4.5% delta to prev. frequency)
Overall 100 - 16.000 Hz
(+) | overall sound is linear (10.2% difference to median)
Compared to same class
» 7% of all tested devices in this class were better, 2% similar, 90% worse
» The best had a delta of 5%, average was 18%, worst was 53%
Compared to all devices tested
» 5% of all tested devices were better, 1% similar, 94% worse
» The best had a delta of 4%, average was 23%, worst was 134%
Energy Management
Power Consumption
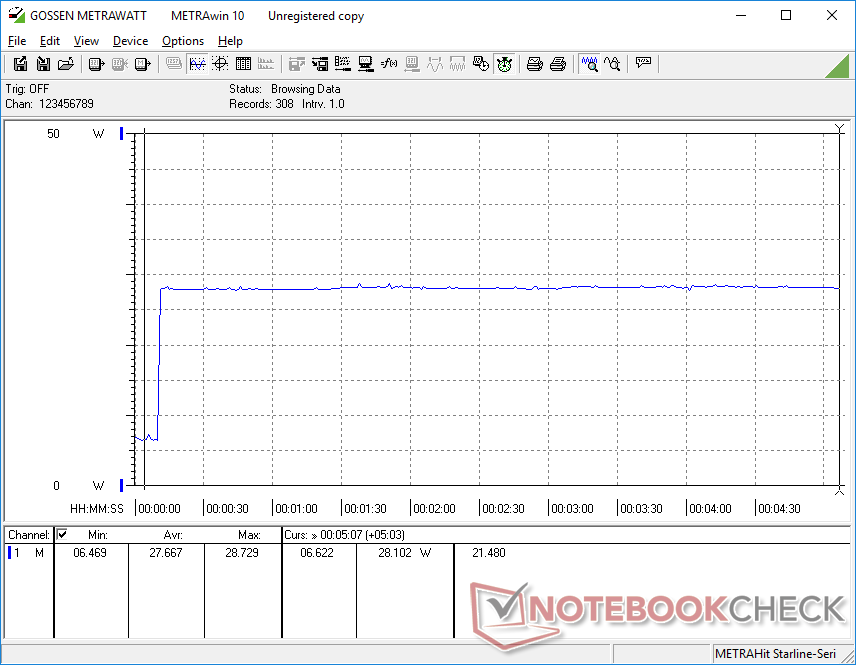
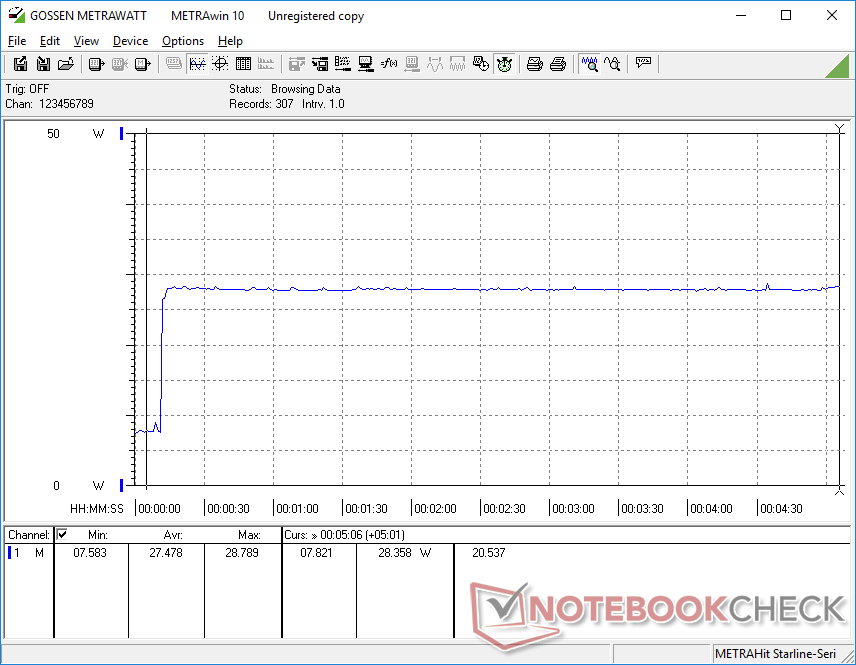
Idling on desktop consumes about 3 W to 7 W depending on the power profile and brightness setting to be just slightly more power efficient than the Asus VivoBook Flip 15 or Lenovo Ideapad C340 each with higher resolution 1080p displays. Running 3DMark 06 will bump consumption to 26.7 W compared to 37 W and 38 W on the Asus VivoBook Flip 15 or Ryzen 3 2300U-powered Dell Inspiron 15 3585. The Pavilion is more efficient mostly because it doesn't benefit from any significant Turbo Boost upticks.
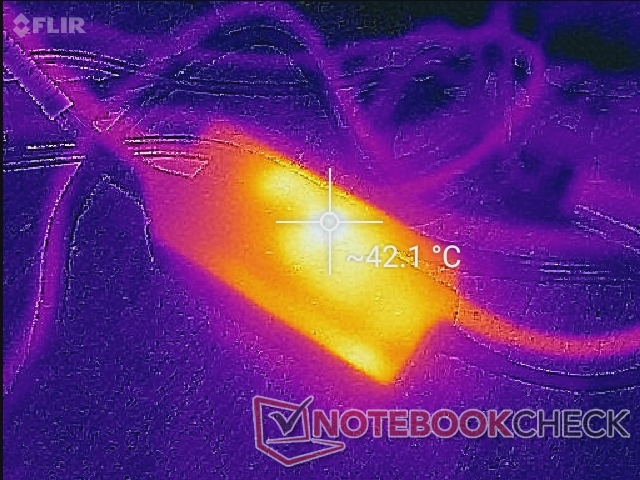
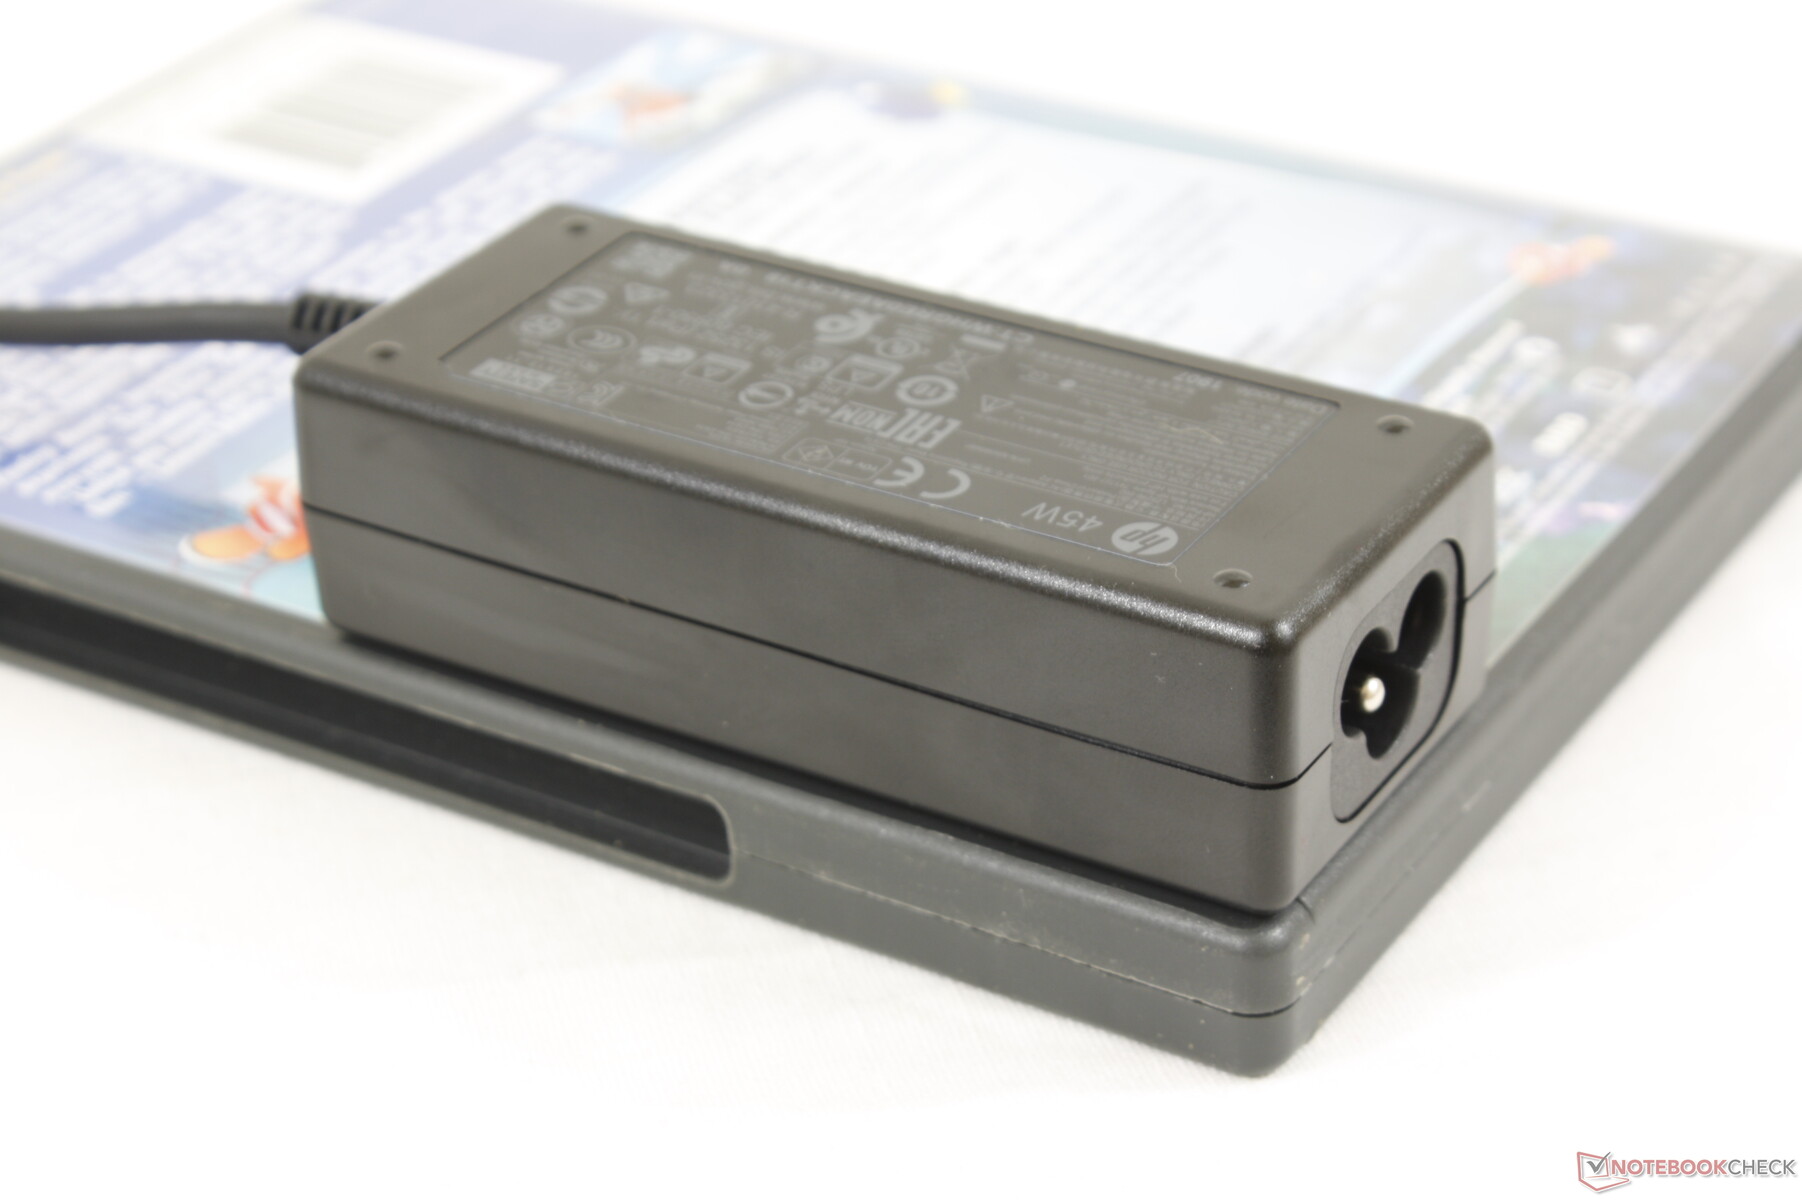
We're able to measure a maximum consumption of 28.8 W from the small (~9.4 x 3.9 x 2.7 cm) 45 W adapter. Attempting to recharge the system via USB Type-C will not work.

| Off / Standby | |
| Idle | |
| Load |
|
Key:
min: | |
| HP Pavilion x360 15-dq0065cl i7-8565U, UHD Graphics 620, Intel SSD 660p SSDPEKNW512G8, TN LED, 1366x768, 15.6" | Asus VivoBook Flip 15 TP510UA-E8073T i5-8250U, UHD Graphics 620, SanDisk SD8SN8U128G1002, IPS, 1920x1080, 15.6" | Lenovo Ideapad C340-15IWL-81N5004QGE i5-8265U, GeForce MX230, SK hynix BC501 HFM128GDJTNG-831, IPS, 1920x1080, 15.6" | HP Envy x360 15-bq102ng R5 2500U, Vega 8, Samsung PM961 MZVLW256HEHP, IPS, 1920x1080, 15.6" | Dell Inspiron 15 3585 (2300U, Vega 6) R3 2300U, Vega 6, Toshiba BG3 KBG30ZMS256G, TN, 1920x1080, 15.6" | Dell XPS 15 7590 i5 iGPU FHD i5-9300H, UHD Graphics 630, Toshiba XG6 KXG60ZNV512G, IPS, 1920x1080, 15.6" | |
|---|---|---|---|---|---|---|
| Power Consumption | -28% | -48% | -43% | -59% | -96% | |
| Idle Minimum * (Watt) | 3.6 | 3.9 -8% | 3.23 10% | 4.8 -33% | 6.3 -75% | 3.79 -5% |
| Idle Average * (Watt) | 5.4 | 7.2 -33% | 6.3 -17% | 7 -30% | 9.2 -70% | 6.9 -28% |
| Idle Maximum * (Watt) | 6.5 | 9.5 -46% | 8 -23% | 9.5 -46% | 9.6 -48% | 9.2 -42% |
| Load Average * (Watt) | 26.7 | 36.8 -38% | 47 -76% | 40.8 -53% | 38 -42% | 62 -132% |
| Load Maximum * (Watt) | 28.8 | 33.1 -15% | 67.3 -134% | 44.3 -54% | 46 -60% | 108 -275% |
* ... smaller is better
Battery Life
Battery capacity is small at just 41 Wh compared to 56 Wh and 84 Wh on the pricier Envy x360 15 and Spectre x360 15, respectively. Runtimes are unsurprisingly short at just over 4 hours of real-world WLAN use. Recharging from empty to full capacity takes about 1.5 hours.
| HP Pavilion x360 15-dq0065cl i7-8565U, UHD Graphics 620, 41 Wh | Asus VivoBook Flip 15 TP510UA-E8073T i5-8250U, UHD Graphics 620, 42 Wh | Lenovo Ideapad C340-15IWL-81N5004QGE i5-8265U, GeForce MX230, 52.5 Wh | HP Envy x360 15-bq102ng R5 2500U, Vega 8, 55.8 Wh | Dell Inspiron 15 3585 (2300U, Vega 6) R3 2300U, Vega 6, 42 Wh | Dell XPS 15 7590 i5 iGPU FHD i5-9300H, UHD Graphics 630, 97 Wh | |
|---|---|---|---|---|---|---|
| Battery runtime | 40% | 100% | 65% | 4% | 125% | |
| Reader / Idle (h) | 12.3 | 7.3 -41% | ||||
| WiFi v1.3 (h) | 4.3 | 6 40% | 8.6 100% | 7.1 65% | 5.3 23% | 14.1 228% |
| Load (h) | 1.4 | 1.8 29% | 1.7 21% |
Pros
Cons
Verdict
The redeeming aspects of the 2019 Pavilion x360 15 are its narrow bezels, light weight, and small dimensions relative to other budget convertibles of this size category. Port options are respectable and fan noise is relatively quiet due to the limited Turbo Boost and good core temperatures.
Unfortunately, almost everything else falls apart. For a $1000, the Pavilion x360 15 offers short battery life, a weak chassis design and one of the worst displays you can get on any laptop with a Whiskey Lake-U CPU. The display is dim, contrast is low, colors are poor, and viewing angles are narrow because of the TN panel which almost completely negates the benefits of a 2-in-1 form factor. A configuration like this should not even exist at this price range.
Now, the actual Pavilion x360 15 model isn't bad for a budget laptop. Lower-end configurations retail for about $500 to be an easier pill to swallow. Nonetheless, we highly recommend configuring any SKU with the 1080p panel instead. If the convertible form factor is not a must-have, then the Walmart Motile could be a worthwhile alternative.
Not worth the exorbitant four-digit market price. If you're willing to spend $1000 on a new laptop, then consider the HP Envy or Spectre instead.
HP Pavilion x360 15-dq0065cl
- 02/09/2020 v7 (old)
Allen Ngo
Price comparison
