6th Gen Intel Skylake-U in 2020: Chuwi AeroBook Plus 4K Laptop Review
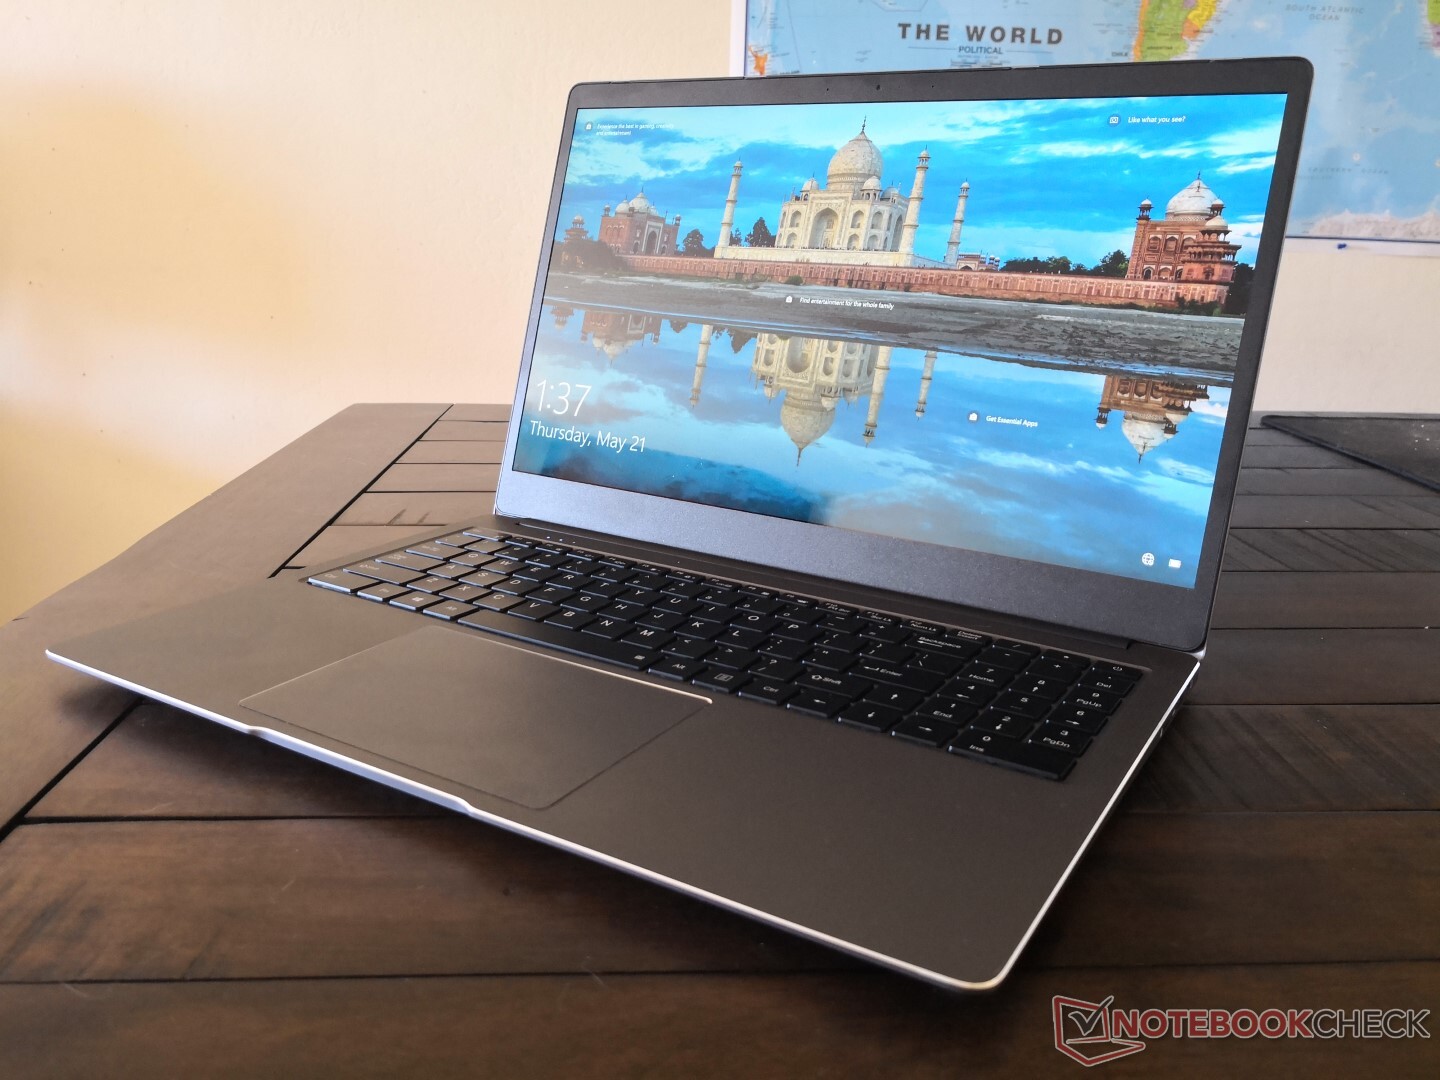
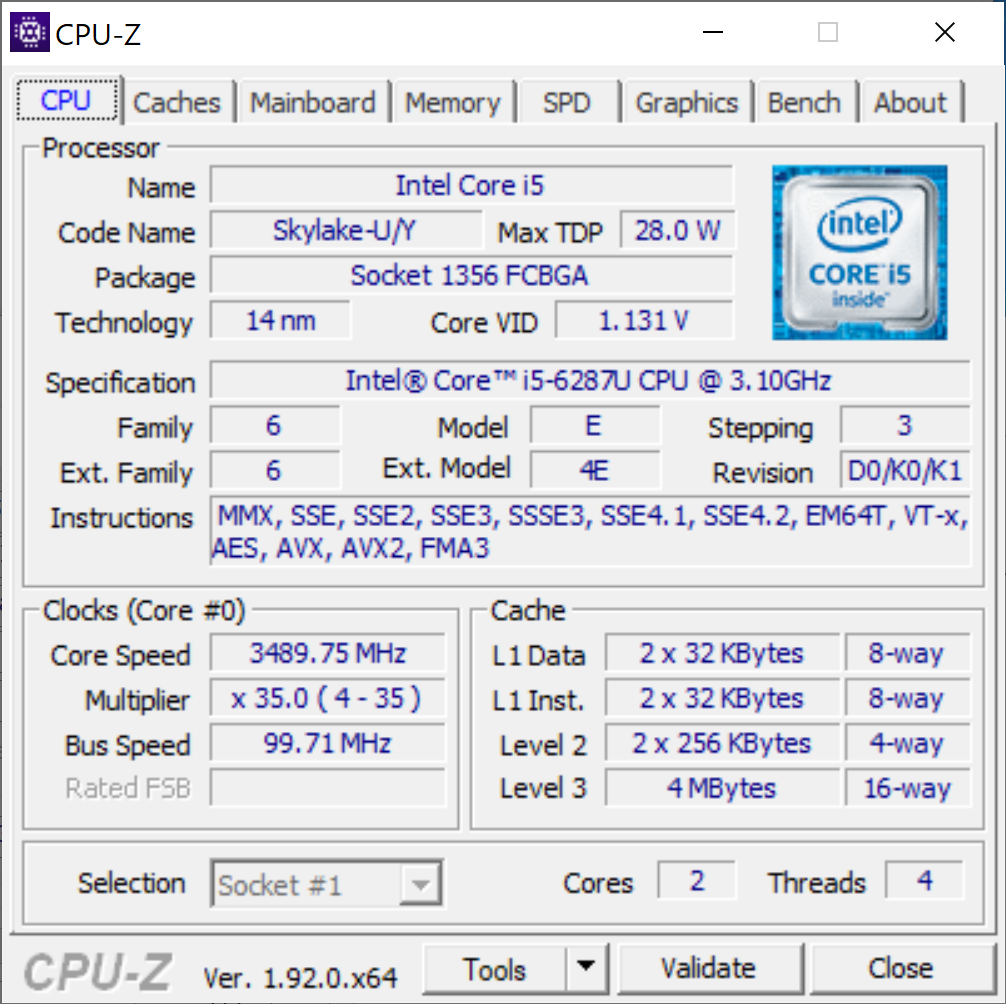
The Chuwi AeroBook Plus (previously the AeroBook Pro 15.6) follows the Chuwi tradition of sleek metal chassis designs powered by low-power or inexpensive processors. In this case, the AeroBook Plus is a MacBook-like laptop with a 15.6-inch 4K UHD display and a 28 W Core i5-6287U CPU. This particular processor is part of Intel's old 6th generation Skylake family that can also be found on the 2016 Apple MacBook Pro 13. Core i7-6567U SKUs are also planned. We suspect that Chuwi wanted to go with these Skylake processors instead of something newer to save on costs.
According to the Chuwi's Indiegogo page, the 4K AeroBook Plus can be had for $530 USD and up. The system is in a unique position because it's designed to look like an Ultrabook worth twice the price while having the performance level of a cheaper subnotebook. We're going to find out in this review how well can a four-year old dual-core Intel processor compete against the latest and most common Ultrabooks from Dell, HP, Lenovo, and others.
More Chuwi reviews:
Rating | Date | Model | Weight | Height | Size | Resolution | Price |
|---|---|---|---|---|---|---|---|
| 73.2 % v7 (old) | 05 / 2020 | Chuwi AeroBook Plus 6287U, Iris Graphics 550 | 1.7 kg | 15.9 mm | 15.60" | 3840x2160 | |
| 87.9 % v7 (old) | 07 / 2018 | Apple MacBook Pro 15 2018 (2.6 GHz, 560X) i7-8850H, Radeon Pro 560X | 1.8 kg | 15.5 mm | 15.40" | 2880x1800 | |
| 81.4 % v7 (old) | 01 / 2020 | Lenovo Ideapad S540-15IML i5-10210U, GeForce MX250 | 1.9 kg | 17 mm | 15.60" | 1920x1080 | |
| 80.1 % v6 (old) | 03 / 2018 | HP Envy x360 15-bq102ng R5 2500U, Vega 8 | 2.1 kg | 19.6 mm | 15.60" | 1920x1080 | |
| 73.1 % v7 (old) | 04 / 2020 | Asus Vivobook 15 F512DA-SH31 R3 3200U, Vega 3 | 1.8 kg | 19.9 mm | 15.60" | 1920x1080 |
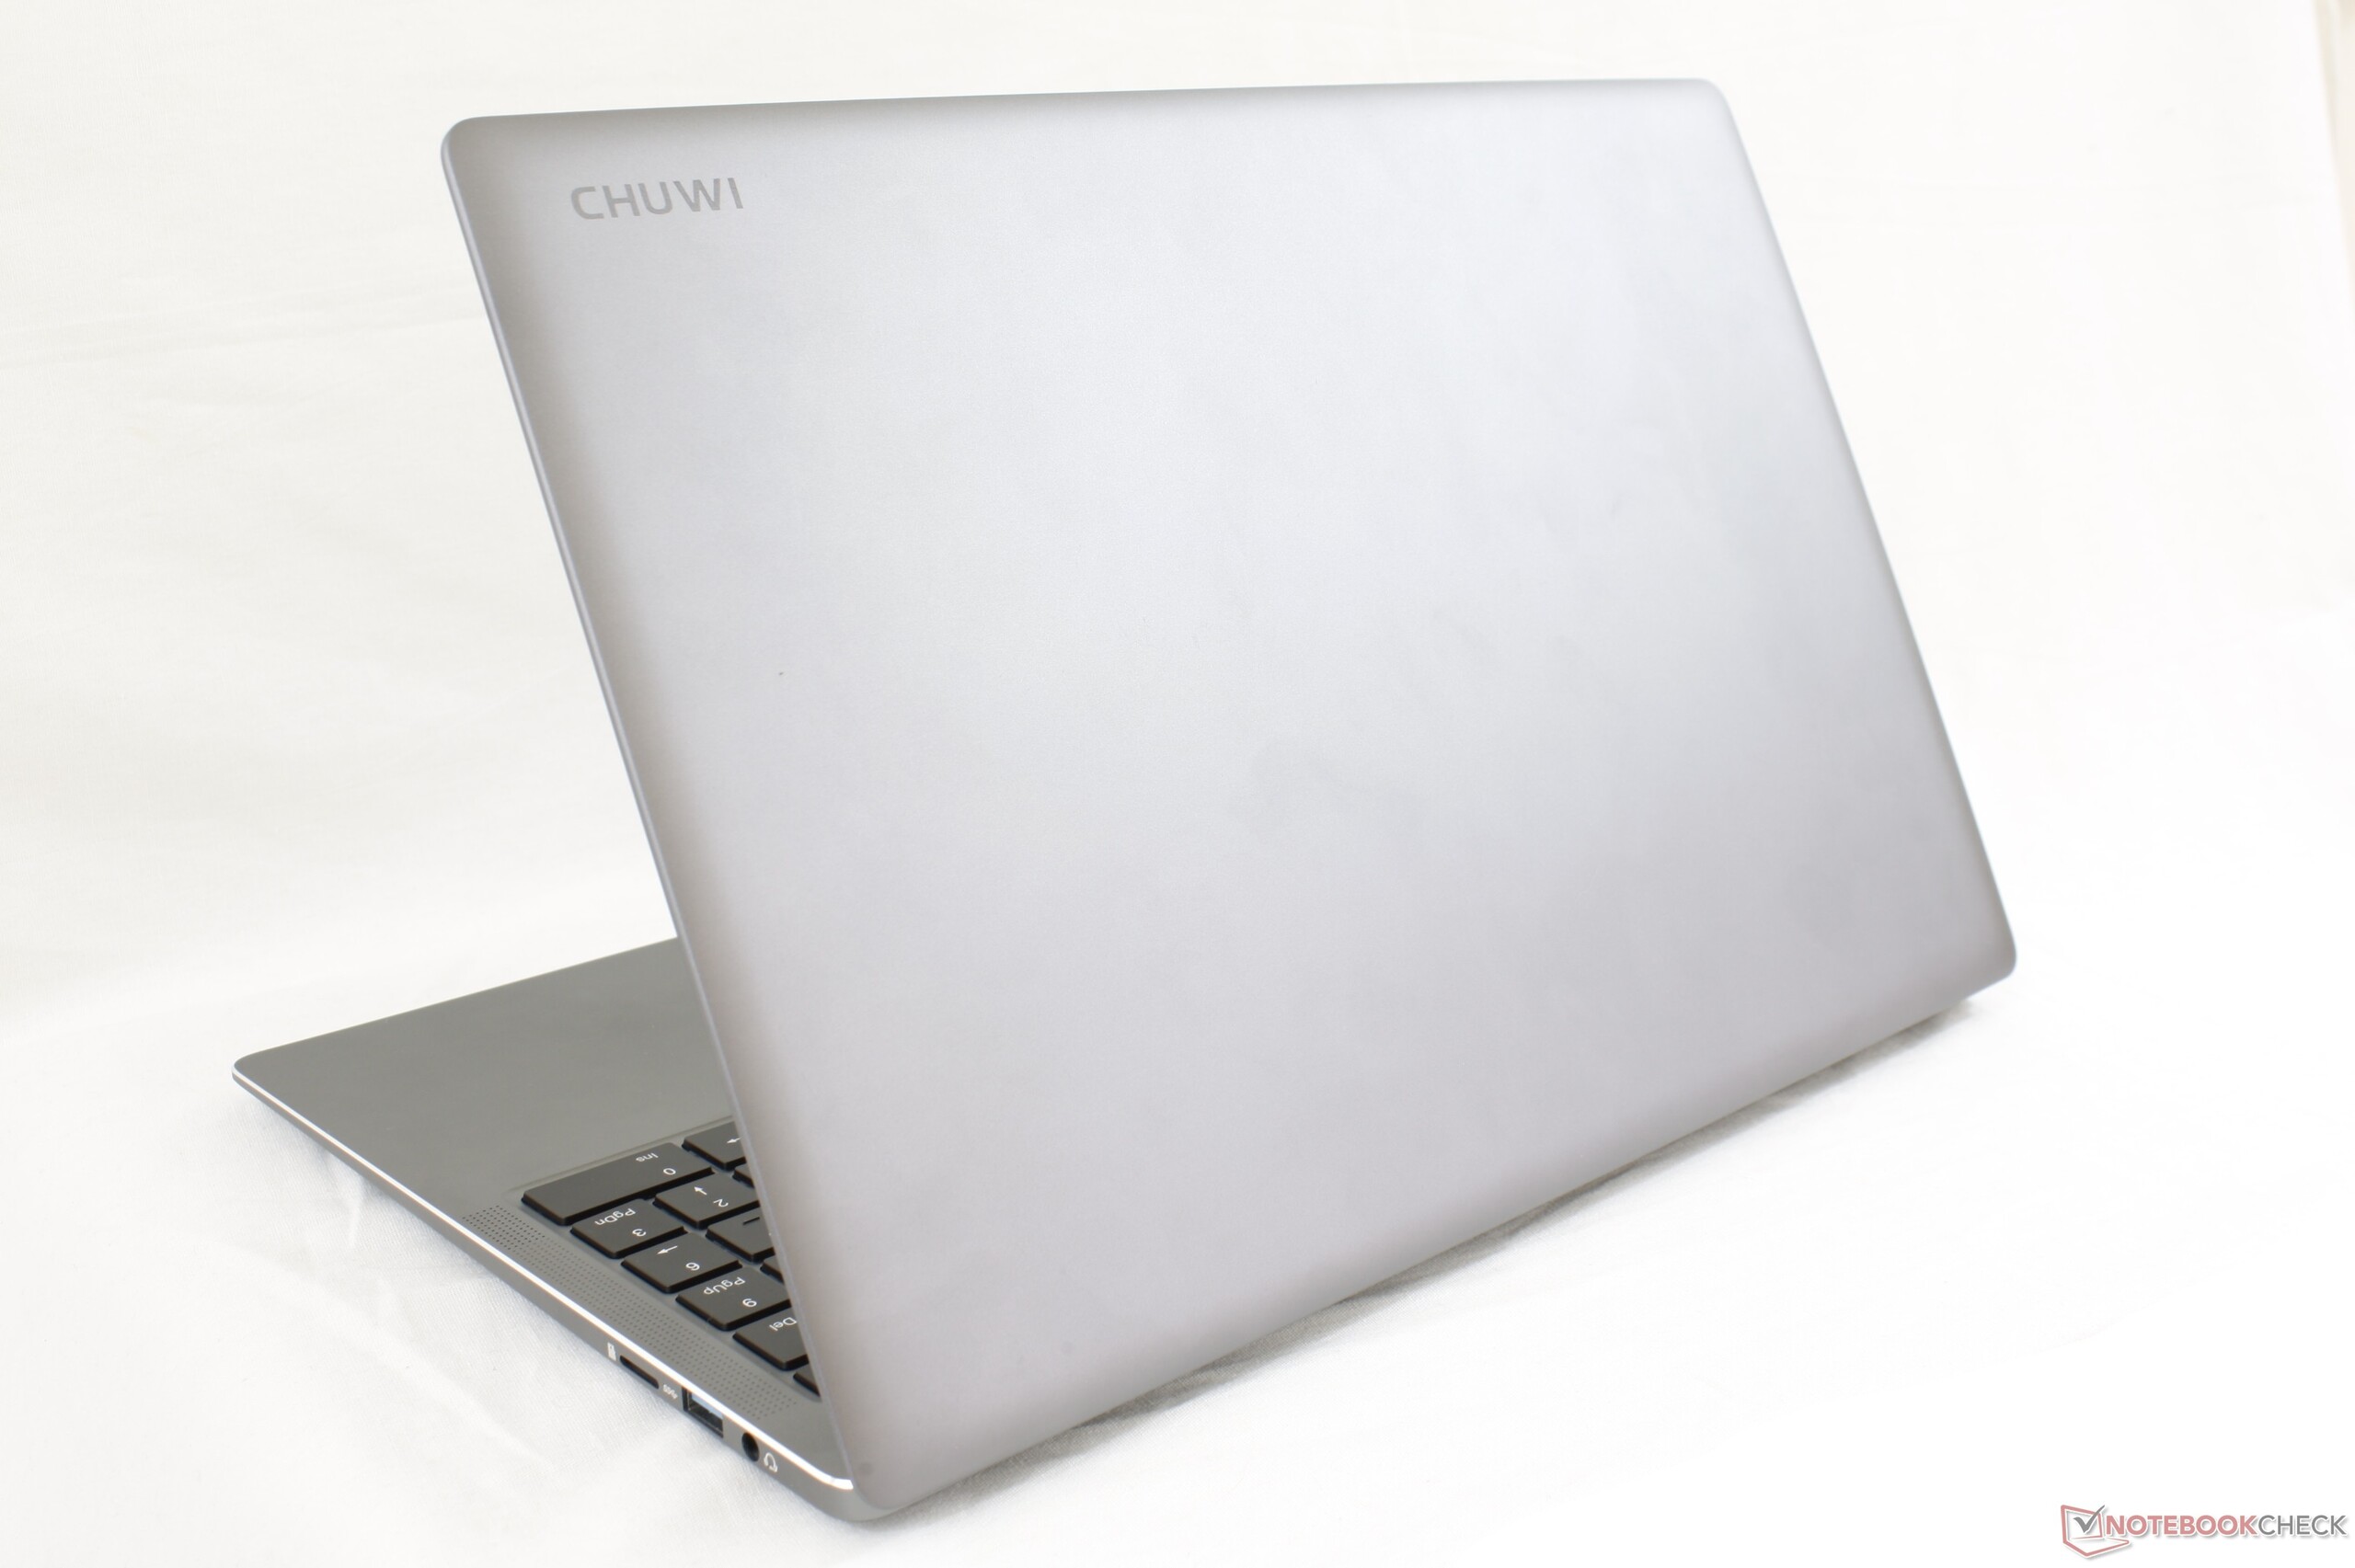
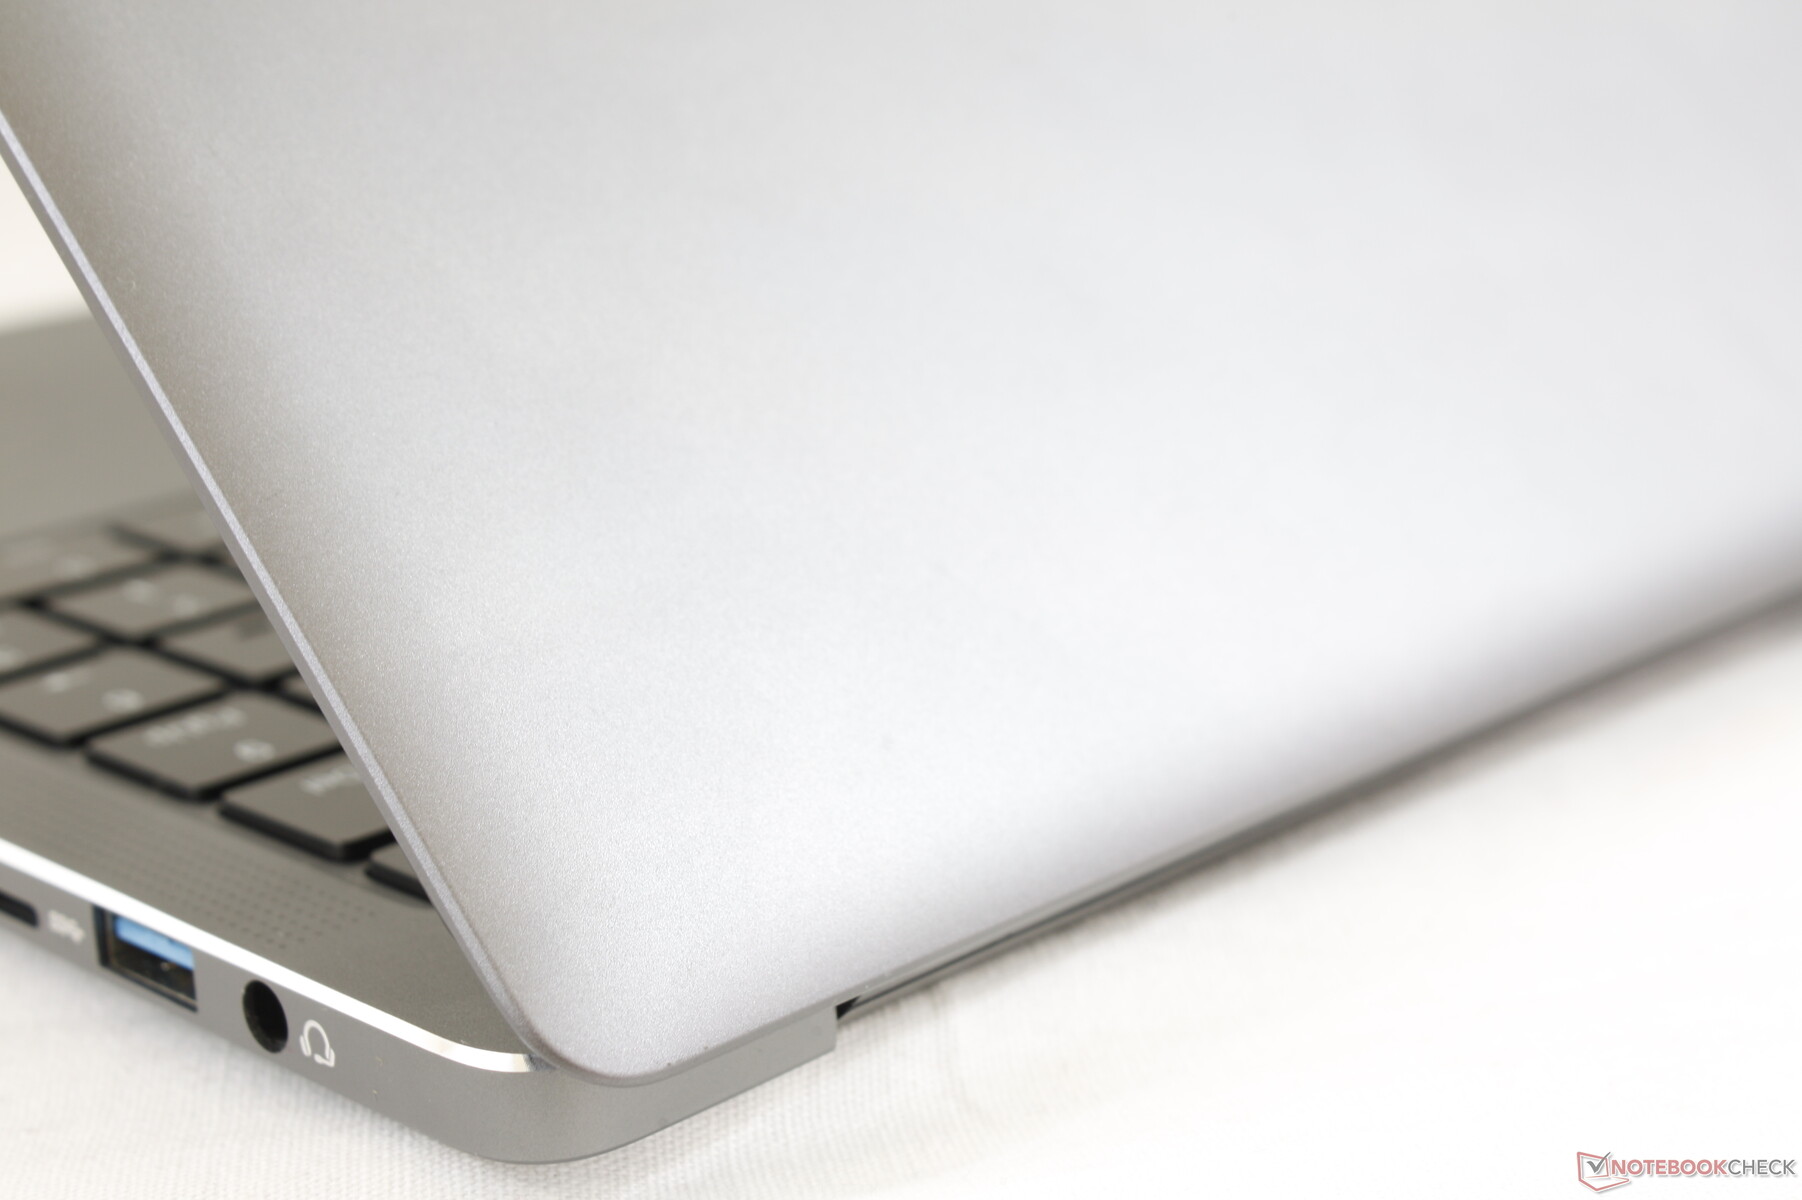
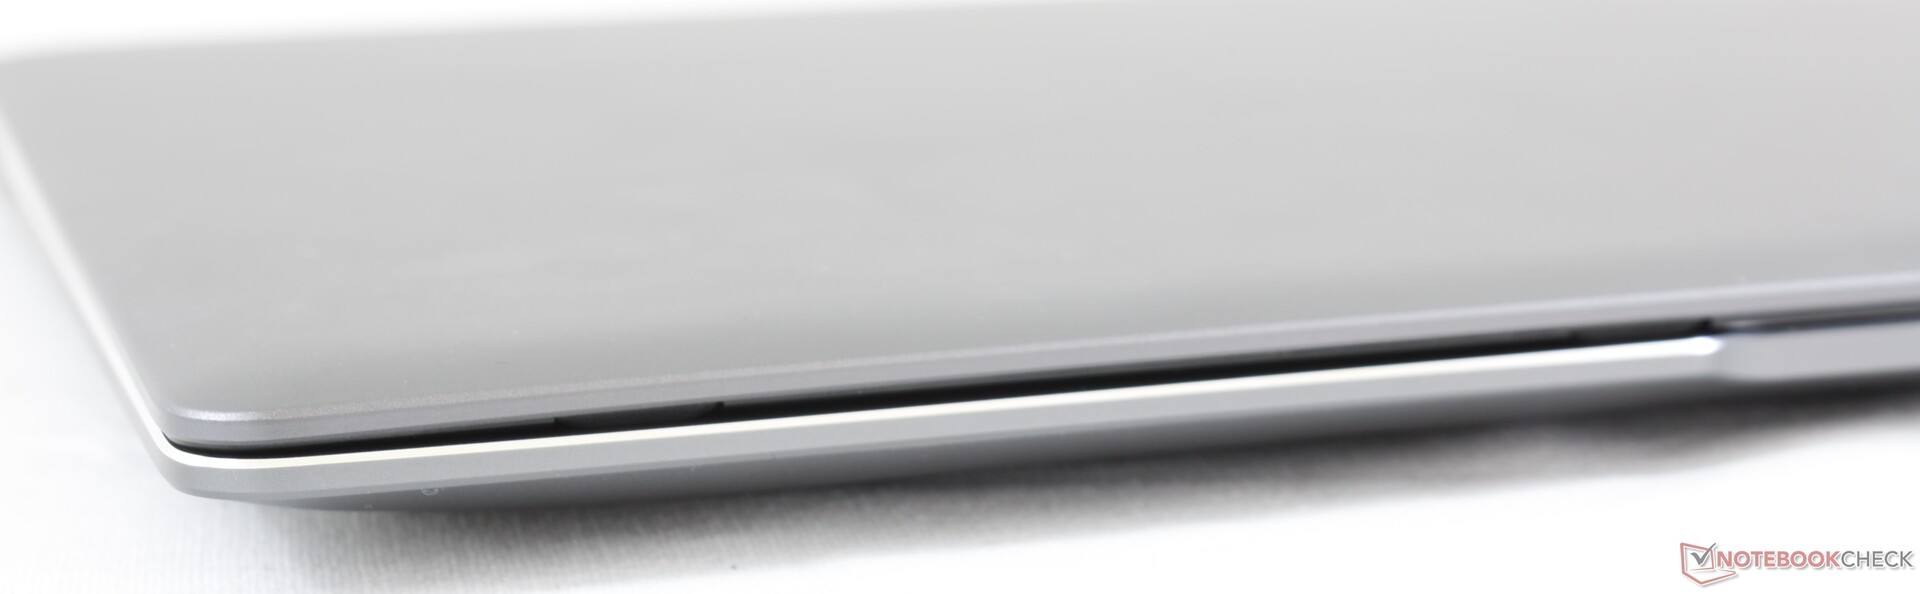
Case
The chassis is mostly metal except for the black plastic strip along the rear. As nice and thin as it may look, the laptop tends to creak and isn't nearly as rigid as the flagship Dell, Apple, or HP Ultrabooks that it's trying to imitate. This is a trend we're seeing on most Chuwi laptops.
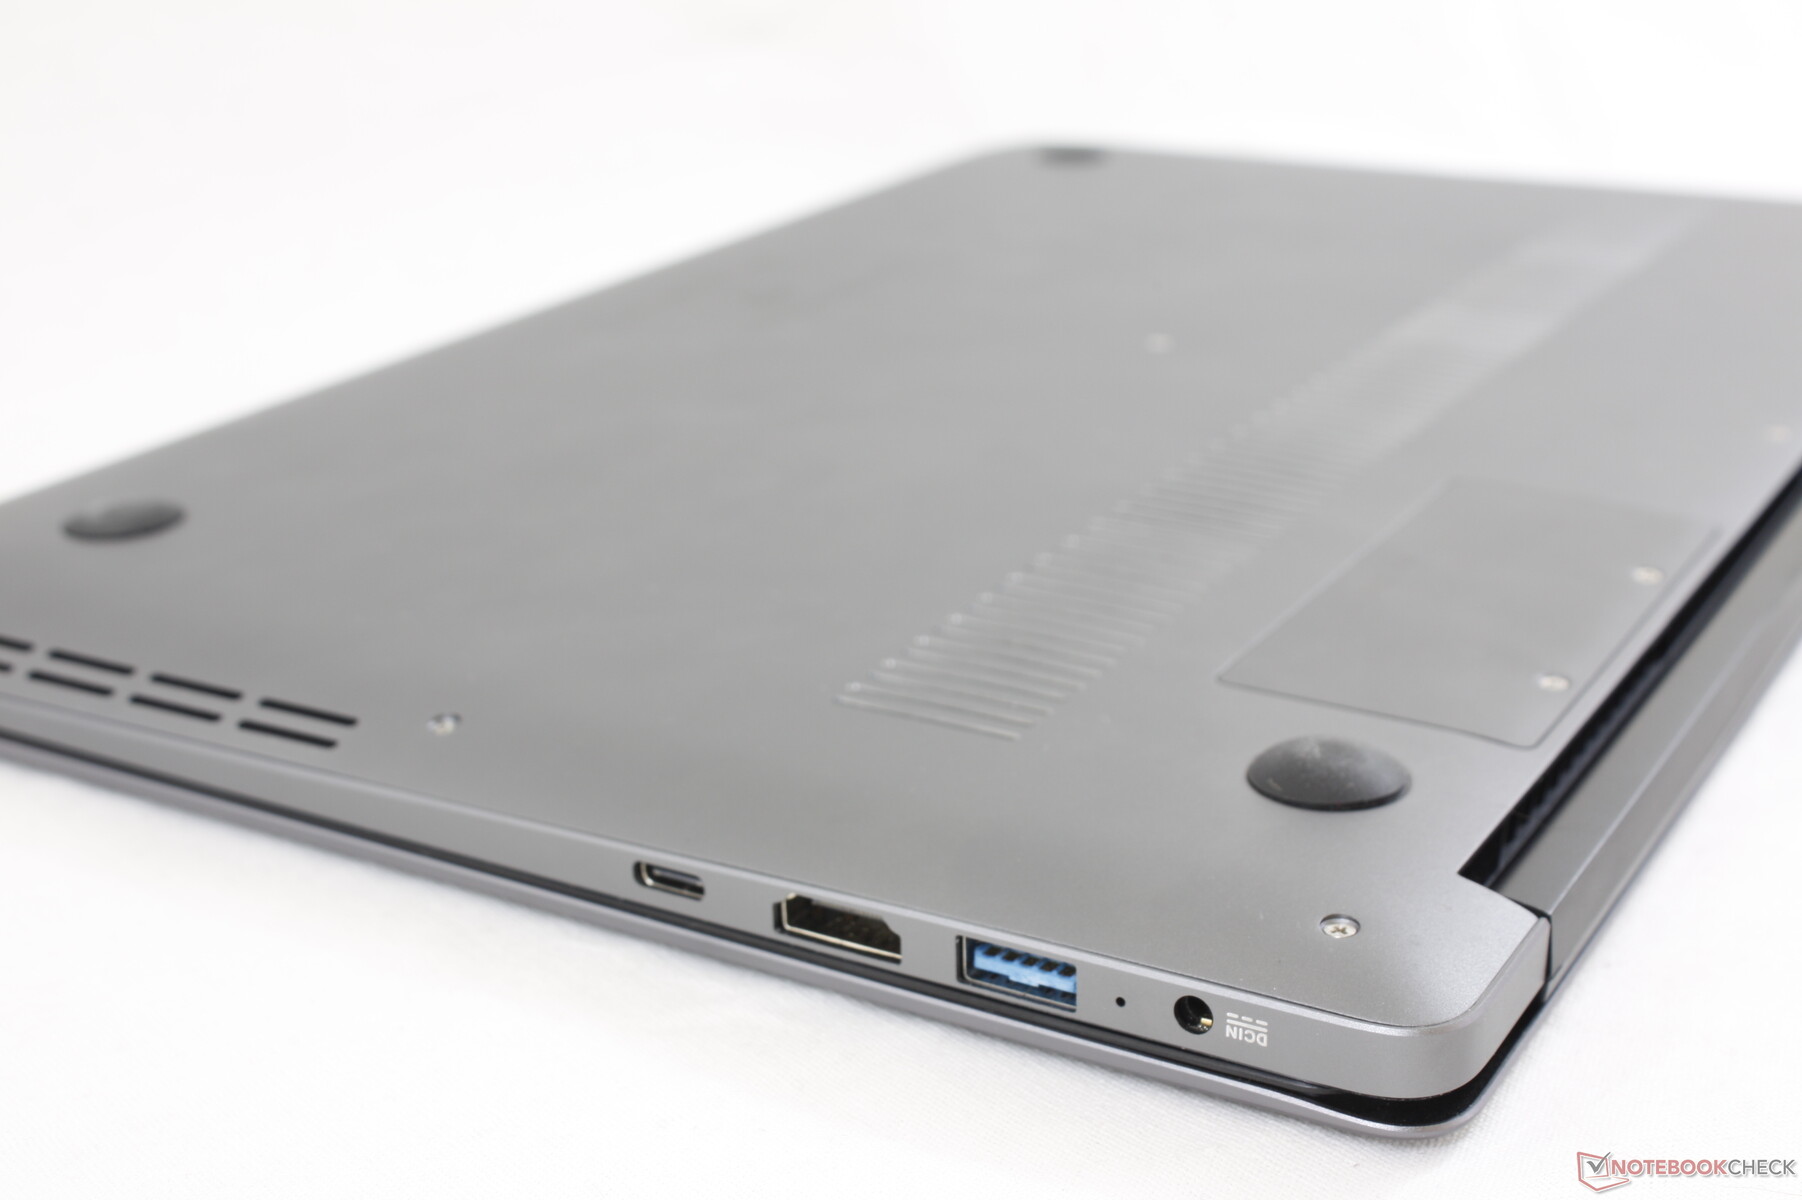
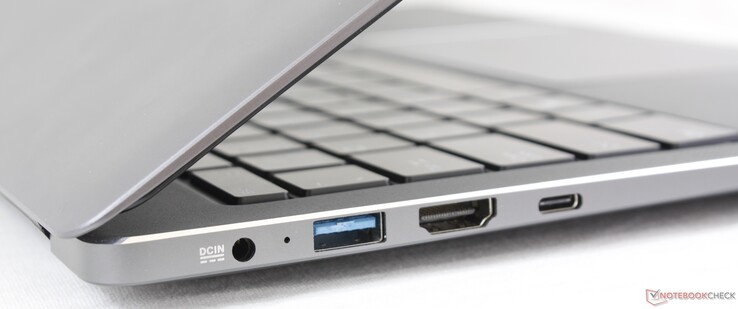
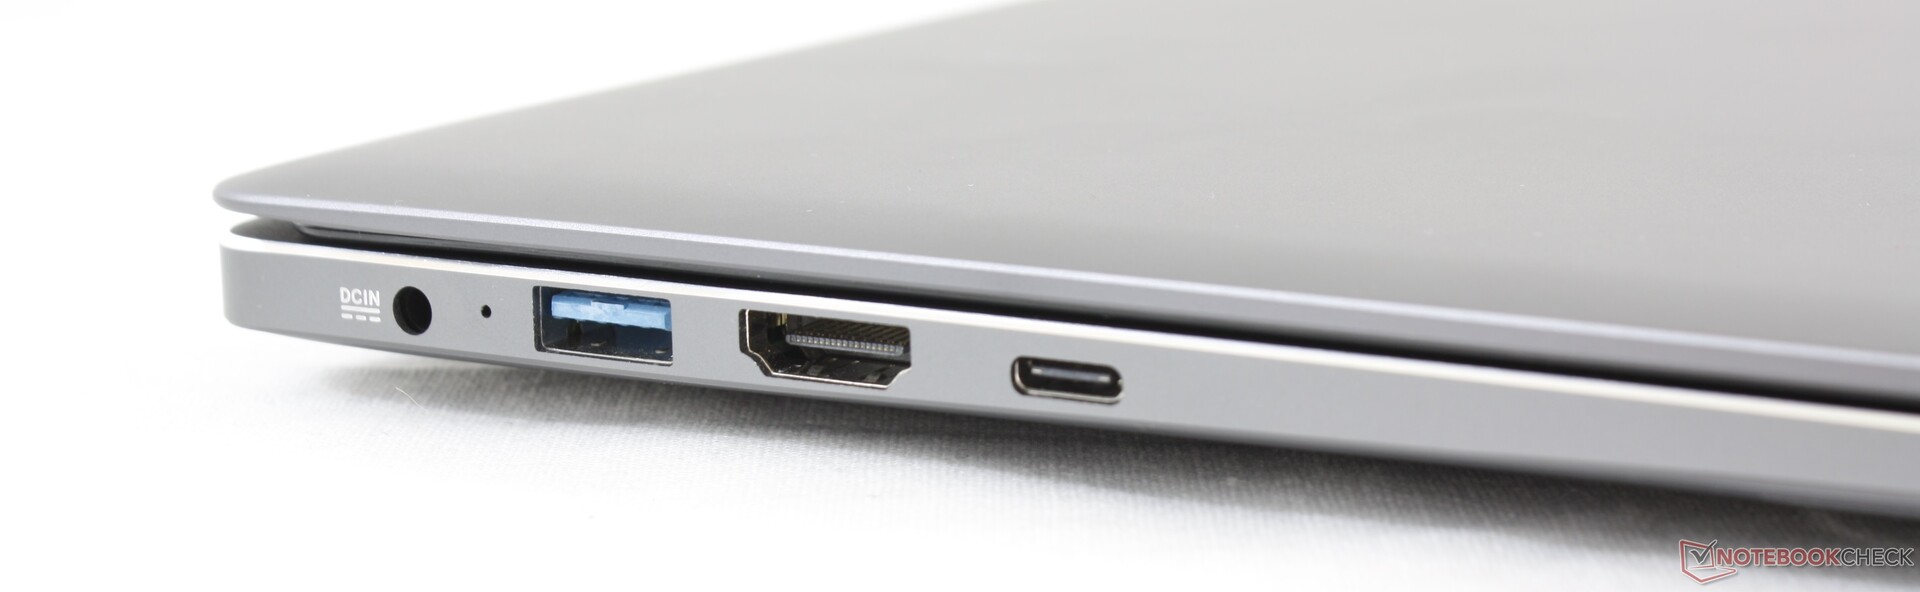
Connectivity
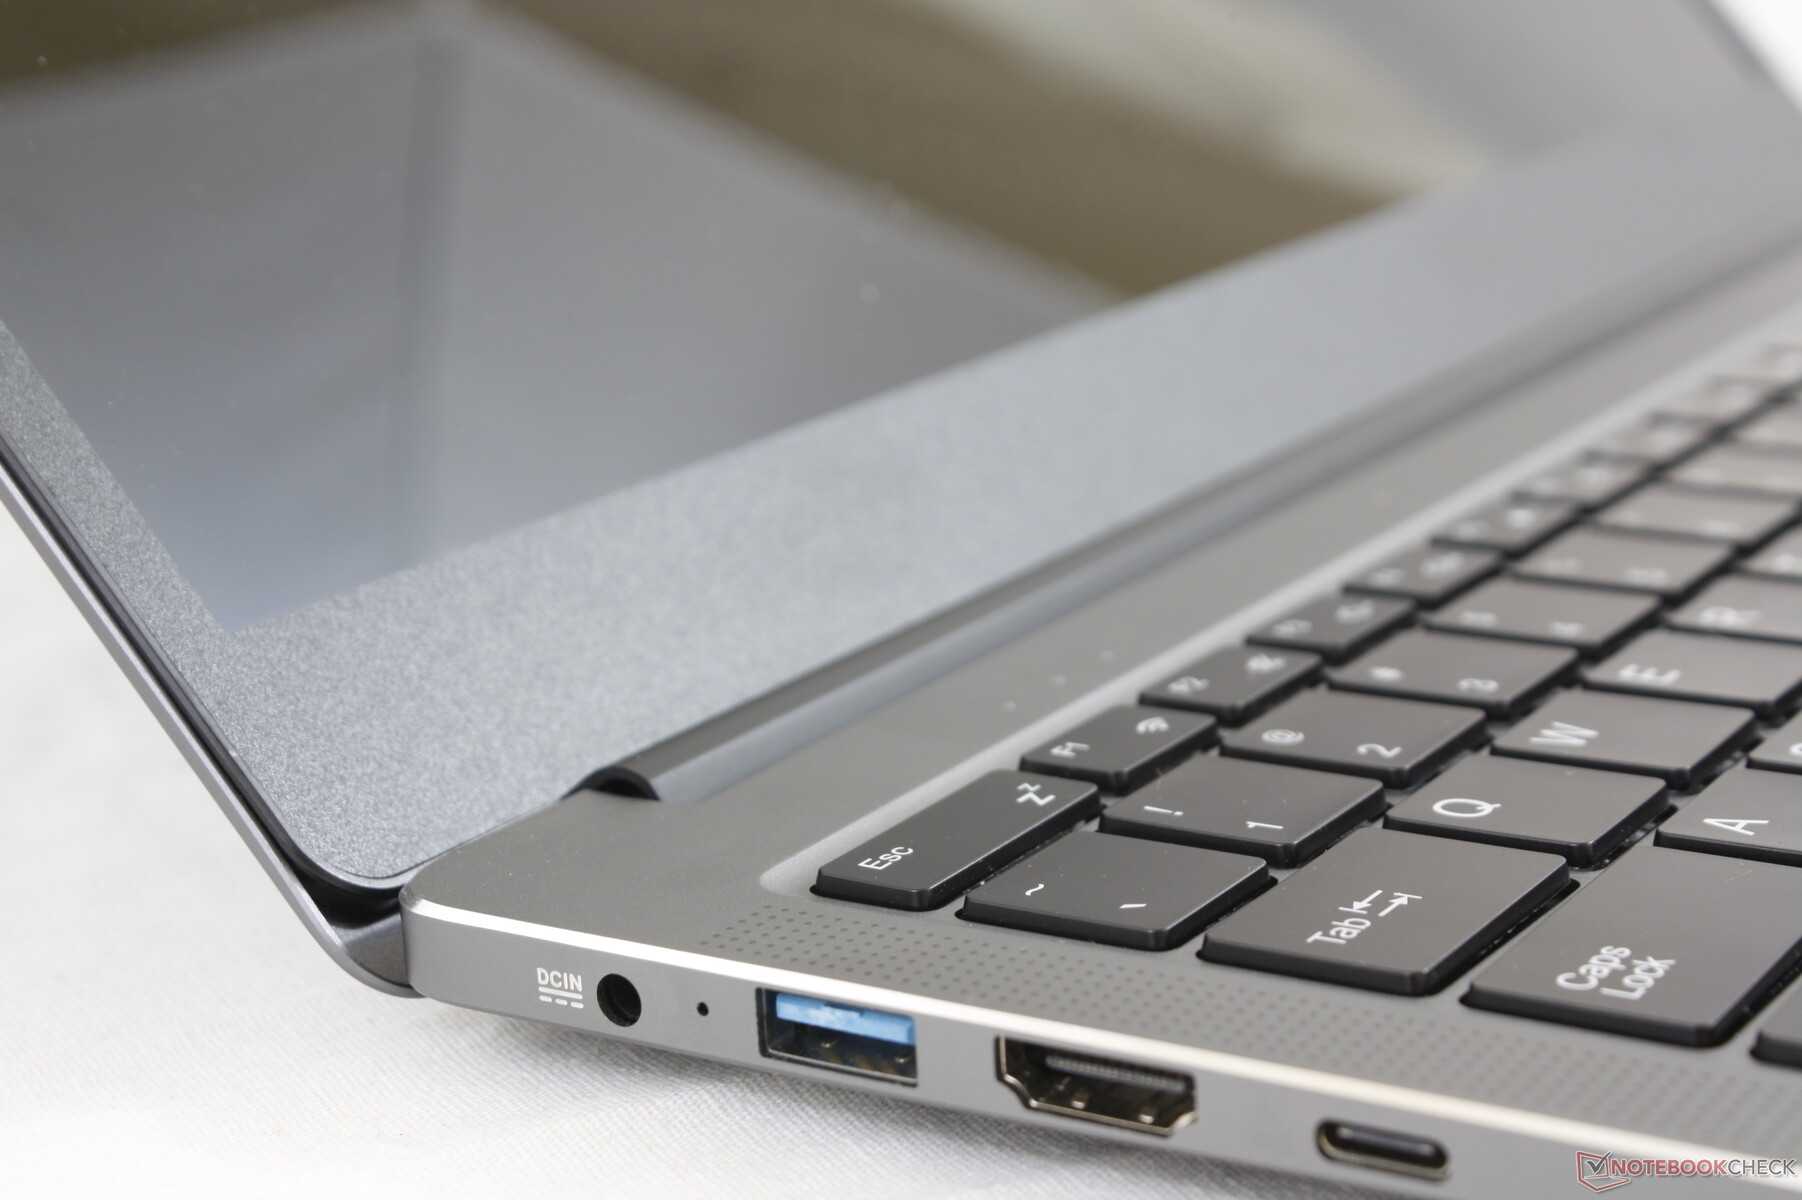
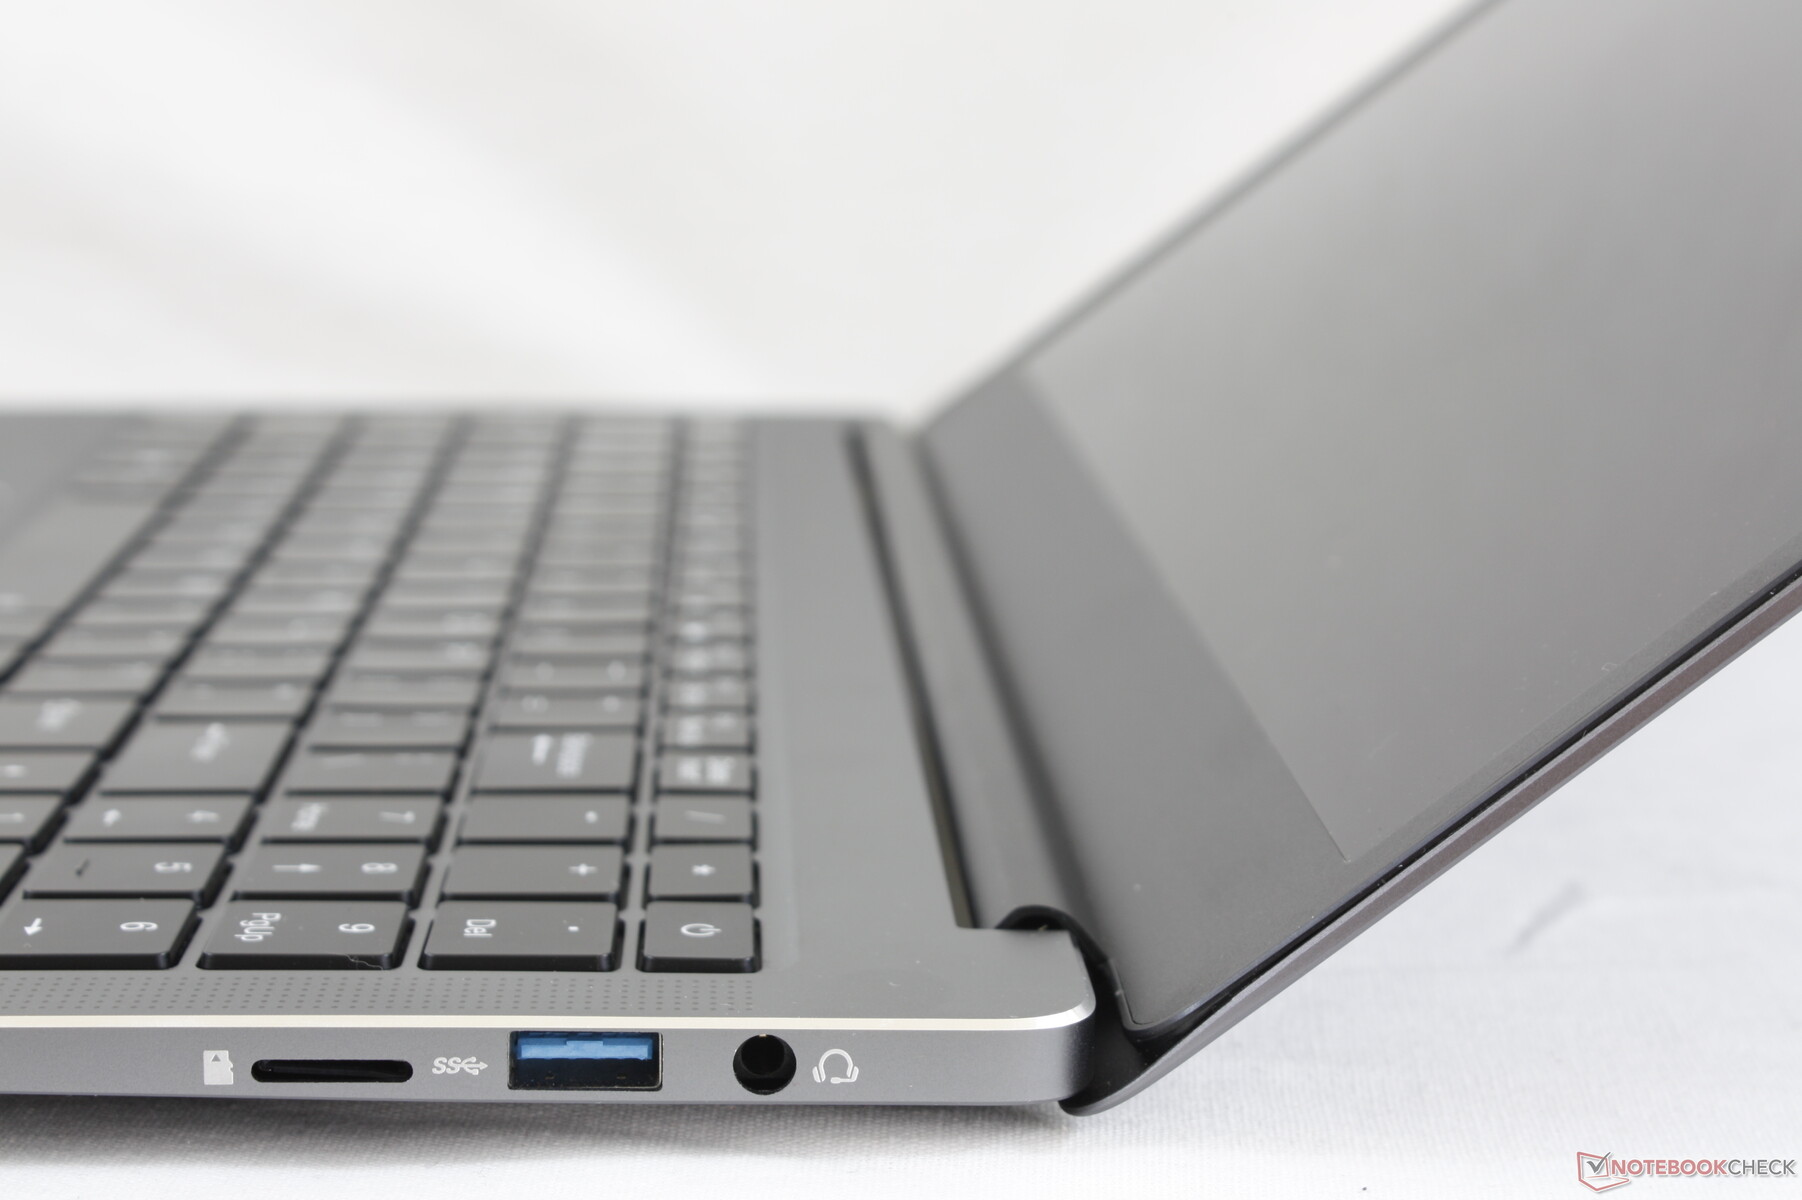
Port options are identical to last year's 13.3-inch AeroBook albeit slightly rearranged. Note that the USB Type-C port supports DisplayPort-out and it can also be used to recharge the laptop should you forget to bring along the proprietary AC adapter.
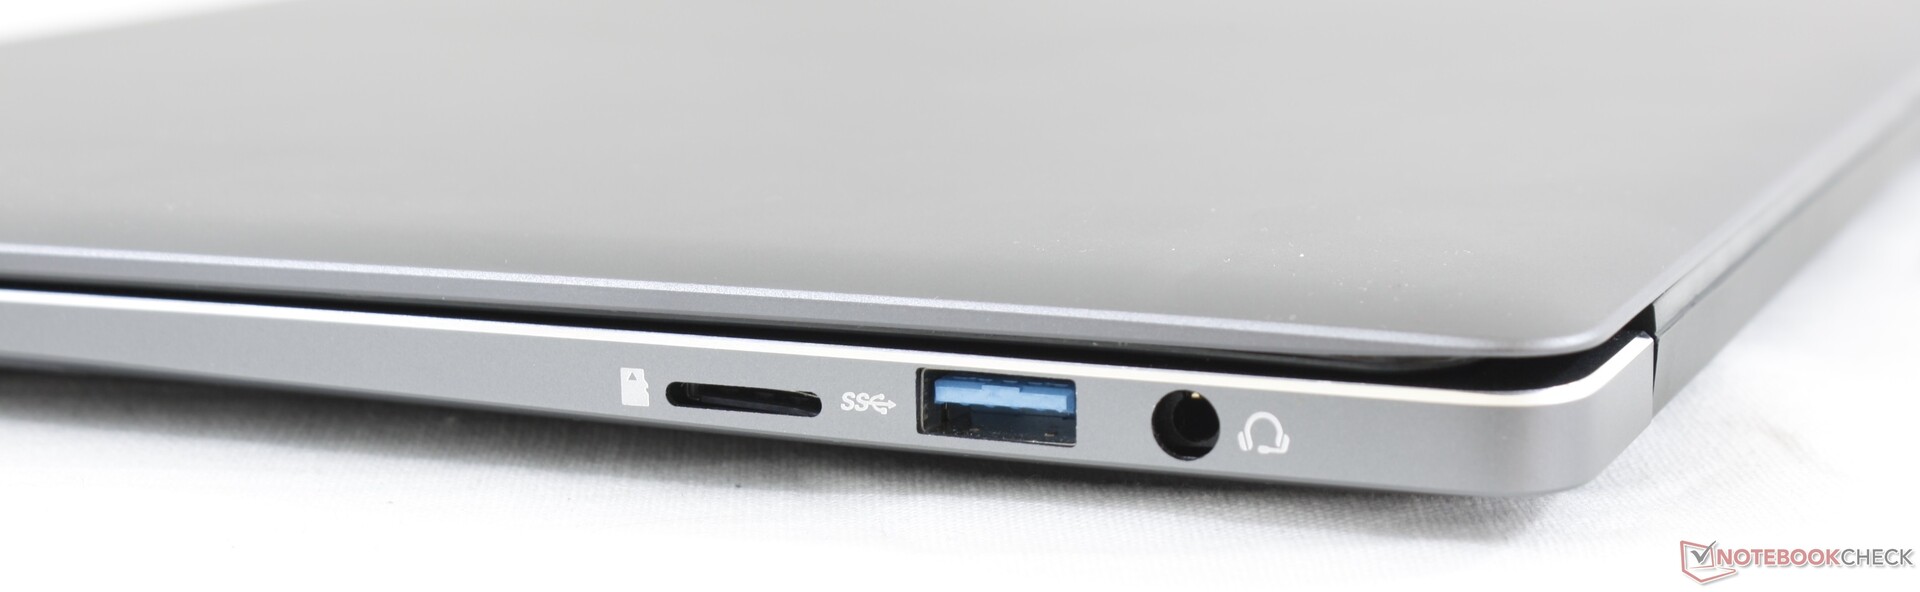
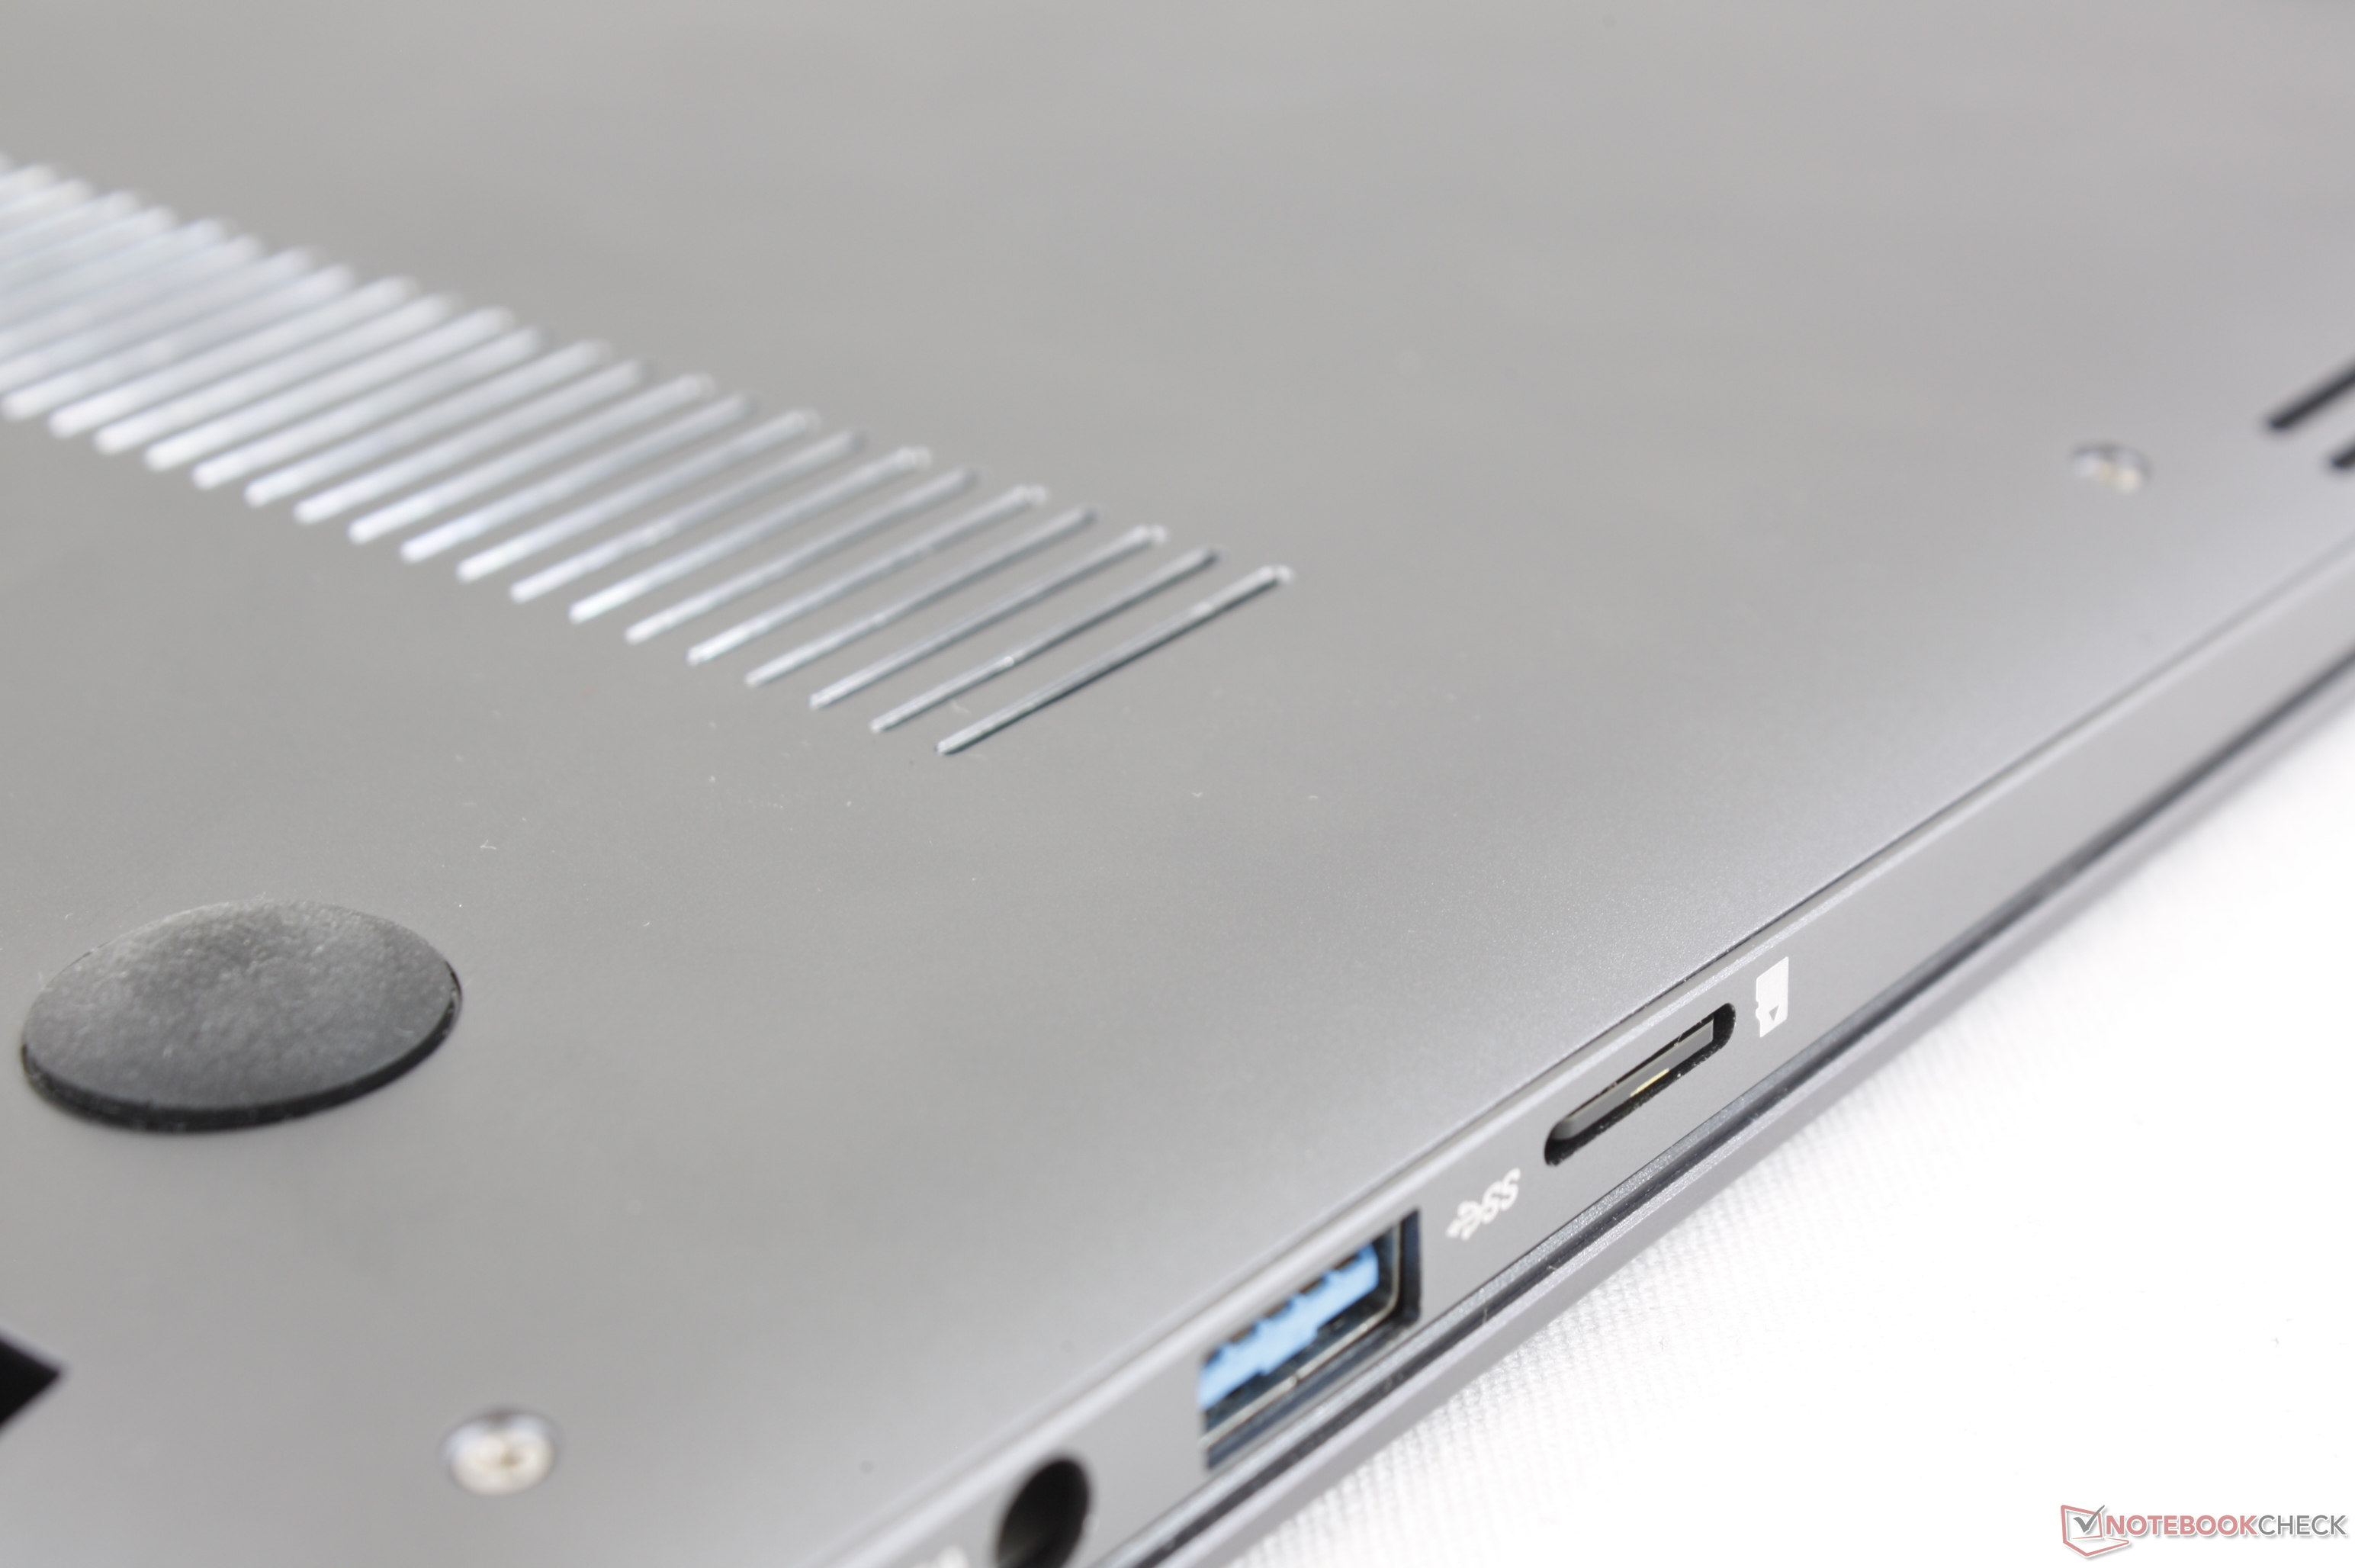
SD Card Reader
The spring-loaded MicroSD card reader is slow. Transferring 1 GB worth of pictures from our UHS-II test card to desktop takes over a minute compared to <8 seconds on the Dell XPS 13.
| SD Card Reader | |
| average JPG Copy Test (av. of 3 runs) | |
| Dell XPS 15 7590 i5 iGPU FHD (Toshiba Exceria Pro SDXC 64 GB UHS-II) | |
| HP Envy x360 15-bq102ng (Toshiba Exceria Pro SDXC 64 GB UHS-II) | |
| Asus Vivobook 15 F512DA-SH31 (Toshiba Exceria Pro M501 64 GB UHS-II) | |
| Chuwi AeroBook Plus (Toshiba Exceria Pro M501 64 GB UHS-II) | |
| maximum AS SSD Seq Read Test (1GB) | |
| Dell XPS 15 7590 i5 iGPU FHD (Toshiba Exceria Pro SDXC 64 GB UHS-II) | |
| HP Envy x360 15-bq102ng (Toshiba Exceria Pro SDXC 64 GB UHS-II) | |
| Asus Vivobook 15 F512DA-SH31 (Toshiba Exceria Pro M501 64 GB UHS-II) | |
| Chuwi AeroBook Plus (Toshiba Exceria Pro M501 64 GB UHS-II) | |
Communication
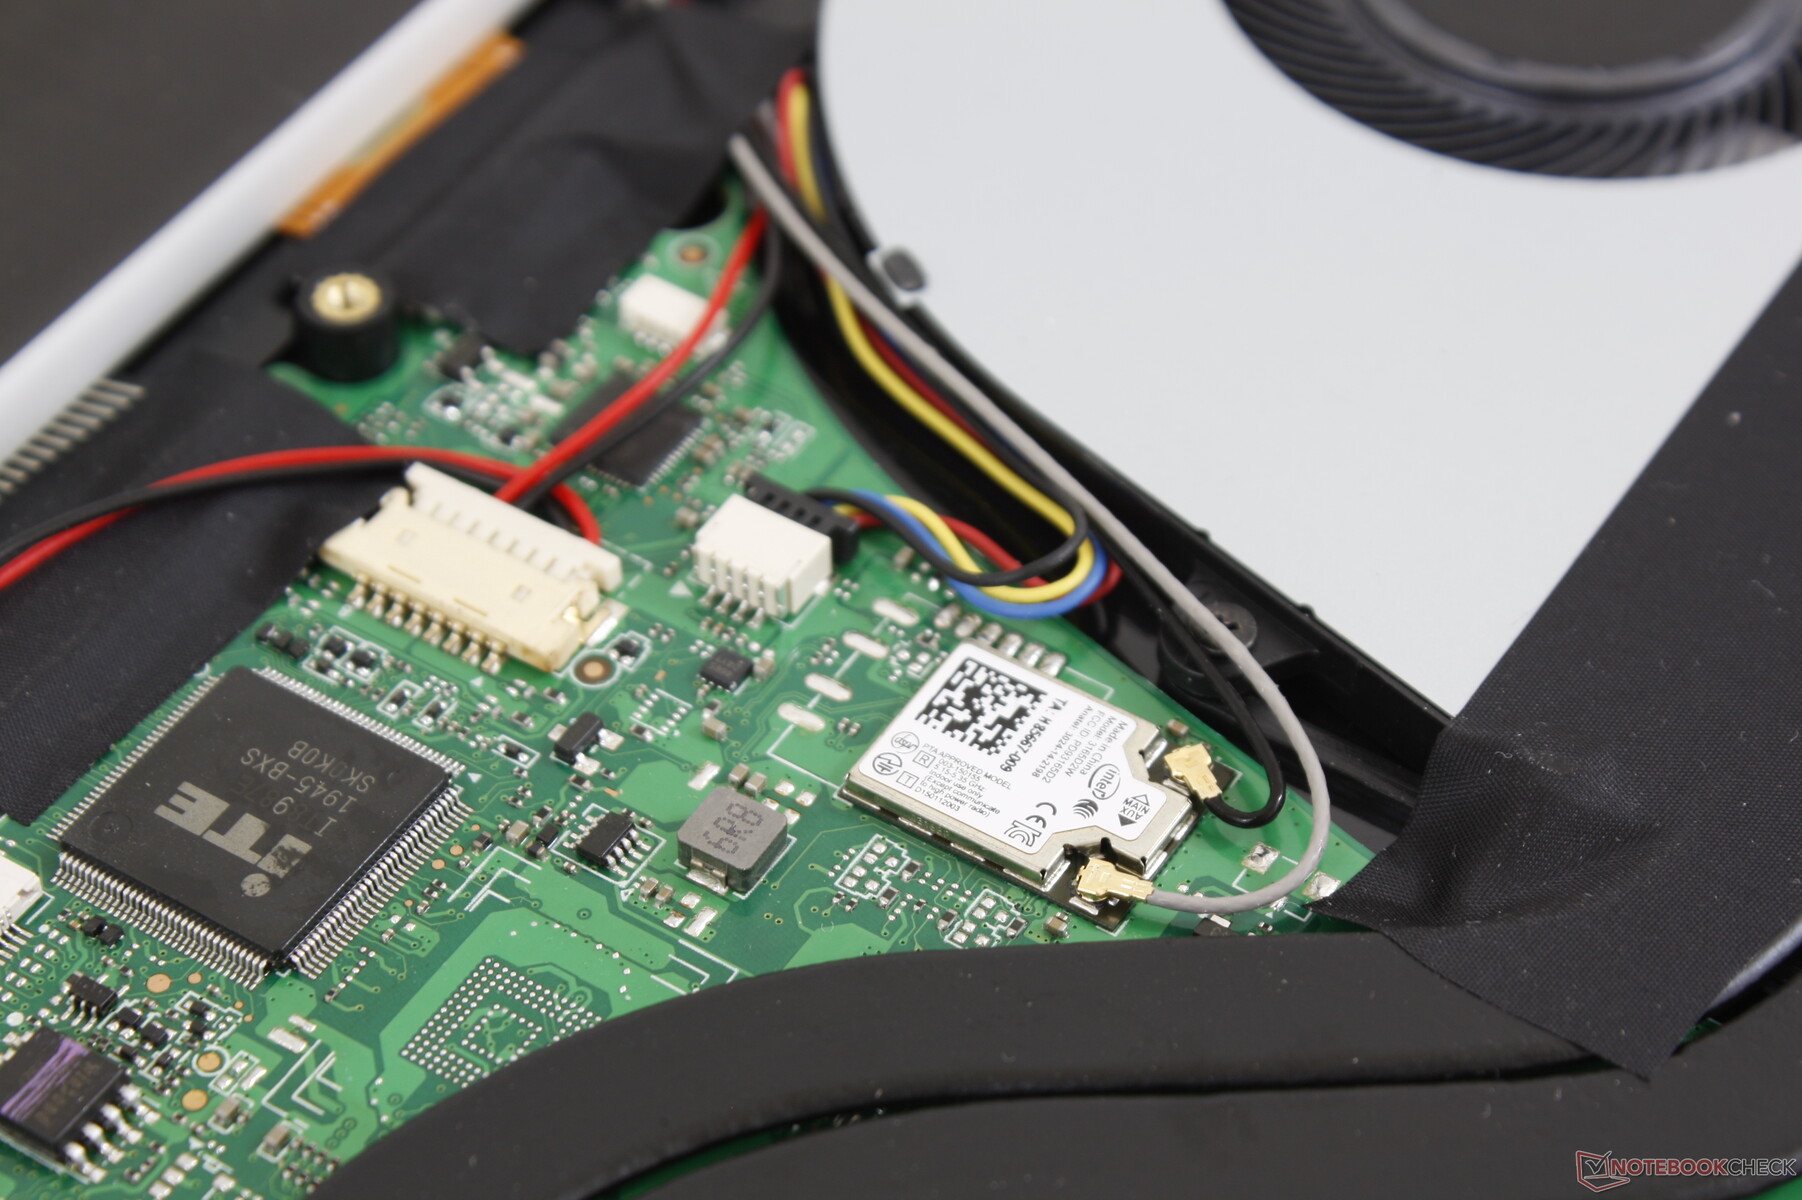
Our unit uses the slower 1x1 Intel 3165 likely to save on costs for a theoretical maximum transfer rate of 433 Mbps. We experienced no issues when connected to our Netgear RAX200 router.
| Networking | |
| iperf3 transmit AX12 | |
| Dynabook Portégé X30L-G | |
| Microsoft Surface Laptop 3 13 Core i5-1035G7 | |
| LG Gram 14Z90N | |
| Chuwi AeroBook Plus | |
| iperf3 receive AX12 | |
| LG Gram 14Z90N | |
| Dynabook Portégé X30L-G | |
| Microsoft Surface Laptop 3 13 Core i5-1035G7 | |
| Chuwi AeroBook Plus | |
Webcam


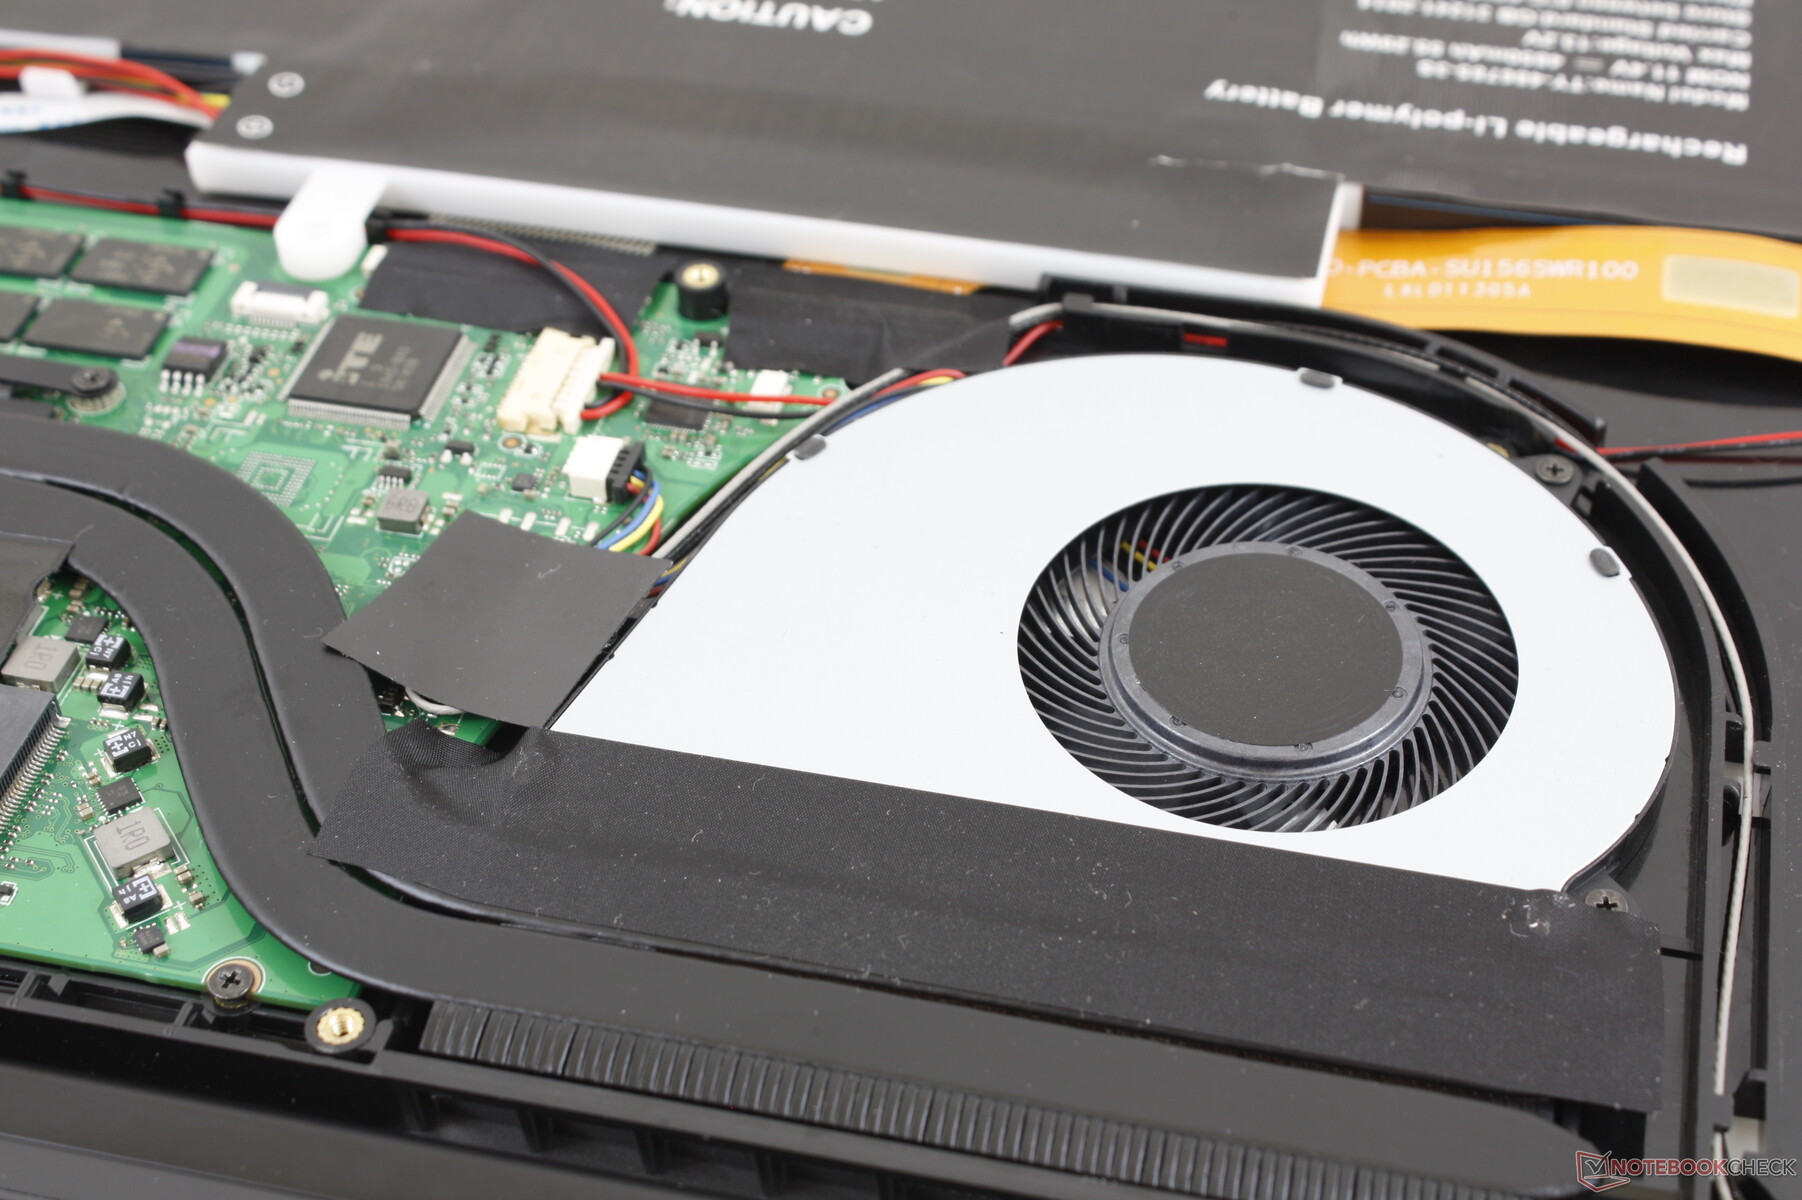
Maintenance
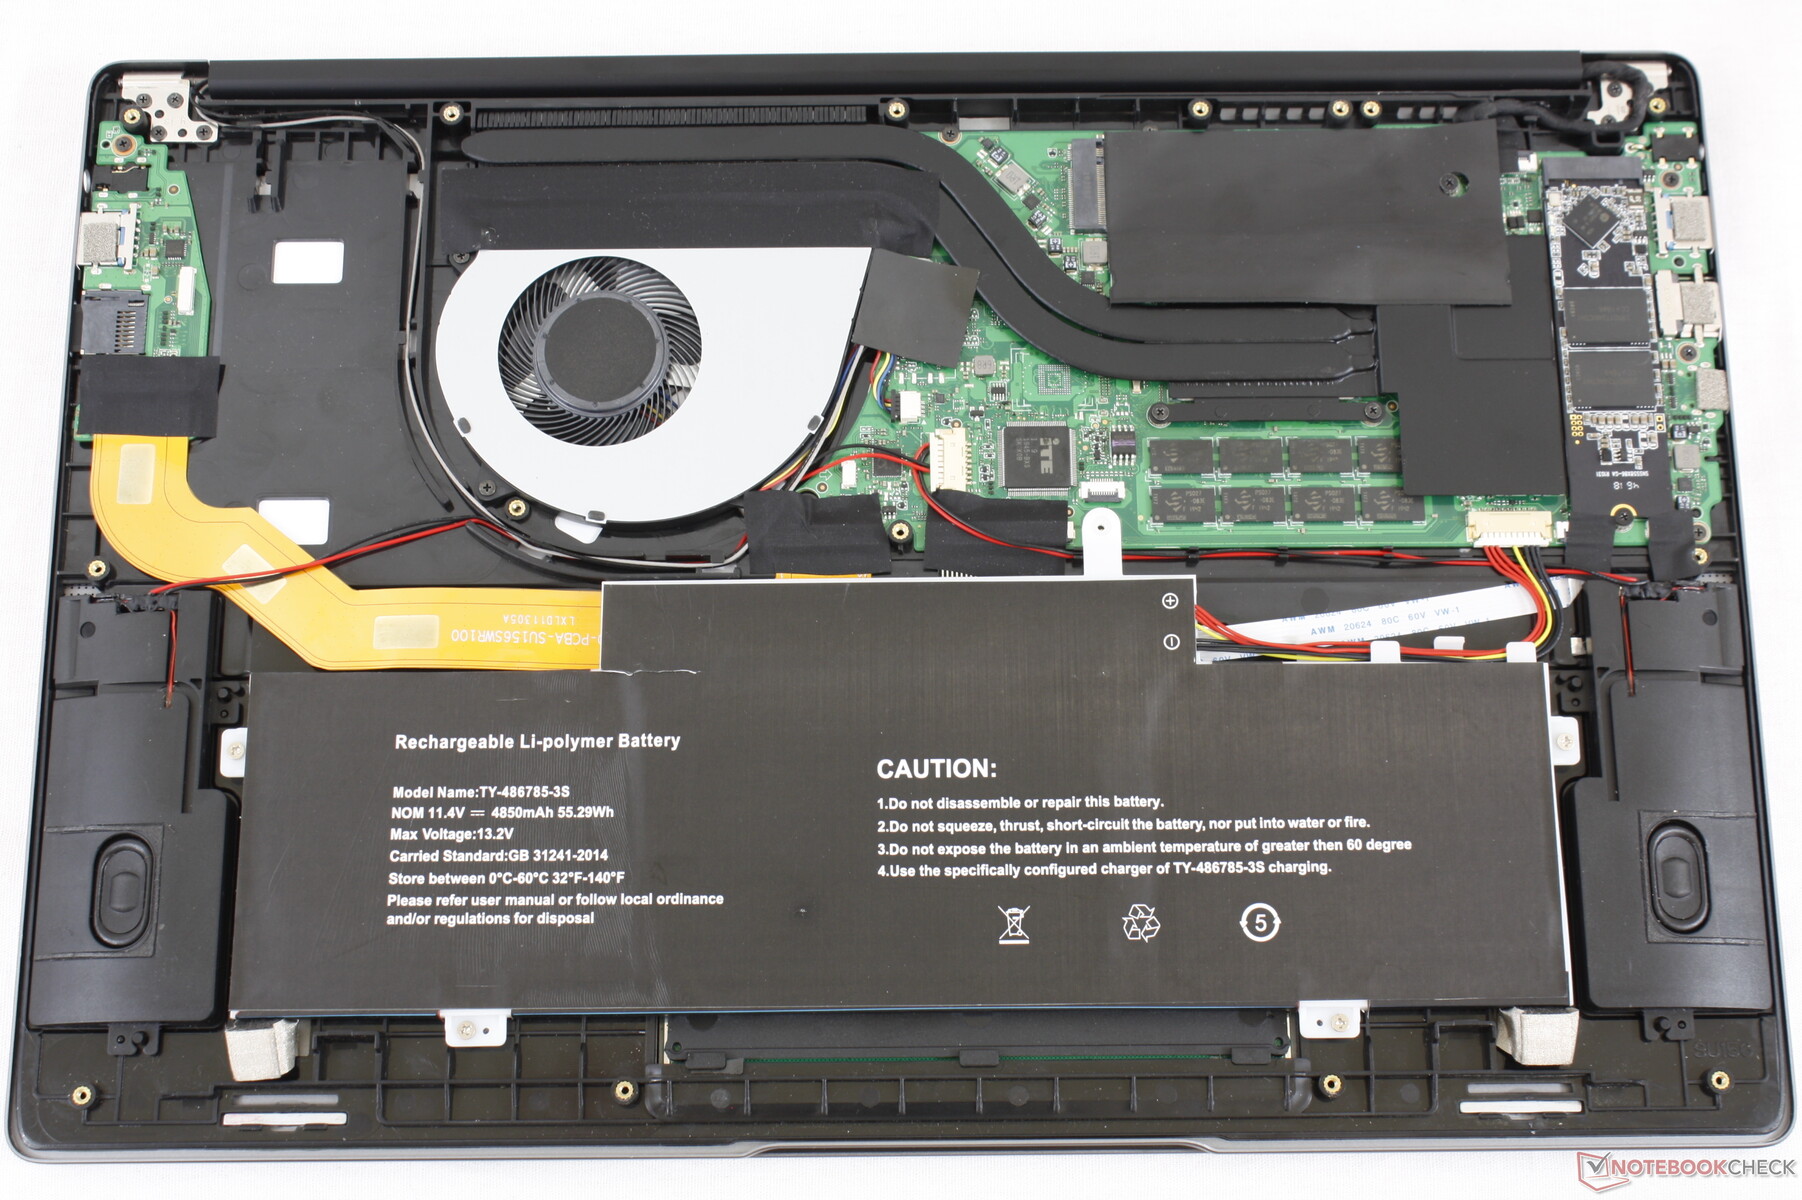
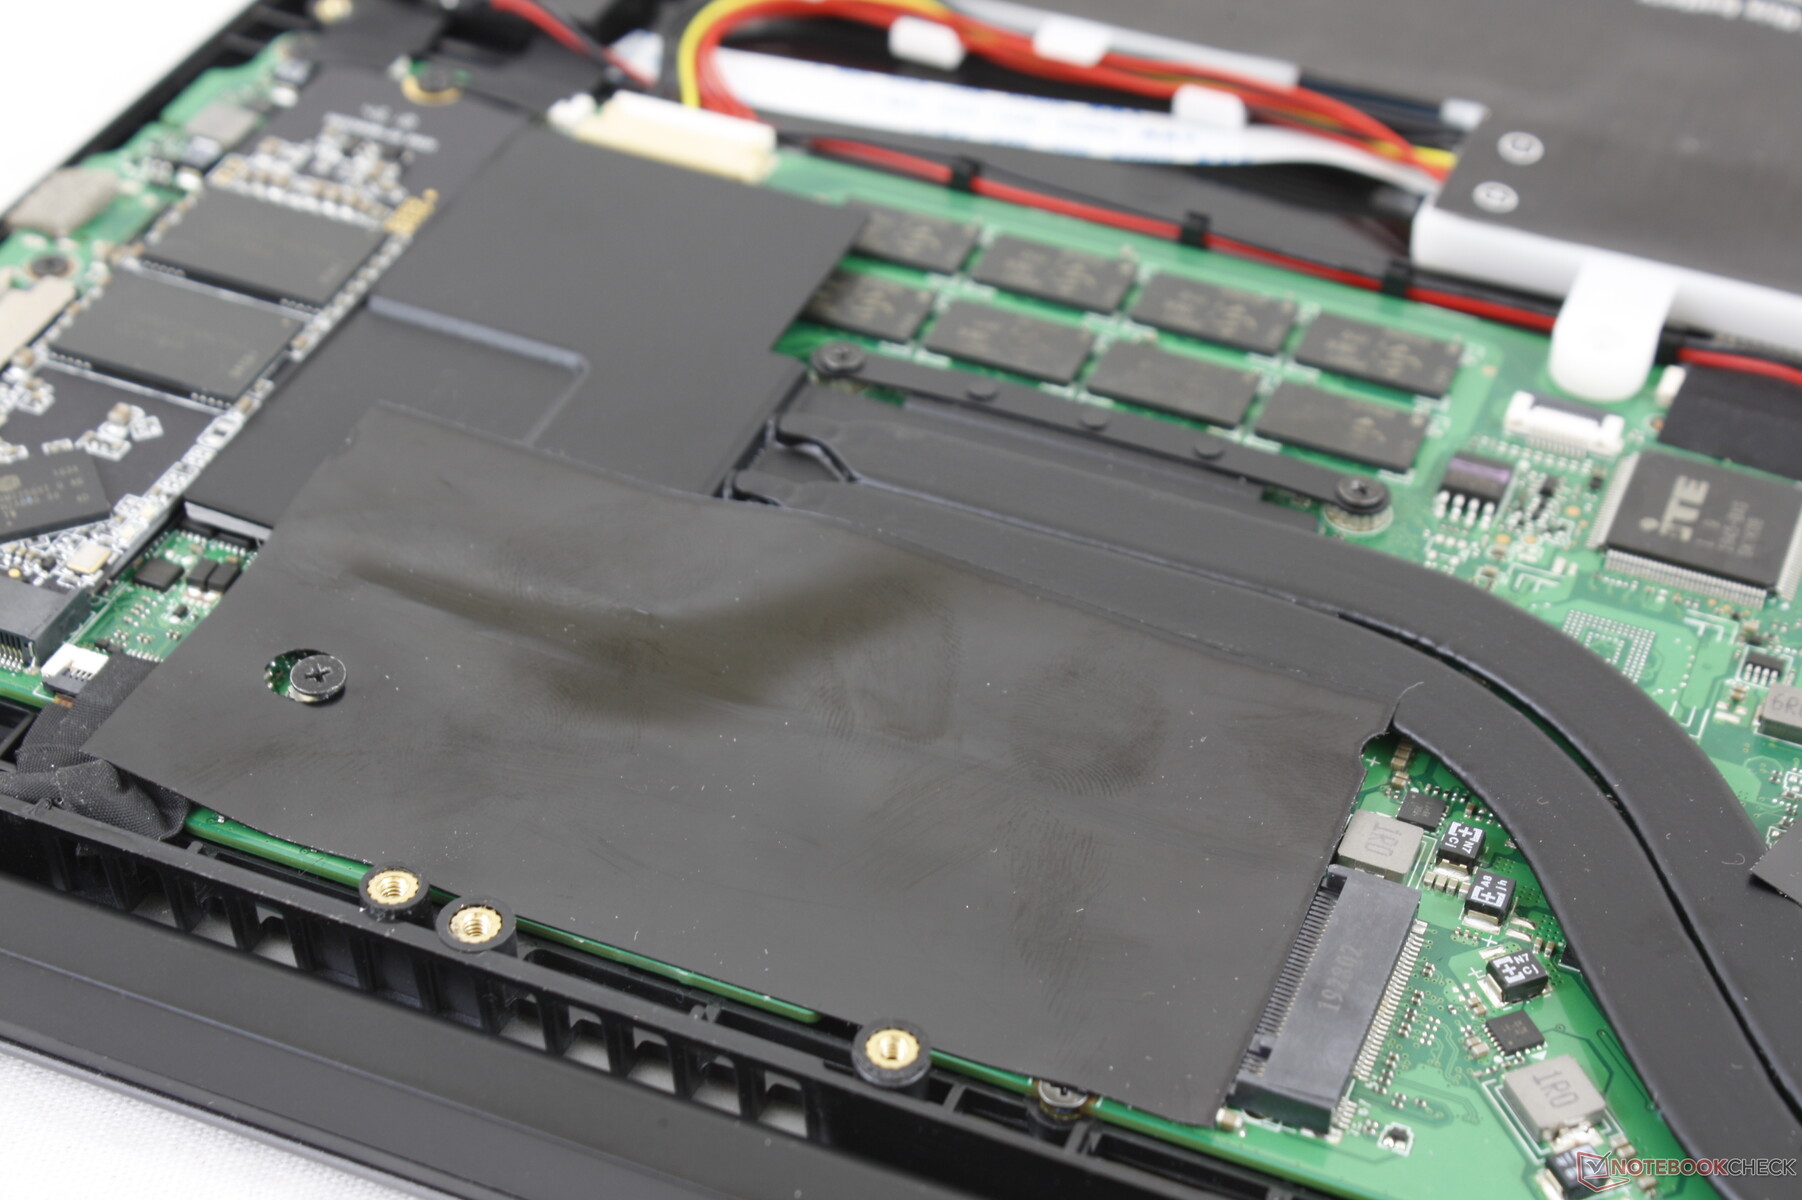
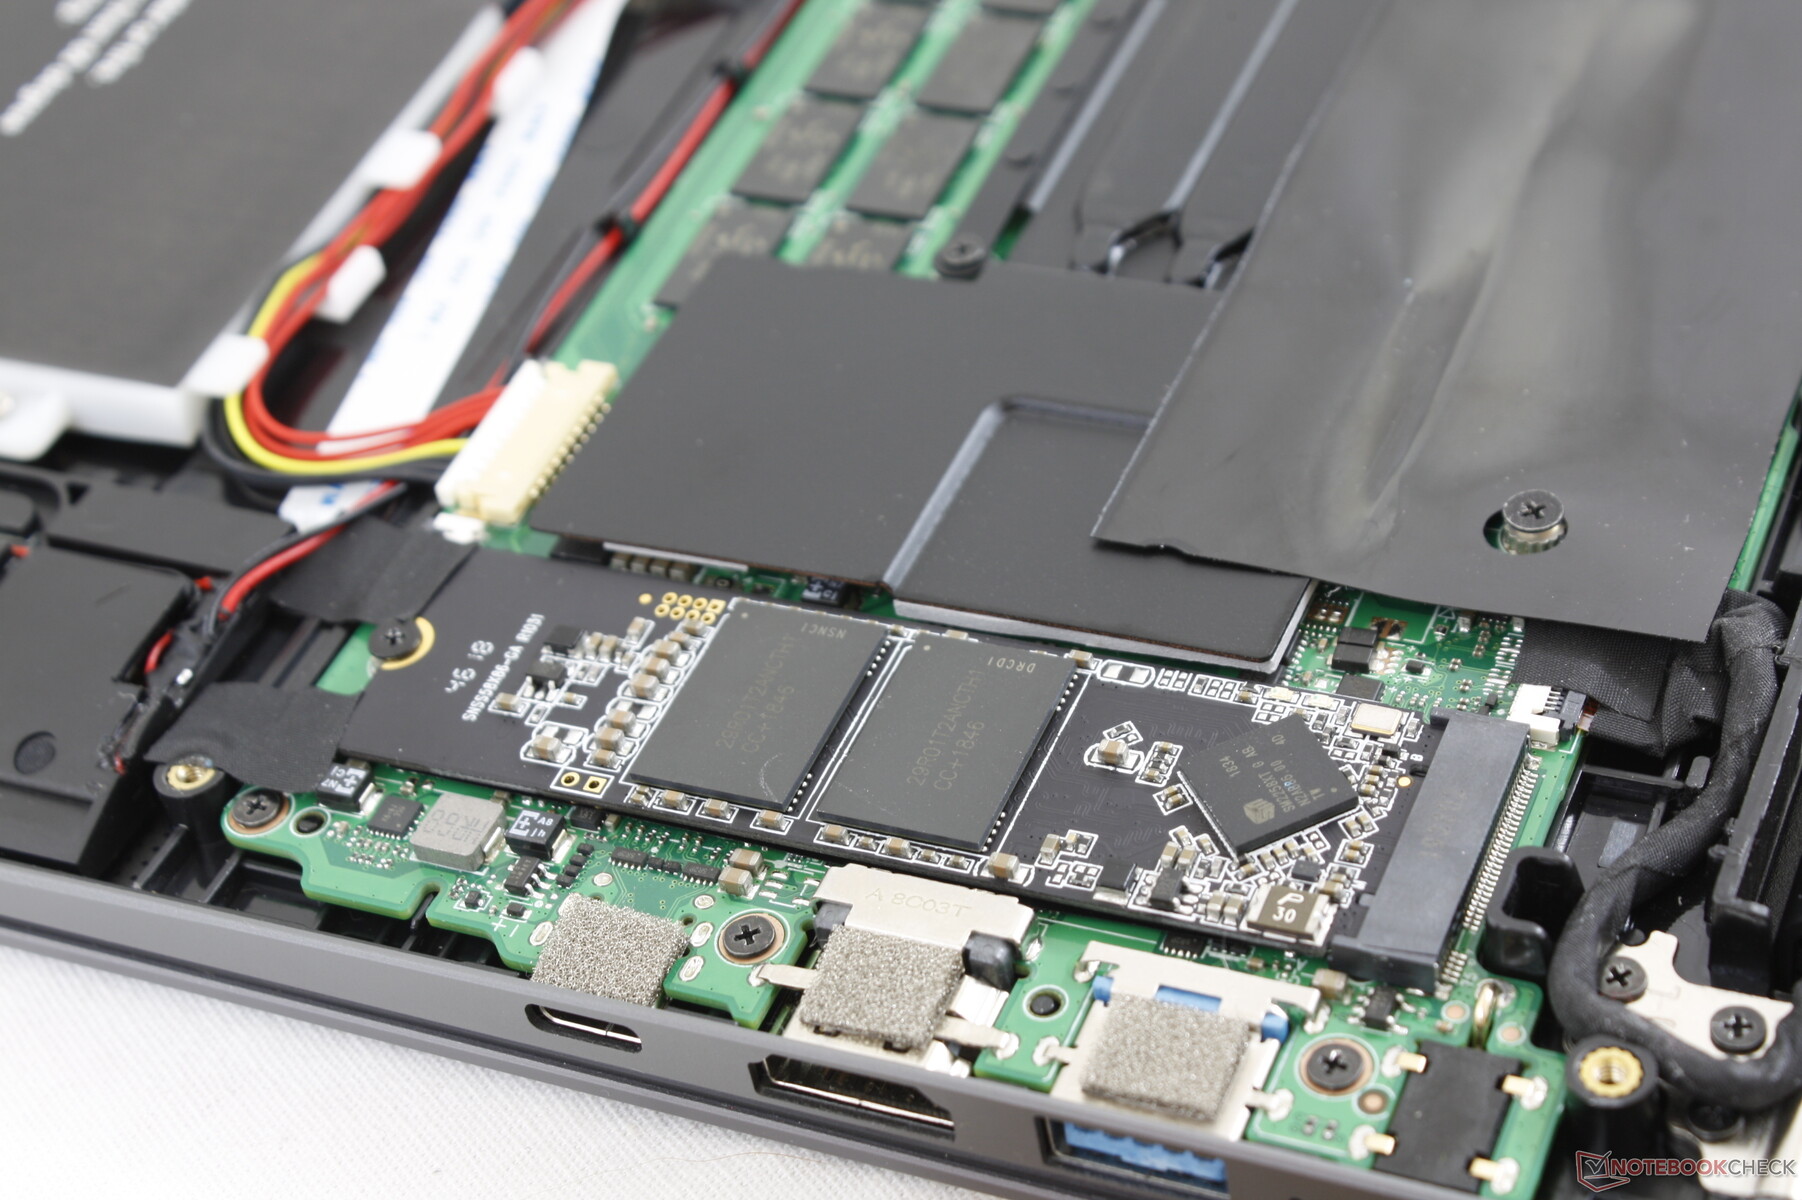
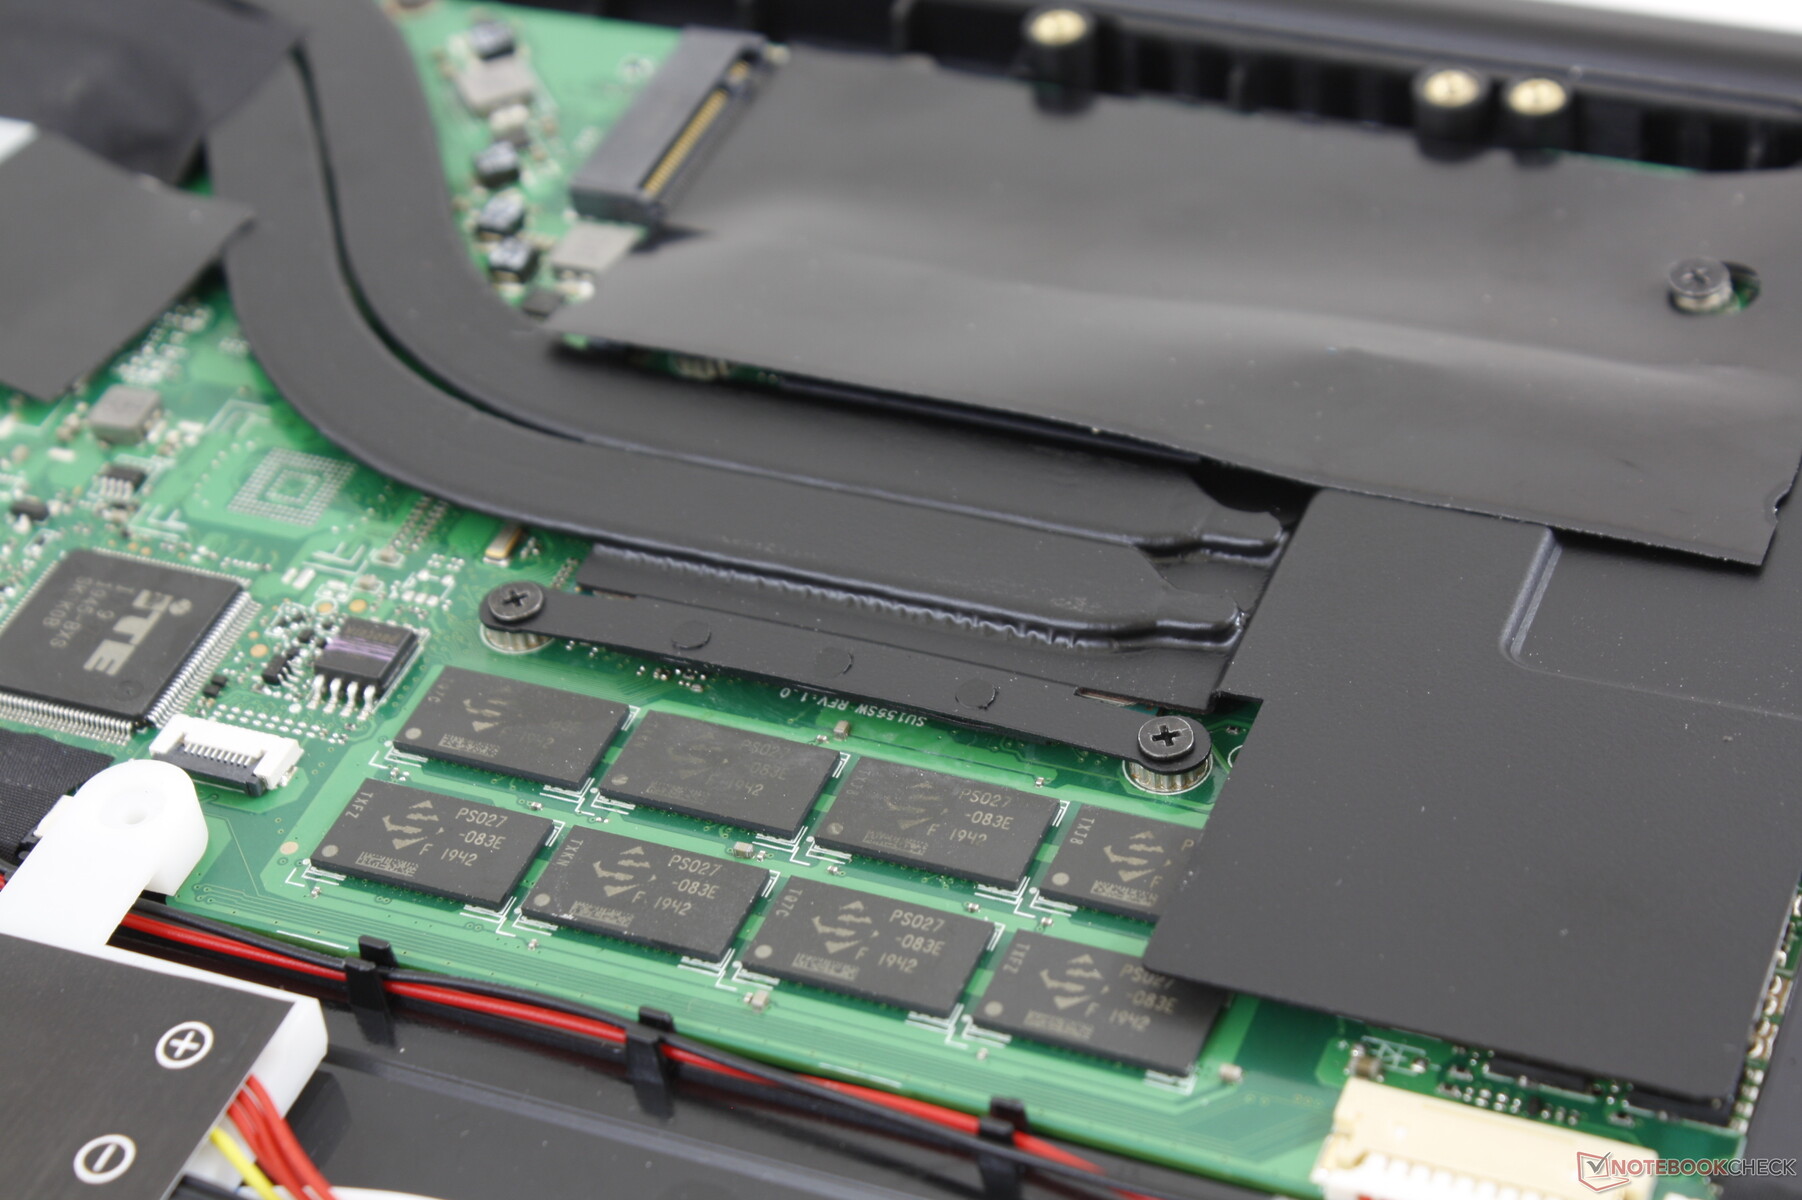
The bottom panel is secured by 14 Philips screws and it is easy to remove. Users can upgrade storage but not RAM or WLAN.
Accessories and Warranty
There are no extras in the box other than the AC adapter and paperwork. Warranty may be tricky to claim since users may have to ship the system overseas.
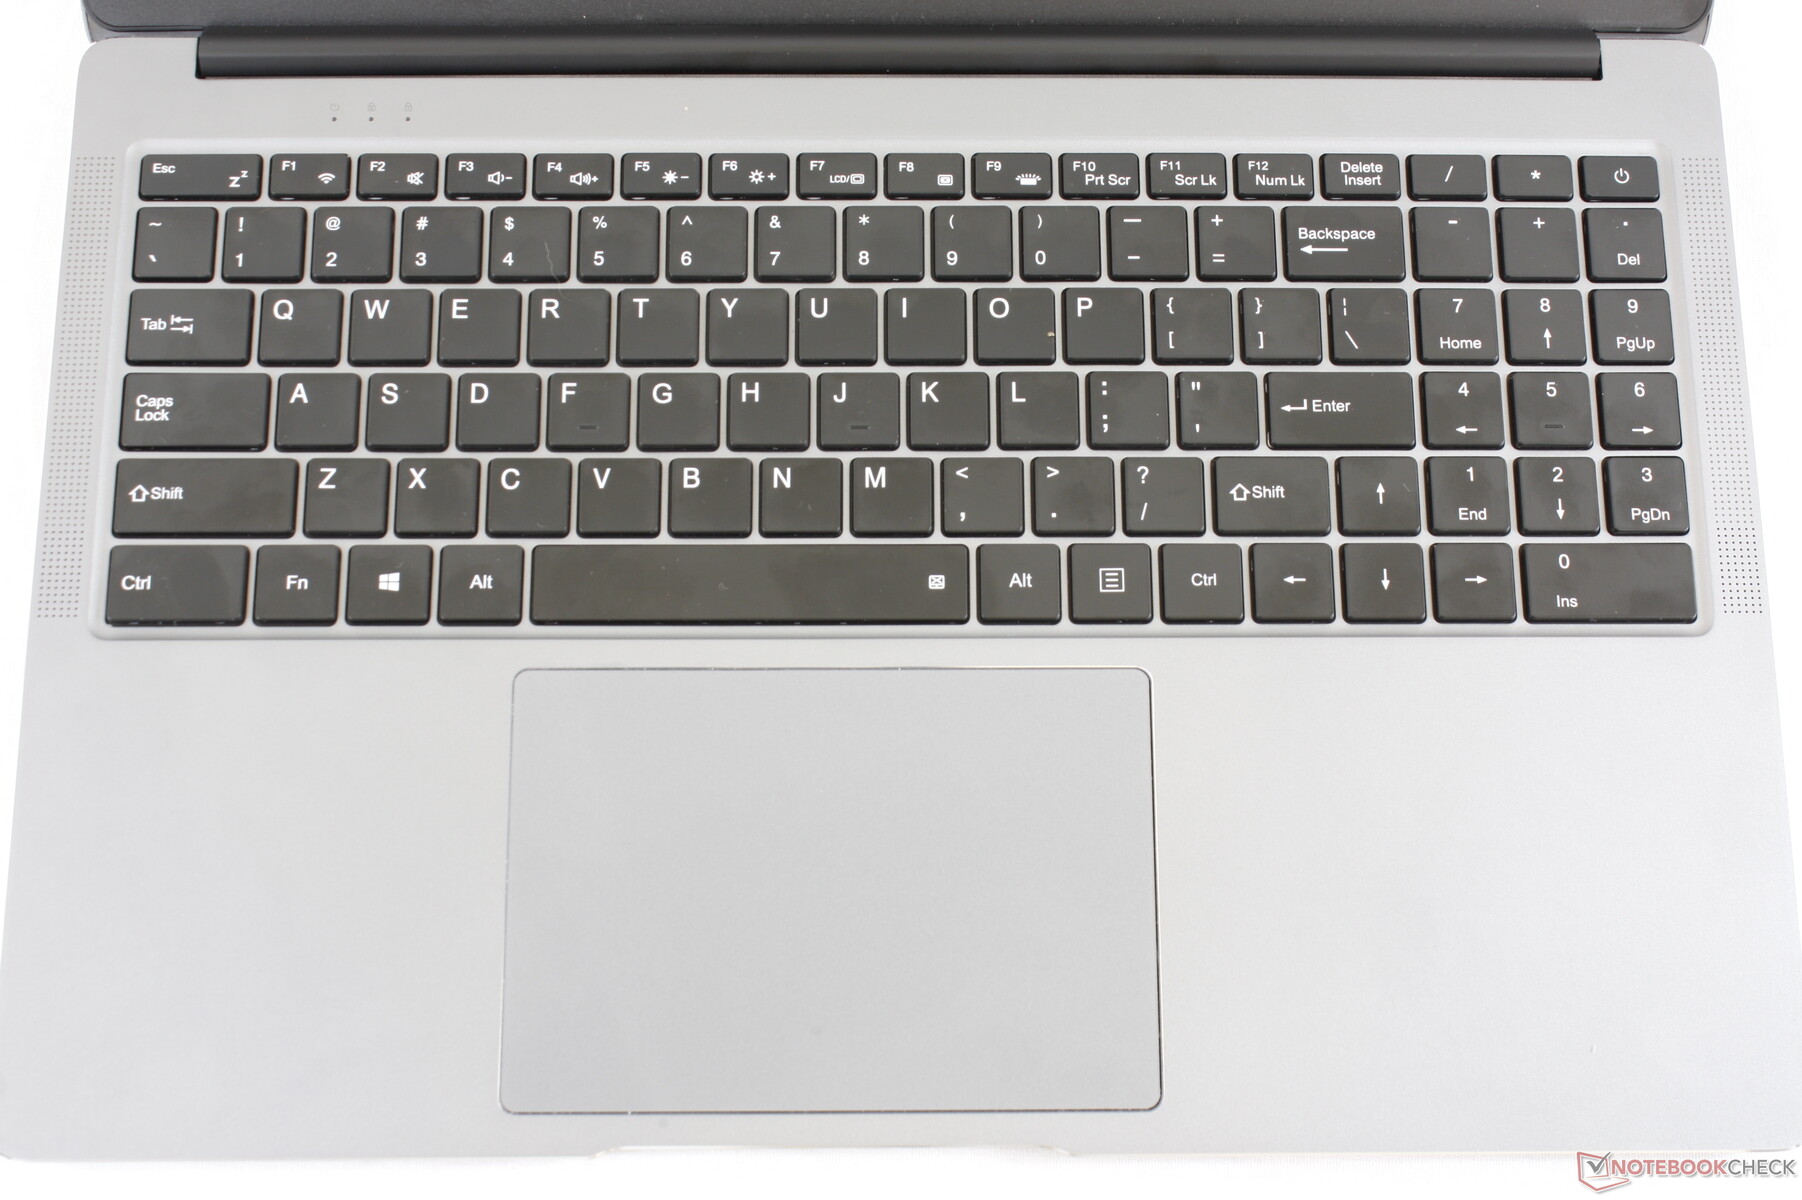
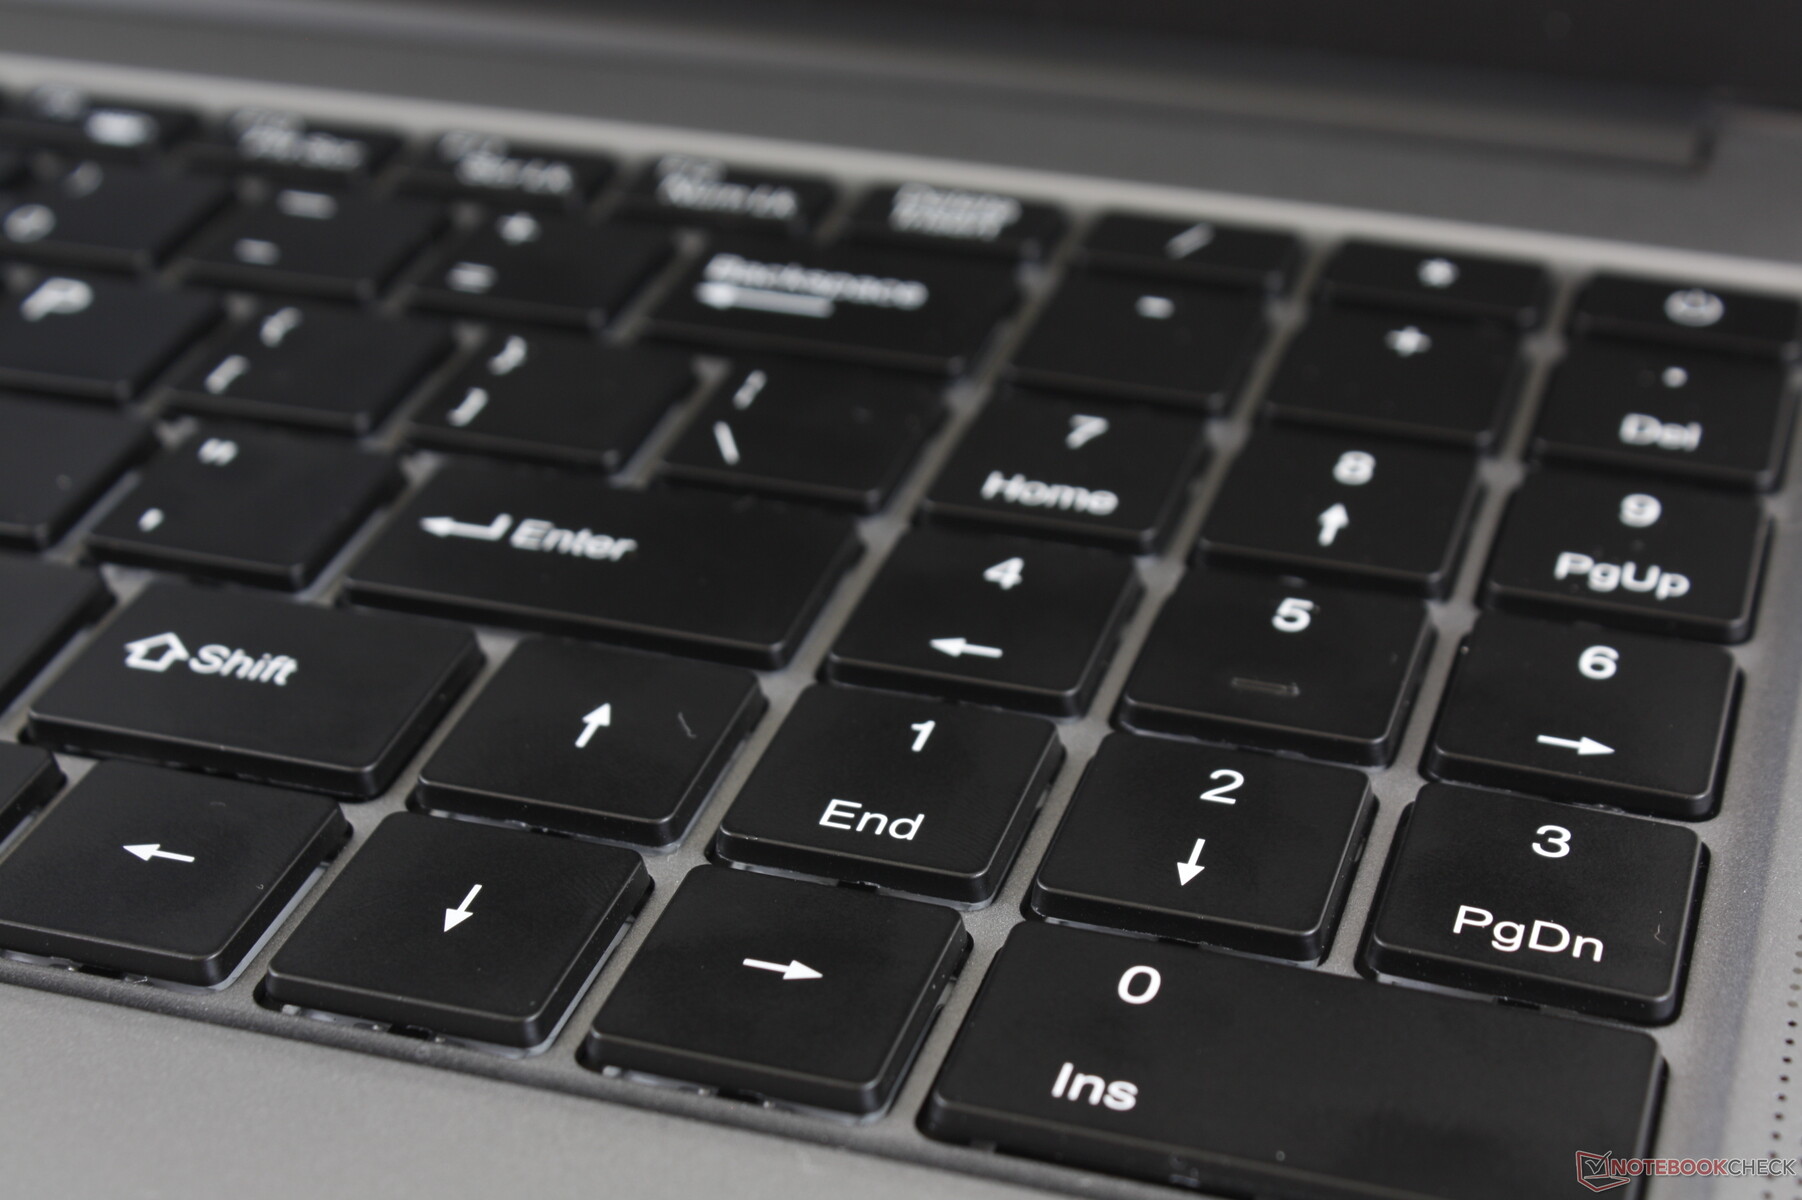
Input Devices
Keyboard
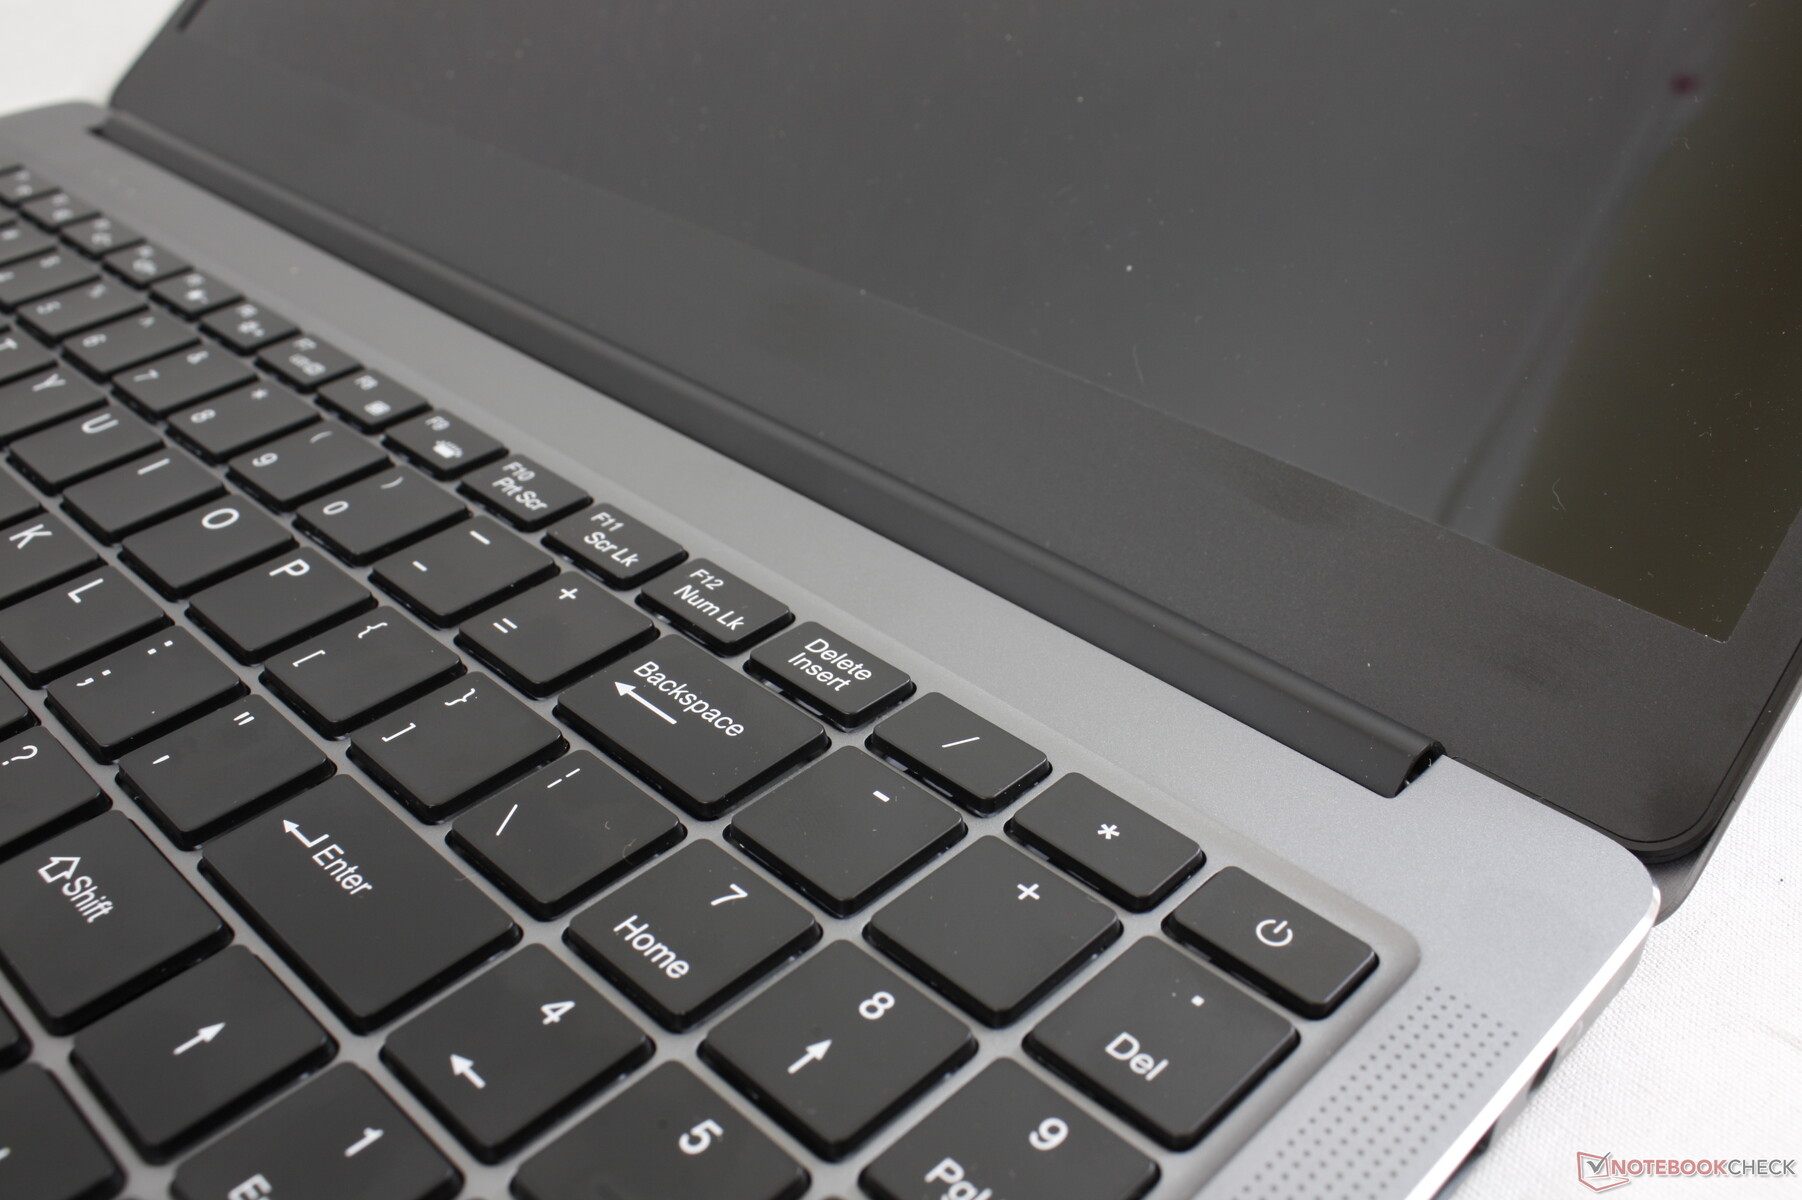
The backlit keys are a mixed bag. They're stiffer and with two times the travel (2.4 mm) than on most other Ultrabooks, but clatter is louder and the actuation force required to push each key feels greater than usual as a result. Furthermore, the Enter key is quite small and spongier than the main QWERTY keys.
The worst aspect of the keyboard is that the Space key is unreliable. Pressing on the edges of this key will sometimes not register which will inevitably be a huge issue.
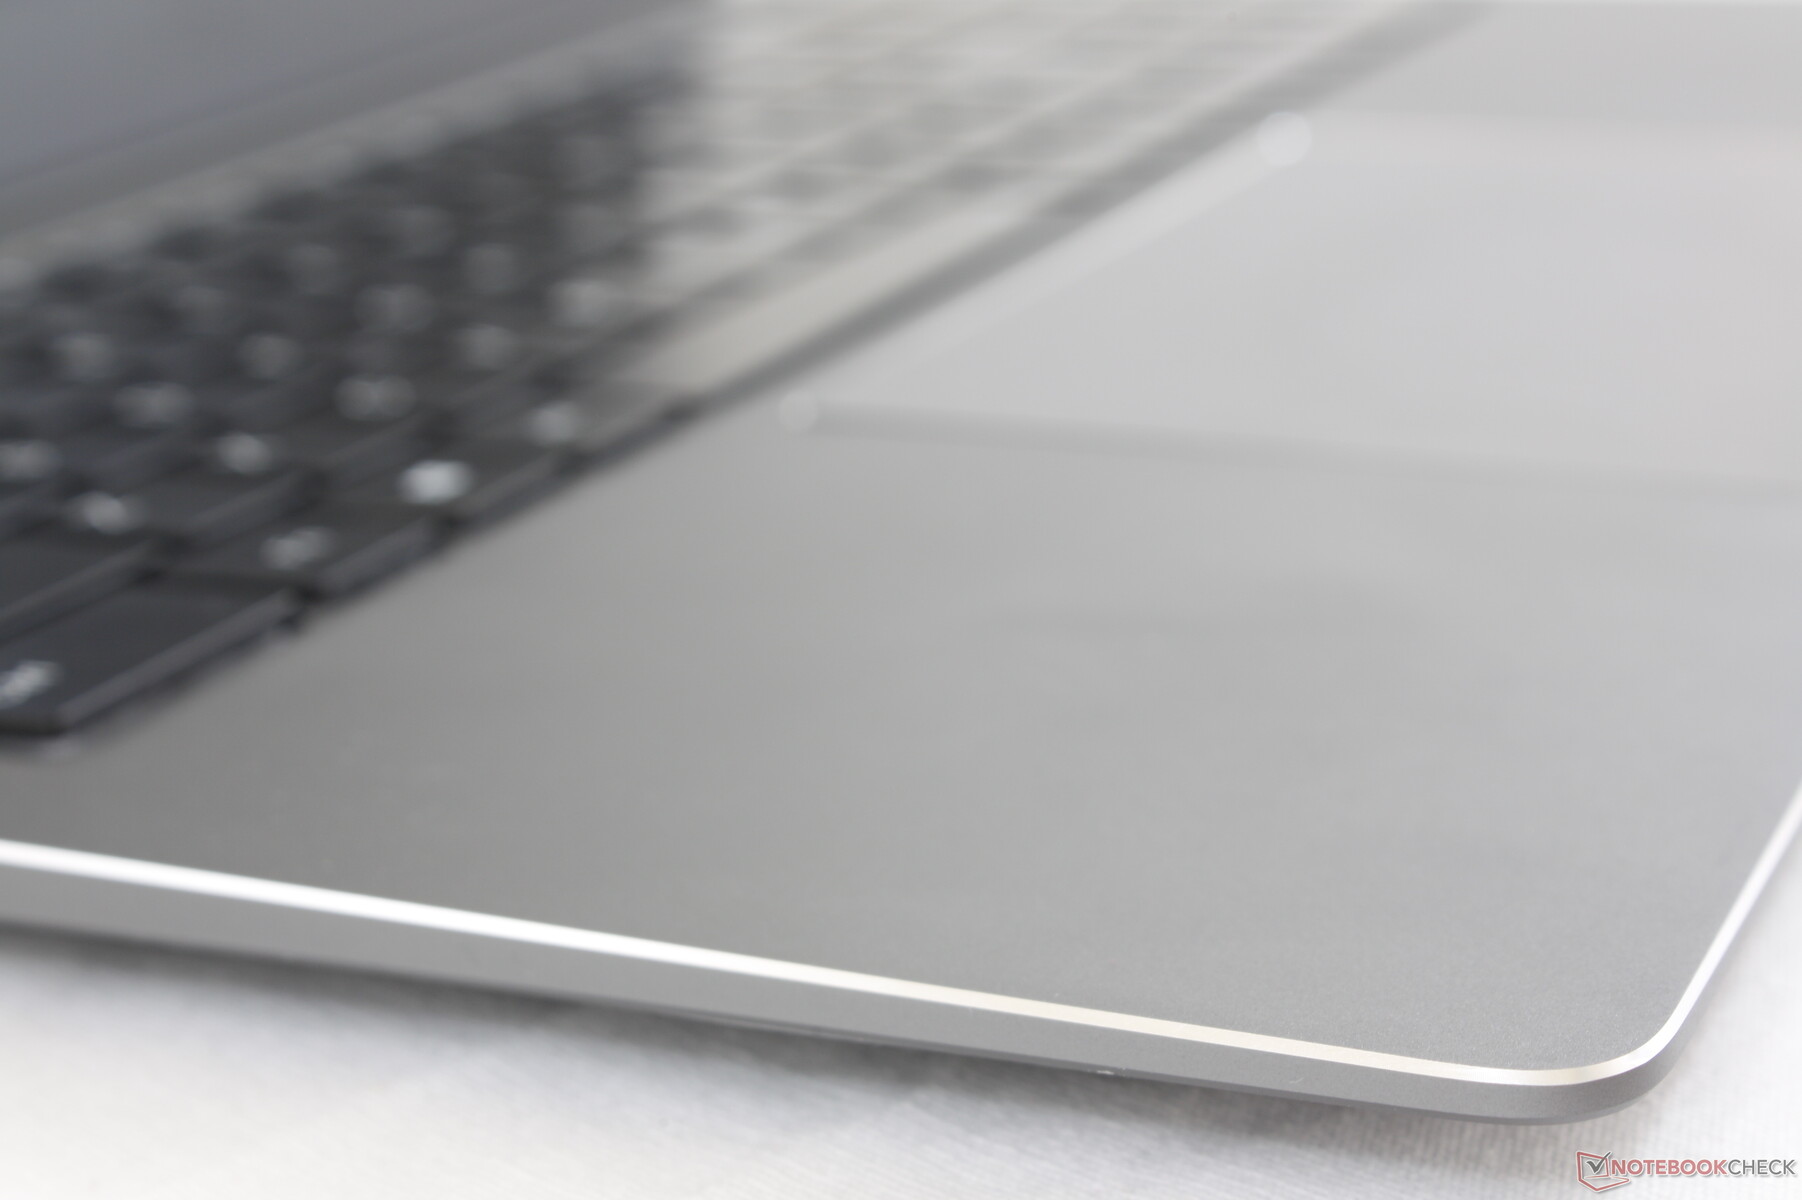
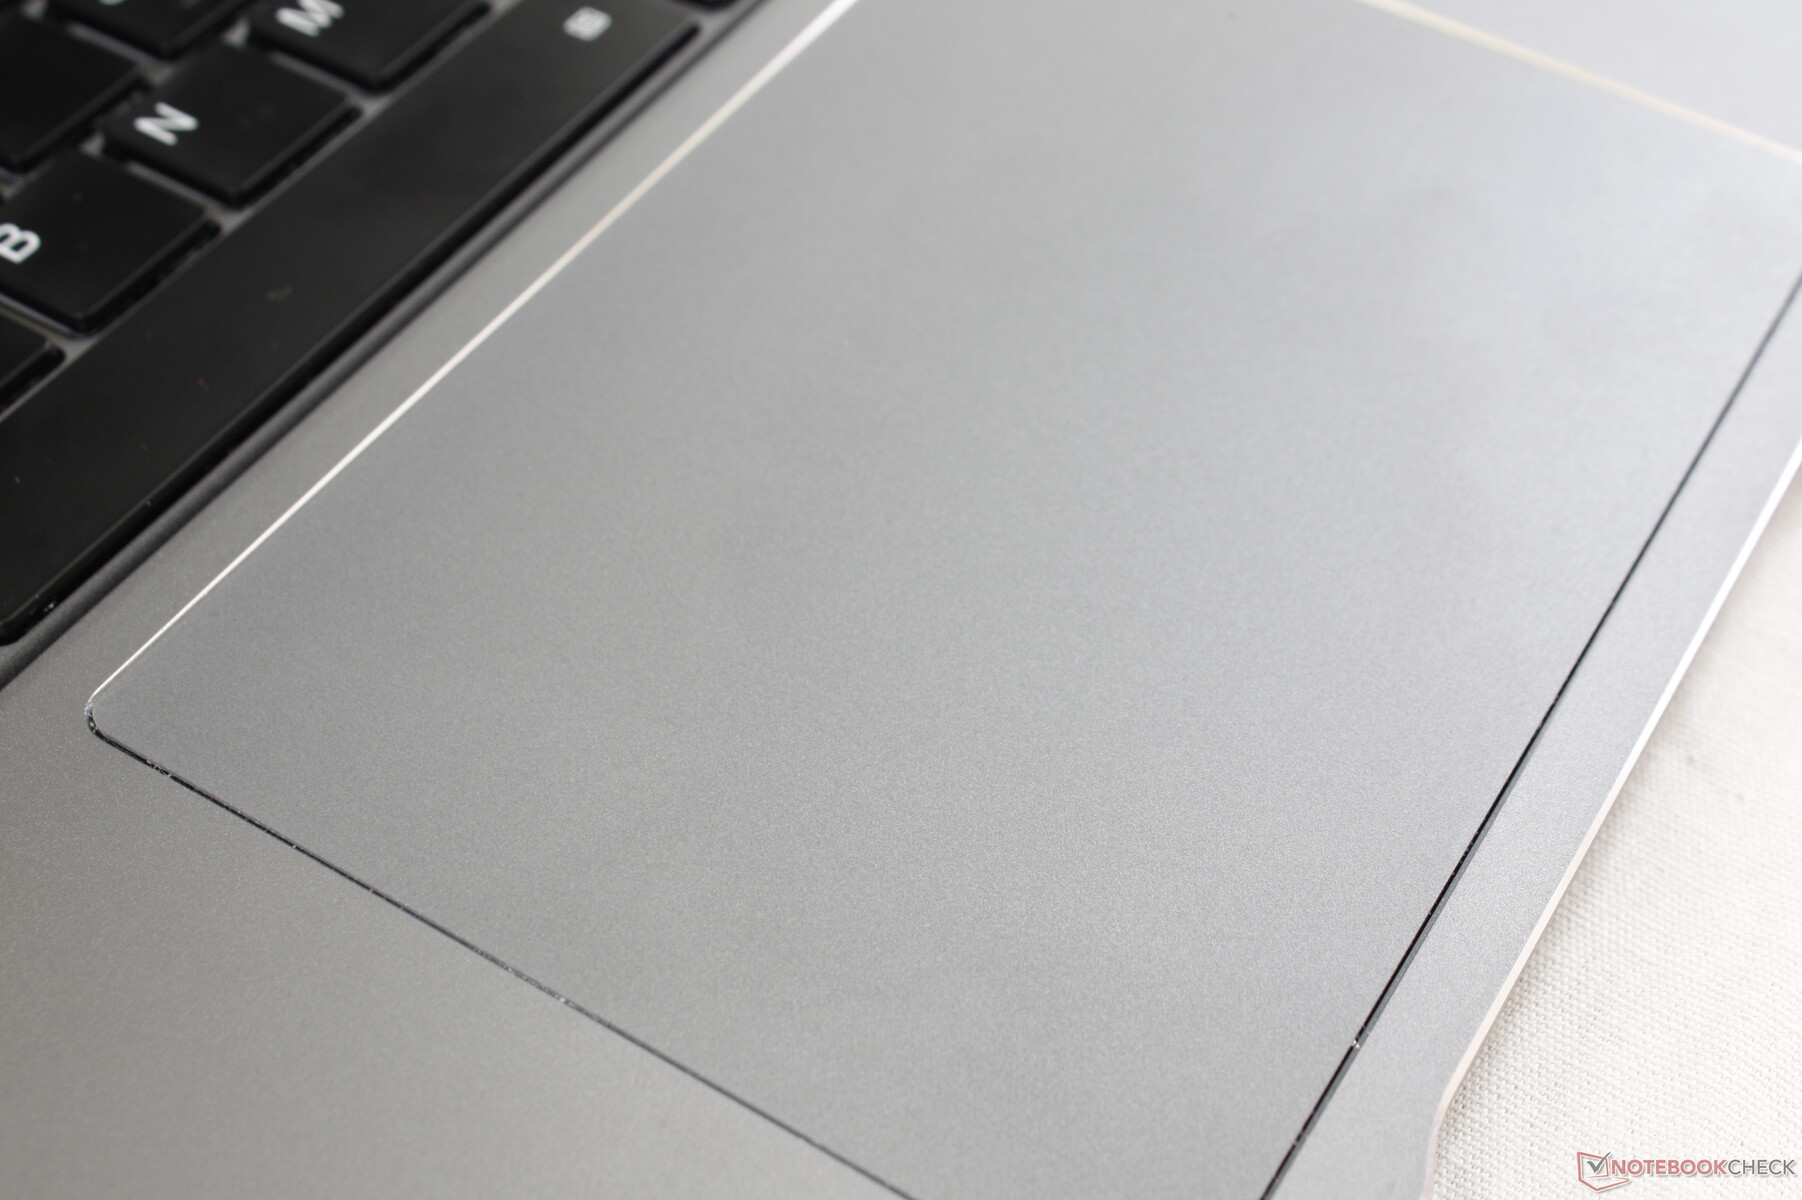
Touchpad
The Precision-enabled clickpad (13 x 9 cm) is larger than on most other Ultrabooks including the Dell XPS 15 (10.5 x 8.5 cm) or HP Spectre x360 15 (12 x 6 cm). Cursor movement, however, can be jumpy because the finger tends to skip when gliding across the surface. Dragging and dropping is therefore more difficult despite the large surface area.
The integrated click keys are soft in feedback with very shallow travel and a weak auditory click for an unsatisfying experience. Firmer feedback or dedicated mouse keys would have made the laptop easier and less frustrating to use.

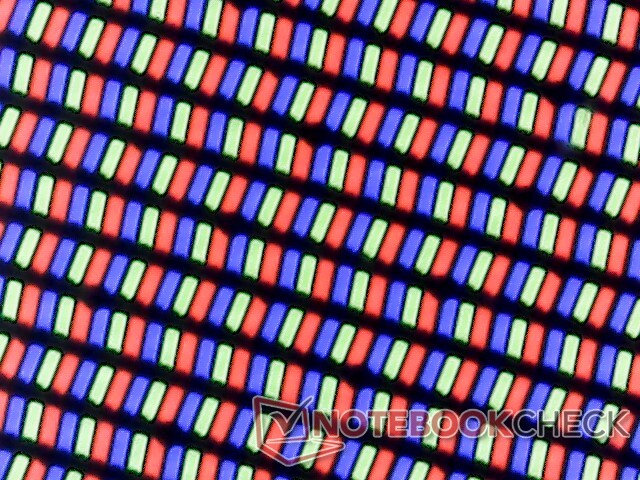
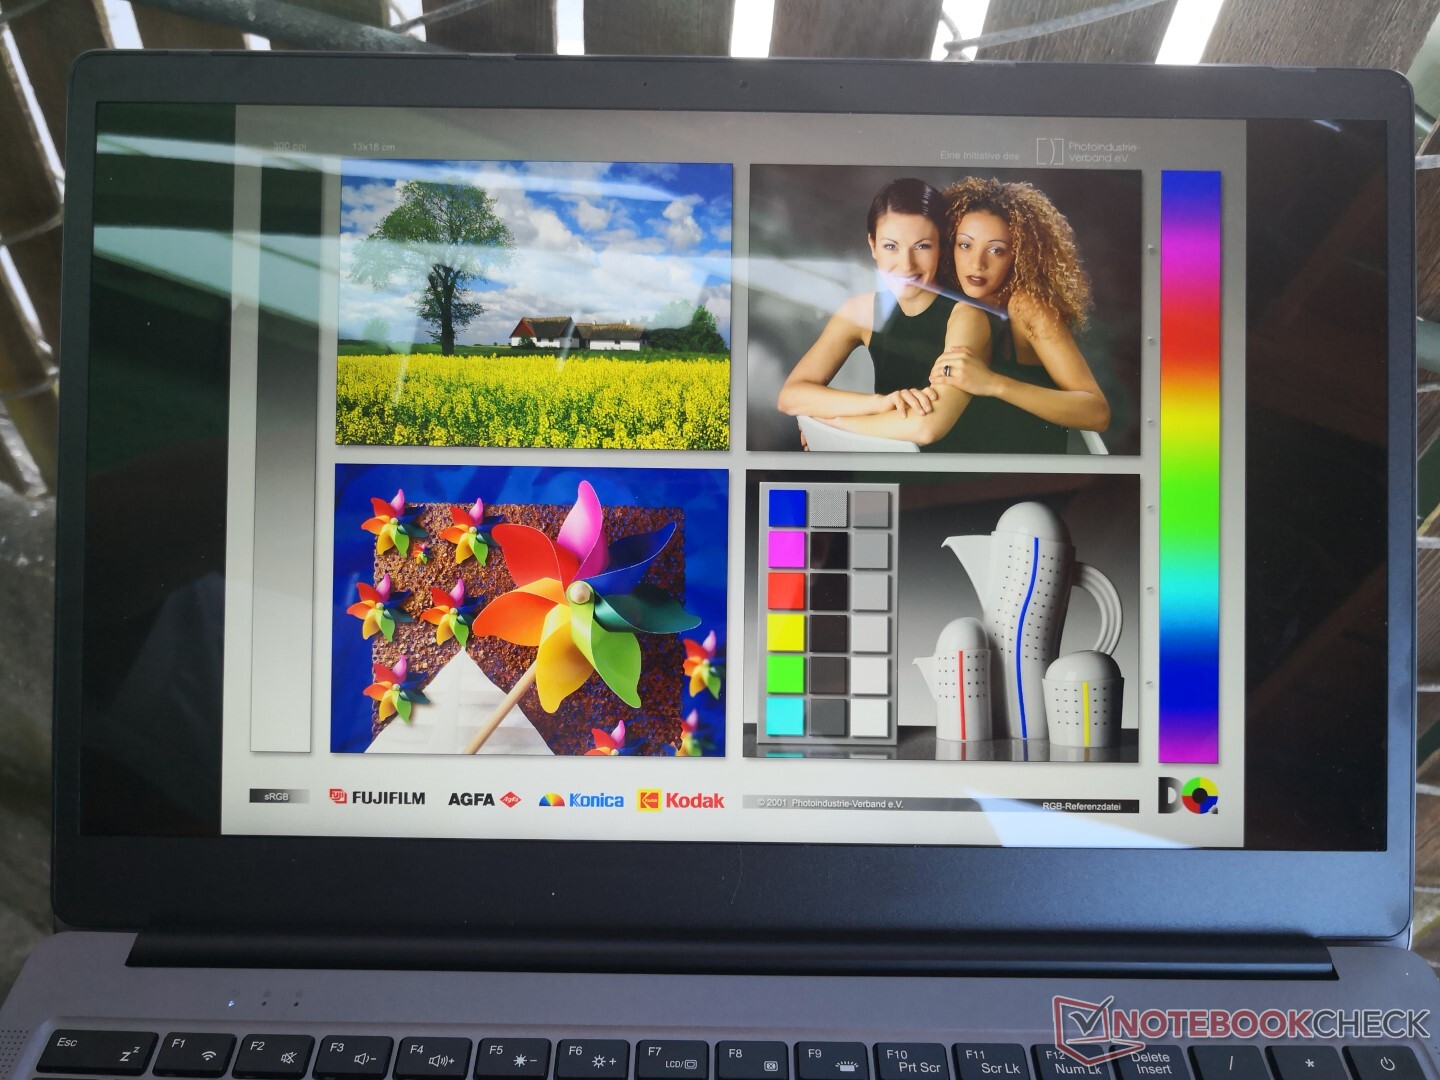
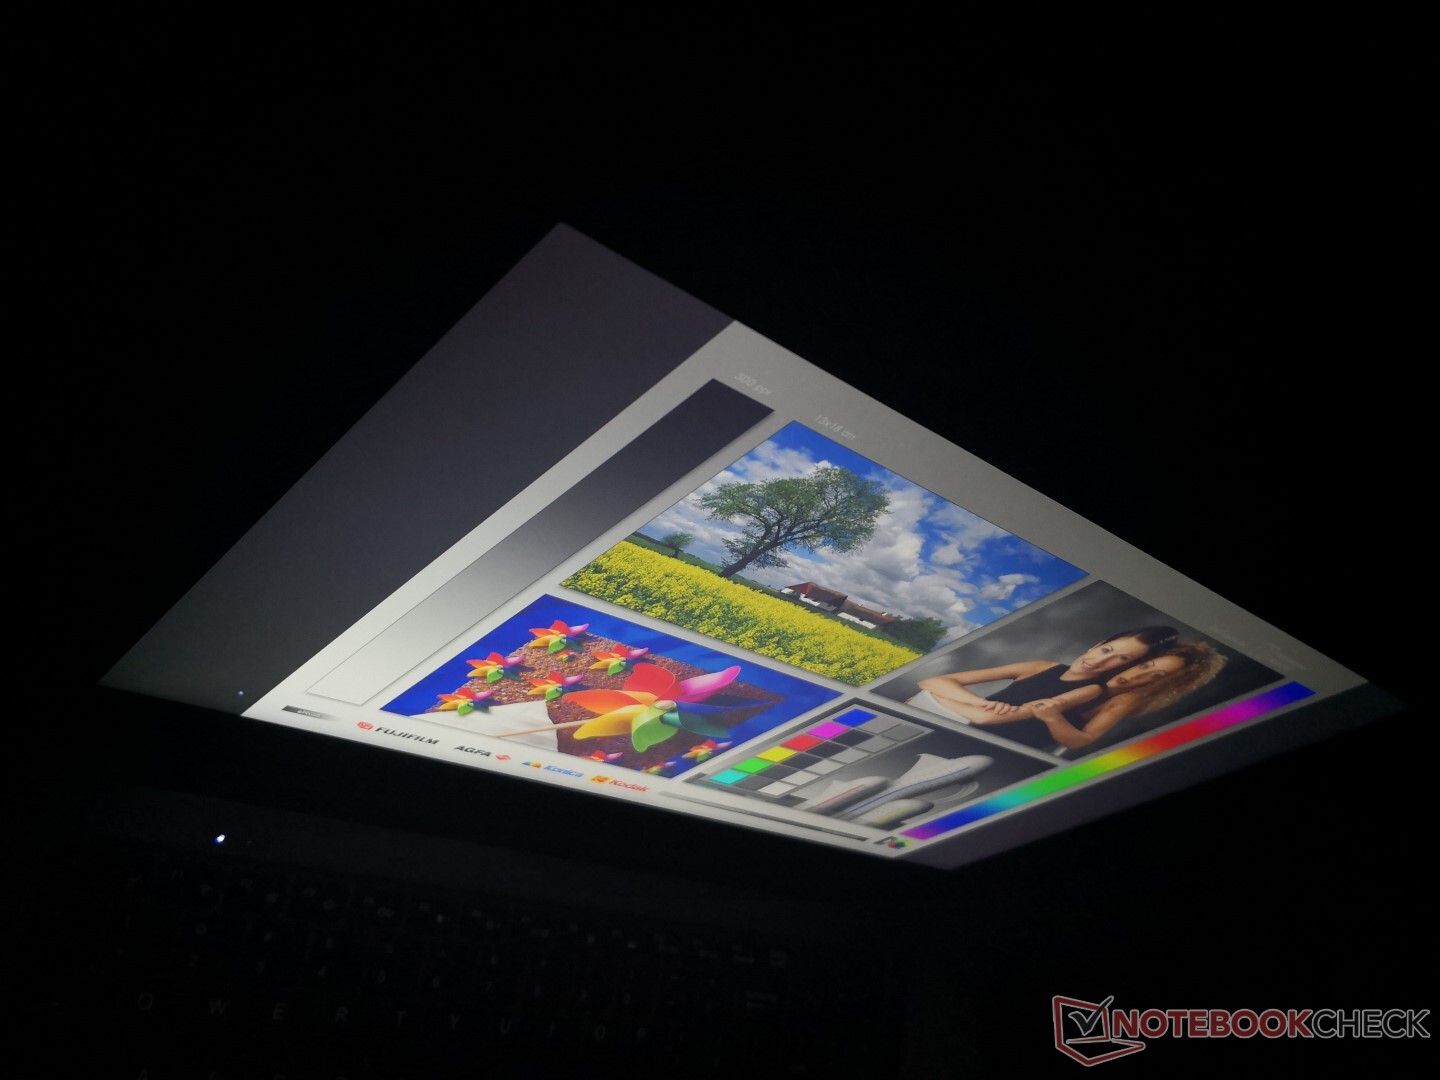
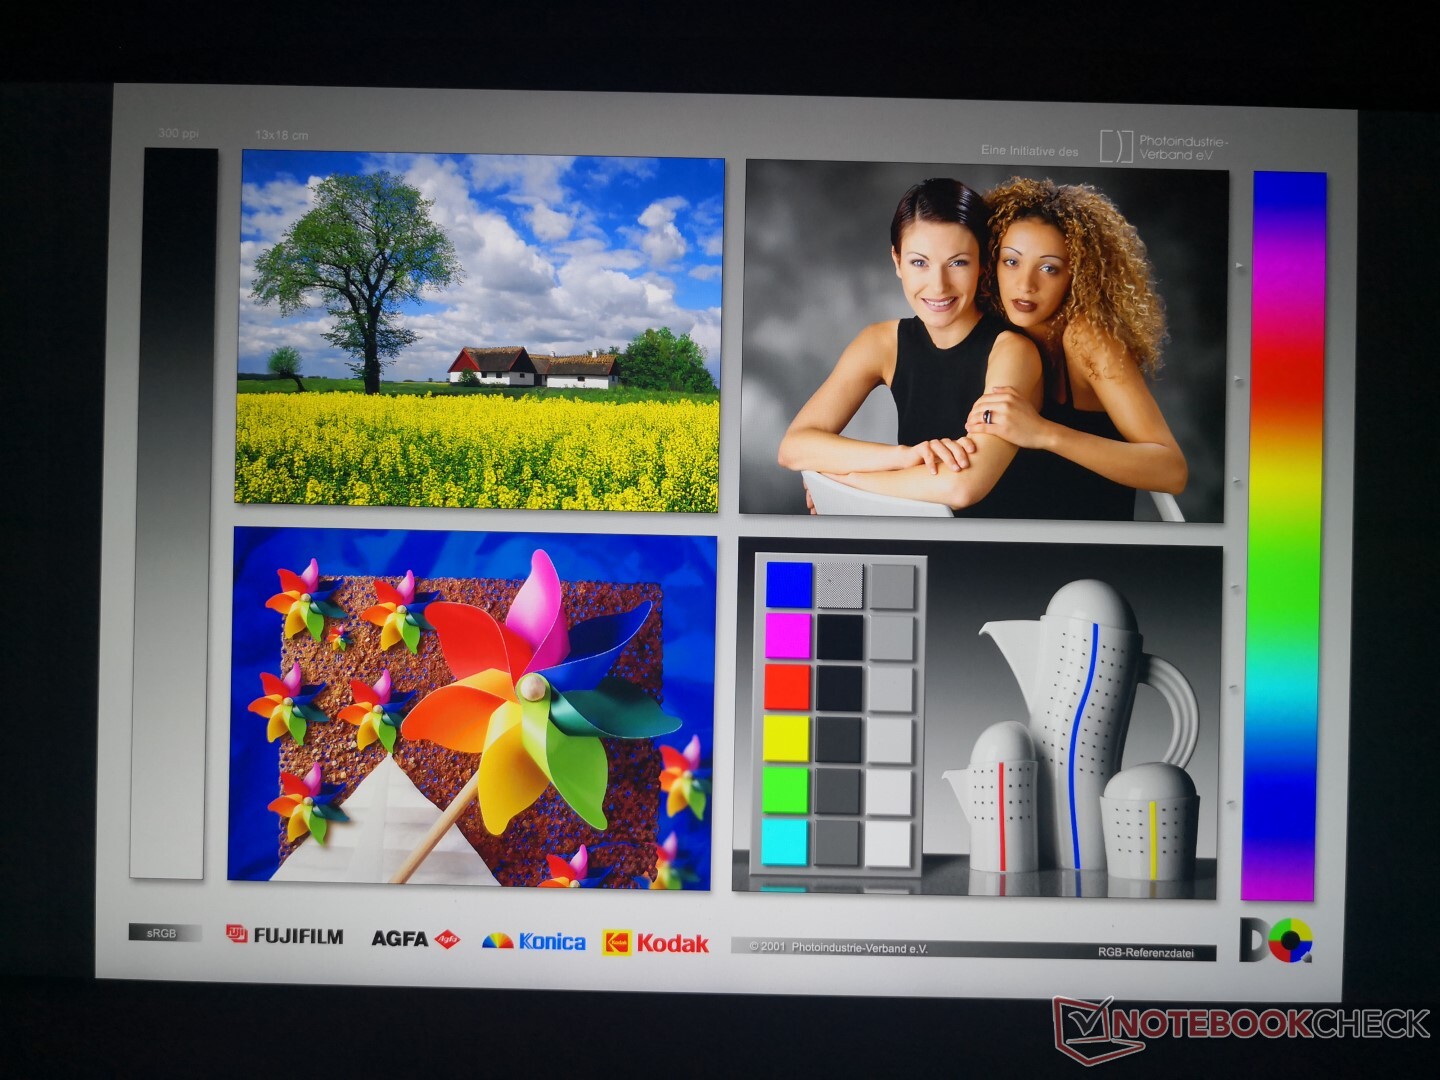
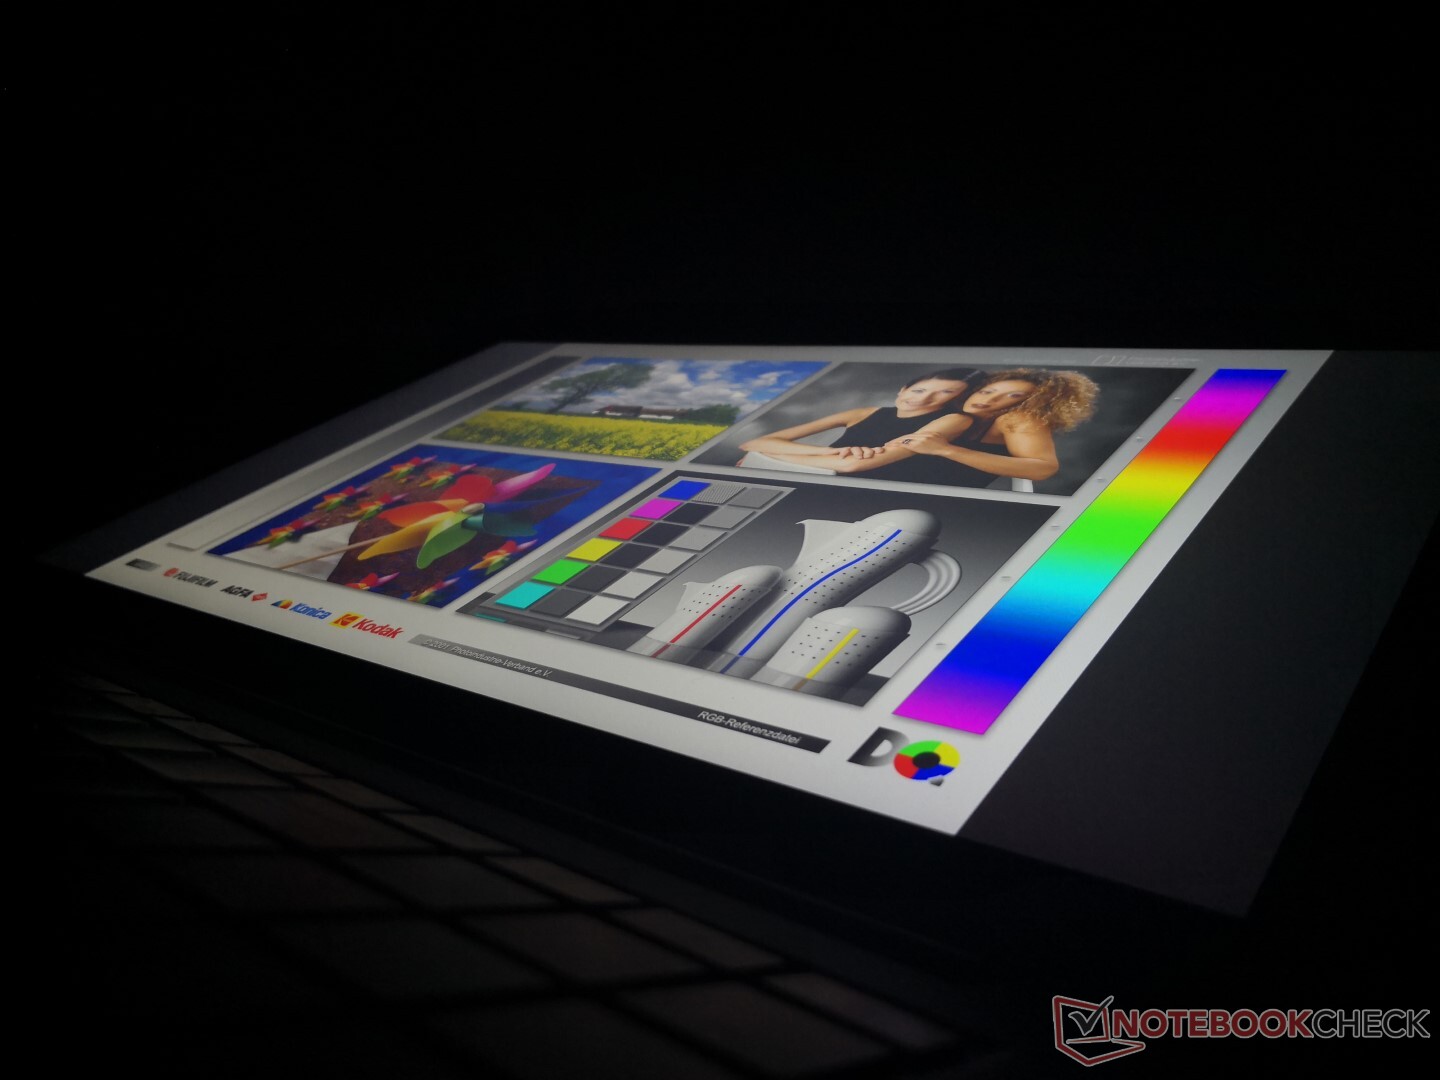
Display
HWiNFO is unable to pull the exact name of the 4K panel in use, but the same BOE06C3 controller can be found on the 4K HP Spectre x360 15 to suggest that both are using similar 4K panels from BOE. The display is easily the highlight of the AeroBook Plus with its excellent contrast ratio, sharp picture, and decent brightness and colors. The displays of the MacBook Pro 15 and Dell XPS 15 are brighter, but they also retail for significantly more.
| |||||||||||||||||||||||||
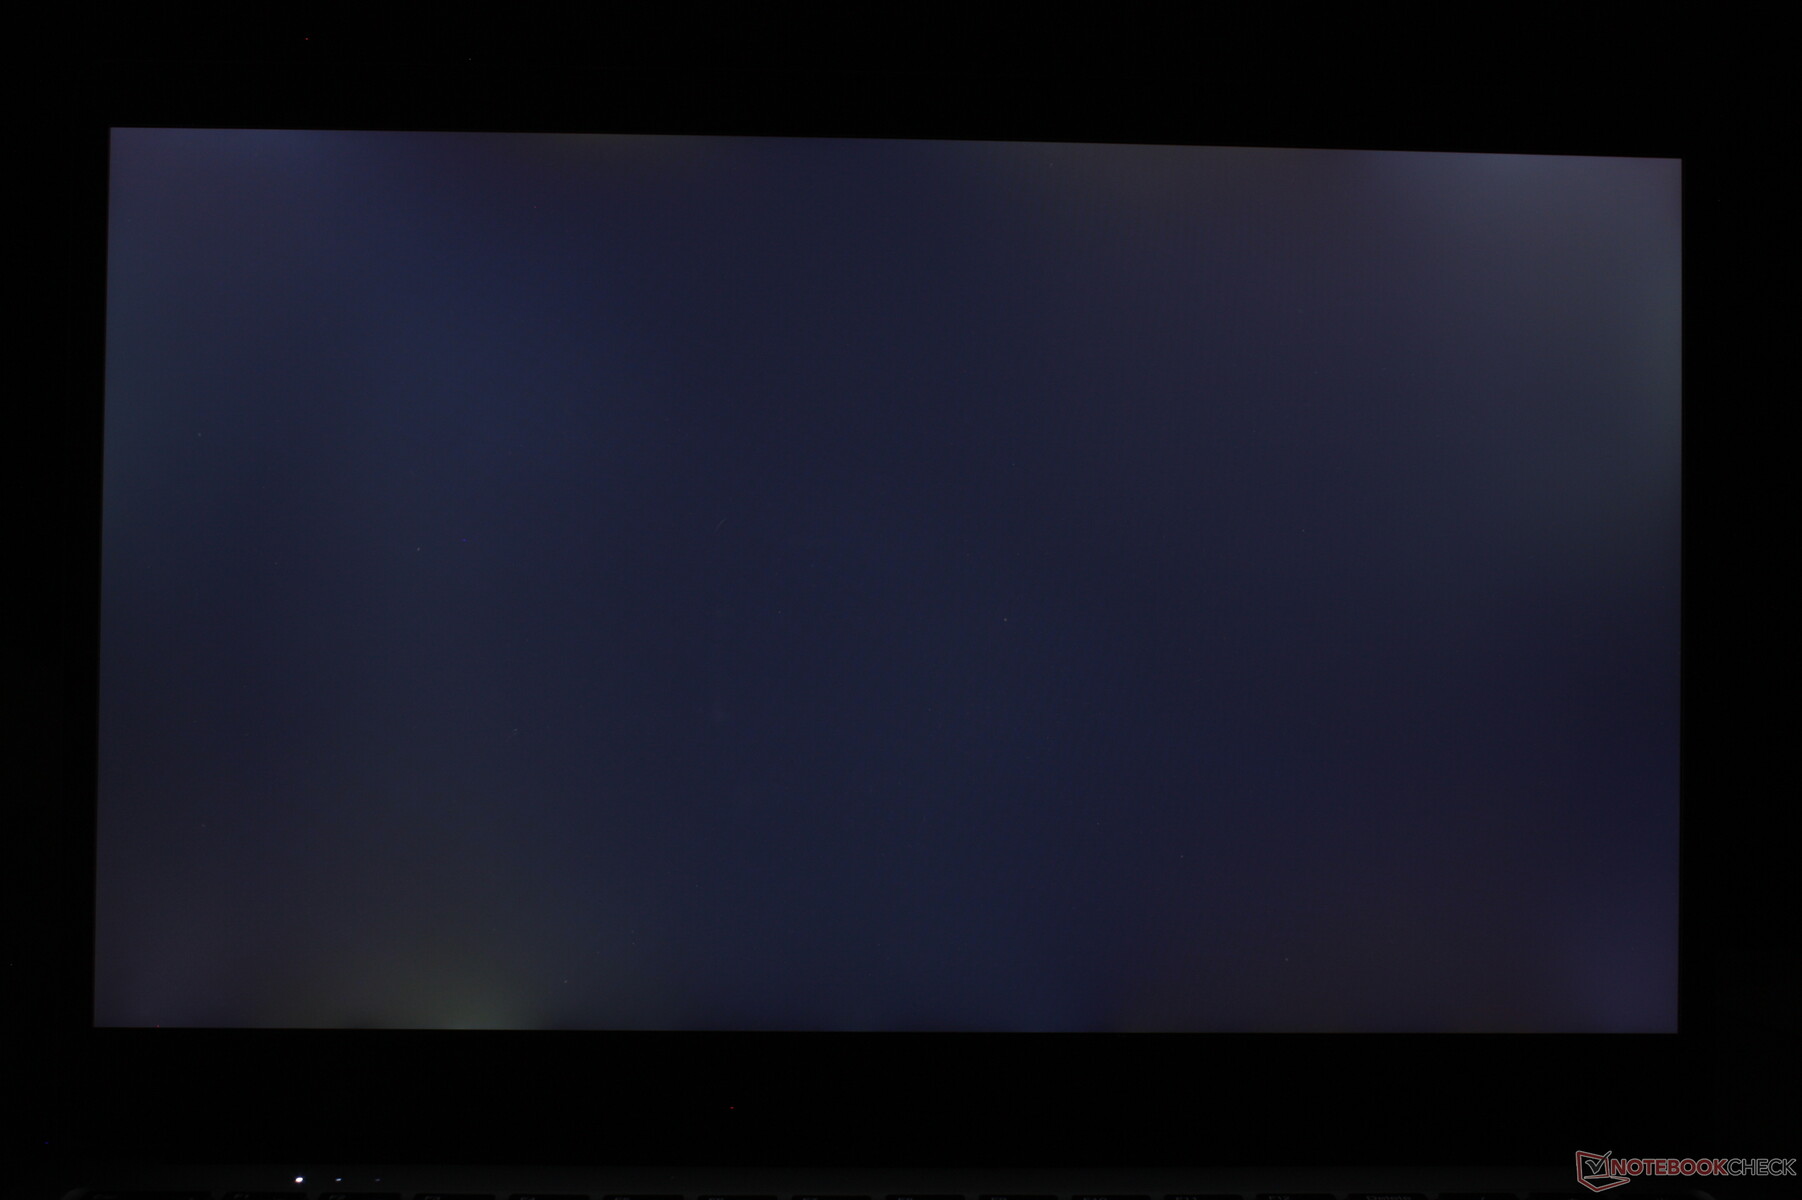
Brightness Distribution: 86 %
Center on Battery: 336.9 cd/m²
Contrast: 1047:1 (Black: 0.33 cd/m²)
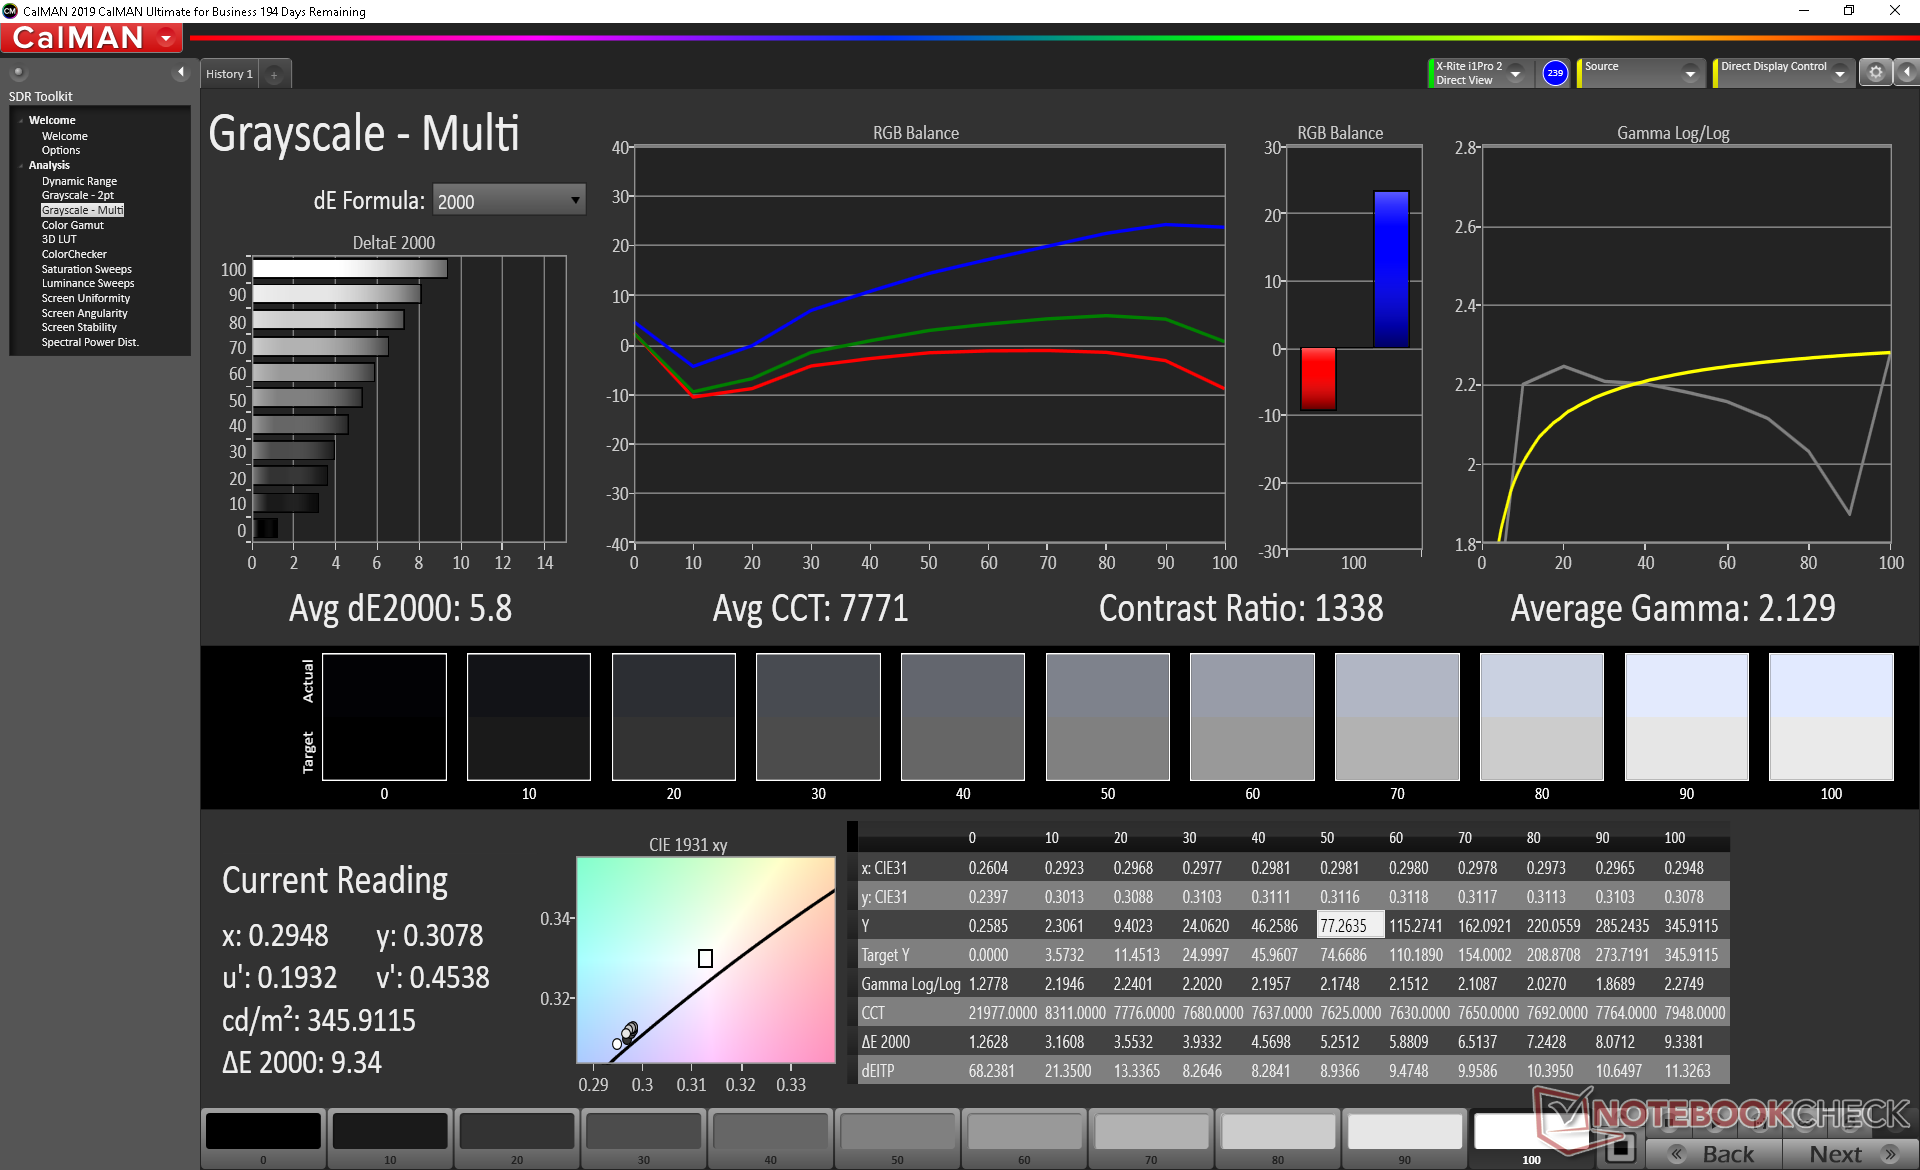
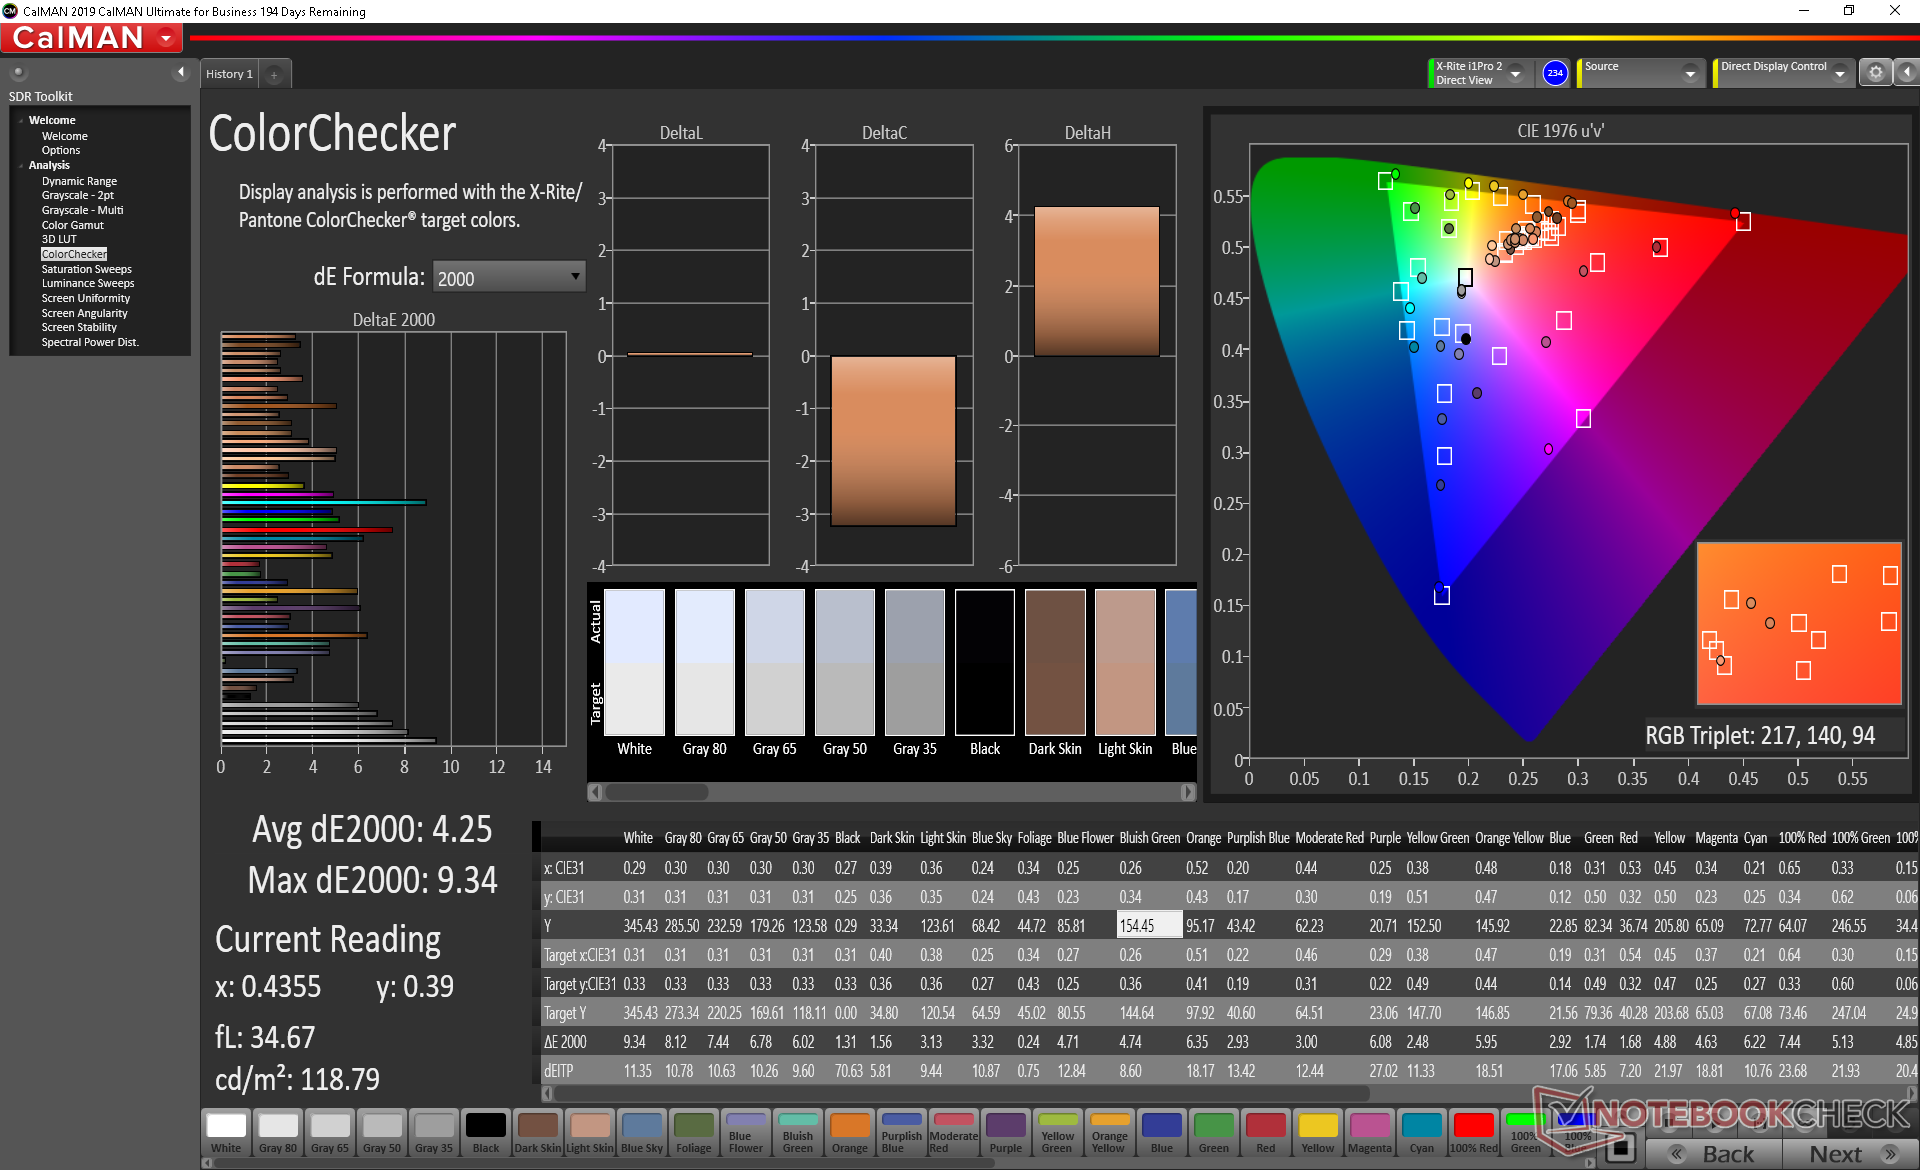
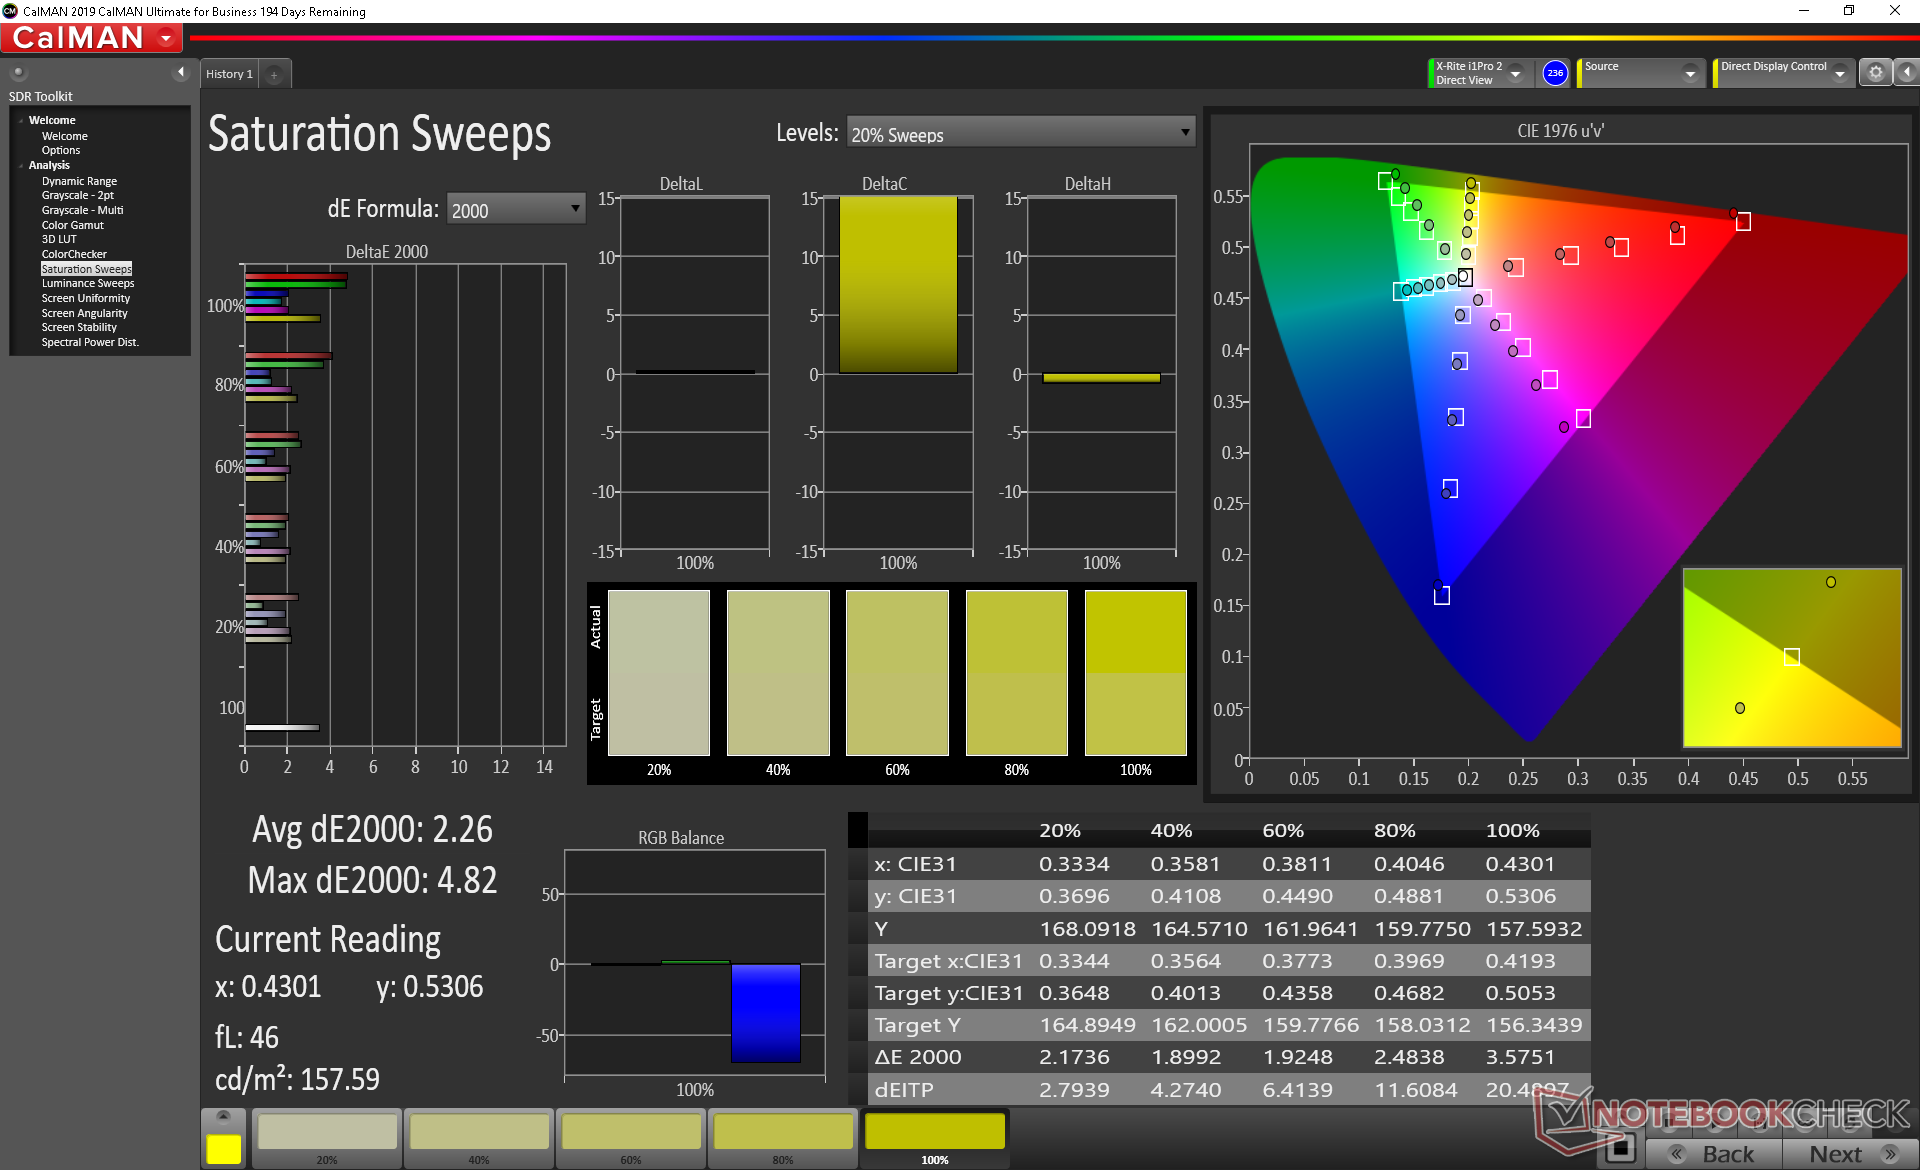
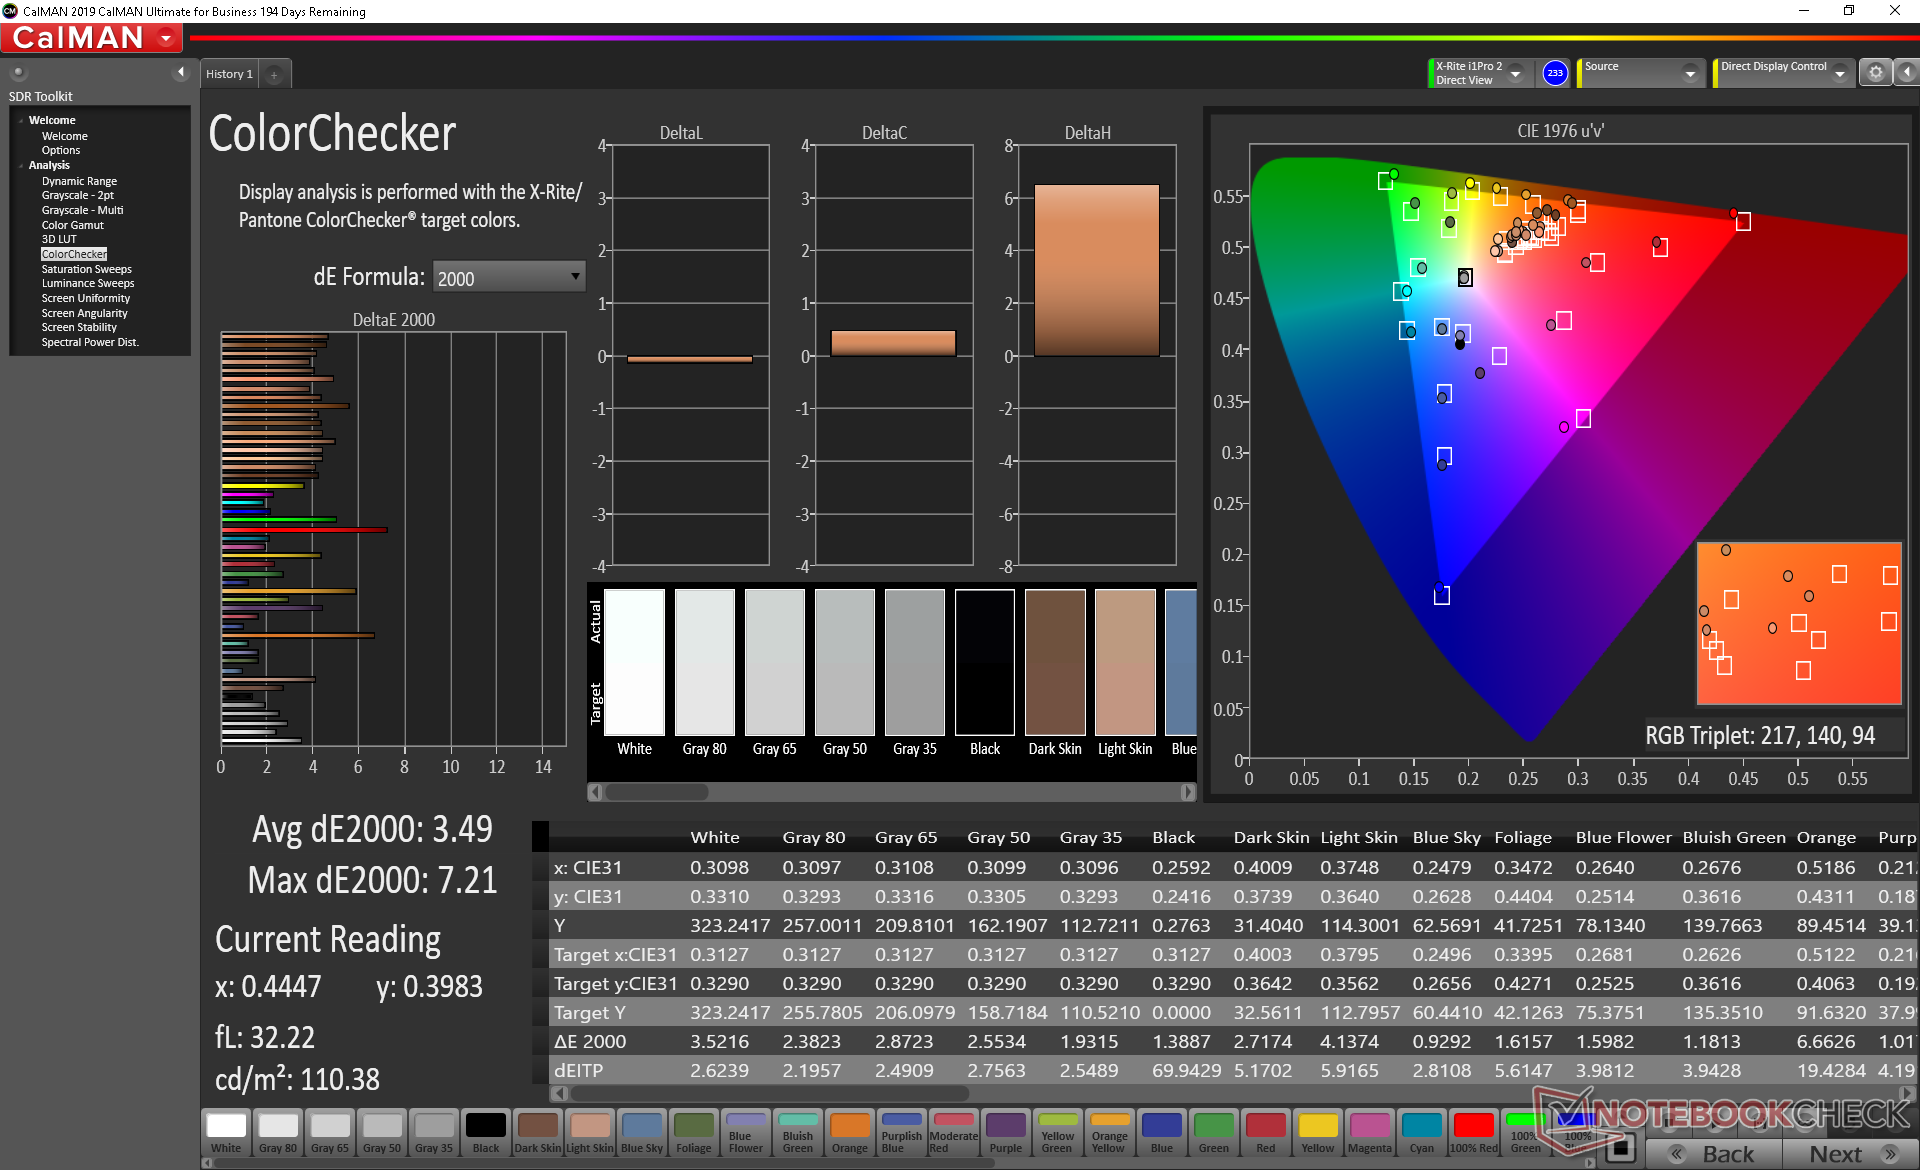
ΔE ColorChecker Calman: 4.25 | ∀{0.5-29.43 Ø4.73}
calibrated: 3.49
ΔE Greyscale Calman: 5.8 | ∀{0.09-98 Ø4.97}
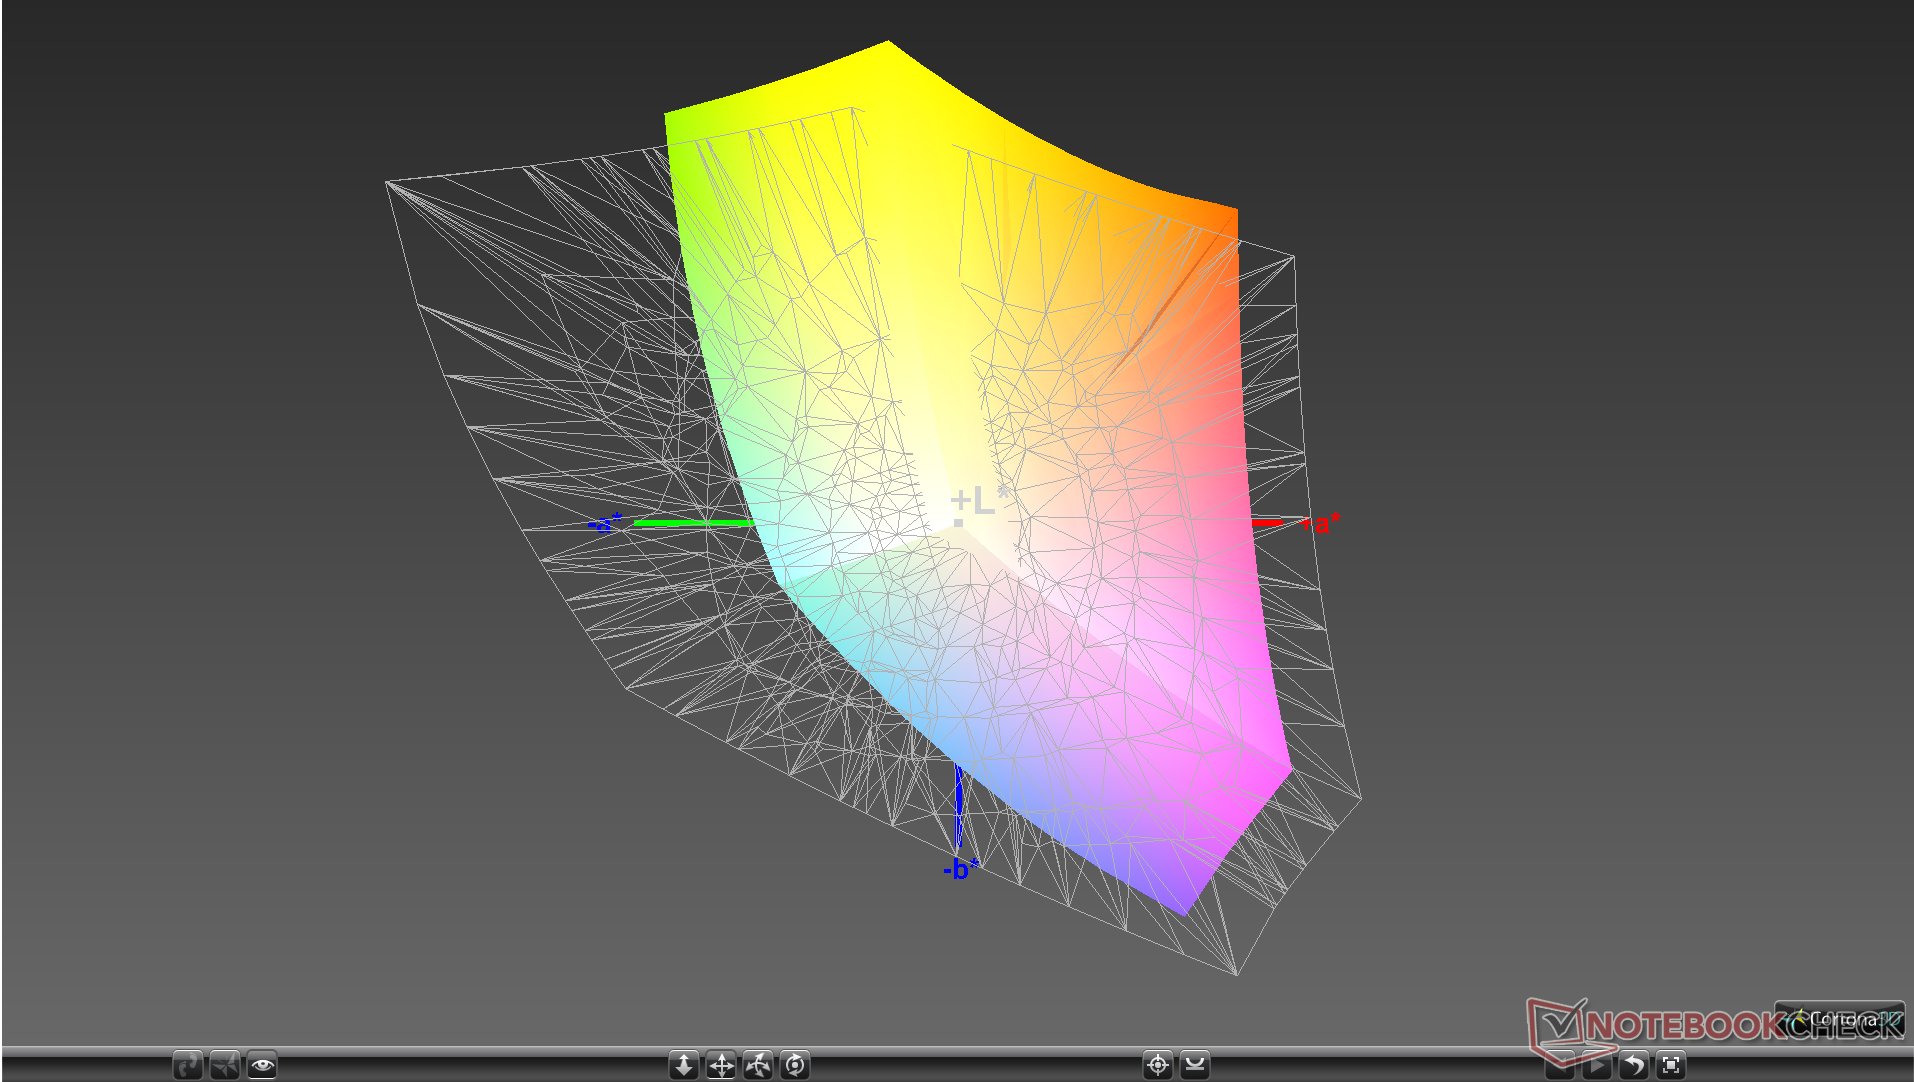
88% sRGB (Argyll 1.6.3 3D)
57.2% AdobeRGB 1998 (Argyll 1.6.3 3D)
64.7% AdobeRGB 1998 (Argyll 3D)
88.4% sRGB (Argyll 3D)
66.7% Display P3 (Argyll 3D)
Gamma: 2.13
CCT: 7771 K
| Chuwi AeroBook Plus BOE06C3, IPS, 15.6", 3840x2160 | Apple MacBook Pro 15 2018 (2.6 GHz, 560X) APPA040, IPS, 15.4", 2880x1800 | Dell XPS 15 7590 i5 iGPU FHD LQ156M1, IPS, 15.6", 1920x1080 | Lenovo Yoga C740-15IML B156HAN02.5, IPS LED, 15.6", 1920x1080 | HP Envy x360 15-bq102ng Chi Mei CM15E9, IPS, 15.6", 1920x1080 | Asus Vivobook 15 F512DA-SH31 AU Optronics B156HAN02.1, IPS, 15.6", 1920x1080 | |
|---|---|---|---|---|---|---|
| Display | 32% | 6% | -38% | -34% | -38% | |
| Display P3 Coverage (%) | 66.7 | 98.7 48% | 66.5 0% | 39.04 -41% | 41.36 -38% | 38.71 -42% |
| sRGB Coverage (%) | 88.4 | 99.9 13% | 98 11% | 57.9 -35% | 62.2 -30% | 58.2 -34% |
| AdobeRGB 1998 Coverage (%) | 64.7 | 86.6 34% | 68.4 6% | 40.33 -38% | 42.74 -34% | 40 -38% |
| Response Times | -11% | -25% | -23% | 3% | 1% | |
| Response Time Grey 50% / Grey 80% * (ms) | 39.6 ? | 43.2 ? -9% | 52.8 ? -33% | 50.8 ? -28% | 40 ? -1% | 36 ? 9% |
| Response Time Black / White * (ms) | 27.6 ? | 31.2 ? -13% | 32 ? -16% | 32.4 ? -17% | 26 ? 6% | 29.6 ? -7% |
| PWM Frequency (Hz) | 943 ? | 117000 ? | 1020 ? | 25000 ? | ||
| Screen | 43% | 33% | -27% | 7% | -39% | |
| Brightness middle (cd/m²) | 345.4 | 520 51% | 588 70% | 286 -17% | 221 -36% | 252.8 -27% |
| Brightness (cd/m²) | 318 | 492 55% | 555 75% | 268 -16% | 207 -35% | 237 -25% |
| Brightness Distribution (%) | 86 | 88 2% | 89 3% | 83 -3% | 87 1% | 89 3% |
| Black Level * (cd/m²) | 0.33 | 0.39 -18% | 0.4 -21% | 0.2 39% | 0.15 55% | 0.86 -161% |
| Contrast (:1) | 1047 | 1333 27% | 1470 40% | 1430 37% | 1473 41% | 294 -72% |
| Colorchecker dE 2000 * | 4.25 | 1.2 72% | 2.5 41% | 7.3 -72% | 4.35 -2% | 4.83 -14% |
| Colorchecker dE 2000 max. * | 9.34 | 2.3 75% | 6.3 33% | 21.7 -132% | 8.98 4% | 16.38 -75% |
| Colorchecker dE 2000 calibrated * | 3.49 | 0.6 83% | 5.1 -46% | 3.78 -8% | ||
| Greyscale dE 2000 * | 5.8 | 1.3 78% | 4.5 22% | 7 -21% | 3.09 47% | 4.6 21% |
| Gamma | 2.13 103% | 2.18 101% | 2.2 100% | 2.35 94% | 2.23 99% | 2.34 94% |
| CCT | 7771 84% | 6738 96% | 6836 95% | 5847 111% | 6068 107% | 6841 95% |
| Color Space (Percent of AdobeRGB 1998) (%) | 57.2 | 63.2 10% | 36.9 -35% | 56 -2% | 36.9 -35% | |
| Color Space (Percent of sRGB) (%) | 88 | 98 11% | 57.5 -35% | 86 -2% | 58.1 -34% | |
| Total Average (Program / Settings) | 21% /
32% | 5% /
21% | -29% /
-29% | -8% /
-2% | -25% /
-34% |
* ... smaller is better
Color space covers approximately 57 percent and 88 percent of AdobeRGB and sRGB, respectively, to be very close to most other high-end Ultrabooks where >95 percent sRGB has become commonplace.
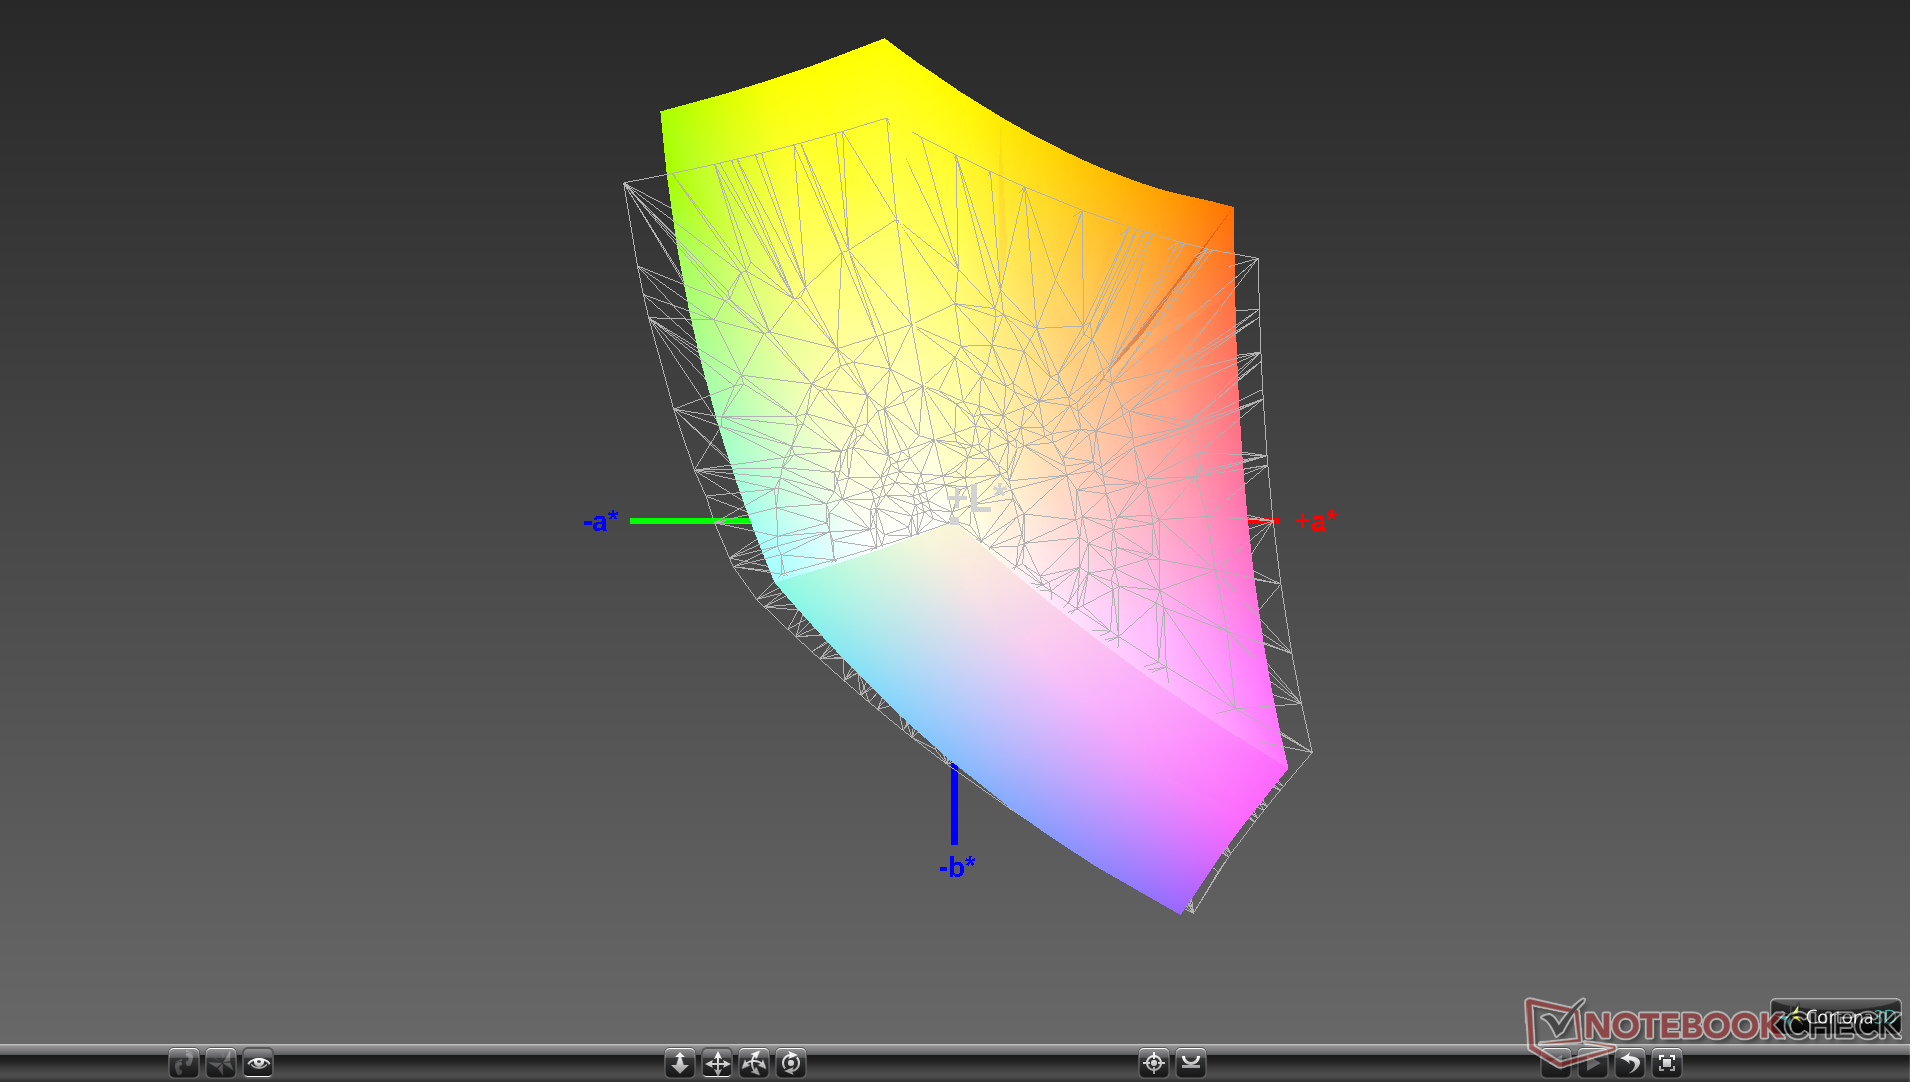
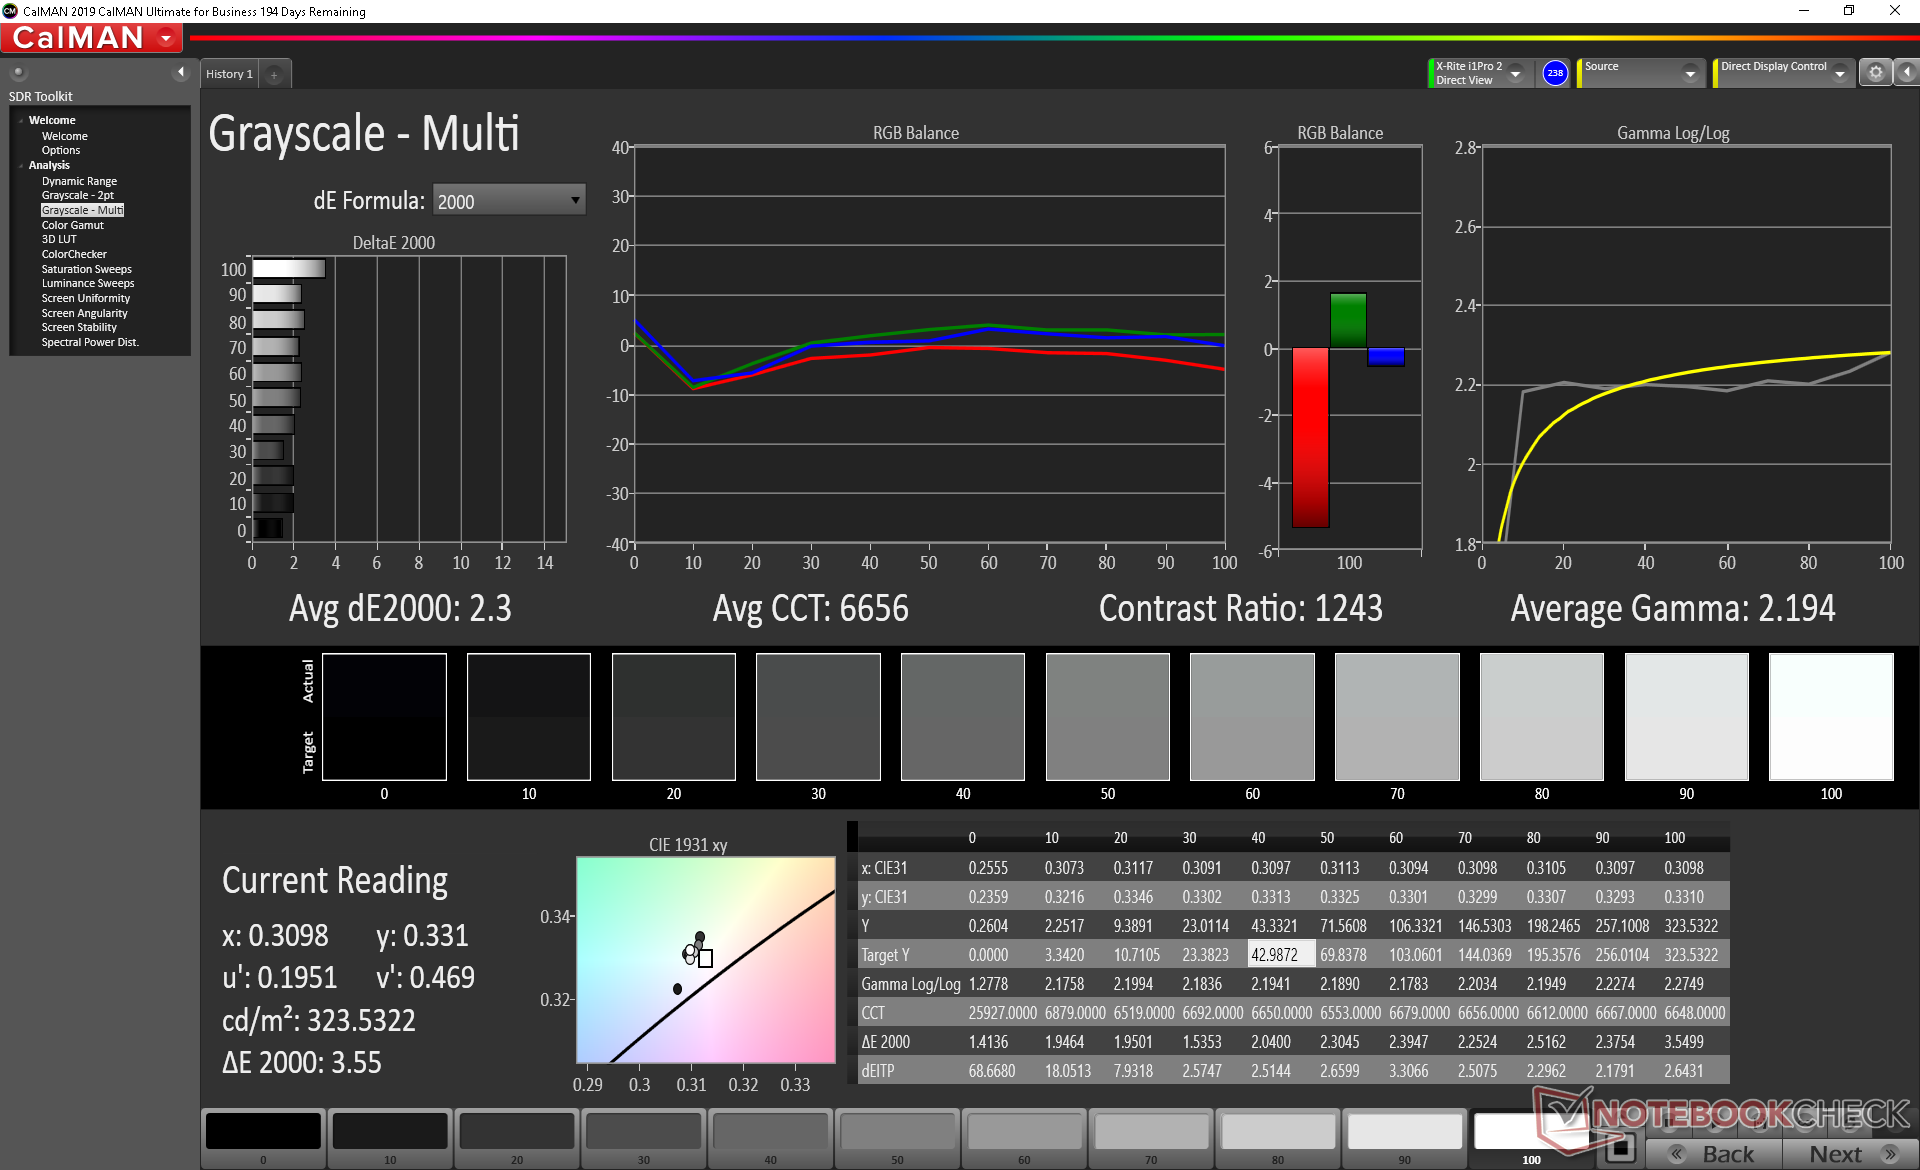
Colors and grayscale are not that well calibrated out of the box as one might expect from a relatively cheap laptop. Calibrating the display ourselves would improve the average grayscale and color DeltaE values from 5.8 to 2.3 and 4.25 and 3.29, respectively. Owners can apply our calibrated ICC profile above.

Display Response Times
| ↔ Response Time Black to White | ||
|---|---|---|
| 27.6 ms ... rise ↗ and fall ↘ combined | ↗ 13.6 ms rise | 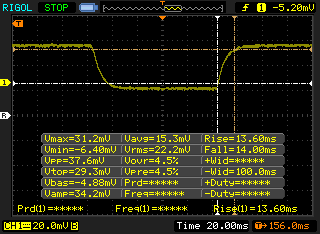 |
| ↘ 14 ms fall | ||
| The screen shows relatively slow response rates in our tests and may be too slow for gamers. In comparison, all tested devices range from 0.1 (minimum) to 240 (maximum) ms. » 70 % of all devices are better. This means that the measured response time is worse than the average of all tested devices (19.9 ms). | ||
| ↔ Response Time 50% Grey to 80% Grey | ||
| 39.6 ms ... rise ↗ and fall ↘ combined | ↗ 20.4 ms rise | 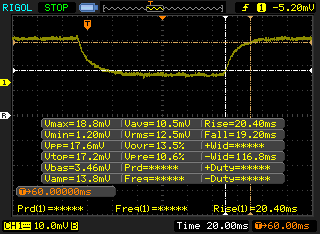 |
| ↘ 19.2 ms fall | ||
| The screen shows slow response rates in our tests and will be unsatisfactory for gamers. In comparison, all tested devices range from 0.165 (minimum) to 636 (maximum) ms. » 60 % of all devices are better. This means that the measured response time is worse than the average of all tested devices (31.1 ms). | ||
Screen Flickering / PWM (Pulse-Width Modulation)
| Screen flickering / PWM detected | 943 Hz | ≤ 99 % brightness setting | 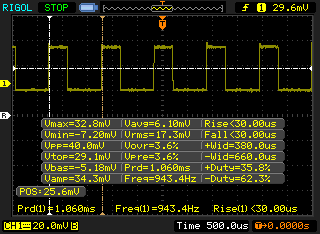 |
The display backlight flickers at 943 Hz (worst case, e.g., utilizing PWM) Flickering detected at a brightness setting of 99 % and below. There should be no flickering or PWM above this brightness setting. The frequency of 943 Hz is quite high, so most users sensitive to PWM should not notice any flickering. In comparison: 52 % of all tested devices do not use PWM to dim the display. If PWM was detected, an average of 7801 (minimum: 5 - maximum: 343500) Hz was measured. | |||
Performance
Processor
Raw CPU performance is most similar to the newest MacBook Air powered by the Core i3-1000NG4 or older laptops still running on the 7th gen Kaby Lake Core i7-7500U. Unlike the Apple, however, the Chuwi system is not passively cooled.
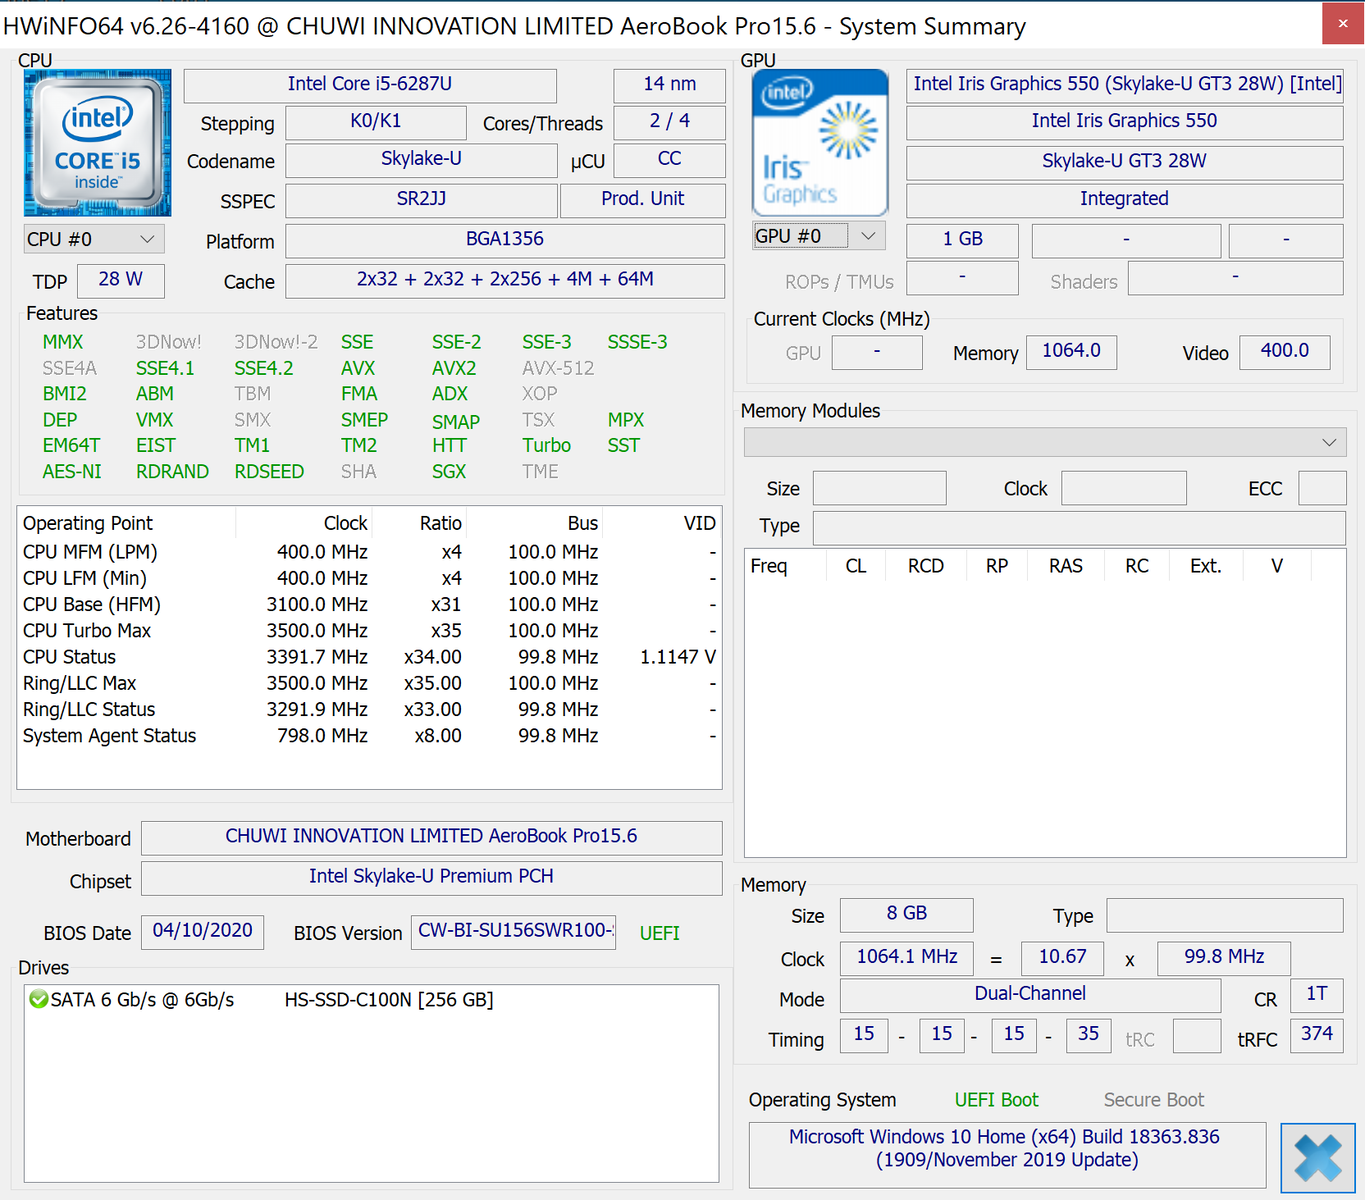
See our dedicated page on the Core i5-6287U for more technical information and benchmark comparisons.
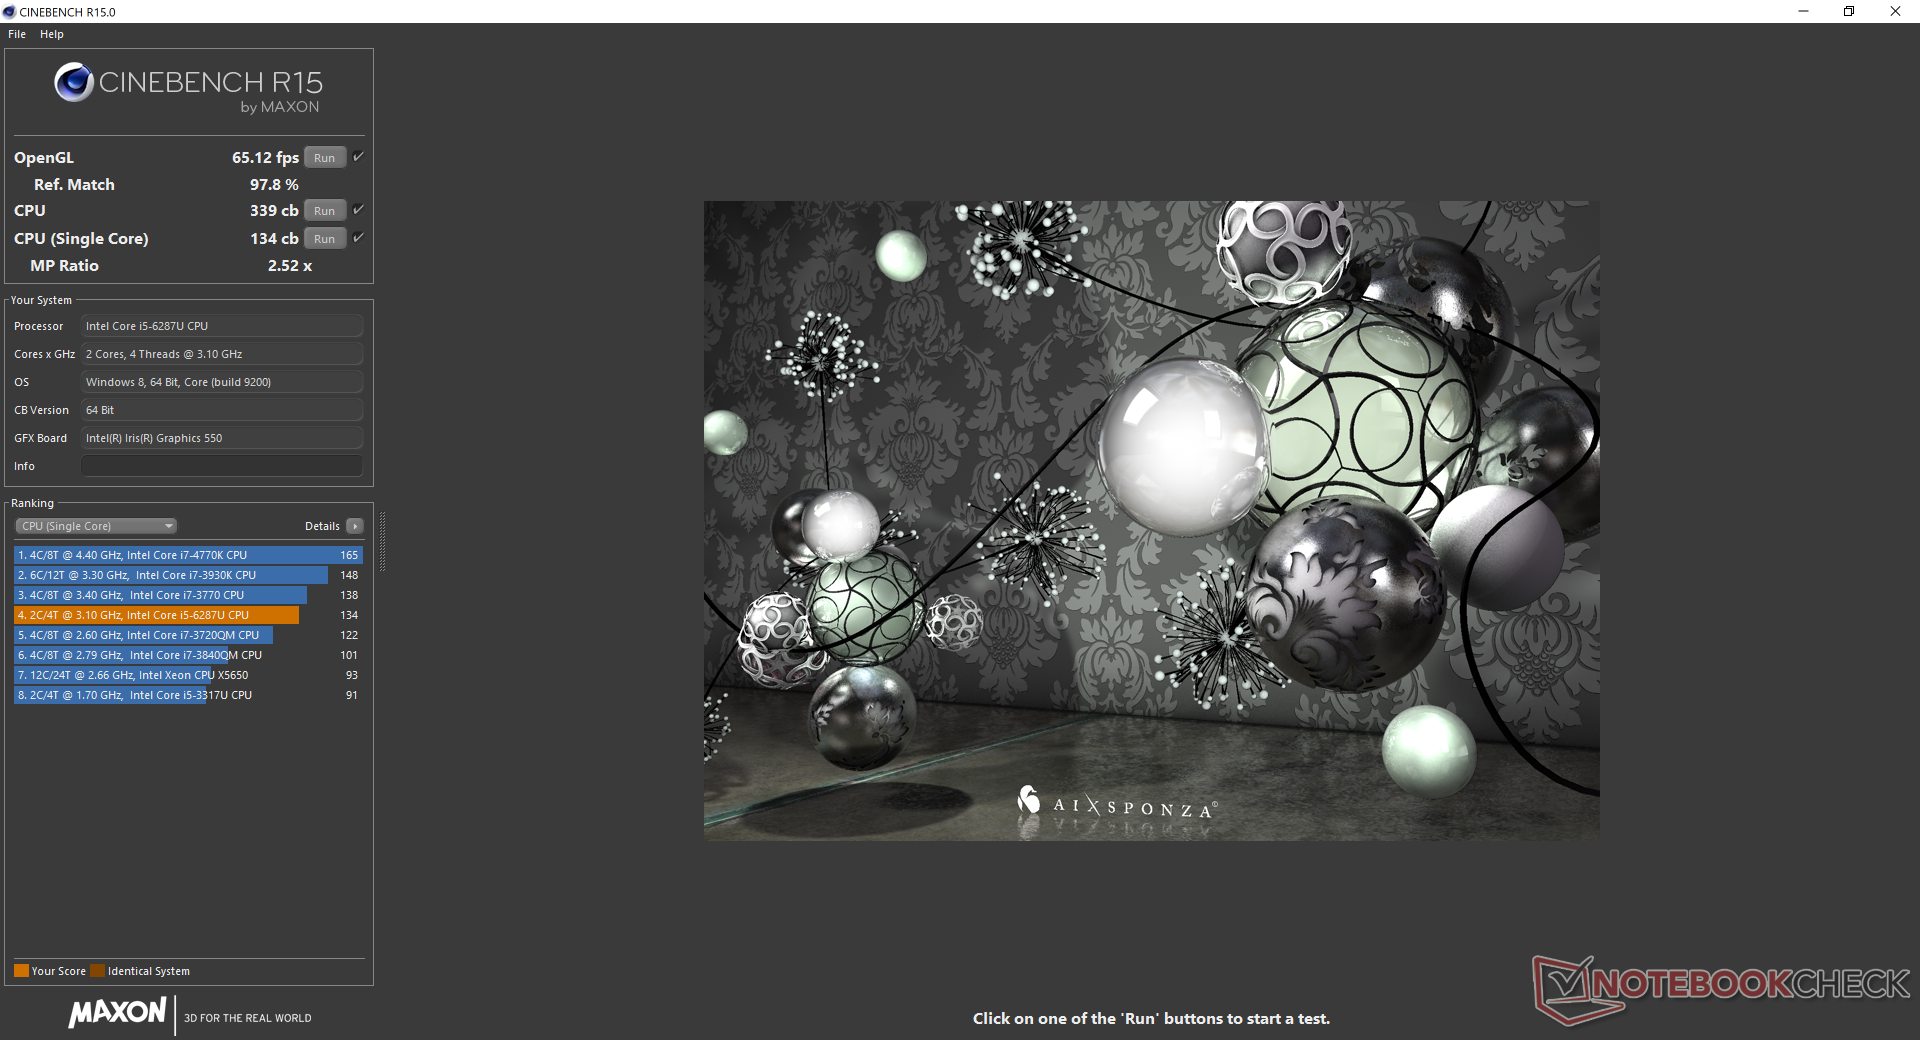
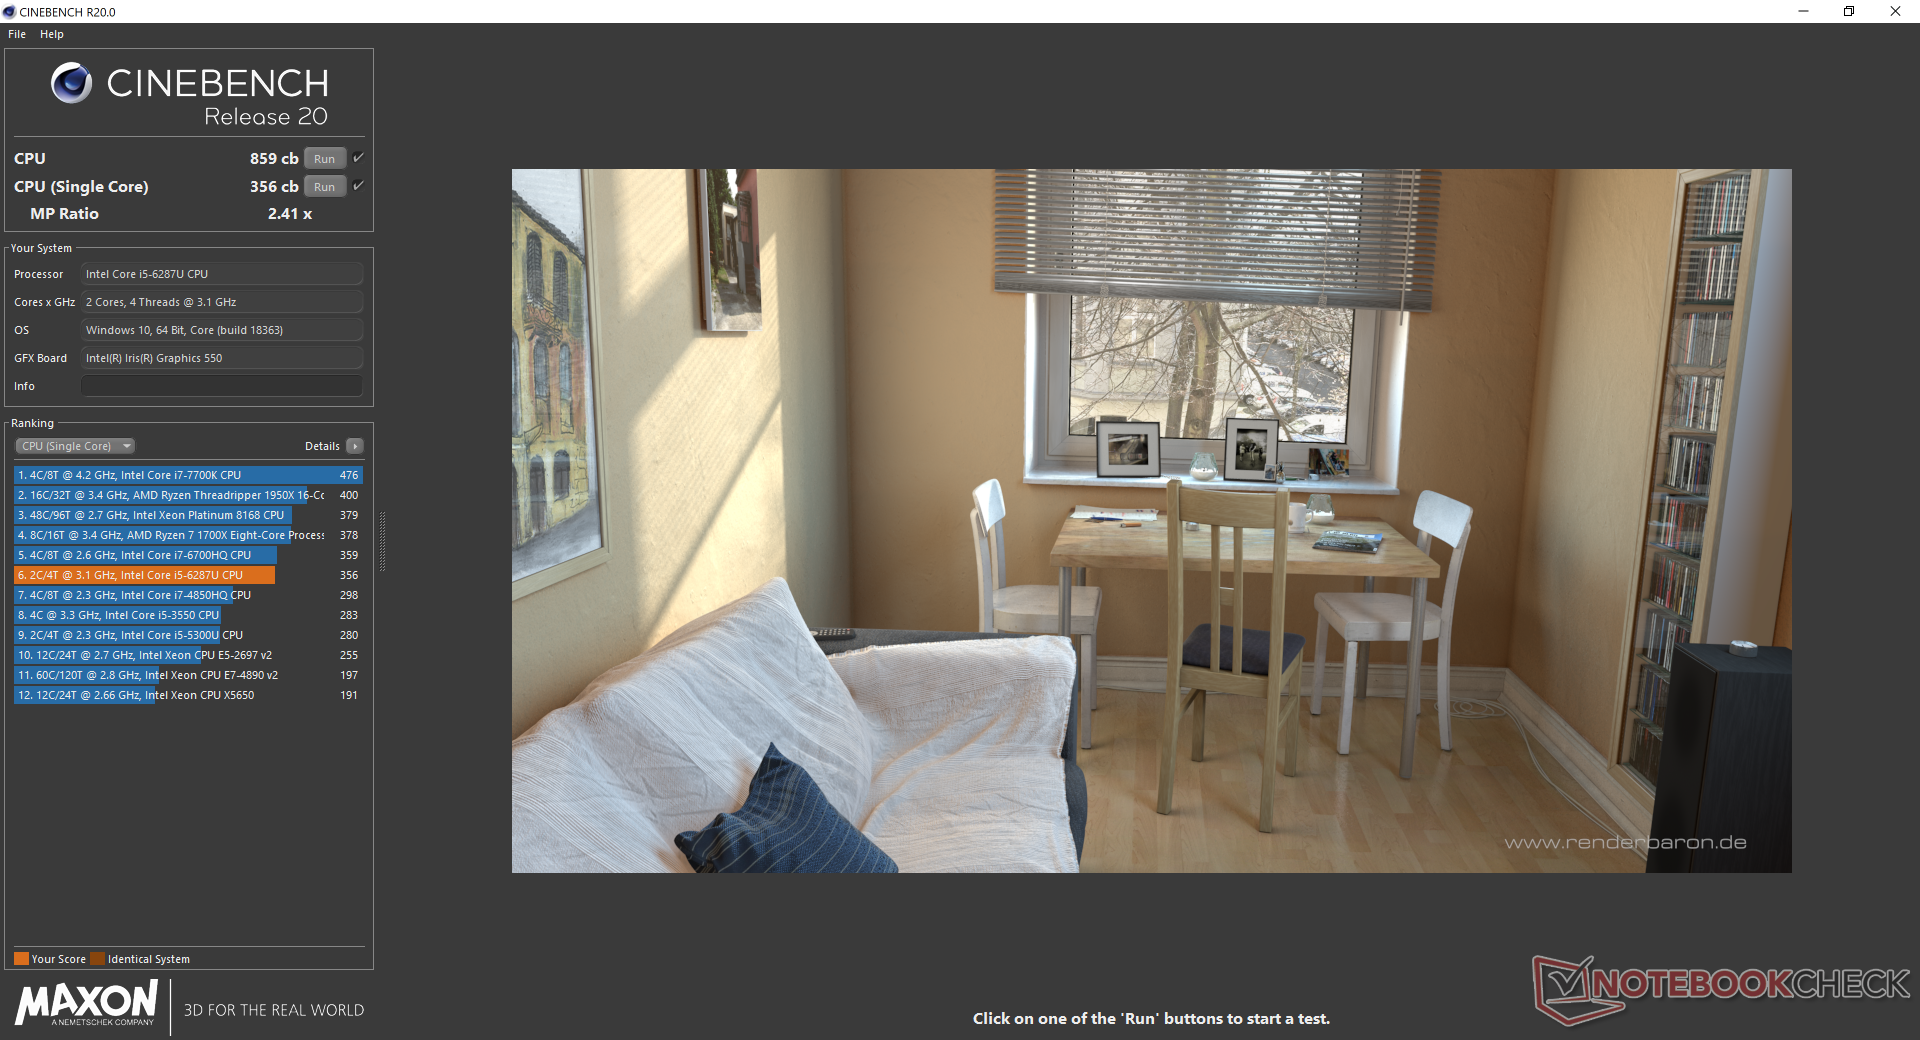
Cinebench R20: CPU (Multi Core) | CPU (Single Core)
Blender: v2.79 BMW27 CPU
7-Zip 18.03: 7z b 4 -mmt1 | 7z b 4
Geekbench 5.5: Single-Core | Multi-Core
HWBOT x265 Benchmark v2.2: 4k Preset
LibreOffice : 20 Documents To PDF
R Benchmark 2.5: Overall mean
| Geekbench 5.5 / Single-Core | |
| Apple MacBook Pro 13 2020 2GHz i5 10th-Gen | |
| Asus ZenBook 15 UX534FTC-A8190T | |
| Apple MacBook Air 2020 i3 | |
| Acer Aspire 5 A515-54G | |
| Wacom MobileStudio Pro 13 i7 256GB | |
| Chuwi AeroBook Plus | |
| Average Intel Core i5-6287U (825 - 939, n=2) | |
| Geekbench 5.5 / Multi-Core | |
| Apple MacBook Pro 13 2020 2GHz i5 10th-Gen | |
| Asus ZenBook 15 UX534FTC-A8190T | |
| Acer Aspire 5 A515-54G | |
| Wacom MobileStudio Pro 13 i7 256GB | |
| Chuwi AeroBook Plus | |
| Apple MacBook Air 2020 i3 | |
| Average Intel Core i5-6287U (1935 - 2042, n=2) | |
| HWBOT x265 Benchmark v2.2 / 4k Preset | |
| Apple MacBook Pro 13 2020 2GHz i5 10th-Gen | |
| Lenovo IdeaPad S540-15IWL 81SW0015GE | |
| Microsoft Surface Laptop 3 13 Core i5-1035G7 | |
| Acer Aspire 5 A515-54G | |
| Dell Latitude 13 3390 | |
| Wacom MobileStudio Pro 13 i7 256GB | |
| Chuwi AeroBook Plus | |
| Average Intel Core i5-6287U (n=1) | |
| Apple MacBook Air 2020 i3 | |
| LibreOffice / 20 Documents To PDF | |
| Apple MacBook Air 2020 i3 | |
| Apple MacBook Pro 13 2020 2GHz i5 10th-Gen | |
| Chuwi AeroBook Plus | |
| Average Intel Core i5-6287U (n=1) | |
| Acer Aspire 5 A515-54G | |
| R Benchmark 2.5 / Overall mean | |
| Apple MacBook Air 2020 i3 | |
| Chuwi AeroBook Plus | |
| Average Intel Core i5-6287U (n=1) | |
| Acer Aspire 5 A515-54G | |
| Apple MacBook Pro 13 2020 2GHz i5 10th-Gen | |
Cinebench R20: CPU (Multi Core) | CPU (Single Core)
Blender: v2.79 BMW27 CPU
7-Zip 18.03: 7z b 4 -mmt1 | 7z b 4
Geekbench 5.5: Single-Core | Multi-Core
HWBOT x265 Benchmark v2.2: 4k Preset
LibreOffice : 20 Documents To PDF
R Benchmark 2.5: Overall mean
* ... smaller is better
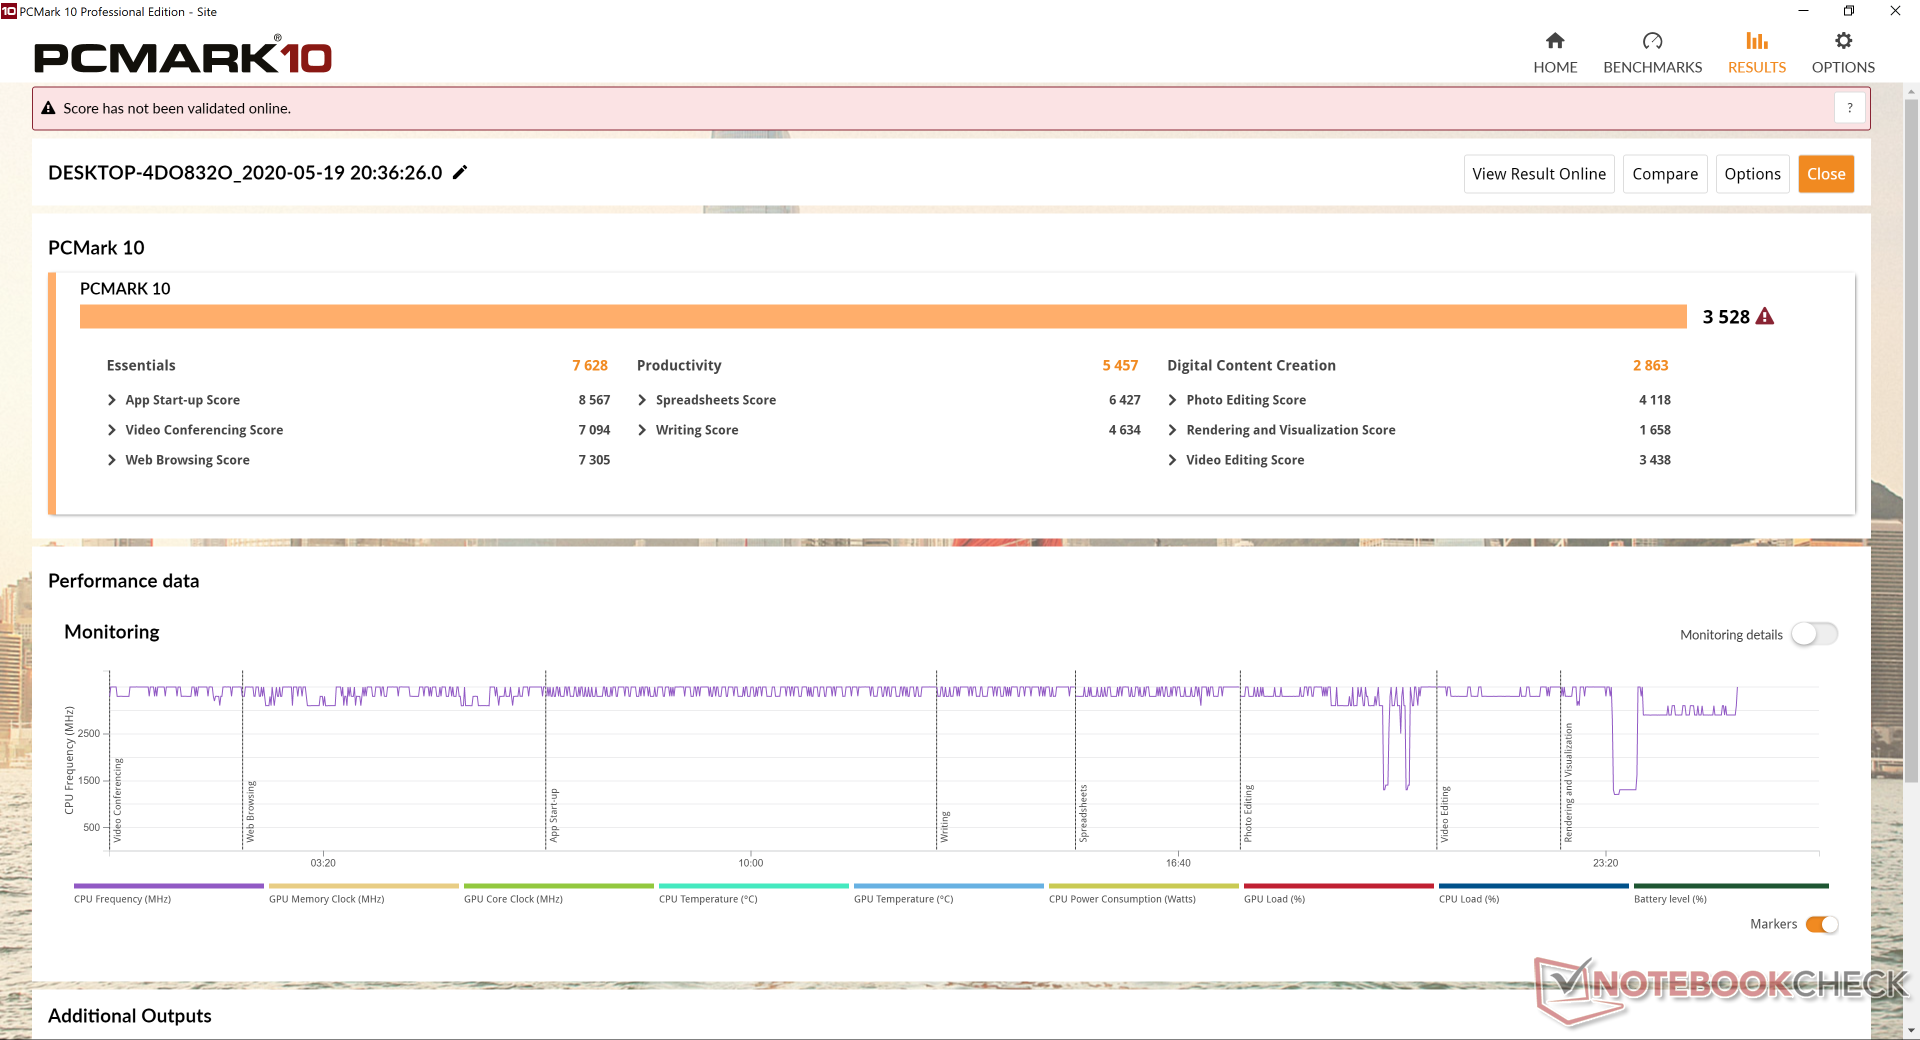
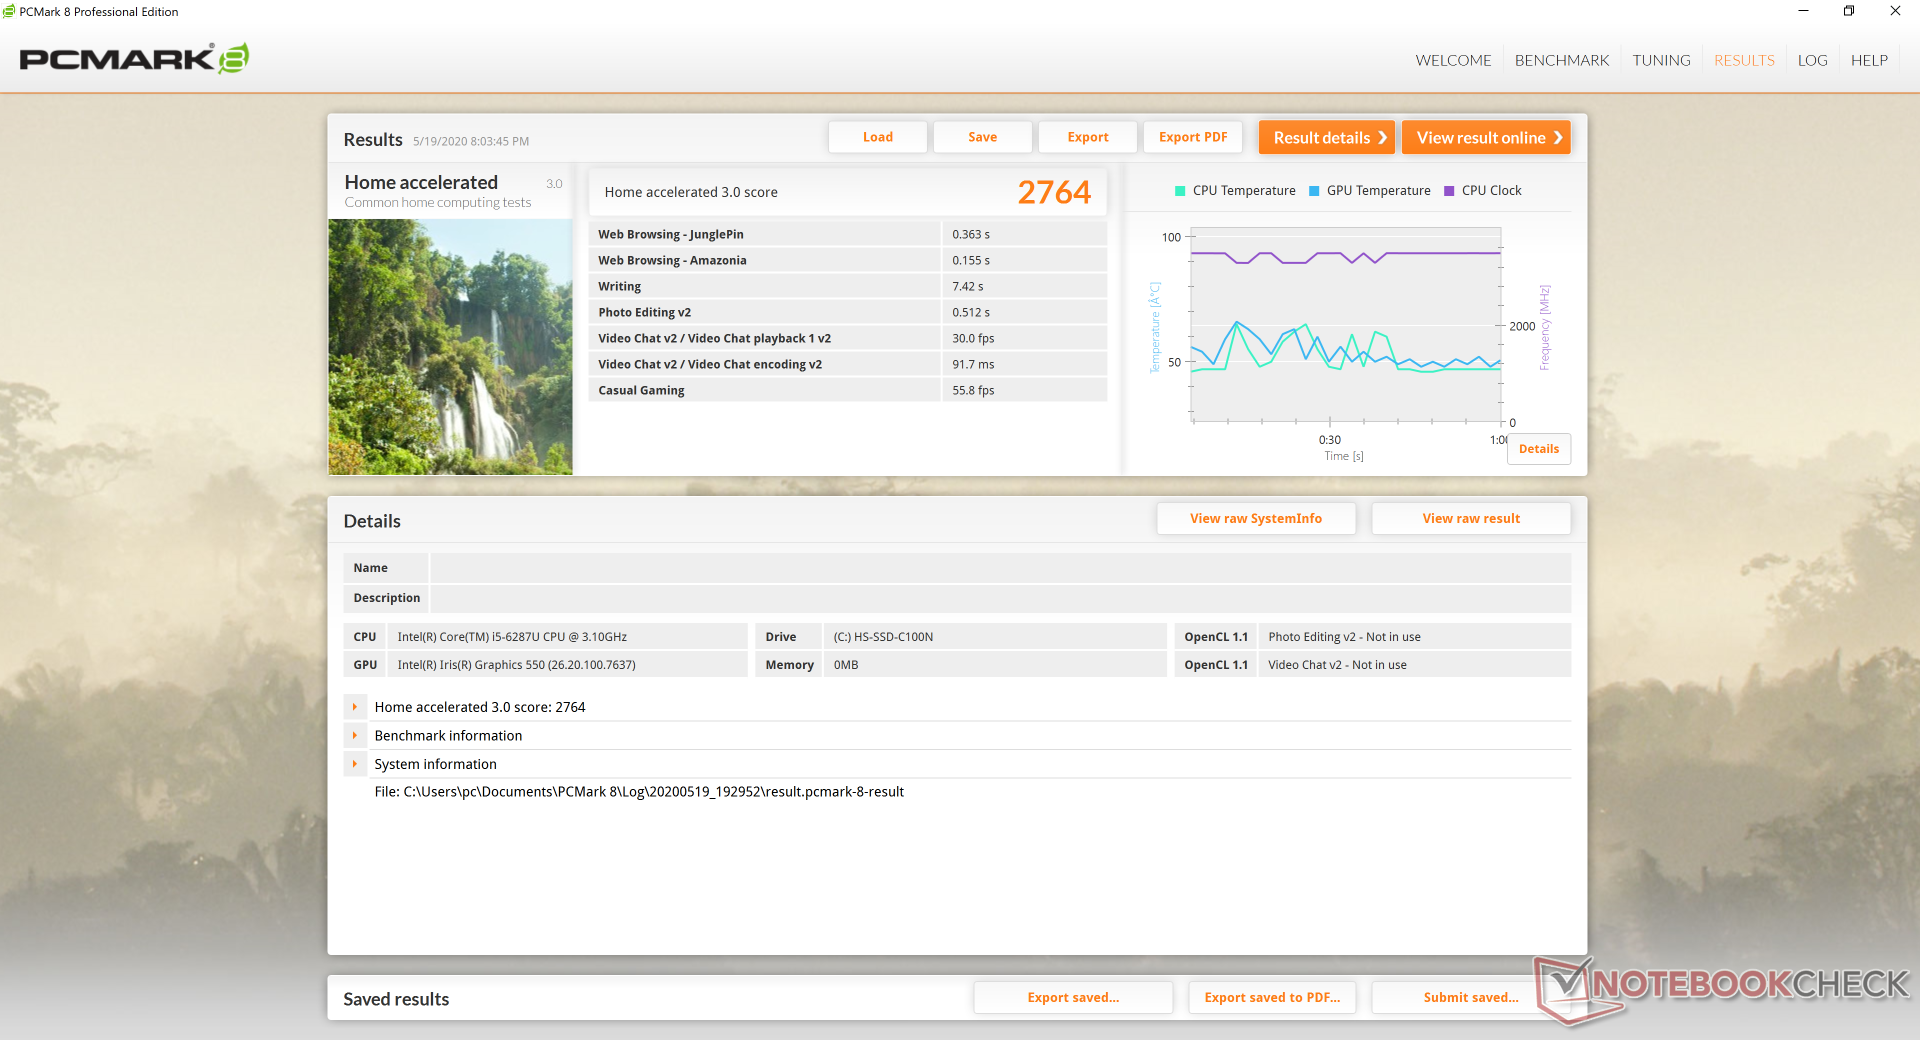
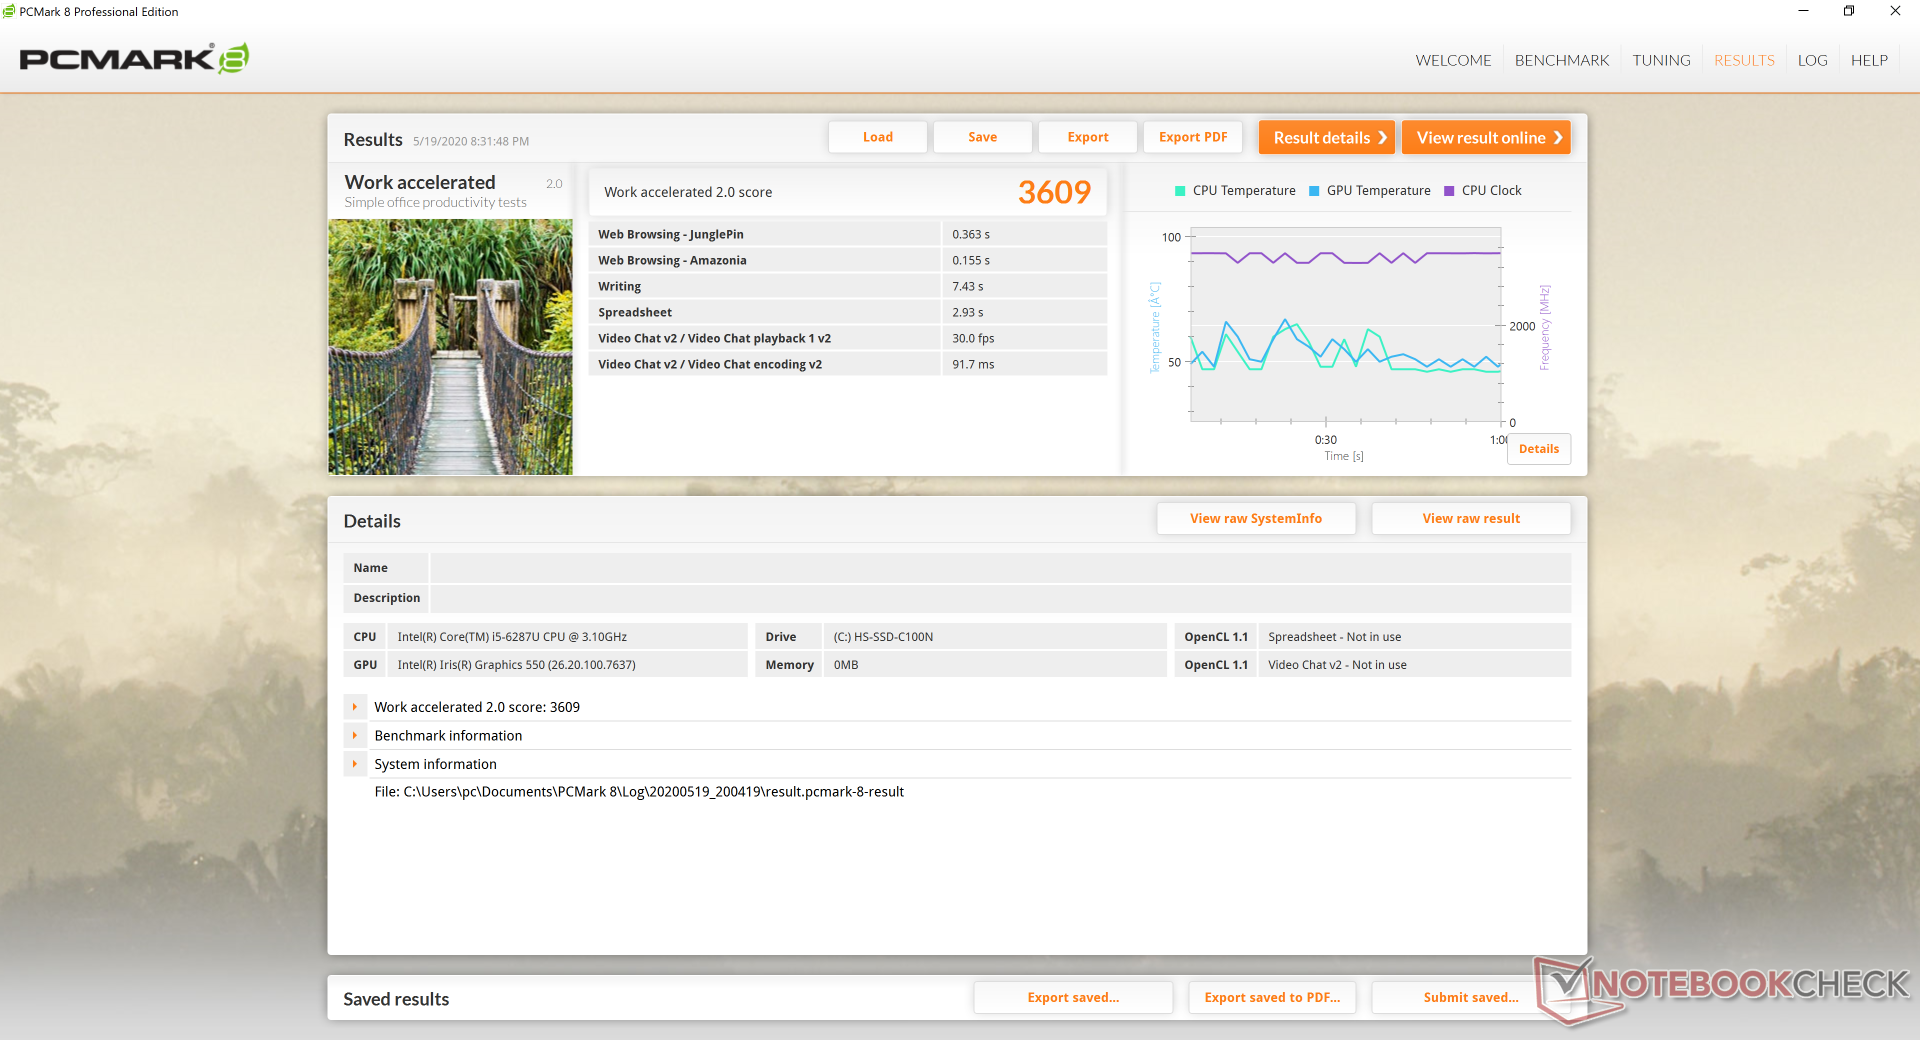
System Performance
PCMark benchmarks are generally higher than laptops running on Ryzen 3 or Ryzen 5 while being on par with the budget Dell Latitude 3590 powered by an old Intel Kaby Lake-R Core i5. We experienced no software issues during our time with the Chuwi laptop.
| PCMark 8 | |
| Home Score Accelerated v2 | |
| Lenovo Yoga C740-15IML | |
| Dell Latitude 15 3590 | |
| HP Envy x360 15-bq102ng | |
| Chuwi AeroBook Plus | |
| Asus Vivobook 15 F512DA-SH31 | |
| Work Score Accelerated v2 | |
| Lenovo Yoga C740-15IML | |
| Dell Latitude 15 3590 | |
| Asus Vivobook 15 F512DA-SH31 | |
| HP Envy x360 15-bq102ng | |
| Chuwi AeroBook Plus | |
| PCMark 8 Home Score Accelerated v2 | 2764 points | |
| PCMark 8 Work Score Accelerated v2 | 3609 points | |
| PCMark 10 Score | 3528 points | |
Help | ||
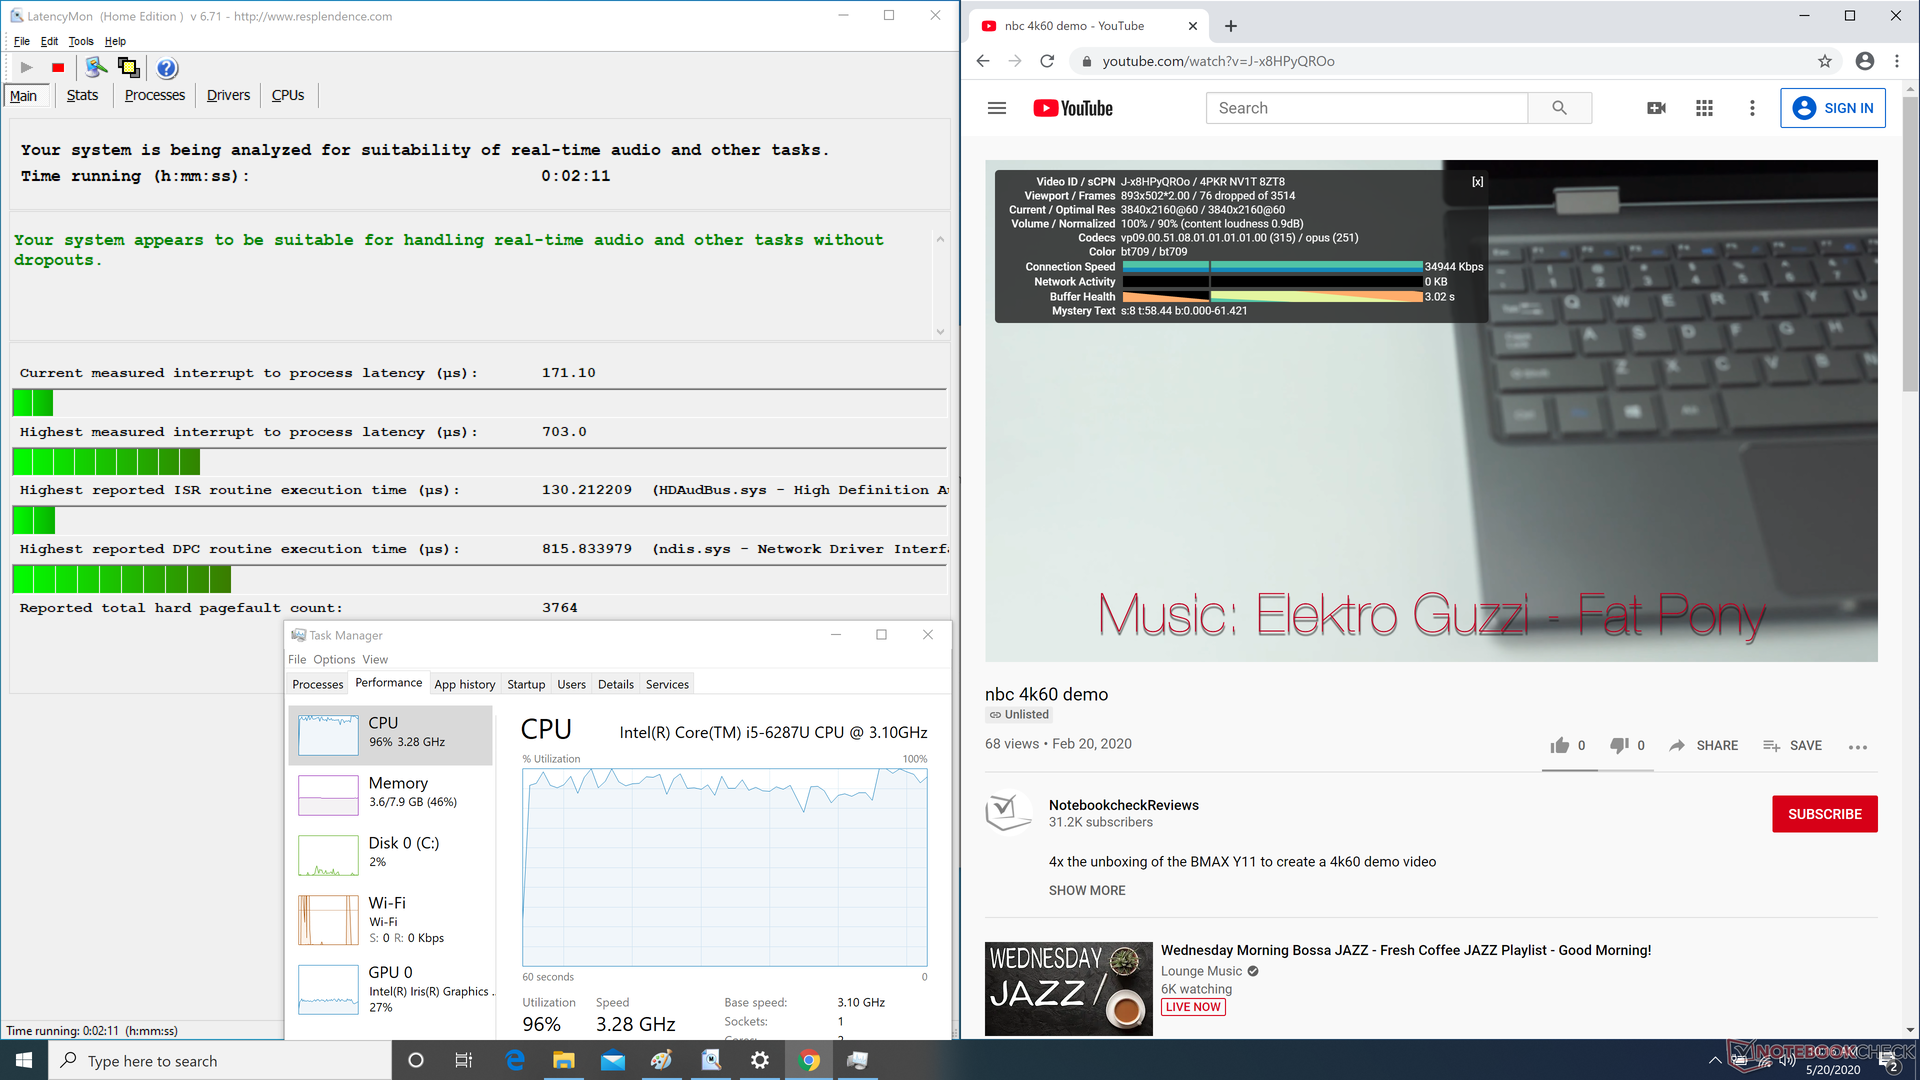
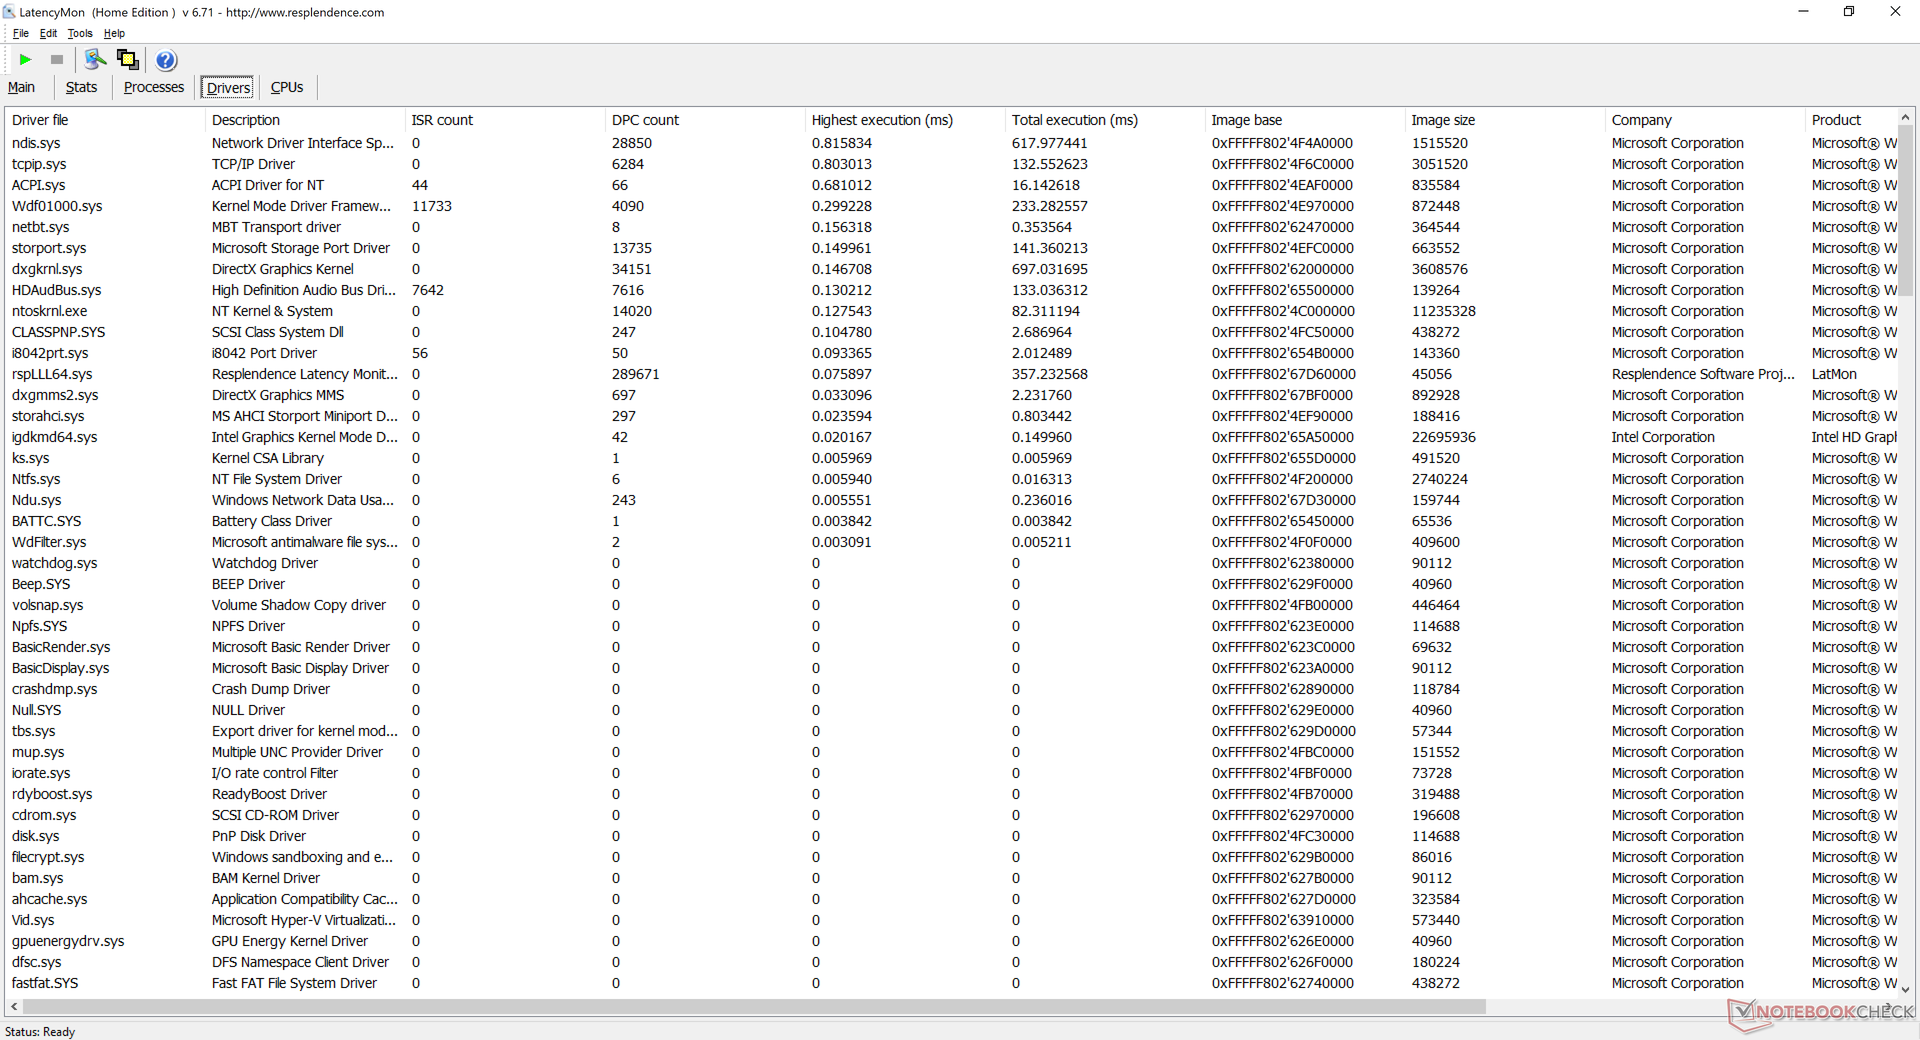
DPC Latency
LatencyMon shows no DPC latency issues when opening multiple Chrome tabs on our homepage. However, 4K video playback is not entirely smooth; we recorded dropped frames and a very high ~95 percent CPU utilization during our minute-long 4K video playback test.
| DPC Latencies / LatencyMon - interrupt to process latency (max), Web, Youtube, Prime95 | |
| Chuwi AeroBook Plus | |
* ... smaller is better
Storage Devices
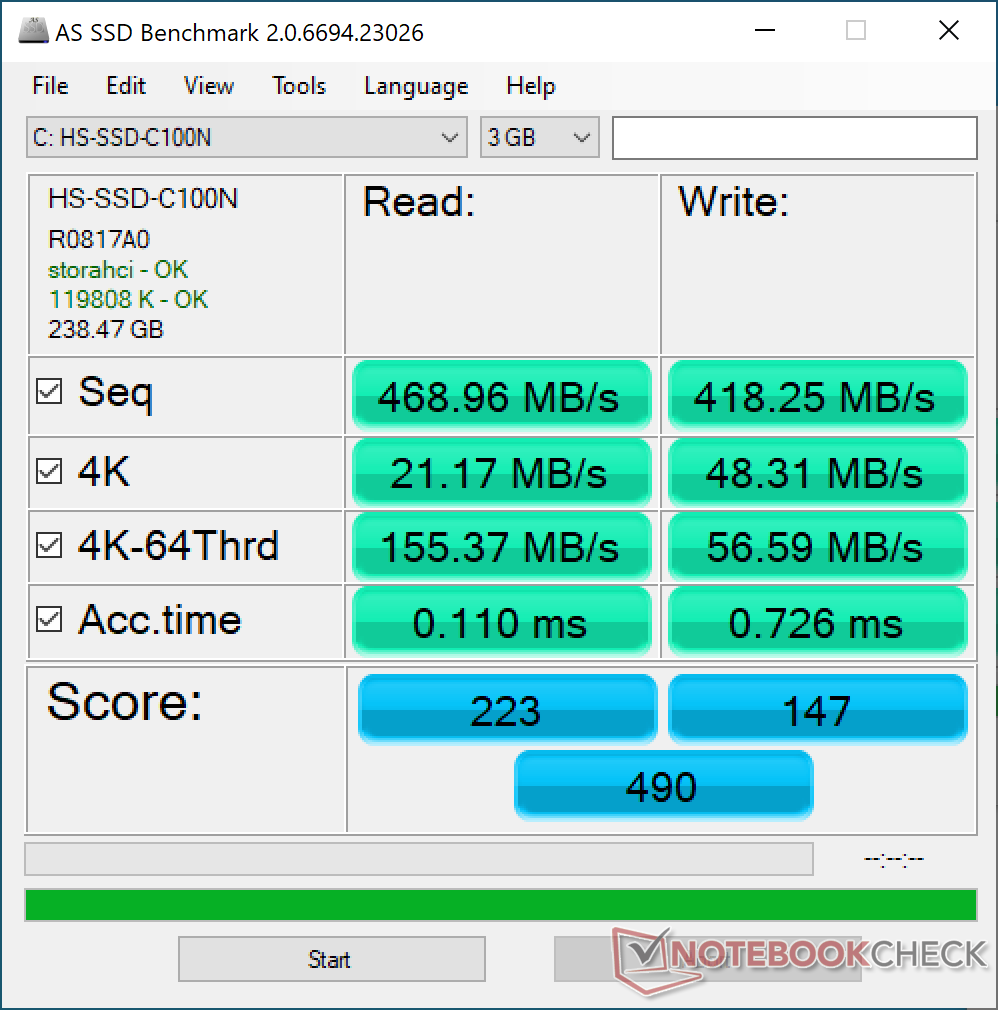
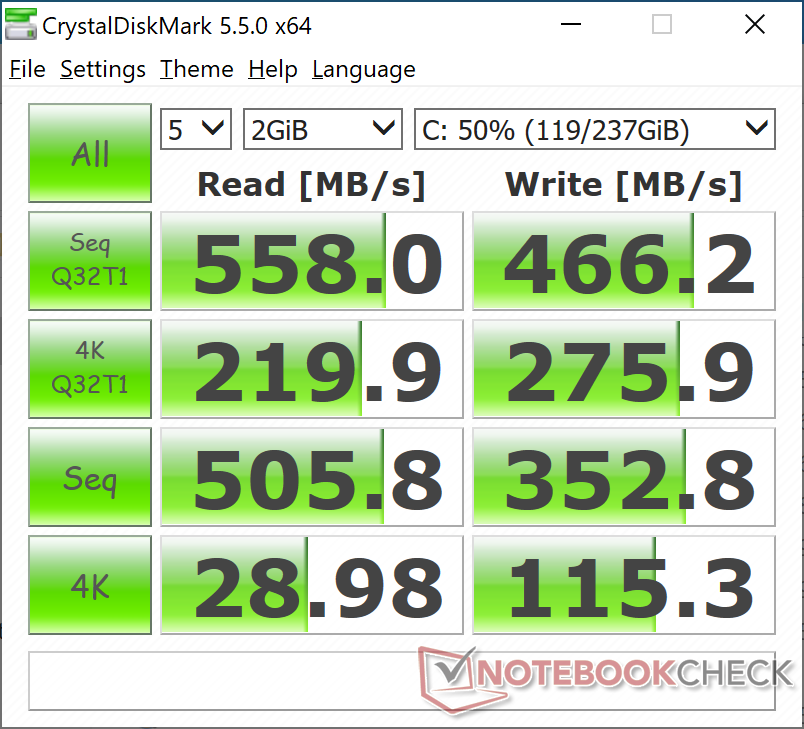
The AeroBook Plus offers two M.2 2280 slots each supporting SATA III SSDs. PCIe NVMe transfer rates are not supported unlike on most other Ultrabooks these days likely to save on costs. The 256 GB Hikvision M.2 drive performs about where we expect it to be for a SATA III-based SSD with sequential transfer rates capping out at ~550 MB/s.
| Chuwi AeroBook Plus HIKVision HS-SSD-C100N M.2 SATA III SSD 256 GB | HP Envy x360 15-bq102ng Samsung PM961 MZVLW256HEHP | Dell XPS 15 7590 i5 iGPU FHD Toshiba XG6 KXG60ZNV512G | Lenovo Yoga C740-15IML Samsung SSD PM981 MZVLB512HAJQ | Asus Vivobook 15 F512DA-SH31 SanDisk X600 SD9SN8W-128G | |
|---|---|---|---|---|---|
| AS SSD | 268% | 640% | 678% | -12% | |
| Seq Read (MB/s) | 469 | 2465 426% | 2357 403% | 2732 483% | 341.4 -27% |
| Seq Write (MB/s) | 418.3 | 1318 215% | 1235 195% | 1477 253% | 134.2 -68% |
| 4K Read (MB/s) | 21.17 | 42.97 103% | 43.29 104% | 57.7 173% | 27.83 31% |
| 4K Write (MB/s) | 48.31 | 81.9 70% | 99.7 106% | 136.3 182% | 54.9 14% |
| 4K-64 Read (MB/s) | 155.4 | 1025 560% | 1020 556% | 1021 557% | 217.1 40% |
| 4K-64 Write (MB/s) | 56.6 | 338.6 498% | 1502 2554% | 1651 2817% | 68.1 20% |
| Access Time Read * (ms) | 0.11 | 0.077 30% | 0.07 36% | 0.062 44% | 0.153 -39% |
| Access Time Write * (ms) | 0.726 | 0.046 94% | 0.039 95% | 0.028 96% | 1.075 -48% |
| Score Read (Points) | 223 | 1314 489% | 1299 483% | 1352 506% | 279 25% |
| Score Write (Points) | 147 | 552 276% | 1726 1074% | 1935 1216% | 136 -7% |
| Score Total (Points) | 490 | 2488 408% | 3640 643% | 3929 702% | 559 14% |
| Copy ISO MB/s (MB/s) | 407 | 700 72% | 2145 427% | 1972 385% | 115.9 -72% |
| Copy Program MB/s (MB/s) | 80.6 | 167.2 107% | 565 601% | 642 697% | 44.51 -45% |
| Copy Game MB/s (MB/s) | 73.9 | 370.4 401% | 1320 1686% | 1090 1375% | 74.3 1% |
| CrystalDiskMark 5.2 / 6 | 152% | 218% | 275% | -22% | |
| Write 4K (MB/s) | 115.3 | 116 1% | 93.6 -19% | 142.3 23% | 65.2 -43% |
| Read 4K (MB/s) | 28.98 | 42.73 47% | 41.87 44% | 47.56 64% | 31.22 8% |
| Write Seq (MB/s) | 352.8 | 1222 246% | 1698 381% | 2185 519% | 284.8 -19% |
| Read Seq (MB/s) | 506 | 1608 218% | 1978 291% | 2235 342% | 497.5 -2% |
| Write 4K Q32T1 (MB/s) | 275.9 | 280.1 2% | 383.1 39% | 515 87% | 164 -41% |
| Read 4K Q32T1 (MB/s) | 219.9 | 333.6 52% | 326.9 49% | 413.4 88% | 230.2 5% |
| Write Seq Q32T1 (MB/s) | 466.2 | 1291 177% | 2778 496% | 2981 539% | 221.7 -52% |
| Read Seq Q32T1 (MB/s) | 558 | 3183 470% | 3119 459% | 3565 539% | 389.7 -30% |
| Total Average (Program / Settings) | 210% /
226% | 429% /
487% | 477% /
531% | -17% /
-15% |
* ... smaller is better

Disk Throttling: DiskSpd Read Loop, Queue Depth 8
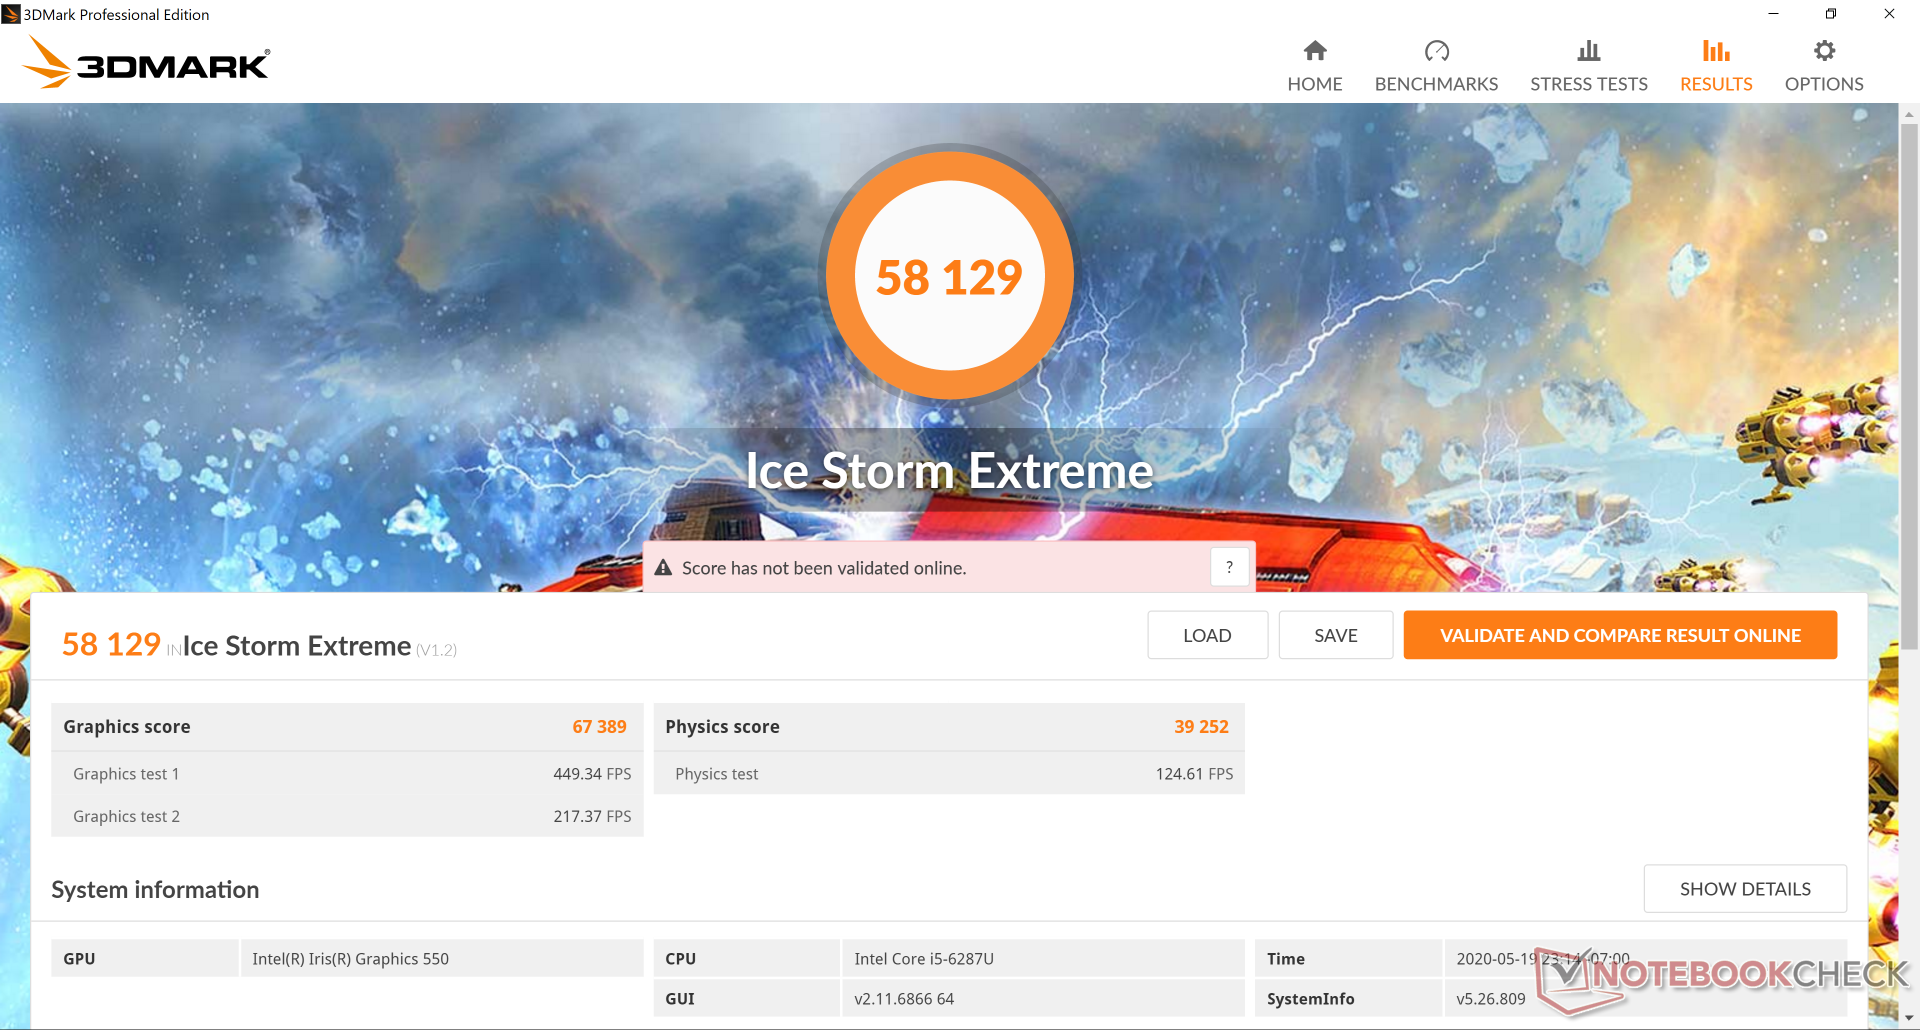
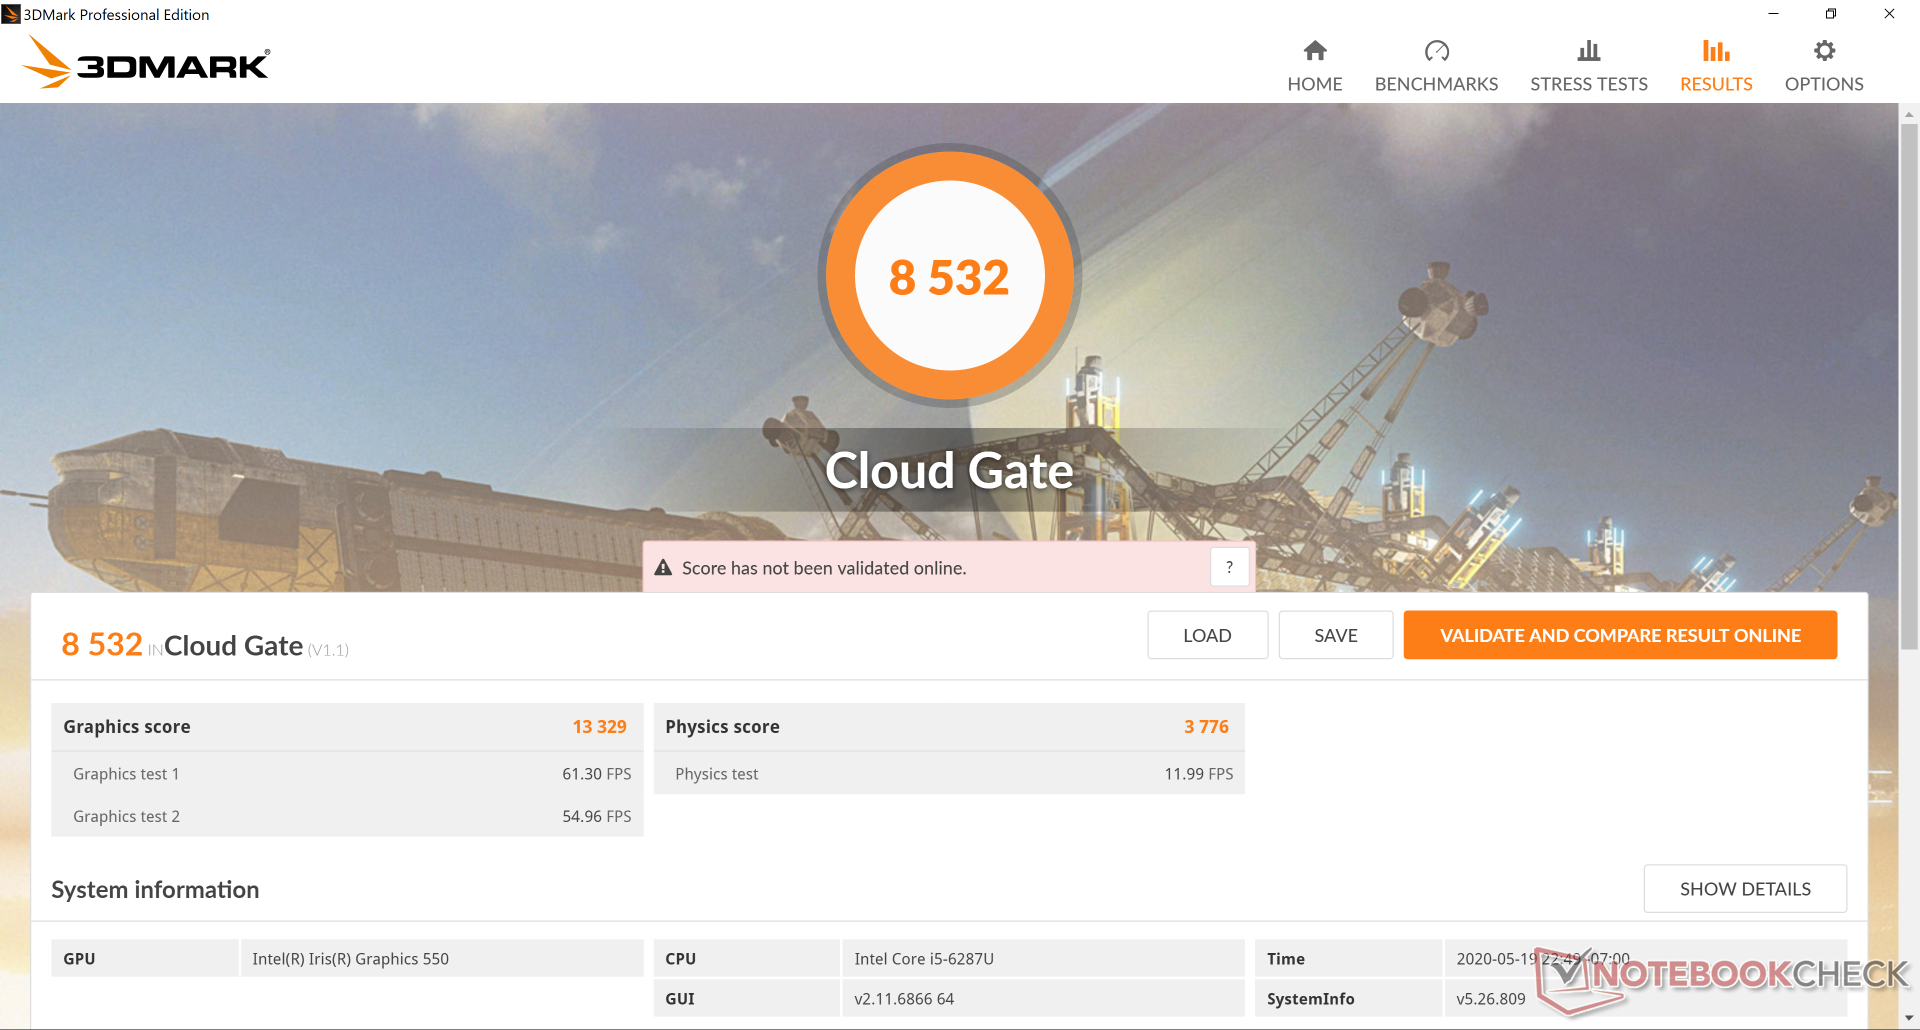
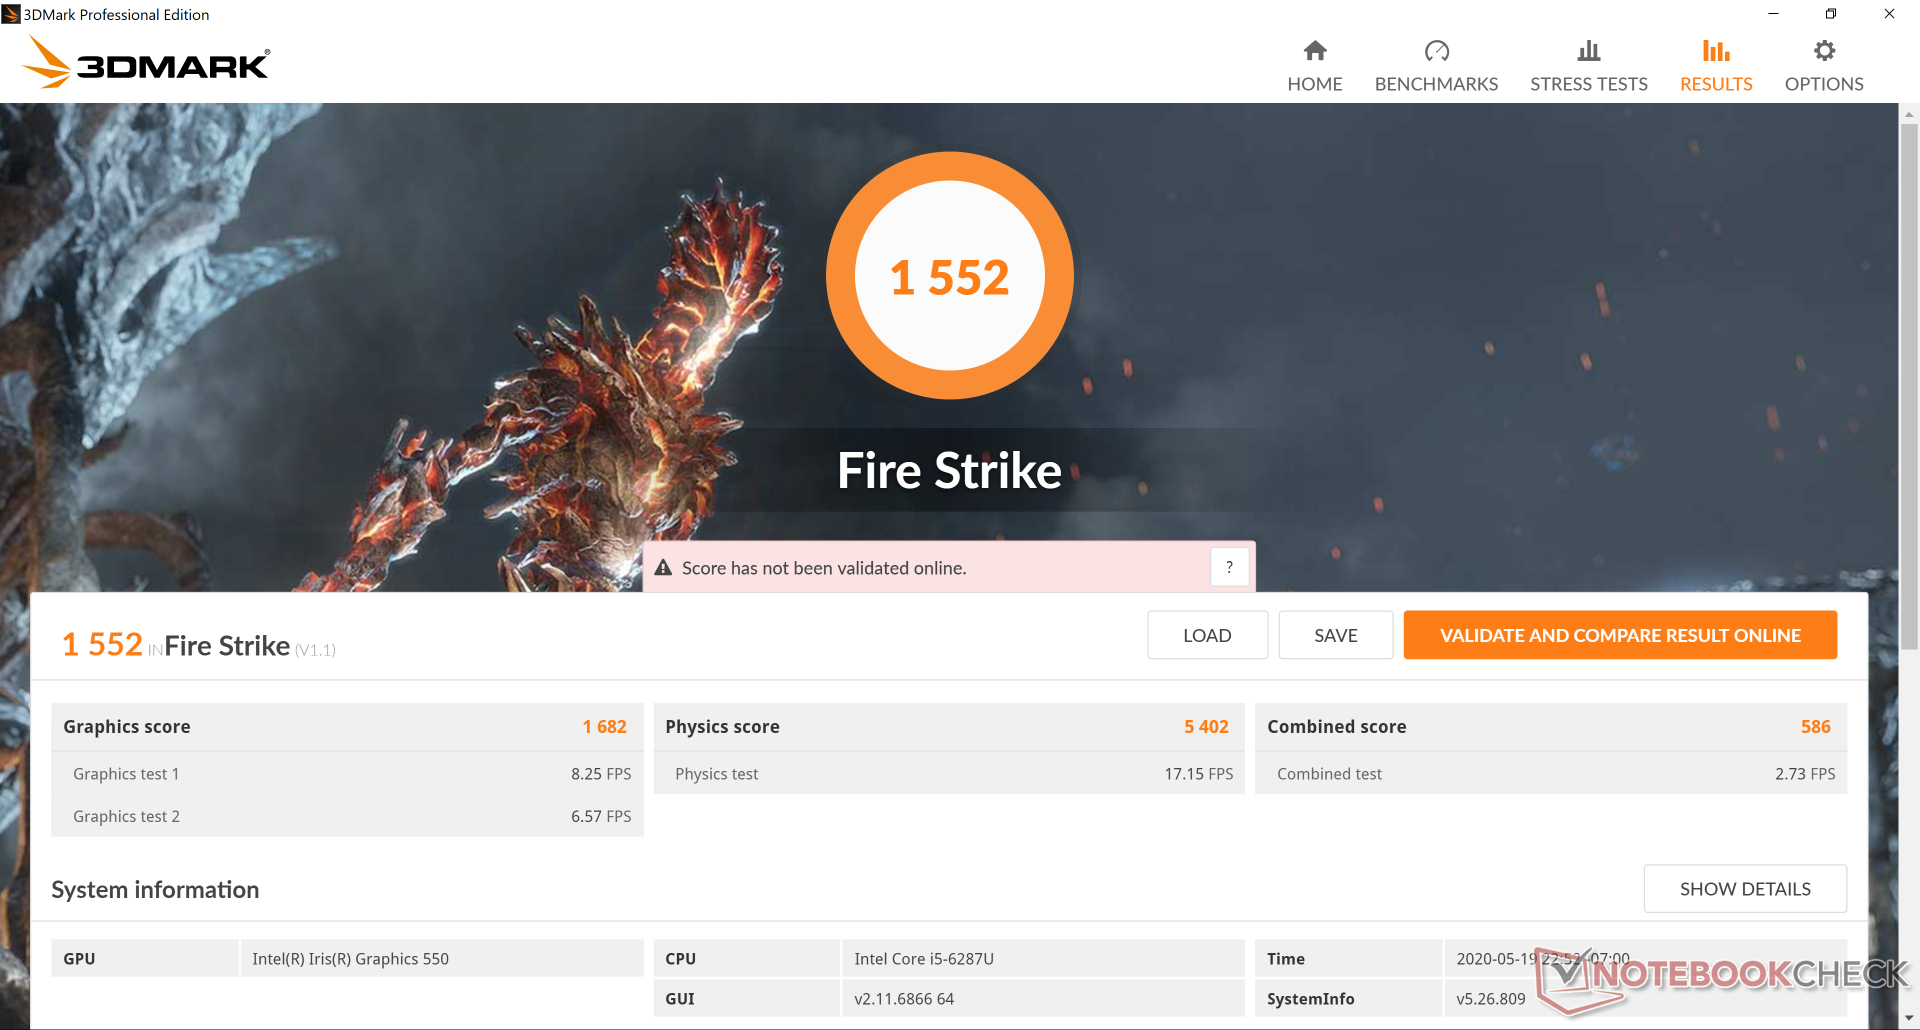
GPU Performance
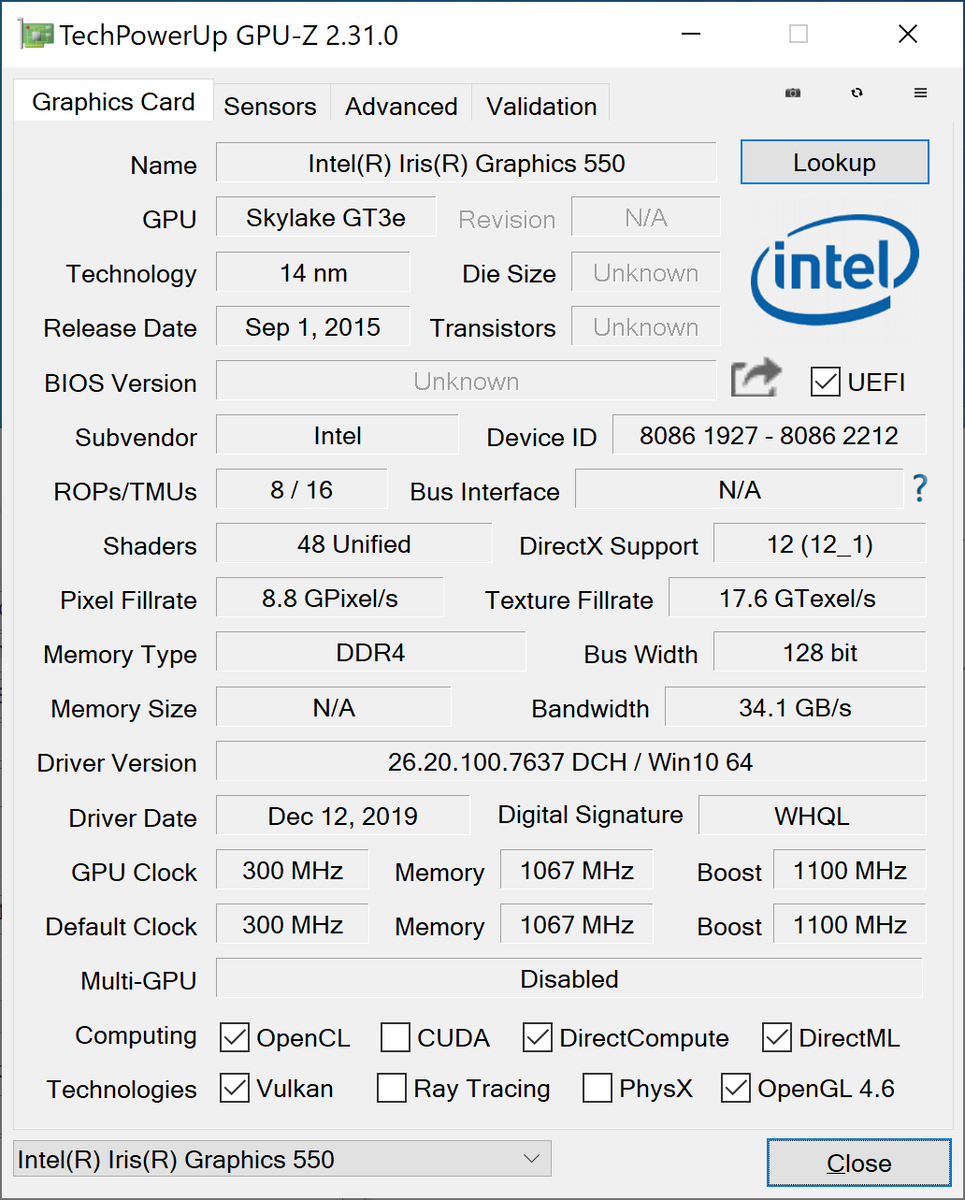
The Iris Graphics 550 is roughly 20 to 30 percent faster than the common UHD Graphics 620 as found on most Ultrabooks. In practice, however, the difference isn't significant enough to have much of an impact.
See our dedicated page on the Iris Graphics 550 for more technical information and benchmark comparisons.
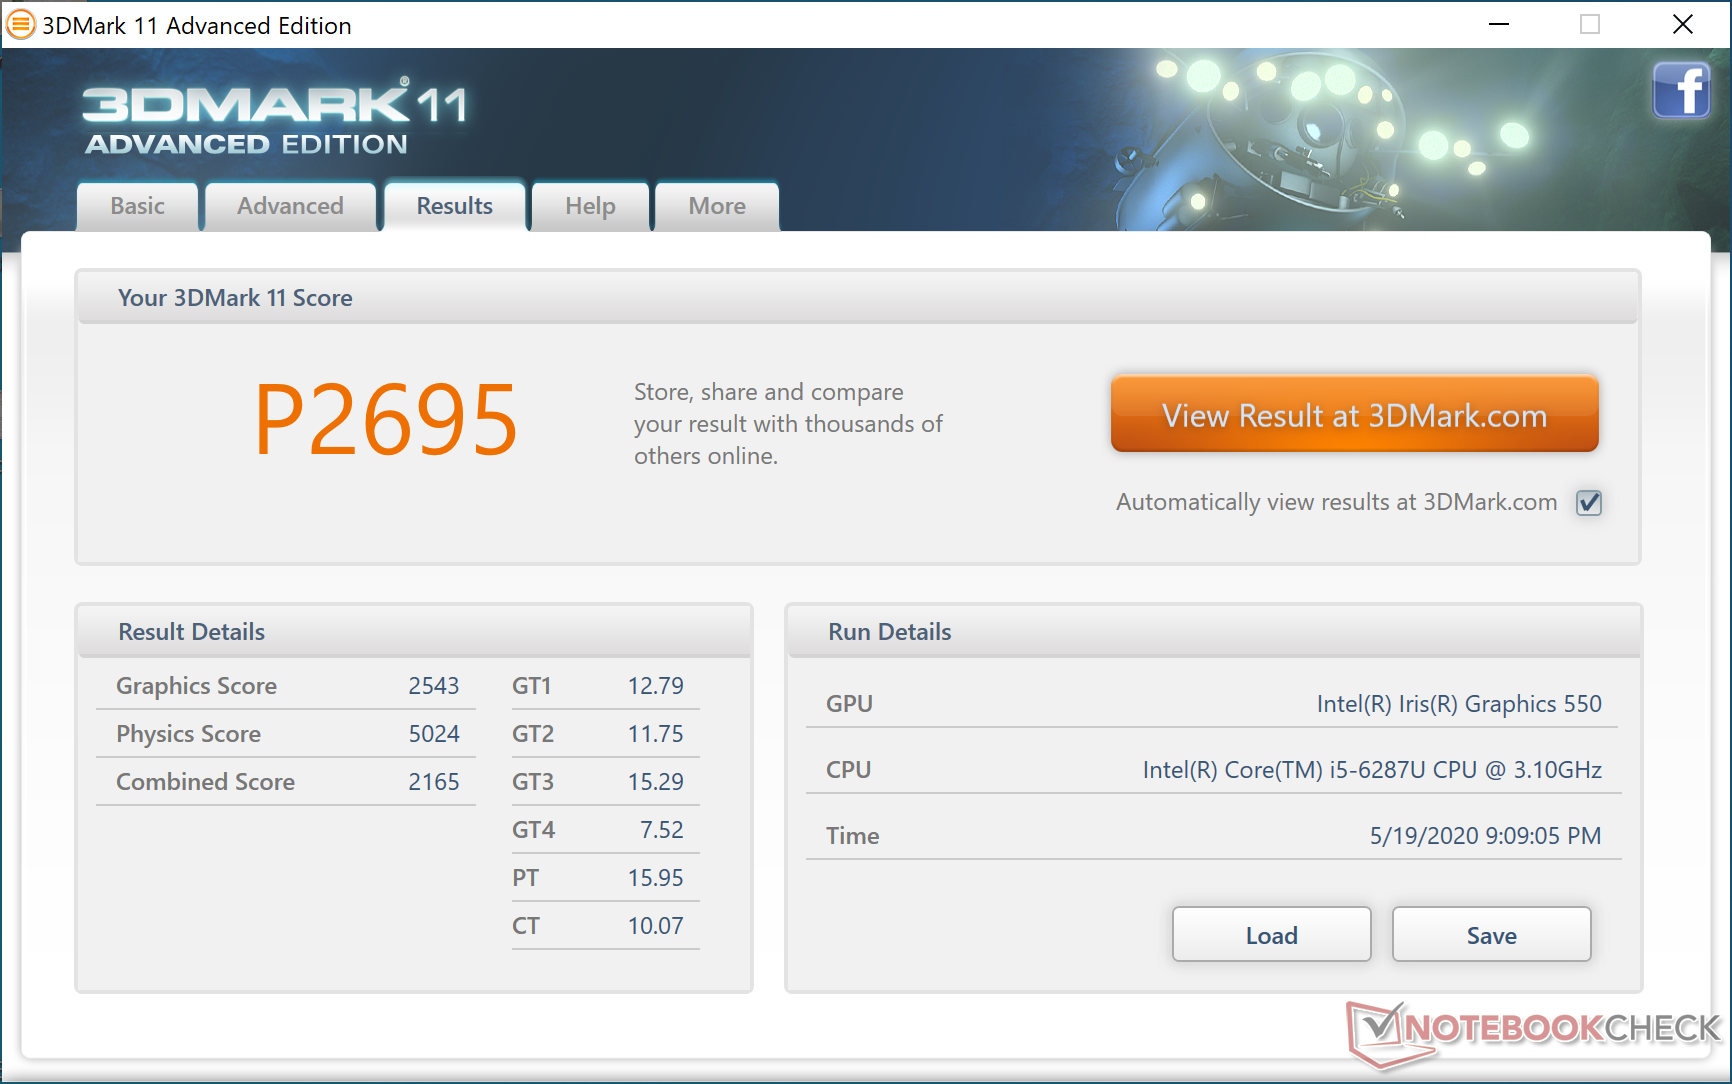
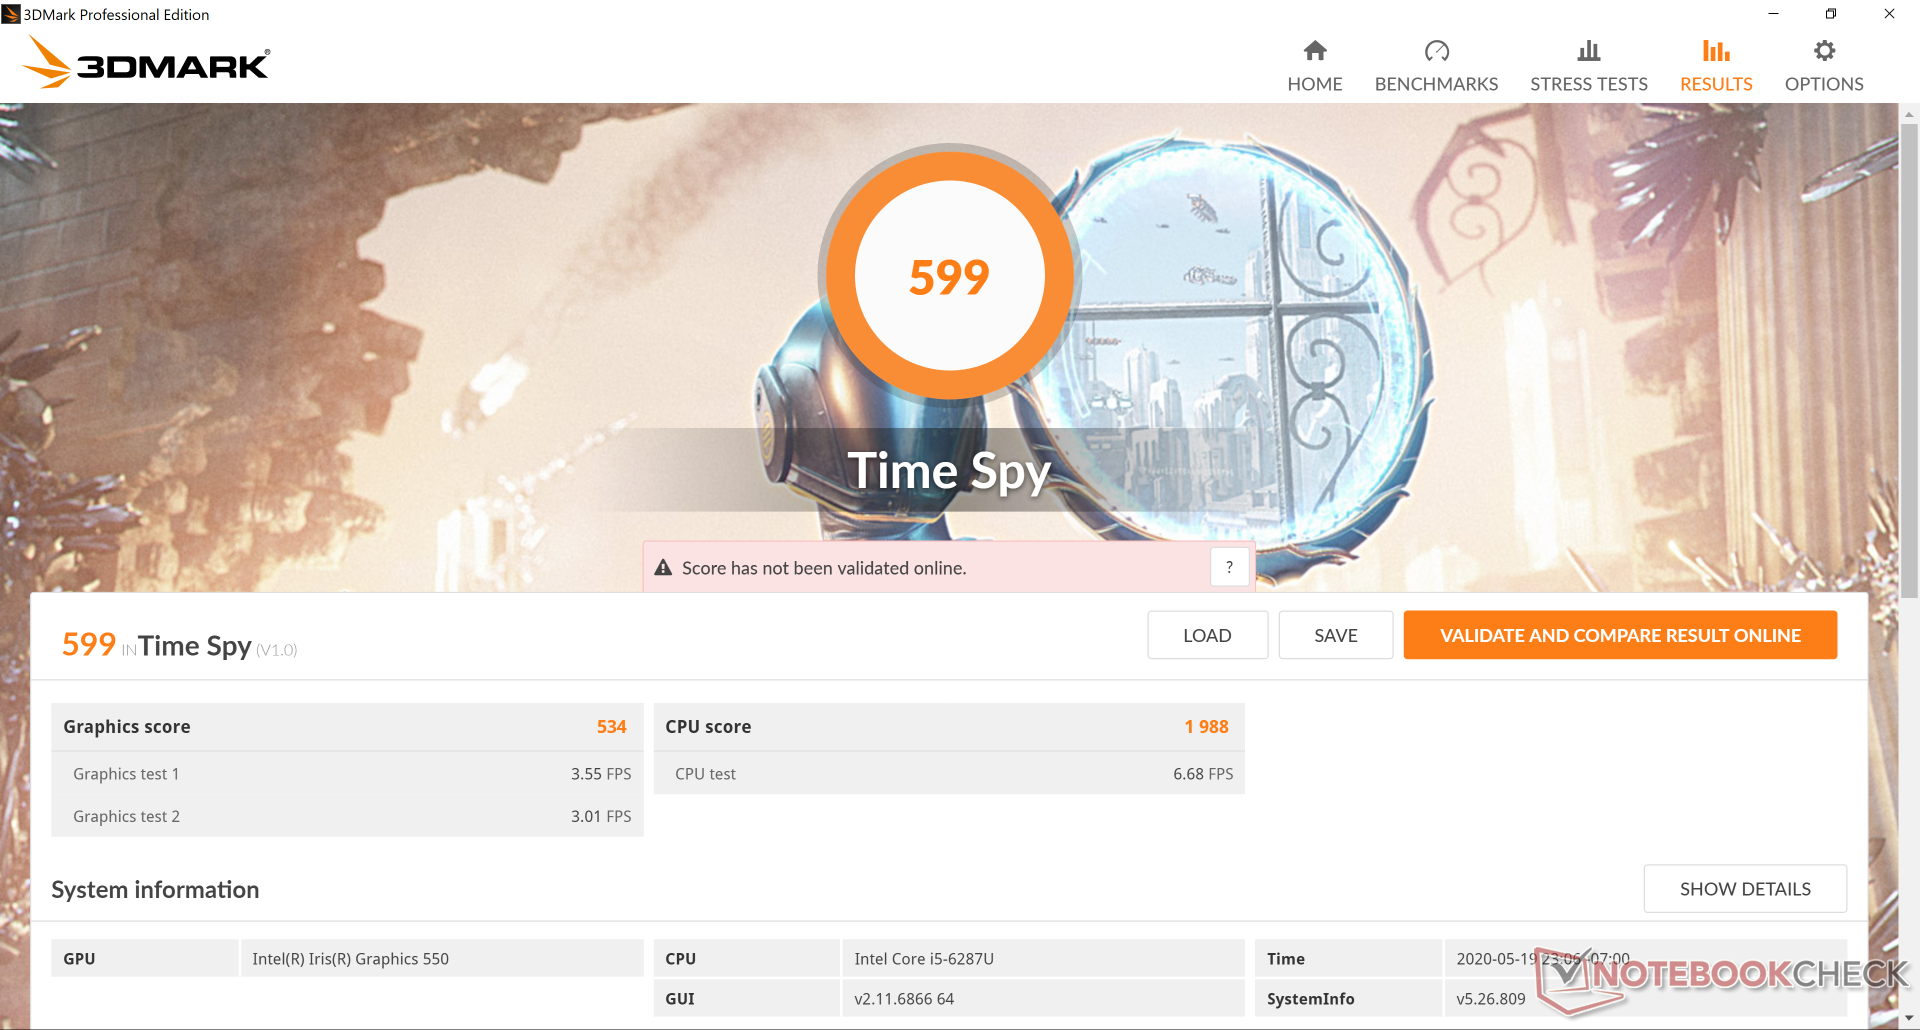
| 3DMark 11 Performance | 2695 points | |
| 3DMark Cloud Gate Standard Score | 8532 points | |
| 3DMark Fire Strike Score | 1552 points | |
| 3DMark Time Spy Score | 599 points | |
Help | ||
| low | med. | high | ultra | |
|---|---|---|---|---|
| Dota 2 Reborn (2015) | 82.5 | 43.5 | 26.9 | 23.6 |
| X-Plane 11.11 (2018) | 22.7 | 15.9 | 14.1 |
Emissions
System Noise
The internal fan pulses more frequently and abruptly than we would like. Expect a fan noise in the 34 to 36 dB(A) range even if simply video streaming to be louder than most other Ultrabooks.
Electronic noise or coil whine is thankfully unnoticeable unless if placing an ear near the keyboard keys.
| Chuwi AeroBook Plus Iris Graphics 550, 6287U, HIKVision HS-SSD-C100N M.2 SATA III SSD 256 GB | Apple MacBook Pro 15 2018 (2.6 GHz, 560X) Radeon Pro 560X, i7-8850H, Apple SSD AP0512 | Dell XPS 15 7590 i5 iGPU FHD UHD Graphics 630, i5-9300H, Toshiba XG6 KXG60ZNV512G | Lenovo Yoga C740-15IML UHD Graphics 620, i7-10510U, Samsung SSD PM981 MZVLB512HAJQ | HP Envy x360 15-bq102ng Vega 8, R5 2500U, Samsung PM961 MZVLW256HEHP | Asus Vivobook 15 F512DA-SH31 Vega 3, R3 3200U, SanDisk X600 SD9SN8W-128G | |
|---|---|---|---|---|---|---|
| Noise | -7% | 5% | 7% | -0% | 8% | |
| off / environment * (dB) | 28.5 | 29.6 -4% | 29.3 -3% | 29.3 -3% | 30.13 -6% | 29.2 -2% |
| Idle Minimum * (dB) | 28.5 | 30.1 -6% | 29.3 -3% | 29.3 -3% | 30.13 -6% | 29.2 -2% |
| Idle Average * (dB) | 31.1 | 30.1 3% | 29.3 6% | 29.3 6% | 30.13 3% | 29.2 6% |
| Idle Maximum * (dB) | 33 | 30.1 9% | 29.8 10% | 29.6 10% | 30.13 9% | 29.2 12% |
| Load Average * (dB) | 36.4 | 46.8 -29% | 32.4 11% | 32.4 11% | 38.8 -7% | 30.5 16% |
| Load Maximum * (dB) | 41.2 | 46.8 -14% | 37.2 10% | 33.3 19% | 38.8 6% | 34 17% |
| Witcher 3 ultra * (dB) | 36 |
* ... smaller is better
Noise level
| Idle |
| 28.5 / 31.1 / 33 dB(A) |
| Load |
| 36.4 / 41.2 dB(A) |
 | ||
30 dB silent 40 dB(A) audible 50 dB(A) loud |
||
min: | ||
Temperature
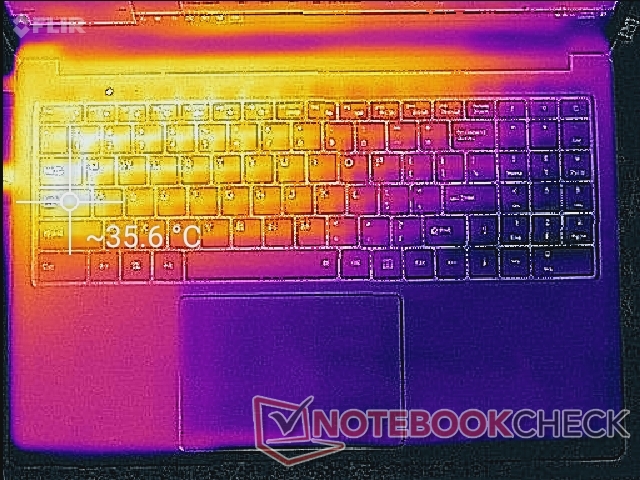
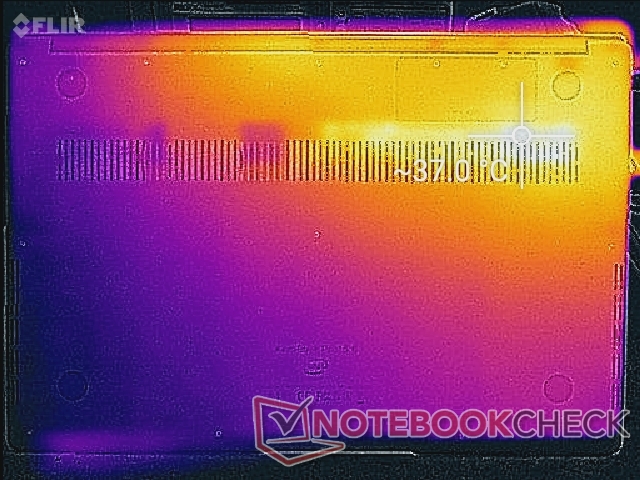
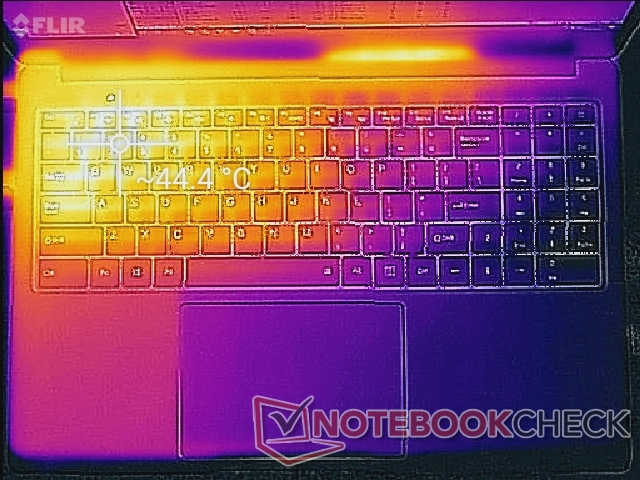
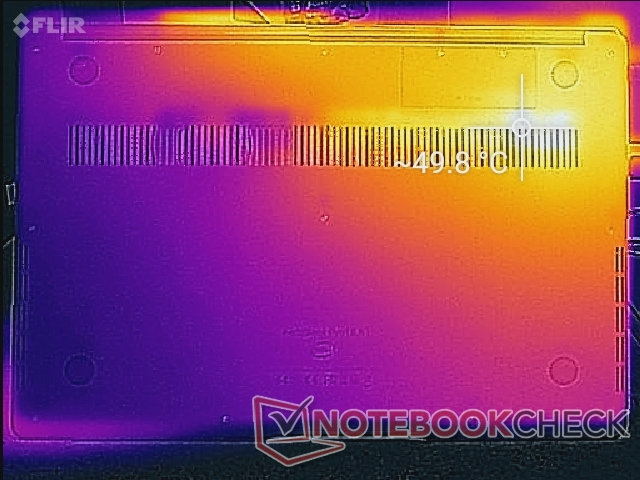
Surface temperatures will always be warmer on the left half of the Chuwi laptop than the right due to how the processor is positioned inside. When idling on desktop, hot spots can be as warm as 35 C compared to just 27 C on the coolest spot. When running heavy loads for long periods, these same hot spots can be as warm as 45 C to 50 C. While not particularly bothersome during day-to-day browsing loads, the wide temperature difference between the two halves of the chassis is very noticeable.
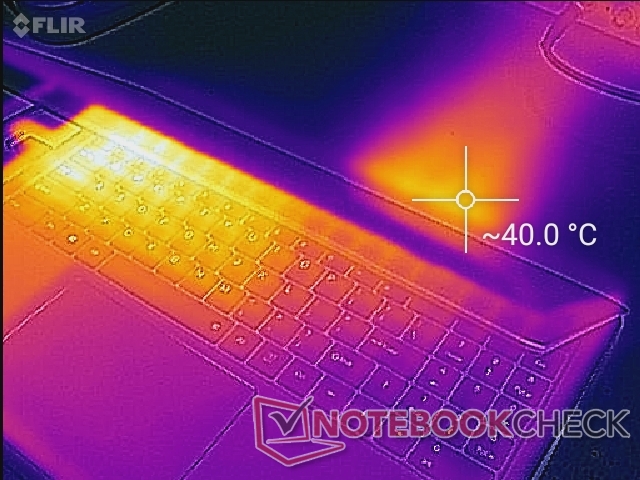
(±) The maximum temperature on the upper side is 44.8 °C / 113 F, compared to the average of 36.8 °C / 98 F, ranging from 21 to 71 °C for the class Multimedia.
(-) The bottom heats up to a maximum of 49.2 °C / 121 F, compared to the average of 39.1 °C / 102 F
(+) In idle usage, the average temperature for the upper side is 30.3 °C / 87 F, compared to the device average of 31.3 °C / 88 F.
(+) The palmrests and touchpad are cooler than skin temperature with a maximum of 31 °C / 87.8 F and are therefore cool to the touch.
(-) The average temperature of the palmrest area of similar devices was 28.7 °C / 83.7 F (-2.3 °C / -4.1 F).
Stress Test
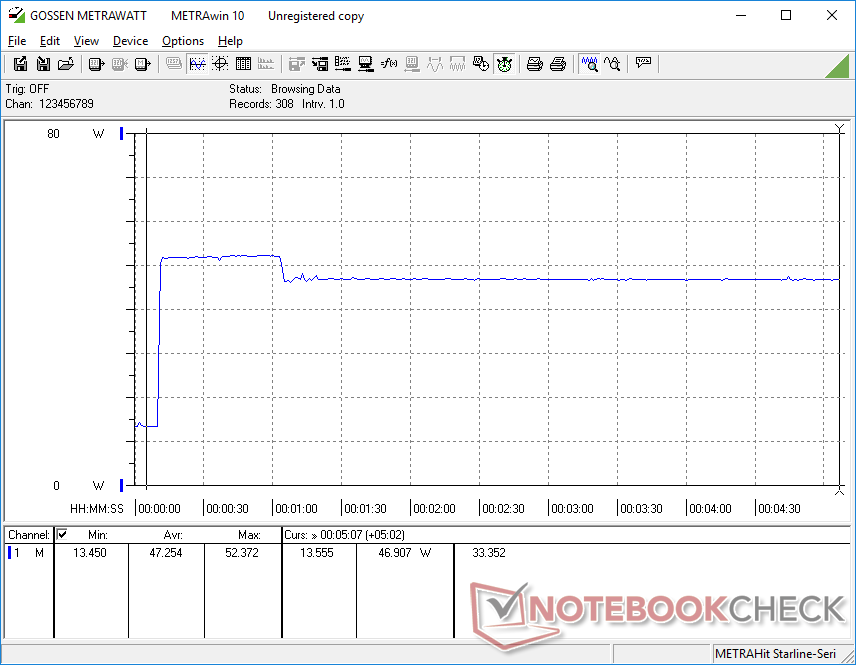
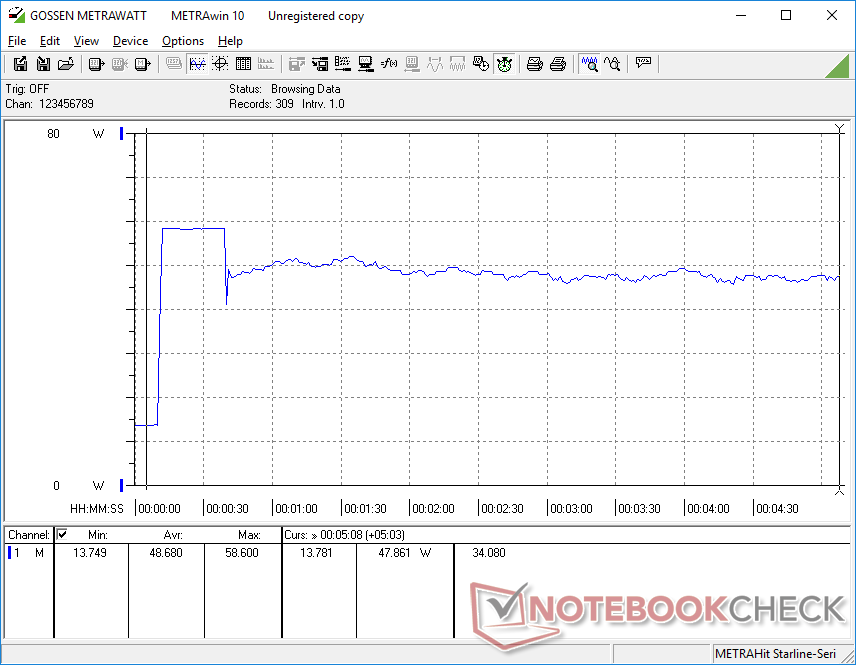
We stress the laptop with synthetic loads to identify for any potential throttling or stability issues. When running Prime95, the CPU would boost to 3.3 GHz for about 20 seconds until it reaches a core temperature of 88 C. Thereafter, clock rates and temperature would drop slightly and stabilize at 3.1 GHz and 86 C, respectively. Running both Prime95 and FurMark would throttle both clock rate and temperature down even further as shown by the screenshots below.
Running on battery power will not limit performance. A 3DMark 11 test on batteries returns Physics and Graphics scores of 5039 and 2692 points, respectively, compared to 5024 and 2543 points when on mains.
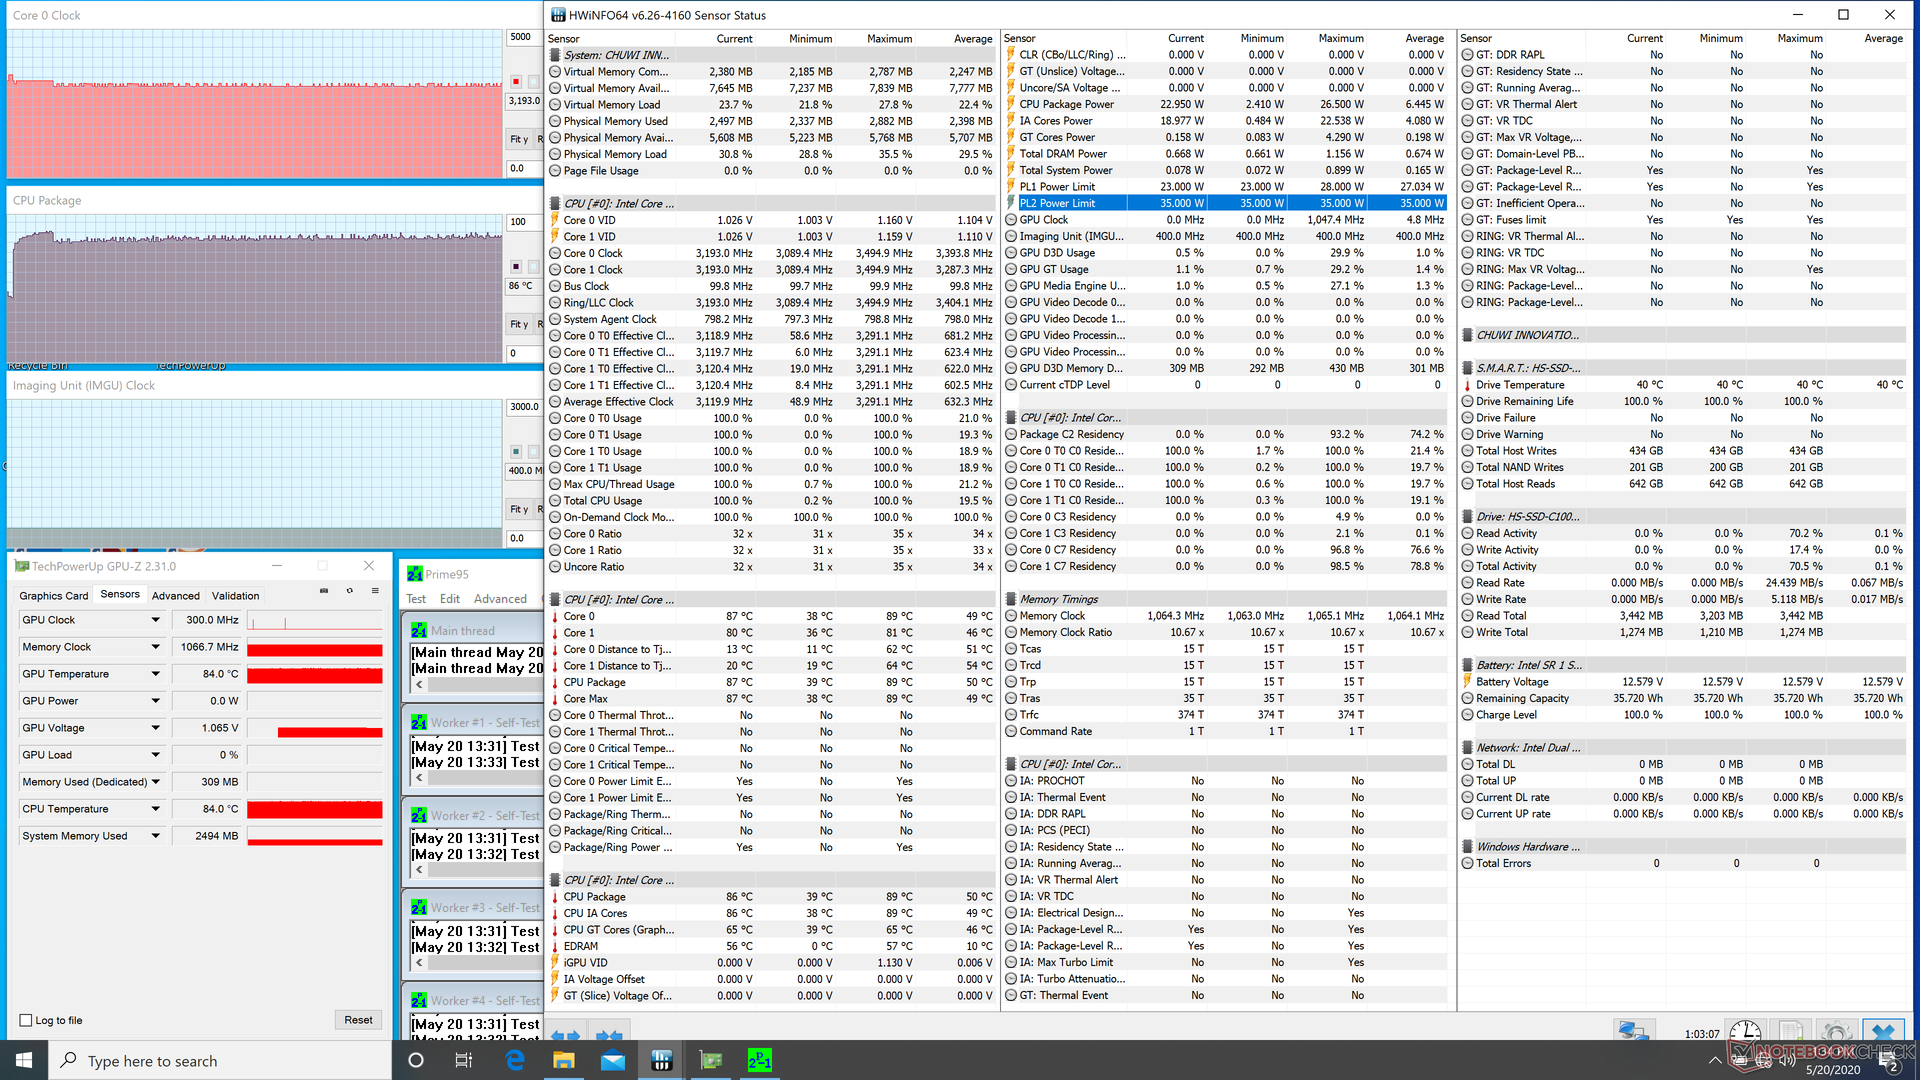
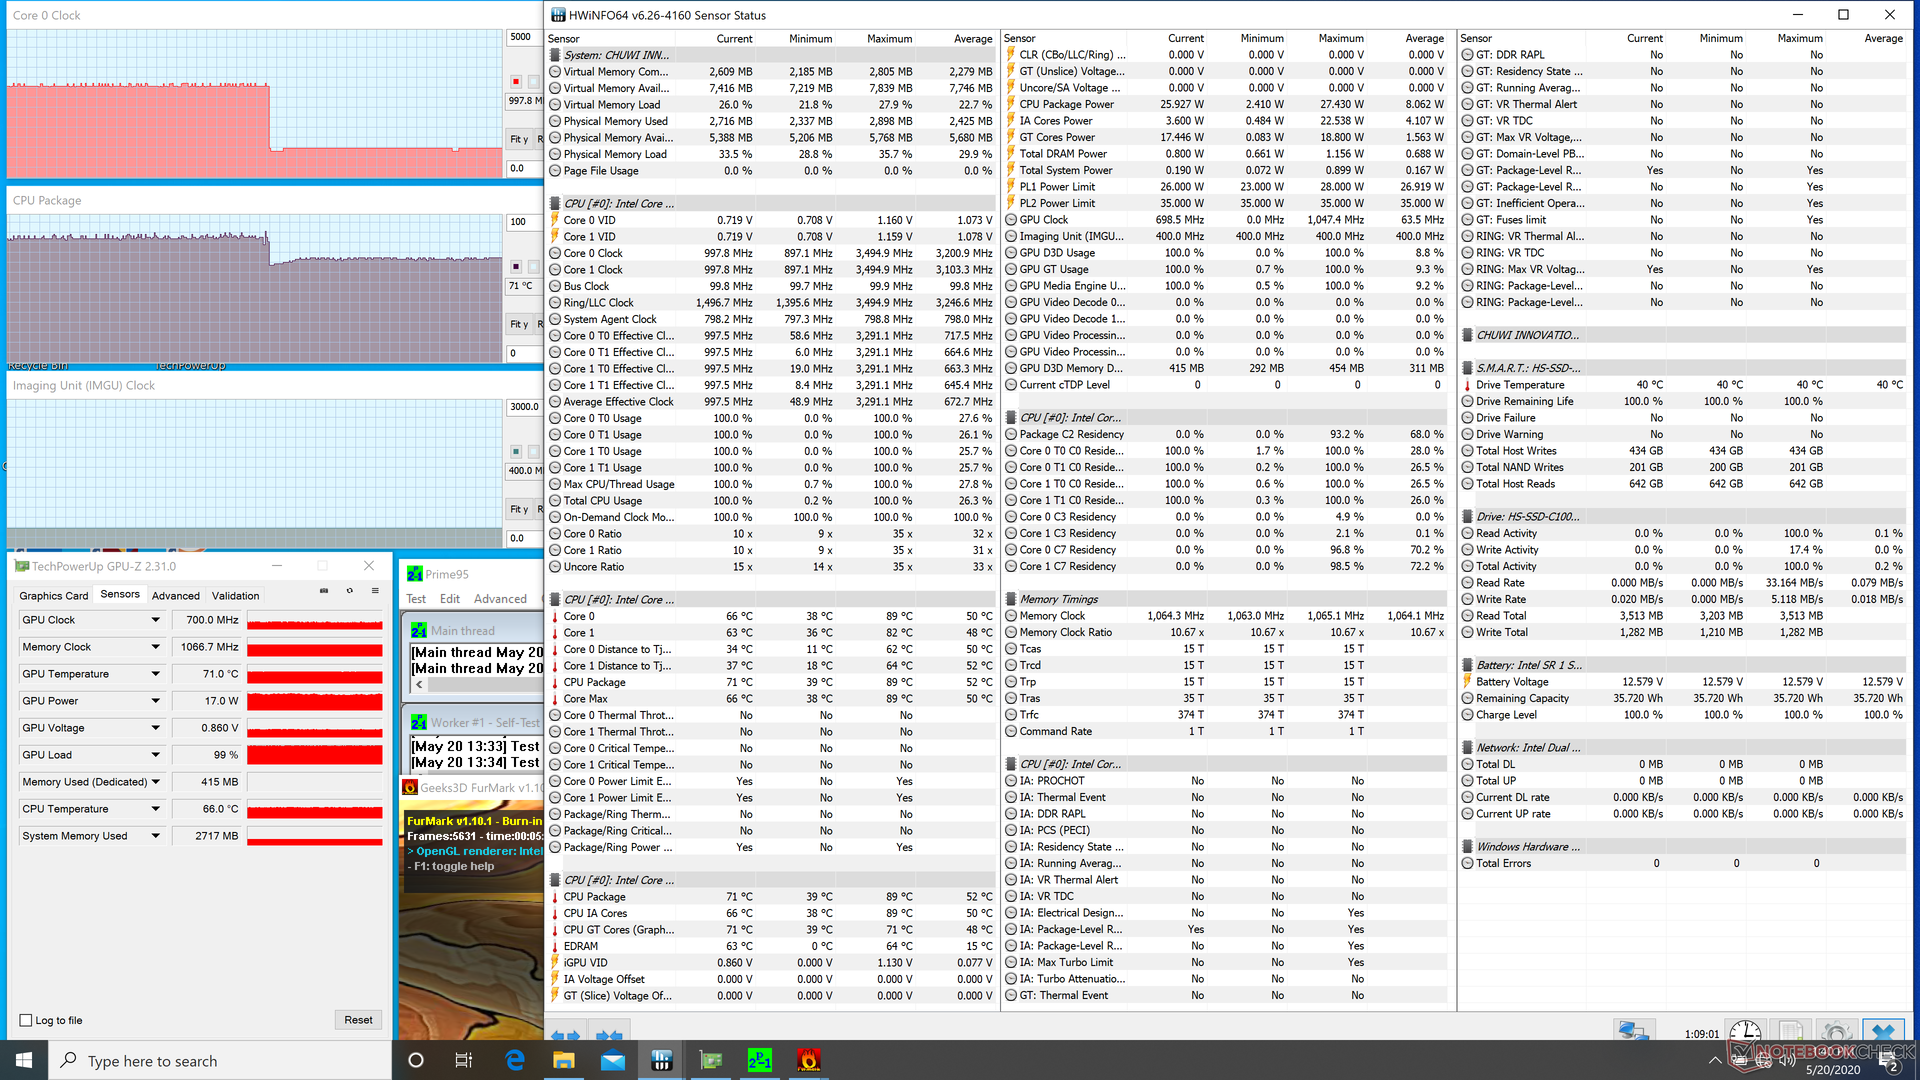
| CPU Clock (GHz) | GPU Clock (MHz) | Average CPU Temperature (°C) | |
| System Idle | -- | -- | 43 |
| Prime95 Stress | 3.2 | -- | 86 |
| Prime95 + FurMark Stress | 1.0 | 700 | 71 |
Speakers


Chuwi AeroBook Plus audio analysis
(±) | speaker loudness is average but good (79.4 dB)
Bass 100 - 315 Hz
(-) | nearly no bass - on average 17.5% lower than median
(±) | linearity of bass is average (10.3% delta to prev. frequency)
Mids 400 - 2000 Hz
(±) | higher mids - on average 6.1% higher than median
(±) | linearity of mids is average (8.8% delta to prev. frequency)
Highs 2 - 16 kHz
(+) | balanced highs - only 4.8% away from median
(±) | linearity of highs is average (10.8% delta to prev. frequency)
Overall 100 - 16.000 Hz
(±) | linearity of overall sound is average (24.3% difference to median)
Compared to same class
» 86% of all tested devices in this class were better, 5% similar, 9% worse
» The best had a delta of 5%, average was 17%, worst was 45%
Compared to all devices tested
» 74% of all tested devices were better, 6% similar, 21% worse
» The best had a delta of 4%, average was 24%, worst was 134%
Apple MacBook 12 (Early 2016) 1.1 GHz audio analysis
(+) | speakers can play relatively loud (83.6 dB)
Bass 100 - 315 Hz
(±) | reduced bass - on average 11.3% lower than median
(±) | linearity of bass is average (14.2% delta to prev. frequency)
Mids 400 - 2000 Hz
(+) | balanced mids - only 2.4% away from median
(+) | mids are linear (5.5% delta to prev. frequency)
Highs 2 - 16 kHz
(+) | balanced highs - only 2% away from median
(+) | highs are linear (4.5% delta to prev. frequency)
Overall 100 - 16.000 Hz
(+) | overall sound is linear (10.2% difference to median)
Compared to same class
» 7% of all tested devices in this class were better, 2% similar, 91% worse
» The best had a delta of 5%, average was 18%, worst was 53%
Compared to all devices tested
» 5% of all tested devices were better, 1% similar, 94% worse
» The best had a delta of 4%, average was 24%, worst was 134%
Energy Management
Power Consumption
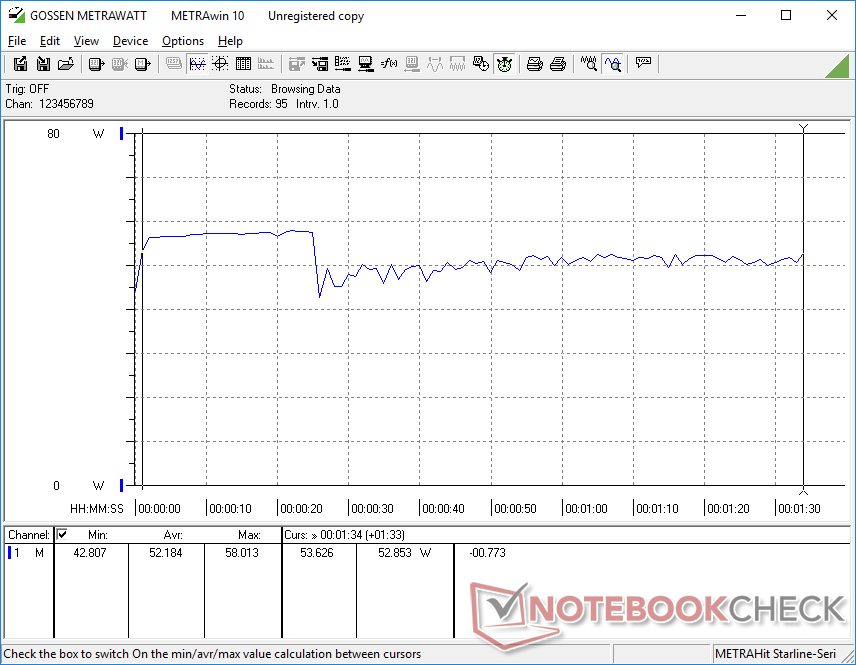
The Chuwi is generally more power demanding than the average Ultrabook due to its 28 W CPU and 4K UHD display. Idling on desktop draws between 11 W and 17 W depending on the brightness level and power profile compared to almost half from that from the 15.6-inch Dell Latitude 3590 or Lenovo Yoga C740 when under similar conditions. Running higher loads like 3DMark 06 will draw approximately 30 percent more power for a rough 25 percent increase in graphics performance.
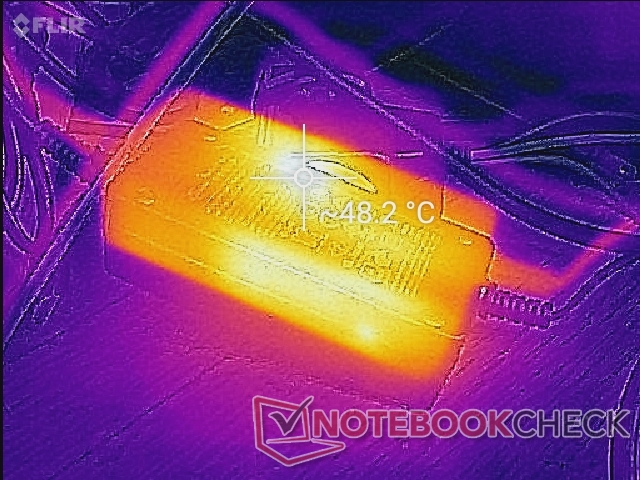
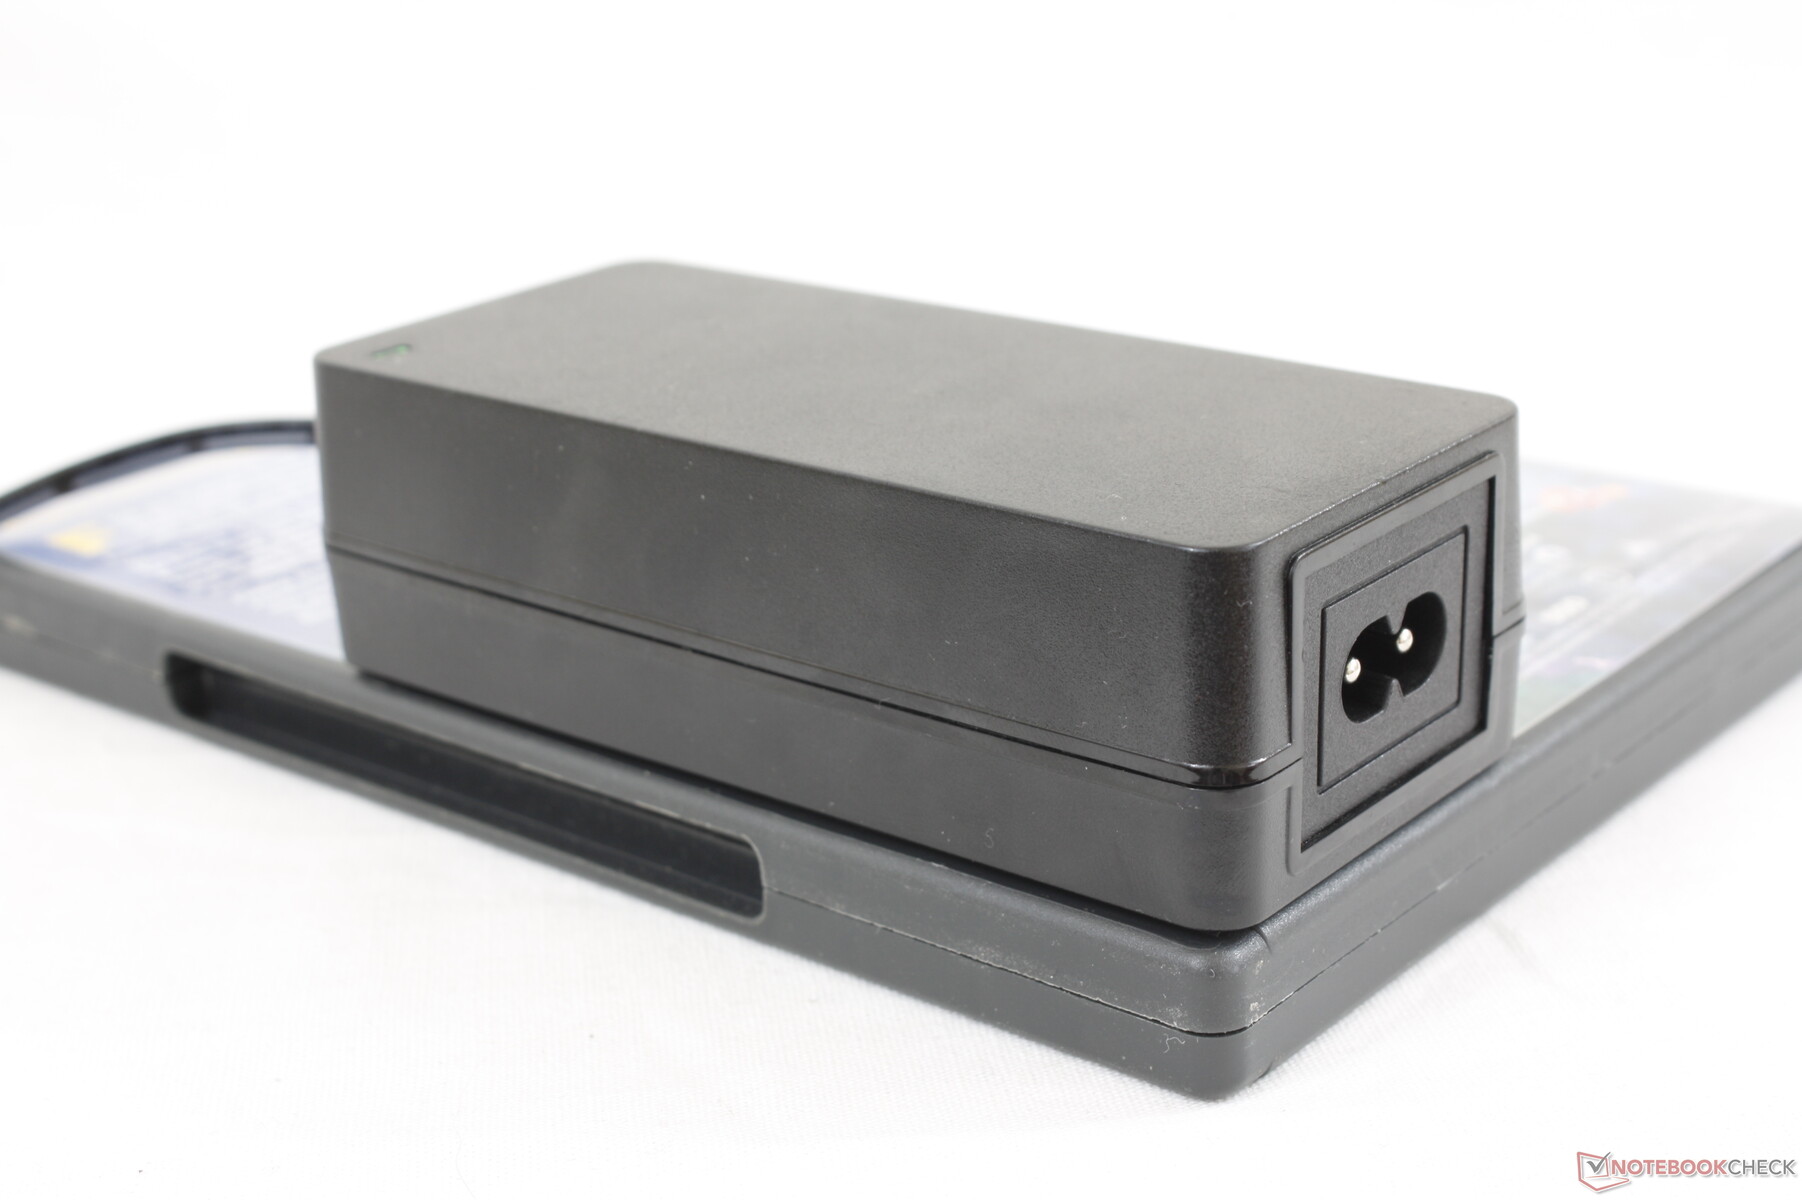
We're able to record a temporary maximum of 58.6 W from the small-medium (~11.2 x 5 x 3.2 cm) 65 W AC adapter as shown by our graphs below.
| Off / Standby | |
| Idle | |
| Load |
|
Key:
min: | |
| Chuwi AeroBook Plus 6287U, Iris Graphics 550, HIKVision HS-SSD-C100N M.2 SATA III SSD 256 GB, IPS, 3840x2160, 15.6" | Apple MacBook Pro 15 2018 (2.6 GHz, 560X) i7-8850H, Radeon Pro 560X, Apple SSD AP0512, IPS, 2880x1800, 15.4" | Dell XPS 15 7590 i5 iGPU FHD i5-9300H, UHD Graphics 630, Toshiba XG6 KXG60ZNV512G, IPS, 1920x1080, 15.6" | Lenovo Yoga C740-15IML i7-10510U, UHD Graphics 620, Samsung SSD PM981 MZVLB512HAJQ, IPS LED, 1920x1080, 15.6" | HP Envy x360 15-bq102ng R5 2500U, Vega 8, Samsung PM961 MZVLW256HEHP, IPS, 1920x1080, 15.6" | Dell Latitude 15 3590 i5-8250U, UHD Graphics 620, Samsung SSD PM871b MZ7LN256HAJQ, TN LED, 1920x1080, 15.6" | |
|---|---|---|---|---|---|---|
| Power Consumption | -2% | 11% | 35% | 39% | 47% | |
| Idle Minimum * (Watt) | 11.8 | 3.4 71% | 3.79 68% | 2.97 75% | 4.8 59% | 4.3 64% |
| Idle Average * (Watt) | 13.3 | 11 17% | 6.9 48% | 7.2 46% | 7 47% | 7.2 46% |
| Idle Maximum * (Watt) | 16.4 | 14.9 9% | 9.2 44% | 9.9 40% | 9.5 42% | 9.8 40% |
| Load Average * (Watt) | 52.2 | 78.9 -51% | 62 -19% | 40.8 22% | 40.8 22% | 38 27% |
| Load Maximum * (Watt) | 58.6 | 91.2 -56% | 108 -84% | 64.7 -10% | 44.3 24% | 24 59% |
* ... smaller is better
Battery Life
Runtimes are average at best with the integrated 55 Wh battery. Web browsing on the Balanced power profile at 150-nit brightness would only last for about 4 hours compared to 6 hours or more on the Asus VivoBook 15 or HP Envy x360 15.
Charging from empty to full capacity with the included AC adapter is slow at approximately 2.5 hours.
| Chuwi AeroBook Plus 6287U, Iris Graphics 550, 55 Wh | Apple MacBook Pro 15 2018 (2.6 GHz, 560X) i7-8850H, Radeon Pro 560X, 83 Wh | Dell XPS 15 7590 i5 iGPU FHD i5-9300H, UHD Graphics 630, 97 Wh | Lenovo Yoga C740-15IML i7-10510U, UHD Graphics 620, 60.3 Wh | HP Envy x360 15-bq102ng R5 2500U, Vega 8, 55.8 Wh | Asus Vivobook 15 F512DA-SH31 R3 3200U, Vega 3, 37 Wh | |
|---|---|---|---|---|---|---|
| Battery runtime | 149% | 244% | 154% | 73% | 46% | |
| WiFi v1.3 (h) | 4.1 | 10.2 149% | 14.1 244% | 10.4 154% | 7.1 73% | 6 46% |
| Witcher 3 ultra (h) | 1.5 | |||||
| Load (h) | 1.7 | 2 |
Pros
Cons
Verdict
The Chuwi AeroBook Plus cuts a lot of corners in order to offer a beautiful 4K display at this price range. Some of them are reasonable like the 1x1 WLAN, soldered RAM, SATA III SSD, and lack of Thunderbolt 3 support. Others, however, are not acceptable. The unreliable keyboard and clickpad make the laptop more difficult to use than it needs to be and the longevity of the hinges is questionable. The quality control of Chuwi products could certainly be better based on our experience with several of their laptops thus far. Still, we acknowledge that our particular unit may be a pre-production system as the AeroBook Plus is still in its crowdfunding phase.
There are a few aspects of the system that deserve praise. The very large clickpad, deep key travel, wide port options, and attractive visual design help the AeroBook Plus stand out from the crowd. Other laptops in its price range like the Asus VivoBook, Dell Inspiron, or HP Pavilion are mostly plastic and thicker in comparison.
If you really want an Ultrabook with a 4K display without breaking the bank, then we recommend older Kaby Lake or Kaby Lake-R laptops from Dell, HP or Lenovo as they offer stronger warranty options and better quality control.
Great looks with a great 4K display. Almost everything else is merely average or in need of fixing such as the jumpy clickpad, weak hinges, or unresponsive keyboard keys.
Chuwi AeroBook Plus
- 05/22/2020 v7 (old)
Allen Ngo
Price comparison
