Toshiba Tecra A50-E-110 (Core i5-8250U, 256 GB SSD, 8 GB RAM) Laptop Review

The Toshiba Tecra series is no stranger to our offices. We reviewed the Tecra X40-E in July this year, a 14-inch laptop that scored highly for its case design, its long battery life and its two Thunderbolt 3 ports among other things in our review. However, the equivalent US configuration to our test device retails for almost $1,400 at the time of writing, which makes it a comparatively expensive laptop and one which many buyers may overlook for other more popular and competitively priced alternatives.
By contrast, the Tecra A50 is much cheaper than its smaller sibling but is equipped with comparable hardware. The Tecra A50 currently starts at $899.99, but this comes with an outdated Core i5 7200U processor. Our test device is named the A50-E-110 and is equipped with a quad-core Core i5-8250U processor that integrates an Intel UHD Graphics 620, 8 GB of RAM and a 256 GB SSD. Toshiba currently sells the equivalent US configuration on its website for $986.99, which is named the A50-E1524. The company ships the A50-E1524 with a DVD drive, which is increasingly rare for devices released in the last few years. However, the DVD drive is a $20 upgrade for Tecra A50 models that do not come with it as standard. Our test device is one such configuration.
The Tecra A50 has plenty of comparably priced competition against which to assess it. We have chosen to compare our test device against the Dell Inspiron 15 5579, the Fujitsu LifeBook E558, the HP ProBook 650 G4 and the Lenovo IdeaPad 330S-15IKB.
Case & Connectivity
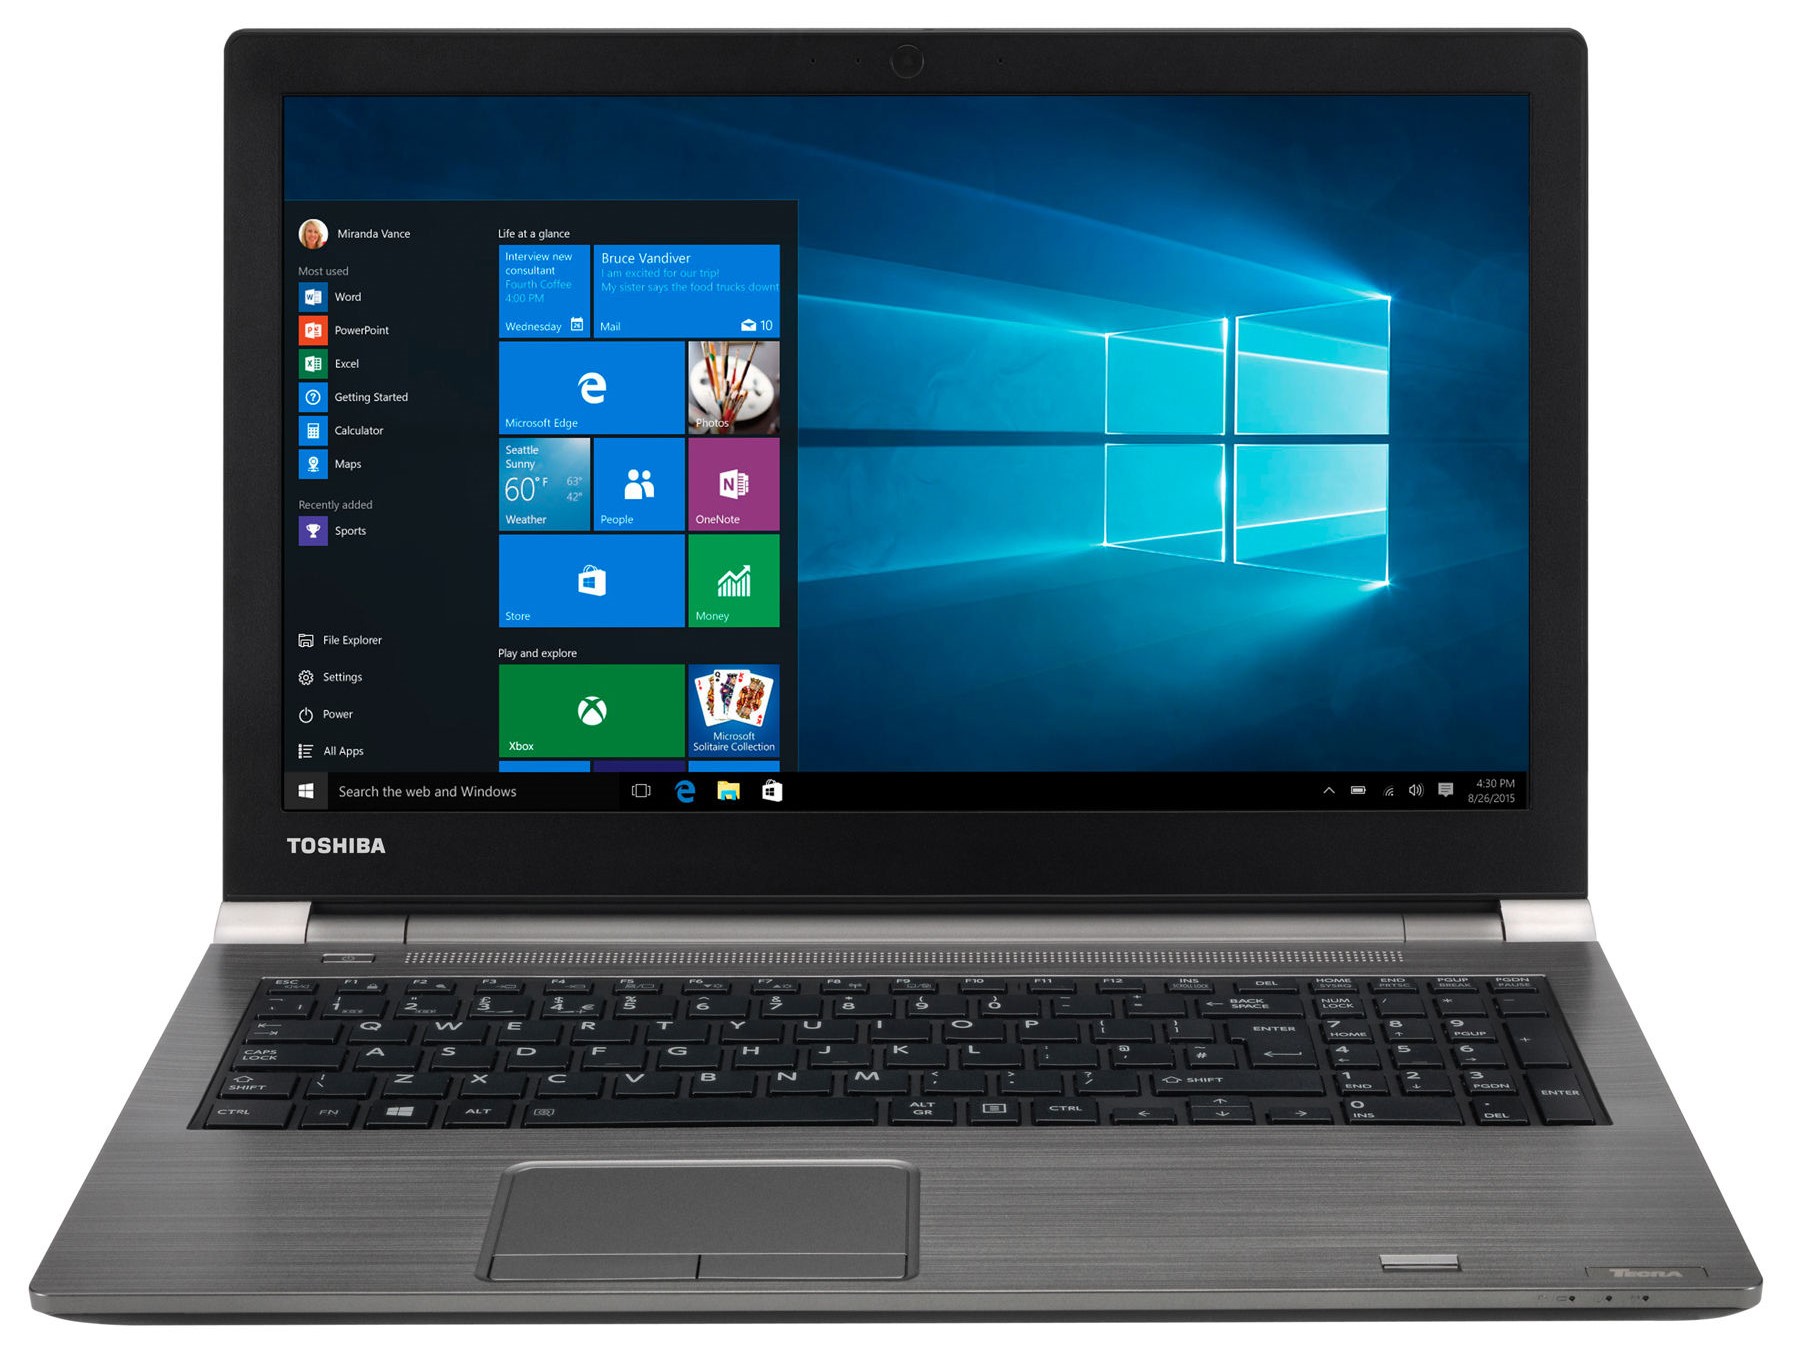
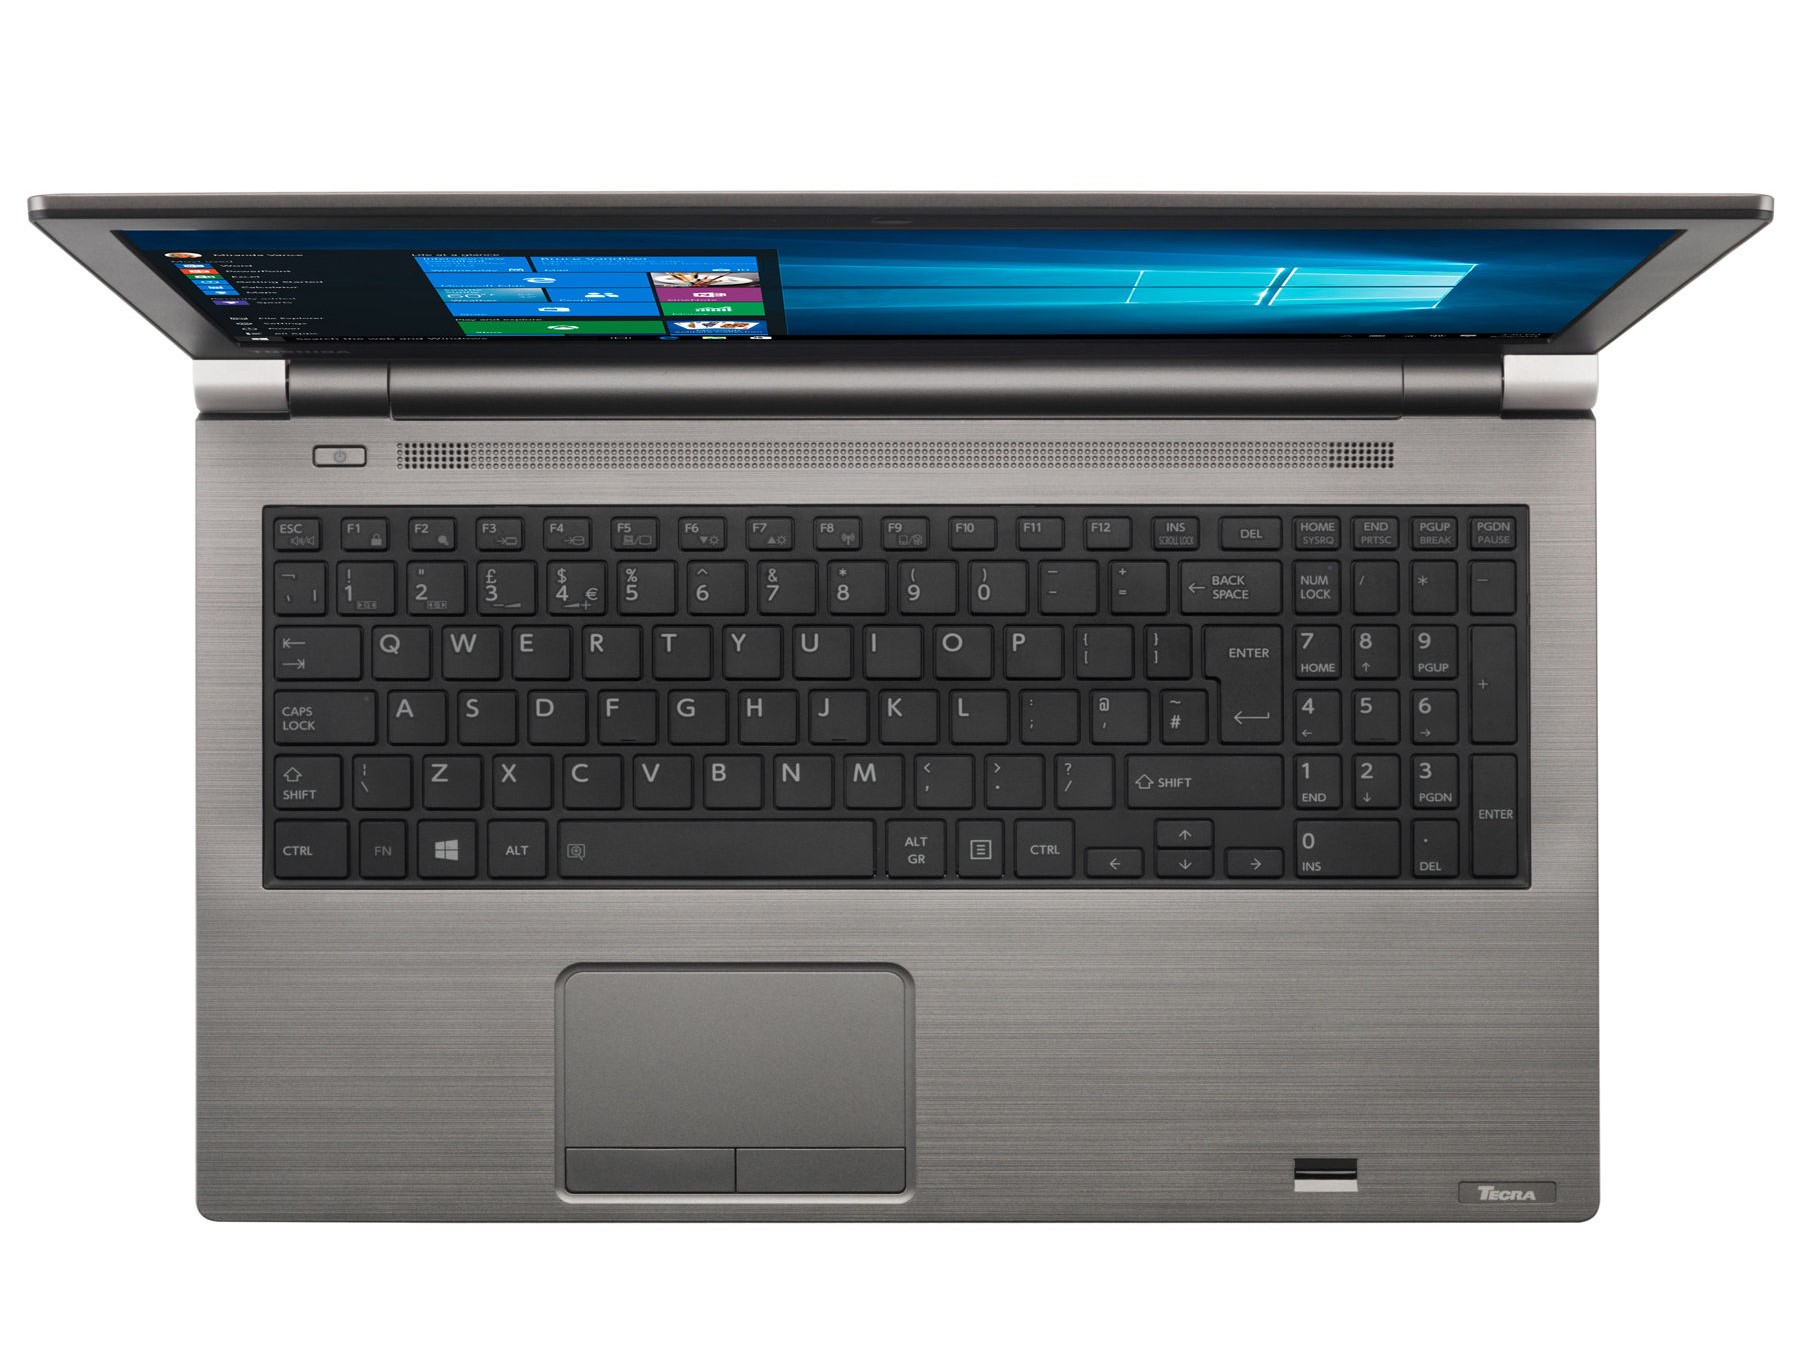
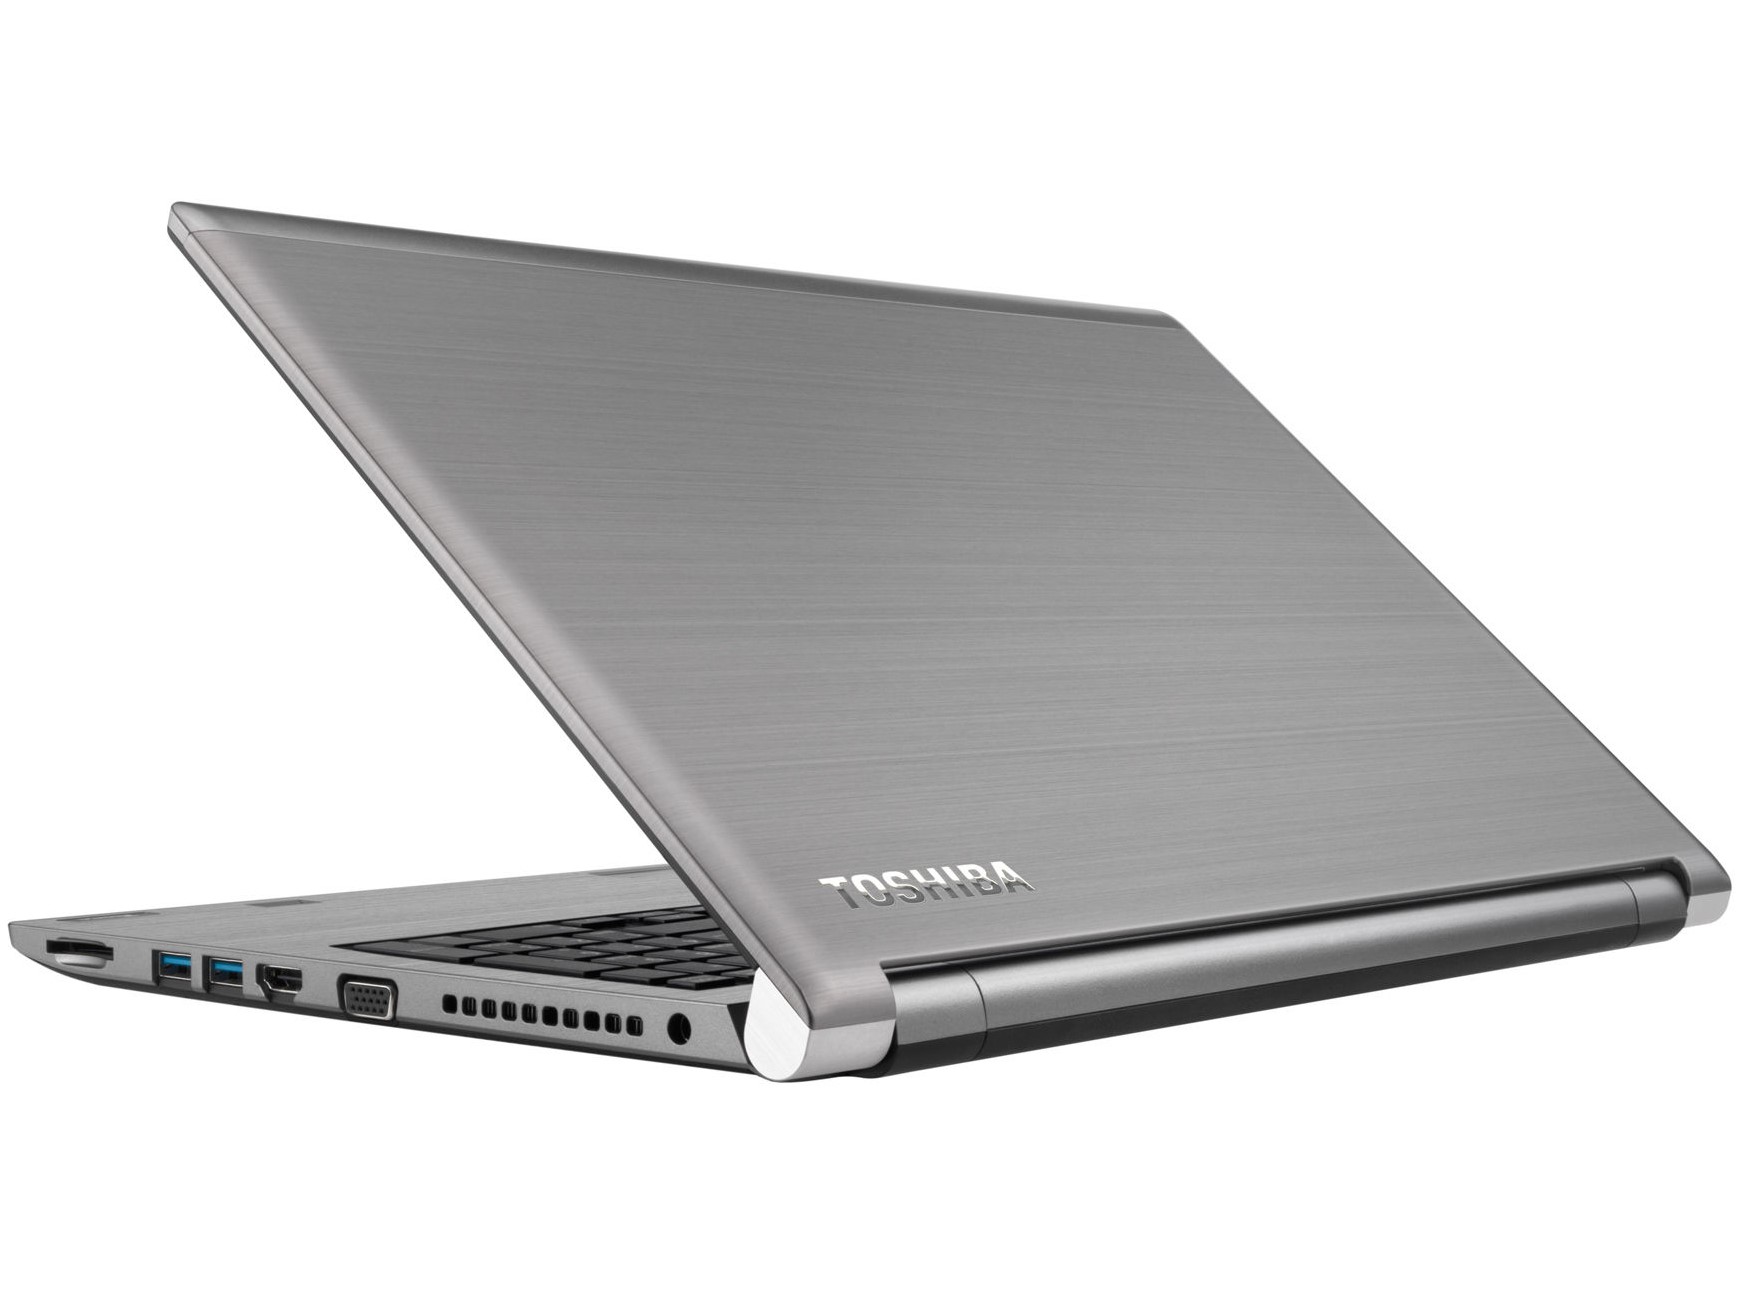
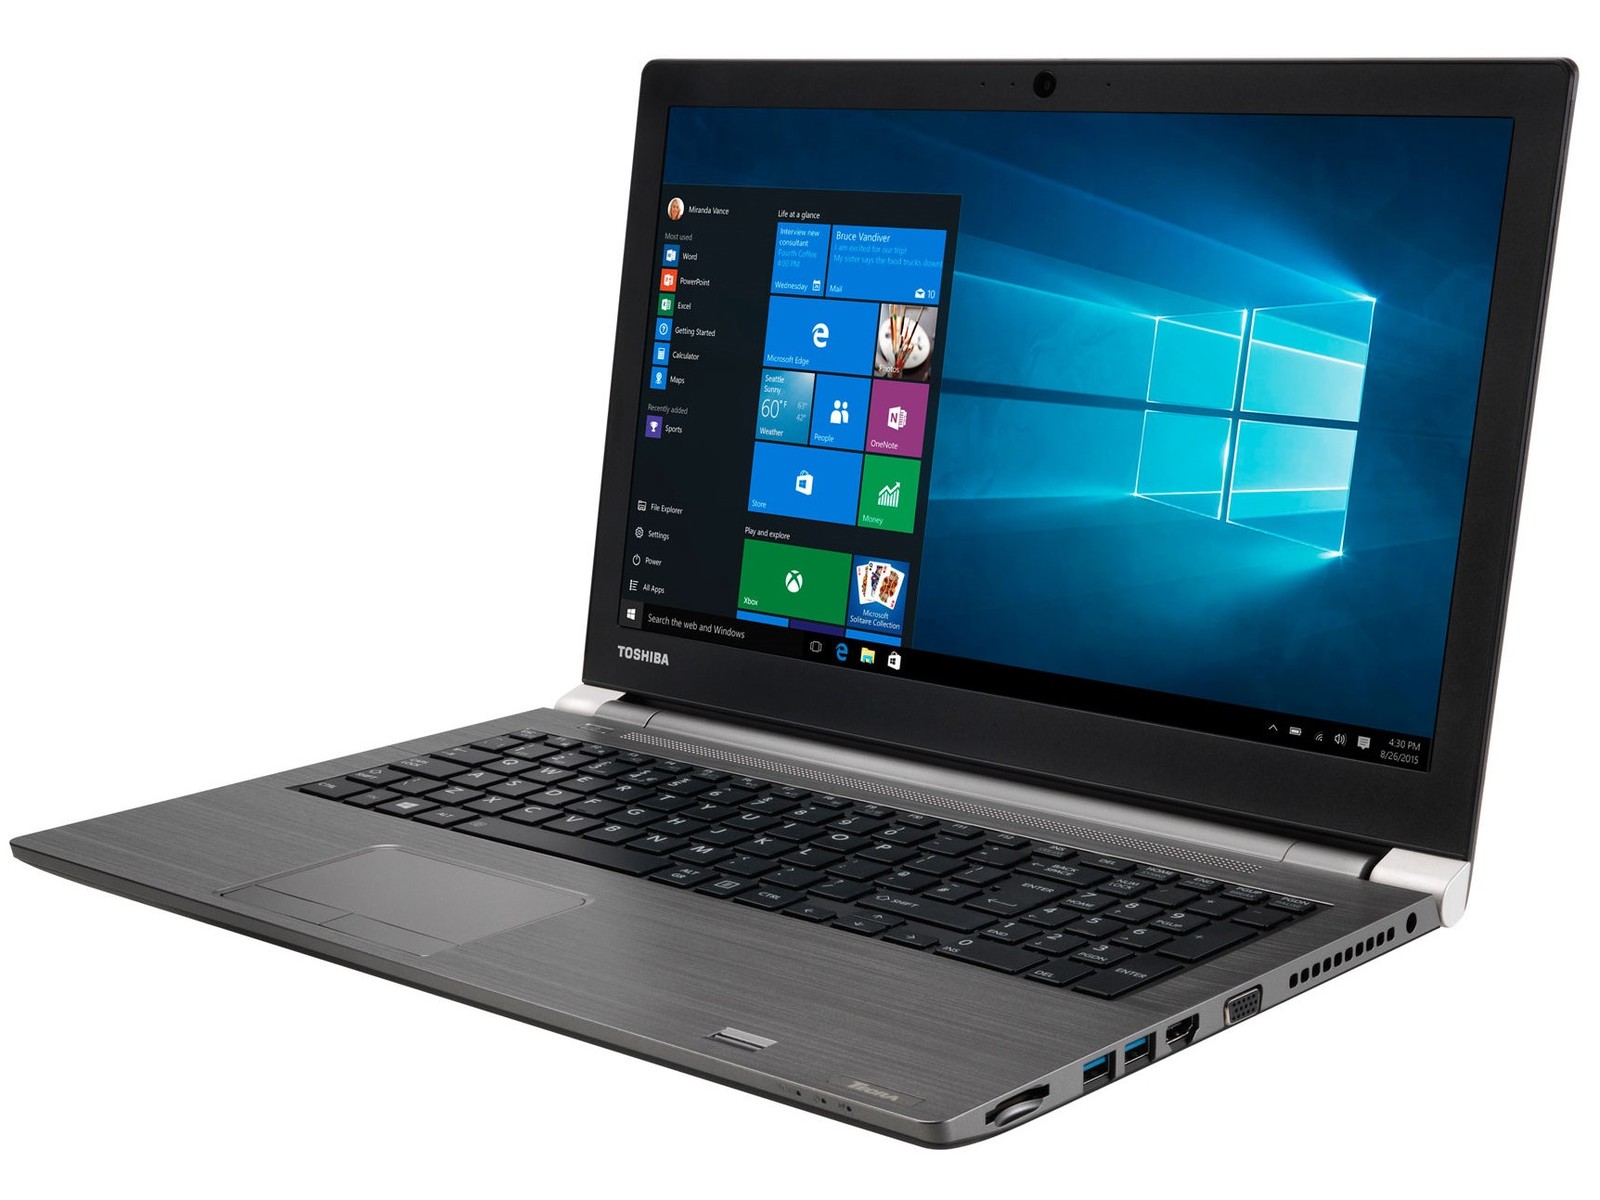
The display case and the top frame of our test device are made from a robust material that Toshiba has finished in a metallic-looking silver/grey. The company has contrasted this colouring with a black plastic display frame, underside and keyboard keys. All ports can be found on the left-hand or right-hand sides of the device, with the former being dominated by the slot where the DVD drive would have been.
There is also a Toshiba Hi-Speed Port Replicator III docking port on the underside of the device, while the battery is removable should you need to swap in additional batteries throughout a long working day. Our test device weighs 2 kg (~4.4 lb), which is on par with our comparison devices. The Tecra A50 is as large as most of our comparison devices with the Lenovo IdeaPad 330S-15IKB being the exception. The latter is noticeably smaller thanks to its narrower display bezels.
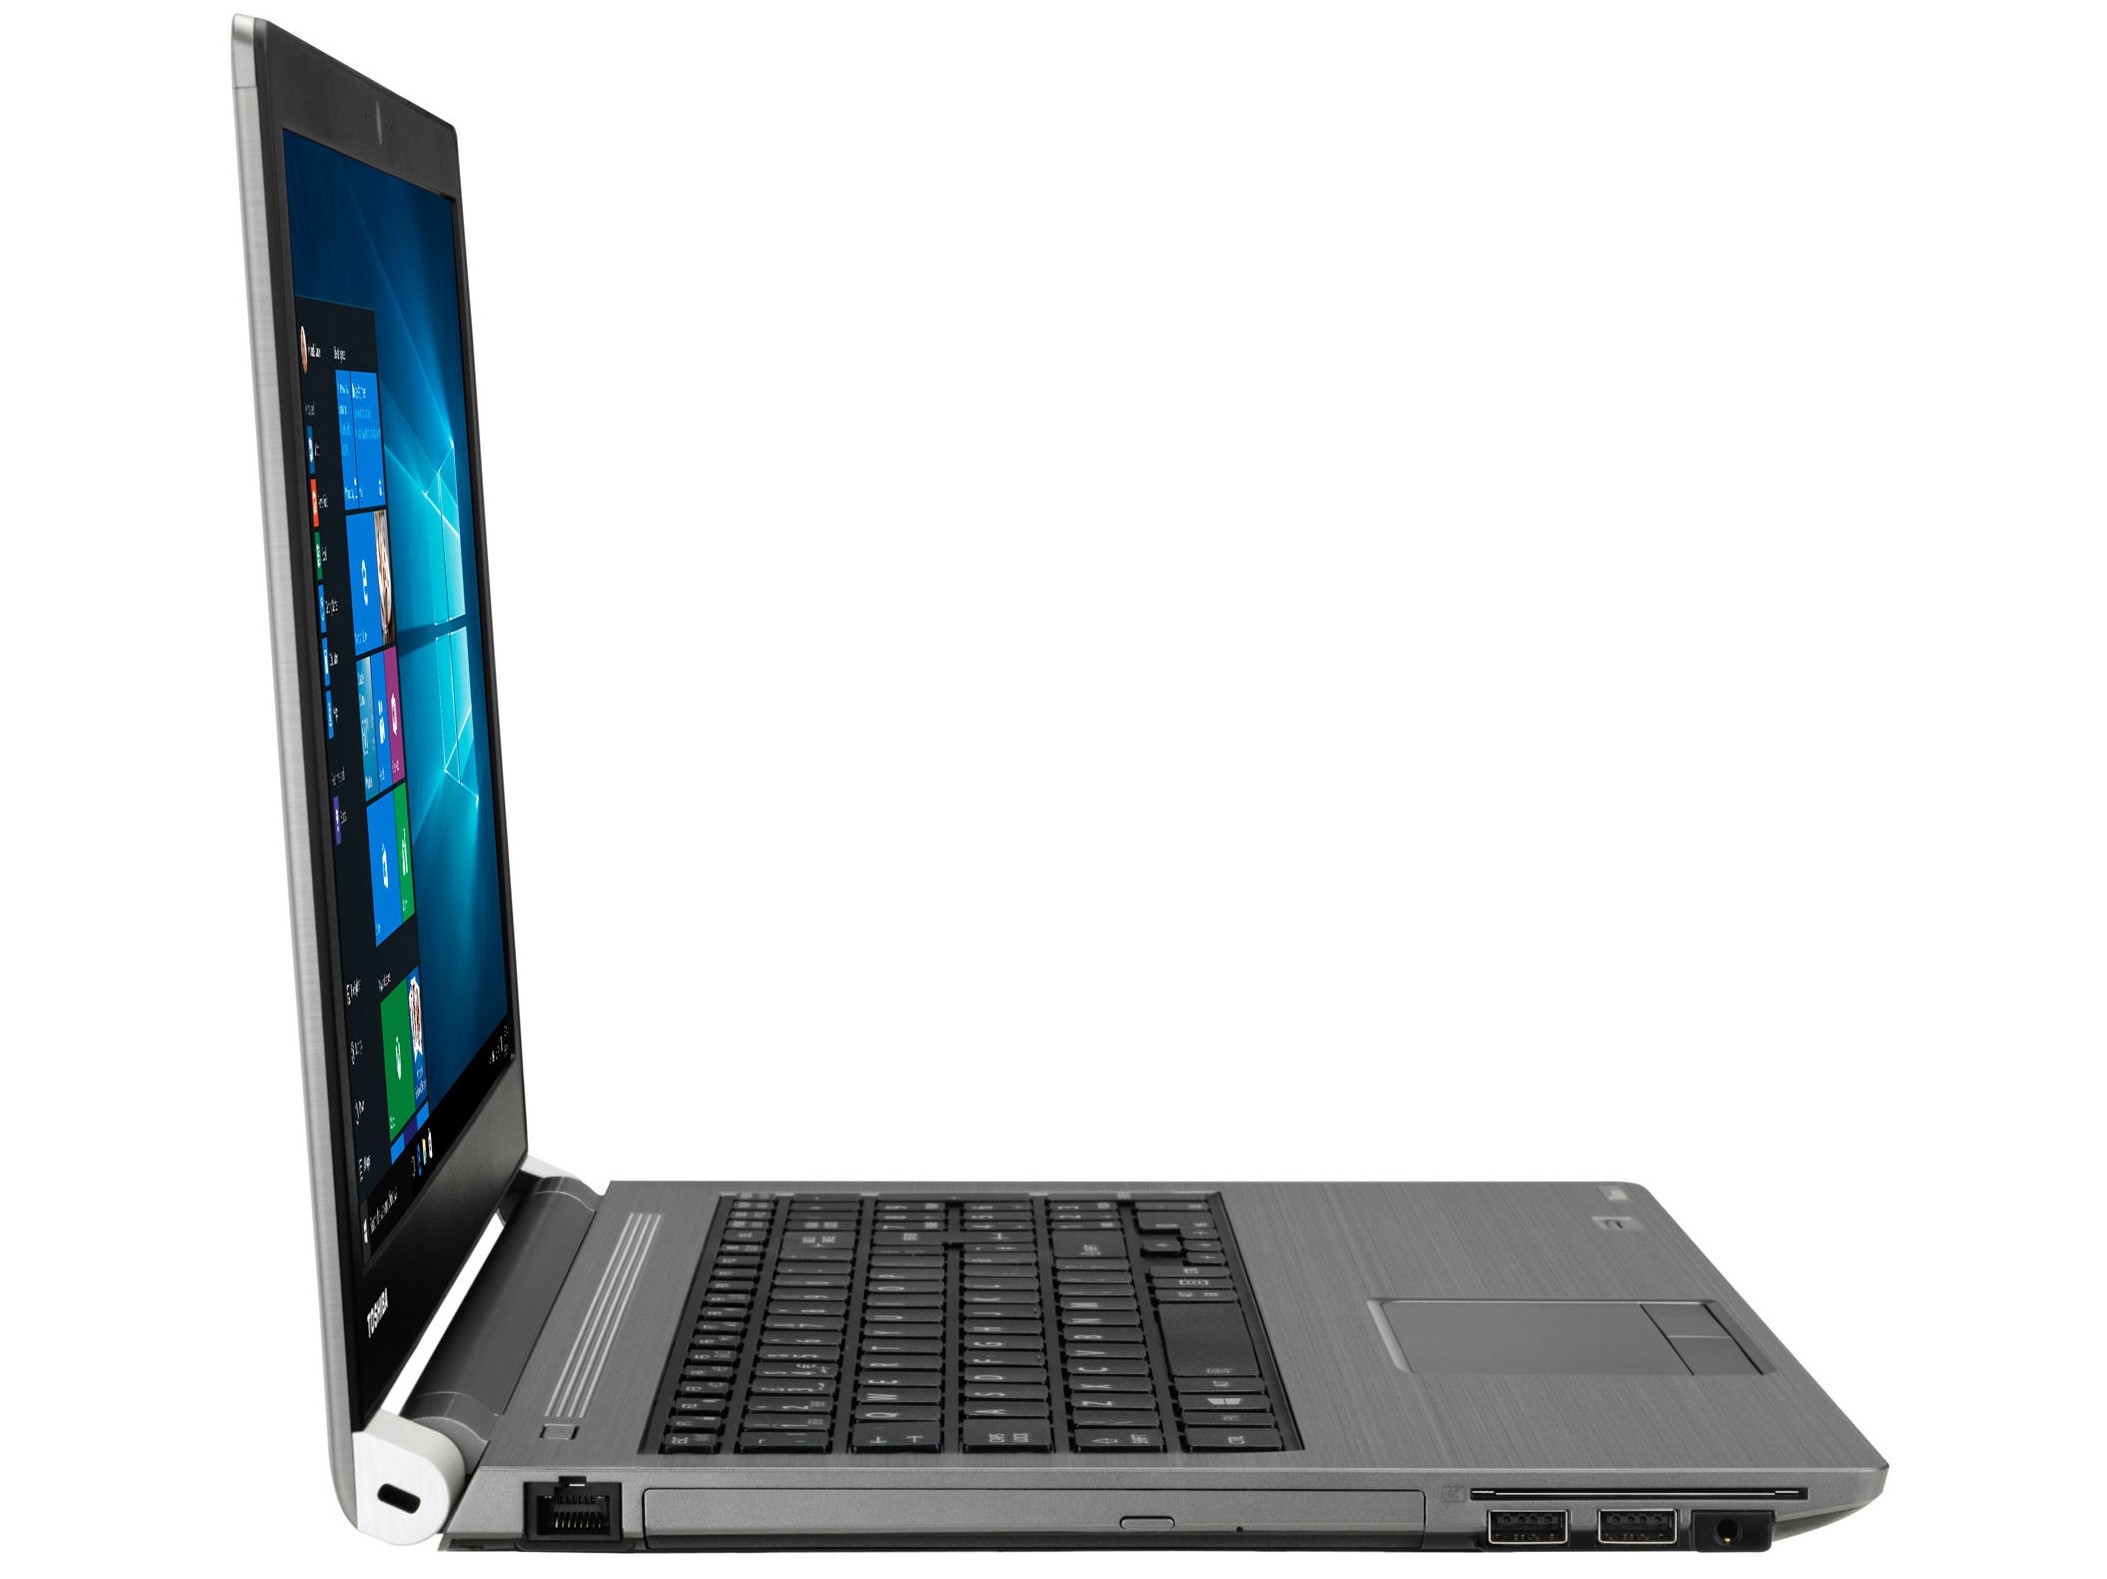
There is an SD card reader on the right-hand side of the device that is a few millimetres longer than full-sized SD cards, so they do not protrude when they are connected to our test device. It is worth noting that the SD card reader achieved comparatively poor transfer speeds with our Toshiba Exceria Pro SDXC 64 GB UHS-II reference card and finished bottom of our comparison table in both tests that we conducted.
The integrated Wi-Fi adapter supports Bluetooth 4.2 and all modern Wi-Fi standards up to IEEE 802.11 ac Wi-Fi. Our test device also finished bottom of our comparison table in the iperf3 Client (receive) Wi-Fi test in which it averaged 295 MBit/s. By contrast, the Dell Inspiron 15 5579 averaged over double that speed with 612 MBit/s. However, the Tecra A50 averaged a more respectable 568 MBit/s in the transmission test, which put it third in our comparison table and around 100 MBit/s behind the Fujitsu LifeBook E558 in first place.

Connectivity
| SD Card Reader | |
| average JPG Copy Test (av. of 3 runs) | |
| HP ProBook 650 G4 3UP57EA (Toshiba Exceria Pro M501 microSDXC 64GB) | |
| Fujitsu Lifebook E558 E5580MP581DE (Toshiba Exceria Pro SDXC 64 GB UHS-II) | |
| Average of class Office (19.8 - 198.5, n=22, last 2 years) | |
| Lenovo IdeaPad 330S-15IKB-81F500N5GE (Toshiba Exceria Pro SDXC 64 GB UHS-II) | |
| Dell Inspiron 15 5579-9672 (Toshiba Exceria Pro SDXC 64 GB UHS-II) | |
| Toshiba Tecra A50-E-110 (Toshiba Exceria Pro SDXC 64 GB UHS-II) | |
| maximum AS SSD Seq Read Test (1GB) | |
| Average of class Office (27.4 - 249, n=21, last 2 years) | |
| HP ProBook 650 G4 3UP57EA (Toshiba Exceria Pro M501 microSDXC 64GB) | |
| Fujitsu Lifebook E558 E5580MP581DE (Toshiba Exceria Pro SDXC 64 GB UHS-II) | |
| Dell Inspiron 15 5579-9672 (Toshiba Exceria Pro SDXC 64 GB UHS-II) | |
| Toshiba Tecra A50-E-110 (Toshiba Exceria Pro SDXC 64 GB UHS-II) | |
Input Devices
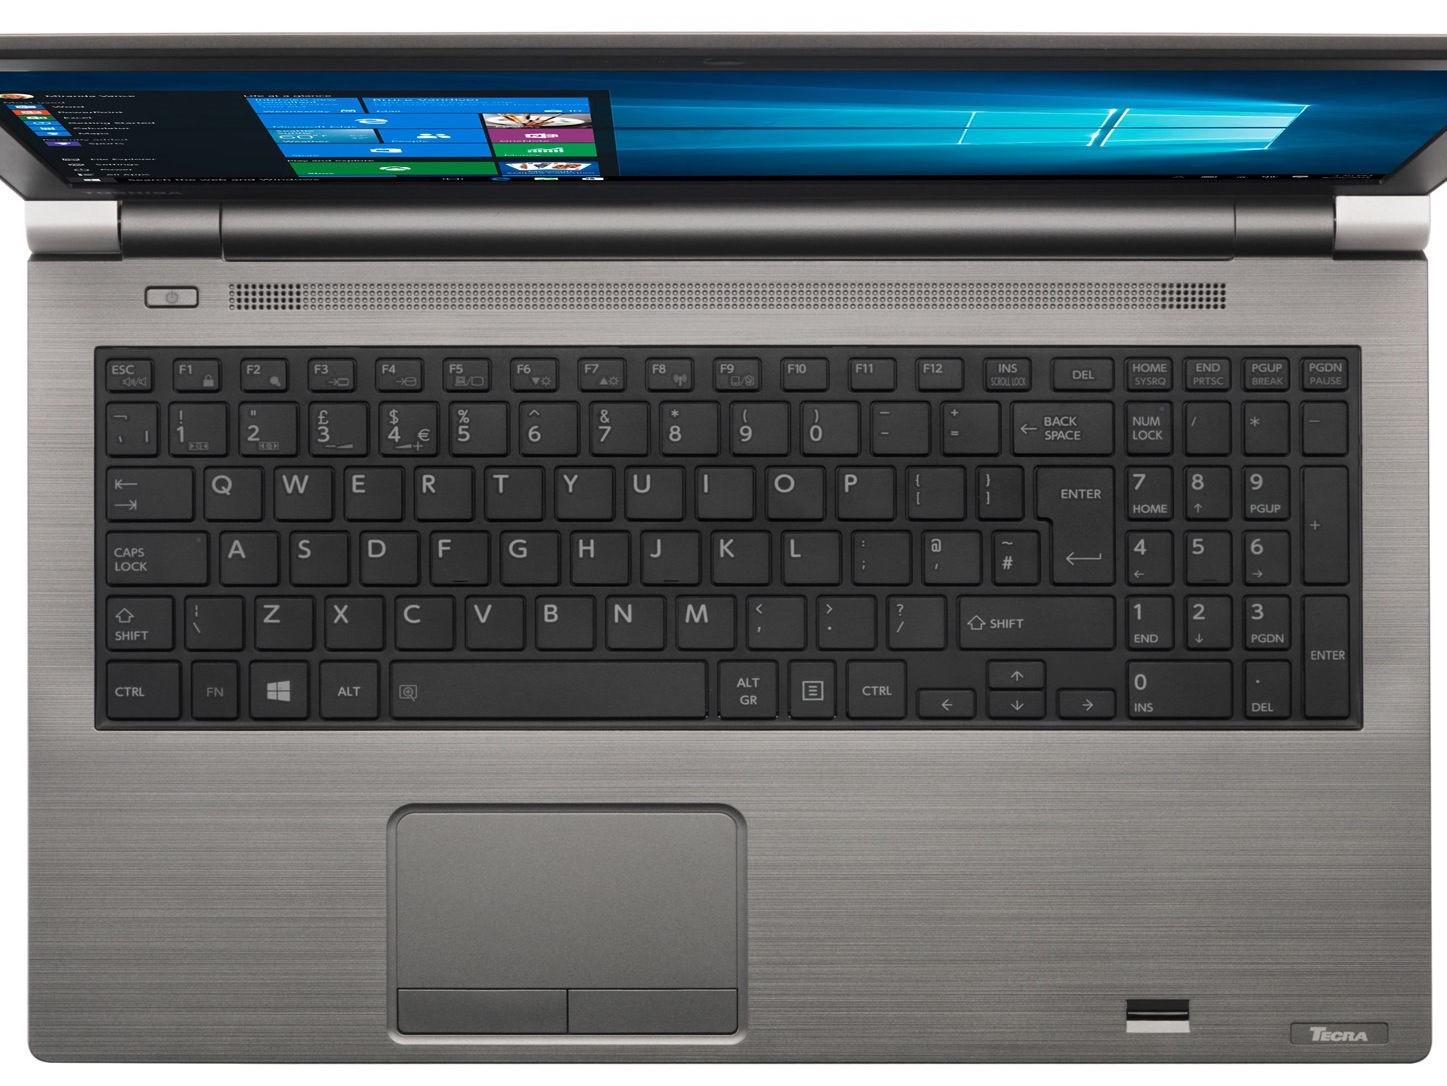
The Tecra A50 has a full-width keyboard with keys that offer a soft pressure point, which should still be firm enough for frequent typists. Moreover, the keys are grippy and provide a pleasant typing experience thanks to the well-designed keyboard layout. The function keys are too small for our liking though, mainly as there is enough space for larger keys.
Toshiba has integrated a classic trackpad that has dedicated mouse buttons. We would have preferred a larger surface area, but it is easy to use, and it worked reliably throughout the testing. The trackpad has a slightly roughened finish too, which makes multi-finger gestures such as drag-and-drop movements difficult. The two dedicated mouse buttons have crisp pressure points and reliably trigger clicks onscreen.
Display
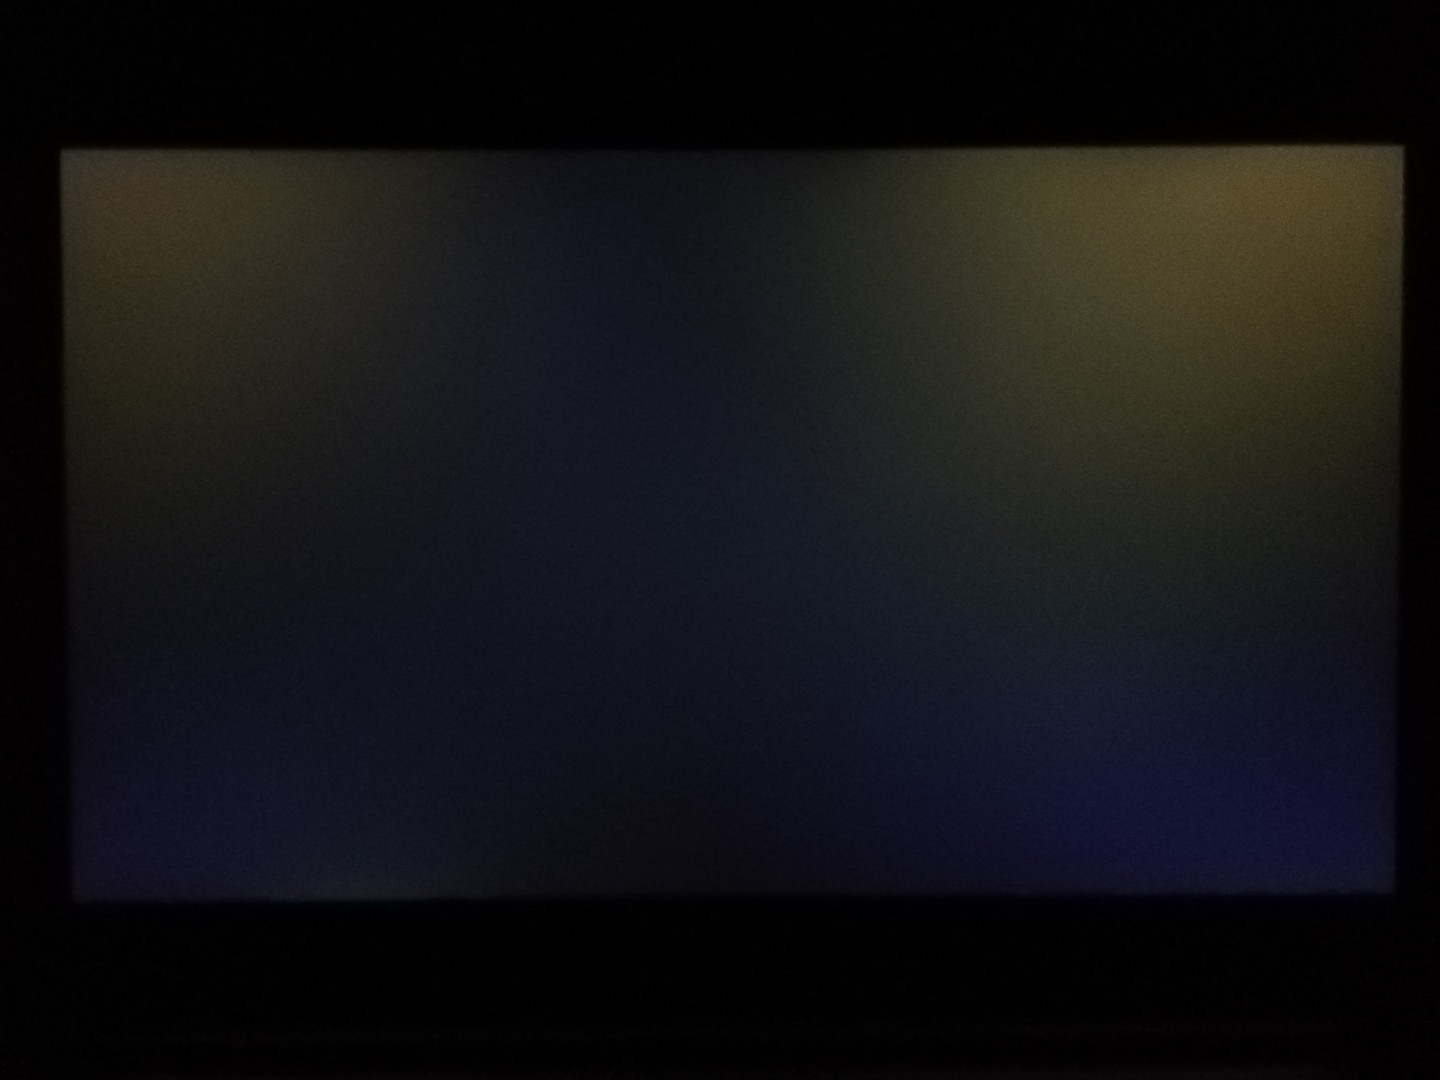
Our test device has a 15.6-inch IPS display that runs at a 1,920x1,080 native resolution. Please bear in mind that the cheapest configuration has a 1,366x768 display, with the 1080p variant being a $60 upgrade. Our test device achieves an average maximum brightness of 249 cd/m² according to X-Rite i1Pro 2, which is on par with the IdeaPad 330S-15IKB and is slightly brighter than the displays in both the Inspiron 15 5579 and the LifeBook E558. By contrast, the ProBook 650 G4 averages 270 cd/m², but all devices have dark displays compared to consumer-focused laptops such as the Dell XPS 15 9570 and the Apple MacBook Pro 15 2017. Our test device also has a 78% evenly lit display, which is lower than many of our comparison devices.
Unfortunately, the Tecra A50 uses pulse-width modulation (PWM) to regulate display brightness, which can cause eye strain and headaches for some people. We measured a 20,000 Hz PWM frequency at 90% brightness and below, which should be high enough not trouble even those who are PWM sensitive; we cannot guarantee this though. The lower resolution display may use PWM too.
| |||||||||||||||||||||||||
Brightness Distribution: 78 %
Center on Battery: 290 cd/m²
Contrast: 763:1 (Black: 0.38 cd/m²)
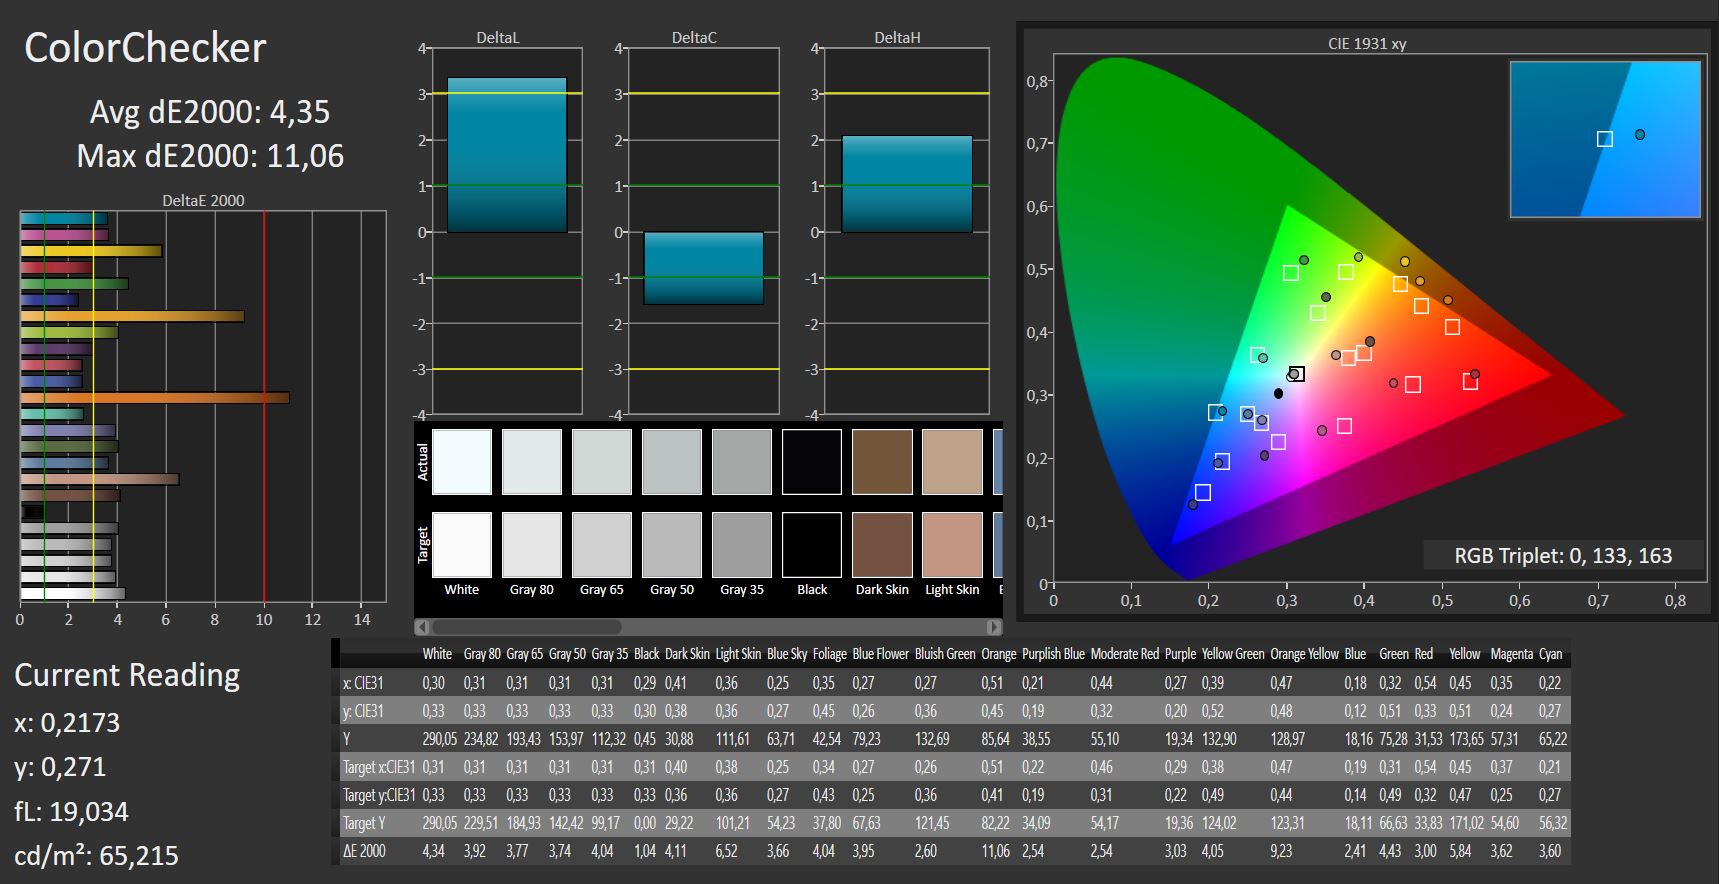
ΔE ColorChecker Calman: 4.35 | ∀{0.5-29.43 Ø4.71}
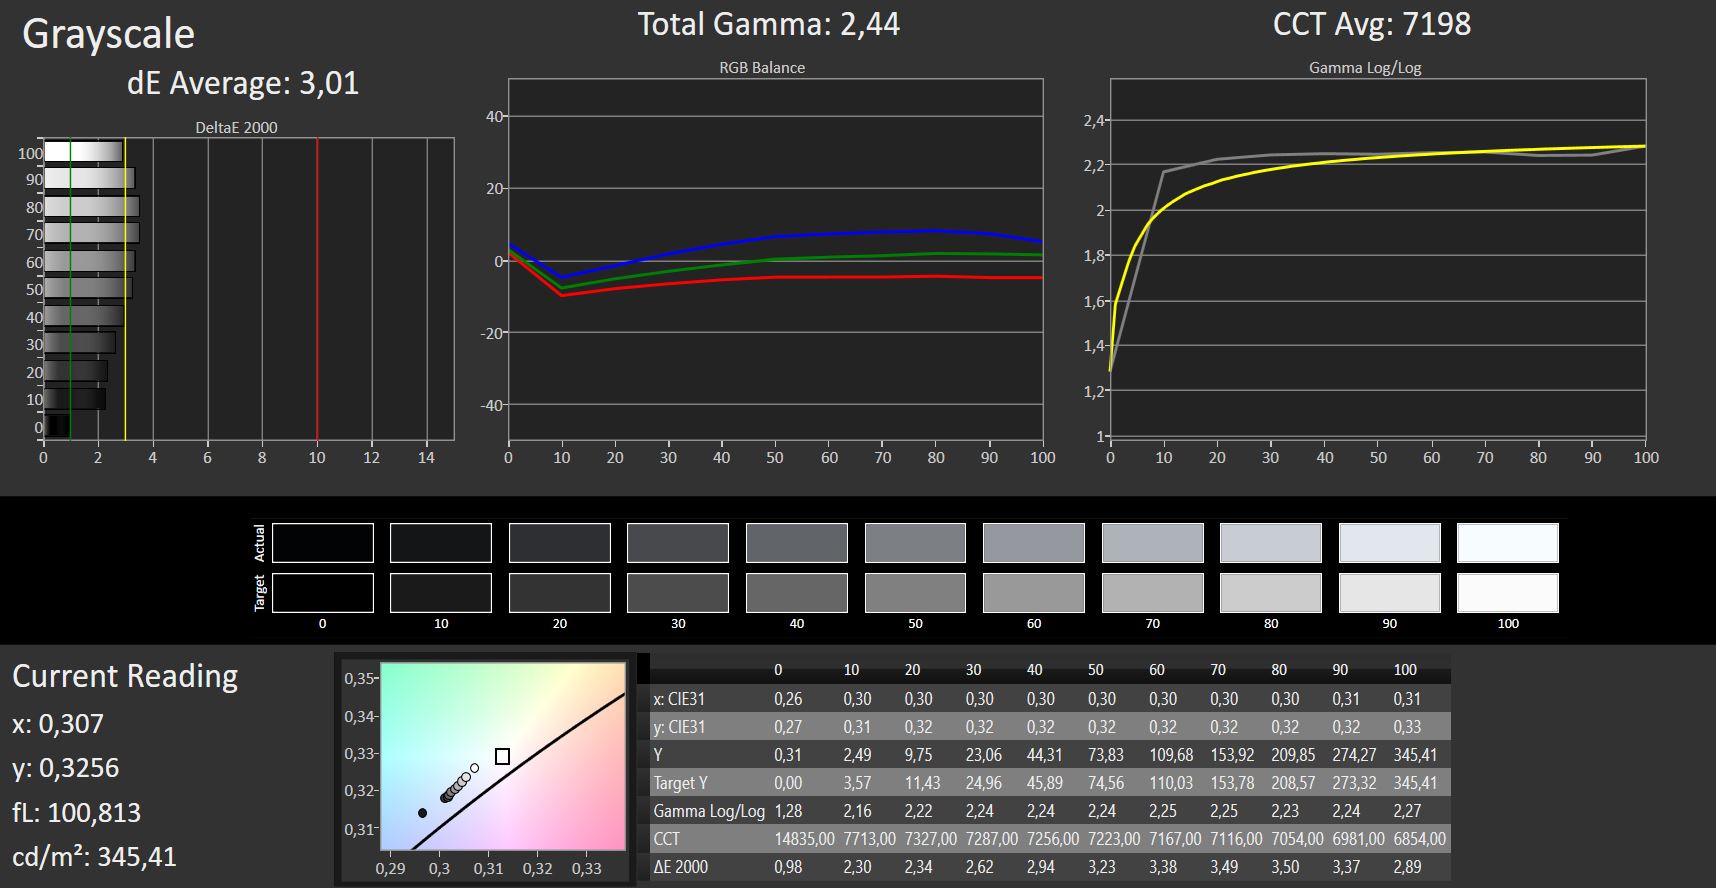
ΔE Greyscale Calman: 3.01 | ∀{0.09-98 Ø4.96}
86% sRGB (Argyll 1.6.3 3D)
56% AdobeRGB 1998 (Argyll 1.6.3 3D)
62.8% AdobeRGB 1998 (Argyll 3D)
85.9% sRGB (Argyll 3D)
65% Display P3 (Argyll 3D)
Gamma: 2.44
CCT: 7198 K
| Toshiba Tecra A50-E-110 TOS508F, , 1920x1080, 15.6" | Lenovo IdeaPad 330S-15IKB-81F500N5GE BOE0700, , 1920x1080, 15.6" | HP ProBook 650 G4 3UP57EA CMN15D3, , 1920x1080, 15.6" | Dell Inspiron 15 5579-9672 AUO, B156HW01, , 1920x1080, 15.6" | Fujitsu Lifebook E558 E5580MP581DE LG Philips LP156WFB-SPB1, , 1920x1080, 15.6" | |
|---|---|---|---|---|---|
| Display | -35% | -31% | -39% | -42% | |
| Display P3 Coverage (%) | 65 | 39.85 -39% | 41.89 -36% | 37 -43% | 35.25 -46% |
| sRGB Coverage (%) | 85.9 | 58.8 -32% | 63 -27% | 55.6 -35% | 53 -38% |
| AdobeRGB 1998 Coverage (%) | 62.8 | 41.17 -34% | 43.28 -31% | 38.23 -39% | 36.43 -42% |
| Response Times | -2% | 25% | 5% | 18% | |
| Response Time Grey 50% / Grey 80% * (ms) | 44 ? | 44 ? -0% | 31 ? 30% | 41 ? 7% | 36 ? 18% |
| Response Time Black / White * (ms) | 30 ? | 31 ? -3% | 24 ? 20% | 29 ? 3% | 25 ? 17% |
| PWM Frequency (Hz) | 20000 ? | 86000 ? | 1000 ? | ||
| Screen | -8% | 6% | 1% | 5% | |
| Brightness middle (cd/m²) | 290 | 283 -2% | 305 5% | 251 -13% | 231 -20% |
| Brightness (cd/m²) | 249 | 252 1% | 270 8% | 240 -4% | 227 -9% |
| Brightness Distribution (%) | 78 | 75 -4% | 80 3% | 84 8% | 88 13% |
| Black Level * (cd/m²) | 0.38 | 0.63 -66% | 0.39 -3% | 0.2 47% | 0.16 58% |
| Contrast (:1) | 763 | 449 -41% | 782 2% | 1255 64% | 1444 89% |
| Colorchecker dE 2000 * | 4.35 | 4.02 8% | 3.26 25% | 5.25 -21% | 4.83 -11% |
| Colorchecker dE 2000 max. * | 11.06 | 8.77 21% | 6.84 38% | 10.04 9% | 8.42 24% |
| Greyscale dE 2000 * | 3.01 | 0.8 73% | 1.98 34% | 3.28 -9% | 3.49 -16% |
| Gamma | 2.44 90% | 2.35 94% | 2.38 92% | 2.15 102% | 2.54 87% |
| CCT | 7198 90% | 6552 99% | 6540 99% | 6502 100% | 6233 104% |
| Color Space (Percent of AdobeRGB 1998) (%) | 56 | 38 -32% | 40 -29% | 35 -37% | 34 -39% |
| Color Space (Percent of sRGB) (%) | 86 | 58 -33% | 63 -27% | 55 -36% | 53 -38% |
| Colorchecker dE 2000 calibrated * | 4.03 | ||||
| Total Average (Program / Settings) | -15% /
-12% | 0% /
1% | -11% /
-7% | -6% /
-3% |
* ... smaller is better
Display Response Times
| ↔ Response Time Black to White | ||
|---|---|---|
| 30 ms ... rise ↗ and fall ↘ combined | ↗ 19 ms rise | 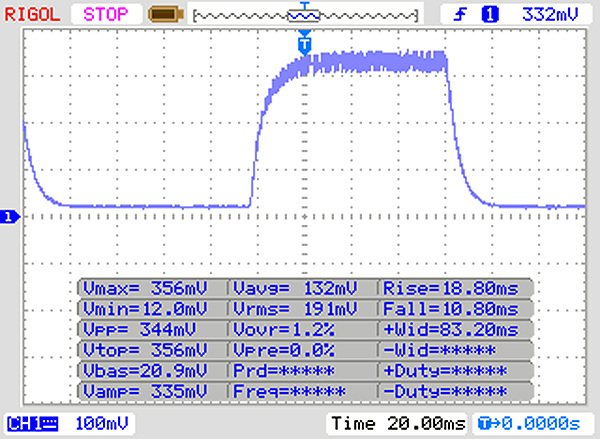 |
| ↘ 11 ms fall | ||
| The screen shows slow response rates in our tests and will be unsatisfactory for gamers. In comparison, all tested devices range from 0.1 (minimum) to 240 (maximum) ms. » 80 % of all devices are better. This means that the measured response time is worse than the average of all tested devices (19.8 ms). | ||
| ↔ Response Time 50% Grey to 80% Grey | ||
| 44 ms ... rise ↗ and fall ↘ combined | ↗ 23 ms rise | 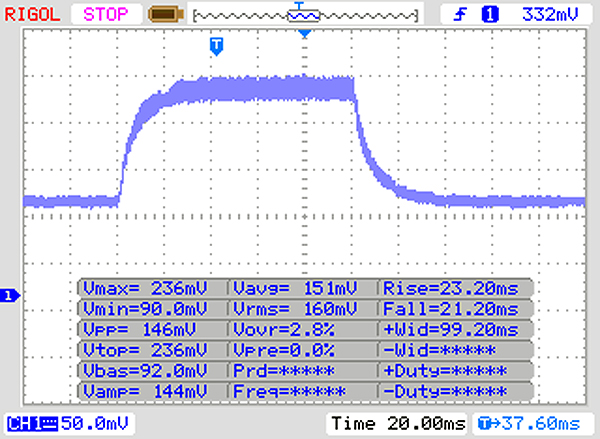 |
| ↘ 21 ms fall | ||
| The screen shows slow response rates in our tests and will be unsatisfactory for gamers. In comparison, all tested devices range from 0.165 (minimum) to 636 (maximum) ms. » 73 % of all devices are better. This means that the measured response time is worse than the average of all tested devices (31 ms). | ||
Screen Flickering / PWM (Pulse-Width Modulation)
| Screen flickering / PWM detected | 20000 Hz | ≤ 90 % brightness setting | 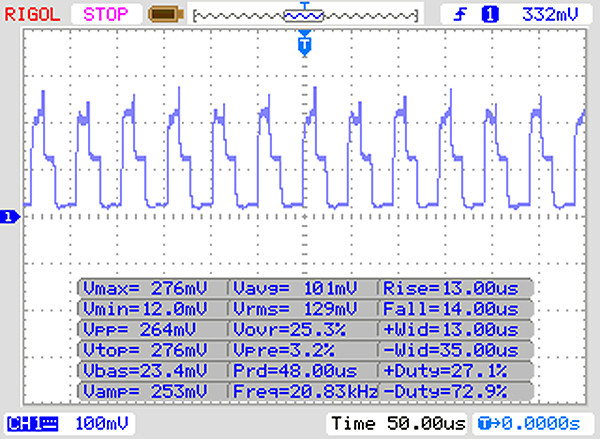 |
The display backlight flickers at 20000 Hz (worst case, e.g., utilizing PWM) Flickering detected at a brightness setting of 90 % and below. There should be no flickering or PWM above this brightness setting. The frequency of 20000 Hz is quite high, so most users sensitive to PWM should not notice any flickering. In comparison: 52 % of all tested devices do not use PWM to dim the display. If PWM was detected, an average of 7754 (minimum: 5 - maximum: 343500) Hz was measured. | |||
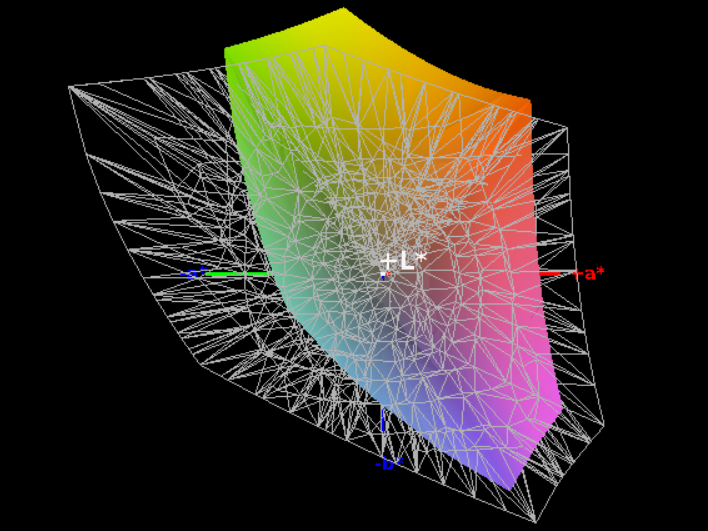
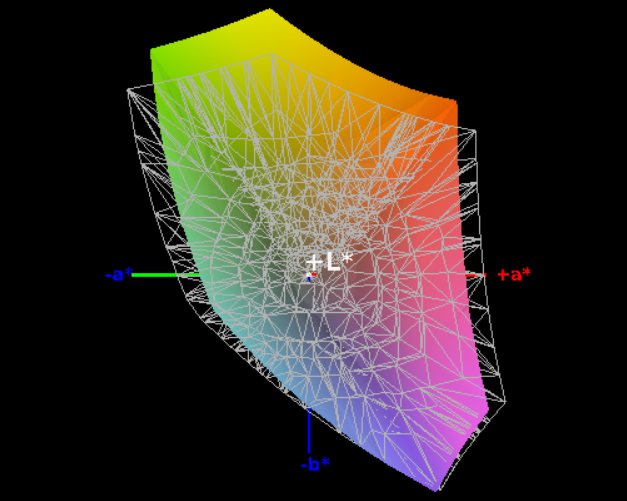
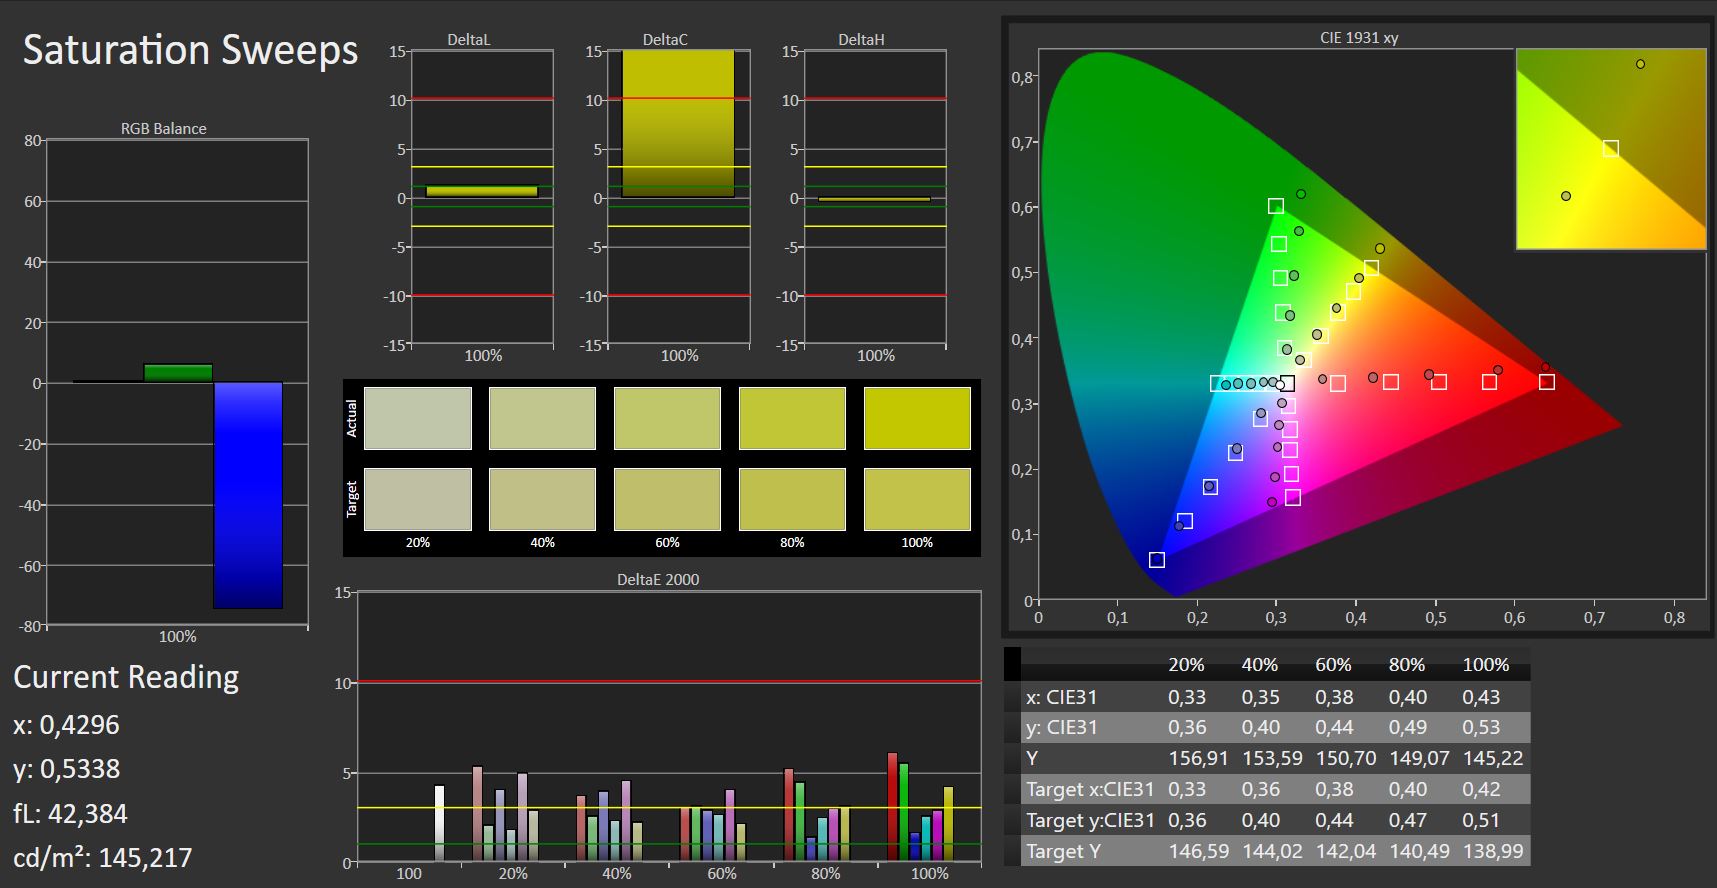
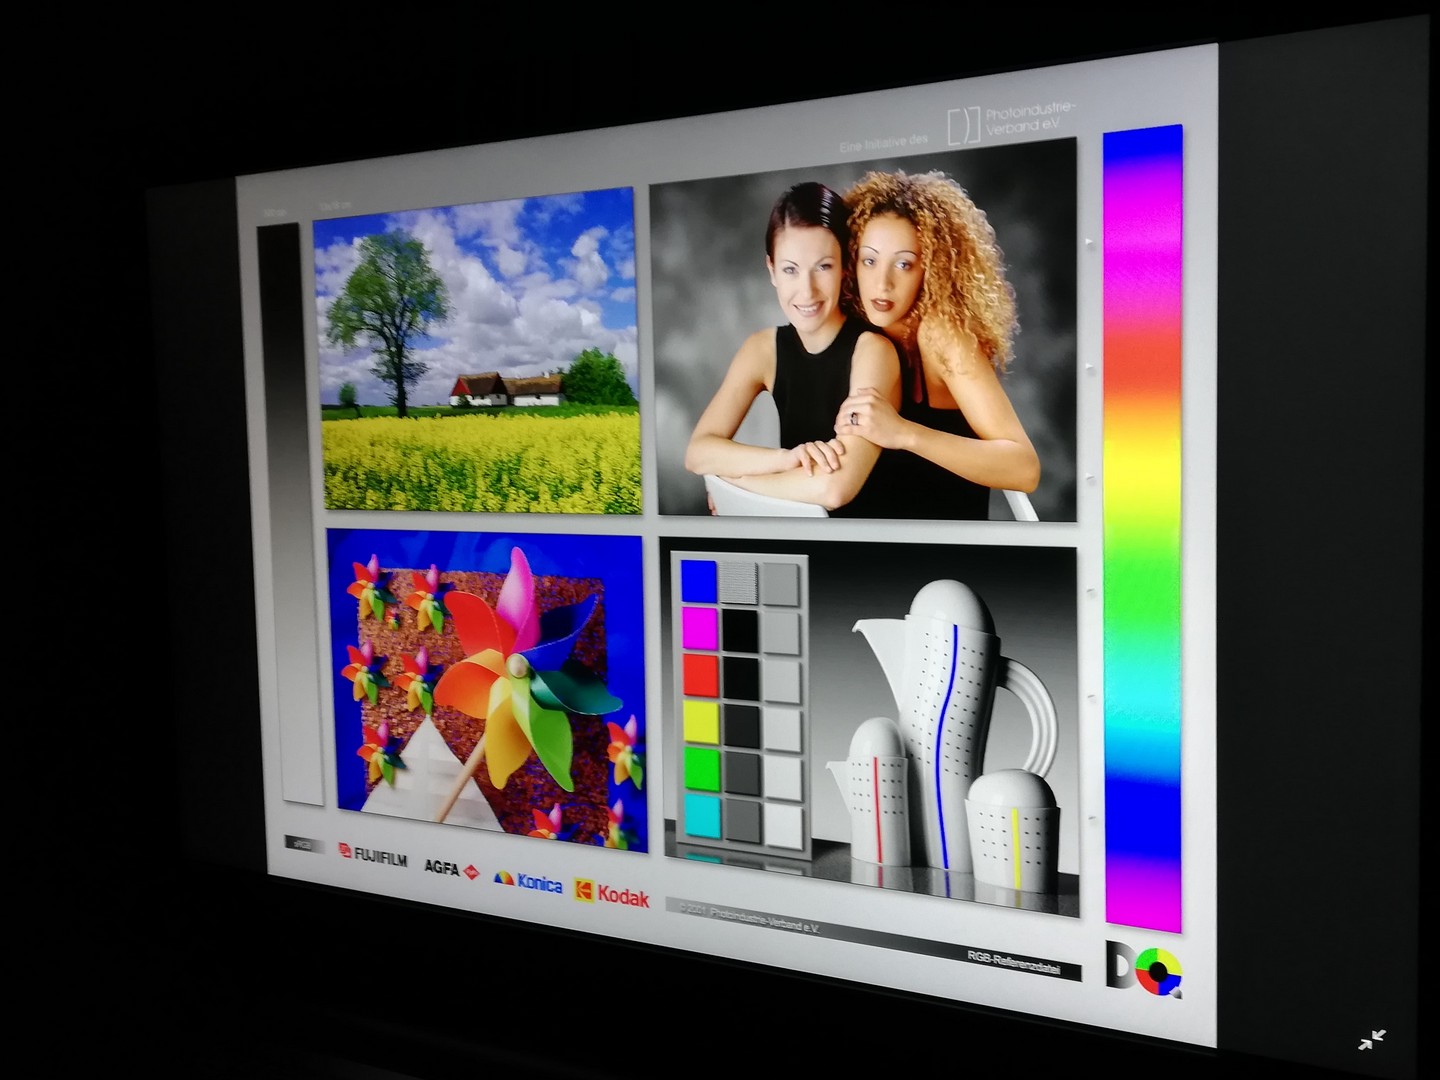
Our test device has a 0.38 cd/m² black value, which combines with the low display brightness to yield a 763:1 contrast ratio. Only the IdeaPad 330S-15IKB has a worse contrast ratio of our test device, while the Inspiron 15 5579 and LifeBook E558 have a 1,255:1 and 1,444:1 contrast ratio respectively. In short, colours will seem more vibrant, and blacks will look deeper on the latter two devices than on the Tecra A50 with the 1080p display. Our test device reproduces colours accurately though, as demonstrated by the CalMAN analysis screenshots that we have included below. The display covers 56% of the AdobeRGB colour space and 86% of the sRGB colour space, which are both higher than what any of our comparison devices can achieve.
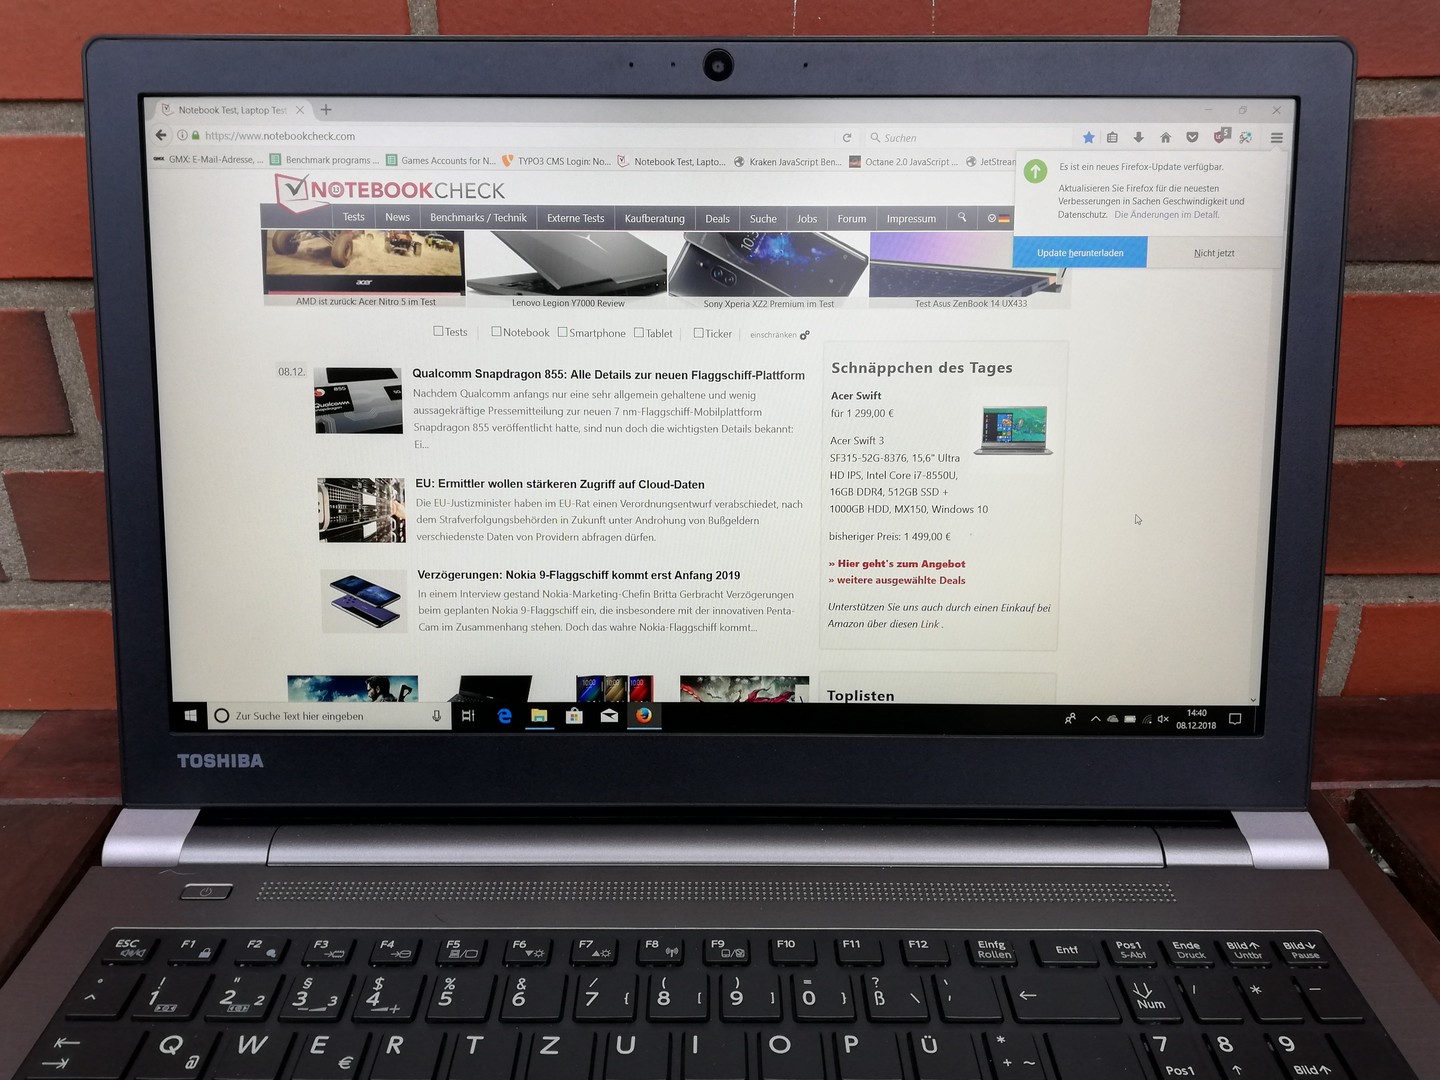
The Tecra A50 is easy to use outdoors on a cloudy day as demonstrated by the photo below. However, we struggled to read the display in direct sunlight as it cannot get bright enough to compensate for reflections.
The IPS display has strong viewing angles though. We did not notice any brightness, colour or image distortions even at acute viewing angles, which means that you will be able to use the device at practically any angle without any display-related issues.
Performance
The Tecra A50-E-110 is equipped with an Intel Core i5-8250U processor that integrates an Intel UHD Graphics 620, 8 GB of RAM and a 256 GB SSD. The combination of components makes the Tecra A50 powerful enough for all major office applications and even some simple image editing. The SSD is fast enough to provide smooth system performance, while the system can be connected to a compatible external dock with the Toshiba Hi-Speed Port Replicator III connector if needed, which is located on the underside of the device.
Processor
The Core i5-8250U is a quad-core processor based from Intel’s Kaby Lake Refresh generation. The CPU has a 1.6 GHz base clock speed that can clock up to 3.6 GHz when required thanks to Intel Turbo Boost technology. The processor also supports Intel Hyper-Threading, which allows it to execute up to 8 threads simultaneously.
The degree to which the CPU can maintain its peak performance depends on the effectiveness of the Tecra A50’s cooling system. We subjected our test device to a looped Cinebench R15 multi-core benchmark to test this. The Tecra A50 initially scored 508 points, but dropped to 480 points in the second benchmark loop, which corresponds with a 5% performance loss. Our test device then consistently scored around 480 points for the remainder of the benchmark loop. In short, you should not experience any thermal throttling in daily use.
Please see our CPU benchmark page and our Core i5-8250U page for more information about the processor and how well it compares against other CPUs.
Our test device finished bottom of our comparison table in the single-core benchmark loop, but this does not tell the whole story. All devices are separated by only 4%, so the Tecra A50’s single-core performance is on par with our comparison devices. However, it finished second last in the multi-core loop and 16% behind the ProBook 650 G4. Likewise, it also finished around 10% below the average of Core 8250U powered devices that we have currently tested. Overall, the Tecra A50 does not get the most from its processor, but it is more powerful than the average of office laptops that we have tested to date. Overall, the device should work smoothly in daily use.
System Performance
This impression corresponds with our PCMark 10 benchmark results, in which our test device finished third behind the IdeaPad 330S-15IKB and the ProBook 650 G4 of our comparison devices, but the PCMark 8 test is slightly worse. The Tecra A50 finished bottom of our PCMark 8 comparison table, but this should be nothing to worry about. The Tecra A50 feels snappy in daily use with program loading quickly. We could access files without delay too and experienced no system or program crashes.
| PCMark 8 Home Score Accelerated v2 | 3113 points | |
| PCMark 10 Score | 3407 points | |
Help | ||
Storage Devices
Toshiba has equipped our test device with a 256 GB Samsung SSD. The drive’s CrystalDiskMark results confirm that it is a SATA III SSD, which is on par with the drives in most of our comparison devices. The giveaway that it is a SATA III SSD is its sequential read speed, which averages around 528 MB/s. SATA III SSDs can only achieve around 500 MB/s sequential speeds, which are considerably slower than what their NVMe counterparts can achieve. The SSD in the ProBook 650 G4 is an example of the difference between technologies as its drive averages close to 2,000 MB/s sequential read speeds. In practice, this should make the ProBook 650 G4 feel faster than the Tecra A50, but the latter is no slouch either with the OS and programs loading quickly in daily use.
Please see our HDD/SSD benchmark page for more information and comparisons among different HDDs and SSDs.
| Toshiba Tecra A50-E-110 Samsung SSD PM871b MZNLN256HAJQ | Lenovo IdeaPad 330S-15IKB-81F500N5GE | HP ProBook 650 G4 3UP57EA Toshiba XG5 KXG50ZNV256G | Dell Inspiron 15 5579-9672 SK hynix SC311 SATA | Fujitsu Lifebook E558 E5580MP581DE Micron 1100 MTFDDAV256TBN | Average Samsung SSD PM871b MZNLN256HAJQ | Average of class Office | |
|---|---|---|---|---|---|---|---|
| CrystalDiskMark 5.2 / 6 | 3% | 87% | -13% | -6% | -2% | 383% | |
| Write 4K (MB/s) | 80.1 | 89.7 12% | 48.25 -40% | 80.5 0% | 78.1 ? -2% | 153.2 ? 91% | |
| Read 4K (MB/s) | 32.05 | 30.73 -4% | 23.77 -26% | 26.14 -18% | 26.8 ? -16% | 73.4 ? 129% | |
| Write Seq (MB/s) | 505 | 158.1 -69% | 385.3 -24% | 444.9 -12% | 356.6 -29% | 439 ? -13% | 2531 ? 401% |
| Read Seq (MB/s) | 528 | 892 69% | 1986 276% | 497.5 -6% | 467.1 -12% | 479 ? -9% | 3292 ? 523% |
| Write 4K Q32T1 (MB/s) | 204.9 | 162.2 -21% | 339.9 66% | 223.5 9% | 257.2 26% | 244 ? 19% | 431 ? 110% |
| Read 4K Q32T1 (MB/s) | 226.6 | 320.4 41% | 241.7 7% | 171.8 -24% | 243.3 7% | 245 ? 8% | 516 ? 128% |
| Write Seq Q32T1 (MB/s) | 533 | 160.2 -70% | 345.2 -35% | 511 -4% | 437.4 -18% | 521 ? -2% | 4178 ? 684% |
| Read Seq Q32T1 (MB/s) | 551 | 933 69% | 2759 401% | 553 0% | 526 -5% | 545 ? -1% | 6043 ? 997% |
| Write 4K Q8T8 (MB/s) | 4.686 | 310.2 | 952 ? | ||||
| Read 4K Q8T8 (MB/s) | 452.5 | 349.5 | 1346 ? | ||||
| AS SSD | -195% | 42% | -12% | -4% | 5% | 337% | |
| Seq Read (MB/s) | 513 | 95.9 -81% | 1542 201% | 497.5 -3% | 445 -13% | 465 ? -9% | 4326 ? 743% |
| Seq Write (MB/s) | 493.3 | 78.9 -84% | 362.7 -26% | 356.2 -28% | 333.8 -32% | 393 ? -20% | 2771 ? 462% |
| 4K Read (MB/s) | 30.36 | 2.25 -93% | 29.81 -2% | 23.71 -22% | 24.6 -19% | 26.8 ? -12% | 58.1 ? 91% |
| 4K Write (MB/s) | 78.8 | 54.9 -30% | 94.9 20% | 47.64 -40% | 71.8 -9% | 70.6 ? -10% | 162.6 ? 106% |
| 4K-64 Read (MB/s) | 366.8 | 43.28 -88% | 408.5 11% | 309.7 -16% | 236 -36% | 352 ? -4% | 958 ? 161% |
| 4K-64 Write (MB/s) | 156.1 | 116.6 -25% | 327.6 110% | 247 58% | 270.9 74% | 260 ? 67% | 1643 ? 953% |
| Access Time Read * (ms) | 0.129 | 2.127 -1549% | 0.079 39% | 0.142 -10% | 0.093 28% | 0.1037 ? 20% | 0.08448 ? 35% |
| Access Time Write * (ms) | 0.046 | 0.045 2% | 0.054 -17% | 0.075 -63% | 0.059 -28% | 0.05 ? -9% | 0.05931 ? -29% |
| Score Read (Points) | 448 | 55 -88% | 592 32% | 383 -15% | 305 -32% | 425 ? -5% | 1449 ? 223% |
| Score Write (Points) | 284 | 179 -37% | 459 62% | 330 16% | 376 32% | 369 ? 30% | 2083 ? 633% |
| Score Total (Points) | 971 | 262 -73% | 1303 34% | 910 -6% | 841 -13% | 1017 ? 5% | 4207 ? 333% |
| Copy ISO MB/s (MB/s) | 369.5 | 301.3 | 302.2 | 497 ? | 2541 ? | ||
| Copy Program MB/s (MB/s) | 246.7 | 166.4 | 154.6 | 280 ? | 790 ? | ||
| Copy Game MB/s (MB/s) | 286.1 | 231.6 | 234.8 | 324 ? | 1627 ? | ||
| Total Average (Program / Settings) | -96% /
-125% | 65% /
61% | -13% /
-12% | -5% /
-5% | 2% /
2% | 360% /
357% |
* ... smaller is better

Graphics Card
The Intel UHD Graphics 620 handles the graphics and is powerful enough for simple image processing or video streaming. The integrated GPU can also play old or casual games smoothly, but it is easily overpowered by complex 3D games. The Tecra A50 finished slightly below average in 3DMark 11 for devices equipped with a Core i5-8250U processor but it scored 6% and 9% higher than the LifeBook E558 and the Inspiron 15 5579 respectively.
Please see our GPU benchmark page for more information on the UHD Graphics 620 and comparisons against other GPUs.
| 3DMark 11 Performance | 1804 points | |
Help | ||
Gaming Performance
As mentioned in the previous section, the UHD Graphics 620 is only powerful enough for older or more casual games. The integrated GPU averages 18.3 FPS at minimum graphics in "Bioshock Infinite", which makes for an unpleasant gaming experience. Simpler games downloadable from the Windows Store are playable, but overall the UHD Graphics 620 is mostly unsuitable for modern gaming.
Please see our games database for more information on what games the UHD Graphics 620 can play smoothly.
| The Witcher 3 | |
| 1024x768 The Witcher 3 low | |
| Average of class Office (32.2 - 135, n=3, last 2 years) | |
| Average Intel UHD Graphics 620 (8.8 - 50.9, n=64) | |
| 1366x768 The Witcher 3 medium | |
| Average of class Office (44.7 - 90.4, n=3, last 2 years) | |
| Average Intel UHD Graphics 620 (8 - 27.9, n=29) | |
| 1920x1080 The Witcher 3 high | |
| Average of class Office (23.7 - 53.4, n=3, last 2 years) | |
| Average Intel UHD Graphics 620 (4.2 - 13.5, n=17) | |
| 1920x1080 The Witcher 3 ultra | |
| Average of class Office (14.8 - 28.1, n=3, last 2 years) | |
| Average Intel UHD Graphics 620 (2.97 - 5.2, n=7) | |
| low | med. | high | ultra | |
|---|---|---|---|---|
| BioShock Infinite (2013) | 18.3 | 11.5 | 8.1 | 4.5 |
Emissions & Power Consumption
Fan Noise
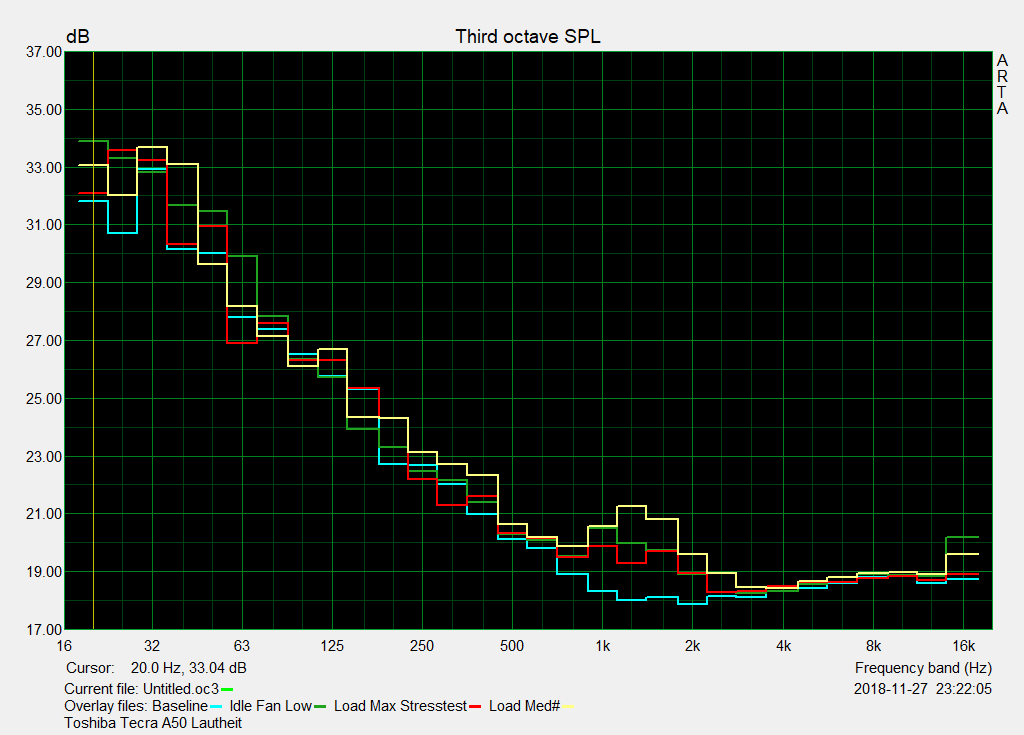
Our test device runs quietly, although the fans do run continuously. The fan noise is barely audible even when the machine is being subjected to sustained load. In short, the fan noise is pleasant and generally blends into the background noise.
Noise level
| Idle |
| 31.4 / 31.4 / 31.5 dB(A) |
| Load |
| 31.9 / 31.4 dB(A) |
 | ||
30 dB silent 40 dB(A) audible 50 dB(A) loud |
||
min: | ||
Temperature
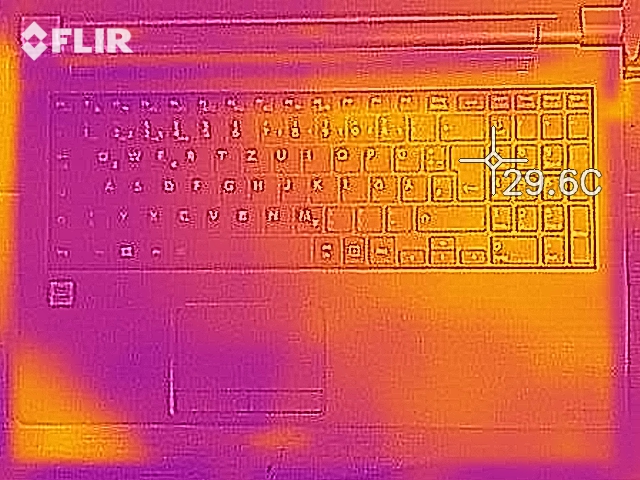
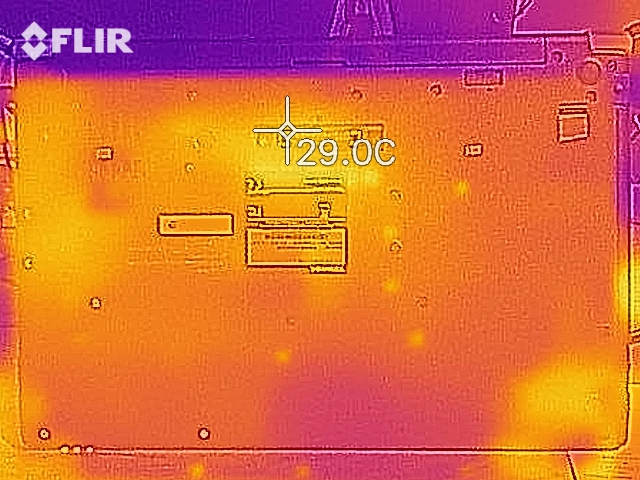
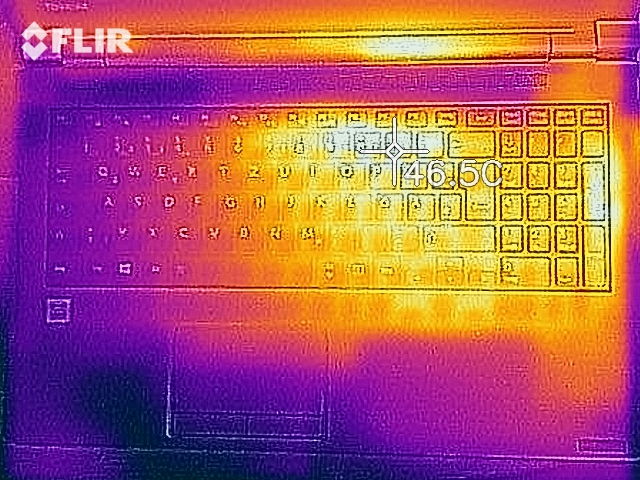
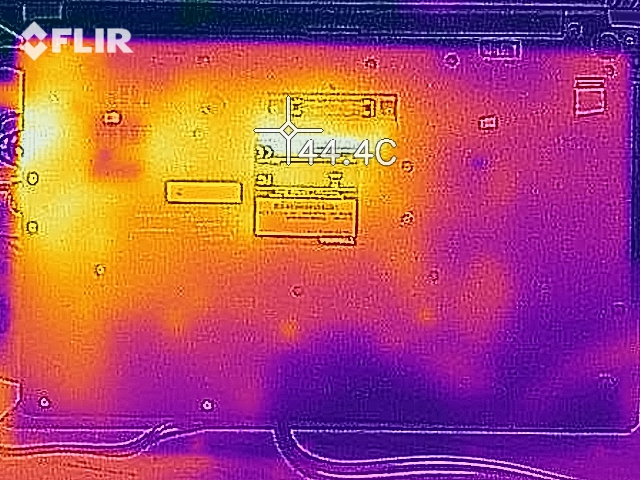
The Tecra A50 also manages its surface temperatures well. Surface temperatures on our test device remain below 30 °C (~86 °F) at idle and rise to a maximum of 41.5 °C (~107 °F) under load. Overall, the machine is suitable for use on a lap even when the system is being pushed hard.
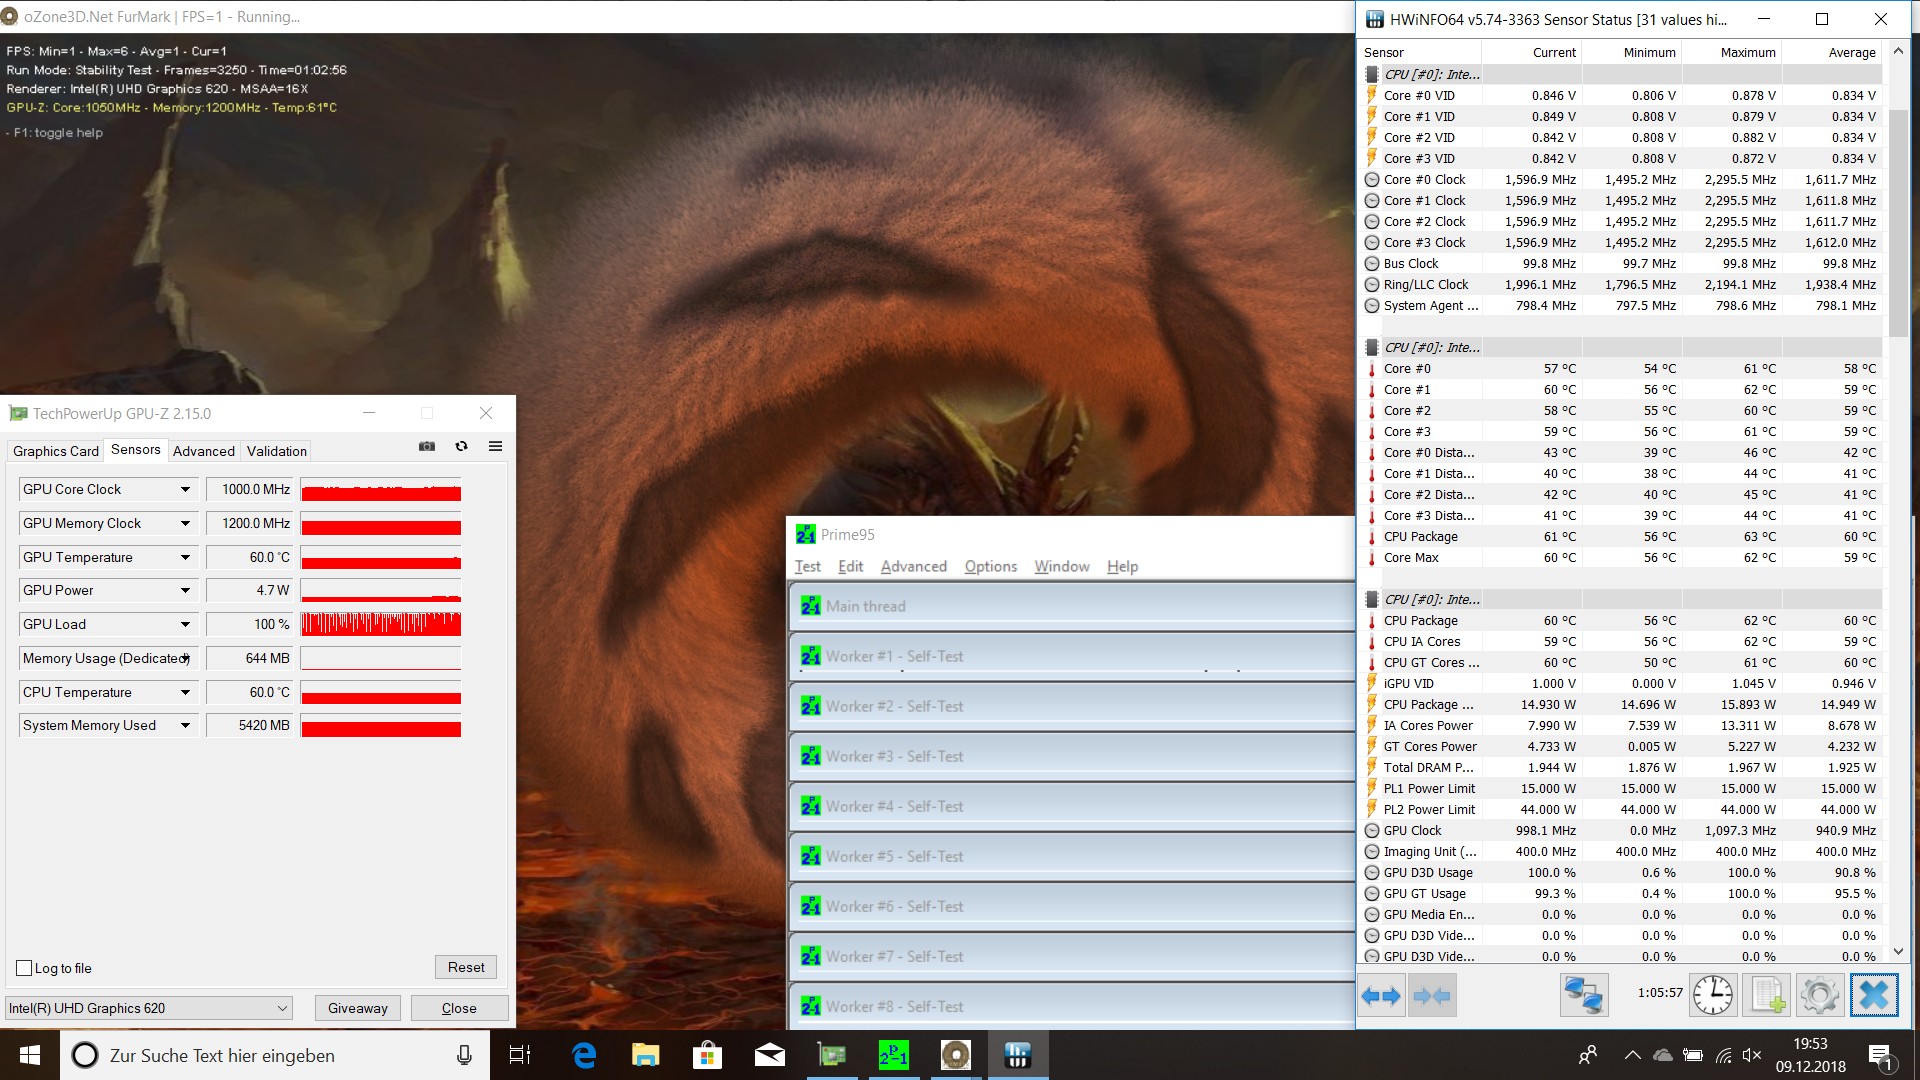
The cooling system also does an excellent job at keeping the CPU from overheating too. Core temperatures reach a maximum of 62 °C (~144 °F) during a stress test, which is around 40 °C (~104 °F) from its maximum operating temperature. The CPU briefly clocked below its 1.6 GHz base clock speed during our stress test, but it broadly operated above or at that threshold while we pushed the system to its limits.
Moreover, our stress test is an extreme scenario that will rarely occur in daily use. Hence, the Tecra A50 should run cooler and more quietly during general tasks such as web browsing or video streaming than it did during our tests. The machine should not thermal throttle either.
(±) The maximum temperature on the upper side is 41.5 °C / 107 F, compared to the average of 34.3 °C / 94 F, ranging from 21.2 to 62.5 °C for the class Office.
(±) The bottom heats up to a maximum of 40 °C / 104 F, compared to the average of 36.8 °C / 98 F
(+) In idle usage, the average temperature for the upper side is 25.5 °C / 78 F, compared to the device average of 29.5 °C / 85 F.
(+) The palmrests and touchpad are cooler than skin temperature with a maximum of 27.5 °C / 81.5 F and are therefore cool to the touch.
(±) The average temperature of the palmrest area of similar devices was 27.5 °C / 81.5 F (0 °C / 0 F).
Speakers
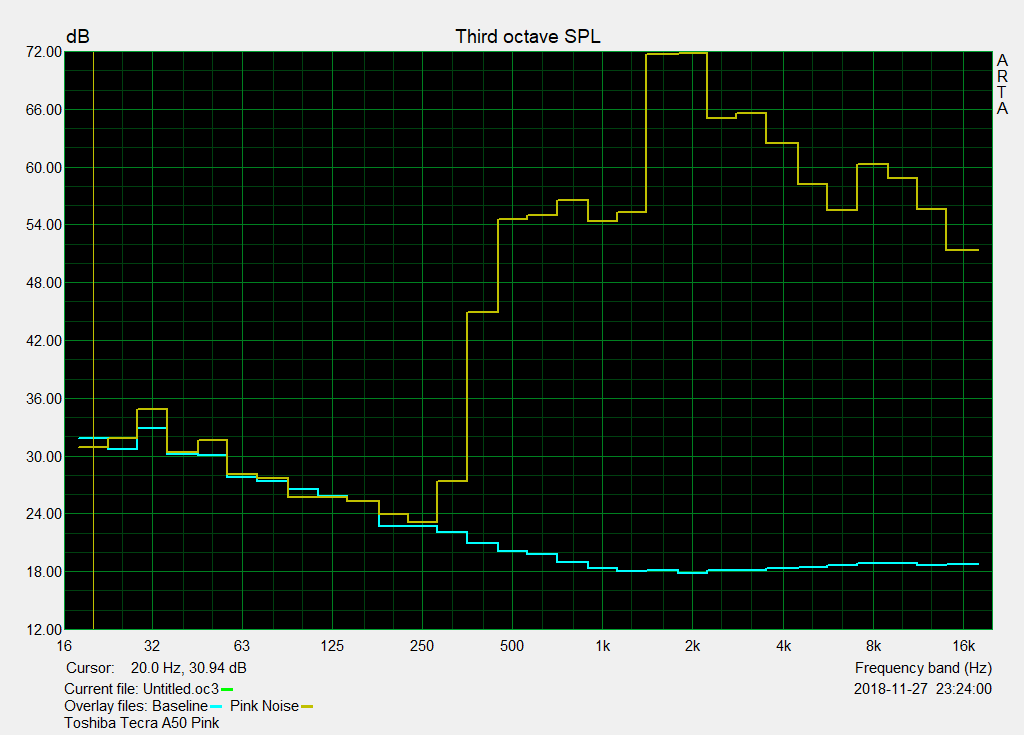
The Tecra A50 has unimpressive speakers. Generally, the sound produced is unbalanced and is dominated by high mid-range tones, which makes music sound tinny. Worse still, the speakers do not get that loud either, which limits their use to only in quiet environments. We would only recommend connecting external speakers or headphones for listening to music or watching videos and using the speakers as a last resort. The 3.5 mm jack by comparison reproduces audio cleanly.
Toshiba Tecra A50-E-110 audio analysis
(-) | not very loud speakers (71.8 dB)
Bass 100 - 315 Hz
(-) | nearly no bass - on average 30.1% lower than median
(+) | bass is linear (4% delta to prev. frequency)
Mids 400 - 2000 Hz
(±) | higher mids - on average 5.8% higher than median
(-) | mids are not linear (16.8% delta to prev. frequency)
Highs 2 - 16 kHz
(±) | higher highs - on average 5.6% higher than median
(±) | linearity of highs is average (9.3% delta to prev. frequency)
Overall 100 - 16.000 Hz
(-) | overall sound is not linear (34.7% difference to median)
Compared to same class
» 97% of all tested devices in this class were better, 1% similar, 2% worse
» The best had a delta of 7%, average was 21%, worst was 53%
Compared to all devices tested
» 93% of all tested devices were better, 1% similar, 6% worse
» The best had a delta of 4%, average was 23%, worst was 134%
Apple MacBook 12 (Early 2016) 1.1 GHz audio analysis
(+) | speakers can play relatively loud (83.6 dB)
Bass 100 - 315 Hz
(±) | reduced bass - on average 11.3% lower than median
(±) | linearity of bass is average (14.2% delta to prev. frequency)
Mids 400 - 2000 Hz
(+) | balanced mids - only 2.4% away from median
(+) | mids are linear (5.5% delta to prev. frequency)
Highs 2 - 16 kHz
(+) | balanced highs - only 2% away from median
(+) | highs are linear (4.5% delta to prev. frequency)
Overall 100 - 16.000 Hz
(+) | overall sound is linear (10.2% difference to median)
Compared to same class
» 7% of all tested devices in this class were better, 2% similar, 90% worse
» The best had a delta of 5%, average was 18%, worst was 53%
Compared to all devices tested
» 5% of all tested devices were better, 1% similar, 94% worse
» The best had a delta of 4%, average was 23%, worst was 134%
Dell Inspiron 15 5579-9672 audio analysis
(±) | speaker loudness is average but good (72.5 dB)
Bass 100 - 315 Hz
(-) | nearly no bass - on average 20.7% lower than median
(±) | linearity of bass is average (11.9% delta to prev. frequency)
Mids 400 - 2000 Hz
(±) | higher mids - on average 7.8% higher than median
(±) | linearity of mids is average (11.2% delta to prev. frequency)
Highs 2 - 16 kHz
(±) | higher highs - on average 5.1% higher than median
(+) | highs are linear (5.7% delta to prev. frequency)
Overall 100 - 16.000 Hz
(±) | linearity of overall sound is average (25.6% difference to median)
Compared to same class
» 78% of all tested devices in this class were better, 5% similar, 17% worse
» The best had a delta of 6%, average was 20%, worst was 57%
Compared to all devices tested
» 79% of all tested devices were better, 4% similar, 17% worse
» The best had a delta of 4%, average was 23%, worst was 134%
Power Consumption
The Tecra A50 is an economical device and consumed a minimum of 3.8 W at idle. Our test device consumes a maximum of 34.6 W under load, which is within tolerances for its 45-W power supply. In short, the Tecra A50 should charge from its power supply regardless of how hard you push it.
| Off / Standby | |
| Idle | |
| Load |
|
Key:
min: | |
Battery Life
The Tecra A50 has a 45-Wh battery that is easily replaceable. Toshiba currently sells additional 45-Wh batteries for $99.99 on its website. Our test device has a disappointing battery life and only lasted 4:51 hours in our Wi-Fi battery life test, which puts it at the bottom of our comparison table. By contrast, the ProBook 650 G4 lasted for an extra 3:20 hours in the same test with a 3-Wh larger battery, while the Inspiron 15 5579 achieved a 7:15 hours runtime with a 3-Wh small battery. Overall, the Tecra A50 will need to be recharged during a working day unless it is connected to a dock.
Pros
Cons
Verdict
The Toshiba Tecra A50-E-110 is a solid 15-inch business laptop that is powerful enough for all standard office programs. Our test device performs slightly below what its hardware could achieve, but the machine feels snappy in daily use. The optional DVD drive and the replaceable battery are rarities for modern computers, although the device has a terrible battery life, so an additional battery may become an essential companion when you are working away from a desk.
The Toshiba Tecra A50-E-110 is a powerful office laptop which harks back to a different time with its replaceable battery and DVD drive.
The included 256 GB SATA III SSD is underwhelming compared to its NVMe counterparts, but it should still prove fast enough for daily office use. Overall, there are fancier office laptops than the Tecra A50, but it is a rock-solid device that will integrate into most office setups well. The machine has its downsides such as its lacklustre speakers, its lack of a maintenance cover and its short battery life, but the Toshiba Tecra A50-E-110 would be a reliable office companion for most people.
Toshiba Tecra A50-E-110
- 12/10/2018 v6 (old)
Mike Wobker
Price comparison

