Chuwi LarkBook Laptop Review: Good Looks, Poor Performance

The Chuwi LarkBook is the company's latest subnotebook that follows the same formula as previous generation models from the manufacturer: create a high-end looking laptop with bottom-of-the-barrel prices and processors. The test unit we have here is one of the very few laptops to come equipped with the dual-core Celeron N4120, but key specifications are otherwise similar to many costlier Ultrabooks including the 1080p IPS display and integrated USB-C port. Chuwi is currently selling the laptop for $489 USD or $399 if on sale.
Competitors in this space include other budget 13.3-inch laptops like the Asus VivoBook S13, Lenovo IdeaPad 3 series, and HP Pavilion 13 series.
More Chuwi reviews:
potential competitors in comparison
Rating | Date | Model | Weight | Height | Size | Resolution | Price |
|---|---|---|---|---|---|---|---|
| 76.9 % v7 (old) | 12 / 2020 | Chuwi LarkBook CWI509 Celeron N4120, UHD Graphics 600 | 1.1 kg | 12.3 mm | 13.30" | 1920x1080 | |
| 91.1 % v7 (old) | 12 / 2020 | Apple MacBook Air 2020 M1 Entry M1, M1 7-Core GPU | 1.3 kg | 16.1 mm | 13.30" | 2560x1600 | |
| 88.1 % v7 (old) | 10 / 2020 | Dell XPS 13 9310 Core i7 FHD i7-1165G7, Iris Xe G7 96EUs | 1.3 kg | 14.8 mm | 13.40" | 1920x1200 | |
| 84.9 % v7 (old) | 12 / 2019 | Lenovo IdeaPad S540-13API R5 3550H, Vega 8 | 1.3 kg | 16 mm | 13.30" | 2560x1600 | |
| 81.5 % v7 (old) | 12 / 2020 | HP Pavilion 13-bb0015cl i7-1165G7, Iris Xe G7 96EUs | 1.2 kg | 17.7 mm | 13.30" | 3840x2160 | |
| 85 % v6 (old) | 12 / 2018 | Asus VivoBook S13 S330UA-EY034T i5-8550U, UHD Graphics 620 | 1.2 kg | 17.9 mm | 13.30" | 1920x1080 |
Case
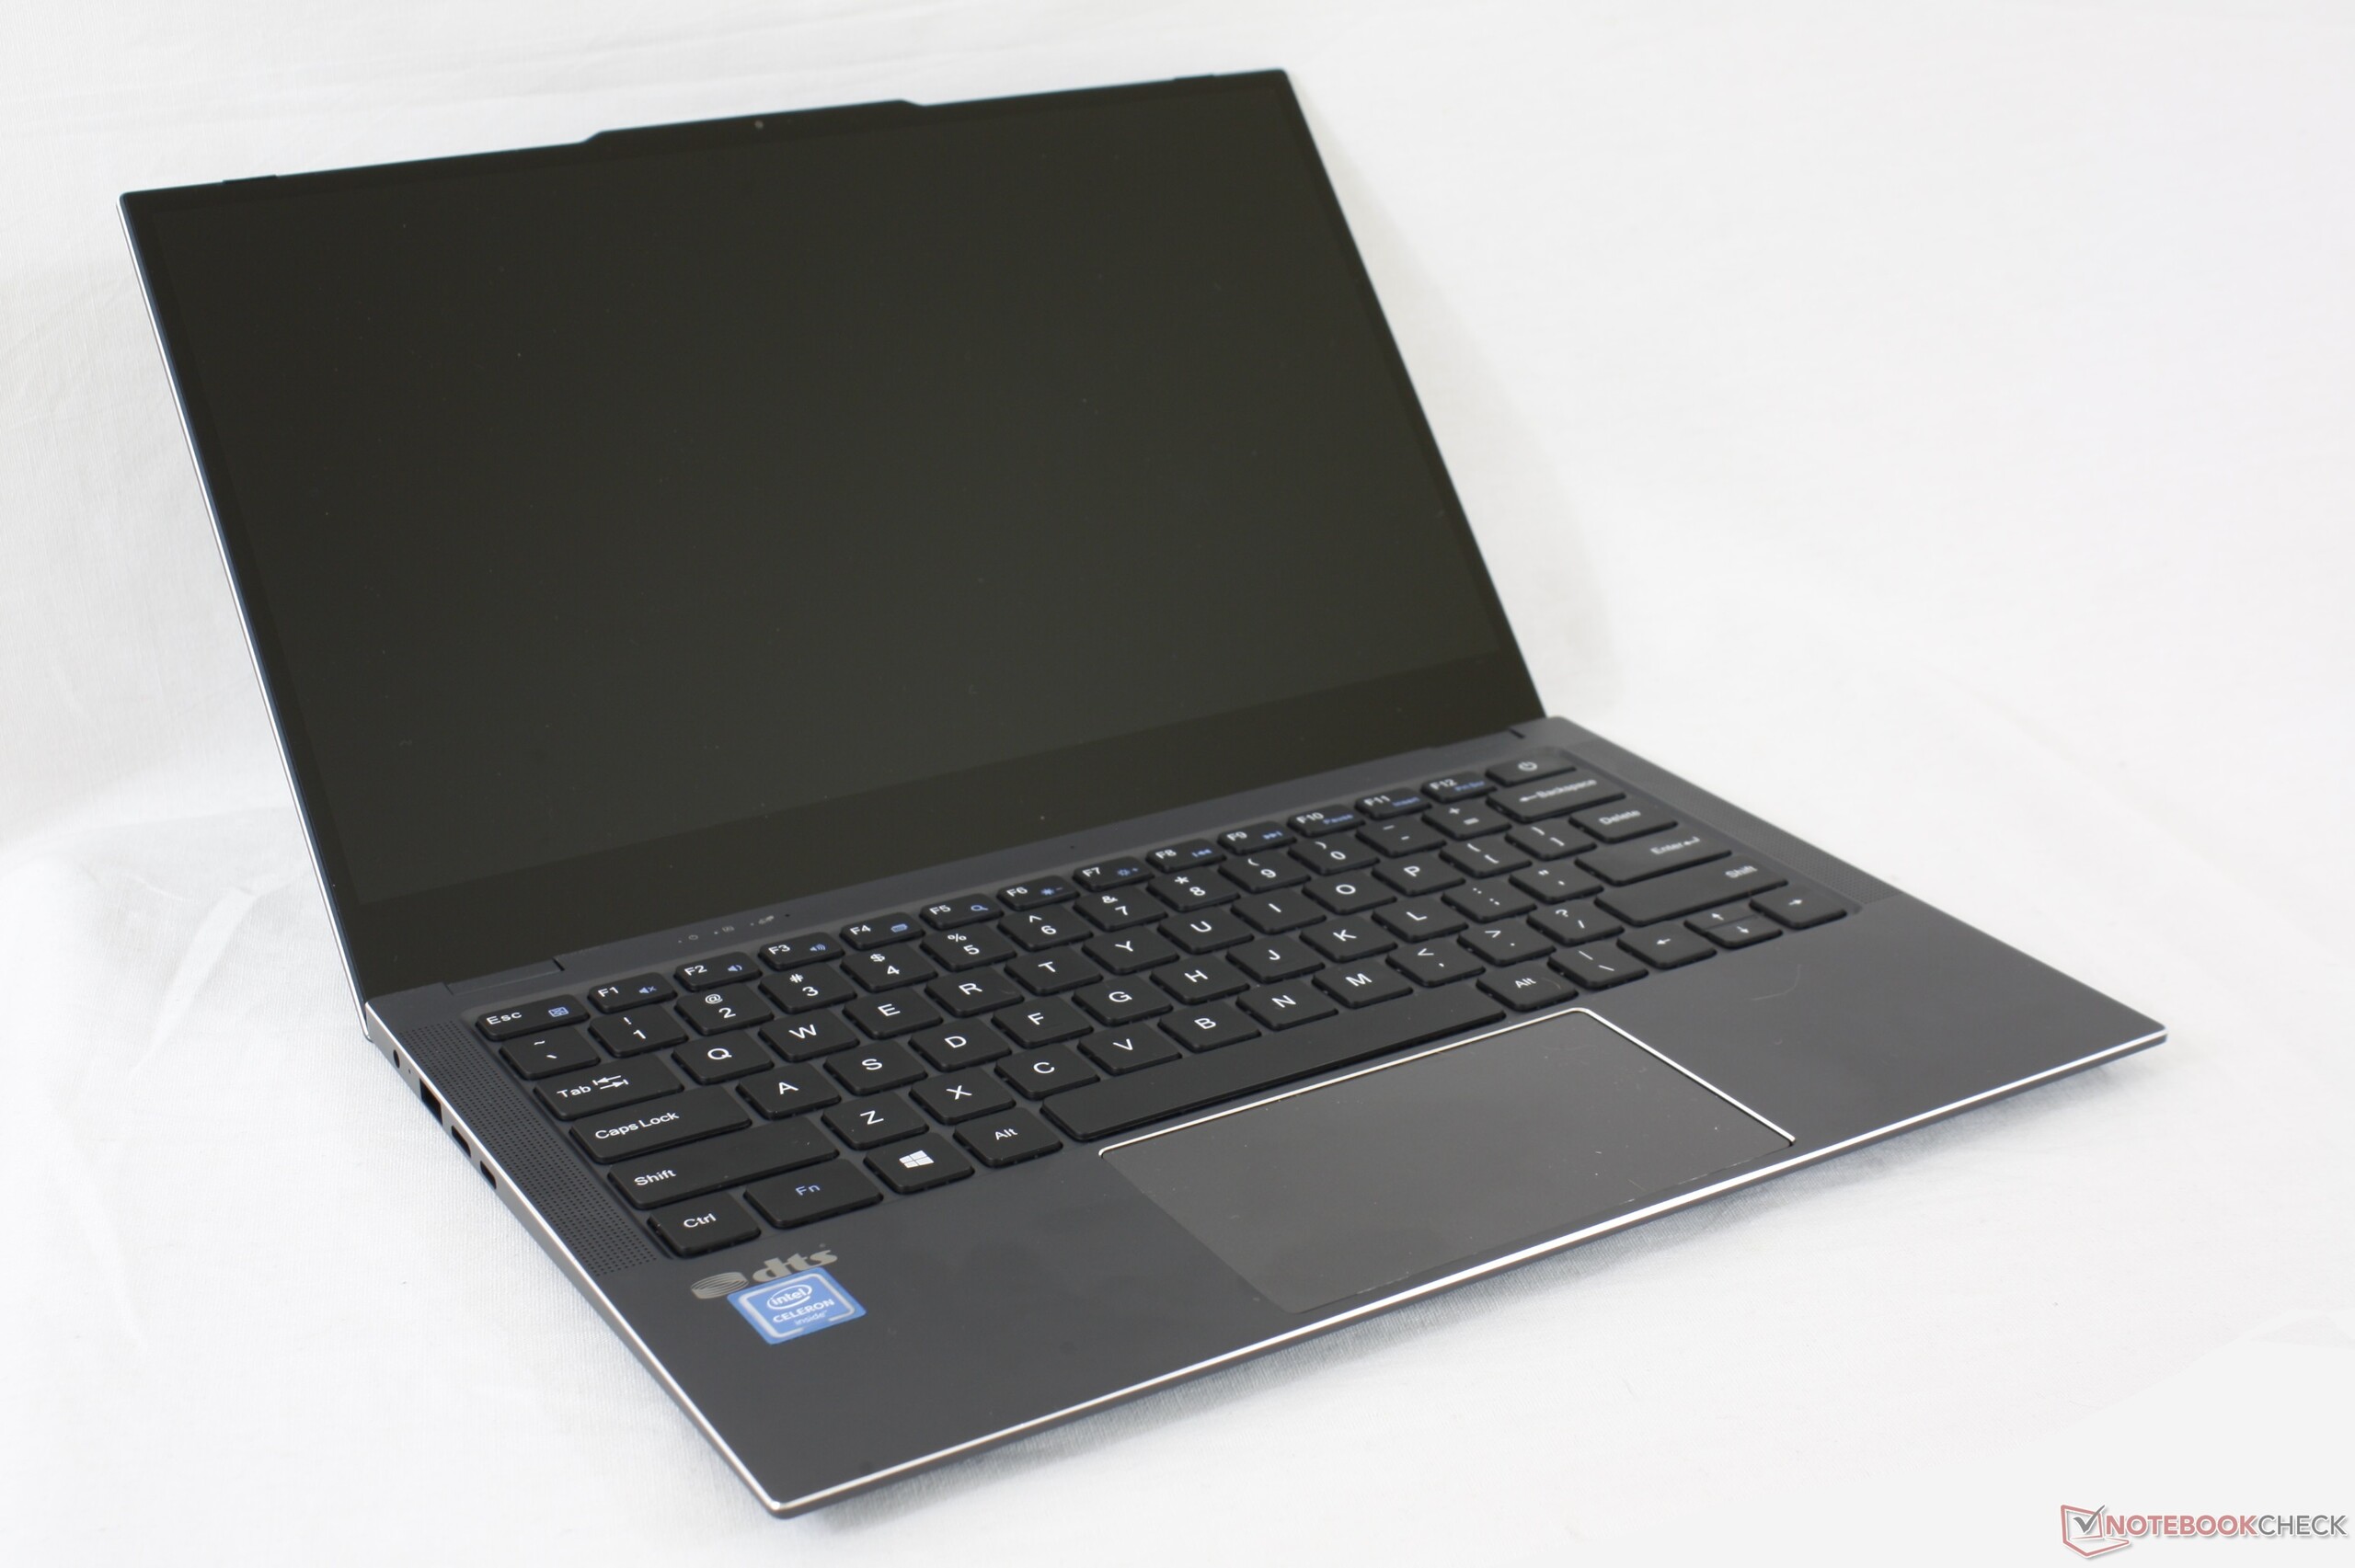
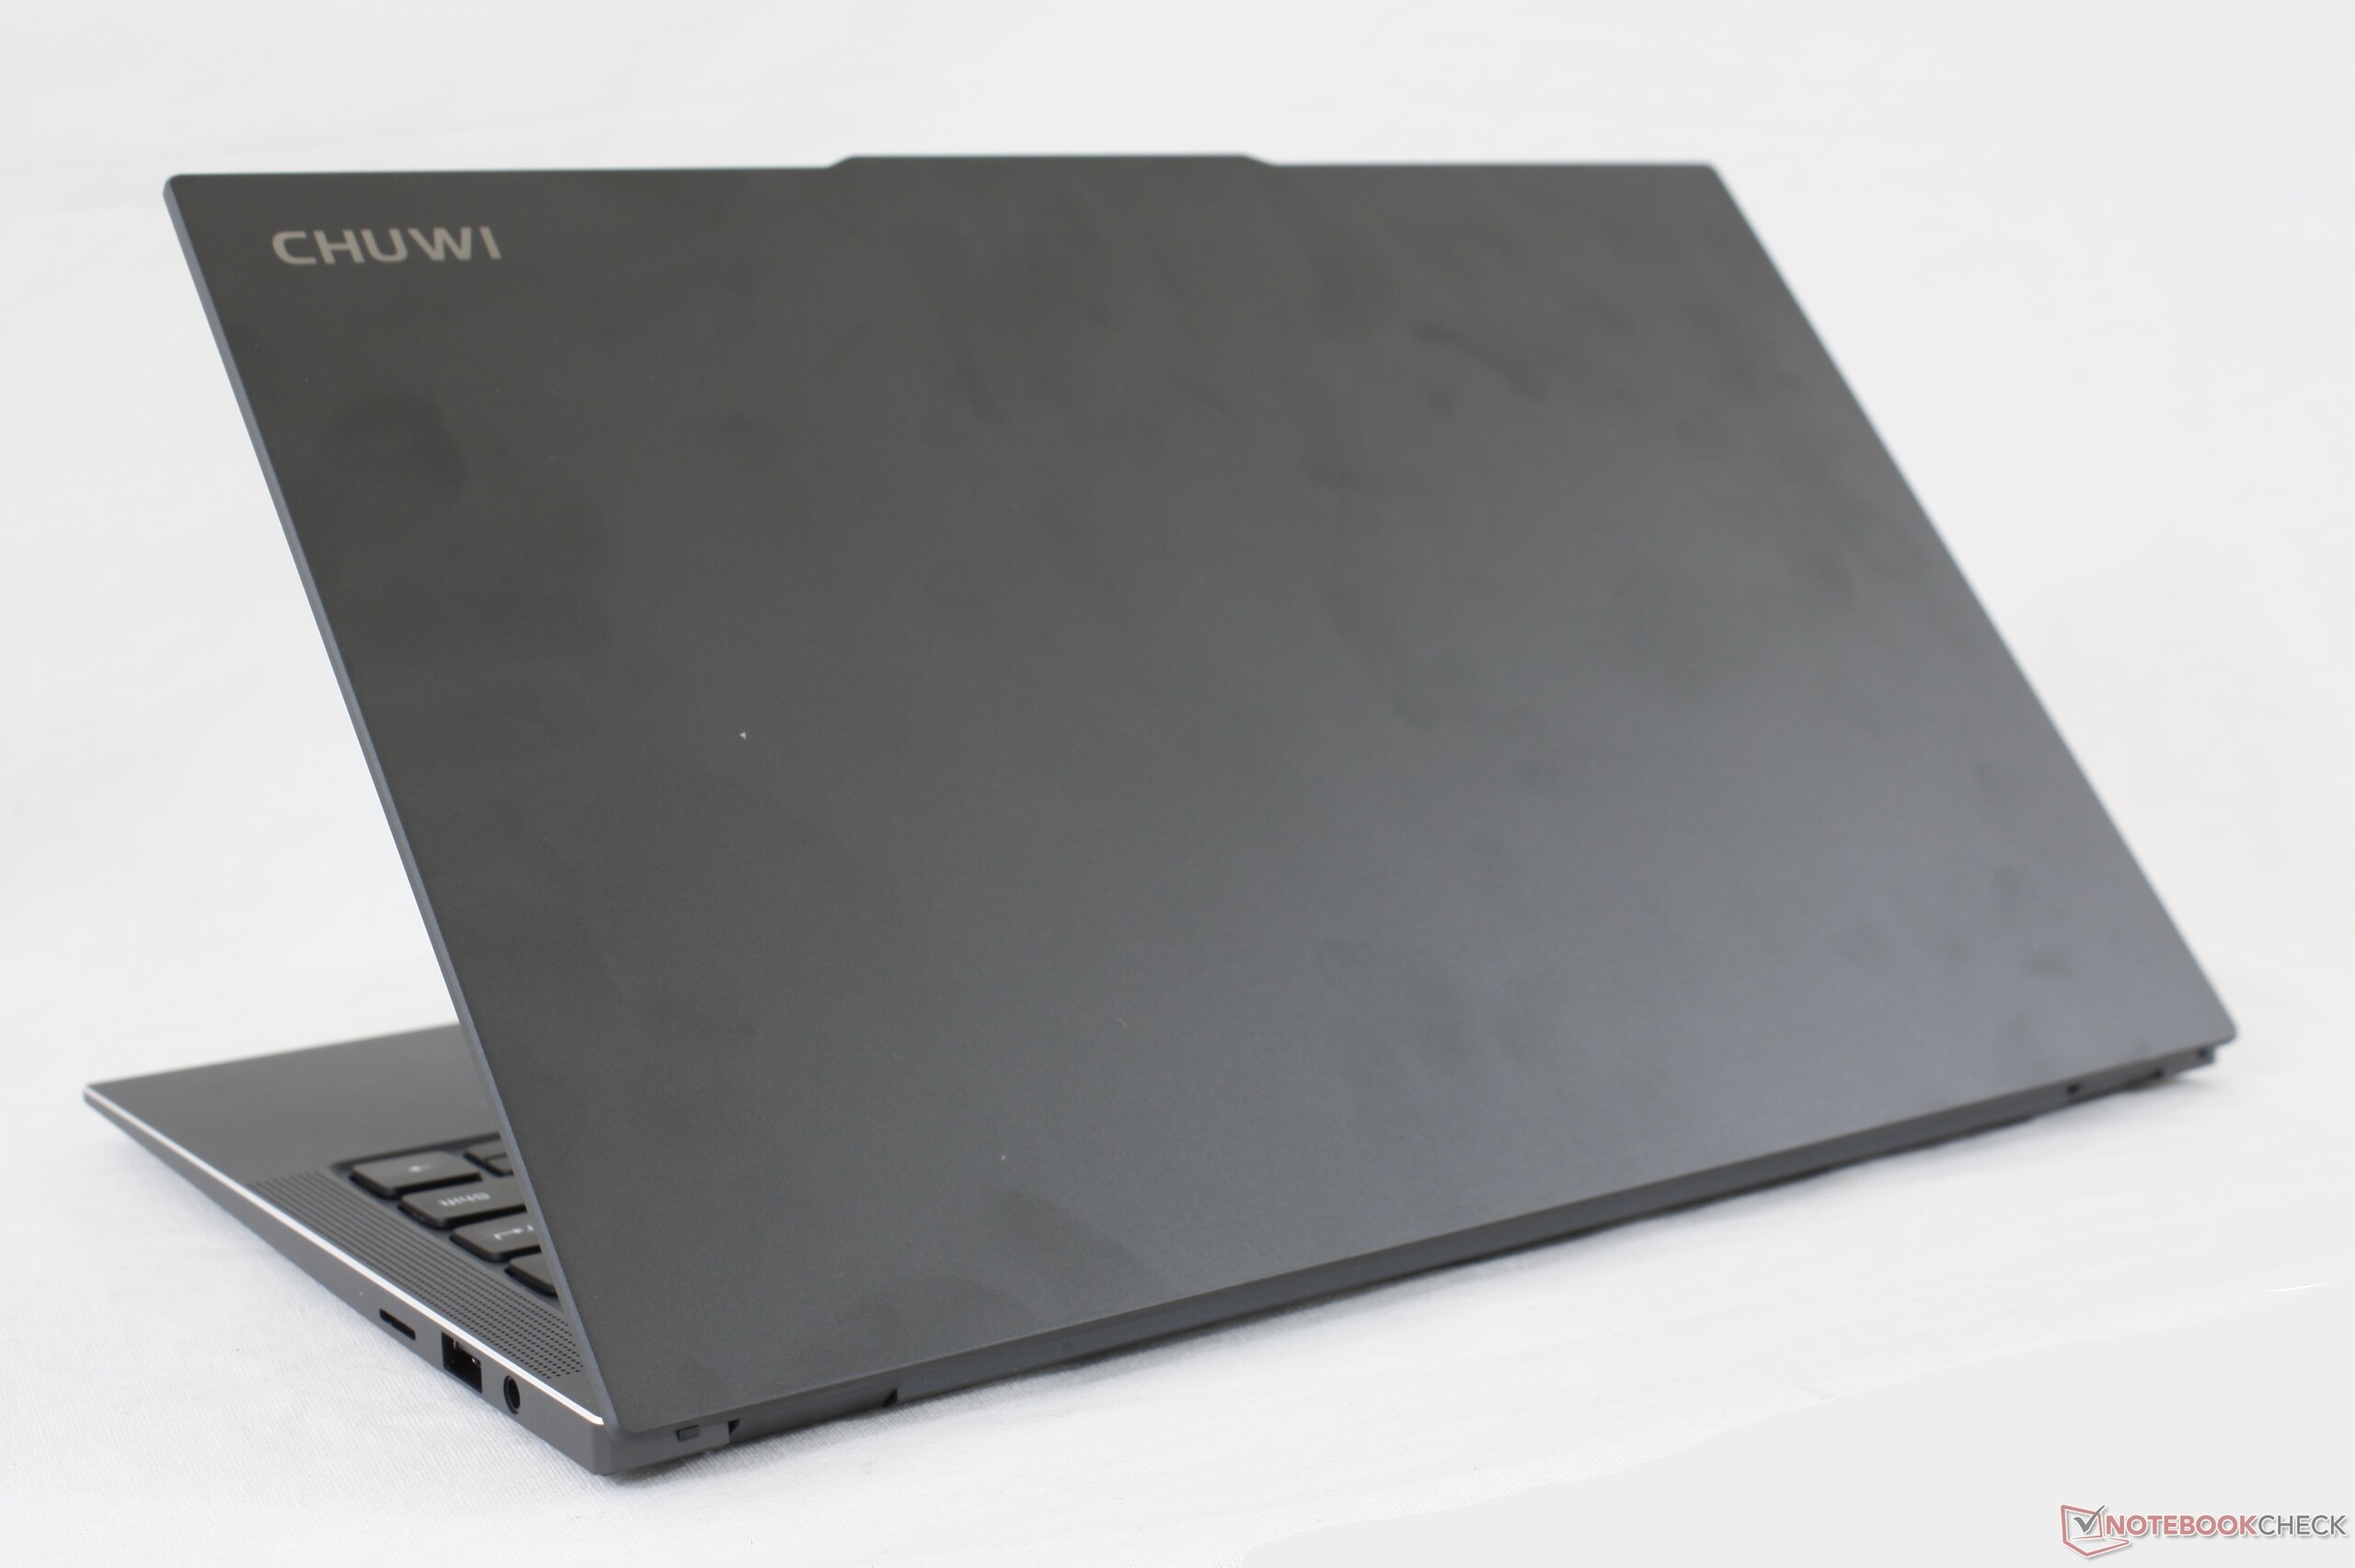
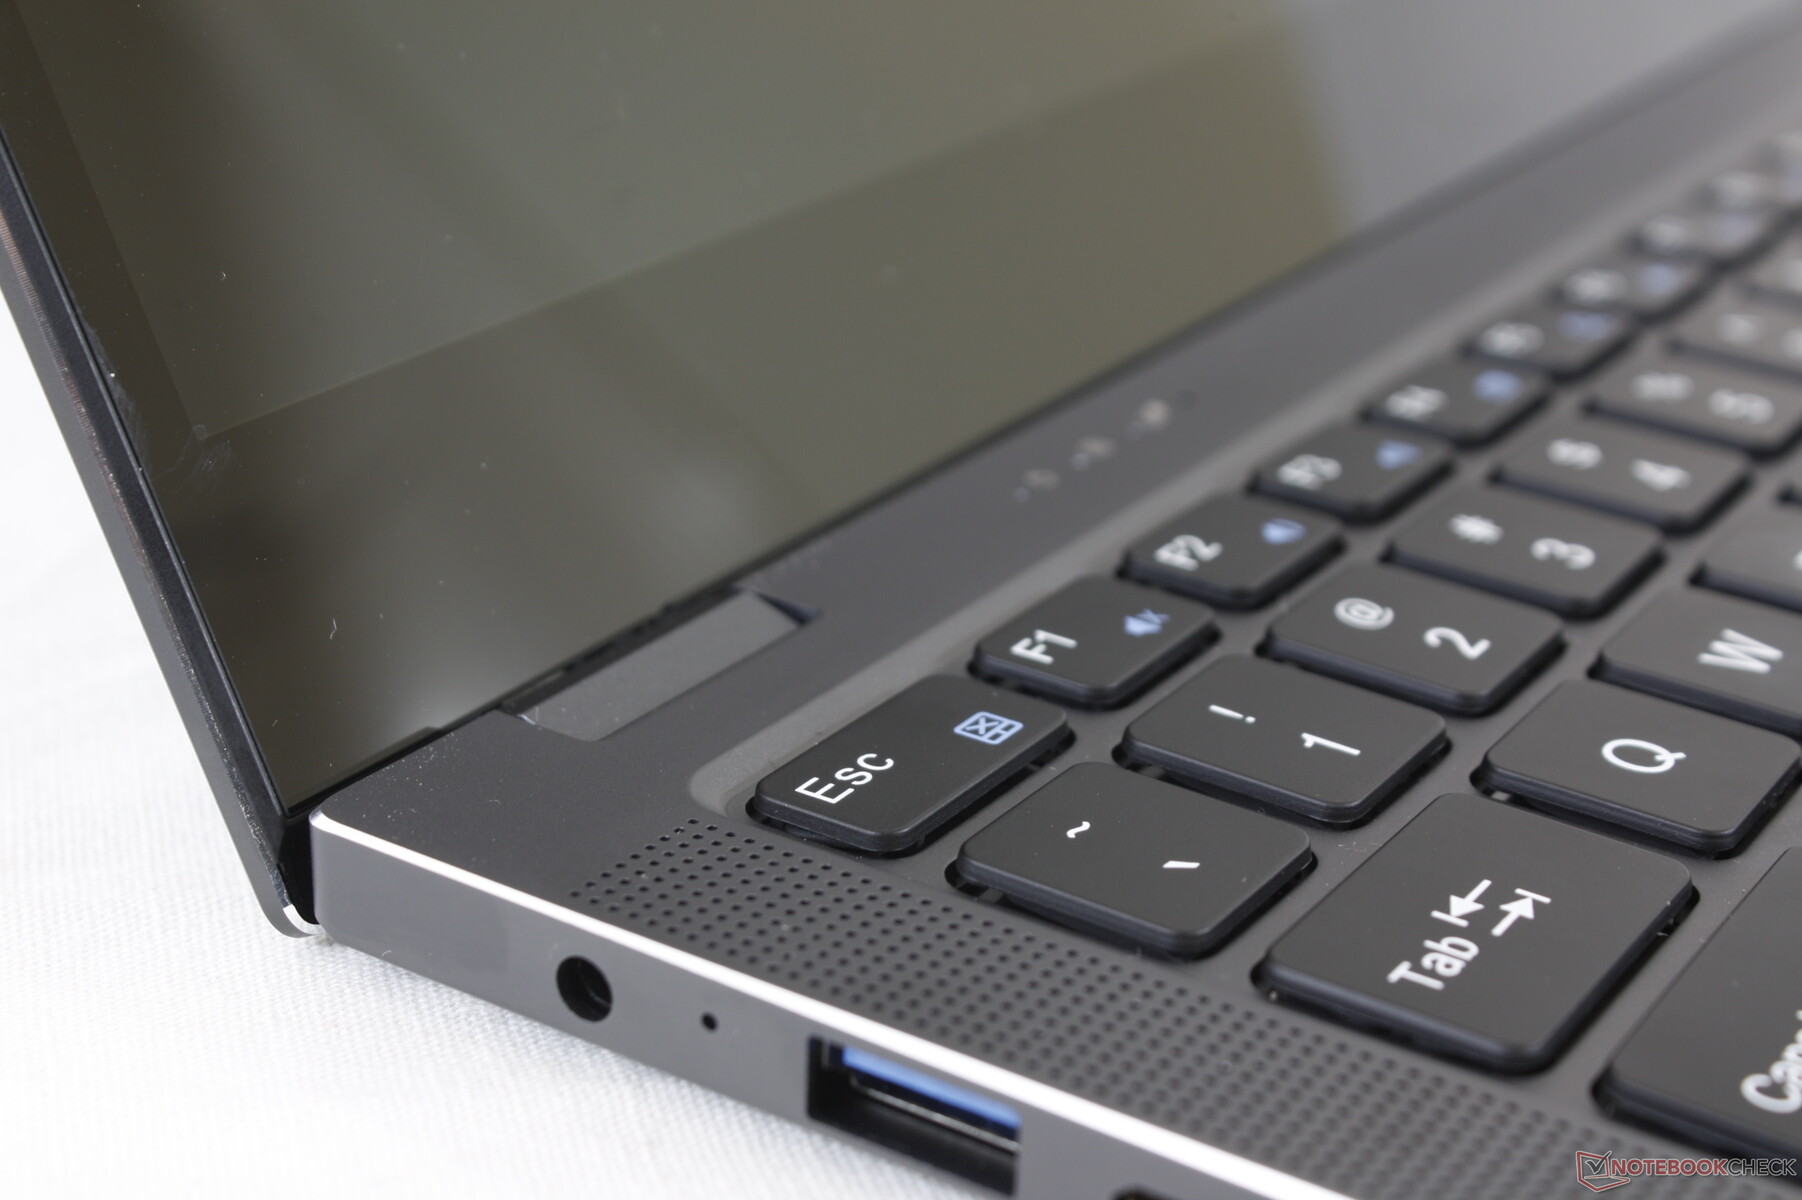
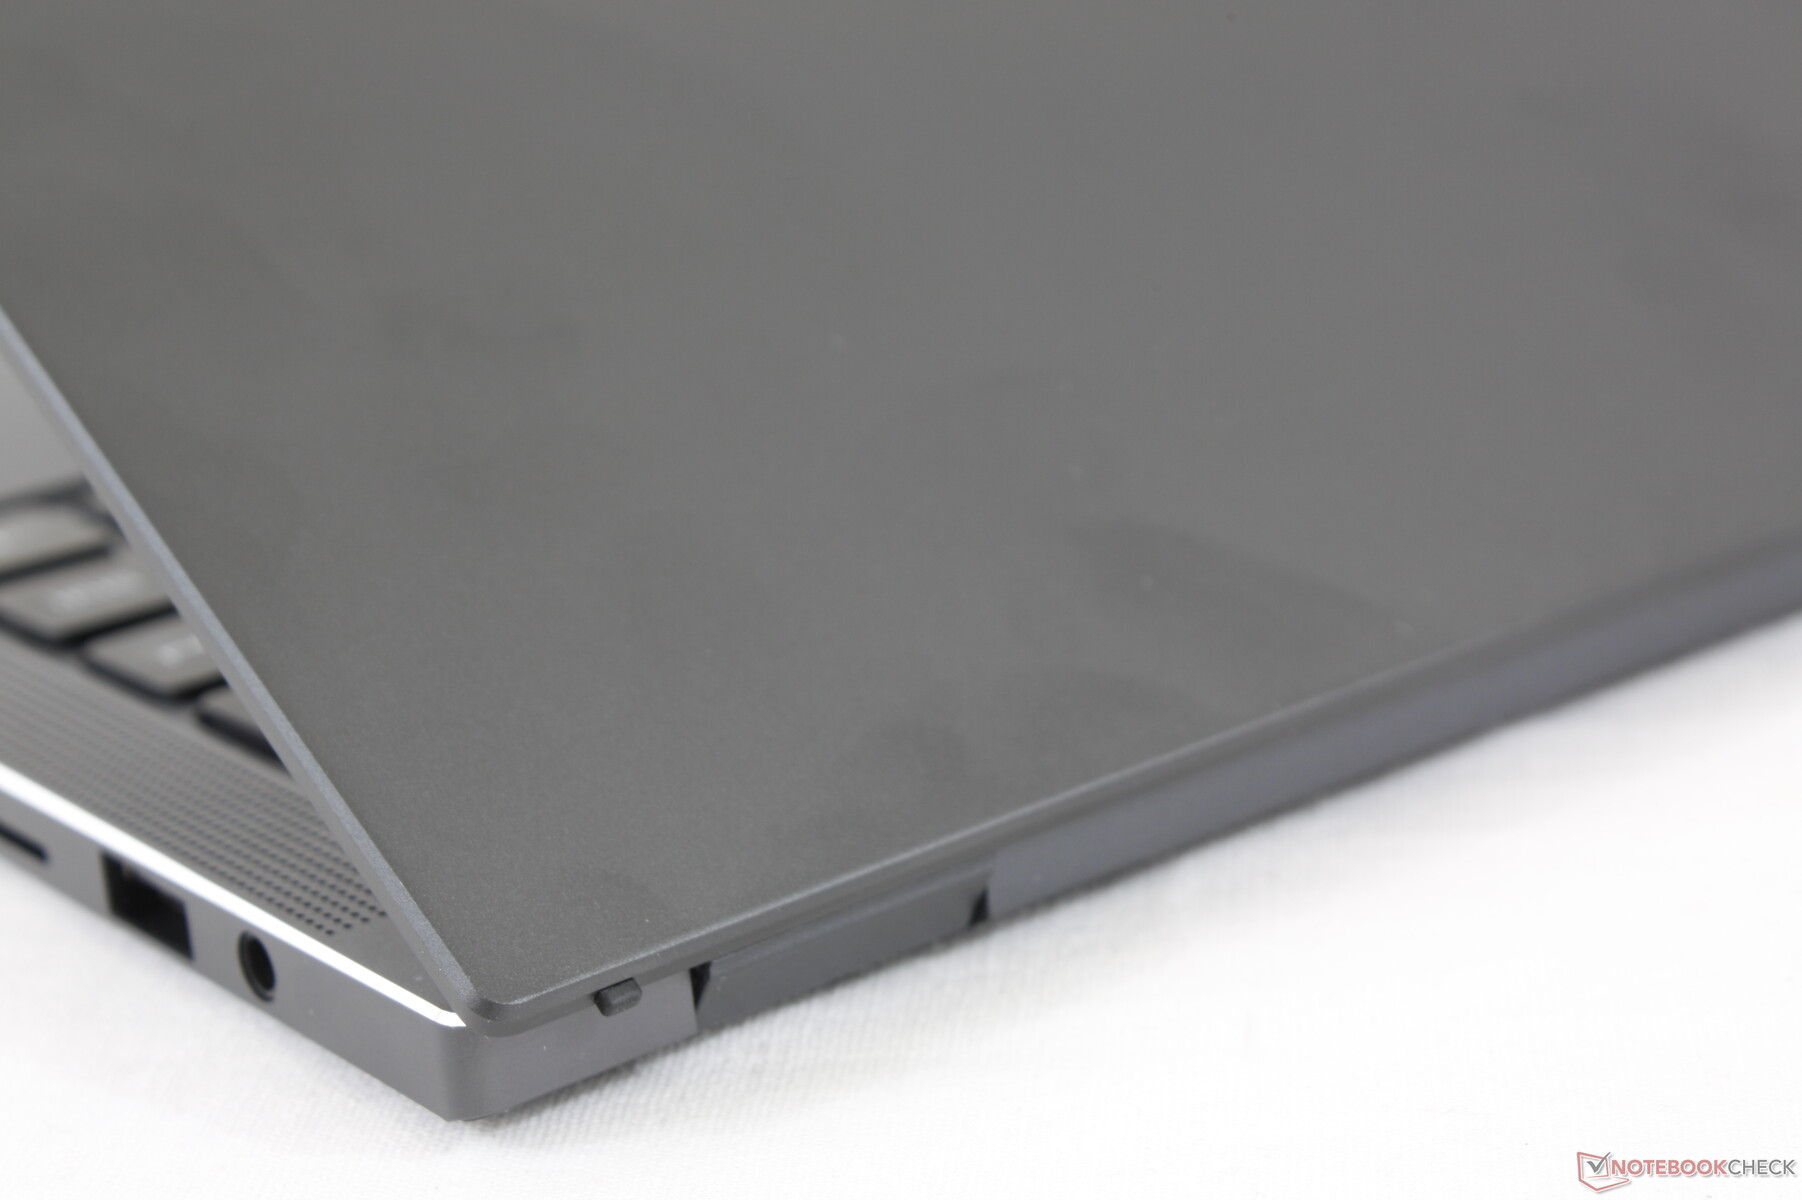
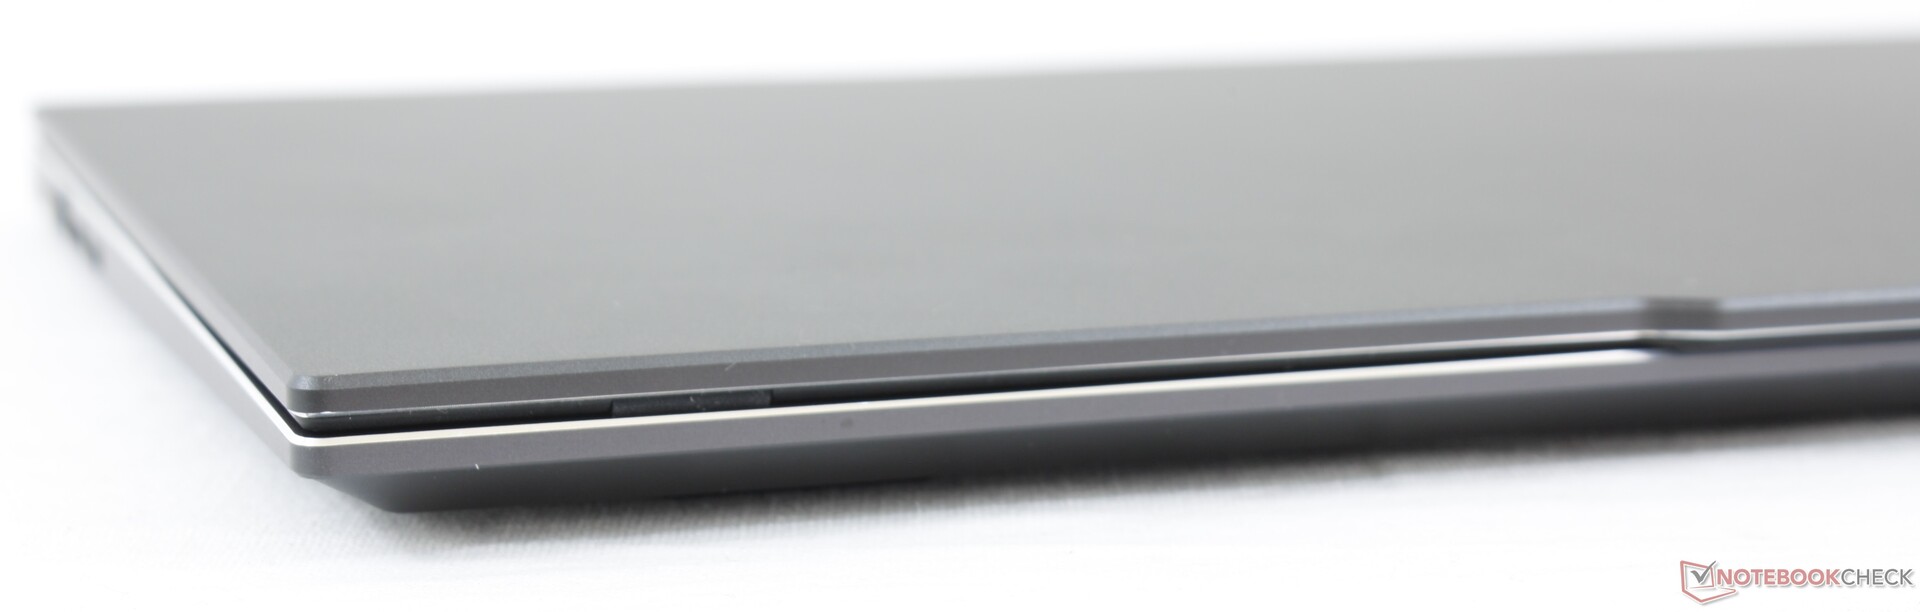
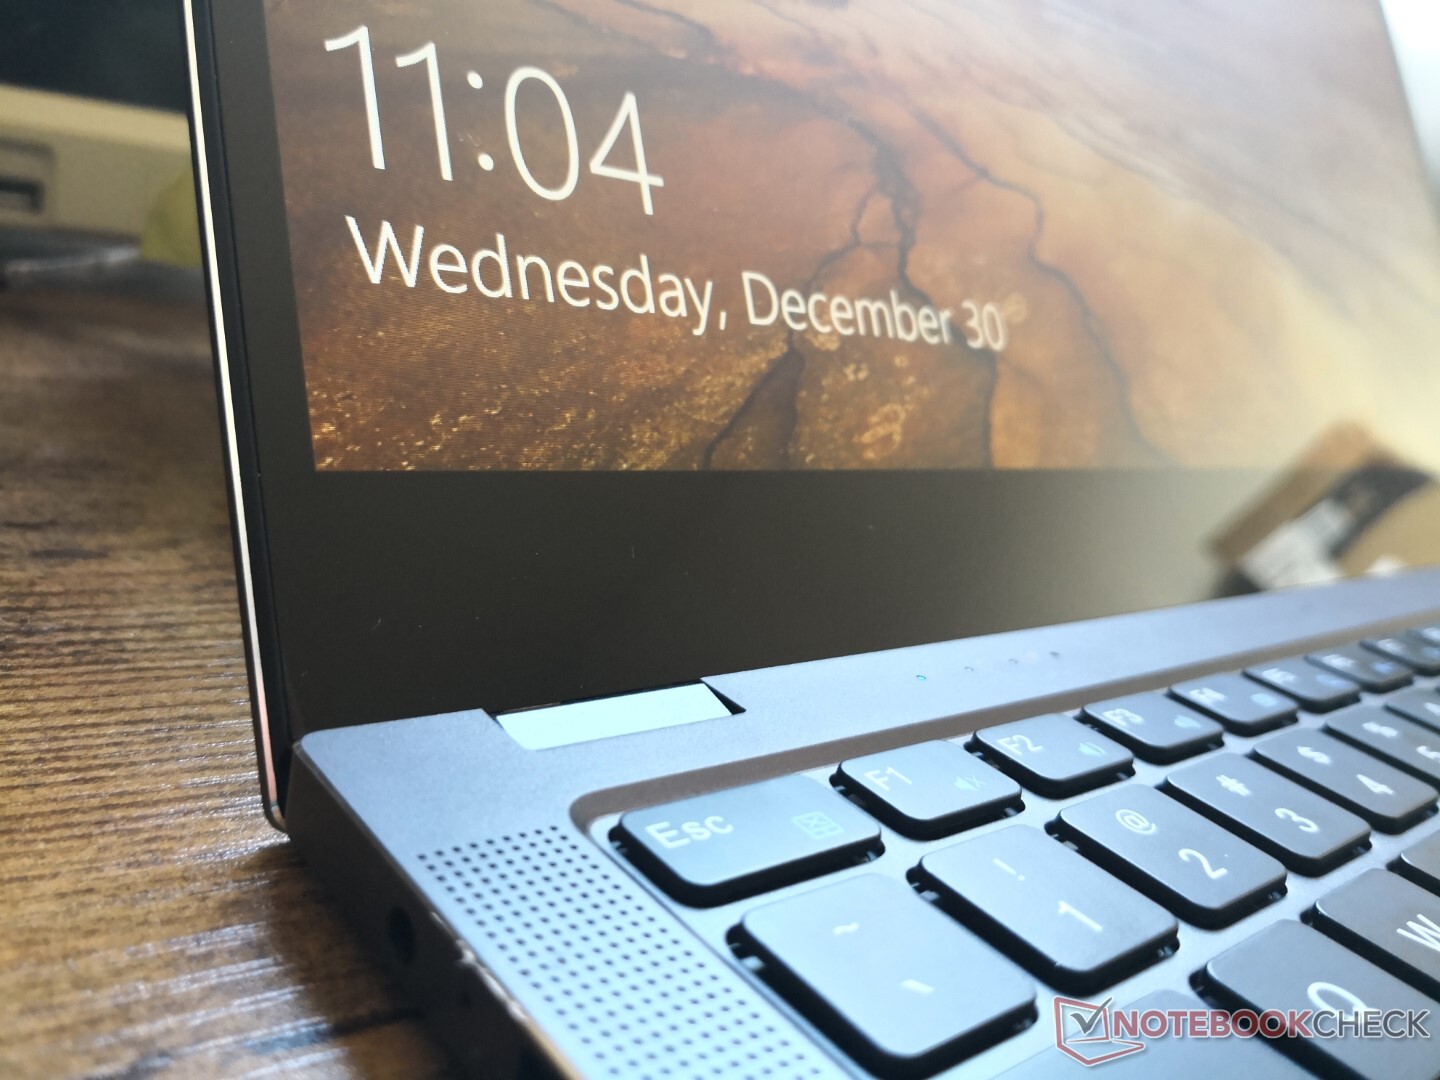
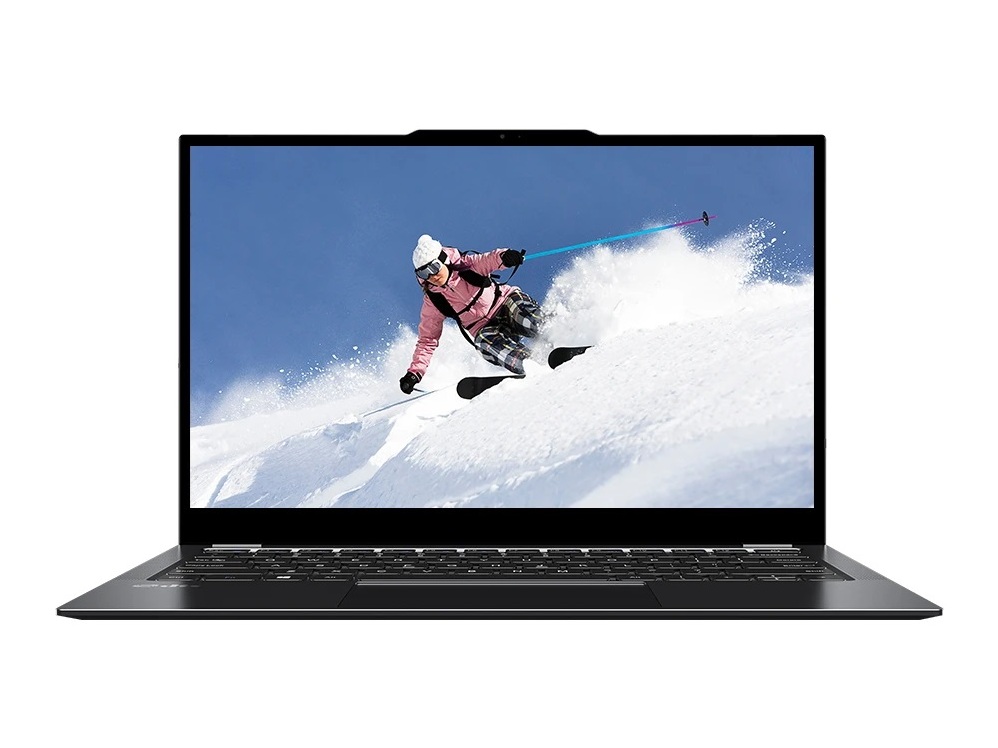
Like most other laptops from Chuwi, the metal chassis is a highlight of the LarkBook. Its design is probably sleeker, sharper, and lighter than any other laptop for the price since plastic is much more common in this sub $500 category. Build quality feels good as well with only minor warping of the base and lid and almost no creaking.
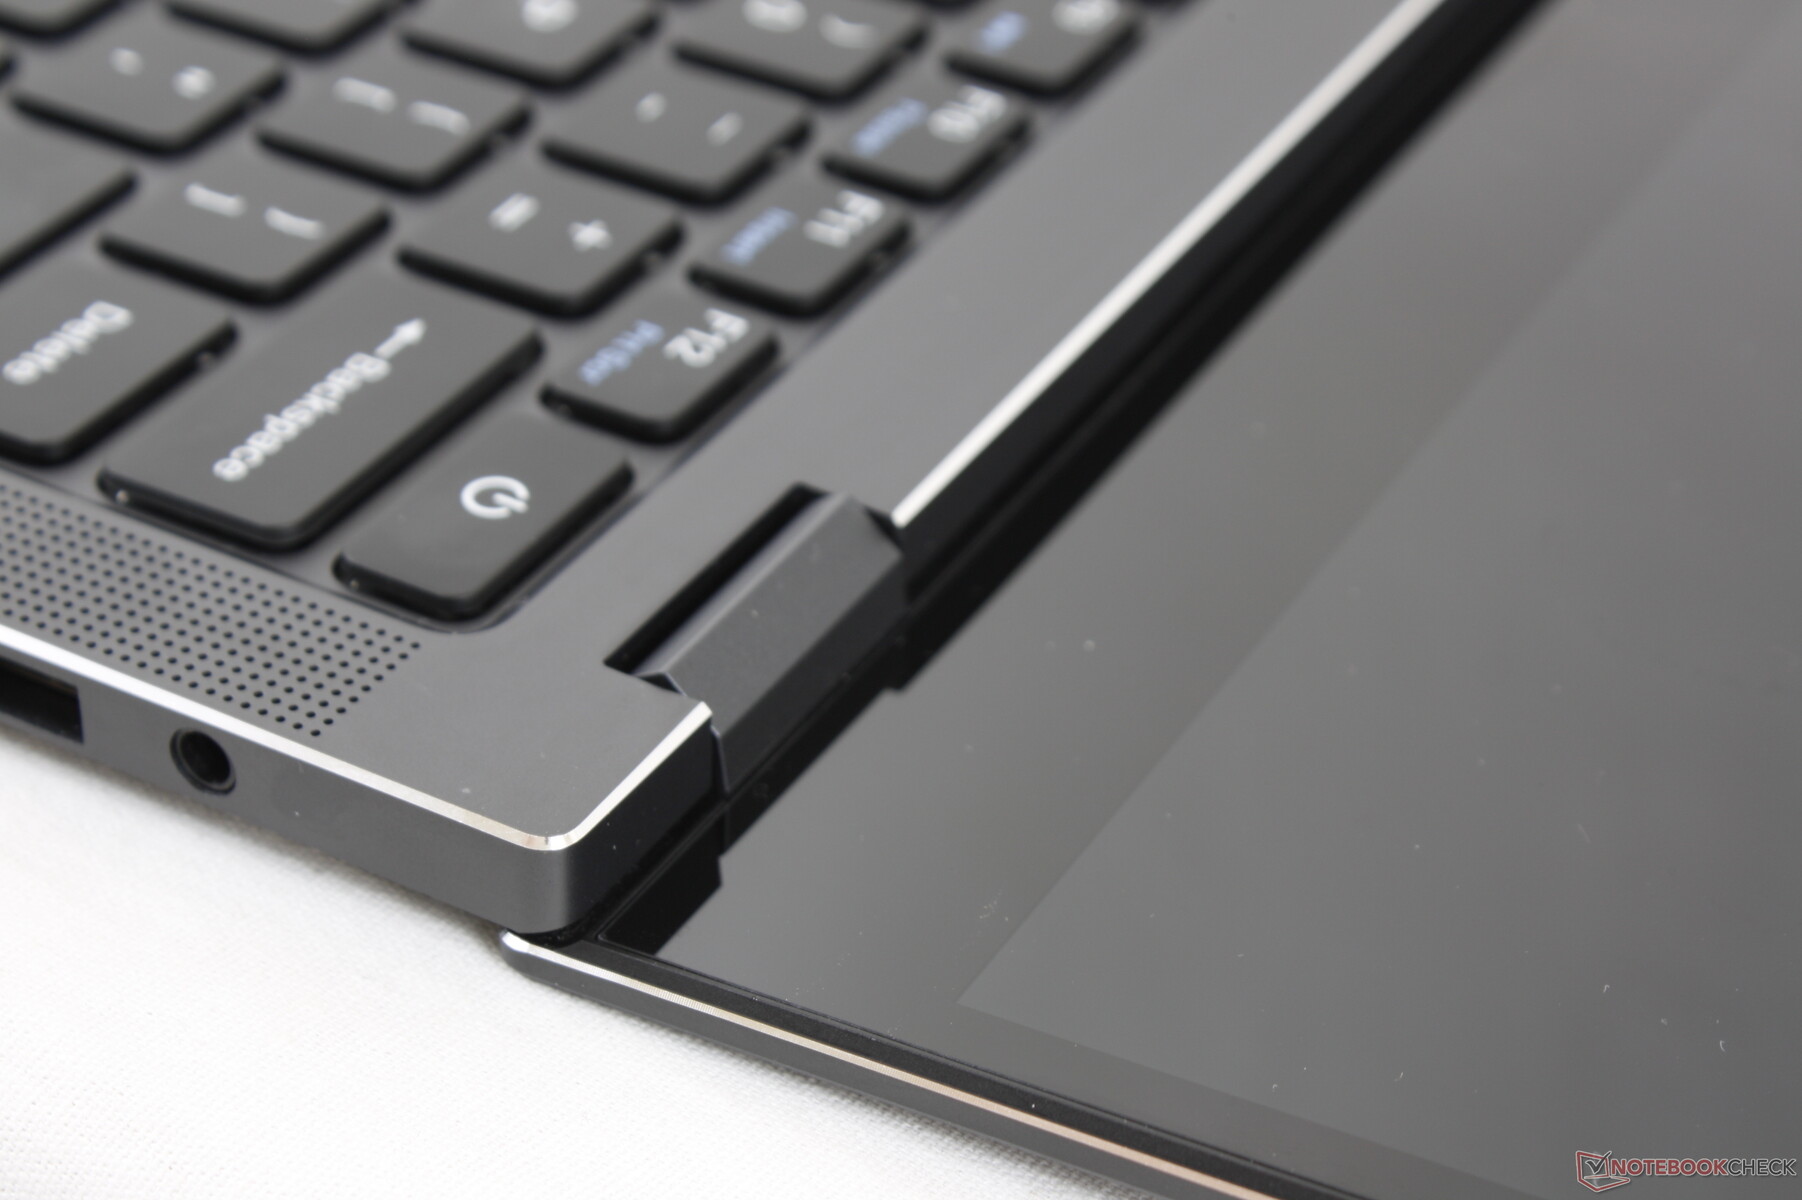
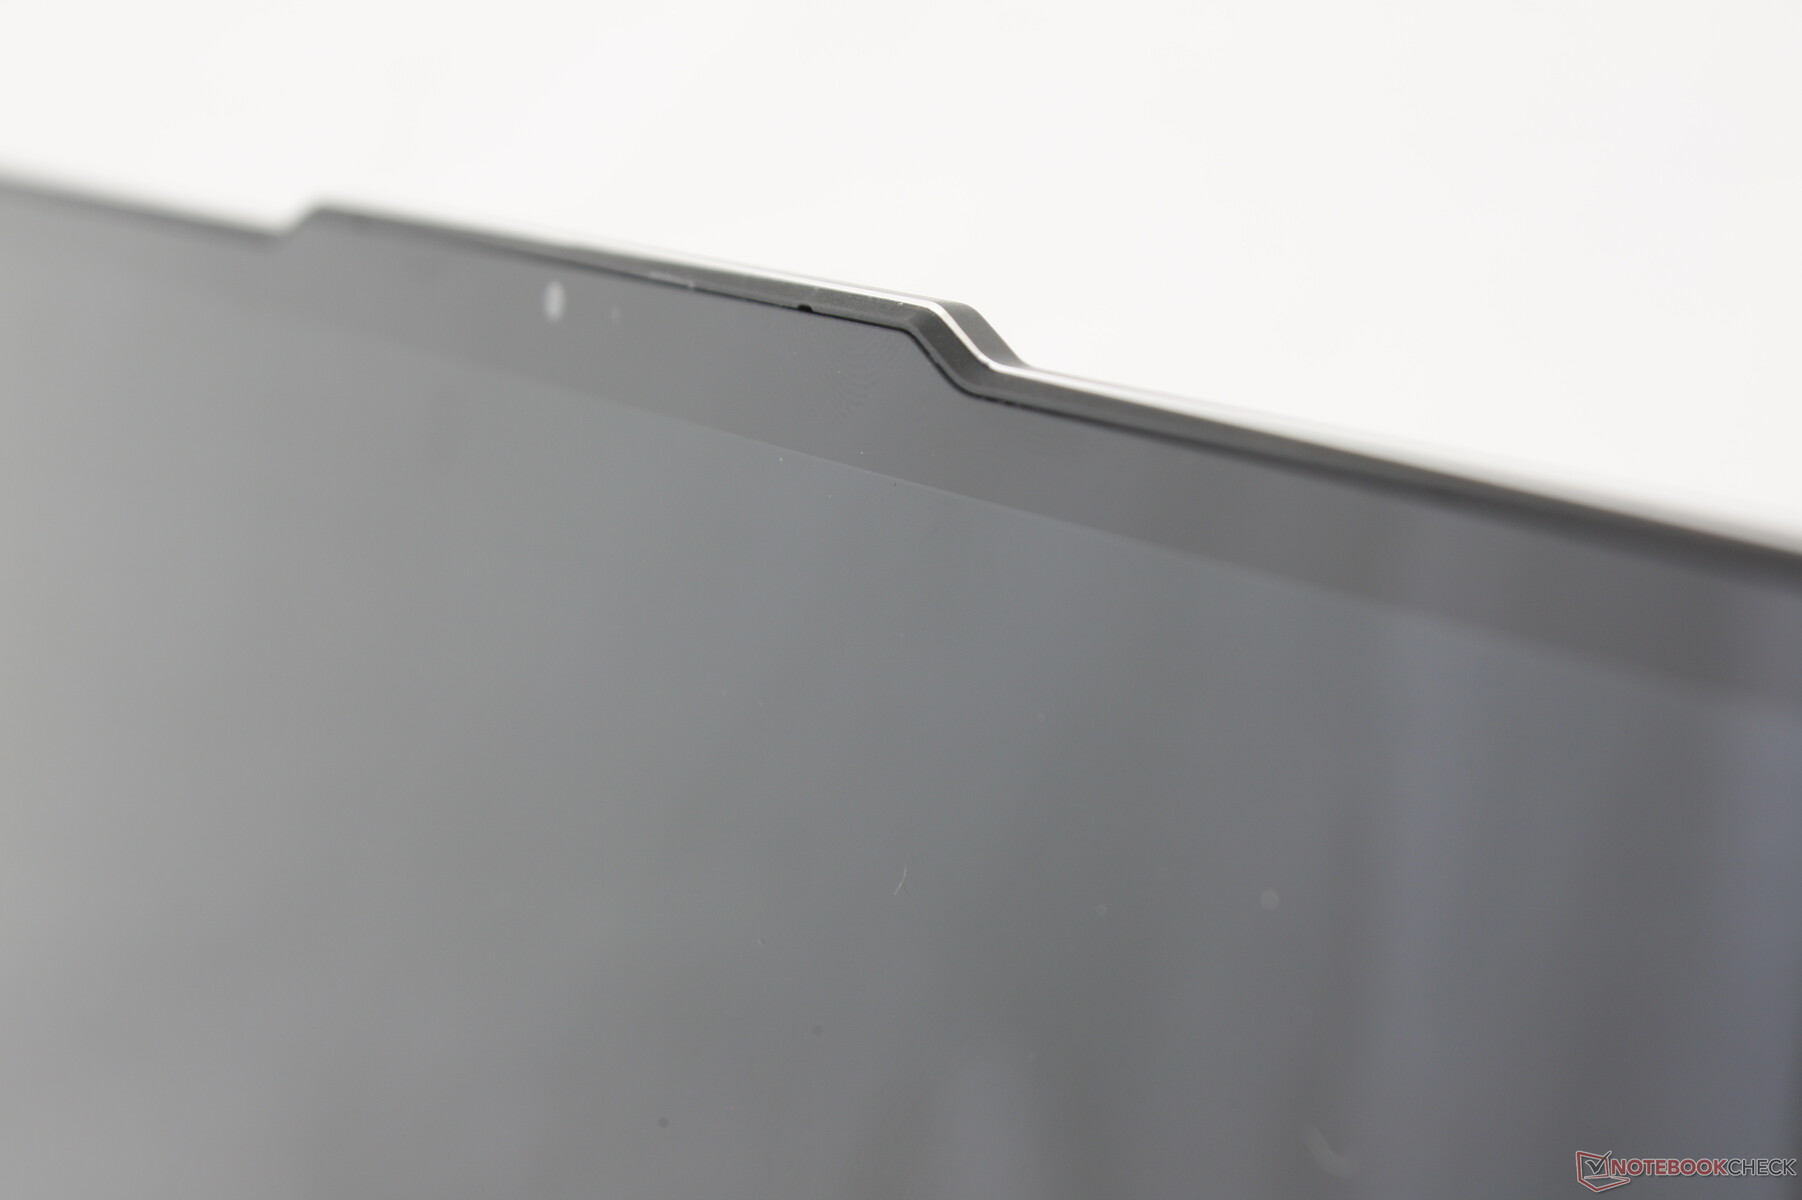
A notable drawback to the chassis are the hinges which feel weaker at certain angles. We wouldn't be surprised if the lid begins to teeter more readily after a year or so.
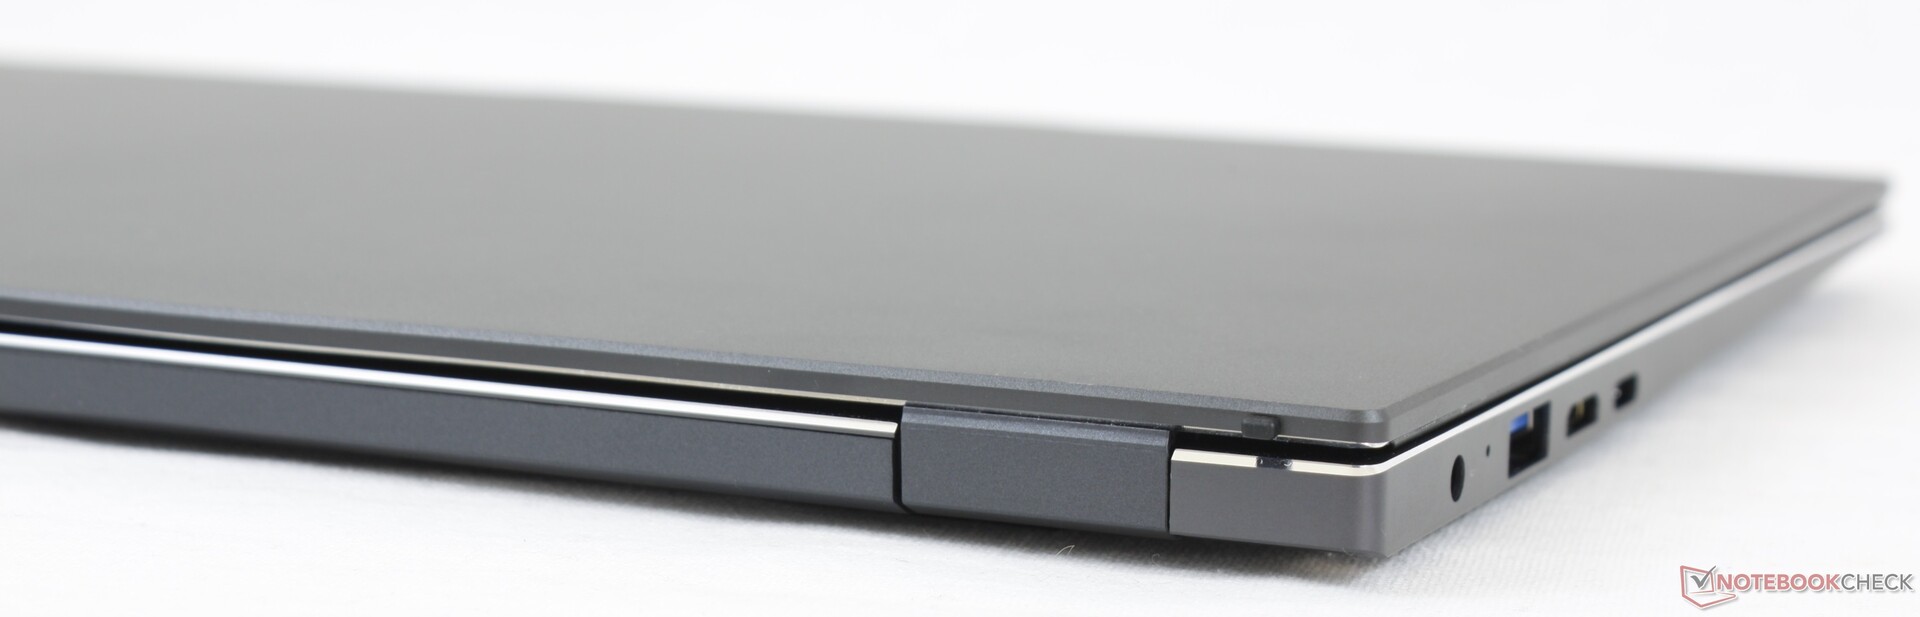
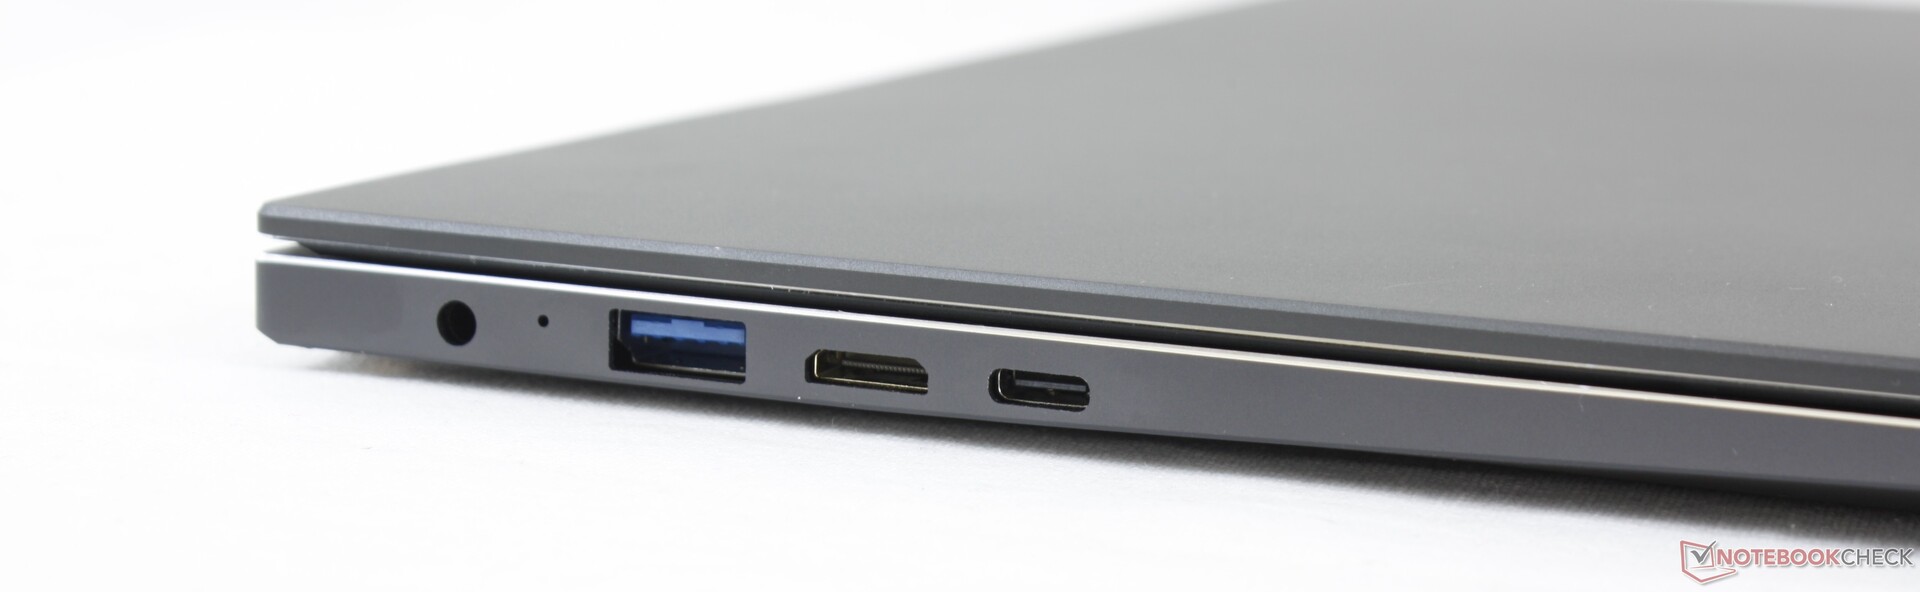
Connectivity
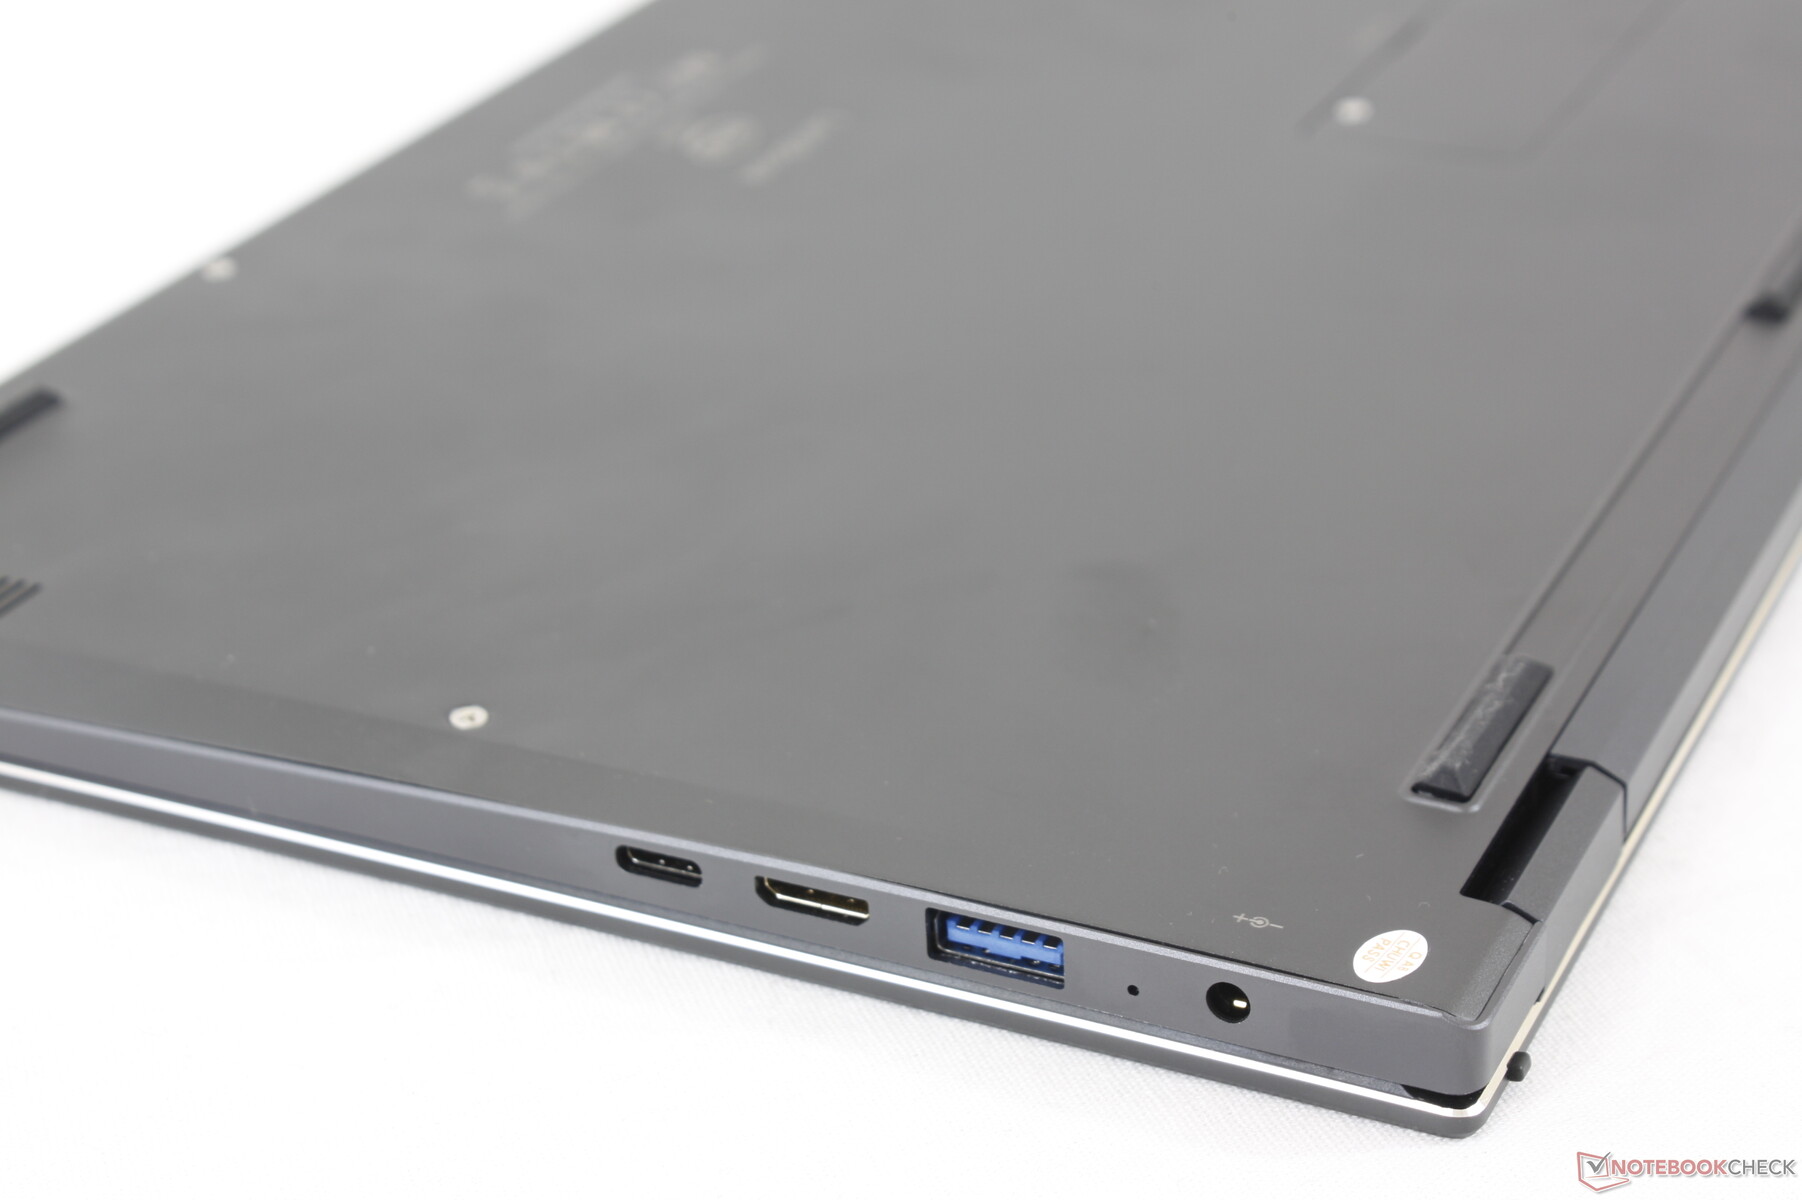
Keep in mind that the laptop integrates mini-HDMI instead of full-size HDMI meaning most users will need an adapter for connecting external monitors.
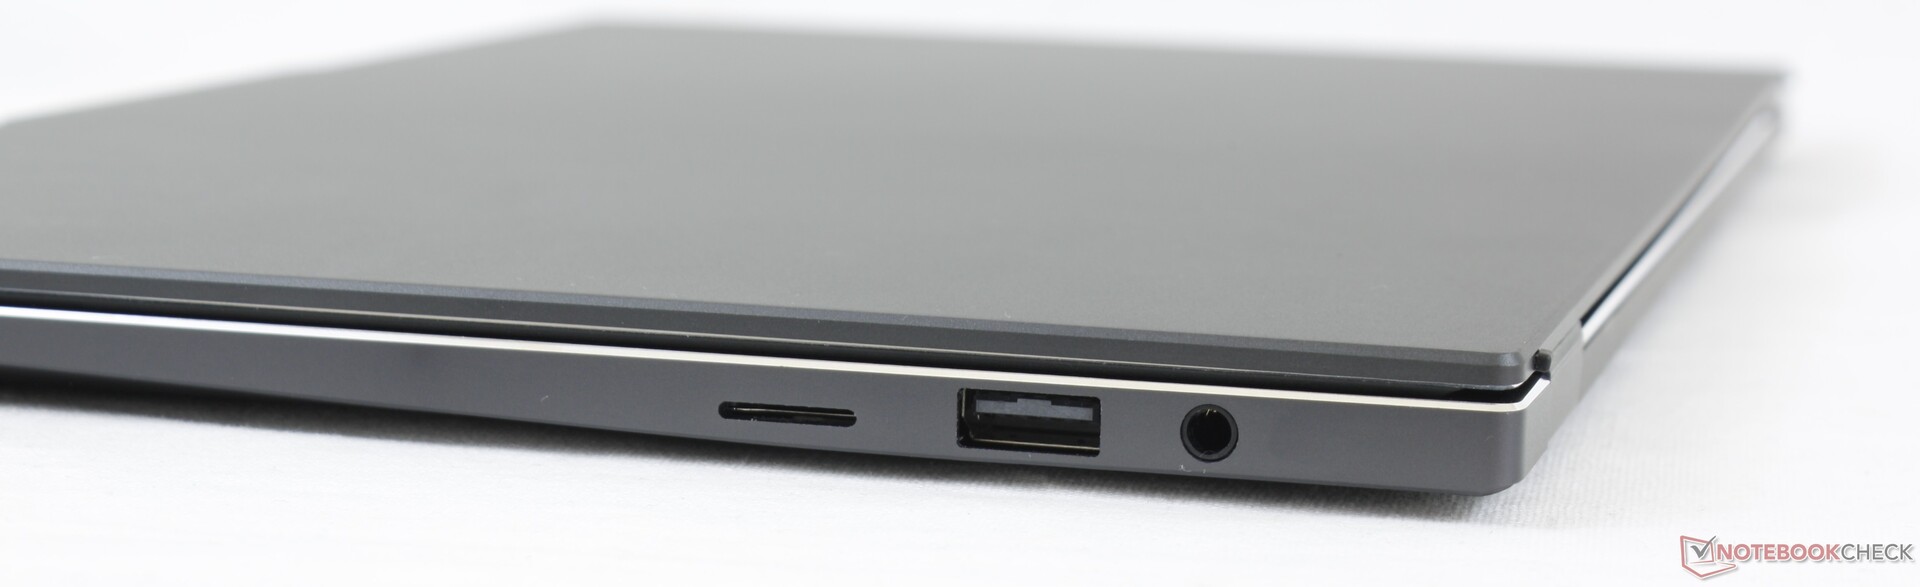
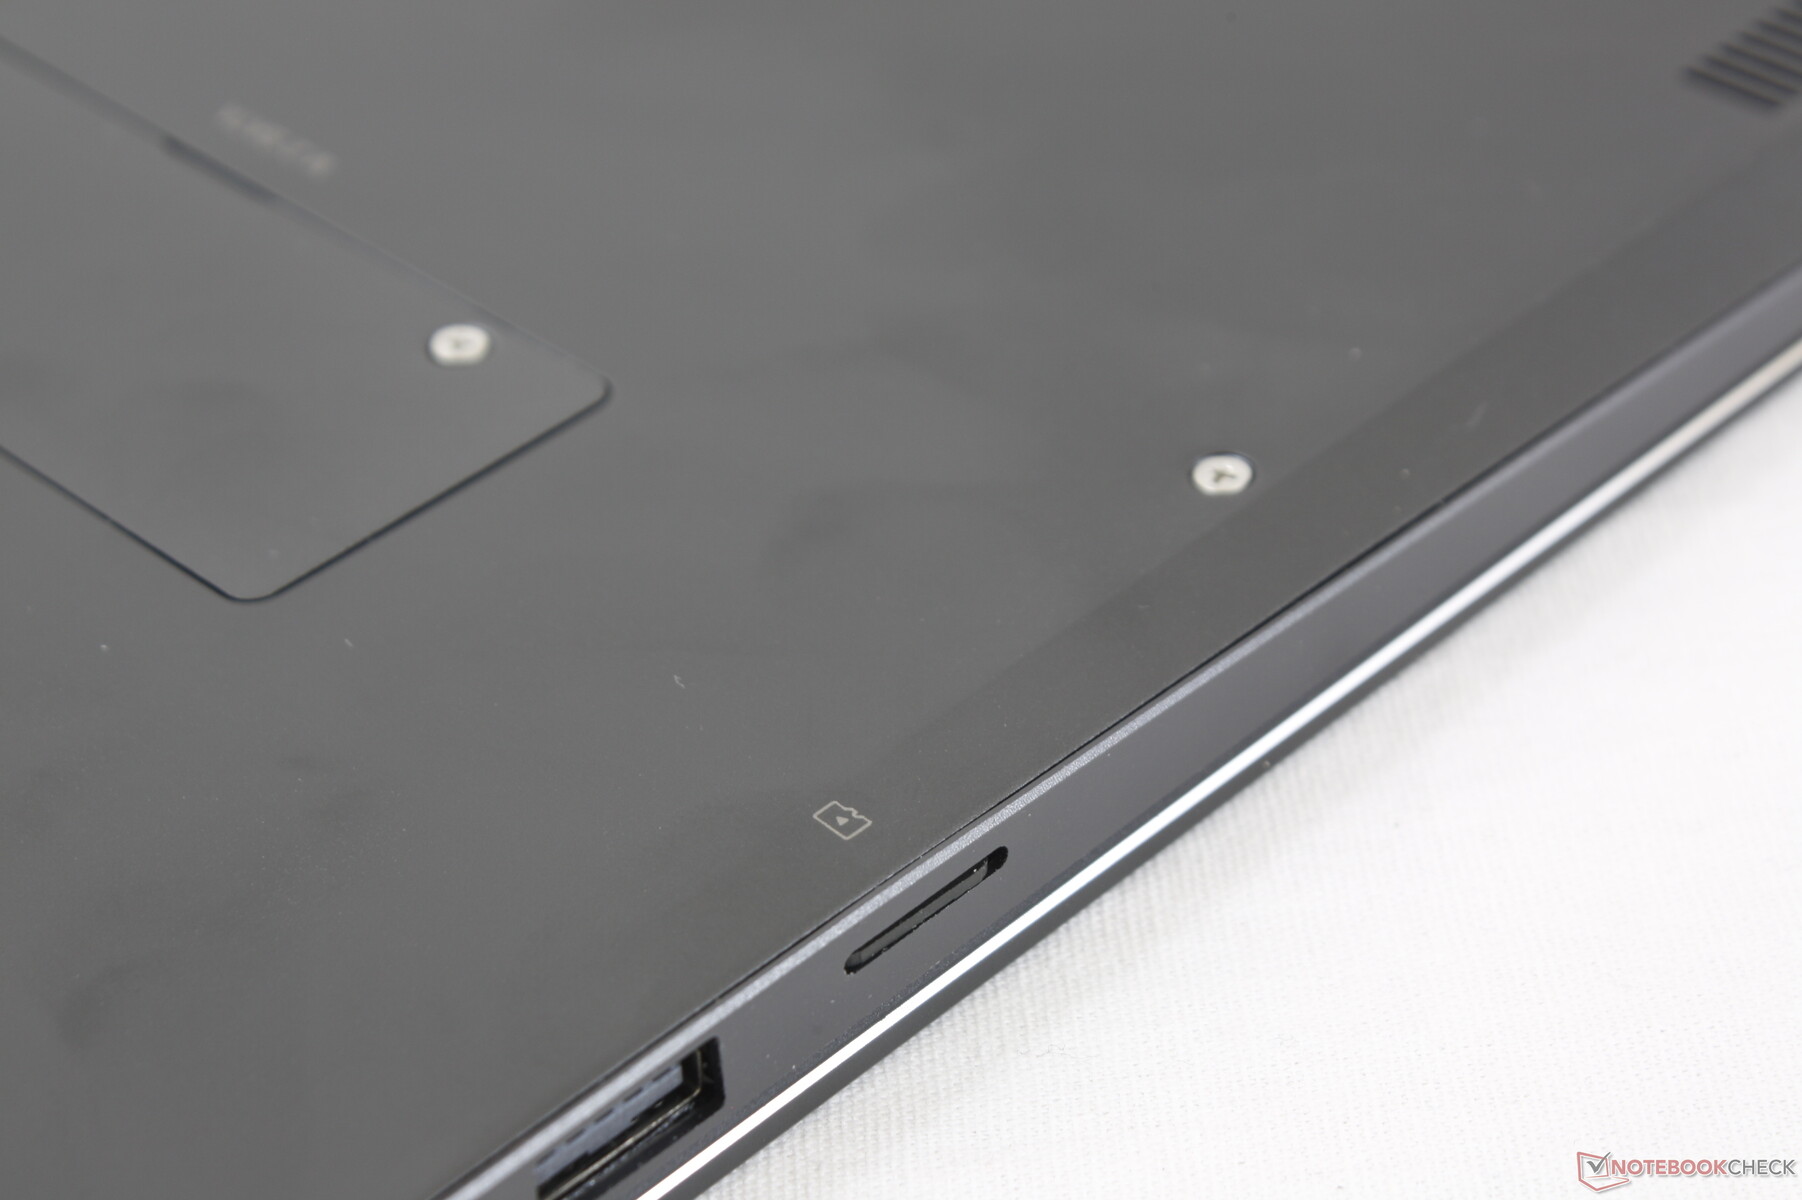
SD Card Reader
Transfer rates from the SD card reader is slow. Furthermore, an inserted card sits deeper than the edge of the laptop and so the card can be difficult to eject.
| SD Card Reader | |
| average JPG Copy Test (av. of 3 runs) | |
| Dell XPS 13 9310 Core i7 FHD (Toshiba Exceria Pro M501 64 GB UHS-II) | |
| HP Pavilion 13-bb0015cl (Toshiba Exceria Pro M501 32 GB UHS-II) | |
| Asus VivoBook S13 S330UA-EY034T (Toshiba Exceria Pro M501 64 GB UHS-II) | |
| Chuwi LarkBook CWI509 (Toshiba Exceria Pro M501 32 GB UHS-II) | |
| maximum AS SSD Seq Read Test (1GB) | |
| Dell XPS 13 9310 Core i7 FHD (Toshiba Exceria Pro M501 64 GB UHS-II) | |
| HP Pavilion 13-bb0015cl (Toshiba Exceria Pro M501 32 GB UHS-II) | |
| Asus VivoBook S13 S330UA-EY034T (Toshiba Exceria Pro M501 64 GB UHS-II) | |
| Chuwi LarkBook CWI509 (Toshiba Exceria Pro M501 32 GB UHS-II) | |
Communication
Webcam


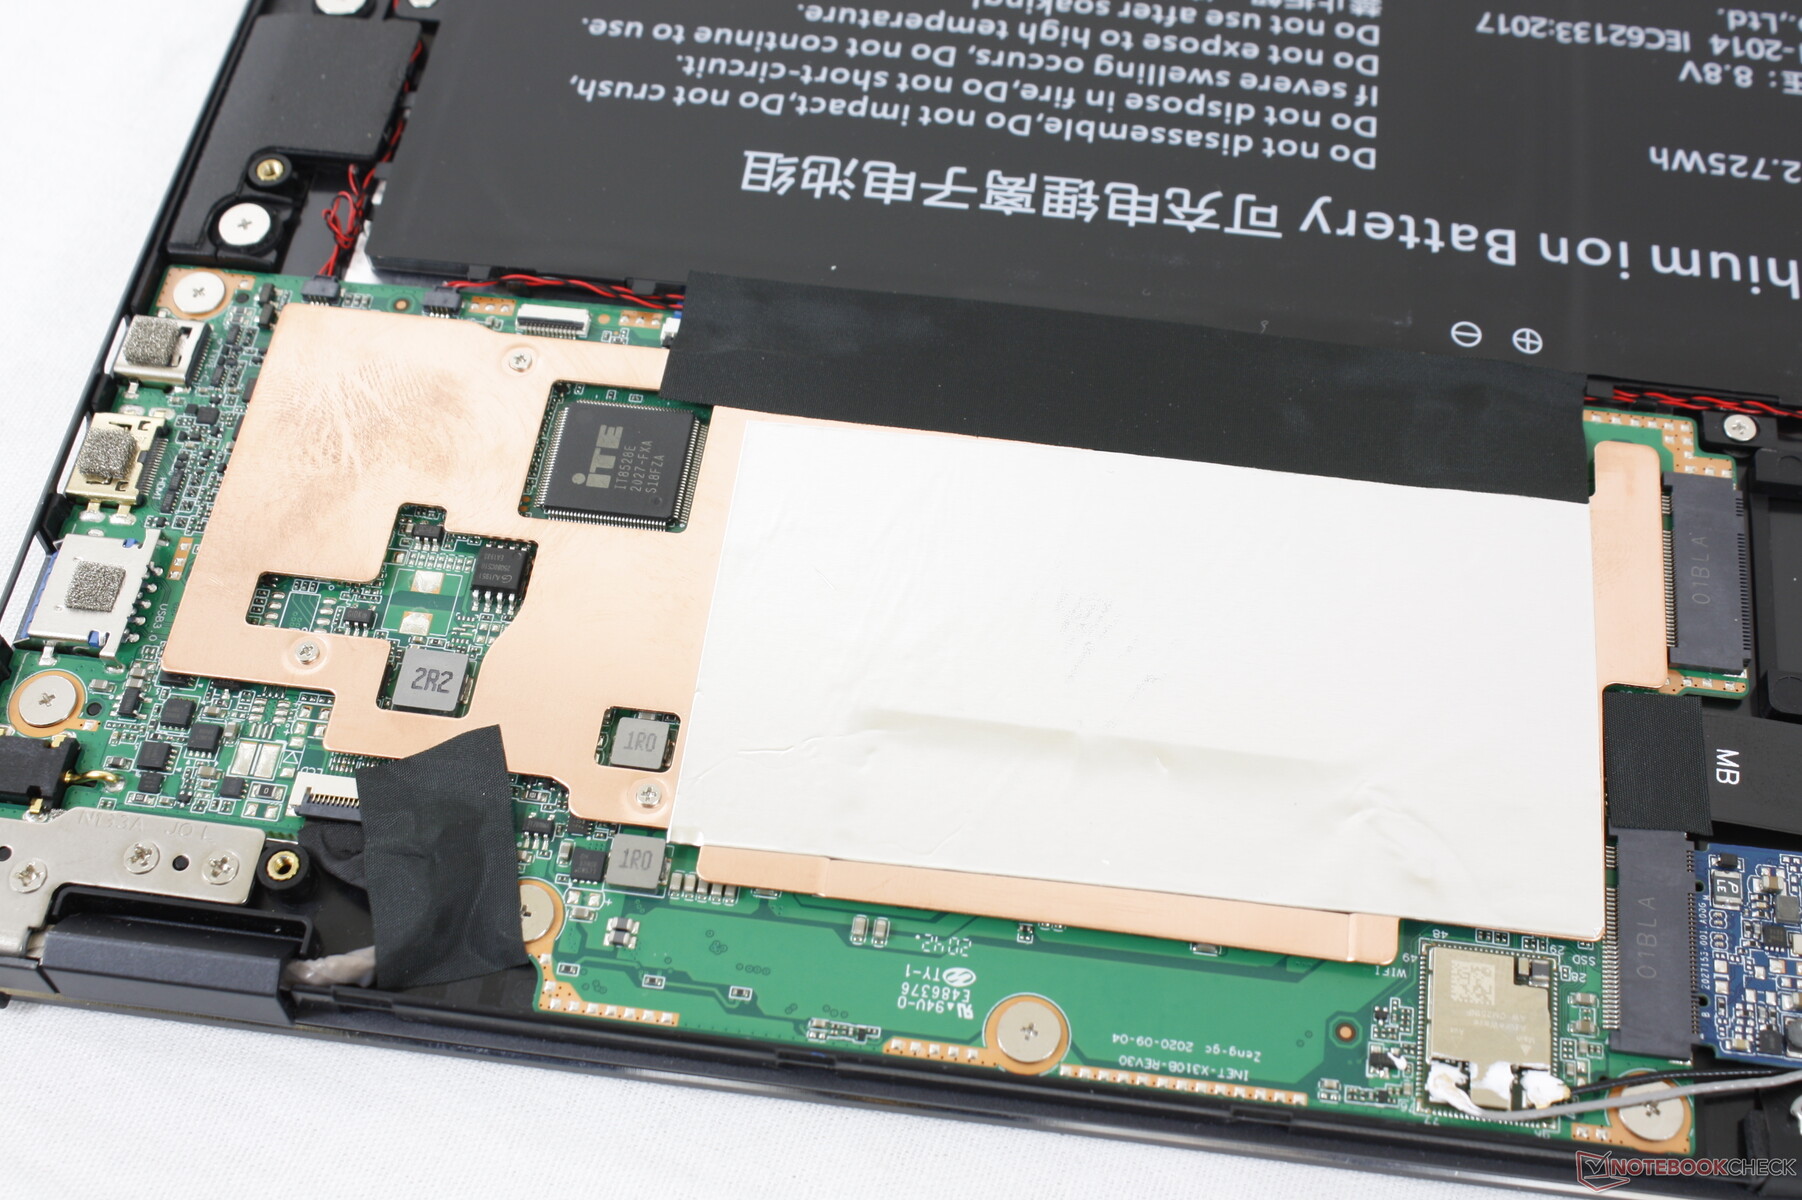
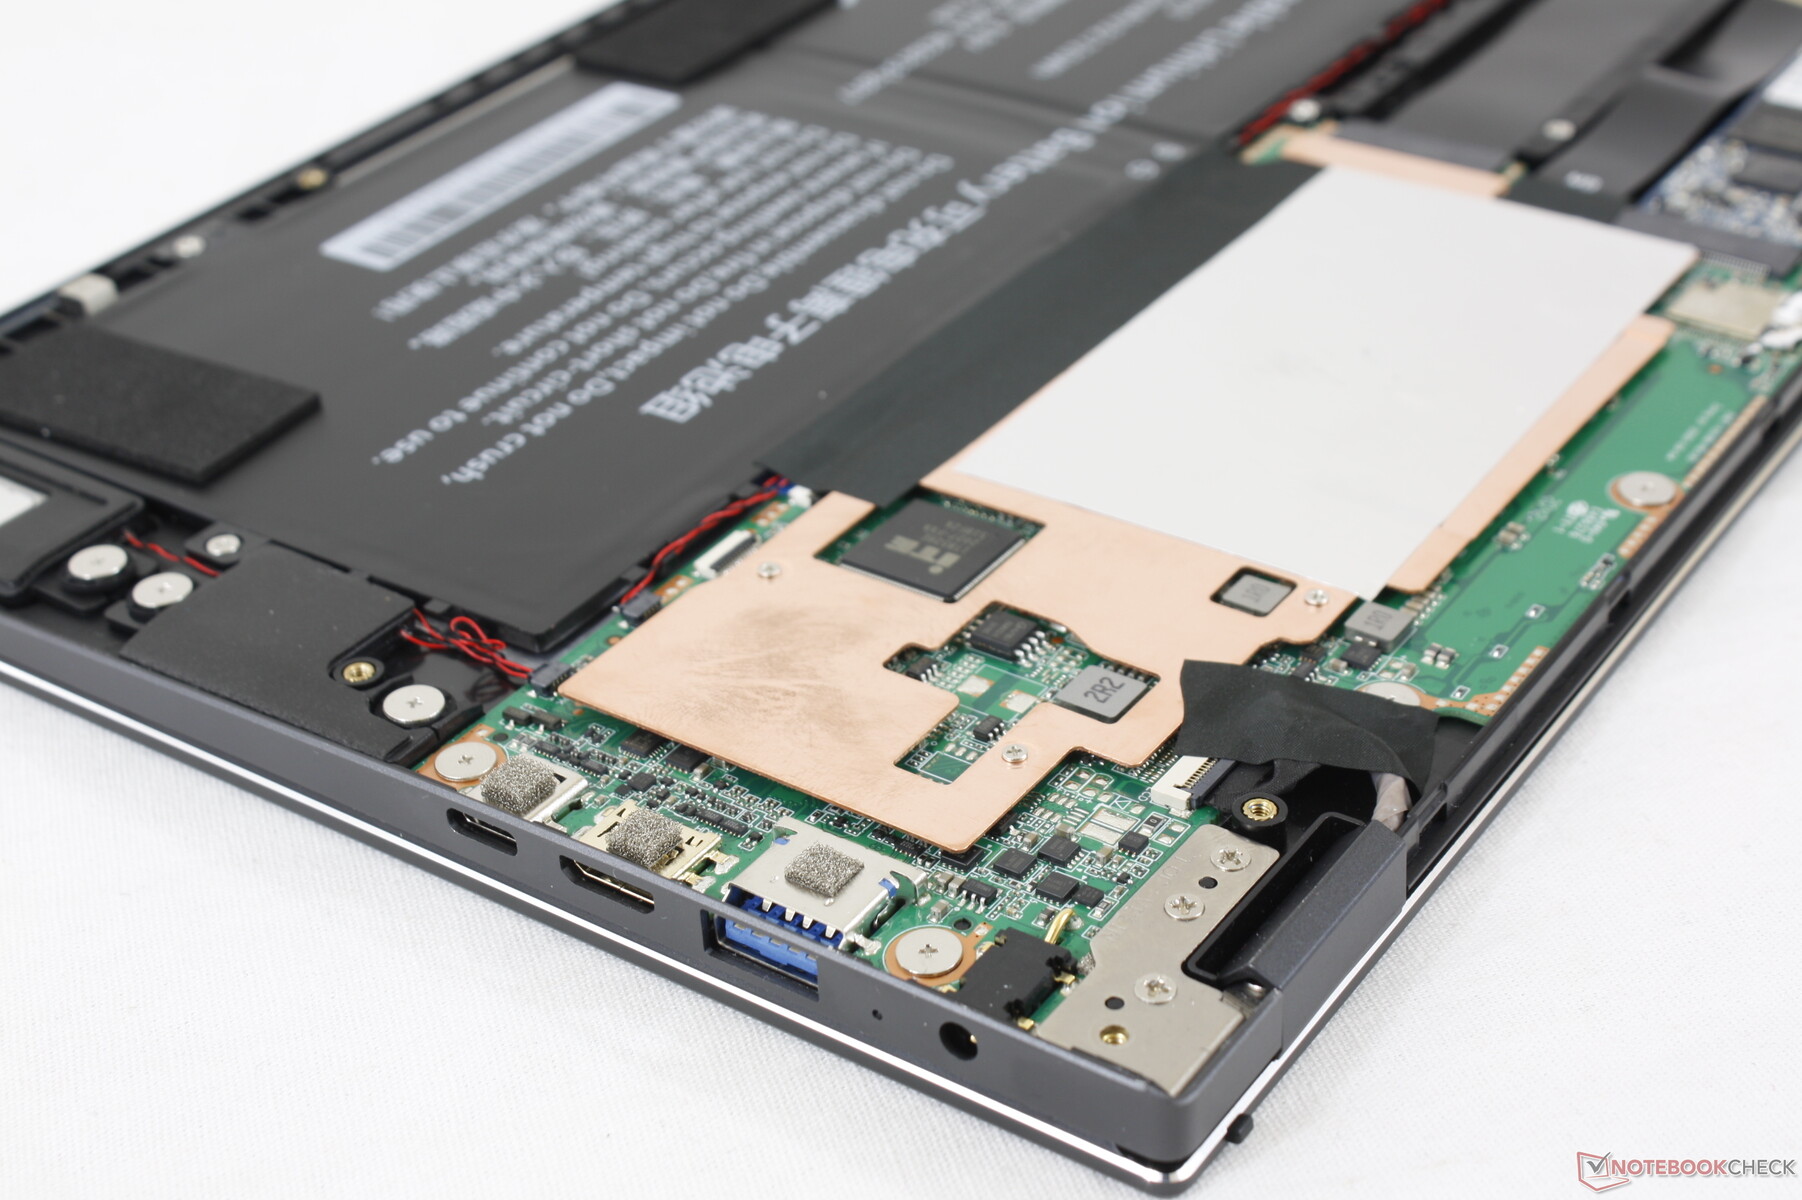
Maintenance
Accessories and Warranty
There are no extras in the box other than the AC adapter. The usual one-year limited warranty applies, but oversea buyers may need to pay for shipping and handling and deal with longer wait times.
Input Devices
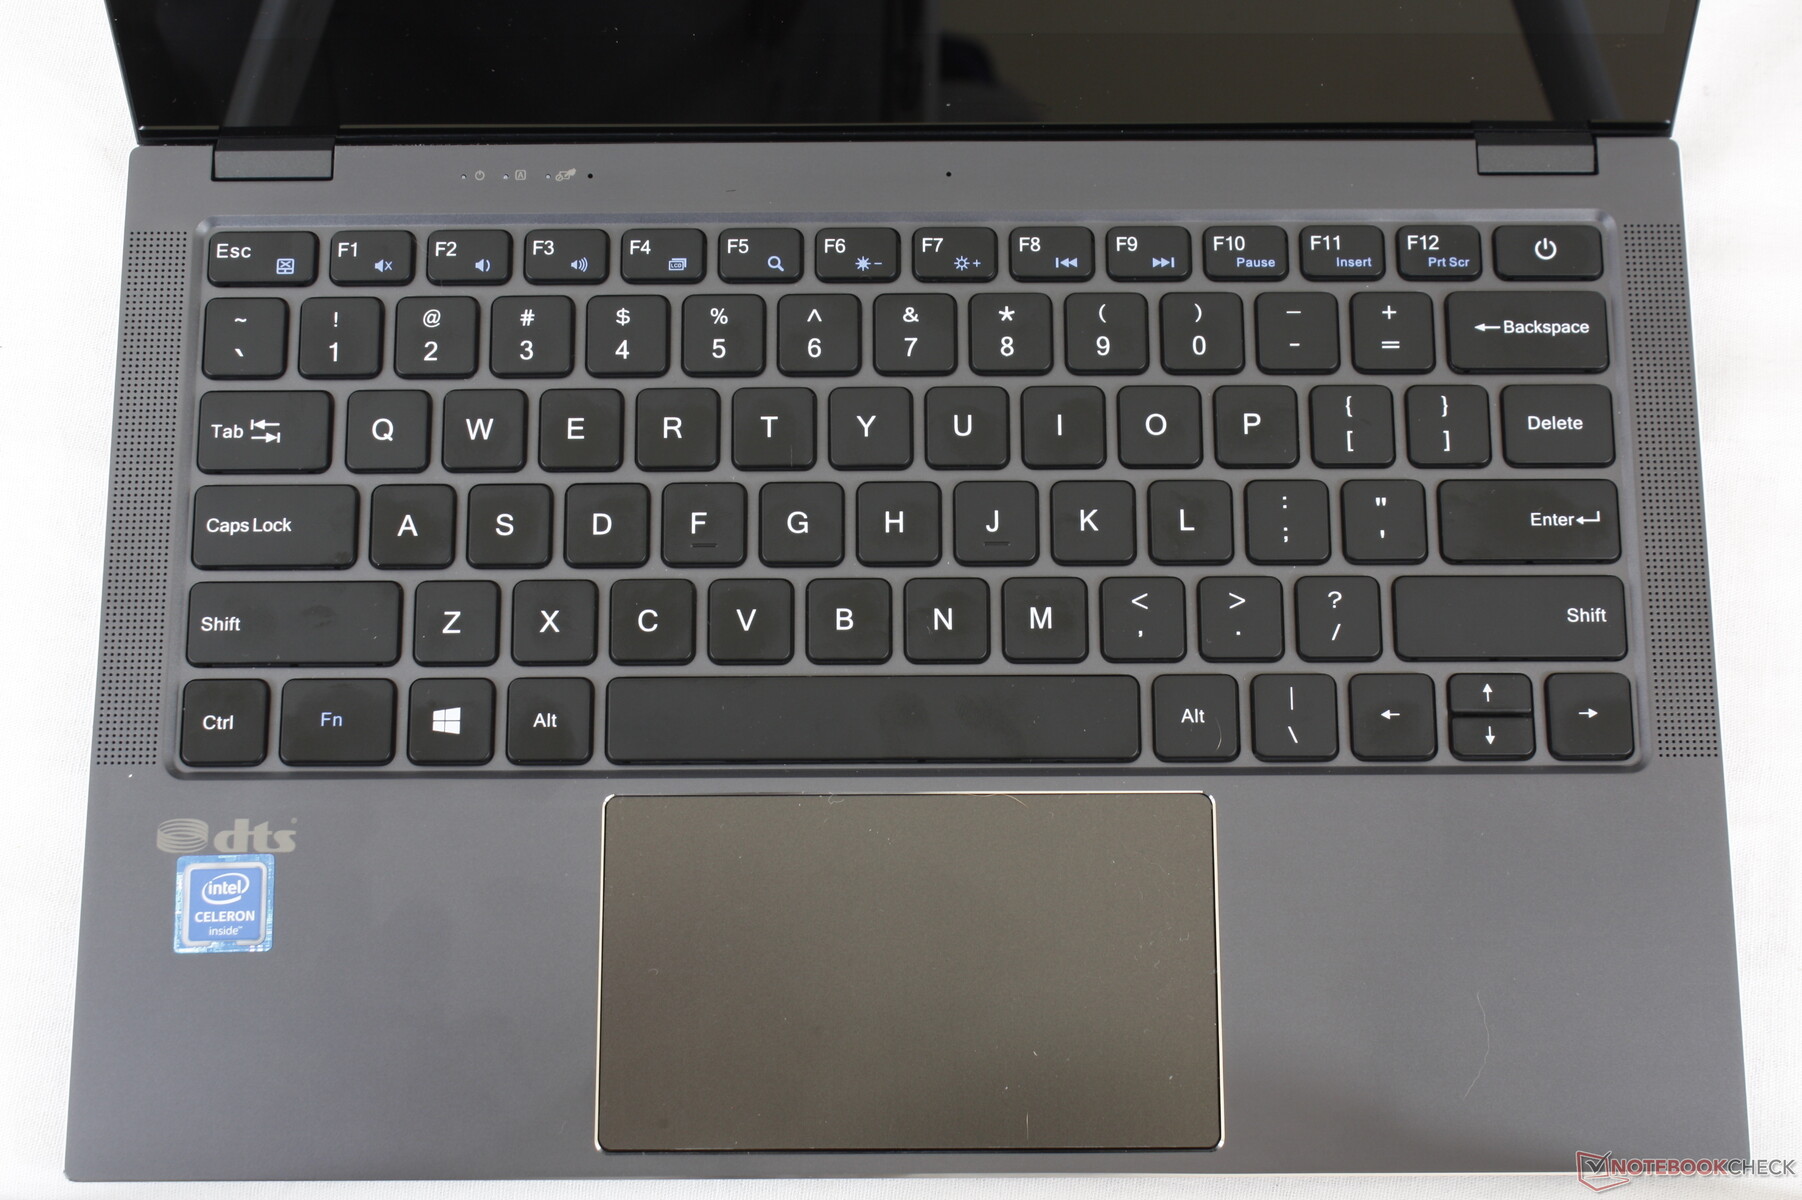
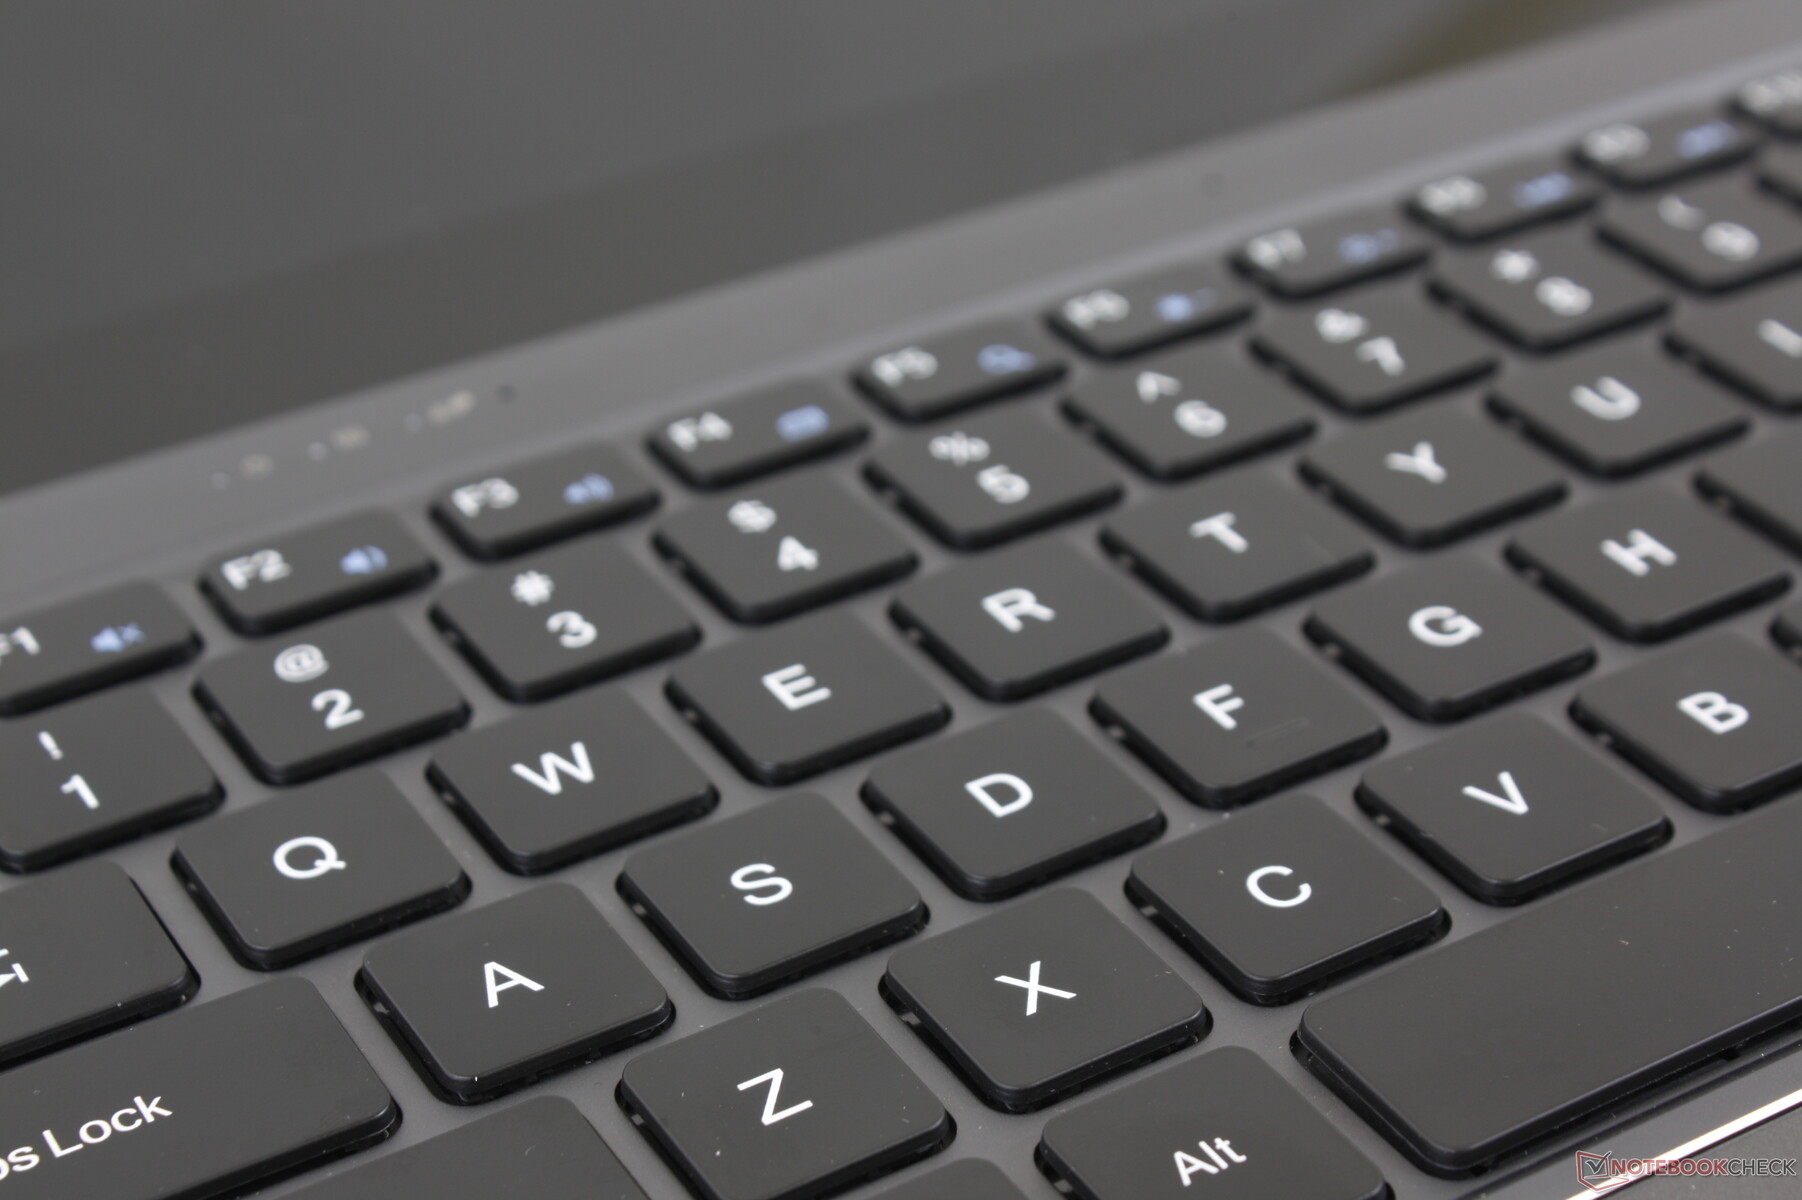
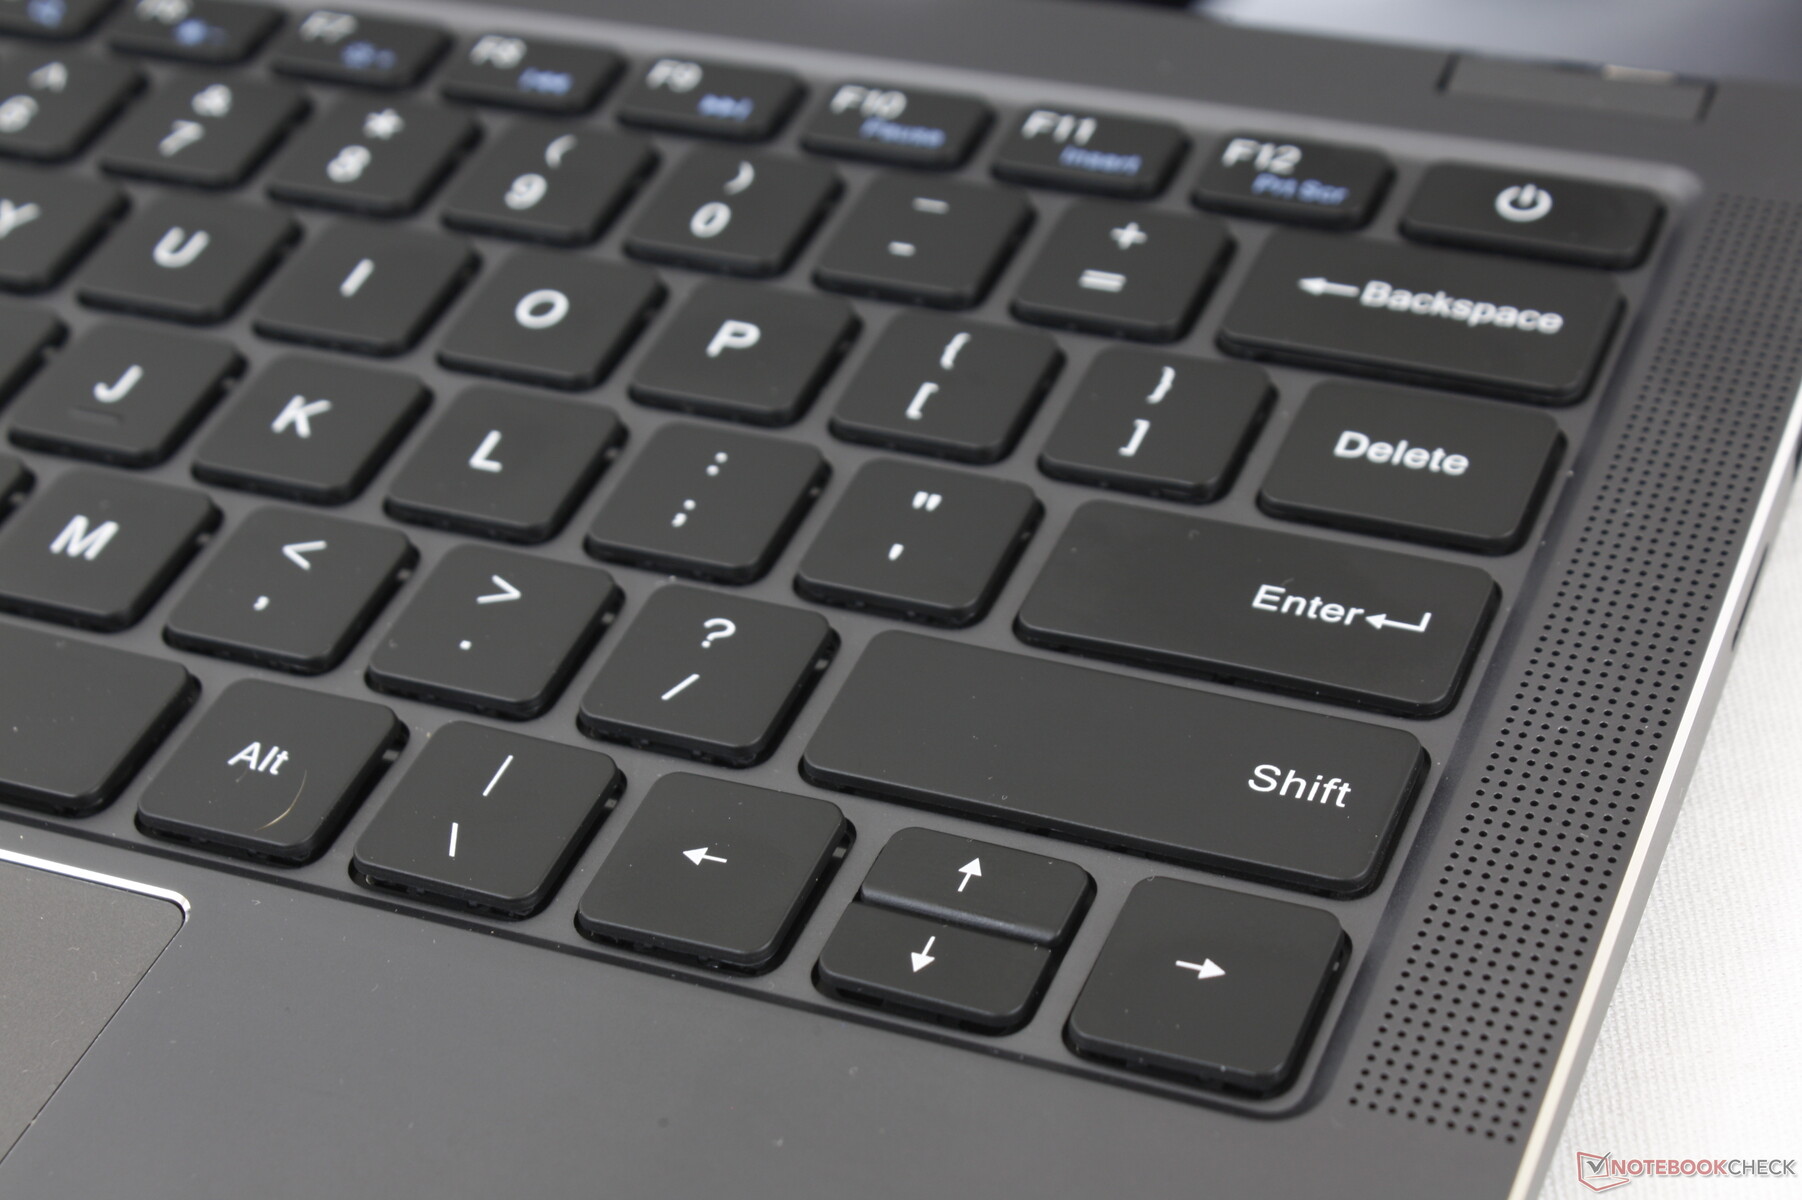
Keyboard
Key feedback is not uniform. The main QWERTY keys, for example, are slightly on the soft side and with quieter clatter than the firmer and louder Backspace key. Even the Enter key feels different with its spongier and lighter feedback than the QWERTY and Backspace keys. Typing on the LarkBook may take some getting used to.
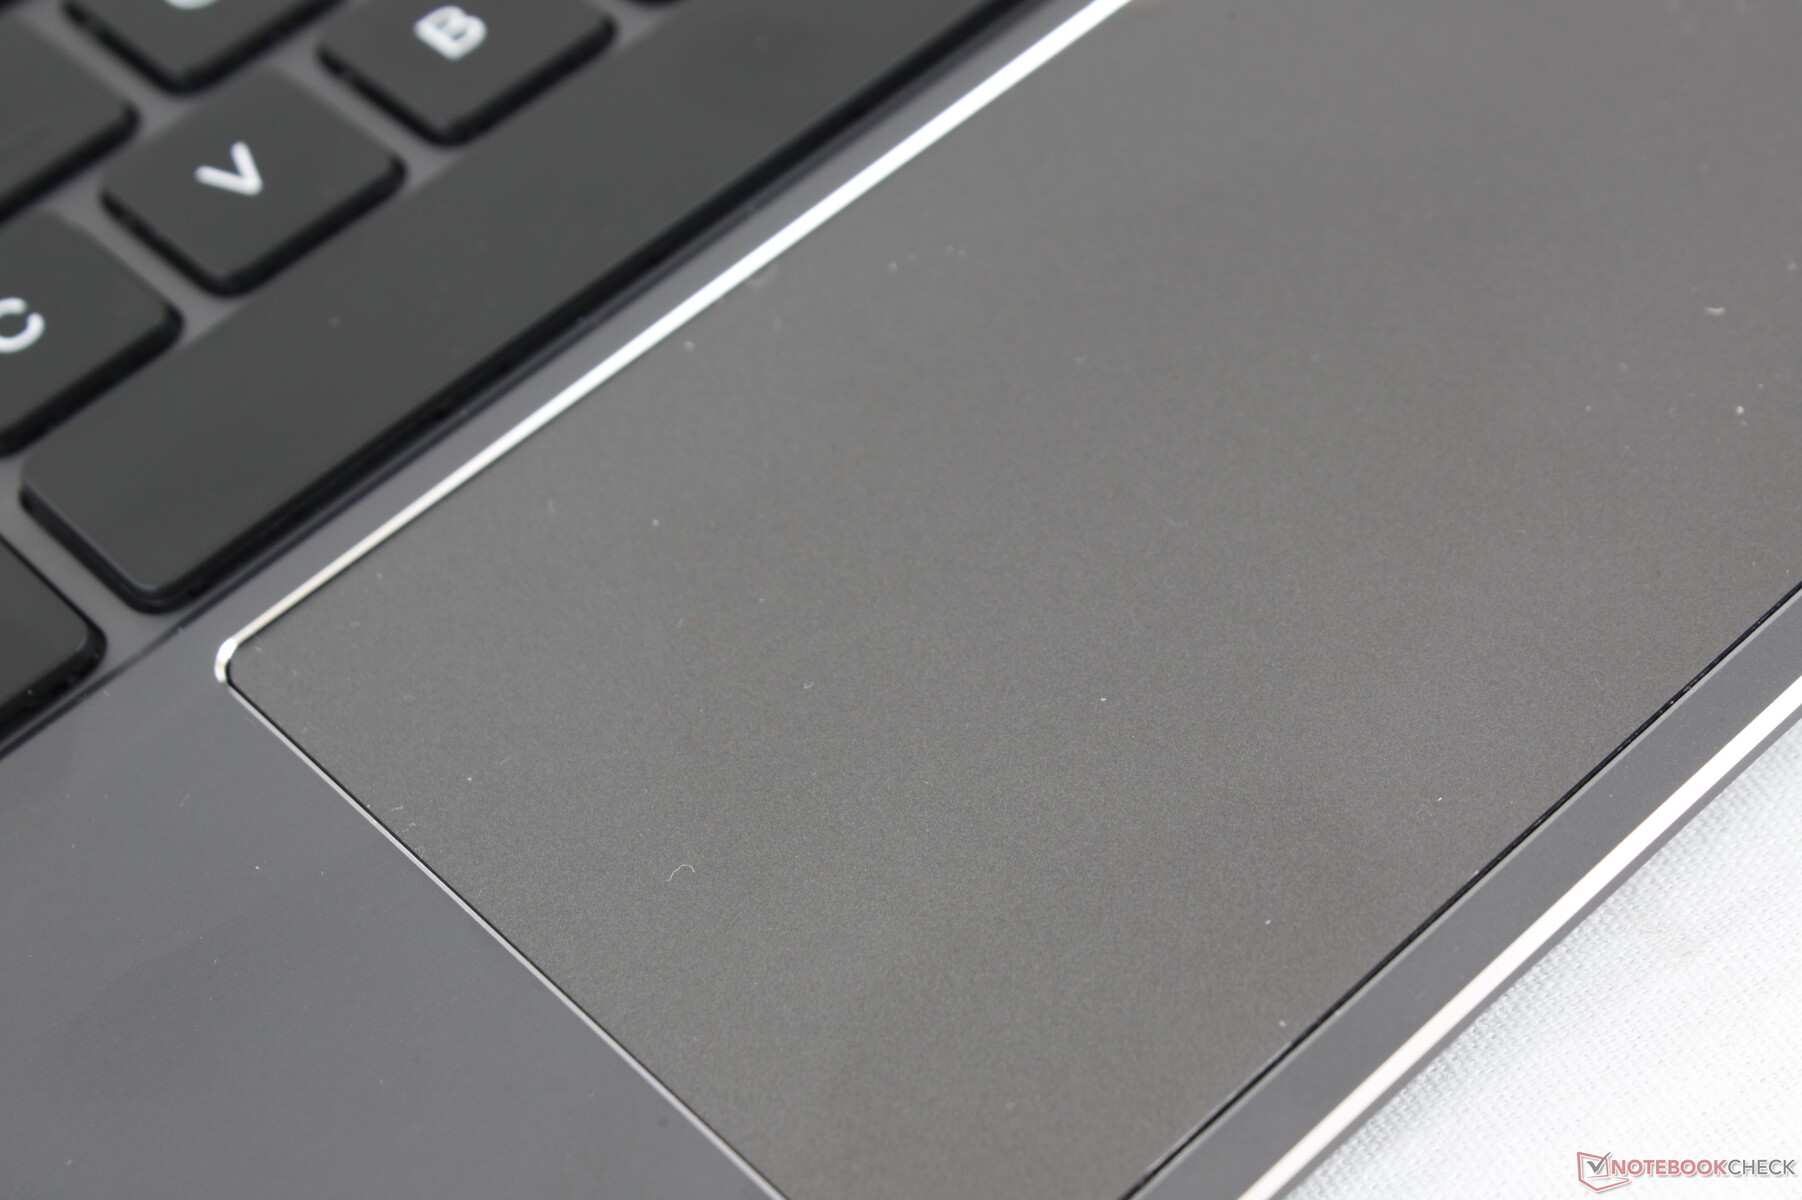
Touchpad
The Precision-enabled clickpad is decent in size (11.5 x 6.5 cm) and with a smooth glide when moving at fast speeds. Unfortunately, there is noticeable sticking when moving at slower or medium speeds and so the cursor tends to jump frequently.
The integrated mouse buttons are both clicky and very shallow. Feedback is weak and could have been stronger.
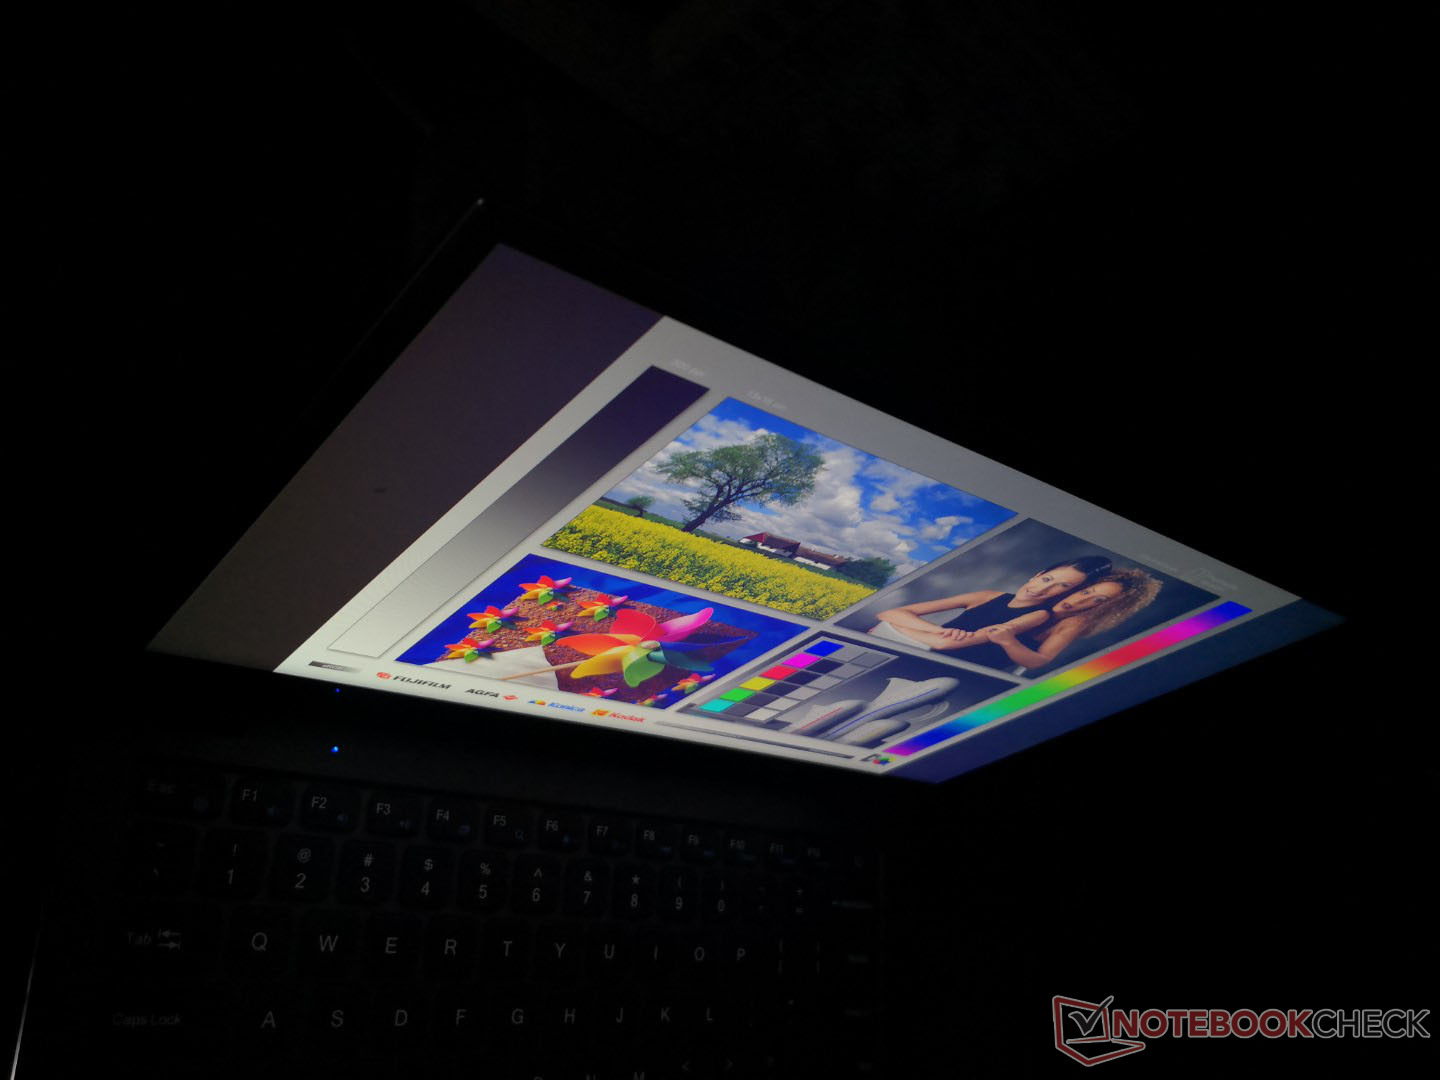
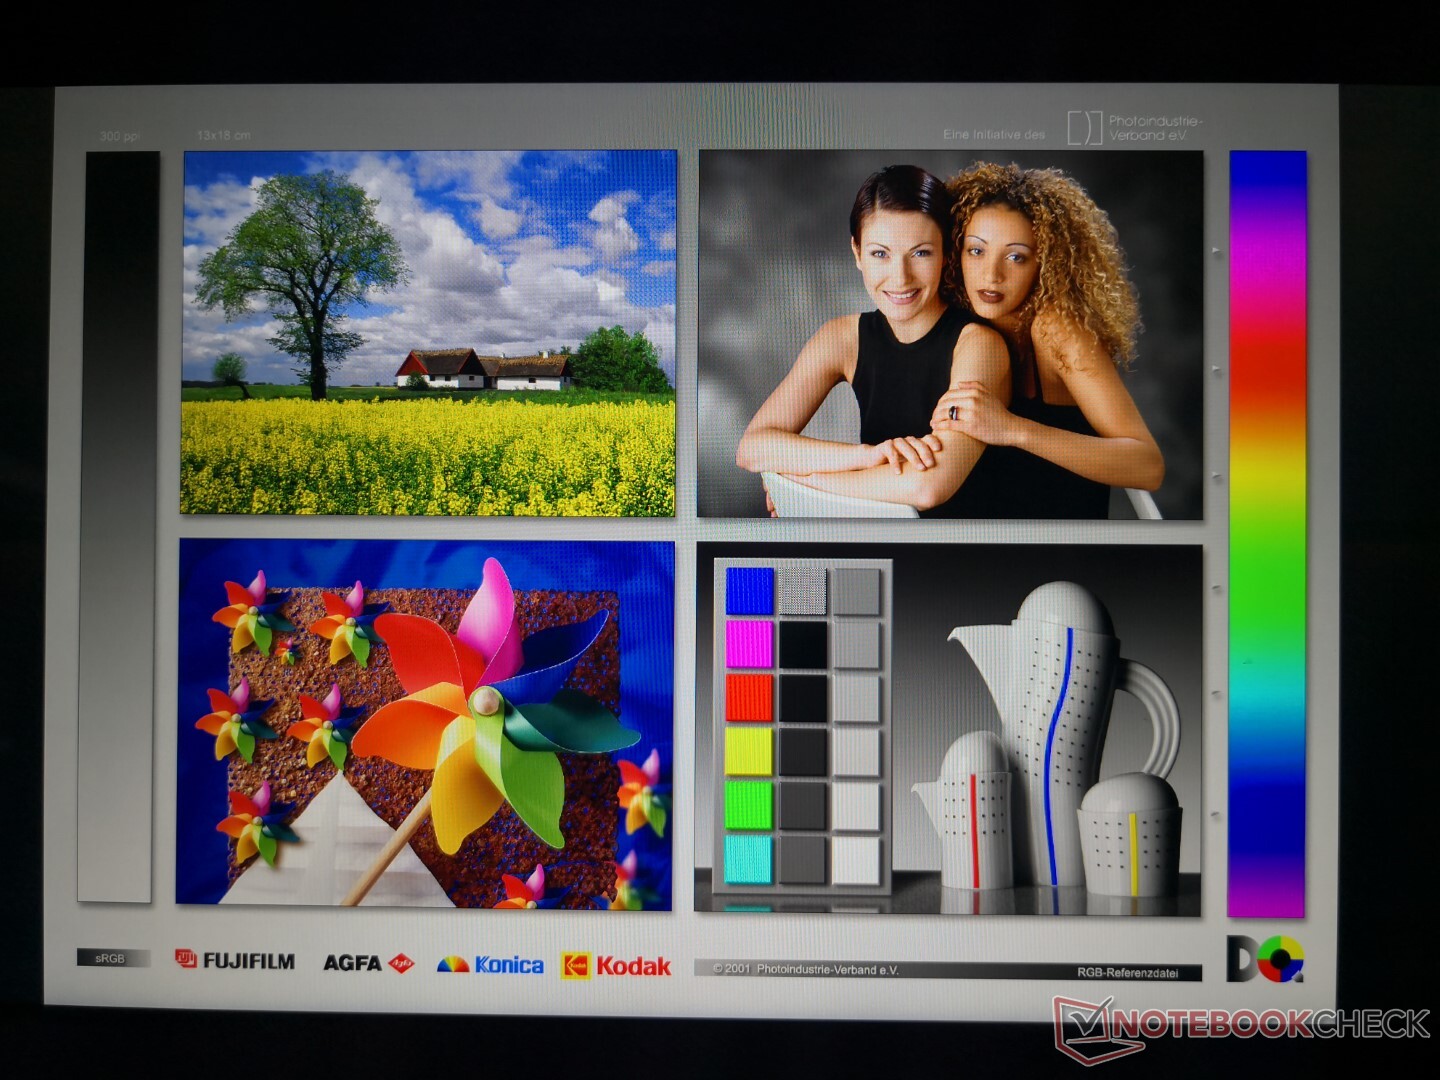
Display
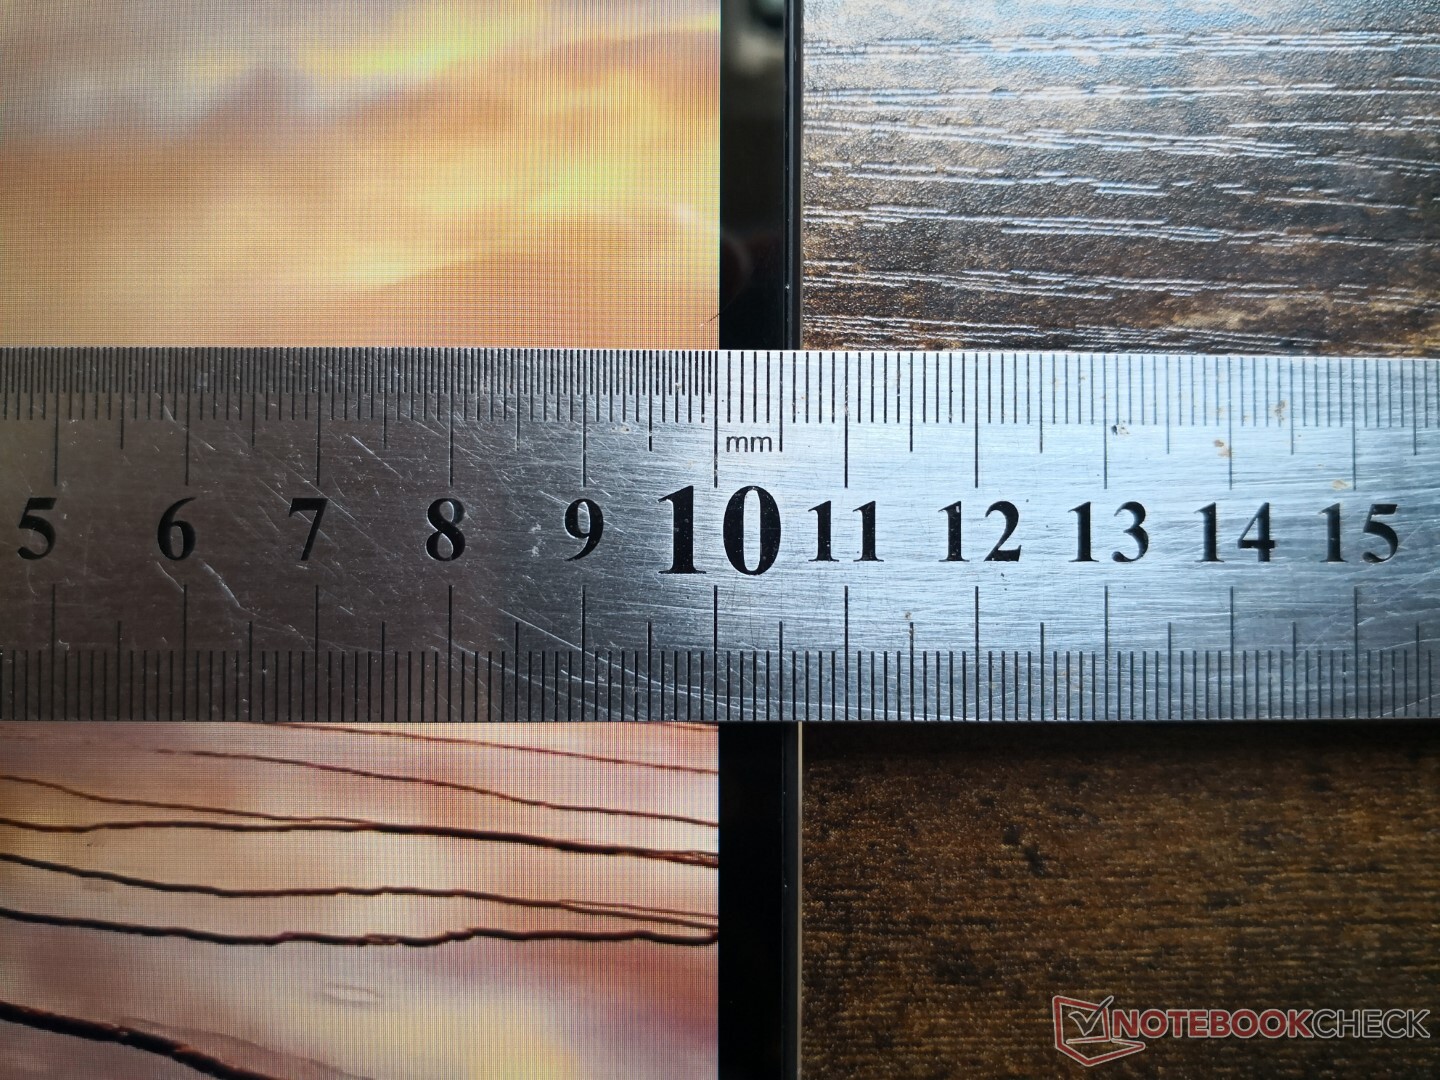
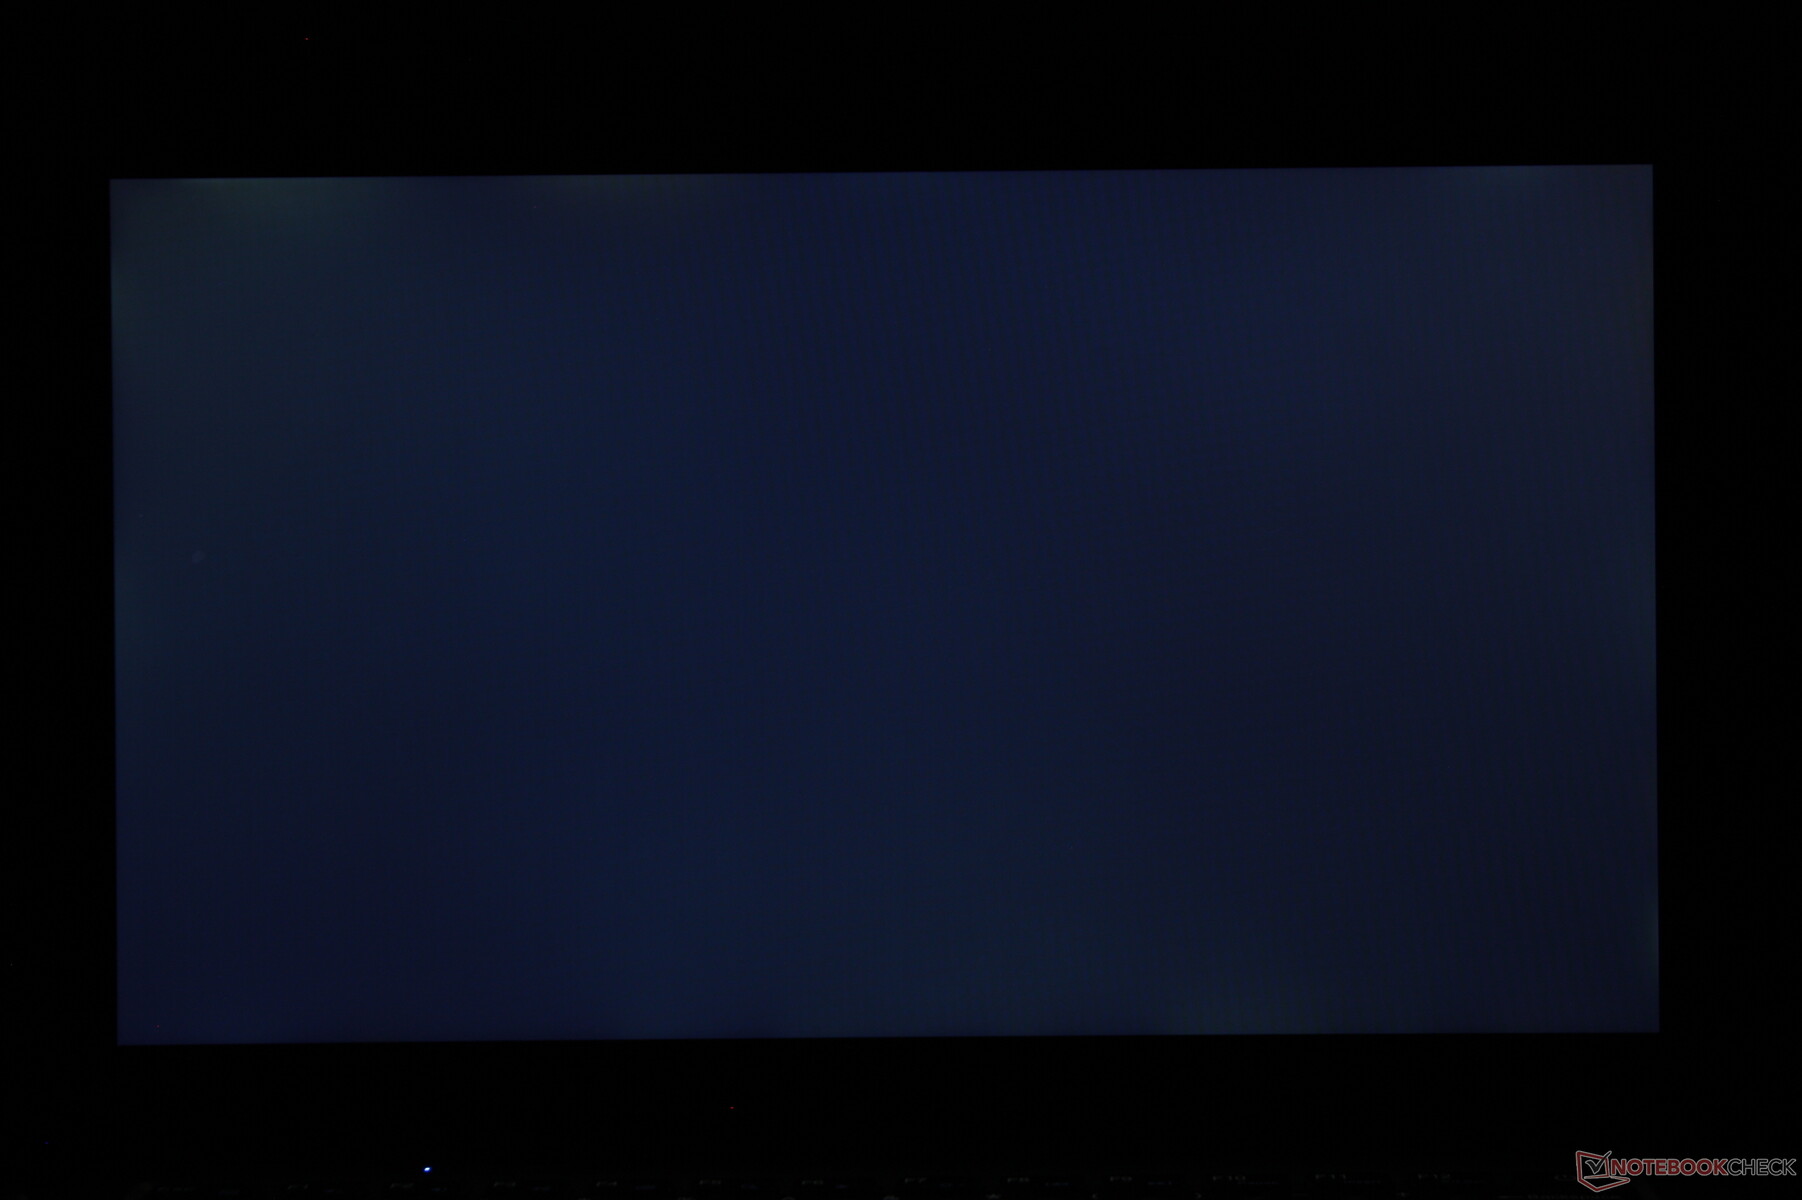
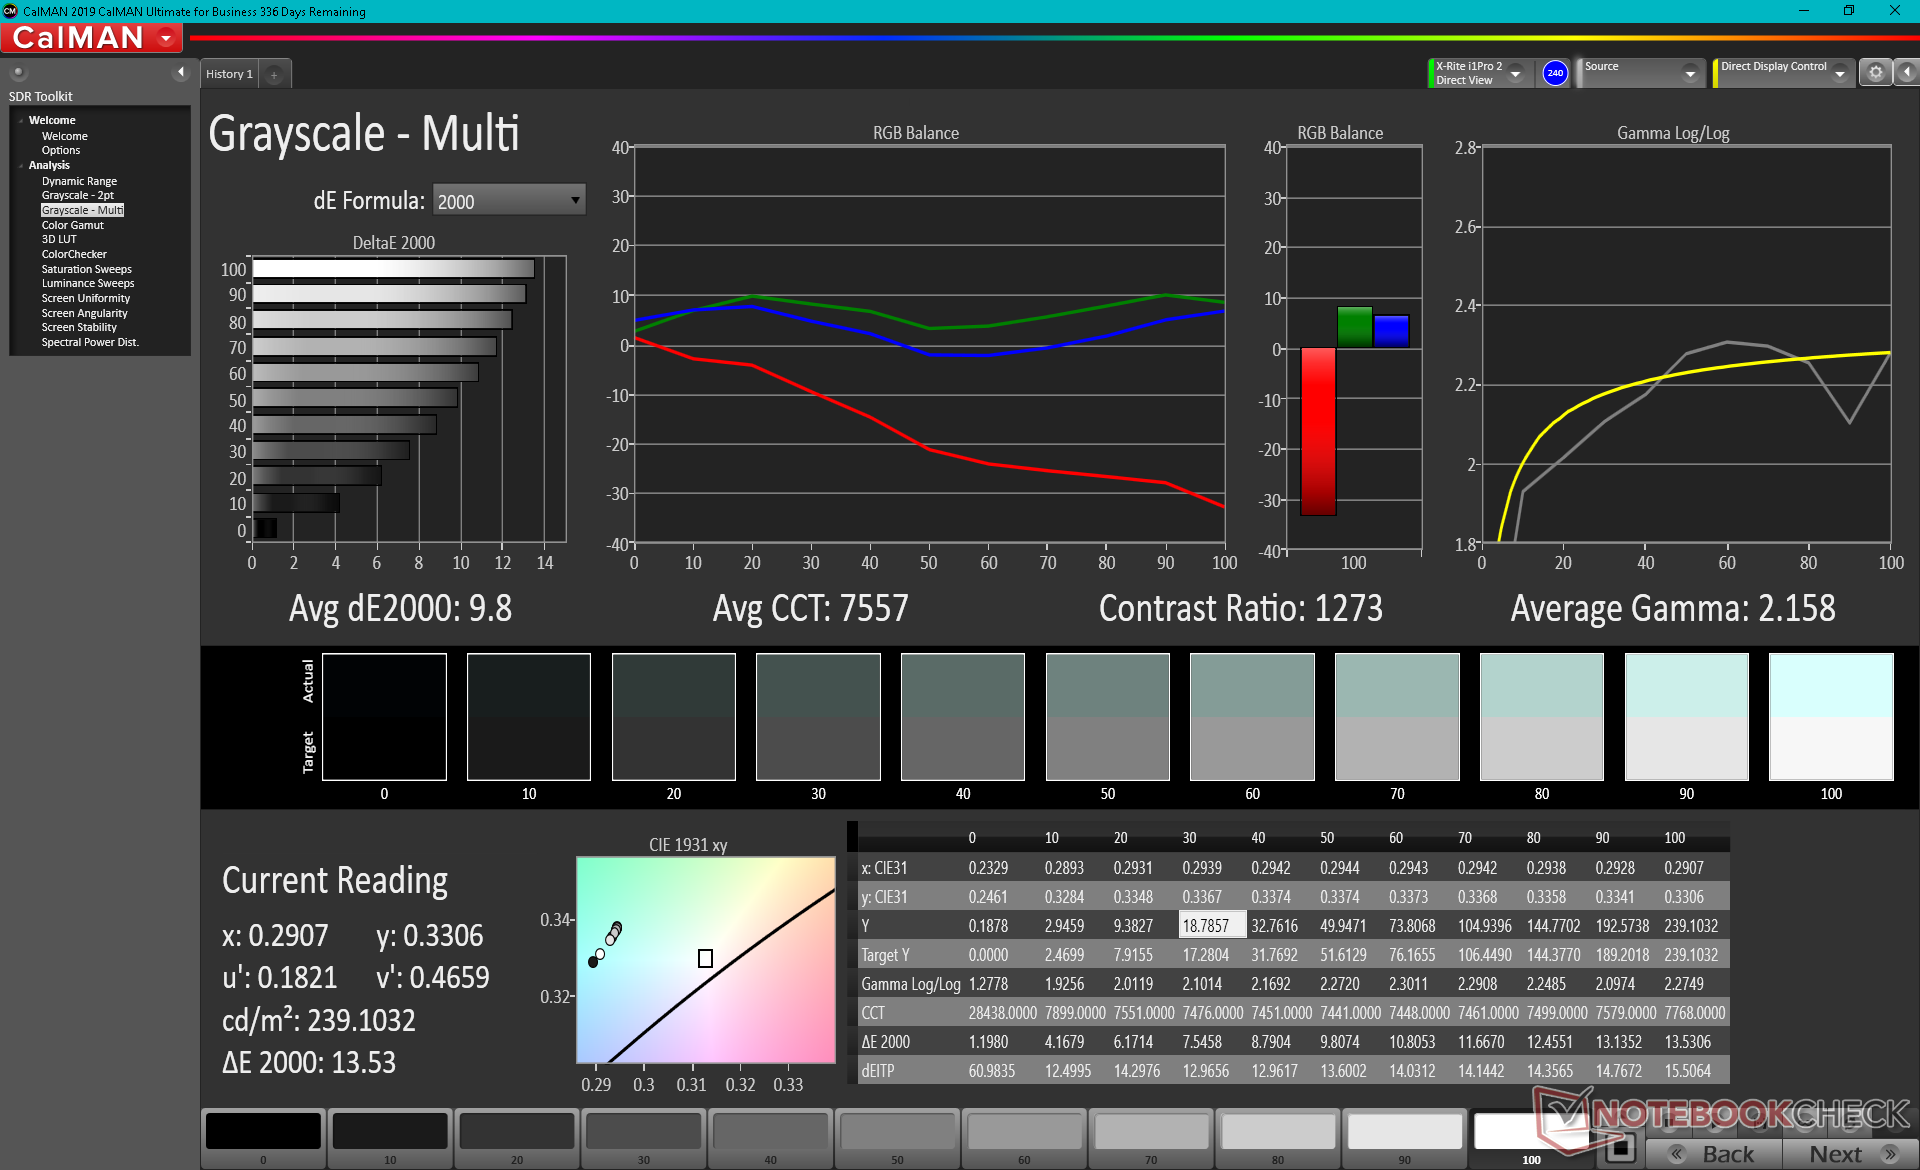
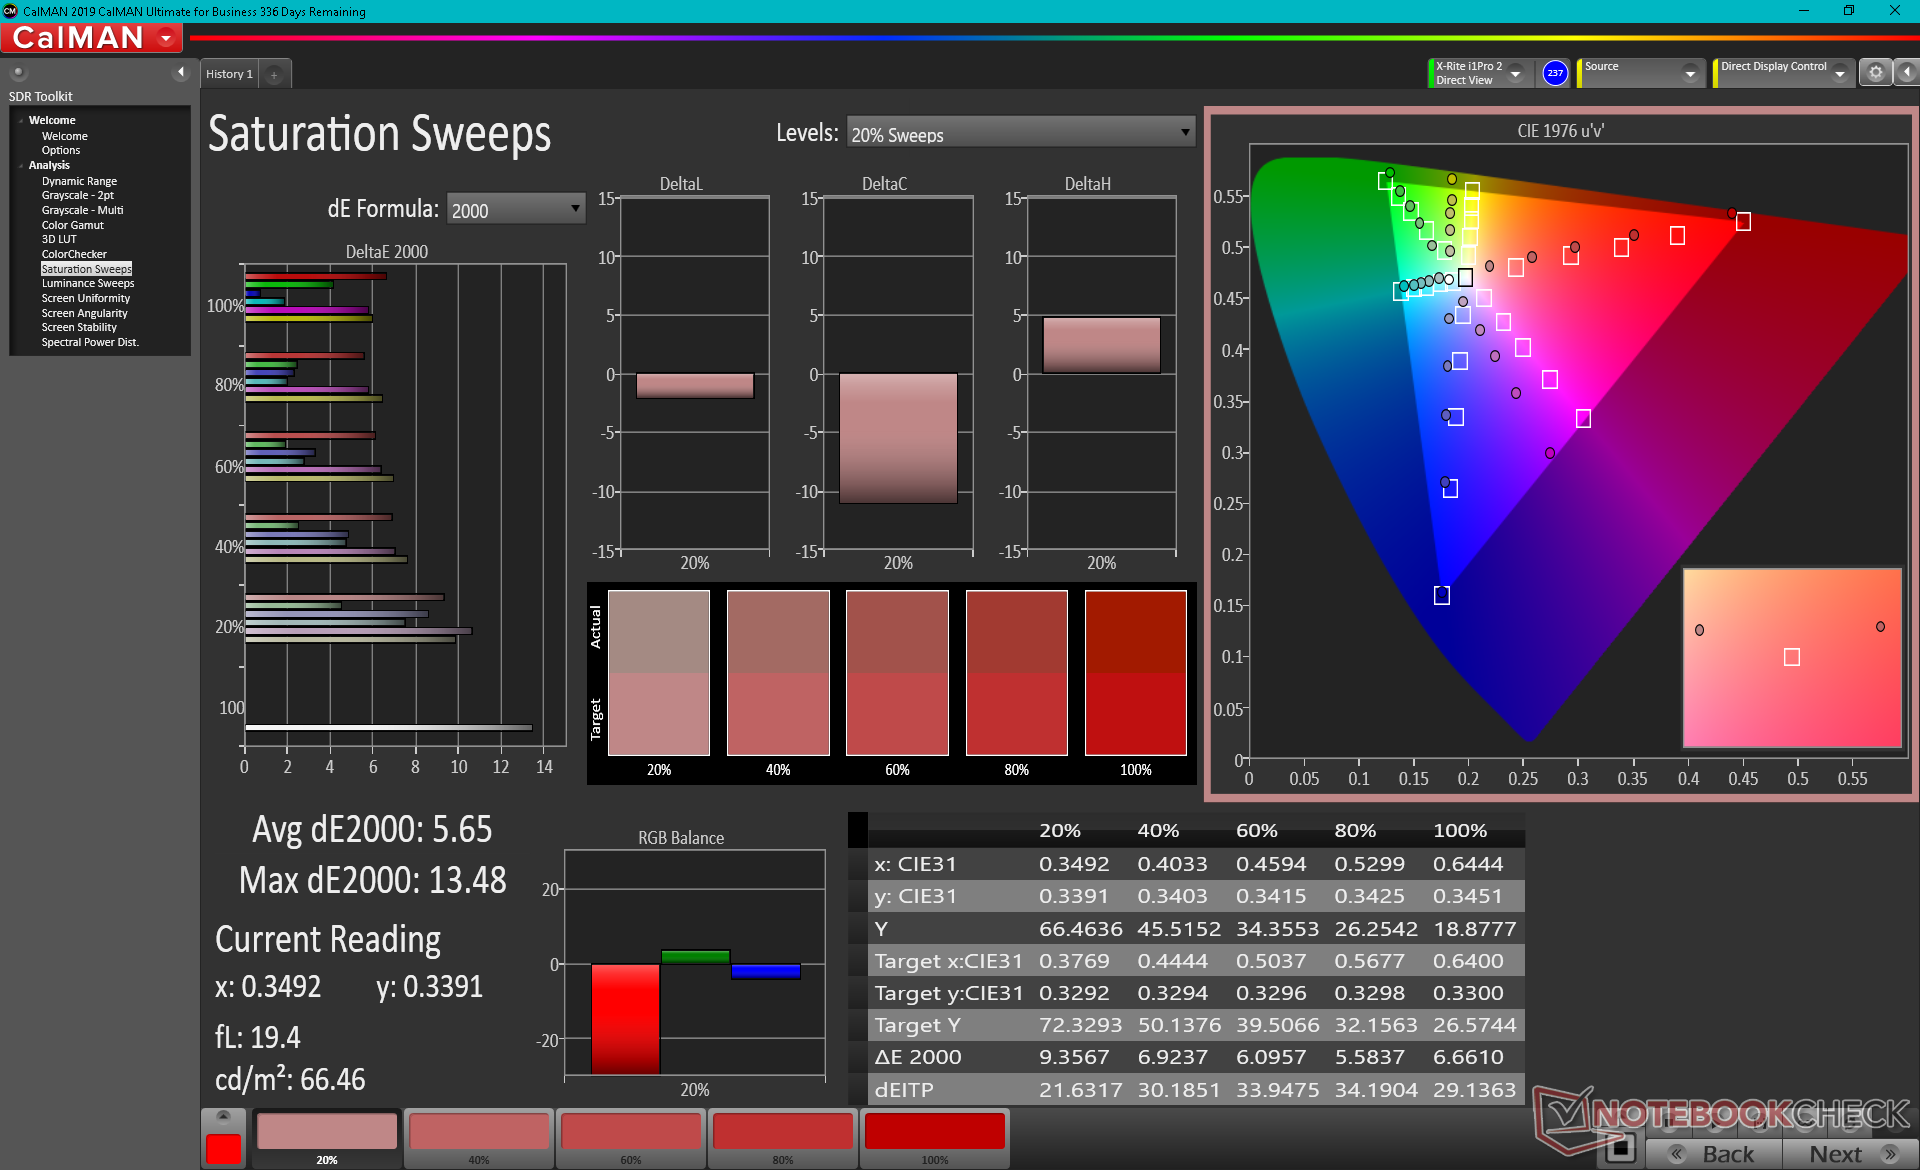
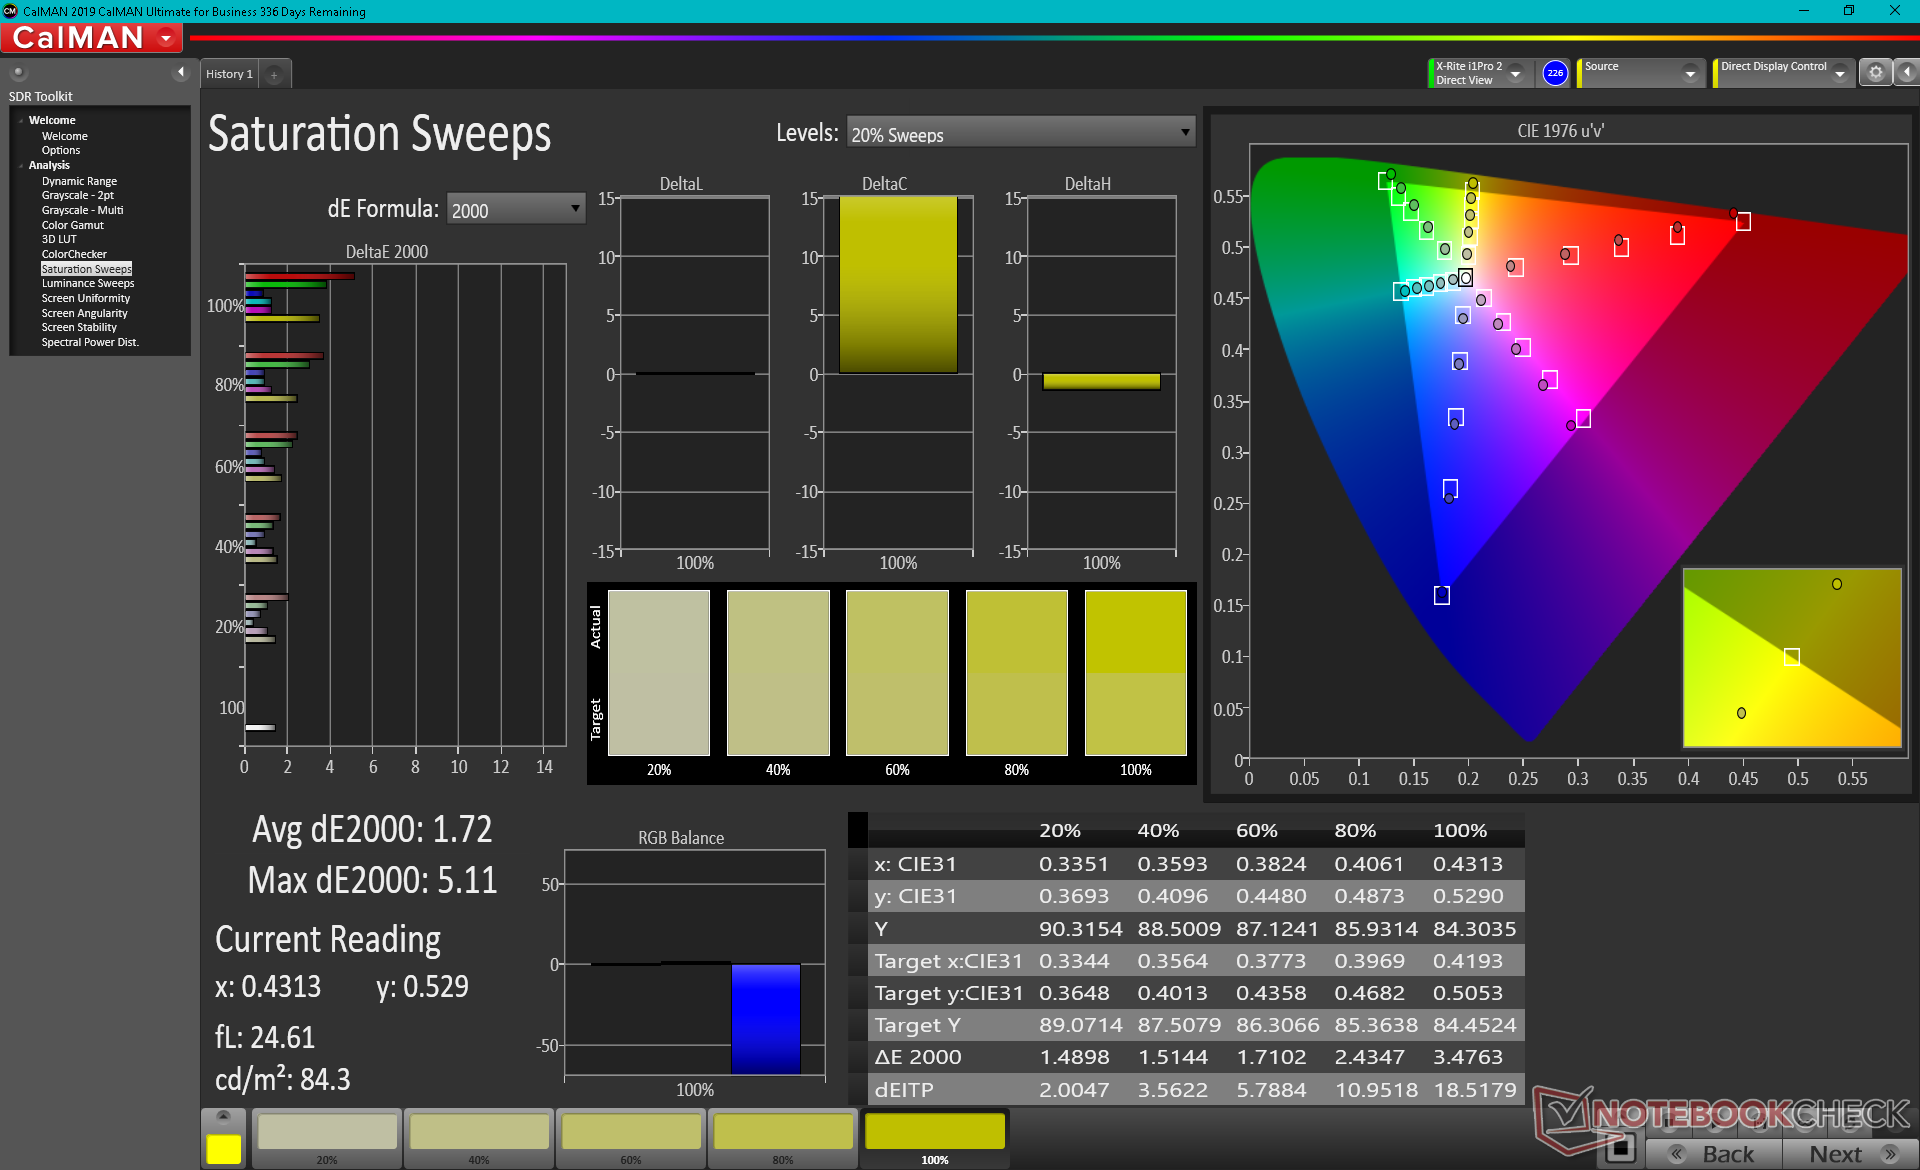
The LarkBook utilizes an IPS panel with the model name M133X56 that can be found on no other laptop in our database as of this writing. Though texts and images are crisp due to the glossy overlay, colors are way off as our X-Rite measurements below will show. Maximum brightness is also dimmer than on most other Ultrabooks. Nonetheless, the high contrast ratio makes it a decent display for 1080p video playback.
Users sensitive to onscreen flickering may want to avoid using this laptop for long periods due to the presence of pulse-width modulation on almost all brightness levels.

| |||||||||||||||||||||||||
Brightness Distribution: 79 %
Center on Battery: 235.3 cd/m²
Contrast: 980:1 (Black: 0.24 cd/m²)
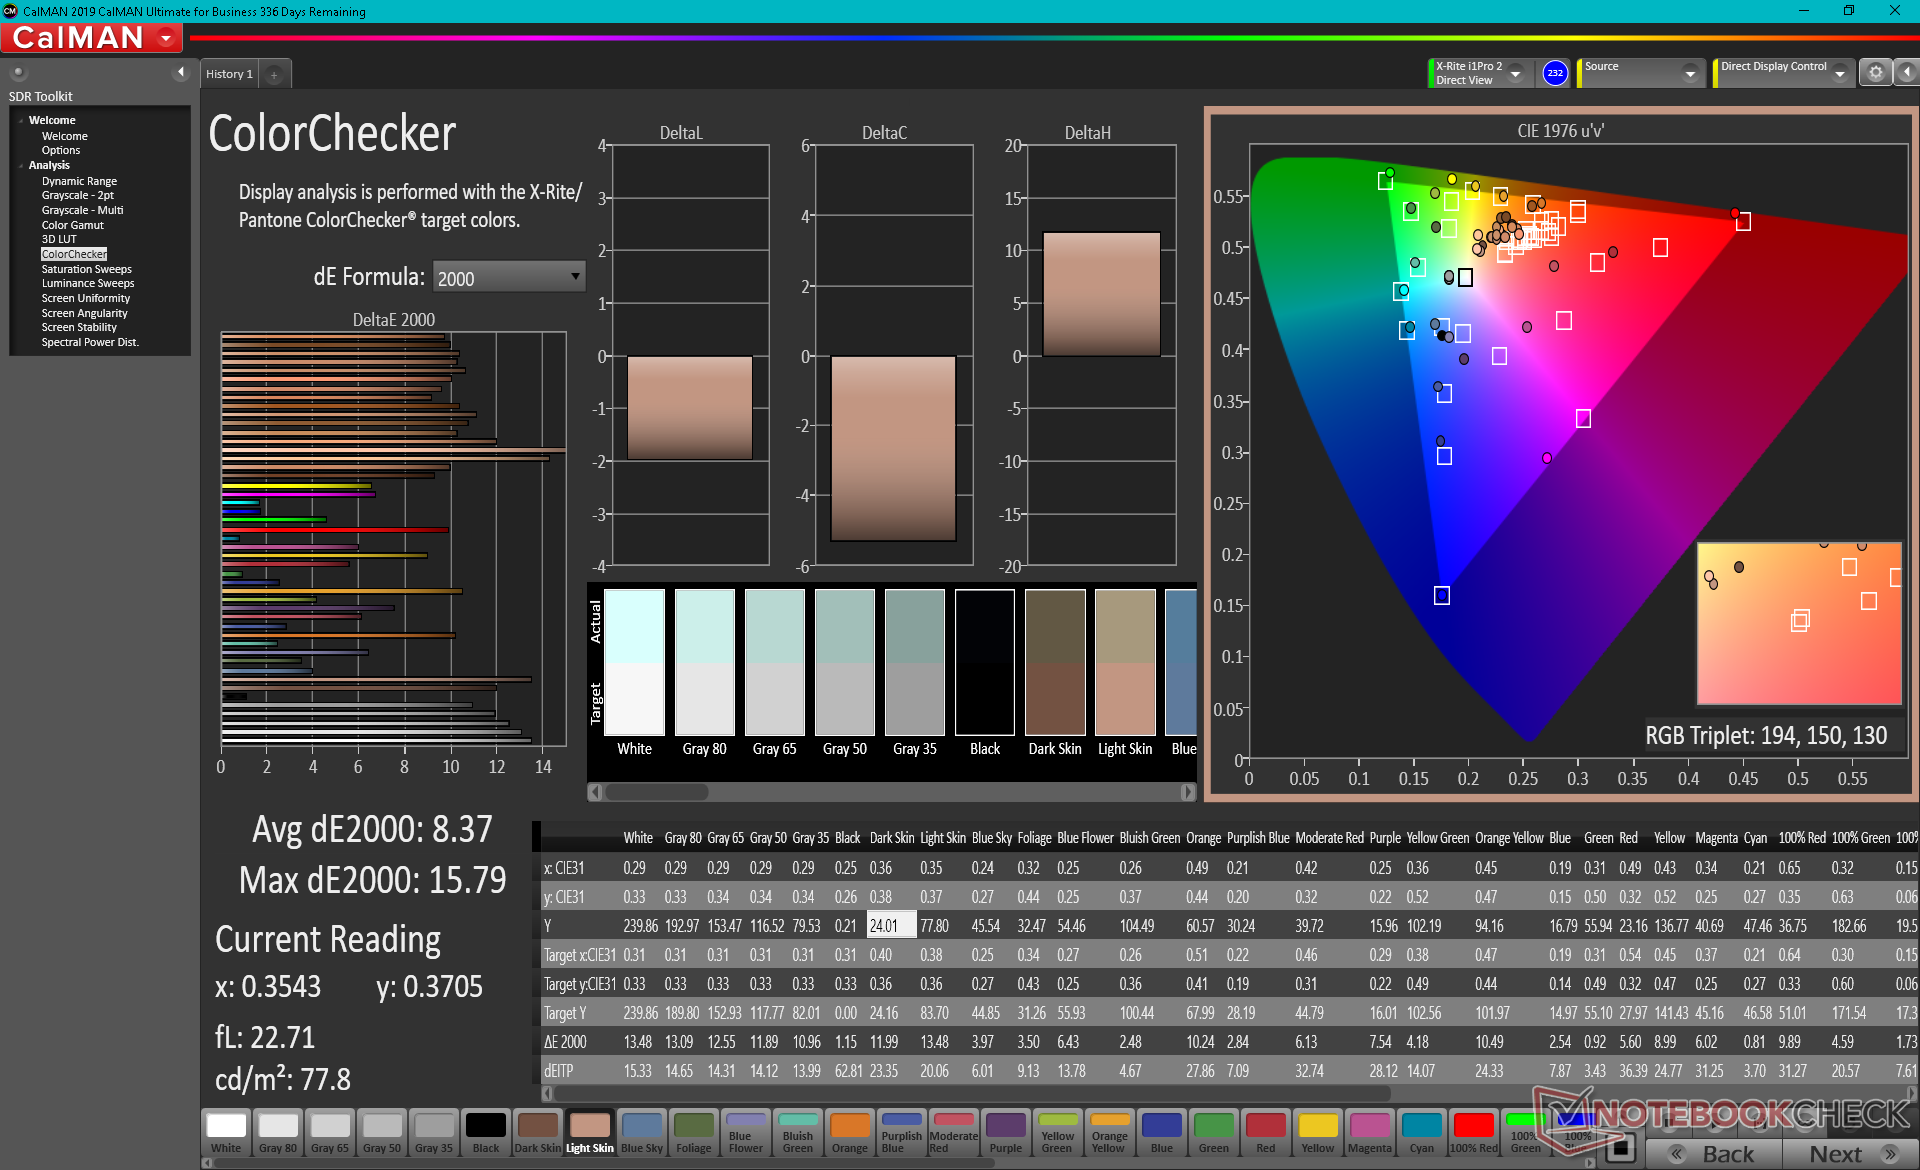
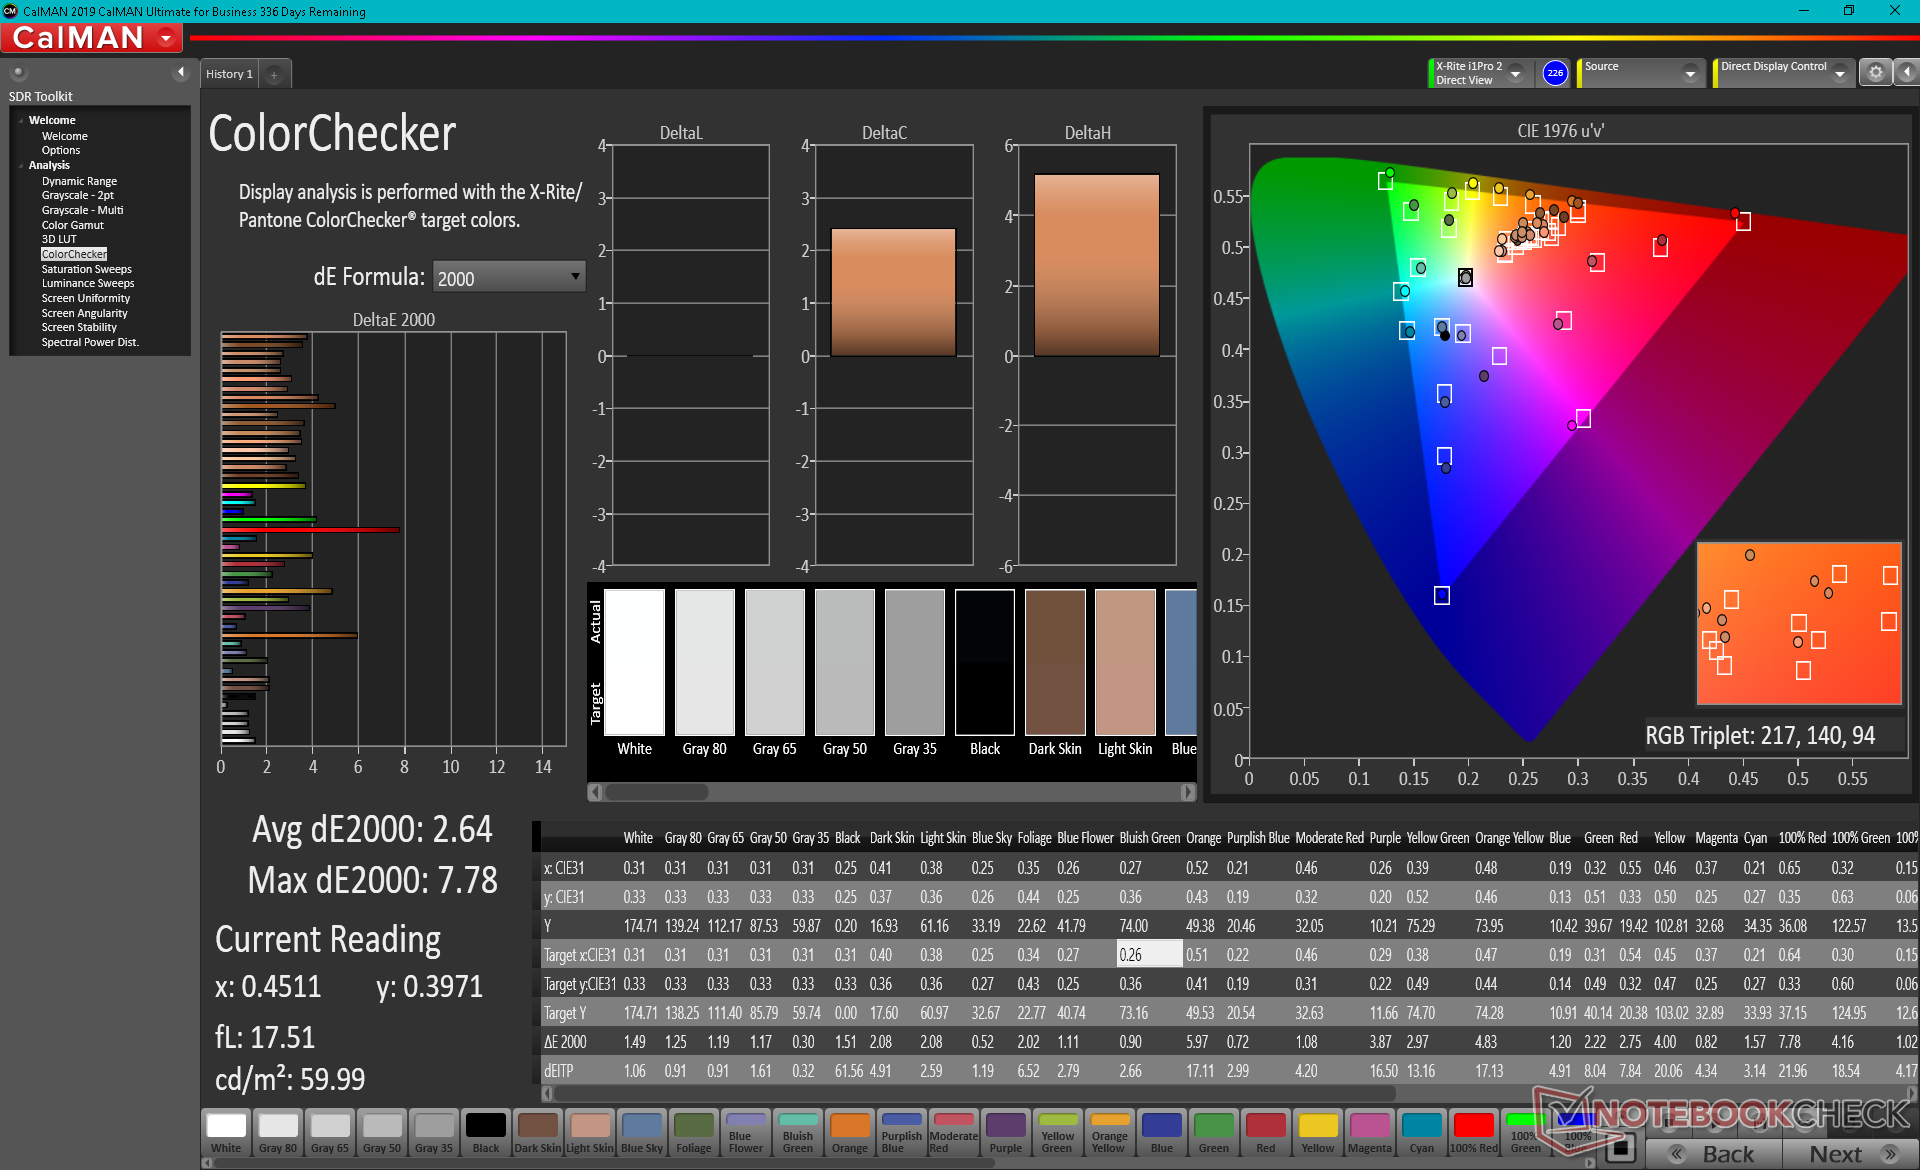
ΔE ColorChecker Calman: 8.37 | ∀{0.5-29.43 Ø4.73}
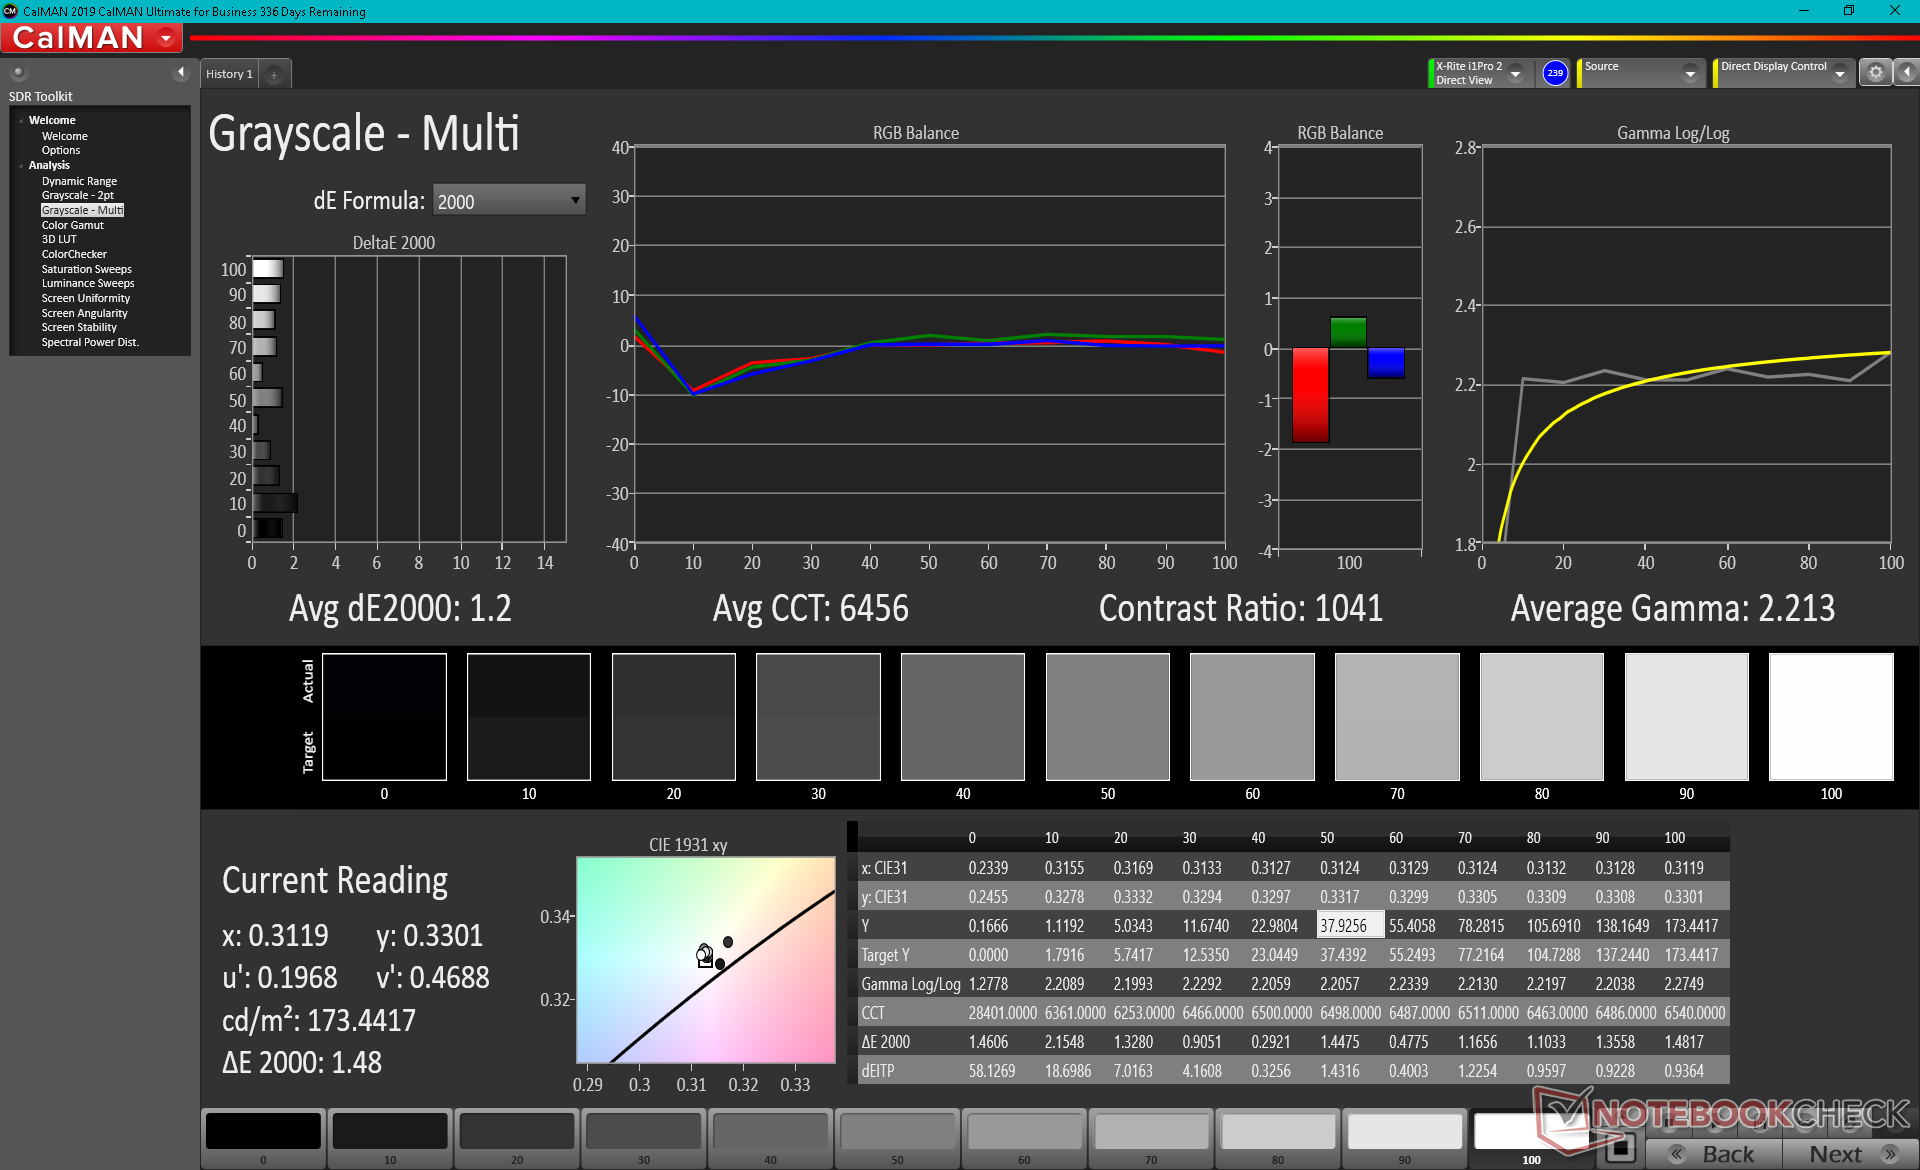
calibrated: 2.64
ΔE Greyscale Calman: 9.8 | ∀{0.09-98 Ø4.97}
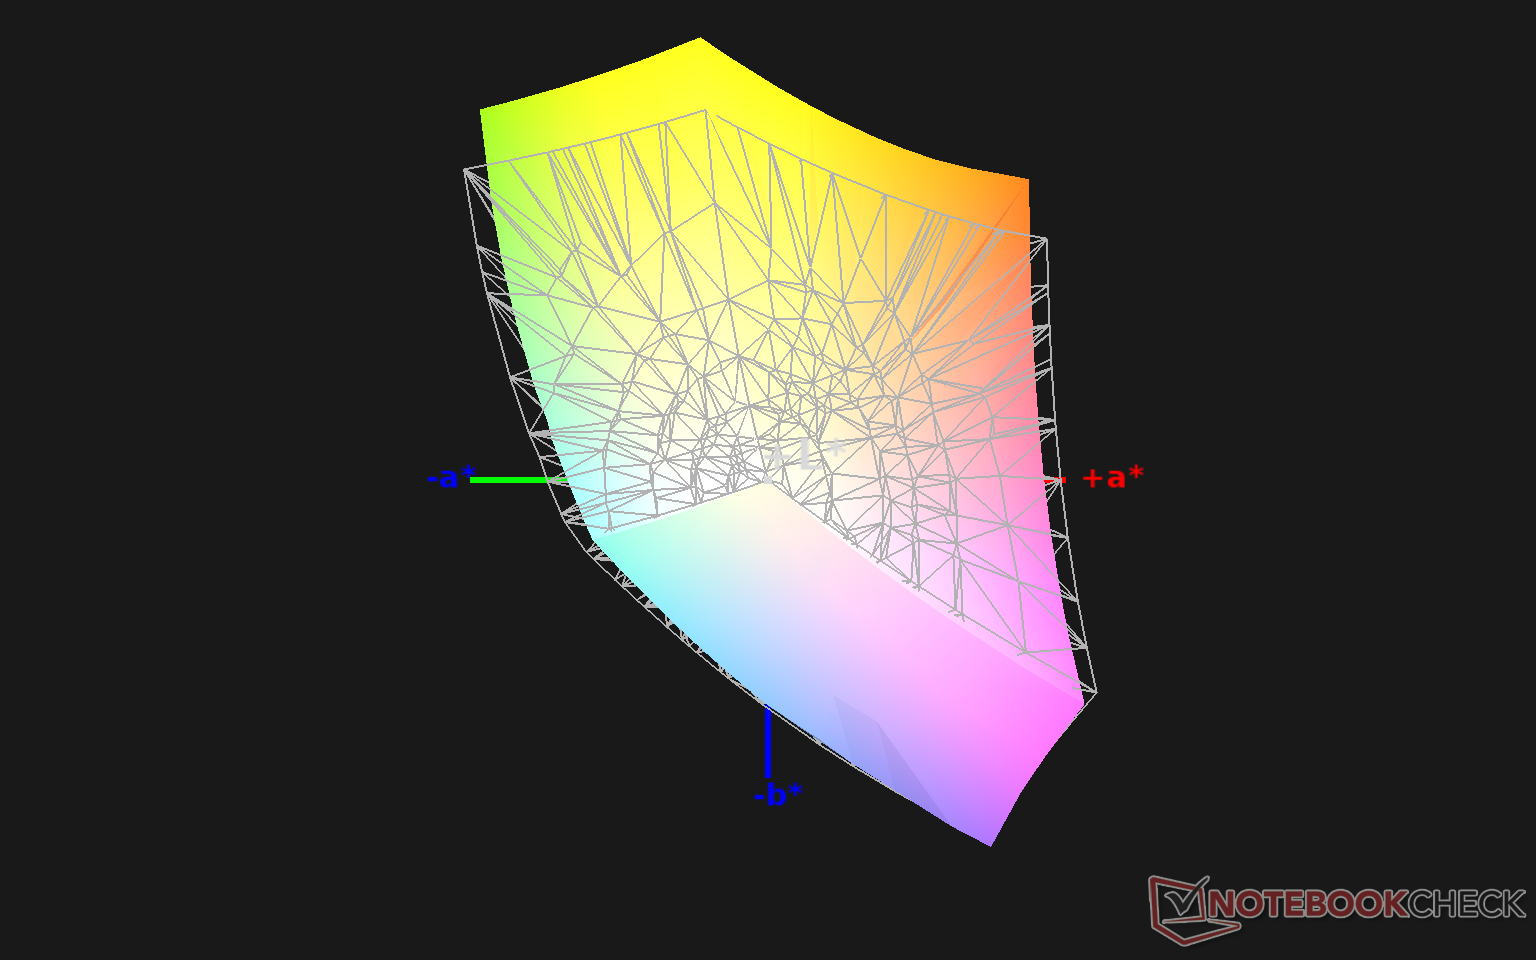
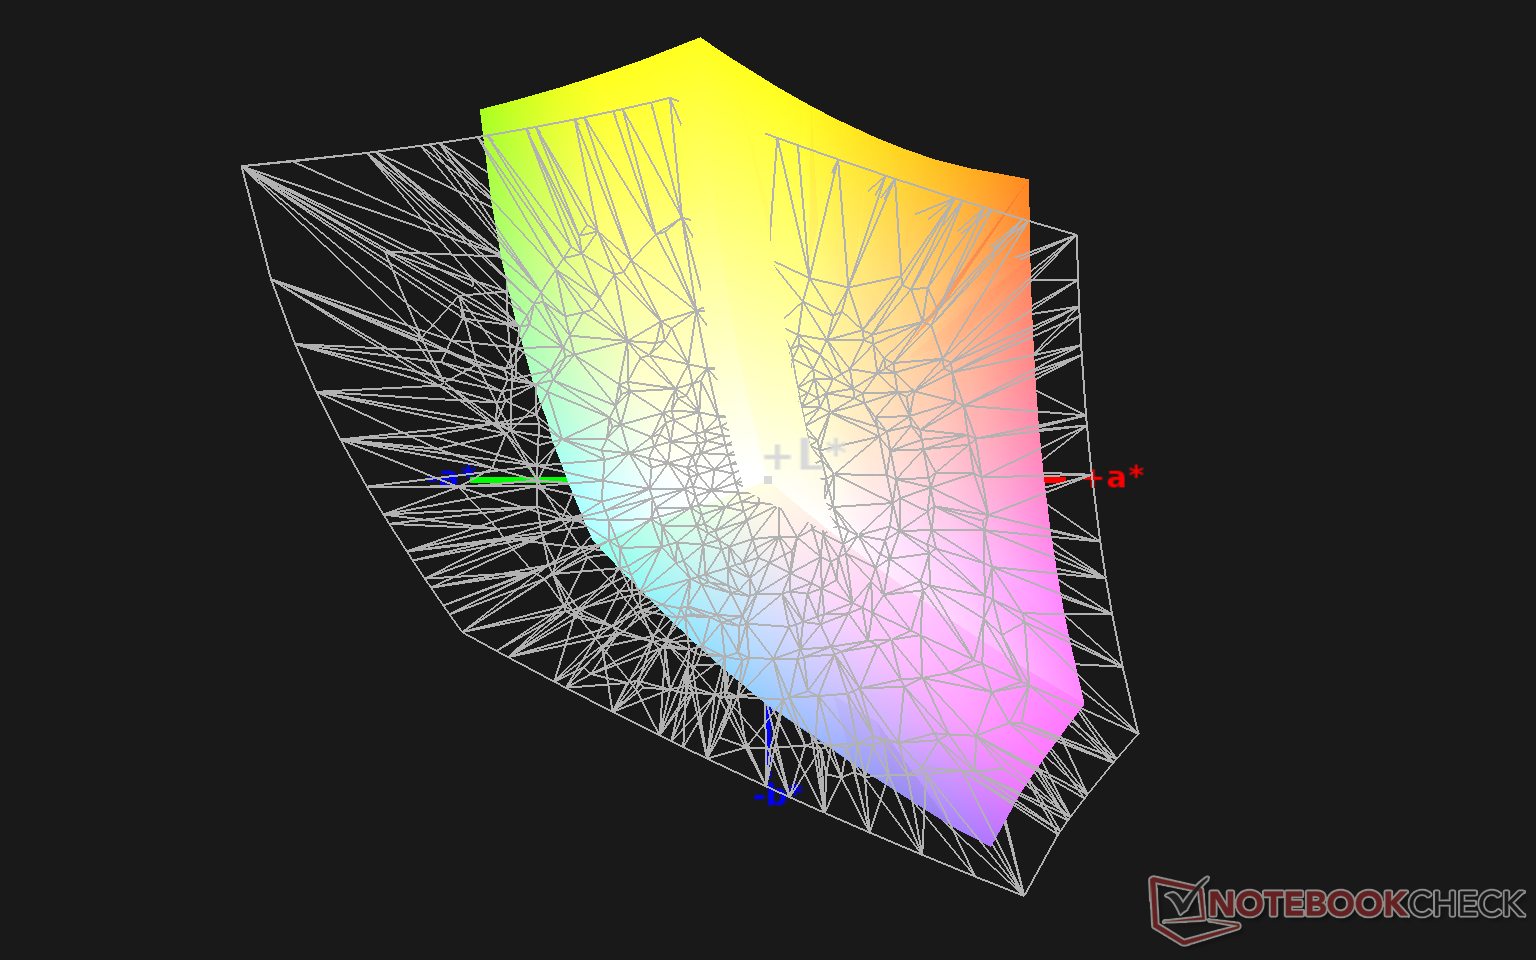
92.4% sRGB (Argyll 1.6.3 3D)
60.1% AdobeRGB 1998 (Argyll 1.6.3 3D)
67.8% AdobeRGB 1998 (Argyll 3D)
92.7% sRGB (Argyll 3D)
69.9% Display P3 (Argyll 3D)
Gamma: 2.16
CCT: 7557 K
| Chuwi LarkBook CWI509 M133X56, IPS, 13.3", 1920x1080 | Apple MacBook Air 2020 M1 Entry IPS, 13.3", 2560x1600 | Dell XPS 13 9310 Core i7 FHD Sharp LQ134N1, IPS, 13.4", 1920x1200 | Lenovo IdeaPad S540-13API CSOT T3 MND307DA1-2, IPS, 13.3", 2560x1600 | HP Pavilion 13-bb0015cl AUOCA8D, IPS, 13.3", 3840x2160 | Asus VivoBook S13 S330UA-EY034T N133HCE-EAA, IPS LED, 13.3", 1920x1080 | |
|---|---|---|---|---|---|---|
| Display | 25% | 5% | 6% | -3% | -36% | |
| Display P3 Coverage (%) | 69.9 | 98.6 41% | 70.9 1% | 73.4 5% | 65 -7% | 42.16 -40% |
| sRGB Coverage (%) | 92.7 | 100 8% | 99.1 7% | 98.6 6% | 93.4 1% | 63.2 -32% |
| AdobeRGB 1998 Coverage (%) | 67.8 | 85.9 27% | 72.9 8% | 72.6 7% | 66.5 -2% | 43.59 -36% |
| Response Times | 14% | -30% | -17% | -43% | -7% | |
| Response Time Grey 50% / Grey 80% * (ms) | 32 ? | 31 ? 3% | 52 ? -63% | 45.6 ? -43% | 52.4 ? -64% | 40.8 ? -27% |
| Response Time Black / White * (ms) | 34.4 ? | 26.1 ? 24% | 33.2 ? 3% | 30.8 ? 10% | 41.6 ? -21% | 29.6 ? 14% |
| PWM Frequency (Hz) | 1000 ? | 118000 ? | 2475 ? | 26040 ? | ||
| Screen | 49% | 46% | 39% | 38% | 0% | |
| Brightness middle (cd/m²) | 235.3 | 417 77% | 543.3 131% | 321 36% | 514.1 118% | 280 19% |
| Brightness (cd/m²) | 223 | 395 77% | 524 135% | 314 41% | 501 125% | 265 19% |
| Brightness Distribution (%) | 79 | 91 15% | 92 16% | 94 19% | 91 15% | 89 13% |
| Black Level * (cd/m²) | 0.24 | 0.39 -63% | 0.38 -58% | 0.19 21% | 0.37 -54% | 0.24 -0% |
| Contrast (:1) | 980 | 1069 9% | 1430 46% | 1689 72% | 1389 42% | 1167 19% |
| Colorchecker dE 2000 * | 8.37 | 1.12 87% | 3.02 64% | 3.3 61% | 4.35 48% | 5.6 33% |
| Colorchecker dE 2000 max. * | 15.79 | 2.71 83% | 7.61 52% | 6 62% | 6.5 59% | 20.7 -31% |
| Colorchecker dE 2000 calibrated * | 2.64 | 0.77 71% | 1.23 53% | 1.7 36% | 2.26 14% | 4.3 -63% |
| Greyscale dE 2000 * | 9.8 | 1.7 83% | 5 49% | 3.5 64% | 5.2 47% | 4.1 58% |
| Gamma | 2.16 102% | 2207 0% | 2.02 109% | 2.08 106% | 2.12 104% | 2.44 90% |
| CCT | 7557 86% | 6870 95% | 6550 99% | 7245 90% | 6308 103% | 6614 98% |
| Color Space (Percent of AdobeRGB 1998) (%) | 60.1 | 66.8 11% | 64.5 7% | 60.6 1% | 40.1 -33% | |
| Color Space (Percent of sRGB) (%) | 92.4 | 99.6 8% | 98.4 6% | 93.3 1% | 63 -32% | |
| Total Average (Program / Settings) | 29% /
39% | 7% /
29% | 9% /
26% | -3% /
20% | -14% /
-7% |
* ... smaller is better
Color space is great at over 90 percent of sRGB to show that the laptop is capable of reproducing similar colors to many mid-range to high-end Ultrabooks. Cheaper panels tend to cover just 60 percent of sRGB only such as the one on the VivoBook S13.
Grayscale and colors are horrendous out of the box. Color temperature in particular is far too cool which is common to see on budget laptops. Calibrating the panel ourselves addresses the problem for a significantly better and more color accurate viewing experience. We highly recommend calibrating the display or applying our calibrated ICC profile above to get the most out of the screen.
Display Response Times
| ↔ Response Time Black to White | ||
|---|---|---|
| 34.4 ms ... rise ↗ and fall ↘ combined | ↗ 19.6 ms rise | 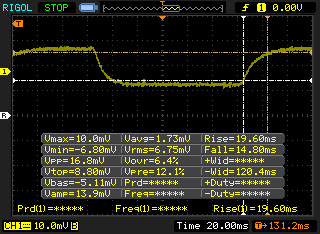 |
| ↘ 14.8 ms fall | ||
| The screen shows slow response rates in our tests and will be unsatisfactory for gamers. In comparison, all tested devices range from 0.1 (minimum) to 240 (maximum) ms. » 92 % of all devices are better. This means that the measured response time is worse than the average of all tested devices (19.9 ms). | ||
| ↔ Response Time 50% Grey to 80% Grey | ||
| 32 ms ... rise ↗ and fall ↘ combined | ↗ 14.8 ms rise | 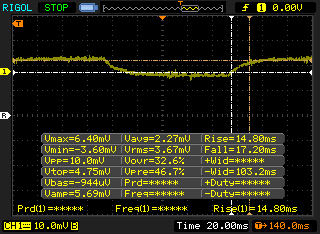 |
| ↘ 17.2 ms fall | ||
| The screen shows slow response rates in our tests and will be unsatisfactory for gamers. In comparison, all tested devices range from 0.165 (minimum) to 636 (maximum) ms. » 43 % of all devices are better. This means that the measured response time is similar to the average of all tested devices (31.1 ms). | ||
Screen Flickering / PWM (Pulse-Width Modulation)
| Screen flickering / PWM detected | 1000 Hz | ≤ 99 % brightness setting | 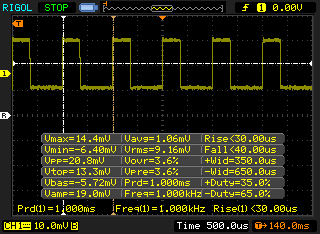 |
The display backlight flickers at 1000 Hz (worst case, e.g., utilizing PWM) Flickering detected at a brightness setting of 99 % and below. There should be no flickering or PWM above this brightness setting. The frequency of 1000 Hz is quite high, so most users sensitive to PWM should not notice any flickering. In comparison: 52 % of all tested devices do not use PWM to dim the display. If PWM was detected, an average of 7794 (minimum: 5 - maximum: 343500) Hz was measured. | |||
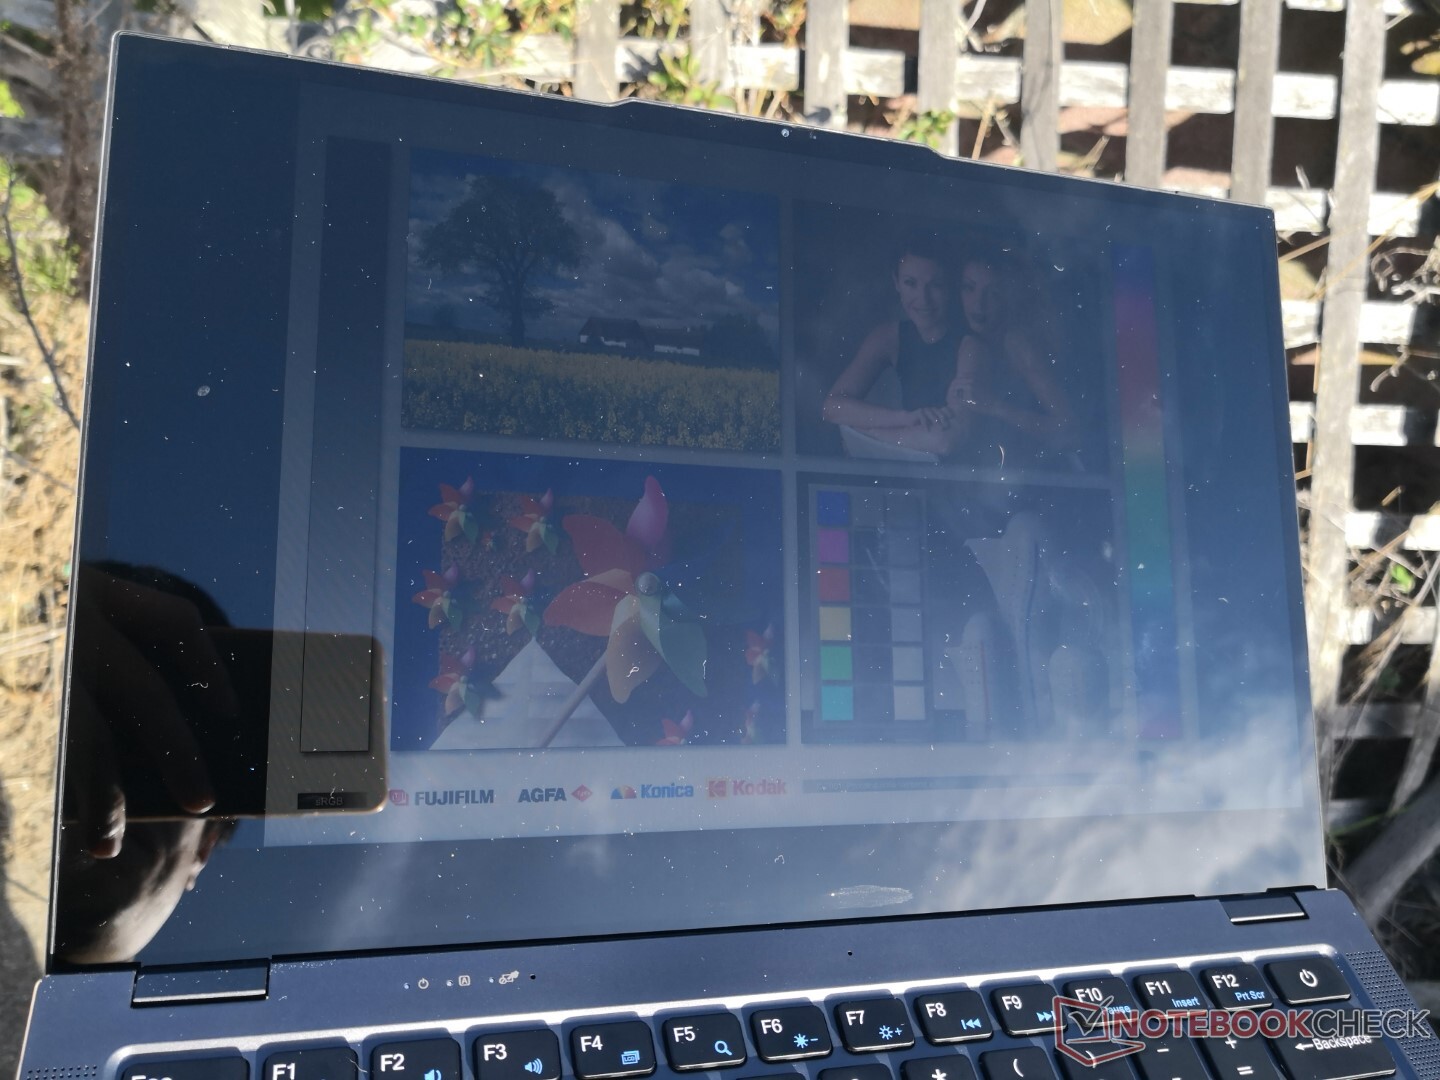
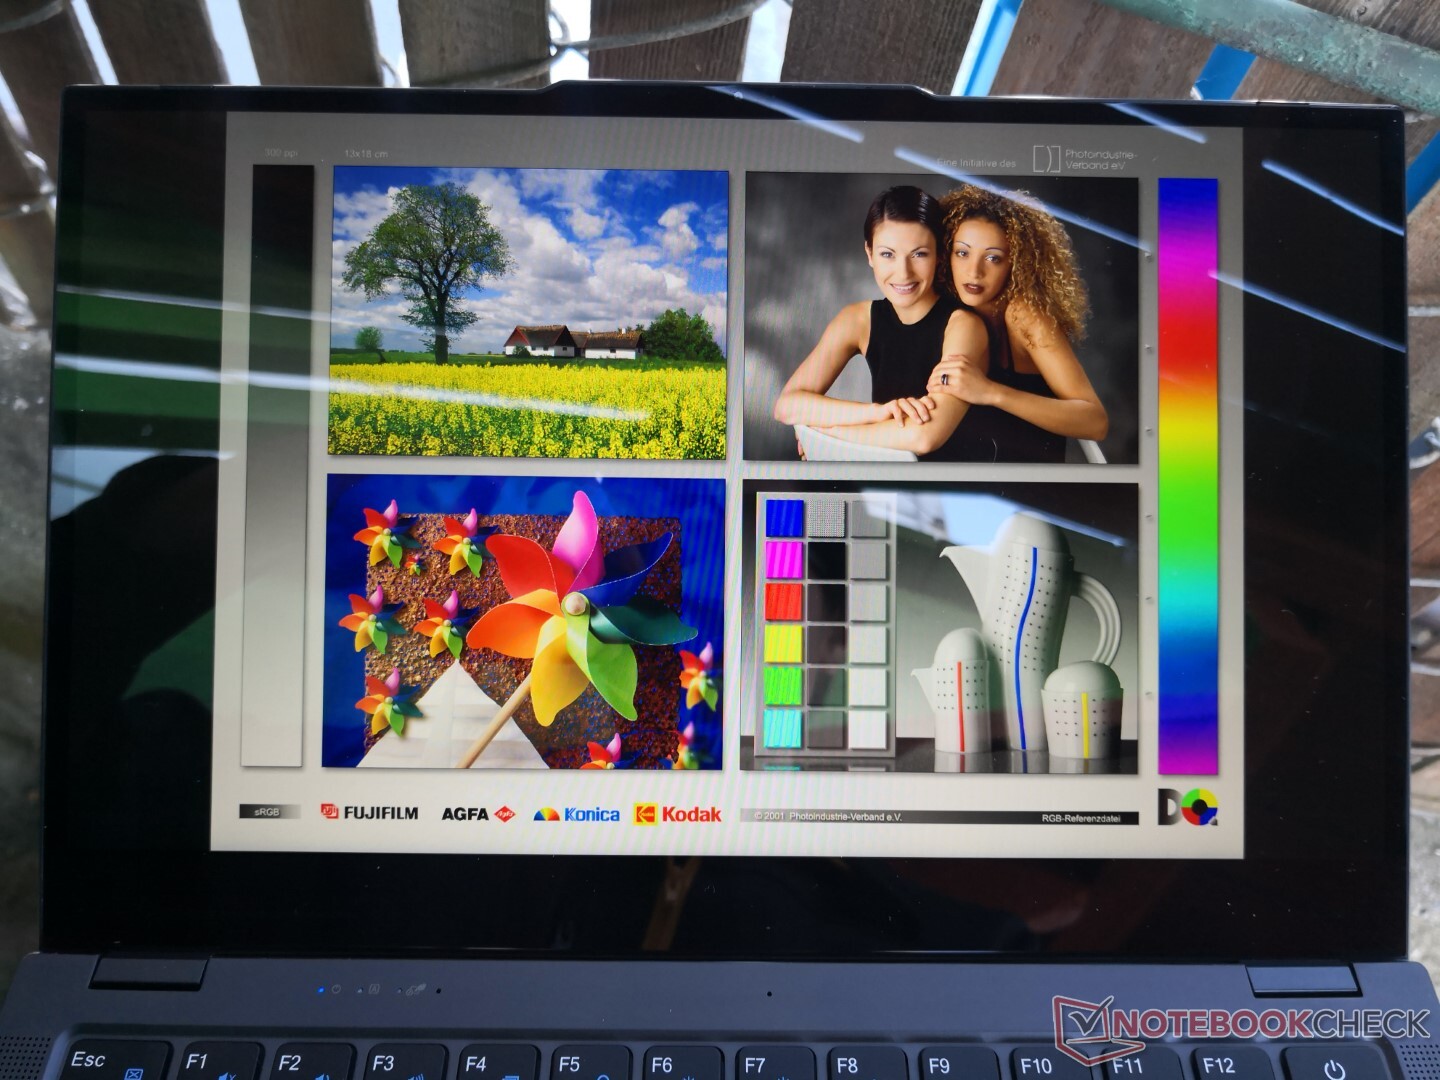
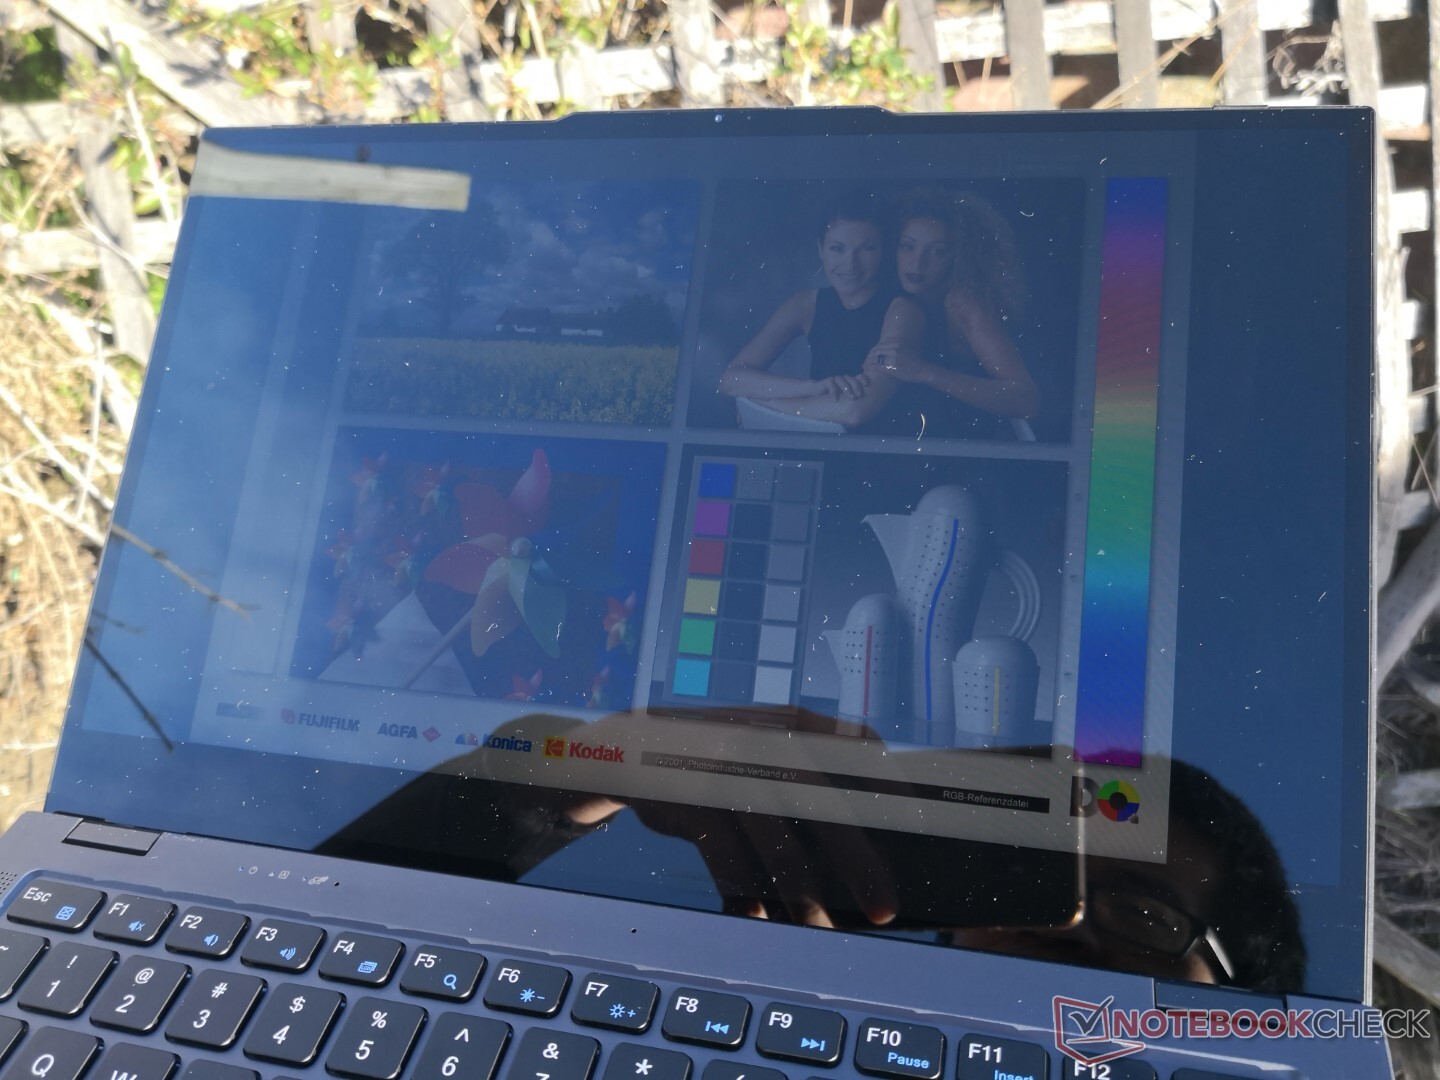
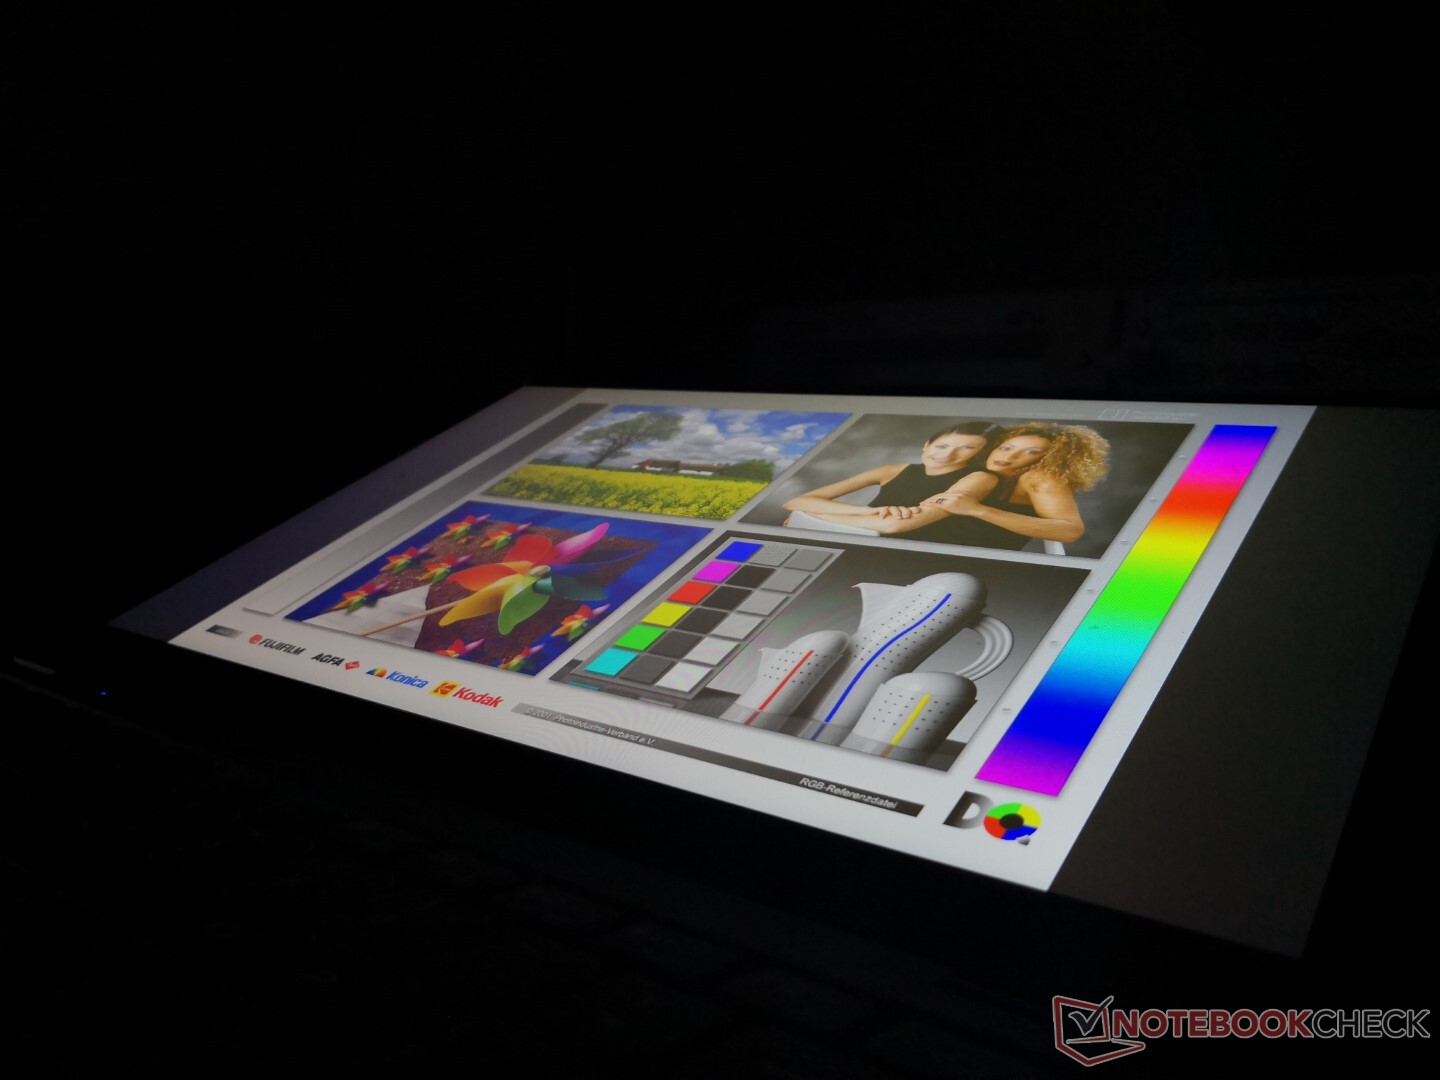
Outdoor visibility is poor due to the glossy overlay and low maximum brightness. Expect a lot of glare and squinting even if working under shade.
Performance
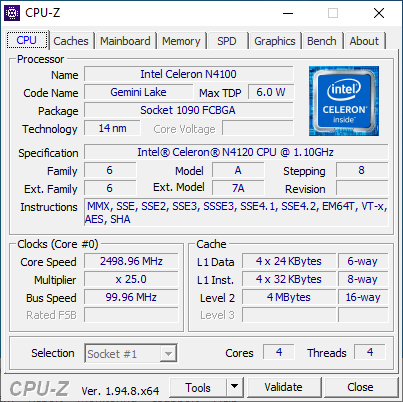
Processor
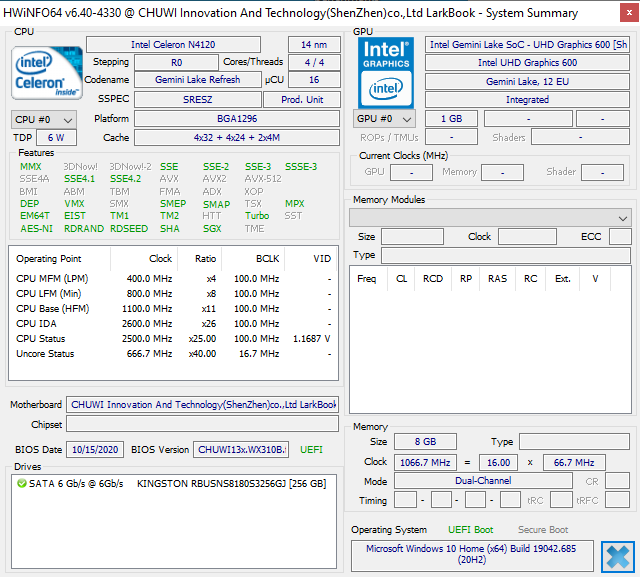
Raw multi-thread CPU performance is comparable to the Celeron J4125 or Core m3-8100Y the latter of which can be found on the Microsoft Surface Go or HP ProBook x360 11.6 convertibles. This particular processor is very slow especially in single-thread performance where even the 5-year old Apple MacBook Air can outperform it in by almost 25 percent. The end-user experience is nowhere near as snappy as laptops powered by the Core i series.
More benchmark comparisons on the Celeron N4120 can be found on our dedicated page here.
Cinebench R20: CPU (Multi Core) | CPU (Single Core)
7-Zip 18.03: 7z b 4 -mmt1 | 7z b 4
Geekbench 5.5: Single-Core | Multi-Core
HWBOT x265 Benchmark v2.2: 4k Preset
LibreOffice : 20 Documents To PDF
R Benchmark 2.5: Overall mean
| Cinebench R20 / CPU (Multi Core) | |
| Apple MacBook Air 2020 M1 Entry | |
| HP Pavilion 13-bb0015cl | |
| Dell XPS 13 7390 2-in-1 Core i3 | |
| Apple MacBook Air 2020 i3 | |
| Microsoft Surface Go 2, m3-8100Y | |
| Chuwi LarkBook CWI509 | |
| Average Intel Celeron N4120 (376 - 516, n=3) | |
| Jumper Tech Ez Book X3 Air | |
| GMK NucBox K1 | |
| Chuwi LapBook Plus | |
| Cinebench R20 / CPU (Single Core) | |
| HP Pavilion 13-bb0015cl | |
| Dell XPS 13 7390 2-in-1 Core i3 | |
| Apple MacBook Air 2020 M1 Entry | |
| Apple MacBook Air 2020 i3 | |
| Microsoft Surface Go 2, m3-8100Y | |
| Chuwi LarkBook CWI509 | |
| Average Intel Celeron N4120 (159 - 166, n=3) | |
| GMK NucBox K1 | |
| Jumper Tech Ez Book X3 Air | |
| Chuwi LapBook Plus | |
| Geekbench 5.5 / Single-Core | |
| Apple MacBook Air 2020 M1 Entry | |
| HP Pavilion 13-bb0015cl | |
| Apple MacBook Air 2020 i3 | |
| Microsoft Surface Go 2, m3-8100Y | |
| Average Intel Celeron N4120 (438 - 449, n=3) | |
| Chuwi LarkBook CWI509 | |
| GMK NucBox K1 | |
| Jumper Tech Ez Book X3 Air | |
| Geekbench 5.5 / Multi-Core | |
| Apple MacBook Air 2020 M1 Entry | |
| HP Pavilion 13-bb0015cl | |
| Apple MacBook Air 2020 i3 | |
| Microsoft Surface Go 2, m3-8100Y | |
| Average Intel Celeron N4120 (1505 - 1561, n=3) | |
| Chuwi LarkBook CWI509 | |
| Jumper Tech Ez Book X3 Air | |
| GMK NucBox K1 | |
| HWBOT x265 Benchmark v2.2 / 4k Preset | |
| HP Pavilion 13-bb0015cl | |
| Dell XPS 13 7390 2-in-1 Core i3 | |
| Apple MacBook Air 2020 i3 | |
| Microsoft Surface Go 2, m3-8100Y | |
| GMK NucBox K1 | |
| Chuwi LarkBook CWI509 | |
| Jumper Tech Ez Book X3 Air | |
| Average Intel Celeron N4120 (1.02 - 1.38, n=3) | |
| Chuwi LapBook Plus | |
| LibreOffice / 20 Documents To PDF | |
| Jumper Tech Ez Book X3 Air | |
| Average Intel Celeron N4120 (131 - 157, n=3) | |
| Chuwi LarkBook CWI509 | |
| GMK NucBox K1 | |
| Apple MacBook Air 2020 i3 | |
| Microsoft Surface Go 2, m3-8100Y | |
| HP Pavilion 13-bb0015cl | |
| Apple MacBook Air 2020 M1 Entry | |
| R Benchmark 2.5 / Overall mean | |
| Jumper Tech Ez Book X3 Air | |
| Average Intel Celeron N4120 (1.642 - 1.649, n=3) | |
| Chuwi LarkBook CWI509 | |
| GMK NucBox K1 | |
| Microsoft Surface Go 2, m3-8100Y | |
| Apple MacBook Air 2020 i3 | |
| Apple MacBook Air 2020 M1 Entry | |
| HP Pavilion 13-bb0015cl | |
Cinebench R20: CPU (Multi Core) | CPU (Single Core)
7-Zip 18.03: 7z b 4 -mmt1 | 7z b 4
Geekbench 5.5: Single-Core | Multi-Core
HWBOT x265 Benchmark v2.2: 4k Preset
LibreOffice : 20 Documents To PDF
R Benchmark 2.5: Overall mean
* ... smaller is better
System Performance
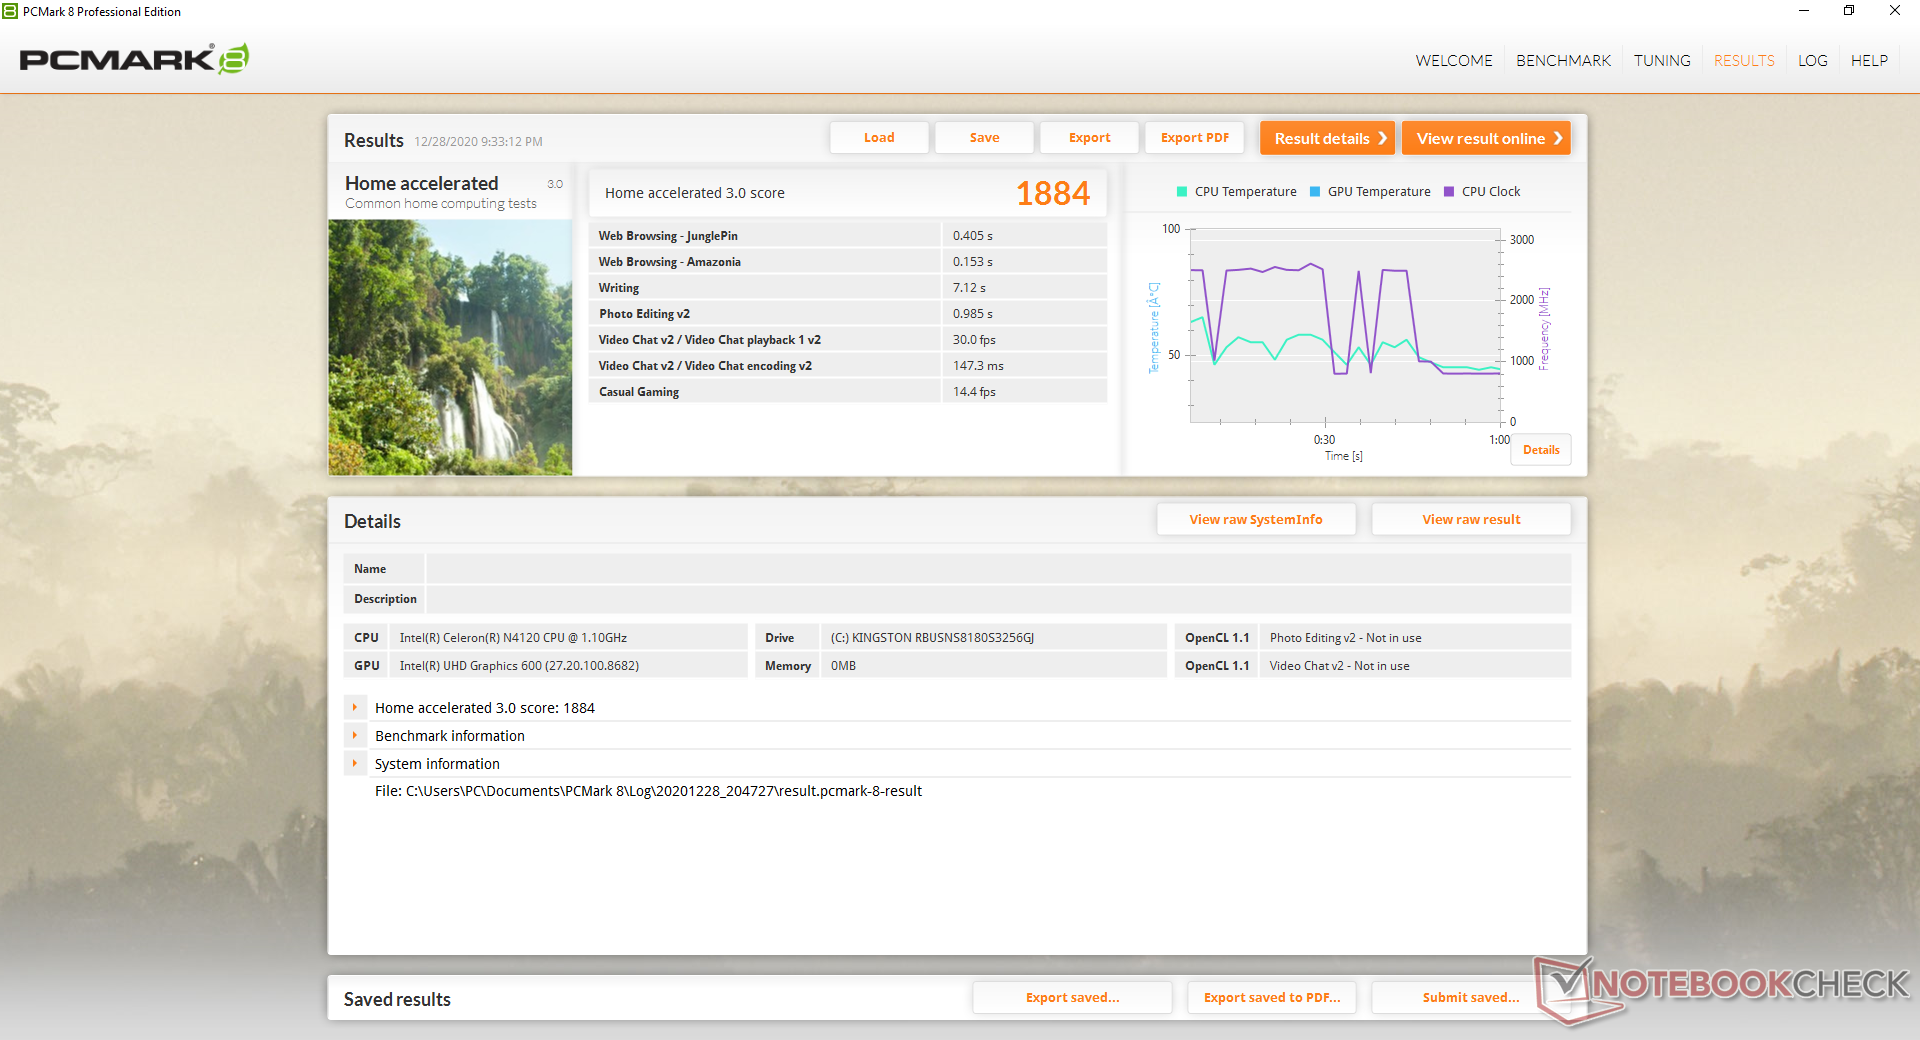
We ran into Windows Update issues on our test unit and certain benchmarks like PCMark 10 or Blender wouldn't even run properly. Thus, we're only able to provide our PCMark 8 Home Accelerated test results below. Scores are about half that of the Asus VivoBook S13 equipped with an older but more capable Core i5-8550U.
| PCMark 8 - Home Score Accelerated v2 | |
| Dell XPS 13 9310 Core i7 FHD | |
| HP Pavilion 13-bb0015cl | |
| Asus VivoBook S13 S330UA-EY034T | |
| Chuwi LarkBook CWI509 | |
| Average Intel Celeron N4120, Intel UHD Graphics 600 (n=1) | |
| PCMark 8 Home Score Accelerated v2 | 1884 points | |
Help | ||
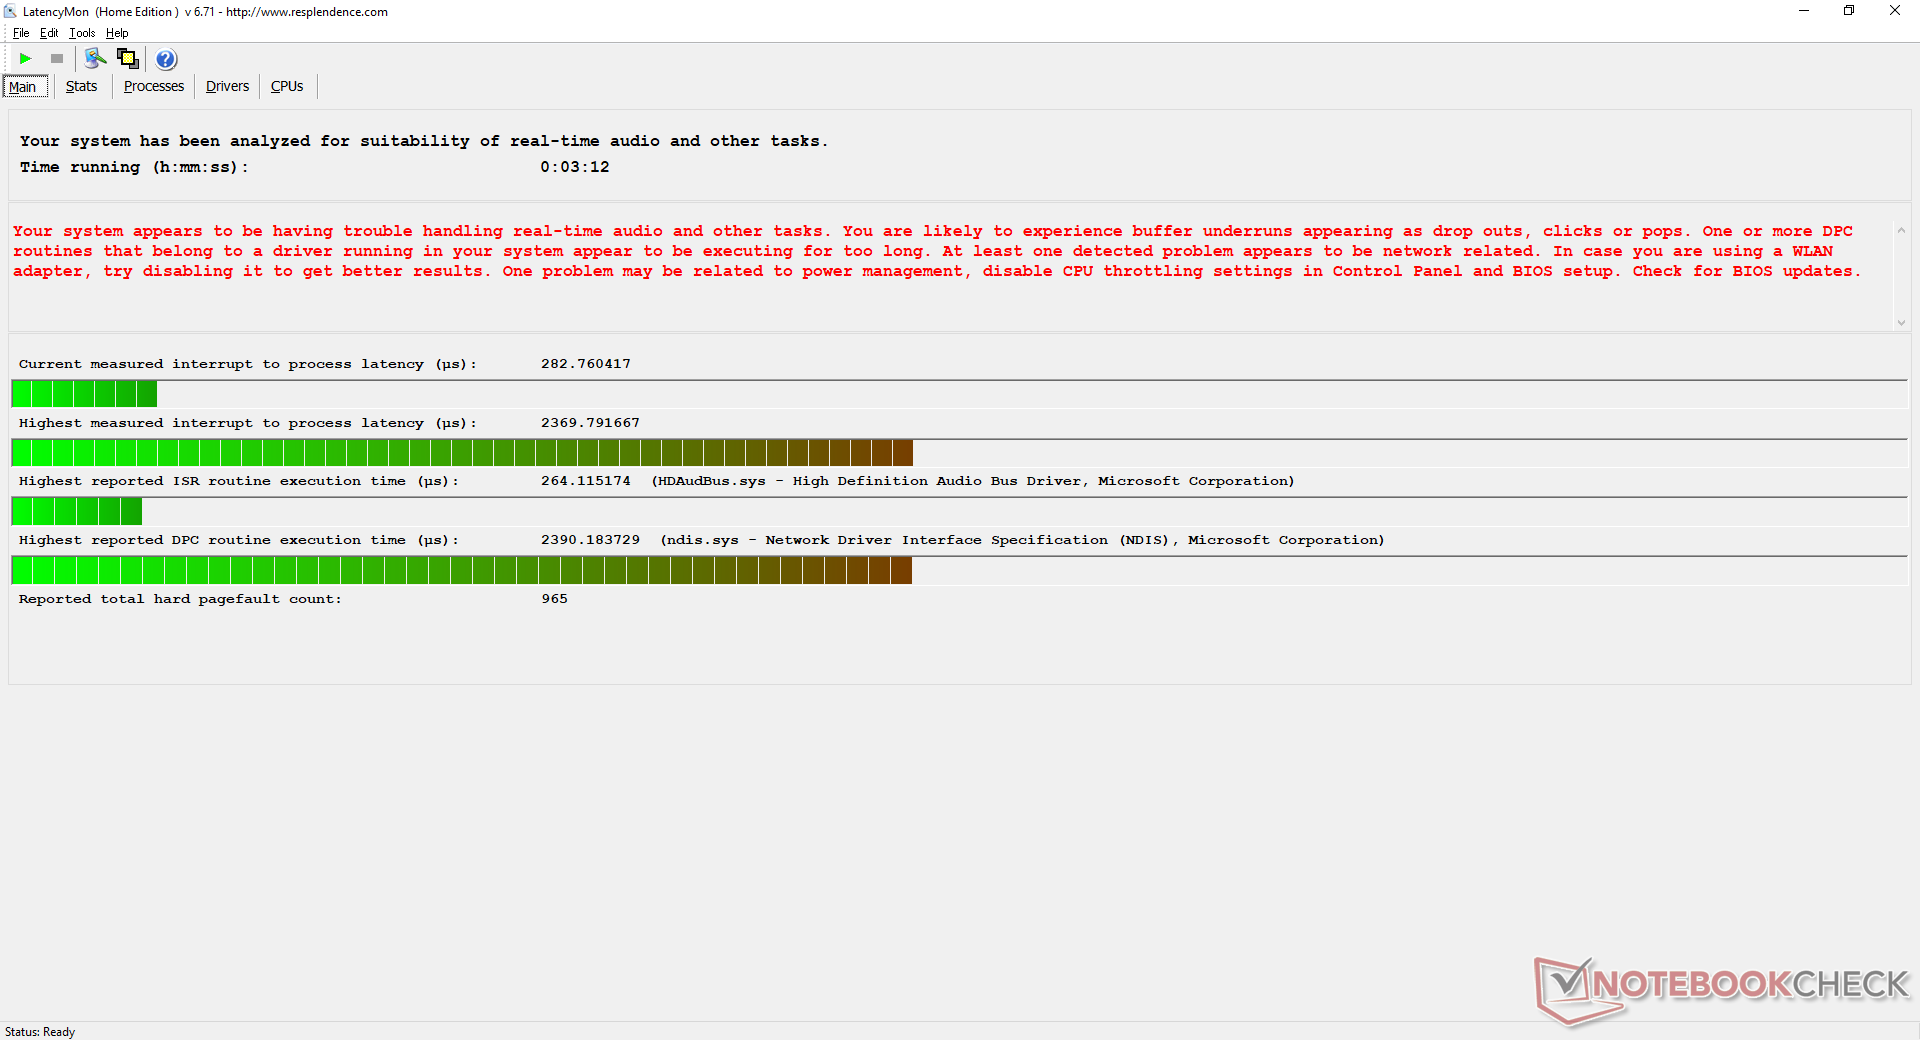
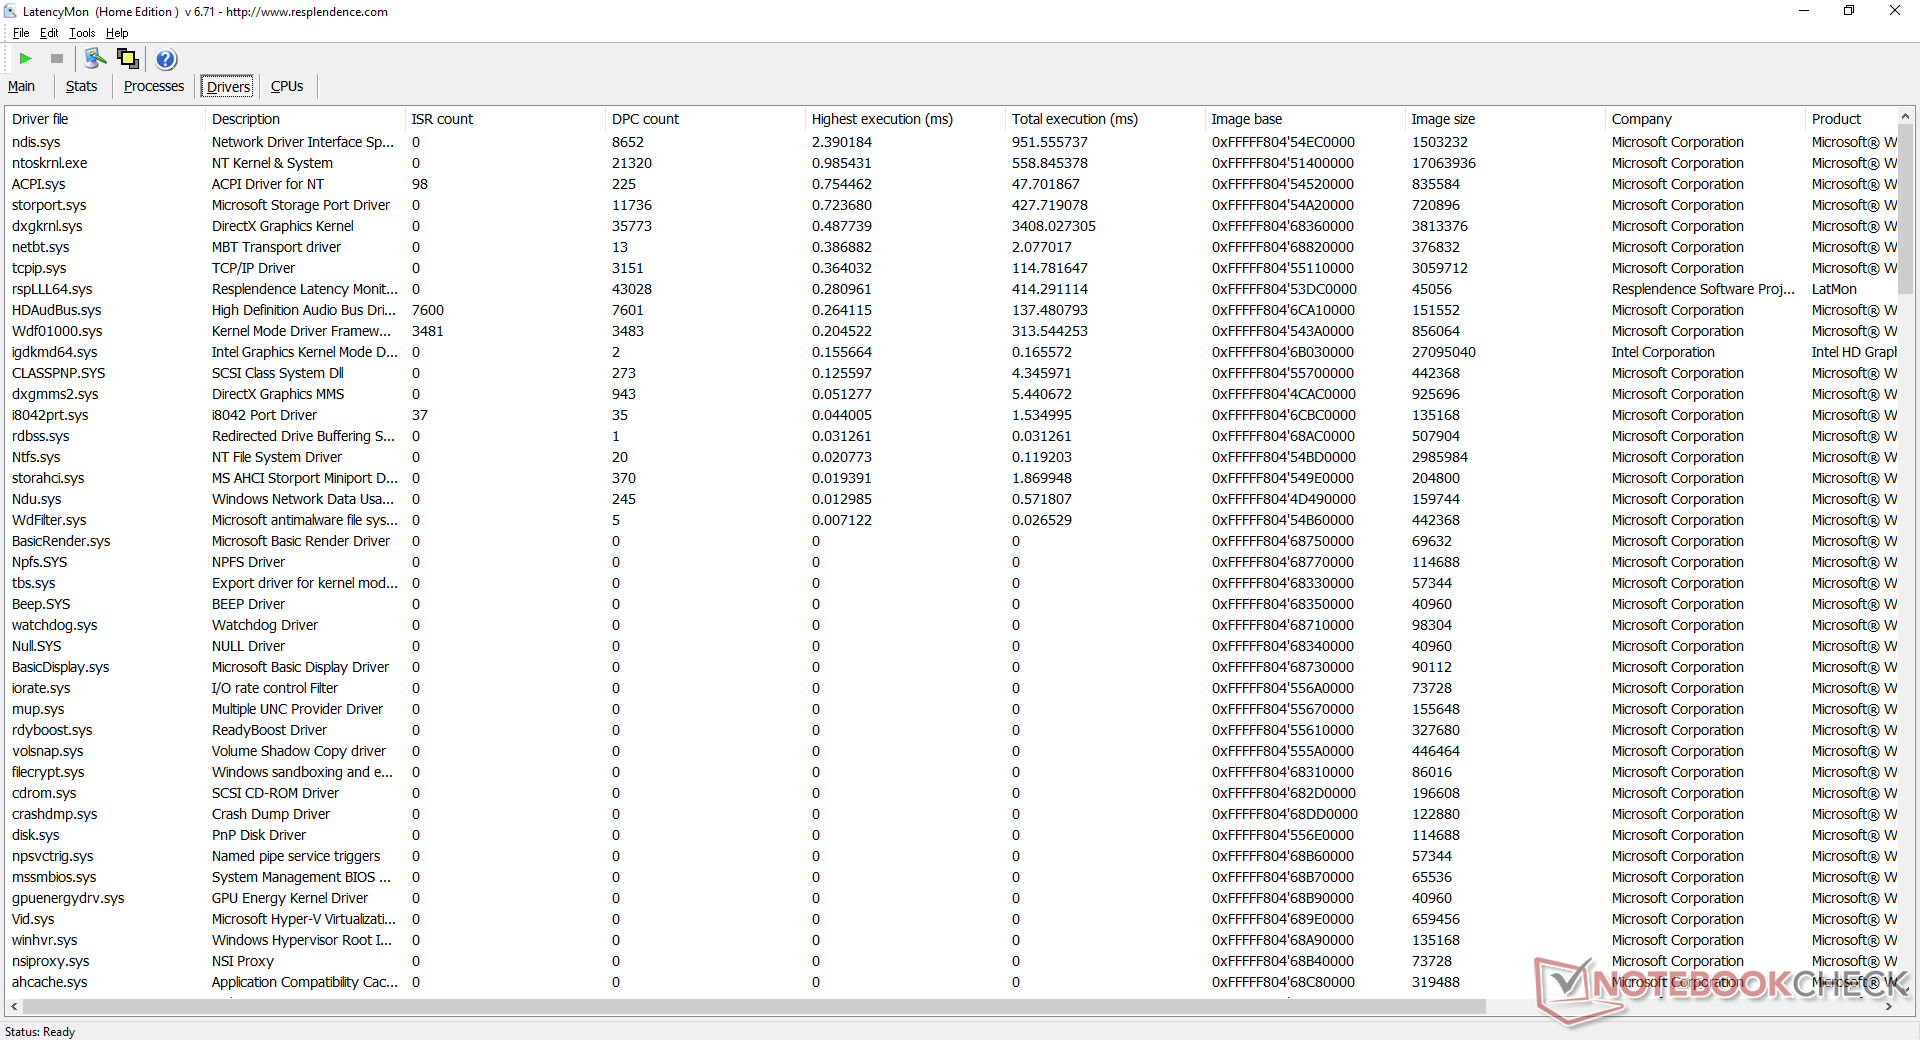
DPC Latency
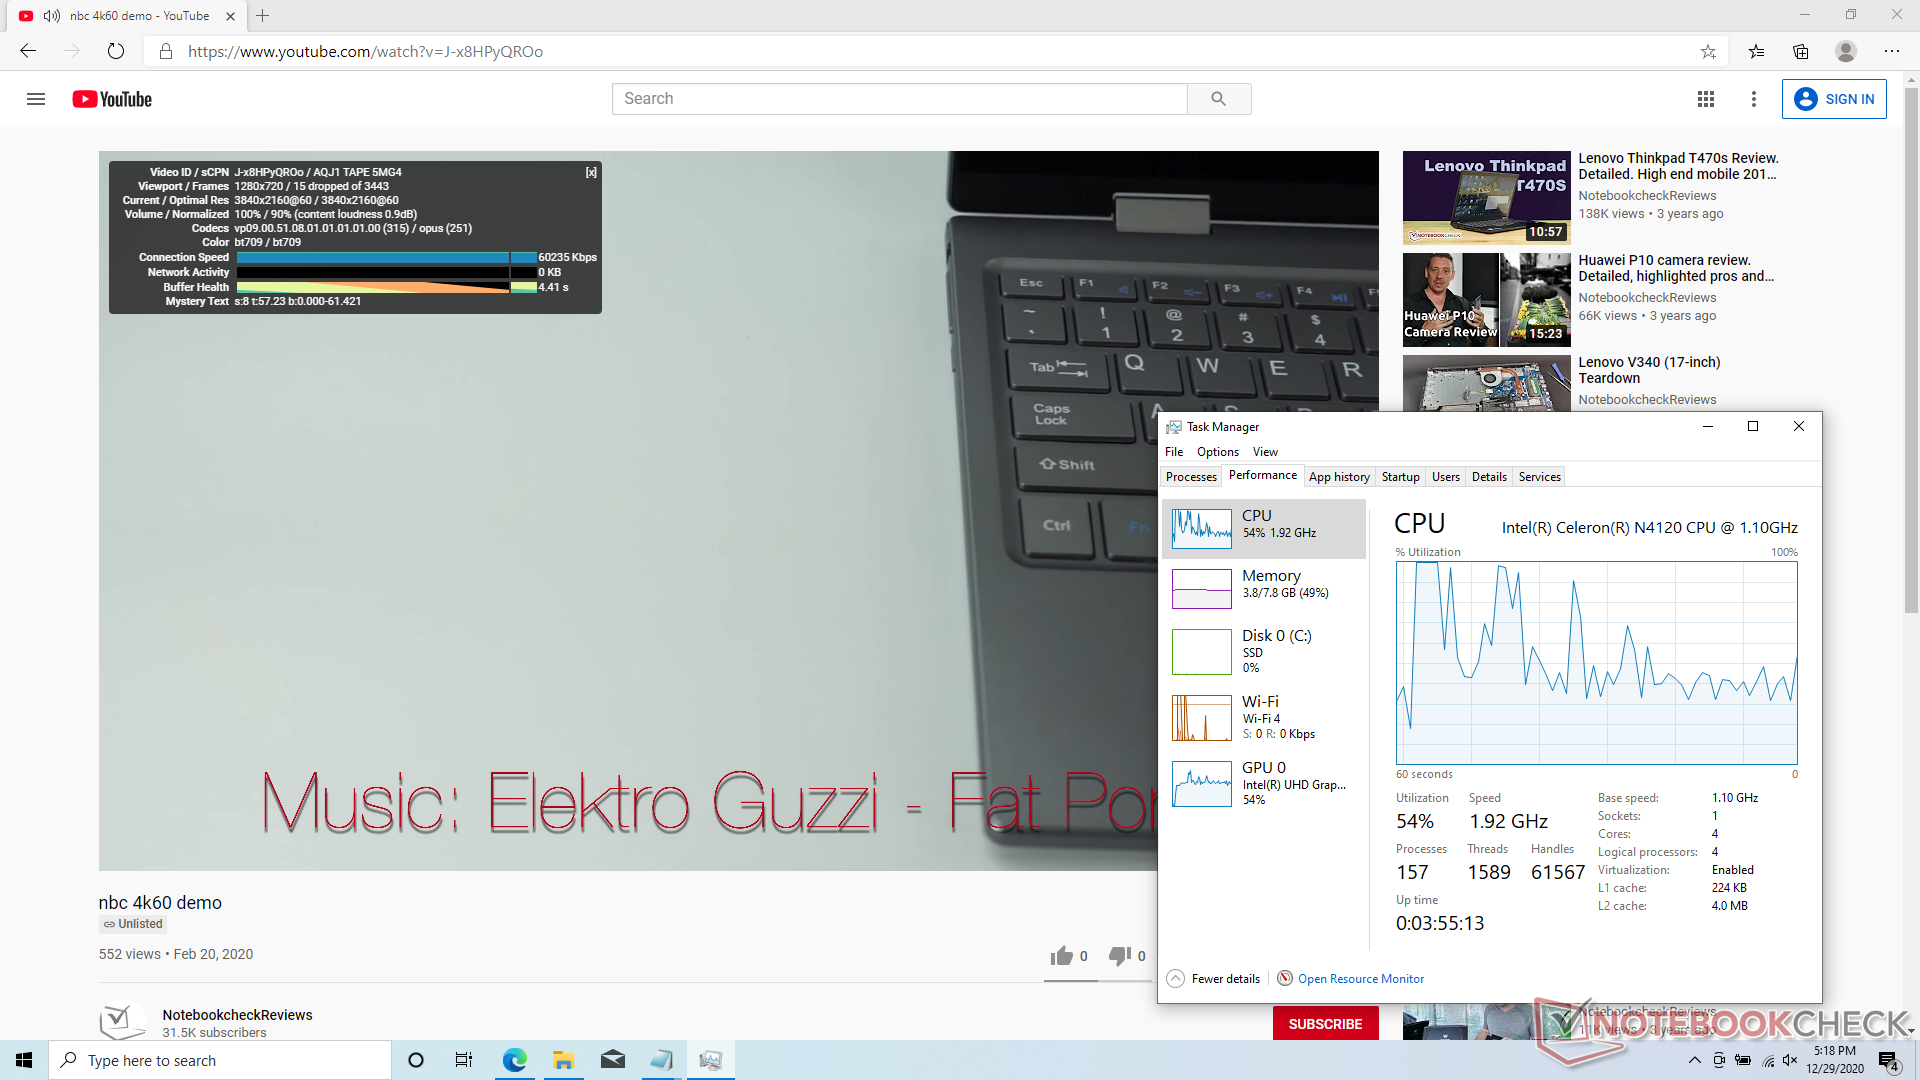
LatencyMon reveals DPC latency issues related to Ndis.sys. Furthermore, 4K UHD video playback at 60 FPS is imperfect with 15 dropped frames during our minute-long YouTube test. We had to rerun this test twice because the CPU would periodically jump to 100 percent utilization and drop even more frames during our first run. Don't plan on doing any multi-tasking when streaming 4K video without incurring noticeable frame drops.
| DPC Latencies / LatencyMon - interrupt to process latency (max), Web, Youtube, Prime95 | |
| Chuwi LarkBook CWI509 | |
| HP Pavilion 13-bb0015cl | |
| GMK NucBox K1 | |
| Jumper Tech Ez Book X3 Air | |
| Dell XPS 13 9310 Core i7 FHD | |
* ... smaller is better
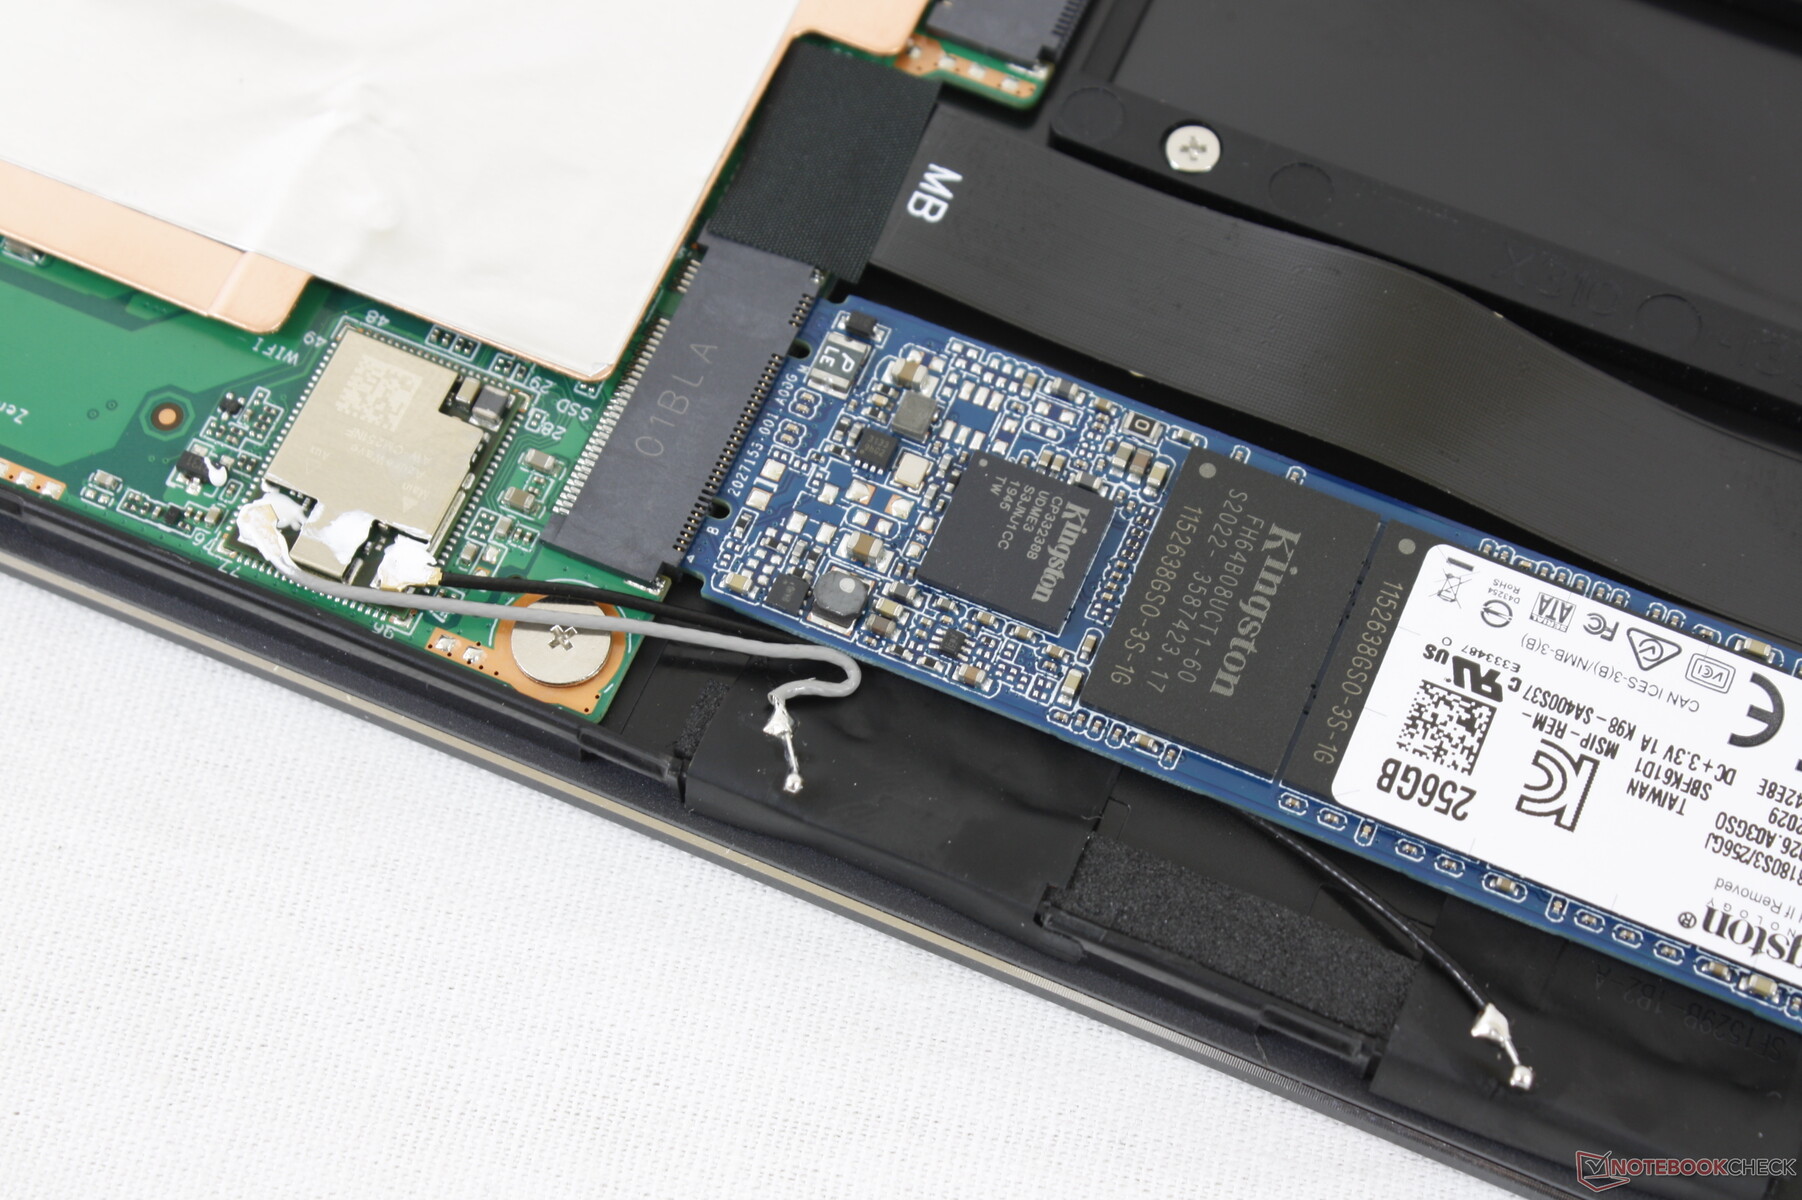
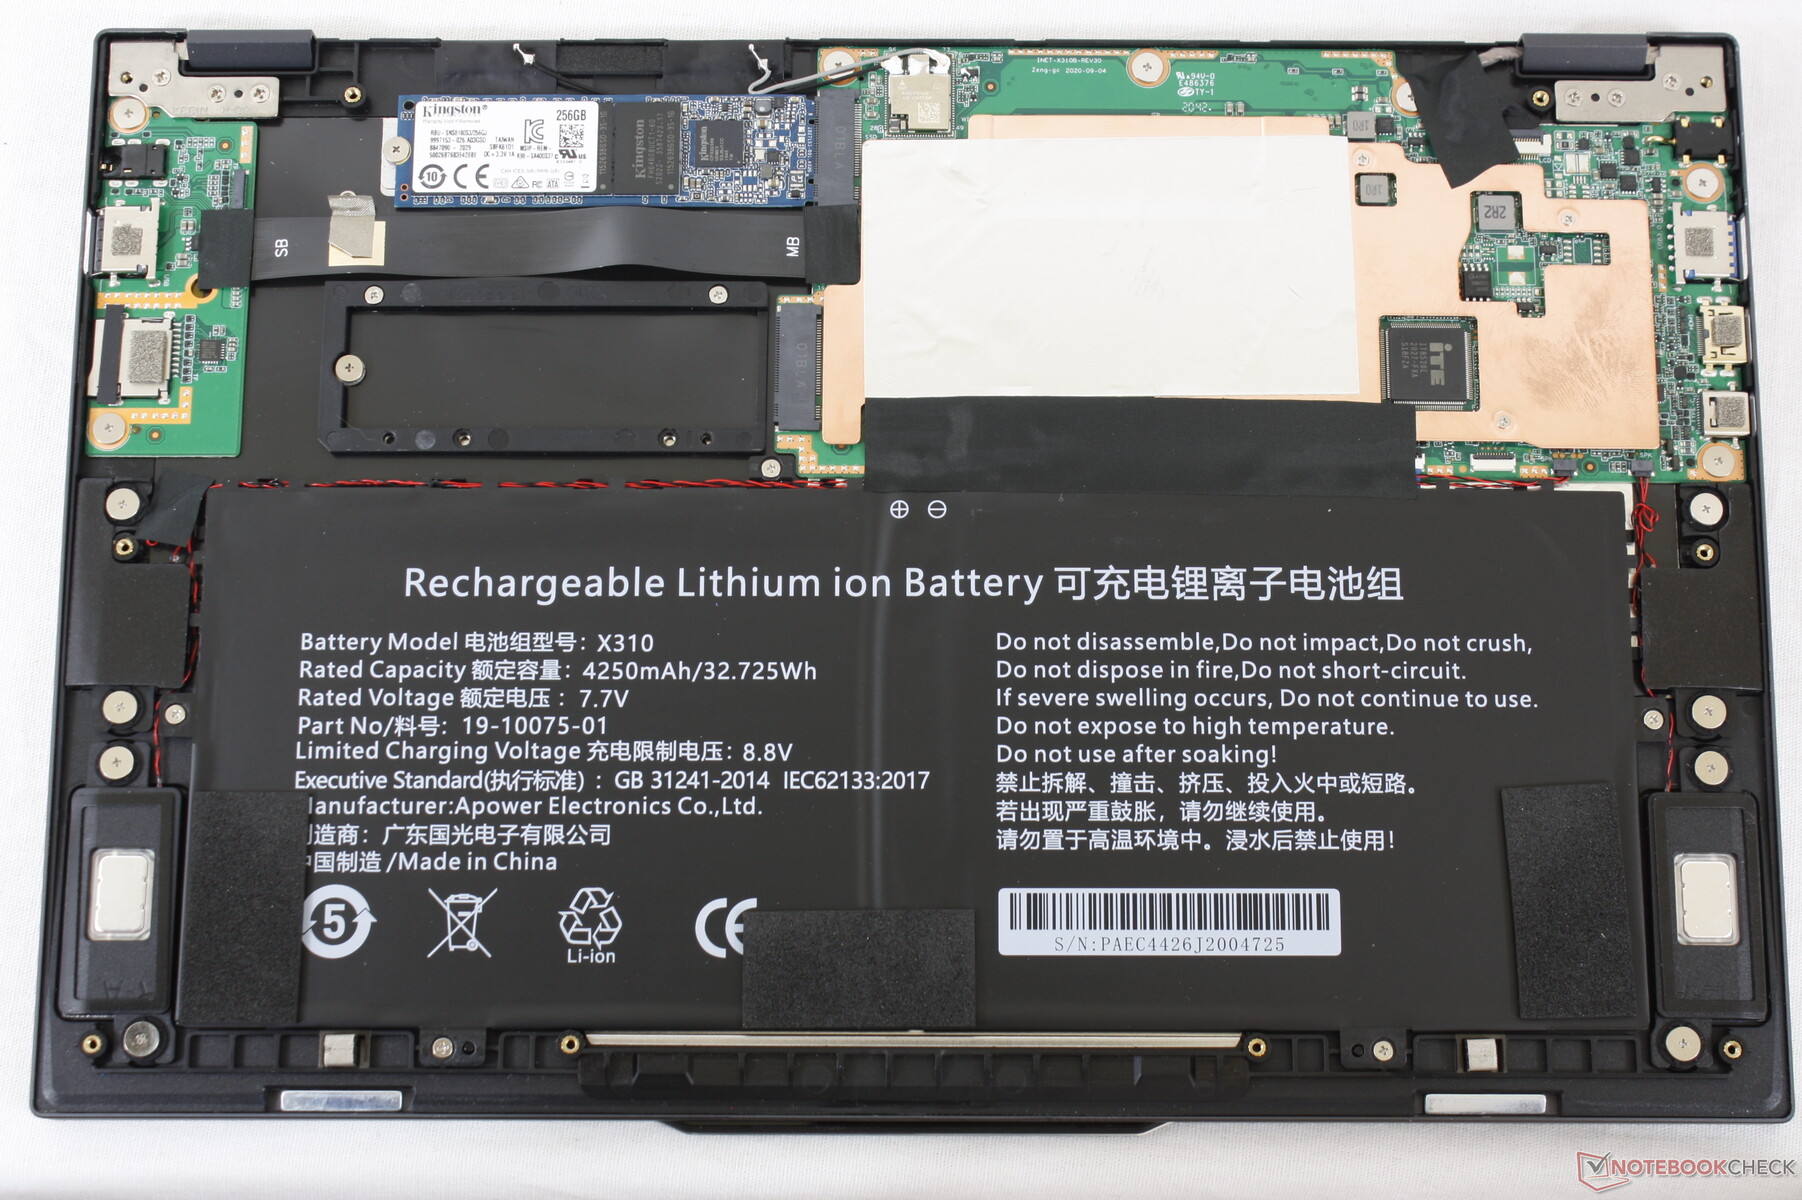
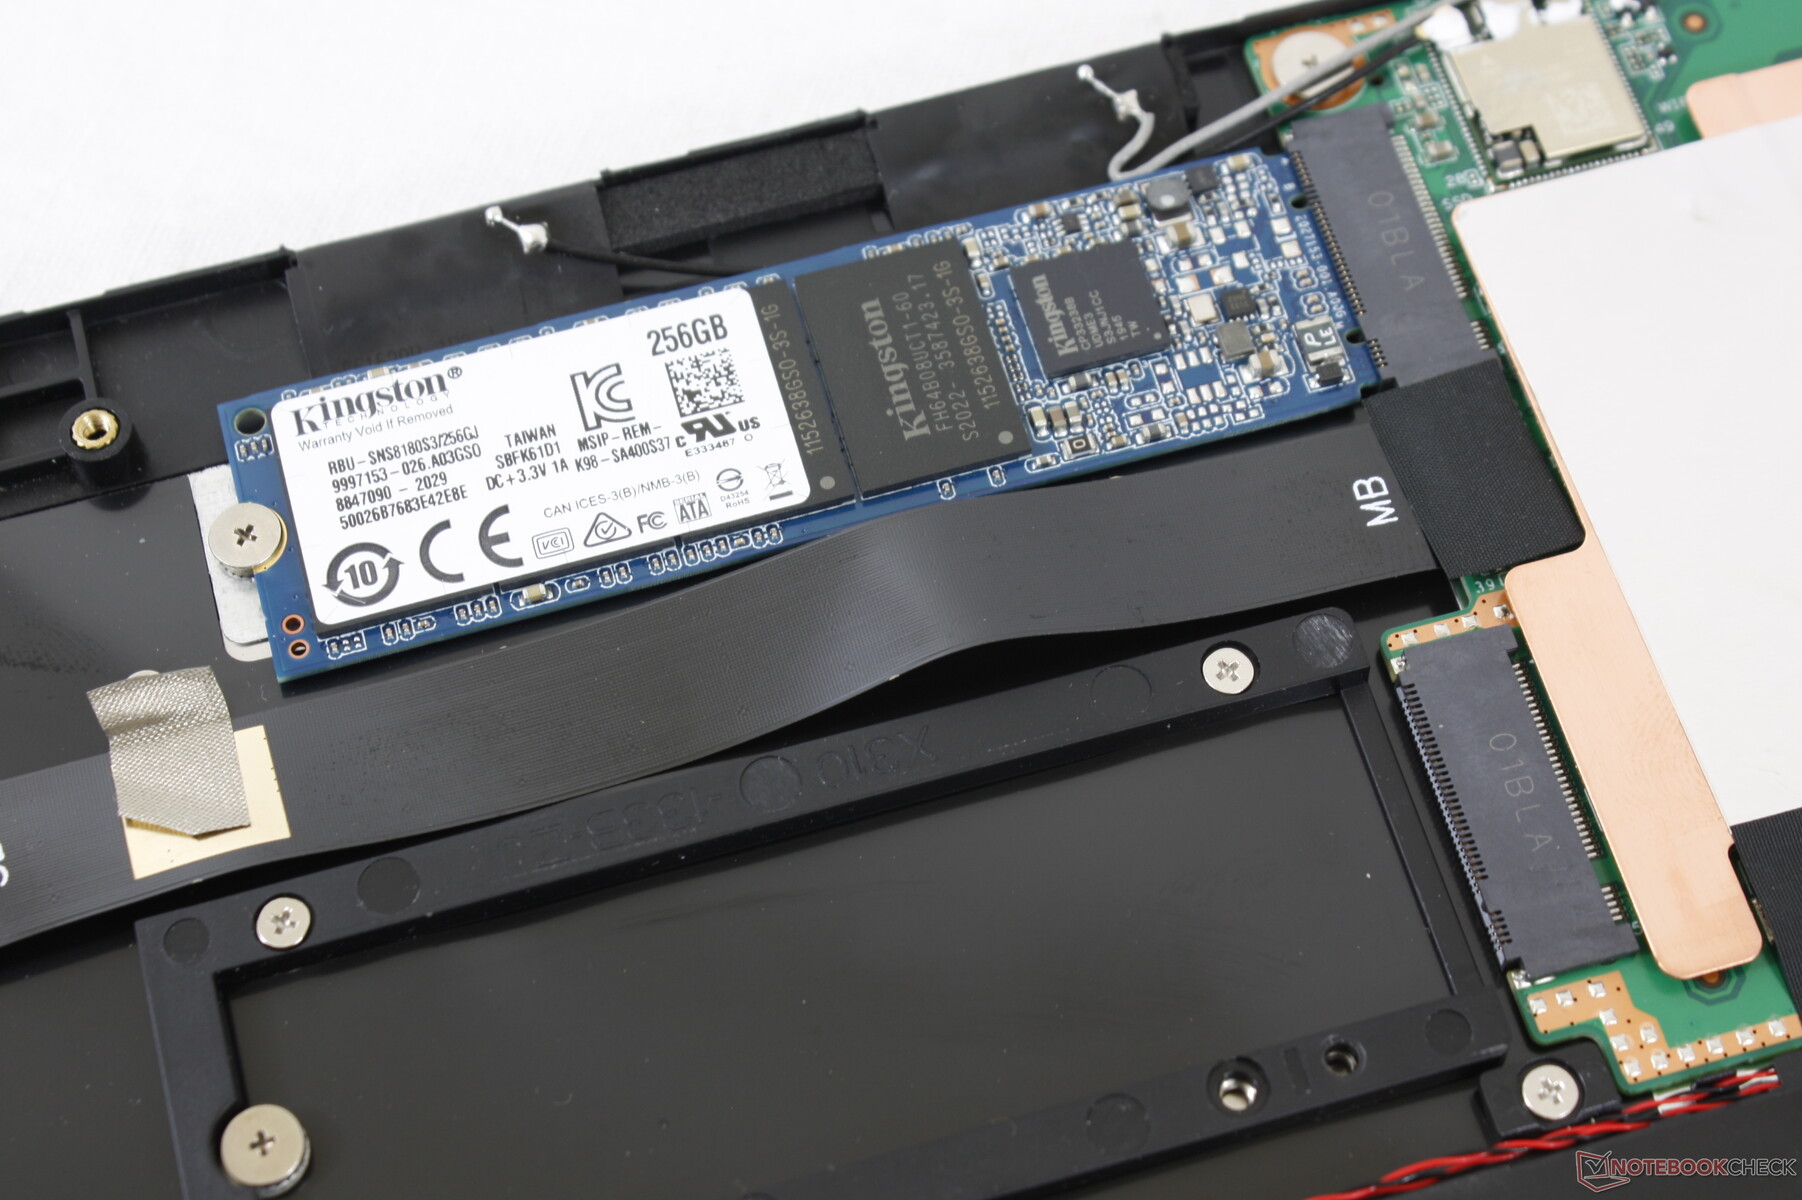
Storage Devices
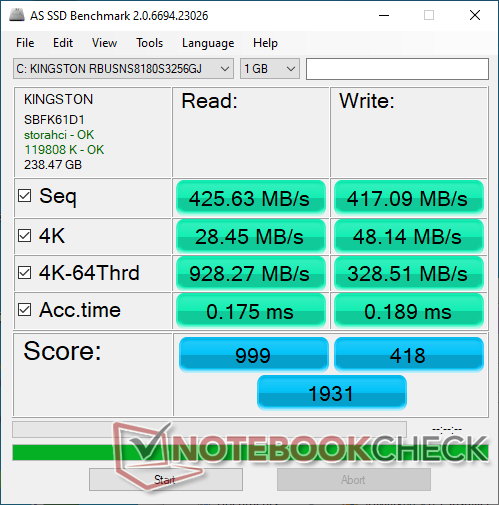
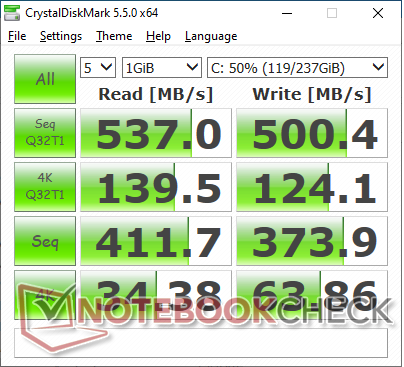
Our unit ships with a 256 GB SATA III M.2 SSD from Kingston. Sequential read and write rates are good at over 400 MB/s each. NVMe drives, which are not compatible with the LarkBook, are both faster and more expensive.
See our table of HDDs and SSDs for more benchmark comparisons.
| Chuwi LarkBook CWI509 Kingston RBUSNS8180DS3256GJ | Dell XPS 13 9310 Core i7 FHD Micron 2300 512GB MTFDHBA512TDV | Lenovo IdeaPad S540-13API Samsung SSD PM981 MZVLB512HAJQ | HP Pavilion 13-bb0015cl Samsung PM991 MZVLQ512HALU | Asus VivoBook S13 S330UA-EY034T Kingston RBU-SNS8180DS3512GJ | |
|---|---|---|---|---|---|
| AS SSD | 164% | 202% | 122% | -8% | |
| Seq Read (MB/s) | 425.6 | 2091 391% | 2792 556% | 1632 283% | 485.5 14% |
| Seq Write (MB/s) | 417.1 | 1396 235% | 2564 515% | 896 115% | 351 -16% |
| 4K Read (MB/s) | 28.45 | 49.29 73% | 47.14 66% | 44.66 57% | 30.94 9% |
| 4K Write (MB/s) | 48.14 | 104.2 116% | 89.5 86% | 128.4 167% | 61.6 28% |
| 4K-64 Read (MB/s) | 928 | 827 -11% | 1159 25% | 862 -7% | 323.8 -65% |
| 4K-64 Write (MB/s) | 328.5 | 1636 398% | 1468 347% | 778 137% | 439.9 34% |
| Access Time Read * (ms) | 0.175 | 0.066 62% | 0.069 61% | 0.064 63% | 0.108 38% |
| Access Time Write * (ms) | 0.189 | 0.365 -93% | 0.043 77% | 0.081 57% | 0.174 8% |
| Score Read (Points) | 999 | 1086 9% | 1486 49% | 1070 7% | 403 -60% |
| Score Write (Points) | 418 | 1880 350% | 1814 334% | 996 138% | 537 28% |
| Score Total (Points) | 1931 | 3499 81% | 4054 110% | 2586 34% | 1150 -40% |
| Copy ISO MB/s (MB/s) | 473.6 | 1544 226% | 1283 171% | 546 15% | |
| Copy Program MB/s (MB/s) | 198.6 | 613 209% | 806 306% | 106.2 -47% | |
| Copy Game MB/s (MB/s) | 415.3 | 1451 249% | 1182 185% | 151 -64% | |
| CrystalDiskMark 5.2 / 6 | 285% | 319% | 177% | 17% | |
| Write 4K (MB/s) | 63.9 | 97.5 53% | 133.9 110% | 96.5 51% | 64.5 1% |
| Read 4K (MB/s) | 34.38 | 50.9 48% | 44.98 31% | 36.81 7% | 24.91 -28% |
| Write Seq (MB/s) | 373.9 | 1811 384% | 2730 630% | 1168 212% | 453.4 21% |
| Read Seq (MB/s) | 411.7 | 1836 346% | 2403 484% | 1476 259% | 424.9 3% |
| Write 4K Q32T1 (MB/s) | 124.1 | 521 320% | 252.2 103% | 389.5 214% | 257.8 108% |
| Read 4K Q32T1 (MB/s) | 139.5 | 357.5 156% | 335.6 141% | 347.8 149% | 200.4 44% |
| Write Seq Q32T1 (MB/s) | 500 | 2879 476% | 2983 497% | 1398 180% | 504 1% |
| Read Seq Q32T1 (MB/s) | 537 | 3204 497% | 3535 558% | 2364 340% | 459.6 -14% |
| Write 4K Q8T8 (MB/s) | 284.4 | ||||
| Read 4K Q8T8 (MB/s) | 301.2 | ||||
| Total Average (Program / Settings) | 225% /
208% | 261% /
252% | 150% /
142% | 5% /
1% |
* ... smaller is better

Disk Throttling: DiskSpd Read Loop, Queue Depth 8
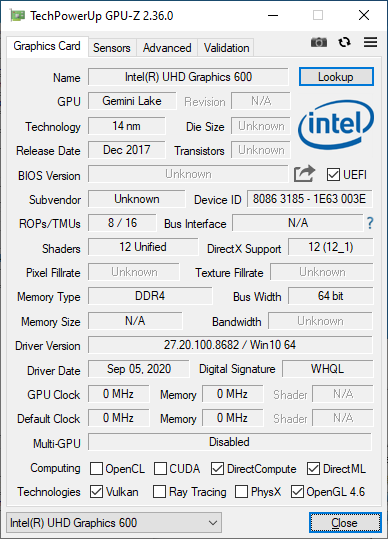
GPU Performance
The UHD Graphics 600 is over 50 percent slower than the already slow UHD Graphics 620. It barely manages to run DOTA 2 at the lowest settings above 30 FPS. This is no gaming machine, after all.
Note that graphics performance is about two times slower than on the Core i3-8100Y even though their multi-thread CPU performances are comparable.
| 3DMark 06 Standard Score | 4151 points | |
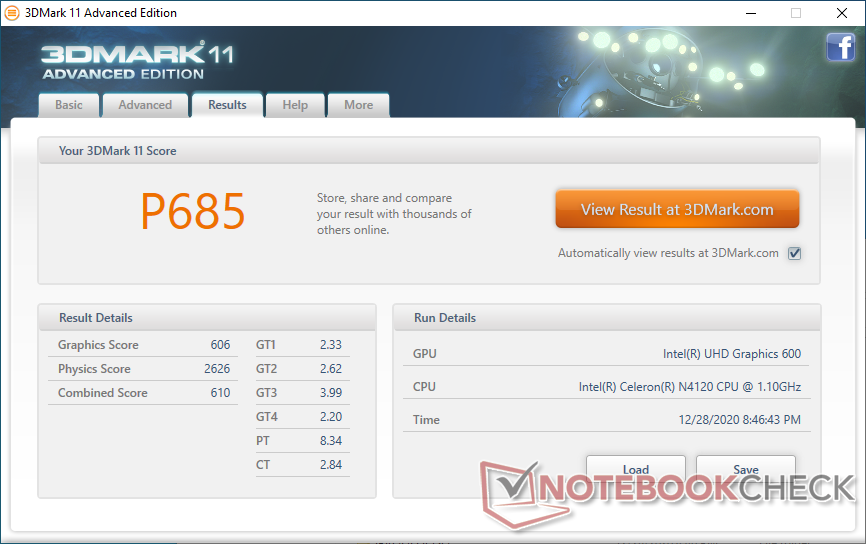
| 3DMark 11 Performance | 685 points | |
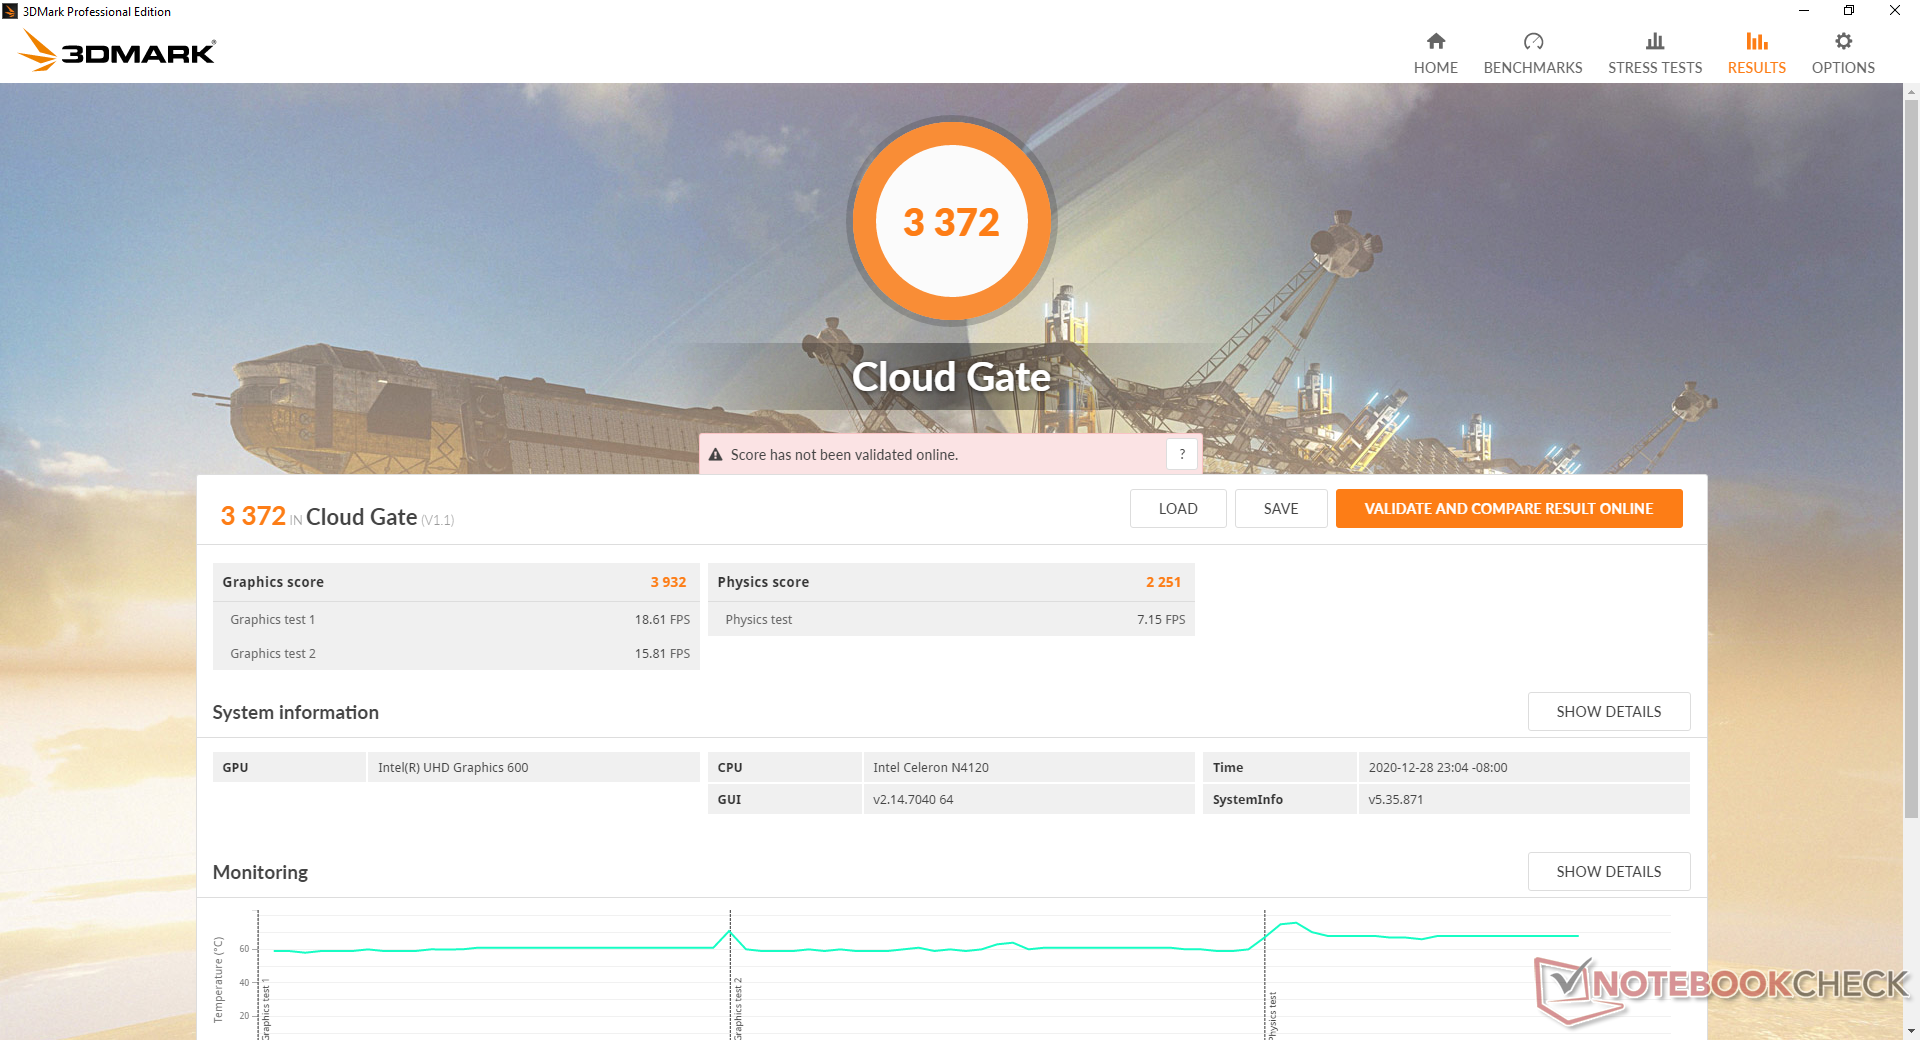
| 3DMark Cloud Gate Standard Score | 3372 points | |
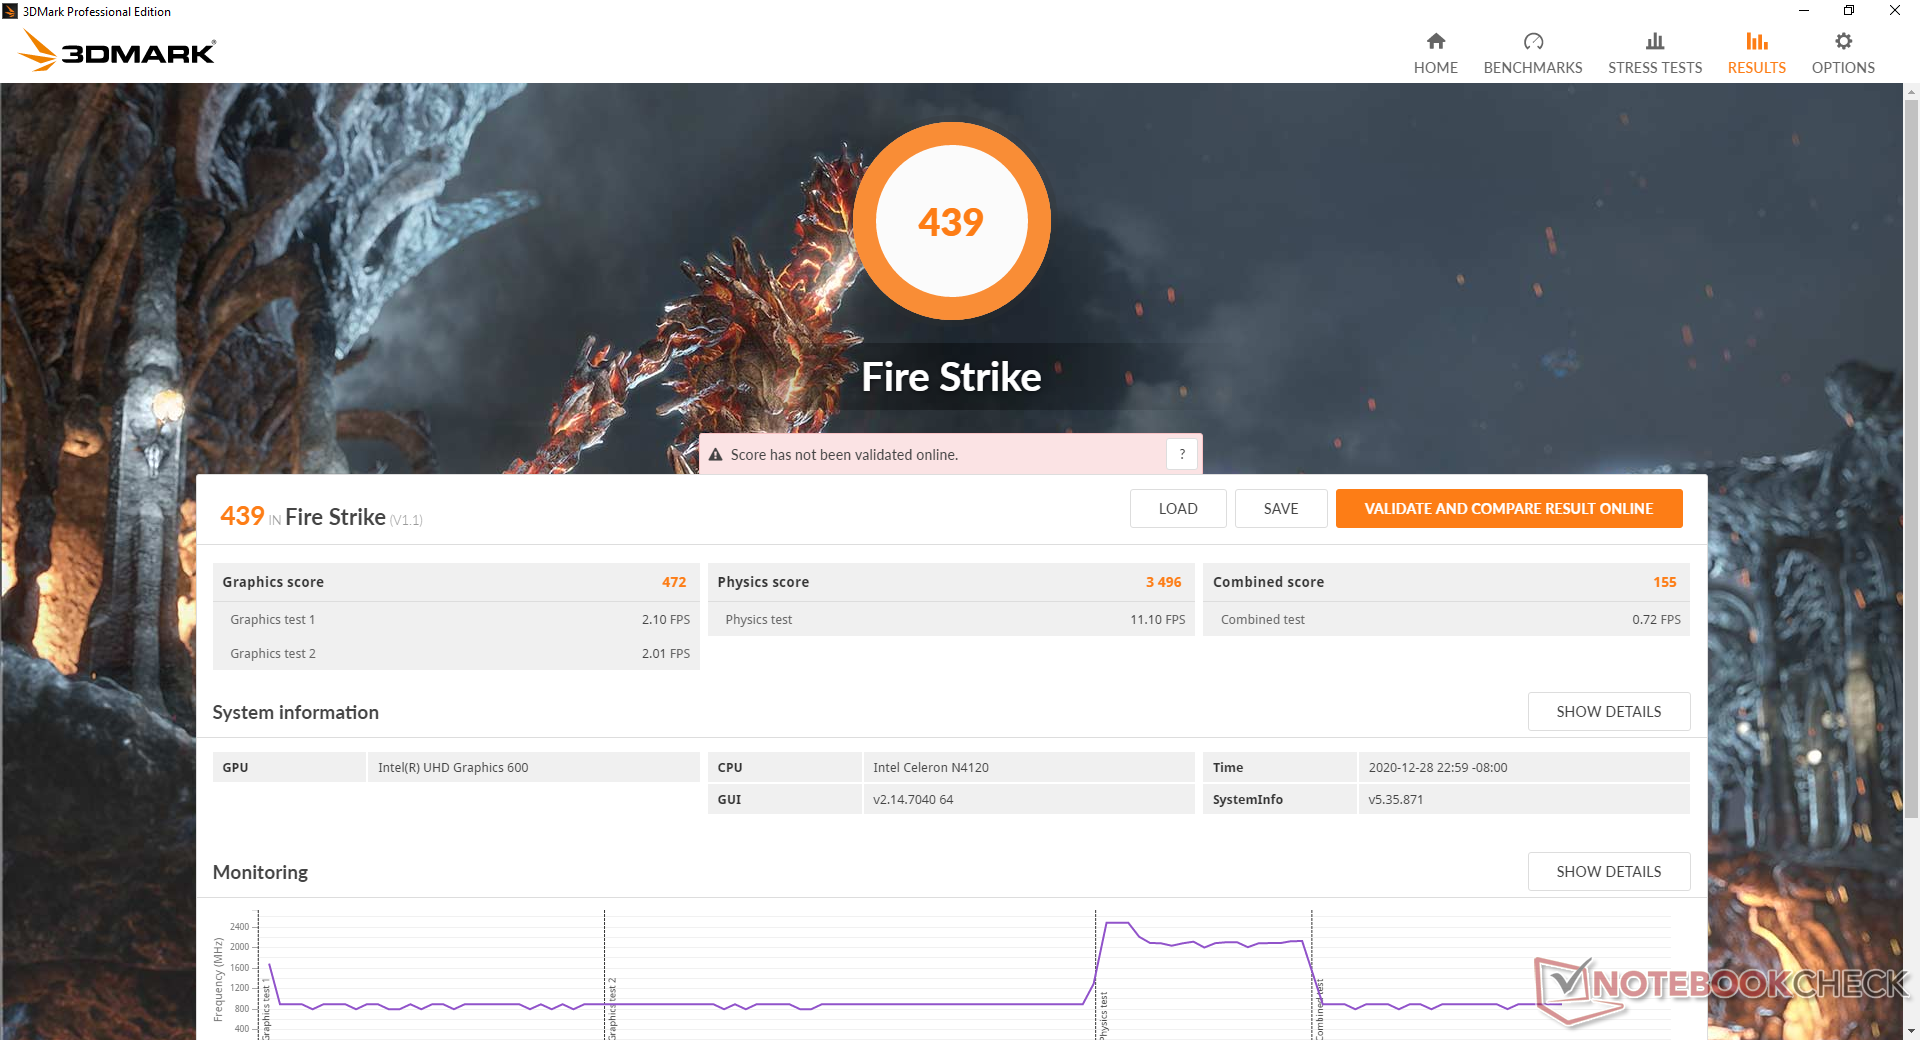
| 3DMark Fire Strike Score | 439 points | |
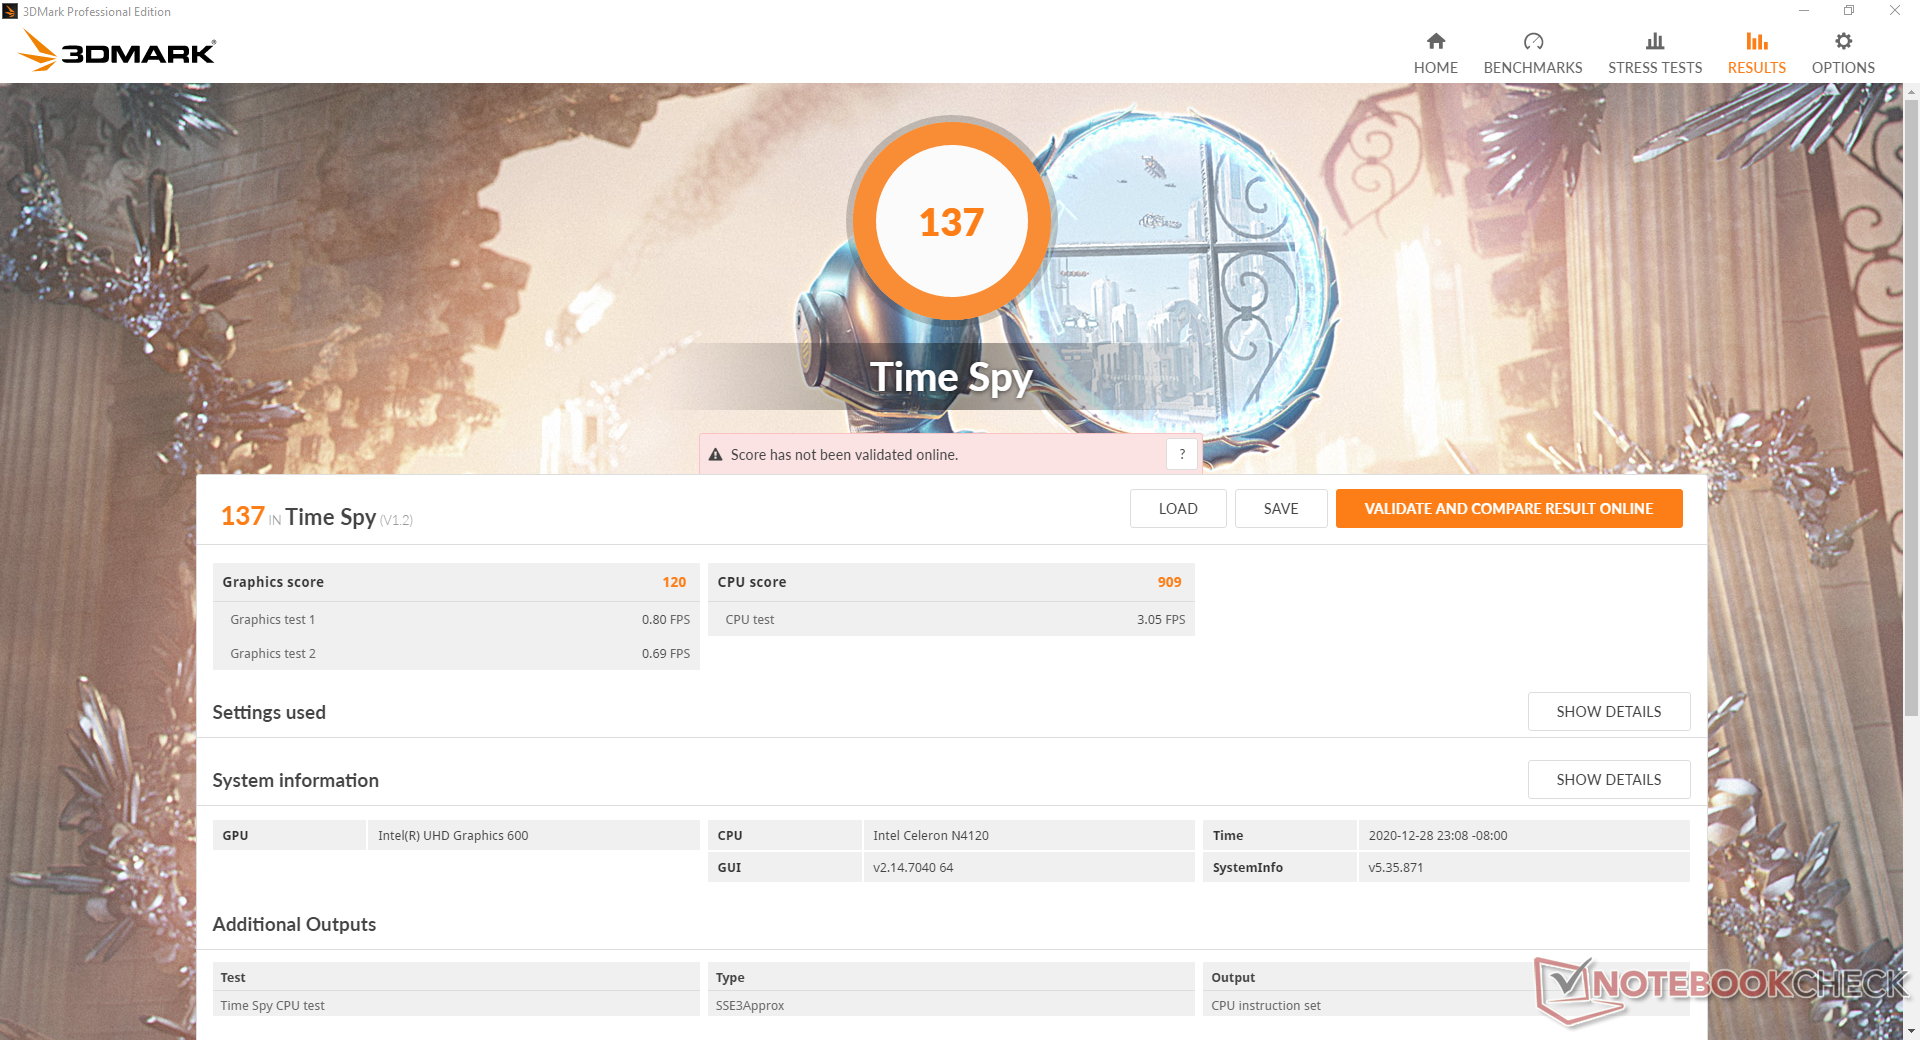
| 3DMark Time Spy Score | 137 points | |
Help | ||
| low | med. | high | ultra | |
|---|---|---|---|---|
| Dota 2 Reborn (2015) | 38.9 | 15.2 | 8 | 7.4 |
| X-Plane 11.11 (2018) | 6.92 | 4.68 | 4.26 |
Emissions
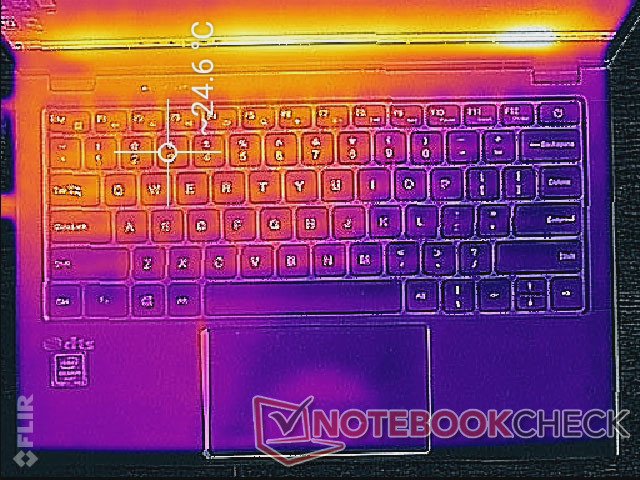
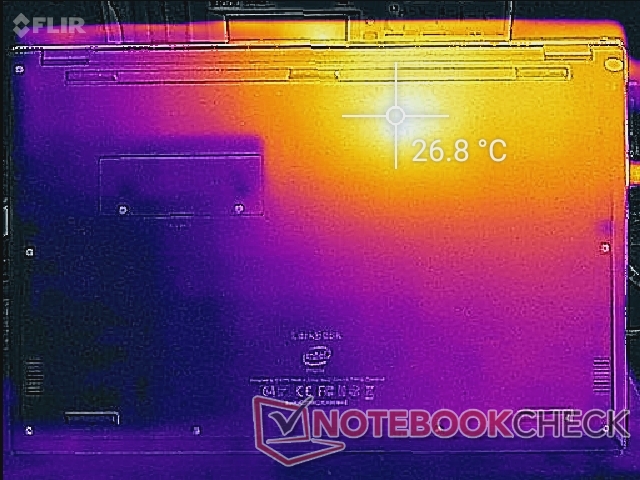
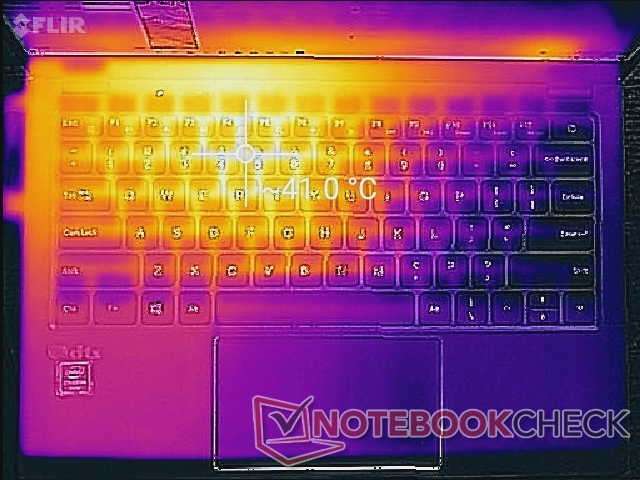
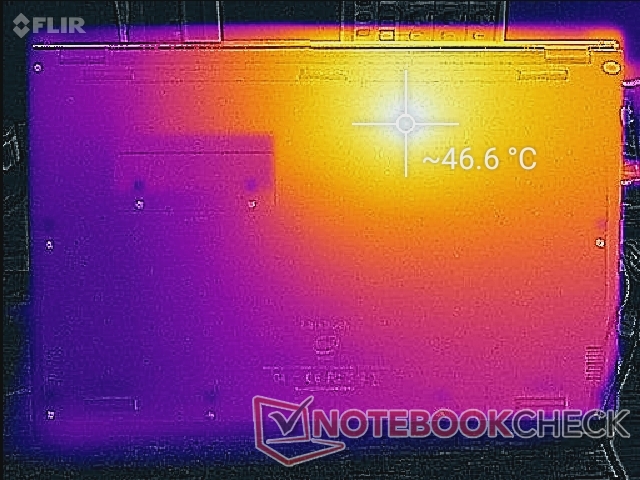
Temperature
The laptop will always be warmer on its left half than the right half due to how the motherboard is positioned inside. Hot spots can become as warm as 41 C to 47 C when under high loads which we find to be noticeable but not vexing.
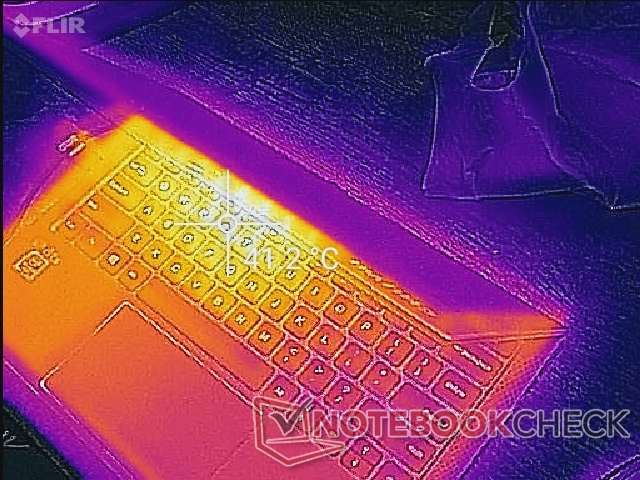
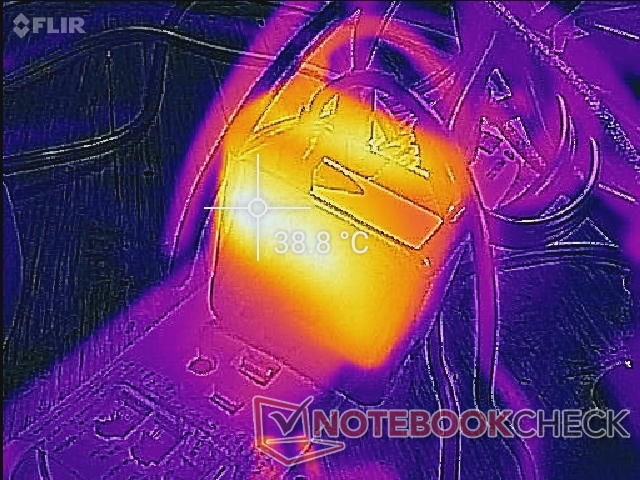
(±) The maximum temperature on the upper side is 41 °C / 106 F, compared to the average of 35.9 °C / 97 F, ranging from 21.4 to 59 °C for the class Subnotebook.
(-) The bottom heats up to a maximum of 46.8 °C / 116 F, compared to the average of 39.2 °C / 103 F
(+) In idle usage, the average temperature for the upper side is 22.3 °C / 72 F, compared to the device average of 30.8 °C / 87 F.
(+) The palmrests and touchpad are cooler than skin temperature with a maximum of 30.2 °C / 86.4 F and are therefore cool to the touch.
(±) The average temperature of the palmrest area of similar devices was 28.2 °C / 82.8 F (-2 °C / -3.6 F).
Stress Test
Running Prime95 causes the CPU to boost to 2.5 GHz for about 15 seconds until reaching a core temperature of 86 C. Thereafter, clock rates and temperature would drop to 1.9 GHz and plateau at 76 C, respectively. The limited Turbo Boost potential is to be expected from a passively-cooled laptop.
Running on battery power will not limit performance. A 3DMark 11 test on batteries would return nearly identical scores.
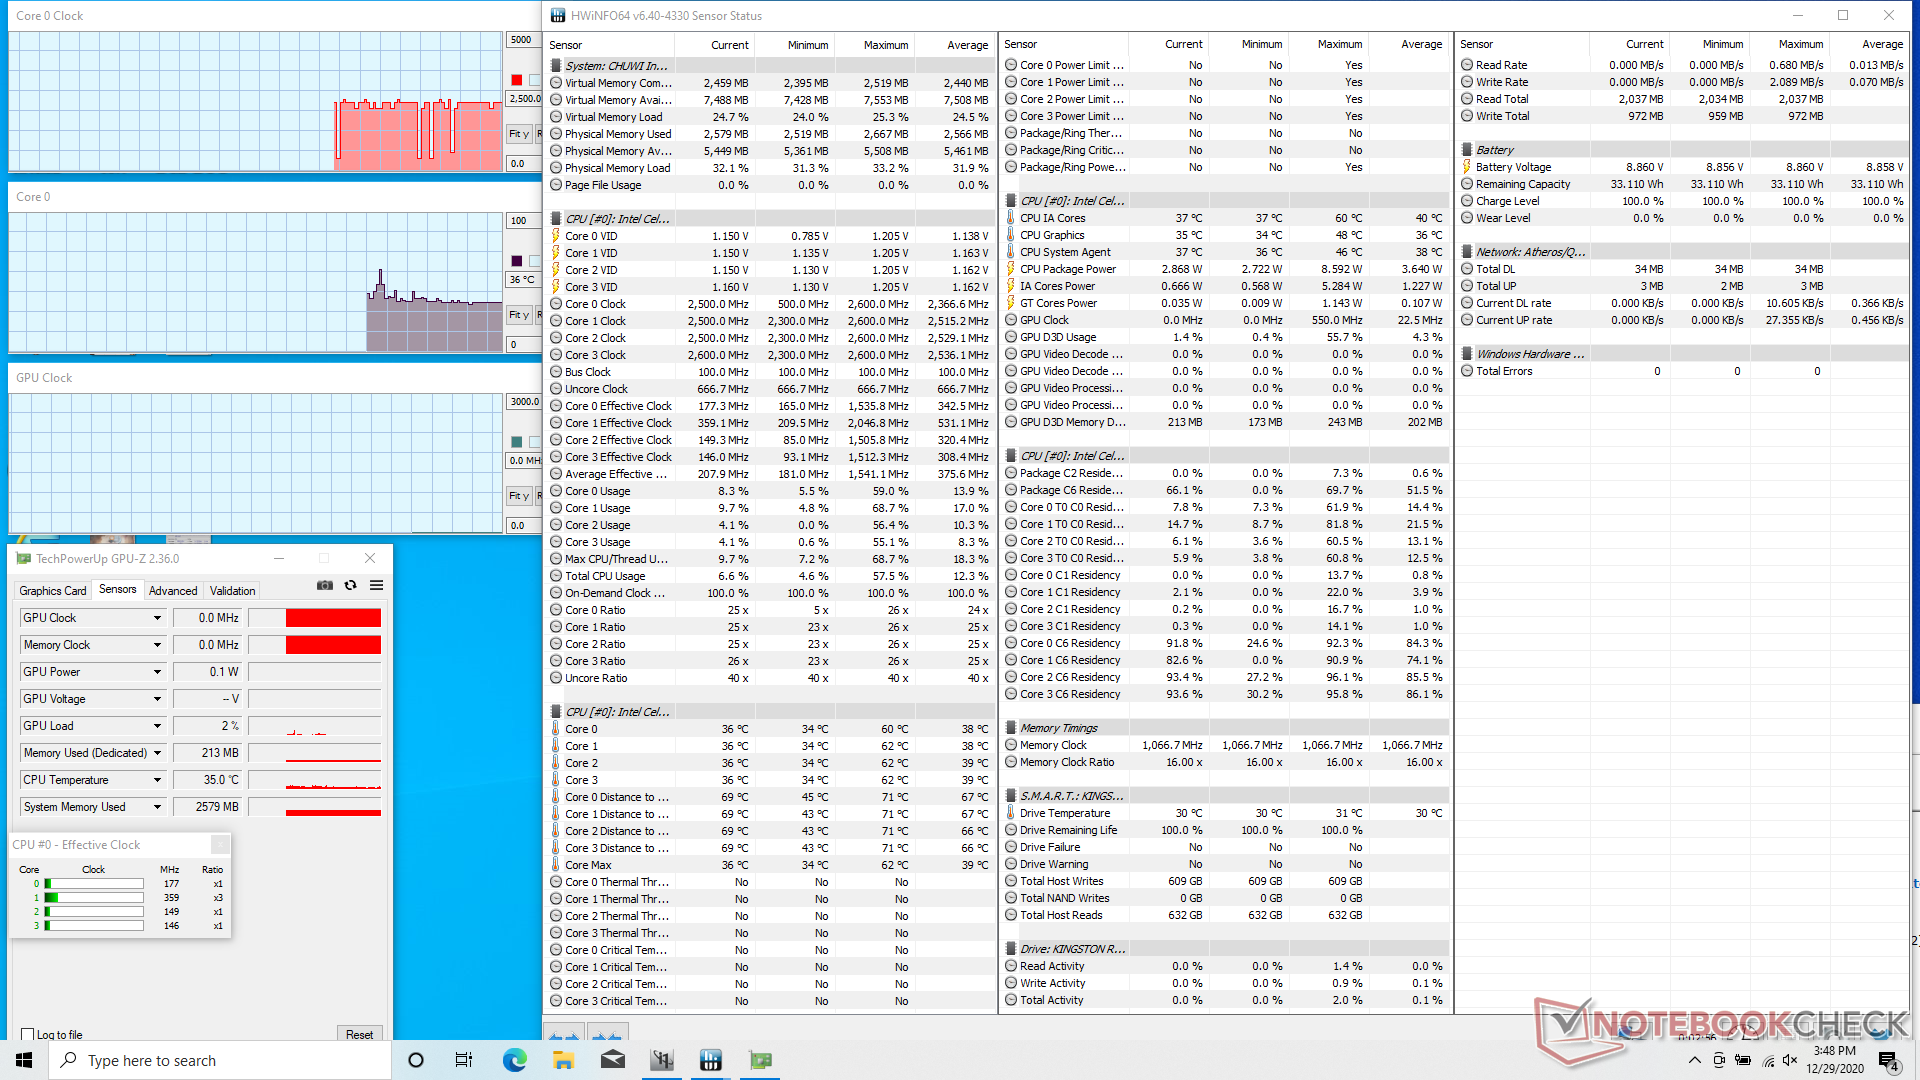
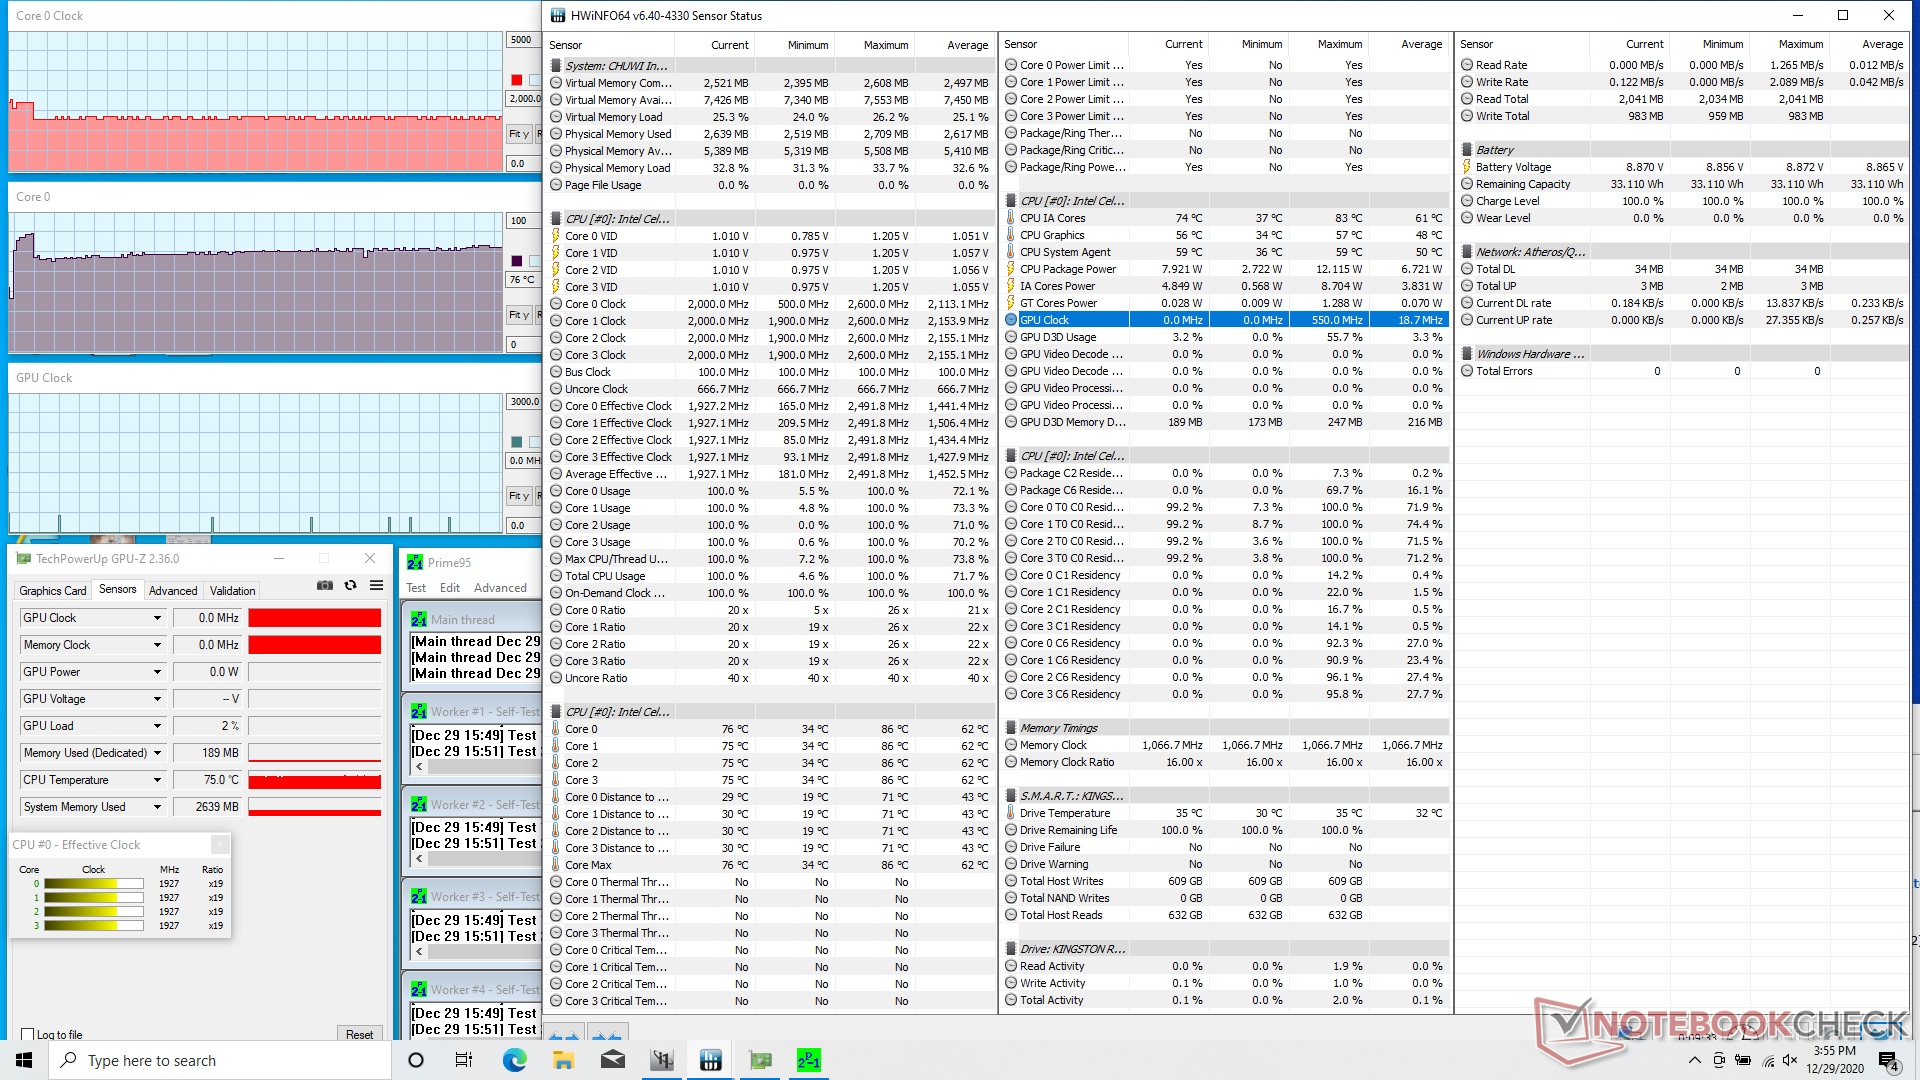
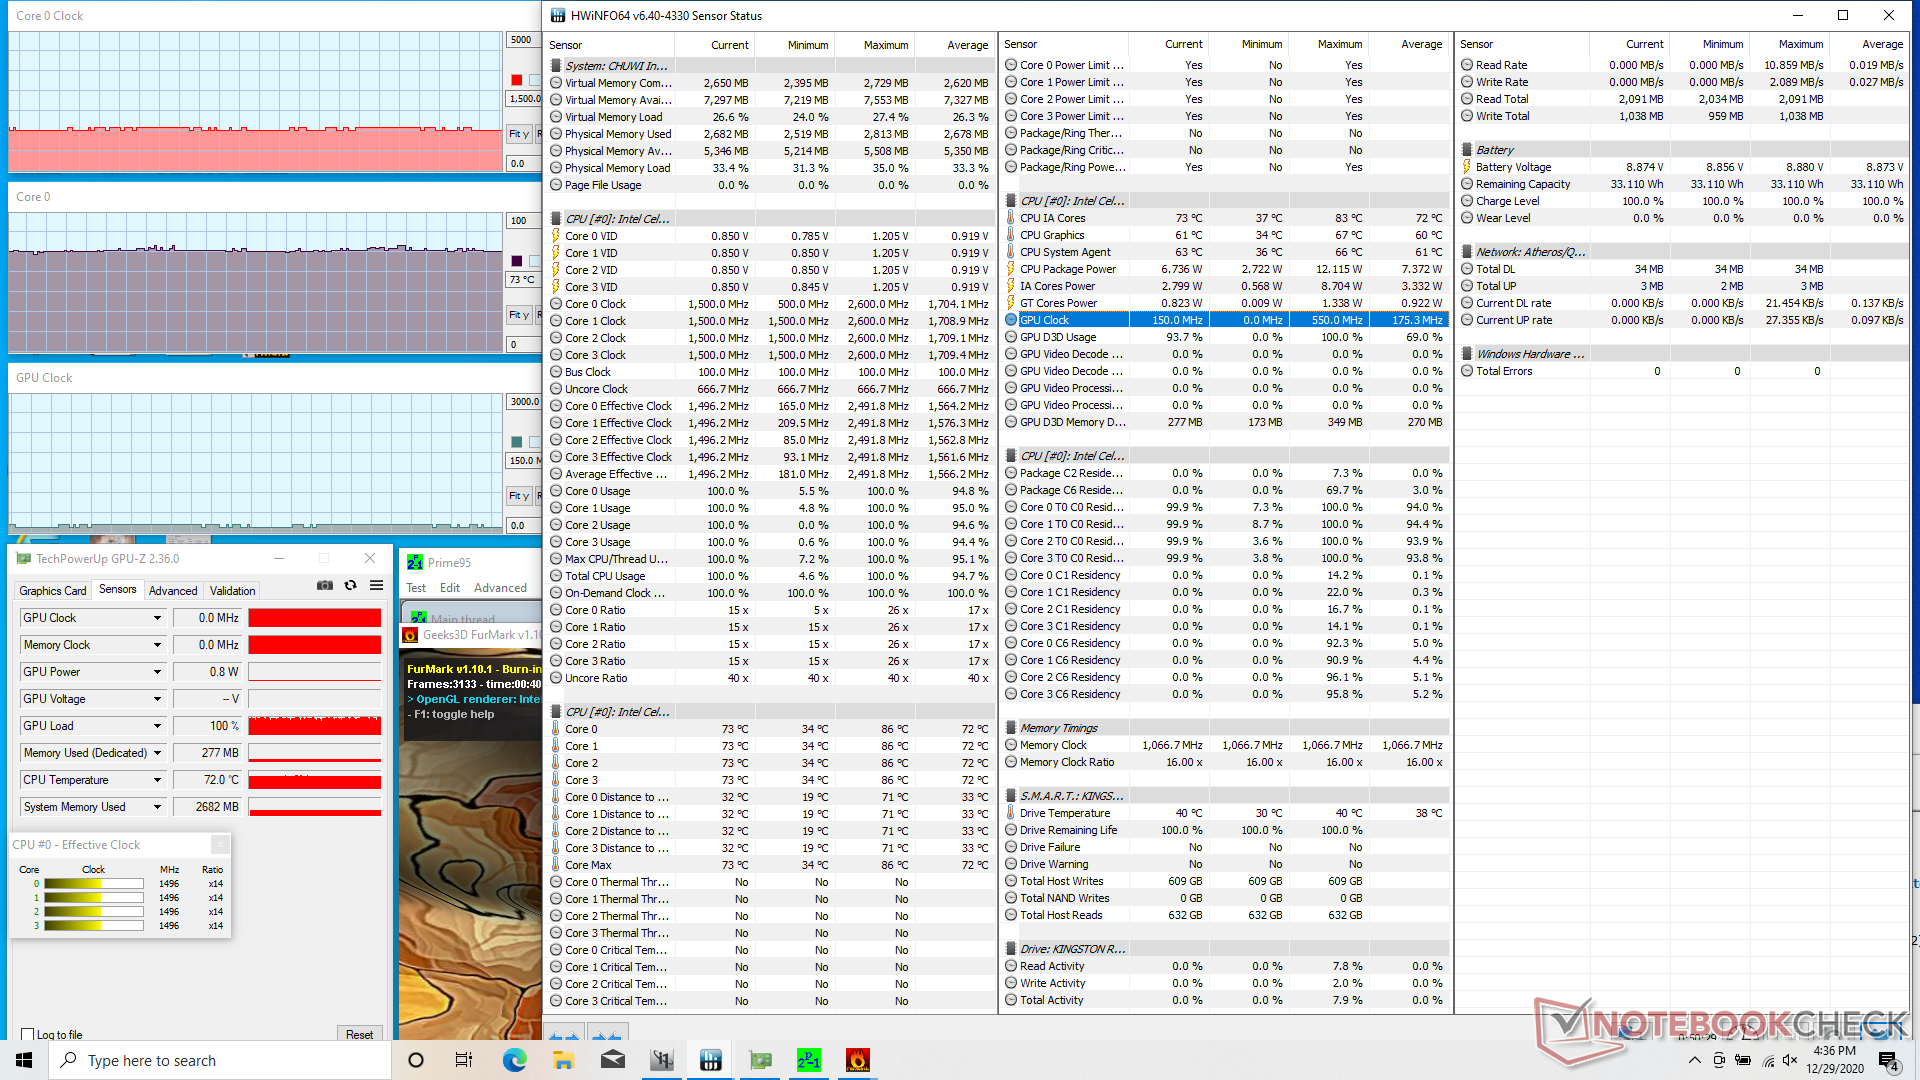
| CPU Clock (GHz) | GPU Clock (MHz) | Average CPU Temperature (°C) | |
| System Idle | -- | -- | 36 |
| Prime95 Stress | 1.9 - 2.0 | -- | 76 |
| Prime95 + FurMark Stress | 1.5 - 1.6 | 150 | 73 |
Speakers
")

Chuwi LarkBook CWI509 audio analysis
(+) | speakers can play relatively loud (82.4 dB)
Bass 100 - 315 Hz
(-) | nearly no bass - on average 22.2% lower than median
(±) | linearity of bass is average (12.6% delta to prev. frequency)
Mids 400 - 2000 Hz
(+) | balanced mids - only 4.7% away from median
(+) | mids are linear (6.9% delta to prev. frequency)
Highs 2 - 16 kHz
(+) | balanced highs - only 4.7% away from median
(±) | linearity of highs is average (7% delta to prev. frequency)
Overall 100 - 16.000 Hz
(±) | linearity of overall sound is average (19.1% difference to median)
Compared to same class
» 59% of all tested devices in this class were better, 6% similar, 36% worse
» The best had a delta of 5%, average was 18%, worst was 53%
Compared to all devices tested
» 46% of all tested devices were better, 7% similar, 47% worse
» The best had a delta of 4%, average was 24%, worst was 134%
Apple MacBook 12 (Early 2016) 1.1 GHz audio analysis
(+) | speakers can play relatively loud (83.6 dB)
Bass 100 - 315 Hz
(±) | reduced bass - on average 11.3% lower than median
(±) | linearity of bass is average (14.2% delta to prev. frequency)
Mids 400 - 2000 Hz
(+) | balanced mids - only 2.4% away from median
(+) | mids are linear (5.5% delta to prev. frequency)
Highs 2 - 16 kHz
(+) | balanced highs - only 2% away from median
(+) | highs are linear (4.5% delta to prev. frequency)
Overall 100 - 16.000 Hz
(+) | overall sound is linear (10.2% difference to median)
Compared to same class
» 7% of all tested devices in this class were better, 2% similar, 91% worse
» The best had a delta of 5%, average was 18%, worst was 53%
Compared to all devices tested
» 5% of all tested devices were better, 1% similar, 94% worse
» The best had a delta of 4%, average was 24%, worst was 134%
Energy Management
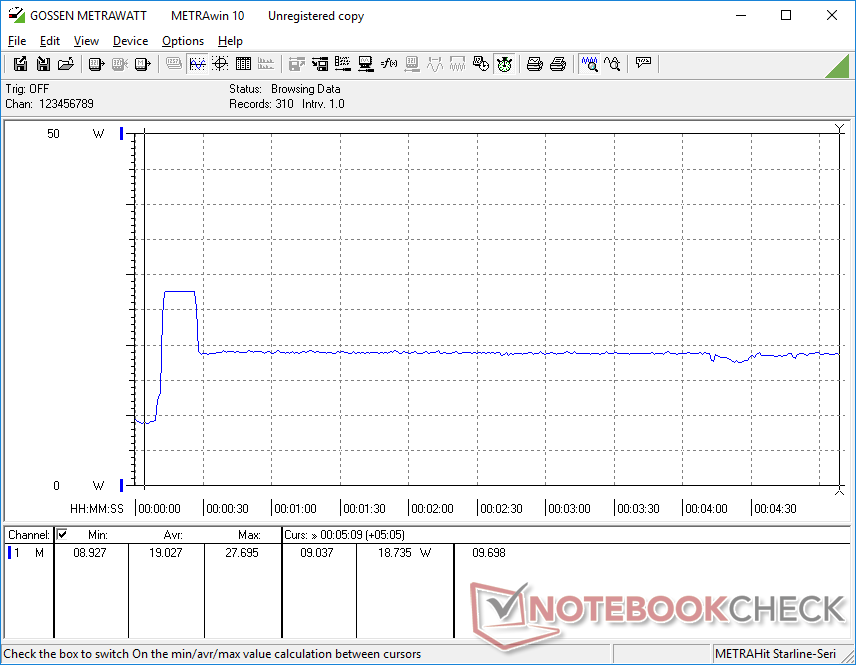
Power Consumption
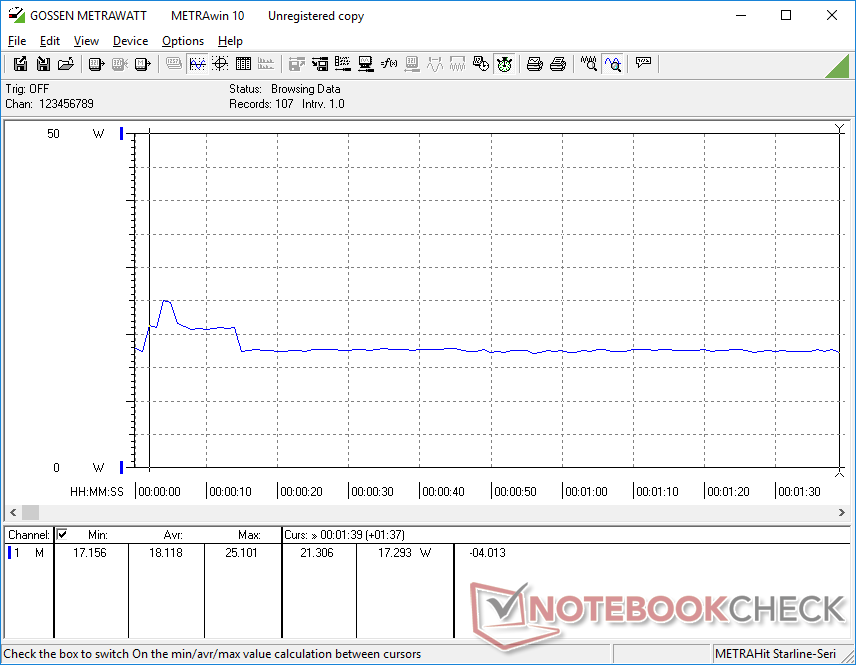
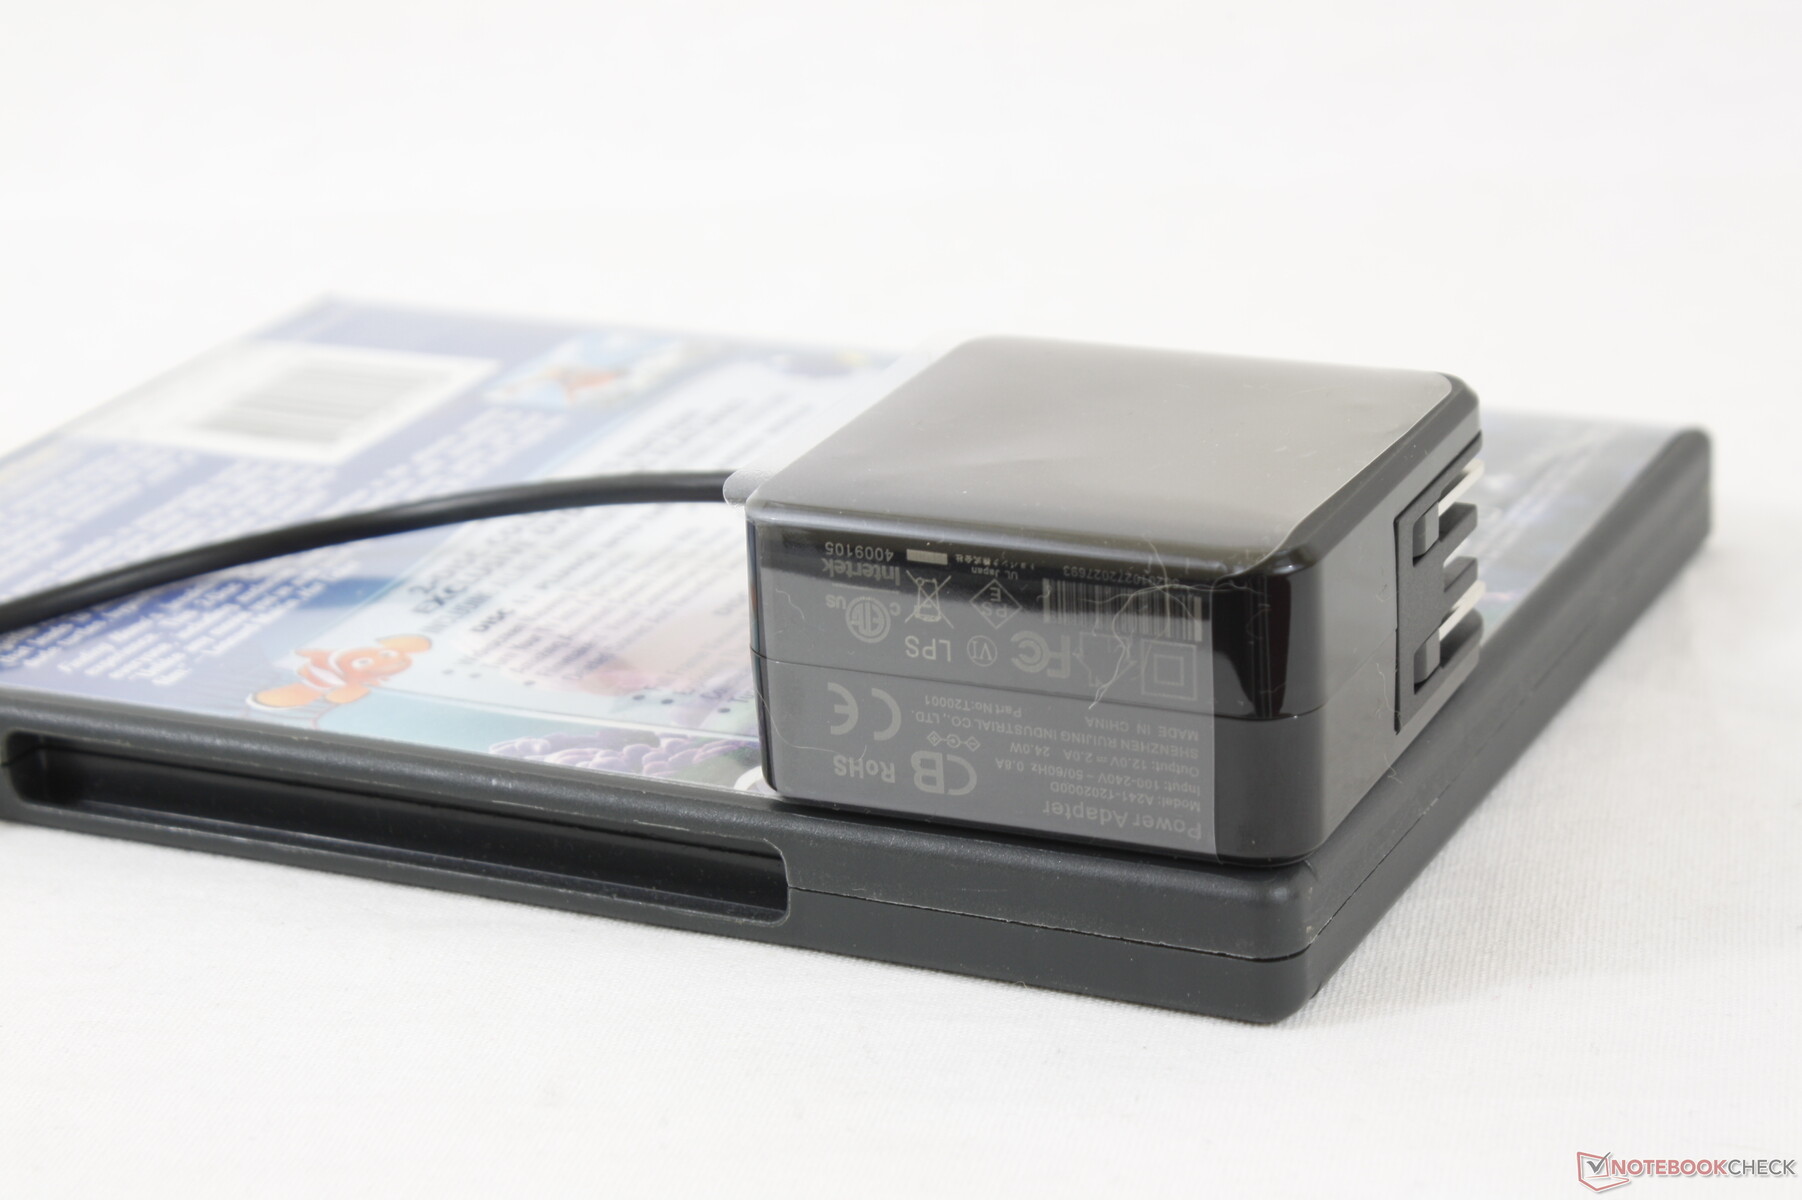
Idling on desktop consumes between 5 W and 9 W which is not all that different from the usual Core i-powered laptop even though the Chuwi is passively cooled and significantly slower. We're able to record a temporary maximum draw of 27.8 W from the small (5.5 x 5.5 x 3 cm) 24 W AC adapter as shown by the graphs before thermal throttling kicks in.

| Off / Standby | |
| Idle | |
| Load |
|
Key:
min: | |
| Chuwi LarkBook CWI509 Celeron N4120, UHD Graphics 600, Kingston RBUSNS8180DS3256GJ, IPS, 1920x1080, 13.3" | Apple MacBook Air 2020 M1 Entry M1, M1 7-Core GPU, Apple SSD AP0256Q, IPS, 2560x1600, 13.3" | Dell XPS 13 9310 Core i7 FHD i7-1165G7, Iris Xe G7 96EUs, Micron 2300 512GB MTFDHBA512TDV, IPS, 1920x1200, 13.4" | Lenovo IdeaPad S540-13API R5 3550H, Vega 8, Samsung SSD PM981 MZVLB512HAJQ, IPS, 2560x1600, 13.3" | HP Pavilion 13-bb0015cl i7-1165G7, Iris Xe G7 96EUs, Samsung PM991 MZVLQ512HALU, IPS, 3840x2160, 13.3" | Asus VivoBook S13 S330UA-EY034T i5-8550U, UHD Graphics 620, Kingston RBU-SNS8180DS3512GJ, IPS LED, 1920x1080, 13.3" | |
|---|---|---|---|---|---|---|
| Power Consumption | 10% | -23% | -41% | -53% | -38% | |
| Idle Minimum * (Watt) | 5.2 | 1.9 63% | 3.9 25% | 5.6 -8% | 4.6 12% | 2.8 46% |
| Idle Average * (Watt) | 7.3 | 6.4 12% | 5.9 19% | 8.2 -12% | 10.6 -45% | 5 32% |
| Idle Maximum * (Watt) | 8.9 | 7 21% | 6.3 29% | 9.1 -2% | 11.4 -28% | 8.3 7% |
| Load Average * (Watt) | 18.1 | 25 -38% | 39.7 -119% | 37.6 -108% | 43.2 -139% | 42.8 -136% |
| Load Maximum * (Watt) | 27.8 | 30.3 -9% | 47.5 -71% | 48.3 -74% | 46 -65% | 65.8 -137% |
| Witcher 3 ultra * (Watt) | 34.8 | 39.9 |
* ... smaller is better
Battery Life
Runtimes are short at just under 4.5 hours of constant WLAN use. Furthermore, charging from empty to full capacity is very slow at almost 3 full hours. The system cannot be recharged via USB-C.
| Chuwi LarkBook CWI509 Celeron N4120, UHD Graphics 600, 34.8 Wh | Apple MacBook Air 2020 M1 Entry M1, M1 7-Core GPU, 49.9 Wh | Dell XPS 13 9310 Core i7 FHD i7-1165G7, Iris Xe G7 96EUs, 52 Wh | Lenovo IdeaPad S540-13API R5 3550H, Vega 8, 56 Wh | HP Pavilion 13-bb0015cl i7-1165G7, Iris Xe G7 96EUs, 43 Wh | Asus VivoBook S13 S330UA-EY034T i5-8550U, UHD Graphics 620, 42 Wh | |
|---|---|---|---|---|---|---|
| Battery runtime | 264% | 150% | 139% | 2% | 91% | |
| WiFi v1.3 (h) | 4.4 | 16 264% | 11 150% | 10.5 139% | 4.5 2% | 8.4 91% |
| Reader / Idle (h) | 30 | 10.8 | ||||
| Load (h) | 3.2 | 1.3 |
Pros
Cons
Verdict
Unless if you can find one deeply discounted, the Chuwi LarkBook is a little costly at its MSRP of nearly $500 USD. You would be better off investing in a four-year old Dell XPS 13 as even a Core i3-powered configuration will run laps around the LarkBook. The longevity of the LarkBook is also questionable as we've had issues related to the hinges and keyboard keys of earlier Chuwi test units like the AeroBook.
The sleek design and crisp IPS display are dragged down by the slow processor performance and imperfect 4K UHD video playback.
The LarkBook is visually attractive and its display is actually pretty good after calibration. As a primary laptop for streaming and browsing, however, you're going to want something faster and longer-lasting.
Price and availability
The Chuwi LarkBook is currently available on the official Chuwi online store for about $400 to $500 USD.
Chuwi LarkBook CWI509
- 12/31/2020 v7 (old)
Allen Ngo
Price comparison
