Chuwi GemiBook CWI528 Laptop Review: Full sRGB Coverage For $300 USD
Chuwi is a company that shamelessly imitates popular laptops but at significantly reduced prices. To reach such affordable levels, the manufacturer cuts major corners by going for cheaper chassis materials, slower processors and more lenient quality control.
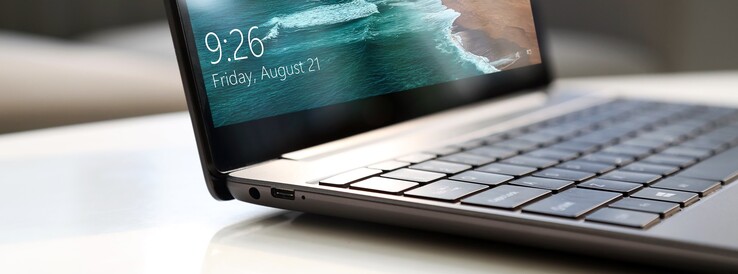
The latest Chuwi laptop is the 13-inch GemiBook "inspired" by the Huawei MateBook 13. It's notable for offering a high resolution 2160 x 1440 3:2 display for just $300 or roughly a third of the price of most other 3:2 laptops like the Microsoft Surface Laptop or aforementioned Huawei.
Users can check out more Chuwi products at AliExpress here.
More Chuwi reviews:
Rating | Date | Model | Weight | Height | Size | Resolution | Price |
|---|---|---|---|---|---|---|---|
| 73.5 % v7 (old) | 09 / 2020 | Chuwi GemiBook CWI528 Celeron J4115, UHD Graphics 600 | 1.3 kg | 17.75 mm | 13.00" | 2160x1440 | |
| 75.2 % v7 (old) | LincPlus P1 Celeron N4000, UHD Graphics 600 | 1.4 kg | 16 mm | 13.30" | 1920x1080 | ||
| 67.7 % v7 (old) | 04 / 2020 | Jumper EZbook X3 Celeron N3350, HD Graphics 500 | 1.3 kg | 18 mm | 13.30" | 1920x1080 | |
| 89.6 % v7 (old) | 05 / 2020 | Apple MacBook Air 2020 i3 i3-1000NG4, Iris Plus Graphics G4 (Ice Lake 48 EU) | 1.3 kg | 16.1 mm | 13.30" | 2560x1600 | |
| 84.5 % v7 (old) | 08 / 2019 | HP Envy 13-aq0003ng i7-8565U, GeForce MX250 | 1.2 kg | 14.7 mm | 13.30" | 1920x1080 | |
| 83.9 % v6 (old) | 02 / 2019 | Tuxedo Book BU1307 i5-8550U, UHD Graphics 620 | 1.4 kg | 21 mm | 13.30" | 1920x1080 |
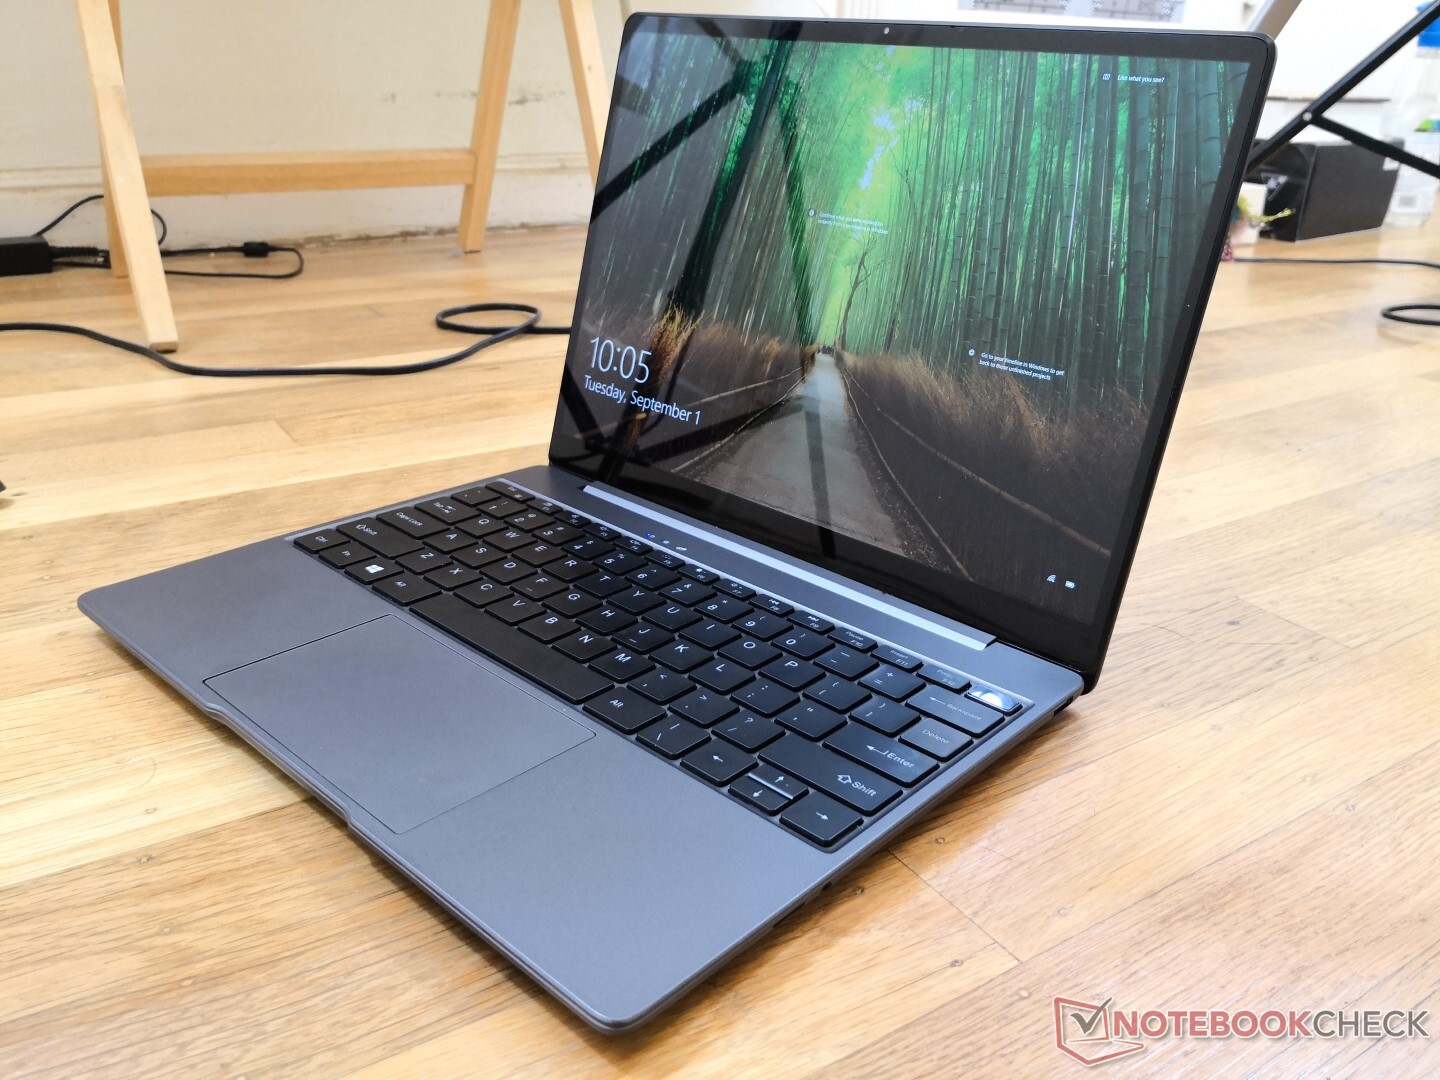
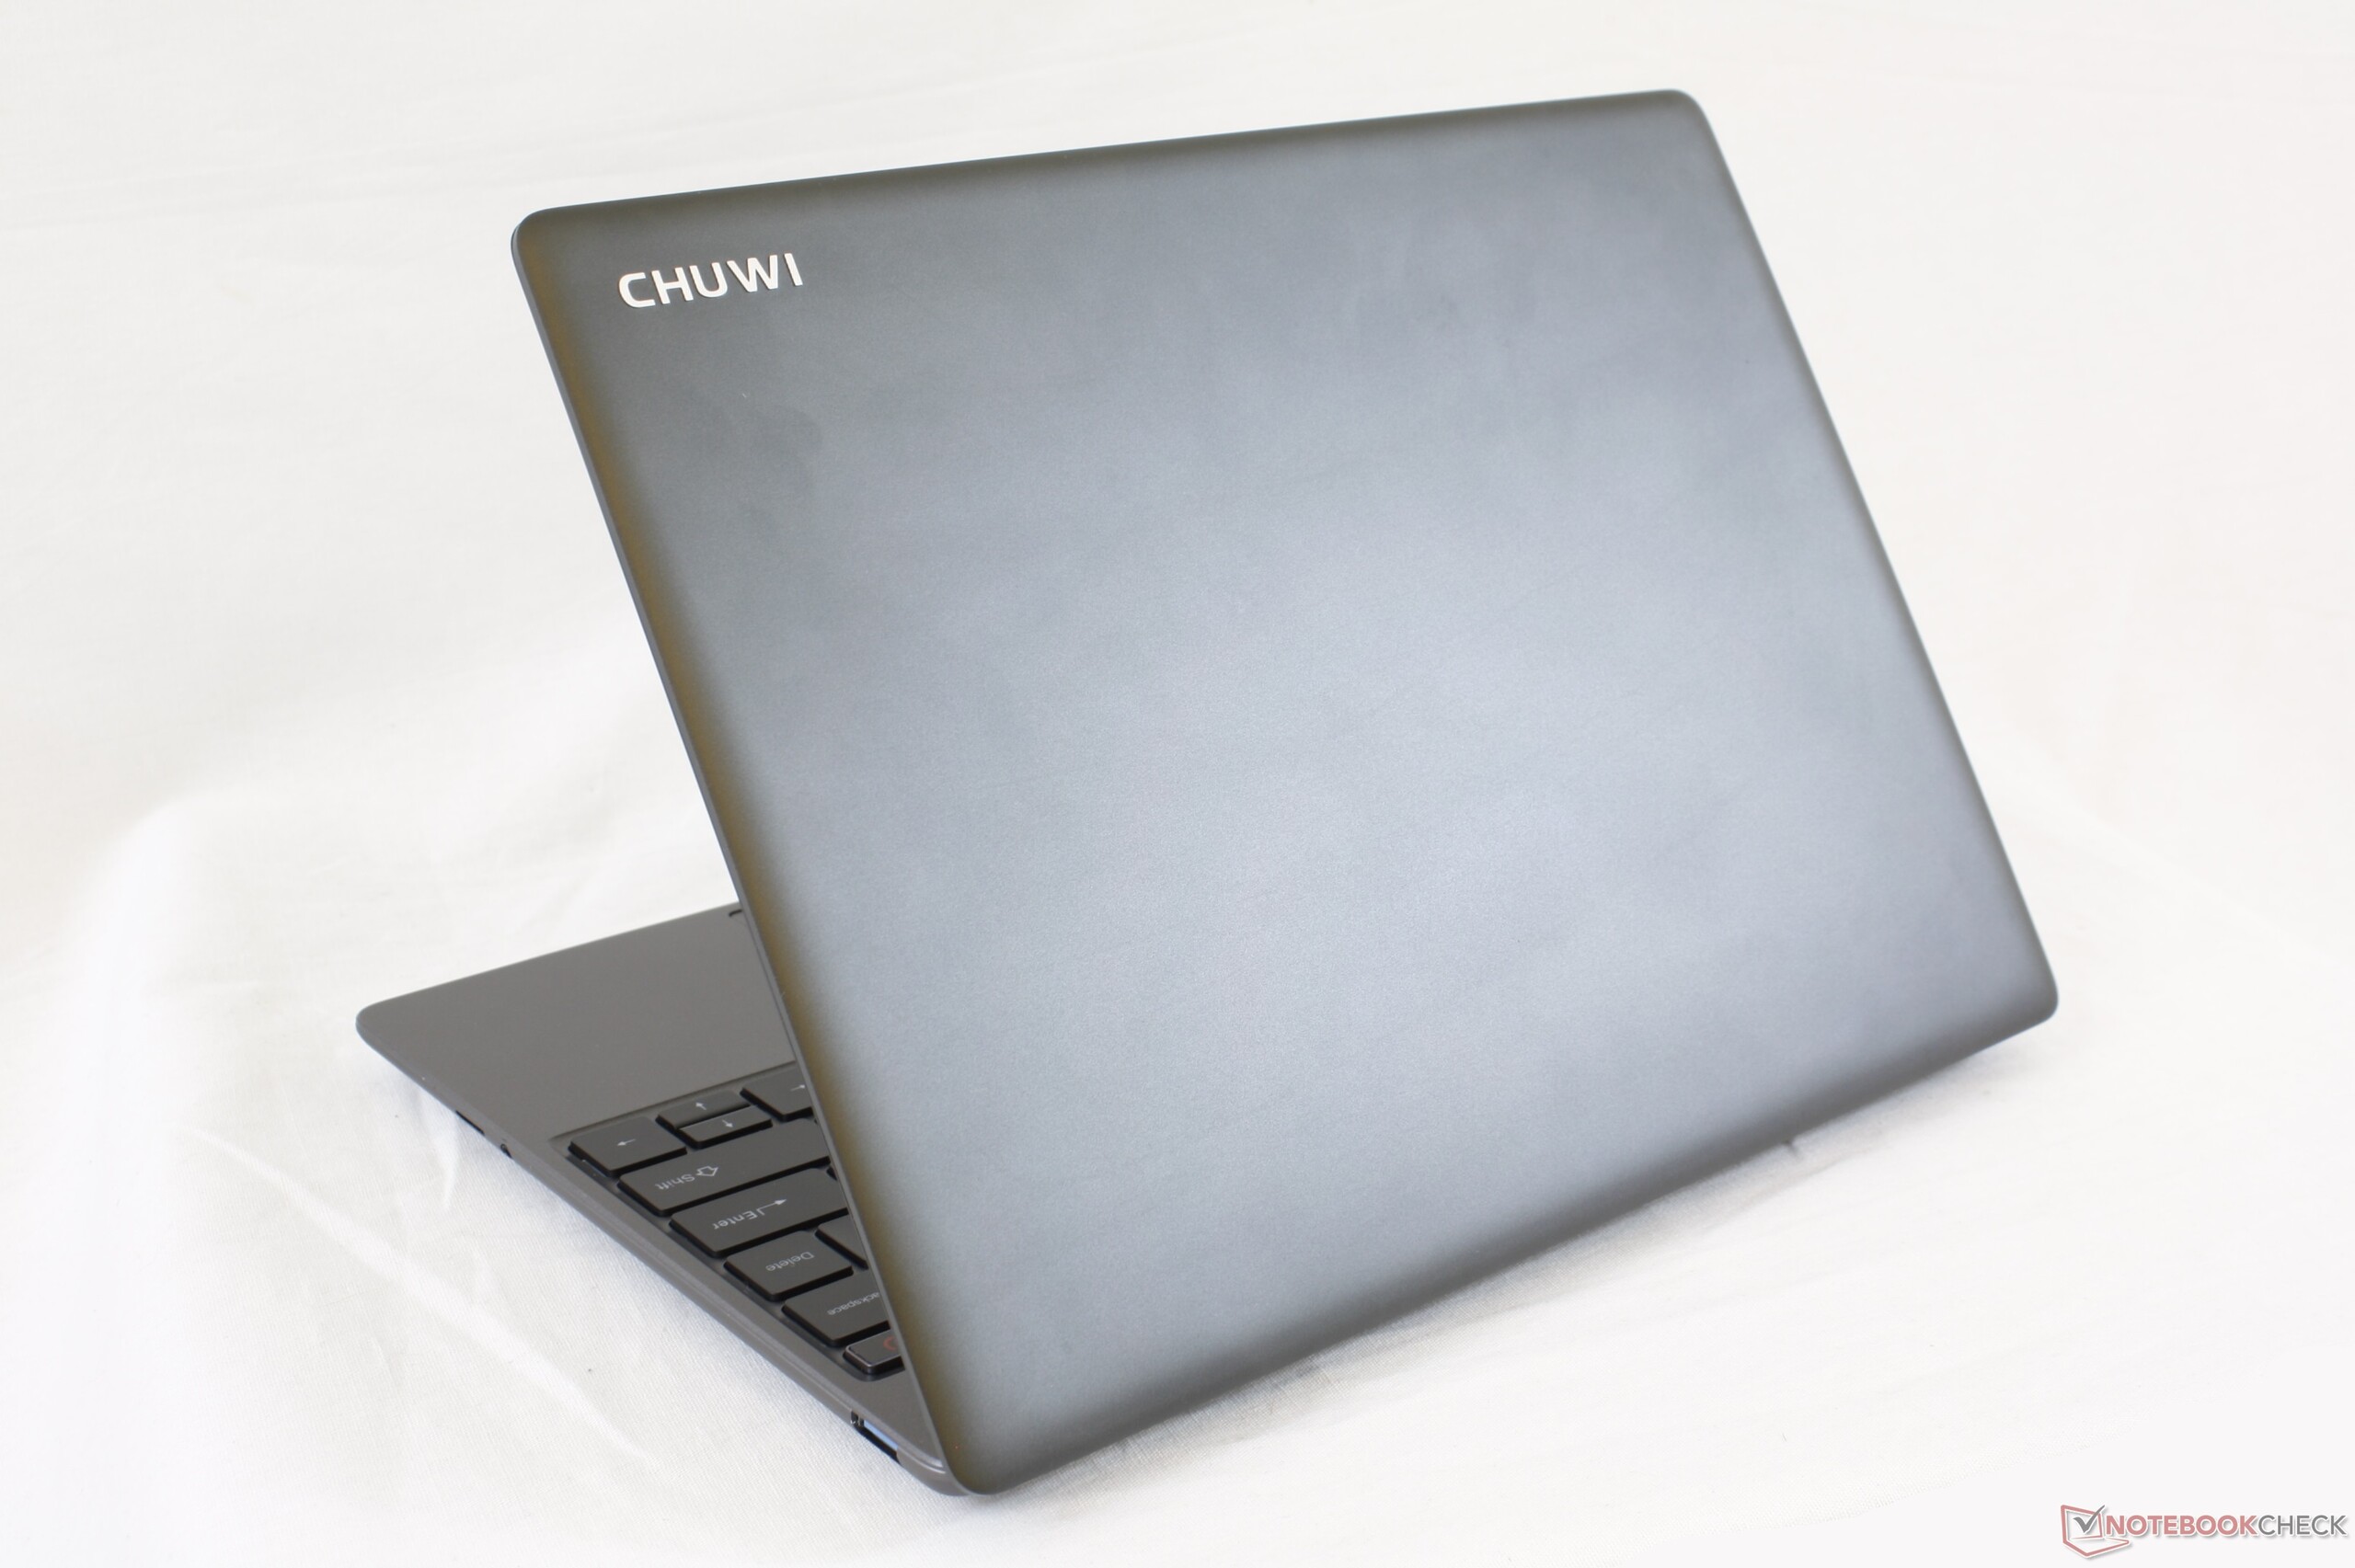
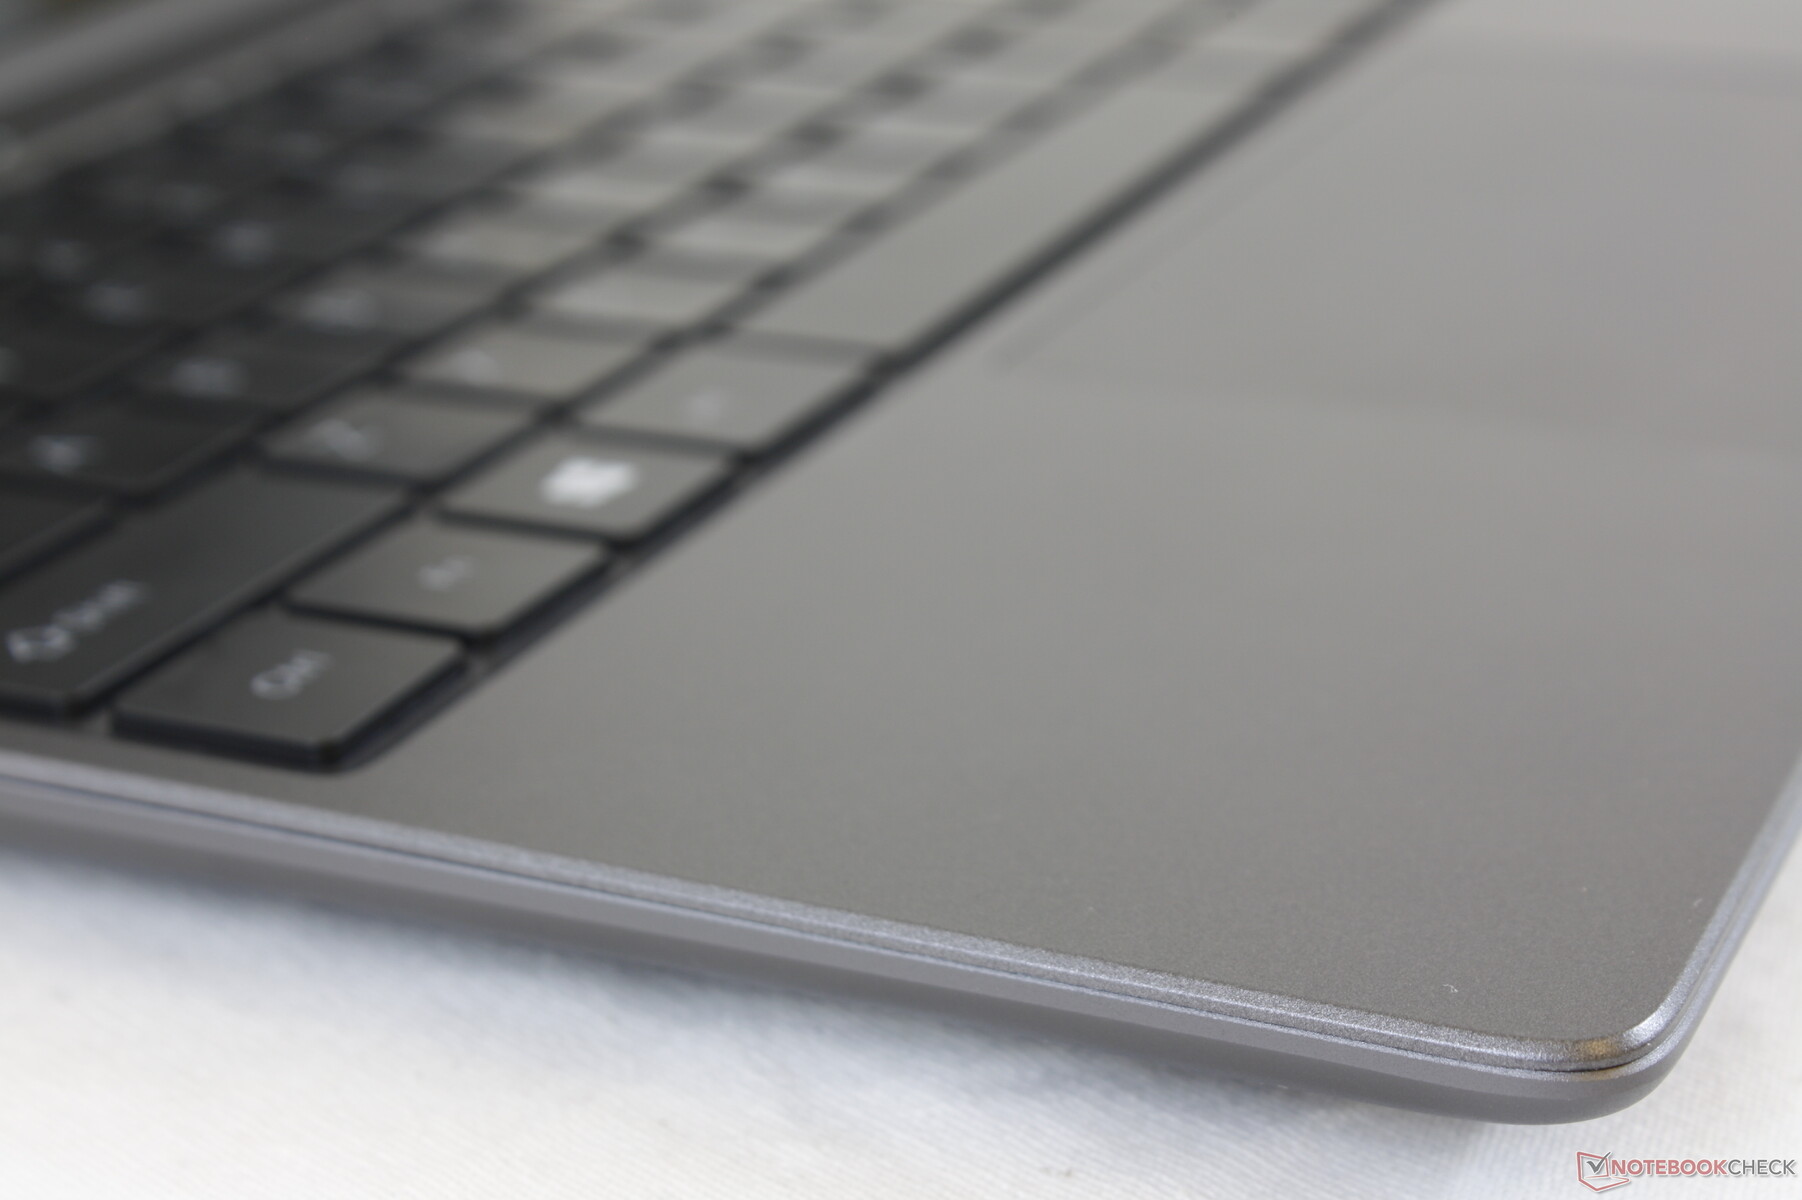
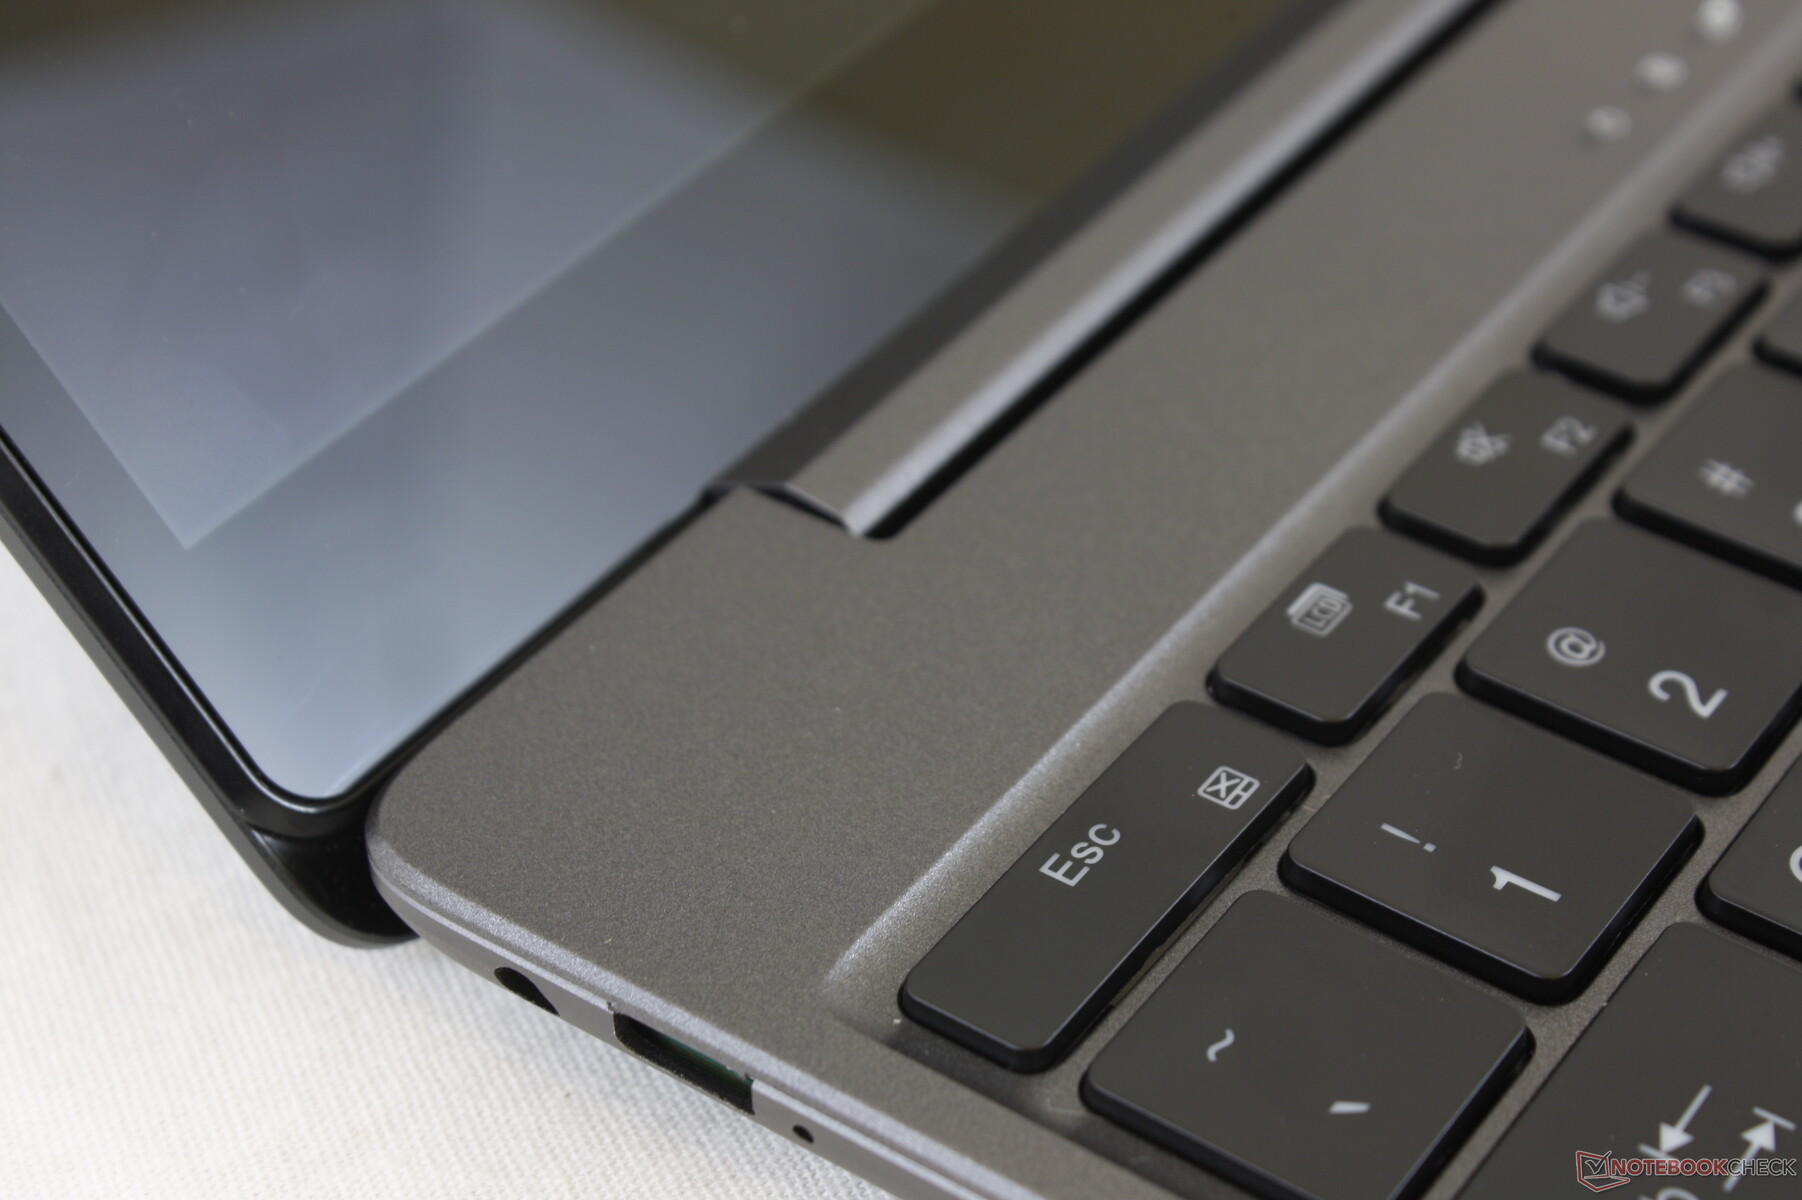
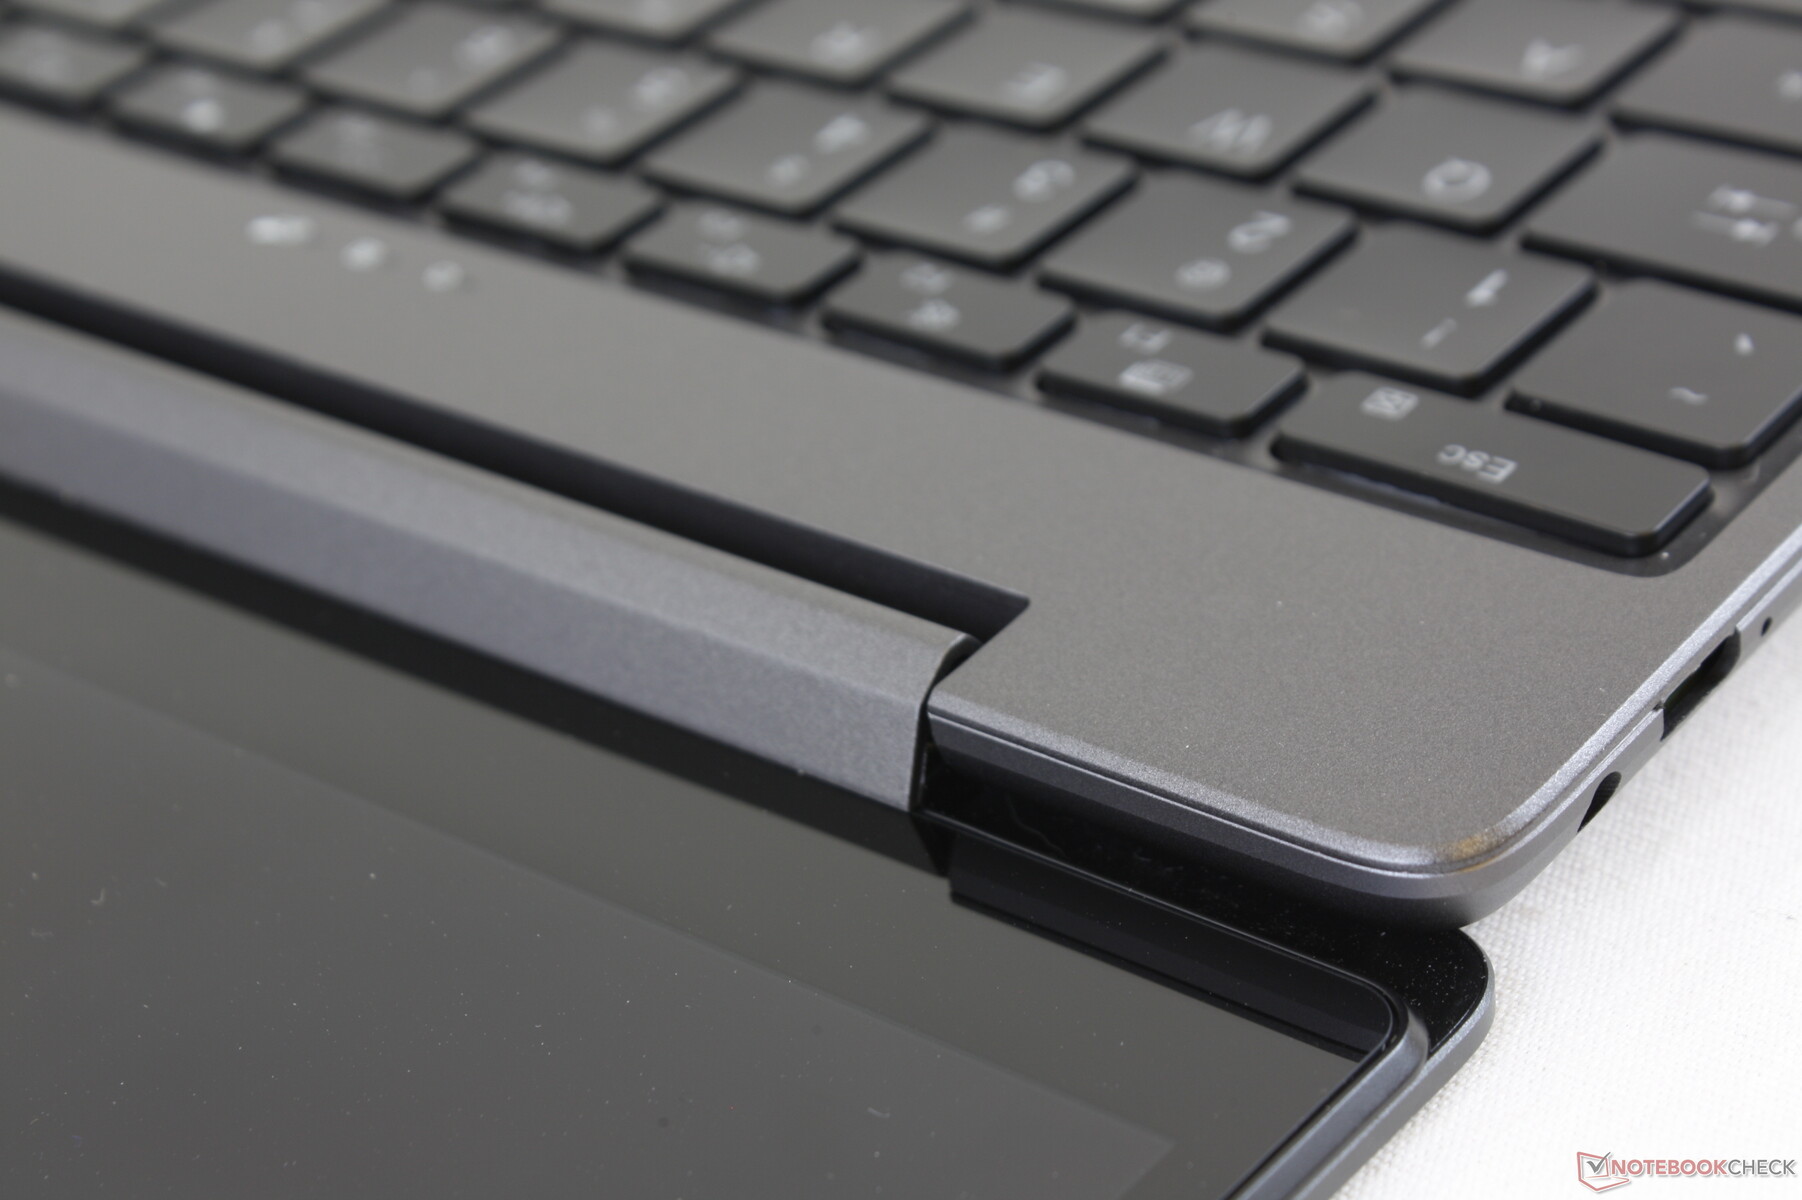
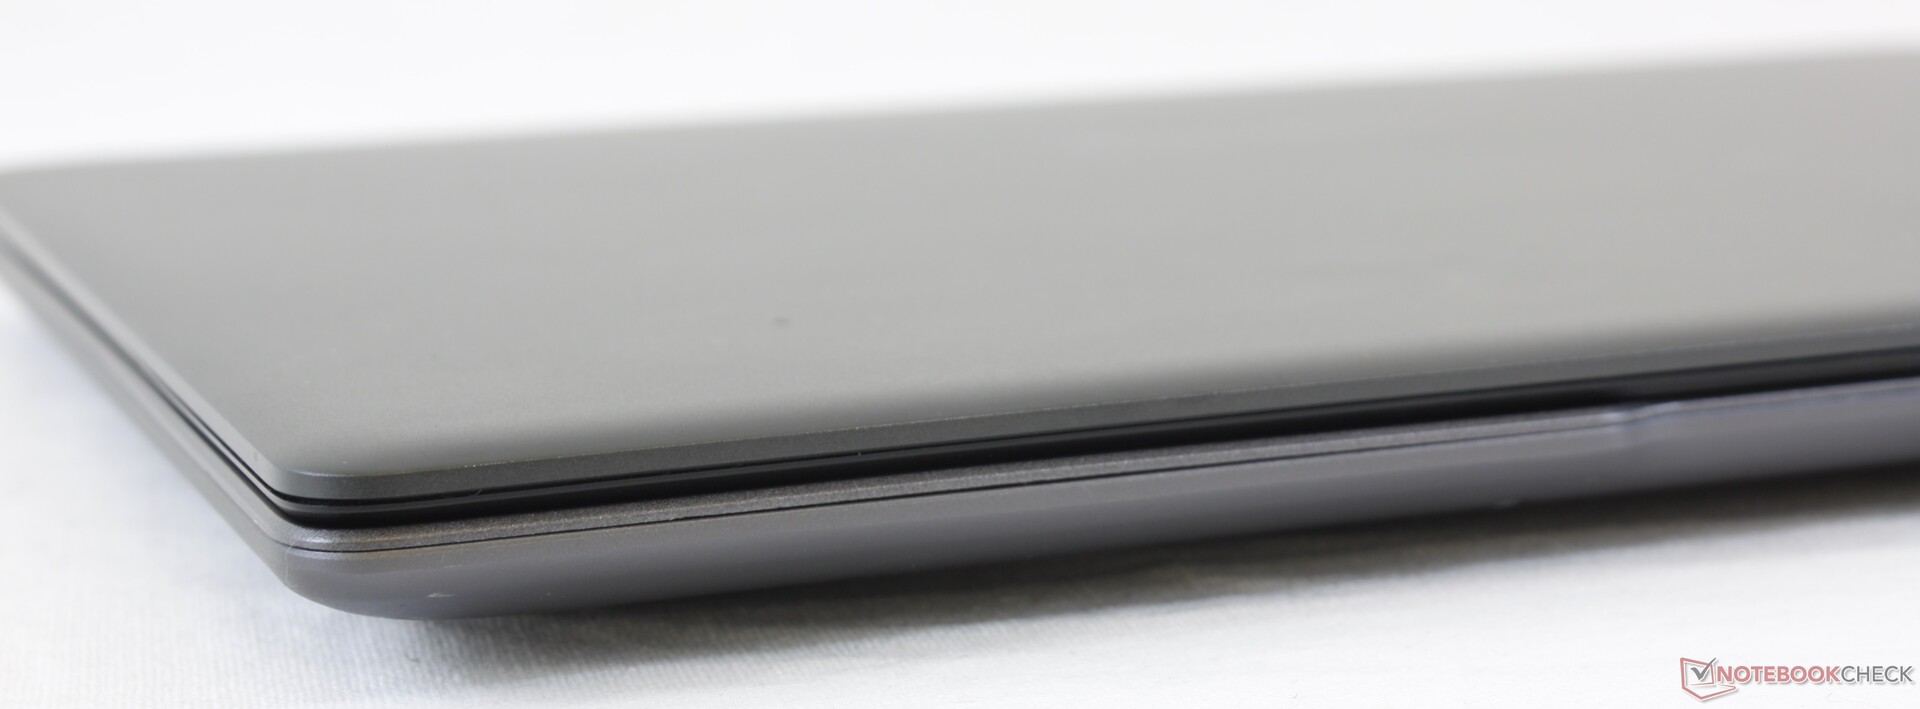
Case
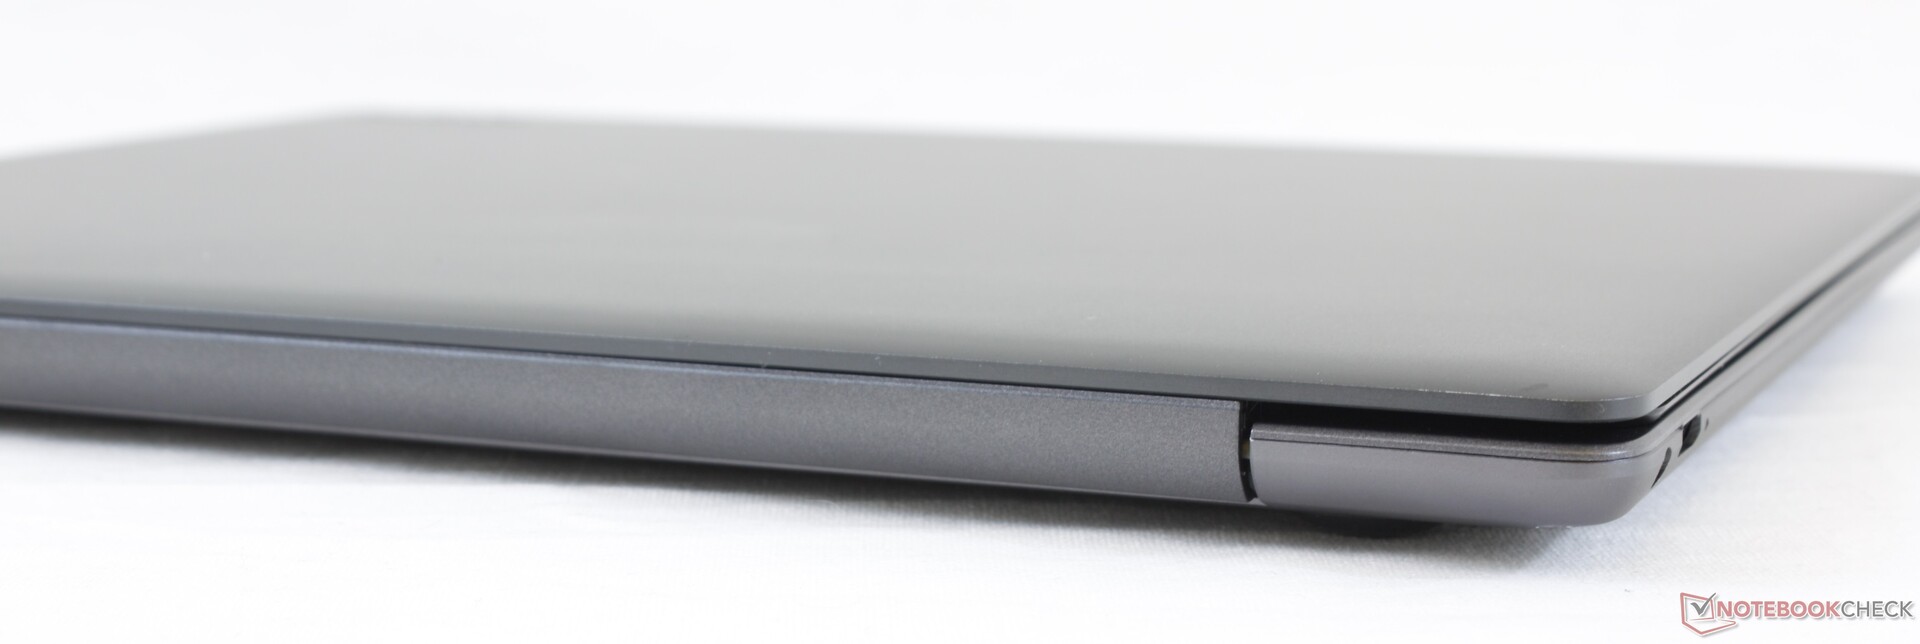
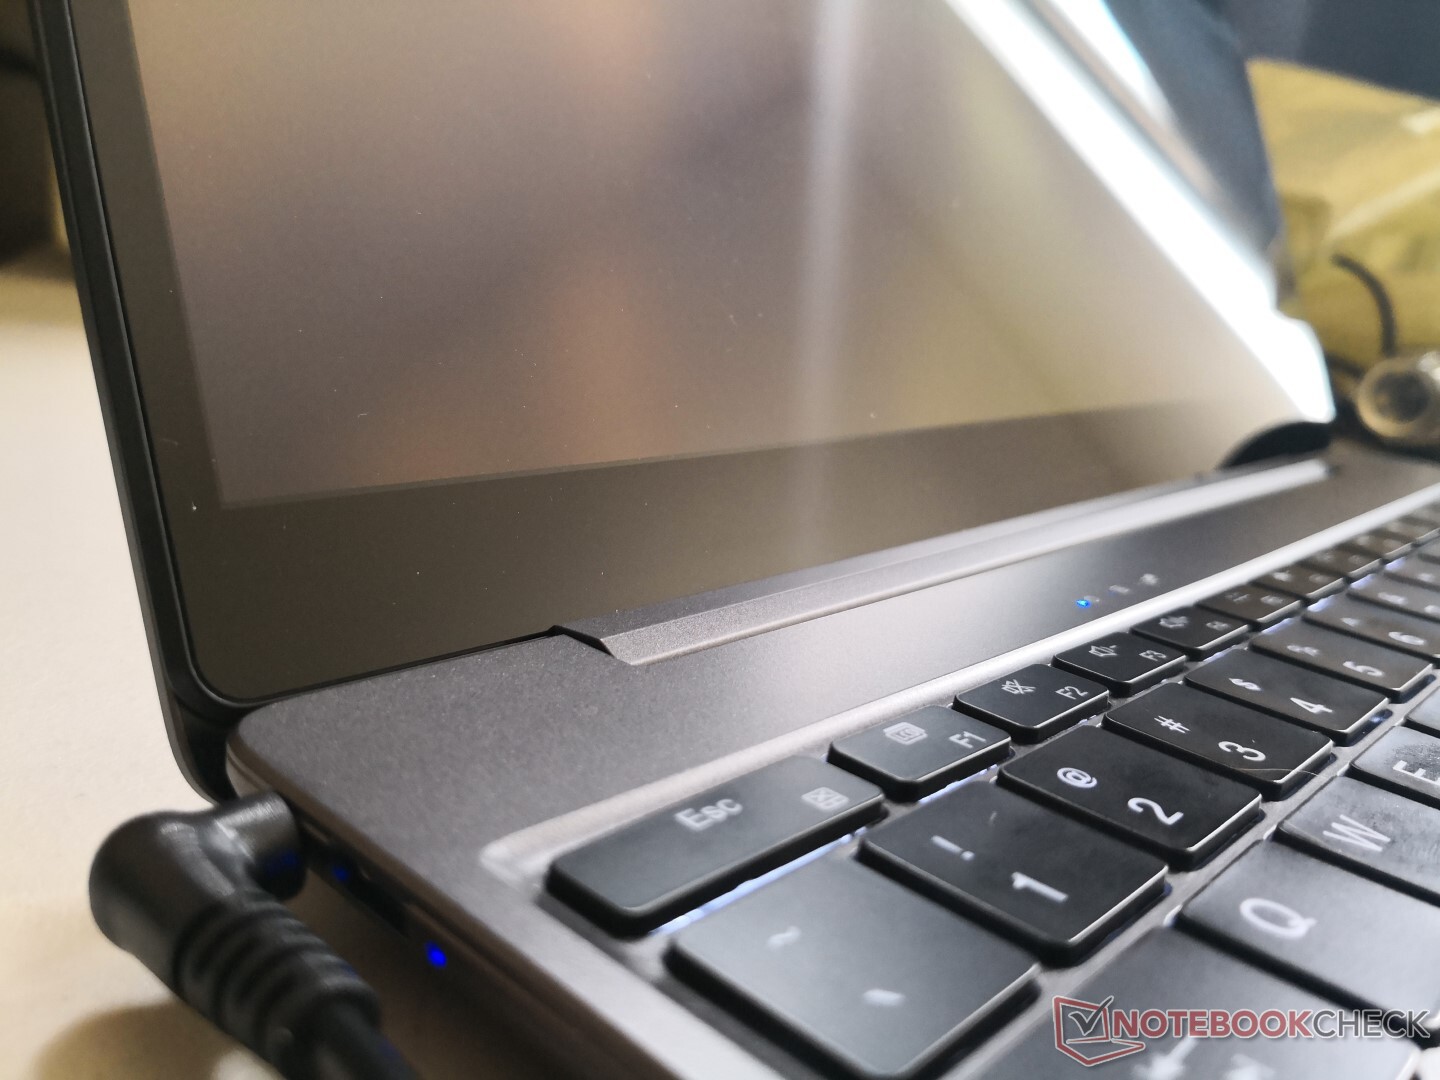
The metal case looks nice and sleek from a distance, but everything falls apart once you start handling the system. The chassis tends to creak and the hinges feel like they'll fail one or two years down the line. Build quality is several steps down from pricier ultra-thin laptops that Chuwi likes to copy including the Apple MacBook Air, Dell XPS, Huawei MateBook, or HP Spectre.
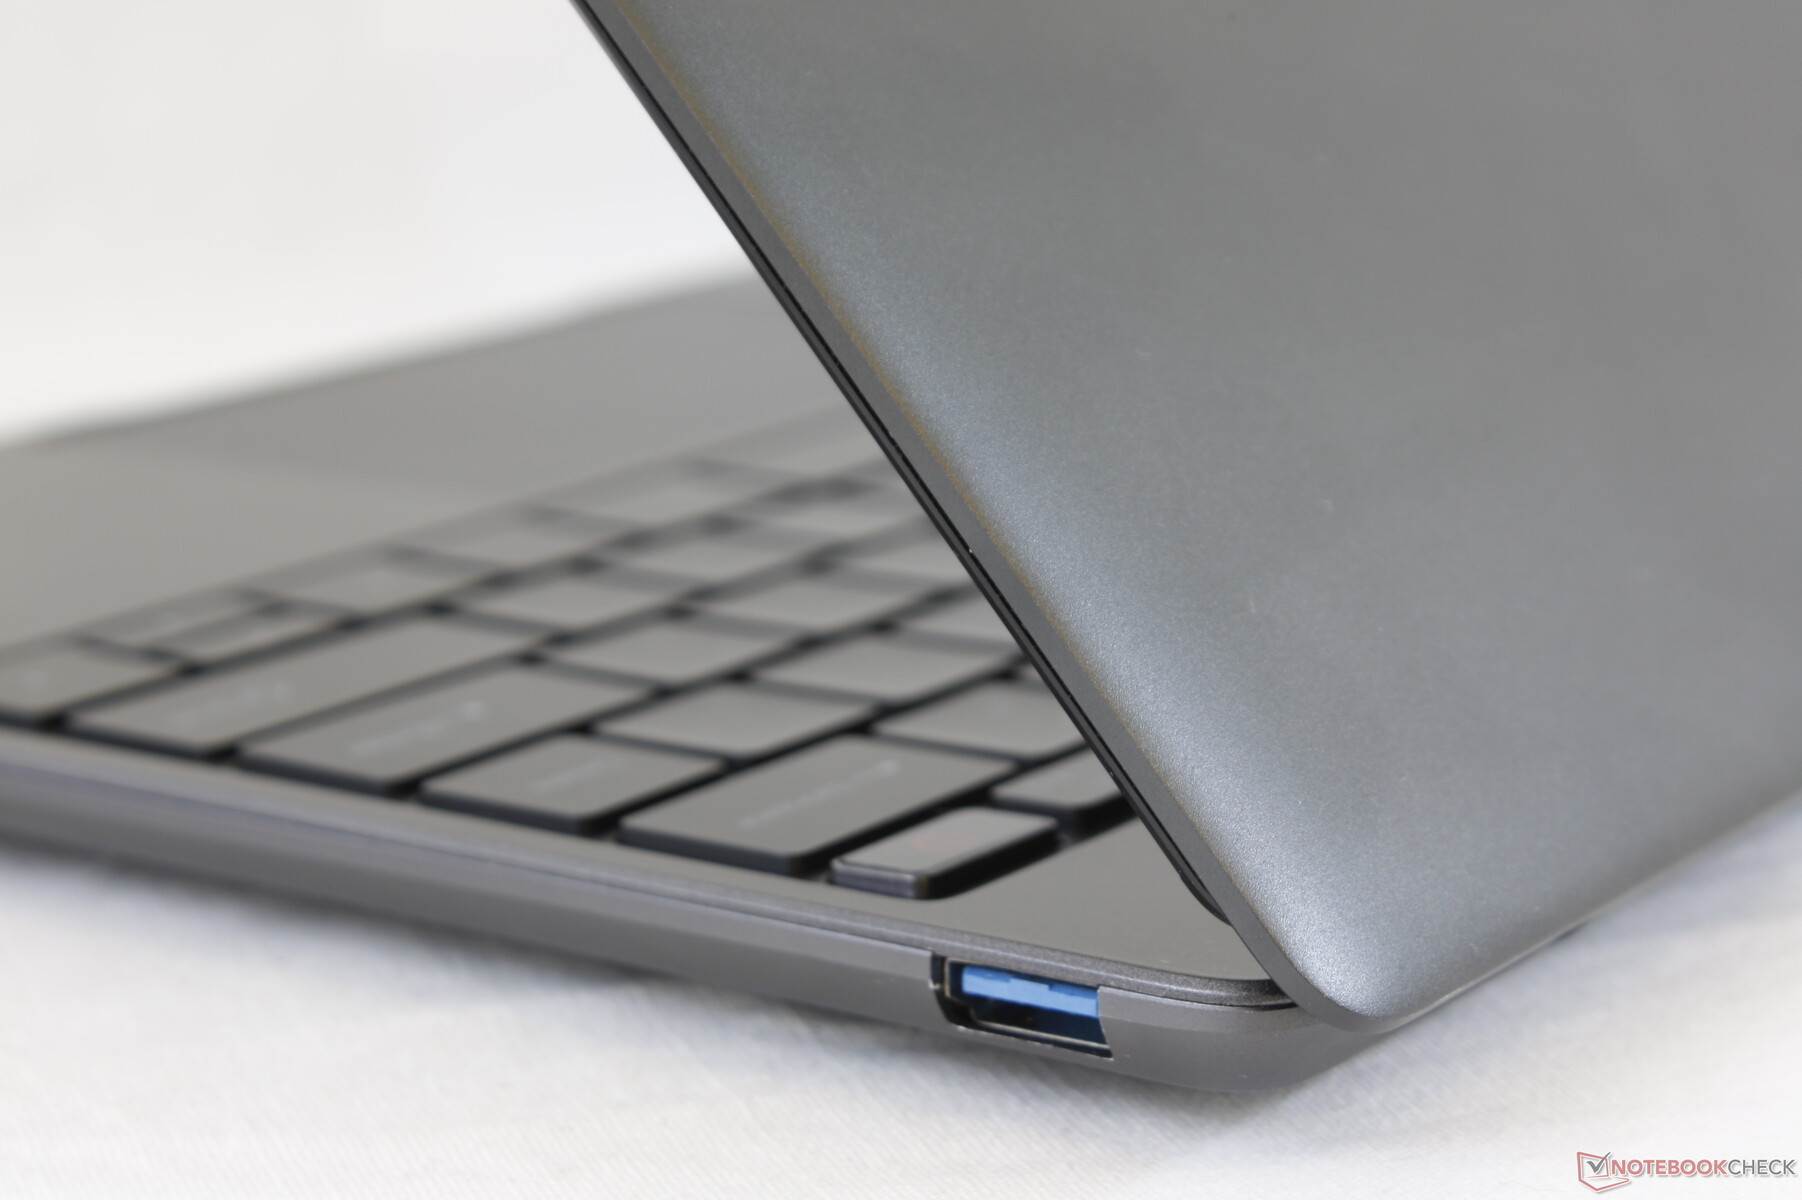
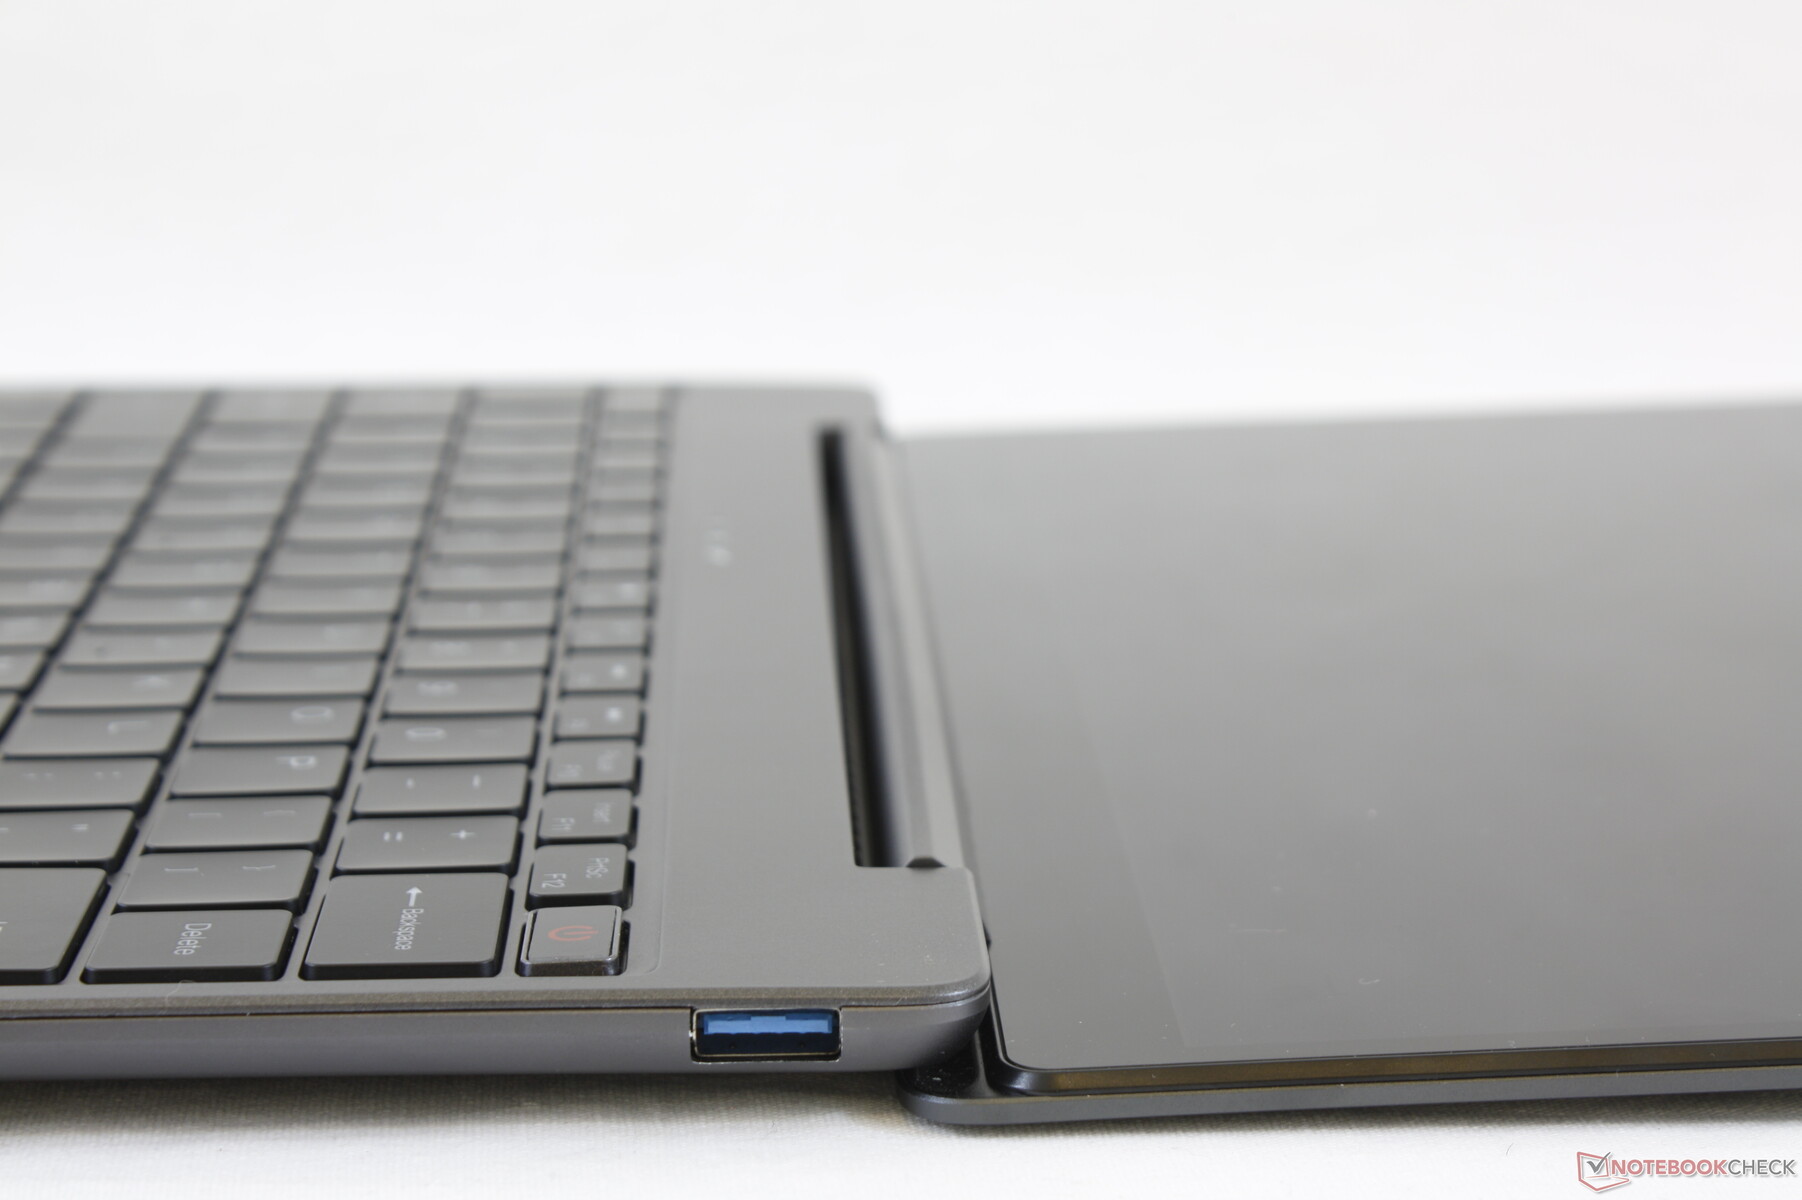
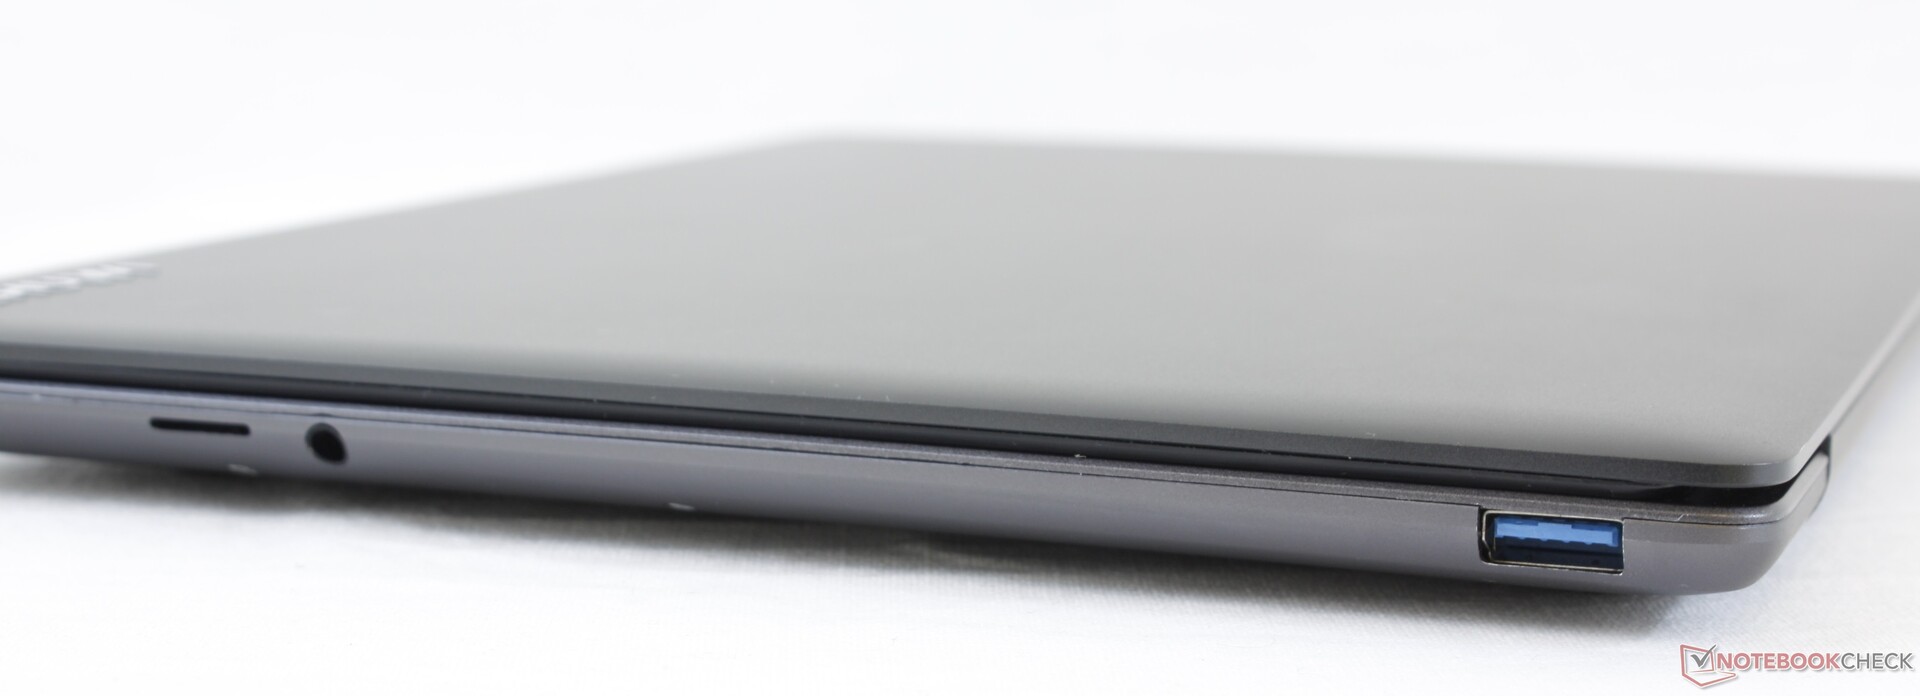
Connectivity
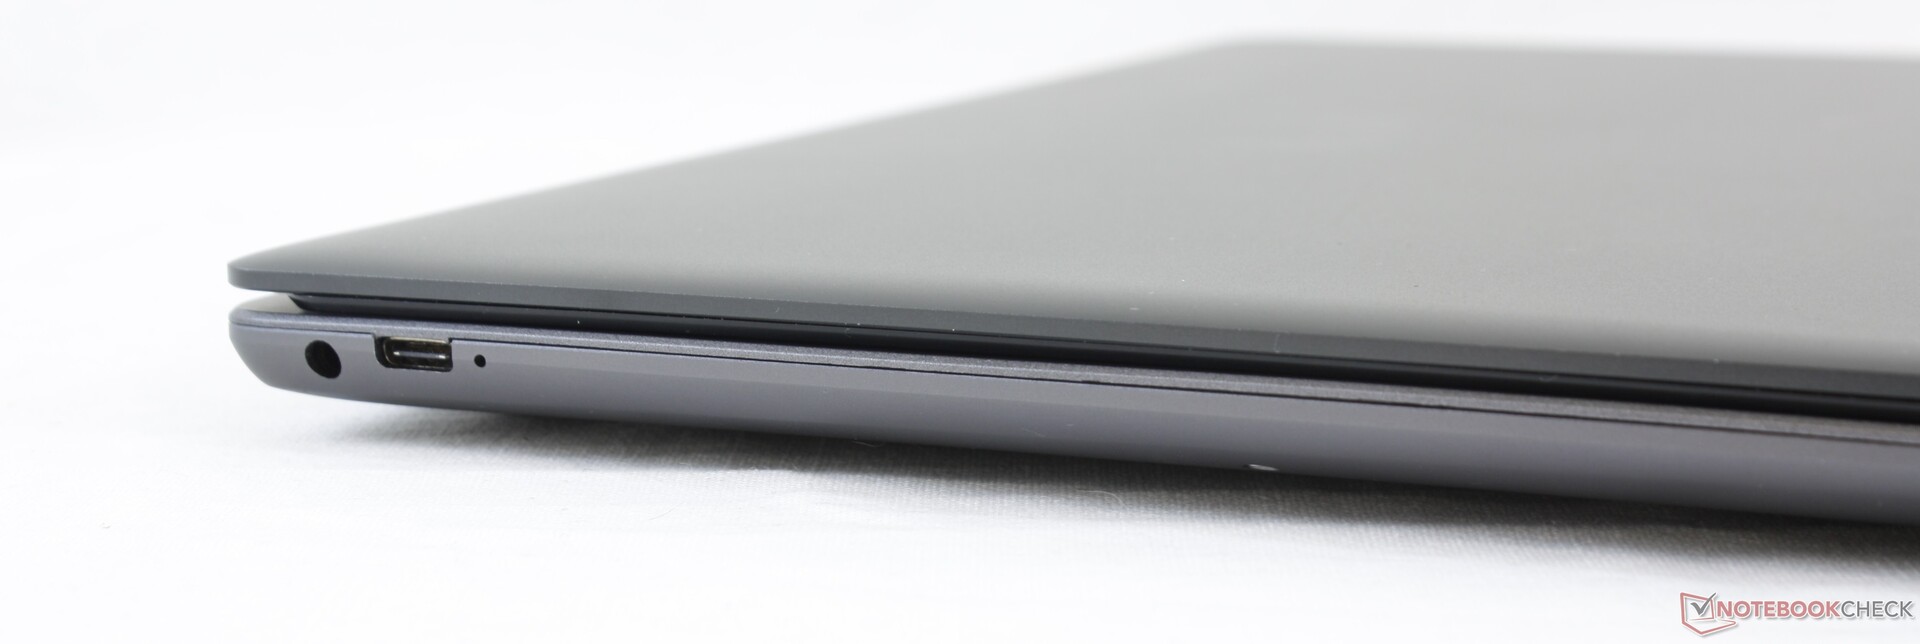
Port options are decent, but users will lament the lack of integrated HDMI. Fortunately, DisplayPort-over-USB is supported.
Port placement between the AC adapter and USB-C ports is too tight especially for thicker USB-C cables.
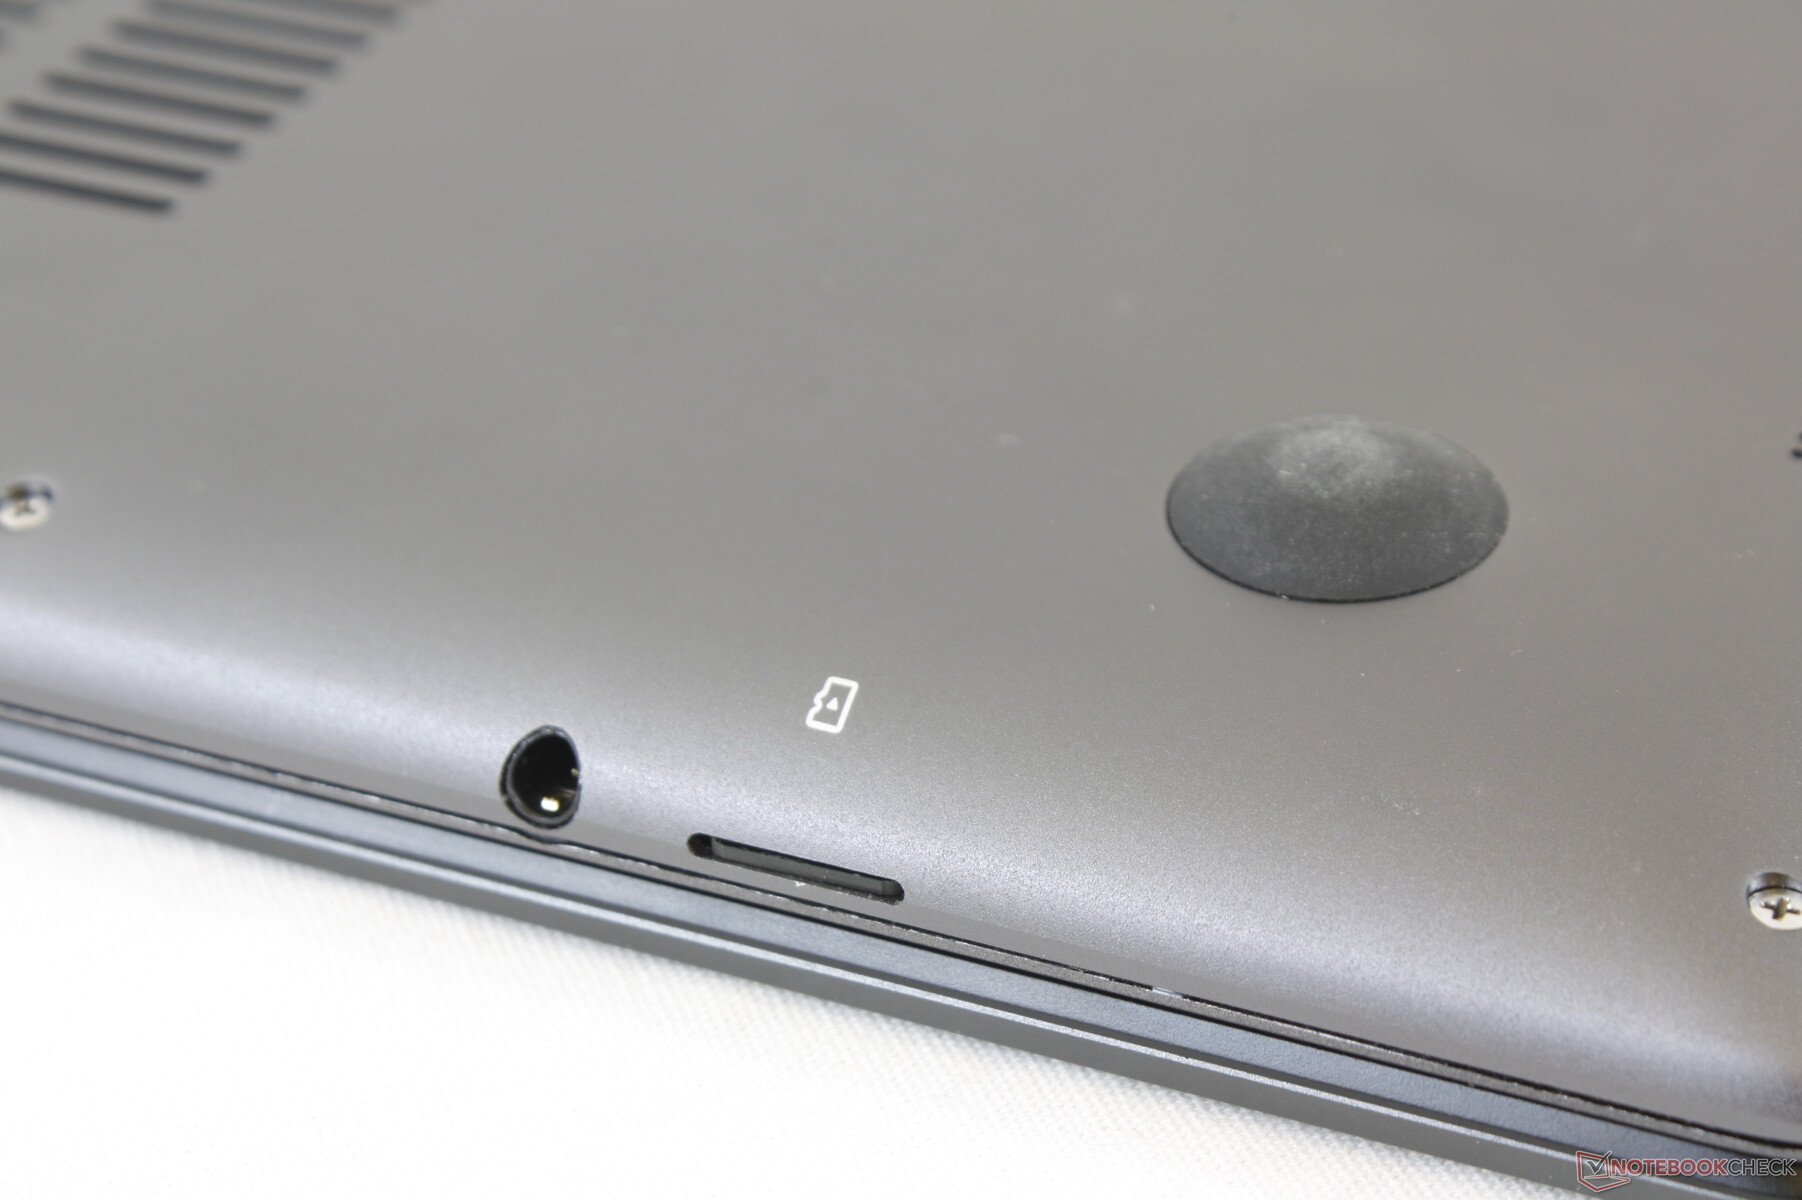
SD Card Reader
| SD Card Reader | |
| average JPG Copy Test (av. of 3 runs) | |
| HP Envy 13-aq0003ng (Toshiba Exceria Pro M501 microSDXC 64GB) | |
| Chuwi GemiBook CWI528 (Toshiba Exceria Pro M501 microSDXC 64GB) | |
| Jumper EZbook X3 | |
| LincPlus P1 | |
| maximum AS SSD Seq Read Test (1GB) | |
| HP Envy 13-aq0003ng (Toshiba Exceria Pro M501 microSDXC 64GB) | |
| Chuwi GemiBook CWI528 (Toshiba Exceria Pro M501 microSDXC 64GB) | |
| Jumper EZbook X3 | |
| LincPlus P1 | |
Communication
| Networking | |
| iperf3 transmit AX12 | |
| Asus ZenBook 13 UX325JA | |
| Samsung Galaxy Book S Intel | |
| Samsung Galaxy Book Ion 13.3 | |
| Chuwi GemiBook CWI528 | |
| iperf3 receive AX12 | |
| Asus ZenBook 13 UX325JA | |
| Samsung Galaxy Book S Intel | |
| Samsung Galaxy Book Ion 13.3 | |
| Chuwi GemiBook CWI528 | |
Webcam


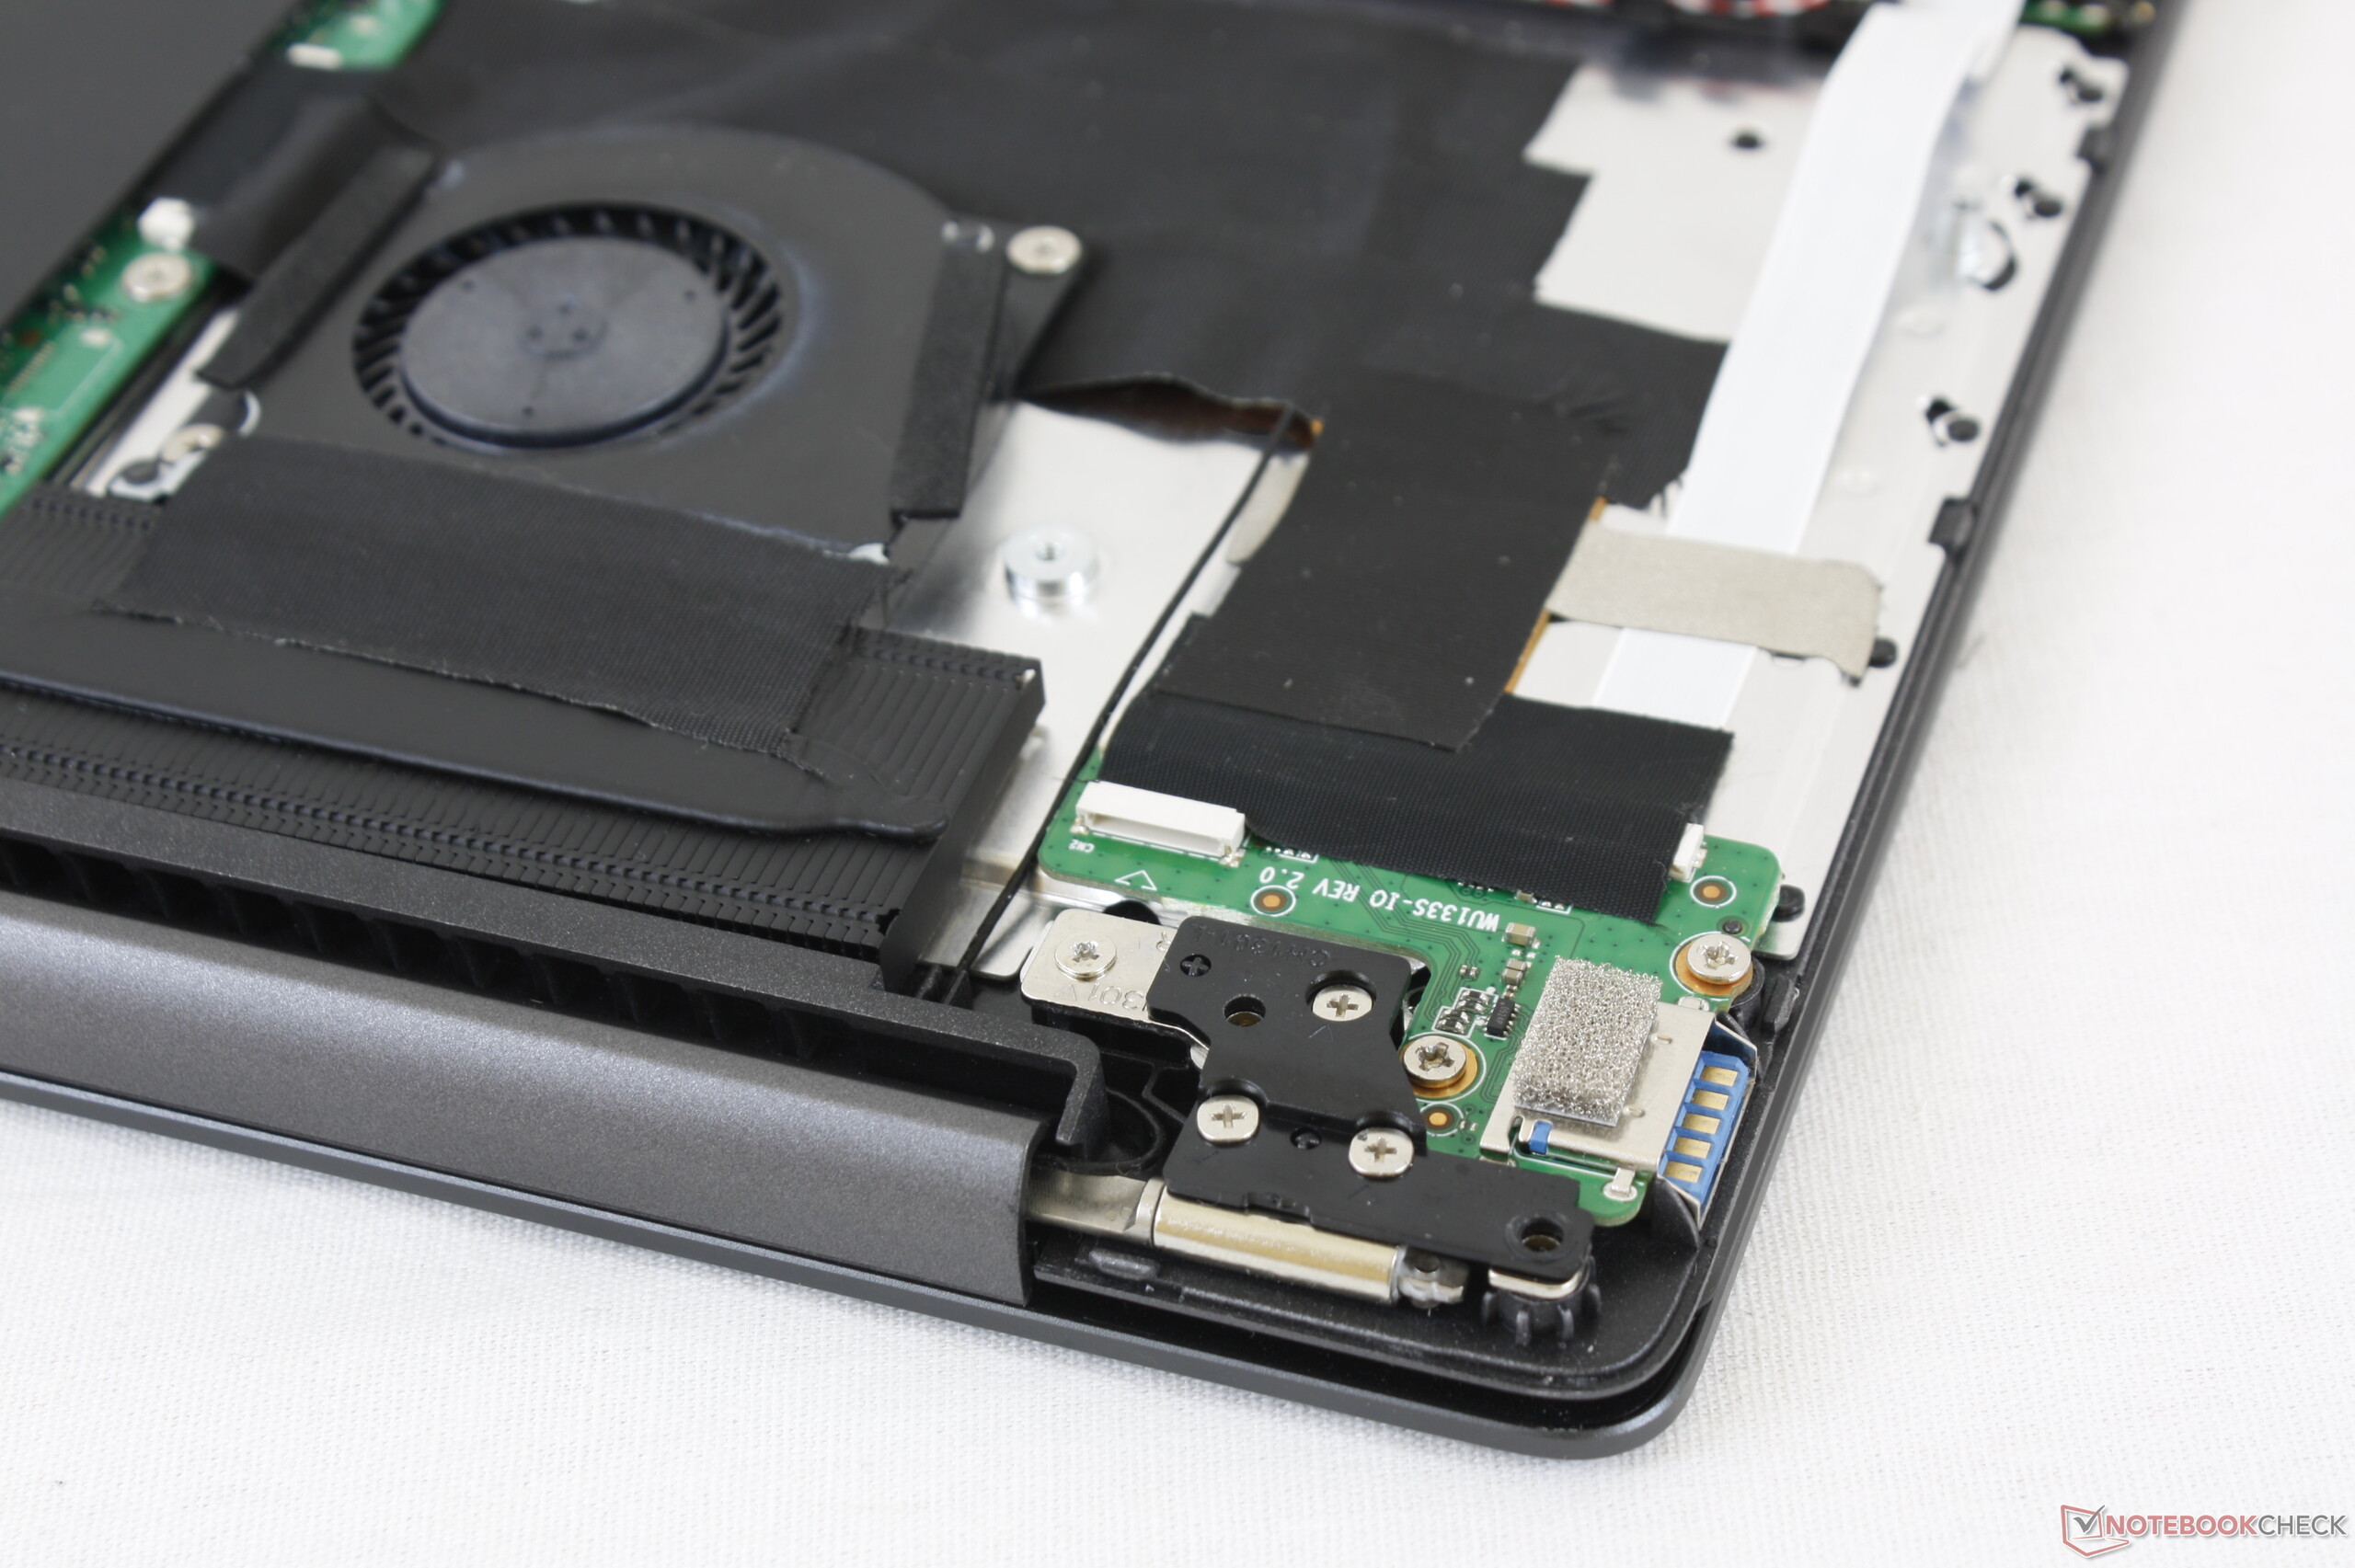
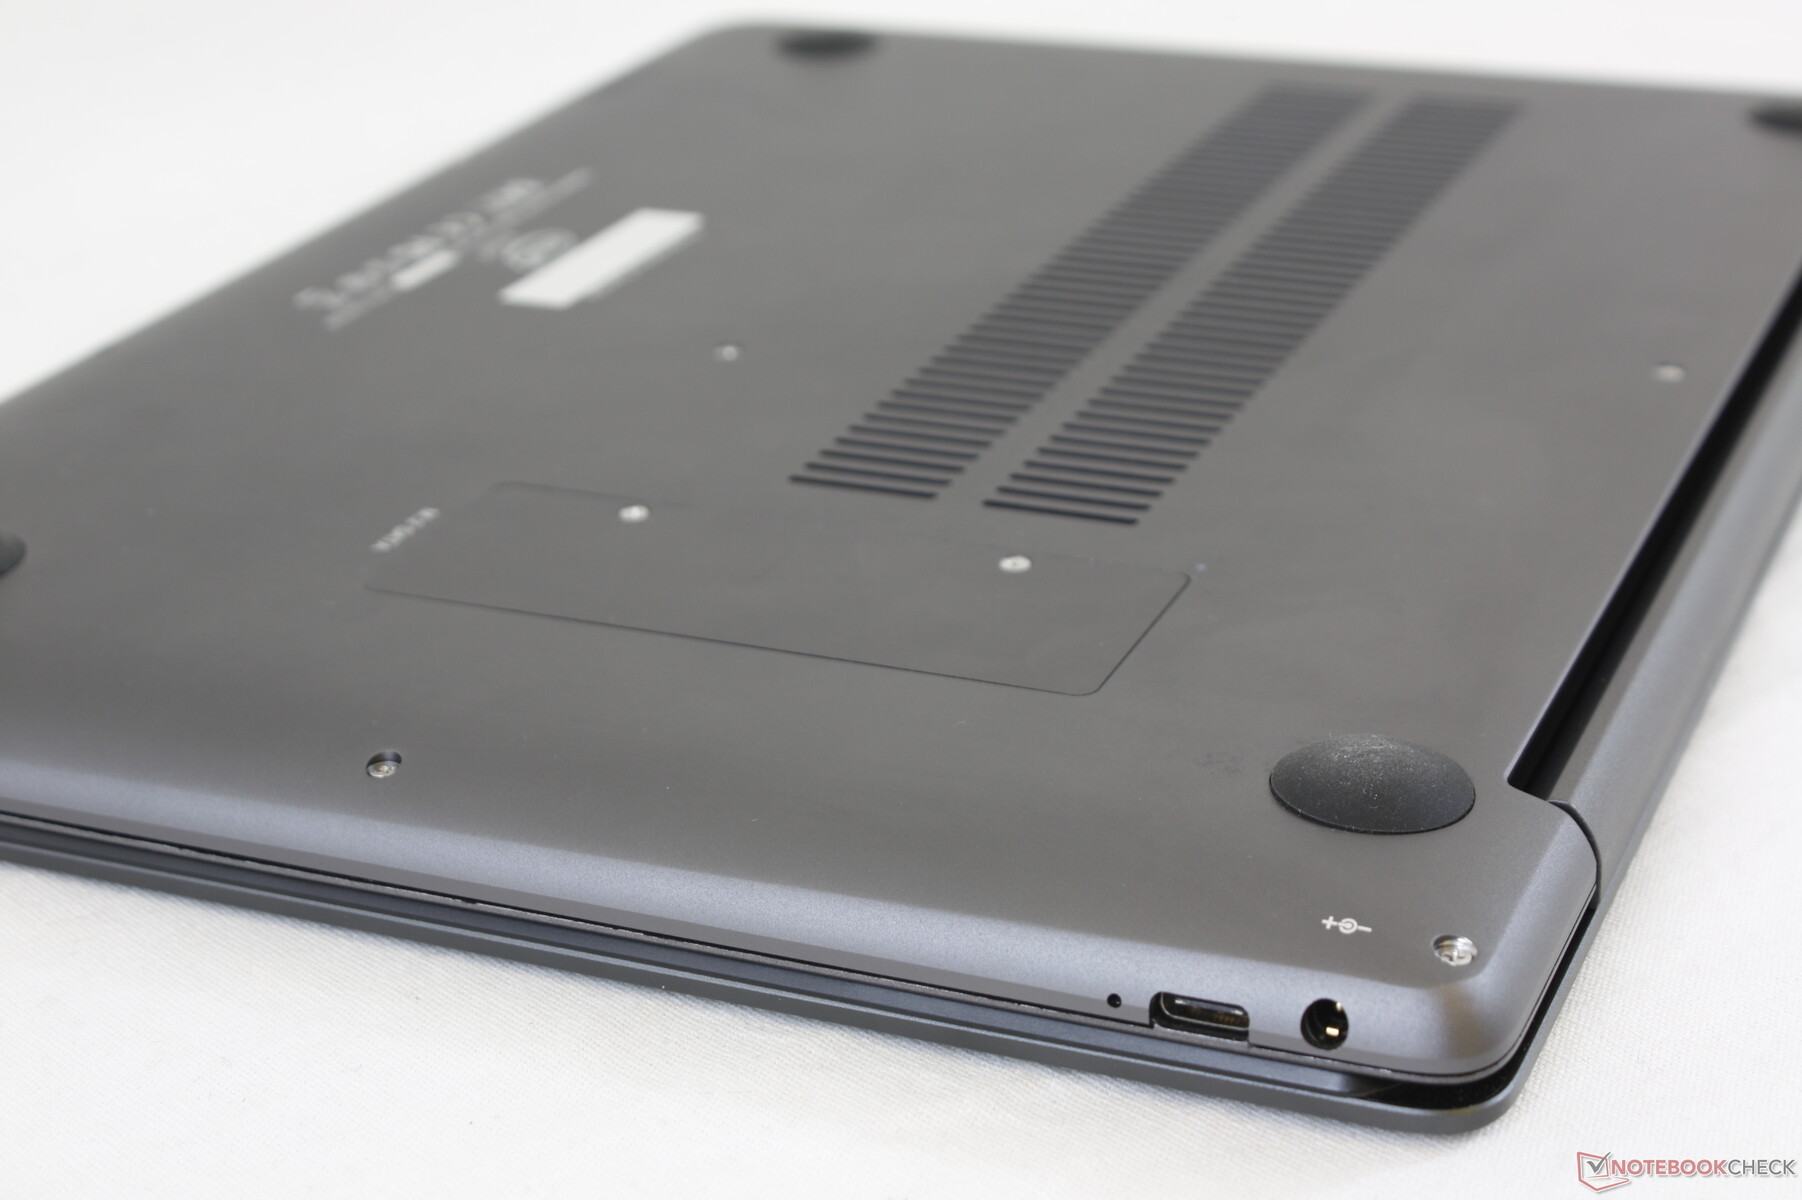
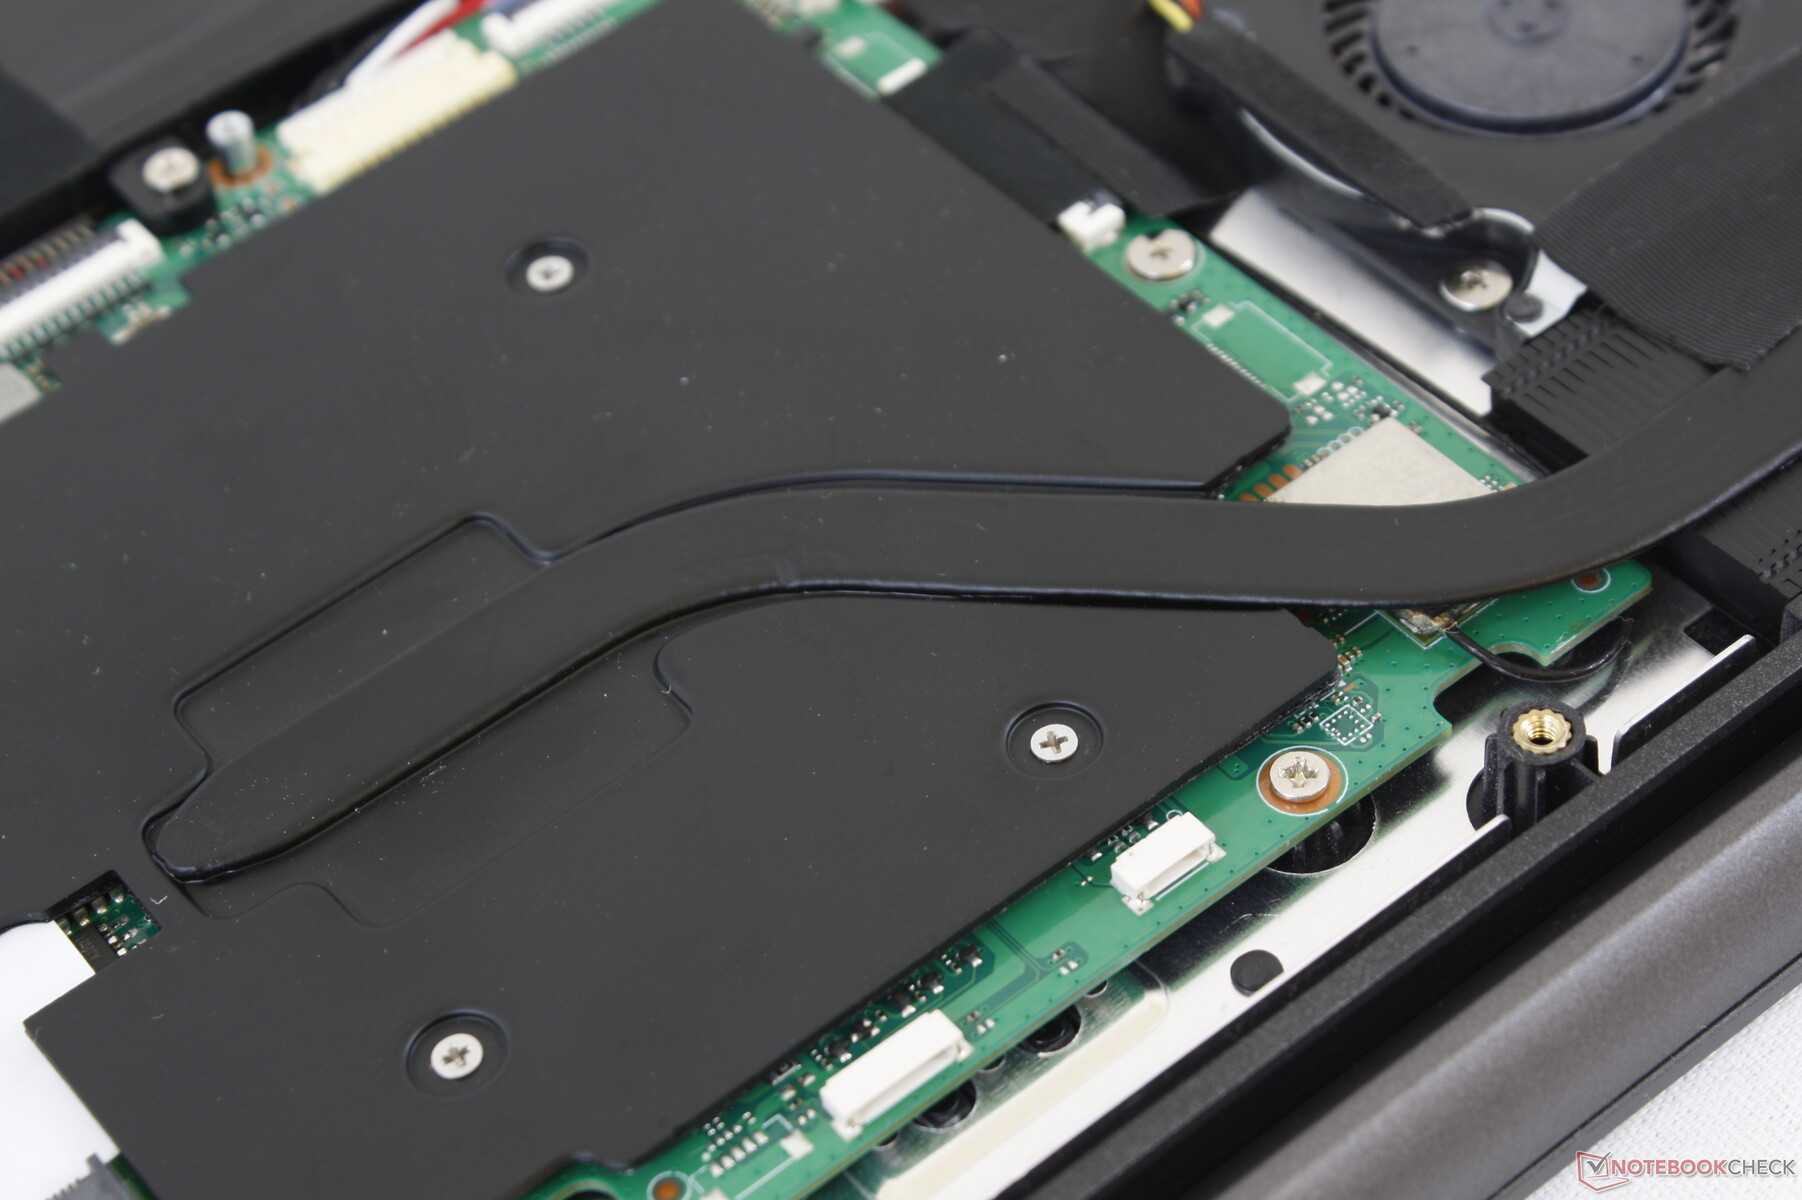
Maintenance
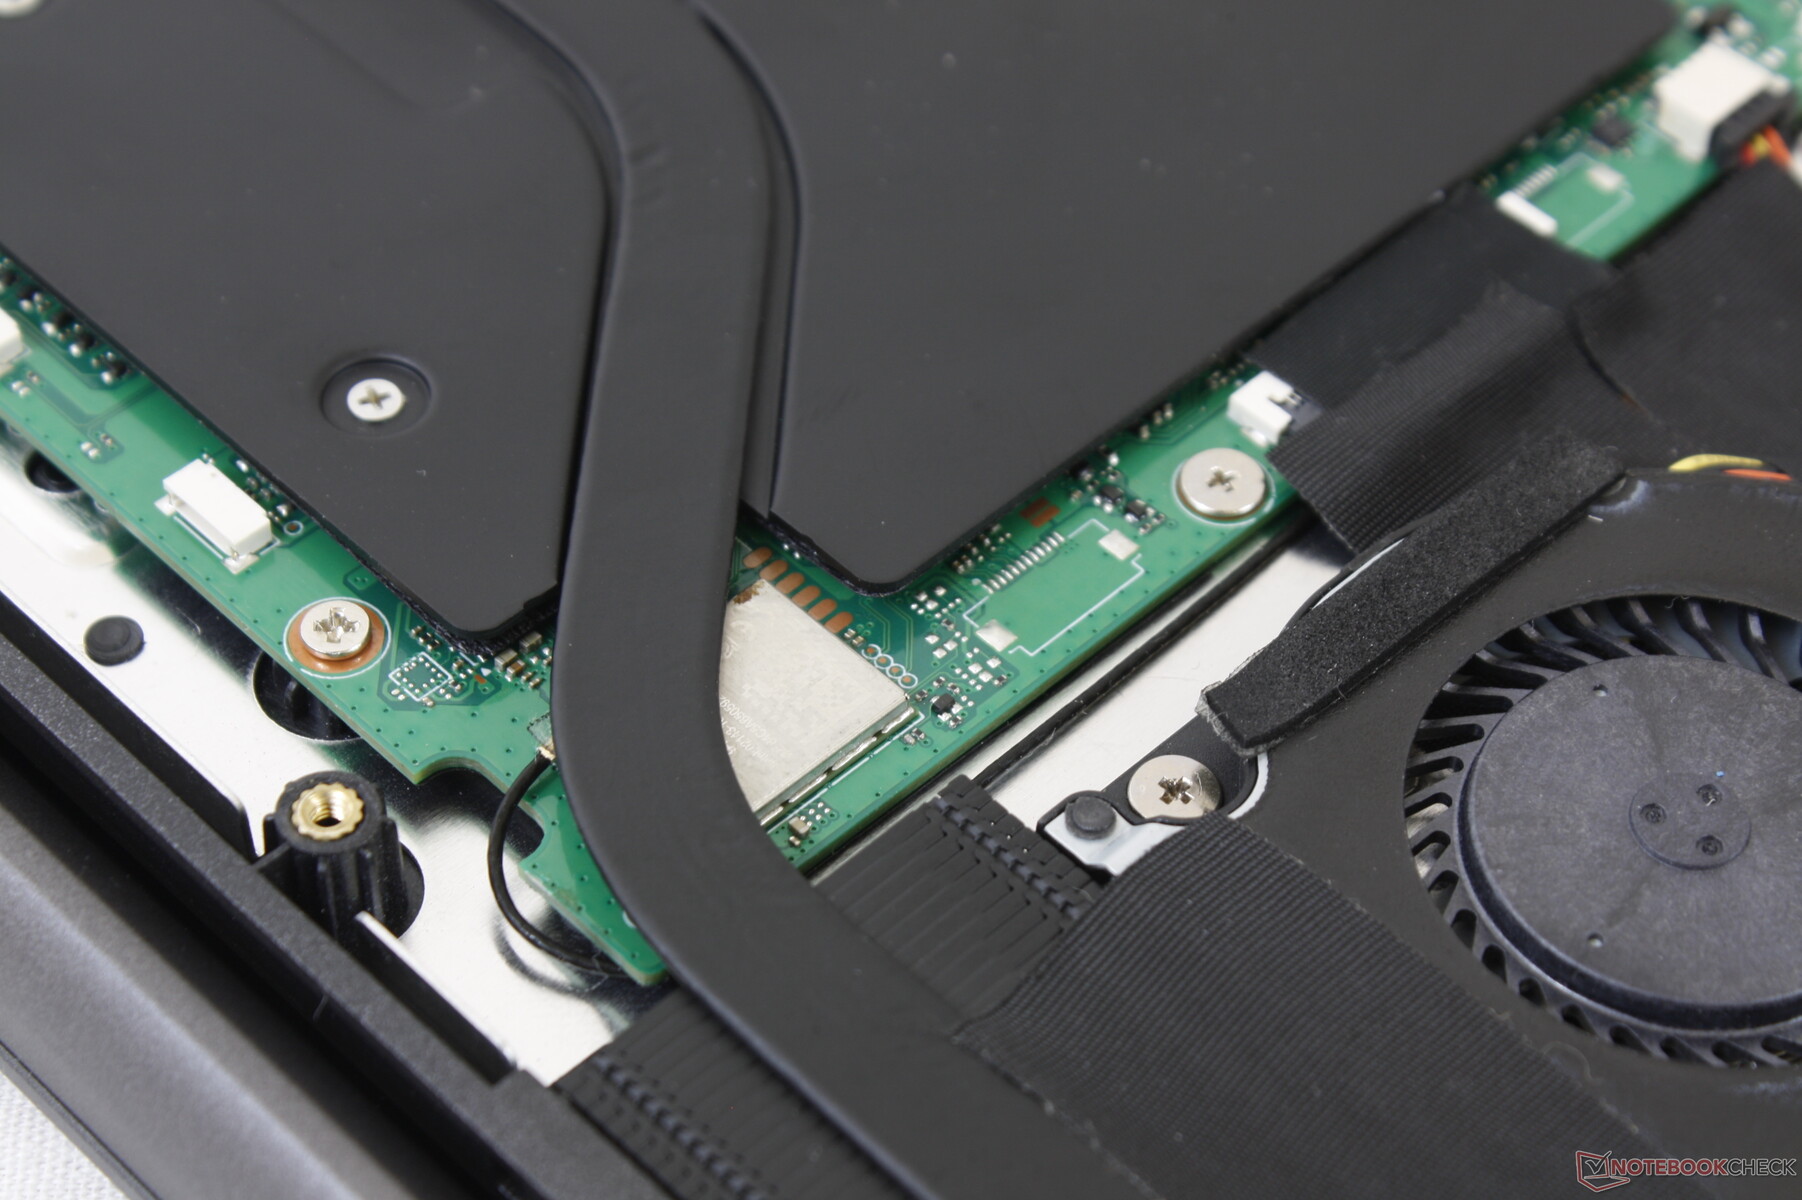
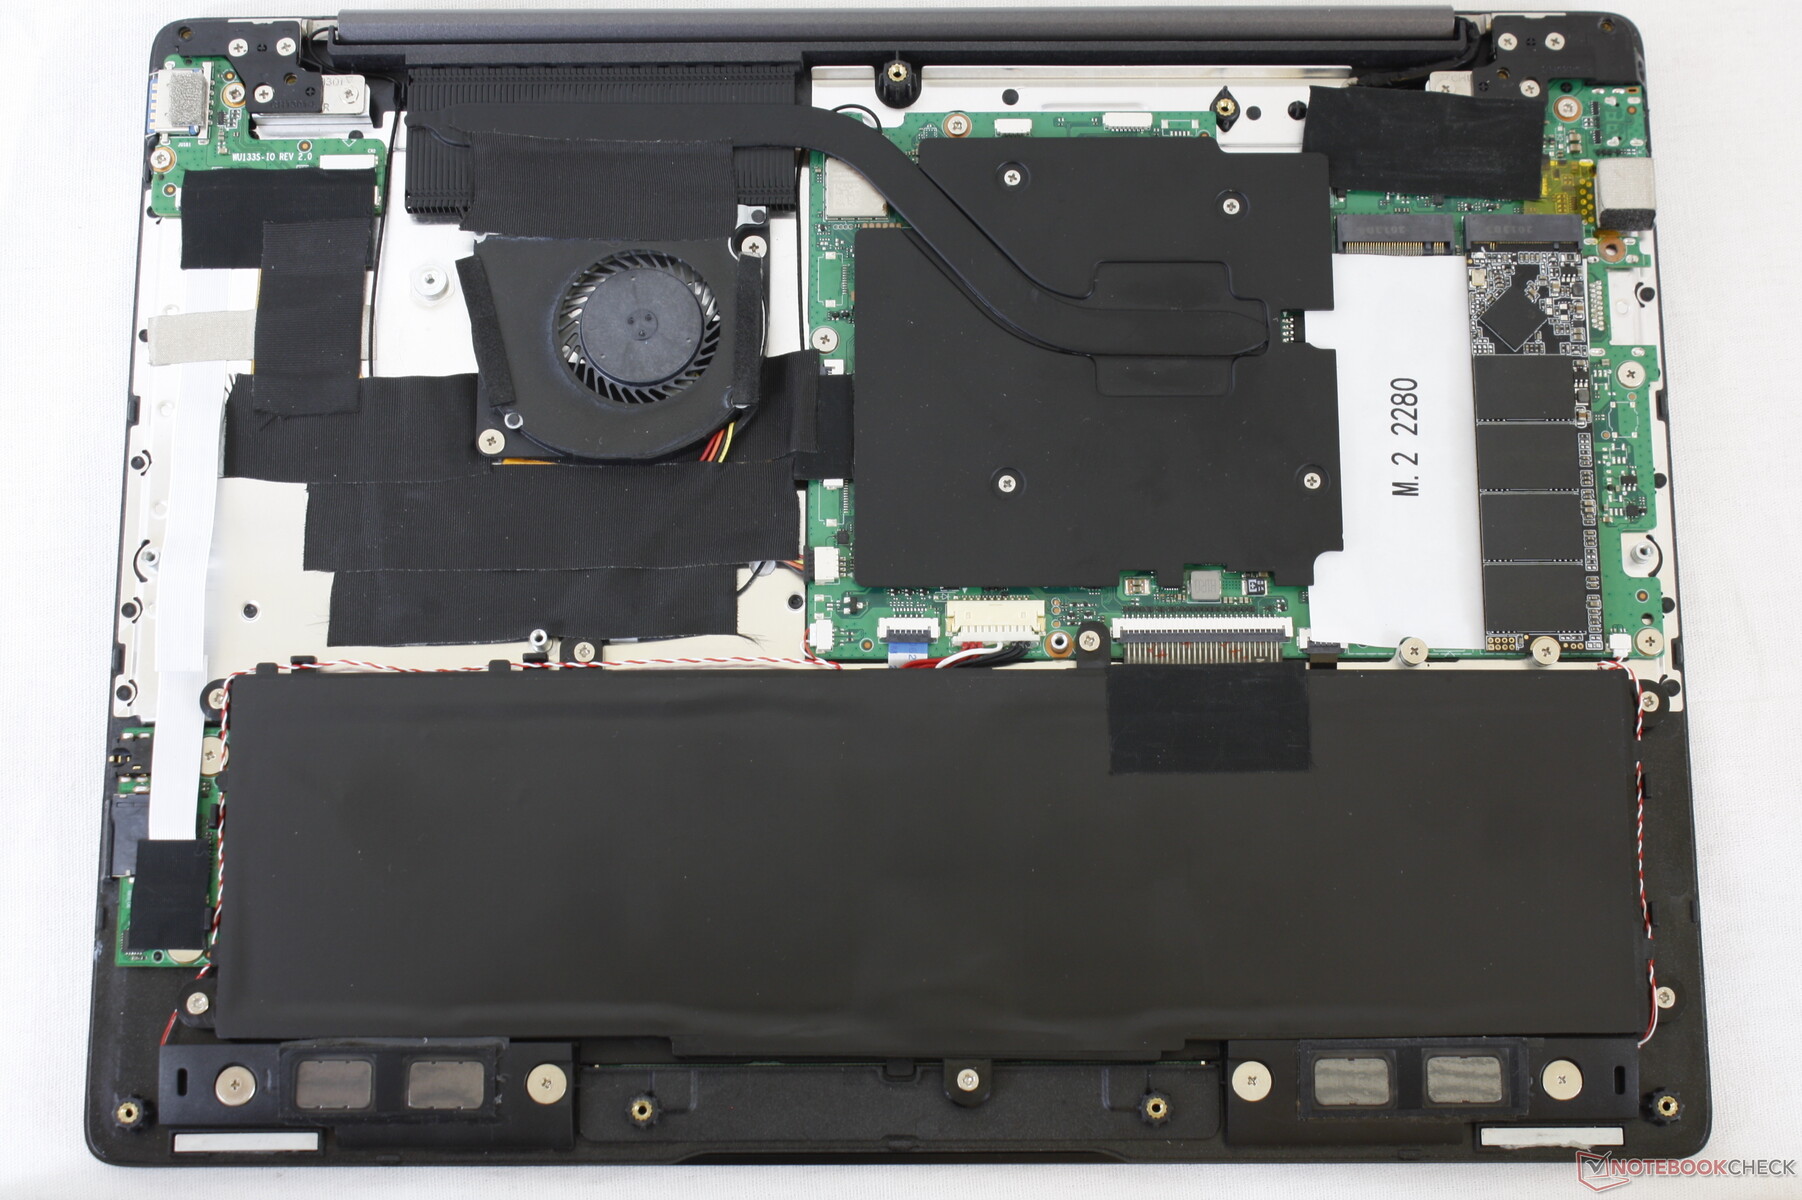
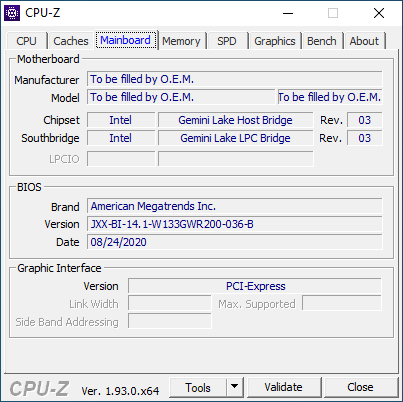
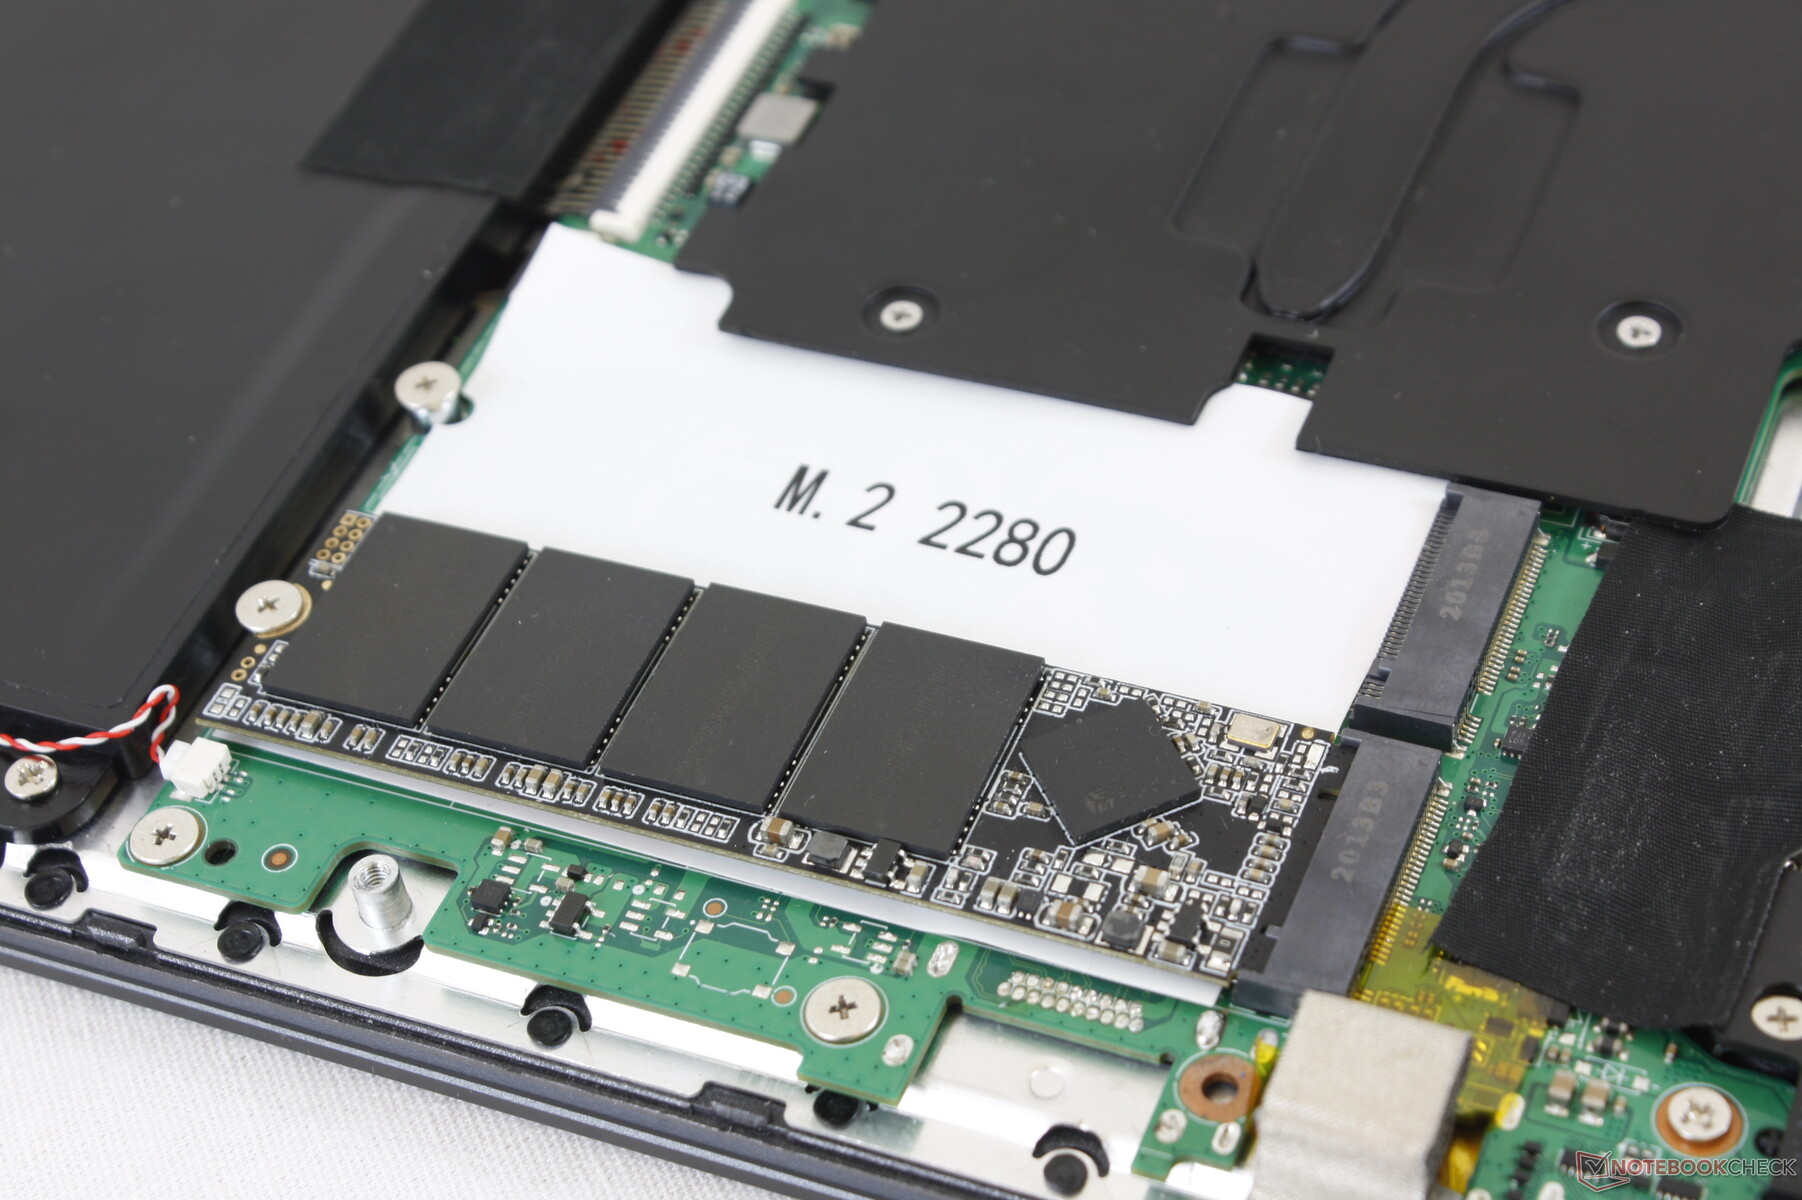
The bottom panel is secured by 14 Philips screws with 2 of them underneath the rear rubber feet. There isn't anything to upgrade beyond storage as RAM and WLAN are soldered.
Accessories and Warranty
There are no extras in the box other than the AC adapter. The standard one-year limited warranty applies, but the return process can be difficult due to overseas shipping to Asia.
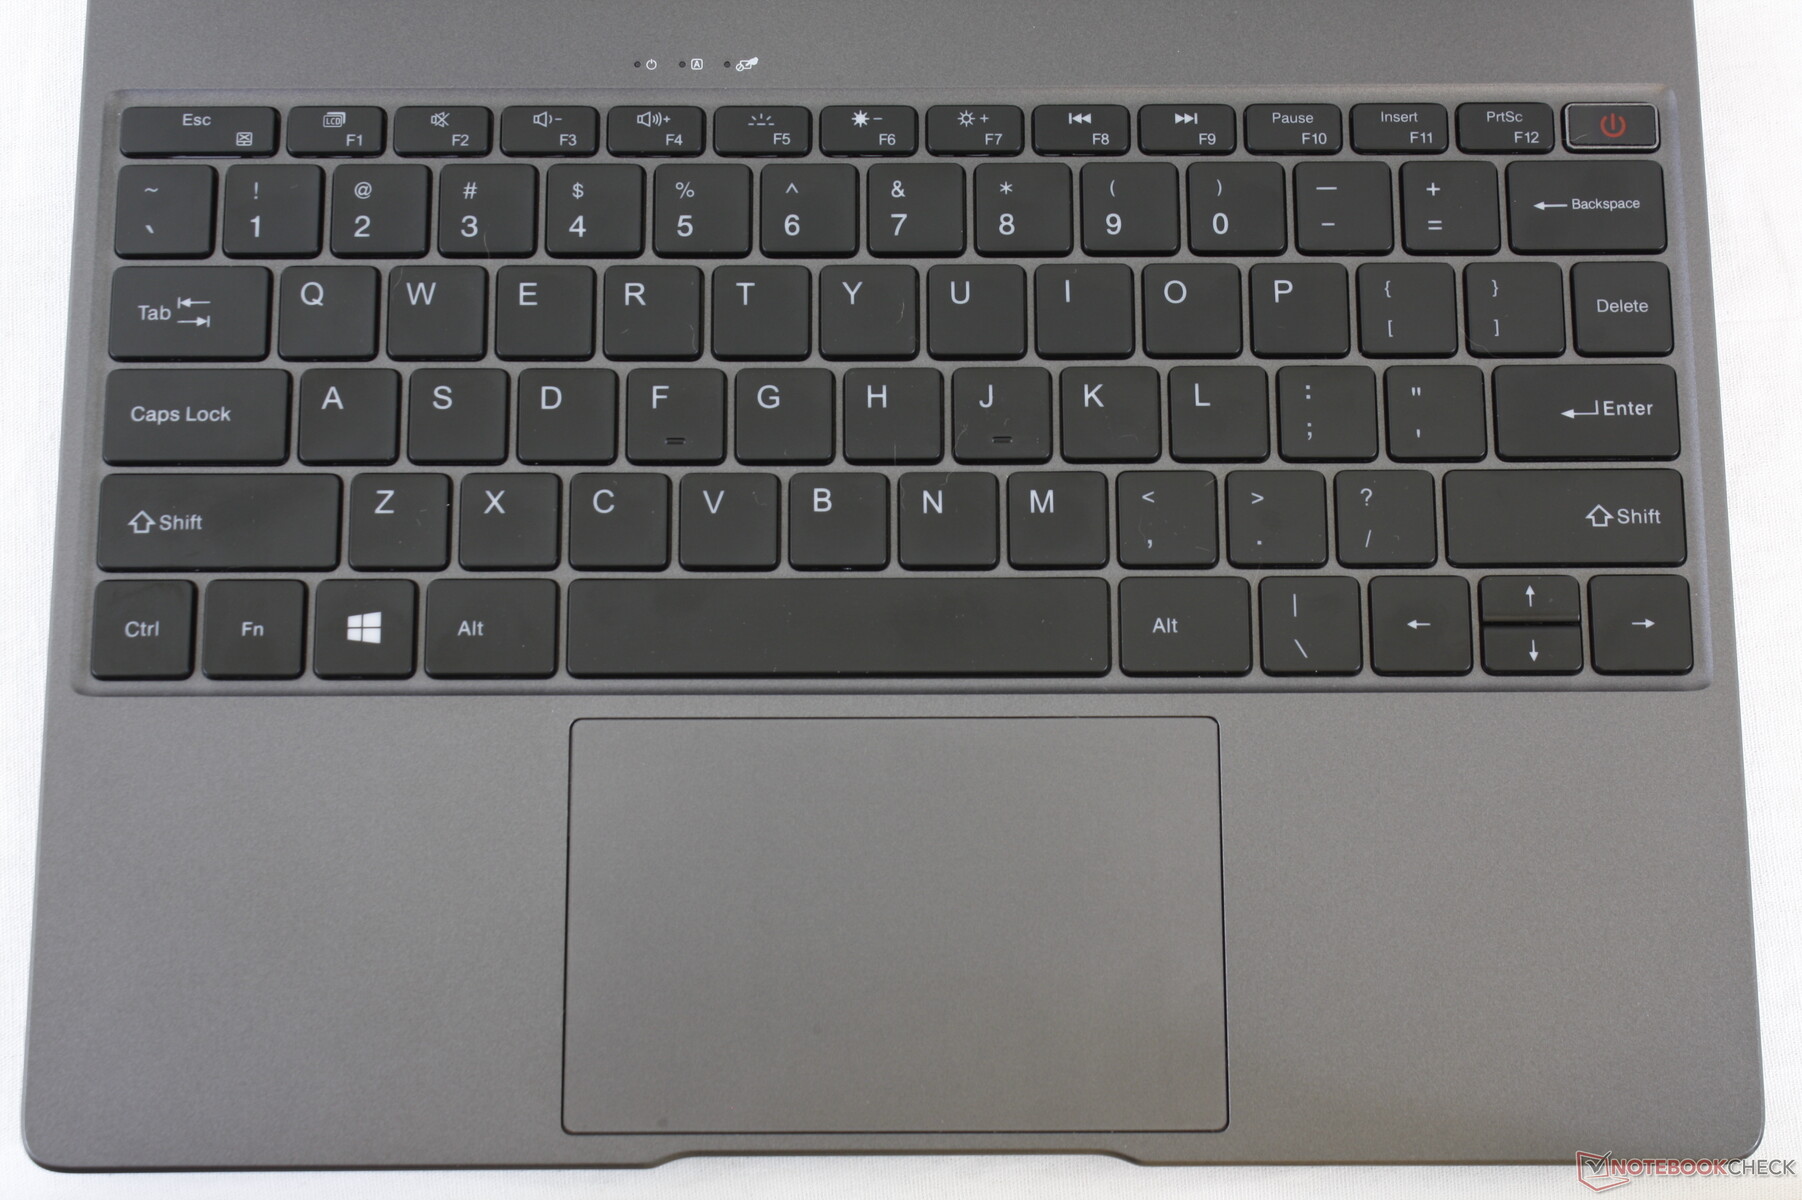
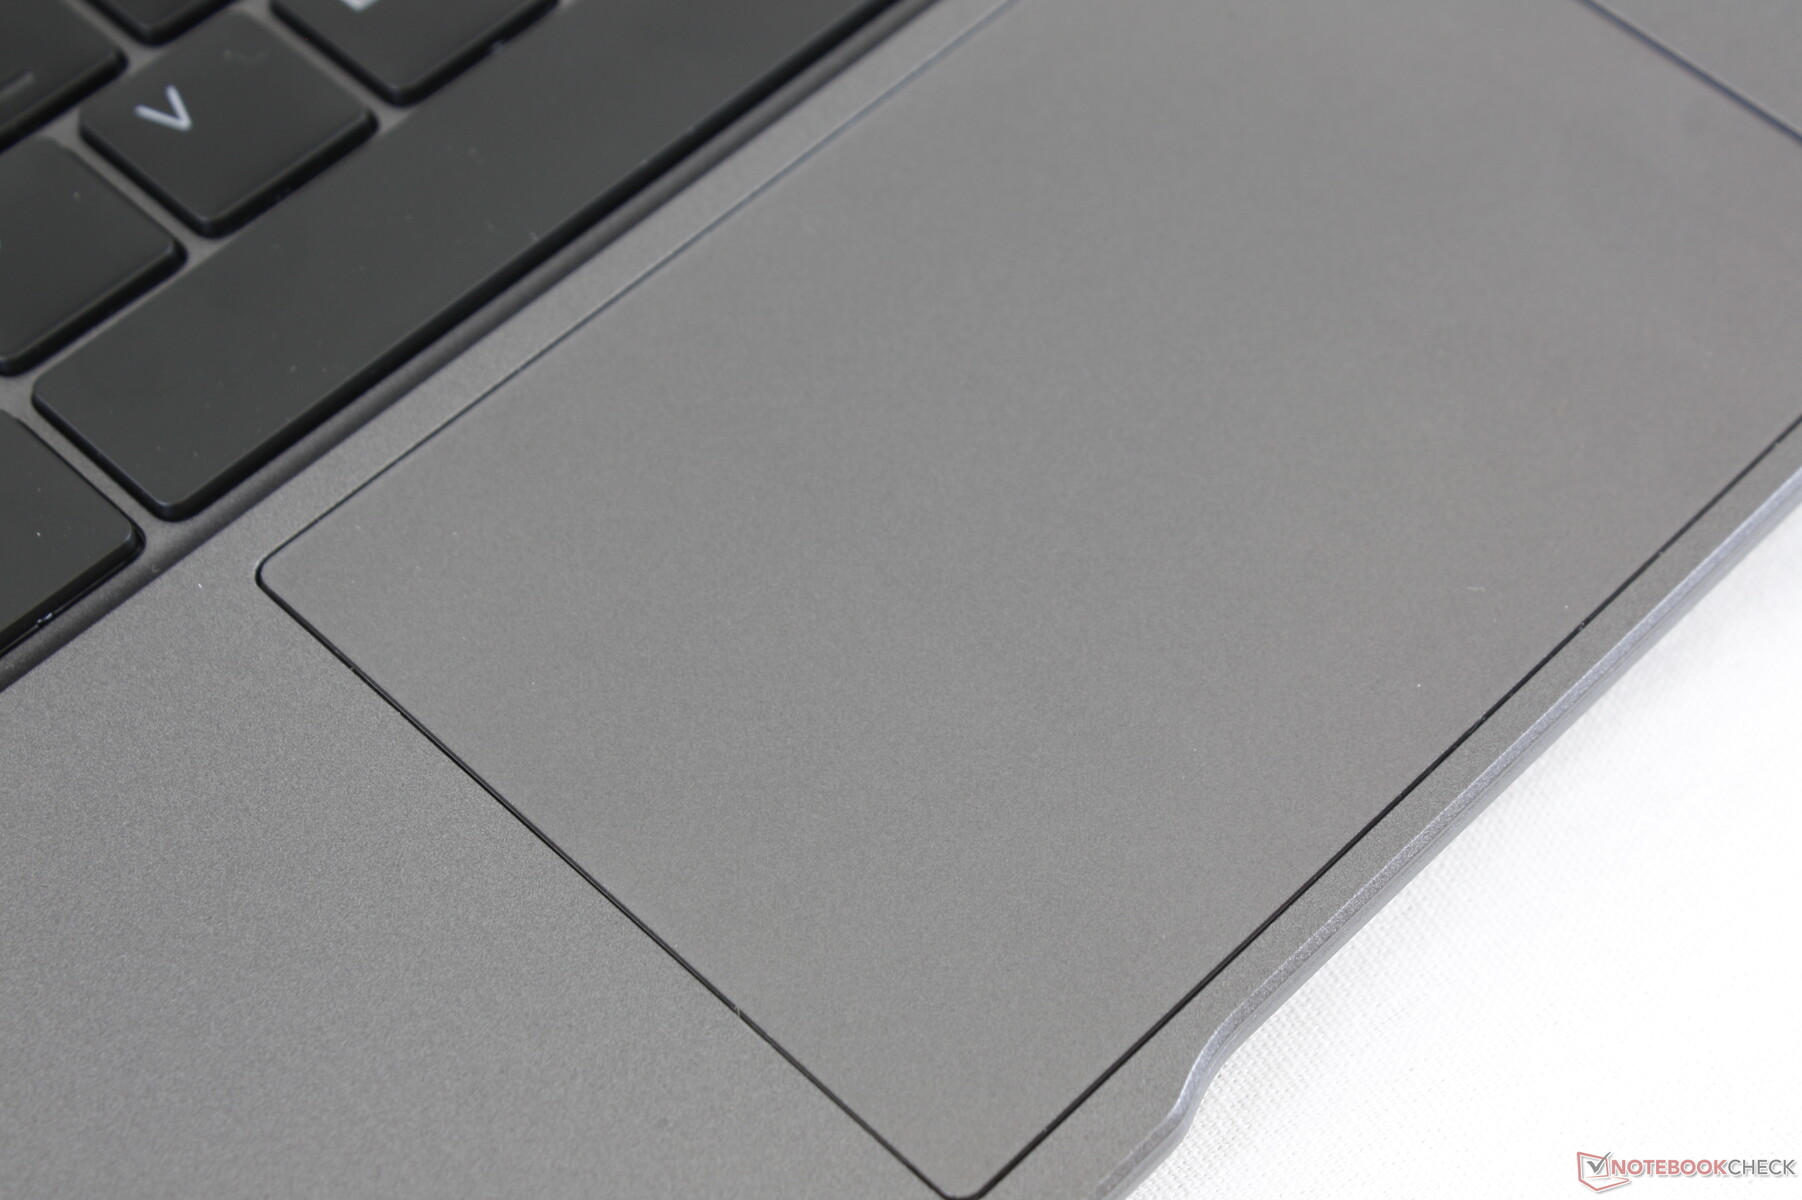
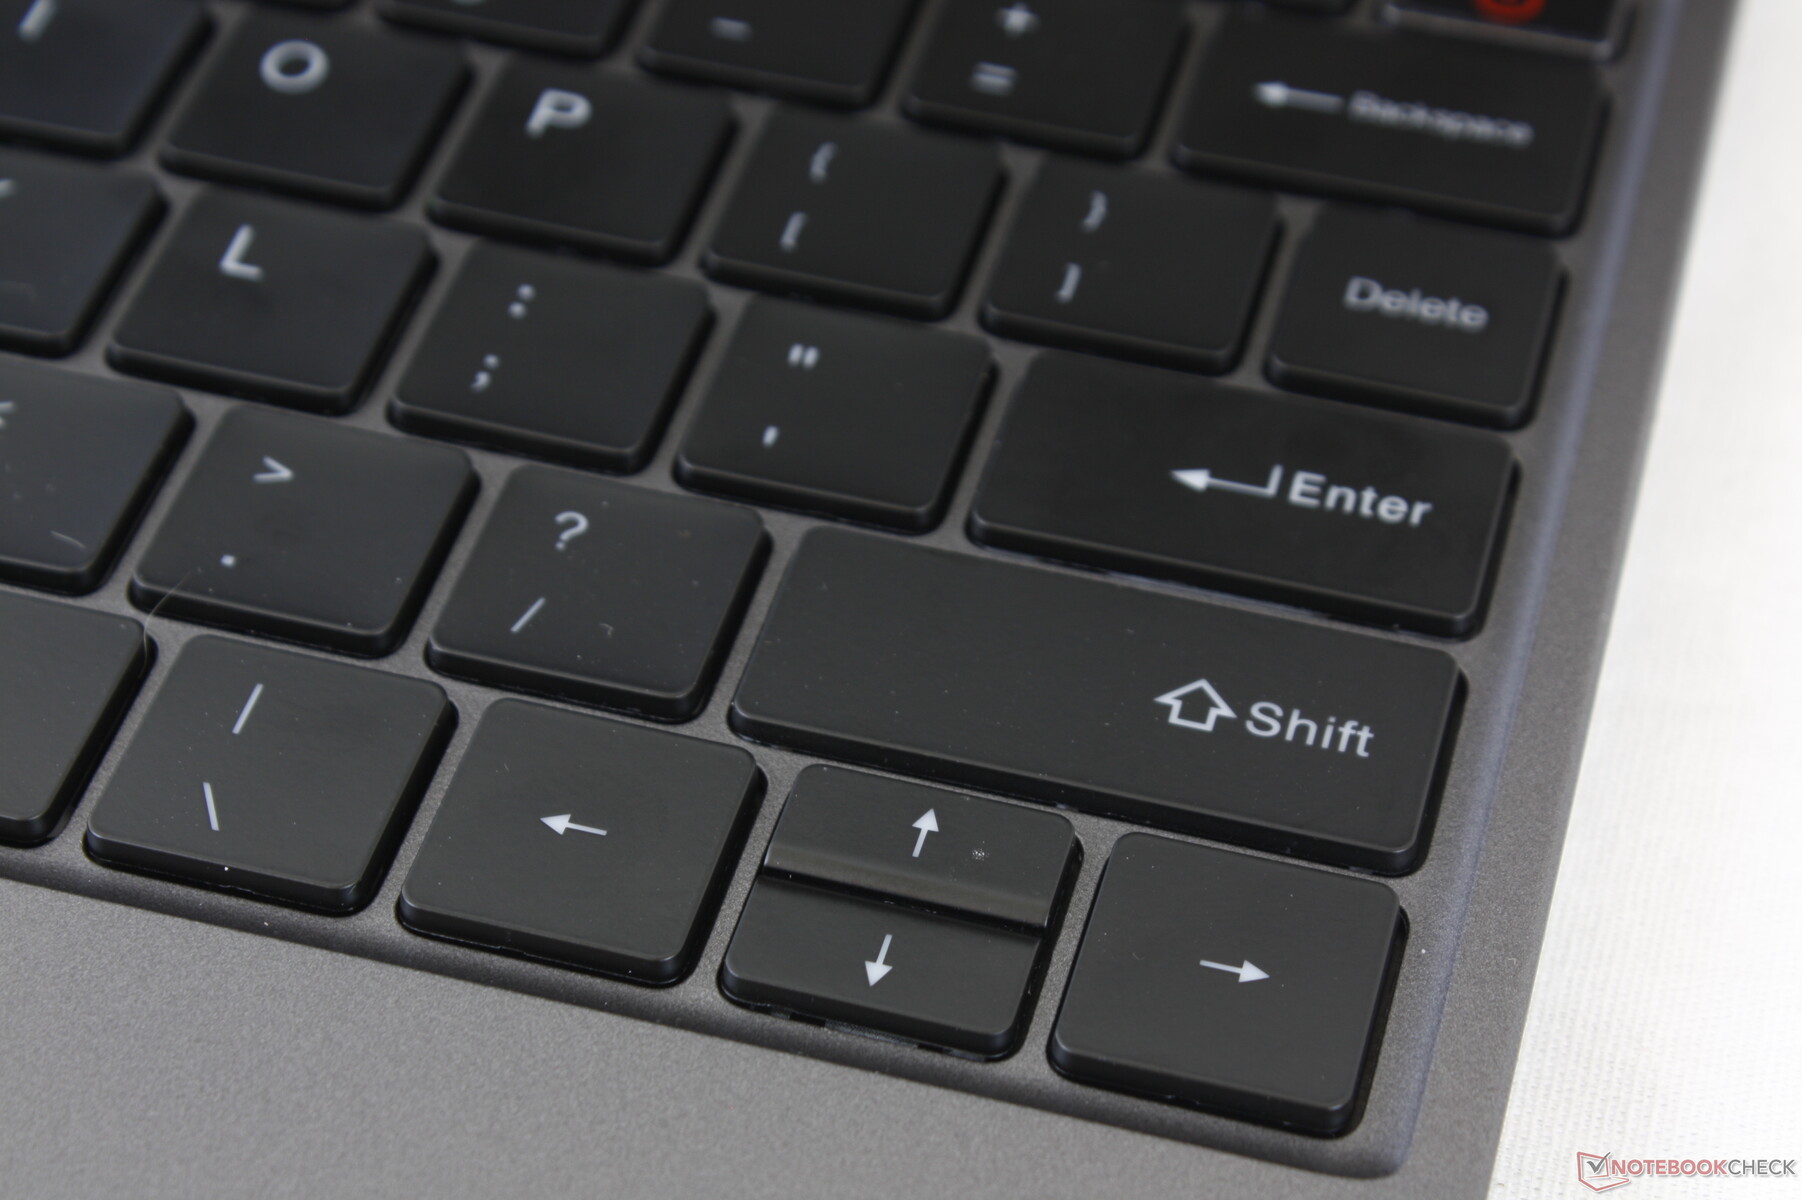
Input Devices

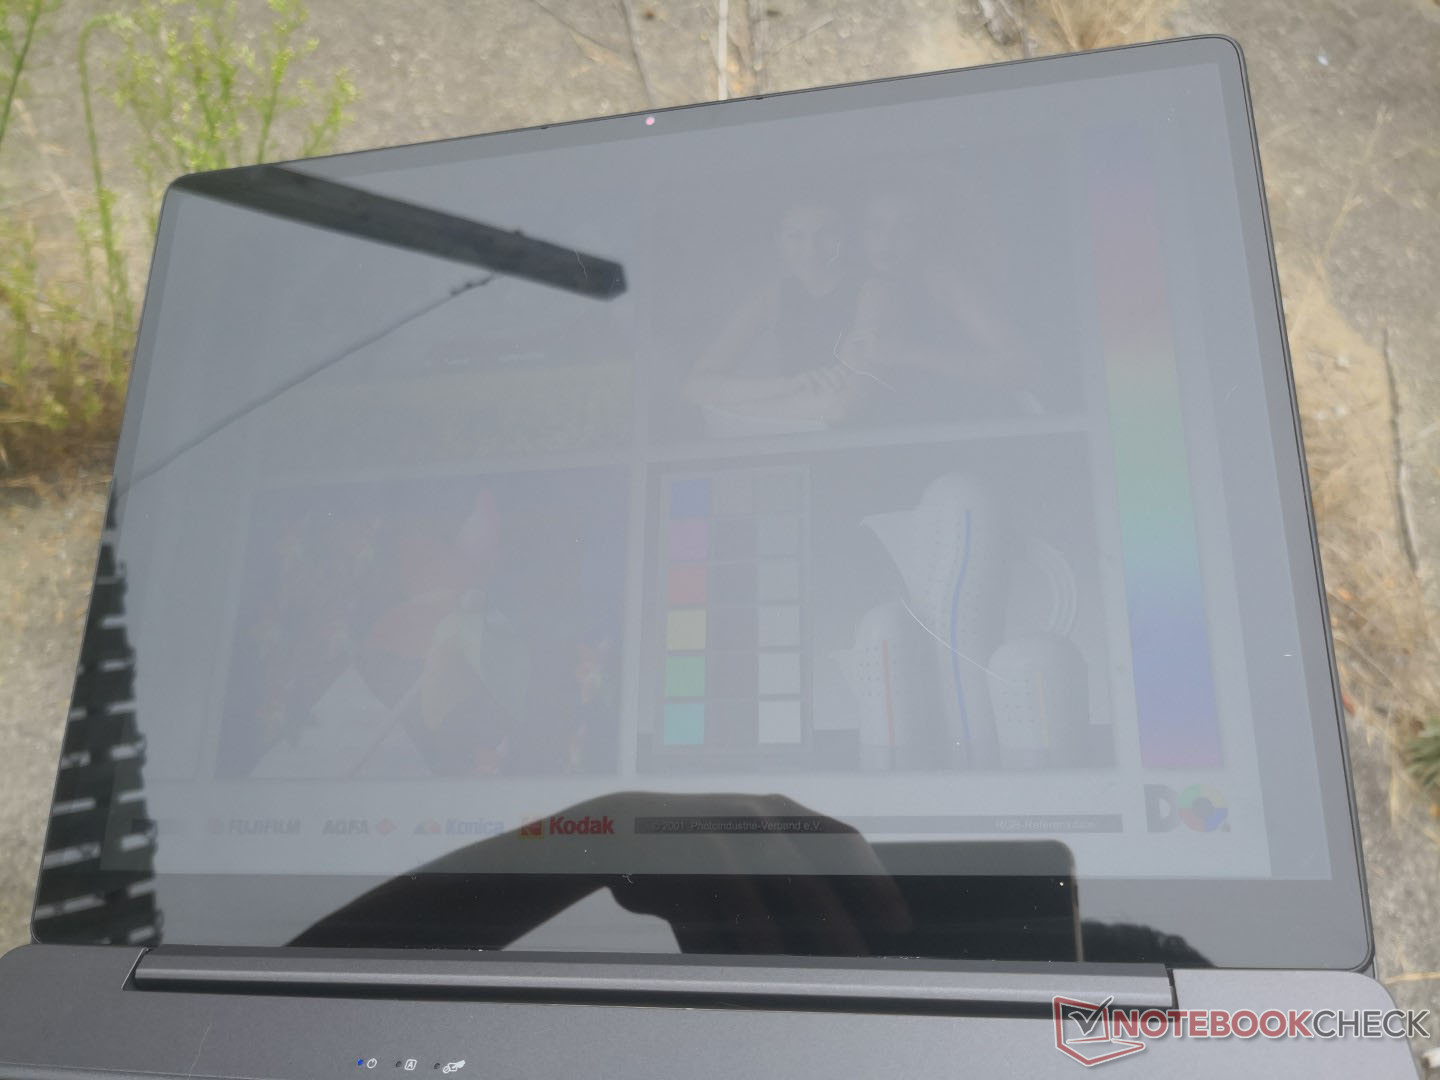
Display
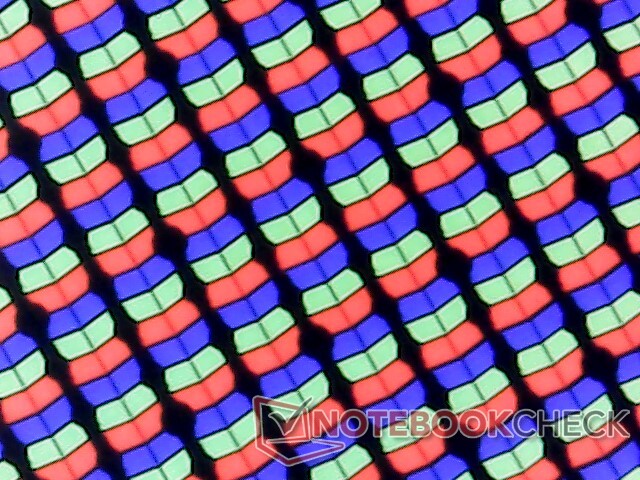
The Chi Mei P130ZFA-BA1 IPS panel on the GemiBook can also be found on the Huawei MateBook 13. Thus, characteristics like colors, response times, and contrast ratios are similar between the two laptops. Keep in mind that the Huawei laptop costs almost $1000 more than our Chuwi.
| |||||||||||||||||||||||||
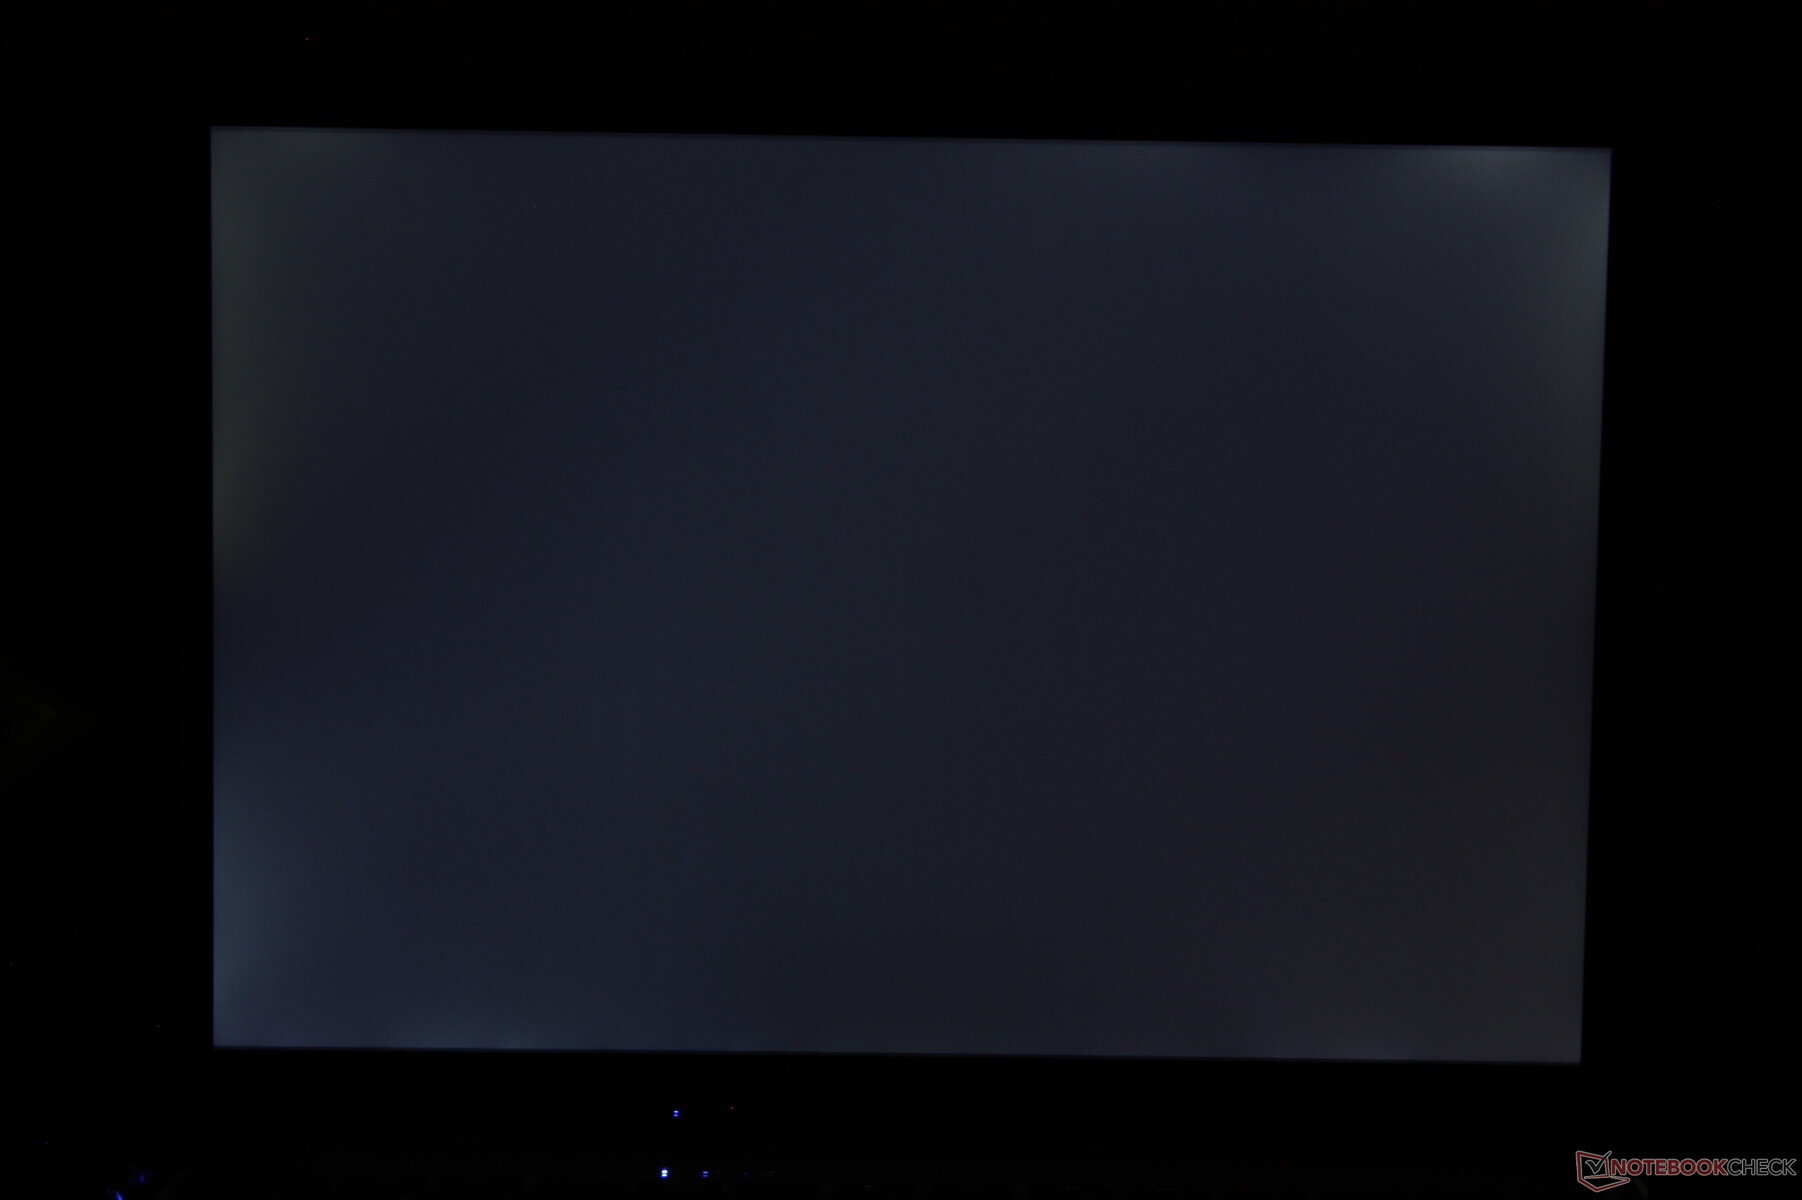
Brightness Distribution: 91 %
Center on Battery: 255.8 cd/m²
Contrast: 1066:1 (Black: 0.24 cd/m²)
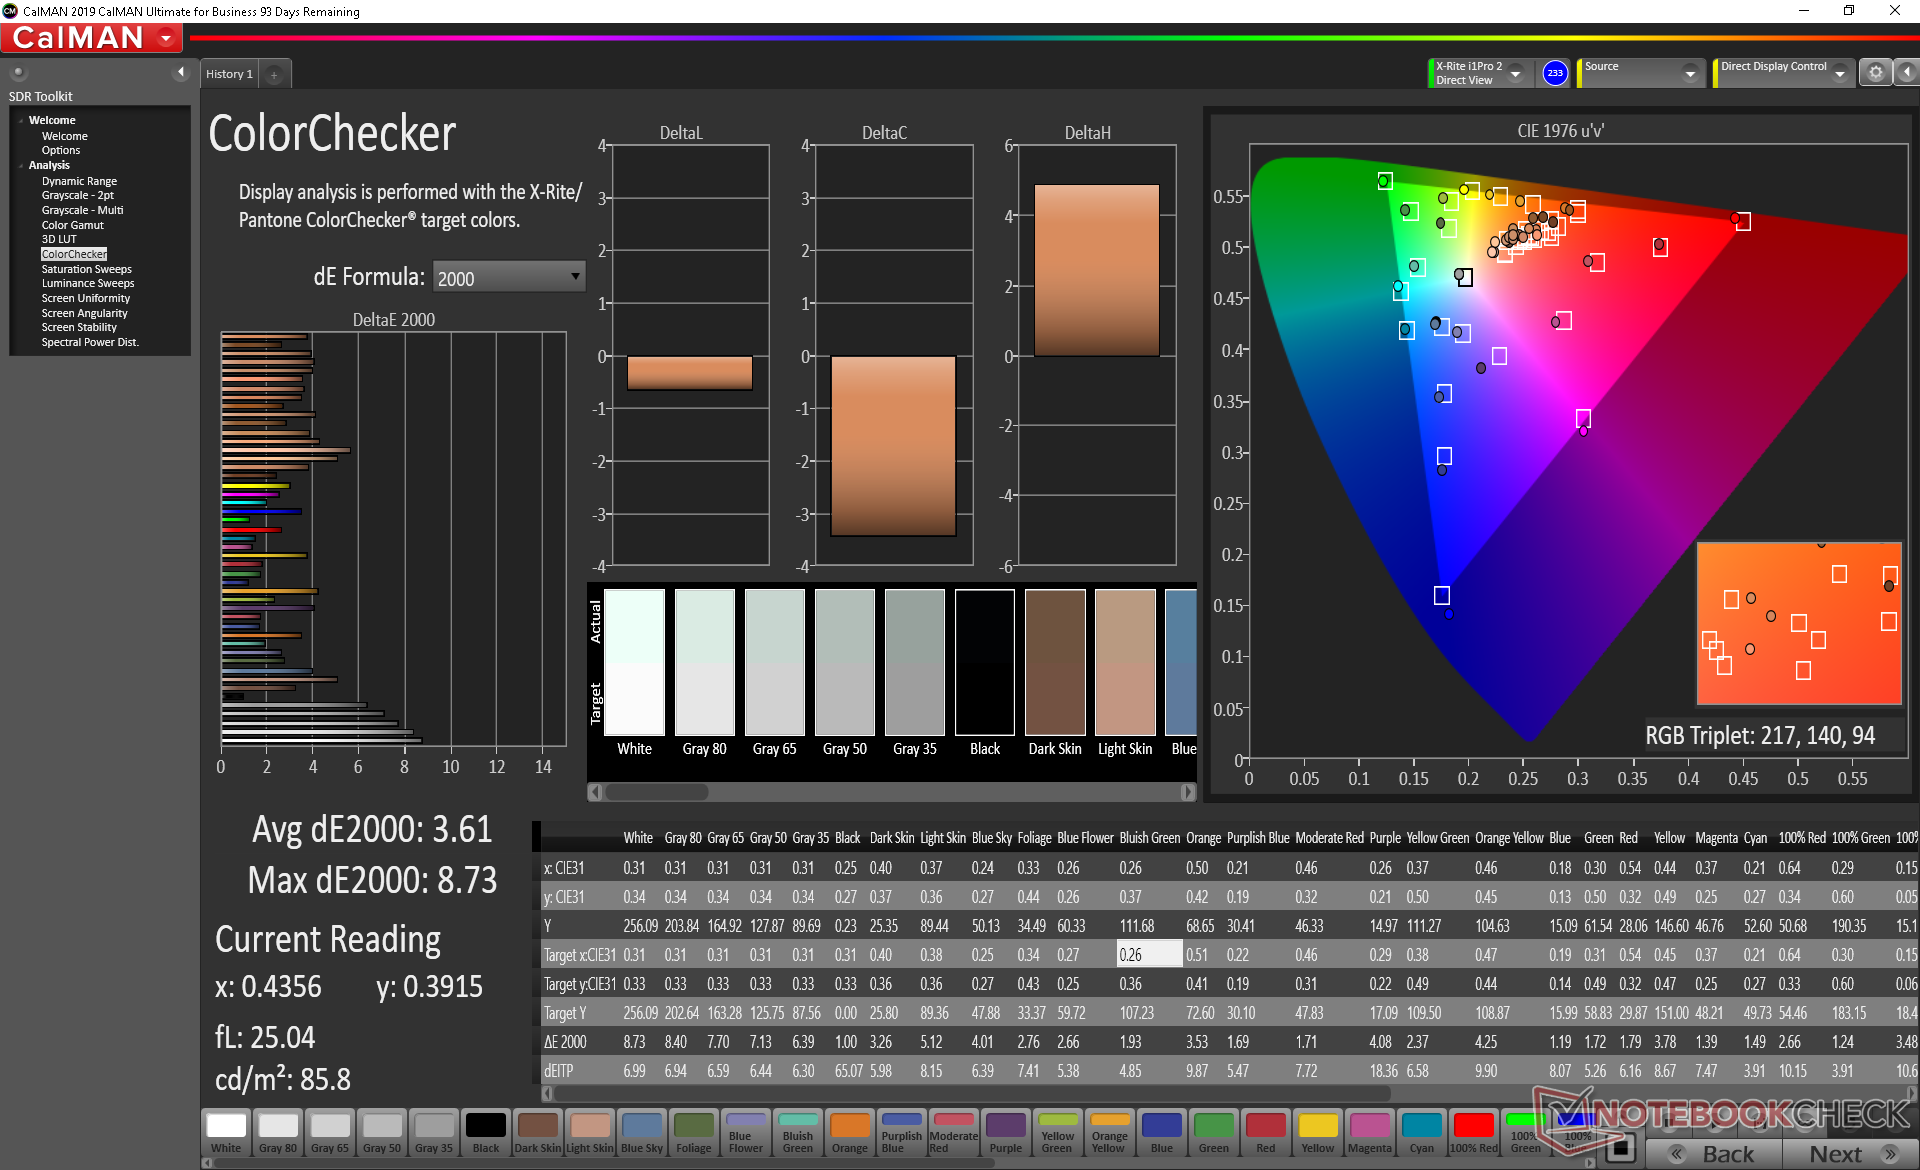
ΔE ColorChecker Calman: 3.61 | ∀{0.5-29.43 Ø4.72}
calibrated: 0.9
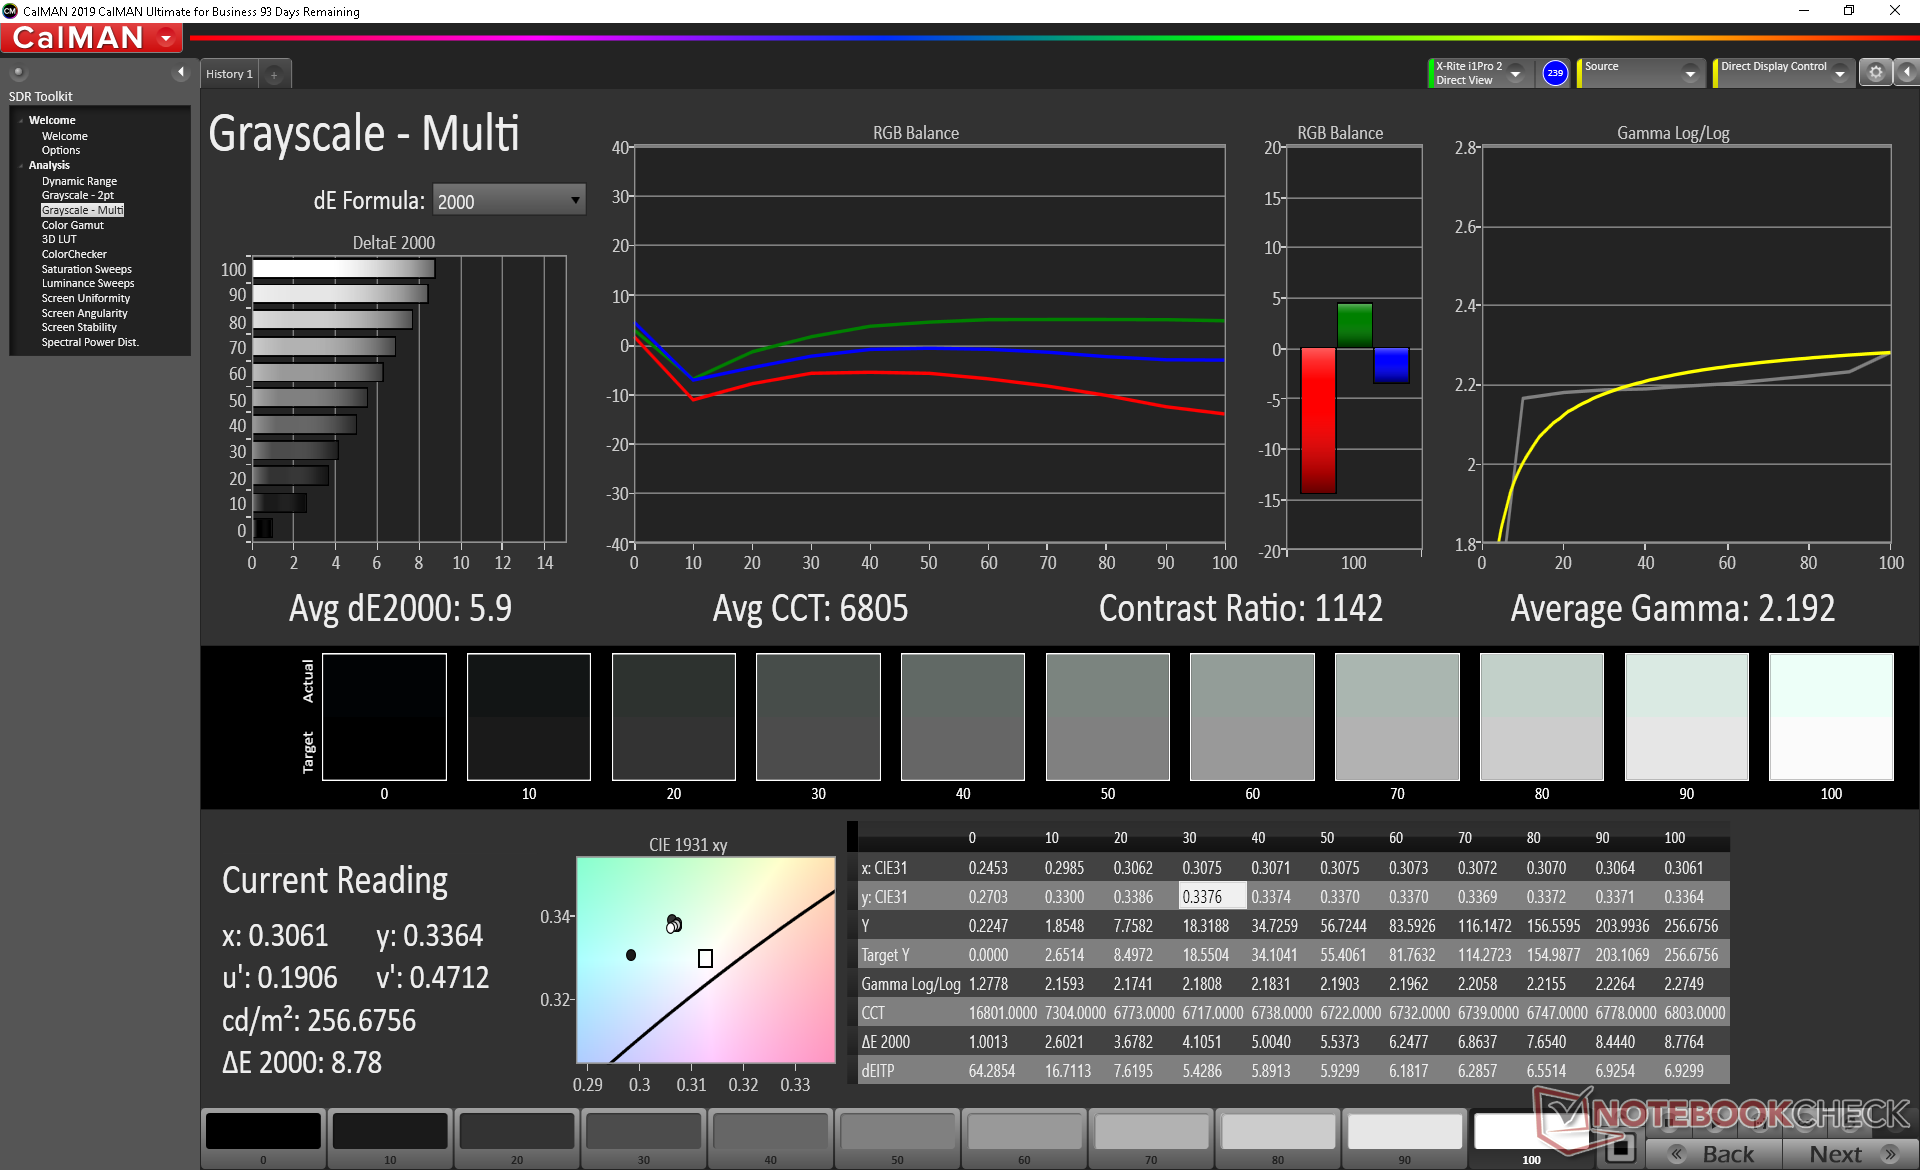
ΔE Greyscale Calman: 5.9 | ∀{0.09-98 Ø4.97}
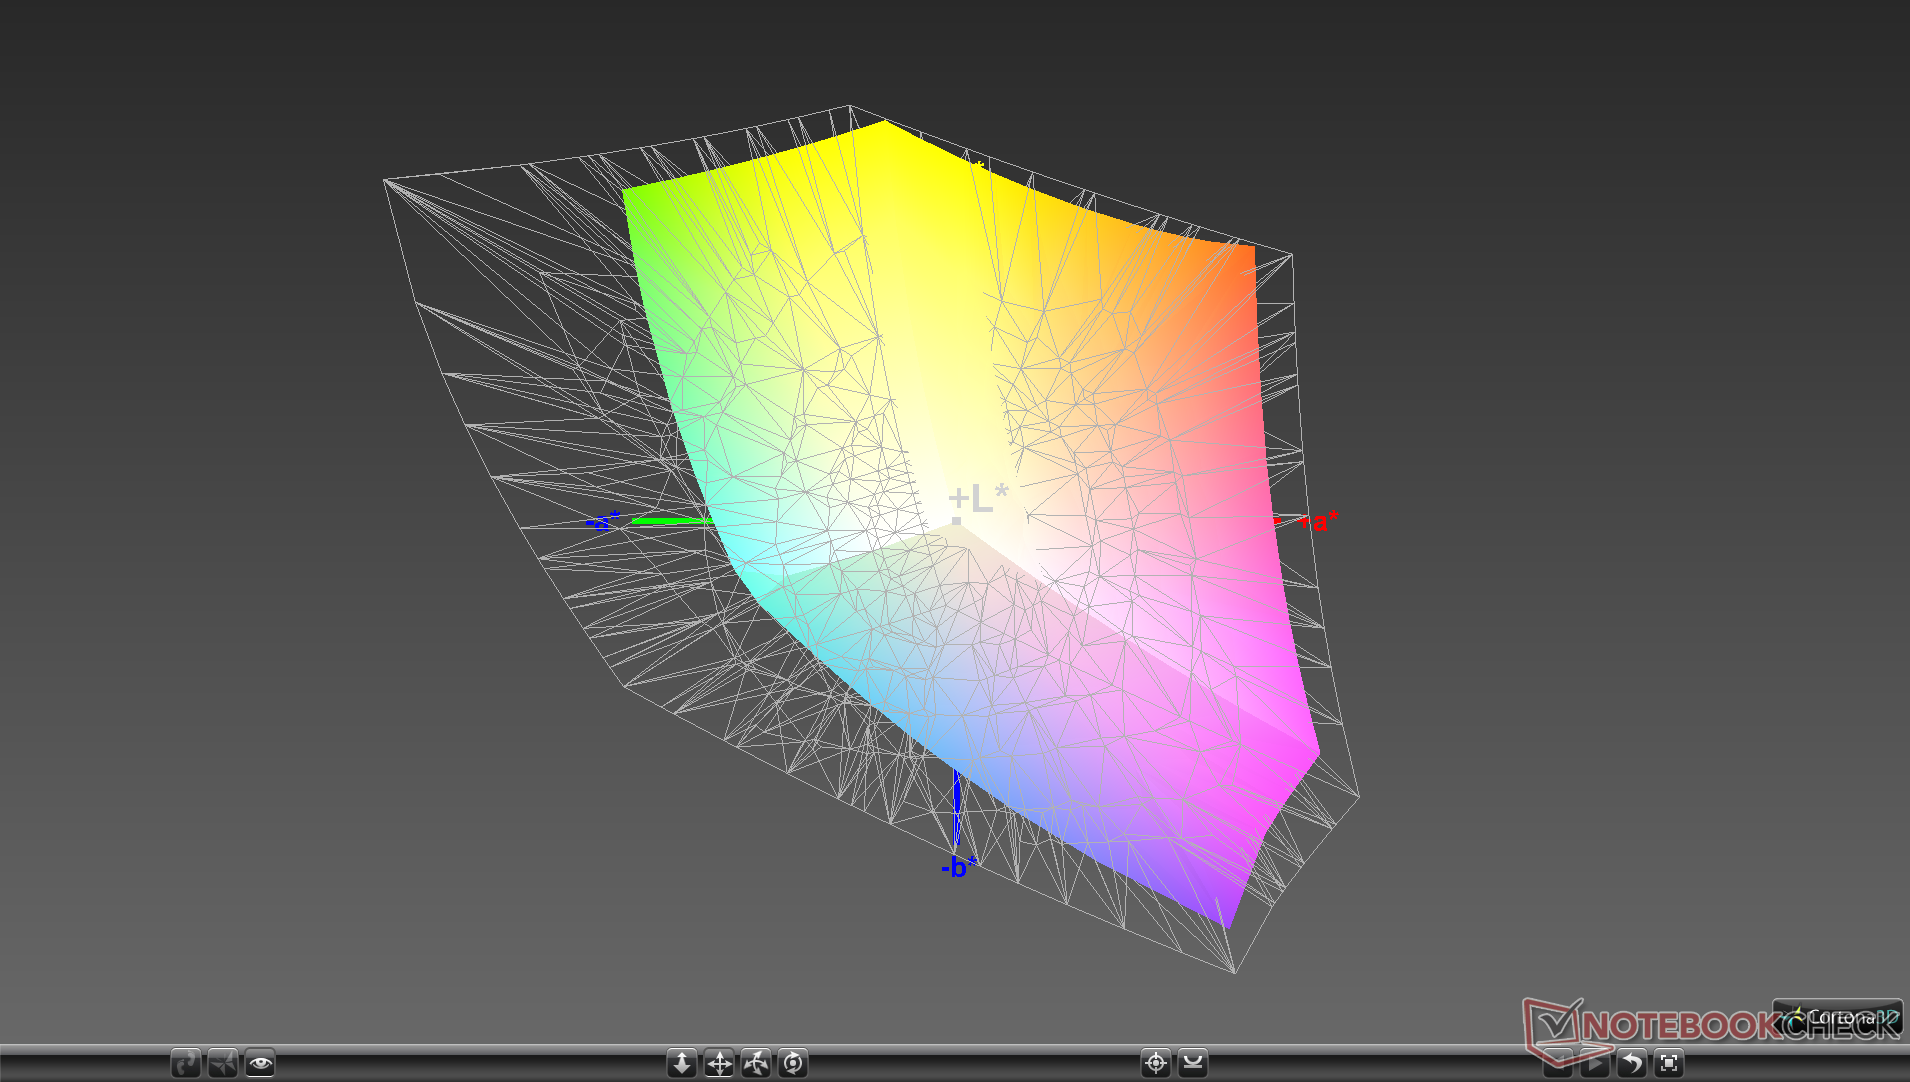
99% sRGB (Argyll 1.6.3 3D)
63.1% AdobeRGB 1998 (Argyll 1.6.3 3D)
68.7% AdobeRGB 1998 (Argyll 3D)
98.6% sRGB (Argyll 3D)
67.2% Display P3 (Argyll 3D)
Gamma: 2.19
CCT: 6805 K
| Chuwi GemiBook CWI528 Chi Mei P130ZFA-BA1, IPS, 13", 2160x1440 | LincPlus P1 LC133LF2L03, IPS, 13.3", 1920x1080 | Jumper EZbook X3 PBTB133F006 A, IPS, 13.3", 1920x1080 | Apple MacBook Air 2020 i3 APPA042, IPS, 13.3", 2560x1600 | HP Envy 13-aq0003ng InfoVision M133NVF3 R2, IPS, 13.3", 1920x1080 | Tuxedo Book BU1307 AUO272D, IPS, 13.3", 1920x1080 | |
|---|---|---|---|---|---|---|
| Display | -3% | -10% | 3% | -5% | ||
| Display P3 Coverage (%) | 67.2 | 65.4 -3% | 60.4 -10% | 70.3 5% | 64.4 -4% | |
| sRGB Coverage (%) | 98.6 | 94.9 -4% | 88.7 -10% | 98 -1% | 91.7 -7% | |
| AdobeRGB 1998 Coverage (%) | 68.7 | 66.8 -3% | 61.7 -10% | 71.6 4% | 65.2 -5% | |
| Response Times | 5% | 1% | 3% | 20% | 21% | |
| Response Time Grey 50% / Grey 80% * (ms) | 37.6 ? | 36 ? 4% | 34 ? 10% | 38.4 ? -2% | 31 ? 18% | 34 ? 10% |
| Response Time Black / White * (ms) | 30.4 ? | 29 ? 5% | 33 ? -9% | 28.4 ? 7% | 24 ? 21% | 21 ? 31% |
| PWM Frequency (Hz) | 250 ? | 119000 ? | 4000 ? | 400 ? | ||
| Screen | -31% | -36% | 34% | 24% | 1% | |
| Brightness middle (cd/m²) | 255.8 | 264 3% | 209 -18% | 416 63% | 768 200% | 333 30% |
| Brightness (cd/m²) | 246 | 256 4% | 203 -17% | 403 64% | 778 216% | 319 30% |
| Brightness Distribution (%) | 91 | 84 -8% | 95 4% | 95 4% | 82 -10% | 83 -9% |
| Black Level * (cd/m²) | 0.24 | 0.25 -4% | 0.2 17% | 0.34 -42% | 0.48 -100% | 0.3 -25% |
| Contrast (:1) | 1066 | 1056 -1% | 1045 -2% | 1224 15% | 1600 50% | 1110 4% |
| Colorchecker dE 2000 * | 3.61 | 7.36 -104% | 8.43 -134% | 0.9 75% | 3.49 3% | |
| Colorchecker dE 2000 max. * | 8.73 | 12.72 -46% | 14.77 -69% | 1.4 84% | 7.41 15% | |
| Colorchecker dE 2000 calibrated * | 0.9 | 2.12 -136% | 1.68 -87% | 0.6 33% | 2.07 -130% | |
| Greyscale dE 2000 * | 5.9 | 8.74 -48% | 9.81 -66% | 1 83% | 4.09 31% | 7.35 -25% |
| Gamma | 2.19 100% | 2.41 91% | 2.46 89% | 2.2 100% | 2.54 87% | 2.35 94% |
| CCT | 6805 96% | 8741 74% | 10135 64% | 6629 98% | 6452 101% | 7156 91% |
| Color Space (Percent of AdobeRGB 1998) (%) | 63.1 | 62 -2% | 57 -10% | 63.9 1% | 60 -5% | |
| Color Space (Percent of sRGB) (%) | 99 | 95 -4% | 89 -10% | 97.6 -1% | 92 -7% | |
| Total Average (Program / Settings) | -10% /
-22% | -15% /
-26% | 13% /
25% | 13% /
18% | 11% /
6% |
* ... smaller is better
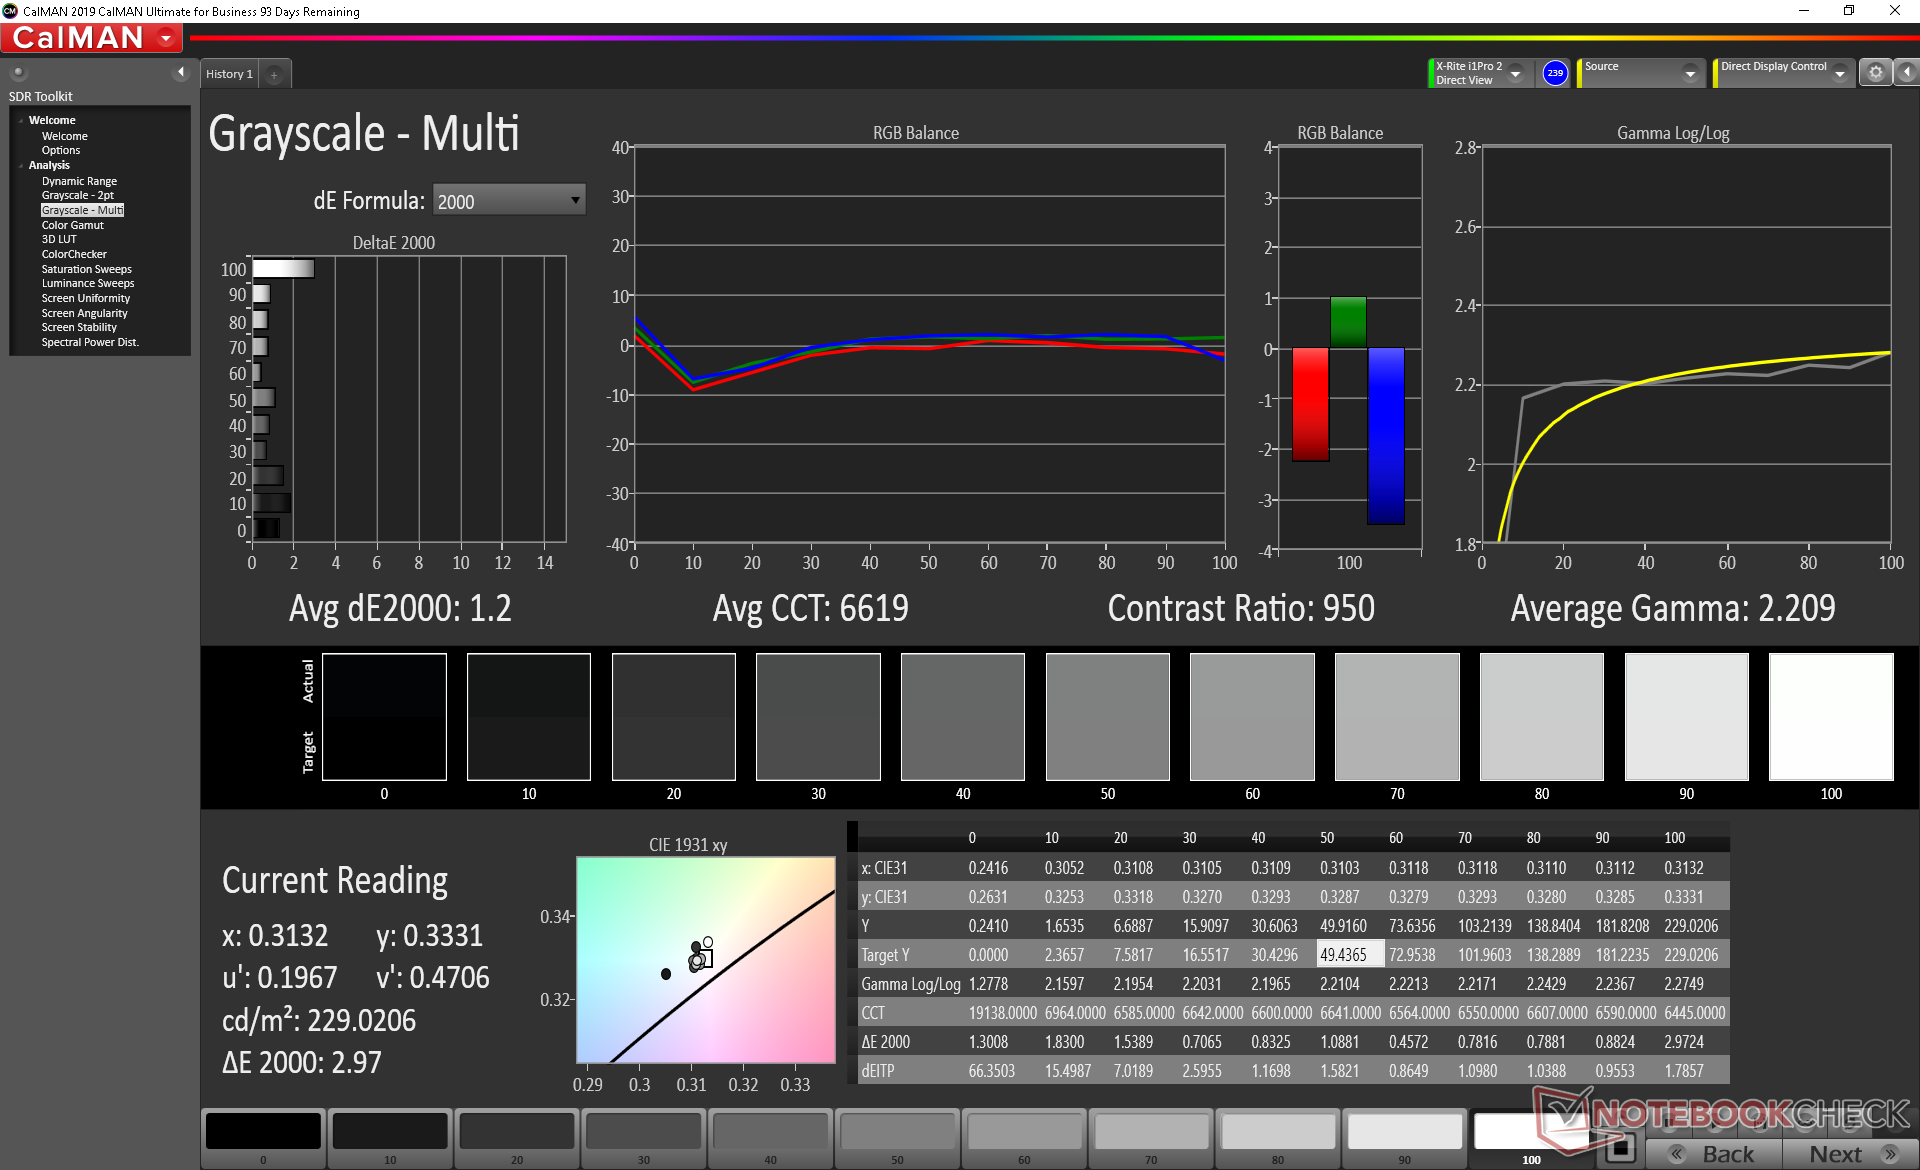
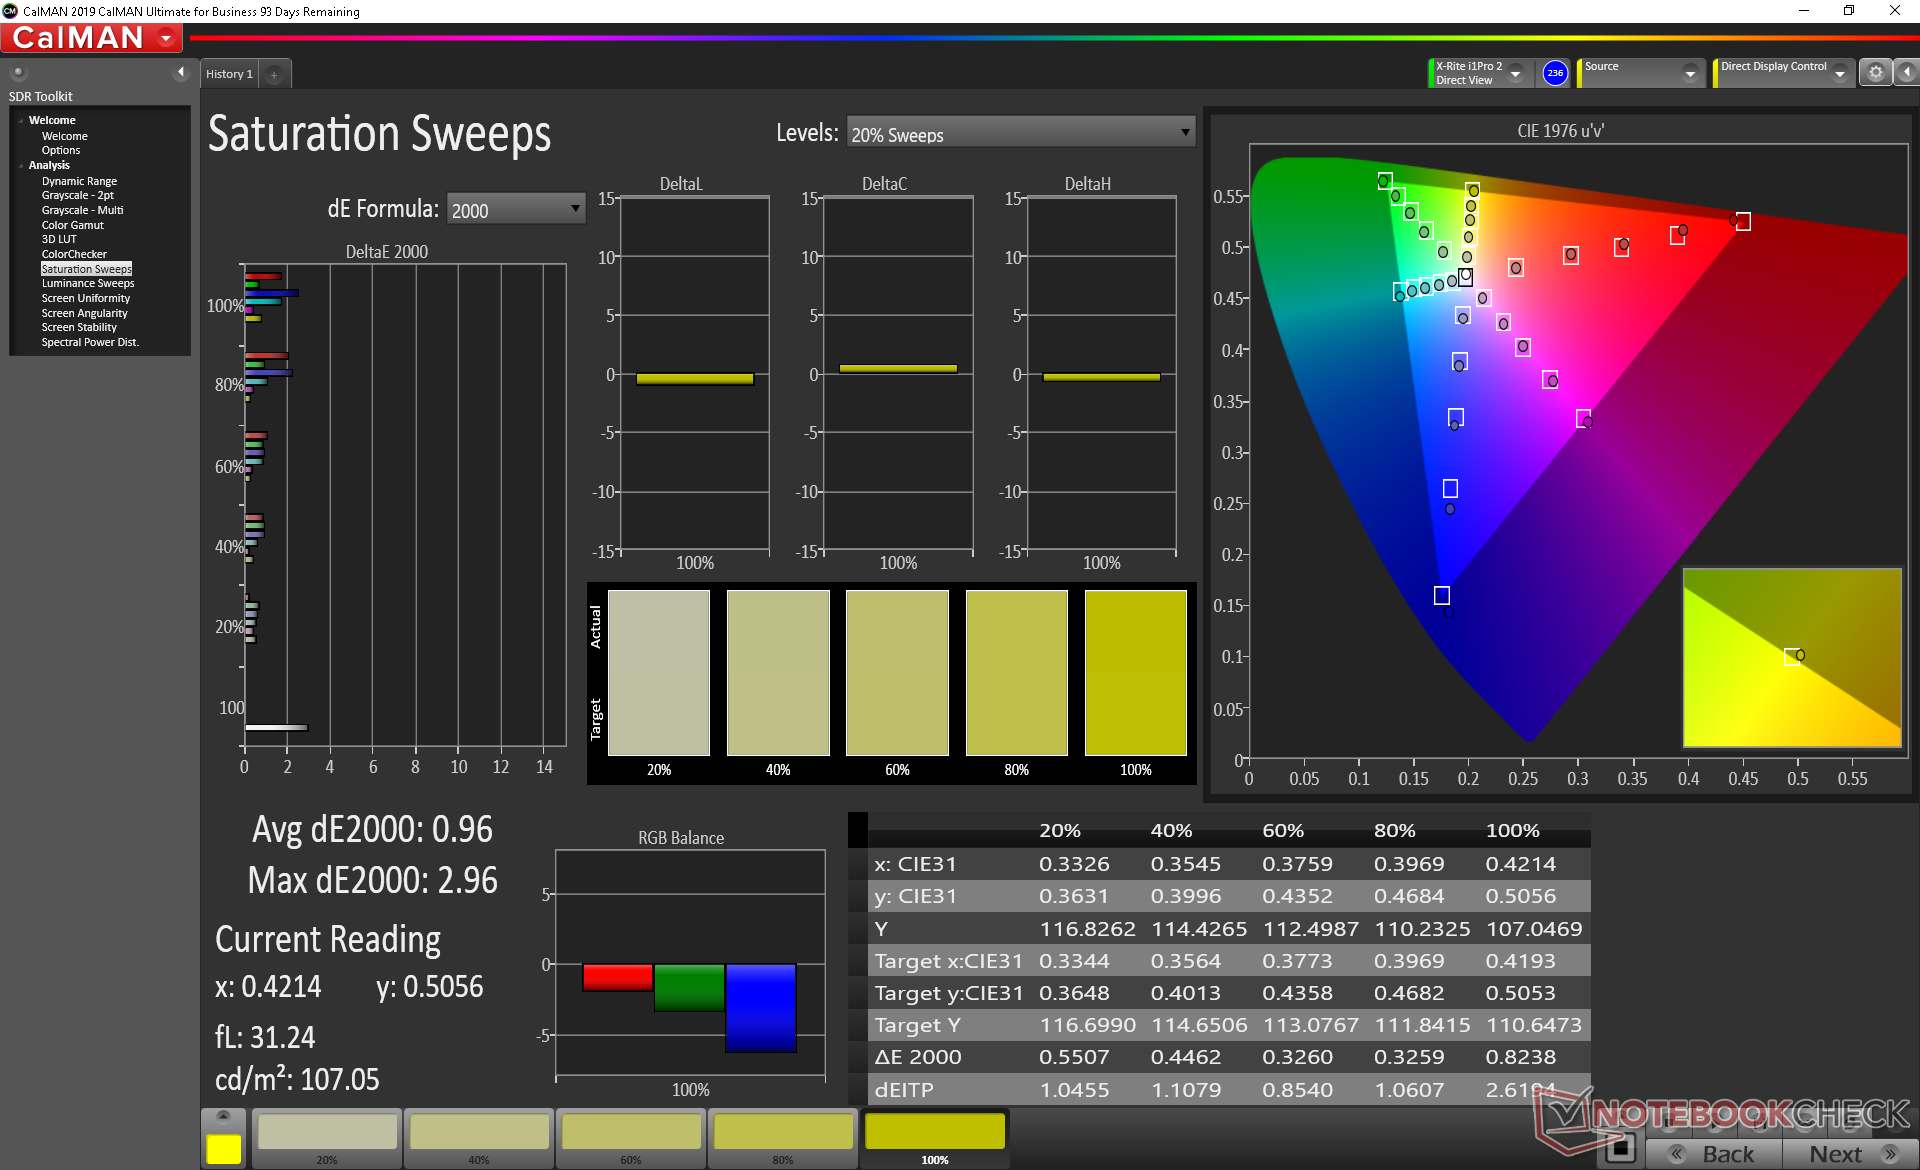
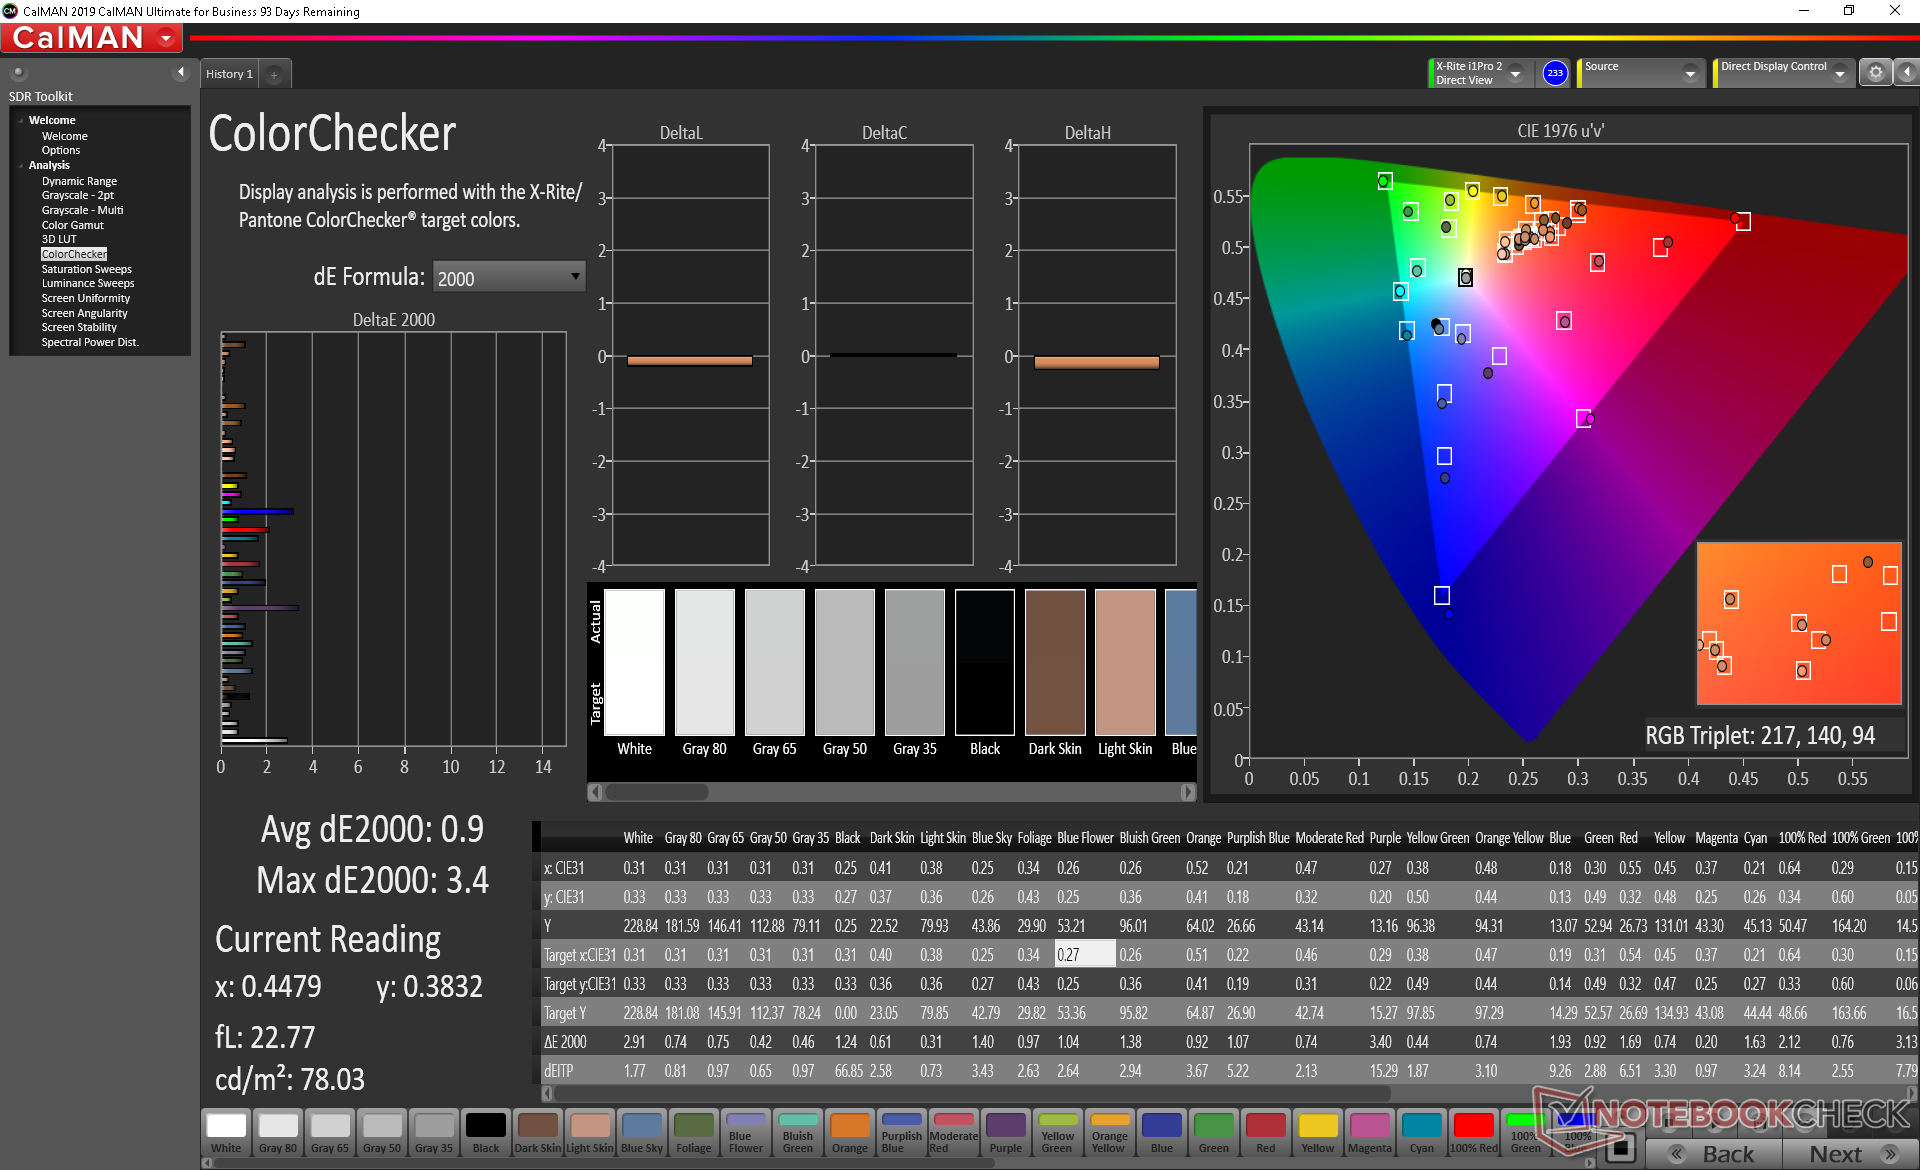
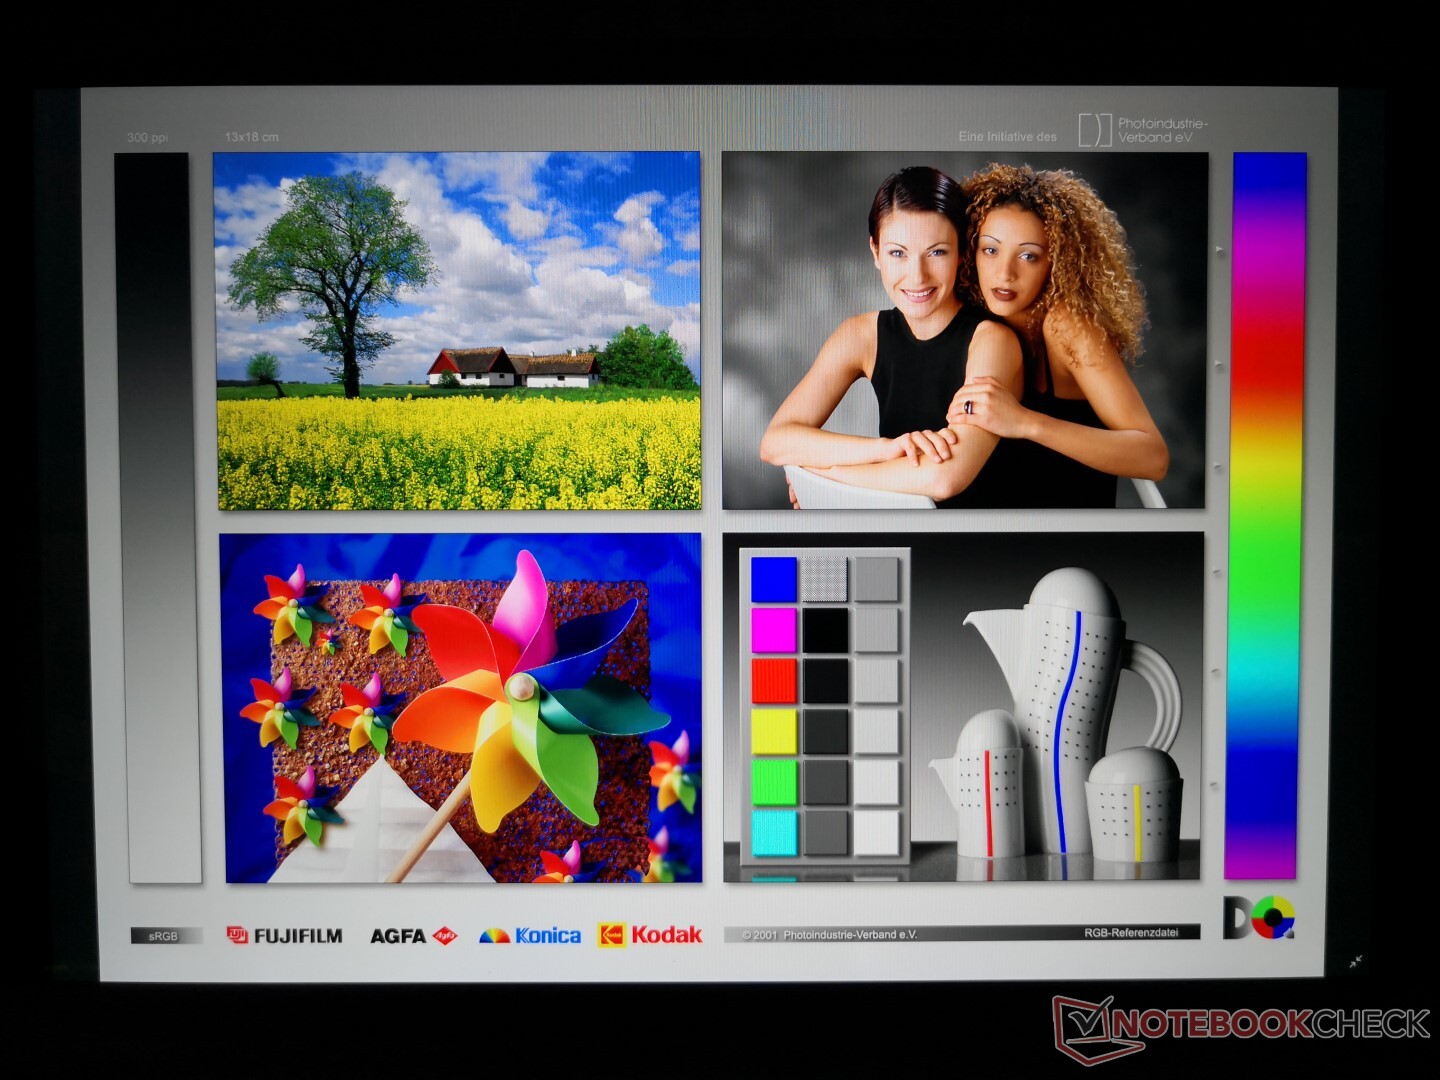
Color space is excellent at 99 percent of sRGB to be comparable to most Ultrabooks retailing for over twice the price.

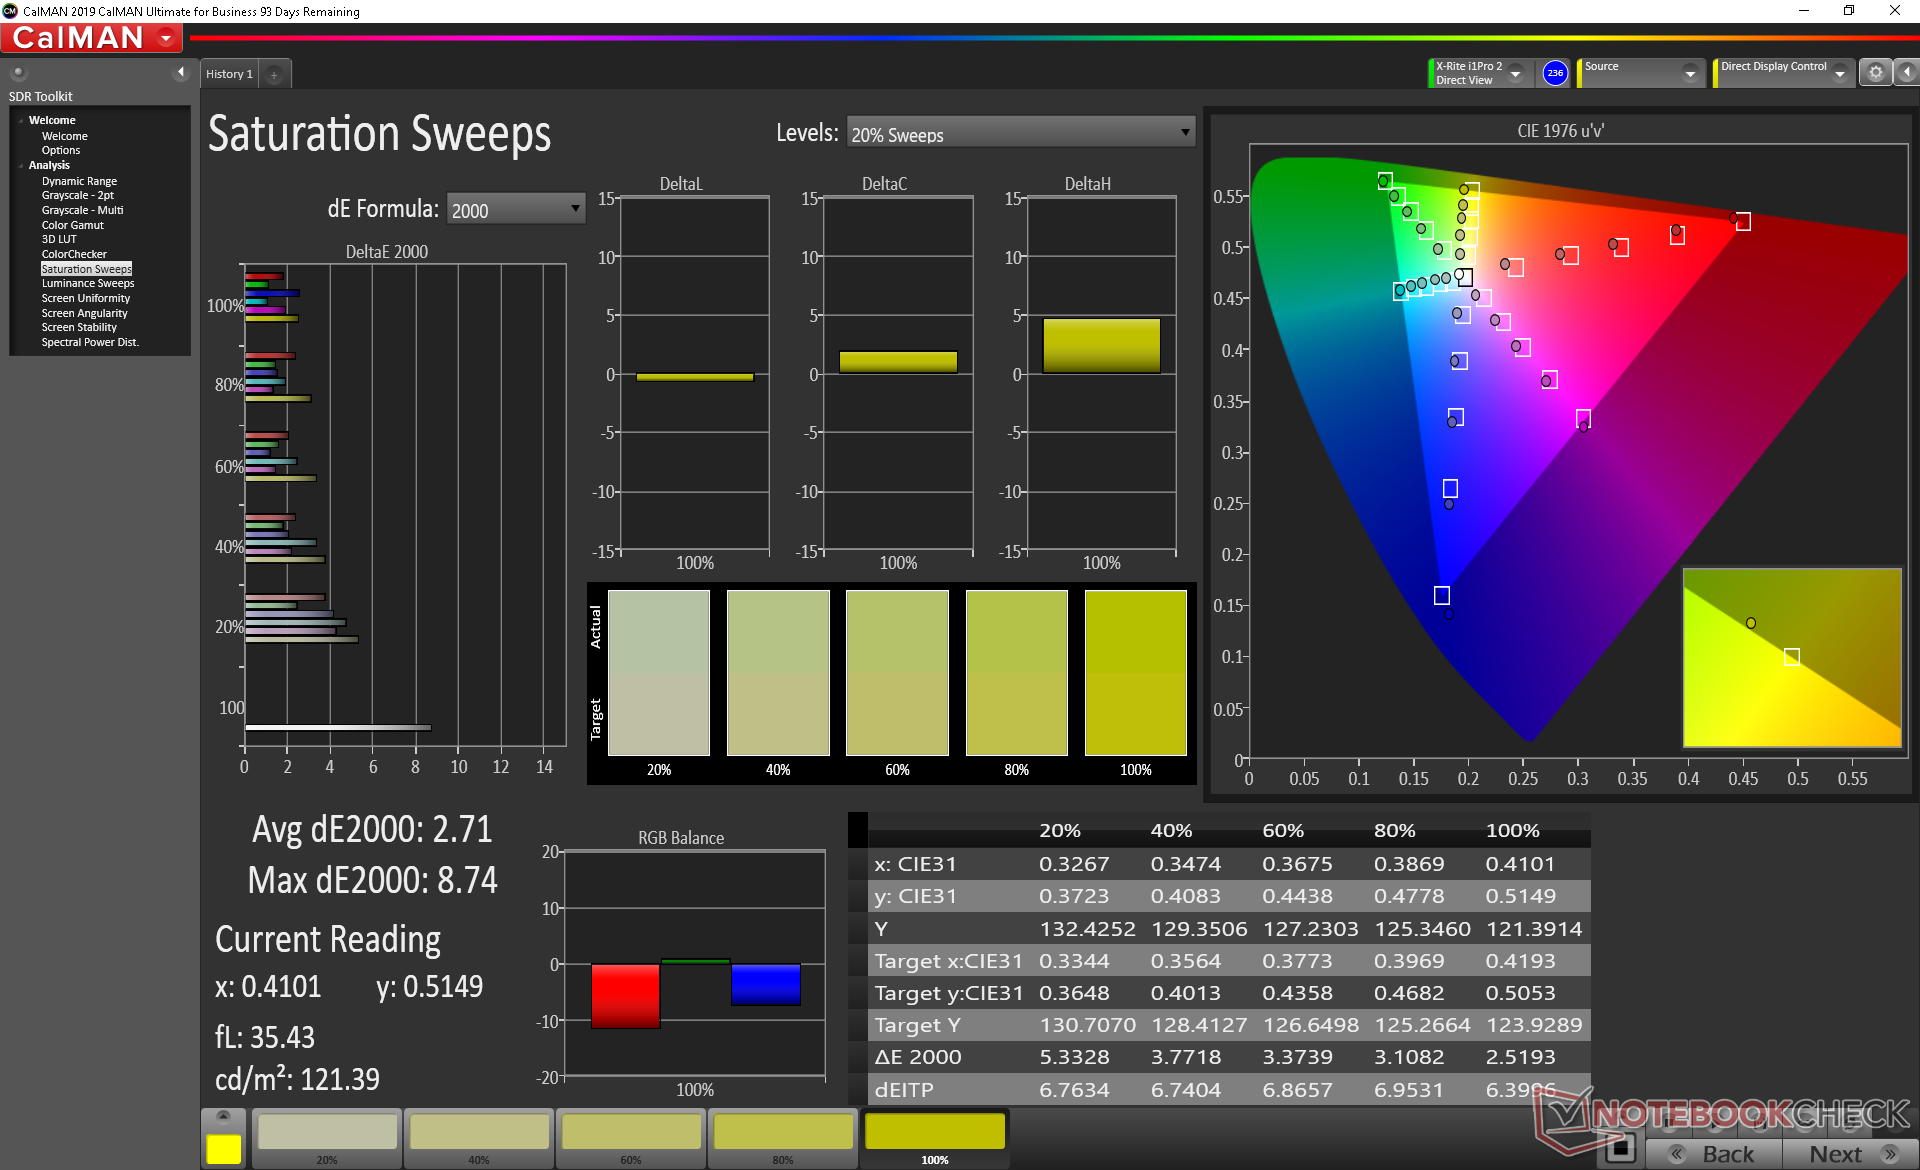
X-Rite colorimeter measurements reveal an overly cool color temperature out of the box. Colors and grayscale improve dramatically after calibration with final average DeltaE values of just 0.9 and 1.2, respectively. We recommend applying our ICC profile above to get the most out of the display.
Display Response Times
| ↔ Response Time Black to White | ||
|---|---|---|
| 30.4 ms ... rise ↗ and fall ↘ combined | ↗ 16.4 ms rise | 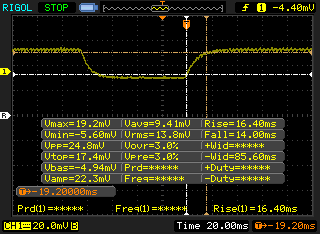 |
| ↘ 14 ms fall | ||
| The screen shows slow response rates in our tests and will be unsatisfactory for gamers. In comparison, all tested devices range from 0.1 (minimum) to 240 (maximum) ms. » 82 % of all devices are better. This means that the measured response time is worse than the average of all tested devices (19.8 ms). | ||
| ↔ Response Time 50% Grey to 80% Grey | ||
| 37.6 ms ... rise ↗ and fall ↘ combined | ↗ 18.8 ms rise | 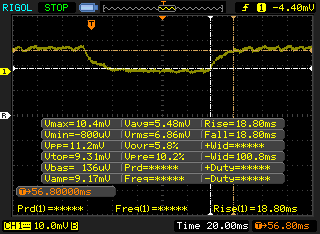 |
| ↘ 18.8 ms fall | ||
| The screen shows slow response rates in our tests and will be unsatisfactory for gamers. In comparison, all tested devices range from 0.165 (minimum) to 636 (maximum) ms. » 55 % of all devices are better. This means that the measured response time is worse than the average of all tested devices (31 ms). | ||
Screen Flickering / PWM (Pulse-Width Modulation)
| Screen flickering / PWM not detected | 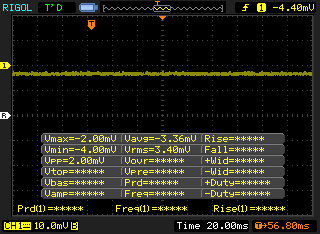 | ||
In comparison: 52 % of all tested devices do not use PWM to dim the display. If PWM was detected, an average of 7750 (minimum: 5 - maximum: 343500) Hz was measured. | |||
Performance
Processor
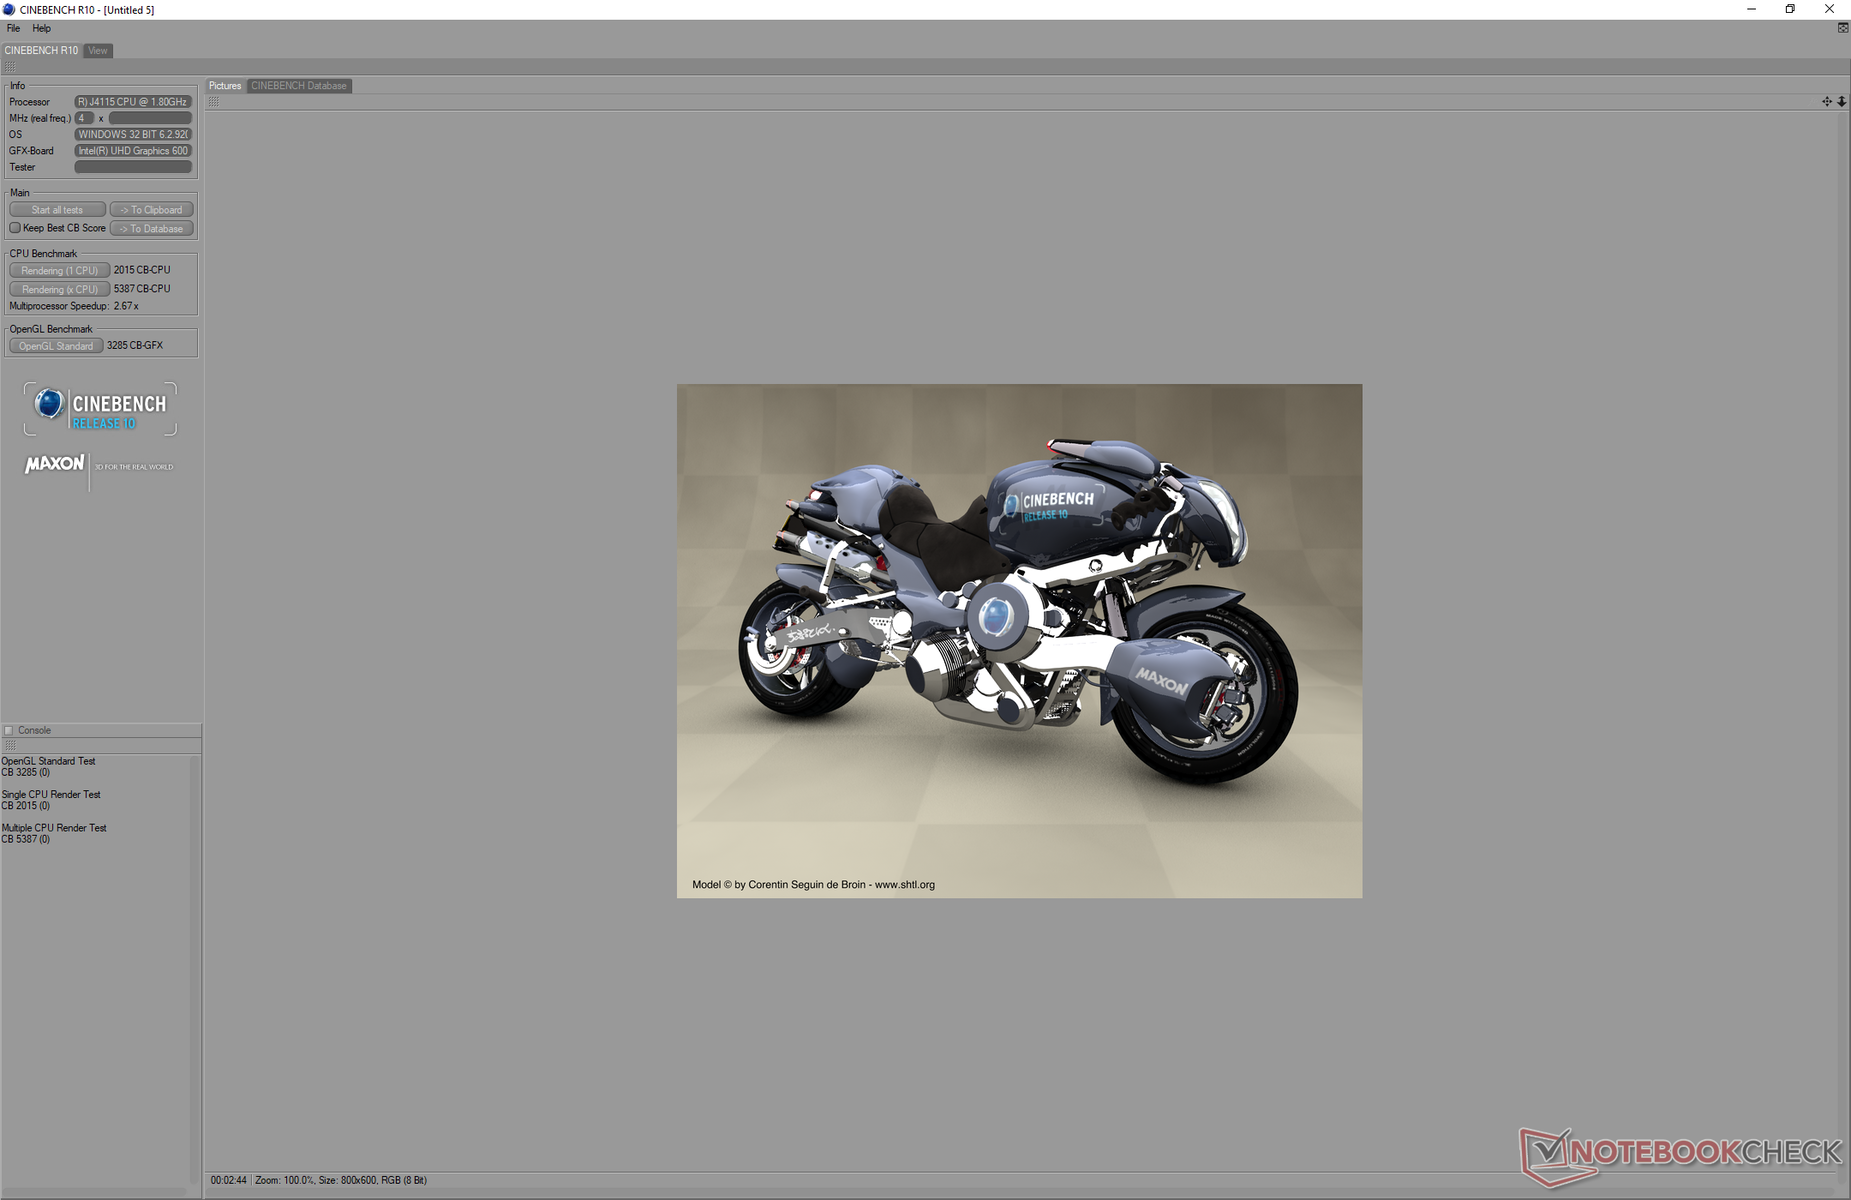
Raw multi-thread performance is about 25 to 35 percent slower than the budget Core i3-8145U while being faster than the older Celeron N4100. Performance sustainability is flat since Turbo Boost potential is extremely short-lived.
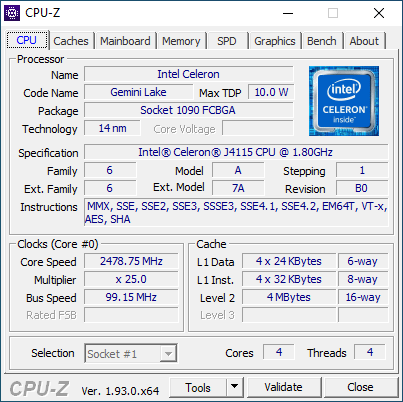
See our dedicated page on the Celeron J4115 for more technical information and benchmark comparisons.
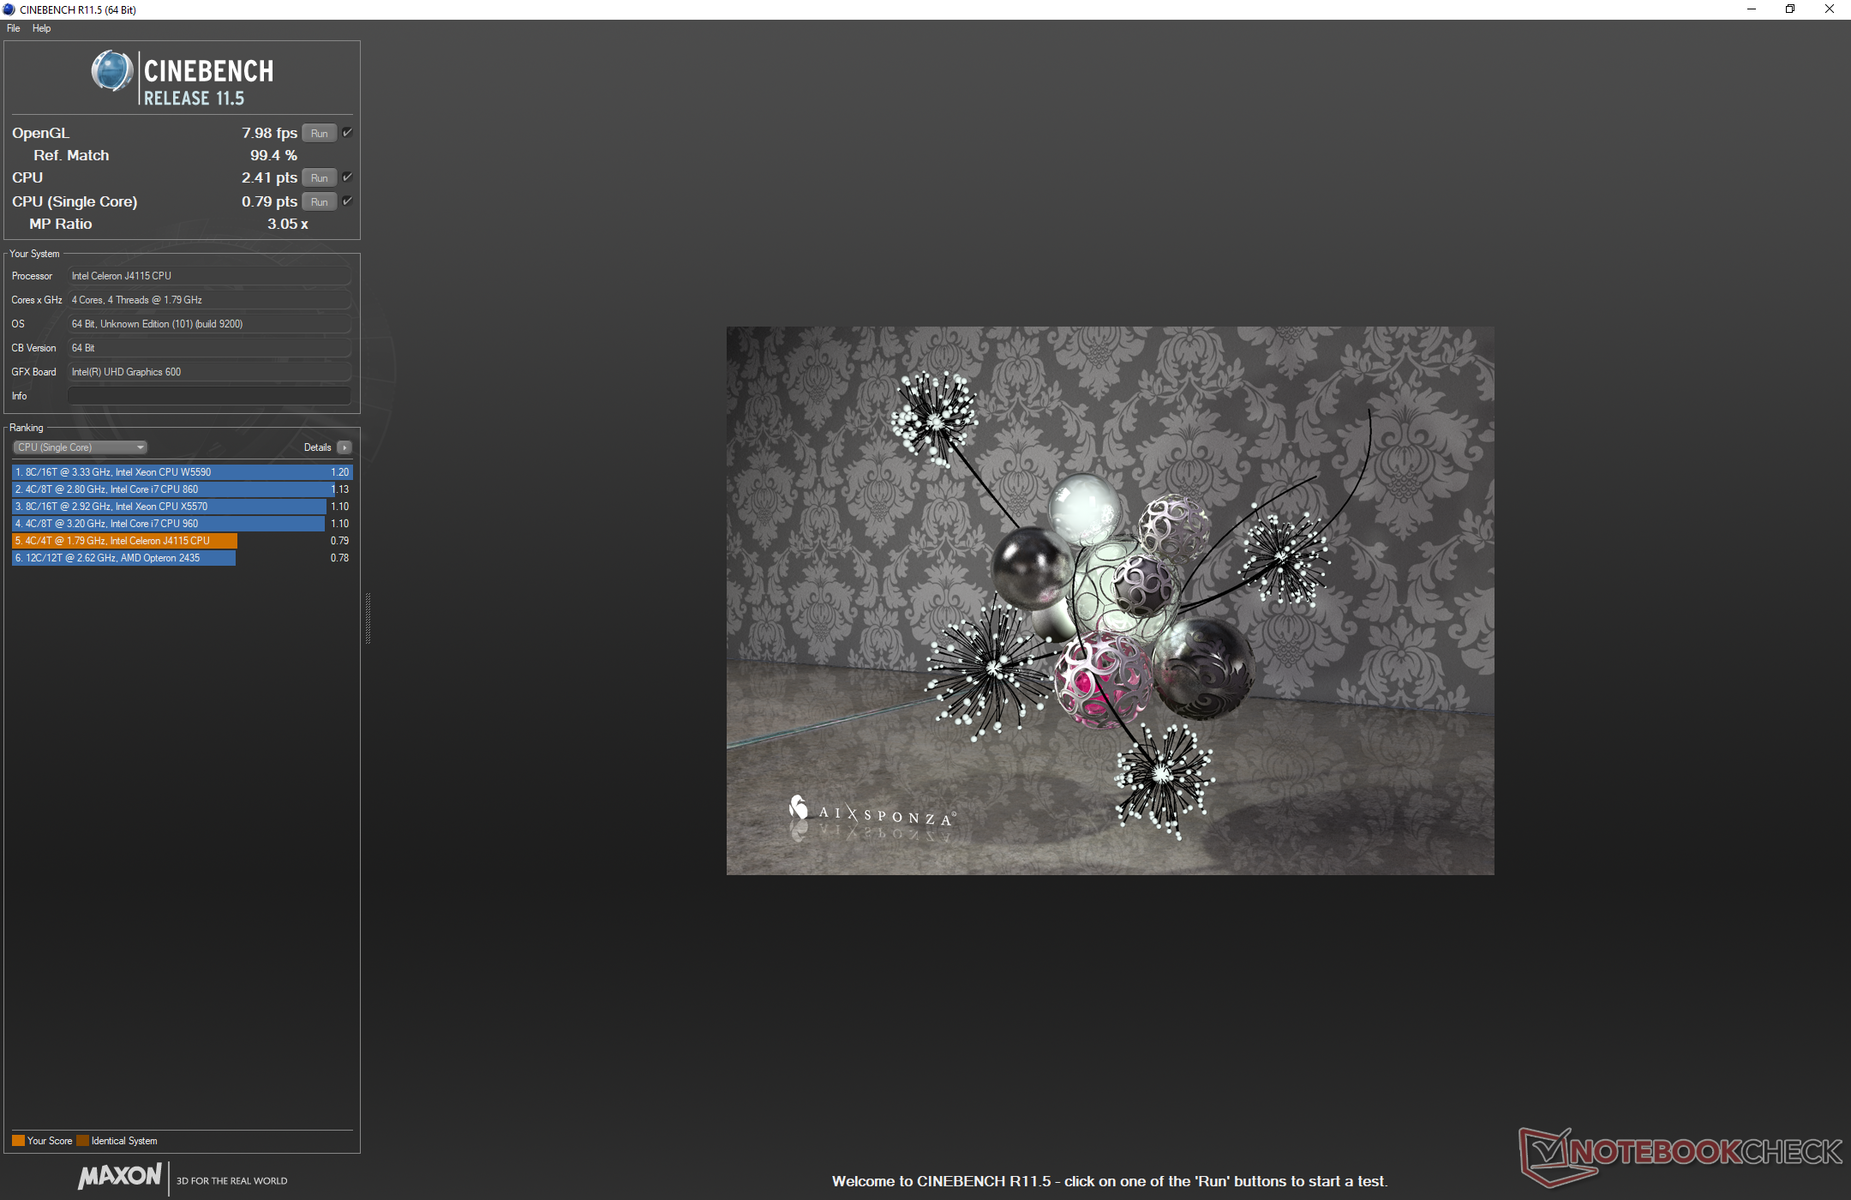
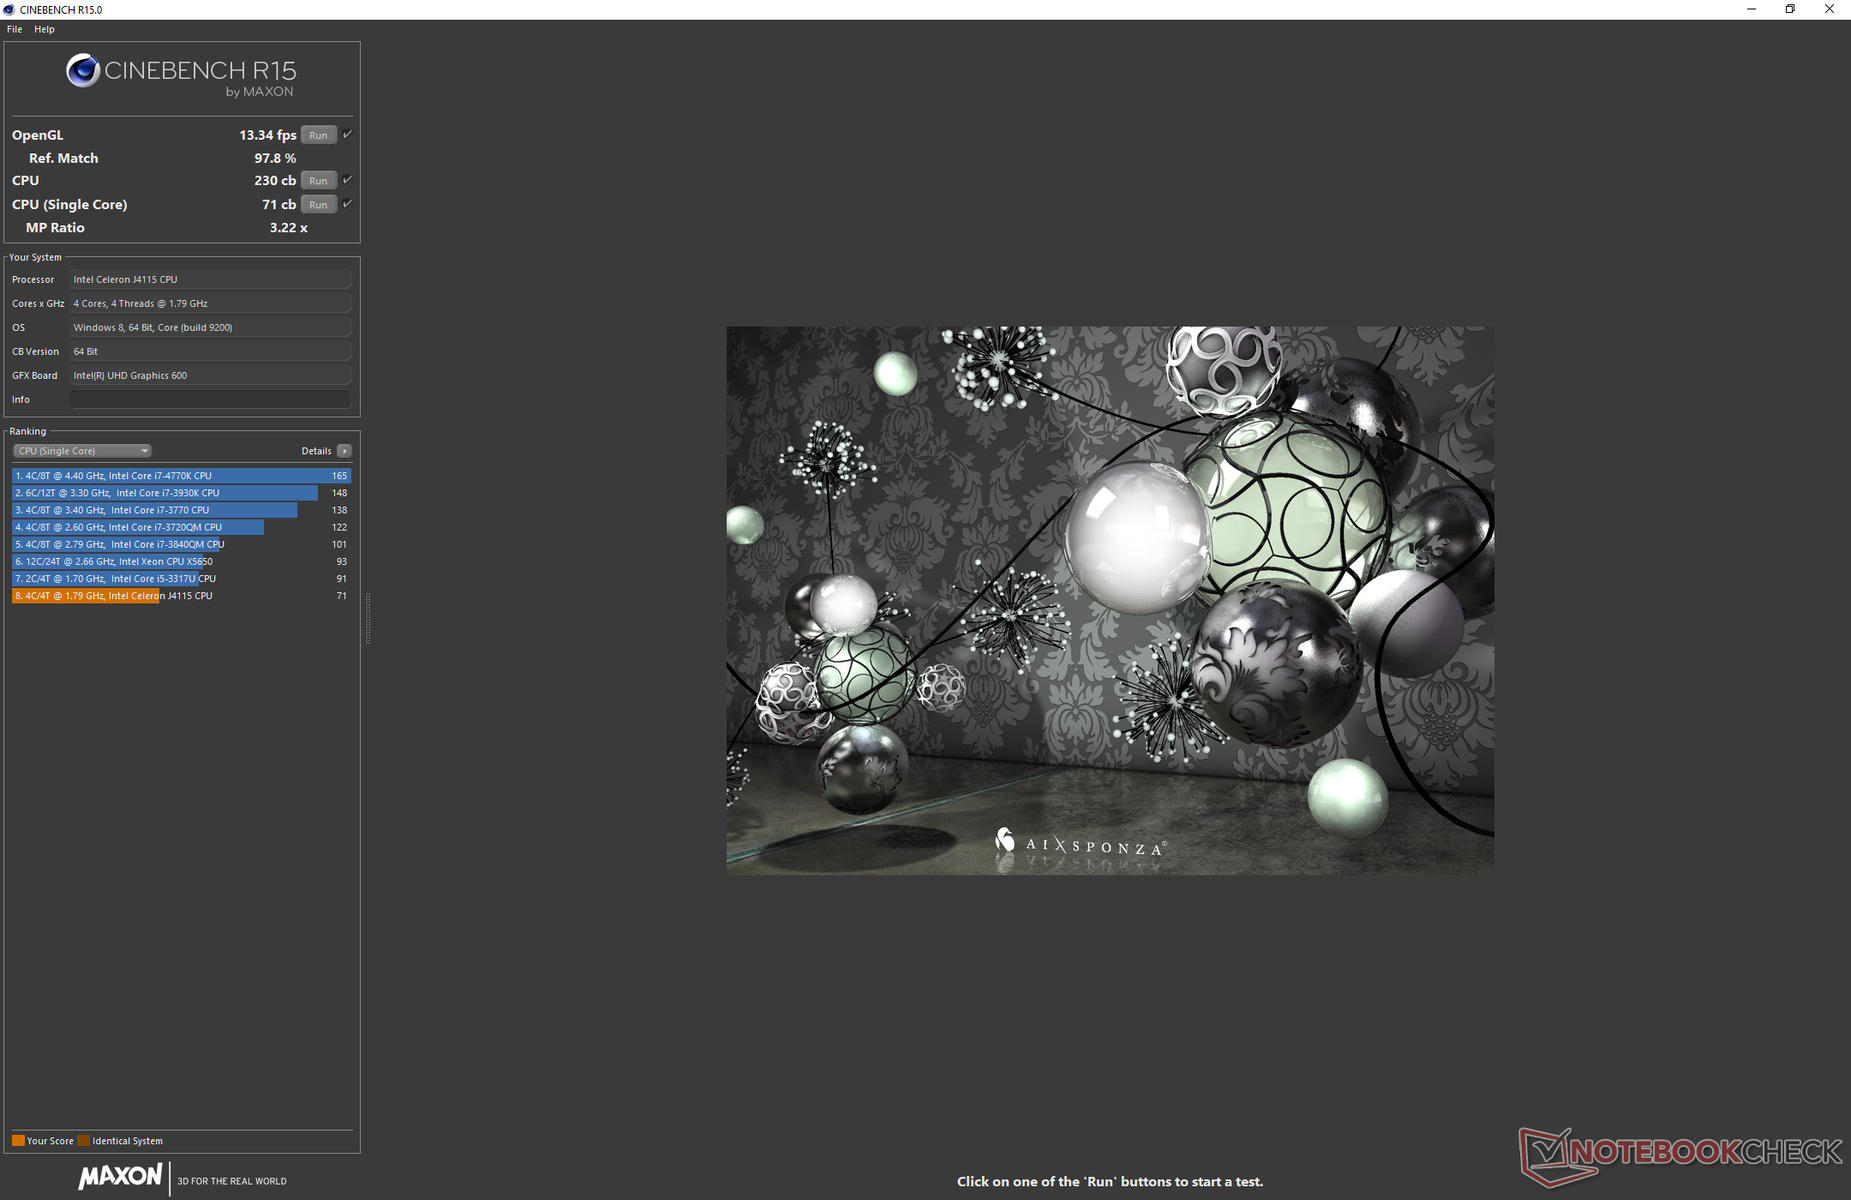
Cinebench R15: CPU Multi 64Bit | CPU Single 64Bit
Blender: v2.79 BMW27 CPU
7-Zip 18.03: 7z b 4 -mmt1 | 7z b 4
Geekbench 5.5: Single-Core | Multi-Core
HWBOT x265 Benchmark v2.2: 4k Preset
LibreOffice : 20 Documents To PDF
R Benchmark 2.5: Overall mean
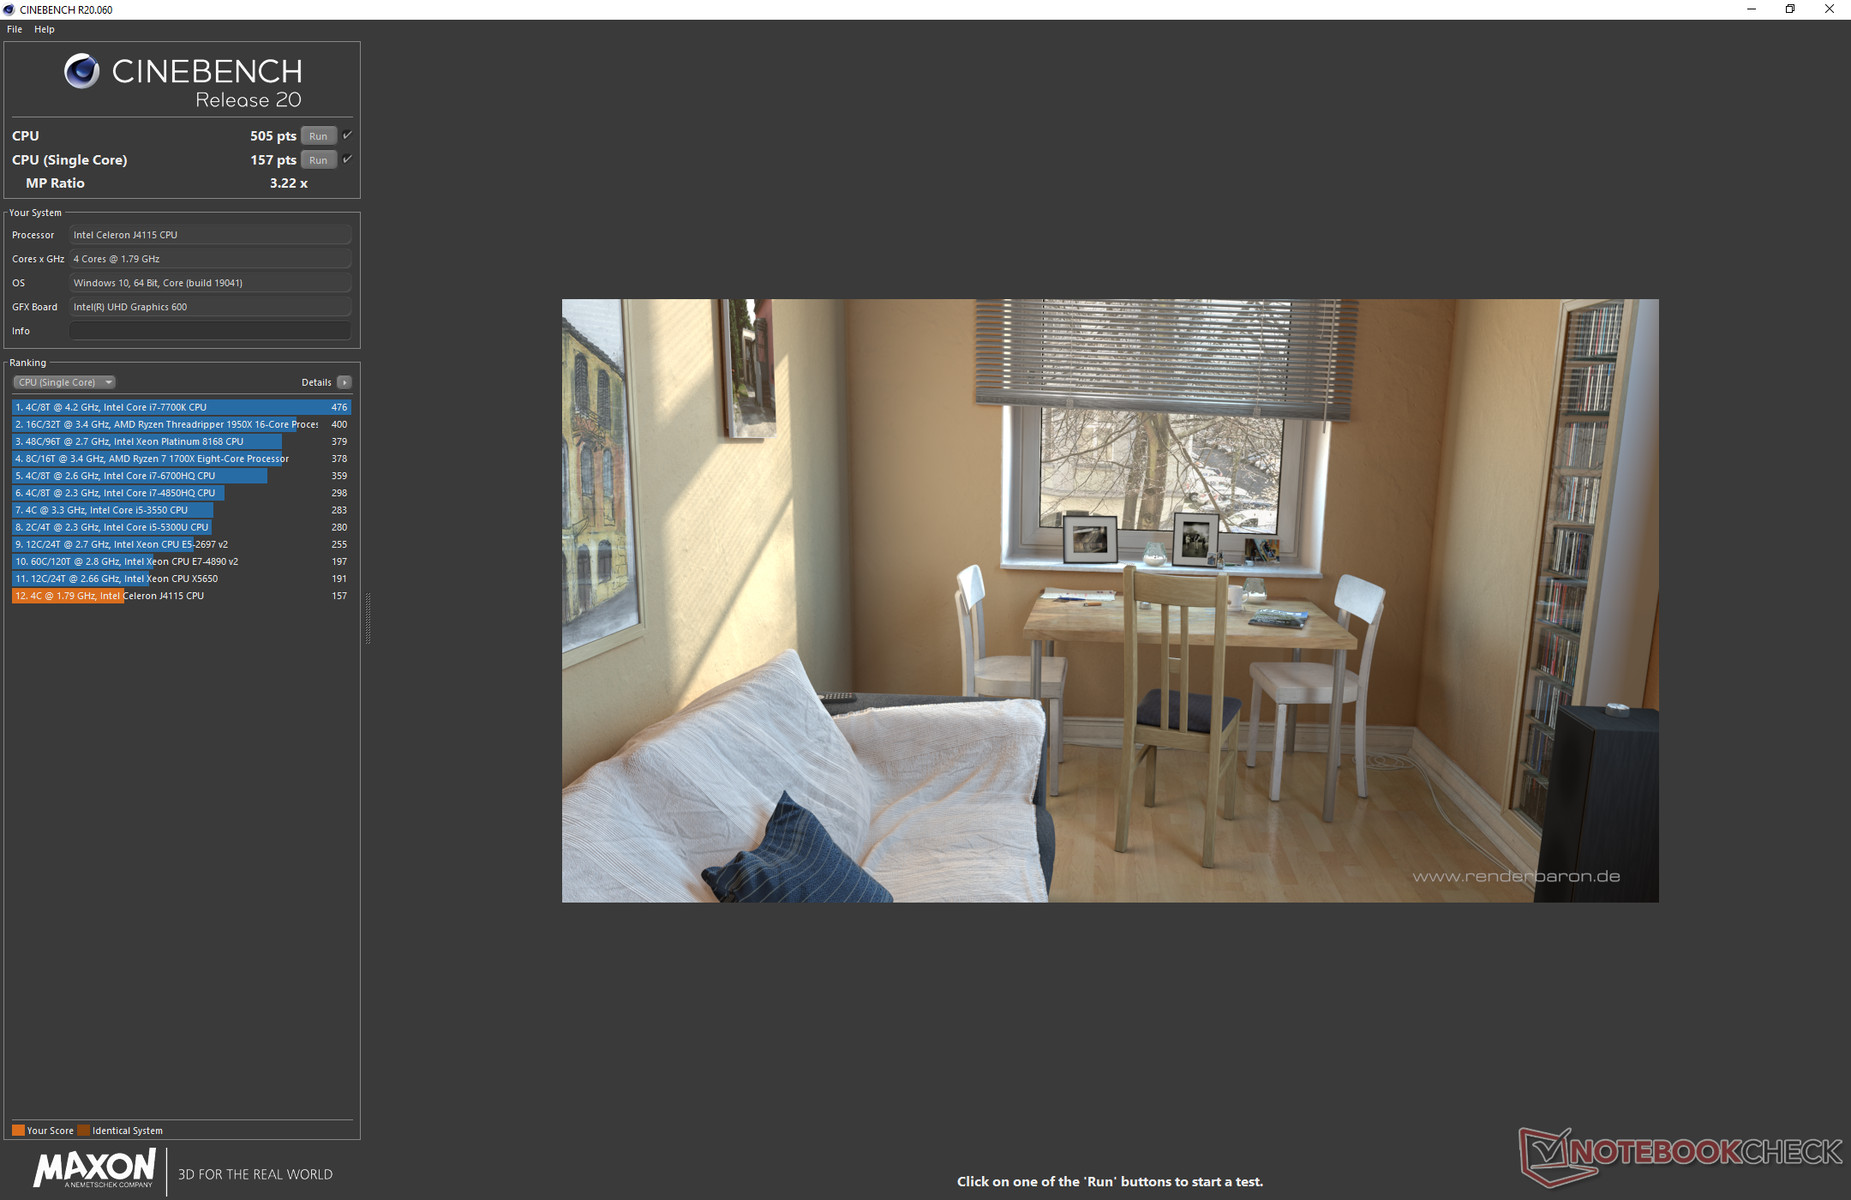
| Cinebench R20 / CPU (Multi Core) | |
| Lenovo IdeaPad 3 14IIL05 | |
| HP 17-by2437ng | |
| Dell Latitude 3400 | |
| Average Intel Celeron J4115 (503 - 590, n=2) | |
| Chuwi GemiBook CWI528 | |
| Chuwi Hi10 X | |
| Lenovo IdeaPad Flex 3 11IGL05 | |
| Chuwi LapBook Plus | |
| XIDU PhilBook Max | |
| Cinebench R20 / CPU (Single Core) | |
| HP 17-by2437ng | |
| Lenovo IdeaPad 3 14IIL05 | |
| Dell Latitude 3400 | |
| Lenovo IdeaPad Flex 3 11IGL05 | |
| Chuwi GemiBook CWI528 | |
| Average Intel Celeron J4115 (156 - 157, n=2) | |
| Chuwi Hi10 X | |
| XIDU PhilBook Max | |
| Chuwi LapBook Plus | |
| Cinebench R15 / CPU Multi 64Bit | |
| Lenovo IdeaPad 3 14IIL05 | |
| Dell Latitude 3400 | |
| HP 17-by2437ng | |
| Average Intel Celeron J4115 (225 - 263, n=2) | |
| Chuwi GemiBook CWI528 | |
| Chuwi Hi10 X | |
| Lenovo IdeaPad Flex 3 11IGL05 | |
| Chuwi LapBook Plus | |
| XIDU PhilBook Max | |
| Cinebench R15 / CPU Single 64Bit | |
| HP 17-by2437ng | |
| Lenovo IdeaPad 3 14IIL05 | |
| Dell Latitude 3400 | |
| Lenovo IdeaPad Flex 3 11IGL05 | |
| Average Intel Celeron J4115 (70.1 - 71.1, n=2) | |
| Chuwi GemiBook CWI528 | |
| Chuwi Hi10 X | |
| XIDU PhilBook Max | |
| Chuwi LapBook Plus | |
| Blender / v2.79 BMW27 CPU | |
| XIDU PhilBook Max | |
| Chuwi LapBook Plus | |
| Lenovo IdeaPad Flex 3 11IGL05 | |
| Chuwi Hi10 X | |
| Chuwi GemiBook CWI528 | |
| Average Intel Celeron J4115 (2380 - 2650, n=2) | |
| HP 17-by2437ng | |
| Lenovo IdeaPad 3 14IIL05 | |
| 7-Zip 18.03 / 7z b 4 -mmt1 | |
| HP 17-by2437ng | |
| Lenovo IdeaPad 3 14IIL05 | |
| Lenovo IdeaPad Flex 3 11IGL05 | |
| Average Intel Celeron J4115 (2184 - 2215, n=2) | |
| Chuwi GemiBook CWI528 | |
| Chuwi Hi10 X | |
| XIDU PhilBook Max | |
| Chuwi LapBook Plus | |
| 7-Zip 18.03 / 7z b 4 | |
| Lenovo IdeaPad 3 14IIL05 | |
| HP 17-by2437ng | |
| Average Intel Celeron J4115 (7129 - 8098, n=2) | |
| Chuwi GemiBook CWI528 | |
| Chuwi Hi10 X | |
| Chuwi LapBook Plus | |
| Lenovo IdeaPad Flex 3 11IGL05 | |
| XIDU PhilBook Max | |
| Geekbench 5.5 / Single-Core | |
| Lenovo IdeaPad 3 14IIL05 | |
| HP 17-by2437ng | |
| Lenovo IdeaPad Flex 3 11IGL05 | |
| Chuwi GemiBook CWI528 | |
| Chuwi Hi10 X | |
| Average Intel Celeron J4115 (388 - 410, n=2) | |
| Geekbench 5.5 / Multi-Core | |
| Lenovo IdeaPad 3 14IIL05 | |
| HP 17-by2437ng | |
| Chuwi GemiBook CWI528 | |
| Average Intel Celeron J4115 (1410 - 1431, n=2) | |
| Chuwi Hi10 X | |
| Lenovo IdeaPad Flex 3 11IGL05 | |
| HWBOT x265 Benchmark v2.2 / 4k Preset | |
| Lenovo IdeaPad 3 14IIL05 | |
| HP 17-by2437ng | |
| Average Intel Celeron J4115 (1.34 - 1.49, n=2) | |
| Chuwi GemiBook CWI528 | |
| Chuwi Hi10 X | |
| Chuwi LapBook Plus | |
| Lenovo IdeaPad Flex 3 11IGL05 | |
| XIDU PhilBook Max | |
| LibreOffice / 20 Documents To PDF | |
| Chuwi Hi10 X | |
| Average Intel Celeron J4115 (134 - 150, n=2) | |
| Lenovo IdeaPad Flex 3 11IGL05 | |
| Chuwi GemiBook CWI528 | |
| HP 17-by2437ng | |
| Lenovo IdeaPad 3 14IIL05 | |
| R Benchmark 2.5 / Overall mean | |
| Chuwi Hi10 X | |
| Chuwi GemiBook CWI528 | |
| Average Intel Celeron J4115 (n=1) | |
| Lenovo IdeaPad Flex 3 11IGL05 | |
| Lenovo IdeaPad 3 14IIL05 | |
| HP 17-by2437ng | |
* ... smaller is better
System Performance
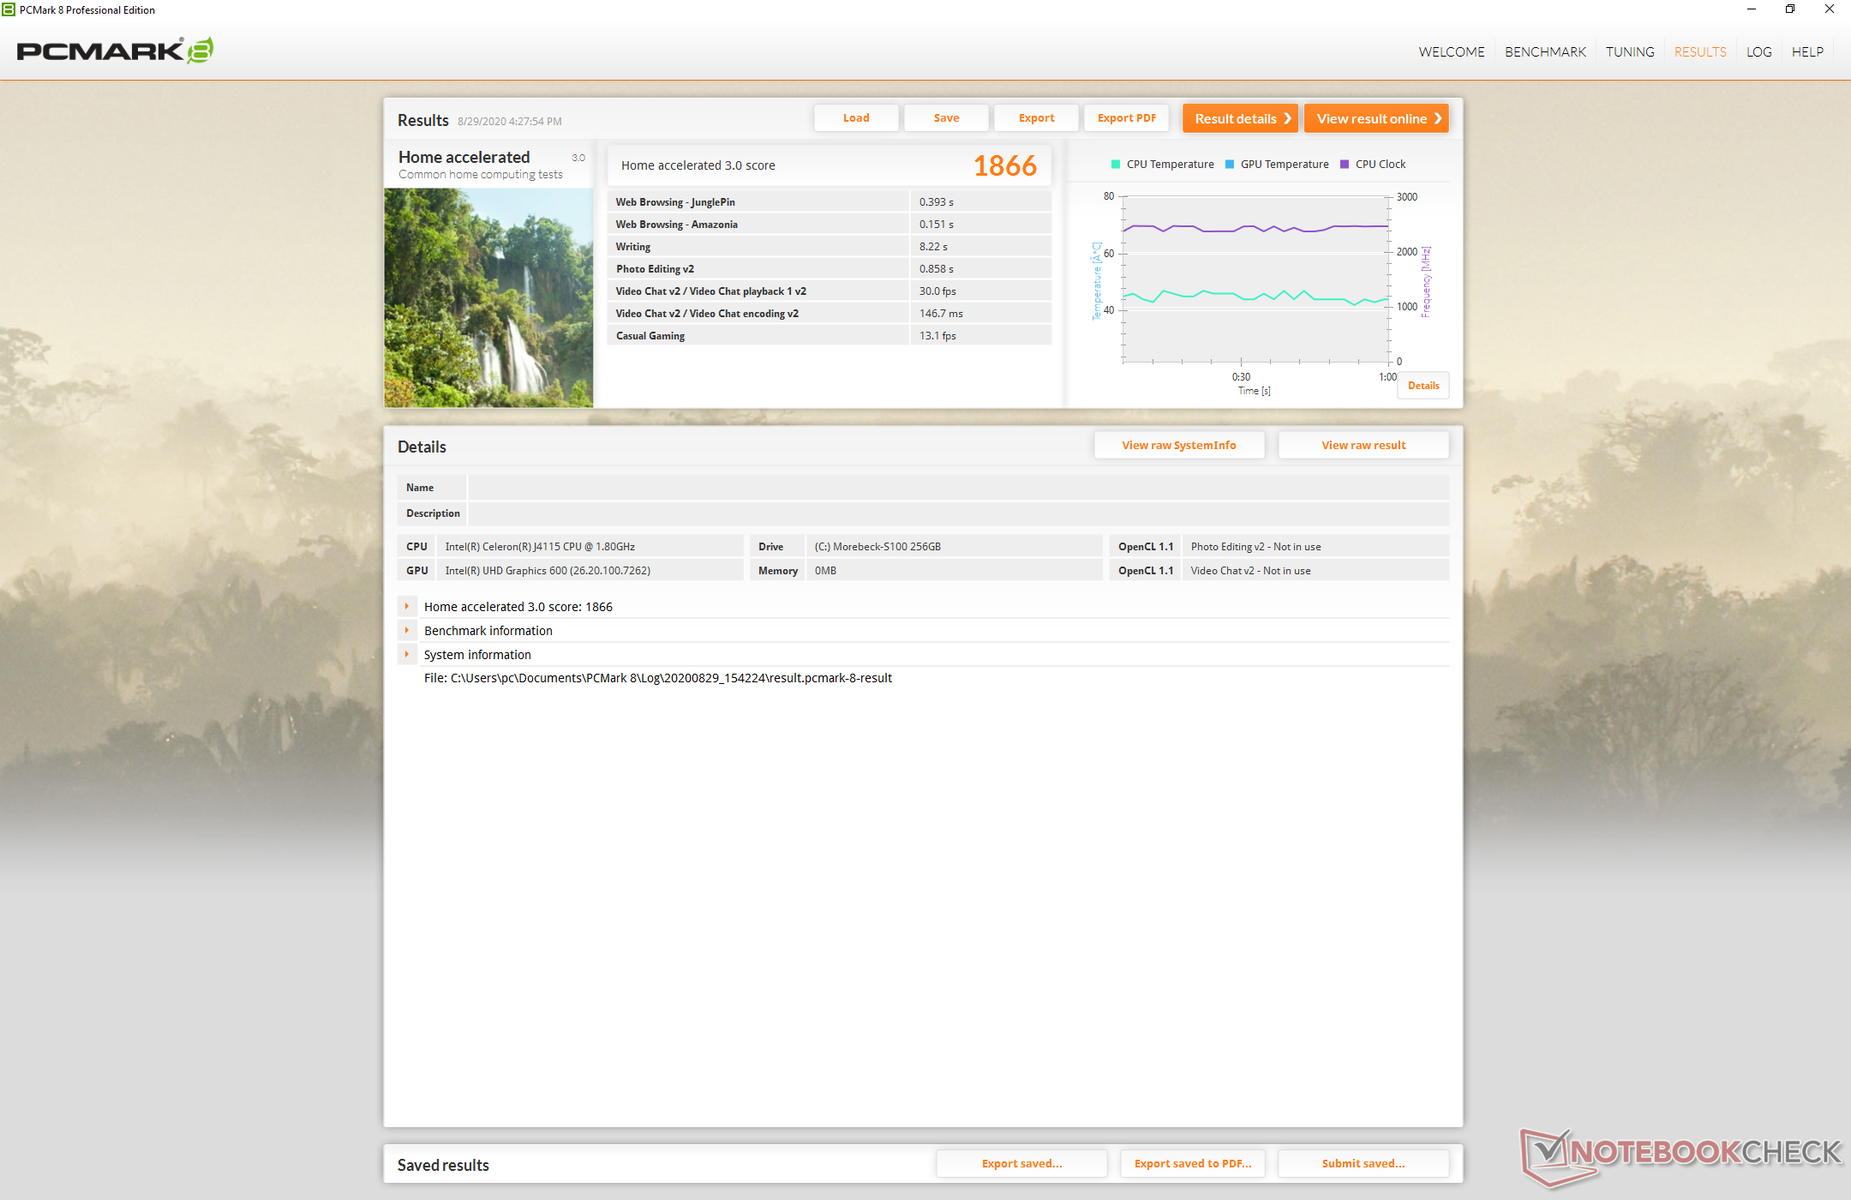
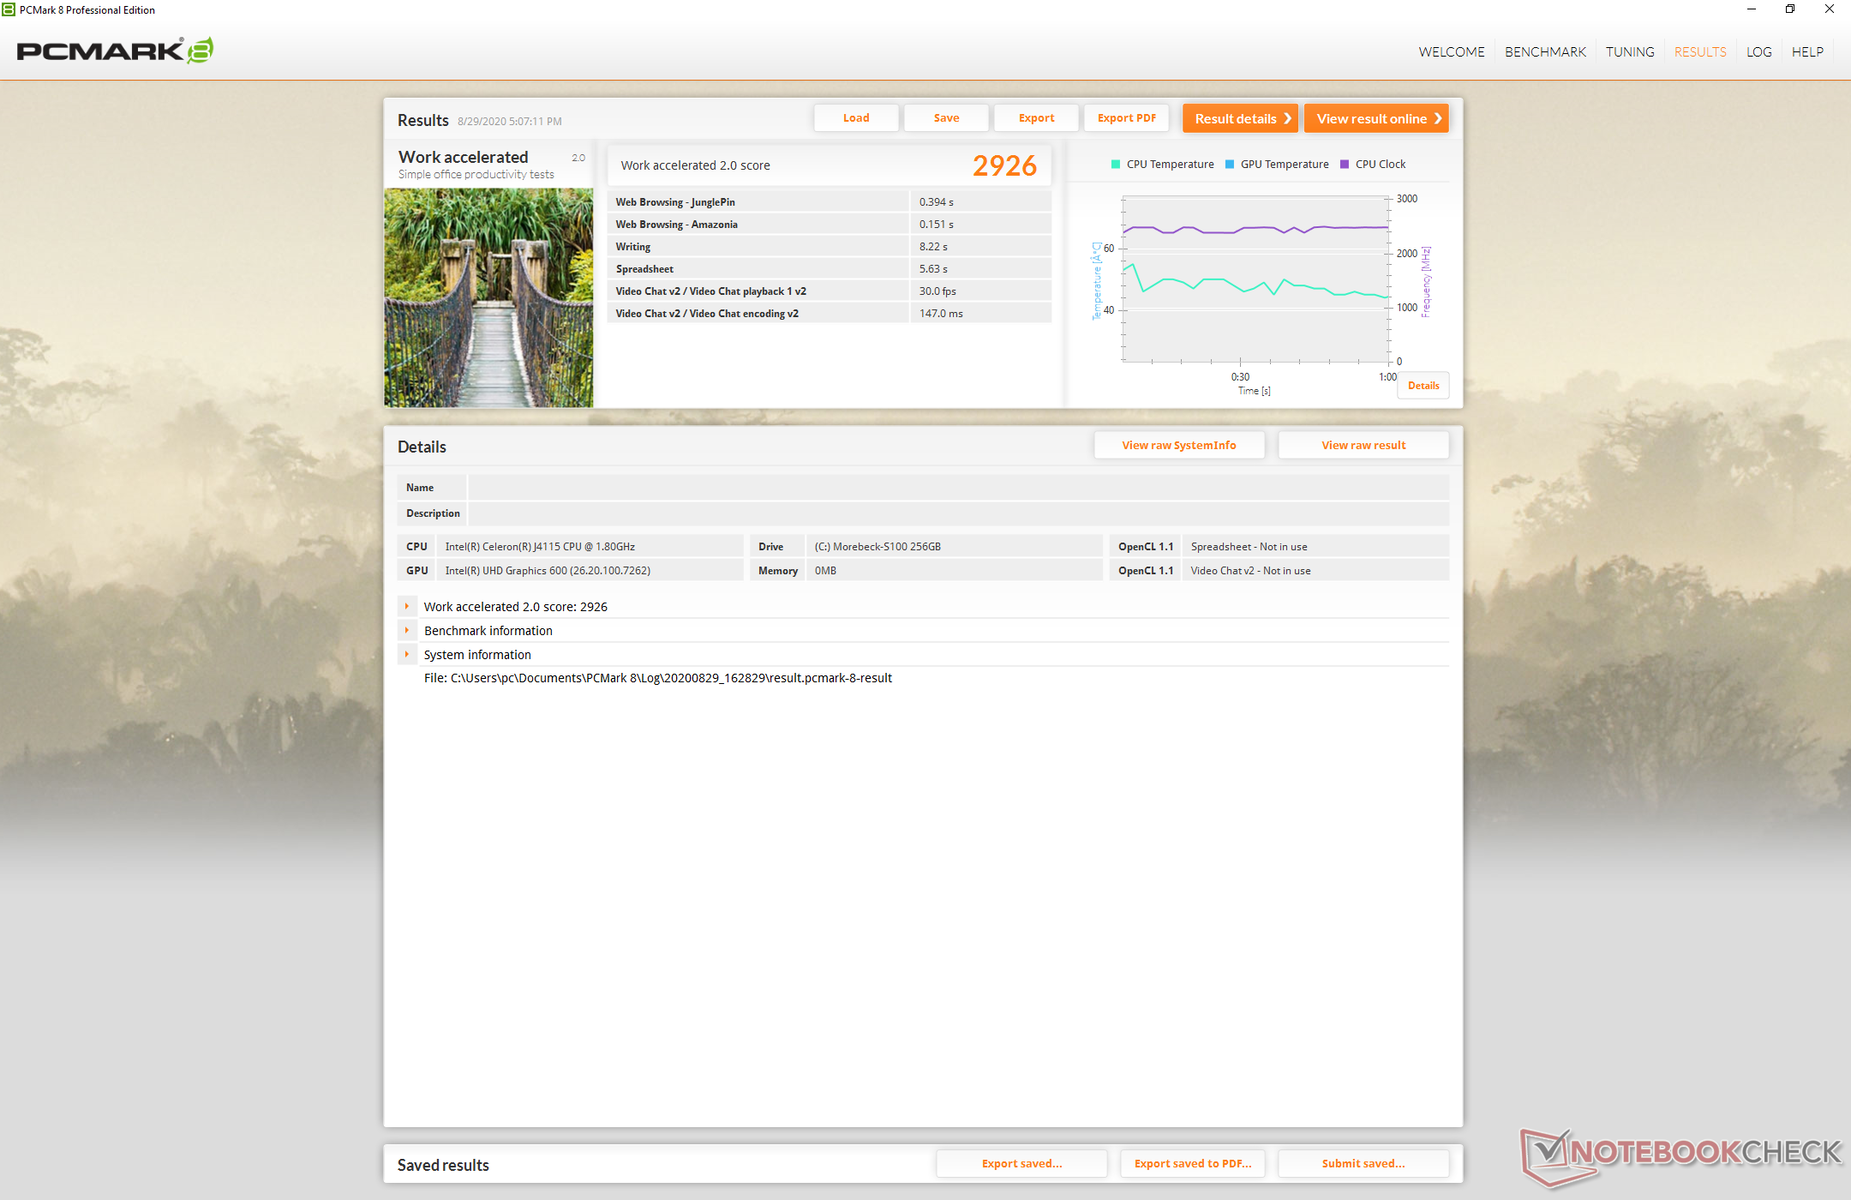
PCMark benchmarks are significantly lower than even an old Ultrabook running on an 8th gen Core i5-8250U. Subjectively, programs are slow to launch and multi-tasking between windows isn't nearly as snappy.
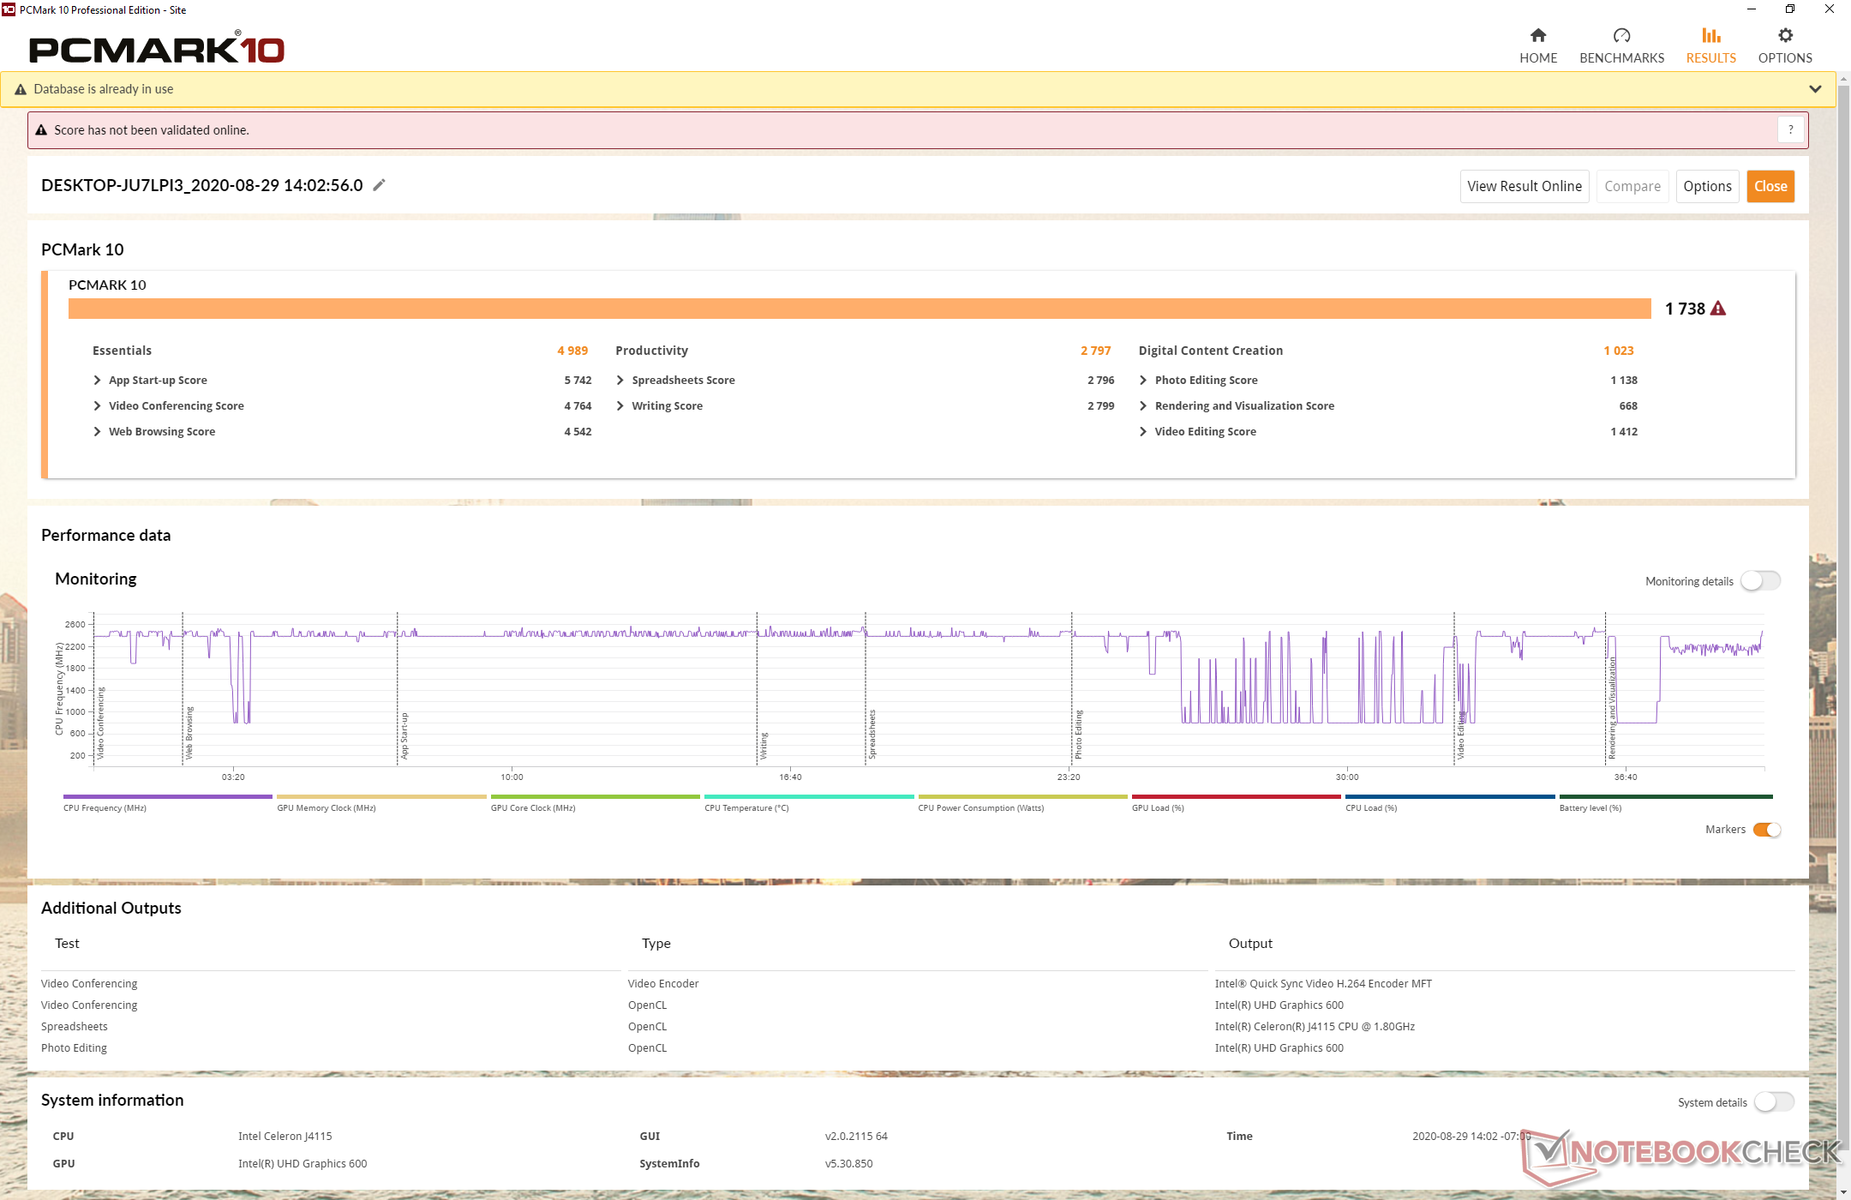
| PCMark 10 | |
| Score | |
| HP Envy 13-aq0003ng | |
| Tuxedo Book BU1307 | |
| Apple MacBook Air 2020 i3 | |
| Chuwi GemiBook CWI528 | |
| LincPlus P1 | |
| Jumper EZbook X3 | |
| Essentials | |
| HP Envy 13-aq0003ng | |
| Tuxedo Book BU1307 | |
| Apple MacBook Air 2020 i3 | |
| Chuwi GemiBook CWI528 | |
| LincPlus P1 | |
| Jumper EZbook X3 | |
| Productivity | |
| HP Envy 13-aq0003ng | |
| Tuxedo Book BU1307 | |
| Apple MacBook Air 2020 i3 | |
| Chuwi GemiBook CWI528 | |
| LincPlus P1 | |
| Jumper EZbook X3 | |
| Digital Content Creation | |
| HP Envy 13-aq0003ng | |
| Tuxedo Book BU1307 | |
| Apple MacBook Air 2020 i3 | |
| Chuwi GemiBook CWI528 | |
| LincPlus P1 | |
| Jumper EZbook X3 | |
| PCMark 8 | |
| Home Score Accelerated v2 | |
| Tuxedo Book BU1307 | |
| HP Envy 13-aq0003ng | |
| Apple MacBook Air 2020 i3 | |
| Chuwi GemiBook CWI528 | |
| Work Score Accelerated v2 | |
| HP Envy 13-aq0003ng | |
| Chuwi GemiBook CWI528 | |
| PCMark 8 Home Score Accelerated v2 | 1866 points | |
| PCMark 8 Work Score Accelerated v2 | 2926 points | |
| PCMark 10 Score | 1738 points | |
Help | ||
DPC Latency
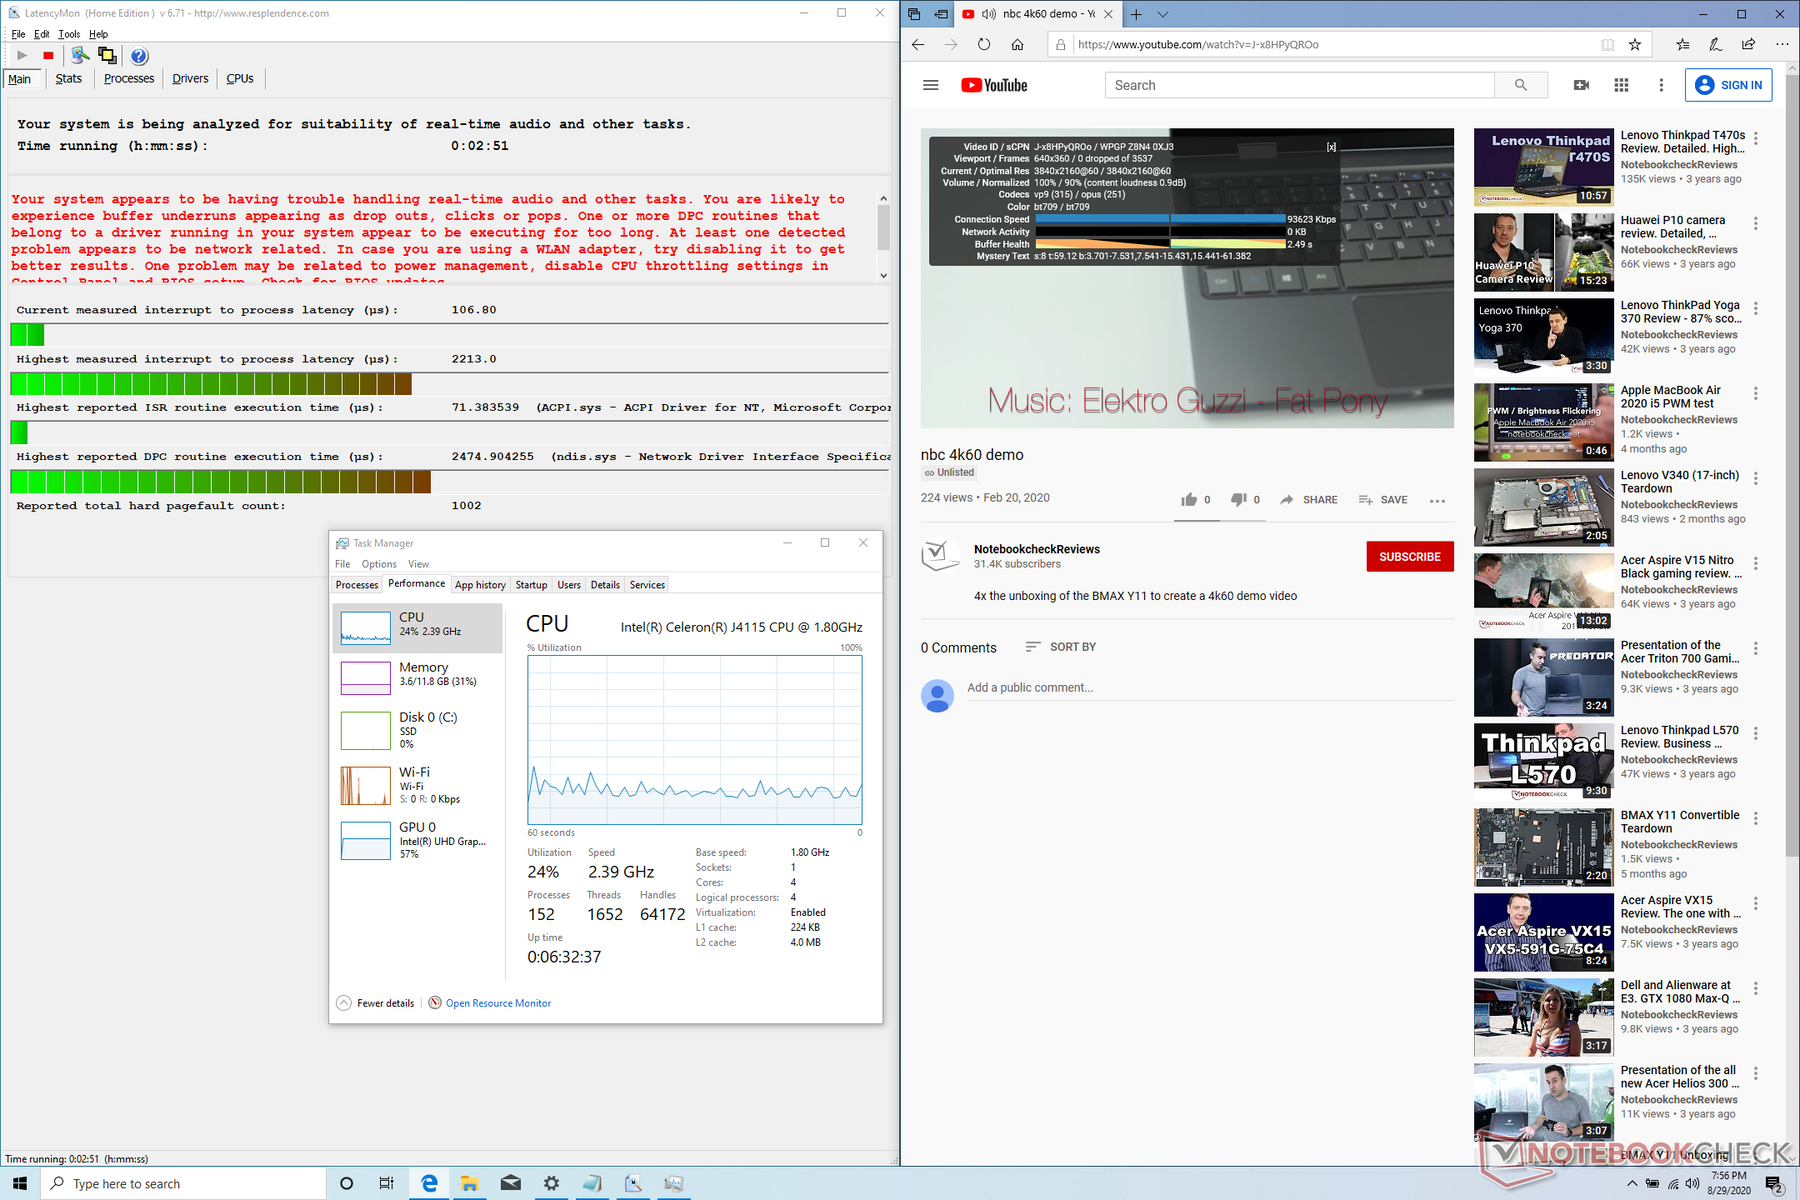
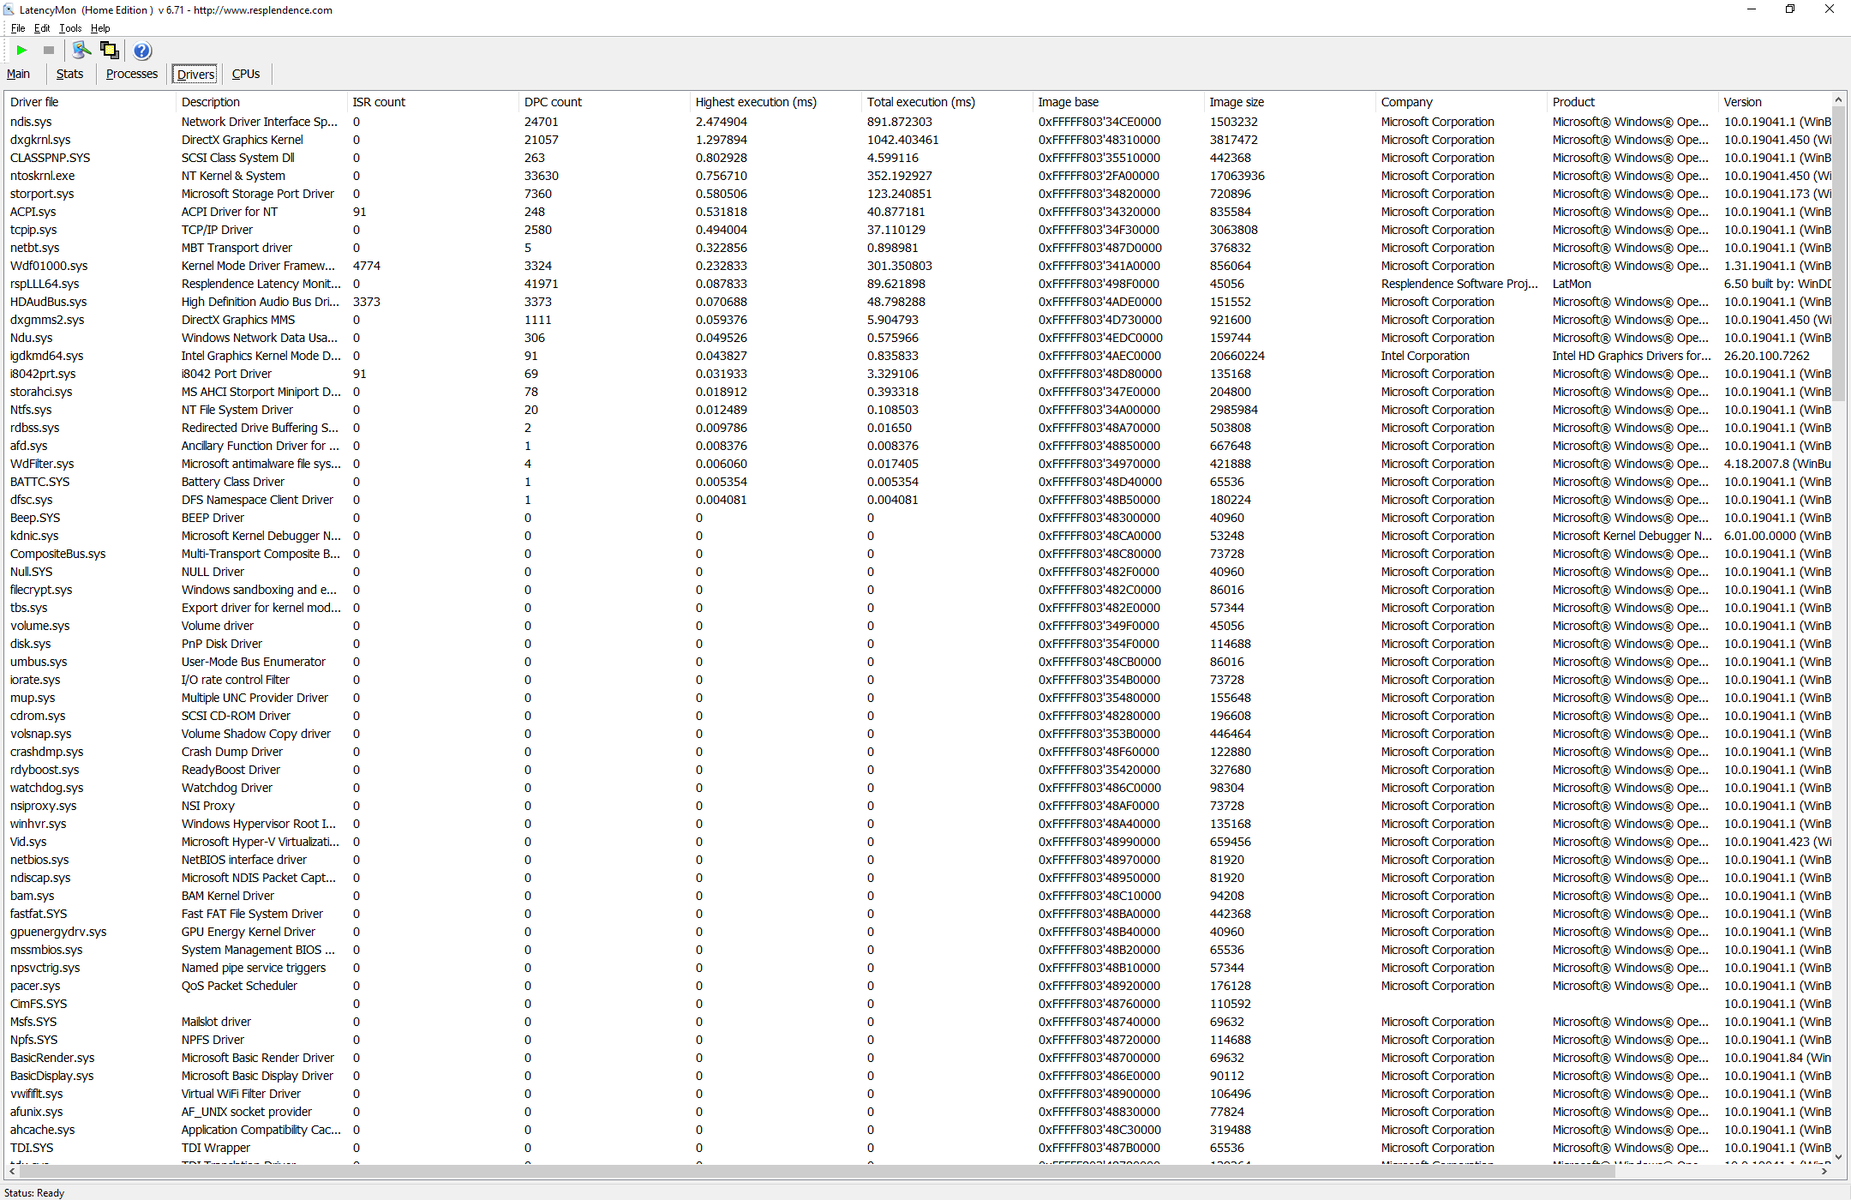
LatencyMon shows DPC latency issues related to ndis.sys while opening multiple tabs on our homepage. 4K UHD video playback at 60 FPS is otherwise smooth and with no dropped frames.
| DPC Latencies / LatencyMon - interrupt to process latency (max), Web, Youtube, Prime95 | |
| HP 17-by2437ng | |
| Lenovo IdeaPad Flex 3 11IGL05 | |
| Chuwi GemiBook CWI528 | |
| Asus ZenBook 13 UX325JA | |
| Chuwi Hi10 X | |
| Samsung Galaxy Book S Intel | |
| Samsung Galaxy Book Ion 13.3 | |
| Acer Swift 3 SF314-42-R27B | |
| Lenovo ThinkPad X1 Carbon 2020-20UAS04T00 | |
| Chuwi LarkBox 4K Mini PC | |
| Lenovo IdeaPad 3 14IIL05 | |
* ... smaller is better
Storage Devices
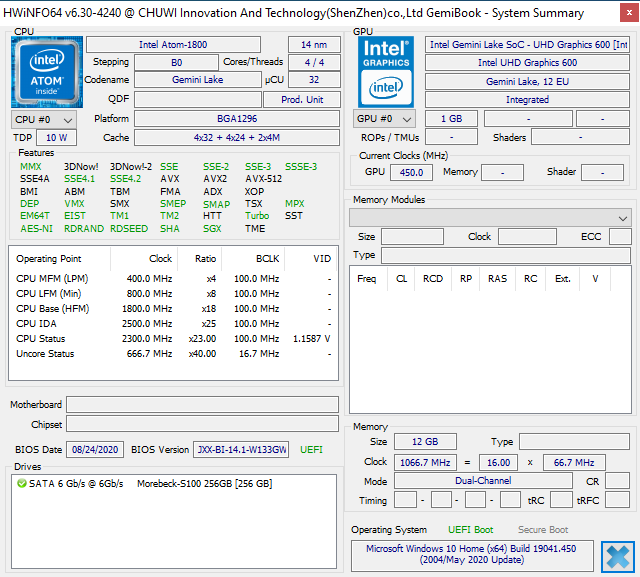
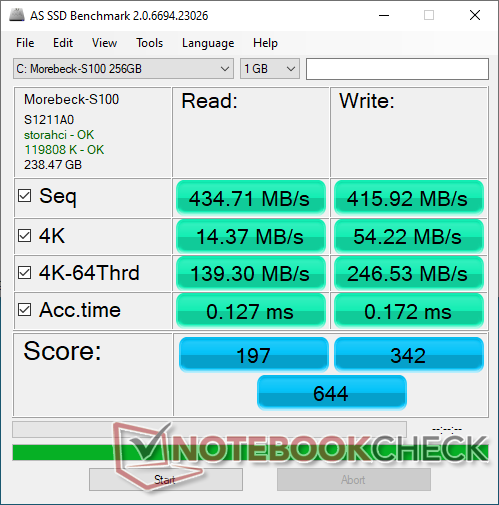
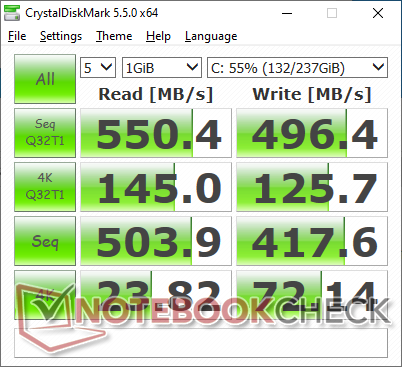
Our unit comes with the uncommon 256 GB Morebeck-S100 M.2 2280 SATA III SSD. Sequential read and write rates are respectable at well over 400 MB/s, but almost any NVMe drive will handily outperform it.
| Chuwi GemiBook CWI528 Morebeck-S100 256GB | LincPlus P1 64 GB eMMC Flash | Jumper EZbook X3 64 GB eMMC Flash | Apple MacBook Air 2020 i3 Apple SSD AP0256 | HP Envy 13-aq0003ng Toshiba KBG30ZMV512G | Tuxedo Book BU1307 Samsung SSD 970 EVO 250GB | |
|---|---|---|---|---|---|---|
| AS SSD | -88% | -81% | 89% | 107% | 18% | |
| Seq Read (MB/s) | 434.7 | 236.1 -46% | 246.2 -43% | 1135 161% | 1295 198% | 2406 453% |
| Seq Write (MB/s) | 415.9 | 151.4 -64% | 155.8 -63% | 1090 162% | 593 43% | 435.1 5% |
| 4K Read (MB/s) | 14.37 | 19.26 34% | 18.41 28% | 14.87 3% | 45.58 217% | 50.2 249% |
| 4K Write (MB/s) | 54.2 | 23.21 -57% | 22 -59% | 26.27 -52% | 118.8 119% | 1.45 -97% |
| 4K-64 Read (MB/s) | 139.3 | 21.08 -85% | 22.45 -84% | 585 320% | 604 334% | 818 487% |
| 4K-64 Write (MB/s) | 246.5 | 23.41 -91% | 22.73 -91% | 154.6 -37% | 272.4 11% | 145.6 -41% |
| Access Time Read * (ms) | 0.127 | 0.23 -81% | 0.246 -94% | 0.126 1% | 0.147 -16% | 0.047 63% |
| Access Time Write * (ms) | 0.172 | 0.774 -350% | 0.621 -261% | 0.058 66% | 0.168 2% | 2.784 -1519% |
| Score Read (Points) | 197 | 64 -68% | 65 -67% | 713 262% | 779 295% | 1108 462% |
| Score Write (Points) | 342 | 62 -82% | 60 -82% | 290 -15% | 450 32% | 191 -44% |
| Score Total (Points) | 644 | 163 -75% | 163 -75% | 1365 112% | 1607 150% | 1780 176% |
| Copy ISO MB/s (MB/s) | 448.9 | 593 32% | ||||
| Copy Program MB/s (MB/s) | 165.3 | 277.6 68% | ||||
| Copy Game MB/s (MB/s) | 413 | 452.7 10% | ||||
| CrystalDiskMark 5.2 / 6 | -73% | -72% | 104% | 90% | 204% | |
| Write 4K (MB/s) | 72.1 | 20.32 -72% | 19.21 -73% | 34.57 -52% | 106.2 47% | 158.2 119% |
| Read 4K (MB/s) | 23.82 | 10.69 -55% | 7.435 -69% | 28.48 20% | 44.89 88% | 38.78 63% |
| Write Seq (MB/s) | 417.6 | 98.6 -76% | 138.8 -67% | 1026 146% | 639 53% | 1487 256% |
| Read Seq (MB/s) | 504 | 217.7 -57% | 219.8 -56% | 1109 120% | 849 68% | 913 81% |
| Write 4K Q32T1 (MB/s) | 125.7 | 23.81 -81% | 24.39 -81% | 178.4 42% | 217.4 73% | 330.5 163% |
| Read 4K Q32T1 (MB/s) | 145 | 21.84 -85% | 22.2 -85% | 557 284% | 322.1 122% | 423.8 192% |
| Write Seq Q32T1 (MB/s) | 496.4 | 79.6 -84% | 122.3 -75% | 970 95% | 865 74% | 1540 210% |
| Read Seq Q32T1 (MB/s) | 550 | 140.8 -74% | 147.6 -73% | 1513 175% | 1630 196% | 3556 547% |
| Total Average (Program / Settings) | -81% /
-82% | -77% /
-77% | 97% /
95% | 99% /
101% | 111% /
96% |
* ... smaller is better

Disk Throttling: DiskSpd Read Loop, Queue Depth 8
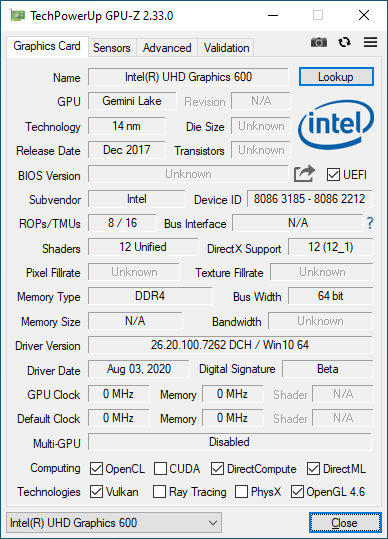
GPU Performance
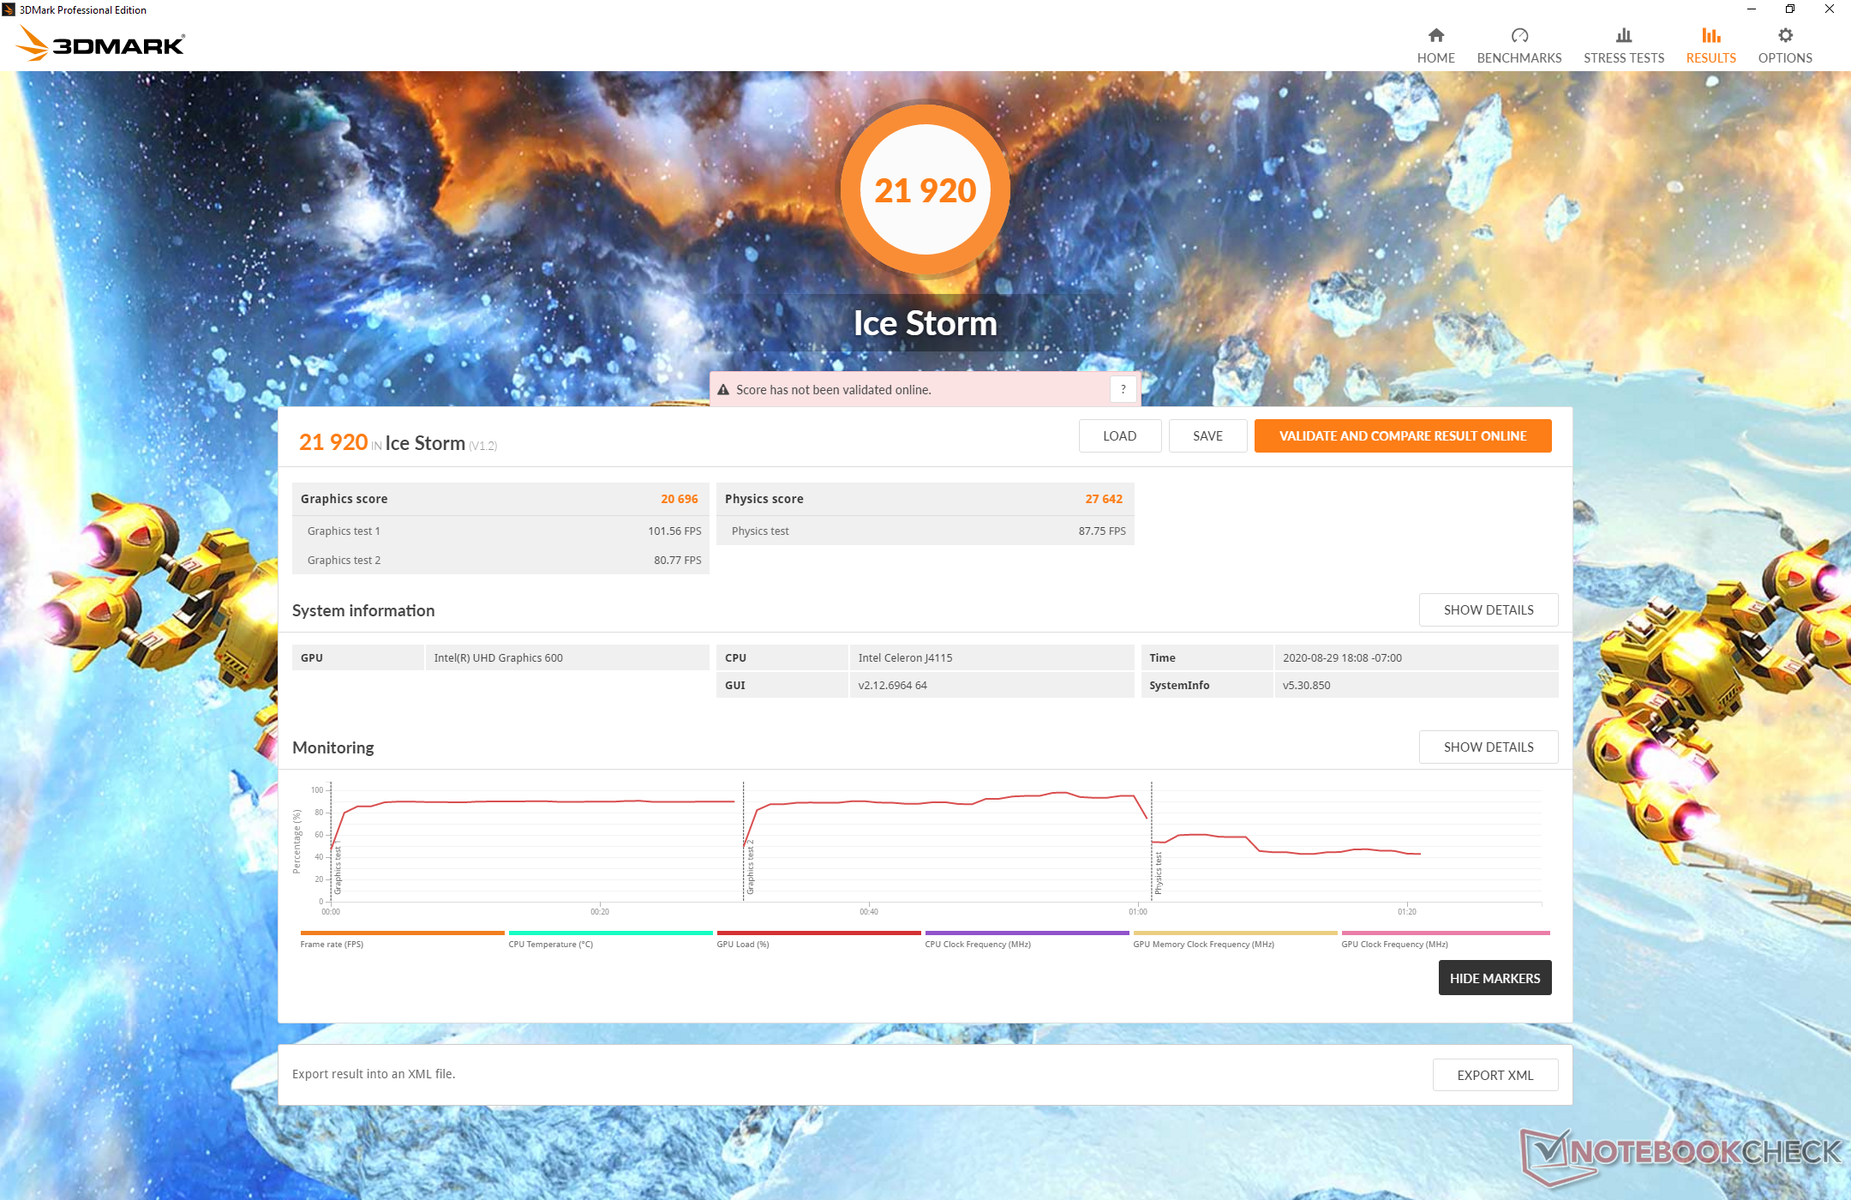
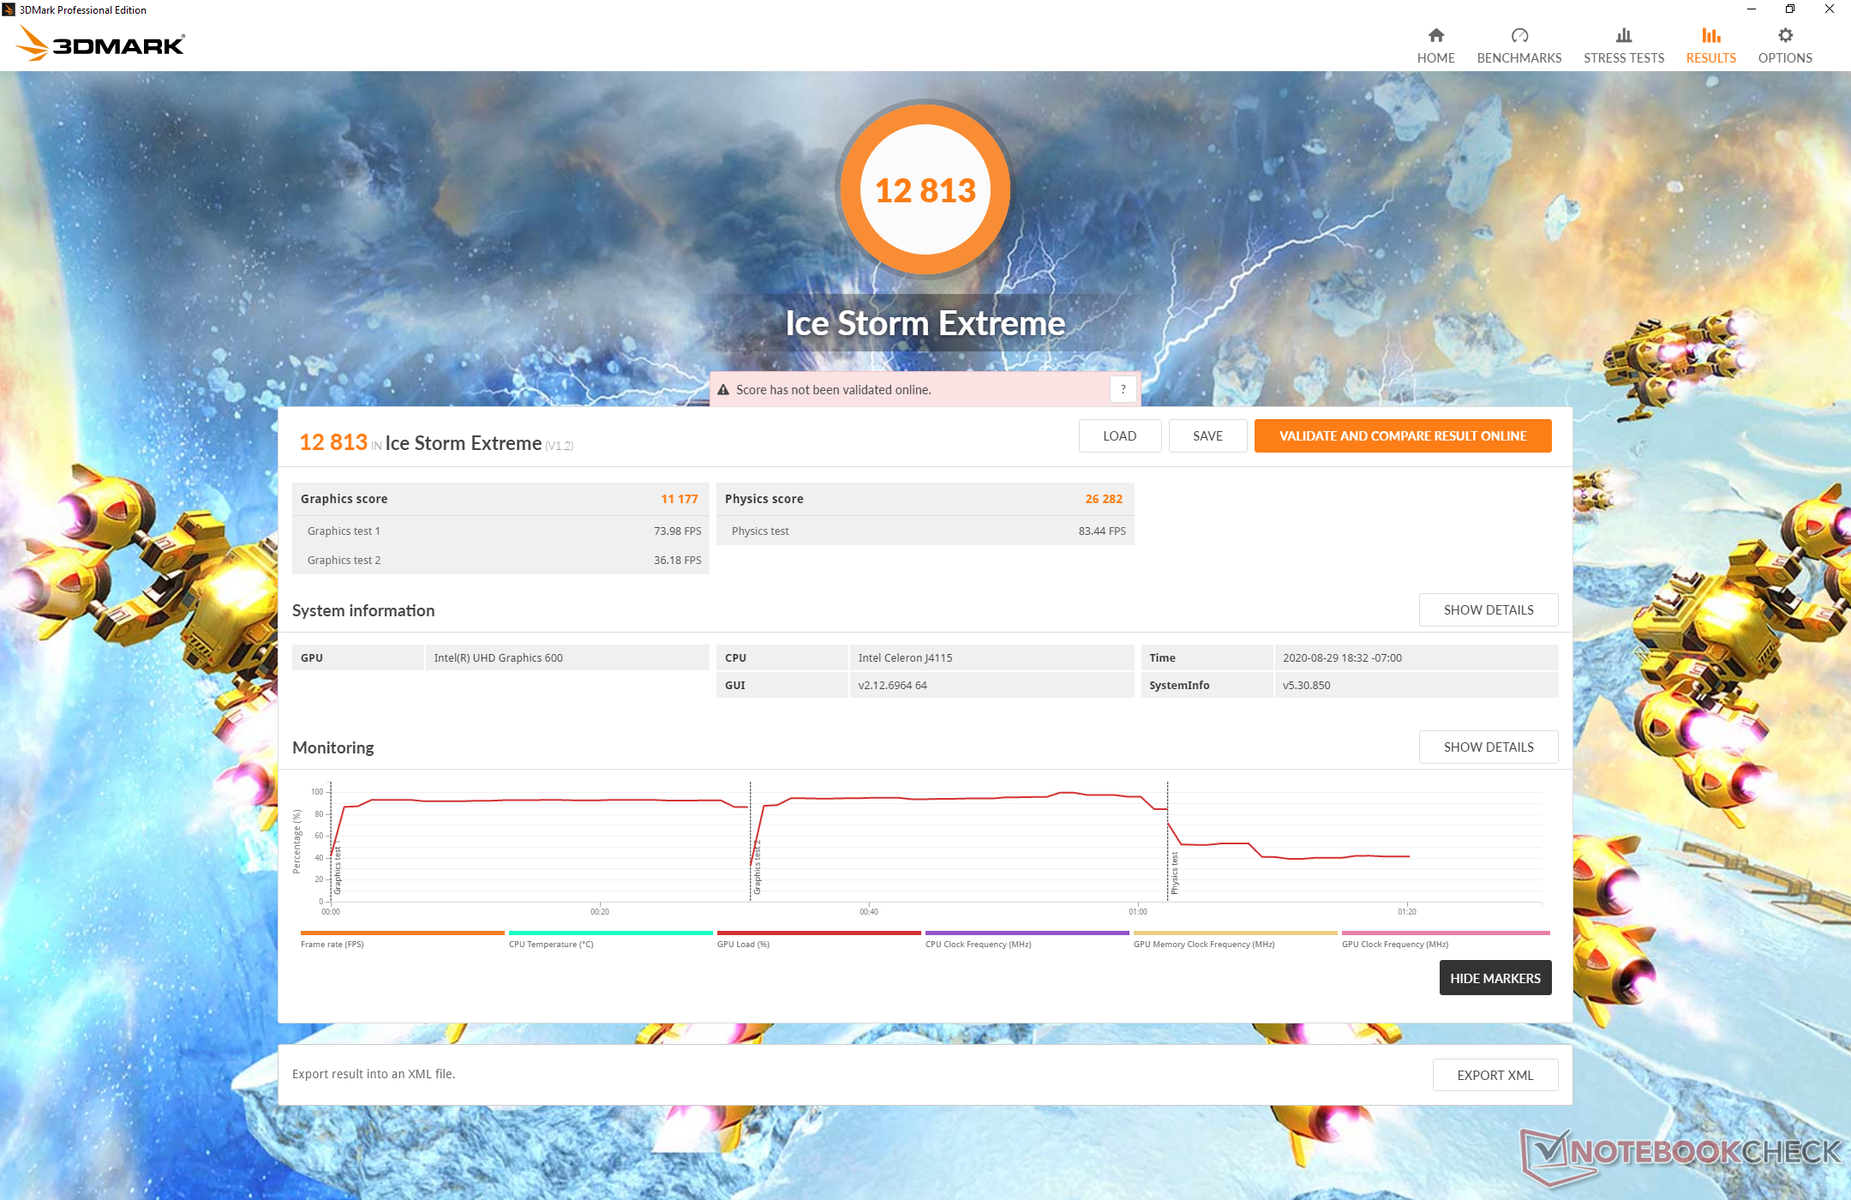
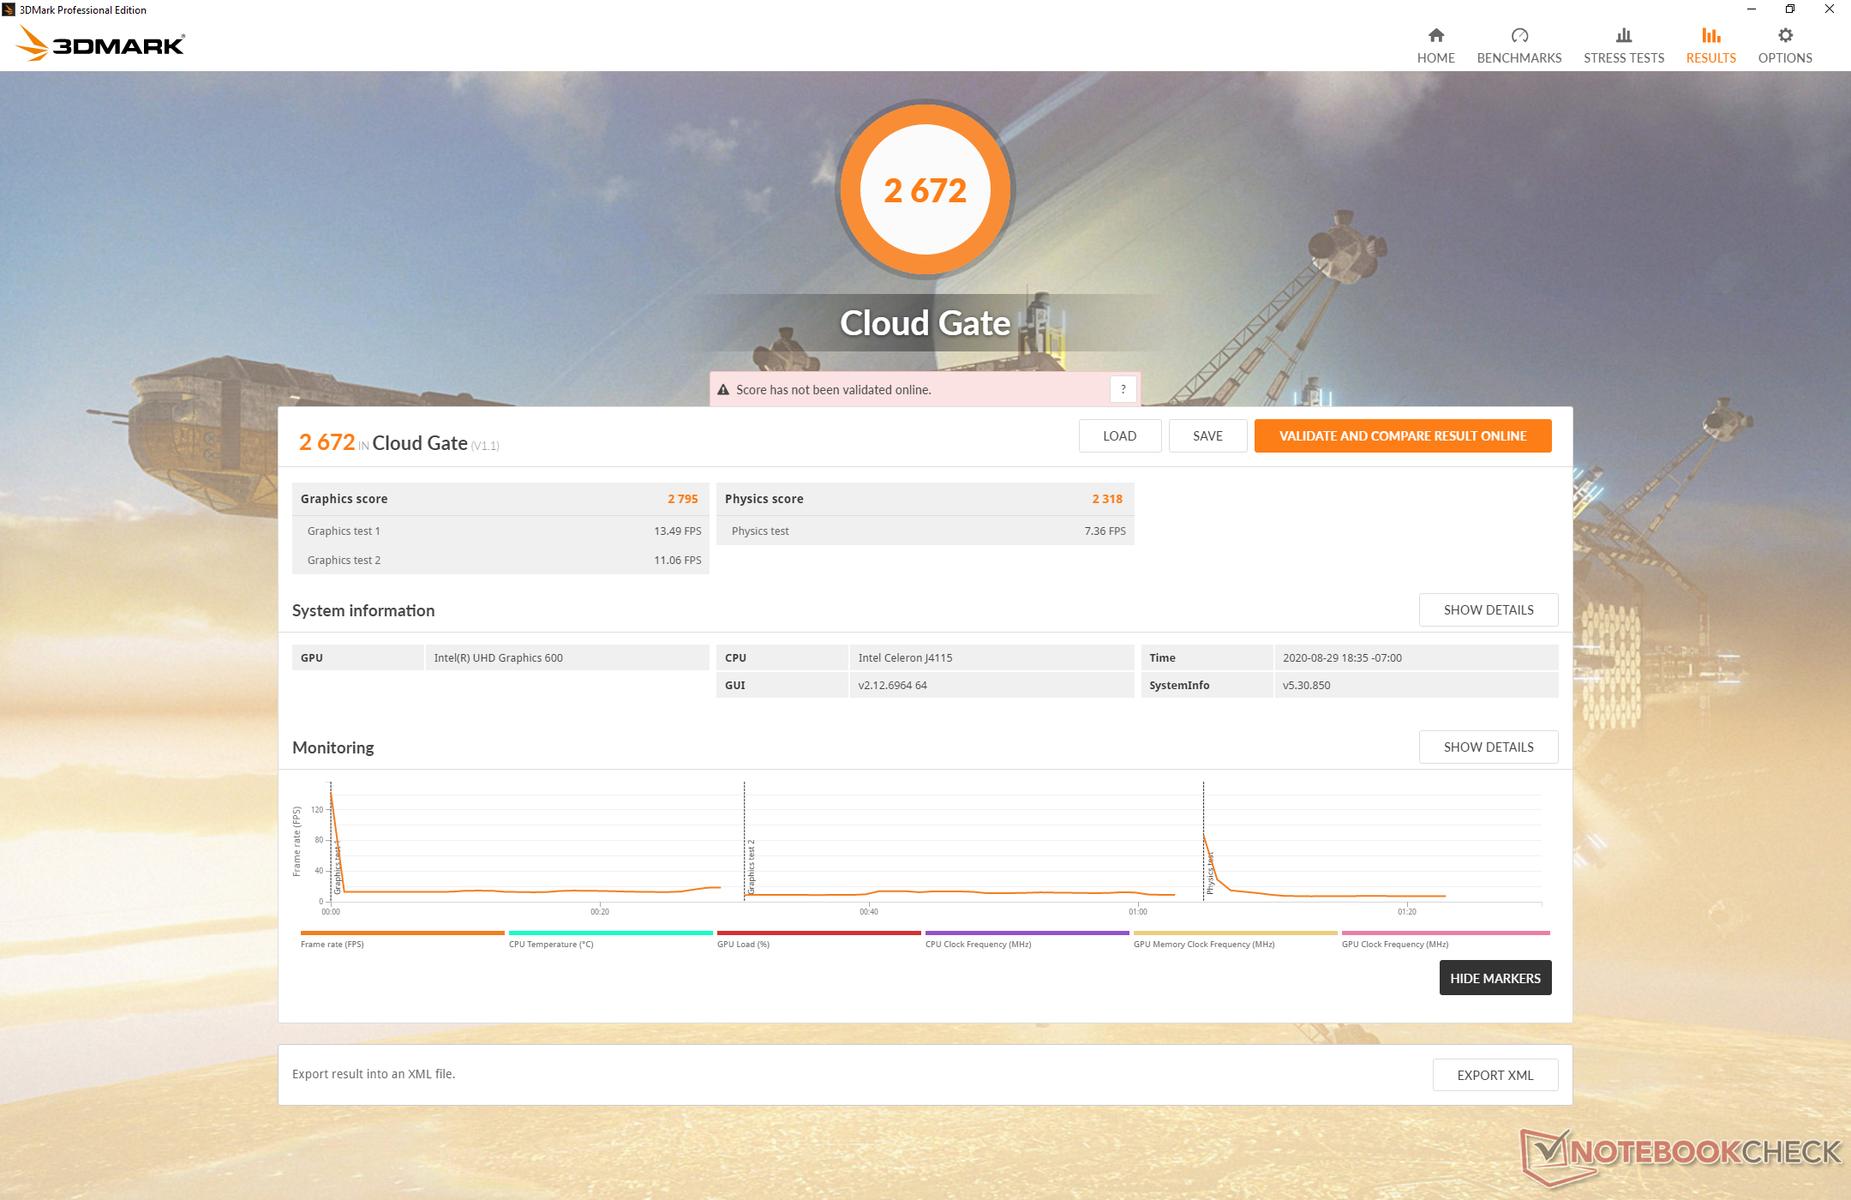
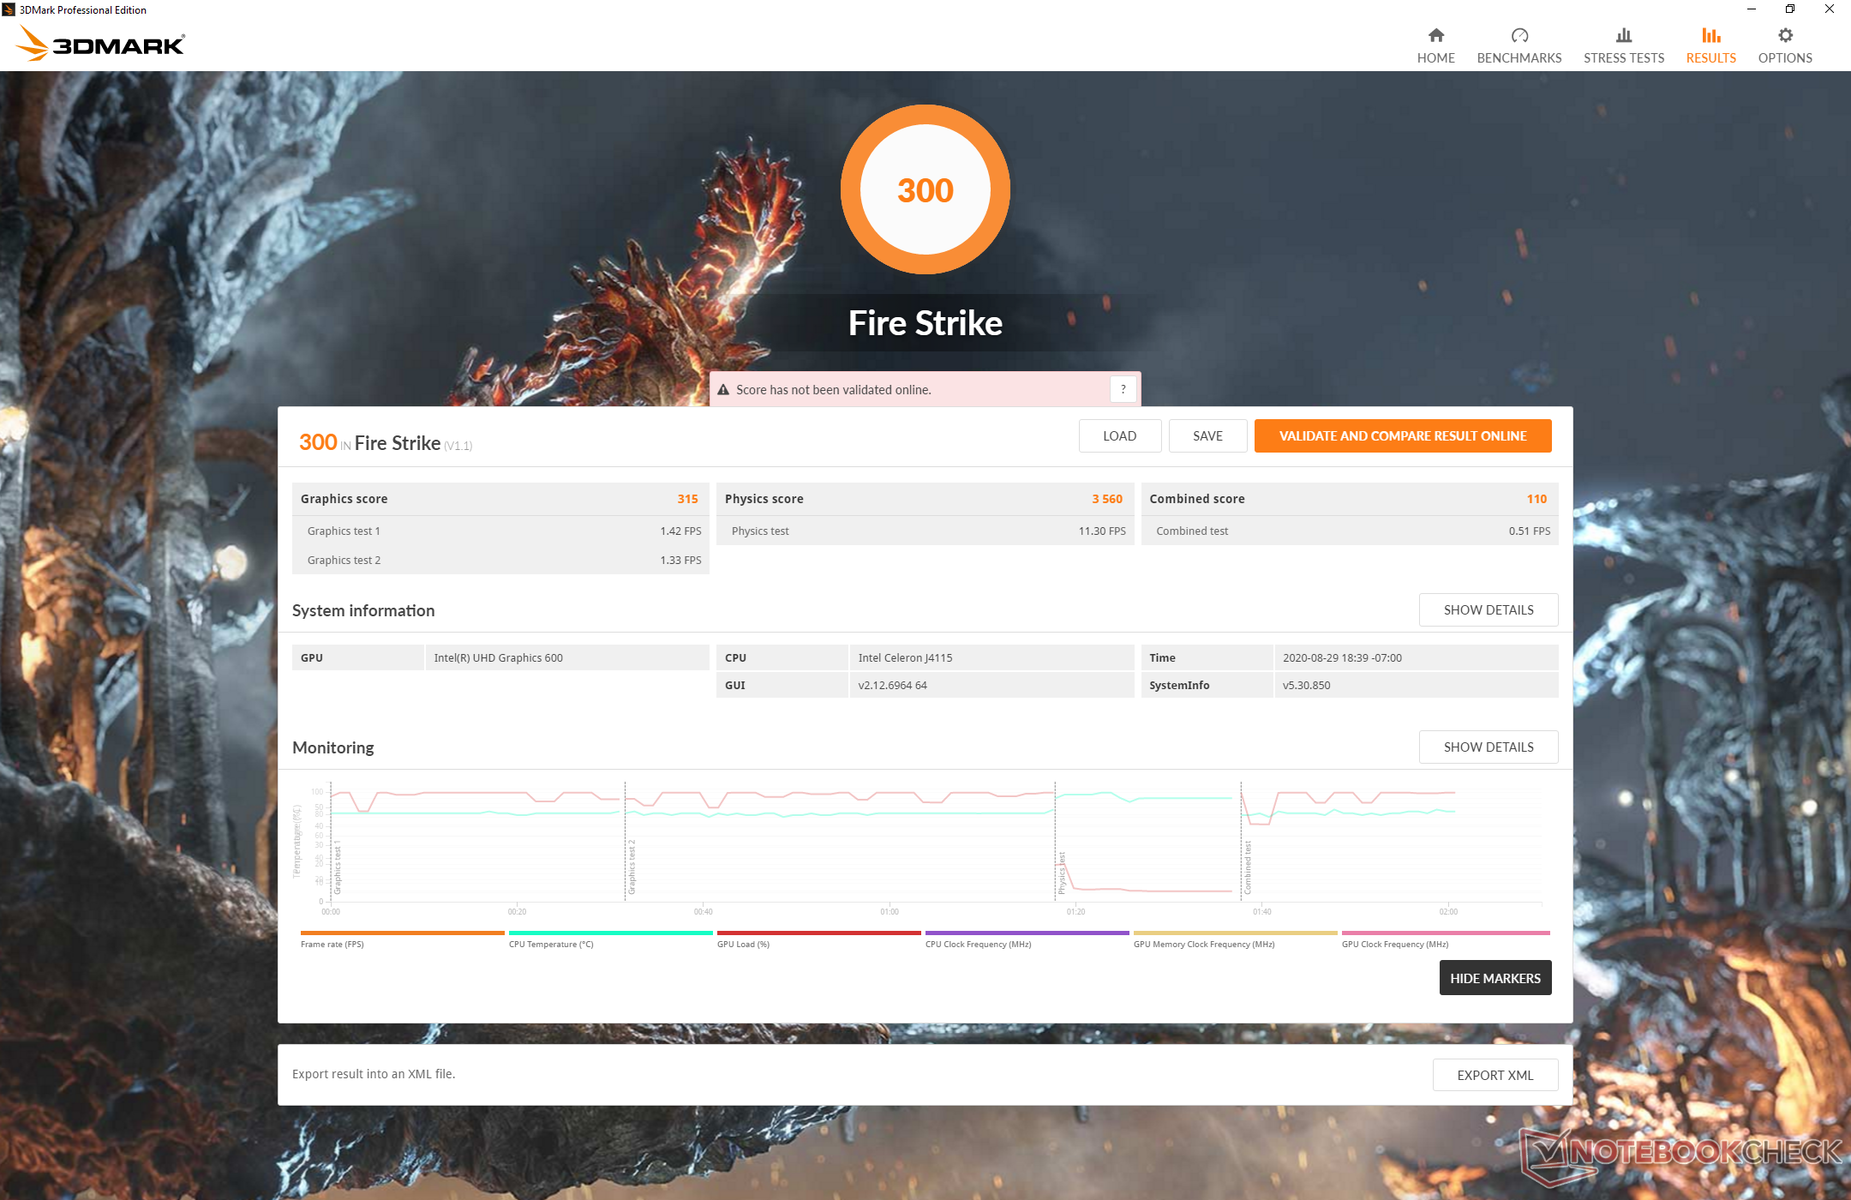
Graphics performance is about 15 to 20 percent slower than the average UHD Graphics 600 in our database or about 70 to 80 percent slower than the common UHD Graphics 620. This isn't a huge issue since the laptop was not built for any sort of gaming.
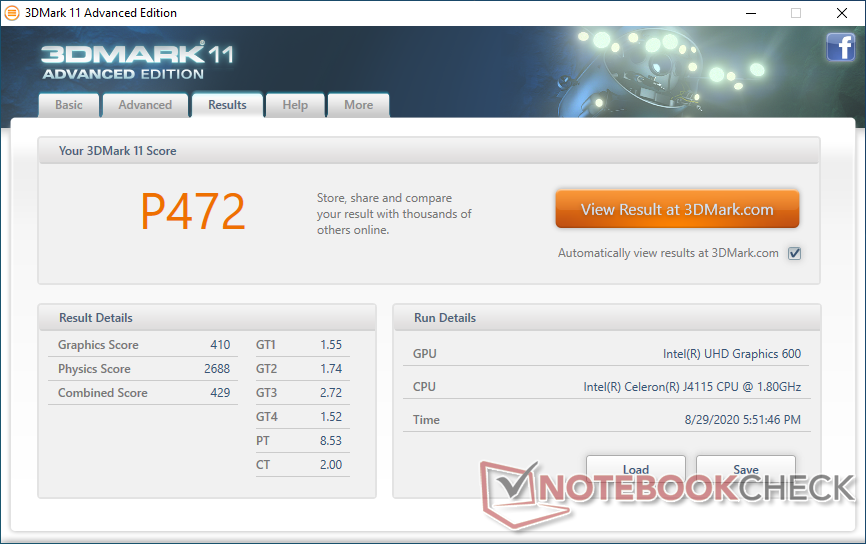
| 3DMark 11 Performance | 472 points | |
| 3DMark Ice Storm Standard Score | 21920 points | |
| 3DMark Cloud Gate Standard Score | 2672 points | |
| 3DMark Fire Strike Score | 300 points | |
Help | ||
| low | med. | high | ultra | |
|---|---|---|---|---|
| Dota 2 Reborn (2015) | 32.2 | 15.5 | 6 | 5.5 |
| X-Plane 11.11 (2018) | 6.15 | 4 | 3.63 |
Emissions
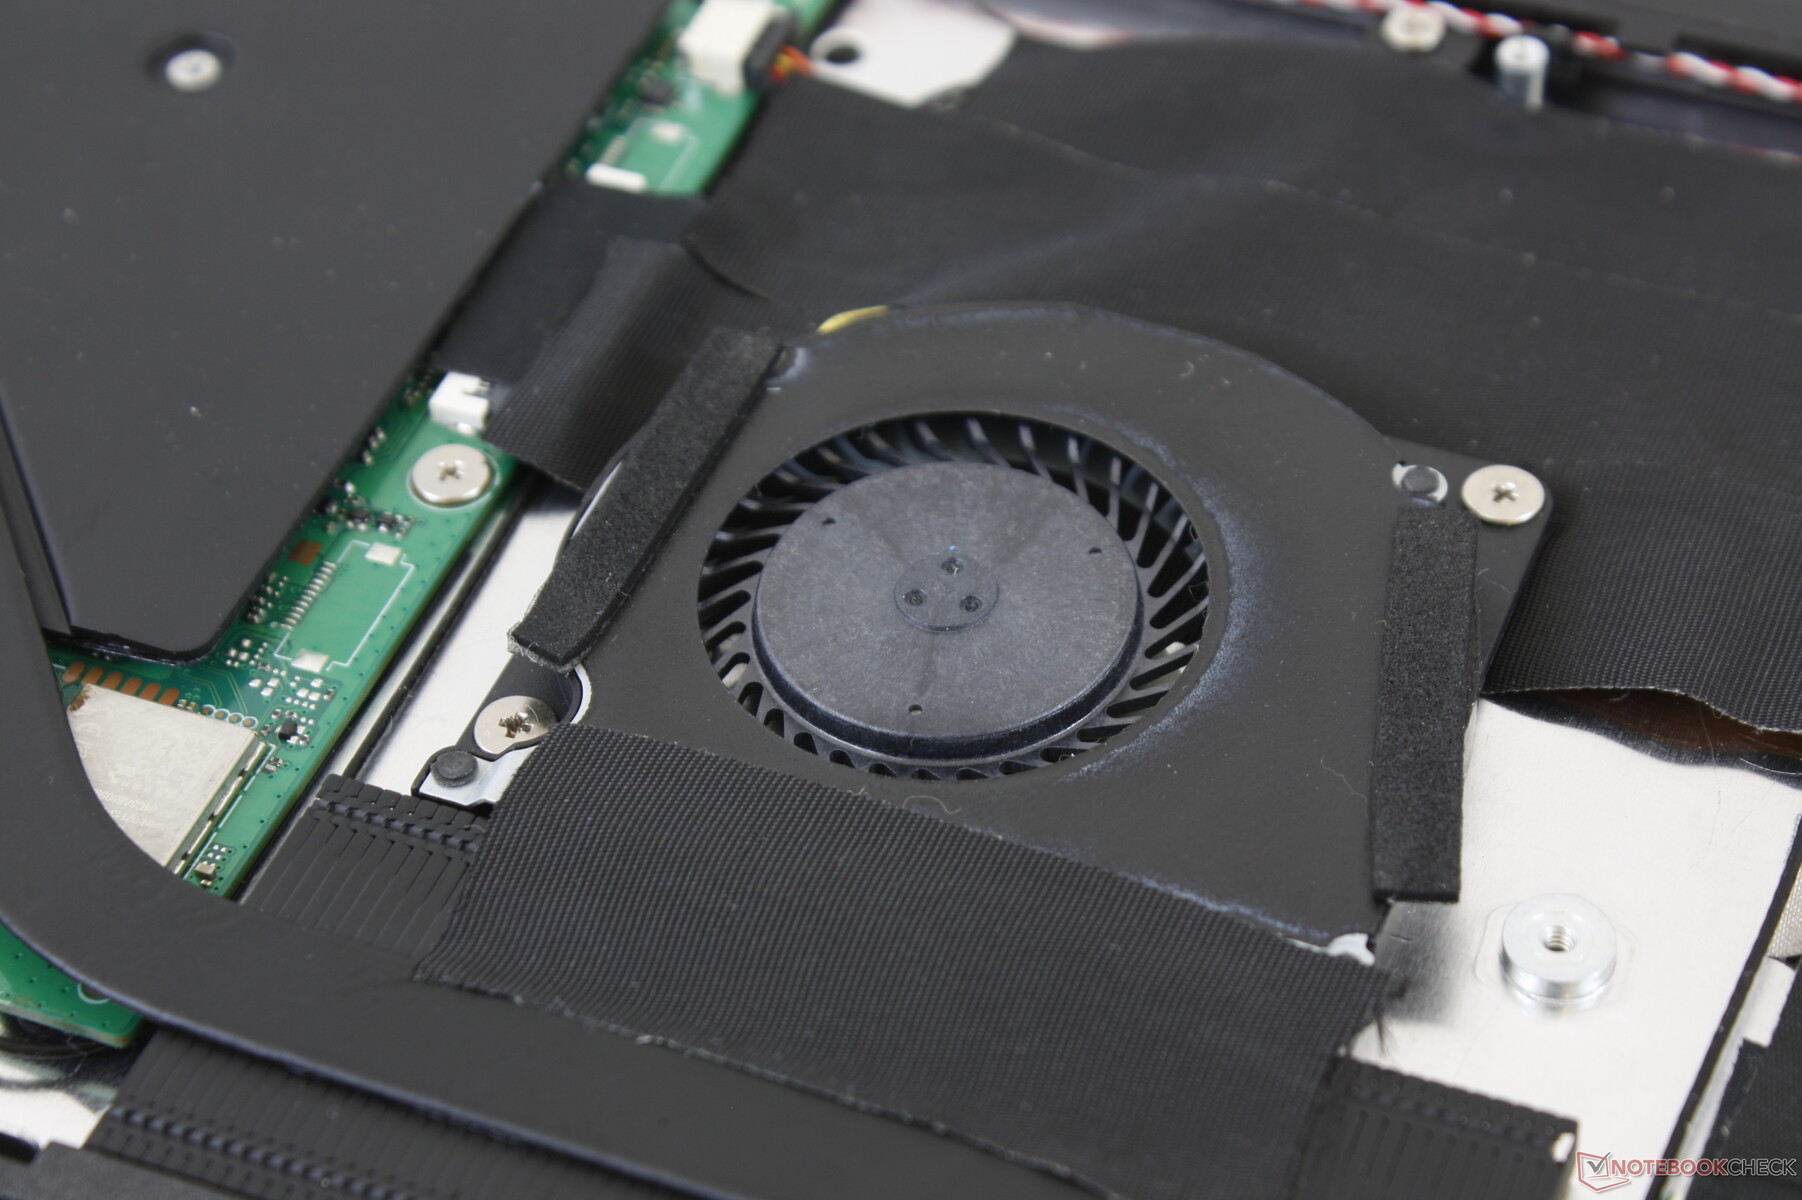
System Noise
The fan is quiet no matter the load. Even when running Prime95, fan noise would top out at only 26.7 dB(A) against a background of 26.2 dB(A). It's essentially unnoticeable in a typical classroom or office environment.
| Chuwi GemiBook CWI528 UHD Graphics 600, Celeron J4115, Morebeck-S100 256GB | LincPlus P1 UHD Graphics 600, Celeron N4000, 64 GB eMMC Flash | Jumper EZbook X3 HD Graphics 500, Celeron N3350, 64 GB eMMC Flash | Apple MacBook Air 2020 i3 Iris Plus Graphics G4 (Ice Lake 48 EU), i3-1000NG4, Apple SSD AP0256 | HP Envy 13-aq0003ng GeForce MX250, i7-8565U, Toshiba KBG30ZMV512G | Tuxedo Book BU1307 UHD Graphics 620, i5-8550U, Samsung SSD 970 EVO 250GB | |
|---|---|---|---|---|---|---|
| Noise | -19% | -22% | -21% | |||
| off / environment * (dB) | 26.2 | 29 -11% | 30 -15% | 30.5 -16% | ||
| Idle Minimum * (dB) | 26.2 | 29 -11% | 30 -15% | 30.5 -16% | ||
| Idle Average * (dB) | 26.2 | 29 -11% | 30 -15% | 30.8 -18% | ||
| Idle Maximum * (dB) | 26.2 | 29 -11% | 30 -15% | 30.8 -18% | ||
| Load Average * (dB) | 26.5 | 31.6 -19% | 34.3 -29% | |||
| Load Maximum * (dB) | 26.7 | 39.4 -48% | 39.5 -48% | 34.3 -28% |
* ... smaller is better
Noise level
| Idle |
| 26.2 / 26.2 / 26.2 dB(A) |
| Load |
| 26.5 / 26.7 dB(A) |
 | ||
30 dB silent 40 dB(A) audible 50 dB(A) loud |
||
min: | ||
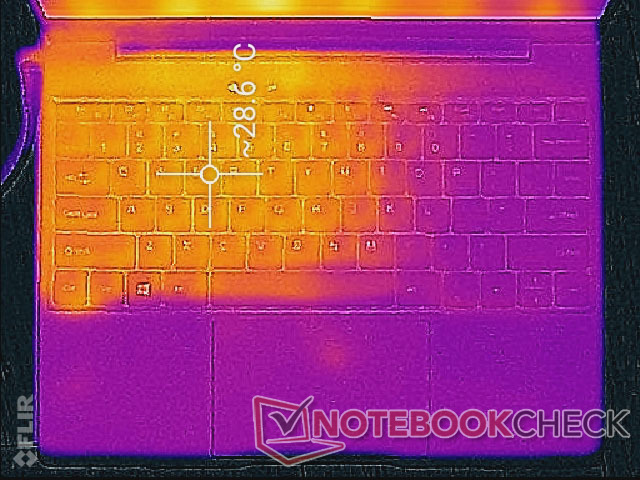
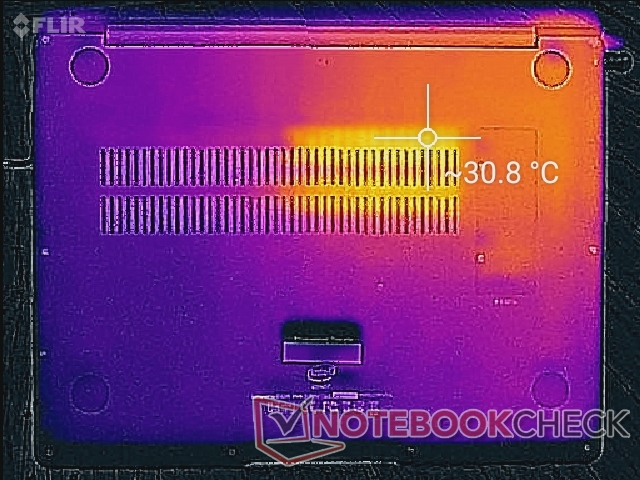
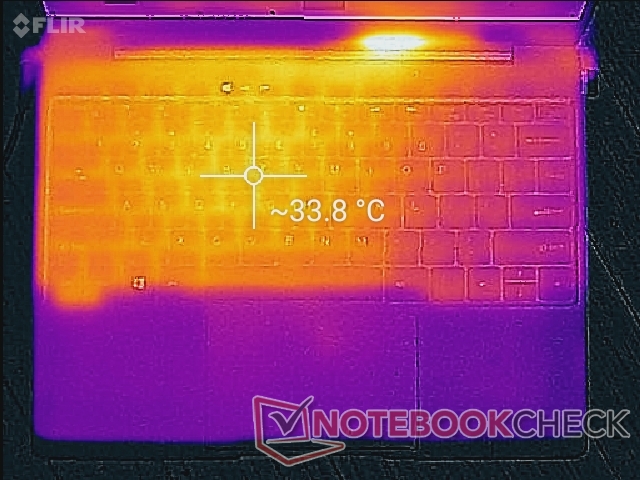
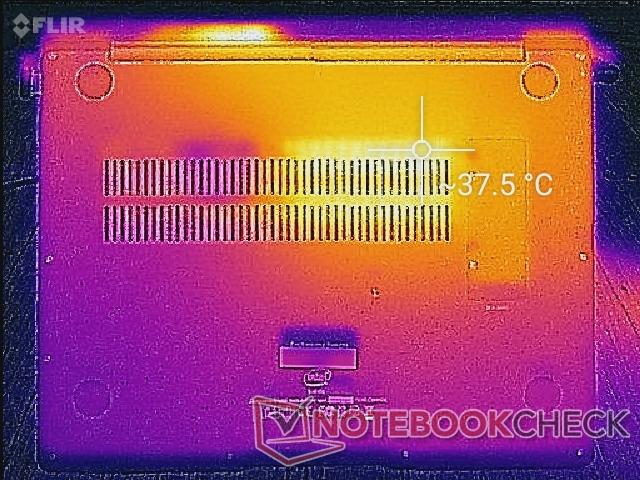
Temperature
Surface temperatures are warmest on the left half of the laptop compared to the right, but never by uncomfortable margins. The keyboard hot spot is only about 34 C when under extreme processing stress.
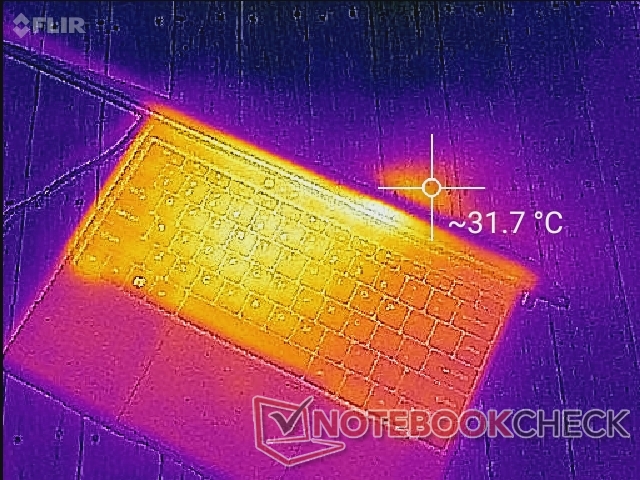
(+) The maximum temperature on the upper side is 33 °C / 91 F, compared to the average of 35.9 °C / 97 F, ranging from 21.4 to 59 °C for the class Subnotebook.
(+) The bottom heats up to a maximum of 38 °C / 100 F, compared to the average of 39.2 °C / 103 F
(+) In idle usage, the average temperature for the upper side is 27.1 °C / 81 F, compared to the device average of 30.8 °C / 87 F.
(+) The palmrests and touchpad are cooler than skin temperature with a maximum of 26.2 °C / 79.2 F and are therefore cool to the touch.
(±) The average temperature of the palmrest area of similar devices was 28.2 °C / 82.8 F (+2 °C / 3.6 F).
Stress Test
When running Prime95, CPU clock rates would jump to 2.4 GHz for just a few seconds until core temperature reaches 60 C. Thereafter, they drop to just 2.1 GHz or 300 MHz above the base clock rate of the Celeron J4115 in order to maintain a core temperature of 62 C.
Running on battery power will limit CPU performance slightly. A 3DMark 11 run on batteries would return a Physic score of 2397 points compared to 2688 points when on mains.
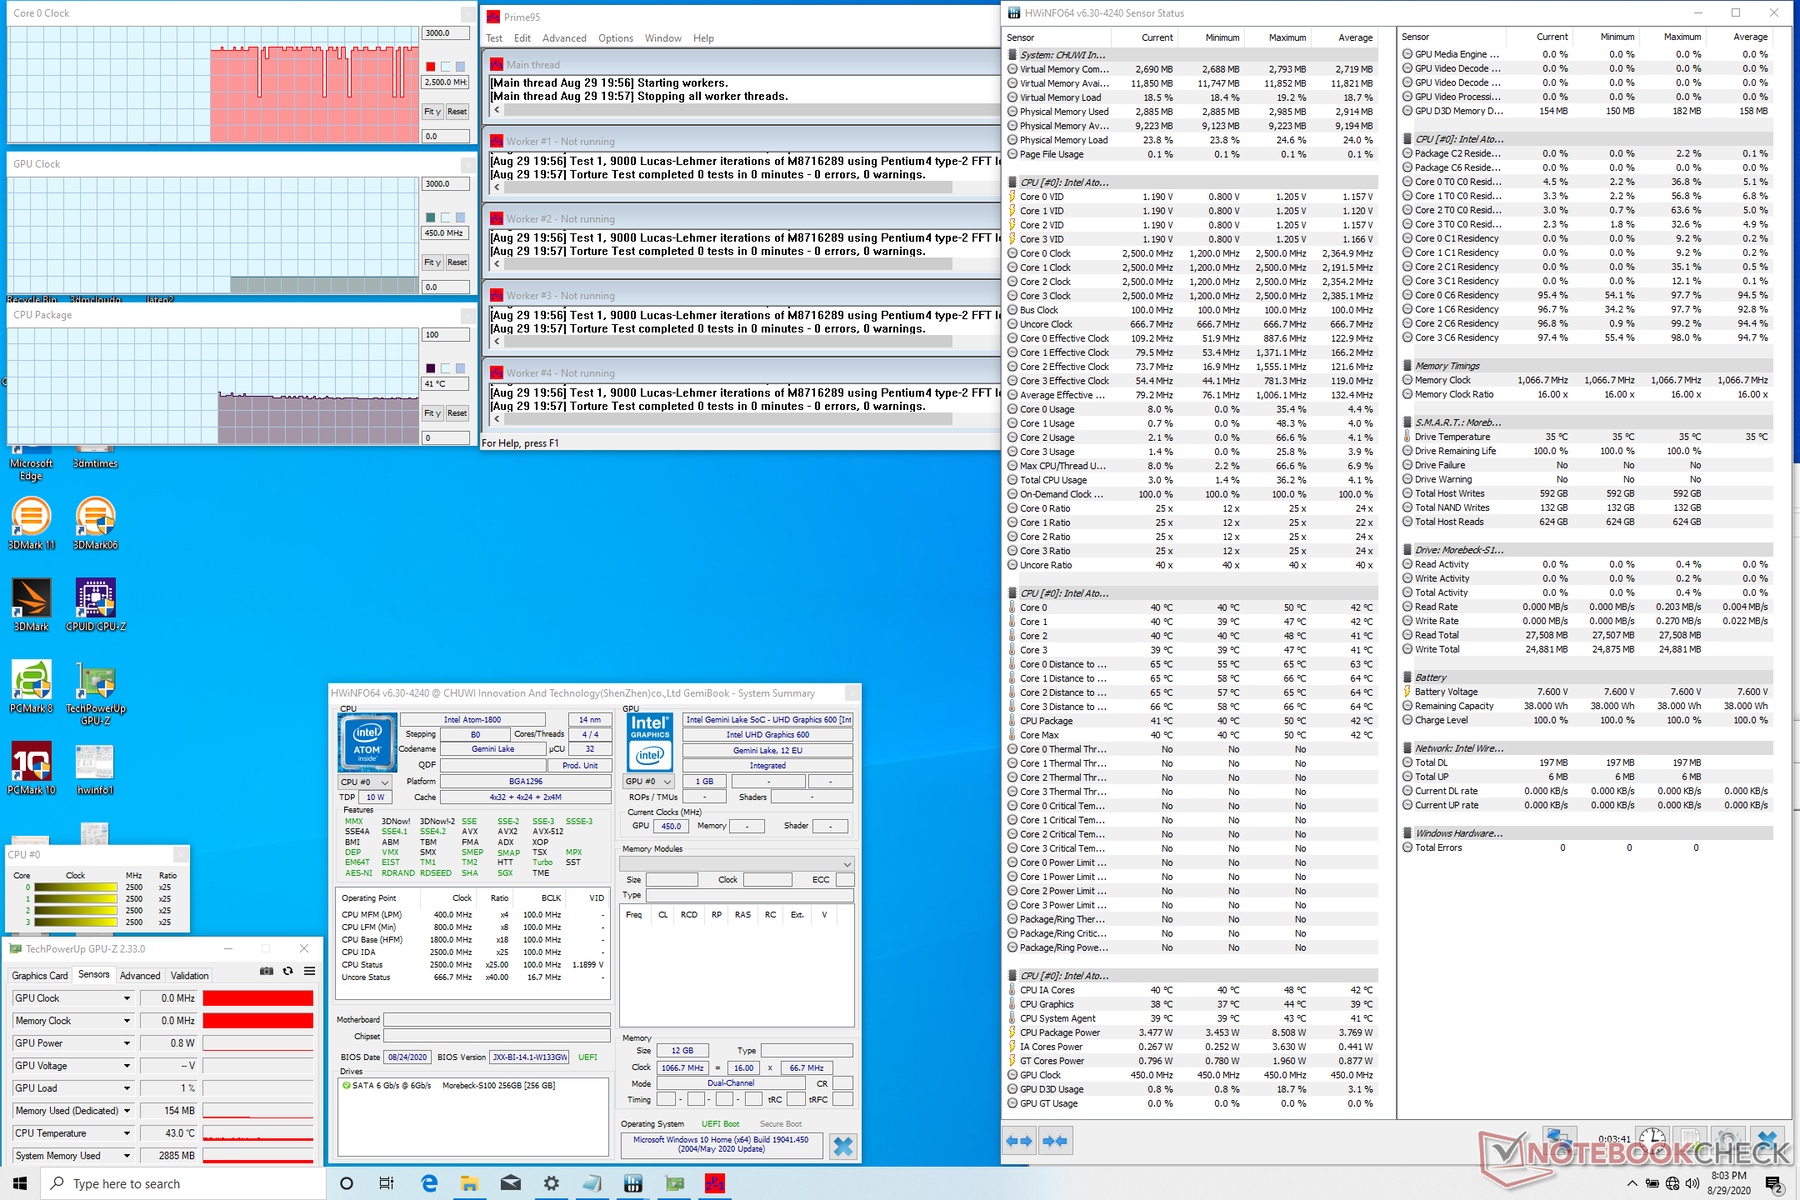
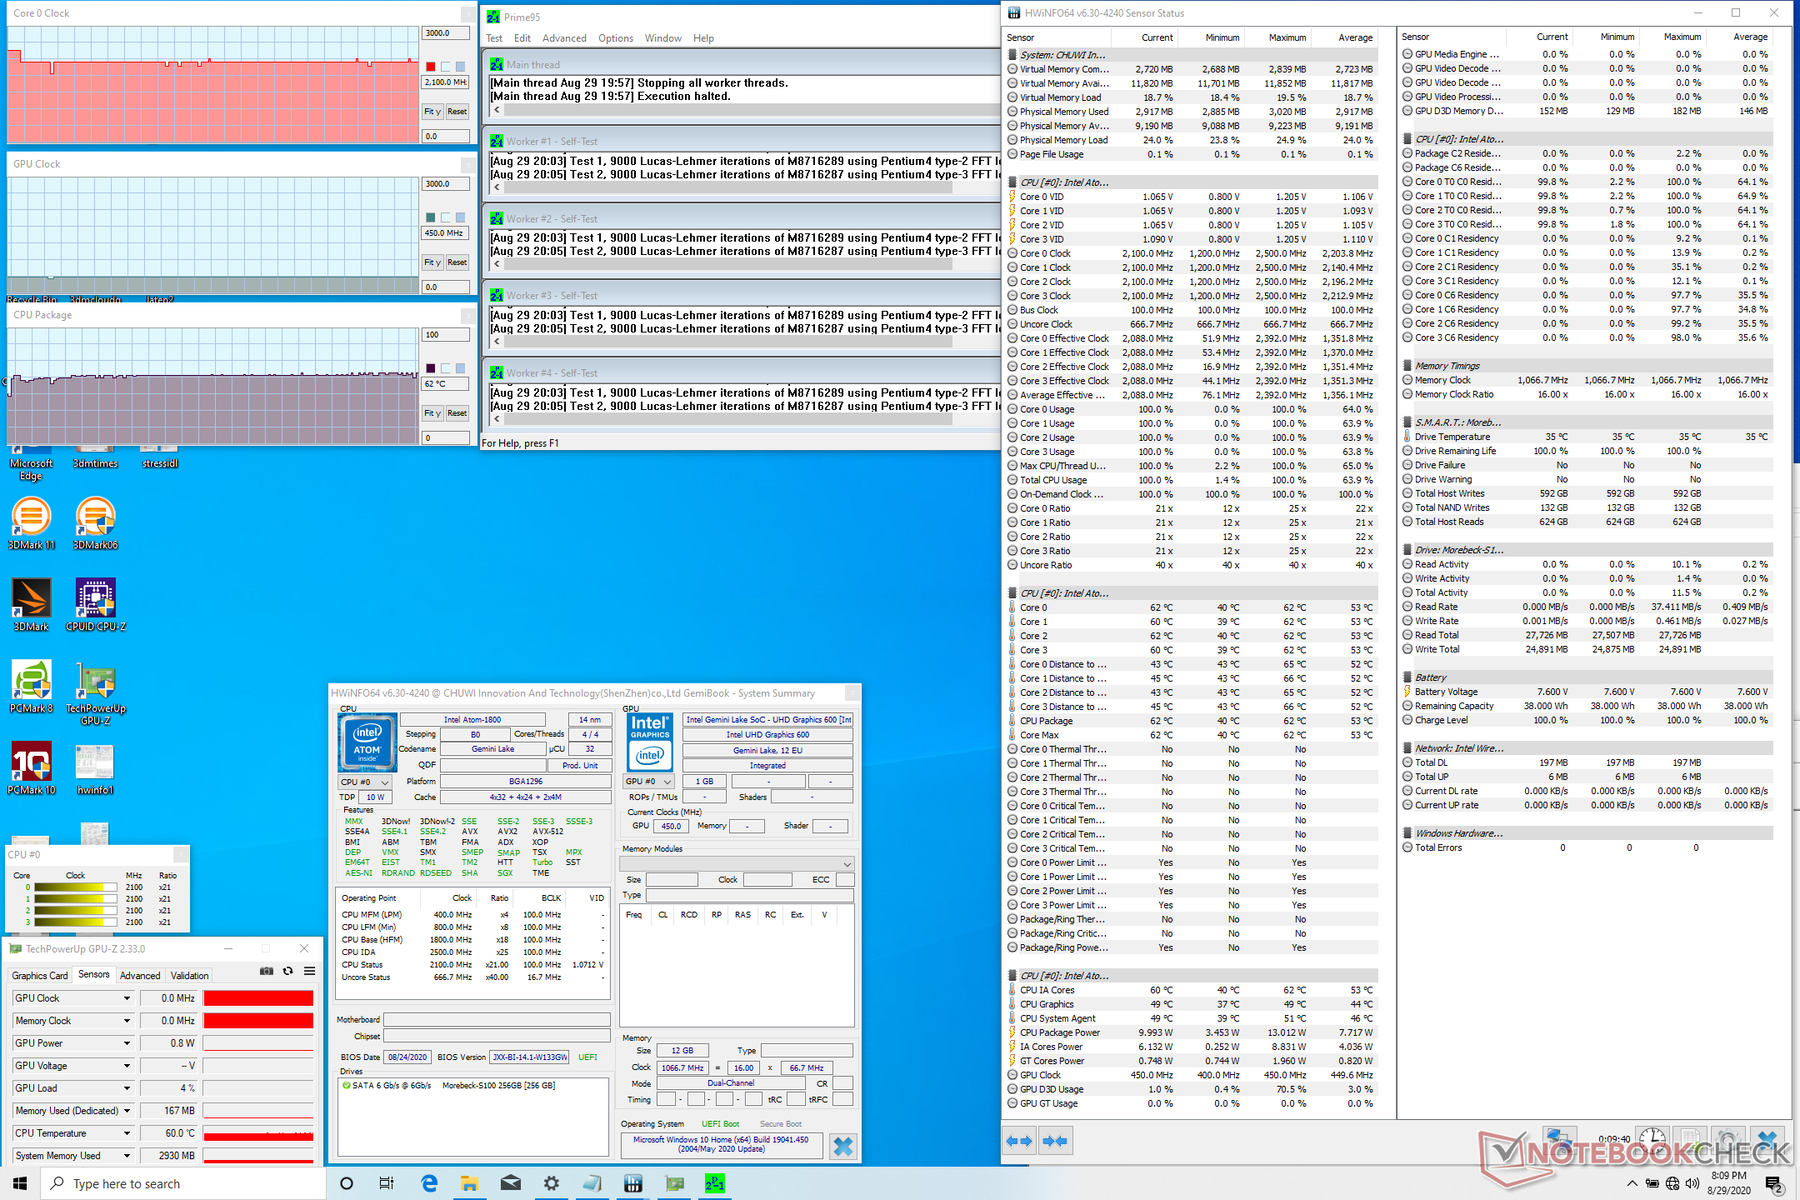
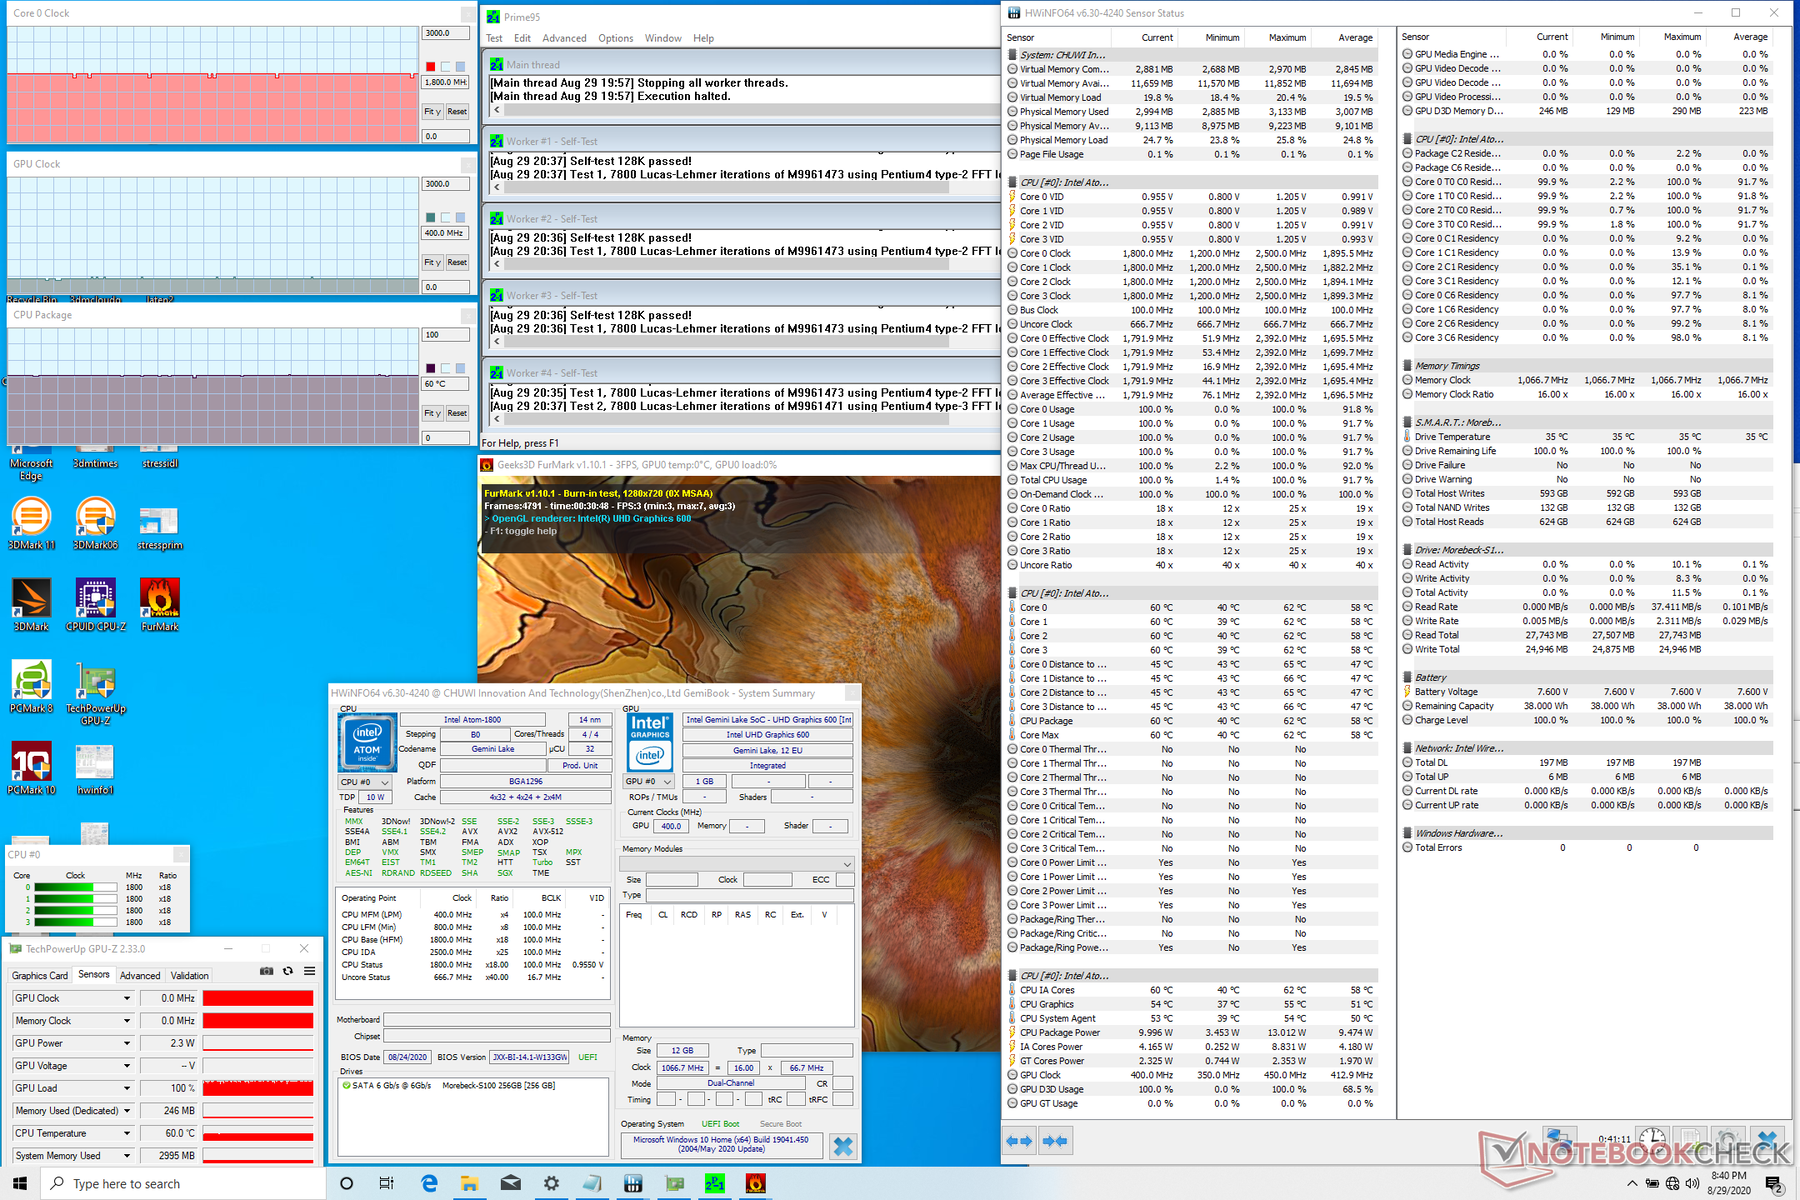
| CPU Clock (GHz) | GPU Clock (MHz) | Average CPU Temperature (°C) | |
| System Idle | -- | -- | 41 |
| Prime95 Stress | 2.1 | -- | 62 |
| Prime95 + FurMark Stress | 1.8 | 400 | 60 |
Speakers


Chuwi GemiBook CWI528 audio analysis
(+) | speakers can play relatively loud (90.1 dB)
Bass 100 - 315 Hz
(-) | nearly no bass - on average 27.6% lower than median
(+) | bass is linear (6.3% delta to prev. frequency)
Mids 400 - 2000 Hz
(±) | reduced mids - on average 5% lower than median
(+) | mids are linear (5.5% delta to prev. frequency)
Highs 2 - 16 kHz
(+) | balanced highs - only 3.3% away from median
(+) | highs are linear (2.9% delta to prev. frequency)
Overall 100 - 16.000 Hz
(±) | linearity of overall sound is average (17.7% difference to median)
Compared to same class
» 49% of all tested devices in this class were better, 7% similar, 44% worse
» The best had a delta of 5%, average was 18%, worst was 53%
Compared to all devices tested
» 35% of all tested devices were better, 8% similar, 57% worse
» The best had a delta of 4%, average was 23%, worst was 134%
Apple MacBook 12 (Early 2016) 1.1 GHz audio analysis
(+) | speakers can play relatively loud (83.6 dB)
Bass 100 - 315 Hz
(±) | reduced bass - on average 11.3% lower than median
(±) | linearity of bass is average (14.2% delta to prev. frequency)
Mids 400 - 2000 Hz
(+) | balanced mids - only 2.4% away from median
(+) | mids are linear (5.5% delta to prev. frequency)
Highs 2 - 16 kHz
(+) | balanced highs - only 2% away from median
(+) | highs are linear (4.5% delta to prev. frequency)
Overall 100 - 16.000 Hz
(+) | overall sound is linear (10.2% difference to median)
Compared to same class
» 7% of all tested devices in this class were better, 2% similar, 91% worse
» The best had a delta of 5%, average was 18%, worst was 53%
Compared to all devices tested
» 5% of all tested devices were better, 1% similar, 94% worse
» The best had a delta of 4%, average was 23%, worst was 134%
Energy Management
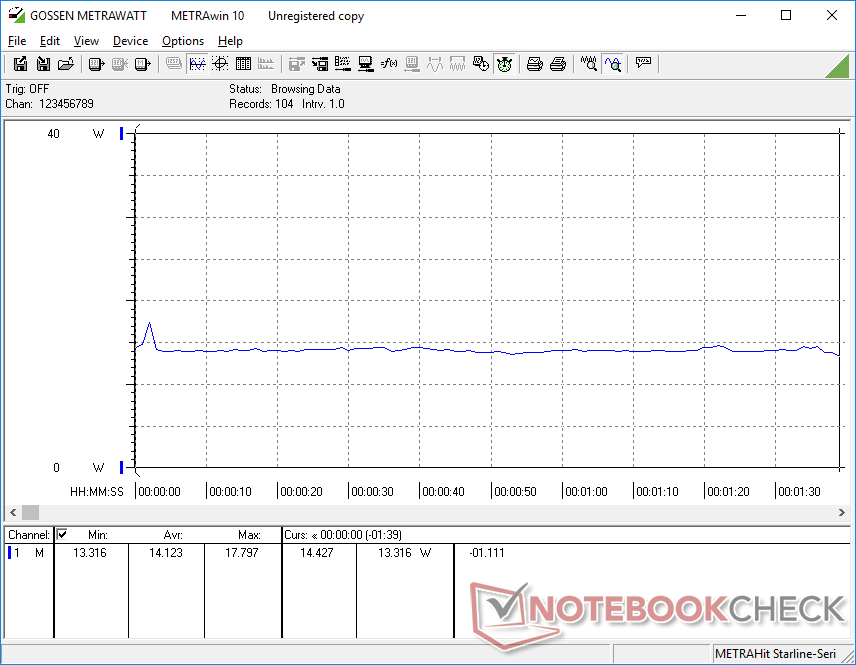
Power Consumption
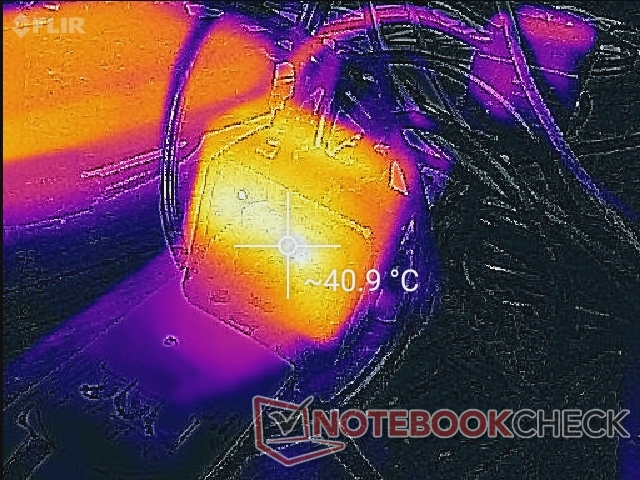
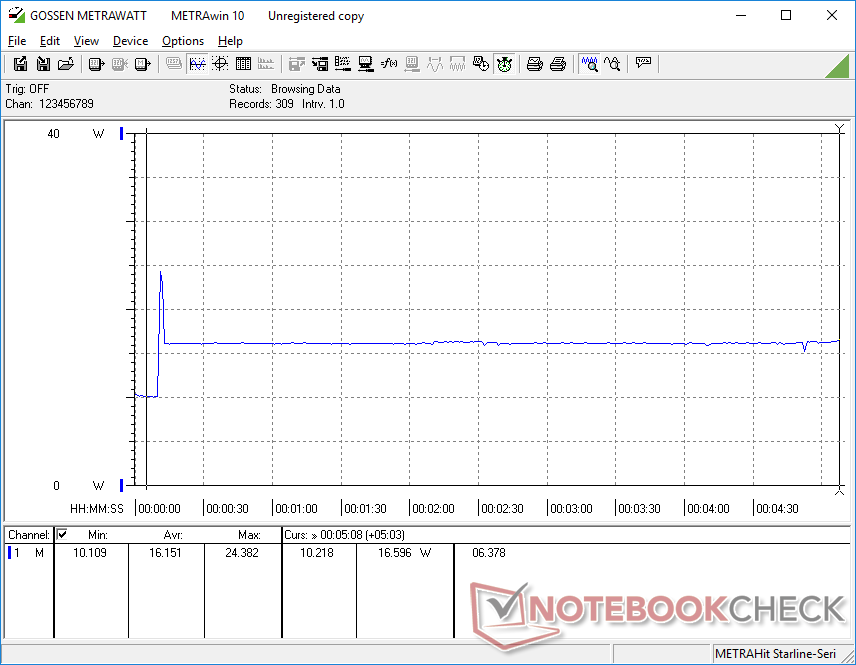
The Chuwi is not that power-efficient even when factoring in the Celeron CPU. Idling on desktop at the lowest settings and brightness level demands about 7 W compared to just 3 W to 4 W on the Jumper EZbook X3 or much more powerful HP Envy 13.
We're able to record a temporary maximum draw of 24.4 W from the small (~5.5 x 5.5 x 3 cm) 24 W AC adapter.
| Off / Standby | |
| Idle | |
| Load |
|
Key:
min: | |
| Chuwi GemiBook CWI528 Celeron J4115, UHD Graphics 600, Morebeck-S100 256GB, IPS, 2160x1440, 13" | LincPlus P1 Celeron N4000, UHD Graphics 600, 64 GB eMMC Flash, IPS, 1920x1080, 13.3" | Jumper EZbook X3 Celeron N3350, HD Graphics 500, 64 GB eMMC Flash, IPS, 1920x1080, 13.3" | Apple MacBook Air 2020 i3 i3-1000NG4, Iris Plus Graphics G4 (Ice Lake 48 EU), Apple SSD AP0256, IPS, 2560x1600, 13.3" | HP Envy 13-aq0003ng i7-8565U, GeForce MX250, Toshiba KBG30ZMV512G, IPS, 1920x1080, 13.3" | Tuxedo Book BU1307 i5-8550U, UHD Graphics 620, Samsung SSD 970 EVO 250GB, IPS, 1920x1080, 13.3" | |
|---|---|---|---|---|---|---|
| Power Consumption | 27% | 32% | 6% | -77% | -38% | |
| Idle Minimum * (Watt) | 7.1 | 2.9 59% | 3.3 54% | 2.1 70% | 3.9 45% | 5.5 23% |
| Idle Average * (Watt) | 9.3 | 7.7 17% | 6.4 31% | 6.2 33% | 7.8 16% | 8.9 4% |
| Idle Maximum * (Watt) | 9.6 | 8.2 15% | 7 27% | 7 27% | 10.8 -13% | 11.5 -20% |
| Load Average * (Watt) | 14.1 | 13.8 2% | 13.4 5% | 24.7 -75% | 53 -276% | 34.6 -145% |
| Load Maximum * (Watt) | 24.4 | 14.5 41% | 14 43% | 30.6 -25% | 62.7 -157% | 36.6 -50% |
* ... smaller is better
Battery Life
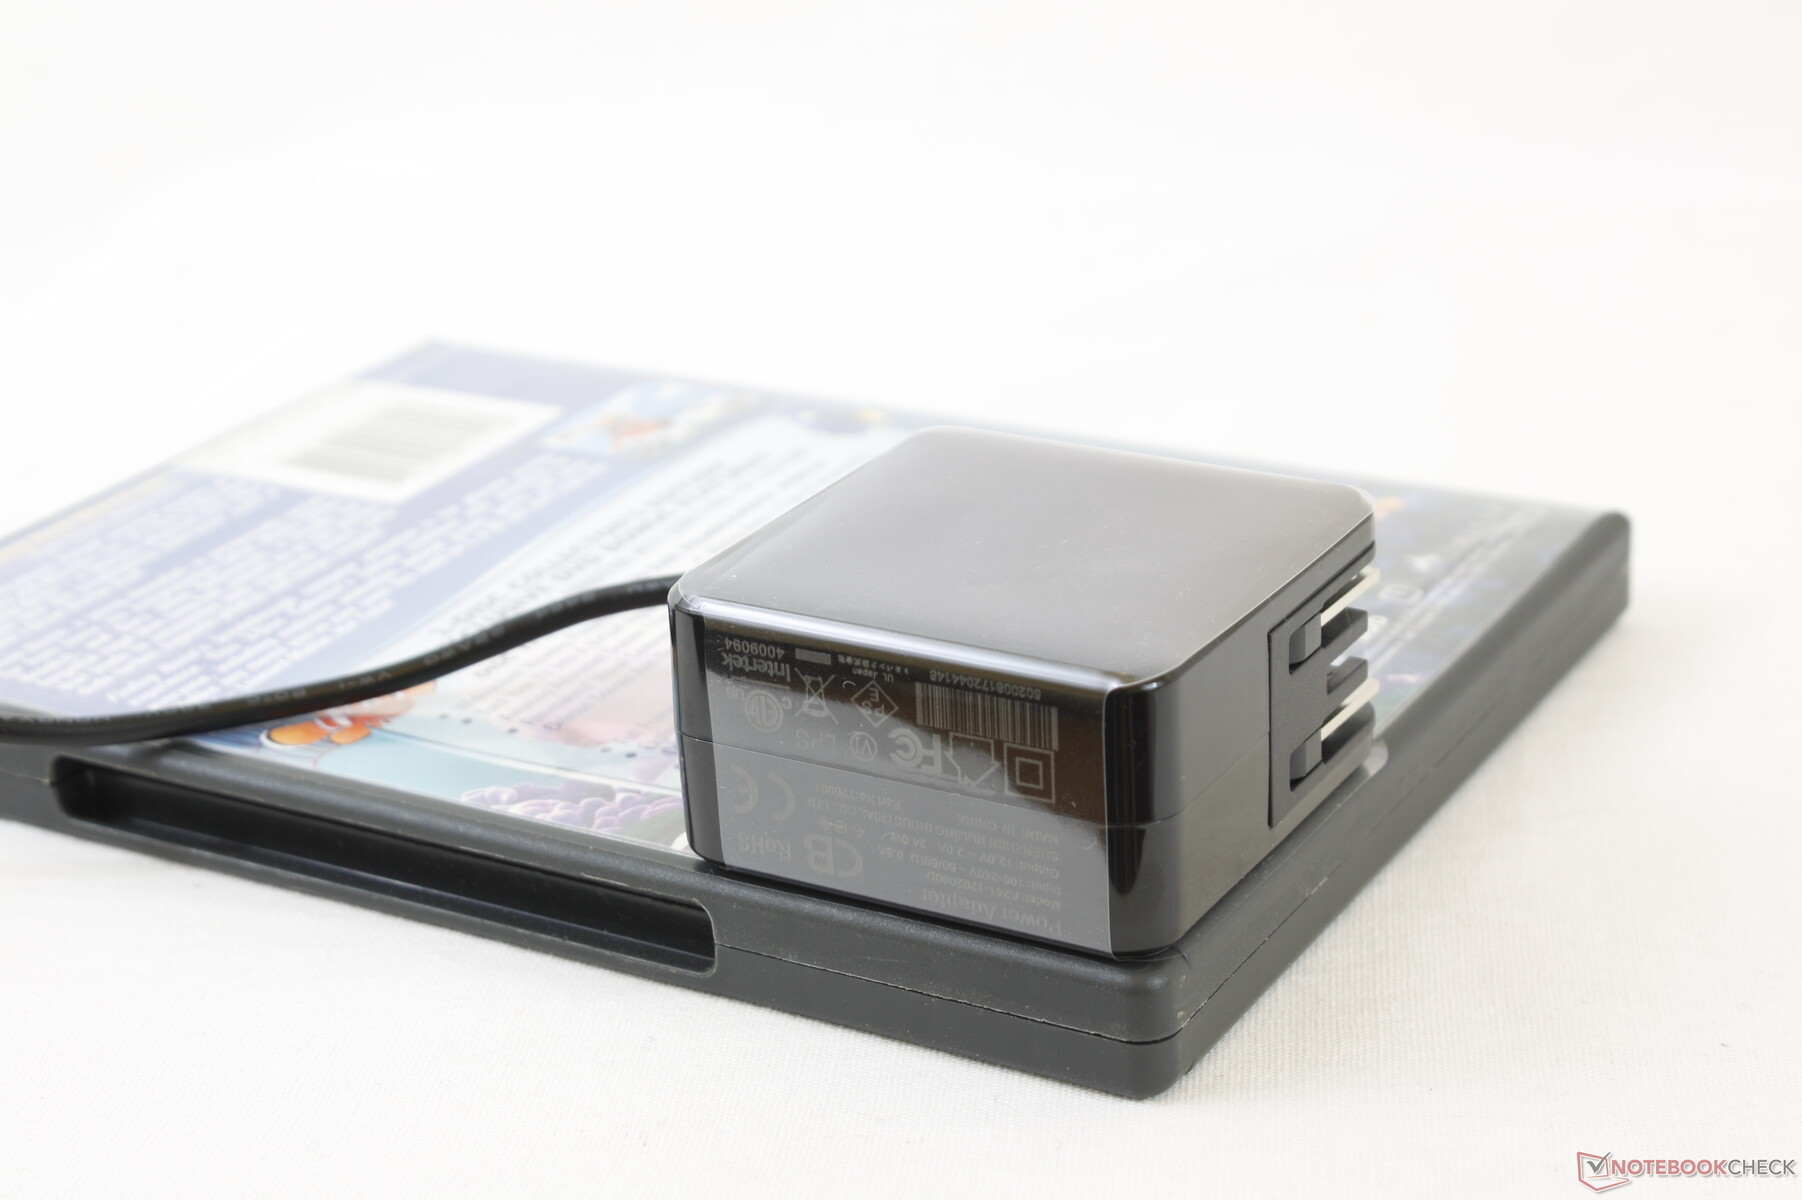
Runtimes are average at about 5.5 hours of real-world WLAN use. Recharging from empty to full capacity is also quite slow at 3.5 hours compared to 90 minutes on most other Ultrabooks. The system cannot be recharged via USB-C.
| Chuwi GemiBook CWI528 Celeron J4115, UHD Graphics 600, 38 Wh | LincPlus P1 Celeron N4000, UHD Graphics 600, 34 Wh | Jumper EZbook X3 Celeron N3350, HD Graphics 500, 34.9 Wh | Apple MacBook Air 2020 i3 i3-1000NG4, Iris Plus Graphics G4 (Ice Lake 48 EU), 49.9 Wh | HP Envy 13-aq0003ng i7-8565U, GeForce MX250, 53.2 Wh | Tuxedo Book BU1307 i5-8550U, UHD Graphics 620, 66 Wh | |
|---|---|---|---|---|---|---|
| Battery runtime | ||||||
| WiFi v1.3 (h) | 5.6 | 6.2 11% | 7.9 41% | 11 96% | 8.5 52% | 9.2 64% |
Pros
Cons
Verdict
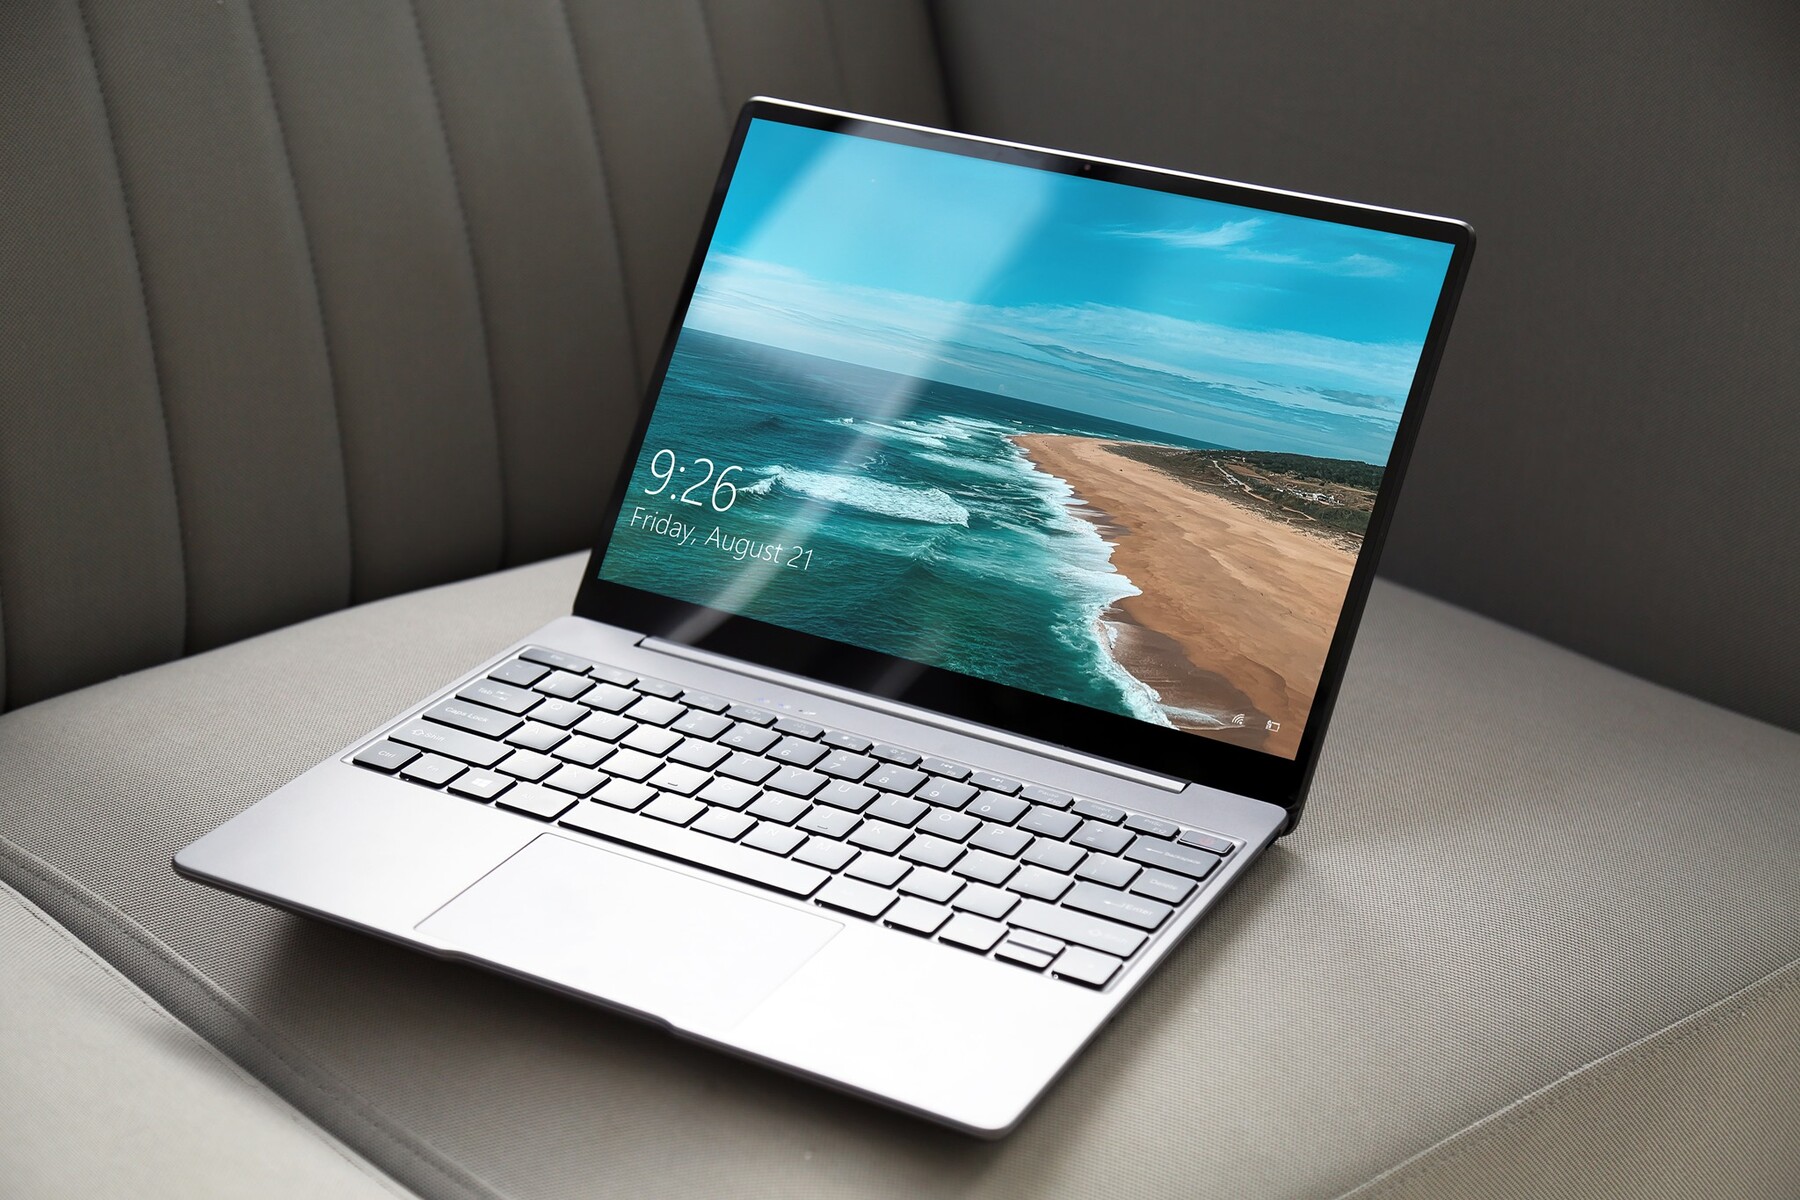
Without a doubt the best part of the Chuwi GemiBook is its high resolution 3:2 display. This display is the same one that Huawei uses for its flagship MateBook 13 meaning that you will get the same visual experience as a $1000+ Ultrabook from this $300 Chuwi. It's an impressive feat from this particular point of view.
Almost everything else falls apart once you look beyond the display. Charging is very slow, performance is even slower, the keyboard keys are loud, and the hinges are weak at certain angles. The MateBook-like design, quiet fan, and dual M.2 storage bays aren't enough to make up for the many drawbacks that impact the usability and longevity of the system. For $300, however, the GemiBook is still a decent if not imbalanced machine considering the asking price. For our money, the AMD-powered Walmart Motile is the better deal overall as it juggles display, performance, and design much better than the Chuwi.
Chuwi GemiBook CWI528
- 09/03/2020 v7 (old)
Allen Ngo
Price comparison
