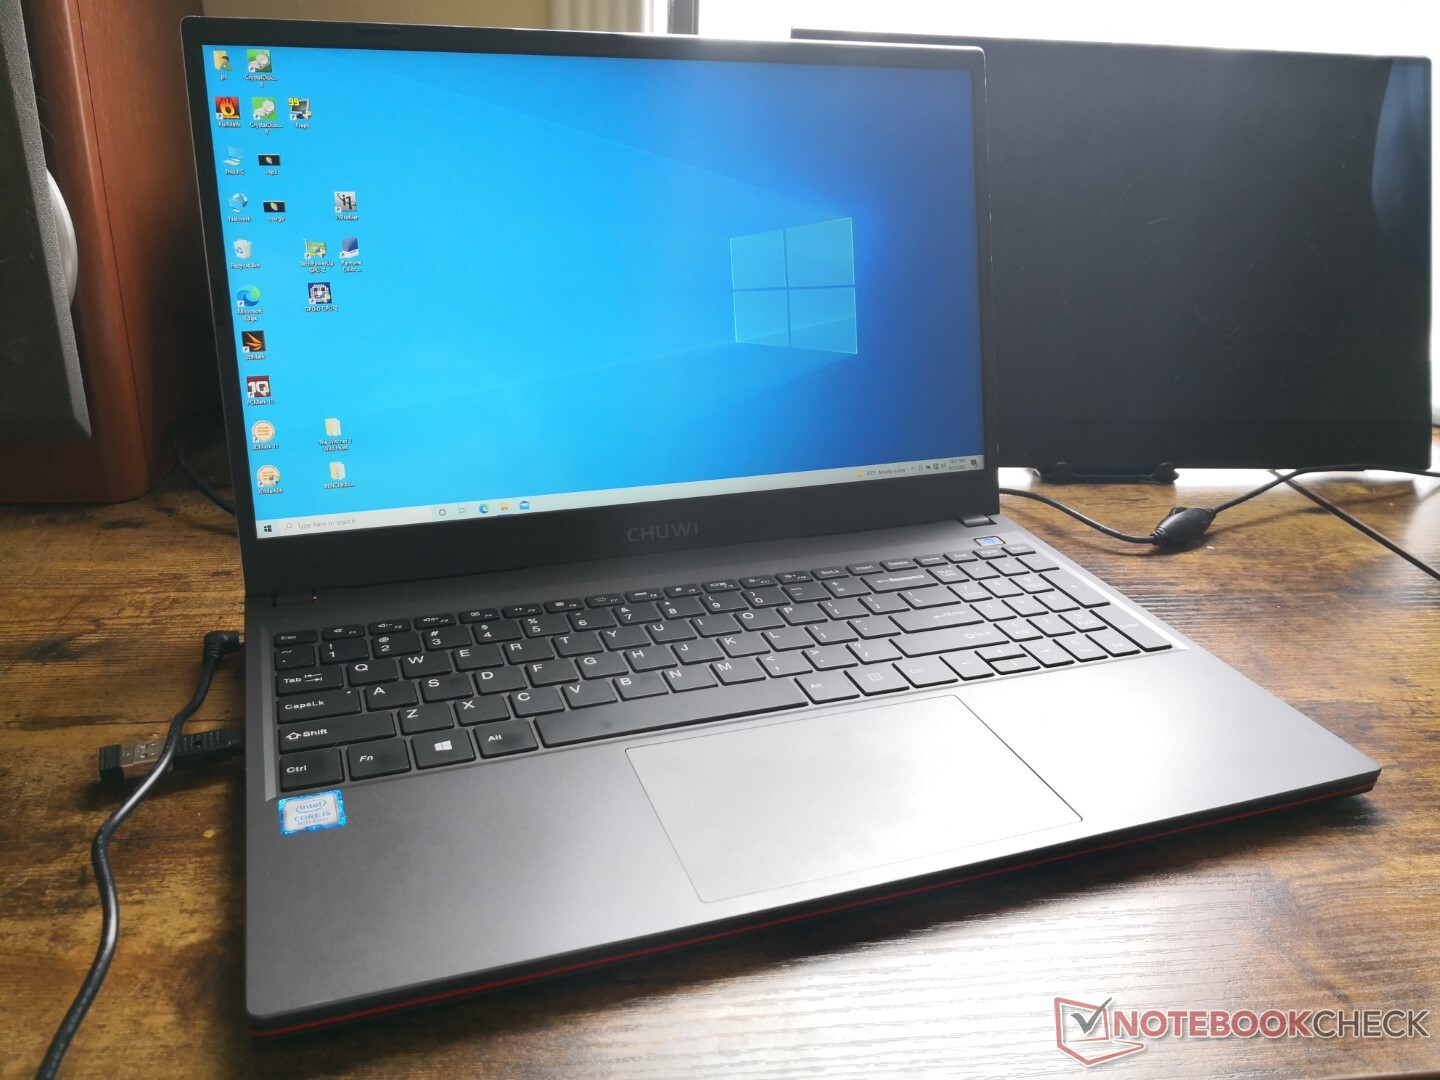
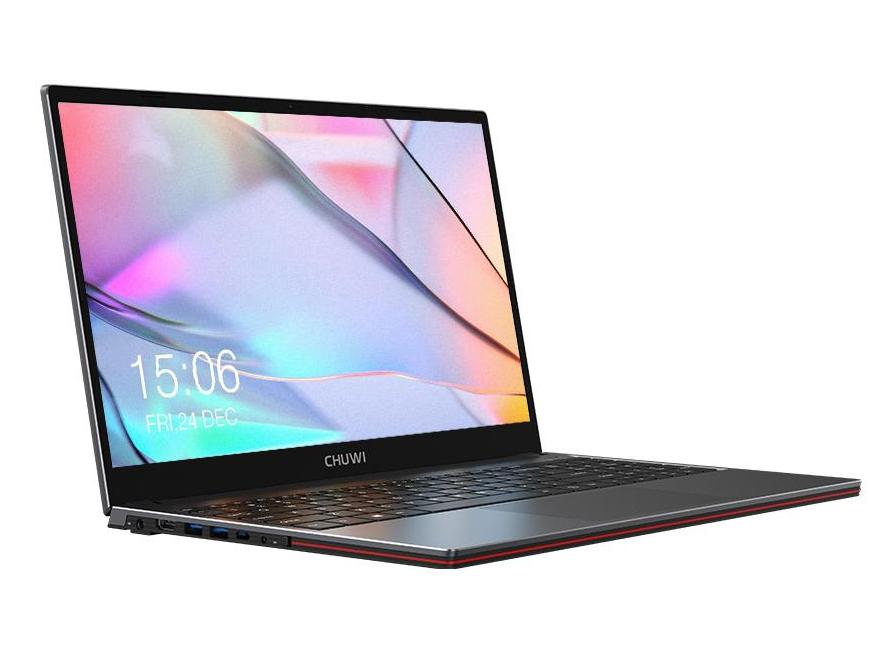
Chuwi CoreBook X Pro laptop review: 120 Hz display for cheap

After having just reviewed the 14-inch CoreBook X a few months ago, Chuwi is now ready to launch the CoreBook X Pro which uses the same Intel 8th gen Core i5-8259U processor but in a larger 15.6-inch form factor. This larger version is a completely different beast in terms of features, display, and visual design when compared to the 14-inch model.
Competitors to the CoreBook X Pro include other budget 15.6-inch multimedia laptops like the HP Pavilion 15, Lenovo IdeaPad 3 series, Dell Inspiron series, or the Acer Aspire 3 series. Chuwi is now selling the model via its official online store for $559 USD.
More Chuwi reviews:
potential competitors in comparison
Rating | Date | Model | Weight | Height | Size | Resolution | Price |
|---|---|---|---|---|---|---|---|
| 74.8 % v7 (old) | 09 / 2021 | Chuwi CoreBook X Pro i5-8259U, Iris Plus Graphics 655 | 1.8 kg | 17.9 mm | 15.60" | 1920x1080 | |
| 77 % v7 (old) | 09 / 2021 | Teclast TBOLT F15 Pro i3-1005G1, UHD Graphics G1 (Ice Lake 32 EU) | 1.9 kg | 20.5 mm | 15.60" | 1920x1080 | |
| 82.1 % v7 (old) | 07 / 2021 | Asus VivoBook S15 D533UA R7 5700U, Vega 8 | 1.8 kg | 16.1 mm | 15.60" | 1920x1080 | |
| 83.3 % v7 (old) | Tuxedo Aura 15 Gen1 R7 4700U, Vega 7 | 1.7 kg | 19.9 mm | 15.60" | 1920x1080 | ||
| 82.8 % v7 (old) | 07 / 2020 | Honor MagicBook 15 R5 3500U, Vega 8 | 1.5 kg | 16.9 mm | 15.60" | 1920x1080 | |
| 86.8 % v7 (old) | 05 / 2020 | Dell XPS 15 9500 Core i5 i5-10300H, UHD Graphics 630 | 1.8 kg | 18 mm | 15.60" | 1920x1200 |
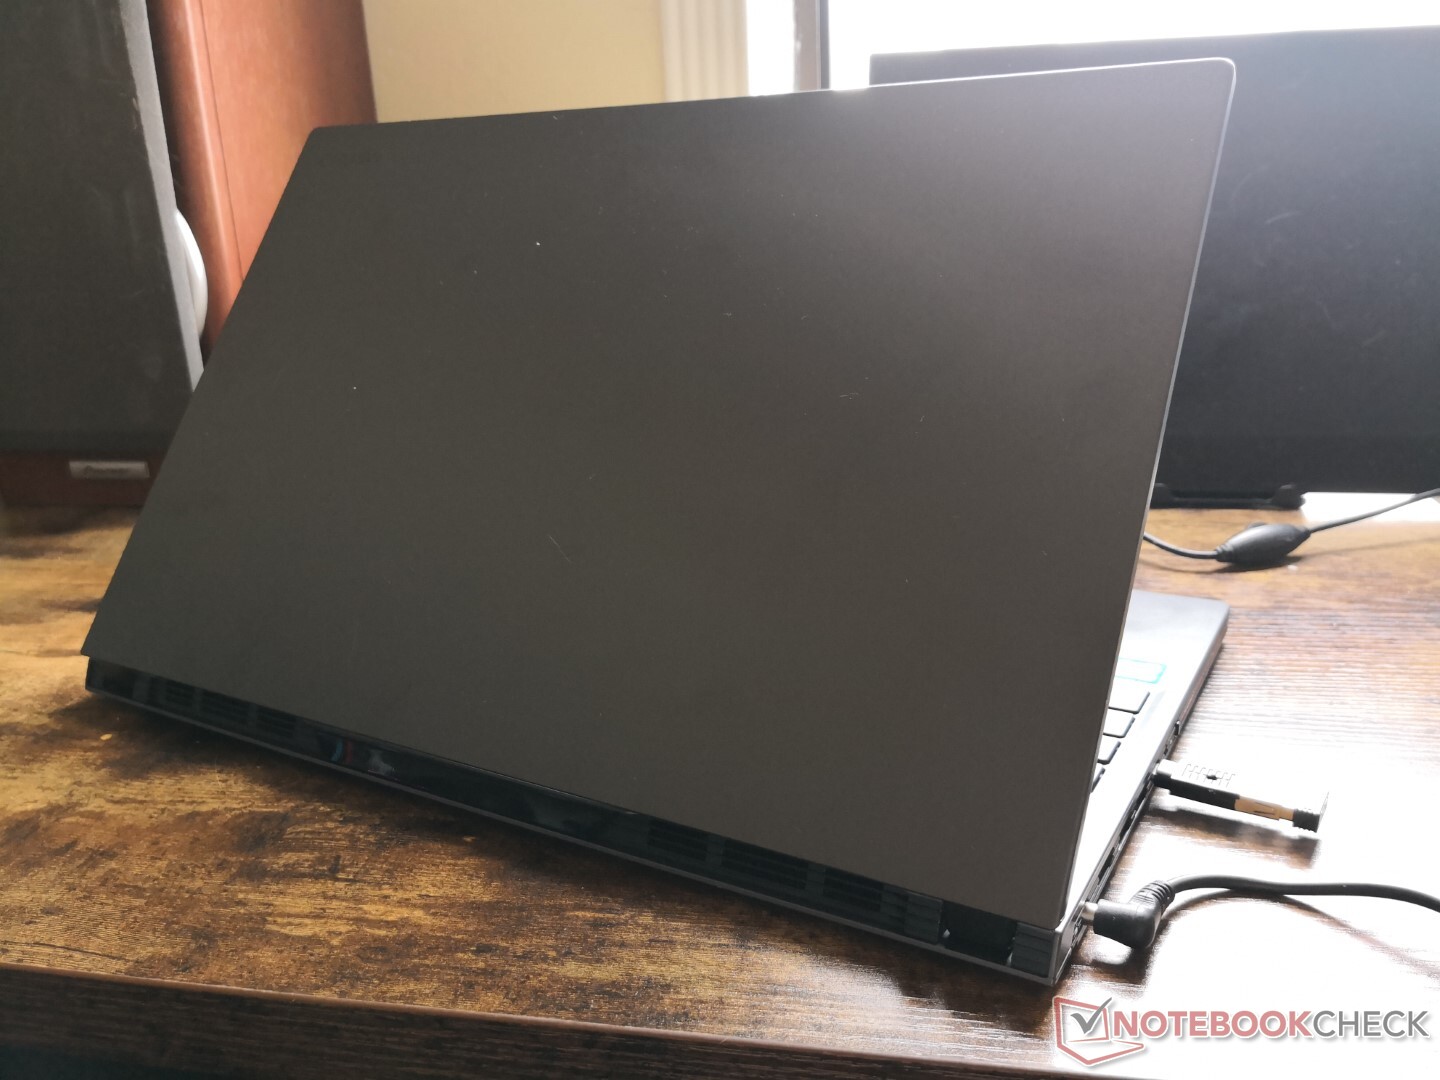
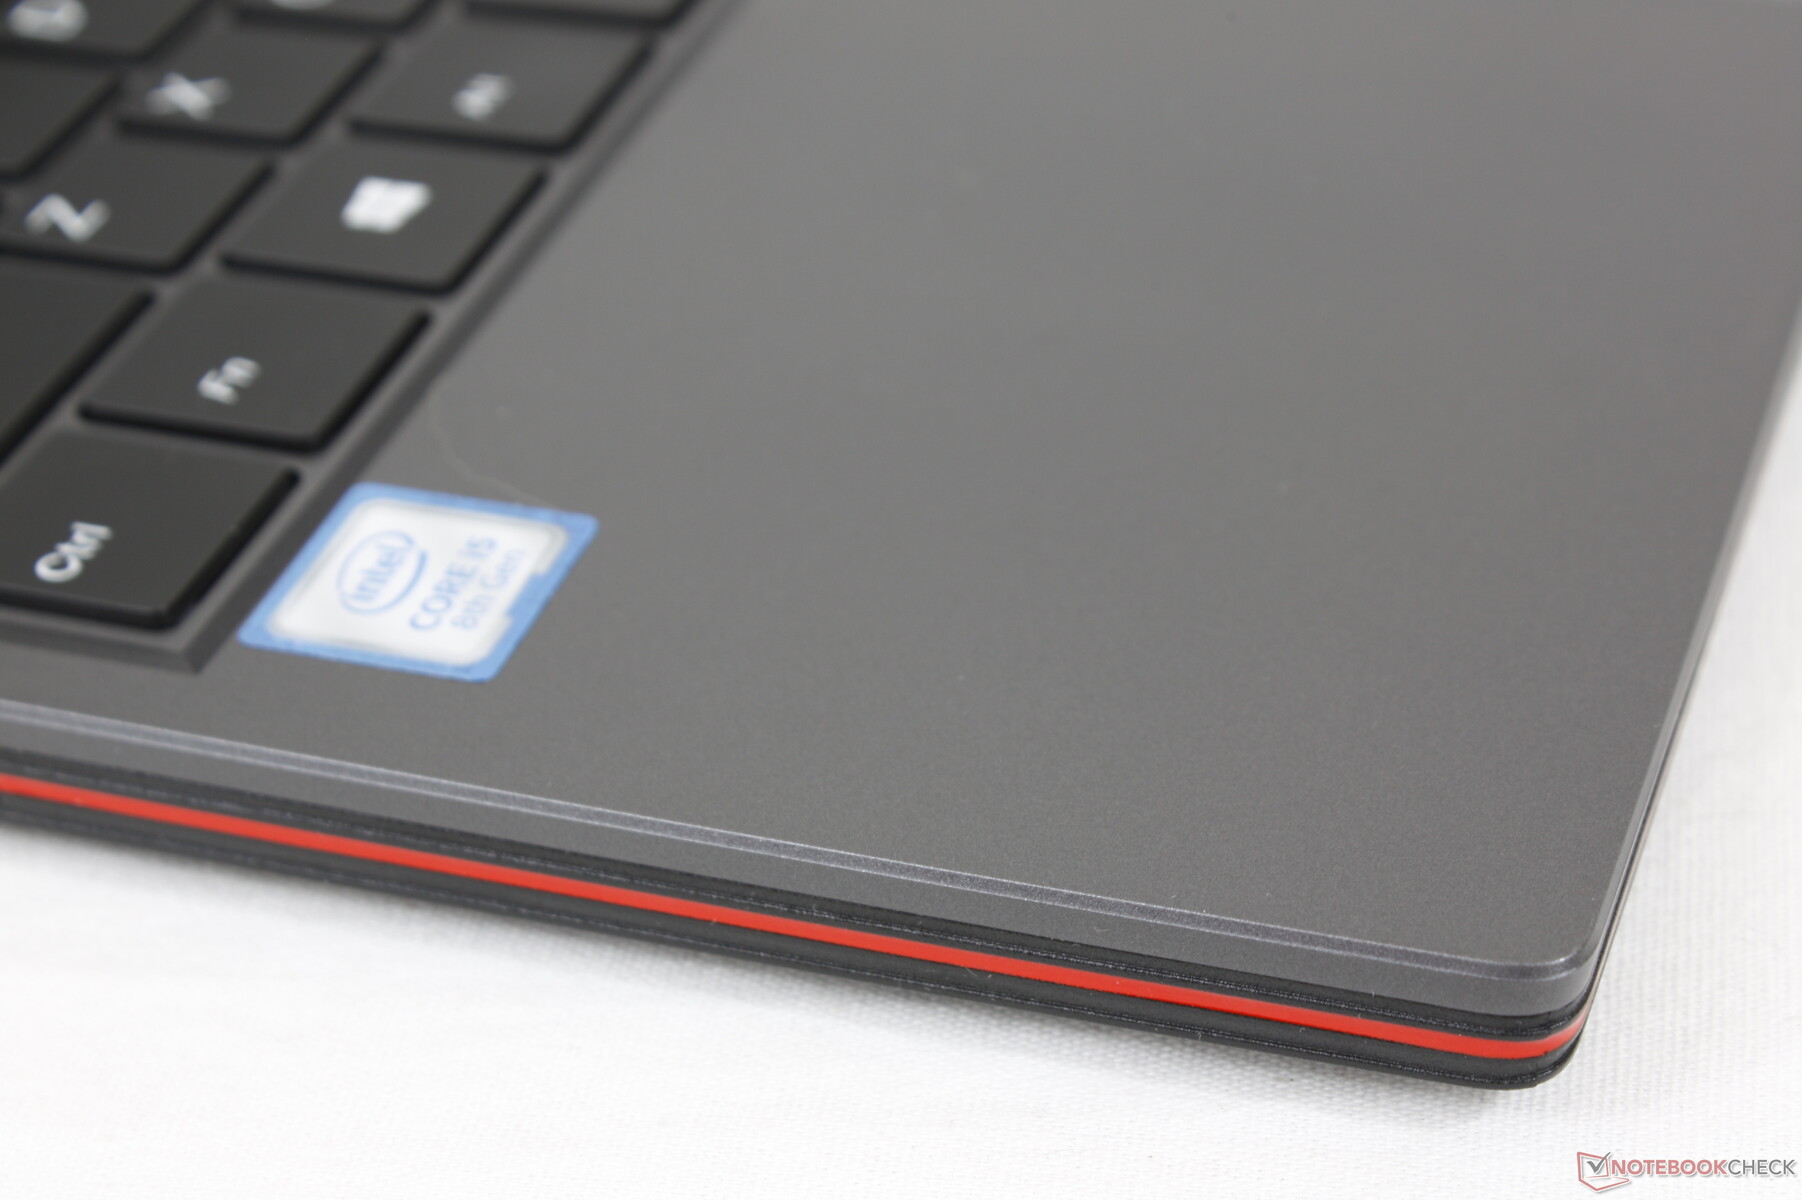
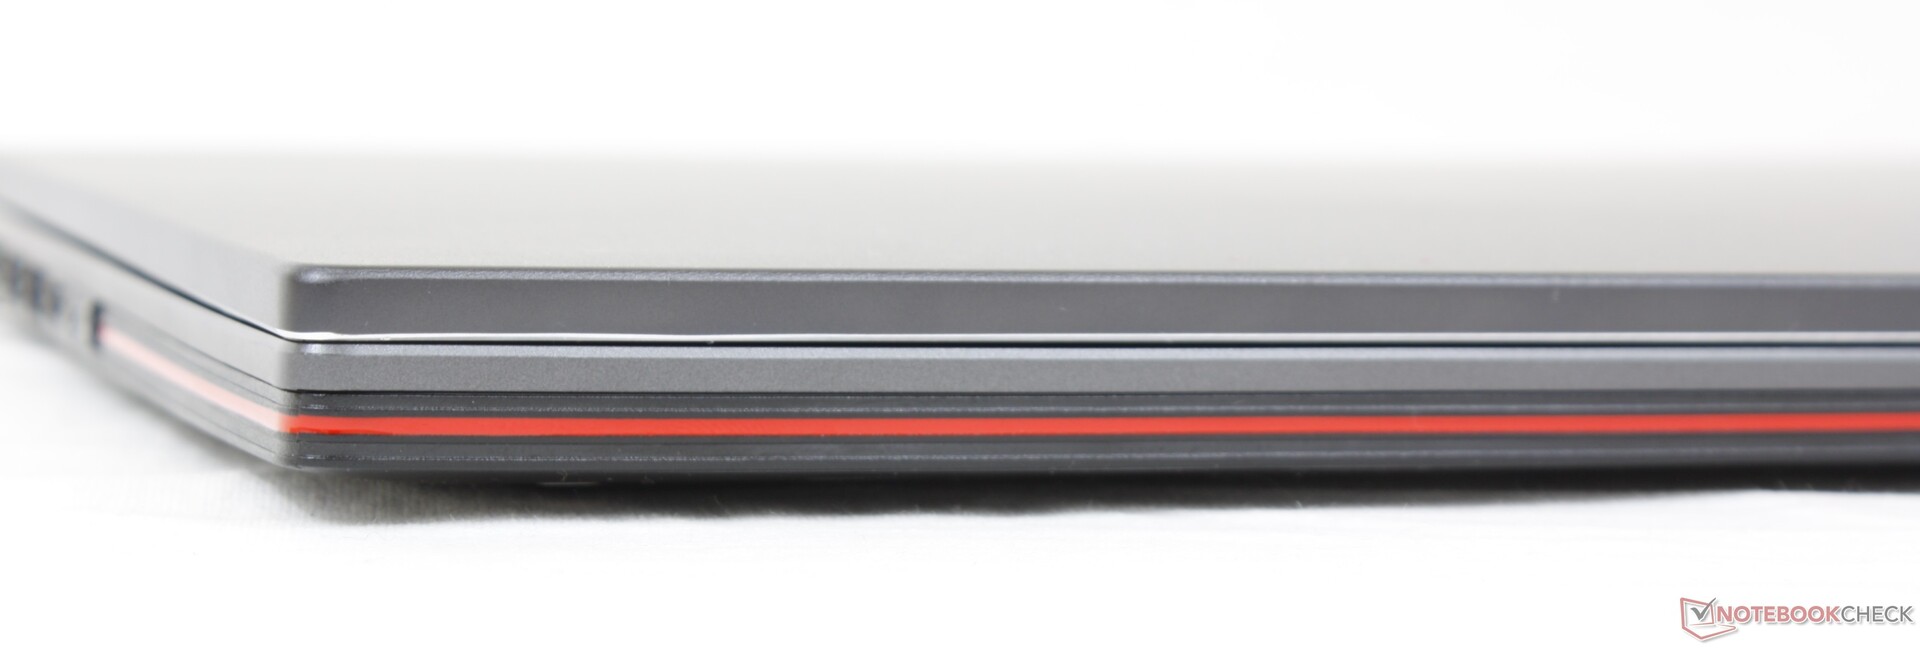
Case — Looks Good, Feels Bad
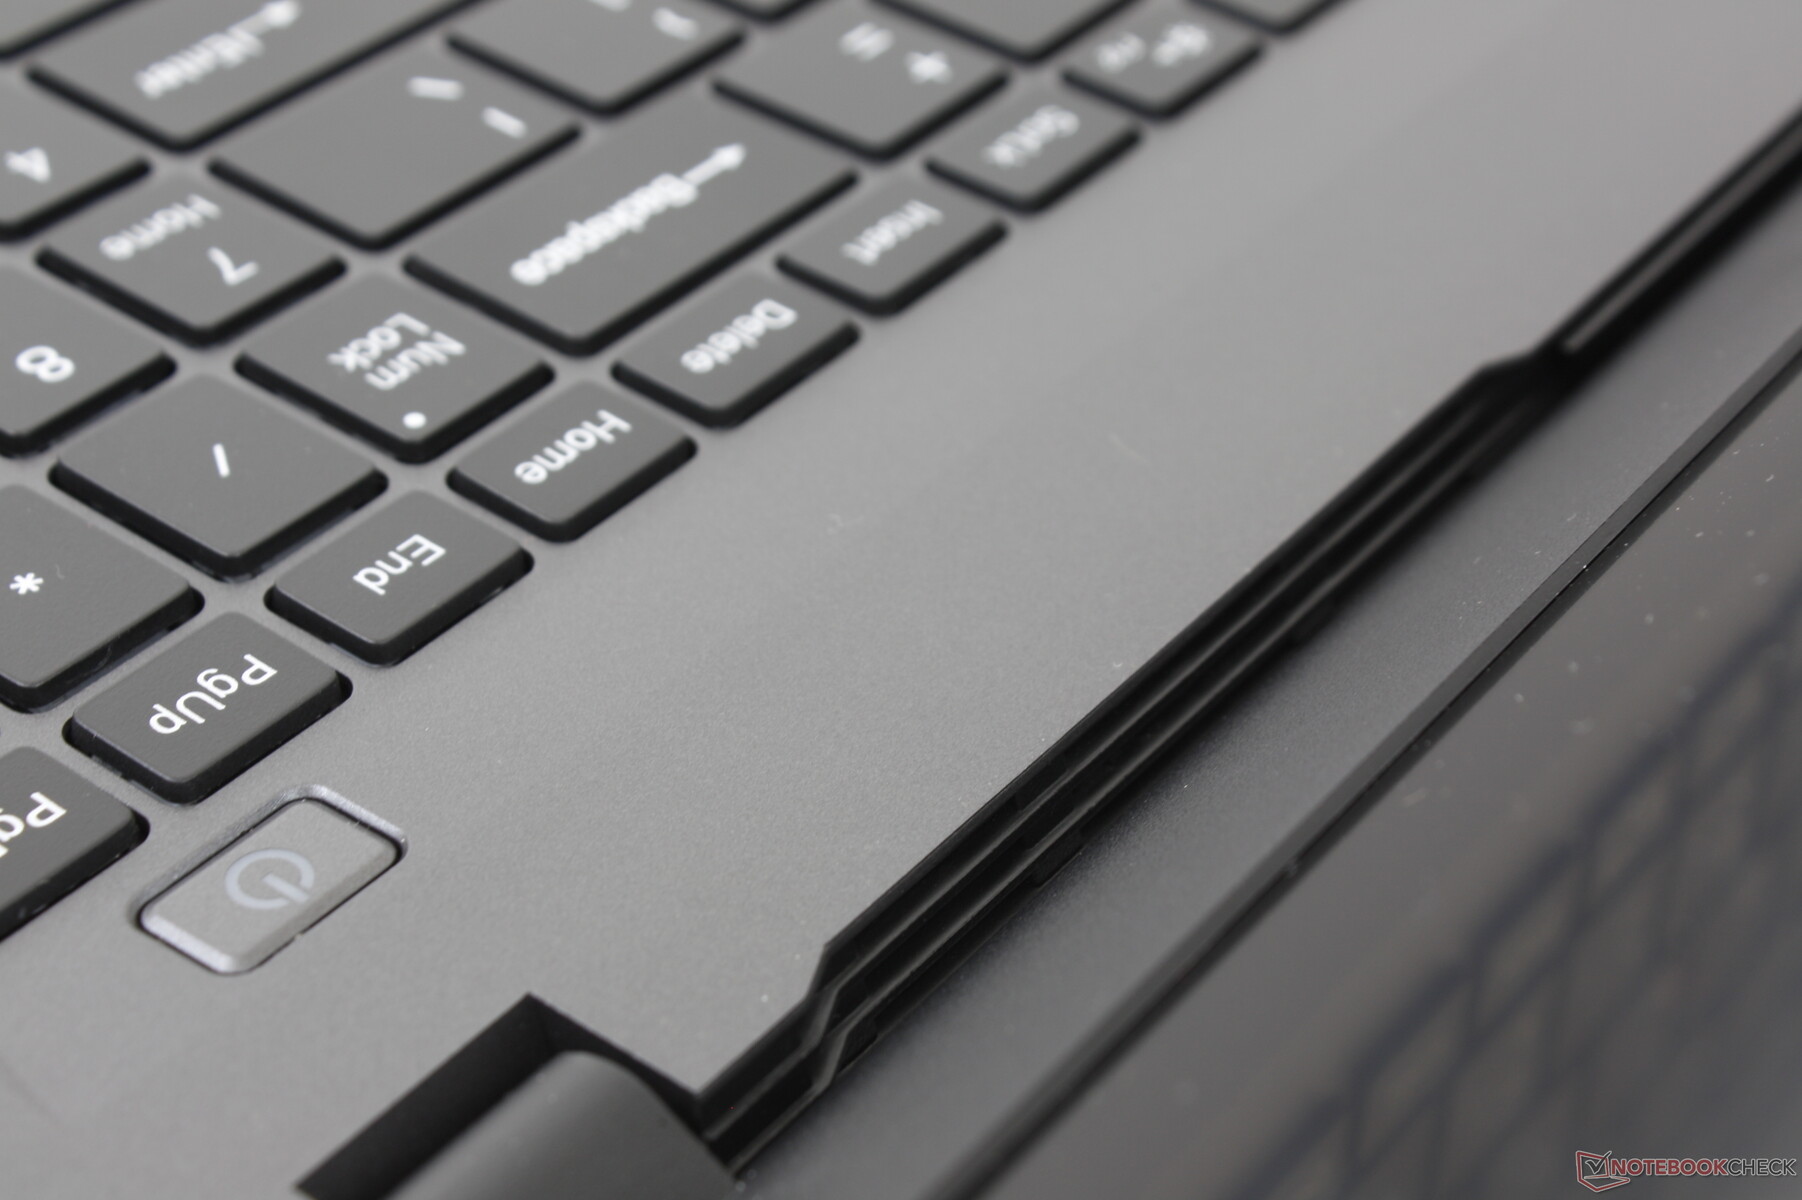
Chuwi laptops have always looked attractive especially for the price and the CoreBook X Pro continues the trend. The manufacturer has even introduced a new chassis design that's more visually unique when compared to the Apple lookalikes of older Chuwi models. Unfortunately, chassis rigidity hasn't really improved as the system creaks and bends more than we would like when twisting its corners. It certainly doesn't feel as strong as it looks.
Overall size is slightly larger and heavier than most other 15.6-inch laptops due to the thick bottom bezel of the CoreBook X Pro. The system weighs about the same as the XPS 15 9500 even though the Chuwi is larger in volume.
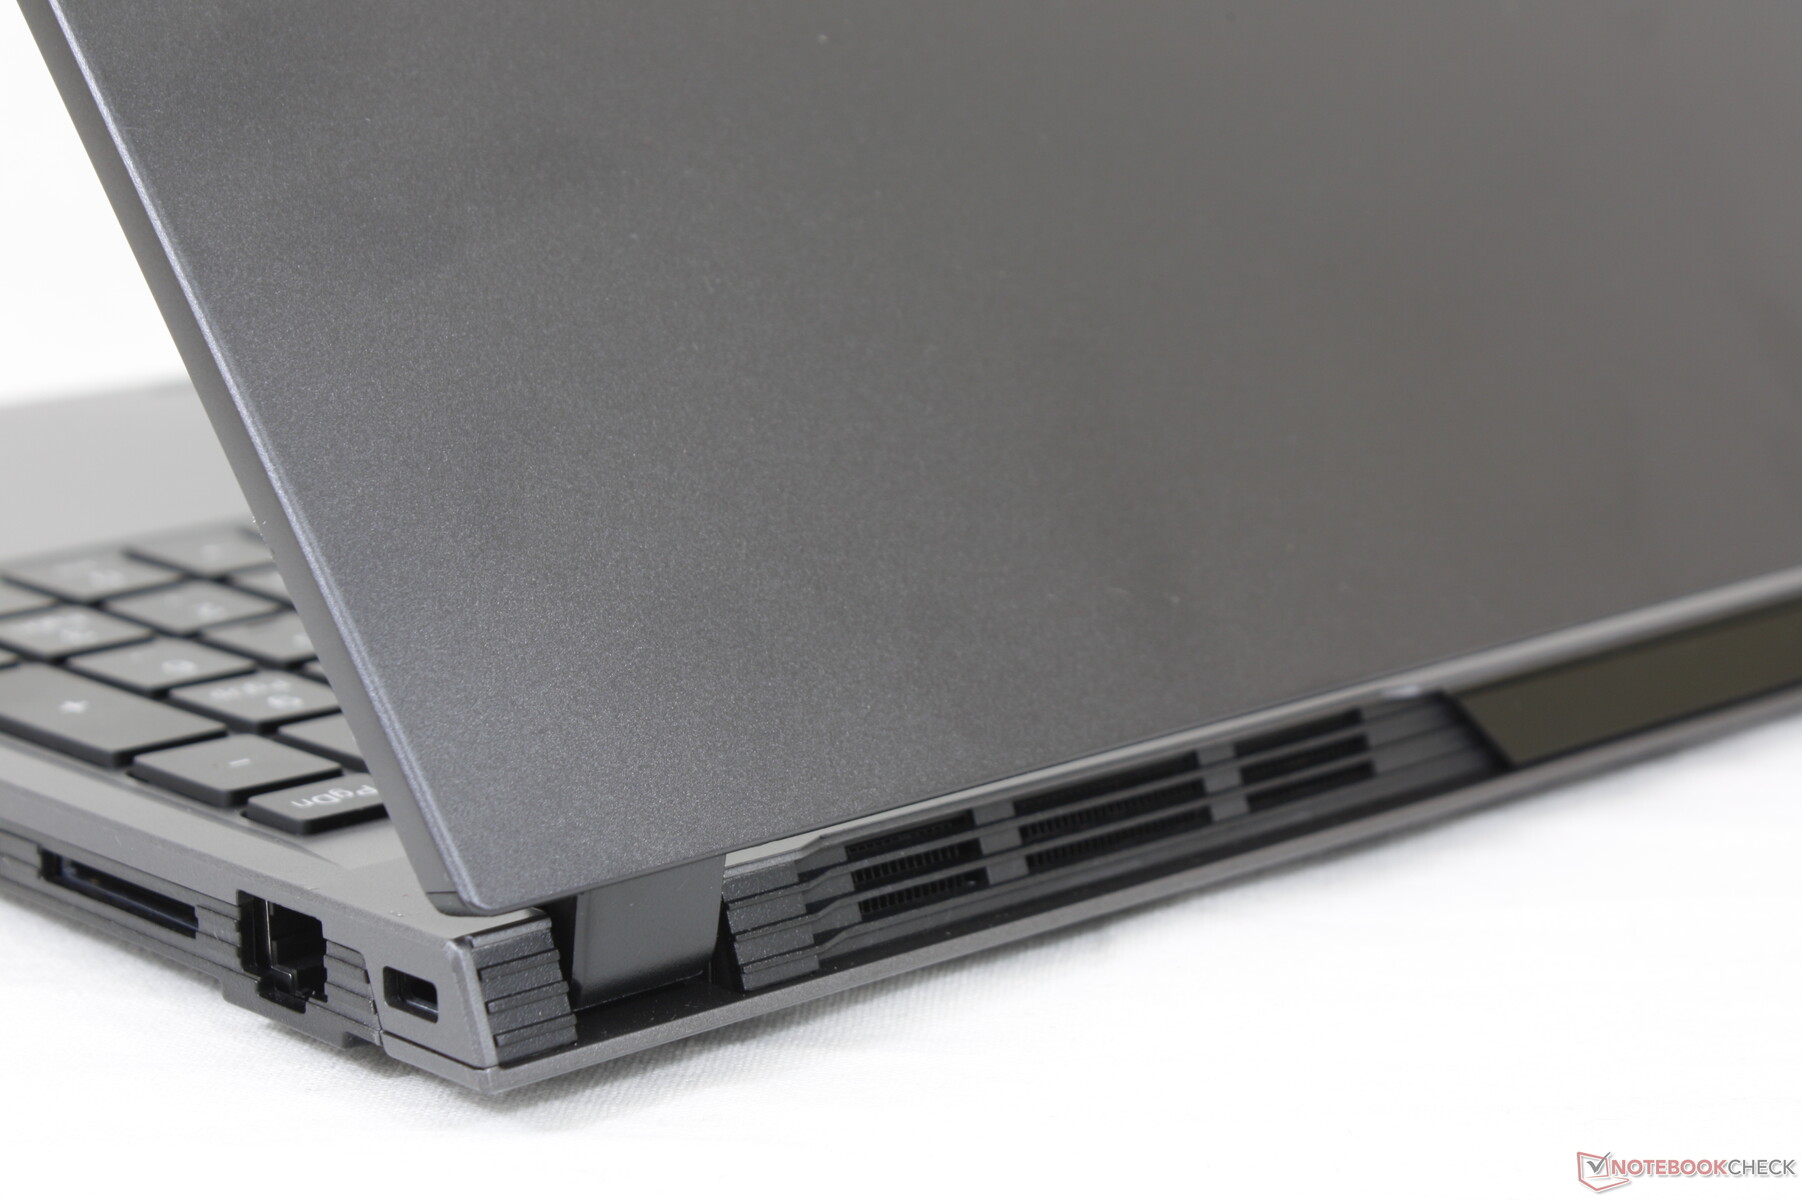
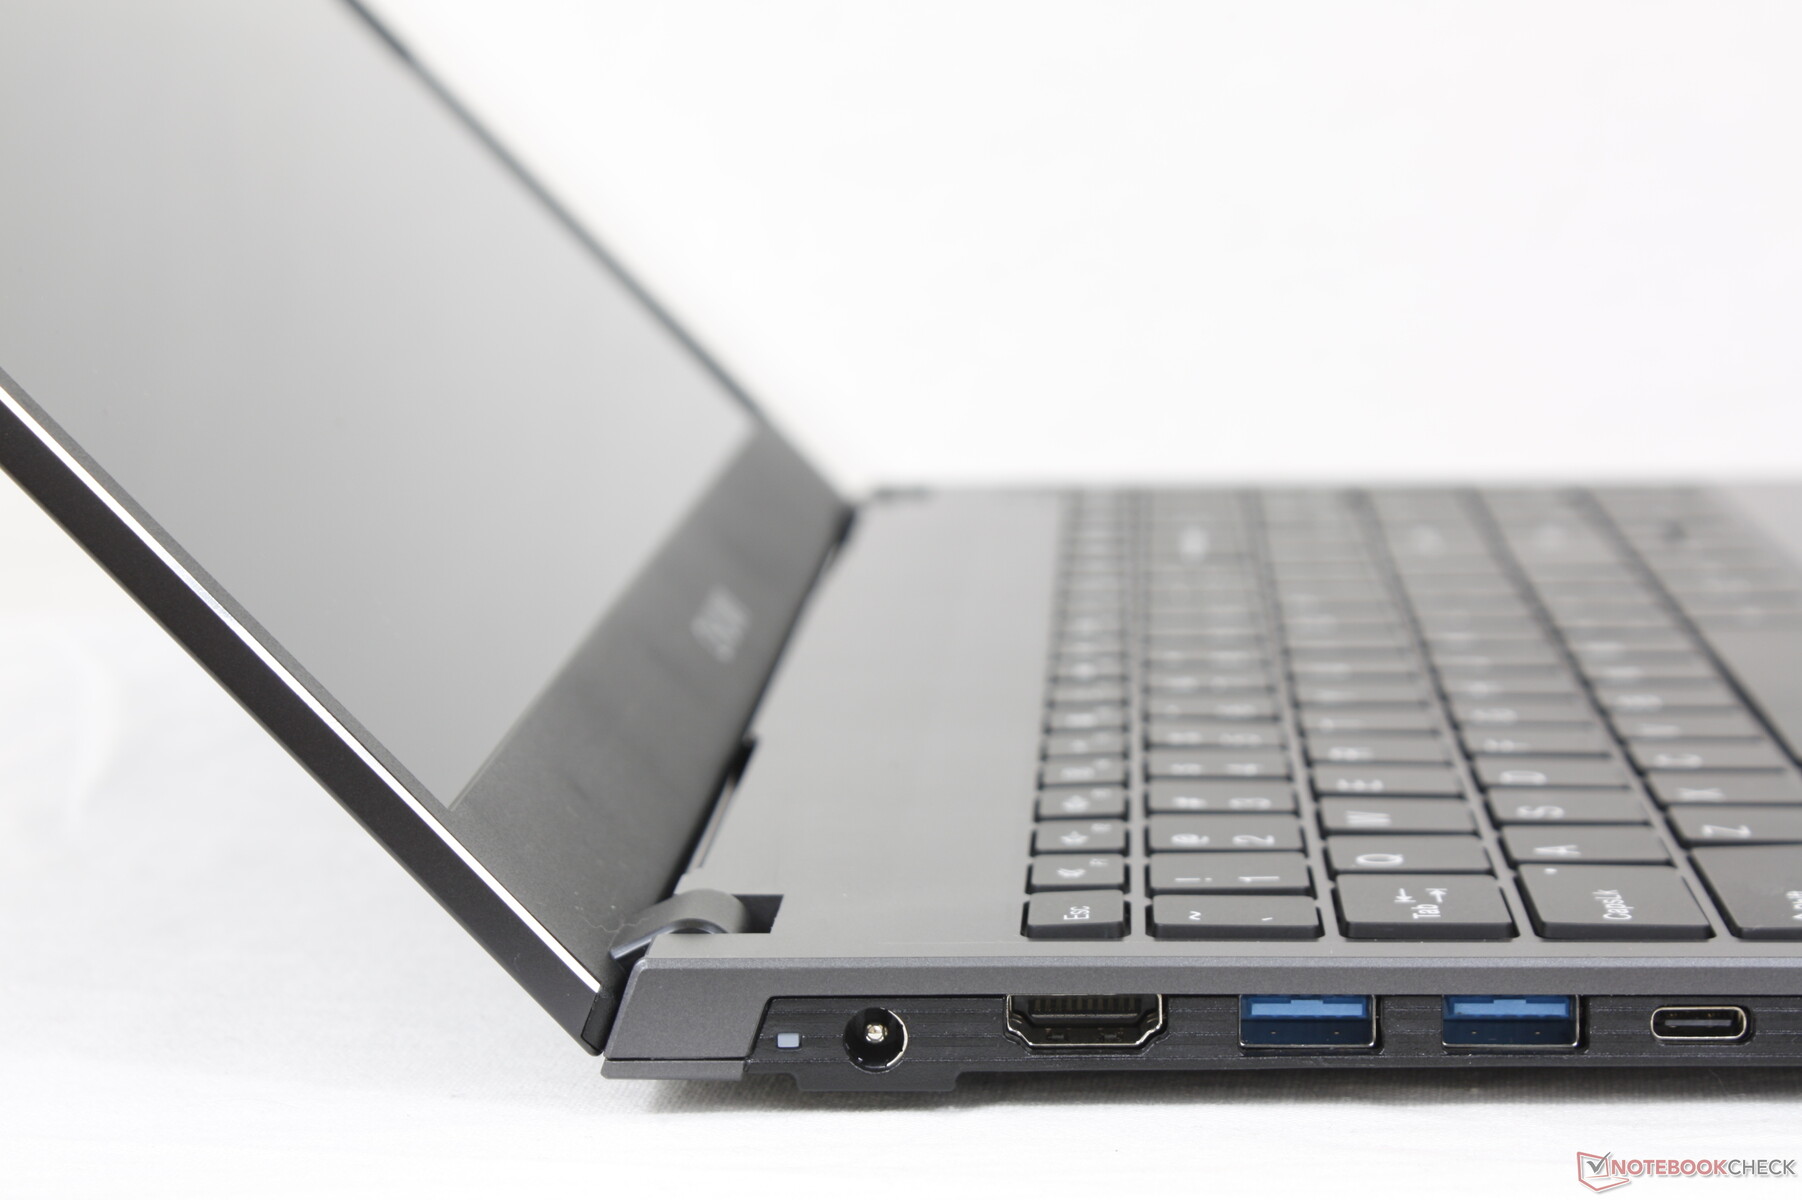
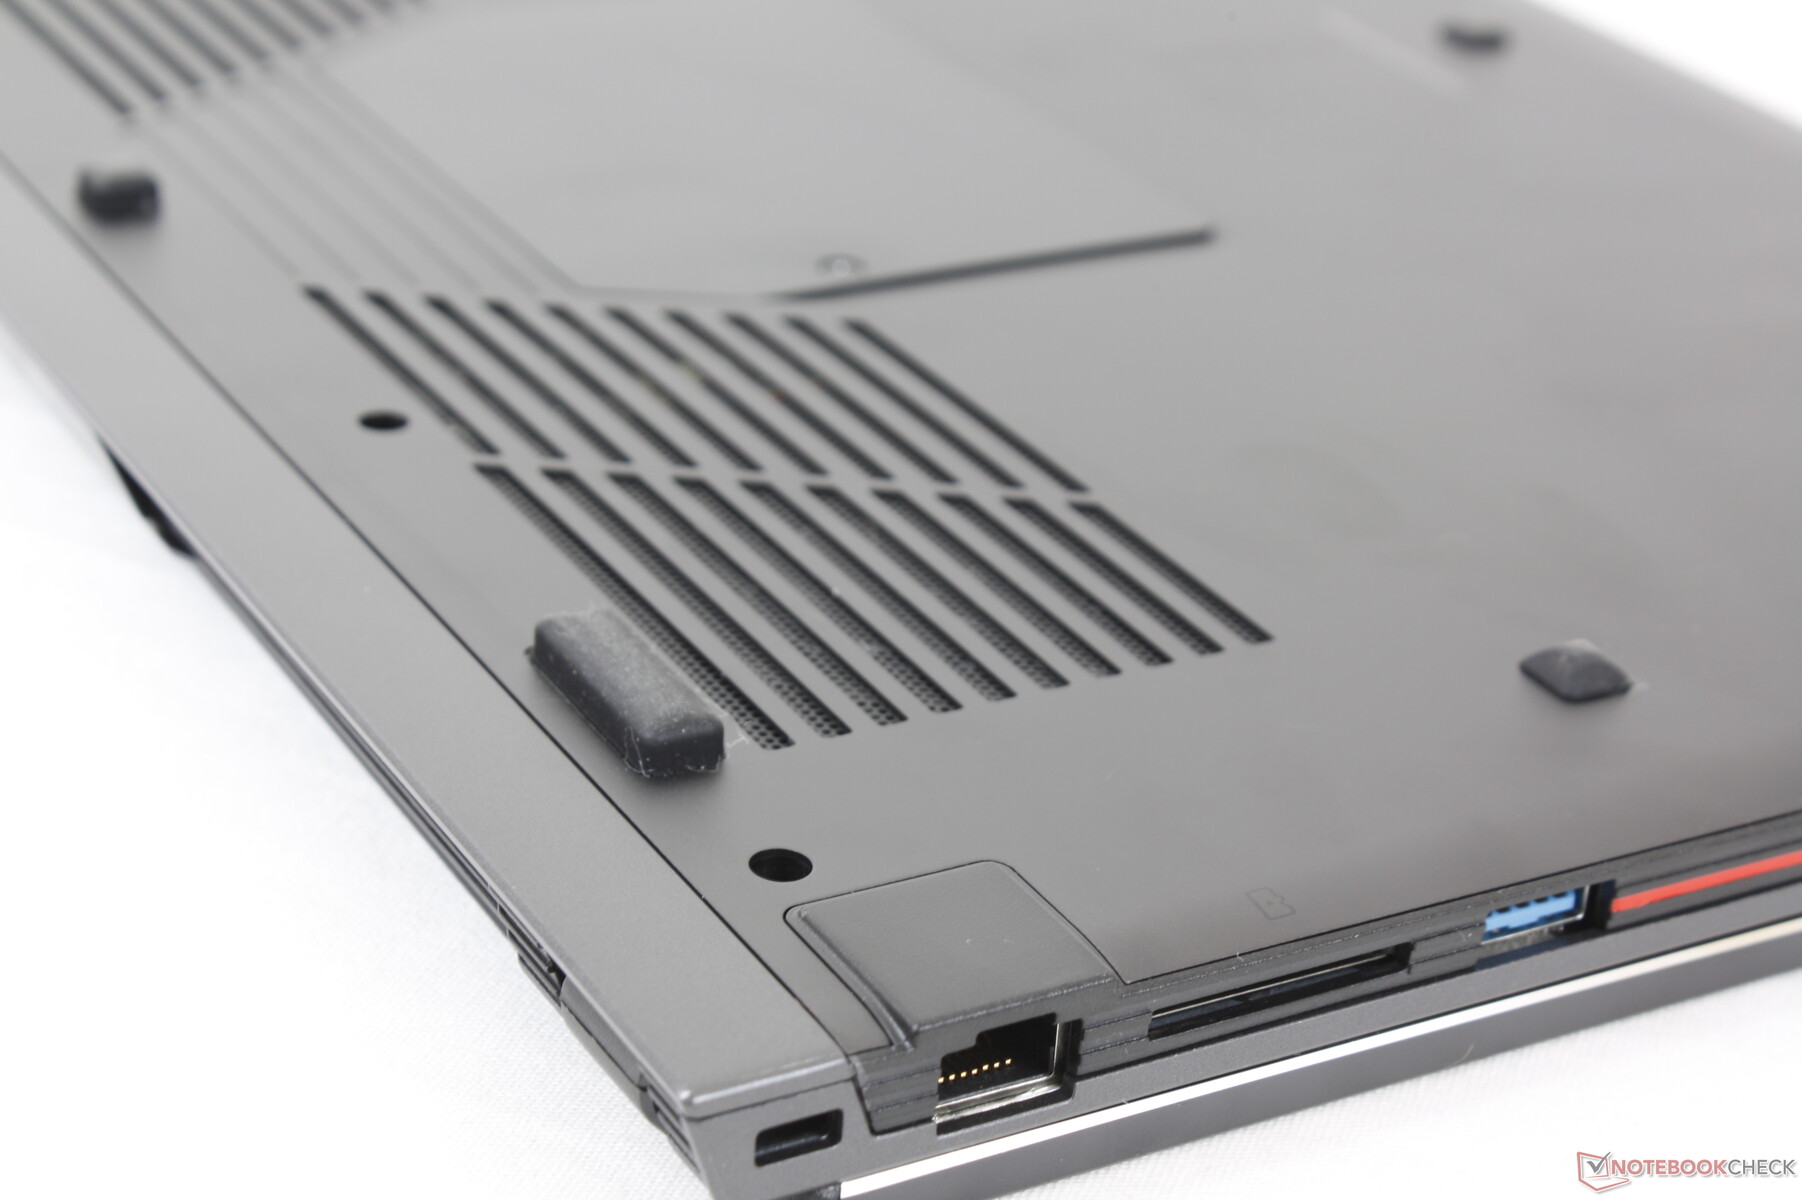
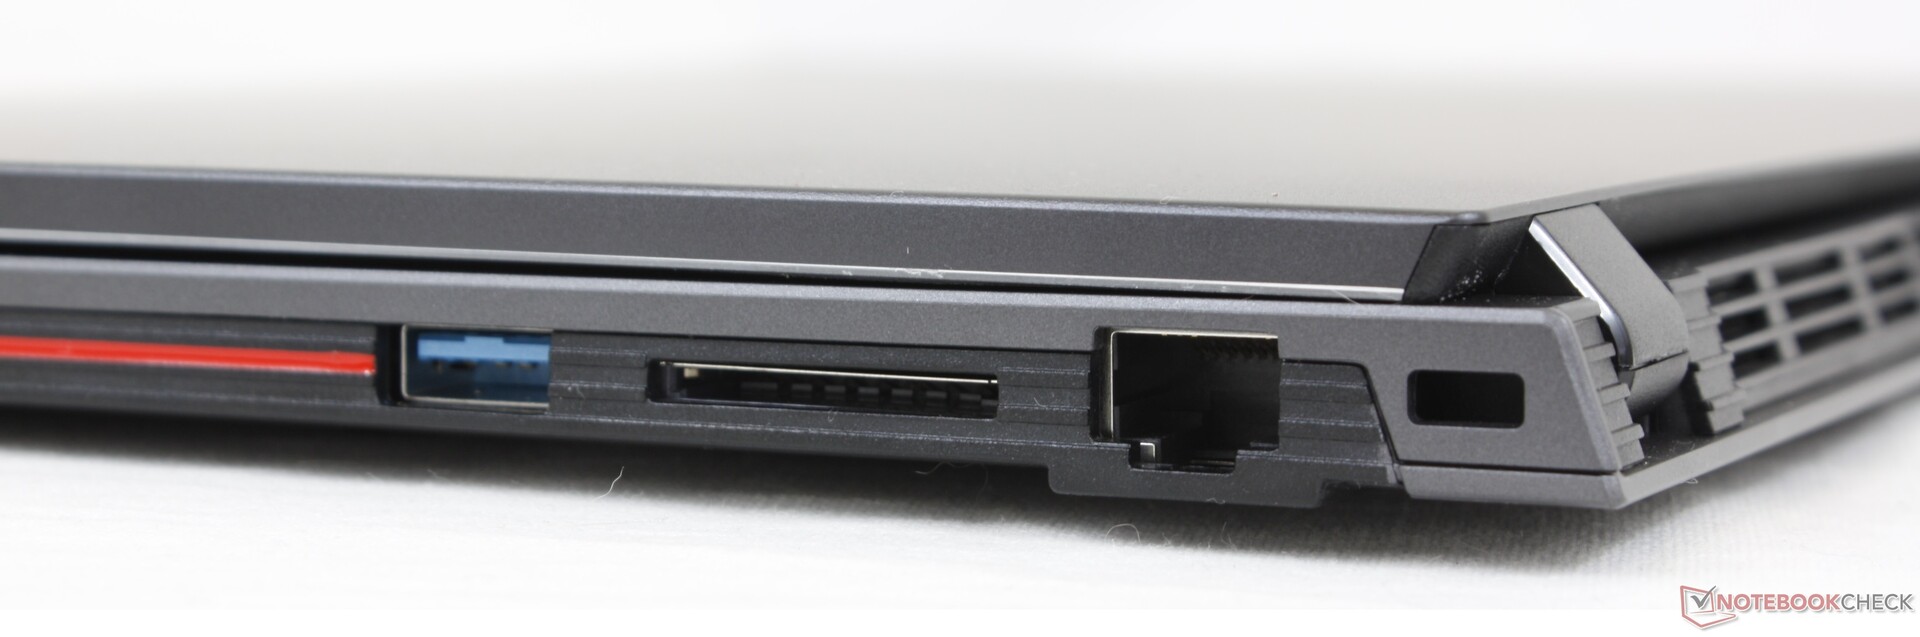
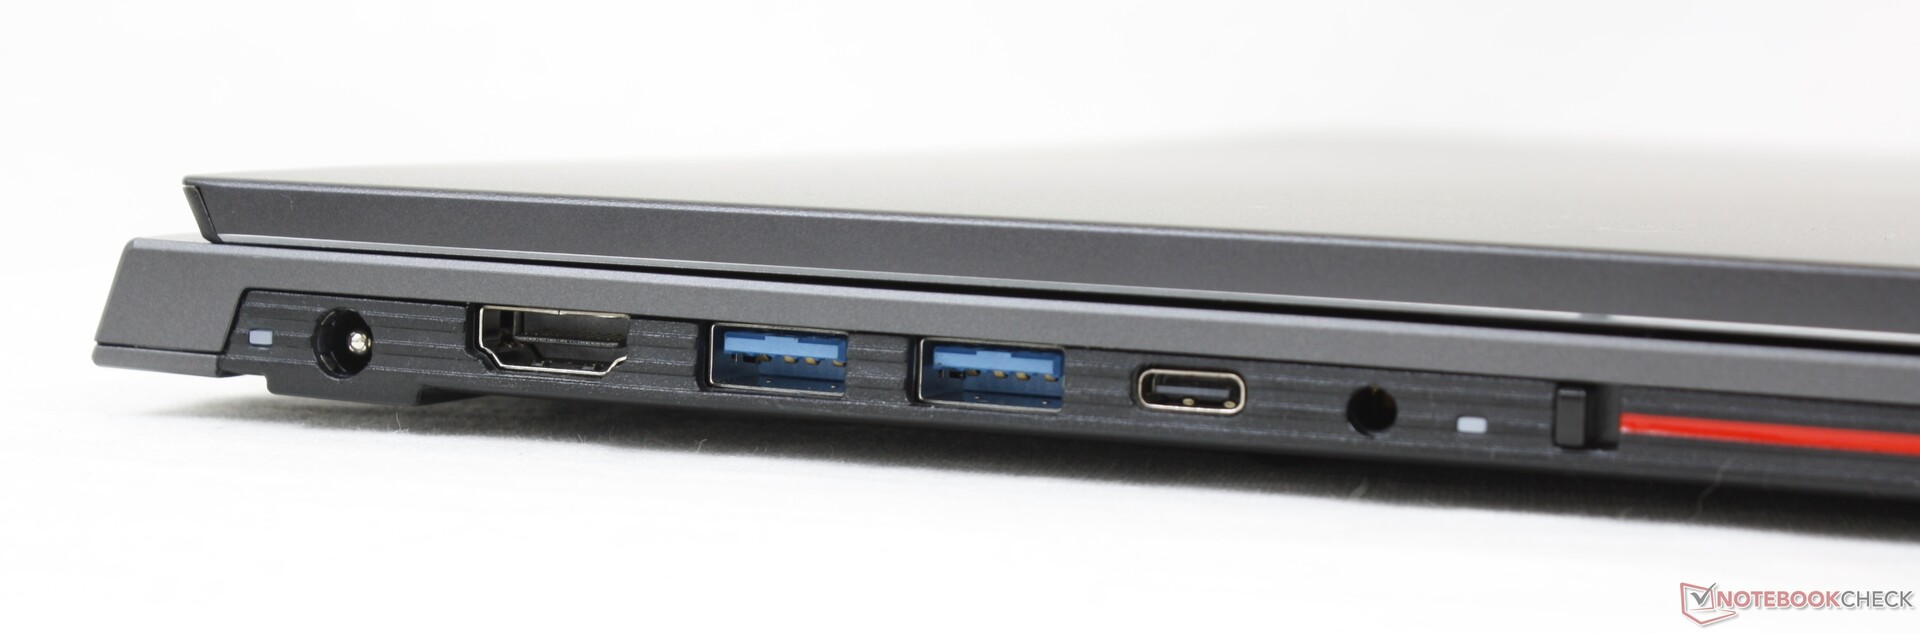
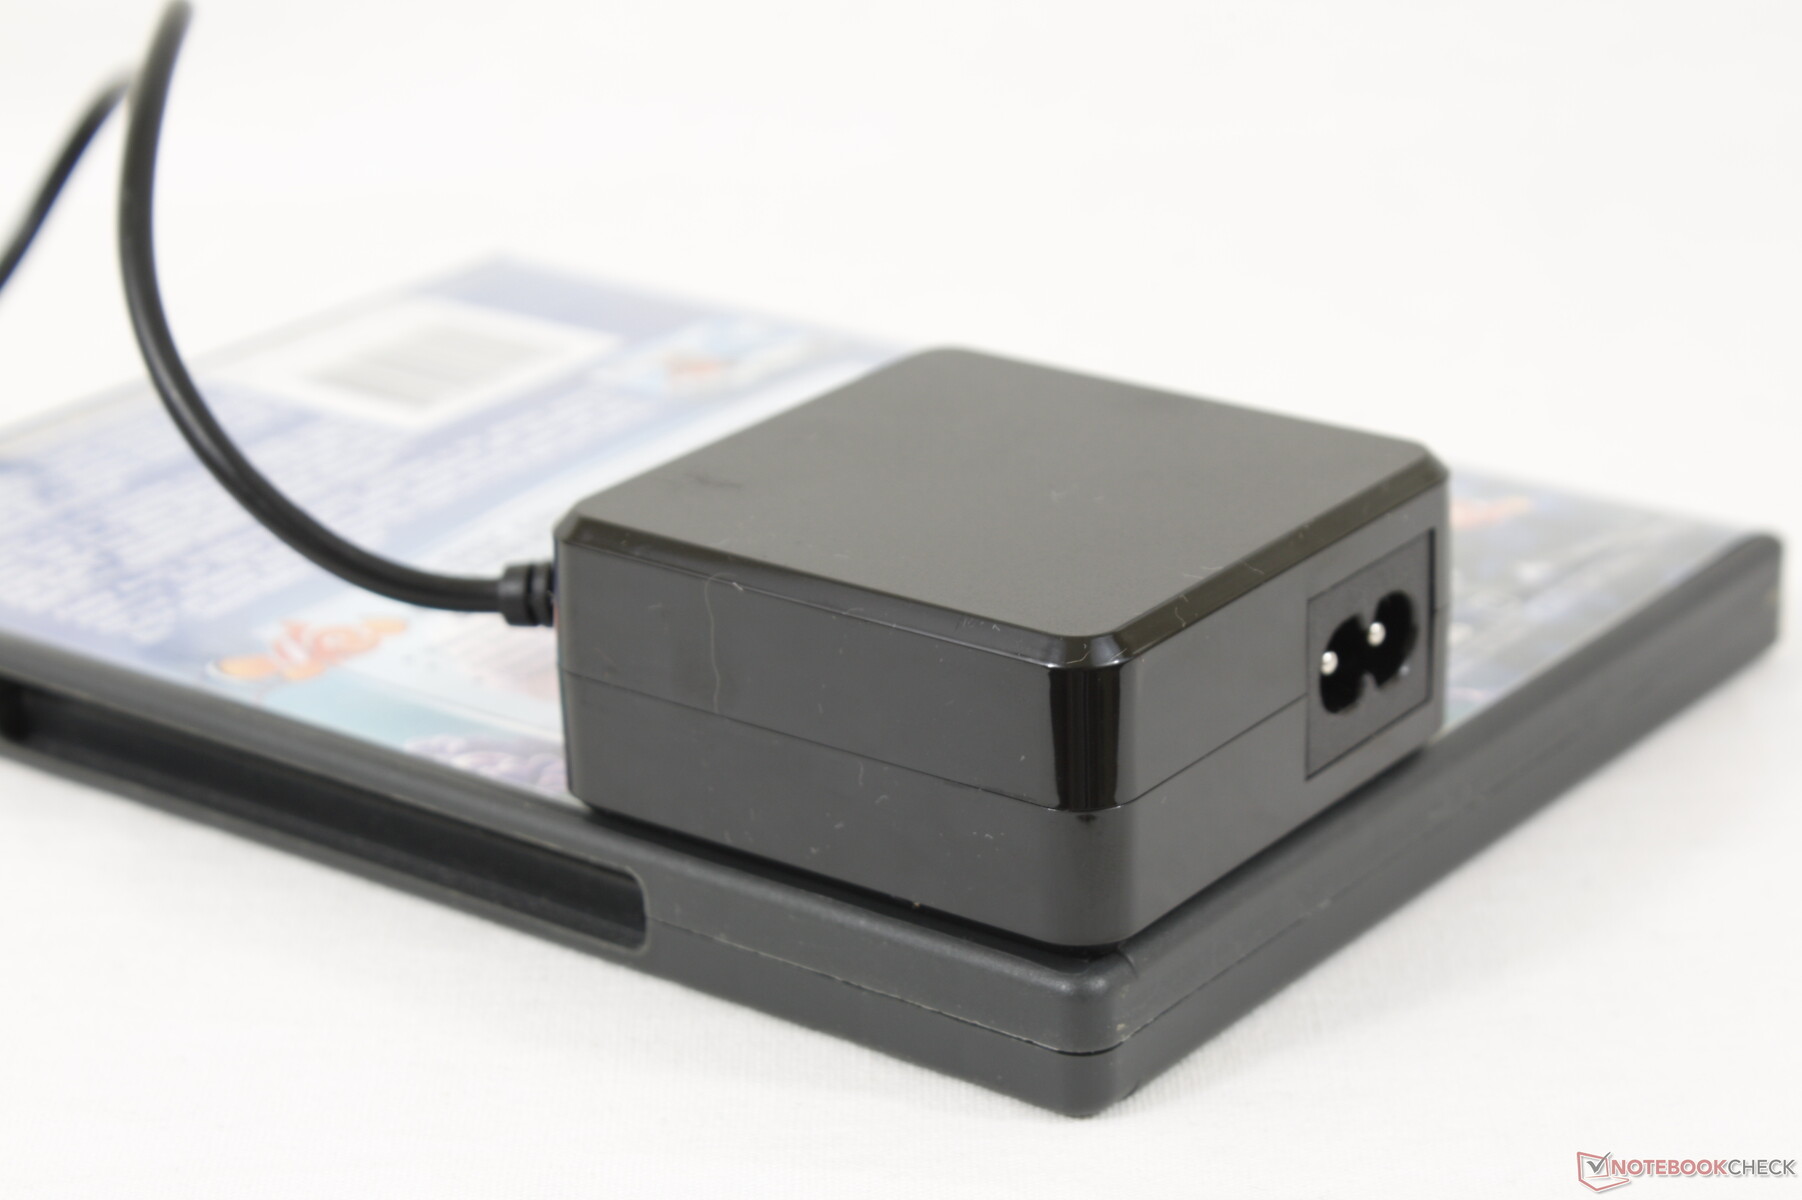
Connectivity — No Power Delivery or DisplayPort
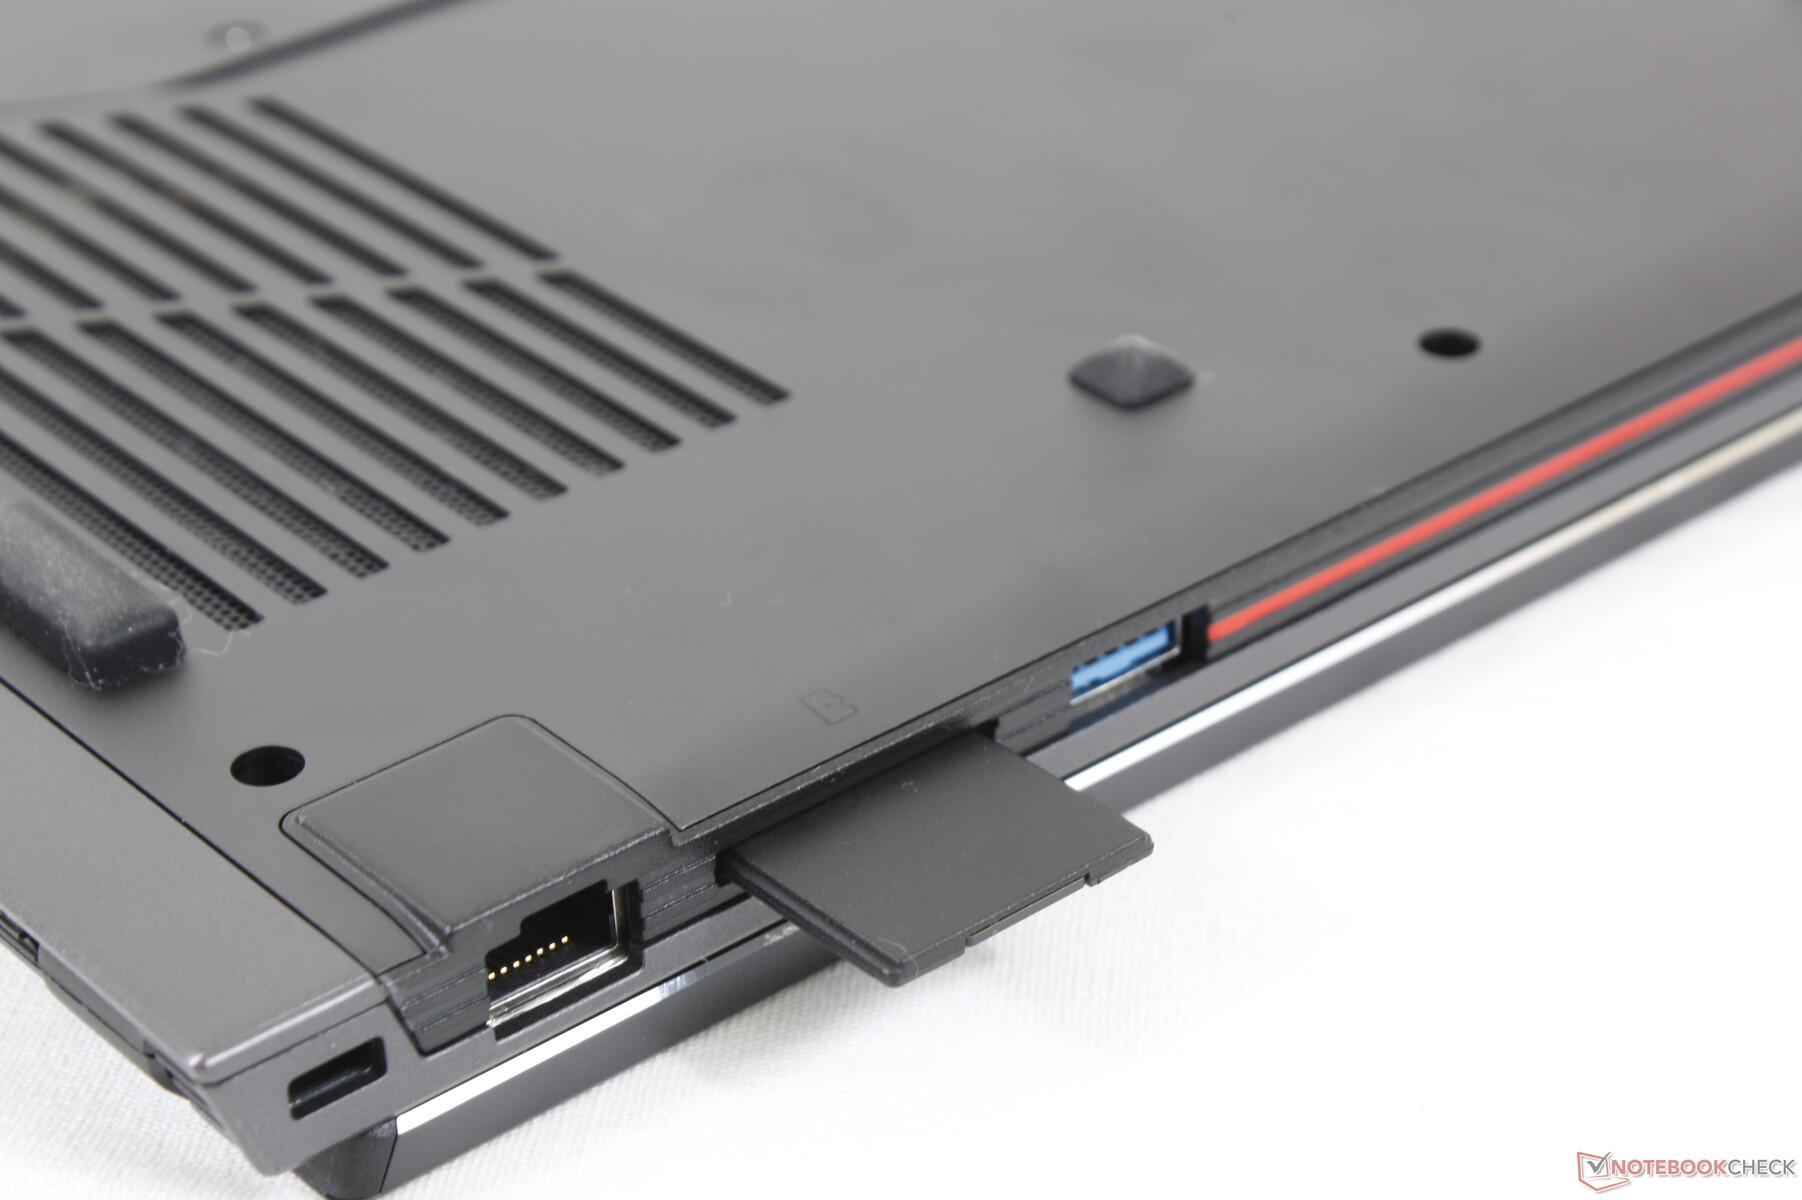
Port options are decent for a 15.6-inch multimedia laptop with plenty of USB ports and even gigabit Ethernet. Unfortunately, the USB-C port does not support DisplayPort or Power Delivery meaning users must use HDMI for any external monitors and the proprietary barrel charger for charging.
SD Card Reader
Transferring 1 GB of photos from our UHS-II SD card to desktop is slow at about 55 seconds compared to just 6 or 7 seconds on a Dell XPS 15.
| SD Card Reader | |
| average JPG Copy Test (av. of 3 runs) | |
| Dell XPS 15 9500 Core i5 (Toshiba Exceria Pro SDXC 64 GB UHS-II) | |
| Tuxedo Aura 15 Gen1 (AV Pro V60) | |
| Asus VivoBook S15 D533UA (AV PRO microSD 128 GB V60) | |
| Teclast TBOLT F15 Pro (AV Pro v60) | |
| Chuwi CoreBook X Pro (AV Pro V60) | |
| maximum AS SSD Seq Read Test (1GB) | |
| Dell XPS 15 9500 Core i5 (Toshiba Exceria Pro SDXC 64 GB UHS-II) | |
| Tuxedo Aura 15 Gen1 (AV Pro V60) | |
| Asus VivoBook S15 D533UA (AV PRO microSD 128 GB V60) | |
| Teclast TBOLT F15 Pro (AV Pro v60) | |
| Chuwi CoreBook X Pro (AV Pro V60) | |
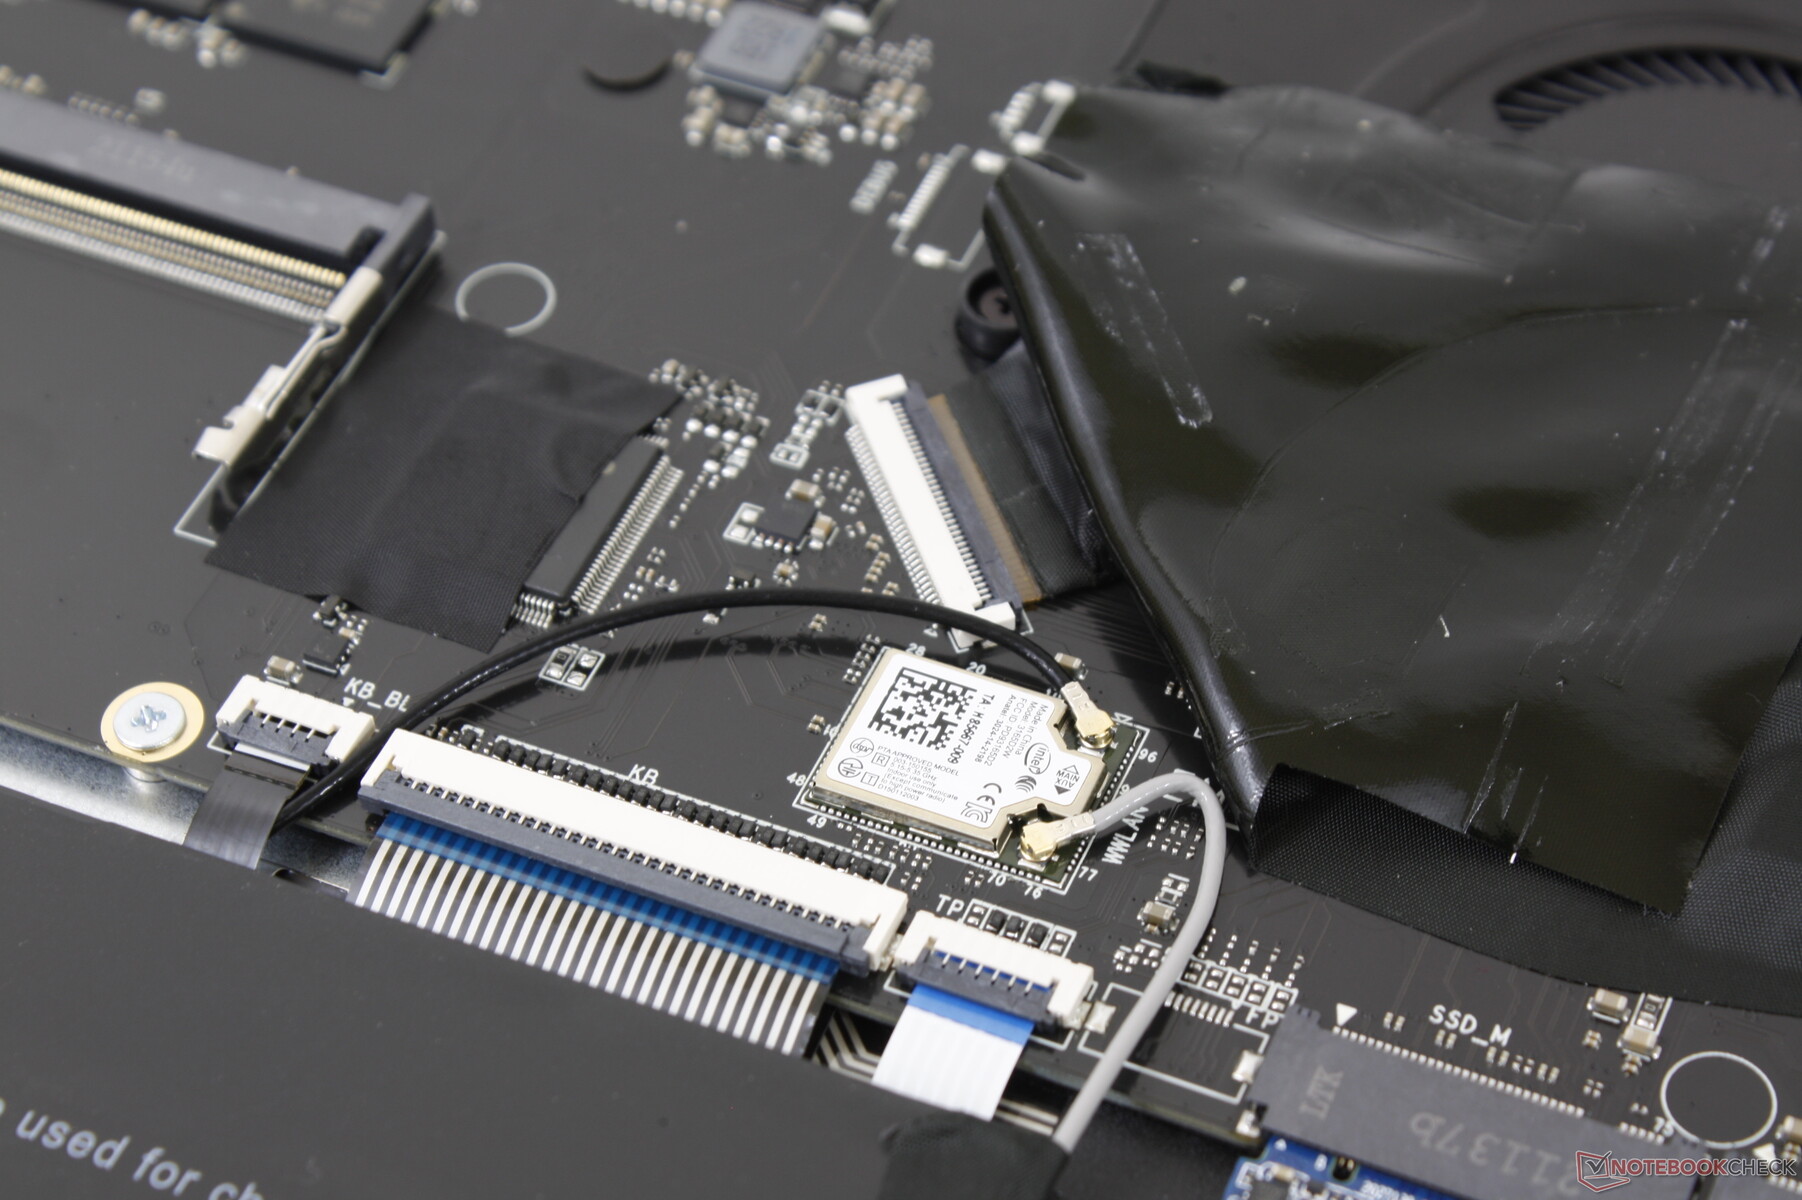
Communication
Wireless performance is below average for the integrated 1x1 Intel 3165 module. Though good enough for browsing and streaming, transfer rates could have been more stable as shown below when paired to our Netgear RAX200 test router.
| Networking | |
| iperf3 transmit AX12 | |
| Tuxedo Aura 15 Gen1 | |
| Asus VivoBook S15 D533UA | |
| Dell XPS 15 9500 Core i5 | |
| Honor MagicBook 15 | |
| Chuwi CoreBook X Pro | |
| Teclast TBOLT F15 Pro | |
| iperf3 receive AX12 | |
| Dell XPS 15 9500 Core i5 | |
| Asus VivoBook S15 D533UA | |
| Tuxedo Aura 15 Gen1 | |
| Honor MagicBook 15 | |
| Teclast TBOLT F15 Pro | |
| Chuwi CoreBook X Pro | |
Webcam
Camera quality is poor even by the already low standards of laptop webcams. Color temperature is far too warm, colors are very off, and the overall picture is muddy despite our bright ambient lighting.


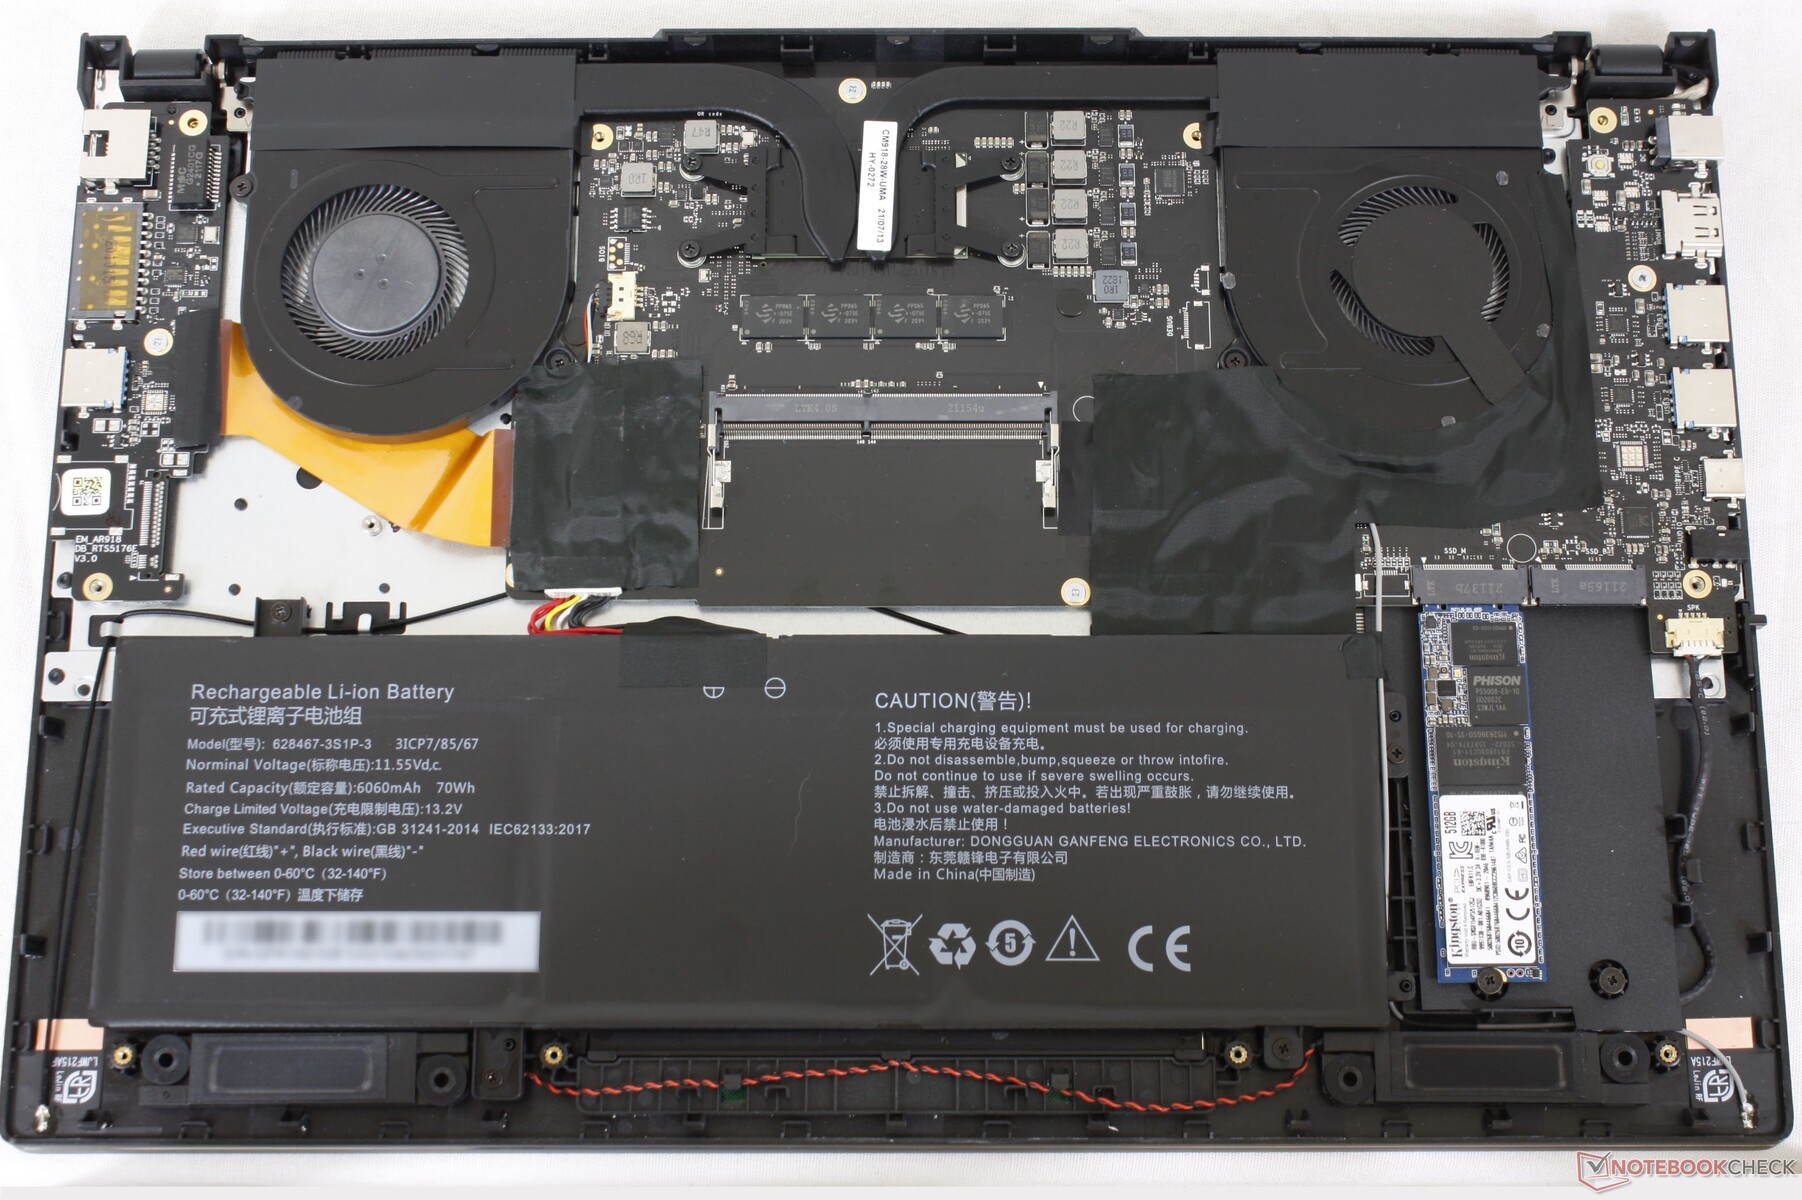
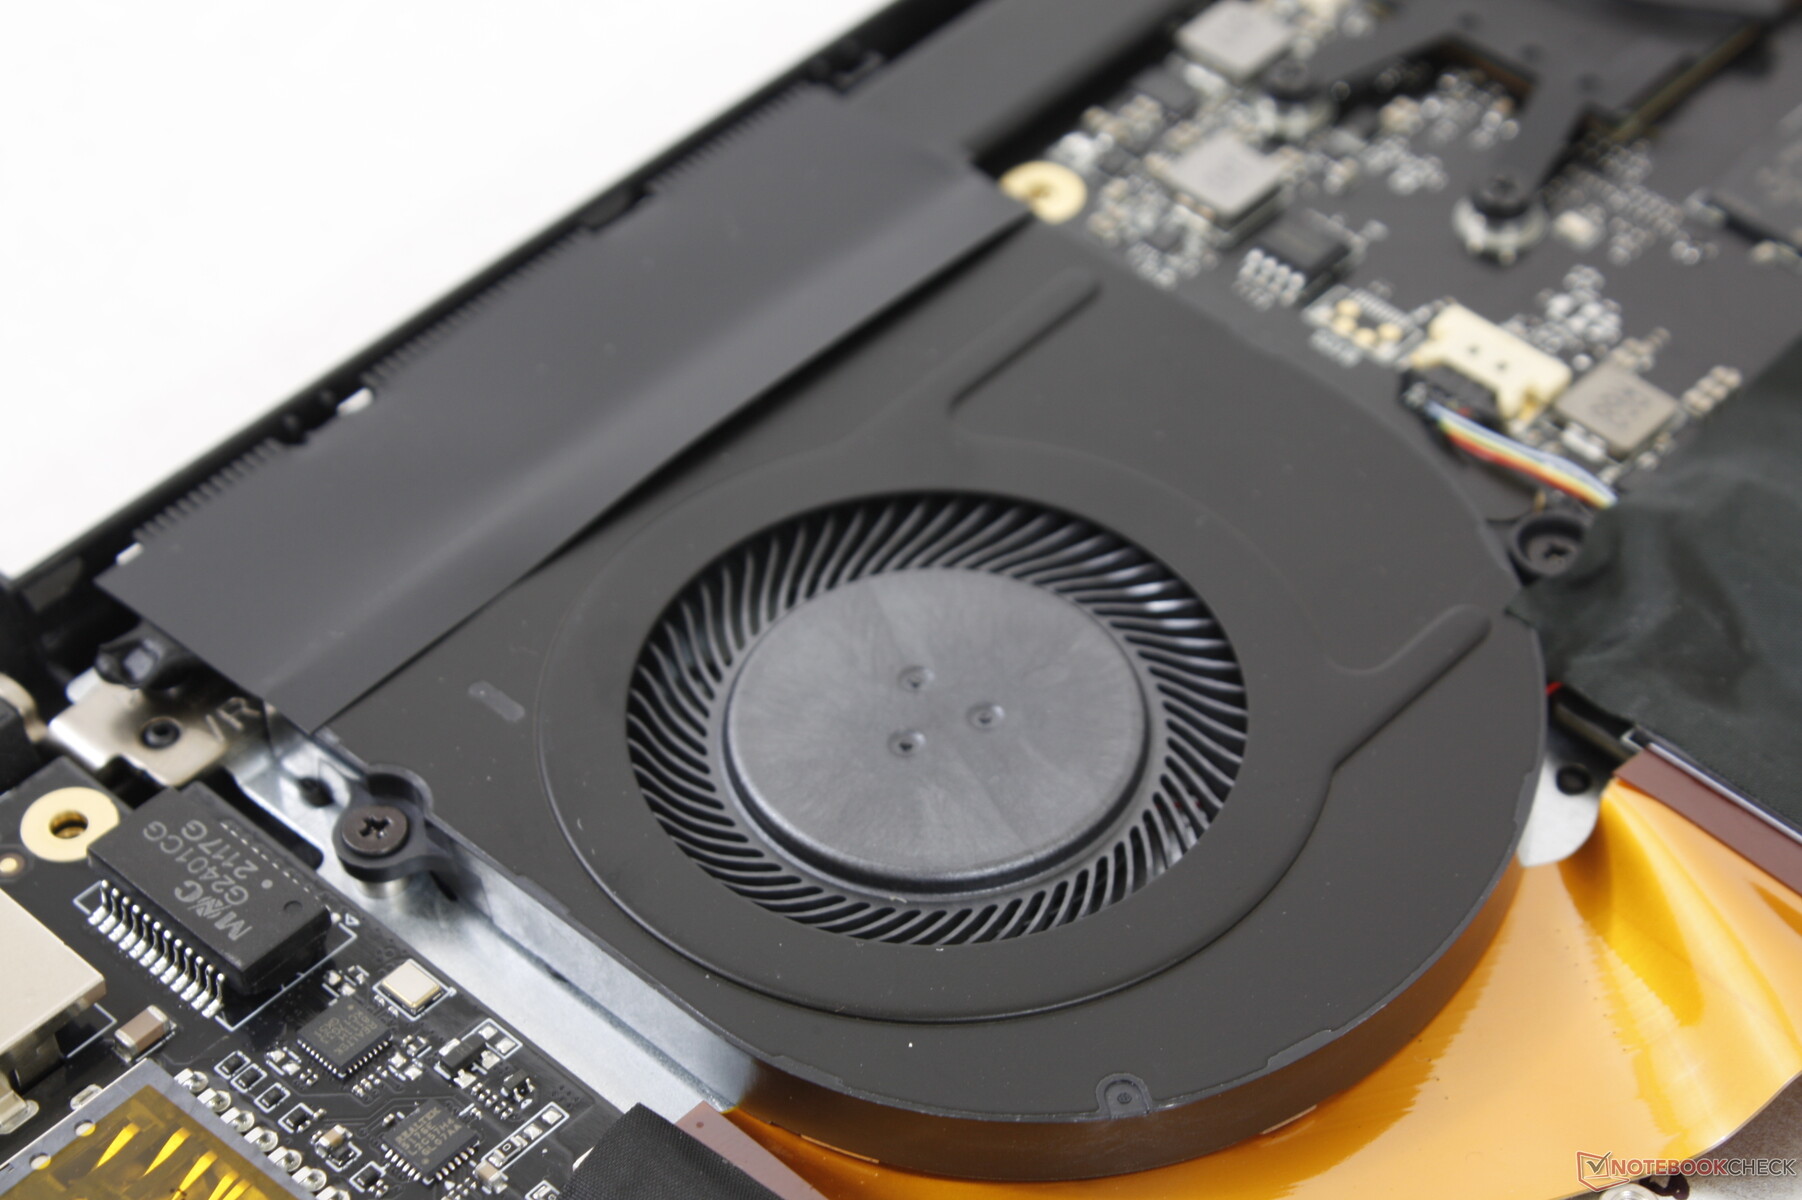
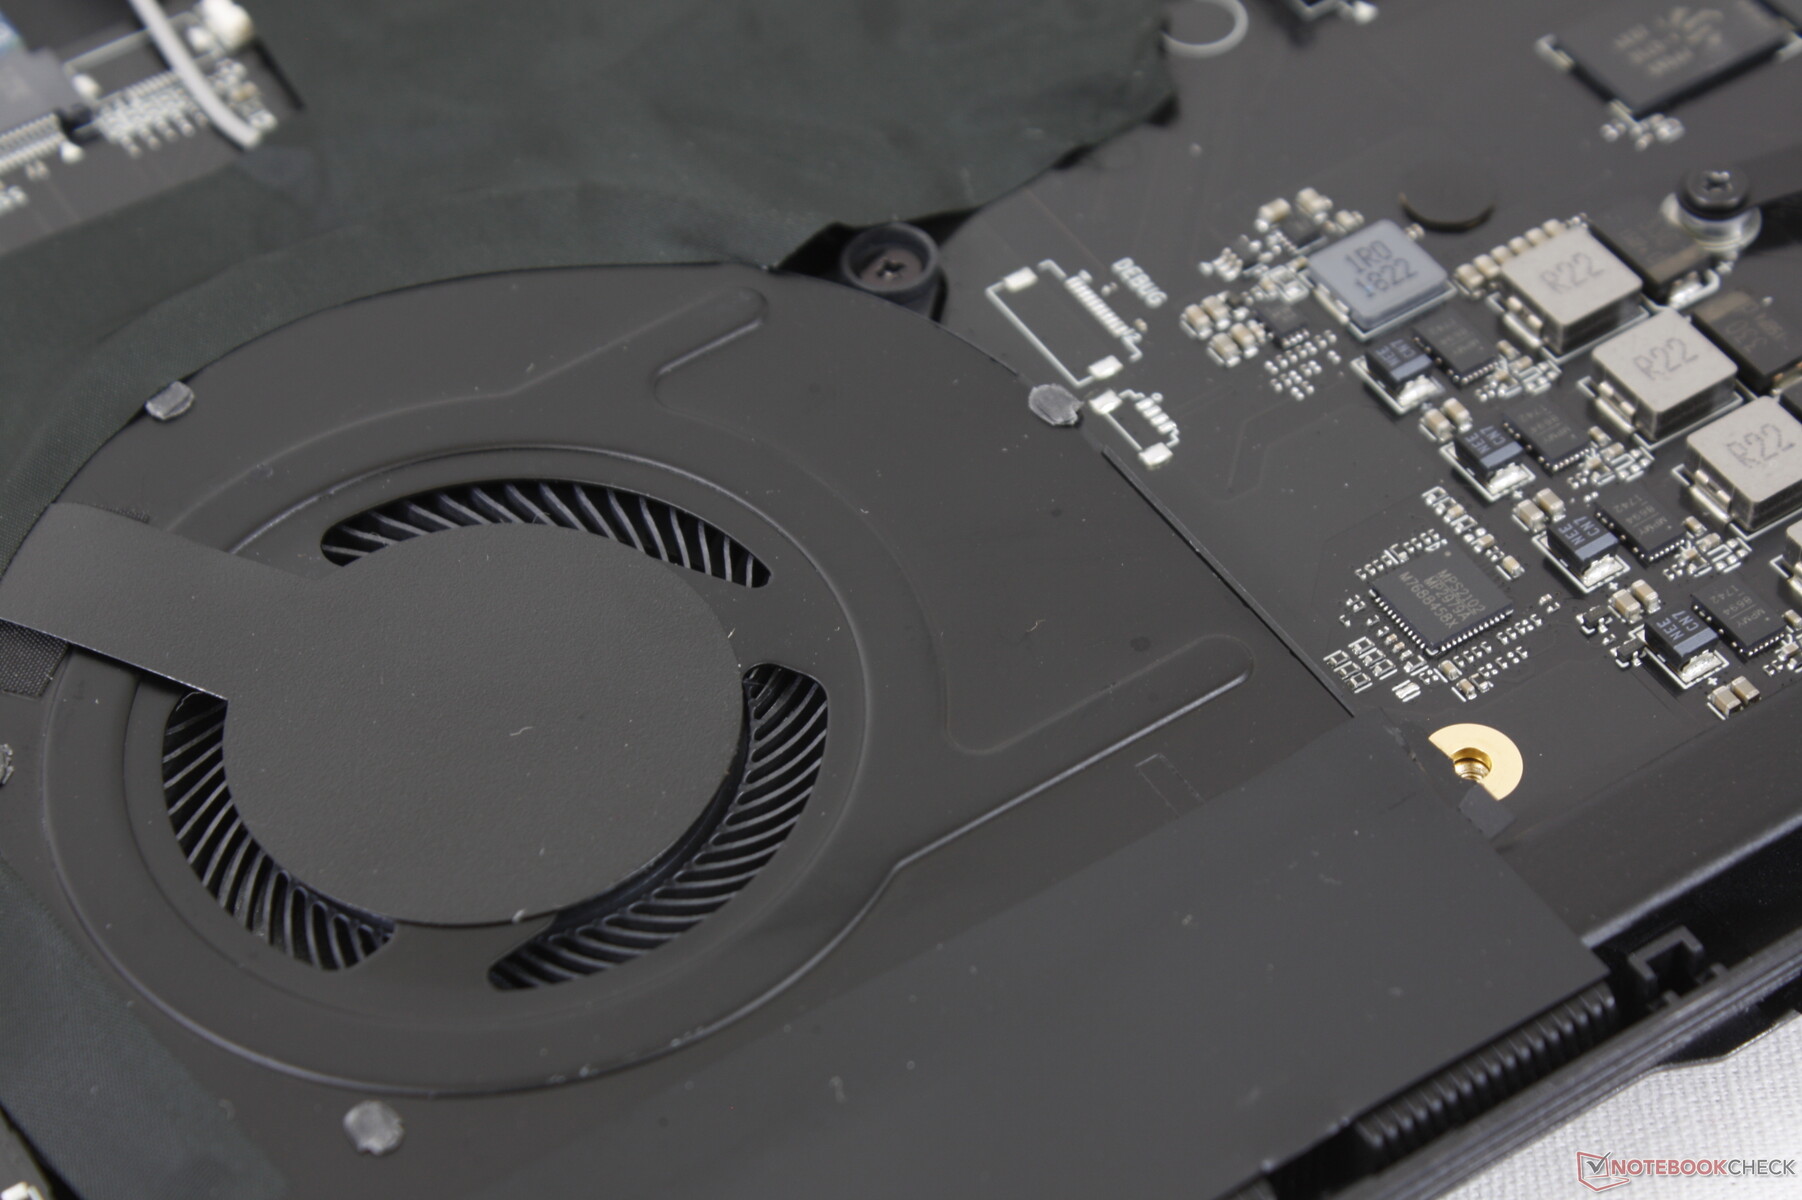
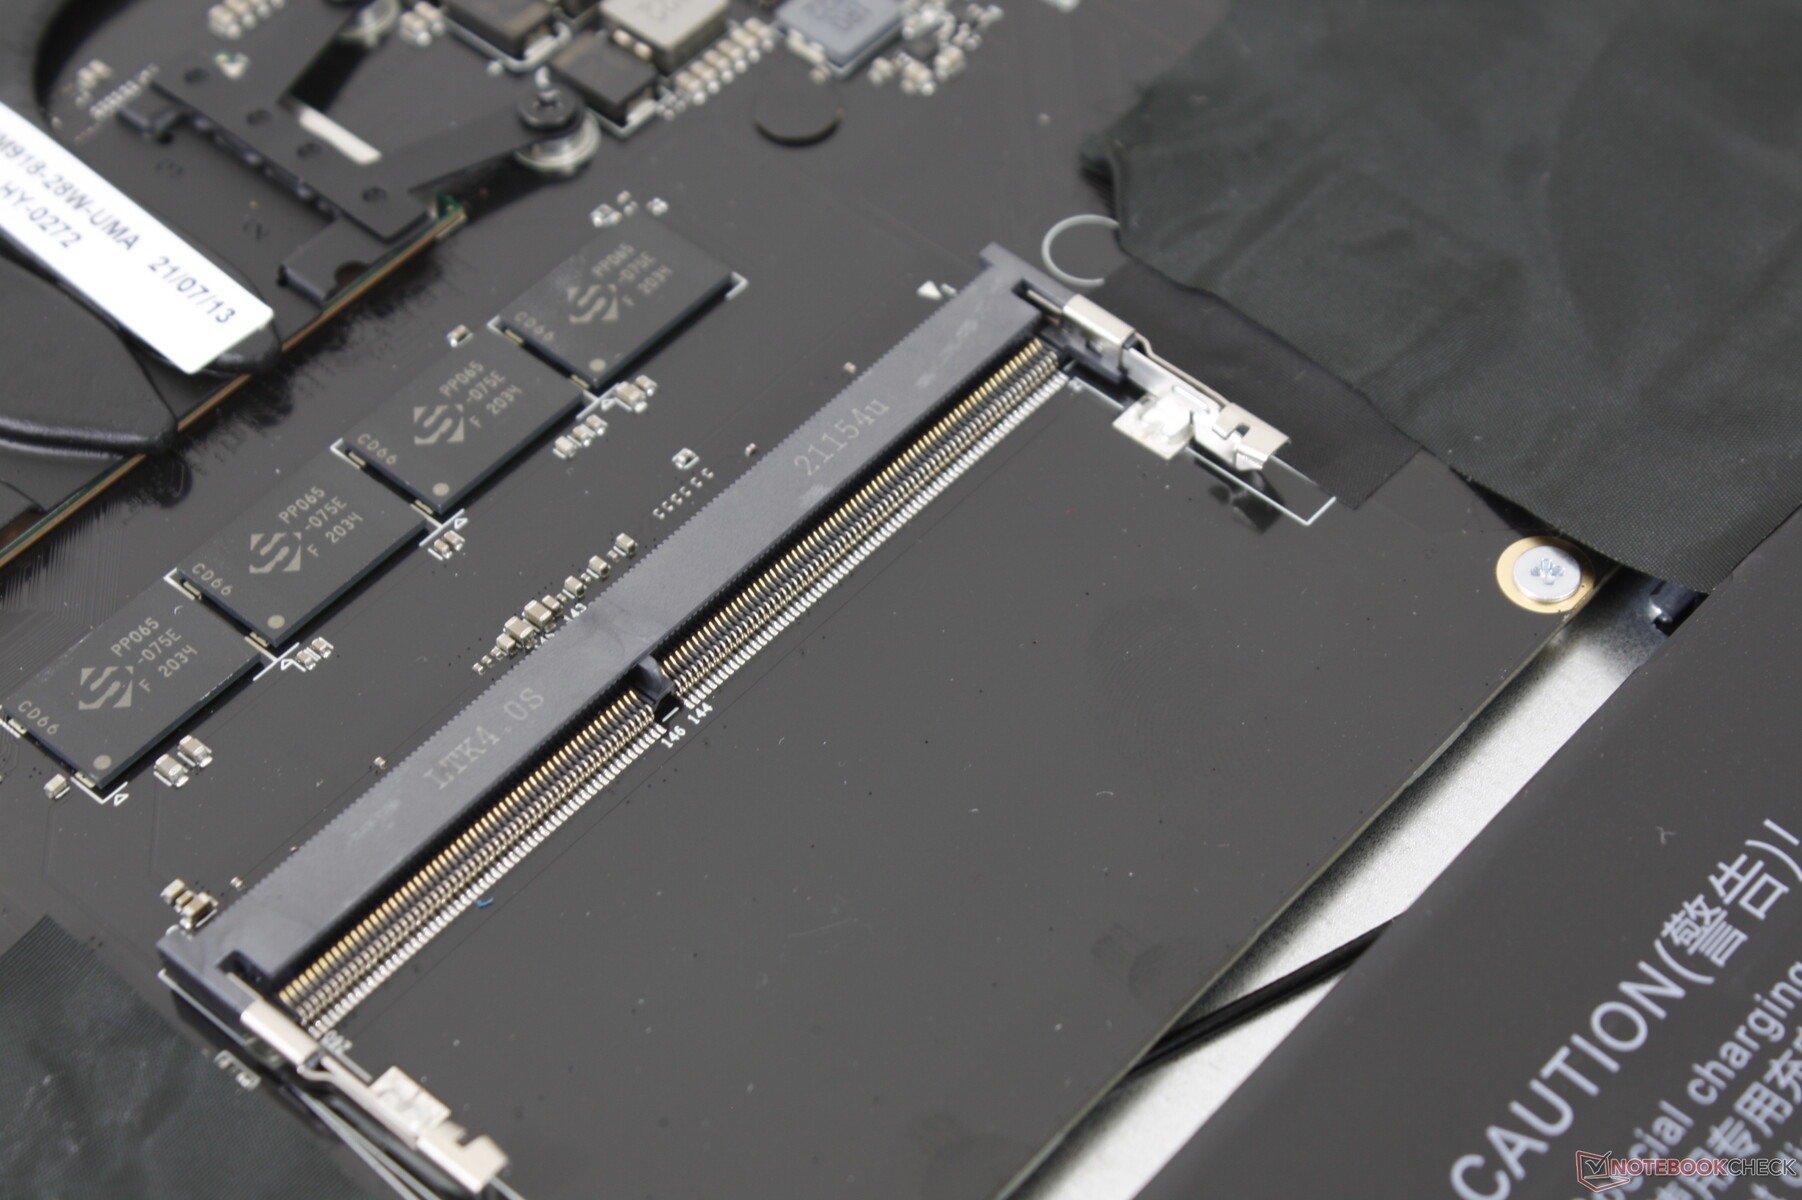
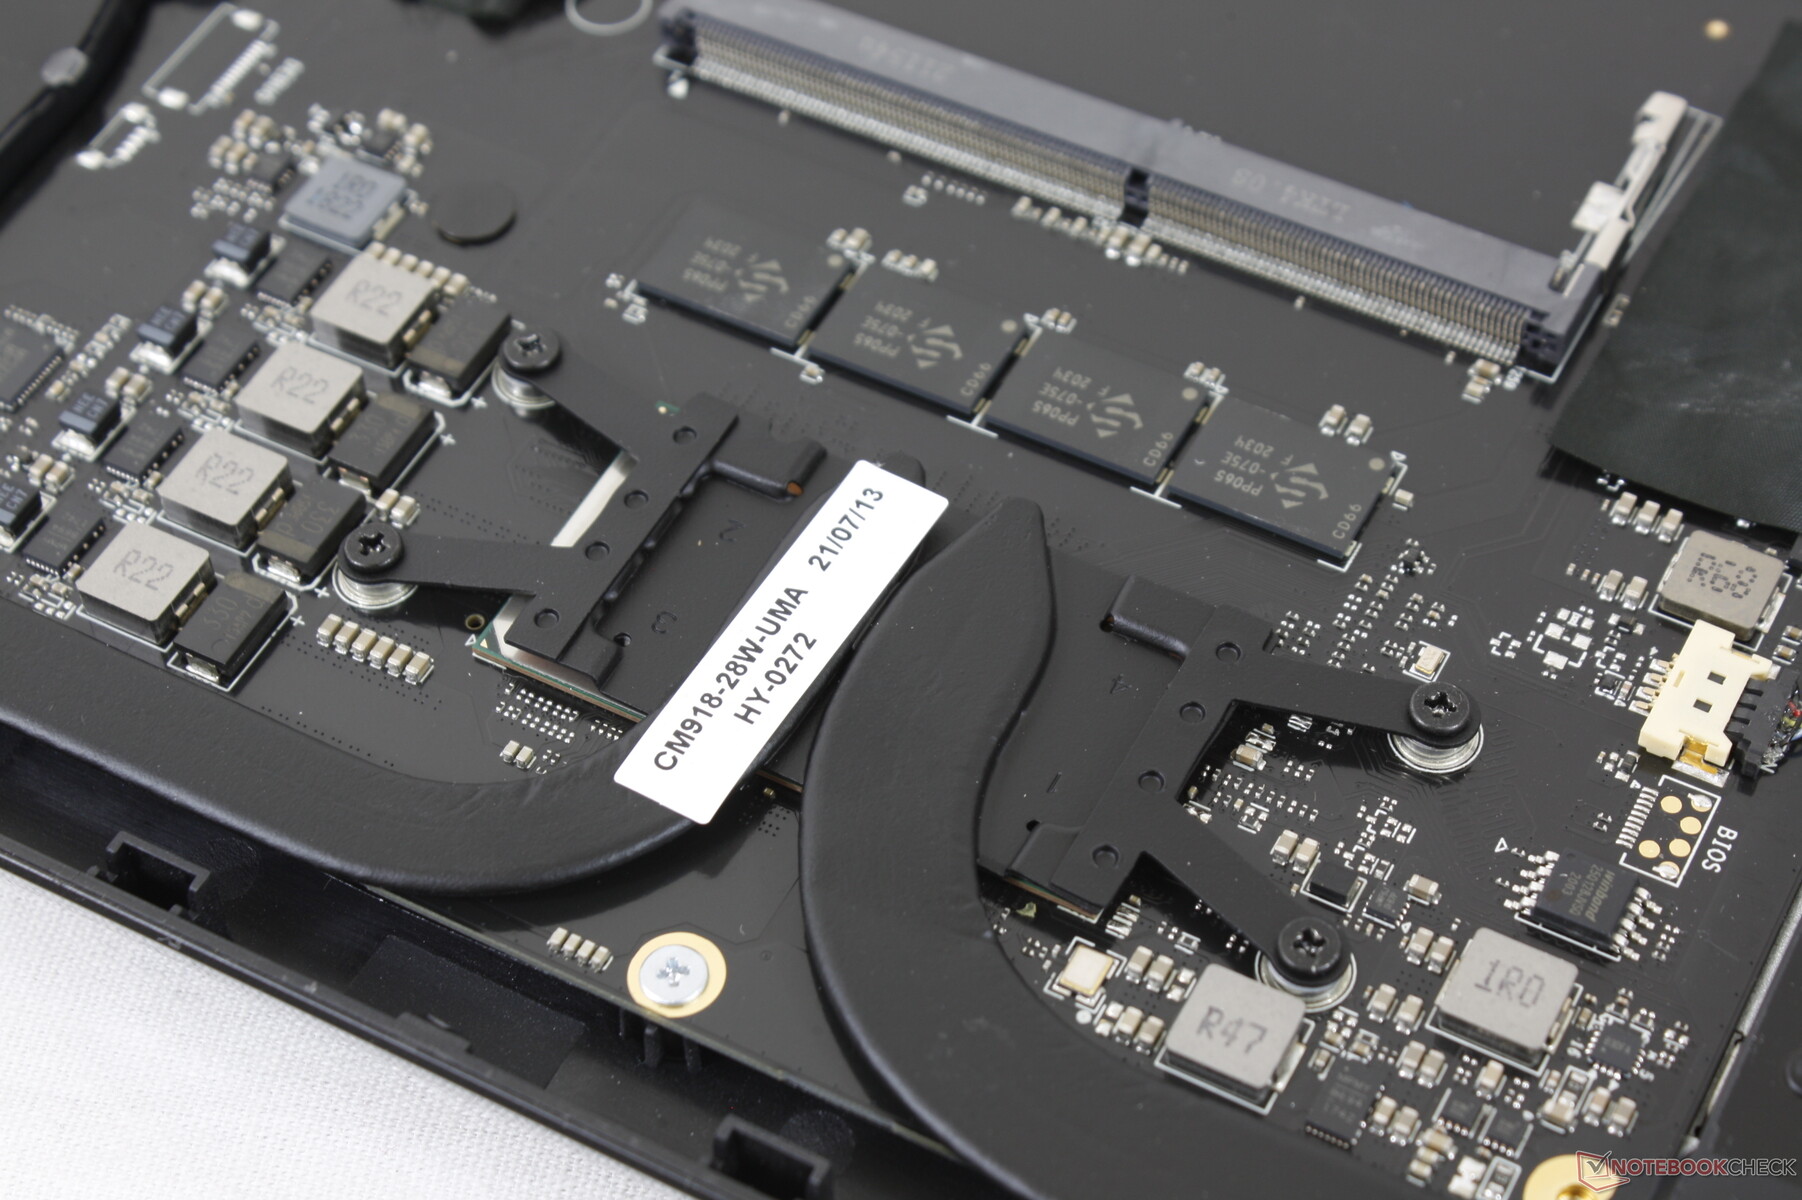
Maintenance
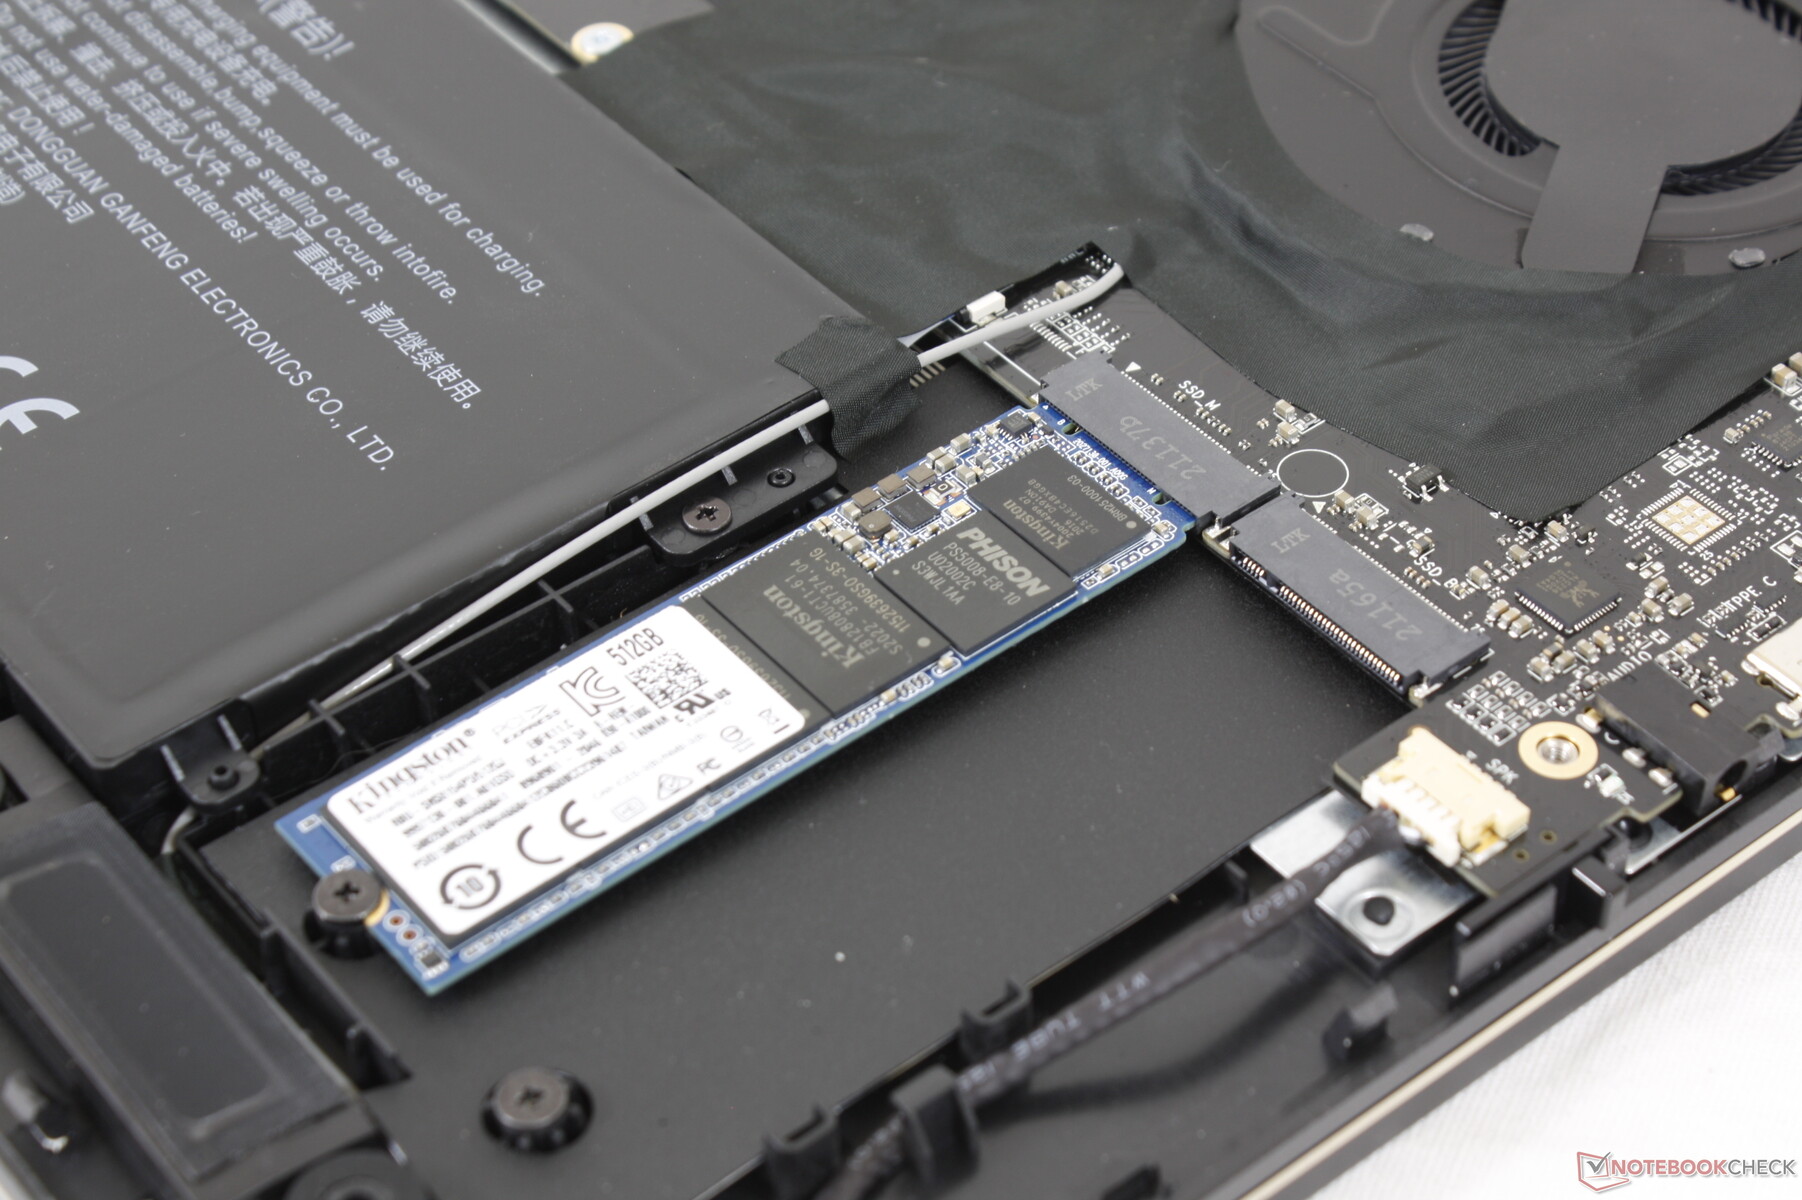
The bottom panel can be easily removed with just a Philips screwdriver and sharp edge. Users have direct access to 2x M.2 bays and a SODIMM slot for expansion.
Accessories and Warranty
There are no extras in the box other than the paperwork and AC adapter. A one year limited manufacturer warranty applies, but claiming warranty may be difficult for buyers overseas due to shipment.
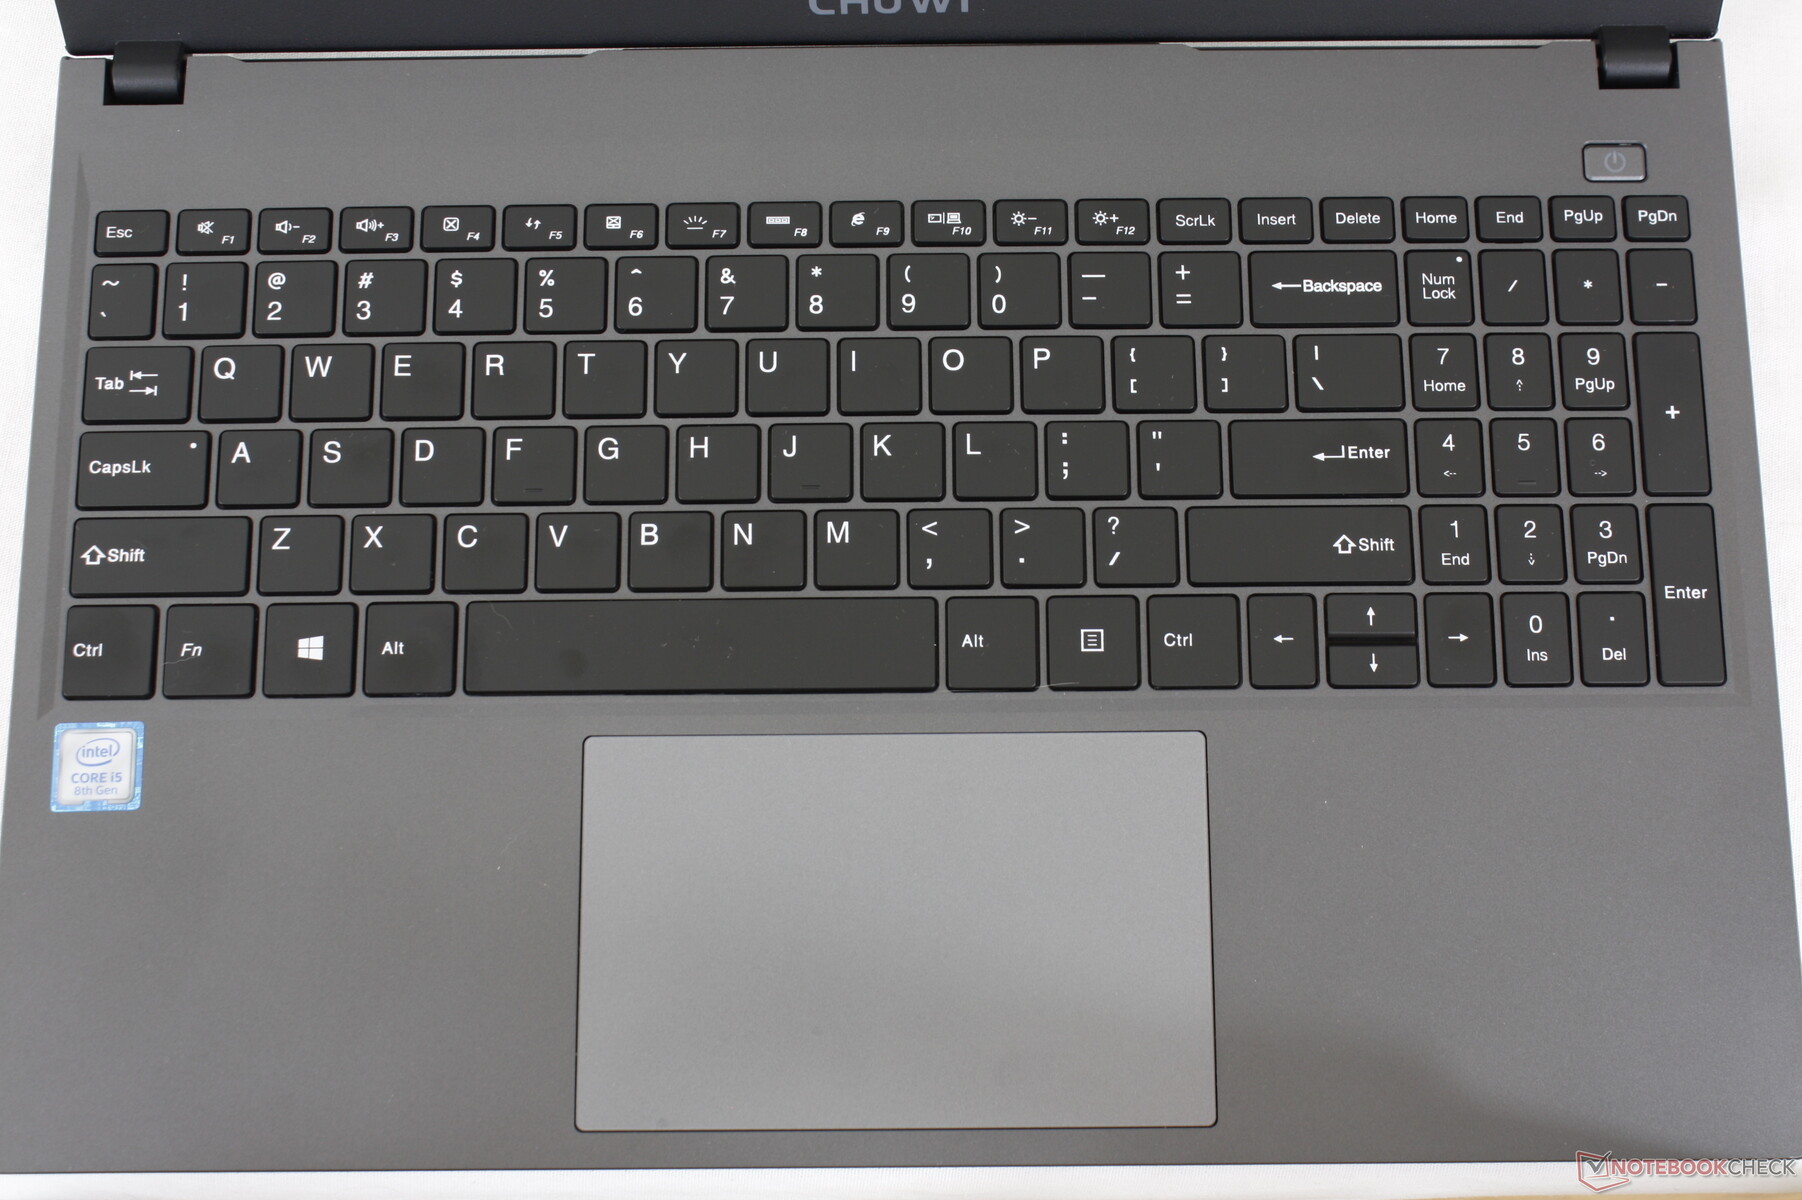
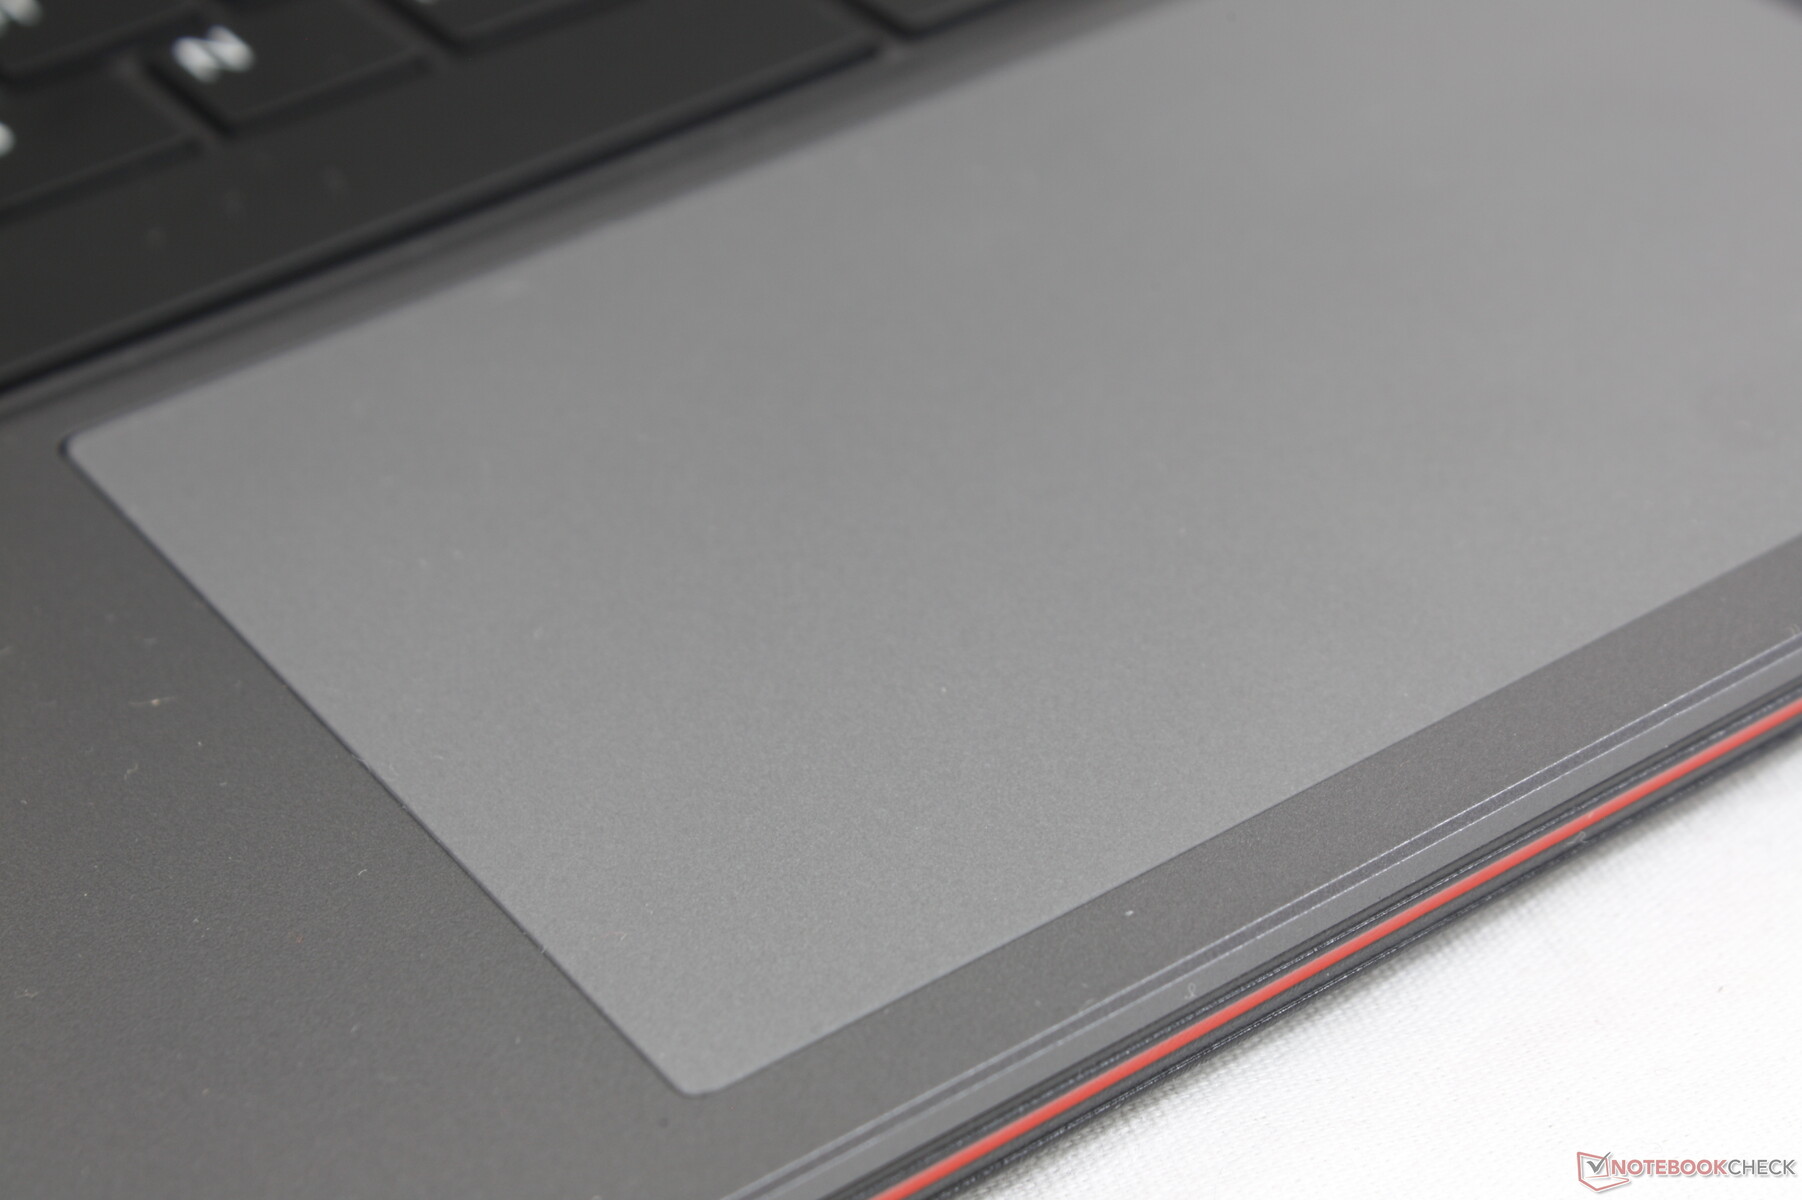
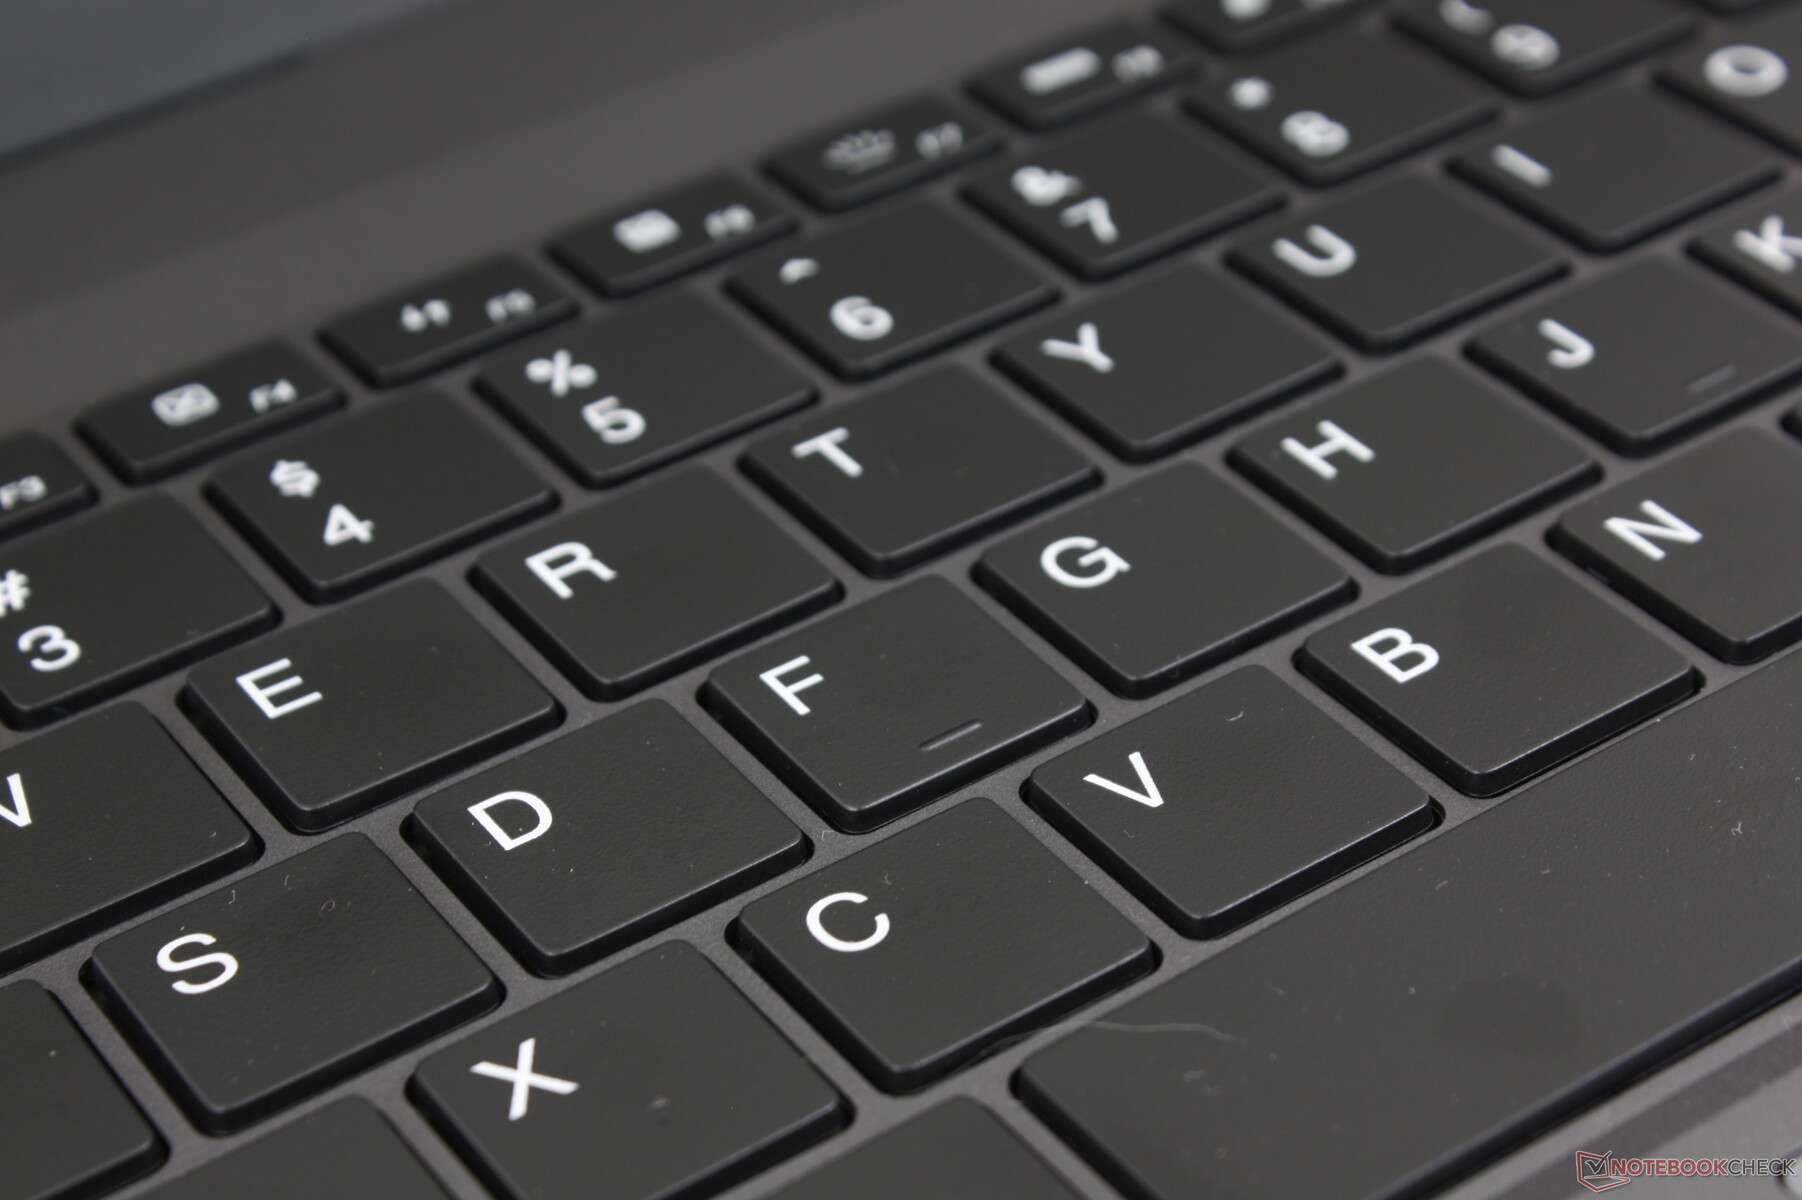
Input Devices — Wonky Keys and Clickpad
Keyboard
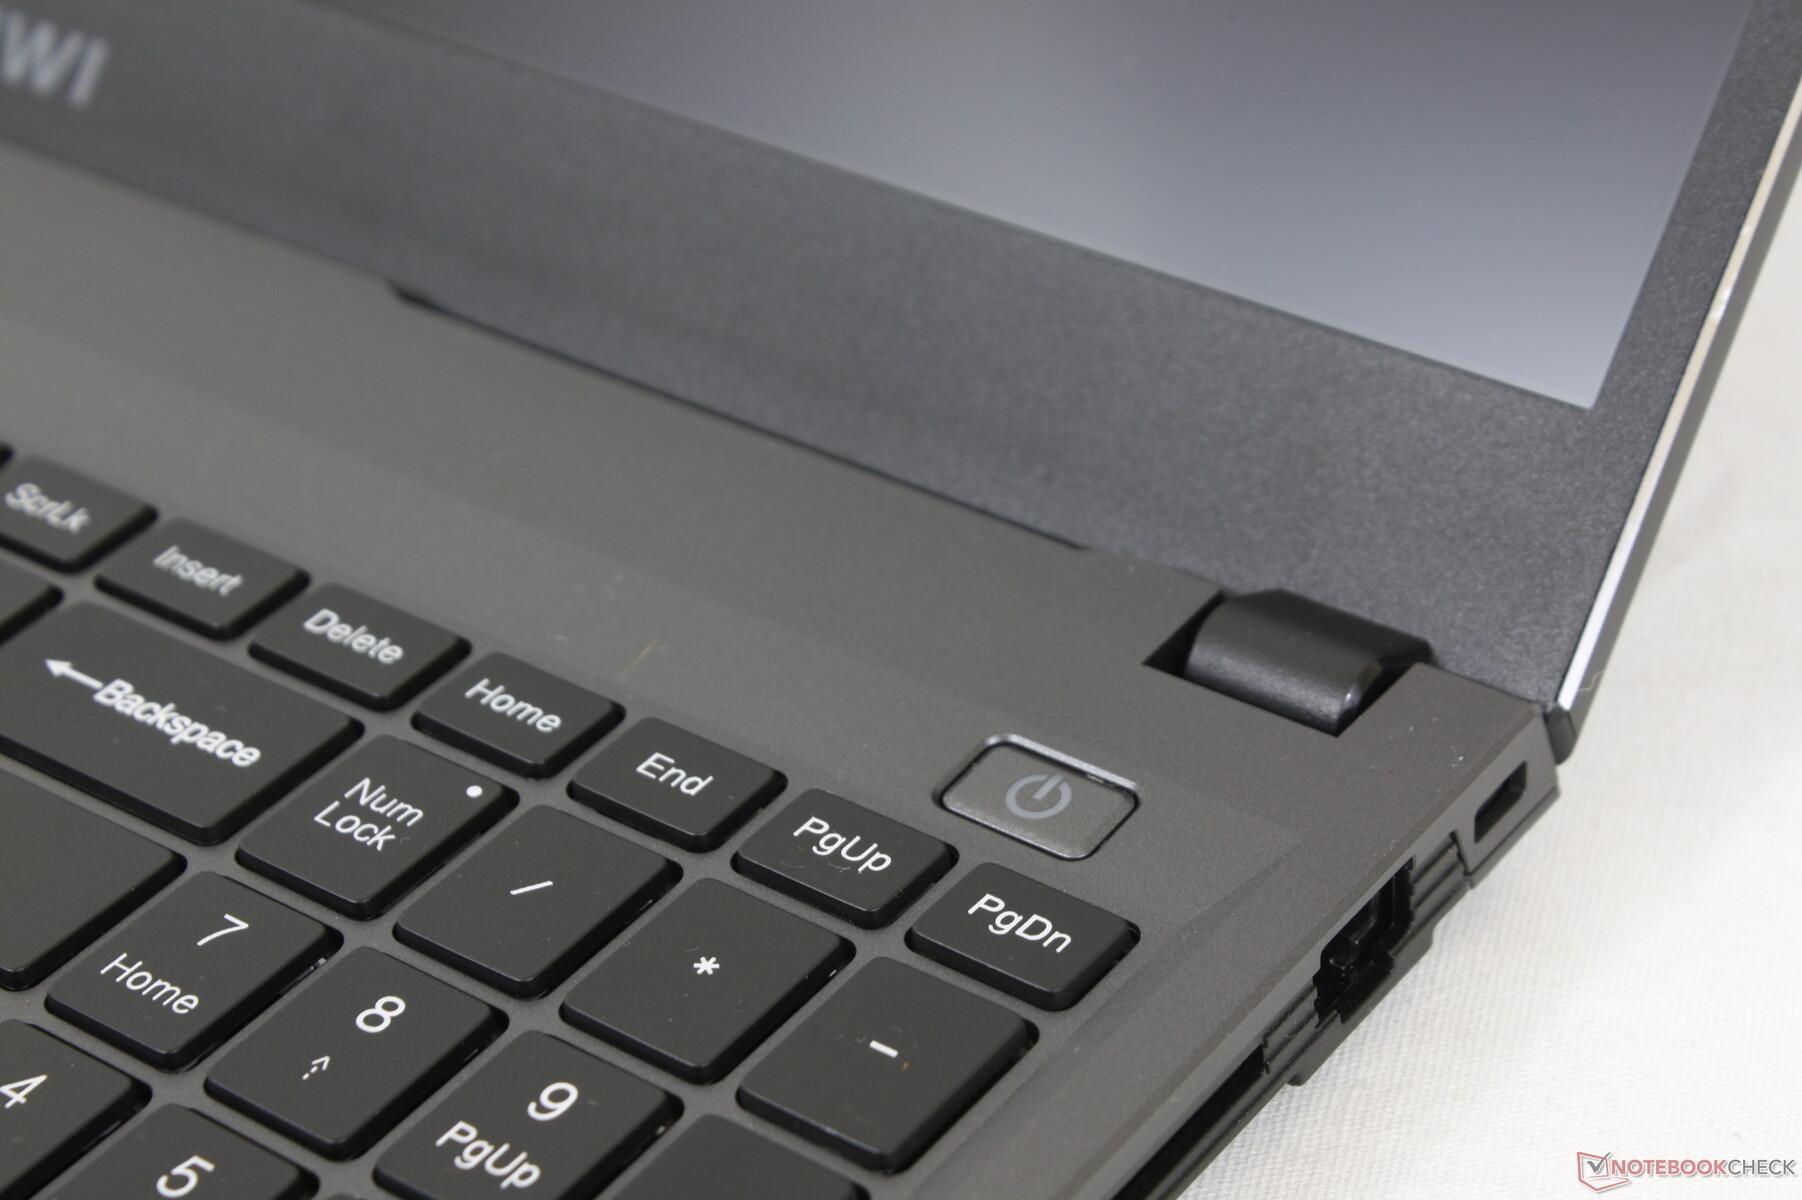
Though Ultrabook keyboards are usually quite shallow, the keys on the CoreBook X Pro are both shallow and soft for an unsatisfying typing experience. The Enter and Space keys in particular are too spongy while the Windows key on our test unit would sometimes not even register a press.
Touchpad
The clickpad is larger than the clickpad on the Microsoft Surface Laptop 3 (12.5 x 7.8 cm vs. 11.5 x 7.6 cm). Regular cursor control is reliable and especially smooth due to the 120 Hz refresh rate of the display. Multi-touch drag and drop actions aren't as reliable, however, as the cursor may sometimes jump. The clickpad surface is also a bit too sticky when gliding at slower speeds which impacts precision clicks.
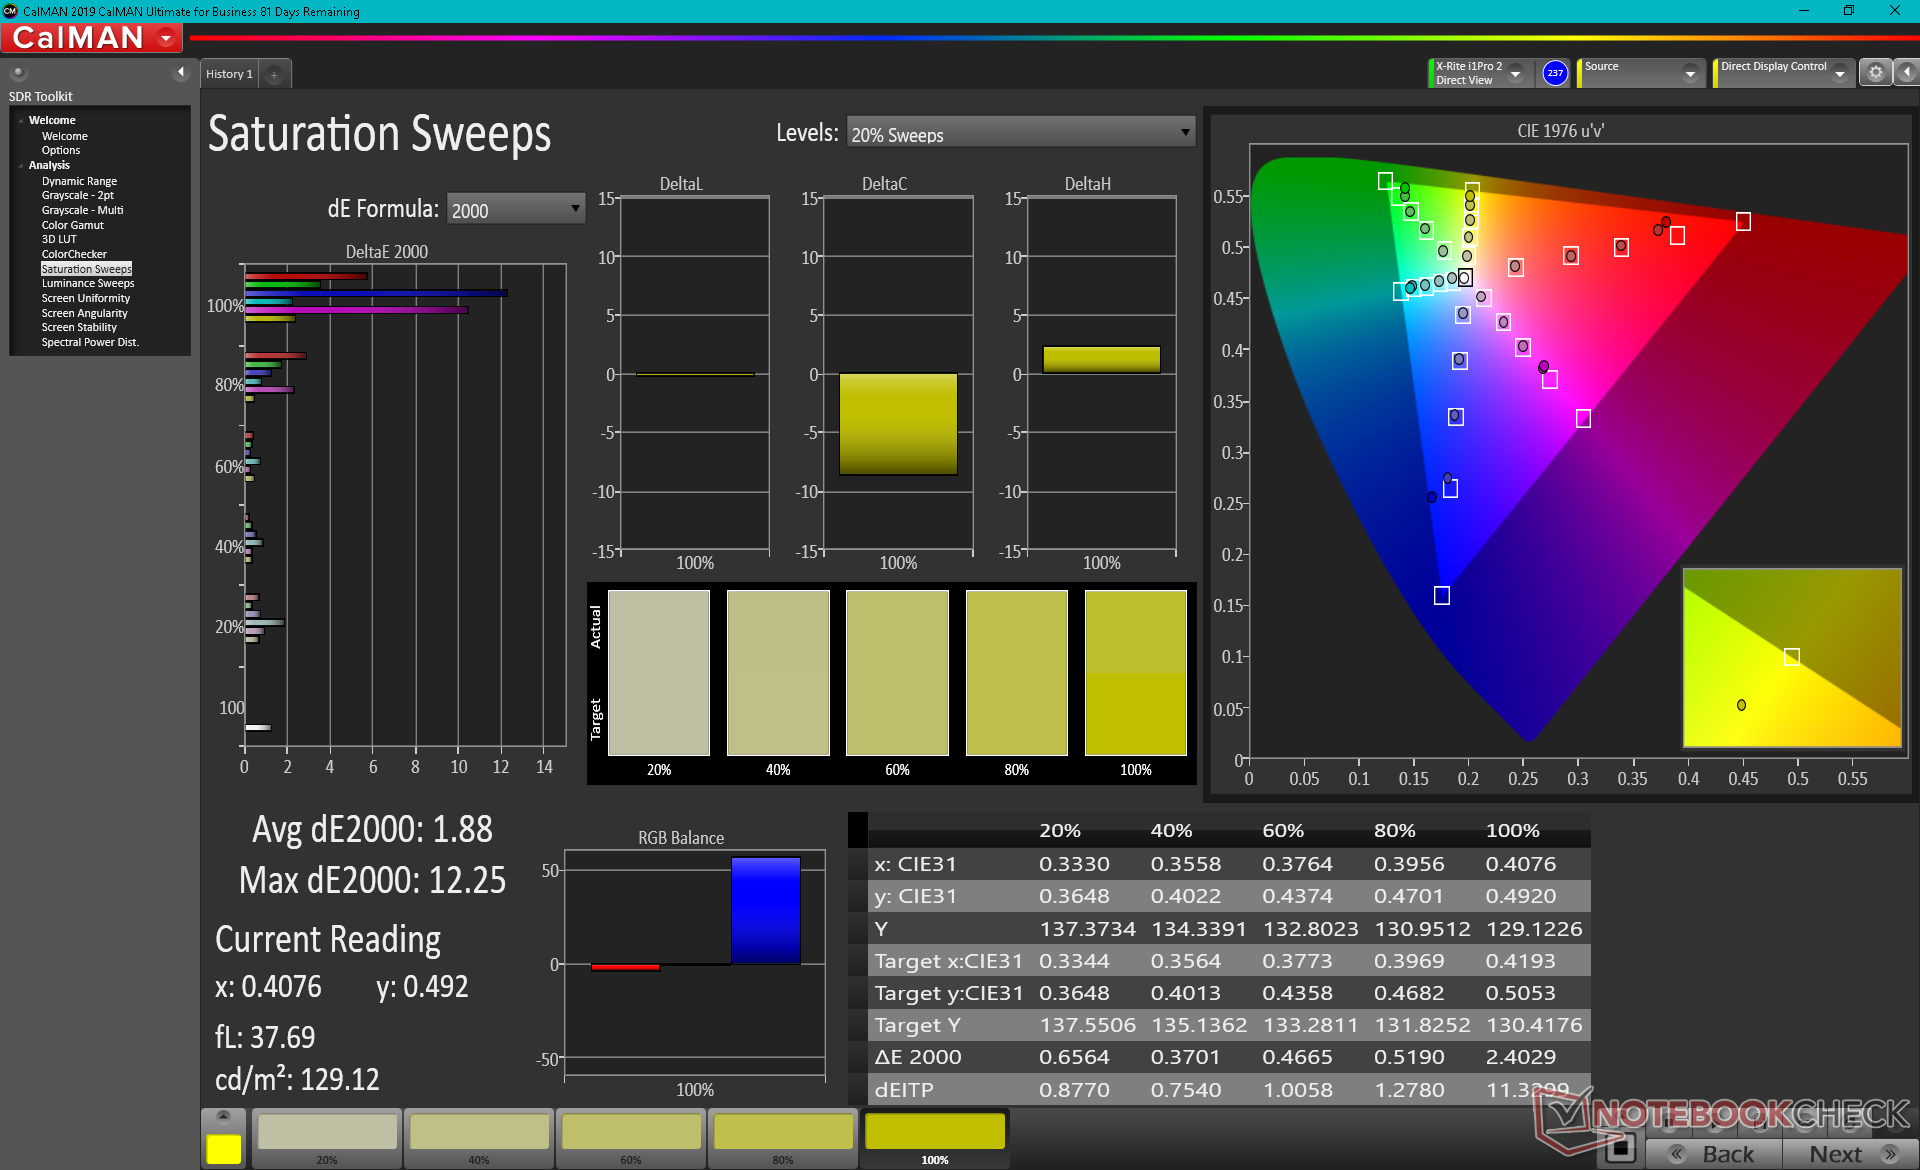
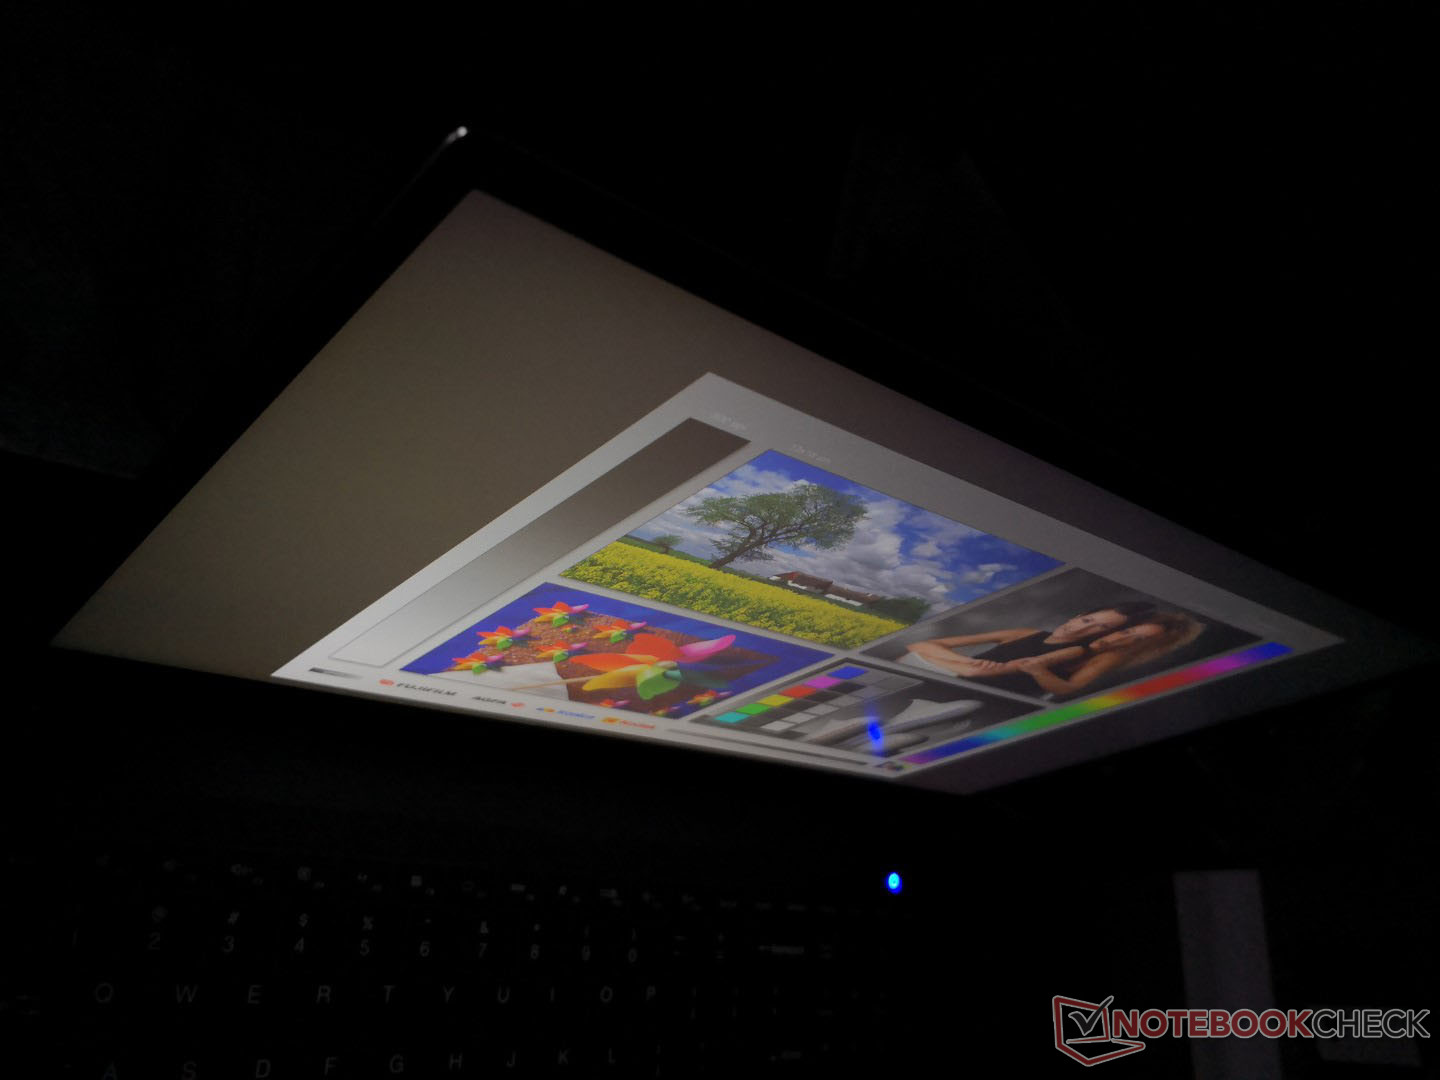
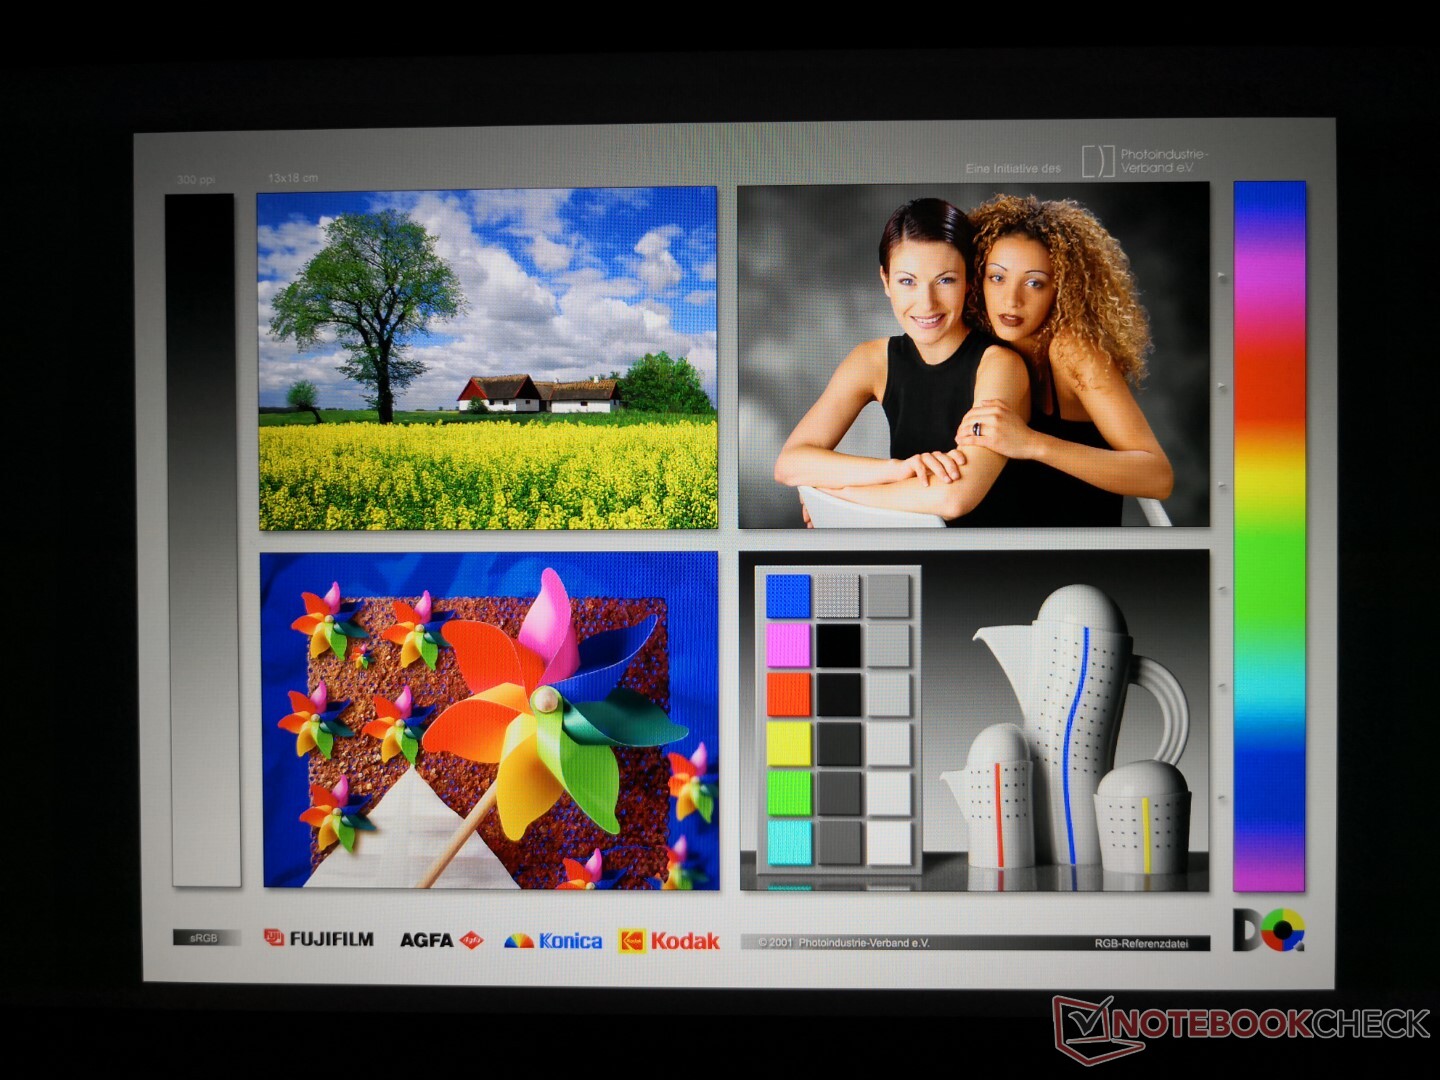
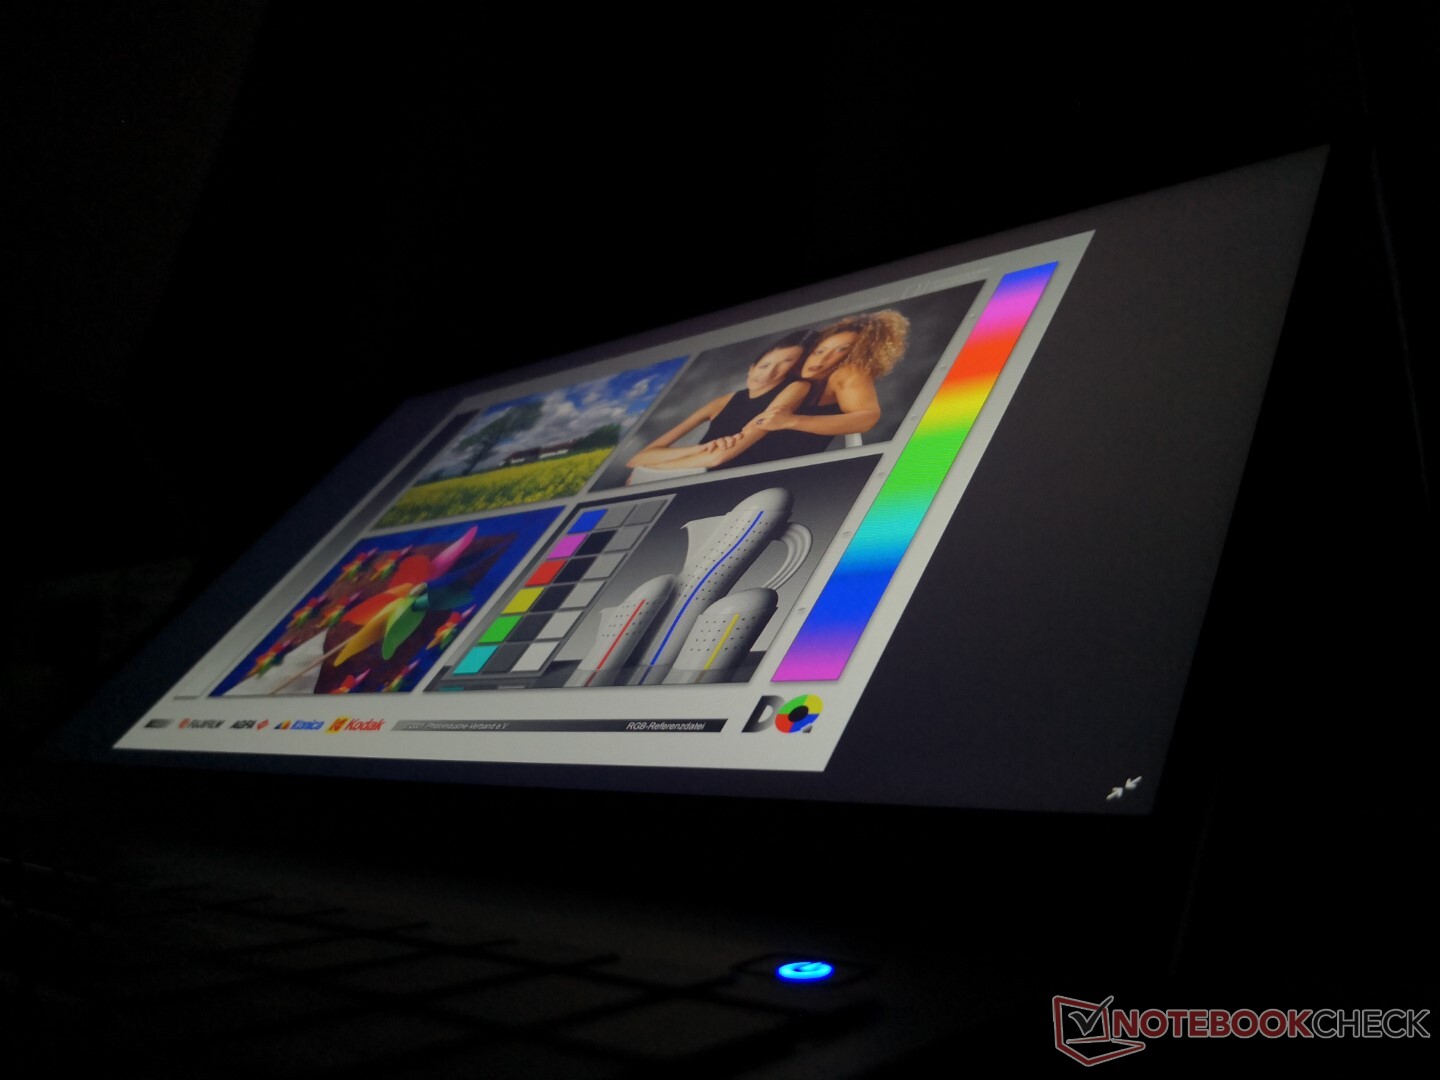
Display — 120 Hz Doesn't Come Free
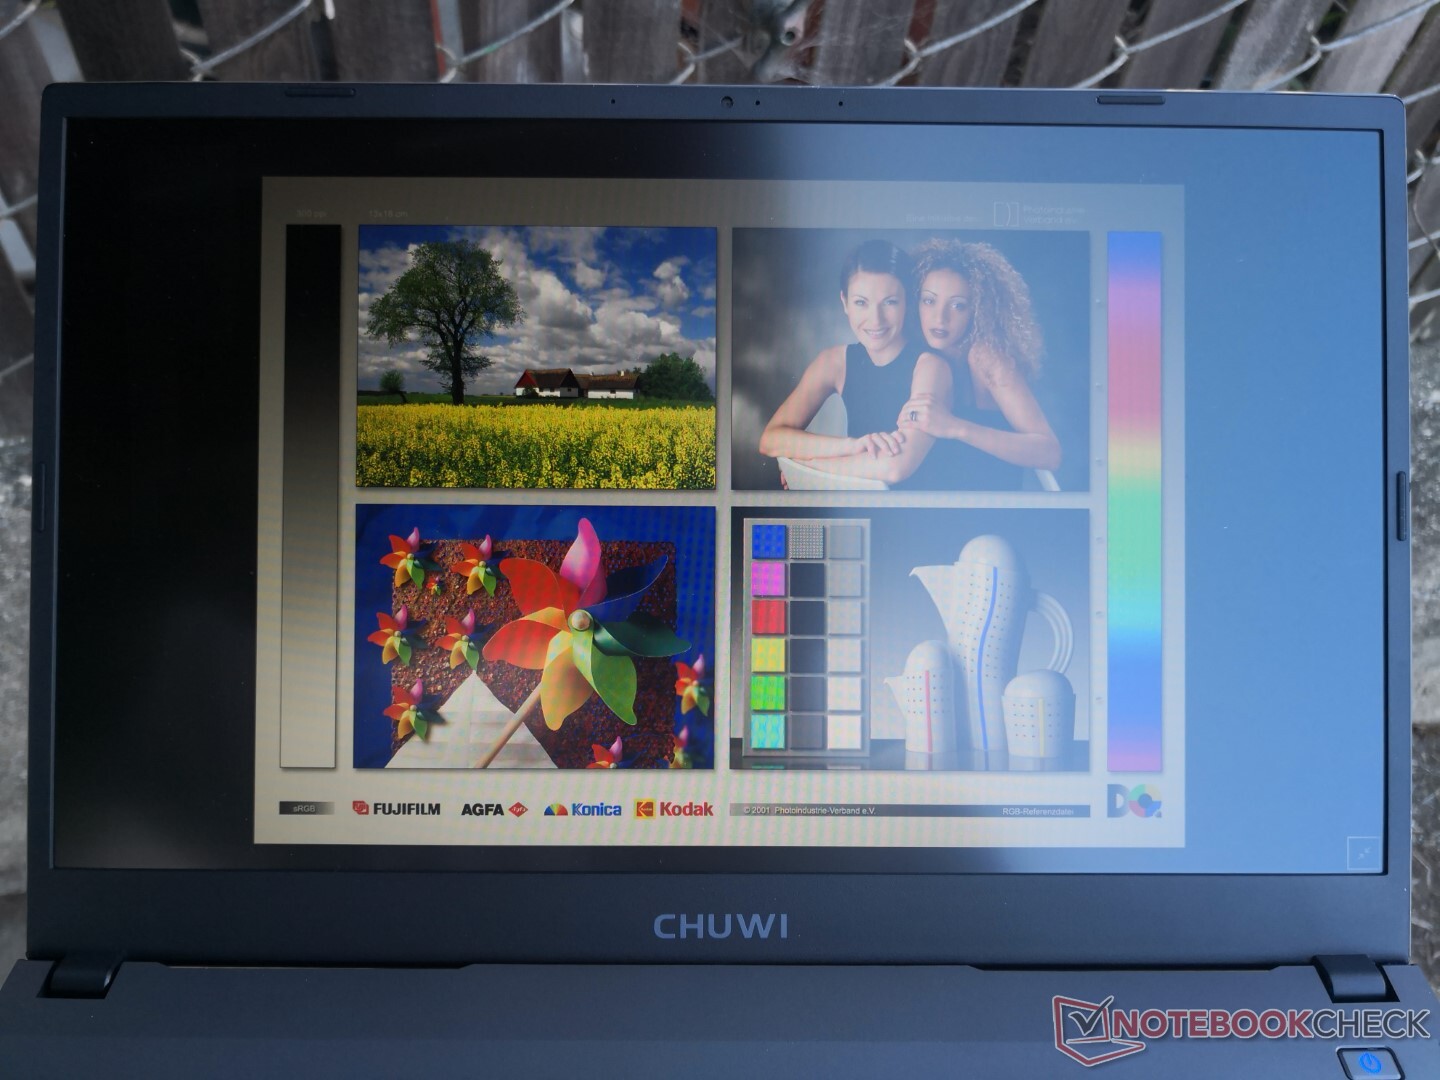
The CoreBook X Pro uses the same Chi Mei N156HRA-EA1 IPS panel as found on the Asus TUF Gaming F15 FX506HM or Acer Nitro 5 AN515-55 gaming laptops. This particular panel offers a native refresh rate of 120 Hz alongside decently fast response times for smoother gameplay. Colors and brightness are limited, however, as this is technically a budget laptop. Higher-end panels like those found on the Razer Blade 15 are able to offer faster response times, faster refresh rates, and deeper colors for both gaming and digital editing.

| |||||||||||||||||||||||||
Brightness Distribution: 87 %
Center on Battery: 269.7 cd/m²
Contrast: 1348:1 (Black: 0.2 cd/m²)
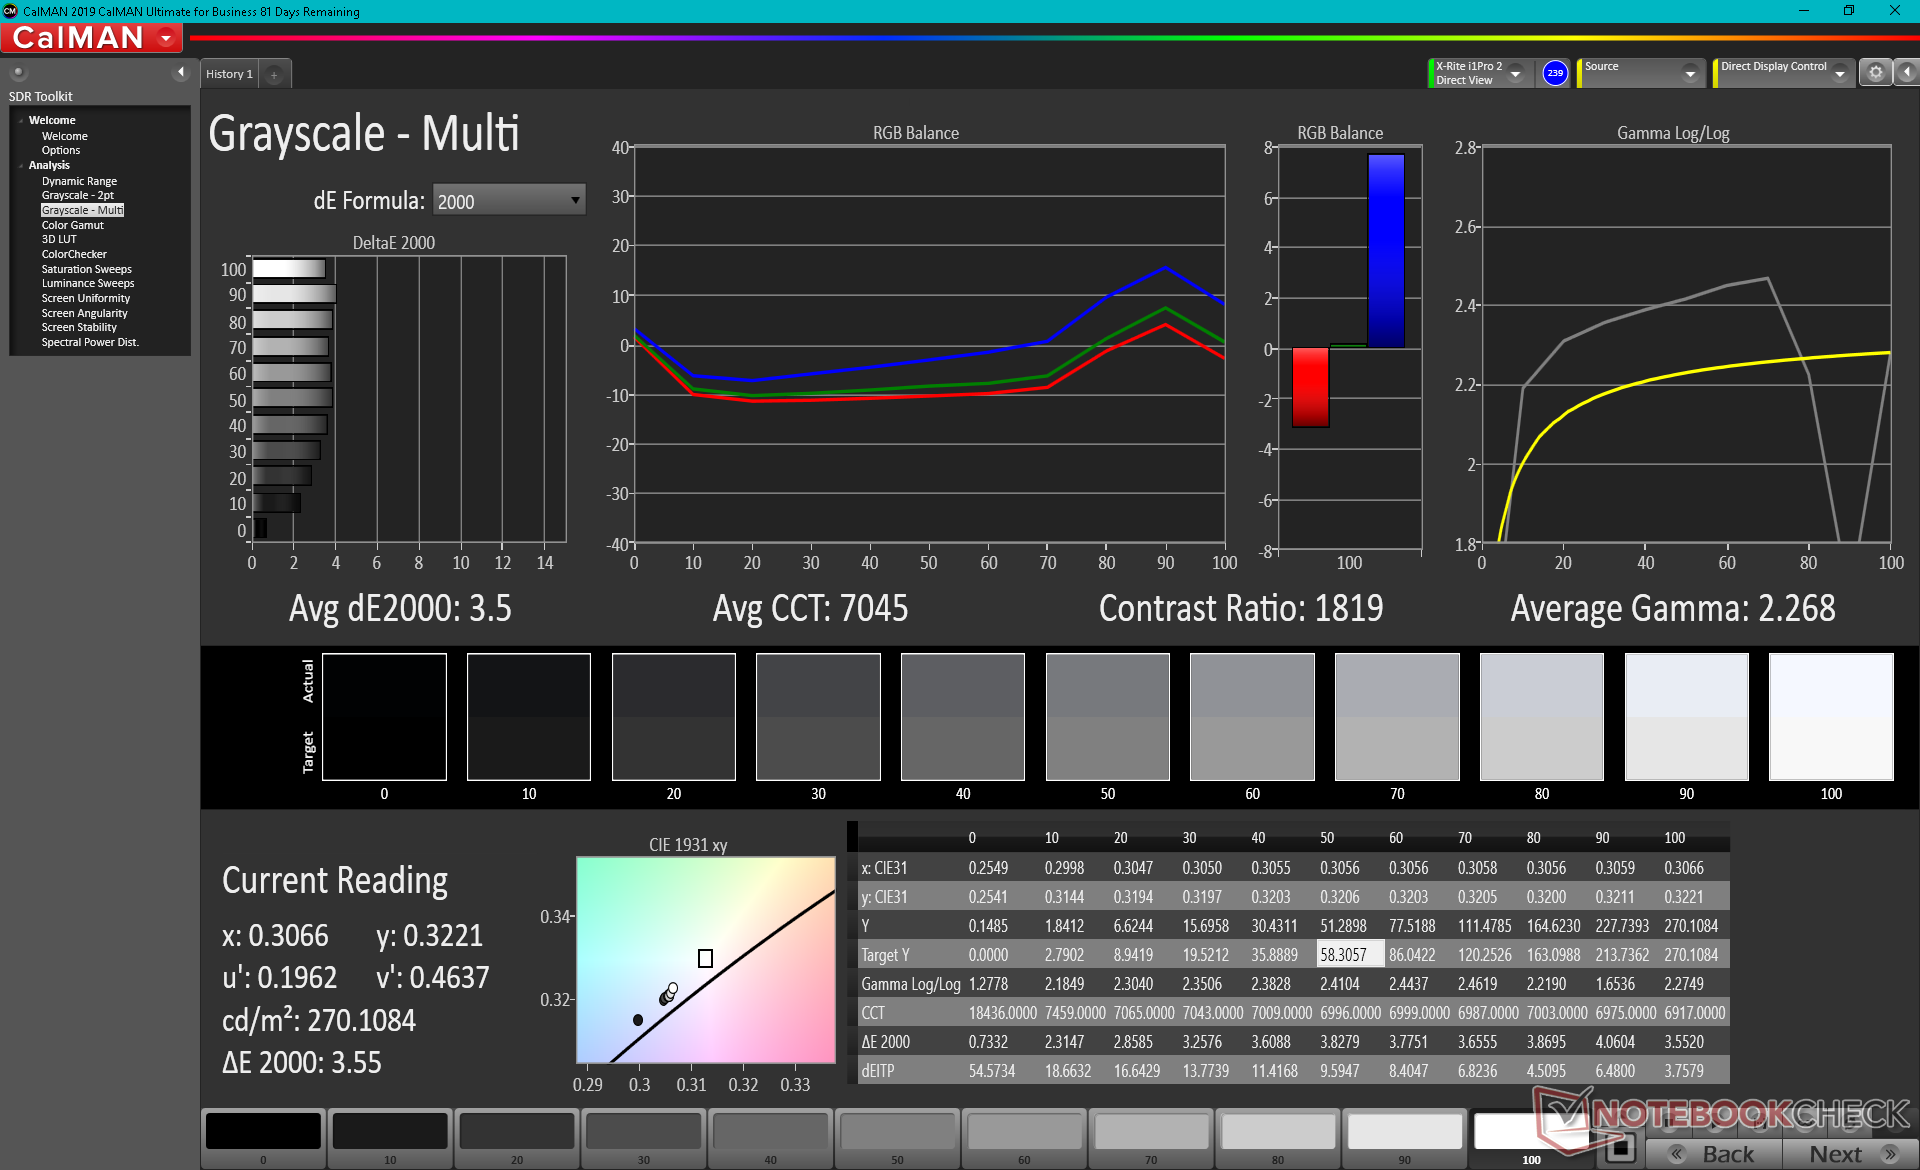
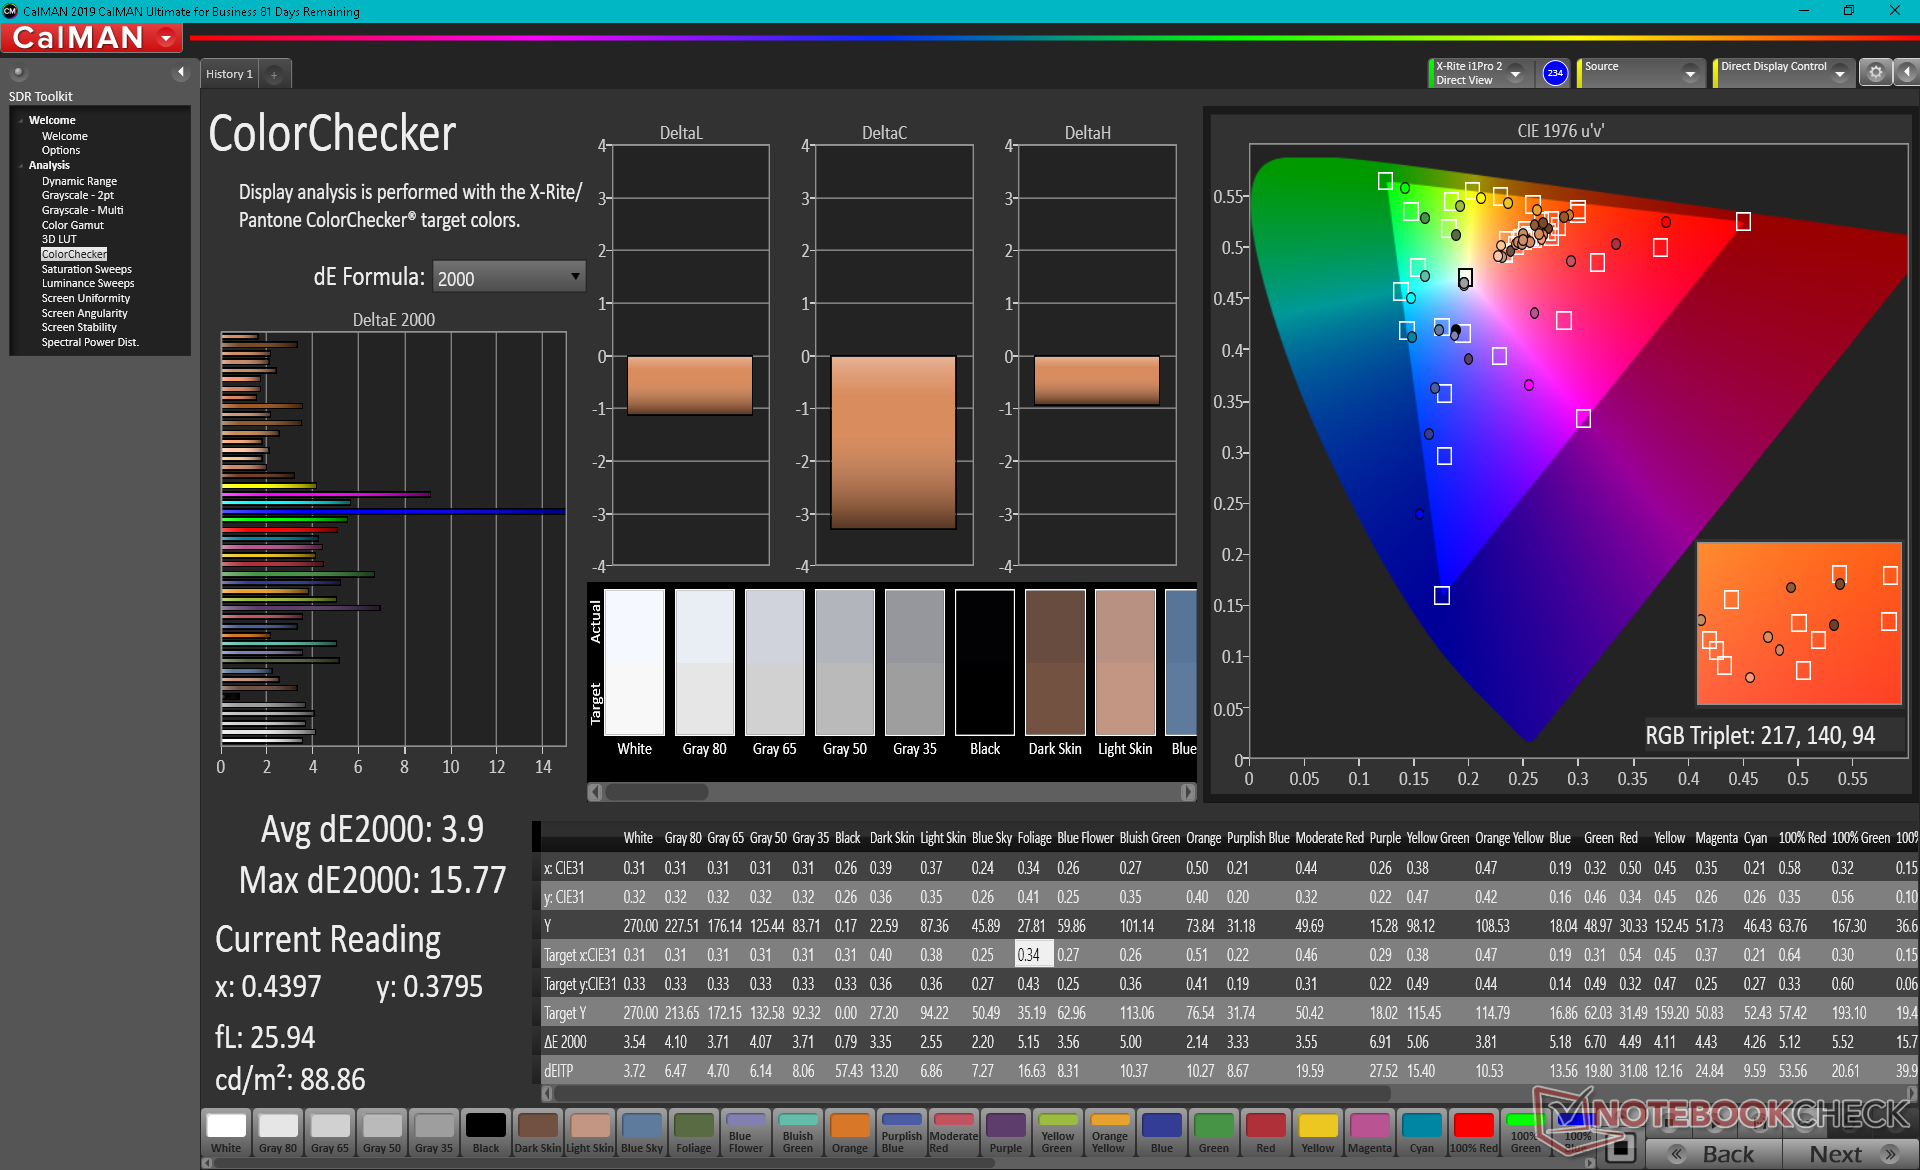
ΔE ColorChecker Calman: 3.9 | ∀{0.5-29.43 Ø4.73}
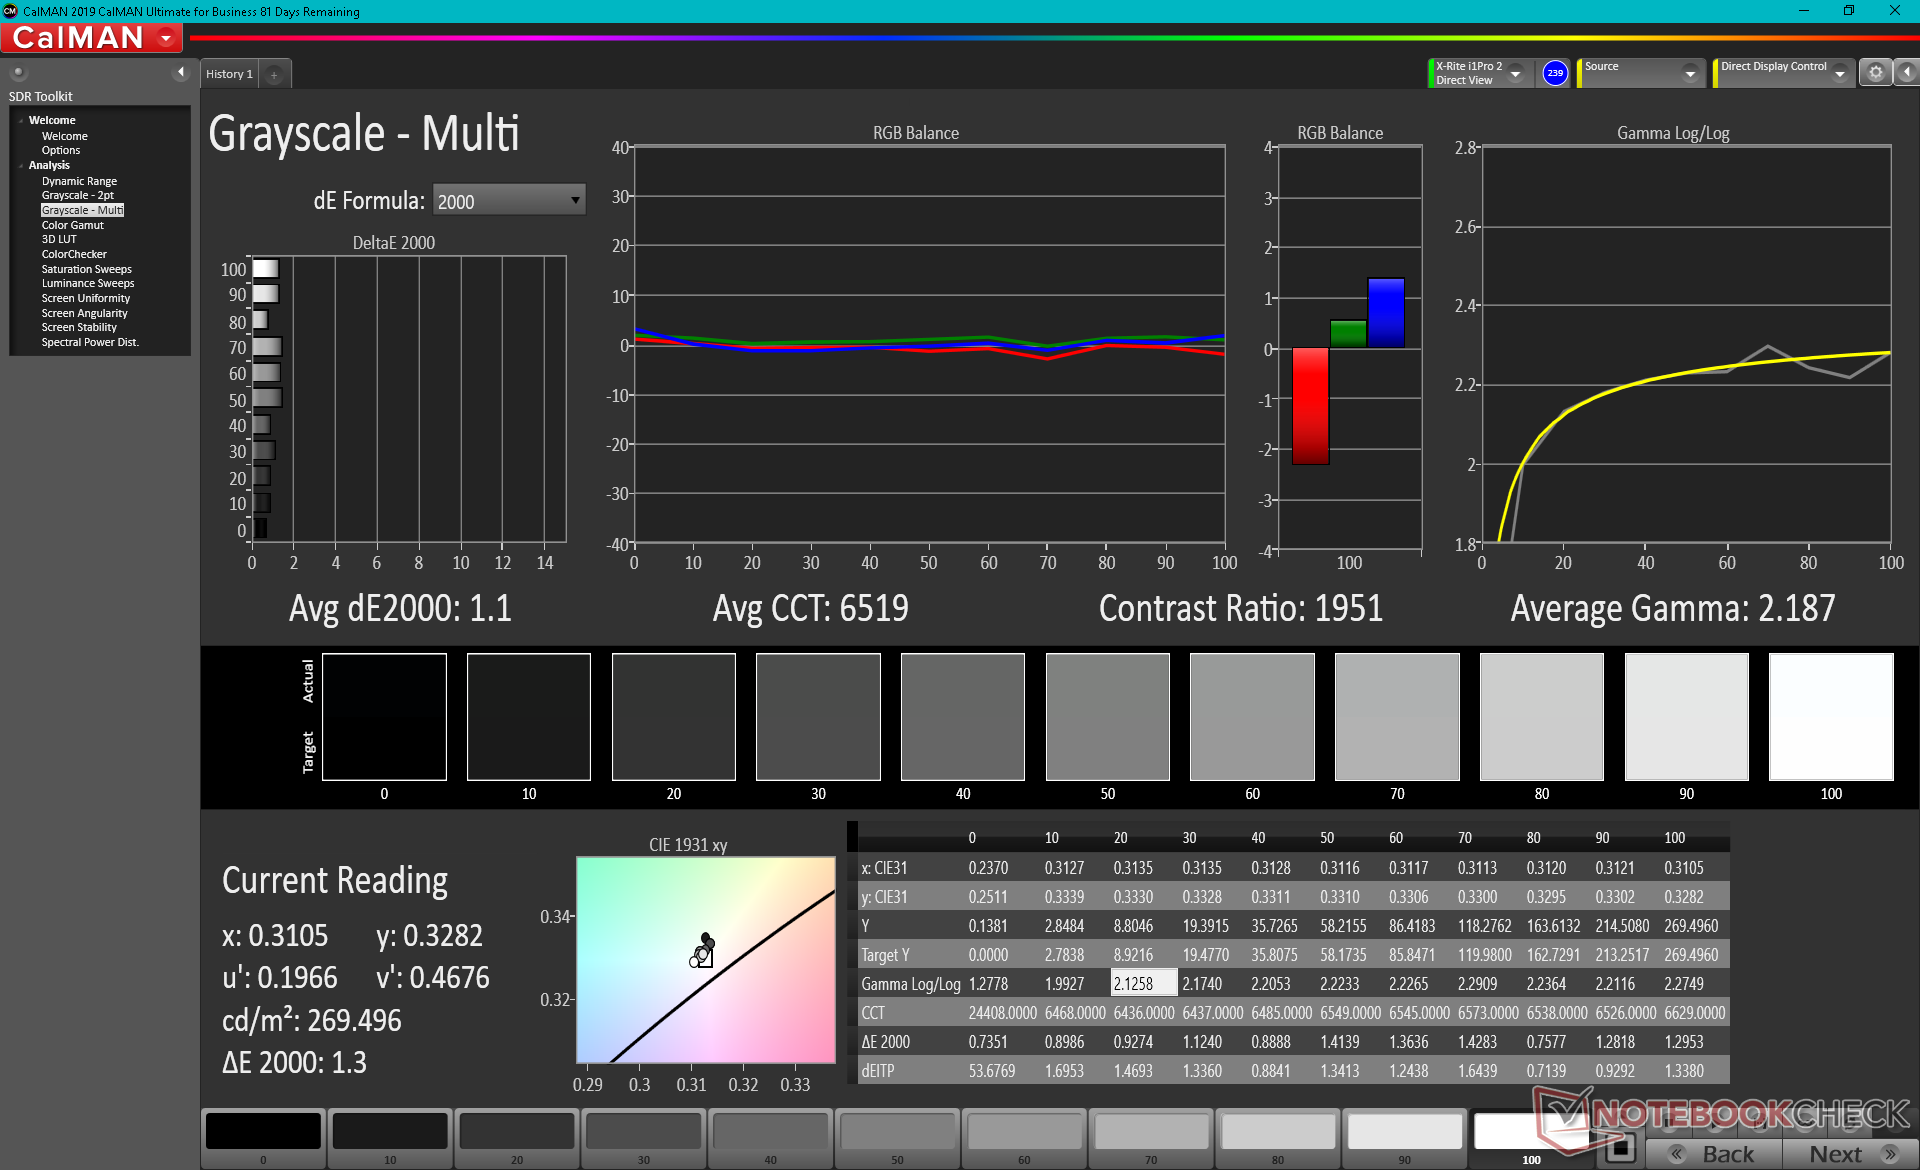
calibrated: 1.61
ΔE Greyscale Calman: 3.5 | ∀{0.09-98 Ø4.97}
43.4% AdobeRGB 1998 (Argyll 3D)
62.9% sRGB (Argyll 3D)
41.9% Display P3 (Argyll 3D)
Gamma: 2.27
CCT: 7045 K
| Chuwi CoreBook X Pro Chi Mei N156HRA-EA1, IPS, 15.6", 1920x1080 | Teclast TBOLT F15 Pro N156HCA-EN1, IPS, 15.6", 1920x1080 | Asus VivoBook S15 D533UA Chi Mei N156HCA-EAB, IPS, 15.6", 1920x1080 | Tuxedo Aura 15 Gen1 N156HCA-EA1, IPS, 15.6", 1920x1080 | Honor MagicBook 15 AU Optronics B156HAN02.8, IPS, 15.6", 1920x1080 | Dell XPS 15 9500 Core i5 Sharp LQ156N1, IPS, 15.6", 1920x1200 | |
|---|---|---|---|---|---|---|
| Display | 56% | 4% | 52% | -5% | 79% | |
| Display P3 Coverage (%) | 41.9 | 65.6 57% | 43.6 4% | 65.9 57% | 39.96 -5% | 81.5 95% |
| sRGB Coverage (%) | 62.9 | 98.1 56% | 65.2 4% | 91.9 46% | 59.7 -5% | 100 59% |
| AdobeRGB 1998 Coverage (%) | 43.4 | 67.8 56% | 45 4% | 66.7 54% | 41.29 -5% | 79.6 83% |
| Response Times | -22% | 30% | -32% | -12% | -30% | |
| Response Time Grey 50% / Grey 80% * (ms) | 31.2 ? | 39.6 ? -27% | 18 ? 42% | 42 ? -35% | 36 ? -15% | 42 ? -35% |
| Response Time Black / White * (ms) | 23.2 ? | 26.8 ? -16% | 19 ? 18% | 29.6 ? -28% | 25 ? -8% | 28.8 ? -24% |
| PWM Frequency (Hz) | 25510 ? | |||||
| Screen | 20% | -22% | -7% | -9% | 17% | |
| Brightness middle (cd/m²) | 269.7 | 293 9% | 289 7% | 351 30% | 251 -7% | 592 120% |
| Brightness (cd/m²) | 253 | 266 5% | 267 6% | 337 33% | 247 -2% | 565 123% |
| Brightness Distribution (%) | 87 | 84 -3% | 85 -2% | 91 5% | 85 -2% | 85 -2% |
| Black Level * (cd/m²) | 0.2 | 0.21 -5% | 0.56 -180% | 0.29 -45% | 0.205 -2% | 0.46 -130% |
| Contrast (:1) | 1348 | 1395 3% | 516 -62% | 1210 -10% | 1224 -9% | 1287 -5% |
| Colorchecker dE 2000 * | 3.9 | 2.1 46% | 3.96 -2% | 4.5 -15% | 3.94 -1% | 3.19 18% |
| Colorchecker dE 2000 max. * | 15.77 | 5 68% | 6.76 57% | 9.4 40% | 7.87 50% | 5.45 65% |
| Colorchecker dE 2000 calibrated * | 1.61 | 0.7 57% | 1.9 -18% | 3.42 -112% | 2.03 -26% | |
| Greyscale dE 2000 * | 3.5 | 3.5 -0% | 3.43 2% | 6.3 -80% | 3.42 2% | 3.9 -11% |
| Gamma | 2.27 97% | 2.21 100% | 2.28 96% | 2.25 98% | 2.44 90% | 2.25 98% |
| CCT | 7045 92% | 6681 97% | 7191 90% | 6601 98% | 6319 103% | 6522 100% |
| Color Space (Percent of AdobeRGB 1998) (%) | 42 | 59.7 | 38 | 71.6 | ||
| Color Space (Percent of sRGB) (%) | 65 | 91.8 | 59 | 100 | ||
| Total Average (Program / Settings) | 18% /
22% | 4% /
-8% | 4% /
2% | -9% /
-9% | 22% /
24% |
* ... smaller is better
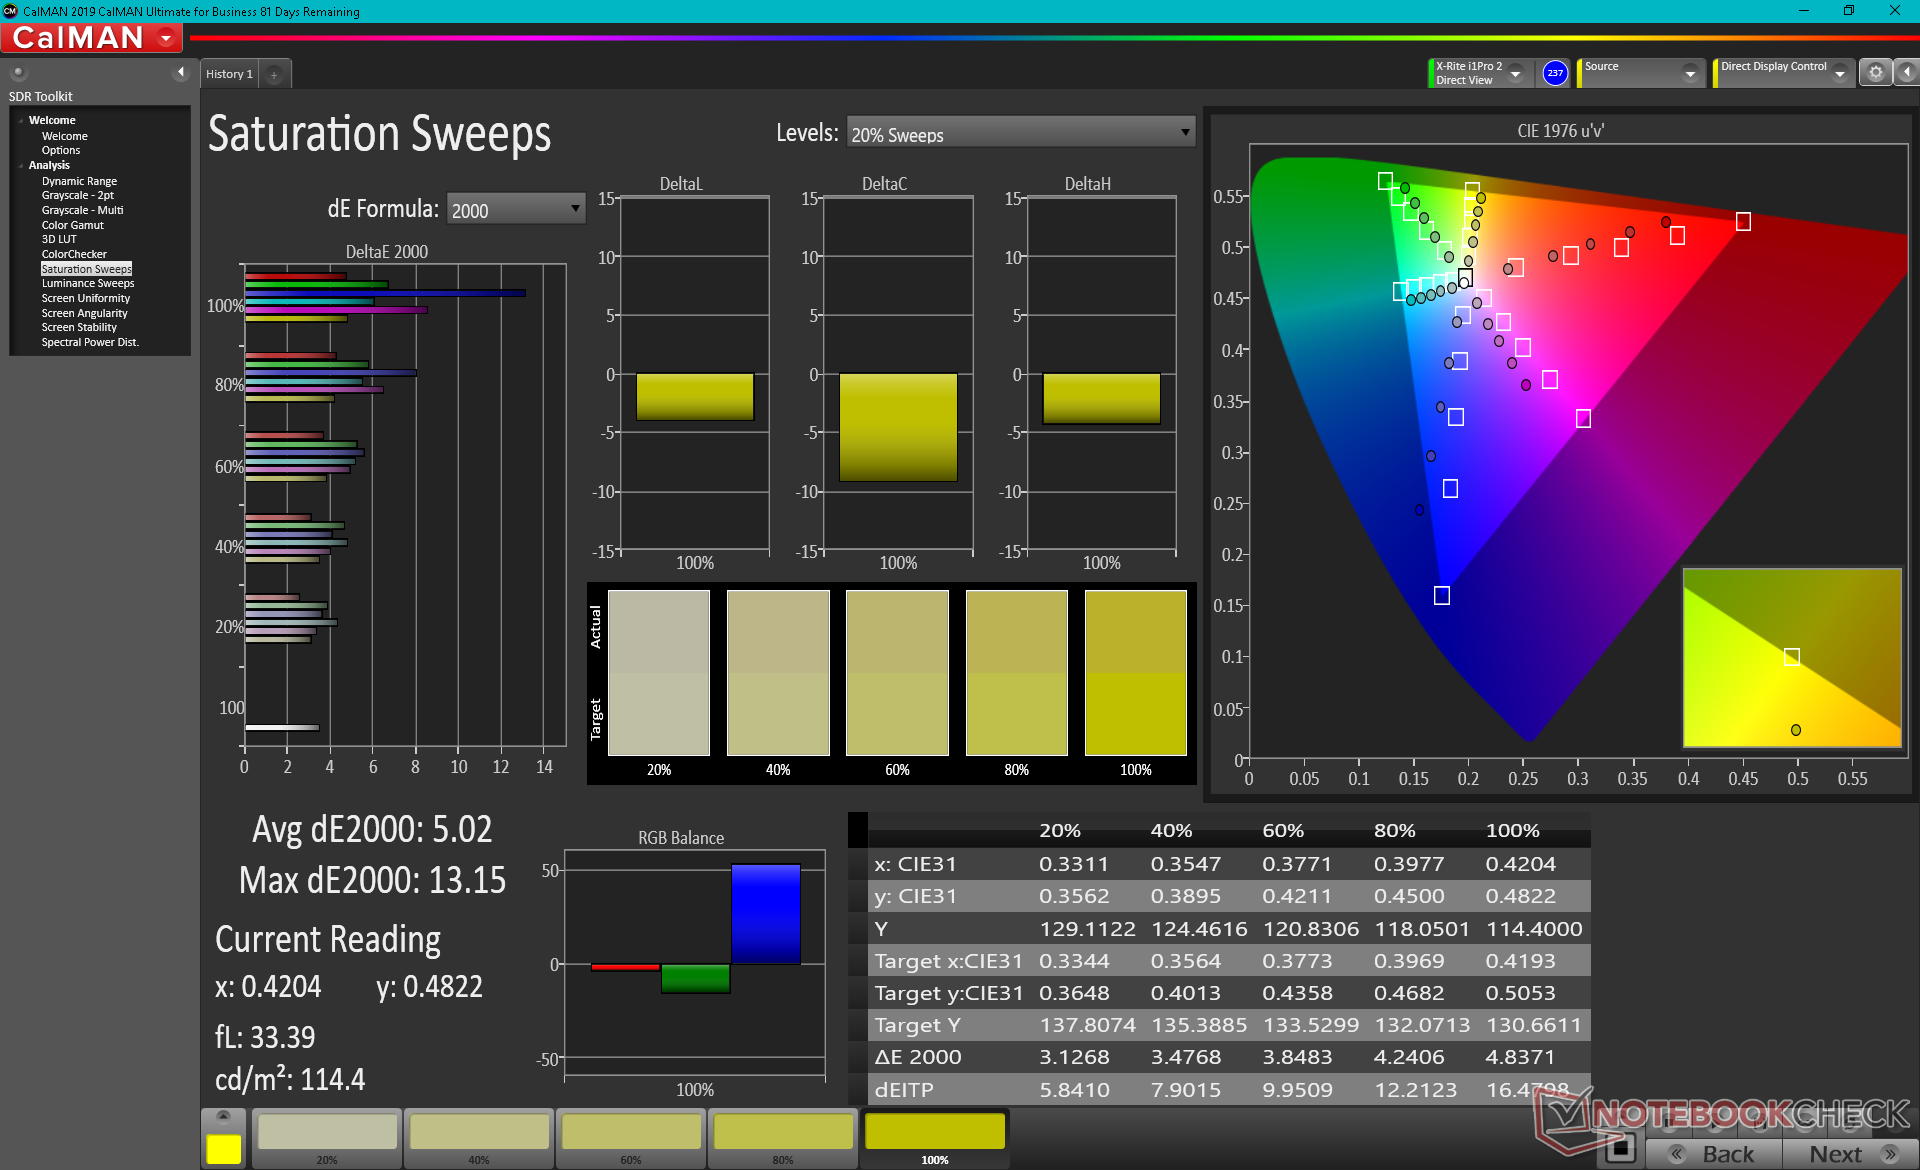
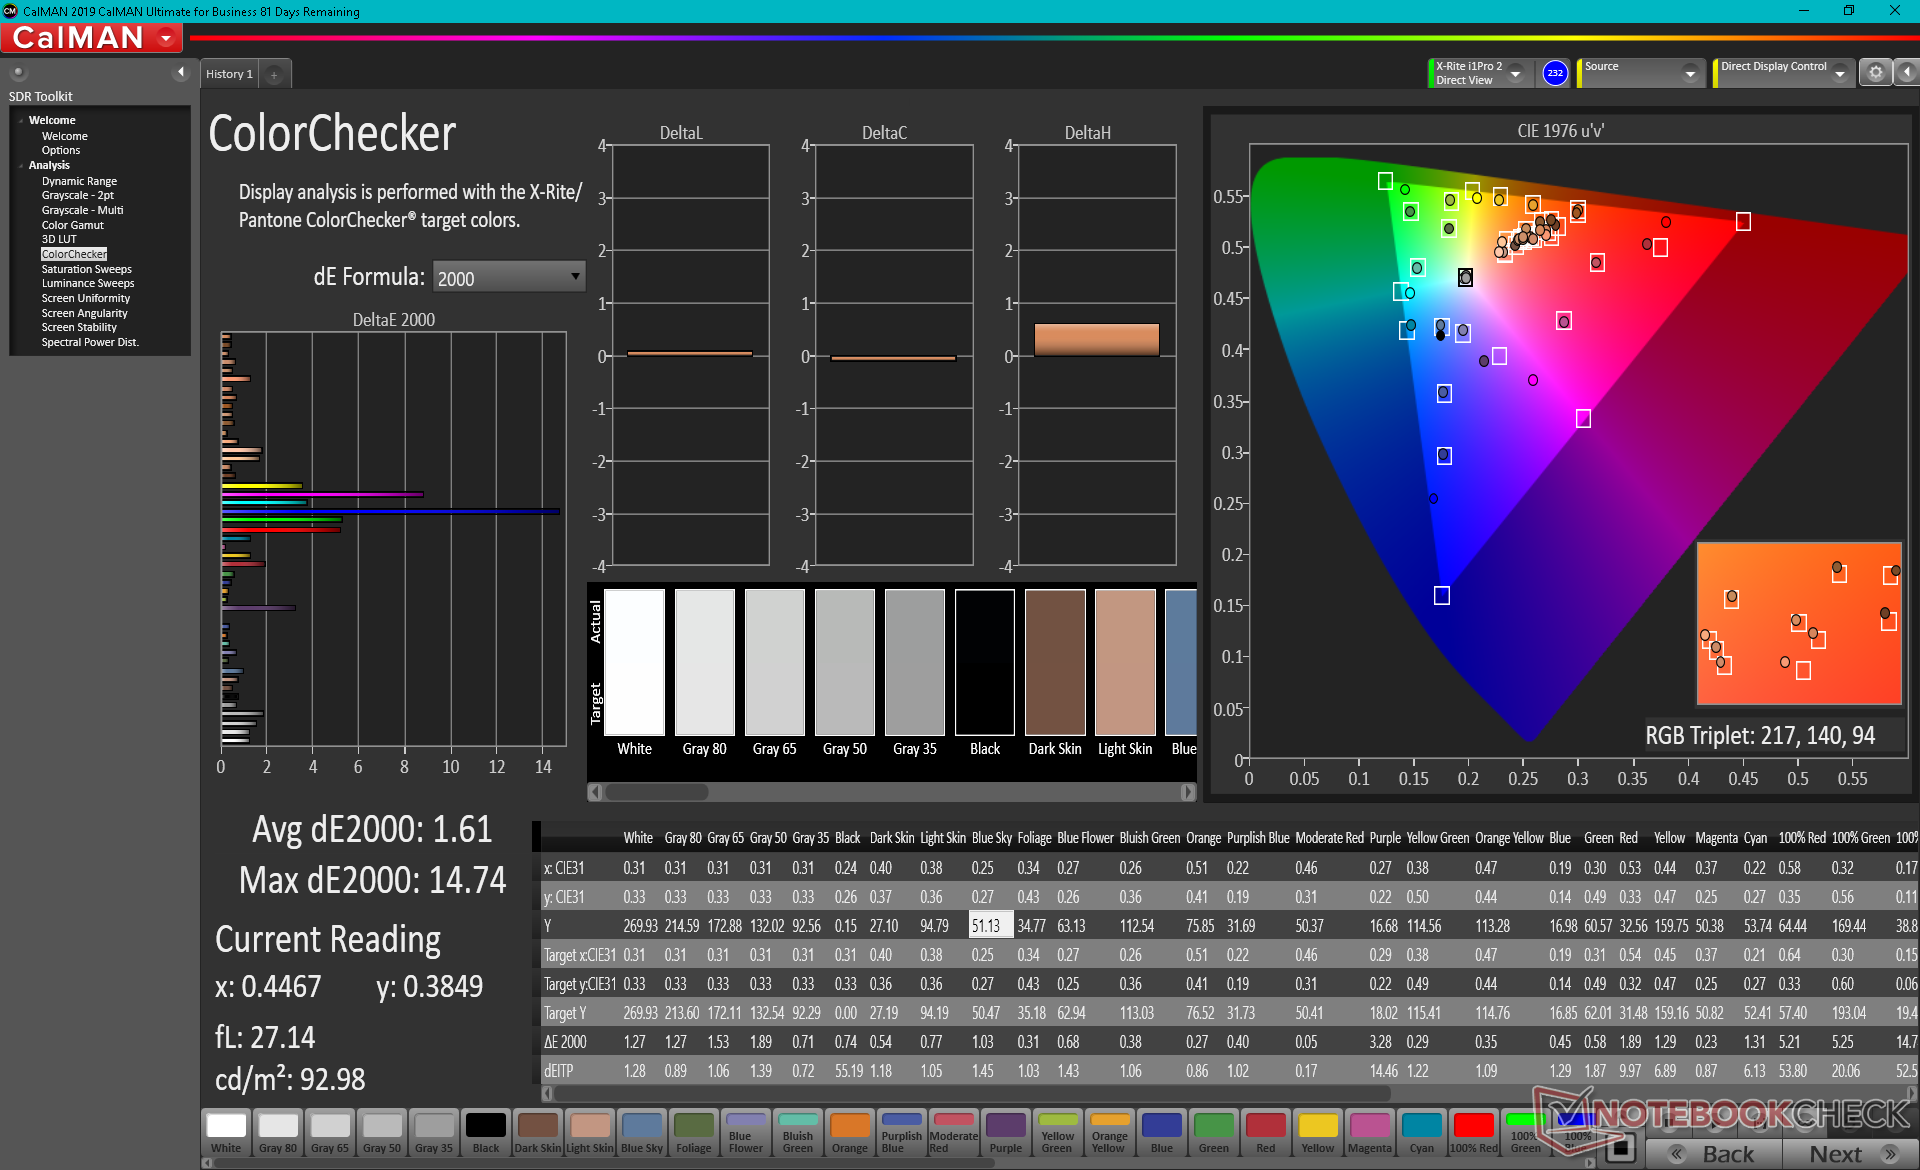
Color space is narrow at just 63 percent of sRGB to be indicative of panel unfit for digital editors. This is one of the few displays with both a high 120 Hz refresh rate and a limited gamut as high refresh rates would usually come with high (>90 percent) sRGB coverage.
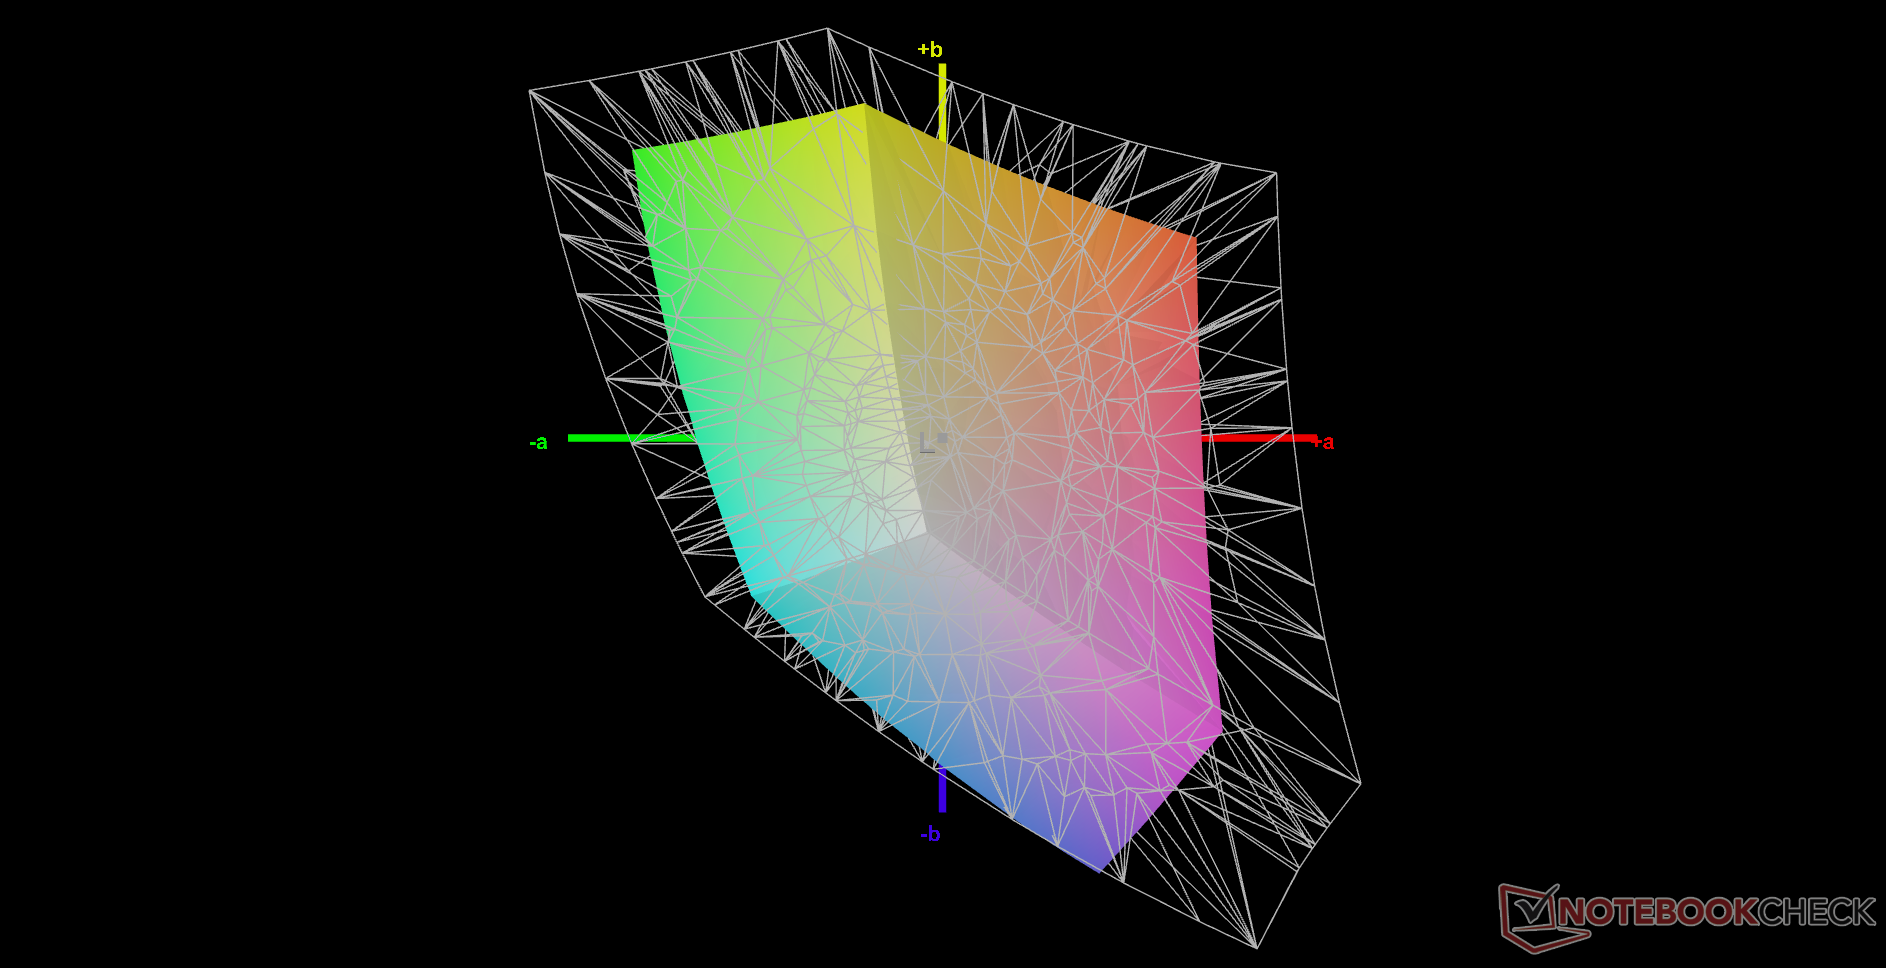
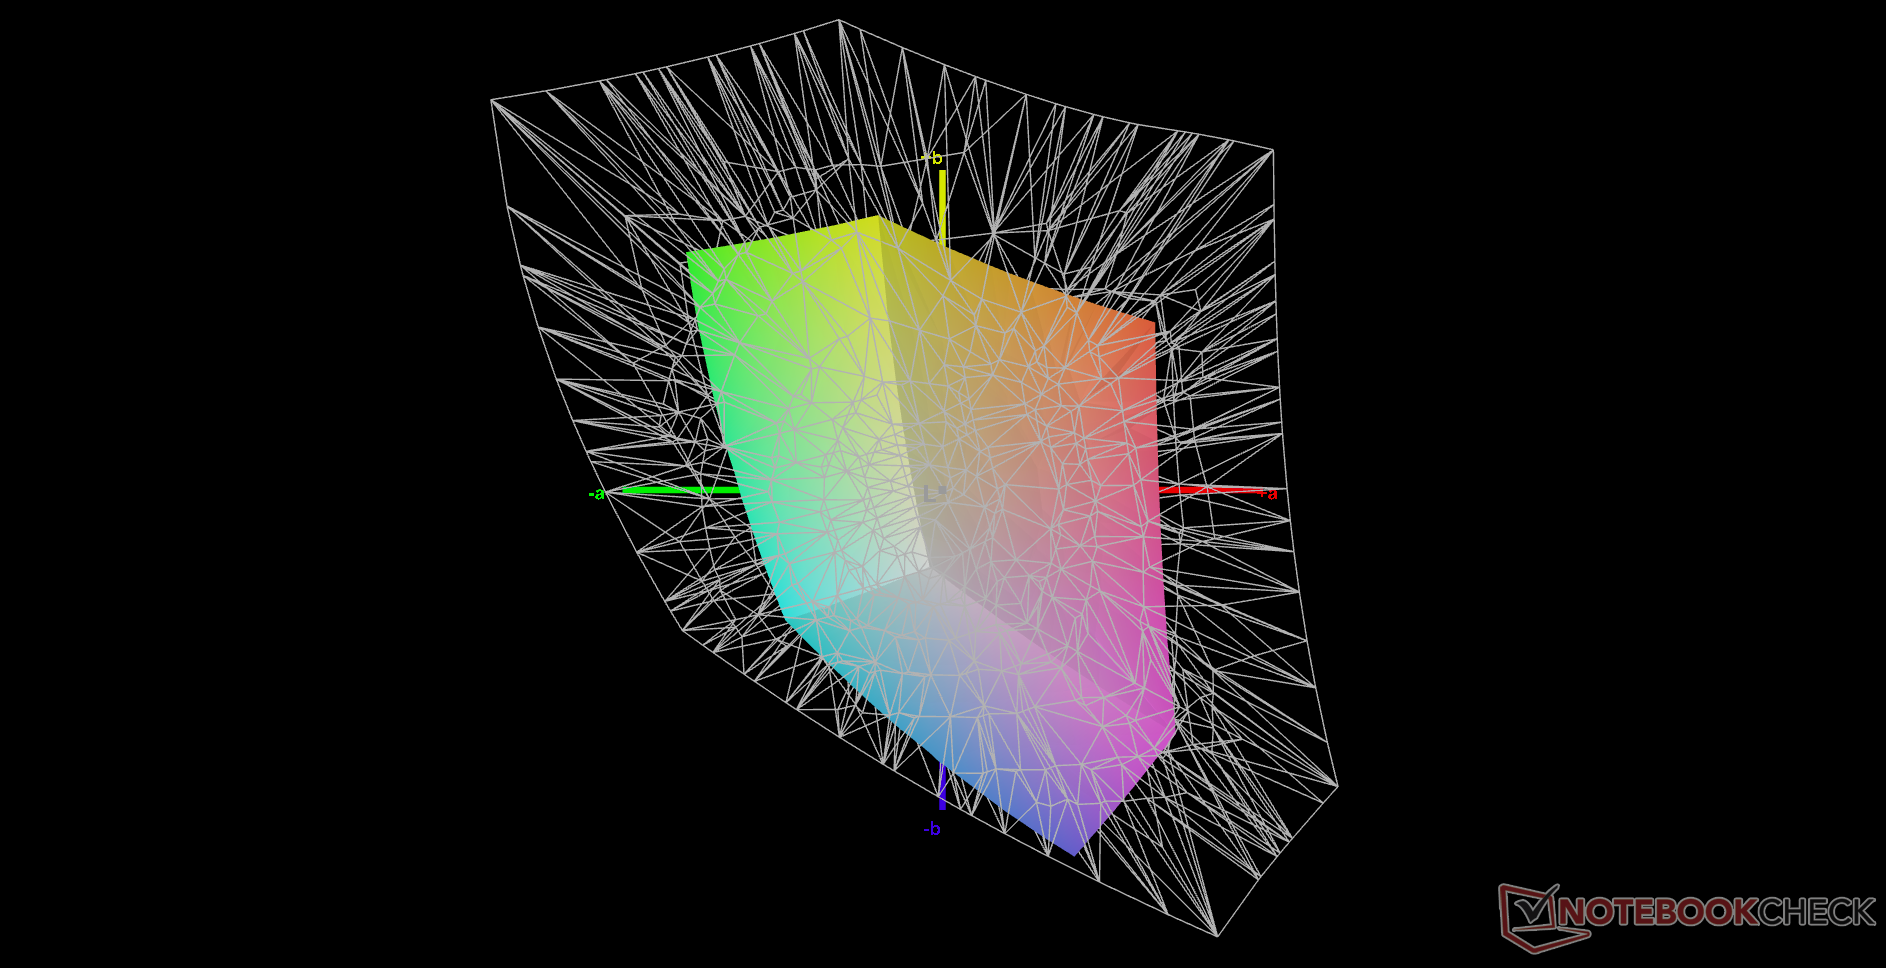
X-Rite colorimeter measurements show color temperature to be slightly too cool at 7045K versus the sRGB target of 6500K. Once we calibrated the display, grayscale and colors would improve noticeably. Colors still become more inaccurate at high saturation levels due to the limited color space of the panel.
Display Response Times
| ↔ Response Time Black to White | ||
|---|---|---|
| 23.2 ms ... rise ↗ and fall ↘ combined | ↗ 12.4 ms rise | 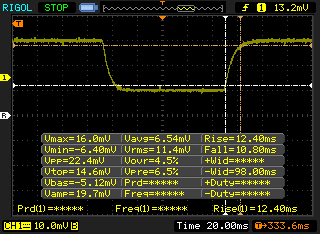 |
| ↘ 10.8 ms fall | ||
| The screen shows good response rates in our tests, but may be too slow for competitive gamers. In comparison, all tested devices range from 0.1 (minimum) to 240 (maximum) ms. » 53 % of all devices are better. This means that the measured response time is worse than the average of all tested devices (19.9 ms). | ||
| ↔ Response Time 50% Grey to 80% Grey | ||
| 31.2 ms ... rise ↗ and fall ↘ combined | ↗ 17.2 ms rise | 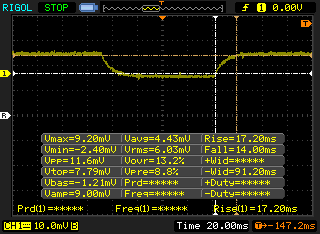 |
| ↘ 14 ms fall | ||
| The screen shows slow response rates in our tests and will be unsatisfactory for gamers. In comparison, all tested devices range from 0.165 (minimum) to 636 (maximum) ms. » 42 % of all devices are better. This means that the measured response time is similar to the average of all tested devices (31.1 ms). | ||
Screen Flickering / PWM (Pulse-Width Modulation)
| Screen flickering / PWM not detected | 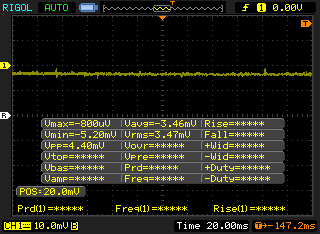 | ||
In comparison: 52 % of all tested devices do not use PWM to dim the display. If PWM was detected, an average of 7798 (minimum: 5 - maximum: 343500) Hz was measured. | |||
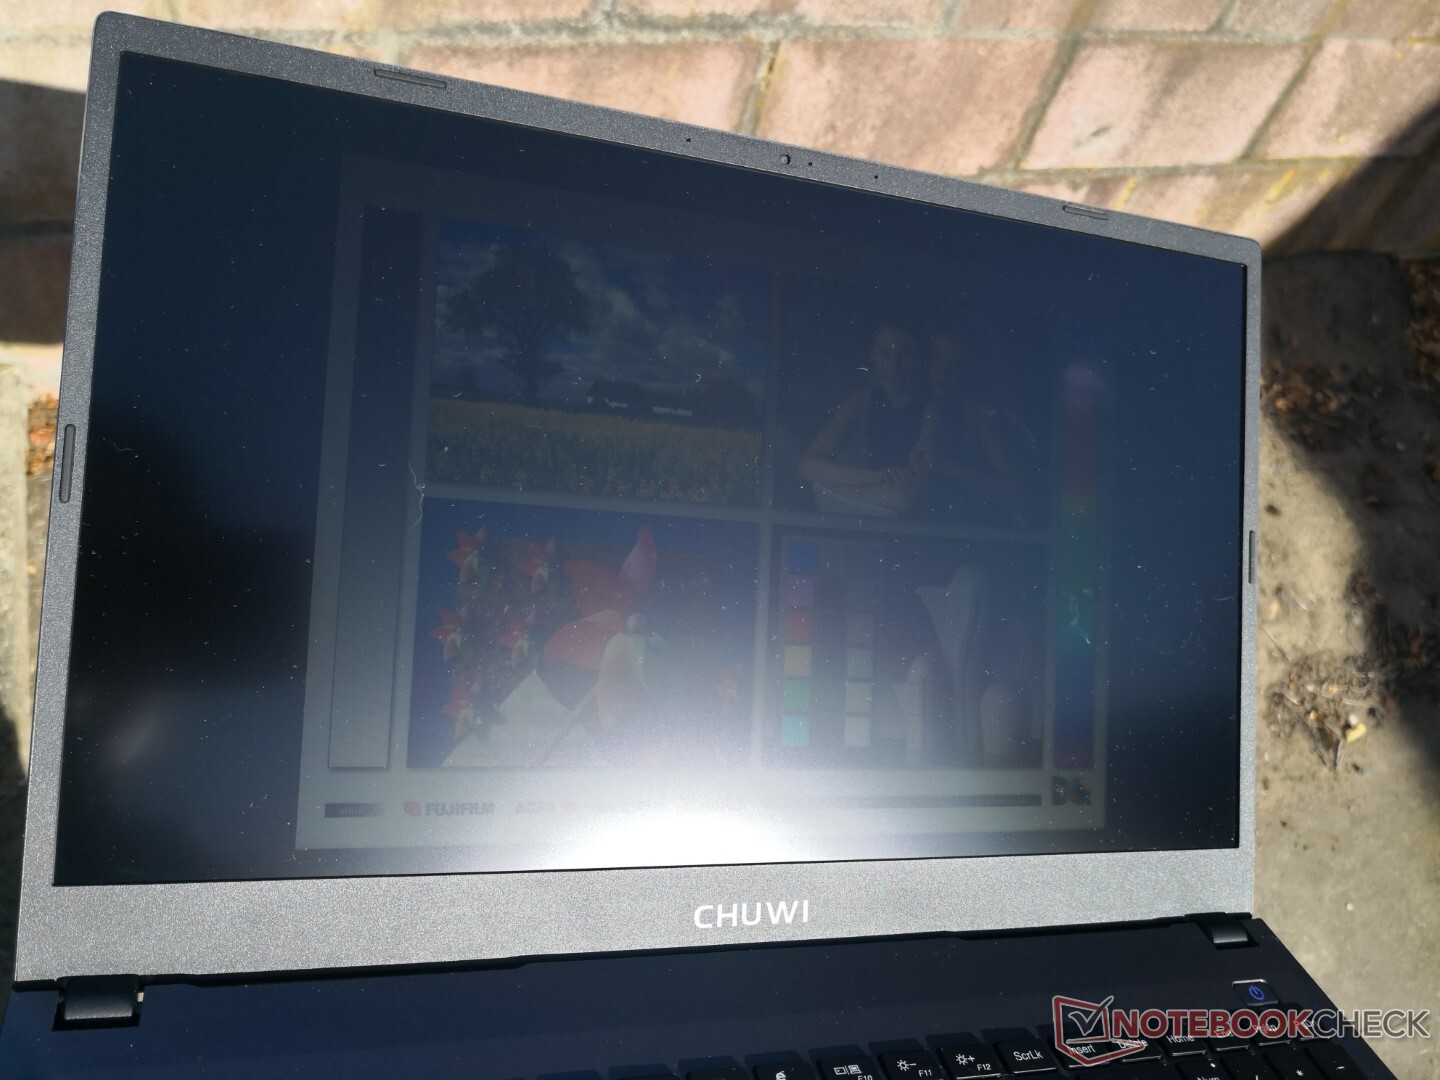
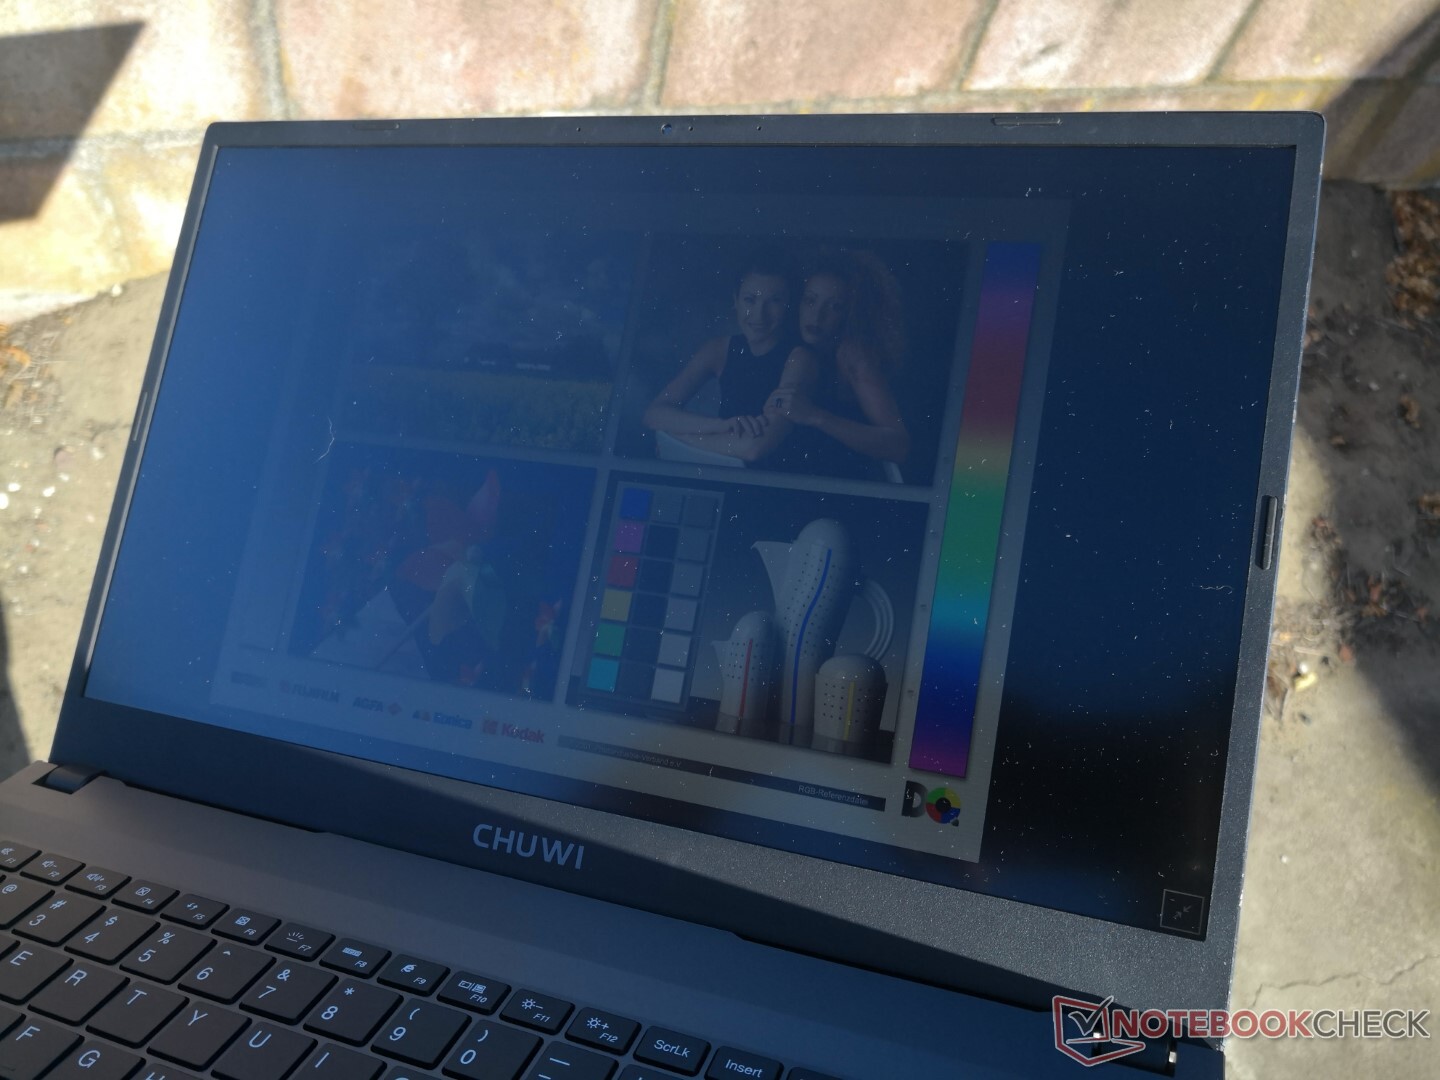
Outdoor visibility is average at best only when under shade as anything brighter will wash out colors and text. This isn't to say that the display is dim as it is sufficiently bright for indoor conditions, but pricier alternatives like the XPS 15 can be two times brighter for significantly better visibility outdoors.
Performance — 28 W TDP Core i5-8259U Returns
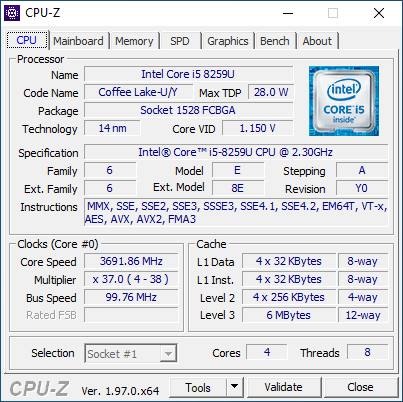
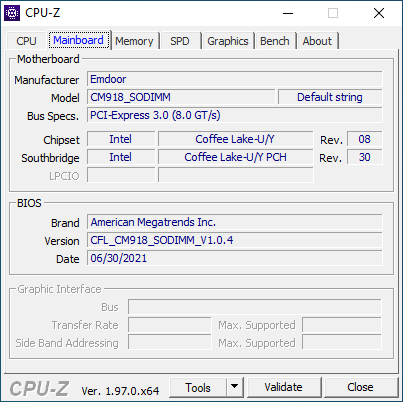
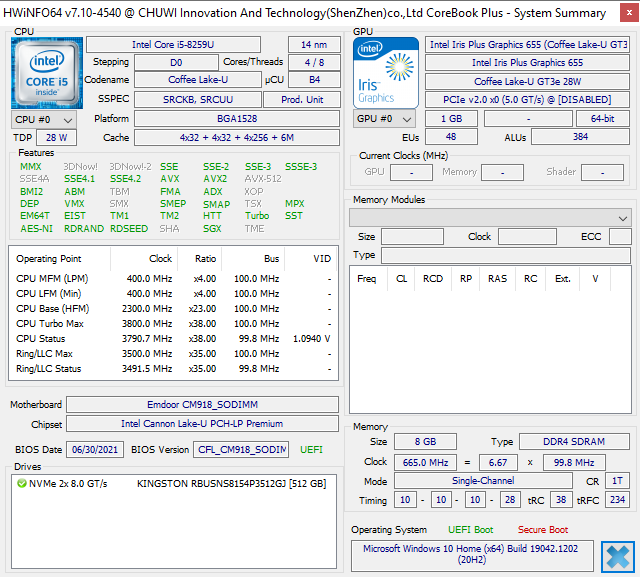
Processor
The 28 W Core i5-8259U holds up well to newer models despite being a few years old. Multi-thread performance edges out both the newer 10th gen Core i5-1035G1 and i7-1065G7 while being behind in single-thread performance by 10 to 15 percent.
Performance sustainability is excellent with no significant dips over time when at 100 percent CPU utilization for extended periods.
Cinebench R15 Multi Loop
Cinebench R23: Multi Core | Single Core
Cinebench R15: CPU Multi 64Bit | CPU Single 64Bit
Blender: v2.79 BMW27 CPU
7-Zip 18.03: 7z b 4 -mmt1 | 7z b 4
Geekbench 5.5: Single-Core | Multi-Core
HWBOT x265 Benchmark v2.2: 4k Preset
LibreOffice : 20 Documents To PDF
R Benchmark 2.5: Overall mean
| Cinebench R20 / CPU (Multi Core) | |
| Tuxedo Aura 15 Gen1 | |
| Honor MagicBook 15 4500U | |
| HP Pavilion 15-eg | |
| HP Pavilion x360 15-er0155ng | |
| Chuwi CoreBook X Pro | |
| Average Intel Core i5-8259U (1385 - 1567, n=5) | |
| HP 15s-fq1440ng | |
| HP 250 G7-15S40ES | |
| Dynabook Satellite Pro C50-E-105 | |
| HP Pavilion x360 15-dq0065cl | |
| Cinebench R20 / CPU (Single Core) | |
| HP Pavilion 15-eg | |
| HP Pavilion x360 15-er0155ng | |
| Tuxedo Aura 15 Gen1 | |
| HP 15s-fq1440ng | |
| Honor MagicBook 15 4500U | |
| HP 250 G7-15S40ES | |
| HP Pavilion x360 15-dq0065cl | |
| Chuwi CoreBook X Pro | |
| Average Intel Core i5-8259U (369 - 386, n=5) | |
| Dynabook Satellite Pro C50-E-105 | |
| Cinebench R23 / Multi Core | |
| Tuxedo Aura 15 Gen1 | |
| HP Pavilion 15-eg | |
| HP Pavilion x360 15-er0155ng | |
| Chuwi CoreBook X Pro | |
| Average Intel Core i5-8259U (3592 - 4025, n=5) | |
| Cinebench R23 / Single Core | |
| HP Pavilion 15-eg | |
| HP Pavilion x360 15-er0155ng | |
| Tuxedo Aura 15 Gen1 | |
| Chuwi CoreBook X Pro | |
| Average Intel Core i5-8259U (959 - 991, n=4) | |
| Cinebench R15 / CPU Multi 64Bit | |
| Tuxedo Aura 15 Gen1 | |
| Honor MagicBook 15 4500U | |
| HP Pavilion 15-eg | |
| HP Pavilion x360 15-er0155ng | |
| HP 15s-fq1440ng | |
| Chuwi CoreBook X Pro | |
| Average Intel Core i5-8259U (575 - 687, n=7) | |
| HP 250 G7-15S40ES | |
| Dynabook Satellite Pro C50-E-105 | |
| HP Pavilion x360 15-dq0065cl | |
| Cinebench R15 / CPU Single 64Bit | |
| HP Pavilion 15-eg | |
| HP Pavilion x360 15-er0155ng | |
| Tuxedo Aura 15 Gen1 | |
| HP 15s-fq1440ng | |
| HP Pavilion x360 15-dq0065cl | |
| Honor MagicBook 15 4500U | |
| HP 250 G7-15S40ES | |
| Chuwi CoreBook X Pro | |
| Average Intel Core i5-8259U (132 - 154, n=6) | |
| Dynabook Satellite Pro C50-E-105 | |
| Blender / v2.79 BMW27 CPU | |
| HP 15s-fq1440ng | |
| HP 250 G7-15S40ES | |
| Dynabook Satellite Pro C50-E-105 | |
| Average Intel Core i5-8259U (688 - 769, n=6) | |
| Chuwi CoreBook X Pro | |
| HP Pavilion x360 15-er0155ng | |
| HP Pavilion 15-eg | |
| Honor MagicBook 15 4500U | |
| Tuxedo Aura 15 Gen1 | |
| 7-Zip 18.03 / 7z b 4 -mmt1 | |
| HP Pavilion 15-eg | |
| HP Pavilion x360 15-er0155ng | |
| HP 15s-fq1440ng | |
| Tuxedo Aura 15 Gen1 | |
| Honor MagicBook 15 4500U | |
| HP 250 G7-15S40ES | |
| Chuwi CoreBook X Pro | |
| Average Intel Core i5-8259U (3753 - 4022, n=6) | |
| Dynabook Satellite Pro C50-E-105 | |
| 7-Zip 18.03 / 7z b 4 | |
| Tuxedo Aura 15 Gen1 | |
| Honor MagicBook 15 4500U | |
| HP Pavilion 15-eg | |
| HP Pavilion x360 15-er0155ng | |
| Average Intel Core i5-8259U (17799 - 28824, n=6) | |
| Chuwi CoreBook X Pro | |
| Dynabook Satellite Pro C50-E-105 | |
| HP 15s-fq1440ng | |
| HP 250 G7-15S40ES | |
| Geekbench 5.5 / Single-Core | |
| HP Pavilion x360 15-er0155ng | |
| HP 15s-fq1440ng | |
| Honor MagicBook 15 4500U | |
| HP 250 G7-15S40ES | |
| Tuxedo Aura 15 Gen1 | |
| Average Intel Core i5-8259U (948 - 984, n=3) | |
| Dynabook Satellite Pro C50-E-105 | |
| Geekbench 5.5 / Multi-Core | |
| Tuxedo Aura 15 Gen1 | |
| Honor MagicBook 15 4500U | |
| HP Pavilion x360 15-er0155ng | |
| HP 15s-fq1440ng | |
| Average Intel Core i5-8259U (3359 - 3839, n=3) | |
| Dynabook Satellite Pro C50-E-105 | |
| HP 250 G7-15S40ES | |
| HWBOT x265 Benchmark v2.2 / 4k Preset | |
| Tuxedo Aura 15 Gen1 | |
| Honor MagicBook 15 4500U | |
| HP Pavilion 15-eg | |
| HP Pavilion x360 15-er0155ng | |
| Chuwi CoreBook X Pro | |
| Average Intel Core i5-8259U (4.72 - 5.49, n=6) | |
| Dynabook Satellite Pro C50-E-105 | |
| HP 15s-fq1440ng | |
| HP 250 G7-15S40ES | |
| LibreOffice / 20 Documents To PDF | |
| Dynabook Satellite Pro C50-E-105 | |
| Chuwi CoreBook X Pro | |
| Average Intel Core i5-8259U (62.7 - 76, n=5) | |
| Honor MagicBook 15 4500U | |
| HP 250 G7-15S40ES | |
| Tuxedo Aura 15 Gen1 | |
| HP 15s-fq1440ng | |
| HP Pavilion x360 15-er0155ng | |
| HP Pavilion 15-eg | |
| R Benchmark 2.5 / Overall mean | |
| Dynabook Satellite Pro C50-E-105 | |
| Average Intel Core i5-8259U (0.738 - 0.818, n=5) | |
| HP 250 G7-15S40ES | |
| Chuwi CoreBook X Pro | |
| HP 15s-fq1440ng | |
| HP Pavilion x360 15-er0155ng | |
| Honor MagicBook 15 4500U | |
| Tuxedo Aura 15 Gen1 | |
| HP Pavilion 15-eg | |
* ... smaller is better
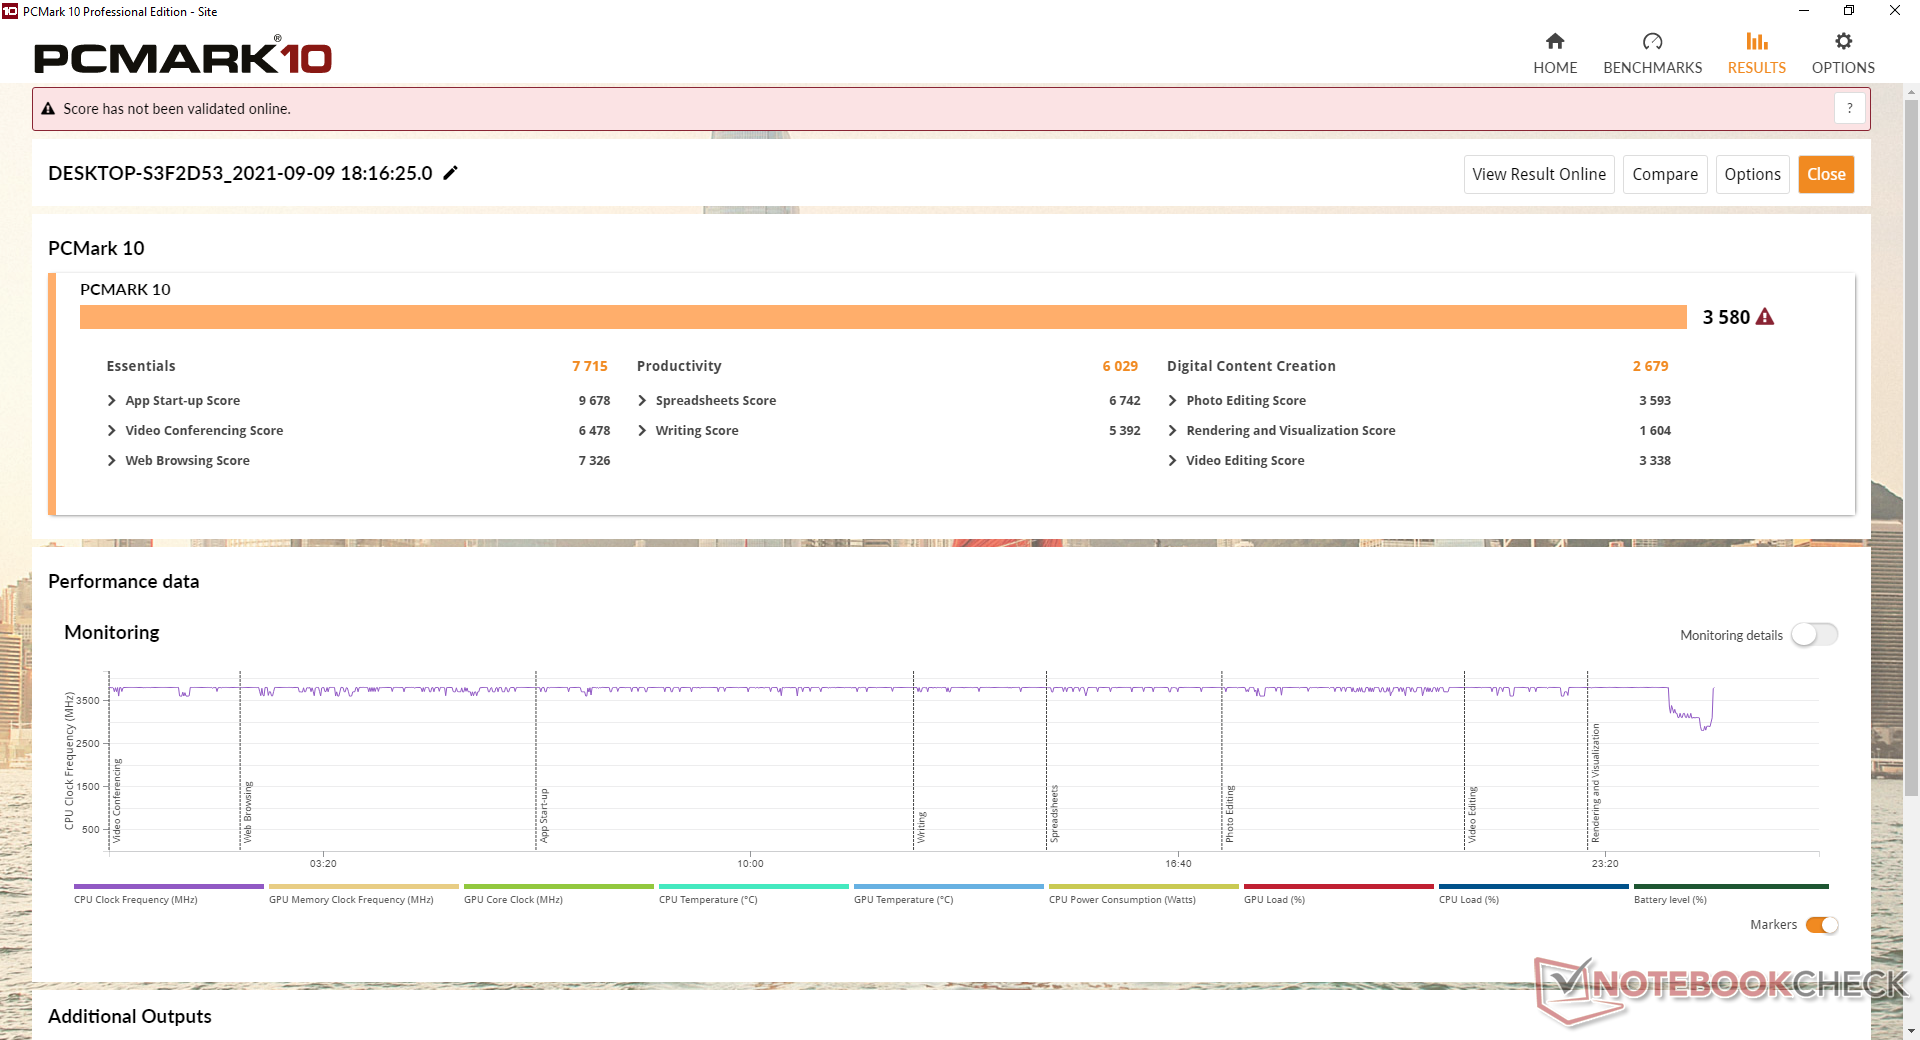
System Performance
PCMark 10 results are dragged down by the slow Iris Plus Graphics 655 in our unit. In particular, our Digital Content Creation score is about 17 percent below where it should be when compared to the average laptop in our database equipped with the exact same GPU.
| PCMark 10 / Score | |
| Asus VivoBook S15 D533UA | |
| Tuxedo Aura 15 Gen1 | |
| Dell XPS 15 9500 Core i5 | |
| Honor MagicBook 15 | |
| Average Intel Core i5-8259U, Intel Iris Plus Graphics 655 (3284 - 4132, n=6) | |
| Chuwi CoreBook X Pro | |
| Teclast TBOLT F15 Pro | |
| PCMark 10 / Essentials | |
| Dell XPS 15 9500 Core i5 | |
| Tuxedo Aura 15 Gen1 | |
| Asus VivoBook S15 D533UA | |
| Teclast TBOLT F15 Pro | |
| Average Intel Core i5-8259U, Intel Iris Plus Graphics 655 (7364 - 8351, n=6) | |
| Honor MagicBook 15 | |
| Chuwi CoreBook X Pro | |
| PCMark 10 / Productivity | |
| Asus VivoBook S15 D533UA | |
| Tuxedo Aura 15 Gen1 | |
| Dell XPS 15 9500 Core i5 | |
| Chuwi CoreBook X Pro | |
| Average Intel Core i5-8259U, Intel Iris Plus Graphics 655 (4390 - 6400, n=6) | |
| Honor MagicBook 15 | |
| Teclast TBOLT F15 Pro | |
| PCMark 10 / Digital Content Creation | |
| Asus VivoBook S15 D533UA | |
| Tuxedo Aura 15 Gen1 | |
| Honor MagicBook 15 | |
| Average Intel Core i5-8259U, Intel Iris Plus Graphics 655 (2679 - 3902, n=6) | |
| Dell XPS 15 9500 Core i5 | |
| Chuwi CoreBook X Pro | |
| Teclast TBOLT F15 Pro | |
| PCMark 10 Score | 3580 points | |
Help | ||
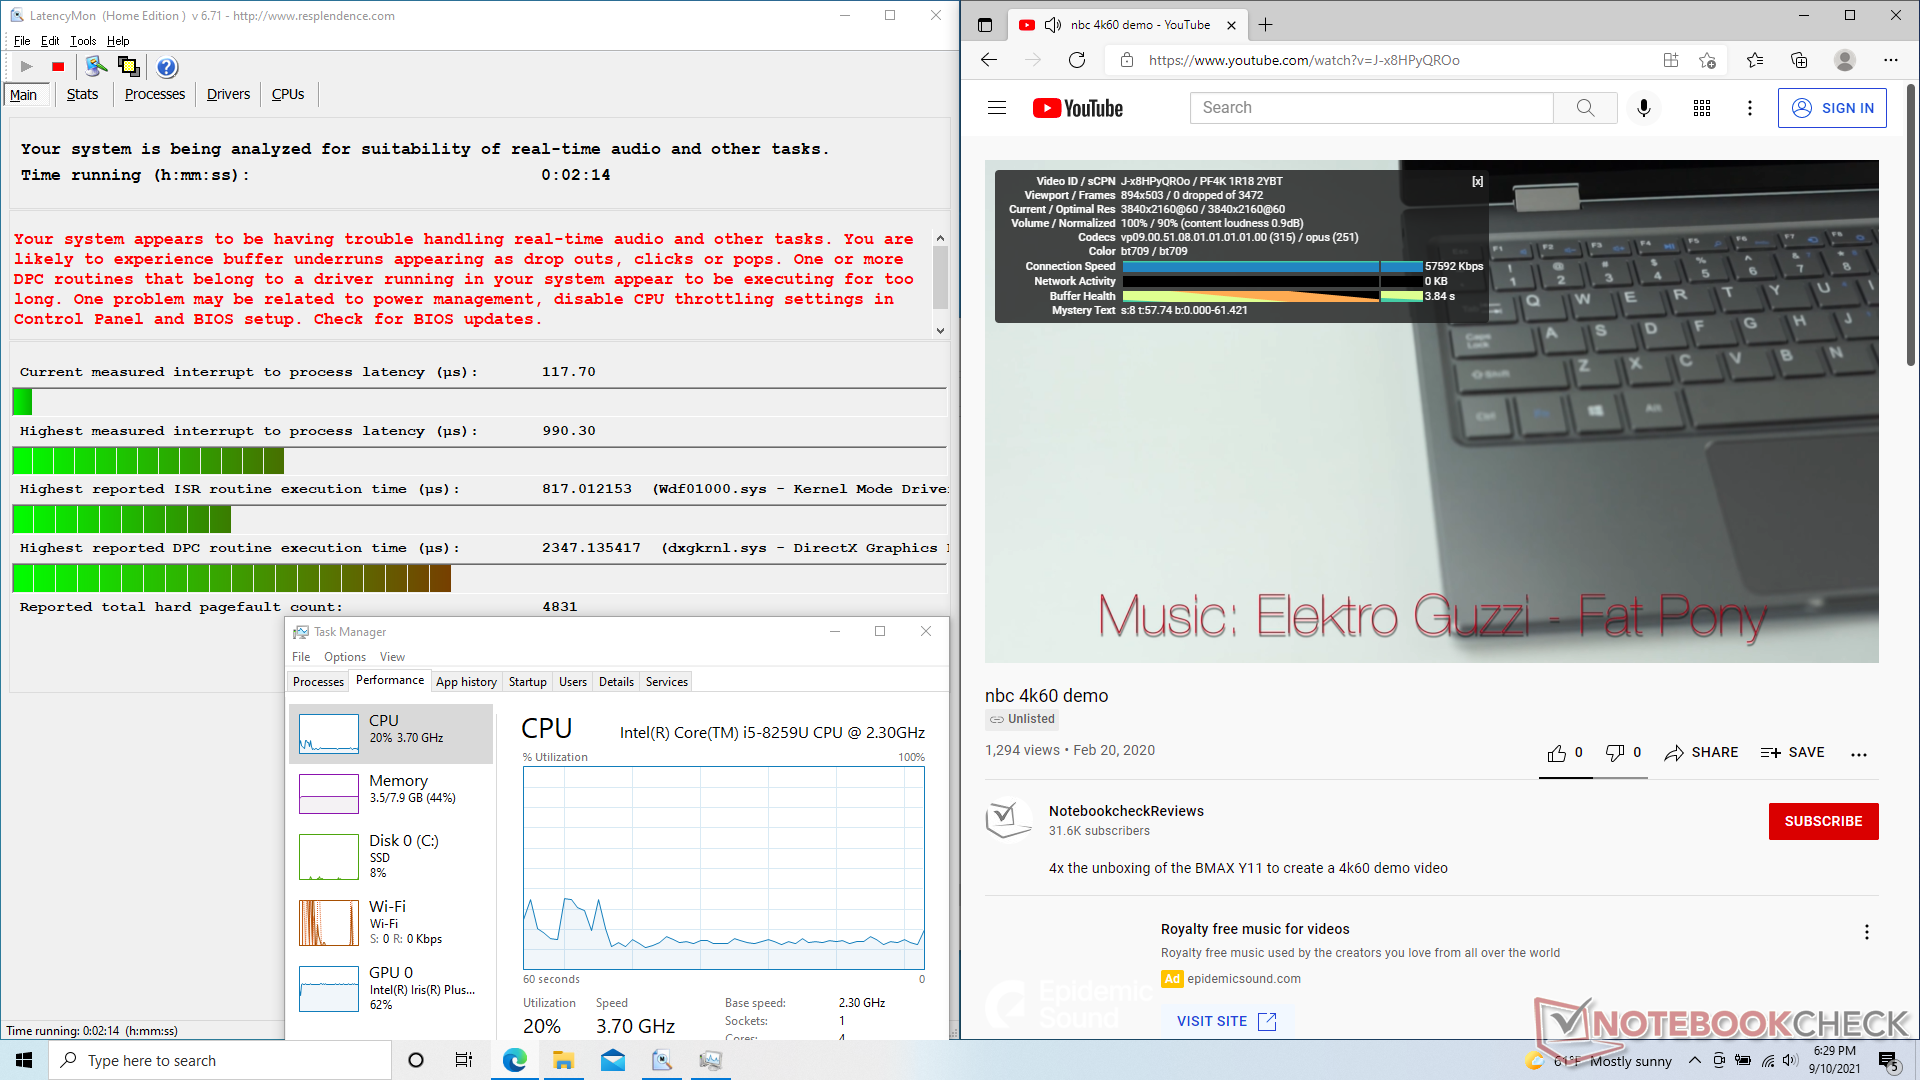
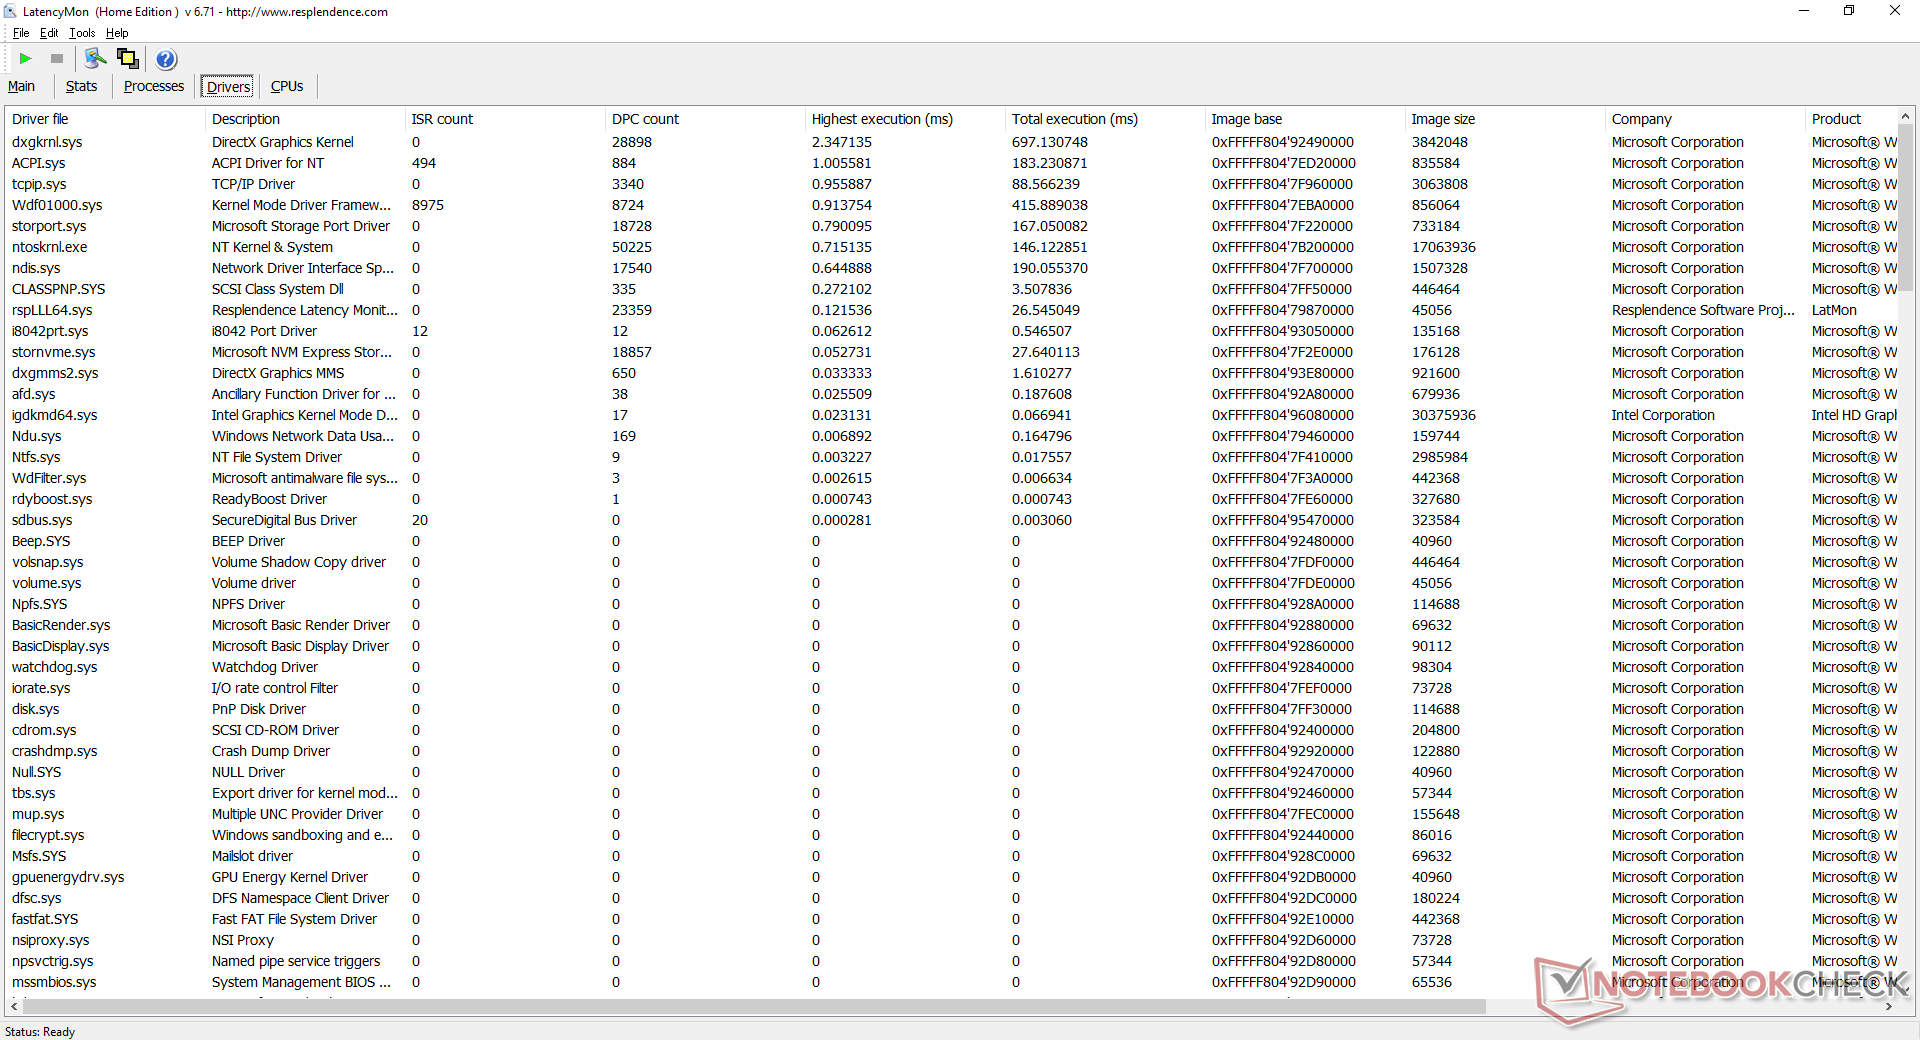
DPC Latency
LatencyMon shows latency issues when opening multiple tabs on our homepage. 4K UHD video playback at 60 FPS is otherwise smooth and with no dropped frames despite the slower-than-expected graphics performance from our Iris Plus Graphics 655.
| DPC Latencies / LatencyMon - interrupt to process latency (max), Web, Youtube, Prime95 | |
| Dell XPS 15 9500 Core i5 | |
| Honor MagicBook 15 | |
| Teclast TBOLT F15 Pro | |
| Chuwi CoreBook X Pro | |
| Asus VivoBook S15 D533UA | |
| Tuxedo Aura 15 Gen1 | |
* ... smaller is better
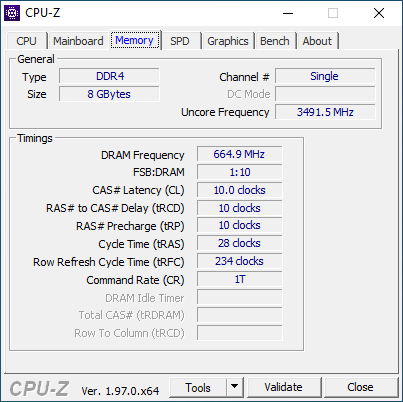
Storage Devices — Up to 2x M.2 2280 SSDs
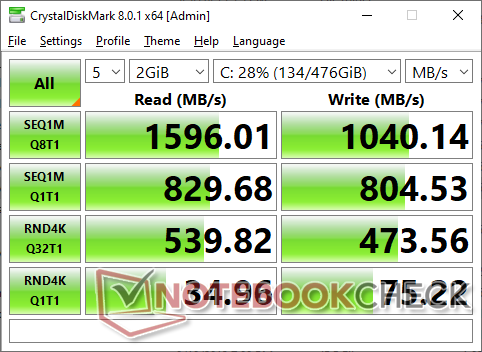
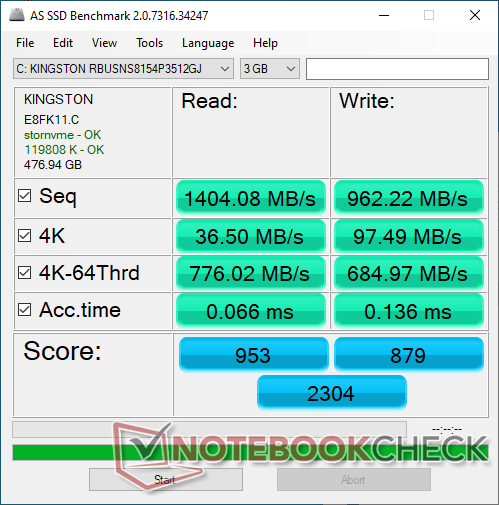
Our test unit ships with a budget 512 GB Kingston NVMe SSD for sequential read and write rates of up to ~1600 MB/s and ~1000 MB/s, respectively, according to our own tests and benchmarks. Faster NVMe drives exist, but the system can only support up to PCI x2 and not x4 speeds which is acceptable given the price, ULV processor, and graphics. If installing a second drive, keep in mind that it must be an M.2 SATA III drive.
| Chuwi CoreBook X Pro Kingston RBUSNS8154P3512GJ | Teclast TBOLT F15 Pro Teclast BD256GB | Asus VivoBook S15 D533UA WDC PC SN530 SDBPNPZ-1T00 | Honor MagicBook 15 Samsung SSD PM981a MZVLB256HBHQ | Dell XPS 15 9500 Core i5 Toshiba KBG40ZNS256G NVMe | |
|---|---|---|---|---|---|
| AS SSD | -54% | 54% | 33% | -35% | |
| Seq Read (MB/s) | 1404 | 523 -63% | 2082 48% | 2830 102% | 1423 1% |
| Seq Write (MB/s) | 962 | 443 -54% | 1844 92% | 2187 127% | 766 -20% |
| 4K Read (MB/s) | 36.5 | 23.12 -37% | 44.33 21% | 45.36 24% | 42.21 16% |
| 4K Write (MB/s) | 97.5 | 97 -1% | 157.5 62% | 88.6 -9% | 74.8 -23% |
| 4K-64 Read (MB/s) | 776 | 202.4 -74% | 1039 34% | 732 -6% | 973 25% |
| 4K-64 Write (MB/s) | 685 | 264.1 -61% | 1556 127% | 1199 75% | 218.8 -68% |
| Access Time Read * (ms) | 0.066 | 0.122 -85% | 0.05 24% | 0.055 17% | 0.125 -89% |
| Access Time Write * (ms) | 0.136 | 0.171 -26% | 0.065 52% | 0.037 73% | 0.552 -306% |
| Score Read (Points) | 953 | 278 -71% | 1292 36% | 1060 11% | 1157 21% |
| Score Write (Points) | 879 | 405 -54% | 1898 116% | 1506 71% | 370 -58% |
| Score Total (Points) | 2304 | 830 -64% | 3845 67% | 3087 34% | 2094 -9% |
| Copy ISO MB/s (MB/s) | 961 | 1441 50% | 1151 20% | 1151 20% | |
| Copy Program MB/s (MB/s) | 442.2 | 484.9 10% | 239.3 -46% | 499.4 13% | |
| Copy Game MB/s (MB/s) | 898 | 1098 22% | 635 -29% | 733 -18% | |
| CrystalDiskMark 5.2 / 6 | -9% | 85% | 99% | 42% | |
| Write 4K (MB/s) | 52.1 | 109.4 110% | 116.8 124% | 136.1 161% | 93.3 79% |
| Read 4K (MB/s) | 27.74 | 38.89 40% | 43.92 58% | 42.88 55% | 45.9 65% |
| Write Seq (MB/s) | 799 | 405.2 -49% | 1990 149% | 2335 192% | 1211 52% |
| Read Seq (MB/s) | 814 | 529 -35% | 1959 141% | 2183 168% | 1633 101% |
| Write 4K Q32T1 (MB/s) | 306.6 | 284.2 -7% | 373.3 22% | 261.2 -15% | 273.1 -11% |
| Read 4K Q32T1 (MB/s) | 373.2 | 337.8 -9% | 524 40% | 328.1 -12% | 356 -5% |
| Write Seq Q32T1 (MB/s) | 1042 | 436.5 -58% | 1985 90% | 2348 125% | 1198 15% |
| Read Seq Q32T1 (MB/s) | 1612 | 560 -65% | 2456 52% | 3564 121% | 2269 41% |
| Total Average (Program / Settings) | -32% /
-35% | 70% /
65% | 66% /
57% | 4% /
-7% |
* ... smaller is better

Disk Throttling: DiskSpd Read Loop, Queue Depth 8
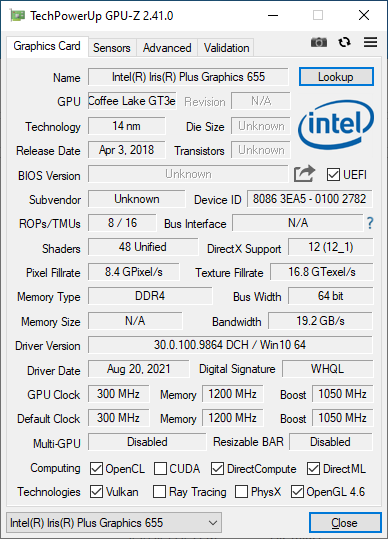
GPU Performance — Underperformer
Graphics performance is unusually low at almost 50 percent slower than the average Iris Plus Graphics 655 in our database. Our results would not change even after updating the drivers.
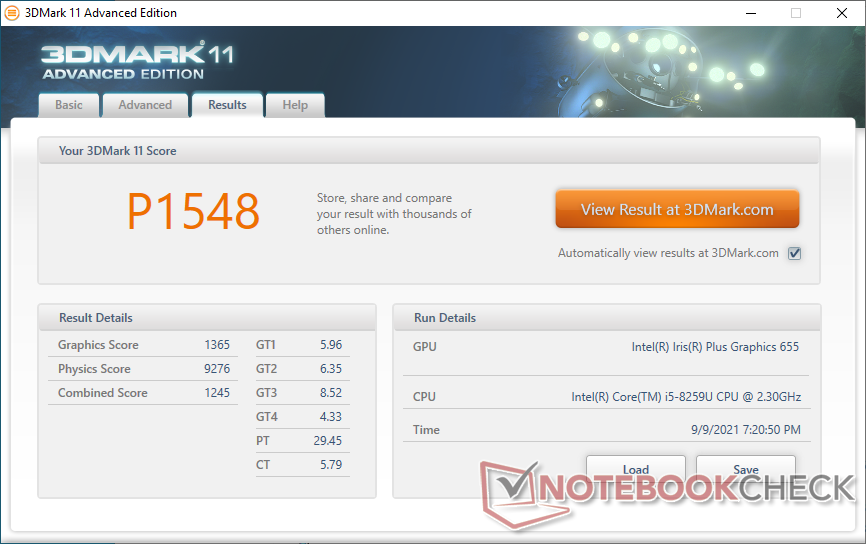
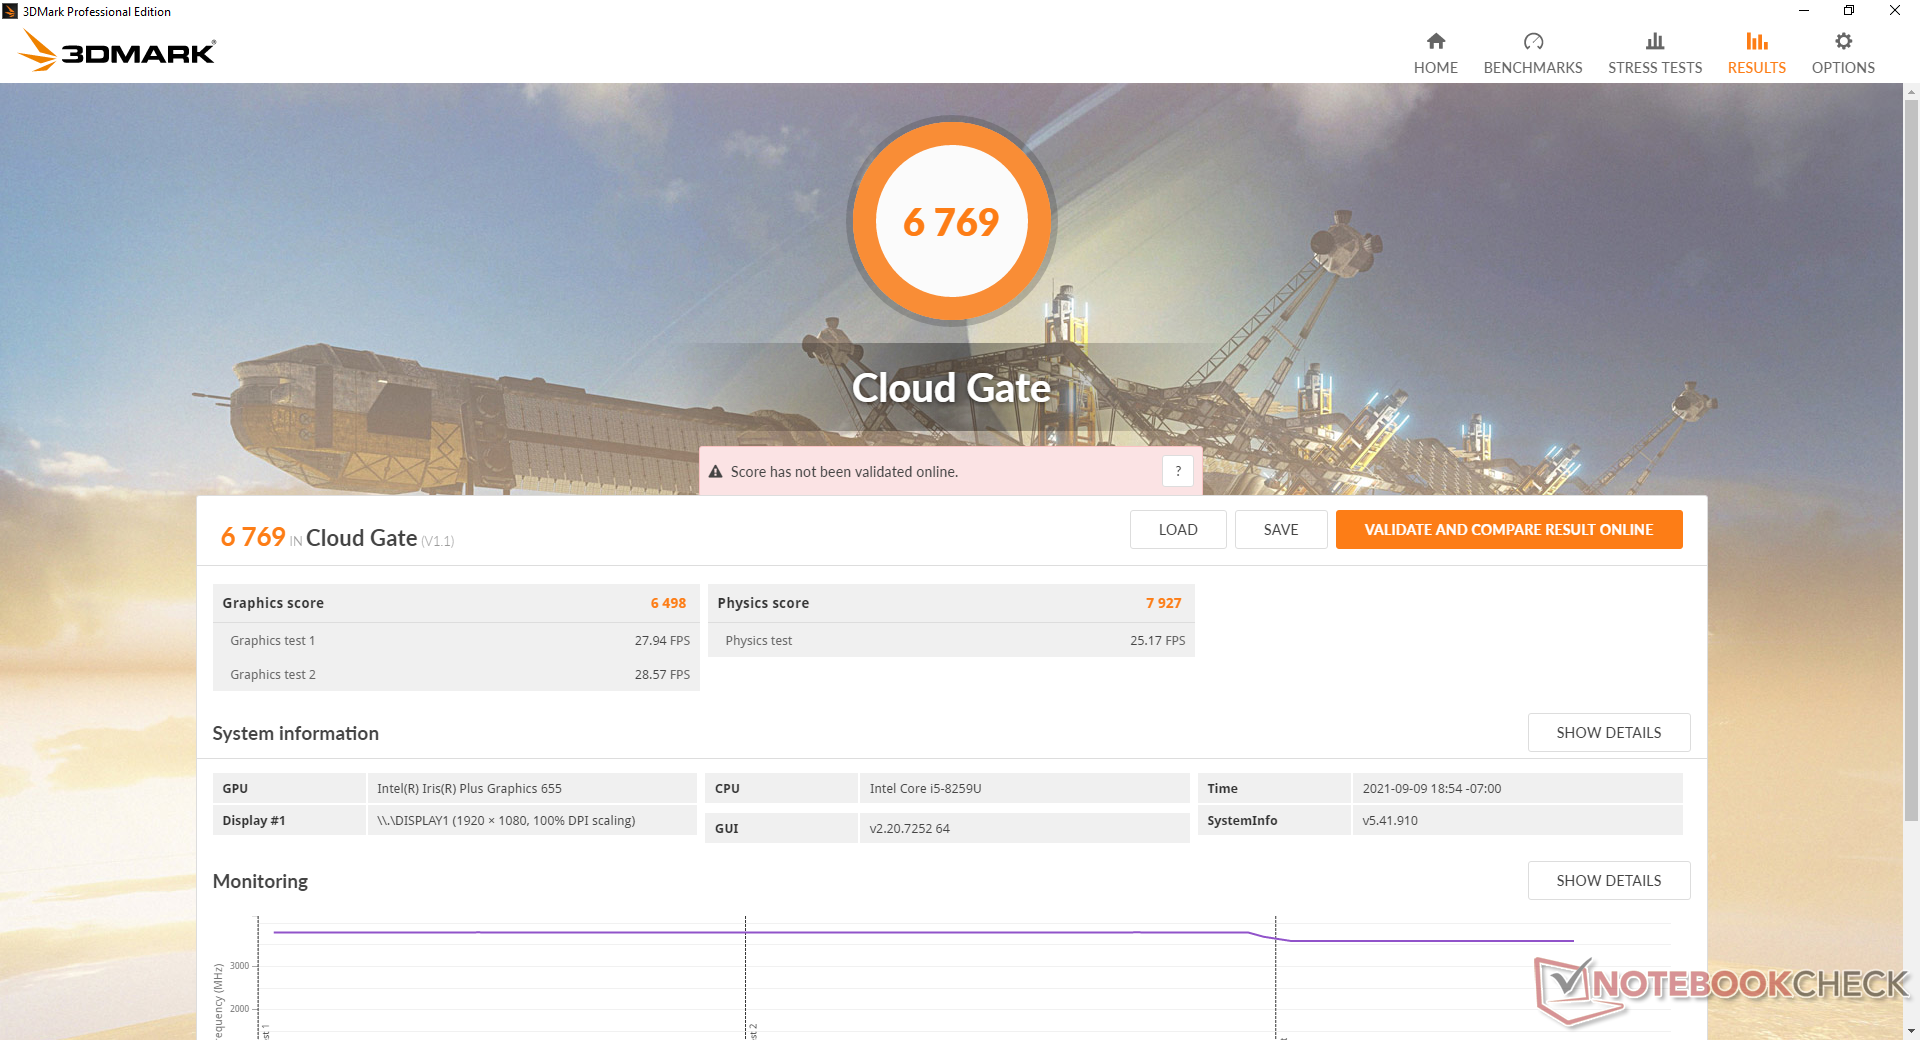
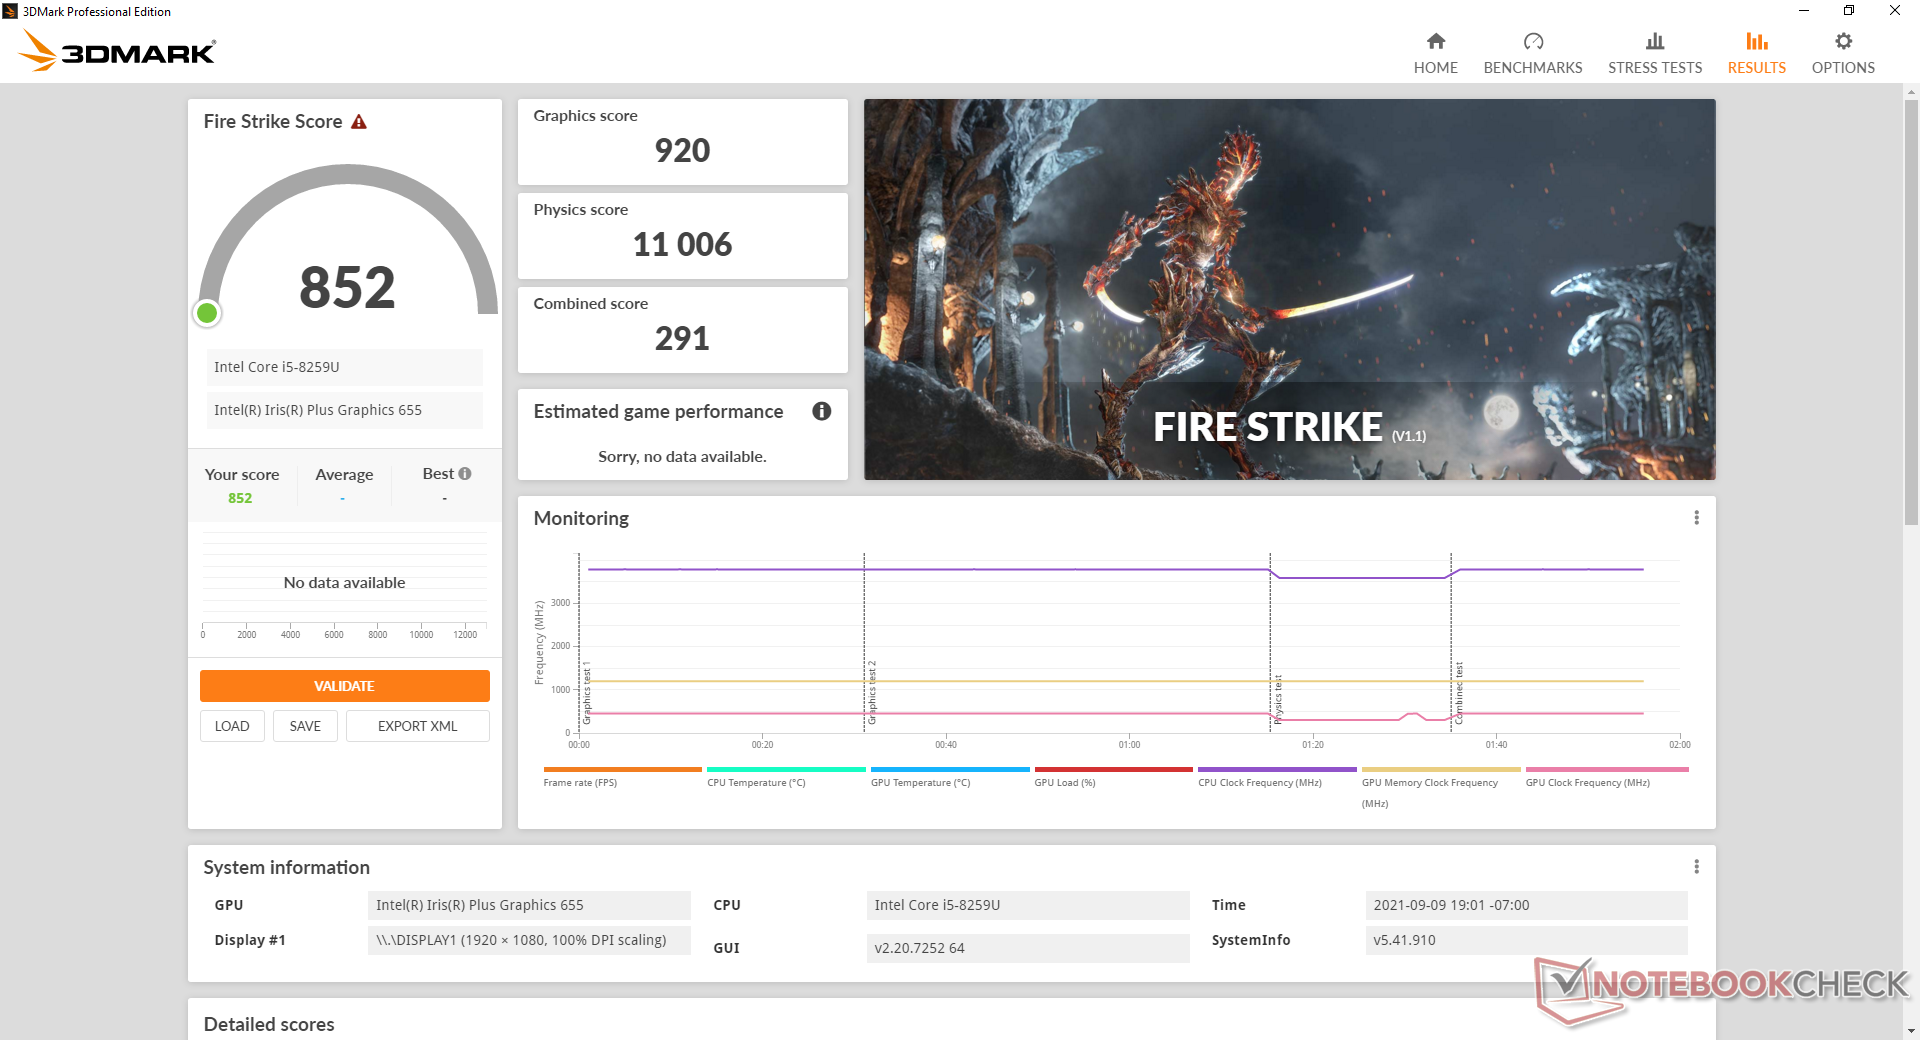
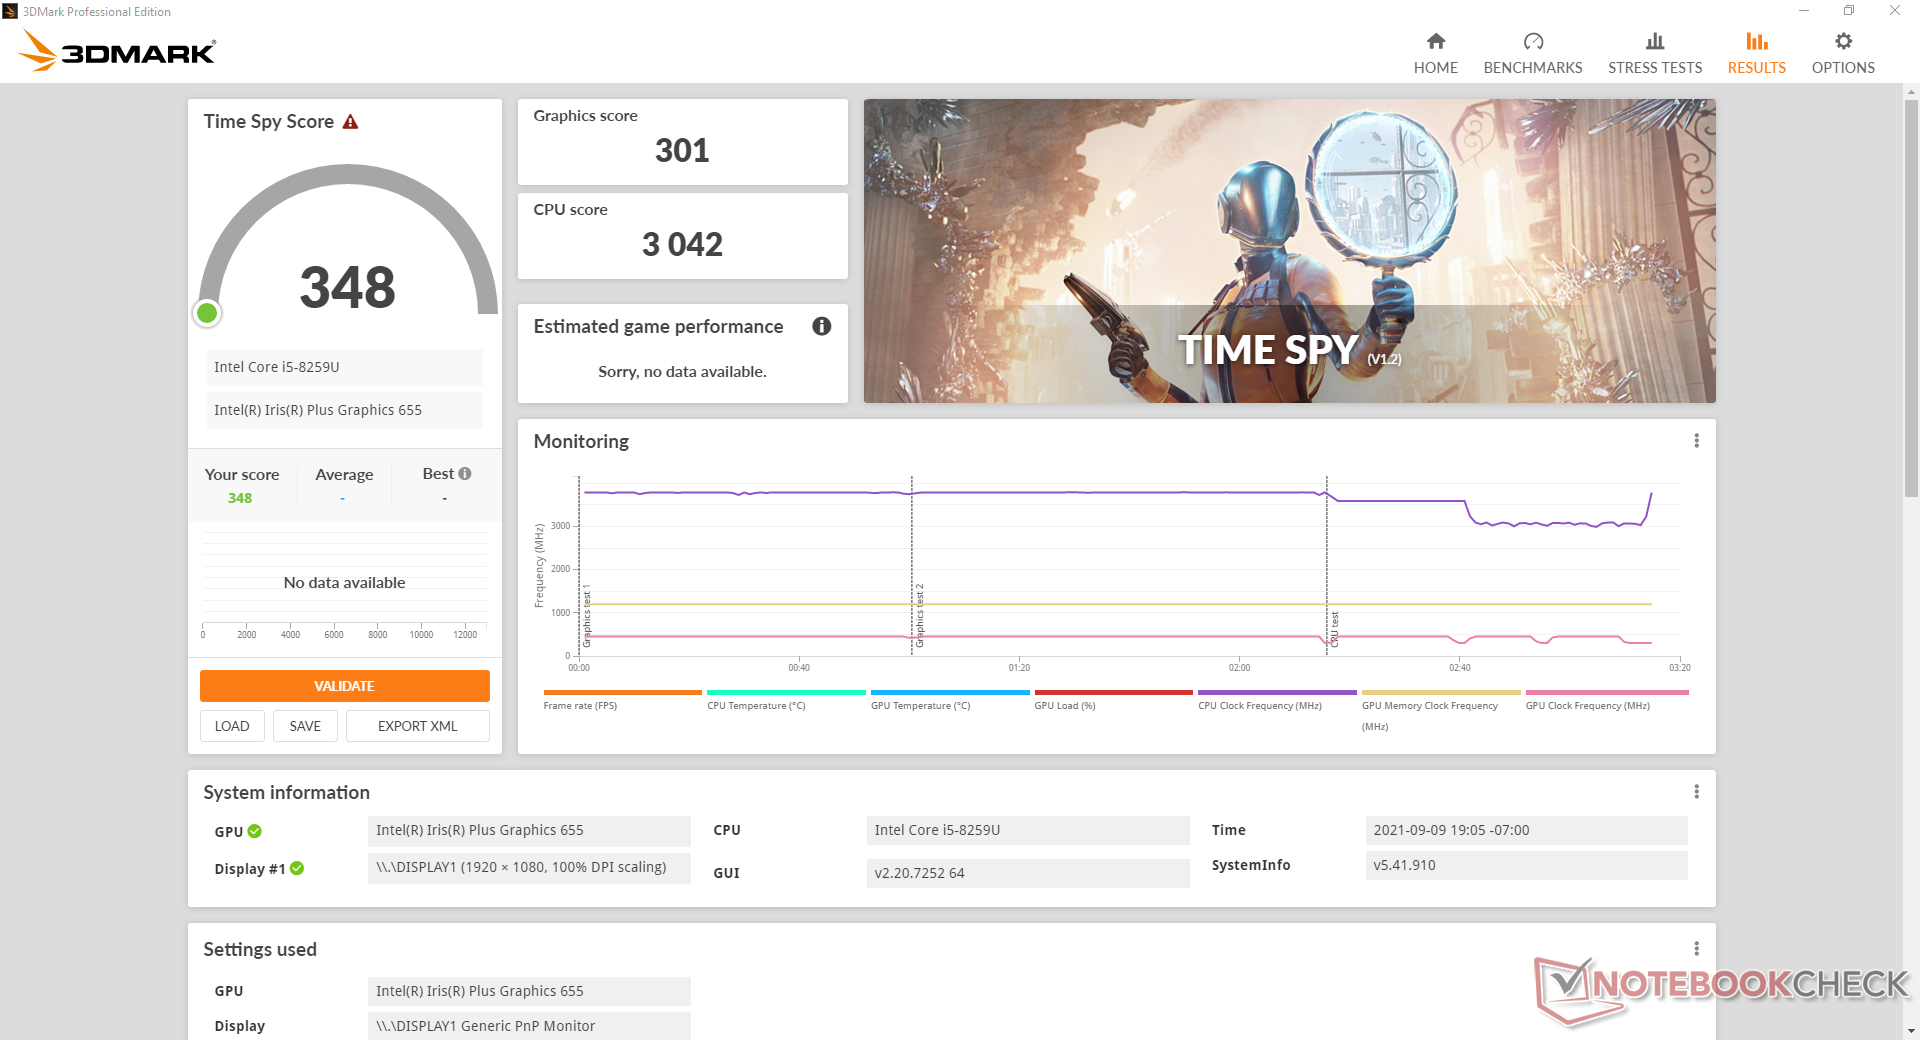
| 3DMark 11 Performance | 1548 points | |
| 3DMark Cloud Gate Standard Score | 6769 points | |
| 3DMark Fire Strike Score | 852 points | |
| 3DMark Time Spy Score | 348 points | |
Help | ||
| Final Fantasy XV Benchmark - 1280x720 Lite Quality | |
| HP Pavilion 15-eg | |
| Asus VivoBook S15 D533UA | |
| HP Pavilion x360 15-er0155ng | |
| Honor MagicBook 15 4500U | |
| Average Intel Iris Plus Graphics 655 (9.11 - 18.1, n=8) | |
| Chuwi CoreBook X | |
| Teclast TBOLT F15 Pro | |
| Chuwi CoreBook X Pro | |
| low | med. | high | ultra | |
|---|---|---|---|---|
| Dota 2 Reborn (2015) | 51.4 | 37.1 | 15.8 | 13.4 |
| Final Fantasy XV Benchmark (2018) | 9.11 | |||
| X-Plane 11.11 (2018) | 13.8 | 9.75 | 8.55 |
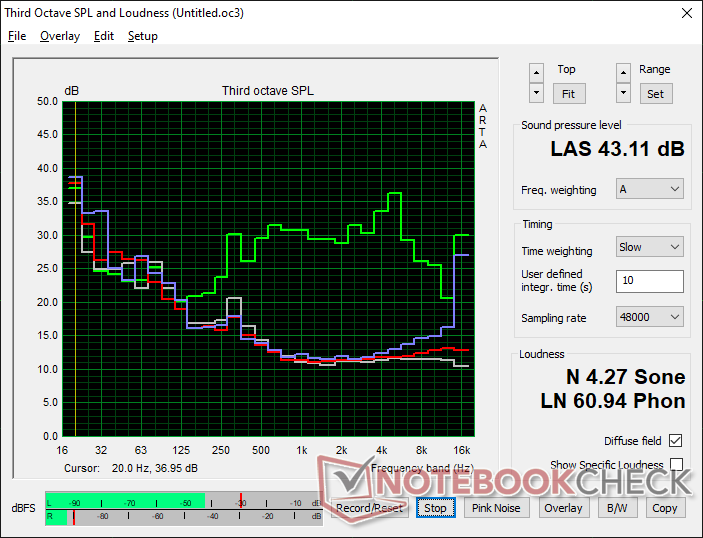
Emissions — Quiet Most of the Time
System Noise
Fan noise is almost always quiet during low to low-medium loads like browsing or streaming. When running the first benchmark scene of 3DMark 06, fan noise would slowly increase to 27.9 dB(A) before falling back down to a barely noticeable 25.9 dB(A).
When running more demanding loads like games for longer periods, fan noise would steadily increase until maxing out at 43 dB(A) which is not an uncommon upper-range for Ultrabooks. It's unlikely users will experience this maximum unless if the CPU is constantly under stressful loads.
| Chuwi CoreBook X Pro Iris Plus Graphics 655, i5-8259U, Kingston RBUSNS8154P3512GJ | Teclast TBOLT F15 Pro UHD Graphics G1 (Ice Lake 32 EU), i3-1005G1, Teclast BD256GB | Asus VivoBook S15 D533UA Vega 8, R7 5700U, WDC PC SN530 SDBPNPZ-1T00 | Honor MagicBook 15 Vega 8, R5 3500U, Samsung SSD PM981a MZVLB256HBHQ | Dell XPS 15 9500 Core i5 UHD Graphics 630, i5-10300H, Toshiba KBG40ZNS256G NVMe | |
|---|---|---|---|---|---|
| Noise | 9% | -18% | -18% | -10% | |
| off / environment * (dB) | 24.3 | 24.2 -0% | 26 -7% | 30.7 -26% | 28 -15% |
| Idle Minimum * (dB) | 24.3 | 24.2 -0% | 26 -7% | 30.7 -26% | 28 -15% |
| Idle Average * (dB) | 24.3 | 24.2 -0% | 26 -7% | 30.7 -26% | 28 -15% |
| Idle Maximum * (dB) | 24.3 | 24.2 -0% | 28.8 -19% | 30.7 -26% | 28 -15% |
| Load Average * (dB) | 27.9 | 24.2 13% | 45 -61% | 32.7 -17% | 28 -0% |
| Load Maximum * (dB) | 43 | 25.3 41% | 45 -5% | 38.4 11% | 41.9 3% |
* ... smaller is better
Noise level
| Idle |
| 24.3 / 24.3 / 24.3 dB(A) |
| Load |
| 27.9 / 43 dB(A) |
 | ||
30 dB silent 40 dB(A) audible 50 dB(A) loud |
||
min: | ||
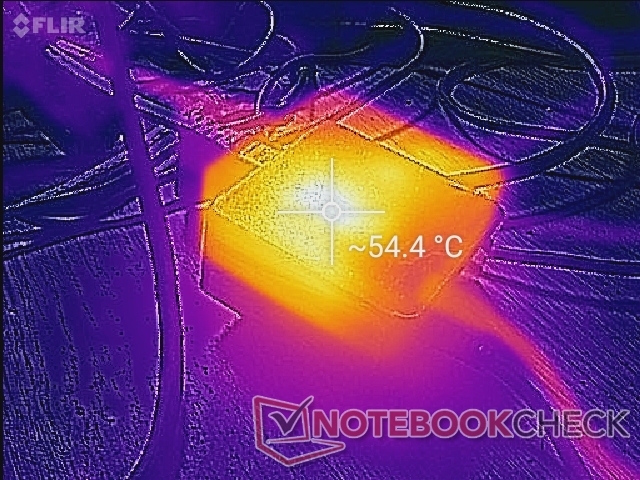
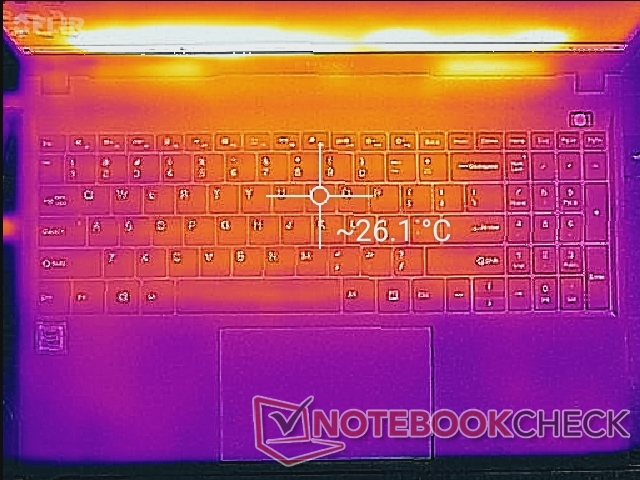
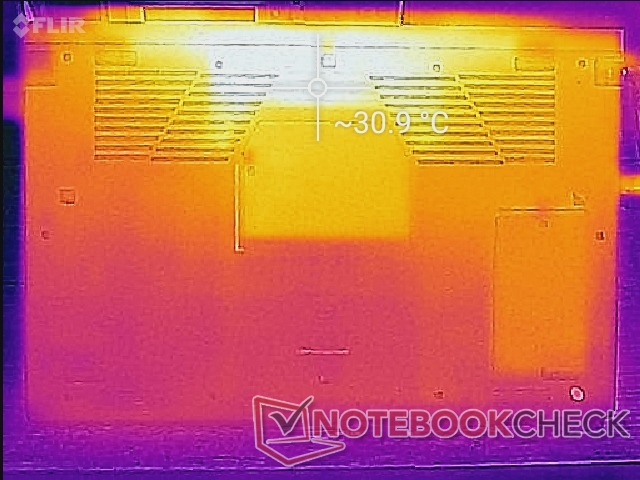
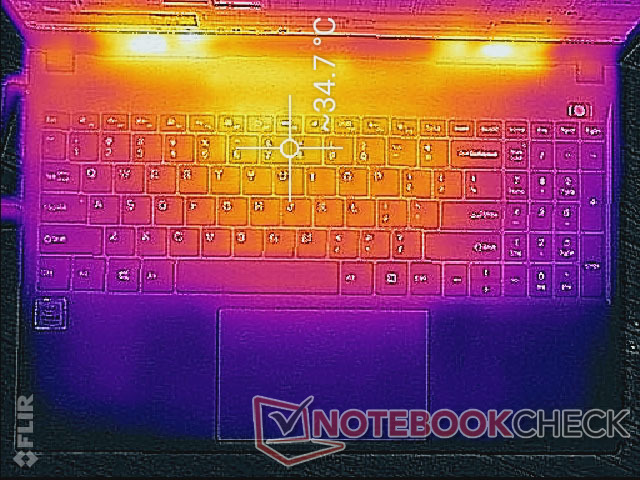
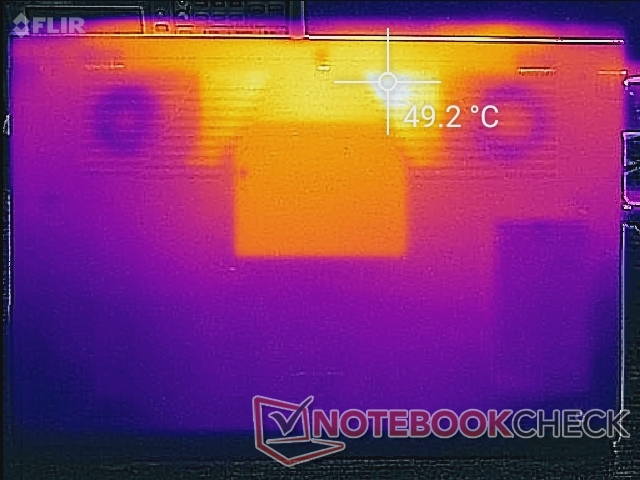
Temperature
Surface temperatures are not an issue no matter the load as the 15.6-inch form factor and dual fans are more than enough to cool a Core-U series processor. Small hot spots on the top and bottom toward the rear of the chassis can reach 35 C and 50 C, respectively, where hands are unlikely to touch.
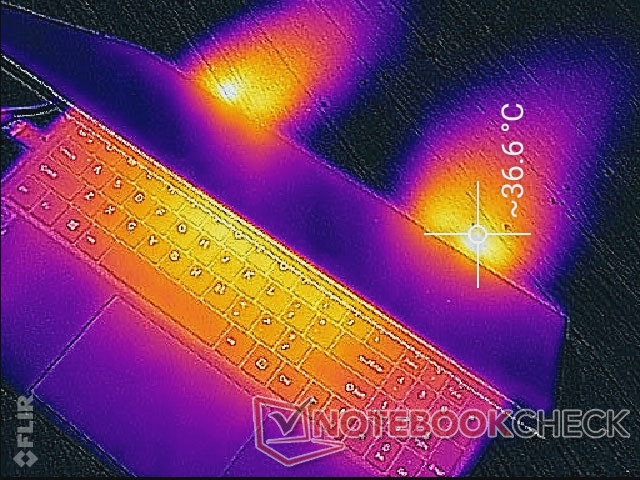
(+) The maximum temperature on the upper side is 35.6 °C / 96 F, compared to the average of 36.8 °C / 98 F, ranging from 21 to 71 °C for the class Multimedia.
(-) The bottom heats up to a maximum of 49 °C / 120 F, compared to the average of 39.1 °C / 102 F
(+) In idle usage, the average temperature for the upper side is 25.2 °C / 77 F, compared to the device average of 31.3 °C / 88 F.
(+) The palmrests and touchpad are cooler than skin temperature with a maximum of 24.2 °C / 75.6 F and are therefore cool to the touch.
(+) The average temperature of the palmrest area of similar devices was 28.7 °C / 83.7 F (+4.5 °C / 8.1 F).
Stress Test
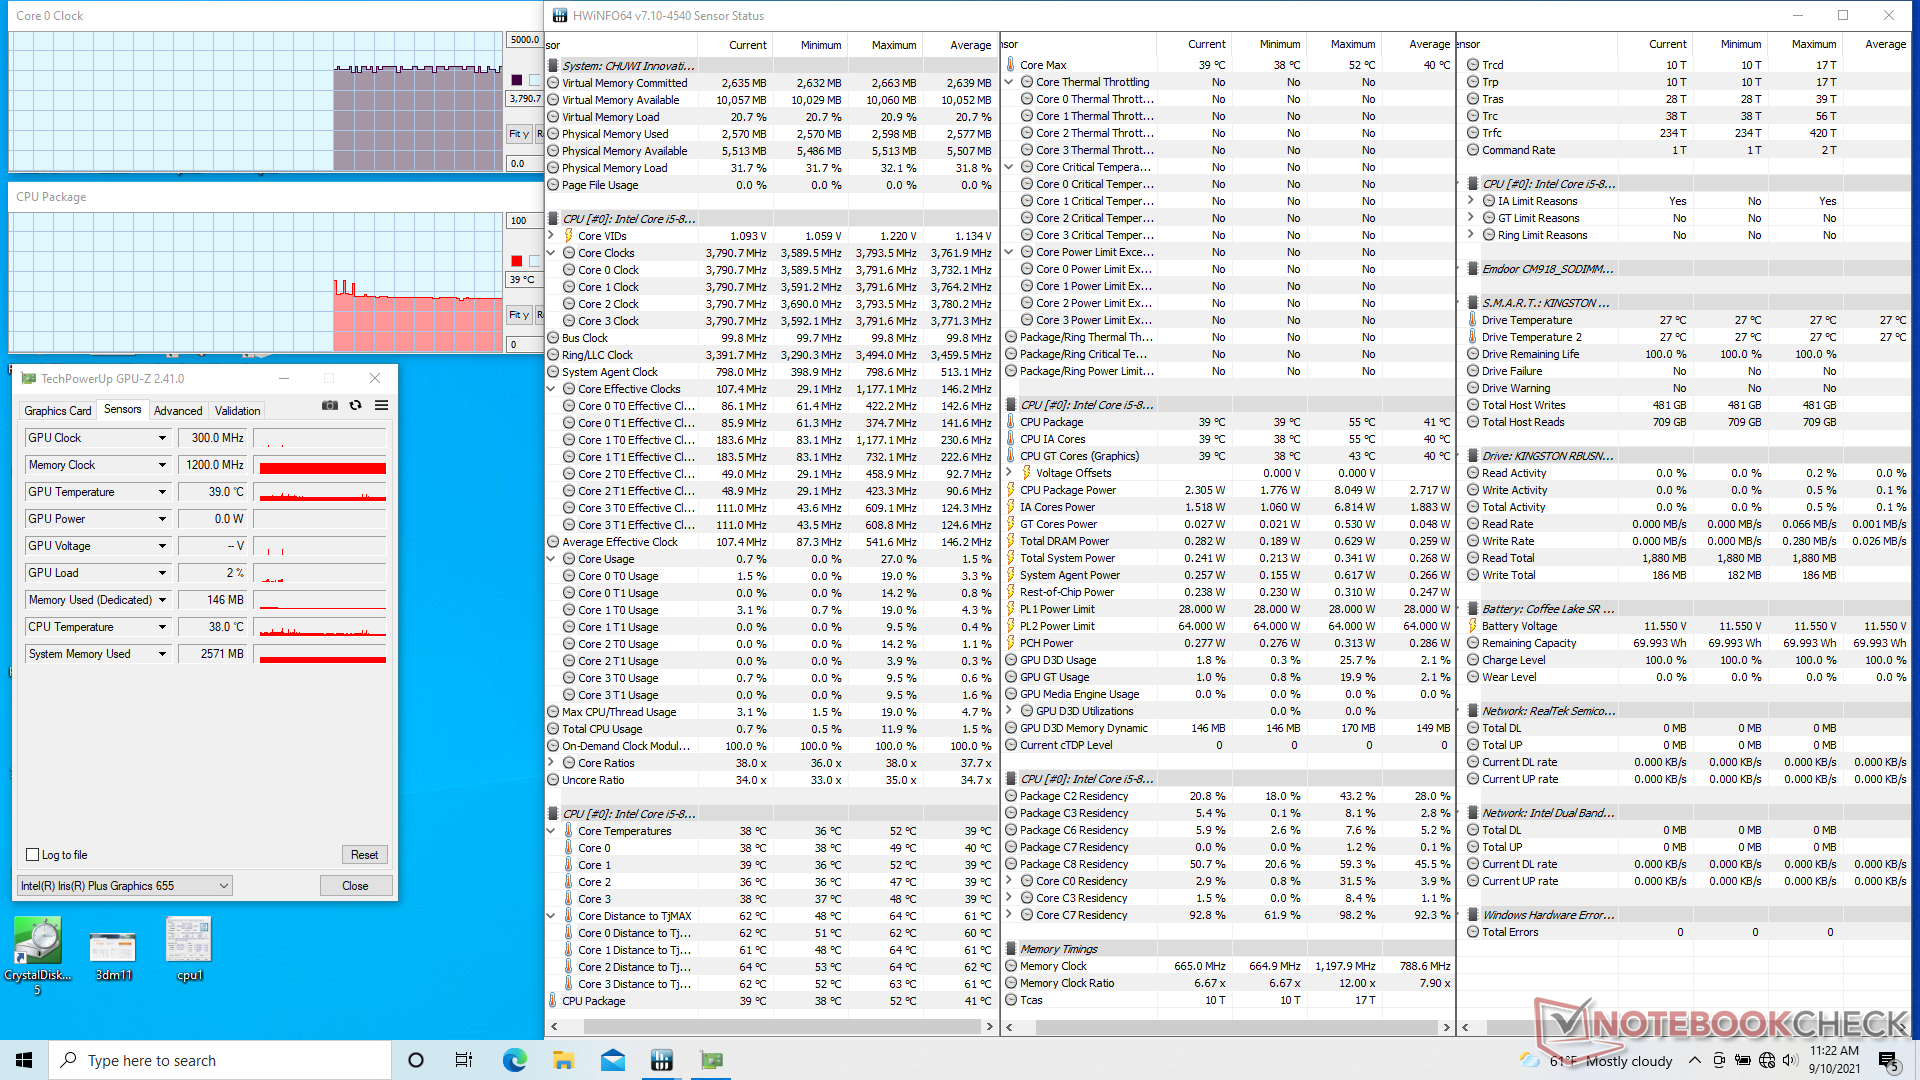
The CPU will boost up to 3 GHz for about 20 seconds when running Prime95 or until core temperatures hit 90 C. Thereafter, clock rates would fall to just 2.4 GHz in order to maintain a cooler core temperature of 69 C. Turbo Boost sustainability is therefore poor as the base clock rate of the Core i5-8259U is 2.3 GHz or just 100 MHz slower than the stable Turbo Boost clock rate.
Running on battery power will impact processor performance. A 3DMark 11 test on batteries would return Physics and Graphics scores of 6738 and 1296 points, respectively, compared to 9276 and 1365 points when on mains.
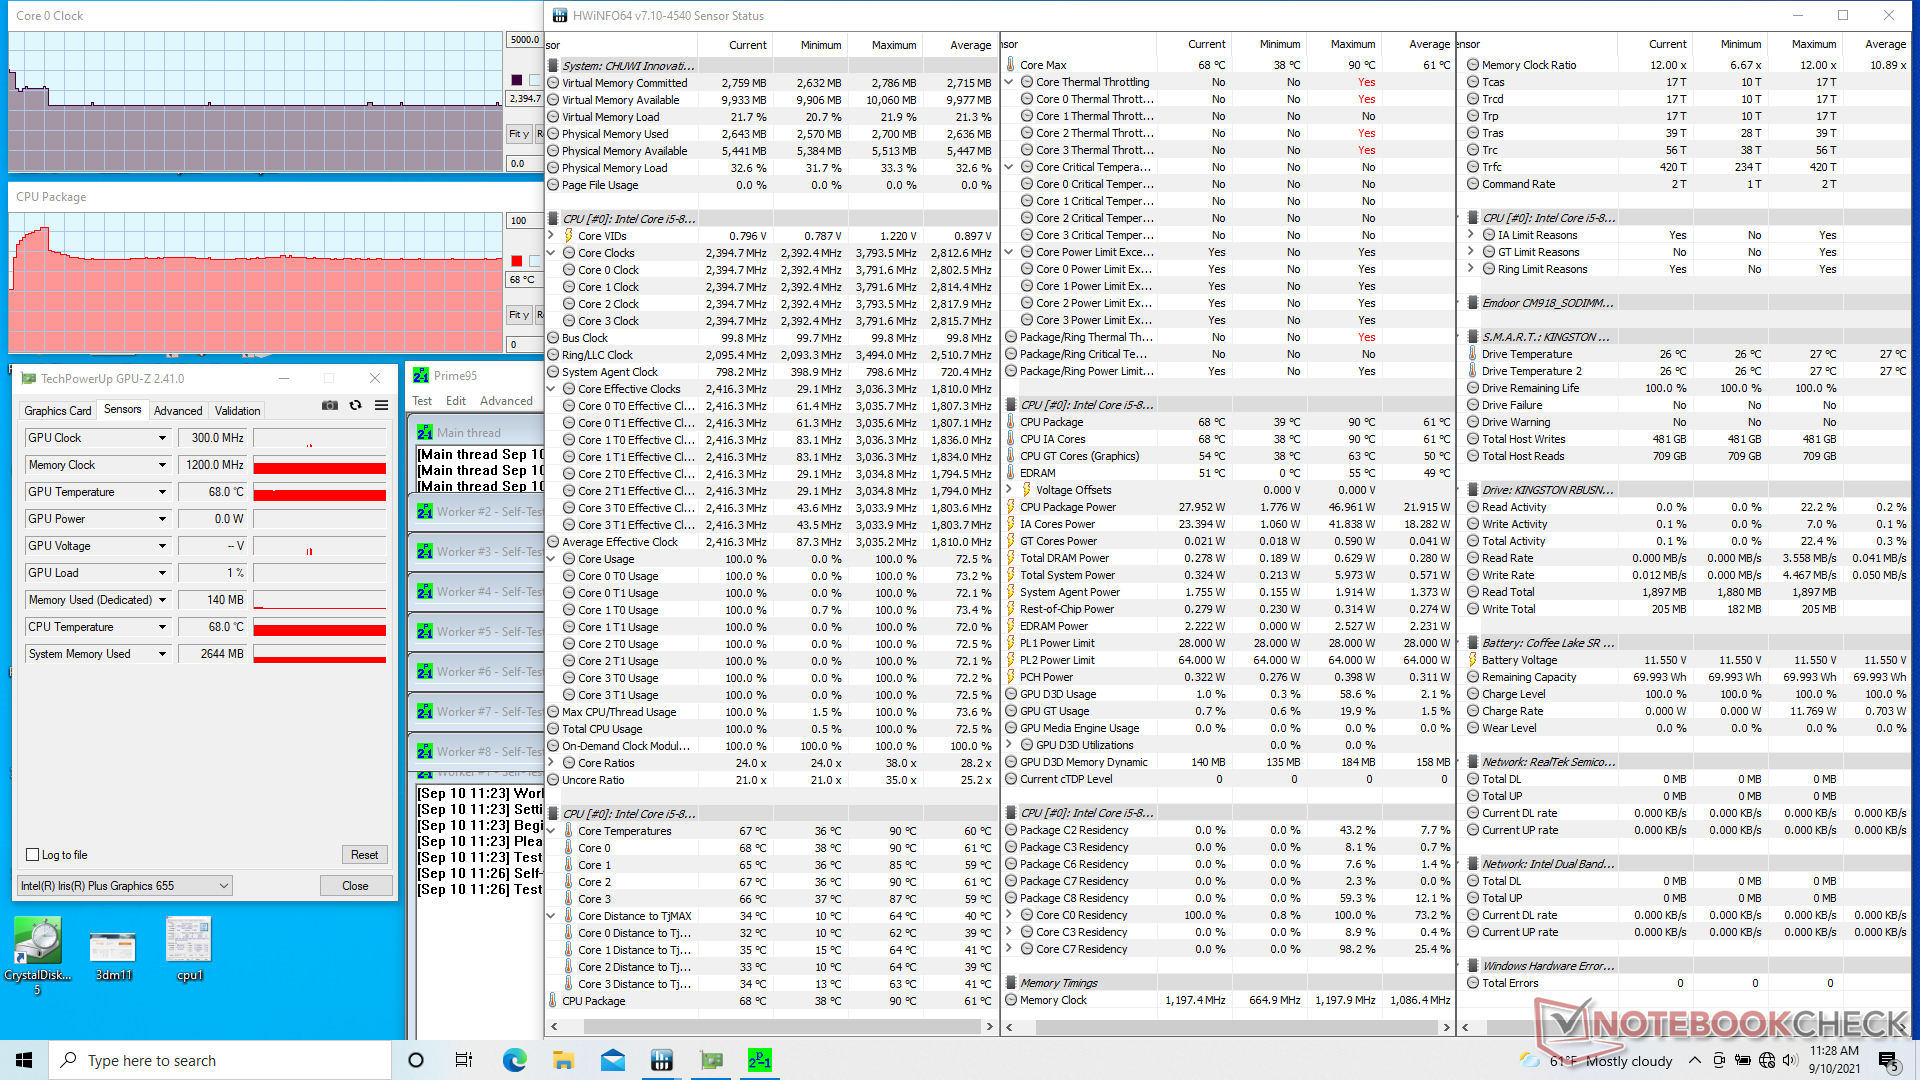
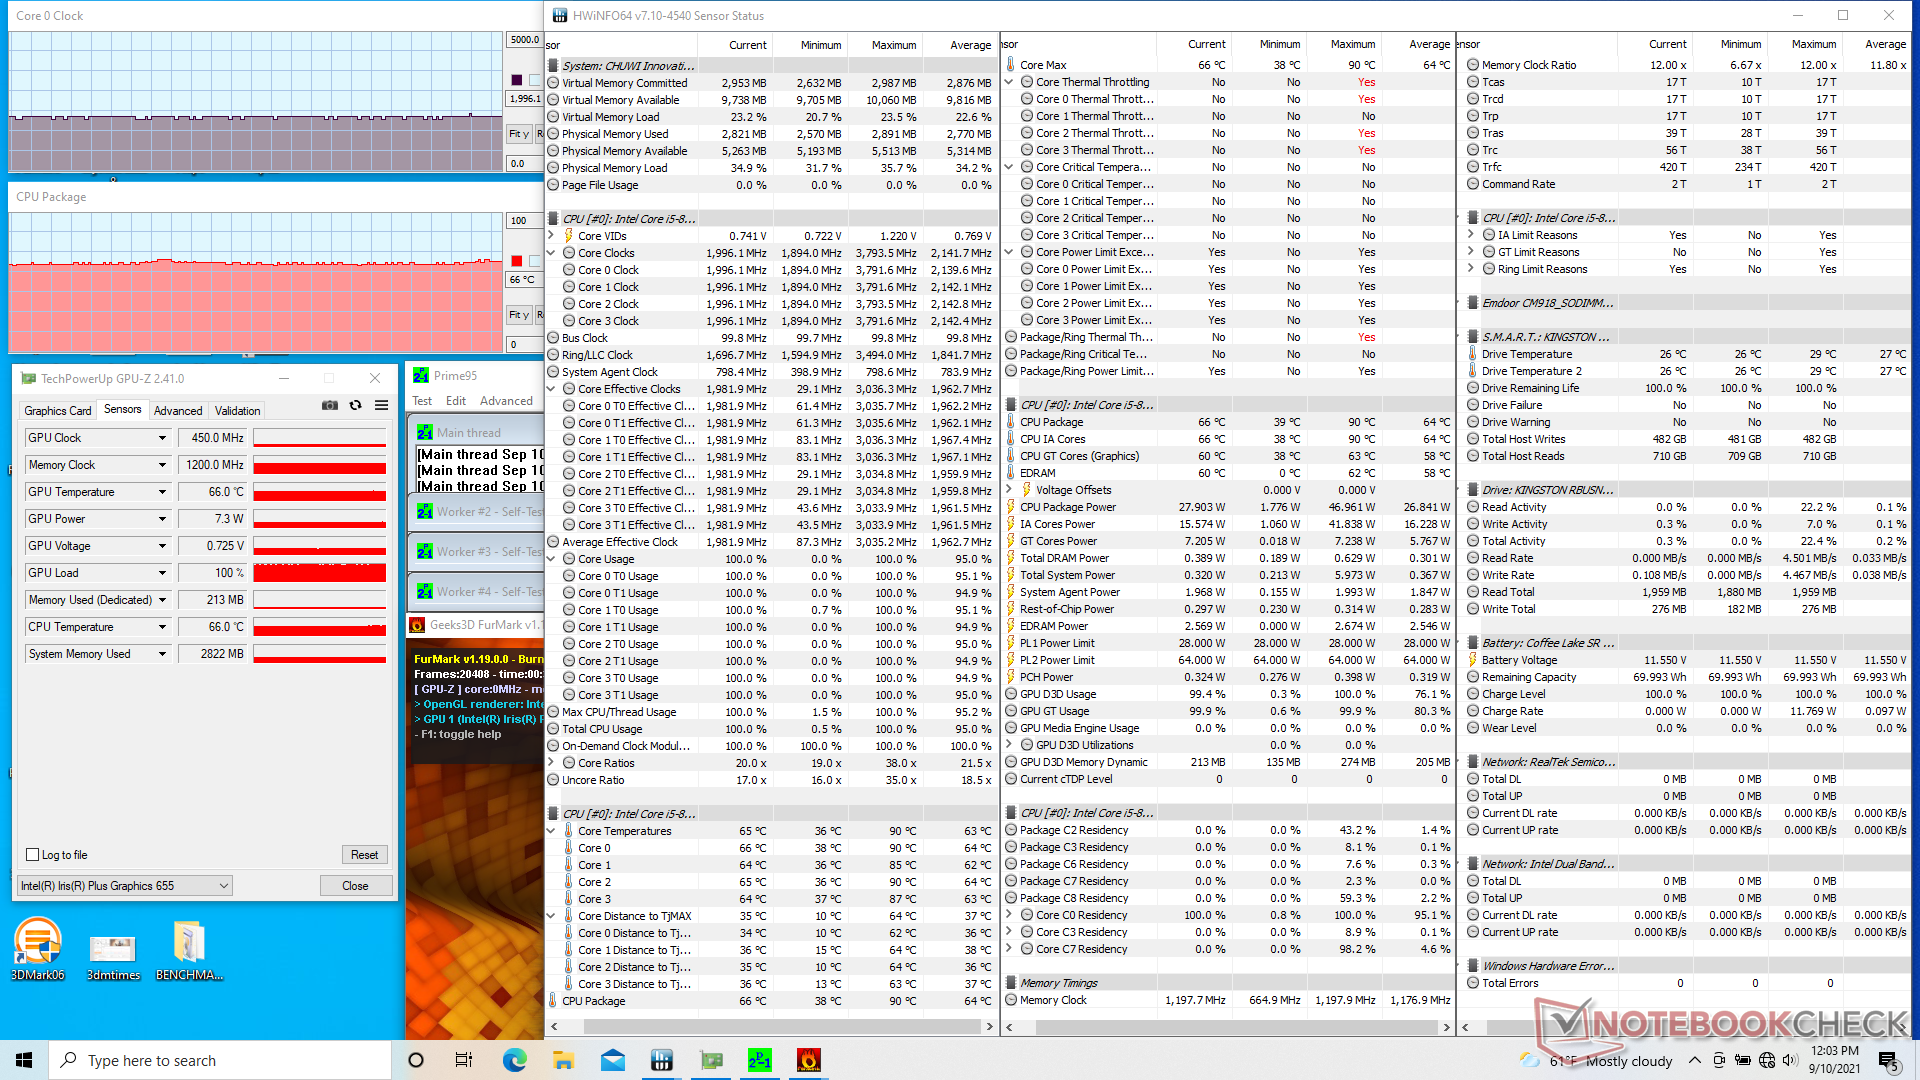
| CPU Clock (GHz) | GPU Clock (MHz) | Average CPU Temperature (°C) | |
| System Idle | -- | -- | 39 |
| Prime95 Stress | 2.4 | -- | 68 |
| Prime95 + FurMark Stress | 2.0 | 450 | 66 |
Speakers — Tin Can Quality


Chuwi CoreBook X Pro audio analysis
(-) | not very loud speakers (68.7 dB)
Bass 100 - 315 Hz
(-) | nearly no bass - on average 29.7% lower than median
(±) | linearity of bass is average (8.8% delta to prev. frequency)
Mids 400 - 2000 Hz
(±) | reduced mids - on average 9.3% lower than median
(±) | linearity of mids is average (13.6% delta to prev. frequency)
Highs 2 - 16 kHz
(+) | balanced highs - only 3.1% away from median
(+) | highs are linear (4.1% delta to prev. frequency)
Overall 100 - 16.000 Hz
(-) | overall sound is not linear (33.8% difference to median)
Compared to same class
» 98% of all tested devices in this class were better, 0% similar, 2% worse
» The best had a delta of 5%, average was 17%, worst was 45%
Compared to all devices tested
» 93% of all tested devices were better, 1% similar, 6% worse
» The best had a delta of 4%, average was 24%, worst was 134%
Apple MacBook 12 (Early 2016) 1.1 GHz audio analysis
(+) | speakers can play relatively loud (83.6 dB)
Bass 100 - 315 Hz
(±) | reduced bass - on average 11.3% lower than median
(±) | linearity of bass is average (14.2% delta to prev. frequency)
Mids 400 - 2000 Hz
(+) | balanced mids - only 2.4% away from median
(+) | mids are linear (5.5% delta to prev. frequency)
Highs 2 - 16 kHz
(+) | balanced highs - only 2% away from median
(+) | highs are linear (4.5% delta to prev. frequency)
Overall 100 - 16.000 Hz
(+) | overall sound is linear (10.2% difference to median)
Compared to same class
» 7% of all tested devices in this class were better, 2% similar, 91% worse
» The best had a delta of 5%, average was 18%, worst was 53%
Compared to all devices tested
» 5% of all tested devices were better, 1% similar, 94% worse
» The best had a delta of 4%, average was 24%, worst was 134%
Energy Management
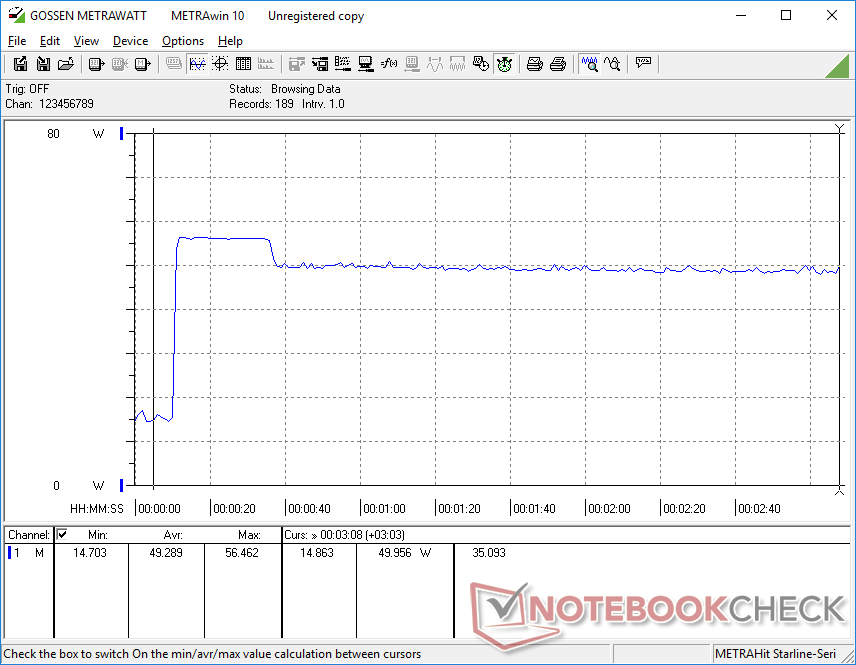
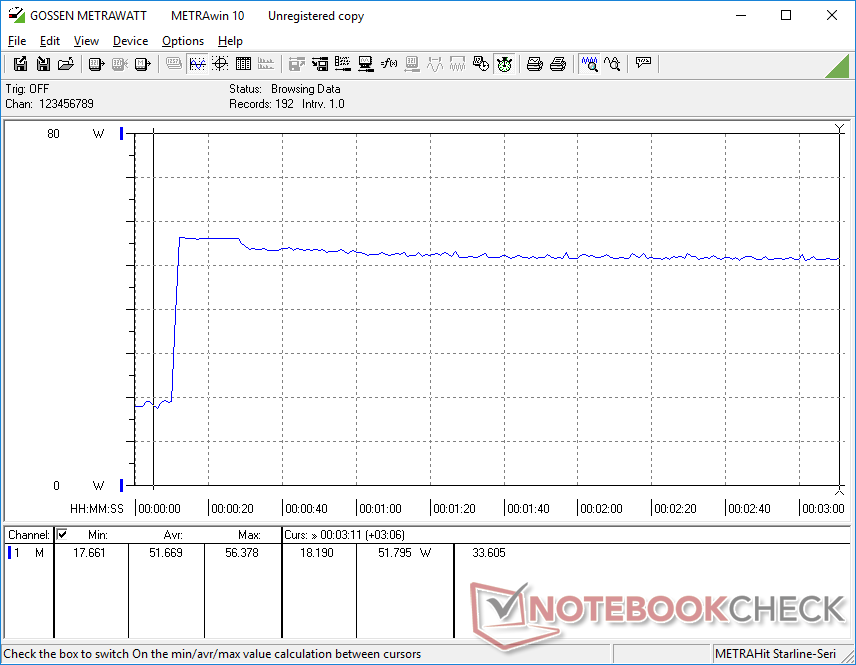
Power Consumption
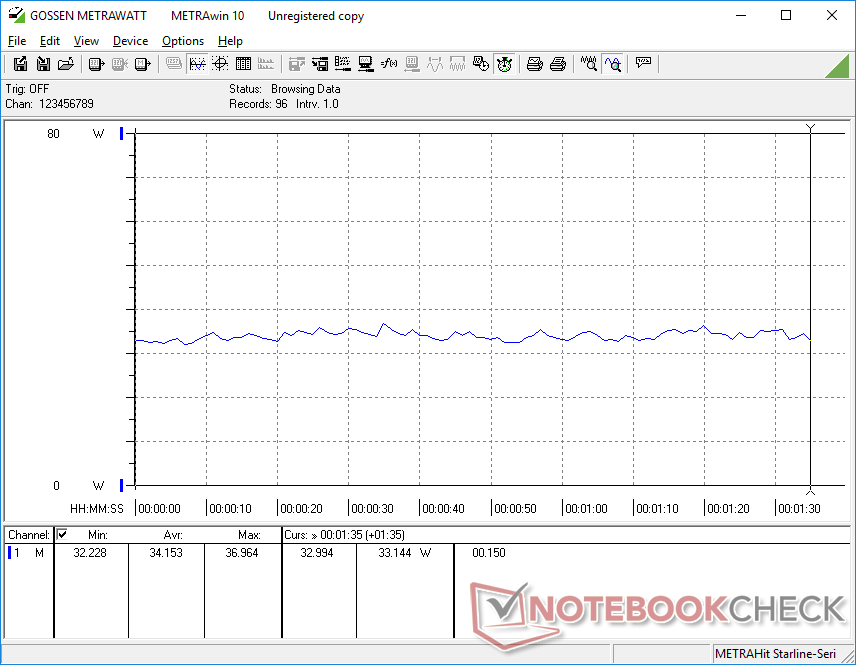
Power consumption is higher-than-expected likely due to the older 8th gen Intel processor. Systems running on Zen 2 or 10th gen Ice Lake CPUs, for example, are much more power efficient during low loads like web browsing and word processing. Gaming consumes between 34 W and 57 W compared to 44 W and 60 W on the AMD-powered Tuxedo Aura 15 which can offer significantly faster graphics performance than our Chuwi.
| Off / Standby | |
| Idle | |
| Load |
|
Key:
min: | |
| Chuwi CoreBook X Pro i5-8259U, Iris Plus Graphics 655, Kingston RBUSNS8154P3512GJ, IPS, 1920x1080, 15.6" | Teclast TBOLT F15 Pro i3-1005G1, UHD Graphics G1 (Ice Lake 32 EU), Teclast BD256GB, IPS, 1920x1080, 15.6" | Asus VivoBook S15 D533UA R7 5700U, Vega 8, WDC PC SN530 SDBPNPZ-1T00, IPS, 1920x1080, 15.6" | Tuxedo Aura 15 Gen1 R7 4700U, Vega 7, Kingston SA2000M81000G, IPS, 1920x1080, 15.6" | Honor MagicBook 15 R5 3500U, Vega 8, Samsung SSD PM981a MZVLB256HBHQ, IPS, 1920x1080, 15.6" | Dell XPS 15 9500 Core i5 i5-10300H, UHD Graphics 630, Toshiba KBG40ZNS256G NVMe, IPS, 1920x1200, 15.6" | |
|---|---|---|---|---|---|---|
| Power Consumption | 35% | 19% | 19% | 32% | 17% | |
| Idle Minimum * (Watt) | 12.6 | 7.3 42% | 5 60% | 4.5 64% | 4.6 63% | 2.9 77% |
| Idle Average * (Watt) | 15 | 9.9 34% | 7.7 49% | 8.6 43% | 8.5 43% | 7.6 49% |
| Idle Maximum * (Watt) | 15.3 | 10.9 29% | 12.2 20% | 11.6 24% | 9.1 41% | 8 48% |
| Load Average * (Watt) | 34.2 | 22 36% | 41 -20% | 44 -29% | 38 -11% | 41.7 -22% |
| Load Maximum * (Watt) | 56.5 | 38 33% | 65 -15% | 59.7 -6% | 44 22% | 94.8 -68% |
| Witcher 3 ultra * (Watt) | 23.3 | 43 | 43.6 |
* ... smaller is better
Power Consumption Witcher 3 / Stresstest
Battery Life — Very Slow Charging
Runtimes are respectable at about 7.5 hours of real-world WLAN use from the decently large 70 Wh battery. Charging from empty to full is slow, however, at 3 full hours compared to only 1.5 hours on most other Ultrabooks.
| Chuwi CoreBook X Pro i5-8259U, Iris Plus Graphics 655, 70 Wh | Teclast TBOLT F15 Pro i3-1005G1, UHD Graphics G1 (Ice Lake 32 EU), 53.8 Wh | Asus VivoBook S15 D533UA R7 5700U, Vega 8, 50 Wh | Tuxedo Aura 15 Gen1 R7 4700U, Vega 7, 49 Wh | Honor MagicBook 15 R5 3500U, Vega 8, 42 Wh | Dell XPS 15 9500 Core i5 i5-10300H, UHD Graphics 630, 56 Wh | |
|---|---|---|---|---|---|---|
| Battery runtime | -20% | 22% | 4% | -19% | 26% | |
| WiFi v1.3 (h) | 7.4 | 5.9 -20% | 9 22% | 7.7 4% | 6 -19% | 9.3 26% |
| Reader / Idle (h) | 26.4 | |||||
| Load (h) | 1.6 |
Pros
Cons
Verdict — Cut Corners Galore
Chuwi laptops all have similar strengths and weaknesses. We have to praise the CoreBook X Pro for its attractive design, high refresh rate display, and a proper Core U-series CPU in contrast to the overly plastic, 60 Hz displays, or Intel Atom or Celeron alternatives that are all too common at this price range. The easy serviceability and upgradeable RAM and storage are nice surprises as well.
The impressive 120 Hz display and attractive visual design mean almost nothing if the keyboard, clickpad, build quality, and hinges could use some work.
Almost everything else about the system just falls apart. The weak hinges, rickety chassis, sticky clickpad, soft speakers, very poor webcam, and unresponsive keyboard keys give us the impression that the laptop might not last more than a couple of years. If longevity is a concern, then we would recommend opting for an older Lenovo Yoga or Dell Inspiron with 8th gen Intel CPUs where warranties are easier to claim. The latest HP Pavilion 15 Core i3 SKU is also an excellent and more reliable alternative.
Price and availability
Chuwi is now shipping its CoreBook X Pro via its official online store for $559 USD. We expect Amazon to have it available in the near future as well.
Chuwi CoreBook X Pro
- 09/15/2021 v7 (old)
Allen Ngo
Price comparison
