Chuwi Hi10 X Convertible Review: Metal Chassis for $230 USD
Chuwi is infamous for its lineup of low-cost laptops and tablets running on Intel Celeron or Atom CPUs that have the appearance of high-end systems. The Chuwi LapBook Air, for example, looks a lot like the Apple MacBook Air except with a much slower CPU for a much lower price to compensate.
The Chuwi Hi10 X is a 10.1-inch Windows tablet with a 16:10 touchscreen and a detachable keyboard base in contrast to the MediaTek-powered Android HiPad or Atom-powered Android Hi10 Pro. It competes directly with other inexpensive Windows 10 tablets like the Lenovo IdeaPad Miix 320, the HP x2, and the Microsoft Surface Go.
More Chuwi reviews:
Rating | Date | Model | Weight | Height | Size | Resolution | Price |
|---|---|---|---|---|---|---|---|
| 69.1 % v7 (old) | 05 / 2020 | Chuwi Hi10 X Celeron N4100, UHD Graphics 600 | 600 g | 8.8 mm | 10.10" | 1920x1200 | |
| 83.3 % v7 (old) | 10 / 2018 | Microsoft Surface Go MHN-00003 Pentium 4415Y, UHD Graphics 615 | 523 g | 8.3 mm | 10.00" | 1800x1200 | |
| 80.4 % v6 (old) | 08 / 2017 | Lenovo IdeaPad Miix 320-10ICR Pro LTE Z8350, HD Graphics 400 (Braswell) | 1 kg | 17.5 mm | 10.10" | 1920x1200 | |
| 77.3 % v6 (old) | 12 / 2018 | HP x2 210 G2 Z8350, HD Graphics 400 (Braswell) | 1.2 kg | 23.5 mm | 10.10" | 1280x800 | |
| 67.7 % v7 (old) | 04 / 2020 | Jumper EZbook X3 Celeron N3350, HD Graphics 500 | 1.3 kg | 18 mm | 13.30" | 1920x1080 |
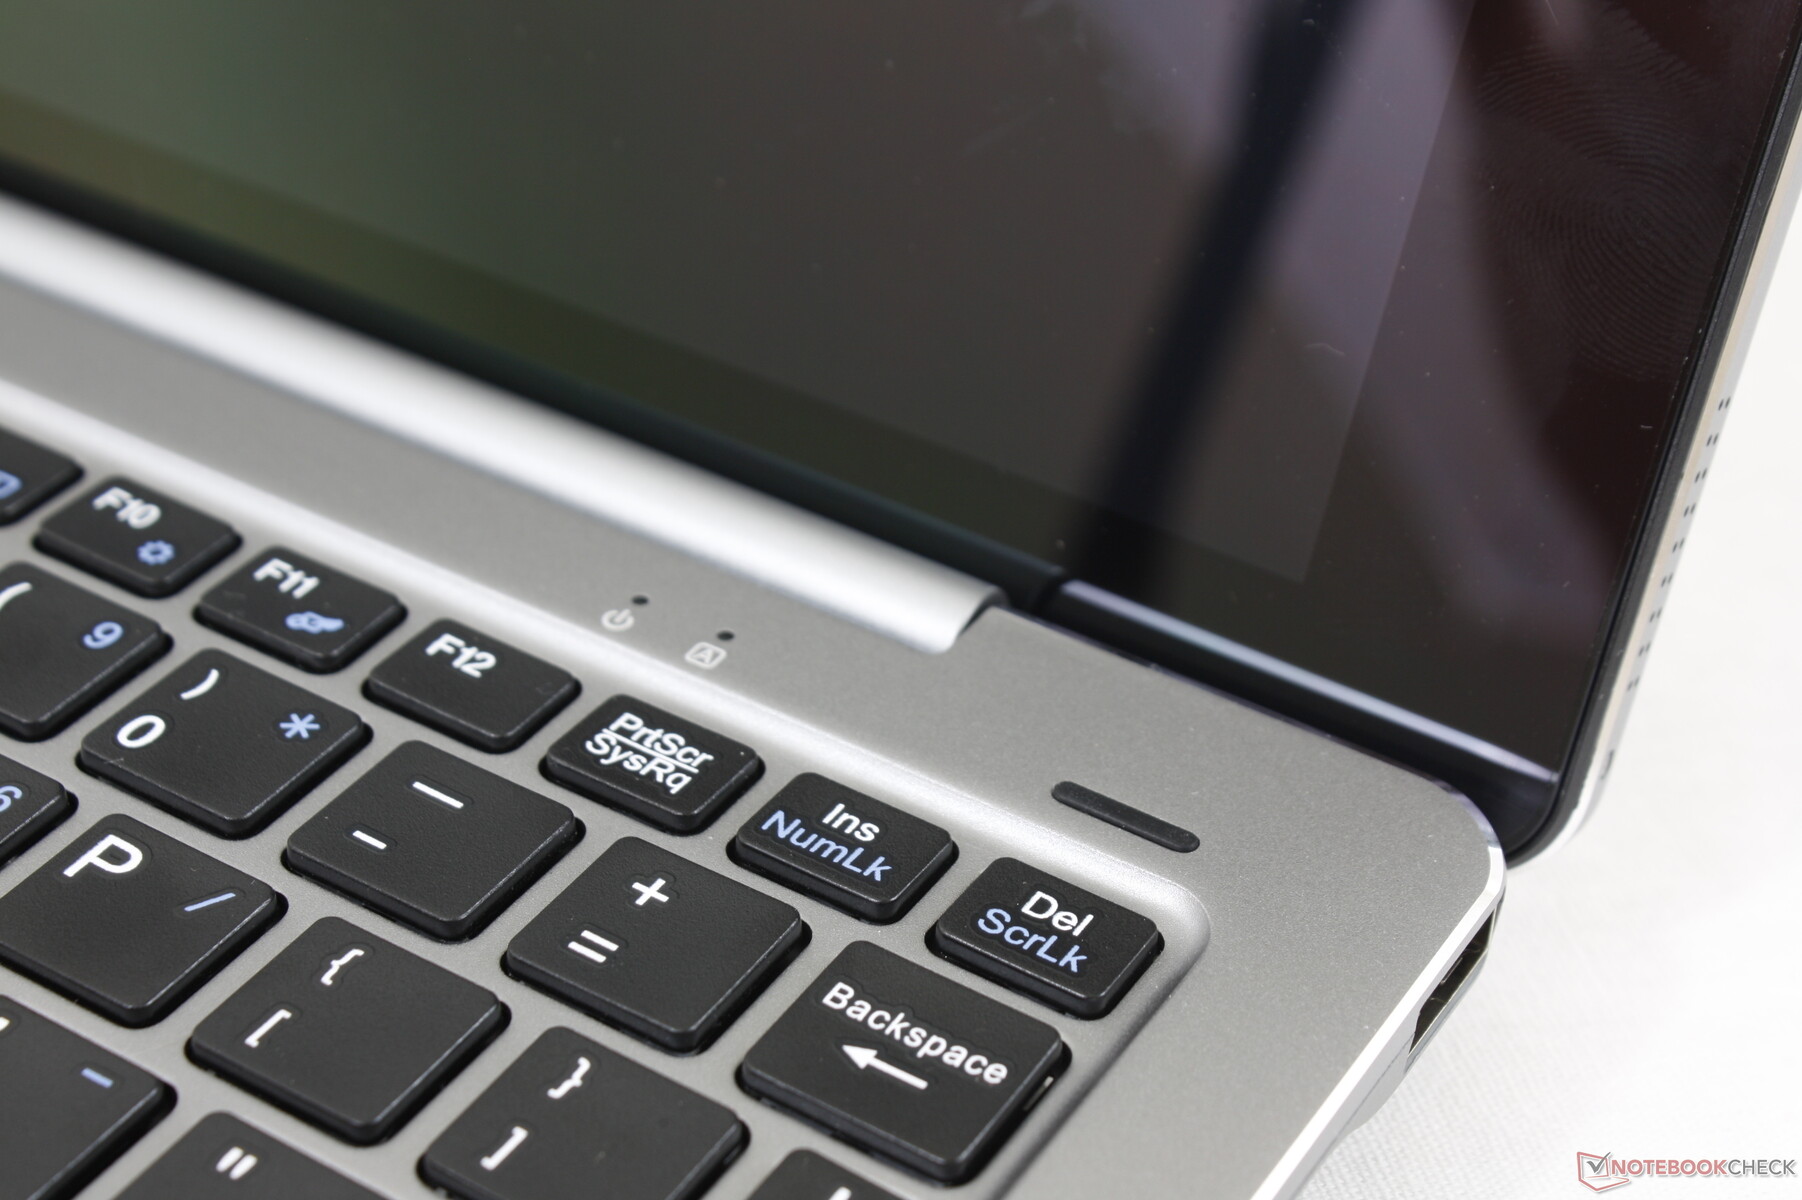
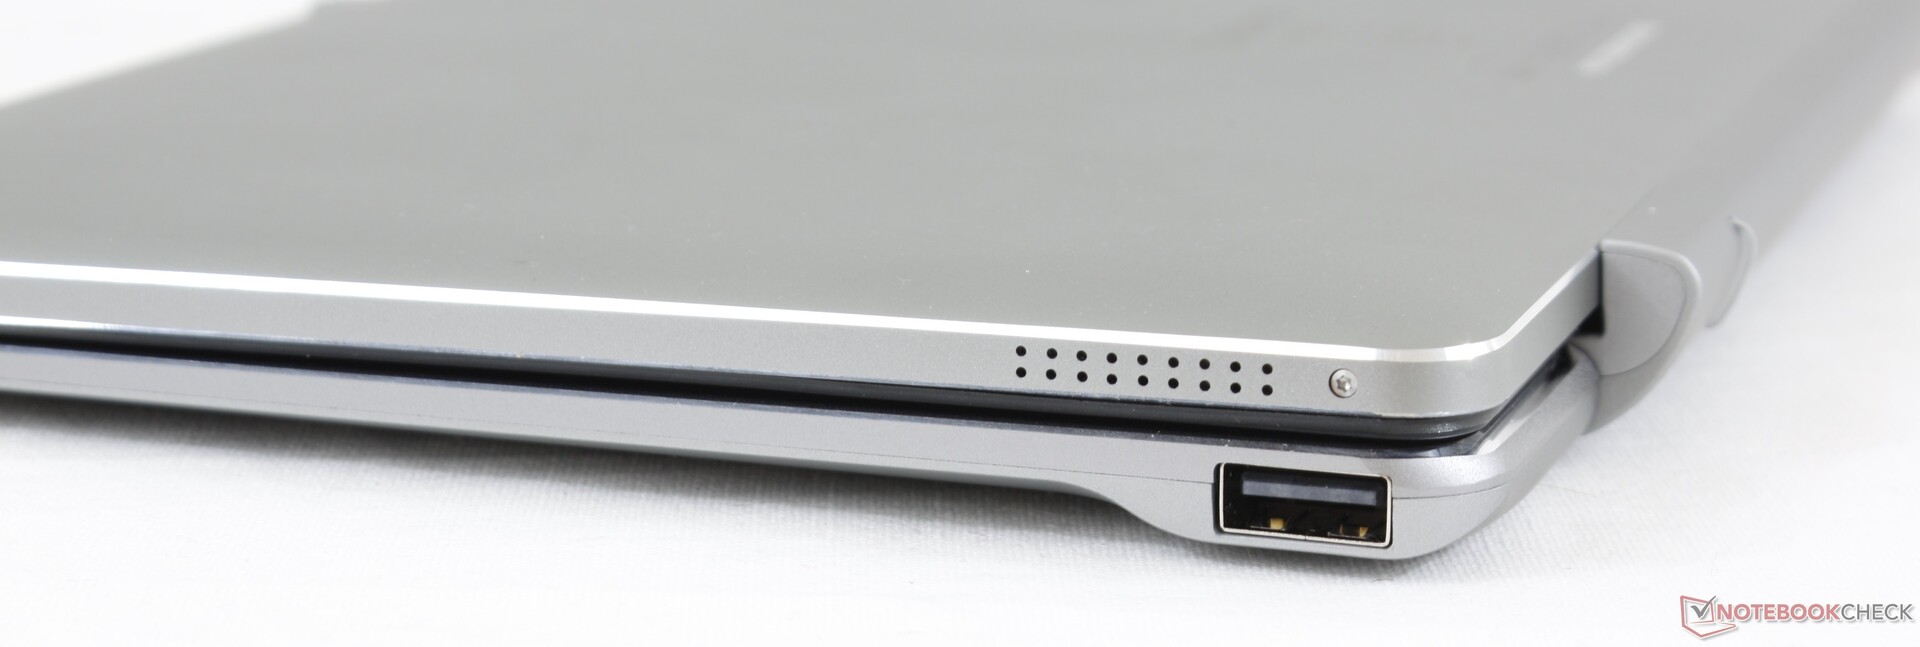
Case
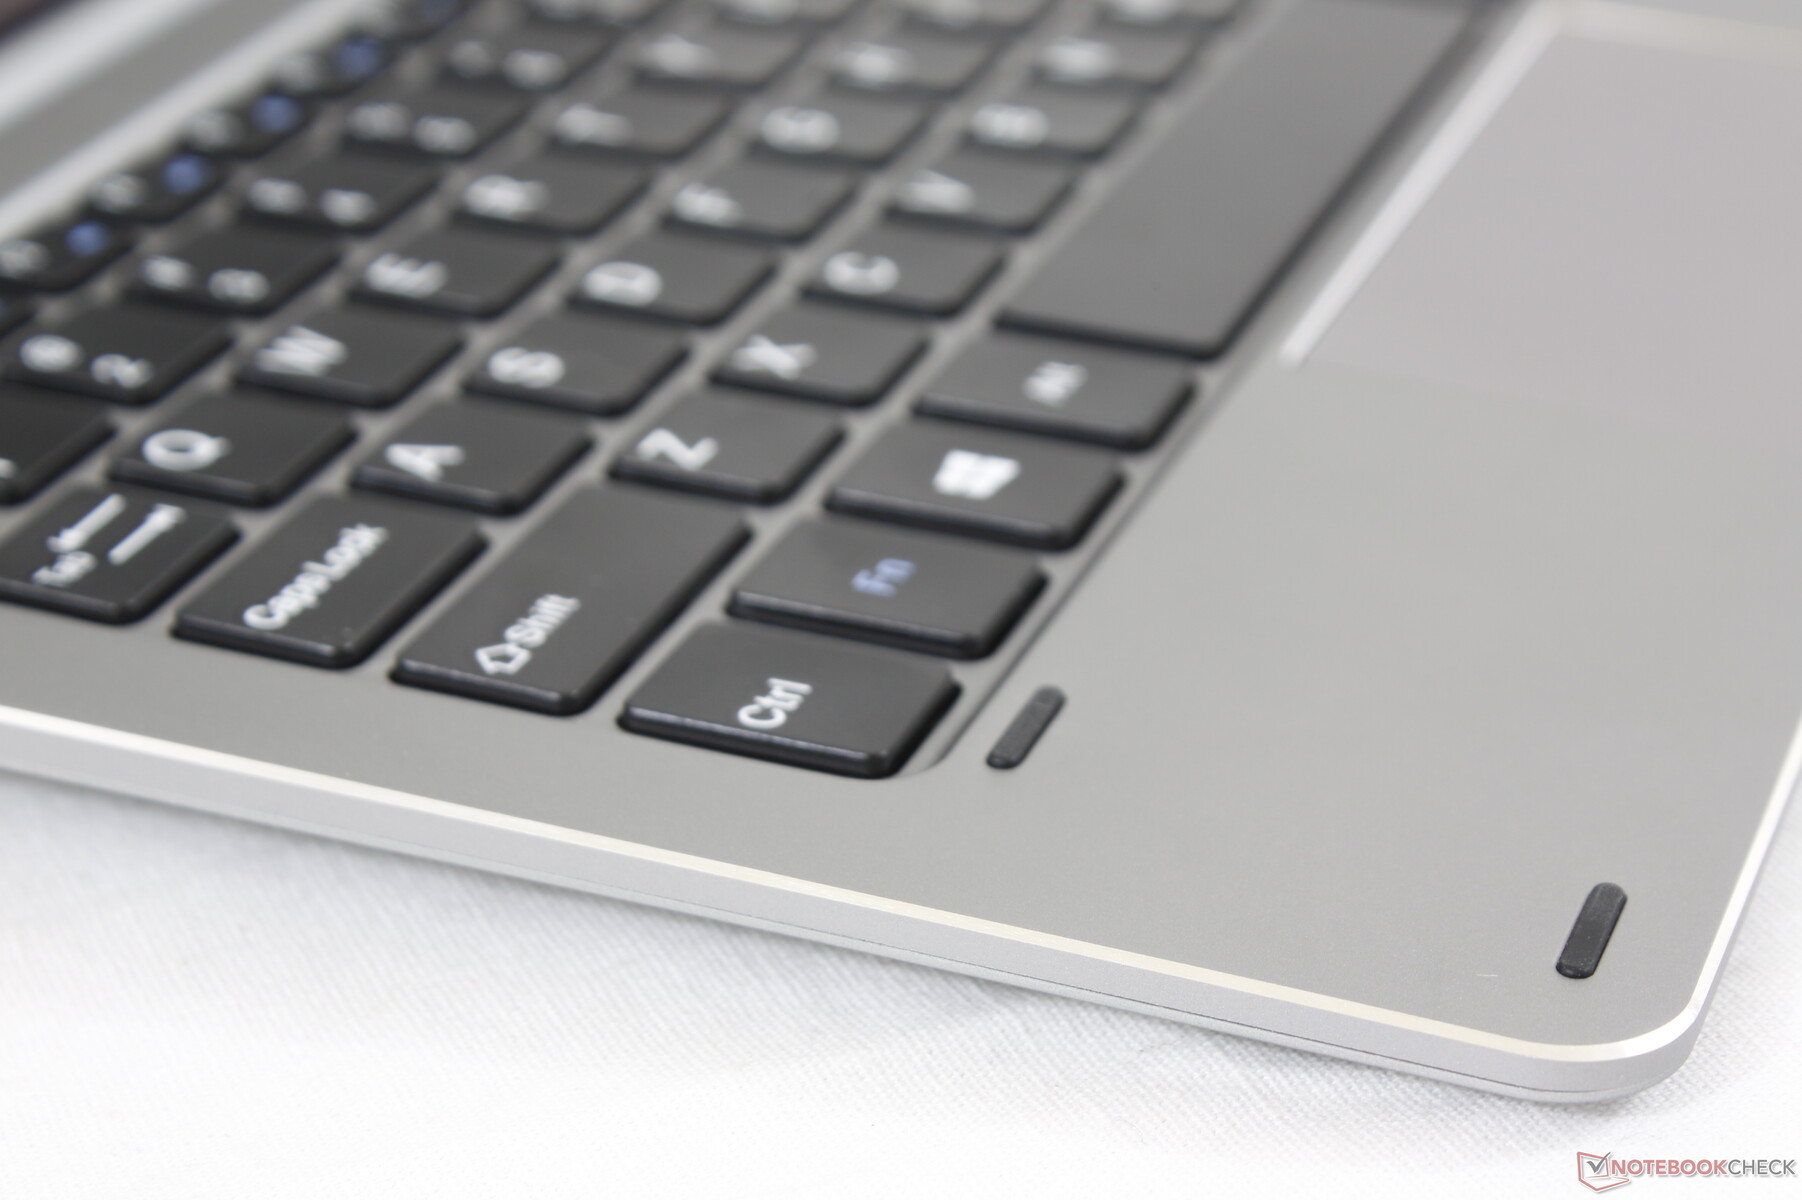
Chuwi devices always feel good in the hand relative to the price and the Hi10 X is no exception. The metal chassis is rigid with only minor creaking or warping when attempting to bend it from the sides. The base is metal as well to be stronger than the much more expensive Microsoft Surface Type Cover.
There are a few major drawbacks to keep in mind. First, the tablet (596 g) and base (584 g) are heavy at for a combined total of almost 1.1 kg. Secondly, the hinges tend to teeter and their maximum angle is quite low.


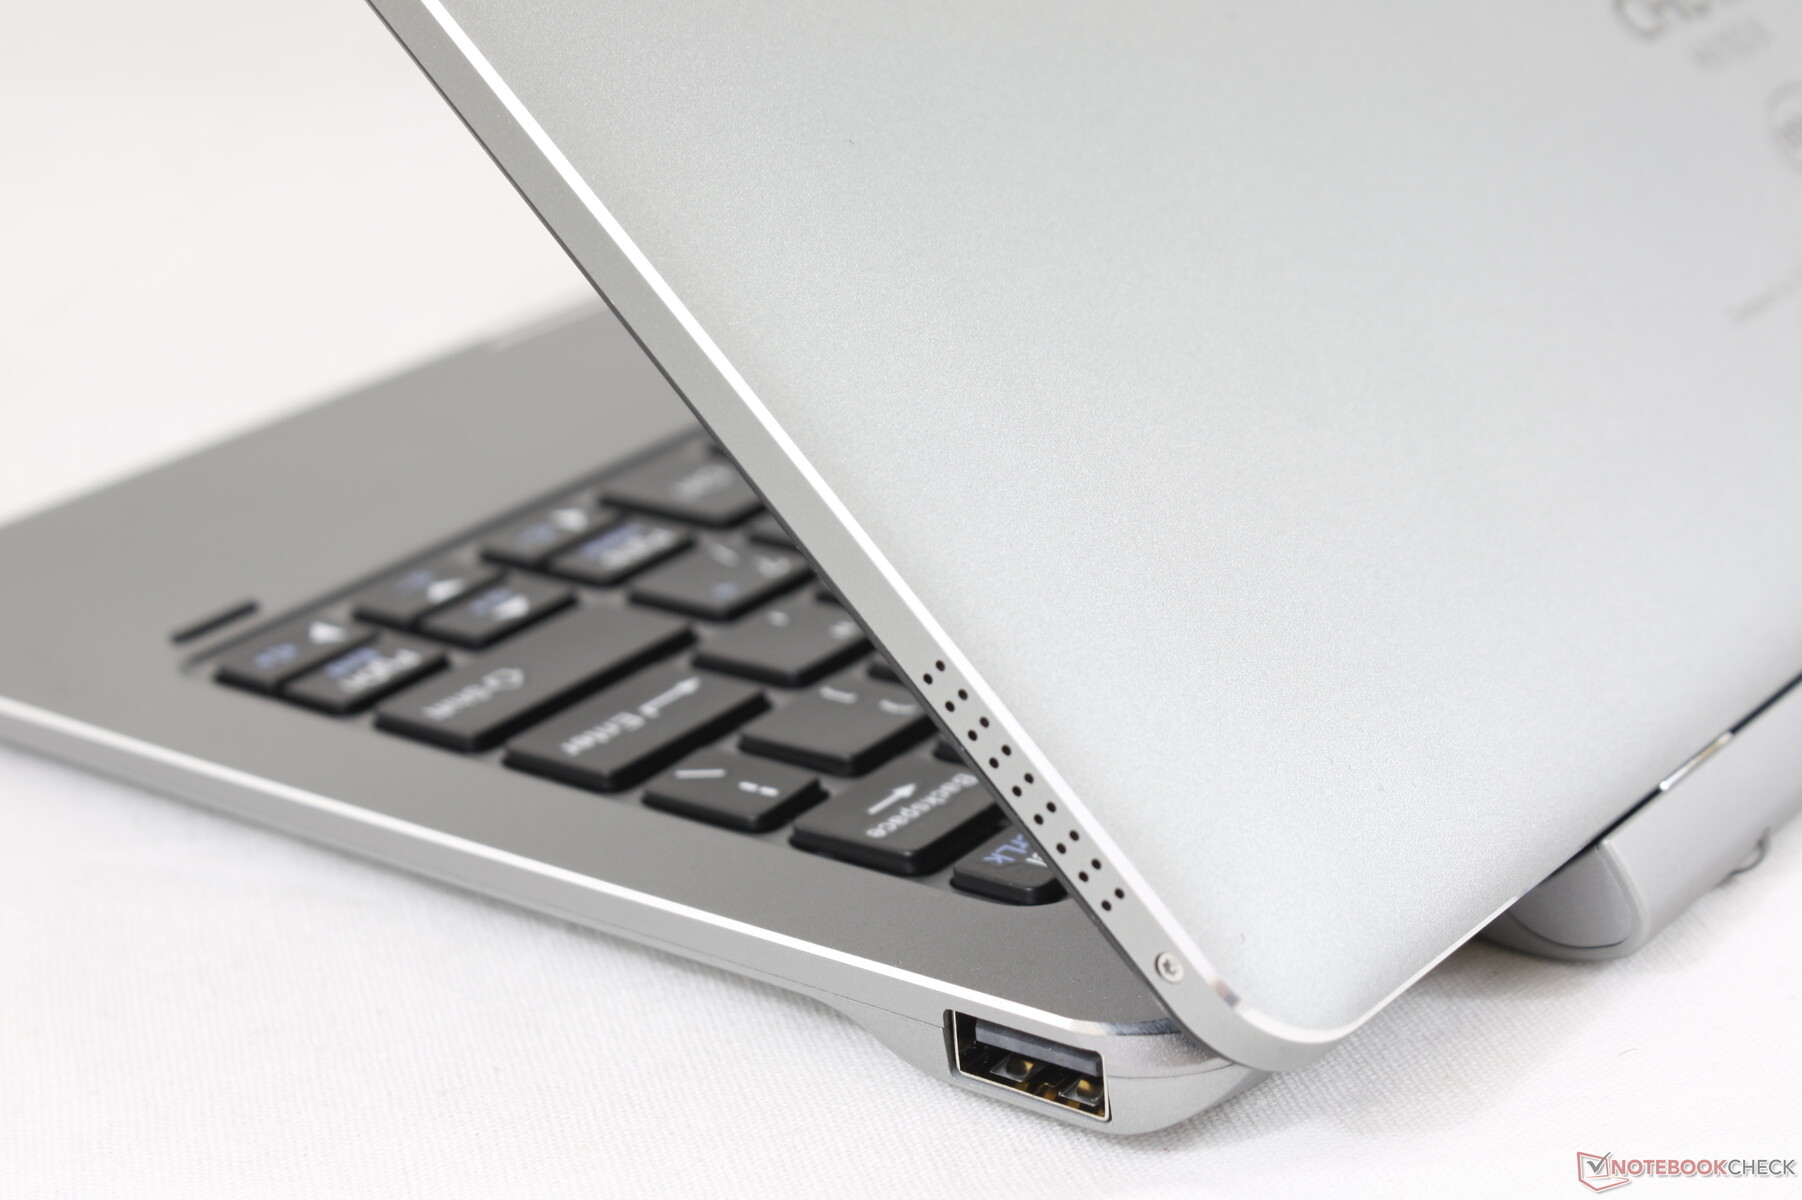
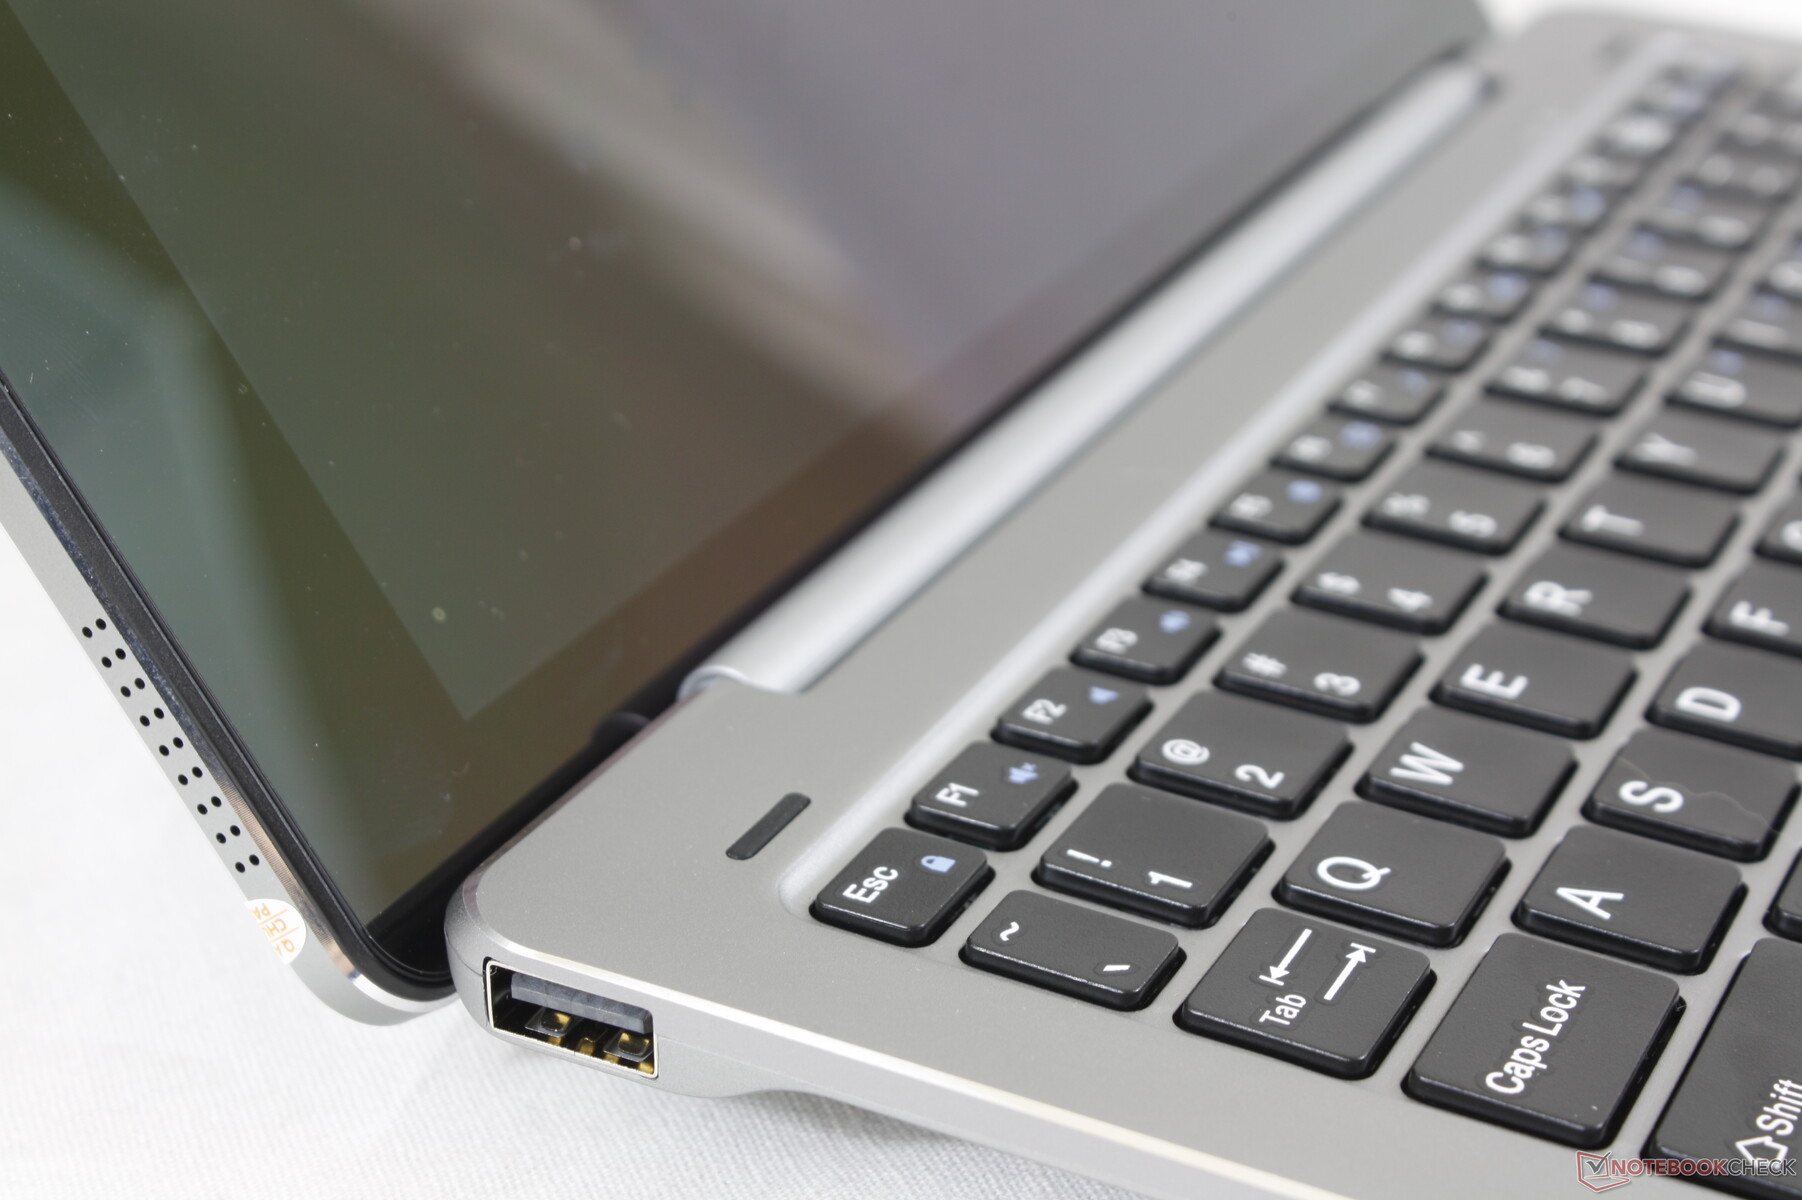
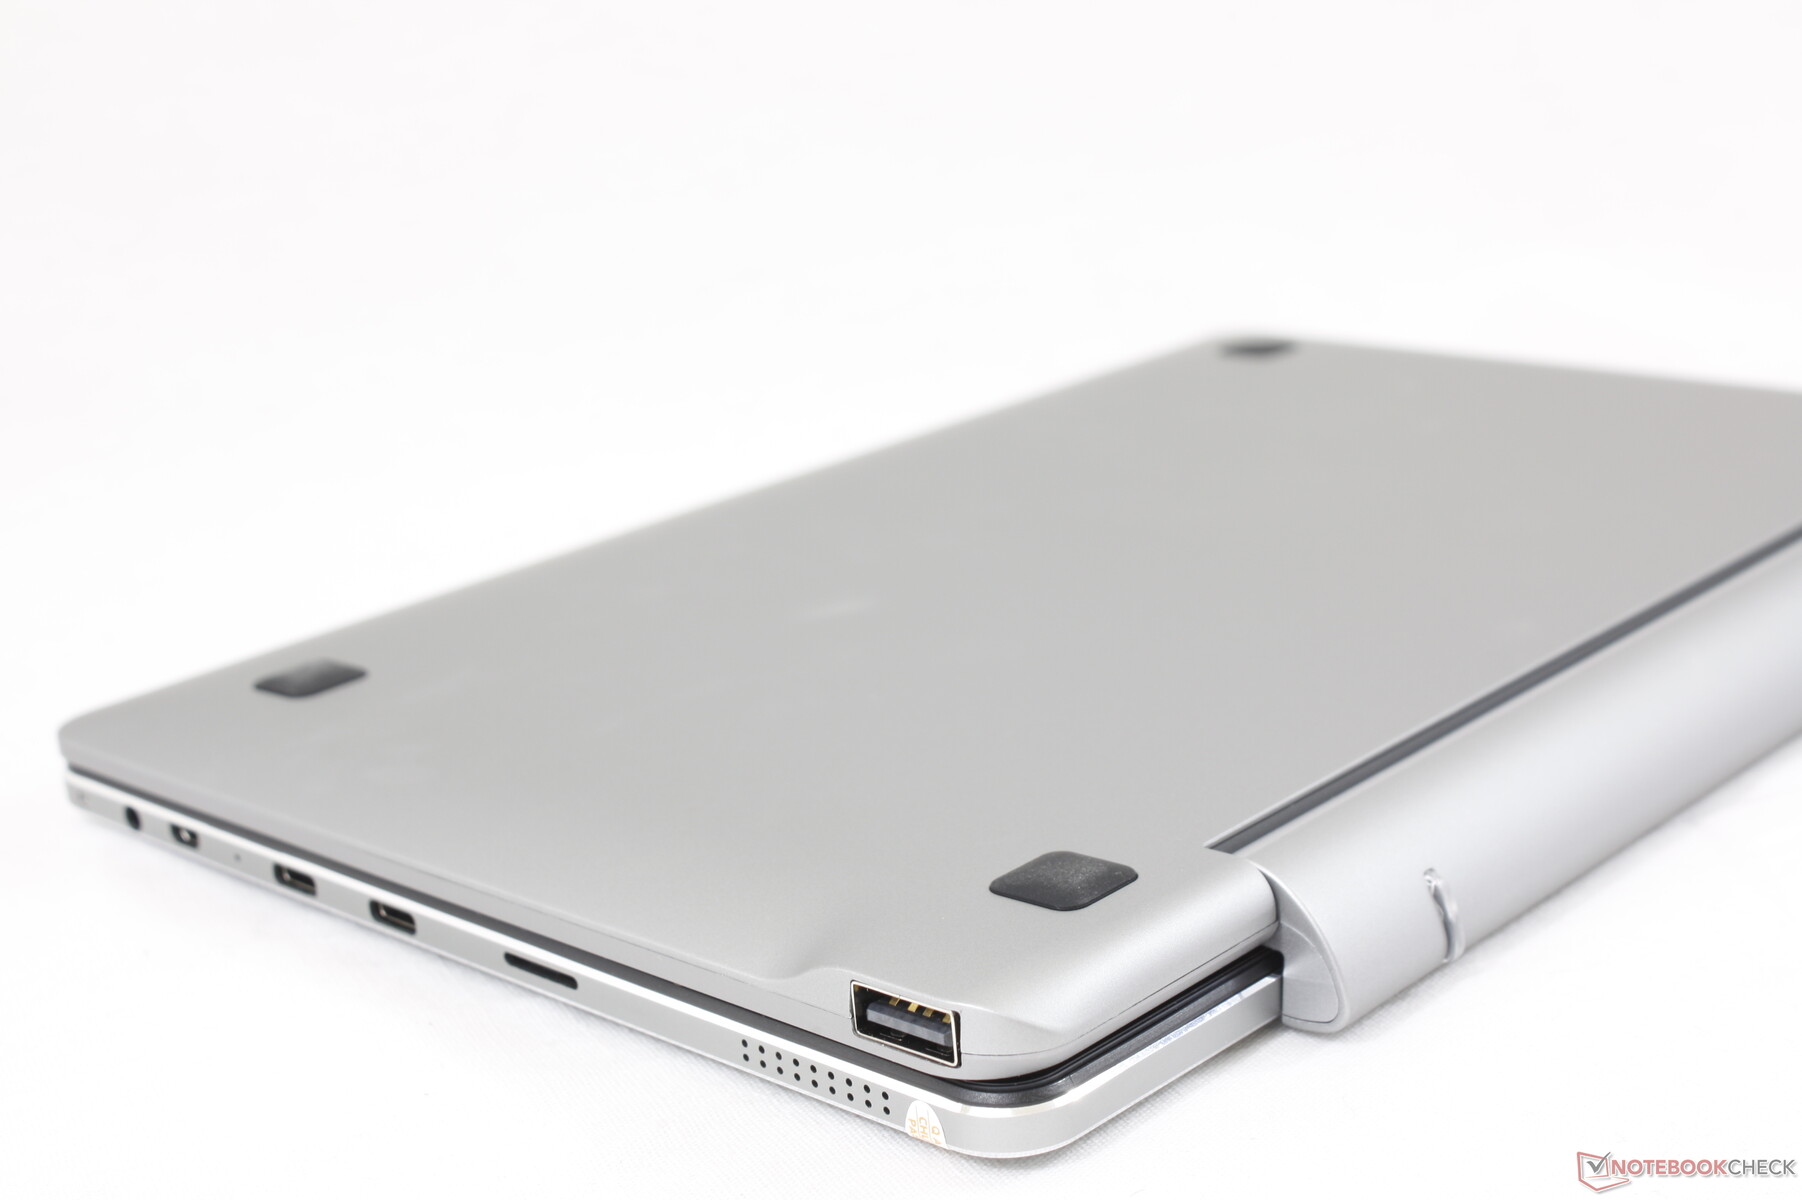
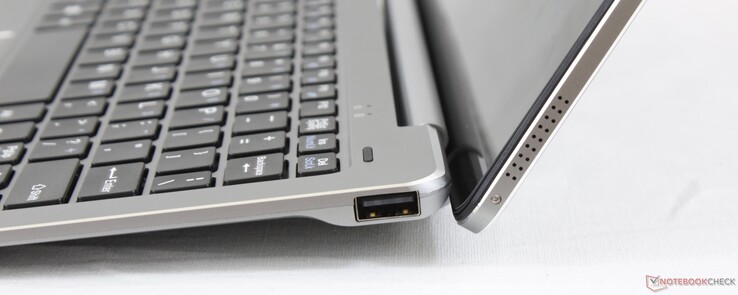
Connectivity
There are two USB Type-C ports and a single Micro-HDMI port on the tablet while the base integrates two USB Type-A ports. If you plan on using the HDMI port, you'll likely have to find a Micro-HDMI adapter to carry around with you.

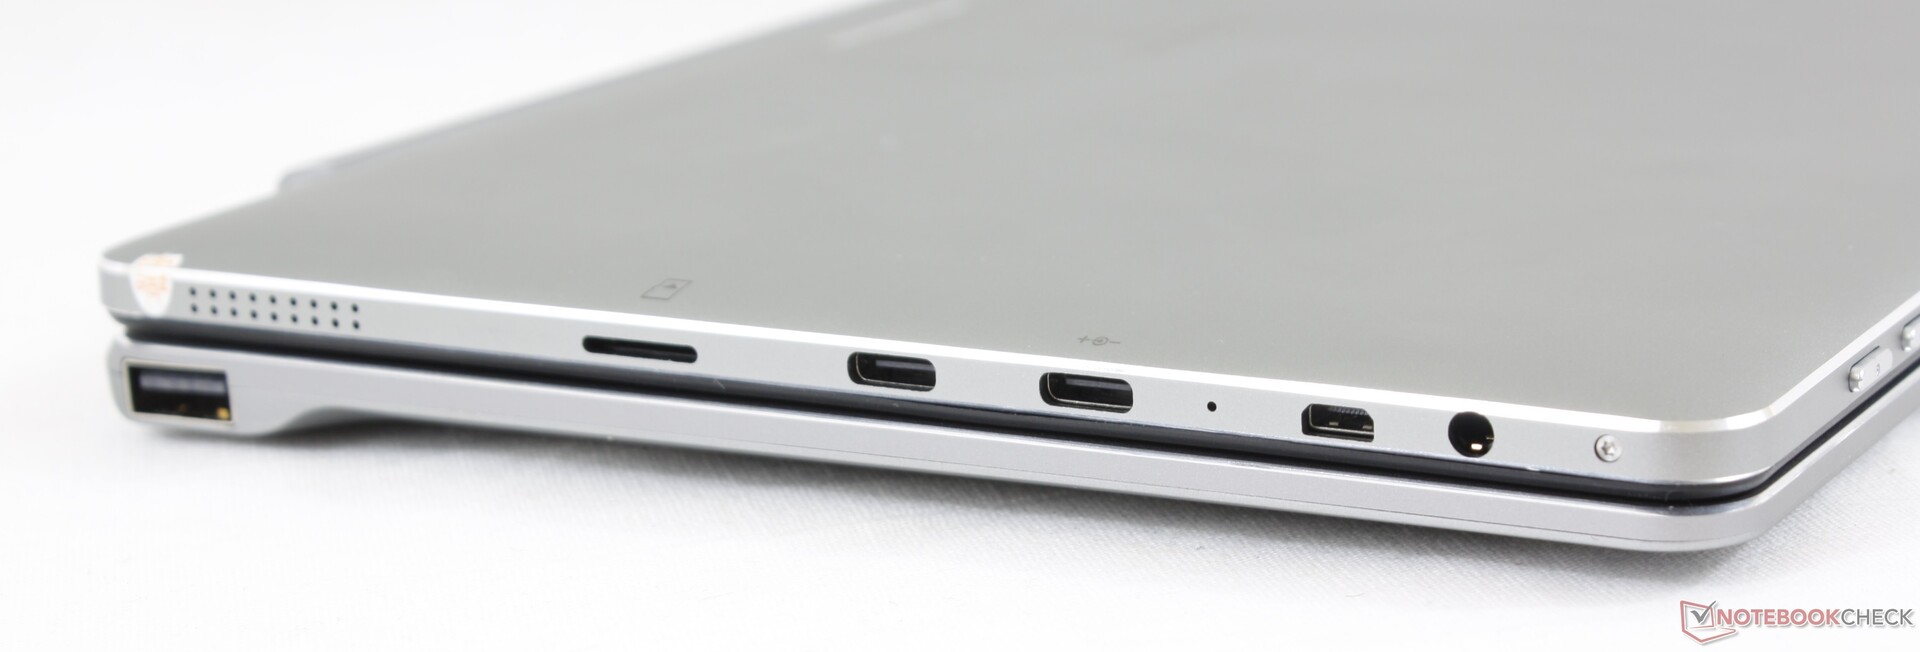
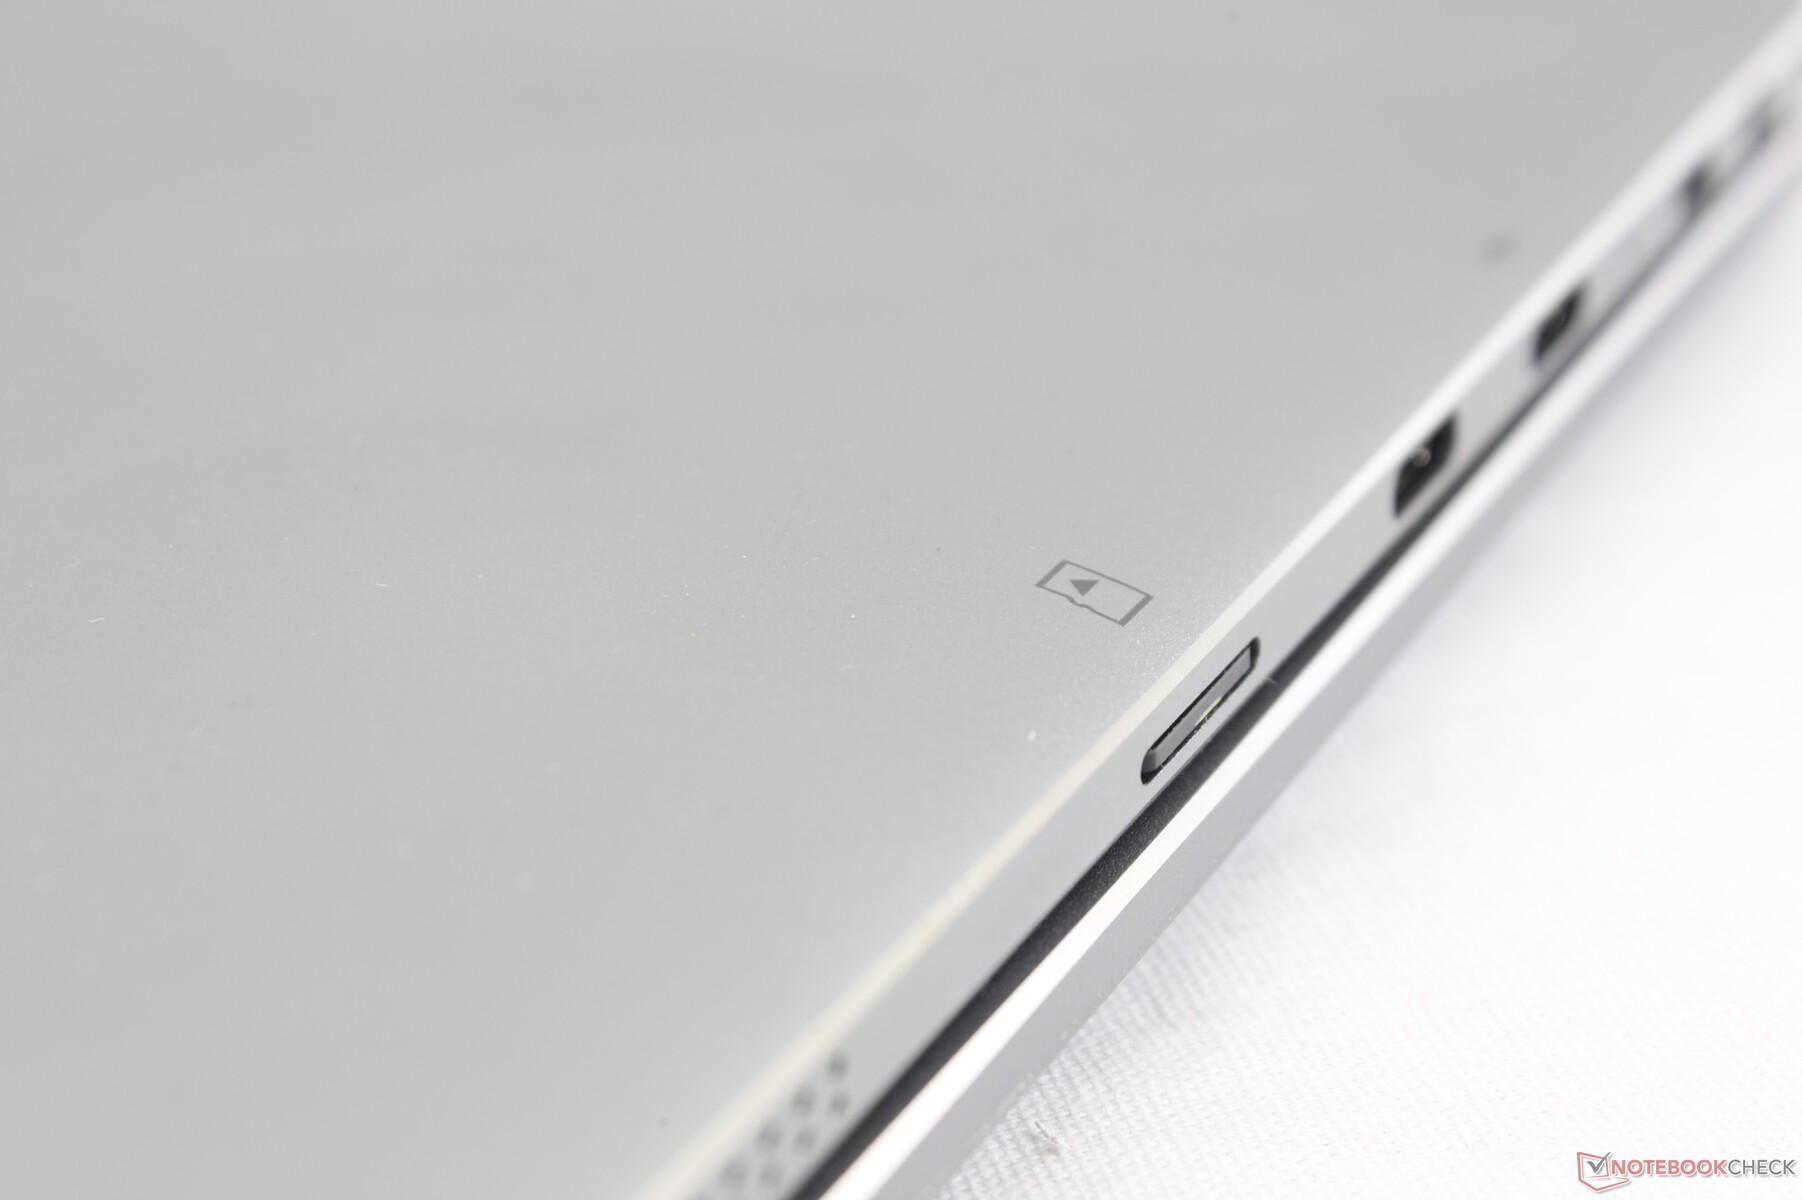
SD Card Reader
Transferring 1 GB of pictures from our UHS-II MicroSD test card to desktop takes about 43 seconds. Inserting the MicroSD card can be tricky and ejecting it can be even trickier since the card sits flushed against the edge of the tablet.
| SD Card Reader | |
| average JPG Copy Test (av. of 3 runs) | |
| Microsoft Surface Go MHN-00003 (Toshiba Exceria Pro M501) | |
| HP x2 210 G2 (Toshiba Exceria Pro M501 microSDXC 64GB) | |
| Jumper EZbook X3 | |
| Chuwi Hi10 X (Toshiba Exceria Pro M501 64 GB UHS-II) | |
| Acer TravelMate Spin B1 B118-G2-RN-P7ED (Toshiba Exceria Pro SDXC 64 GB UHS-II) | |
| Dell Latitude 3400 (Toshiba Exceria Pro SDXC 64 GB UHS-II) | |
| LincPlus P1 | |
| maximum AS SSD Seq Read Test (1GB) | |
| Microsoft Surface Go MHN-00003 (Toshiba Exceria Pro M501) | |
| HP x2 210 G2 (Toshiba Exceria Pro M501 microSDXC 64GB) | |
| Dell Latitude 3400 (Toshiba Exceria Pro SDXC 64 GB UHS-II) | |
| Acer TravelMate Spin B1 B118-G2-RN-P7ED (Toshiba Exceria Pro SDXC 64 GB UHS-II) | |
| Jumper EZbook X3 | |
| LincPlus P1 | |
| Chuwi Hi10 X (Toshiba Exceria Pro M501 64 GB UHS-II) | |
Communication
The integrated 1x1 Intel Wireless AC-9461 offers a theoretical maximum transfer rate of 433 Mbps while our own real-world test shows an average of 367 Mbps when connected to our Netgear RAX200 router. We experienced no connectivity issues during our time with the system. Bluetooth 5.1 is supported.
| Networking | |
| iperf3 transmit AX12 | |
| HP x2 210 G2 | |
| Microsoft Surface Go MHN-00003 | |
| Chuwi Hi10 X | |
| Lenovo IdeaPad Miix 320-10ICR Pro LTE | |
| iperf3 receive AX12 | |
| Microsoft Surface Go MHN-00003 | |
| HP x2 210 G2 | |
| Chuwi Hi10 X | |
| Lenovo IdeaPad Miix 320-10ICR Pro LTE | |
Webcam


Accessories and Warranty
There are no extras in the box other than the usual paperwork and AC adapter. An HDMI adapter or active pen would have been nice to include. Instead, Chuwi offers the active pen as a separate purchase for an additional $20 USD.
A one-year limited manufacturer warranty applies. Returning the system may require overseas shipping which would slow the process for most users.
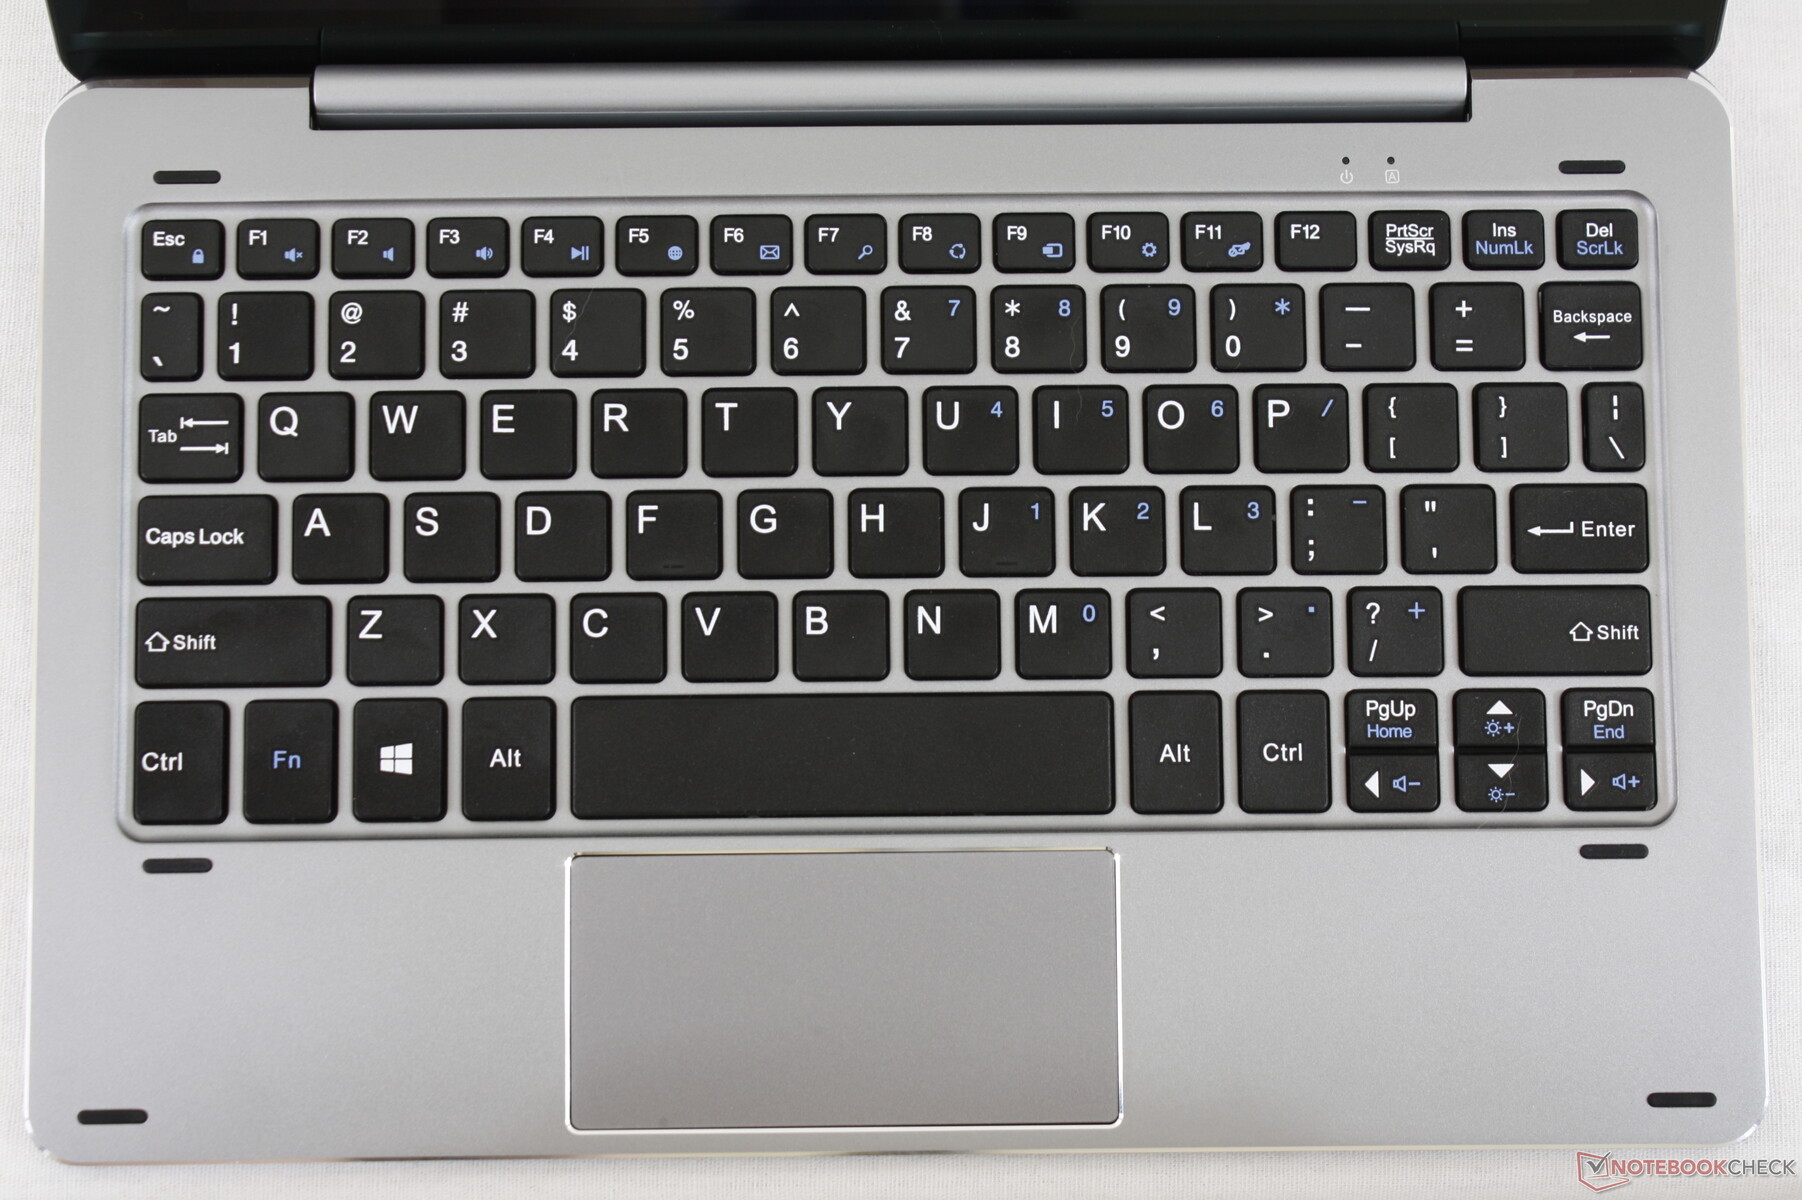
Input Devices
Keyboard
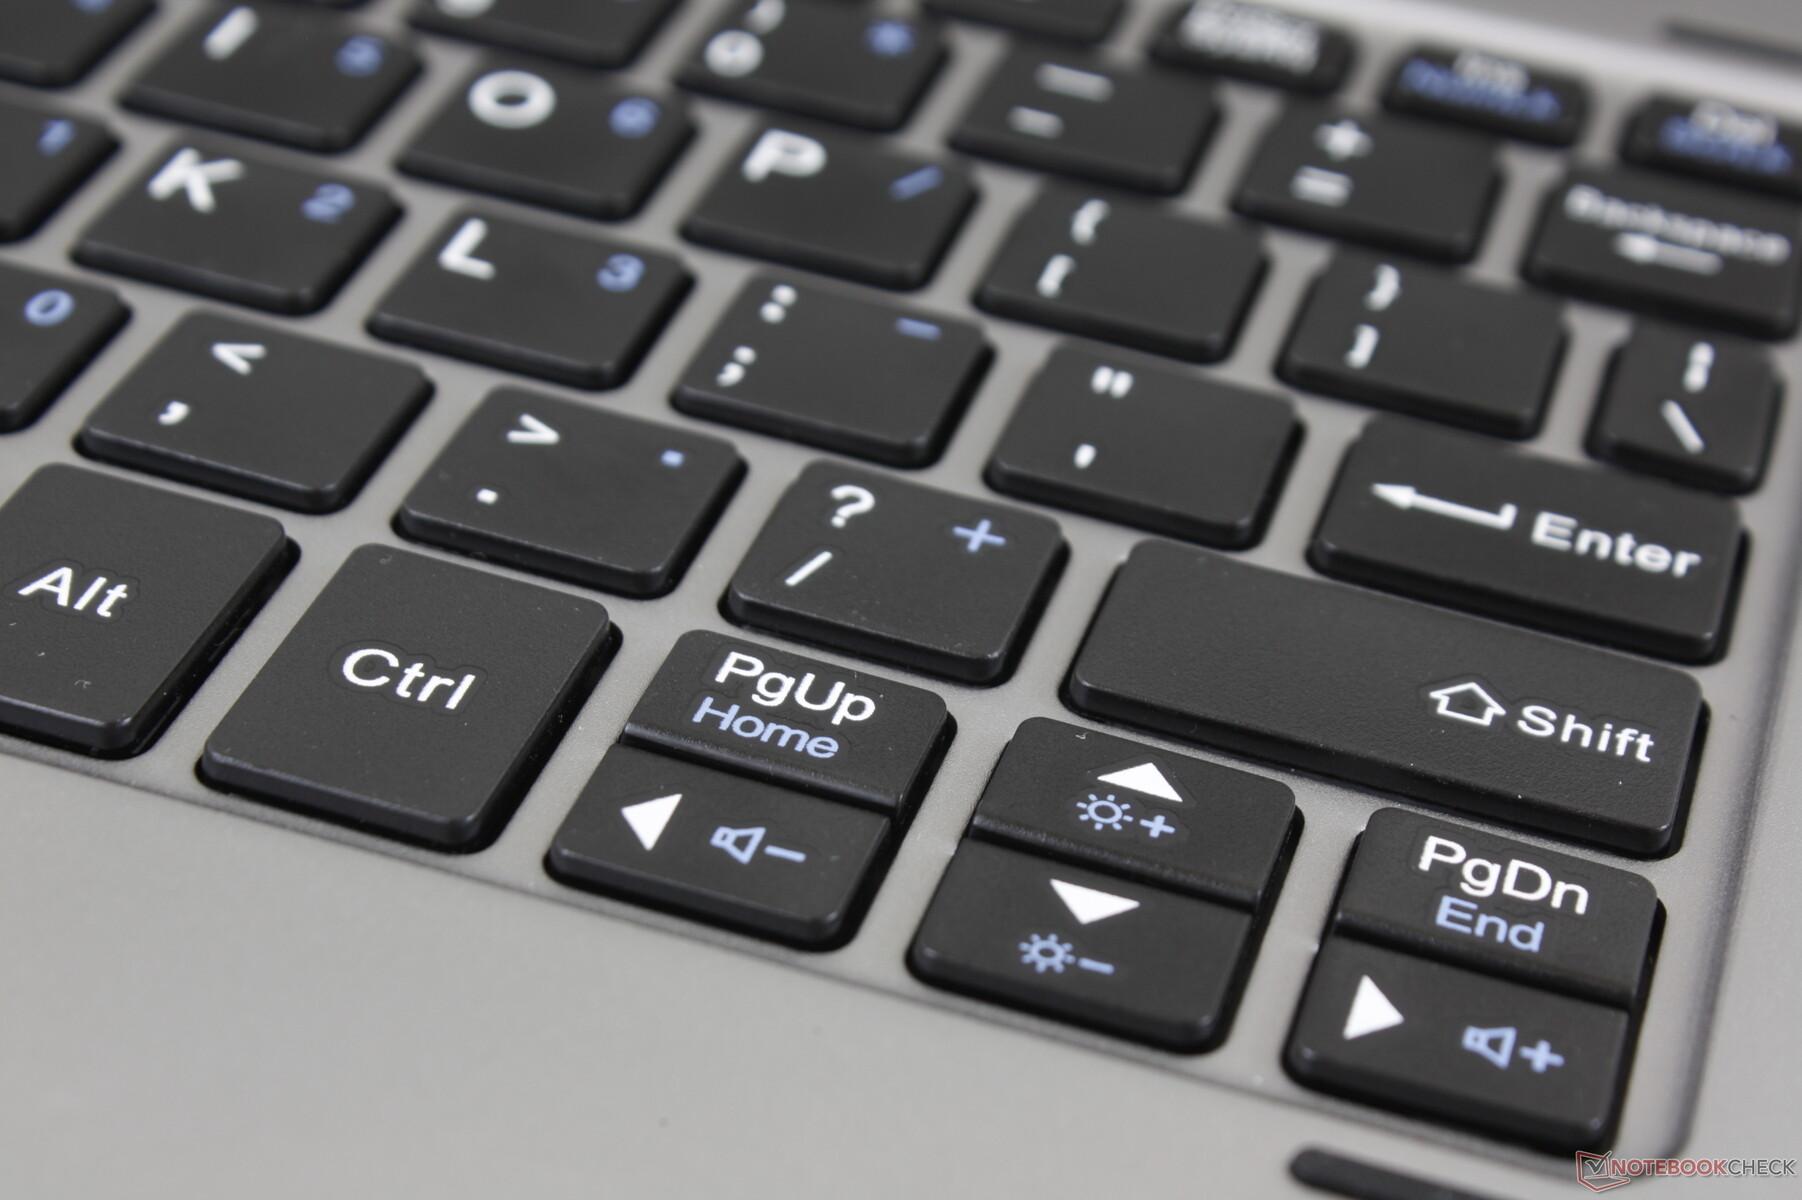
Key feedback on the detachable keyboard is above average especially for its category. Whereas keys on most other detachable keyboards tend to be soft, the QWERTY keys here are firmer and more uniform. Of course, typing still feels cramped due to the small screen size.
Unfortunately, there is no keyboard backlight and the printed letters and symbols on the plastic keys will eventually rub off. The smaller F keys, PgUp and PgDn keys, and arrow keys are also much spongier compared to the main QWERTY keys.
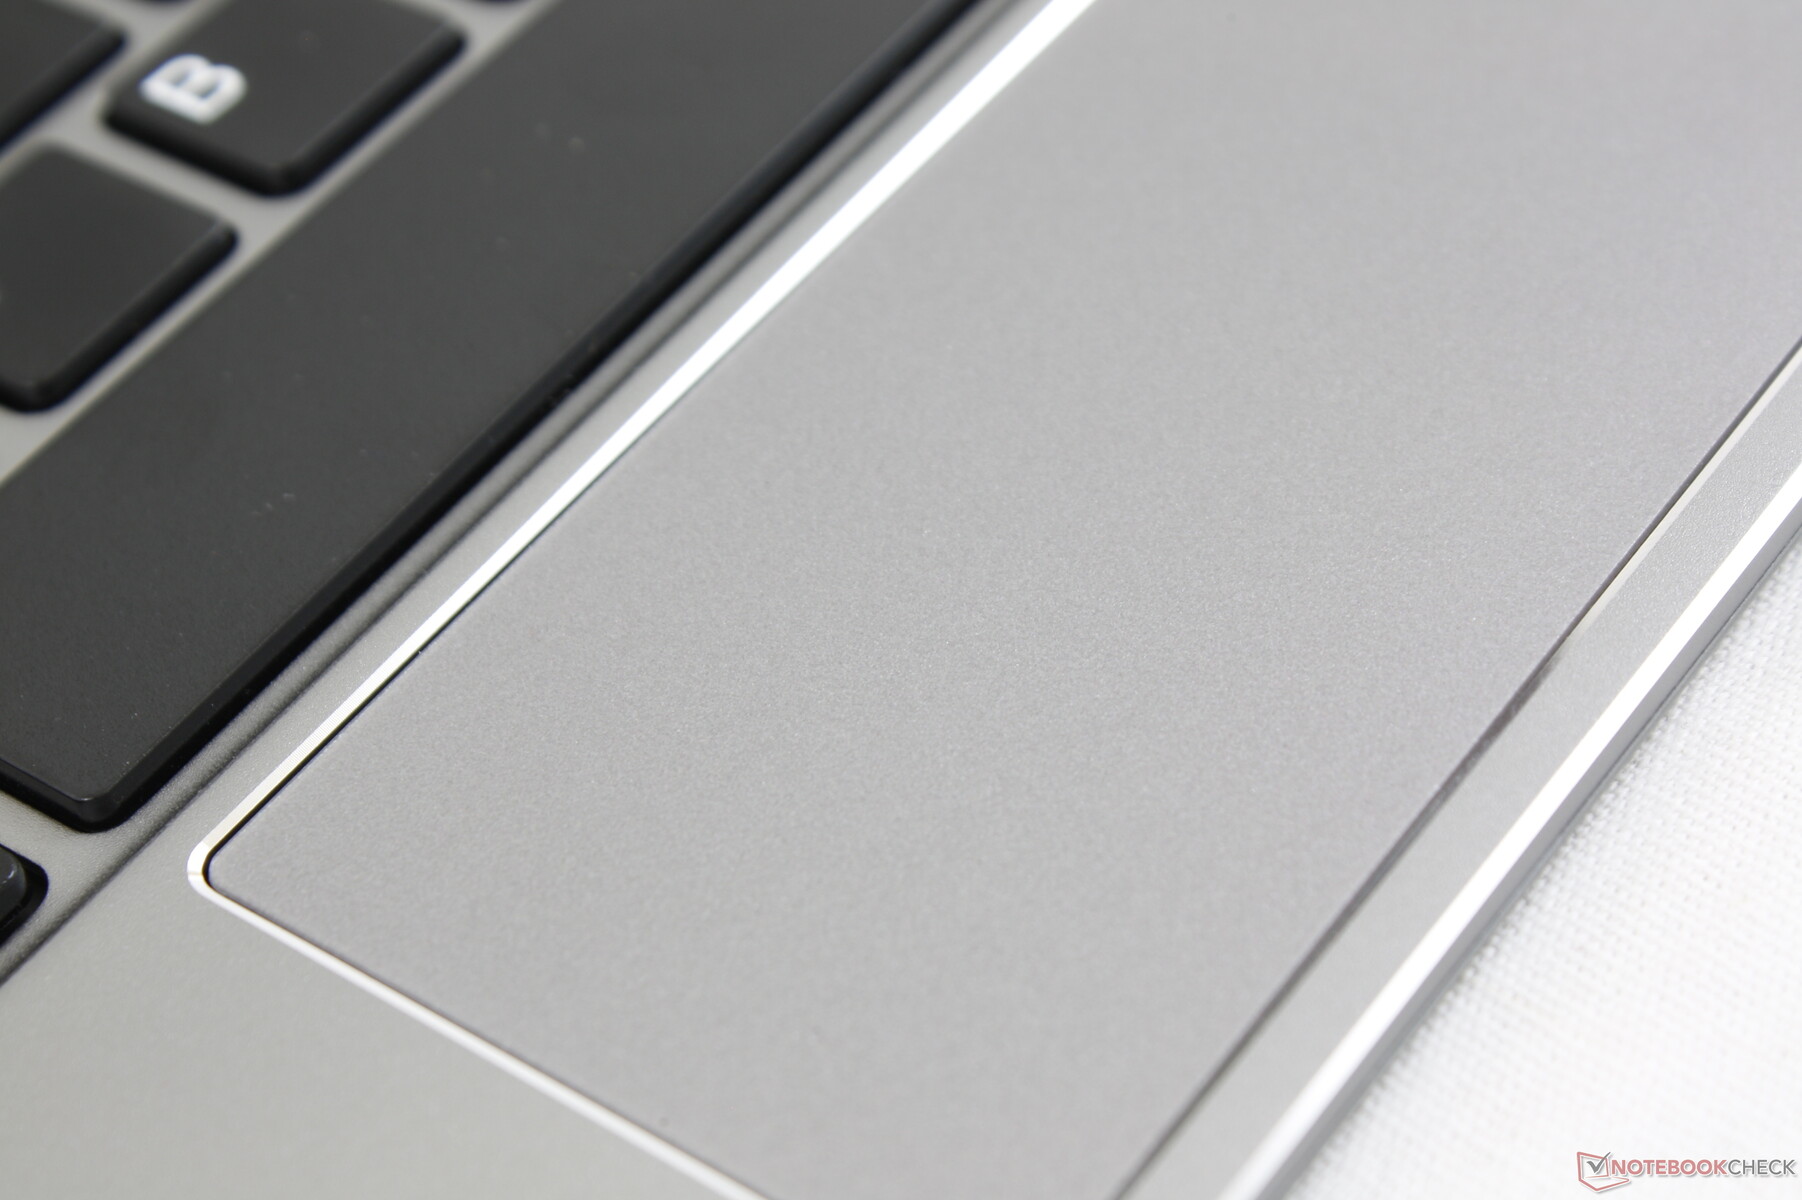
Touchpad
The clickpad (~8.4 x 4.2 cm) is two times wider than it is tall for easier horizontal movement at the cost of cramped vertical movement. Vursor control is slow to respond and it tends to skip as well. The unreliability of the clickpad makes the tablet difficult to use without an external mouse.
Additionally, the clickpad is not Precision-enabled. Two-finger inputs are supported albeit inconsistent.

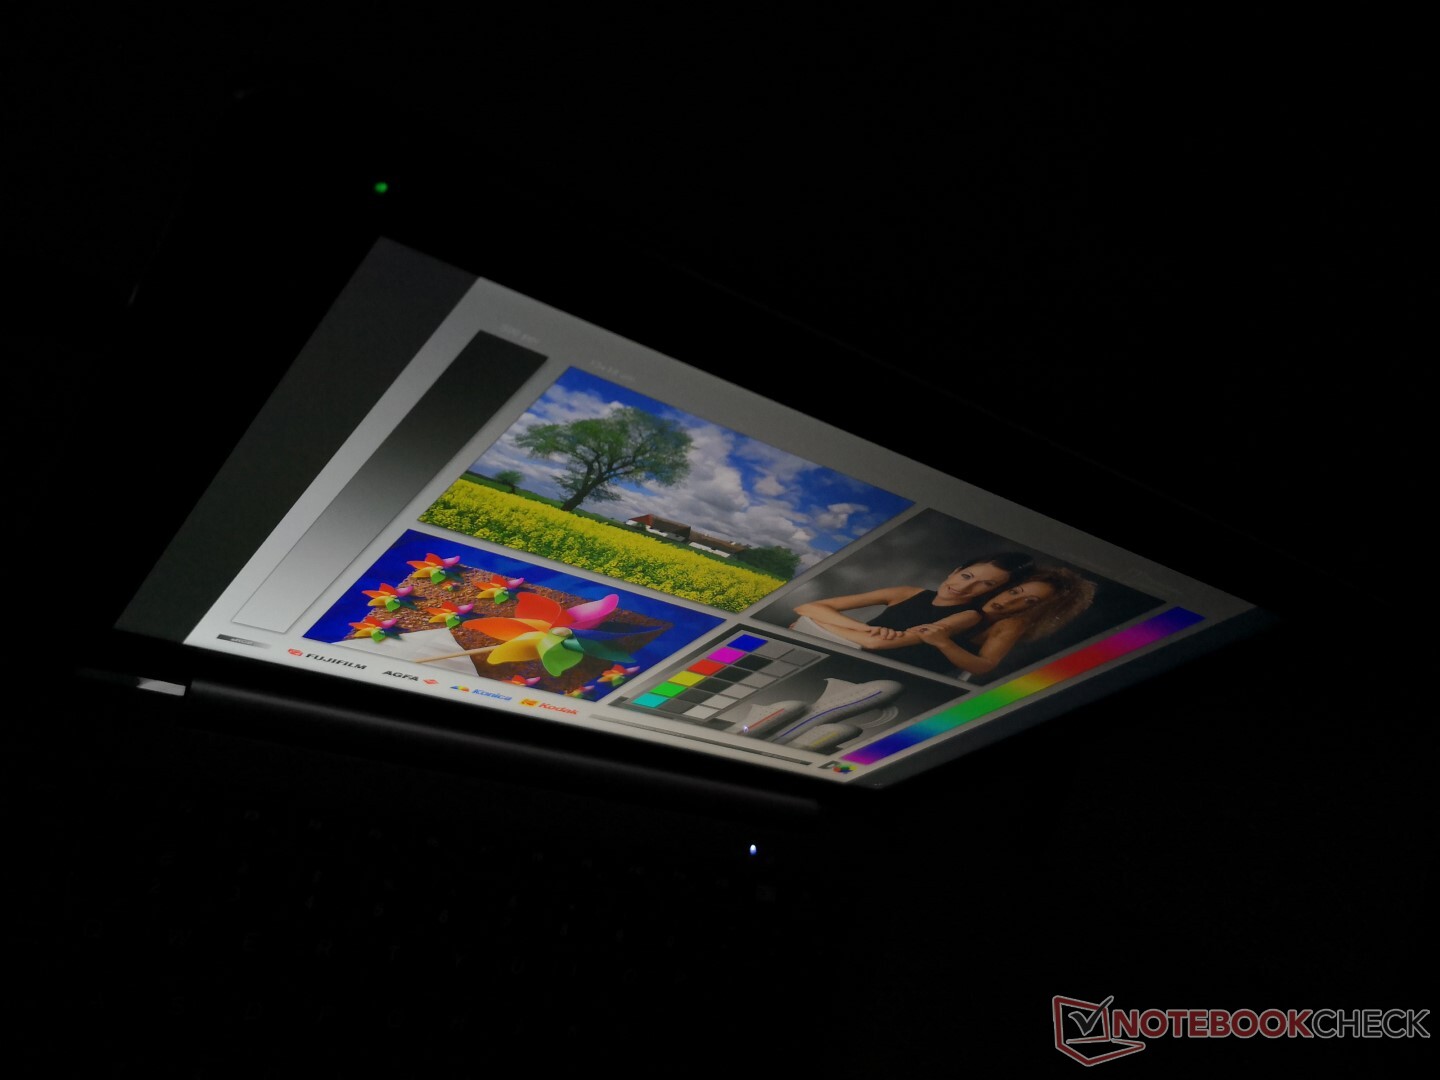
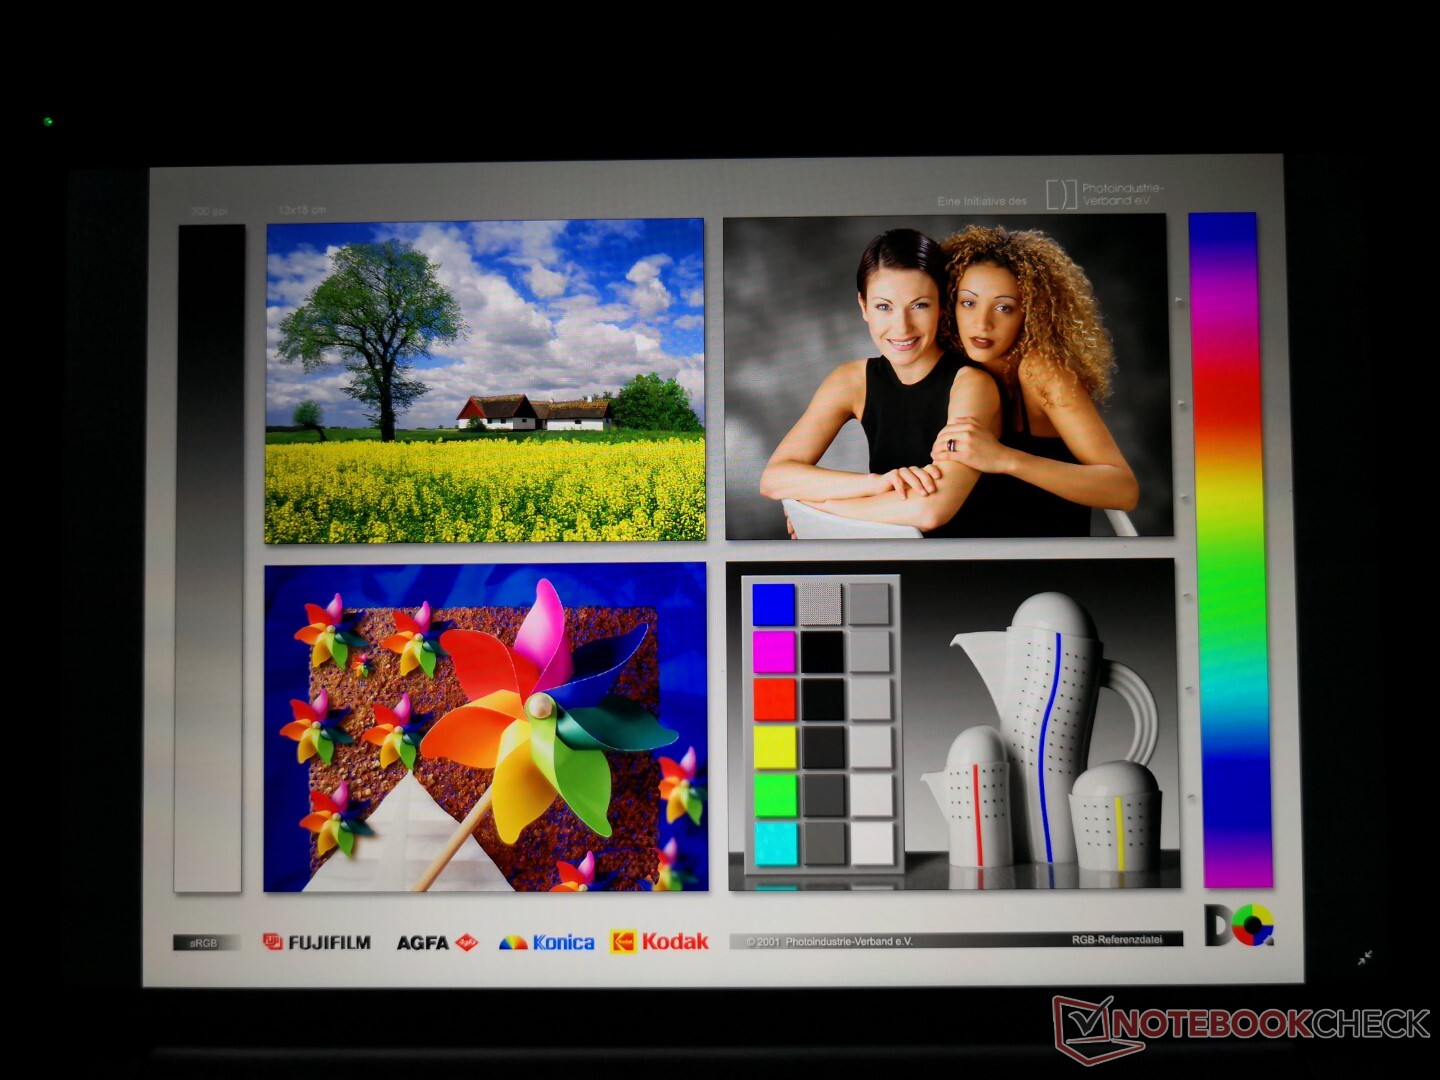
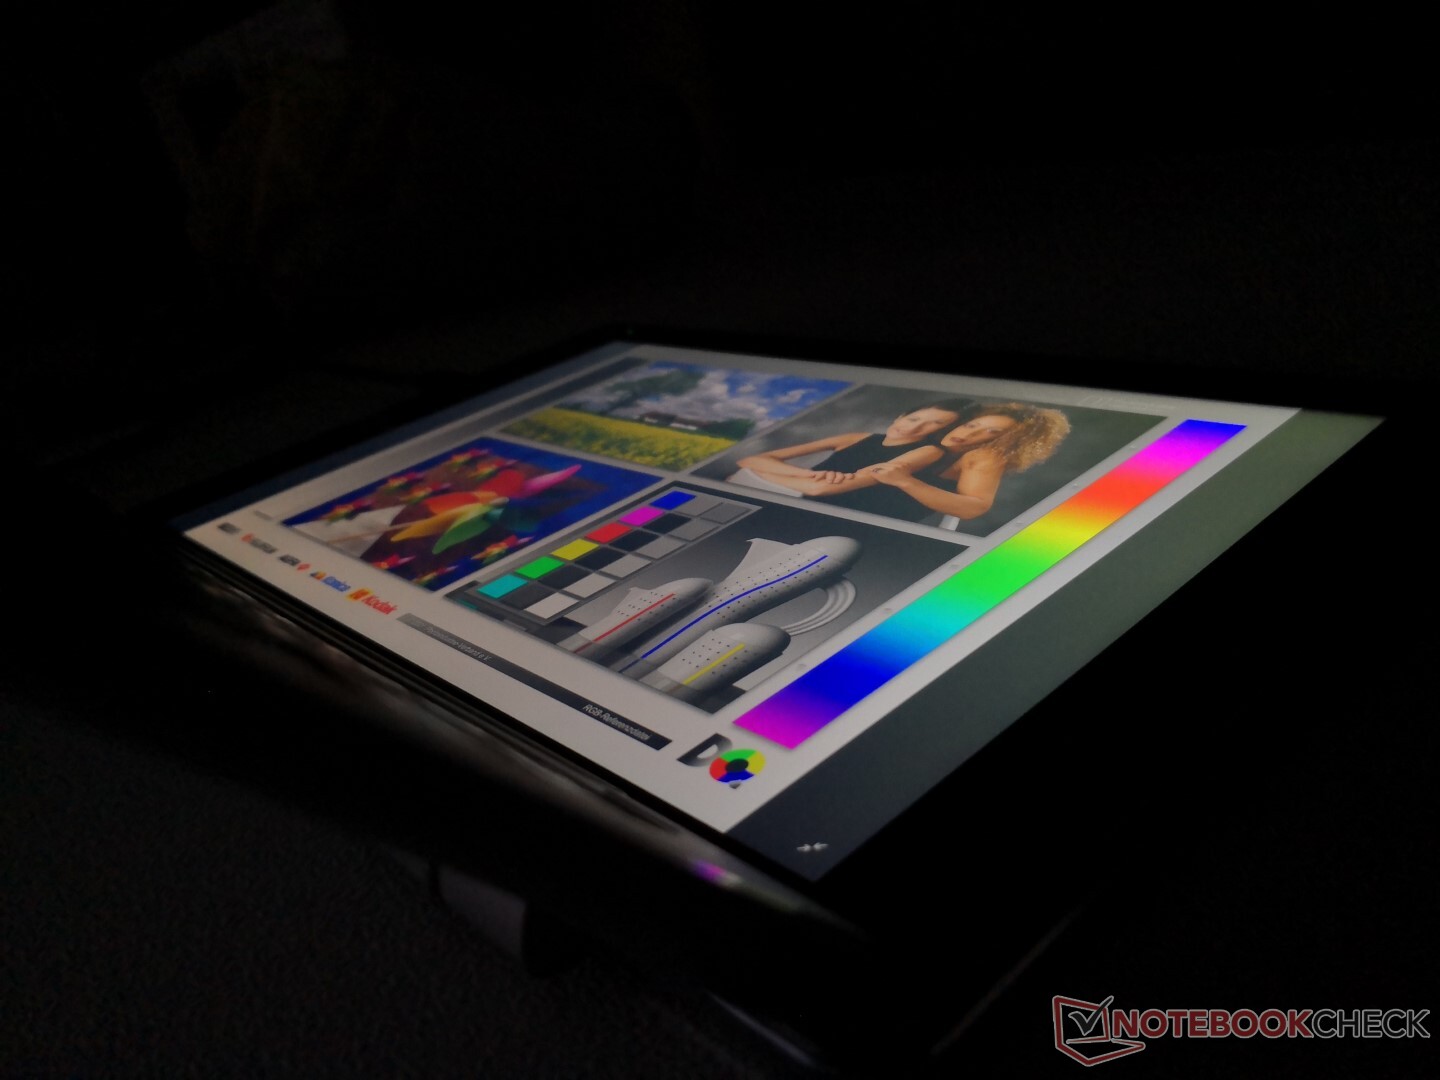
Display
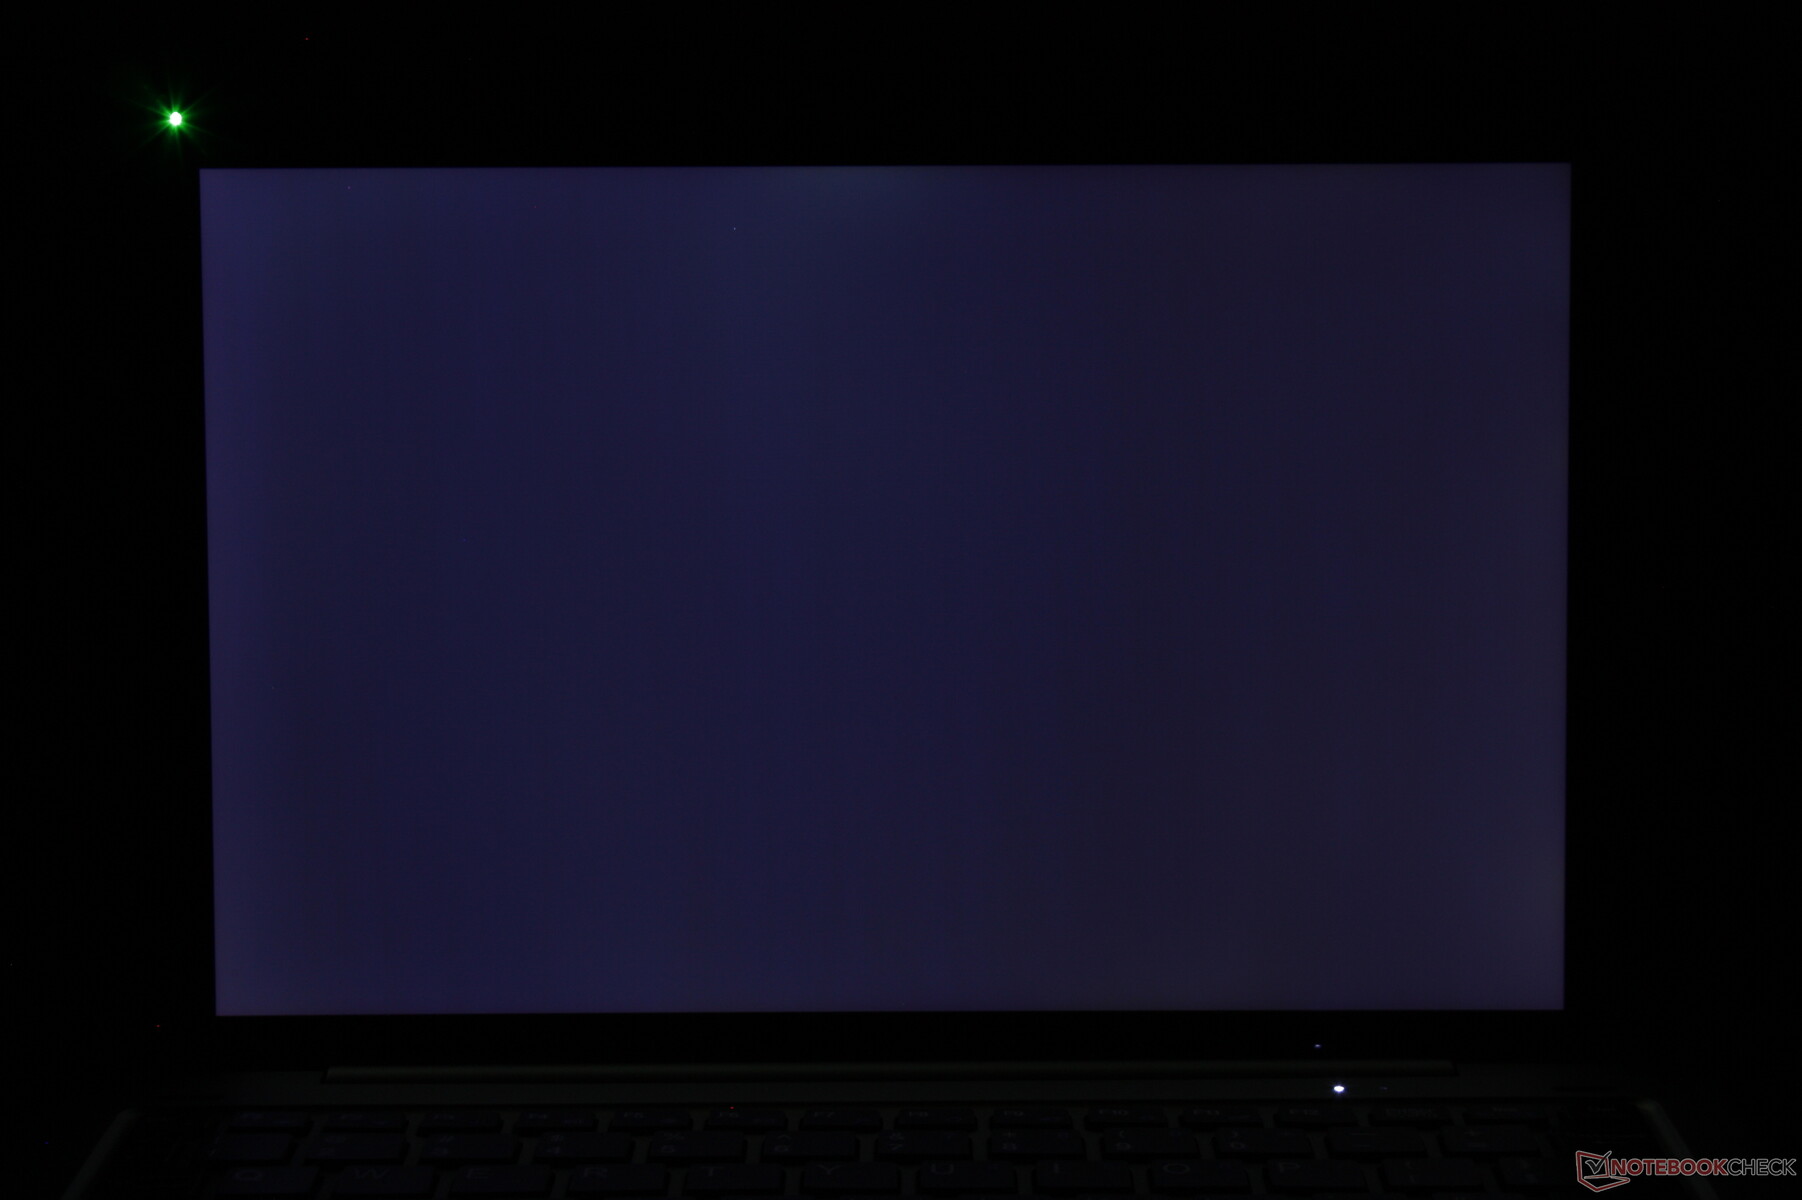
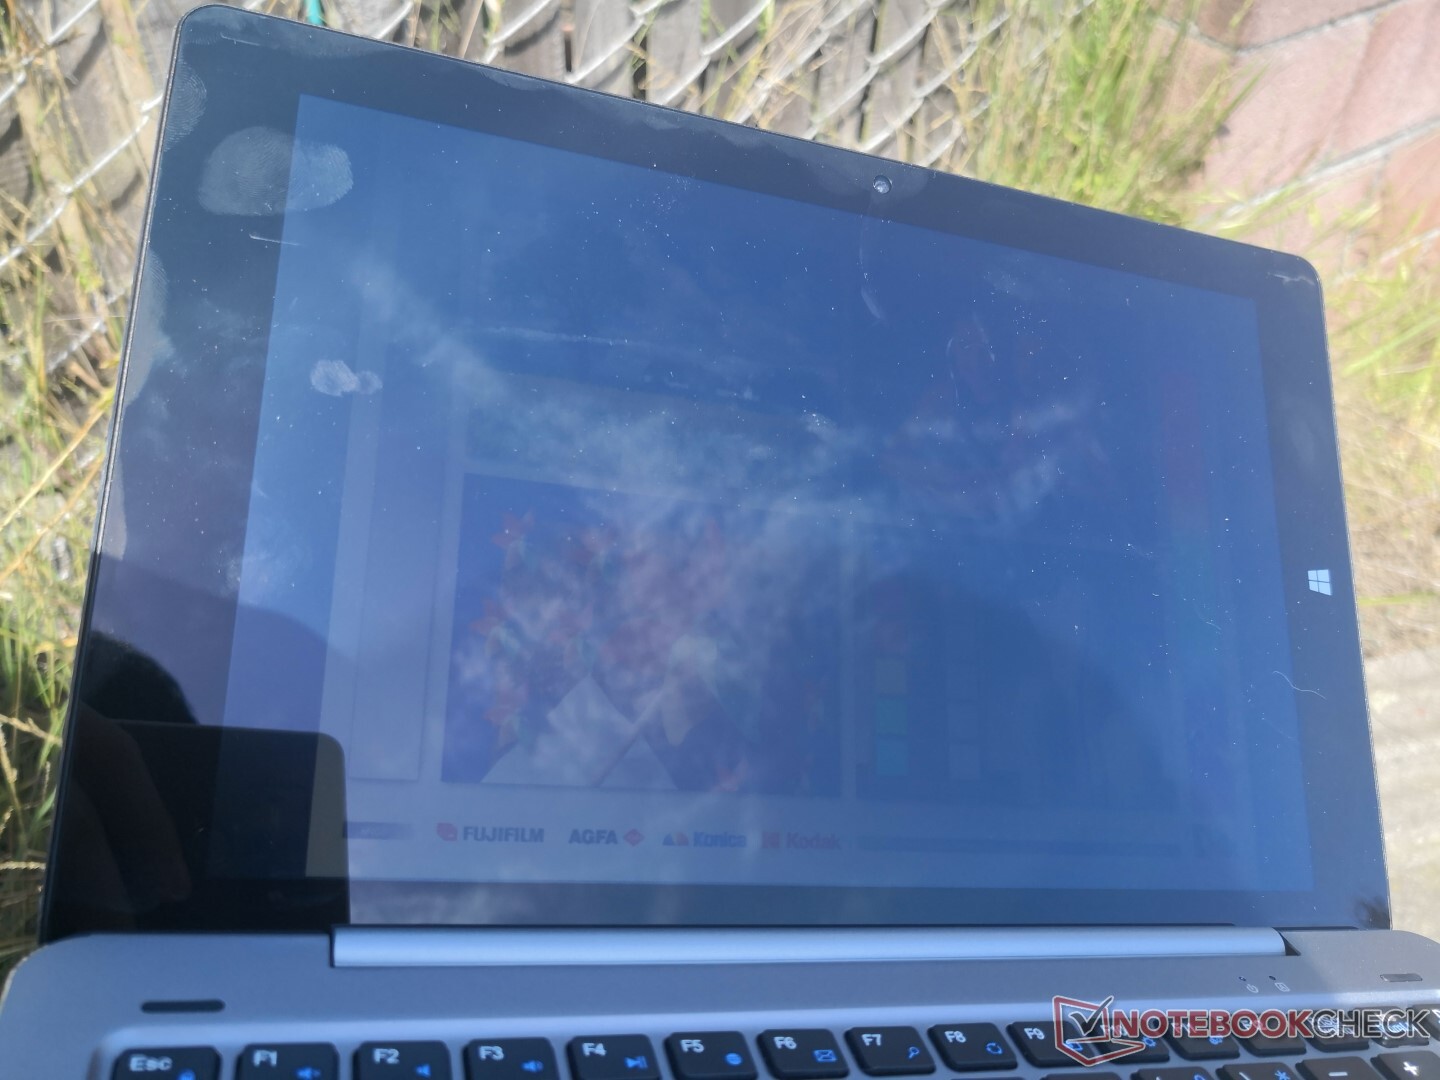
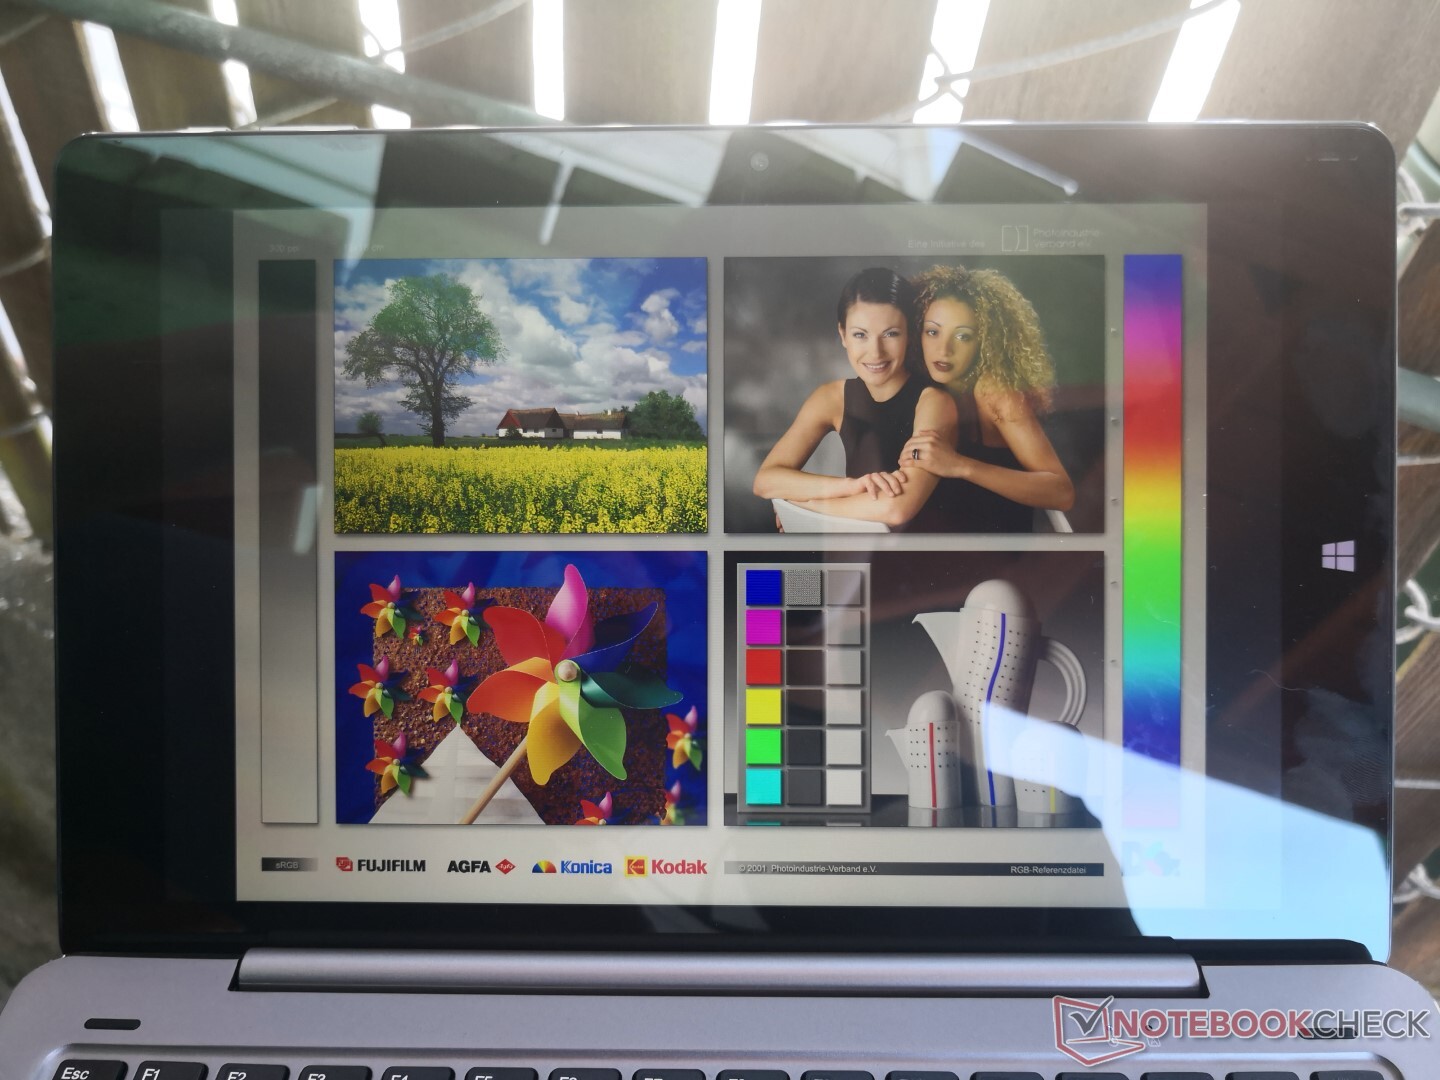
The glossy 16:10 1200p touchscreen is slightly grainy and colors are way off. Its biggest drawback, however, is the relatively dim backlight of just 256 nits maximum. In comparison, most other tablets reach over 400 nits to be much easier to use and see when outdoors.

| |||||||||||||||||||||||||
Brightness Distribution: 93 %
Center on Battery: 256.3 cd/m²
Contrast: 625:1 (Black: 0.41 cd/m²)
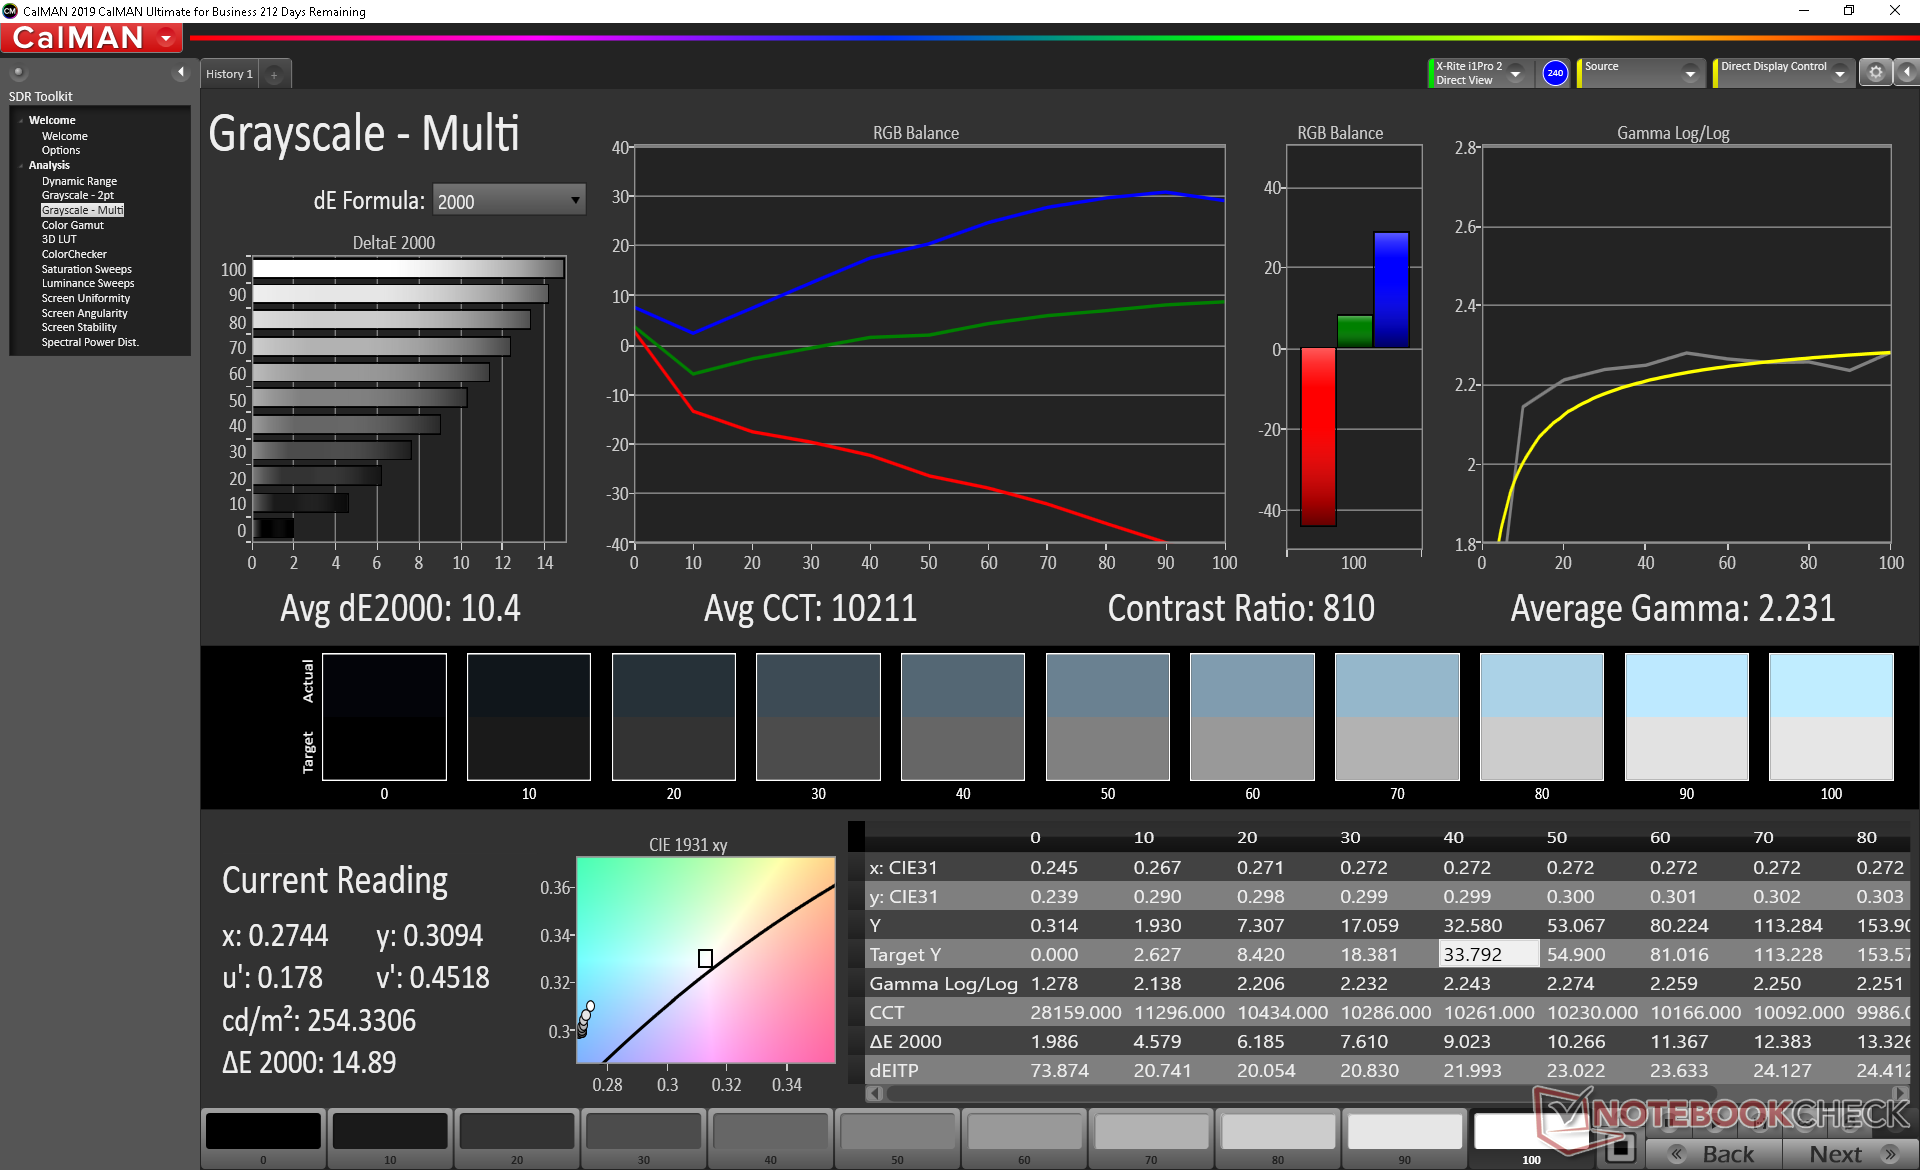
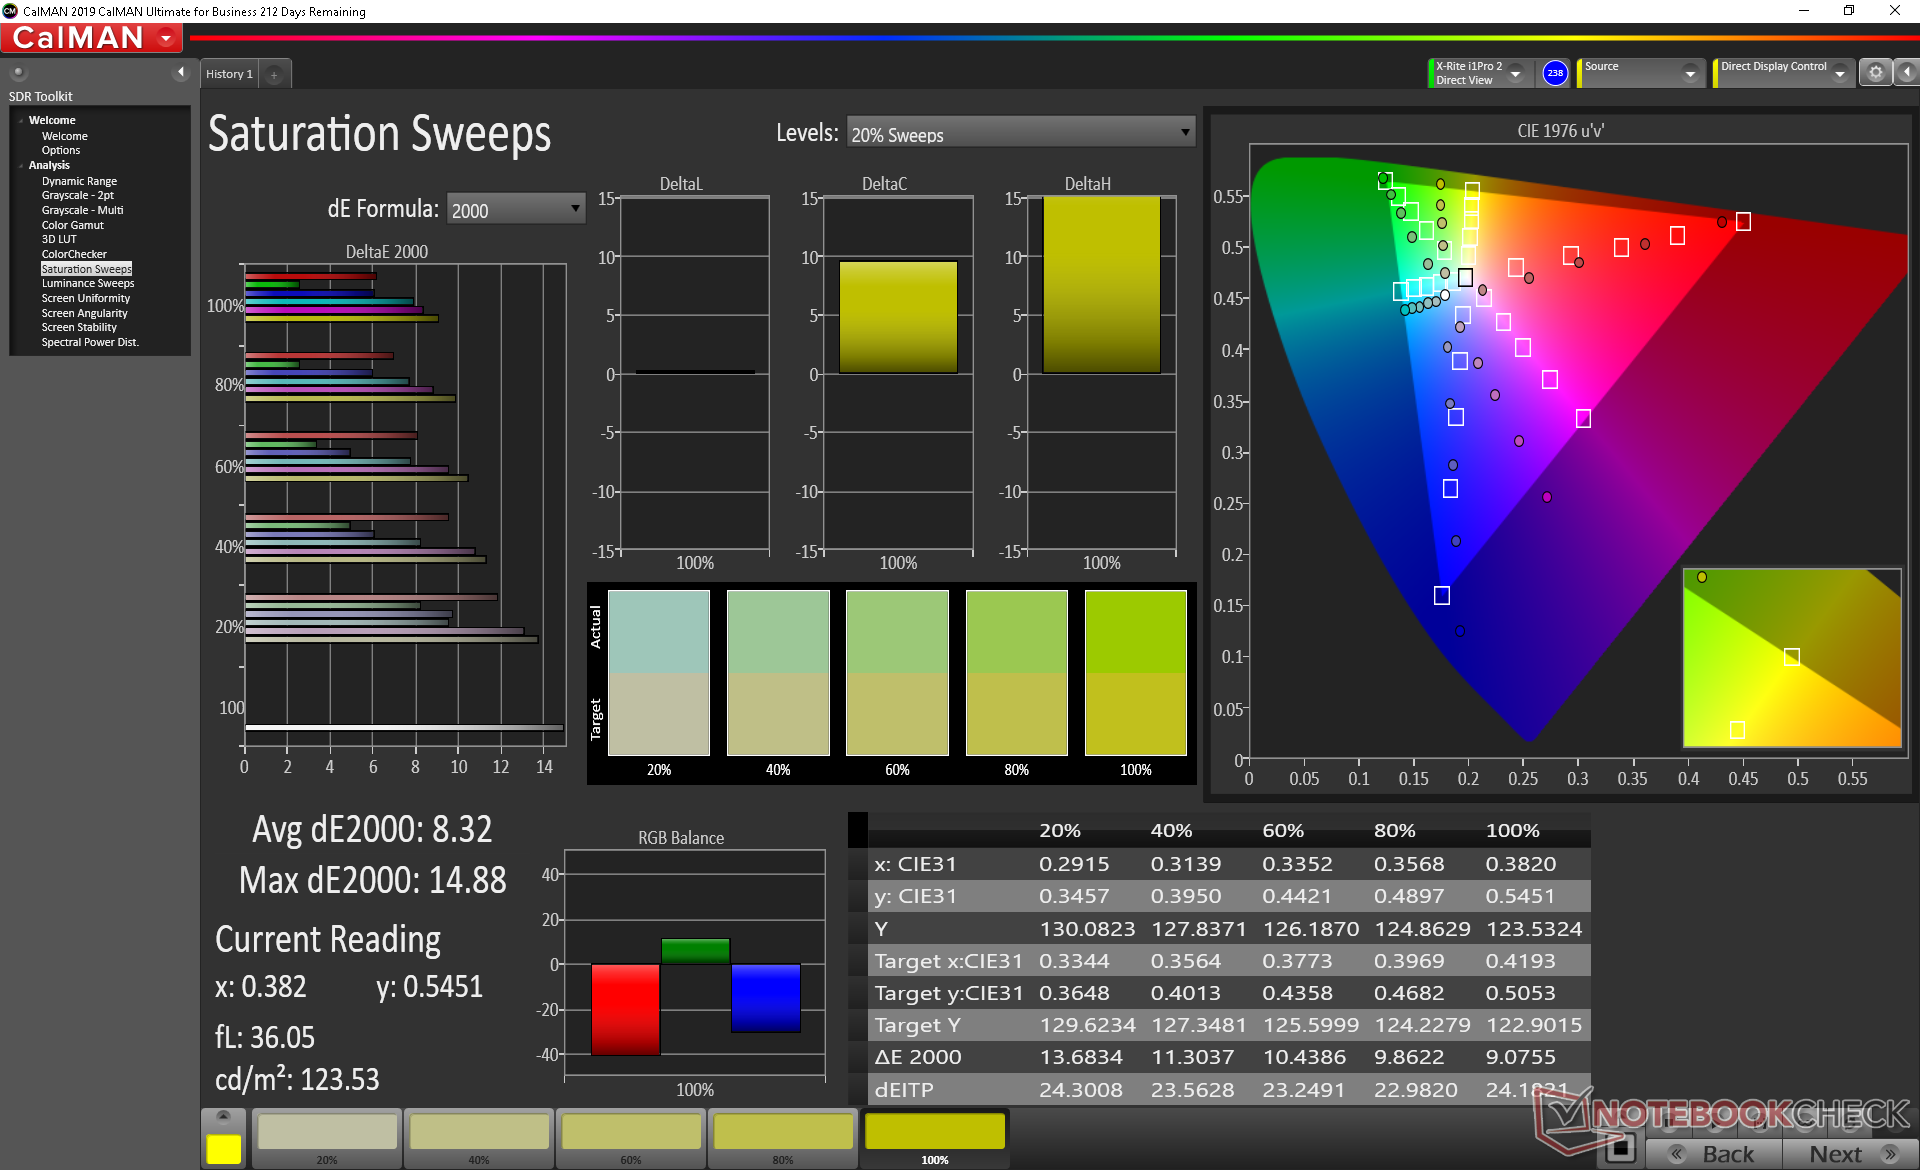
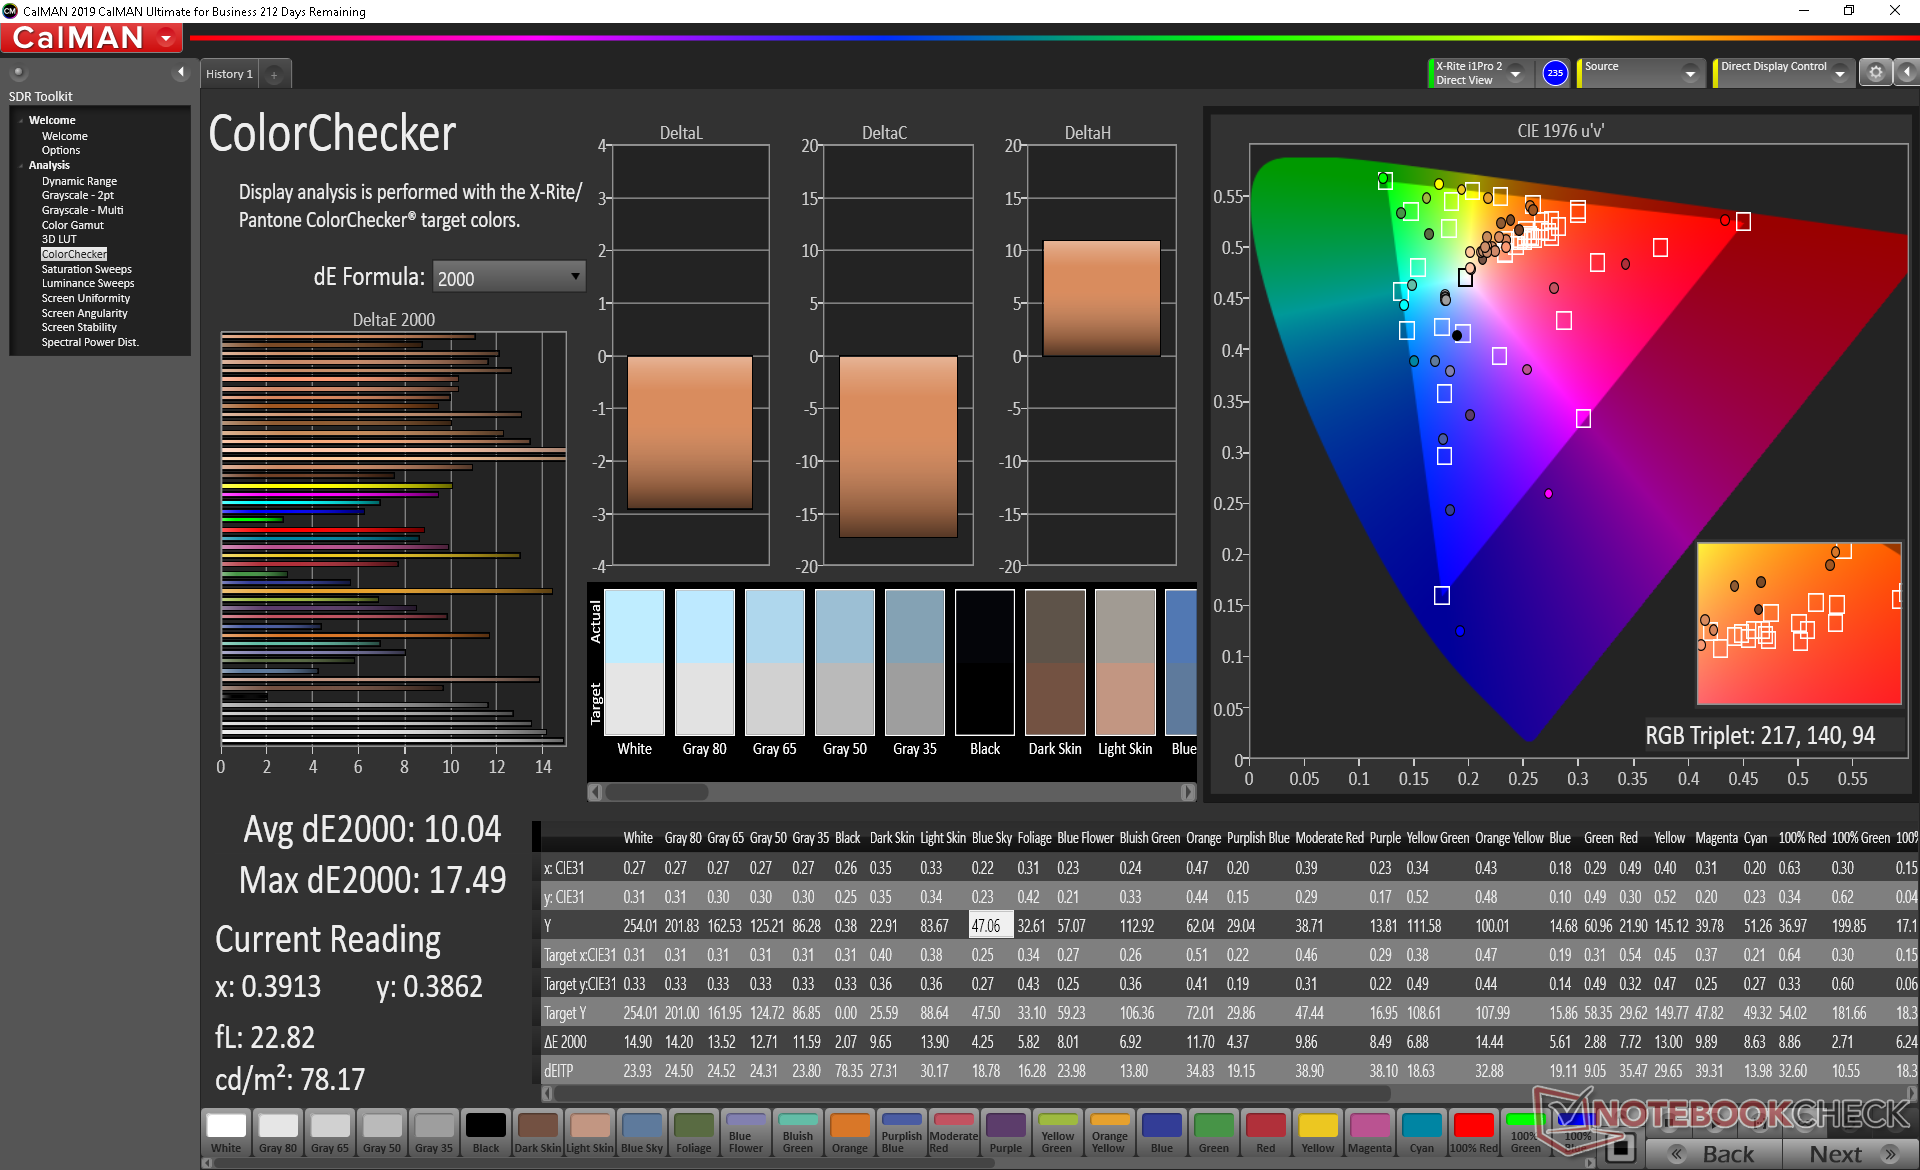
ΔE ColorChecker Calman: 10.04 | ∀{0.5-29.43 Ø4.71}
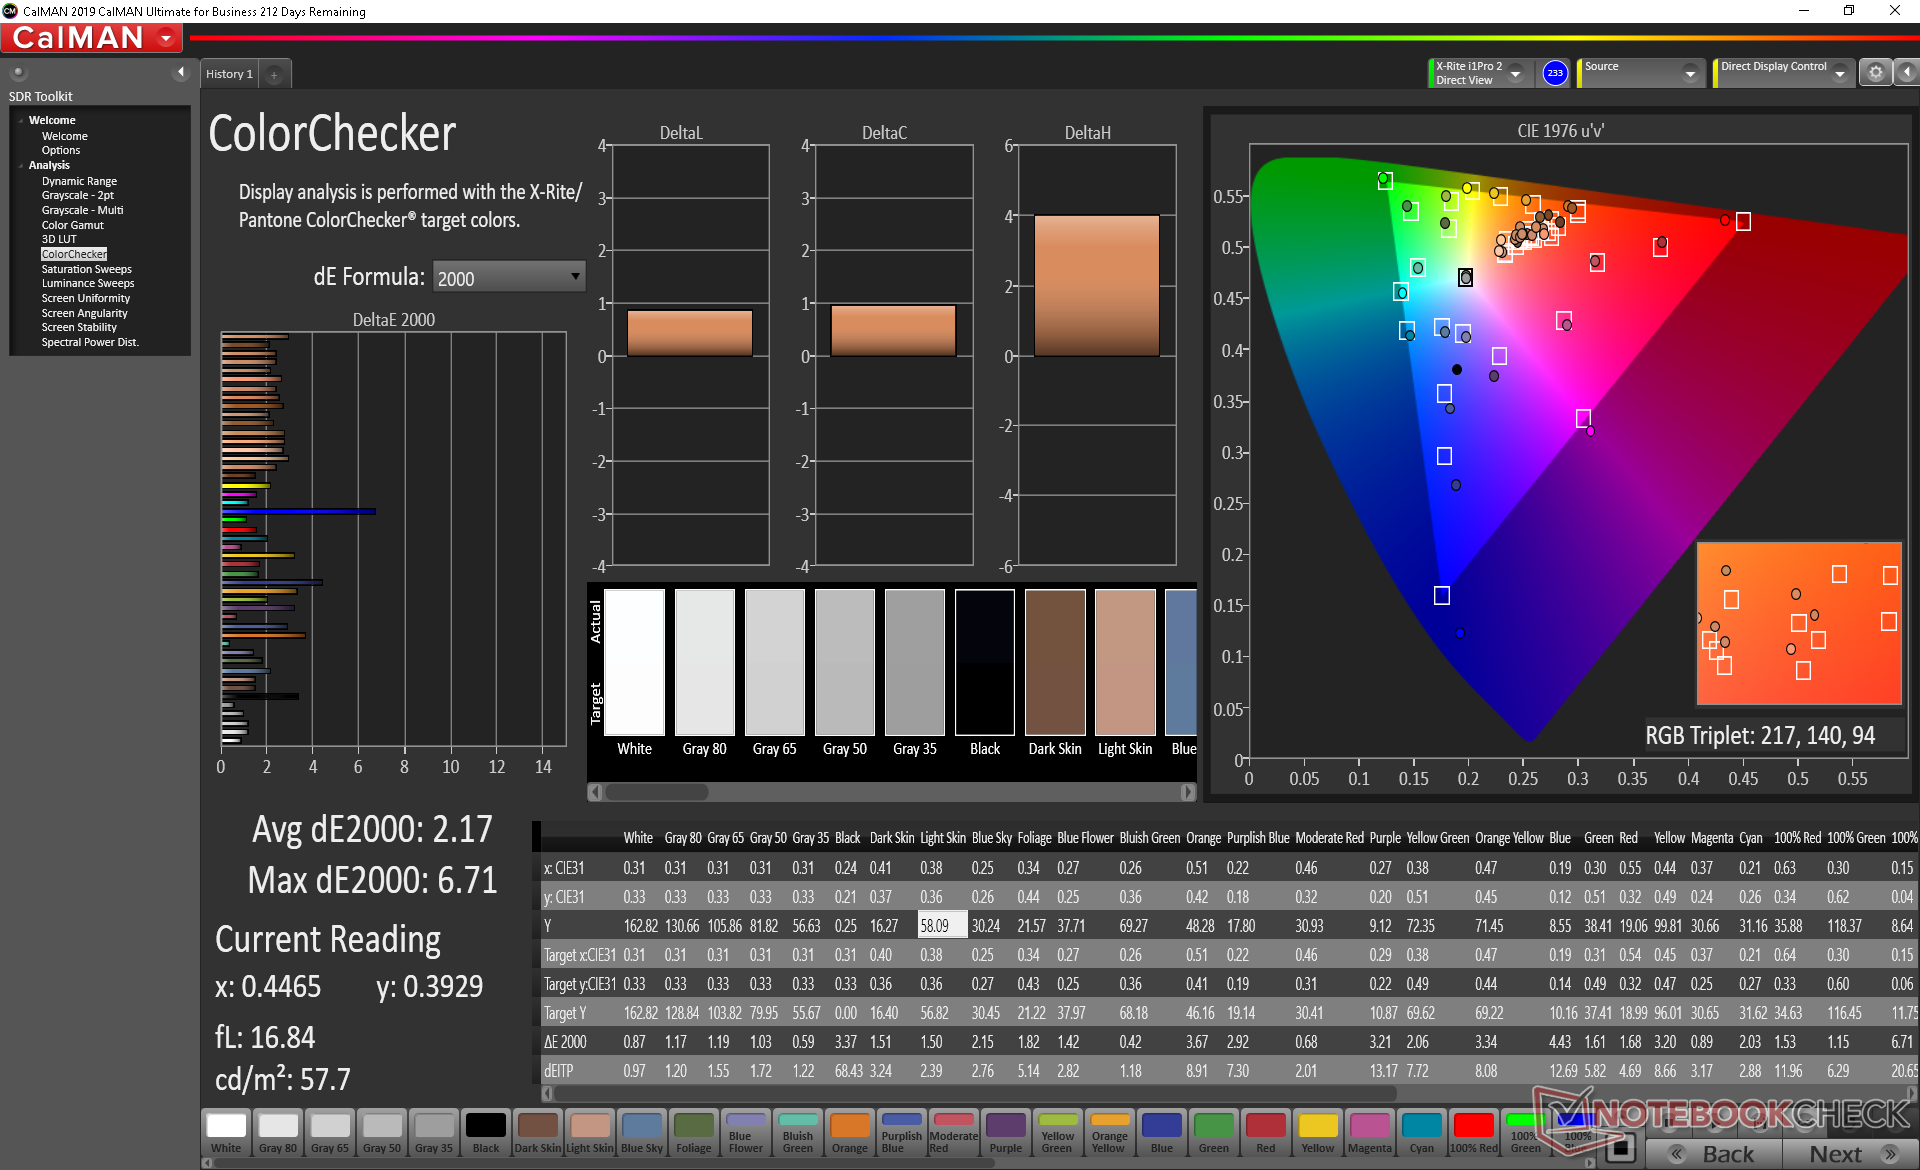
calibrated: 2.17
ΔE Greyscale Calman: 10.4 | ∀{0.09-98 Ø4.96}
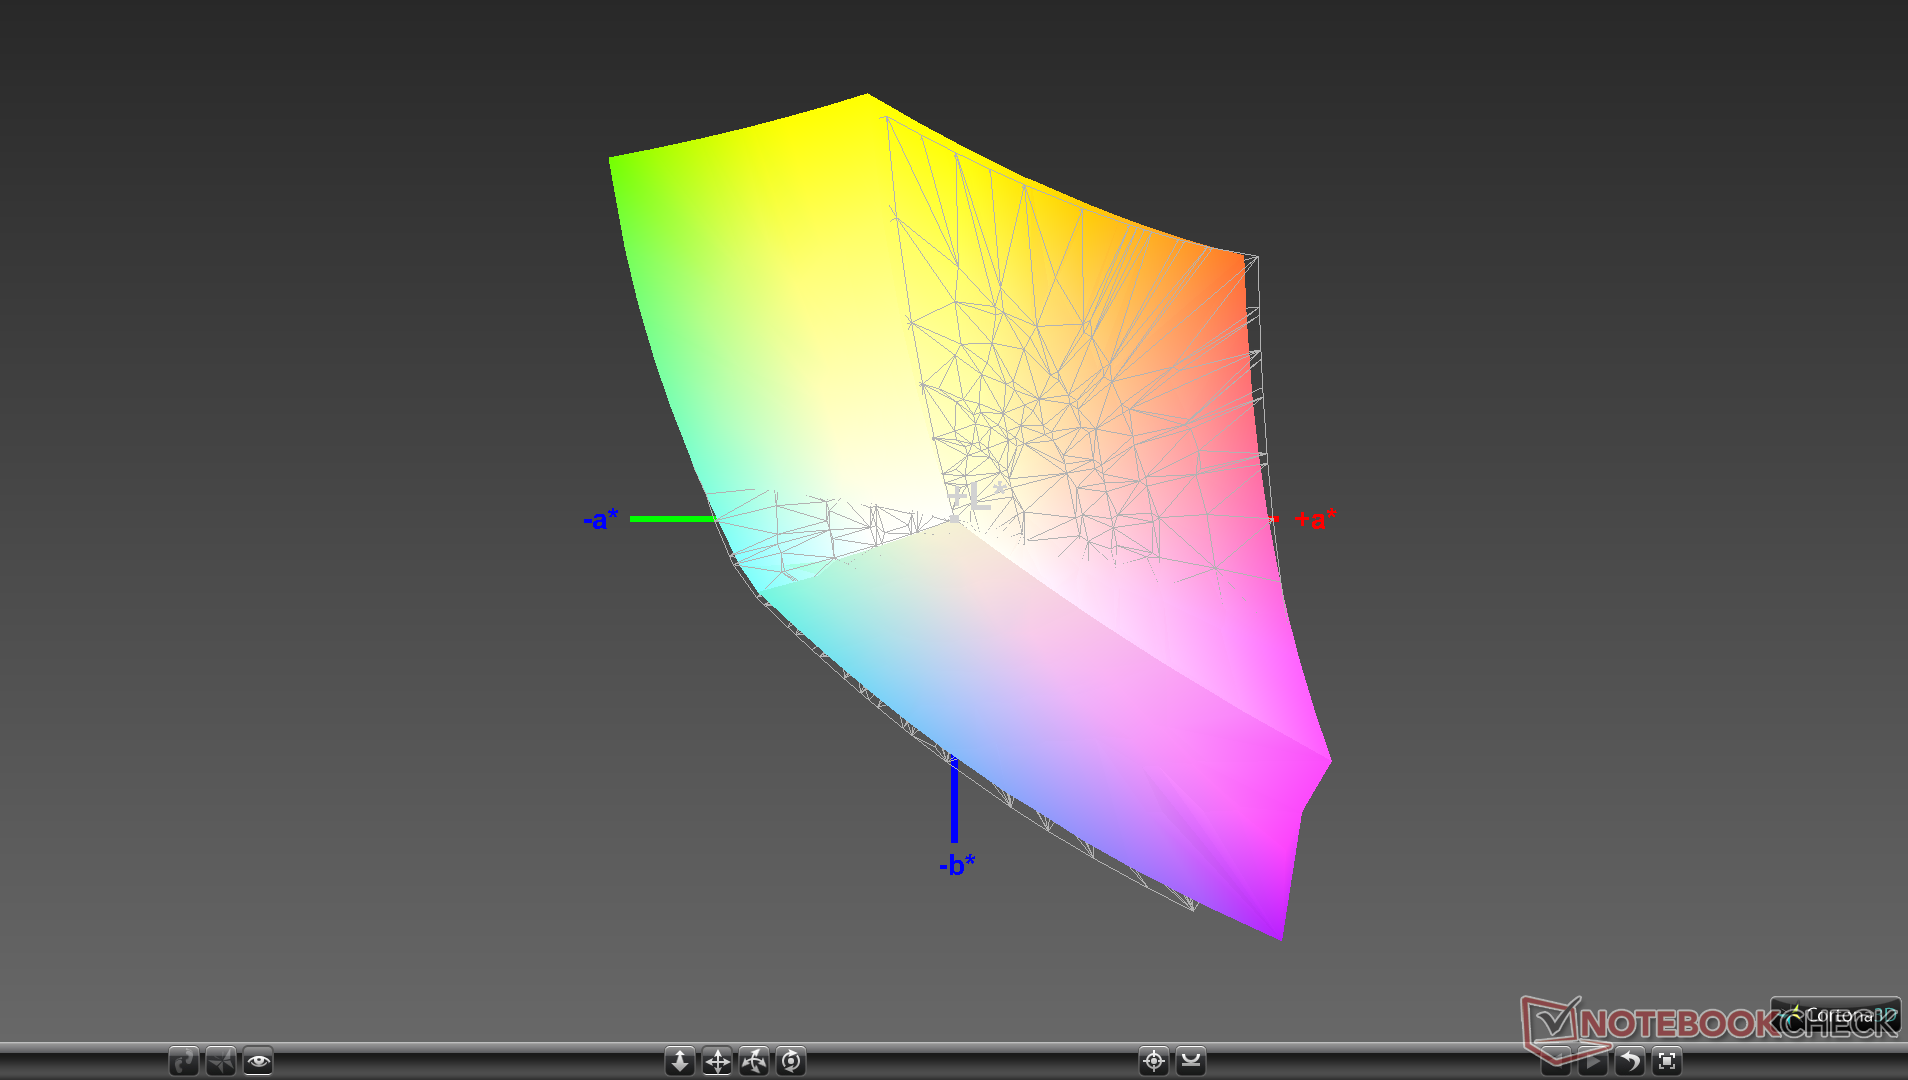
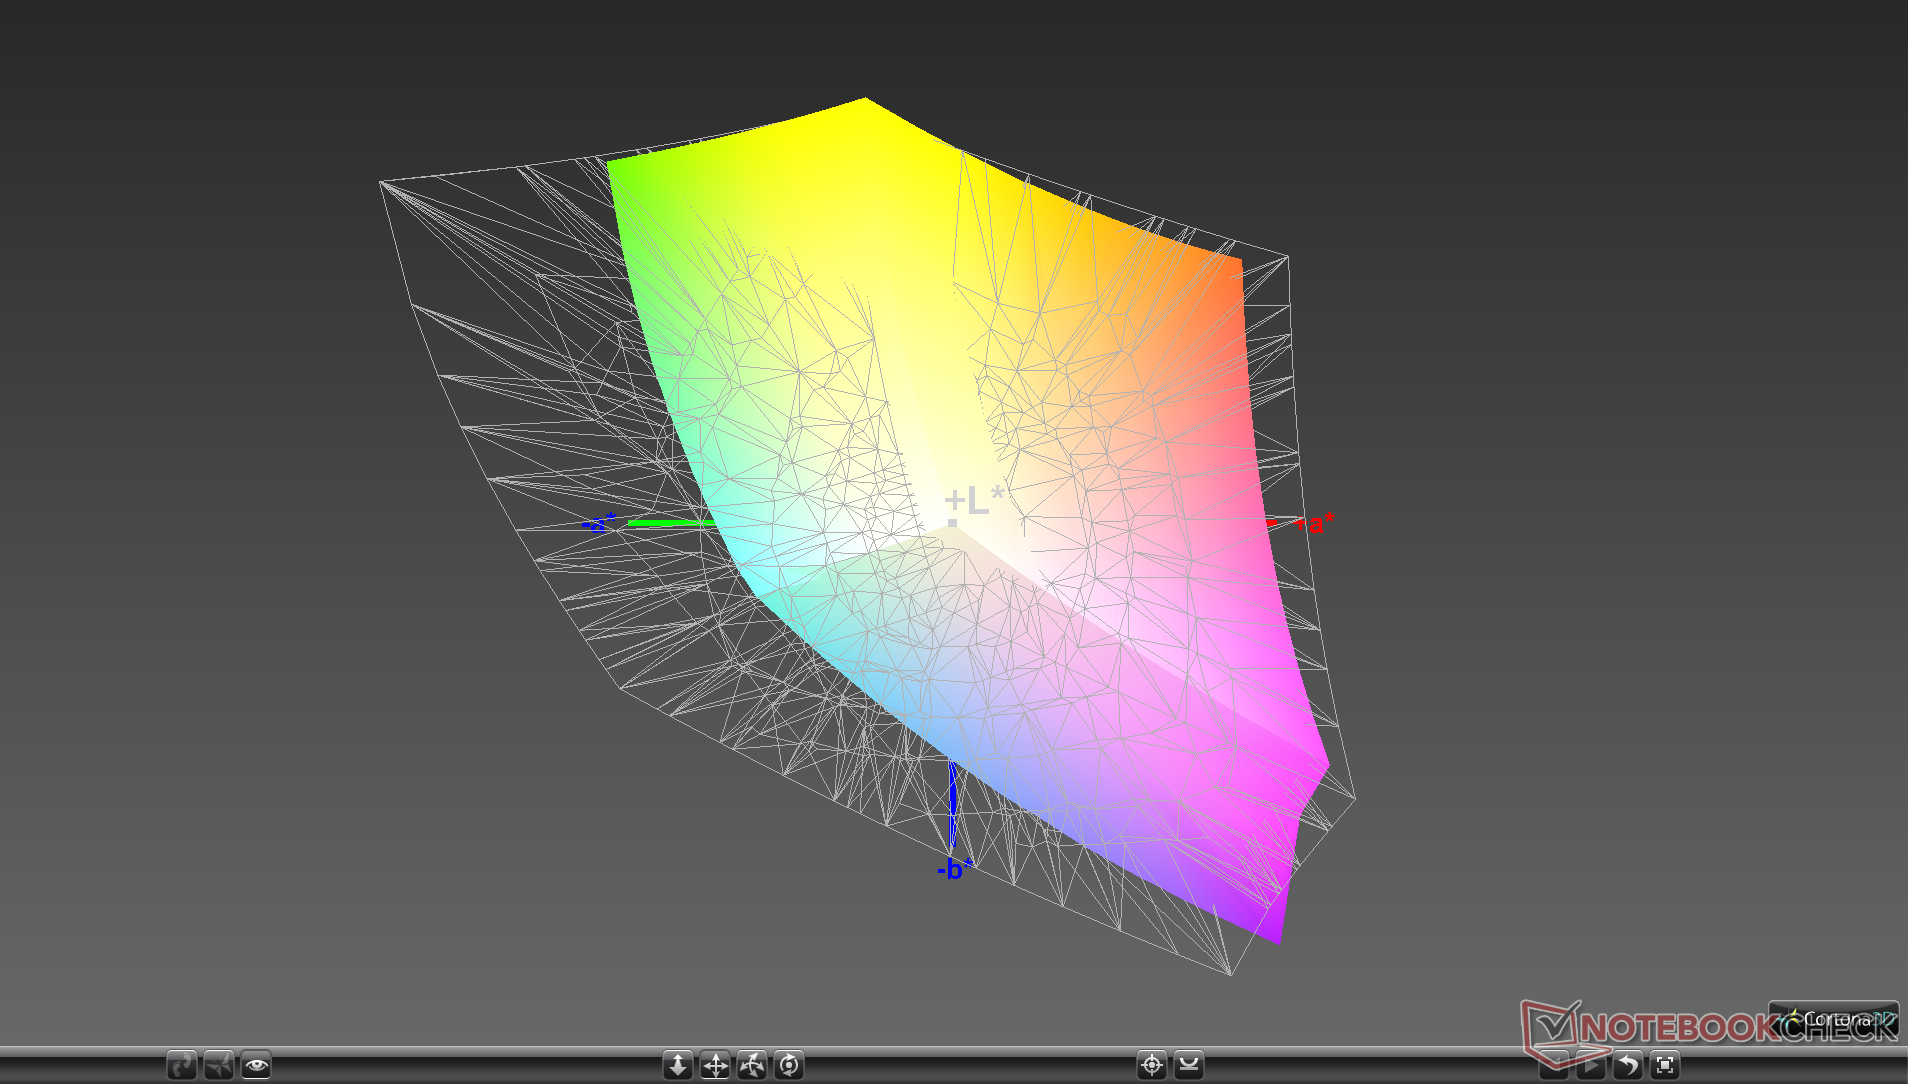
96.7% sRGB (Argyll 1.6.3 3D)
63% AdobeRGB 1998 (Argyll 1.6.3 3D)
68.9% AdobeRGB 1998 (Argyll 3D)
96.8% sRGB (Argyll 3D)
67.9% Display P3 (Argyll 3D)
Gamma: 2.23
CCT: 10211 K
| Chuwi Hi10 X AU Optronics AUO17D8, IPS, 10.1", 1920x1200 | Amazon Fire HD 10 2019 IPS, 10.1", 1920x1200 | Samsung Galaxy Tab A 10.1 2019 TFT-LCD, 10.1", 1920x1200 | Chuwi HiPad IPS, 10.1", 1920x1200 | Microsoft Surface Go MHN-00003 Sharp SHP14A6, IPS, 10", 1800x1200 | Lenovo IdeaPad Miix 320-10ICR Pro LTE YF102, MS_9003, IPS, 10.1", 1920x1200 | |
|---|---|---|---|---|---|---|
| Display | -1% | -18% | ||||
| Display P3 Coverage (%) | 67.9 | 66.5 -2% | 54.2 -20% | |||
| sRGB Coverage (%) | 96.8 | 97.5 1% | 81.4 -16% | |||
| AdobeRGB 1998 Coverage (%) | 68.9 | 67.5 -2% | 56 -19% | |||
| Response Times | -34% | -52% | -39% | -25% | -2% | |
| Response Time Grey 50% / Grey 80% * (ms) | 30.4 ? | 49.6 ? -63% | 52.8 ? -74% | 33.2 ? -9% | 44 ? -45% | 32 ? -5% |
| Response Time Black / White * (ms) | 24.4 ? | 25.6 ? -5% | 31.6 ? -30% | 41.2 ? -69% | 25.6 ? -5% | 24 ? 2% |
| PWM Frequency (Hz) | 1020 ? | 19000 ? | ||||
| Screen | 38% | 39% | 36% | 55% | 12% | |
| Brightness middle (cd/m²) | 256.3 | 449 75% | 401 56% | 408.7 59% | 456 78% | 251 -2% |
| Brightness (cd/m²) | 255 | 425 67% | 396 55% | 396 55% | 426 67% | 244 -4% |
| Brightness Distribution (%) | 93 | 89 -4% | 86 -8% | 85 -9% | 88 -5% | 79 -15% |
| Black Level * (cd/m²) | 0.41 | 0.6 -46% | 0.5 -22% | 0.51 -24% | 0.31 24% | 0.33 20% |
| Contrast (:1) | 625 | 748 20% | 802 28% | 801 28% | 1471 135% | 761 22% |
| Colorchecker dE 2000 * | 10.04 | 3.1 69% | 2.9 71% | 4.13 59% | 1.3 87% | 5.34 47% |
| Colorchecker dE 2000 max. * | 17.49 | 6.4 63% | 5.8 67% | 7.34 58% | 3 83% | 9.91 43% |
| Colorchecker dE 2000 calibrated * | 2.17 | 1.1 49% | ||||
| Greyscale dE 2000 * | 10.4 | 3.8 63% | 4.1 61% | 4.4 58% | 1.4 87% | 6.04 42% |
| Gamma | 2.23 99% | 2.09 105% | 2.36 93% | 2.24 98% | 2.24 98% | 3.23 68% |
| CCT | 10211 64% | 7202 90% | 7263 89% | 7389 88% | 6687 97% | 7491 87% |
| Color Space (Percent of AdobeRGB 1998) (%) | 63 | 62.3 -1% | 51 -19% | |||
| Color Space (Percent of sRGB) (%) | 96.7 | 96.8 0% | 81 -16% | |||
| Total Average (Program / Settings) | 2% /
24% | -7% /
20% | -2% /
21% | 10% /
34% | -3% /
4% |
* ... smaller is better
Color space covers approximately 97 percent of sRGB to be higher than anticipated for such an inexpensive Windows tablet. This suggests that the Hi10 X is capable of reproducing accurate colors at least in theory.
Further measurements with an X-Rite colorimeter show an overly cool color temperature with extremely inaccurate colors as a result. Because of the wide color space mentioned above, however, the display becomes much more accurate after calibrating it ourselves. Average grayscale DeltaE, for example, improves from 10.4 to just 1.0 and so we recommend applying our ICC profile above to get the most out of the display.


Display Response Times
| ↔ Response Time Black to White | ||
|---|---|---|
| 24.4 ms ... rise ↗ and fall ↘ combined | ↗ 12.4 ms rise | 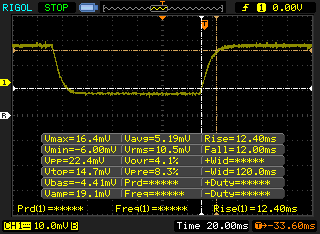 |
| ↘ 12 ms fall | ||
| The screen shows good response rates in our tests, but may be too slow for competitive gamers. In comparison, all tested devices range from 0.1 (minimum) to 240 (maximum) ms. » 58 % of all devices are better. This means that the measured response time is worse than the average of all tested devices (19.8 ms). | ||
| ↔ Response Time 50% Grey to 80% Grey | ||
| 30.4 ms ... rise ↗ and fall ↘ combined | ↗ 18.8 ms rise | 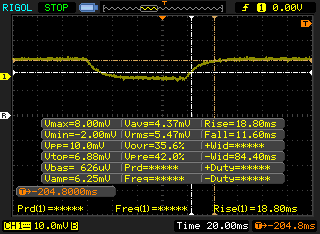 |
| ↘ 11.6 ms fall | ||
| The screen shows slow response rates in our tests and will be unsatisfactory for gamers. In comparison, all tested devices range from 0.165 (minimum) to 636 (maximum) ms. » 41 % of all devices are better. This means that the measured response time is similar to the average of all tested devices (31 ms). | ||
Screen Flickering / PWM (Pulse-Width Modulation)
| Screen flickering / PWM not detected | 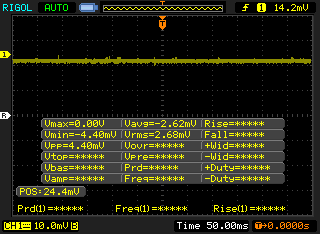 | ||
In comparison: 52 % of all tested devices do not use PWM to dim the display. If PWM was detected, an average of 7754 (minimum: 5 - maximum: 343500) Hz was measured. | |||
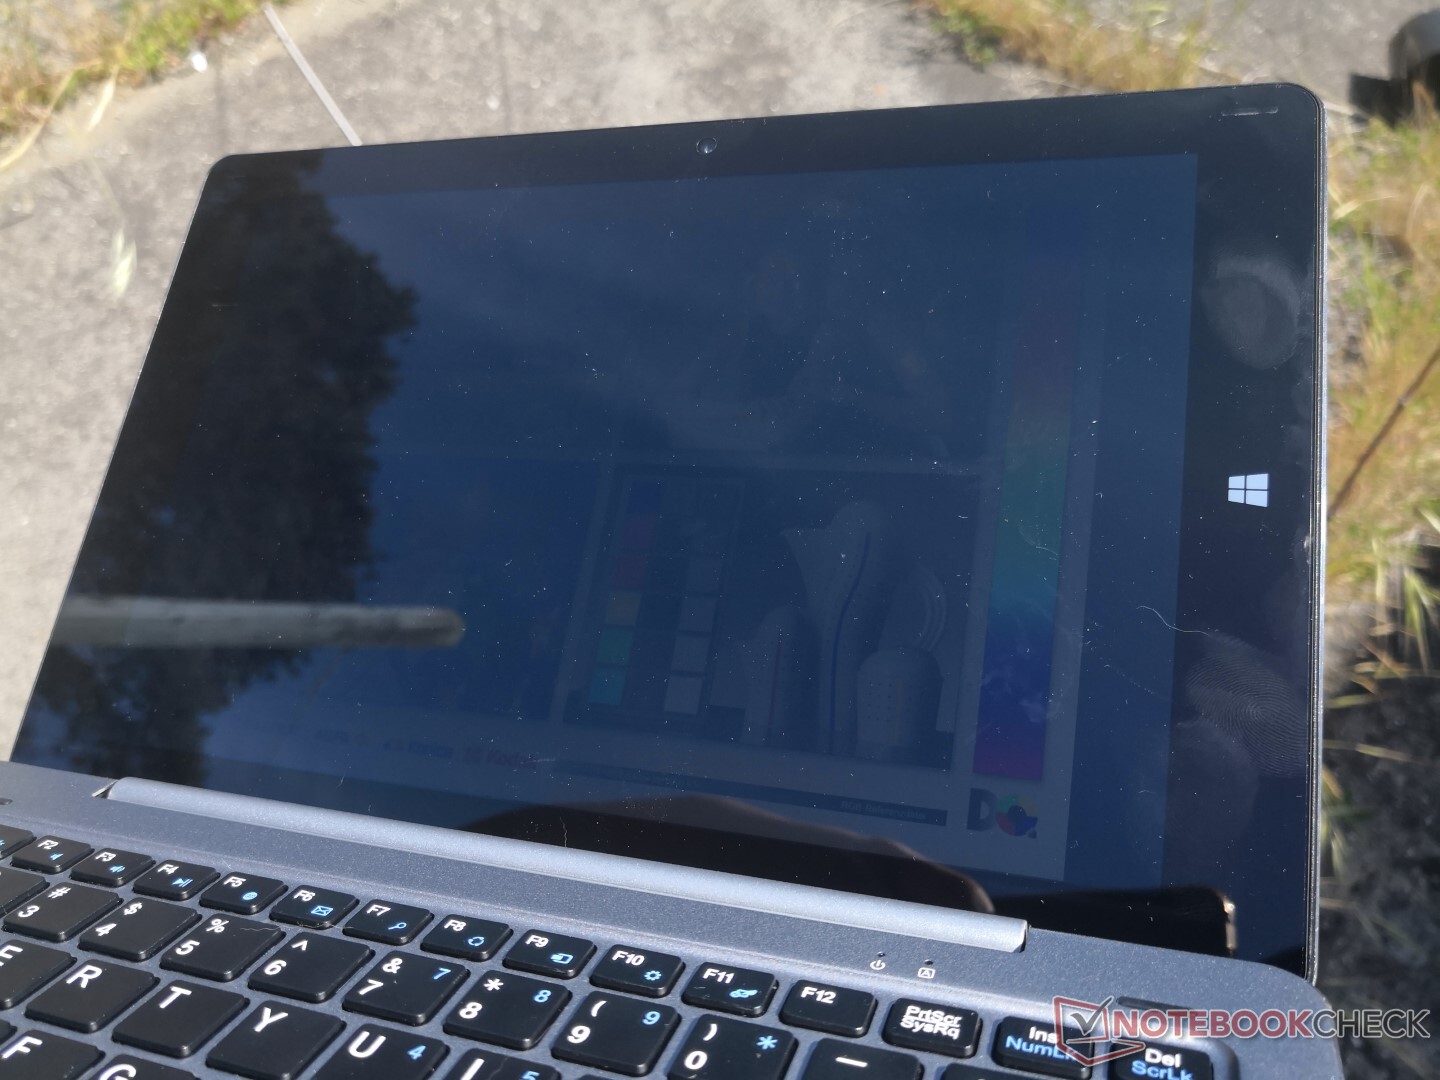
Outdoor visibility is poor because of the dim display. The wide viewing angles alone aren't enough to mitigate the unavoidable glare.
Performance
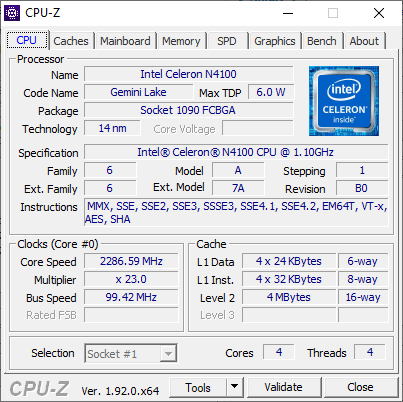
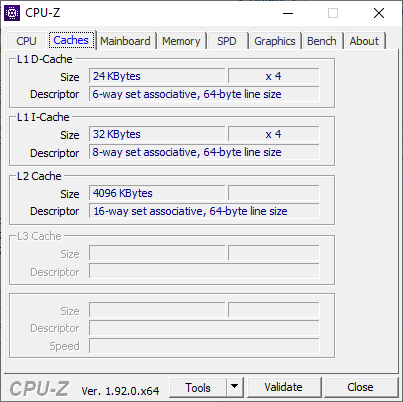
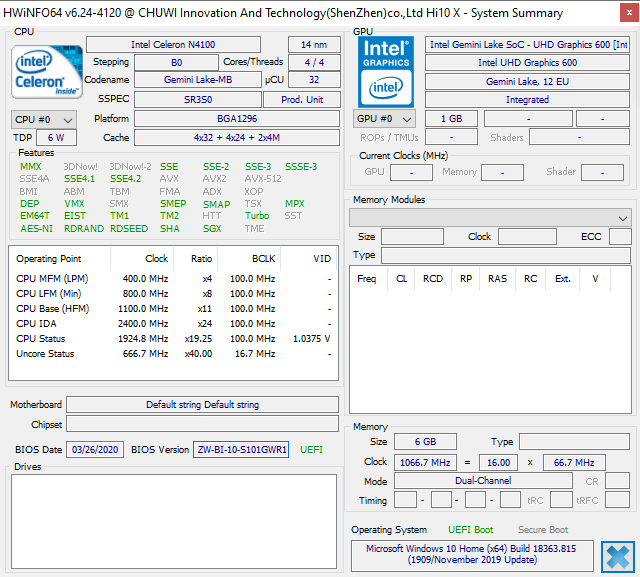
Processor
The Celeron N4100 is about 9 to 13 percent slower than the average Celeron N4100 in our database. CPU performance is still similar to the Pentium 4415Y as found on the Surface Go even though the latter offers significantly faster GPU performance.
See our dedicated page on the Celeron N4100 for more technical information and benchmark comparisons.
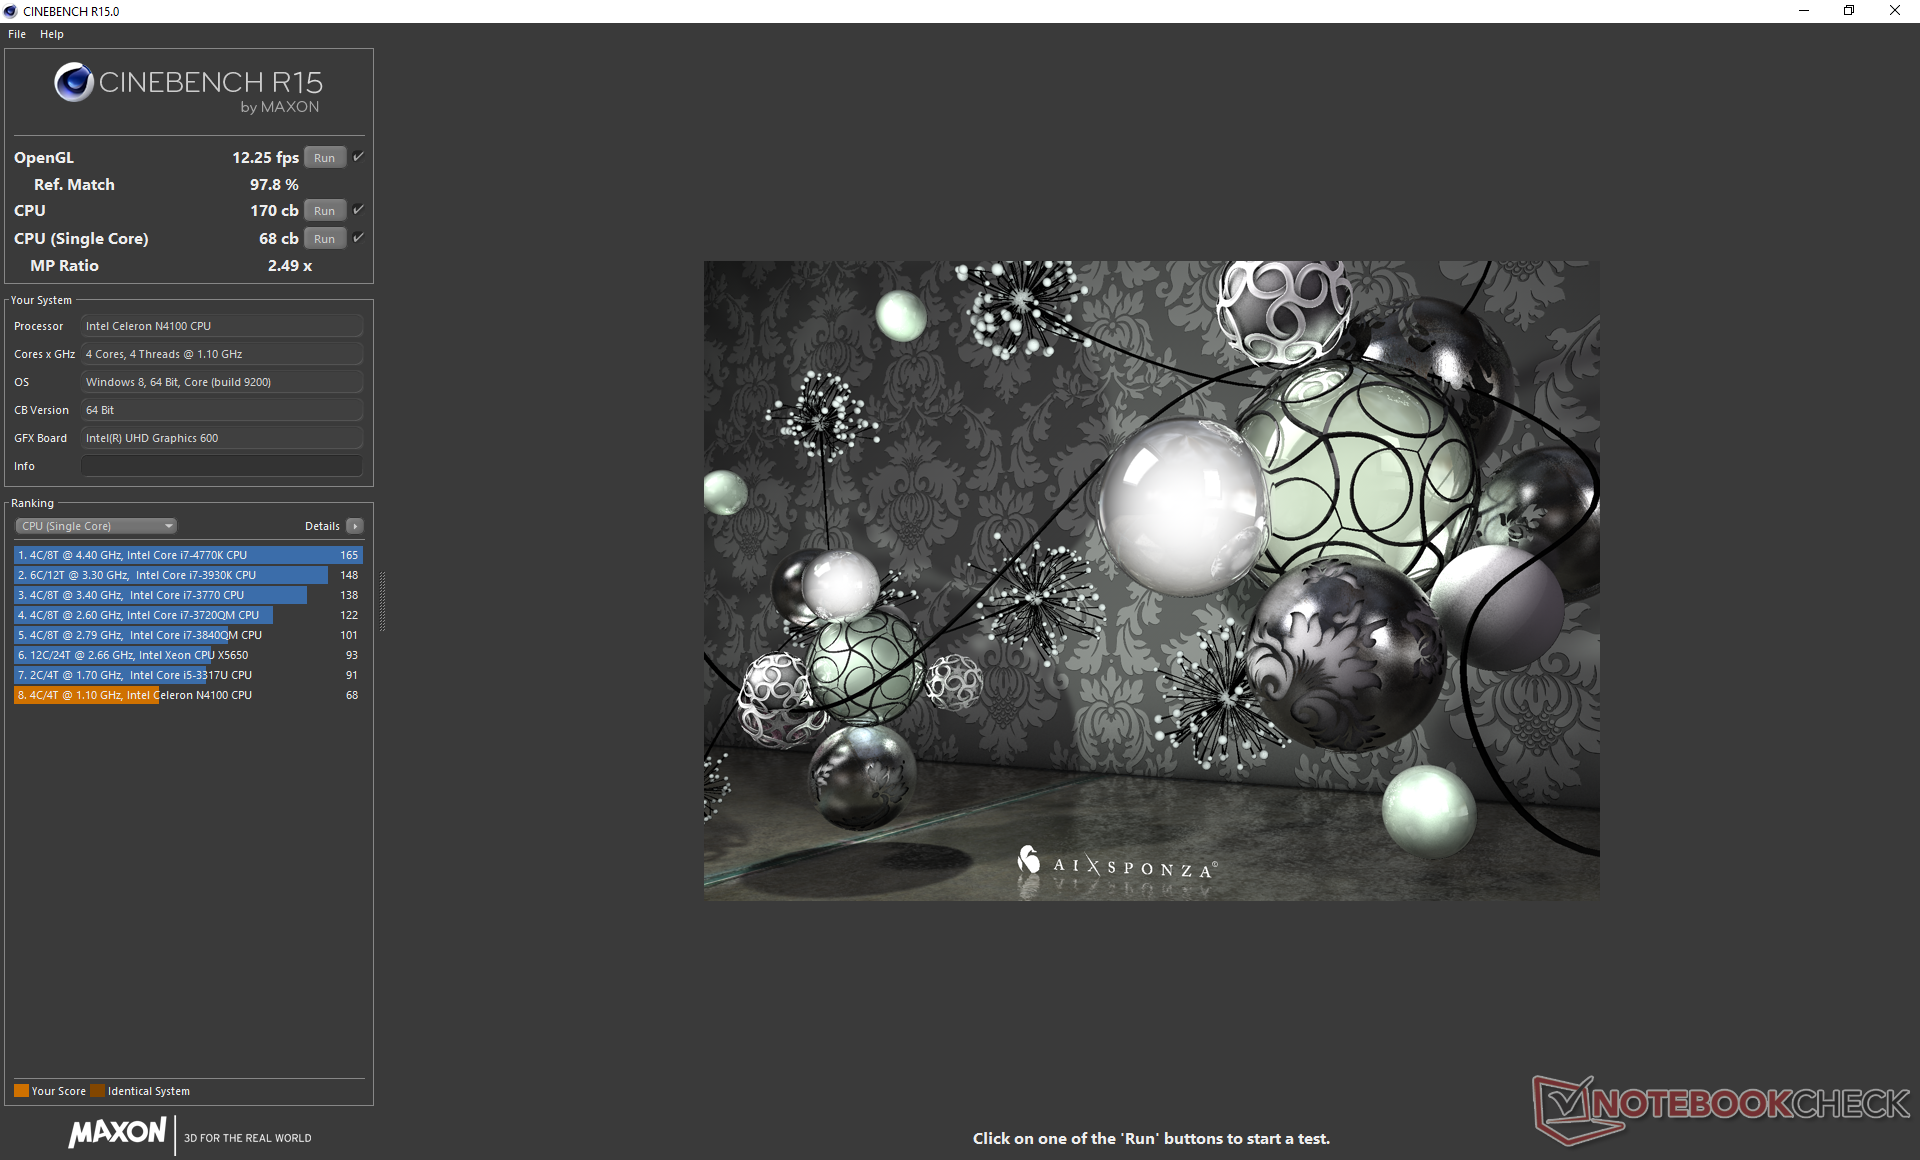

Cinebench R20: CPU (Single Core) | CPU (Multi Core)
Blender: v2.79 BMW27 CPU
7-Zip 18.03: 7z b 4 -mmt1 | 7z b 4
Geekbench 5.5: Single-Core | Multi-Core
HWBOT x265 Benchmark v2.2: 4k Preset
LibreOffice : 20 Documents To PDF
R Benchmark 2.5: Overall mean
| Cinebench R15 / CPU Multi 64Bit | |
| Dell XPS 13 7390 2-in-1 Core i3 | |
| Dell Latitude 3400 | |
| Acer TravelMate Spin B1 B118-G2-RN-P7ED | |
| Average Intel Celeron N4100 (161 - 254, n=12) | |
| Dell Venue 11 Pro 7140 | |
| Chuwi Hi10 X | |
| Microsoft Surface Go MHN-00003 | |
| Lhmzniy A9 15.6 | |
| LincPlus P1 | |
| HP x2 210 G2 | |
| Lenovo IdeaPad Miix 320-10ICR Pro LTE | |
| Jumper EZbook X3 | |
| Cinebench R15 / CPU Single 64Bit | |
| Dell XPS 13 7390 2-in-1 Core i3 | |
| Dell Latitude 3400 | |
| Dell Venue 11 Pro 7140 | |
| Acer TravelMate Spin B1 B118-G2-RN-P7ED | |
| LincPlus P1 | |
| Chuwi Hi10 X | |
| Average Intel Celeron N4100 (62 - 71, n=12) | |
| Microsoft Surface Go MHN-00003 | |
| Jumper EZbook X3 | |
| Lenovo IdeaPad Miix 320-10ICR Pro LTE | |
| HP x2 210 G2 | |
| Cinebench R20 / CPU (Single Core) | |
| Dell XPS 13 7390 2-in-1 Core i3 | |
| Dell Latitude 3400 | |
| LincPlus P1 | |
| Chuwi Hi10 X | |
| Average Intel Celeron N4100 (151 - 155, n=7) | |
| Jumper EZbook X3 | |
| Cinebench R20 / CPU (Multi Core) | |
| Dell XPS 13 7390 2-in-1 Core i3 | |
| Dell Latitude 3400 | |
| Average Intel Celeron N4100 (368 - 560, n=7) | |
| Chuwi Hi10 X | |
| LincPlus P1 | |
| Jumper EZbook X3 | |
| Lhmzniy A9 15.6 | |
| Blender / v2.79 BMW27 CPU | |
| Jumper EZbook X3 | |
| LincPlus P1 | |
| Chuwi Hi10 X | |
| Average Intel Celeron N4100 (2437 - 3527, n=7) | |
| Dell XPS 13 7390 2-in-1 Core i3 | |
| 7-Zip 18.03 / 7z b 4 -mmt1 | |
| Dell XPS 13 7390 2-in-1 Core i3 | |
| LincPlus P1 | |
| Average Intel Celeron N4100 (2125 - 2459, n=7) | |
| Chuwi Hi10 X | |
| Jumper EZbook X3 | |
| 7-Zip 18.03 / 7z b 4 | |
| Dell XPS 13 7390 2-in-1 Core i3 | |
| Average Intel Celeron N4100 (5620 - 7835, n=7) | |
| Chuwi Hi10 X | |
| LincPlus P1 | |
| Jumper EZbook X3 | |
| Geekbench 5.5 / Single-Core | |
| LincPlus P1 | |
| Lhmzniy A9 15.6 | |
| Chuwi Hi10 X | |
| Average Intel Celeron N4100 (378 - 414, n=7) | |
| Jumper EZbook X3 | |
| Geekbench 5.5 / Multi-Core | |
| Average Intel Celeron N4100 (1082 - 1419, n=7) | |
| Chuwi Hi10 X | |
| Lhmzniy A9 15.6 | |
| LincPlus P1 | |
| Jumper EZbook X3 | |
| HWBOT x265 Benchmark v2.2 / 4k Preset | |
| Dell XPS 13 7390 2-in-1 Core i3 | |
| Average Intel Celeron N4100 (0.974 - 1.5, n=6) | |
| Microsoft Surface Go MHN-00003 | |
| Chuwi Hi10 X | |
| LincPlus P1 | |
| Jumper EZbook X3 | |
| LibreOffice / 20 Documents To PDF | |
| Jumper EZbook X3 | |
| Average Intel Celeron N4100 (155 - 178, n=5) | |
| Chuwi Hi10 X | |
| LincPlus P1 | |
| R Benchmark 2.5 / Overall mean | |
| Jumper EZbook X3 | |
| Average Intel Celeron N4100 (1.75 - 1.786, n=5) | |
| Chuwi Hi10 X | |
| LincPlus P1 | |
* ... smaller is better
System Performance
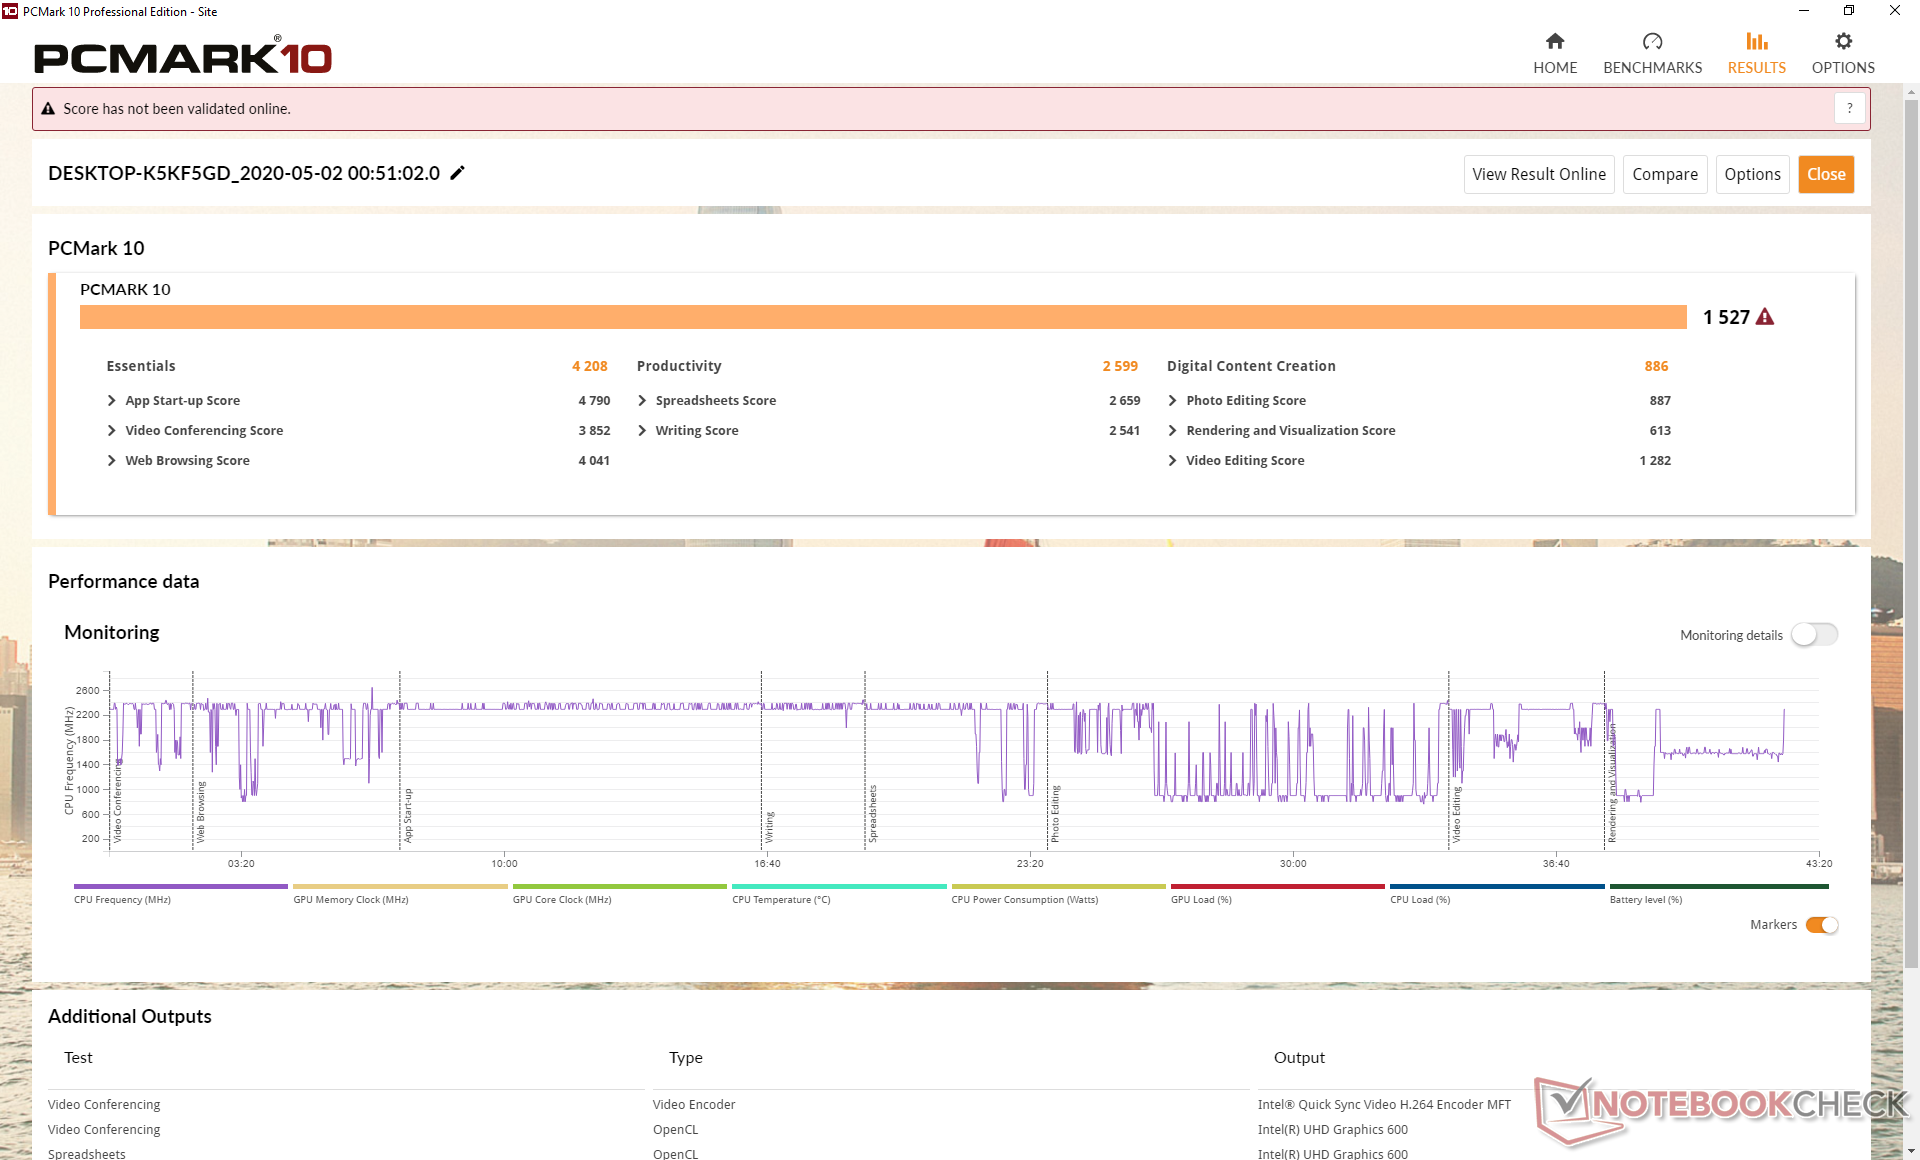
PCMark benchmarks are consistently below the average Intel Celeron N4100 PC in our database. System performance is so slow that Windows will often skip frames or have noticeable input delays that impact the user experience.
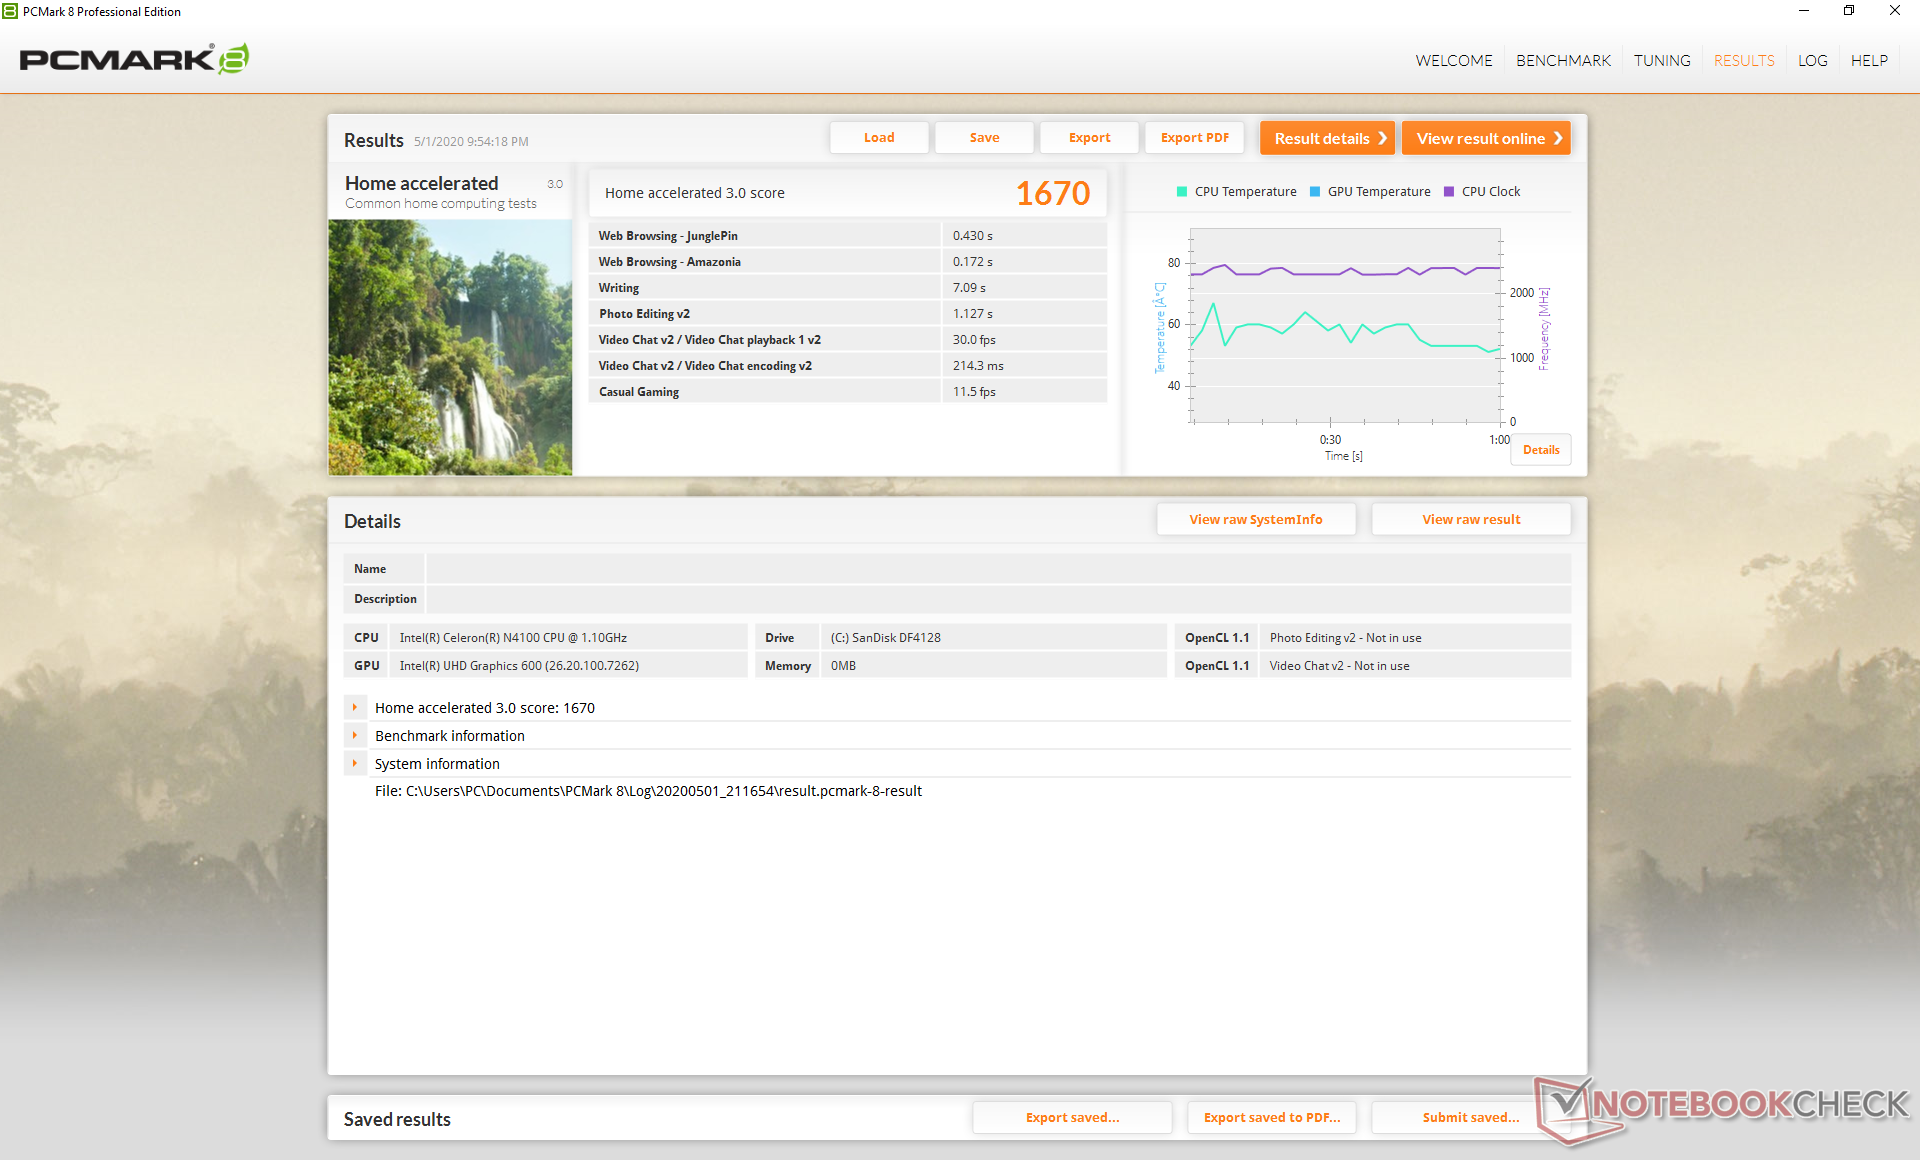

| PCMark 8 Home Score Accelerated v2 | 1670 points | |
| PCMark 8 Work Score Accelerated v2 | 2738 points | |
| PCMark 10 Score | 1527 points | |
Help | ||
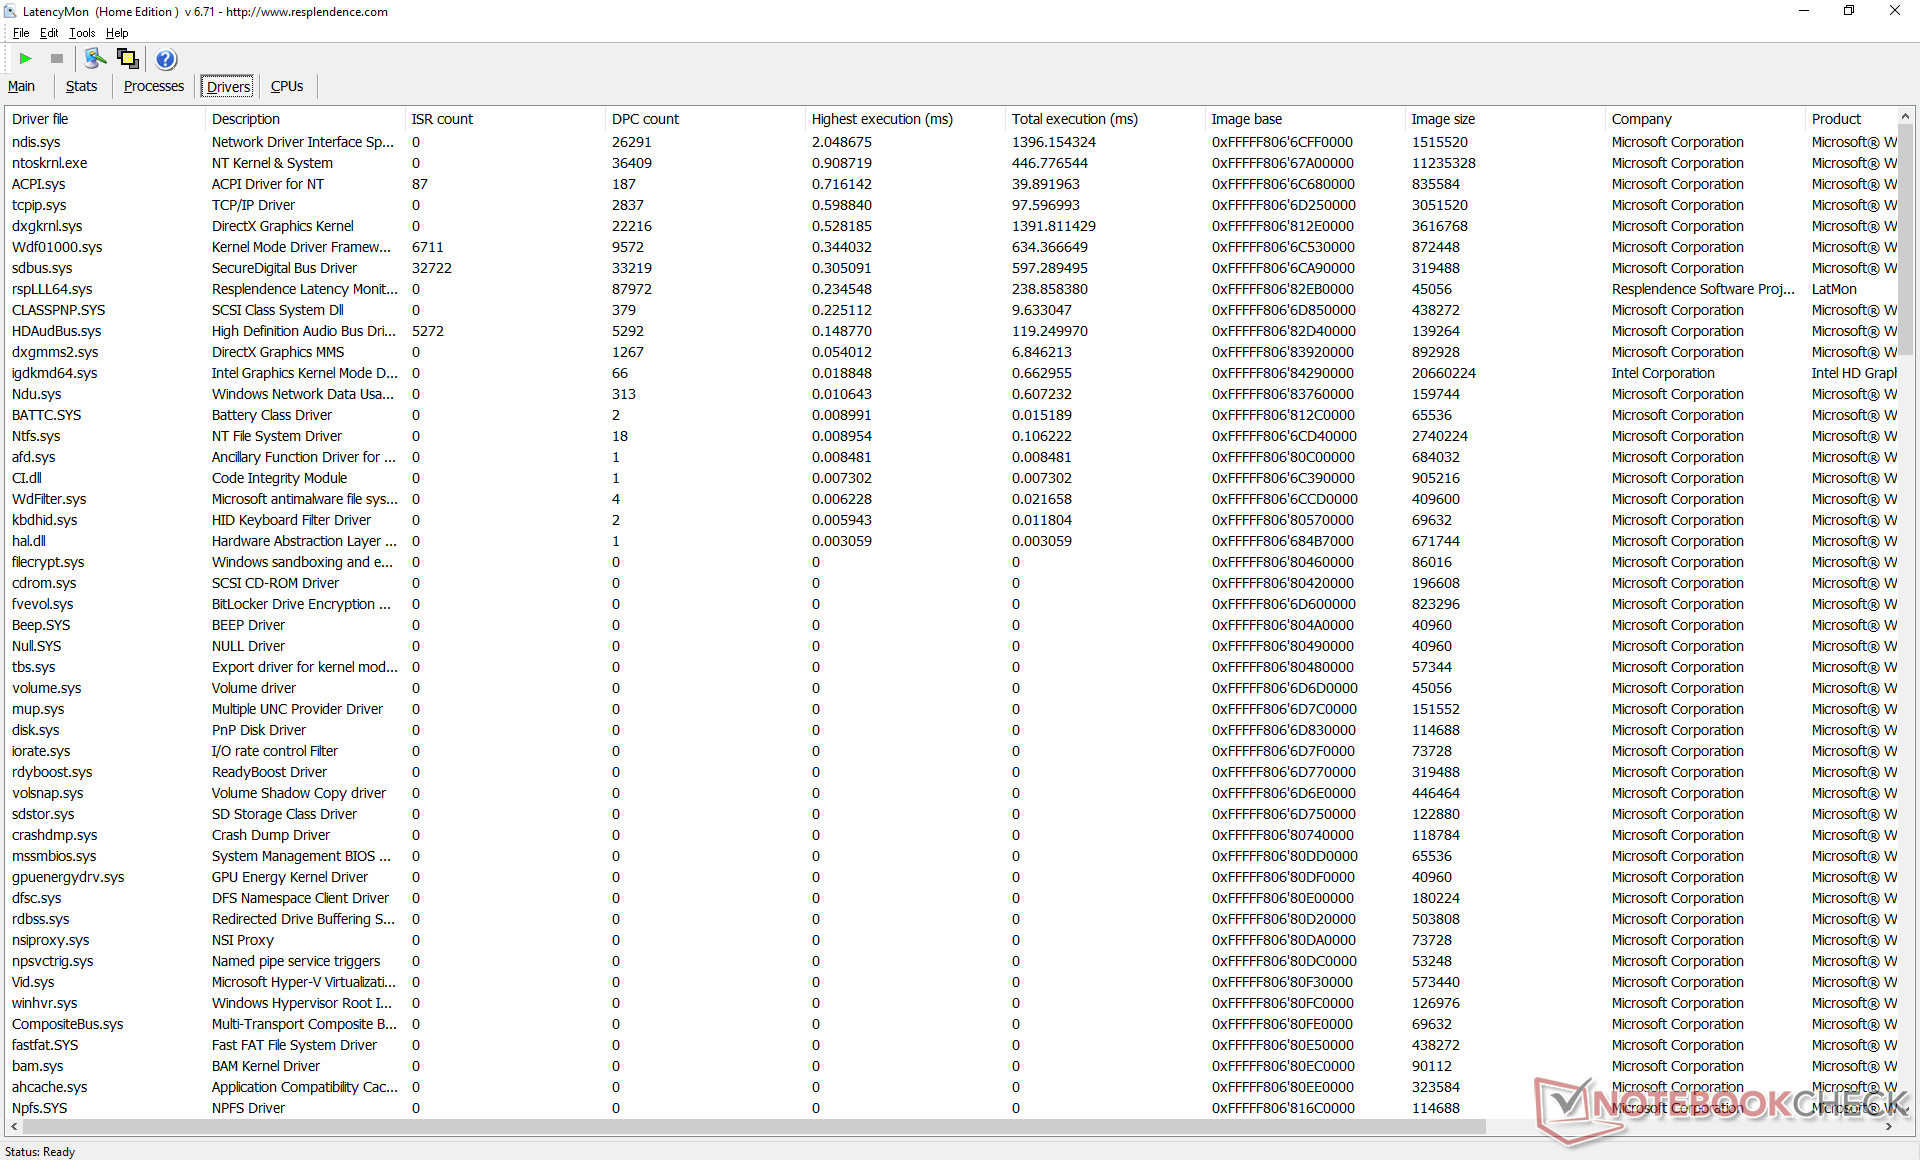
DPC Latency
LatencyMon shows DPC latency issues when opening multiple browser tabs and running Prime95 in sequence. You may want to avoid multi-tasking if using the tablet for real-time audio recording.

| DPC Latencies / LatencyMon - interrupt to process latency (max), Web, Youtube, Prime95 | |
| Chuwi Hi10 X | |
* ... smaller is better
Storage Devices
The integrated 128 GB SanDisk DF4128 SSD offers sequential read and write rates of about 250 MB/s and 120 MB/s, respectively, to be slower than most SATA III-based SSDs where 500 MB/s is the norm. Results are at least faster than on the Lenovo IdeaPad Miix 320 equipped with the same SanDisk SSD.
See our table of HDDs and SSDs for more benchmark comparisons.
| Chuwi Hi10 X SanDisk DF4128 | Microsoft Surface Go MHN-00003 64 GB eMMC Flash | Lenovo IdeaPad Miix 320-10ICR Pro LTE SanDisk DF4128 | HP x2 210 G2 64 GB eMMC Flash | Dell Venue 11 Pro 7140 Sandisk X110 M.2 SD6SP1M-128G | |
|---|---|---|---|---|---|
| AS SSD | 83% | -22% | 382% | ||
| Seq Read (MB/s) | 258.5 | 289.8 12% | 127.5 -51% | 405.4 57% | |
| Seq Write (MB/s) | 120.8 | 126.7 5% | 41.75 -65% | 134.7 12% | |
| 4K Read (MB/s) | 5.94 | 18.29 208% | 5.51 -7% | 19.3 225% | |
| 4K Write (MB/s) | 12.4 | 35.07 183% | 7.42 -40% | 33.22 168% | |
| 4K-64 Read (MB/s) | 25.96 | 40.27 55% | 28.99 12% | 242 832% | |
| 4K-64 Write (MB/s) | 10.16 | 44.48 338% | 12.91 27% | 152.5 1401% | |
| Access Time Read * (ms) | 0.597 | 0.151 75% | 0.454 24% | 0.16 73% | |
| Access Time Write * (ms) | 1.105 | 0.233 79% | 0.896 19% | 0.104 91% | |
| Score Read (Points) | 58 | 88 52% | 47 -19% | 302 421% | |
| Score Write (Points) | 35 | 92 163% | 28 -20% | 199 469% | |
| Score Total (Points) | 117 | 225 92% | 94 -20% | 648 454% | |
| Copy ISO MB/s (MB/s) | 130.2 | 99.1 -24% | 57.2 -56% | ||
| Copy Program MB/s (MB/s) | 88.3 | 44.34 -50% | 36.15 -59% | ||
| Copy Game MB/s (MB/s) | 103.8 | 76.5 -26% | 51.4 -50% | ||
| CrystalDiskMark 5.2 / 6 | 77% | 17% | |||
| Write 4K (MB/s) | 12.85 | 26.91 109% | 18.11 41% | ||
| Read 4K (MB/s) | 10.02 | 19.72 97% | 15.77 57% | ||
| Write Seq (MB/s) | 120.8 | 126.2 4% | 62.5 -48% | ||
| Read Seq (MB/s) | 259.7 | 268 3% | 121.8 -53% | ||
| Write 4K Q32T1 (MB/s) | 15.17 | 62.9 315% | 31.72 109% | ||
| Read 4K Q32T1 (MB/s) | 33.09 | 39.82 20% | 48.64 47% | ||
| Write Seq Q32T1 (MB/s) | 108.8 | 131.3 21% | 95.6 -12% | ||
| Read Seq Q32T1 (MB/s) | 180.1 | 259.3 44% | 166.5 -8% | ||
| Total Average (Program / Settings) | 80% /
81% | -22% /
-22% | 17% /
17% | 382% /
382% |
* ... smaller is better

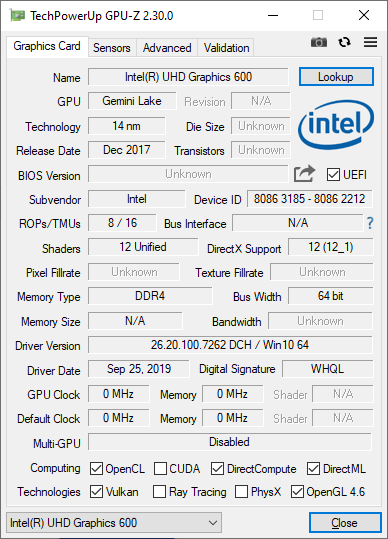
GPU Performance
The integrated UHD Graphics 600 is unfit for gaming as one would expect. Performance is about 60 percent slower than the already slow UHD Graphics 620 as found on most Core ix CPUs. Thankfully, the tablet can still handle 4K playback on YouTube without any dropped frames.
See our dedicated page on the UHD Graphics 600 for more technical information and benchmark comparisons.


| 3DMark 11 | |
| 1280x720 Performance GPU | |
| Dell XPS 13 7390 2-in-1 Core i3 | |
| Dell Latitude 3400 | |
| Microsoft Surface Go MHN-00003 | |
| Dell Venue 11 Pro 7140 | |
| Acer TravelMate Spin B1 B118-G2-RN-P7ED | |
| Average Intel UHD Graphics 600 (410 - 854, n=27) | |
| Chuwi Hi10 X | |
| HP x2 210 G2 | |
| Lenovo IdeaPad Miix 320-10ICR Pro LTE | |
| 1280x720 Performance Combined | |
| Dell XPS 13 7390 2-in-1 Core i3 | |
| Dell Latitude 3400 | |
| Microsoft Surface Go MHN-00003 | |
| Dell Venue 11 Pro 7140 | |
| Acer TravelMate Spin B1 B118-G2-RN-P7ED | |
| Average Intel UHD Graphics 600 (362 - 983, n=27) | |
| HP x2 210 G2 | |
| Chuwi Hi10 X | |
| Lenovo IdeaPad Miix 320-10ICR Pro LTE | |
| 3DMark | |
| 1280x720 Cloud Gate Standard Graphics | |
| Dell XPS 13 7390 2-in-1 Core i3 | |
| Dell Latitude 3400 | |
| Microsoft Surface Go MHN-00003 | |
| Dell Venue 11 Pro 7140 | |
| Acer TravelMate Spin B1 B118-G2-RN-P7ED | |
| Average Intel UHD Graphics 600 (2346 - 4958, n=20) | |
| Chuwi Hi10 X | |
| HP x2 210 G2 | |
| 1920x1080 Fire Strike Graphics | |
| Dell XPS 13 7390 2-in-1 Core i3 | |
| Dell Latitude 3400 | |
| Microsoft Surface Go MHN-00003 | |
| Dell Venue 11 Pro 7140 | |
| Acer TravelMate Spin B1 B118-G2-RN-P7ED | |
| Average Intel UHD Graphics 600 (307 - 637, n=21) | |
| LincPlus P1 | |
| Jumper EZbook X3 | |
| Chuwi Hi10 X | |
| HP x2 210 G2 | |
| 1920x1080 Ice Storm Extreme Graphics | |
| Dell XPS 13 7390 2-in-1 Core i3 | |
| Microsoft Surface Go MHN-00003 | |
| Dell Latitude 3400 | |
| Average Intel UHD Graphics 600 (8277 - 19919, n=12) | |
| 2560x1440 Time Spy Graphics | |
| Dell Latitude 3400 | |
| Average Intel UHD Graphics 600 (85 - 124, n=12) | |
| Chuwi Hi10 X | |
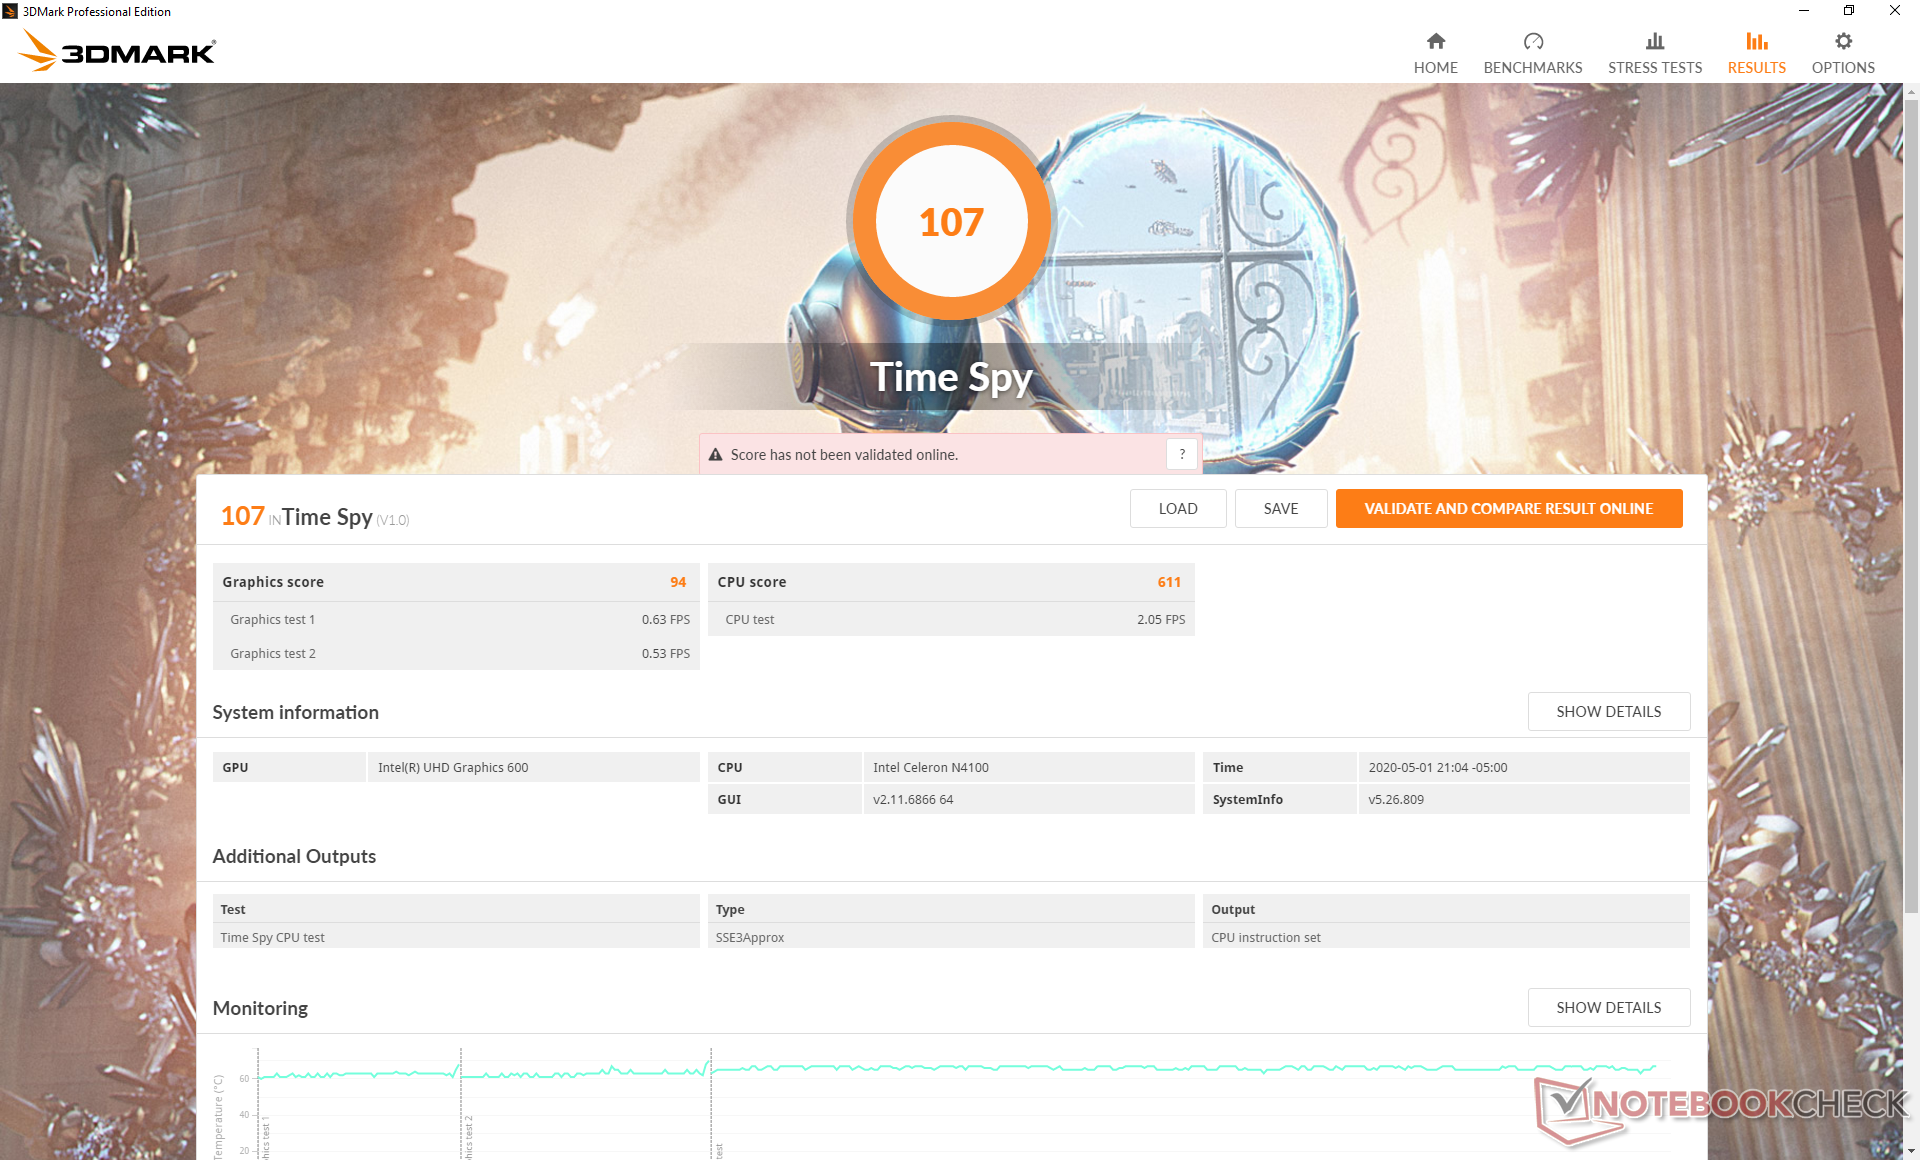
| 3DMark 11 Performance | 519 points | |
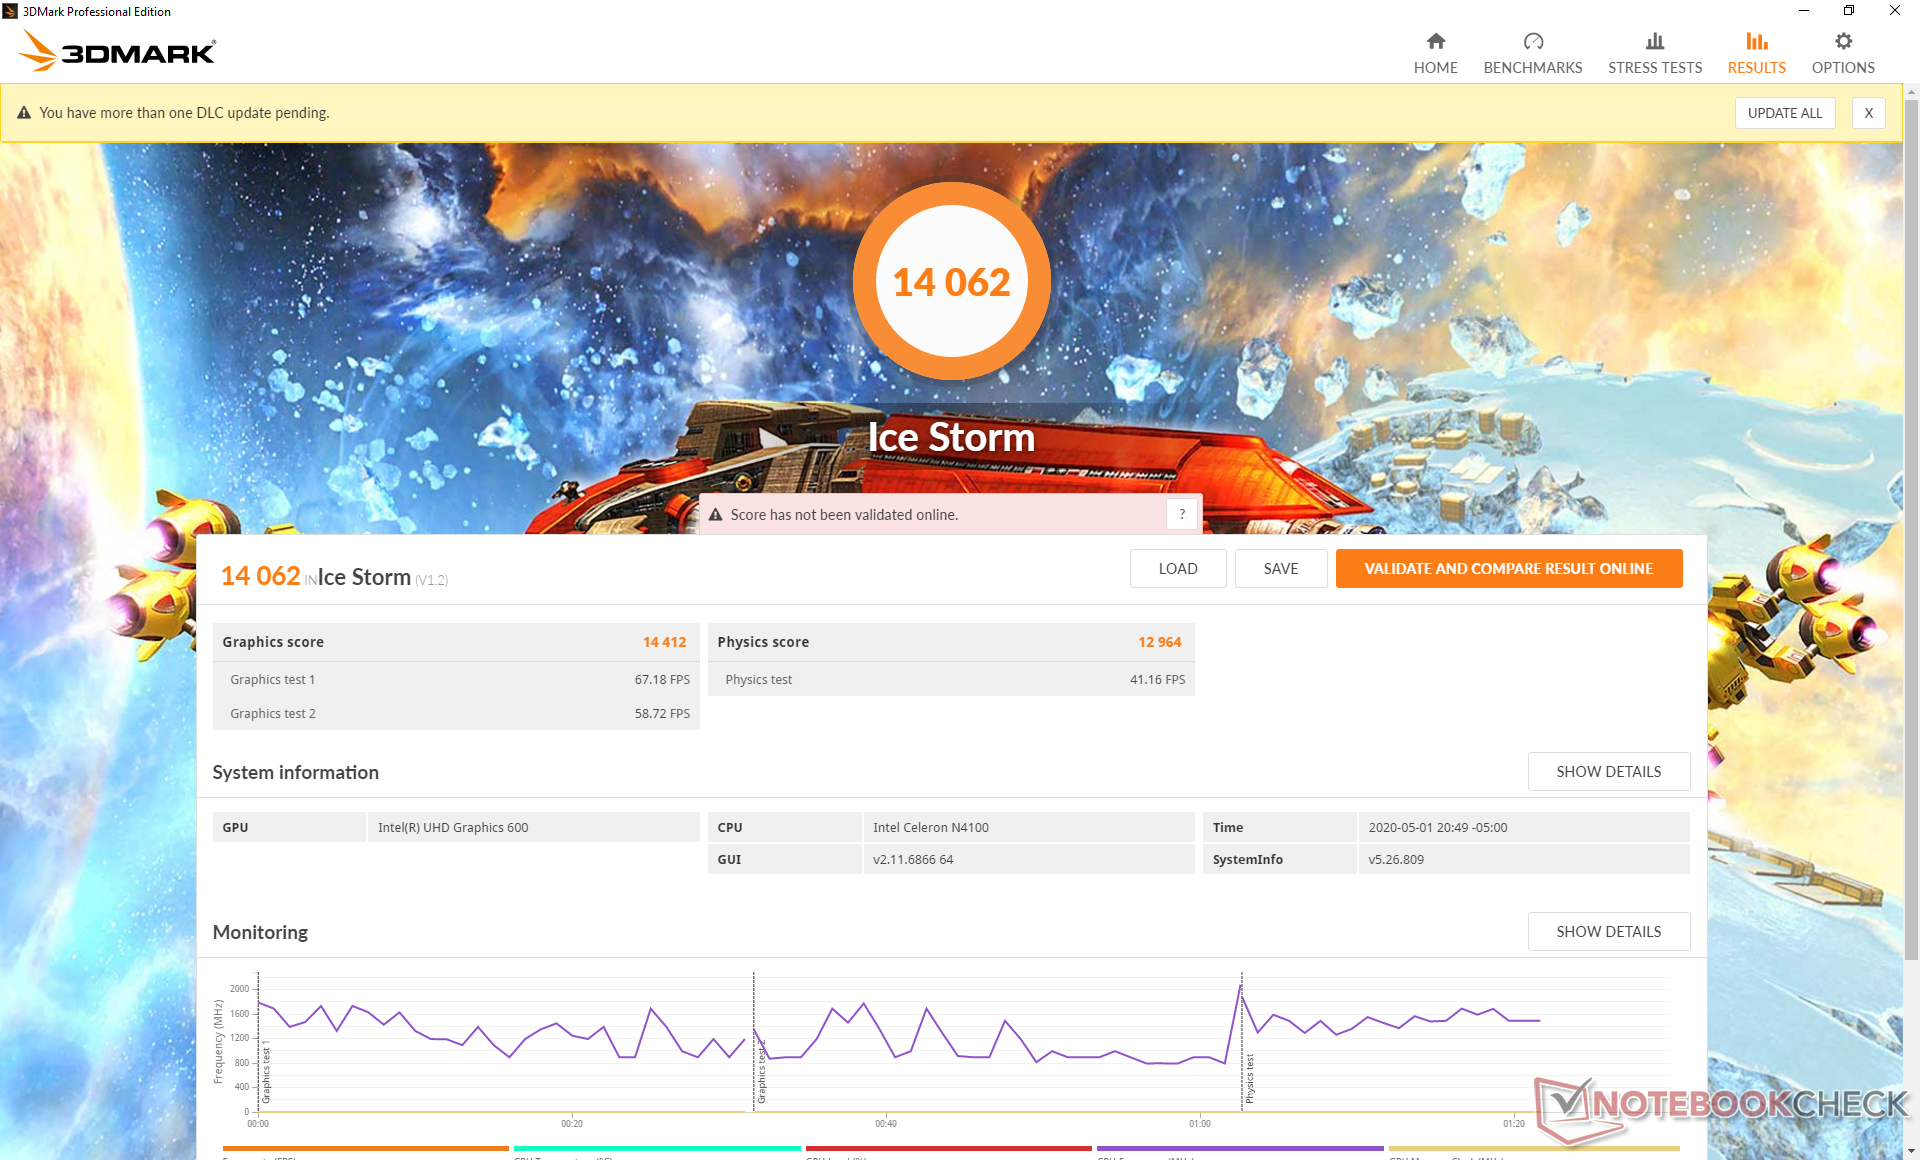
| 3DMark Ice Storm Standard Score | 14062 points | |
| 3DMark Cloud Gate Standard Score | 2346 points | |
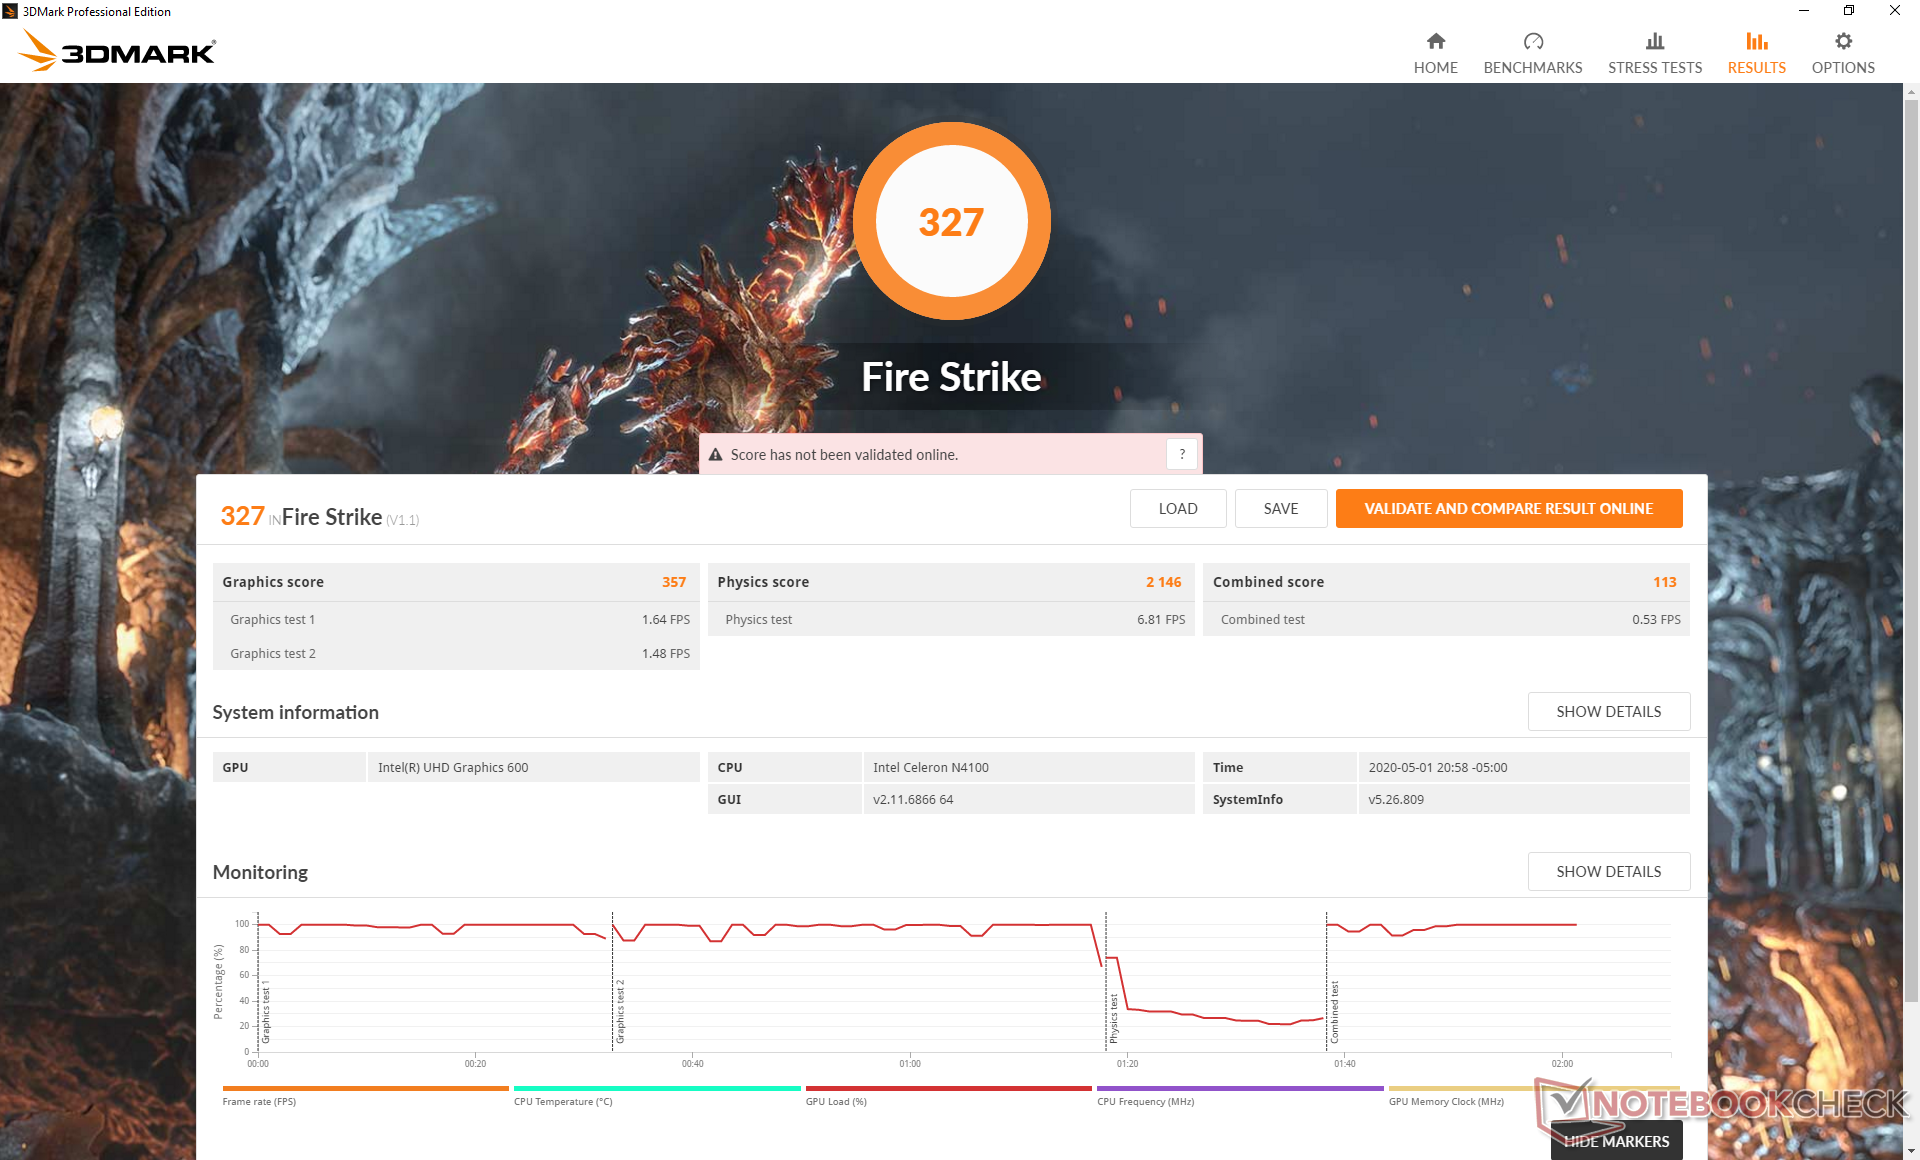
| 3DMark Fire Strike Score | 327 points | |
| 3DMark Time Spy Score | 107 points | |
Help | ||
| low | med. | high | ultra | |
|---|---|---|---|---|
| Dota 2 Reborn (2015) | 19.1 | 12.4 | 5.9 | 5.7 |
| X-Plane 11.11 (2018) | 3.94 | 3.48 | 3.18 |
Emissions
Temperature
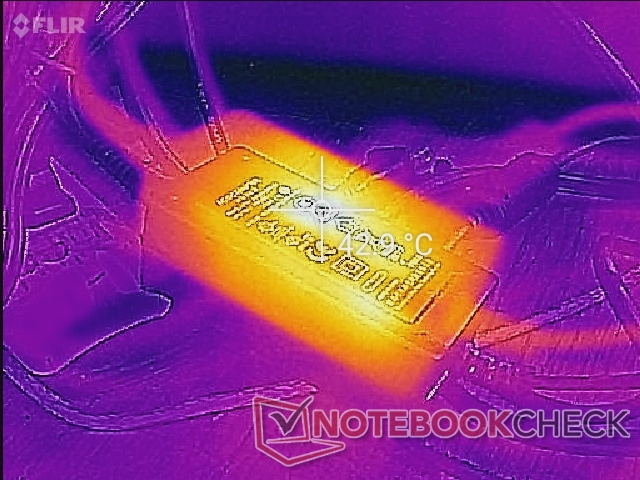
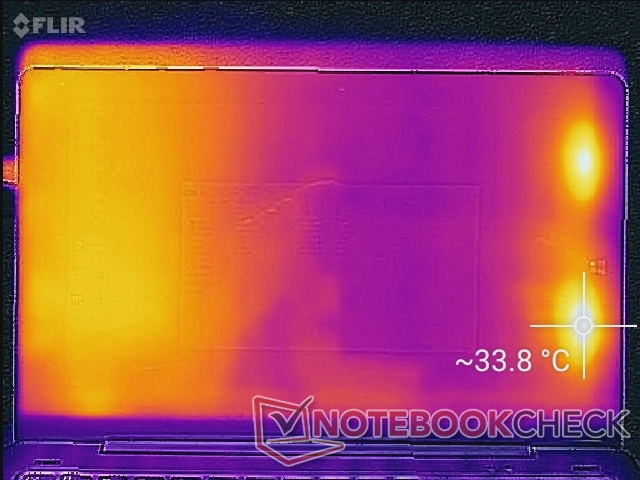
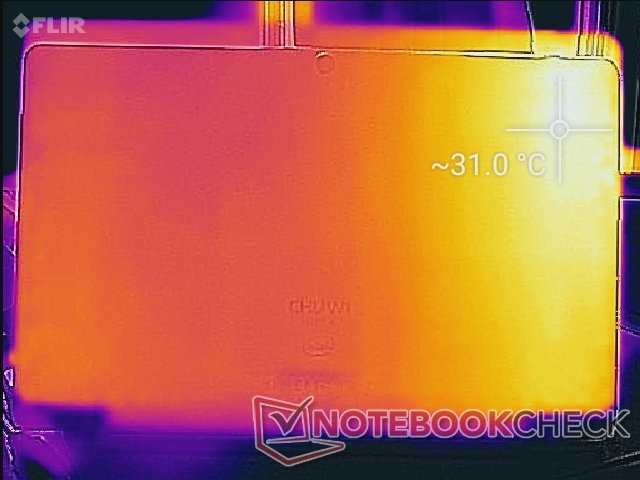
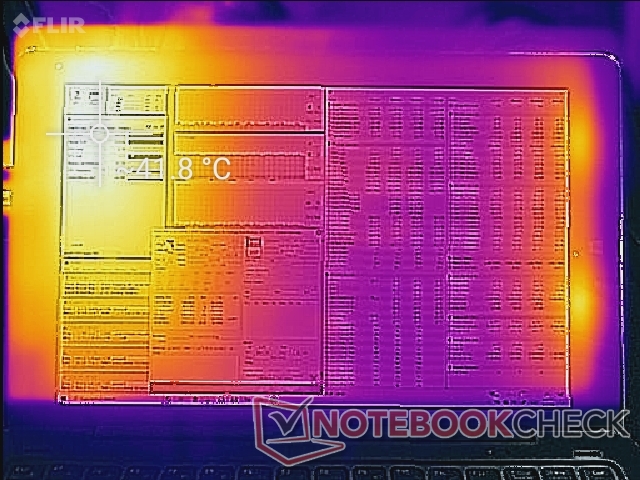
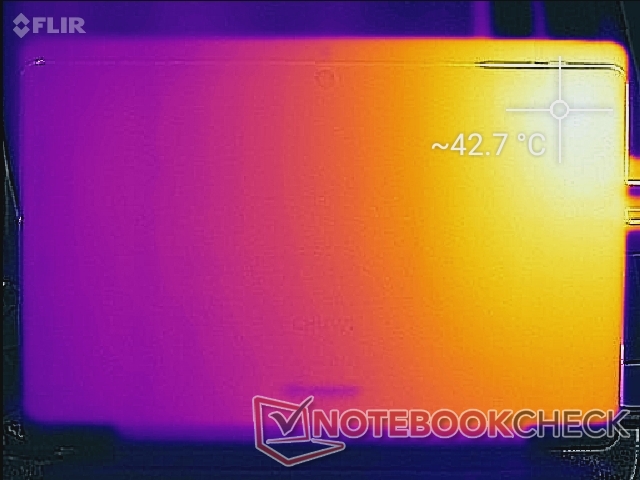
Surface temperatures are generally warmer on the left half of the tablet than the right half since the motherboard is positioned on this side of the device. At worst, the corner hot spot can become as warm as 43 C as shown by the temperature maps below compared to 47 C on the Surface Go.
(±) The maximum temperature on the upper side is 41.8 °C / 107 F, compared to the average of 35.4 °C / 96 F, ranging from 19.6 to 60 °C for the class Convertible.
(±) The bottom heats up to a maximum of 42.8 °C / 109 F, compared to the average of 36.9 °C / 98 F
(+) In idle usage, the average temperature for the upper side is 28.6 °C / 83 F, compared to the device average of 30.3 °C / 87 F.
(±) The palmrests and touchpad can get very hot to the touch with a maximum of 39 °C / 102.2 F.
(-) The average temperature of the palmrest area of similar devices was 28 °C / 82.4 F (-11 °C / -19.8 F).
Stress Test
Running Prime95 causes CPU clock rates to boost to 1.8 GHz for about a second or two before stabilizing at 1.5 GHz. After about a minute, however, clock rates would begin fluctuating between 0.9 GHz and 1.5 GHz as shown by the screenshot below. This cycling behavior mirrors our power consumption observations. Core temperature remains steady at about 65 C when under such extreme loads.
Running on battery power will impact performance slightly. A 3DMark 11 test on battery power returns Physics and Graphics scores of 1918 and 408 points, respectively, compared to 2009 and 477 points when on mains.
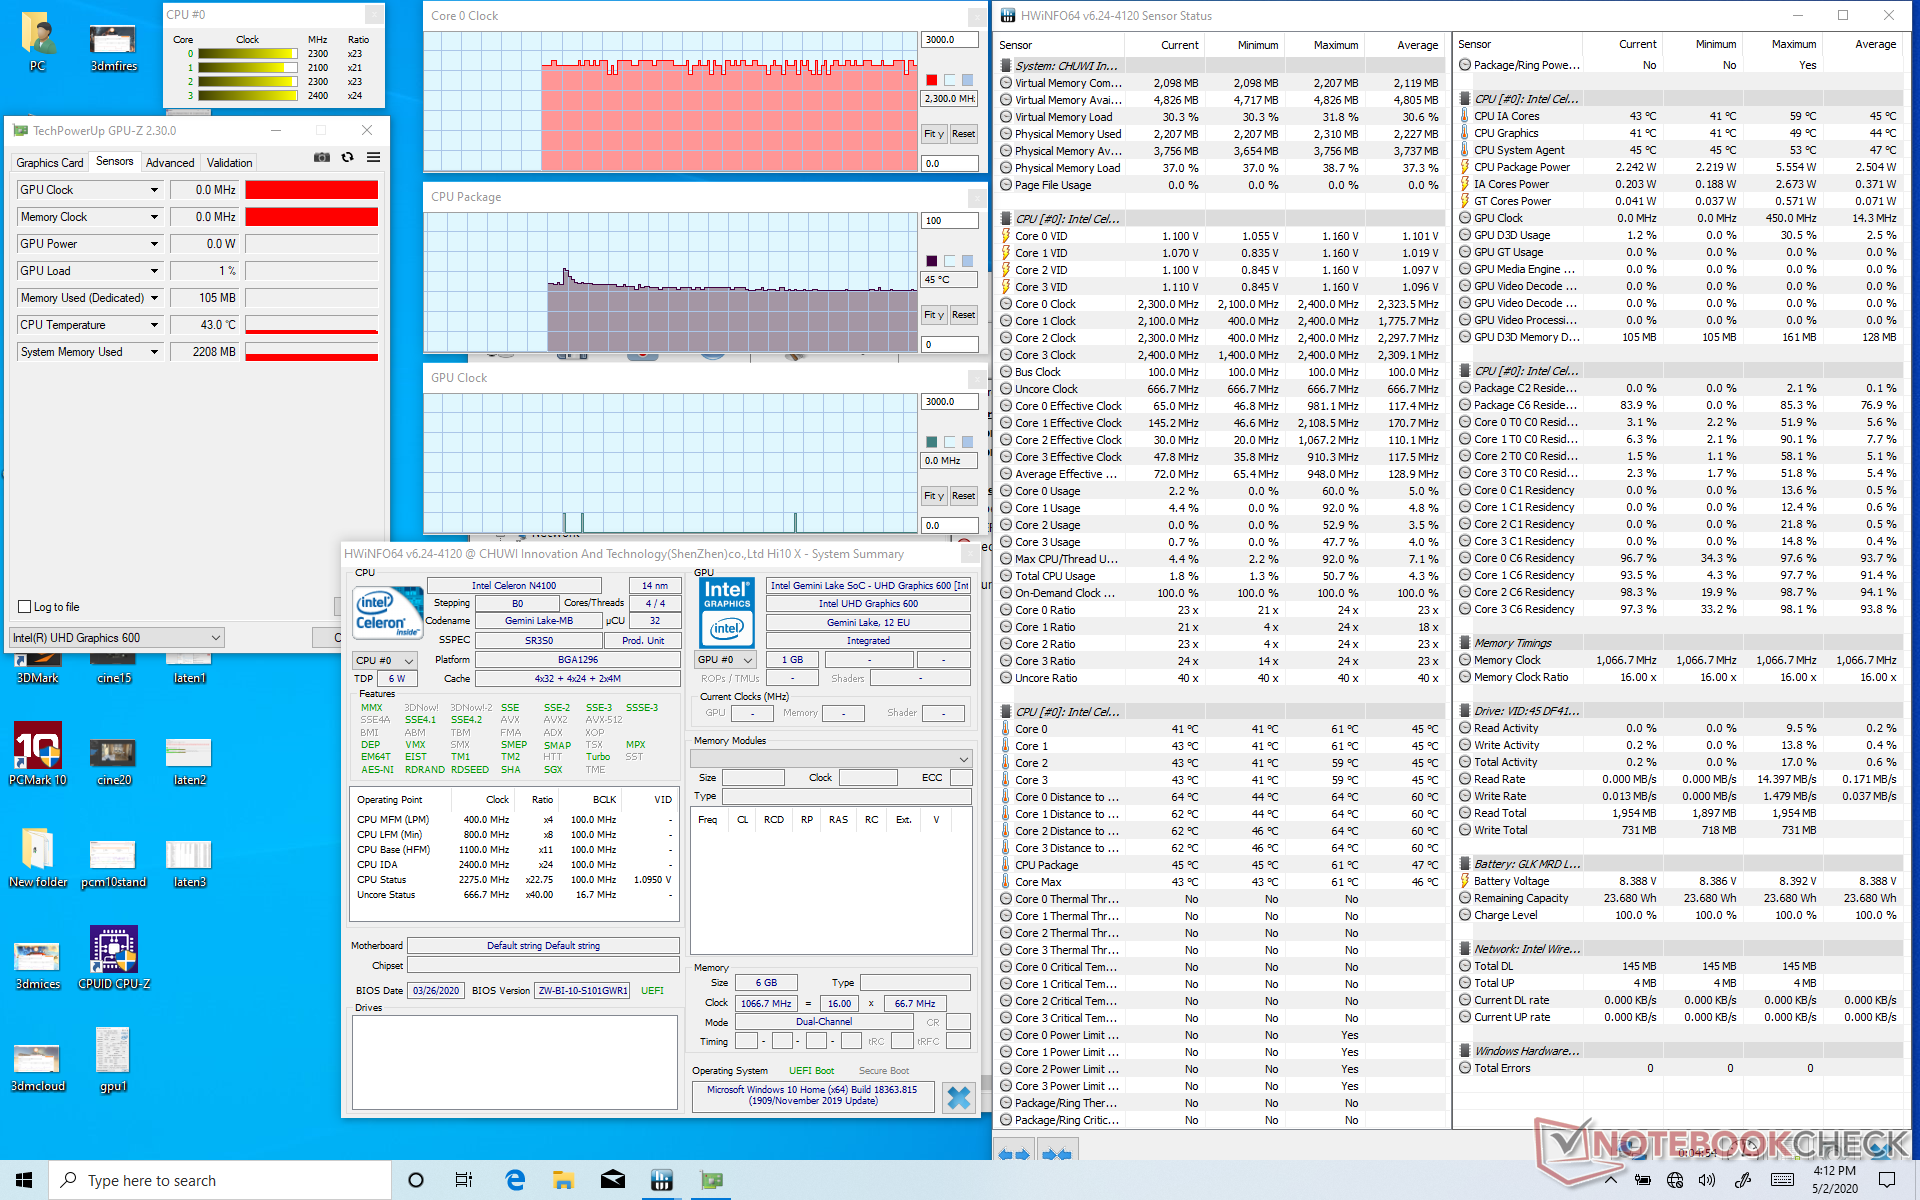
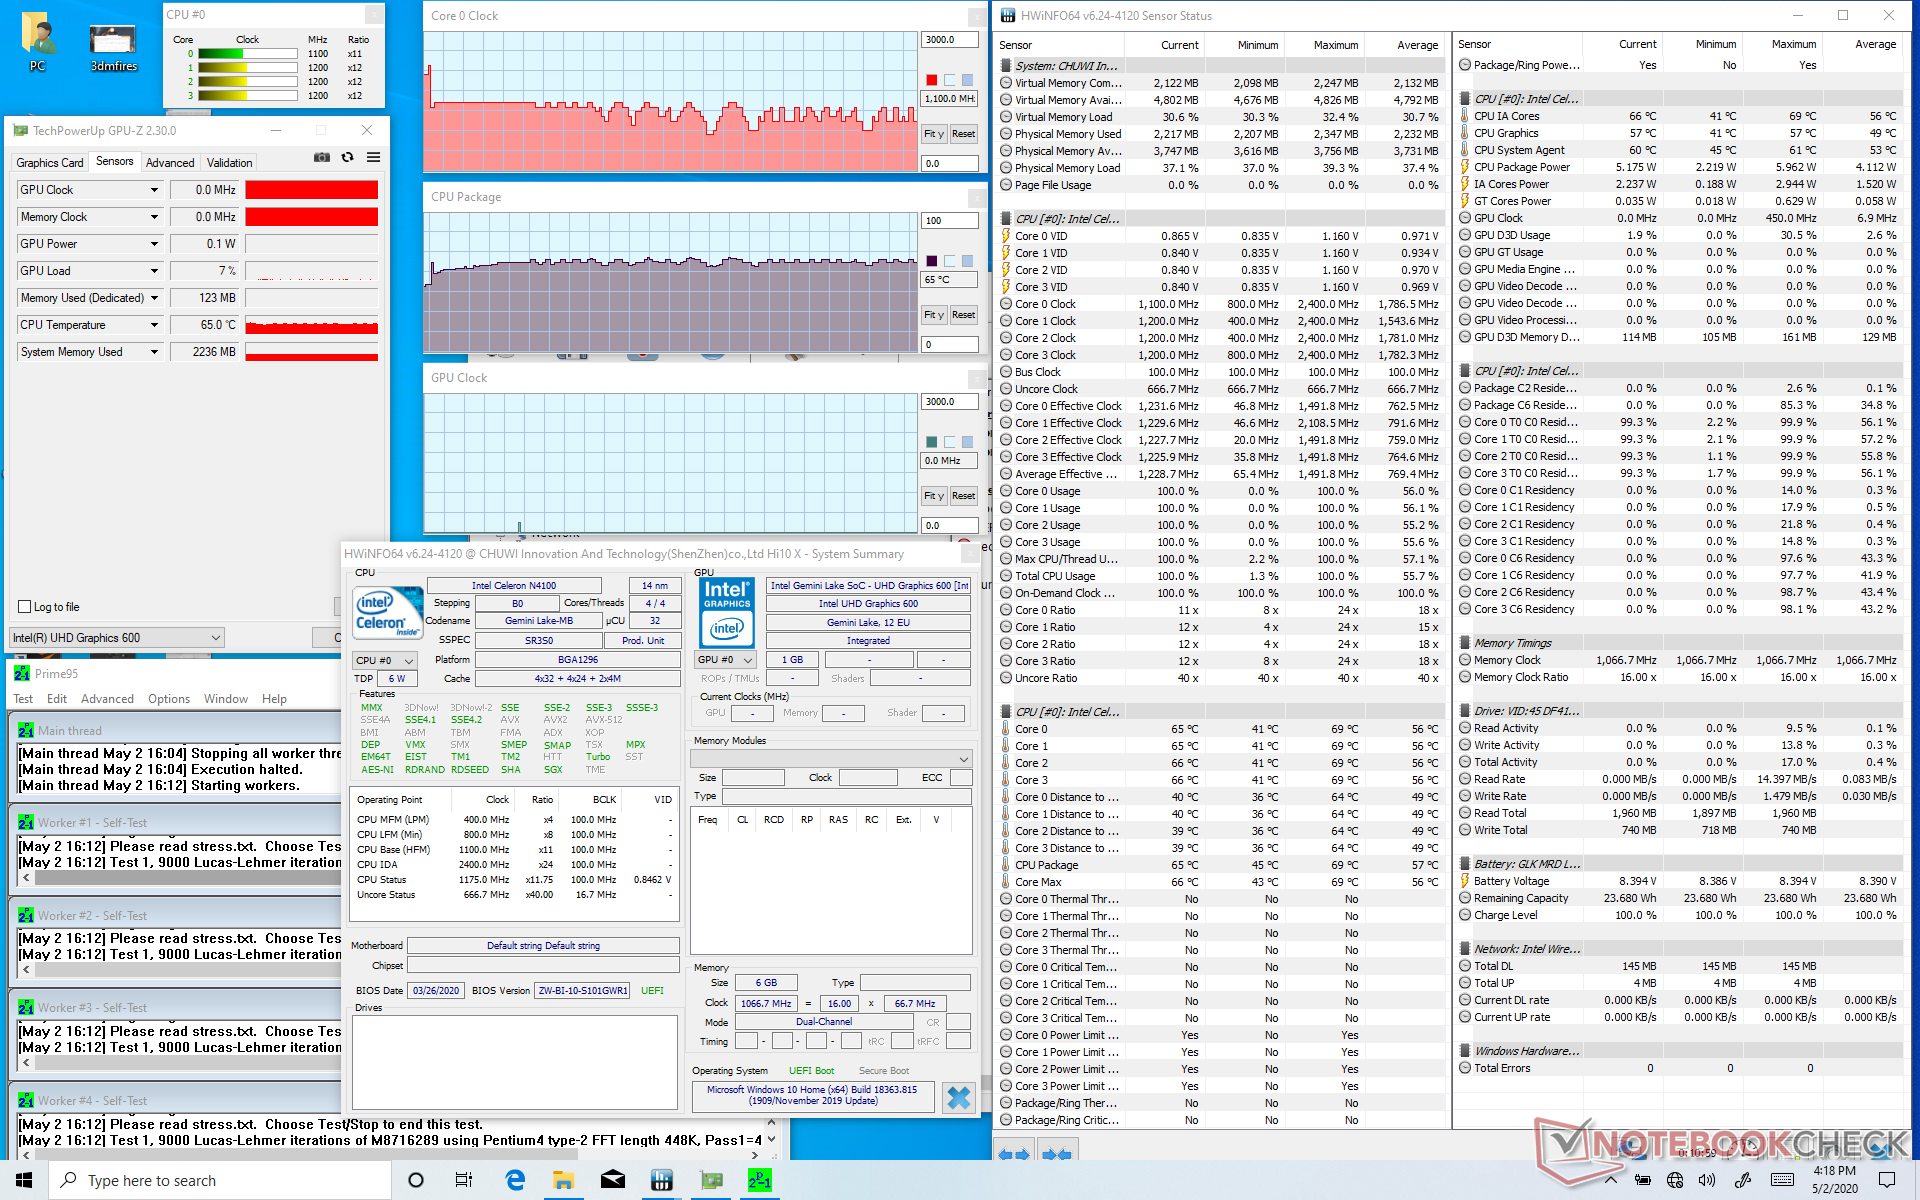
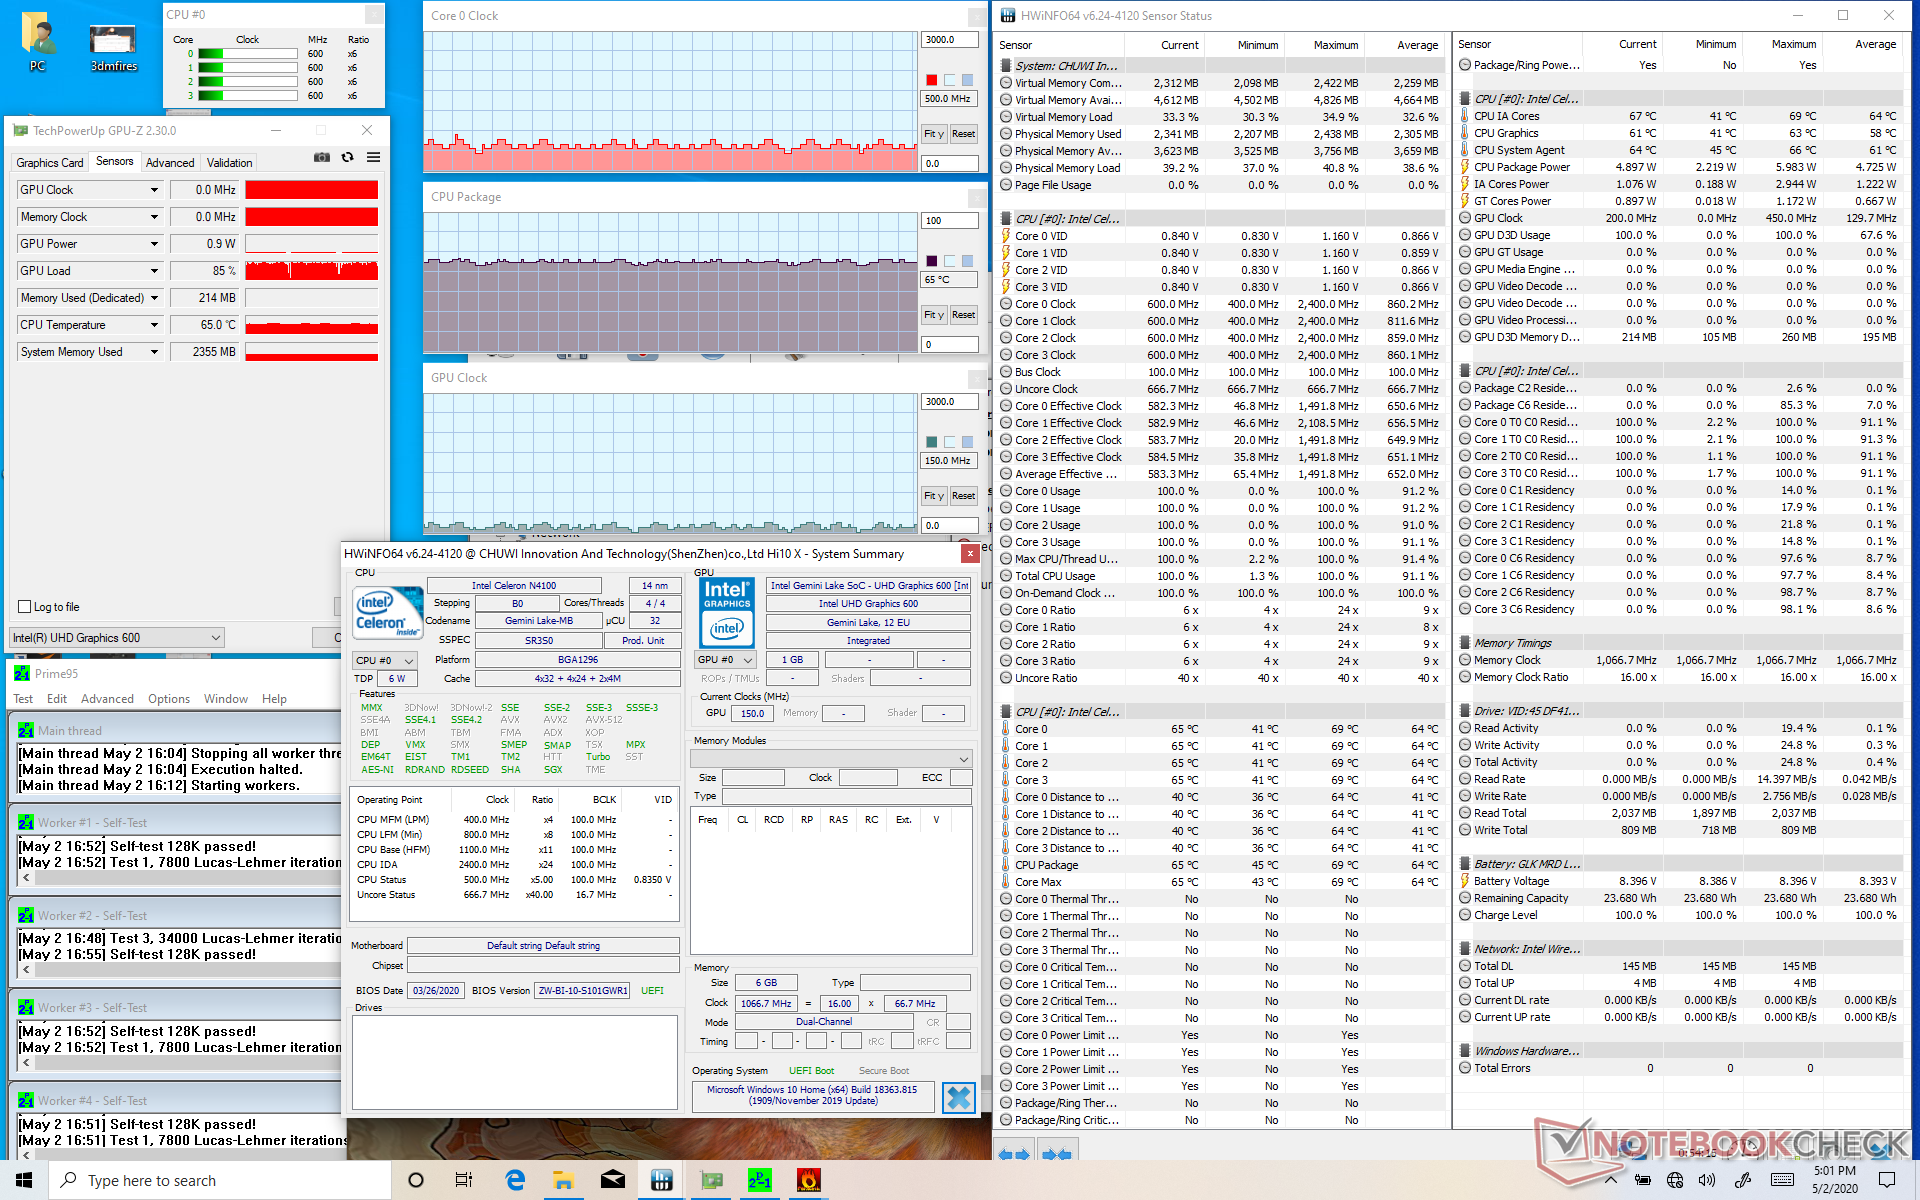
| CPU Clock (GHz) | GPU Clock (MHz) | Average CPU Temperature (°C) | |
| System Idle | -- | -- | 45 |
| Prime95 Stress | 0.9 - 1.5 | -- | ~65 |
| Prime95 + FurMark Stress | 0.4 - 0.6 | -- | ~65 |
Speakers


Chuwi Hi10 X audio analysis
(-) | not very loud speakers (71 dB)
Bass 100 - 315 Hz
(±) | reduced bass - on average 14.4% lower than median
(+) | bass is linear (5.2% delta to prev. frequency)
Mids 400 - 2000 Hz
(±) | higher mids - on average 6.2% higher than median
(±) | linearity of mids is average (14.8% delta to prev. frequency)
Highs 2 - 16 kHz
(±) | higher highs - on average 7.3% higher than median
(-) | highs are not linear (21.2% delta to prev. frequency)
Overall 100 - 16.000 Hz
(-) | overall sound is not linear (44.6% difference to median)
Compared to same class
» 99% of all tested devices in this class were better, 0% similar, 1% worse
» The best had a delta of 6%, average was 20%, worst was 57%
Compared to all devices tested
» 96% of all tested devices were better, 0% similar, 4% worse
» The best had a delta of 4%, average was 23%, worst was 134%
Apple MacBook 12 (Early 2016) 1.1 GHz audio analysis
(+) | speakers can play relatively loud (83.6 dB)
Bass 100 - 315 Hz
(±) | reduced bass - on average 11.3% lower than median
(±) | linearity of bass is average (14.2% delta to prev. frequency)
Mids 400 - 2000 Hz
(+) | balanced mids - only 2.4% away from median
(+) | mids are linear (5.5% delta to prev. frequency)
Highs 2 - 16 kHz
(+) | balanced highs - only 2% away from median
(+) | highs are linear (4.5% delta to prev. frequency)
Overall 100 - 16.000 Hz
(+) | overall sound is linear (10.2% difference to median)
Compared to same class
» 7% of all tested devices in this class were better, 2% similar, 90% worse
» The best had a delta of 5%, average was 18%, worst was 53%
Compared to all devices tested
» 5% of all tested devices were better, 1% similar, 94% worse
» The best had a delta of 4%, average was 23%, worst was 134%
Energy Management
Power Consumption
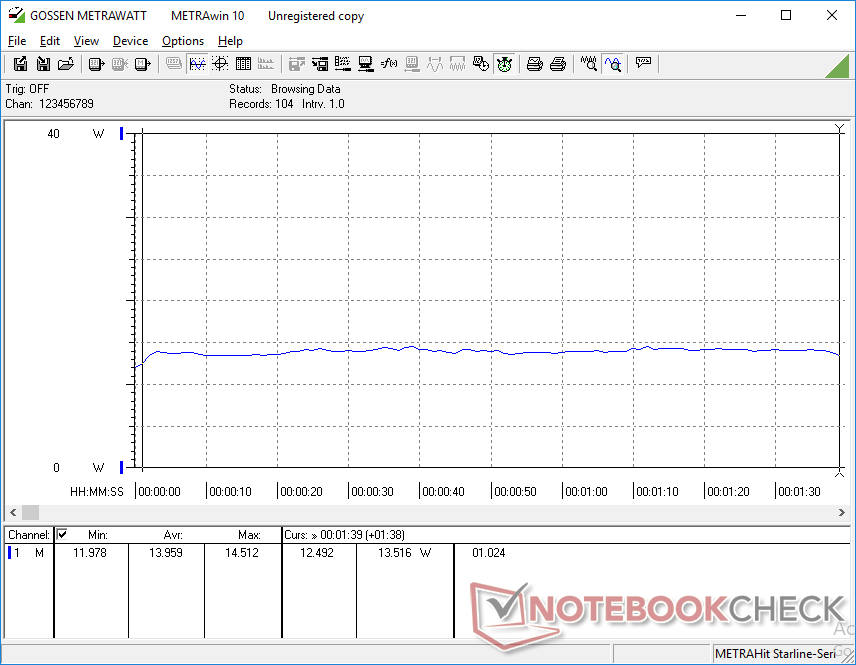
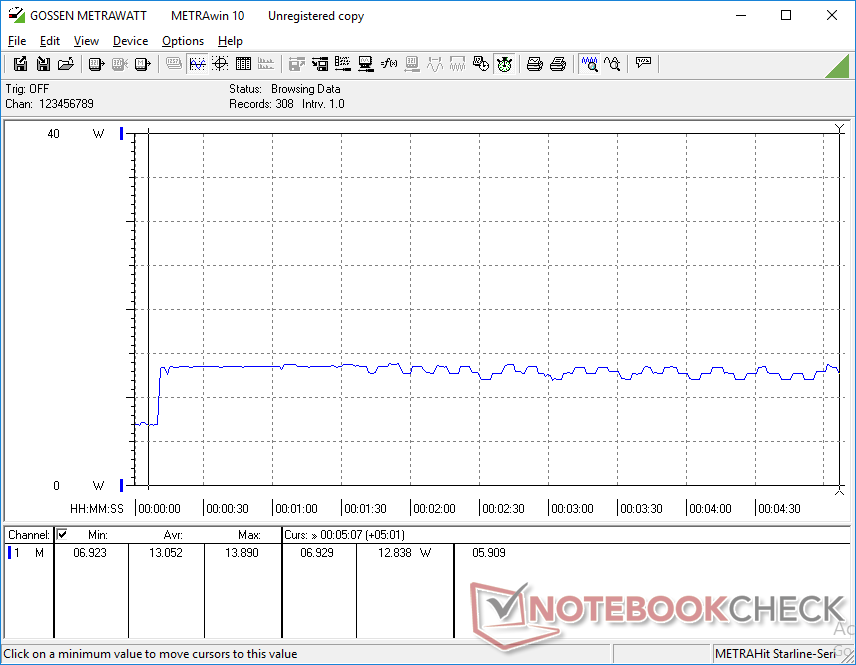
Idling on desktop consumes between 3 W and 7 W depending on the brightness setting and power profile. The difference between minimum brightness and maximum brightness is about 2.6 W.
Running 3DMark 06 demands an average of 14 W to be a couple watts higher than some Atom-based tablets like the Lenovo IdeaPad Miix 320 or HP x2. We're able to record a maximum consumption of 14.5 W from the small (~9 x 4.3 x 3 cm) 24 W AC adapter.
| Off / Standby | |
| Idle | |
| Load |
|
Key:
min: | |
| Chuwi Hi10 X Celeron N4100, UHD Graphics 600, SanDisk DF4128, IPS, 1920x1200, 10.1" | Microsoft Surface Go MHN-00003 Pentium 4415Y, UHD Graphics 615, 64 GB eMMC Flash, IPS, 1800x1200, 10" | Lenovo IdeaPad Miix 320-10ICR Pro LTE Z8350, HD Graphics 400 (Braswell), SanDisk DF4128, IPS, 1920x1200, 10.1" | HP x2 210 G2 Z8350, HD Graphics 400 (Braswell), 64 GB eMMC Flash, IPS, 1280x800, 10.1" | Dell Venue 11 Pro 7140 5Y10a, HD Graphics 5300, Sandisk X110 M.2 SD6SP1M-128G, IPS, 1920x1080, 10.8" | |
|---|---|---|---|---|---|
| Power Consumption | -10% | 17% | 24% | -1% | |
| Idle Minimum * (Watt) | 3.7 | 2.88 22% | 3 19% | 2.9 22% | 2 46% |
| Idle Average * (Watt) | 6.3 | 4.8 24% | 5.3 16% | 4.8 24% | 5.9 6% |
| Idle Maximum * (Watt) | 6.7 | 7.5 -12% | 6.4 4% | 5.2 22% | 6.2 7% |
| Load Average * (Watt) | 14 | 16.9 -21% | 10.9 22% | 10.4 26% | 19.1 -36% |
| Load Maximum * (Watt) | 14.5 | 23.8 -64% | 11 24% | 10.9 25% | 18.2 -26% |
* ... smaller is better
Battery Life

The small 24 Wh battery provides about 5.5 hours of real-world WLAN use. Recharging from empty to full capacity takes about two hours. Keep in mind that charging must be done via a specific USB Type-C port even though there are two ports available.
| Chuwi Hi10 X Celeron N4100, UHD Graphics 600, 24 Wh | Microsoft Surface Go MHN-00003 Pentium 4415Y, UHD Graphics 615, 28 Wh | Lenovo IdeaPad Miix 320-10ICR Pro LTE Z8350, HD Graphics 400 (Braswell), 33.3 Wh | HP x2 210 G2 Z8350, HD Graphics 400 (Braswell), 32.5 Wh | Dell Venue 11 Pro 7140 5Y10a, HD Graphics 5300, 38 Wh | Lenovo Yoga Smart Tab YT-X705F SD 439, Adreno 505, 27 Wh | |
|---|---|---|---|---|---|---|
| Battery runtime | 34% | 38% | 64% | 138% | ||
| WiFi v1.3 (h) | 5.6 | 7.5 34% | 7.7 38% | 9.2 64% | 13.3 138% | |
| Reader / Idle (h) | 12.9 | 13 | 34.7 | |||
| Load (h) | 3 | 4.1 | 4.8 | |||
| WiFi (h) | 9.4 |
Pros
Cons
Verdict

There are a small handful of redeeming qualities about the Chuwi Hi10 X. The strong chassis and keyboard base leave solid first impressions considering the low asking price and the number of integrated port options is commendable. Unfortunately, these don't make up for the unreliable clickpad, teetering hinges, dim display, or laggy Windows experience. Trying to use the tablet outdoors or even indoors without a dedicated mouse can be frustrating. This is more of a backup Windows tablet or a tablet for some light browsing and video streaming as anything heavier will slow it to a crawl.
A decent Windows tablet for low processing loads or even as an HTPC solely for video streaming purposes. Otherwise, the clickpad is unreliable and the display is too tim for outdoor conditions.
Chuwi Hi10 X
- 05/05/2020 v7 (old)
Allen Ngo
Price comparison
