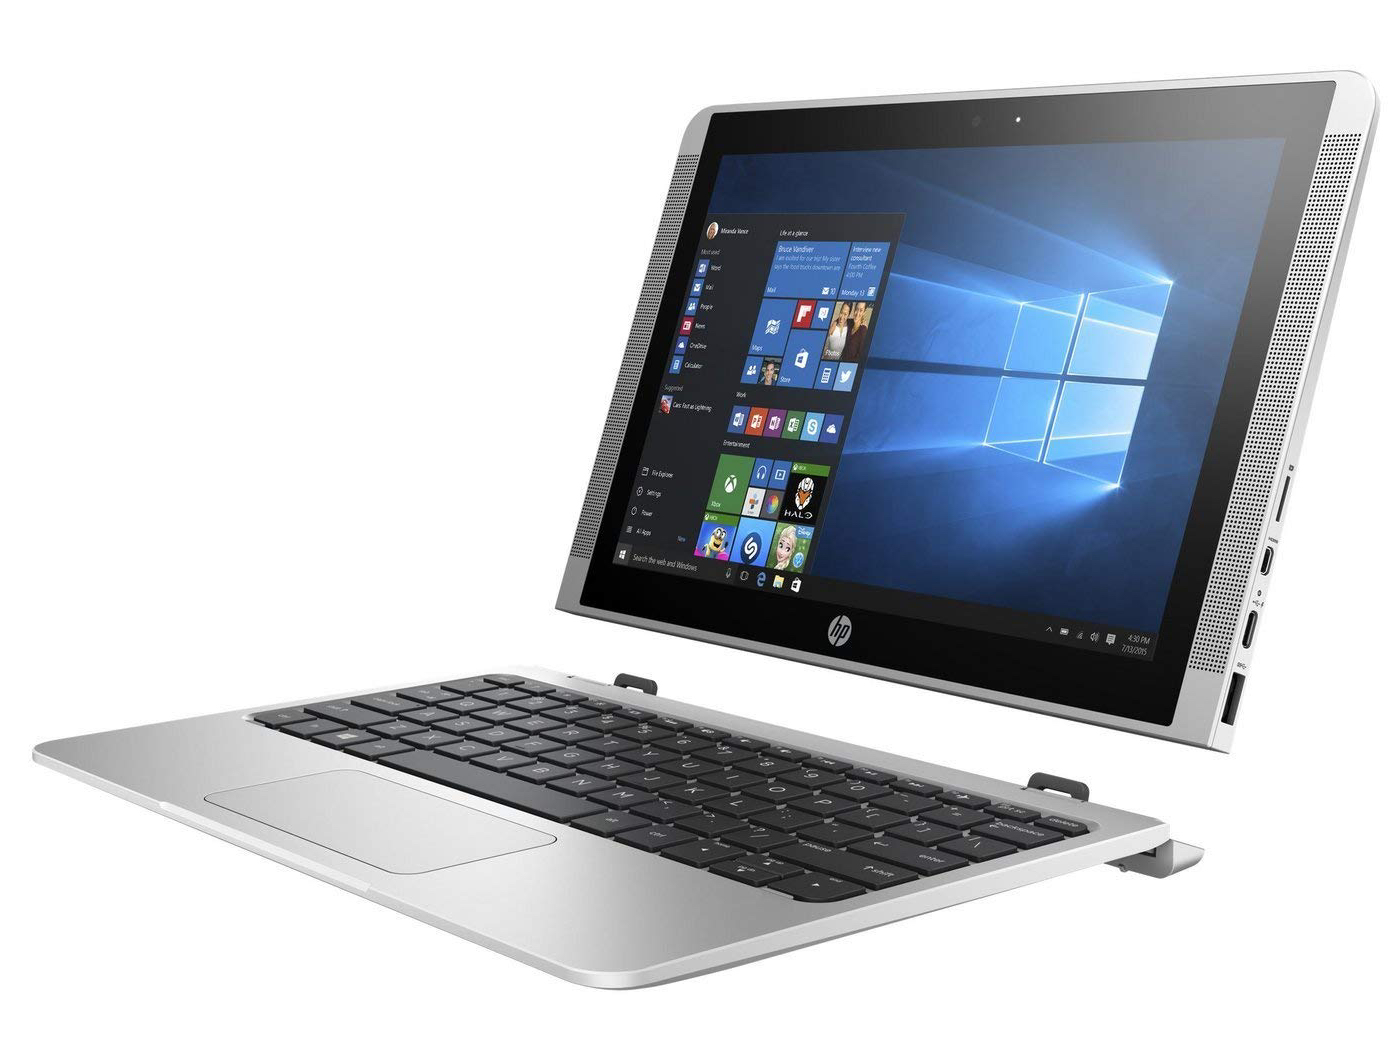
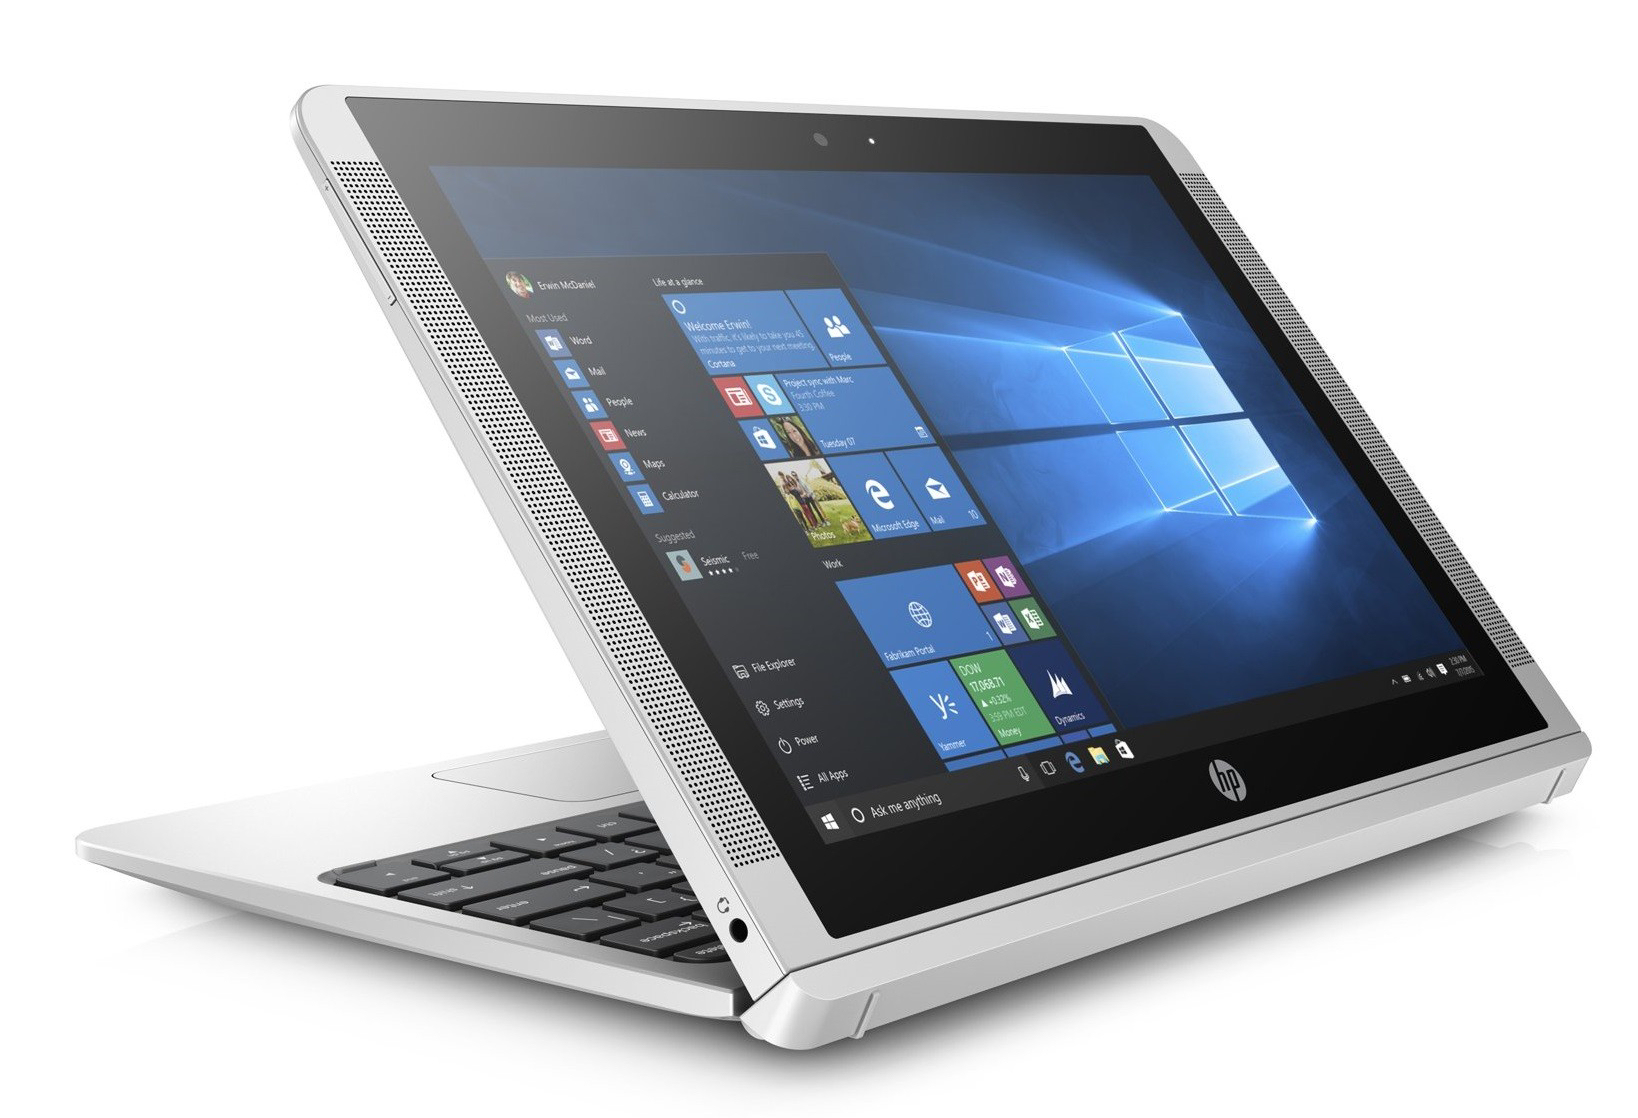
HP x2 210 G2 (x5-Z8350, eMMC, WXGA) Convertible Review

Today’s review unit is the second generation x2 210, which besides a few minor changes is almost identical to the previous model. Case and internal hardware are basically identical, and the CPU has been bumped to a slightly faster model. Its main competitors are the Asus Transformer Book T102HA, the Lenovo IdeaPad D330-10IGM, the Microsoft Surface Go, the Lenovo IdeaPad Miix 320-10ICR, and the Apple iPad.
Given that the HP x2 210 G1 and G2 are identical to the HP Pavilion x2 10, we are not going to discuss case, connectivity, input devices, display, and speakers in great detail in this review, except of course in case they differ. If you are interested in these aspects we would like to refer you to our reviews of the Pavilion and the x2 210 G1 instead.
Case
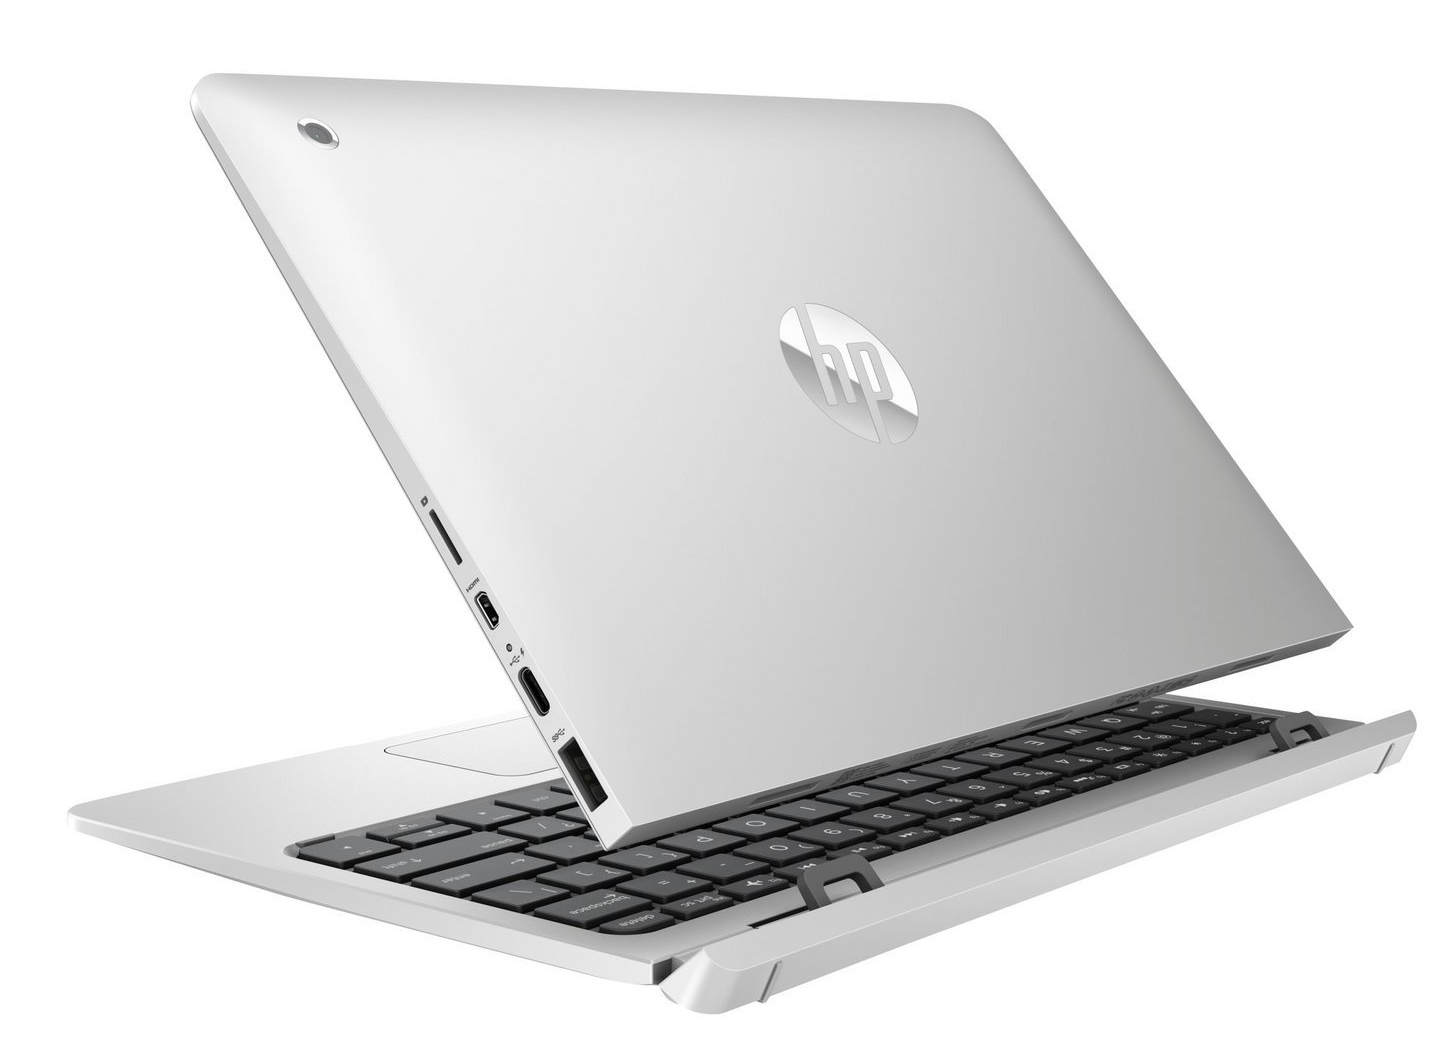
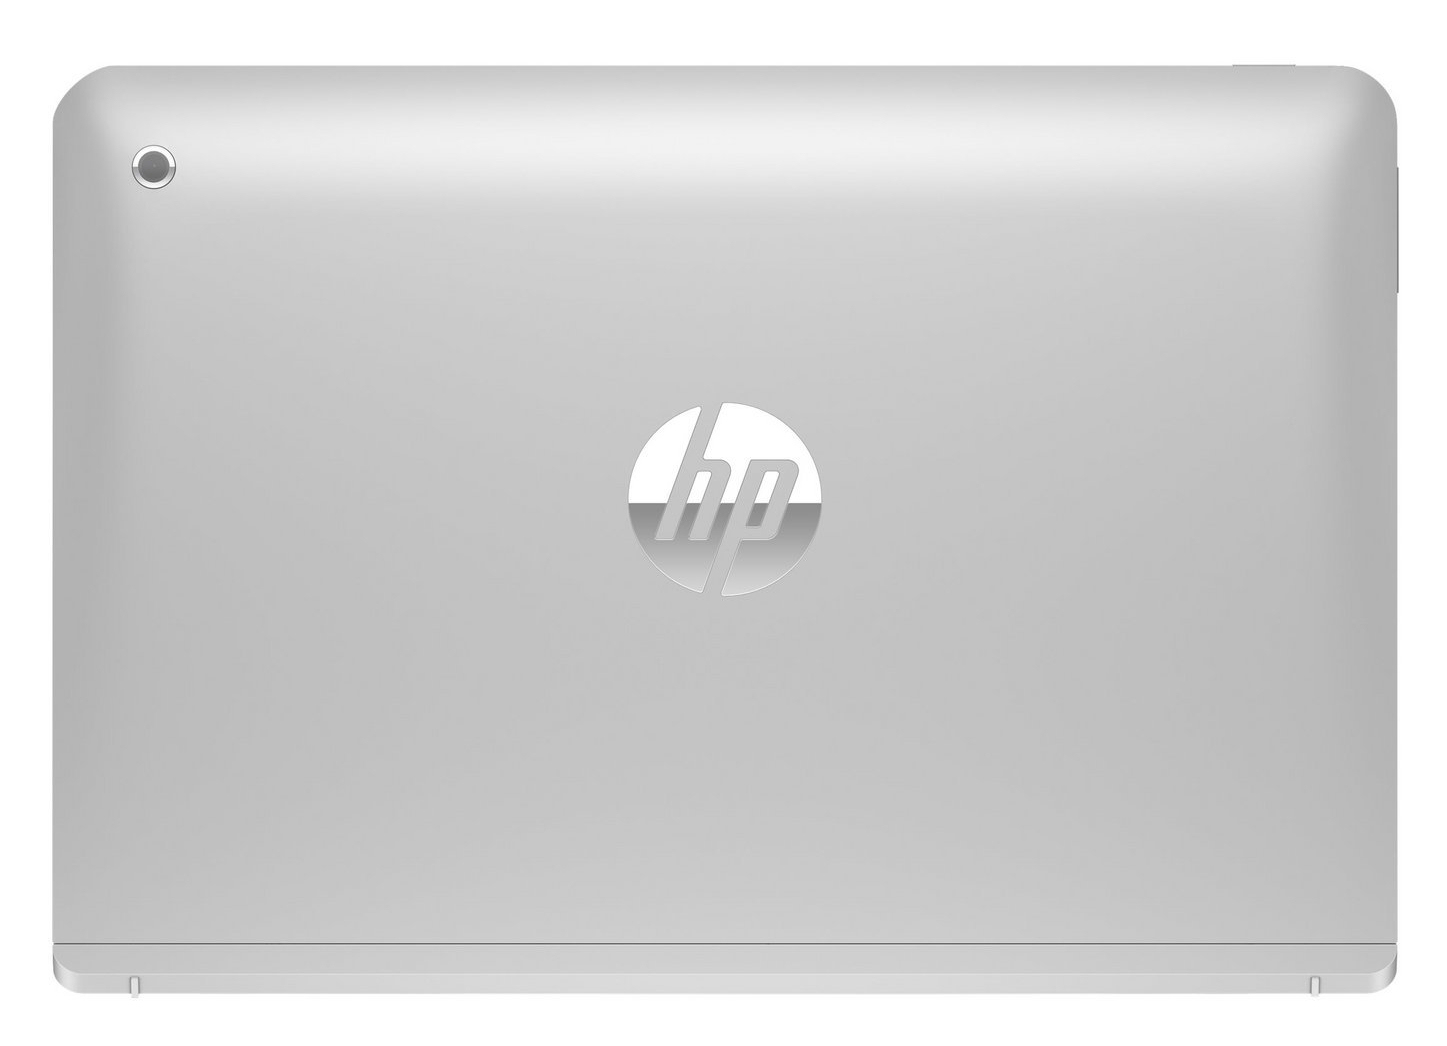
The only noticeable difference between today’s review unit and the HP x2 210 G1 is the placement of the power button and volume rocker, as well as the lack of the dedicated Windows button that was still present on the x2 210 G1. Instead, the second generation comes with a rear-facing 5 MP camera.
Connectivity
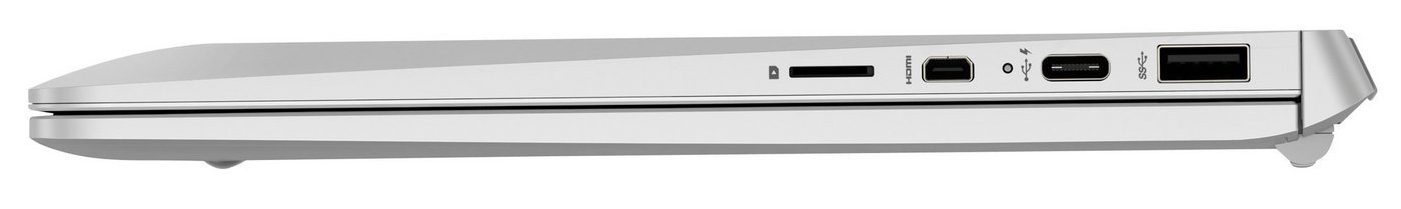
| SD Card Reader | |
| average JPG Copy Test (av. of 3 runs) | |
| Average of class Convertible (29.4 - 186, n=21, last 2 years) | |
| Microsoft Surface Go MHN-00003 (Toshiba Exceria Pro M501) | |
| Asus Transformer Book T102HA-GR022T (Toshiba Exceria Pro M501 microSDXC 64GB) | |
| HP x2 210 G2 (Toshiba Exceria Pro M501 microSDXC 64GB) | |
| maximum AS SSD Seq Read Test (1GB) | |
| Average of class Convertible (67.5 - 254, n=20, last 2 years) | |
| Microsoft Surface Go MHN-00003 (Toshiba Exceria Pro M501) | |
| HP x2 210 G2 (Toshiba Exceria Pro M501 microSDXC 64GB) | |
Display
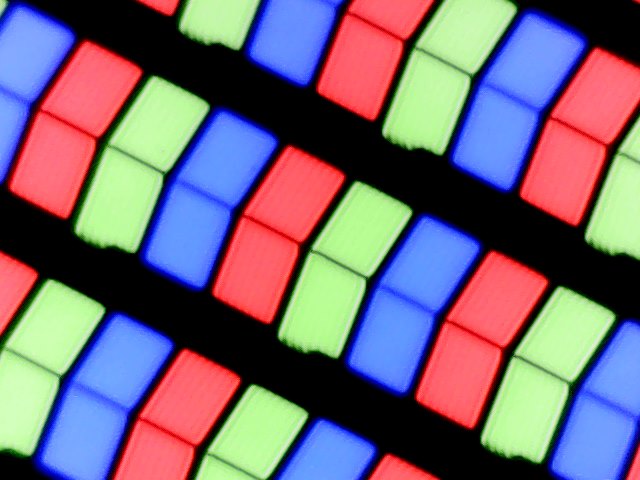
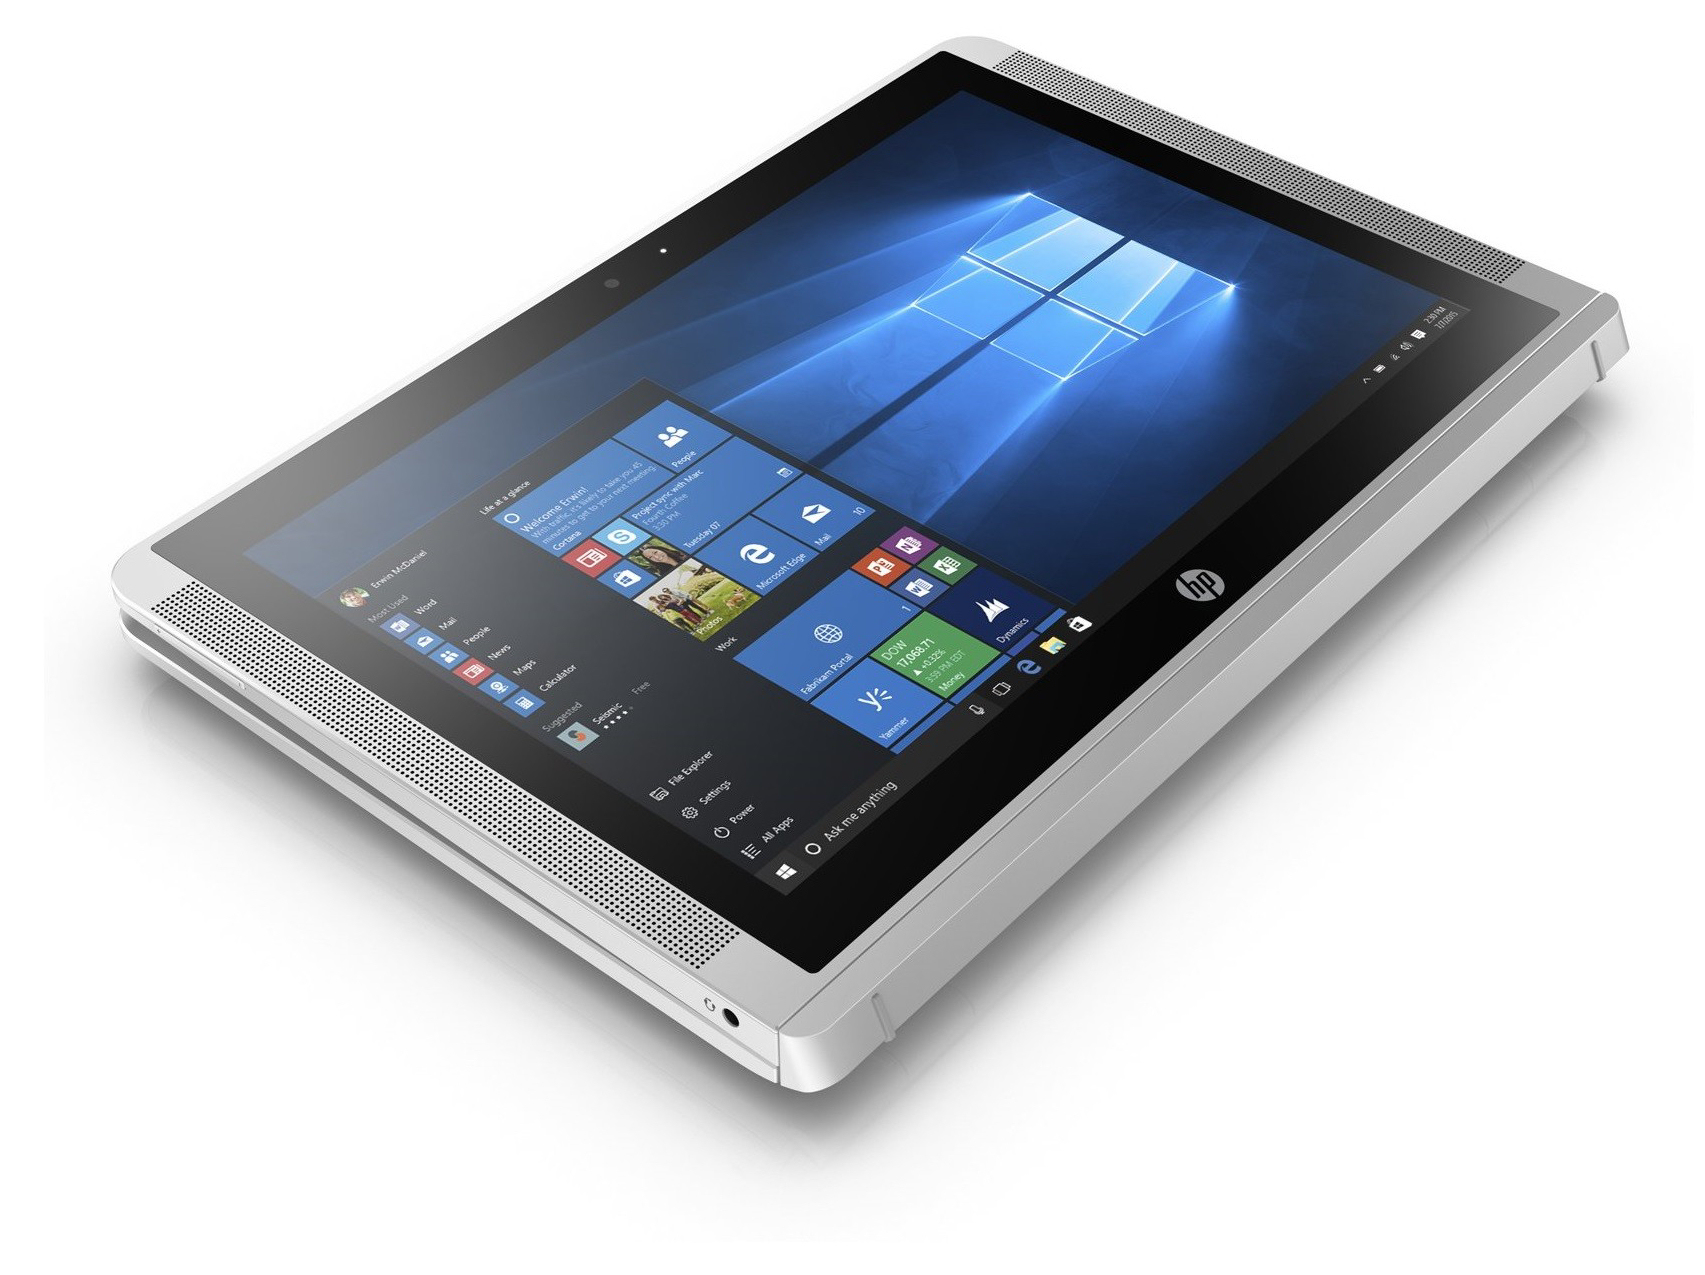
The 10.1-inch IPS touchscreen display features a native resolution of 1280 x 800 pixels, and the display is the same that we already found on the x2 210 G1. Nevertheless, both units differed slightly from one another since even two seemingly identical displays produced on the same day in the same factory are never truly 100% identical.
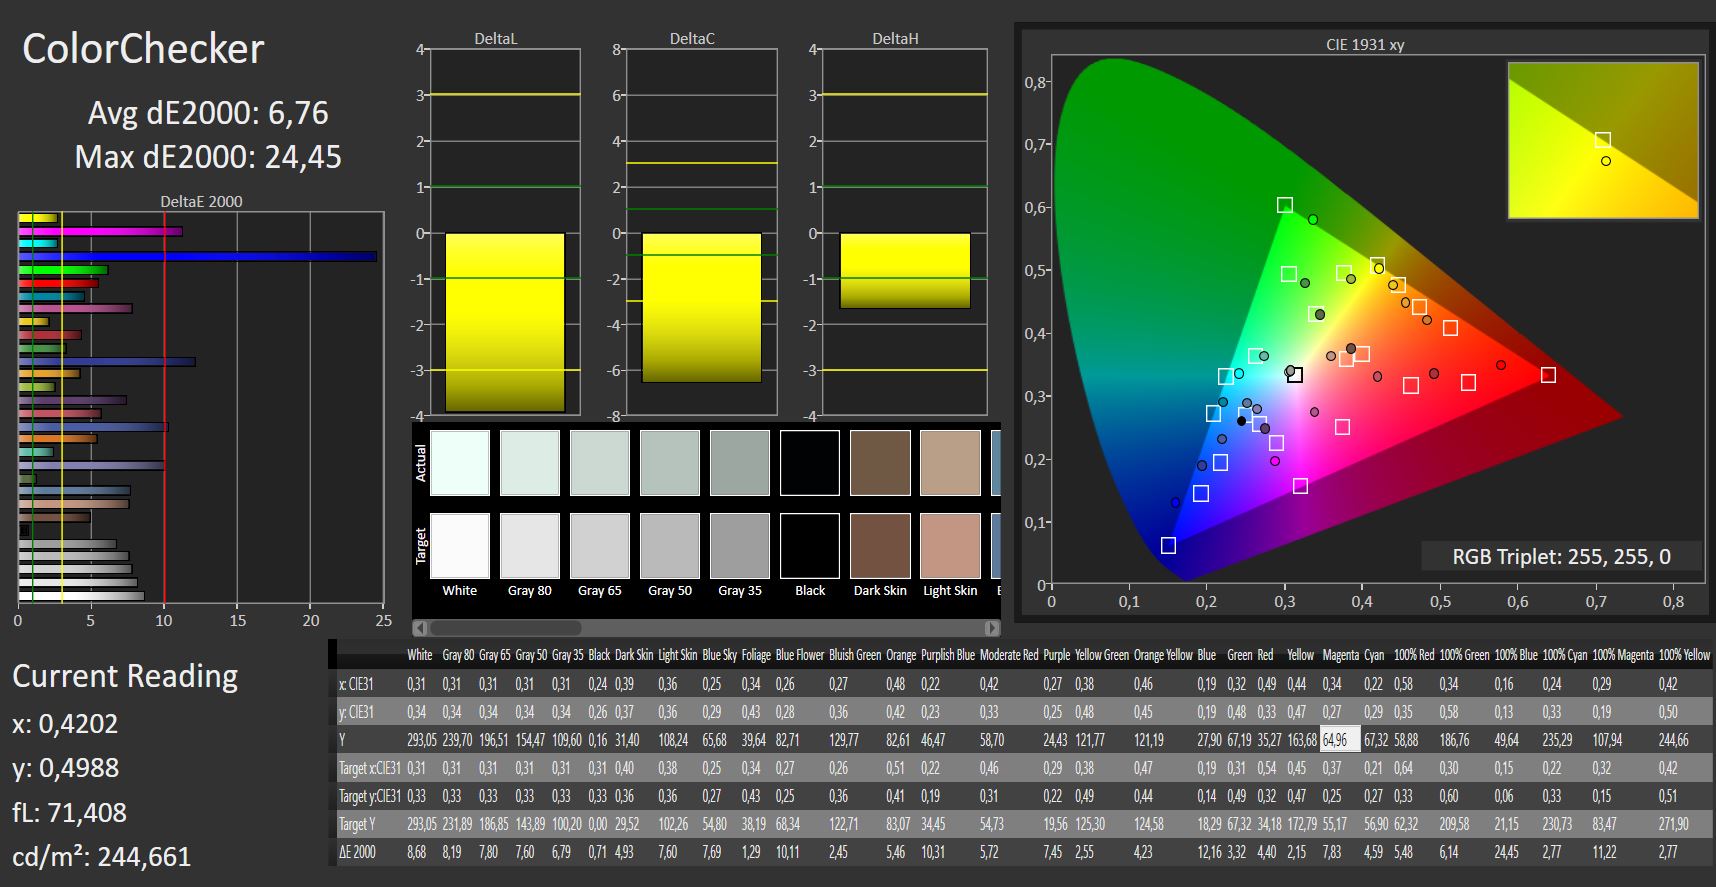
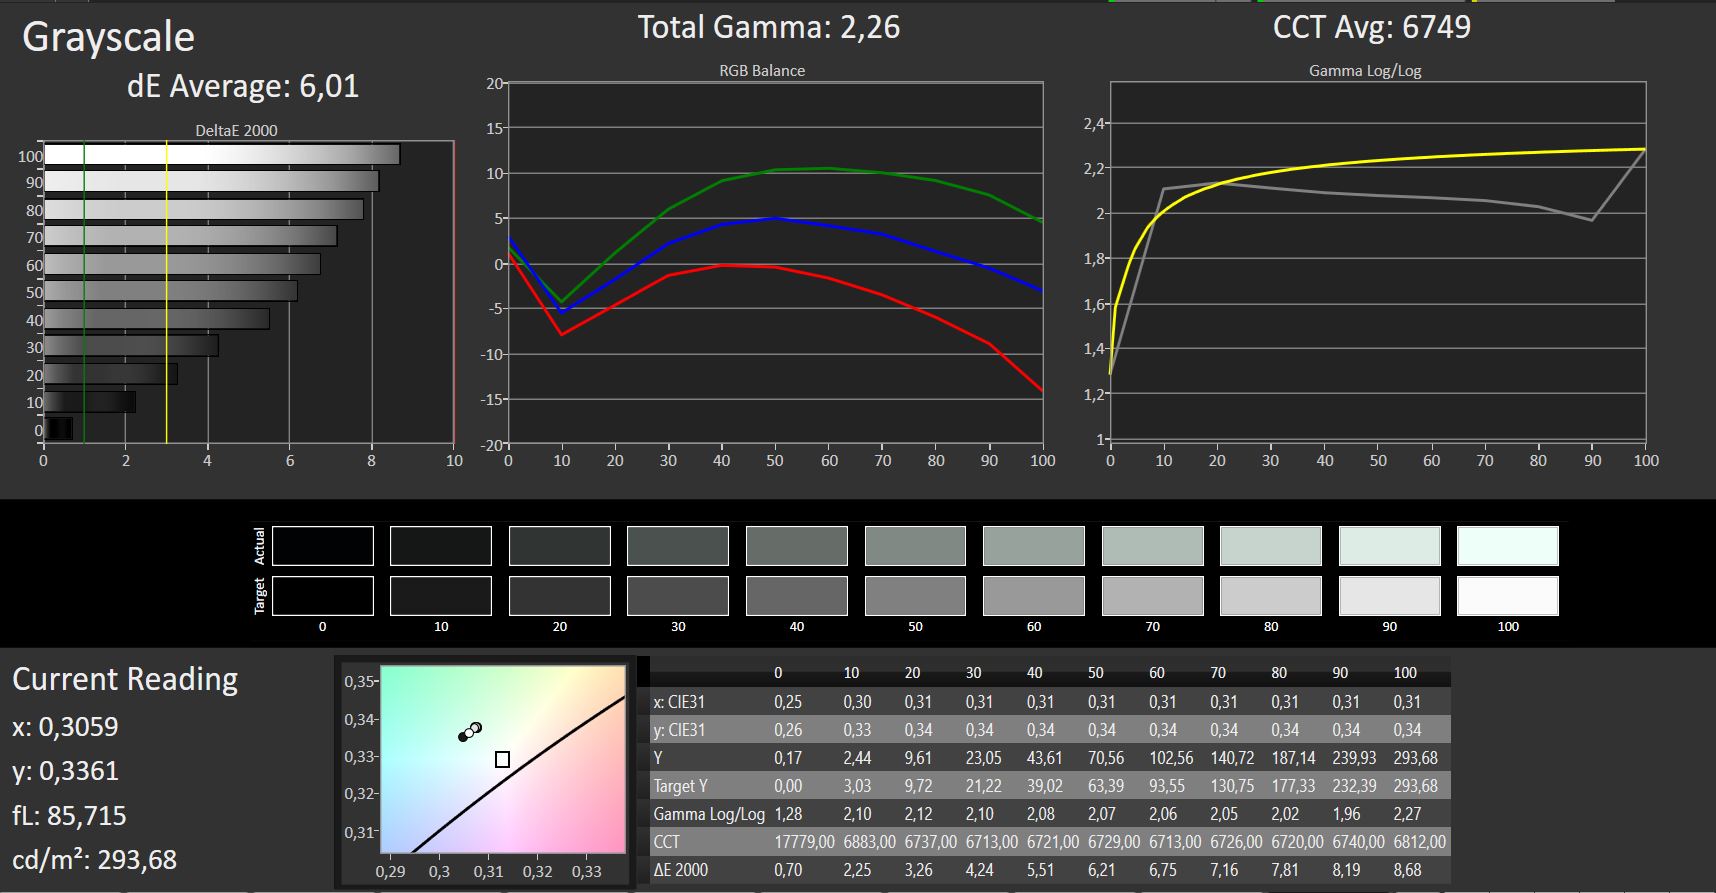
The display featured a very good contrast ratio of 1,718:1 and an acceptable maximum brightness of 274.6 nits. Accordingly, the device is best used indoors only. The G2’s competitors offer much brighter displays, particularly the Asus Transformer Book T102HA. We found no evidence of PWM flickering on the x2 210 G2.
| |||||||||||||||||||||||||
Brightness Distribution: 82 %
Center on Battery: 293 cd/m²
Contrast: 1718:1 (Black: 0.17 cd/m²)
ΔE ColorChecker Calman: 6.76 | ∀{0.5-29.43 Ø4.71}
ΔE Greyscale Calman: 6.01 | ∀{0.09-98 Ø4.96}
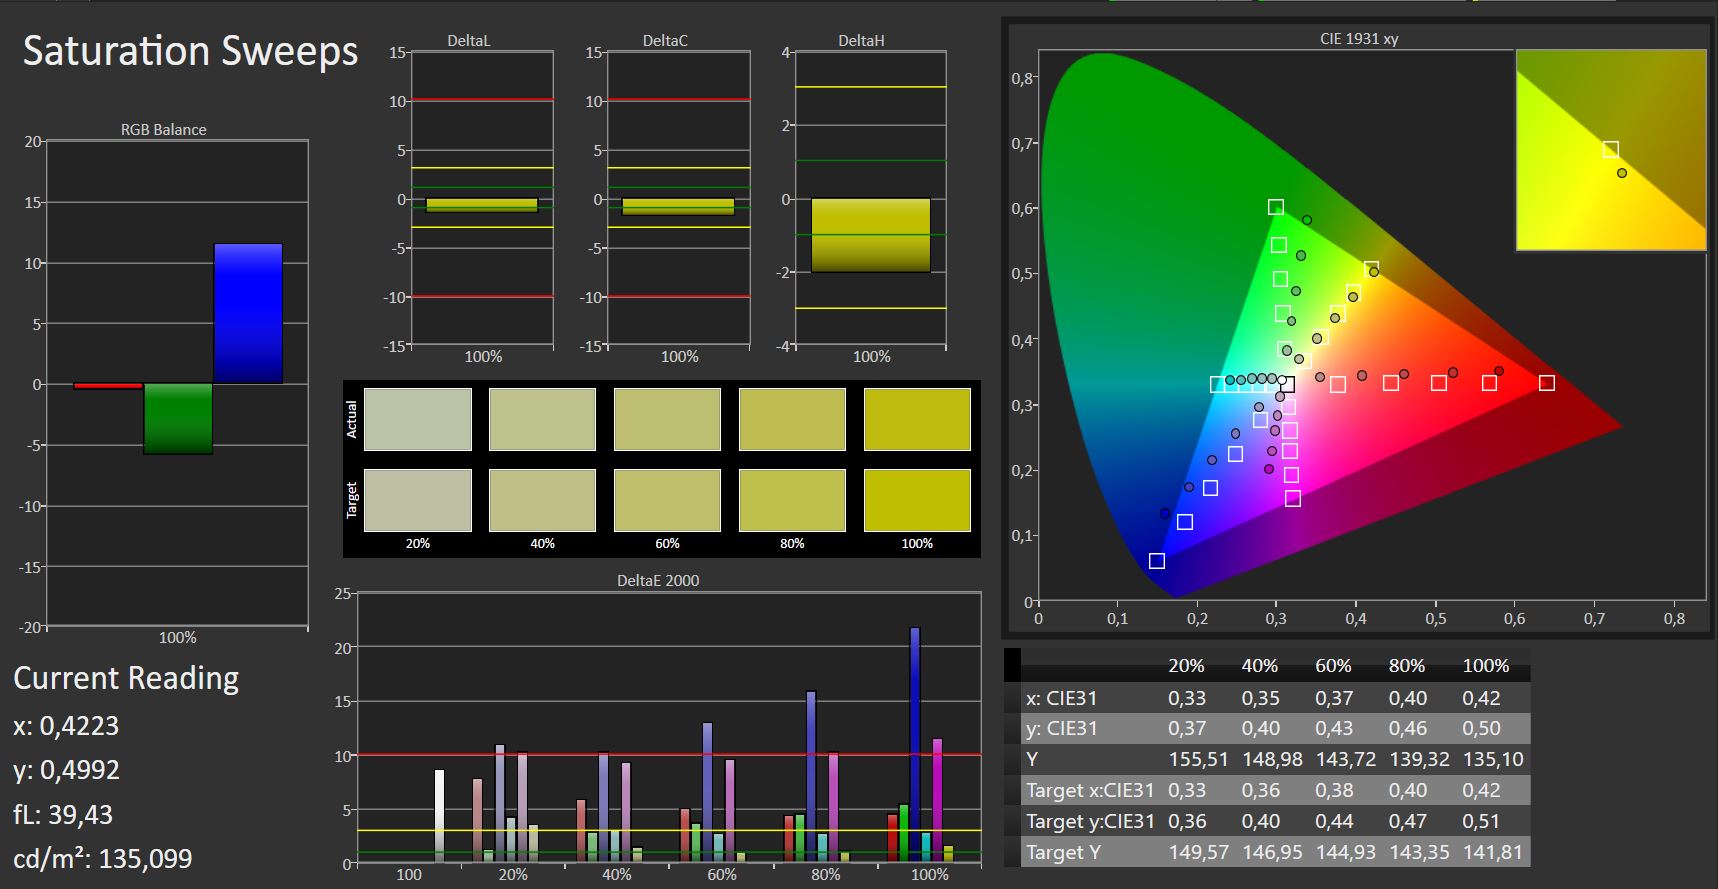
63% sRGB (Argyll 1.6.3 3D)
40% AdobeRGB 1998 (Argyll 1.6.3 3D)
43.6% AdobeRGB 1998 (Argyll 3D)
62.9% sRGB (Argyll 3D)
42.17% Display P3 (Argyll 3D)
Gamma: 2.26
CCT: 6749 K
| HP x2 210 G2 IPS, 1280x800, 10.1" | HP x2 210 G1 IPS, 1280x800, 10.1" | Lenovo Ideapad D330-10IGM IPS, 1920x1200, 10.1" | Microsoft Surface Go MHN-00003 IPS, 1800x1200, 10" | Asus Transformer Book T102HA-GR022T IPS, 1280x800, 10.1" | Lenovo IdeaPad Miix 320-10ICR Pro LTE IPS, 1920x1200, 10.1" | Apple iPad 6 2018 IPS, 2048x1536, 9.7" | |
|---|---|---|---|---|---|---|---|
| Display | 1% | 28% | 56% | 25% | 29% | ||
| Display P3 Coverage (%) | 42.17 | 42.77 1% | 54.1 28% | 66.5 58% | 53.4 27% | 54.2 29% | |
| sRGB Coverage (%) | 62.9 | 63.7 1% | 81.2 29% | 97.5 55% | 76.9 22% | 81.4 29% | |
| AdobeRGB 1998 Coverage (%) | 43.6 | 44.22 1% | 55.9 28% | 67.5 55% | 55.3 27% | 56 28% | |
| Response Times | 18% | 16% | 16% | 29% | 31% | 35% | |
| Response Time Grey 50% / Grey 80% * (ms) | 46 ? | 43 ? 7% | 39 ? 15% | 44 ? 4% | 29 ? 37% | 32 ? 30% | 26.4 ? 43% |
| Response Time Black / White * (ms) | 35 ? | 25 ? 29% | 29 ? 17% | 25.6 ? 27% | 28 ? 20% | 24 ? 31% | 25.9 ? 26% |
| PWM Frequency (Hz) | 50 ? | 1020 ? | 294 ? | 19000 ? | |||
| Screen | 1% | 3% | 38% | 16% | -4% | 16% | |
| Brightness middle (cd/m²) | 292 | 313 7% | 389 33% | 456 56% | 530 82% | 251 -14% | 530 82% |
| Brightness (cd/m²) | 275 | 295 7% | 376 37% | 426 55% | 491 79% | 244 -11% | 513 87% |
| Brightness Distribution (%) | 82 | 84 2% | 91 11% | 88 7% | 88 7% | 79 -4% | 92 12% |
| Black Level * (cd/m²) | 0.17 | 0.21 -24% | 0.43 -153% | 0.31 -82% | 0.46 -171% | 0.33 -94% | 0.61 -259% |
| Contrast (:1) | 1718 | 1490 -13% | 905 -47% | 1471 -14% | 1152 -33% | 761 -56% | 869 -49% |
| Colorchecker dE 2000 * | 6.76 | 6.79 -0% | 5.23 23% | 1.3 81% | 4.33 36% | 5.34 21% | 1.2 82% |
| Colorchecker dE 2000 max. * | 24.45 | 14.11 42% | 9.39 62% | 3 88% | 7.32 70% | 9.91 59% | 3.2 87% |
| Greyscale dE 2000 * | 6.01 | 6.78 -13% | 5.45 9% | 1.4 77% | 3.51 42% | 6.04 -0% | 1 83% |
| Gamma | 2.26 97% | 2.26 97% | 2.49 88% | 2.24 98% | 2.36 93% | 3.23 68% | 2.28 96% |
| CCT | 6749 96% | 6708 97% | 7728 84% | 6687 97% | 7007 93% | 7491 87% | 6588 99% |
| Color Space (Percent of AdobeRGB 1998) (%) | 40 | 41 2% | 51 27% | 62.3 56% | 50 25% | 51 27% | |
| Color Space (Percent of sRGB) (%) | 63 | 63 0% | 81 29% | 96.8 54% | 77 22% | 81 29% | |
| Colorchecker dE 2000 calibrated * | 1.99 | 1.1 | |||||
| Total Average (Program / Settings) | 7% /
3% | 16% /
10% | 37% /
38% | 23% /
19% | 19% /
7% | 26% /
19% |
* ... smaller is better
Screen Flickering / PWM (Pulse-Width Modulation)
| Screen flickering / PWM not detected | 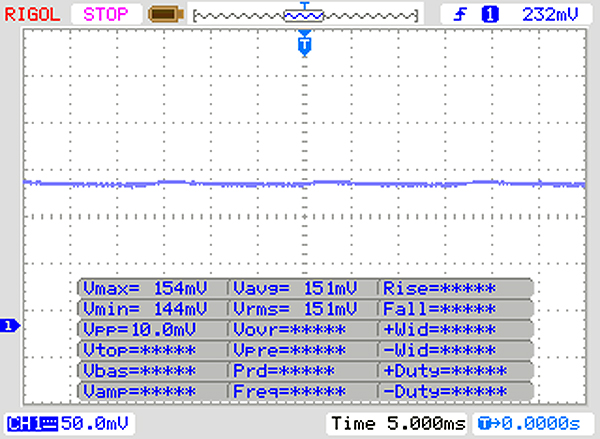 | ||
In comparison: 52 % of all tested devices do not use PWM to dim the display. If PWM was detected, an average of 7741 (minimum: 5 - maximum: 343500) Hz was measured. | |||
Display Response Times
| ↔ Response Time Black to White | ||
|---|---|---|
| 35 ms ... rise ↗ and fall ↘ combined | ↗ 18 ms rise | 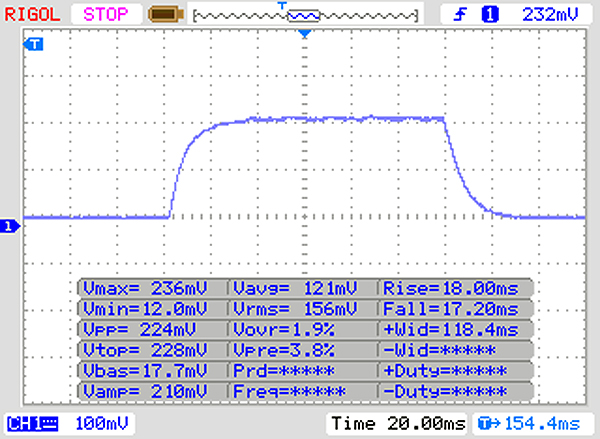 |
| ↘ 17 ms fall | ||
| The screen shows slow response rates in our tests and will be unsatisfactory for gamers. In comparison, all tested devices range from 0.1 (minimum) to 240 (maximum) ms. » 92 % of all devices are better. This means that the measured response time is worse than the average of all tested devices (19.8 ms). | ||
| ↔ Response Time 50% Grey to 80% Grey | ||
| 46 ms ... rise ↗ and fall ↘ combined | ↗ 22 ms rise | 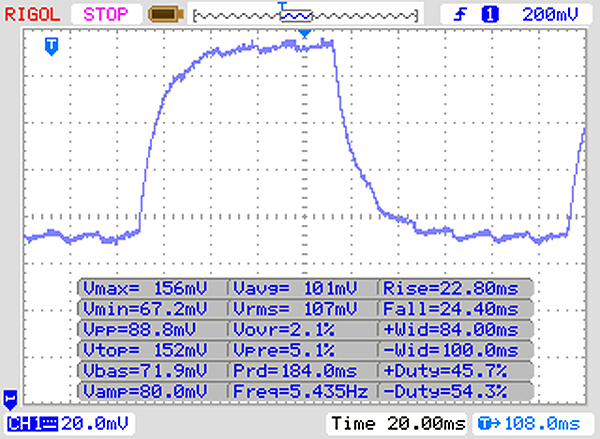 |
| ↘ 24 ms fall | ||
| The screen shows slow response rates in our tests and will be unsatisfactory for gamers. In comparison, all tested devices range from 0.165 (minimum) to 636 (maximum) ms. » 79 % of all devices are better. This means that the measured response time is worse than the average of all tested devices (30.9 ms). | ||
Performance
Hewlett Packard’s x2 210 G2 is a 10.1-inch convertible made primarily for basic office and Internet tasks and workflows. Our review unit was the series’ base model which currently sells for around $450. Other more expensive SKUs are also available, however they only differ in regards to operating system and eMMC storage size.
Processor
HP decided not to pester its customers with new and modern CPUs. Instead, the x2 210 G2 features an Intel Atom x5-Z8350 (Cherry Trail) quad-core CPU, a rather slow microprocessor that is barely fast enough for simple office and Internet tasks.
Thanks to its low TDP of just 4 W the system does not require a fan at all. The CPU runs at a base clock speed of 1.44 GHz and features a turbo boost of up to 1.92 GHz. Our multi-thread benchmark tests were performed at a decent 1.68 GHz. During our single-thread tests, the CPU oscillated between 1.68 and 1.92 GHz. This behavior was identical regardless of power source (battery or mains).
We test whether or not the device is capable of maintaining a high turbo boost level even under long-lasting sustained load by running Cinebench R15’s multi-thread test in a 30-minute loop. We are happy to report that the scores did not drop and remained at their initial level. In other words, turbo boost is applied consistently even under sustained load.
| Geekbench 3 | |
| 32 Bit Multi-Core Score | |
| Lenovo Ideapad D330-10IGM | |
| HP x2 210 G2 | |
| Average Intel Atom x5-Z8350 (2130 - 2332, n=5) | |
| 32 Bit Single-Core Score | |
| Lenovo Ideapad D330-10IGM | |
| HP x2 210 G2 | |
| Average Intel Atom x5-Z8350 (709 - 796, n=5) | |
| Geekbench 4.0 | |
| 64 Bit Multi-Core Score | |
| Average of class Convertible (23833 - 37474, n=5, last 2 years) | |
| Lenovo Ideapad D330-10IGM | |
| HP x2 210 G2 | |
| Average Intel Atom x5-Z8350 (1980 - 2399, n=4) | |
| 64 Bit Single-Core Score | |
| Average of class Convertible (6365 - 8254, n=5, last 2 years) | |
| Lenovo Ideapad D330-10IGM | |
| HP x2 210 G2 | |
| Average Intel Atom x5-Z8350 (836 - 934, n=4) | |
| Mozilla Kraken 1.1 - Total | |
| HP x2 210 G2 (Edge 44) | |
| Average Intel Atom x5-Z8350 (5047 - 7230, n=5) | |
| Microsoft Surface Go MHN-00003 (Edge 42.17134.1.0) | |
| Lenovo Ideapad D330-10IGM (Edge 42) | |
| Apple iPad 6 2018 (Safari Mobile 11.3) | |
| Average of class Convertible (386 - 1089, n=52, last 2 years) | |
| Octane V2 - Total Score | |
| Average of class Convertible (50984 - 123023, n=13, last 2 years) | |
| Apple iPad 6 2018 (Safari Mobile 11.3) | |
| Lenovo Ideapad D330-10IGM (Edge 42) | |
| Microsoft Surface Go MHN-00003 (Edge 42.17134.1.0) | |
| Average Intel Atom x5-Z8350 (4722 - 7265, n=5) | |
| HP x2 210 G2 (Edge 44) | |
| JetStream 1.1 - 1.1 Total | |
| Apple iPad 6 2018 (Safari Mobile 11.3) | |
| Lenovo Ideapad D330-10IGM (Edge 42) | |
| Microsoft Surface Go MHN-00003 (Edge 42.17134.1.0) | |
| Lenovo IdeaPad Miix 320-10ICR Pro LTE (Edge 38.14393.1066.0) | |
| HP x2 210 G1 (Edge 25.10586.0.0) | |
| Asus Transformer Book T102HA-GR022T | |
| Average Intel Atom x5-Z8350 (34.8 - 45.8, n=10) | |
| HP x2 210 G2 (Edge 44) | |
* ... smaller is better
System Performance
As long as you do not ask too much of the slow CPU the system feels generally quite snappy and smooth. However, having several websites open simultaneously in your web browser of choice is going to bring the device to its knees, and it is going to start slowing down noticeably. We suggest limiting the device to no more than basic office and Internet tasks and workflows. The PCMark benchmark results reflect this quite accurately.
| PCMark 8 Home Score Accelerated v2 | 1546 points | |
| PCMark 8 Creative Score Accelerated v2 | 1571 points | |
| PCMark 8 Work Score Accelerated v2 | 1220 points | |
| PCMark 10 Score | 872 points | |
Help | ||
Storage Devices
The eMMC storage offers 64 GB of capacity, of which around 40 GB are available to the user out of the box. We were able to free up additional space by removing some of the preloaded applications and tools. We suggest keeping at least 10 GB of free space in order to ensure enough space for the bi-annual Windows 10 upgrades. Transfer rates were at a level expected of eMMC storage.
In theory, the x2 210 G2 supports storage expansion via microSD card. However, it seems to be limited to microSD cards of no more than 64 GB capacity. The device failed to recognize a 128 GB SanDisk Extreme microSD card.
According to HP’s manual, some SKUs support a 2.5-inch hard disk drive as secondary storage in addition to the eMMC flash storage available on all units. The drive is located in the keyboard dock, however our particular dock lacked a SATA port and we were thus unable to retroactively install a 2.5-inch drive.

| HP x2 210 G2 64 GB eMMC Flash | HP x2 210 G1 64 GB eMMC Flash | Lenovo Ideapad D330-10IGM 128 GB eMMC Flash | Microsoft Surface Go MHN-00003 64 GB eMMC Flash | Asus Transformer Book T102HA-GR022T 128 GB eMMC Flash | Lenovo IdeaPad Miix 320-10ICR Pro LTE SanDisk DF4128 | Average 64 GB eMMC Flash | Average of class Convertible | |
|---|---|---|---|---|---|---|---|---|
| CrystalDiskMark 3.0 | -17% | 104% | 45% | -27% | -41% | -23% | ||
| Write 4k QD32 (MB/s) | 33.97 | 11.84 -65% | 46.5 37% | 33.64 -1% | 10.67 -69% | 11.5 -66% | 12.1 ? -64% | |
| Read 4k QD32 (MB/s) | 47.91 | 35.31 -26% | 14.51 -70% | 34.45 -28% | 30.03 -37% | 32.71 -32% | 24.8 ? -48% | |
| Write 4k (MB/s) | 17.65 | 10.06 -43% | 35.53 101% | 24.27 38% | 9.877 -44% | 8.555 -52% | 9.29 ? -47% | |
| Read 4k (MB/s) | 15.78 | 15.79 0% | 25.18 60% | 19.06 21% | 9.935 -37% | 6.705 -58% | 12.2 ? -23% | |
| Write 512 (MB/s) | 53 | 57.7 9% | 206 289% | 107.1 102% | 44.39 -16% | 39.86 -25% | 49.3 ? -7% | |
| Read 512 (MB/s) | 110.3 | 112.9 2% | 240.9 118% | 190.6 73% | 121 10% | 68.6 -38% | 127.2 ? 15% | |
| Write Seq (MB/s) | 73.9 | 66.1 -11% | 215.2 191% | 122.4 66% | 54.1 -27% | 54.5 -26% | 60.7 ? -18% | |
| Read Seq (MB/s) | 137.8 | 134.1 -3% | 288.4 109% | 259.6 88% | 139 1% | 92.7 -33% | 145.5 ? 6% |
GPU Performance
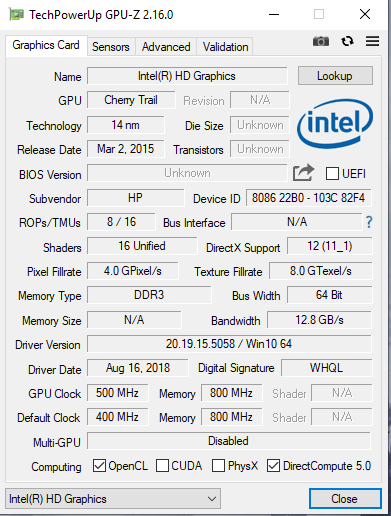
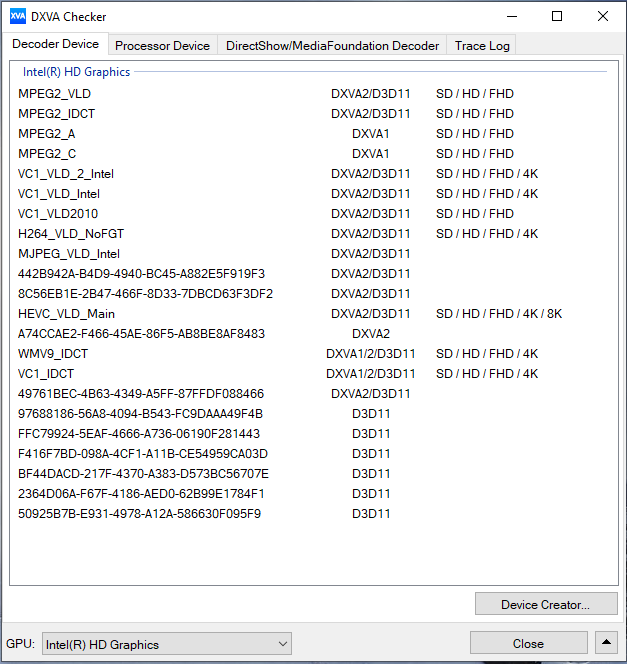
The GPU integrated into the Atom CPU is Intel’s HD Graphics (Cherry Trail). It supports DirectX 12 and runs at clock speeds of up to 500 MHz. 3DMark results were at a level expected of this GPU. Thanks to its integrated video decoder, the GPU supports H.264 and HEVC/H.265 media decoding in hardware. The device should thus be well suited for streaming movies over the Internet.
| 3DMark 11 Performance | 397 points | |
| 3DMark Cloud Gate Standard Score | 1511 points | |
| 3DMark Fire Strike Score | 200 points | |
Help | ||
Gaming Performance
Most games in our database are not going to run at all on the x2 210 G2. Some titles might manage to run smoothly albeit at drastically reduced details and resolutions. In return, most casual games that can be found in the Microsoft Store should run just fine.
| low | med. | high | ultra | |
|---|---|---|---|---|
| Anno 2070 (2011) | 27.7 | |||
| Diablo III (2012) | 18.3 | |||
| Counter-Strike: GO (2012) | 10.5 | |||
| BioShock Infinite (2013) | 16.9 | |||
| X-Plane 10.25 (2013) | 11.8 | |||
| Alien: Isolation (2014) | 11.5 | |||
| Metal Gear Solid V (2015) | 13.3 | |||
| Civilization 6 (2016) | 9.7 | |||
| Prey (2017) | 6.8 | |||
| Farming Simulator 19 (2018) | 14.1 |
Emissions and Energy
System Noise
Given that the Elite x2 lacks active cooling and a mechanical drive it is completely silent.
Temperature
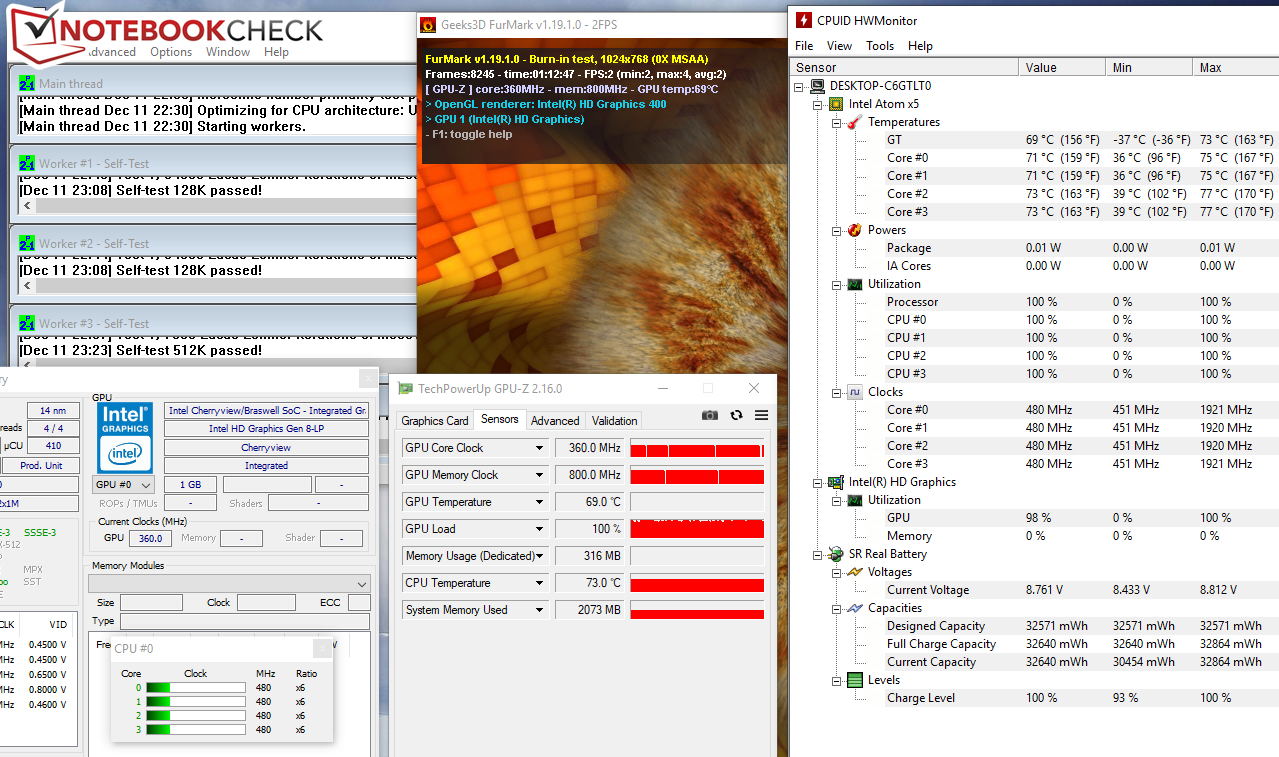
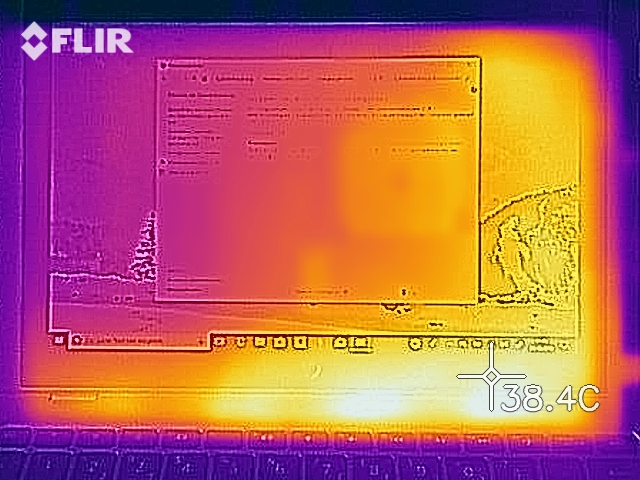
Our stress test (Prime95 and FurMark running simultaneously for at least one hour) ran identically on both mains and battery. The CPU starts out at clock speeds of between 1.4 and 1.7 GHz but subsequently and continuously drops as low as 480 MHz. GPU clock speeds are reduced from 460 MHz at first to 340 MHz over the course of the test.
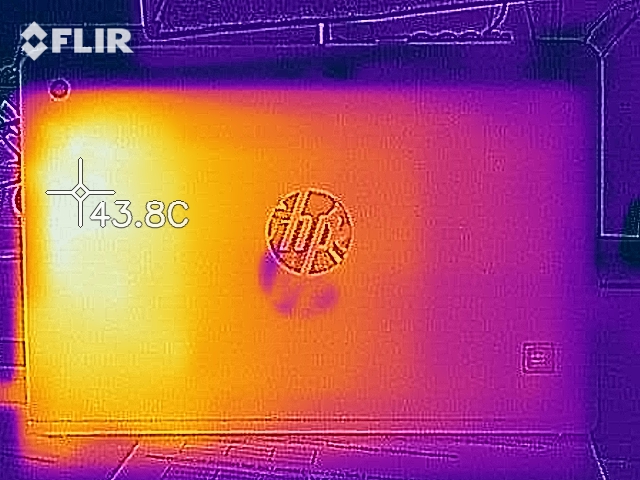
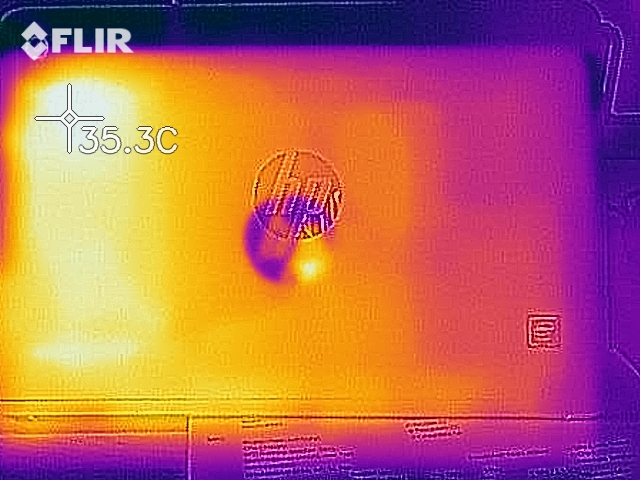
All things considered, HP’s tablet remained fairly cool. We found two hotspots of slightly over 40 °C (104 °F) while running our stress test. However, said stress test is an extreme load scenario that is rarely ever encountered in real world usage. We use this test to detect stability issues and thermal bottlenecks at maximum load, and are happy to report that temperatures were not noticeable during everyday use.
(±) The maximum temperature on the upper side is 40.8 °C / 105 F, compared to the average of 35.4 °C / 96 F, ranging from 19.6 to 60 °C for the class Convertible.
(+) The bottom heats up to a maximum of 38.9 °C / 102 F, compared to the average of 36.9 °C / 98 F
(+) In idle usage, the average temperature for the upper side is 28.7 °C / 84 F, compared to the device average of 30.3 °C / 87 F.
(±) The palmrests and touchpad can get very hot to the touch with a maximum of 37 °C / 98.6 F.
(-) The average temperature of the palmrest area of similar devices was 28 °C / 82.4 F (-9 °C / -16.2 F).

Speakers
HP x2 210 G2 audio analysis
(-) | not very loud speakers (67.6 dB)
Bass 100 - 315 Hz
(-) | nearly no bass - on average 15.9% lower than median
(+) | bass is linear (6.5% delta to prev. frequency)
Mids 400 - 2000 Hz
(+) | balanced mids - only 3.5% away from median
(+) | mids are linear (5.2% delta to prev. frequency)
Highs 2 - 16 kHz
(+) | balanced highs - only 4.9% away from median
(+) | highs are linear (4.5% delta to prev. frequency)
Overall 100 - 16.000 Hz
(±) | linearity of overall sound is average (22.2% difference to median)
Compared to same class
» 66% of all tested devices in this class were better, 6% similar, 29% worse
» The best had a delta of 6%, average was 20%, worst was 57%
Compared to all devices tested
» 65% of all tested devices were better, 6% similar, 29% worse
» The best had a delta of 4%, average was 23%, worst was 134%
Lenovo Ideapad D330-10IGM audio analysis
(-) | not very loud speakers (67.1 dB)
Bass 100 - 315 Hz
(-) | nearly no bass - on average 27.1% lower than median
(±) | linearity of bass is average (7.5% delta to prev. frequency)
Mids 400 - 2000 Hz
(+) | balanced mids - only 4.6% away from median
(±) | linearity of mids is average (11.5% delta to prev. frequency)
Highs 2 - 16 kHz
(+) | balanced highs - only 3.3% away from median
(+) | highs are linear (4.4% delta to prev. frequency)
Overall 100 - 16.000 Hz
(±) | linearity of overall sound is average (28.9% difference to median)
Compared to same class
» 87% of all tested devices in this class were better, 3% similar, 10% worse
» The best had a delta of 6%, average was 20%, worst was 57%
Compared to all devices tested
» 87% of all tested devices were better, 2% similar, 11% worse
» The best had a delta of 4%, average was 23%, worst was 134%
Asus Transformer Book T102HA-GR022T audio analysis
(-) | not very loud speakers (71.1 dB)
Bass 100 - 315 Hz
(-) | nearly no bass - on average 19.8% lower than median
(±) | linearity of bass is average (11.4% delta to prev. frequency)
Mids 400 - 2000 Hz
(+) | balanced mids - only 2.4% away from median
(±) | linearity of mids is average (9.7% delta to prev. frequency)
Highs 2 - 16 kHz
(±) | higher highs - on average 6.8% higher than median
(±) | linearity of highs is average (11.6% delta to prev. frequency)
Overall 100 - 16.000 Hz
(±) | linearity of overall sound is average (24.6% difference to median)
Compared to same class
» 75% of all tested devices in this class were better, 6% similar, 19% worse
» The best had a delta of 6%, average was 20%, worst was 57%
Compared to all devices tested
» 75% of all tested devices were better, 5% similar, 20% worse
» The best had a delta of 4%, average was 23%, worst was 134%
Power Consumption
The x2 was very energy efficient over the entire load spectrum. When idle we measured a maximum of 5.2 W. When put under the immense pressure of our stress test, it peaked at just 10.9 W due to the fact that both CPU and GPU throttled massively. The included USB-C power supply is rated at 45 W.
| Off / Standby | |
| Idle | |
| Load |
|
Key:
min: | |
Battery Life
We simulate real-world conditions with our Wi-Fi test. With the energy plan set to “Balanced”, the brightness normalized to 150 nits, and all energy saving features disabled the HP notebook lasted for exactly 9:11 hours.
Pros
Cons
Verdict
The x2 210 G2 is based on old technology. The installed Atom x5-Z8350 CPU is several years old and offers barely enough power for basic office and Internet tasks. At least the GPU includes a hardware decoder for video streaming, which means that the device is usable for streaming movies while remaining completely silent thanks to its passive cooling.
Storage space is fairly limited as well, and just 40 out of the installed 64 GB of eMMC storage are available out of the box. Storage expansion is supported, however limited to no more than 64 GB.
The IPS touchscreen offers wide viewing angles and a decent contrast ratio. Display brightness is acceptable, and the display is certainly bright enough for indoor use. The keyboard was decent, and so was battery life.
The HP x2 210 G2 is a long-running office and web device. However, given that HP is selling outdated and poorly performing components at a comparatively high price the device does not deserve our endorsement.
The Lenovo IdeaPad Miix 320-10ICR is equipped identically and can be had for around $200. Modern devices with detachable screens, such as for example the recently reviewed Lenovo IdeaPad D330-10IGM, are much more powerful than the x2 210 G2. HP’s target audience seems to be the educational market - after all, the device comes preloaded with HP’s School Pack Installer that can be used to download various educational software packages.
HP x2 210 G2
- 12/20/2018 v6 (old)
Sascha Mölck
Price comparison

