Lenovo IdeaPad D330-10IGM (Pentium Silver N5000, eMMC, LTE, WUXGA) Convertible Review

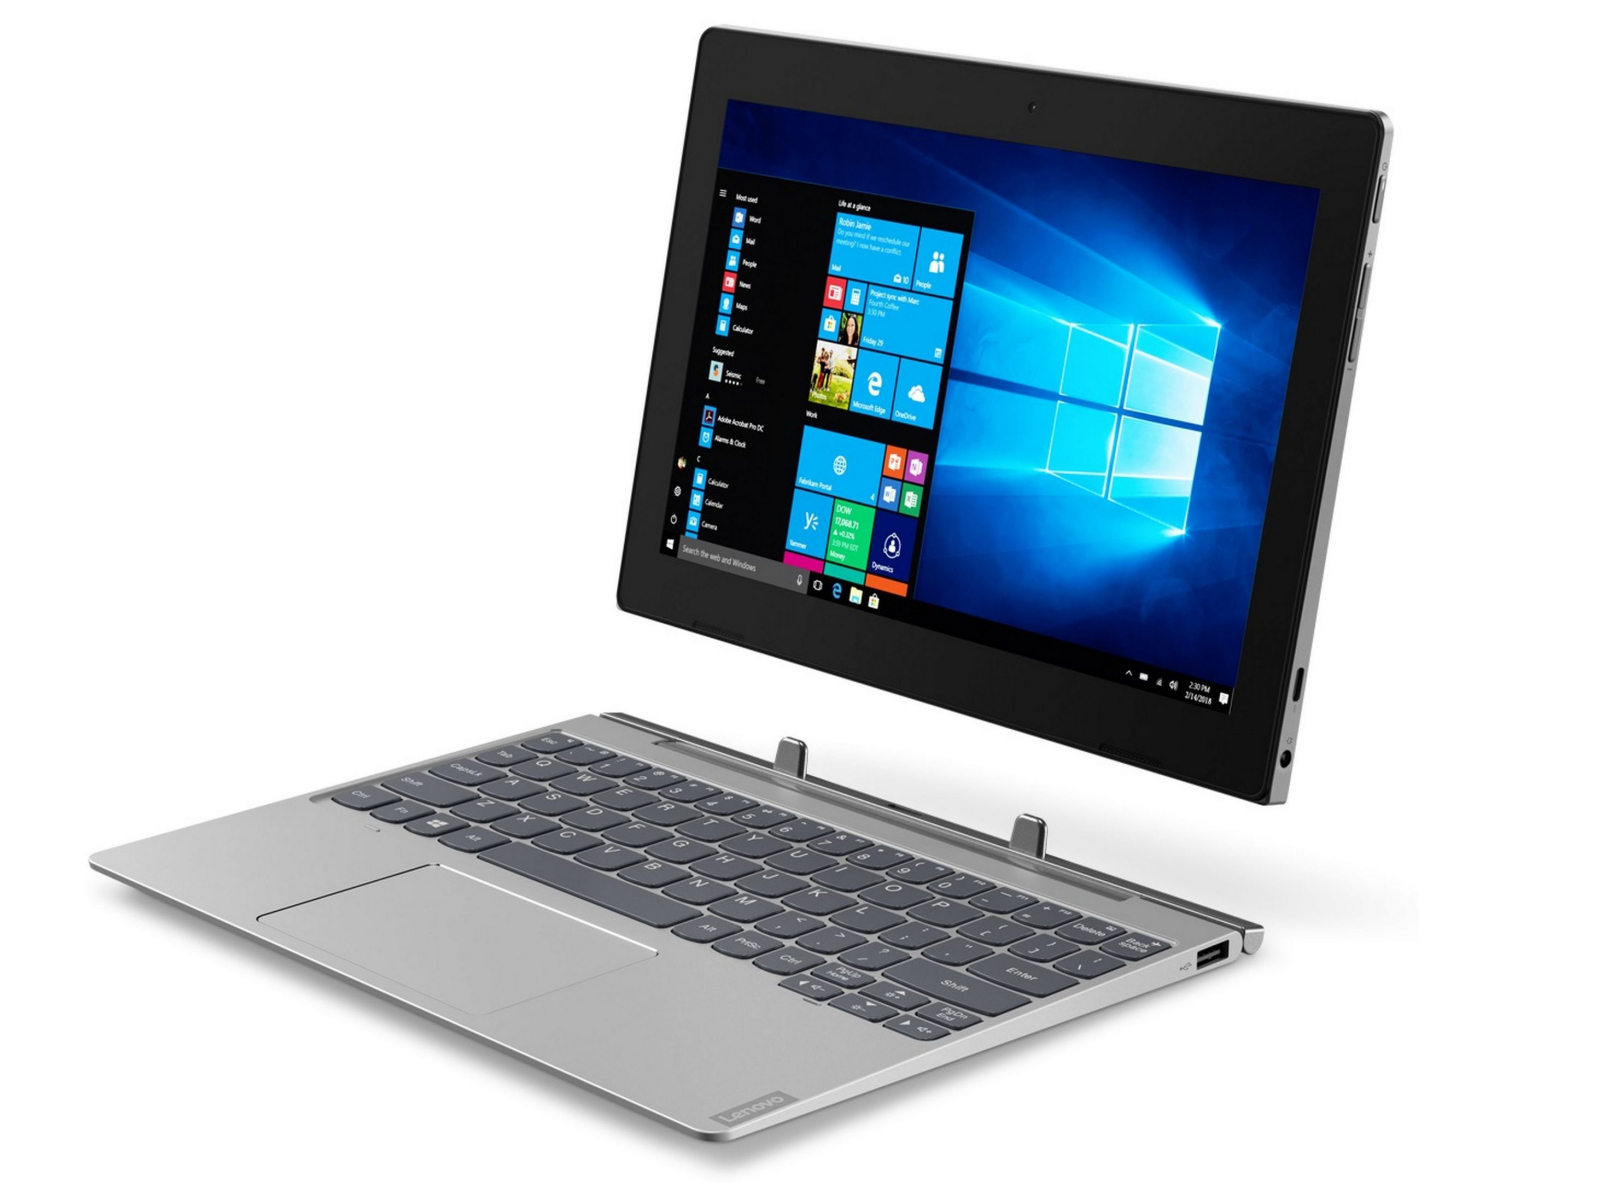
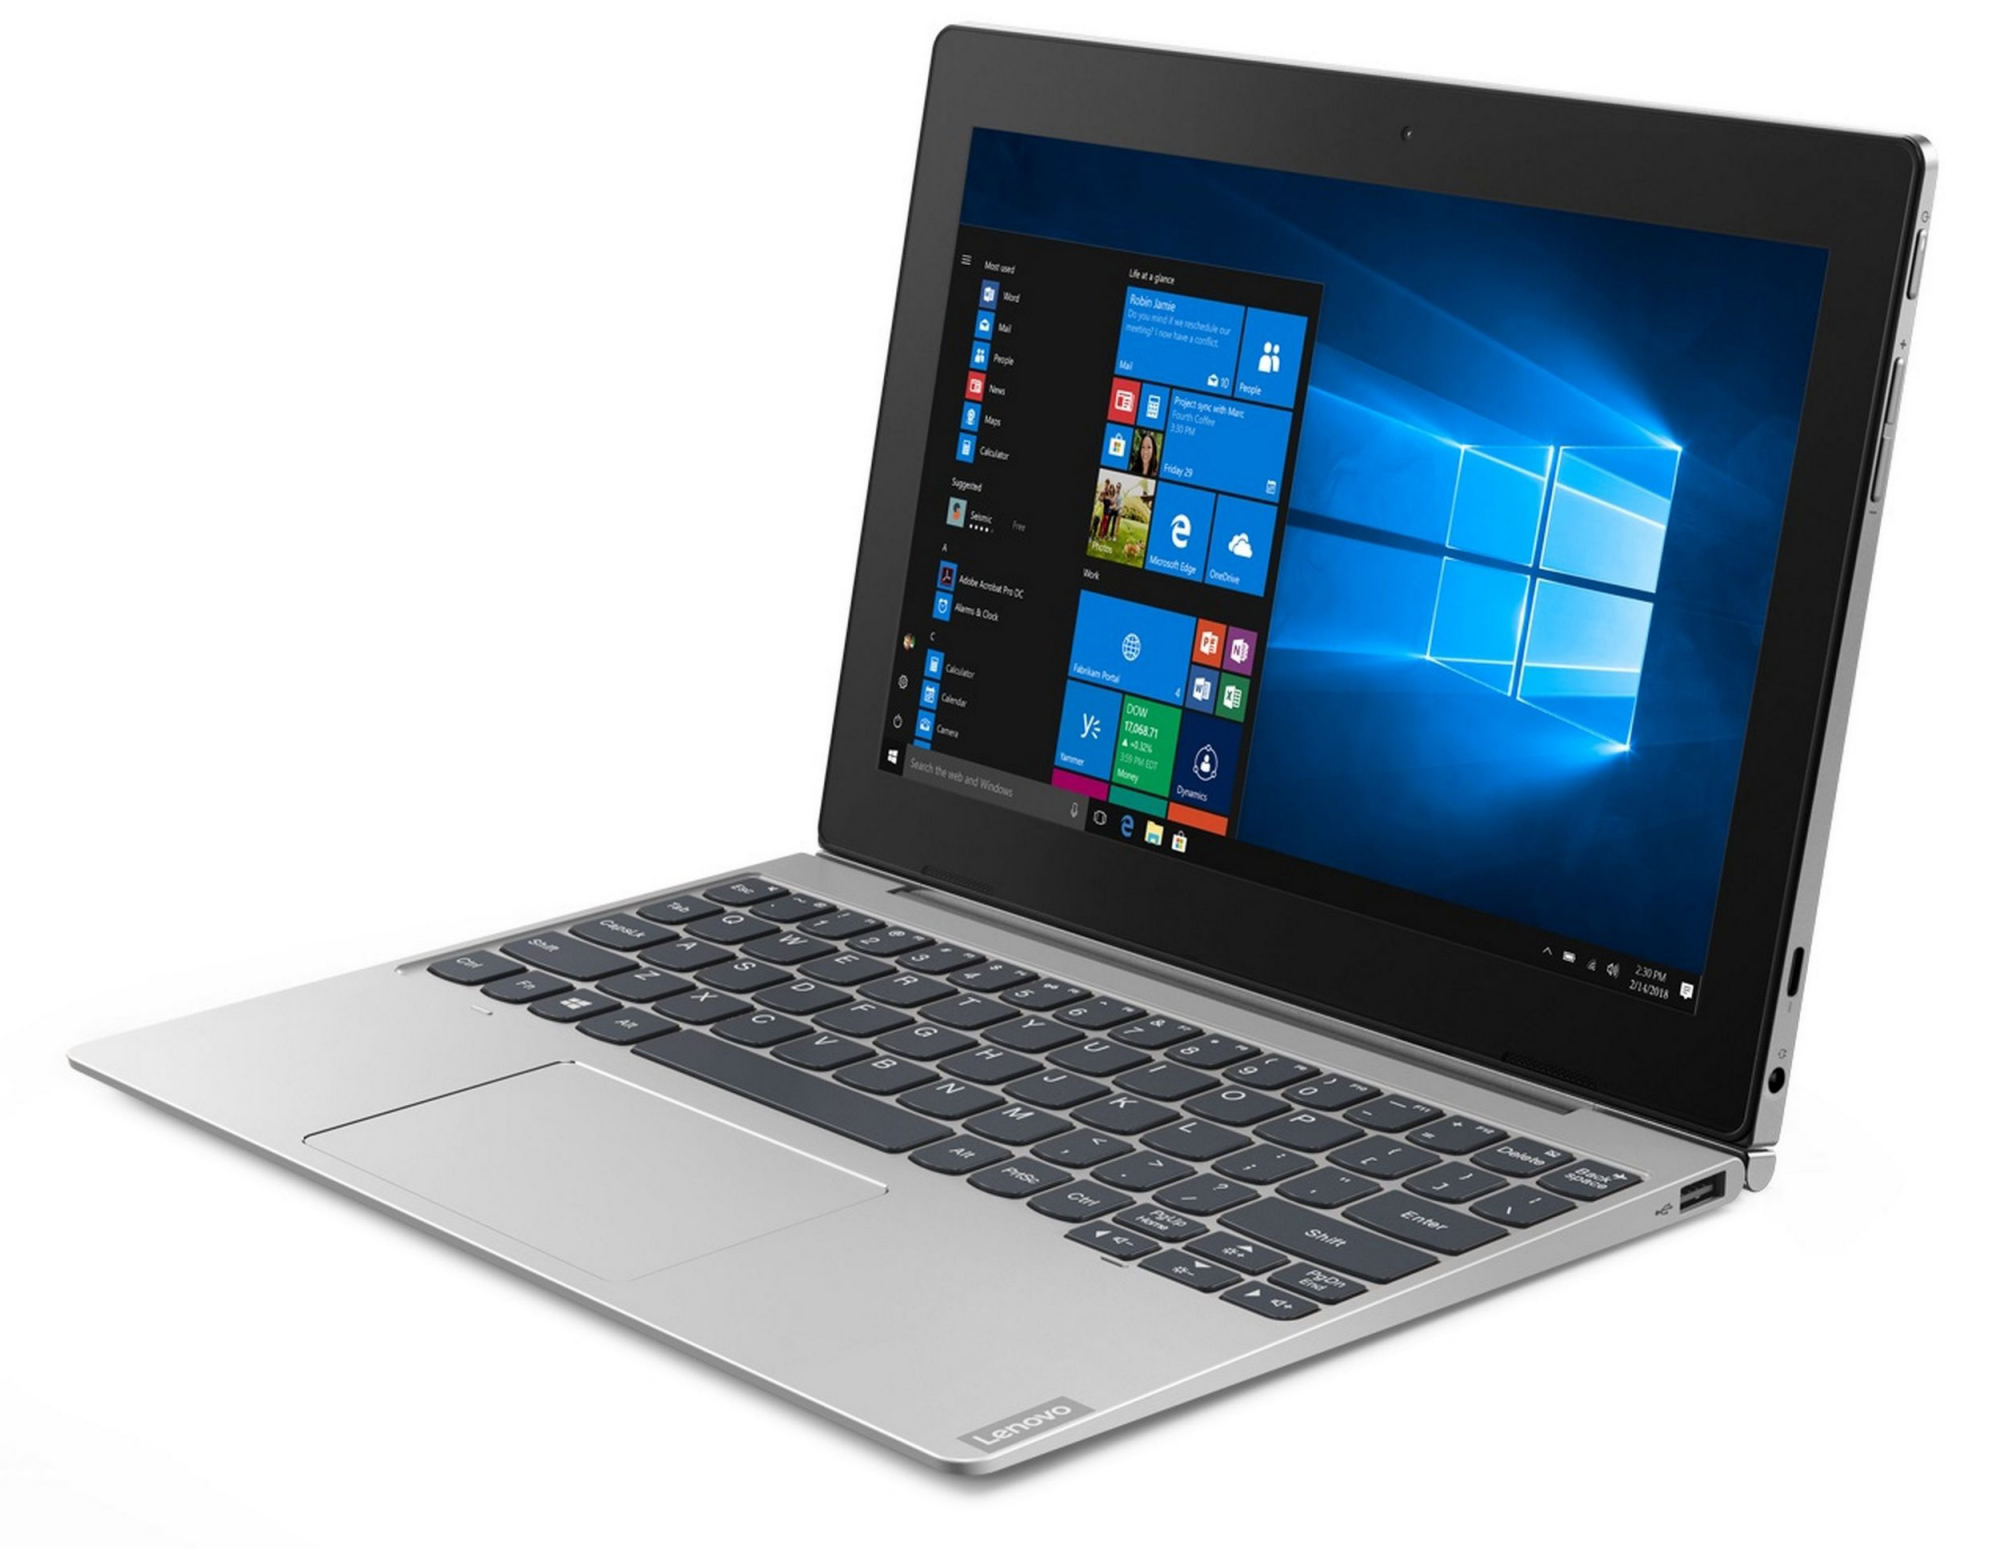
The IdeaPad D330-10IGM is a 10.1-inch 2-in-1 device with a detachable keyboard. Both the model name and the exterior confirm that the device is the successor to the Lenovo IdeaPad Miix 320 Pro, which we have already reviewed. The two devices share many traits, but they are not identical.
We have chosen to compare the D330-10IGM against the Apple iPad 6 (2018), the ASUS Transformer Book T102HA, the Huawei MediaPad M5 10.8, the Microsoft Surface Go and the Samsung Galaxy Tab A 10.5.
Case & Connectivity
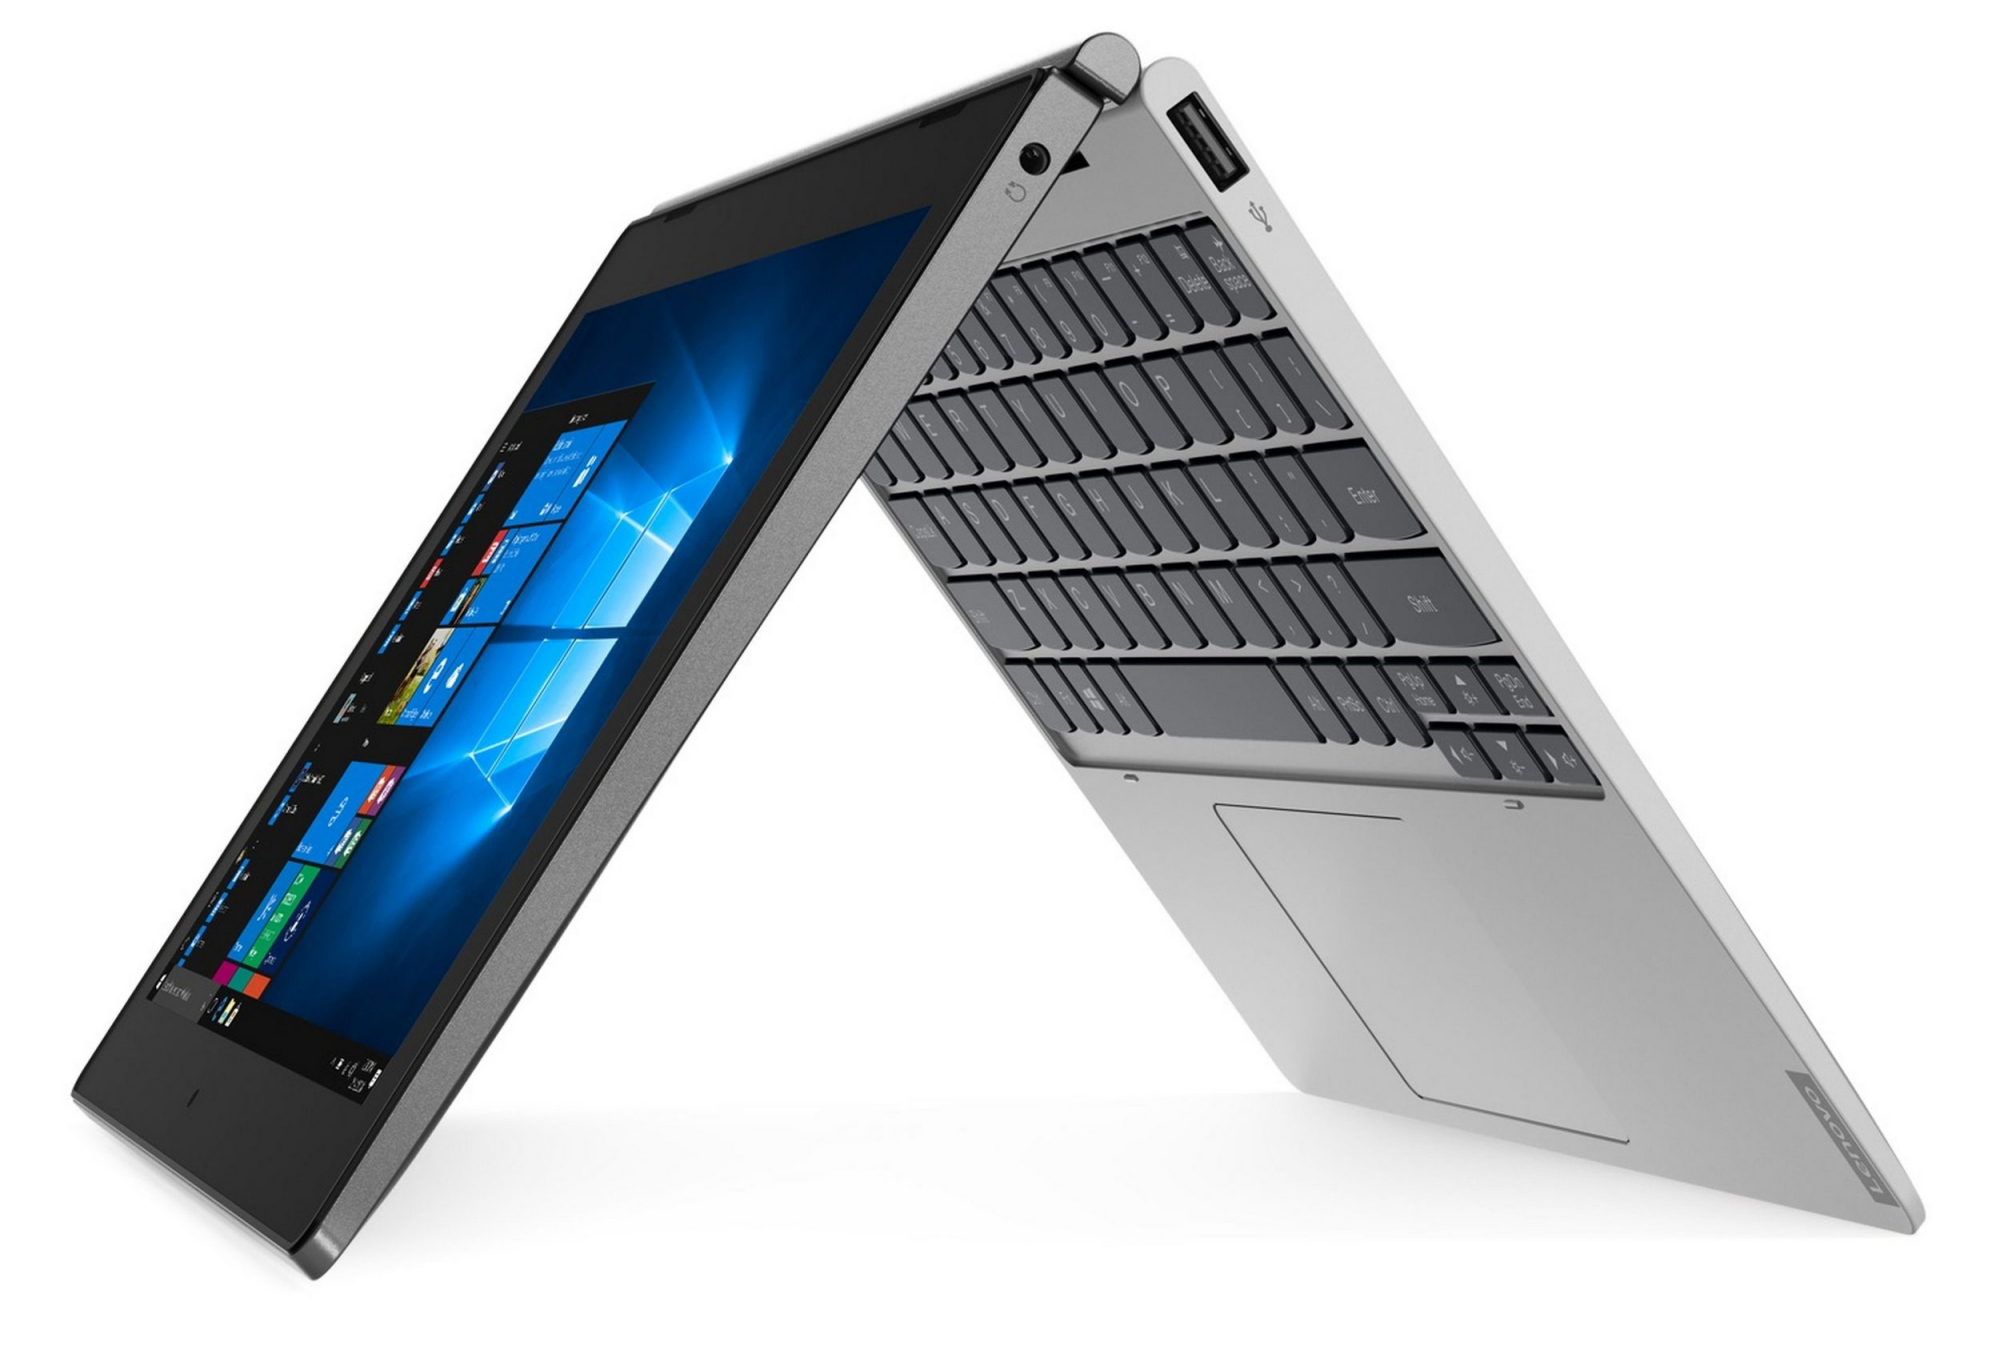
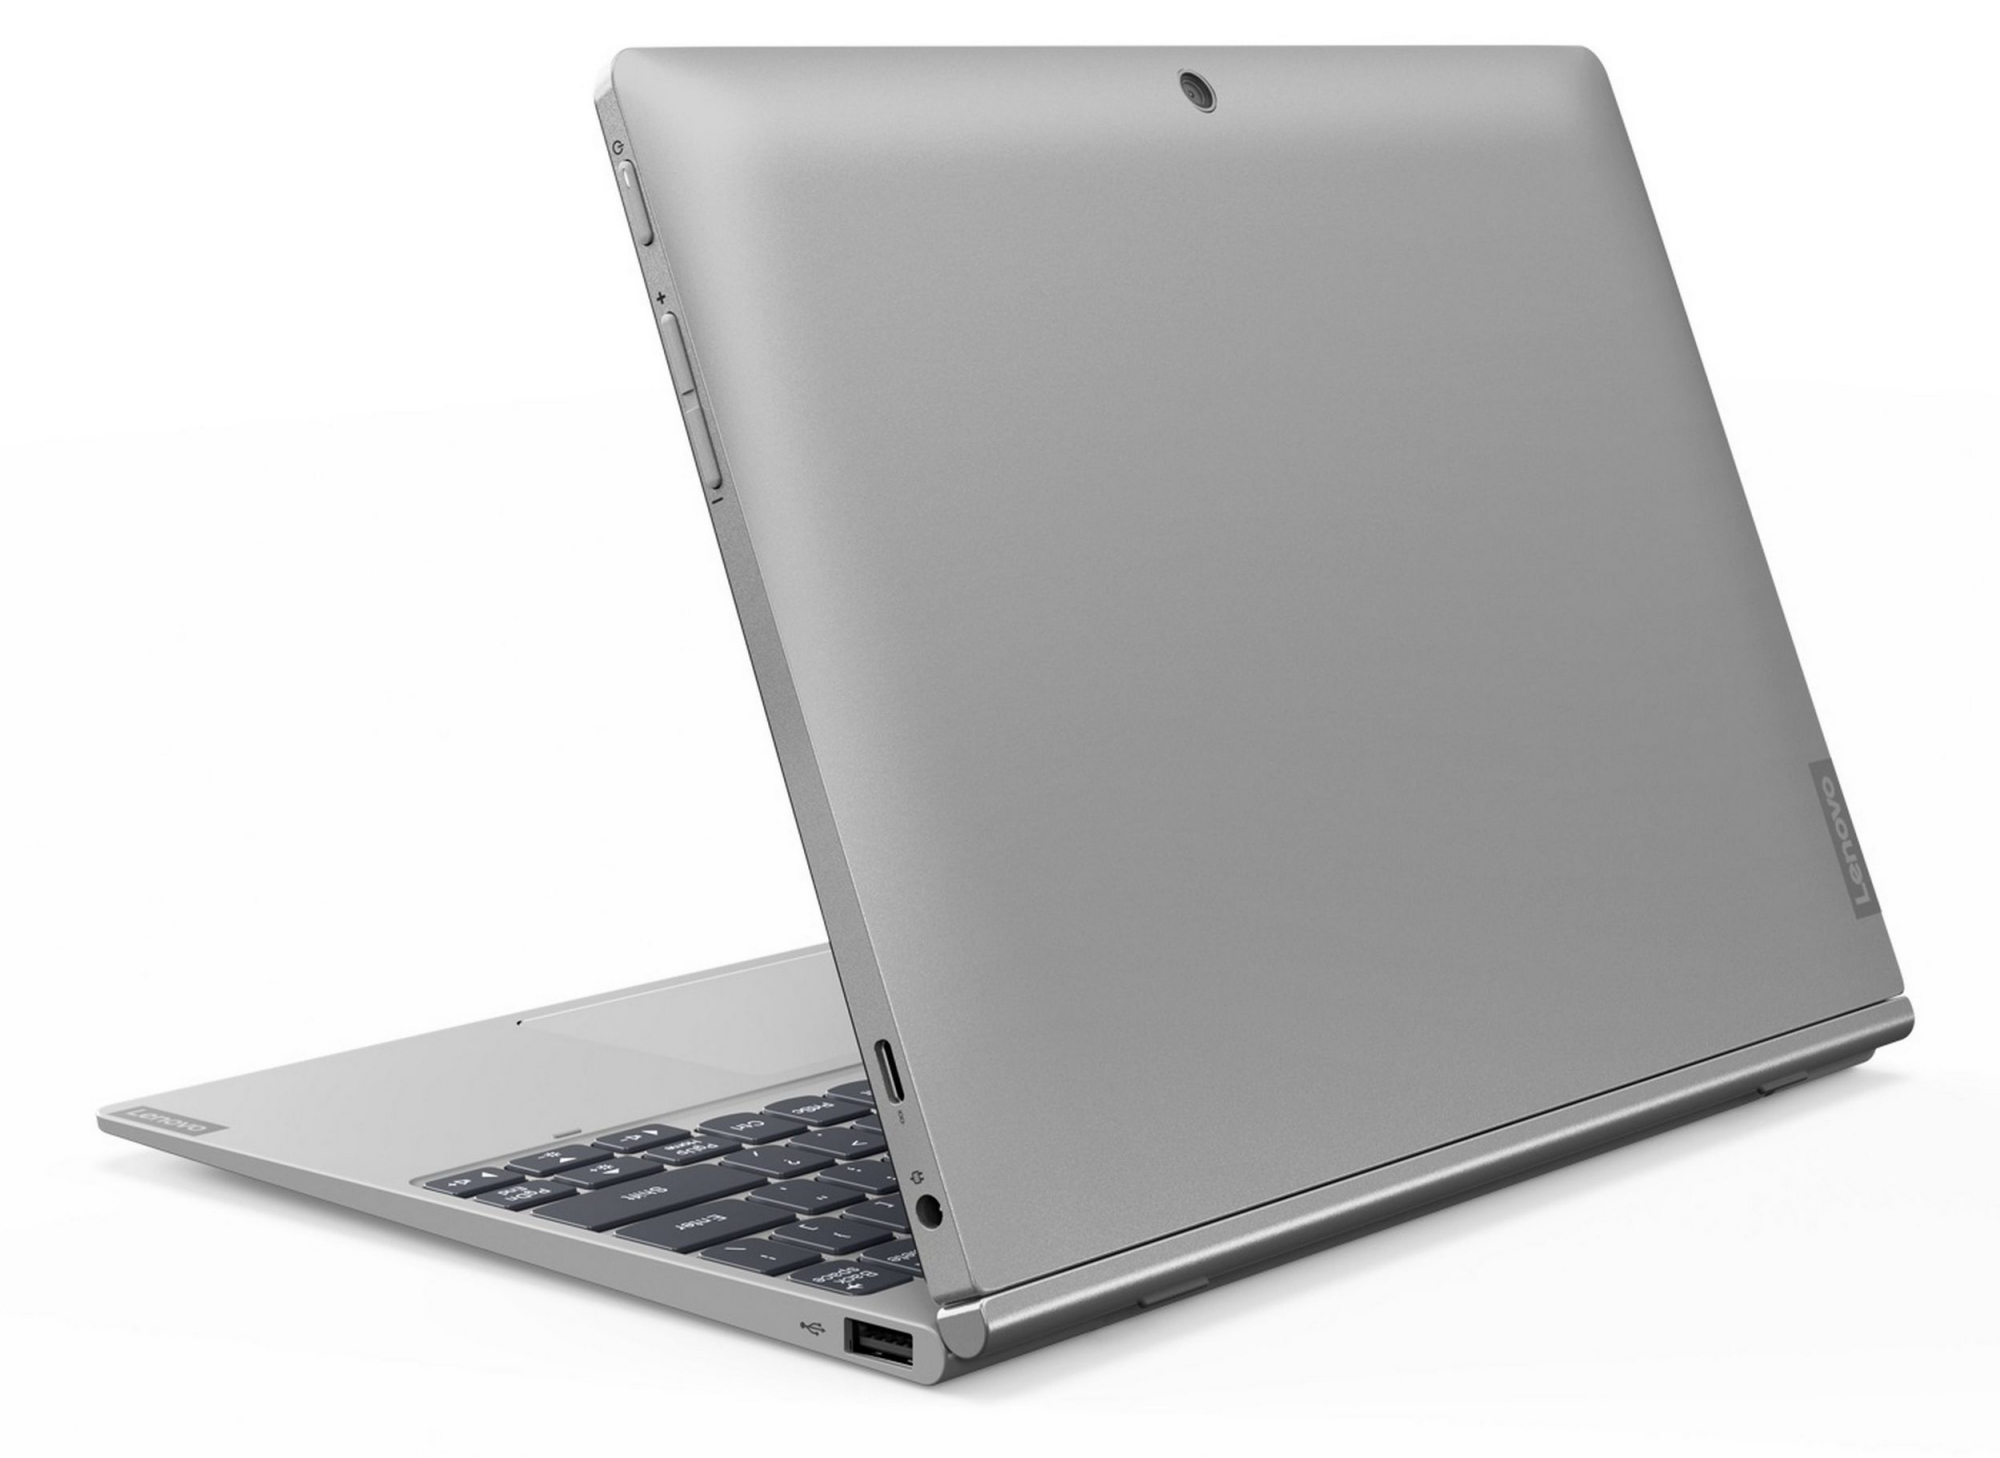
Lenovo has made the D330-10IGM from silver and grey plastic, so the device may disappoint fans of premium materials. The device is also heavier than our comparison devices that are made from metal alloys, with the tablet weighing 610 g and the keyboard 535 g for a combined weight of 1.145 kg. However, our test device is well-made with no processing-related defects. The tablet is sturdy too, but the keyboard lacks the rigidity of the tablet and is easily twisted.
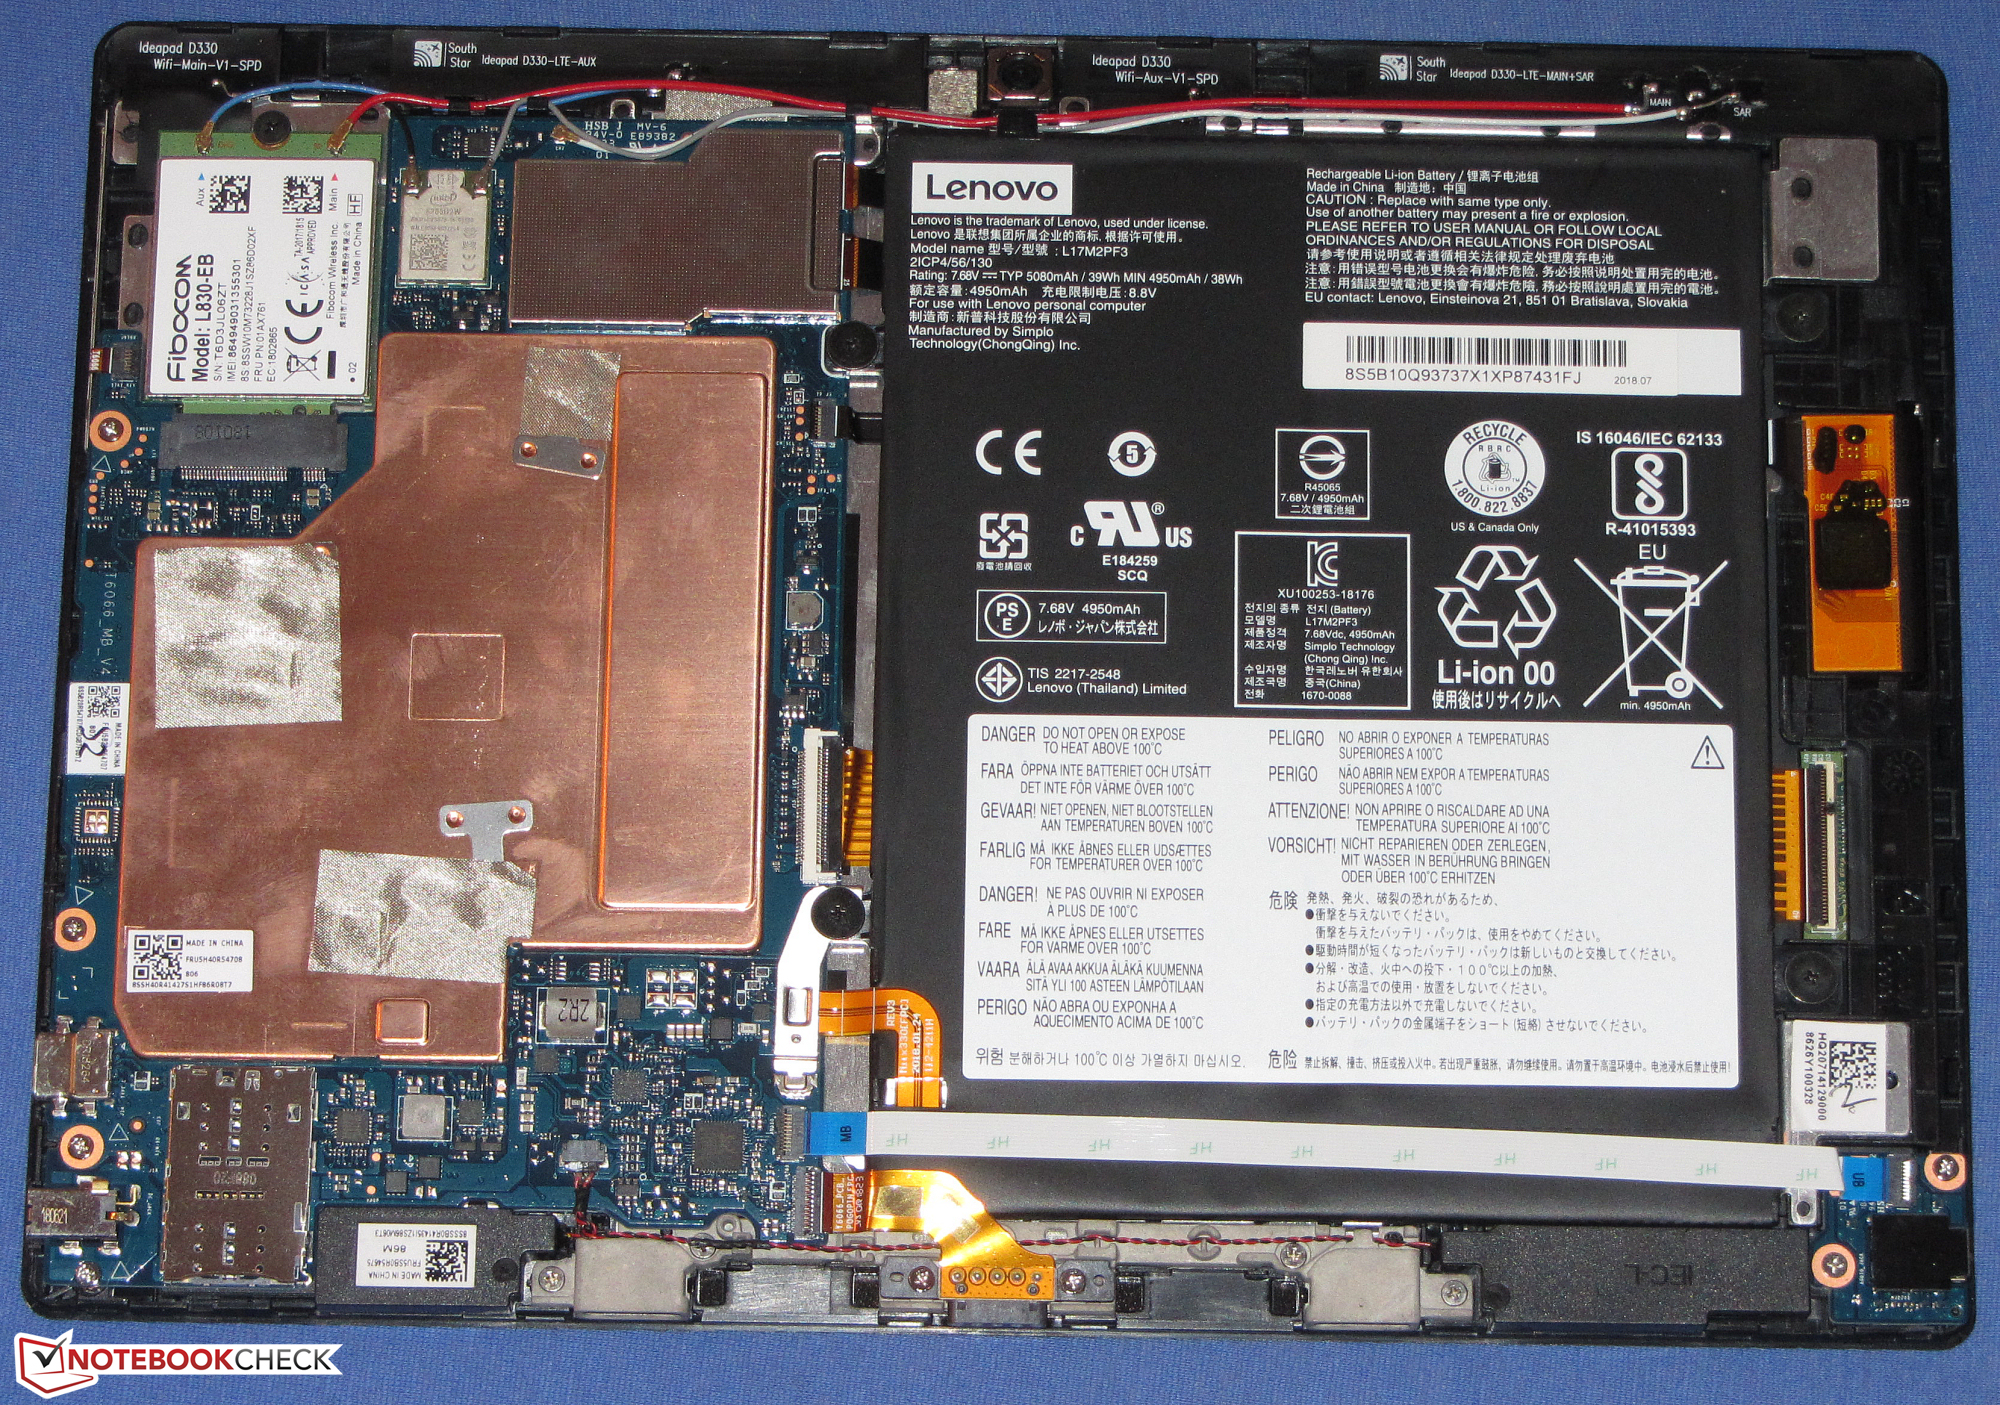
The D330-10IGM scores points for its maintainability too. The back of the tablet is only attached to the device with no glue or screws holding it in place. We managed to pry the case up with a flat plastic spatula or even a short thumbnail. We would stress taking care not to damage the display when removing the back case.
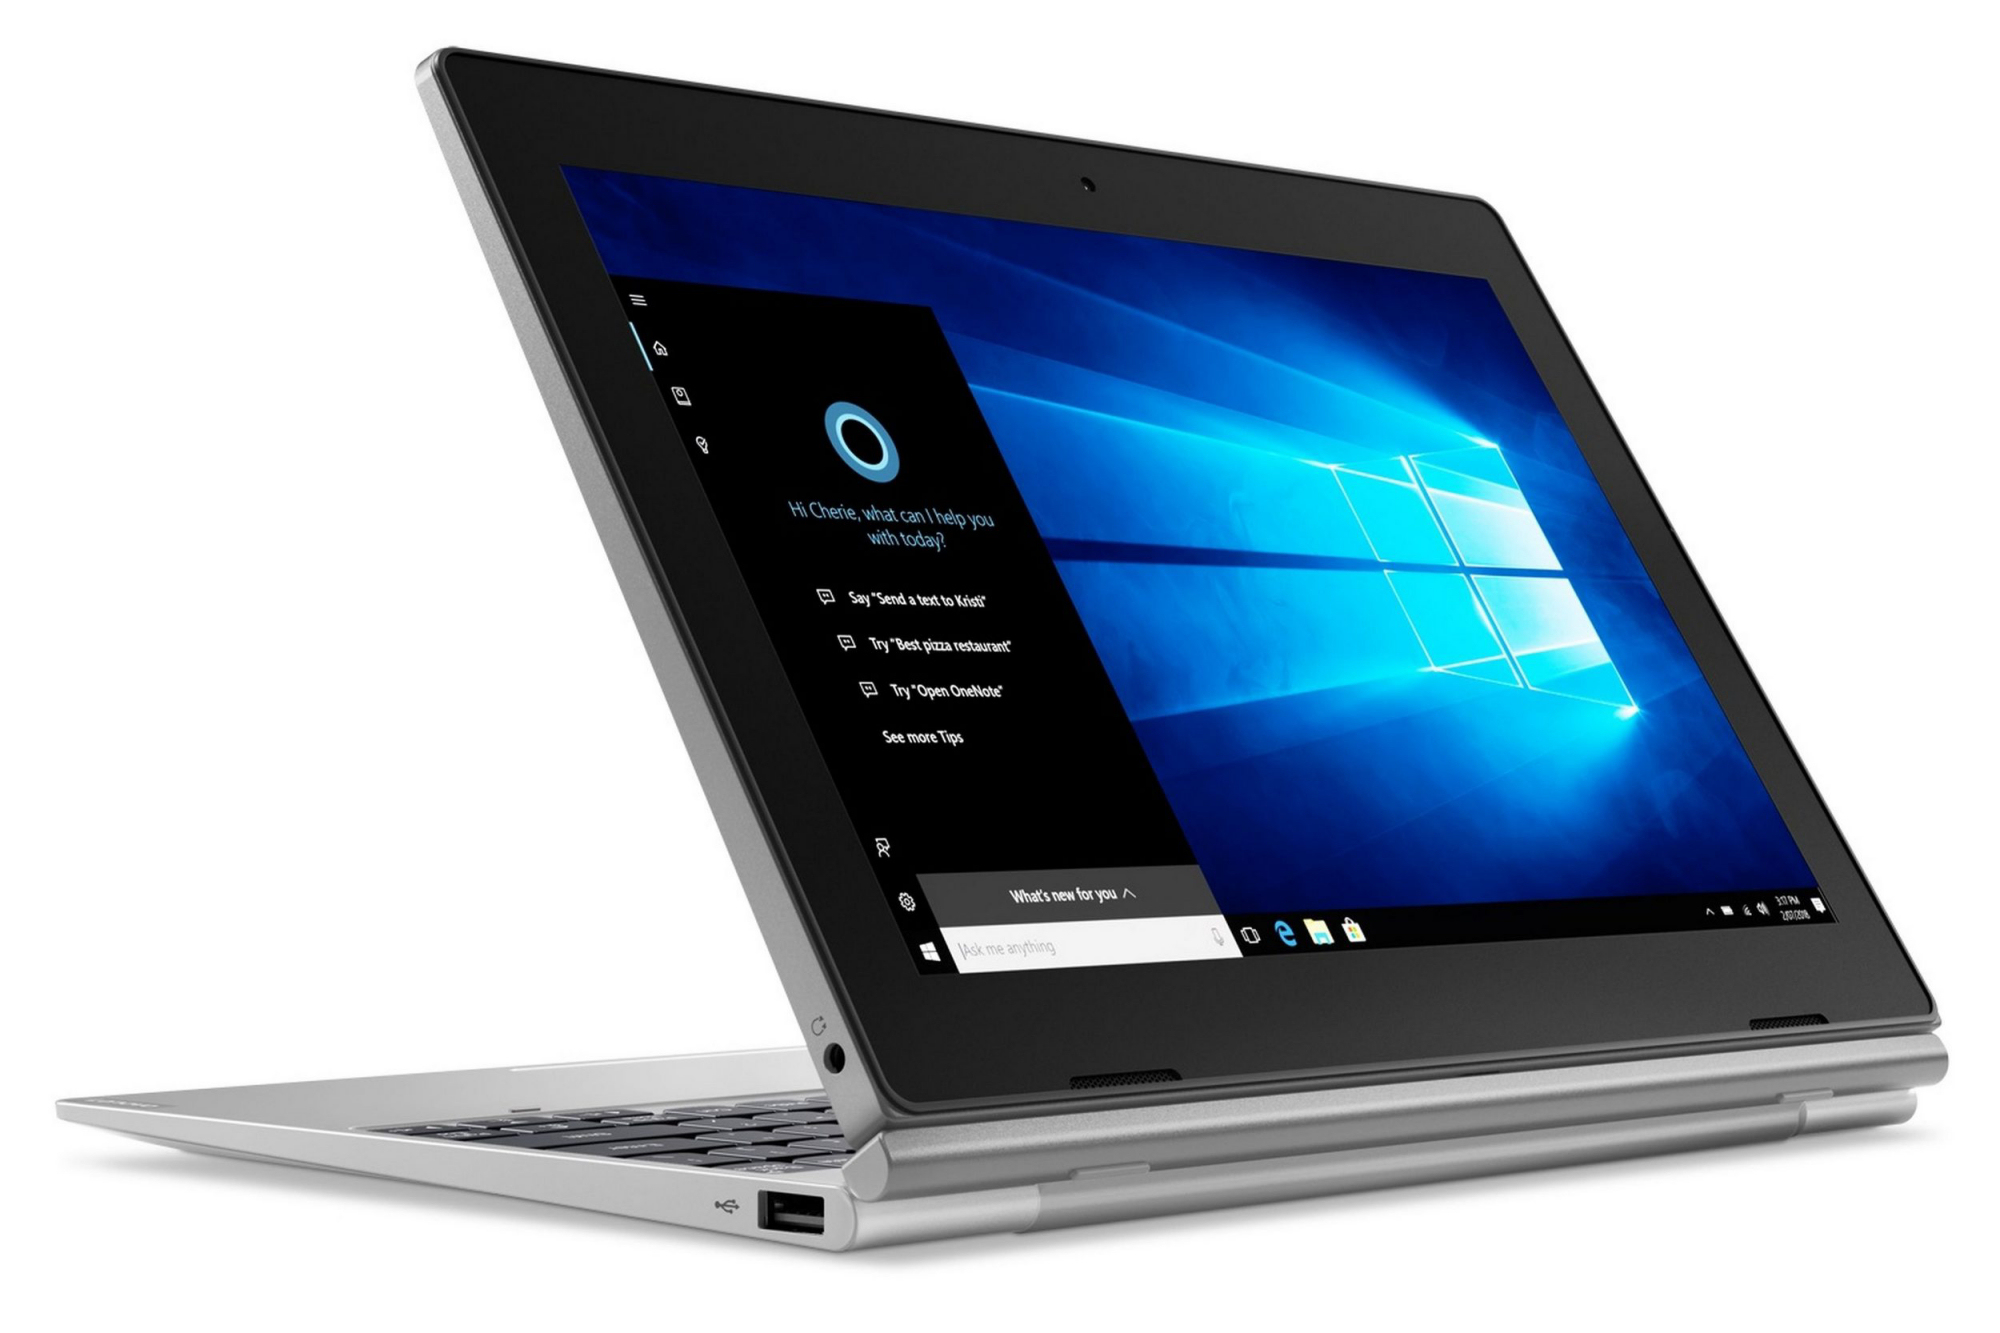
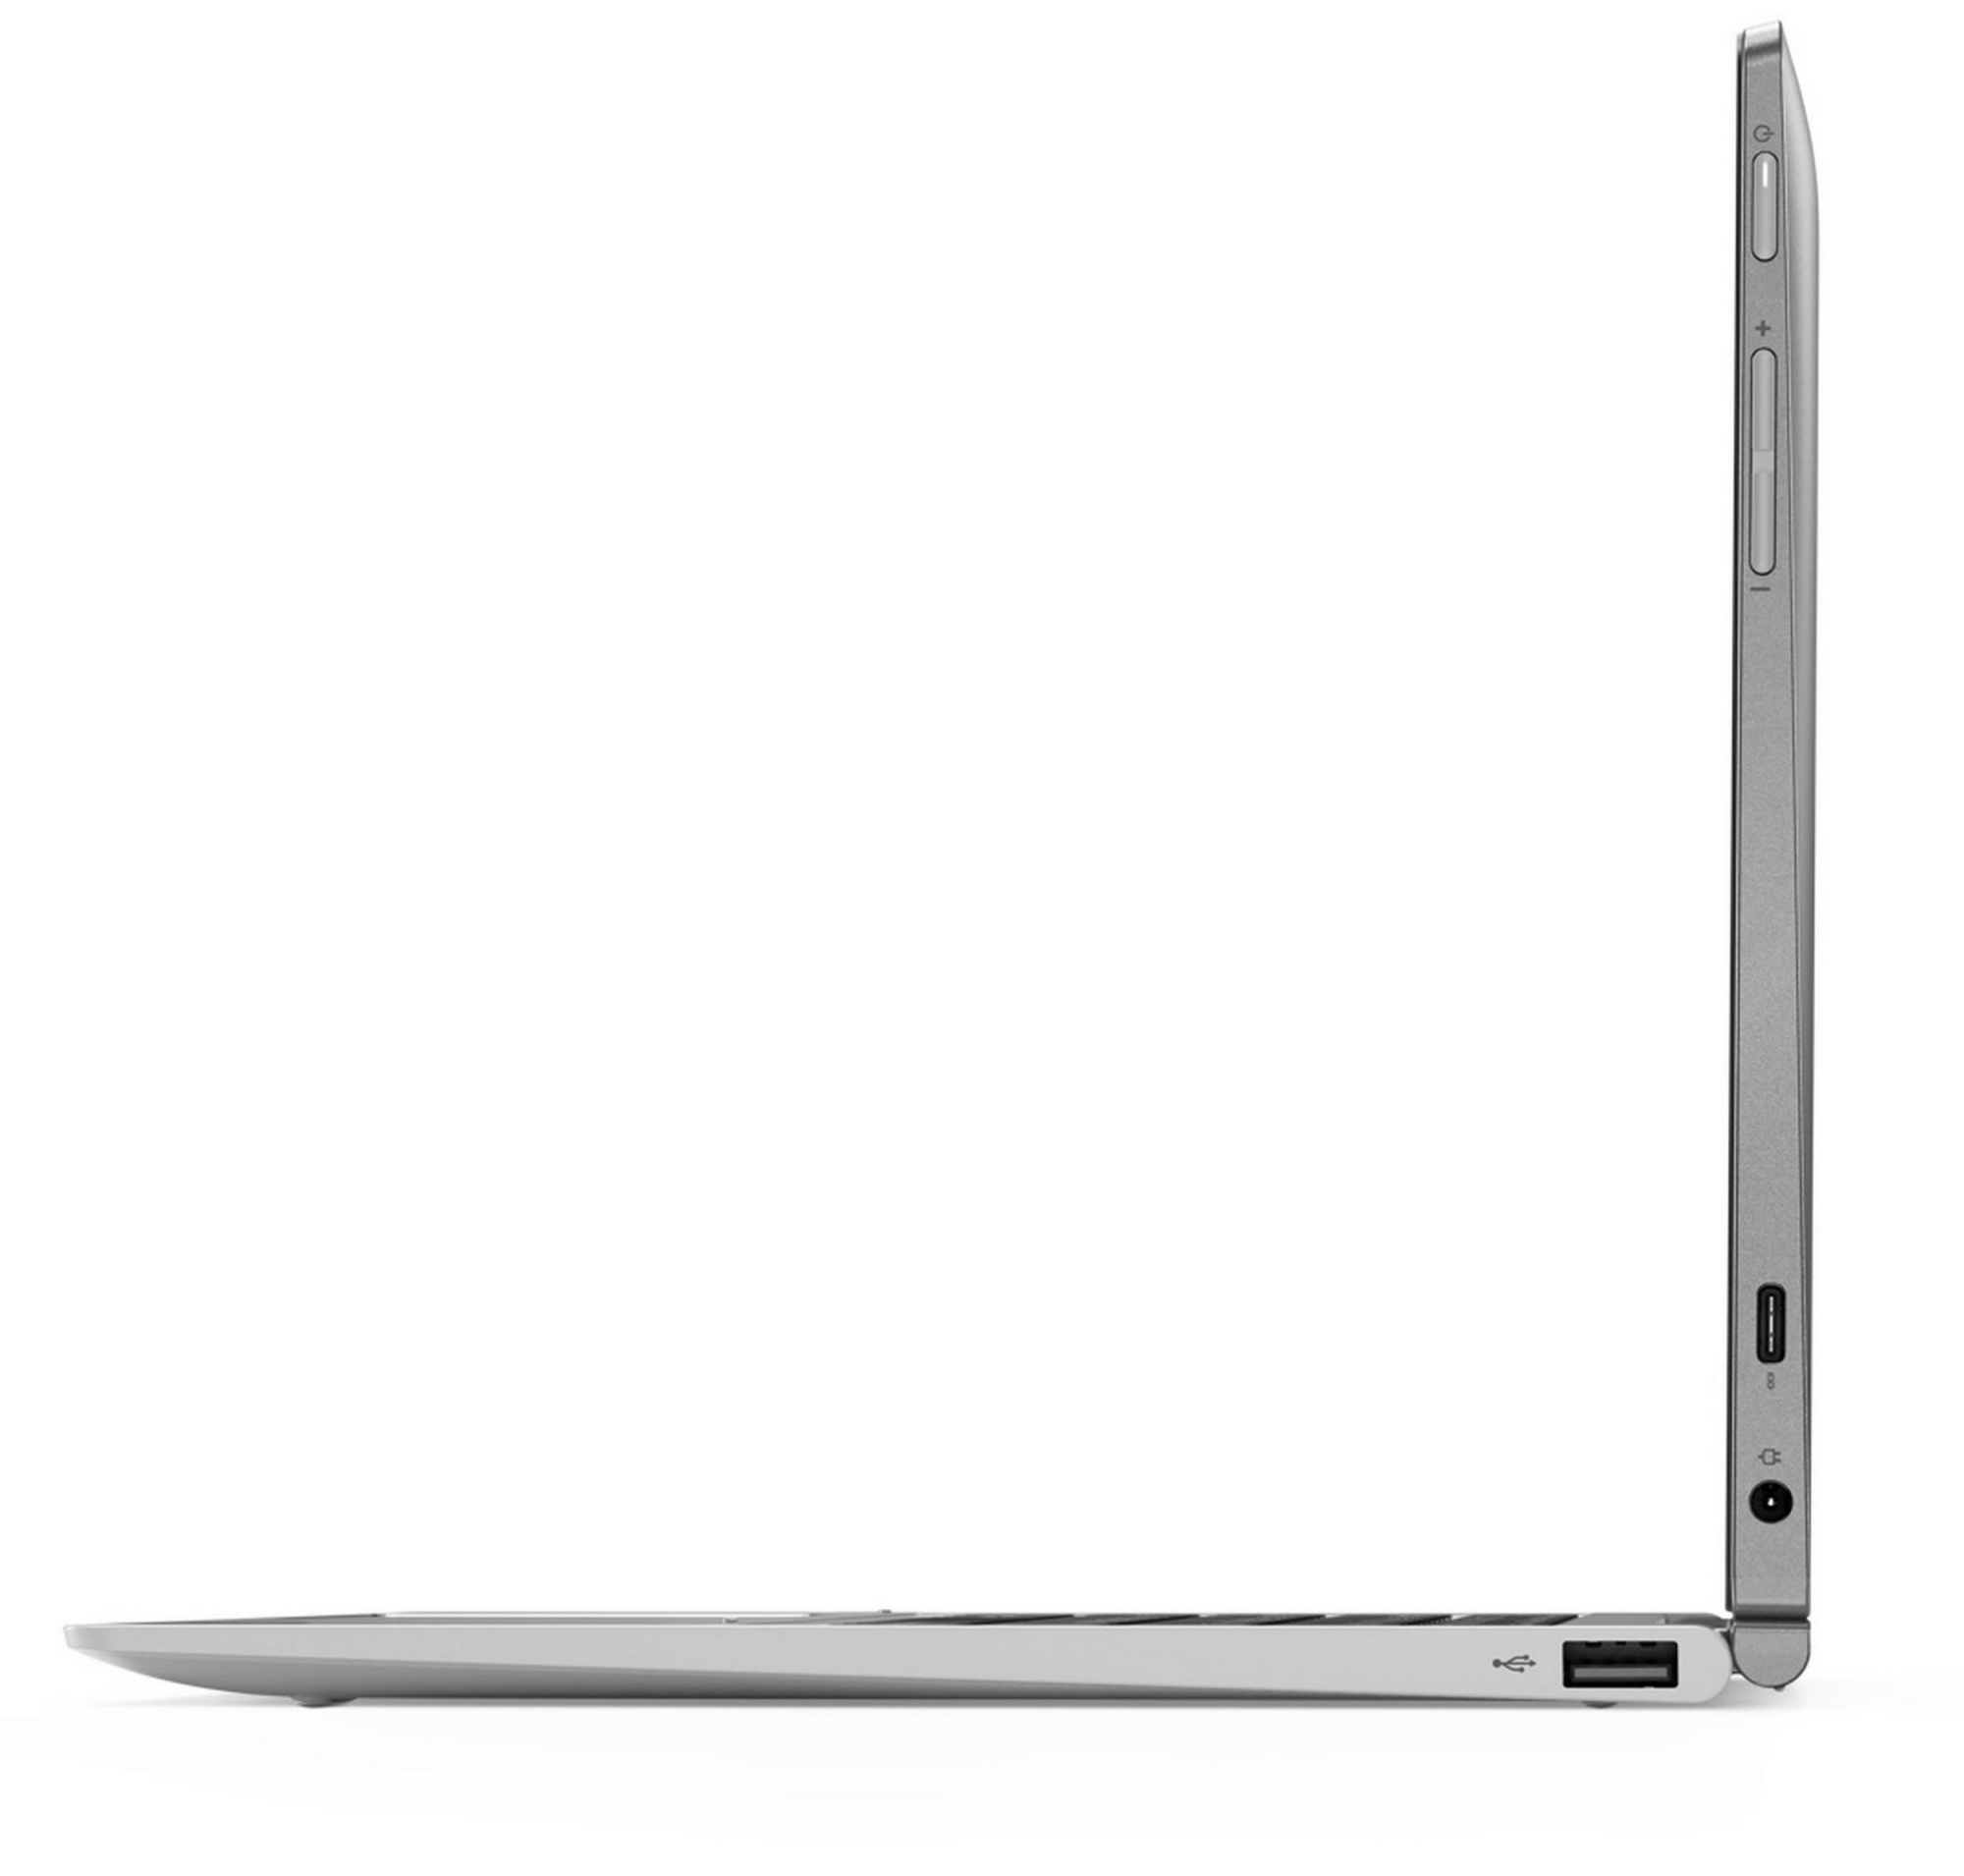
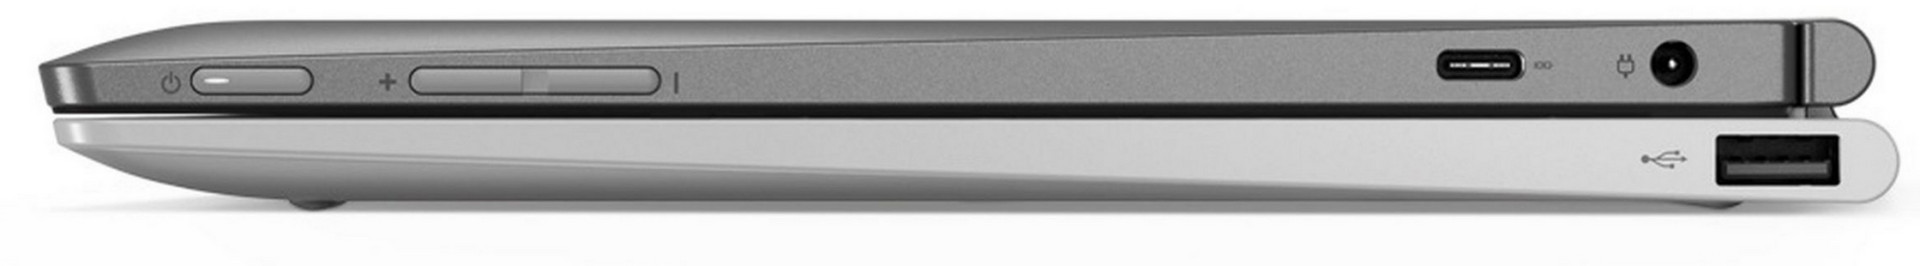
Lenovo has not blessed the D330-10IGM with ports. The tablet portion has a headphone jack and a single USB Type-C port, the latter of which is used for charging the tablet with the included power supply. The ports can be used to transfer data, video and to connect peripherals to the tablet with the appropriate adapter.
The tablet also has a conventional barrel-shaped charging port, the power supply for which Lenovo did not include with our test device. Theoretically, you could charge the entire device from the port on the keyboard having connected an external monitor to the USB Type-C port. With that said, it would have been more useful had Lenovo equipped the D330-10IGM with a second USB Type-C port rather than a proprietary charging port.
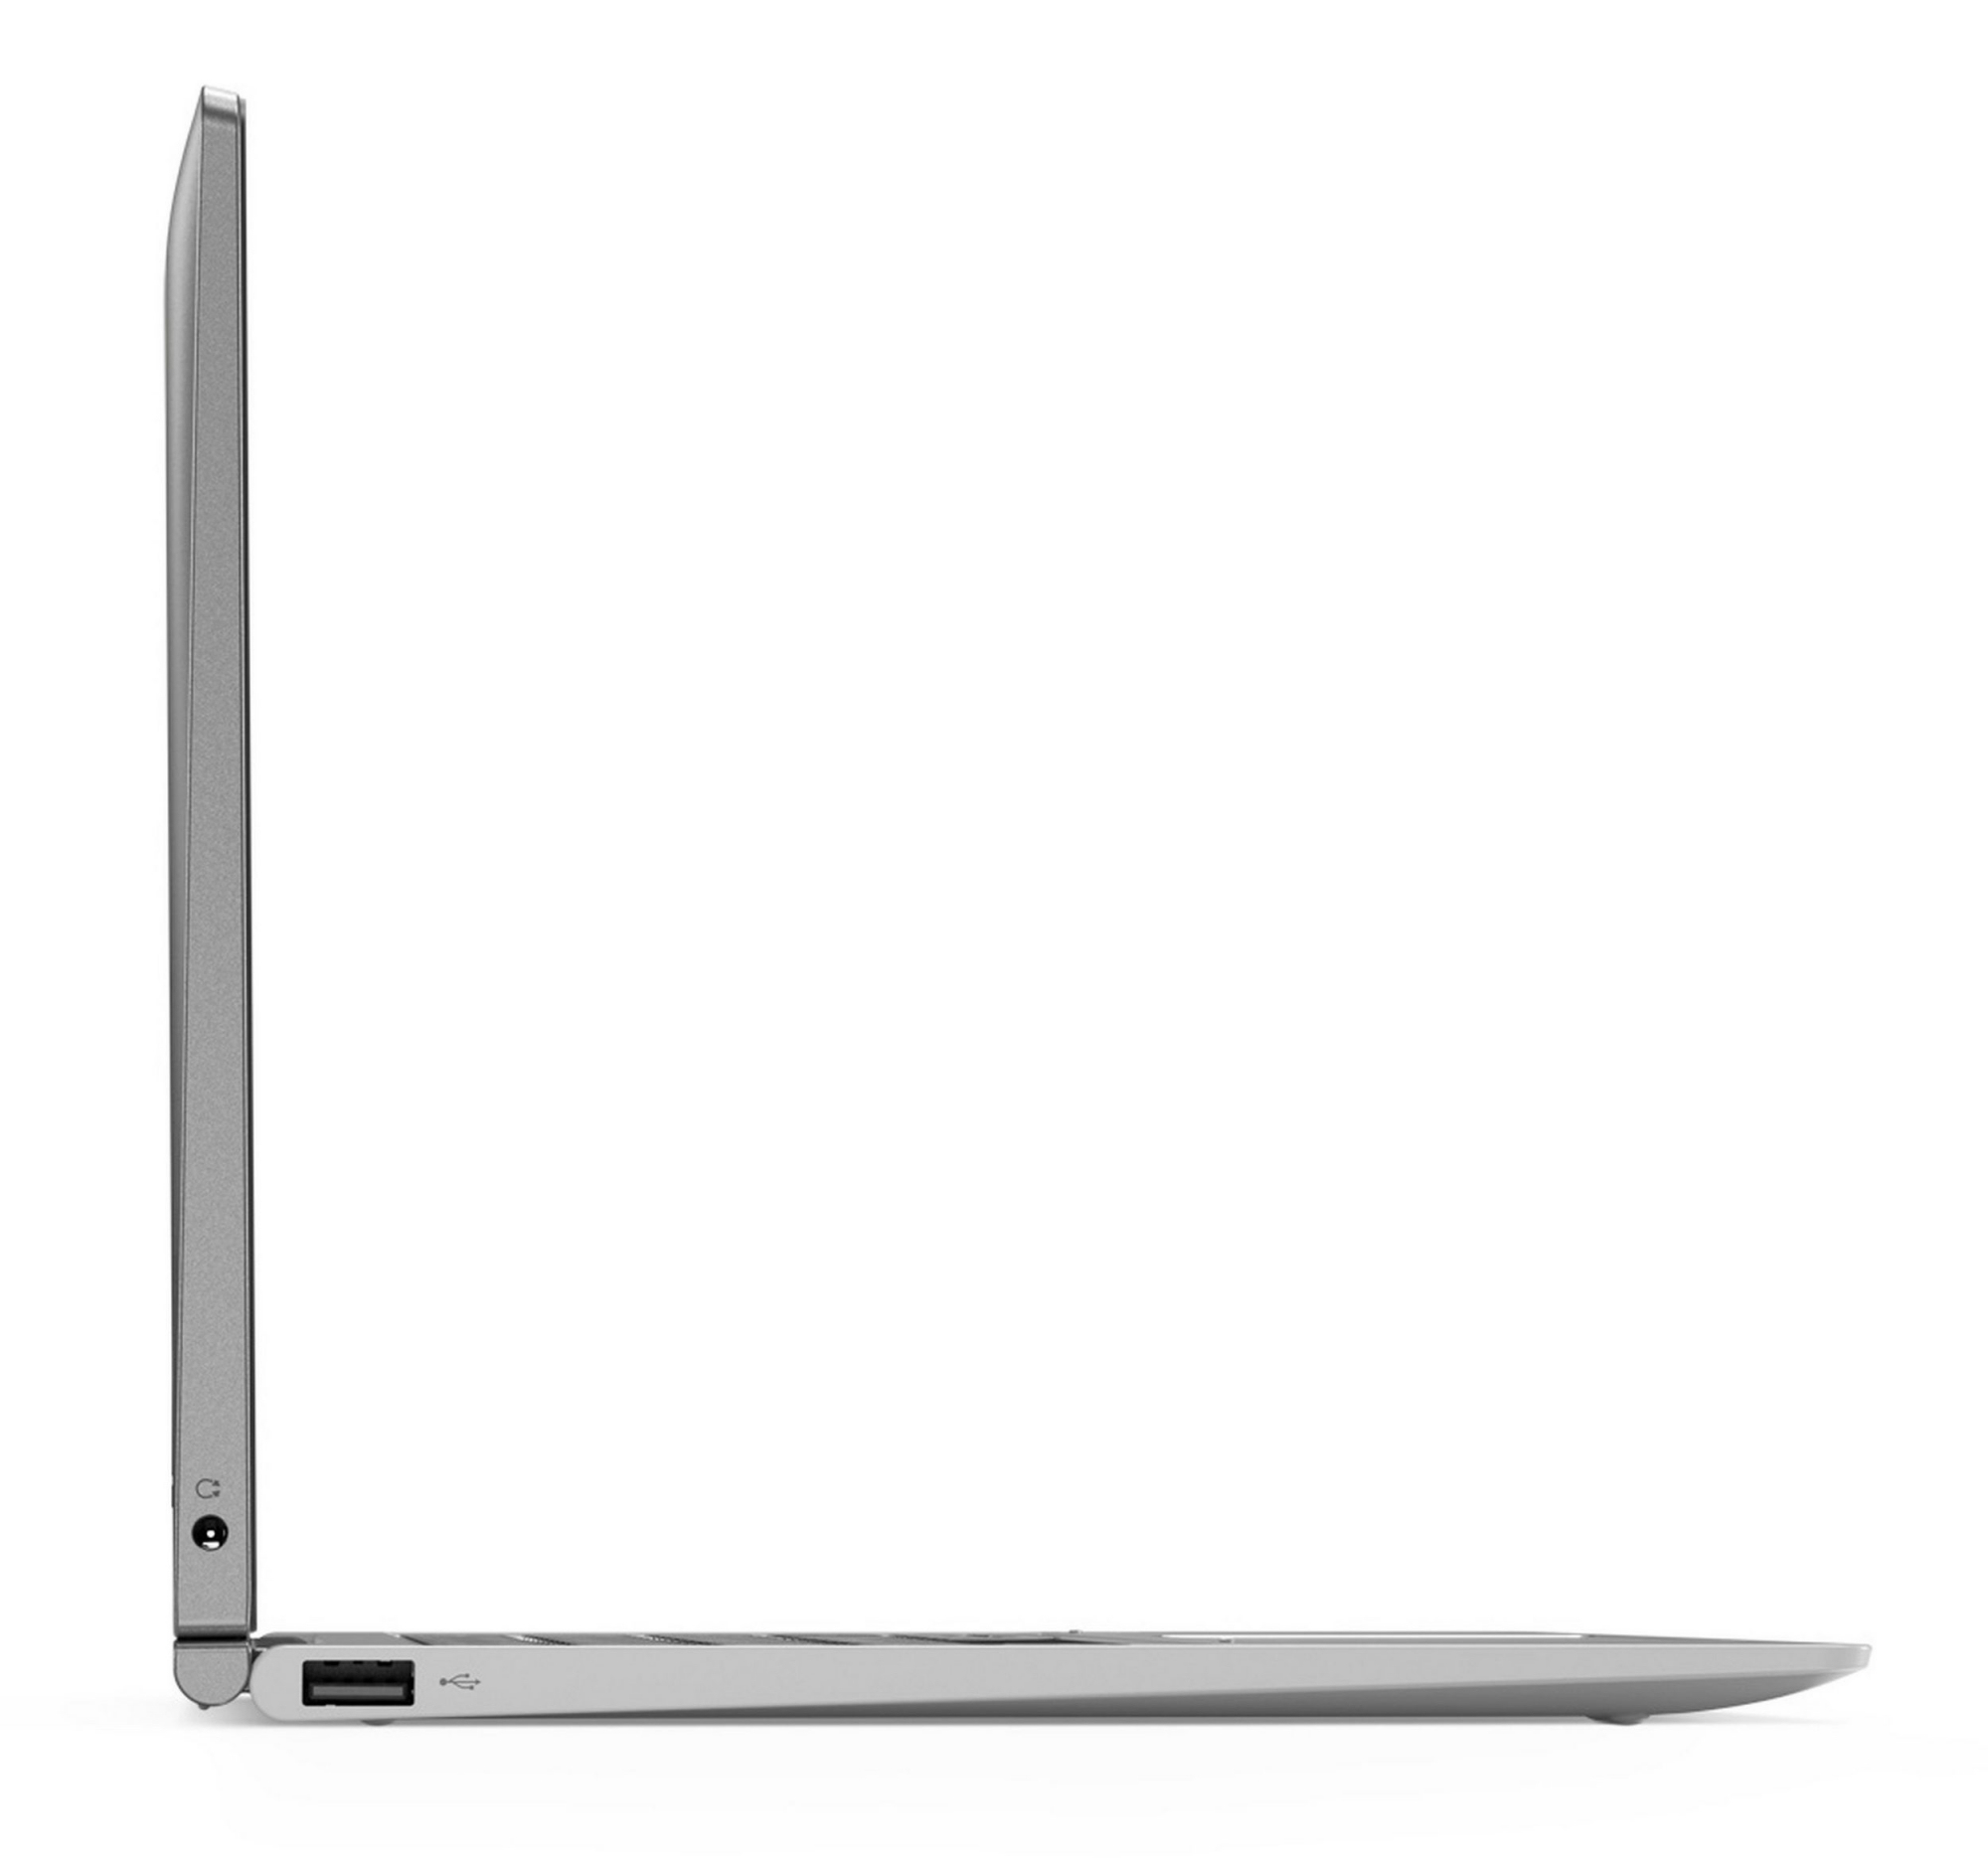
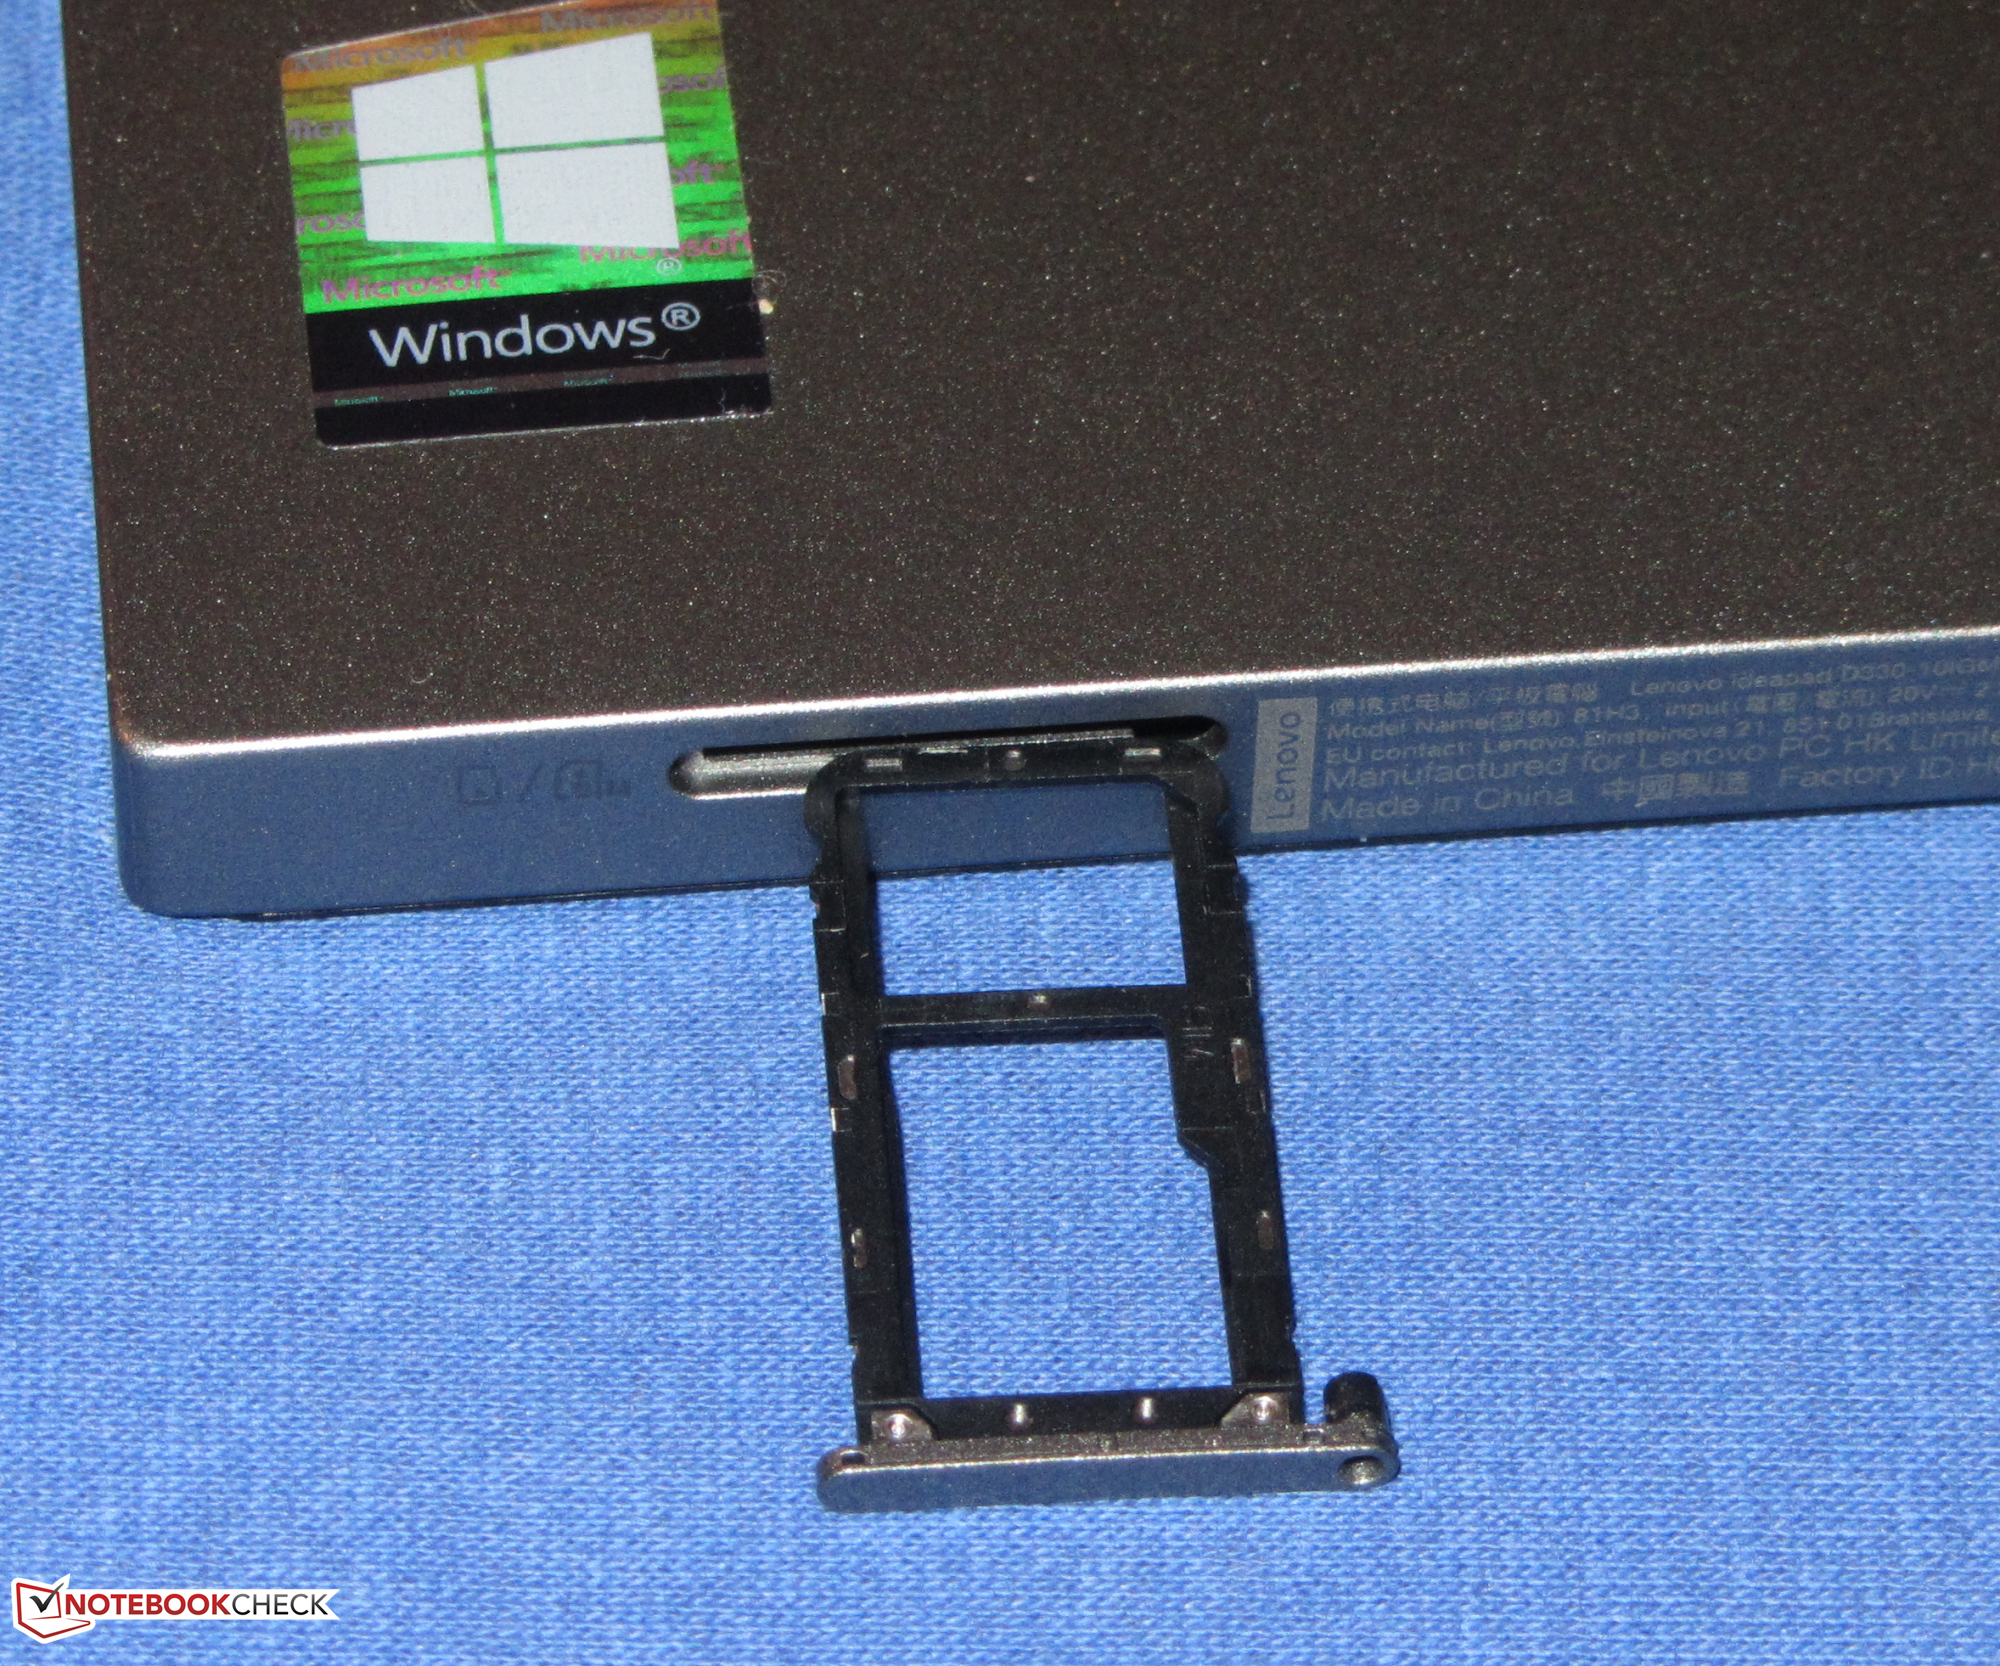
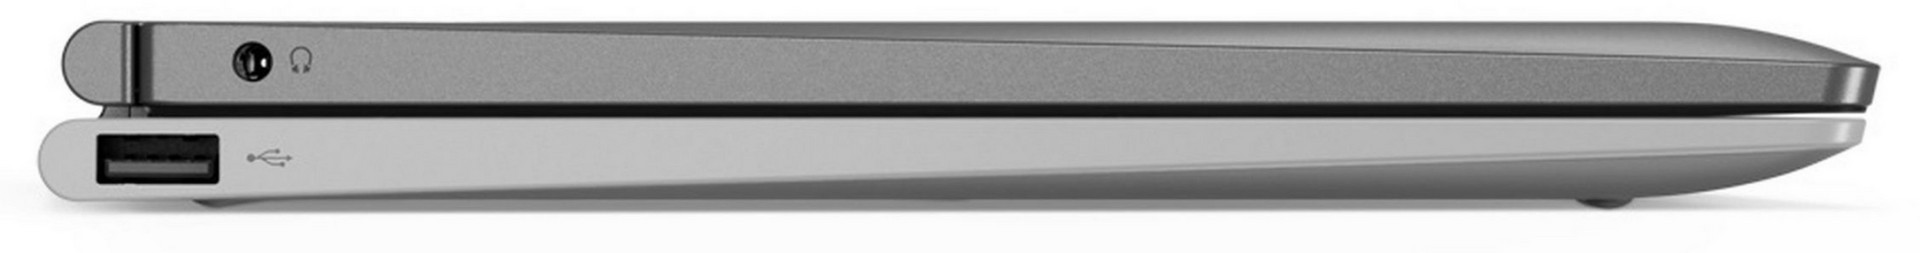
The detachable keyboard has two USB Type-A ports. Incomprehensibly, these are USB 2.0 ports, which are considerably slower than USB 3.1 Gen 1. Lenovo has included a microSD card slot too, which is located with the SIM-card tray on the underside of the tablet.
The D330-10IGM has an Intel Dual Band Wireless-AC 8265 modem, which supports IEEE 802.11 a/b/g/n and, as the name suggests, ac Wi-Fi. Transfer speeds are comparatively good too when we tested the device next to our reference router and with no other devices near our unit.
Lenovo offers an LTE modem for certain variants, of which our test device is one. The associated SIM-card slot accepts nano-SIMs.
Connectivity


Input Devices & Operation
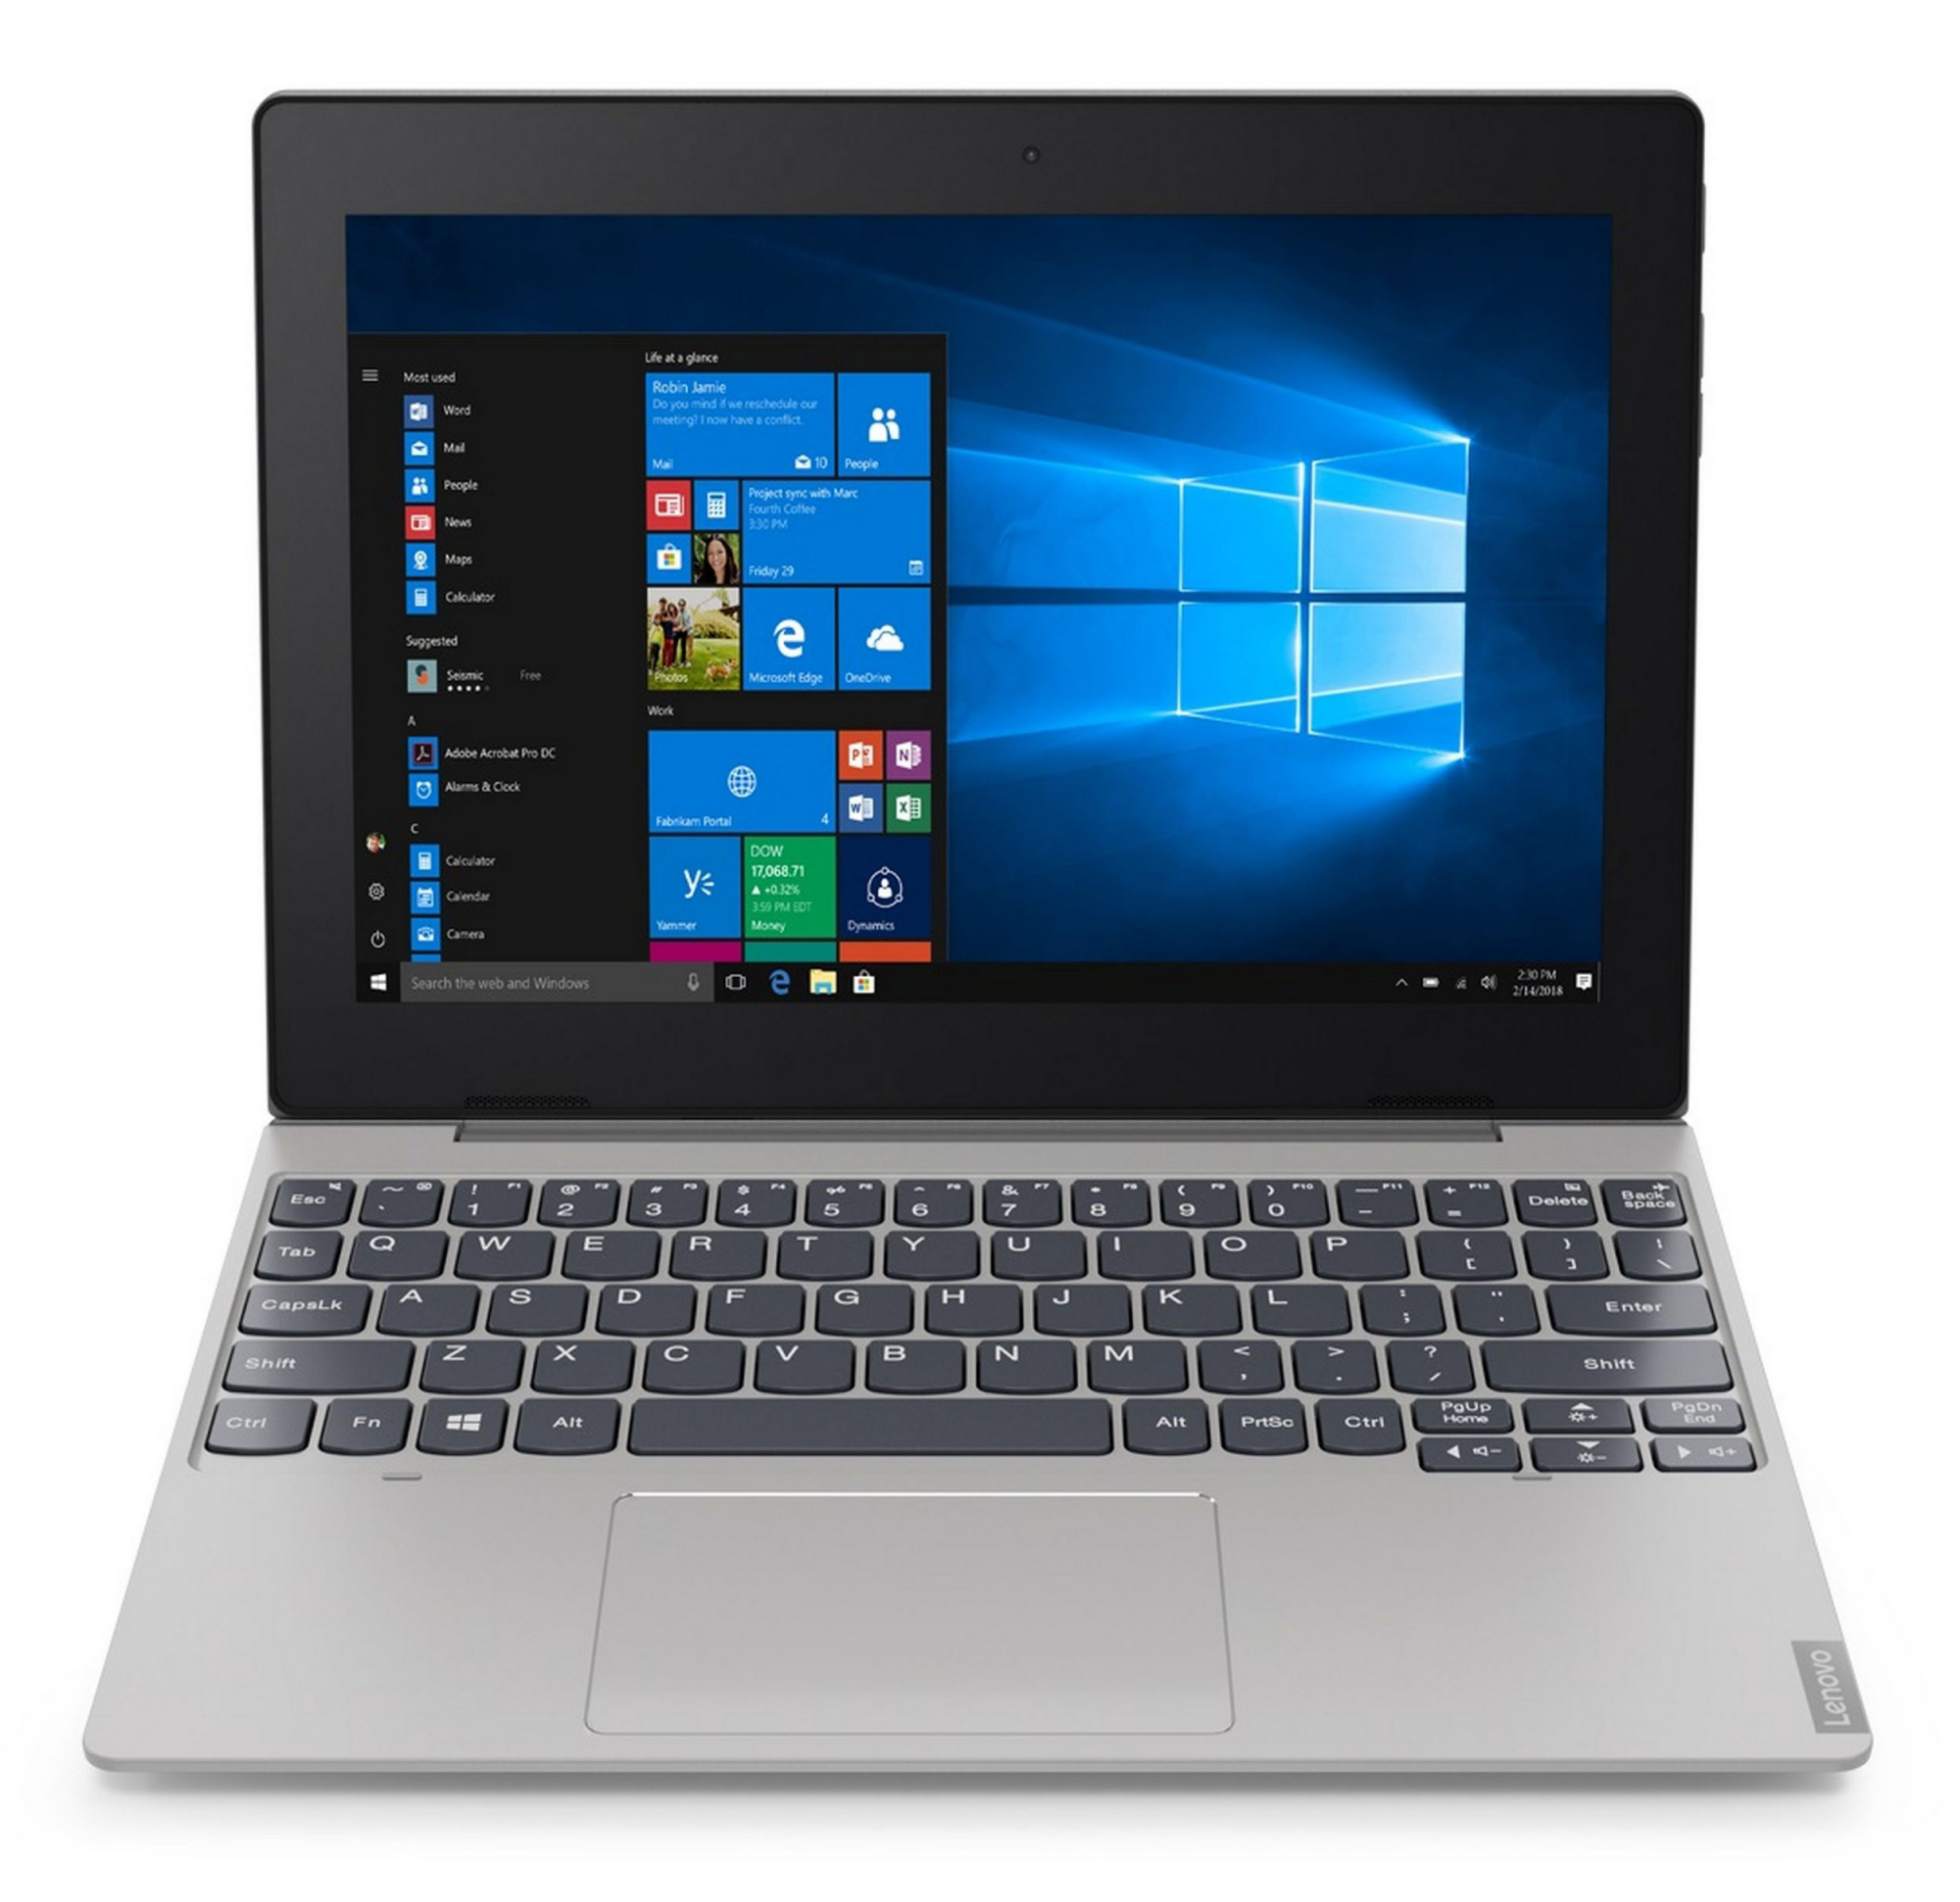
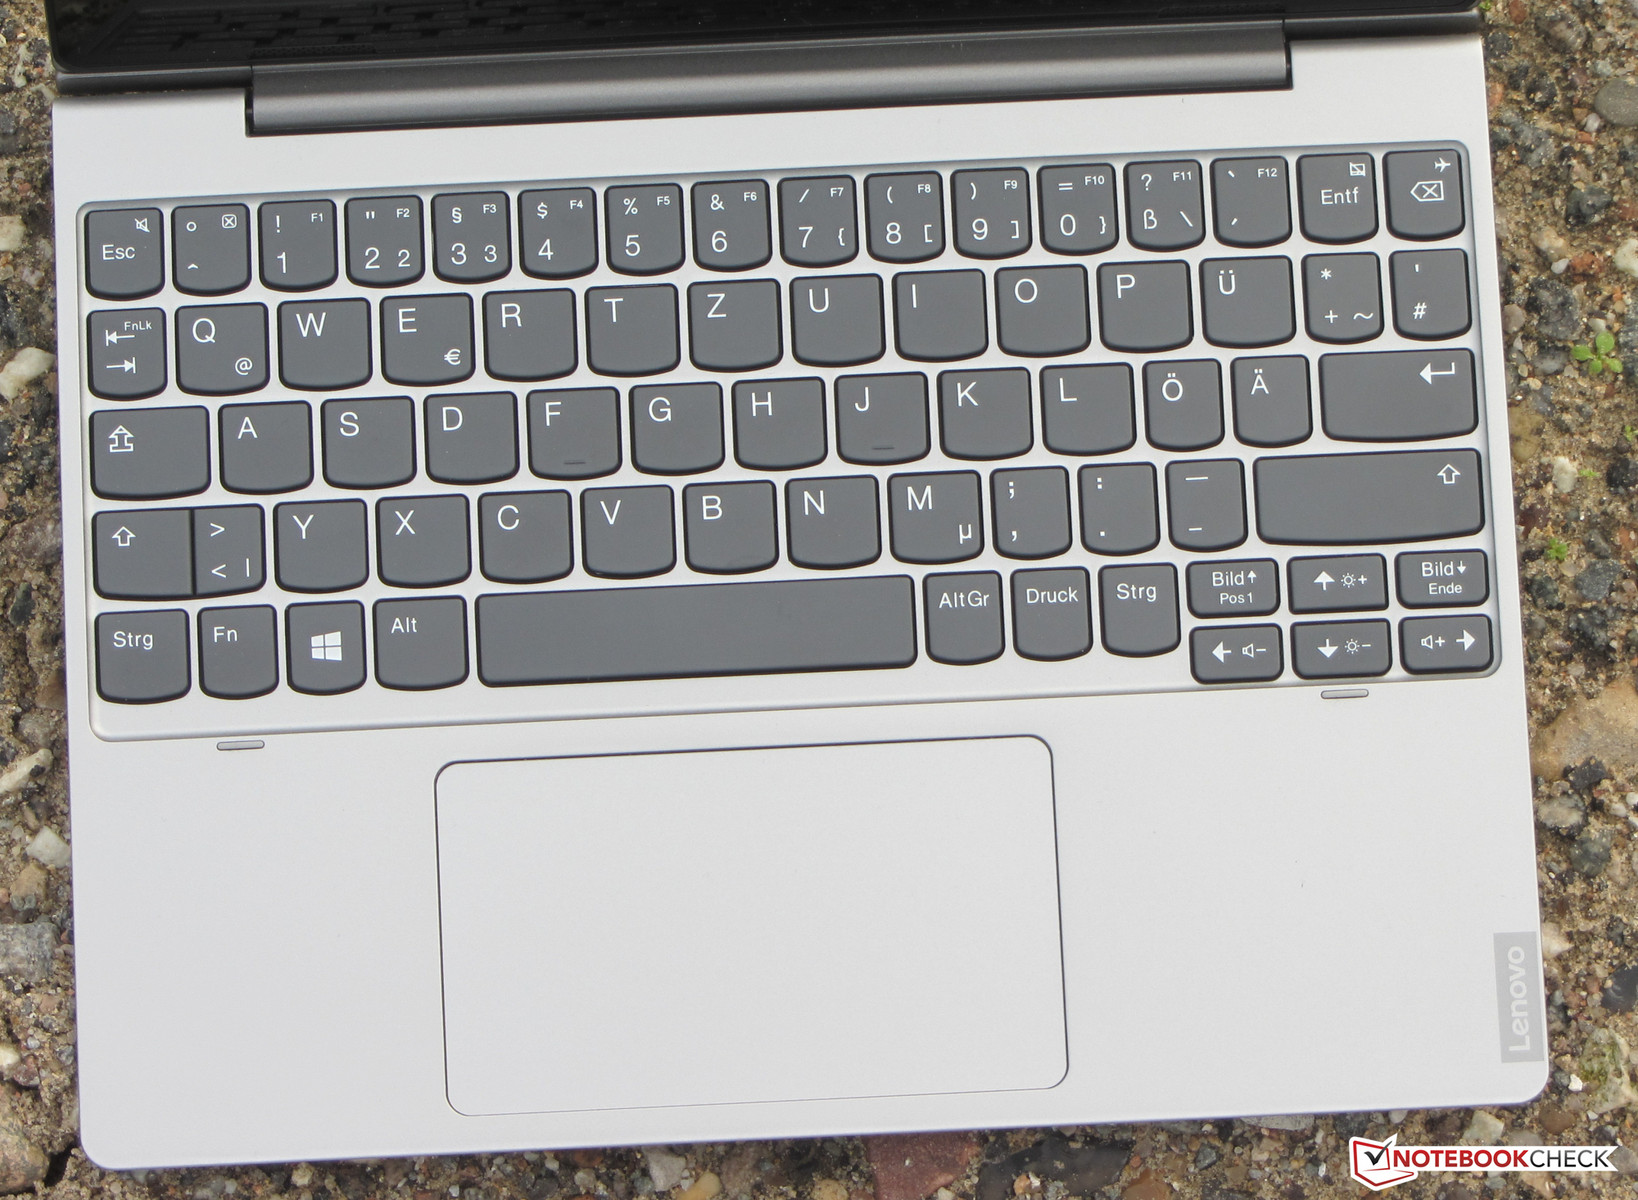
The D330-10IGM has a chiclet keyboard that has slightly roughened, flat keys that have a clear pressure point. The key resistance should be crisper, but that is a matter of taste. Overall, Lenovo has equipped the device with a decent keyboard for home use, but the lack of backlighting is frustrating.
The device has a multi-touch trackpad too, which measures around 10.5 x 6 cm. The trackpad is large enough for performing multi-finger gestures and its smooth finish makes it easy to move our fingers across its surface. Lenovo has integrated two mouse buttons in the bottom portion of the trackpad, which have a short stroke and a tangible pressure point that is clearly audible.
The tablet has a 10-point multitouch touchscreen that accurately and precisely reproduced our inputs throughout testing. The D330-10IGM also supports pen input according to Lenovo’s website. Our test device’s manual confirms this, stating that the D330-10IGM supports the Lenovo Active Pen 1 and the Lenovo Active Pen 2. The latter supports Bluetooth and 4,096 levels of pressure, which is double the level that the Active Pen 1 has. Our test device came with no pen in the box, but Lenovo currently sells the pens on its US website for $31.99 and $55.99 respectively. The company's UK site lists the Active Pen 1 for £39.60 and the Active Pen 2 for £74.99.
We did not have any Lenovo pens on hand during testing, so we used two third-party active pens instead. A pen by Hama functioned without issue, but it has no pressure levels. Writing and sketching worked well though. Unfortunately, Wacom’s Bamboo Ink pen did not work with our test device.
Display

The D330-10IGM has a 10.1-inch IPS display that runs at a 1920x1200 native resolution and in a 16:10 aspect ratio. X-Rite i1Pro 2 determined that our test device’s display has 0.41 cd/m² black value and a 905:1 contrast ratio, which is good for a device at this price. The display gets bright too with a maximum luminosity of 389 cd/m² at the centre of the panel and an average maximum brightness of 376.4 cd/m². This corresponds with a 91% uniformly lit display, which is more even than most of our comparison devices. However, the D330-10IGM has a worse contrast ratio and maximum brightness value than most of our comparison devices. Positively, we could not measure any pulse-width modulation (PWM) display flickering, which can cause eye strain and headaches for some people.
| |||||||||||||||||||||||||
Brightness Distribution: 91 %
Center on Battery: 389 cd/m²
Contrast: 905:1 (Black: 0.43 cd/m²)
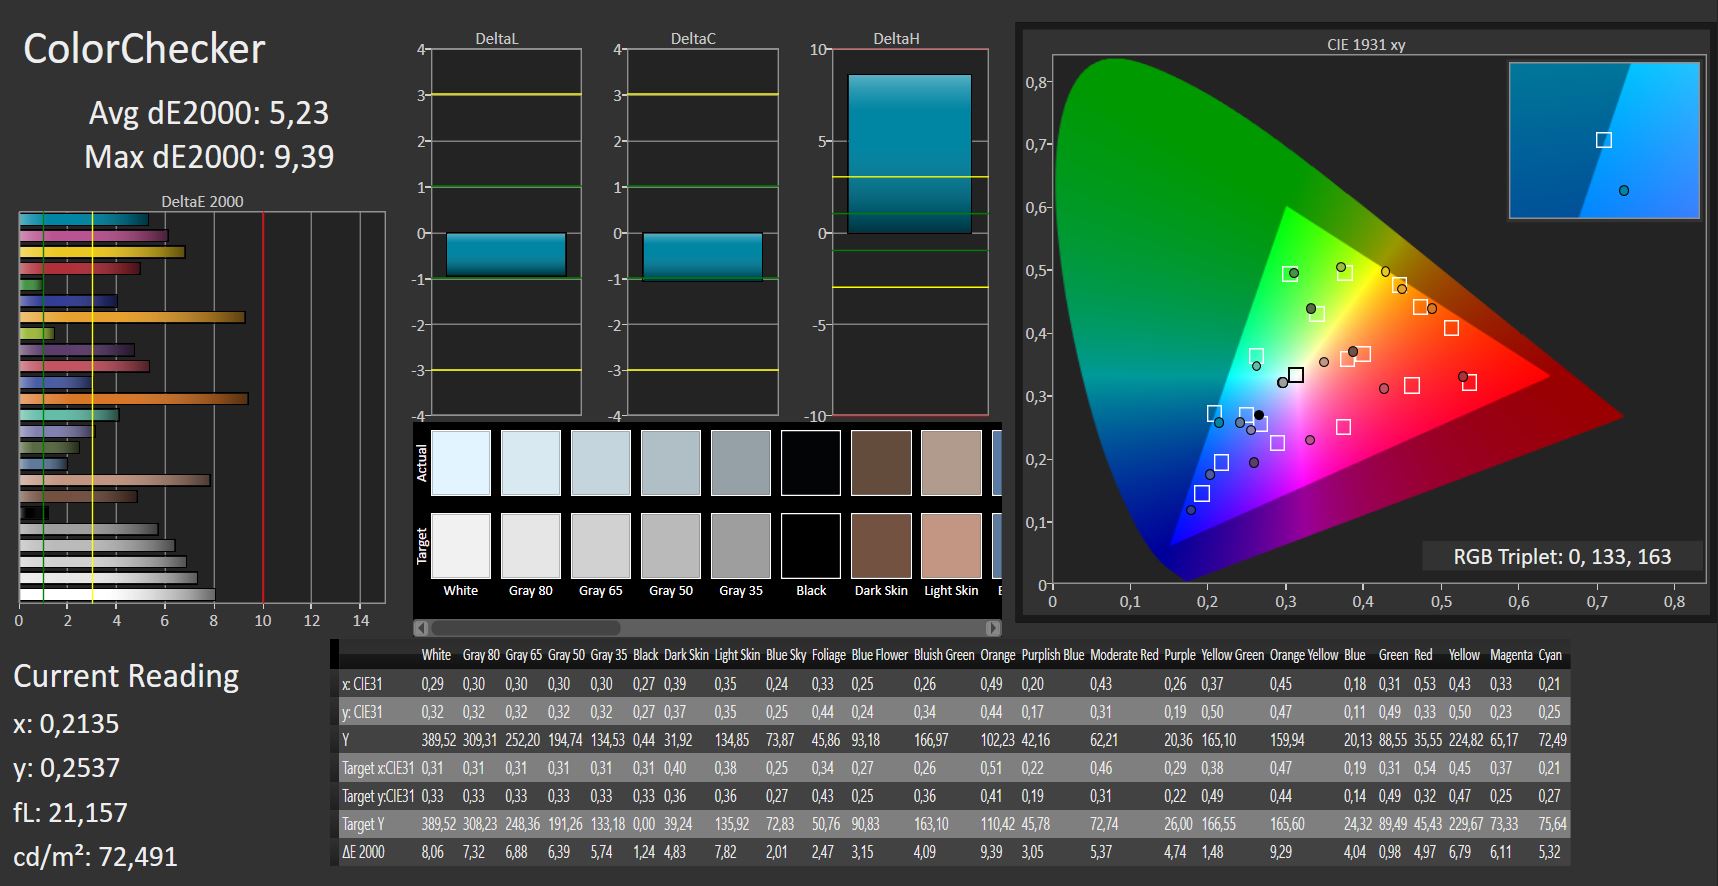
ΔE ColorChecker Calman: 5.23 | ∀{0.5-29.43 Ø4.73}
calibrated: 1.99
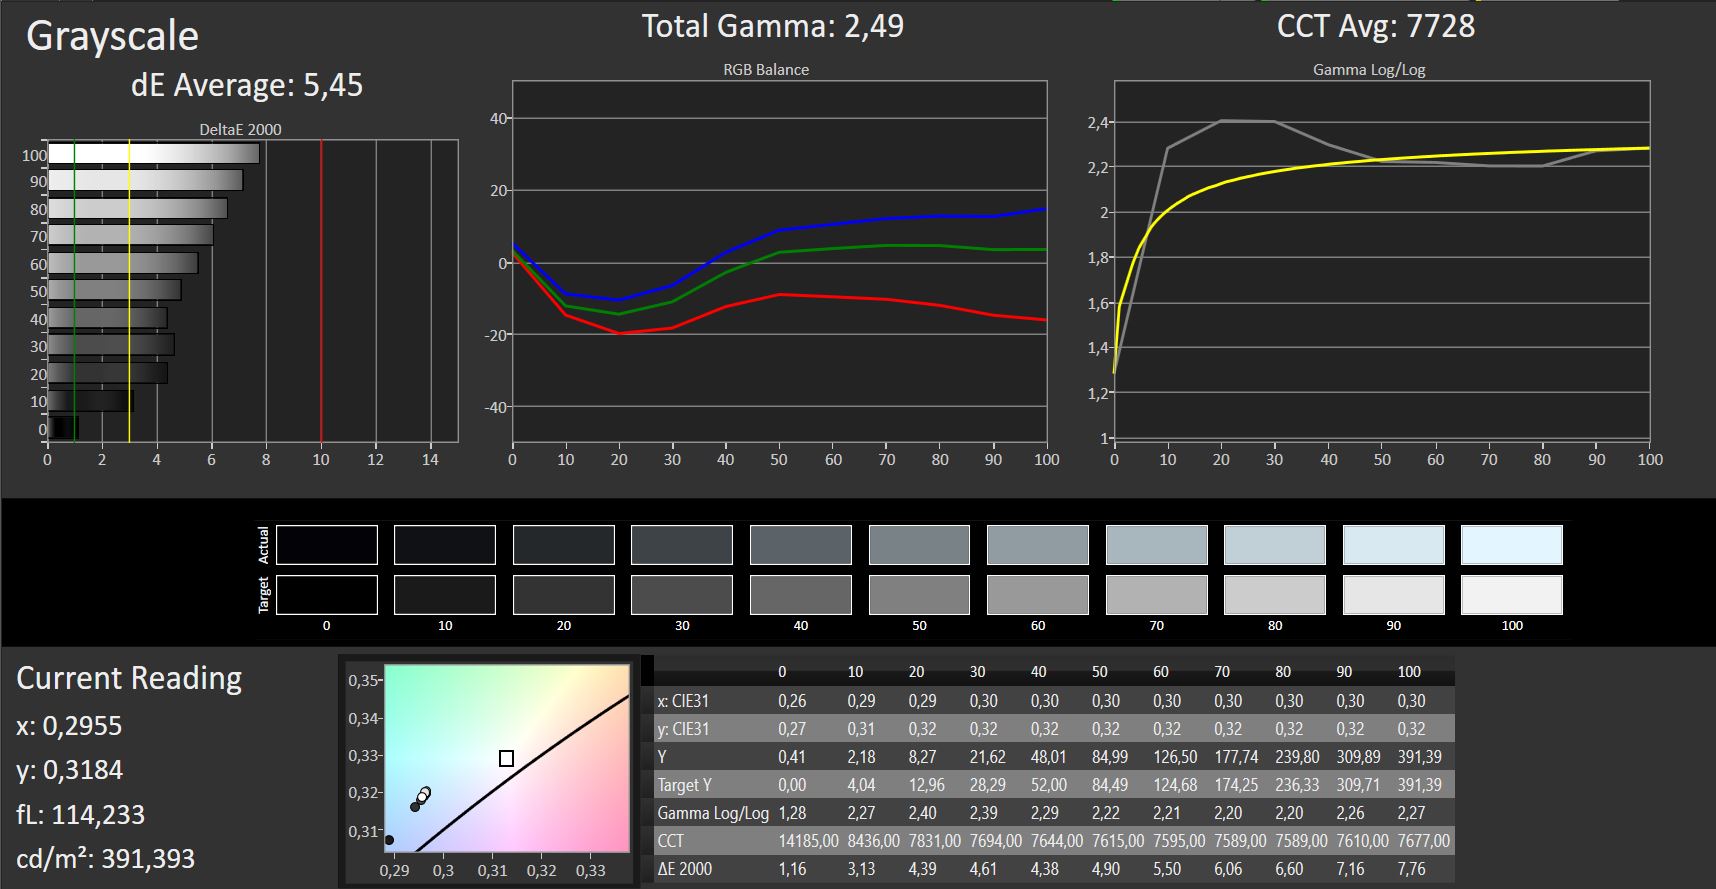
ΔE Greyscale Calman: 5.45 | ∀{0.09-98 Ø4.97}
81% sRGB (Argyll 1.6.3 3D)
51% AdobeRGB 1998 (Argyll 1.6.3 3D)
55.9% AdobeRGB 1998 (Argyll 3D)
81.2% sRGB (Argyll 3D)
54.1% Display P3 (Argyll 3D)
Gamma: 2.49
CCT: 7728 K
| Lenovo Ideapad D330-10IGM IPS, 1920x1200, 10.1" | Lenovo IdeaPad Miix 320-10ICR Pro LTE IPS, 1920x1200, 10.1" | Microsoft Surface Go MHN-00003 IPS, 1800x1200, 10" | Huawei MediaPad M5 10.8 IPS, 2560x1600, 10.8" | Asus Transformer Book T102HA-GR022T IPS, 1280x800, 10.1" | Apple iPad 6 2018 IPS, 2048x1536, 9.7" | Samsung Galaxy Tab A 10.5 SM-T590N IPS, 1920x1200, 10.5" | |
|---|---|---|---|---|---|---|---|
| Display | 0% | 21% | -2% | ||||
| Display P3 Coverage (%) | 54.1 | 54.2 0% | 66.5 23% | 53.4 -1% | |||
| sRGB Coverage (%) | 81.2 | 81.4 0% | 97.5 20% | 76.9 -5% | |||
| AdobeRGB 1998 Coverage (%) | 55.9 | 56 0% | 67.5 21% | 55.3 -1% | |||
| Response Times | 18% | -1% | -7% | 15% | 22% | -14% | |
| Response Time Grey 50% / Grey 80% * (ms) | 39 ? | 32 ? 18% | 44 ? -13% | 42.4 ? -9% | 29 ? 26% | 26.4 ? 32% | 54.8 ? -41% |
| Response Time Black / White * (ms) | 29 ? | 24 ? 17% | 25.6 ? 12% | 30.4 ? -5% | 28 ? 3% | 25.9 ? 11% | 24.8 ? 14% |
| PWM Frequency (Hz) | 19000 ? | 1020 ? | 19530 ? | 294 ? | |||
| Screen | -10% | 38% | 30% | 15% | 32% | 40% | |
| Brightness middle (cd/m²) | 389 | 251 -35% | 456 17% | 382 -2% | 530 36% | 530 36% | 556 43% |
| Brightness (cd/m²) | 376 | 244 -35% | 426 13% | 378 1% | 491 31% | 513 36% | 514 37% |
| Brightness Distribution (%) | 91 | 79 -13% | 88 -3% | 92 1% | 88 -3% | 92 1% | 87 -4% |
| Black Level * (cd/m²) | 0.43 | 0.33 23% | 0.31 28% | 0.24 44% | 0.46 -7% | 0.61 -42% | 0.42 2% |
| Contrast (:1) | 905 | 761 -16% | 1471 63% | 1592 76% | 1152 27% | 869 -4% | 1324 46% |
| Colorchecker dE 2000 * | 5.23 | 5.34 -2% | 1.3 75% | 2.8 46% | 4.33 17% | 1.2 77% | 1.8 66% |
| Colorchecker dE 2000 max. * | 9.39 | 9.91 -6% | 3 68% | 6 36% | 7.32 22% | 3.2 66% | 3.2 66% |
| Colorchecker dE 2000 calibrated * | 1.99 | 1.1 45% | |||||
| Greyscale dE 2000 * | 5.45 | 6.04 -11% | 1.4 74% | 3.5 36% | 3.51 36% | 1 82% | 2.2 60% |
| Gamma | 2.49 88% | 3.23 68% | 2.24 98% | 2.33 94% | 2.36 93% | 2.28 96% | 2.26 97% |
| CCT | 7728 84% | 7491 87% | 6687 97% | 6903 94% | 7007 93% | 6588 99% | 6819 95% |
| Color Space (Percent of AdobeRGB 1998) (%) | 51 | 51 0% | 62.3 22% | 50 -2% | |||
| Color Space (Percent of sRGB) (%) | 81 | 81 0% | 96.8 20% | 77 -5% | |||
| Total Average (Program / Settings) | 3% /
-4% | 19% /
30% | 12% /
22% | 9% /
12% | 27% /
30% | 13% /
29% |
* ... smaller is better
Screen Flickering / PWM (Pulse-Width Modulation)
| Screen flickering / PWM not detected | 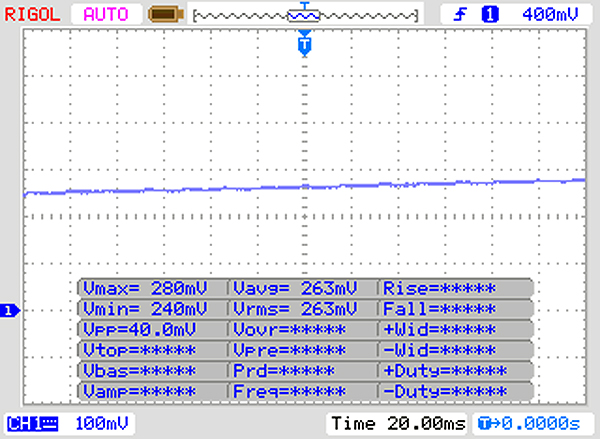 | ||
In comparison: 52 % of all tested devices do not use PWM to dim the display. If PWM was detected, an average of 7794 (minimum: 5 - maximum: 343500) Hz was measured. | |||
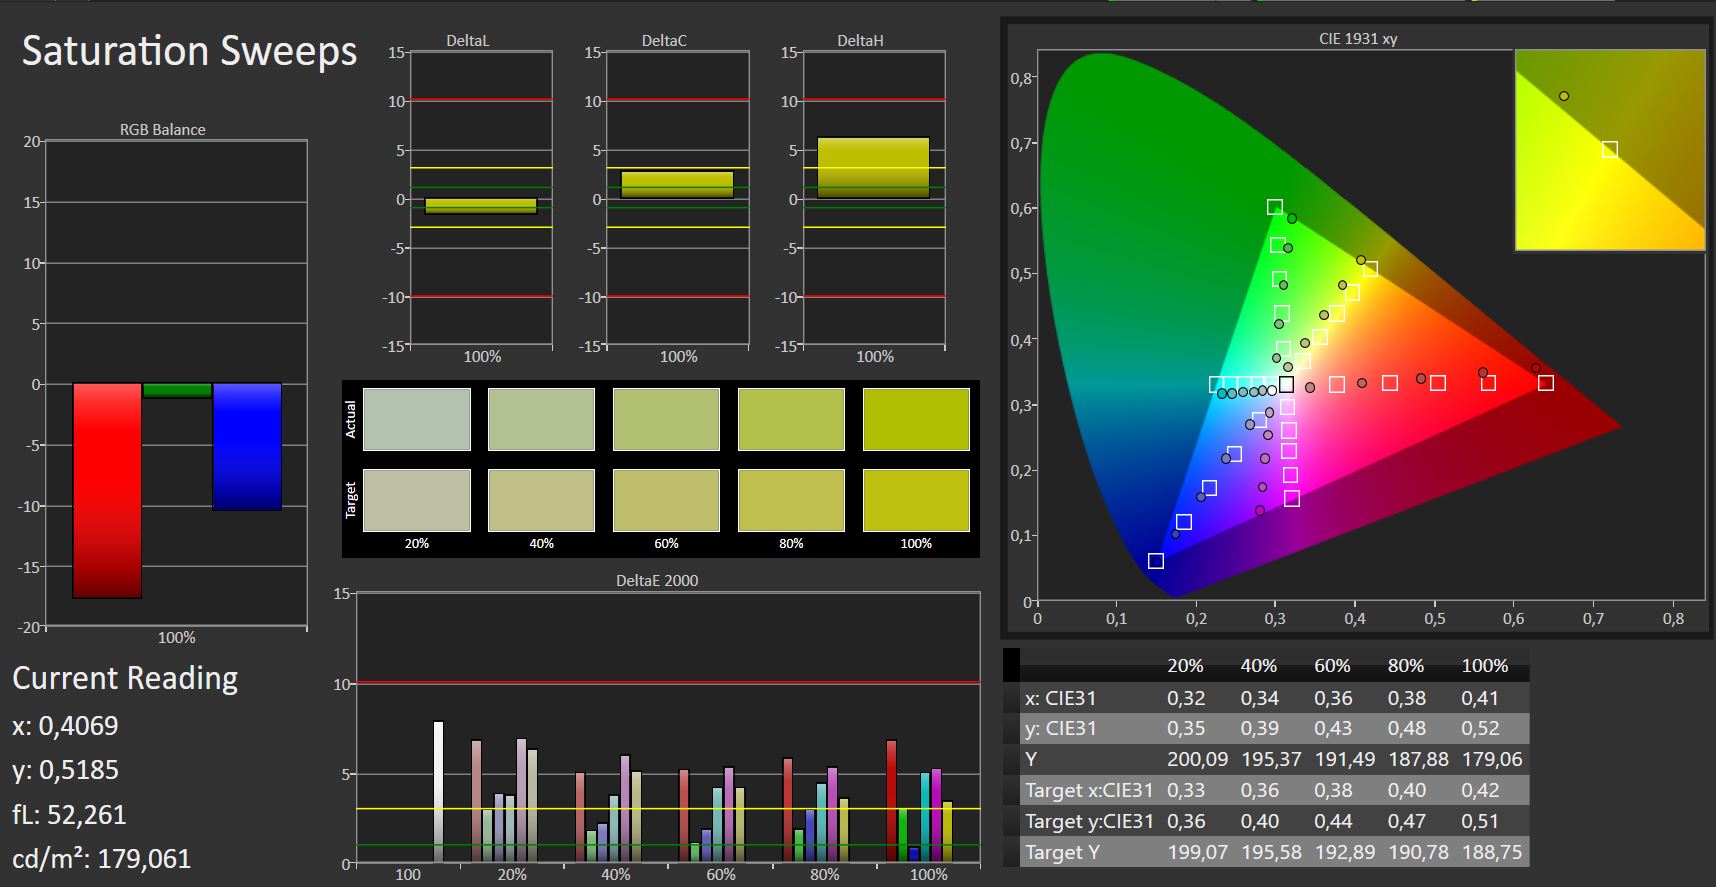
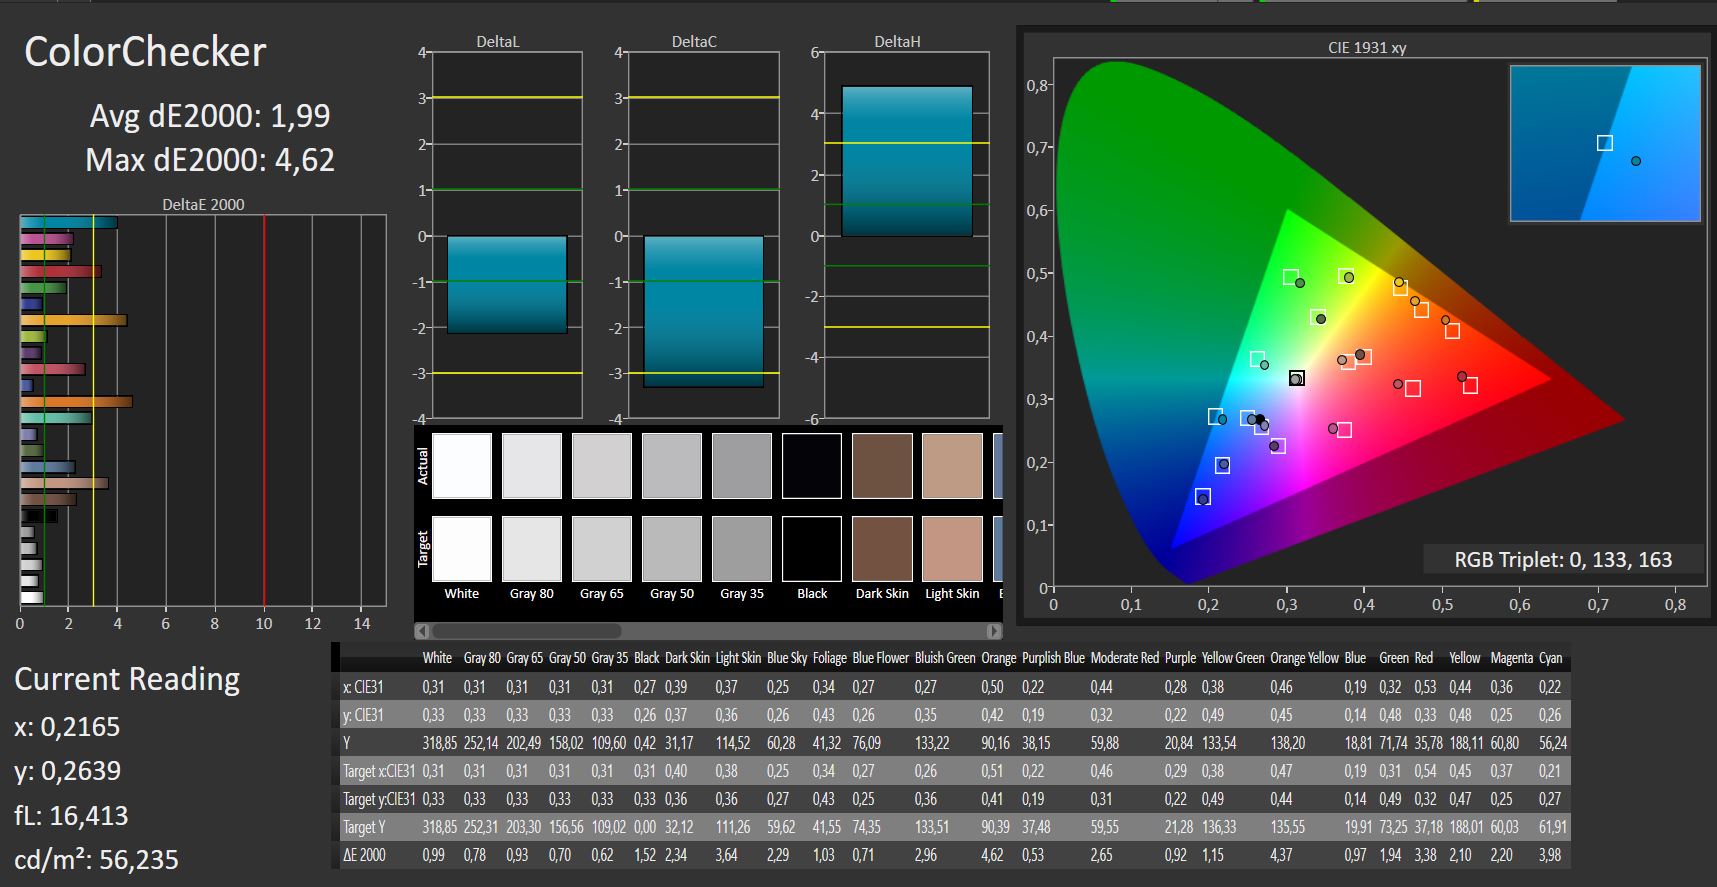
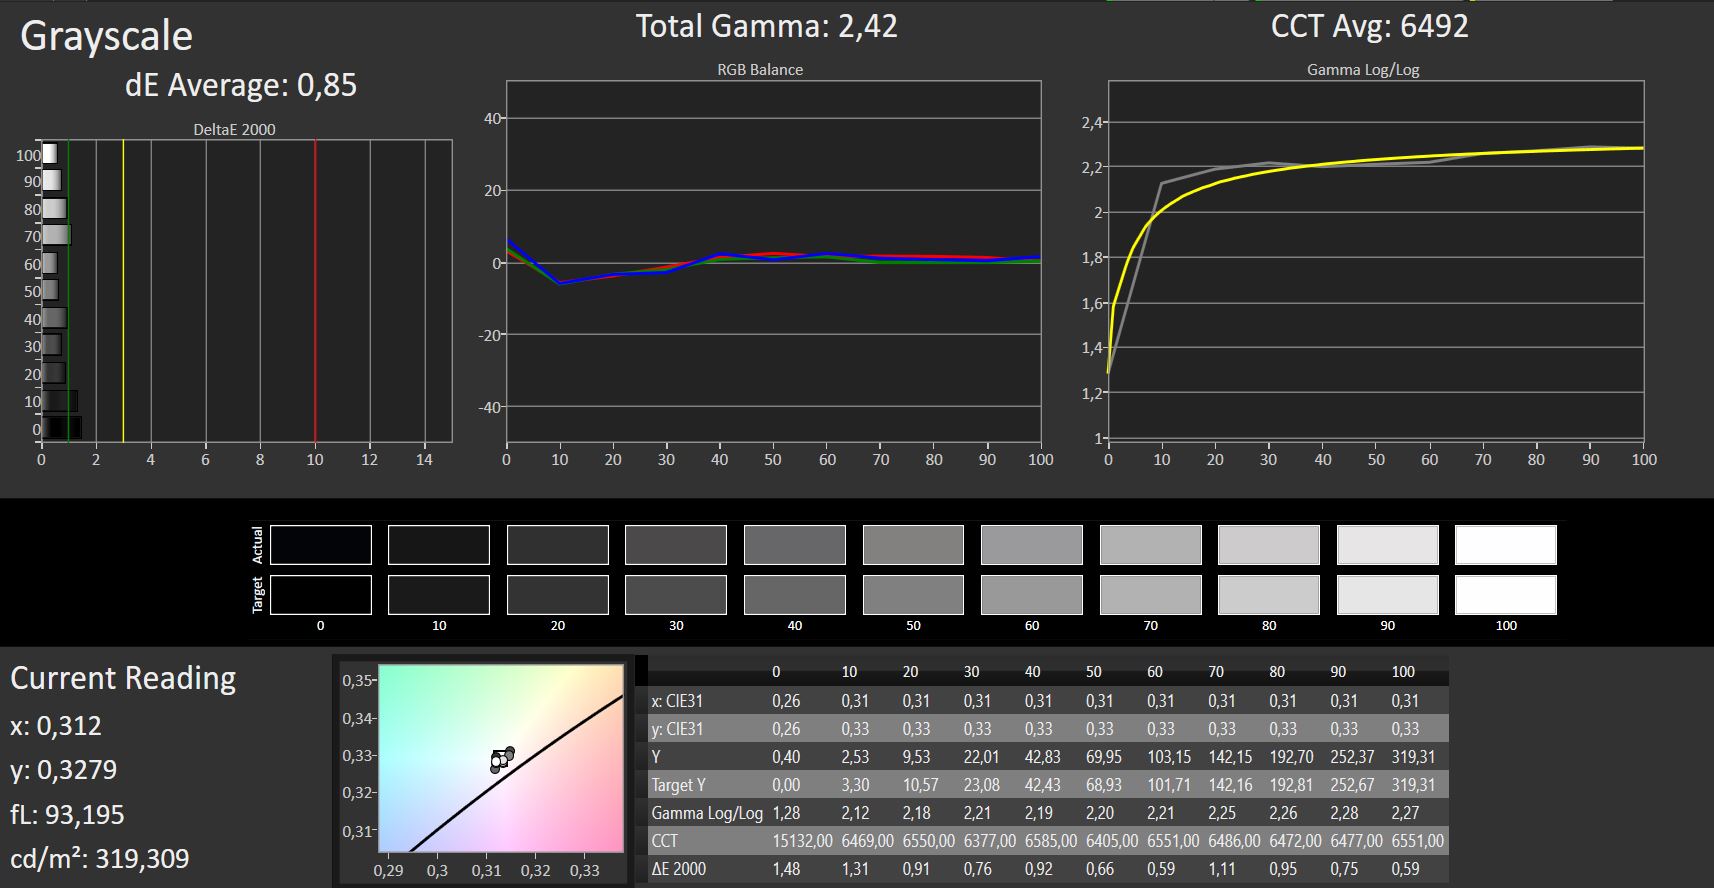
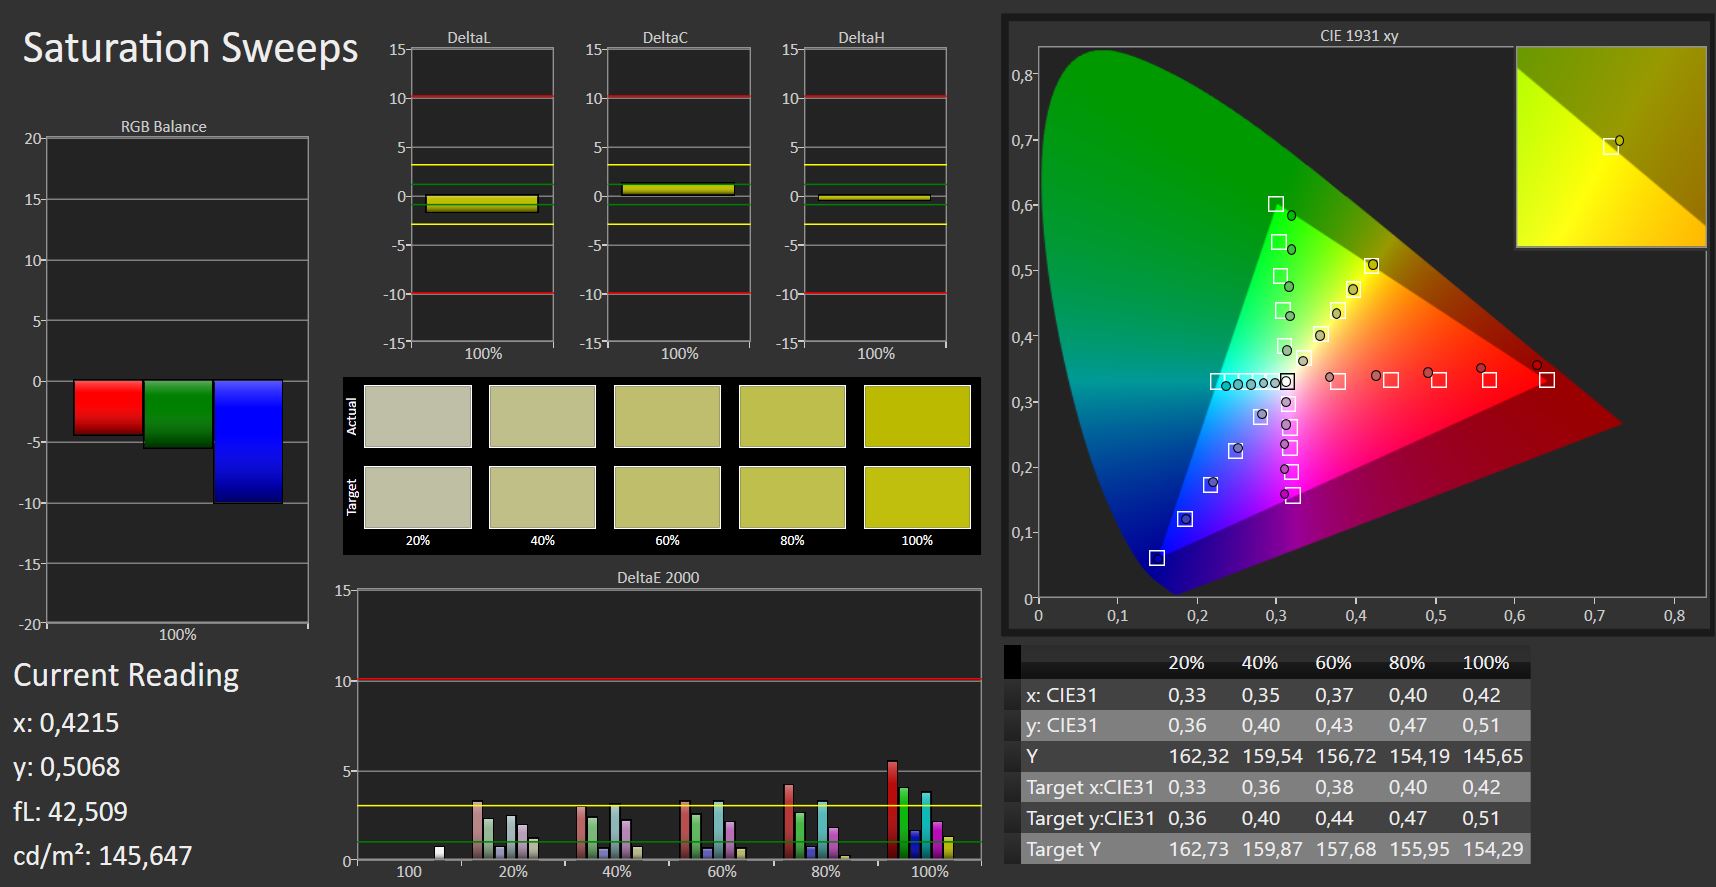
Our test device has a DeltaE 2000 deviation of 5.23 out of the box, which is only marginally above the ideal DeltaE value of 3. Calibrating the display resulted in the DeltaE colour deviation dropping a better than ideal value of 1.99. Calibration also removed the slight blue tint that the display had upon delivery too.
We have included our calibrated ICC file above our comparison table should you wish to use it. Manufacturers often use multiple displays on the same device line, so please make sure that your device has the same model number as our test device. Applying our ICC profile to a different display may result in the colour accuracy worsening rather than improving.
Display Response Times
| ↔ Response Time Black to White | ||
|---|---|---|
| 29 ms ... rise ↗ and fall ↘ combined | ↗ 17 ms rise | 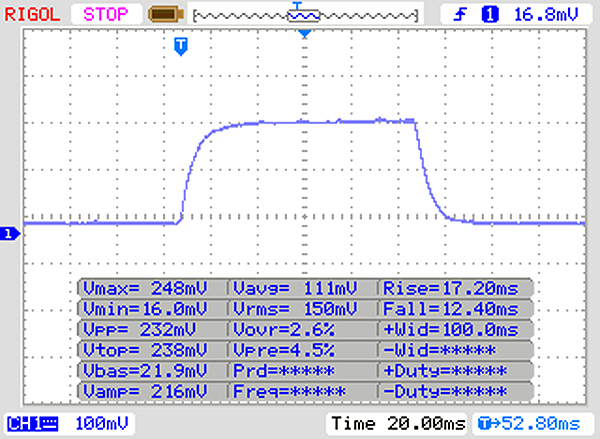 |
| ↘ 12 ms fall | ||
| The screen shows relatively slow response rates in our tests and may be too slow for gamers. In comparison, all tested devices range from 0.1 (minimum) to 240 (maximum) ms. » 77 % of all devices are better. This means that the measured response time is worse than the average of all tested devices (19.9 ms). | ||
| ↔ Response Time 50% Grey to 80% Grey | ||
| 39 ms ... rise ↗ and fall ↘ combined | ↗ 21 ms rise | 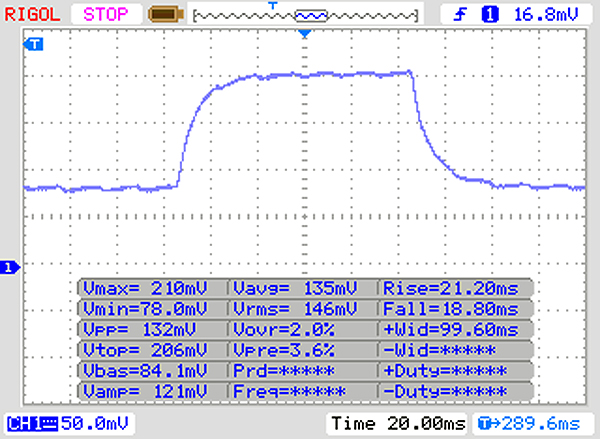 |
| ↘ 18 ms fall | ||
| The screen shows slow response rates in our tests and will be unsatisfactory for gamers. In comparison, all tested devices range from 0.165 (minimum) to 636 (maximum) ms. » 59 % of all devices are better. This means that the measured response time is worse than the average of all tested devices (31.1 ms). | ||
Our test device has stable viewing angles thanks to its IPS display. We noticed no brightness or colour distortions even at acute angles.
Additionally, the device is difficult to use outdoors even with its relatively bright display. The display’s glossy finish is highly reflective, and our test device does not get bright enough to counteract this. We would recommend using the D330-10IGM in the shade or in such a way to avoid reflections if you are using it outside.

Performance
Our test device has an Intel Pentium Silver N5000, which is powerful enough for most office-based and Internet applications. The D330-10IGM is currently not listed on either Lenovo UK or US but starts at 299 Euros (~$339) on Lenovo Germany. Our test device cost 499 Euros (~$567) at the time of writing.
Processor
The Pentium Silver N5000 is a quad-core processor based on Intel Gemini Lake architecture. The processor has a 6 W thermal design power (TDP), which is low enough to allow for passive cooling. The N5000 has a 1.1 GHz base clock speed that can increase up to 2.6 GHz across all cores or 2.7 GHz on one core. The processor does not support Intel Turbo Boost or Hyper-Threading though.
The processor initially operates at 2.6 GHz in a Cinebench R15 multi-core benchmark but after a few seconds drops to 1.9-2.1 GHz. By contrast, the CPU runs consistently at 2.6 GHz in the single-threaded benchmark. Our test device performs just as well on battery as it does on mains power.
We ran the multithreaded portion of Cinebench R15 to determine how well our test device can maintain peak CPU performance. As the results below demonstrate, performance drops by around 2% after the first benchmark run through and then is consistent for the remainder of the benchmark loop. 2% is not a tangible performance drop though and does not constitute thermal throttling.
Our test device performs at an expected level for a Pentium Silver N5000-powered device. Moreover, the CPU in our test device is considerably more powerful than the Pentium Gold 4415Y processor that powers the Surface Go. The performance gap is more pronounced in multi-core applications than in single-core applications.
| Geekbench 3 | |
| 32 Bit Multi-Core Score | |
| Lenovo Ideapad D330-10IGM | |
| Average Intel Pentium Silver N5000 (5045 - 5868, n=6) | |
| 32 Bit Single-Core Score | |
| Lenovo Ideapad D330-10IGM | |
| Average Intel Pentium Silver N5000 (1707 - 1876, n=6) | |
| Mozilla Kraken 1.1 - Total | |
| Samsung Galaxy Tab A 10.5 SM-T590N (Chrome 69.0.3497.100) | |
| Huawei MediaPad M5 10.8 (Chrome 65) | |
| Microsoft Surface Go MHN-00003 (Edge 42.17134.1.0) | |
| Lenovo Ideapad D330-10IGM (Edge 42) | |
| Average Intel Pentium Silver N5000 (2251 - 2871, n=5) | |
| Apple iPad 6 2018 (Safari Mobile 11.3) | |
| Average of class Convertible (386 - 1089, n=52, last 2 years) | |
| Octane V2 - Total Score | |
| Average of class Convertible (50984 - 123023, n=13, last 2 years) | |
| Apple iPad 6 2018 (Safari Mobile 11.3) | |
| Average Intel Pentium Silver N5000 (13075 - 14601, n=4) | |
| Lenovo Ideapad D330-10IGM (Edge 42) | |
| Microsoft Surface Go MHN-00003 (Edge 42.17134.1.0) | |
| Huawei MediaPad M5 10.8 (Chrome 65) | |
| Samsung Galaxy Tab A 10.5 SM-T590N (Chrome 69.0.3497.100) | |
| JetStream 1.1 - 1.1 Total | |
| Apple iPad 6 2018 (Safari Mobile 11.3) | |
| Average Intel Pentium Silver N5000 (104.4 - 109.8, n=6) | |
| Lenovo Ideapad D330-10IGM (Edge 42) | |
| Microsoft Surface Go MHN-00003 (Edge 42.17134.1.0) | |
| Lenovo IdeaPad Miix 320-10ICR Pro LTE (Edge 38.14393.1066.0) | |
| Asus Transformer Book T102HA-GR022T | |
| Huawei MediaPad M5 10.8 (Chrome 65) | |
| Samsung Galaxy Tab A 10.5 SM-T590N (Chrome 69.0.3497.100) | |
* ... smaller is better
System Performance
Our test device worked well throughout testing and encountered no issues. The Pentium Silver N5000 is powerful enough for office and Internet applications, which is confirmed by the comparatively impressive PCMark benchmark results.
| PCMark 8 Home Score Accelerated v2 | 2201 points | |
| PCMark 8 Creative Score Accelerated v2 | 2607 points | |
| PCMark 8 Work Score Accelerated v2 | 3125 points | |
| PCMark 10 Score | 1912 points | |
Help | ||
Storage Devices
The D330-10IGM has 128 GB of eMMC flash memory, of which around 94 GB is free to use. The remaining capacity is taken up by Windows 10 and its associated recovery partitions. The transfer speeds of the eMMC drive in our test device are faster than average and all our comparison devices.

| Lenovo Ideapad D330-10IGM 128 GB eMMC Flash | Lenovo IdeaPad Miix 320-10ICR Pro LTE SanDisk DF4128 | Microsoft Surface Go MHN-00003 64 GB eMMC Flash | Asus Transformer Book T102HA-GR022T 128 GB eMMC Flash | Average 128 GB eMMC Flash | Average of class Convertible | |
|---|---|---|---|---|---|---|
| CrystalDiskMark 3.0 | -49% | -9% | -45% | -35% | 2959% | |
| Read Seq (MB/s) | 288.4 | 92.7 -68% | 259.6 -10% | 139 -52% | 184.8 ? -36% | 5193 ? 1701% |
| Write Seq (MB/s) | 215.2 | 54.5 -75% | 122.4 -43% | 54.1 -75% | 86.4 ? -60% | 4573 ? 2025% |
| Read 512 (MB/s) | 240.9 | 68.6 -72% | 190.6 -21% | 121 -50% | 157.8 ? -34% | 390 ? 62% |
| Write 512 (MB/s) | 206 | 39.86 -81% | 107.1 -48% | 44.39 -78% | 73.5 ? -64% | 455 ? 121% |
| Read 4k (MB/s) | 25.18 | 6.705 -73% | 19.06 -24% | 9.935 -61% | 14.5 ? -42% | 2706 ? 10647% |
| Write 4k (MB/s) | 35.53 | 8.555 -76% | 24.27 -32% | 9.877 -72% | 13.1 ? -63% | 3099 ? 8622% |
| Read 4k QD32 (MB/s) | 14.51 | 32.71 125% | 34.45 137% | 30.03 107% | 26.6 ? 83% | 58.5 ? 303% |
| Write 4k QD32 (MB/s) | 46.5 | 11.5 -75% | 33.64 -28% | 10.67 -77% | 15.3 ? -67% | 135 ? 190% |
Graphics Card
The Pentium Silver N5000 integrates an Intel UHD Graphics 605 GPU, which handles graphics. The iGPU supports DirectX 12 and clocks up to 750 MHz. Performance in 3DMark benchmarks is on par with other UHD Graphics 605-equipped devices that also have dual-channel RAM.
| 3DMark 11 Performance | 846 points | |
| 3DMark Ice Storm Standard Score | 24818 points | |
| 3DMark Cloud Gate Standard Score | 3579 points | |
| 3DMark Fire Strike Score | 514 points | |
Help | ||
| 3DMark - 1280x720 offscreen Ice Storm Unlimited Graphics Score | |
| Average of class Convertible (55846 - 395092, n=4, last 2 years) | |
| Apple iPad 6 2018 | |
| Microsoft Surface Go MHN-00003 | |
| Lenovo Ideapad D330-10IGM | |
| Average Intel UHD Graphics 605 (32770 - 55453, n=9) | |
| Huawei MediaPad M5 10.8 | |
| Samsung Galaxy Tab A 10.5 SM-T590N | |
| Geekbench 4.0 - Compute OpenCL Score | |
| Lenovo Ideapad D330-10IGM | |
| Average Intel UHD Graphics 605 (9118 - 16860, n=4) | |
| Geekbench 4.4 - Compute OpenCL Score | |
| Average of class Convertible (47247 - 77461, n=2, last 2 years) | |
| Lenovo Ideapad D330-10IGM | |
| Average Intel UHD Graphics 605 (9226 - 17429, n=9) | |
| GFXBench (DX / GLBenchmark) 2.7 | |
| 1920x1080 T-Rex Offscreen | |
| Average of class Convertible (83 - 495, n=3, last 2 years) | |
| Apple iPad 6 2018 (OpenGL) | |
| Apple iPad 6 2018 (Metal) | |
| Huawei MediaPad M5 10.8 | |
| Lenovo Ideapad D330-10IGM (OpenGL) | |
| Average Intel UHD Graphics 605 (32 - 51.9, n=3) | |
| Samsung Galaxy Tab A 10.5 SM-T590N | |
| T-Rex Onscreen | |
| Average of class Convertible (n=1last 2 years) | |
| Lenovo Ideapad D330-10IGM (OpenGL) | |
| Apple iPad 6 2018 (Metal) | |
| Apple iPad 6 2018 (OpenGL) | |
| Average Intel UHD Graphics 605 (24 - 67.5, n=3) | |
| Huawei MediaPad M5 10.8 | |
| Samsung Galaxy Tab A 10.5 SM-T590N | |
| GFXBench 3.0 | |
| 1920x1080 1080p Manhattan Offscreen | |
| Average of class Convertible (48 - 290, n=3, last 2 years) | |
| Apple iPad 6 2018 (OpenGL) | |
| Apple iPad 6 2018 (Metal) | |
| Huawei MediaPad M5 10.8 | |
| Lenovo Ideapad D330-10IGM (OpenGL) | |
| Average Intel UHD Graphics 605 (16 - 33.4, n=3) | |
| Samsung Galaxy Tab A 10.5 SM-T590N | |
| on screen Manhattan Onscreen OGL | |
| Average of class Convertible (n=1last 2 years) | |
| Lenovo Ideapad D330-10IGM (OpenGL) | |
| Apple iPad 6 2018 (Metal) | |
| Apple iPad 6 2018 (OpenGL) | |
| Huawei MediaPad M5 10.8 | |
| Average Intel UHD Graphics 605 (14 - 42.2, n=3) | |
| Samsung Galaxy Tab A 10.5 SM-T590N | |
| GFXBench 3.1 | |
| 1920x1080 Manhattan ES 3.1 Offscreen | |
| Average of class Convertible (34 - 229, n=3, last 2 years) | |
| Apple iPad 6 2018 (Metal) | |
| Lenovo Ideapad D330-10IGM (OpenGL) | |
| Huawei MediaPad M5 10.8 | |
| Average Intel UHD Graphics 605 (13 - 23.3, n=3) | |
| Samsung Galaxy Tab A 10.5 SM-T590N | |
| on screen Manhattan ES 3.1 Onscreen | |
| Average of class Convertible (n=1last 2 years) | |
| Lenovo Ideapad D330-10IGM (OpenGL) | |
| Apple iPad 6 2018 (Metal) | |
| Average Intel UHD Graphics 605 (11 - 35.5, n=3) | |
| Huawei MediaPad M5 10.8 | |
| Samsung Galaxy Tab A 10.5 SM-T590N | |
Gaming Performance
The D330-10IGM is powerful enough to play browser-based games or simple titles that are downloadable from the Microsoft Store. The device can handle full-fledged games too but only older titles like the Sims 4 or Team Fortress 2 that are relatively undemanding. These games are only playable though when set to low resolutions and low graphics levels.
| low | med. | high | ultra | |
|---|---|---|---|---|
| Counter-Strike: GO (2012) | 48.4 | 27.5 | 16.4 | |
| BioShock Infinite (2013) | 33.2 | 17.2 | 15.2 | 4.3 |
| Dota 2 Reborn (2015) | 33.7 | 14 | 7.8 | |
| Rocket League (2017) | 22.6 | 10 | ||
| Team Fortress 2 (2017) | 41.4 | 36.5 | 18.4 | |
| The Crew 2 (2018) | 8.8 | |||
| Monster Hunter World (2018) | 4.6 | |||
| F1 2018 (2018) | 12 | |||
| Shadow of the Tomb Raider (2018) | 4 | |||
| Forza Horizon 4 (2018) | 4 | |||
| Assassin´s Creed Odyssey (2018) | 4 |
Emissions
Fan Noise
The D330-10IGM runs silently as it does not have a fan or a mechanical HDD.
Temperature
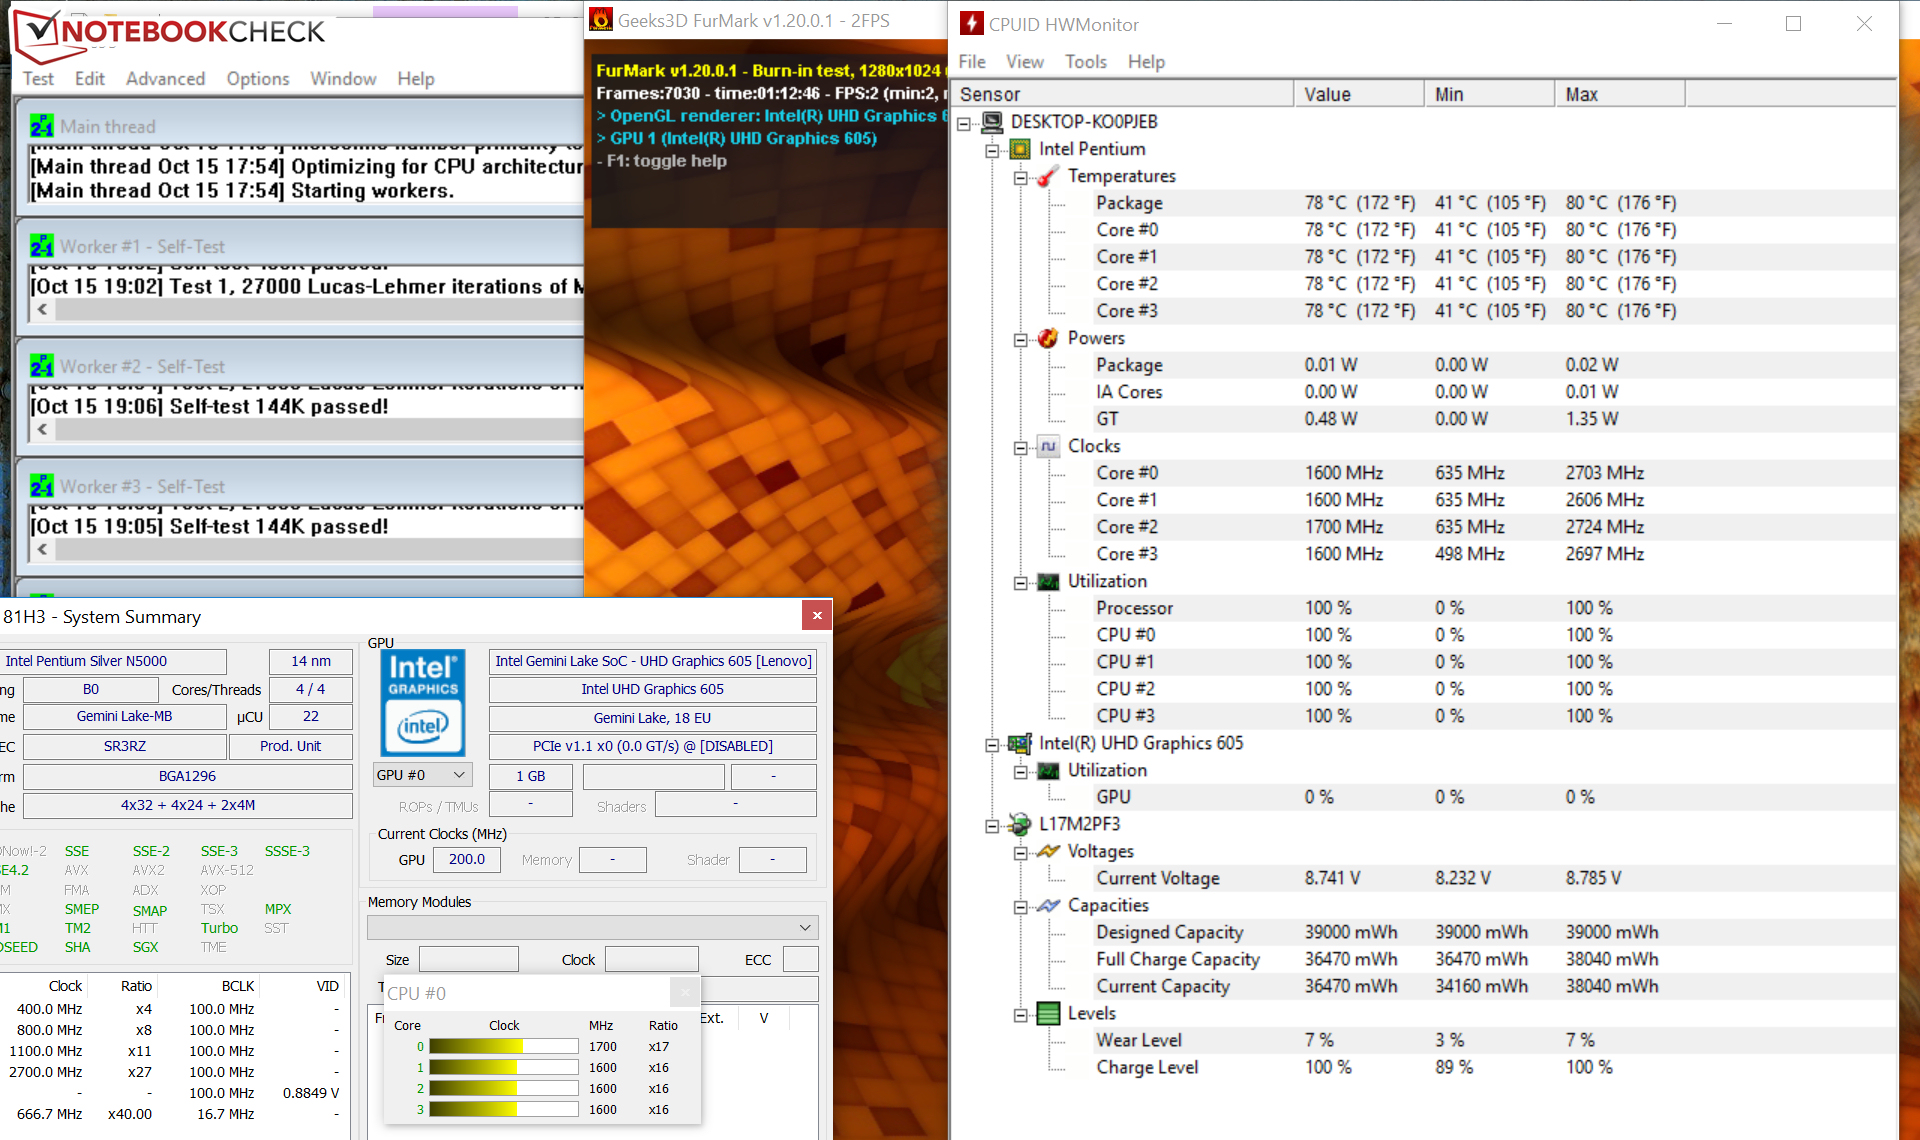
We stress tested the D330-10IGM using FurMark and Prime95, which run just as on battery as they do on mains power. The CPU operates at 1.6-1.7 GHz during a combined stress test, while the GPU throttles to 200-250 MHz. Neither chip can work at peak performance as they share the same 6 W TDP.
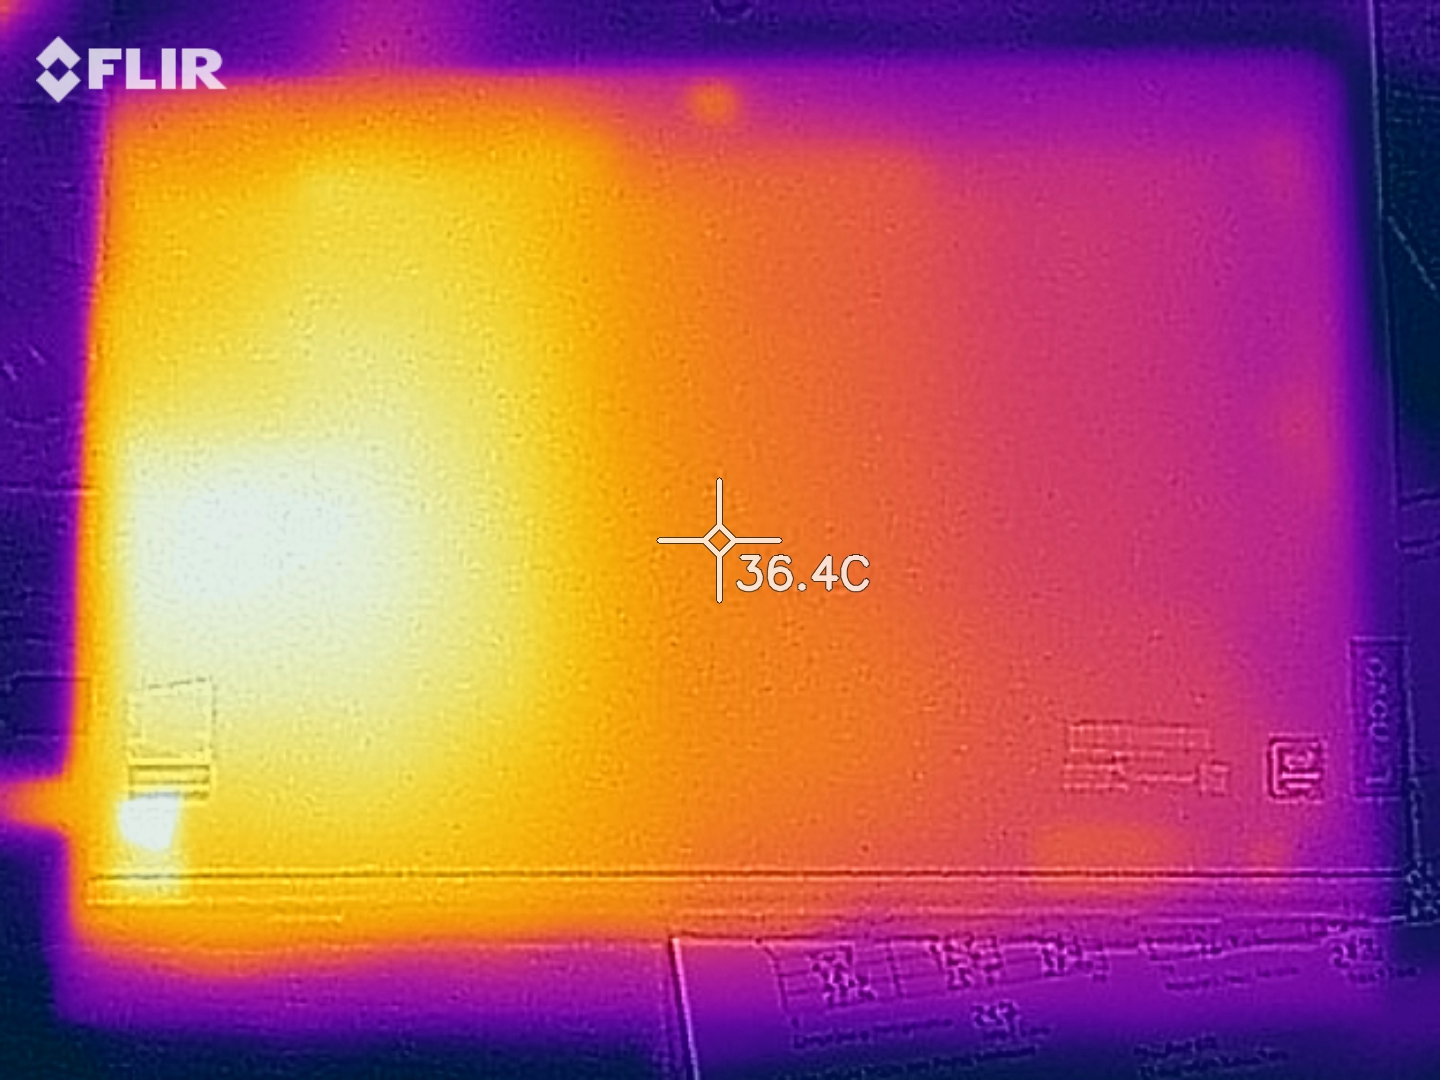
Surface temperatures reach a maximum of 41.7 °C on one area of our test device when under sustained load, but surface temperatures average 35.2 °C across the whole device overall. Moreover, our stress tests are extreme scenarios that do not occur in daily use.
(±) The maximum temperature on the upper side is 41.7 °C / 107 F, compared to the average of 35.4 °C / 96 F, ranging from 19.6 to 60 °C for the class Convertible.
(+) The bottom heats up to a maximum of 39.7 °C / 103 F, compared to the average of 36.9 °C / 98 F
(+) In idle usage, the average temperature for the upper side is 27.8 °C / 82 F, compared to the device average of 30.3 °C / 87 F.
(±) The palmrests and touchpad can get very hot to the touch with a maximum of 39.9 °C / 103.8 F.
(-) The average temperature of the palmrest area of similar devices was 28 °C / 82.4 F (-11.9 °C / -21.4 F).


Speakers
The D330-10IGM has two speakers, which are on the front of the tablet, and they are located at the bottom of the device when the keyboard dock is connected. The speakers reach a relatively loud maximum volume of 75.2 dB(A) and while their sound quality is good, bass tones are largely missing. We would recommend using headphones or connecting the device to external speakers for a better sound experience.
Lenovo Ideapad D330-10IGM audio analysis
(-) | not very loud speakers (67.1 dB)
Bass 100 - 315 Hz
(-) | nearly no bass - on average 27.1% lower than median
(±) | linearity of bass is average (7.5% delta to prev. frequency)
Mids 400 - 2000 Hz
(+) | balanced mids - only 4.6% away from median
(±) | linearity of mids is average (11.5% delta to prev. frequency)
Highs 2 - 16 kHz
(+) | balanced highs - only 3.3% away from median
(+) | highs are linear (4.4% delta to prev. frequency)
Overall 100 - 16.000 Hz
(±) | linearity of overall sound is average (28.9% difference to median)
Compared to same class
» 87% of all tested devices in this class were better, 3% similar, 11% worse
» The best had a delta of 6%, average was 20%, worst was 57%
Compared to all devices tested
» 87% of all tested devices were better, 2% similar, 11% worse
» The best had a delta of 4%, average was 24%, worst was 134%
Apple MacBook 12 (Early 2016) 1.1 GHz audio analysis
(+) | speakers can play relatively loud (83.6 dB)
Bass 100 - 315 Hz
(±) | reduced bass - on average 11.3% lower than median
(±) | linearity of bass is average (14.2% delta to prev. frequency)
Mids 400 - 2000 Hz
(+) | balanced mids - only 2.4% away from median
(+) | mids are linear (5.5% delta to prev. frequency)
Highs 2 - 16 kHz
(+) | balanced highs - only 2% away from median
(+) | highs are linear (4.5% delta to prev. frequency)
Overall 100 - 16.000 Hz
(+) | overall sound is linear (10.2% difference to median)
Compared to same class
» 7% of all tested devices in this class were better, 2% similar, 91% worse
» The best had a delta of 5%, average was 18%, worst was 53%
Compared to all devices tested
» 5% of all tested devices were better, 1% similar, 94% worse
» The best had a delta of 4%, average was 24%, worst was 134%
Power Consumption
The D330-10IGM is a relatively energy-efficient device and consumes a maximum of 6.2 W at idle. Power consumption increases to a maximum of 15.3 W during a combined stress test and 18.6 W when we just ran Prime95.
The USB Type-C power supply is rated at 45 W, which is powerful enough to charge the device even when it is being stress-tested.
| Off / Standby | |
| Idle | |
| Load |
|
Key:
min: | |
Battery Life
Lenovo has equipped the D330-10IGM with a 39 Wh battery, which is larger than the batteries in our comparison devices. Our test device lasted 11 h 24 m in our Wi-Fi battery life test, during which we run a script that simulates the load required to render websites. We conduct all our Wi-Fi battery tests with the Windows 10 power mode set to “Balanced”, all energy-saving features disabled and the display set to approximately 150 cd/m². Our test device finishes third in our comparison table and has above average battery life. The Samsung Galaxy Tab A takes the crown here though with an outstanding runtime of 15 h 38 m.
Pros
Cons
Verdict
The Lenovo IdeaPad D330-10IGM is a worthy upgrade over its predecessor, the IdeaPad Miix 320-10ICR Pro. Its Pentium Silver N5000 processor is powerful enough for simple tasks and is on par with Broadwell Core i3 processors. However, the N5000 is more energy-efficient than its Broadwell counterparts, and it can also be passively cooled. The integrated UHD Graphics 605 GPU is suitable for streaming or light gaming too.
The IdeaPad D330-10IGM knows how to please and outclasses its predecessor in every respect. Lenovo has equipped the device with faster memory, more processing power, a brighter display and longer battery life, which all make the D330-10IGM a big upgrade over its predecessor.
The 128 GB of eMMC flash memory should be enough for most users, but there is microSD card expansion should you need more storage. The keyboard dock is impressive too and is suitable for every-day use. We just wish Lenovo had added backlighting though.
The D330-10IGM also has great battery life and its LTE modem will prove useful for users who regularly work on the move. Equally, the WUXGA IPS touchscreen display is bright, has stable viewing angles and it has a good contrast ratio. The device also supports pen input, but this must be bought separately.
The port selection is underwhelming though. Lenovo has equipped the keyboard dock with two USB 2.0 Type-A ports, but we would have preferred at least one to have been the faster USB 3.1 Gen 1 standard. Likewise, a second USB Type-C port would have been more useful than the proprietary power connector, for which Lenovo curiously does not supply a charger. Instead, our test device came with a USB Type-C charger, making the power connector somewhat redundant.
The D330-10IGM’s main competition is the Microsoft Go, which it consistently outperformed in our tests. The Lenovo 2-in-1 has more computing power, better battery life, and an LTE modem. The D330-10IGM costs around 50 Euros (~$56) more than the Surface Go, but it offers considerably better value for money. The only plus for the Surface Go is its 3:2 aspect ratio, which is better suited for tablet and 2-in-1 use than the 16:10 aspect ratio on the D330-10IGM. Overall, the Lenovo IdeaPad D330-10IGM is a decent budget 2-in-1 device that offers more than its competitors.
Please note: We updated this review on 09/26/2019 to our new rating version 7. The former rating according to version 6 was at 84 %. If you would like to learn more about our new rating system please click here.
Lenovo Ideapad D330-10IGM
- 09/26/2019 v7 (old)
Sascha Mölck
Price comparison

