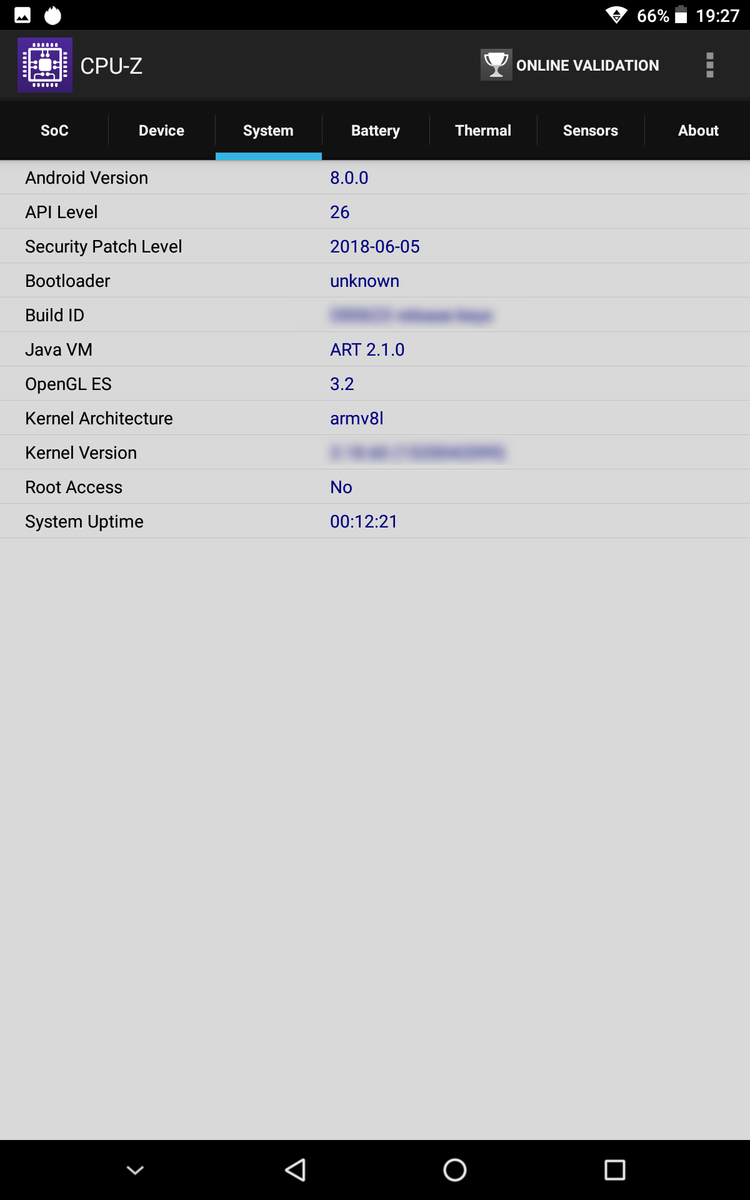
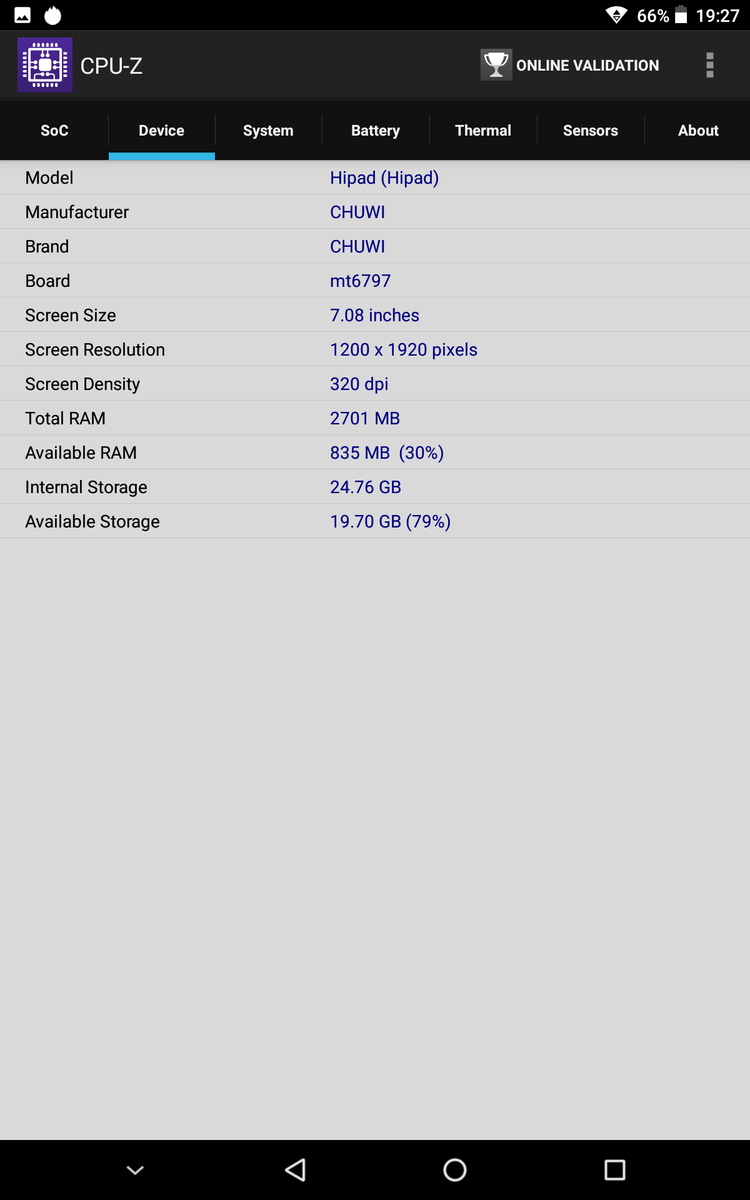
Chuwi HiPad Tablet Review
The HiPad is an inexpensive Android tablet from Chinese manufacturer Chuwi. Unlike the innumerable amount of alternatives available, the HiPad is distinguished by its newer MediaTek Helio X27 SoC and 16:10 display instead of the common 16:9. These advantages should make the HiPad a better fit for word processing or photo viewing where the squarer aspect ratio can come in handy.
The 10.1-inch tablet competes against other budget alternatives retailing for under $200 USD including the Lenovo Tab 4, Asus ZenPad 10, Samsung Galaxy Tab A 10.1, and the Amazon Fire HD 10. A higher-end version of the HiPad is also available as the Hi9 Plus.
More Chuwi reviews:
Case
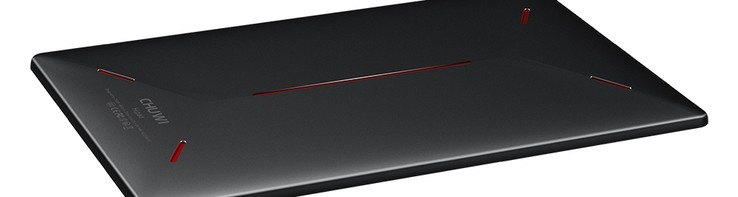
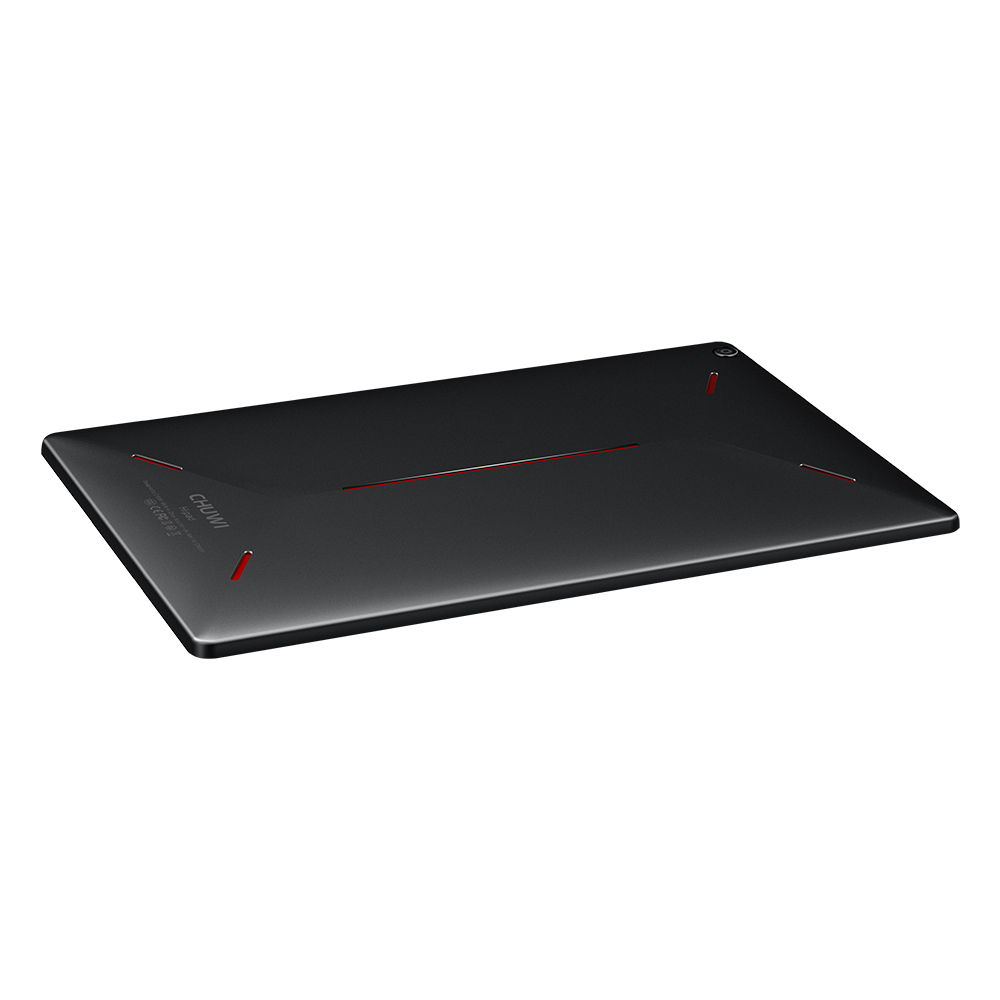
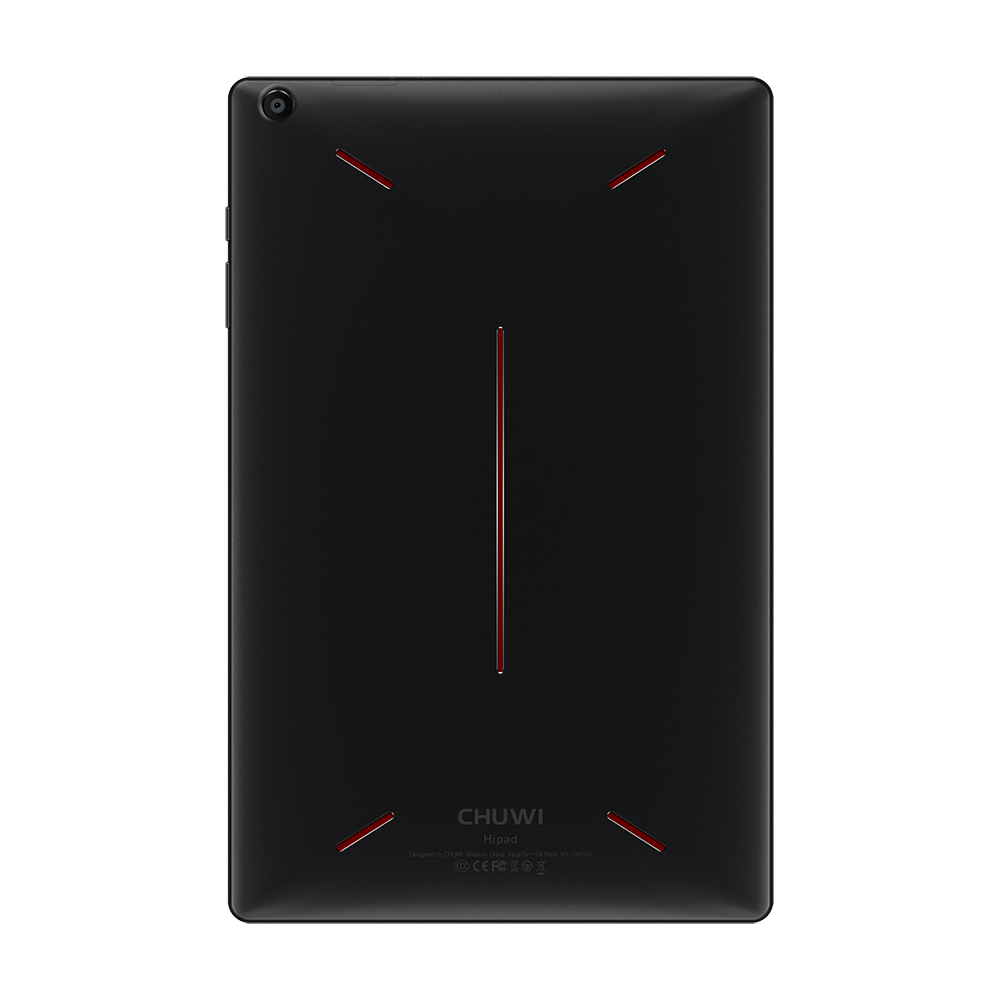
Budget Android tablets like the HiPad are getting better and better each year in terms of looks and first impressions. The glass front, slightly rounded aluminum back, and chrome-cut edges and corners feel good in the hand with no hint of visual defects on our test unit. The red trims on the back are becoming a signature Chuwi aesthetic as they can also be found on the Chuwi GBox mini PC. Attempting to twist the tablet with two hands results in just slight flexing and creaking that shouldn't be of any concern during day-to-day use. In short, the HiPad feels more rigid than its low price would otherwise suggest.

Connectivity
Communication and GPS
We experienced no issues with the integrated 802.11ac wireless. Interestingly, AliExpress advertises GPS for this product while the official Chuwi spec sheet omits the acronym "GPS" altogether. Either way, there appears to be no GPS functionality on our test unit.
Cameras
The rear 5 MP camera takes muddy pictures with muted colors even when outdoors with ample lighting. It exhibits all the properties of a very cheap smartphone camera including overexposure, purple fringing, and lack of an optical image stabilizer.

Accessories and Warranty
Included extras are a warranty card, MicroSD tray needle, Quick Start guide, AC adapter, and USB Type-C cable. Manufacturer limited warranty lasts for once year after date of purchase. Because Chuwi is overseas, however, the buyer would likely be responsible for any shipping costs. Please see our Guarantees, Return policies and Warranties article for country-specific information.
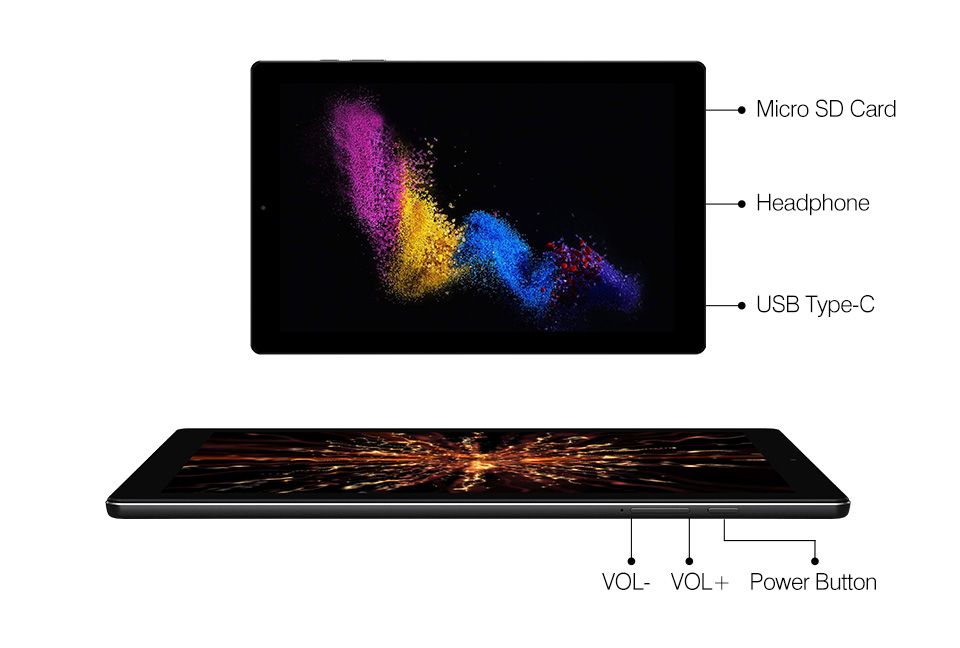
Input Devices
Keyboard
The 10-point capacitive touchscreen thankfully includes haptic feedback. Accuracy, however, does not appear to be always perfect. Typing at medium speed results in more frequently missed letters and inputs than usual. Responsiveness is good enough for light games and inputting short URLs, but extended messaging is best done elsewhere.
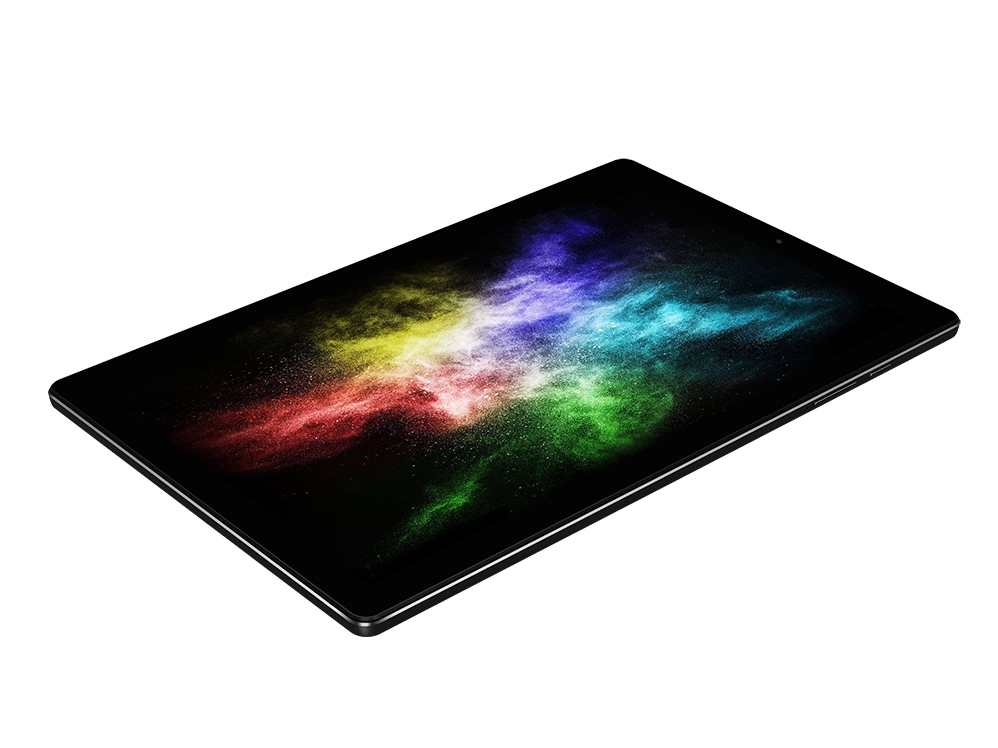
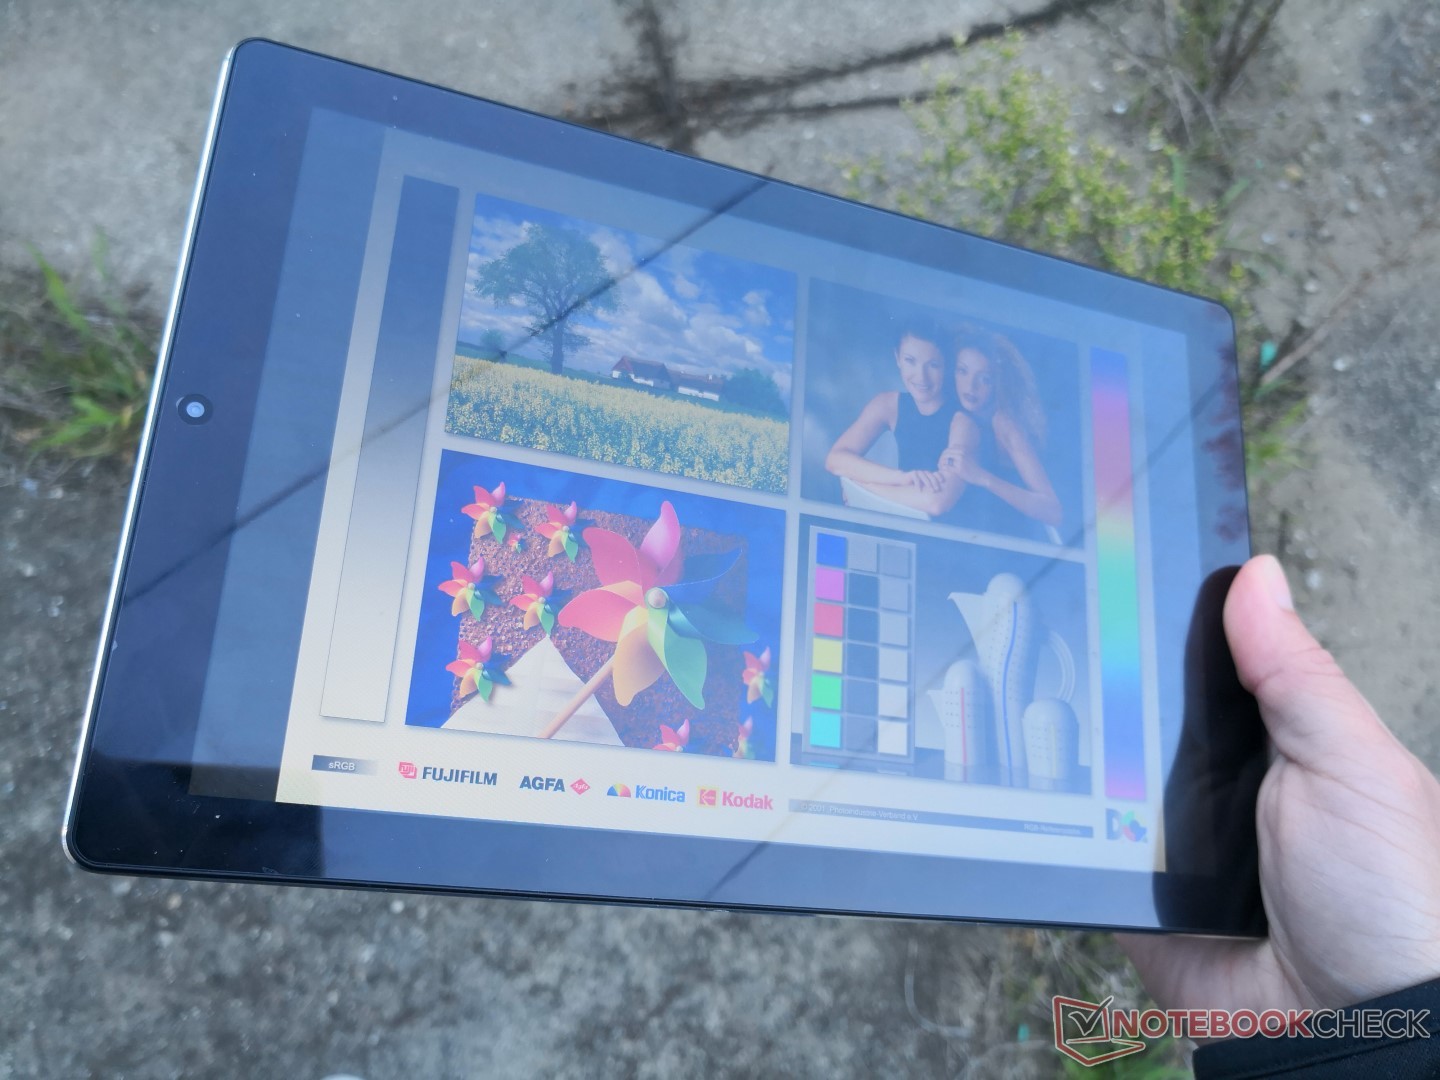
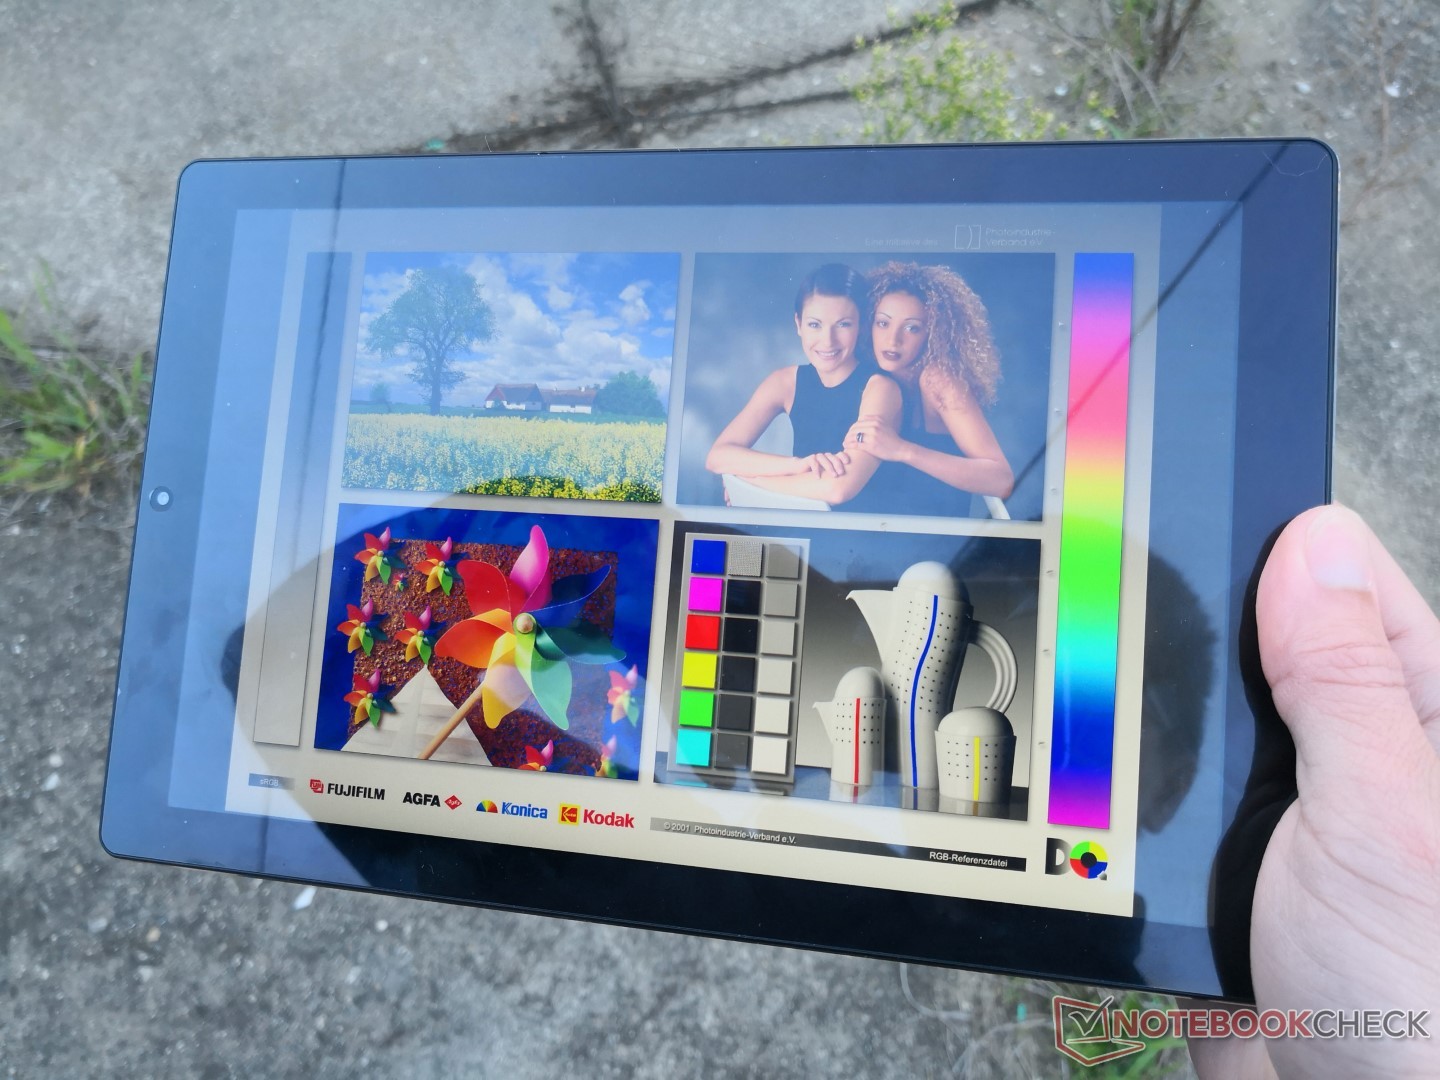
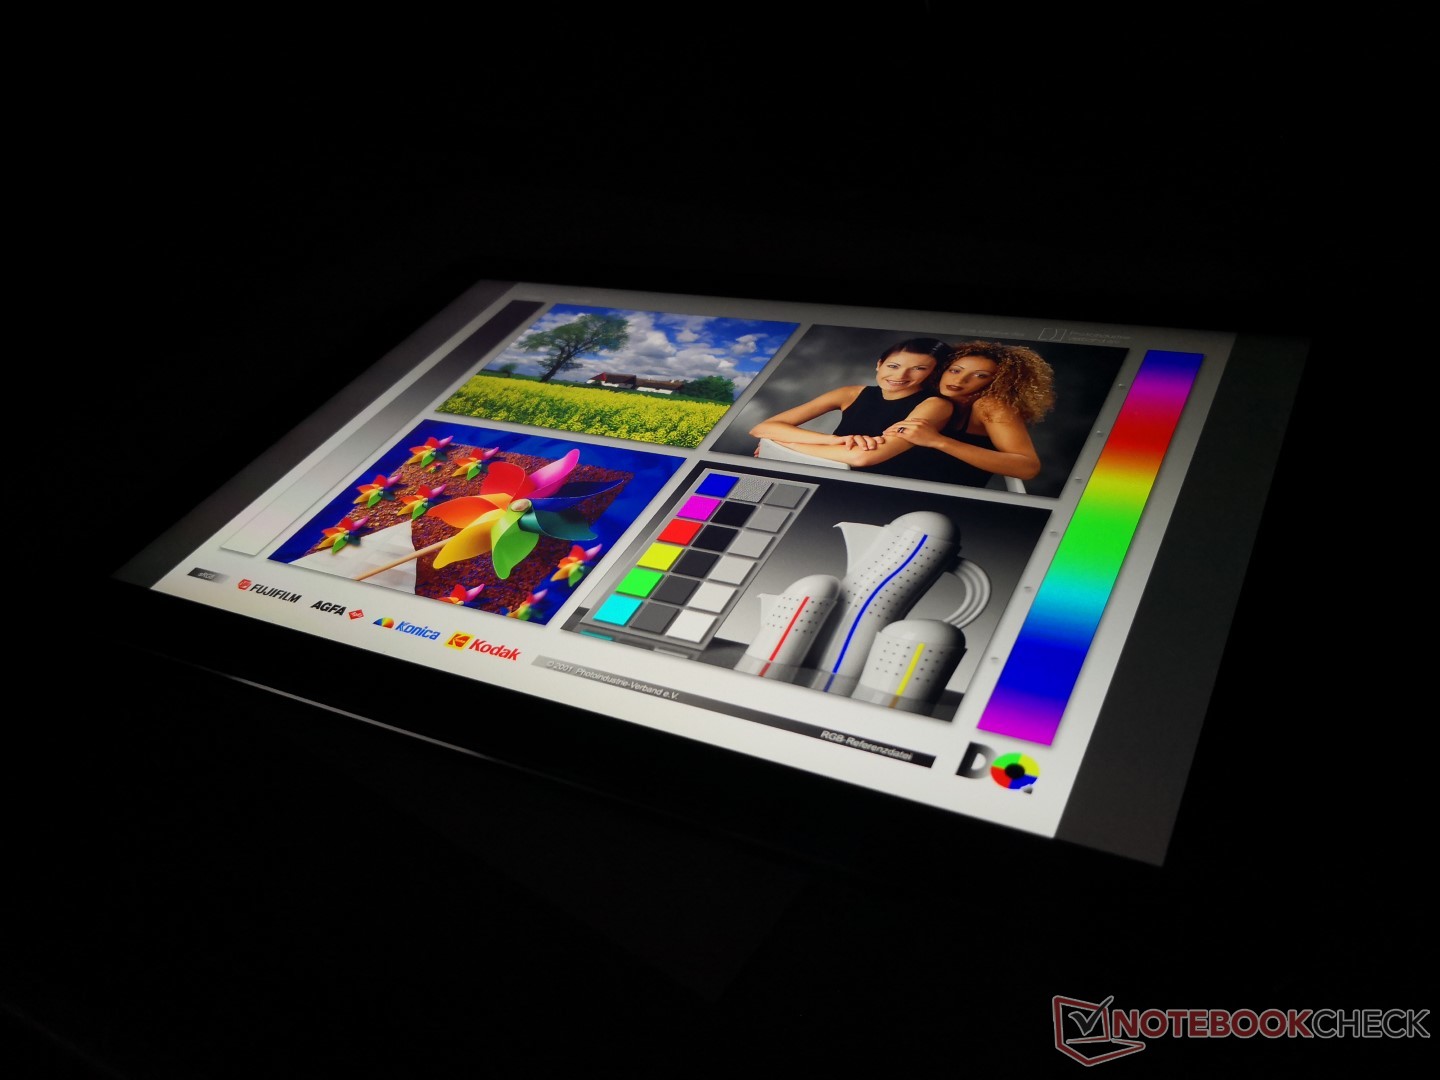
Display
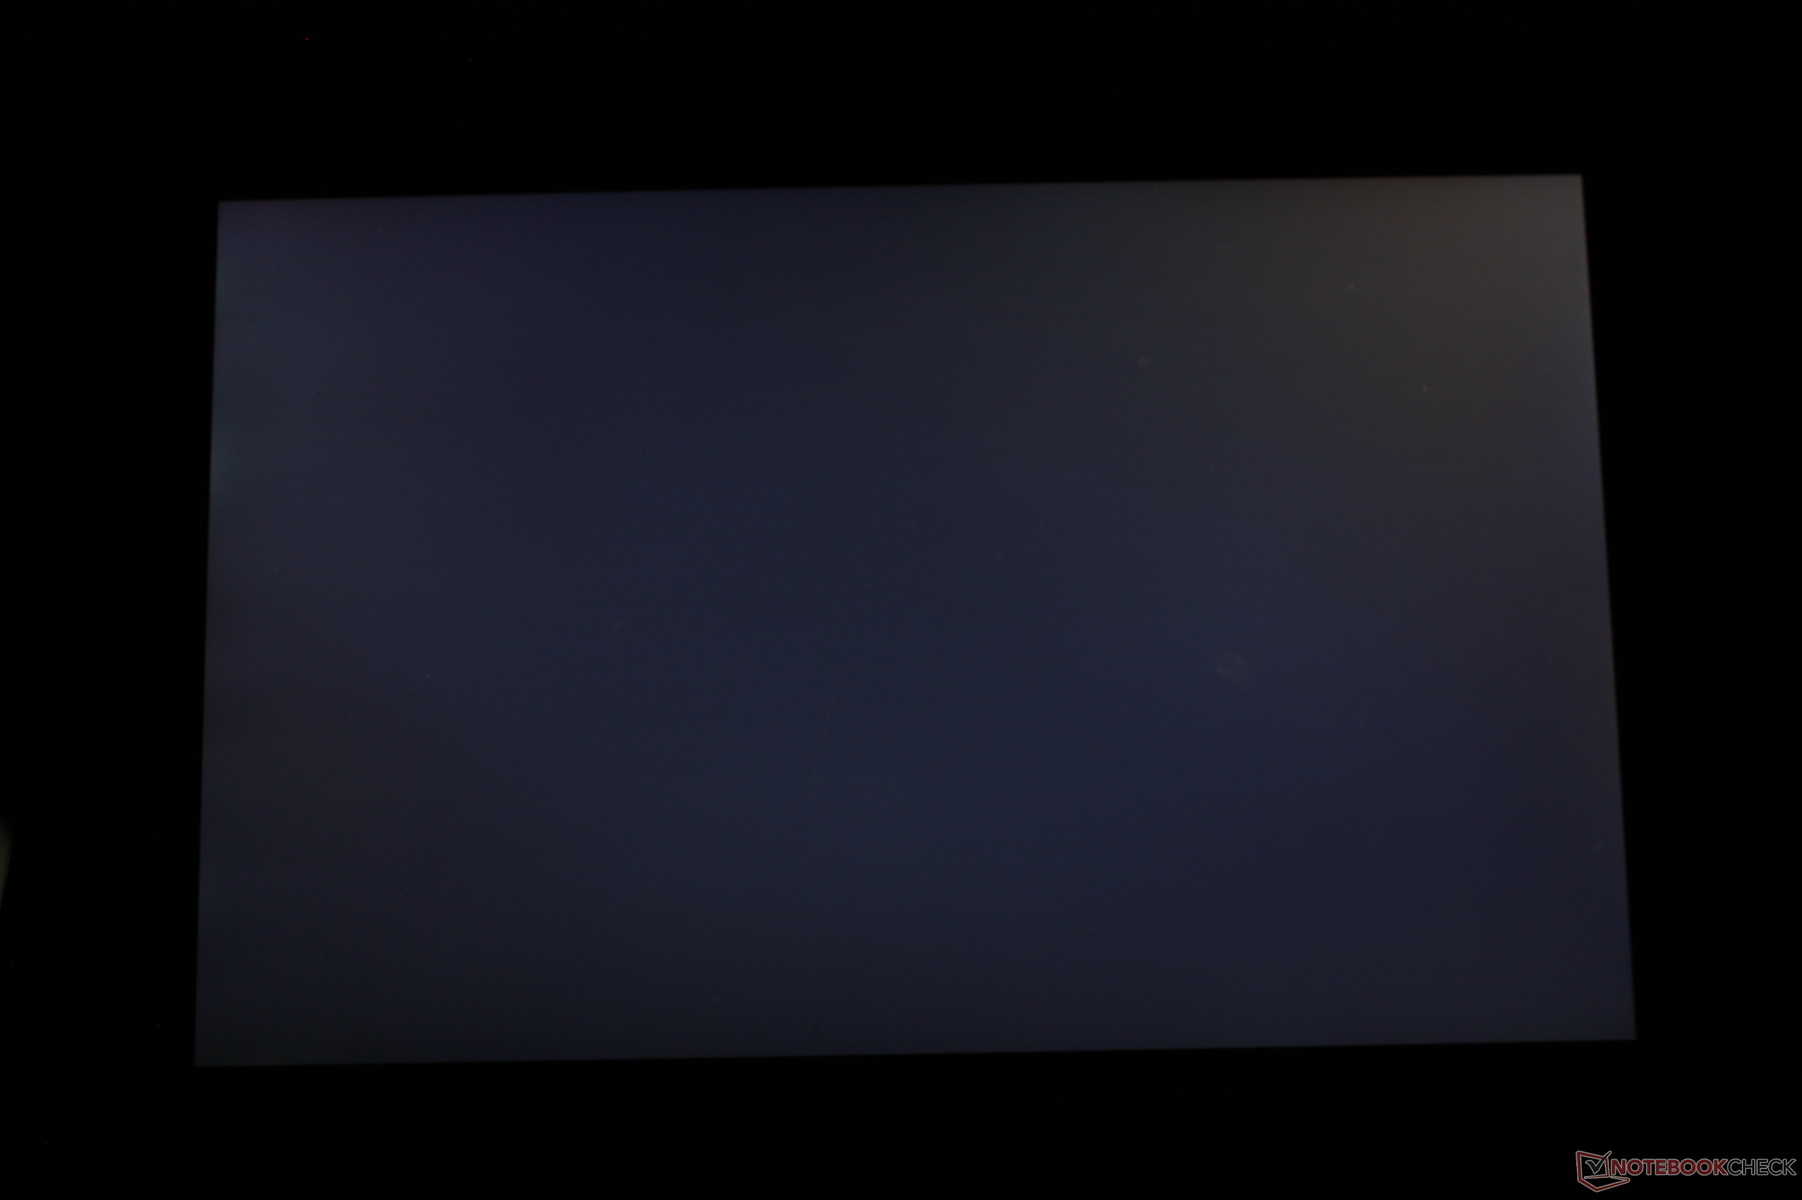
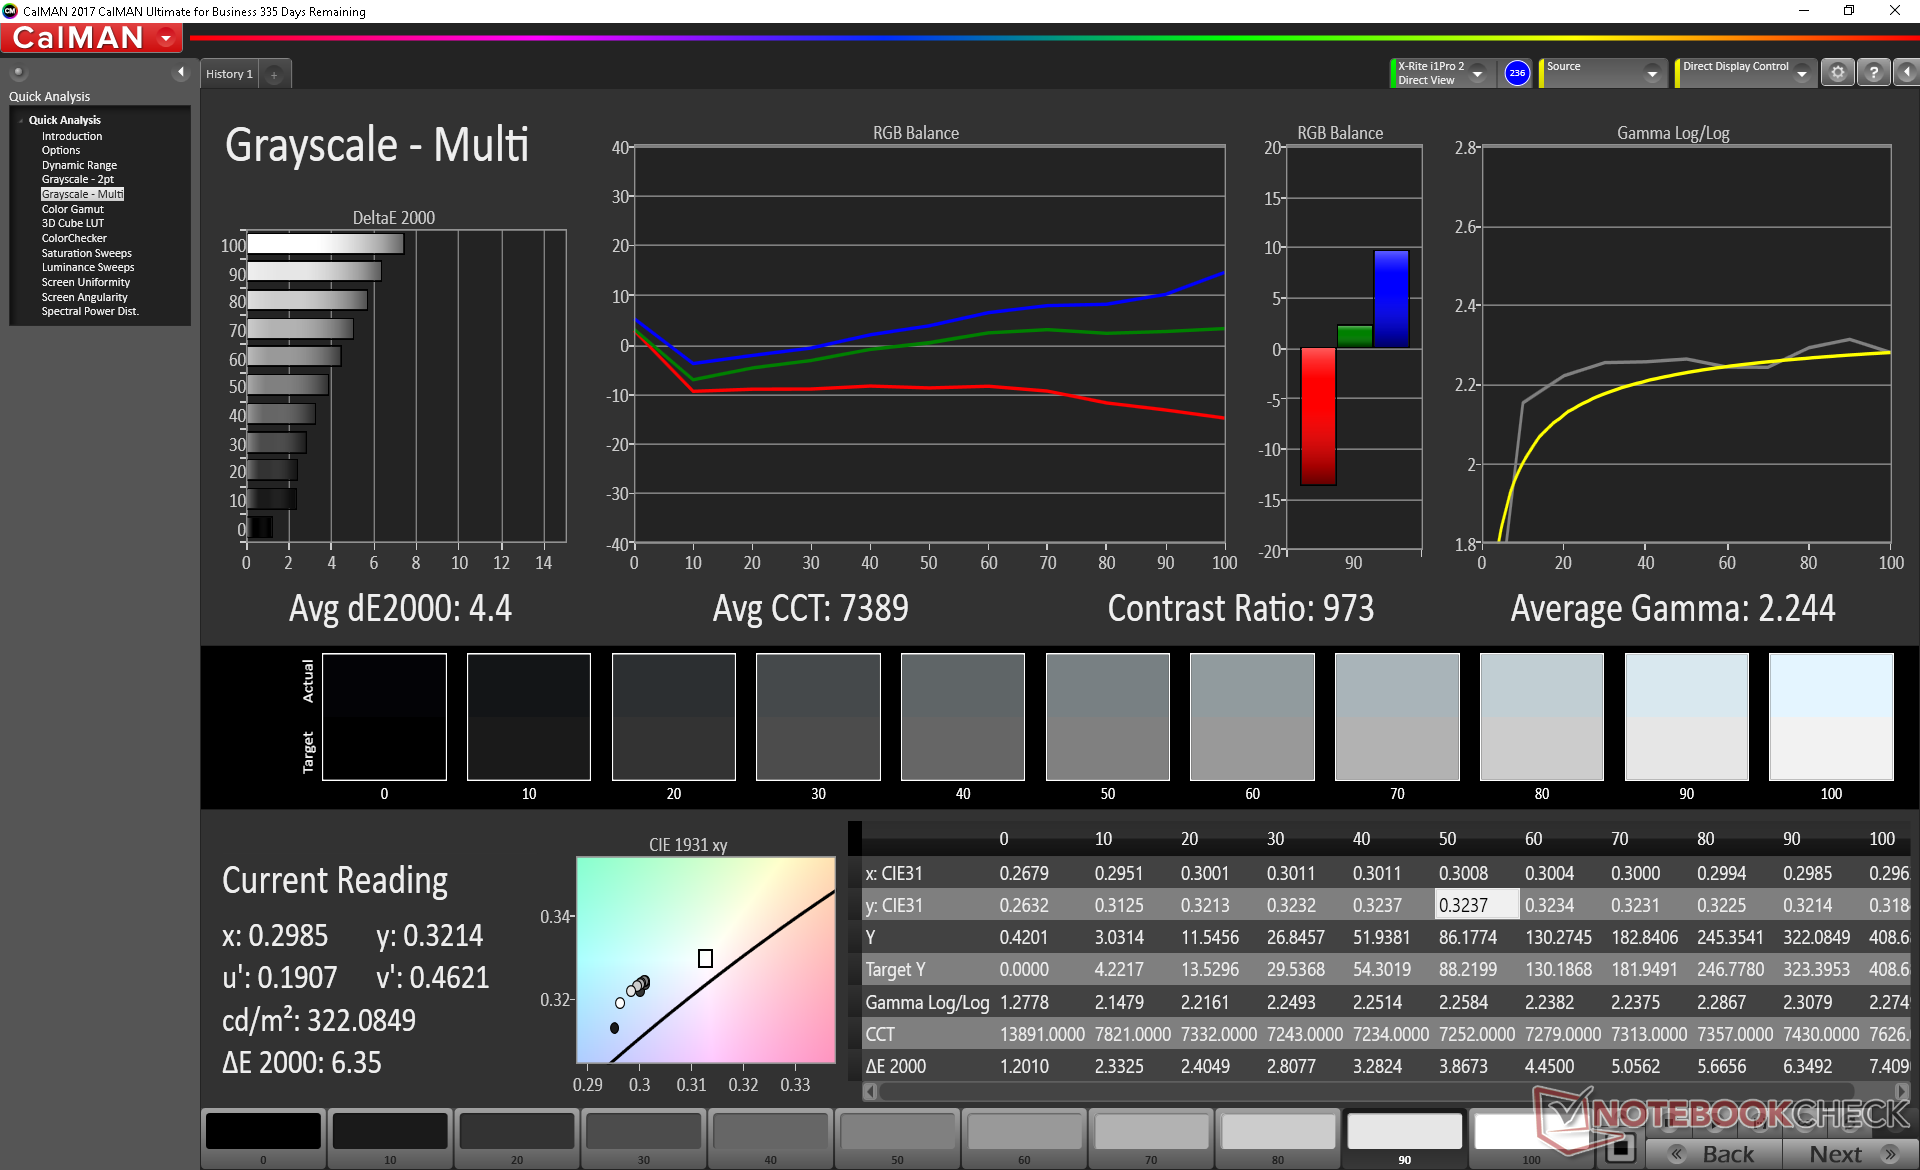
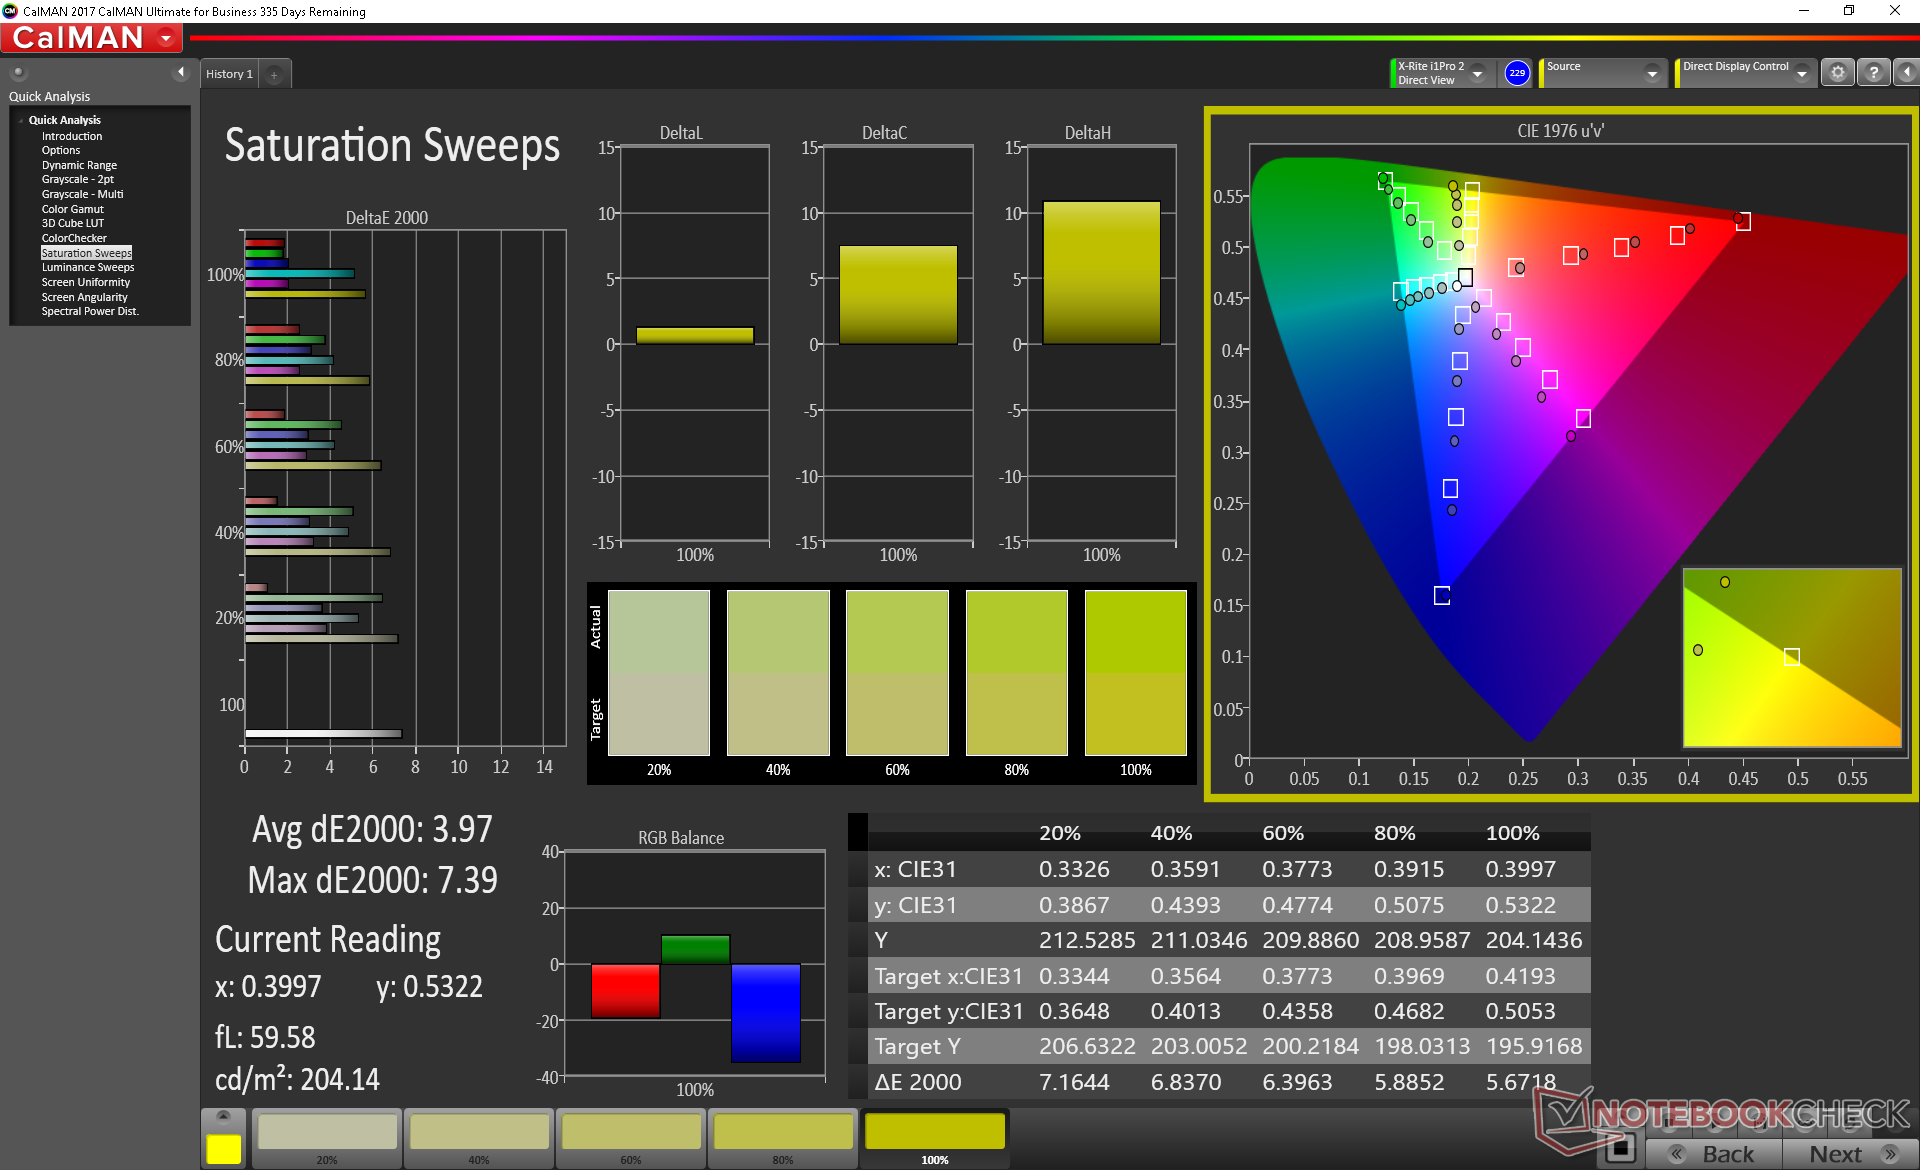
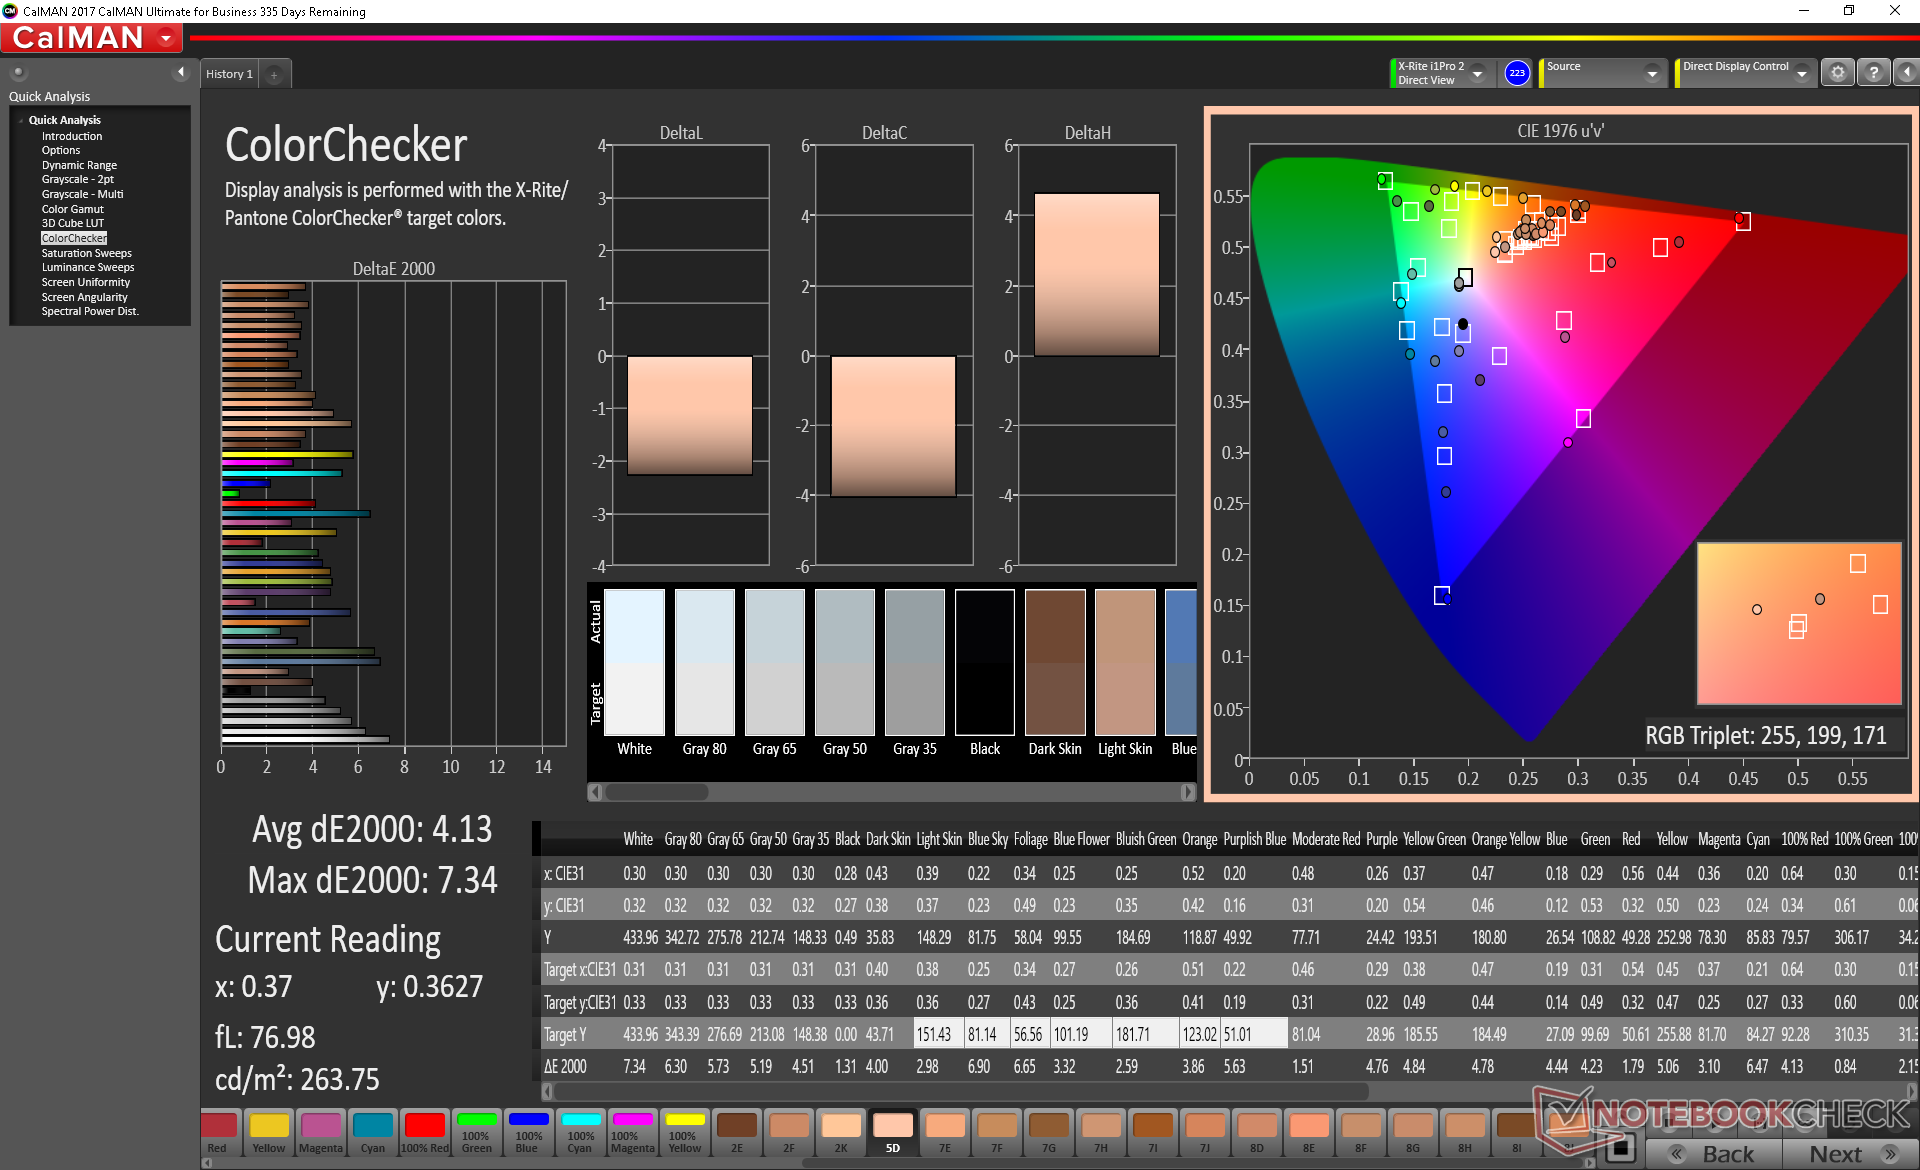
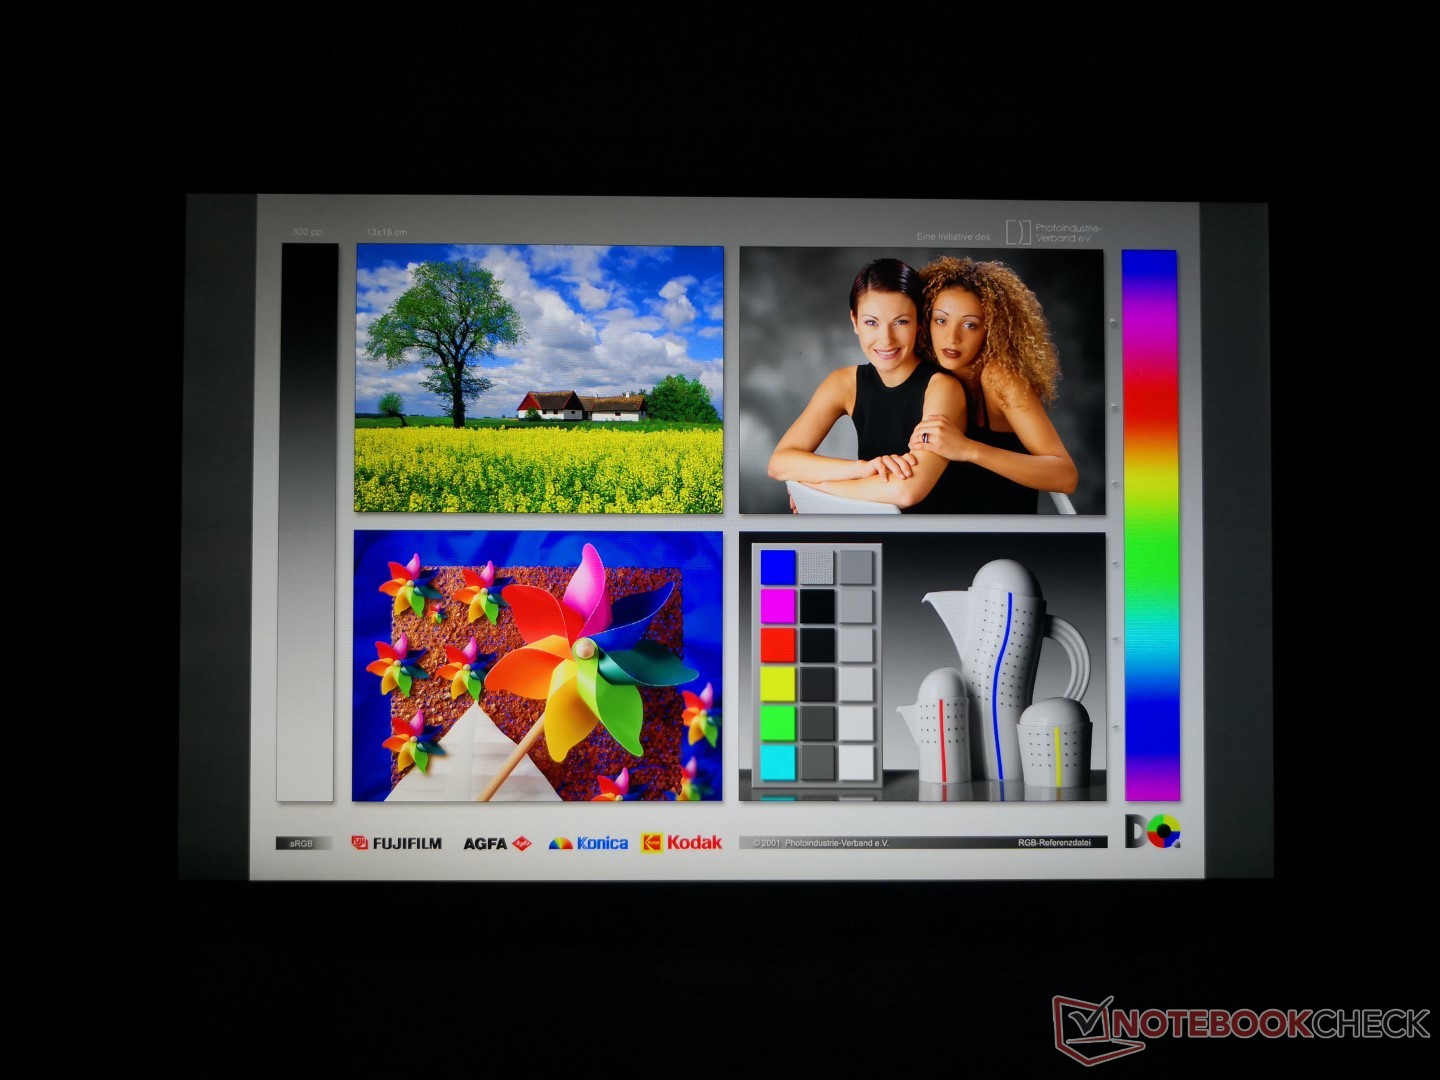
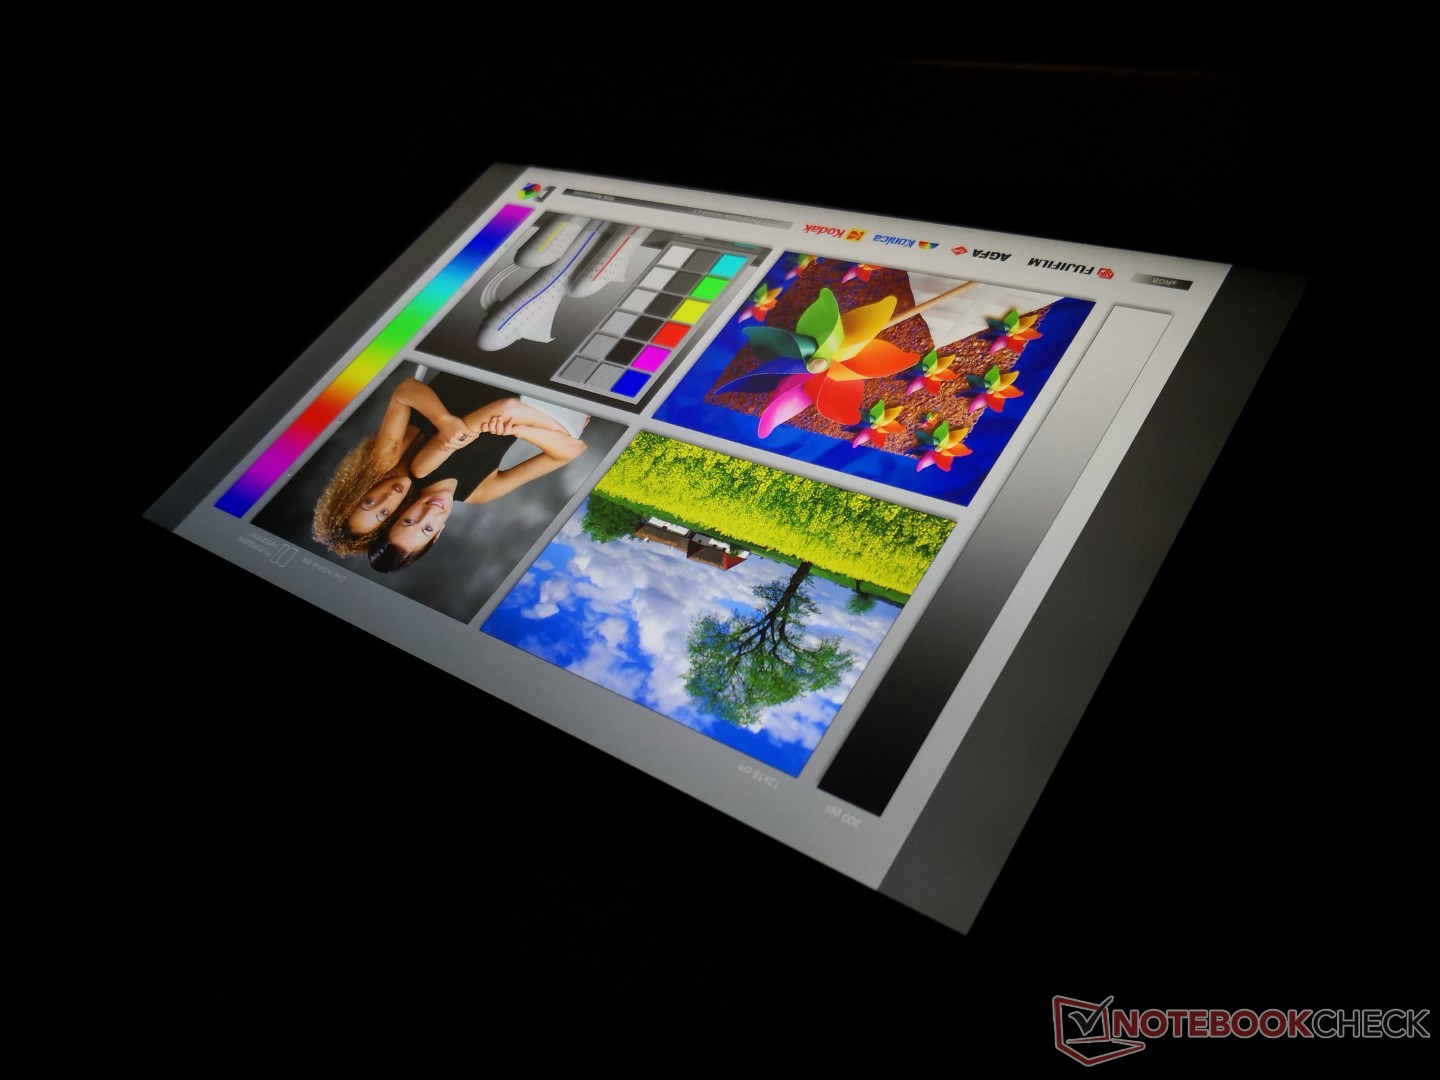
The 1080p touchscreen is a mixture of pros and cons. Text is sharp, the backlight is fairly bright, contrast is good, and colors are reasonably accurate considering the affordable price of the HiPad. On the other hand, backlight uniformity is noticeably uneven as there is bleeding along the left edge of the screen. Response times are also measurably slower than competing tablets like the Galaxy Tab A 10.5 or Huawei MediaPad M5 lite for more ghosting when gaming or scrolling through web pages.
A very slight layer of graininess is noticeable on the display surface. It's difficult to see without a flagship alternative nearby such as an Apple iPad 6, but picture quality is crisper on the Apple even before accounting for its resolution advantage.
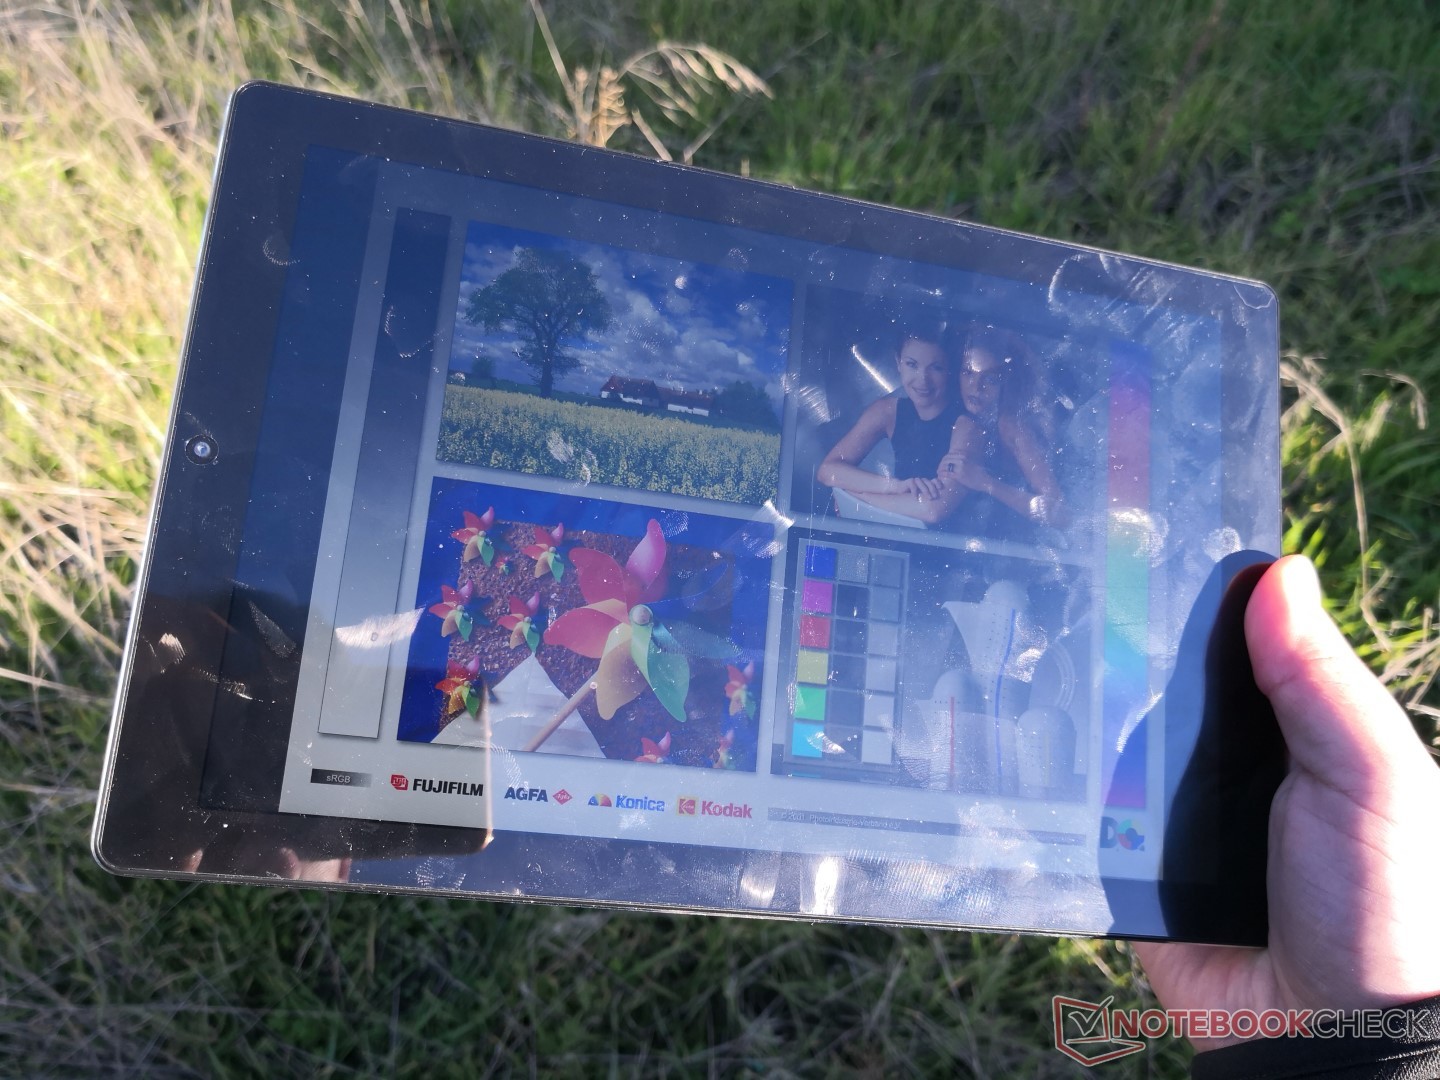
Outdoor visibility is average for a tablet as competitors often have brighter panels.
| |||||||||||||||||||||||||
Brightness Distribution: 85 %
Center on Battery: 408.7 cd/m²
Contrast: 801:1 (Black: 0.51 cd/m²)
ΔE ColorChecker Calman: 4.13 | ∀{0.5-29.43 Ø4.71}
ΔE Greyscale Calman: 4.4 | ∀{0.09-98 Ø4.96}
Gamma: 2.24
CCT: 7389 K
| Chuwi HiPad IPS, 10.1", 1920x1200 | Samsung Galaxy Tab S4 Super AMOLED, 10.5", 2560x1600 | Samsung Galaxy Tab A 10.5 SM-T590N IPS, 10.5", 1920x1200 | Microsoft Surface Go MHN-00003 Sharp SHP14A6, IPS, 10", 1800x1200 | Huawei MediaPad M5 lite IPS, 10.1", 1920x1200 | Lenovo Tab 4 10 Plus IPS, 10.1", 1920x1200 | |
|---|---|---|---|---|---|---|
| Display | ||||||
| Display P3 Coverage (%) | 66.5 | |||||
| sRGB Coverage (%) | 97.5 | |||||
| AdobeRGB 1998 Coverage (%) | 67.5 | |||||
| Response Times | 88% | -13% | 3% | 22% | -18% | |
| Response Time Grey 50% / Grey 80% * (ms) | 33.2 ? | 4.8 ? 86% | 54.8 ? -65% | 44 ? -33% | 36 ? -8% | 52 ? -57% |
| Response Time Black / White * (ms) | 41.2 ? | 4 ? 90% | 24.8 ? 40% | 25.6 ? 38% | 20 ? 51% | 32 ? 22% |
| PWM Frequency (Hz) | 240.4 ? | 1020 ? | 100 ? | |||
| Screen | 26% | 39% | 43% | -24% | 21% | |
| Brightness middle (cd/m²) | 408.7 | 474 16% | 556 36% | 456 12% | 514 26% | 443 8% |
| Brightness (cd/m²) | 396 | 477 20% | 514 30% | 426 8% | 492 24% | 428 8% |
| Brightness Distribution (%) | 85 | 91 7% | 87 2% | 88 4% | 80 -6% | 94 11% |
| Black Level * (cd/m²) | 0.51 | 0.42 18% | 0.31 39% | 0.96 -88% | 0.36 29% | |
| Contrast (:1) | 801 | 1324 65% | 1471 84% | 535 -33% | 1231 54% | |
| Colorchecker dE 2000 * | 4.13 | 2.5 39% | 1.8 56% | 1.3 69% | 5.42 -31% | 3.3 20% |
| Colorchecker dE 2000 max. * | 7.34 | 5.8 21% | 3.2 56% | 3 59% | 9.84 -34% | 7.2 2% |
| Greyscale dE 2000 * | 4.4 | 2.1 52% | 2.2 50% | 1.4 68% | 6.5 -48% | 2.9 34% |
| Gamma | 2.24 98% | 2.08 106% | 2.26 97% | 2.24 98% | 2.216 99% | 2.27 97% |
| CCT | 7389 88% | 6281 103% | 6819 95% | 6687 97% | 6780 96% | 6961 93% |
| Colorchecker dE 2000 calibrated * | 1.1 | |||||
| Color Space (Percent of AdobeRGB 1998) (%) | 62.3 | |||||
| Color Space (Percent of sRGB) (%) | 96.8 | |||||
| Total Average (Program / Settings) | 57% /
41% | 13% /
29% | 23% /
35% | -1% /
-15% | 2% /
13% |
* ... smaller is better
Display Response Times
| ↔ Response Time Black to White | ||
|---|---|---|
| 41.2 ms ... rise ↗ and fall ↘ combined | ↗ 25.2 ms rise | 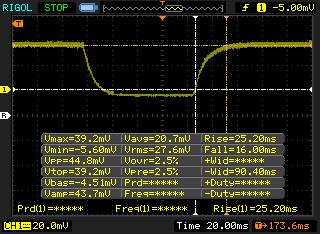 |
| ↘ 16 ms fall | ||
| The screen shows slow response rates in our tests and will be unsatisfactory for gamers. In comparison, all tested devices range from 0.1 (minimum) to 240 (maximum) ms. » 98 % of all devices are better. This means that the measured response time is worse than the average of all tested devices (19.8 ms). | ||
| ↔ Response Time 50% Grey to 80% Grey | ||
| 33.2 ms ... rise ↗ and fall ↘ combined | ↗ 16.4 ms rise | 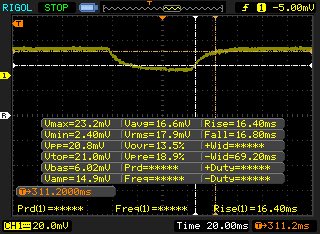 |
| ↘ 16.8 ms fall | ||
| The screen shows slow response rates in our tests and will be unsatisfactory for gamers. In comparison, all tested devices range from 0.165 (minimum) to 636 (maximum) ms. » 46 % of all devices are better. This means that the measured response time is similar to the average of all tested devices (30.9 ms). | ||
Screen Flickering / PWM (Pulse-Width Modulation)
| Screen flickering / PWM not detected | 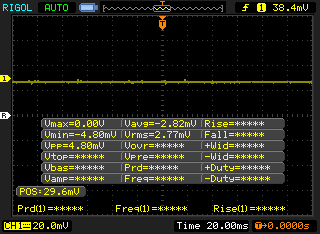 | ||
In comparison: 52 % of all tested devices do not use PWM to dim the display. If PWM was detected, an average of 7748 (minimum: 5 - maximum: 343500) Hz was measured. | |||
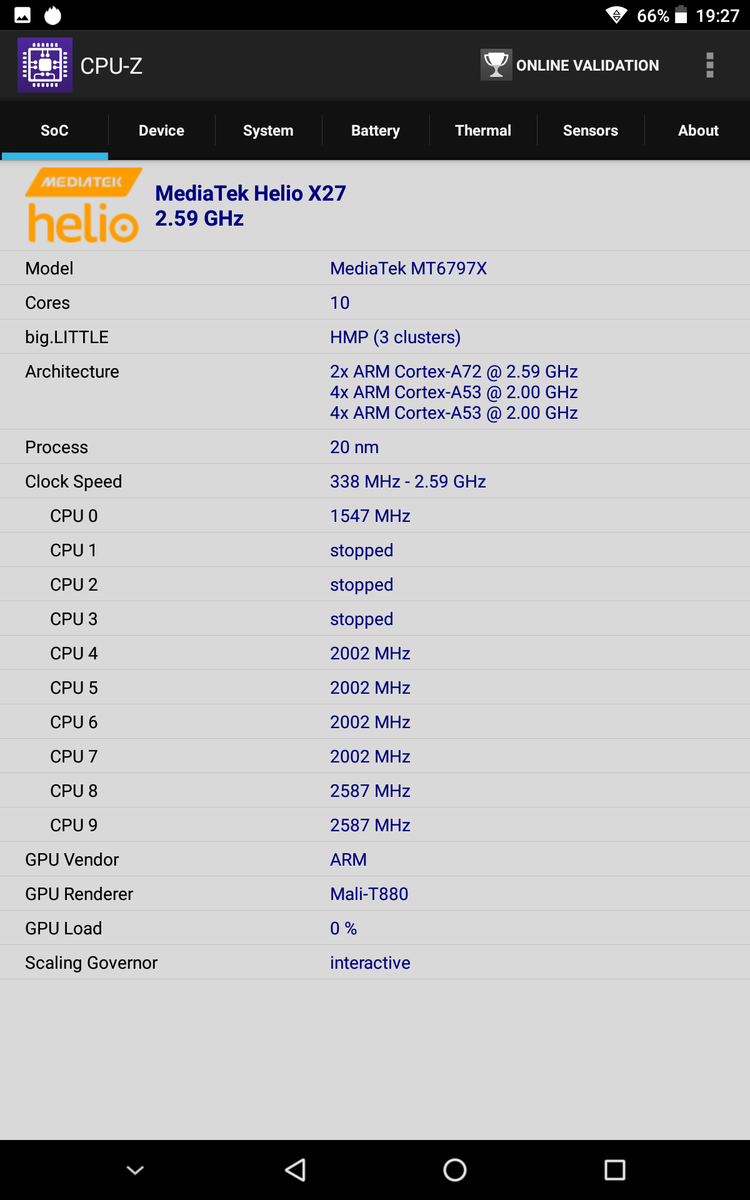
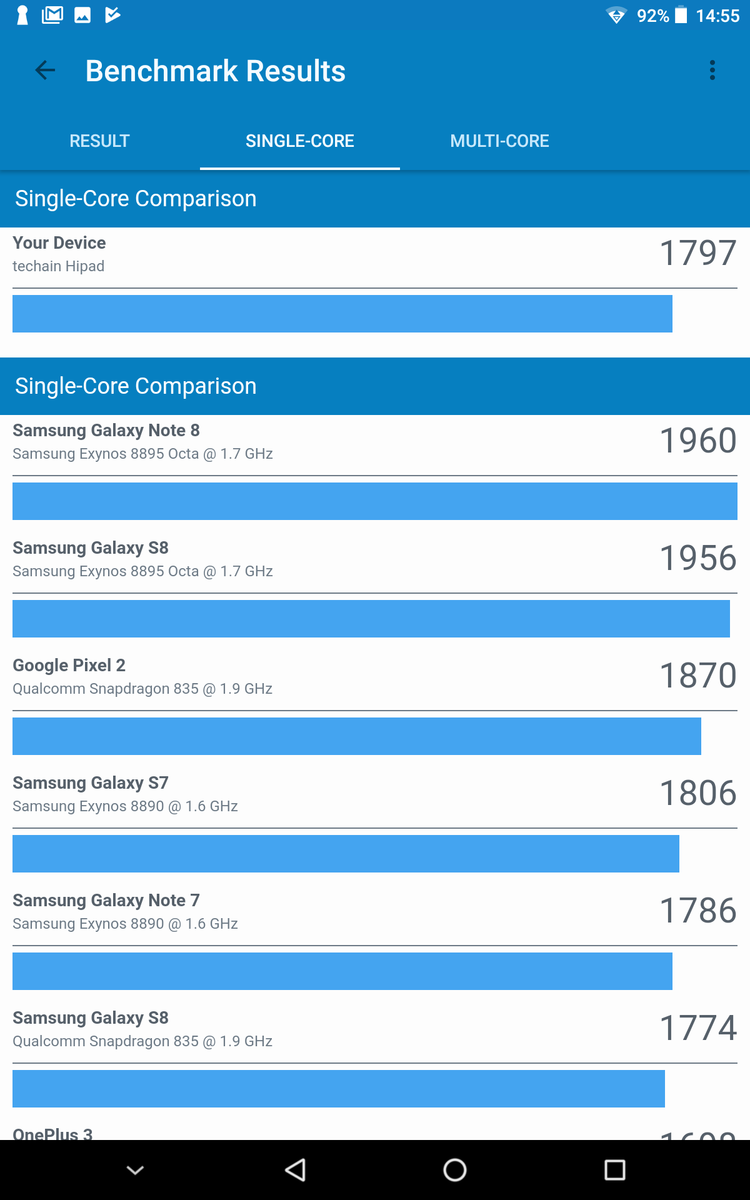
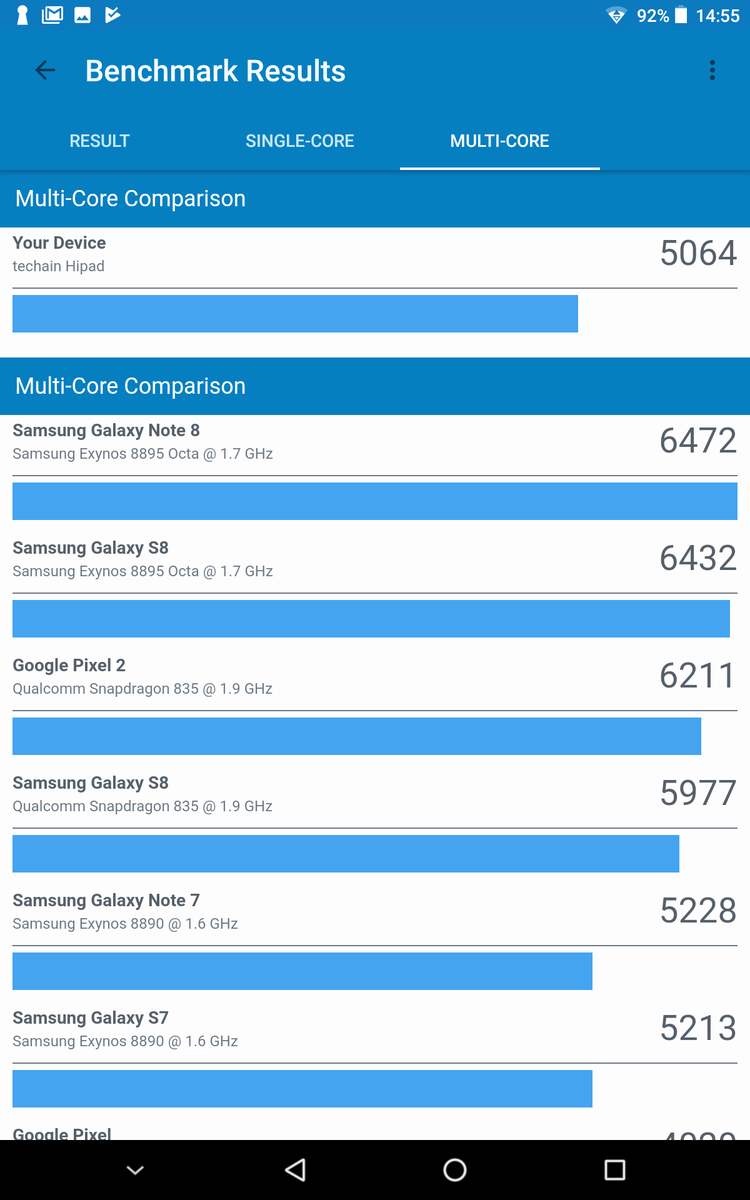
Performance
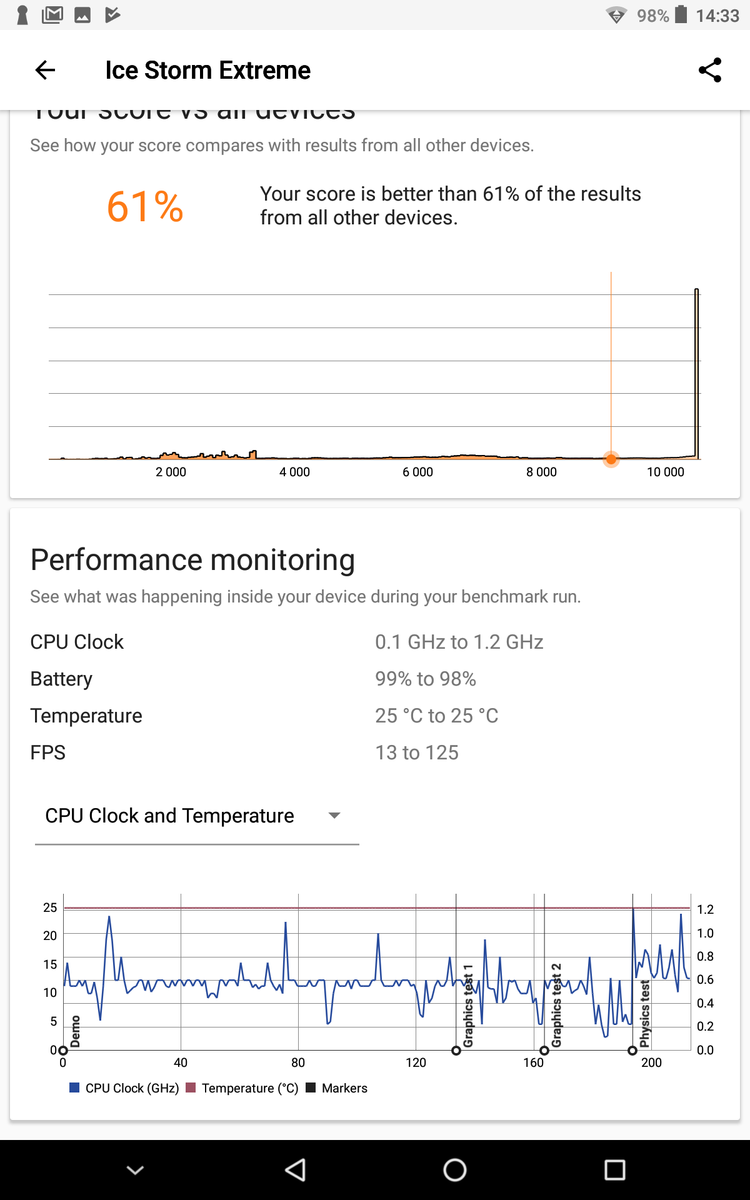
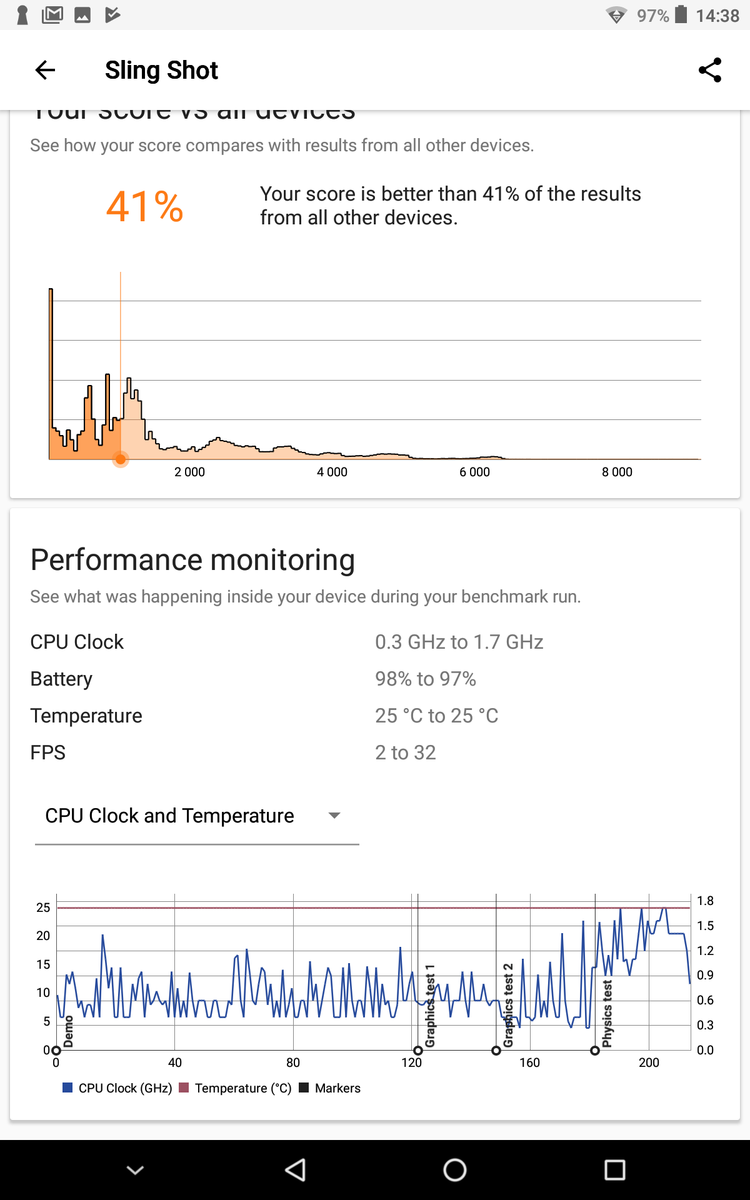
The HiPad uses the same Helio X27 SoC as on the Hi9 Plus for similar benchmark results between them. Users can expect both 20 to 25 percent slower multi-thread CPU performance and 50 percent slower GPU performance than on the Snapdragon 835. The mid-range Huawei HiSilicon Kirin 960 is also able to outperform our Helio X27 SoC in both CPU and GPU power. The slow graphics performance on the HiPad becomes evident when playing demanding games on the Google Play Store.
Subjectively, system performance is clunky and it suffers from skipped frames very often. Apps do not launch immediately upon touch and we often found ourselves tapping icons twice since we are unsure if the first tap had even registered.
| Basemark GPU 1.1 | |
| 1920x1080 Vulkan Medium Offscreen | |
| Samsung Galaxy Tab S4 | |
| Vulkan Medium Native | |
| Samsung Galaxy Tab S4 | |
| 1920x1080 OpenGL Medium Offscreen | |
| Samsung Galaxy Tab S4 | |
| Average MediaTek Helio X27 MT6797X (n=1) | |
* ... smaller is better
Storage Devices
The internal 32 GB eMMC performs a bit more slowly than the 64 GB eMMC as found on the Chuwi Hi9 Plus according to AndroBench. In particular, its sequential write rate is nearly half as fast at just 74 MB/s. Transfer rates from the MicroSD card reader are much better and comparable to the Galaxy Tab S4. Chuwi says the tablet can support MicroSD cards of up to 128 GB in capacity.
| Chuwi HiPad 32 GB eMMC Flash | Samsung Galaxy Tab S4 64 GB UFS 2.1 Flash | Samsung Galaxy Tab A 10.5 SM-T590N 32 GB eMMC Flash | Huawei MediaPad M5 lite 32 GB eMMC Flash | Lenovo Tab 4 10 Plus 64 GB eMMC Flash | Chuwi Hi9 Plus 64 GB eMMC Flash | |
|---|---|---|---|---|---|---|
| AndroBench 3-5 | 164% | 43% | 150% | 33% | -4% | |
| Sequential Write 256KB SDCard (MB/s) | 66.8 | 59.1 -12% | 60.4 -10% | 72.8 9% | 61.1 -9% | 20.44 -69% |
| Sequential Read 256KB SDCard (MB/s) | 65.9 | 80.1 22% | 80.6 22% | 83.7 27% | 83.9 27% | 21.16 -68% |
| Random Write 4KB (MB/s) | 10.28 | 24.43 138% | 13.39 30% | 77.3 652% | 11.8 15% | 13.01 27% |
| Random Read 4KB (MB/s) | 40.21 | 142 253% | 71.1 77% | 73.5 83% | 37.3 -7% | 42.2 5% |
| Sequential Write 256KB (MB/s) | 73.6 | 195.8 166% | 103.3 40% | 82.6 12% | 135.5 84% | 132.5 80% |
| Sequential Read 256KB (MB/s) | 144.3 | 741 414% | 285.6 98% | 308.1 114% | 270.1 87% | 145 0% |
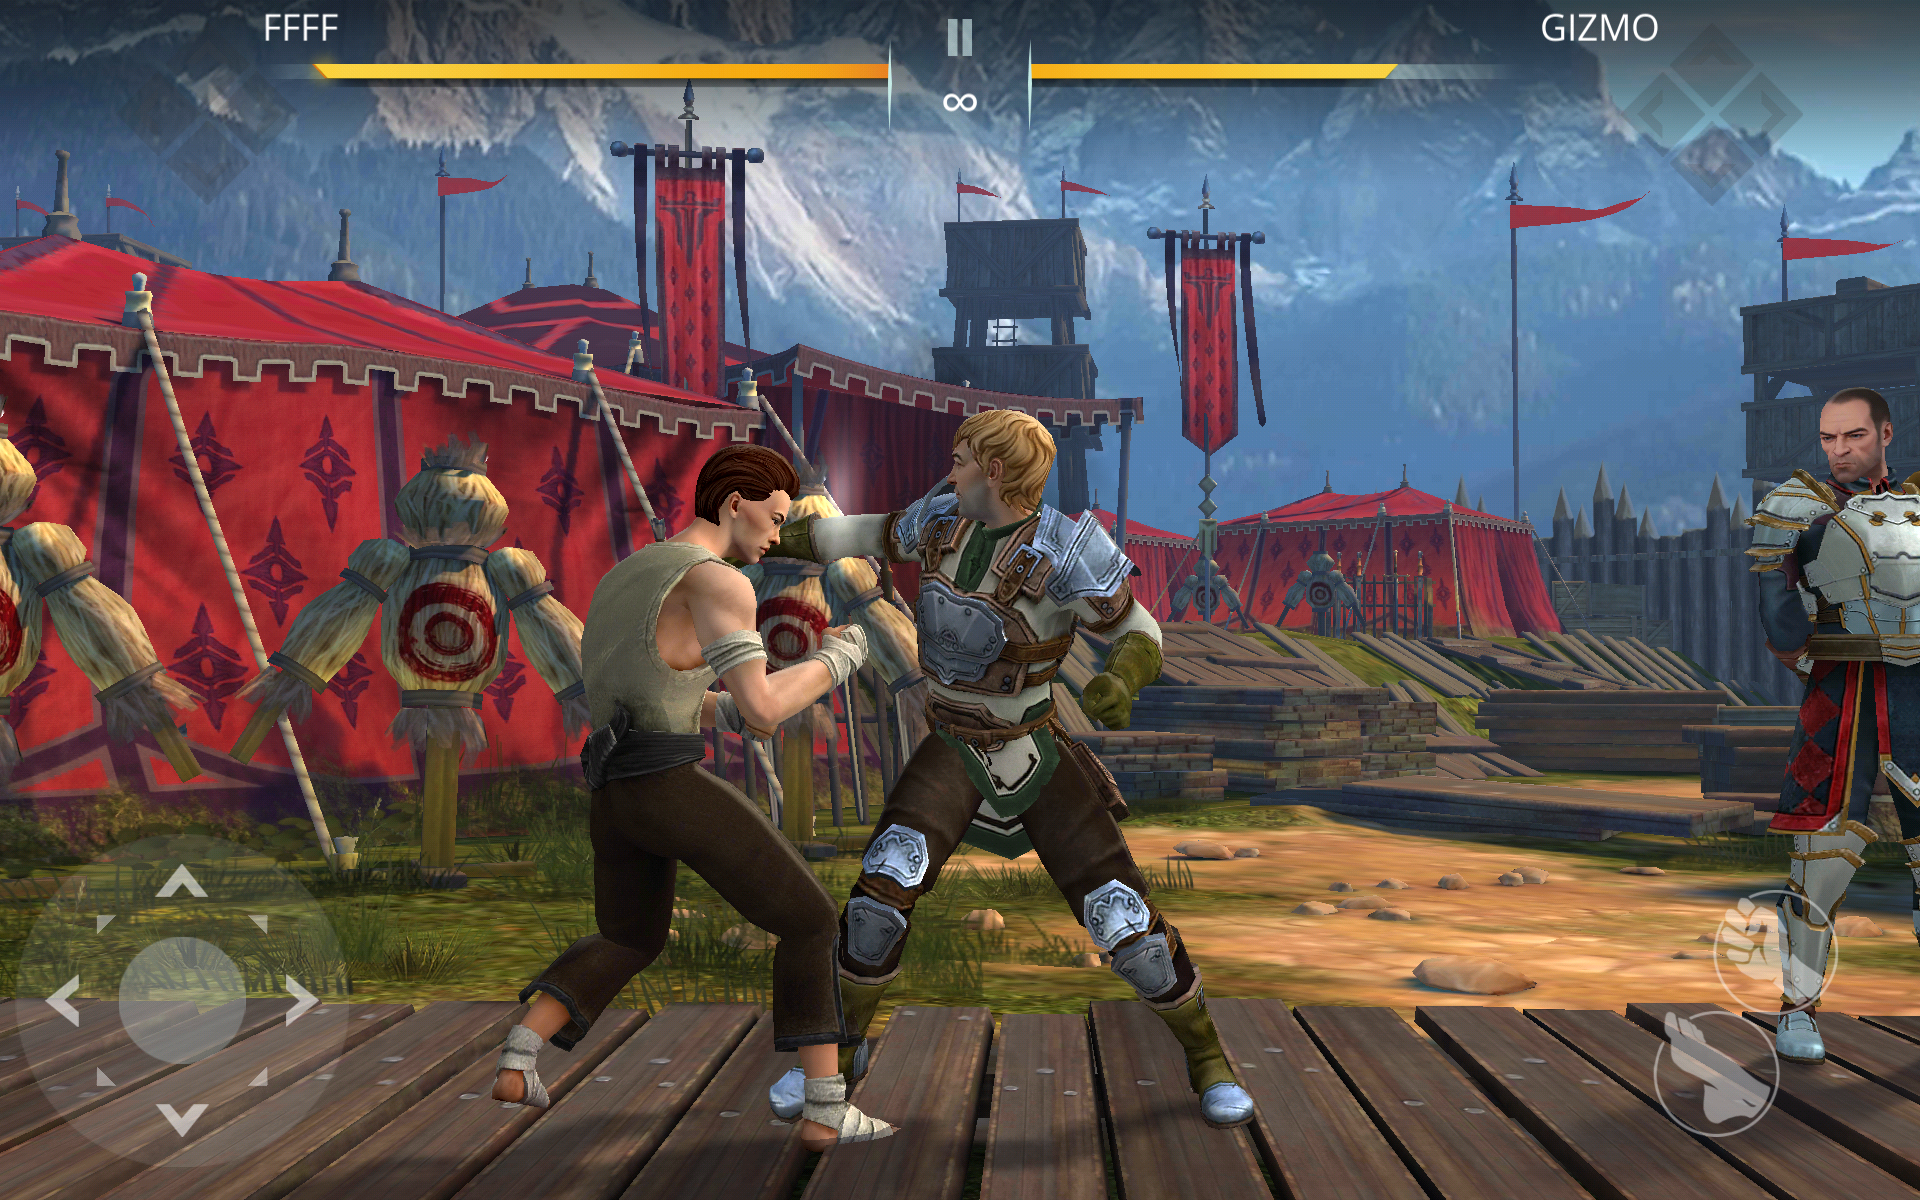
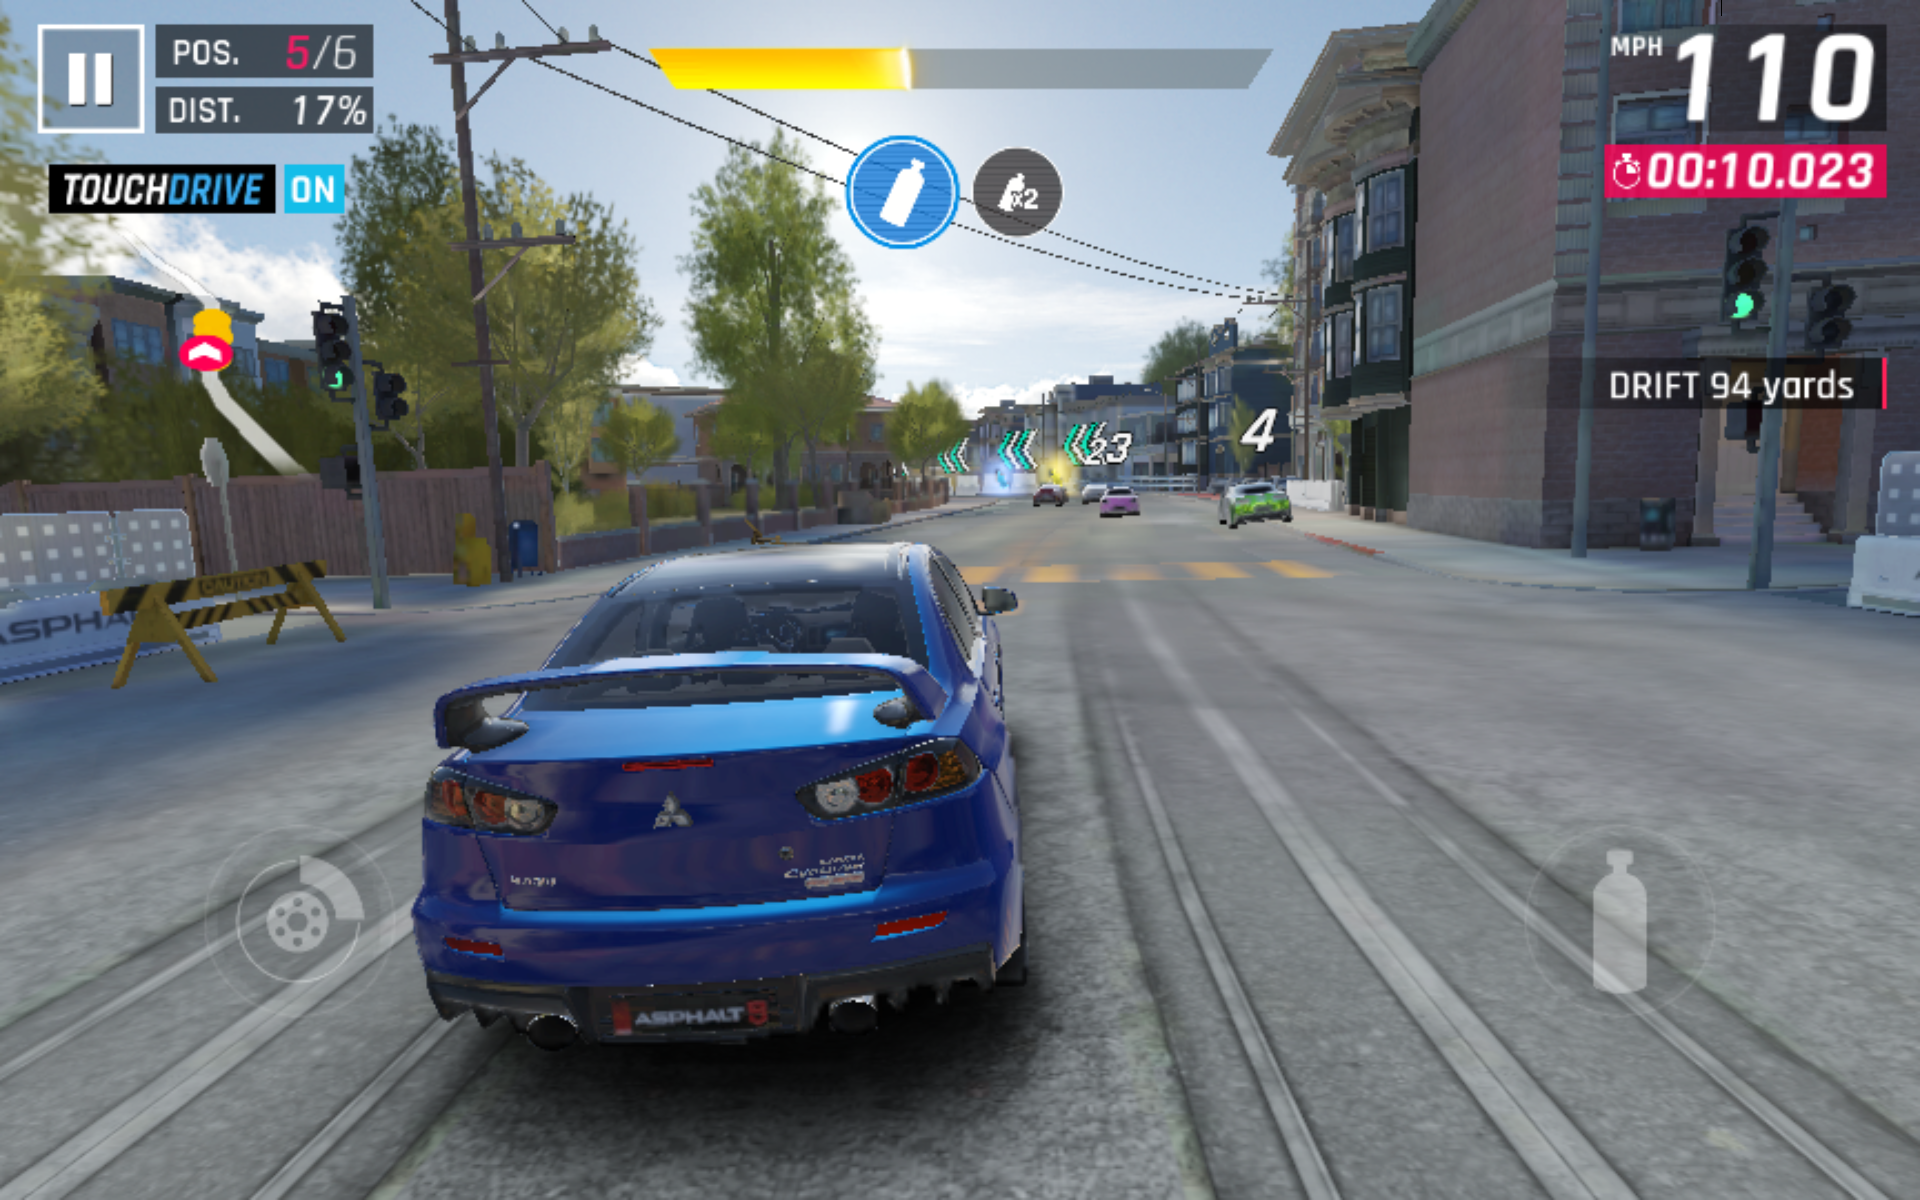
Games
Gaming performance is a mixed bag. When playing Asphalt 9, for example, we can notice texture pop-in, major aliasing on cars, and overall muddy textures. Perhaps the worst offender is its unstable frame rate for a less than optimal gaming experience. Less demanding titles like Shadow Fight 3 run more smoothly.
» No benchmarks for this notebook found!
Emissions
Temperature
Surface temperatures are warmest towards the USB port as the motherboard is likely positioned in this quadrant. When under very high loads, we are able to record a hot spot of almost 37 C whereas the right half of the tablet can be as cool as 23 C.
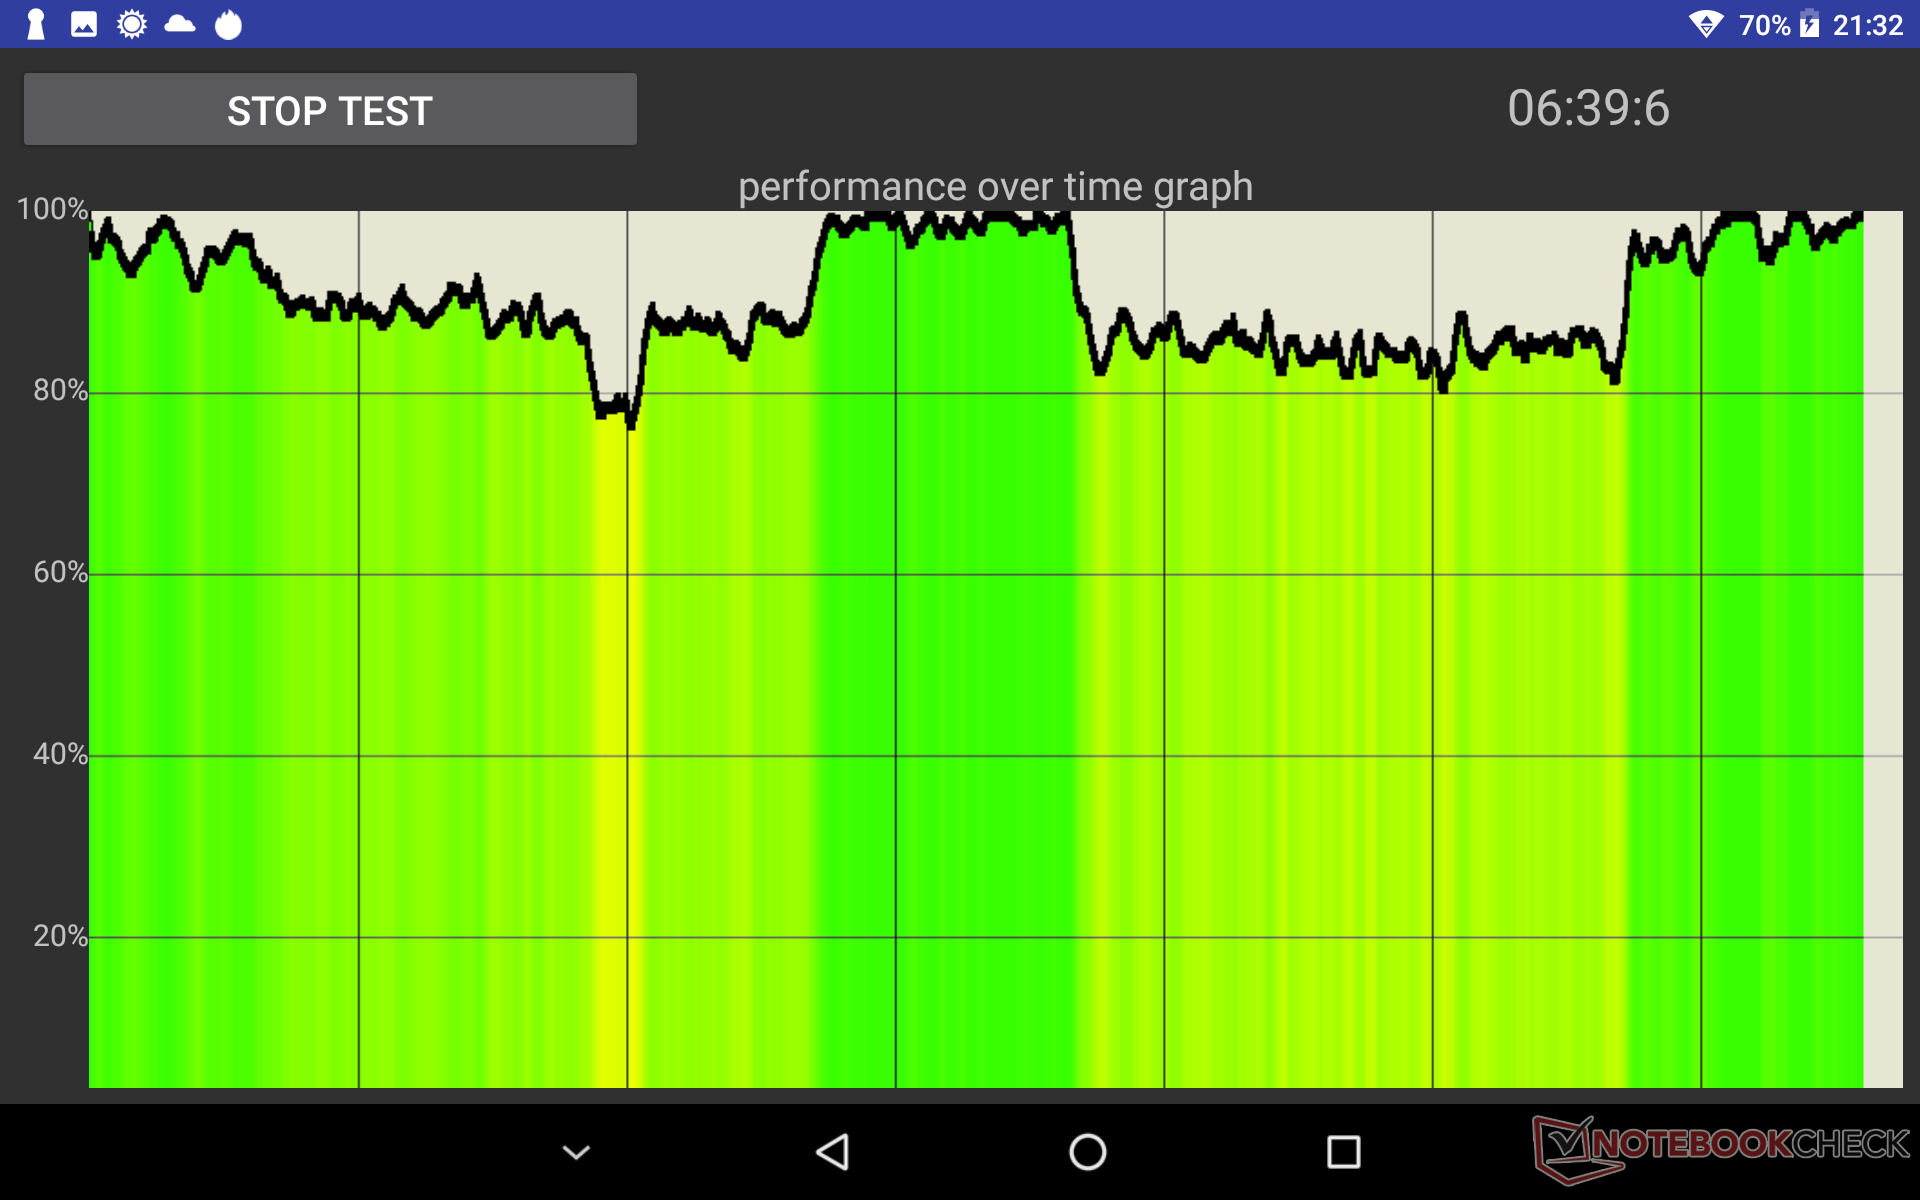
The processor is unable to maintain maximum clock rates indefinitely as shown by our performance over time graph to the right. Clock rates appear to cycle over time.
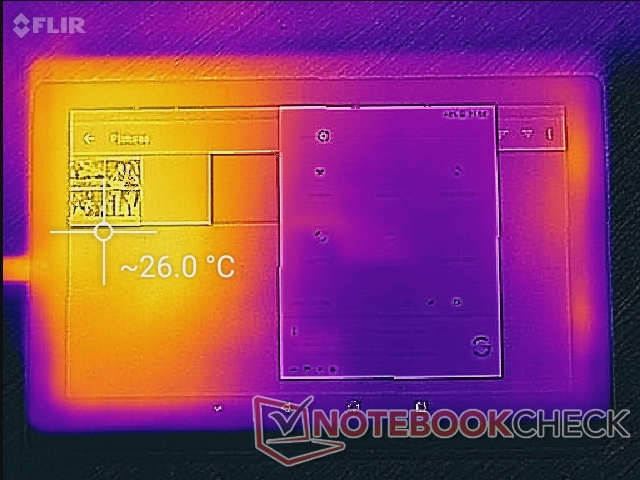
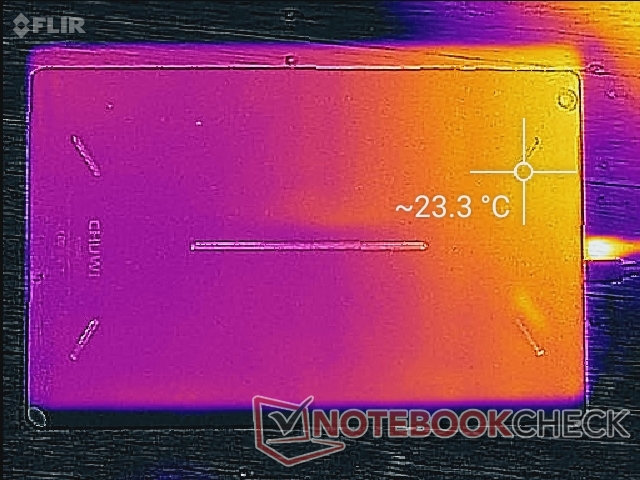
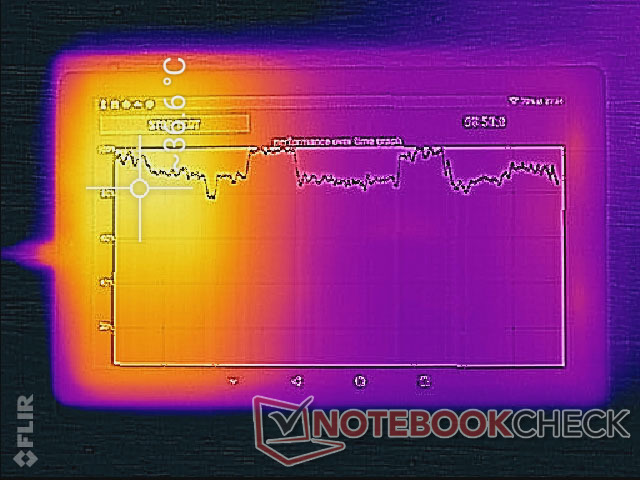

(+) The maximum temperature on the upper side is 36 °C / 97 F, compared to the average of 33.7 °C / 93 F, ranging from 20.7 to 53.2 °C for the class Tablet.
(+) The bottom heats up to a maximum of 32 °C / 90 F, compared to the average of 33.2 °C / 92 F
(+) In idle usage, the average temperature for the upper side is 23.8 °C / 75 F, compared to the device average of 30 °C / 86 F.
Speakers
The integrated speaker lacks depth and bass and maximum volume could have been louder. Our pink noise graph below shows peaks at certain frequencies whereas a more balanced audio system would have a flatter and broader line to represent treble and bass more evenly. Slight chassis reverberation can be felt near the bottom of the tablet when at the maximum volume setting.

Chuwi HiPad audio analysis
(-) | not very loud speakers (68.4 dB)
Bass 100 - 315 Hz
(-) | nearly no bass - on average 24.2% lower than median
(±) | linearity of bass is average (8.4% delta to prev. frequency)
Mids 400 - 2000 Hz
(±) | higher mids - on average 6.1% higher than median
(-) | mids are not linear (17.2% delta to prev. frequency)
Highs 2 - 16 kHz
(±) | higher highs - on average 5.3% higher than median
(±) | linearity of highs is average (11.2% delta to prev. frequency)
Overall 100 - 16.000 Hz
(-) | overall sound is not linear (34.3% difference to median)
Compared to same class
» 94% of all tested devices in this class were better, 2% similar, 4% worse
» The best had a delta of 7%, average was 20%, worst was 129%
Compared to all devices tested
» 93% of all tested devices were better, 1% similar, 6% worse
» The best had a delta of 4%, average was 23%, worst was 134%
Apple MacBook 12 (Early 2016) 1.1 GHz audio analysis
(+) | speakers can play relatively loud (83.6 dB)
Bass 100 - 315 Hz
(±) | reduced bass - on average 11.3% lower than median
(±) | linearity of bass is average (14.2% delta to prev. frequency)
Mids 400 - 2000 Hz
(+) | balanced mids - only 2.4% away from median
(+) | mids are linear (5.5% delta to prev. frequency)
Highs 2 - 16 kHz
(+) | balanced highs - only 2% away from median
(+) | highs are linear (4.5% delta to prev. frequency)
Overall 100 - 16.000 Hz
(+) | overall sound is linear (10.2% difference to median)
Compared to same class
» 7% of all tested devices in this class were better, 2% similar, 90% worse
» The best had a delta of 5%, average was 18%, worst was 53%
Compared to all devices tested
» 5% of all tested devices were better, 1% similar, 94% worse
» The best had a delta of 4%, average was 23%, worst was 134%
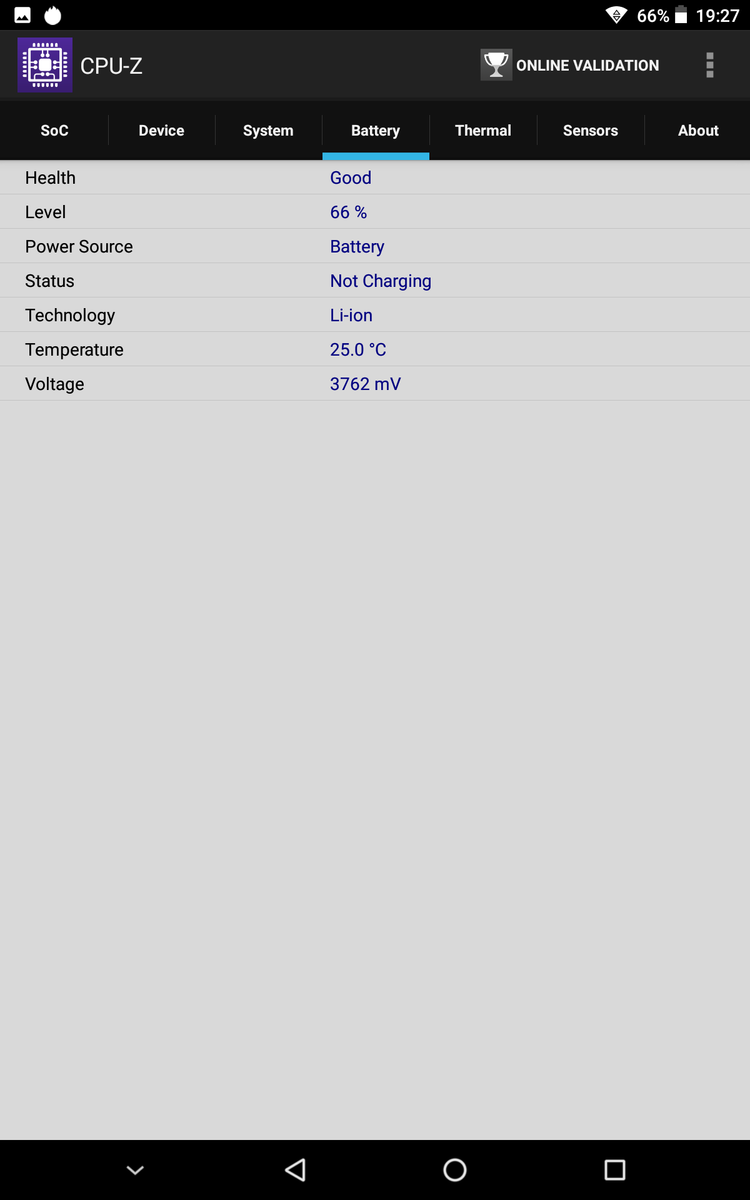
Energy Management
Power Consumption
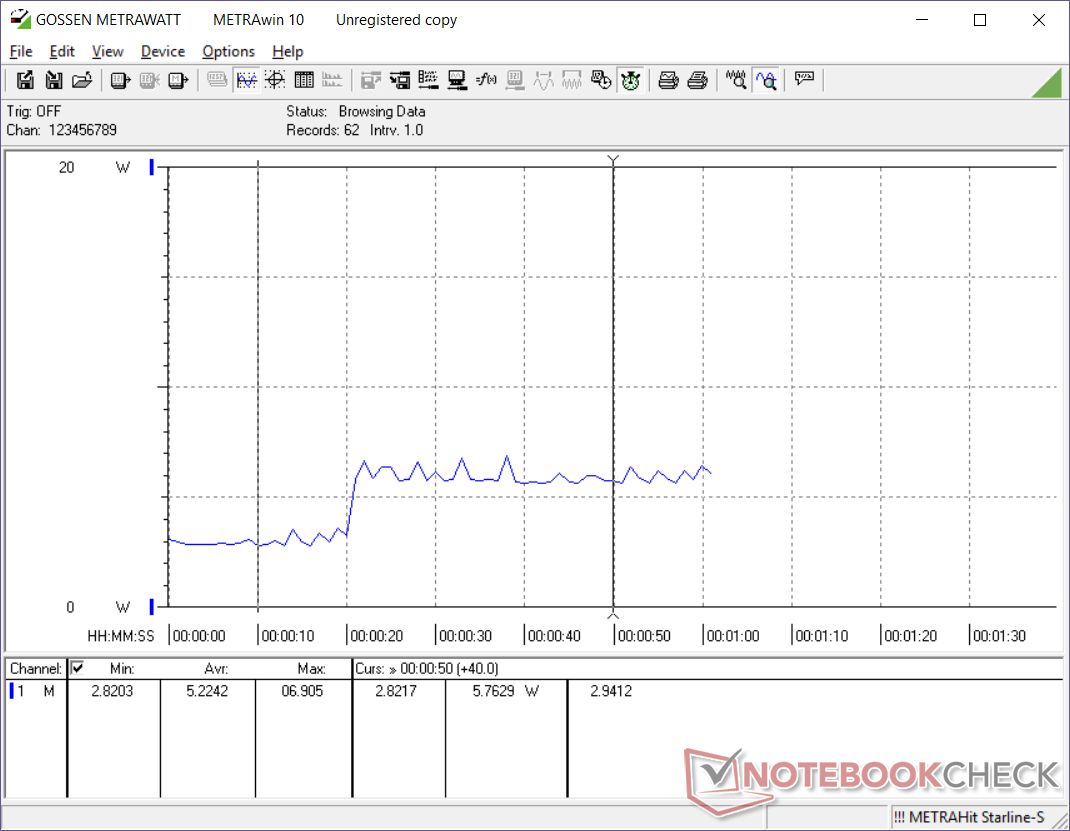
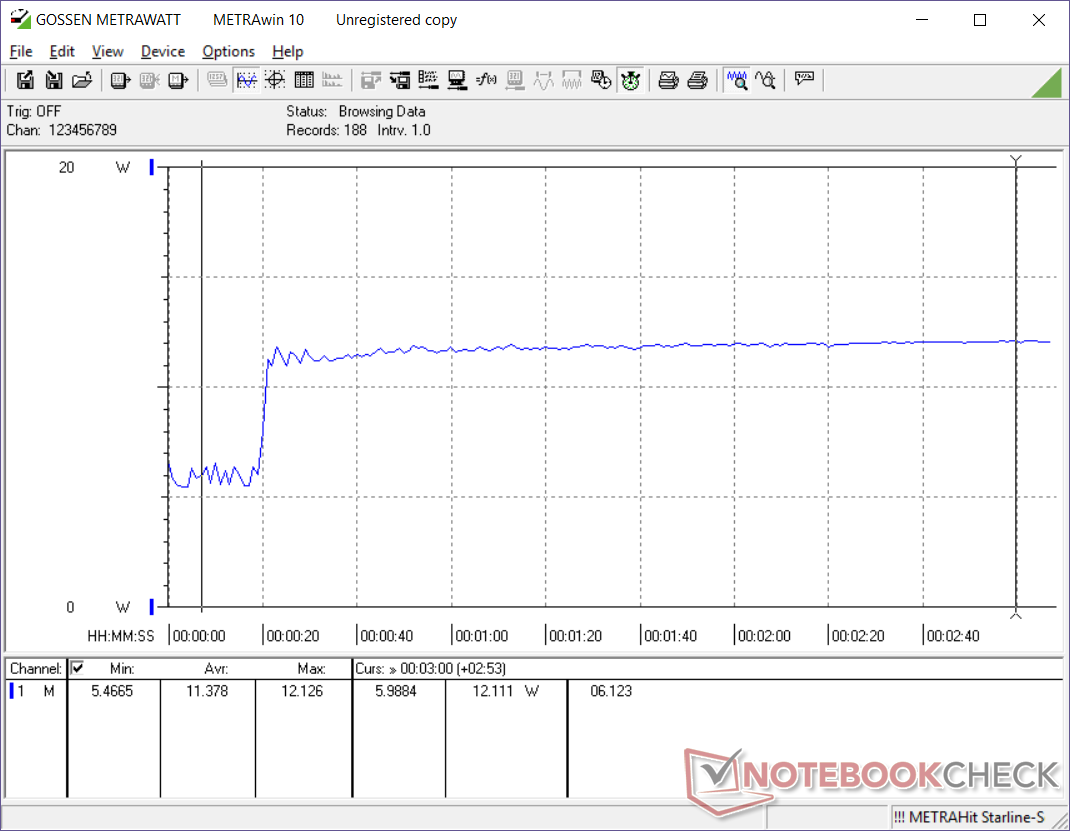
The HiPad is not as power efficient as its competitors. Idling on the Home screen demands anywhere between 2.7 W to 5.6 W depending on the brightness setting compared to 1.2 W to 4 W on the similarly sized Lenovo Tab 4 10 Plus. Playing video draws 7 W and maximum CPU load demands 12 W compared to almost half that on the Samsung Galaxy Tab S4 or Huawei MediaPad M5 lite.
Be aware that the included 10 W (5 V/2 A) AC charger is European in origin and so it is not compatible with U.S. outlets without an adapter.
| Off / Standby | |
| Idle | |
| Load |
|
Key:
min: | |
| Chuwi HiPad MT6797X, Mali-T880 MP4, 32 GB eMMC Flash, IPS, 1920x1200, 10.1" | Samsung Galaxy Tab S4 SD 835, Adreno 540, 64 GB UFS 2.1 Flash, Super AMOLED, 2560x1600, 10.5" | Samsung Galaxy Tab A 10.5 SM-T590N SD 450, Adreno 506, 32 GB eMMC Flash, IPS, 1920x1200, 10.5" | Microsoft Surface Go MHN-00003 Pentium 4415Y, UHD Graphics 615, 64 GB eMMC Flash, IPS, 1800x1200, 10" | Huawei MediaPad M5 lite Kirin 659, Mali-T830 MP2, 32 GB eMMC Flash, IPS, 1920x1200, 10.1" | Lenovo Tab 4 10 Plus 625, Adreno 506, 64 GB eMMC Flash, IPS, 1920x1200, 10.1" | |
|---|---|---|---|---|---|---|
| Power Consumption | 31% | 33% | -53% | 27% | 36% | |
| Idle Minimum * (Watt) | 2.7 | 1.76 35% | 1.26 53% | 2.88 -7% | 2.8 -4% | 1.23 54% |
| Idle Average * (Watt) | 5.5 | 4.22 23% | 4.22 23% | 4.8 13% | 3.3 40% | 3.92 29% |
| Idle Maximum * (Watt) | 5.6 | 4.25 24% | 4.29 23% | 7.5 -34% | 3.9 30% | 4.03 28% |
| Load Average * (Watt) | 7 | 4.52 35% | 5.48 22% | 16.9 -141% | 5.2 26% | 5 29% |
| Load Maximum * (Watt) | 12.2 | 7.35 40% | 6.57 46% | 23.8 -95% | 7.2 41% | 7.09 42% |
* ... smaller is better
Battery Life
Runtimes from the 7000 mAh battery are average. Users can expect just over 10 hours of real-world WLAN use to be comparable to the Lenovo Tab 4 10 Plus. The relatively large battery makes up for the poorer power efficiency of the SoC.
Recharge time is slow at approximately 3 hours from empty to full capacity with the included 10 W AC adapter.
| Chuwi HiPad MT6797X, Mali-T880 MP4, Wh | Samsung Galaxy Tab S4 SD 835, Adreno 540, Wh | Samsung Galaxy Tab A 10.5 SM-T590N SD 450, Adreno 506, Wh | Microsoft Surface Go MHN-00003 Pentium 4415Y, UHD Graphics 615, 28 Wh | Huawei MediaPad M5 lite Kirin 659, Mali-T830 MP2, Wh | Lenovo Tab 4 10 Plus 625, Adreno 506, 26.6 Wh | |
|---|---|---|---|---|---|---|
| Battery runtime | -19% | 51% | -27% | 38% | 5% | |
| WiFi v1.3 (h) | 10.3 | 8.3 -19% | 15.6 51% | 7.5 -27% | 14.2 38% | 10.8 5% |
| Reader / Idle (h) | 20.5 | 32.7 | 12.9 | 36 | 27.1 | |
| Load (h) | 4.1 | 6.4 | 3 | 5 | 4.3 |
Verdict
Pros
Cons
We don't expect very much at the $200 range. Smooth performance, a strong chassis, and a nice screen are perhaps our top three demands for a "perfect" inexpensive tablet. In Chuwi's case, the HiPad hits a home run in two out of those three characteristics.
The metal chassis is perhaps the highlight of the HiPad. Its thin form factor and gamer-like black and red aesthetic give an impression of a pricier tablet. The glass IPS touchscreen is also above average in regard to color accuracy and contrast ratio.
Performance is where the HiPad falters. Simple actions like scrolling through pages or launching applications have a latency to them not found on mainstream to flagship tablets or smartphones. This is where the "budget" in budget category begins to show. Other auxiliary features like the poor camera, poor speakers, and slow charging are easier to live with at this price point, but smoother performance would have made the general user experience more seamless. Fortunately, the tablet is still excellent for FHD video playback and the occasional light browsing that its target audience can appreciate.
The display is better than we had anticipated in terms of color accuracy and contrast for this low of a price point. The low frame rate and sluggish performance bring down an otherwise attractive budget Android tablet.
Chuwi HiPad
- 01/02/2019 v6 (old)
Allen Ngo
Price comparison
