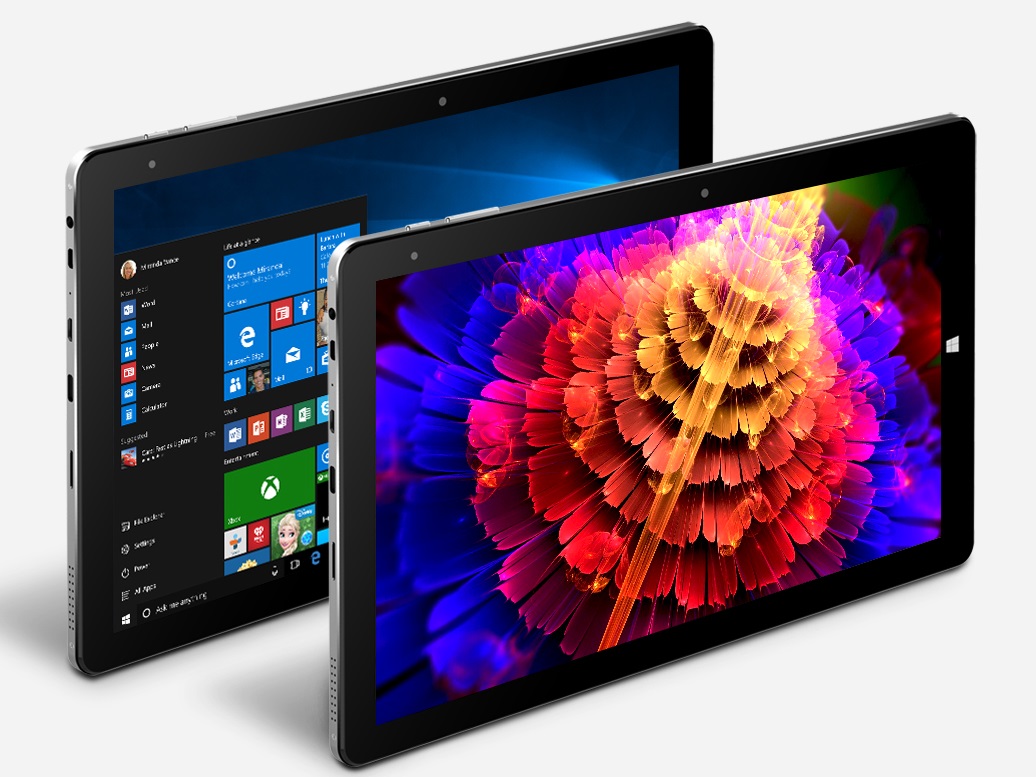
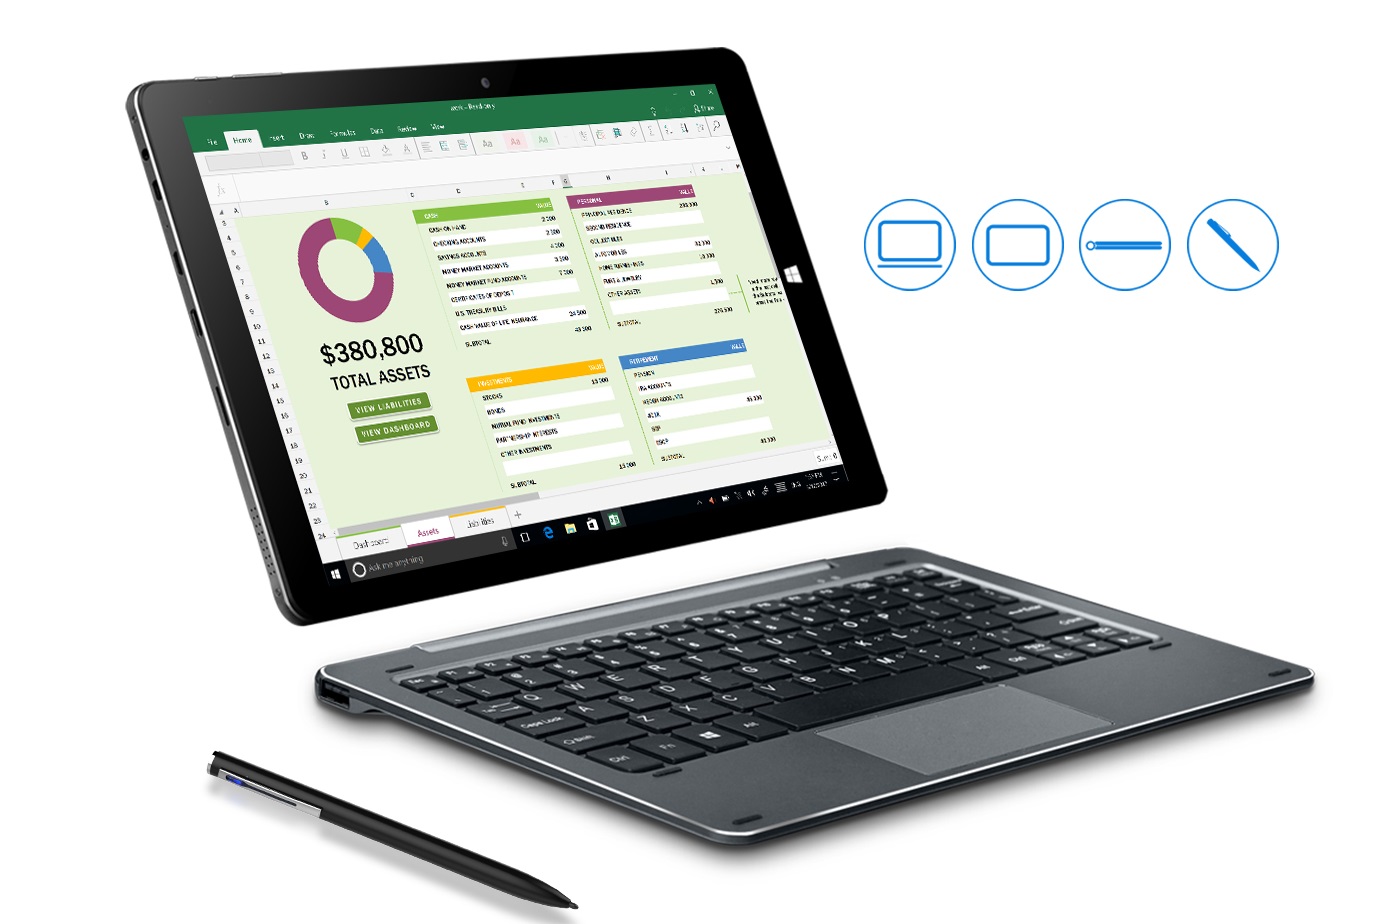
Chuwi Hi10 Air (Atom x5-Z8350, 4 GB RAM, 64 GB eMMC) Convertible Review
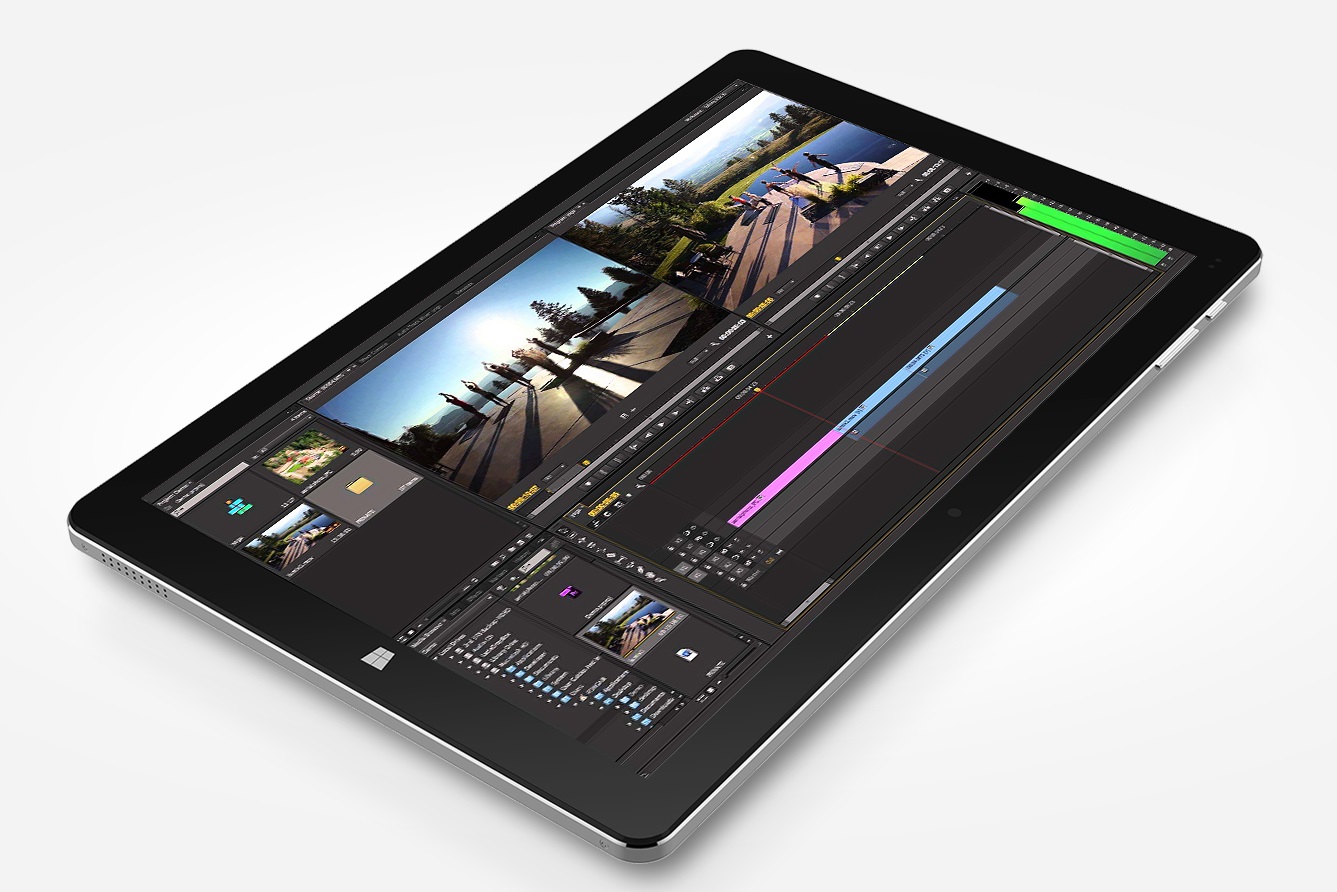
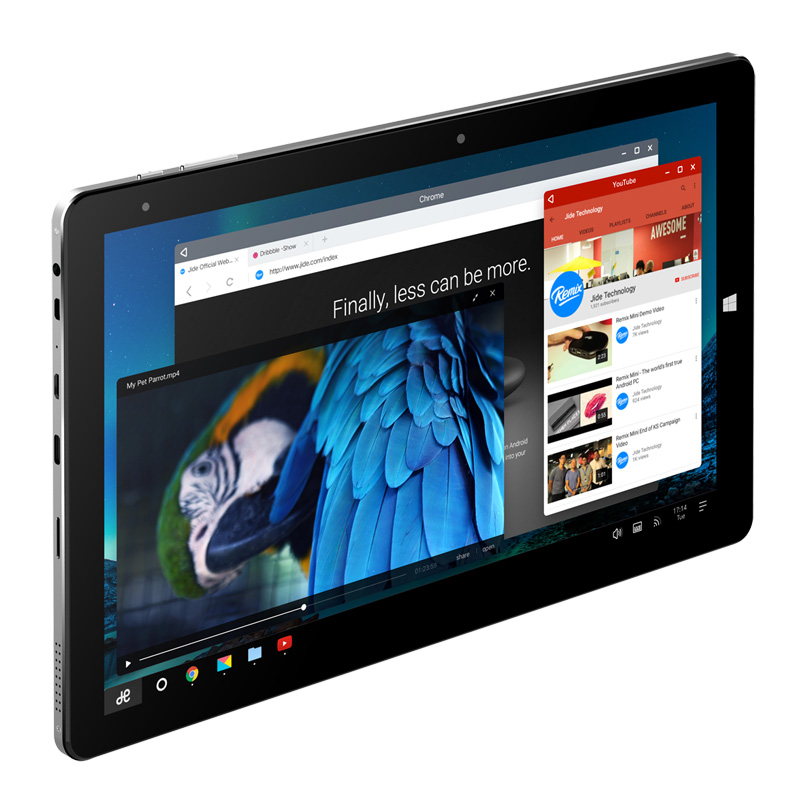
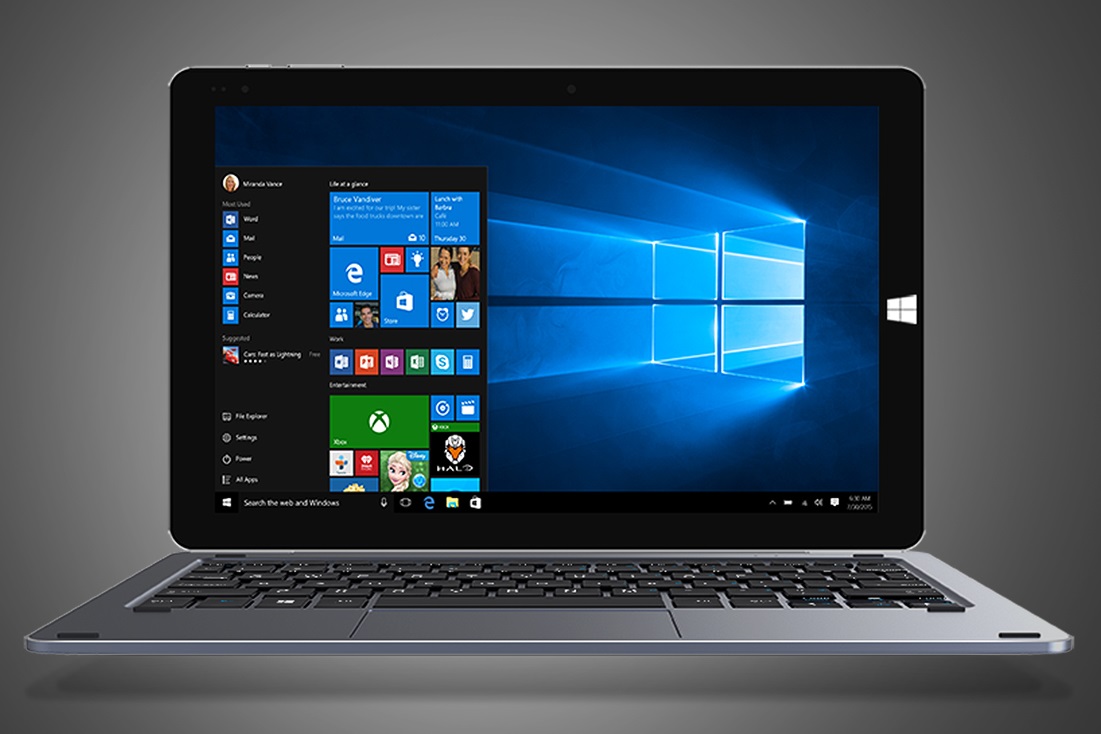
The Chuwi Hi10 Air is a 10-inch Windows 10 tablet that looks and performs unerringly like the Hi10 Pro, which the Chinese manufacturer released in 2016. Hardly anything seems to have changed in three years. The two devices share largely the same case and many internal components too. Please keep in mind that while we reviewed the Hi10 Pro with an Intel Atom x5 Z8300, Chuwi also sells the device with the x5-Z8350, which is the same processor that it uses in the Hi10 Air. The Air also lacks the Pro’s dual-boot functionality, which allows it to boot into Android or Windows. Instead, the Air only comes with Windows 10 pre-installed. Chuwi has apparently made one notable change though. The Hi10 Air has a one glass solution (OGS) full lamination touchscreen, which should provide improved touch accuracy and color reproduction.
Our review unit currently costs €210 (~US$234) on Amazon, but it is cheaper still if imported from China. Buying from the latter source does not include the keyboard and pen though, which cost an additional €50 (~US$56) and are bundled with the Amazon version.
On the face of it, the Hi10 Air looks like a bargain despite its comparatively outdated hardware. We have chosen to compare the device against the Chuwi Hi10 Pro, HP x2 210 G2, Lenovo IdeaPad D330 and the Microsoft Surface Go. The latter three cost €399 (~US$446), €499 (~US$557) and €449 (~US$501) for reference, which underlines the good value for money of the Hi10 Air (at least on paper).
Case & Connectivity
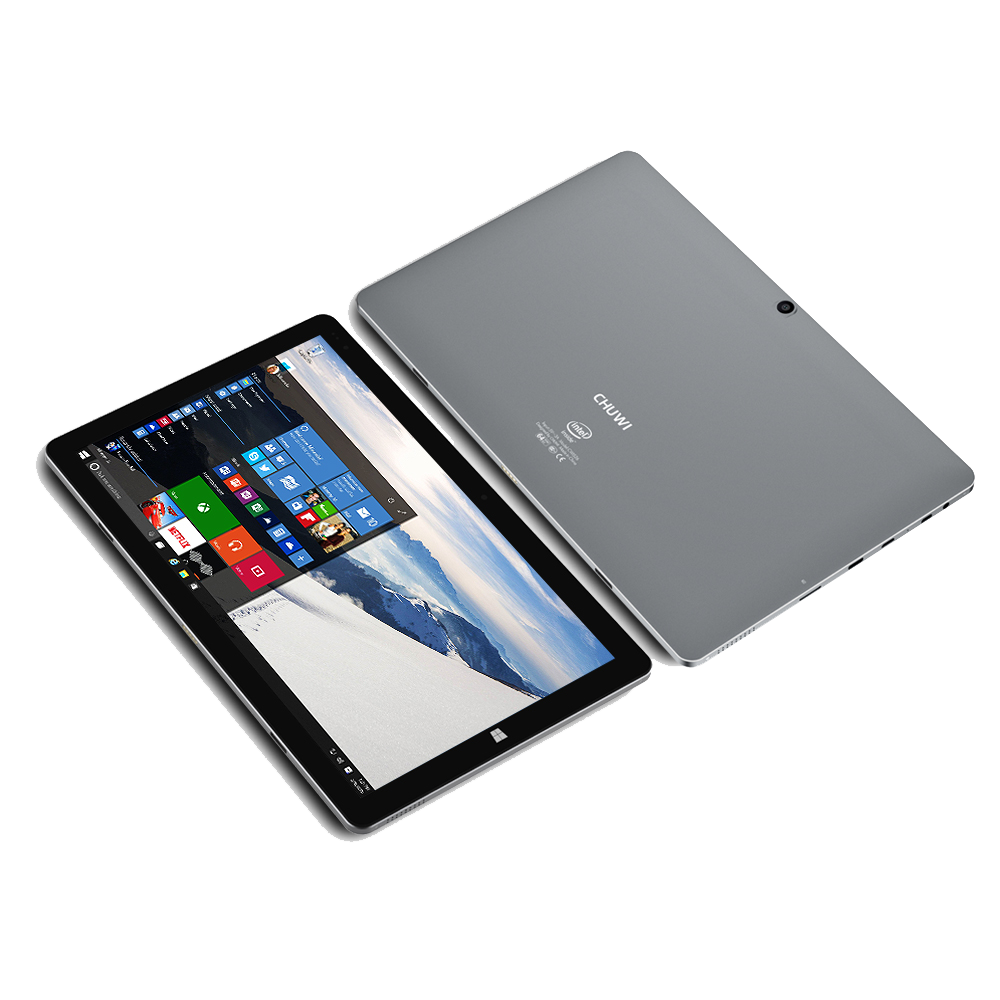
The Hi10 Air has a mostly aluminum design despite its low price, which makes our review unit feel sturdy. The aluminum case should also provide better heat dissipation than a plastic case would. There are also no plastic edges around the screen, and the front is completely made of glass, albeit it has chunky black bezels. The glass sits on top of rather than within the frame, which creates a subtle lip around the edges of the device.
Our test device is well built too. The device has no glaring processing errors, with all gaps between materials being evenly tight. The power and volume buttons wobble in their housings slightly, but they are both aluminum and have decent pressure points. Moreover, the case withstands most stresses and strains well, albeit we can get the display to temporarily deform by pressing hard on the back of the case. These are only minor gripes though; overall the Hi10 Air is a surprisingly well-built device for the money.

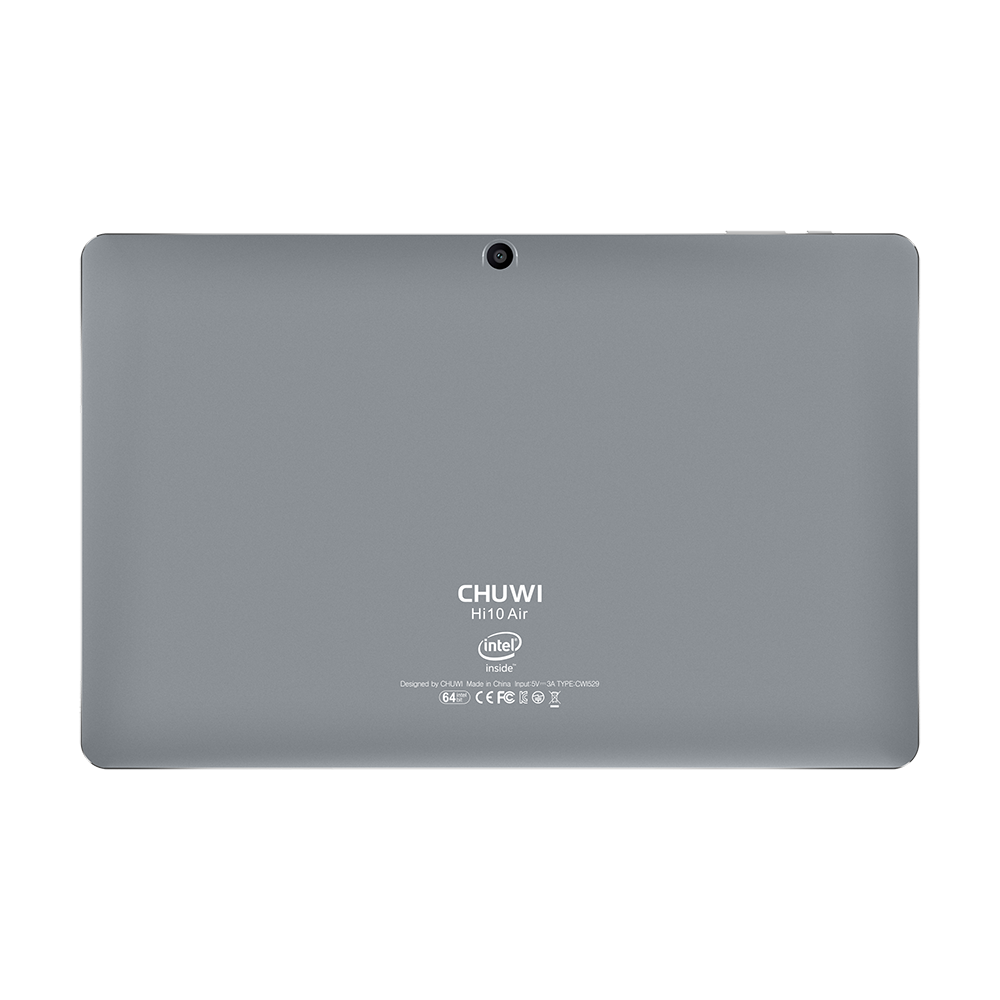

Our review unit is almost the same size as the Hi10 Pro, although it is 0.3 mm thicker than its older sibling. We suspect that Chuwi has used the same case for both devices, but the change in lamination method may be the reason for the marginally different thickness.
The Hi10 Air weighs about 40 g (~1.4 oz) less than the Hi10 Pro, which makes it lighter than its keyboard dock. Incidentally, the dock weighs approximately 580 g (~1.3 lb), which brings the total device weight up to 1.1 kg (~2.4 lb). The combined weight puts the Hi10 Air on par with the IdeaPad D330-10IGM and makes it about 100 g (~3.5 oz) lighter than the HP x2 210 G2.
The Hi10 Air has disappointingly sluggish Wi-Fi and microSD card speeds. Our review unit achieved noticeably slower Wi-Fi transfer speeds in iperf3 Client tests than the Hi10 Pro too, which is unfathomable considering that three years have passed between their releases.
The x2 210 G2 and Surface Go are in a different league here. Both devices averaged well above 400 Mbit/s in both Wi-Fi tests, which is well over 1,000% faster than the Hi10 Air’s paltry sub-35 Mbit/s speeds.
In addition to Wi-Fi, the Hi10 Air supports Bluetooth 4.0, which has been replaced with Bluetooth 4.1, 4.2, 5.0 and 5.1. Chuwi does not sell an LTE variant of the Hi10 Air at the time of writing.
| SD Card Reader | |
| average JPG Copy Test (av. of 3 runs) | |
| Microsoft Surface Go MHN-00003 (Toshiba Exceria Pro M501) | |
| Average of class Convertible (28.1 - 197, n=23, last 2 years) | |
| HP x2 210 G2 (Toshiba Exceria Pro M501 microSDXC 64GB) | |
| maximum AS SSD Seq Read Test (1GB) | |
| Average of class Convertible (28.9 - 254, n=22, last 2 years) | |
| Microsoft Surface Go MHN-00003 (Toshiba Exceria Pro M501) | |
| HP x2 210 G2 (Toshiba Exceria Pro M501 microSDXC 64GB) | |
| Chuwi Hi10 Air (Toshiba Exceria Pro M501 microSDXC 64GB) | |
| Networking | |
| iperf3 transmit AX12 | |
| HP x2 210 G2 | |
| Microsoft Surface Go MHN-00003 | |
| Chuwi Hi10 Pro | |
| Chuwi Hi10 Air | |
| iperf3 receive AX12 | |
| Microsoft Surface Go MHN-00003 | |
| HP x2 210 G2 | |
| Chuwi Hi10 Pro | |
| Chuwi Hi10 Air | |
Connectivity
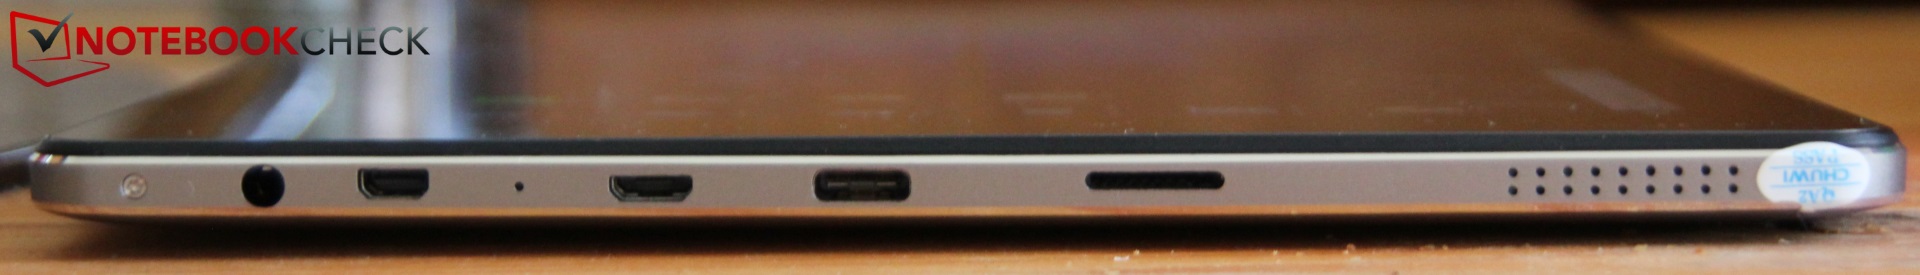
Chuwi has placed all the Air’s ports on its left-hand side. Here you will find a microSD reader, a USB Type-C port, a mini HDMI port and a headphone jack. The latter two are quite close to each other so you may struggle to have two cables connected if they are rather thick. Incidentally, the keyboard dock also has two USB Type-A ports. Unfortunately, these only operate at the slower USB 2.0 standard rather than the faster USB 3.0 or 3.1 standard.
Cameras
The Hi10 Air has two cameras like many tablets do; one on the front and one on the back. Both are 2 MP sensors, and Chuwi appears to have used the same chip. The cameras only produced slightly different results; photos taken with the rear-facing camera tend to look less overexposed and have slightly richer colors, but the differences are hardly noticeable.
Overall, both cameras produce disappointing looking results. Photos look washed out and pale, while details are severely lacking. In short, the photos taken with our test device look dull. We shot our sample photos in strong sunshine, but you can hardly tell from the photos below. Likewise, the flower petals were a striking yellow that contrasted with the green of the meadow. This is not discernible from our sample shots.


Input Devices
Typically, the keyboard dock and pen are optional accessories, which leaves the touchscreen as the only way of interacting with the Hi10 Air without using external peripherals. The touchscreen in our review unit worked well and precisely throughout our tests, although some people on Amazon have reported experiencing touchscreen issues. We encountered no such problems during our tests.
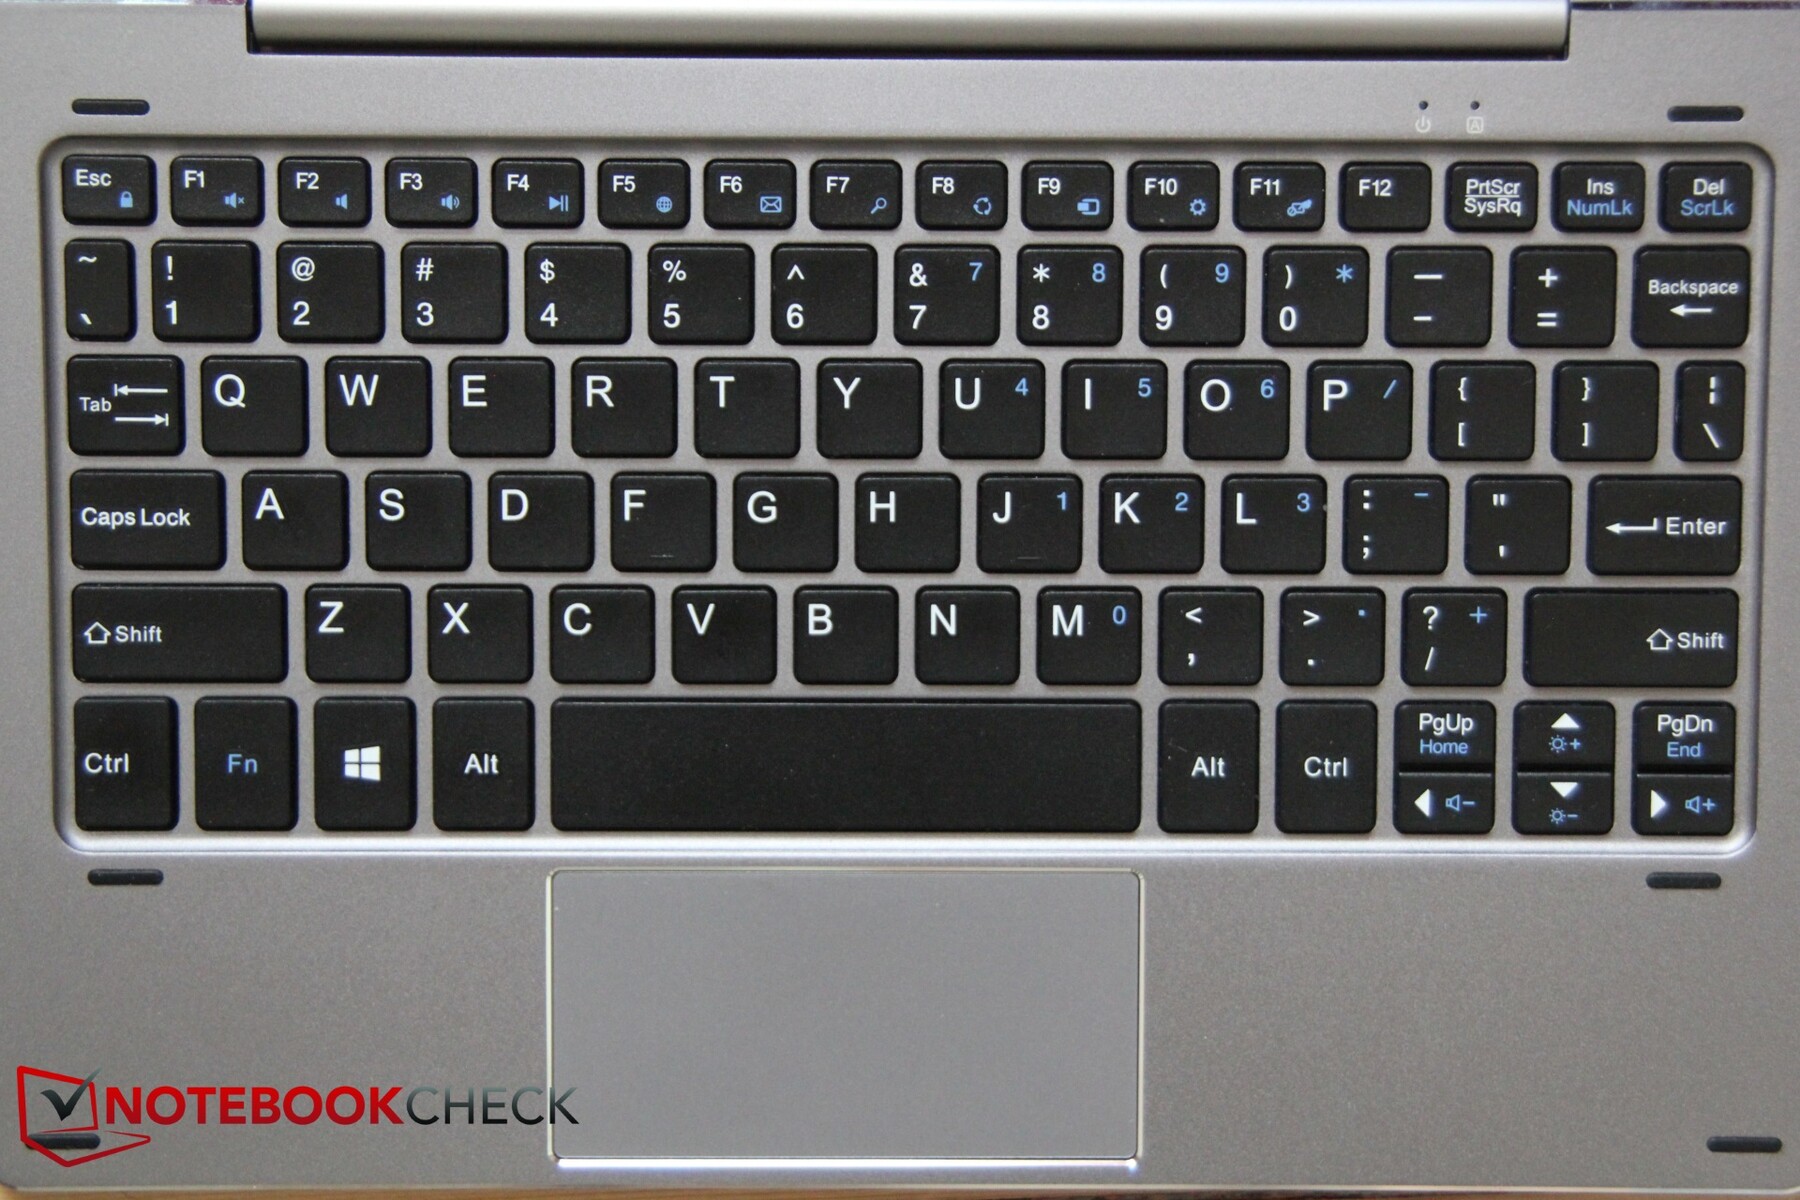
Our review unit came with the keyboard dock and pen included, which Chuwi has specifically designed for the Hi10 Air. The keyboard attaches via a magnetic connection and holds the tablet firmly in place with its extremely tight hinges.
Unfortunately, the keyboard is not backlit, but it is decent other than this omission. The keys have pleasant pressure points, and their stroke is by no means short for a convertible laptop. We found it easy to type quickly on the keyboard thanks to its relatively wide keys. The keys are not overly loud either, although they may be slightly too loud for working in noise-sensitive environments.

The pen has a built-in battery that you recharge via micro USB. Chuwi has incorporated a power button that flashes blue when the pen is switched on. The pen worked flawlessly and precisely on our review unit. In short, it is accurate enough for note-taking and drawing the occasional doodle.
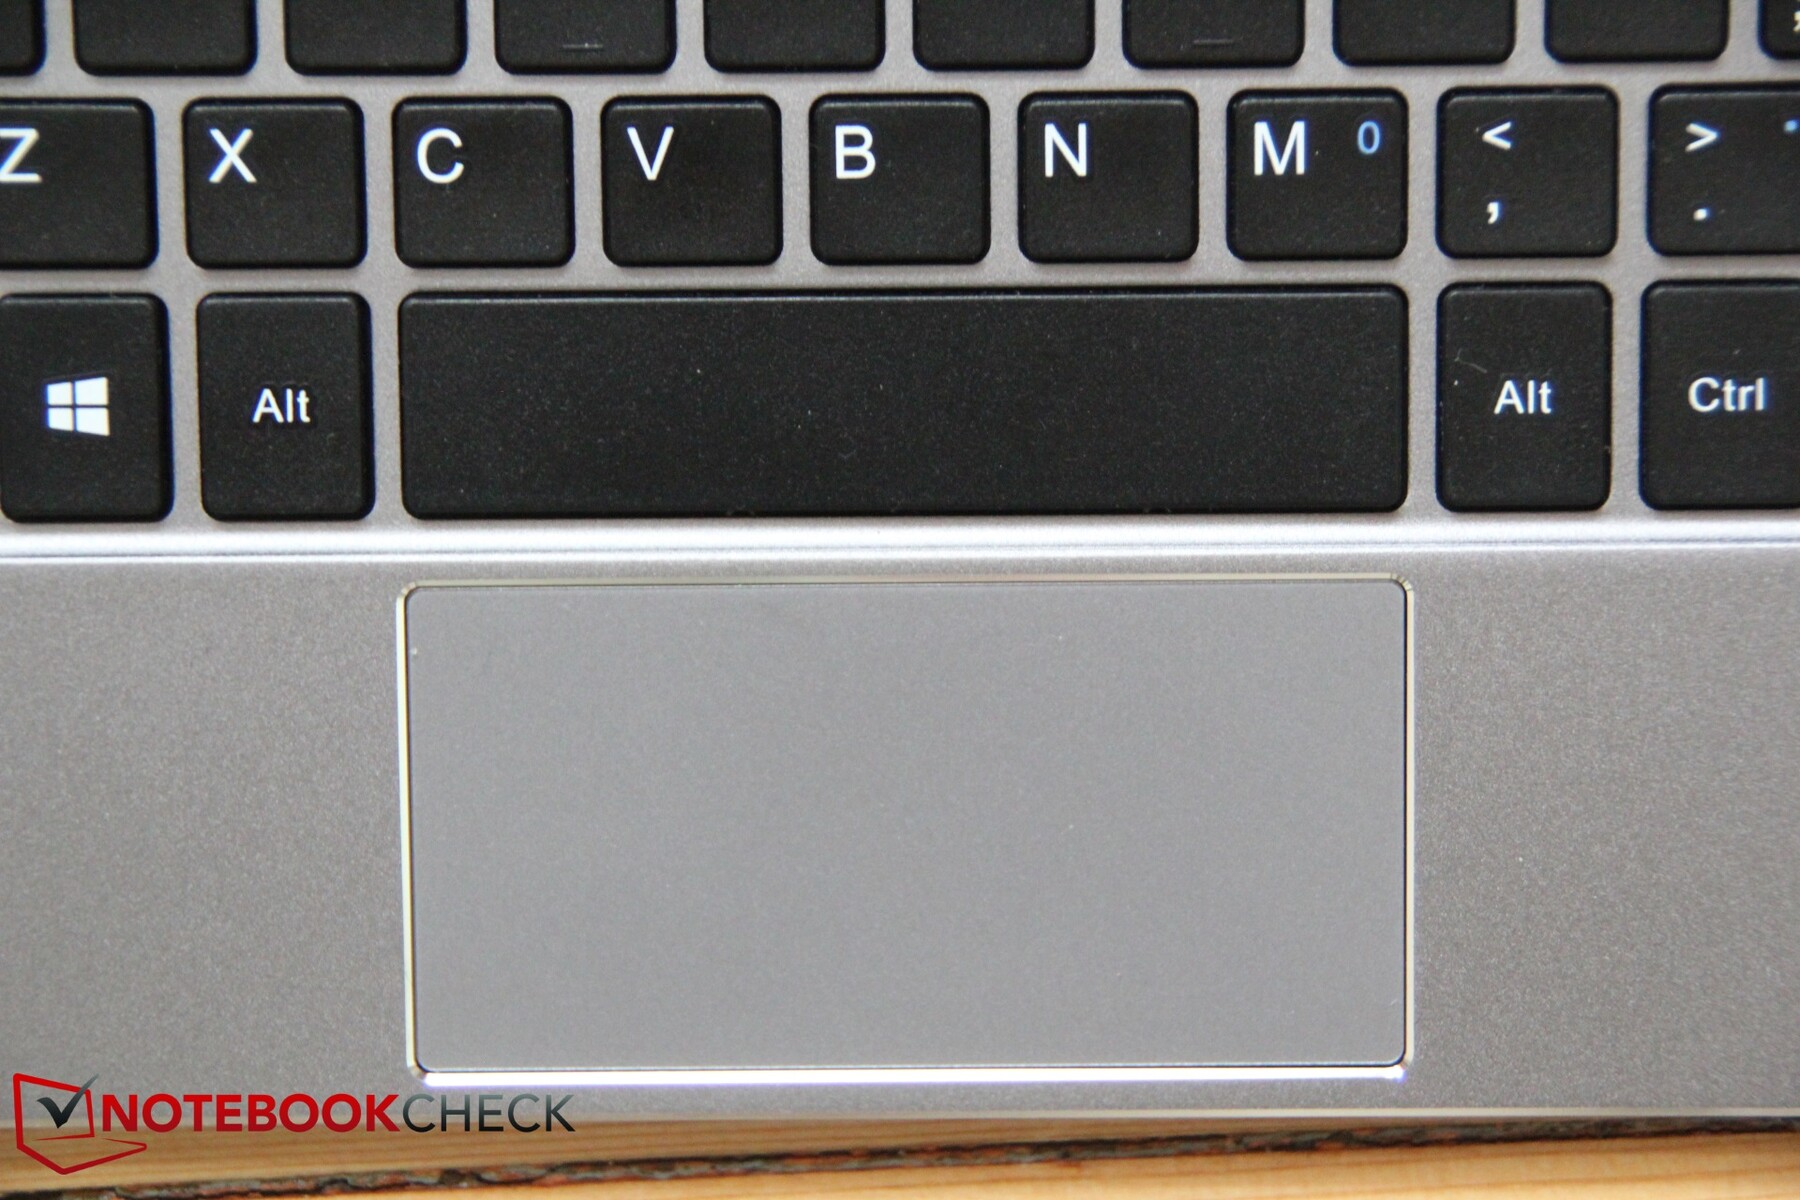
We cannot say the same for the trackpad though. Firstly, the positioning of the keyboard means that Chuwi could only fit in a rather narrow trackpad, which is a shame. Moreover, the one in our review unit is overly sensitive and we frequently inadvertently triggered the Display Desktop gesture. This behaviour quickly had us longing for an external mouse and made the Hi10 Air frustrating to use. This could potentially be a driver issue, but we would not rule out it being a hardware problem too. The trackpad does not have dedicated mouse buttons, which at least allows it to be slightly larger than if Chuwi had included physical mouse buttons. Instead, you can activate the buttons by pressing down on the corresponding bottom edge. The trackpad emits an audible clicking sound when pressed, which are is not particularly quiet.
Display
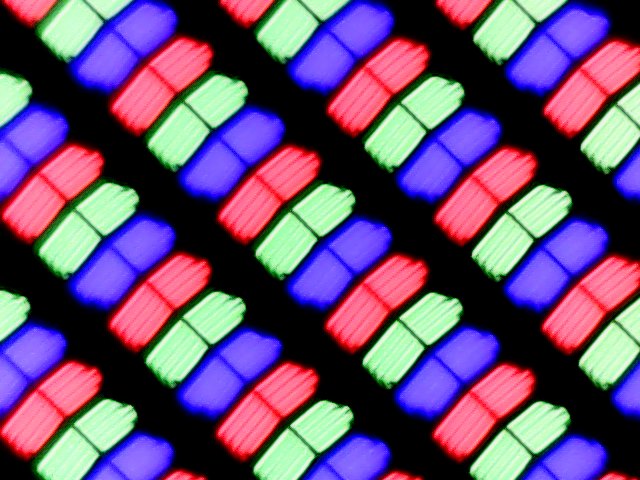
The Hi10 Air has a 10-inch display that operates natively at 1,920 x 1,200. The panel in our review unit is made by BOE and carries the model number TV101WUM. The display has an aspect ratio of 16:10 and achieved an average maximum brightness of 328 cd/m² according to X-Rite i1Pro 2. This maximum brightness is fine, although most of our comparison devices have brighter displays, including the Hi10 Pro, whose display reached around 9% brighter in our tests.
Disappointingly, our review unit has only a 78% evenly lit display, which means that large areas of color will look less homogeneous than they would on our comparison devices.
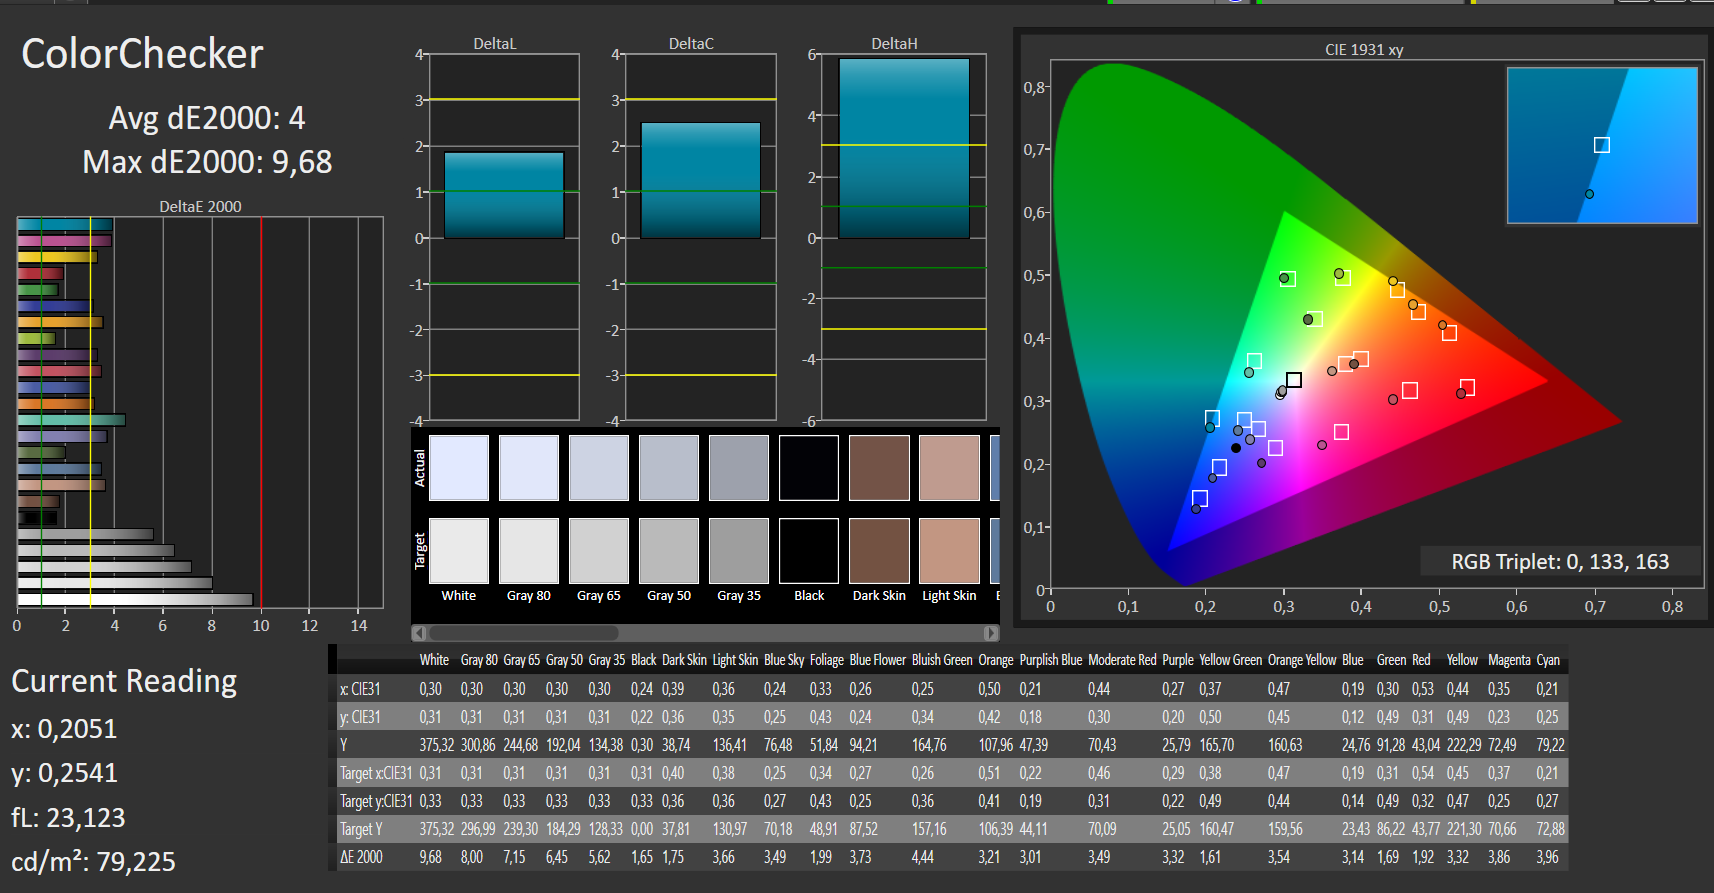
The Hi10 Air has a comparatively low black value though that we measured at 0.3 cd/m², which helps the display have a 1,247:1 contrast ratio. Our review unit does comparatively well here and has around a 27/28% higher contrast ratio than the Hi10 Pro and IdeaPad D330-10IGM. Positively, the Hi10 Air has 99% sRGB and 64% AdobeRGB colour space coverage, which makes the device impressively color accurate for the money. Color space coverage this high is not a given at this price range.
Moreover, our review unit suffers from hardly any backlight bleeding or halo effects, which is good. Even some expensive convertibles and laptops suffer from these issues, so the Hi10 Air does comparatively well here.
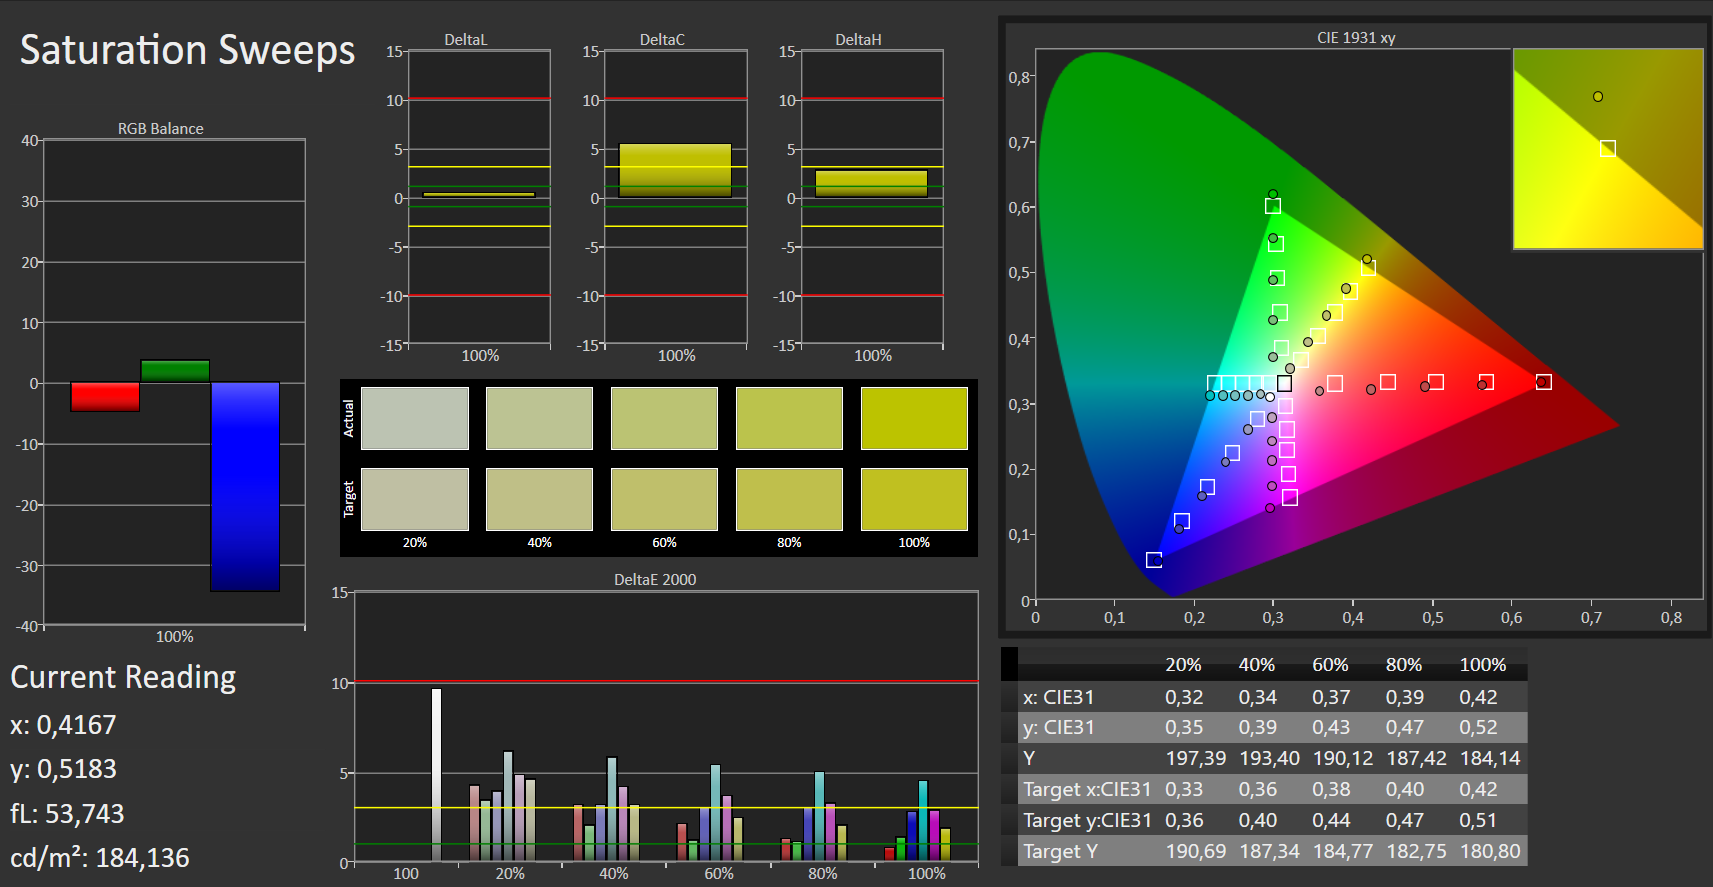
In short, the Hi10 Air has a color accurate and vibrant display. It does not come close to the levels of the Surface Go, but it holds its own against our other comparison devices.
| |||||||||||||||||||||||||
Brightness Distribution: 78 %
Center on Battery: 315 cd/m²
Contrast: 1247:1 (Black: 0.3 cd/m²)
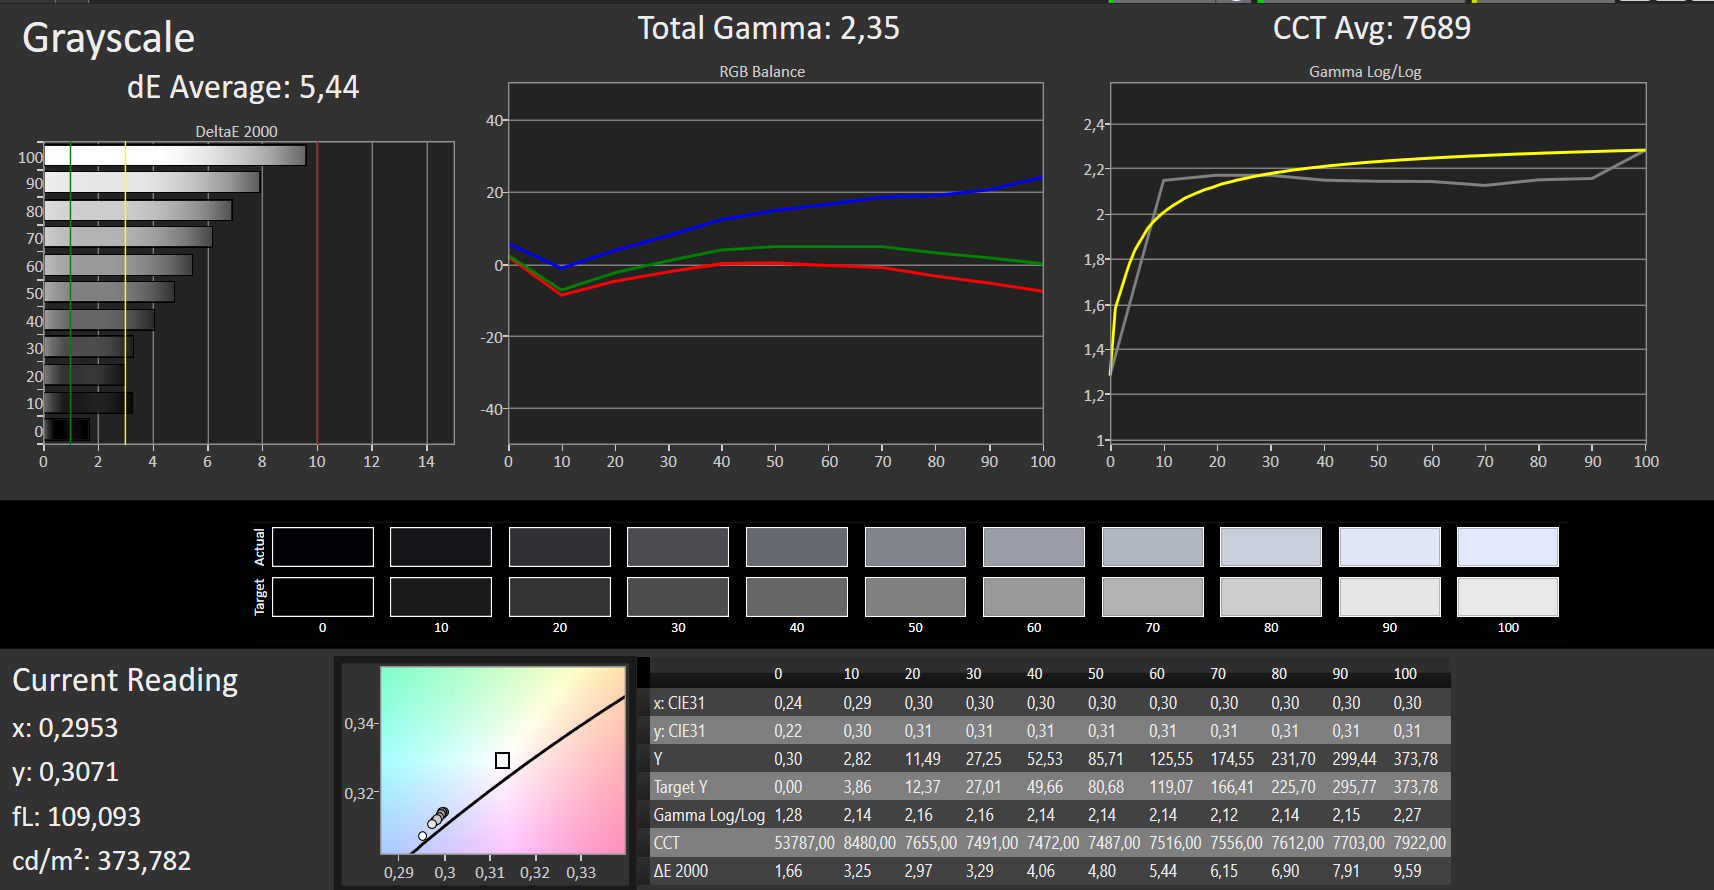
ΔE ColorChecker Calman: 4 | ∀{0.5-29.43 Ø4.73}
ΔE Greyscale Calman: 5.44 | ∀{0.09-98 Ø4.97}
99% sRGB (Argyll 1.6.3 3D)
64% AdobeRGB 1998 (Argyll 1.6.3 3D)
70.2% AdobeRGB 1998 (Argyll 3D)
98.9% sRGB (Argyll 3D)
68.5% Display P3 (Argyll 3D)
Gamma: 2.35
CCT: 7689 K
| Chuwi Hi10 Air BOE TV101WUM, , 1920x1200, 10.1" | Chuwi Hi10 Pro LCD, , 1920x1200, 10.1" | HP x2 210 G2 AU Optronics AUO18D4, , 1280x800, 10.1" | Lenovo Ideapad D330-10IGM AU Optronics B101UAN01.7, , 1920x1200, 10.1" | Microsoft Surface Go MHN-00003 Sharp SHP14A6, , 1800x1200, 10" | |
|---|---|---|---|---|---|
| Display | -37% | -20% | -3% | ||
| Display P3 Coverage (%) | 68.5 | 42.17 -38% | 54.1 -21% | 66.5 -3% | |
| sRGB Coverage (%) | 98.9 | 62.9 -36% | 81.2 -18% | 97.5 -1% | |
| AdobeRGB 1998 Coverage (%) | 70.2 | 43.6 -38% | 55.9 -20% | 67.5 -4% | |
| Response Times | -64% | -28% | -7% | -6% | |
| Response Time Grey 50% / Grey 80% * (ms) | 40 ? | 83 ? -108% | 46 ? -15% | 39 ? 2% | 44 ? -10% |
| Response Time Black / White * (ms) | 25 ? | 30 ? -20% | 35 ? -40% | 29 ? -16% | 25.6 ? -2% |
| PWM Frequency (Hz) | 1020 ? | ||||
| Screen | -13% | -26% | -10% | 29% | |
| Brightness middle (cd/m²) | 374 | 379 1% | 292 -22% | 389 4% | 456 22% |
| Brightness (cd/m²) | 328 | 356 9% | 275 -16% | 376 15% | 426 30% |
| Brightness Distribution (%) | 78 | 87 12% | 82 5% | 91 17% | 88 13% |
| Black Level * (cd/m²) | 0.3 | 0.42 -40% | 0.17 43% | 0.43 -43% | 0.31 -3% |
| Contrast (:1) | 1247 | 902 -28% | 1718 38% | 905 -27% | 1471 18% |
| Colorchecker dE 2000 * | 4 | 4.8 -20% | 6.76 -69% | 5.23 -31% | 1.3 67% |
| Colorchecker dE 2000 max. * | 9.68 | 11.2 -16% | 24.45 -153% | 9.39 3% | 3 69% |
| Greyscale dE 2000 * | 5.44 | 6.7 -23% | 6.01 -10% | 5.45 -0% | 1.4 74% |
| Gamma | 2.35 94% | 2.23 99% | 2.26 97% | 2.49 88% | 2.24 98% |
| CCT | 7689 85% | 6988 93% | 6749 96% | 7728 84% | 6687 97% |
| Color Space (Percent of AdobeRGB 1998) (%) | 64 | 40 -37% | 51 -20% | 62.3 -3% | |
| Color Space (Percent of sRGB) (%) | 99 | 63 -36% | 81 -18% | 96.8 -2% | |
| Colorchecker dE 2000 calibrated * | 1.99 | 1.1 | |||
| Total Average (Program / Settings) | -39% /
-23% | -30% /
-28% | -12% /
-12% | 7% /
18% |
* ... smaller is better
Display Response Times
| ↔ Response Time Black to White | ||
|---|---|---|
| 25 ms ... rise ↗ and fall ↘ combined | ↗ 14 ms rise | 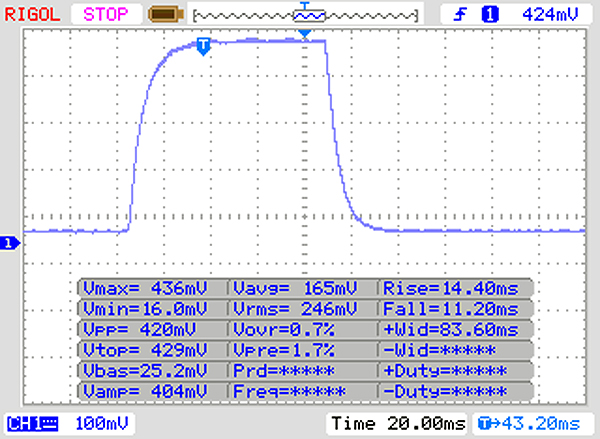 |
| ↘ 11 ms fall | ||
| The screen shows relatively slow response rates in our tests and may be too slow for gamers. In comparison, all tested devices range from 0.1 (minimum) to 240 (maximum) ms. » 59 % of all devices are better. This means that the measured response time is worse than the average of all tested devices (19.9 ms). | ||
| ↔ Response Time 50% Grey to 80% Grey | ||
| 40 ms ... rise ↗ and fall ↘ combined | ↗ 21 ms rise | 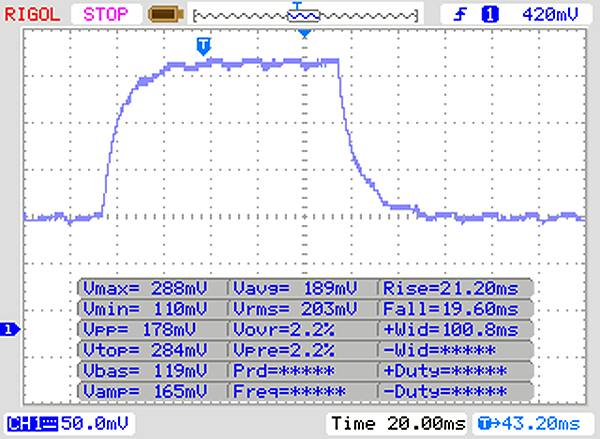 |
| ↘ 19 ms fall | ||
| The screen shows slow response rates in our tests and will be unsatisfactory for gamers. In comparison, all tested devices range from 0.165 (minimum) to 636 (maximum) ms. » 61 % of all devices are better. This means that the measured response time is worse than the average of all tested devices (31.1 ms). | ||
Screen Flickering / PWM (Pulse-Width Modulation)
| Screen flickering / PWM not detected | 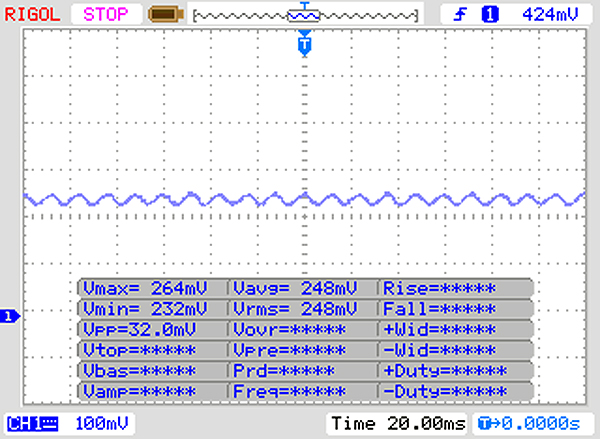 | ||
In comparison: 52 % of all tested devices do not use PWM to dim the display. If PWM was detected, an average of 7798 (minimum: 5 - maximum: 343500) Hz was measured. | |||
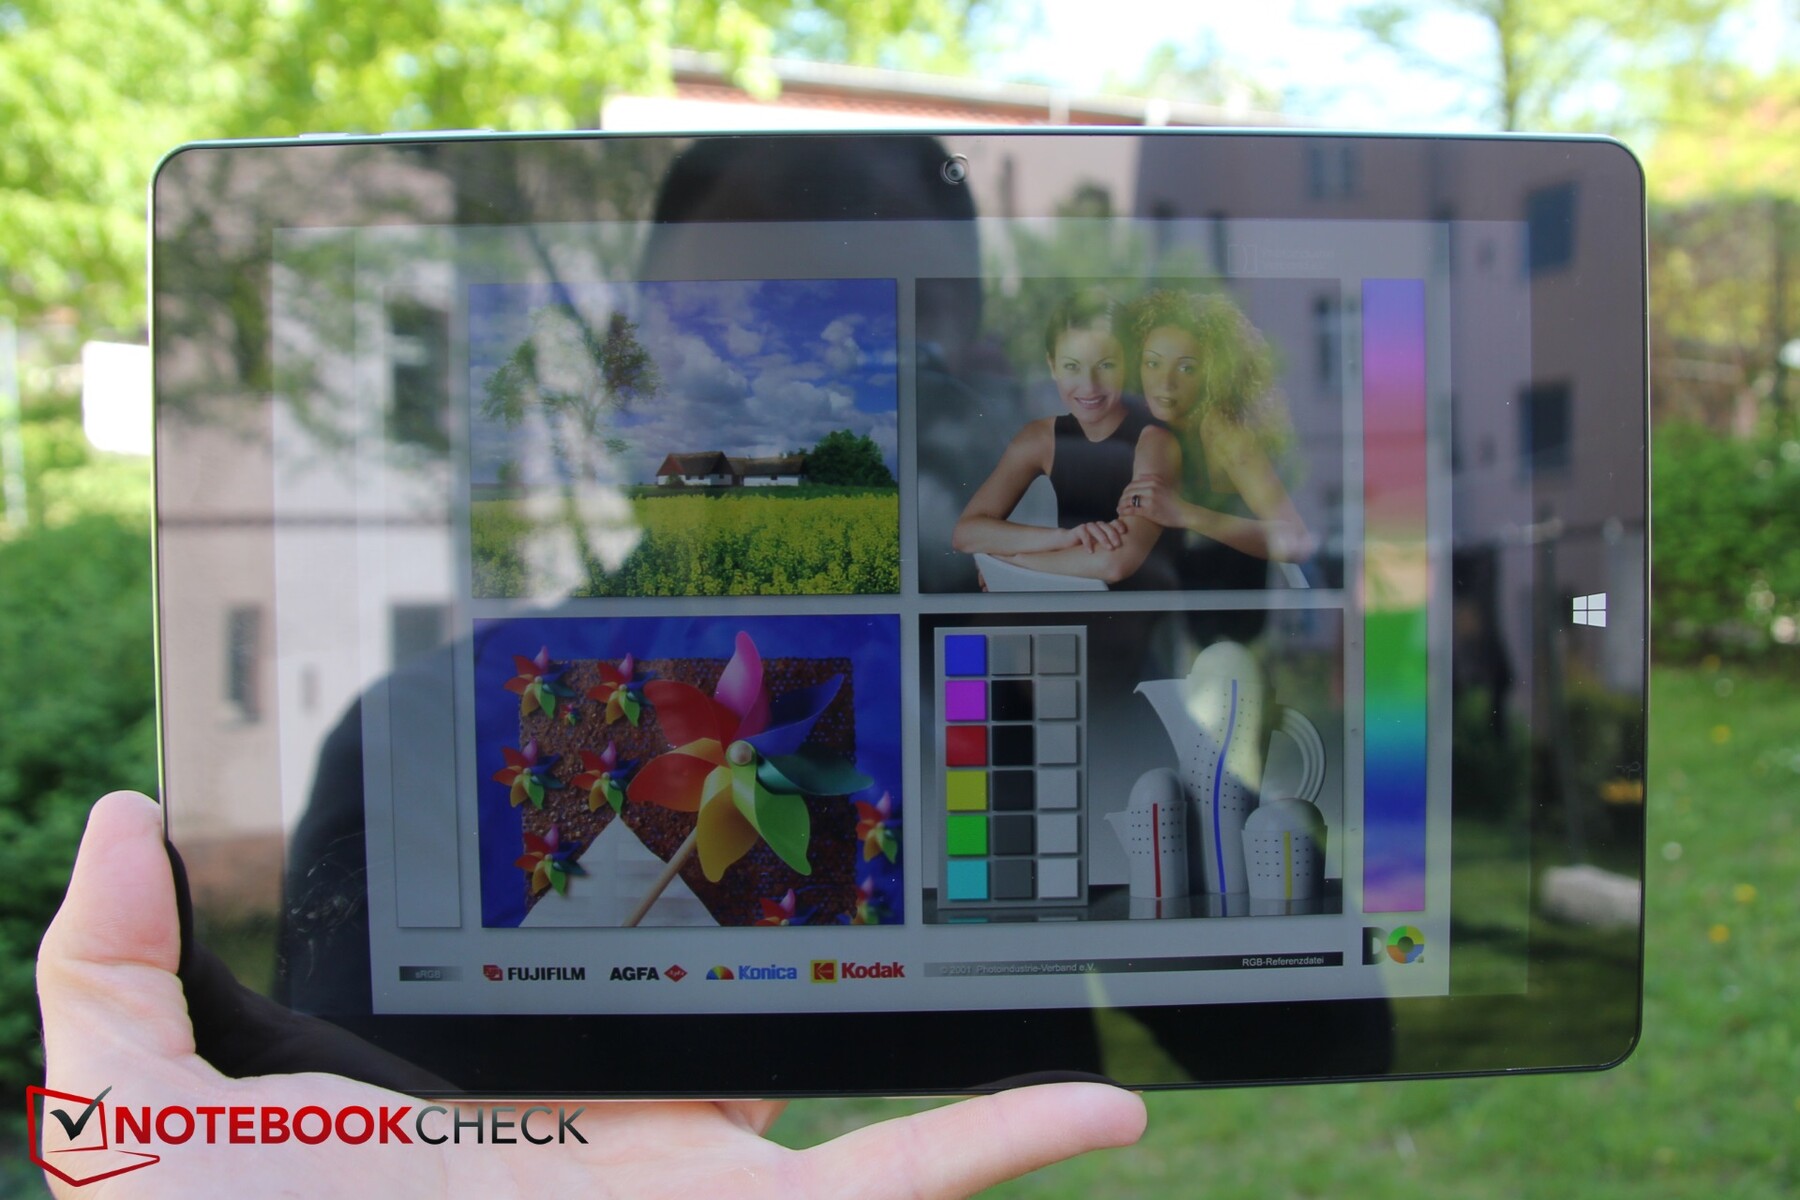
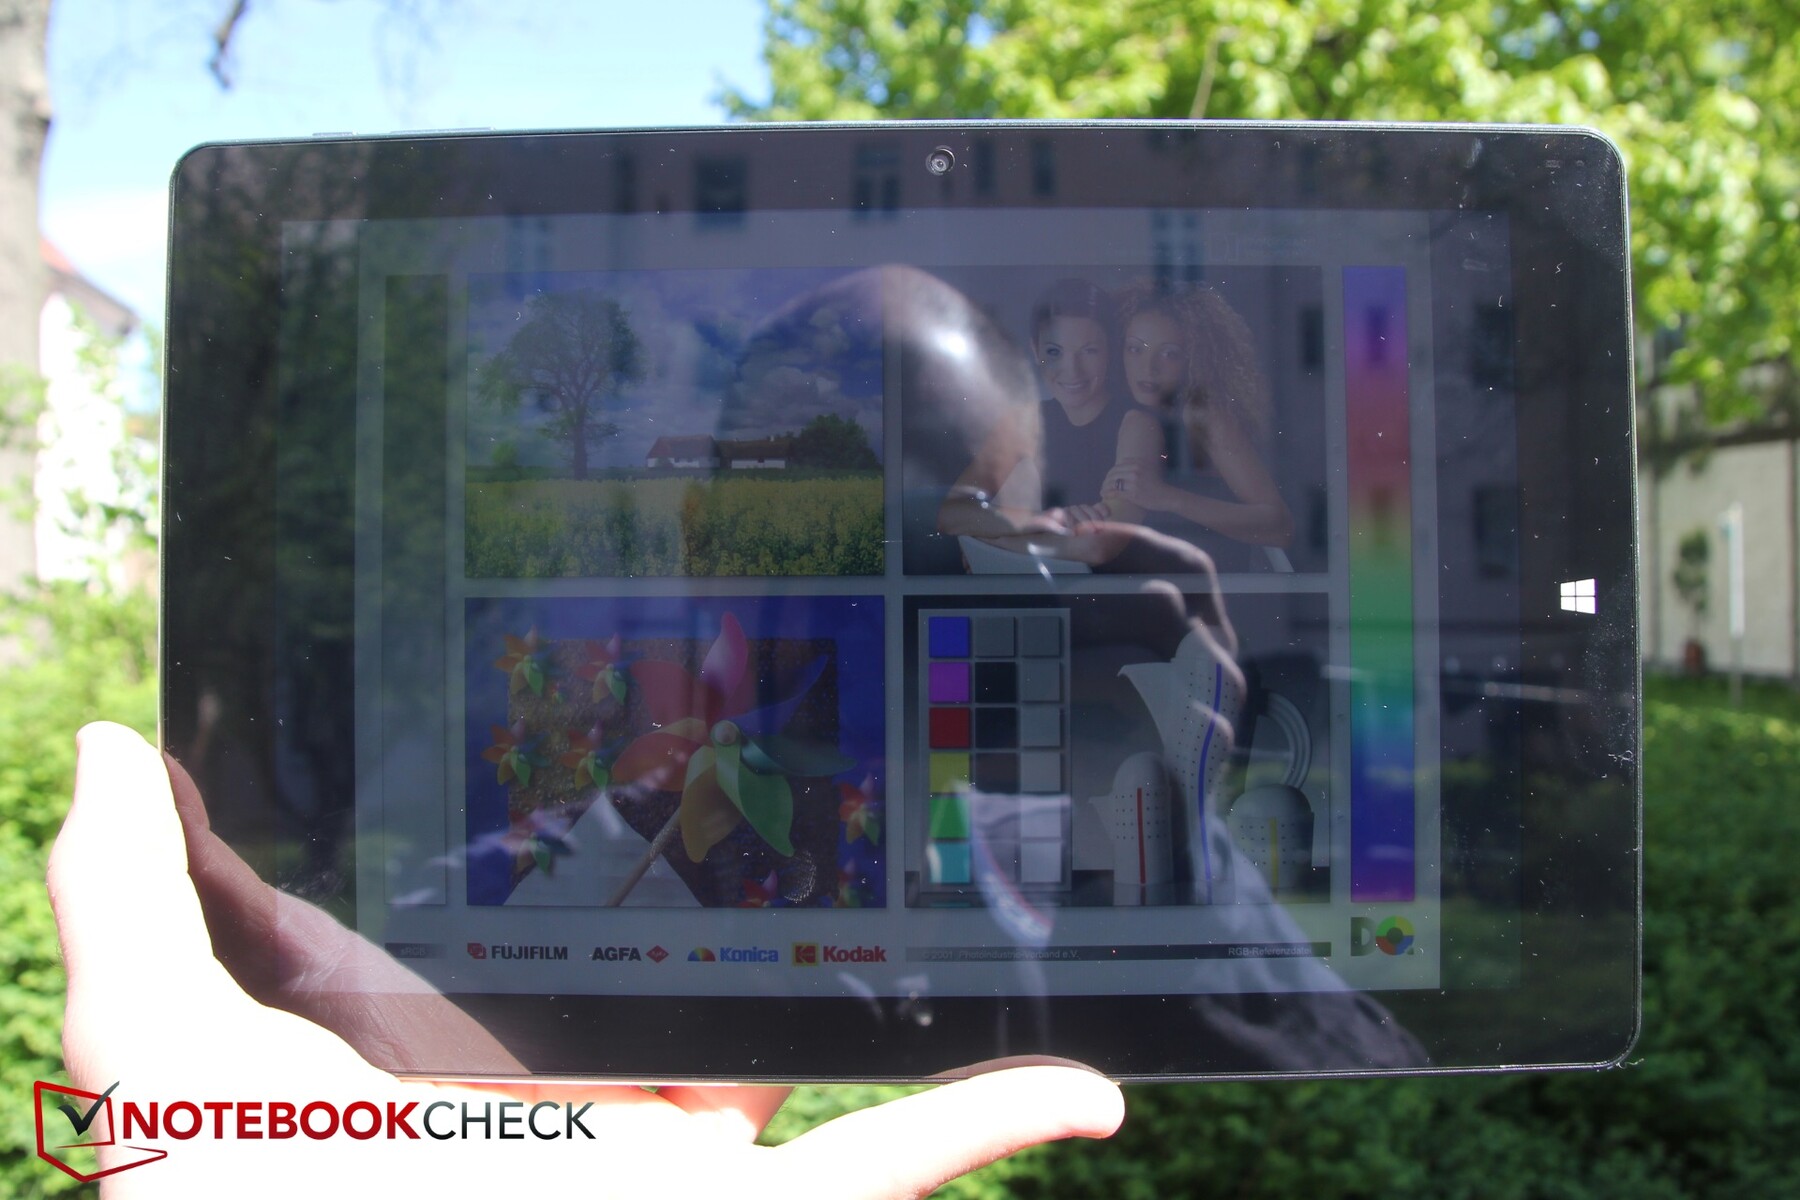
The display in the Hi10 Air has a highly reflective, glossy finish. Correspondingly, it catches the sun and makes content on the screen look washed out. Overall though, the Hi10 Air is usable outdoors, but we would recommend finding a shady spot where possible on sunny days.
Likewise, the device has stable viewing angles thanks to its IPS panel. The display is readable from practically any angle, but there are some minor color distortions at acute angles.

Performance
Chuwi has equipped the Hi10 Air with an Intel Atom x5-Z8350 processor, which is not a powerful processor. The tablet can handle light office work and web browsing, but resource intensive programs or heavy multitasking will bring the system to its knees. The weak chipset is complemented by slow eMMC flash storage and LPDDR3 RAM, the latter of which runs in single-channel mode. All these components combine to deliver sluggish performance that is reflected in our benchmark comparison tables, of which the Hi10 Air usually finishes towards the bottom.
Processor
The Atom x5-Z8350 is a quad-core chip that Intel manufacturers on a 14 nm FinFET processor. The processor has a 2 W thermal design power (TDP) and a 1.44 GHz base clock speed that it can increase to 1.92 GHz on a single core when required. The x5-Z8350 does not use Intel Turbo Boost technology though and uses what Intel calls “burst” instead.
The CPU performs roughly on par with the Qualcomm Snapdragon 801 and cannot keep pace with the more expensive Intel Core series. The Atom x5-Z8350 would be well suited for running Android, but it struggles in Windows and can only run basic applications.
Our review unit achieved expected values for its processor in benchmarks like Cinebench R15 and even ekes out a 14% lead in CB R15 Multi 64Bit over the Hi10 Pro with its Atom x5 Z8300 processor. The x5-Z8350 falls well short of the Intel Pentium series powering the IdeaPad D330-10IGM and Surface Go though.
We also subjected the Hi10 Air to a CB R15 Multi 64Bit loop that we continuously run for 30 minutes. Our review unit only managed 3 pass throughs in that time, which is appallingly slow by modern Intel Core standards. However, it scored a consistent 95 points in our looped test, so at least the device does not thermal throttle.
System Performance
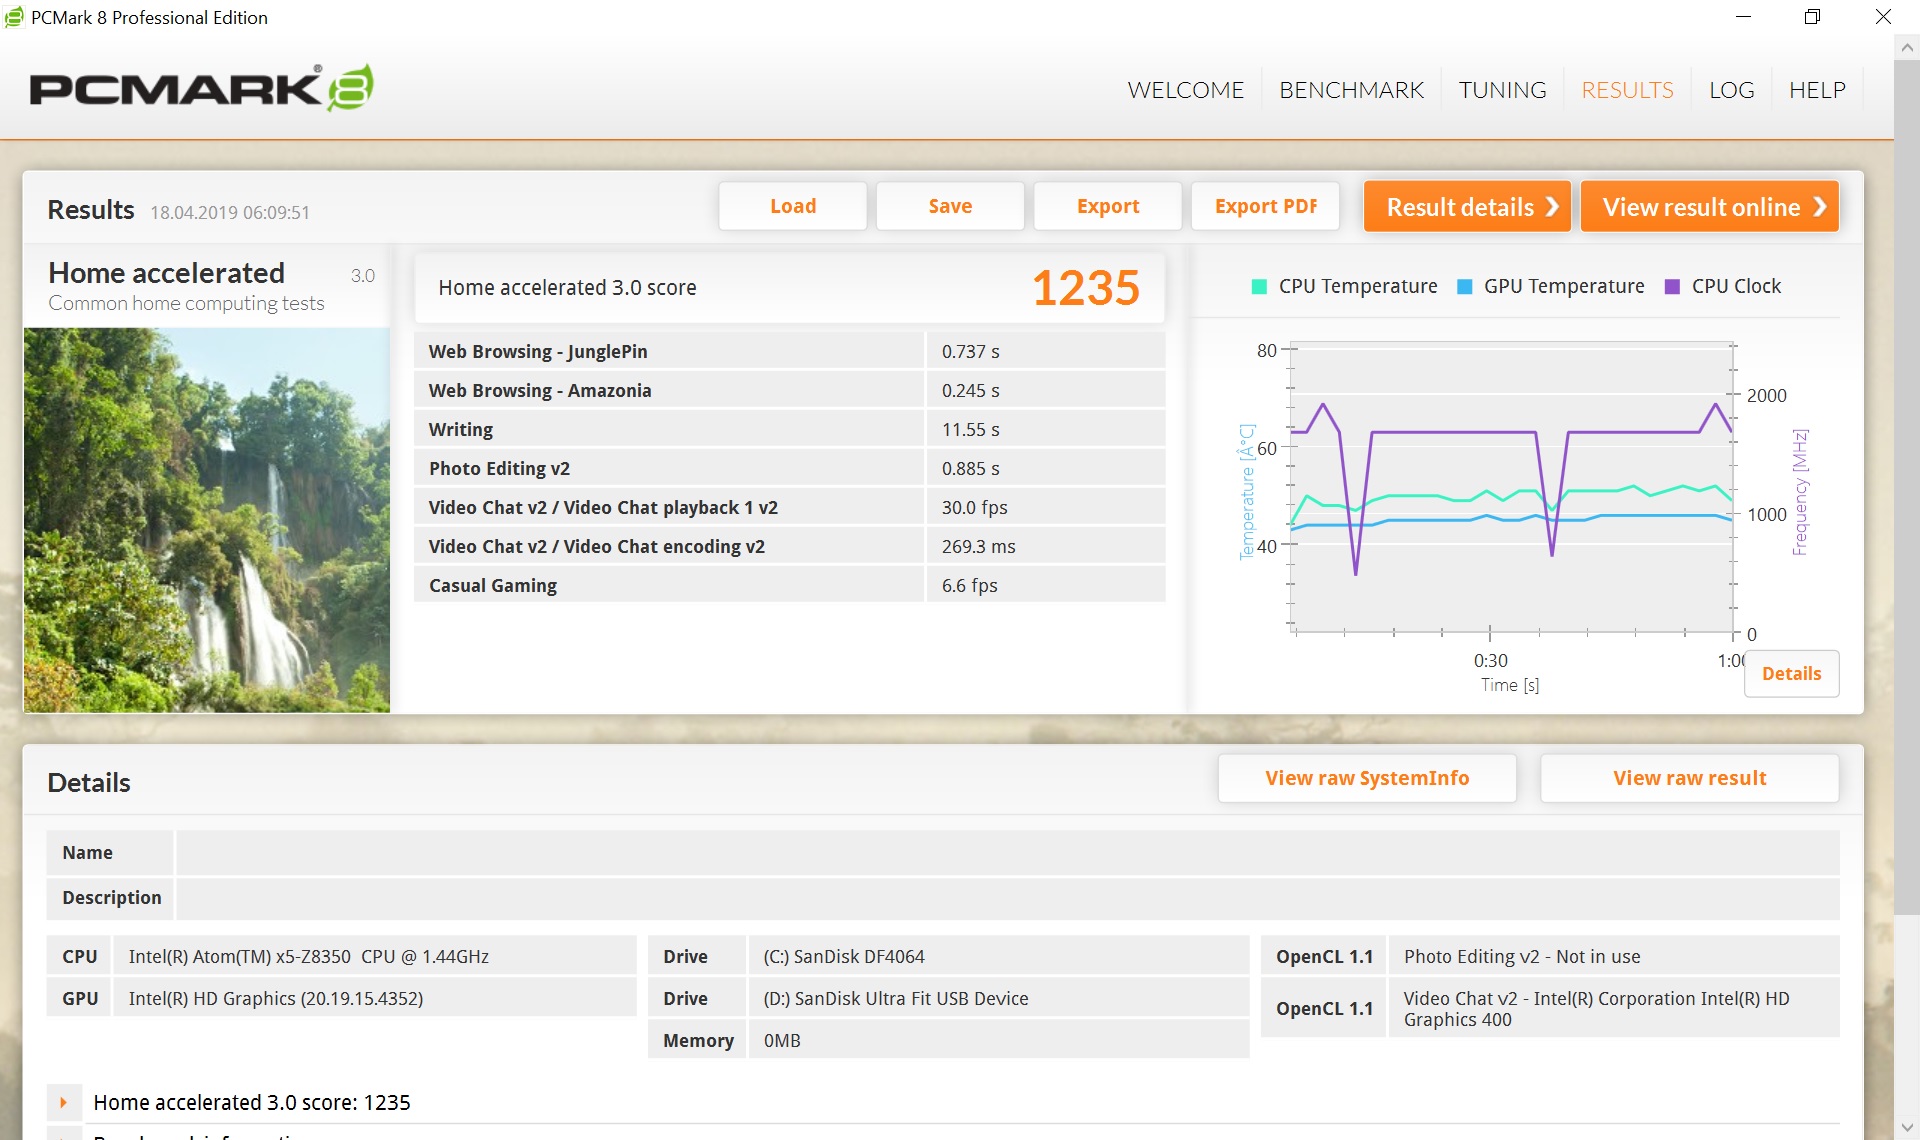
The Hi10 Air also scored comparatively poorly in PCMark 8, finishing in penultimate place in our comparison table. Surprisingly, our review unit scored 67% more than the Surface Go. Meanwhile, the Hi10 Air scored 20% less than the x2 210 G2, despite them both being equipped with the same CPU.
Subjectively, Windows 10 runs smoothly, but loading times are significantly longer on Intel Core powered laptops. We noticed regular system stutters and lags during our tests, while even just having several browser tabs open bogged the system down. Overall, we got the impression that Windows 10 is too resource heavy for Cherry Trail chipsets, especially as simple things like keystrokes would often take a second or two to display on-screen. Frustrating stuff, indeed.
| PCMark 8 Home Score Accelerated v2 | 1235 points | |
Help | ||
Storage Devices
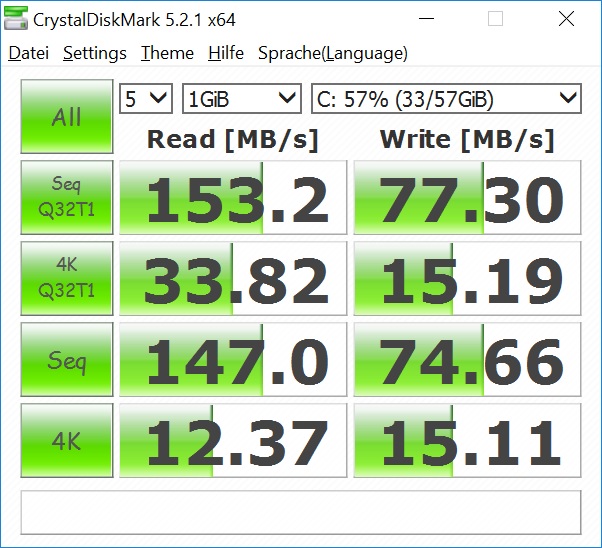
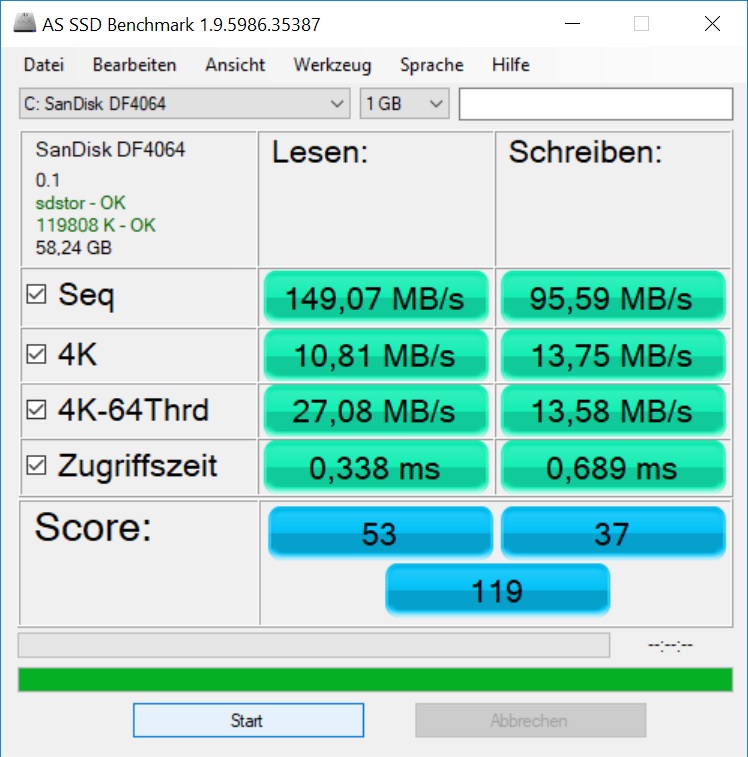
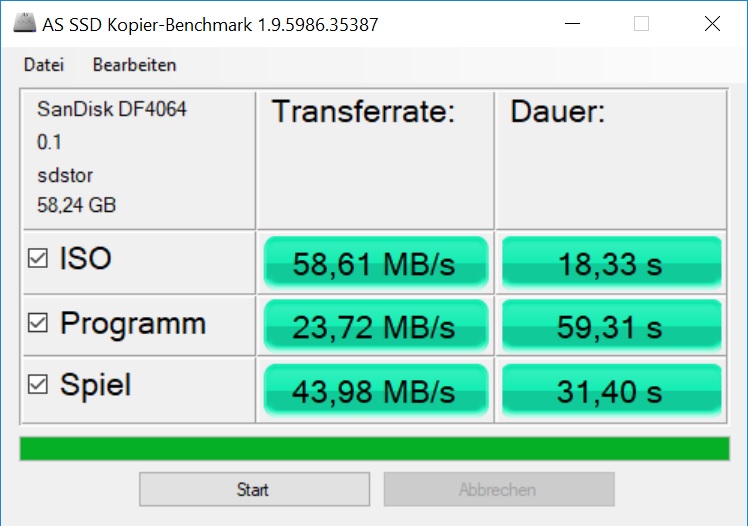
The rather below-average eMMC flash storage is certainly one of the reasons why, comparatively, the Hi10 Air takes a while to load programs. All our comparison devices are equipped with eMMC flash storage too, but they all averaged between 25% and 95% faster transfer speeds than our review unit did in CrystalDiskMark, for example.
| Chuwi Hi10 Air 64 GB eMMC Flash | HP x2 210 G2 64 GB eMMC Flash | Lenovo Ideapad D330-10IGM 128 GB eMMC Flash | Microsoft Surface Go MHN-00003 64 GB eMMC Flash | Average 64 GB eMMC Flash | Average of class Convertible | |
|---|---|---|---|---|---|---|
| CrystalDiskMark 5.2 / 6 | 25% | 86% | 95% | 21% | 2543% | |
| Write 4K (MB/s) | 15.11 | 18.11 20% | 39.04 158% | 26.91 78% | 16 ? 6% | 144.3 ? 855% |
| Read 4K (MB/s) | 12.37 | 15.77 27% | 6.114 -51% | 19.72 59% | 11 ? -11% | 67.3 ? 444% |
| Write Seq (MB/s) | 74.7 | 62.5 -16% | 220 195% | 126.2 69% | 109 ? 46% | 2614 ? 3399% |
| Read Seq (MB/s) | 147 | 121.8 -17% | 213.5 45% | 268 82% | 207 ? 41% | 2957 ? 1912% |
| Write 4K Q32T1 (MB/s) | 15.19 | 31.72 109% | 46.89 209% | 62.9 314% | 22.4 ? 47% | 454 ? 2889% |
| Read 4K Q32T1 (MB/s) | 33.82 | 48.64 44% | 40.26 19% | 39.82 18% | 31.5 ? -7% | 583 ? 1624% |
| Write Seq Q32T1 (MB/s) | 77.3 | 95.6 24% | 145.2 88% | 131.3 70% | 104.6 ? 35% | 4362 ? 5543% |
| Read Seq Q32T1 (MB/s) | 153.2 | 166.5 9% | 194.4 27% | 259.3 69% | 166.5 ? 9% | 5787 ? 3677% |

Graphics Card
The x5-Z8350 integrates the Intel HD Graphics (Cherry Trail), which is powerful enough to run simple Android games smoothly. However, most Windows games are out of the question and are just too resource intensive for the Hi10 Air and its integrated GPU. The HD Graphics (Cherry Trail) can at least decode H.265 videos shot in 4K though, which takes some pressure off the CPU.
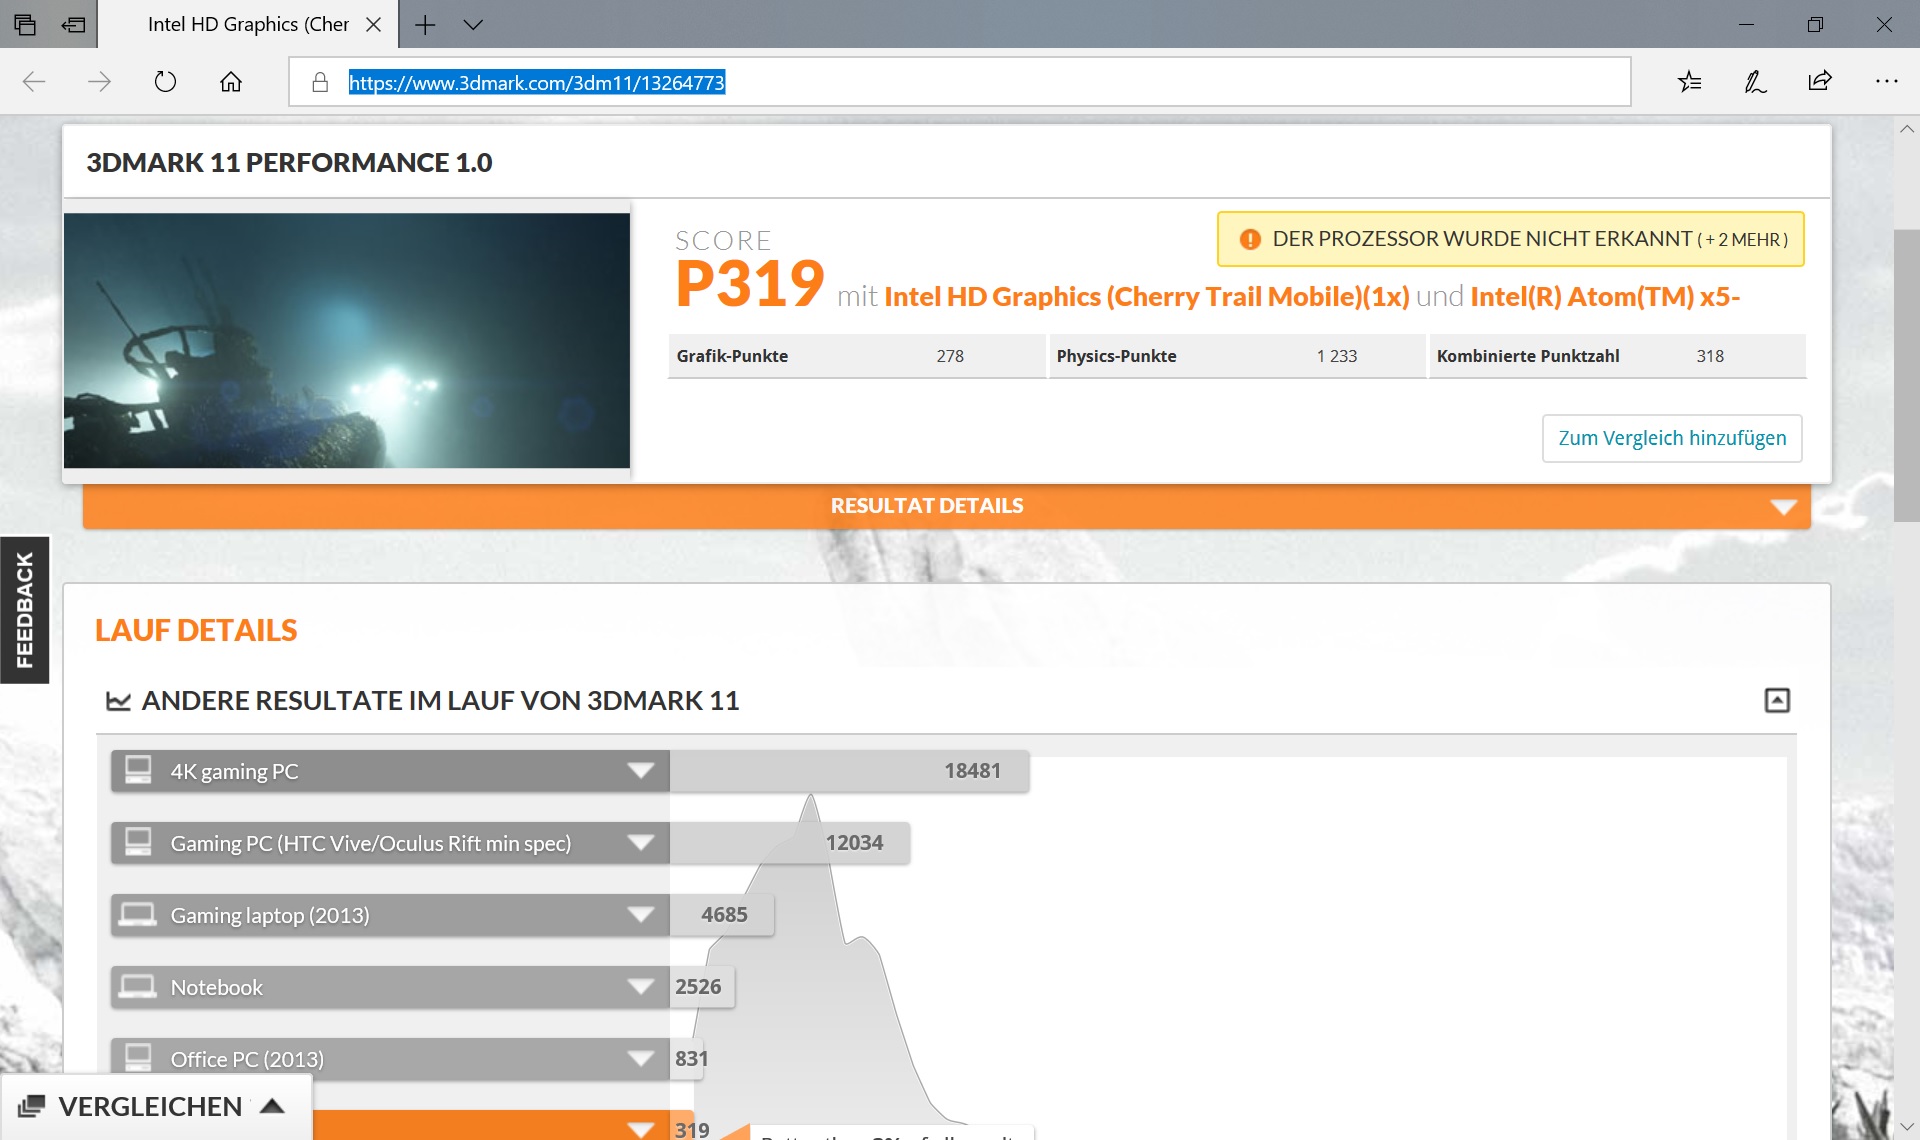
Perhaps predictably, the Hi10 Air finished in last place in our 3DMark 11 comparison table. Disappointingly, the device scored 13% less than what we would have expected and 20% less than the x2 210 G2.
| 3DMark 11 Performance | 319 points | |
Help | ||
Gaming Performance
As we mentioned in the preceding section, gaming is not a strength of the Hi10 Air. Even older titles like Counter Strike: Go and Diablo 3, which both came out in 2012, only average around 25 FPS. The system even struggles with older games like World of Warcraft, which Blizzard released in 2008, at all but the lowest resolutions and graphics settings.
Please see our gaming benchmarks page for more information about the Intel HD Graphics (Cherry Trail) and how it compares against other GPUs.
Emissions
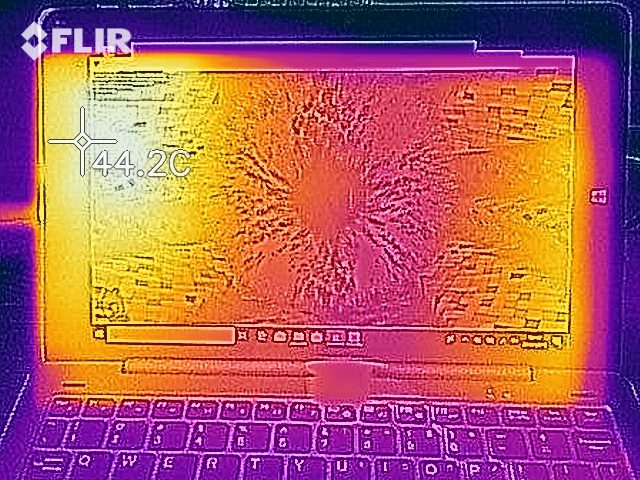
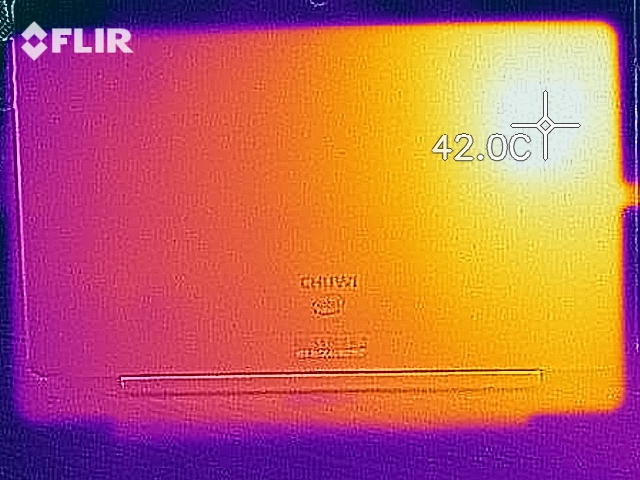
Temperature
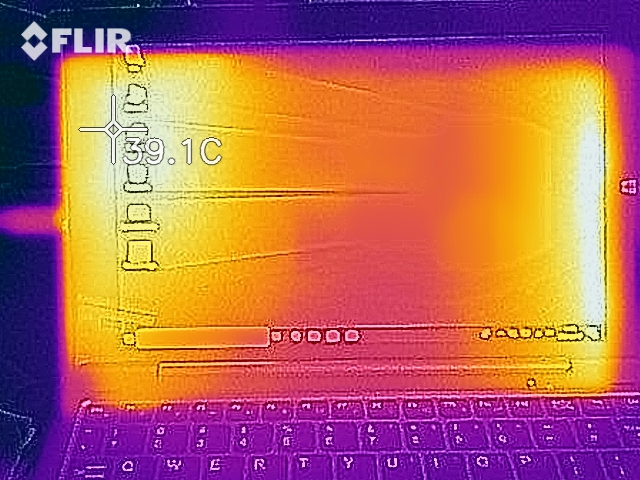
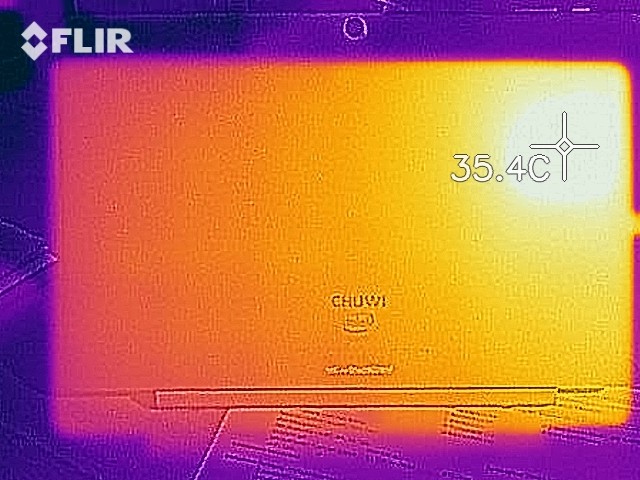
The Hi10 Air also runs rather hot. Surface temperatures on our review unit reached a maximum of 42.4 °C (~108 °F) on the display and 37.7 °C (~100 °F) on the back case. These temperatures are slightly higher than the class average, but they are not dangerously hot. The tablet may feel uncomfortably warm to the touch if you are holding and pushing the system hard, but that should rarely occur. By contrast, the Hi10 Pro never exceeded 34 °C (~93 °F) during our tests and most other comparable tablets run at well below 30 °C (~86 °F) even under maximum load.
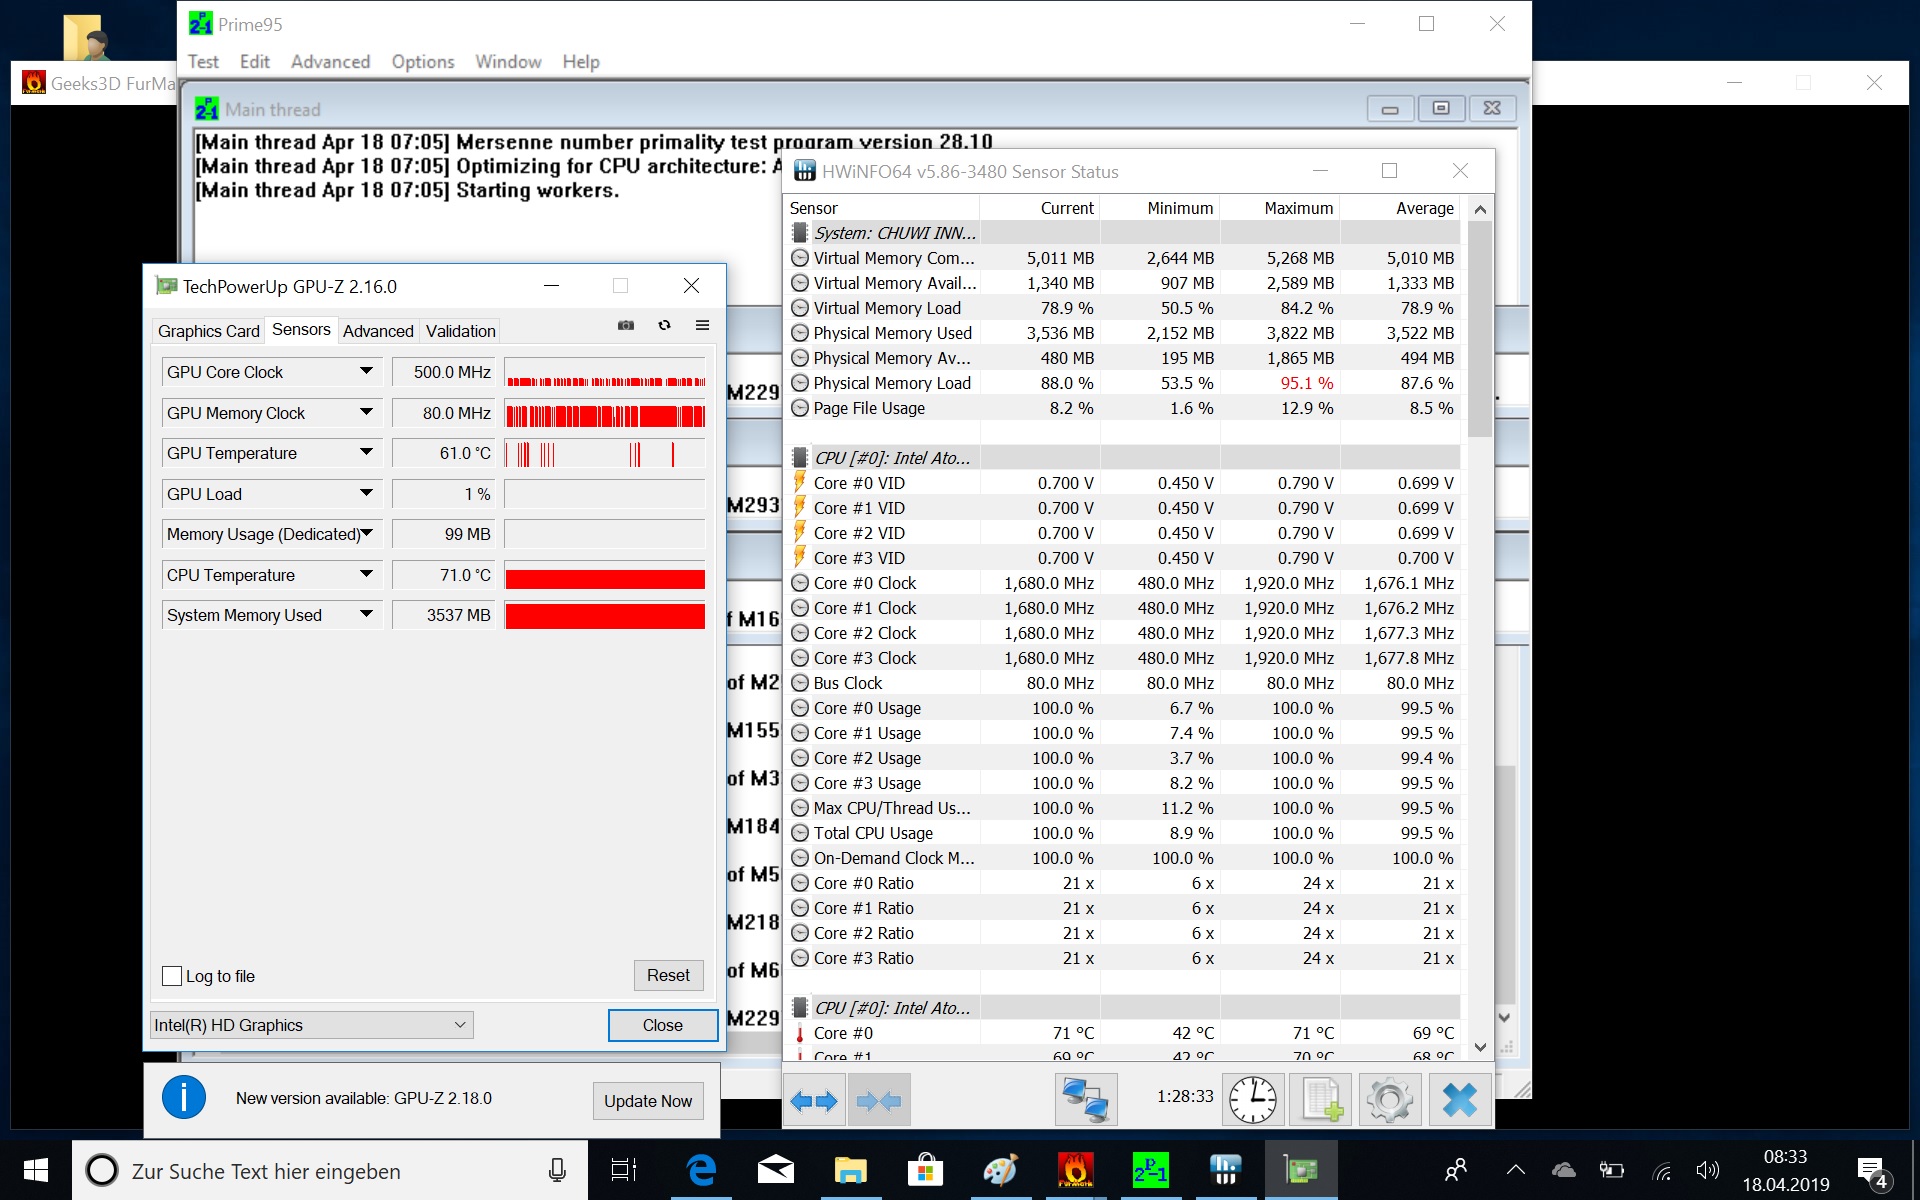
Our test device performed well in our one-hour long stress test though, during which we run FurMark and Prime95 on a loop and measure changes in internal temperatures along with clock speeds. CPU speeds fluctuated widely during this test, but they averaged around 1.6 GHz, which is above its base clock. The CPU core temperatures also averaged approximately 70 °C (~158 °F), which is not dangerously high.
| Chuwi Hi10 Air HD Graphics (Cherry Trail), Z8350, 64 GB eMMC Flash | Chuwi Hi10 Pro HD Graphics (Cherry Trail), Z8300, 64 GB eMMC Flash | HP x2 210 G2 HD Graphics 400 (Braswell), Z8350, 64 GB eMMC Flash | Lenovo Ideapad D330-10IGM UHD Graphics 605, Pentium N5000, 128 GB eMMC Flash | Microsoft Surface Go MHN-00003 UHD Graphics 615, Pentium 4415Y, 64 GB eMMC Flash | |
|---|---|---|---|---|---|
| Heat | -2% | 2% | 4% | 6% | |
| Maximum Upper Side * (°C) | 42.4 | 43.5 -3% | 40.8 4% | 41.7 2% | 44 -4% |
| Maximum Bottom * (°C) | 37.7 | 36 5% | 38.9 -3% | 39.7 -5% | 43 -14% |
| Idle Upper Side * (°C) | 33.8 | 35.5 -5% | 32.4 4% | 31.7 6% | 26 23% |
| Idle Bottom * (°C) | 30.4 | 32.2 -6% | 29.8 2% | 26.5 13% | 24.4 20% |
* ... smaller is better
(±) The maximum temperature on the upper side is 42.4 °C / 108 F, compared to the average of 35.4 °C / 96 F, ranging from 19.6 to 60 °C for the class Convertible.
(+) The bottom heats up to a maximum of 37.7 °C / 100 F, compared to the average of 36.9 °C / 98 F
(+) In idle usage, the average temperature for the upper side is 30.6 °C / 87 F, compared to the device average of 30.3 °C / 87 F.
(±) The palmrests and touchpad can get very hot to the touch with a maximum of 36.2 °C / 97.2 F.
(-) The average temperature of the palmrest area of similar devices was 28 °C / 82.4 F (-8.2 °C / -14.8 F).
Speakers
The speakers in the Hi10 Air will not annoy the neighbors or blow out any windows, but they are loud enough for occasionally listening to music and watching videos. The speakers reached a maximum of 73.8 dB(A) during our tests, but bass tones are all but absent from the frequencies that they reproduce. Moreover, mid tones do not increase in pitch linearly, and the speakers reproduce too many high-pitched frequencies for our liking, which can make some audio sound tinny at high volumes.
Subjectively, we have heard worse speakers on tablets. While there is hardly any bass, at least that which is reproduced is done so linearly. We would recommend using external speakers or headphones for a better listening experience, where possible. We had no issues with listening to music using Bluetooth, the headphone jack or USB.
Chuwi Hi10 Air audio analysis
(-) | not very loud speakers (67 dB)
Bass 100 - 315 Hz
(-) | nearly no bass - on average 28% lower than median
(+) | bass is linear (3% delta to prev. frequency)
Mids 400 - 2000 Hz
(±) | reduced mids - on average 9.6% lower than median
(-) | mids are not linear (20% delta to prev. frequency)
Highs 2 - 16 kHz
(±) | higher highs - on average 6.4% higher than median
(±) | linearity of highs is average (12.3% delta to prev. frequency)
Overall 100 - 16.000 Hz
(-) | overall sound is not linear (39.2% difference to median)
Compared to same class
» 97% of all tested devices in this class were better, 1% similar, 2% worse
» The best had a delta of 6%, average was 20%, worst was 57%
Compared to all devices tested
» 95% of all tested devices were better, 0% similar, 5% worse
» The best had a delta of 4%, average was 24%, worst was 134%
HP x2 210 G2 audio analysis
(-) | not very loud speakers (67.6 dB)
Bass 100 - 315 Hz
(-) | nearly no bass - on average 15.9% lower than median
(+) | bass is linear (6.5% delta to prev. frequency)
Mids 400 - 2000 Hz
(+) | balanced mids - only 3.5% away from median
(+) | mids are linear (5.2% delta to prev. frequency)
Highs 2 - 16 kHz
(+) | balanced highs - only 4.9% away from median
(+) | highs are linear (4.5% delta to prev. frequency)
Overall 100 - 16.000 Hz
(±) | linearity of overall sound is average (22.2% difference to median)
Compared to same class
» 65% of all tested devices in this class were better, 6% similar, 29% worse
» The best had a delta of 6%, average was 20%, worst was 57%
Compared to all devices tested
» 64% of all tested devices were better, 6% similar, 29% worse
» The best had a delta of 4%, average was 24%, worst was 134%
Power Management
Power Consumption
The Hi10 Air has comparably excellent power consumption. A look at our comparison table below demonstrates the gulf in consumption between our review unit and our comparison devices. The Hi10 Air consumes a minimum of 1.2 W at idle, which rises to a maximum of 6.8 W under load. Only the Hi10 Pro gets close to matching the Hi10 Air’s consumption at idle, but no device consumes as little as our review unit does under load.
Chuwi includes a 5V/3A USB Type-C power supply in the box that also has quick charge functionality. The charger recharged our review unit quickly during our tests, but for some reason it would not let the charger know when it was fully charged. We encountered no problems relating to this during our time with the device, but this behaviour can damage the battery over time.
| Chuwi Hi10 Air HD Graphics (Cherry Trail), Z8350, 64 GB eMMC Flash | Chuwi Hi10 Pro HD Graphics (Cherry Trail), Z8300, 64 GB eMMC Flash | HP x2 210 G2 HD Graphics 400 (Braswell), Z8350, 64 GB eMMC Flash | Lenovo Ideapad D330-10IGM UHD Graphics 605, Pentium N5000, 128 GB eMMC Flash | Microsoft Surface Go MHN-00003 UHD Graphics 615, Pentium 4415Y, 64 GB eMMC Flash | |
|---|---|---|---|---|---|
| Power Consumption | -132% | -146% | -195% | -230% | |
| Idle Minimum * (Watt) | 1.2 | 1.4 -17% | 2.9 -142% | 3.1 -158% | 2.88 -140% |
| Idle Average * (Watt) | 1.3 | 4.82 -271% | 4.8 -269% | 5.6 -331% | 4.8 -269% |
| Idle Maximum * (Watt) | 1.8 | 5.43 -202% | 5.2 -189% | 6.2 -244% | 7.5 -317% |
| Load Average * (Watt) | 6.2 | 11.61 -87% | 10.4 -68% | 13.5 -118% | 16.9 -173% |
| Load Maximum * (Watt) | 6.8 | 12.48 -84% | 10.9 -60% | 15.3 -125% | 23.8 -250% |
* ... smaller is better
| Off / Standby | |
| Idle | |
| Load |
|
Key:
min: | |
Battery Life
The Hi10 Air has surprisingly poor battery life considering its low power consumption. Our review unit lasted about 30 minutes longer than the Hi10 Pro in our practical Wi-Fi battery life test, but it needed recharging between almost one hour and almost five hours sooner than our comparison devices. The Hi10 Air still achieved a 6:35 hours runtime in this test, so it should last a working day between charges.
| Chuwi Hi10 Air Z8350, HD Graphics (Cherry Trail), Wh | Chuwi Hi10 Pro Z8300, HD Graphics (Cherry Trail), 0 Wh | HP x2 210 G2 Z8350, HD Graphics 400 (Braswell), 32.5 Wh | Lenovo Ideapad D330-10IGM Pentium N5000, UHD Graphics 605, 39 Wh | Microsoft Surface Go MHN-00003 Pentium 4415Y, UHD Graphics 615, 28 Wh | Average of class Convertible | |
|---|---|---|---|---|---|---|
| Battery runtime | ||||||
| WiFi v1.3 (h) | 6.6 | 6.1 -8% | 9.2 39% | 11.4 73% | 7.5 14% | 11.9 ? 80% |
Pros
Cons
Verdict
The Chuwi Hi10 Air is an intriguing device. It is cheap and has many outdated parts, but it is still surprisingly good value for money. The Hi10 Air has a well-made aluminum case and an impressive display, while its keyboard is decent too.
Windows 10 usually runs smoothly too, but this is where things start to fall apart. You cannot officially boot into Android as you can with the Hi10 Pro, which is a shame as the Hi10 Air cannot perform any multitasking without the system grinding to a halt.
Moreover, the trackpad is overly sensitive, and the tablet’s battery life is curiously poor. Additionally, some of the Hi10 Air’s parts have not aged well. The device has awful microSD, and Wi-Fi performance and the less said about its Atom processor, the better. The eMMC flash storage is much slower than those used in our comparison devices too.
The Chuwi Hi10 Air is a surprisingly good package overall, despite its outdated hardware. The tablet is good value for money and only has a few practical shortcomings.
Alternatively, it may even be worth looking at the Hi10 Pro if you are interested in the Hi10 Air. It may have been released in 2016, but it shares most of the same parts with its newer siblings and has hardly any shortcomings that the Hi10 Air does not already have. It relies on Android 5.1 as its second OS though, which is hopelessly outdated, so we can see why Chuwi did not include it on the Hi10 Air if that is all that they could manage.
Chuwi Hi10 Air
- 04/25/2019 v6 (old)
Christian Hintze
Price comparison

