Jumper Tech EZbook X3 Air Laptop in review: Appealing design meets reasonable price

In addition to the established brand names of large manufacturers, there are also many inexpensive laptop providers on the market that can offer extremely low prices and quite well designed devices. Mostly older hardware is used, which is only suitable for simple applications.
This also includes the Jumper Tech EZbook X3 Air, which we compared in our test with the competing devices listed below. Under each section you can add notebooks from our database for comparison.
Rating | Date | Model | Weight | Height | Size | Resolution | Price |
|---|---|---|---|---|---|---|---|
| 79.4 % v7 (old) | 10 / 2020 | Jumper Tech Ez Book X3 Air Celeron N4100, UHD Graphics 600 | 1.1 kg | 11 mm | 13.30" | 1920x1080 | |
| 69.1 % v7 (old) | 05 / 2020 | Chuwi Hi10 X Celeron N4100, UHD Graphics 600 | 600 g | 8.8 mm | 10.10" | 1920x1200 | |
| 74.9 % v7 (old) | 03 / 2020 | BMAX MaxBook Y11 H1M6 Celeron N4100, UHD Graphics 600 | 1 kg | 14.4 mm | 11.60" | 1920x1080 | |
| 73.3 % v6 (old) | 09 / 2018 | Lenovo IdeaPad 330-15IGM Celeron N4100, UHD Graphics 600 | 2 kg | 23 mm | 15.60" | 1366x768 |
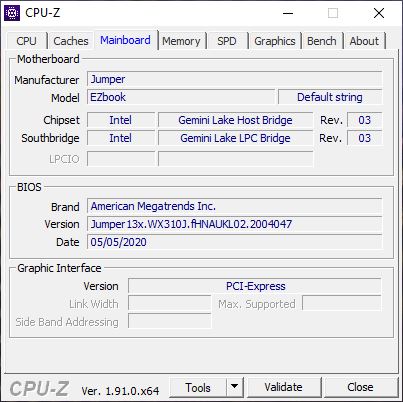
Case - Sturdy metal netbook
Jumper makes the EZbook X3 Air case from metal. This makes the device look very robust and there are no defects in the workmanship. The screen can be folded back up to an angle of 180 degrees and the hinges are quite smooth. The screen is nevertheless reliably held in the set position.
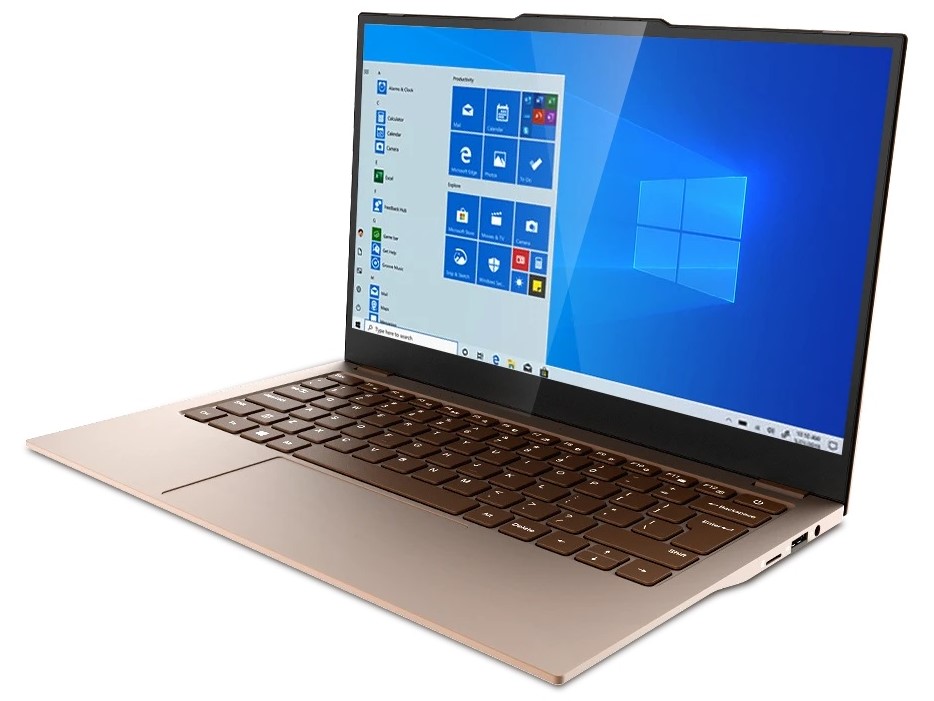
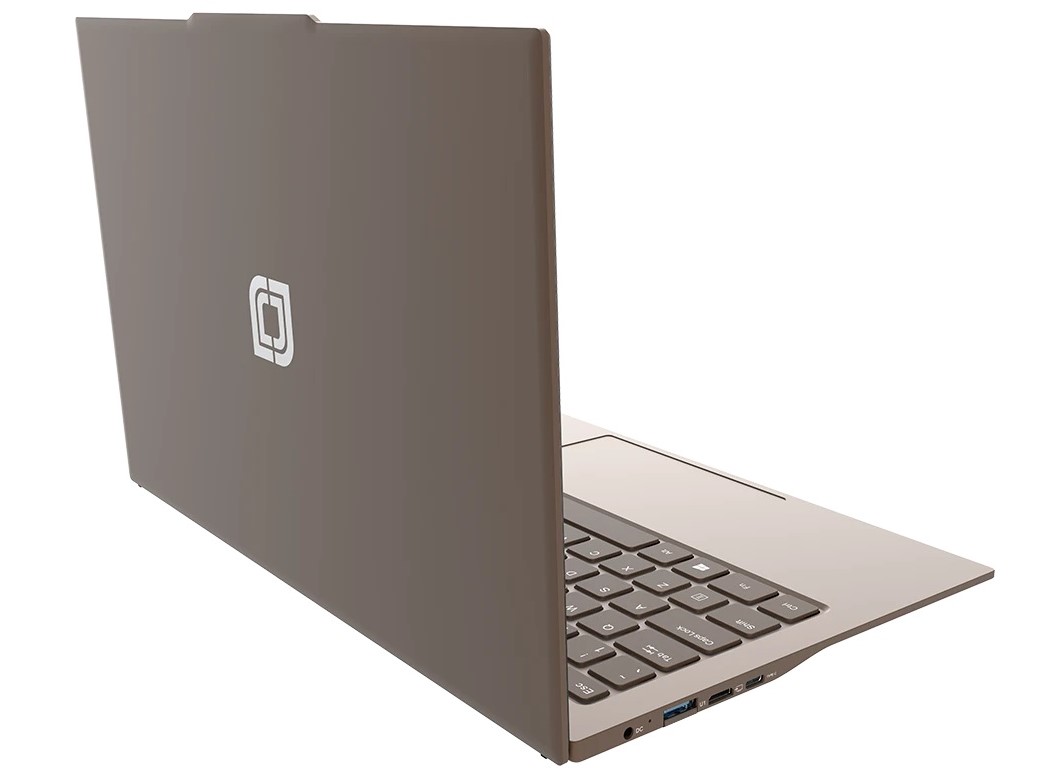
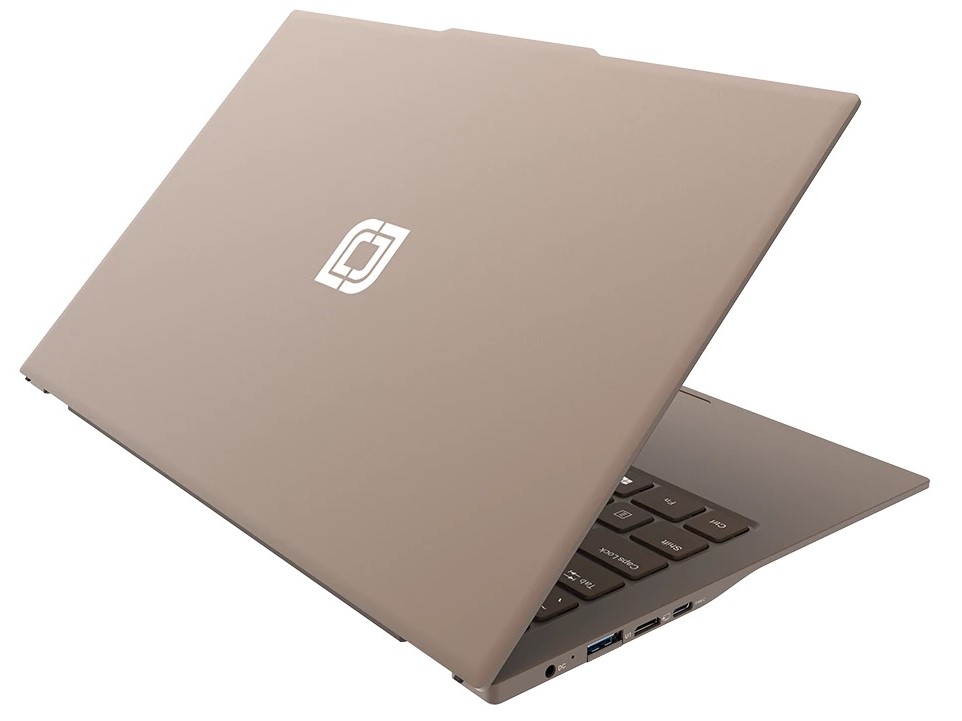
Compared to the competition, the Jumper laptop is placed in the mid-range. At only 1.1 kg it is light and very compact due to the narrow bezels.
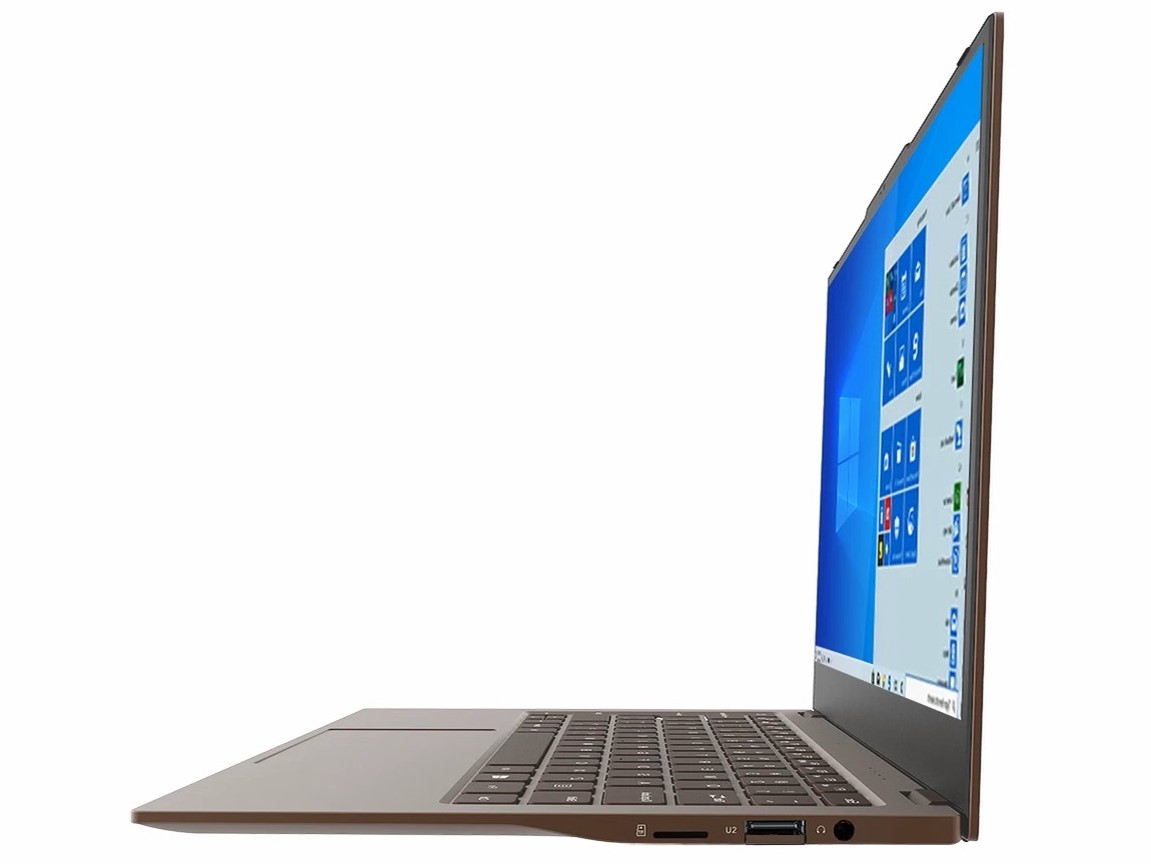
Equipment - Jumper laptop with USB Type-C
The Jumper EZbook X3 Air offers a basically solid connectivity choice. Monitors can be connected via MiniHDMI and the USB type C port is also suitable for charging the notebook.
SD card reader
The memory card reader accepts microSD cards and achieves rather slow speeds with our reference memory card Toshiba Exceria Pro SDXC 64 GB UHS-II, which, however, corresponds to the level of our test field.
| SD Card Reader | |
| average JPG Copy Test (av. of 3 runs) | |
| Lenovo IdeaPad 330-15IGM (Toshiba Exceria Pro SDXC 64 GB UHS-II) | |
| BMAX MaxBook Y11 H1M6 (Toshiba Exceria Pro M501 64 GB UHS-II) | |
| Chuwi Hi10 X (Toshiba Exceria Pro M501 64 GB UHS-II) | |
| maximum AS SSD Seq Read Test (1GB) | |
| BMAX MaxBook Y11 H1M6 (Toshiba Exceria Pro M501 64 GB UHS-II) | |
| Jumper Tech Ez Book X3 Air | |
| Lenovo IdeaPad 330-15IGM (Toshiba Exceria Pro SDXC 64 GB UHS-II) | |
| Chuwi Hi10 X (Toshiba Exceria Pro M501 64 GB UHS-II) | |
Communication
The Jumper EZbook can establish wireless connections via Bluetooth 4.2 and Wi-Fi 5. Here, too, the speeds achieved are on par with those of comparable devices.
Webcam
The webcam of the X3 Air resolves images at 0.9 MP, as is the case with most notebooks currently available. Our test shot shows that colors look very pale and image content is blurred.


Accessories
The scope of delivery includes the laptop itself and a suitable power supply unit.
Maintenance
On the bottom side of the EZbook there is a space with a free M.2 slot for installing an additional mass storage device.
Warranty
The manufacturer grants buyers a warranty period of 12 months.
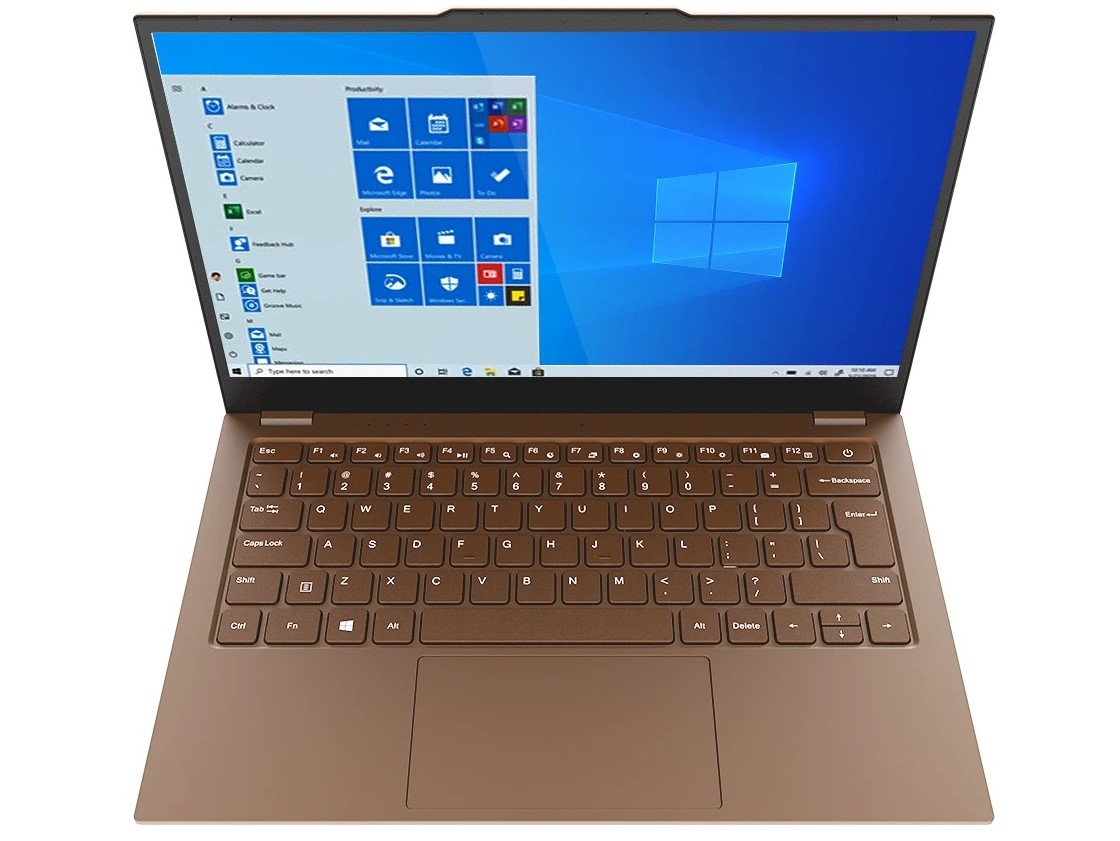
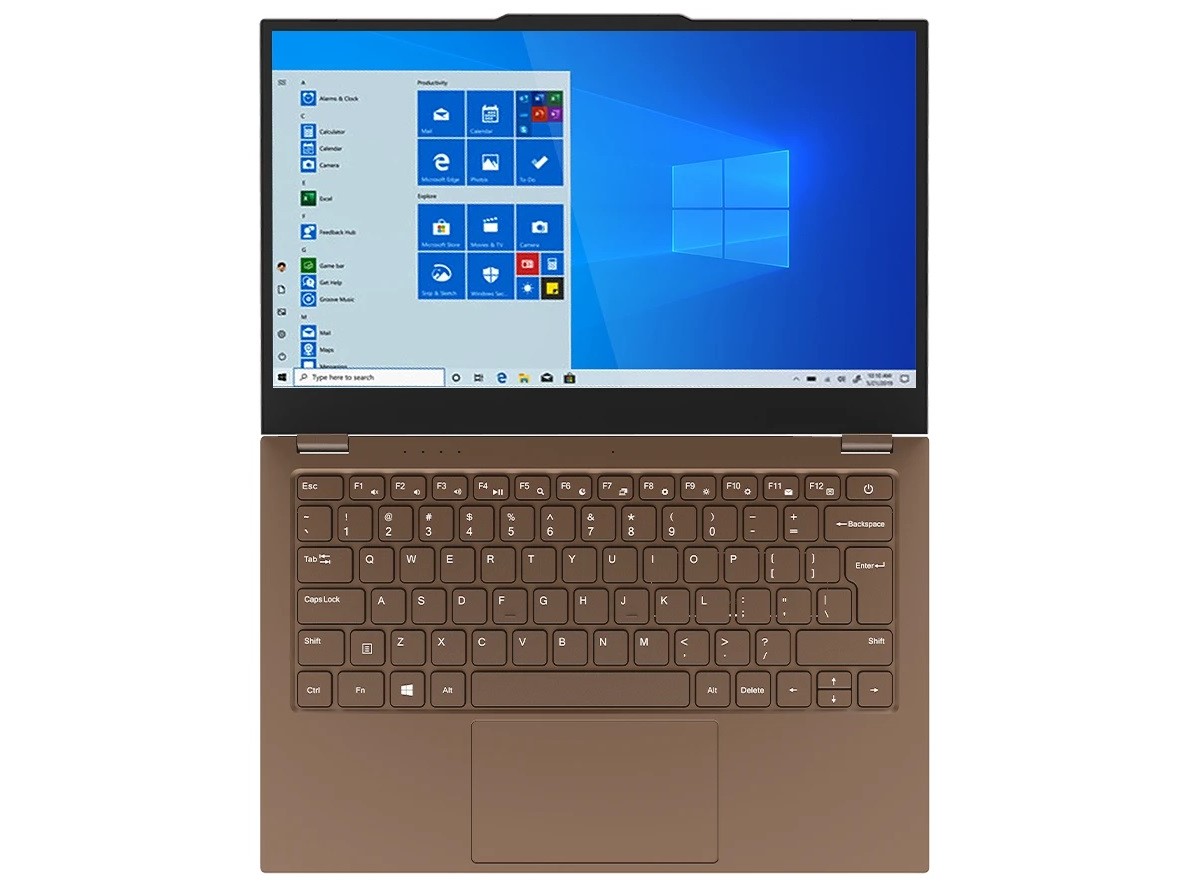
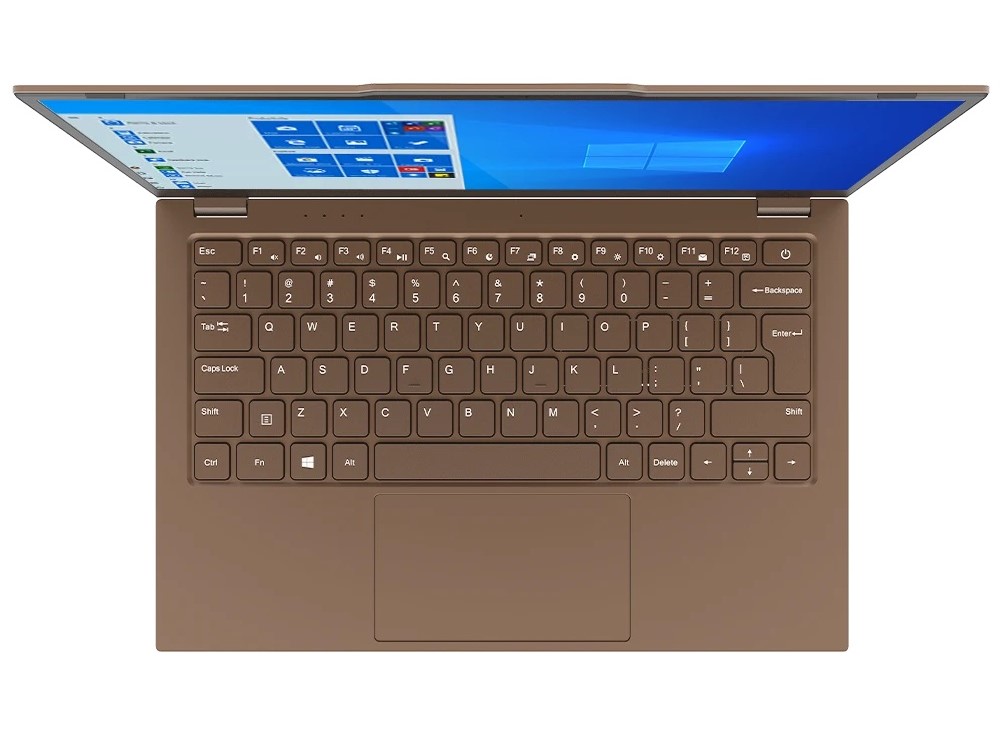
Input devices - Large ClickPad and QWERTY layout
Keyboard
The keys on the Jumper EZbook X3 Air offer a non-slip surface and a very palpable pressure point. While the arrow up and arrow down keys are only half the size, the scroll keys, End, Insert and Pos1 have been omitted completely. Due to the QWERTY layout, users also have to do without labeled umlauts.
Touchpad
As a mouse substitute Jumper uses a ClickPad, which is well suited for mouse pointer navigation. Right and left mouse clicks can be triggered by a light pressure in the lower corners and the pad also reacts reliably to touch gestures.
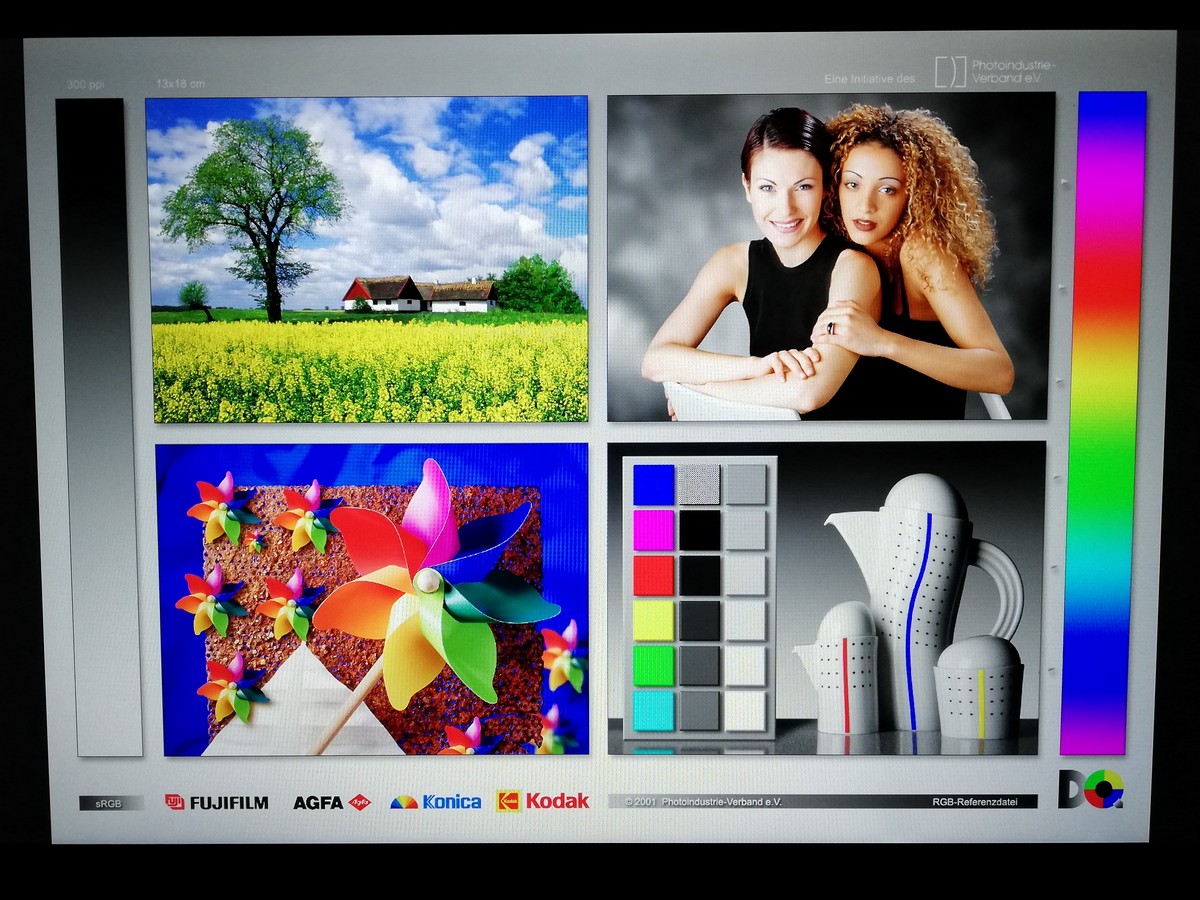
Display - bright and highly reflective

The Jumper EZbook X3 Air's screen consists of a 13.3-inch IPS panel and offers a resolution of 1920x1080 pixels. With an average brightness of 330 cd/m², the laptop can lead our test field. The illumination, however, is only average at 88%.
With a brightness value below 10%, the screen flickers at a frequency of 250 Hz.
| |||||||||||||||||||||||||
Brightness Distribution: 88 %
Center on Battery: 355 cd/m²
Contrast: 1291:1 (Black: 0.275 cd/m²)
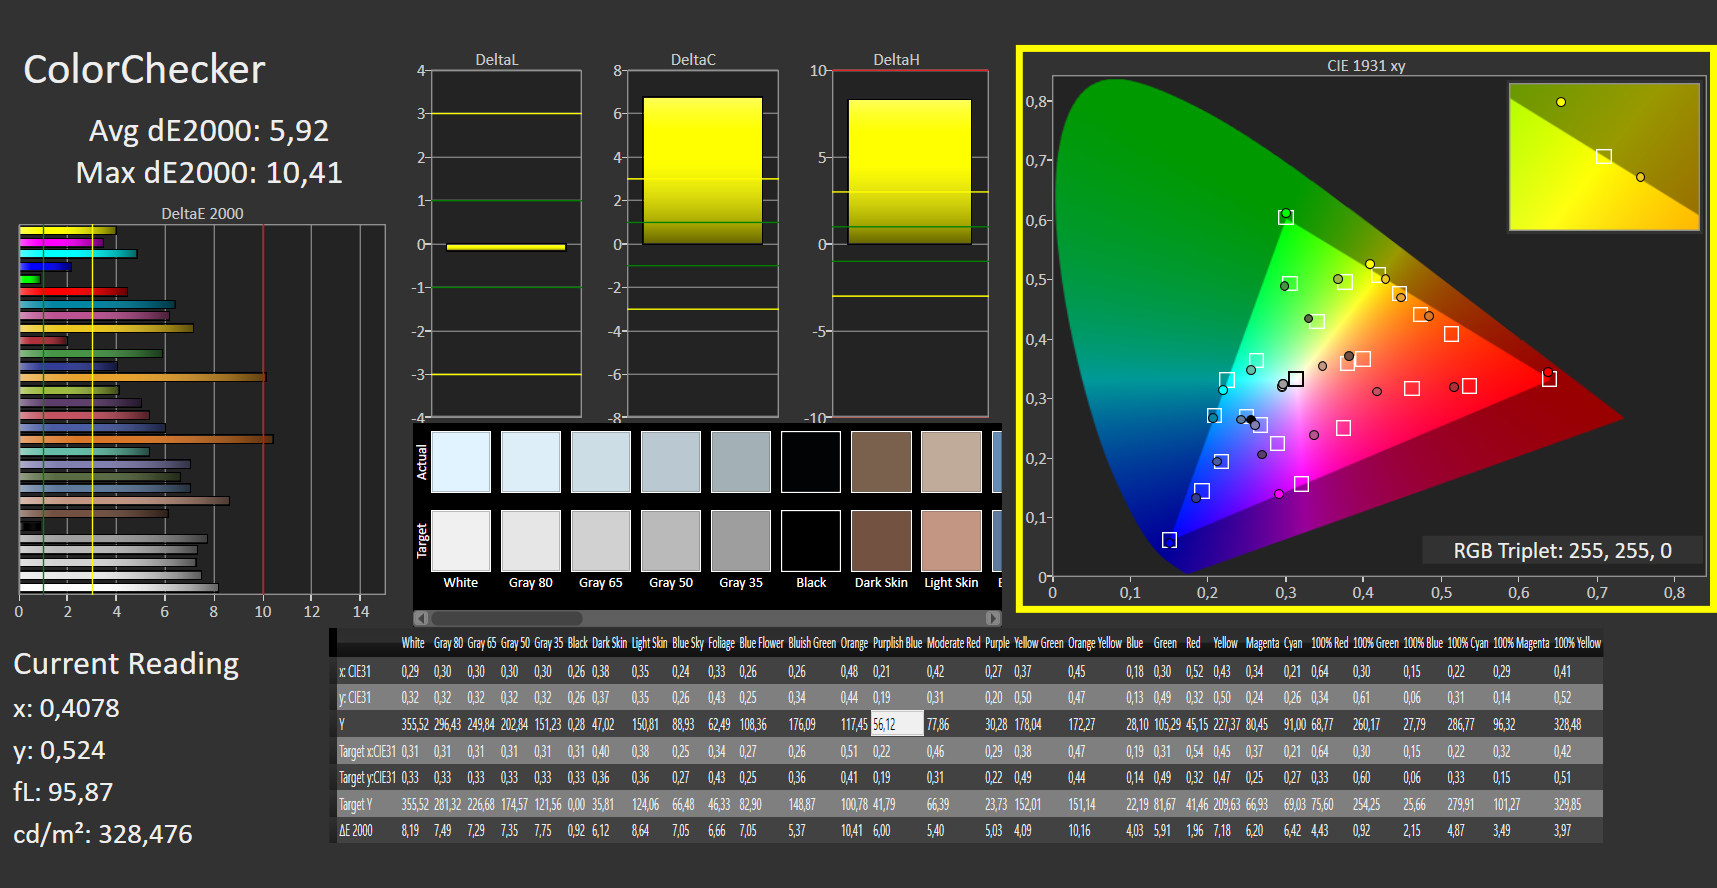
ΔE ColorChecker Calman: 5.92 | ∀{0.5-29.43 Ø4.73}
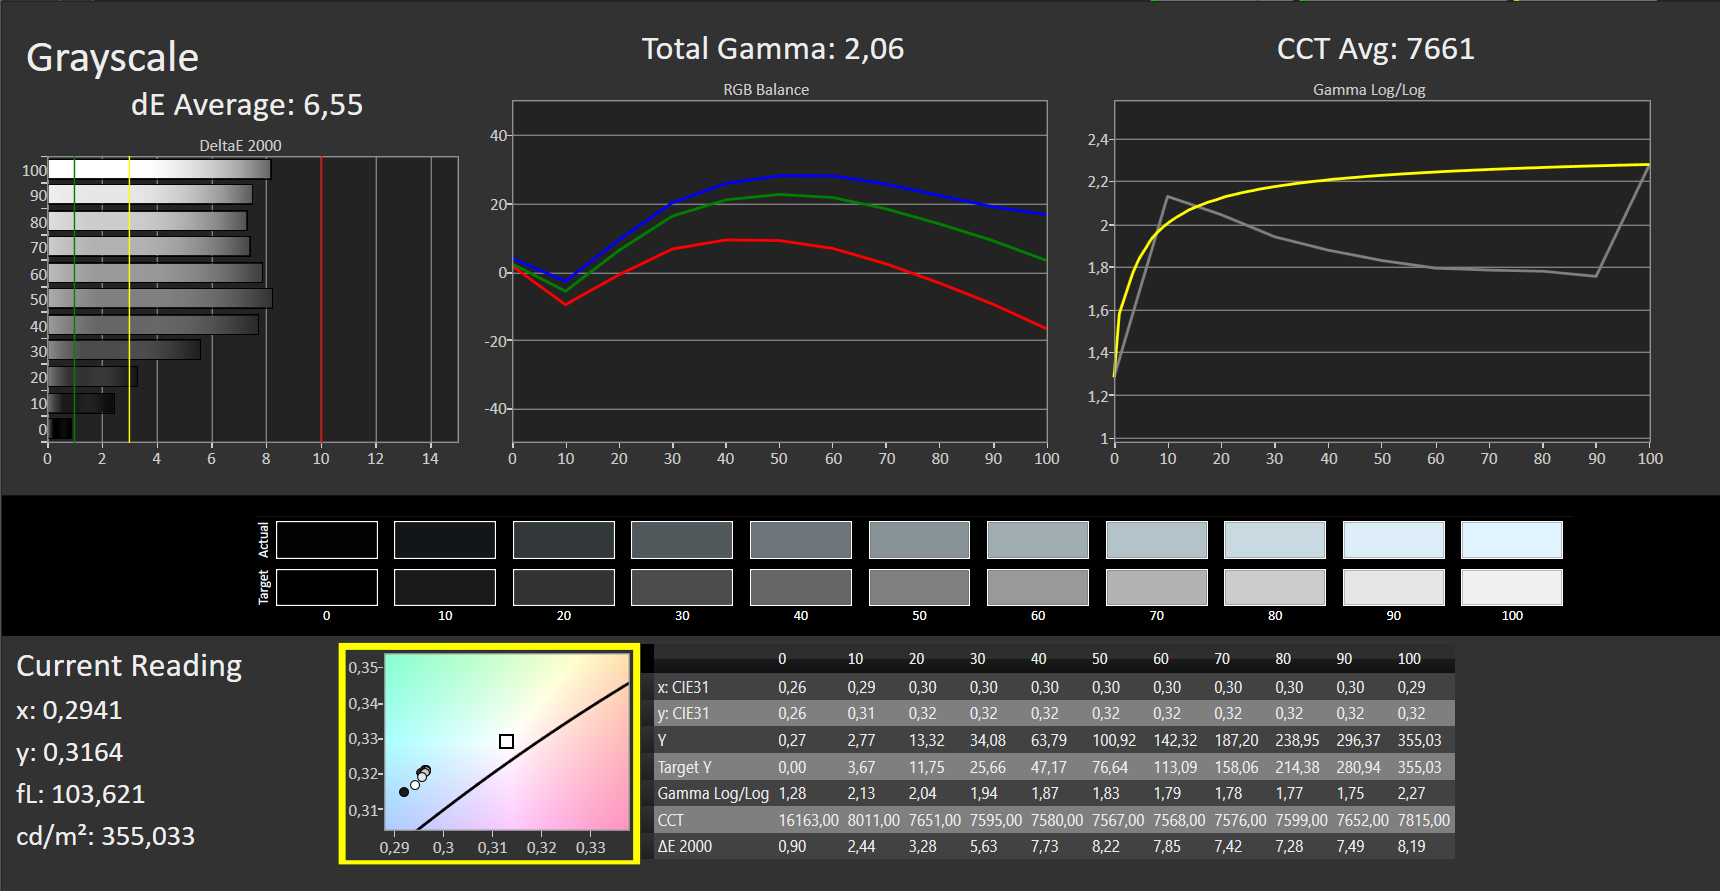
ΔE Greyscale Calman: 6.55 | ∀{0.09-98 Ø4.97}
96% sRGB (Argyll 1.6.3 3D)
61% AdobeRGB 1998 (Argyll 1.6.3 3D)
67.4% AdobeRGB 1998 (Argyll 3D)
95.6% sRGB (Argyll 3D)
65.5% Display P3 (Argyll 3D)
Gamma: 2.06
CCT: 7661 K
| Jumper Tech Ez Book X3 Air Sharp SHP1447, IPSJ390, 1920x1080, 13.3" | Chuwi Hi10 X AU Optronics AUO17D8, IPS, 1920x1200, 10.1" | BMAX MaxBook Y11 H1M6 LC116LF3L01, IPS, 1920x1080, 11.6" | Lenovo IdeaPad 330-15IGM NT156WHM-N42, TN LED, 1366x768, 15.6" | |
|---|---|---|---|---|
| Display | 2% | -4% | -45% | |
| Display P3 Coverage (%) | 65.5 | 67.9 4% | 62.4 -5% | 35.95 -45% |
| sRGB Coverage (%) | 95.6 | 96.8 1% | 93.4 -2% | 53.9 -44% |
| AdobeRGB 1998 Coverage (%) | 67.4 | 68.9 2% | 64.2 -5% | 37.14 -45% |
| Response Times | 21% | 4% | 30% | |
| Response Time Grey 50% / Grey 80% * (ms) | 41 ? | 30.4 ? 26% | 36.1 ? 12% | 38.4 ? 6% |
| Response Time Black / White * (ms) | 29 ? | 24.4 ? 16% | 30.4 ? -5% | 13.6 ? 53% |
| PWM Frequency (Hz) | 250 ? | 20000 ? | 893 ? | |
| Screen | -34% | -22% | -56% | |
| Brightness middle (cd/m²) | 355 | 256.3 -28% | 258 -27% | 212.7 -40% |
| Brightness (cd/m²) | 330 | 255 -23% | 248 -25% | 203 -38% |
| Brightness Distribution (%) | 88 | 93 6% | 94 7% | 82 -7% |
| Black Level * (cd/m²) | 0.275 | 0.41 -49% | 0.26 5% | 0.52 -89% |
| Contrast (:1) | 1291 | 625 -52% | 992 -23% | 409 -68% |
| Colorchecker dE 2000 * | 5.92 | 10.04 -70% | 7.1 -20% | 8.75 -48% |
| Colorchecker dE 2000 max. * | 10.41 | 17.49 -68% | 14.8 -42% | 23.6 -127% |
| Greyscale dE 2000 * | 6.55 | 10.4 -59% | 9.6 -47% | 10.1 -54% |
| Gamma | 2.06 107% | 2.23 99% | 2.148 102% | 2.14 103% |
| CCT | 7661 85% | 10211 64% | 10313 63% | 10452 62% |
| Color Space (Percent of AdobeRGB 1998) (%) | 61 | 63 3% | 34.1 -44% | |
| Color Space (Percent of sRGB) (%) | 96 | 96.7 1% | 53.6 -44% | |
| Colorchecker dE 2000 calibrated * | 2.17 | 1.3 | 4.92 | |
| Total Average (Program / Settings) | -4% /
-19% | -7% /
-14% | -24% /
-42% |
* ... smaller is better
Our measurements confirm that the X3 Air has a good contrast ratio of 1,291:1 and an equally good black level of 0.275 cd/m². Thus, colors appear well separated from each other and black image contents appear relatively saturated. Added to this is very good color-space coverages of 96% (sRGB) and 61% (AdobeRGB).
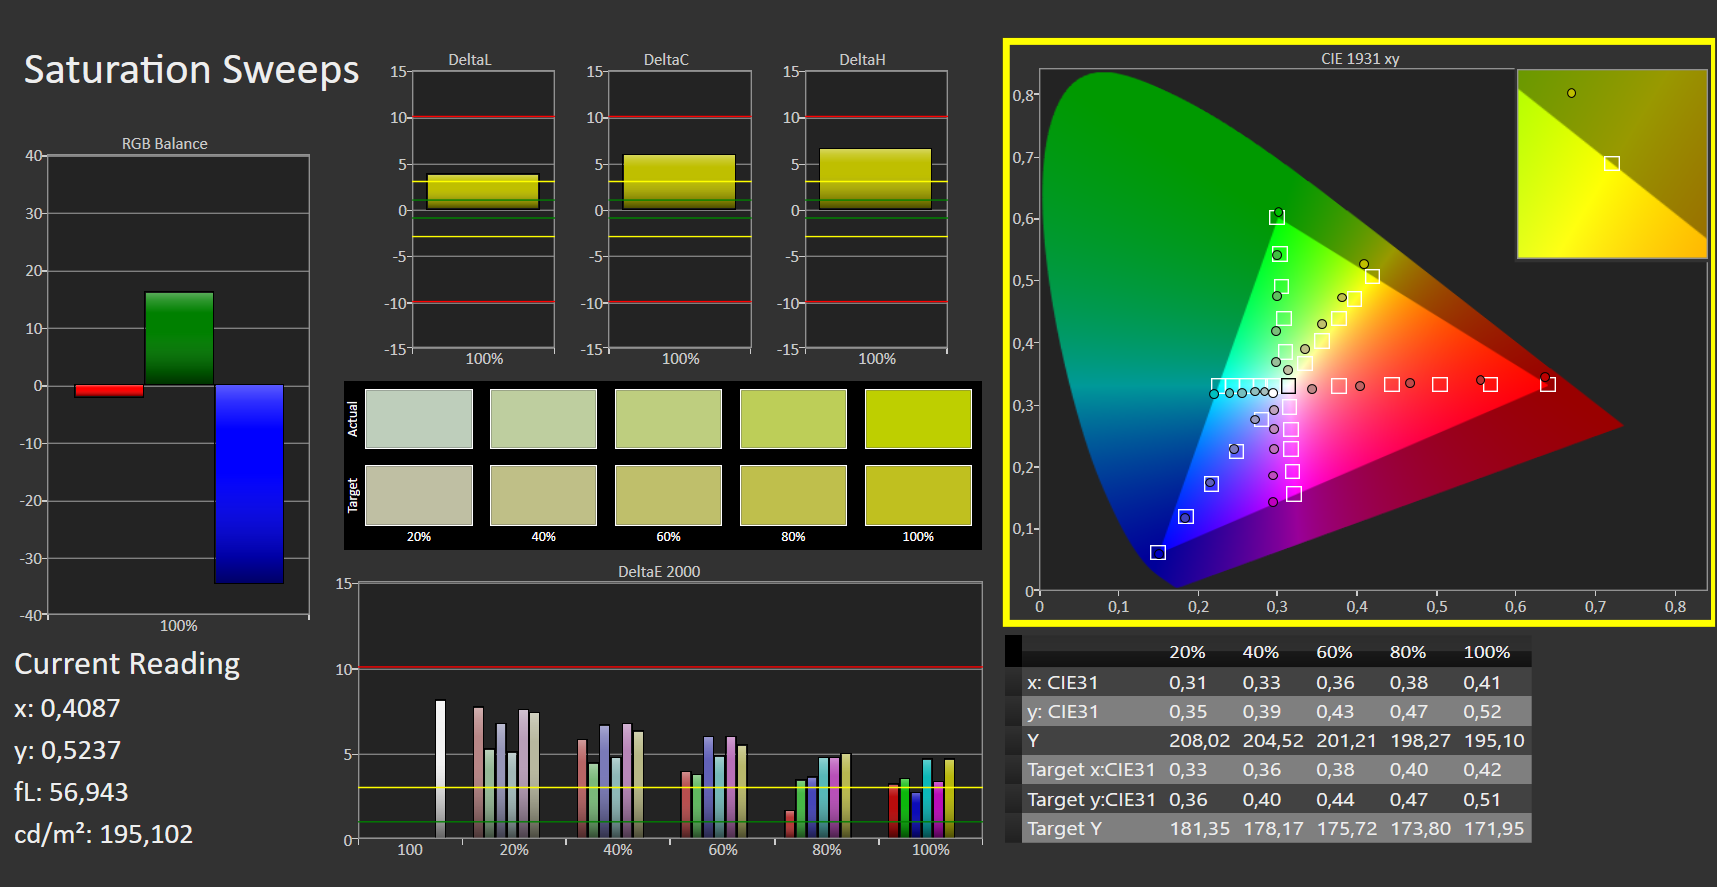
CalMAN analysis also shows that the display shows image content with too low a red component and too high a blue component.
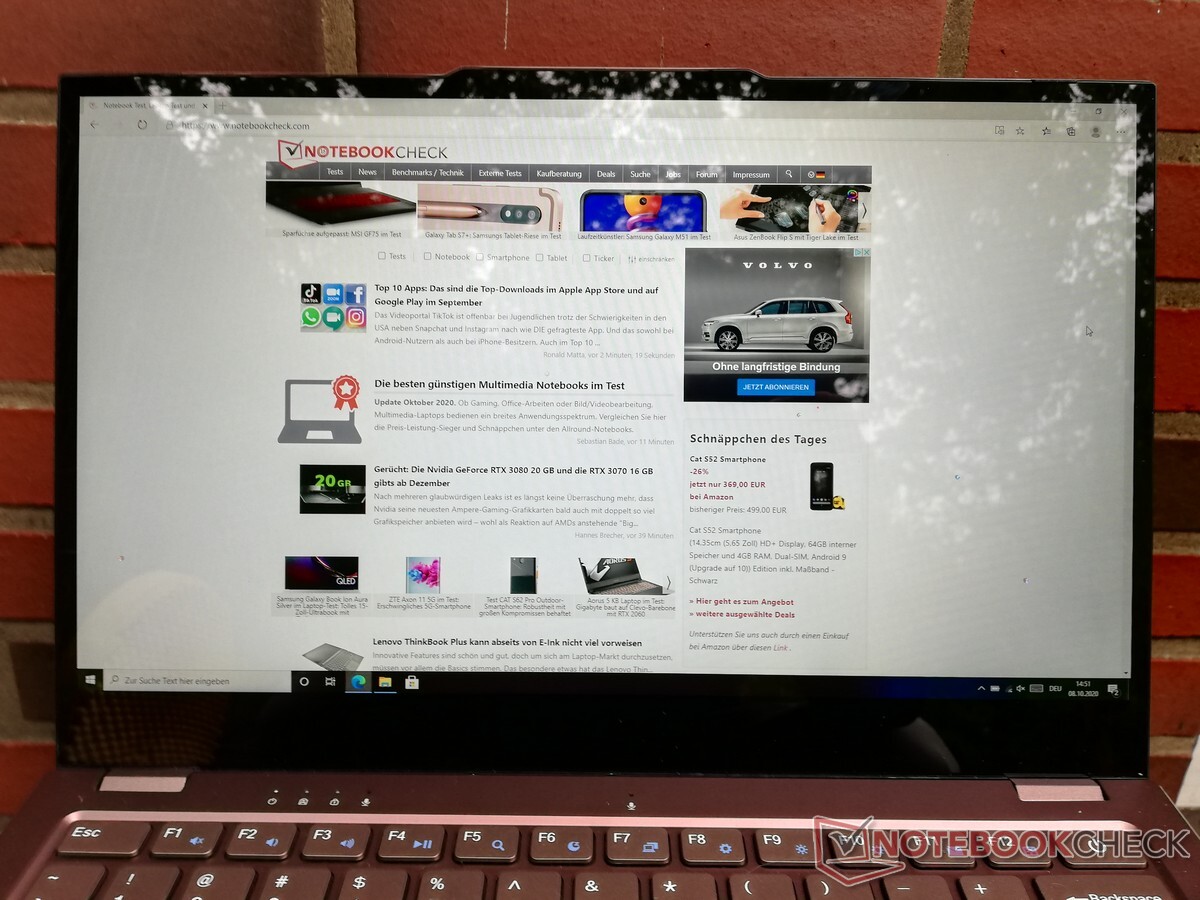
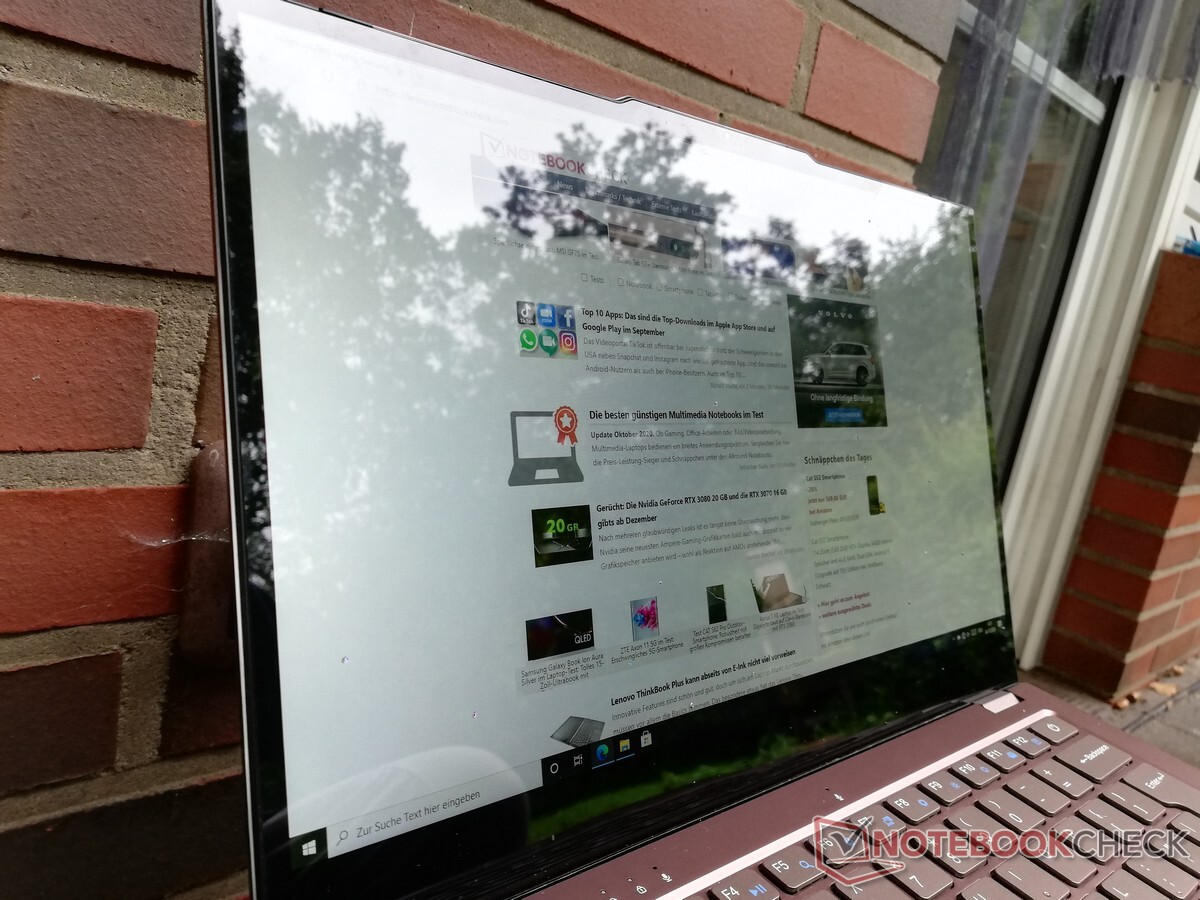
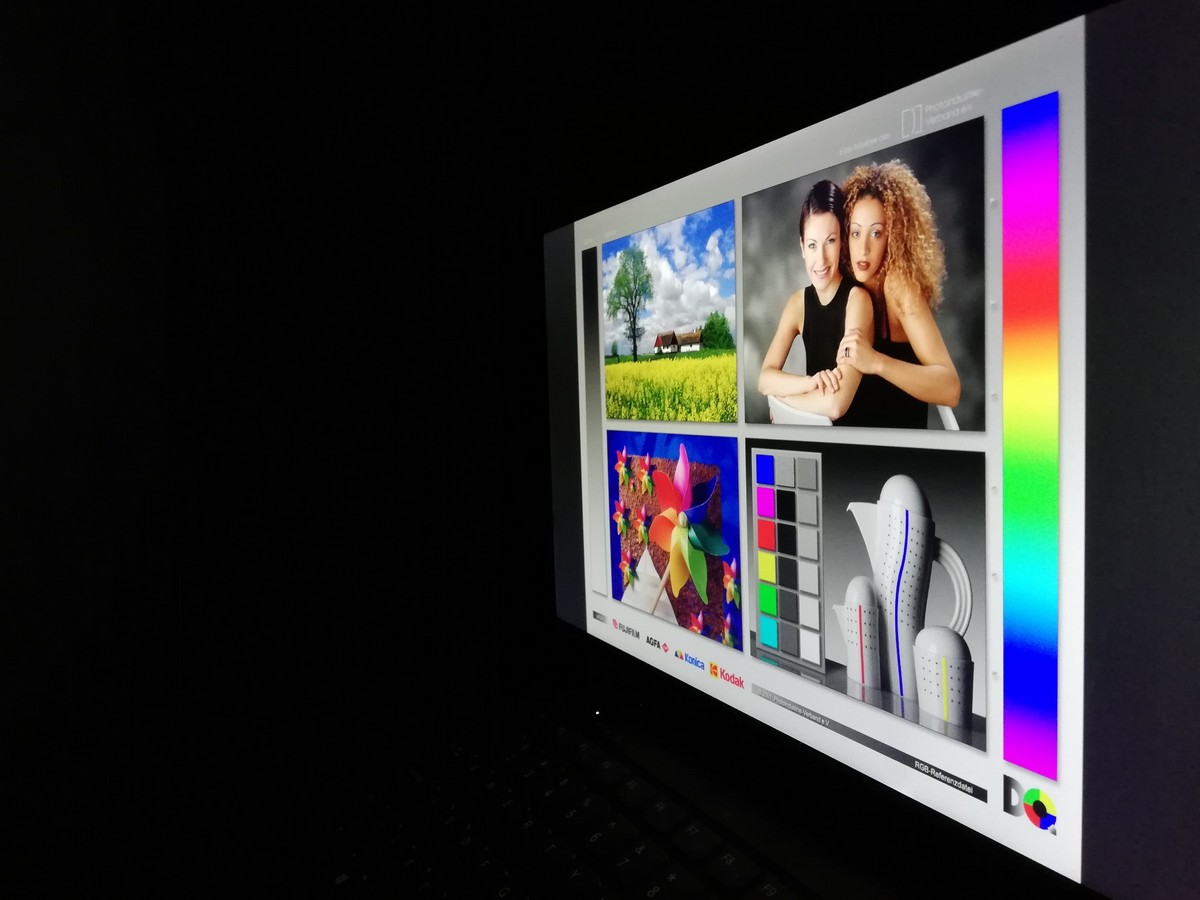
Due to the highly reflective surface of the screen, the EZbook X3 Air is not suitable for outdoor use. In closed rooms, artificial light sources can cause strong reflections.
Display Response Times
| ↔ Response Time Black to White | ||
|---|---|---|
| 29 ms ... rise ↗ and fall ↘ combined | ↗ 16 ms rise | 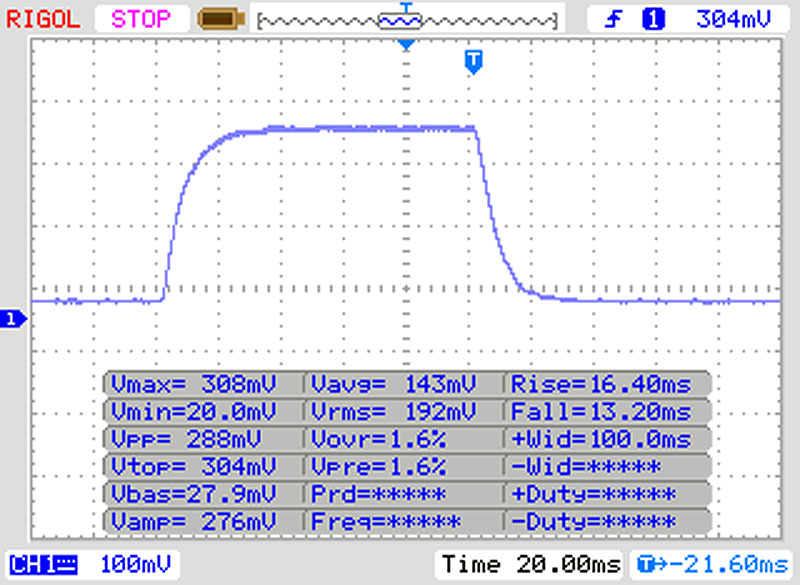 |
| ↘ 13 ms fall | ||
| The screen shows relatively slow response rates in our tests and may be too slow for gamers. In comparison, all tested devices range from 0.1 (minimum) to 240 (maximum) ms. » 77 % of all devices are better. This means that the measured response time is worse than the average of all tested devices (19.9 ms). | ||
| ↔ Response Time 50% Grey to 80% Grey | ||
| 41 ms ... rise ↗ and fall ↘ combined | ↗ 21 ms rise | 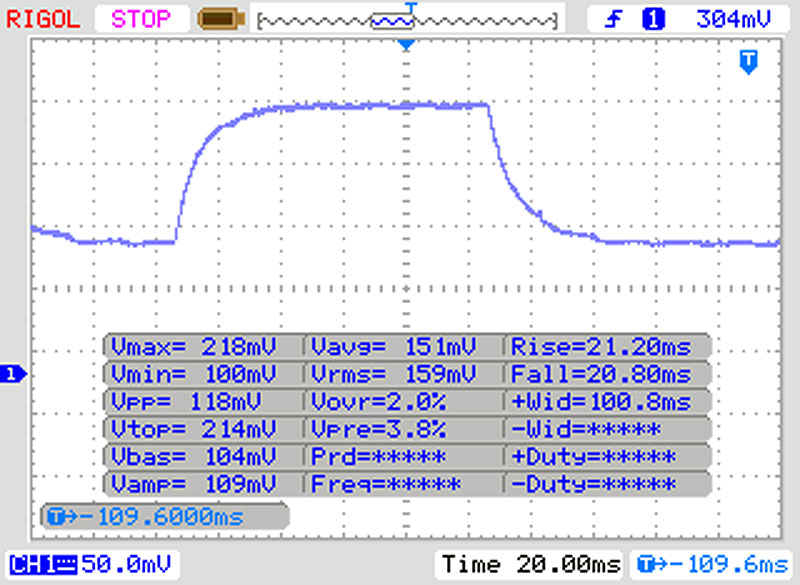 |
| ↘ 20 ms fall | ||
| The screen shows slow response rates in our tests and will be unsatisfactory for gamers. In comparison, all tested devices range from 0.165 (minimum) to 636 (maximum) ms. » 65 % of all devices are better. This means that the measured response time is worse than the average of all tested devices (31.1 ms). | ||
Screen Flickering / PWM (Pulse-Width Modulation)
| Screen flickering / PWM detected | 250 Hz | ≤ 10 % brightness setting | 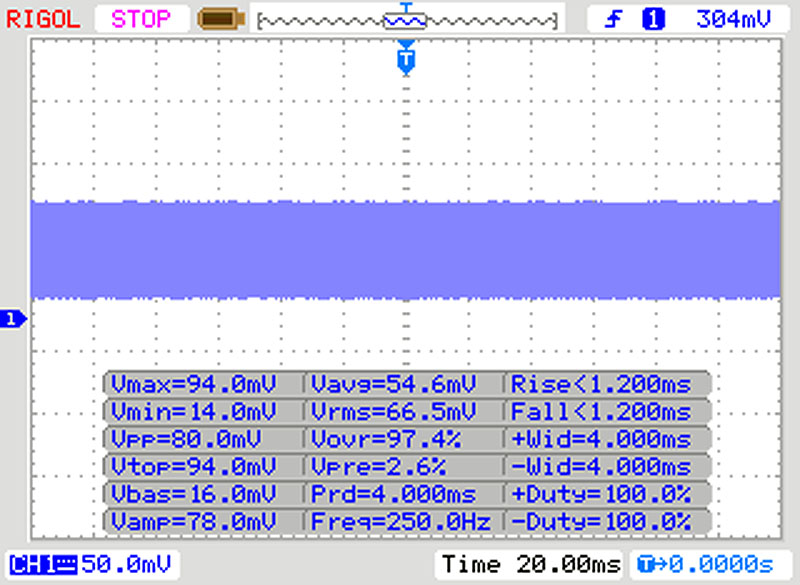 |
The display backlight flickers at 250 Hz (worst case, e.g., utilizing PWM) Flickering detected at a brightness setting of 10 % and below. There should be no flickering or PWM above this brightness setting. The frequency of 250 Hz is relatively low, so sensitive users will likely notice flickering and experience eyestrain at the stated brightness setting and below. In comparison: 52 % of all tested devices do not use PWM to dim the display. If PWM was detected, an average of 7810 (minimum: 5 - maximum: 343500) Hz was measured. | |||
The IPS panel of the Jumper laptop has very stable viewing angles. Image content can be read even from very flat angles without being distorted or displayed with distorted colors.
Performance - Laptop for simple tasks
Jumper targets users with low laptop requirements with the EZbook X3 Air. The hardware installed here is therefore only suitable for simple office work and surfing the Internet.
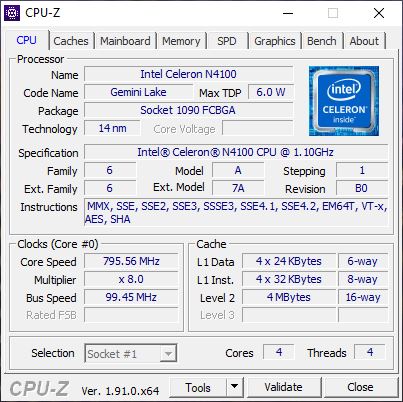
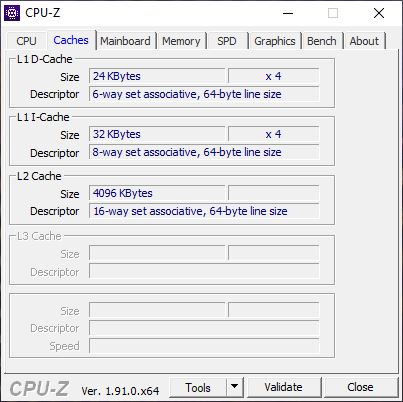

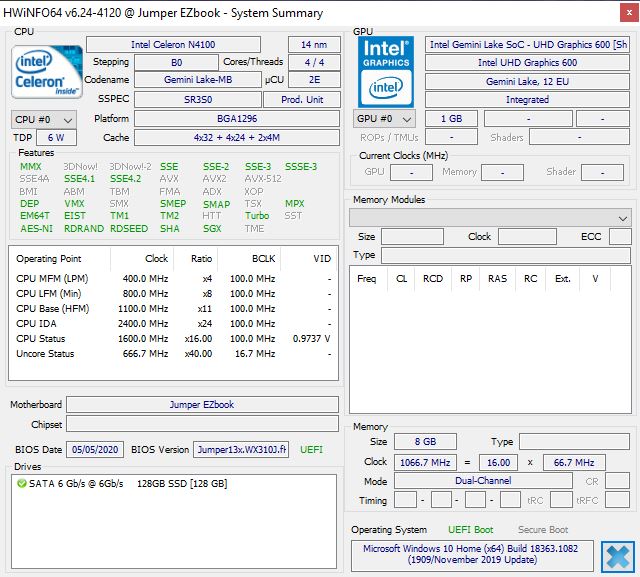
Processor
The Intel Celeron N4100 used here is a low-cost processor from 2017. The four cores offer clock rates between 1.1 and 2.4 GHz, with maximum performance depending on the cooling. With its passive cooling, the Jumper notebook can maintain its performance evenly over a longer period of time in our Cinebench R15 endurance test. The results of the individual benchmarks also show that the performance of the CPU is on par with other laptops with this processor.
Cinebench R15: CPU Single 64Bit | CPU Multi 64Bit
Blender: v2.79 BMW27 CPU
7-Zip 18.03: 7z b 4 -mmt1 | 7z b 4
Geekbench 5.5: Single-Core | Multi-Core
HWBOT x265 Benchmark v2.2: 4k Preset
LibreOffice : 20 Documents To PDF
R Benchmark 2.5: Overall mean
| Cinebench R20 / CPU (Single Core) | |
| Chuwi Hi10 X | |
| Average Intel Celeron N4100 (151 - 155, n=7) | |
| BMAX MaxBook Y11 H1M6 | |
| Jumper Tech Ez Book X3 Air | |
| Cinebench R20 / CPU (Multi Core) | |
| Jumper Tech Ez Book X3 Air | |
| Average Intel Celeron N4100 (368 - 560, n=7) | |
| BMAX MaxBook Y11 H1M6 | |
| Chuwi Hi10 X | |
| Cinebench R15 / CPU Single 64Bit | |
| Chuwi Hi10 X | |
| Jumper Tech Ez Book X3 Air | |
| Average Intel Celeron N4100 (62 - 71, n=12) | |
| Lenovo IdeaPad 330-15IGM | |
| BMAX MaxBook Y11 H1M6 | |
| Cinebench R15 / CPU Multi 64Bit | |
| Jumper Tech Ez Book X3 Air | |
| Average Intel Celeron N4100 (161 - 254, n=12) | |
| BMAX MaxBook Y11 H1M6 | |
| Lenovo IdeaPad 330-15IGM | |
| Chuwi Hi10 X | |
| Blender / v2.79 BMW27 CPU | |
| Chuwi Hi10 X | |
| BMAX MaxBook Y11 H1M6 | |
| Average Intel Celeron N4100 (2437 - 3527, n=7) | |
| Jumper Tech Ez Book X3 Air | |
| 7-Zip 18.03 / 7z b 4 -mmt1 | |
| Average Intel Celeron N4100 (2125 - 2459, n=7) | |
| Jumper Tech Ez Book X3 Air | |
| Chuwi Hi10 X | |
| BMAX MaxBook Y11 H1M6 | |
| 7-Zip 18.03 / 7z b 4 | |
| Jumper Tech Ez Book X3 Air | |
| Average Intel Celeron N4100 (5620 - 7835, n=7) | |
| BMAX MaxBook Y11 H1M6 | |
| Chuwi Hi10 X | |
| Geekbench 5.5 / Single-Core | |
| Chuwi Hi10 X | |
| Jumper Tech Ez Book X3 Air | |
| Average Intel Celeron N4100 (378 - 414, n=7) | |
| BMAX MaxBook Y11 H1M6 | |
| Geekbench 5.5 / Multi-Core | |
| Jumper Tech Ez Book X3 Air | |
| BMAX MaxBook Y11 H1M6 | |
| Average Intel Celeron N4100 (1082 - 1419, n=7) | |
| Chuwi Hi10 X | |
| HWBOT x265 Benchmark v2.2 / 4k Preset | |
| Jumper Tech Ez Book X3 Air | |
| Average Intel Celeron N4100 (0.974 - 1.5, n=6) | |
| BMAX MaxBook Y11 H1M6 | |
| Chuwi Hi10 X | |
| LibreOffice / 20 Documents To PDF | |
| BMAX MaxBook Y11 H1M6 | |
| Average Intel Celeron N4100 (155 - 178, n=5) | |
| Chuwi Hi10 X | |
| Jumper Tech Ez Book X3 Air | |
| R Benchmark 2.5 / Overall mean | |
| Average Intel Celeron N4100 (1.75 - 1.786, n=5) | |
| BMAX MaxBook Y11 H1M6 | |
| Jumper Tech Ez Book X3 Air | |
| Chuwi Hi10 X | |
* ... smaller is better
System Performance
In the PCMark-8 system performance benchmarks, the Jumper EZbook X3 Air leads our test field. In everyday life, the system usually runs smoothly and starting programs and accessing files involves only short waiting times. Occasionally, the mouse pointer lagged a little behind the movement on the touchpad.
Our CPU benchmark list shows what performance other laptops could achieve.
| PCMark 8 Home Score Accelerated v2 | 1910 points | |
| PCMark 8 Work Score Accelerated v2 | 2920 points | |
Help | ||
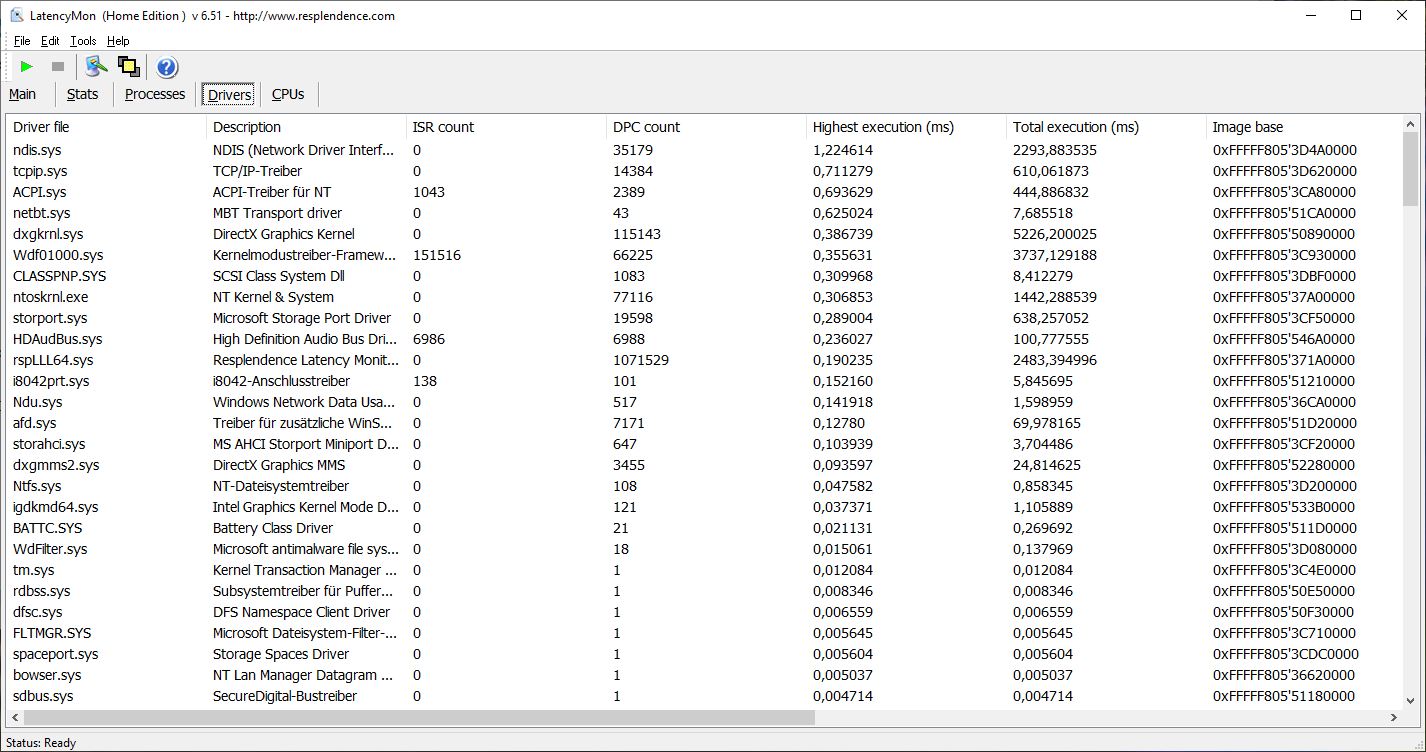
DPC latencies
Our latency test certifies that the EZbook X3 Air has relatively low latency, making it suitable for use in real-time audio applications, for example.

| DPC Latencies / LatencyMon - interrupt to process latency (max), Web, Youtube, Prime95 | |
| BMAX MaxBook Y11 H1M6 | |
| Chuwi Hi10 X | |
| Jumper Tech Ez Book X3 Air | |
* ... smaller is better
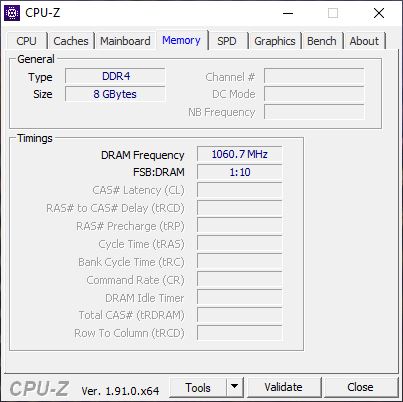
Mass Storage
Users have a 128 GB SSD available in the X3 Air. This offers averagely good write and read rates, which are sufficient for second place in our test field.
Our HDD/SSD benchmark list shows what performance other mass storage devices offer in comparison.
| Jumper Tech Ez Book X3 Air 128 GB NVMe | Chuwi Hi10 X SanDisk DF4128 | BMAX MaxBook Y11 H1M6 FORESEE 256GB | Lenovo IdeaPad 330-15IGM BMSC51A3500F4SA | Average 128 GB NVMe | |
|---|---|---|---|---|---|
| CrystalDiskMark 5.2 / 6 | -60% | 6% | 0% | ||
| Write 4K (MB/s) | 54.2 | 12.85 -76% | 66.1 22% | 54.2 ? 0% | |
| Read 4K (MB/s) | 9.892 | 10.02 1% | 8.937 -10% | 9.89 ? 0% | |
| Write Seq (MB/s) | 391.3 | 120.8 -69% | 385.3 -2% | 391 ? 0% | |
| Read Seq (MB/s) | 403.6 | 259.7 -36% | 429.1 6% | 404 ? 0% | |
| Write 4K Q32T1 (MB/s) | 122.3 | 15.17 -88% | 106.8 -13% | 122.3 ? 0% | |
| Read 4K Q32T1 (MB/s) | 96.1 | 33.09 -66% | 130.7 36% | 96.1 ? 0% | |
| Write Seq Q32T1 (MB/s) | 464.3 | 108.8 -77% | 478.2 3% | 464 ? 0% | |
| Read Seq Q32T1 (MB/s) | 539 | 180.1 -67% | 550 2% | 539 ? 0% | |
| AS SSD | -78% | -1% | 24% | 0% | |
| Seq Read (MB/s) | 469.7 | 258.5 -45% | 476 1% | 440.9 -6% | 470 ? 0% |
| Seq Write (MB/s) | 422.9 | 120.8 -71% | 445 5% | 426.1 1% | 423 ? 0% |
| 4K Read (MB/s) | 18.01 | 5.94 -67% | 20.03 11% | 14.99 -17% | 18 ? 0% |
| 4K Write (MB/s) | 40.29 | 12.4 -69% | 39.11 -3% | 52.1 29% | 40.3 ? 0% |
| 4K-64 Read (MB/s) | 94.5 | 25.96 -73% | 113.4 20% | 168.2 78% | 94.5 ? 0% |
| 4K-64 Write (MB/s) | 194.6 | 10.16 -95% | 205.1 5% | 217.8 12% | 194.6 ? 0% |
| Access Time Read * (ms) | 0.437 | 0.597 -37% | 0.794 -82% | 0.111 75% | 0.437 ? -0% |
| Access Time Write * (ms) | 0.41 | 1.105 -170% | 0.383 7% | 0.355 13% | 0.41 ? -0% |
| Score Read (Points) | 159 | 58 -64% | 181 14% | 227 43% | 159 ? 0% |
| Score Write (Points) | 277 | 35 -87% | 289 4% | 313 13% | 277 ? 0% |
| Score Total (Points) | 523 | 117 -78% | 569 9% | 660 26% | 523 ? 0% |
| Total Average (Program / Settings) | -69% /
-70% | -1% /
-1% | 15% /
16% | 0% /
0% |
* ... smaller is better

Continuous read: DiskSpd Read Loop, Queue Depth 8
Graphics card
In the Jumper EZbook X3 Air, the internal Intel UHD Graphics 600 graphics unit is responsible for displaying image content. This is only suitable for applications with low demands on graphics performance, which means that waiting times can be expected even with simple image processing. In the benchmarks, the GPU achieves a slightly above-average result and can therefore lead our test field.
What performance other graphics cards offer can be seen in our GPU benchmark list.
| 3DMark 11 - 1280x720 Performance GPU | |
| Jumper Tech Ez Book X3 Air | |
| Average Intel UHD Graphics 600 (410 - 854, n=27) | |
| Chuwi Hi10 X | |
| Lenovo IdeaPad 330-15IGM | |
| BMAX MaxBook Y11 H1M6 | |
| 3DMark | |
| 1920x1080 Fire Strike Graphics | |
| Jumper Tech Ez Book X3 Air | |
| Average Intel UHD Graphics 600 (307 - 637, n=21) | |
| Chuwi Hi10 X | |
| BMAX MaxBook Y11 H1M6 | |
| 2560x1440 Time Spy Graphics | |
| Jumper Tech Ez Book X3 Air | |
| Average Intel UHD Graphics 600 (85 - 124, n=12) | |
| Chuwi Hi10 X | |
| BMAX MaxBook Y11 H1M6 | |
| 3DMark 11 Performance | 674 points | |
| 3DMark Fire Strike Score | 451 points | |
| 3DMark Time Spy Score | 141 points | |
Help | ||
Gaming Performance
The power of the X3 Air is only sufficient for very simple or old titles. For example, we were able to play the economic and already five-year-old Dota 2 Reborn smoothly, but more modern or more-demanding titles were not playable.
What gaming performance can be expected from Intel's UHD Graphics 600 is shown in our GPU games list.
| Dota 2 Reborn | |
| 1280x720 min (0/3) fastest | |
| Average Intel UHD Graphics 600 (15.5 - 42.9, n=19) | |
| Jumper Tech Ez Book X3 Air | |
| Chuwi Hi10 X | |
| BMAX MaxBook Y11 H1M6 | |
| 1366x768 med (1/3) | |
| Jumper Tech Ez Book X3 Air | |
| Average Intel UHD Graphics 600 (6.9 - 20.8, n=19) | |
| Chuwi Hi10 X | |
| BMAX MaxBook Y11 H1M6 | |
| X-Plane 11.11 - 1280x720 low (fps_test=1) | |
| Jumper Tech Ez Book X3 Air | |
| Average Intel UHD Graphics 600 (3.94 - 8.89, n=18) | |
| Chuwi Hi10 X | |
| Final Fantasy XV Benchmark - 1280x720 Lite Quality | |
| Average Intel UHD Graphics 600 (2.9 - 5.49, n=9) | |
| Jumper Tech Ez Book X3 Air | |
| low | med. | high | ultra | |
|---|---|---|---|---|
| Dota 2 Reborn (2015) | 31 | 15.8 | 7.7 | 7.1 |
| Final Fantasy XV Benchmark (2018) | 4 | |||
| X-Plane 11.11 (2018) | 7.09 | 5 | 4.53 |
Emissions - silent operation
Noise emissions
Since the Jumper EZbook X3 Air is passively cooled, there is no fan noise. We also couldn't perceive coil whistles or similar noises.
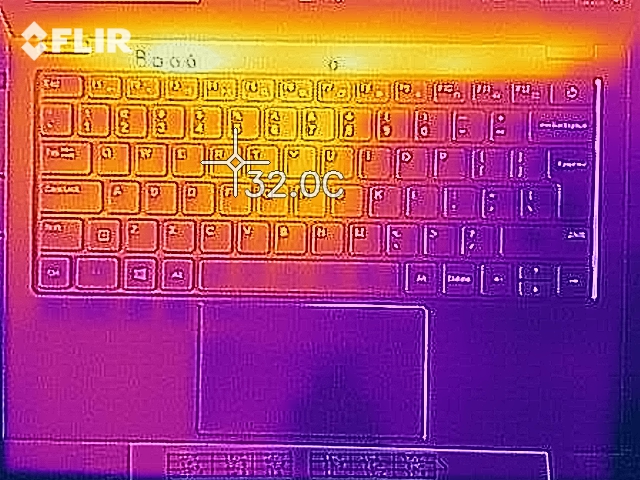
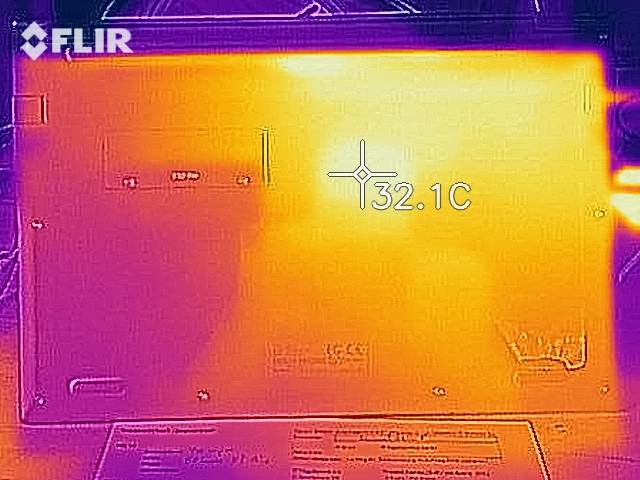
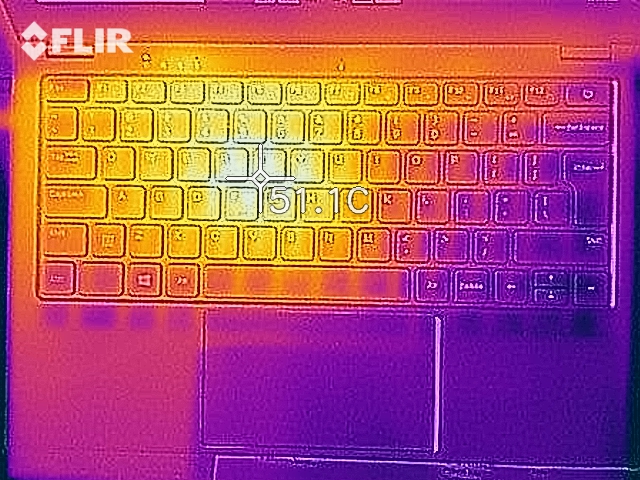
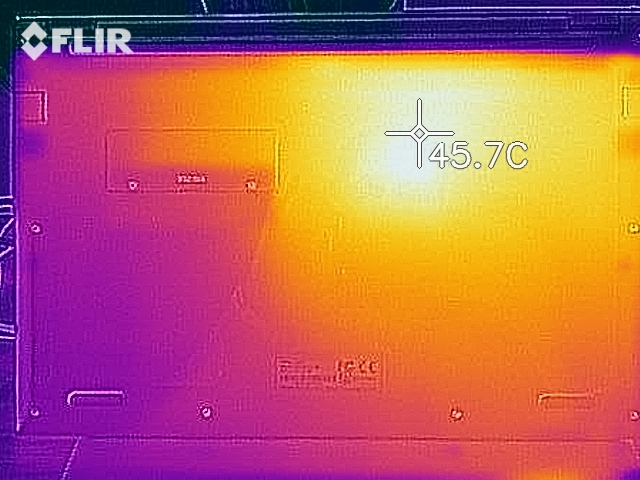
Temperature
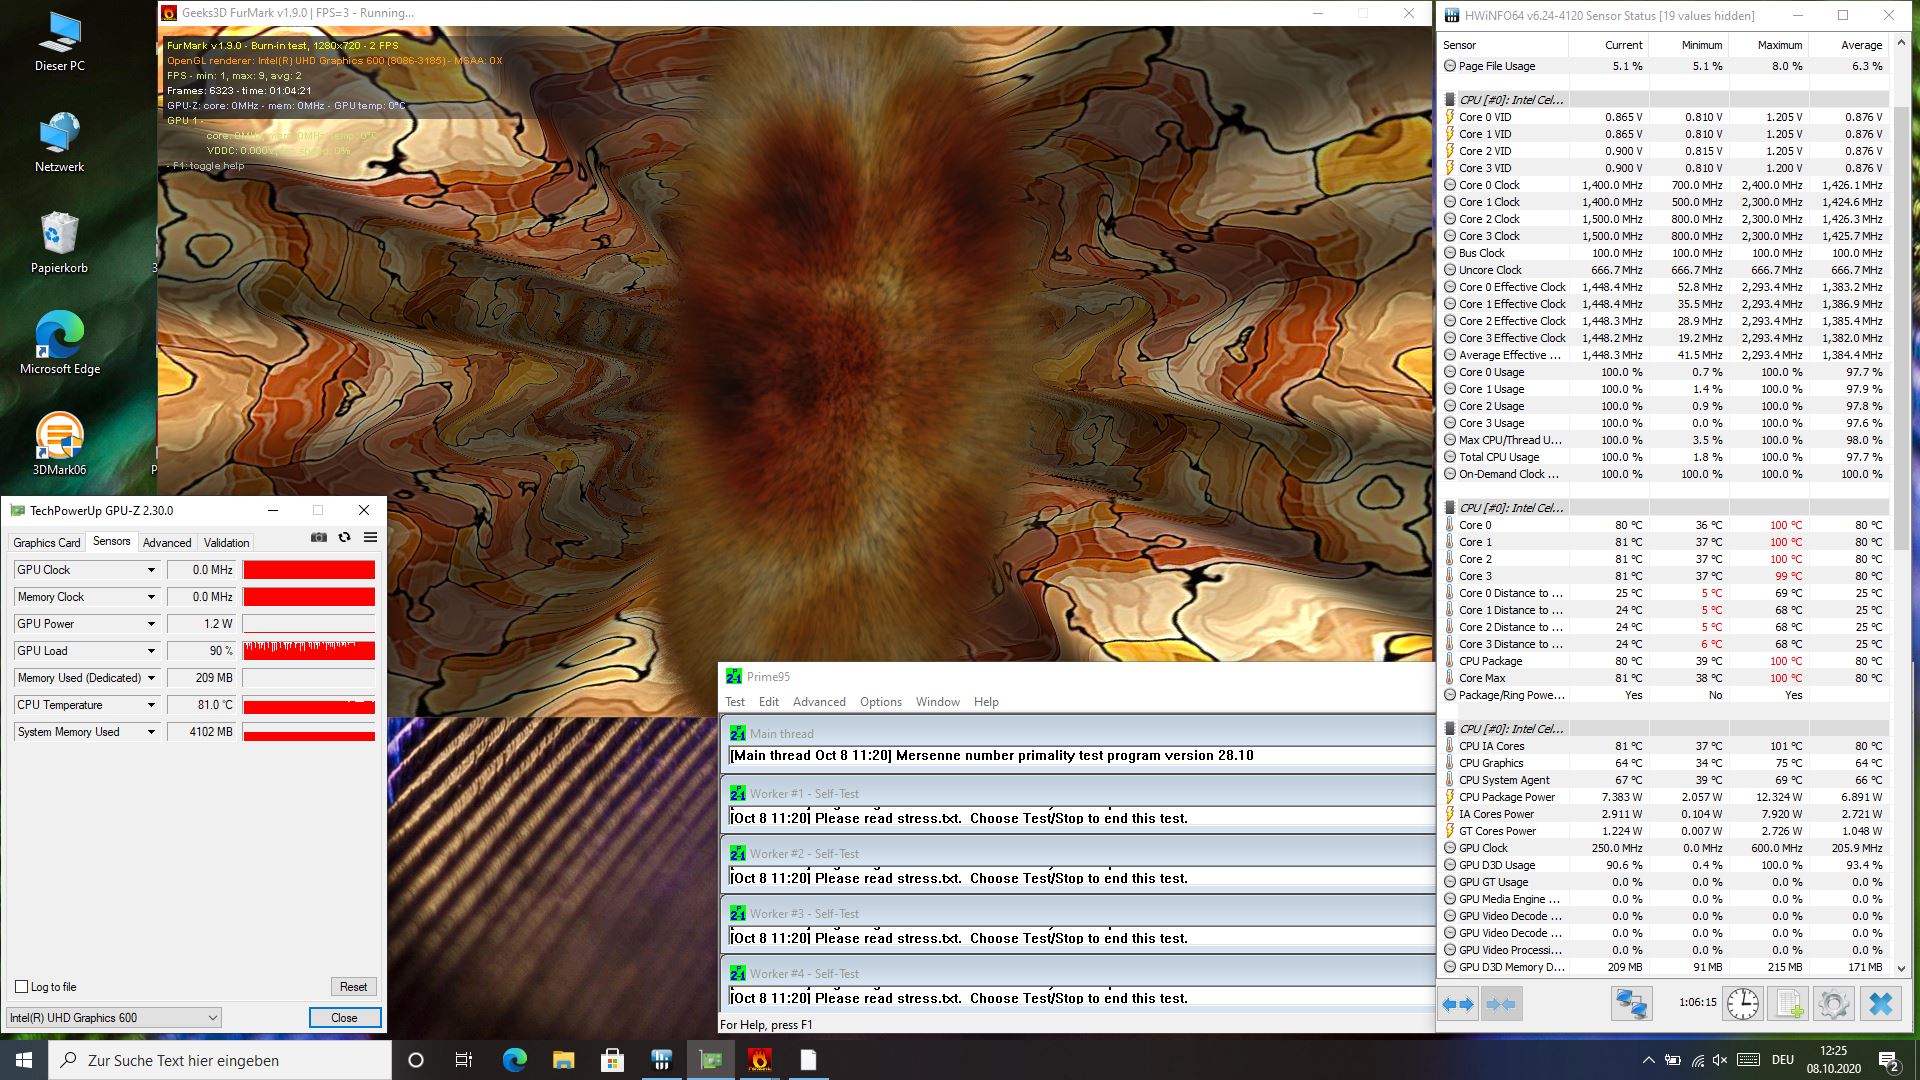
In our test, the Jumper laptop warms up to 41.6 °C under load. Thus, it feels warm but can still be placed on the thighs, for example. During our one-hour stress test, the CPU reaches temperatures of up to 100 °C. Afterwards, the system runs somewhat sluggishly but stabilizes again quite quickly. Therefore, users only have to expect performance drops under longer loads.
(±) The maximum temperature on the upper side is 41.6 °C / 107 F, compared to the average of 33.1 °C / 92 F, ranging from 21.6 to 53.2 °C for the class Netbook.
(+) The bottom heats up to a maximum of 39.4 °C / 103 F, compared to the average of 36.6 °C / 98 F
(+) In idle usage, the average temperature for the upper side is 25.7 °C / 78 F, compared to the device average of 29.8 °C / 86 F.
(+) The palmrests and touchpad are cooler than skin temperature with a maximum of 31.2 °C / 88.2 F and are therefore cool to the touch.
(±) The average temperature of the palmrest area of similar devices was 29.3 °C / 84.7 F (-1.9 °C / -3.5 F).
Speakers
The X3 Air's speakers offer a medium volume and a sound spectrum pronounced on tones above the mid-range. This makes it suitable for occasional playback of media content in quiet environments. In the long run, however, external speakers or headphones are recommended.
Jumper Tech Ez Book X3 Air audio analysis
(±) | speaker loudness is average but good (74.8 dB)
Bass 100 - 315 Hz
(-) | nearly no bass - on average 24.9% lower than median
(±) | linearity of bass is average (8.7% delta to prev. frequency)
Mids 400 - 2000 Hz
(+) | balanced mids - only 4.8% away from median
(±) | linearity of mids is average (7.4% delta to prev. frequency)
Highs 2 - 16 kHz
(+) | balanced highs - only 2.7% away from median
(+) | highs are linear (4.3% delta to prev. frequency)
Overall 100 - 16.000 Hz
(±) | linearity of overall sound is average (19.1% difference to median)
Compared to same class
» 29% of all tested devices in this class were better, 14% similar, 57% worse
» The best had a delta of 14%, average was 25%, worst was 35%
Compared to all devices tested
» 46% of all tested devices were better, 7% similar, 47% worse
» The best had a delta of 4%, average was 24%, worst was 134%
Apple MacBook 12 (Early 2016) 1.1 GHz audio analysis
(+) | speakers can play relatively loud (83.6 dB)
Bass 100 - 315 Hz
(±) | reduced bass - on average 11.3% lower than median
(±) | linearity of bass is average (14.2% delta to prev. frequency)
Mids 400 - 2000 Hz
(+) | balanced mids - only 2.4% away from median
(+) | mids are linear (5.5% delta to prev. frequency)
Highs 2 - 16 kHz
(+) | balanced highs - only 2% away from median
(+) | highs are linear (4.5% delta to prev. frequency)
Overall 100 - 16.000 Hz
(+) | overall sound is linear (10.2% difference to median)
Compared to same class
» 7% of all tested devices in this class were better, 2% similar, 91% worse
» The best had a delta of 5%, average was 18%, worst was 53%
Compared to all devices tested
» 5% of all tested devices were better, 1% similar, 94% worse
» The best had a delta of 4%, average was 24%, worst was 134%
Power management - Average battery life
Energy consumption
The Jumper EZbook X3 Air shows a maximum power consumption of 18.5 watts under load. Thus, it requires more energy than the other laptops in our test field. The included charger offers an output power of 36 watts and is therefore sufficiently high dimensioned.
| Off / Standby | |
| Idle | |
| Load |
|
Key:
min: | |
| Jumper Tech Ez Book X3 Air Celeron N4100, UHD Graphics 600, 128 GB NVMe, IPSJ390, 1920x1080, 13.3" | Chuwi Hi10 X Celeron N4100, UHD Graphics 600, SanDisk DF4128, IPS, 1920x1200, 10.1" | BMAX MaxBook Y11 H1M6 Celeron N4100, UHD Graphics 600, FORESEE 256GB, IPS, 1920x1080, 11.6" | Lenovo IdeaPad 330-15IGM Celeron N4100, UHD Graphics 600, BMSC51A3500F4SA, TN LED, 1366x768, 15.6" | Average Intel UHD Graphics 600 | Average of class Netbook | |
|---|---|---|---|---|---|---|
| Power Consumption | 10% | -11% | 17% | 8% | ||
| Idle Minimum * (Watt) | 3.4 | 3.7 -9% | 4.1 -21% | 3 12% | 3.47 ? -2% | |
| Idle Average * (Watt) | 6.9 | 6.3 9% | 7.7 -12% | 5.7 17% | 5.61 ? 19% | |
| Idle Maximum * (Watt) | 7.4 | 6.7 9% | 9 -22% | 7.5 -1% | 6.6 ? 11% | |
| Load Average * (Watt) | 17 | 14 18% | 14.5 15% | 12.6 26% | 13.6 ? 20% | |
| Load Maximum * (Watt) | 18.5 | 14.5 22% | 21 -14% | 13.1 29% | 20.2 ? -9% |
* ... smaller is better
Battery life
In our practical WLAN test, the EZbook X3 Air achieved a runtime of 7 h 21 m. Thus it lasts longer than the other laptops in our test field and can make good use of its 4,250 mAh battery.
| Jumper Tech Ez Book X3 Air Celeron N4100, UHD Graphics 600, Wh | Chuwi Hi10 X Celeron N4100, UHD Graphics 600, 24 Wh | BMAX MaxBook Y11 H1M6 Celeron N4100, UHD Graphics 600, 26.6 Wh | Lenovo IdeaPad 330-15IGM Celeron N4100, UHD Graphics 600, 30 Wh | Average of class Netbook | |
|---|---|---|---|---|---|
| Battery runtime | |||||
| WiFi v1.3 (h) | 7.4 | 5.6 -24% | 4.1 -45% | 5.5 -26% |
Pros
Cons
Verdict - Simple hardware in a robust housing

Before purchasing the Jumper EZbook X3 Air, buyers should carefully consider the application for which the laptop is intended. If only simple office programs and the Internet browser are to be used for occasional work, the small notebook does a good job. Components such as WLAN, SSD and display reliably fulfill their tasks, whereby the latter also offers good brightness. On top of that, the case feels high-quality and offers an easily accessible slot for memory expansion.
The Jumper EZbook X3 Air is an affordable laptop with enough power for simple tasks.
In addition to performance sufficient for simple tasks, users must also live with the highly reflective screen surface. As a result, the notebook can hardly be used outdoors and even in closed rooms, for example, artificial light sources are reflected. The QWERTY layout of the keyboard may also not be comfortable for every user.
Jumper EZbook X3 Air at Gearbest
Jumper Tech Ez Book X3 Air
- 10/08/2020 v7 (old)
Mike Wobker
Price comparison

