Gigabyte Sabre 17 (i7-8750H, GTX 1060) Laptop Review
Until now, we had yet to review the 17-inch version of the Gigabyte Sabre. Now we will catch up with a comprehensive review of the current model, which is equipped with the quite new Intel Core i7-8750H and an Nvidia GeForce GTX 1060. Our comparison devices for this review will include the Asus Strix GL703GM-DS74 and the less expensive Asus TUF FX705GM, both of which are equipped with the same processor. The new Sabre will also come up against the MSI GP72VR 7RFX and the once-dominant Razer Blade Pro RZ09-0220, two devices with older processors but the same GPU.
Our review reveals whether the "saber's" blade is equally sharp for various applications—home office tasks, video editing and gaming—and where the 17-inch powerhouse's weak spots are.
Case - Big Gigabyte
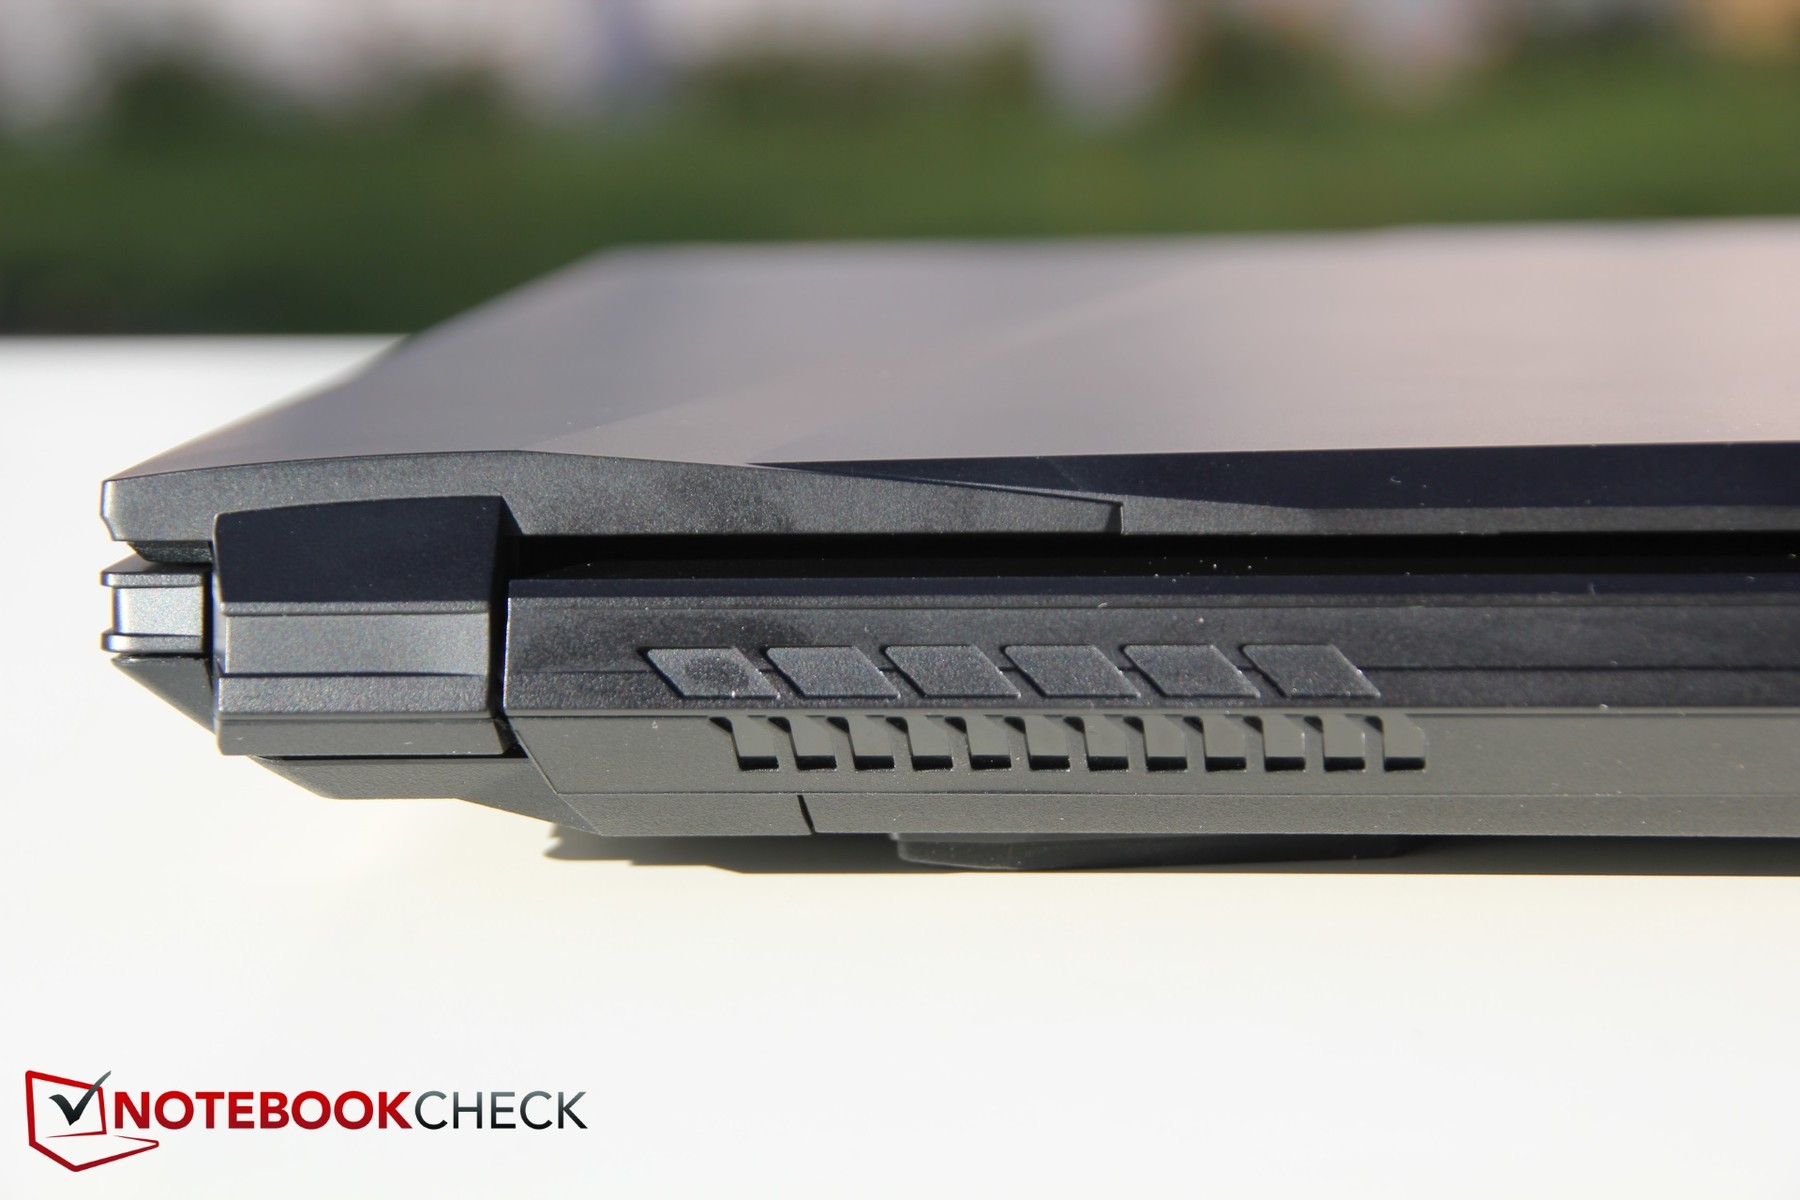
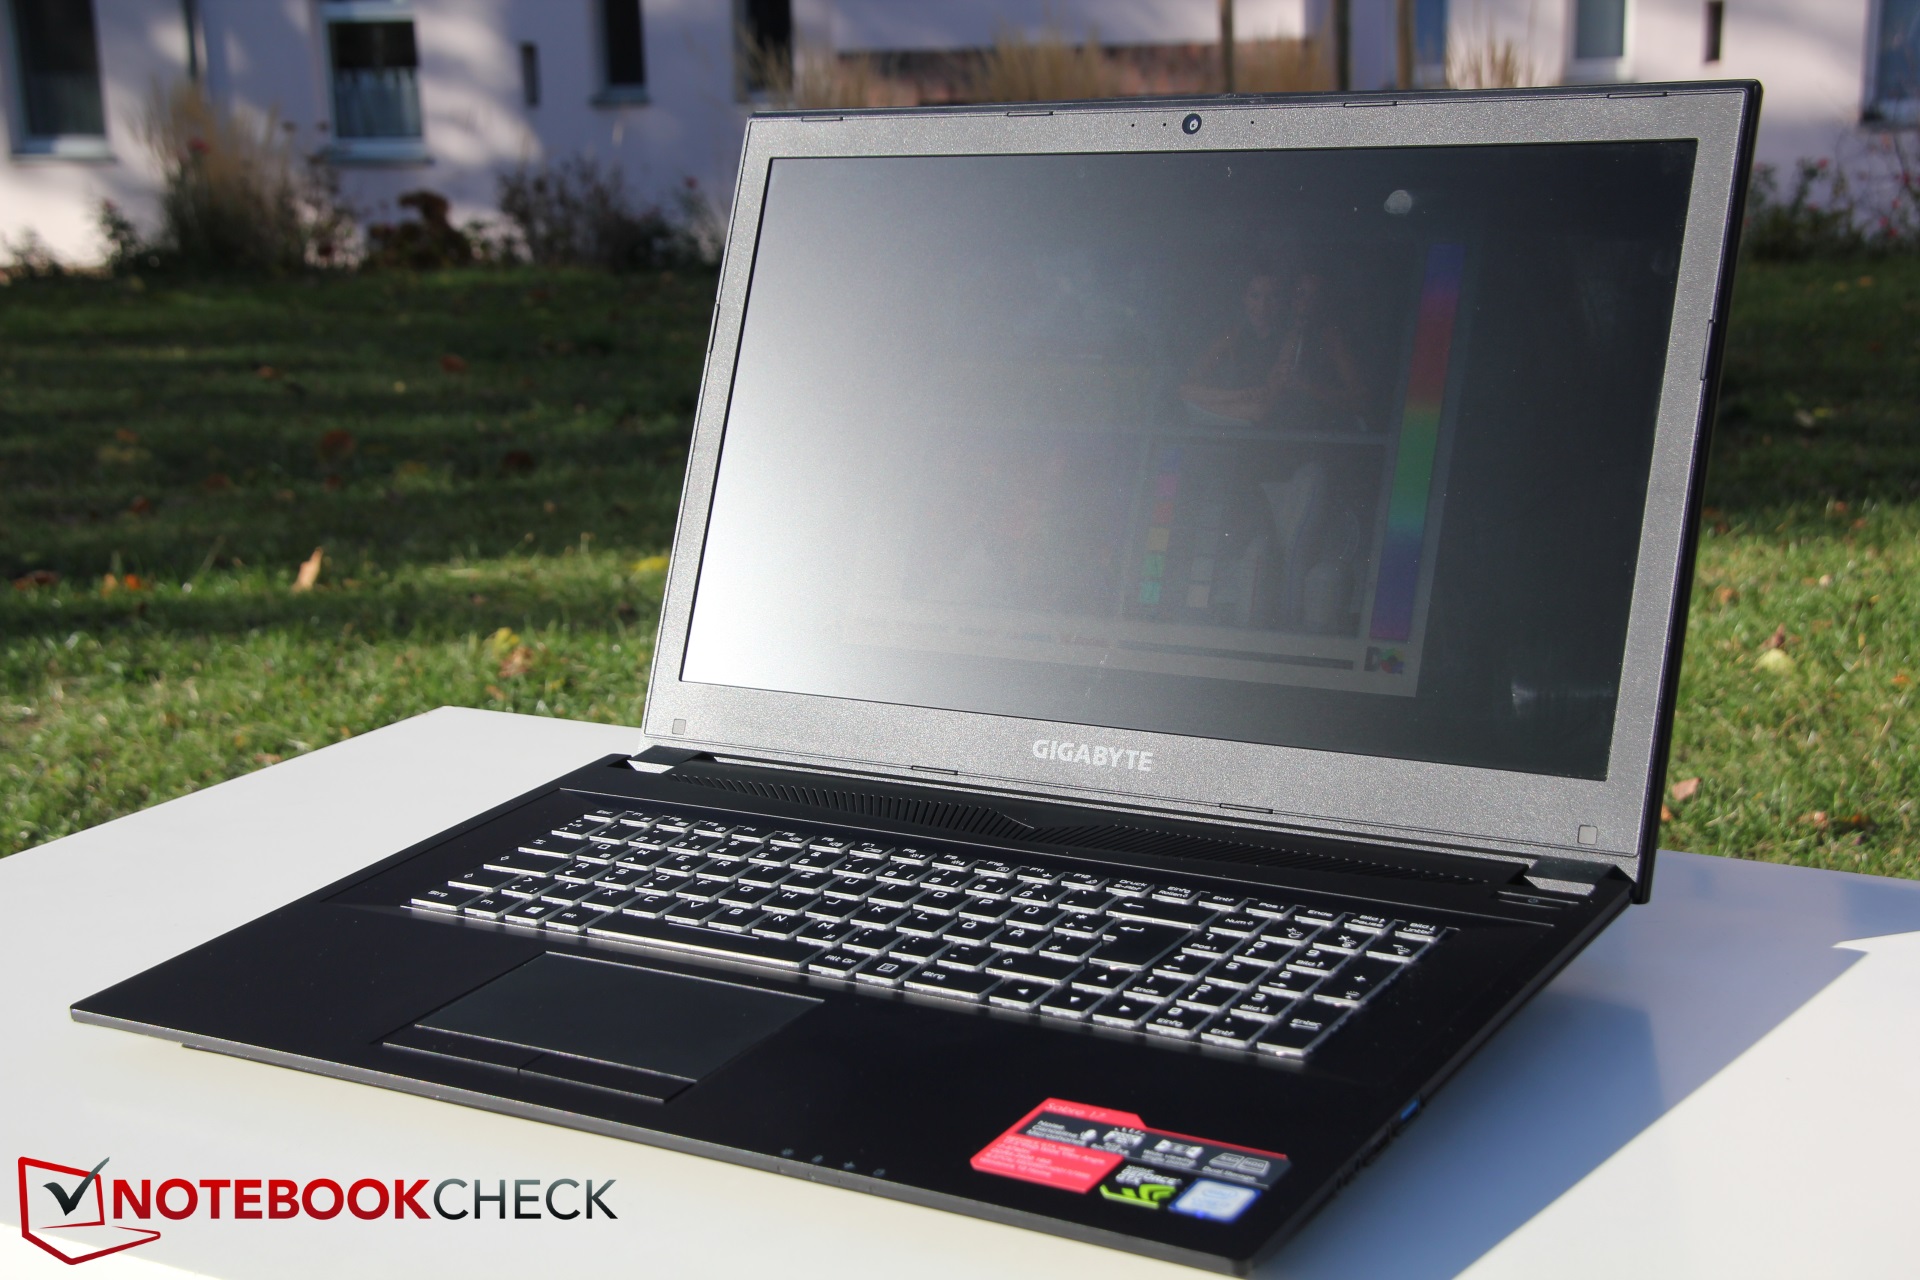
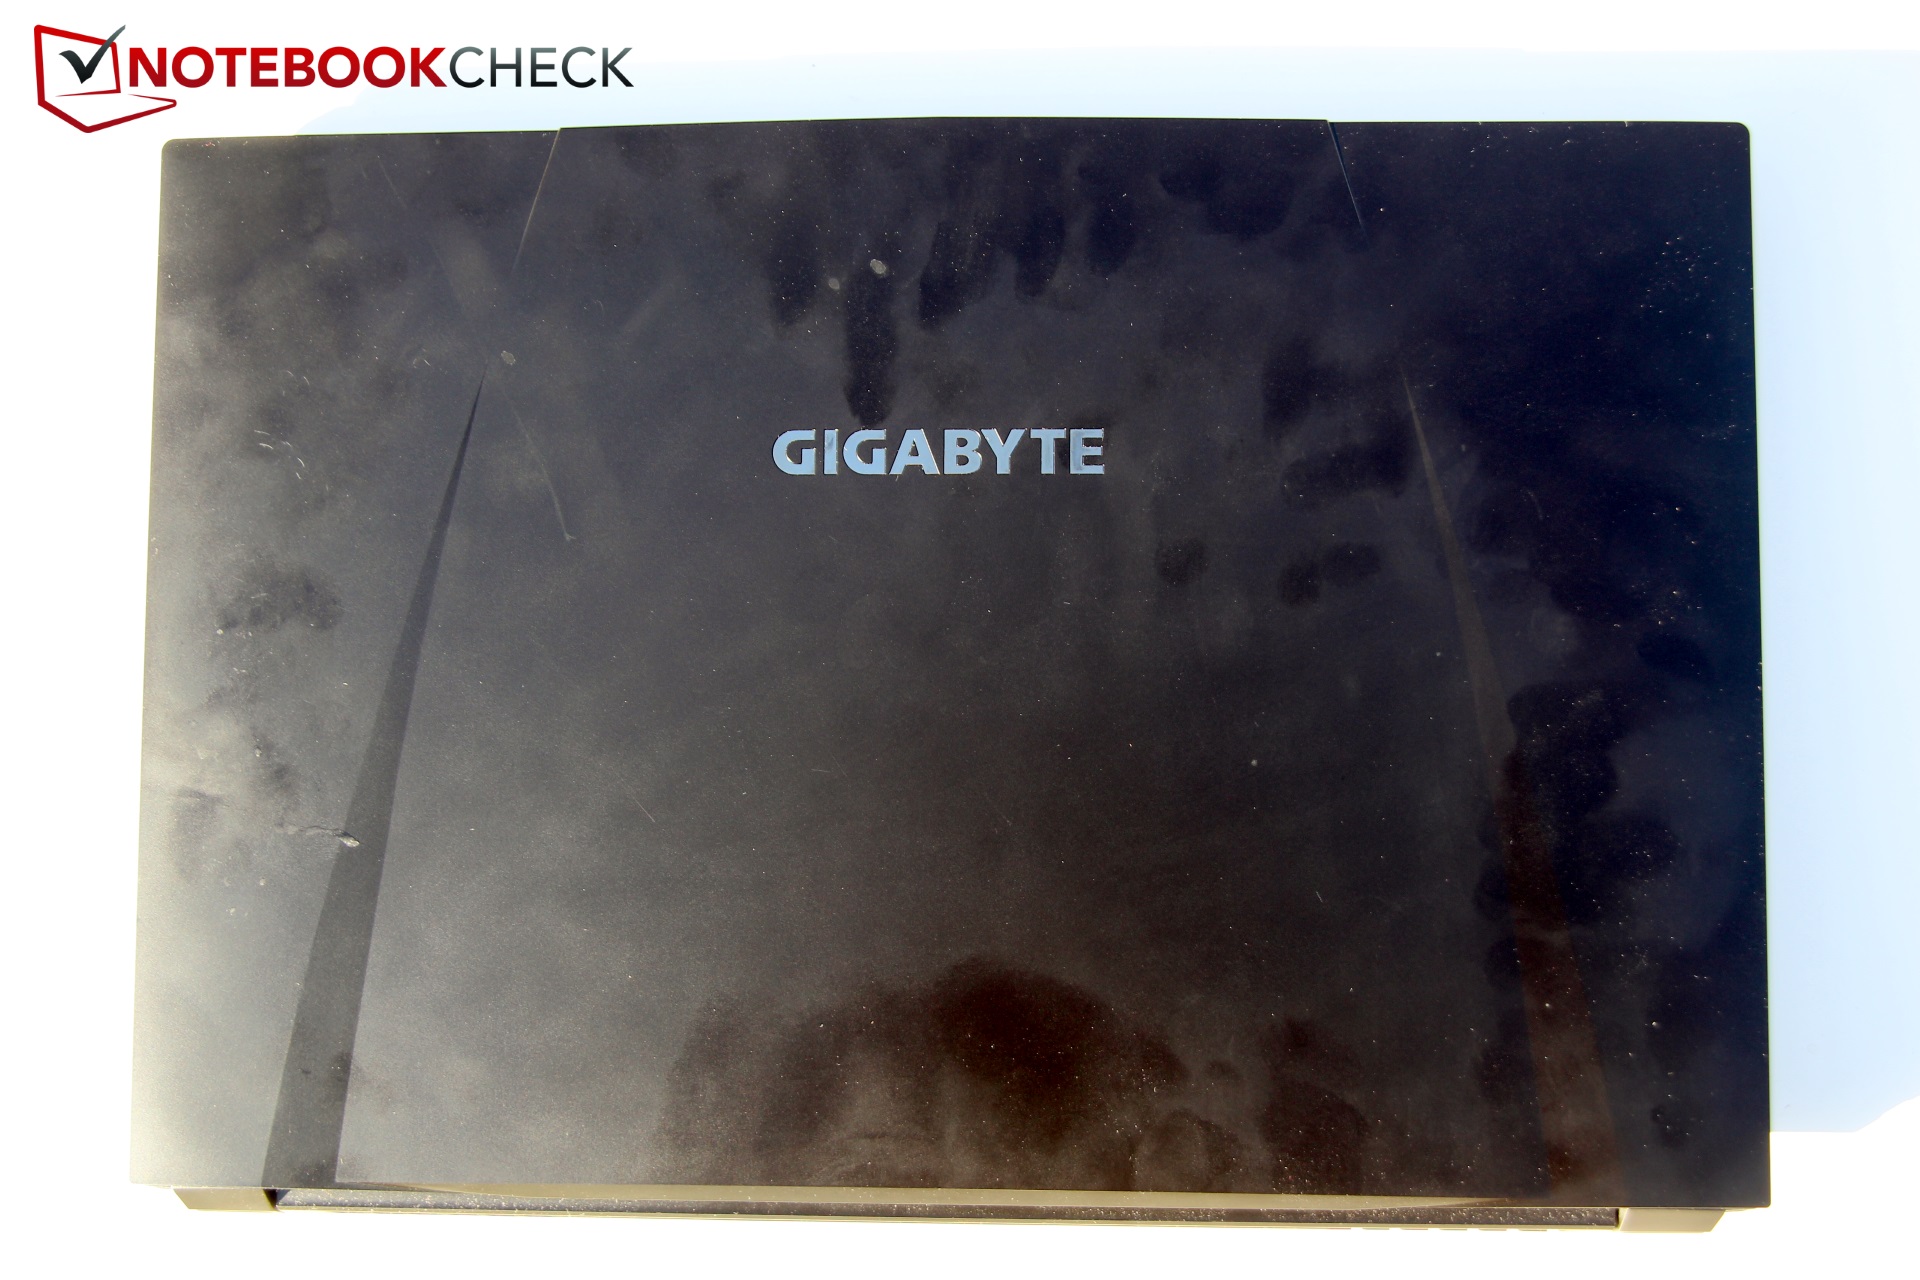
Gigabyte has chosen a rather angular design for the big Sabre. Almost the entire case is made of black plastic. The surface is matte, but it seems to attract fingerprints (grease marks) as if by magic. Twisting the machine can produce a quite creaking sound, but we did not experience any loud cracking noises. Large gaps between structural elements are also nowhere to be seen. All in all, the manufacturing quality seems to be good. The base is also quite stable; its only weakness is the middle of the keyboard, which gives somewhat when the user is typing.
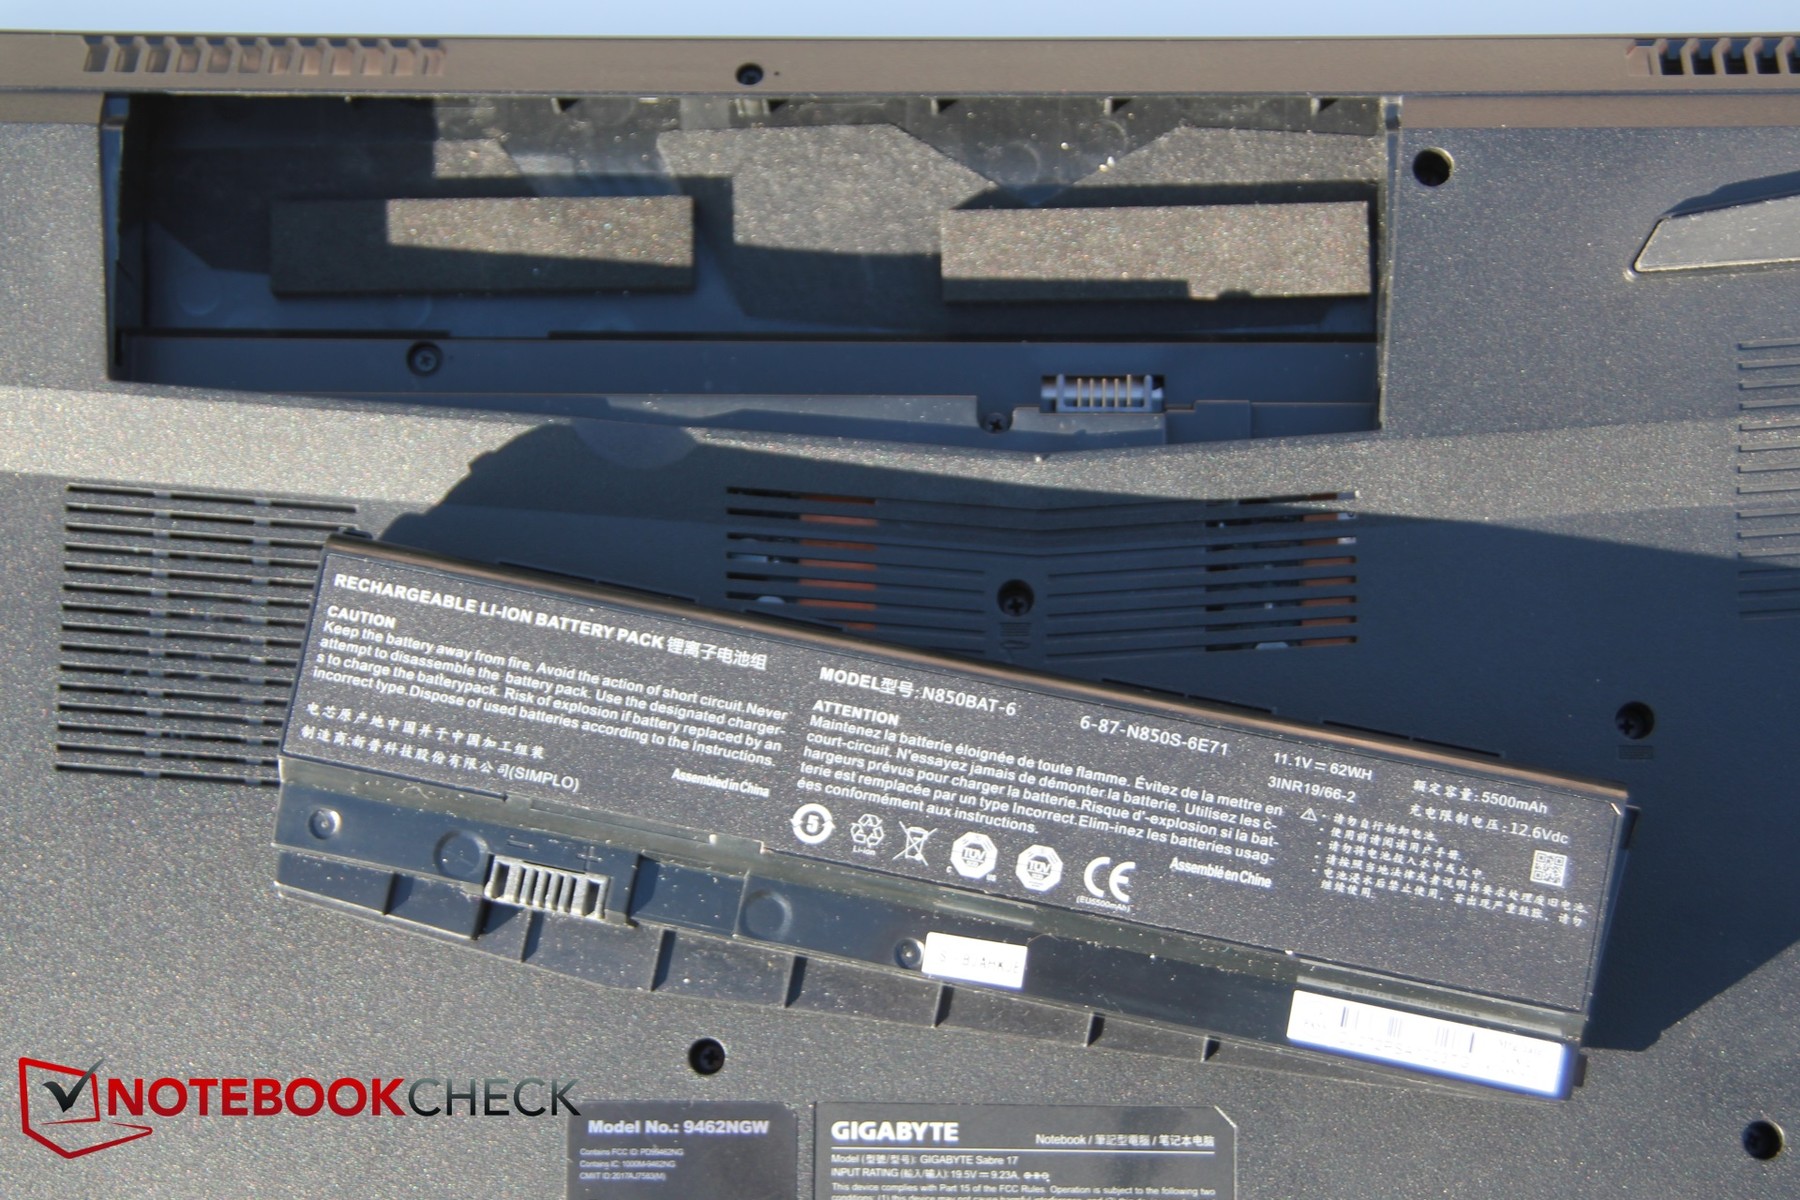
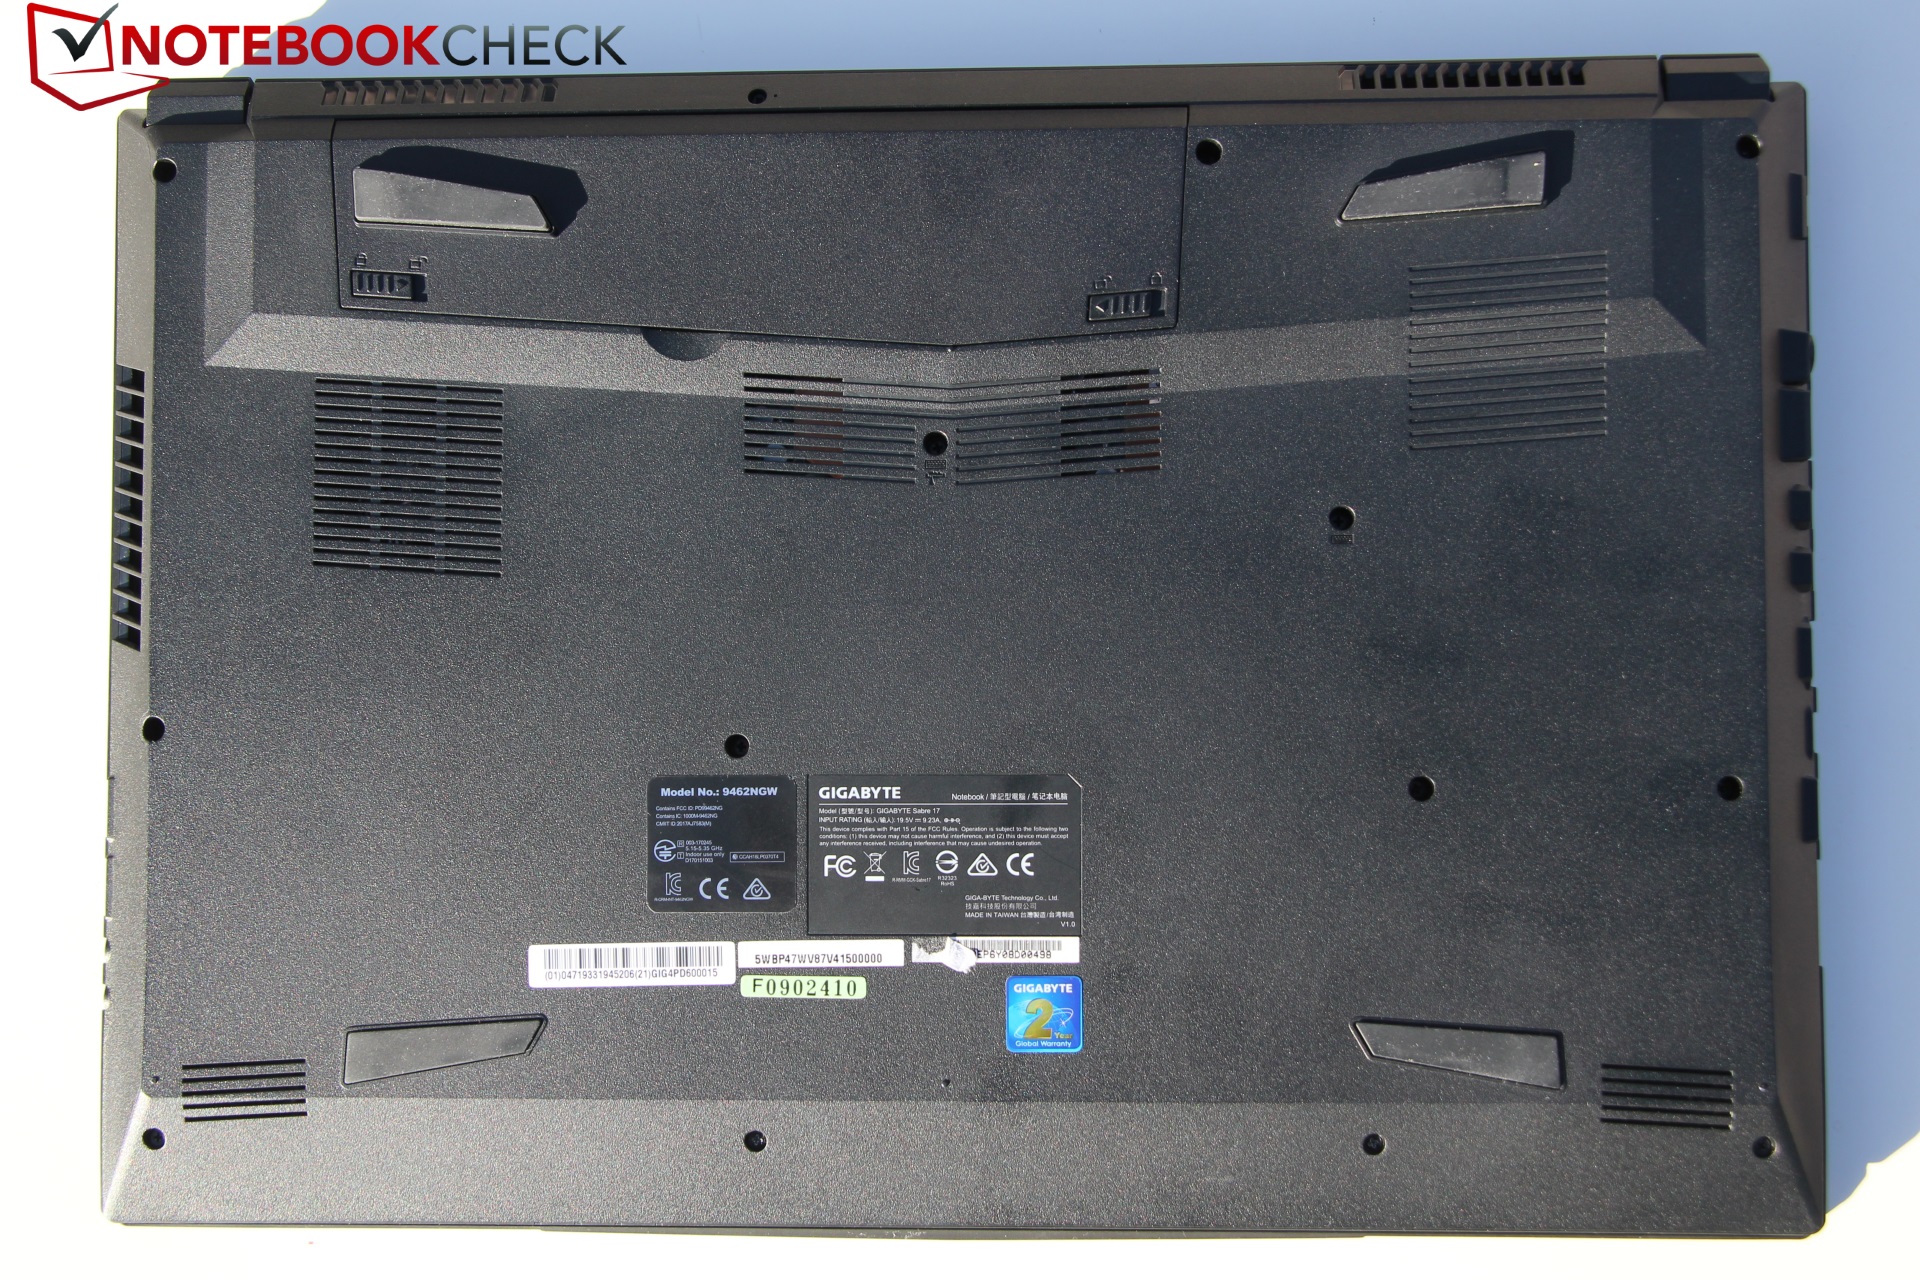
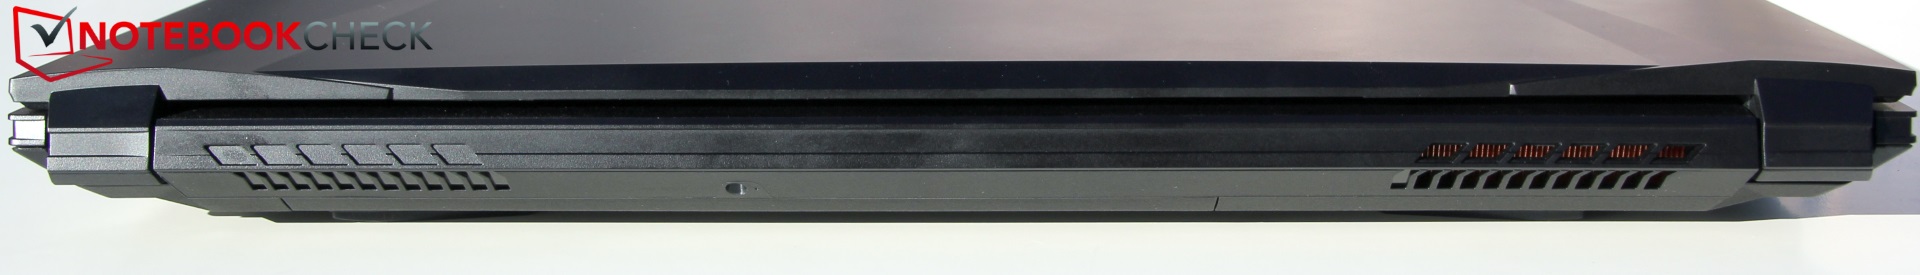
The bottom is robust, bulges slightly in the back, and houses the ventilation slots. Air is pulled in from the right side and from the bottom; hot air escapes on the left side toward the back. To make the appearance symmetrical, there is a dummy ventilation slot on the right side toward the back. A big plus: The battery is not permanently installed. It can be taken out and even exchanged if necessary.
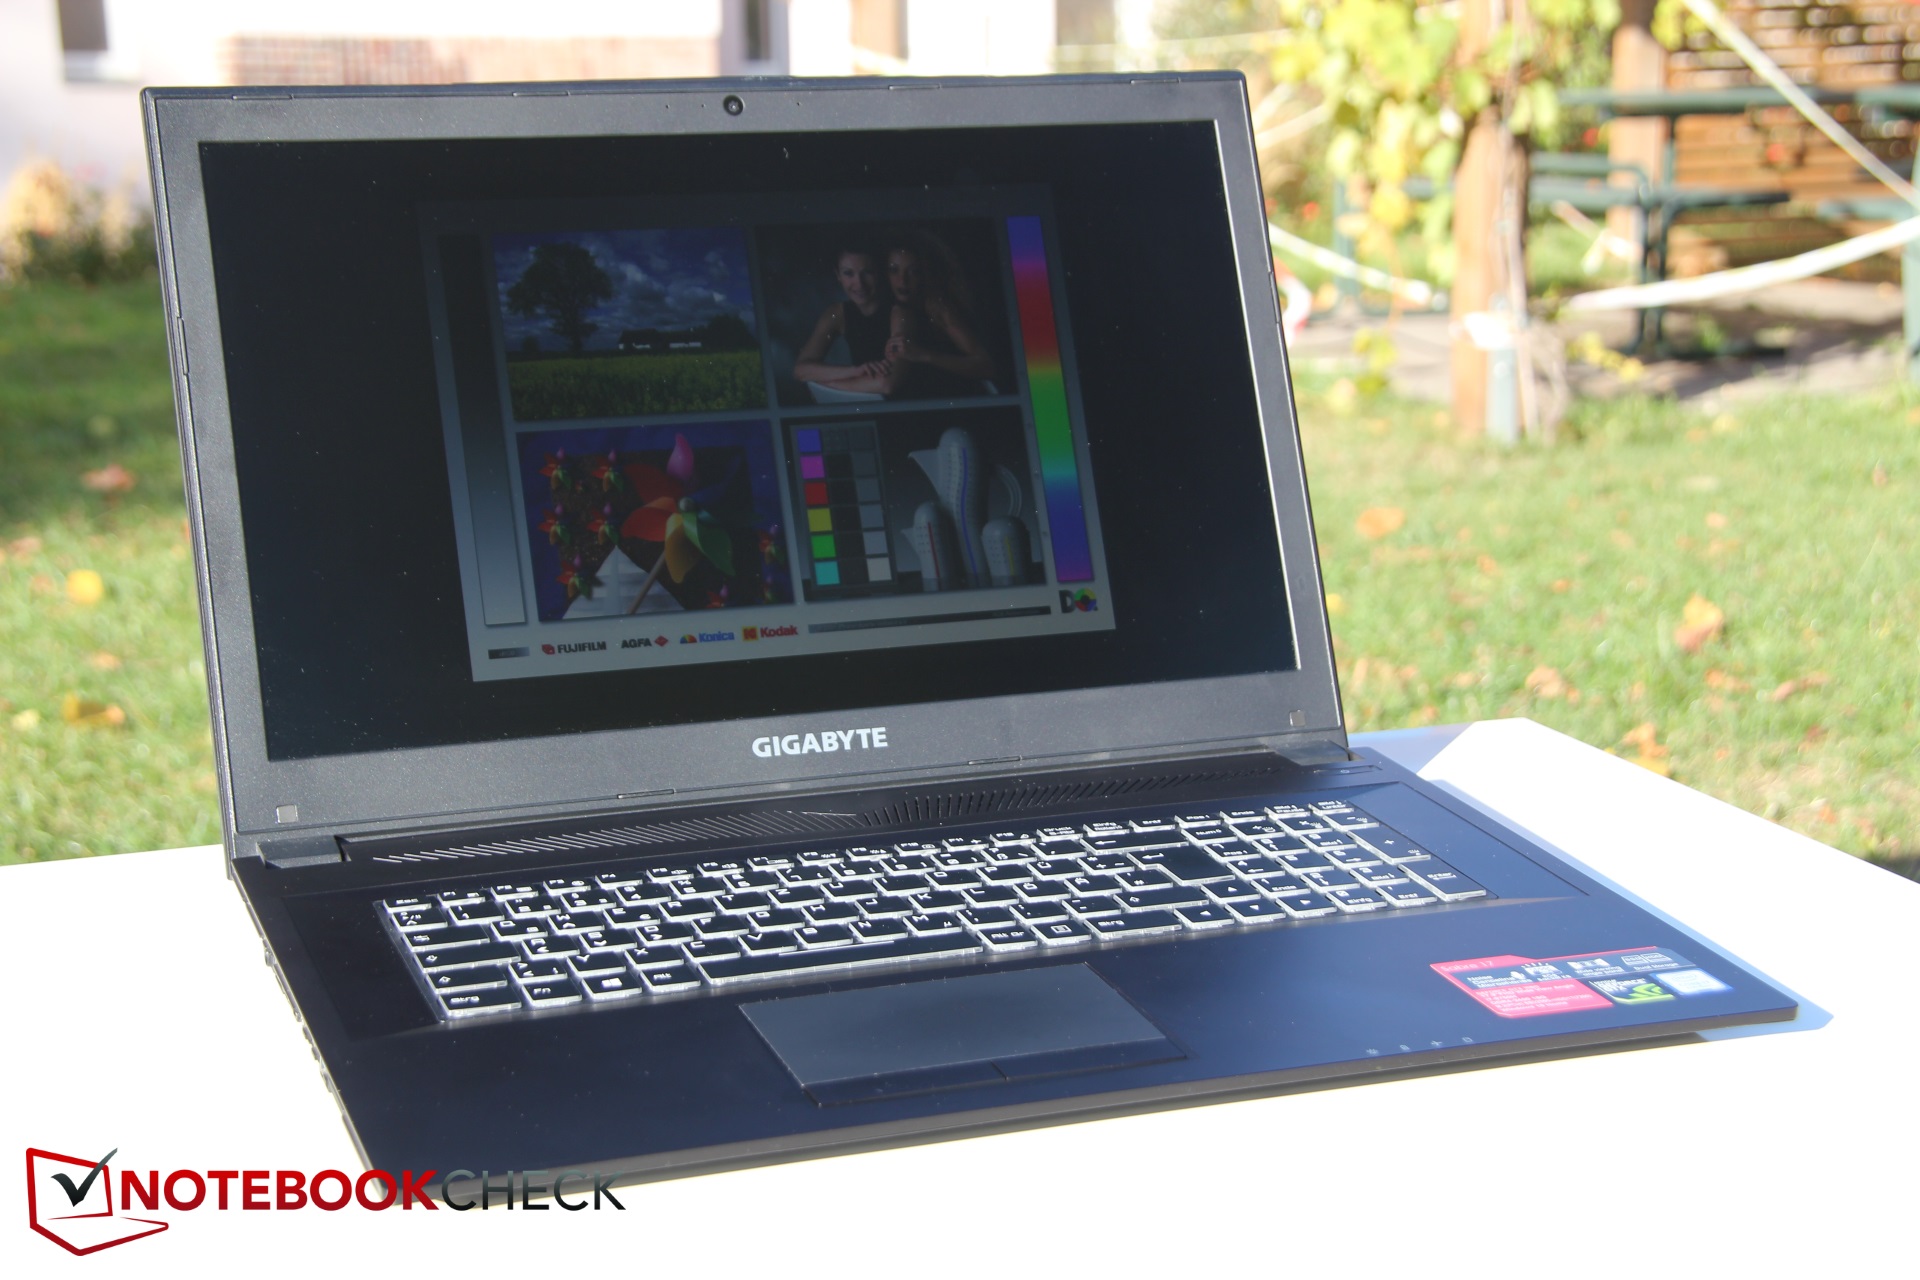
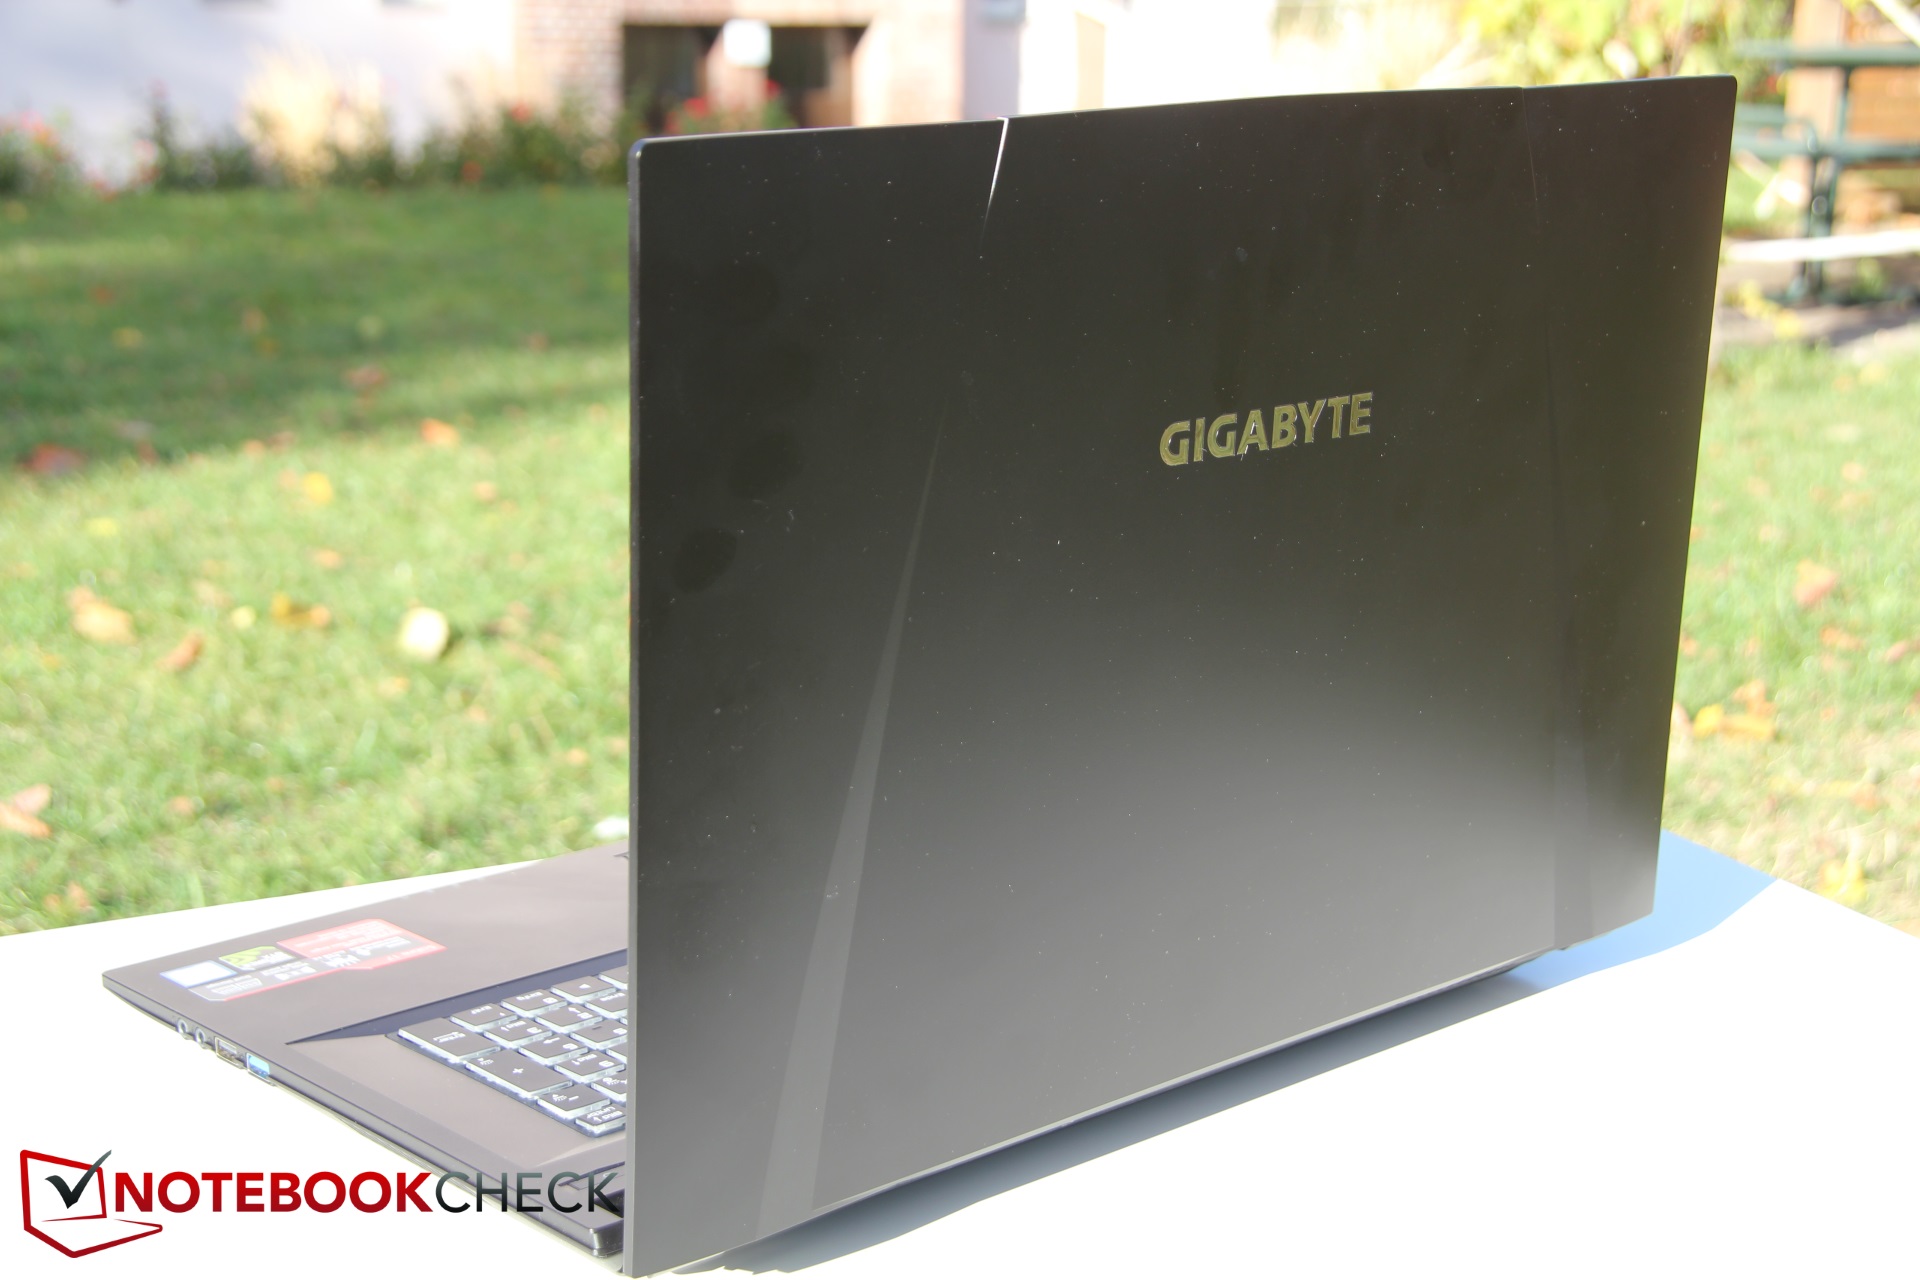
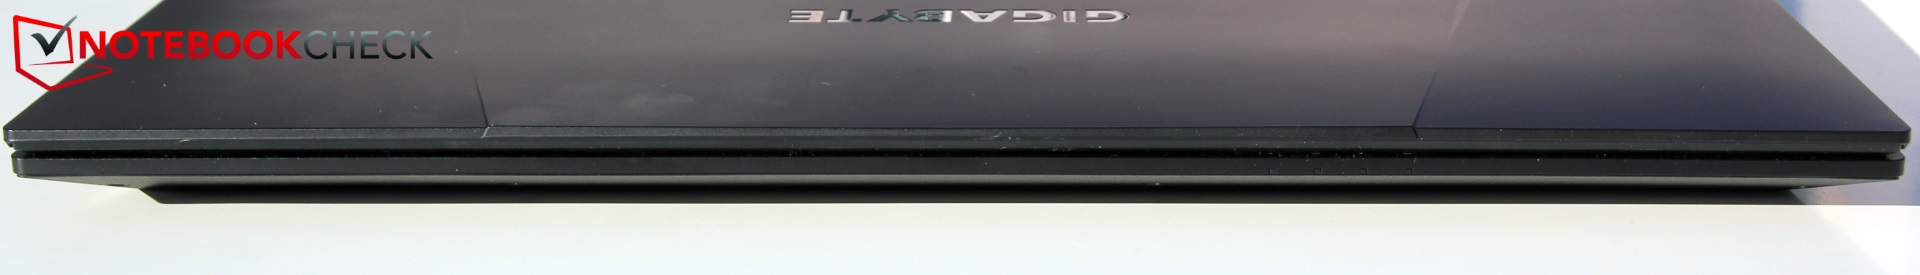
The display reacts very sensitively when it comes to twisting and pressure on the display lid. The display lid is emblazoned with the silver Gigabyte logo. The top of the lid is not flat—instead it sports an indentation of sorts as a design feature. The display itself has a relatively wide bezel. The camera and microphone are located along the top, while another Gigabyte logo adorns the bottom part of the frame.
Compared to the competition, the new Sabre 17 is one of the biggest and clunkiest devices—only the MSI is around 2 mm (~0.08 in) fatter and similarly sized. As a result, the Sabre 17 works better as a desktop replacement than a mobile device. For the most part, the Gigabyte's rivals take up a little less room. In terms of weight, on the other hand, our test device is in line with most of the rest of the competitors. Only the Razer Blade breaks ranks here, weighing in at a little over 3 kg (~7 lbs).
Connectivity - Versatile Sabre 17
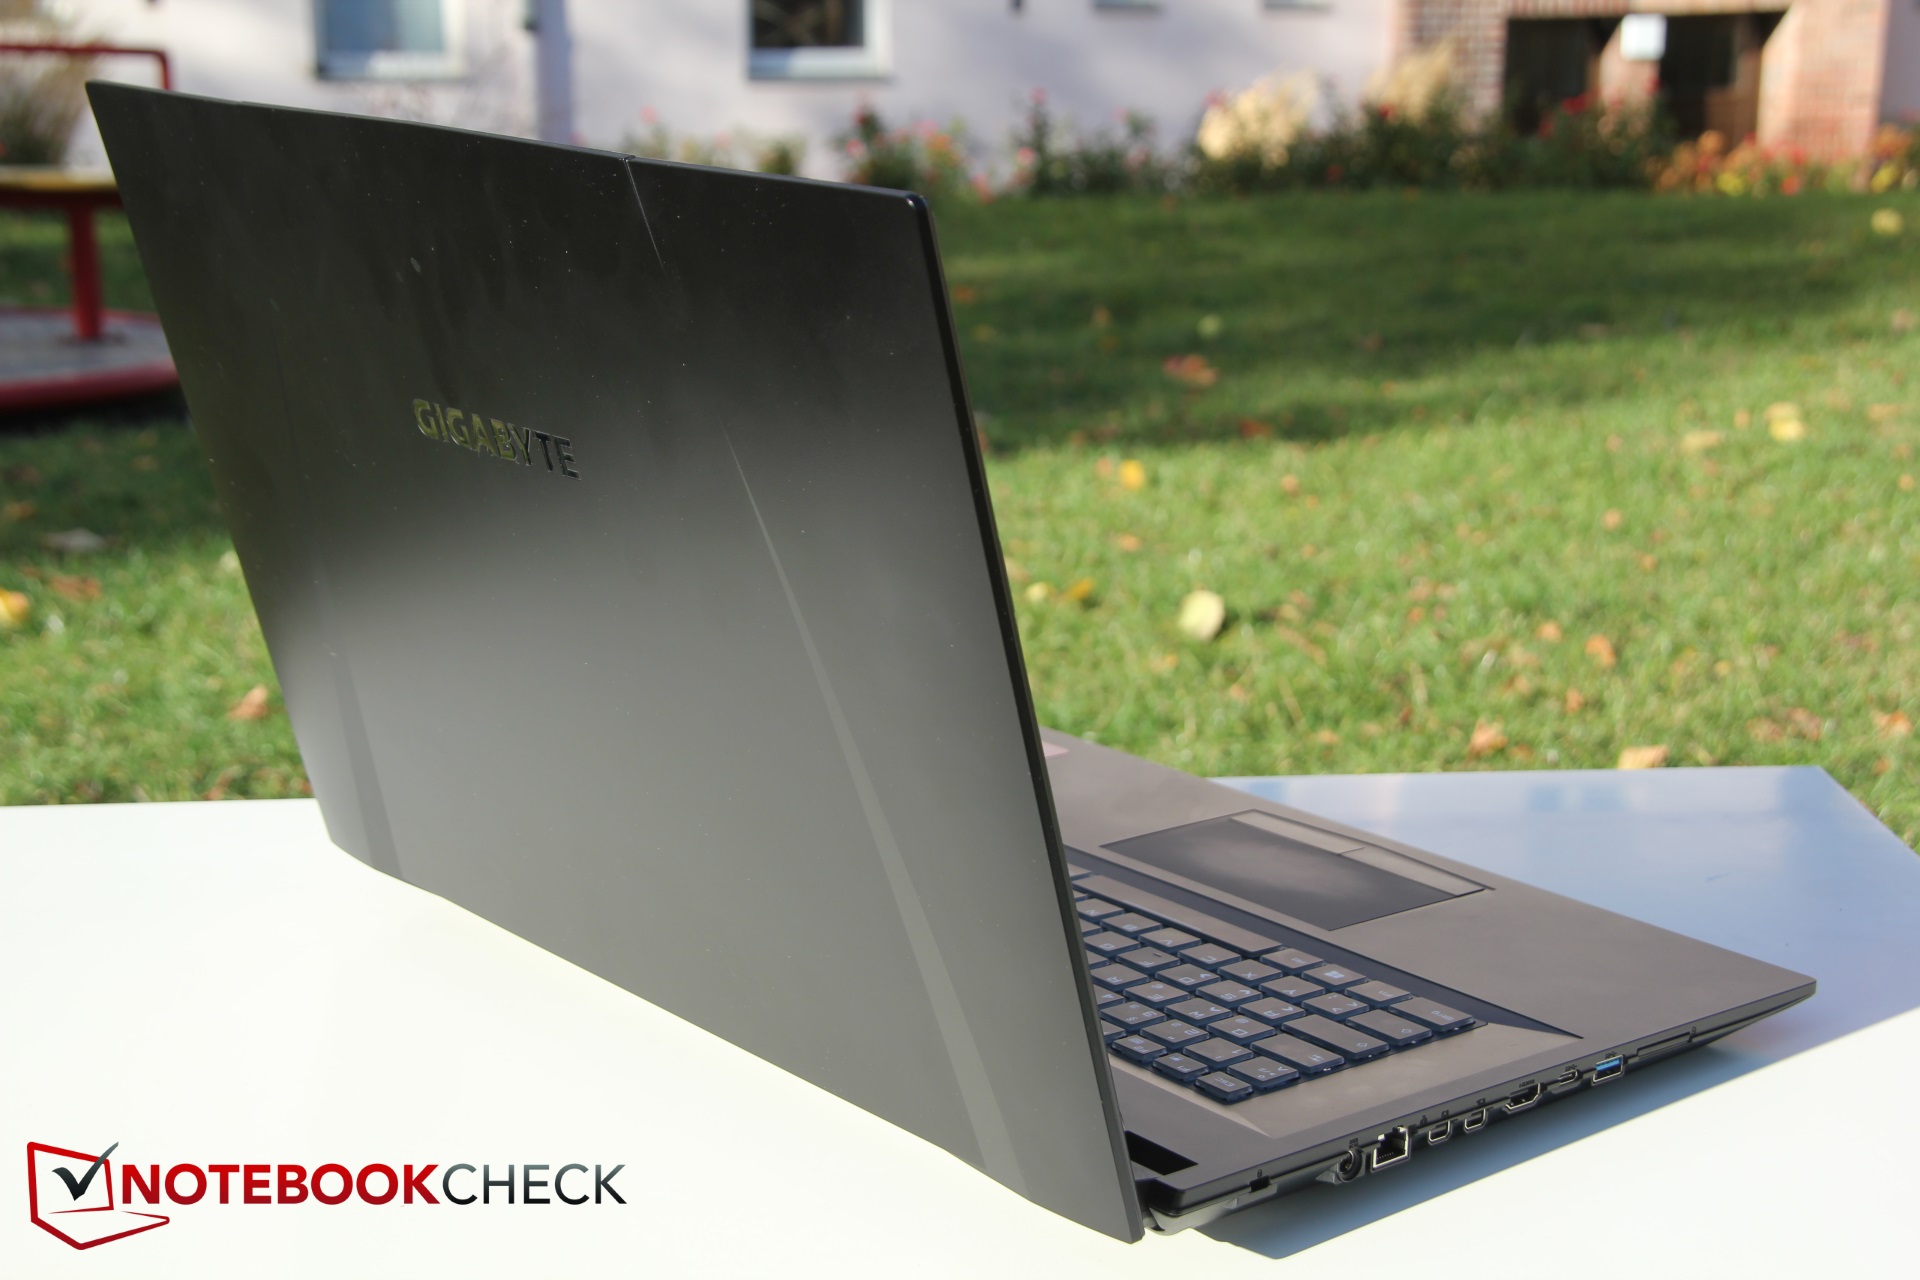
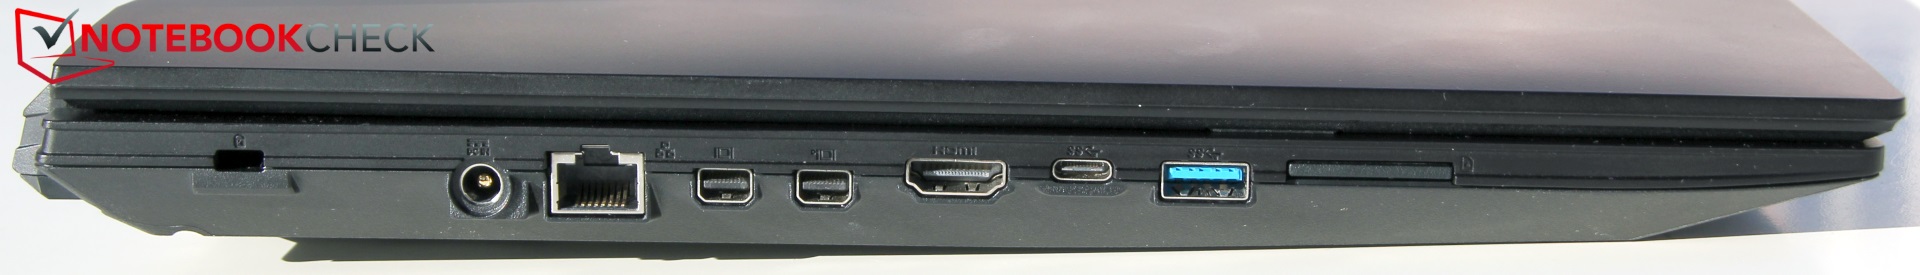
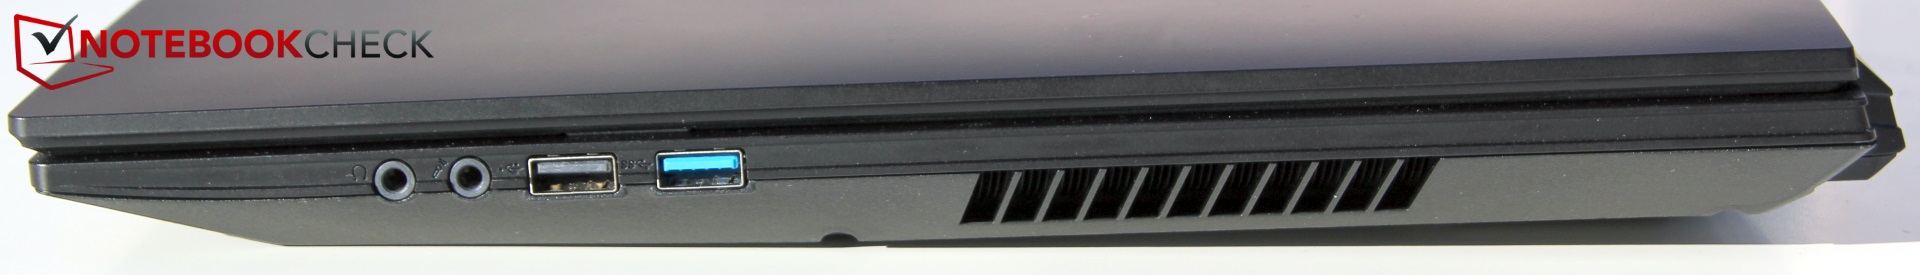
In terms of connections, the Sabre is comparatively generously equipped. Buyers who place value on being able to connect multiple screens to their laptop—whether for gaming or for work—will be especially pleased here. Alongside the usual HDMI port, the Gigabyte also offers two Mini DisplayPorts, enabling the user to connect three external monitors at once. In addition, the computer is equipped with four USB slots, one of which is Type C. Another praiseworthy feature: Two USB ports support the USB 3.1 Gen2 standard. The one USB 2.0 port is the only superfluous item—here would would have liked to see another USB 3.x port or better yet, a Thunderbolt connection. The latter is unfortunately missing. For headsets, the laptop is outfitted with separate plugs for a microphone and headphones.
Due to the plethora of connections, the LAN and full-fledged SD card reader are located quite close to one another. But for the majority of uses, and regardless of what devices/cables may be connected to the computer, the distances between these two connections should generally be sufficient. Very few ports are located on the right side, but they are all positioned toward the front in the space where a right-handed person's mouse (i.e. hand) would be. In this case, cables or connected USB devices could get in each other's way.
SD Card Reader
According to our tests with our Toshiba Exceria Pro SDXC 64 GB UHS-II reference memory card, the card reader's transfer speeds are acceptable. The Sabre ranks in the middle of the competition here.
| SD Card Reader | |
| average JPG Copy Test (av. of 3 runs) | |
| Average of class Multimedia (23 - 531, n=36, last 2 years) | |
| Asus Strix GL703GM-DS74 (Toshiba Exceria Pro SDXC 64 GB UHS-II) | |
| Gigabyte Sabre 17-W8 (Toshiba Exceria Pro SDXC 64 GB UHS-II) | |
| Razer Blade Pro RZ09-0220 (Toshiba Exceria Pro SDXC 64 GB UHS-II) | |
| MSI GP72VR 7RFX (Toshiba Exceria Pro SDXC 64 GB UHS-II) | |
| maximum AS SSD Seq Read Test (1GB) | |
| Average of class Multimedia (37.3 - 1455, n=35, last 2 years) | |
| Asus Strix GL703GM-DS74 (Toshiba Exceria Pro SDXC 64 GB UHS-II) | |
| Gigabyte Sabre 17-W8 (Toshiba Exceria Pro SDXC 64 GB UHS-II) | |
| Razer Blade Pro RZ09-0220 (Toshiba Exceria Pro SDXC 64 GB UHS-II) | |
| MSI GP72VR 7RFX (Toshiba Exceria Pro SDXC 64 GB UHS-II) | |
Communication
Following our empirical tests, the Sabre 17 will not win any awards for its Wi-Fi performance. Only the MSI performed worse in this discipline. Overall, the Gigabyte laptop's results were around 40% worse than the class average.
This will not be noticeable in everyday use, however, unless you depend on the Wi-Fi functioning at maximum speed. Otherwise the WLAN connections worked flawlessly in our tests. The connections were never disrupted. Still, at a time when gigabit connections have been around for a while, it would have been nice to see some more speed.
| Networking | |
| iperf3 transmit AX12 | |
| Asus TUF FX705GM | |
| Razer Blade Pro RZ09-0220 | |
| Asus Strix GL703GM-DS74 | |
| Gigabyte Sabre 17-W8 | |
| MSI GP72VR 7RFX | |
| iperf3 receive AX12 | |
| Asus TUF FX705GM | |
| Asus Strix GL703GM-DS74 | |
| Razer Blade Pro RZ09-0220 | |
| Gigabyte Sabre 17-W8 | |
| MSI GP72VR 7RFX | |
Security
For a gaming laptop, security is not necessarily a main concern. A fingerprint reader or similar frill is nowhere to be found, and a smart card would also be sought in vain. Of course, there is a Kensington lock and TPM on board.
Accessories
The Sabre does not come with any accessories. The box contents are limited to the power supply, the battery and the laptop itself.
Maintenance
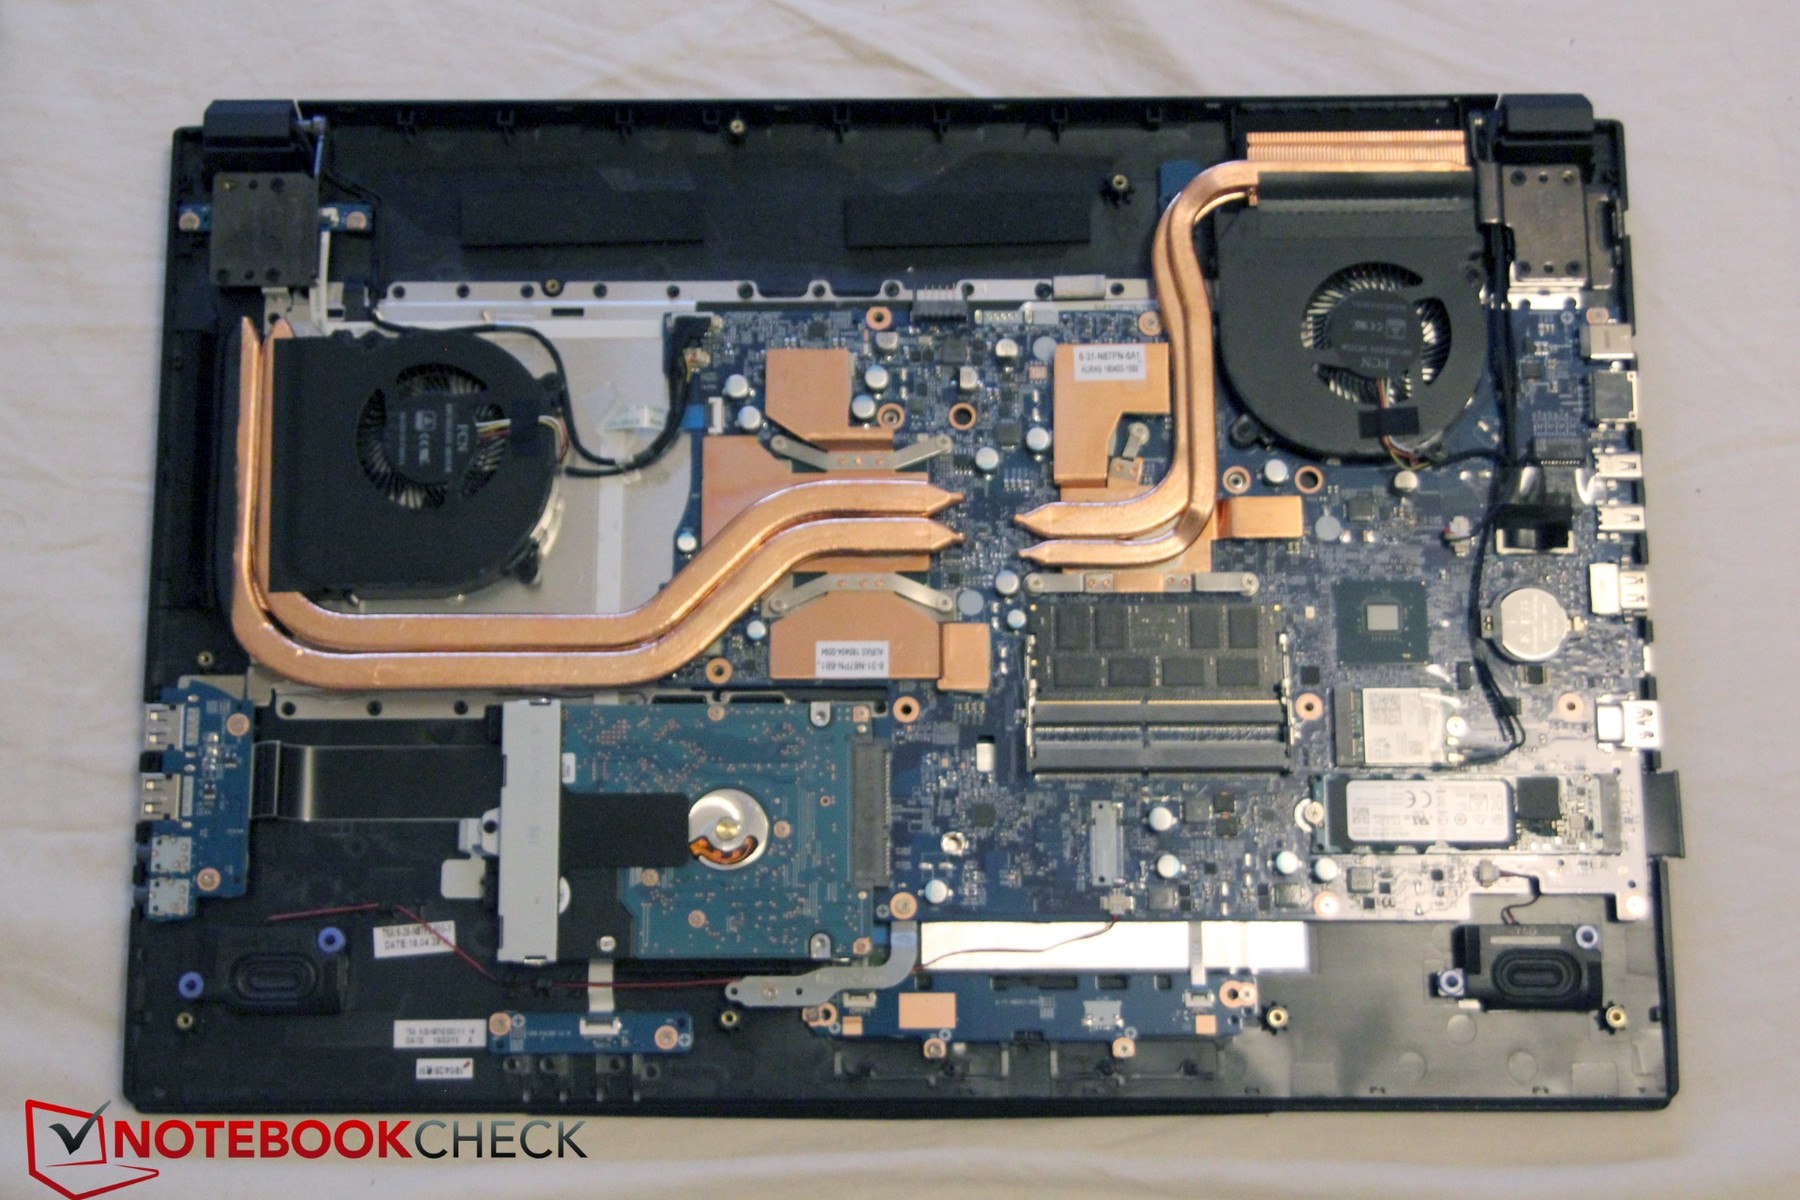
The Sabre 17 does not have a maintenance hatch, meaning that you need to remove the base plate to access the computer's inner workings. The biggest hurdle is the number of screws. The base plate is secured with 16 Phillips screws, plus a variety of plastic hooks inside the case. Once you have successfully completed this time-intensive endeavor, you will have access to both drive bays, the RAM slots and the WLAN module.
Warranty
The manufacturer's warranty lasts for two years, i.e. 24 months. Because the device is still very new, no store has listed it yet. This means, of course, that there are not any offers yet for warranty extensions. Please see our Guarantees, Return policies and Warranties FAQ for country-specific information.
Input Devices - Satisfactory Gigabyte Sabre
Keyboard
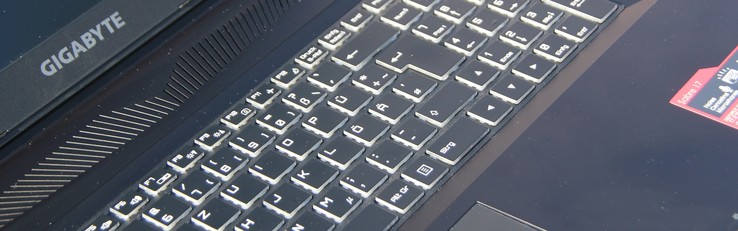
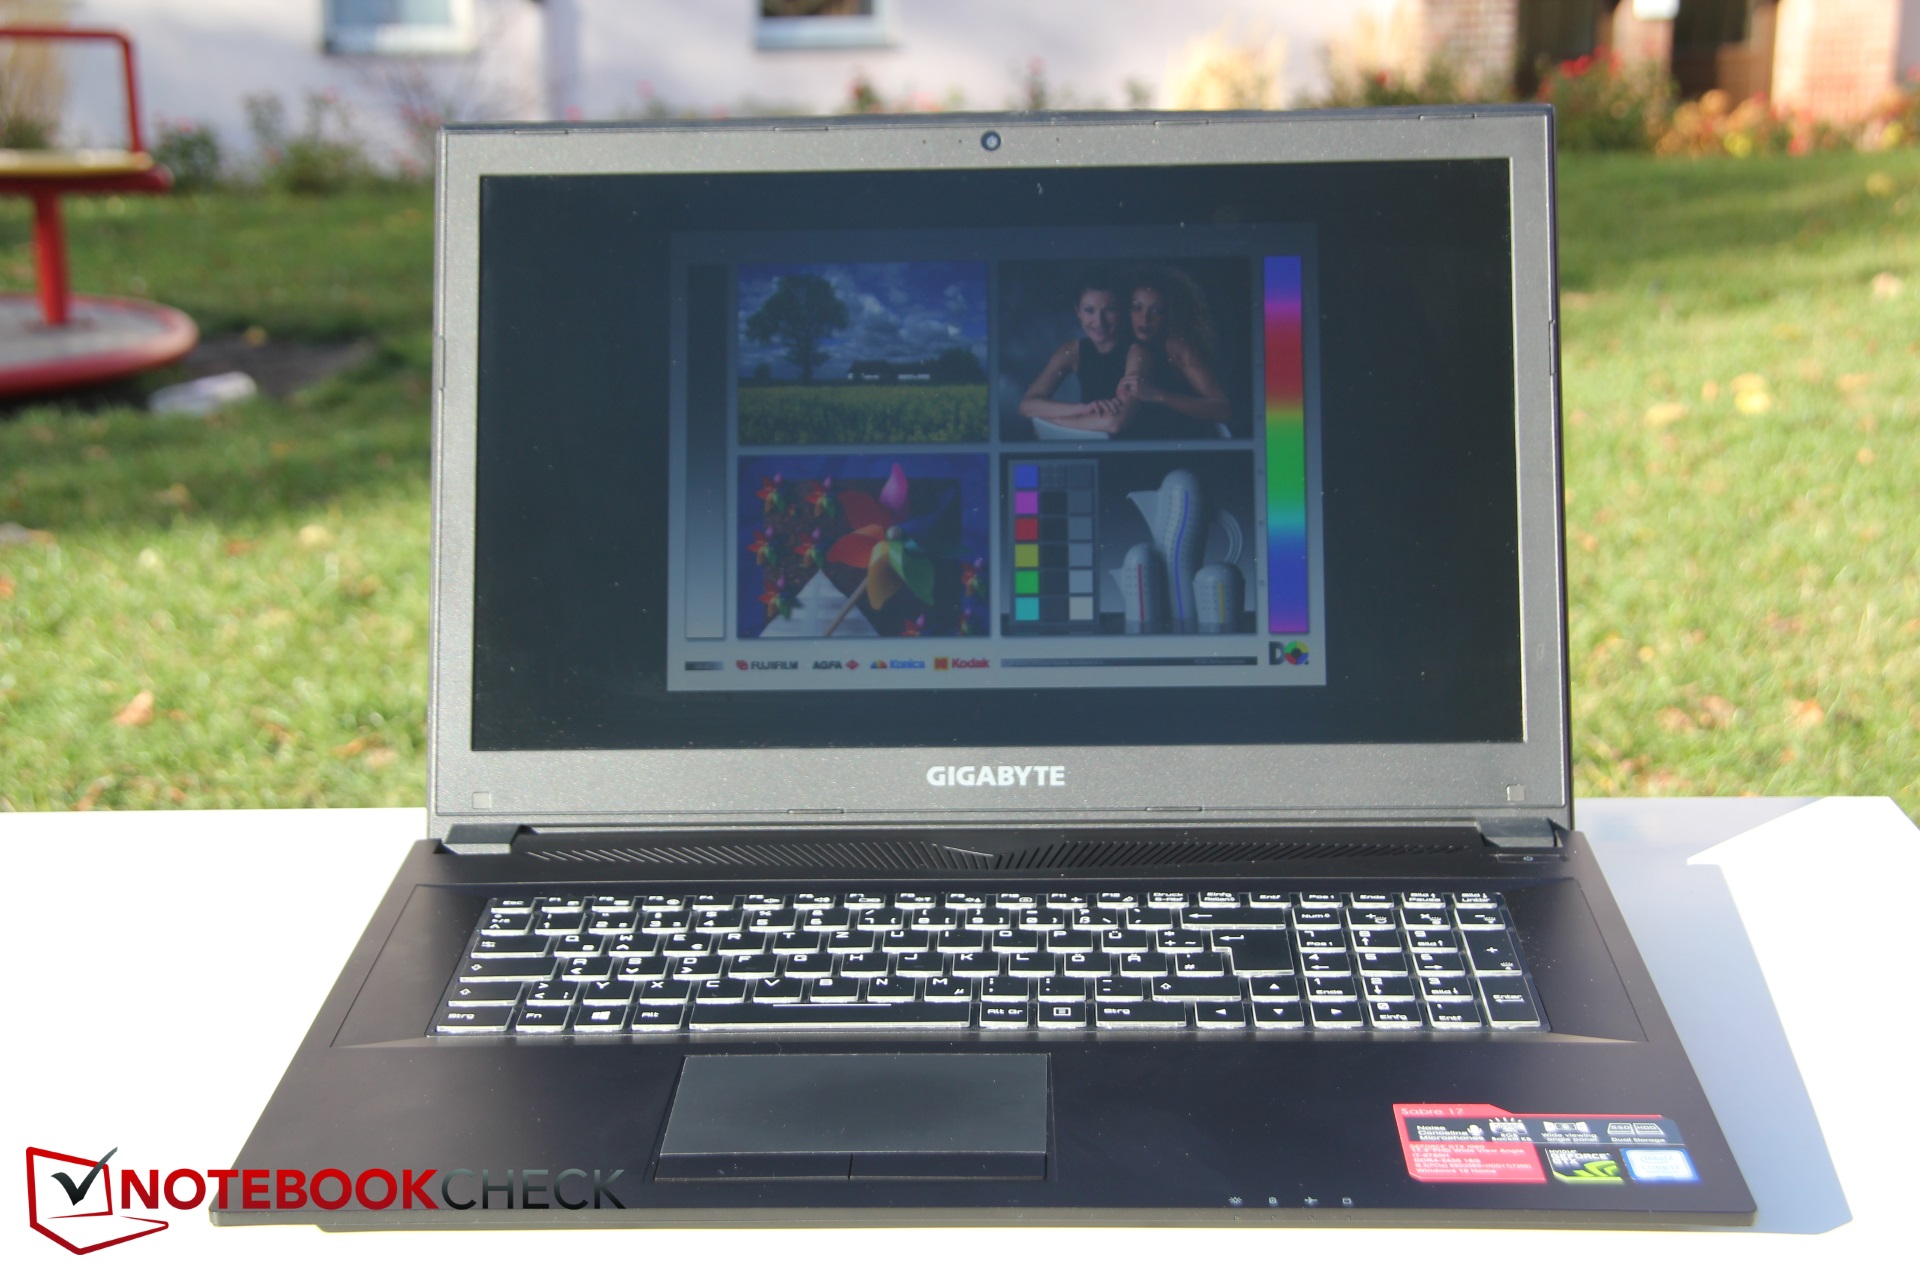
The chiclet keyboard offers an intuitive and neat layout, including a number block on the right side. The entire keyboard unit sits slightly recessed in the case. The markings are all easily legible, and the built-in backlighting is certainly one of the laptop's highlights. Here is why: The backlighting can be independently configured in three different zones, and even the colors can be set separately from one another in all three areas. It is even possible to set the colors to shuffle randomly. You can also create custom macros, and the brightness can be regulated across three levels. The controls can be accessed by pressing the "Fn" key plus various keys on the number pad.
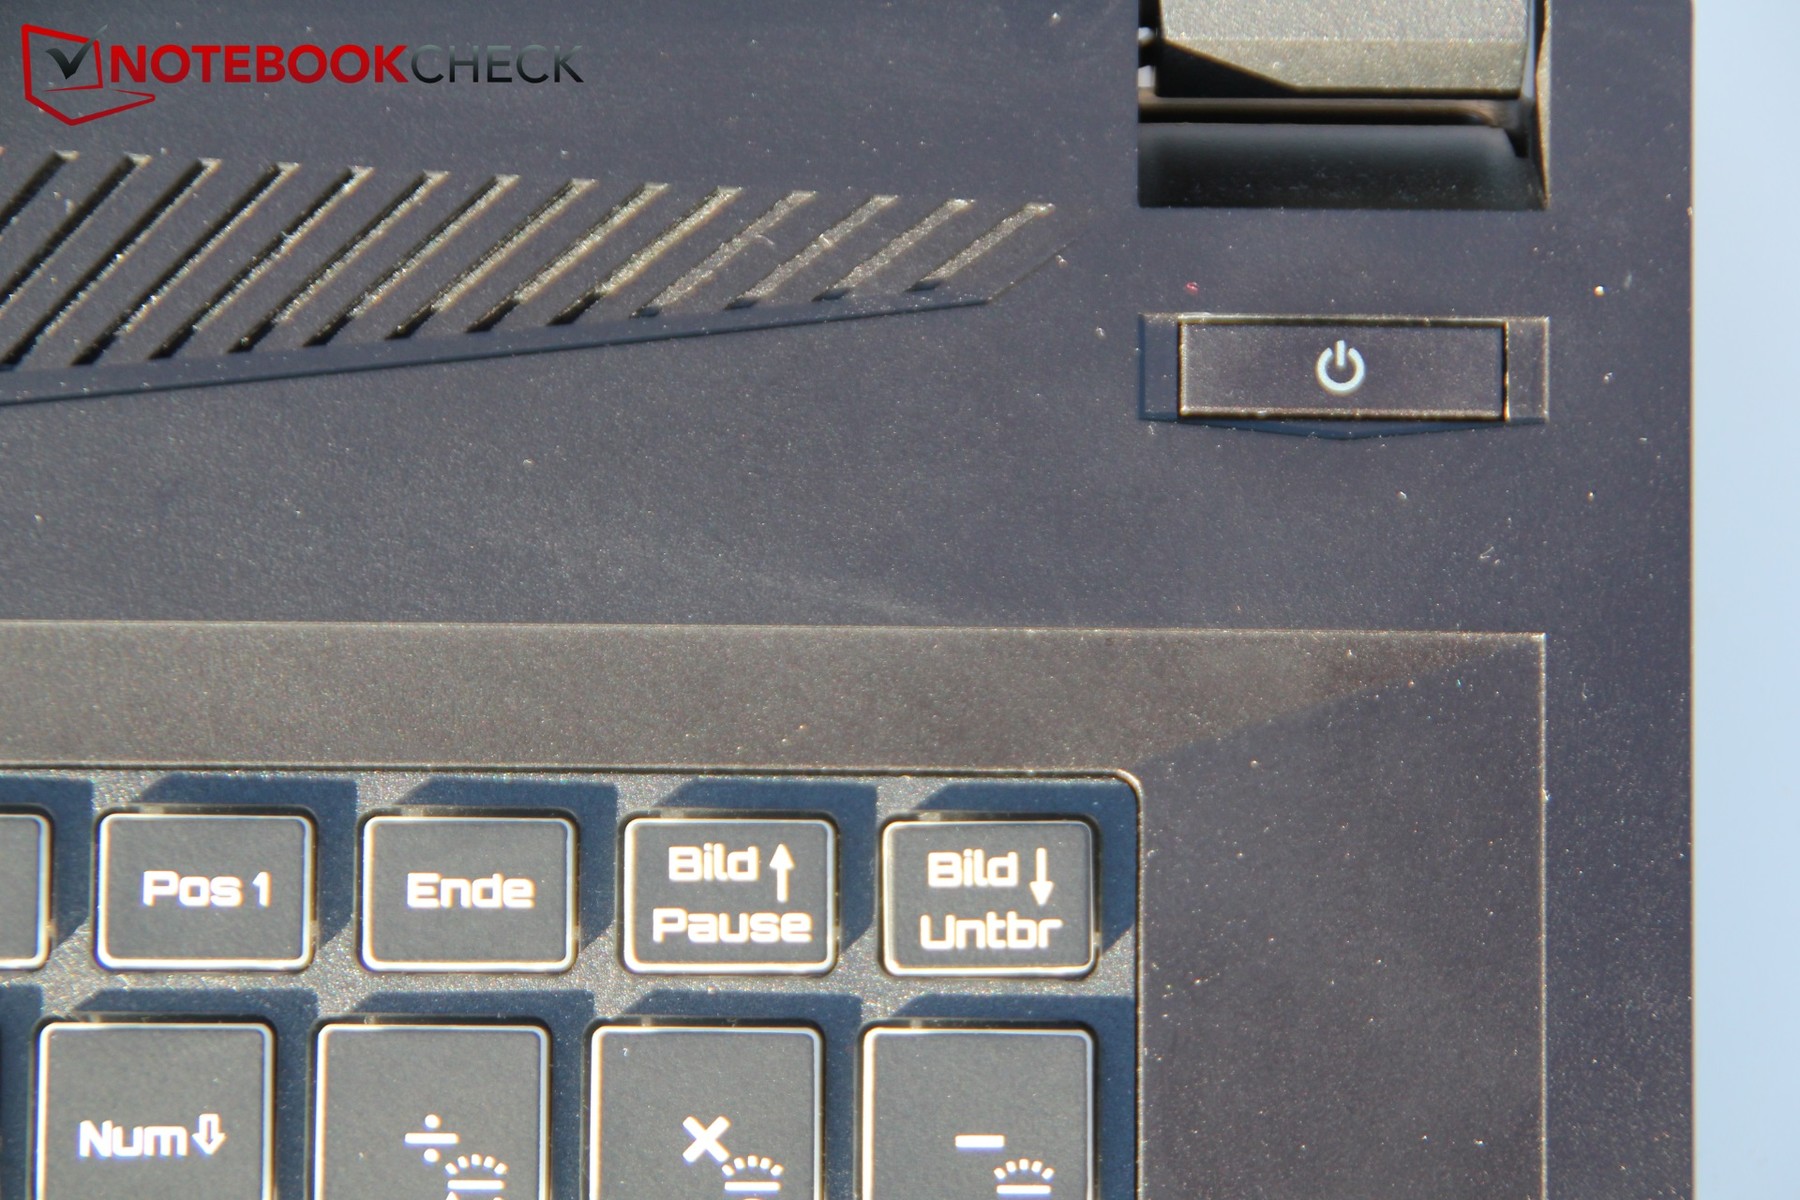
The power button is separate from the keyboard, preventing the user from pressing it by accident.
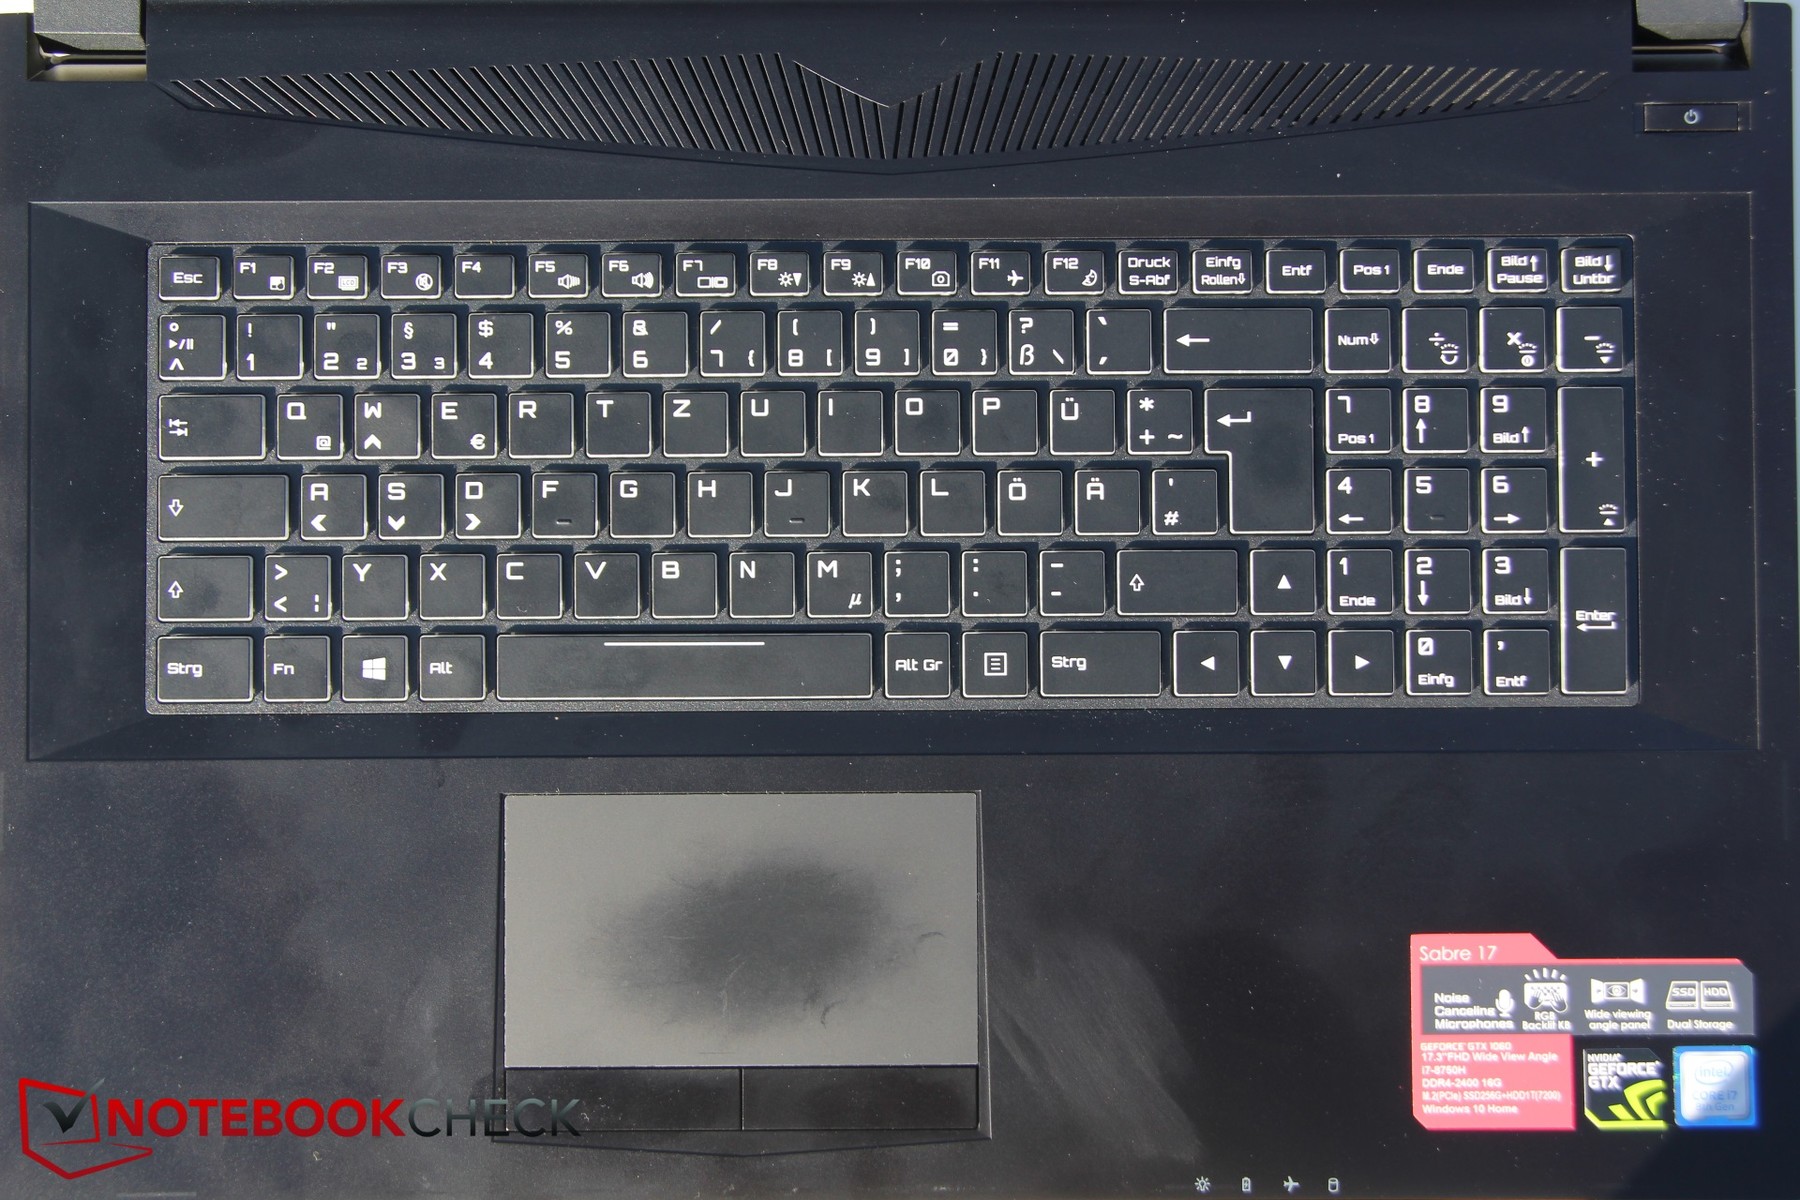
The keys themselves are large and offer a comparatively long travel length, while the click point fortunately is not too soft. These characteristics make it easy to type quickly and accurately. The sound produced by the keyboard while typing is by and large unobtrusive, even if the space key is slightly louder than the rest.
Touchpad
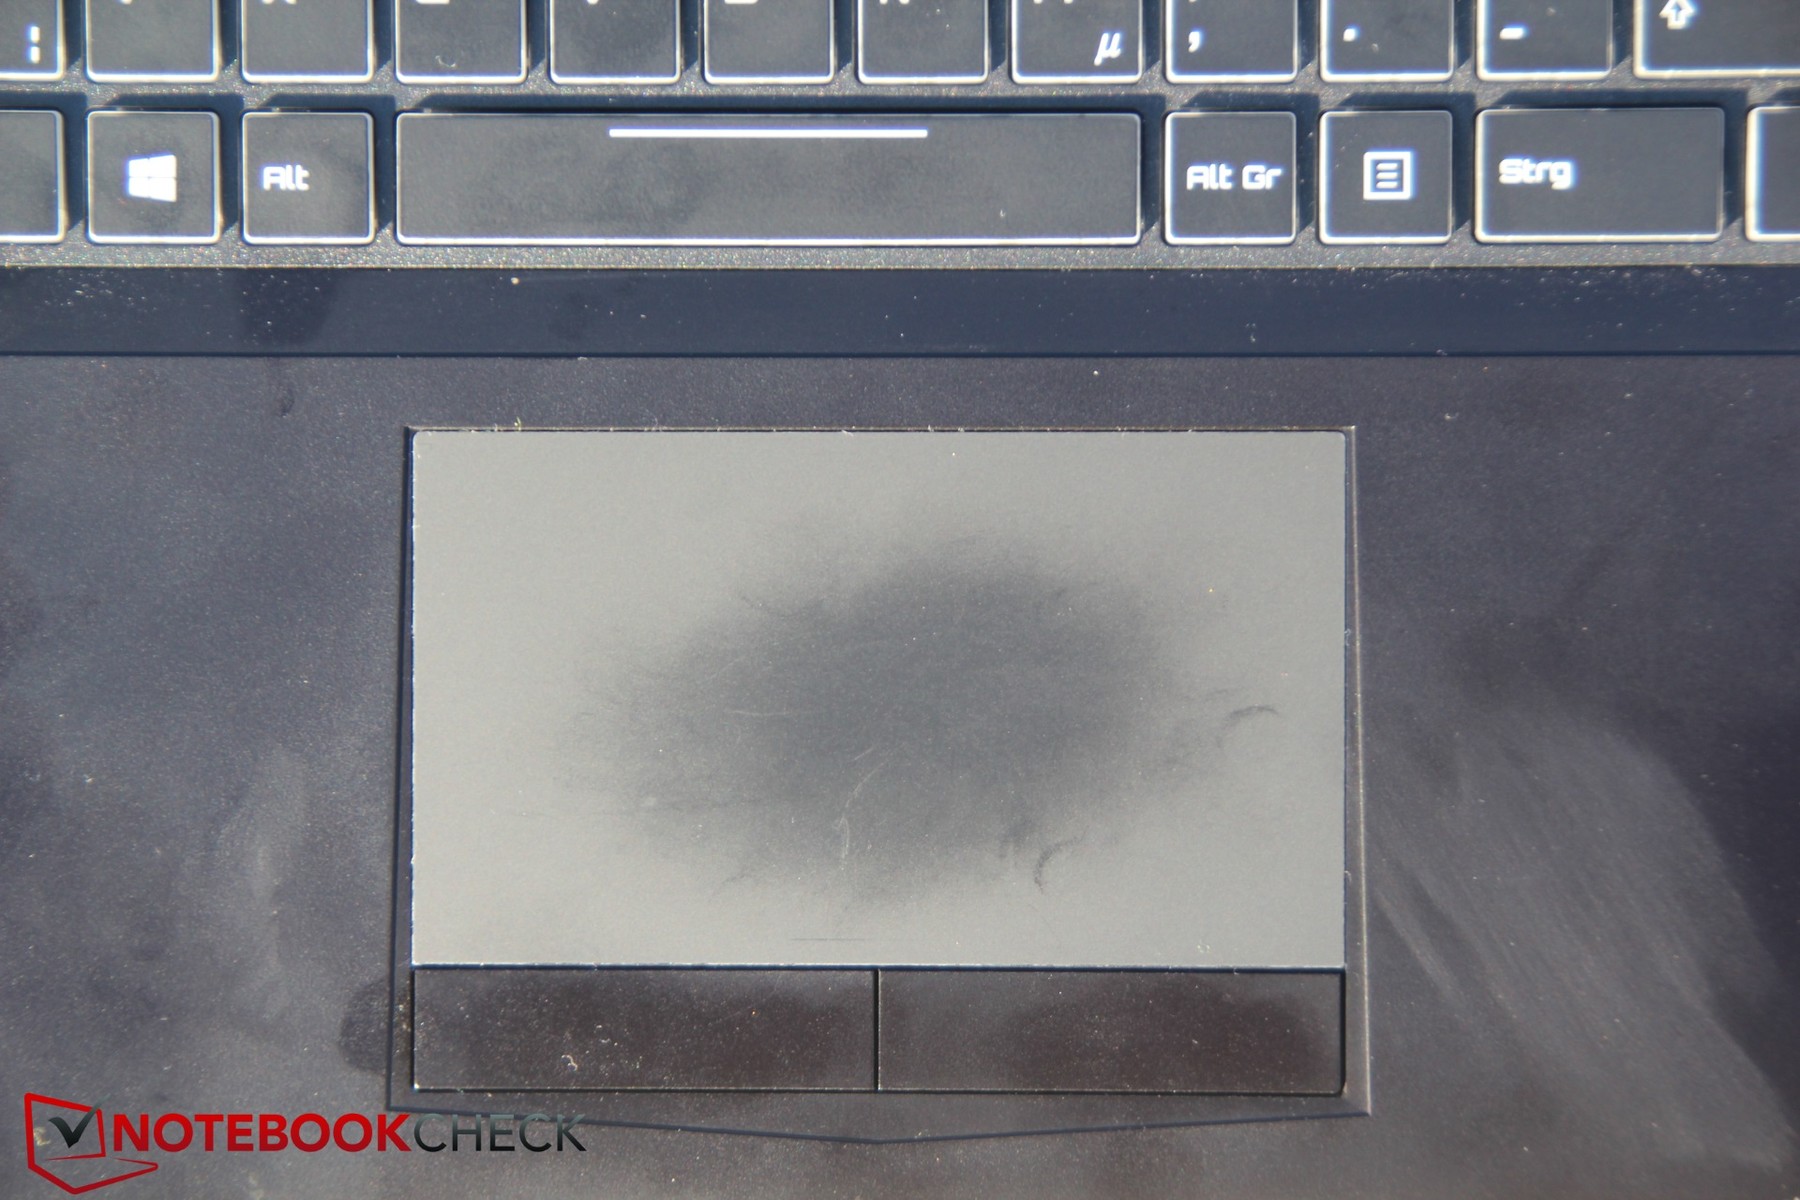
The touchpad measures around 11 x 6.3 cm (~4.33 x 2.5 inches), which means that the available space for gliding and finger gestures is comparatively roomy. Two separate keys sit underneath the touchpad. The only tactile change when you move from the pad to the keys occurs as you move downwards, which requires some adjustment. The keys are not raised above the touchpad, so it is easy to find yourself searching blindly for them at first. The click sounds of the keys are quite soft, though the left key in particular feels somewhat rickety. Fingers glide smoothly across the touchpad's glossy surface, and gestures work exactly as they ought.
Display - Bright Gigabyte laptop
The Sabre 17's display is a matte TN panel with Full HD resolution, manufactured by Chi Mei. One disadvantage of its TN technology is that the screen content distorts more easily when the display is viewed from less than ideal vantage points. Its colors are also less rich than those of its IPS counterpart's. In exchange, the manufacturer claims the display's reaction time is a fast 3 ms and its refresh rate is 120 Hz. These are indeed good qualifications for a gaming display. When it comes to a realistic measurement of the display's reaction time, we measured 8 ms from black to white.
The average brightness comes to a good 309 cd/m²; out of the devices we have selected for comparison, only the Razer Blade Pro's panel is brighter. On the other hand, the similarity of brightness distribution across the screen is a mediocre 82%. In the middle of the screen, the brightness reaches up to 326 cd/m², while this number falls as low as 277 cd/m² along the edges.
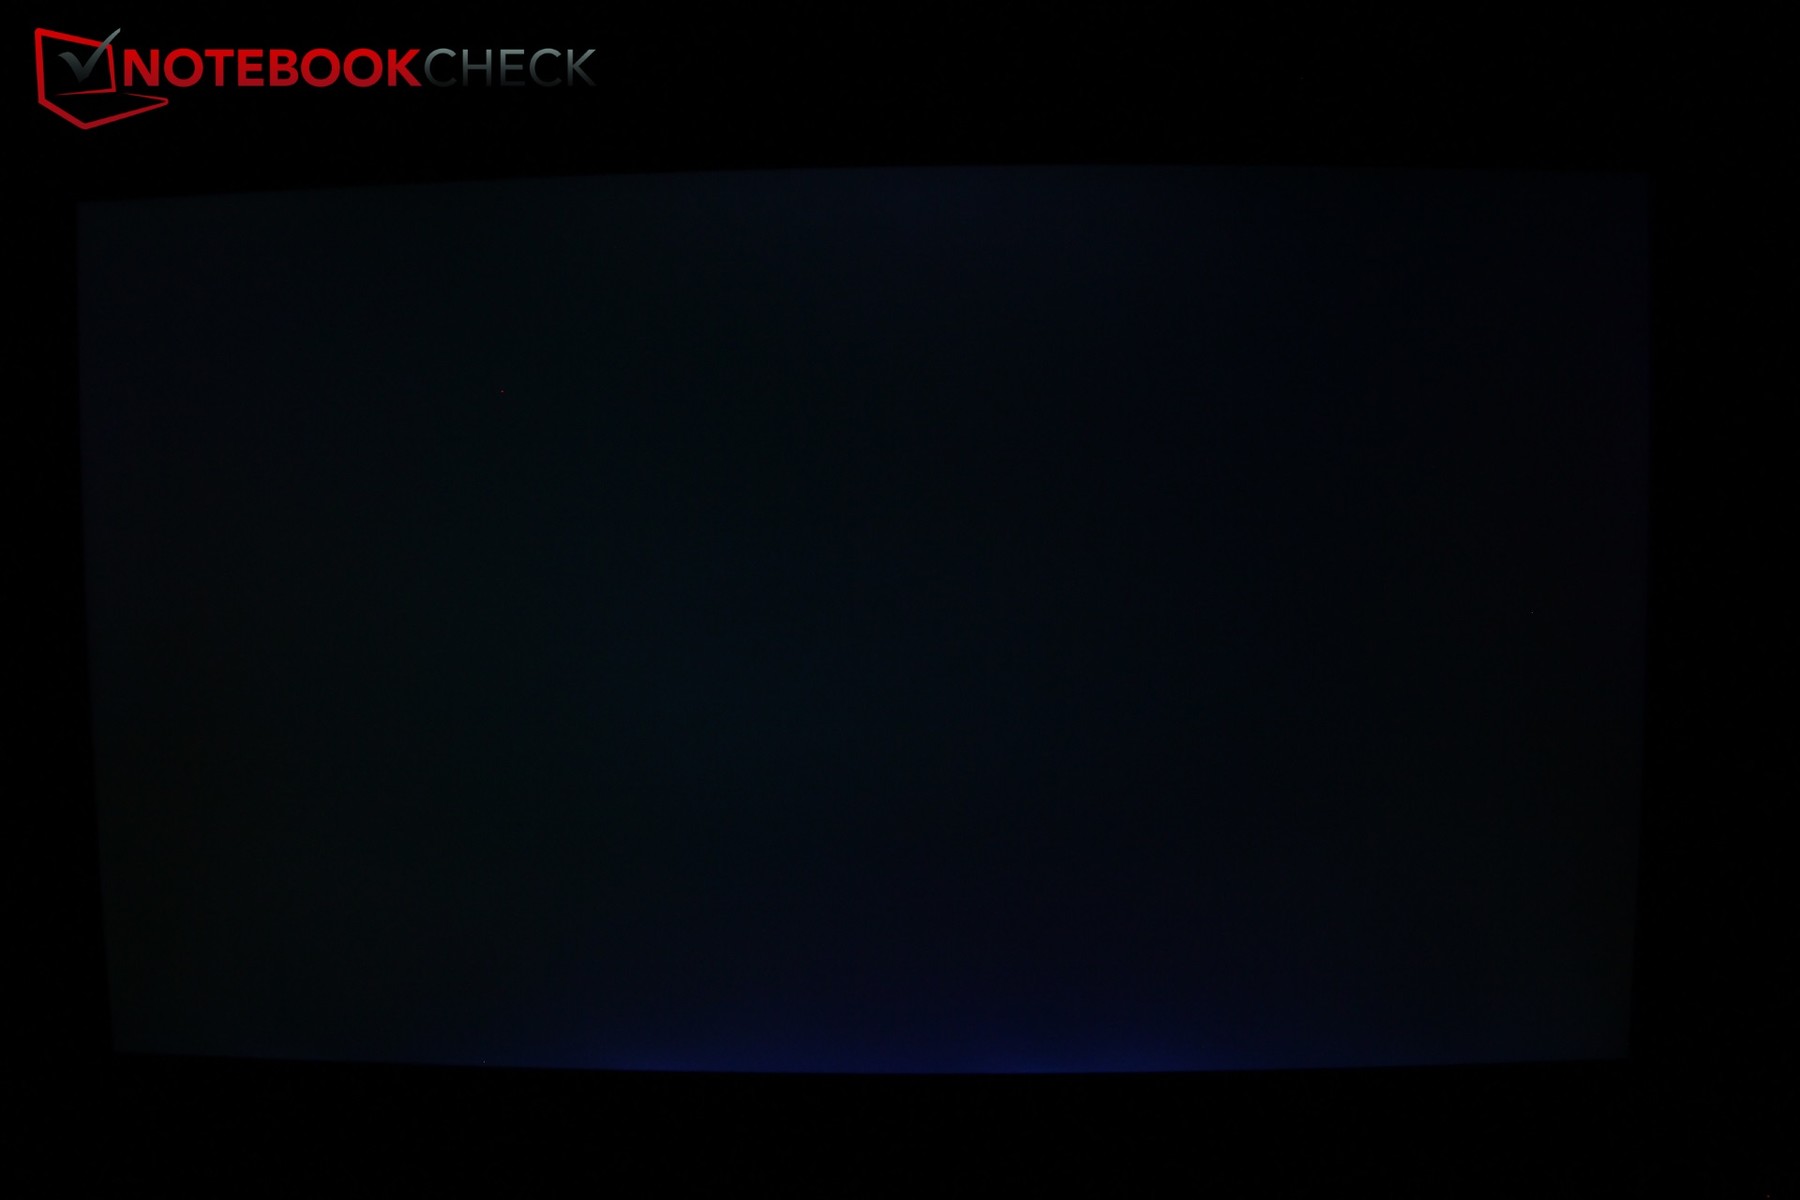
Even less appealing is the noticeable screen bleeding along the lower edge. The halation is not terribly pronounced, but it is certainly visible in dark environments.
| |||||||||||||||||||||||||
Brightness Distribution: 82 %
Center on Battery: 327 cd/m²
Contrast: 1207:1 (Black: 0.27 cd/m²)
ΔE ColorChecker Calman: 9.11 | ∀{0.5-29.43 Ø4.71}
calibrated: 2.62
ΔE Greyscale Calman: 11.17 | ∀{0.09-98 Ø4.96}
100% sRGB (Argyll 1.6.3 3D)
76% AdobeRGB 1998 (Argyll 1.6.3 3D)
85.1% AdobeRGB 1998 (Argyll 3D)
100% sRGB (Argyll 3D)
89.9% Display P3 (Argyll 3D)
Gamma: 2.28
CCT: 12475 K
| Gigabyte Sabre 17-W8 Chi Mei CMN1747, , 1920x1080, 17.3" | Asus TUF FX705GM AU Optronics B173HAN04.0 (AUO409D), , 1920x1080, 17.3" | Asus Strix GL703GM-DS74 Chi Mei CMN1747 M173JJE-G32, , 1920x1080, 17.3" | Razer Blade Pro RZ09-0220 ID: AUO169D, Name: AU Optronics B173HAN01.6, , 1920x1080, 17.3" | MSI GP72VR 7RFX CMN1747, , 1920x1080, 17.3" | |
|---|---|---|---|---|---|
| Display | -22% | 0% | -21% | 1% | |
| Display P3 Coverage (%) | 89.9 | 62.4 -31% | 90 0% | 64 -29% | 89.9 0% |
| sRGB Coverage (%) | 100 | 88.8 -11% | 100 0% | 89.7 -10% | 99.7 0% |
| AdobeRGB 1998 Coverage (%) | 85.1 | 63.8 -25% | 84.8 0% | 64.9 -24% | 86.5 2% |
| Response Times | -4% | 5% | -337% | -79% | |
| Response Time Grey 50% / Grey 80% * (ms) | 9 ? | 7.4 ? 18% | 8.8 ? 2% | 36.8 ? -309% | 21.6 ? -140% |
| Response Time Black / White * (ms) | 8 ? | 10 ? -25% | 7.4 ? 7% | 37.2 ? -365% | 9.4 ? -18% |
| PWM Frequency (Hz) | 25000 ? | 25510 ? | 25000 ? | ||
| Screen | 18% | 10% | 13% | -72% | |
| Brightness middle (cd/m²) | 326 | 234 -28% | 297.8 -9% | 367.4 13% | 309 -5% |
| Brightness (cd/m²) | 309 | 228 -26% | 285 -8% | 363 17% | 290 -6% |
| Brightness Distribution (%) | 82 | 85 4% | 84 2% | 86 5% | 88 7% |
| Black Level * (cd/m²) | 0.27 | 0.2 26% | 0.33 -22% | 0.32 -19% | 0.22 19% |
| Contrast (:1) | 1207 | 1170 -3% | 902 -25% | 1148 -5% | 1405 16% |
| Colorchecker dE 2000 * | 9.11 | 2.16 76% | 3.68 60% | 3.8 58% | 7.2 21% |
| Colorchecker dE 2000 max. * | 14.14 | 3.39 76% | 7.71 45% | 10.4 26% | 12.8 9% |
| Colorchecker dE 2000 calibrated * | 2.62 | 2.02 23% | 2.71 -3% | ||
| Greyscale dE 2000 * | 11.17 | 2 82% | 5 55% | 3.5 69% | 98 -777% |
| Gamma | 2.28 96% | 2.46 89% | 2.06 107% | 2.18 101% | 1.96 112% |
| CCT | 12475 52% | 6394 102% | 6728 97% | 6467 101% | 10963 59% |
| Color Space (Percent of AdobeRGB 1998) (%) | 76 | 58 -24% | 84.77 12% | 58.1 -24% | 77 1% |
| Color Space (Percent of sRGB) (%) | 100 | 89 -11% | 99.97 0% | 89.3 -11% | 100 0% |
| Total Average (Program / Settings) | -3% /
8% | 5% /
7% | -115% /
-41% | -50% /
-58% |
* ... smaller is better
Even though this is a TN panel, the black value measured in at a good 0.27. The contrast ratio of 1207:1 is also more than satisfactory. But as to be expected, the TFT performs poorly in terms of color reproduction. ColorChecker testifies to mediocre DeltaE 2000 values at best; our test device's results here are the worst among the comparison group, though a calibration diminishes the problem somewhat.
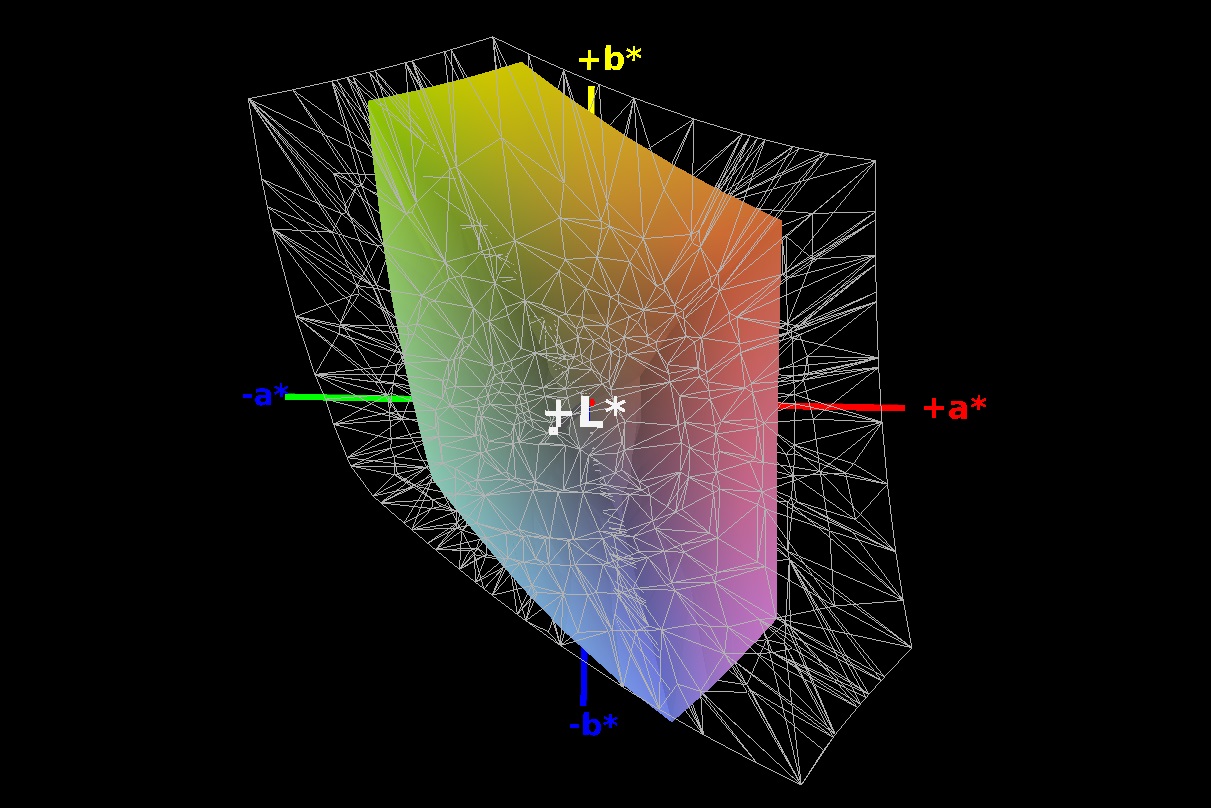
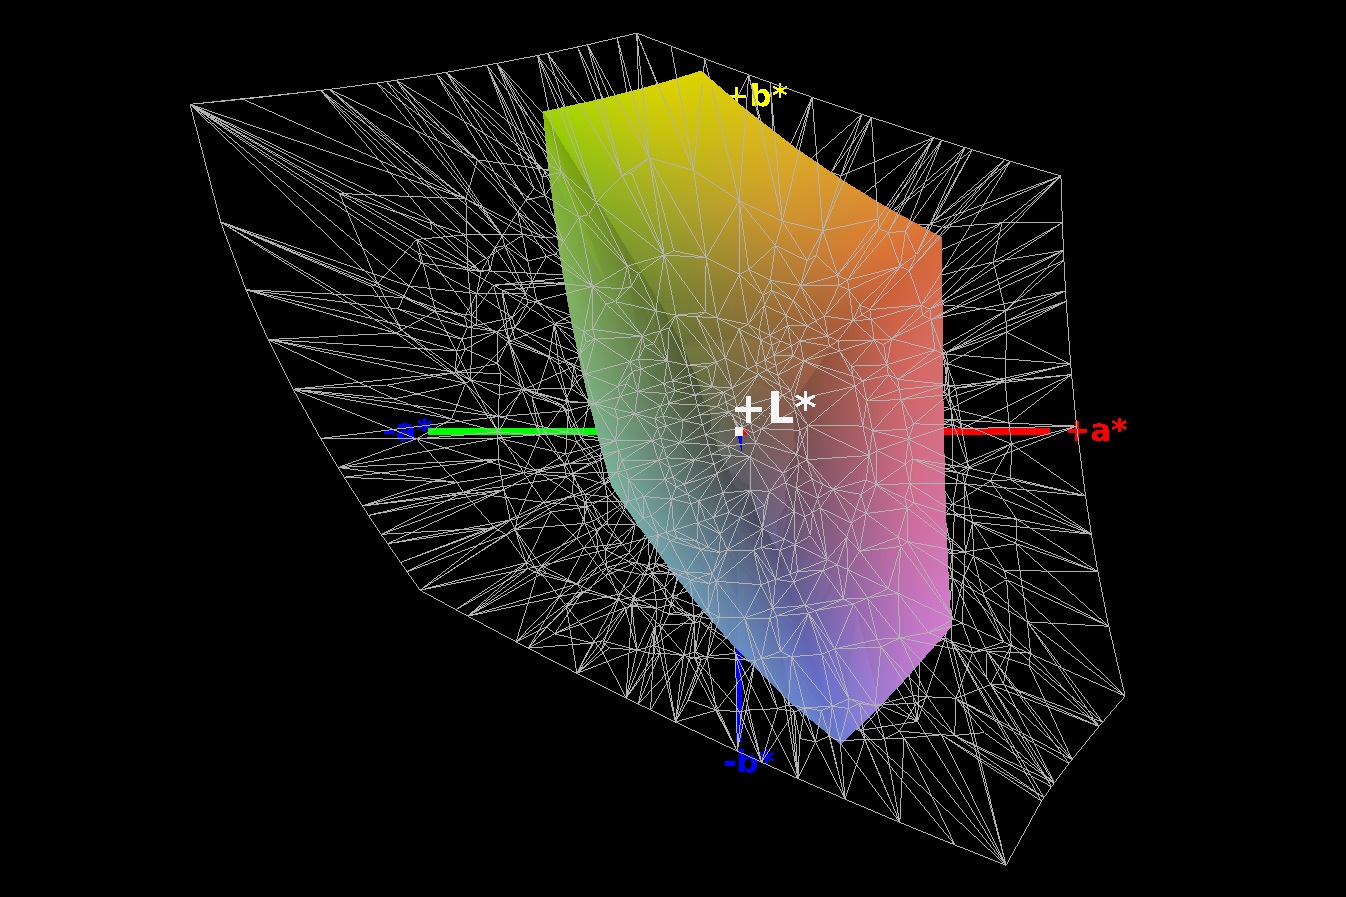
In terms of color space coverage, the Sabre is back in the lead: A full 100% of the sRGB color space and a good 76% of Adobe RGB are excellent results. Only the Asus Strix does better here; the MSI is more or less on par with our Gigabyte device.
We did determine that the display uses PWM backlight flickering. However, the flickering only kicks in at brightness levels of 20% and below—and at a frequency as high as 25,000 Hz, even the most sensitive users should not have any problems here.
From a subjective perspective, the display is reasonably good. Buyers should in fact be prepared for less than brilliant colors, but everything looks sharp. The display reacts very quickly, so even in the fastest action games, there should not be any bothersome streaking. As a result, the display is very well-suited for gaming.
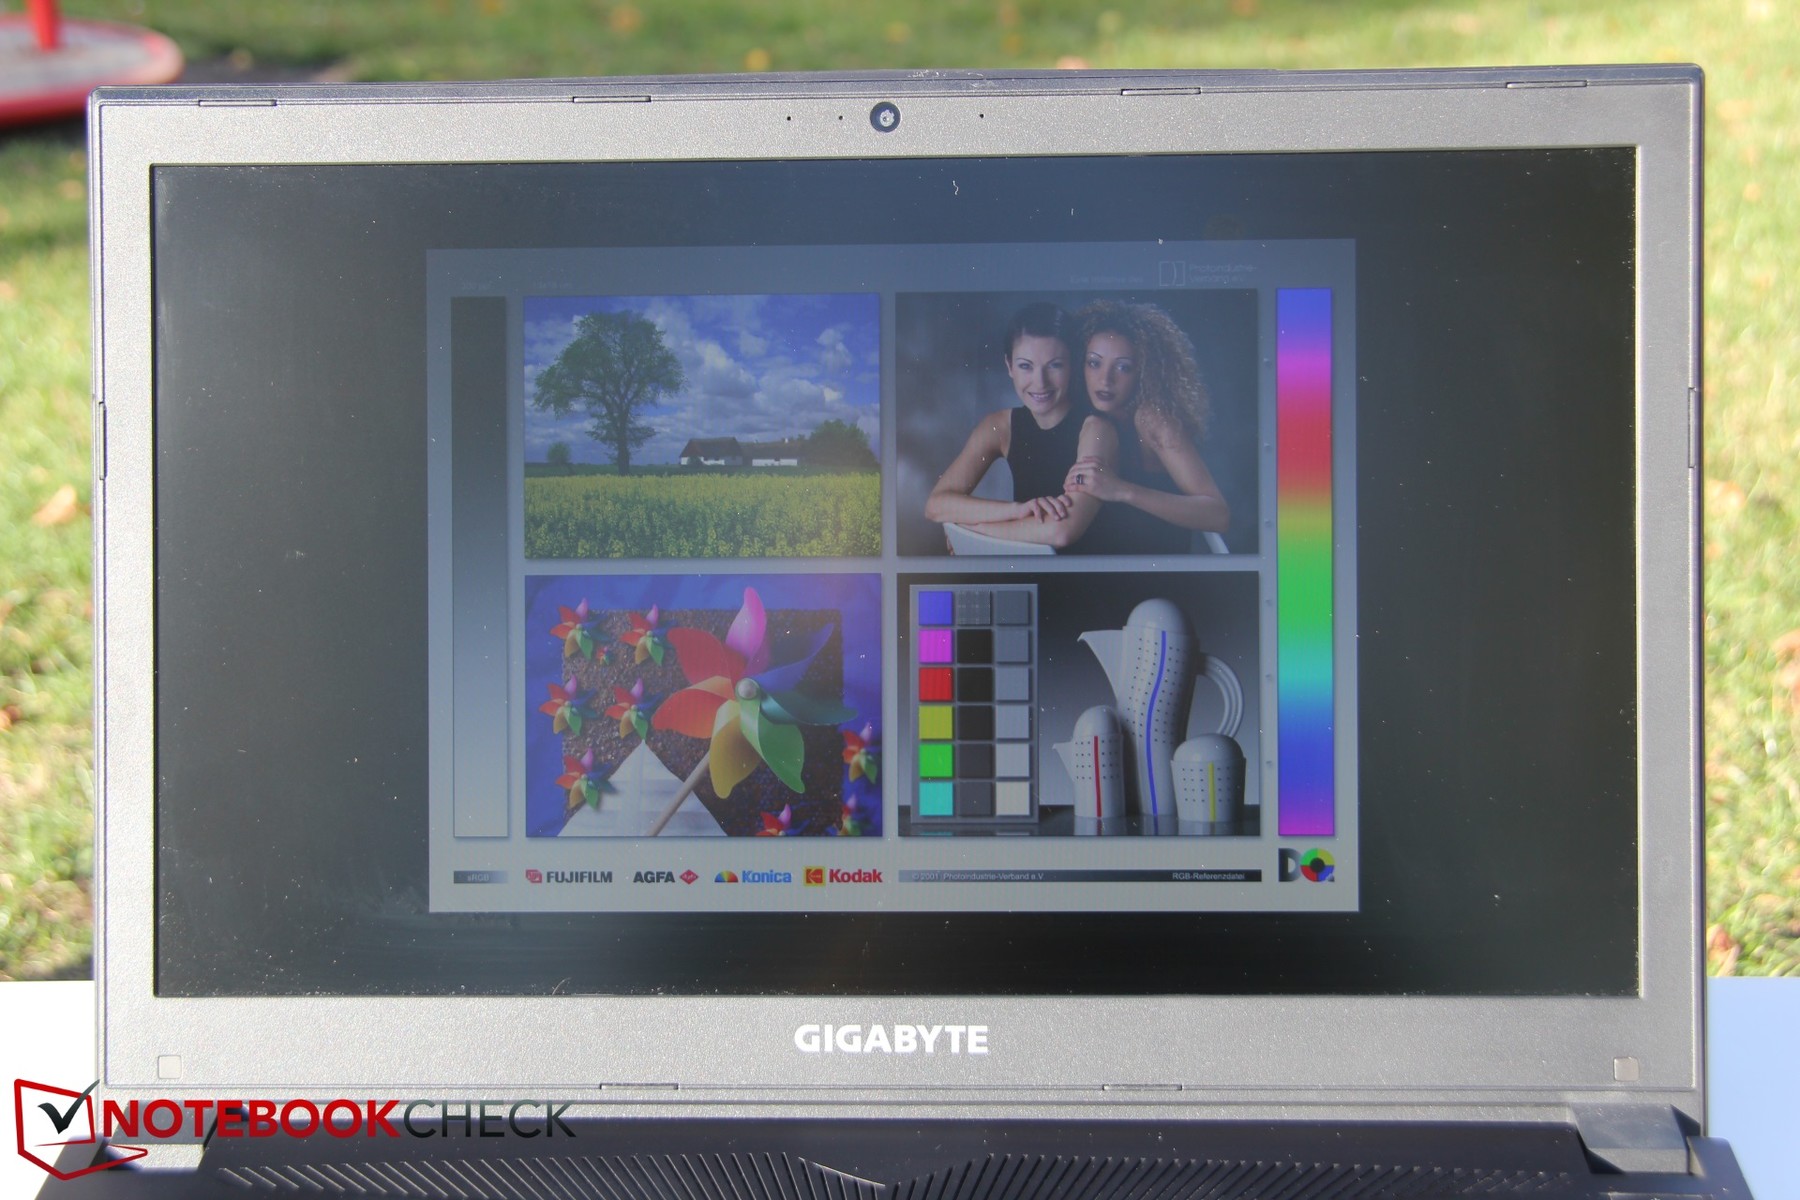
The manufacturer has chosen to install a matte display. This fact, plus the display's average brightness level of 309 cd/m², means that the laptop can definately be used outdoors. However, the fact that you need to view the screen from the proper angle is somewhat frustrating —especially when it comes to the up-down perspective. If you are not looking at the display from the perfect angle, the brightness is immediately reduced. Overall, though, the users can play games or work outdoors on the Sabre 17—at least where the display is concerned.
Display Response Times
| ↔ Response Time Black to White | ||
|---|---|---|
| 8 ms ... rise ↗ and fall ↘ combined | ↗ 6 ms rise | 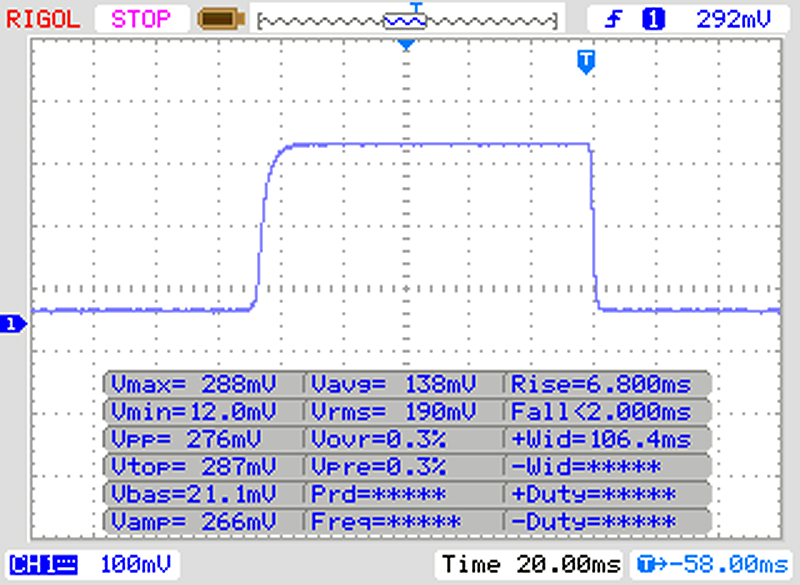 |
| ↘ 2 ms fall | ||
| The screen shows fast response rates in our tests and should be suited for gaming. In comparison, all tested devices range from 0.1 (minimum) to 240 (maximum) ms. » 22 % of all devices are better. This means that the measured response time is better than the average of all tested devices (19.8 ms). | ||
| ↔ Response Time 50% Grey to 80% Grey | ||
| 9 ms ... rise ↗ and fall ↘ combined | ↗ 5 ms rise | 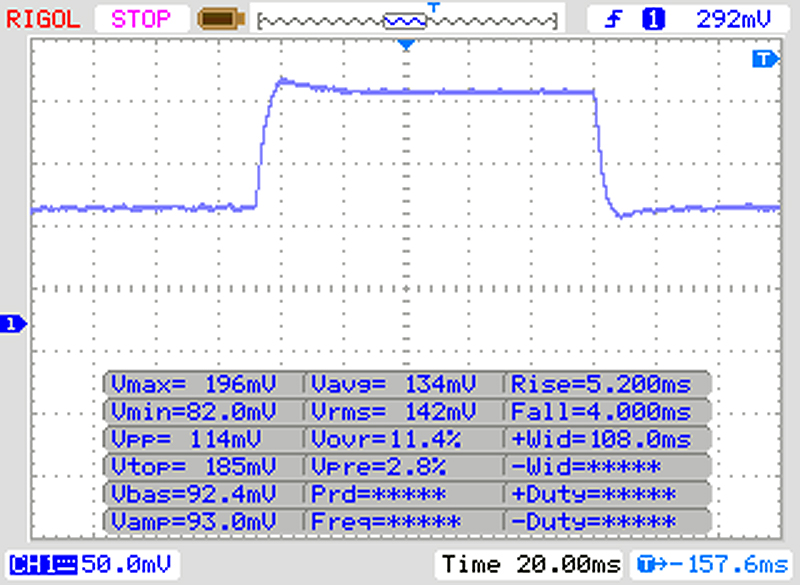 |
| ↘ 4 ms fall | ||
| The screen shows fast response rates in our tests and should be suited for gaming. In comparison, all tested devices range from 0.165 (minimum) to 636 (maximum) ms. » 23 % of all devices are better. This means that the measured response time is better than the average of all tested devices (30.9 ms). | ||
Screen Flickering / PWM (Pulse-Width Modulation)
| Screen flickering / PWM detected | 25000 Hz | ≤ 20 % brightness setting | 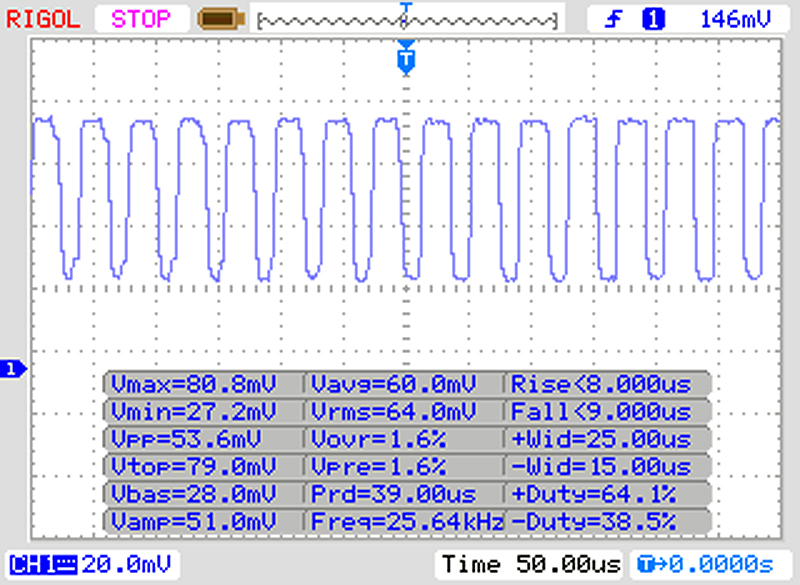 |
The display backlight flickers at 25000 Hz (worst case, e.g., utilizing PWM) Flickering detected at a brightness setting of 20 % and below. There should be no flickering or PWM above this brightness setting. The frequency of 25000 Hz is quite high, so most users sensitive to PWM should not notice any flickering. In comparison: 52 % of all tested devices do not use PWM to dim the display. If PWM was detected, an average of 7744 (minimum: 5 - maximum: 343500) Hz was measured. | |||
The viewing angle stability on the TN panel is, of course, worse than on an IPS display. In principle, this is also true of the Sabre 17, though it certainly surprised us with its capabilities here. From the sides, the screen content actually continues to look fairly accurate. Only a small amount of detail is lost. Looking from above or below, however, reveals a less than perfect picture. Both brightness and details are quickly lost here, so it is important to open the display to exactly the right angle.

Performance - Gaming laptop with weaknesses
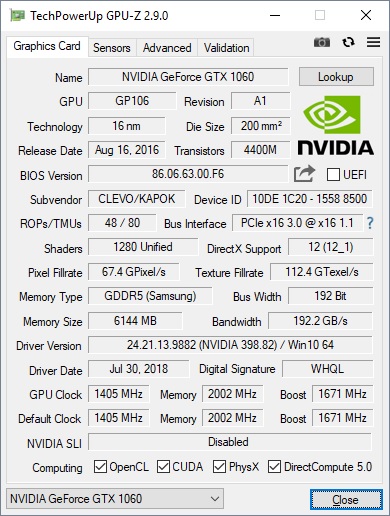
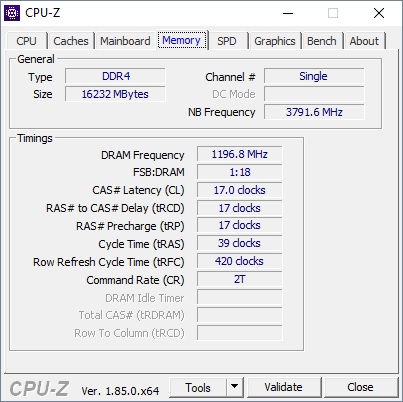
An Intel Core i7-8750H, an Nvidia GeForce GTX 1060, 16 GB of RAM and a dual storage solution comprised of an SSD and an HDD—those are the specs listed on the Gigabyte Sabre 17's base configuration sheet. These features theoretically qualify the laptop for virtually any intended application. The size of the device alone limits its on-the-go usefulnesss, but as a desktop replacement, the Sabre should be well-prepared to tackle anything. The GTX 1060 graphics card is just as well-suited for gaming as for photo and video editing. In the following sections, we will evaluate whether our test device truly lives up to its theoretical potential.
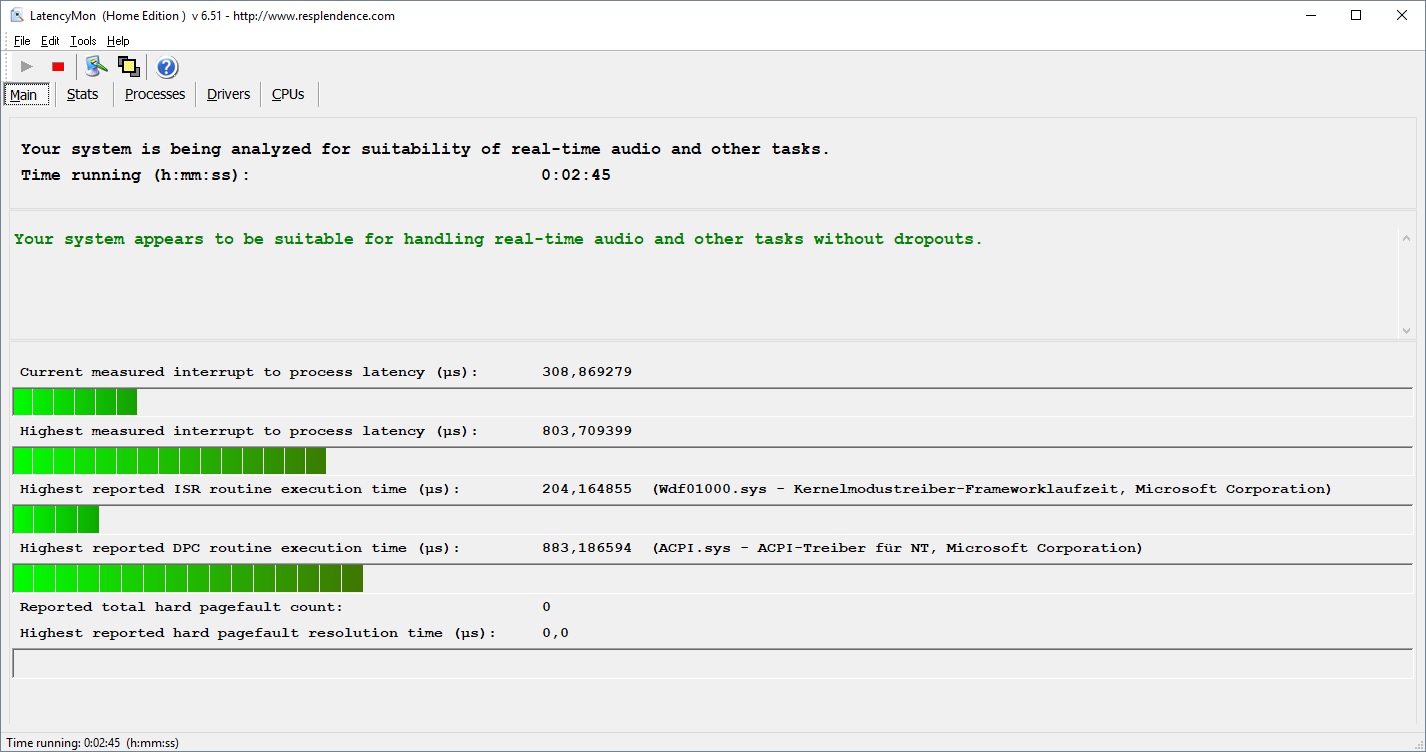
Our test to determine if there are any latencies came back negative—that is to say, we did not experience any bothersome latencies.
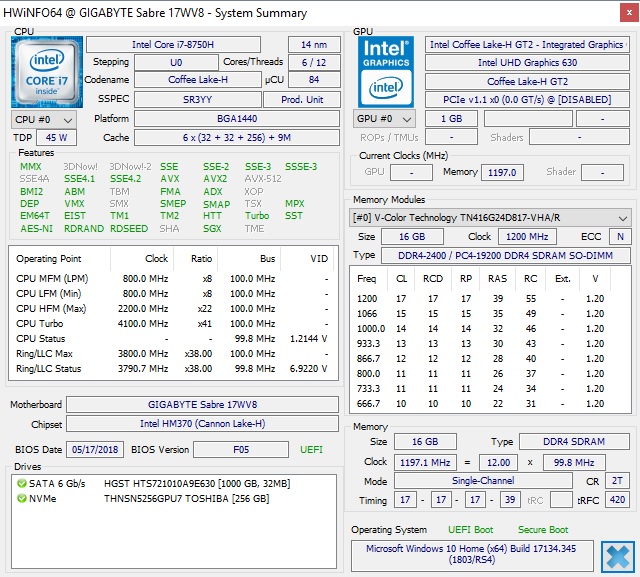
Processor
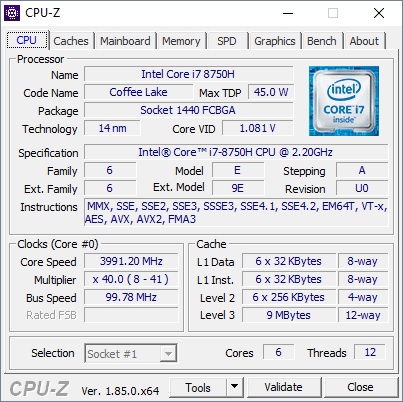
A high-performance Intel Core i7-8750H serves as the laptop's processor. This processor was released at the beginning of 2018. It has 6 cores with a clock rate between 2.2 and 4.1 GHz (single-core turbo) or 3.9 GHz (multi-core turbo). Naturally, it supports Coffee Lake CPU hyperthreading and can thus process up to 12 threads simultaneously. Its maximum power draw is 45 watts. This CPU should be fit to tackle any task.
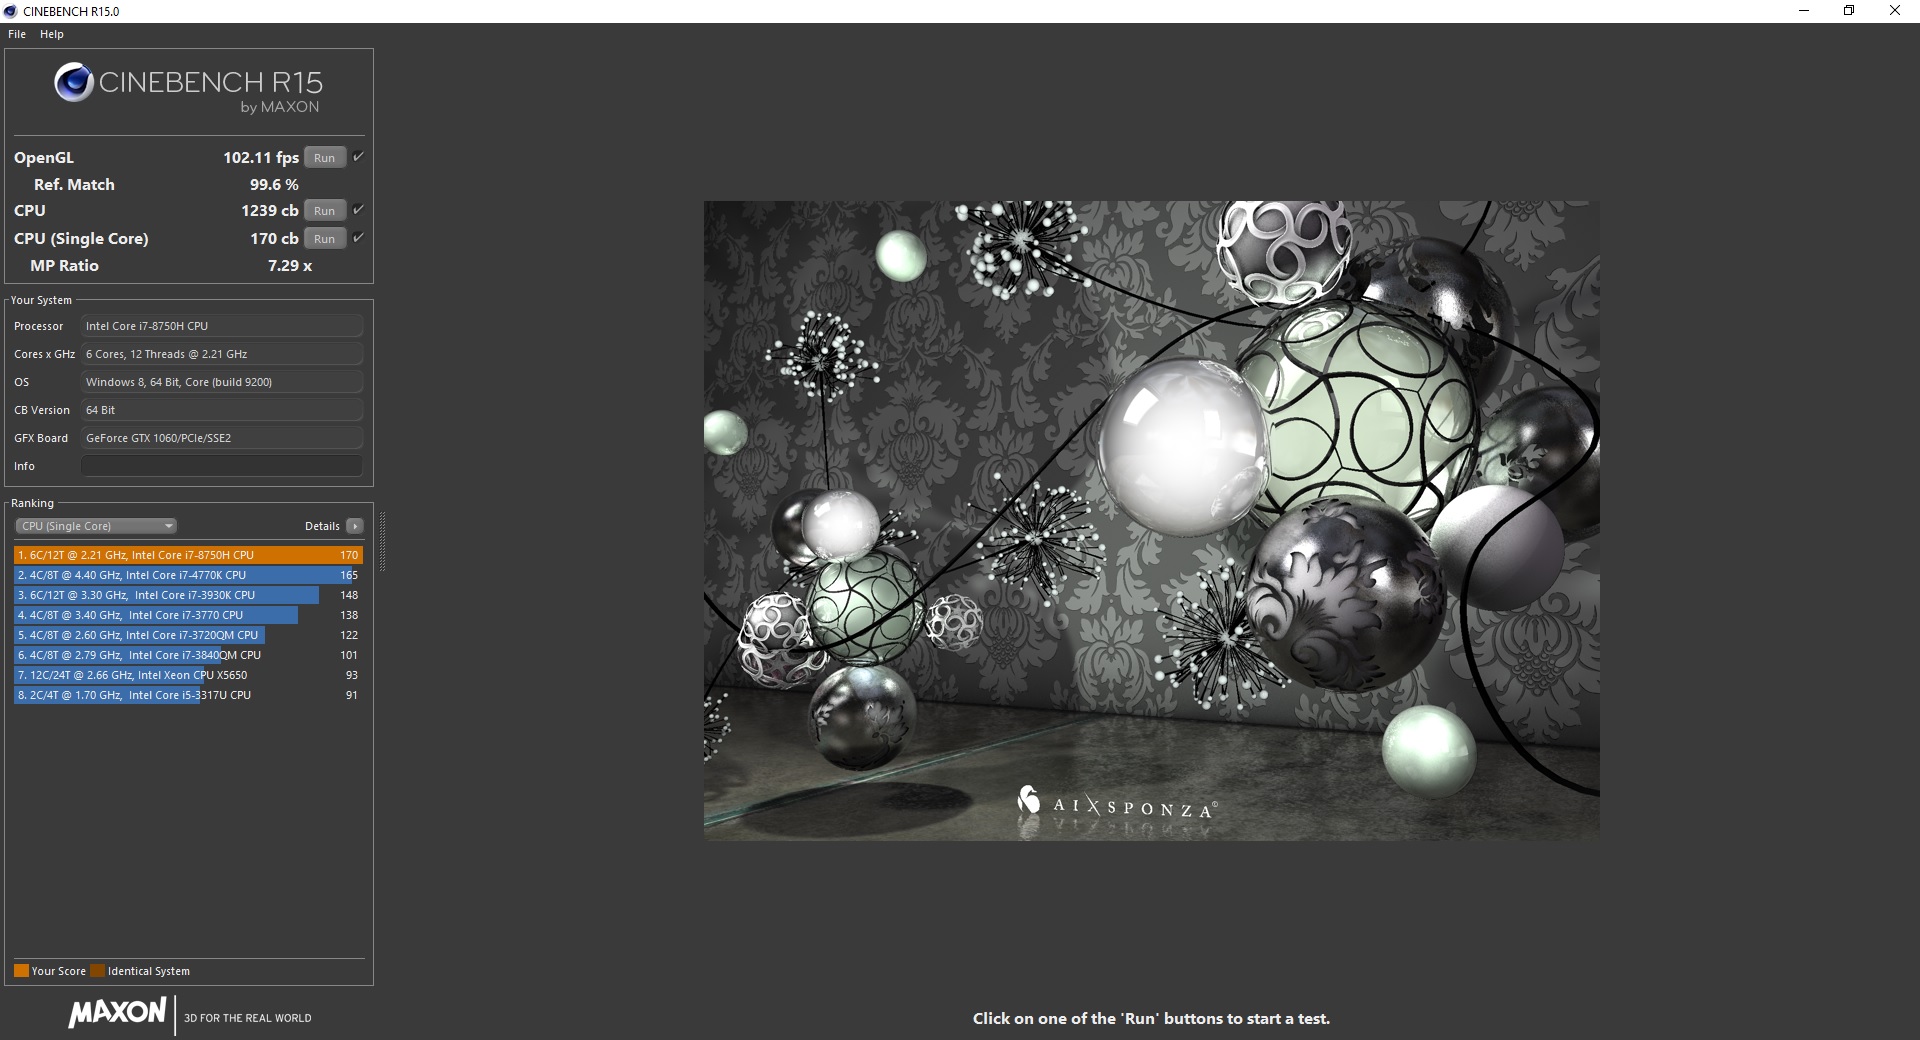
In the Cinebench R15 loop, the Sabre reaches a substantially higher score in the first cycle, slumps drastically within the first three cycles, then levels off after 4 to 10 cycles and remains constant thereafter. Between the first cycle and the later stable cycles, the laptop loses about 14% of its performance power. Even so, our test device's competitors behave similarly, and the Sabre can boast of the best (starting) performance. The Asus Strix, which is equipped with the same processor, is easily beaten by the Sabre. The Asus TUF is nearly on par with our test device. The processor never falls below its base clock rate.

If you unplug the Gigabyte laptop, its performance power drops off significantly in battery mode. Instead of a starting score of around 1200, the Sabre only manages around 670 points. That means the performance in battery mode is cut nearly in half. If we take the constant AC power mode performance as our reference point (around 1034 points), the portable energy store can still only take us to 65% of the performance available through a wall socket.
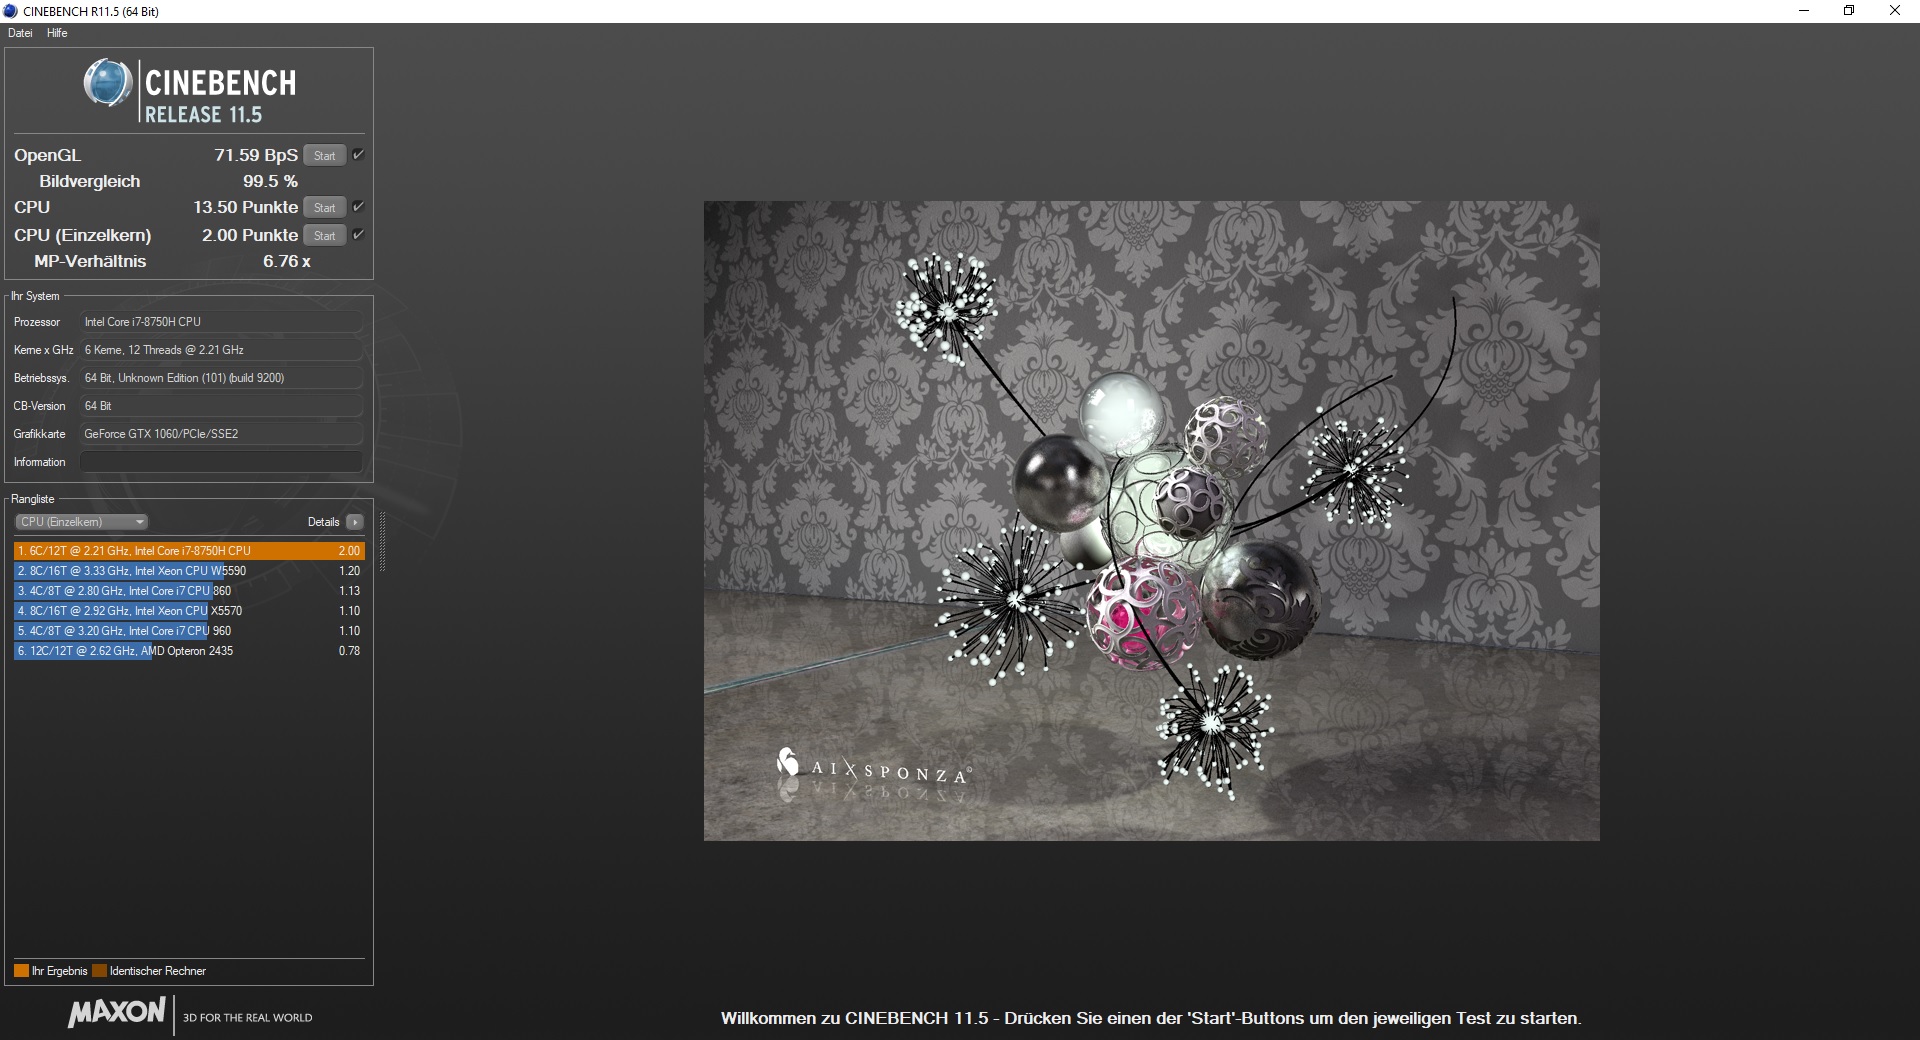
The Asus TUF proves to be the toughest competitor in the CPU tests. In the single-core test, at least, the two machines are on par with one another in both Cinebench R11.5 and R10. But in the multi-core test, the Sabre flexes its muscles and takes down the Asus TUF as well. The other comparison devices perform more poorly. Overall, the Sabre's CPU performance falls within the expected range for a computer with an i7-8750H—if not perhaps a cut above.
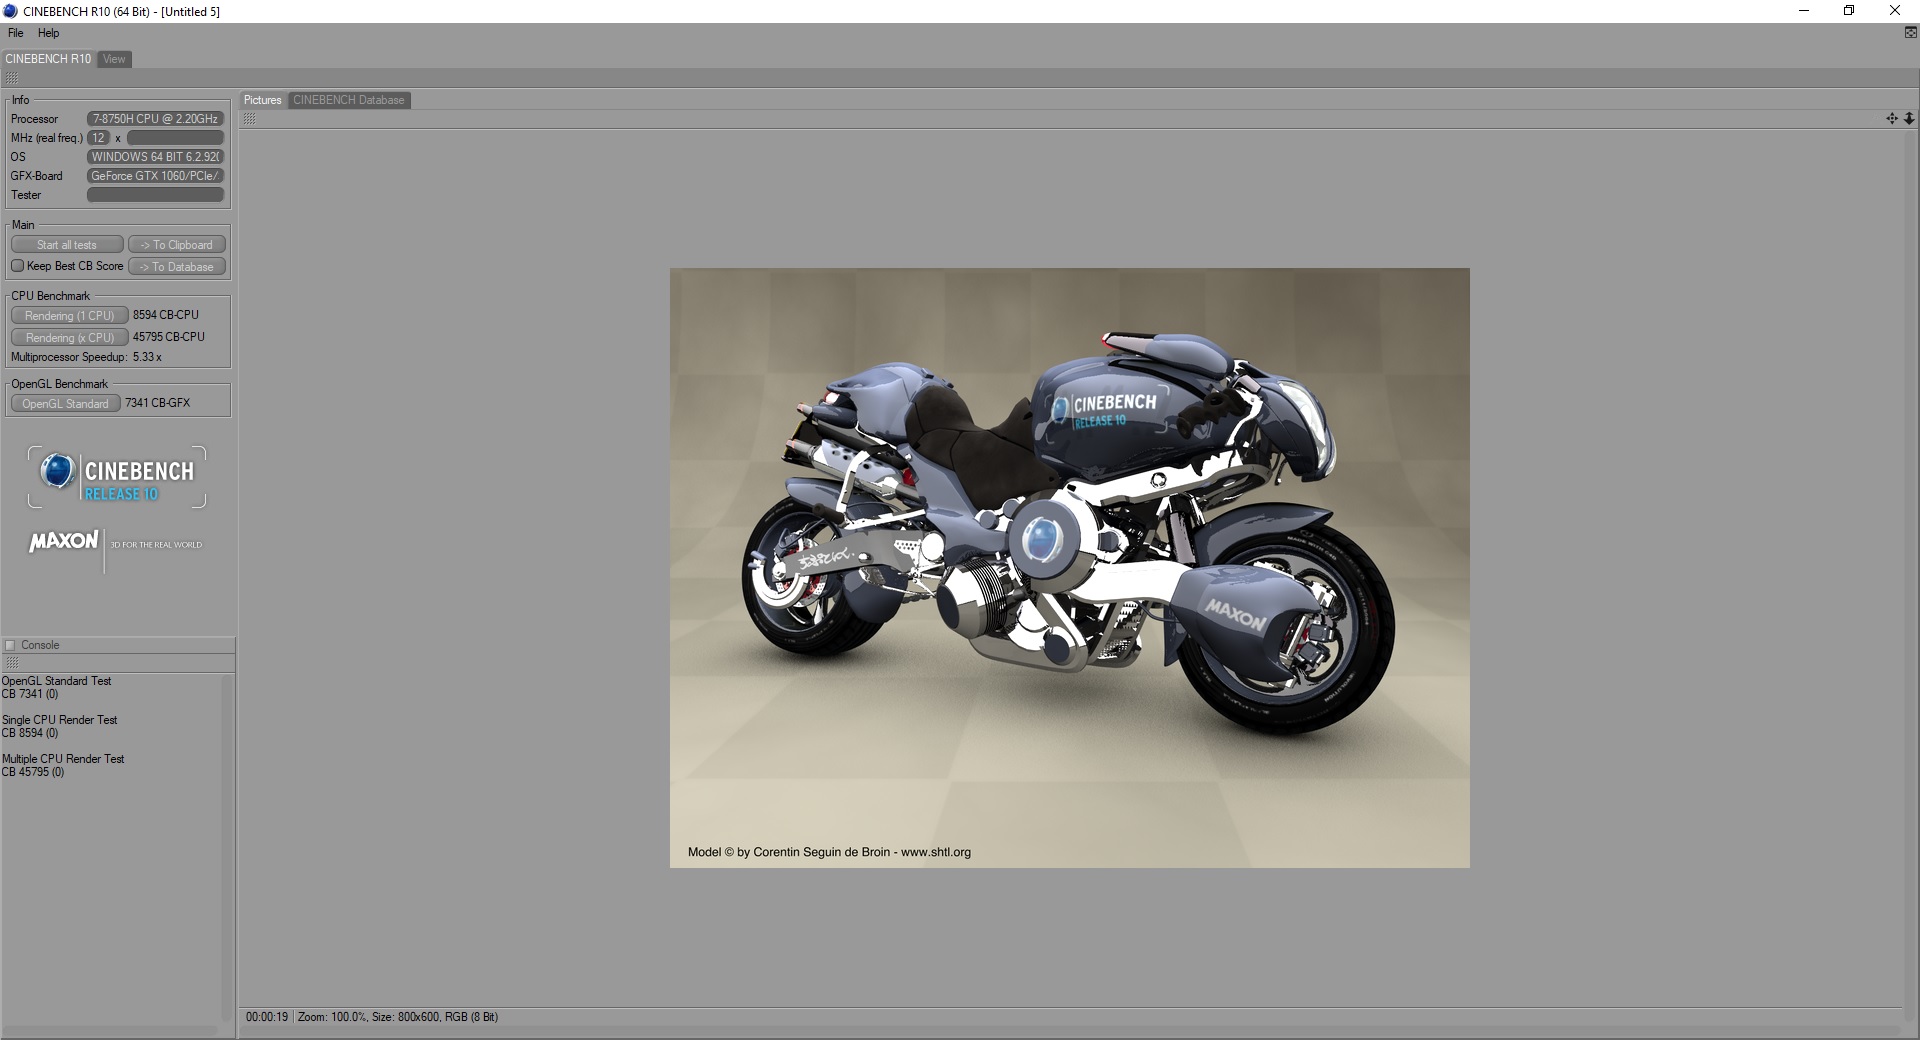
| Cinebench R10 | |
| Rendering Single CPUs 64Bit | |
| Gigabyte Sabre 17-W8 | |
| Average Intel Core i7-8750H (8472 - 8665, n=5) | |
| Rendering Multiple CPUs 64Bit | |
| Gigabyte Sabre 17-W8 | |
| Average Intel Core i7-8750H (33944 - 46384, n=5) | |
System Performance
The gain the Gigabyte Sabre 17 won over its competitors in the Cinebench benchmarks seems to be all but lost in the PCMark benchmarks. Compared to the two Asus devices with the same processor, the Sabre receives a Work score that is 4-7% lower. Even so, our test device comes in slightly ahead of the Razer Blade Pro and the MSI. The Sabre falls even further behind in the Home test—the two Asus competitors are 10% (TUF) and even 27% (Strix) faster.
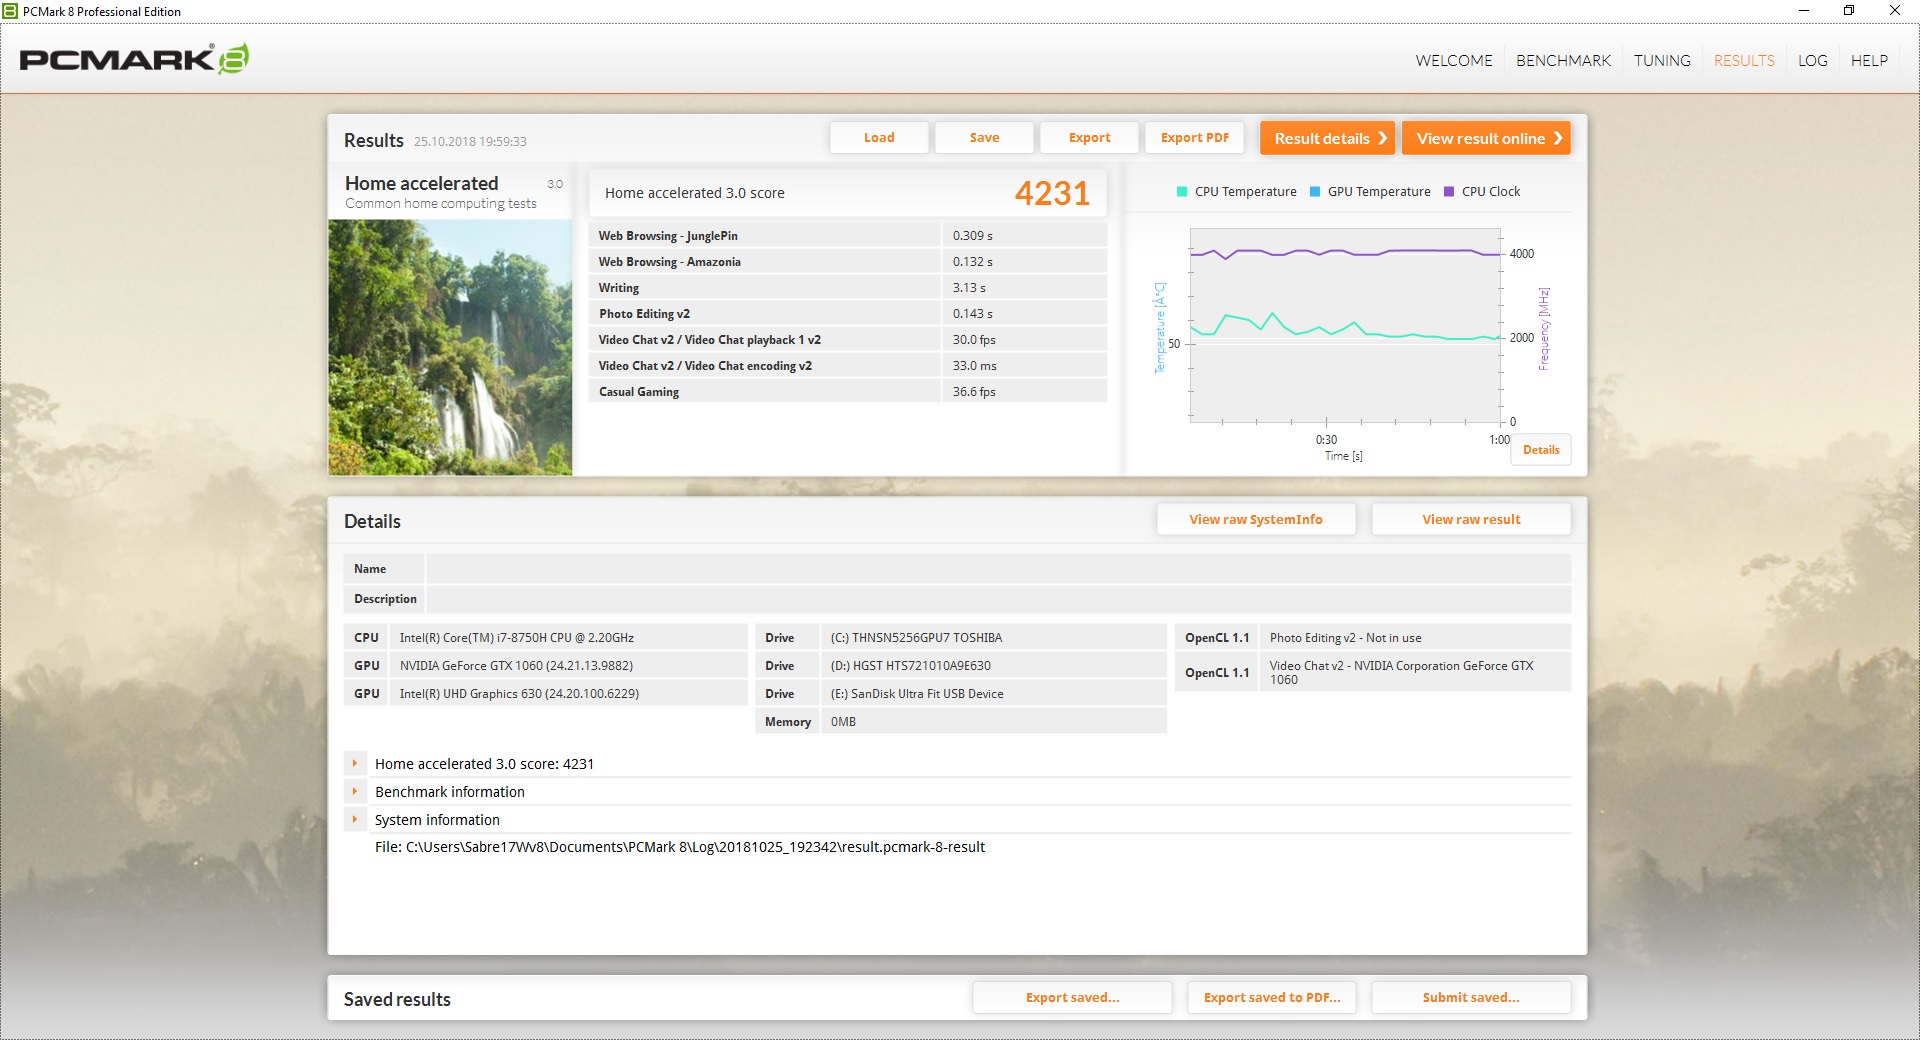
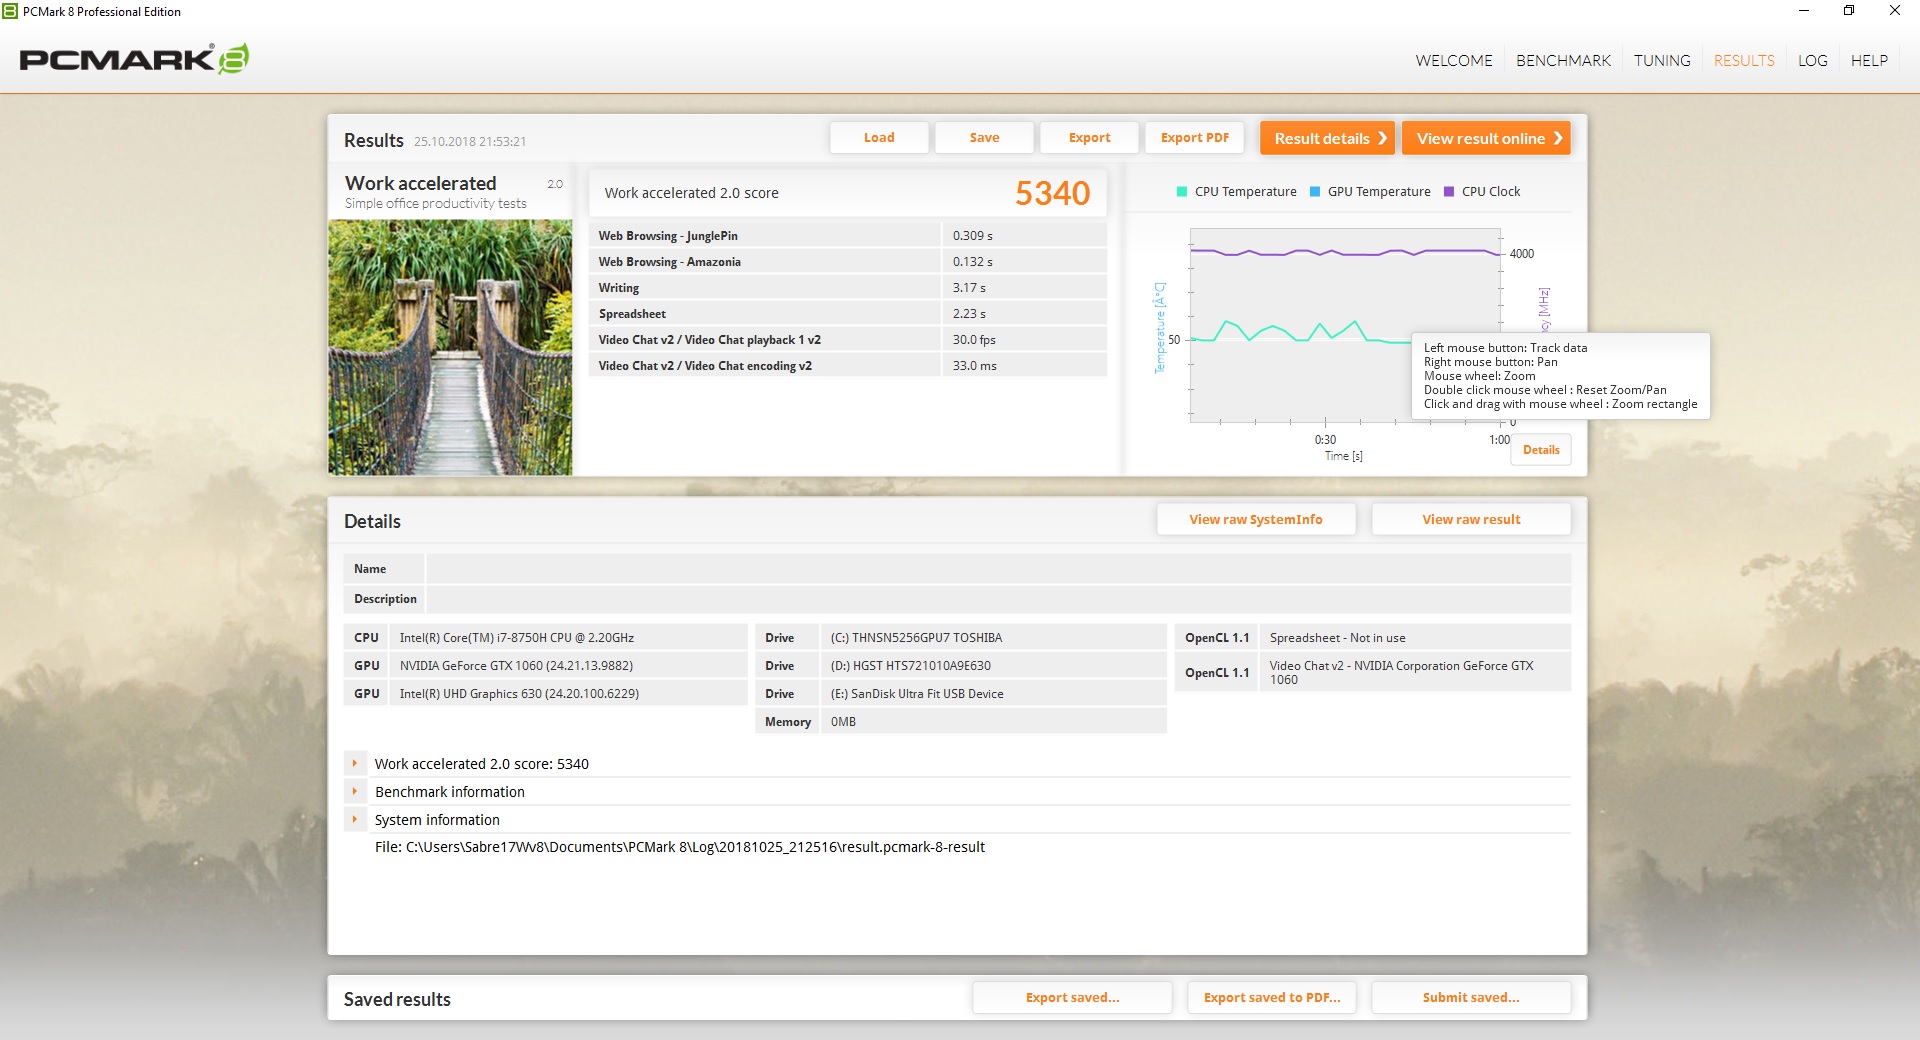
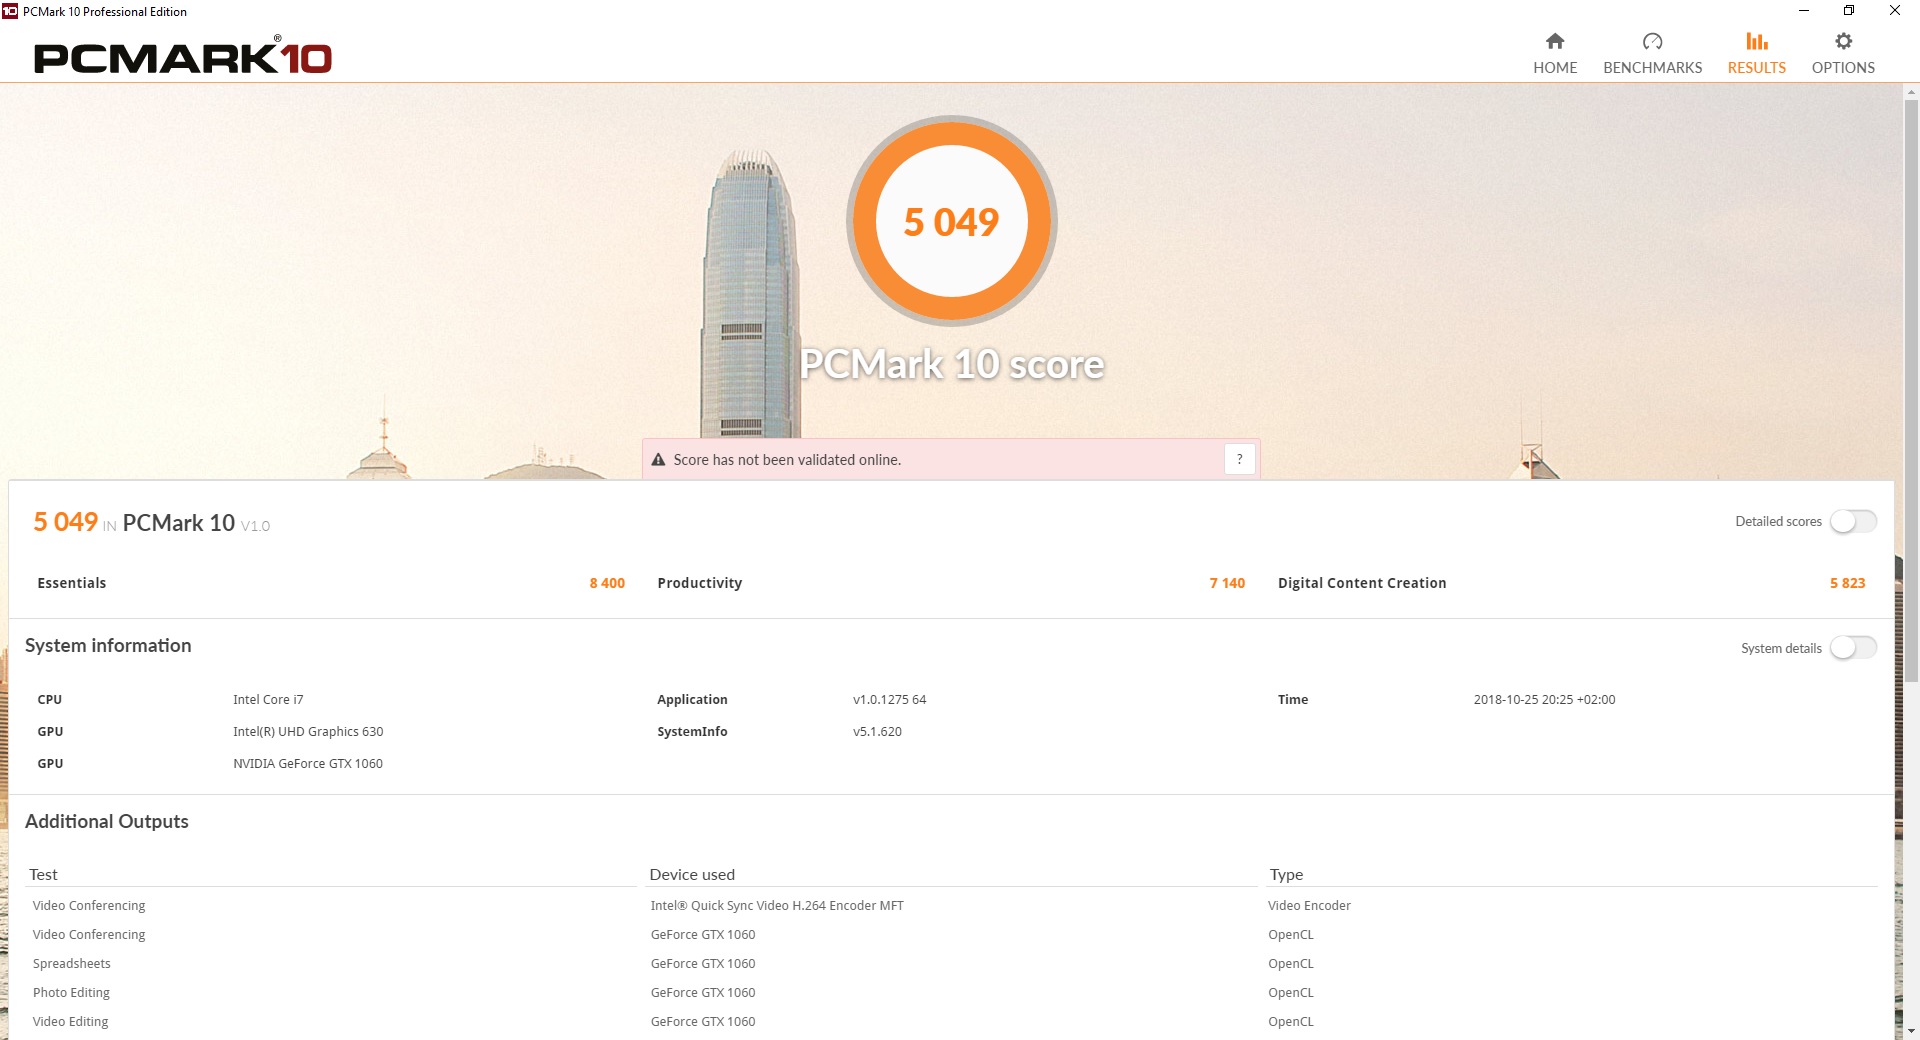
In everyday use, however, this difference will not be noticeable. All programs run smoothly; we did not experience any lags.
| PCMark 8 Home Score Accelerated v2 | 4231 points | |
| PCMark 8 Work Score Accelerated v2 | 5340 points | |
| PCMark 10 Score | 5049 points | |
Help | ||
Storage Solution
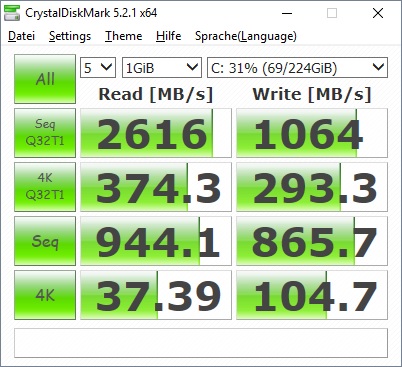
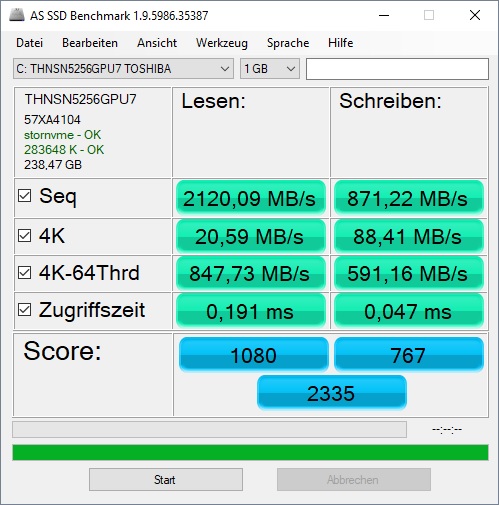
Our test model has a dual storage solution: Windows runs on a 256 GB Toshiba SSD, while larger data quantities can be stored on a 1-TB conventional hard drive. In our all-time top rankings, the former takes 57th place. True, this is not a Top 10 SSD, but it should be sufficiently fast.
In our test with CrystalDiskMark 5, however, the SSD achieved slightly below average results. On the other hand, AS SSD reports above average results. Overall, then, the Toshiba is solid where it ought to be. In everyday use, the drive tackles tasks effectively.
| Gigabyte Sabre 17-W8 Toshiba NVMe THNSN5256GPU7 | Asus TUF FX705GM WDC PC SN520 SDAPNUW-256G | Asus Strix GL703GM-DS74 Samsung PM961 MZVLW256HEHP | Razer Blade Pro RZ09-0220 Samsung SSD PM951 MZVLV256HCHP | MSI GP72VR 7RFX Samsung SM961 MZVKW512HMJP m.2 PCI-e | Average Toshiba NVMe THNSN5256GPU7 | |
|---|---|---|---|---|---|---|
| CrystalDiskMark 5.2 / 6 | 9% | 2% | -3% | 51% | 11% | |
| Write 4K (MB/s) | 104.7 | 104.2 0% | 87.8 -16% | 155.1 48% | 186 78% | 107.5 ? 3% |
| Read 4K (MB/s) | 37.39 | 41.46 11% | 38.41 3% | 44.22 18% | 55.6 49% | 38.8 ? 4% |
| Write Seq (MB/s) | 866 | 1295 50% | 1177 36% | 311.2 -64% | 1599 85% | 625 ? -28% |
| Read Seq (MB/s) | 944 | 1325 40% | 868 -8% | 1247 32% | 999 6% | 733 ? -22% |
| Write 4K Q32T1 (MB/s) | 293.3 | 282.8 -4% | 266.5 -9% | 310.3 6% | 493.3 68% | 466 ? 59% |
| Read 4K Q32T1 (MB/s) | 374.3 | 321.3 -14% | 307.1 -18% | 551 47% | 556 49% | 636 ? 70% |
| Write Seq Q32T1 (MB/s) | 1064 | 1301 22% | 1212 14% | 311.5 -71% | 1674 57% | 1109 ? 4% |
| Read Seq Q32T1 (MB/s) | 2616 | 1704 -35% | 3006 15% | 1560 -40% | 3083 18% | 2504 ? -4% |

Graphics Cards
When it comes to graphics cards, our test device relies on two models: the UHD Graphics 630 integrated into the processor enables Windows to run in an energy-efficient manner, while the dedicated Nvidia GTX 1060 is responsible for graphics-heavy tasks. Before the new 2000 generation was released, the latter was nominally the third-most powerful mobile graphics card (Max-Q variations notwithstanding) and should be well-suited for running graphics-heavy games.
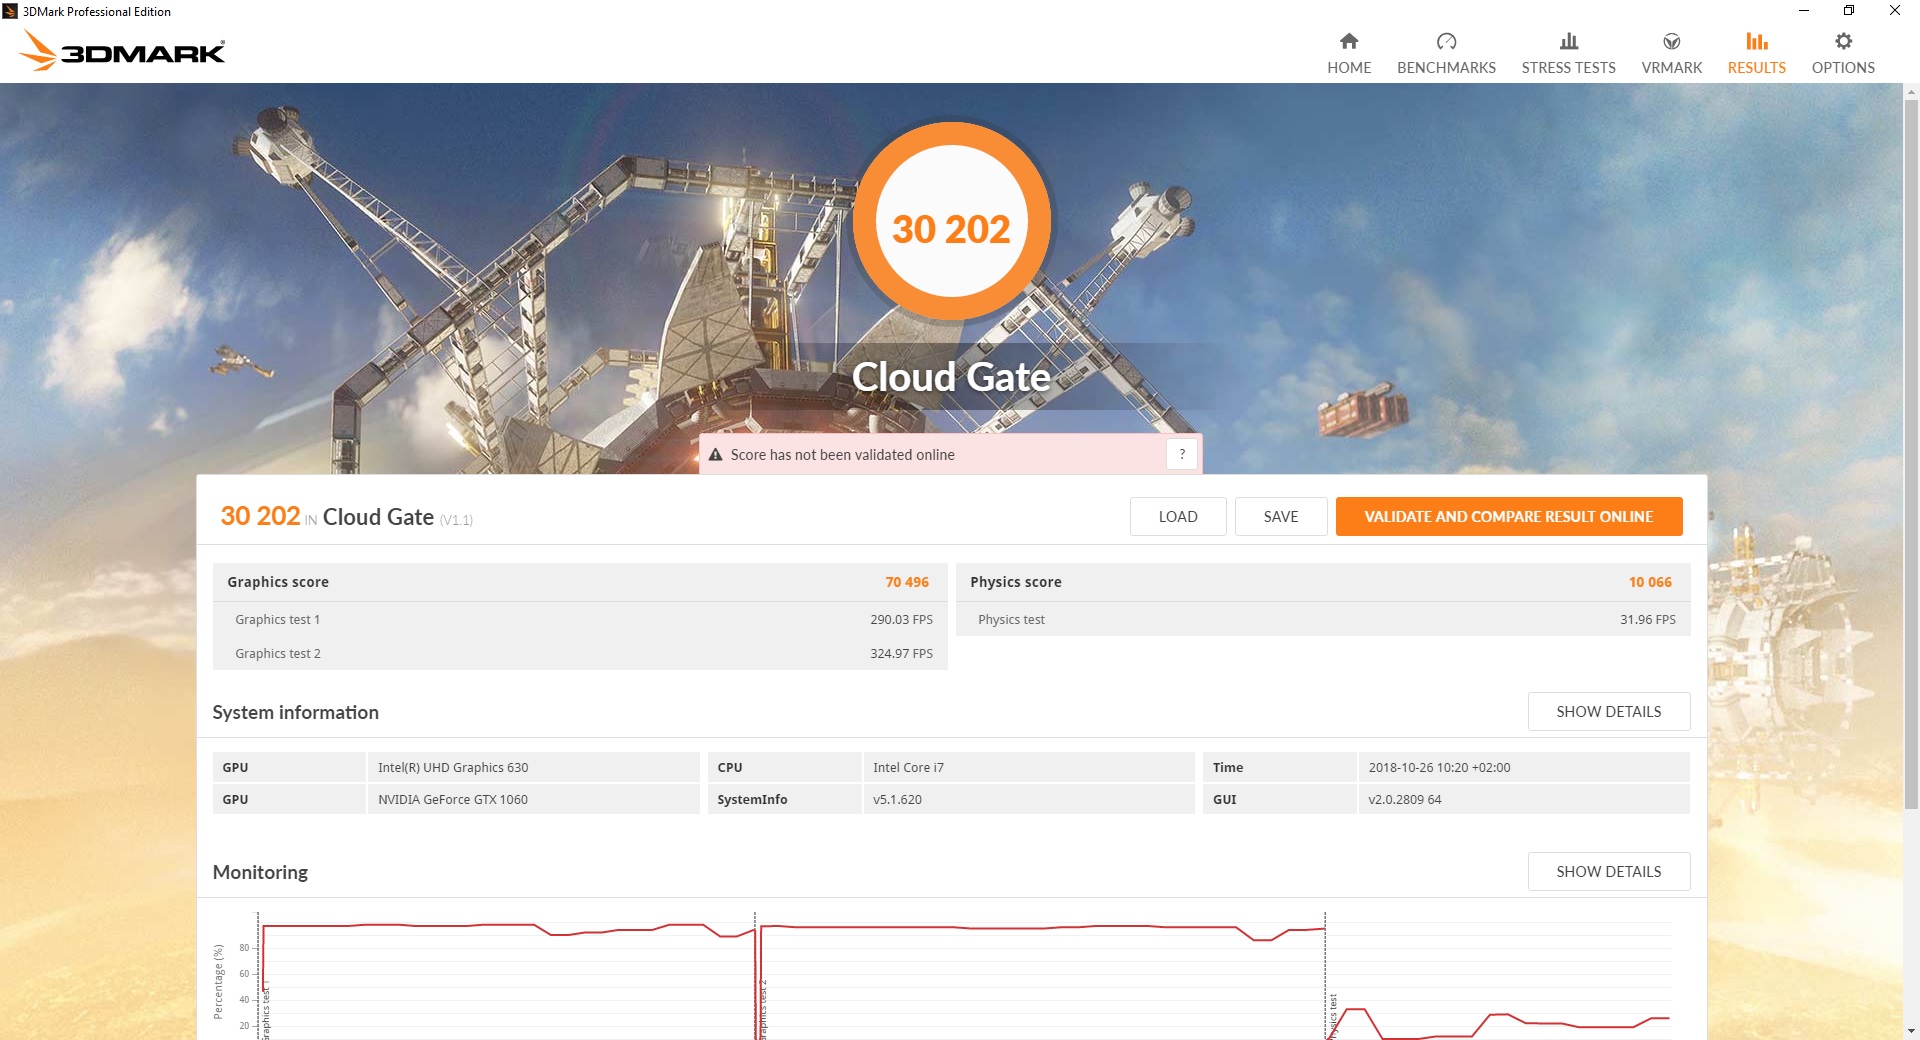
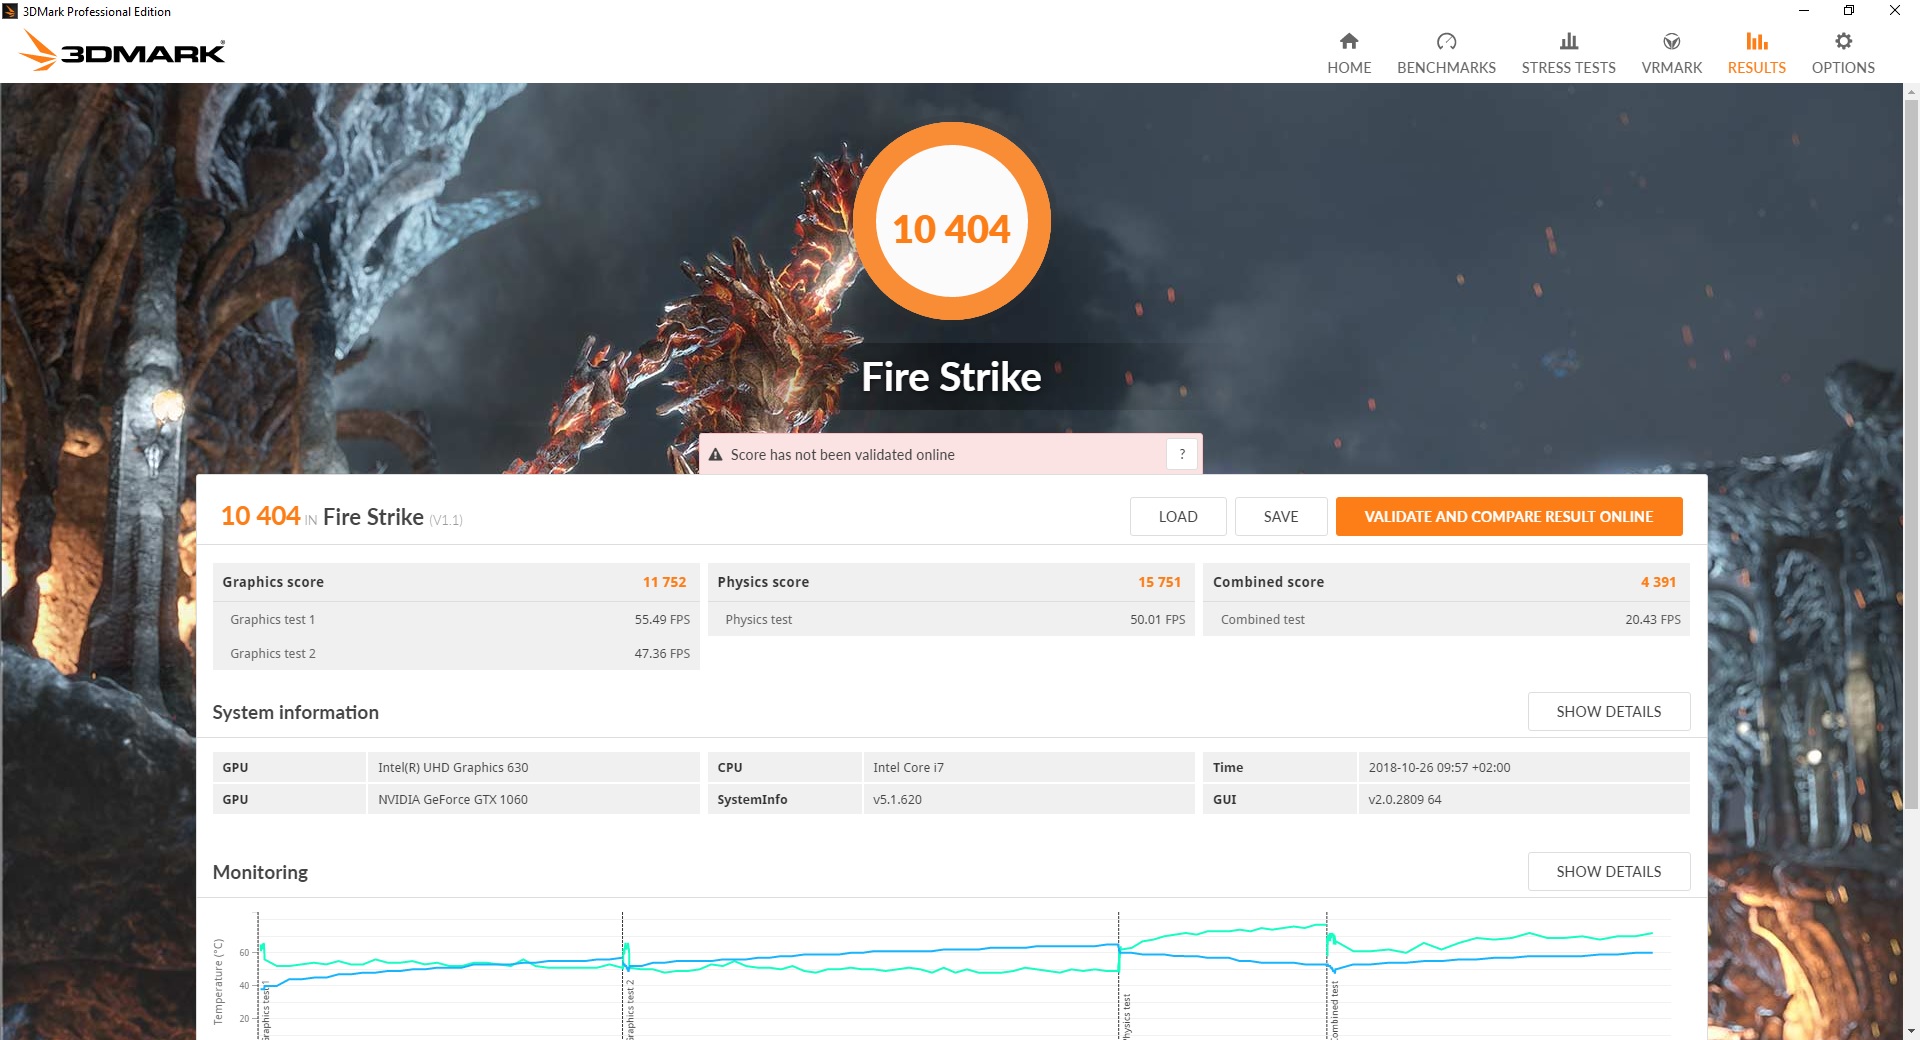
In 3DMark 11, the MSI clambers to the performance peak first, but the Sabre follows close behind in second place. Overall, the differences between the devices are fairly minimal here. In the 3DMark Fire Strike test, the picture looks similar—though the gaps of just 2% are negligible. In the Cloud Gate test, on the other hand, suddenly all the competitors perform between 9% (Razer) and 16% (Asus Strix) better than the Sabre. The result was reproducible, but it is also exactly average for a GTX 1060. Here the competition appears to be able to tickle out a little more performance.
We used the 3DMark 11 benchmark once again as our performance test in battery mode. Compared to the result in AC power mode, the score sank by almost 30%. Without a connection to a power socket, it can sometimes be necessary to lower a game's detail setting or resolution.
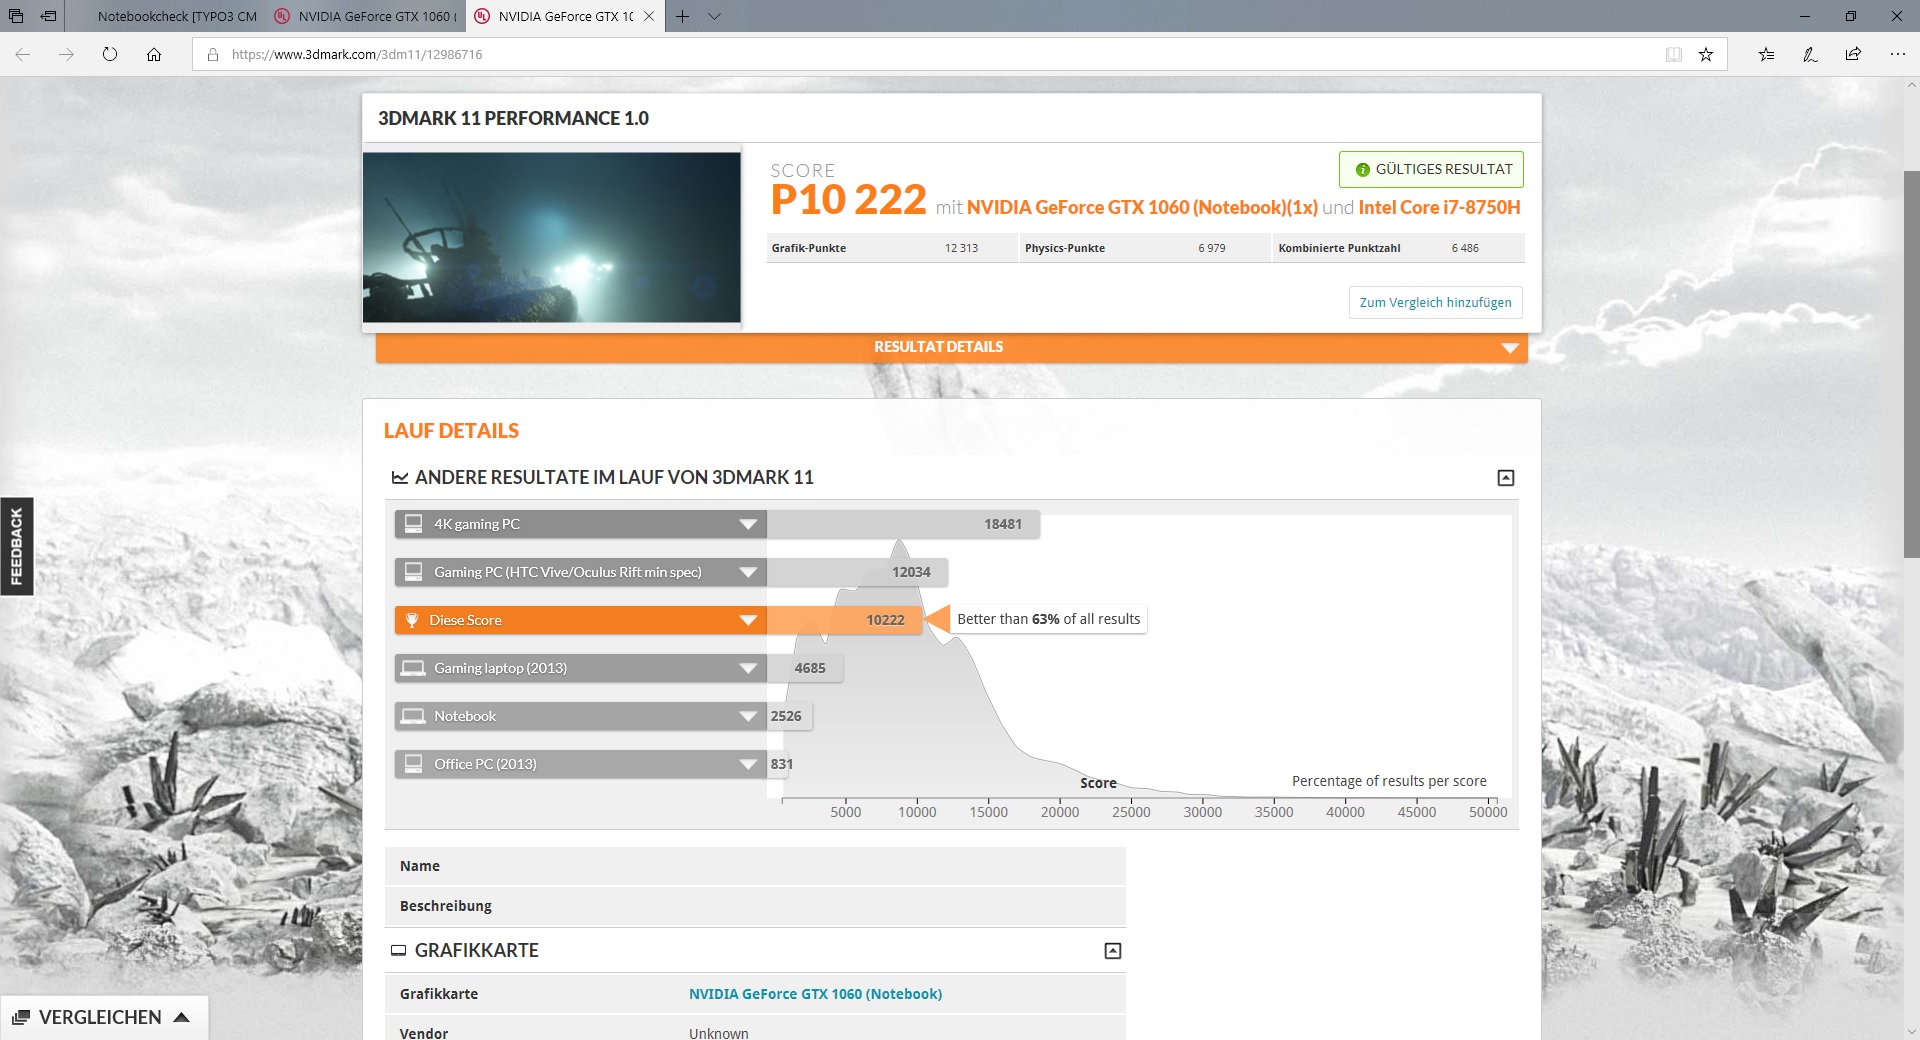
| 3DMark 11 Performance | 12678 points | |
| 3DMark Cloud Gate Standard Score | 30202 points | |
| 3DMark Fire Strike Score | 10404 points | |
Help | ||
Gaming Performance
The Sabre 17's gaming performance can be categorized as good. Even in graphics-heavy games, the performance is often sufficient for high detail settings in Full HD. Only at ultra settings does the Gigabyte sometimes start to stutter. This means, for example, that you can easily play “The Witcher 3” in Full HD at high details. If you switch to ultra, the frame rate falls to an average of 30 FPS. At that point, the stuttering is palpable and gets in the way of the fun. Below you can see our graph of the frame rate progression in “The Witcher 3” at ultra settings. From beginning to end, the progression is quite constant at 29-30 FPS. Our character is only standing in this instance—if it moved, the rate fell to 24 FPS.
“Rise of the Tomb Raider” can also be played smoothly at maximum details in Full HD; the frame rate here comes to around 60 FPS.
“Doom” also runs smooth as butter at 66 FPS in maximum details and Full HD.
The Witcher 3 framerate graph
Though the gaming performance is satisfactory, it nevertheless appears to be below average compared to the competition. This is especially apparent in our test of “The Witcher 3” at ultra settings. While the game is no longer playable on the Sabre at 24 FPS, most of the competition runs at least 12 FPS faster and thus in a playable range. This is, of course, very frustrating, given that an entire quality setting is not really available. The same situation occurs in other games as well; the Sabre 17 performs consistently below average in terms of graphics performance.
All in all, the Sabre 17's gaming performance is disappointing. It does not live up to its graphics potential. Most games are playable in Full HD and at high details, but compared to the class average, the Gigabyte laptop's deficit here can make a difference at high quality settings.
| The Witcher 3 | |
| 1024x768 Low Graphics & Postprocessing | |
| Asus Strix GL703GM-DS74 | |
| Average NVIDIA GeForce GTX 1060 Mobile (130.2 - 207, n=17) | |
| Gigabyte Sabre 17-W8 | |
| Average of class Multimedia (68 - 147, n=3, last 2 years) | |
| 1366x768 Medium Graphics & Postprocessing | |
| Asus Strix GL703GM-DS74 | |
| Average NVIDIA GeForce GTX 1060 Mobile (91.7 - 138.7, n=16) | |
| Gigabyte Sabre 17-W8 | |
| Average of class Multimedia (41 - 73, n=2, last 2 years) | |
| 1920x1080 High Graphics & Postprocessing (Nvidia HairWorks Off) | |
| Average of class Multimedia (22 - 157, n=5, last 2 years) | |
| Average NVIDIA GeForce GTX 1060 Mobile (52.6 - 80.6, n=49) | |
| Razer Blade Pro RZ09-0220 | |
| Asus TUF FX705GM | |
| Asus Strix GL703GM-DS74 | |
| Gigabyte Sabre 17-W8 | |
| 1920x1080 Ultra Graphics & Postprocessing (HBAO+) | |
| Average of class Multimedia (11 - 107, n=5, last 2 years) | |
| Asus Strix GL703GM-DS74 | |
| MSI GP72VR 7RFX | |
| Average NVIDIA GeForce GTX 1060 Mobile (24 - 42.3, n=60) | |
| Razer Blade Pro RZ09-0220 | |
| Asus TUF FX705GM | |
| Gigabyte Sabre 17-W8 | |
| Rise of the Tomb Raider | |
| 1024x768 Lowest Preset | |
| Asus Strix GL703GM-DS74 | |
| Average NVIDIA GeForce GTX 1060 Mobile (105.7 - 203, n=15) | |
| Gigabyte Sabre 17-W8 | |
| 1366x768 Medium Preset AF:2x | |
| Asus Strix GL703GM-DS74 | |
| Average NVIDIA GeForce GTX 1060 Mobile (82.2 - 140, n=14) | |
| Gigabyte Sabre 17-W8 | |
| 1920x1080 High Preset AA:FX AF:4x | |
| Asus Strix GL703GM-DS74 | |
| Gigabyte Sabre 17-W8 | |
| Average NVIDIA GeForce GTX 1060 Mobile (65.3 - 82, n=24) | |
| Razer Blade Pro RZ09-0220 | |
| 1920x1080 Very High Preset AA:FX AF:16x | |
| Asus Strix GL703GM-DS74 | |
| Average NVIDIA GeForce GTX 1060 Mobile (51 - 68.8, n=37) | |
| Gigabyte Sabre 17-W8 | |
| Razer Blade Pro RZ09-0220 | |
| Doom | |
| 1280x720 Low Preset | |
| Average NVIDIA GeForce GTX 1060 Mobile (121.4 - 155.3, n=3) | |
| Gigabyte Sabre 17-W8 | |
| 1366x768 Medium Preset | |
| Average NVIDIA GeForce GTX 1060 Mobile (115.5 - 146.4, n=3) | |
| Gigabyte Sabre 17-W8 | |
| 1920x1080 Medium Preset | |
| Average NVIDIA GeForce GTX 1060 Mobile (72.3 - 110, n=3) | |
| Gigabyte Sabre 17-W8 | |
| 1920x1080 High Preset AA:FX | |
| Average NVIDIA GeForce GTX 1060 Mobile (68.6 - 102.2, n=6) | |
| Gigabyte Sabre 17-W8 | |
| 1920x1080 Ultra Preset AA:SM | |
| Average NVIDIA GeForce GTX 1060 Mobile (66 - 103.3, n=17) | |
| Gigabyte Sabre 17-W8 | |
| low | med. | high | ultra | |
|---|---|---|---|---|
| The Witcher 3 (2015) | 131.3 | 91.7 | 53.9 | 24 |
| Rise of the Tomb Raider (2016) | 113.4 | 82.2 | 74.4 | 60.9 |
| Doom (2016) | 121.4 | 115.5 | 68.6 | 66 |
Emissions - Cool and quiet Gigabyte laptop
Noise Emissions

When it comes to background noise, in idle mode, the Sabre is somewhat louder than the competition. The fans almost never stand still and are thus always faintly audible, though not to a bothersome extent. Under load, the laptop's behavior is comparatively inconspicuous. Under average load, the fans generate around 43 db(A) of noise. In a direct comparison, only the expensive Razer Blade Pro does significantly better here. But the same Razer Blade stumbles under maximum load—here the Sabre (along with the other competitors) is actually somewhat quieter than the luxury model.
The fans turn at a relatively constant pace without any irritating subtones, reliably spinning heat out of the case. The increase in fan speed between idle and load is also steady and unobtrusive, rather than sudden and bothersome.
| Gigabyte Sabre 17-W8 GeForce GTX 1060 Mobile, i7-8750H, Toshiba NVMe THNSN5256GPU7 | Asus TUF FX705GM GeForce GTX 1060 Mobile, i7-8750H, WDC PC SN520 SDAPNUW-256G | Asus Strix GL703GM-DS74 GeForce GTX 1060 Mobile, i7-8750H, Samsung PM961 MZVLW256HEHP | Razer Blade Pro RZ09-0220 GeForce GTX 1060 Mobile, i7-7700HQ, Samsung SSD PM951 MZVLV256HCHP | MSI GP72VR 7RFX GeForce GTX 1060 Mobile, i7-7700HQ, Samsung SM961 MZVKW512HMJP m.2 PCI-e | |
|---|---|---|---|---|---|
| Noise | -7% | 4% | 9% | 2% | |
| off / environment * (dB) | 30.5 | 29 5% | 28.6 6% | 28.1 8% | 28.3 7% |
| Idle Minimum * (dB) | 32.1 | 32 -0% | 29.4 8% | 29.5 8% | 29.2 9% |
| Idle Average * (dB) | 32.1 | 33 -3% | 29.4 8% | 29.6 8% | 29.2 9% |
| Idle Maximum * (dB) | 32.3 | 44 -36% | 33.7 -4% | 29.6 8% | 37 -15% |
| Load Average * (dB) | 42.9 | 46 -7% | 41.2 4% | 31.6 26% | 43.7 -2% |
| Load Maximum * (dB) | 48.8 | 50 -2% | 48.3 1% | 51.8 -6% | 46.4 5% |
| Witcher 3 ultra * (dB) | 48 | 47.3 | 46 | 45.7 |
* ... smaller is better
Noise level
| Idle |
| 32.1 / 32.1 / 32.3 dB(A) |
| HDD |
| 32.4 dB(A) |
| Load |
| 42.9 / 48.8 dB(A) |
 | ||
30 dB silent 40 dB(A) audible 50 dB(A) loud |
||
min: | ||
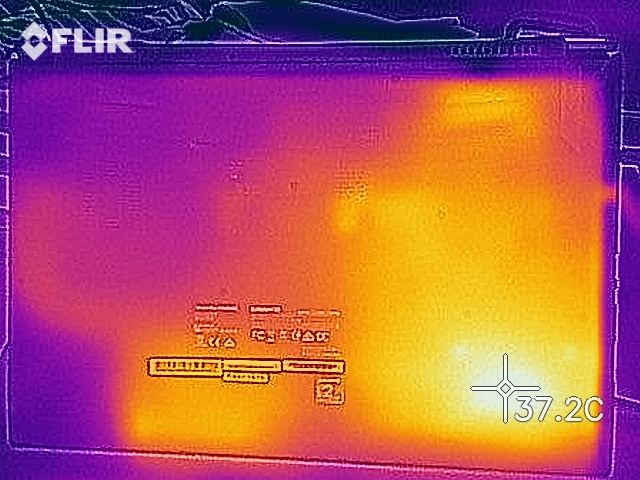
Temperature

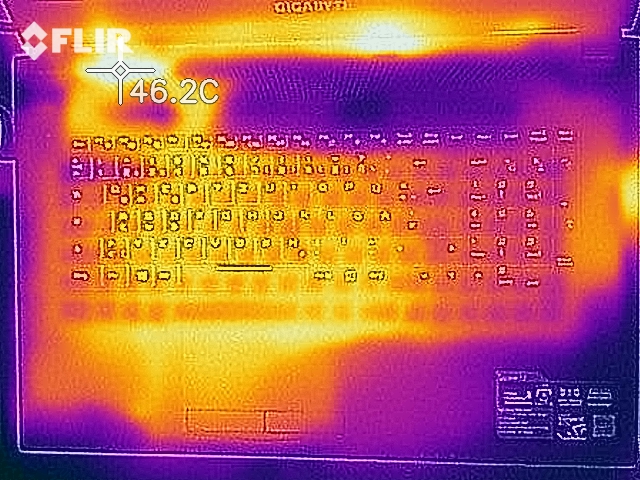
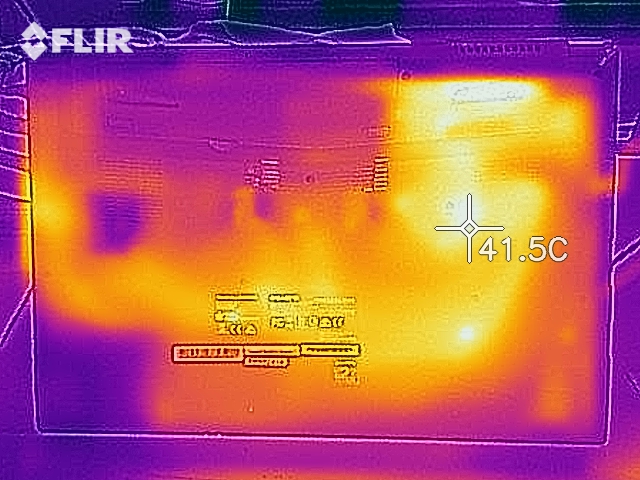
The Sabre's heat generation can be safely categorized as moderate. Even under higher levels of stress, the laptop's surfaces do not heat to more than 35°C (95°F). Inside, the temperatures get around 10°C (18°F) hotter. Particularly under load, some of the competition heats up significantly more. However, these devices also perform better—at least in graphics-heavy applications. The palm rest on the left side sometimes gets a little hot. 35°C (95°F) is still acceptable, though, and the right side remains cooler.
Our stress test, which lasts at least 1 hour, demonstrates that the CPU and GPU temperatures are cooled to a quite constant 60°C (140°F). As a result, the CPU can continue its work right at its base clock rate; the GPU's clock rate falls to 1050 MHz. These throttlings are noticeable in 3D mode. When we ran 3DMark 11 once again directly following the stress test, the Sabre only managed around 5000 points, rather than its original 12000. In exchange, the device's temperatures always remain in a moderate range.
| Gigabyte Sabre 17-W8 GeForce GTX 1060 Mobile, i7-8750H, Toshiba NVMe THNSN5256GPU7 | Asus TUF FX705GM GeForce GTX 1060 Mobile, i7-8750H, WDC PC SN520 SDAPNUW-256G | Asus Strix GL703GM-DS74 GeForce GTX 1060 Mobile, i7-8750H, Samsung PM961 MZVLW256HEHP | Razer Blade Pro RZ09-0220 GeForce GTX 1060 Mobile, i7-7700HQ, Samsung SSD PM951 MZVLV256HCHP | MSI GP72VR 7RFX GeForce GTX 1060 Mobile, i7-7700HQ, Samsung SM961 MZVKW512HMJP m.2 PCI-e | |
|---|---|---|---|---|---|
| Heat | -27% | -27% | -8% | -35% | |
| Maximum Upper Side * (°C) | 35 | 54 -54% | 54.6 -56% | 48.2 -38% | 53.8 -54% |
| Maximum Bottom * (°C) | 34.3 | 53 -55% | 41.2 -20% | 43.2 -26% | 52.2 -52% |
| Idle Upper Side * (°C) | 30.1 | 30 -0% | 35 -16% | 25.4 16% | 37.2 -24% |
| Idle Bottom * (°C) | 30.5 | 30 2% | 35.2 -15% | 25.8 15% | 34 -11% |
* ... smaller is better
(+) The maximum temperature on the upper side is 35 °C / 95 F, compared to the average of 36.8 °C / 98 F, ranging from 21 to 71 °C for the class Multimedia.
(+) The bottom heats up to a maximum of 34.3 °C / 94 F, compared to the average of 39.1 °C / 102 F
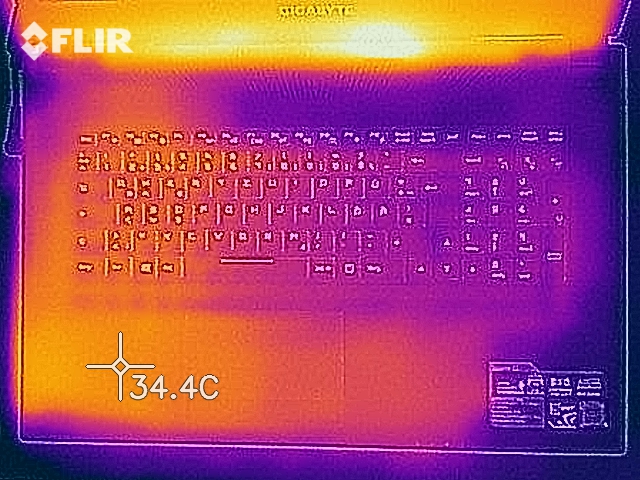
(+) In idle usage, the average temperature for the upper side is 27.8 °C / 82 F, compared to the device average of 31.3 °C / 88 F.
(+) The palmrests and touchpad are reaching skin temperature as a maximum (34.6 °C / 94.3 F) and are therefore not hot.
(-) The average temperature of the palmrest area of similar devices was 28.7 °C / 83.7 F (-5.9 °C / -10.6 F).
Speakers
In a 17-inch case, there is generally enough room for somewhat superior speakers compared to smaller models. However, the Sabre's speakers are not particularly good. They are extremely quiet—even at full volume, many applications are only reasonably audible in quieter environments. The sound is also very tinny and lacking in bass. Our sound test reports that 98% of all devices in this class are equipped with better speakers.
As a result, it is better to reach for a pair of headphones or some external speakers. The Sabre is outfitted with an audio output jack and a microphone input jack for this purpose. The latter also functions as a line-in.
Gigabyte Sabre 17-W8 audio analysis
(-) | not very loud speakers (69.2 dB)
Bass 100 - 315 Hz
(-) | nearly no bass - on average 25.8% lower than median
(±) | linearity of bass is average (8.6% delta to prev. frequency)
Mids 400 - 2000 Hz
(±) | higher mids - on average 8.1% higher than median
(±) | linearity of mids is average (12.8% delta to prev. frequency)
Highs 2 - 16 kHz
(±) | higher highs - on average 7.7% higher than median
(-) | highs are not linear (15.3% delta to prev. frequency)
Overall 100 - 16.000 Hz
(-) | overall sound is not linear (35.6% difference to median)
Compared to same class
» 98% of all tested devices in this class were better, 0% similar, 1% worse
» The best had a delta of 5%, average was 17%, worst was 45%
Compared to all devices tested
» 94% of all tested devices were better, 1% similar, 5% worse
» The best had a delta of 4%, average was 23%, worst was 134%
Asus TUF FX705GM audio analysis
(±) | speaker loudness is average but good (76 dB)
Bass 100 - 315 Hz
(-) | nearly no bass - on average 16.1% lower than median
(±) | linearity of bass is average (11.5% delta to prev. frequency)
Mids 400 - 2000 Hz
(+) | balanced mids - only 4% away from median
(+) | mids are linear (5.7% delta to prev. frequency)
Highs 2 - 16 kHz
(±) | higher highs - on average 5.1% higher than median
(+) | highs are linear (4.6% delta to prev. frequency)
Overall 100 - 16.000 Hz
(±) | linearity of overall sound is average (21.6% difference to median)
Compared to same class
» 77% of all tested devices in this class were better, 5% similar, 18% worse
» The best had a delta of 6%, average was 18%, worst was 132%
Compared to all devices tested
» 61% of all tested devices were better, 7% similar, 32% worse
» The best had a delta of 4%, average was 23%, worst was 134%
Energy Management - Energy-saving gaming laptop
Energy Consumption
In terms of energy consumption, the Sabre only goes overboard under maximum load—otherwise it is comparatively rather frugal. In many application scenarios, the Gigabyte is the most energy-saving device in our direct comparison list. Only under maximum load does the Sabre devour more power than the competition (a maximum of 187 watts); in every other state, our test device needs less energy than its direct rivals.
| Off / Standby | |
| Idle | |
| Load |
|
Key:
min: | |
| Gigabyte Sabre 17-W8 i7-8750H, GeForce GTX 1060 Mobile, Toshiba NVMe THNSN5256GPU7, TN, 1920x1080, 17.3" | Asus TUF FX705GM i7-8750H, GeForce GTX 1060 Mobile, WDC PC SN520 SDAPNUW-256G, IPS, 1920x1080, 17.3" | Asus Strix GL703GM-DS74 i7-8750H, GeForce GTX 1060 Mobile, Samsung PM961 MZVLW256HEHP, TN LED, 1920x1080, 17.3" | Razer Blade Pro RZ09-0220 i7-7700HQ, GeForce GTX 1060 Mobile, Samsung SSD PM951 MZVLV256HCHP, IPS, 1920x1080, 17.3" | MSI GP72VR 7RFX i7-7700HQ, GeForce GTX 1060 Mobile, Samsung SM961 MZVKW512HMJP m.2 PCI-e, TN LED, 1920x1080, 17.3" | Average NVIDIA GeForce GTX 1060 Mobile | Average of class Multimedia | |
|---|---|---|---|---|---|---|---|
| Power Consumption | -26% | -54% | -1% | -31% | -17% | 30% | |
| Idle Minimum * (Watt) | 9.3 | 13 -40% | 18.88 -103% | 10.6 -14% | 17.3 -86% | 12.7 ? -37% | 5.62 ? 40% |
| Idle Average * (Watt) | 14.8 | 17 -15% | 24.36 -65% | 16 -8% | 22.5 -52% | 17.5 ? -18% | 10.2 ? 31% |
| Idle Maximum * (Watt) | 22 | 24 -9% | 32.27 -47% | 16.4 25% | 22.5 -2% | 21.8 ? 1% | 12.5 ? 43% |
| Load Average * (Watt) | 63 | 106 -68% | 107.74 -71% | 75.9 -20% | 85.1 -35% | 91.7 ? -46% | 65 ? -3% |
| Load Maximum * (Watt) | 187 | 179 4% | 160.28 14% | 163.8 12% | 151.3 19% | 156.4 ? 16% | 111.9 ? 40% |
| Witcher 3 ultra * (Watt) | 151 | 142 | 111.2 | 141.7 |
* ... smaller is better
Battery Life
Our battery life analysis revealed the following results:
By means of the BatteryEater tool, our idle test determines the maximum battery life users can expect. The display brightness is set to minimum, all the communication modules are turned off, and the energy-saving profile is active. In this state, the Sabre comes to a maximum of 6 hours and 50 minutes; only the Razer Blade does somewhat better here.
Our WLAN test, which is designed to simulate practical, everyday use, determines a computer's run time when surfing the internet via a surf script that loads new web pages on a minute cycle. The energy-saving profile is active, the brightness is set to 150 cd/m², and WLAN is active. Here the Sabre lasts 5 hours and 21 minutes. Once again, only the Razer Blade outperforms our Gigabyte in this test.
After that, we test a laptop's run time during video playback of an H.264 encoded film in a loop. The energy-saving profile is active again, as is the airplane mode. Here, too, our test model keeps going for around 5 hours and 20 minutes—and once again, only the Razer Blade overtakes it.
We determine the minimum battery life using the Battery Eater Classic Test, which simulates a high level of load. The display brightness is set to maximum, all communication modules are turned on, and the high performance energy profile is active. The Gigabyte reaches 84 minutes in this test.
Overall, the Sabre 17 performs very well here. In all but one instance, it comes in second behind the Razer Blade Pro. Only under high levels of load does the Sabre fail to outlast the majority of its competitors.
| Gigabyte Sabre 17-W8 i7-8750H, GeForce GTX 1060 Mobile, 62 Wh | Asus TUF FX705GM i7-8750H, GeForce GTX 1060 Mobile, 64 Wh | Asus Strix GL703GM-DS74 i7-8750H, GeForce GTX 1060 Mobile, 74 Wh | Razer Blade Pro RZ09-0220 i7-7700HQ, GeForce GTX 1060 Mobile, 70 Wh | MSI GP72VR 7RFX i7-7700HQ, GeForce GTX 1060 Mobile, 41 Wh | Average of class Multimedia | |
|---|---|---|---|---|---|---|
| Battery Runtime | ||||||
| WiFi Websurfing (h) | 5.4 | 4.5 -17% | 3.6 -33% | 7 30% | 2.1 -61% | 12.3 ? 128% |
| Battery runtime | -5% | -19% | 30% | 27% | 165% | |
| Reader / Idle (h) | 6.9 | 6.3 -9% | 5.3 -23% | 12 74% | 0.7 -90% | 24.9 ? 261% |
| H.264 (h) | 5.3 | 4.3 -19% | 16.8 ? 217% | |||
| Load (h) | 1.4 | 1.6 14% | 1.2 -14% | 1.2 -14% | 3.4 143% | 1.645 ? 18% |
| Total Average (Program / Settings) | -11% /
-8% | -26% /
-23% | 30% /
30% | -17% /
-3% | 147% /
156% |
Verdict
Pros
Cons
All in all, the Gigabyte Sabre 17 WV8 is a good desktop replacement that can handle almost any task. It does a lot right, but it tails in a crucial area—gaming performance.
The display is clearly designed for gaming and offers very good response times, though in exchange users will have to go without brilliant colors. In almost every respect, the laptop's performance is more than satisfactory—except in terms of gaming, where its direct rivals perform better. The Sabre trumps the competition in other applications, for example in the Cinebench benchmarks. Its energy balance is also good. Even under load, the Gigabyte always remains cool and quiet. It scores additional points in terms of energy consumption and battery life. The many connections for external monitors are also a great feature.
The Sabre deserves criticism for its weak gaming performance and its tinny, too quiet speakers. The Sabre 17 seems to needlessly gamble away a number of points on this first count. The laptop can be purchased for around 1500 Euros (~$1700).
Prospective buyers looking for a quiet, cool and comparatively energy-saving desktop replacement are in the right place with the Sabre 17. But if gaming performance is a first priority, it would be better to look for an alternative.
Gigabyte Sabre 17-W8
- 11/01/2018 v6 (old)
Christian Hintze
Price comparison
