Dell Precision 3530 (Xeon E-2176M, Quadro P600) Workstation Review
Recent years have seen a renewed focus on affordability and consumer choice in the mobile workstation market. While workstation-class notebooks used to be some of the most expensive machines available (and many still are), it seems that companies are trying to offer cheaper options. Enter the Precision 3530. While not necessarily "cheap" by most laptop users' standards, the starting MSRP of USD $949 is a bargain for the workstation market. (For a bit of context, most workstations are priced between $2000-3000 and can run much higher.)
For less than $1000, users can expect a decent amount of power under the hood (Core i5-8300H, Quadro P600), but in typical Dell fashion, there are several configurations available. Our review unit today boasts some of the best specs users can choose: a six-core Intel Xeon E-2176M, an Nvidia Quadro P600, 32 GB of RAM, and a 512 GB PCIe SSD. This bumps the price to $2650 at the time of this writing. We'll see if the upgrades are worth the increased price.
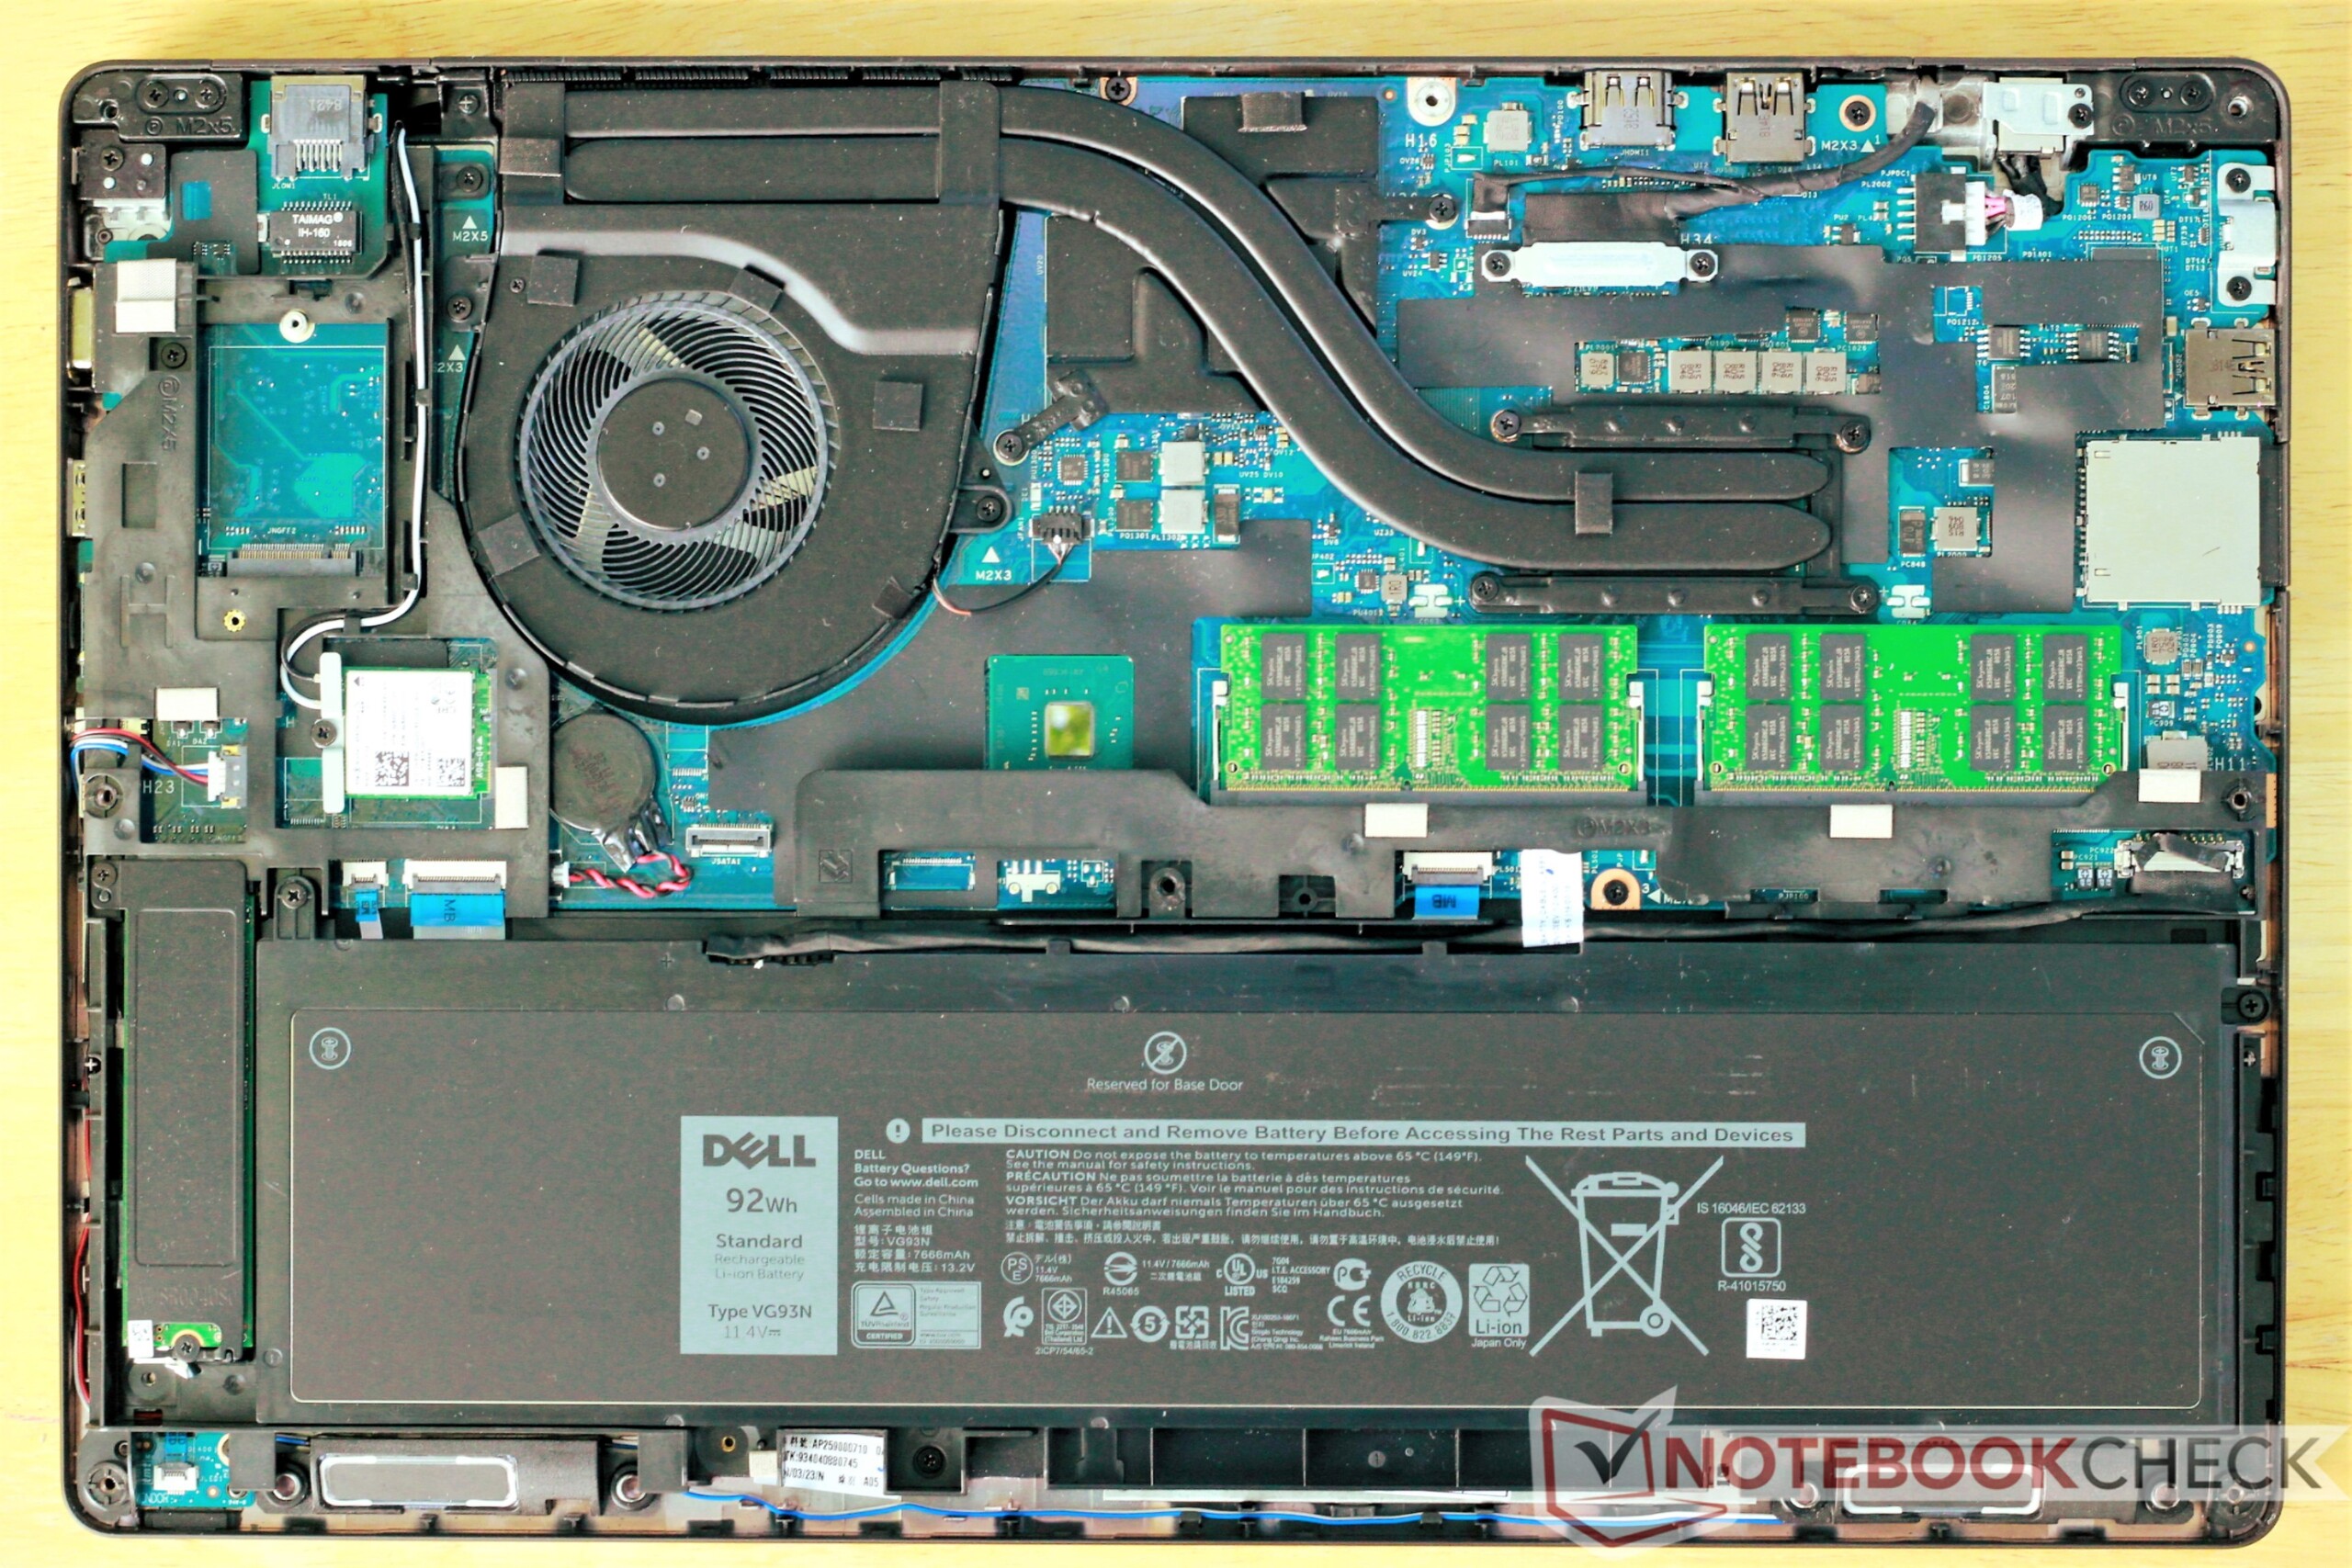
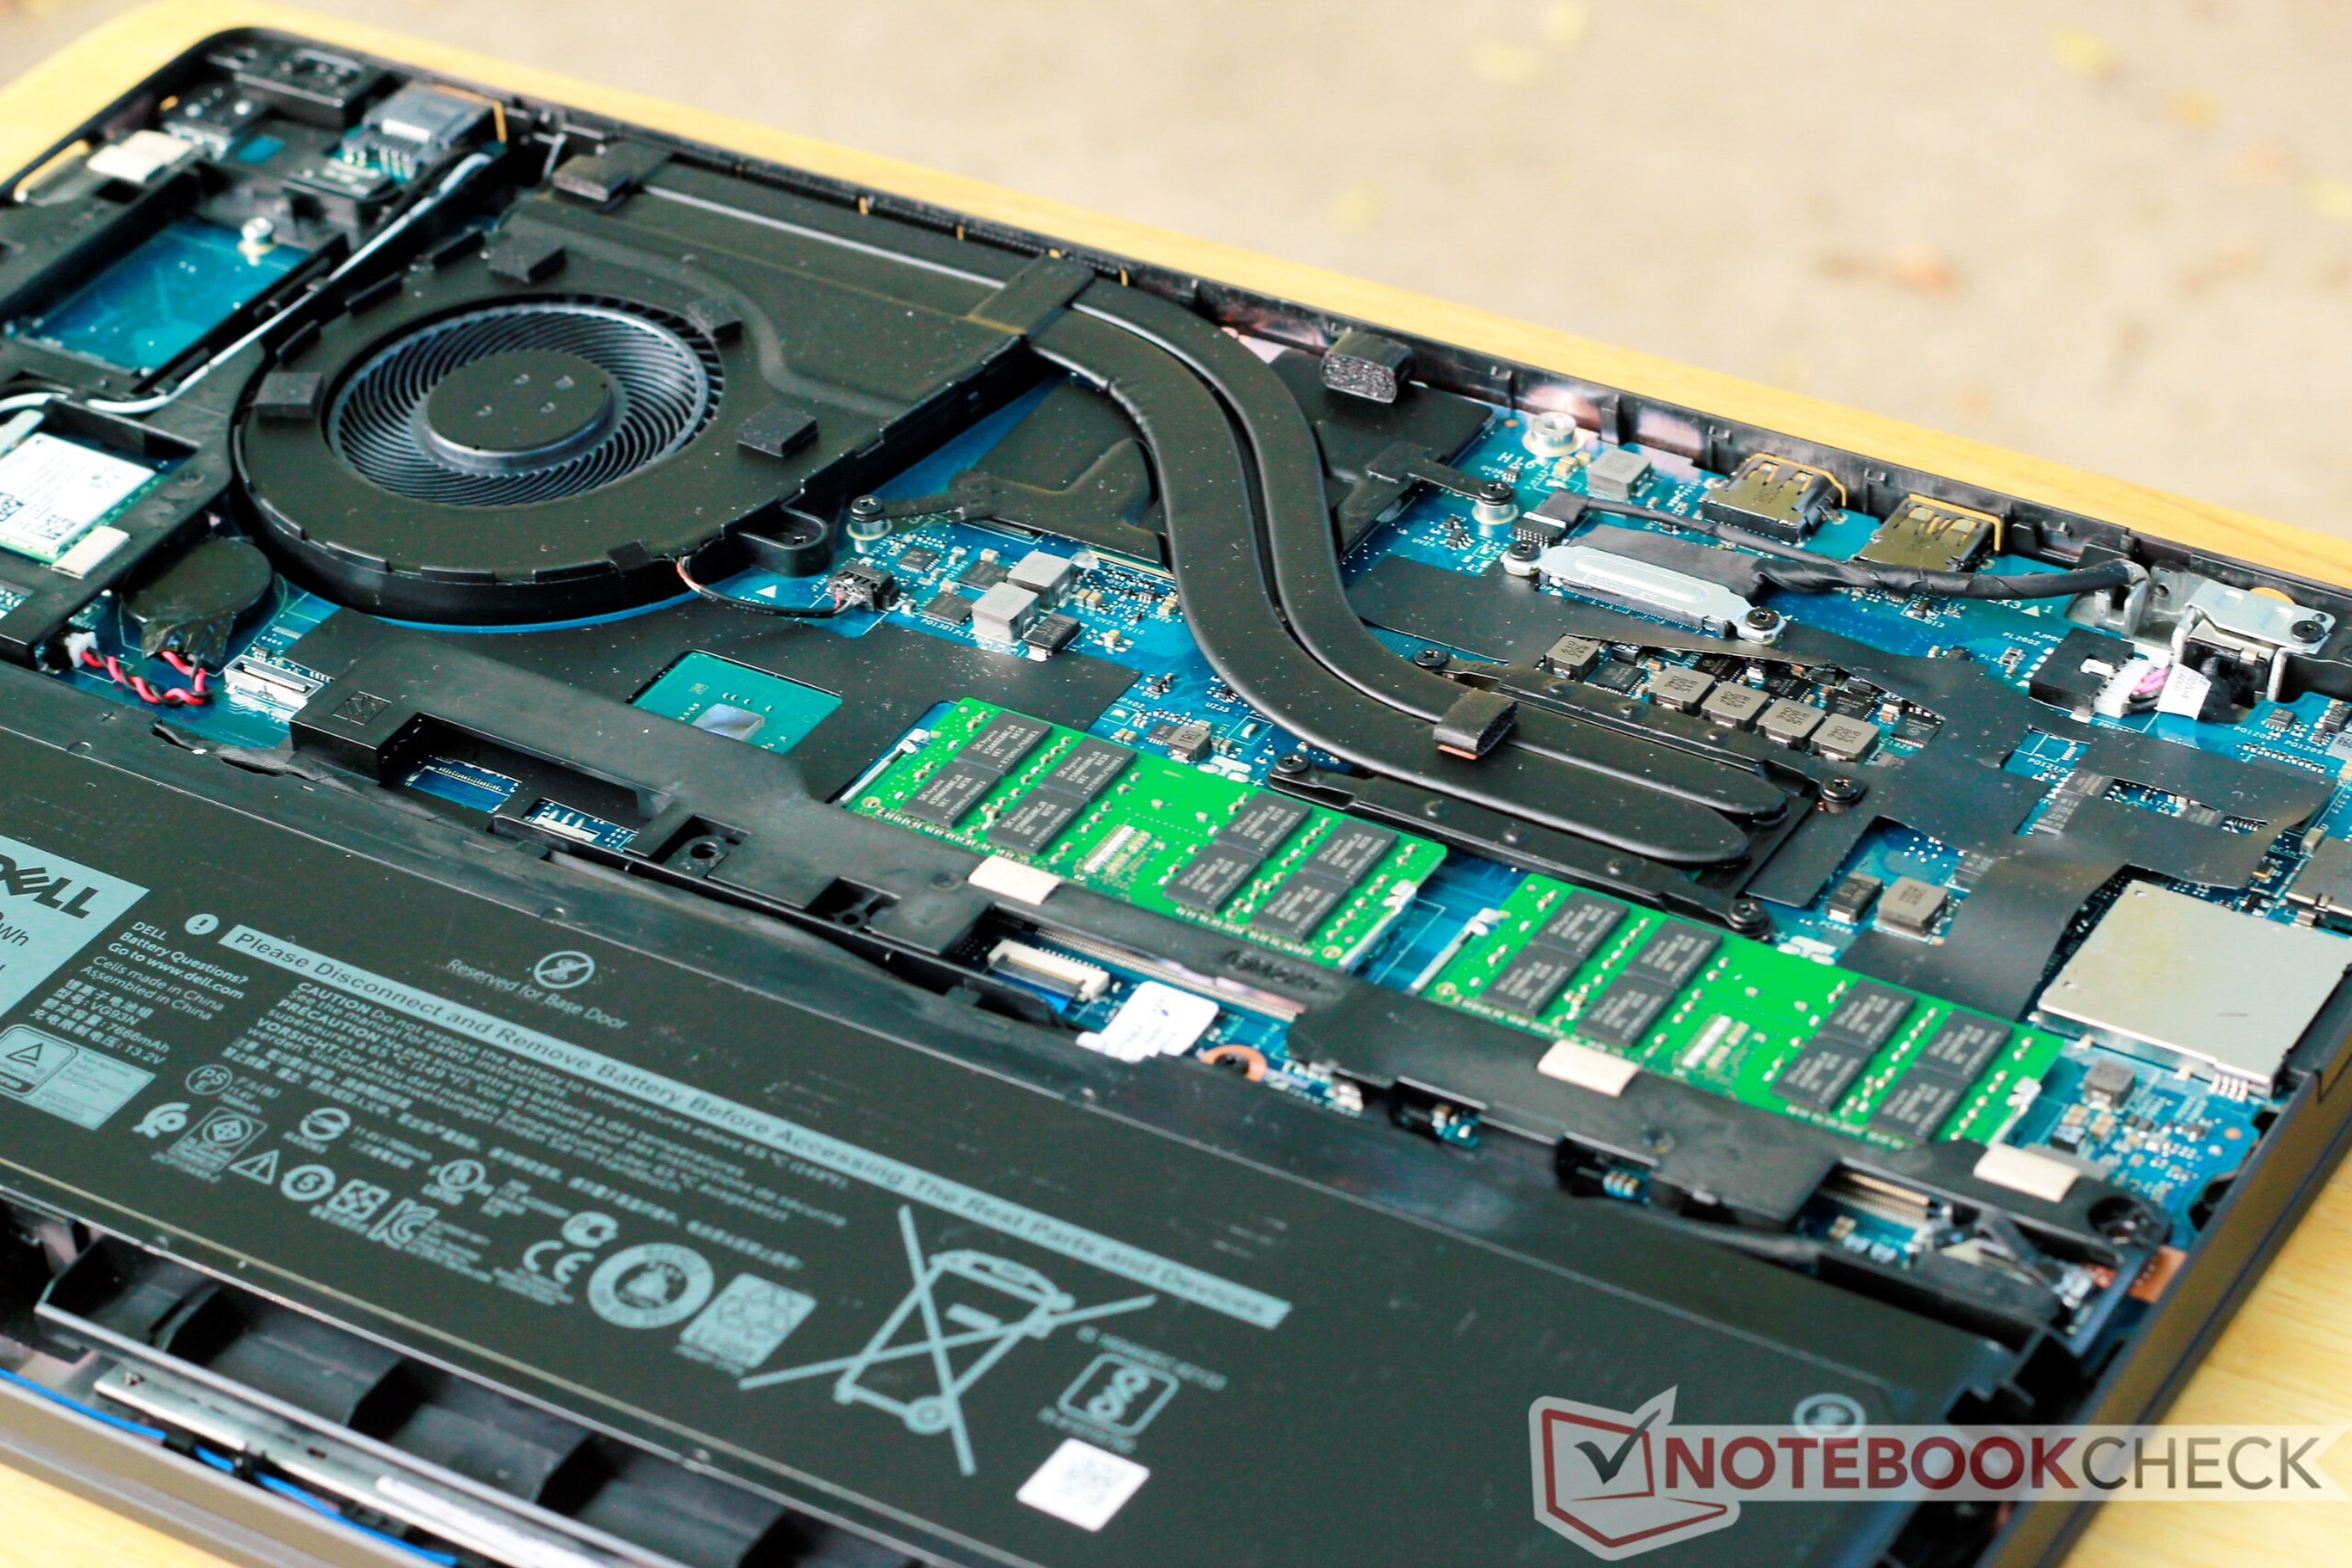
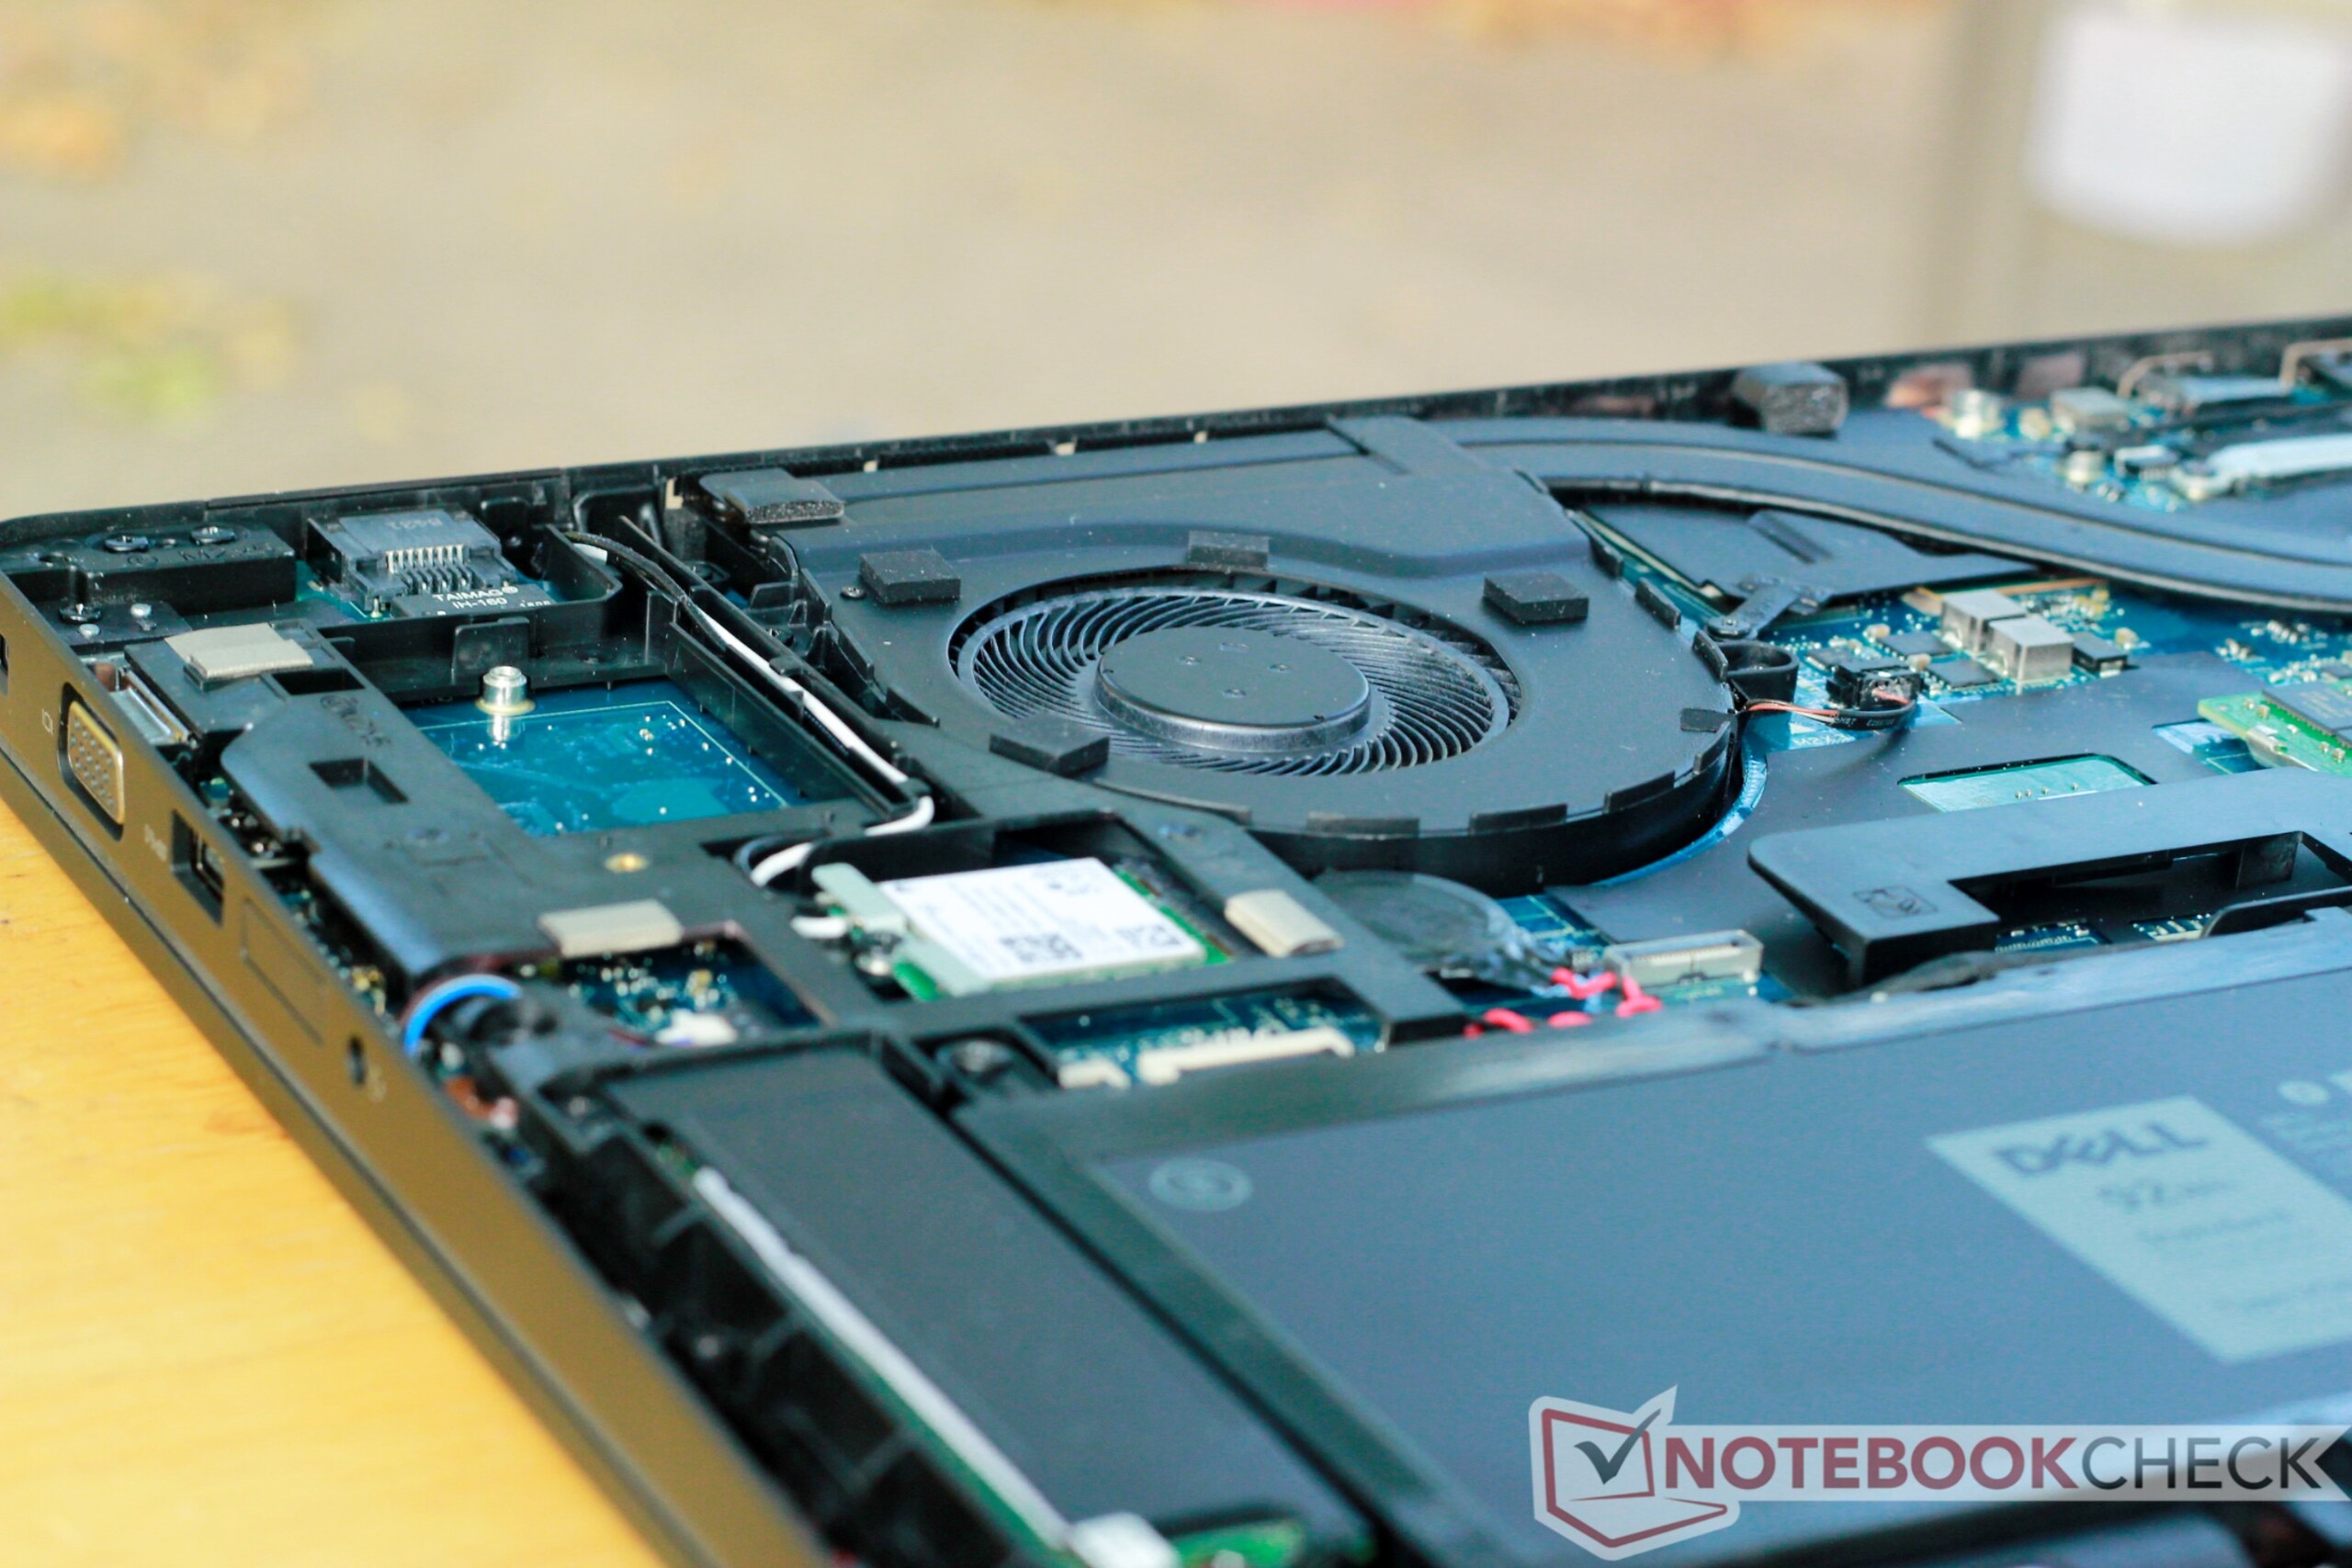
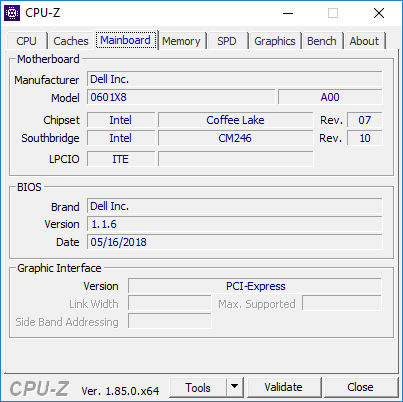
Since the Precision 3530 is essentially just an upgrade of last year's Precision 3520, we will forgo discussion on the size, case, and maintenance options. For details on these factors, please check the review of the Precision 3520. We have posted some photos of the updated motherboard below.
The 3530 competes well against other entry-level and mid-range workstations, including the HP ZBook 15 G4, Lenovo's ThinkPad P52, and the older Precision 3520. We will also compare the Lenovo ThinkPad P52s and Dell Precision 5520 to see if ultrabook-styled workstations can keep up. Let's dive in.
| SD Card Reader | |
| average JPG Copy Test (av. of 3 runs) | |
| Dell Precision 3520 (Toshiba Exceria Pro SDXC 64 GB UHS-II) | |
| HP ZBook 15 G4-Y4E80AV (Toshiba Exceria Pro SDXC 64 GB UHS-II) | |
| Dell Precision 3530 (Toshiba Exceria Pro SDXC 64 GB UHS-II) | |
| Lenovo ThinkPad P52 20MAS03N00 (Toshiba Exceria Pro SDXC 64 GB UHS-II) | |
| Dell Precision 5520 UHD (Toshiba Exceria Pro SDXC 64 GB UHS-II) | |
| Average of class Workstation (49.6 - 681, n=14, last 2 years) | |
| Lenovo ThinkPad P52S-20LB001FUS (Toshiba Exceria Pro SDXC 64 GB UHS-II) | |
| maximum AS SSD Seq Read Test (1GB) | |
| Dell Precision 5520 UHD (Toshiba Exceria Pro SDXC 64 GB UHS-II) | |
| Average of class Workstation (87.6 - 1455, n=14, last 2 years) | |
| HP ZBook 15 G4-Y4E80AV (Toshiba Exceria Pro SDXC 64 GB UHS-II) | |
| Dell Precision 3530 (Toshiba Exceria Pro SDXC 64 GB UHS-II) | |
| Lenovo ThinkPad P52 20MAS03N00 (Toshiba Exceria Pro SDXC 64 GB UHS-II) | |
| Dell Precision 3520 (Toshiba Exceria Pro SDXC 64 GB UHS-II) | |
| Lenovo ThinkPad P52S-20LB001FUS (Toshiba Exceria Pro SDXC 64 GB UHS-II) | |
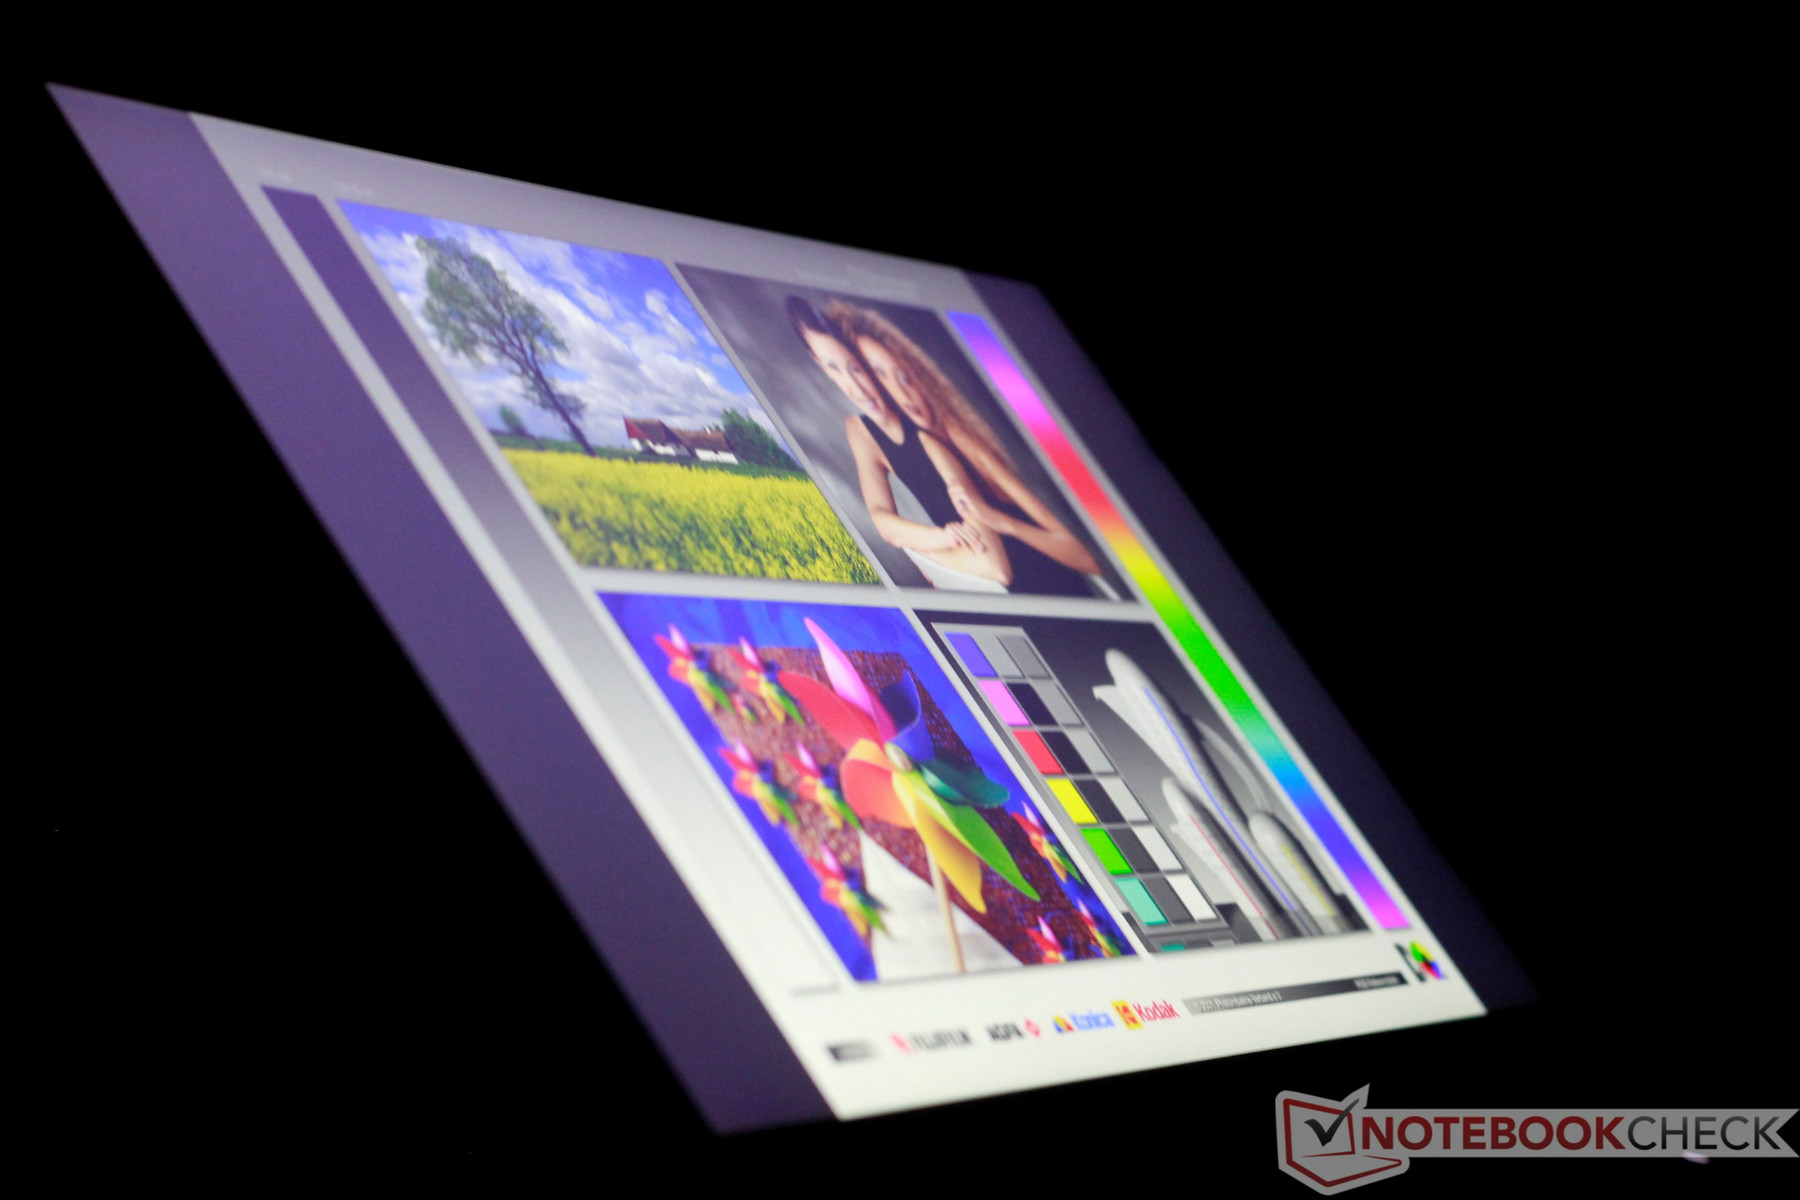
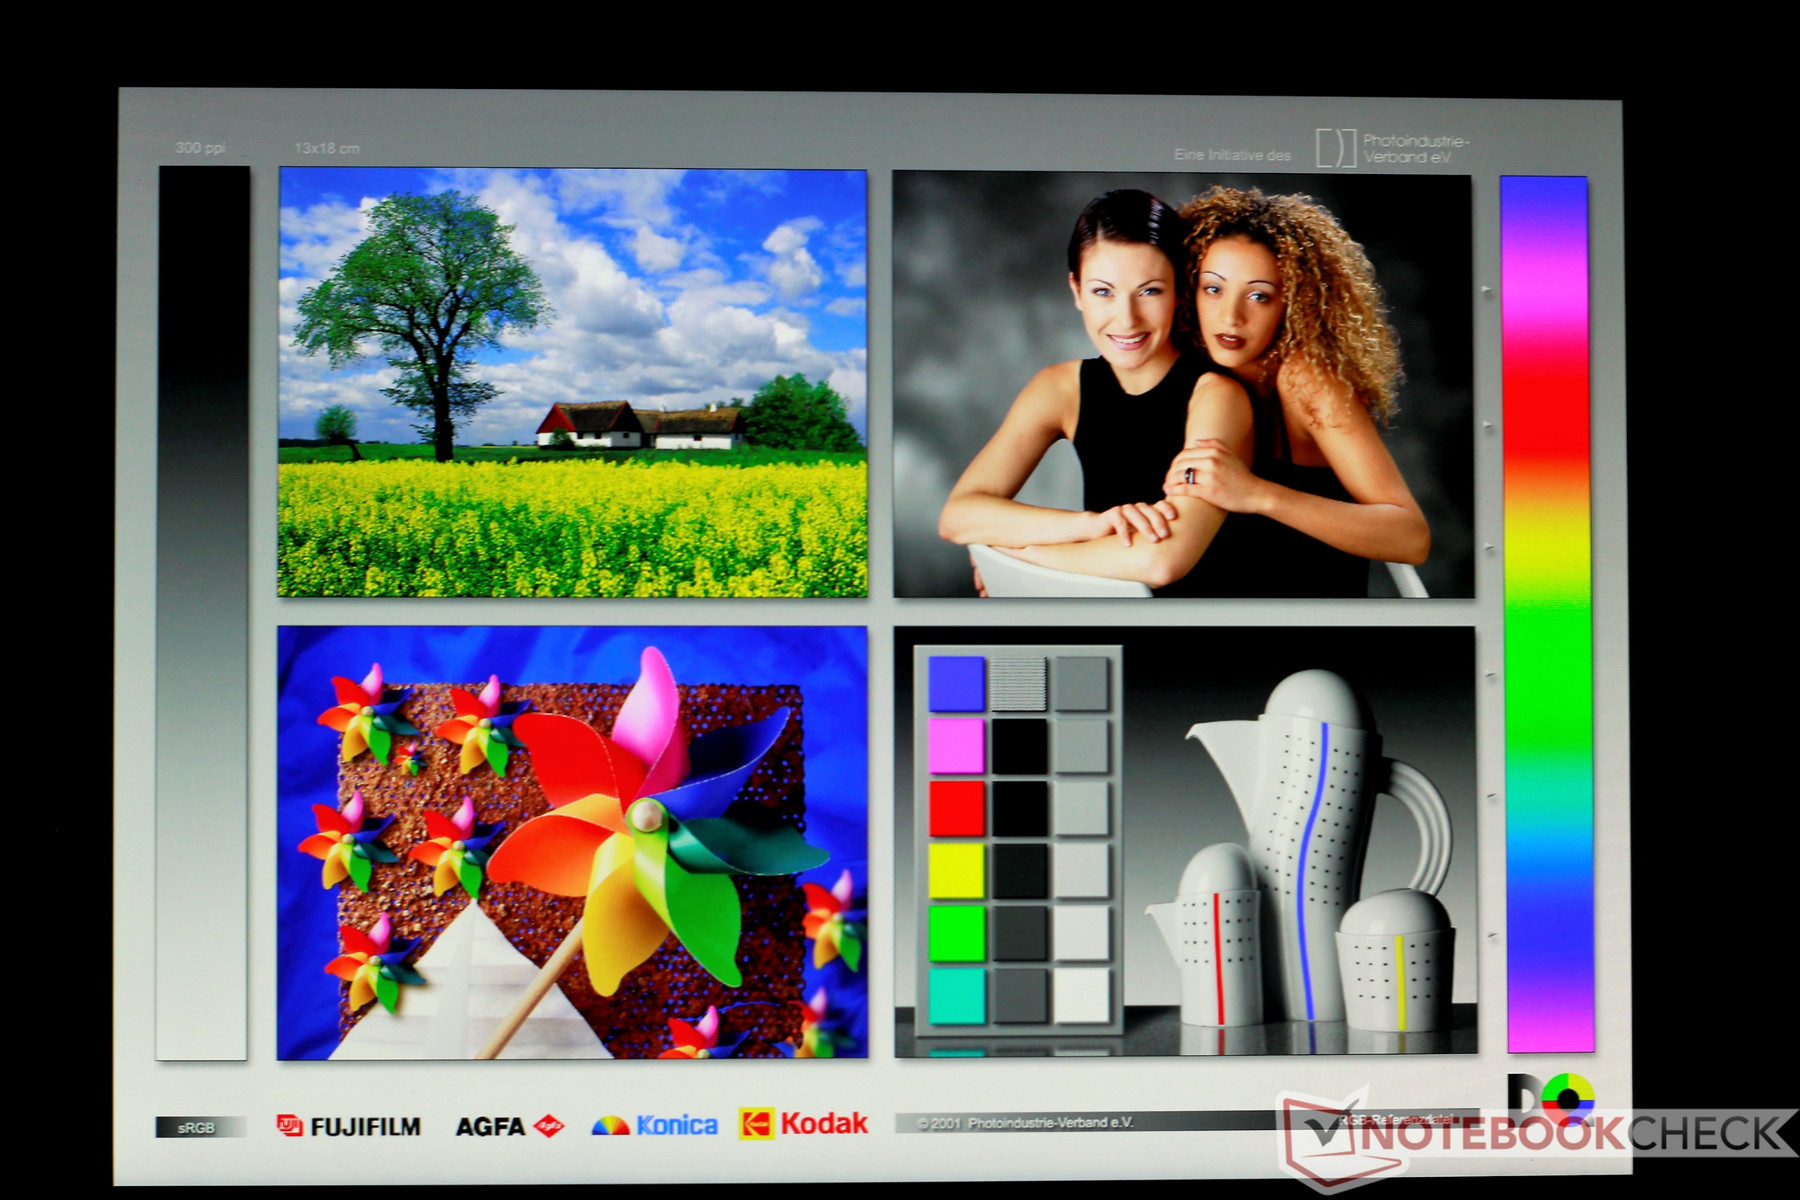
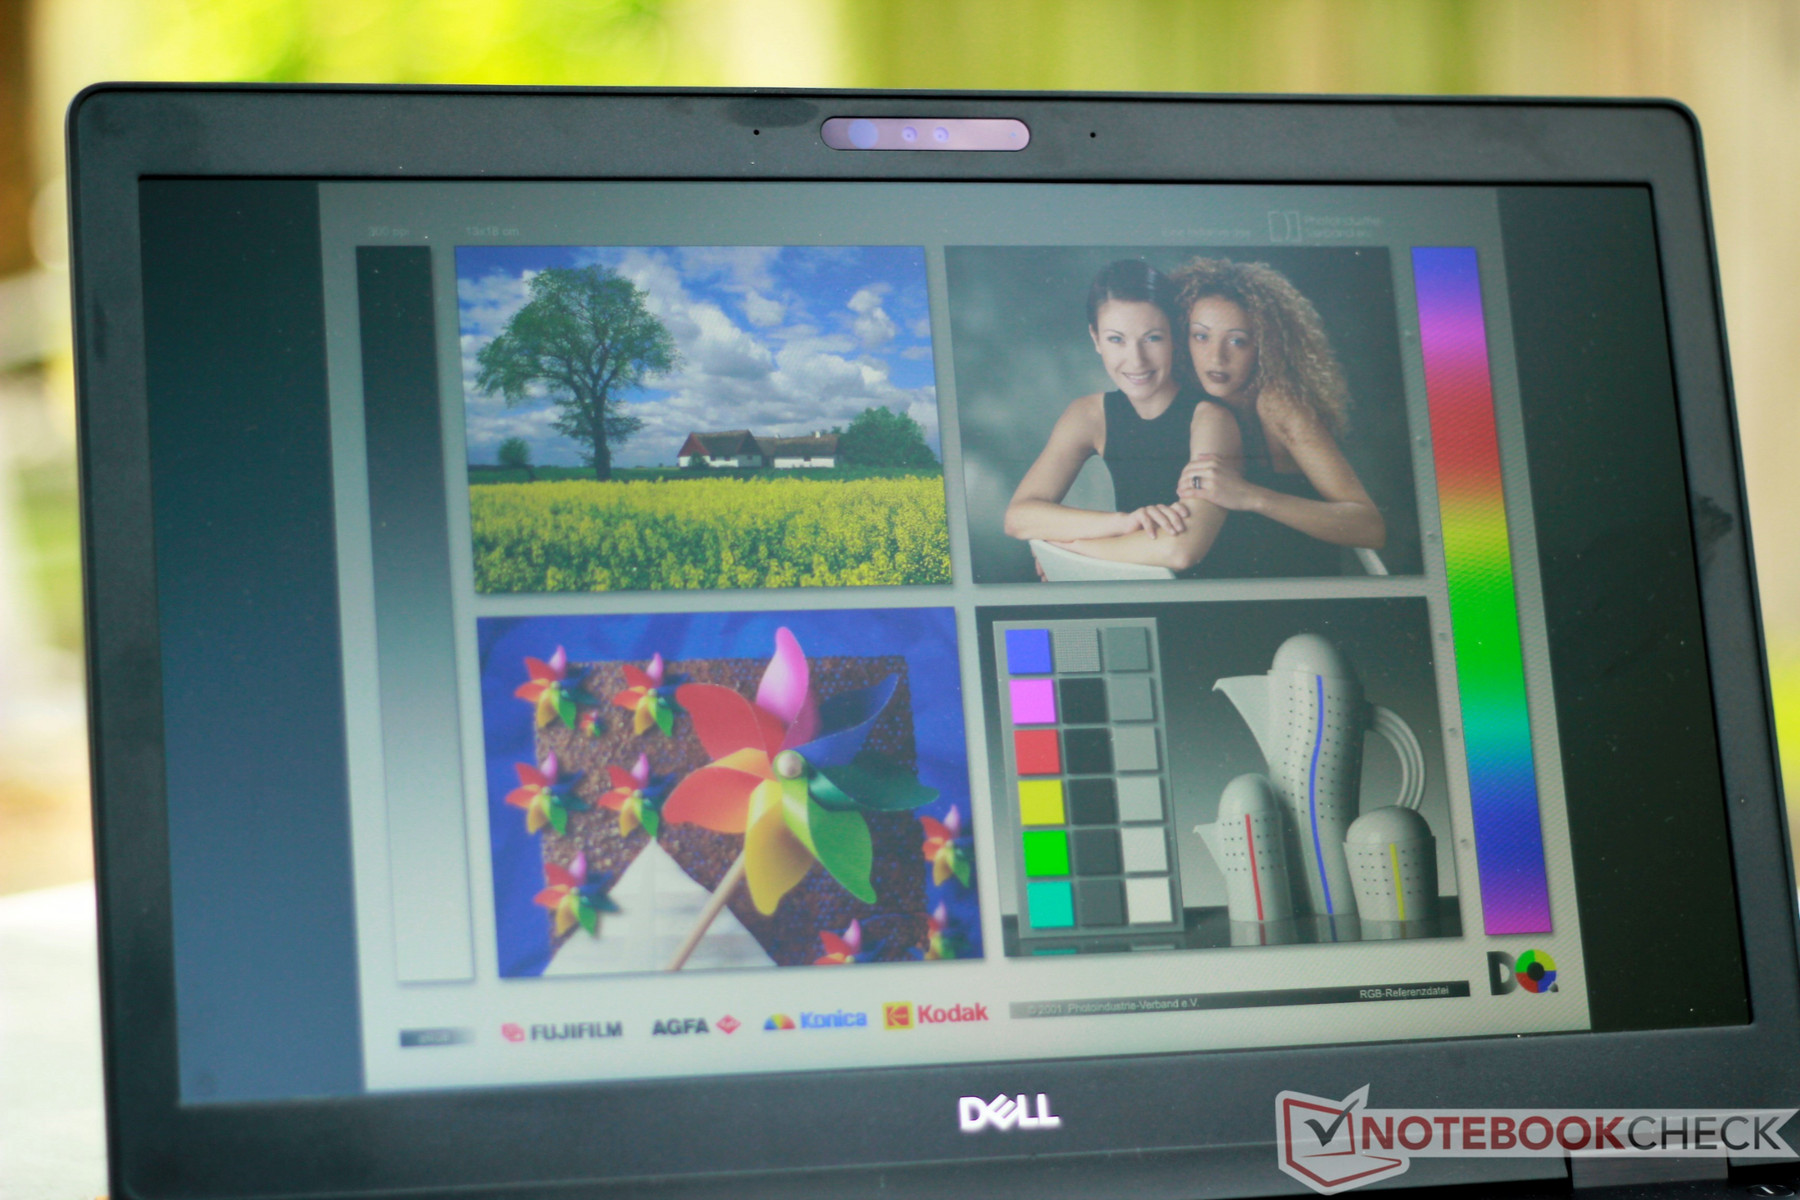
Display
There are a few display options available ranging from a 1366x768 panel to a FHD touchscreen. The BOE display in our model has a 1920x1080 non-touch panel with a matte finish. PWM is present, just as in the Precision 3520, but shouldn't be distracting.
The weakest point is the screen's low average brightness, which is a disappointing change from last year. At 275 nits, the Precision 3530's screen is about 16% dimmer than the Precision 3520's. In everyday use, this doesn't present much of a problem unless the laptop is used outdoors or in direct sunlight. The backlight is fairly even with a distribution of 85%. Response times are average and in line with similar workstations.
| |||||||||||||||||||||||||
Brightness Distribution: 85 %
Center on Battery: 285.7 cd/m²
Contrast: 922:1 (Black: 0.31 cd/m²)
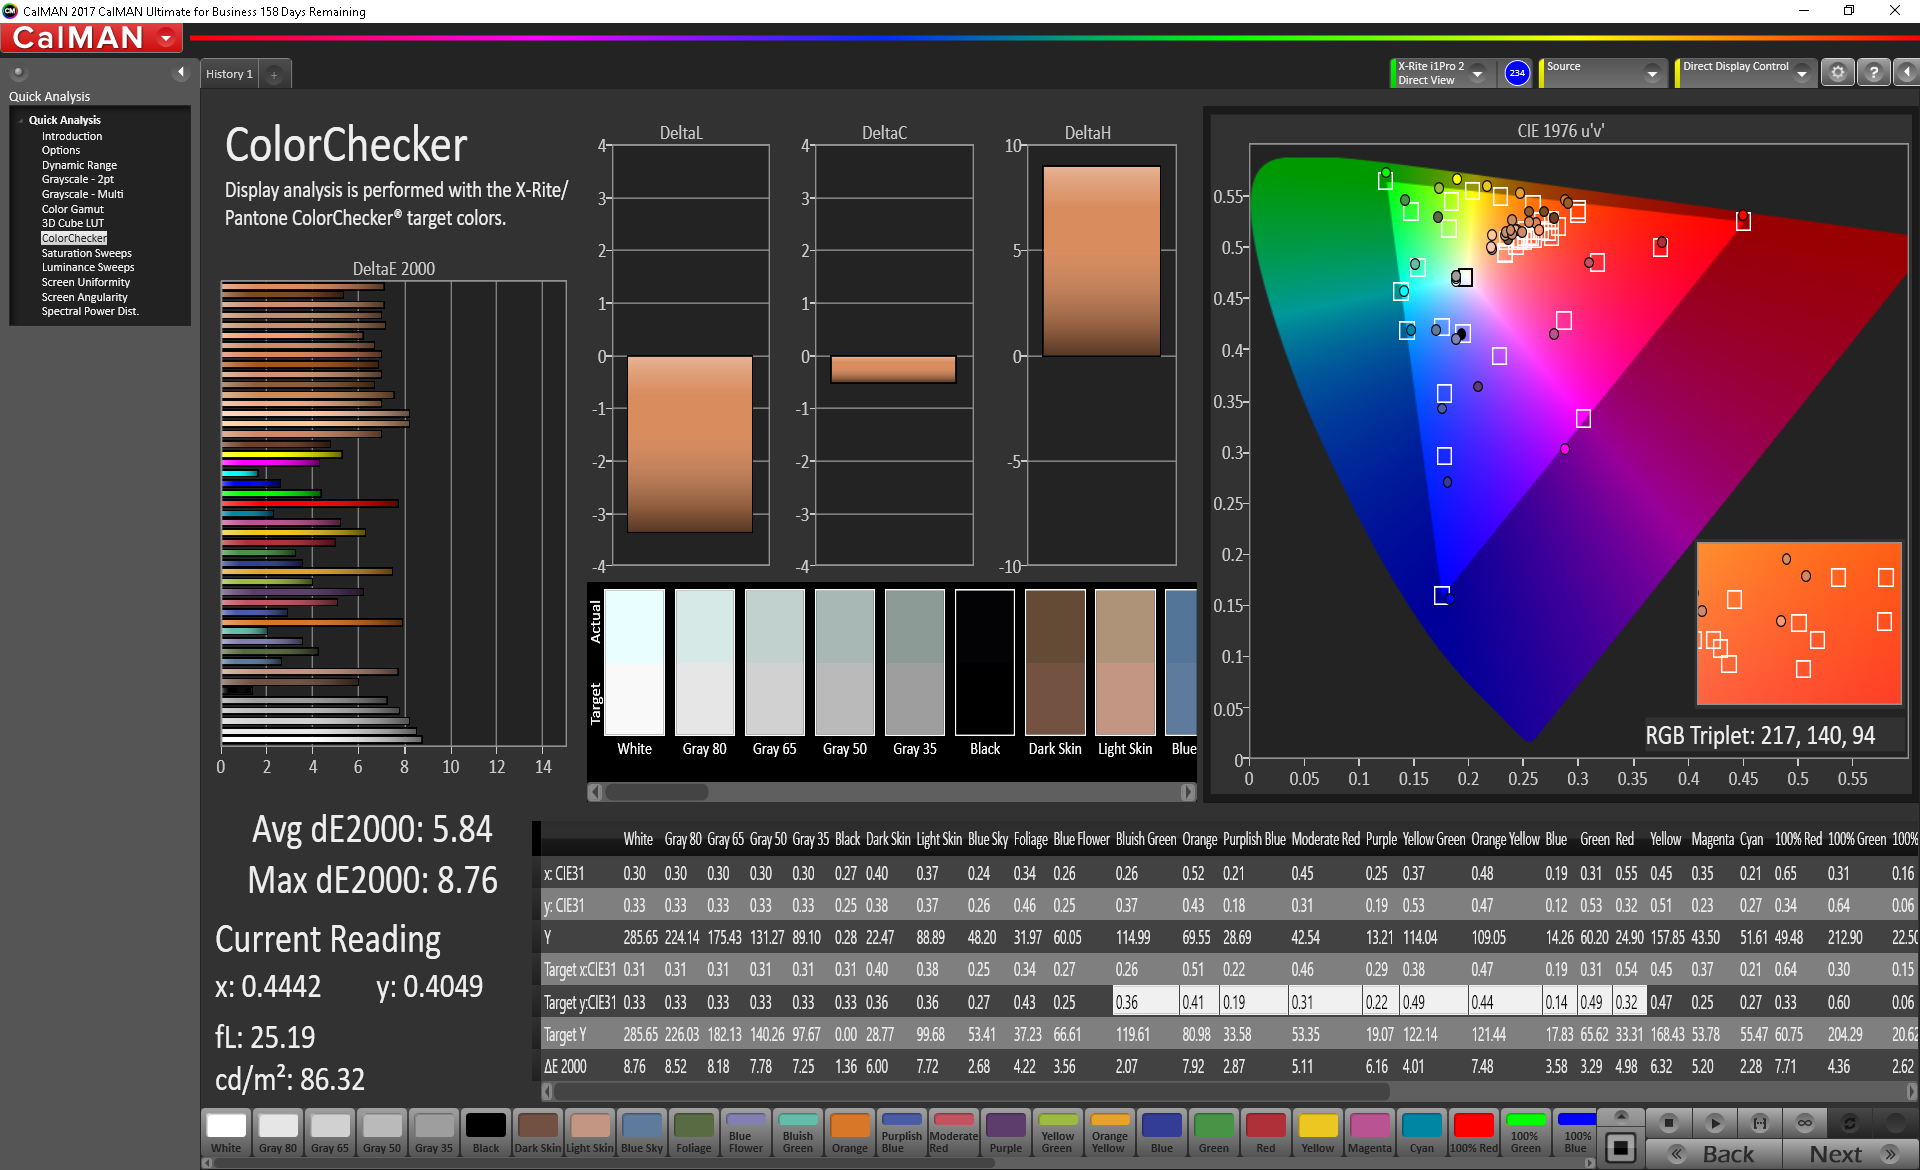
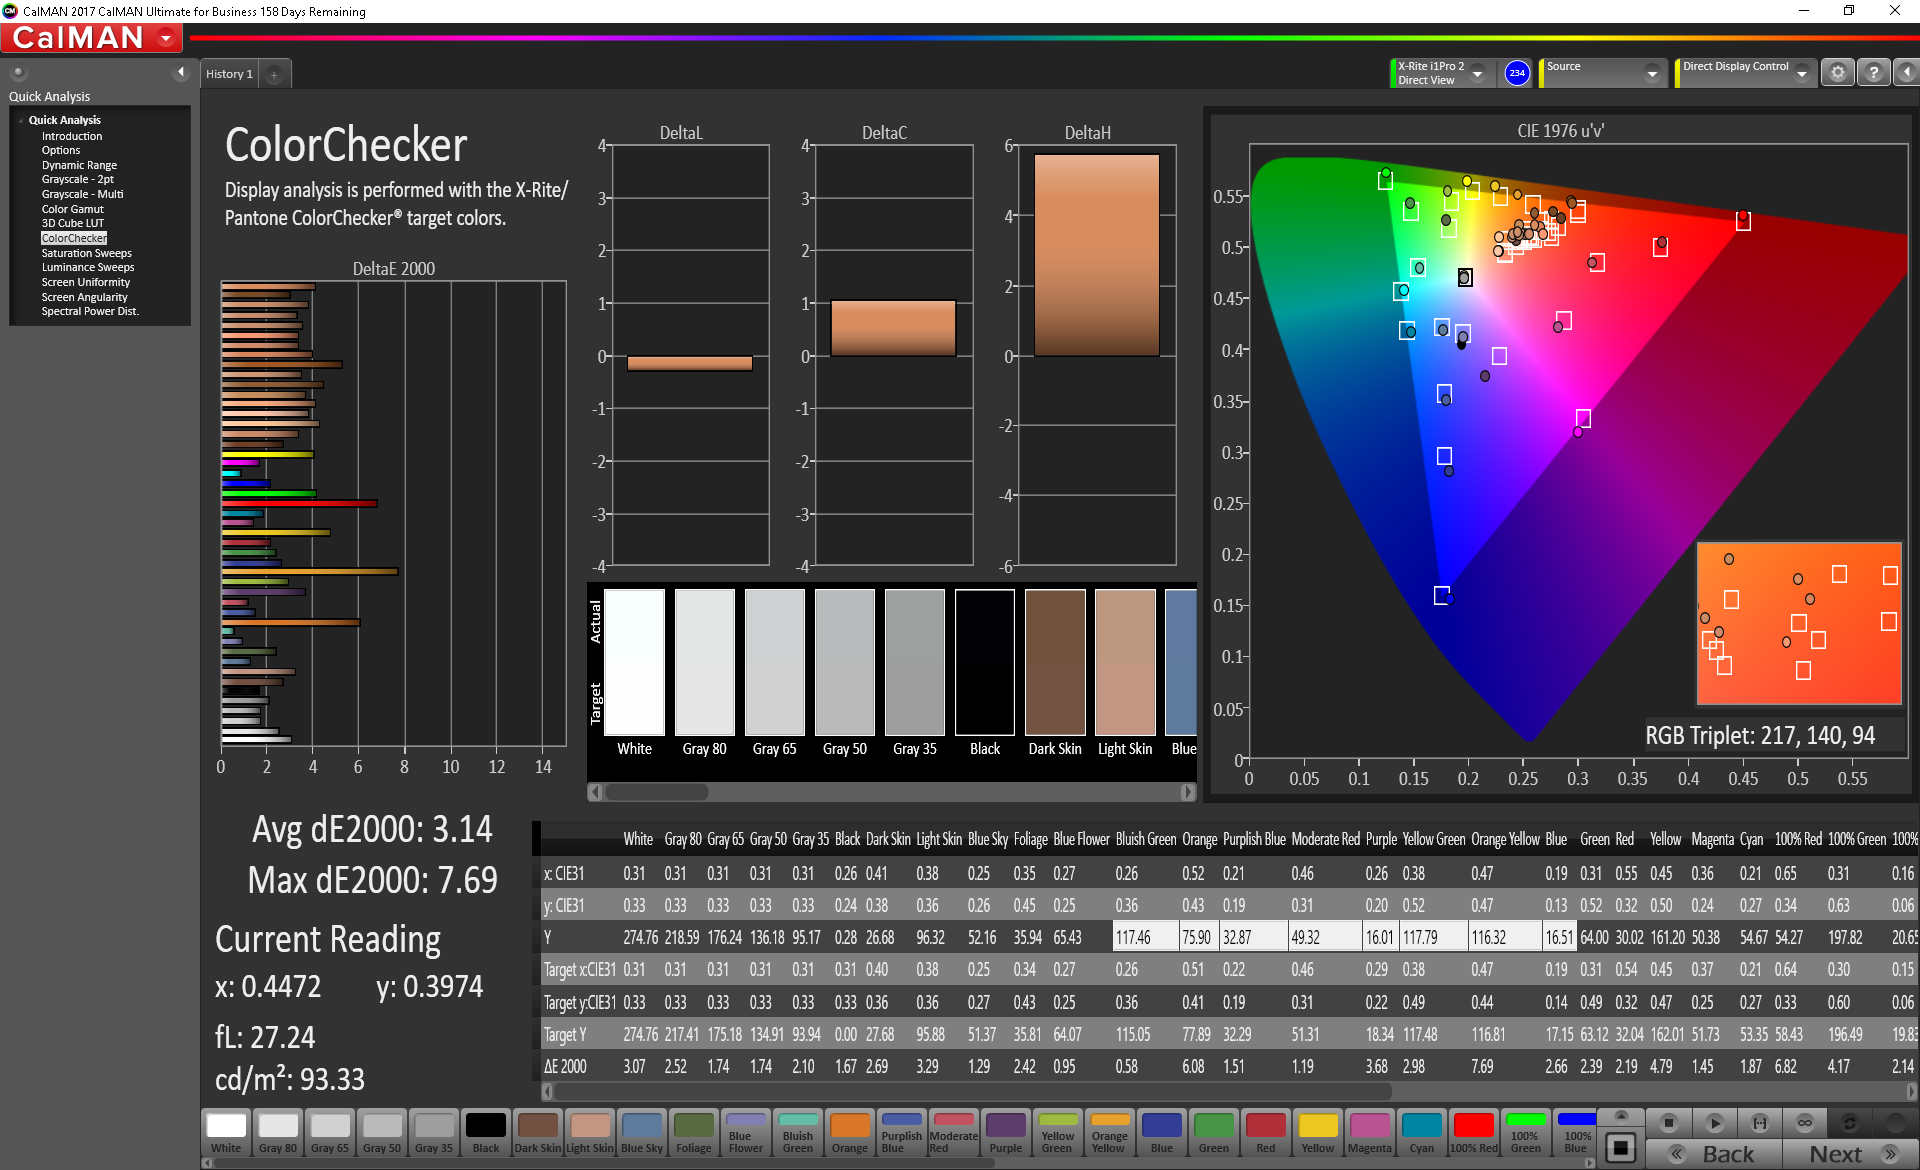
ΔE ColorChecker Calman: 5.84 | ∀{0.5-29.43 Ø4.71}
calibrated: 3.14
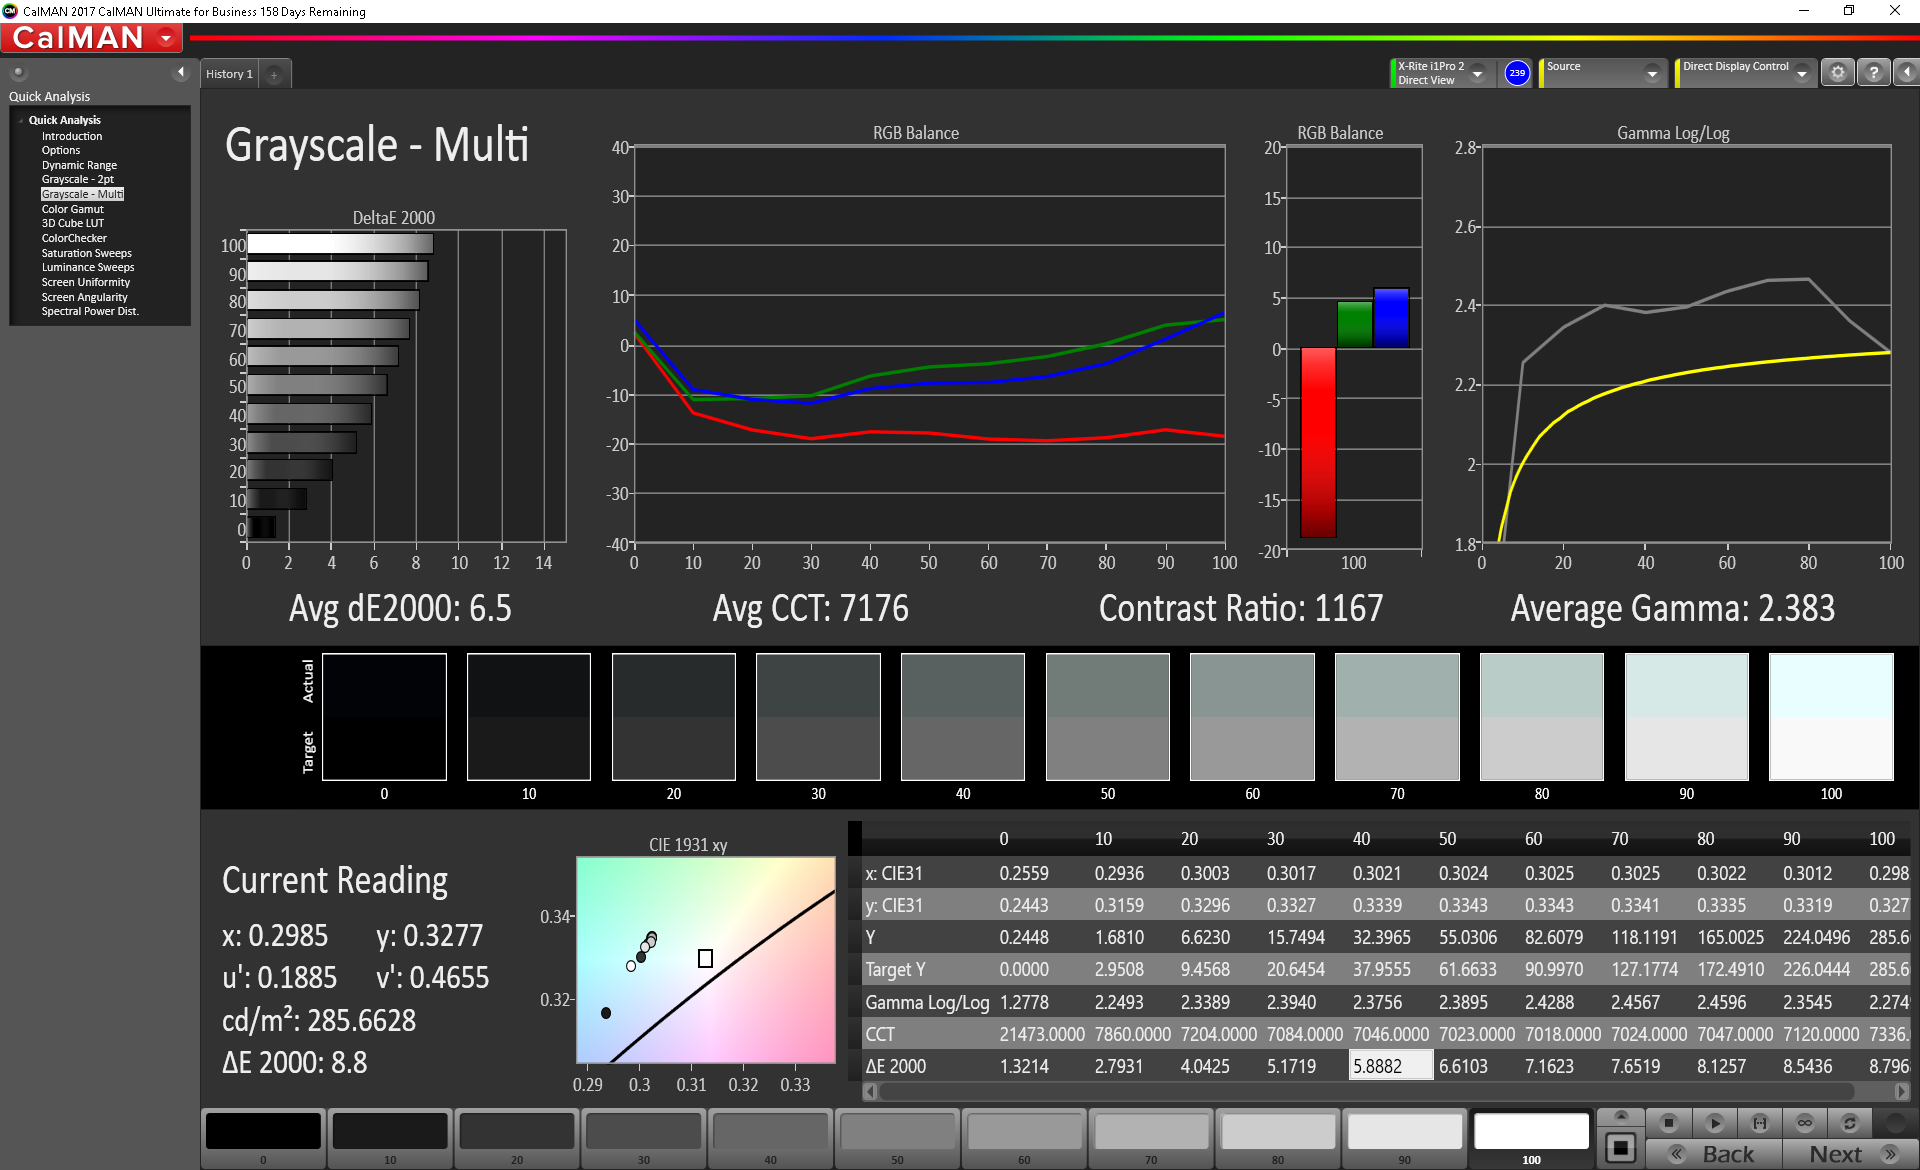
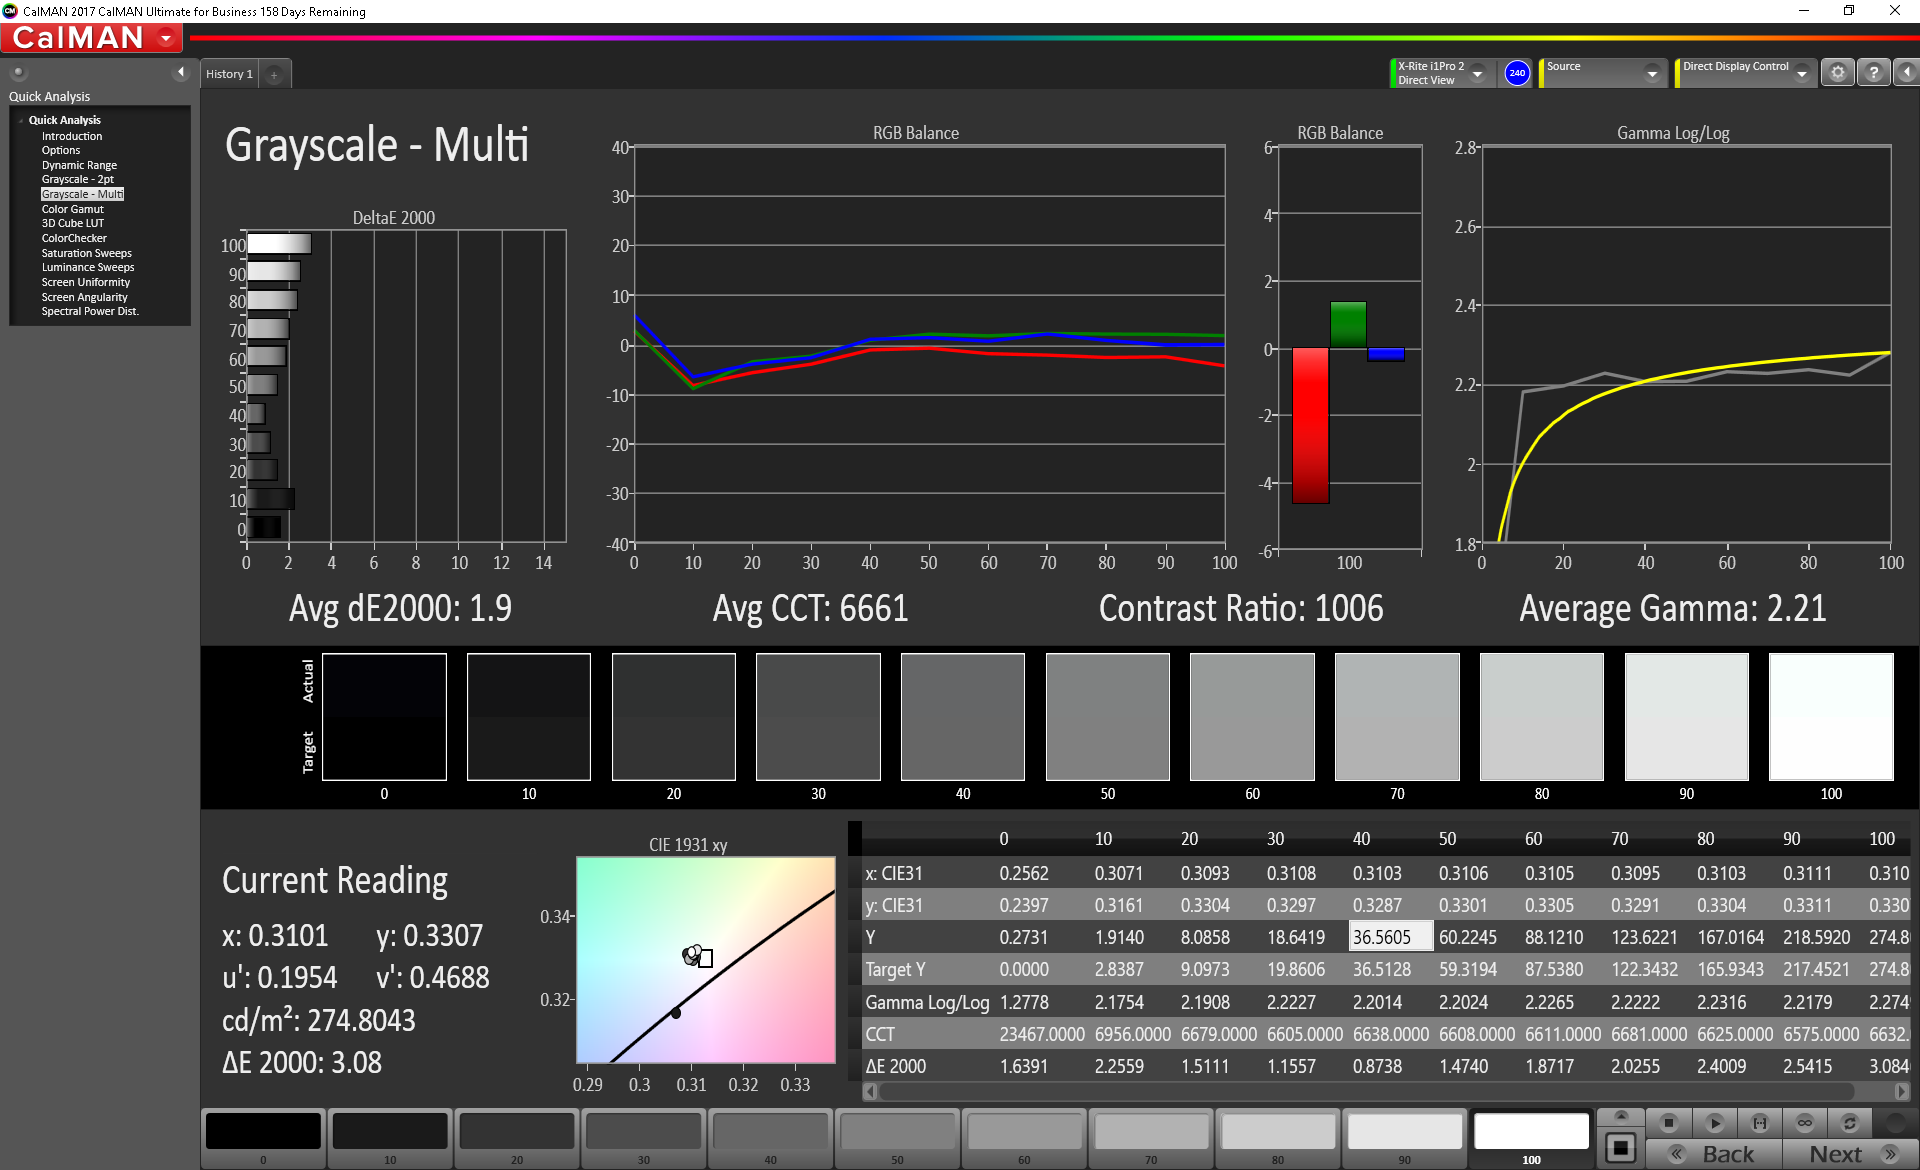
ΔE Greyscale Calman: 6.5 | ∀{0.09-98 Ø4.96}
94% sRGB (Argyll 1.6.3 3D)
62% AdobeRGB 1998 (Argyll 1.6.3 3D)
69.3% AdobeRGB 1998 (Argyll 3D)
94.6% sRGB (Argyll 3D)
72.8% Display P3 (Argyll 3D)
Gamma: 2.383
CCT: 7176 K
| Dell Precision 3530 BOE BOE06F1, IPS, 15.6", 1920x1080 | Dell Precision 3520 IPS LED, 15.6", 1920x1080 | Dell Precision 5520 UHD SHP1476, IPS, 15.6", 3840x2160 | Lenovo ThinkPad P52 20MAS03N00 N156HCE-EN1, IPS LED, 15.6", 1920x1080 | Lenovo ThinkPad P52S-20LB001FUS Lenovo LEN40BD, IPS, 15.6", 3840x2160 | HP ZBook 15 G4-Y4E80AV LG Philips LGD057E, IPS, 15.6", 1920x1080 | |
|---|---|---|---|---|---|---|
| Display | 0% | -1% | -7% | -6% | -13% | |
| Display P3 Coverage (%) | 72.8 | 72.7 0% | 67.4 -7% | 65.6 -10% | 67.3 -8% | 64 -12% |
| sRGB Coverage (%) | 94.6 | 94.8 0% | 98.5 4% | 90.3 -5% | 89.4 -5% | 82.7 -13% |
| AdobeRGB 1998 Coverage (%) | 69.3 | 69.3 0% | 68.9 -1% | 65.9 -5% | 65.4 -6% | 60.4 -13% |
| Response Times | -9% | -34% | 14% | 21% | 15% | |
| Response Time Grey 50% / Grey 80% * (ms) | 40.4 ? | 48 ? -19% | 59.2 ? -47% | 39.2 ? 3% | 43.2 ? -7% | 39.2 ? 3% |
| Response Time Black / White * (ms) | 34.8 ? | 34.4 ? 1% | 41.6 ? -20% | 26 ? 25% | 18 ? 48% | 25.6 ? 26% |
| PWM Frequency (Hz) | 1053 ? | 1064 ? | 25250 ? | 980 | 20830 ? | |
| Screen | 6% | 14% | 11% | 13% | 10% | |
| Brightness middle (cd/m²) | 285.7 | 345 21% | 372.4 30% | 304 6% | 305.5 7% | 321 12% |
| Brightness (cd/m²) | 275 | 329 20% | 368 34% | 293 7% | 282 3% | 320 16% |
| Brightness Distribution (%) | 85 | 88 4% | 90 6% | 88 4% | 78 -8% | 89 5% |
| Black Level * (cd/m²) | 0.31 | 0.37 -19% | 0.48 -55% | 0.26 16% | 0.24 23% | 0.29 6% |
| Contrast (:1) | 922 | 932 1% | 776 -16% | 1169 27% | 1273 38% | 1107 20% |
| Colorchecker dE 2000 * | 5.84 | 5 14% | 2.6 55% | 4.5 23% | 3.51 40% | 4.5 23% |
| Colorchecker dE 2000 max. * | 8.76 | 8 9% | 5.6 36% | 7.7 12% | 7.28 17% | 9.5 -8% |
| Colorchecker dE 2000 calibrated * | 3.14 | 2.4 24% | 3.15 -0% | |||
| Greyscale dE 2000 * | 6.5 | 6.2 5% | 3.7 43% | 5.2 20% | 4 38% | 2.9 55% |
| Gamma | 2.383 92% | 2.35 94% | 2.14 103% | 2.26 97% | 2.18 101% | 2.27 97% |
| CCT | 7176 91% | 6702 97% | 7096 92% | 6789 96% | 7291 89% | 6519 100% |
| Color Space (Percent of AdobeRGB 1998) (%) | 62 | 61.8 0% | 63 2% | 53.8 -13% | 58 -6% | 54.2 -13% |
| Color Space (Percent of sRGB) (%) | 94 | 94.7 1% | 99 5% | 90.1 -4% | 89 -5% | 82.6 -12% |
| Total Average (Program / Settings) | -1% /
3% | -7% /
5% | 6% /
8% | 9% /
11% | 4% /
6% |
* ... smaller is better
Color coverage is good, but the Precision 3530 falls short for professional color use. The display covers almost all of the sRGB gamut (94%) but only manages to reproduce 62% of the AdobeRGB gamut. This coverage is a bit higher than the average workstation and should be more than adequate for most users, but photographers, videographers, and others that rely on large color spaces should look elsewhere.
Color accuracy is average. The DeltaE2000 score for colors sits at 5.84, which is decent. Unfortunately, it falls short of professional grade, generally considered to be a DeltaE2000 of 3 or less. The max DeltaE2000 for colors is 8.76, which indicates a fairly tight window of variance. Reds are a bit less accurate than other colors, but not so much so that they adversely affect the display. Calibration brings colors accuracy down to 3.14, which should be good enough for most color work.
Grays tell a similar story with a DeltaE2000 of 6.5. Calibration here helps a lot, dropping the DeltaE2000 score to 1.9 and tightening up the RGB balance quite a bit. Color temperature out of the box is cool at 7176; sharp-eyed users might pick out a slight blue hue on white backgrounds. Again, calibration corrects this and brings it 6661, much closer to the ideal of 6500. Contrast is average and hovers at about 922:1. Blacks look good, but some workstations, like the HP ZBook 15 G4, offer a better overall screen.
Display Response Times
| ↔ Response Time Black to White | ||
|---|---|---|
| 34.8 ms ... rise ↗ and fall ↘ combined | ↗ 20.8 ms rise |  |
| ↘ 14 ms fall | ||
| The screen shows slow response rates in our tests and will be unsatisfactory for gamers. In comparison, all tested devices range from 0.1 (minimum) to 240 (maximum) ms. » 92 % of all devices are better. This means that the measured response time is worse than the average of all tested devices (19.8 ms). | ||
| ↔ Response Time 50% Grey to 80% Grey | ||
| 40.4 ms ... rise ↗ and fall ↘ combined | ↗ 22 ms rise | 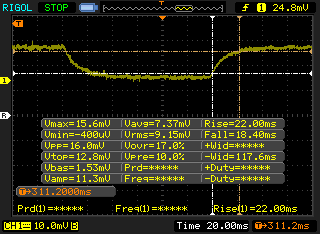 |
| ↘ 18.4 ms fall | ||
| The screen shows slow response rates in our tests and will be unsatisfactory for gamers. In comparison, all tested devices range from 0.165 (minimum) to 636 (maximum) ms. » 64 % of all devices are better. This means that the measured response time is worse than the average of all tested devices (31 ms). | ||
Screen Flickering / PWM (Pulse-Width Modulation)
| Screen flickering / PWM detected | 1053 Hz | ≤ 98 % brightness setting |  |
The display backlight flickers at 1053 Hz (worst case, e.g., utilizing PWM) Flickering detected at a brightness setting of 98 % and below. There should be no flickering or PWM above this brightness setting. The frequency of 1053 Hz is quite high, so most users sensitive to PWM should not notice any flickering. In comparison: 52 % of all tested devices do not use PWM to dim the display. If PWM was detected, an average of 7754 (minimum: 5 - maximum: 343500) Hz was measured. | |||
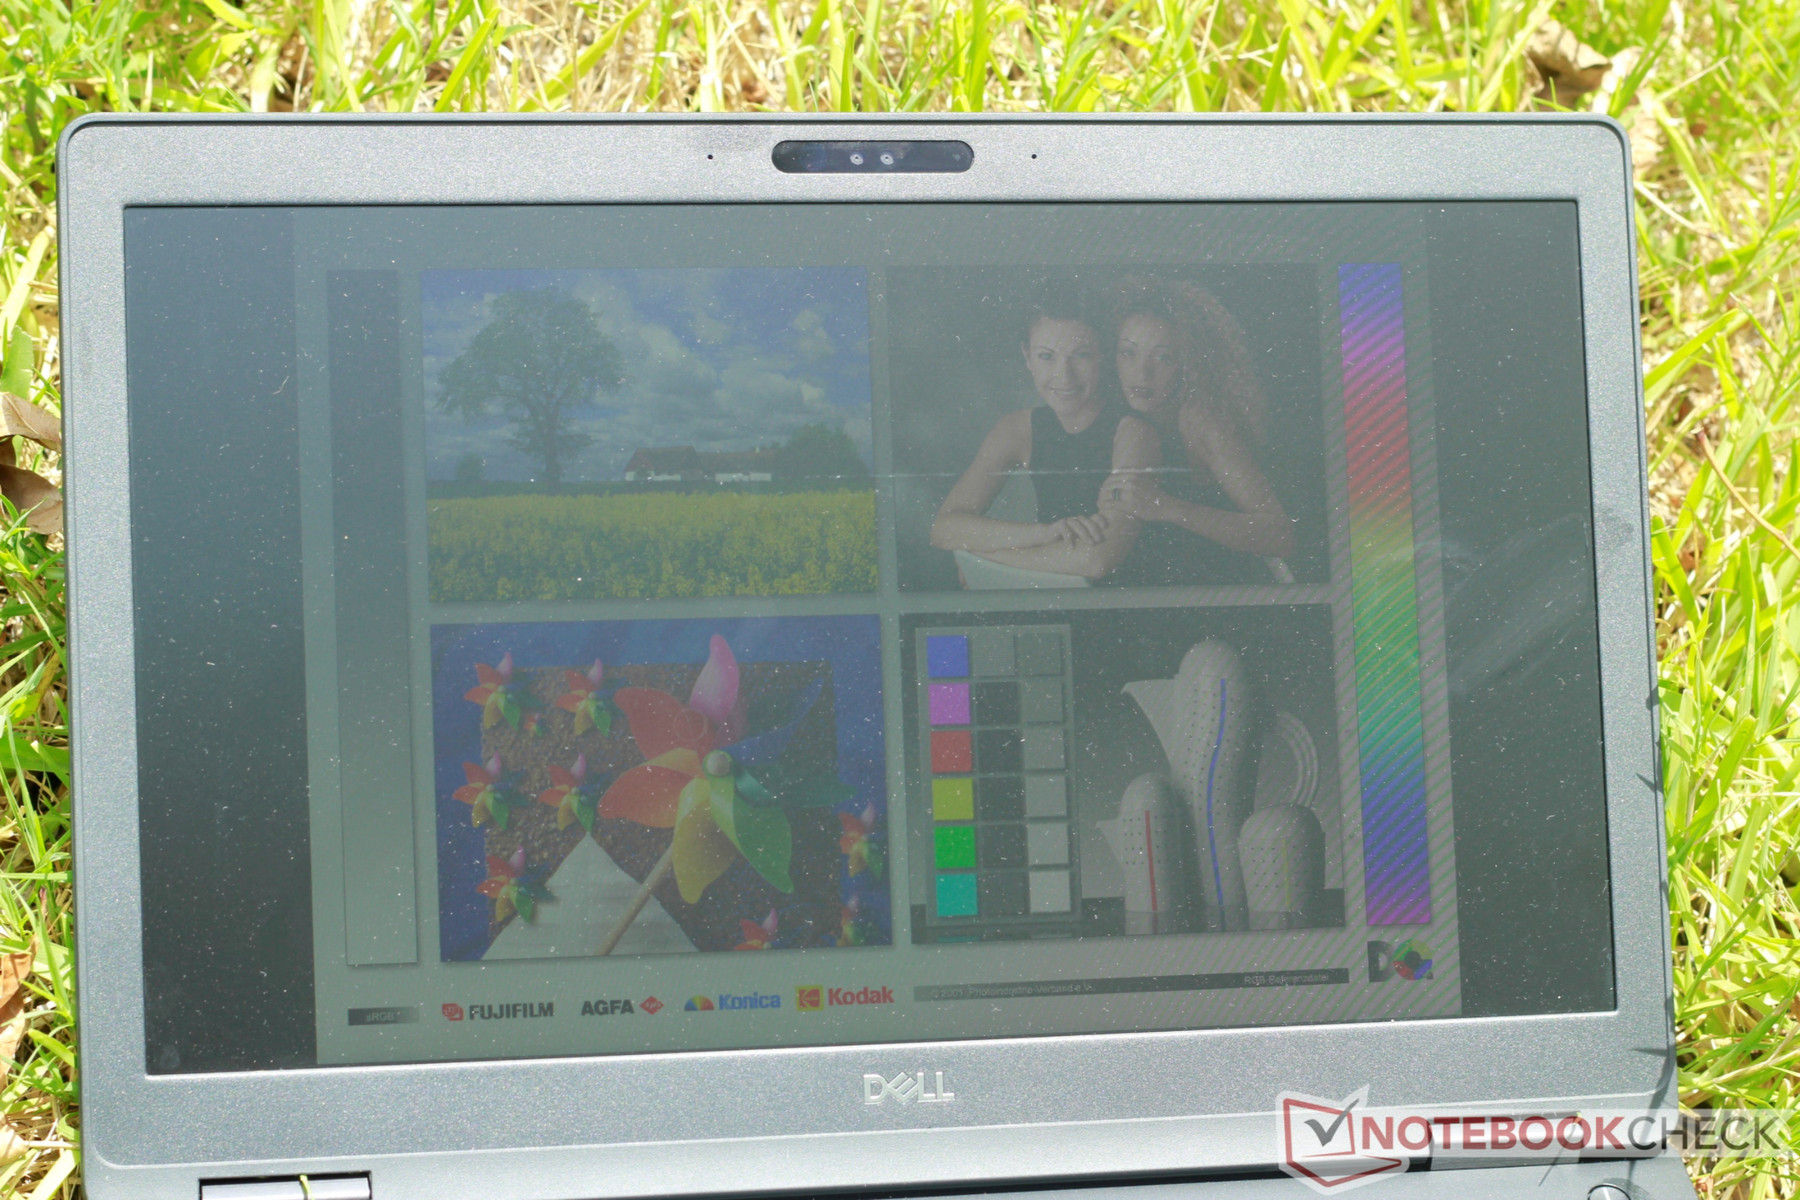
Outdoor use is hindered by the dim backlight. As such, the screen is somewhat visible in shade and all but useless under direct sunlight. Window seats should be avoided. Viewing angles are good. Images and colors remain clear and accurate when viewed off-angle but start to dim at about 60°. The screen suffers very little backlight bleed, primarily along the bottom right corner. The matte finish is a bit grainy, primarily on white backgrounds. This is only visible when sitting close to the screen (8 inches or fewer).

Performance
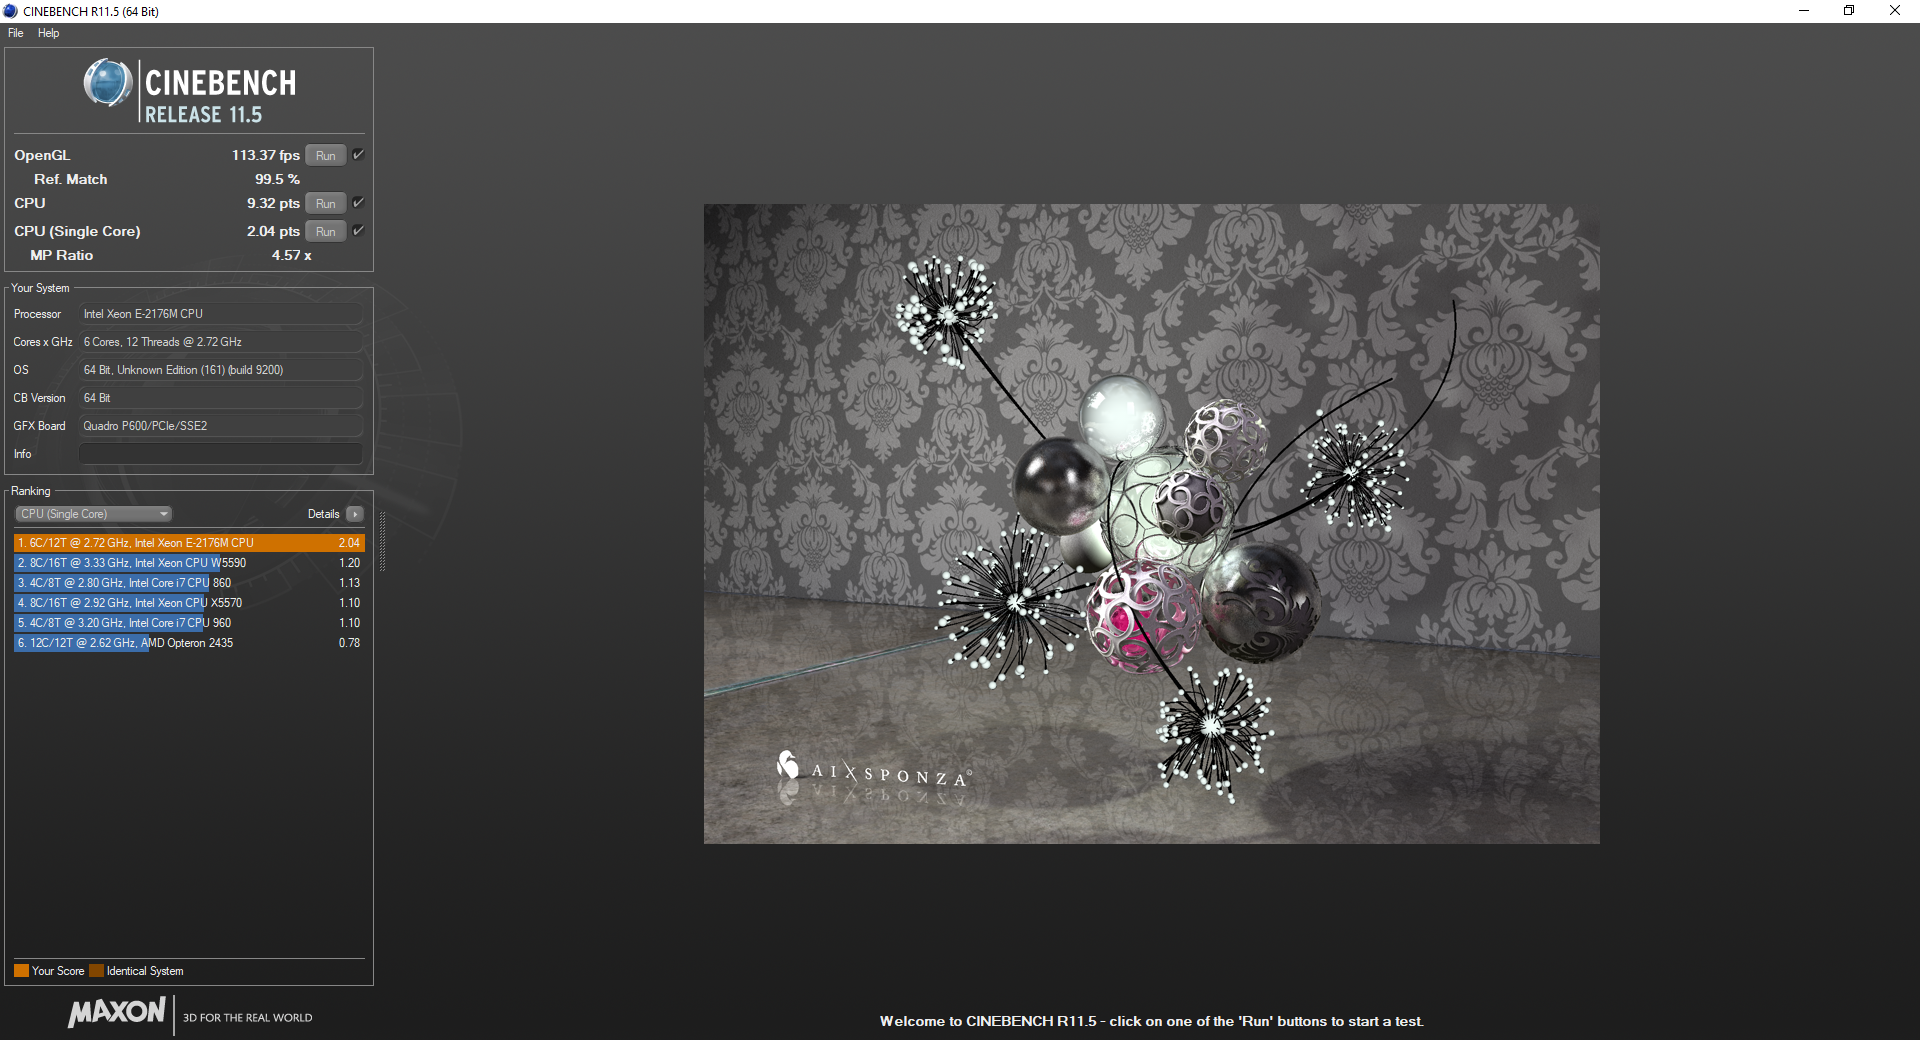
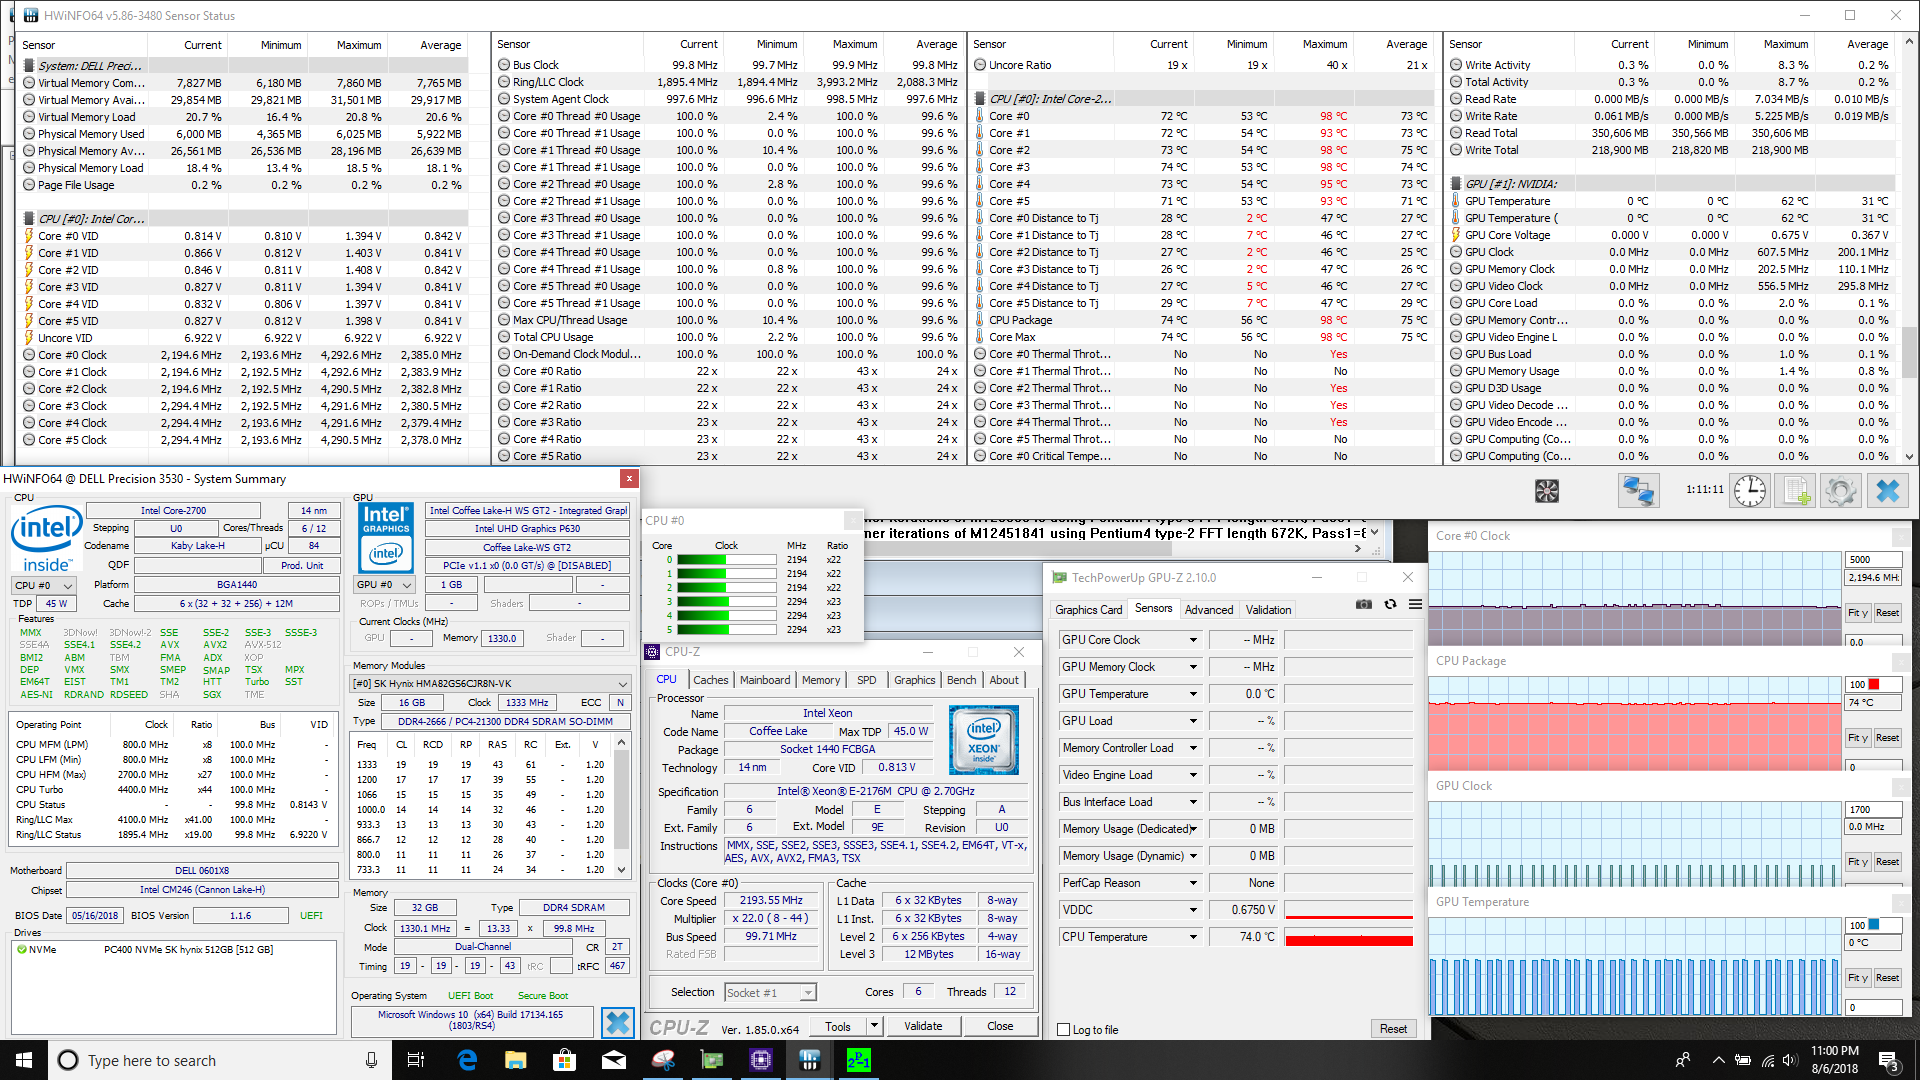
The Precision 3530's hardware seems to be at odds with itself. While the Xeon E-2176M is one of the highest-tier CPUs currently on the mobile market, the Nvidia Quadro P600 is designed to keep costs and power draw down. In addition, the CPU is so new that driver issues may be holding it back. As such, the notebook may not be taking full advantage of the hardware available to it. Both components also prove to be too much for the system to handle, as heat and thermal throttling issues persist in heavy use cases.
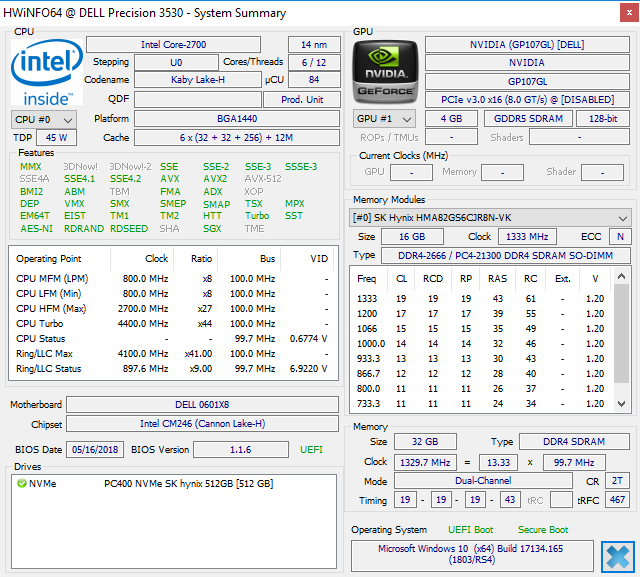
Note that while HWiNFO64 cannot recognize the name of the CPU, it can detect all 6 cores (12 threads) and all other hardware contained within the CPU.
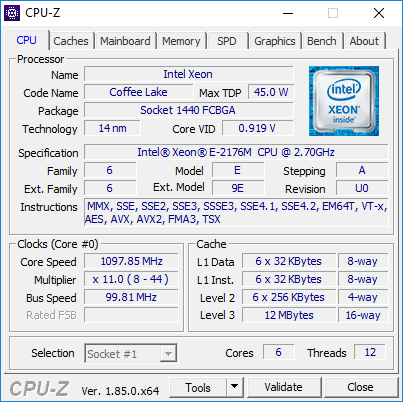
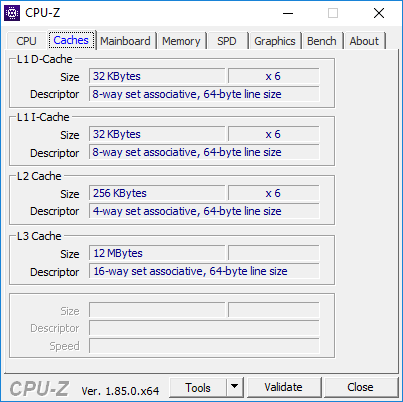
Processor
The Intel Xeon E-2176M is a recent addition to the Xeon family. Based on Intel's Coffee Lake architecture, the six-core hyperthreaded CPU is specially tuned for workstation-class projects and supports the typical workstation features, including ECC RAM. With a base clock of 2.7 GHz and a single-core boost clock of 4.4 GHz, the CPU is poised to blaze through any heavy workloads thrown its way.
Unfortunately, the Precision 3530 is not the best showcase of the new CPU. In Cinebench R15, the CPU puts up impressive multi-core scores... if that's the only test run. In our Cinebench R15 loop, which runs through the multi-core benchmark 50 times the CPU sees a performance drop of 18-20%. The most likely culprit for the throttling is the cooling system, which we will examine closer down below. All said, CPU performance is disappointing and doesn't live up to its full potential.
For more about the Intel Xeon E-2176M, please see our dedicated CPU page here.


| Cinebench R10 | |
| Rendering Multiple CPUs 32Bit | |
| Average of class Workstation (n=1last 2 years) | |
| Average Intel Xeon E-2176M (31923 - 43681, n=3) | |
| Dell Precision 3530 | |
| Lenovo ThinkPad P52S-20LB001FUS | |
| Rendering Single 32Bit | |
| Average of class Workstation (n=1last 2 years) | |
| Average Intel Xeon E-2176M (6928 - 9142, n=3) | |
| Dell Precision 3530 | |
| Lenovo ThinkPad P52S-20LB001FUS | |
| wPrime 2.10 - 1024m | |
| Dell Precision 5520 UHD | |
| Eurocom Tornado F5W | |
| Average of class Workstation (n=1last 2 years) | |
| Dell Precision 3530 | |
| Average Intel Xeon E-2176M (147 - 179.6, n=2) | |
* ... smaller is better
System Performance
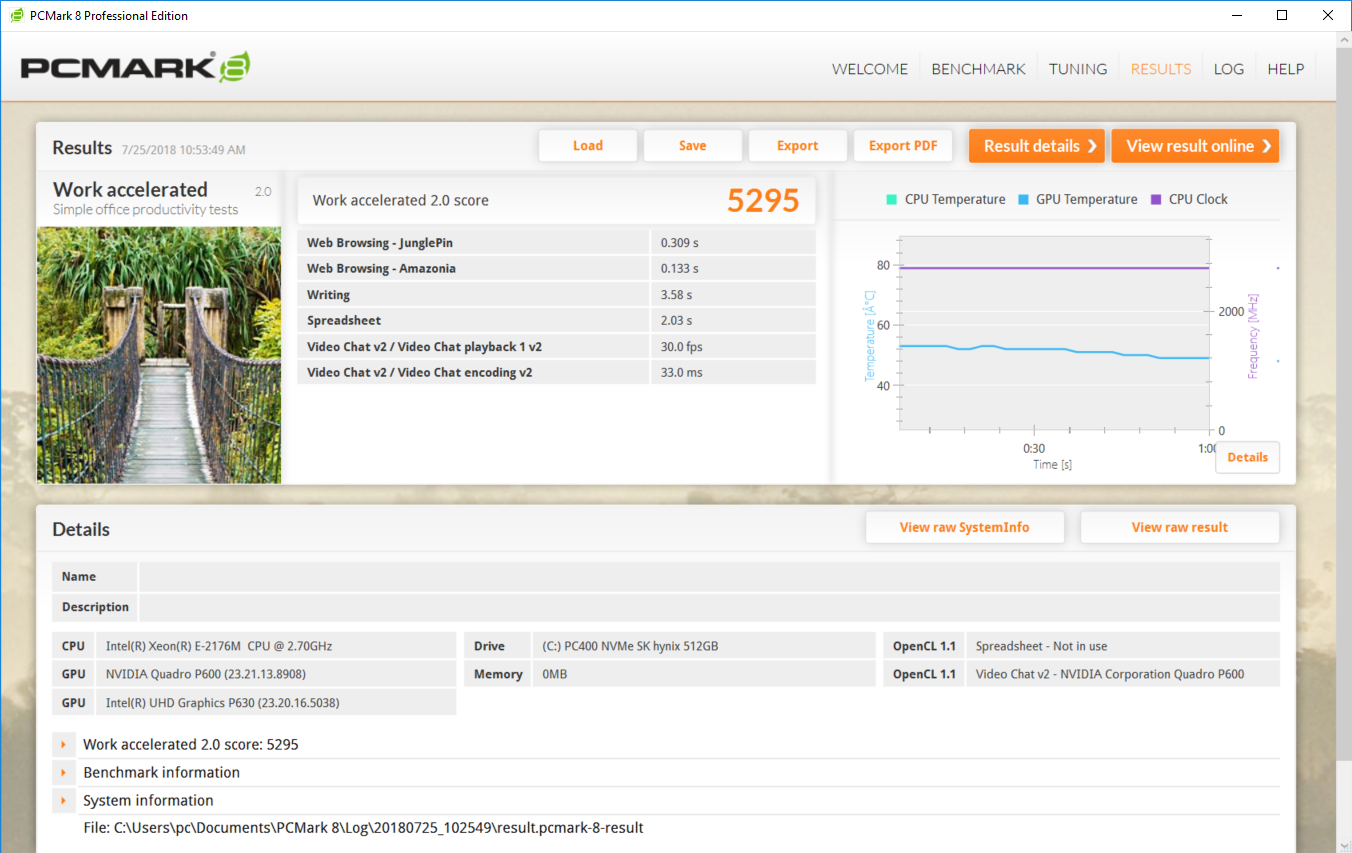
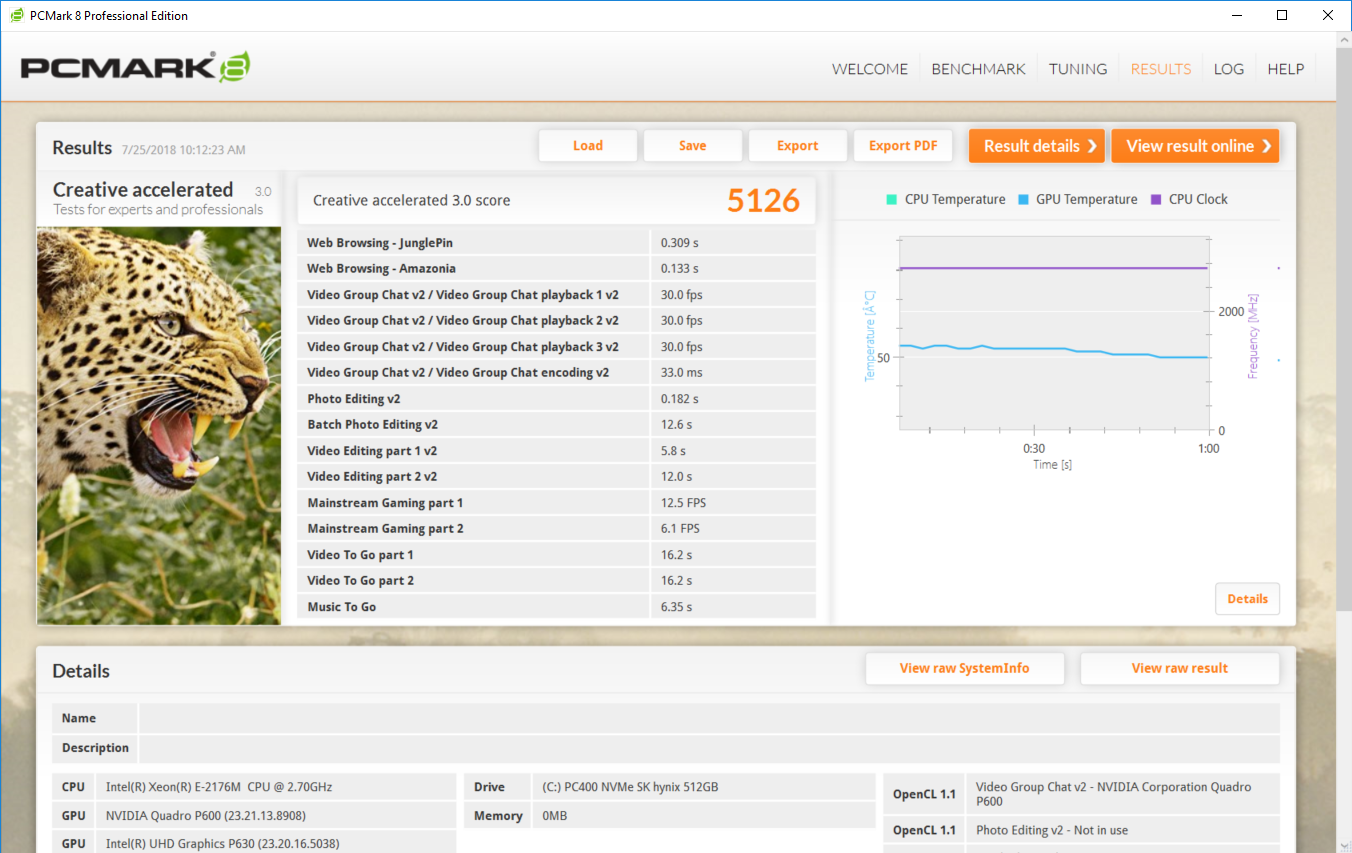
Even with the CPU throttling we just saw, overall system performance is fairly good. The combination of a strong entry-level GPU and a PCIe drive makes for a snappy system. In PCMark 8 and PCMark 10, the Precision 3530 is able to keep pace with similar workstations. The machine is more than capable of handling standard office tasks and should keep up with light to moderate CAD work.
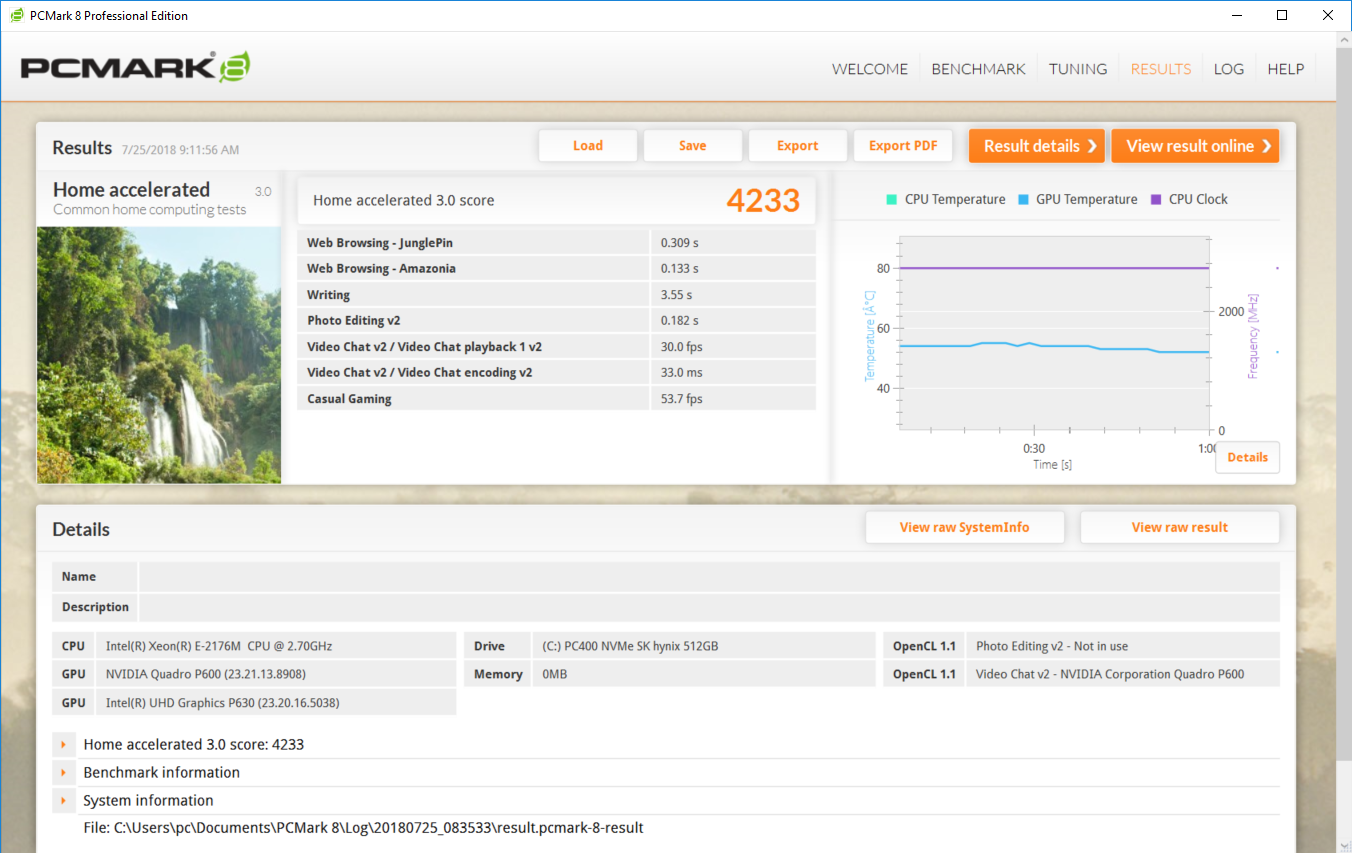

| PCMark 8 Home Score Accelerated v2 | 4233 points | |
| PCMark 8 Creative Score Accelerated v2 | 5126 points | |
| PCMark 8 Work Score Accelerated v2 | 5295 points | |
| PCMark 10 Score | 4817 points | |
Help | ||
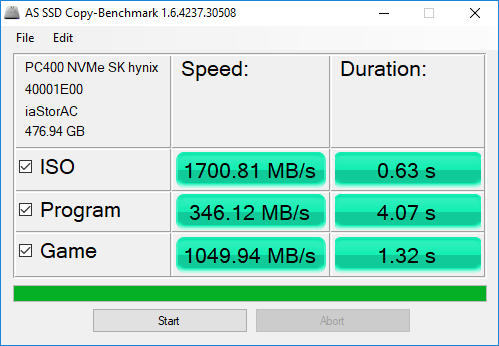
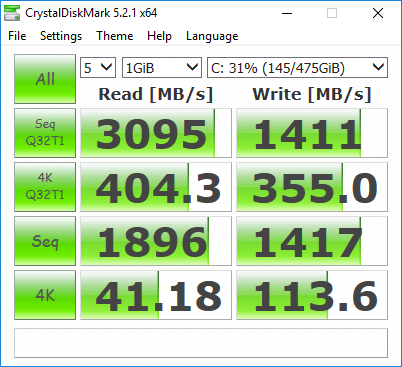
Storage Devices
The SK Hynix drive is a definite improvement over the Toshiba NVMe drive used in the older Precision 3520. Still, the Precision 3530 can't quite keep up with machines running Samsung's drives. Both the SM961 and PM981 trounce the SK Hynix PC400 in overall drive speed, particularly access times and 4K read and write times. Users can replace the drive and also add a second 2.5" SATA drive.
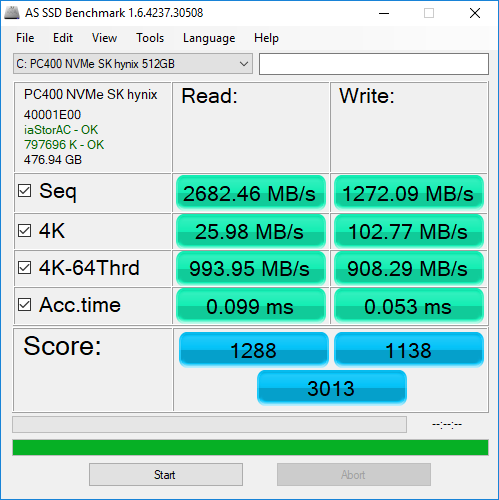
| Dell Precision 3530 SK hynix PC400 512 GB | Dell Precision 3520 Toshiba XG4 NVMe (THNSN5512GPUK) | Dell Precision 5520 UHD Samsung SM961 MZVKW512HMJP m.2 PCI-e | Lenovo ThinkPad P52 20MAS03N00 Samsung SSD PM981 MZVLB512HAJQ | Lenovo ThinkPad P52S-20LB001FUS Samsung SSD PM981 MZVLB1T0HALR | HP ZBook 15 G4-Y4E80AV Samsung SSD SM961 1TB M.2 MZVKW1T0HMLH | |
|---|---|---|---|---|---|---|
| AS SSD | -31% | 29% | 33% | 26% | 35% | |
| Copy Game MB/s (MB/s) | 1050 | 747 -29% | 921 -12% | 1016 -3% | 982 -6% | |
| Copy Program MB/s (MB/s) | 346.1 | 340.4 -2% | 372.8 8% | 476.9 38% | 325.4 -6% | |
| Copy ISO MB/s (MB/s) | 1701 | 1053 -38% | 1659 -2% | 1016 -40% | 1486 -13% | |
| Score Total (Points) | 3013 | 1646 -45% | 3681 22% | 4307 43% | 4038 34% | 4303 43% |
| Score Write (Points) | 1138 | 248 -78% | 1379 21% | 2079 83% | 1468 29% | 1472 29% |
| Score Read (Points) | 1288 | 961 -25% | 1554 21% | 1485 15% | 1703 32% | 1902 48% |
| Access Time Write * (ms) | 0.053 | 0.034 36% | 0.023 57% | 0.031 42% | 0.04 25% | 0.023 57% |
| Access Time Read * (ms) | 0.099 | 0.123 -24% | 0.038 62% | 0.072 27% | 0.04 60% | 0.034 66% |
| 4K-64 Write (MB/s) | 908 | 134.5 -85% | 1055 16% | 1780 96% | 1245 37% | 1136 25% |
| 4K-64 Read (MB/s) | 994 | 788 -21% | 1223 23% | 1203 21% | 1524 53% | 1578 59% |
| 4K Write (MB/s) | 102.8 | 93.8 -9% | 155.3 51% | 121 18% | 100.5 -2% | 158 54% |
| 4K Read (MB/s) | 25.98 | 32.58 25% | 51.5 98% | 52.6 102% | 44.33 71% | 51.7 99% |
| Seq Write (MB/s) | 1272 | 201.9 -84% | 1694 33% | 1781 40% | 1220 -4% | 1777 40% |
| Seq Read (MB/s) | 2682 | 1406 -48% | 2799 4% | 2294 -14% | 1351 -50% | 2719 1% |
* ... smaller is better

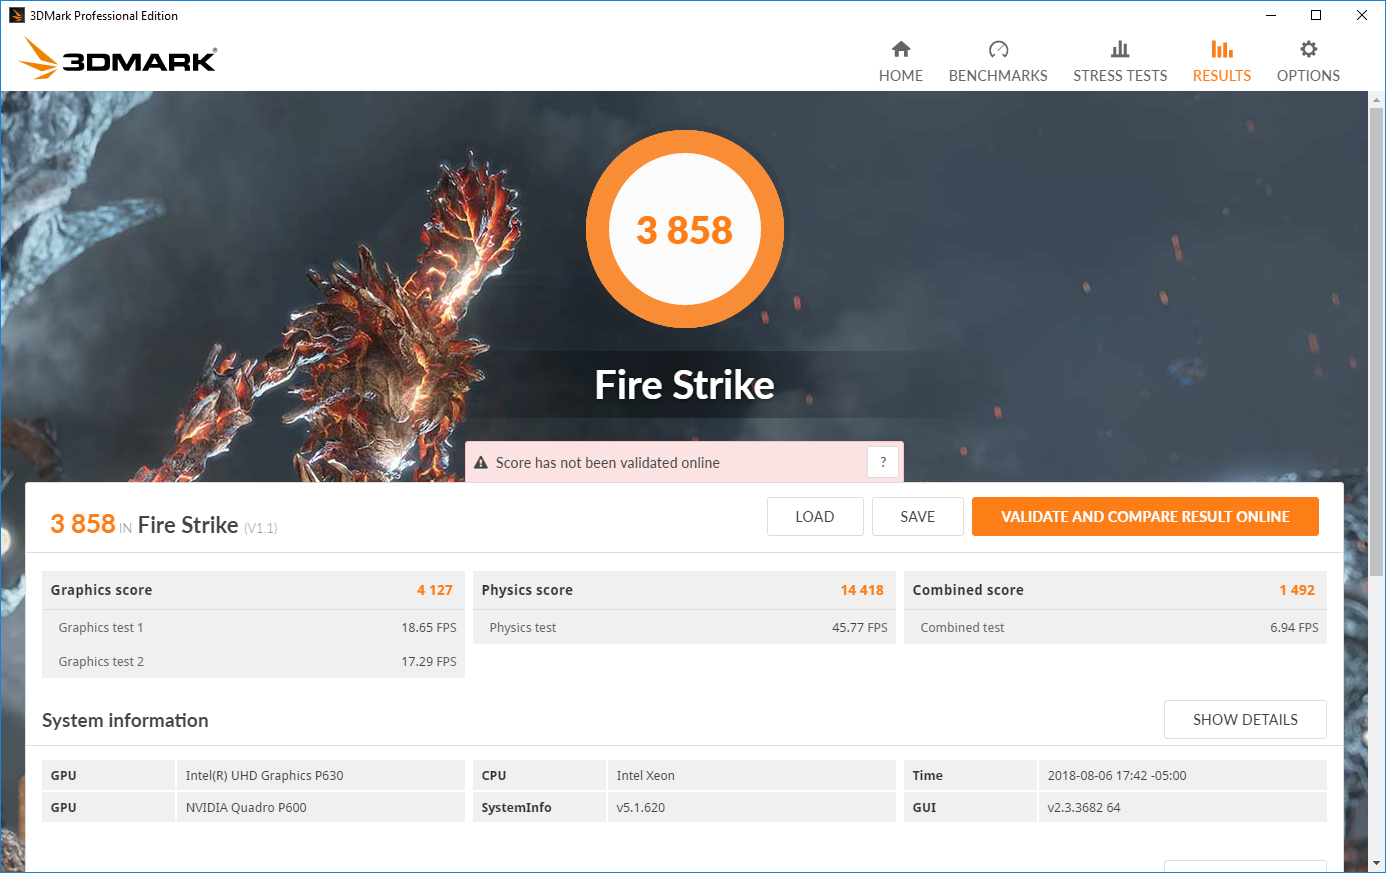
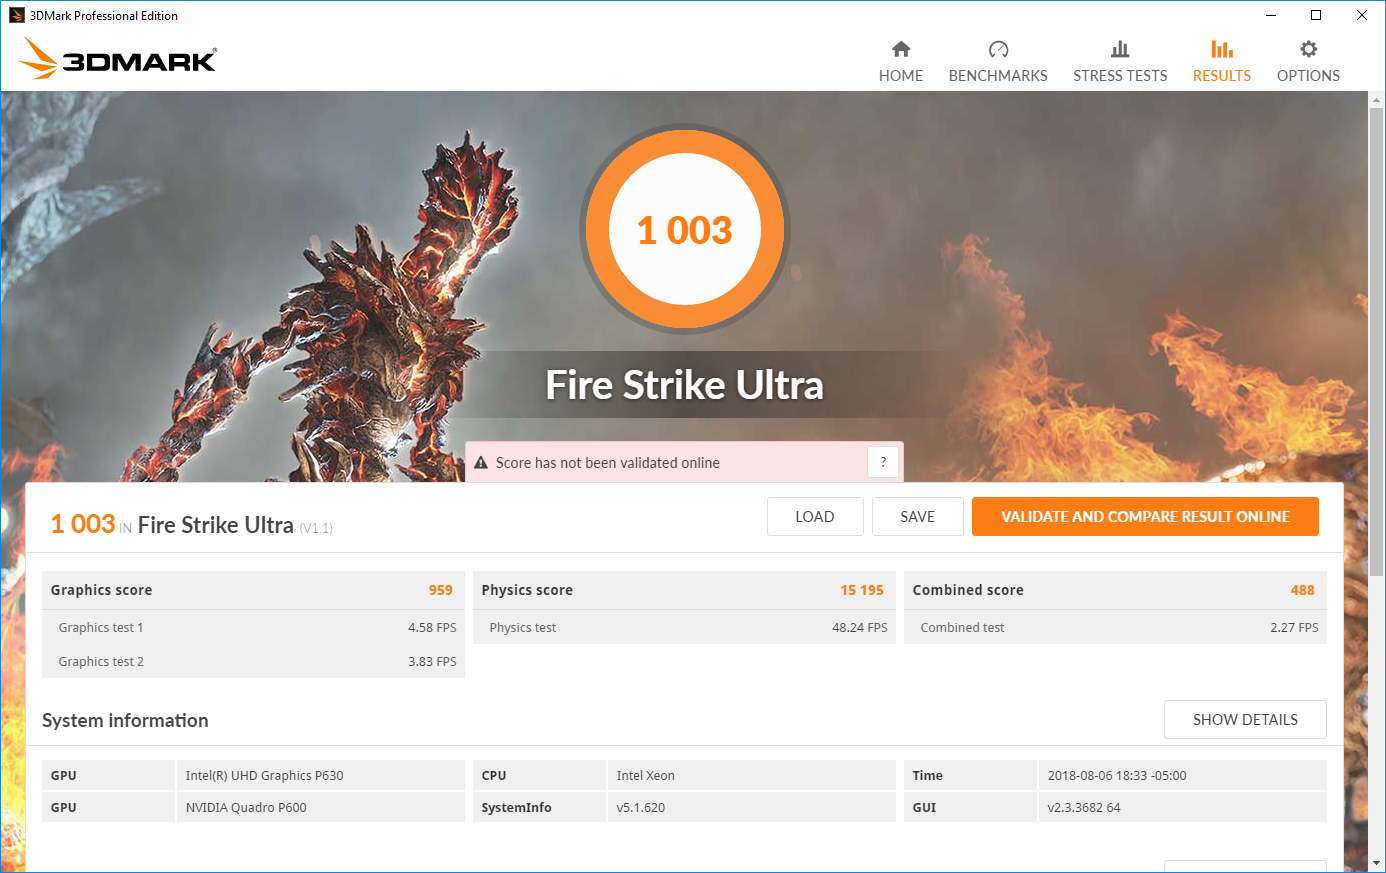
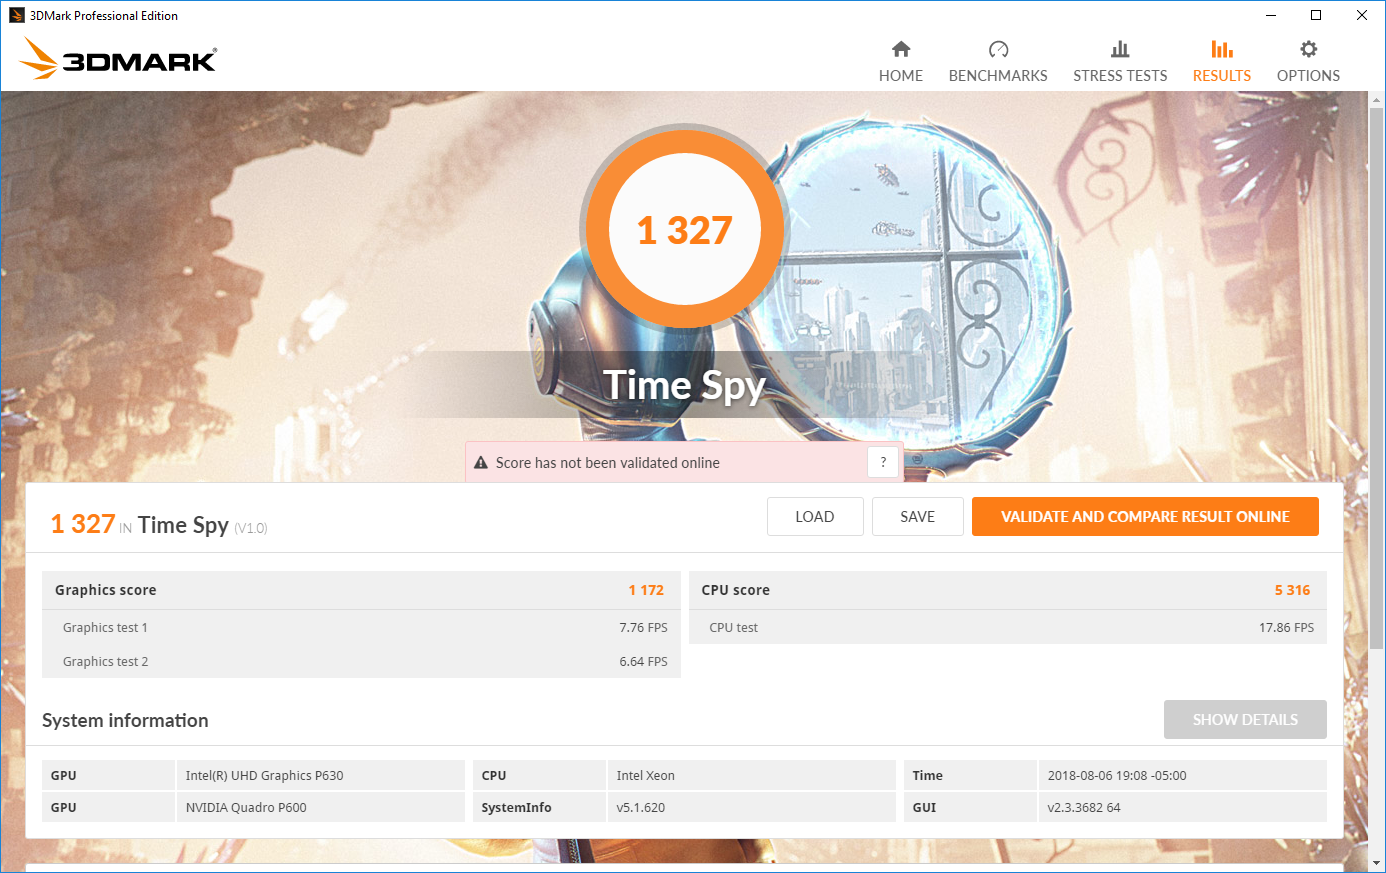
GPU Performance
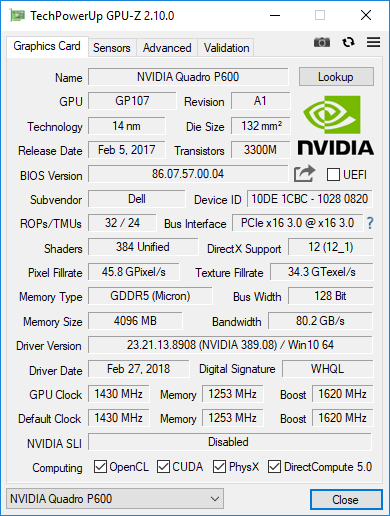
The Nvidia Quadro P600 sits near the bottom of the Quadro pile, just above the Quadro P500. That said, the P600 still packs a punch. The card is designed to replace last year's Quadro M1200. Performance is thus similar to the M1200 and about the same as the GeForce MX150 or GeForce GTX 960M. The P600 has 4 GB of GDDR5 RAM on a 64-bit bus and 384 CUDA cores, just like the MX150. However, the Quadro is set apart by higher quality silicon (better "binning") and certified Quadro drivers specifically made for professional design and graphical work.
In practice, the Quadro P600 is about twice as fast as the Quadro P500 seen in the ThinkPad P52s, making a GPU upgrade something to consider. The Quadro P1000 offers only about 10-15% better performance, positioning the P600 in a nice entry-level sweet spot. The card should be able to handle most low- to mid-level design and graphical work, but heavier projects may be bottlenecked by the GPU.
For more information on the Nvidia Quadro P600, please see our dedicated GPU page here.
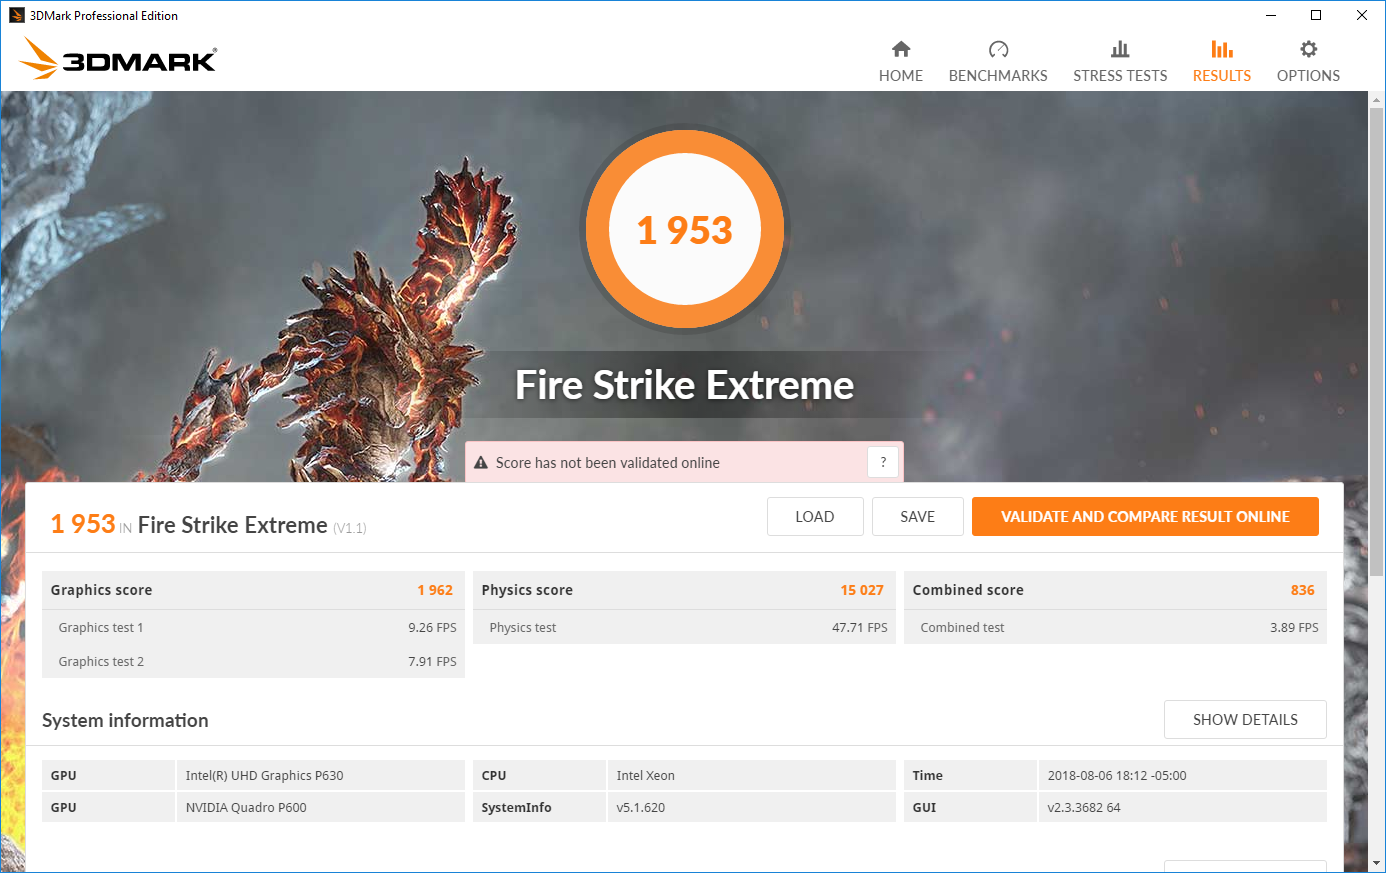
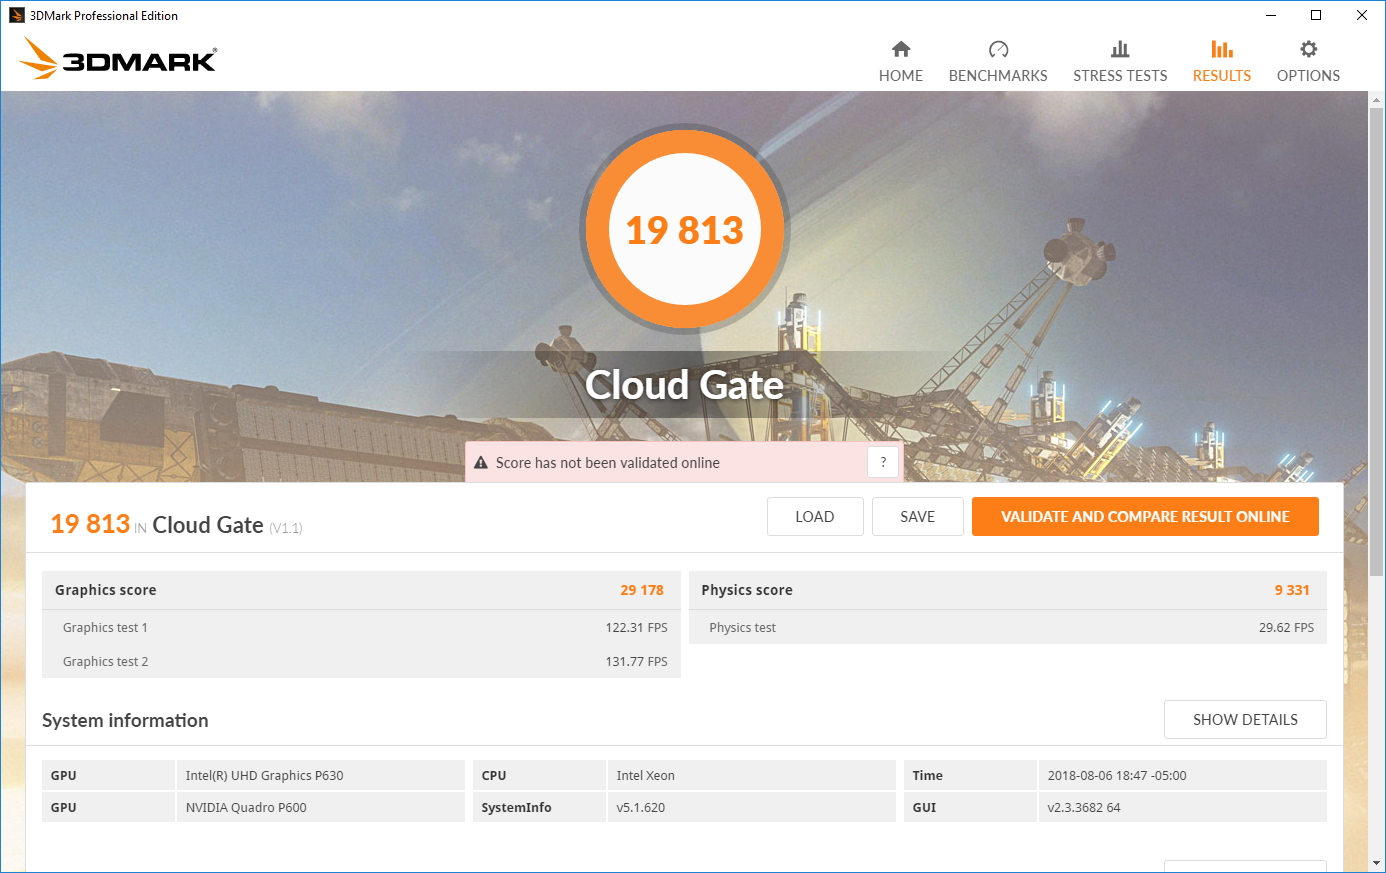
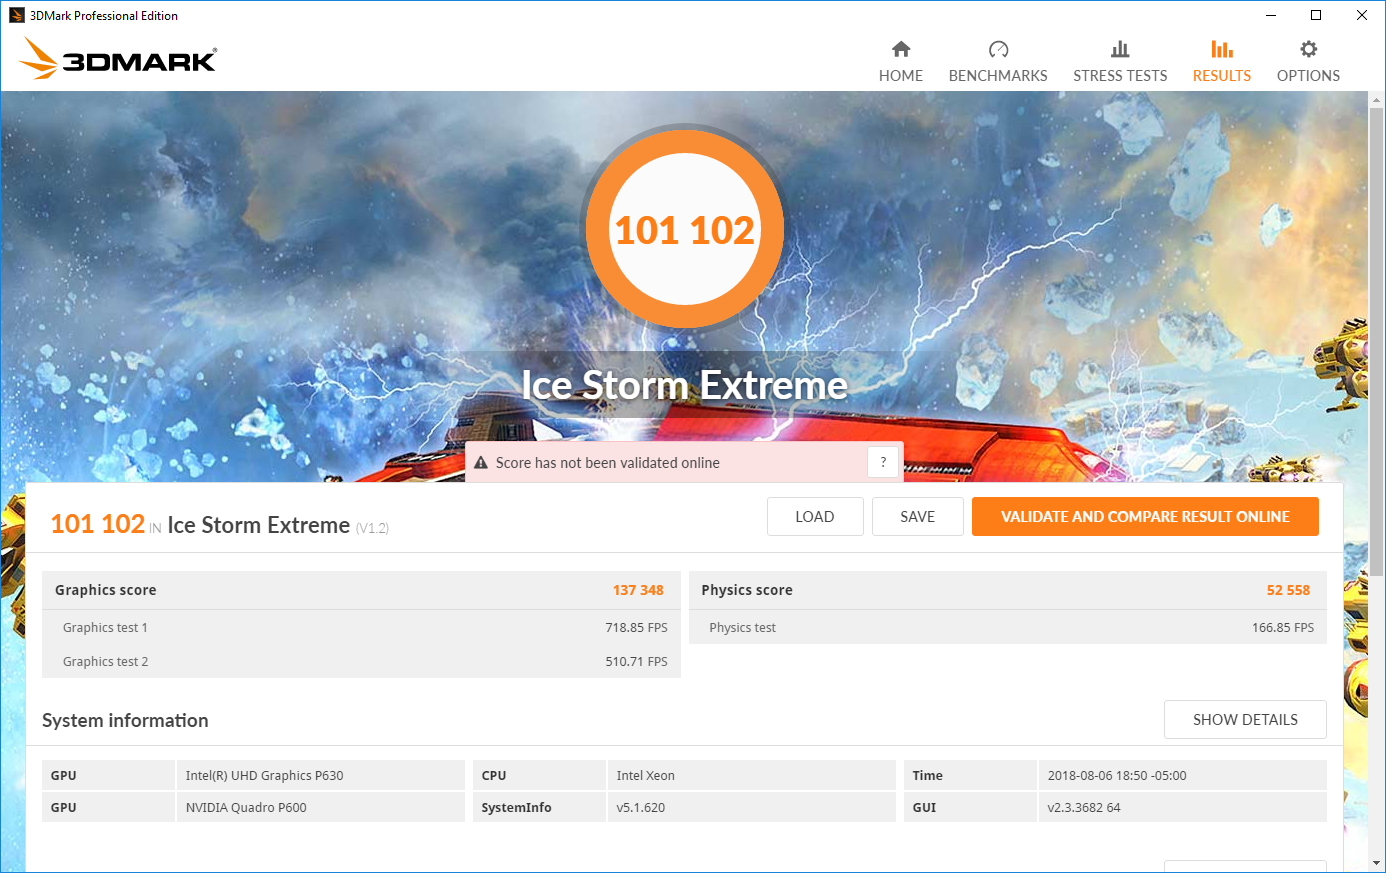
| 3DMark 06 Standard Score | 18112 points | |
| 3DMark 11 Performance | 5193 points | |
| 3DMark Cloud Gate Standard Score | 19813 points | |
| 3DMark Fire Strike Score | 3858 points | |
Help | ||
Gaming Performance
Gaming is possible, but users should temper expectations. Again, the P600's performance is about on par with the Nvidia GeForce MX150. As such, most modern titles can be played at 1280x720/Low settings. Some games can be pushed to Medium settings and still hit 30 fps or higher, but more demanding titles are out of reach. Casual/competitive titles, like Rocket League, can be played at Full HD, albeit it at Medium/High settings.
| BioShock Infinite - 1920x1080 Ultra Preset, DX11 (DDOF) (sort by value) | |
| Dell Precision 3520 | |
| Dell Precision 5520 UHD | |
| MSI WS63VR 7RL-023US | |
| Average NVIDIA Quadro P600 (n=1) | |
| Rise of the Tomb Raider | |
| 1920x1080 Very High Preset AA:FX AF:16x (sort by value) | |
| Dell Precision 3530 | |
| Lenovo ThinkPad P52S-20LB001FUS | |
| MSI WS63VR 7RL-023US | |
| Average NVIDIA Quadro P600 (20 - 21, n=2) | |
| 1366x768 Medium Preset AF:2x (sort by value) | |
| Dell Precision 3530 | |
| Dell Precision 3520 | |
| Lenovo ThinkPad P52S-20LB001FUS | |
| MSI WS63VR 7RL-023US | |
| Average NVIDIA Quadro P600 (45 - 46.5, n=2) | |
| low | med. | high | ultra | |
|---|---|---|---|---|
| The Witcher 3 (2015) | 60 | 45 | 25 | 14 |
| Rise of the Tomb Raider (2016) | 70 | 45 | 23 | 20 |
| Rocket League (2017) | 220 | 118 | 72 | |
| Middle-earth: Shadow of War (2017) | 81 | 32 | 23 | 17 |
Stress Test
Stress testing the Precision 3530 confirms our suspicions of throttling. As seen in our Cinebench R15 loop, the CPU cannot maintain its full clock under load for very long. After a short period of boosting to 4.3 GHz, the CPU ratchets back to about 2.2 GHz (500 Mhz below its rated base clock). This throttling is likely to hold temperatures at bay; at the beginning of the test, the CPU rapidly approached Intel's rated thermal limit of 100° C when boosting. After falling back, core temperatures settle to about 74° C. Running Prime95 with FurMark sees a similar story; the CPU swiftly climbs close to 100° C before choking back to about 85° C, resulting in clock speeds falling below its base.
The GPU suffers the same fate as the CPU, although not to as extreme a degree. Performance when running FurMark for an hour is fairly consistent at about 1300 MHz, and temperatures hold steady at 79° C. Unfortunately, adding any CPU load (such as running Prime95 on top of FurMark) sees intermittent spikes in both the GPU's clock speed and temperature. An hour-long play session of The Witcher 3, which fully loads the CPU and GPU with a more realistic level of stress, pushes the GPU past 90° C. Performance again bounces around, spiking between 1570-1600 MHz. This has little effect on real-world frames per second, which stay consistent. All said, the thermal control of the Precision 3530 is limited, and this may result in inconsistent performance over heavy workloads.
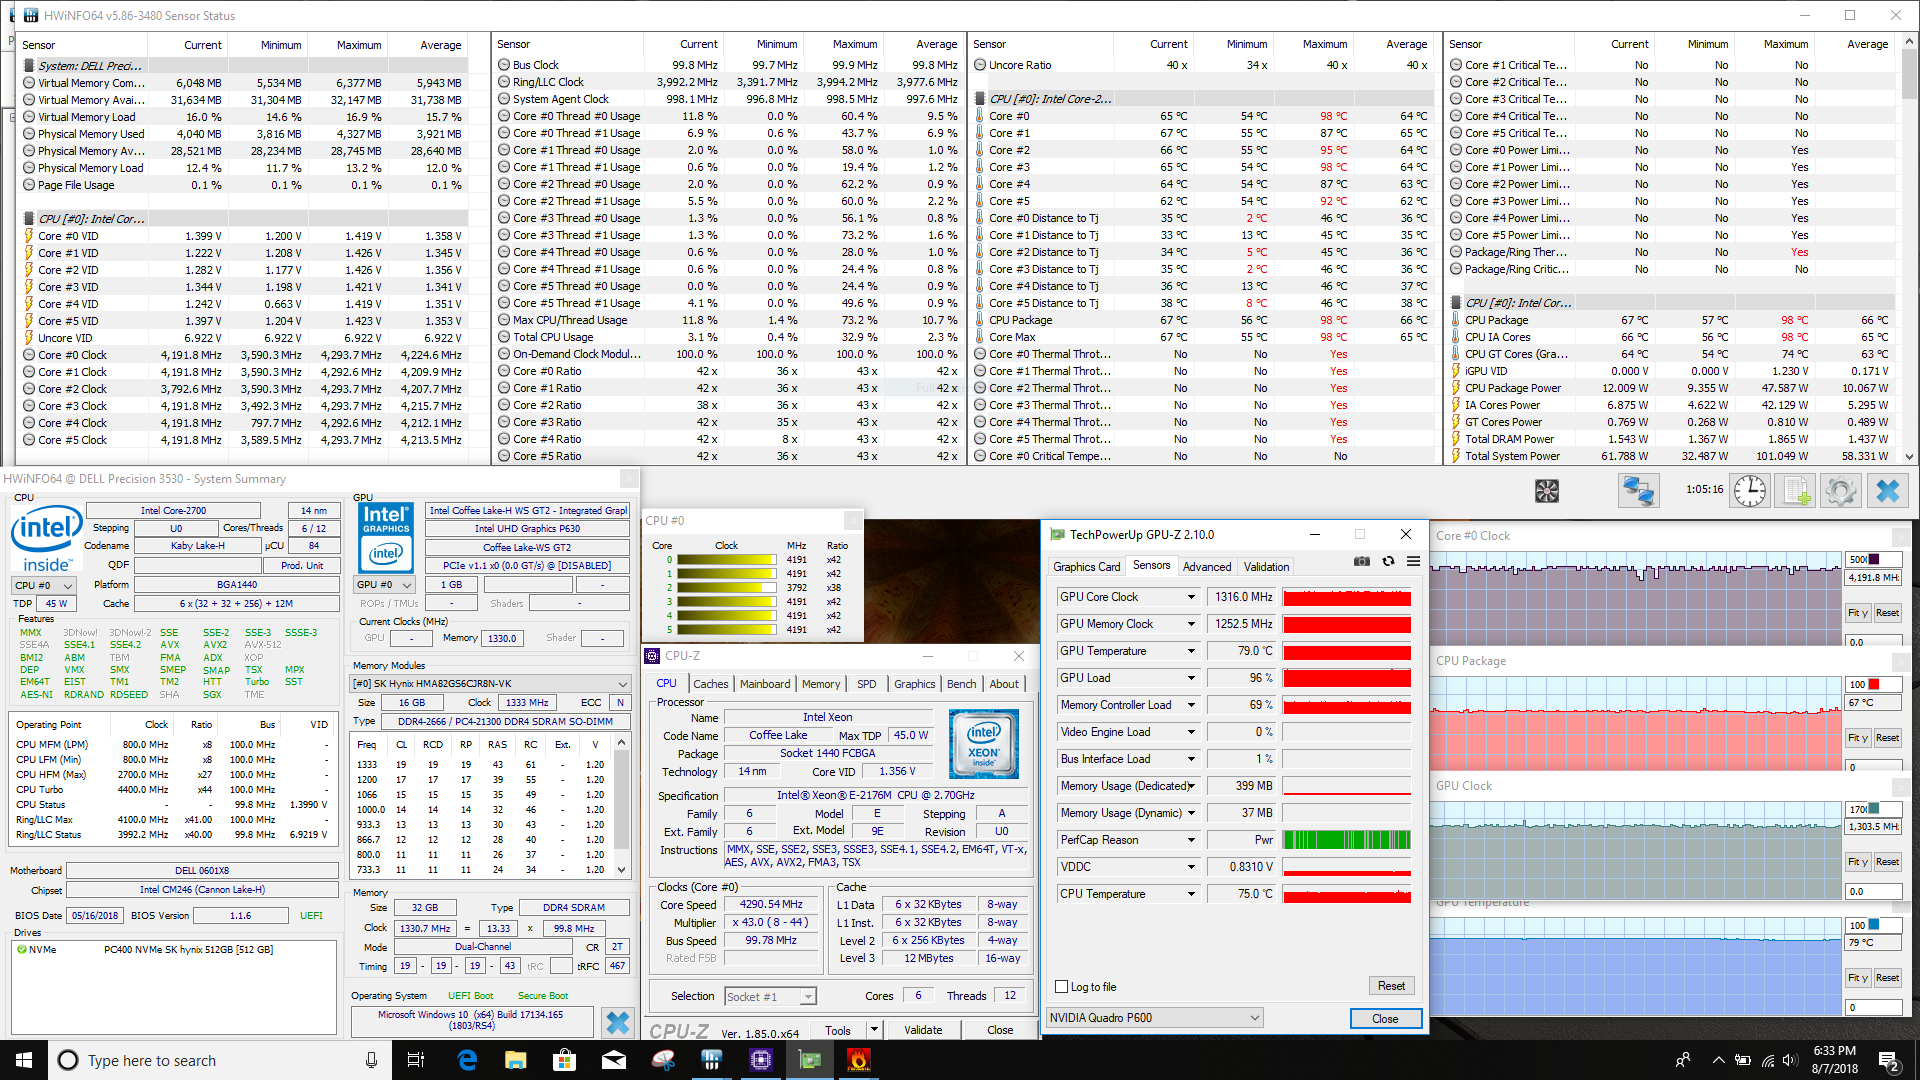

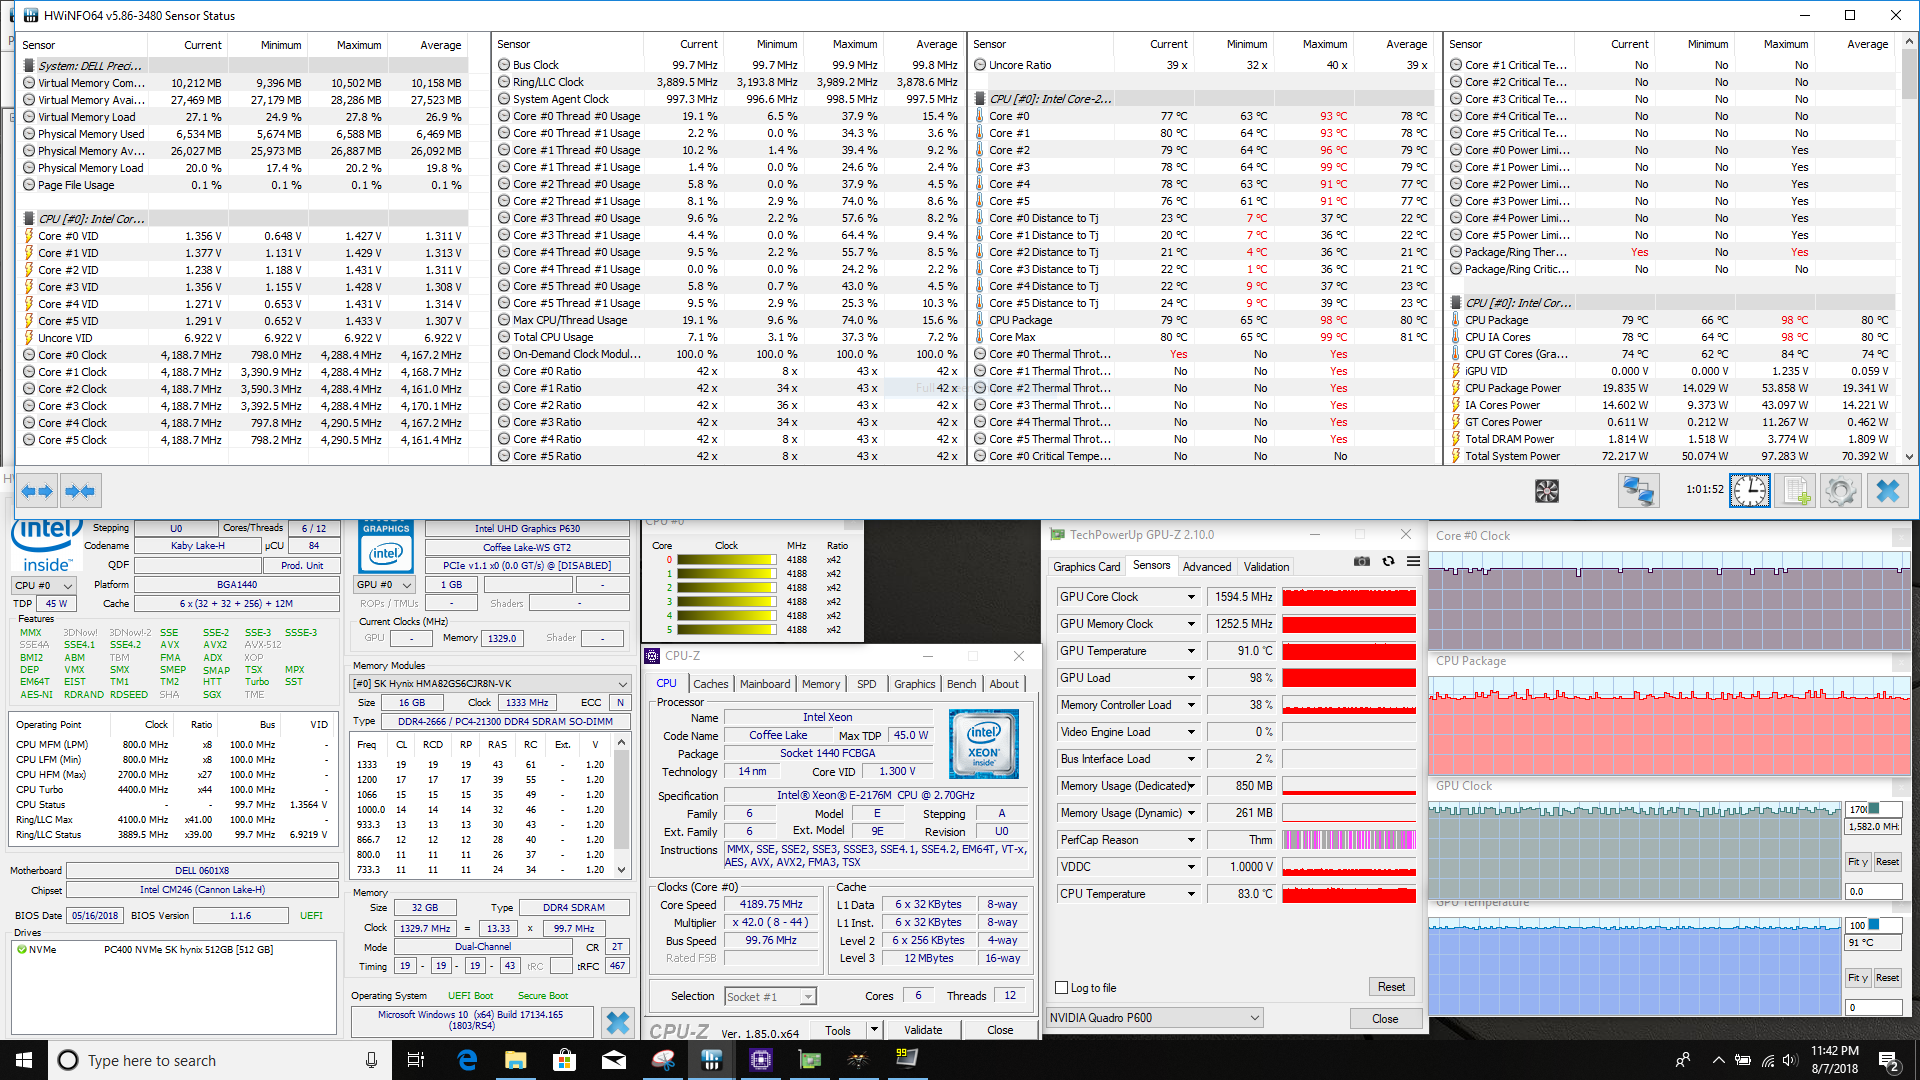
| CPU Clock (GHz) | GPU Clock (MHz) | Average CPU Temperature (°C) | Average GPU Temperature (°C) | |
| Prime95 Stress | 2.2 | - | 74 | - |
| FurMark Stress | 4.2 | 1300 | 67 | 79 |
| Prime95 + FurMark Stress | 2.0 | 1290 | 85 | 87 |
| Witcher 3 Stress | 4.2 | 1585 | 80 | 91 |
Emissions
System Noise
The problems with heat management create a ripple effect to other aspects of the notebook. In particular, fan noise suffers. The fan ramps up aggressively even under light work (office work, web browsing, etc.). Under full load, the fan has its work cut out for it. In order to dump all the heat generated by the CPU and GPU, it is forced to spin fast and loud. Noise levels hit just shy of 50 dB(A), and the high pitch of the fan will cut through an office. Dell would have done well to had a second fan to improve both heat and noise management. The ThinkPad P52 and HP ZBook are much quieter. On the plus side, there is no noticeable coil whine or other unwarranted electrical noise.
Noise level
| Idle |
| 28.3 / 28.3 / 28.4 dB(A) |
| Load |
| 46.2 / 48.6 dB(A) |
 | ||
30 dB silent 40 dB(A) audible 50 dB(A) loud |
||
min: | ||
| Dell Precision 3530 Quadro P600, E-2176M, SK hynix PC400 512 GB | Dell Precision 3520 Quadro M620, i7-7820HQ, Toshiba XG4 NVMe (THNSN5512GPUK) | Dell Precision 5520 UHD Quadro M1200, E3-1505M v6, Samsung SM961 MZVKW512HMJP m.2 PCI-e | Lenovo ThinkPad P52 20MAS03N00 Quadro P1000, i7-8750H, Samsung SSD PM981 MZVLB512HAJQ | Lenovo ThinkPad P52S-20LB001FUS Quadro P500, i7-8650U, Samsung SSD PM981 MZVLB1T0HALR | HP ZBook 15 G4-Y4E80AV Quadro M2200, E3-1535M v6, Samsung SSD SM961 1TB M.2 MZVKW1T0HMLH | |
|---|---|---|---|---|---|---|
| Noise | -3% | -2% | 5% | 4% | 4% | |
| off / environment * (dB) | 28.1 | 29.6 -5% | 28.7 -2% | 29.5 -5% | 28.3 -1% | 29.5 -5% |
| Idle Minimum * (dB) | 28.3 | 29.6 -5% | 28.7 -1% | 29.5 -4% | 28.3 -0% | 29.5 -4% |
| Idle Average * (dB) | 28.3 | 29.6 -5% | 32.1 -13% | 29.5 -4% | 28.3 -0% | 29.5 -4% |
| Idle Maximum * (dB) | 28.4 | 31.2 -10% | 32.1 -13% | 29.5 -4% | 29.8 -5% | 30 -6% |
| Load Average * (dB) | 46.2 | 43 7% | 41.3 11% | 34.7 25% | 40.6 12% | 39.5 15% |
| Load Maximum * (dB) | 48.6 | 46.9 3% | 45.5 6% | 39.4 19% | 40.6 16% | 36 26% |
| Witcher 3 ultra * (dB) | 45.5 | 33.1 | 40.6 | 39.5 |
* ... smaller is better
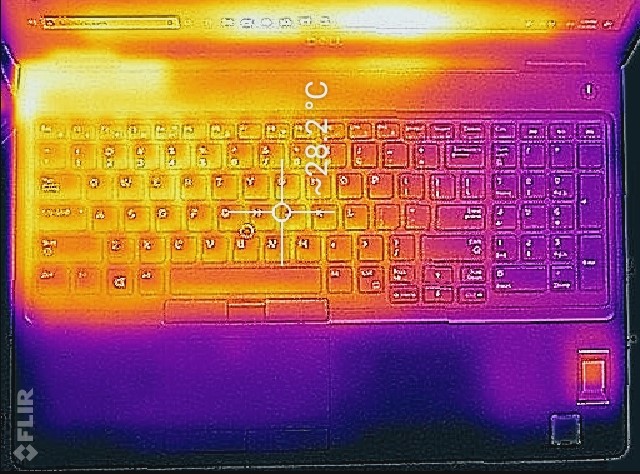
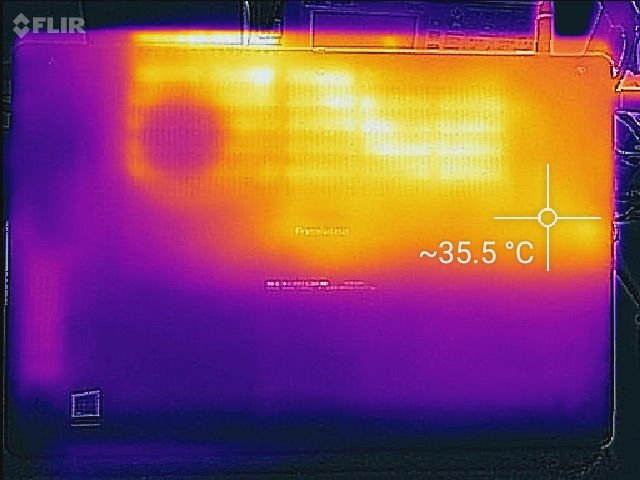
Temperature
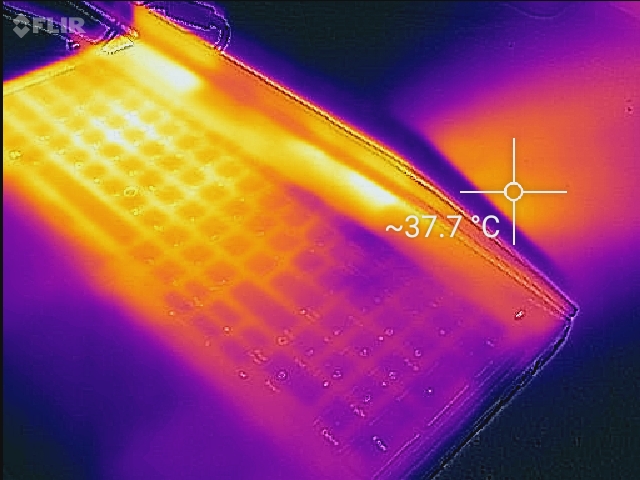
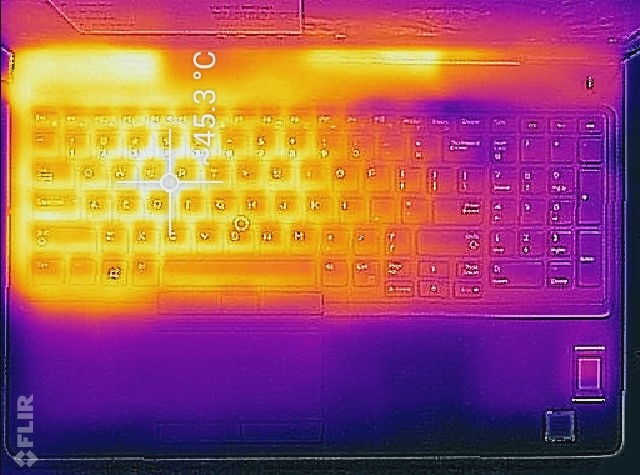
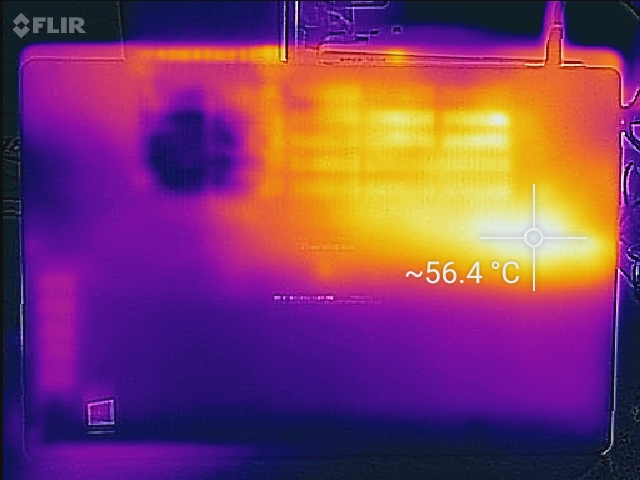
Again, the poor heat management of the Precision 3530 rears its ugly head: external temperatures fall far short of the ideal. Heat is mostly contained around the CPU and GPU (along the left side of the notebook). As such, the right side of the keyboard and bottom panel remain cool, even under load, but the left side of the keyboard gets warm to the touch, and the bottom panel gets too hot to hold in a lap. The device cannot move enough heat away from the CPU and GPU to make lap use comfortable.
(±) The maximum temperature on the upper side is 44.8 °C / 113 F, compared to the average of 38.2 °C / 101 F, ranging from 22.2 to 69.8 °C for the class Workstation.
(-) The bottom heats up to a maximum of 56.4 °C / 134 F, compared to the average of 41.1 °C / 106 F
(+) In idle usage, the average temperature for the upper side is 25.9 °C / 79 F, compared to the device average of 32 °C / 90 F.
(+) The palmrests and touchpad are cooler than skin temperature with a maximum of 23.4 °C / 74.1 F and are therefore cool to the touch.
(+) The average temperature of the palmrest area of similar devices was 27.8 °C / 82 F (+4.4 °C / 7.9 F).
Speakers

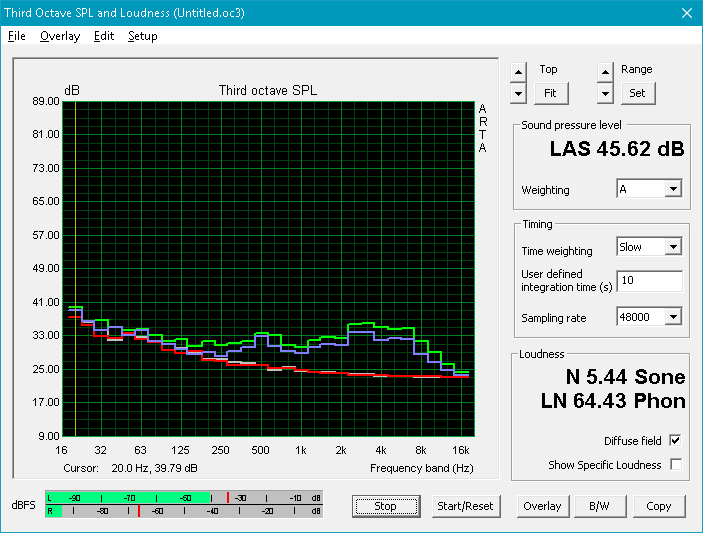
The speakers are above average. While bass is anemic, mids and highs are loud and remain clear, even at maximum volume. This makes the Precision 3530 well-tuned for video conferencing and vocal audio. As far as multimedia and music go, the Precision 3530 is disappointing. The weak bass makes the overall profile sound thin. However, this isn't uncommon for workstations. After all, their main purpose is not for media consumption.
Dell Precision 3530 audio analysis
(±) | speaker loudness is average but good (74 dB)
Bass 100 - 315 Hz
(±) | reduced bass - on average 13.4% lower than median
(±) | linearity of bass is average (14.9% delta to prev. frequency)
Mids 400 - 2000 Hz
(±) | higher mids - on average 5.5% higher than median
(±) | linearity of mids is average (7.5% delta to prev. frequency)
Highs 2 - 16 kHz
(+) | balanced highs - only 1.3% away from median
(+) | highs are linear (5.2% delta to prev. frequency)
Overall 100 - 16.000 Hz
(±) | linearity of overall sound is average (17.9% difference to median)
Compared to same class
» 56% of all tested devices in this class were better, 11% similar, 33% worse
» The best had a delta of 7%, average was 17%, worst was 35%
Compared to all devices tested
» 37% of all tested devices were better, 8% similar, 55% worse
» The best had a delta of 4%, average was 23%, worst was 134%
Dell Precision 5520 UHD audio analysis
(±) | speaker loudness is average but good (79.6 dB)
Bass 100 - 315 Hz
(±) | reduced bass - on average 12.8% lower than median
(±) | linearity of bass is average (14.2% delta to prev. frequency)
Mids 400 - 2000 Hz
(+) | balanced mids - only 4% away from median
(±) | linearity of mids is average (9.9% delta to prev. frequency)
Highs 2 - 16 kHz
(+) | balanced highs - only 3.3% away from median
(±) | linearity of highs is average (12% delta to prev. frequency)
Overall 100 - 16.000 Hz
(±) | linearity of overall sound is average (16.7% difference to median)
Compared to same class
» 46% of all tested devices in this class were better, 9% similar, 45% worse
» The best had a delta of 7%, average was 17%, worst was 35%
Compared to all devices tested
» 29% of all tested devices were better, 7% similar, 64% worse
» The best had a delta of 4%, average was 23%, worst was 134%
Energy Management
Power Consumption
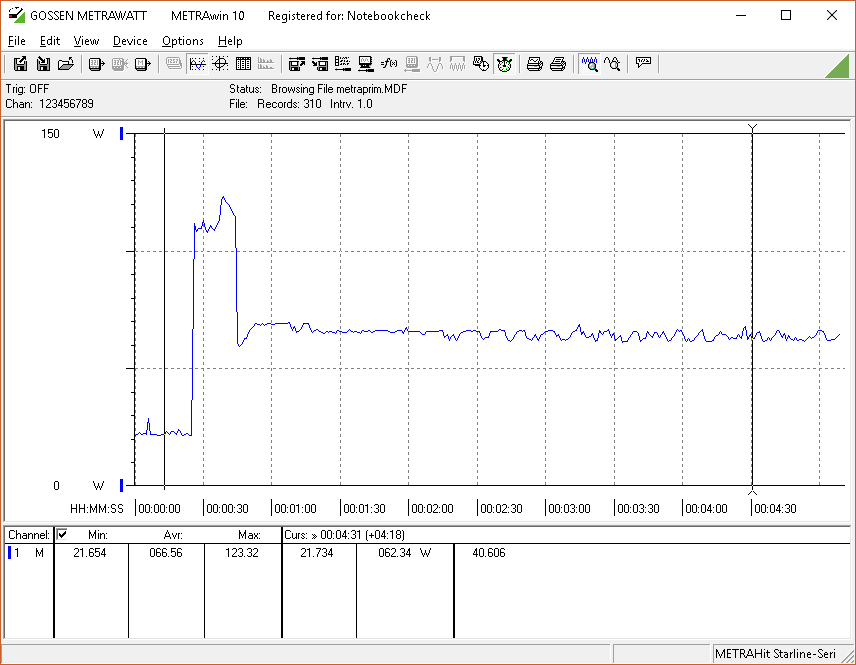
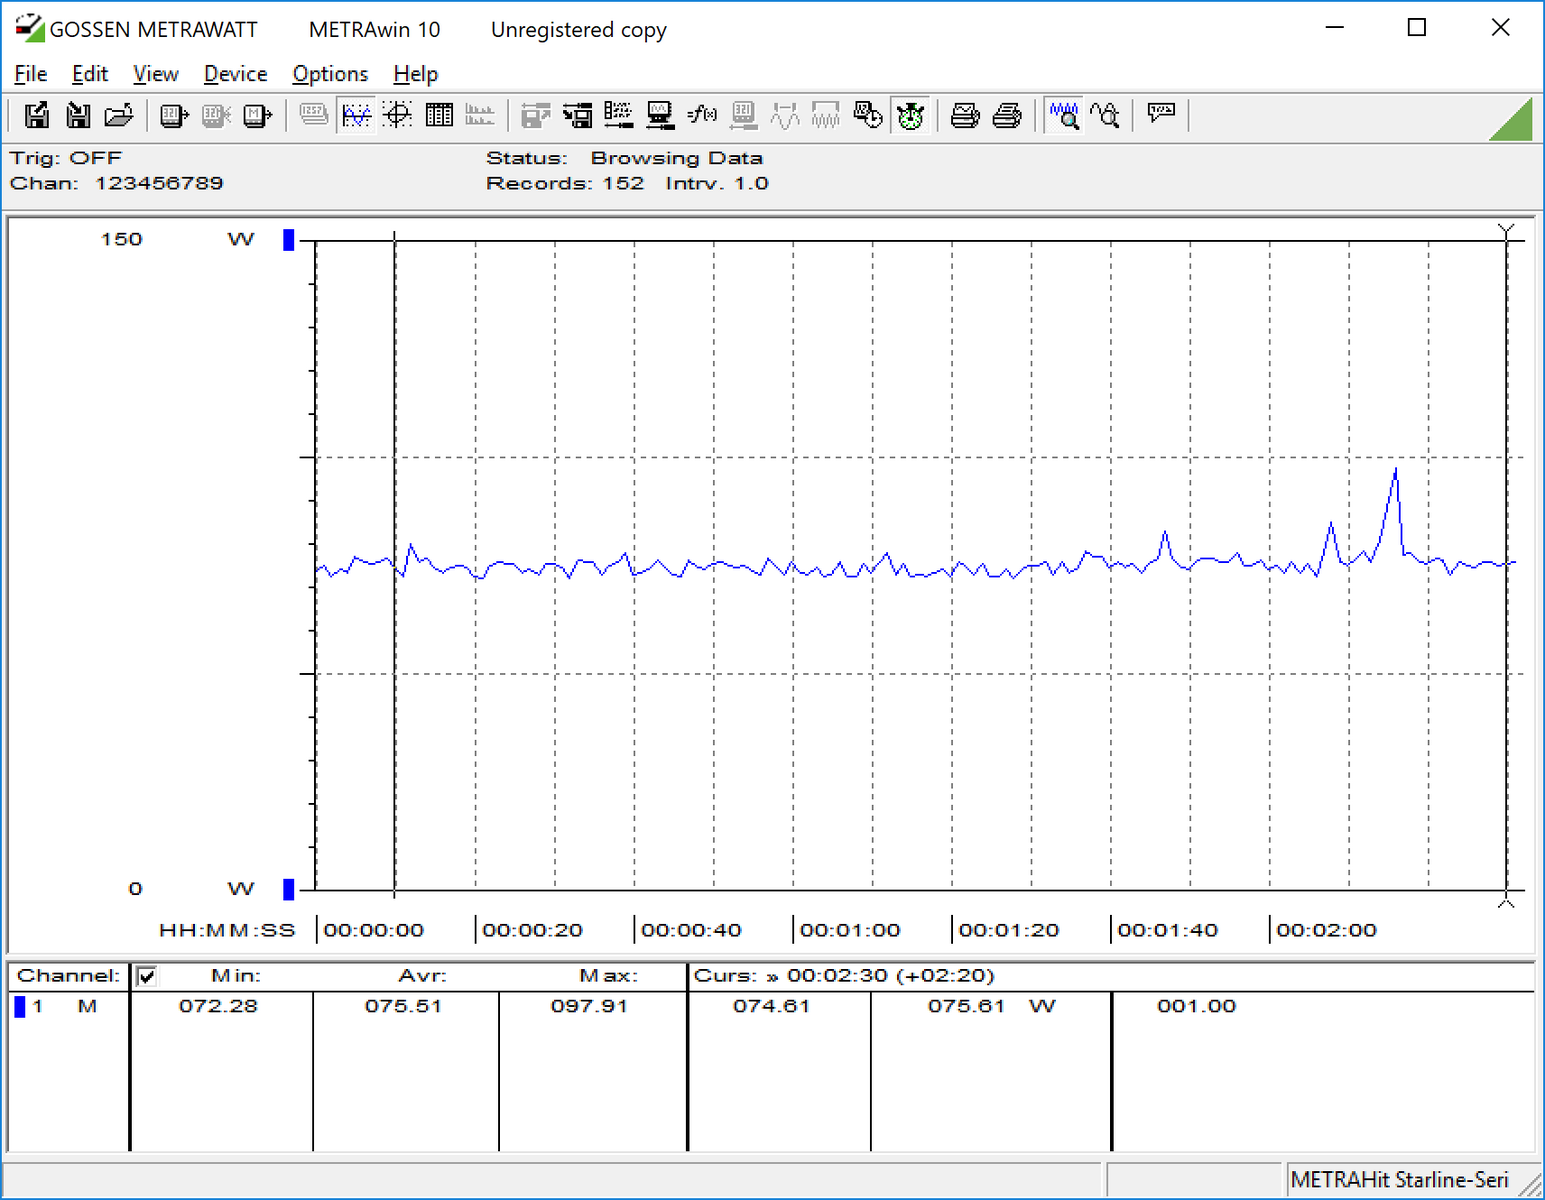
The Precision 3530 is fairly power efficient, especially compared to similarly-specced workstations. Under load, the machine pulls about 85 Watts on average, which is about in line with competing devices. Under full load, power draw stays below 92 Watts, which looks significantly better than other workstations on paper. However, keep in mind that the Precision 3530 throttles under load. This may explain the lower power draw compared to other notebooks. The 180 Watt power supply supplies more than enough power for the machine.
| Off / Standby | |
| Idle | |
| Load |
|
Key:
min: | |
| Dell Precision 3530 E-2176M, Quadro P600, SK hynix PC400 512 GB, IPS, 1920x1080, 15.6" | Dell Precision 3520 i7-7820HQ, Quadro M620, Toshiba XG4 NVMe (THNSN5512GPUK), IPS LED, 1920x1080, 15.6" | Dell Precision 5520 UHD E3-1505M v6, Quadro M1200, Samsung SM961 MZVKW512HMJP m.2 PCI-e, IPS, 3840x2160, 15.6" | Lenovo ThinkPad P52 20MAS03N00 i7-8750H, Quadro P1000, Samsung SSD PM981 MZVLB512HAJQ, IPS LED, 1920x1080, 15.6" | Lenovo ThinkPad P52S-20LB001FUS i7-8650U, Quadro P500, Samsung SSD PM981 MZVLB1T0HALR, IPS, 3840x2160, 15.6" | HP ZBook 15 G4-Y4E80AV E3-1535M v6, Quadro M2200, Samsung SSD SM961 1TB M.2 MZVKW1T0HMLH, IPS, 1920x1080, 15.6" | |
|---|---|---|---|---|---|---|
| Power Consumption | 0% | -30% | 4% | 10% | -13% | |
| Idle Minimum * (Watt) | 5.3 | 5.8 -9% | 8.9 -68% | 4.02 24% | 5.9 -11% | 5.9 -11% |
| Idle Average * (Watt) | 10.7 | 10.7 -0% | 13.6 -27% | 7.2 33% | 11.7 -9% | 8.9 17% |
| Idle Maximum * (Watt) | 14.1 | 13.3 6% | 14.1 -0% | 11.46 19% | 15.6 -11% | 12.7 10% |
| Load Average * (Watt) | 85.4 | 78.2 8% | 100.3 -17% | 76.3 11% | 63 26% | 95.2 -11% |
| Witcher 3 ultra * (Watt) | 75.5 | 58.8 22% | 100.2 -33% | 74 2% | 48.4 36% | 87.7 -16% |
| Load Maximum * (Watt) | 91.9 | 116 -26% | 126.3 -37% | 154 -68% | 63.1 31% | 154 -68% |
* ... smaller is better
Battery Life
Battery runtimes are one of the high points of the device. The Precision 3530 lasts over 9 hours in our WiFi v1.3 battery test and should easily get through a workday unplugged, so long as work is limited to light web browsing and simple office tasks (word processing, email, etc.). Dell offers a few options for battery capacity, including the same 68 Wh battery used in the older 3520. Runtimes with the smaller battery should be about in line with those of the 3520. Road warriors that need even longer battery life should look to Lenovo and the ThinkPad P52, which topped the Precision 3530 by 78 minutes in the same WiFi battery test.
| Dell Precision 3530 E-2176M, Quadro P600, 92 Wh | Dell Precision 3520 i7-7820HQ, Quadro M620, 68 Wh | Dell Precision 5520 UHD E3-1505M v6, Quadro M1200, 97 Wh | Lenovo ThinkPad P52 20MAS03N00 i7-8750H, Quadro P1000, 96 Wh | Lenovo ThinkPad P52S-20LB001FUS i7-8650U, Quadro P500, 80 Wh | HP ZBook 15 G4-Y4E80AV E3-1535M v6, Quadro M2200, 90 Wh | |
|---|---|---|---|---|---|---|
| Battery runtime | -16% | -43% | 10% | 20% | 5% | |
| Reader / Idle (h) | 18.8 | 16.6 -12% | 12.1 -36% | 25.3 35% | 17.2 -9% | 18.3 -3% |
| WiFi v1.3 (h) | 9.3 | 7.6 -18% | 4.2 -55% | 10.6 14% | 11.1 19% | 9.1 -2% |
| Load (h) | 1.6 | 1.3 -19% | 1 -37% | 1.3 -19% | 2.4 50% | 1.9 19% |
Pros
Cons
Verdict
The story of the Dell Precision 3530 is one of compromise. Dell has recycled the chassis of the older 3520 but packed in more powerful hardware. This choice plagues the 3530 with similar problems, notably heat and noise management. Just like the 3520, the 3530 has uncomfortably warm hot spots. The fan also ramps up quickly and loudly. Worse yet, the poor heat management results in some severe thermal throttling, limiting CPU performance over heavy loads by up to 20%.
These compromises mar an otherwise great device. The 3530 is built well, has an excellent keyboard, and has a great compliment of ports (including a Thunderbolt 3 port). The screen is about average and should be adequate for non-color dependent professional work. Battery runtimes are excellent.
Despite all these positives, the Precision 3530 ultimately falls flat due to its inconsistent performance. The Xeon CPU and Quadro GPU are just too much for the mediocre heat system. The result is heavy throttling, especially in CPU performance, and a loud and aggressive fan. There are much better options that offer similar (if not better) performance that is much more consistent. HP's Zbook 15 G4 or the Lenovo ThinkPad P52 would be better choices.
Dell Precision 3530
- 08/13/2018 v6 (old)
Sam Medley
Price comparison
