2022 Beelink GTR5 mini PC review: An Intel NUC with AMD Ryzen 9

In the early days of NUC-sized mini PCs, such products were typically seen as ultra low-power alternatives to the typical desktop or laptop. Nowadays, mini PCs have evolved to include gaming-level specifications and other powerful features. The Beelink GTR5 is the latest high-performance mini PC from the manufacturer equipped with an AMD Zen 3 Ryzen 9 5900HX processor that is typically reserved for powerful gaming laptops like the Asus ROG Zephyrus Duo 15 SE, Lenovo Legion 7 16, or the Gigabyte A7 X1. To see such an option for a 0.8 L form factor PC should automatically make the GTR5 one of the fastest in its category should everything run as advertised.
The GTR5 is currently on Indiegogo ranging from $620 USD for a barebones kit up to $950 if fully configured. All SKUs come with the same Ryzen 9 5900HX processor. The GTR5 should not be confused with the GTR7 which is actually an older Beelink model running on the much slower Ryzen 7 3750H.
More Beelink reviews:
Potential Competitors in Comparison
Rating | Date | Model | Weight | Height | Size | Resolution | Price |
|---|---|---|---|---|---|---|---|
v (old) | 01 / 2022 | Beelink GTR5 R9 5900HX, Vega 8 | 686 g | 39 mm | x | ||
v (old) | 12 / 2021 | Beelink GTI 11 i5-1135G7, Iris Xe G7 80EUs | 638 g | 39 mm | x | ||
v (old) | 03 / 2021 | GMK NucBox 2 i5-8259U, Iris Plus Graphics 655 | 430 g | 50 mm | x | ||
v (old) | 04 / 2021 | Intel NUC11PHKi7C i7-1165G7, GeForce RTX 2060 Mobile | 1.4 kg | 42 mm | x | ||
v (old) | 02 / 2021 | Intel NUC11PAQi7 i7-1165G7, Iris Xe G7 96EUs | 647 g | 56 mm | x | ||
v (old) | 05 / 2021 | Beelink GK Mini Celeron J4125, UHD Graphics 600 | 269 g | 43 mm | x |
Case
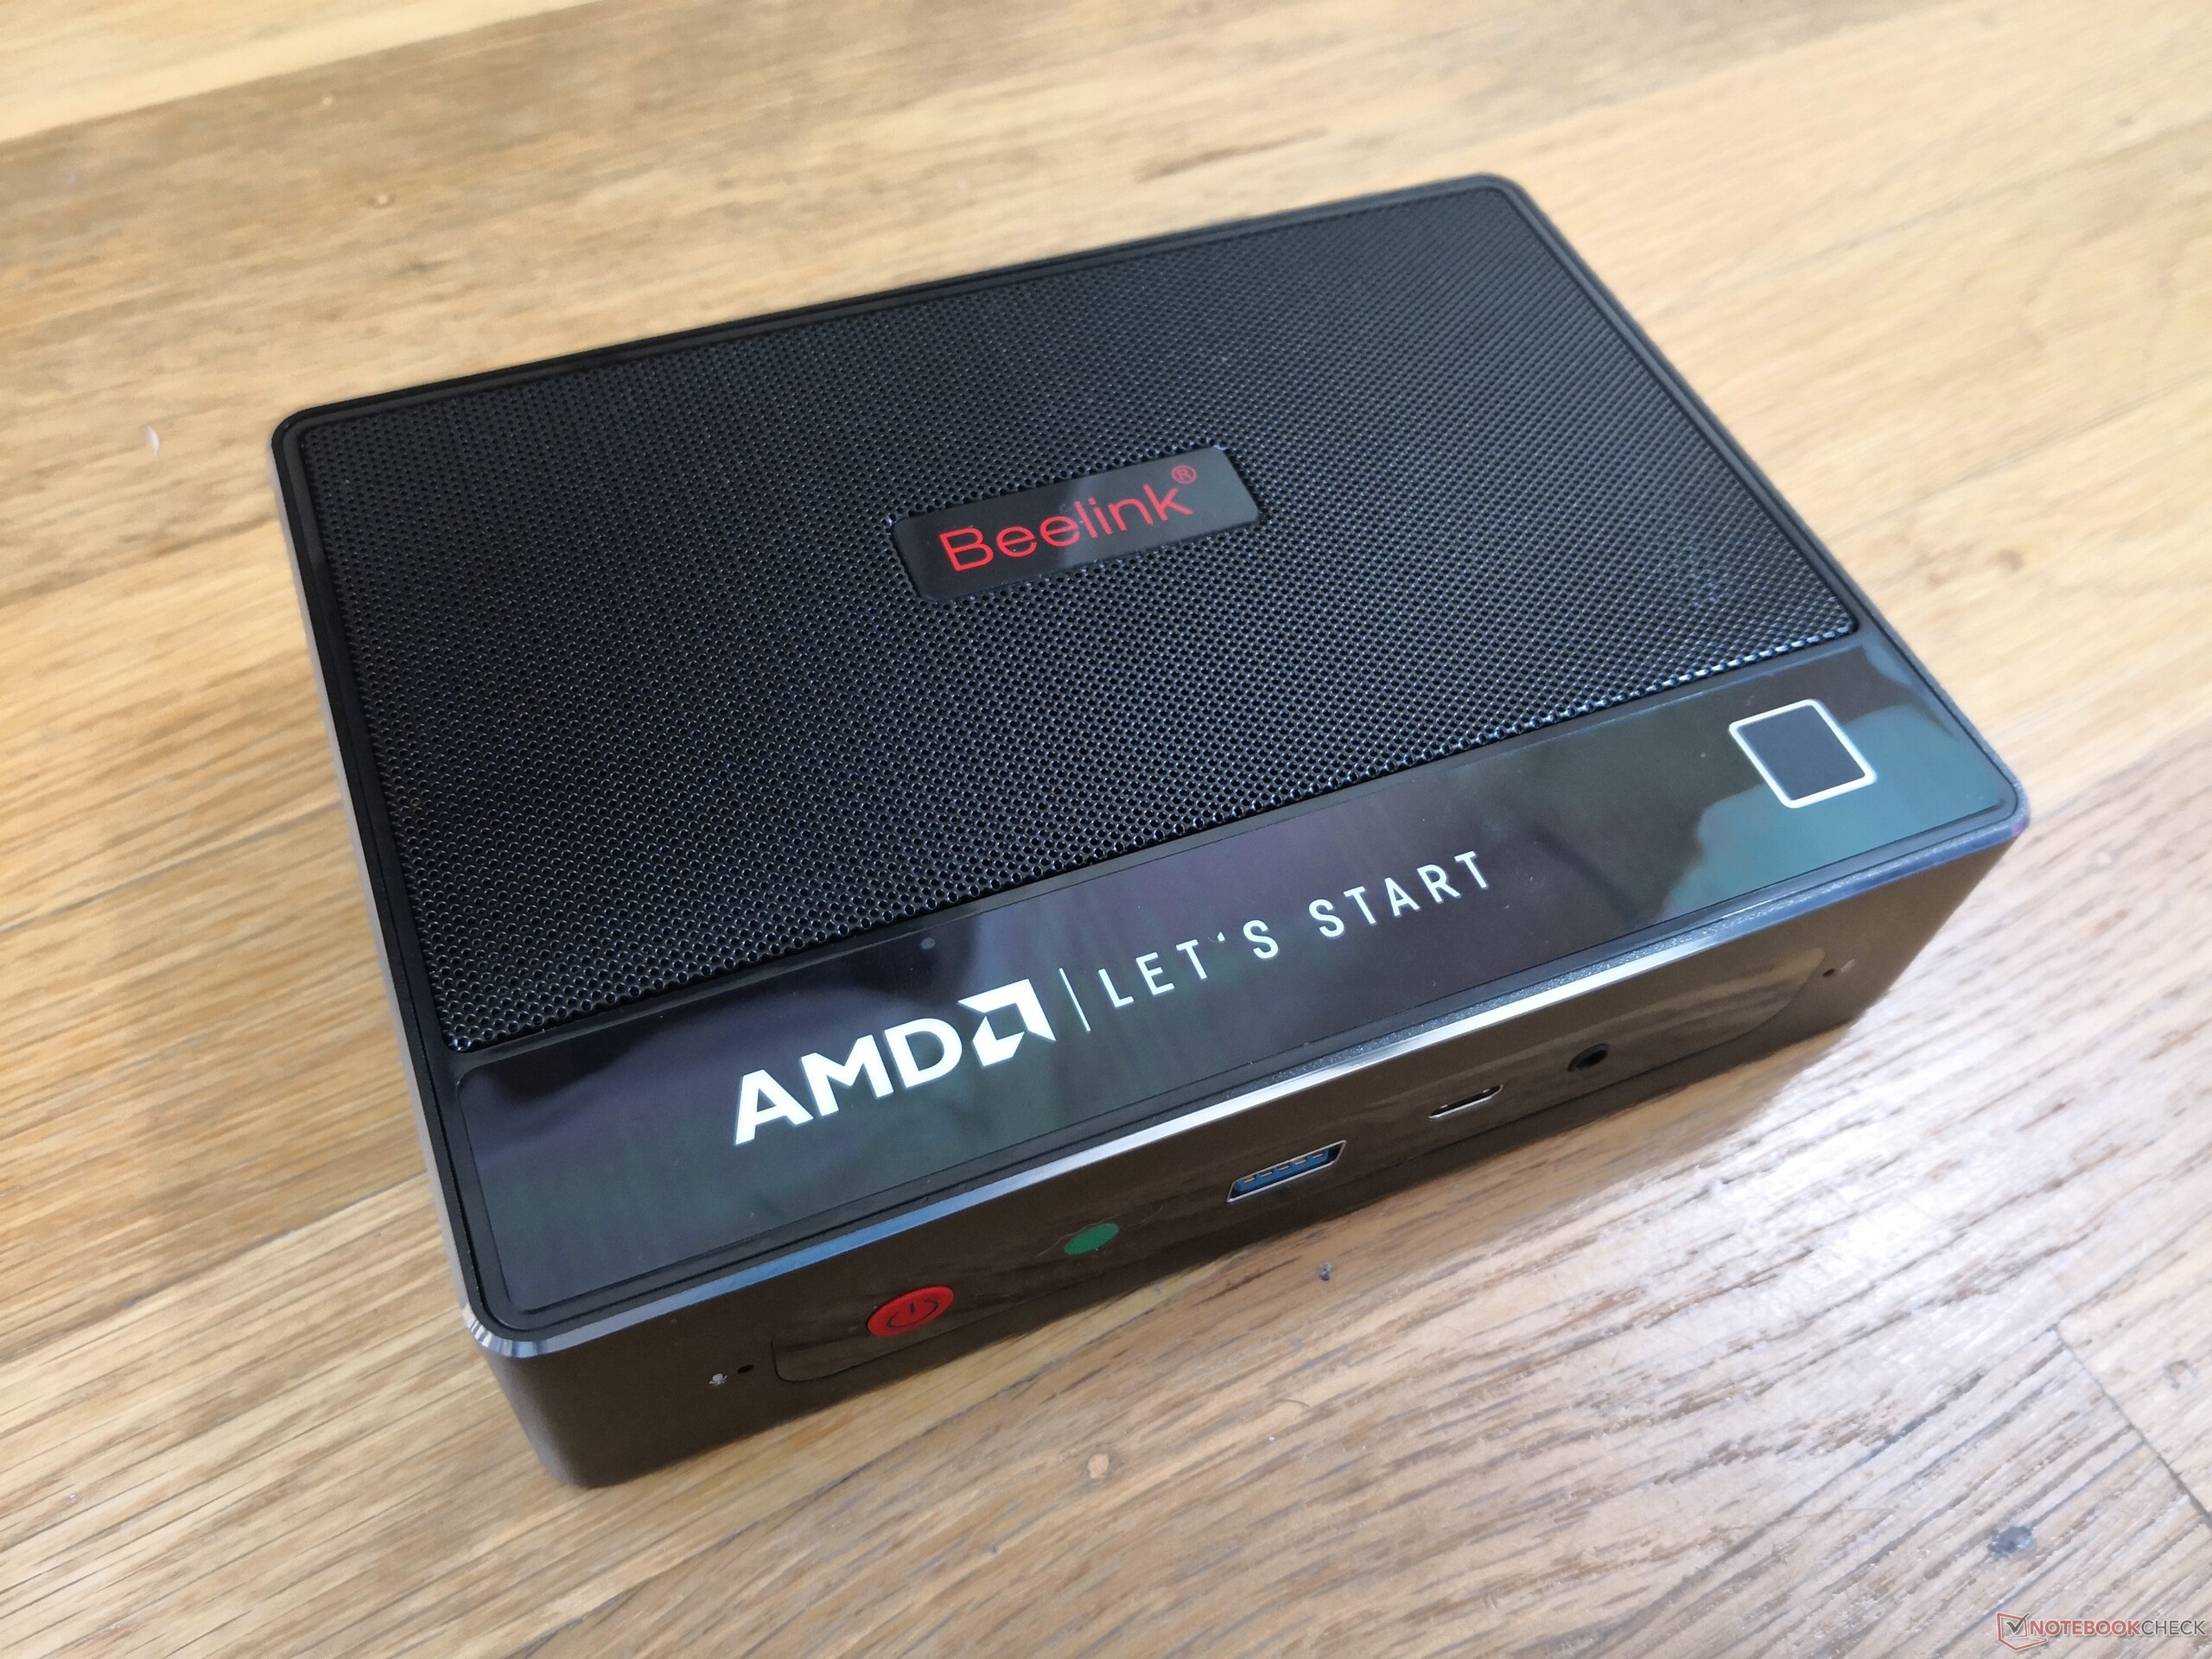
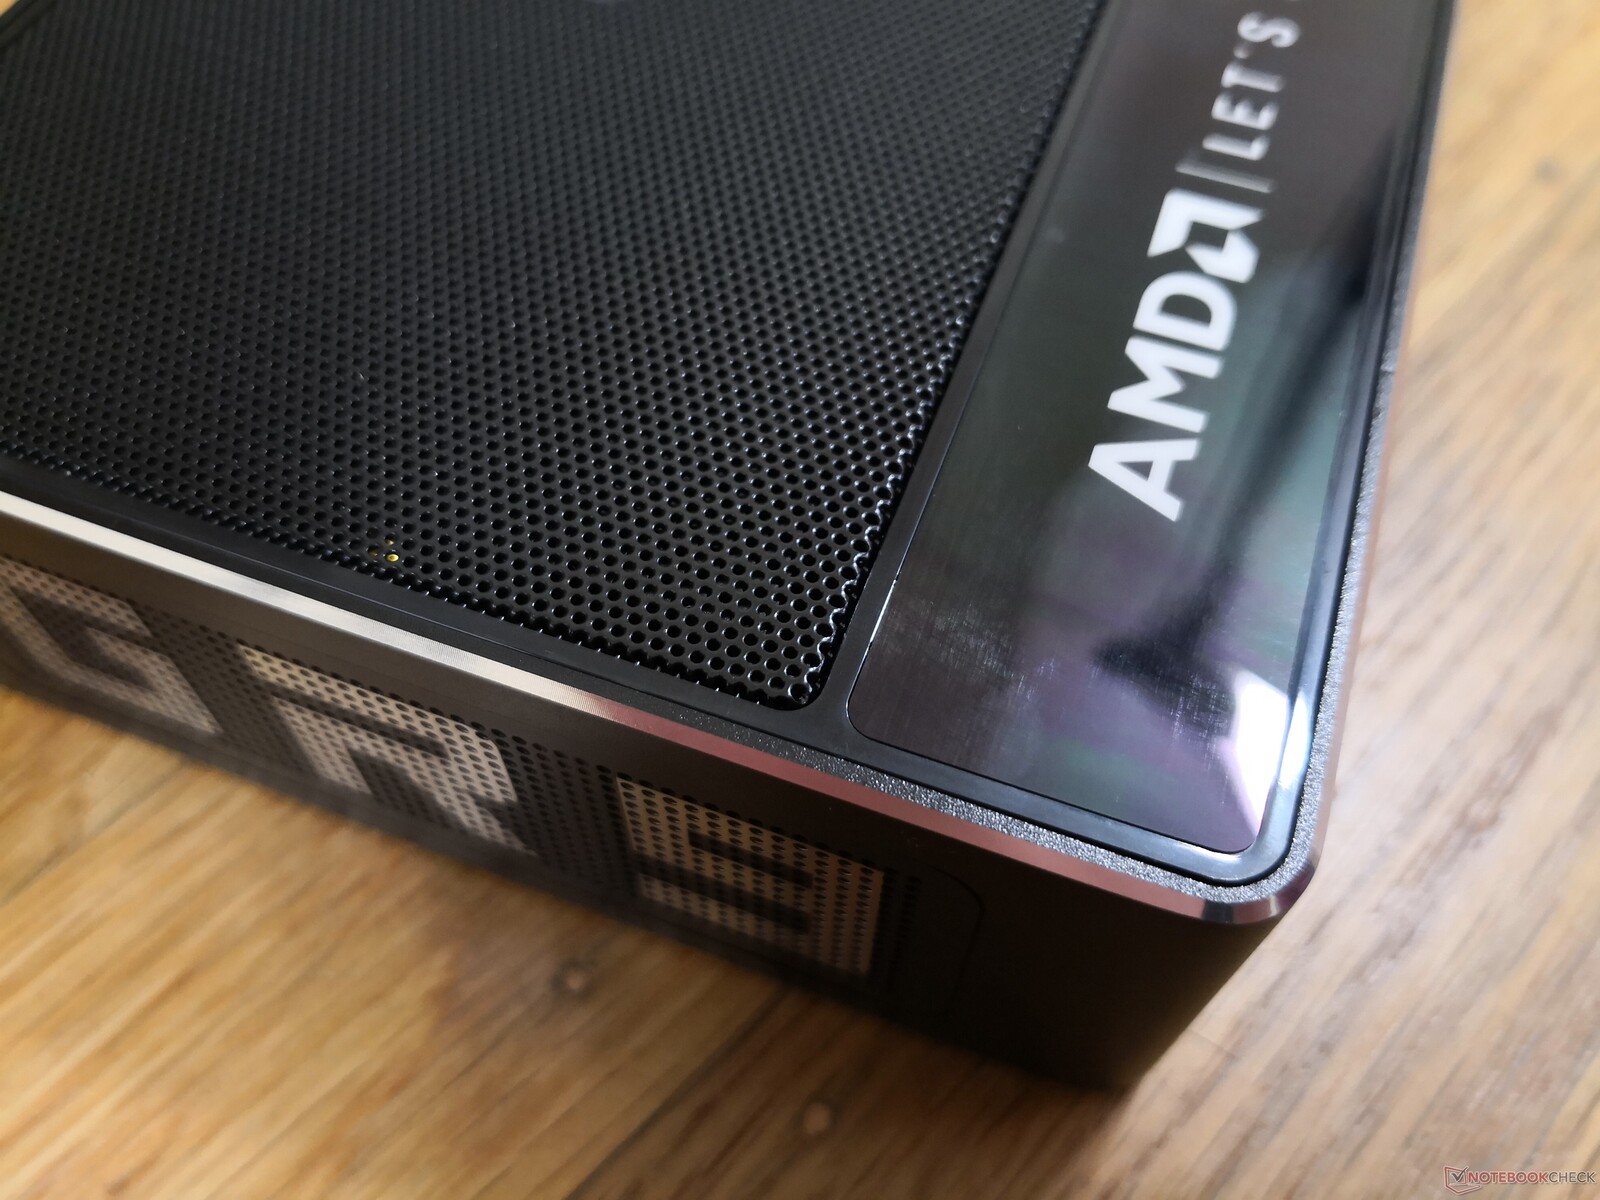
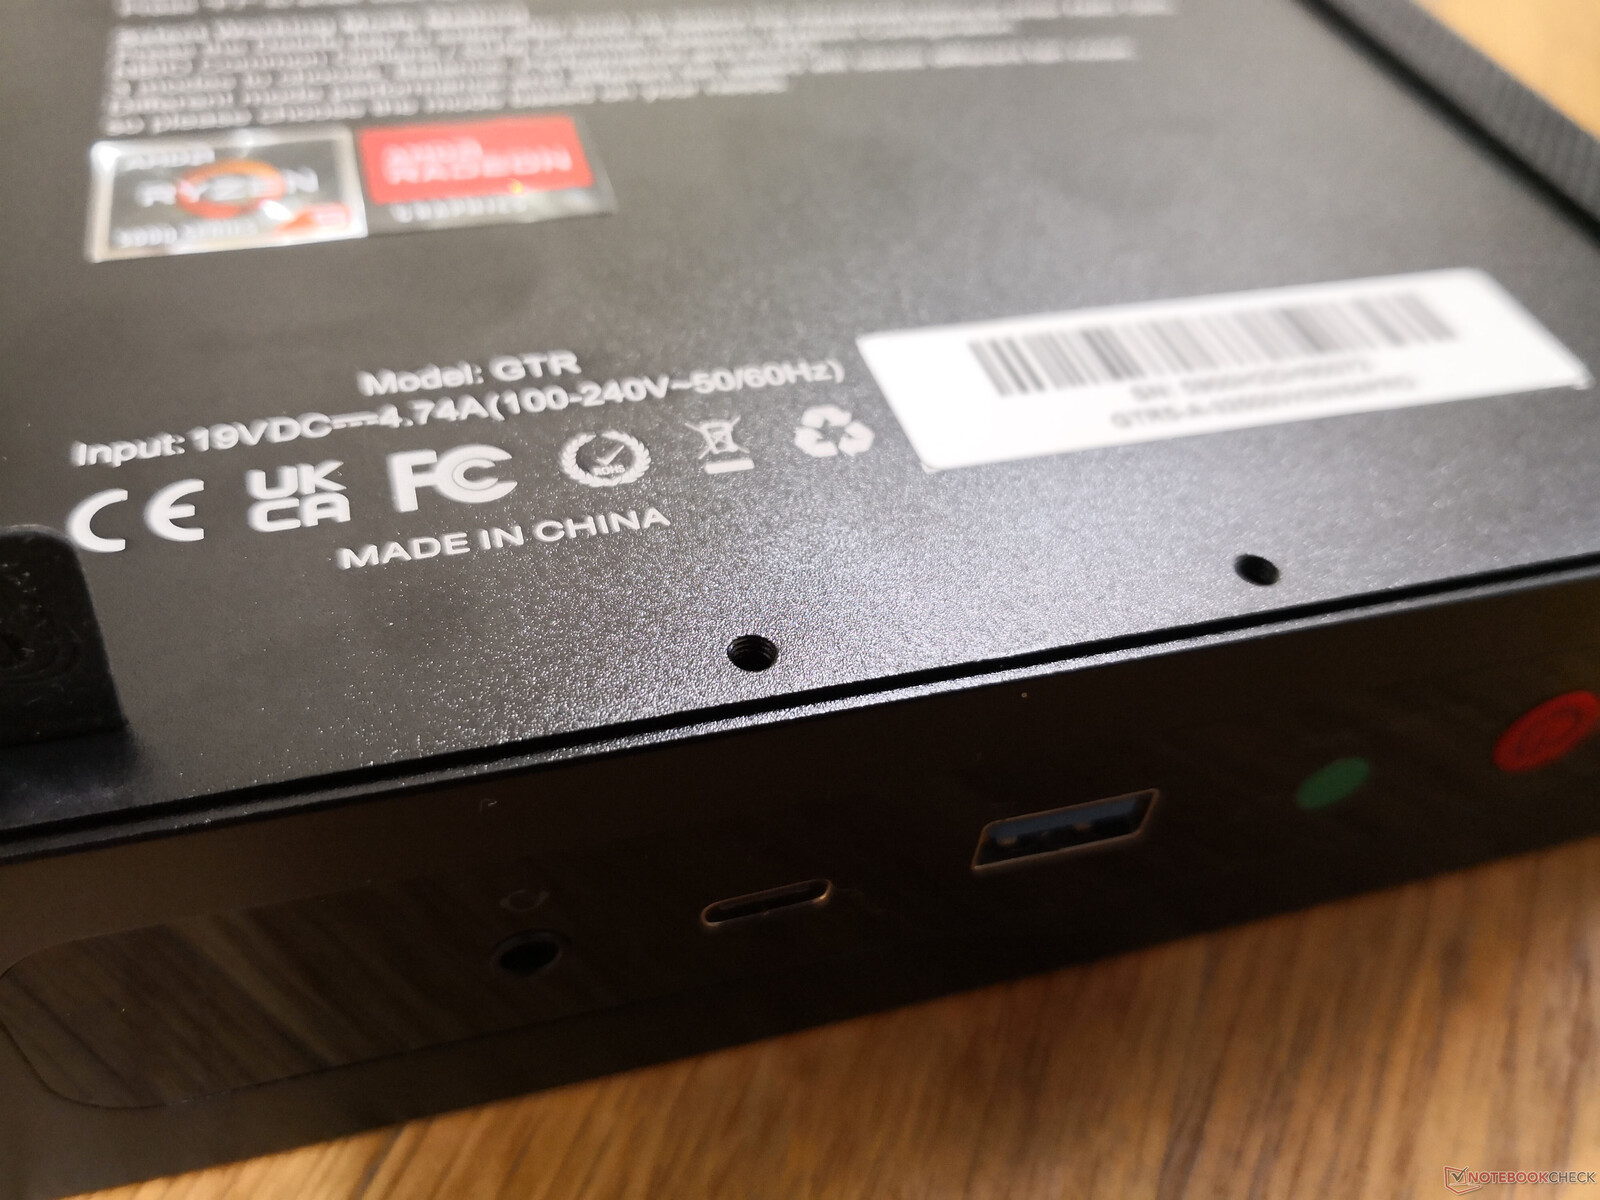
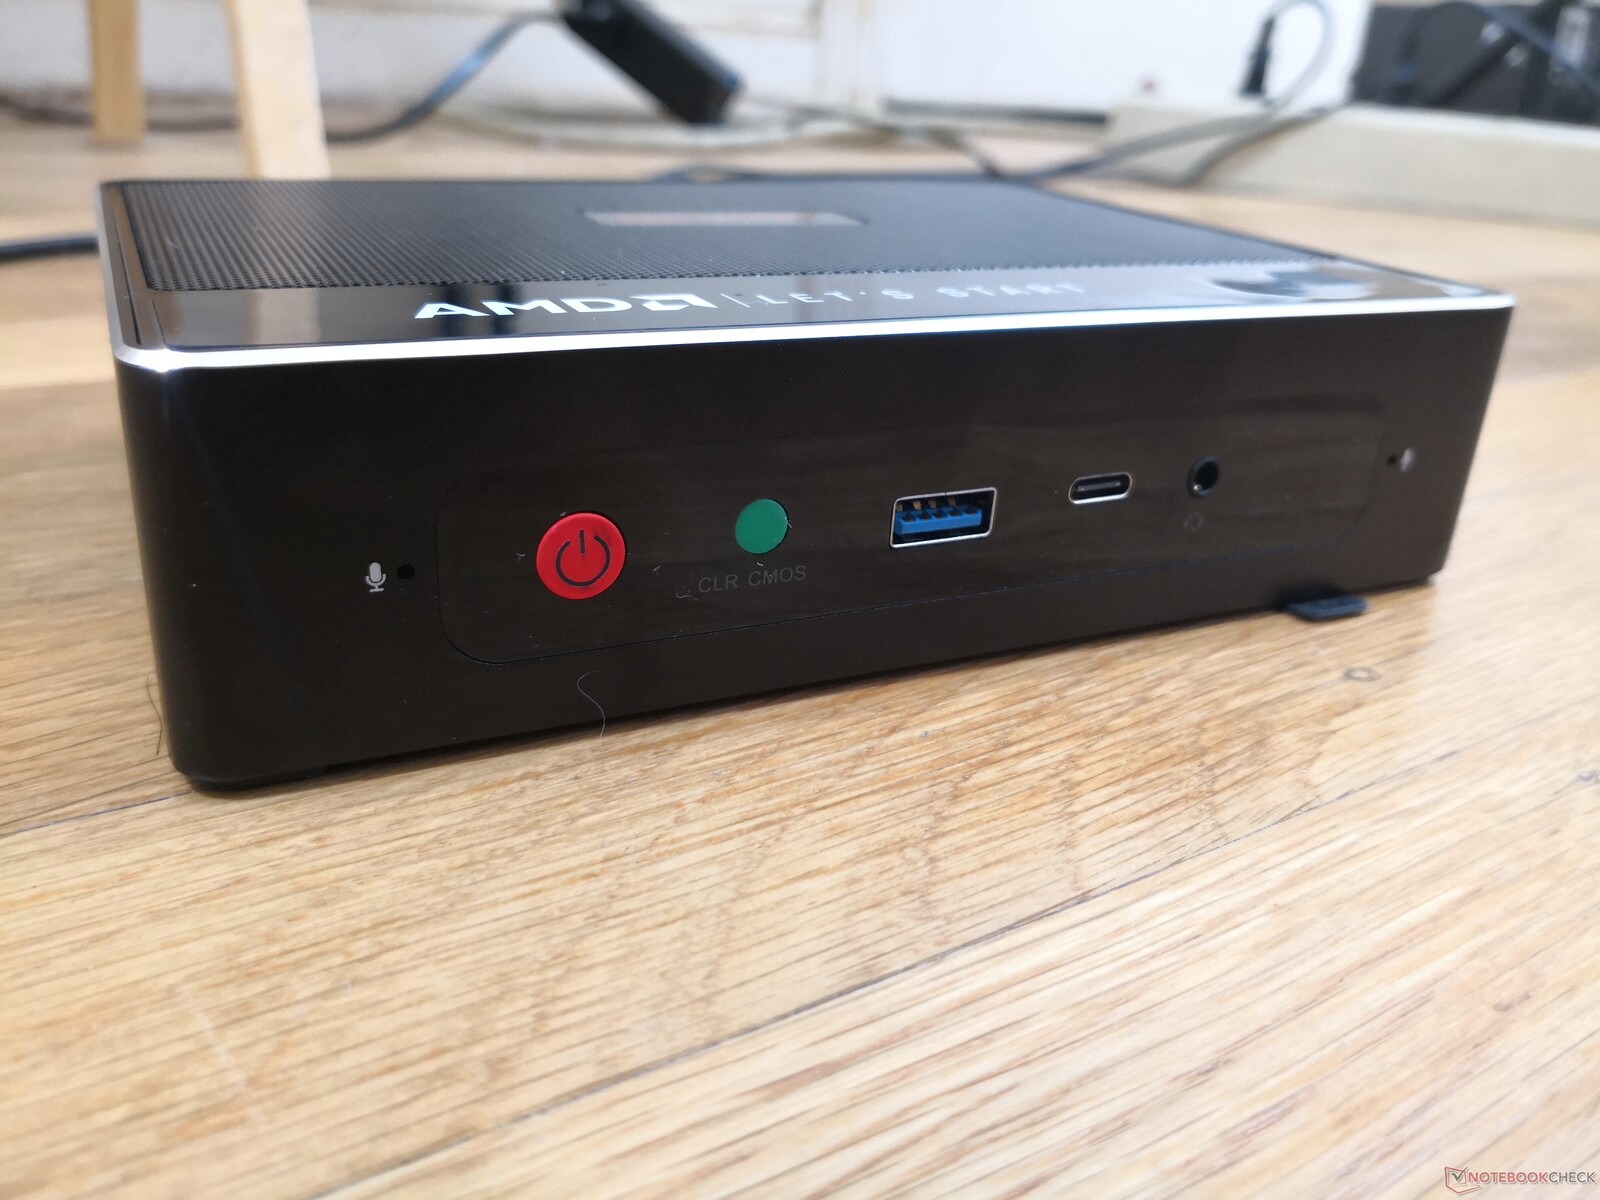
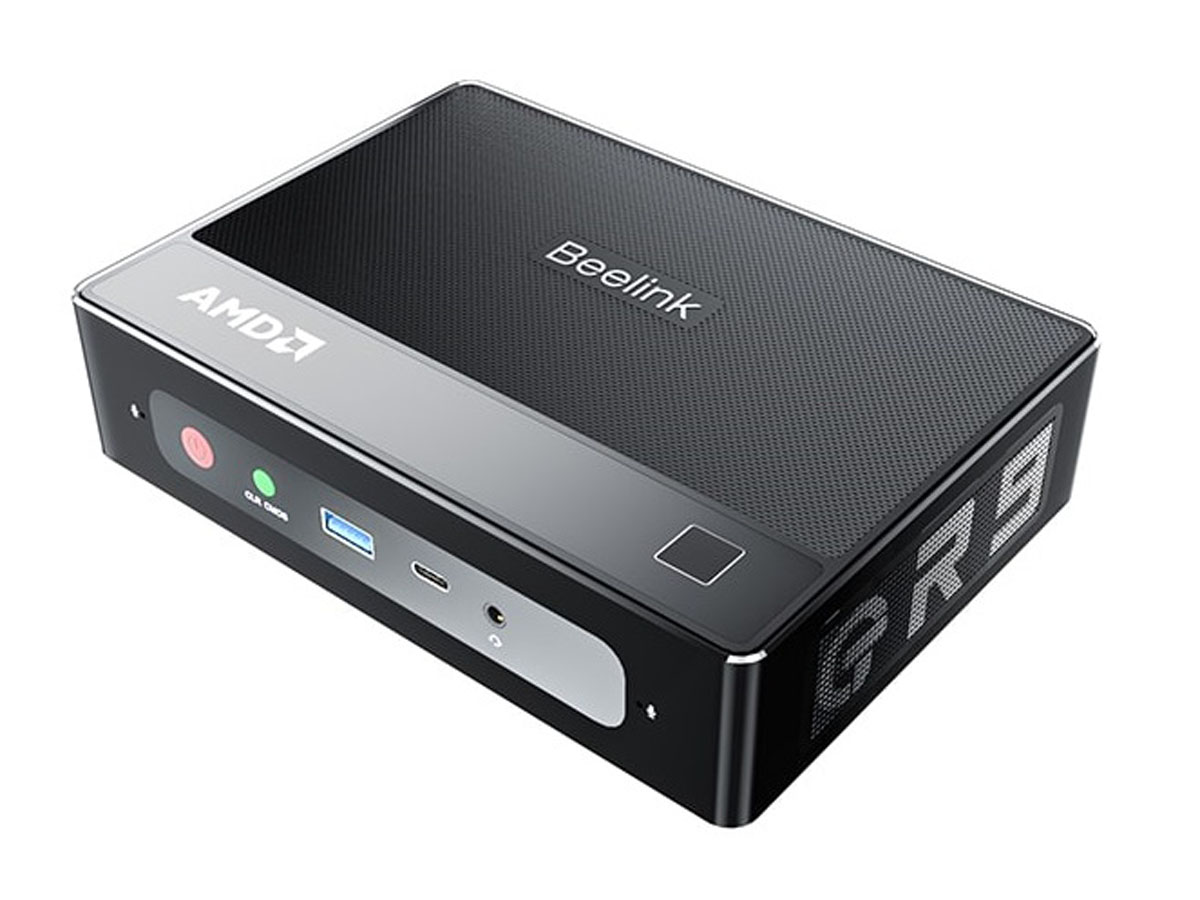
Beelink has repurposed its Intel GTI11 chassis for the AMD GTR5 as the dimensions and overall build of the GTR5 are essentially identical to its Intel counterpart. The most notable change is to the top of the unit to better accommodate the more demanding H-series AMD processor. This surface is now perforated instead of smooth glossy plastic for better airflow.

Connectivity
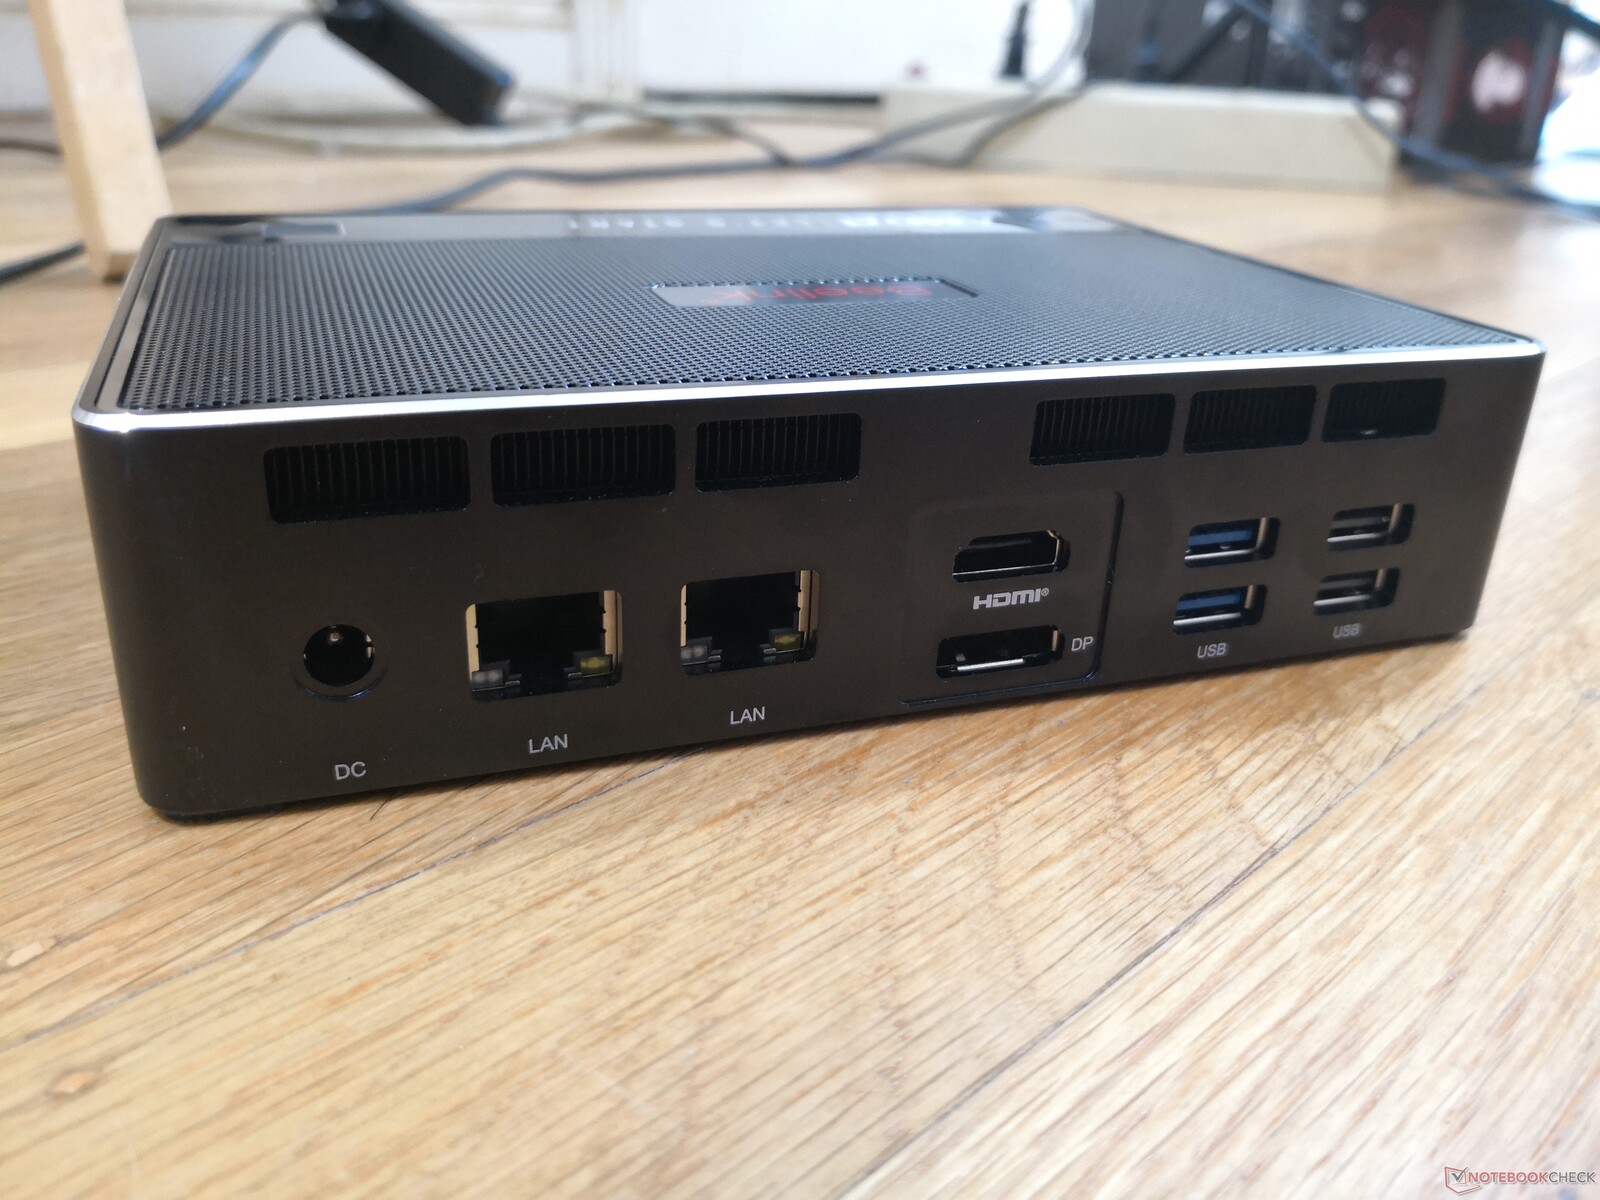
(June 11, 2023 update: The integrated DisplayPort is version 1.2 and not 1.4 as originally stated. The caption has been corrected.)
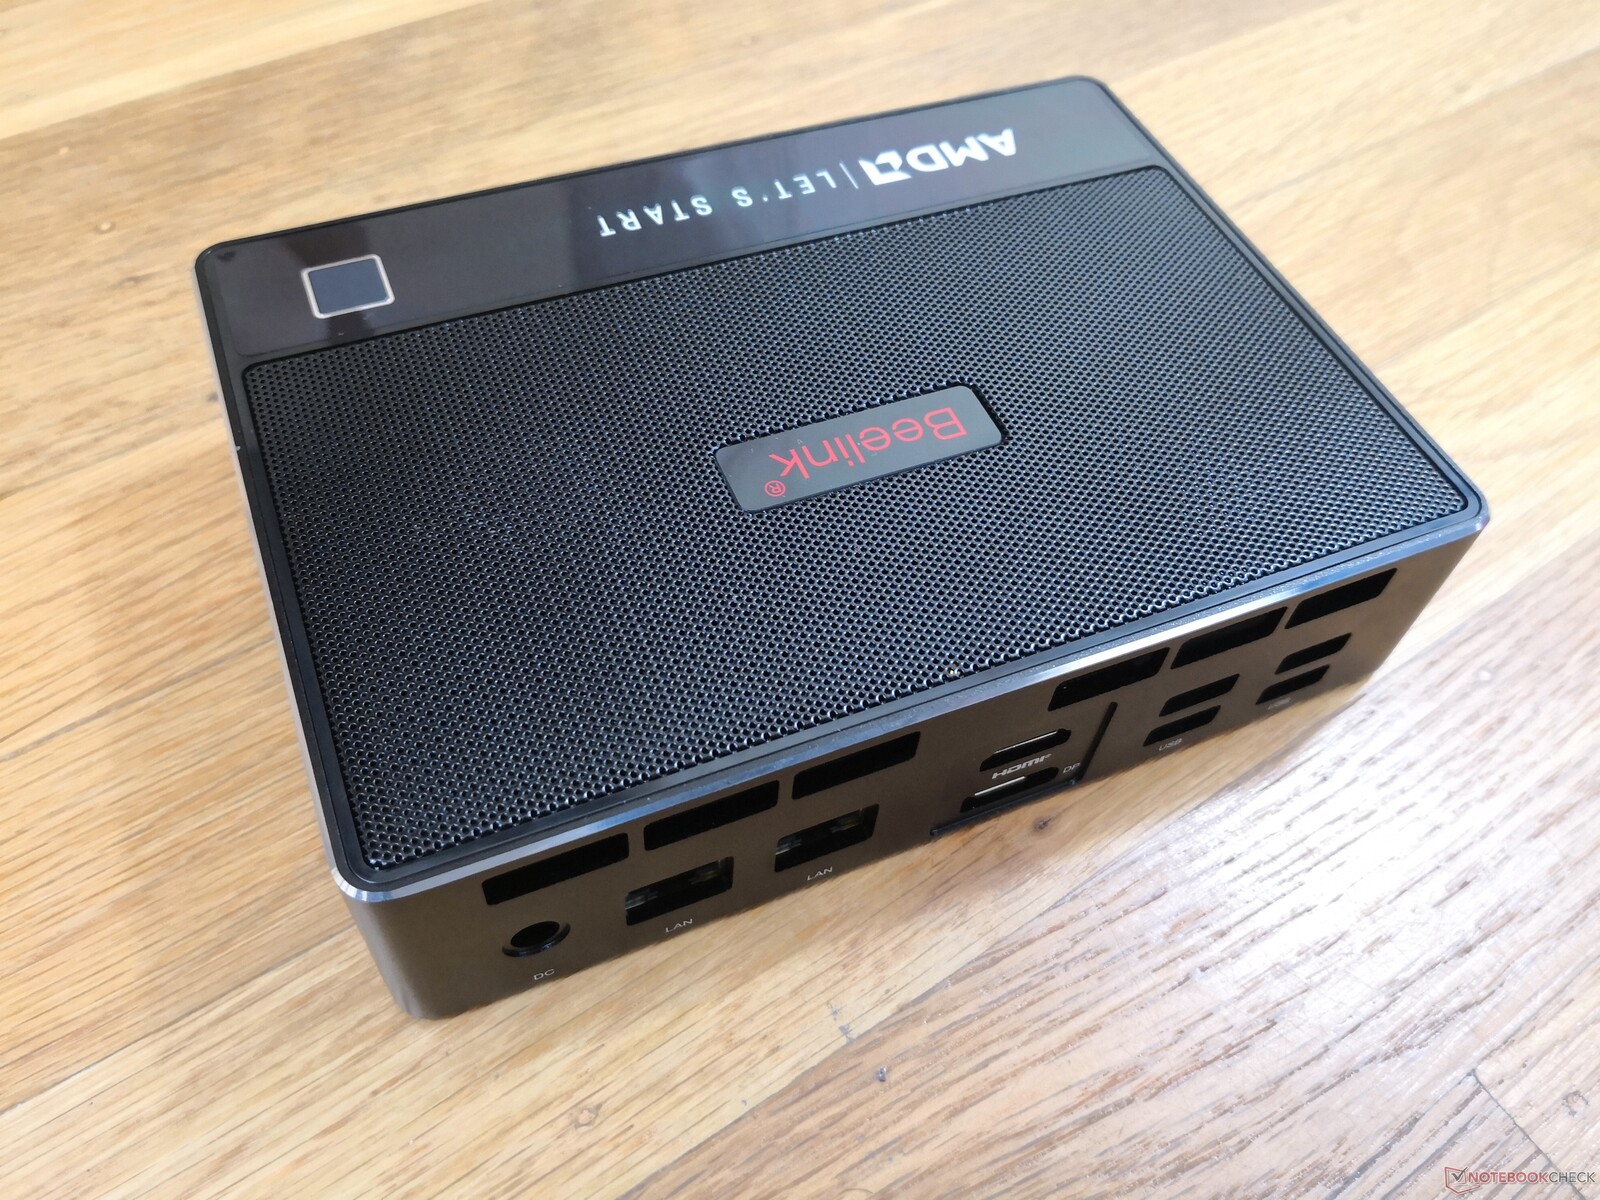
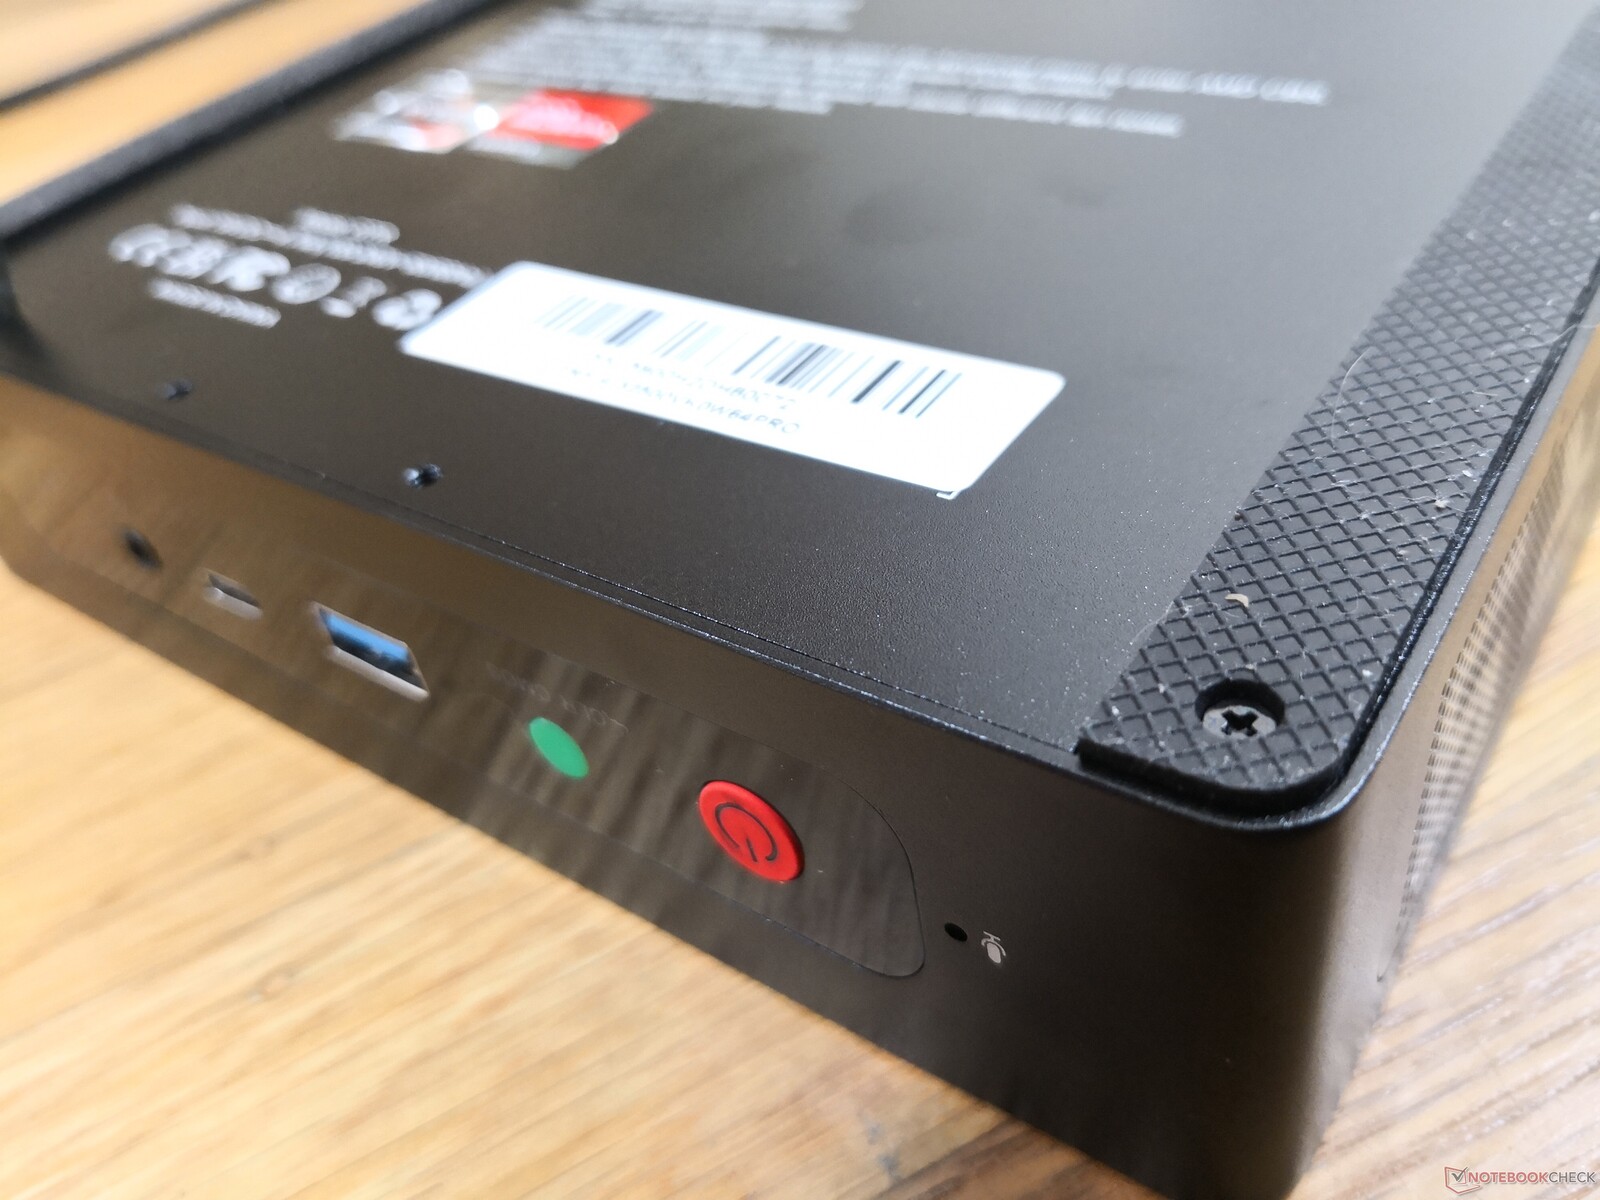
Port options are identical to the Beelink GTI 11 save for two important distinctions: our AMD-powered GTR5 is lacking Thunderbolt support and an extra USB-A port. We would have preferred more USB-C ports much like on the Intel Phantom Canyon NUC11PHKi7C or at least an integrated SD card reader.
Interestingly, the system can be powered by USB-C should you ever lose the proprietary 90 W AC adapter. We connected our Dell XPS 15 9575 130 W USB-C adapter to the GTR5 and it powered on without any problems. Nonetheless, we recommend using the proprietary 90 W AC adapter whenever possible since most third-party USB-C adapters have much lower power outputs.
Communication
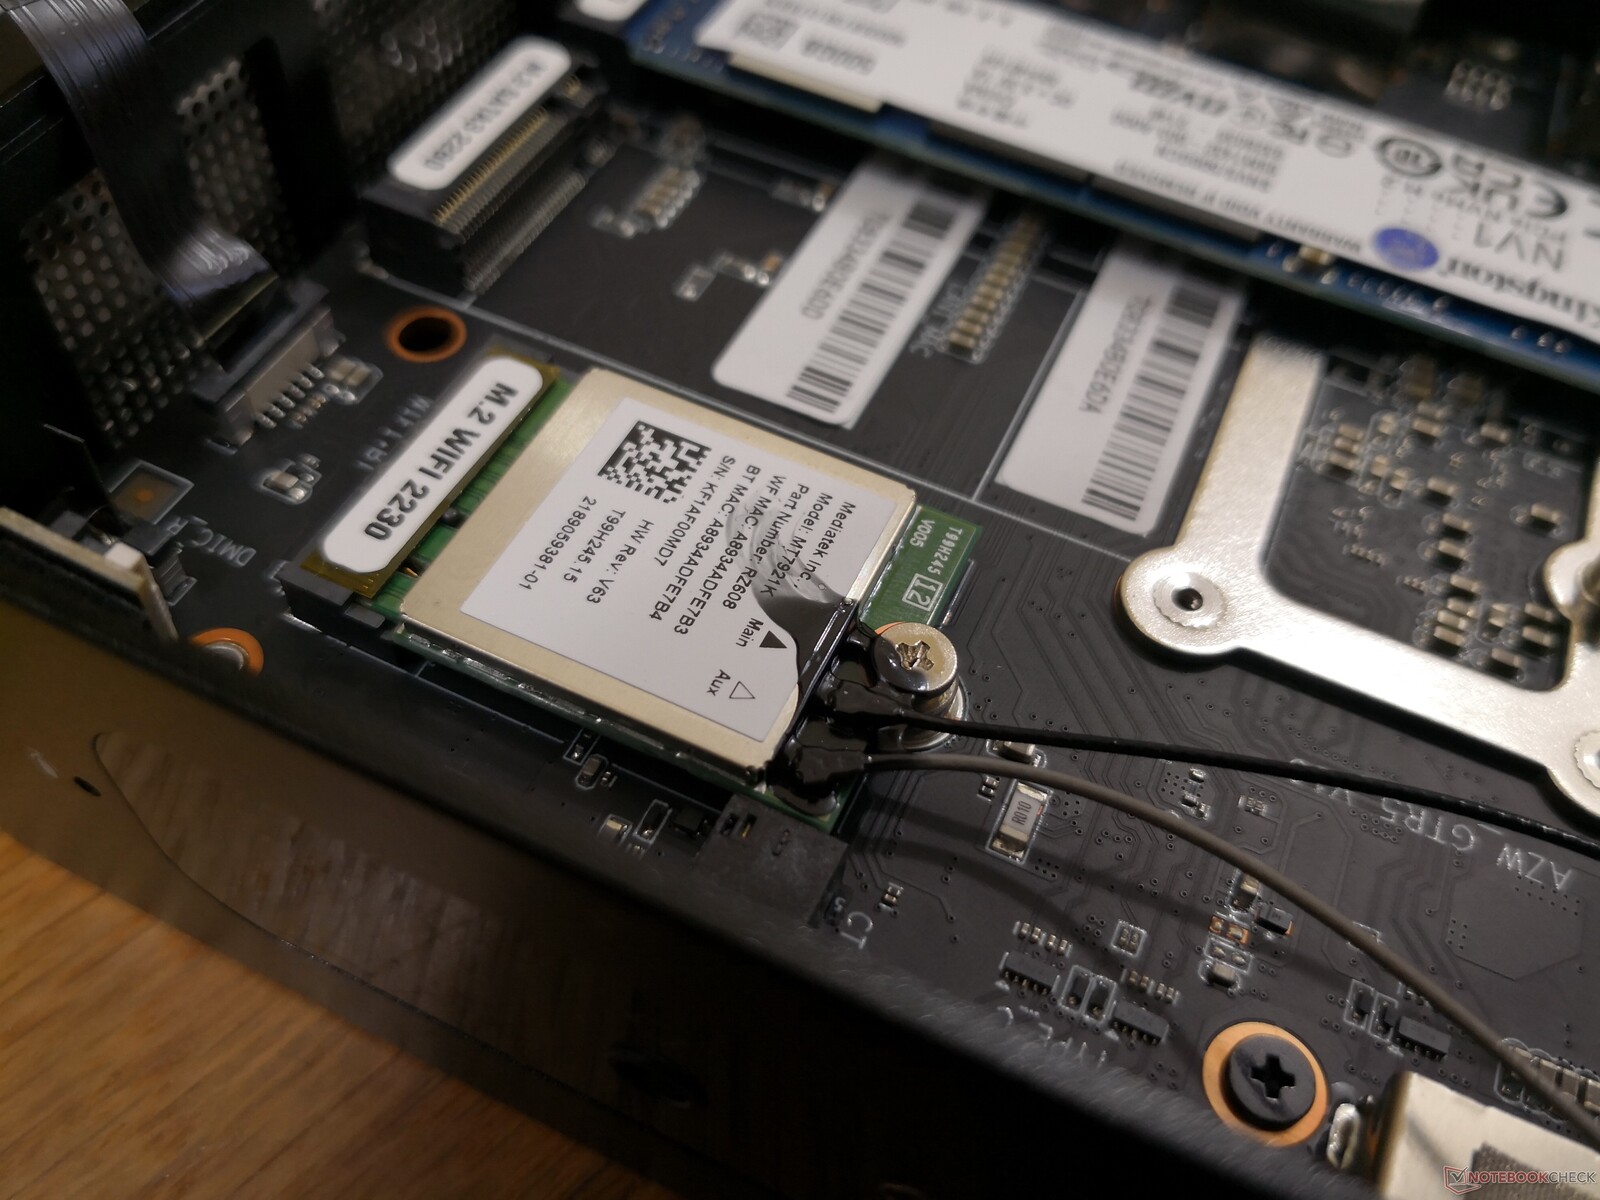
The GTR5 is one of the first mini PCs to utilize the MediaTek RZ608 instead of the more typical Intel AX200 series or Qualcomm Atheros. The module is capable of Wi-Fi 6E speeds, but we're limited to our Wi-Fi 6 Netgear RAX200 for now. Transfer rates are reliable nonetheless.
| Networking | |
| iperf3 transmit AX12 | |
| Beelink GTI 11 | |
| Intel NUC11PHKi7C | |
| Beelink GTR5 | |
| Intel NUC11PAQi7 | |
| GMK NucBox 2 | |
| Beelink GK Mini | |
| iperf3 receive AX12 | |
| Beelink GTI 11 | |
| Intel NUC11PHKi7C | |
| Intel NUC11PAQi7 | |
| Beelink GTR5 | |
| GMK NucBox 2 | |
| Beelink GK Mini | |
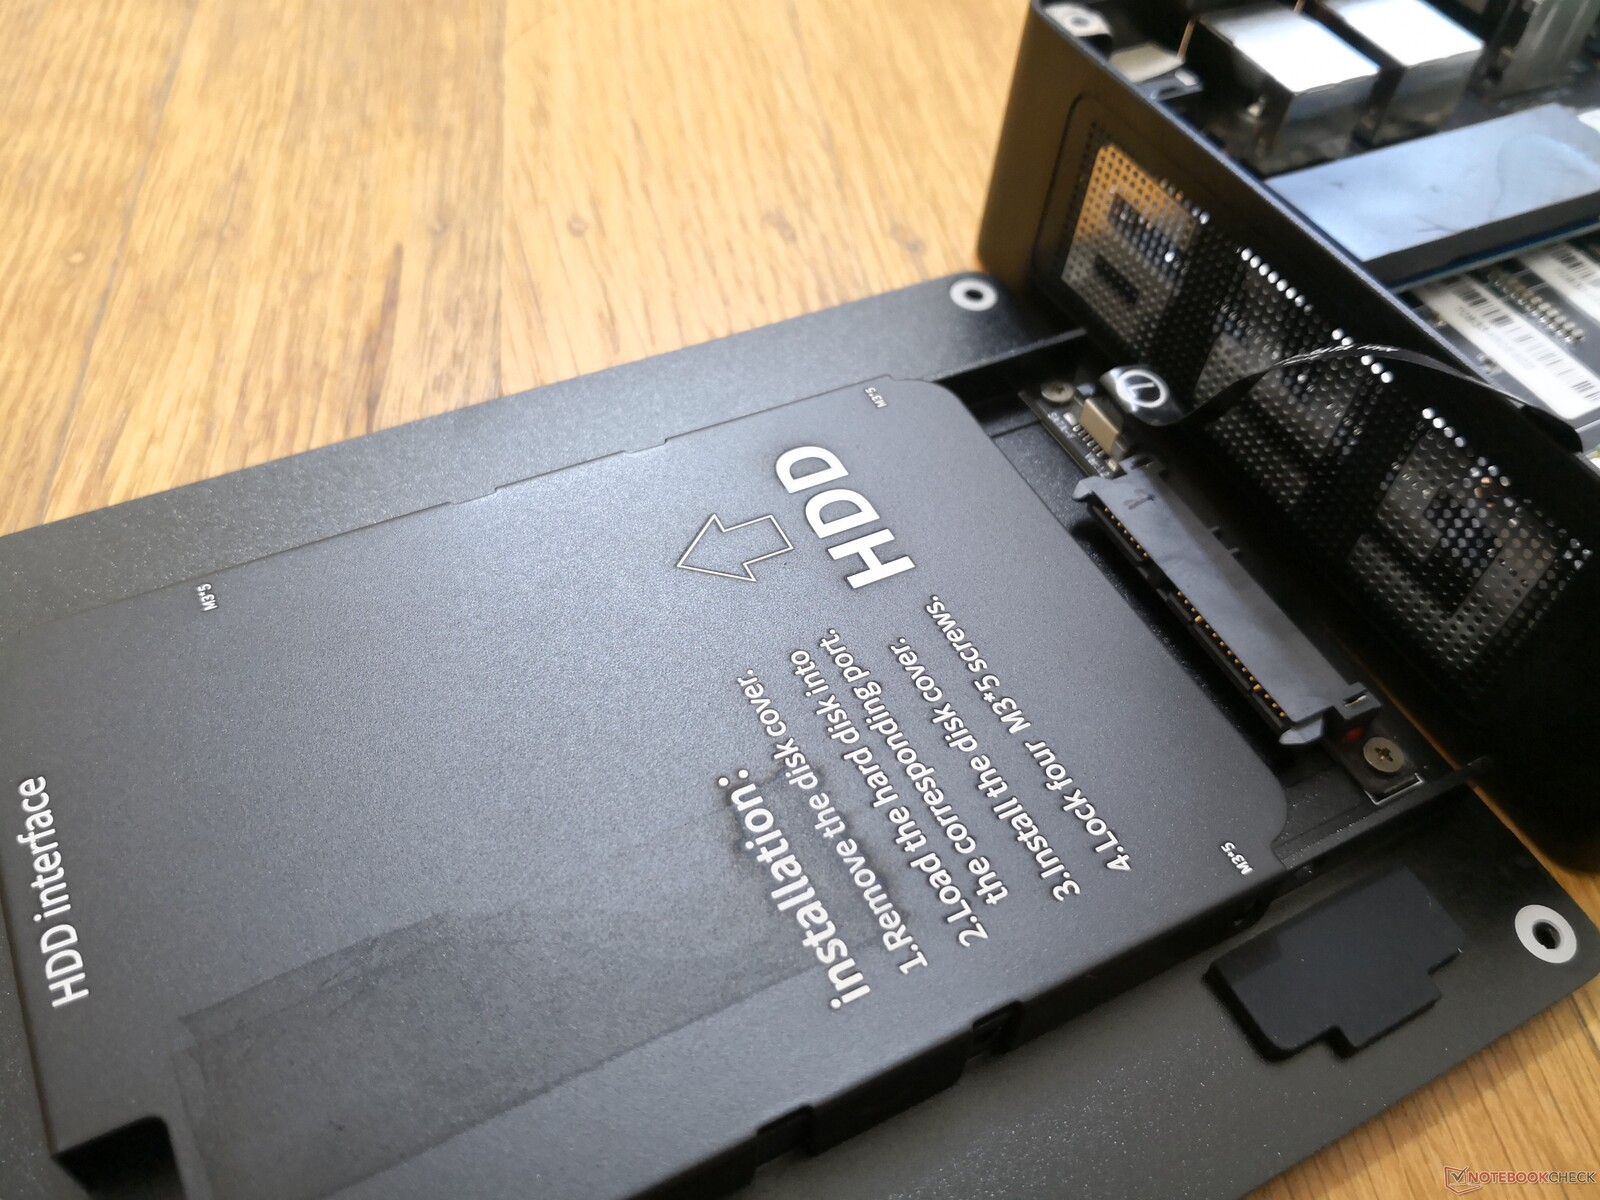
Maintenance
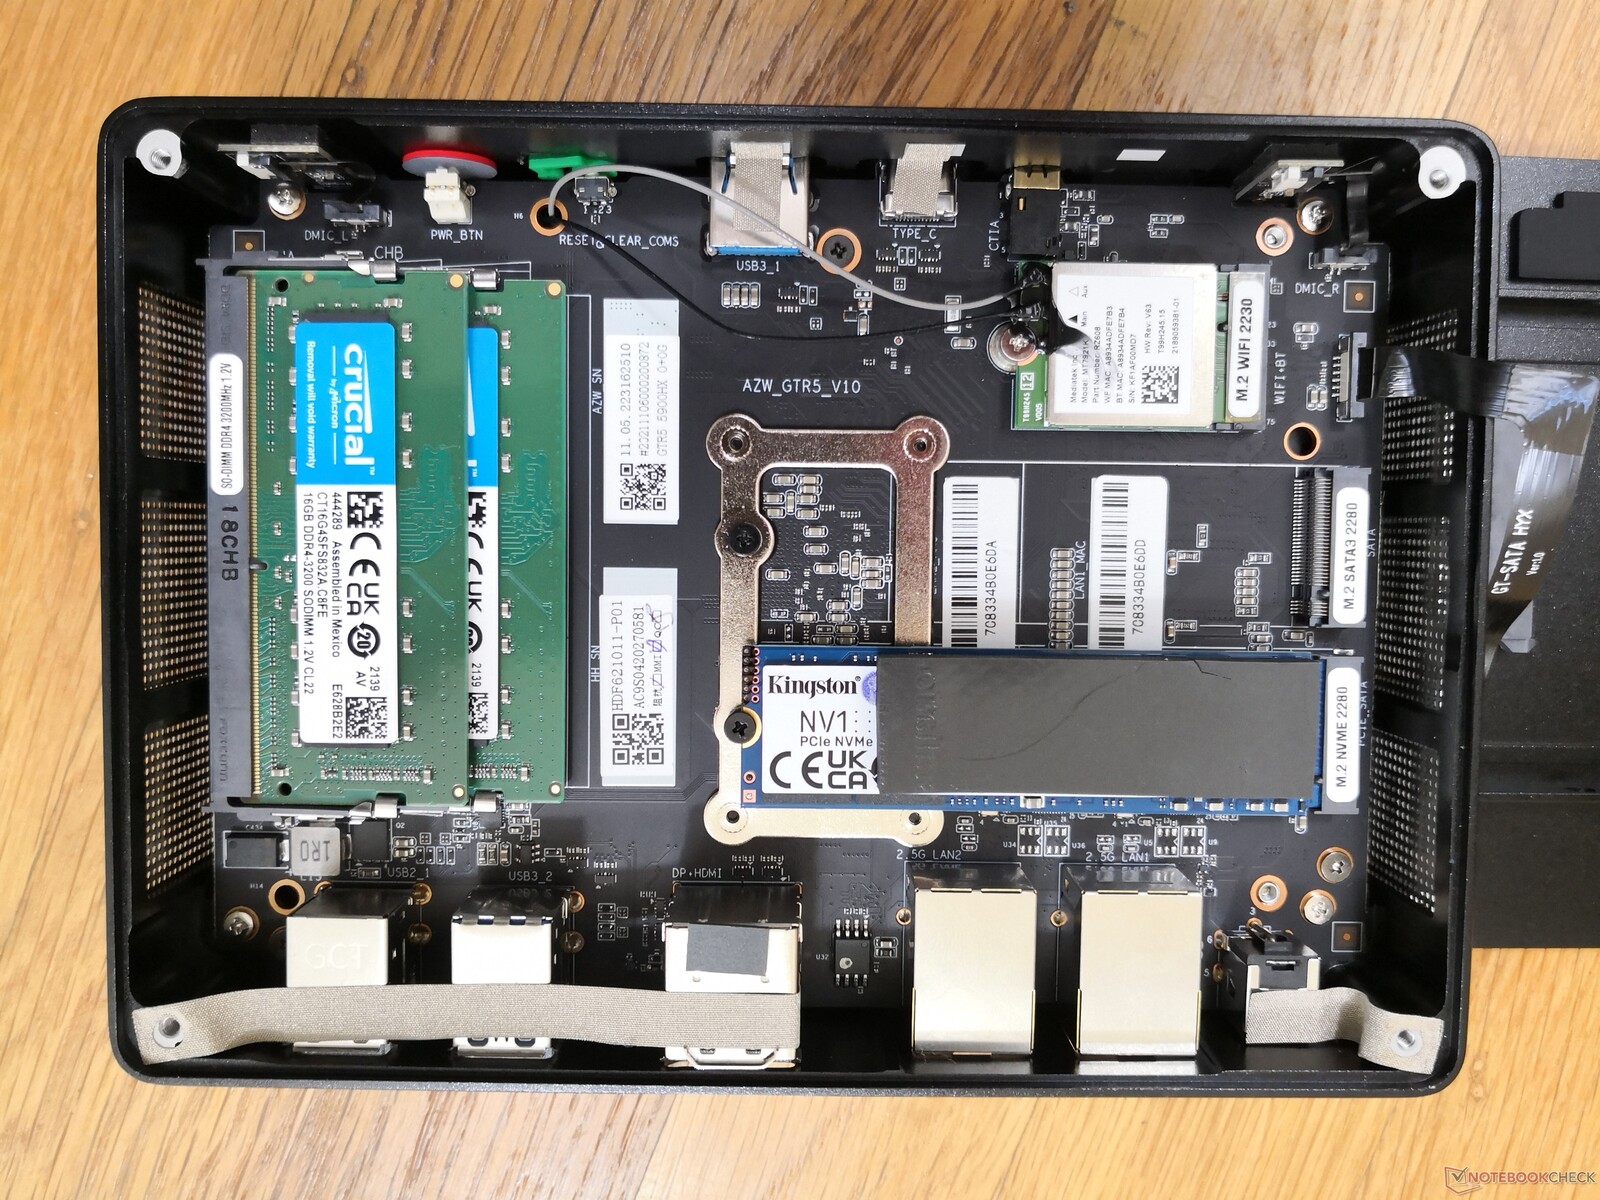
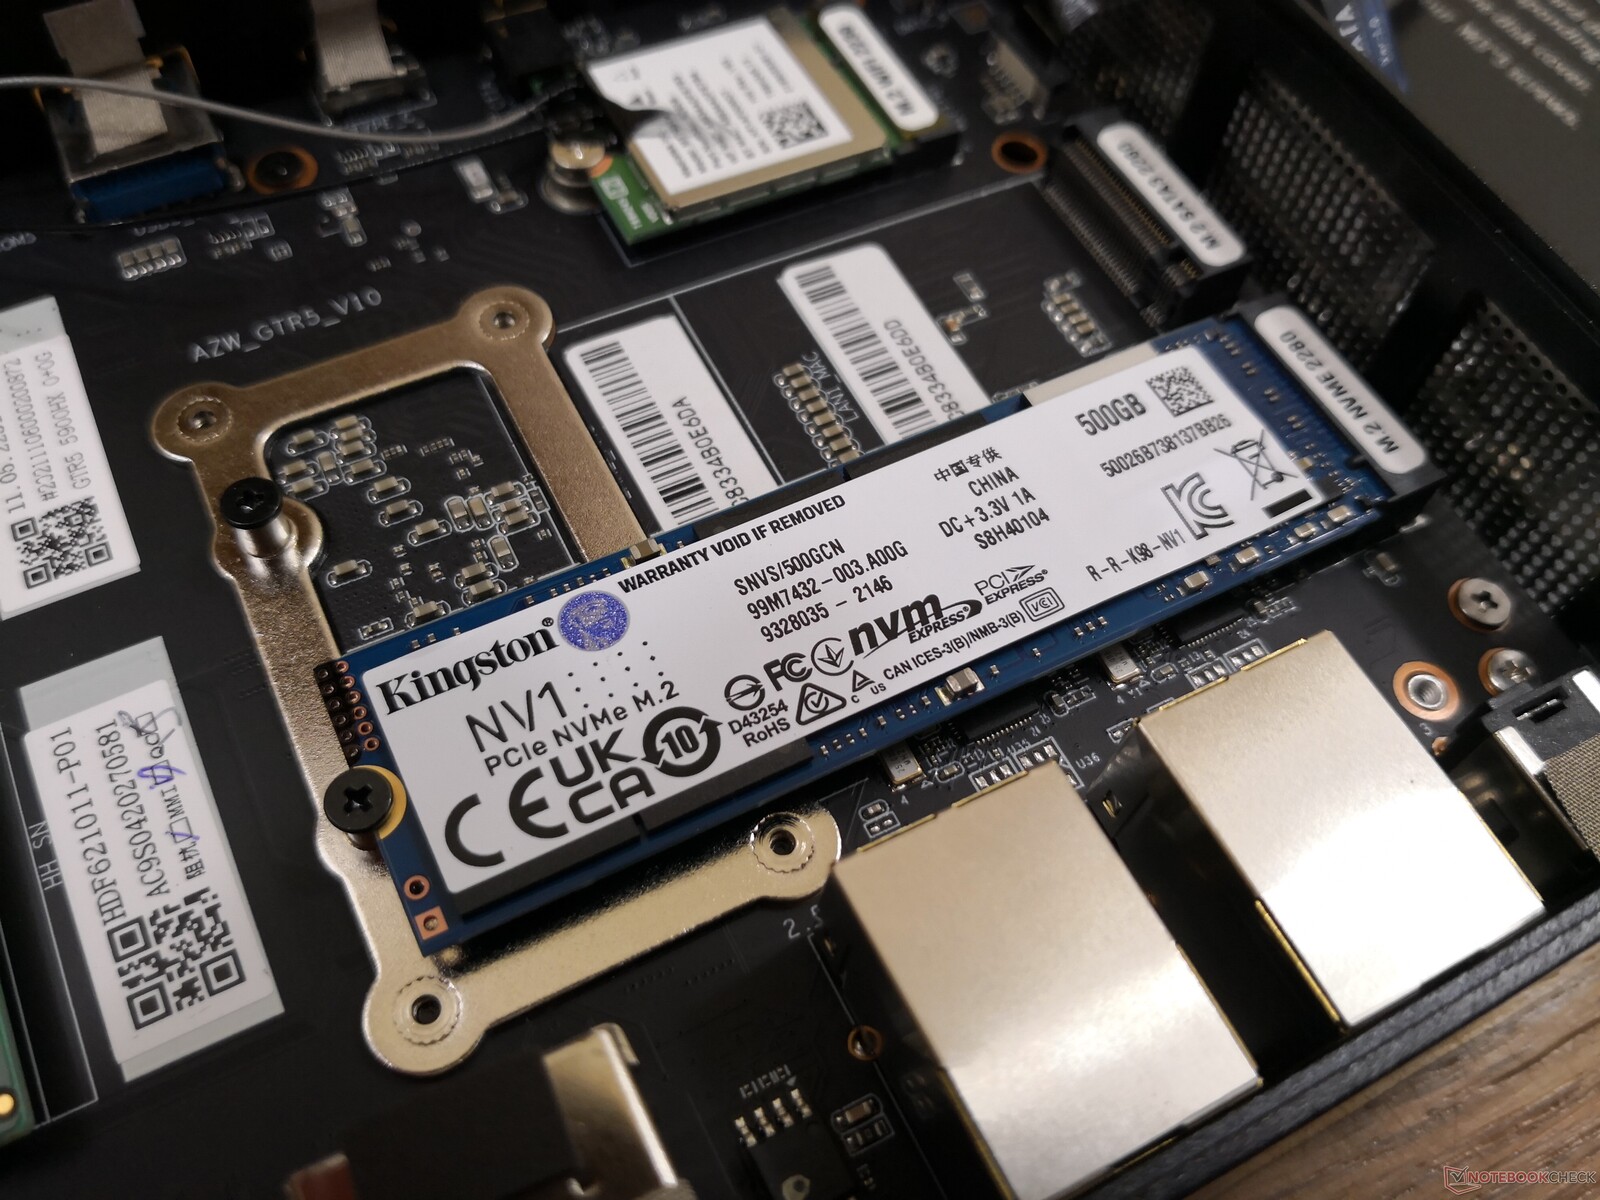
The bottom panel is secured by just four Philips screws for easy servicing. Unlike the thumb screws on an Intel NUC, however, the screws here are much smaller and will require a screwdriver to remove. Once inside, users will have direct access to 2x SODIMM, 3x storage bays, and then WLAN module. Additional disassembly is unfortunately required if you want to clean the dual fans that are on the other side of the motherboard.
Accessories and Warranty
The retail box includes the AC adapter, paperwork, an HDMI cable, and a VESA mounting bracket with screws. The standard one-year limited manufacturer warranty applies.
Performance
Testing Conditions
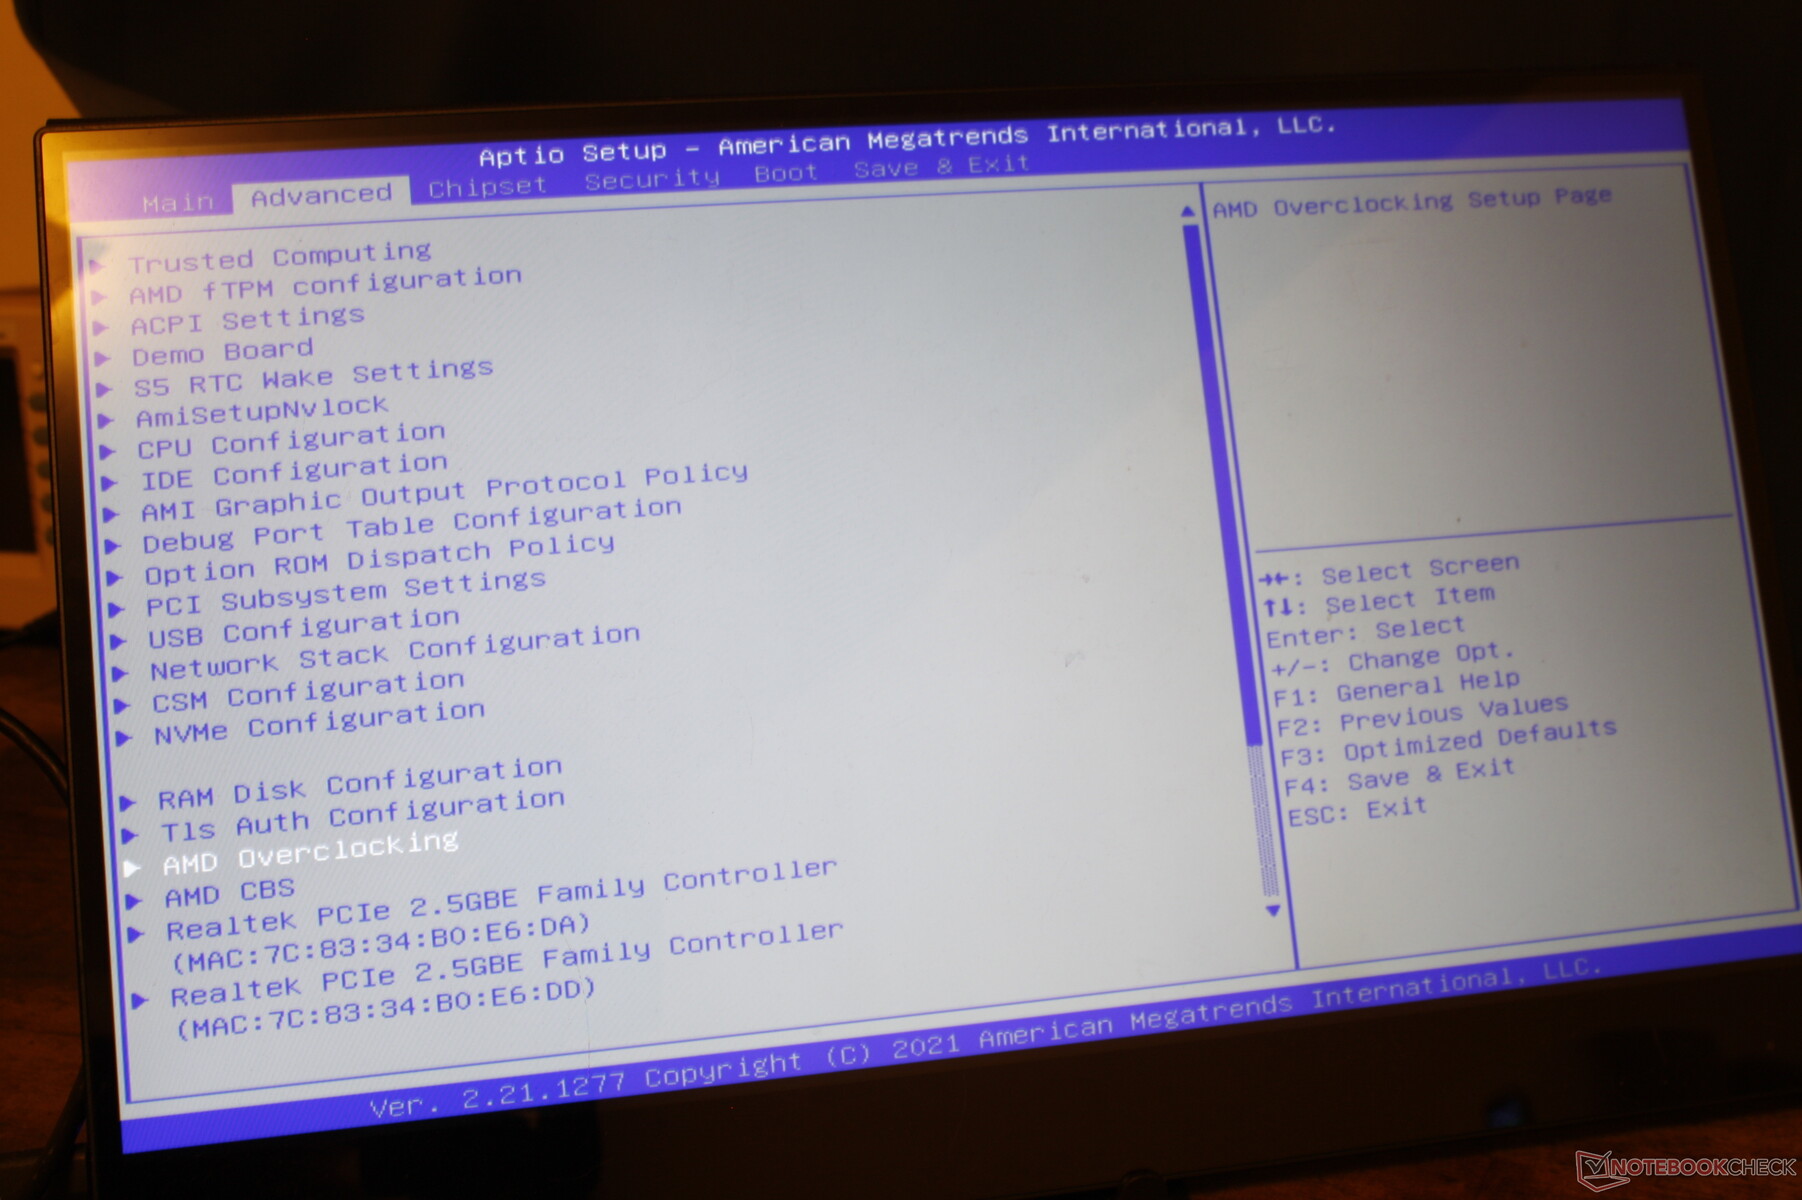
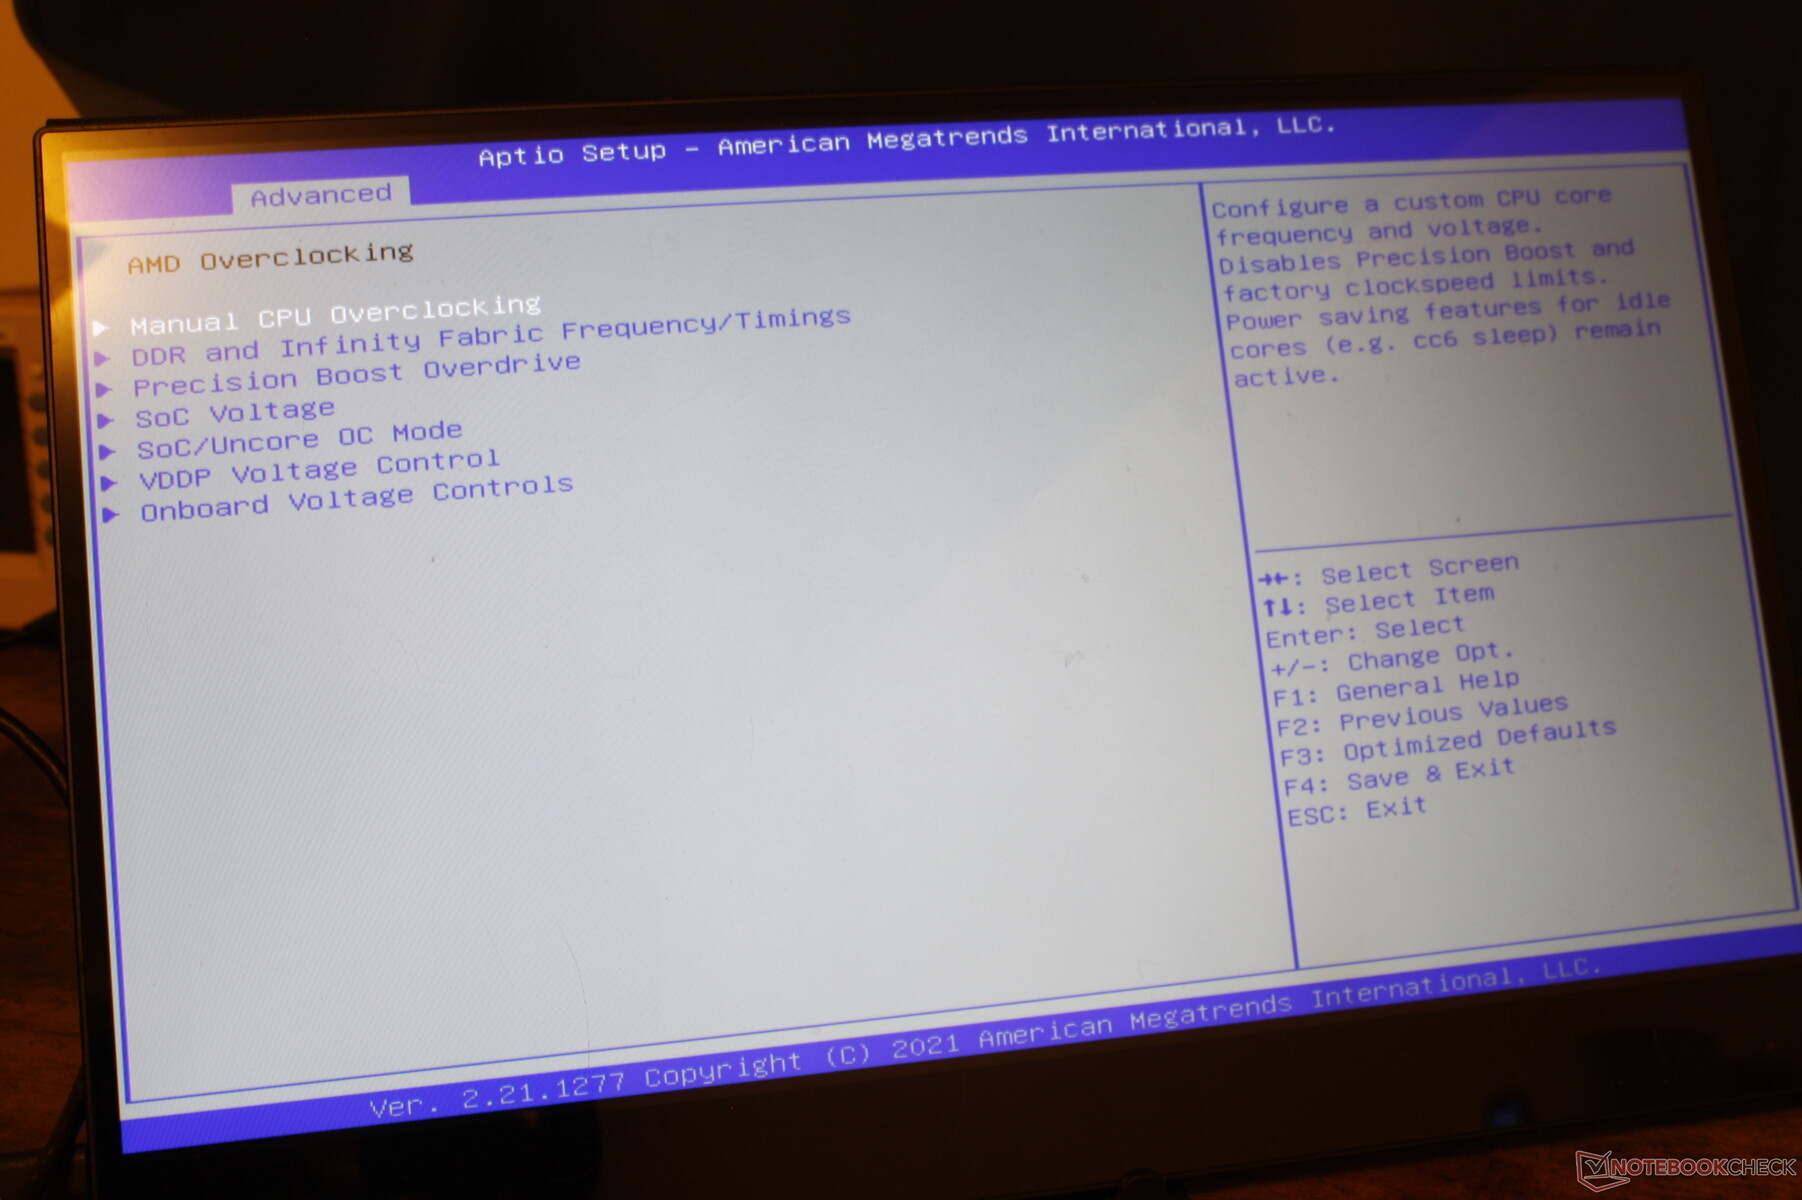
We used stock BIOS settings and the Windows Performance power profile prior to running any of our benchmarks below. Users can optionally overclock the CPU through BIOS to squeeze more performance if desired.
Processor
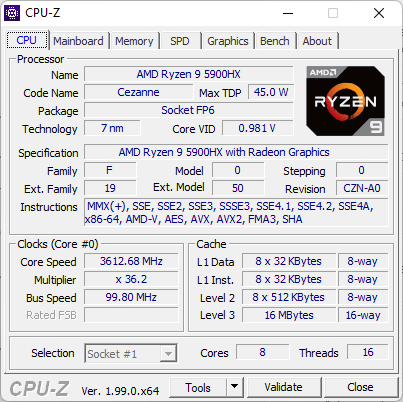
Raw multi-thread CPU performance is faster than on most gaming laptops running on 11th gen Core i7 CPUs while being comparable to those on 11th gen Core i9. When compared to other laptops with the same Ryzen 9 5900HX, however, our Beelink comes up short by about 5 percent. Performance is nonetheless very close to the Ryzen 9 5900X as found on the Eurocom Nightsky ARX15 even before any overclocking.
Cinebench R15 Multi Loop
Cinebench R20: CPU (Multi Core) | CPU (Single Core)
Cinebench R15: CPU Multi 64Bit | CPU Single 64Bit
Blender: v2.79 BMW27 CPU
7-Zip 18.03: 7z b 4 | 7z b 4 -mmt1
Geekbench 5.5: Multi-Core | Single-Core
HWBOT x265 Benchmark v2.2: 4k Preset
LibreOffice : 20 Documents To PDF
R Benchmark 2.5: Overall mean
* ... smaller is better
AIDA64: FP32 Ray-Trace | FPU Julia | CPU SHA3 | CPU Queen | FPU SinJulia | FPU Mandel | CPU AES | CPU ZLib | FP64 Ray-Trace | CPU PhotoWorxx
| Performance rating | |
| Average AMD Ryzen 9 5900HX | |
| Beelink GTR5 | |
| Beelink GTI 11 | |
| Intel NUC11PHKi7C | |
| GMK NucBox 2 | |
| Beelink GK Mini | |
| AIDA64 / FP32 Ray-Trace | |
| Average AMD Ryzen 9 5900HX (12470 - 16014, n=26) | |
| Beelink GTR5 | |
| Beelink GTI 11 | |
| Intel NUC11PHKi7C | |
| GMK NucBox 2 | |
| Beelink GK Mini | |
| AIDA64 / FPU Julia | |
| Average AMD Ryzen 9 5900HX (79554 - 101008, n=26) | |
| Beelink GTR5 | |
| Beelink GTI 11 | |
| Intel NUC11PHKi7C | |
| GMK NucBox 2 | |
| Beelink GK Mini | |
| AIDA64 / CPU SHA3 | |
| Average AMD Ryzen 9 5900HX (2754 - 3444, n=26) | |
| Beelink GTR5 | |
| Beelink GTI 11 | |
| Intel NUC11PHKi7C | |
| GMK NucBox 2 | |
| Beelink GK Mini | |
| AIDA64 / CPU Queen | |
| Average AMD Ryzen 9 5900HX (87865 - 105123, n=26) | |
| Beelink GTR5 | |
| Intel NUC11PHKi7C | |
| Beelink GTI 11 | |
| GMK NucBox 2 | |
| Beelink GK Mini | |
| AIDA64 / FPU SinJulia | |
| Beelink GTR5 | |
| Average AMD Ryzen 9 5900HX (10899 - 12806, n=26) | |
| Intel NUC11PHKi7C | |
| Beelink GTI 11 | |
| GMK NucBox 2 | |
| Beelink GK Mini | |
| AIDA64 / FPU Mandel | |
| Average AMD Ryzen 9 5900HX (43685 - 55702, n=26) | |
| Beelink GTR5 | |
| Intel NUC11PHKi7C | |
| Beelink GTI 11 | |
| GMK NucBox 2 | |
| Beelink GK Mini | |
| AIDA64 / CPU AES | |
| Average AMD Ryzen 9 5900HX (109927 - 137901, n=26) | |
| Beelink GTR5 | |
| Intel NUC11PHKi7C | |
| Beelink GTI 11 | |
| GMK NucBox 2 | |
| Beelink GK Mini | |
| AIDA64 / CPU ZLib | |
| Average AMD Ryzen 9 5900HX (706 - 878, n=26) | |
| Beelink GTR5 | |
| Intel NUC11PHKi7C | |
| Beelink GTI 11 | |
| GMK NucBox 2 | |
| Beelink GK Mini | |
| AIDA64 / FP64 Ray-Trace | |
| Average AMD Ryzen 9 5900HX (6664 - 8644, n=26) | |
| Beelink GTR5 | |
| Beelink GTI 11 | |
| Intel NUC11PHKi7C | |
| GMK NucBox 2 | |
| Beelink GK Mini | |
| AIDA64 / CPU PhotoWorxx | |
| Beelink GTI 11 | |
| Intel NUC11PHKi7C | |
| Beelink GTR5 | |
| Average AMD Ryzen 9 5900HX (14344 - 25533, n=26) | |
| GMK NucBox 2 | |
| Beelink GK Mini | |
System Performance
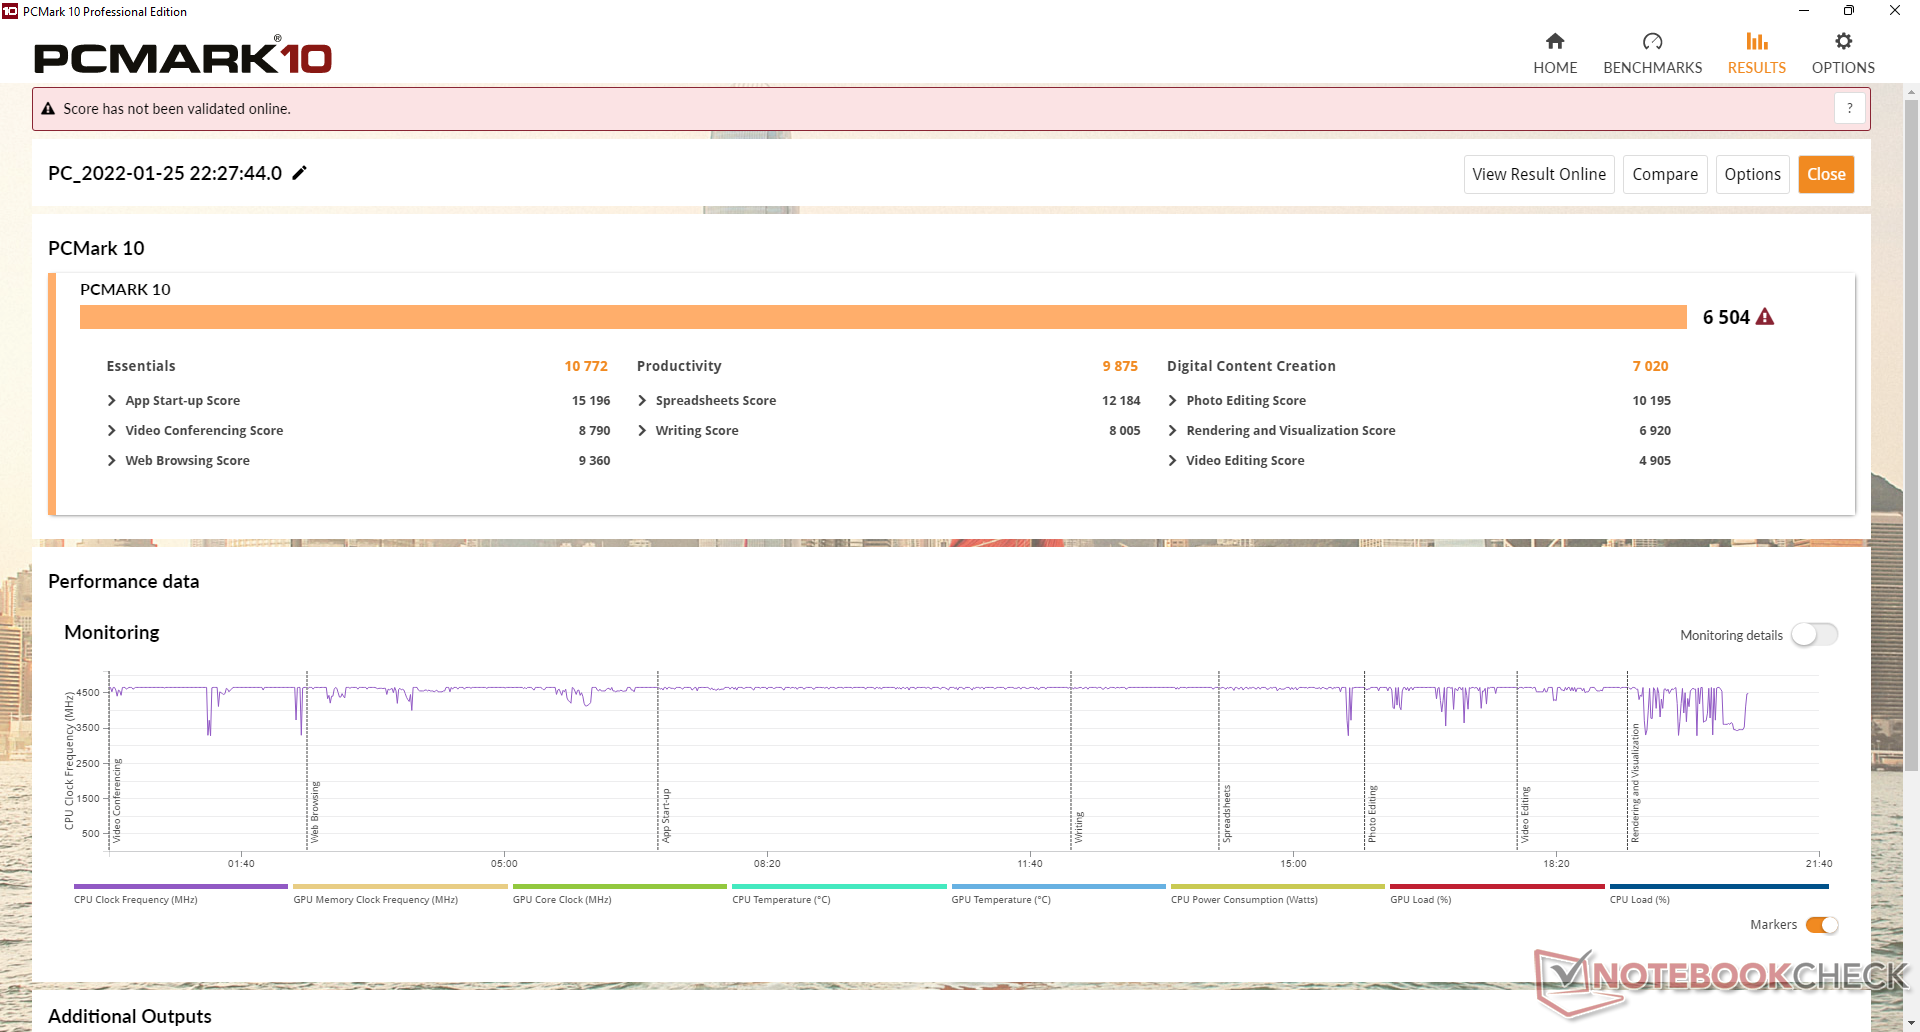
PCMark results are excellent and well above most other mini PCs and NUCs. However, we did encounter two crashes during our testing where the unit would automatically power off for seemingly no reason. We were unable to reliably repeat the crashes for better or worse.
CrossMark: Overall | Productivity | Creativity | Responsiveness
| PCMark 10 / Score | |
| Beelink GTR5 | |
| Average AMD Ryzen 9 5900HX, AMD Radeon RX Vega 8 (Ryzen 4000/5000) (6290 - 6507, n=5) | |
| Intel NUC11PHKi7C | |
| Intel NUC11PAQi7 | |
| Beelink GTI 11 | |
| GMK NucBox 2 | |
| Beelink GK Mini | |
| PCMark 10 / Essentials | |
| Beelink GTR5 | |
| Average AMD Ryzen 9 5900HX, AMD Radeon RX Vega 8 (Ryzen 4000/5000) (10087 - 10836, n=5) | |
| Intel NUC11PAQi7 | |
| Beelink GTI 11 | |
| Intel NUC11PHKi7C | |
| GMK NucBox 2 | |
| Beelink GK Mini | |
| PCMark 10 / Productivity | |
| Average AMD Ryzen 9 5900HX, AMD Radeon RX Vega 8 (Ryzen 4000/5000) (9852 - 10196, n=5) | |
| Beelink GTR5 | |
| Intel NUC11PHKi7C | |
| Intel NUC11PAQi7 | |
| Beelink GTI 11 | |
| GMK NucBox 2 | |
| Beelink GK Mini | |
| PCMark 10 / Digital Content Creation | |
| Beelink GTR5 | |
| Intel NUC11PHKi7C | |
| Average AMD Ryzen 9 5900HX, AMD Radeon RX Vega 8 (Ryzen 4000/5000) (6660 - 7105, n=5) | |
| Beelink GTI 11 | |
| Intel NUC11PAQi7 | |
| GMK NucBox 2 | |
| Beelink GK Mini | |
| CrossMark / Overall | |
| Beelink GTR5 | |
| Average AMD Ryzen 9 5900HX, AMD Radeon RX Vega 8 (Ryzen 4000/5000) (1402 - 1501, n=2) | |
| CrossMark / Productivity | |
| Beelink GTR5 | |
| Average AMD Ryzen 9 5900HX, AMD Radeon RX Vega 8 (Ryzen 4000/5000) (1387 - 1495, n=2) | |
| CrossMark / Creativity | |
| Beelink GTR5 | |
| Average AMD Ryzen 9 5900HX, AMD Radeon RX Vega 8 (Ryzen 4000/5000) (1553 - 1589, n=2) | |
| CrossMark / Responsiveness | |
| Beelink GTR5 | |
| Average AMD Ryzen 9 5900HX, AMD Radeon RX Vega 8 (Ryzen 4000/5000) (1068 - 1281, n=2) | |
| PCMark 10 Score | 6504 points | |
Help | ||
| AIDA64 / Memory Copy | |
| GMK NucBox 2 | |
| Beelink GTR5 | |
| Beelink GTI 11 | |
| Average AMD Ryzen 9 5900HX (36725 - 43318, n=26) | |
| Intel NUC11PHKi7C | |
| Beelink GK Mini | |
| AIDA64 / Memory Read | |
| Beelink GTR5 | |
| Beelink GTI 11 | |
| Average AMD Ryzen 9 5900HX (41378 - 47593, n=26) | |
| Intel NUC11PHKi7C | |
| GMK NucBox 2 | |
| Beelink GK Mini | |
| AIDA64 / Memory Write | |
| GMK NucBox 2 | |
| Beelink GTI 11 | |
| Beelink GTR5 | |
| Average AMD Ryzen 9 5900HX (32536 - 46718, n=26) | |
| Intel NUC11PHKi7C | |
| Beelink GK Mini | |
| AIDA64 / Memory Latency | |
| Intel NUC11PHKi7C | |
| Beelink GTR5 | |
| Average AMD Ryzen 9 5900HX (73.5 - 97.1, n=26) | |
| Beelink GK Mini | |
| Beelink GTI 11 | |
| GMK NucBox 2 | |
* ... smaller is better
DPC Latency
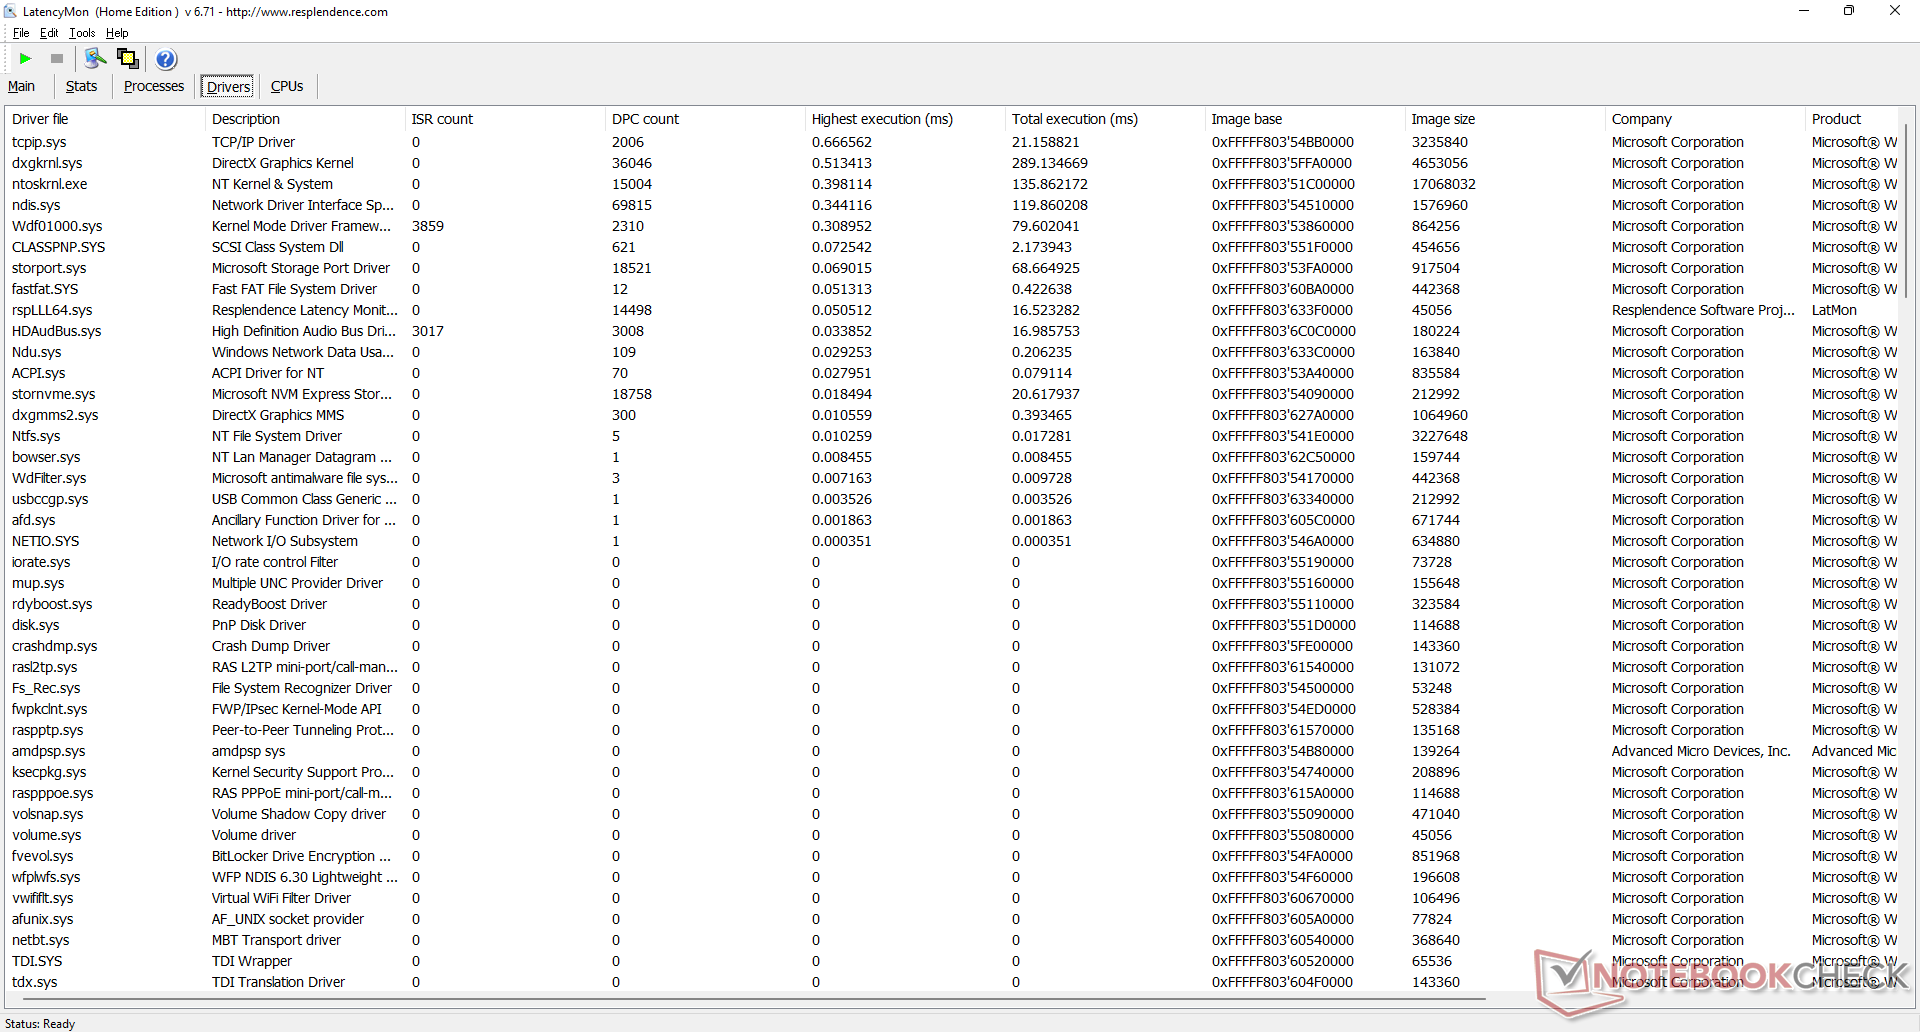
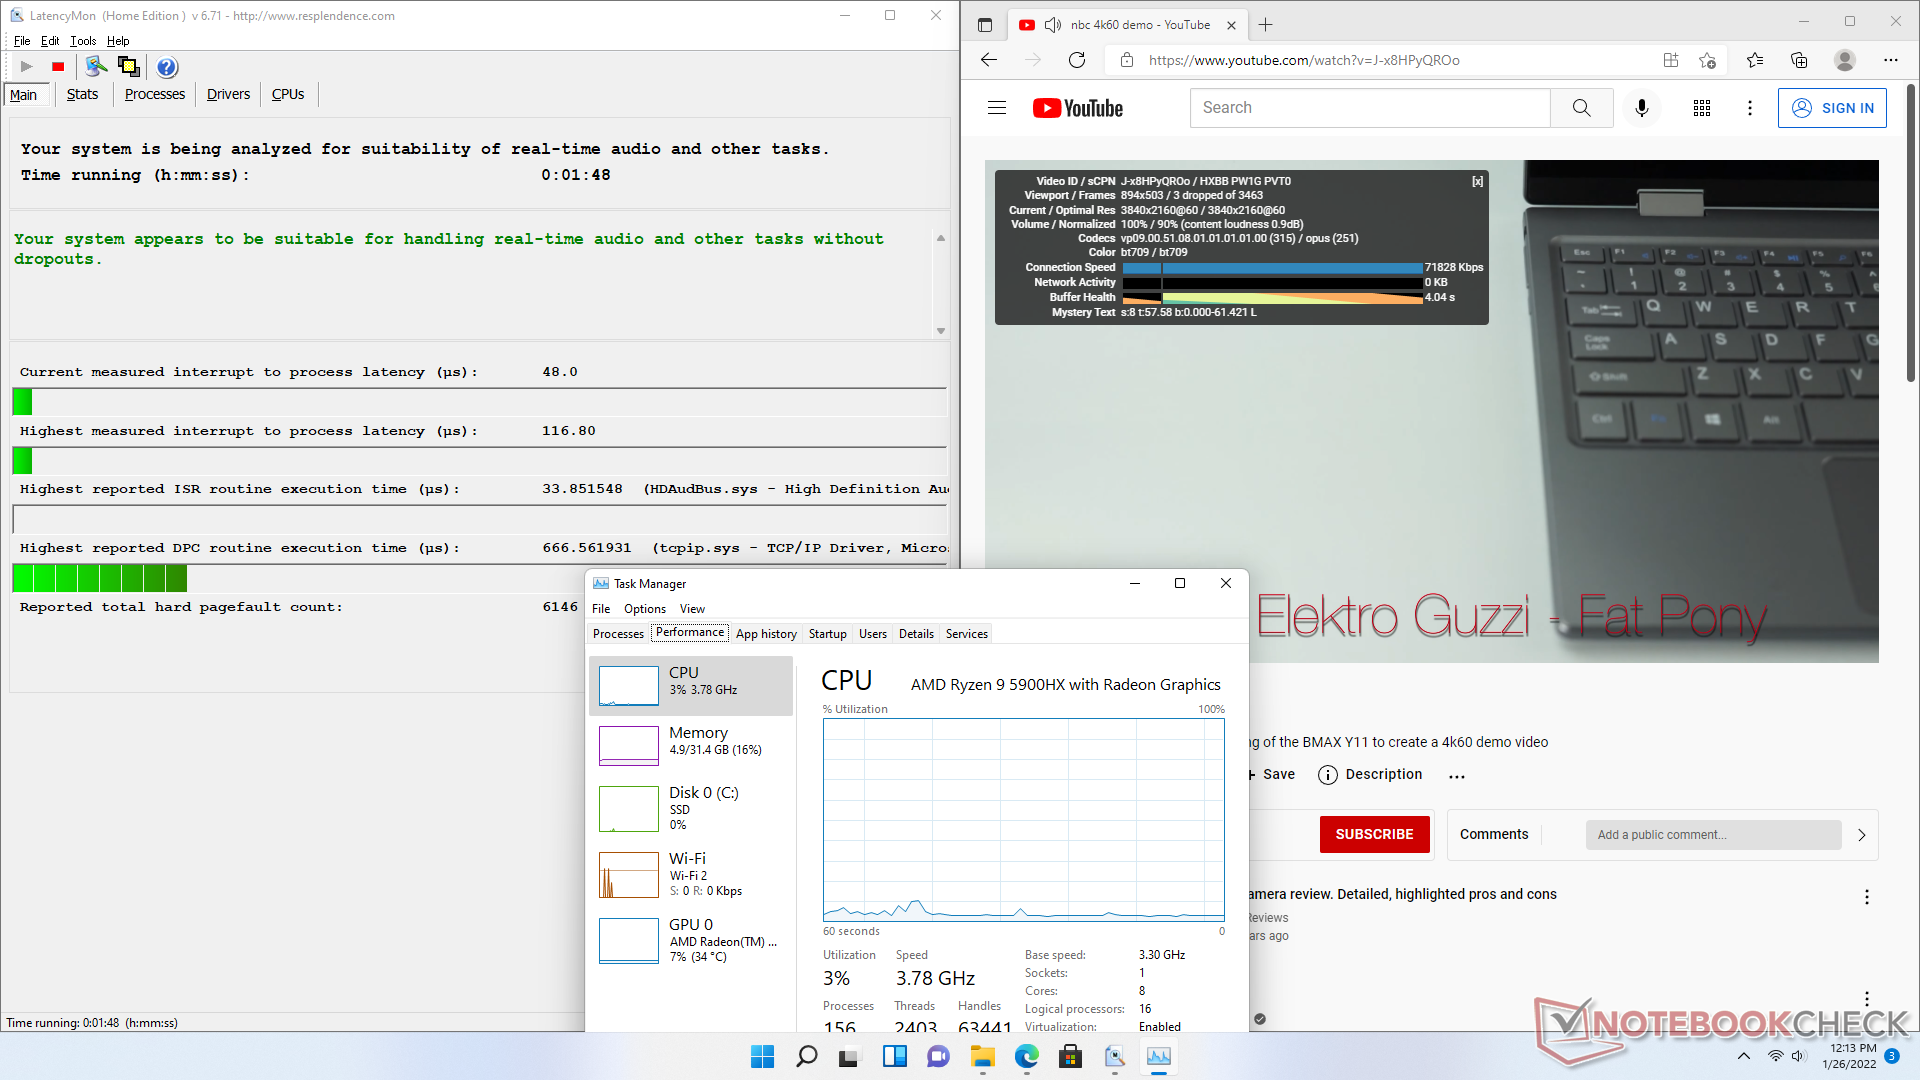
LatencyMon shows no DPC issues when opening multiple browser tabs on our homepage. 4K video playback at 60 FPS is smooth with just 3 dropped frames during our minute-long YouTube test.
| DPC Latencies / LatencyMon - interrupt to process latency (max), Web, Youtube, Prime95 | |
| Beelink GK Mini | |
| Intel NUC11PHKi7C | |
| GMK NucBox 2 | |
| Intel NUC11PAQi7 | |
| Beelink GTI 11 | |
| Beelink GTR5 | |
* ... smaller is better
Storage Devices
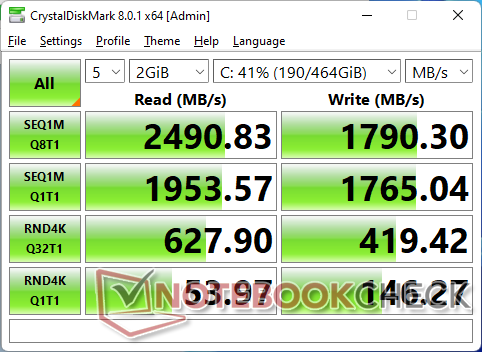
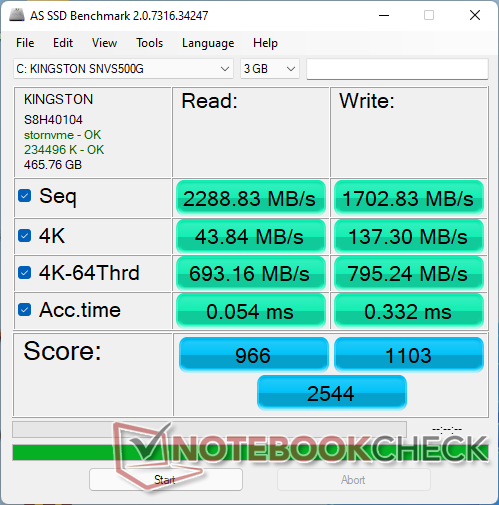
Our test unit comes with a midrange 500 GB Kingston NV1 PCIe3 x4 SSD. PCIe4 speeds are not supported unlike on the latest Intel NUCs running on 11th gen Core CPUs. The Kingston drive otherwise shows no issues maintaining its maximum transfer rate of ~2300 MB/s for extended periods.

| Drive Performance rating - Percent | |
| Intel NUC11PAQi7 | |
| Beelink GTI 11 | |
| Intel NUC11PHKi7C | |
| Beelink GTR5 | |
| GMK NucBox 2 | |
| Beelink GK Mini | |
* ... smaller is better
Disk Throttling: DiskSpd Read Loop, Queue Depth 8
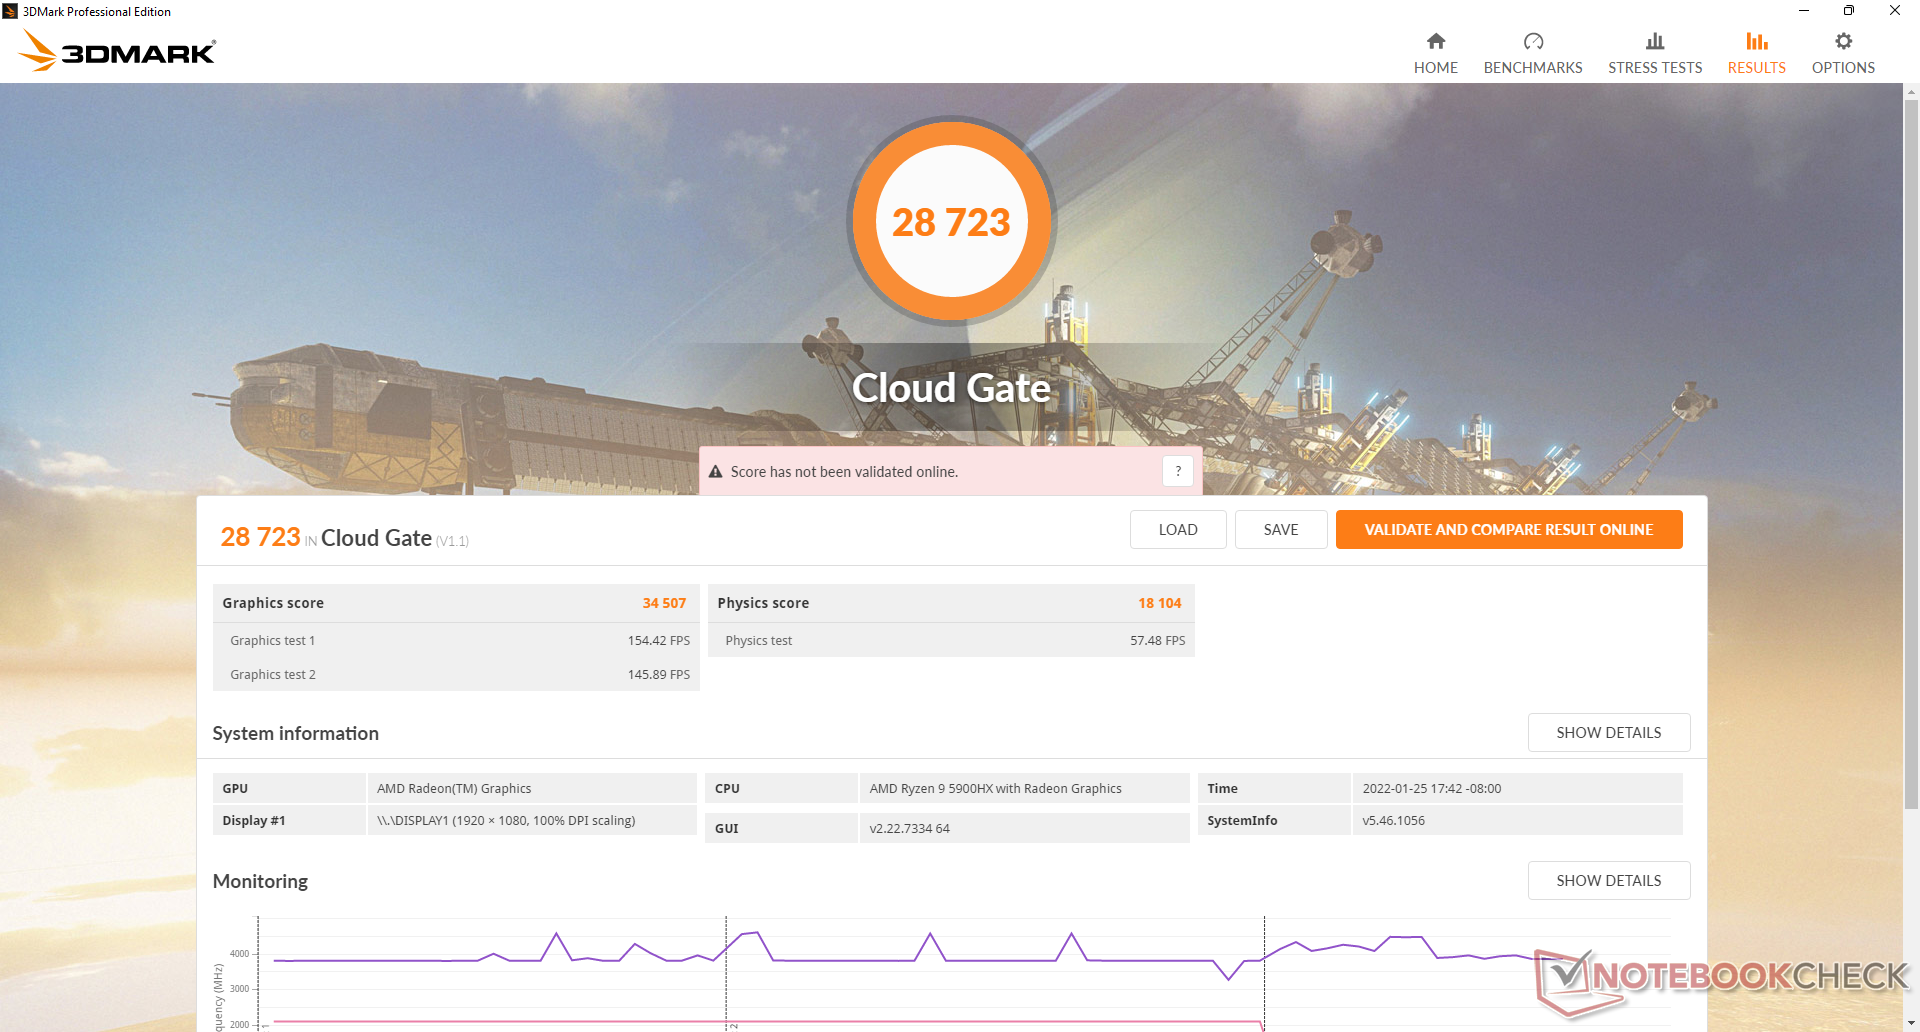
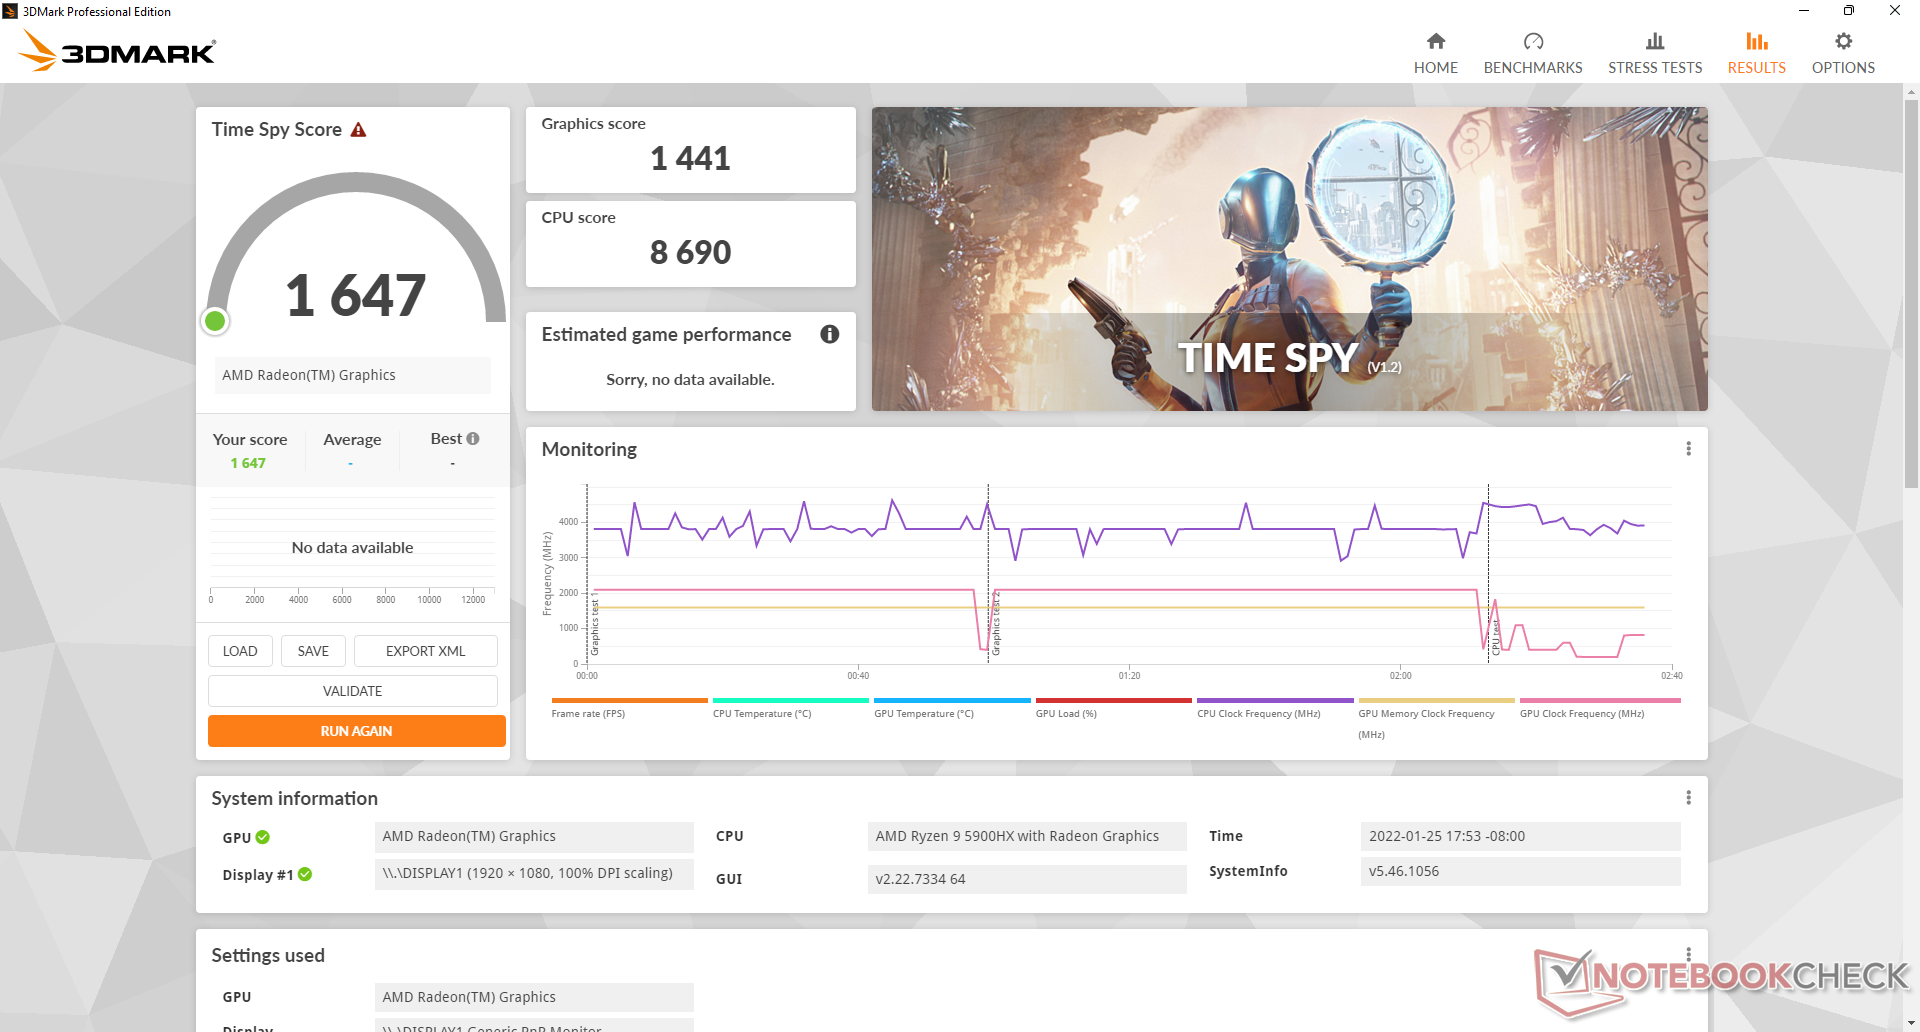
GPU Performance
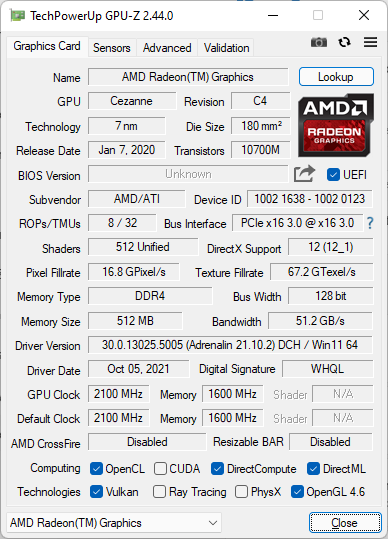
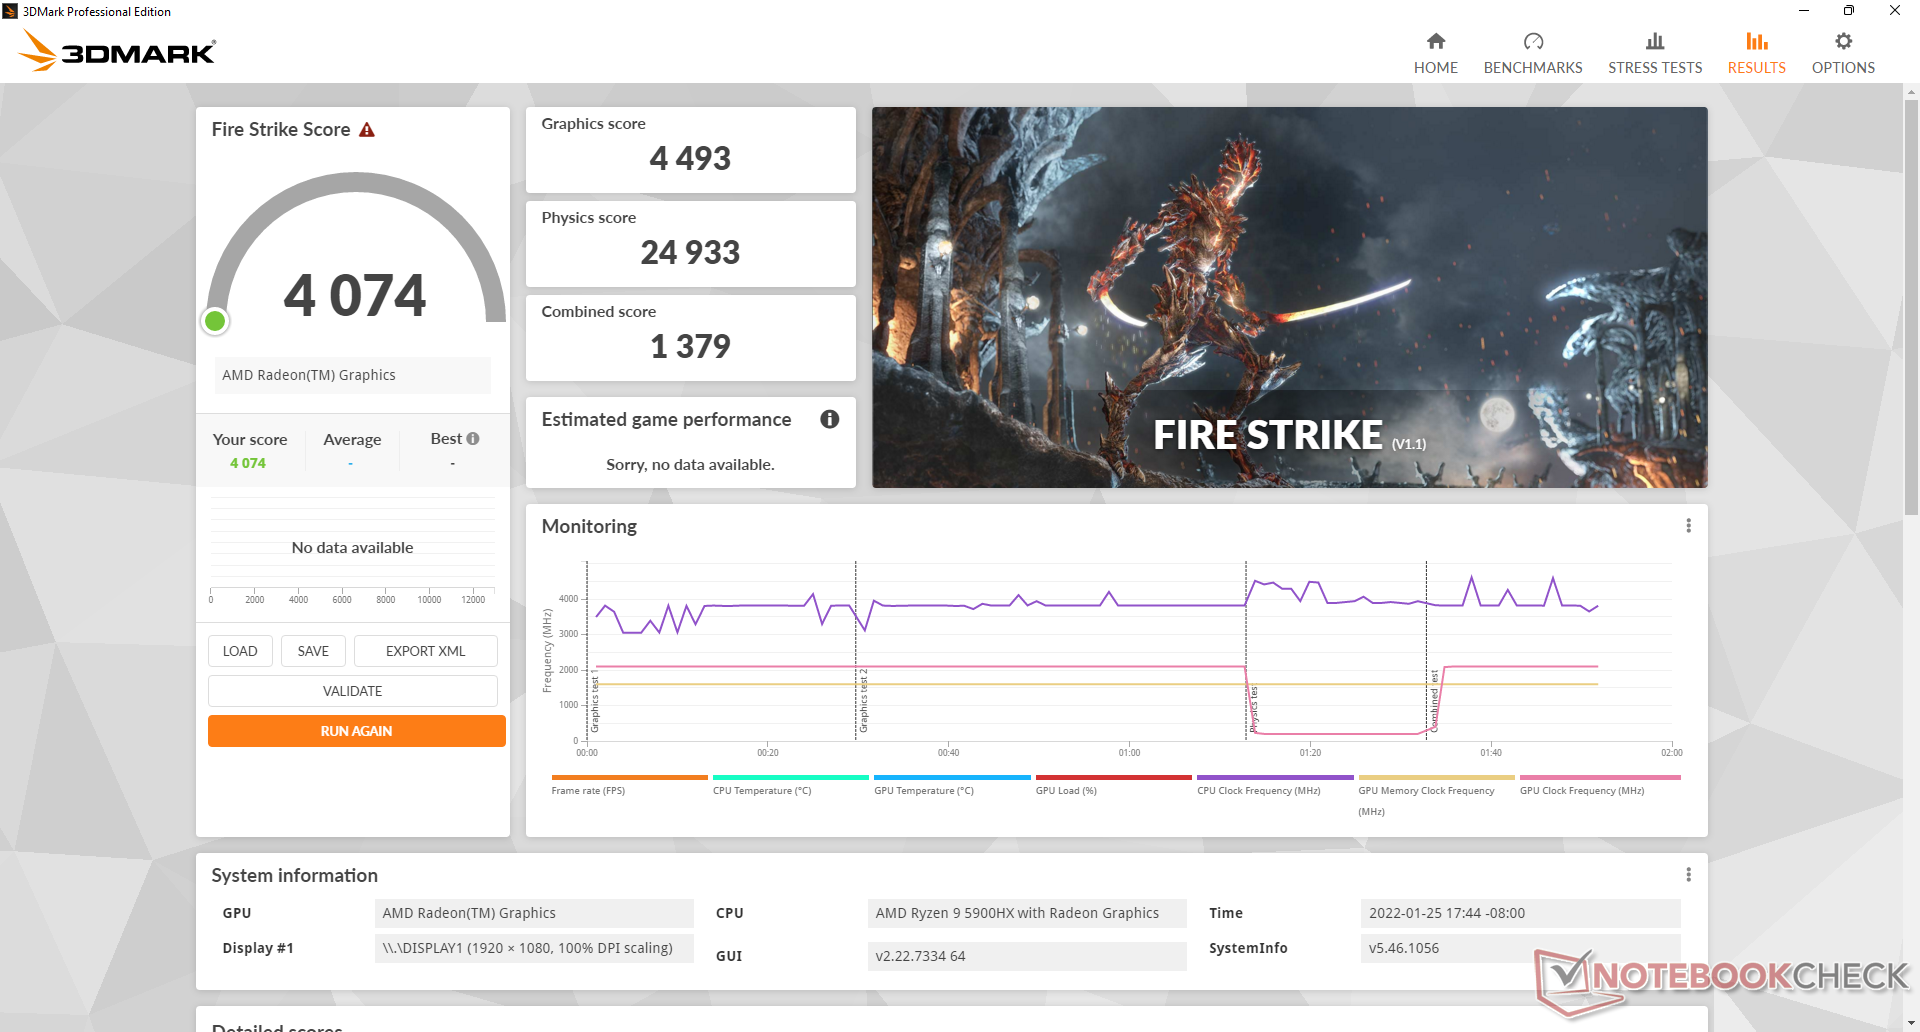
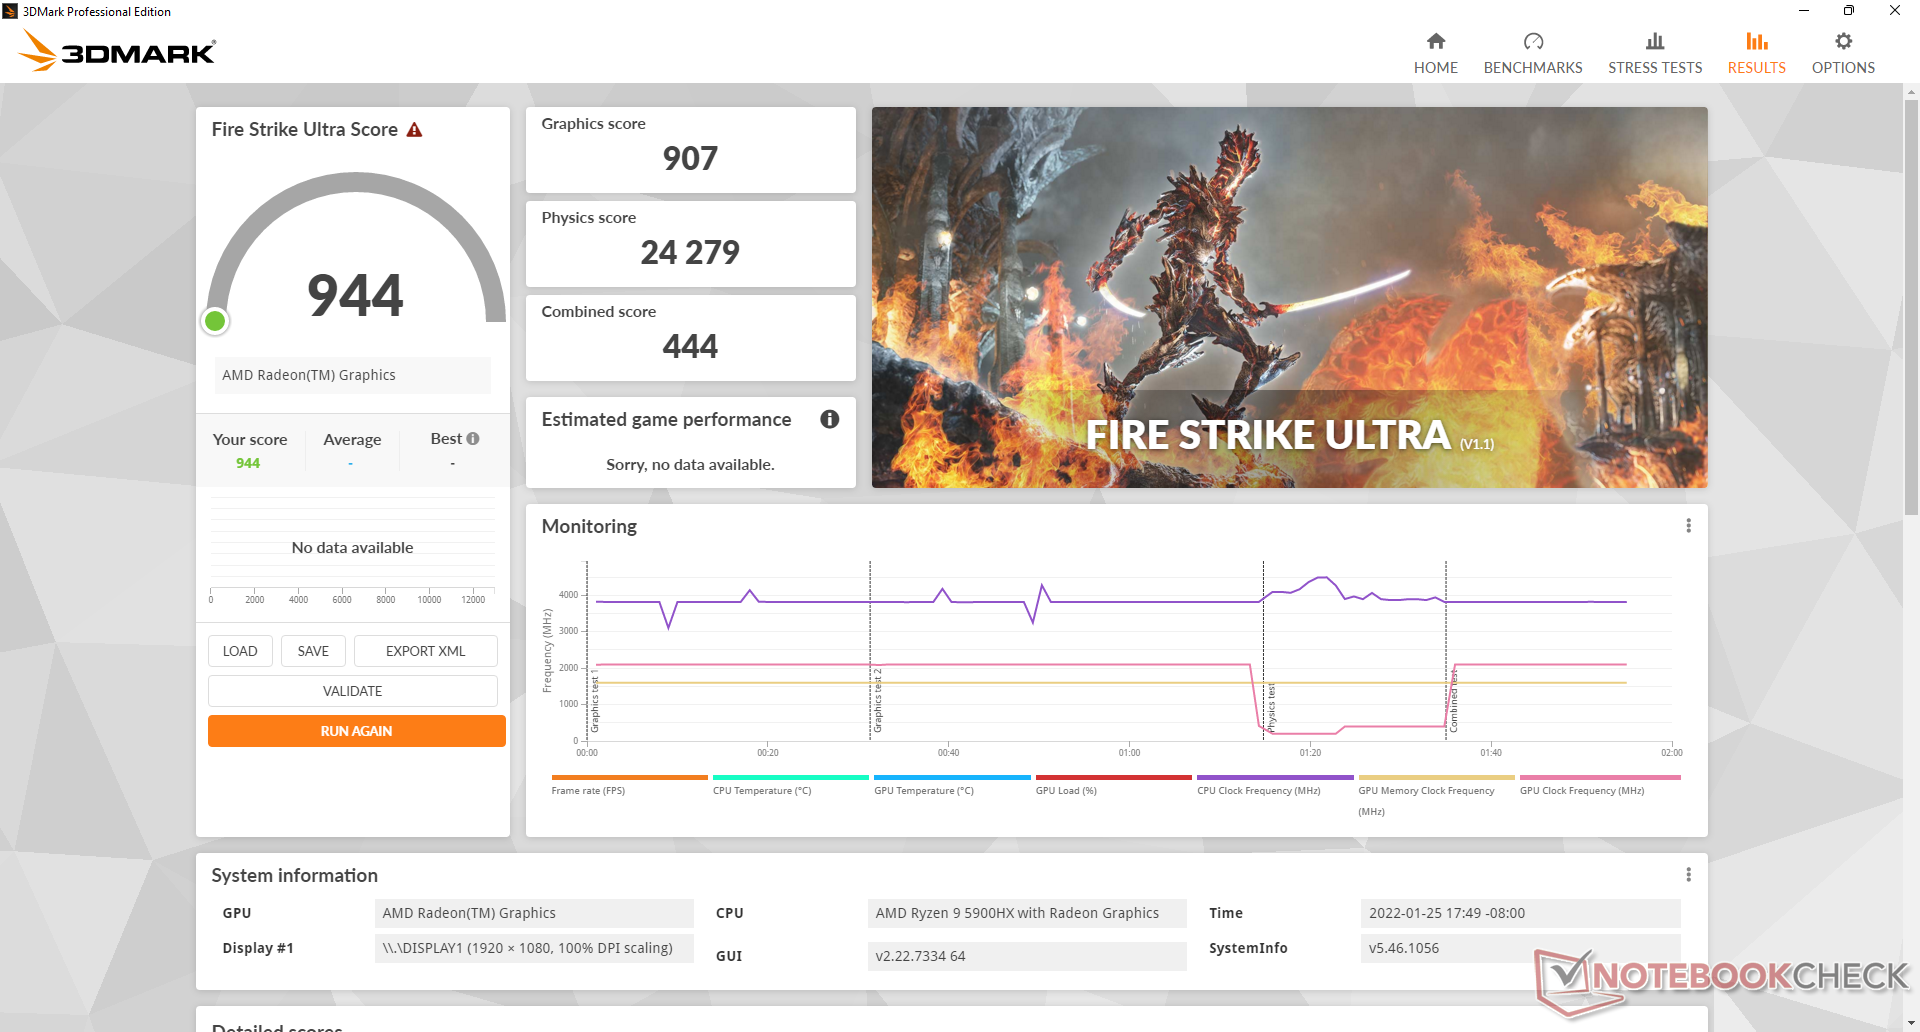
The integrated Radeon RX Vega 8 here is about 20 percent faster than the average laptop in our database equipped with the same integrated GPU. Intel's Iris Xe 96 EUs solution as found on most 11th gen Core i7 laptops still edges our AMD solution in most titles, but the delta between them is much narrower this time around. Most modern and demanding titles run reasonably well at 1080p low settings.
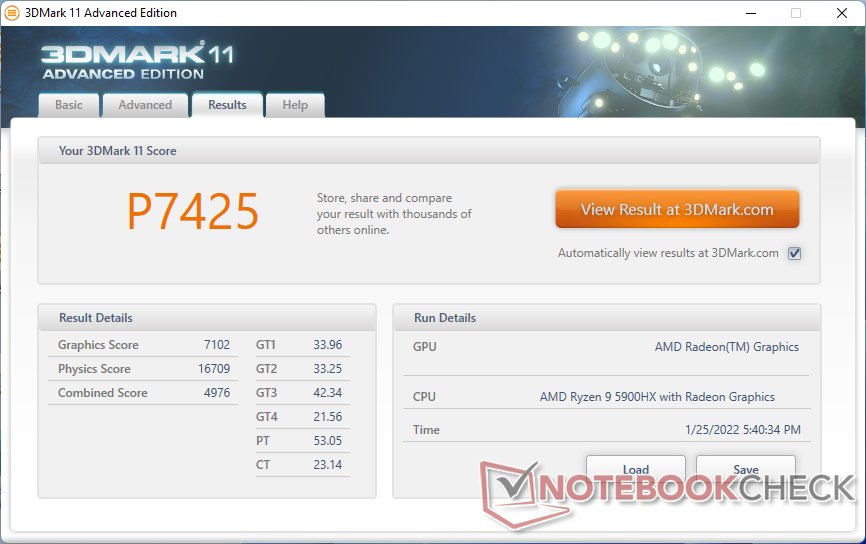
| 3DMark 11 Performance | 7425 points | |
| 3DMark Cloud Gate Standard Score | 28723 points | |
| 3DMark Fire Strike Score | 4074 points | |
| 3DMark Time Spy Score | 1647 points | |
Help | ||
Witcher 3 FPS Chart
| low | med. | high | ultra | |
|---|---|---|---|---|
| GTA V (2015) | 140 | 124 | 33.4 | 15.1 |
| The Witcher 3 (2015) | 86.9 | 55.2 | 26.8 | 17.1 |
| Dota 2 Reborn (2015) | 135 | 107 | 63.8 | 59.9 |
| Final Fantasy XV Benchmark (2018) | 44.8 | 22.3 | 15.7 | |
| X-Plane 11.11 (2018) | 58.2 | 45.7 | 40.5 | |
| Far Cry 5 (2018) | 62 | 29 | 27 | 25 |
| Strange Brigade (2018) | 99.1 | 37.8 | 31.9 | 27.5 |
Emissions
System Noise
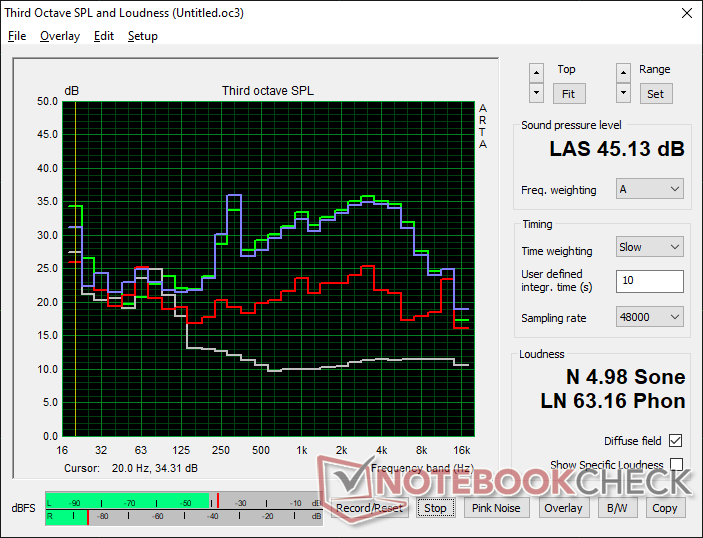
The GTR5 is one of the louder mini PCs we've tested as its two internal fans are essentially always active. When simply sitting on the Windows desktop screen, for example, we're already able to record a fan noise of 34.2 dB(A) compared to ~25 dB(A) on the GMK NucBox 2 or Intel NUC11PAQi7 each with less powerful CPUs.
Running higher loads like games may induce a fan noise of 41 to 45 dB(A) to be even louder than the Intel NUC11PHKi7C equipped with the significantly faster GeForce RTX 2060. No matter how you cut it, the GTR5 is going to be loud under most conditions. The good news is that the fans do not pulse or cycle very frequently which would have made the noise even more annoying.
Noise level
| Idle |
| 34.2 / 34.2 / 34.2 dB(A) |
| Load |
| 44.6 / 45.1 dB(A) |
 | ||
30 dB silent 40 dB(A) audible 50 dB(A) loud |
||
min: | ||
| Beelink GTR5 Vega 8, R9 5900HX, Kingston NV1 SNVS/500GCN | Beelink GTI 11 Iris Xe G7 80EUs, i5-1135G7, Kingston SA2000M8500G | GMK NucBox 2 Iris Plus Graphics 655, i5-8259U, Netac S930E8/256GPN | Intel NUC11PHKi7C GeForce RTX 2060 Mobile, i7-1165G7, Samsung SSD 980 Pro 500GB MZ-V8P500BW | Intel NUC11PAQi7 Iris Xe G7 96EUs, i7-1165G7, Samsung SSD 980 Pro 500GB MZ-V8P500BW | Beelink GK Mini UHD Graphics 600, Celeron J4125, Silicon Motion SM2258XT 256GB | |
|---|---|---|---|---|---|---|
| Noise | -4% | 18% | 13% | 12% | 1% | |
| off / environment * (dB) | 23.1 | 25.7 -11% | 25.6 -11% | 24.5 -6% | 25.6 -11% | 24.6 -6% |
| Idle Minimum * (dB) | 34.2 | 28.4 17% | 25.7 25% | 25.3 26% | 25.6 25% | 36.9 -8% |
| Idle Average * (dB) | 34.2 | 32 6% | 25.7 25% | 25.3 26% | 25.6 25% | 36.9 -8% |
| Idle Maximum * (dB) | 34.2 | 37.7 -10% | 25.7 25% | 25.3 26% | 25.6 25% | 36.9 -8% |
| Load Average * (dB) | 44.6 | 44.2 1% | 35.3 21% | 36.4 18% | 33.6 25% | 37 17% |
| Witcher 3 ultra * (dB) | 41.4 | 44.5 -7% | 39.7 4% | 33.6 19% | ||
| Load Maximum * (dB) | 45.1 | 56 -24% | 35.1 22% | 47.9 -6% | 54.5 -21% | 37 18% |
* ... smaller is better
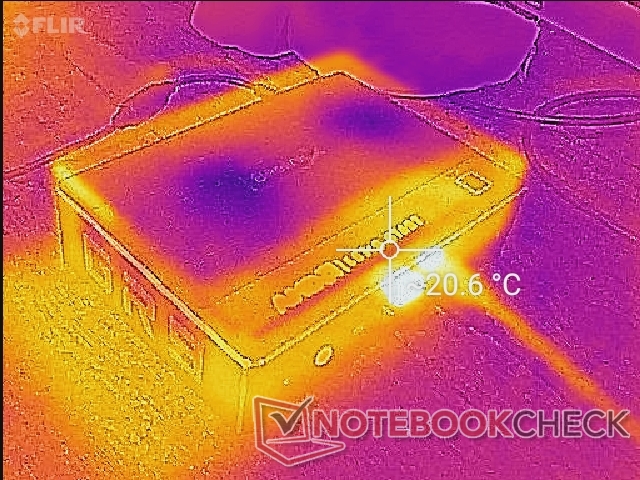
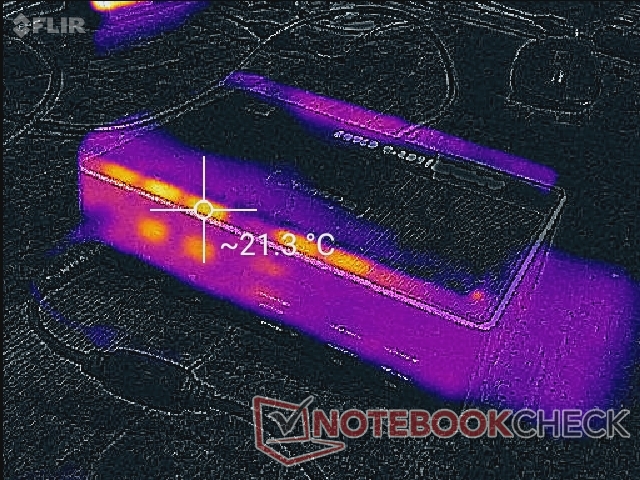
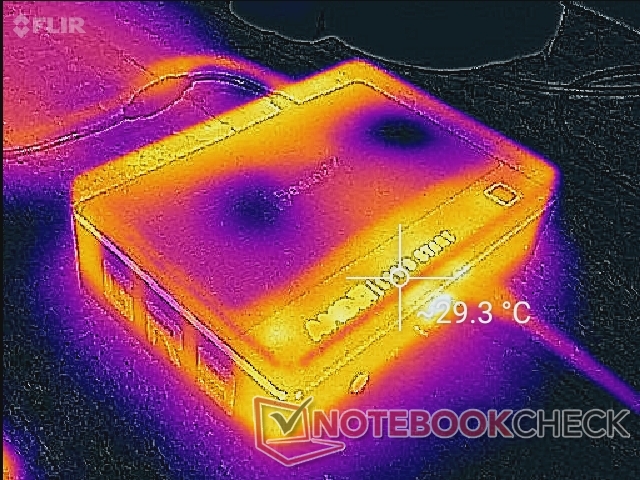
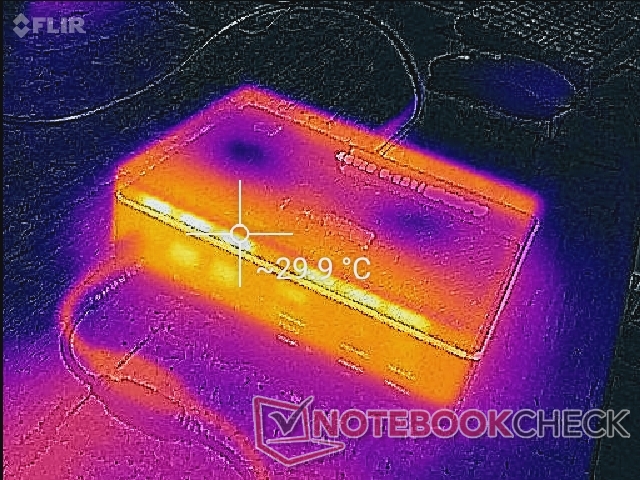
Temperature
Surface temperatures are not an issue especially since the entire top of the unit is a vent for air intake. As a result, it's not recommended to place any papers or books on top of the mini PC. If positioning the unit vertically, make sure to not press the top of the mini PC against any walls or shelves to preserve airflow.
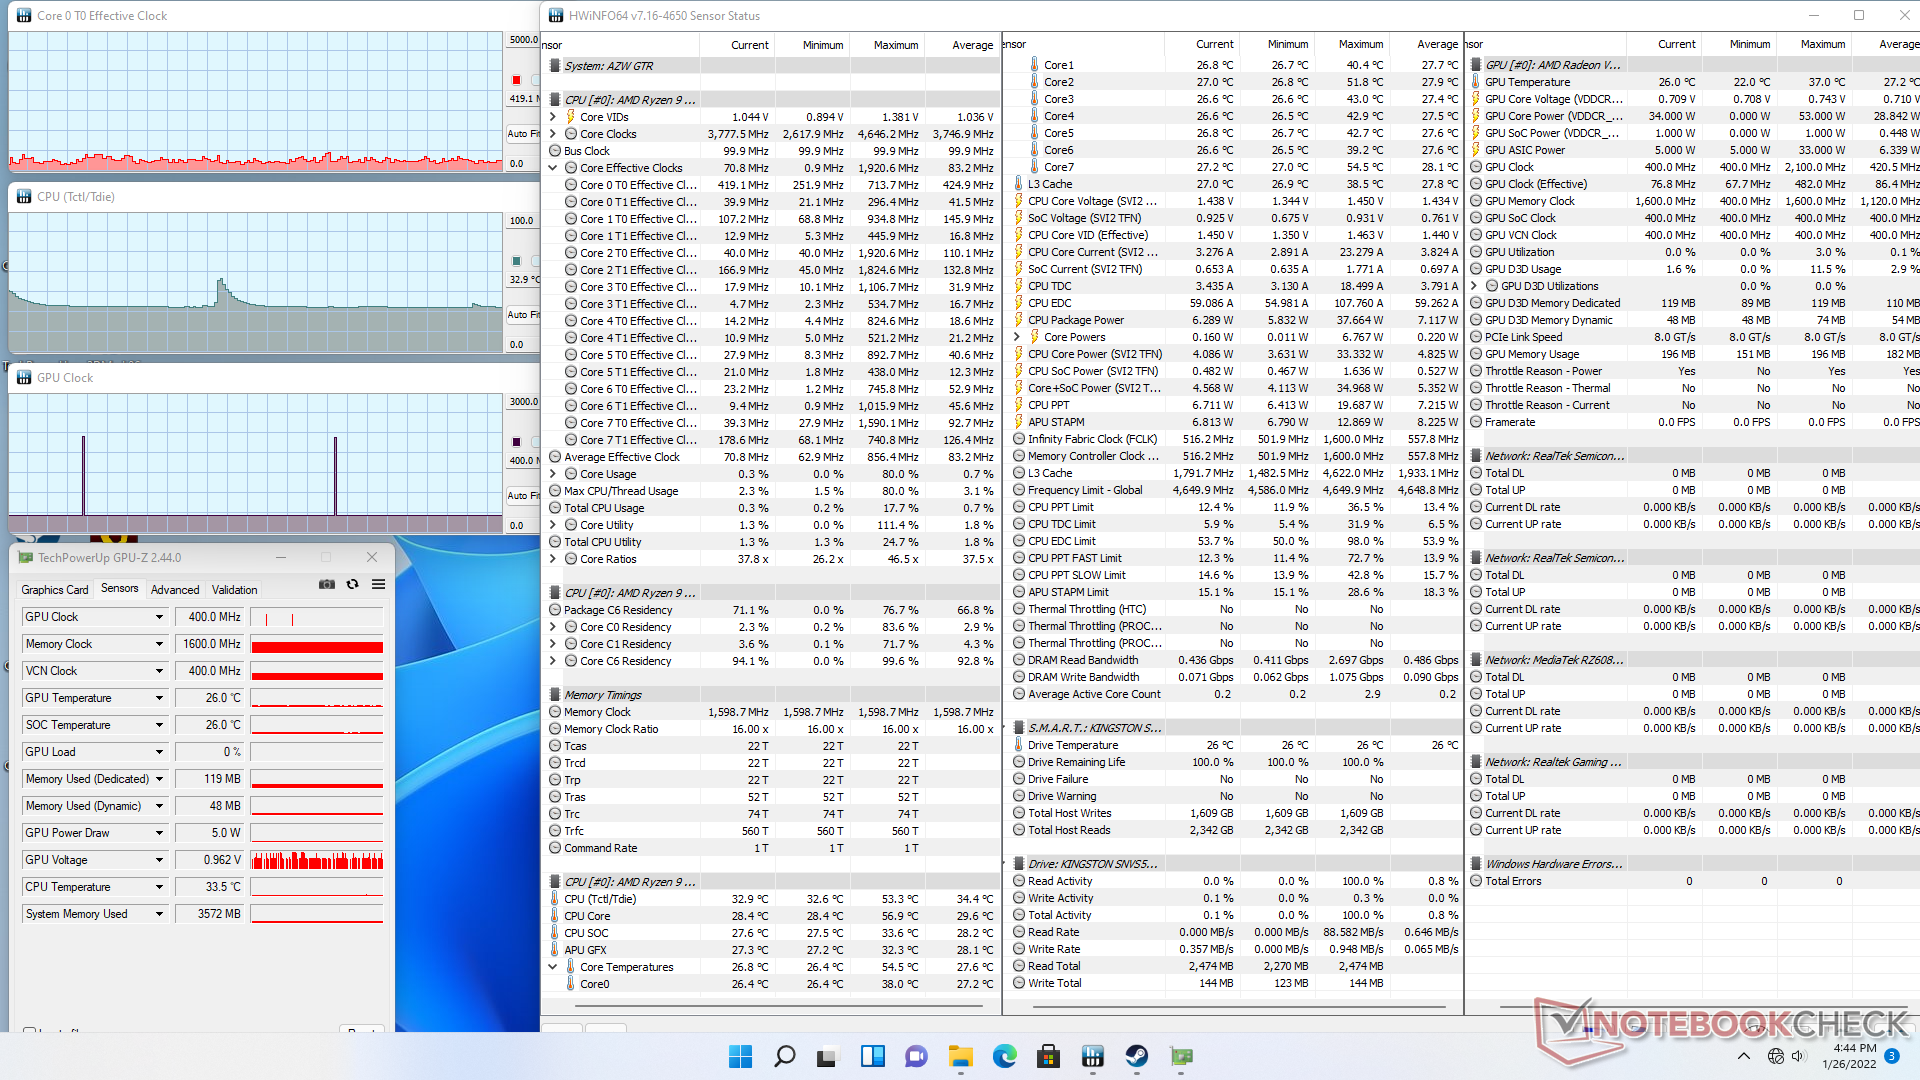
Stress Test
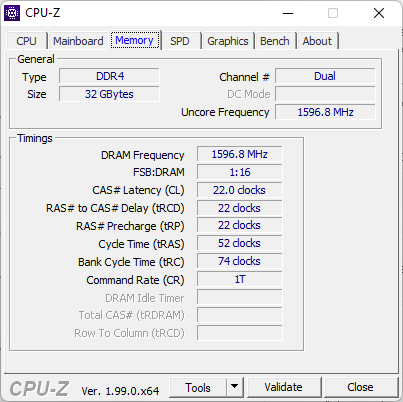
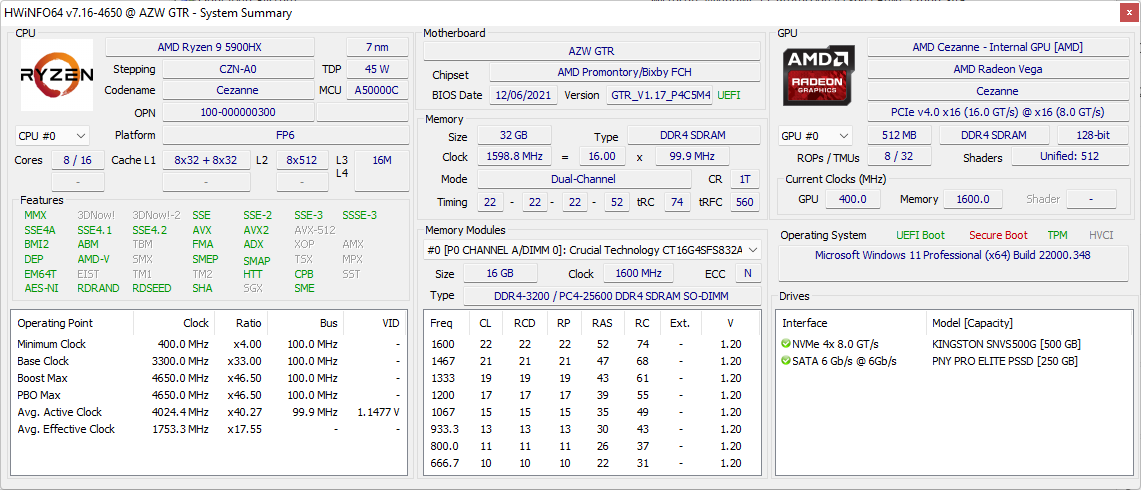
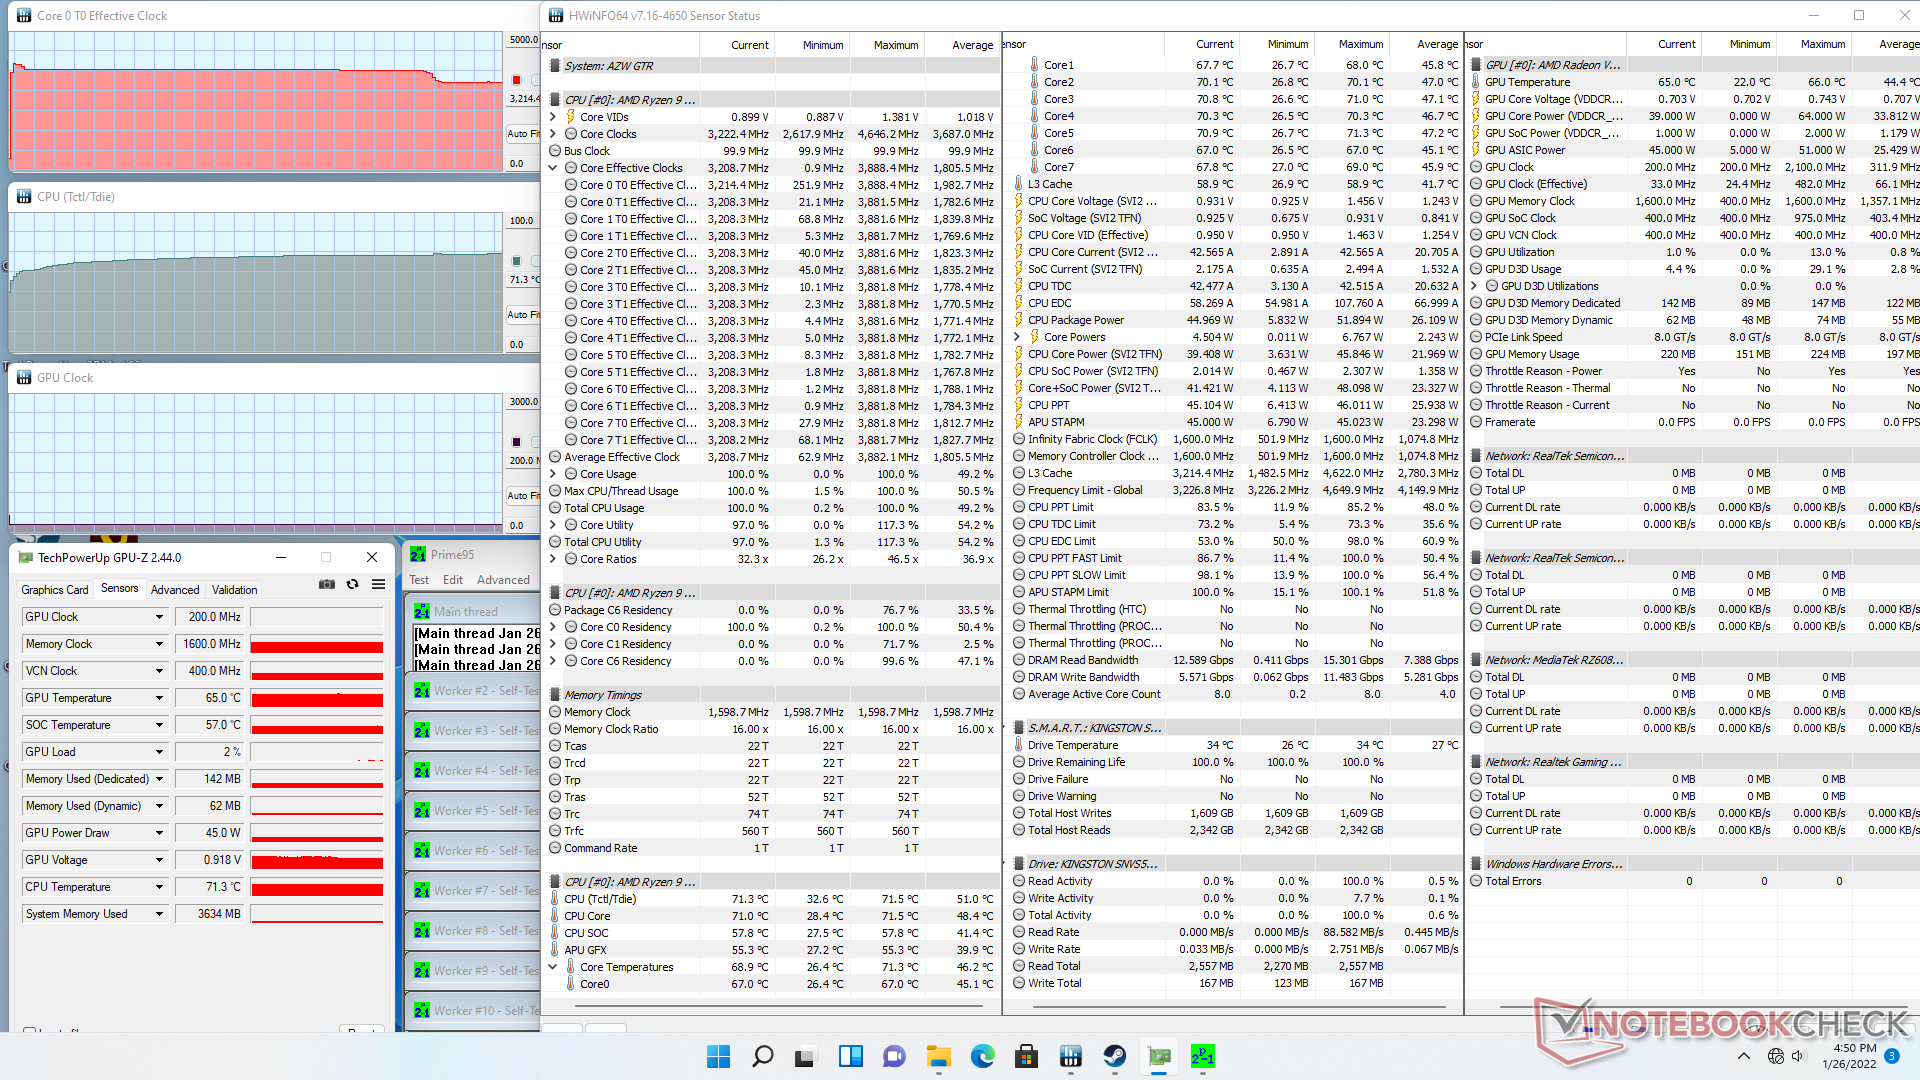
When running Prime95 to stress the CPU on stock BIOS settings, clock rates would boost to 3.9 GHz for the first few seconds before falling slightly to a more stable 3.8 GHz. Core temperature (Tctl/Tdie) would stabilize at 74 C to leave enough room for overclocking. CPU TDP appears to top out at 55 W during the start of the test before settling at 45 W according to HWiNFO.
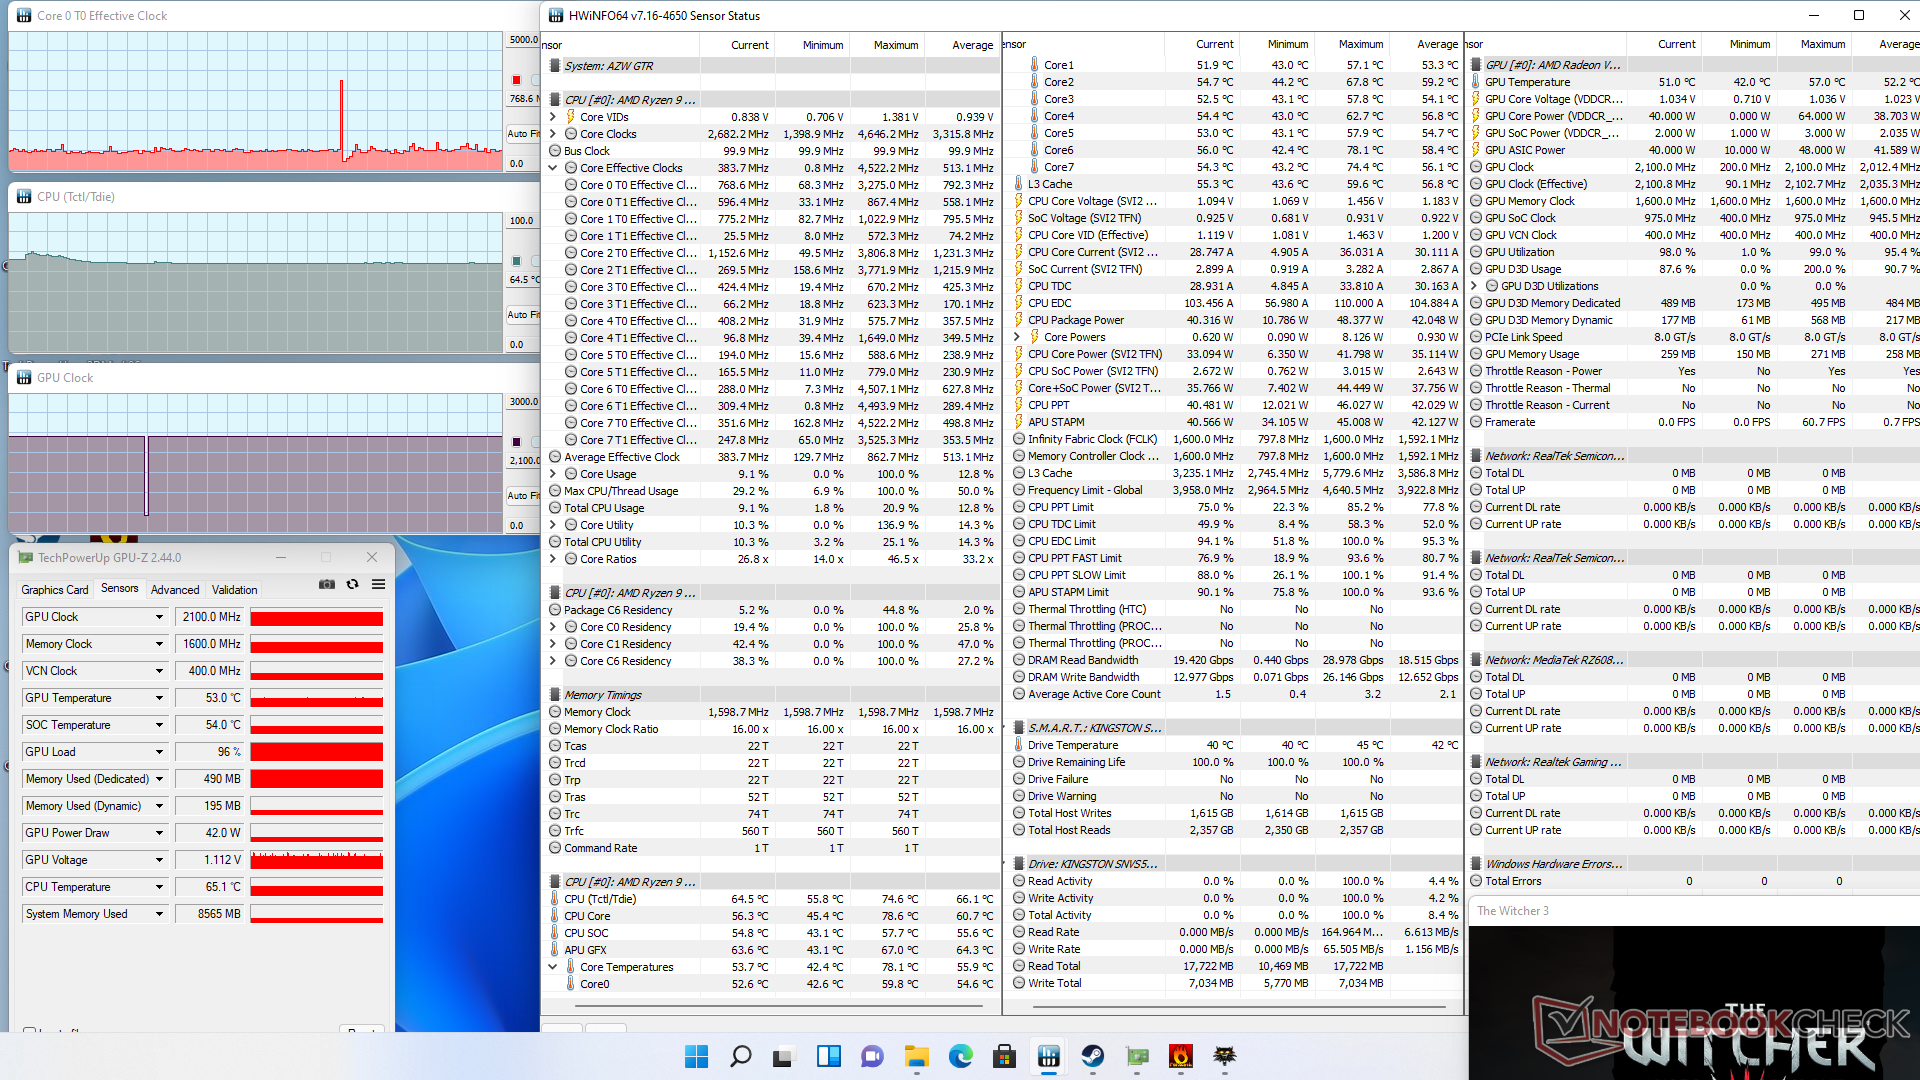
When running Witcher 3 to represent gaming stress, the integrated GPU would stabilize at 2100 MHz and at a CPU (Tctl/Tdie) core temperature of 65 C. Running this same test on the Beelink GTI11 equipped with the less demanding Core i5-1135G7 would have similar temperature results.
| CPU Clock (GHz) | GPU Clock (MHz) | Average CPU Temperature Tctl/Tdie (°C) | |
| System Idle | -- | -- | 33 |
| Prime95 Stress | 3.8 | -- | 74 |
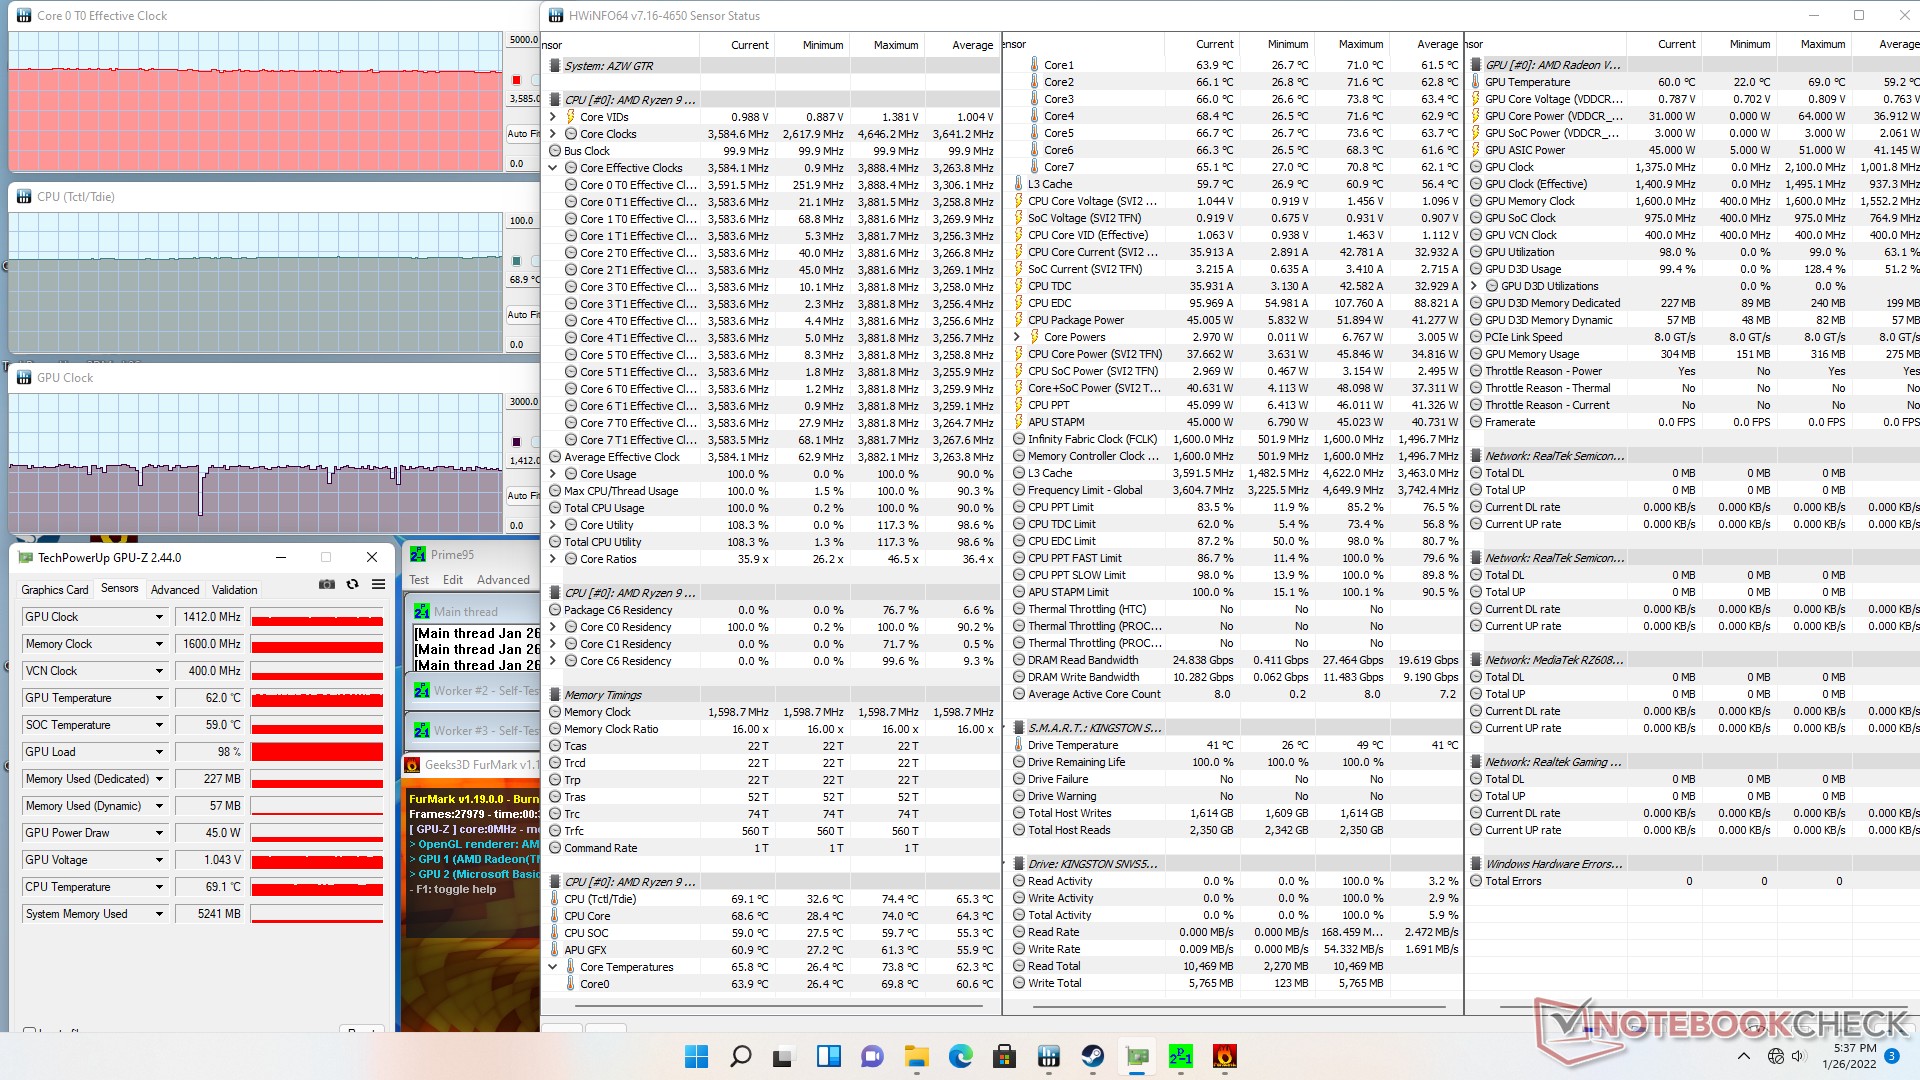
| Prime95 + FurMark Stress | 3.6 | 1412 | 69 |
| Witcher 3 Stress | ~0.8 | 2100 | 65 |
Energy Management
Power Consumption
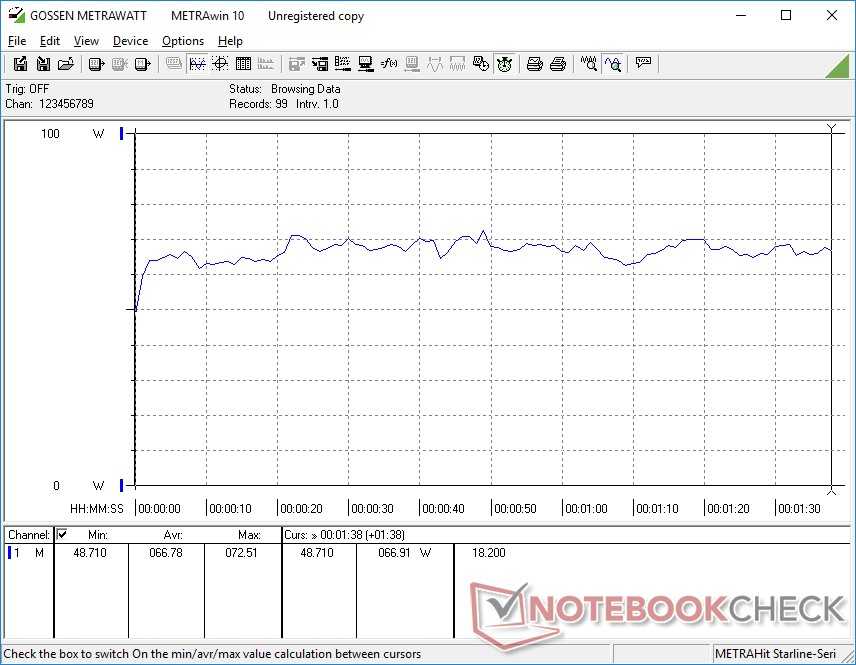
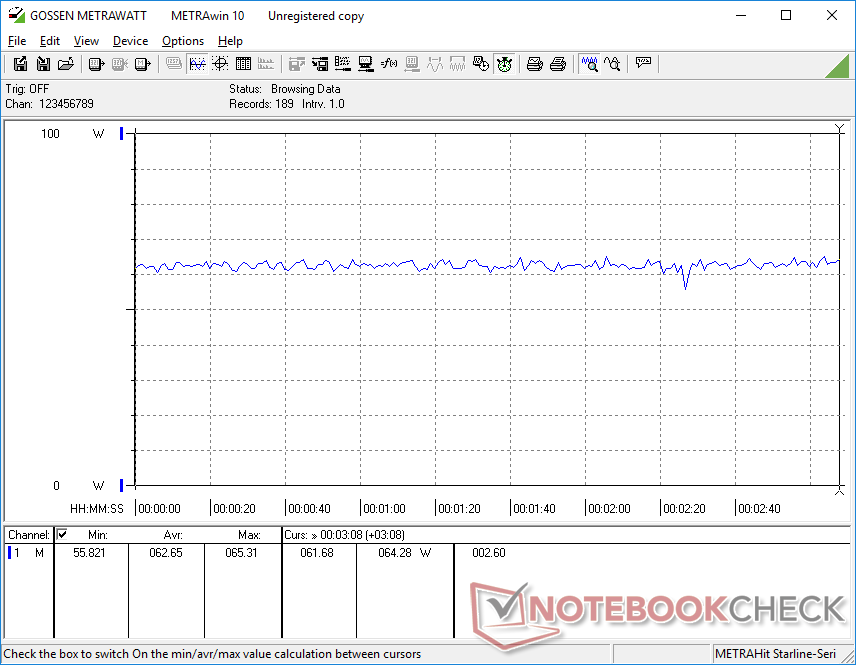
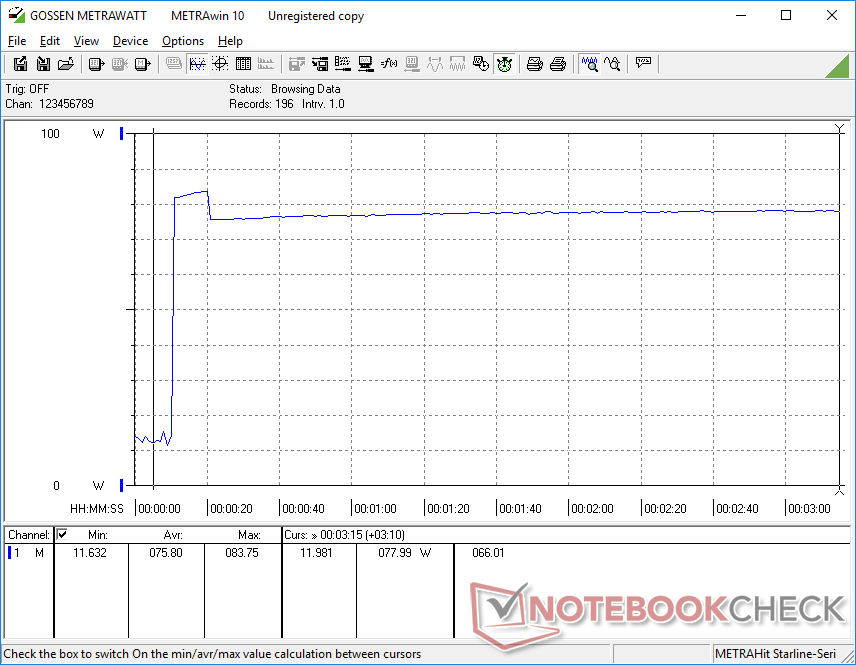
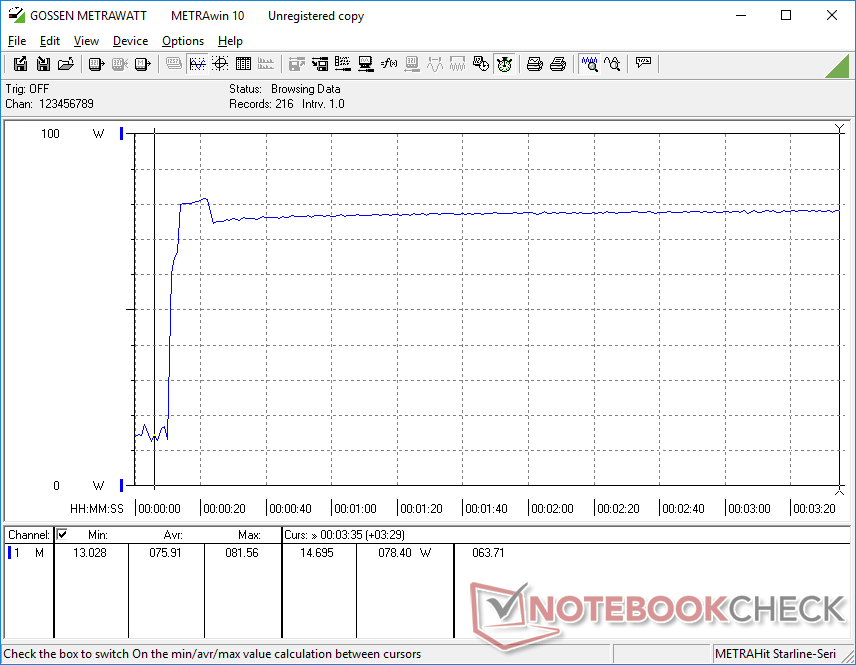
Running higher loads like games will consume about 2x more power than the Core i7-powered Intel NUC11PAQi7 despite the slightly lower graphics performance of our Radeon RX Vega 8. GTR5 owners would still be getting approximately 70 percent faster multi-thread CPU performance, however, which may offset its comparatively higher power consumption.
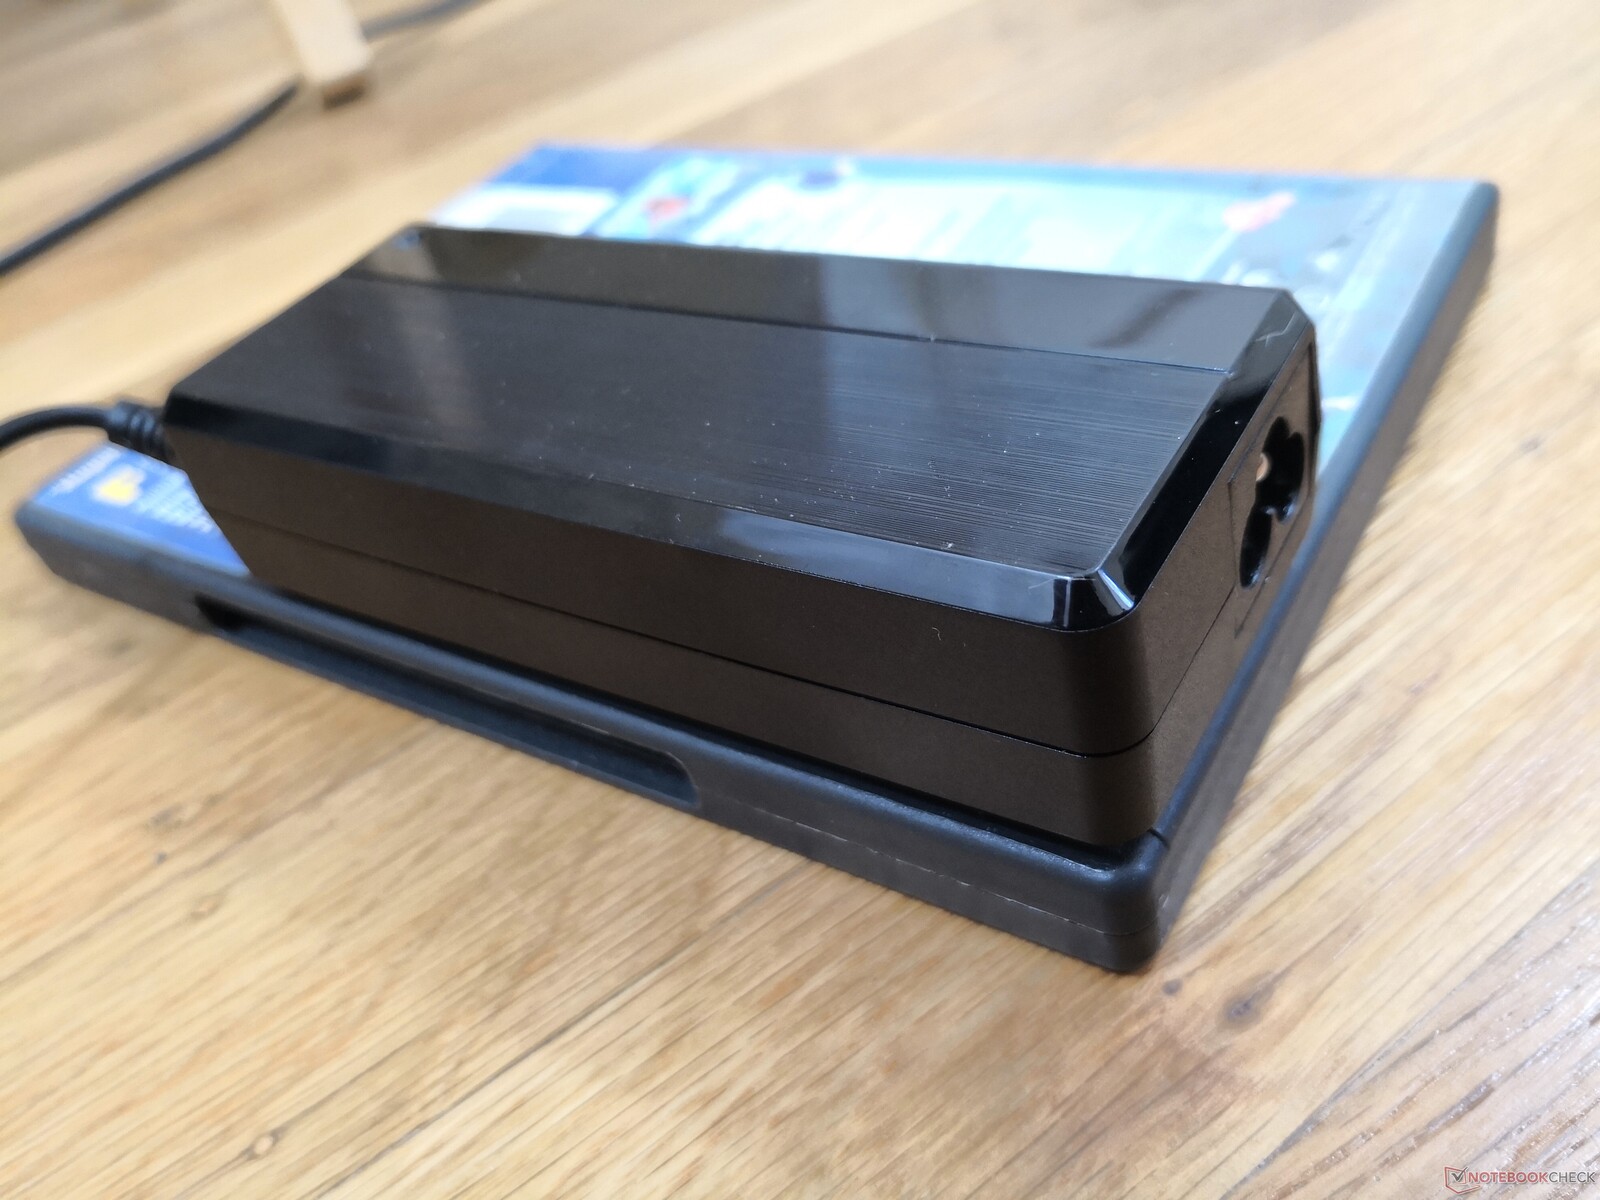
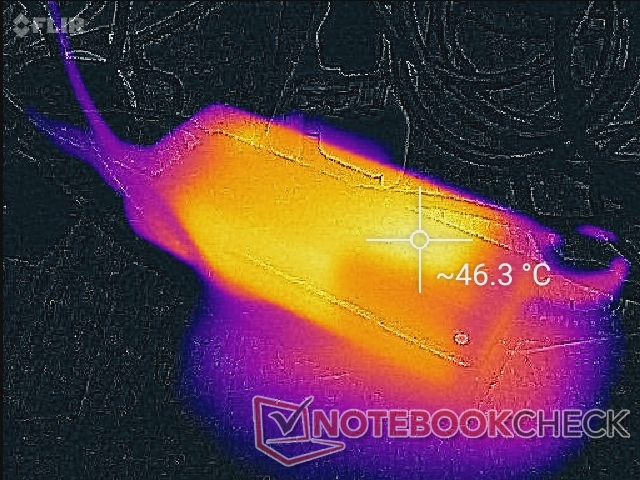
We're able to record a maximum draw of 82 W from the small (12.5 x 5 x 3 cm) 90 W AC adapter when running extreme Prime95 and FurMark loads.
| Off / Standby | |
| Idle | |
| Load |
|
Key:
min: | |
| Beelink GTR5 R9 5900HX, Vega 8, Kingston NV1 SNVS/500GCN, , x, | Beelink GTI 11 i5-1135G7, Iris Xe G7 80EUs, Kingston SA2000M8500G, , x, | GMK NucBox 2 i5-8259U, Iris Plus Graphics 655, Netac S930E8/256GPN, , x, | Intel NUC11PHKi7C i7-1165G7, GeForce RTX 2060 Mobile, Samsung SSD 980 Pro 500GB MZ-V8P500BW, , x, | Intel NUC11PAQi7 i7-1165G7, Iris Xe G7 96EUs, Samsung SSD 980 Pro 500GB MZ-V8P500BW, , x, | Beelink GK Mini Celeron J4125, UHD Graphics 600, Silicon Motion SM2258XT 256GB, , x, | |
|---|---|---|---|---|---|---|
| Power Consumption | -48% | 23% | -85% | 29% | 66% | |
| Idle Minimum * (Watt) | 6.2 | 15.2 -145% | 6.1 2% | 5.8 6% | 5.6 10% | 3.2 48% |
| Idle Average * (Watt) | 8.9 | 16 -80% | 6.8 24% | 5.9 34% | 5.6 37% | 3.3 63% |
| Idle Maximum * (Watt) | 9 | 16 -78% | 7.3 19% | 20.7 -130% | 6 33% | 3.7 59% |
| Load Average * (Watt) | 66.8 | 48.6 27% | 46.3 31% | 130.8 -96% | 31.4 53% | 13.6 80% |
| Witcher 3 ultra * (Watt) | 62.6 | 53.8 14% | 154.4 -147% | 39 38% | ||
| Load Maximum * (Watt) | 81.6 | 104.3 -28% | 50.7 38% | 225.2 -176% | 80.5 1% | 17.8 78% |
* ... smaller is better
Power Consumption Witcher 3 / Stresstest
Power Consumption external Monitor
Pros
Cons
Verdict — All About That Processor
Any PC with the Ryzen 9 5900HX is going to be insanely fast for the price and the Beelink GTR5 is no exception. The AMD processor rivals any mobile 11th gen Intel solution in raw CPU performance including the more expensive Core i9-11900H. If you want to maximize processor performance while keeping the system as small as possible, then the GTR5 is going to be your best bet.
For maximum CPU performance at minimal cost and size, look no further than the Beelink GTR5.
There are two main disadvantages to keep in mind. Firstly, graphics are limited by the integrated Radeon Vega 8 GPU whereas most laptops with the same CPU would typically come with faster discrete graphics. Users will almost surely be GPU bound when running more intensive applications such as graphics editing or gaming. It's a shame that Thunderbolt is not supported which would have addressed this limitation via eGPUs. Secondly, fan noise is louder than most other mini PCs as a direct result of stuffing such a fast processor in such a small chassis size. Thus, the GTR5 may not be the best choice for HTPC or conference room setups where ambient noise should be kept to a minimum. Perhaps a move to vapor chamber cooling in the future could reduce overall fan noise. CPU performance hunters on tighter budgets will nonetheless be impressed by what the GTR5 has to offer.
Price and Availability
The Beelink GTR5 is not yet widely available. Its Indiegogo page can be found here.
Price comparison
