Ryzen 3 outperforming Core i3: Lenovo IdeaPad 3 15ALC6 laptop review
The IdeaPad 3 family is home to bottom-of-the-barrel laptop models that are beneath the already inexpensive IdeaPad 5 and IdeaPad 7 families. If you're on a very tight budget, then the low starting prices of an IdeaPad 3 may seem attractive.
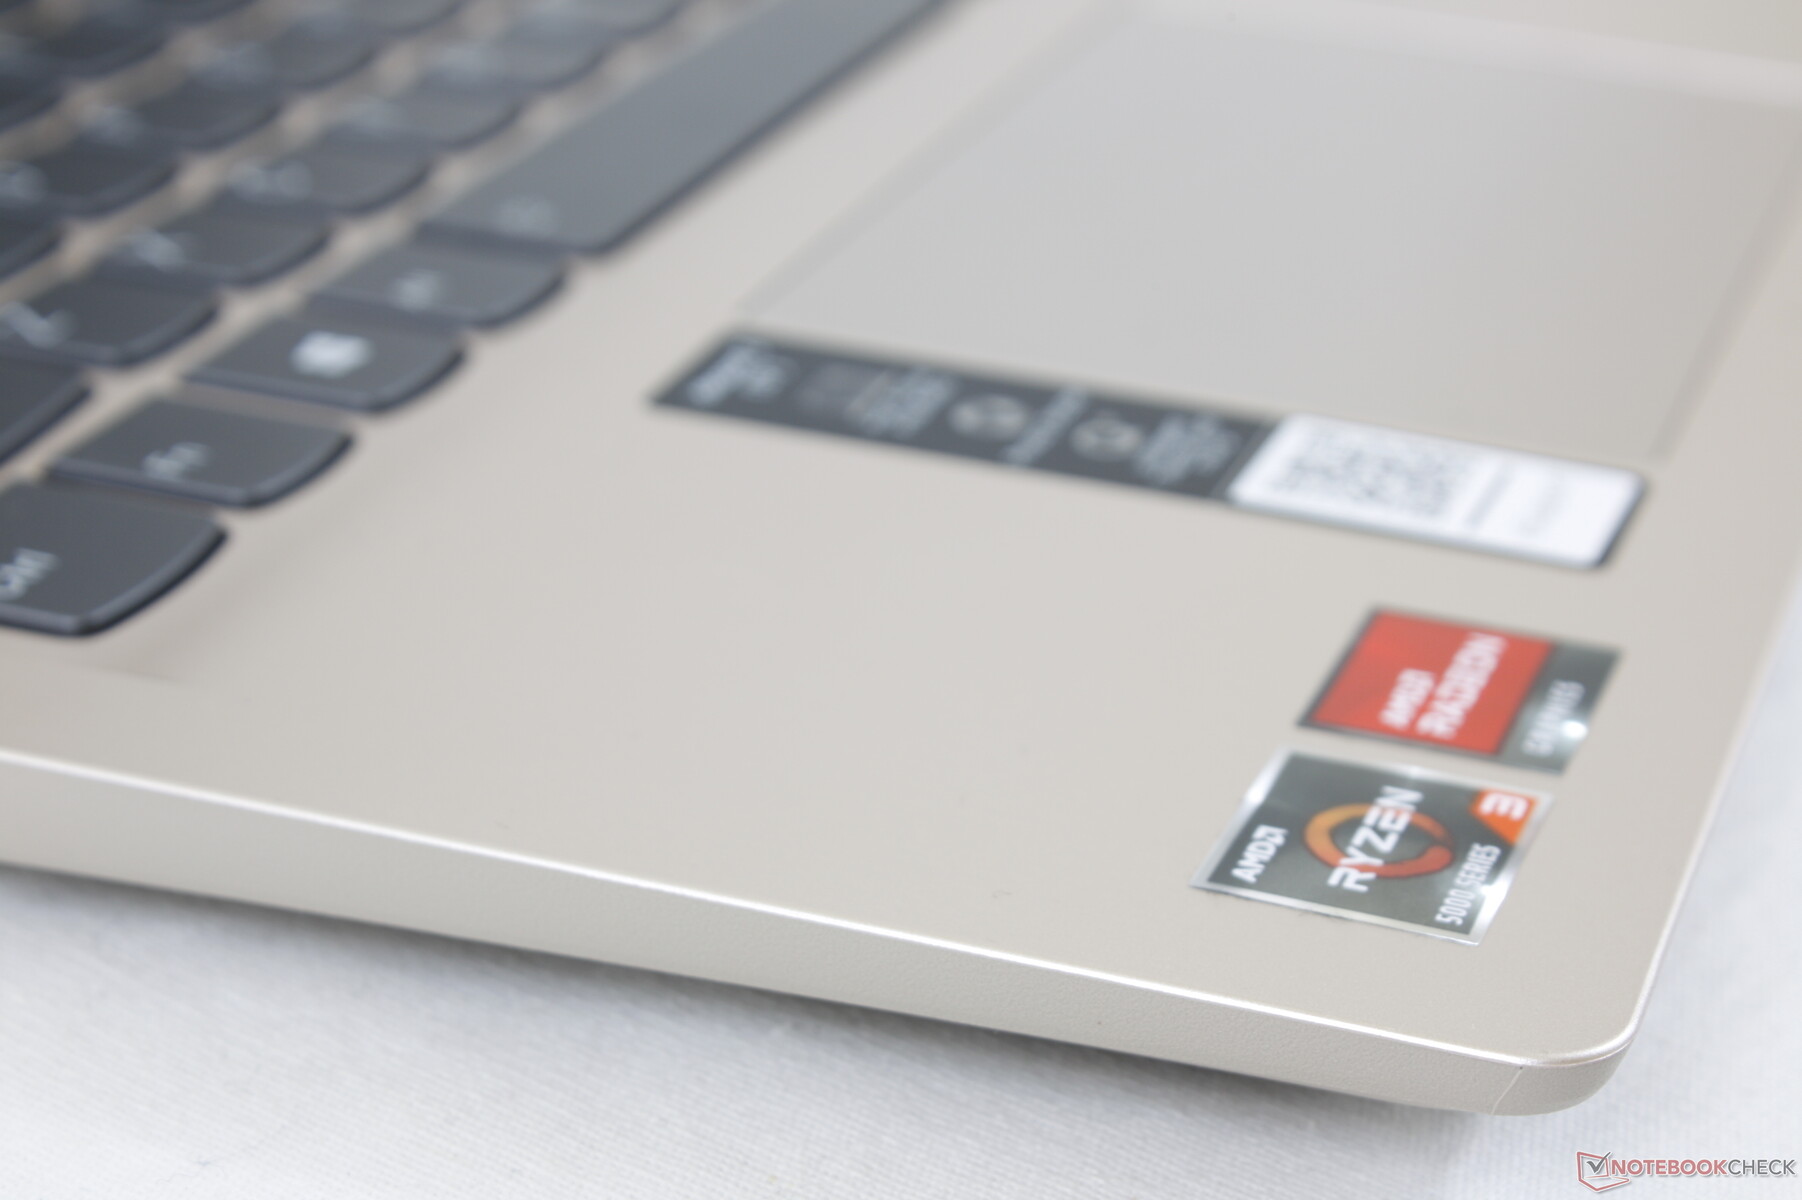
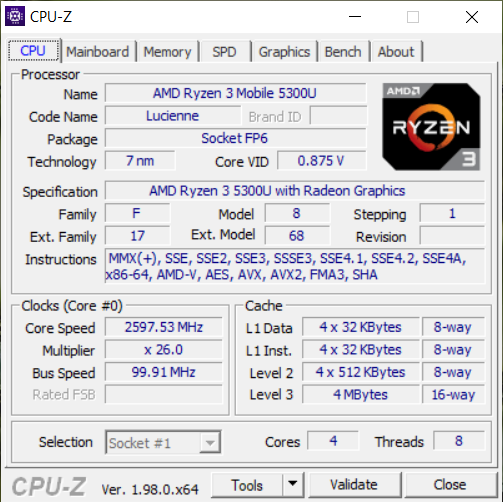
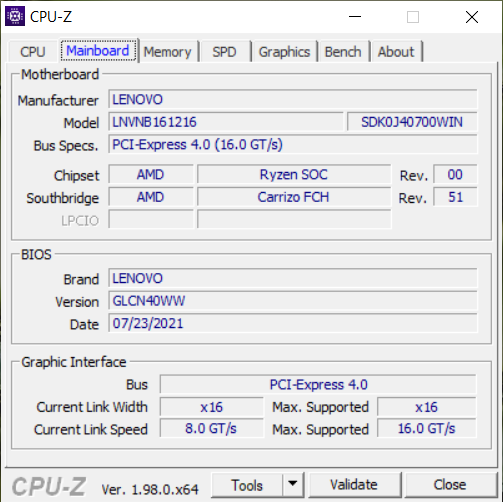
Our test unit comes with the quad-core Ryzen 3 5300U Zen 2 CPU, 8 GB RAM, 1080p IPS display, and 512 GB PCIe3 NVMe SSD for approximately $539 USD retail or even less when on sale. Higher-end SKUs may be available with the Ryzen 5 5500U or Ryzen 7 5700U and with more RAM or storage. Competitors to the IdeaPad 3 include other inexpensive consumer laptops like the HP Pavilion 15, Asus VivoBook F series, Dell Inspiron series, or the Acer Aspire 3 series.
More Lenovo reviews:
Potential Competitors in Comparison
Rating | Date | Model | Weight | Height | Size | Resolution | Price |
|---|---|---|---|---|---|---|---|
| 80.4 % v7 (old) | 12 / 2021 | Lenovo IdeaPad 3 15ALC6 R3 5300U, Vega 6 | 1.7 kg | 19.9 mm | 15.60" | 1920x1080 | |
| 83 % v7 (old) | 07 / 2020 | Lenovo IdeaPad 5 15IIL05 i5-1035G1, GeForce MX350 | 1.7 kg | 17.9 mm | 15.60" | 1920x1080 | |
| 81.4 % v7 (old) | 01 / 2020 | Lenovo Ideapad S540-15IML i5-10210U, GeForce MX250 | 1.9 kg | 17 mm | 15.60" | 1920x1080 | |
| 80.5 % v7 (old) | 10 / 2021 | Dell Inspiron 15 3501 i7-1165G7, Iris Xe G7 96EUs | 2 kg | 19.9 mm | 15.60" | 1920x1080 | |
| 81.2 % v7 (old) | 06 / 2021 | HP Pavilion 15-eg i7-1165G7, GeForce MX450 | 1.7 kg | 17.9 mm | 15.60" | 1920x1080 | |
| 80.5 % v7 (old) | 11 / 2021 | Asus VivoBook 15 KM513UA-L503TS R5 5500U, Vega 7 | 1.8 kg | 18.6 mm | 15.60" | 1920x1080 |
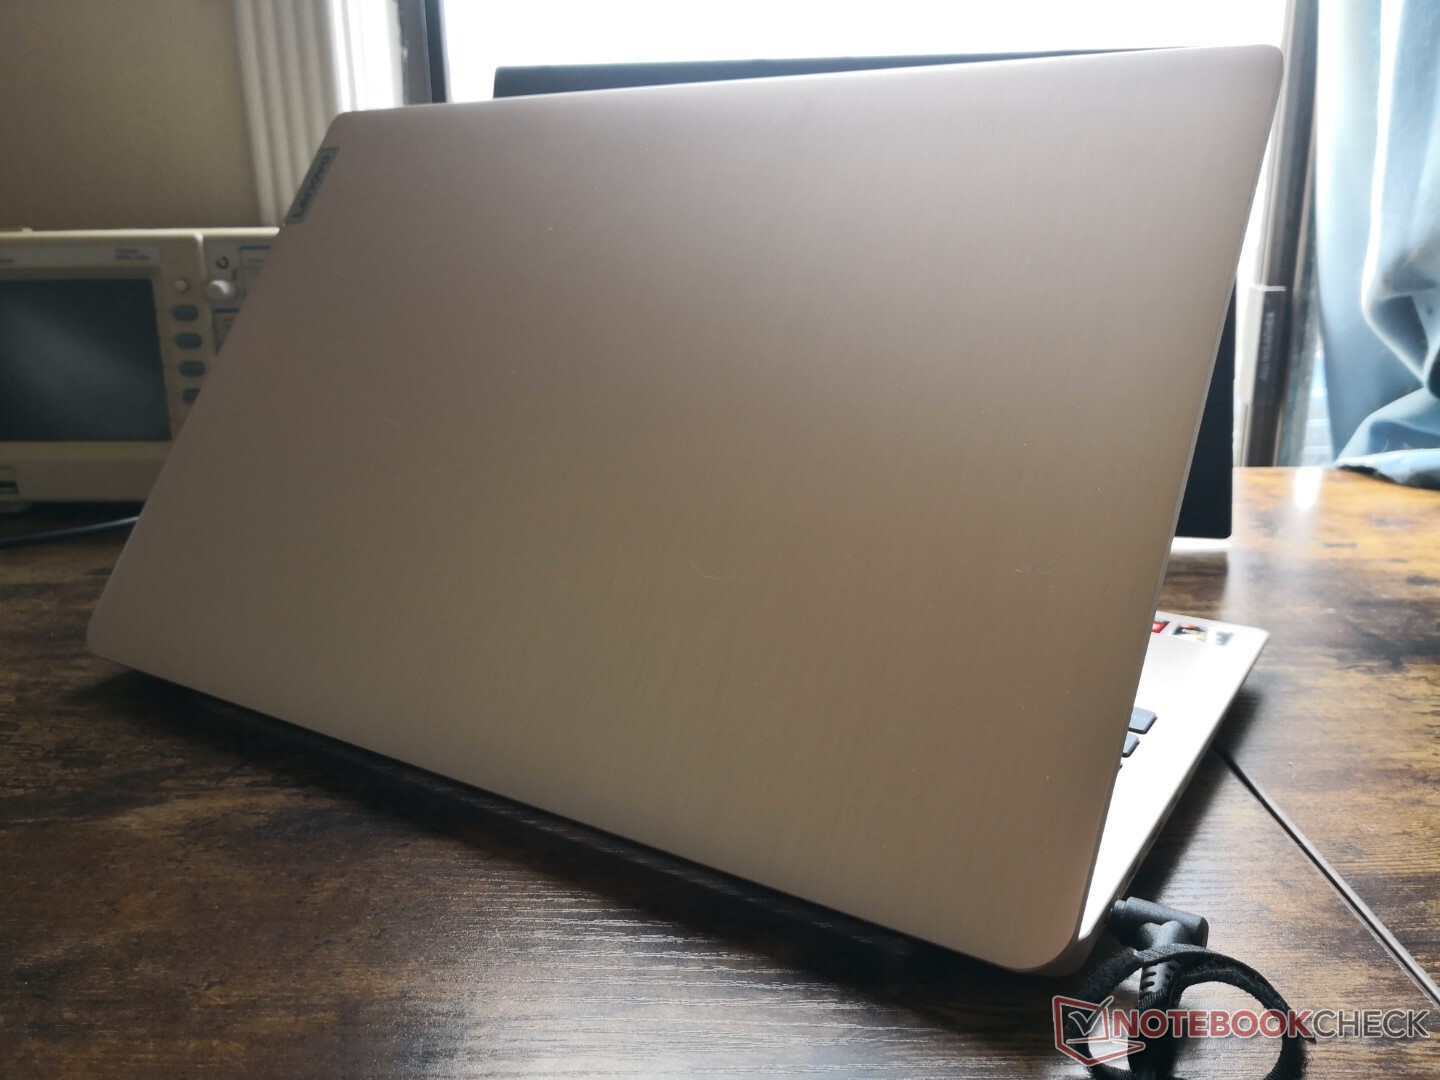
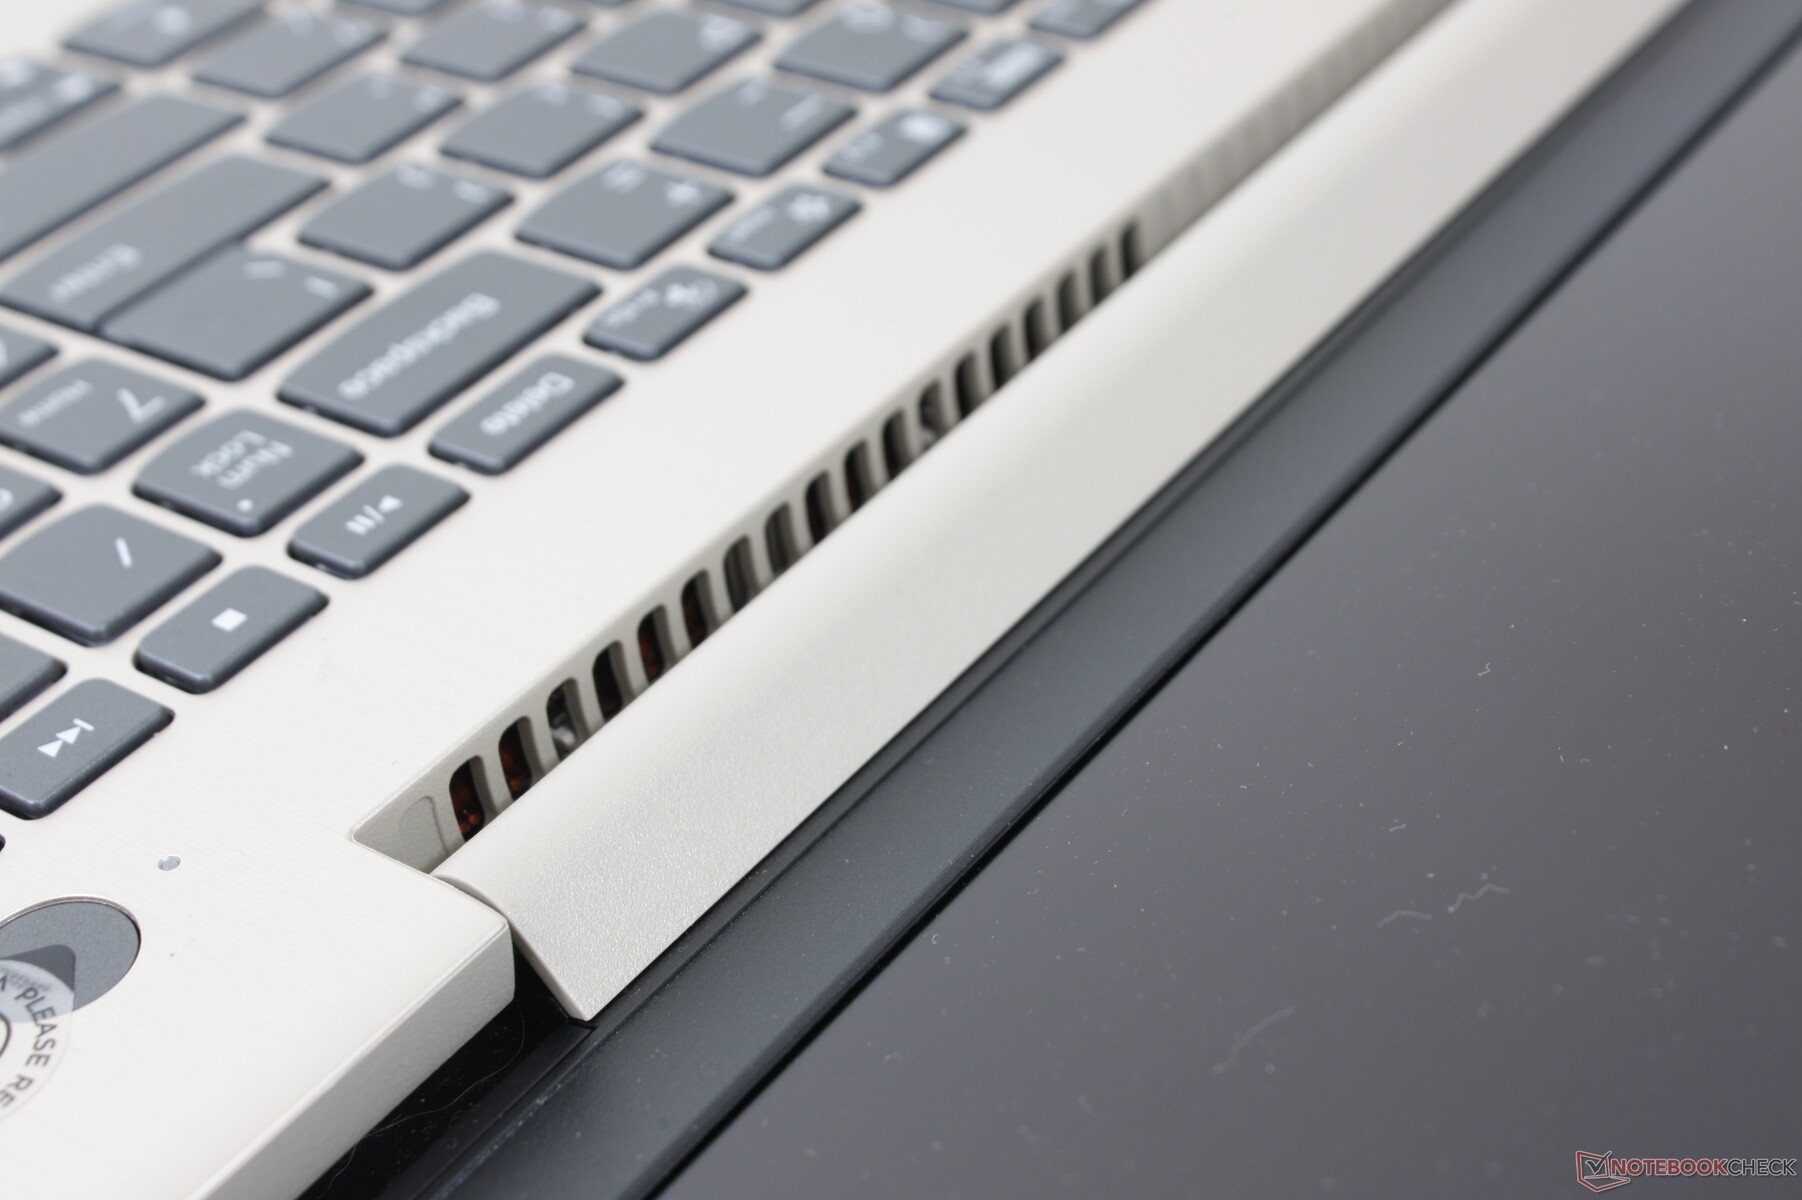
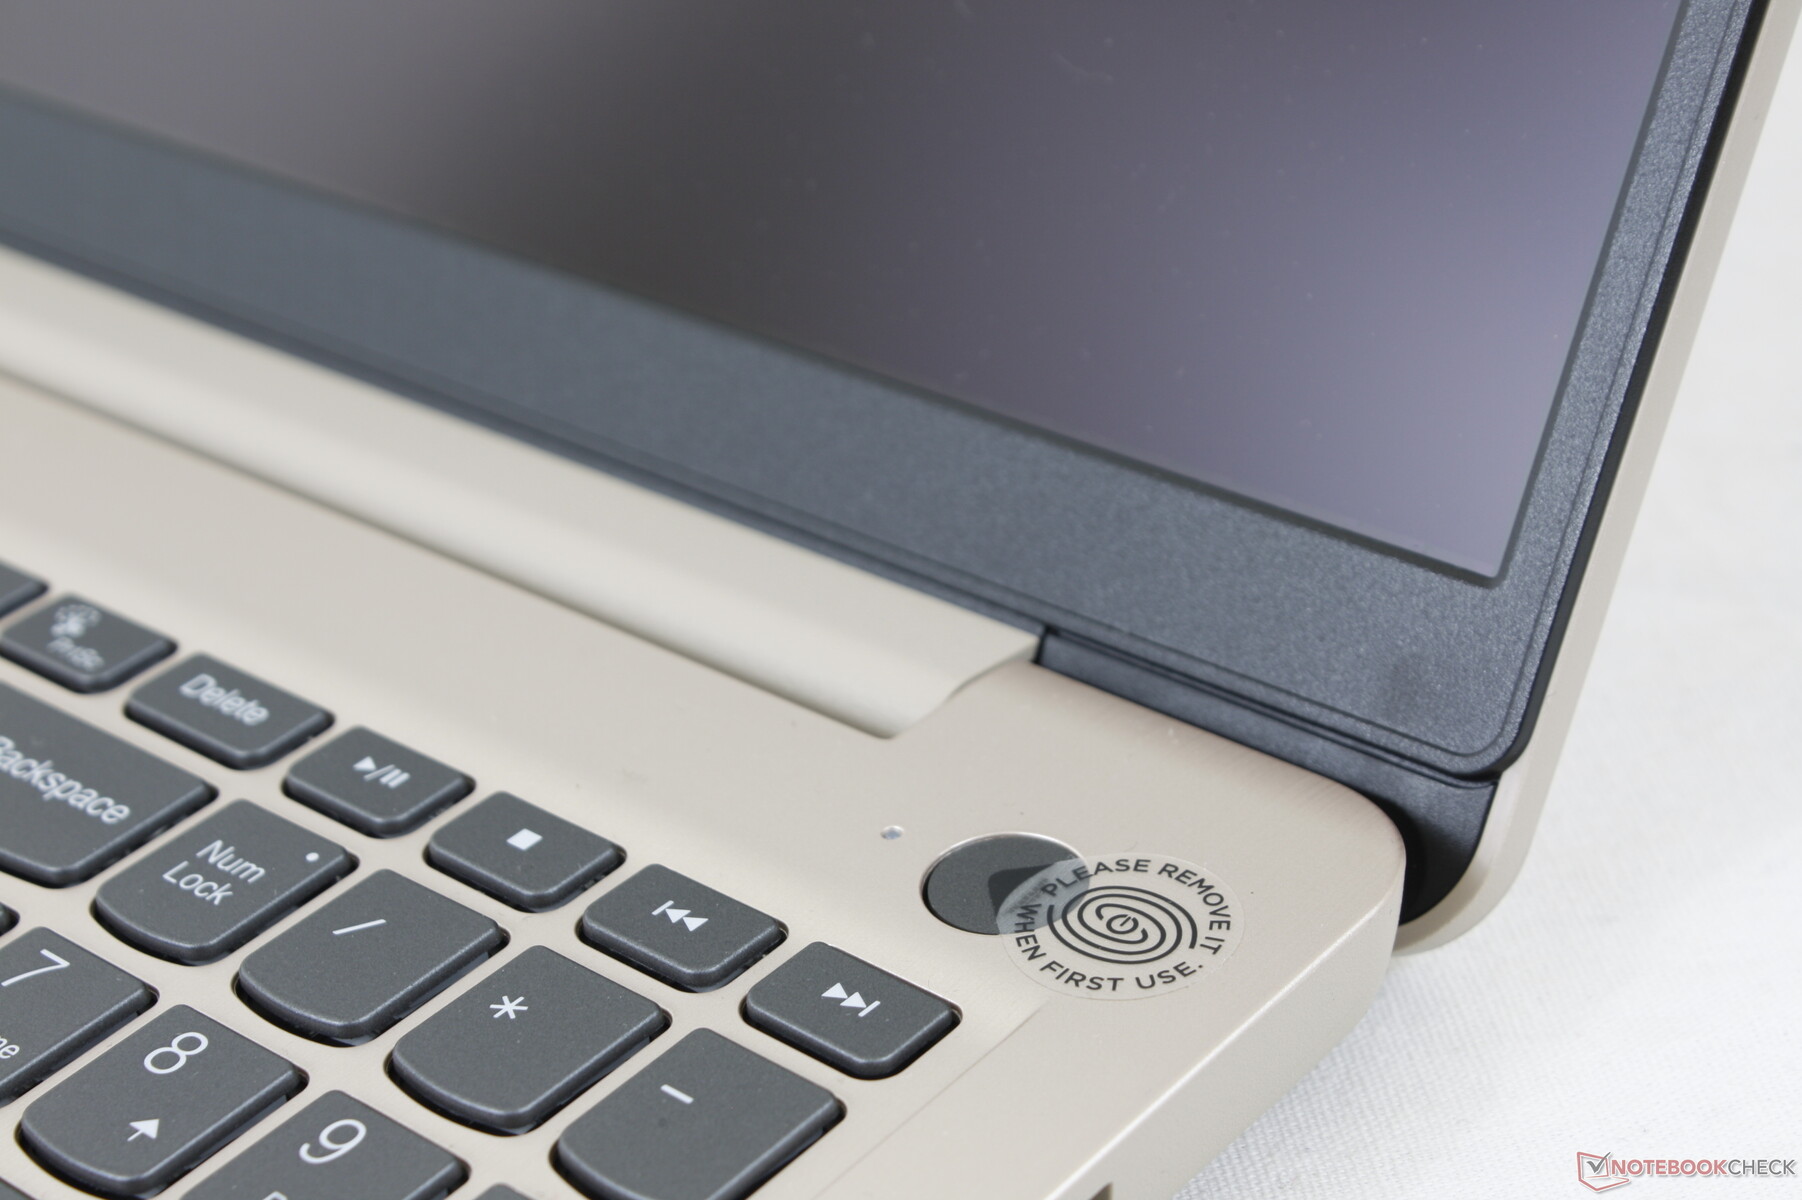
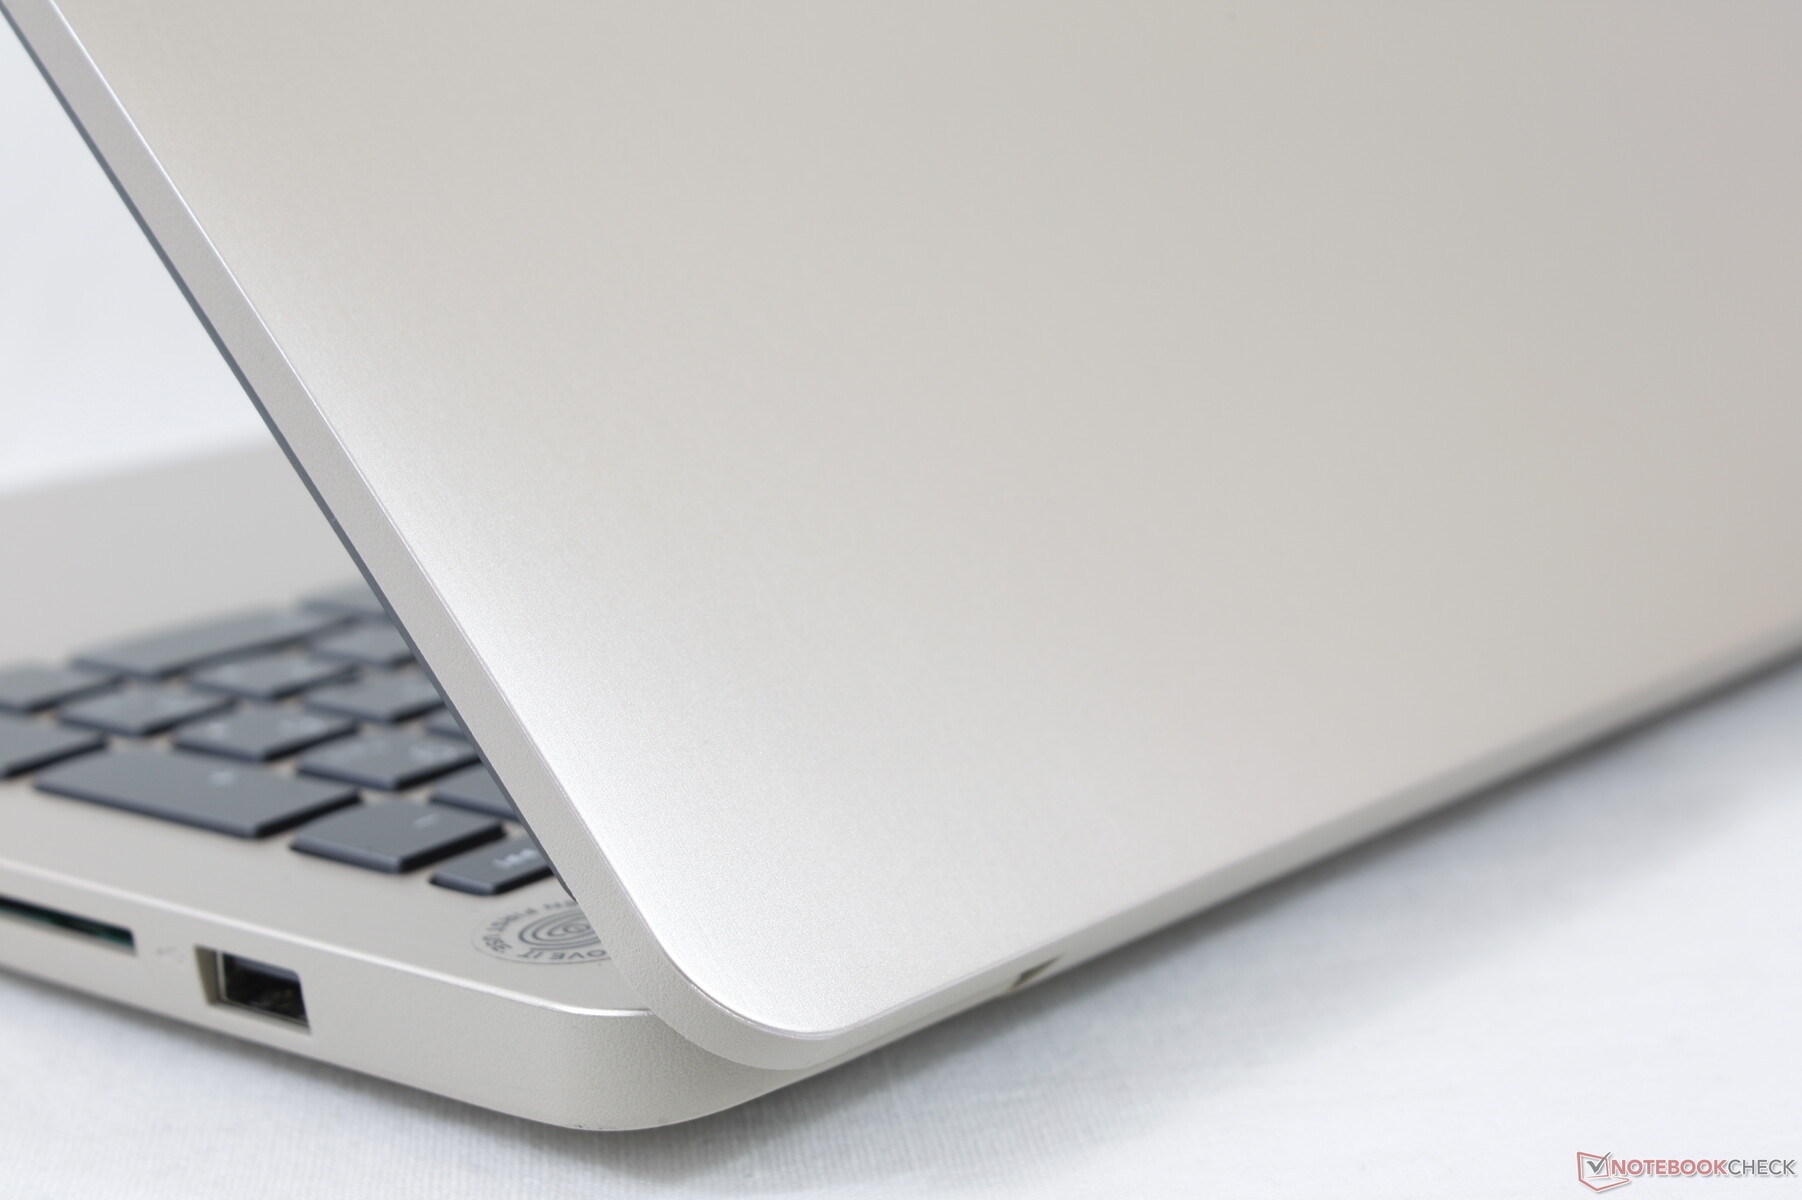
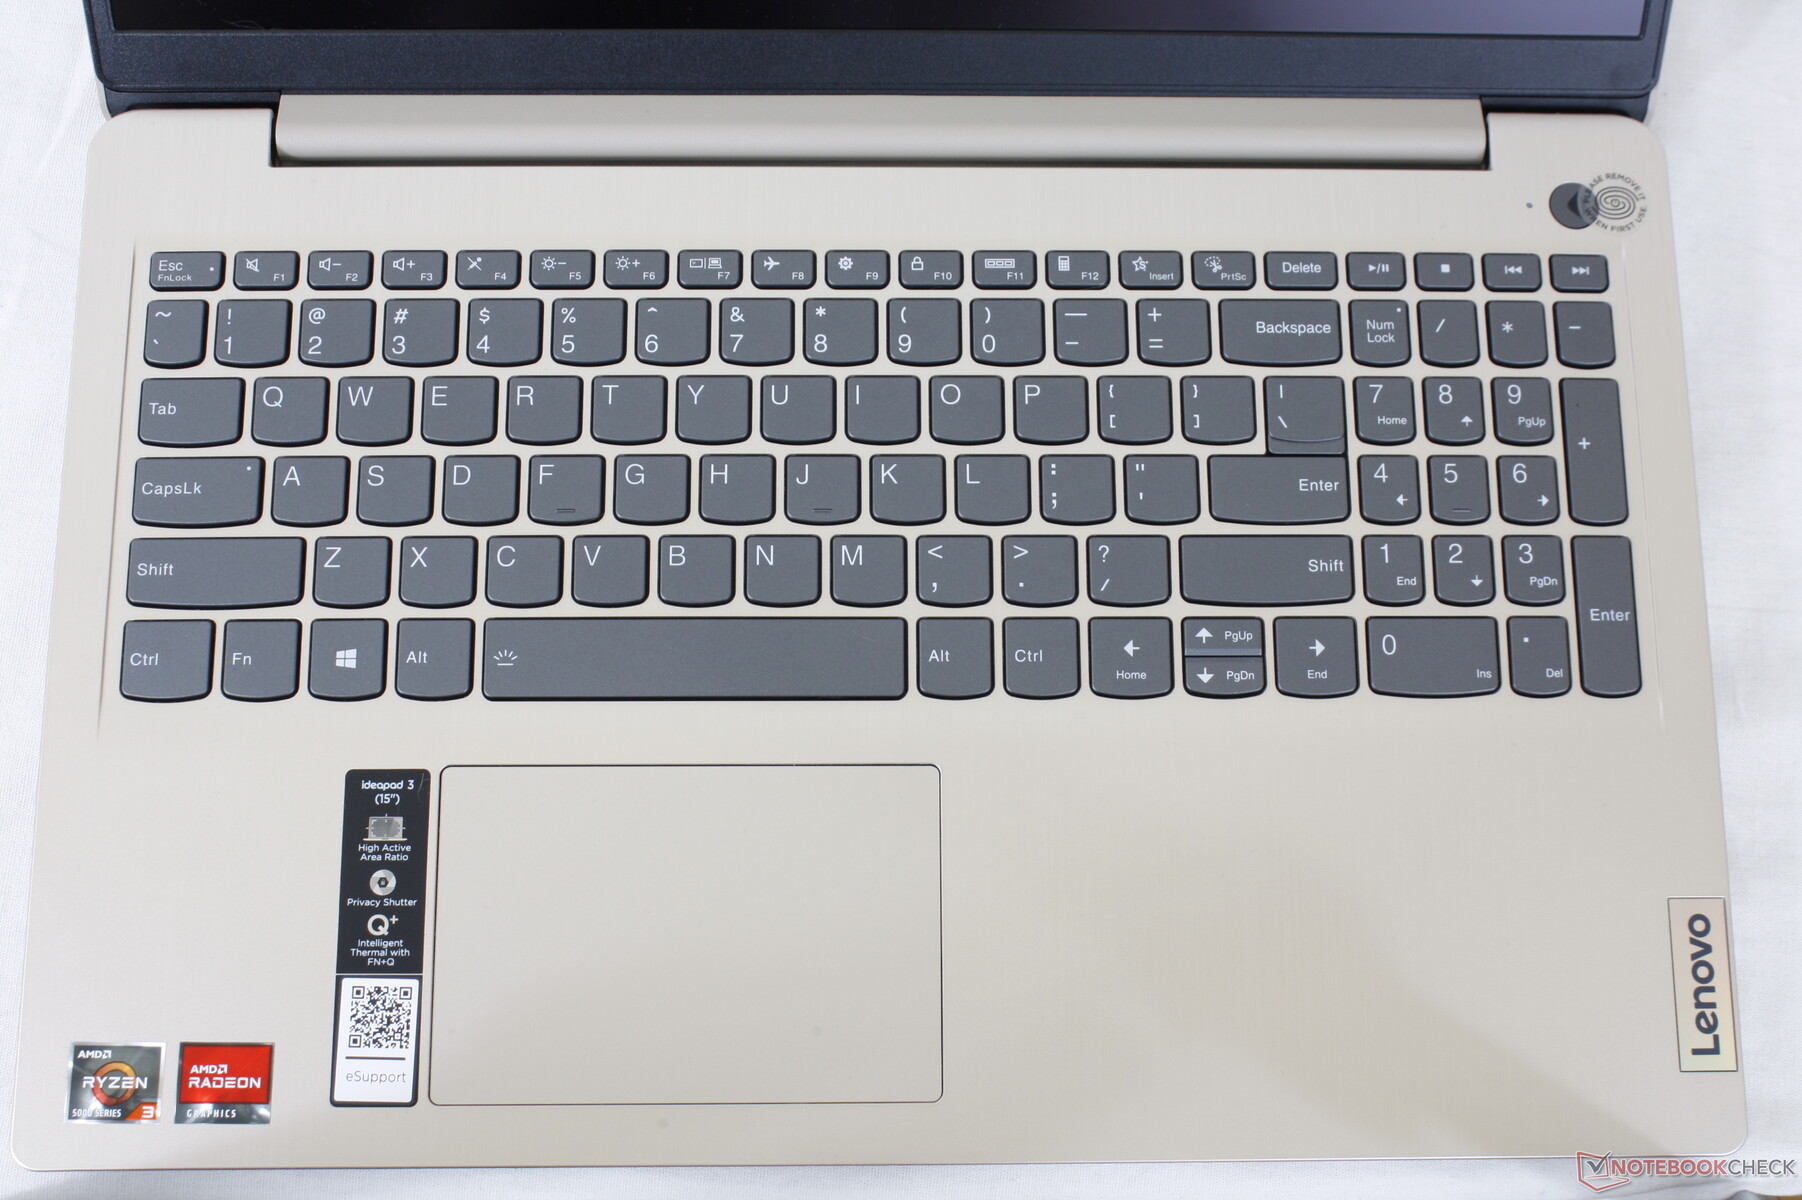
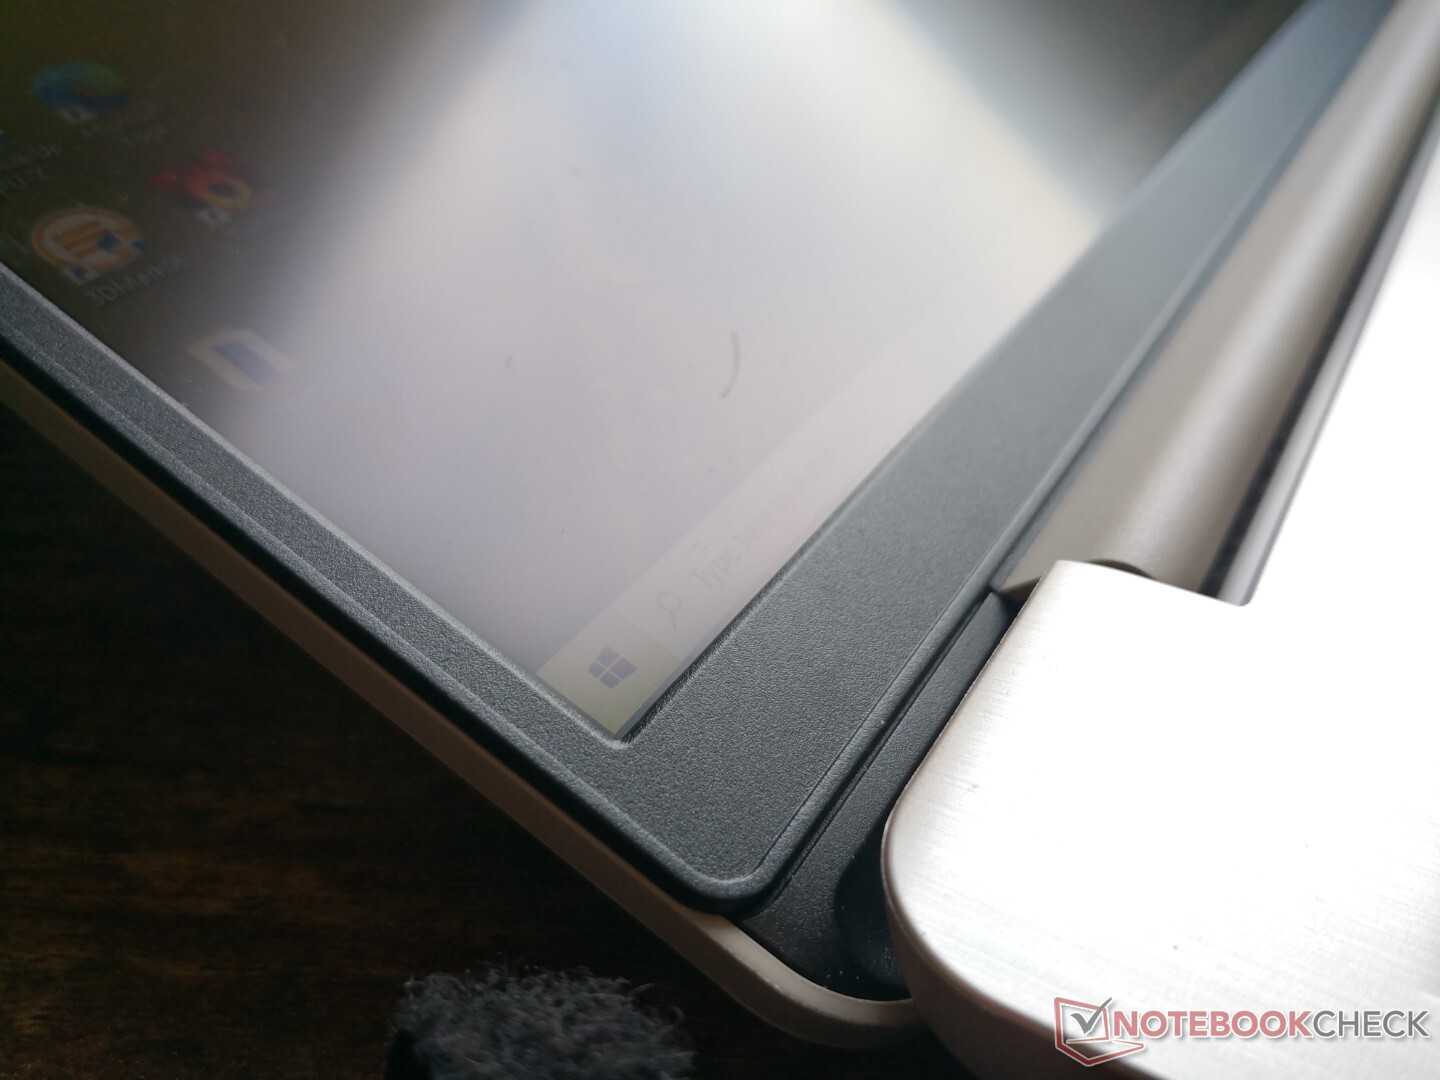
Case — Cheap Looks
The keyboard deck and outer lid utilize brushed aluminum for improved aesthetics. However, the chassis exhibits both flexing and slight but audible creaking as well. Overall rigidity is slightly worse than the competing HP Pavilion 15 or Asus VivoBook 15 models.
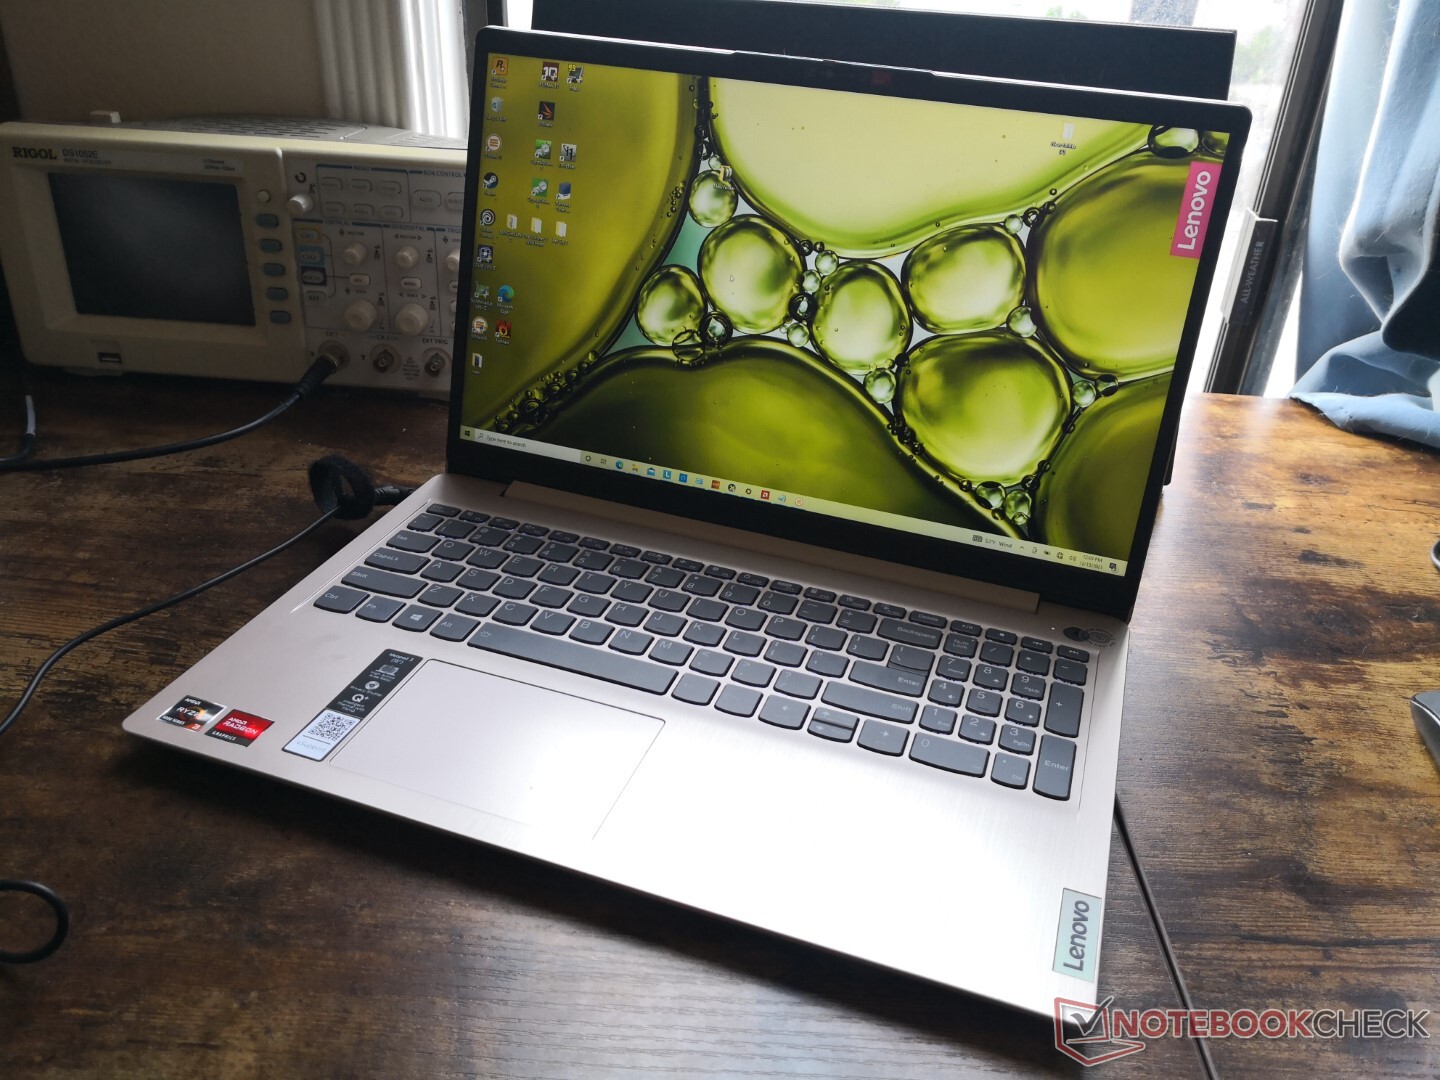
Chassis size and dimensions are nearly identical to both the Pavilion 15 and VivoBook 15 meaning users won't be getting any weight or travel benefits by choosing the Lenovo. The Inspiron 3501 is notably larger and heavier than all three.
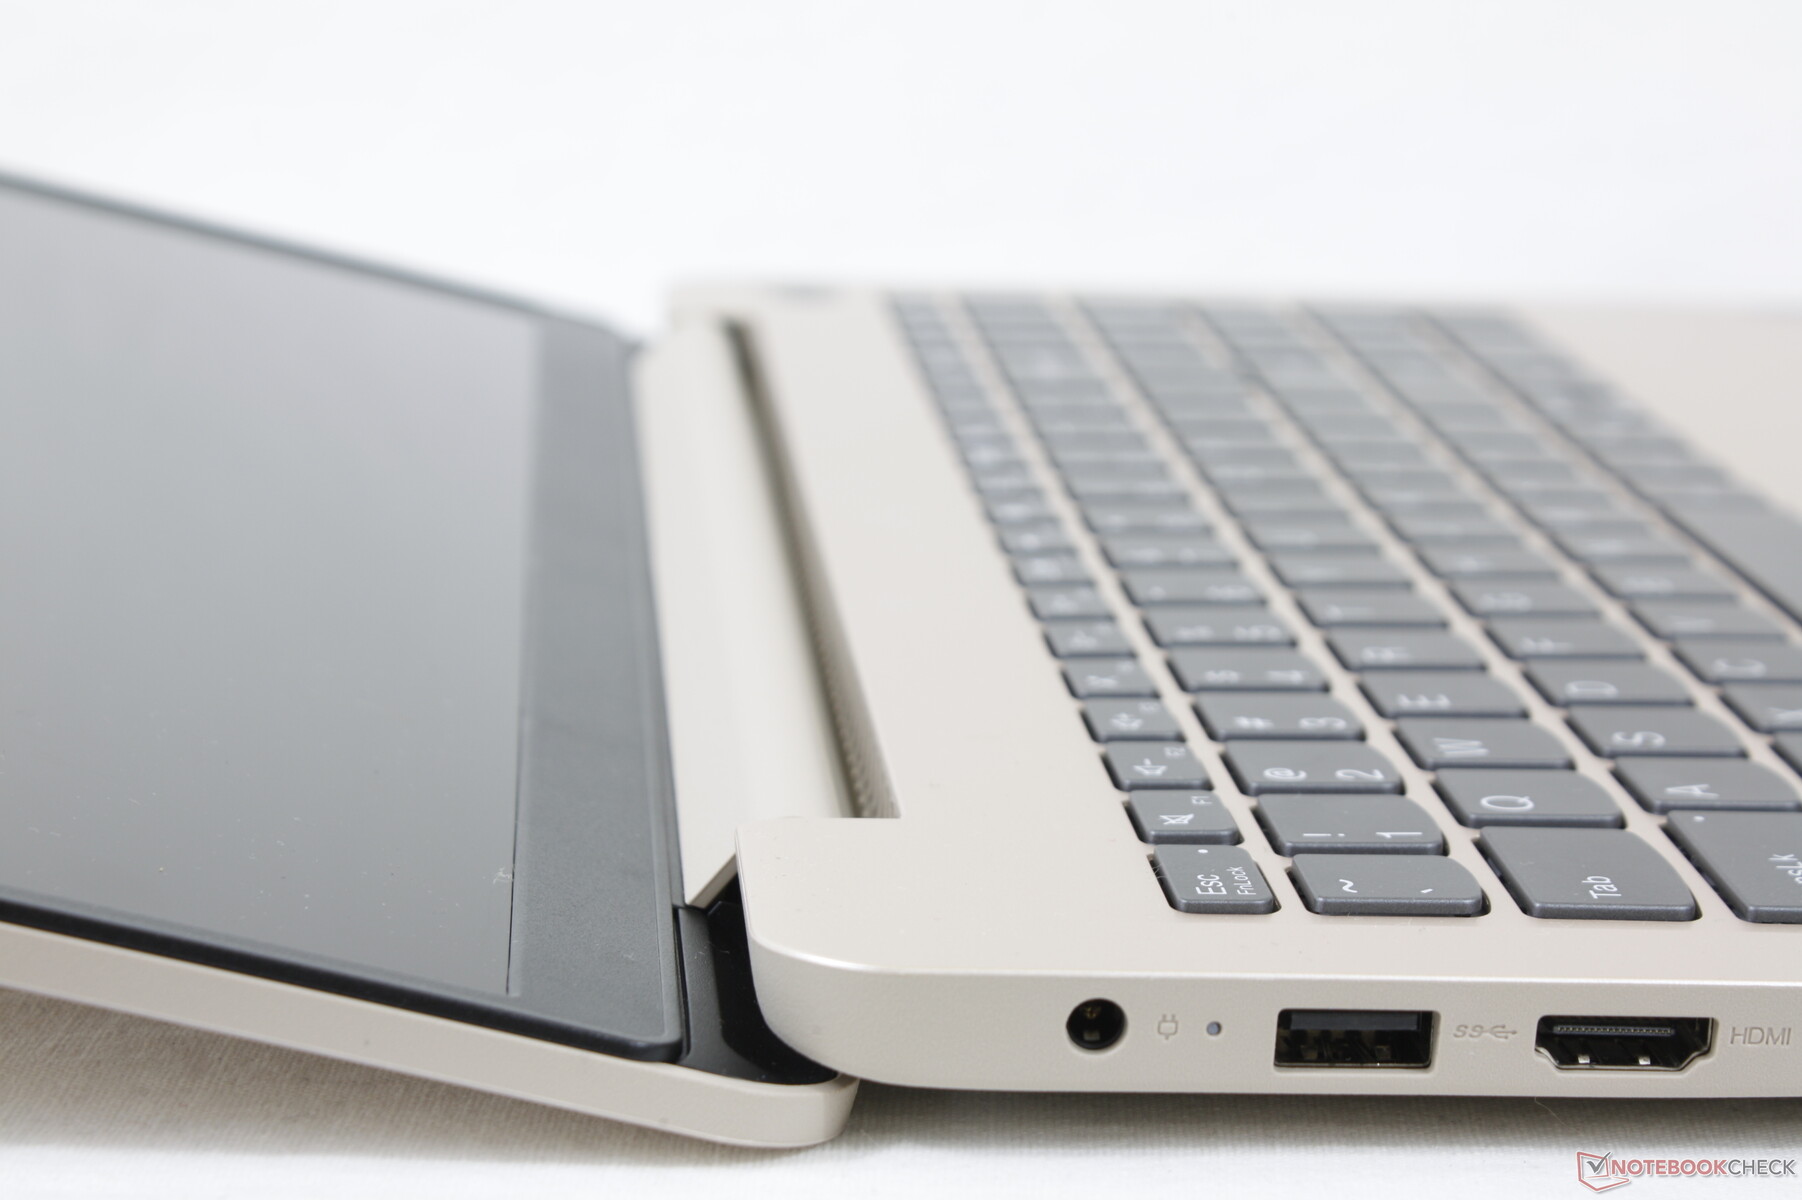
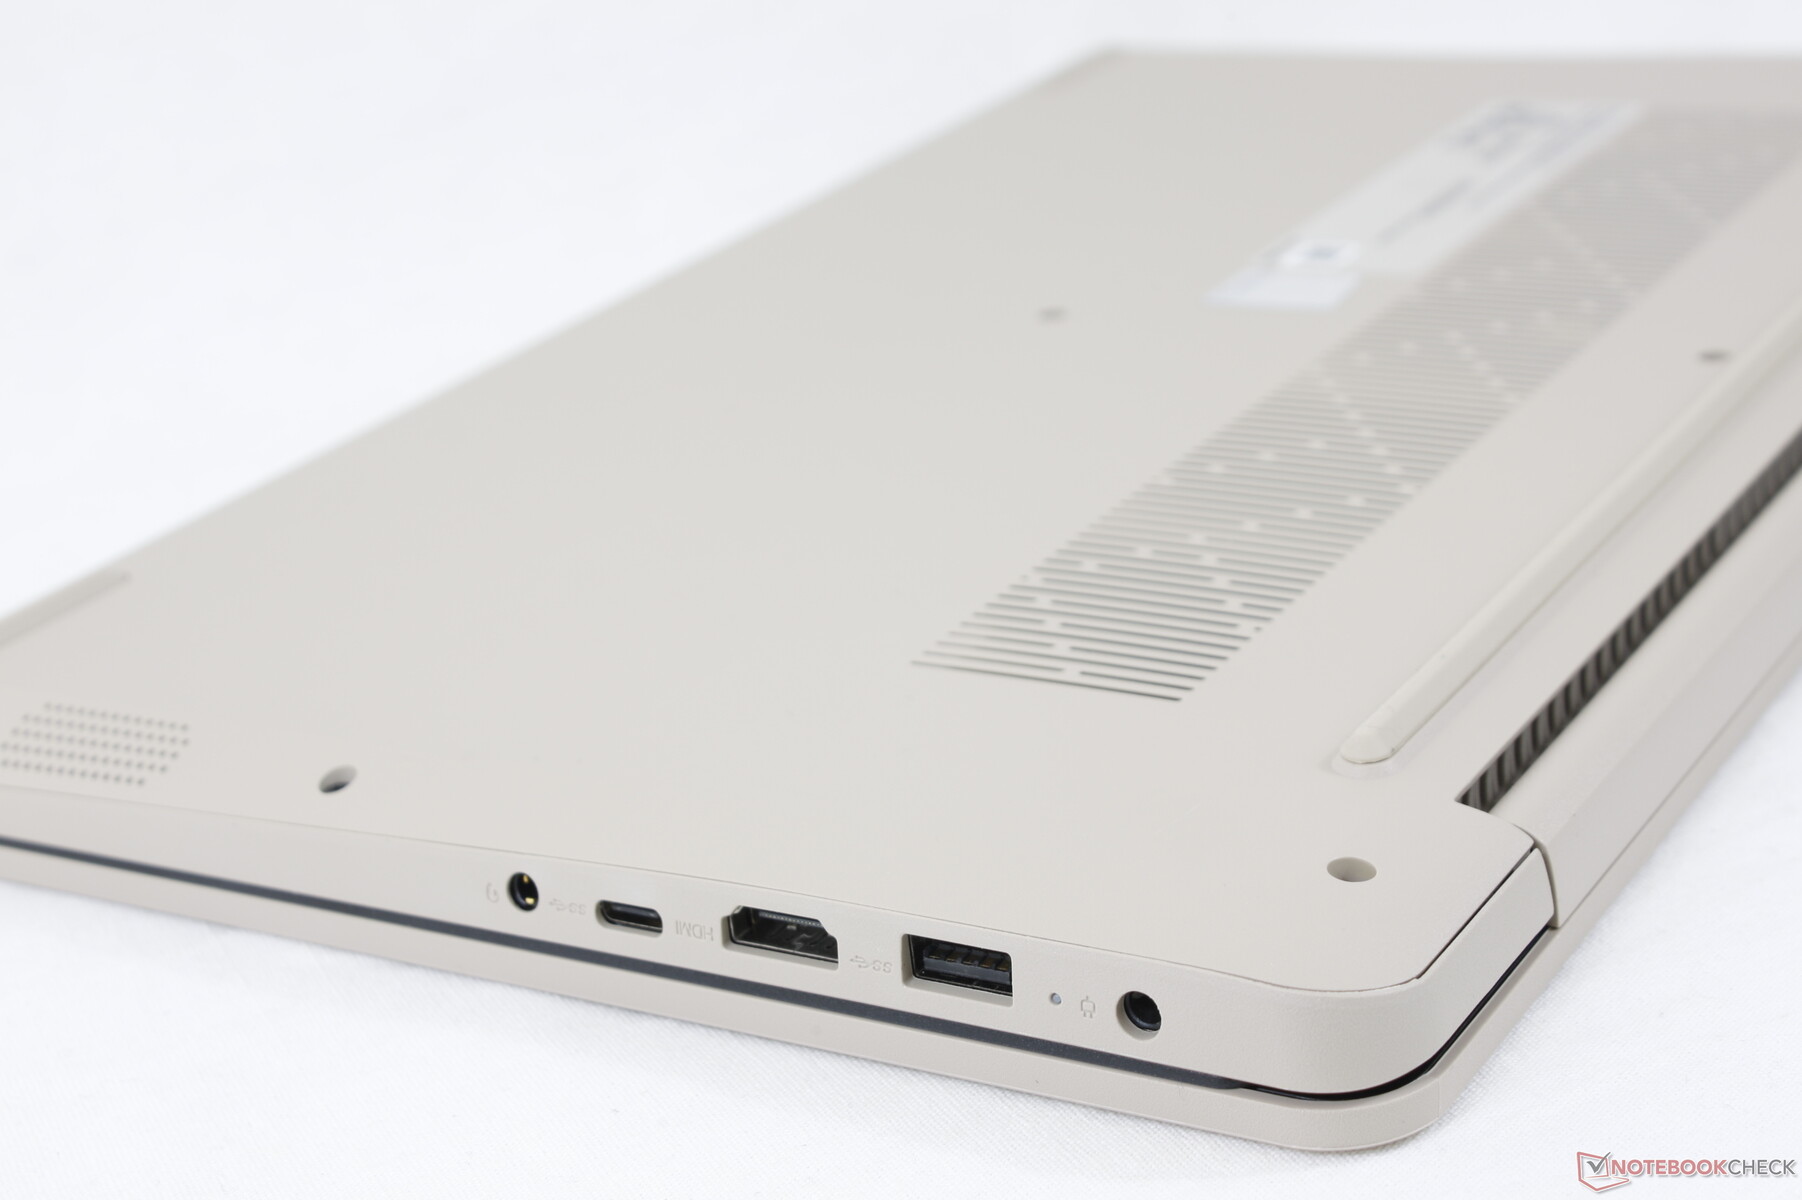
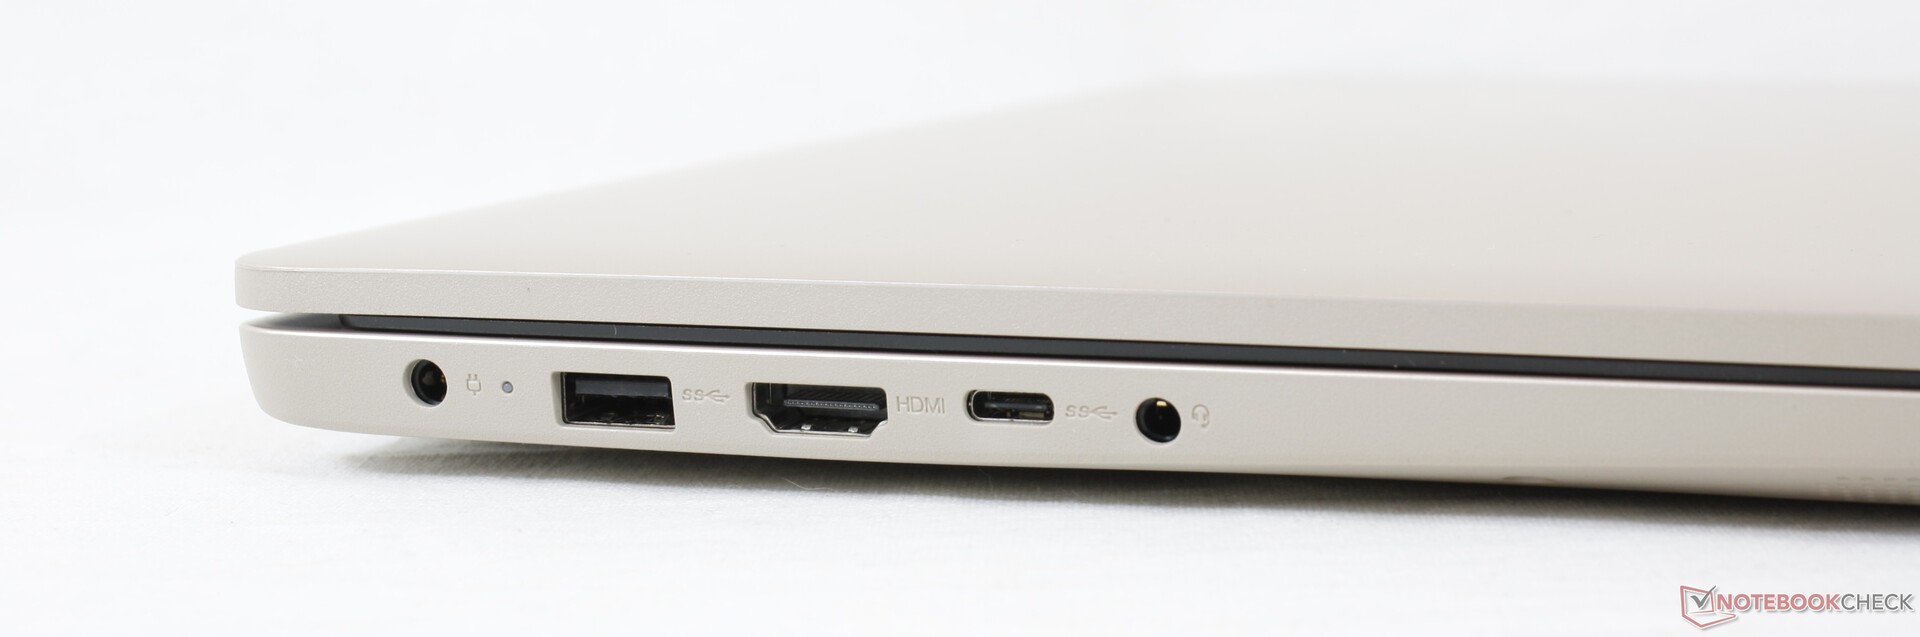
Connectivity — Neutered USB-C Port
Port options and positioning are both different than what you'll find on other IdeaPad laptops like the IdeaPad S340, IdeaPad 3 14, IdeaPad S540, or the IdeaPad 5 15. Perhaps the most important thing to keep in mind is that the single USB-C port does not support Power Delivery or DisplayPort unlike the USB-C ports on most Intel laptops. Video output must be done via HDMI instead.
It's worth mentioning that we experienced power issues when attempting to connect our PNY Pro Elite external SSD to the USB-C port. We are unsure if this is specific to our unit or a more widespread problem.
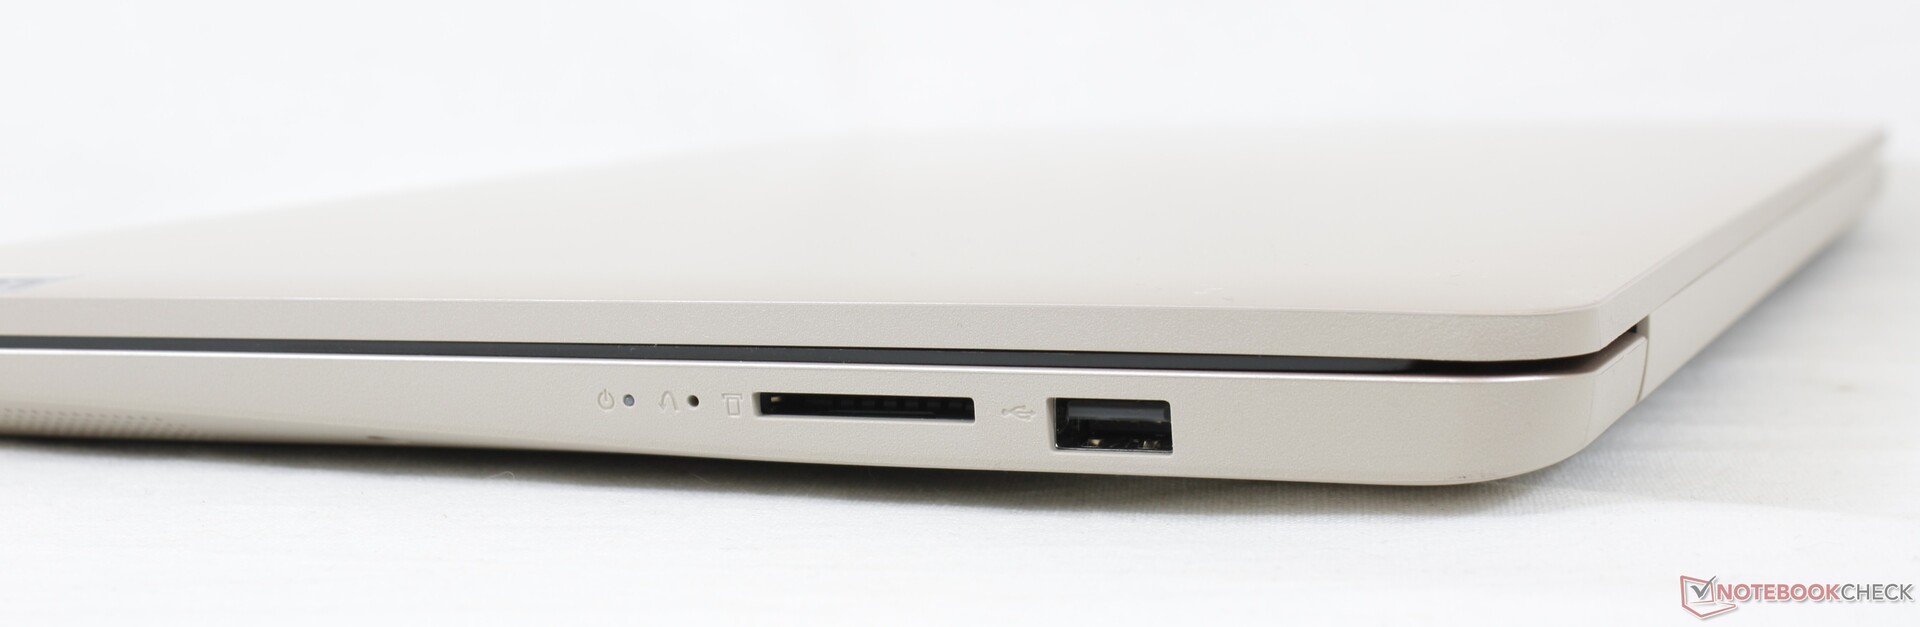
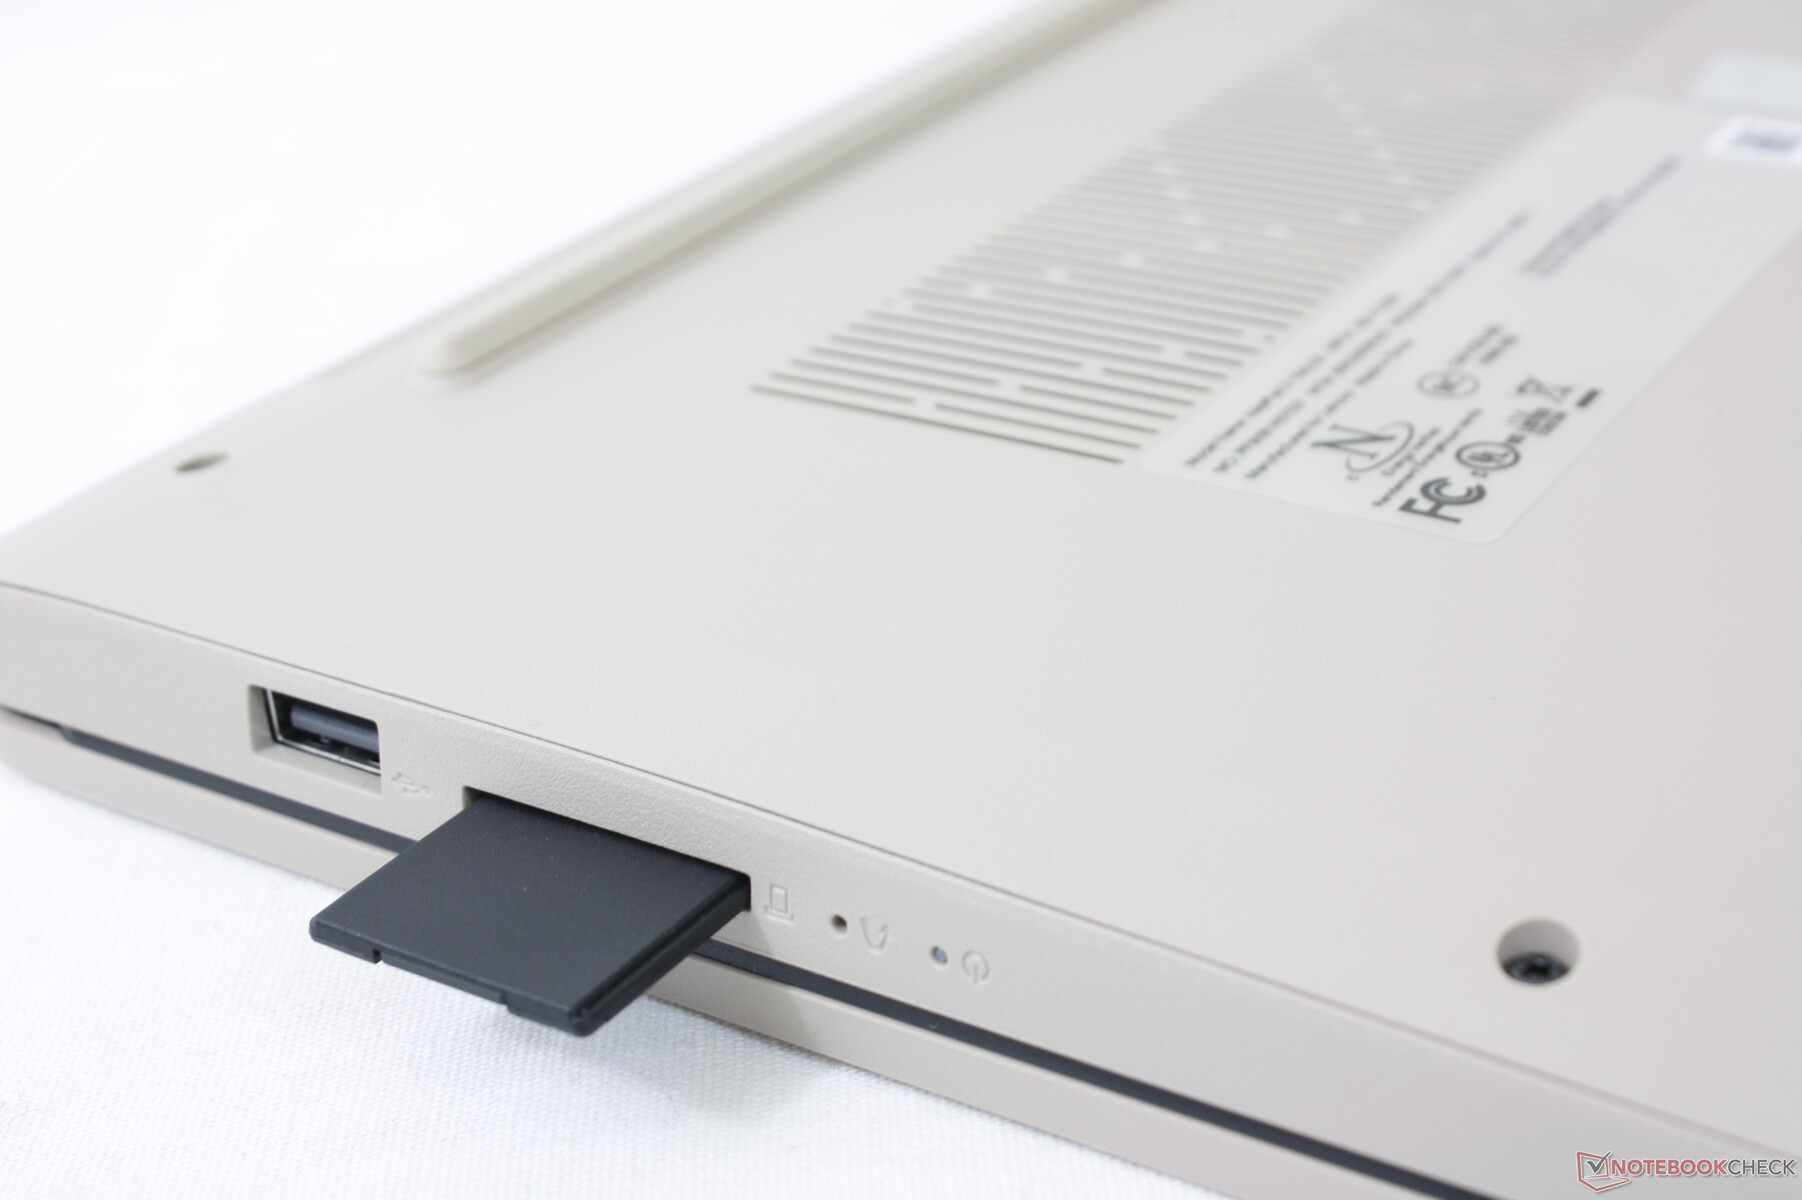
SD Card Reader
The integrated SD card reader is slow. Transferring 1 GB of images from our UHS-II test card to desktop takes about 36 seconds compared to about half that on the Pavilion 15. The card reader is not spring-loaded either and so fully inserted cards will still protrude for potentially unsafe handling.
| SD Card Reader | |
| average JPG Copy Test (av. of 3 runs) | |
| Lenovo Ideapad S540-15IML (Toshiba Exceria Pro SDXC 64 GB UHS-II) | |
| HP Pavilion 15-eg (AV PRO microSD 128 GB V60) | |
| Asus VivoBook 15 KM513UA-L503TS (AV PRO microSD 128 GB V60) | |
| Lenovo IdeaPad 3 15ALC6 (AV PRO microSD 128 GB V60) | |
| Lenovo IdeaPad 5 15IIL05 (Toshiba Exceria Pro SDXC 64 GB UHS-II) | |
| Dell Inspiron 15 3501 (AV Pro SD 128 GB V60) | |
| maximum AS SSD Seq Read Test (1GB) | |
| Lenovo Ideapad S540-15IML (Toshiba Exceria Pro SDXC 64 GB UHS-II) | |
| HP Pavilion 15-eg (AV PRO microSD 128 GB V60) | |
| Lenovo IdeaPad 3 15ALC6 (AV PRO microSD 128 GB V60) | |
| Asus VivoBook 15 KM513UA-L503TS (AV PRO microSD 128 GB V60) | |
| Lenovo IdeaPad 5 15IIL05 (Toshiba Exceria Pro SDXC 64 GB UHS-II) | |
| Dell Inspiron 15 3501 (AV Pro SD microSD 128 GB V60) | |
Communication
Our configuration utilizes Wi-Fi 5 instead of Wi-Fi 6 likely to save on costs. Transfer rates are steady when paired to our Netgear RAX200 test router.
Webcam
Webcam quality is poor at only 1 MP. Furthermore, there is no IR sensor for Windows Hello support. A manual privacy shutter comes standard.


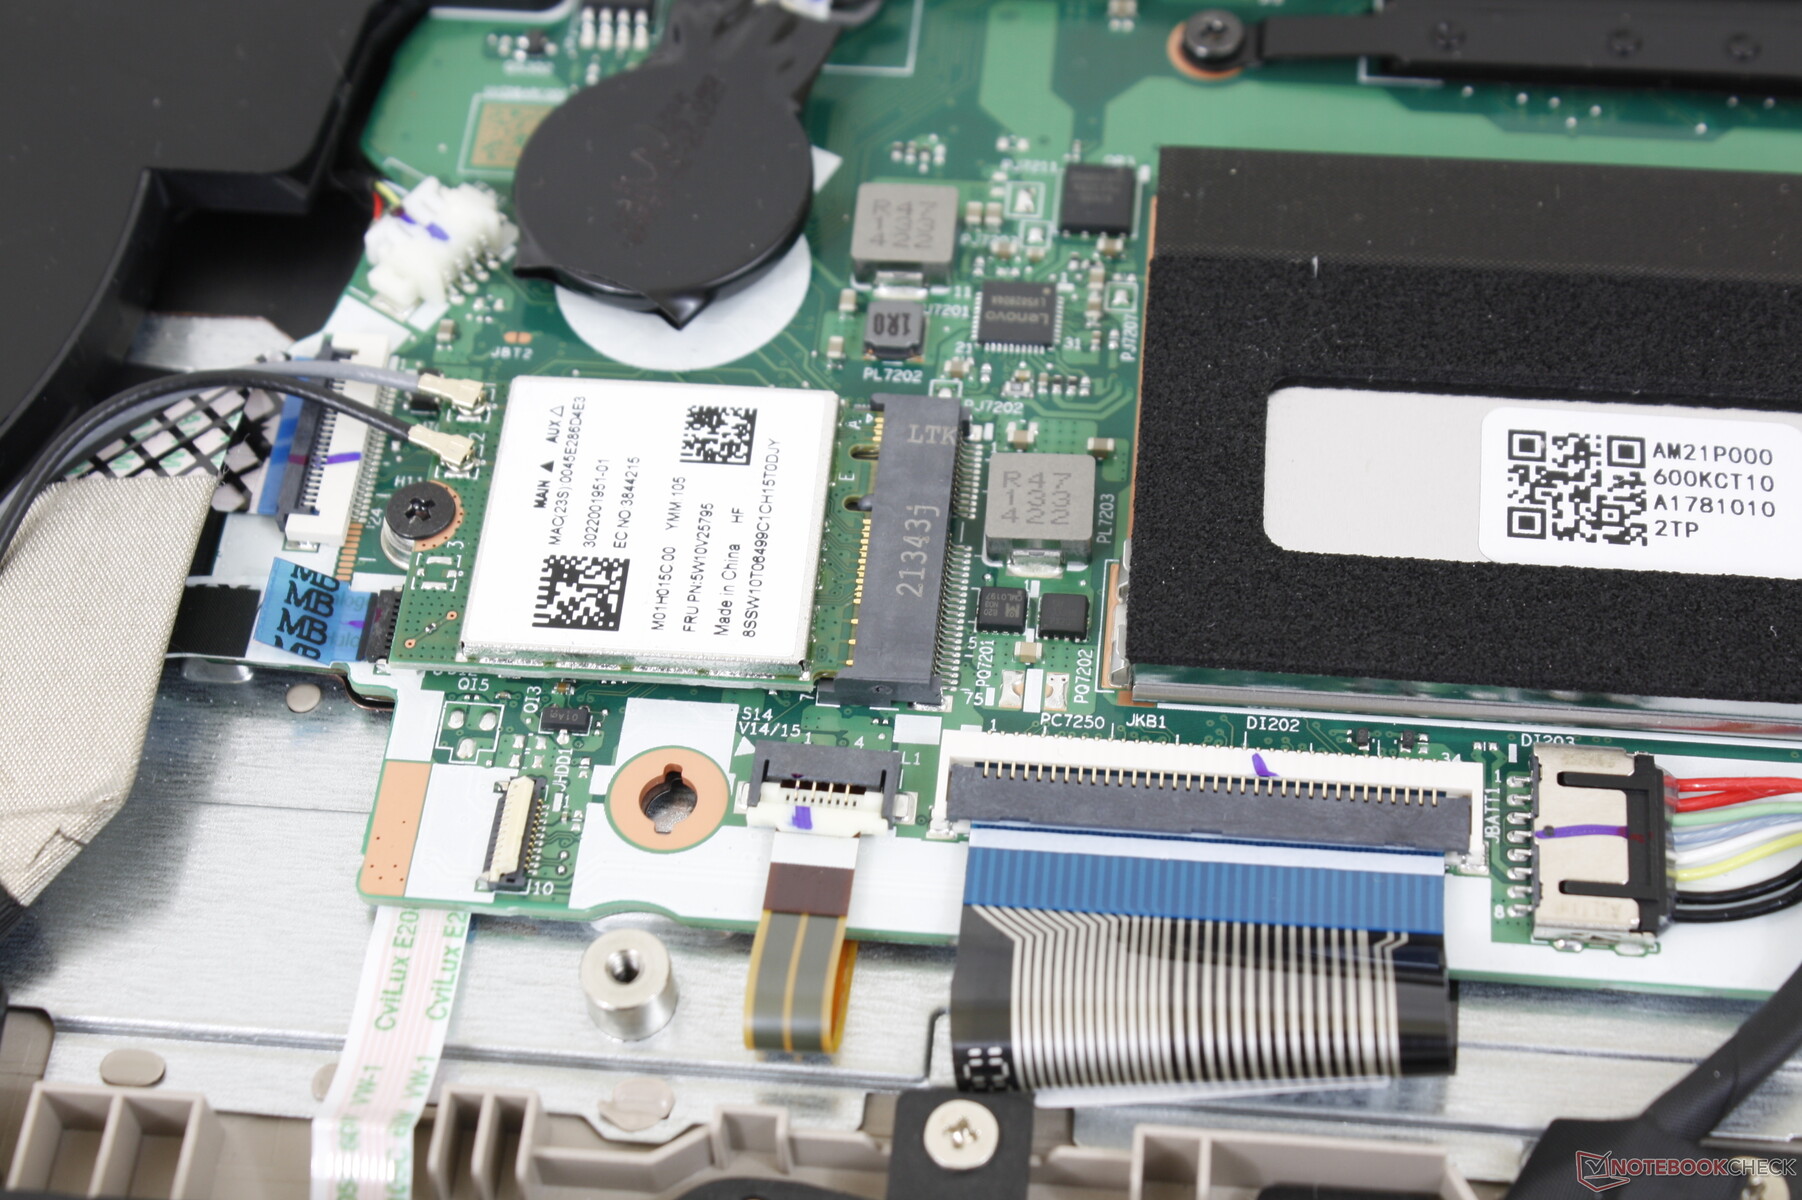
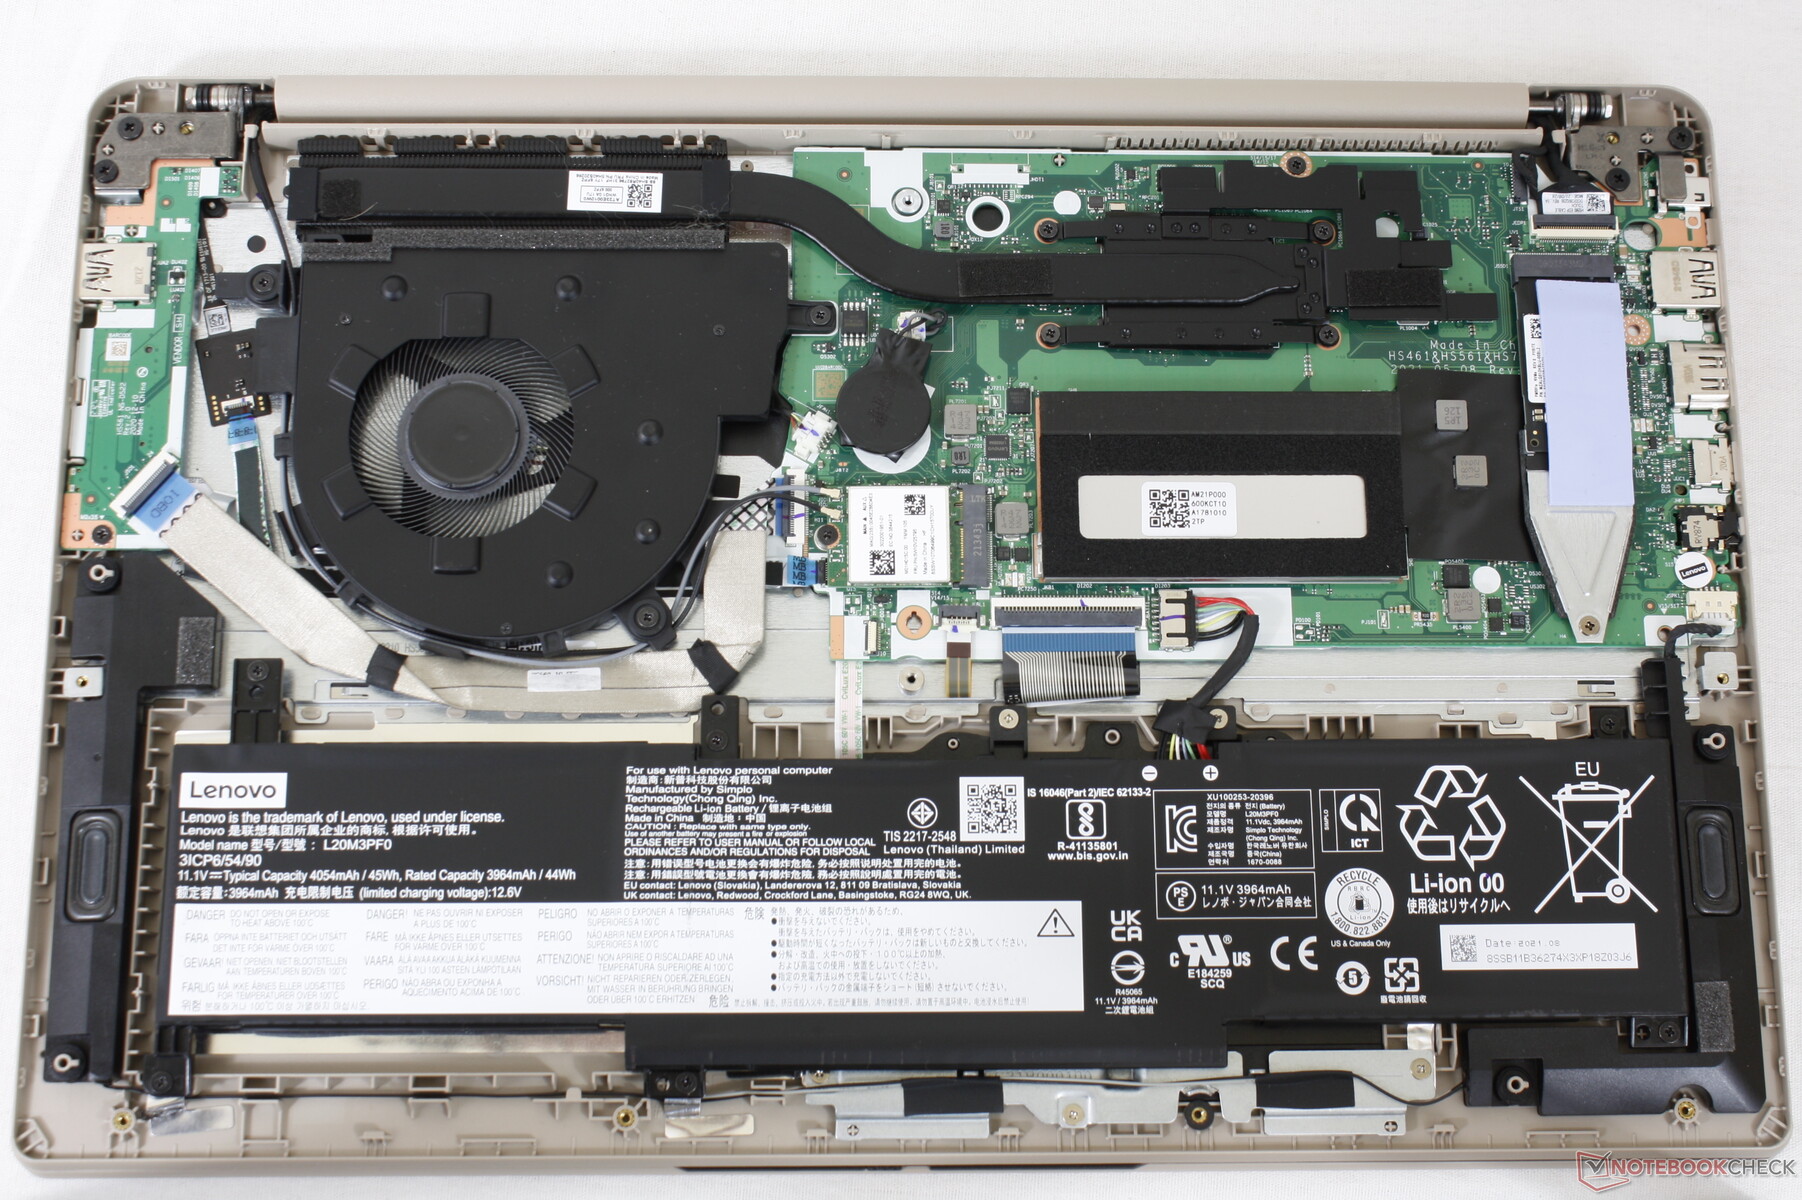
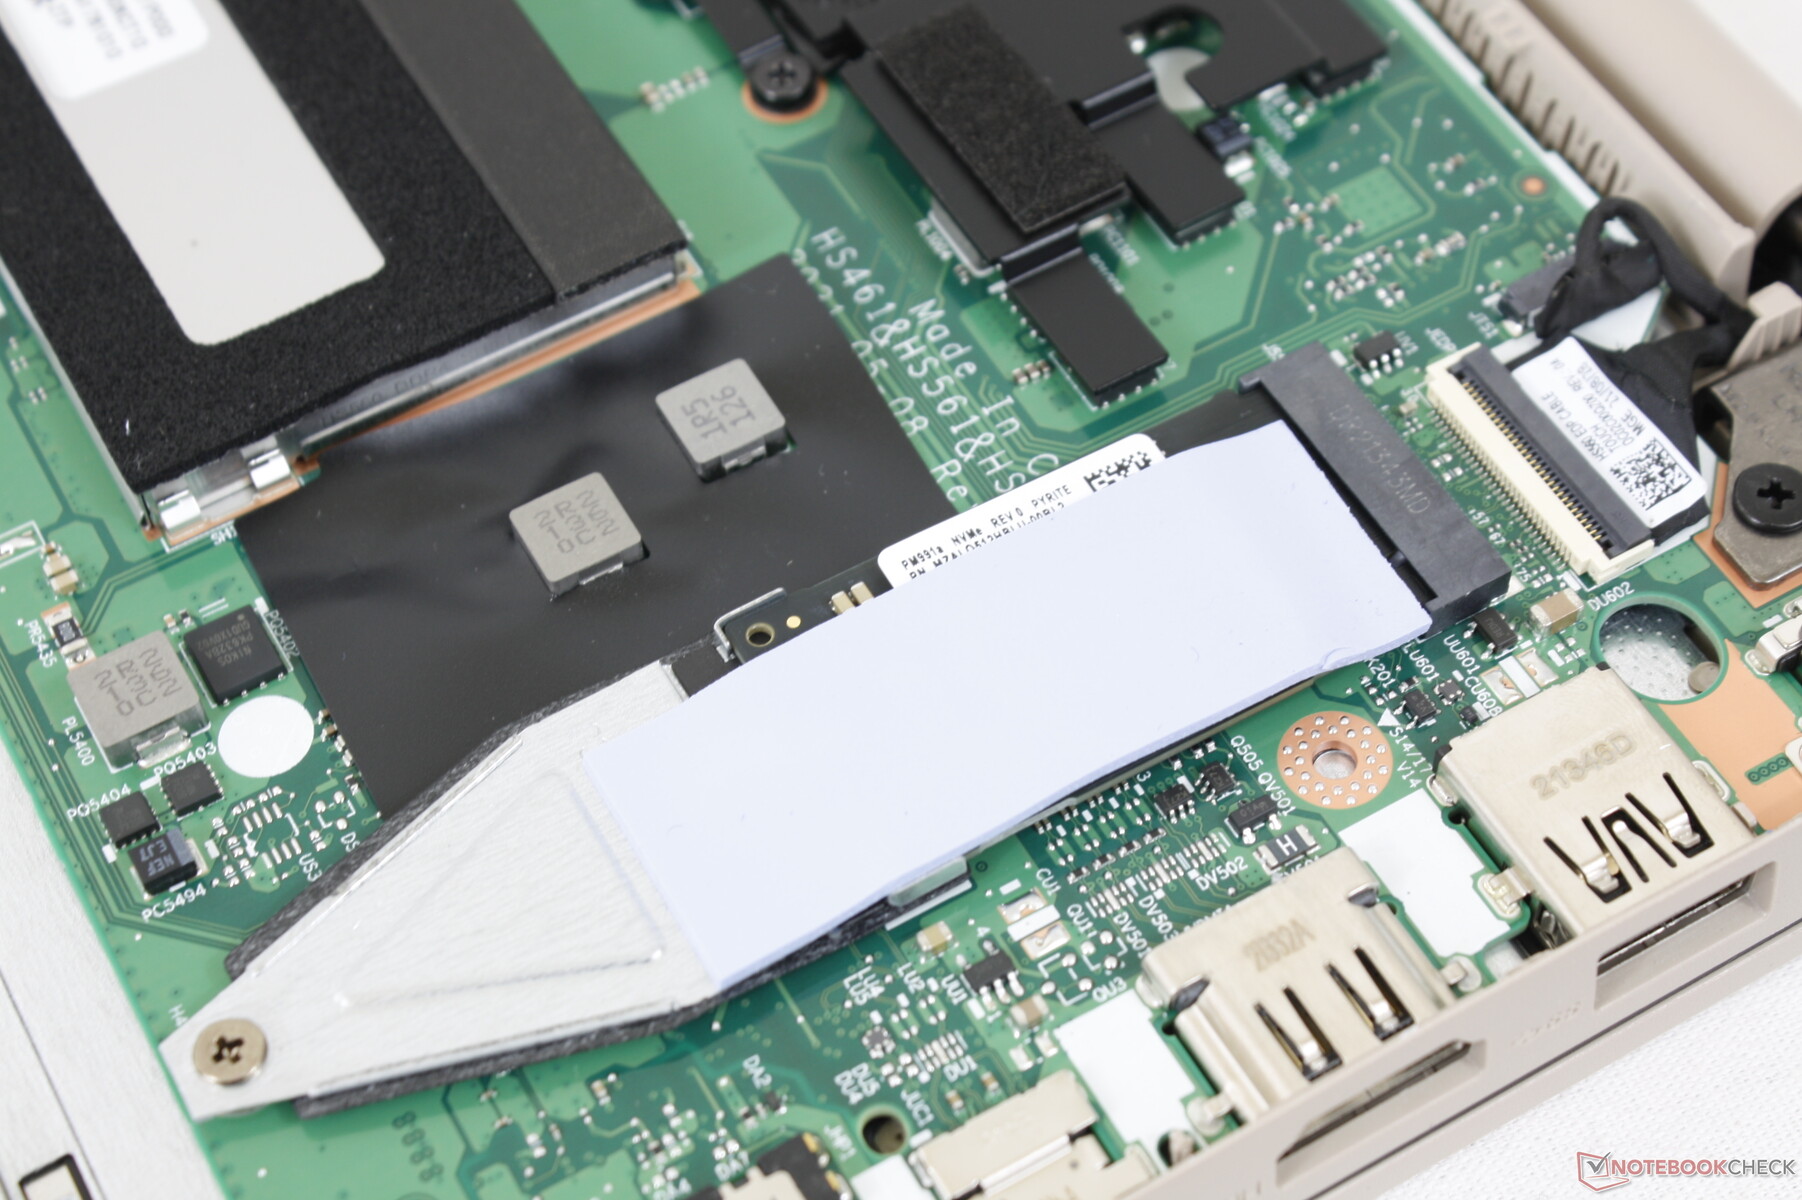
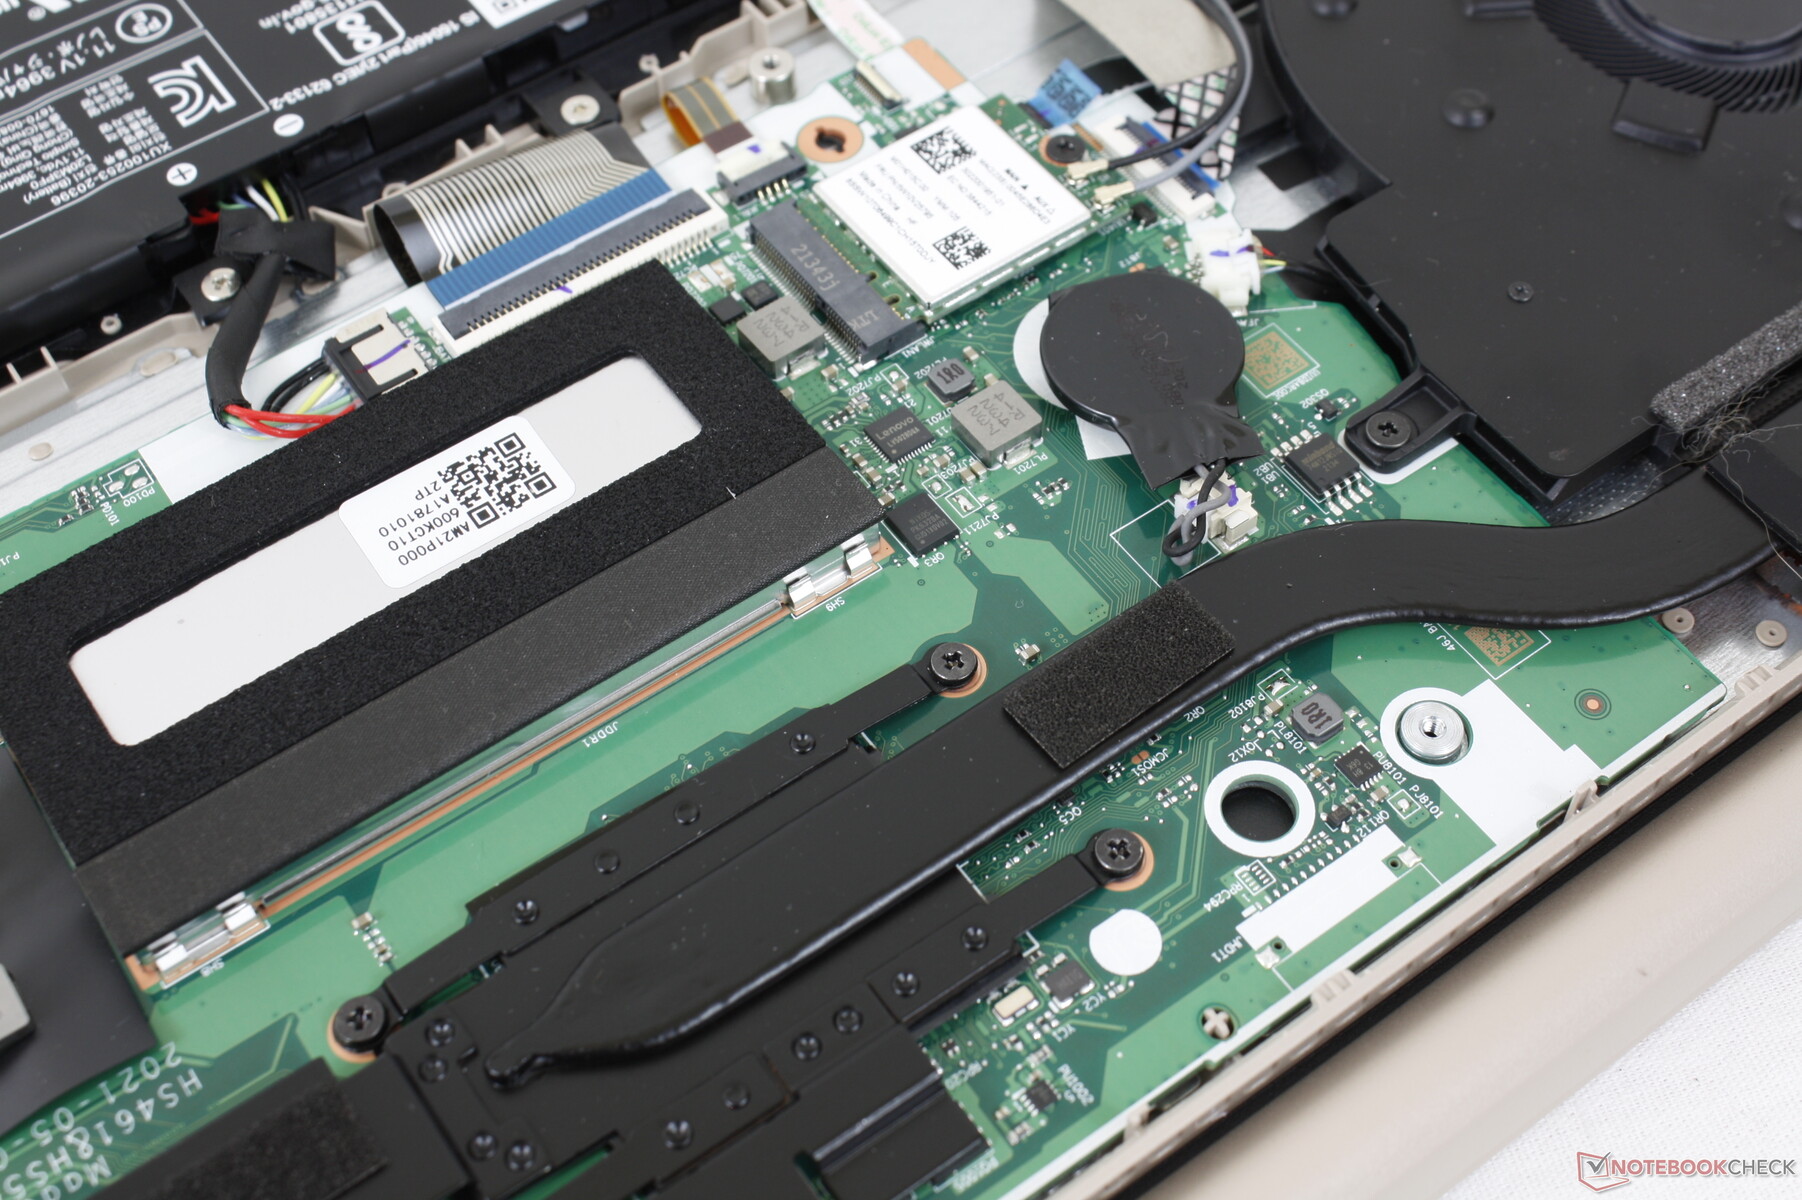
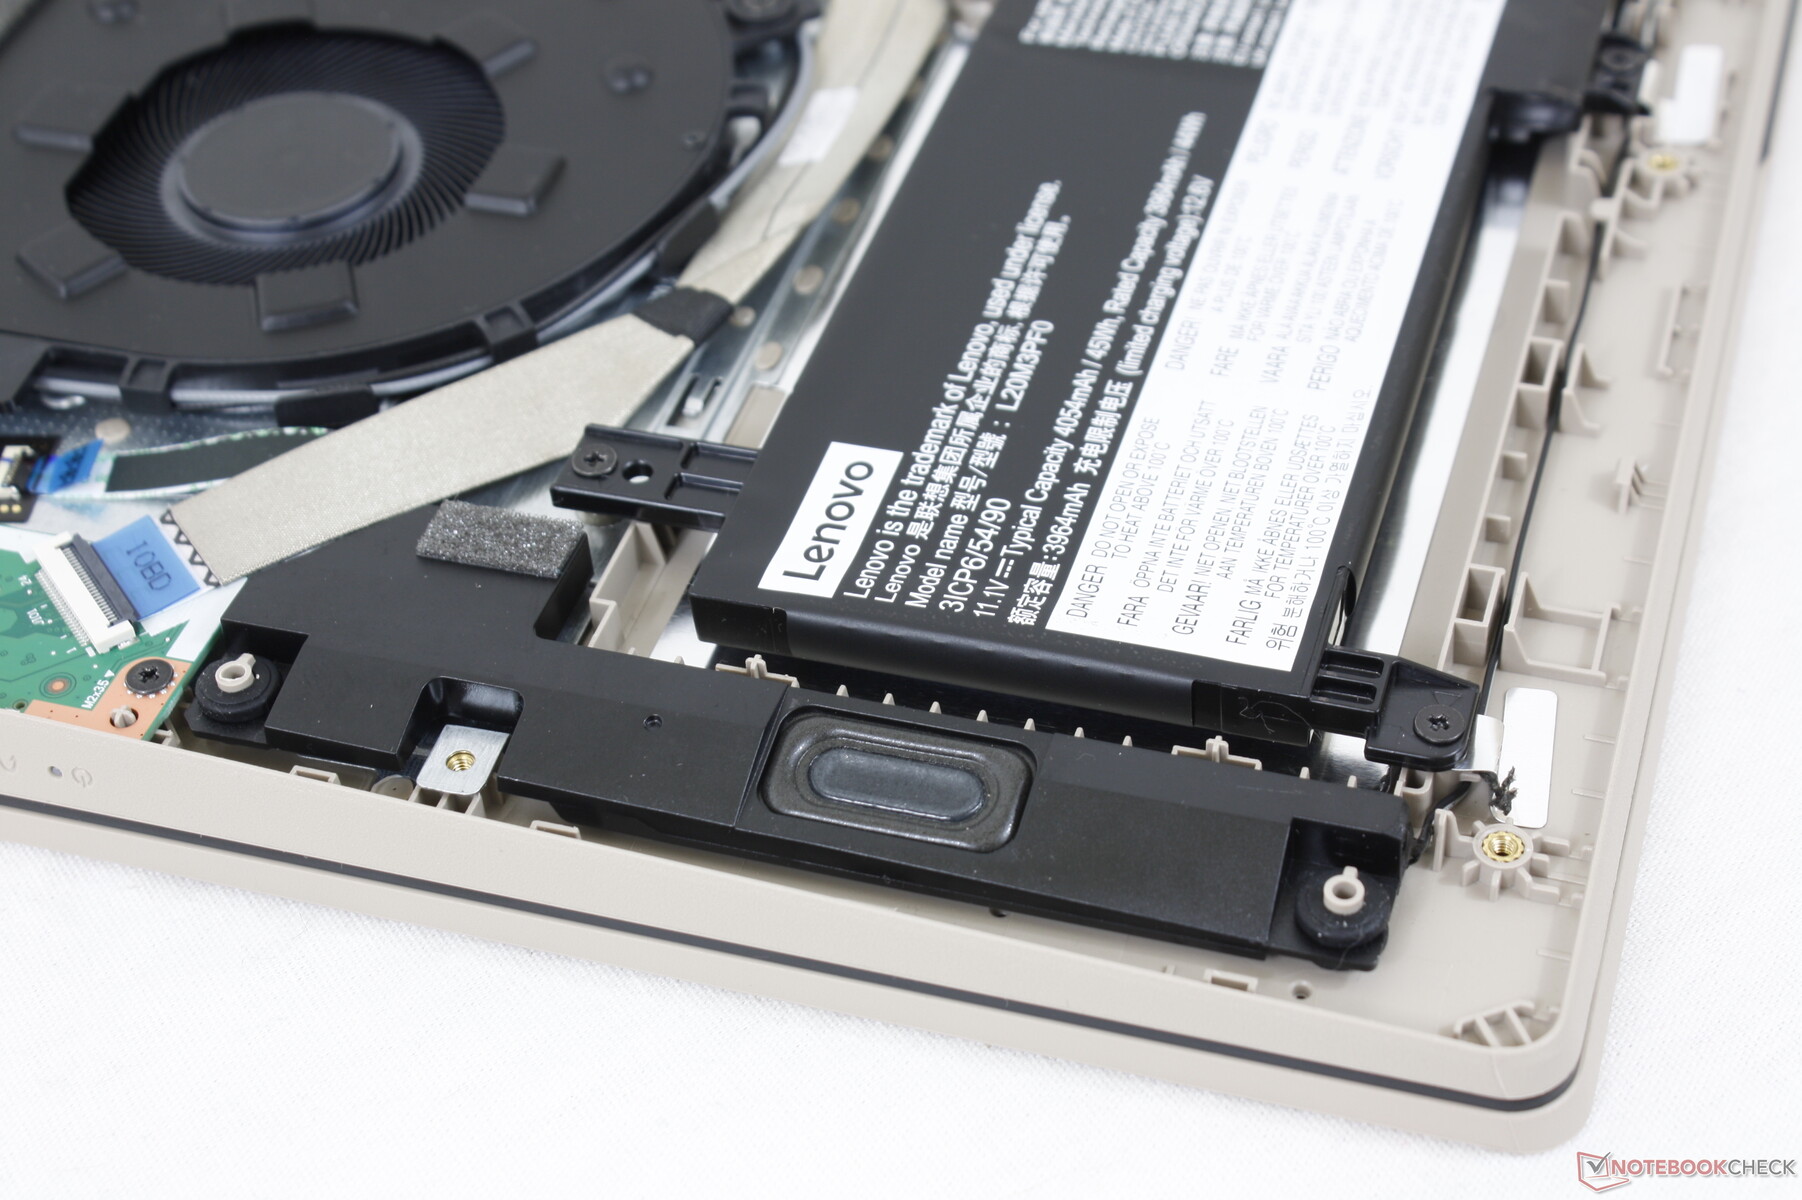
Maintenance — Easy to Open
The bottom panel can be easily removed with just a Philips screwdriver whereas many other budget laptops are typically more difficult to service. Users will see just one M.2 PCIe3 x4 2280 slot for storage, one WLAN slot, and one SODIMM slot to supplement the soldered 4 GB of RAM.
Accessories and Warranty
There are no extras in the box other than the AC adapter and paperwork. The usual one-year limited manufacturer warranty applies.
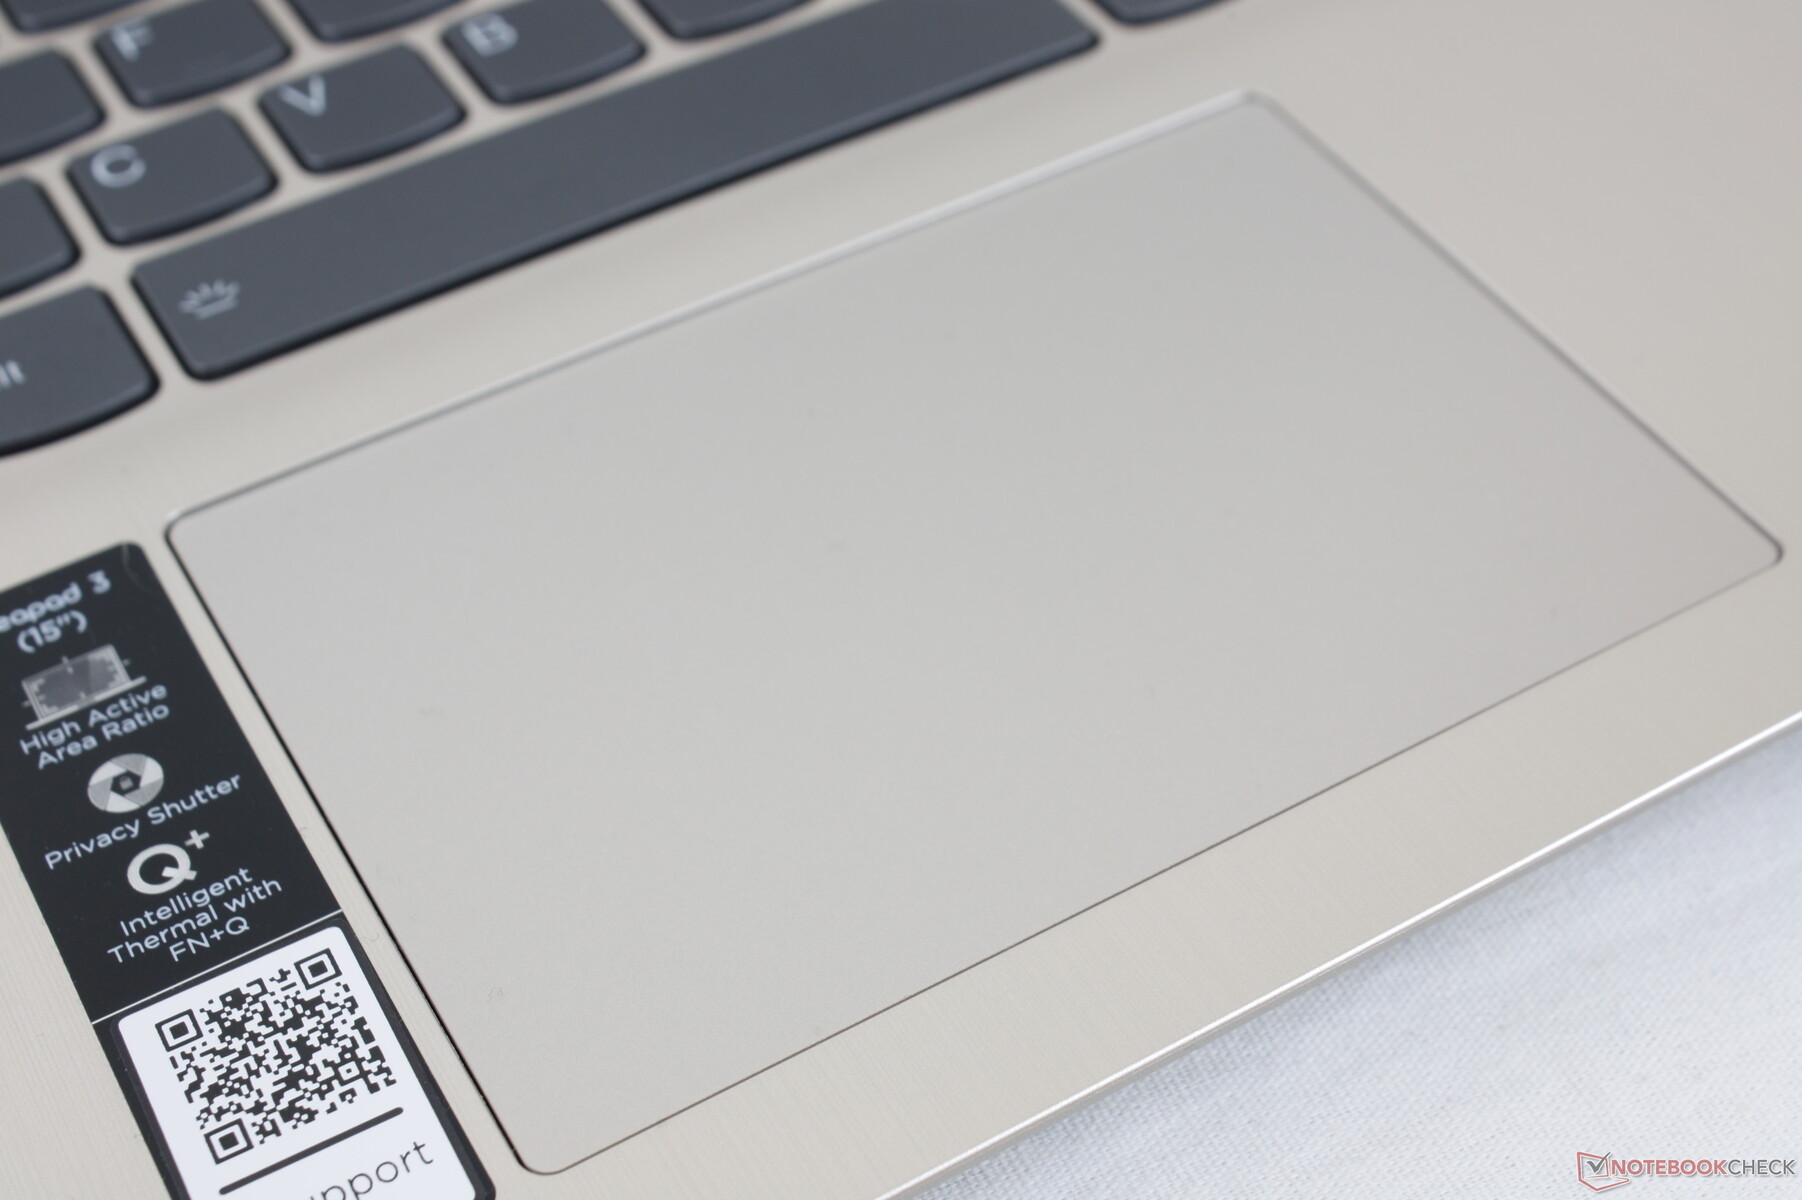
Input Devices — Spongy Clickpad
Keyboard
The backlit keys have short travel with relatively weak feedback when pressed especially when compared to the keys on a pricier ThinkPad or HP Spectre laptop. Key clatter is quieter than expected as a result of the soft feedback.
Touchpad
The clickpad is slightly smaller than the one on the 14-inch IdeaPad 5 Pro 14 (10 x 7 cm vs. 10.5 x 7 cm). Gliding is smooth at medium or higher speeds while the finger tends to stick at slower speeds for more accurate clicking. Unfortunately, clicking on the clickpad feels shallow and spongy with unsatisfying feedback.


Display — FreeSync and Touchscreen Support
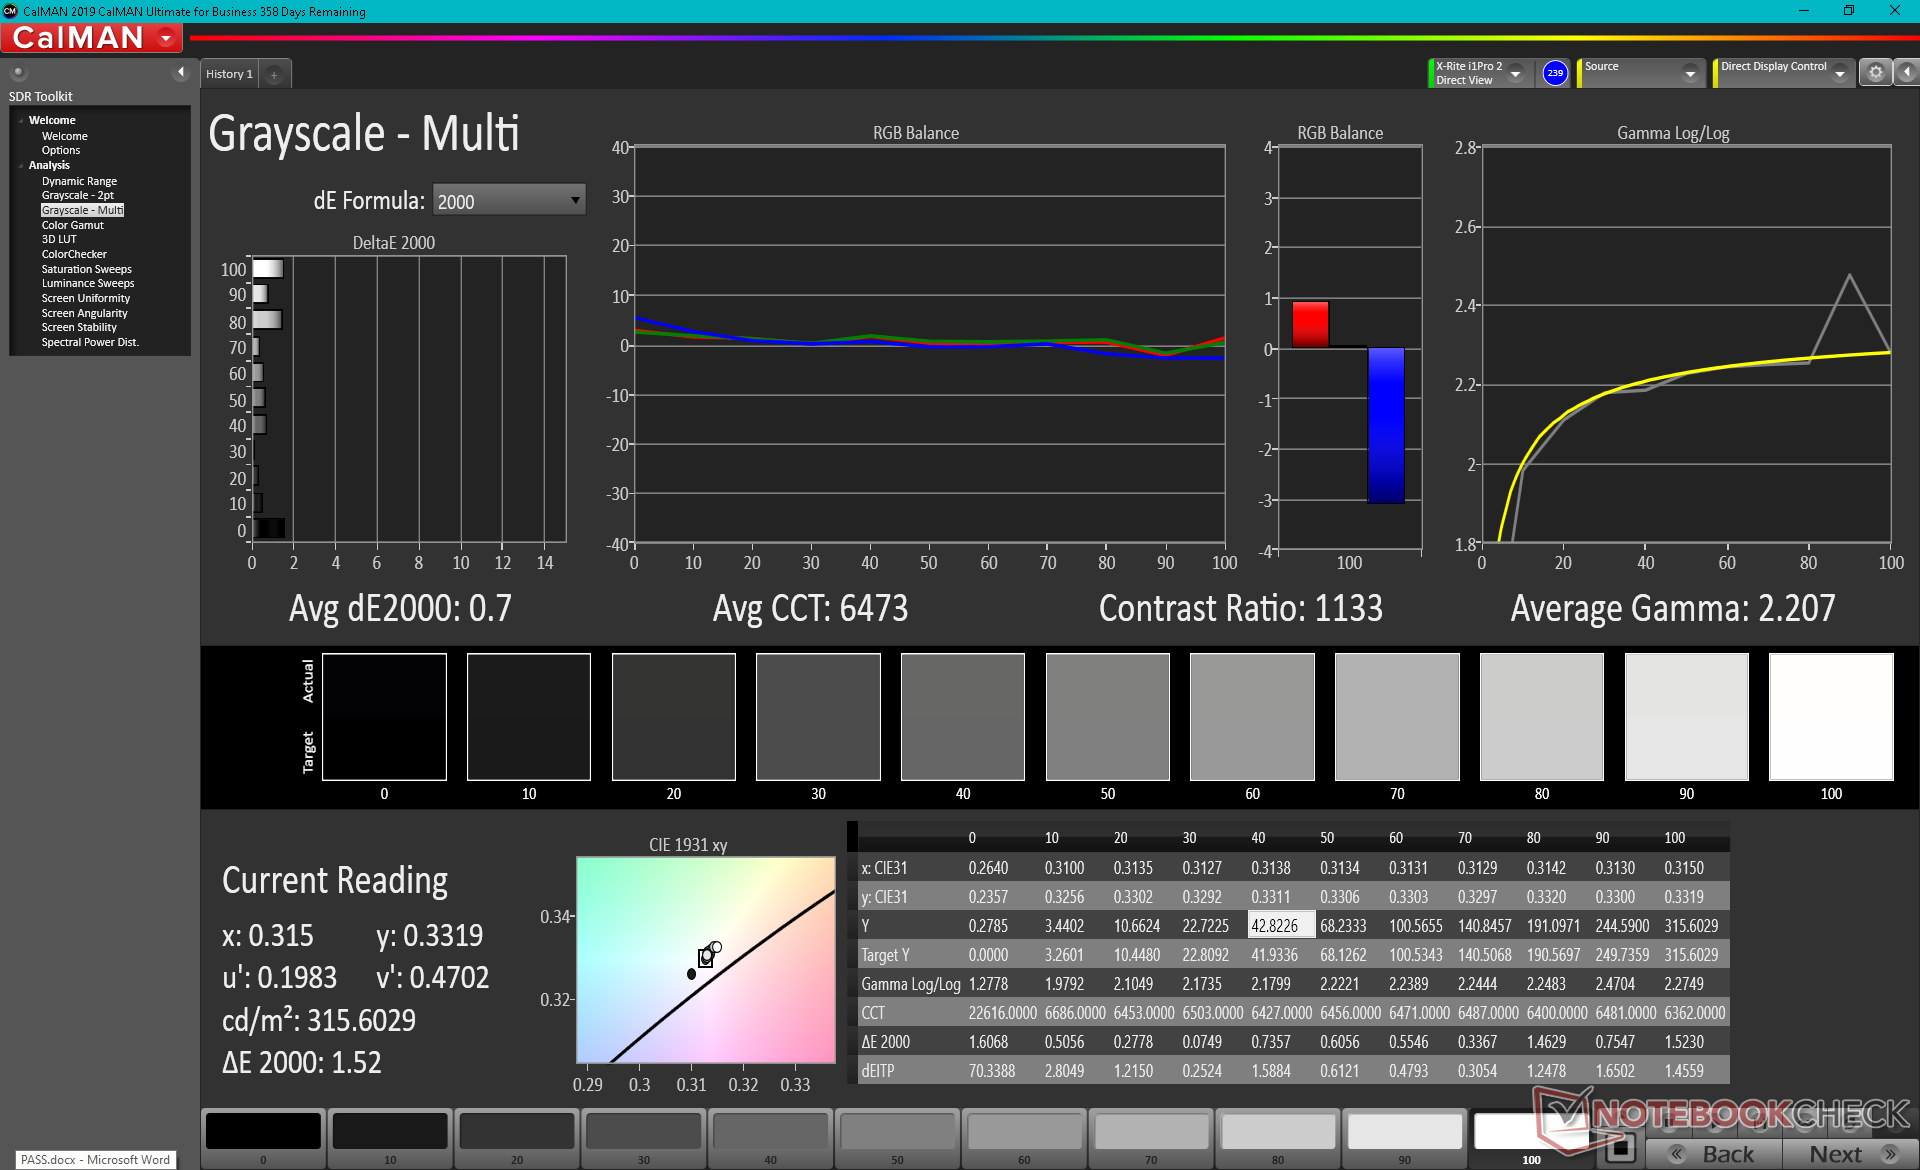
The BOE CQ NV156FHM-T07 IPS panel can be found on no other laptop in our database. While its high contrast ratio of 1400:1 and reasonable black-white response times deserve praise, its colors are mediocre at best and nowhere near as vibrant as the displays on a Yoga model.
Perhaps the most noteworthy aspect of the display is that it's also a touchscreen with FreeSync support which is almost unheard of for a sub $500 laptop. Such features will likely only appeal to a very small subset of the target audience.


| |||||||||||||||||||||||||
Brightness Distribution: 84 %
Center on Battery: 336.4 cd/m²
Contrast: 1402:1 (Black: 0.24 cd/m²)
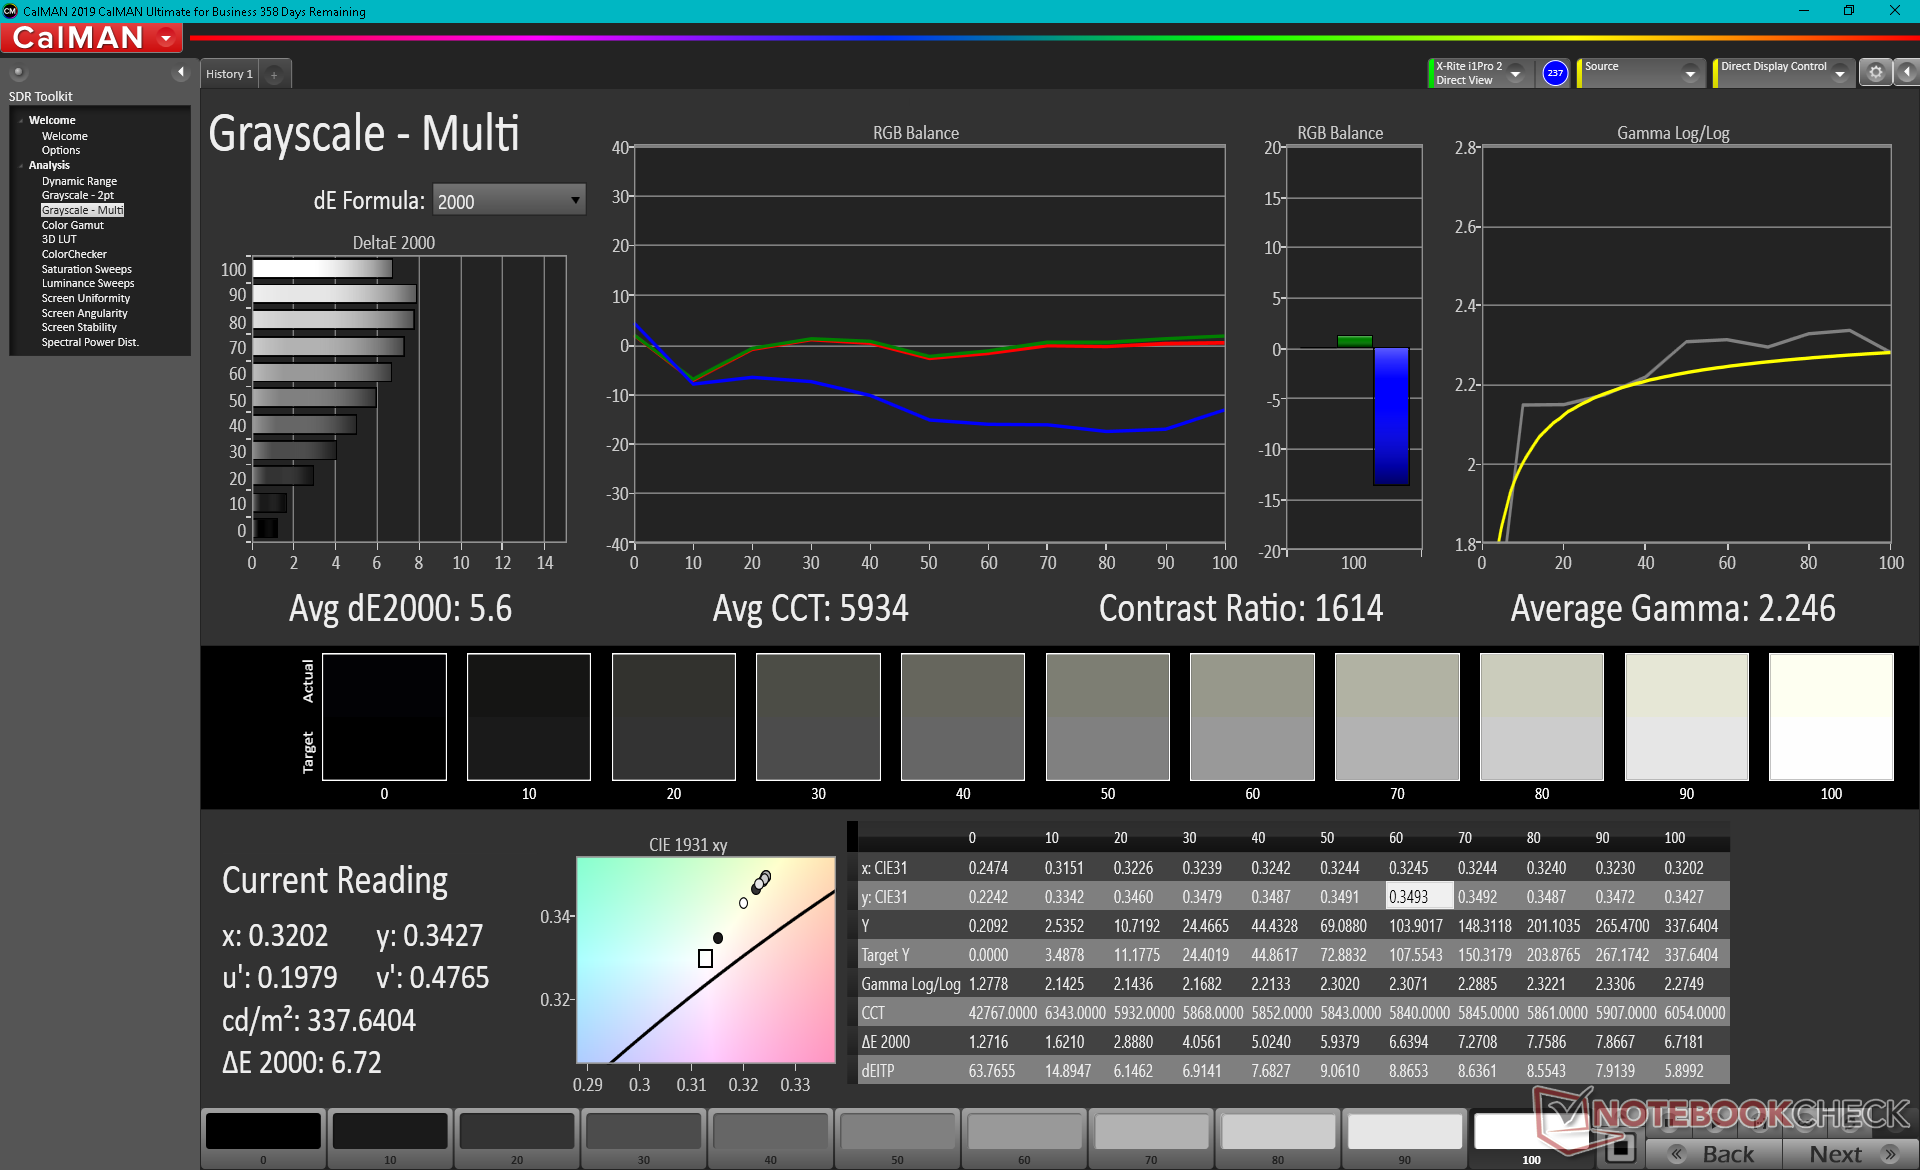
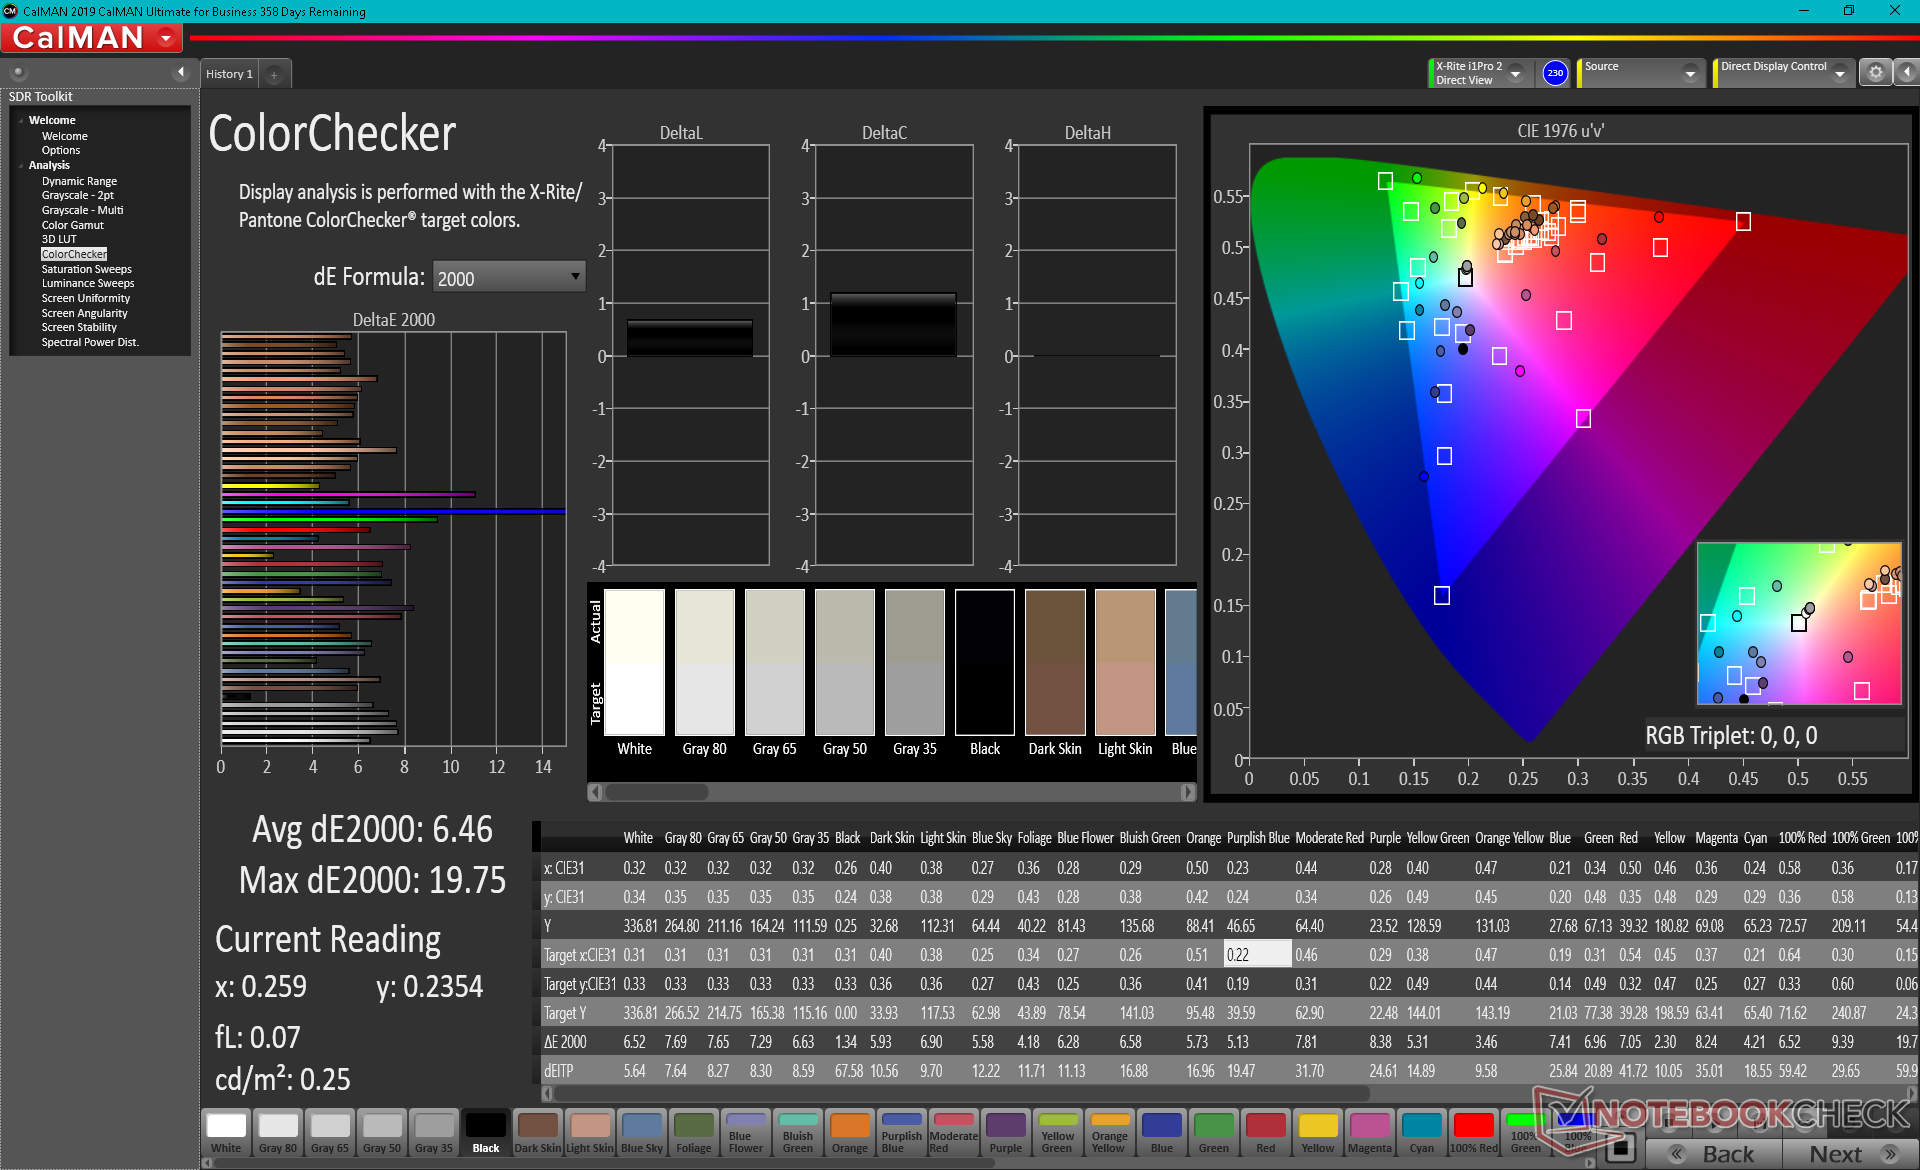
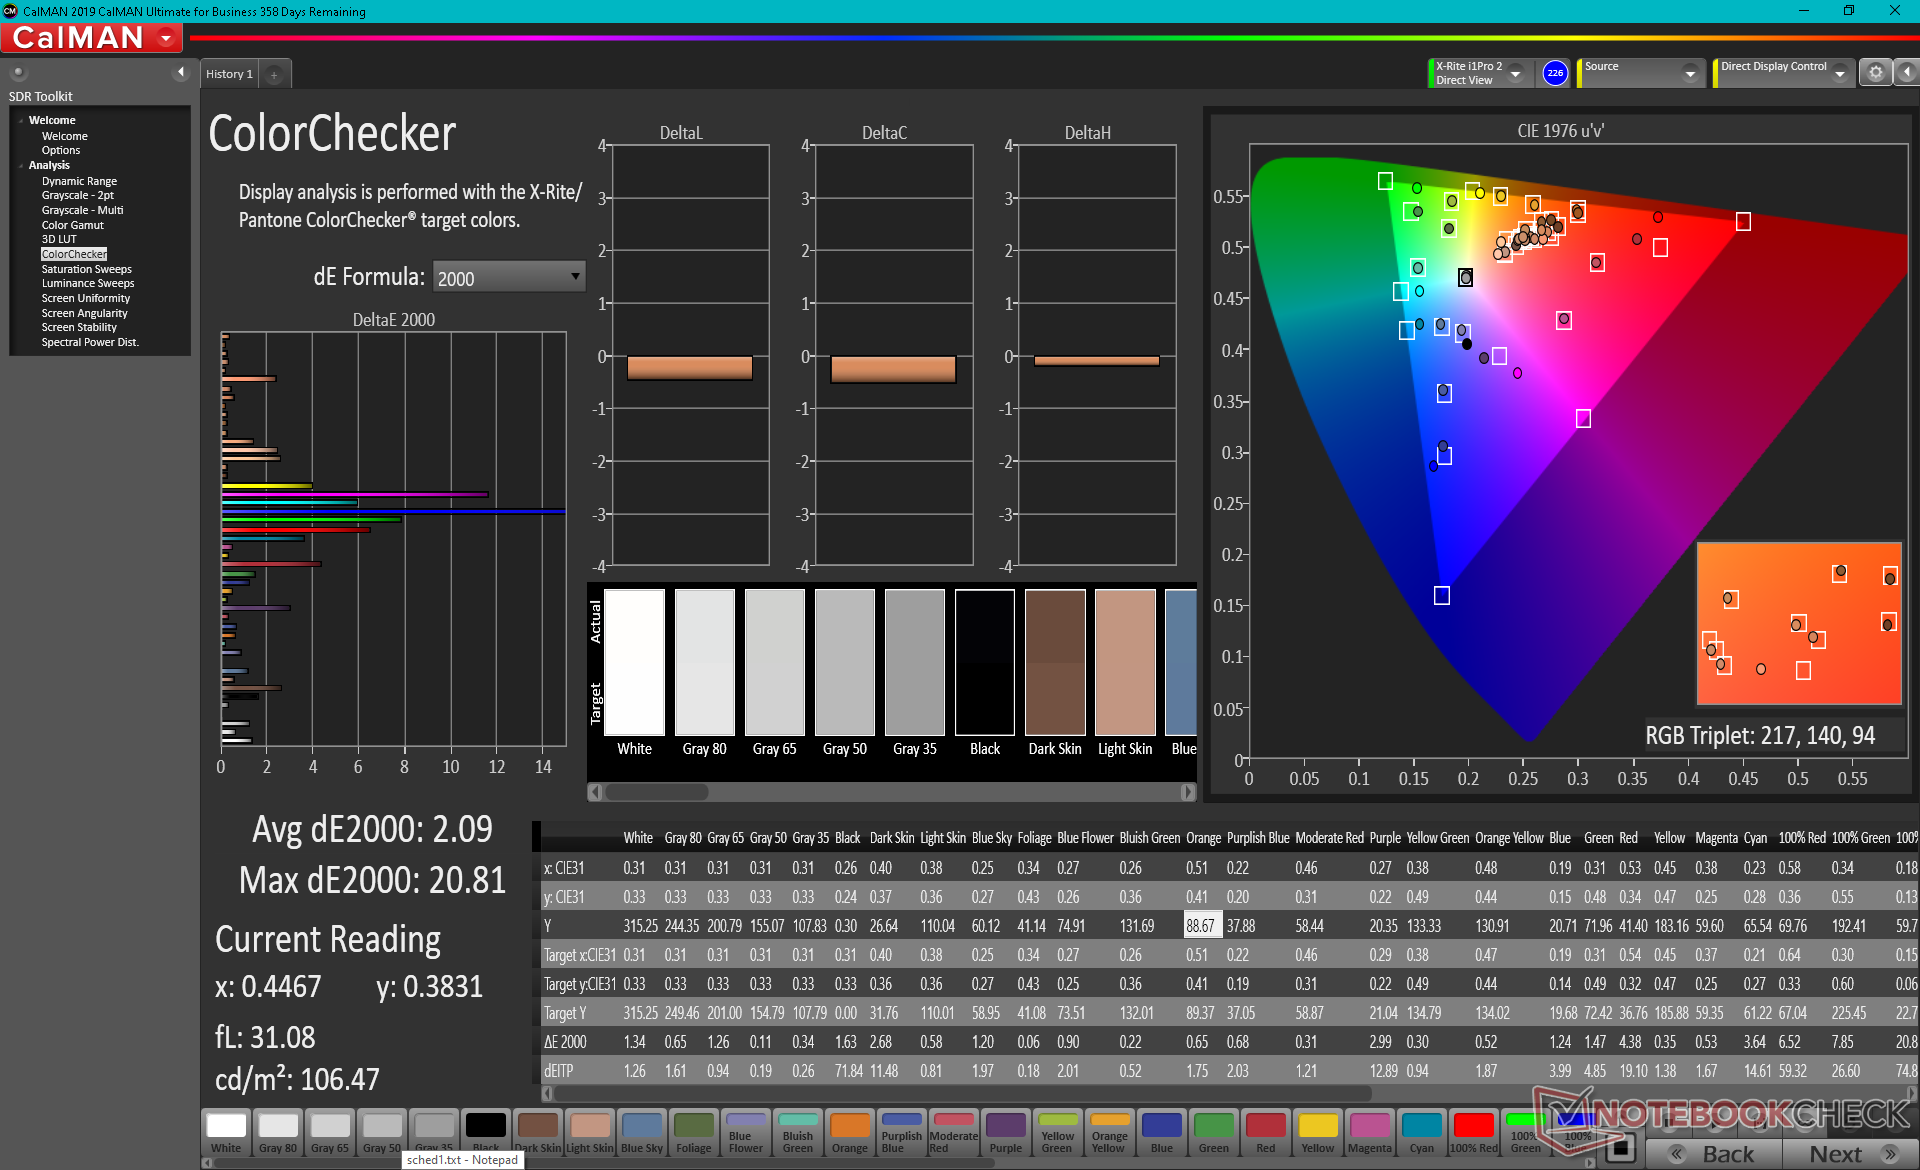
ΔE ColorChecker Calman: 6.46 | ∀{0.5-29.43 Ø4.71}
calibrated: 2.09
ΔE Greyscale Calman: 5.6 | ∀{0.09-98 Ø4.96}
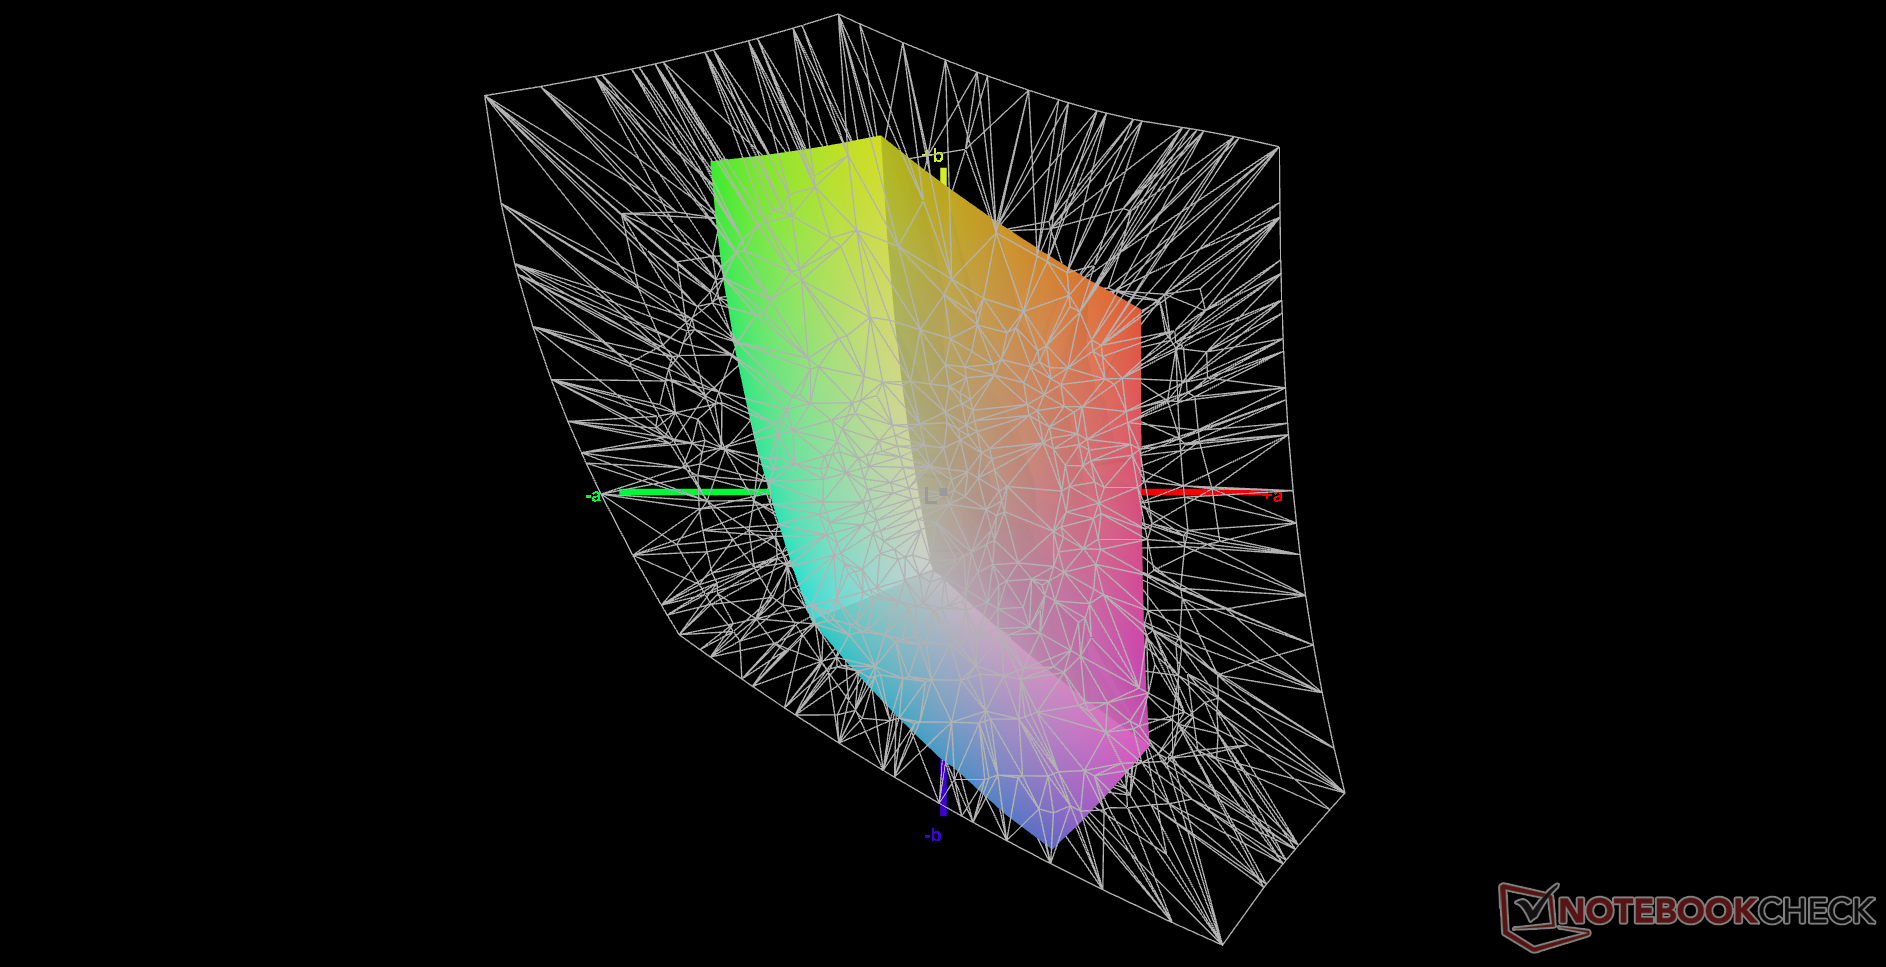
41.2% AdobeRGB 1998 (Argyll 3D)
57.7% sRGB (Argyll 3D)
40% Display P3 (Argyll 3D)
Gamma: 2.25
CCT: 5934 K
| Lenovo IdeaPad 3 15ALC6 BOE CQ NV156FHM-T07, IPS, 1920x1080, 15.6" | Lenovo IdeaPad 5 15IIL05 AU Optronics B156HAN02.1, IPS, 1920x1080, 15.6" | Lenovo Ideapad S540-15IML BOEhydis NV156FHM-N61 (BOE06FB), IPS, 1920x1080, 15.6" | Dell Inspiron 15 3501 BOE NV15N3D (Dell P/N: N39X1), IPS, 1920x1080, 15.6" | HP Pavilion 15-eg Chi Mei CMN1523, IPS, 1920x1080, 15.6" | Asus VivoBook 15 KM513UA-L503TS Samsung ATNA56YX03-0, OLED, 1920x1080, 15.6" | |
|---|---|---|---|---|---|---|
| Display | -5% | 57% | 0% | 9% | 119% | |
| Display P3 Coverage (%) | 40 | 37.63 -6% | 66.8 67% | 39.4 -1% | 42.9 7% | 99.9 150% |
| sRGB Coverage (%) | 57.7 | 56.5 -2% | 86.5 50% | 58.7 2% | 64 11% | 100 73% |
| AdobeRGB 1998 Coverage (%) | 41.2 | 38.88 -6% | 63.2 53% | 40.7 -1% | 44.4 8% | 96.7 135% |
| Response Times | -32% | -62% | -43% | 13% | 94% | |
| Response Time Grey 50% / Grey 80% * (ms) | 24.8 ? | 42 ? -69% | 49.6 ? -100% | 43 ? -73% | 22.8 ? 8% | 0.89 ? 96% |
| Response Time Black / White * (ms) | 28.4 ? | 27 ? 5% | 34.8 ? -23% | 32 ? -13% | 23.6 ? 17% | 2.31 ? 92% |
| PWM Frequency (Hz) | 202 ? | 1000 ? | 26320 ? | 60 ? | ||
| Screen | -15% | 5% | 21% | -7% | 33% | |
| Brightness middle (cd/m²) | 336.4 | 340 1% | 299 -11% | 271 -19% | 294.3 -13% | 401 19% |
| Brightness (cd/m²) | 318 | 325 2% | 278 -13% | 263 -17% | 251 -21% | 403 27% |
| Brightness Distribution (%) | 84 | 88 5% | 87 4% | 92 10% | 76 -10% | 98 17% |
| Black Level * (cd/m²) | 0.24 | 0.27 -13% | 0.25 -4% | 0.15 37% | 0.26 -8% | |
| Contrast (:1) | 1402 | 1259 -10% | 1196 -15% | 1807 29% | 1132 -19% | |
| Colorchecker dE 2000 * | 6.46 | 6.62 -2% | 4.32 33% | 4.83 25% | 4.08 37% | 3.24 50% |
| Colorchecker dE 2000 max. * | 19.75 | 21.05 -7% | 9.3 53% | 7 65% | 19.49 1% | 6.42 67% |
| Colorchecker dE 2000 calibrated * | 2.09 | 4.71 -125% | 2.58 -23% | 3.7 -77% | 2.13 -2% | |
| Greyscale dE 2000 * | 5.6 | 4.61 18% | 4.21 25% | 3.36 40% | 3 46% | 2.7 52% |
| Gamma | 2.25 98% | 2.74 80% | 2.39 92% | 2.56 86% | 2.21 100% | 2.14 103% |
| CCT | 5934 110% | 6262 104% | 6799 96% | 6764 96% | 6616 98% | 6374 102% |
| Color Space (Percent of AdobeRGB 1998) (%) | 36 | 57 | ||||
| Color Space (Percent of sRGB) (%) | 56 | 86 | ||||
| Total Average (Program / Settings) | -17% /
-15% | 0% /
7% | -7% /
6% | 5% /
-1% | 82% /
65% |
* ... smaller is better
Color space is narrow at just 58 percent of sRGB compared to 90 percent or greater on pricier midrange or higher Ultrabooks.
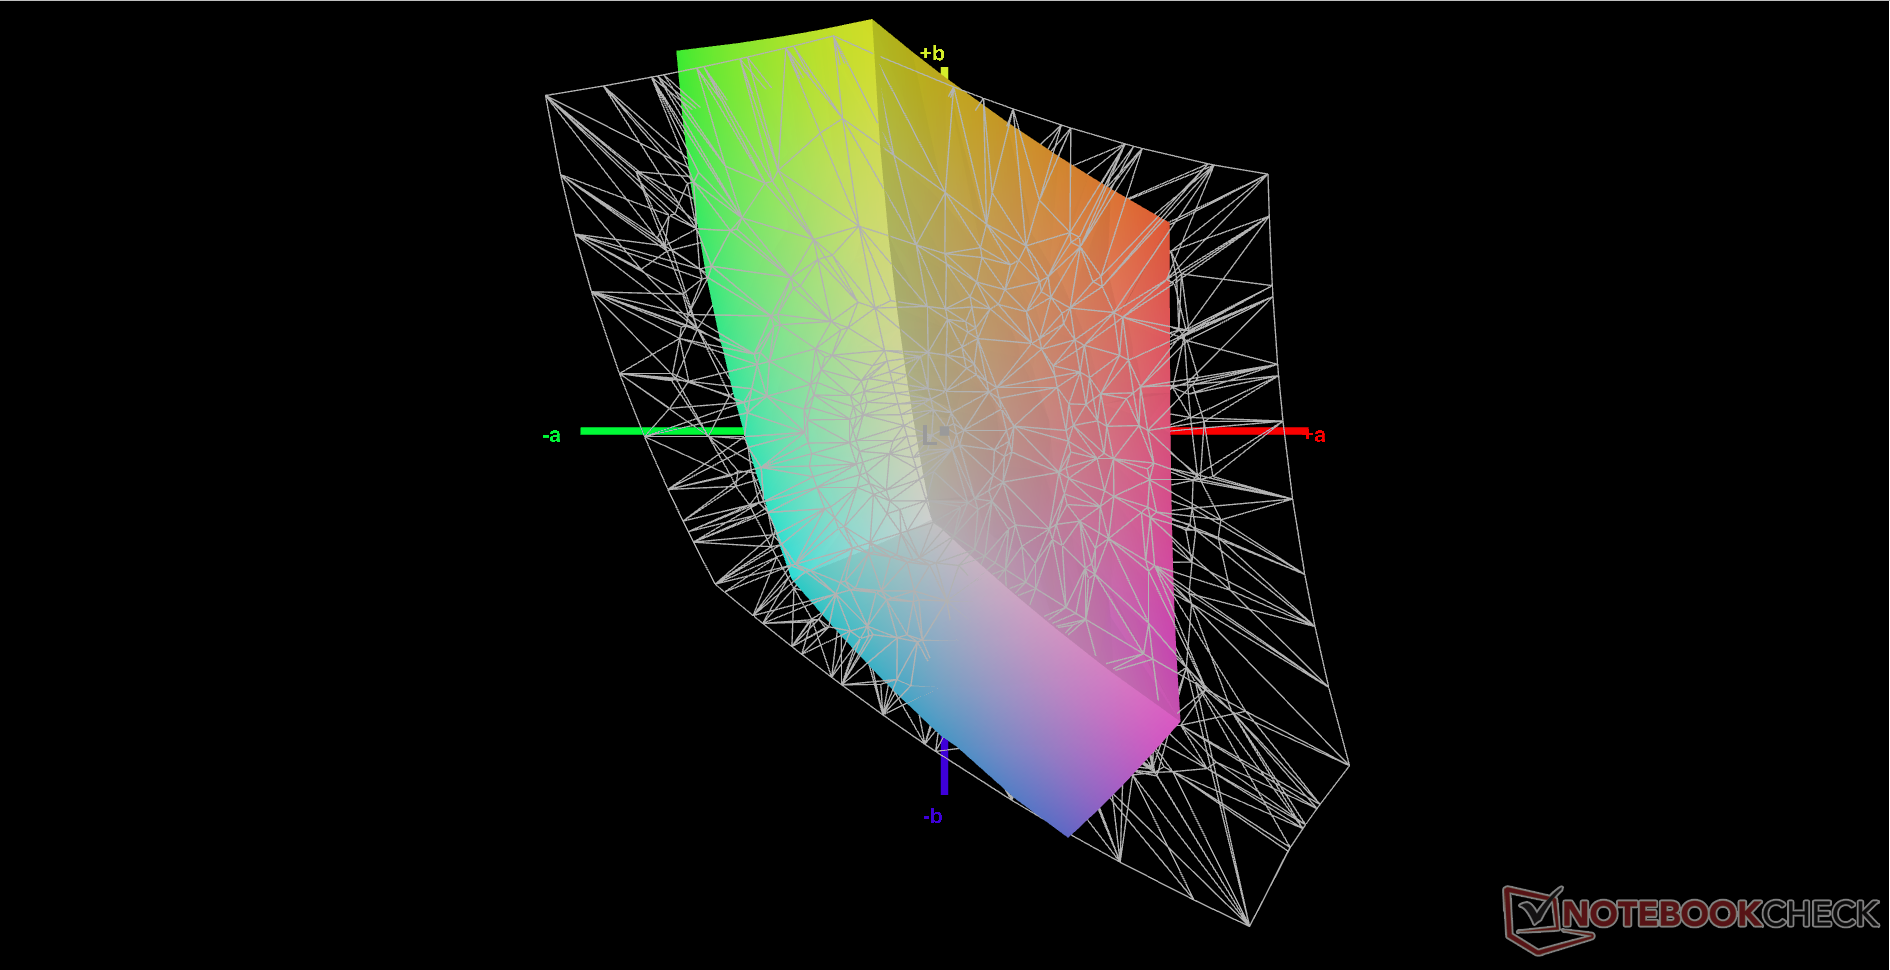
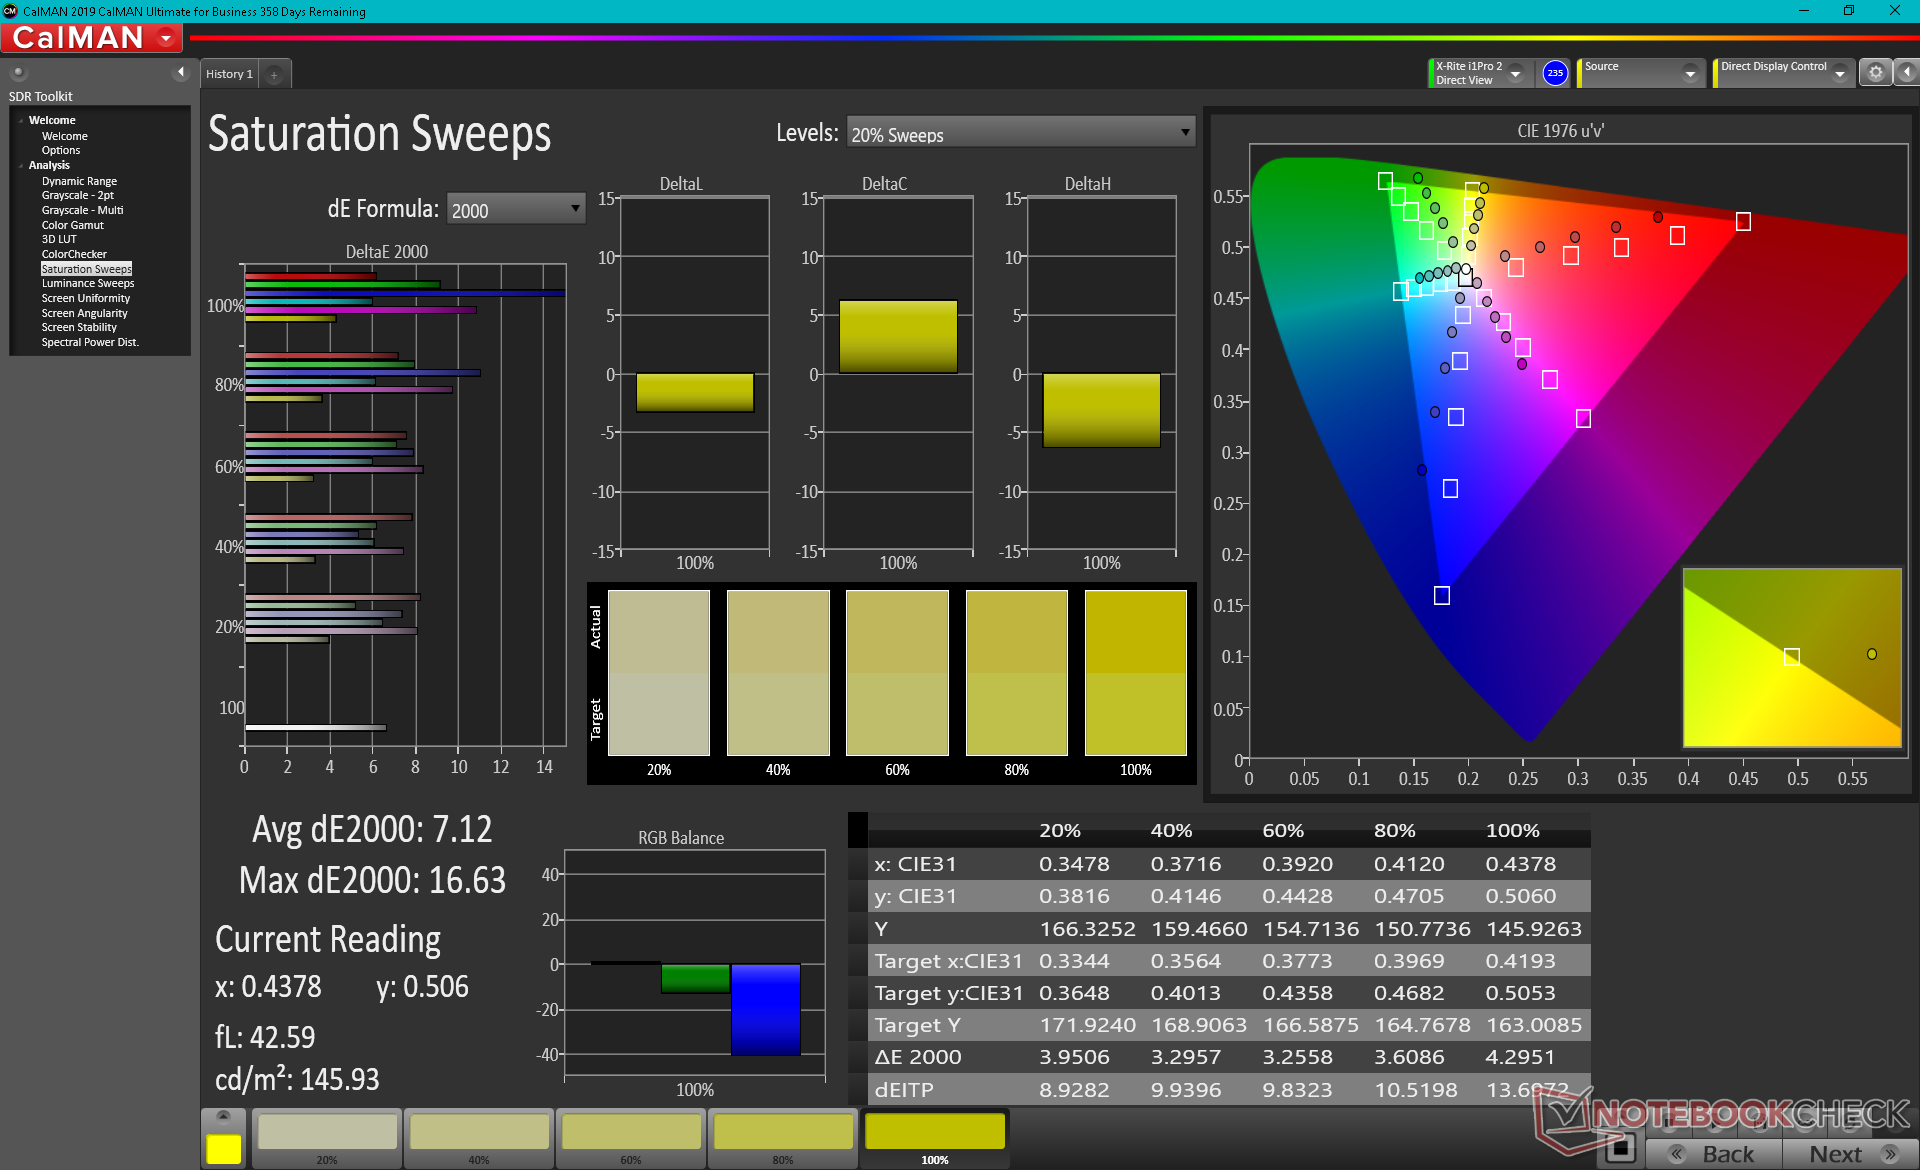
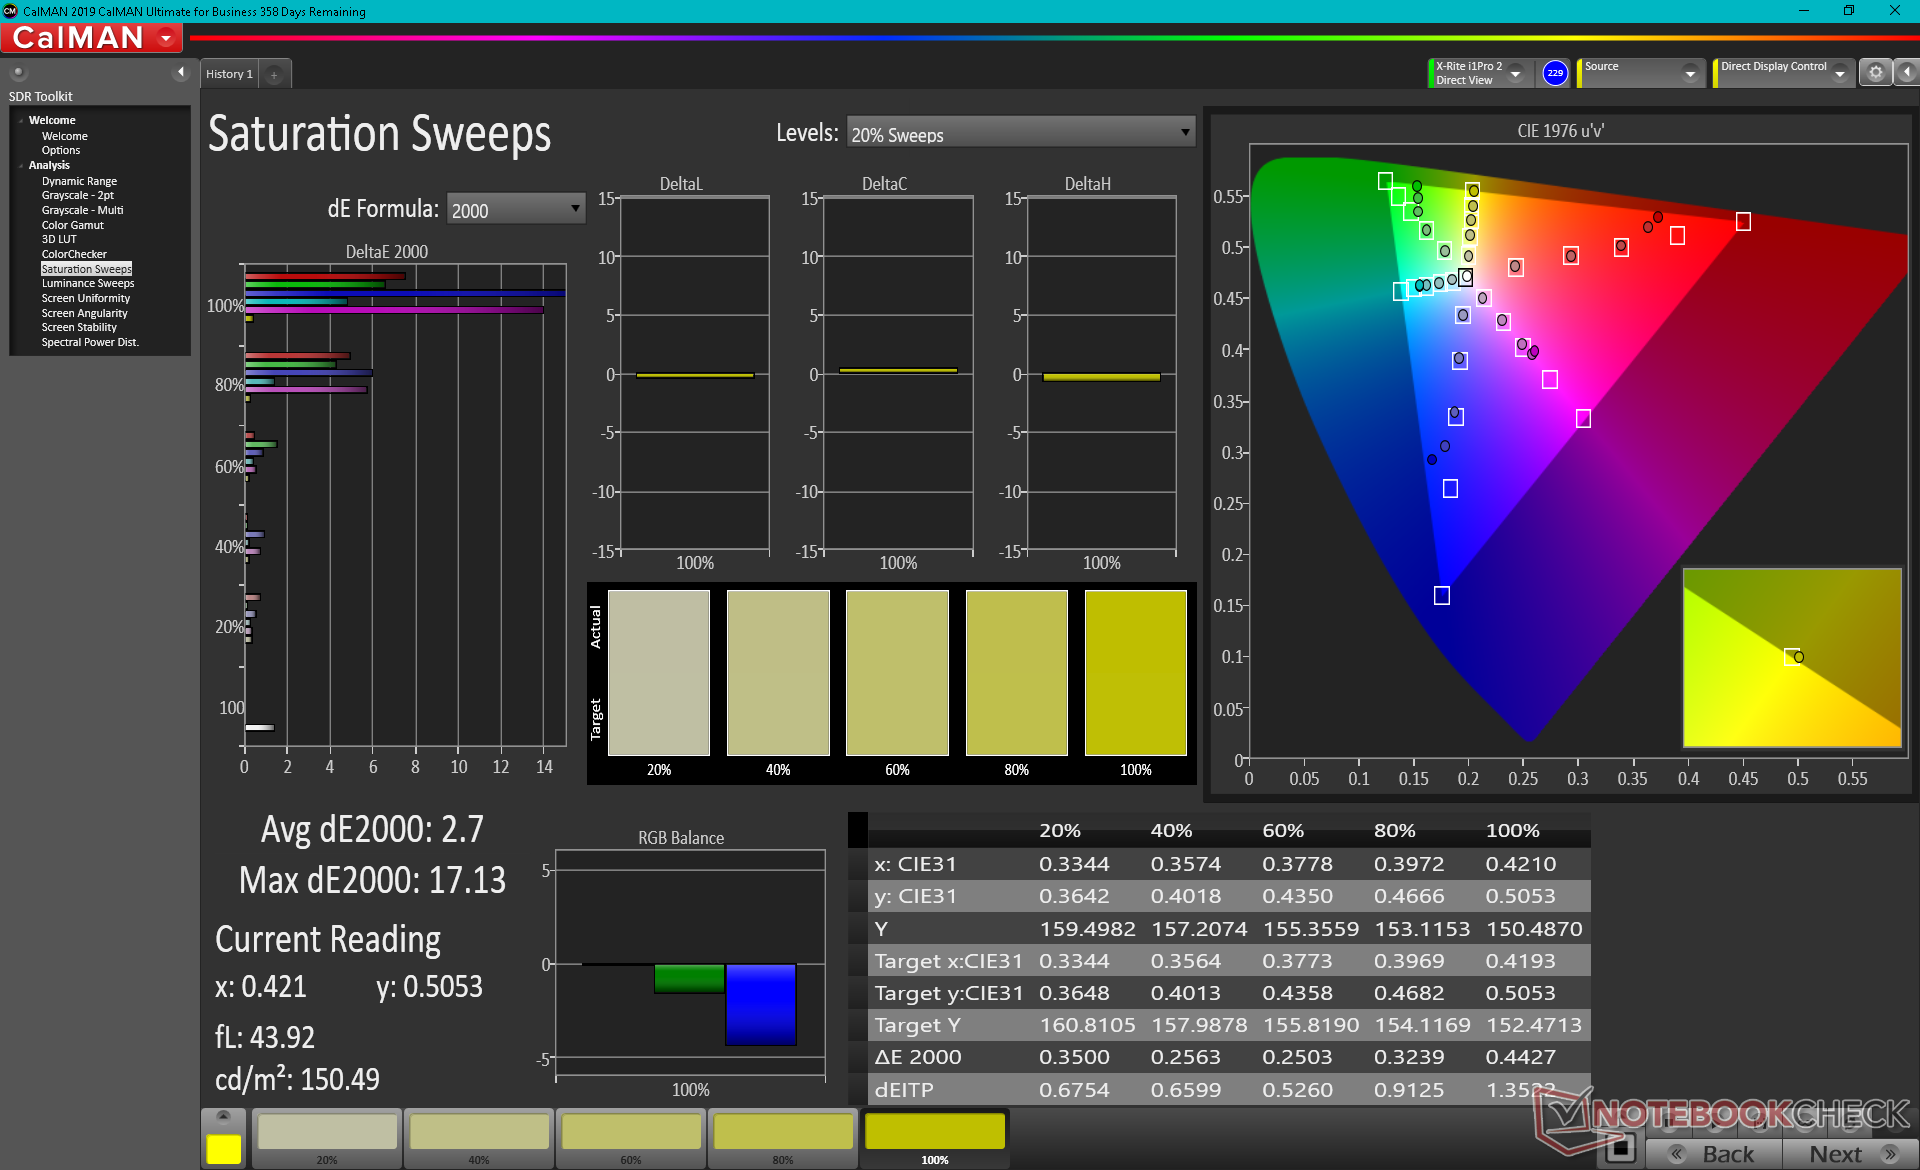
The display is not well-calibrated out of the box as to be expected on most budget laptops. Color temperature, for example, is too warm. Calibrating the panel ourselves with an X-Rite colorimeter would improve average DeltaE values significantly as shown by our results below. Nonetheless, colors are still inaccurate at high saturation levels due to the limited color space mentioned above with Blue being the most notable offender.
Display Response Times
| ↔ Response Time Black to White | ||
|---|---|---|
| 28.4 ms ... rise ↗ and fall ↘ combined | ↗ 17.2 ms rise | 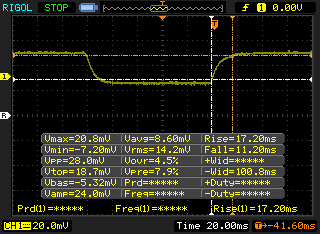 |
| ↘ 11.2 ms fall | ||
| The screen shows relatively slow response rates in our tests and may be too slow for gamers. In comparison, all tested devices range from 0.1 (minimum) to 240 (maximum) ms. » 75 % of all devices are better. This means that the measured response time is worse than the average of all tested devices (19.8 ms). | ||
| ↔ Response Time 50% Grey to 80% Grey | ||
| 24.8 ms ... rise ↗ and fall ↘ combined | ↗ 10.8 ms rise | 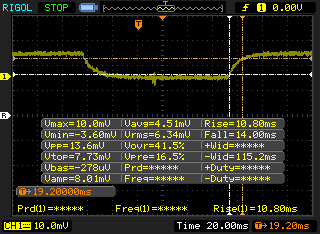 |
| ↘ 14 ms fall | ||
| The screen shows good response rates in our tests, but may be too slow for competitive gamers. In comparison, all tested devices range from 0.165 (minimum) to 636 (maximum) ms. » 35 % of all devices are better. This means that the measured response time is better than the average of all tested devices (30.9 ms). | ||
Screen Flickering / PWM (Pulse-Width Modulation)
| Screen flickering / PWM not detected | 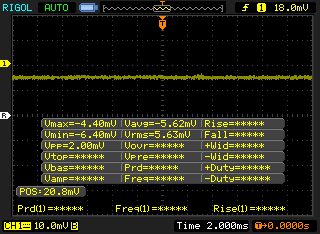 | ||
In comparison: 52 % of all tested devices do not use PWM to dim the display. If PWM was detected, an average of 7741 (minimum: 5 - maximum: 343500) Hz was measured. | |||
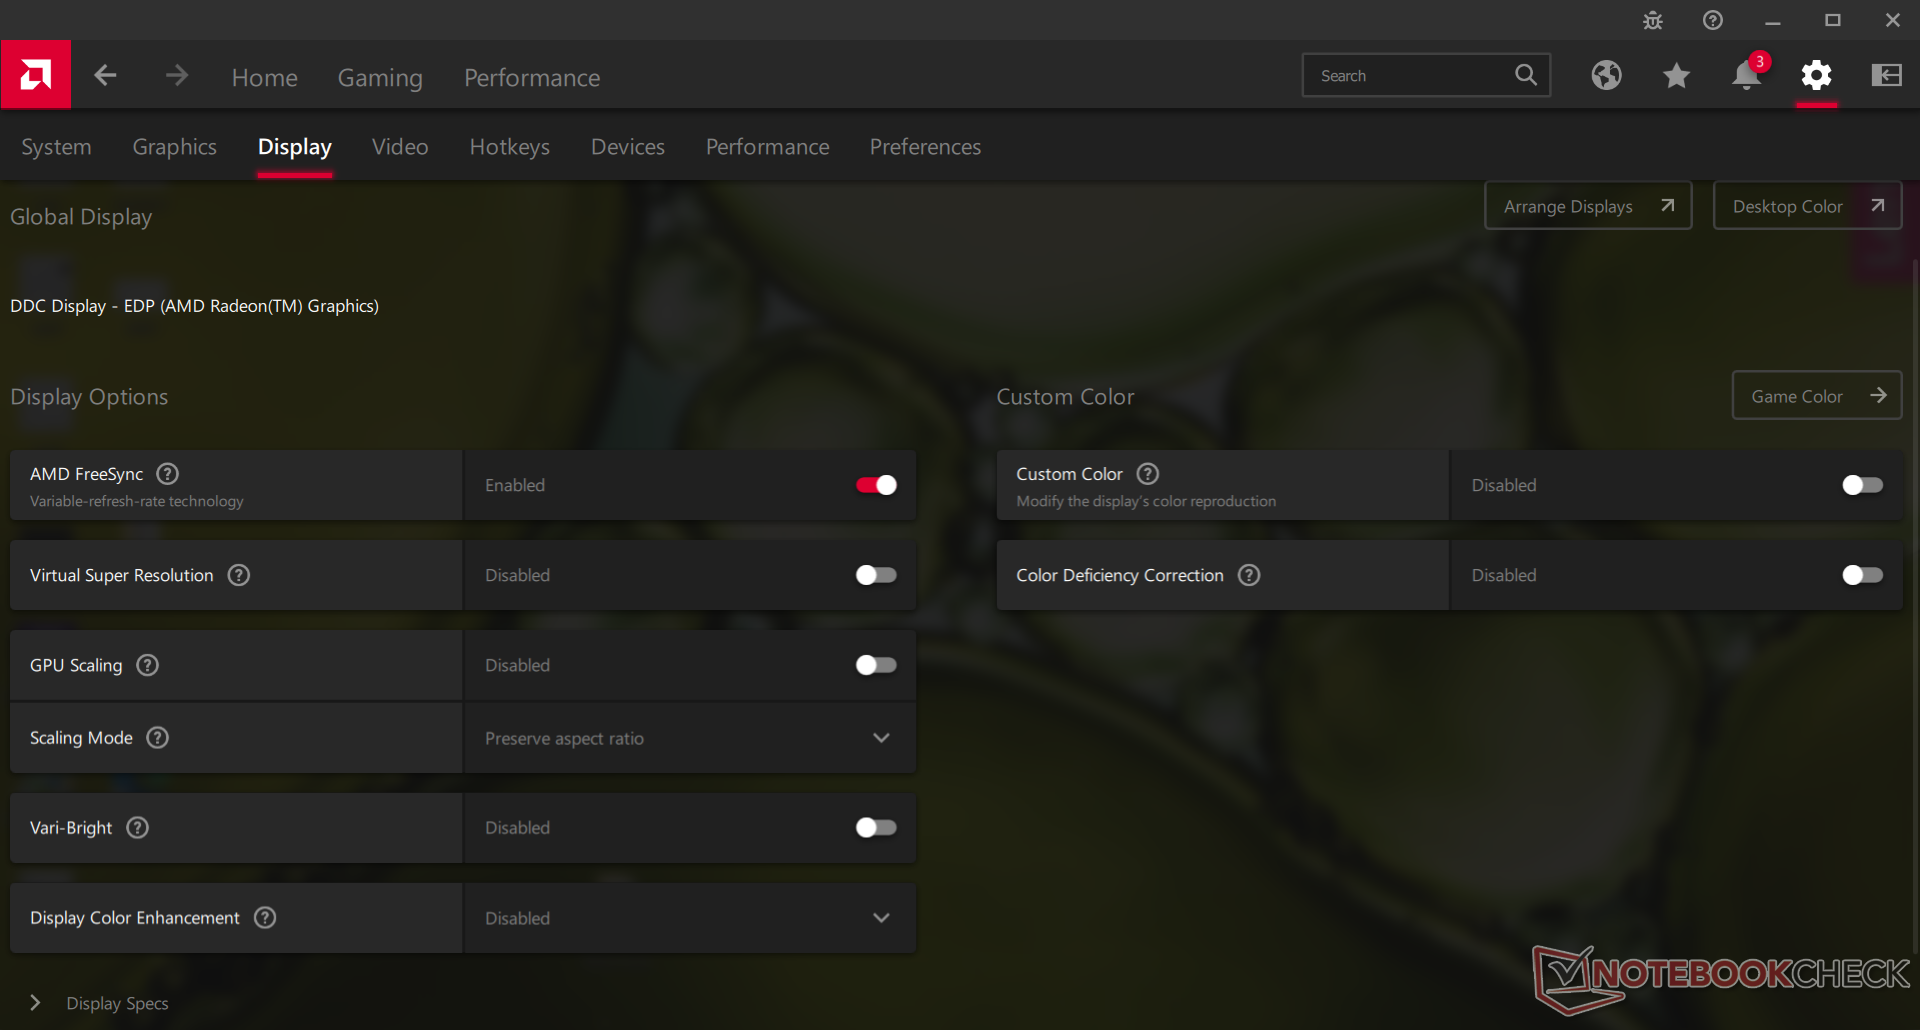
Outdoor visibility is decent when under shade due to the reasonably bright 300 nit display. Just be sure to disable AMD Vari-Bright which is enabled by default through the AMD software or else maximum brightness will automatically lower when running on battery power.

Performance
Testing Conditions
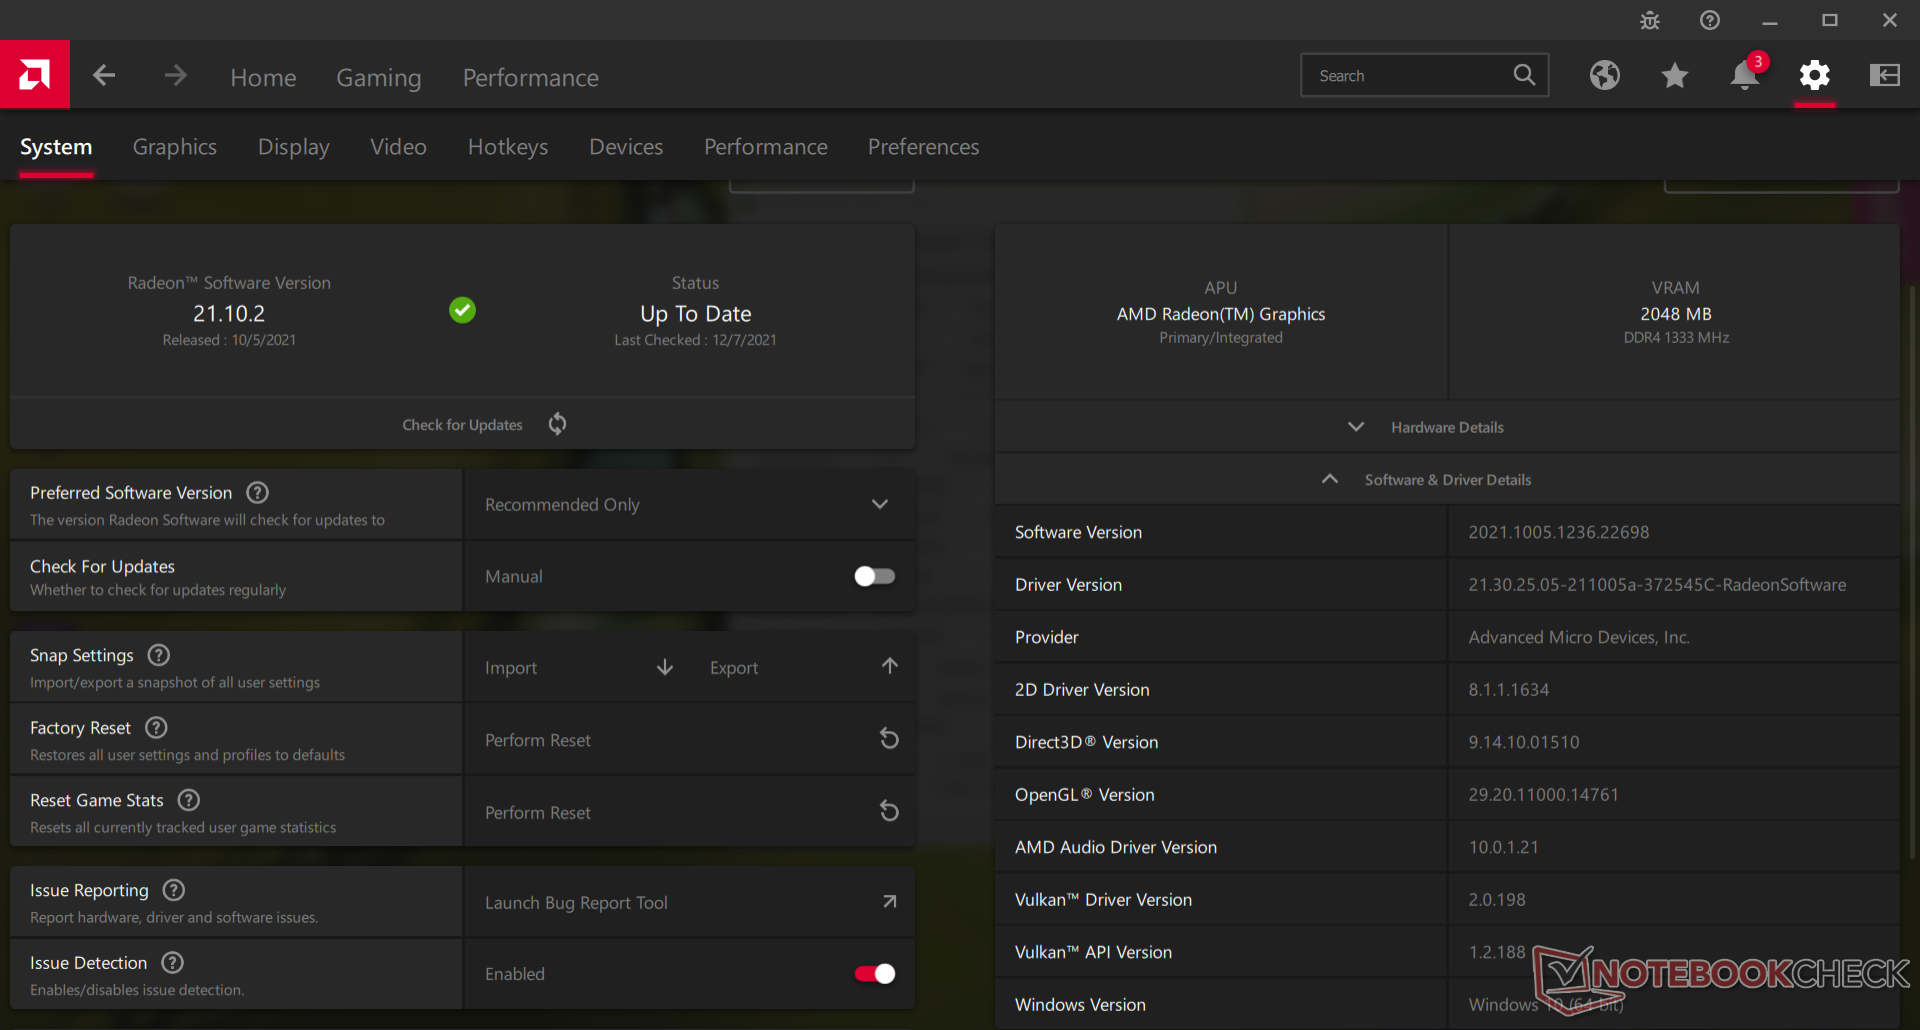
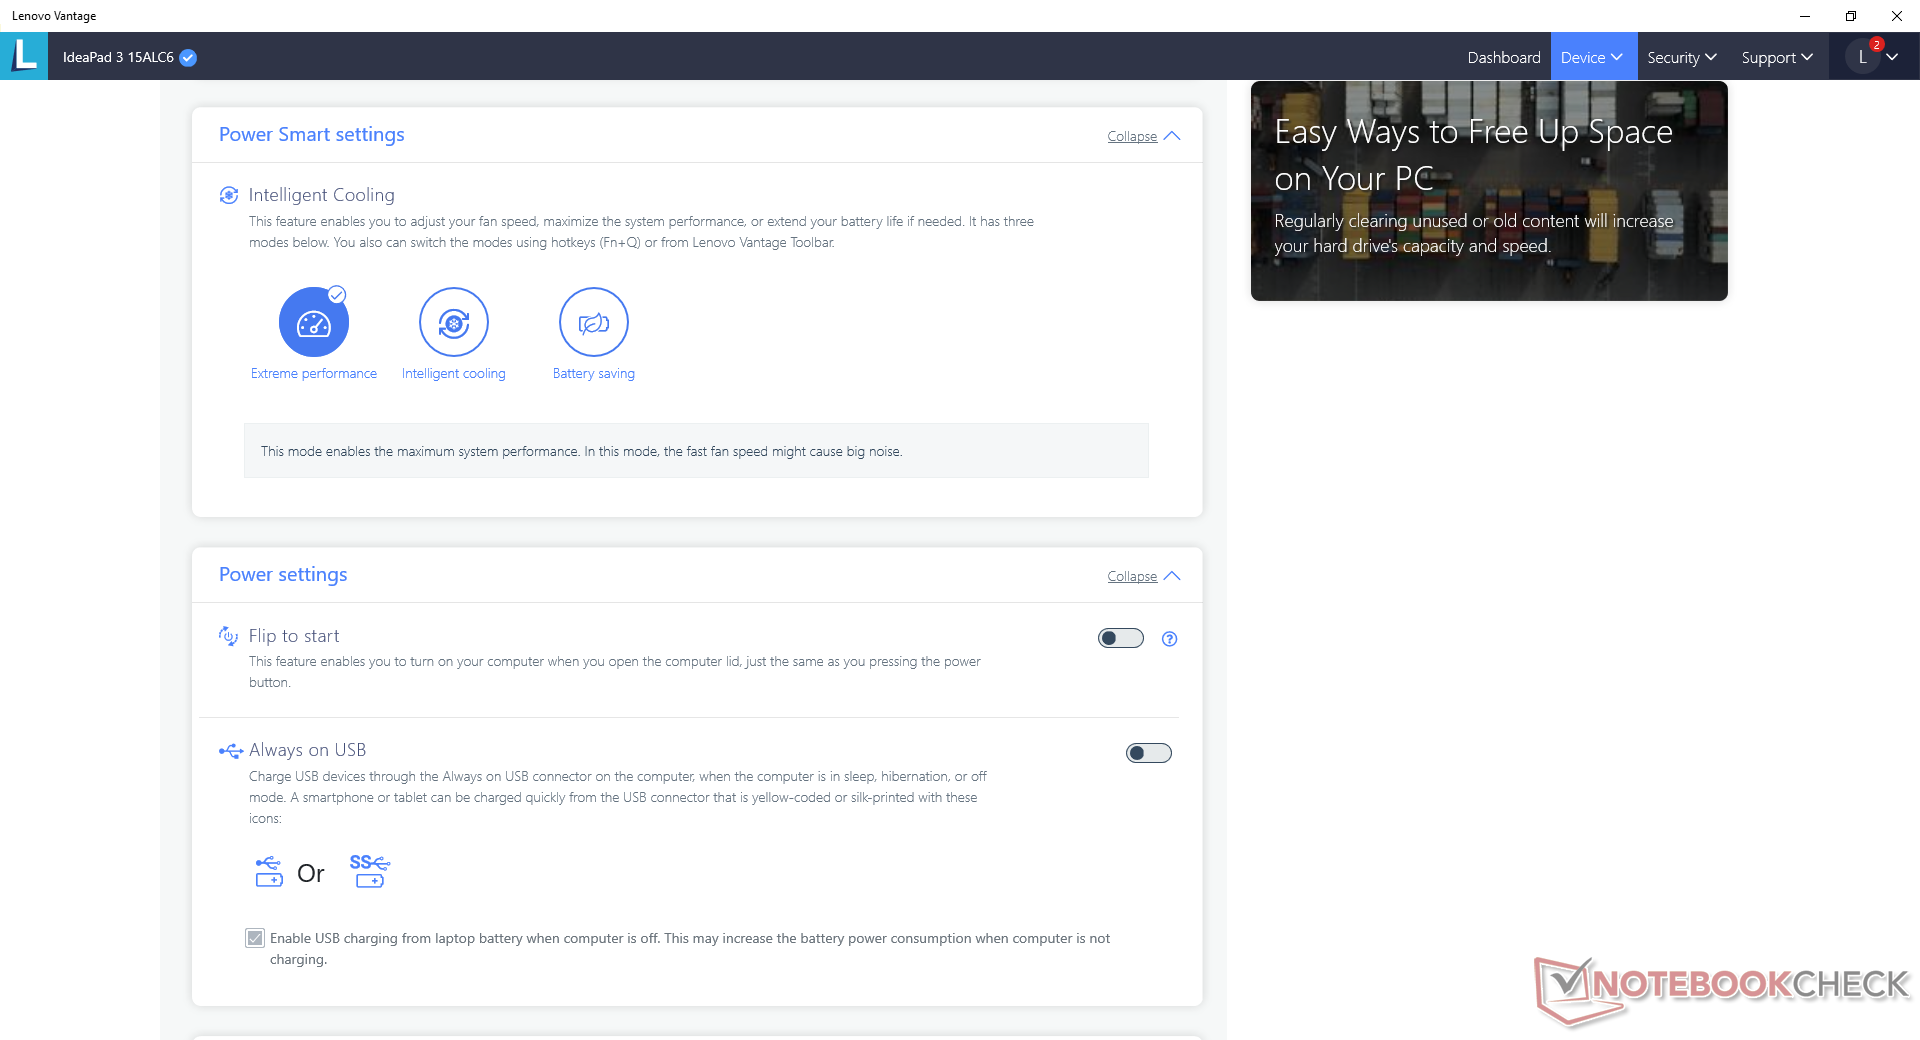
Our unit was set to Extreme Performance mode via the pre-installed Lenovo Vantage software for the highest possible benchmark scores. We recommend users become familiar with both Vantage and the AMD Radeon software as many key system features and updates are toggled here.
Processor — Fast for a Ryzen 3
Raw CPU performance is excellent when considering that the Ryzen 3 is positioned as a Core i3 alternative. Its most striking advantage lies in its multi-thread performance which can be up to 70 to 80 percent faster than the competing Core i3-1115G4 since the Ryzen 3 5300U processor has double the physical cores. Raw multi-thread performance is actually comparable to the Core i7-1165G7 while single-thread performance is only about 25 percent slower.
Performance sustainability is excellent with no major throttling issues when running CineBench R15 xT in a continuous loop.
Cinebench R15 Multi Loop
Cinebench R23: Multi Core | Single Core
Cinebench R20: CPU (Multi Core) | CPU (Single Core)
Cinebench R15: CPU Multi 64Bit | CPU Single 64Bit
Blender: v2.79 BMW27 CPU
7-Zip 18.03: 7z b 4 | 7z b 4 -mmt1
Geekbench 5.5: Multi-Core | Single-Core
HWBOT x265 Benchmark v2.2: 4k Preset
LibreOffice : 20 Documents To PDF
R Benchmark 2.5: Overall mean
| CPU Performance rating | |
| Asus VivoBook S15 D533UA | |
| MSI Prestige 15 A10SC -10! | |
| Asus VivoBook 15 KM513UA-L503TS | |
| HP Pavilion 15-eg -2! | |
| HP Pavilion x360 15-er0155ng | |
| Lenovo IdeaPad 3 15ALC6 | |
| Lenovo IdeaPad 5 15IIL05 -2! | |
| Average AMD Ryzen 3 5300U | |
| Lenovo Ideapad S540-15IML -10! | |
| Lenovo ThinkPad L15 G2-20X4S0KU00 | |
| Teclast TBOLT F15 Pro | |
| HP 255 G7 159P1EA | |
| Beelink U59 -2! | |
| LibreOffice / 20 Documents To PDF | |
| Beelink U59 | |
| HP 255 G7 159P1EA | |
| Teclast TBOLT F15 Pro | |
| Average AMD Ryzen 3 5300U (63.4 - 77.1, n=3) | |
| Lenovo IdeaPad 3 15ALC6 | |
| Asus VivoBook 15 KM513UA-L503TS | |
| Asus VivoBook S15 D533UA | |
| Lenovo IdeaPad 5 15IIL05 | |
| Lenovo ThinkPad L15 G2-20X4S0KU00 | |
| HP Pavilion x360 15-er0155ng | |
| HP Pavilion 15-eg | |
Cinebench R23: Multi Core | Single Core
Cinebench R20: CPU (Multi Core) | CPU (Single Core)
Cinebench R15: CPU Multi 64Bit | CPU Single 64Bit
Blender: v2.79 BMW27 CPU
7-Zip 18.03: 7z b 4 | 7z b 4 -mmt1
Geekbench 5.5: Multi-Core | Single-Core
HWBOT x265 Benchmark v2.2: 4k Preset
LibreOffice : 20 Documents To PDF
R Benchmark 2.5: Overall mean
* ... smaller is better
AIDA64: FP32 Ray-Trace | FPU Julia | CPU SHA3 | CPU Queen | FPU SinJulia | FPU Mandel | CPU AES | CPU ZLib | FP64 Ray-Trace | CPU PhotoWorxx
| Performance rating | |
| Asus VivoBook 15 KM513UA-L503TS | |
| HP Pavilion 15-eg | |
| Lenovo IdeaPad 3 15ALC6 | |
| Lenovo IdeaPad 5 15IIL05 | |
| Dell Inspiron 15 3501 | |
| Average AMD Ryzen 3 5300U | |
| AIDA64 / FP32 Ray-Trace | |
| Asus VivoBook 15 KM513UA-L503TS | |
| Lenovo IdeaPad 3 15ALC6 | |
| Lenovo IdeaPad 5 15IIL05 | |
| HP Pavilion 15-eg | |
| Dell Inspiron 15 3501 | |
| Average AMD Ryzen 3 5300U (3612 - 7053, n=3) | |
| AIDA64 / FPU Julia | |
| Asus VivoBook 15 KM513UA-L503TS | |
| Lenovo IdeaPad 3 15ALC6 | |
| Average AMD Ryzen 3 5300U (33606 - 37829, n=3) | |
| Lenovo IdeaPad 5 15IIL05 | |
| HP Pavilion 15-eg | |
| Dell Inspiron 15 3501 | |
| AIDA64 / CPU SHA3 | |
| Lenovo IdeaPad 5 15IIL05 | |
| HP Pavilion 15-eg | |
| Dell Inspiron 15 3501 | |
| Asus VivoBook 15 KM513UA-L503TS | |
| Lenovo IdeaPad 3 15ALC6 | |
| Average AMD Ryzen 3 5300U (1244 - 1248, n=2) | |
| AIDA64 / CPU Queen | |
| Asus VivoBook 15 KM513UA-L503TS | |
| Lenovo IdeaPad 3 15ALC6 | |
| Average AMD Ryzen 3 5300U (51280 - 51454, n=3) | |
| HP Pavilion 15-eg | |
| Dell Inspiron 15 3501 | |
| Lenovo IdeaPad 5 15IIL05 | |
| AIDA64 / FPU SinJulia | |
| Asus VivoBook 15 KM513UA-L503TS | |
| Lenovo IdeaPad 3 15ALC6 | |
| Average AMD Ryzen 3 5300U (6686 - 6703, n=3) | |
| HP Pavilion 15-eg | |
| Dell Inspiron 15 3501 | |
| Lenovo IdeaPad 5 15IIL05 | |
| AIDA64 / FPU Mandel | |
| Asus VivoBook 15 KM513UA-L503TS | |
| Lenovo IdeaPad 3 15ALC6 | |
| Average AMD Ryzen 3 5300U (17564 - 20109, n=3) | |
| HP Pavilion 15-eg | |
| Lenovo IdeaPad 5 15IIL05 | |
| Dell Inspiron 15 3501 | |
| AIDA64 / CPU AES | |
| HP Pavilion 15-eg | |
| Dell Inspiron 15 3501 | |
| Lenovo IdeaPad 5 15IIL05 | |
| Asus VivoBook 15 KM513UA-L503TS | |
| Lenovo IdeaPad 3 15ALC6 | |
| Average AMD Ryzen 3 5300U (19307 - 34964, n=3) | |
| AIDA64 / CPU ZLib | |
| Asus VivoBook 15 KM513UA-L503TS | |
| Lenovo IdeaPad 3 15ALC6 | |
| Average AMD Ryzen 3 5300U (374 - 396, n=3) | |
| Dell Inspiron 15 3501 | |
| Lenovo IdeaPad 5 15IIL05 | |
| HP Pavilion 15-eg | |
| AIDA64 / FP64 Ray-Trace | |
| Asus VivoBook 15 KM513UA-L503TS | |
| Lenovo IdeaPad 3 15ALC6 | |
| Average AMD Ryzen 3 5300U (3199 - 3768, n=3) | |
| Lenovo IdeaPad 5 15IIL05 | |
| Dell Inspiron 15 3501 | |
| HP Pavilion 15-eg | |
| AIDA64 / CPU PhotoWorxx | |
| HP Pavilion 15-eg | |
| Lenovo IdeaPad 5 15IIL05 | |
| Lenovo IdeaPad 3 15ALC6 | |
| Dell Inspiron 15 3501 | |
| Average AMD Ryzen 3 5300U (16799 - 17037, n=3) | |
| Asus VivoBook 15 KM513UA-L503TS | |
System Performance
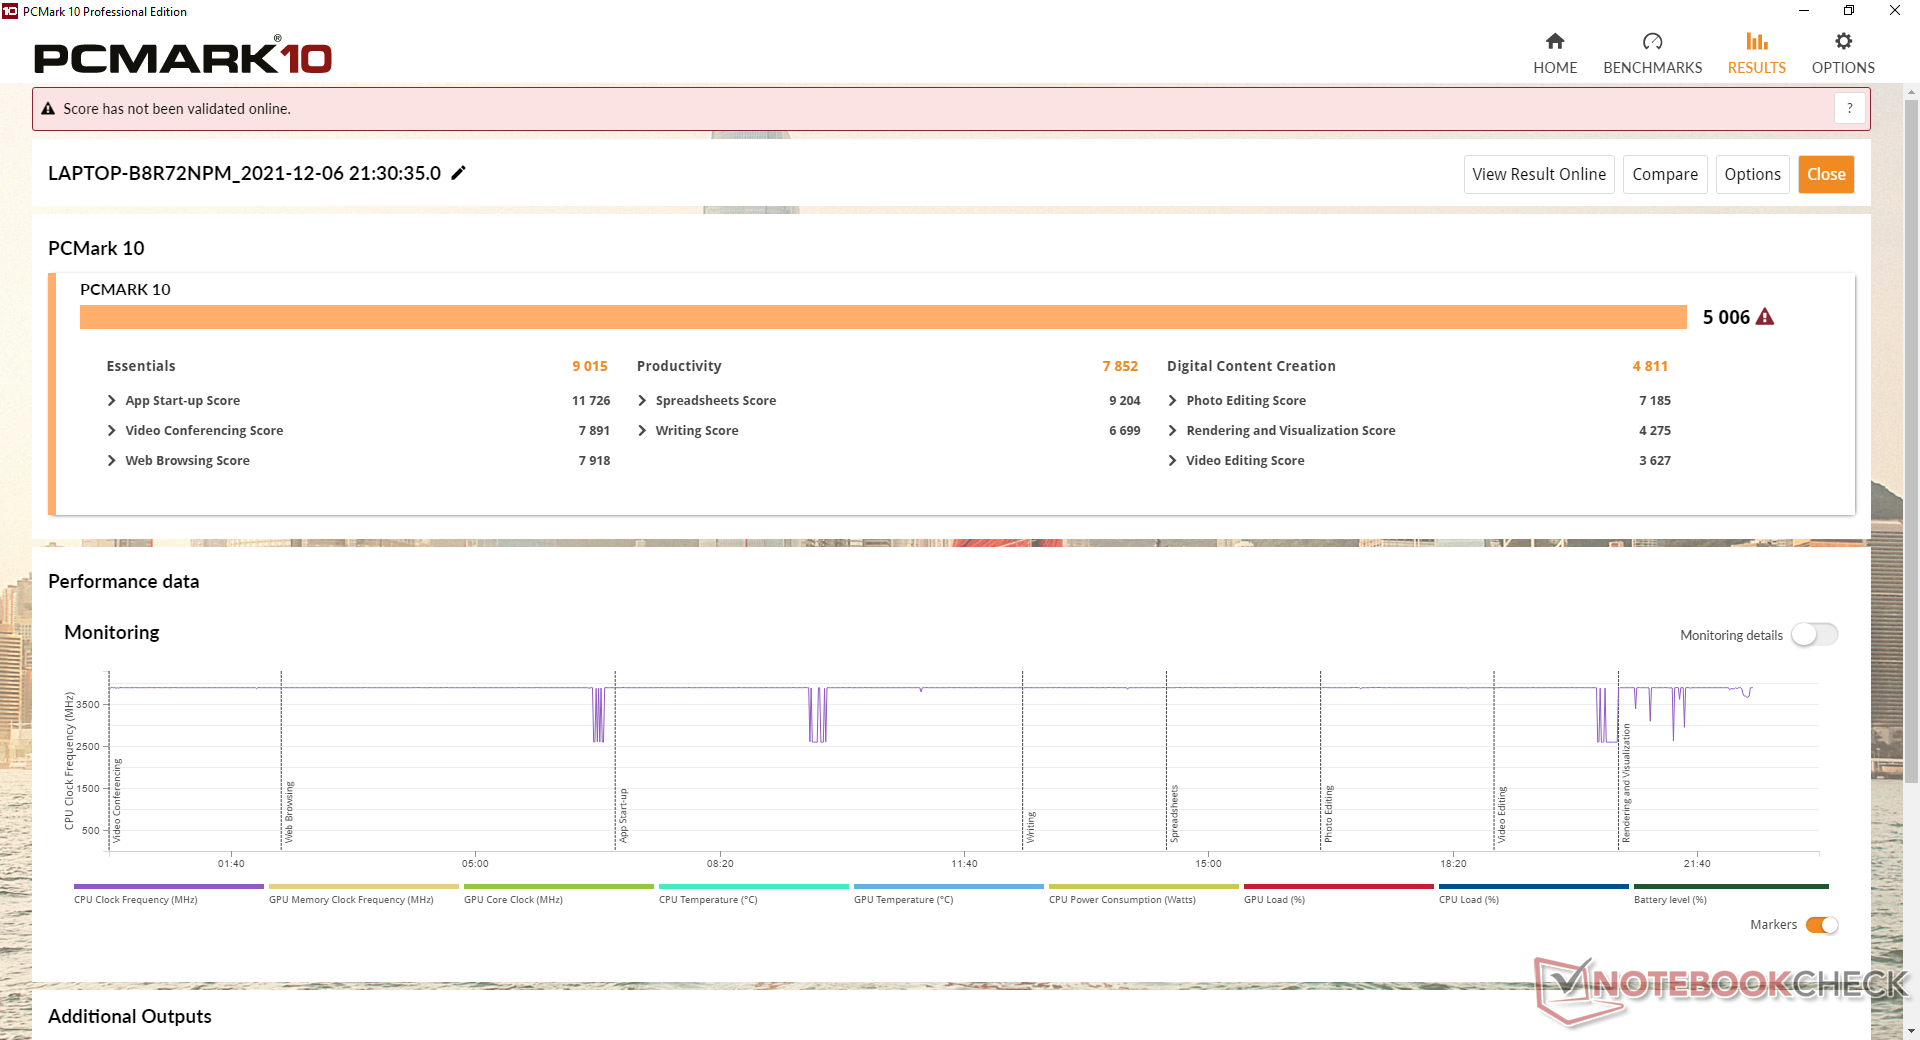
PCMark results are comparable to laptops running on the pricier Intel Core i7-1165G7 such as the Dell Inspiron 15 3501. The UI experience is just as smooth and buttery despite "only" running on a budget Ryzen 3 CPU.
| PCMark 10 / Score | |
| HP Pavilion 15-eg | |
| Asus VivoBook 15 KM513UA-L503TS | |
| Lenovo IdeaPad 3 15ALC6 | |
| Dell Inspiron 15 3501 | |
| Average AMD Ryzen 3 5300U, AMD Radeon RX Vega 6 (Ryzen 4000/5000) (4299 - 5006, n=3) | |
| Lenovo Ideapad S540-15IML | |
| Lenovo IdeaPad 5 15IIL05 | |
| PCMark 10 / Essentials | |
| HP Pavilion 15-eg | |
| Dell Inspiron 15 3501 | |
| Lenovo Ideapad S540-15IML | |
| Asus VivoBook 15 KM513UA-L503TS | |
| Lenovo IdeaPad 3 15ALC6 | |
| Average AMD Ryzen 3 5300U, AMD Radeon RX Vega 6 (Ryzen 4000/5000) (7833 - 9015, n=3) | |
| Lenovo IdeaPad 5 15IIL05 | |
| PCMark 10 / Productivity | |
| HP Pavilion 15-eg | |
| Lenovo IdeaPad 3 15ALC6 | |
| Asus VivoBook 15 KM513UA-L503TS | |
| Lenovo Ideapad S540-15IML | |
| Average AMD Ryzen 3 5300U, AMD Radeon RX Vega 6 (Ryzen 4000/5000) (6596 - 7852, n=3) | |
| Lenovo IdeaPad 5 15IIL05 | |
| Dell Inspiron 15 3501 | |
| PCMark 10 / Digital Content Creation | |
| HP Pavilion 15-eg | |
| Asus VivoBook 15 KM513UA-L503TS | |
| Dell Inspiron 15 3501 | |
| Lenovo IdeaPad 3 15ALC6 | |
| Average AMD Ryzen 3 5300U, AMD Radeon RX Vega 6 (Ryzen 4000/5000) (4136 - 4811, n=3) | |
| Lenovo IdeaPad 5 15IIL05 | |
| Lenovo Ideapad S540-15IML | |
| PCMark 10 Score | 5006 points | |
Help | ||
| AIDA64 / Memory Copy | |
| HP Pavilion 15-eg | |
| Asus VivoBook 15 KM513UA-L503TS | |
| Lenovo IdeaPad 5 15IIL05 | |
| Average AMD Ryzen 3 5300U (30710 - 36092, n=3) | |
| Lenovo IdeaPad 3 15ALC6 | |
| Dell Inspiron 15 3501 | |
| AIDA64 / Memory Read | |
| HP Pavilion 15-eg | |
| Asus VivoBook 15 KM513UA-L503TS | |
| Lenovo IdeaPad 5 15IIL05 | |
| Dell Inspiron 15 3501 | |
| Lenovo IdeaPad 3 15ALC6 | |
| Average AMD Ryzen 3 5300U (34493 - 35443, n=3) | |
| AIDA64 / Memory Write | |
| HP Pavilion 15-eg | |
| Lenovo IdeaPad 5 15IIL05 | |
| Average AMD Ryzen 3 5300U (38052 - 40554, n=3) | |
| Asus VivoBook 15 KM513UA-L503TS | |
| Lenovo IdeaPad 3 15ALC6 | |
| Dell Inspiron 15 3501 | |
| AIDA64 / Memory Latency | |
| Average AMD Ryzen 3 5300U (97.1 - 113.5, n=3) | |
| Lenovo IdeaPad 3 15ALC6 | |
| Asus VivoBook 15 KM513UA-L503TS | |
| Dell Inspiron 15 3501 | |
| Lenovo IdeaPad 5 15IIL05 | |
| HP Pavilion 15-eg | |
* ... smaller is better
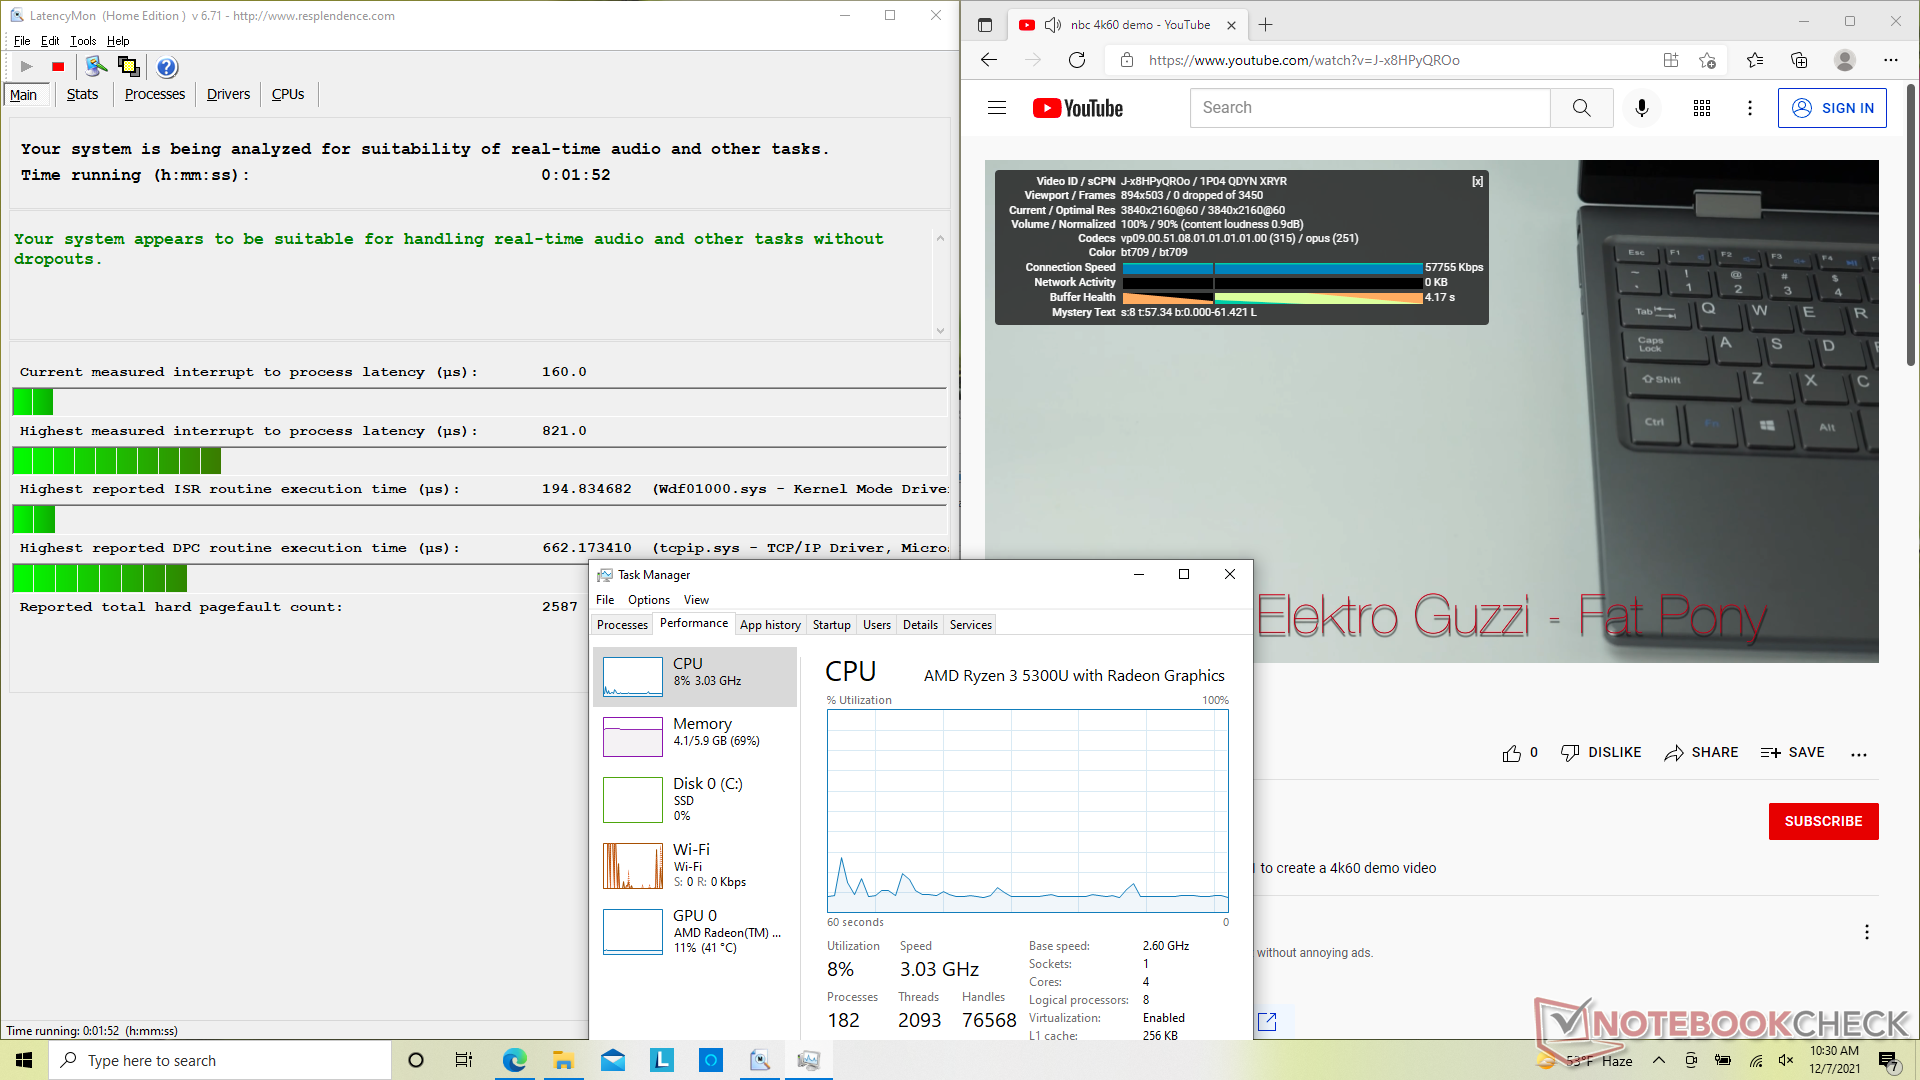
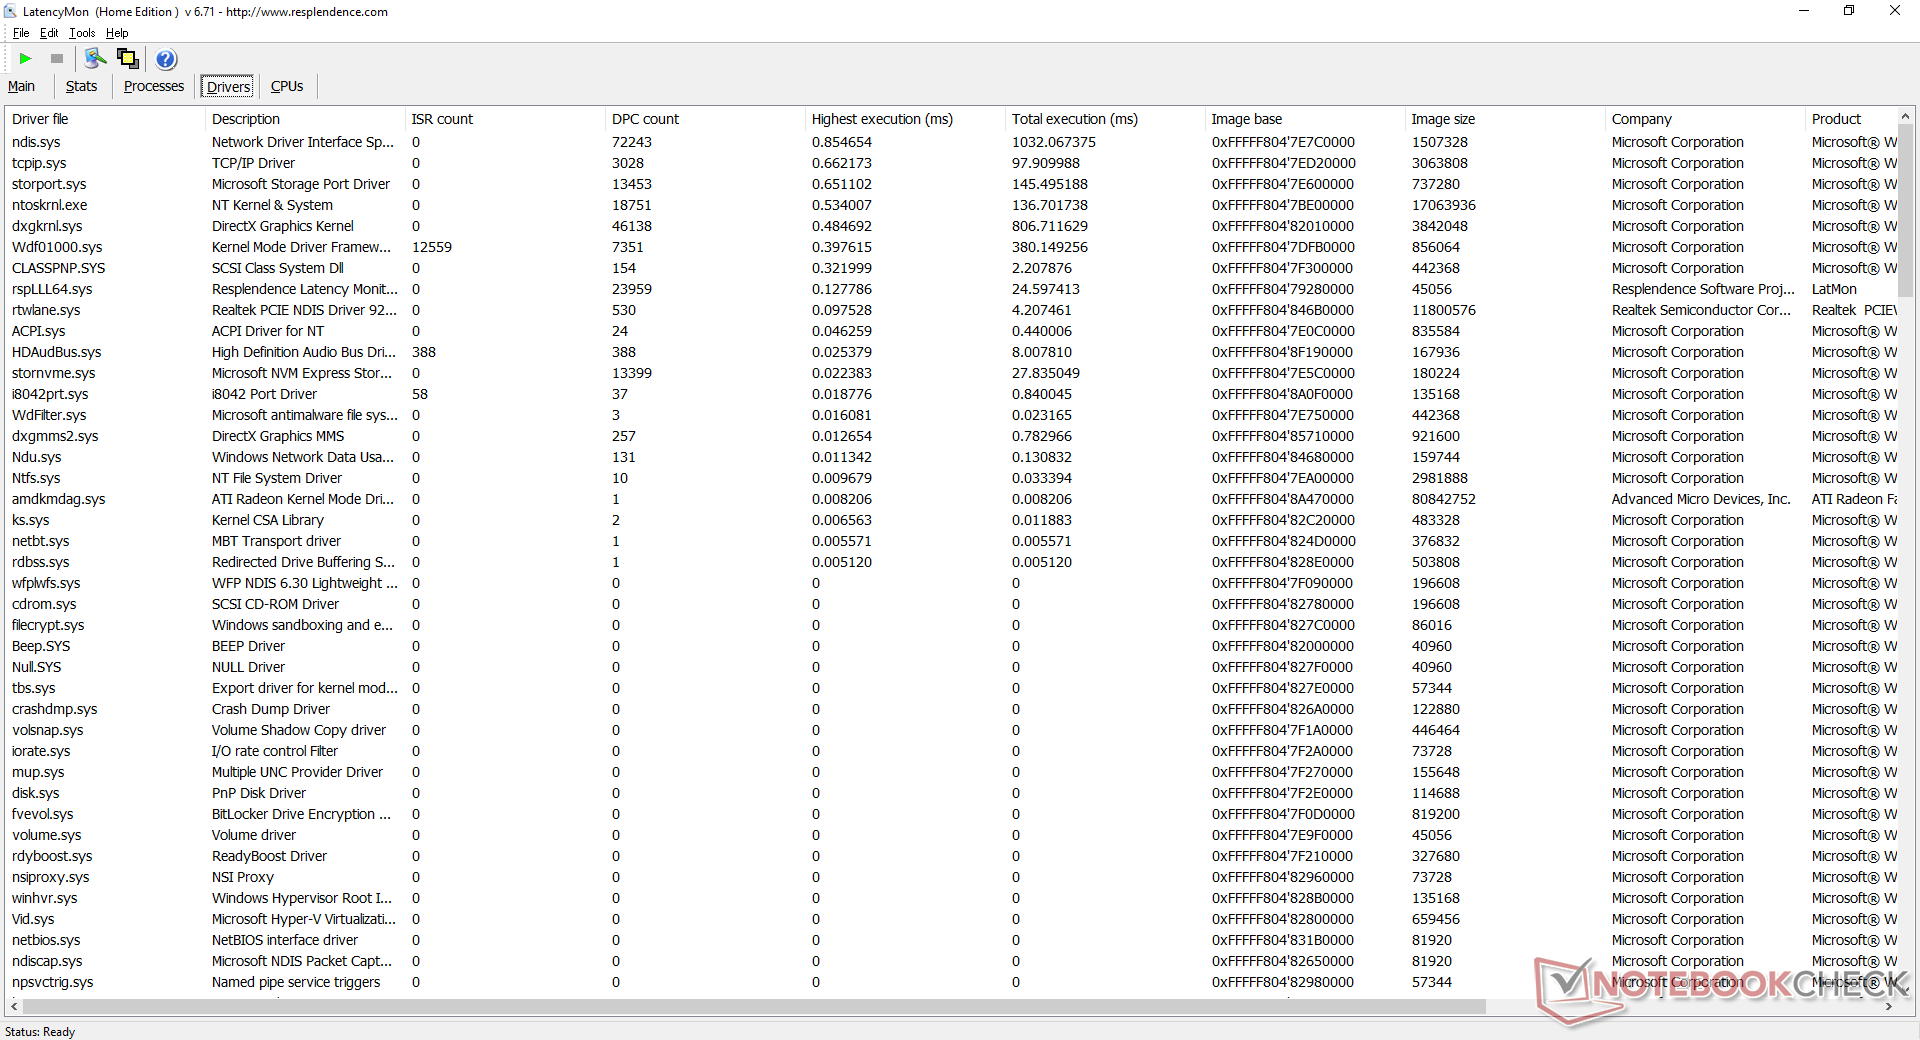
DPC Latency
LatencyMon shows no latency issues when opening multiple browser tabs on our homepage. 4K video playback at 60 FPS is perfect with minimal CPU and GPU utilization and no dropped frames.
| DPC Latencies / LatencyMon - interrupt to process latency (max), Web, Youtube, Prime95 | |
| HP Pavilion 15-eg | |
| Asus VivoBook 15 KM513UA-L503TS | |
| Dell Inspiron 15 3501 | |
| Lenovo IdeaPad 3 15ALC6 | |
| Lenovo IdeaPad 5 15IIL05 | |
* ... smaller is better
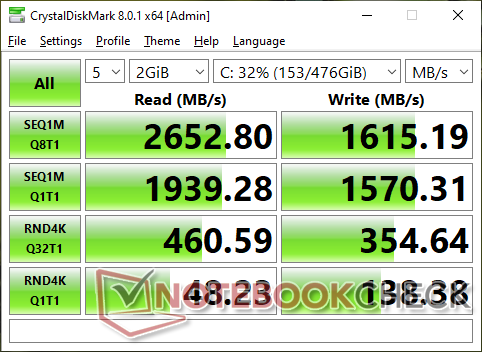
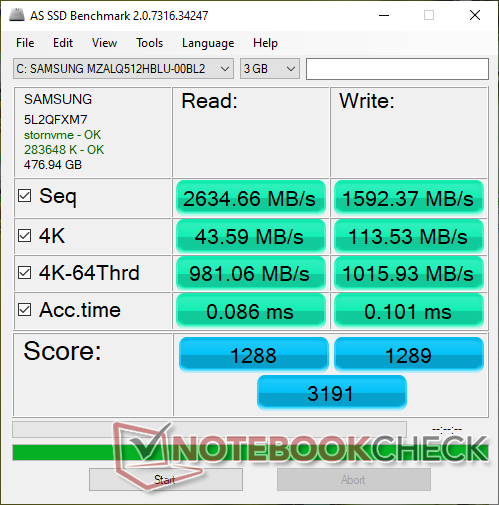
Storage Devices — Just One M.2 2280 PCIe3 x4 Slot
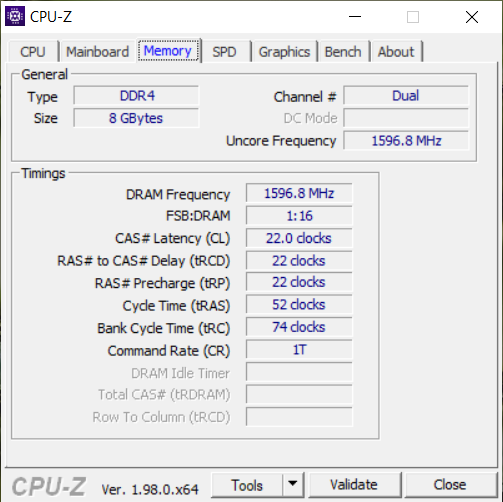
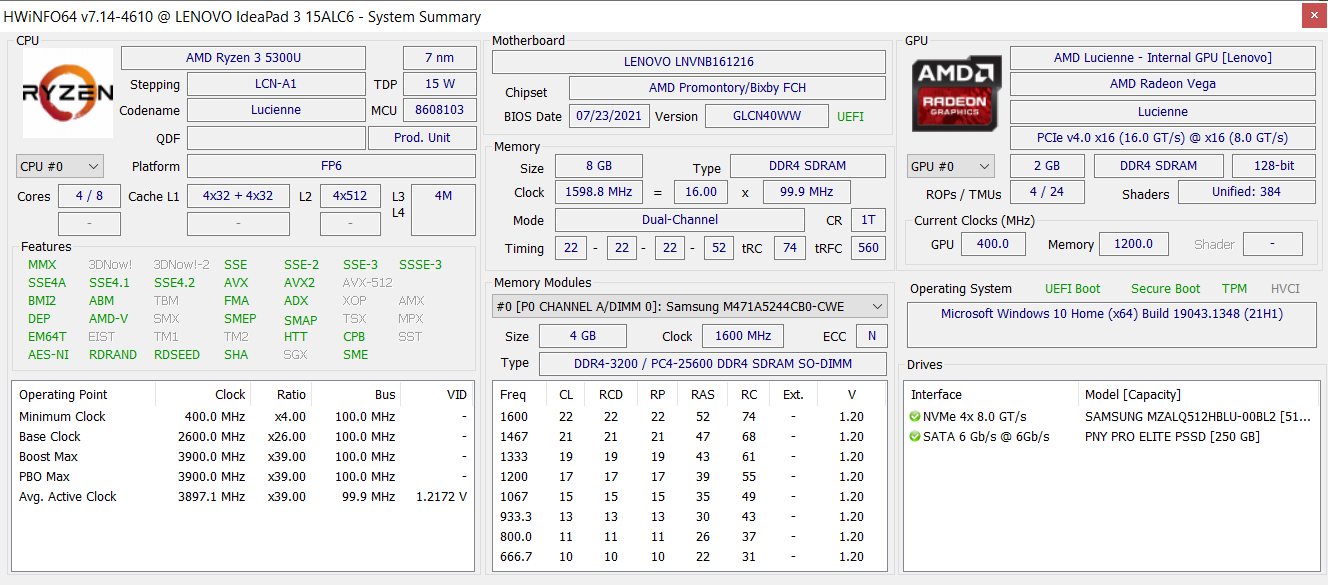
The 512 GB Samsung PM991a is an upper midrange PCIe3 x4 NVMe SSD with theoretical sequential read and write rates of 3100 MB/s and 1800 MB/s, respectively, according to Samsung's official specifications. However, the drive in our Lenovo is a bit slower with real-world read and write rates only approaching 2700 MB/s and 1600 MB/s, respectively. Performance appears to slow if stressed for long periods as shown by our DiskSpd Read Loop test below likely due to thermal reasons.

| Drive Performance rating - Percent | |
| Lenovo Ideapad S540-15IML -8! | |
| Dell Inspiron 15 3501 | |
| Lenovo IdeaPad 3 15ALC6 | |
| HP Pavilion 15-eg | |
| Lenovo IdeaPad 5 15IIL05 | |
| Asus VivoBook 15 KM513UA-L503TS | |
* ... smaller is better
Disk Throttling: DiskSpd Read Loop, Queue Depth 8
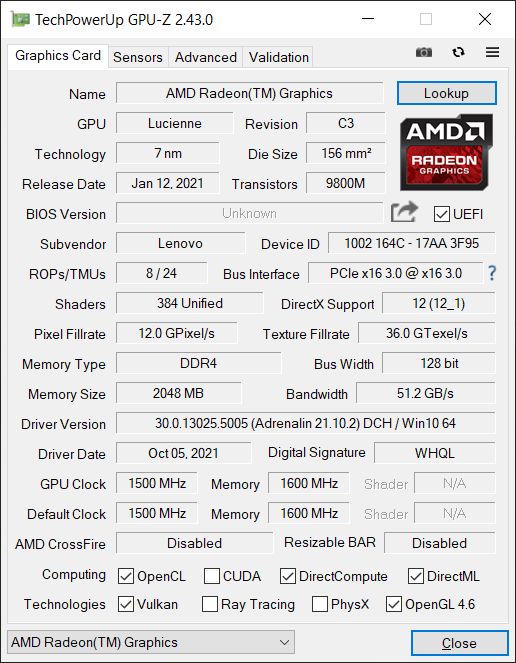
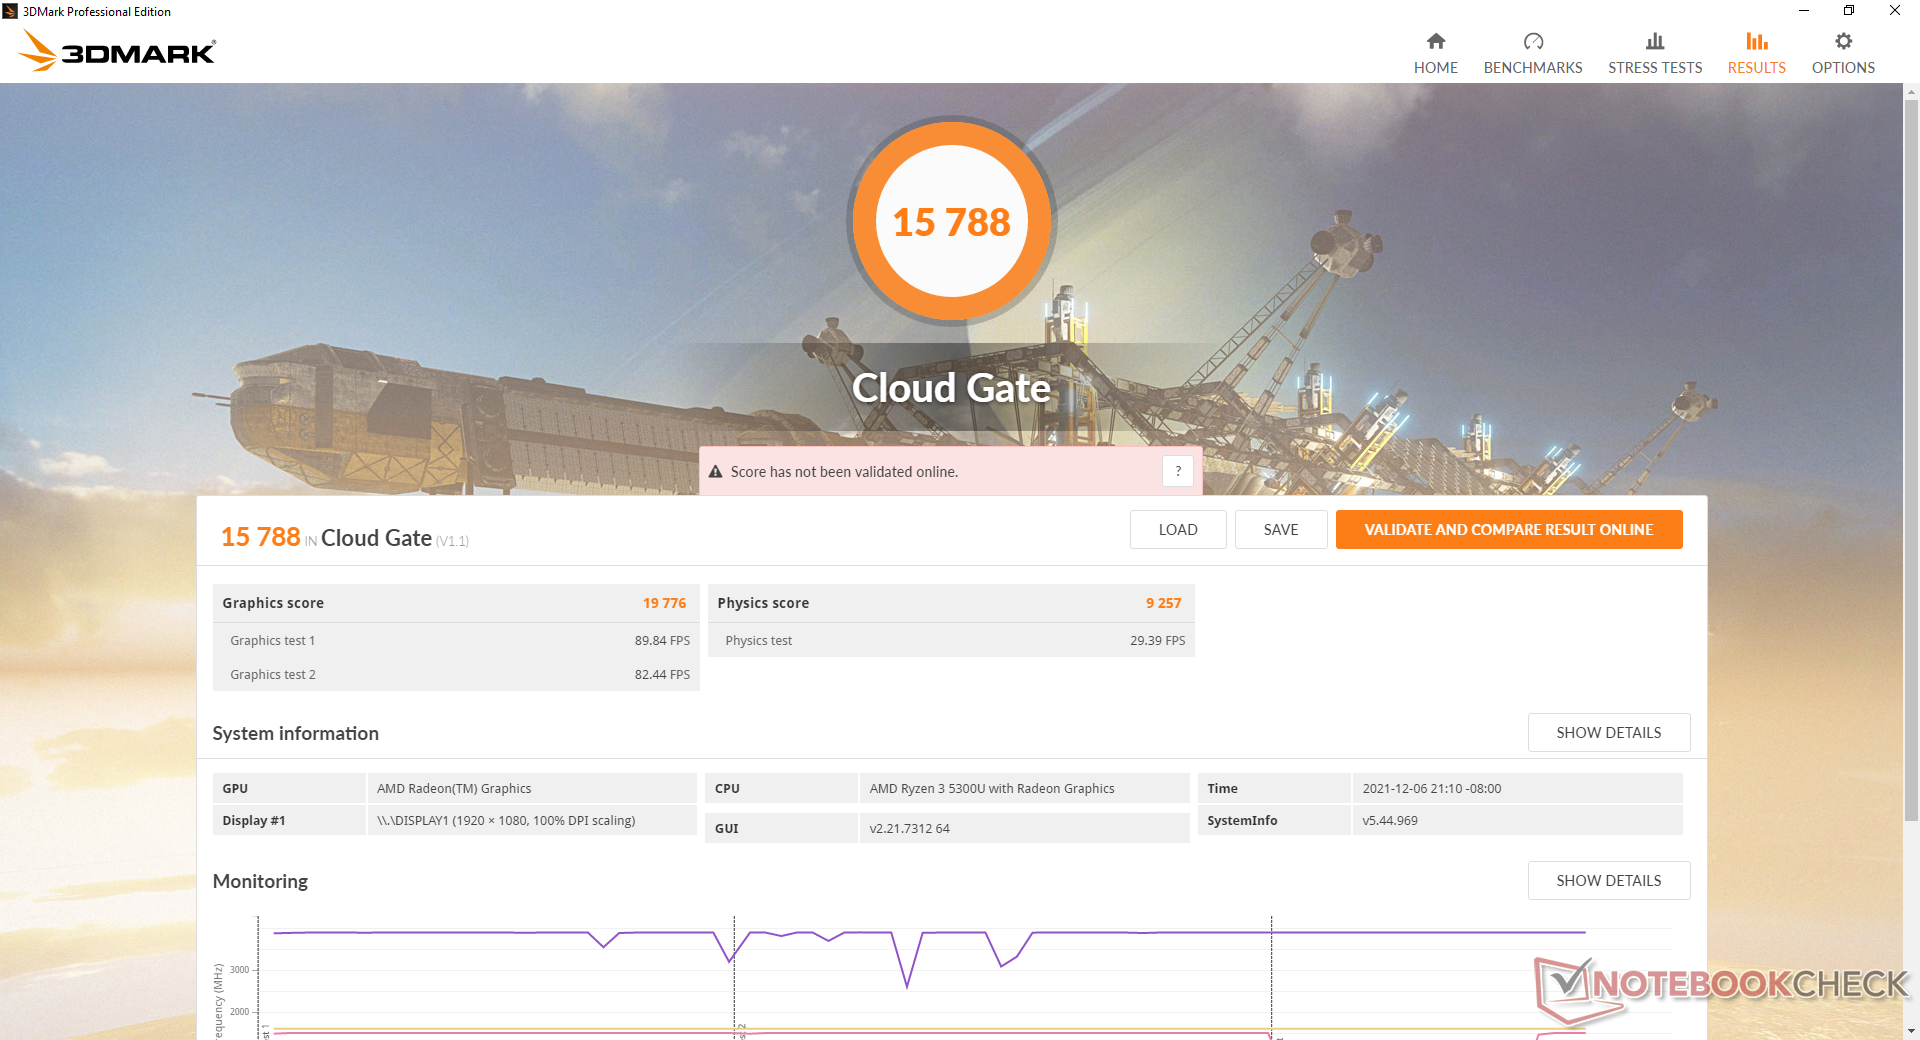
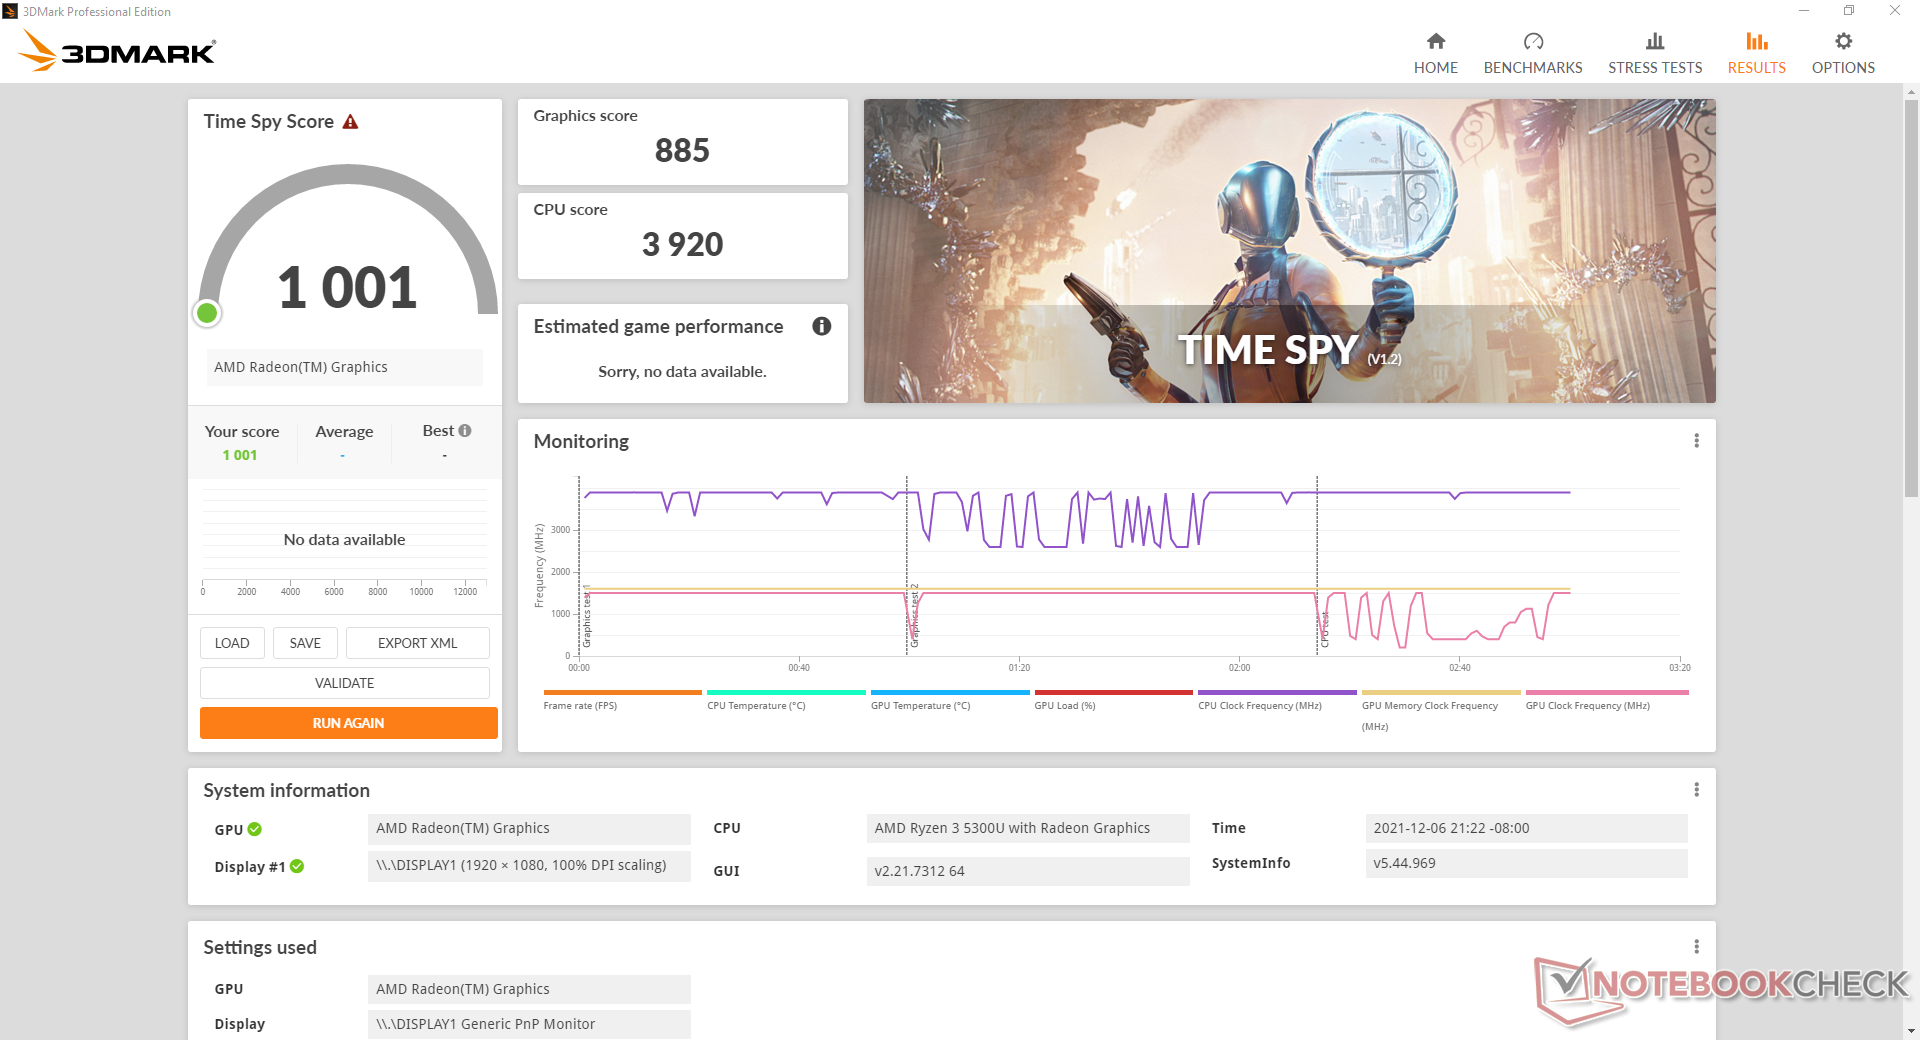
GPU Performance — Much Better than UHD Graphics 620
Raw graphics performance is 30 to 50 percent faster than the Iris Xe G4 48 EUs as found on many 11th gen Intel Core i3 CPUs or approximately 2x faster than the common UHD Graphics 620. Though the speed boost is notable, it's still not enough to run most games well at resolutions greater than 720p. Upgrading to the Ryzen 7 5700U SKU with its more powerful Radeon RX Vega 8 will boost performance by about 30 percent over our Radeon RX Vega 6.
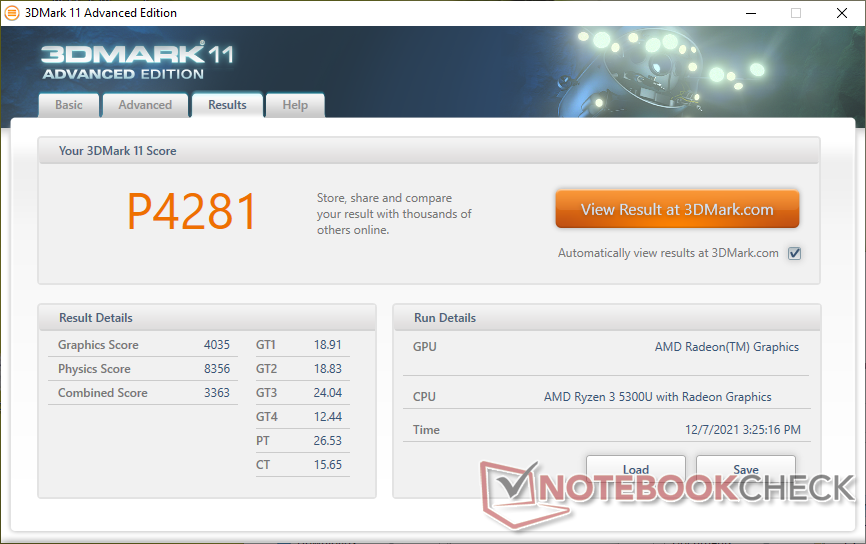
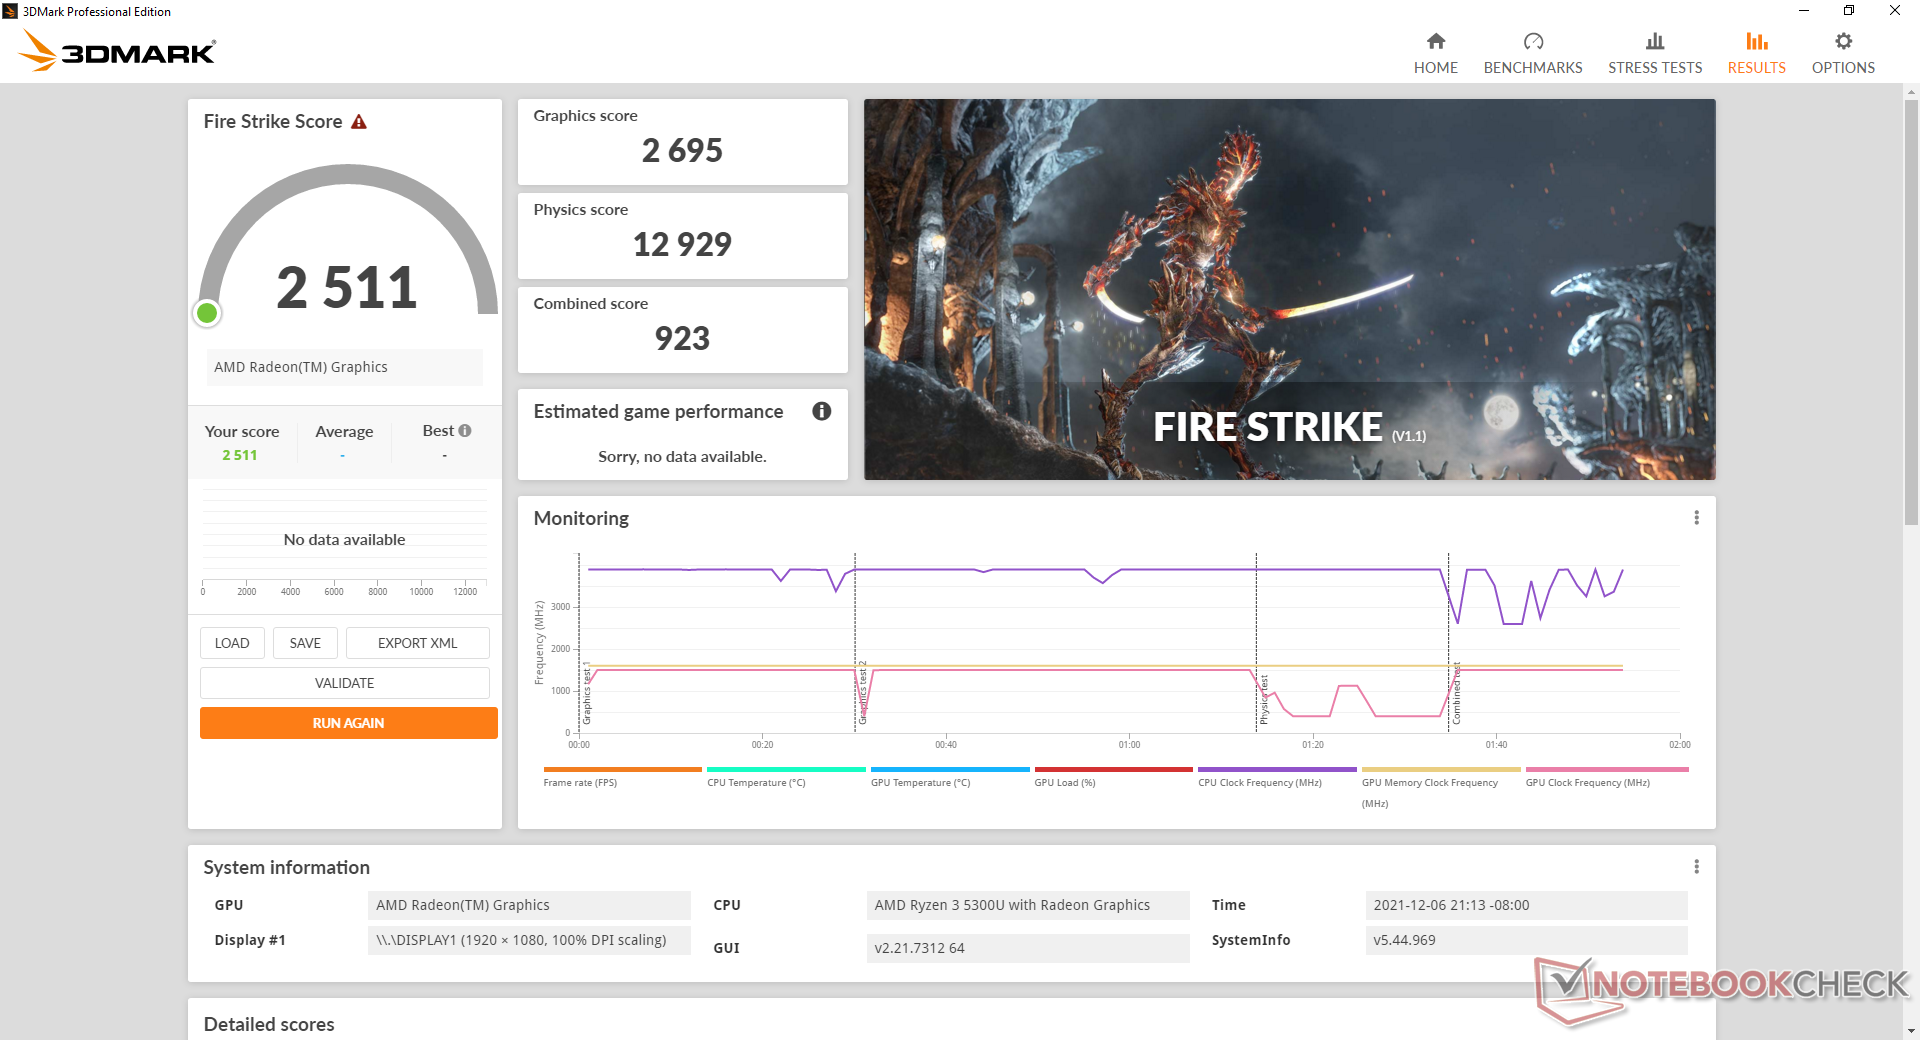
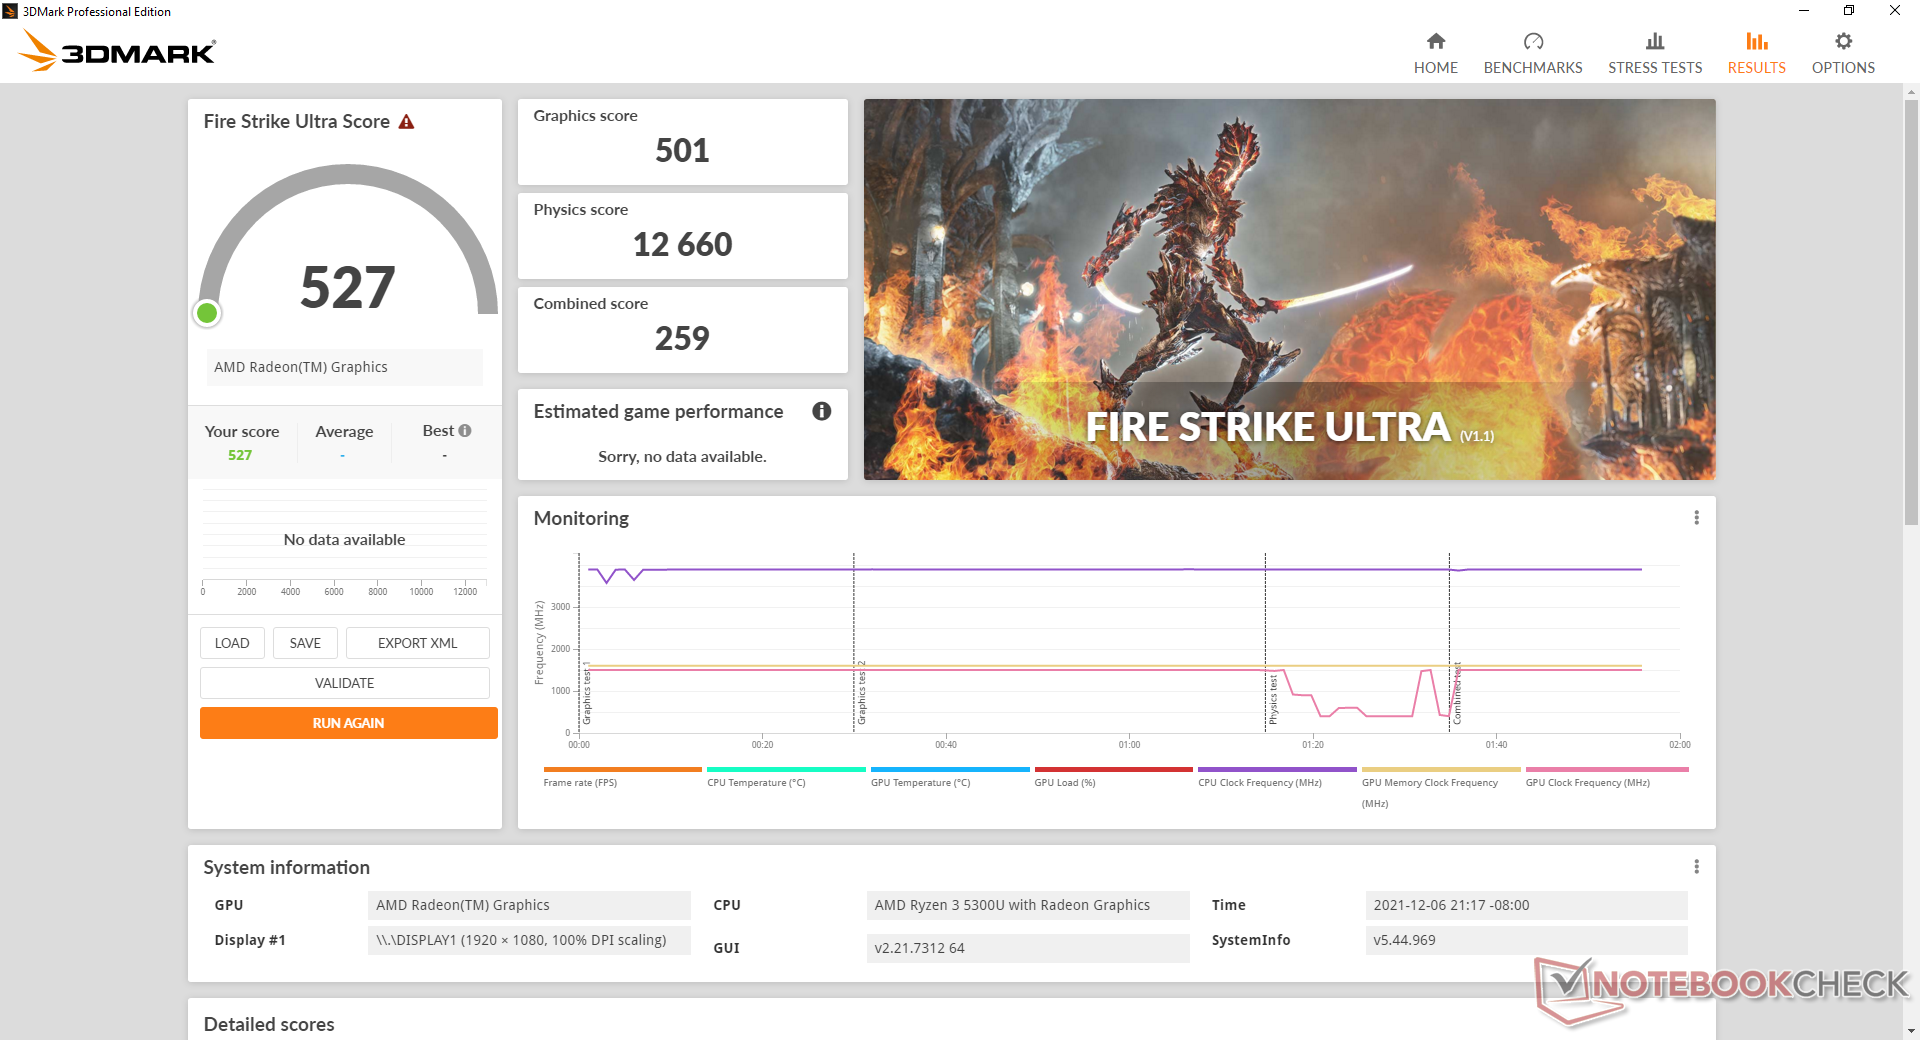
| 3DMark 11 Performance | 4281 points | |
| 3DMark Cloud Gate Standard Score | 15788 points | |
| 3DMark Fire Strike Score | 2511 points | |
| 3DMark Time Spy Score | 1001 points | |
Help | ||
Witcher 3 FPS Chart
| low | med. | high | ultra | |
|---|---|---|---|---|
| GTA V (2015) | 81.7 | 72.5 | 20.6 | 9.41 |
| The Witcher 3 (2015) | 52.2 | 33 | 17 | 10.2 |
| Dota 2 Reborn (2015) | 95.5 | 74 | 42.4 | 40 |
| Final Fantasy XV Benchmark (2018) | 28.6 | 14.2 | 9.99 | |
| X-Plane 11.11 (2018) | 36.7 | 28 | 25.5 | |
| Far Cry 5 (2018) | 39 | 18 | 16 | 15 |
| Strange Brigade (2018) | 67.3 | 26.3 | 21.7 | 18.5 |
Emissions
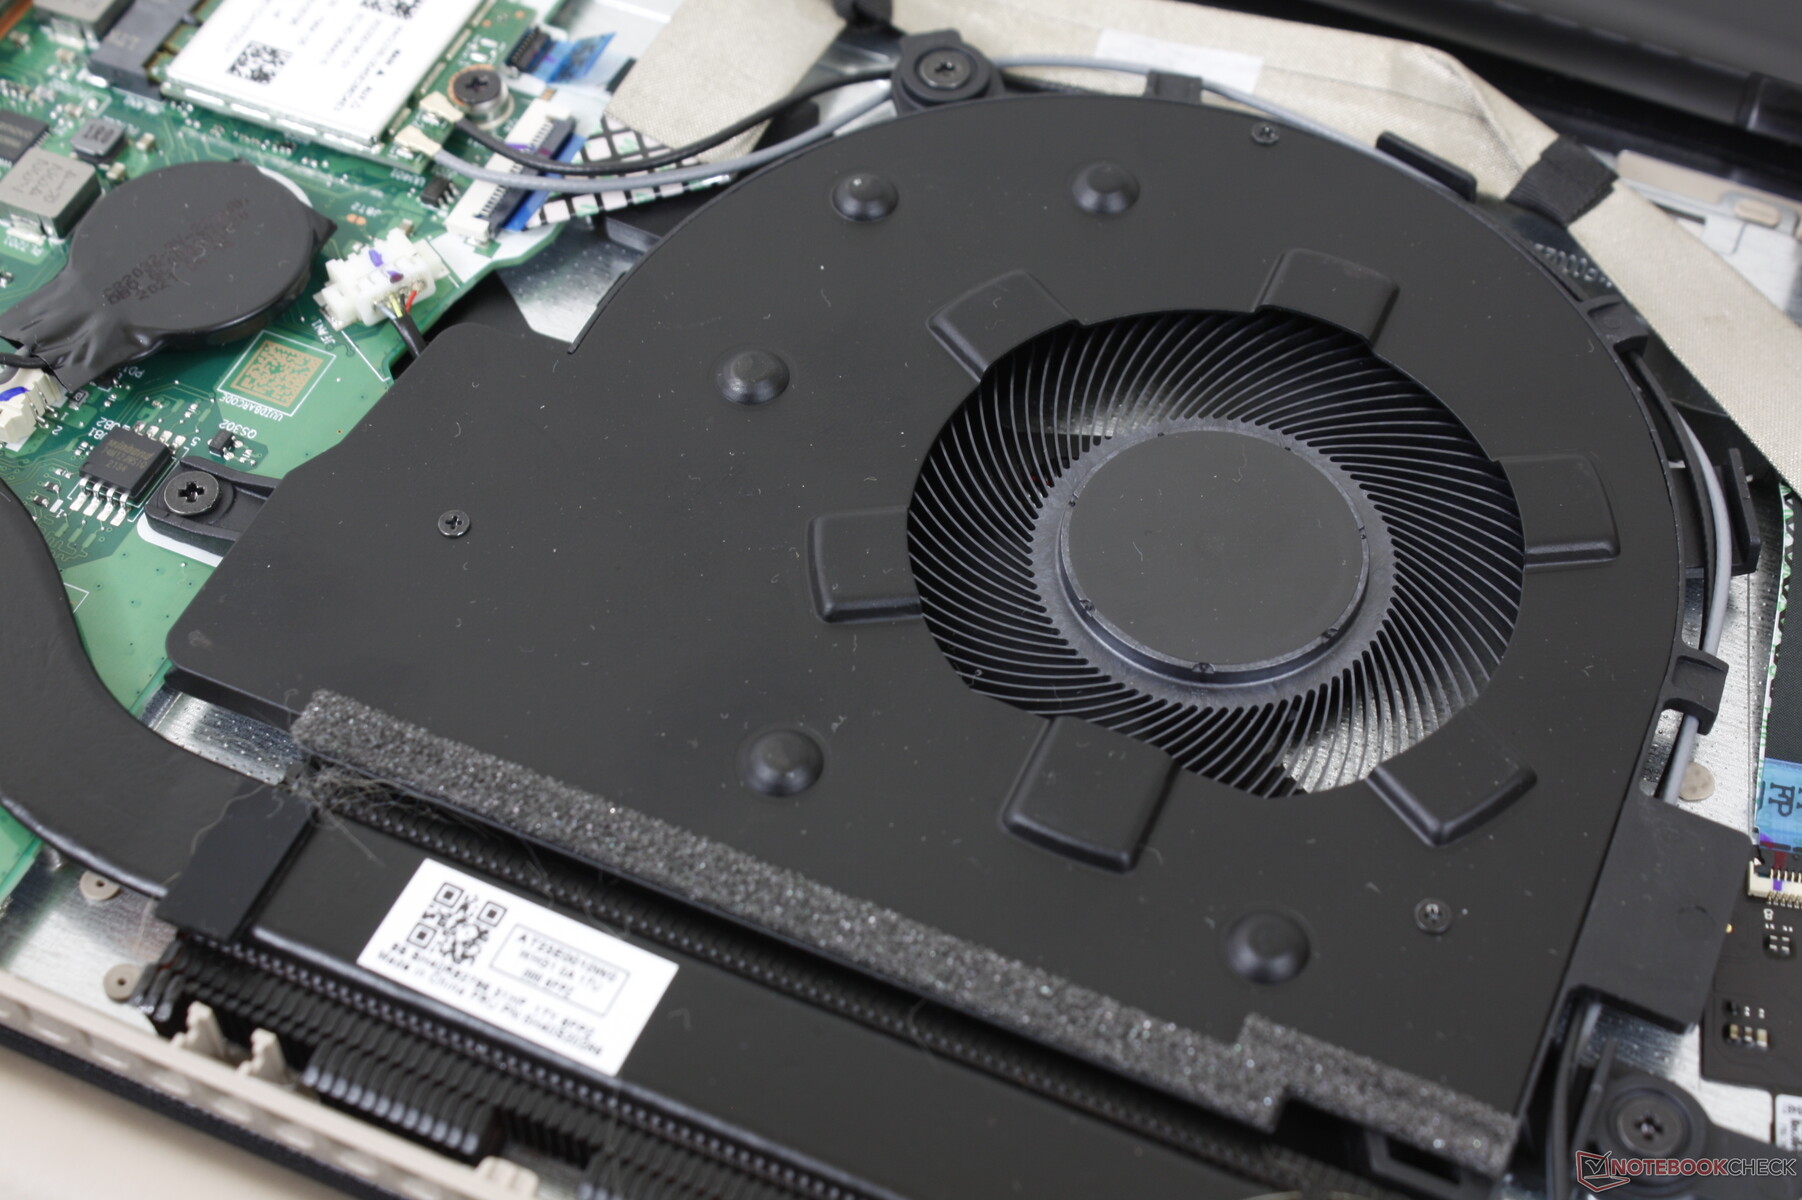
System Noise — Quiet Under Most Conditions
The system is quieter than expected. Running the first benchmark scene in 3DMark 06, for example, would cause the fan to top out at just 32 dB(A) compared to 40 dB(A) on the GeForce-powered IdeaPad 5 or HP Pavilion 15. If the CPU is stressed more heavily for longer periods, however, fan noise would steadily rise to 44 dB(A) to be more in line with what we've observed on other inexpensive multimedia laptops. In short, it takes our IdeaPad 3 longer to reach the same maximum fan noise levels as many of its peers.
Noise level
| Idle |
| 25.8 / 25.8 / 25.8 dB(A) |
| Load |
| 32.3 / 44 dB(A) |
 | ||
30 dB silent 40 dB(A) audible 50 dB(A) loud |
||
min: | ||
| Lenovo IdeaPad 3 15ALC6 Vega 6, R3 5300U, Samsung PM991a MZALQ512HBLU | Lenovo IdeaPad 5 15IIL05 GeForce MX350, i5-1035G1, SK hynix BC511 HFM512GDHTNI-87A0B | Lenovo Ideapad S540-15IML GeForce MX250, i5-10210U, Samsung SSD PM981a MZVLB512HBJQ | Dell Inspiron 15 3501 Iris Xe G7 96EUs, i7-1165G7, Samsung PM991a MZ9LQ512HBLU-00BD1 | HP Pavilion 15-eg GeForce MX450, i7-1165G7, Samsung PM991 MZVLQ1T0HALB | Asus VivoBook 15 KM513UA-L503TS Vega 7, R5 5500U, WDC PC SN530 SDBPMPZ-265G | |
|---|---|---|---|---|---|---|
| Noise | -21% | -21% | 0% | -5% | -12% | |
| off / environment * (dB) | 25.2 | 30.7 -22% | 30 -19% | 26 -3% | 25.4 -1% | 28.28 -12% |
| Idle Minimum * (dB) | 25.8 | 30.7 -19% | 30 -16% | 26 -1% | 25.6 1% | 28.28 -10% |
| Idle Average * (dB) | 25.8 | 30.7 -19% | 32 -24% | 26 -1% | 25.6 1% | 28.28 -10% |
| Idle Maximum * (dB) | 25.8 | 30.7 -19% | 37 -43% | 26 -1% | 25.6 1% | 28.28 -10% |
| Load Average * (dB) | 32.3 | 43.4 -34% | 41 -27% | 35.9 -11% | 39.2 -21% | 35.76 -11% |
| Witcher 3 ultra * (dB) | 32 | 43.2 -35% | 39 -22% | 39.1 -22% | 42.79 -34% | |
| Load Maximum * (dB) | 44 | 43.7 1% | 42 5% | 35.8 19% | 41.5 6% | 42.67 3% |
* ... smaller is better
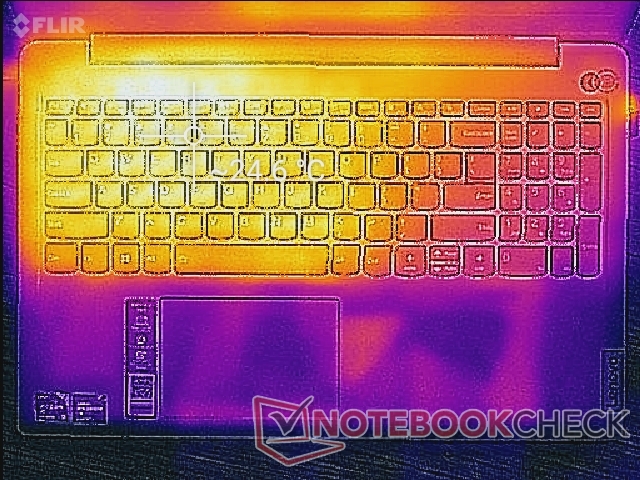
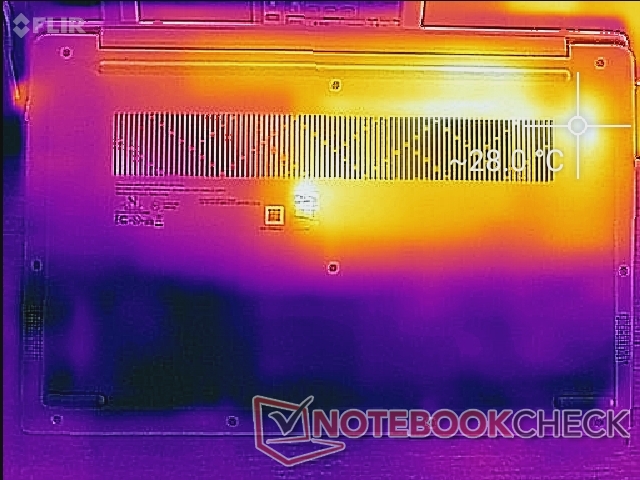
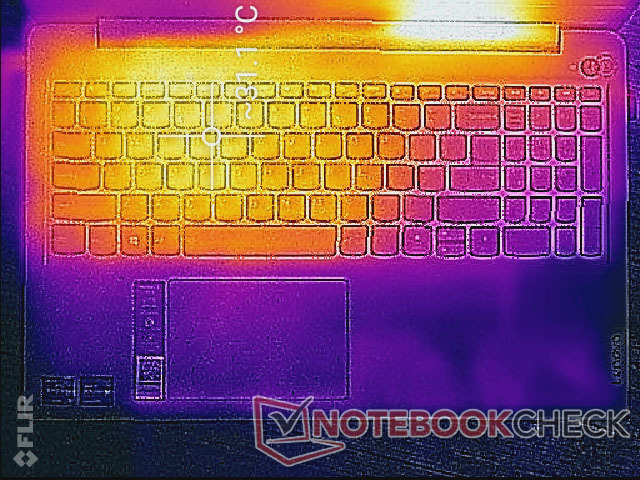
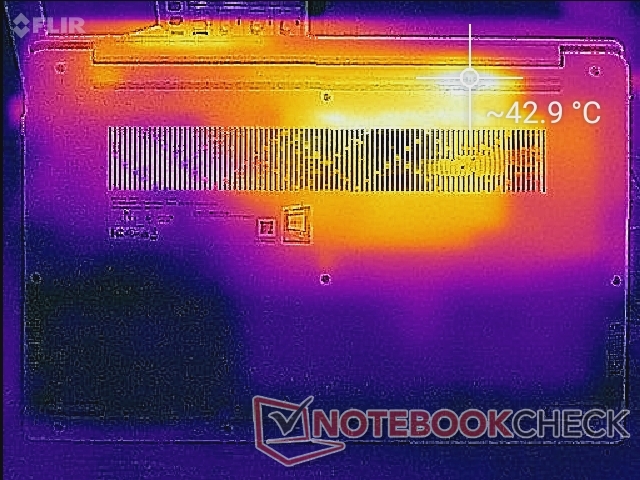
Temperature
Surface temperatures are never overly warm no matter the load especially on the keyboard deck. Hot spots when gaming are barely over 30 C as shown by our temperature maps below compared to 40 C on the Asus VivoBook 15 KM513UA. The bottom of our Lenovo can reach 43 C, but this is thankfully just a small spot towards the rear of the system where users are unlikely to touch.
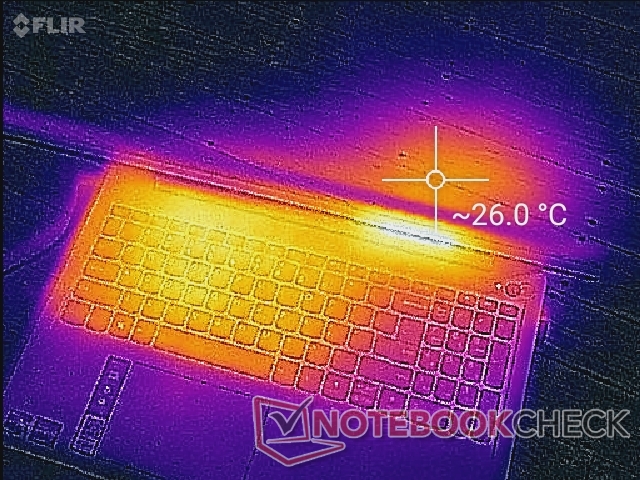
(+) The maximum temperature on the upper side is 31.2 °C / 88 F, compared to the average of 36.8 °C / 98 F, ranging from 21 to 71 °C for the class Multimedia.
(±) The bottom heats up to a maximum of 43 °C / 109 F, compared to the average of 39.1 °C / 102 F
(+) In idle usage, the average temperature for the upper side is 22.8 °C / 73 F, compared to the device average of 31.3 °C / 88 F.
(+) The palmrests and touchpad are cooler than skin temperature with a maximum of 21 °C / 69.8 F and are therefore cool to the touch.
(+) The average temperature of the palmrest area of similar devices was 28.7 °C / 83.7 F (+7.7 °C / 13.9 F).
| Lenovo IdeaPad 3 15ALC6 AMD Ryzen 3 5300U, AMD Radeon RX Vega 6 (Ryzen 4000/5000) | Lenovo IdeaPad 5 15IIL05 Intel Core i5-1035G1, NVIDIA GeForce MX350 | Lenovo Ideapad S540-15IML Intel Core i5-10210U, NVIDIA GeForce MX250 | Dell Inspiron 15 3501 Intel Core i7-1165G7, Intel Iris Xe Graphics G7 96EUs | HP Pavilion 15-eg Intel Core i7-1165G7, NVIDIA GeForce MX450 | Asus VivoBook 15 KM513UA-L503TS AMD Ryzen 5 5500U, AMD Radeon RX Vega 7 | |
|---|---|---|---|---|---|---|
| Heat | -21% | -8% | -15% | -19% | -22% | |
| Maximum Upper Side * (°C) | 31.2 | 43.1 -38% | 42 -35% | 45.6 -46% | 44 -41% | 43.8 -40% |
| Maximum Bottom * (°C) | 43 | 50.9 -18% | 45 -5% | 41 5% | 53.4 -24% | 42.2 2% |
| Idle Upper Side * (°C) | 24.8 | 29 -17% | 25 -1% | 28.2 -14% | 27.4 -10% | 33.4 -35% |
| Idle Bottom * (°C) | 28.2 | 31 -10% | 26 8% | 29.1 -3% | 28.8 -2% | 32.6 -16% |
* ... smaller is better
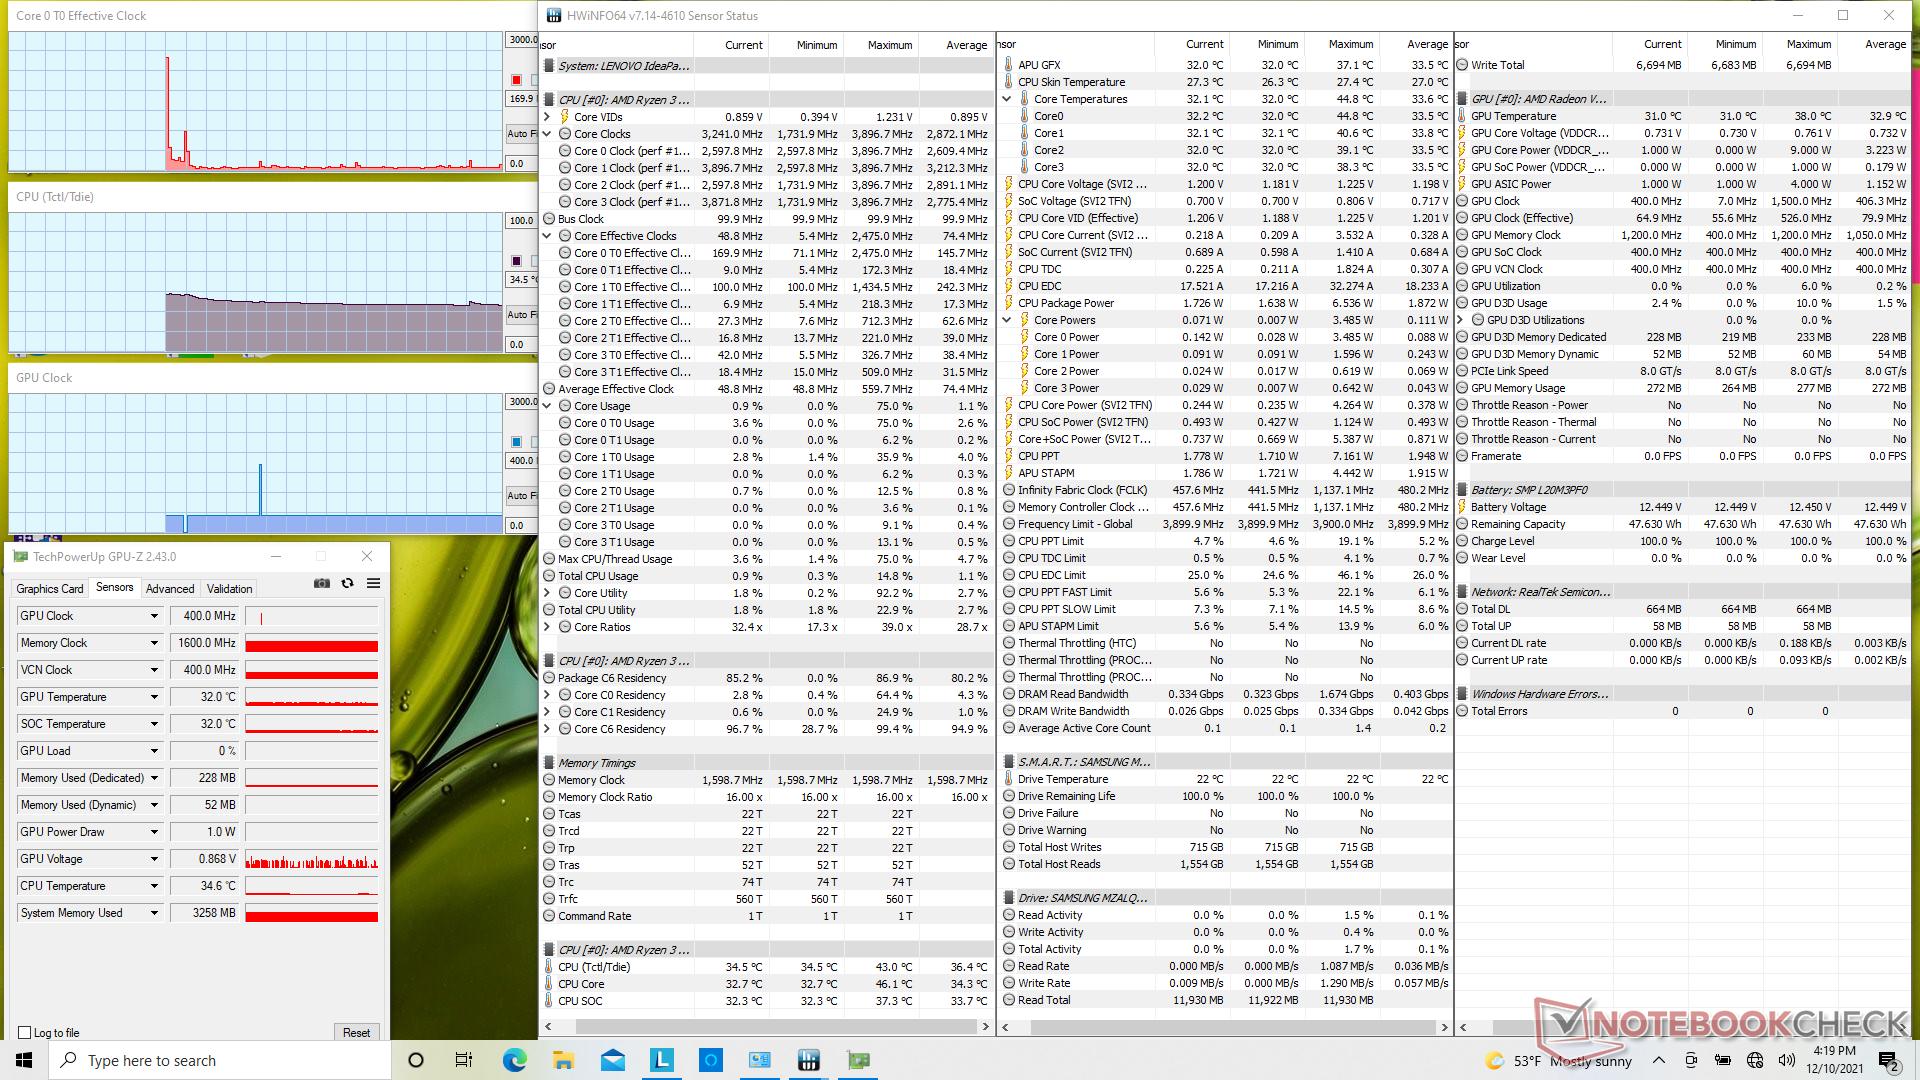
Stress Test
When running Prime95 to stress the CPU, clock rates would boost to 3.9 GHz and at a peak package power draw of 29 W before hitting a core temperature of 80 C about 30 seconds later. Thereafter, clock rates and package power would fall slightly to 3.7 GHz and 24 W, respectively, in order to maintain a cooler core temperature of 72 C.
When running Witcher 3, the integrated GPU would stabilize at 1500 MHz as advertised. Core temperature would also stabilize at just 57 C compared to 74 C on the faster and thinner IdeaPad 5 Pro 14.
Running on battery power will impact performance. A 3DMark 11 run on batteries would return Physics and Graphics scores of 7818 and 3818 points, respectively, compared to 8356 and 4035 points when on mains.
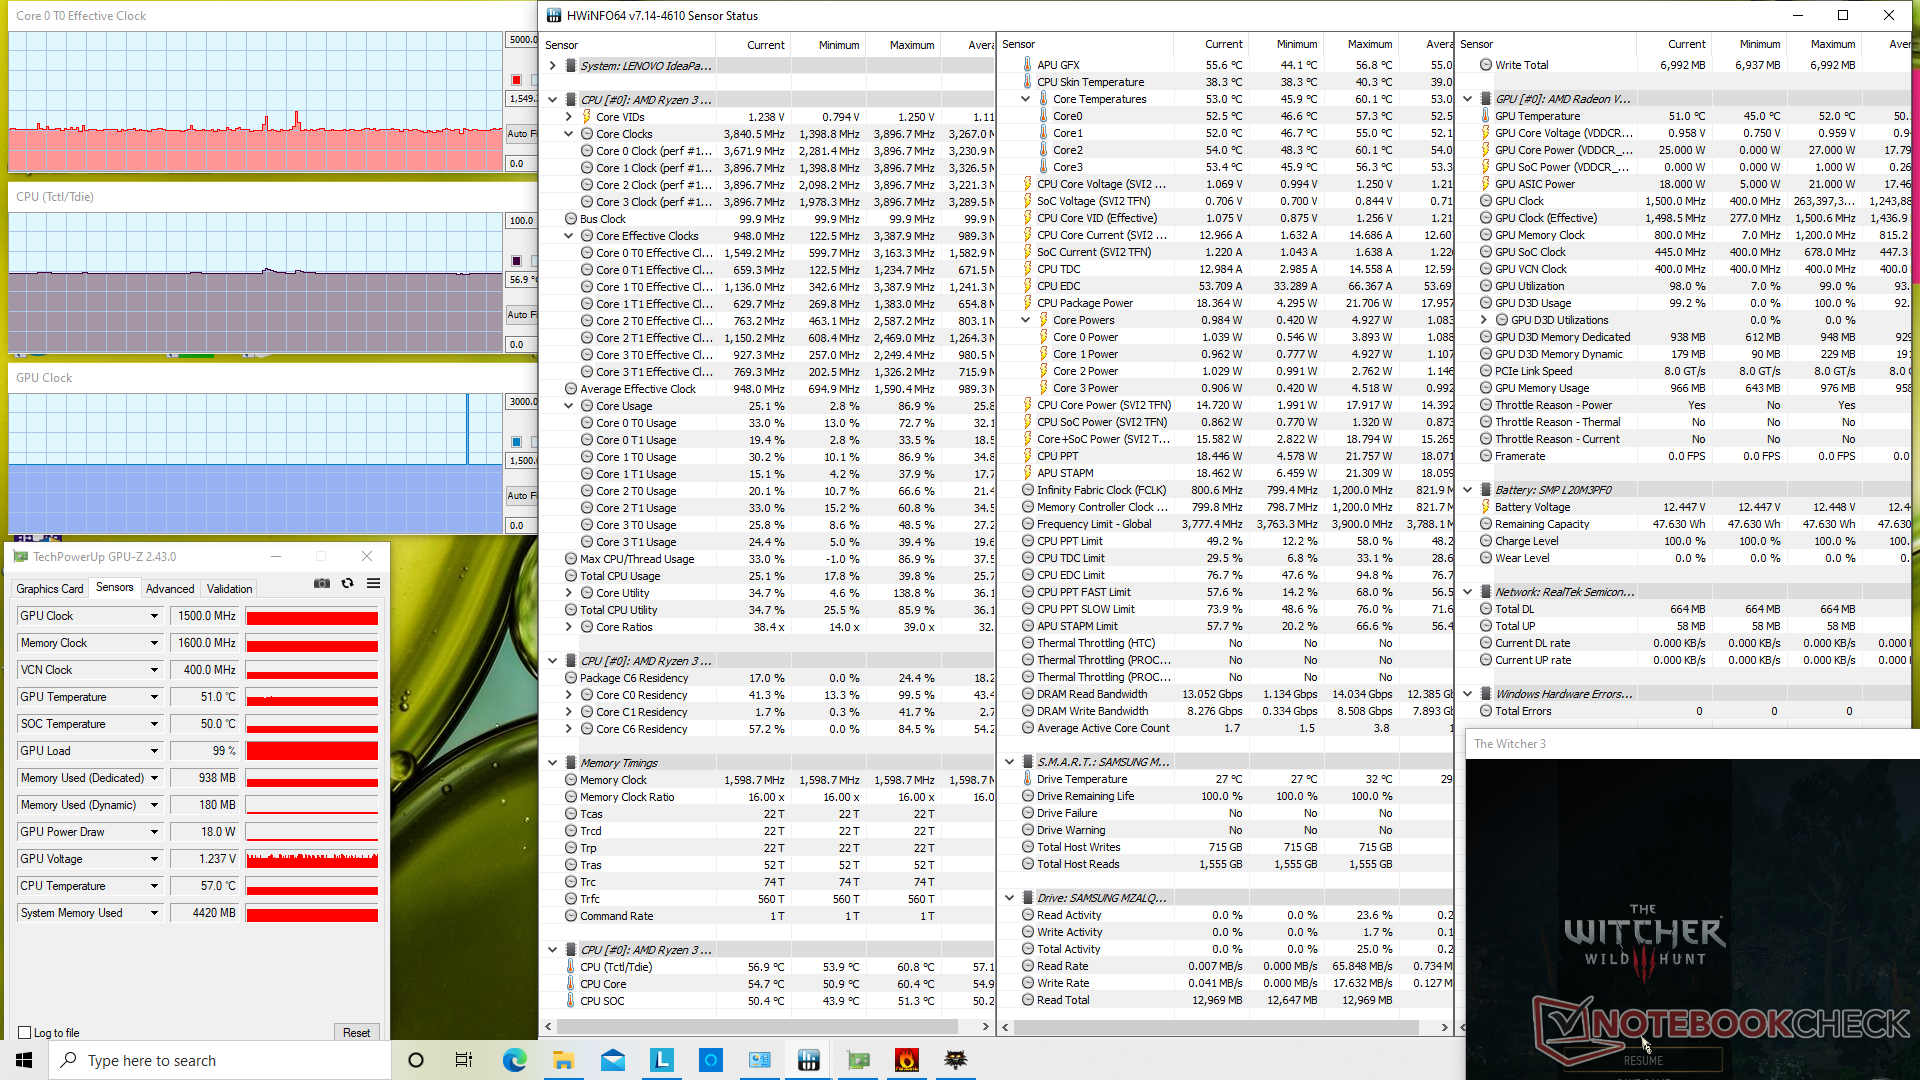
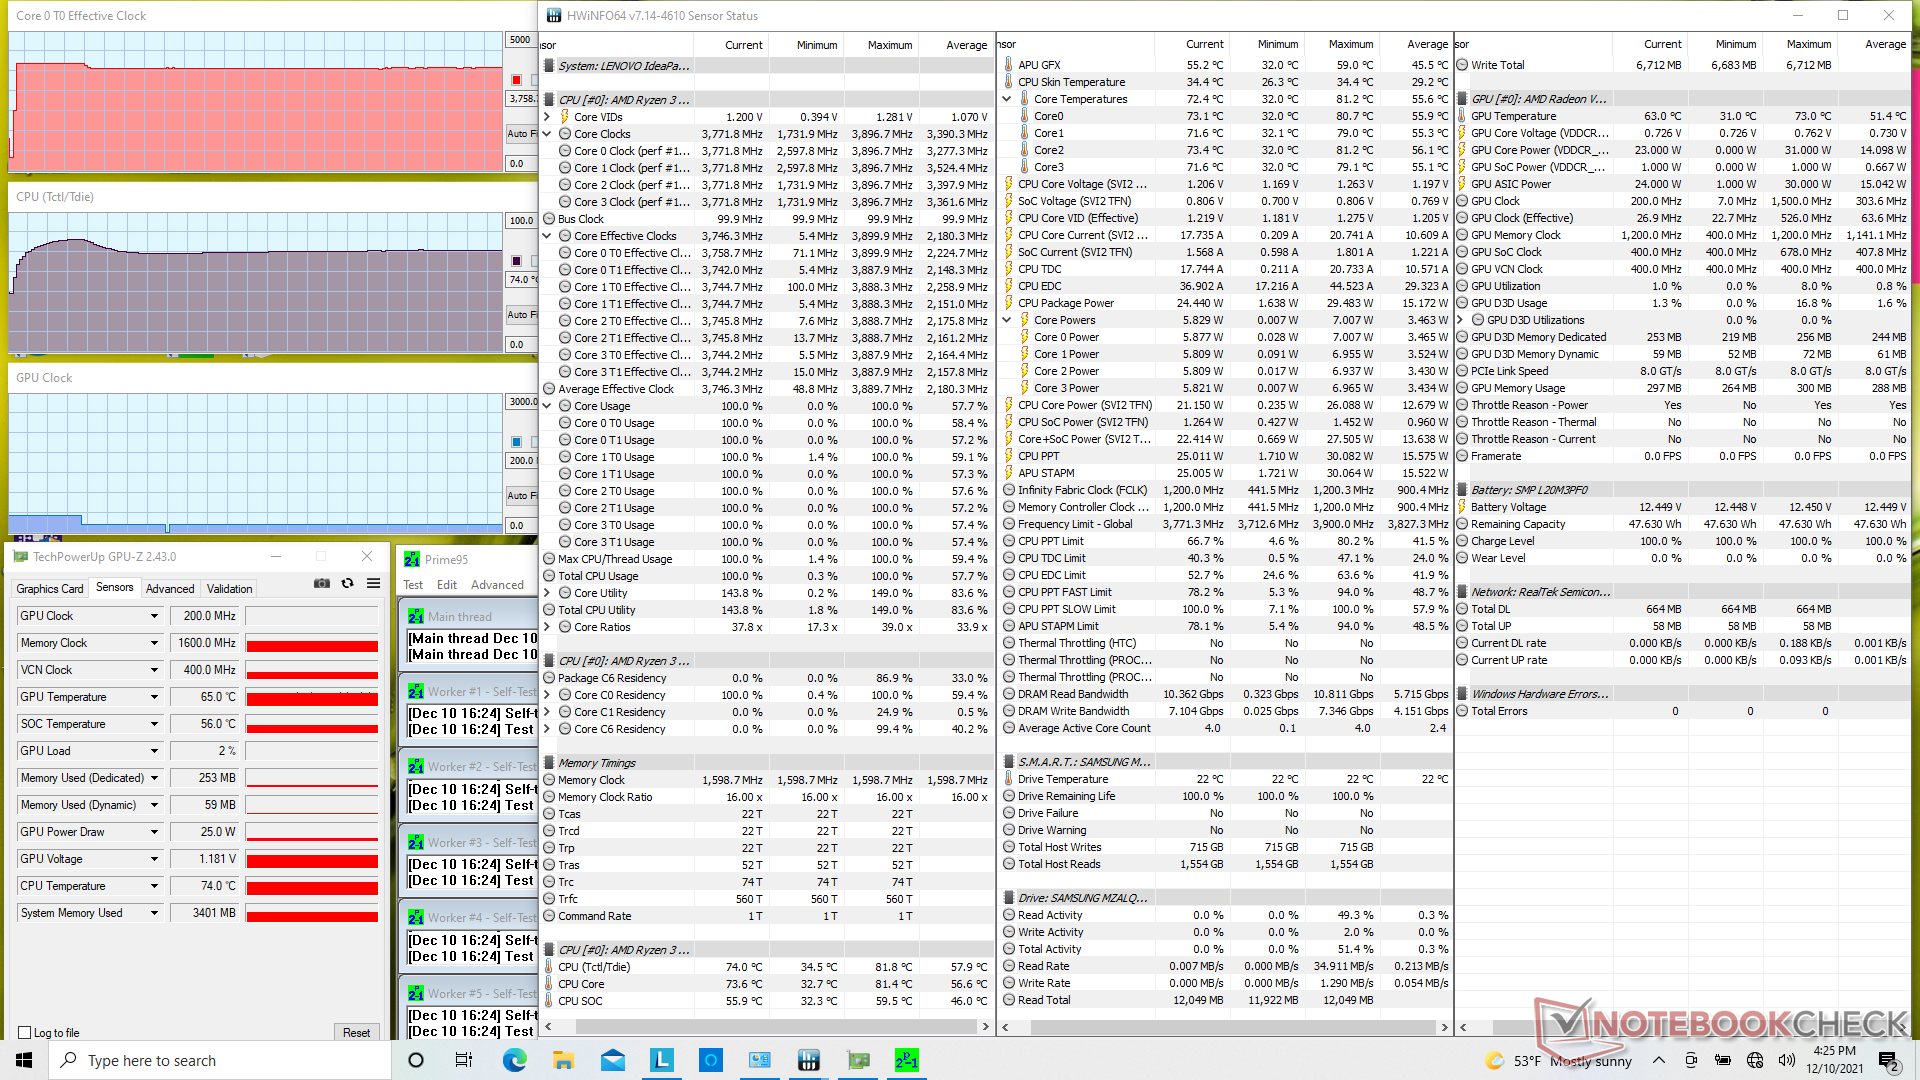
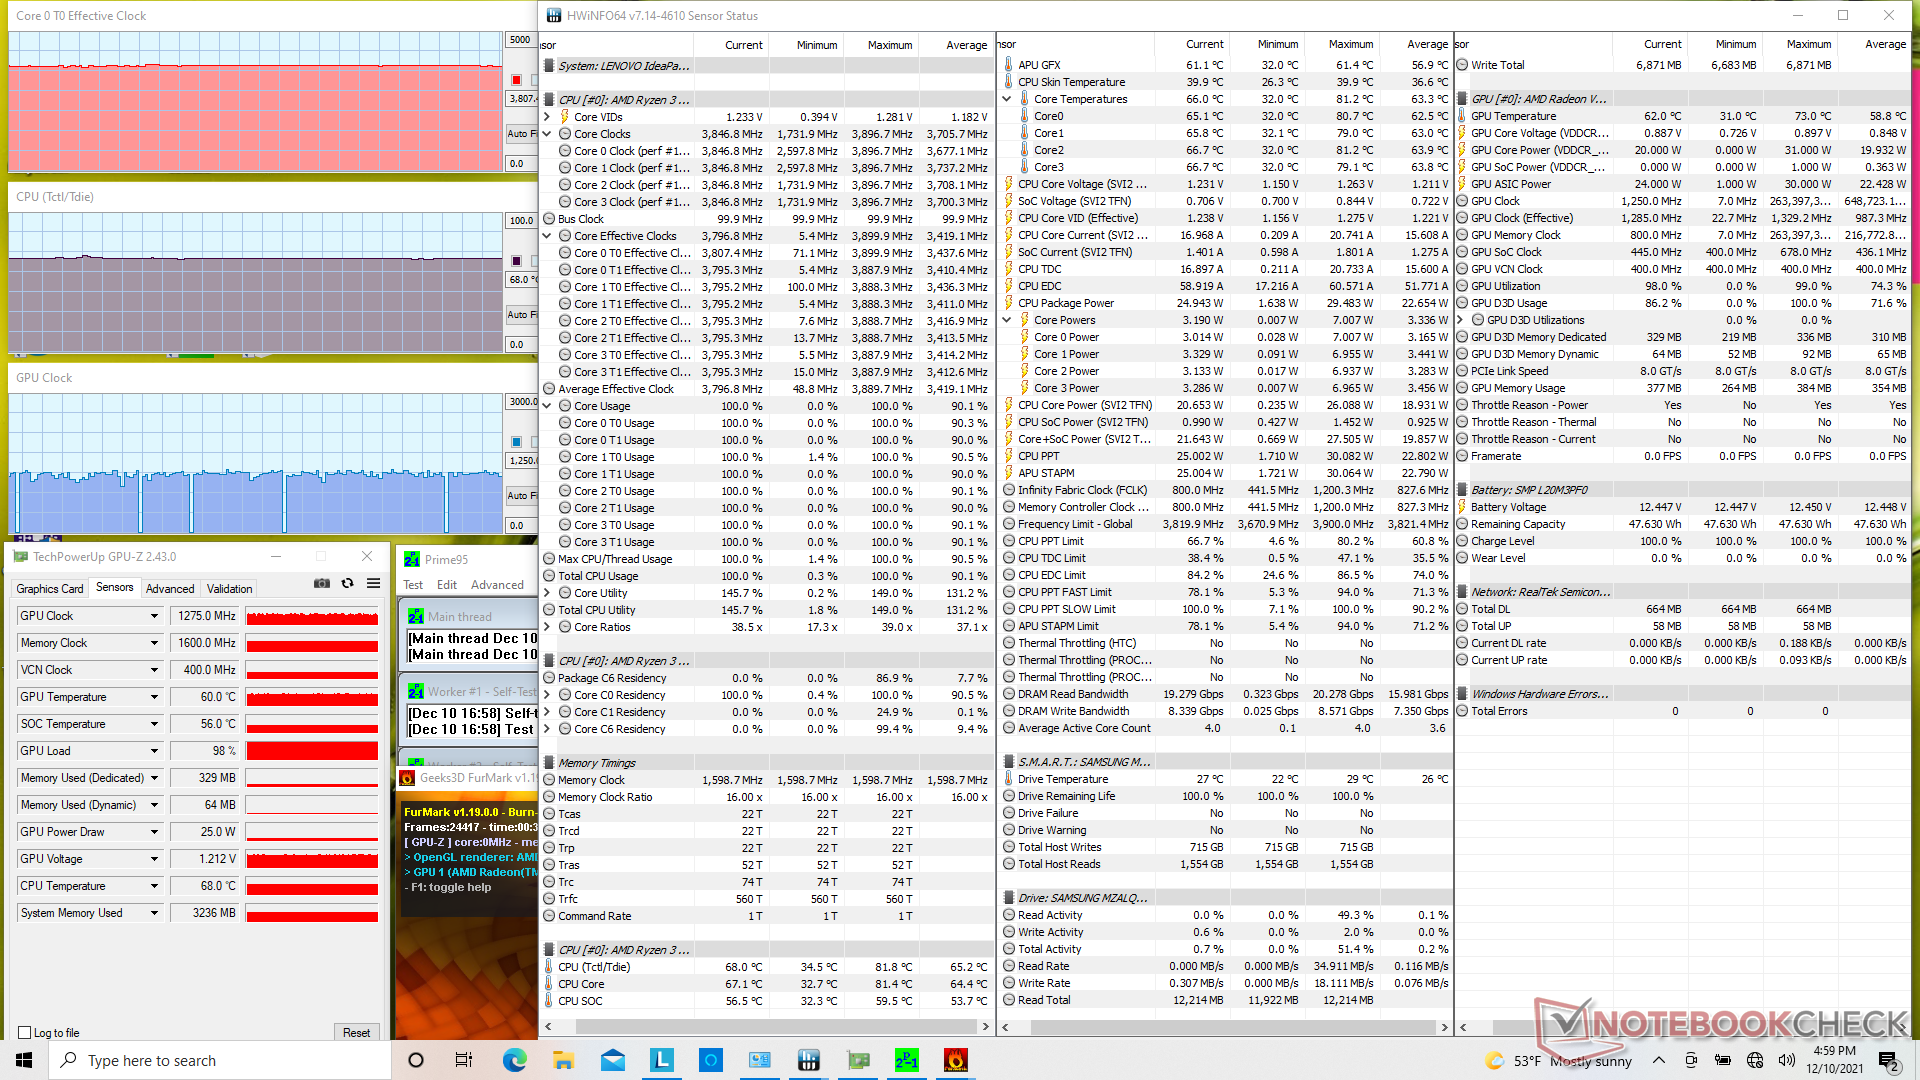
| CPU Clock (GHz) | GPU Clock (MHz) | Average CPU Temperature (°C) | |
| System Idle | -- | -- | 35 |
| Prime95 Stress | 3.8 | -- | 74 |
| Prime95 + FurMark Stress | 3.8 | 1250 | 68 |
| Witcher 3 Stress | 1.6 | 1500 | 57 |
Speakers
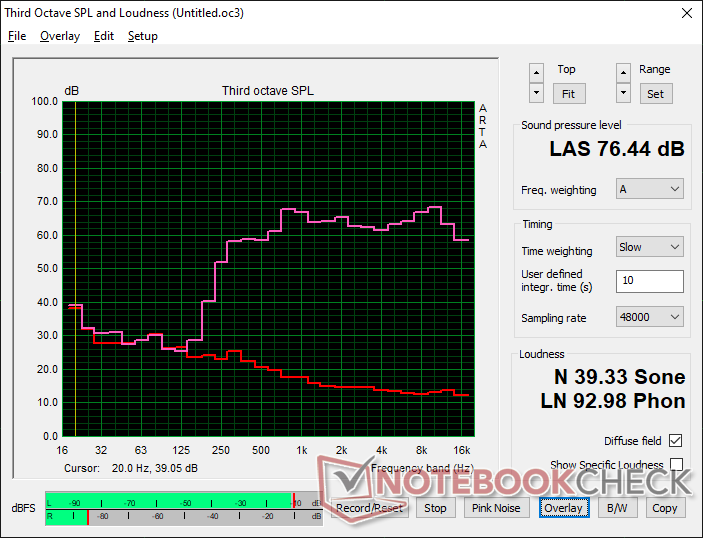
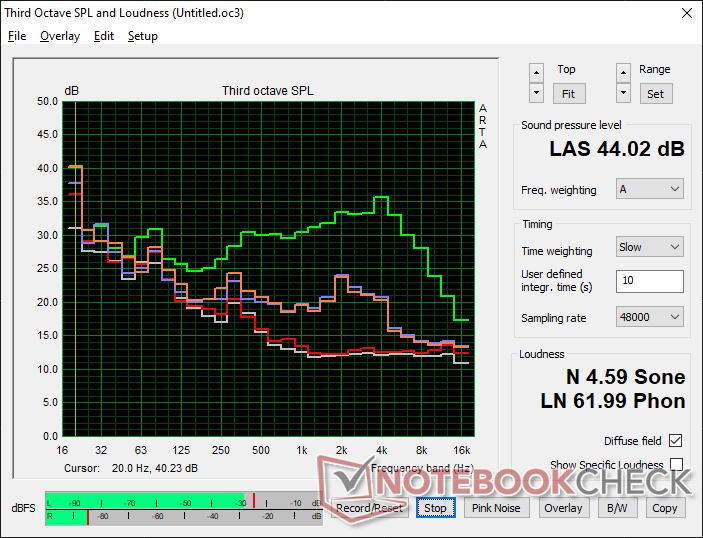
Lenovo IdeaPad 3 15ALC6 audio analysis
(±) | speaker loudness is average but good (76.4 dB)
Bass 100 - 315 Hz
(-) | nearly no bass - on average 24% lower than median
(±) | linearity of bass is average (13.4% delta to prev. frequency)
Mids 400 - 2000 Hz
(+) | balanced mids - only 3.1% away from median
(+) | mids are linear (4.2% delta to prev. frequency)
Highs 2 - 16 kHz
(+) | balanced highs - only 2.1% away from median
(+) | highs are linear (3.4% delta to prev. frequency)
Overall 100 - 16.000 Hz
(±) | linearity of overall sound is average (19.3% difference to median)
Compared to same class
» 62% of all tested devices in this class were better, 8% similar, 30% worse
» The best had a delta of 5%, average was 17%, worst was 45%
Compared to all devices tested
» 47% of all tested devices were better, 8% similar, 46% worse
» The best had a delta of 4%, average was 23%, worst was 134%
Apple MacBook 12 (Early 2016) 1.1 GHz audio analysis
(+) | speakers can play relatively loud (83.6 dB)
Bass 100 - 315 Hz
(±) | reduced bass - on average 11.3% lower than median
(±) | linearity of bass is average (14.2% delta to prev. frequency)
Mids 400 - 2000 Hz
(+) | balanced mids - only 2.4% away from median
(+) | mids are linear (5.5% delta to prev. frequency)
Highs 2 - 16 kHz
(+) | balanced highs - only 2% away from median
(+) | highs are linear (4.5% delta to prev. frequency)
Overall 100 - 16.000 Hz
(+) | overall sound is linear (10.2% difference to median)
Compared to same class
» 7% of all tested devices in this class were better, 2% similar, 90% worse
» The best had a delta of 5%, average was 18%, worst was 53%
Compared to all devices tested
» 5% of all tested devices were better, 1% similar, 94% worse
» The best had a delta of 4%, average was 23%, worst was 134%
Energy Management
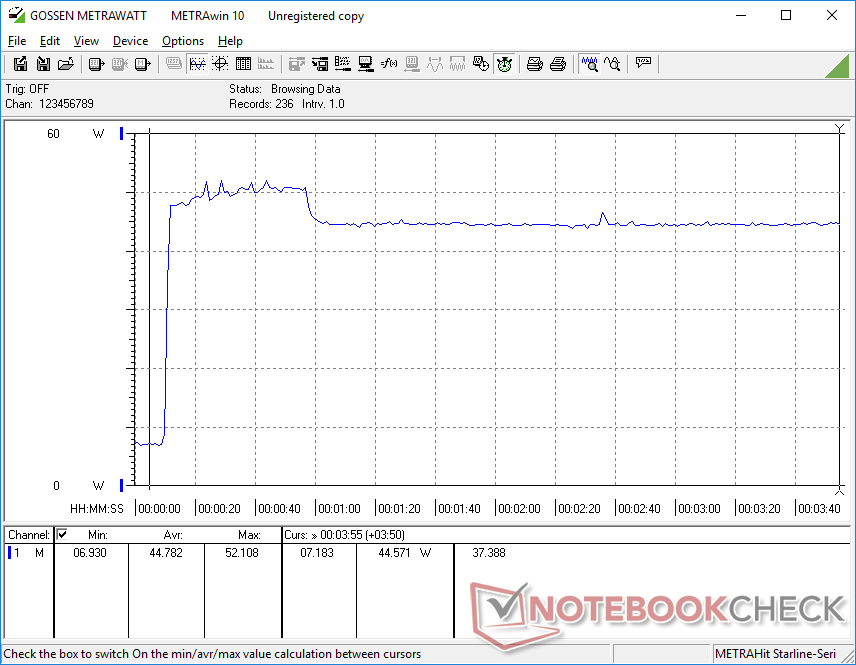
Power Consumption — High CPU Performance-per-Watt
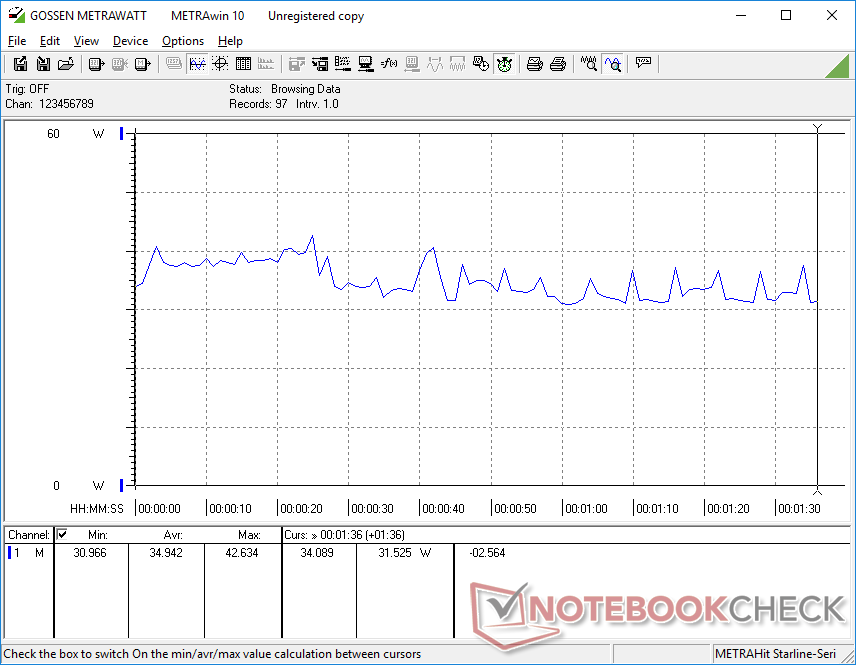
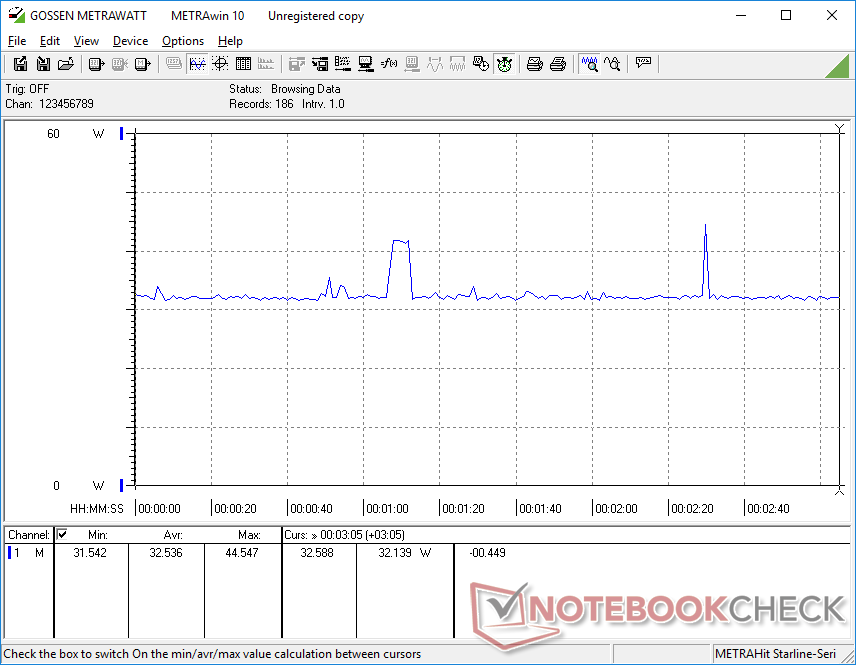
The system is more demanding than the Core i3-powered Lenovo ThinkPad L15 G2 when running medium or higher loads. Running 3DMark 06, for example, would consume almost 37 percent more power on our IdeaPad. The performance advantages of our Ryzen 3 CPU over the Core i3 alternative may be worth the increase in power consumption for many users. Any power consumption differences when running lower loads like web browsing or video streaming are minimal.
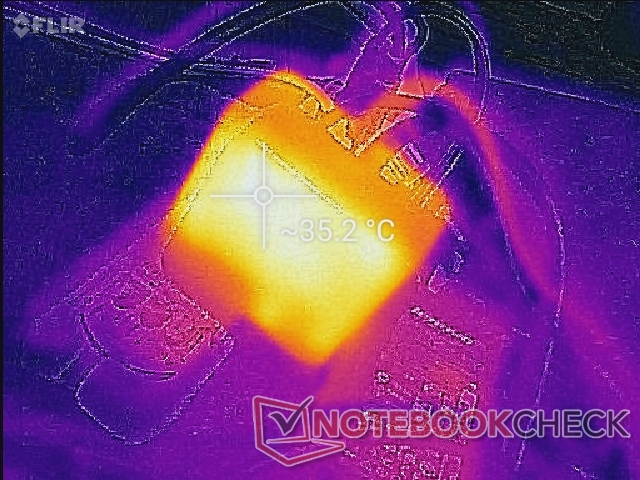
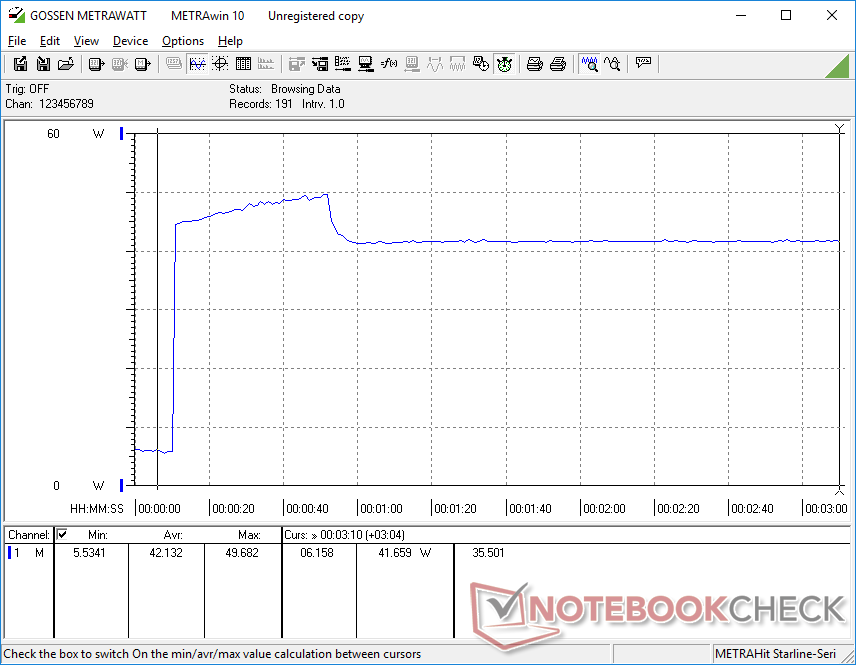
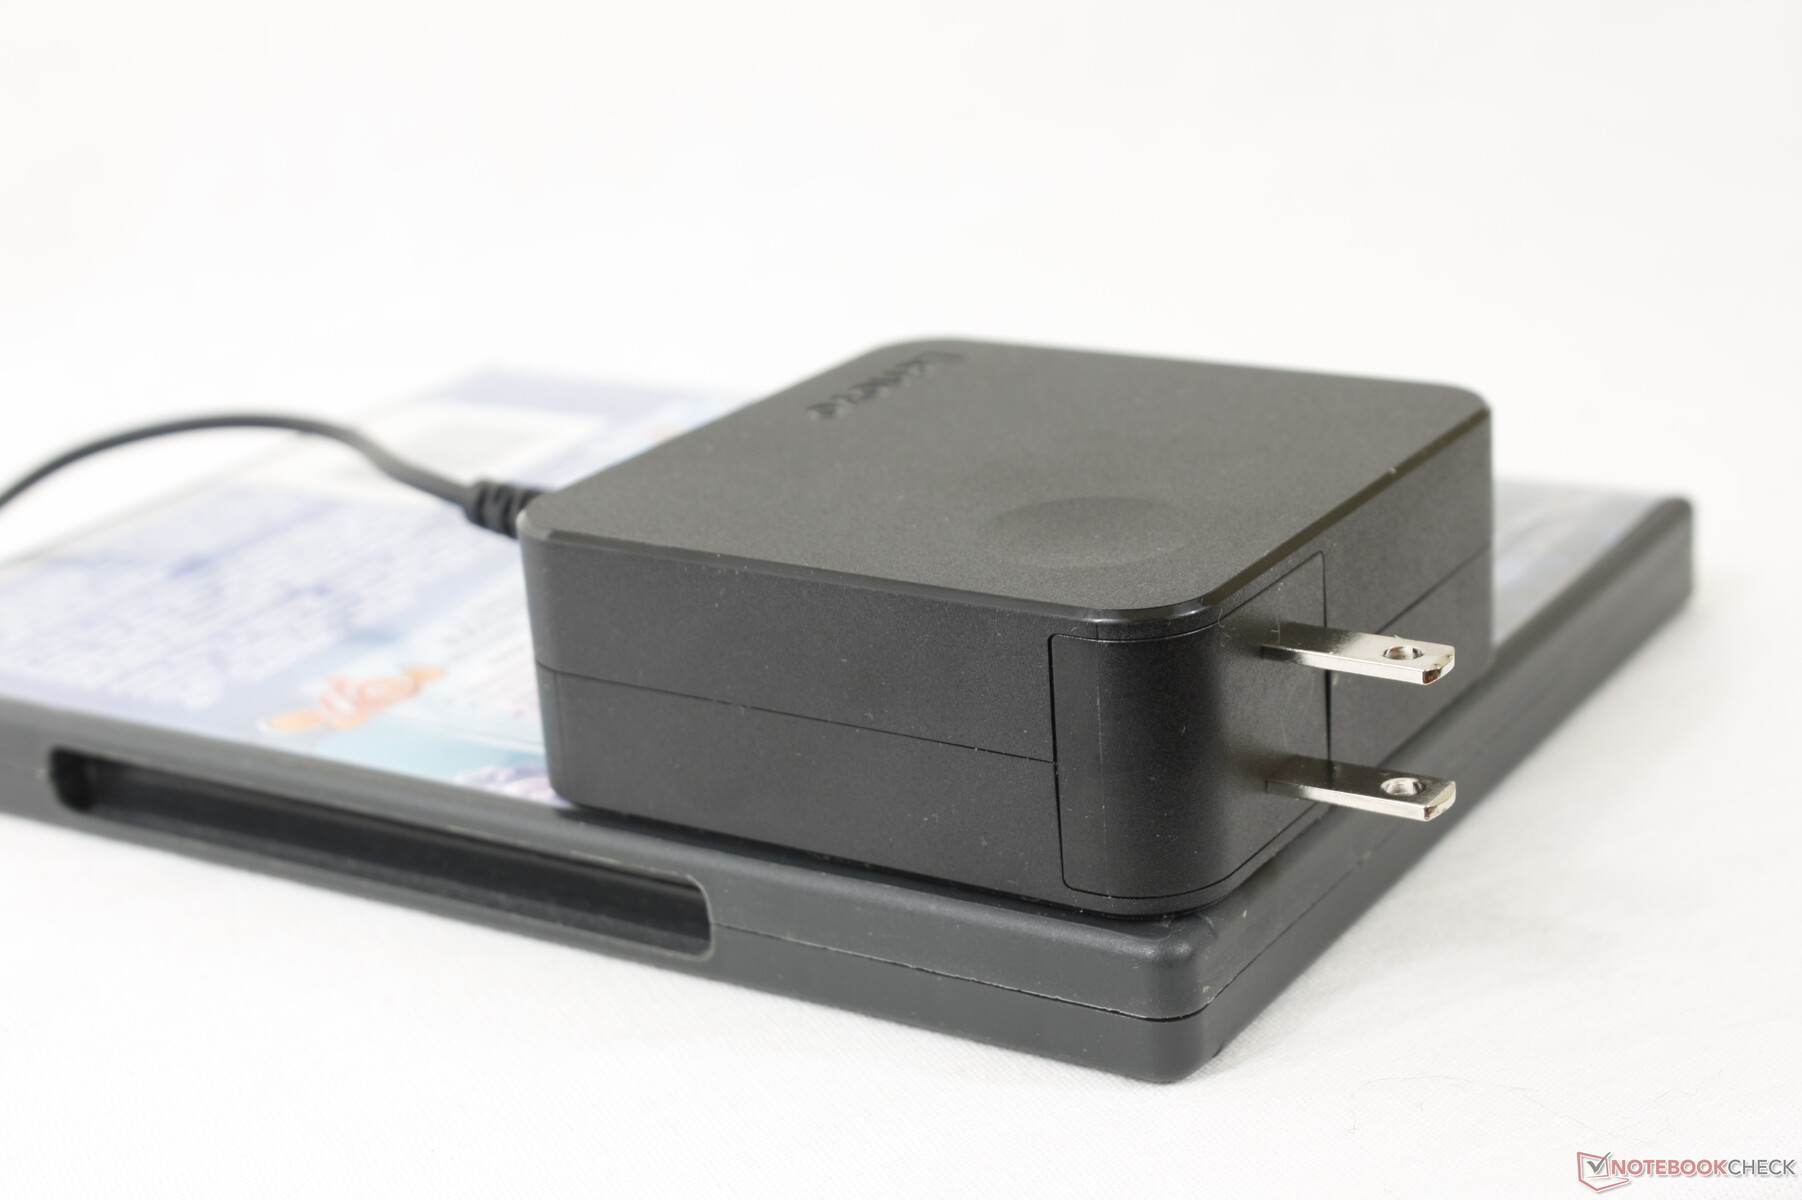
We're able to record a temporary maximum draw of 52 W from the small (~7.5 x 7.5 x 2.8 cm) 65 W AC adapter. The prongs on the adapter are unfortunately not retractable which can be an annoyance when traveling.
| Off / Standby | |
| Idle | |
| Load |
|
Key:
min: | |
| Lenovo IdeaPad 3 15ALC6 R3 5300U, Vega 6, Samsung PM991a MZALQ512HBLU, IPS, 1920x1080, 15.6" | Lenovo IdeaPad 5 15IIL05 i5-1035G1, GeForce MX350, SK hynix BC511 HFM512GDHTNI-87A0B, IPS, 1920x1080, 15.6" | Lenovo Ideapad S540-15IML i5-10210U, GeForce MX250, Samsung SSD PM981a MZVLB512HBJQ, IPS, 1920x1080, 15.6" | Dell Inspiron 15 3501 i7-1165G7, Iris Xe G7 96EUs, Samsung PM991a MZ9LQ512HBLU-00BD1, IPS, 1920x1080, 15.6" | Asus VivoBook 15 KM513UA-L503TS R5 5500U, Vega 7, WDC PC SN530 SDBPMPZ-265G, OLED, 1920x1080, 15.6" | Lenovo ThinkPad L15 G2-20X4S0KU00 i3-1115G4, UHD Graphics Xe G4 48EUs, Samsung SSD PM981a MZVLB256HBHQ, IPS, 1920x1080, 15.6" | |
|---|---|---|---|---|---|---|
| Power Consumption | -50% | -33% | 1% | -10% | -3% | |
| Idle Minimum * (Watt) | 5.6 | 4.9 12% | 5 11% | 3.6 36% | 4.96 11% | 4.08 27% |
| Idle Average * (Watt) | 6 | 9.1 -52% | 7 -17% | 6.4 -7% | 7.38 -23% | 8 -33% |
| Idle Maximum * (Watt) | 7 | 11.6 -66% | 10 -43% | 7.9 -13% | 7.79 -11% | 8.89 -27% |
| Load Average * (Watt) | 34.9 | 65 -86% | 64 -83% | 39 -12% | 41.77 -20% | 25.64 27% |
| Witcher 3 ultra * (Watt) | 32.5 | 59 -82% | 44 -35% | 37.6 -16% | 38.2 -18% | 31.7 2% |
| Load Maximum * (Watt) | 52.1 | 65.3 -25% | 67 -29% | 41.8 20% | 50.95 2% | 60.31 -16% |
* ... smaller is better
Power Consumption Witcher 3 / Stresstest
Power Consumption external Monitor
Battery Life — Low Capacity, Long Runtimes
Battery capacity is small at 45 Wh which is to be expected from a budget system. Nevertheless, runtimes are still excellent at almost 10.5 hours of real-world WLAN to be comparable to the more expensive IdeaPad 5.
Charging from empty to full capacity takes just under 2.5 hours compared to 1.5 hours on most other Ultrabooks. Unfortunately, the system cannot be recharged via USB-C.
| Lenovo IdeaPad 3 15ALC6 R3 5300U, Vega 6, 45 Wh | Lenovo IdeaPad 5 15IIL05 i5-1035G1, GeForce MX350, 70 Wh | Lenovo Ideapad S540-15IML i5-10210U, GeForce MX250, 70 Wh | Dell Inspiron 15 3501 i7-1165G7, Iris Xe G7 96EUs, 42 Wh | HP Pavilion 15-eg i7-1165G7, GeForce MX450, 41 Wh | Asus VivoBook 15 KM513UA-L503TS R5 5500U, Vega 7, 42 Wh | |
|---|---|---|---|---|---|---|
| Battery runtime | 23% | 17% | -35% | -29% | -41% | |
| Reader / Idle (h) | 20.1 | 23.2 15% | 30.2 50% | 15 -25% | 11.8 -41% | |
| WiFi v1.3 (h) | 10.5 | 11.4 9% | 12.1 15% | 6.8 -35% | 6.6 -37% | 6.4 -39% |
| Load (h) | 1.6 | 2.3 44% | 1.4 -13% | 1.2 -25% | 0.9 -44% | |
| H.264 (h) | 16.1 |
Pros
Cons
Verdict — Giving Core i3 a Run for its Money
The IdeaPad 3 15ALC6 has three strong features that many other models in its price range lack: easy serviceability, a bright FreeSync-enabled touchscreen, and a surprisingly fast CPU. These attributes contribute to the longevity of the system as owners can easily add more storage or RAM down the line and have confidence that the Ryzen 3 5300U won't be outdated too soon. Battery life and fan noise are long and quiet, respectively, due partly to the efficiency of the processor.
The fast Ryzen 3 5300U CPU propels an otherwise dull budget laptop with mediocre build quality, colors, and aesthetics.
There are always cut corners associated with budget laptops and the IdeaPad 3 is no exception. In this case, the system suffers from relatively soft keys, spongy clickpad, a weak chassis design, and shallow color reproduction. The latter in particular is common on almost all budget laptops and so we can't single out the Lenovo for its poor colors, but the chassis could definitely use some work to make it feel stronger and longer-lasting.
Price and Availability
Lenovo IdeaPad 3 15ALC6
- 12/14/2021 v7 (old)
Allen Ngo
Price comparison
