Celeron N5105 Jasper Lake debut: Beelink U59 mini PC review
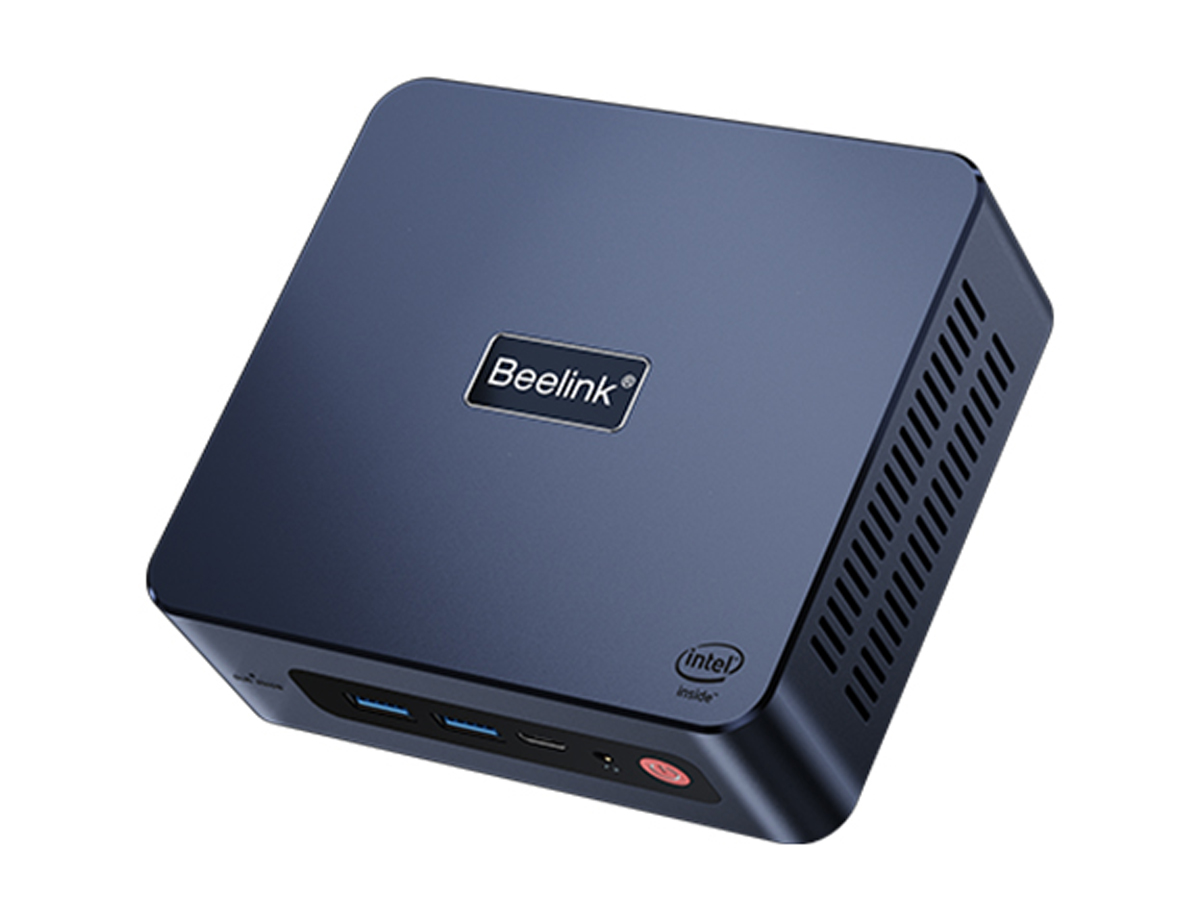
Beelink has updated one of its least expensive mini PCs with a faster Jasper Lake Intel Celeron N5105 CPU to replace the Celeron N5095 on the previous U59 model. Though the chassis remains nearly the same as before, there are a few important differences which we will note in the review below.
The Beelink U59 competes with other inexpensive mini PCs like the Zotac Nano series, GMK NucBox series, or the Chuwi GBox.
More Beelink reviews:
Potential Competitors in Comparison
Rating | Date | Model | Weight | Height | Size | Resolution | Price |
|---|---|---|---|---|---|---|---|
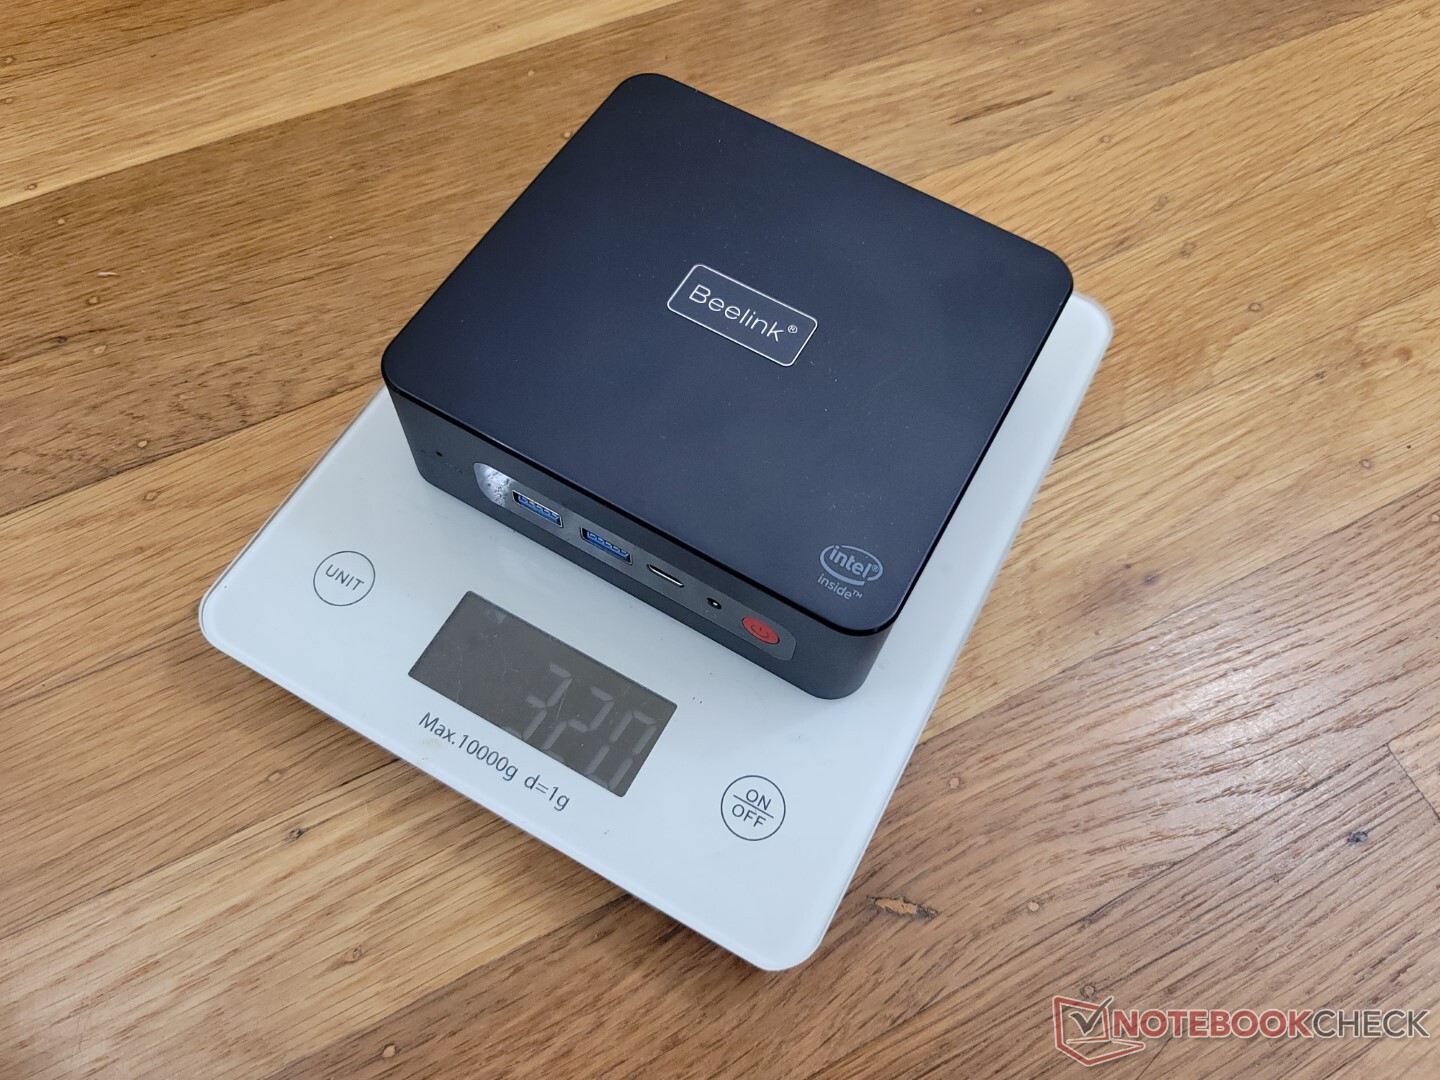
v (old) | 09 / 2022 | Beelink U59 N5105 Celeron N5105, UHD Graphics (Jasper Lake 24 EU) | 320 g | 42 mm | x | ||
v (old) | 06 / 2022 | Beelink U59 Mini-S Celeron N5095, UHD Graphics (Jasper Lake 16 EU) | 279 g | 41 mm | x | ||
v (old) | 04 / 2022 | Beelink SER4 R7 4800U, Vega 8 | 494 g | 40 mm | x | ||
v (old) | 11 / 2021 | Beelink SER3 R7 3750H, Vega 10 | 492 g | 40 mm | x | ||
v (old) | 04 / 2021 | Intel NUC11TNKi5 i5-1135G7, Iris Xe G7 80EUs | 504 g | 37 mm | x | ||
v (old) | 07 / 2022 | Zotac ZBOX PI336 pico Celeron N6211, UHD Graphics (Elkhart Lake 16 EU) | 293 g | 20.7 mm | x |
Case
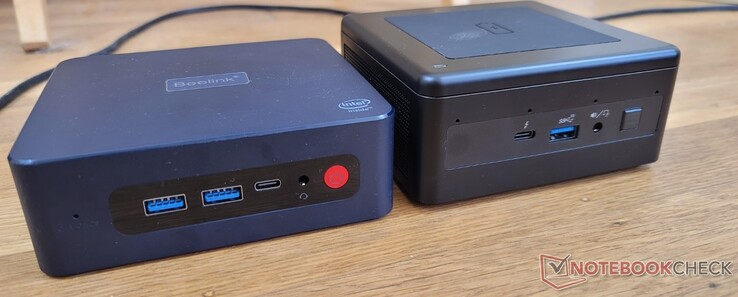
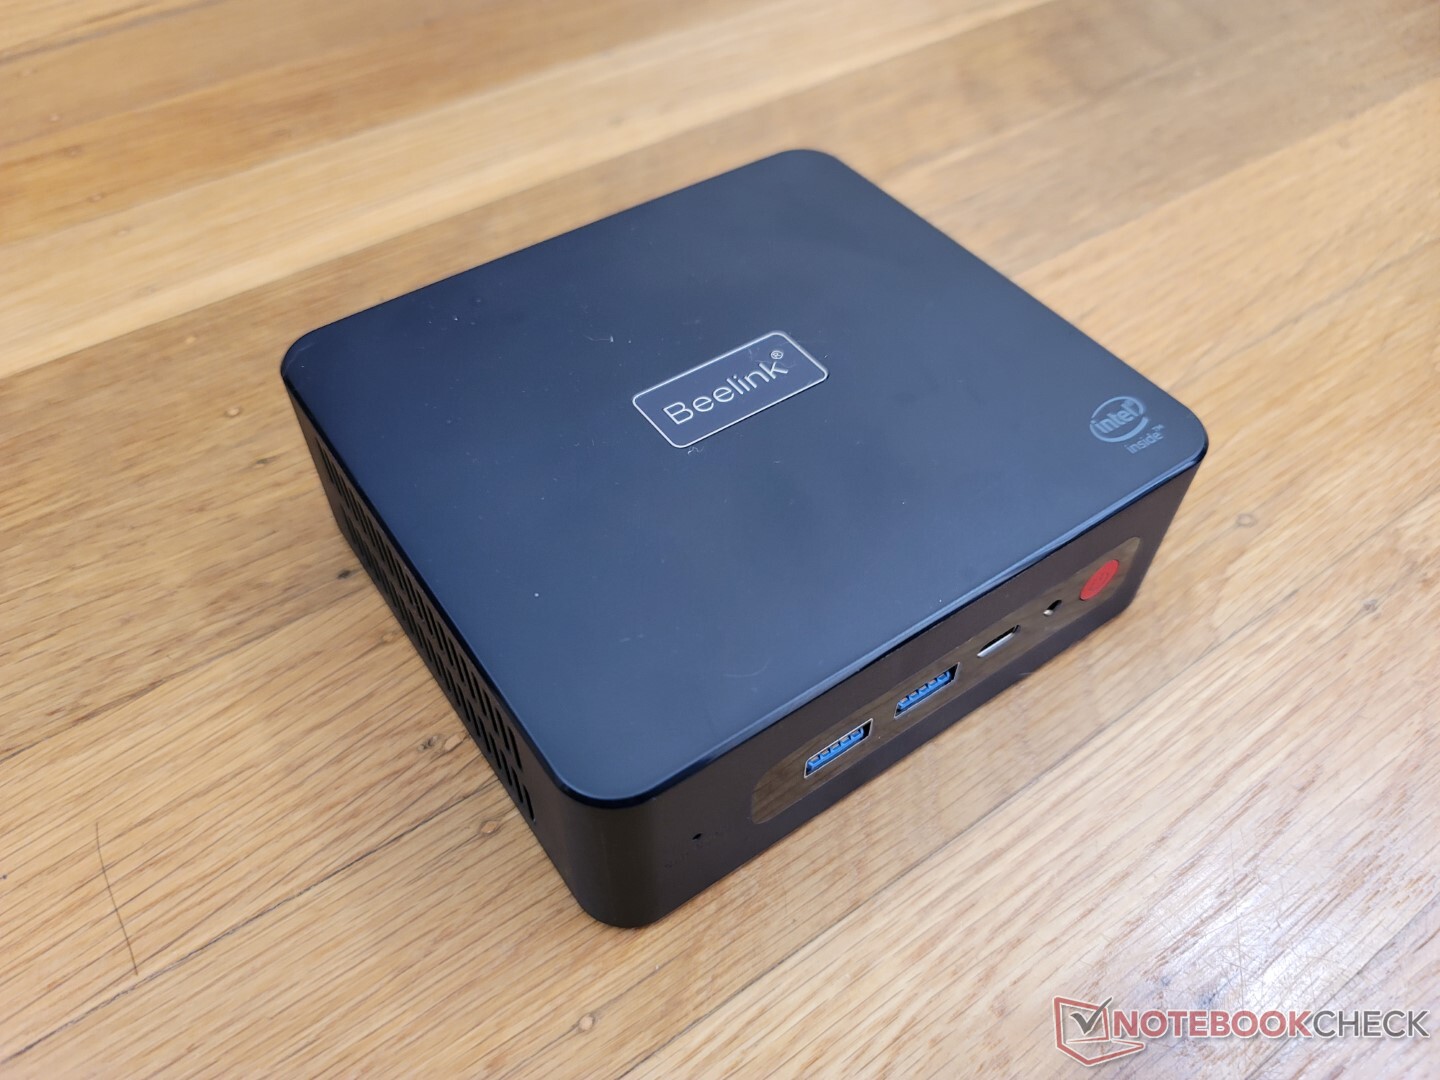
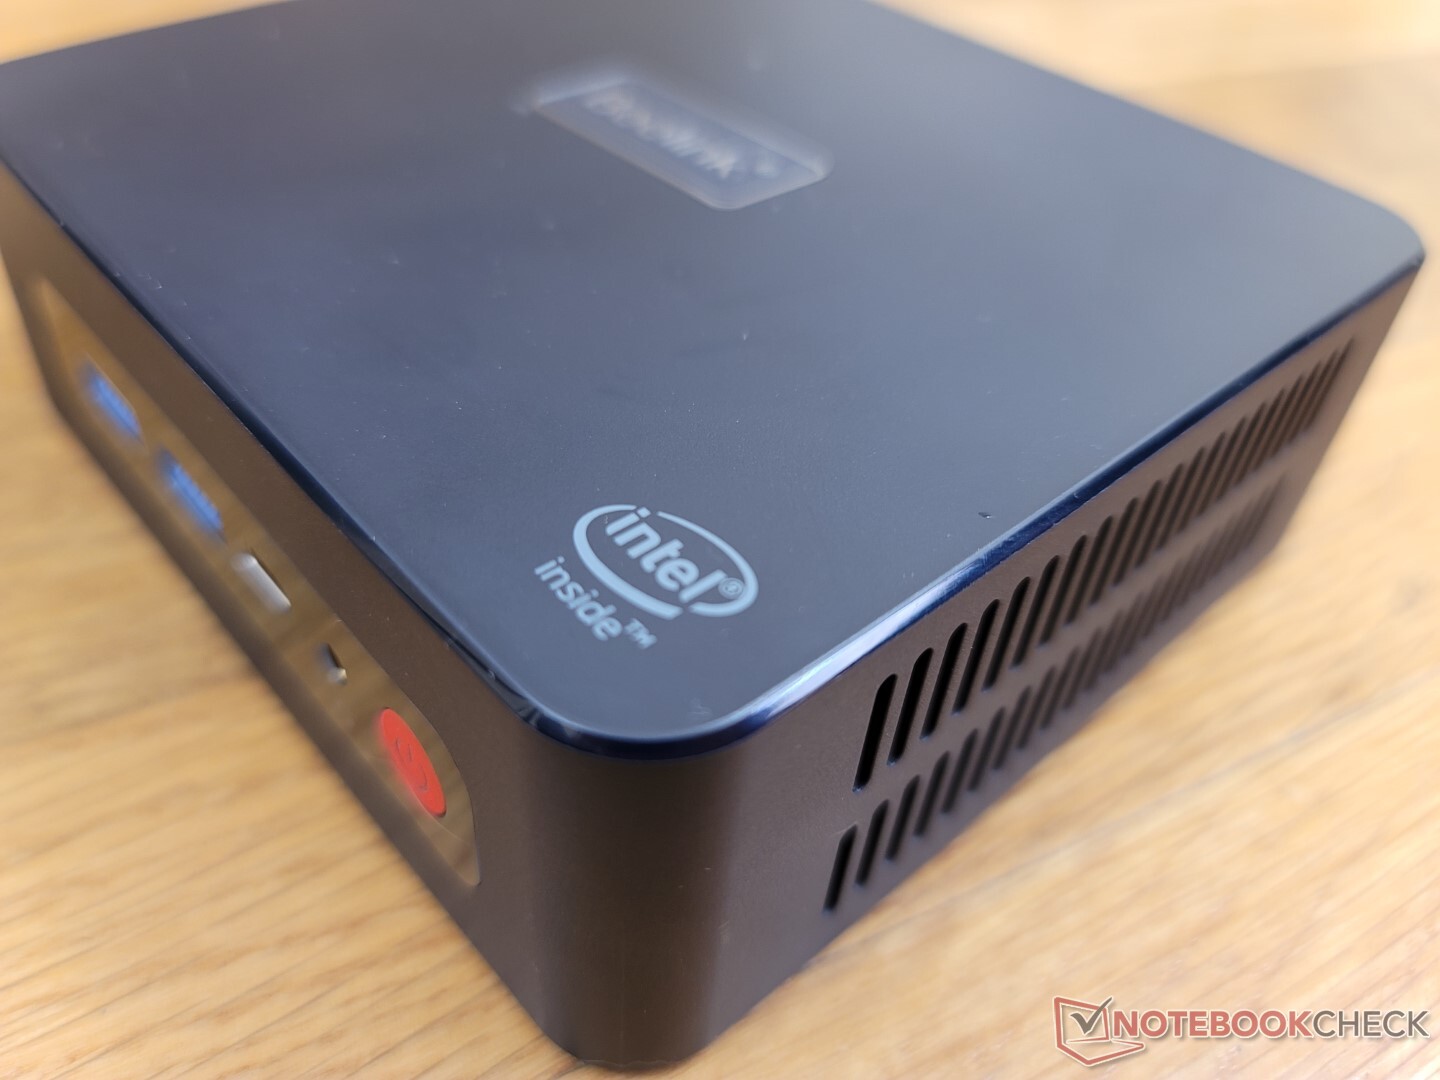
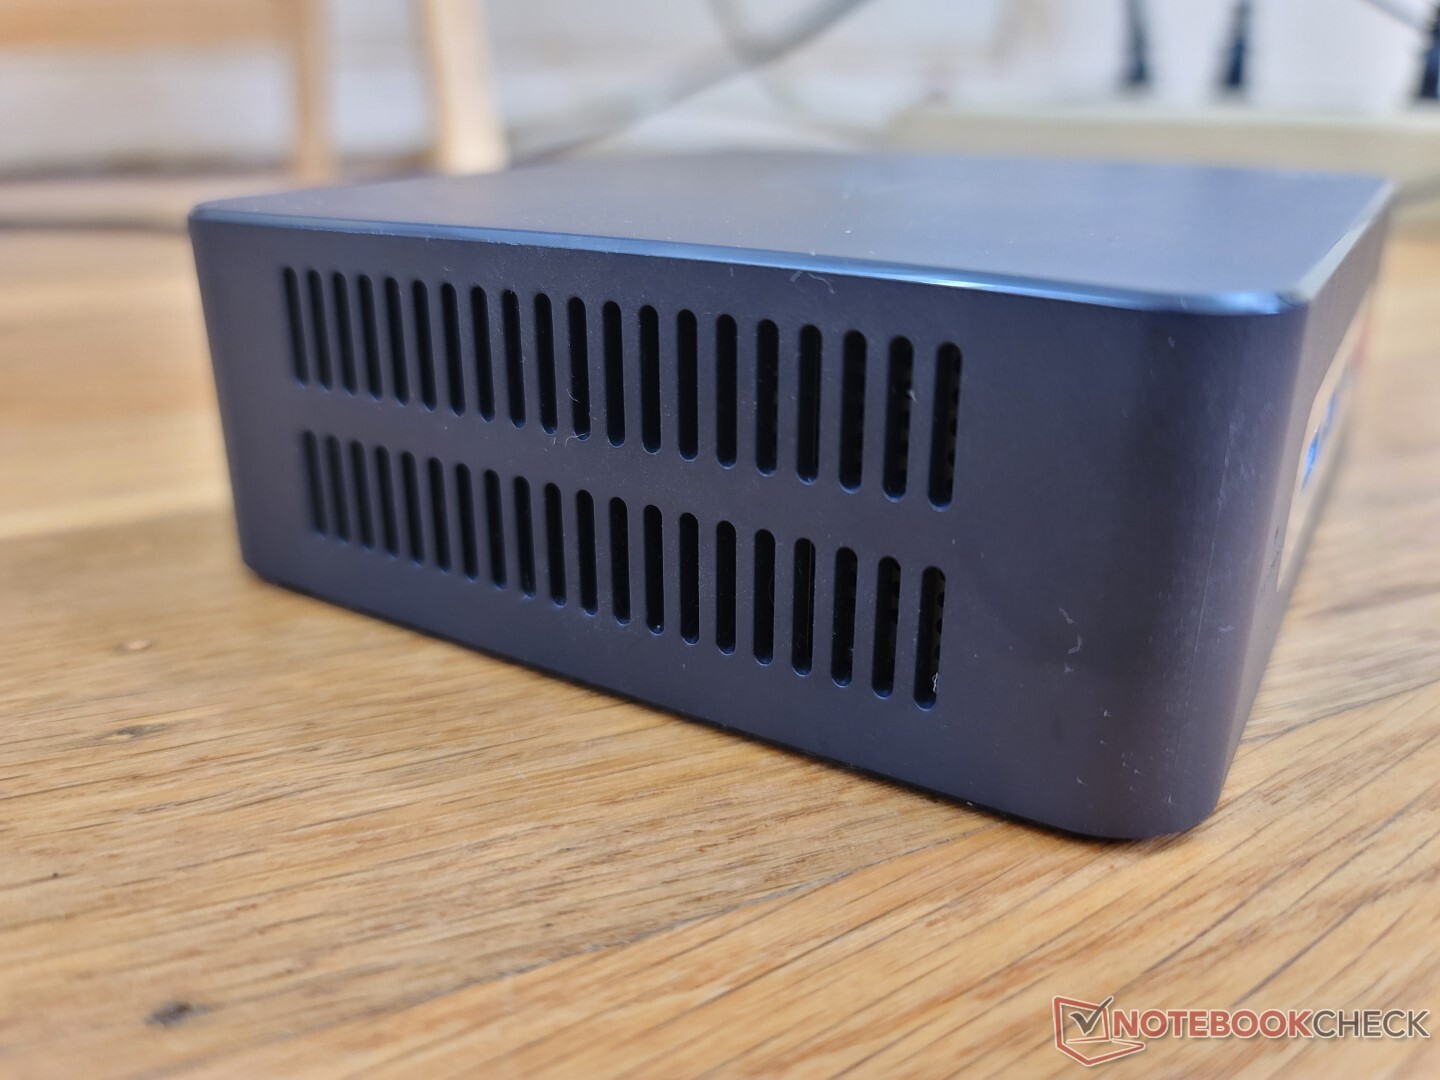
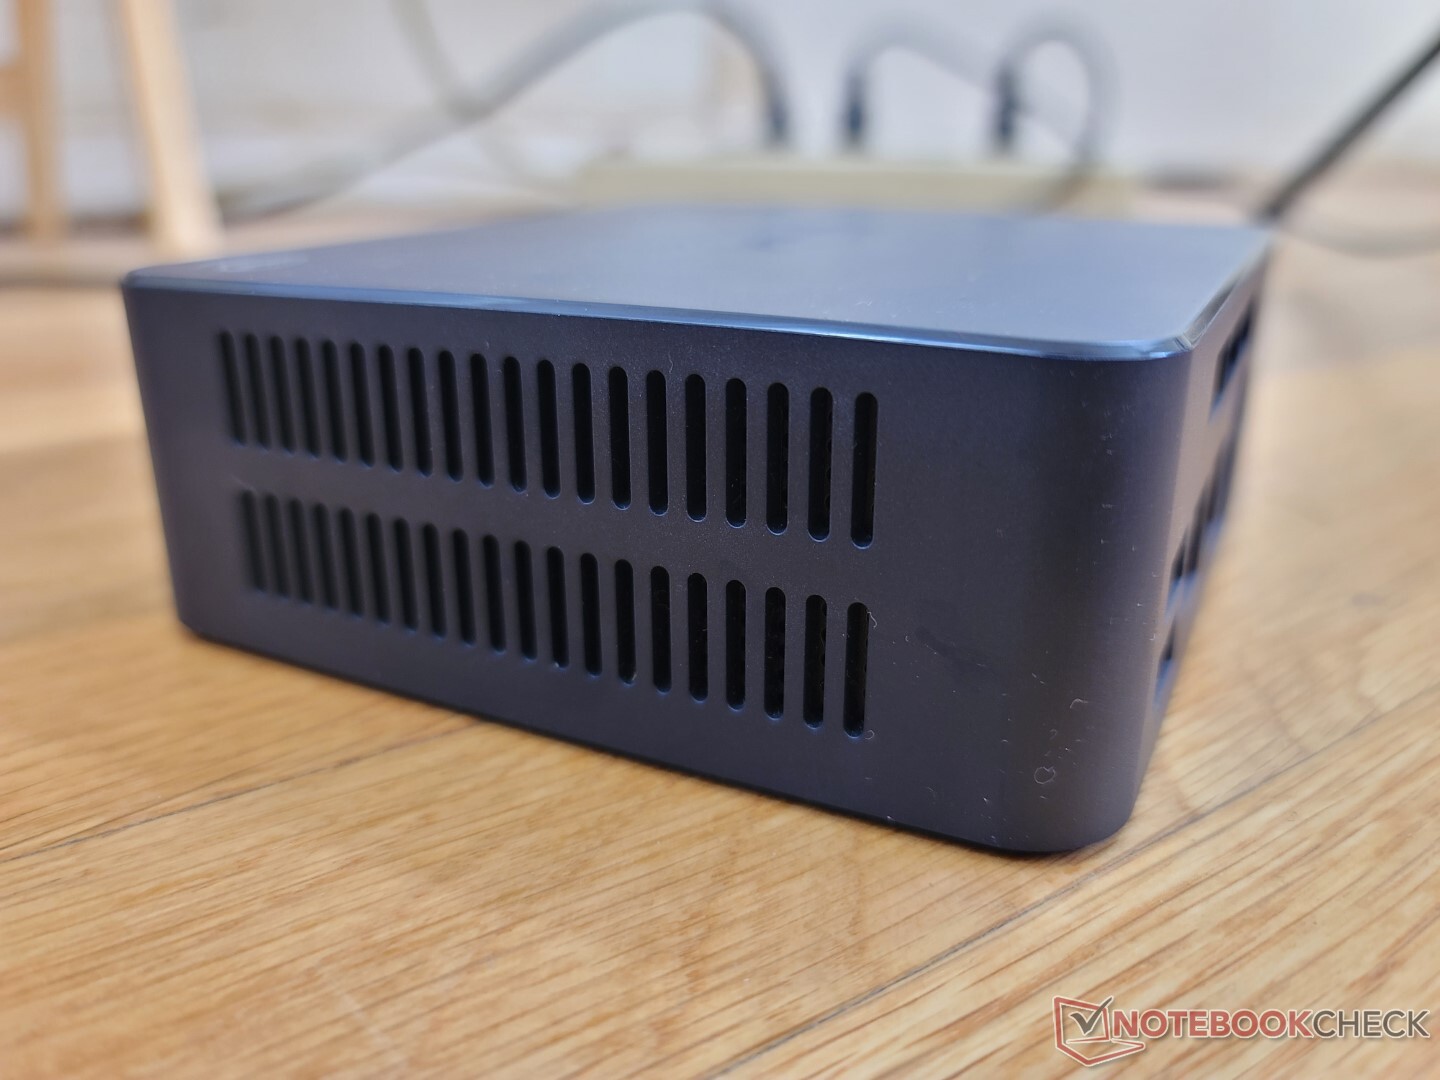
Annoyingly, Beelink offers three different U59 designs each with slightly different port options, designs, and internal features. Their dimensions and weight are otherwise nearly the same between them. For our review model here, the chassis has larger ventilation grilles and an all-matte top and logo compared to the smaller grilles and glossy tops of previous models.
Connectivity
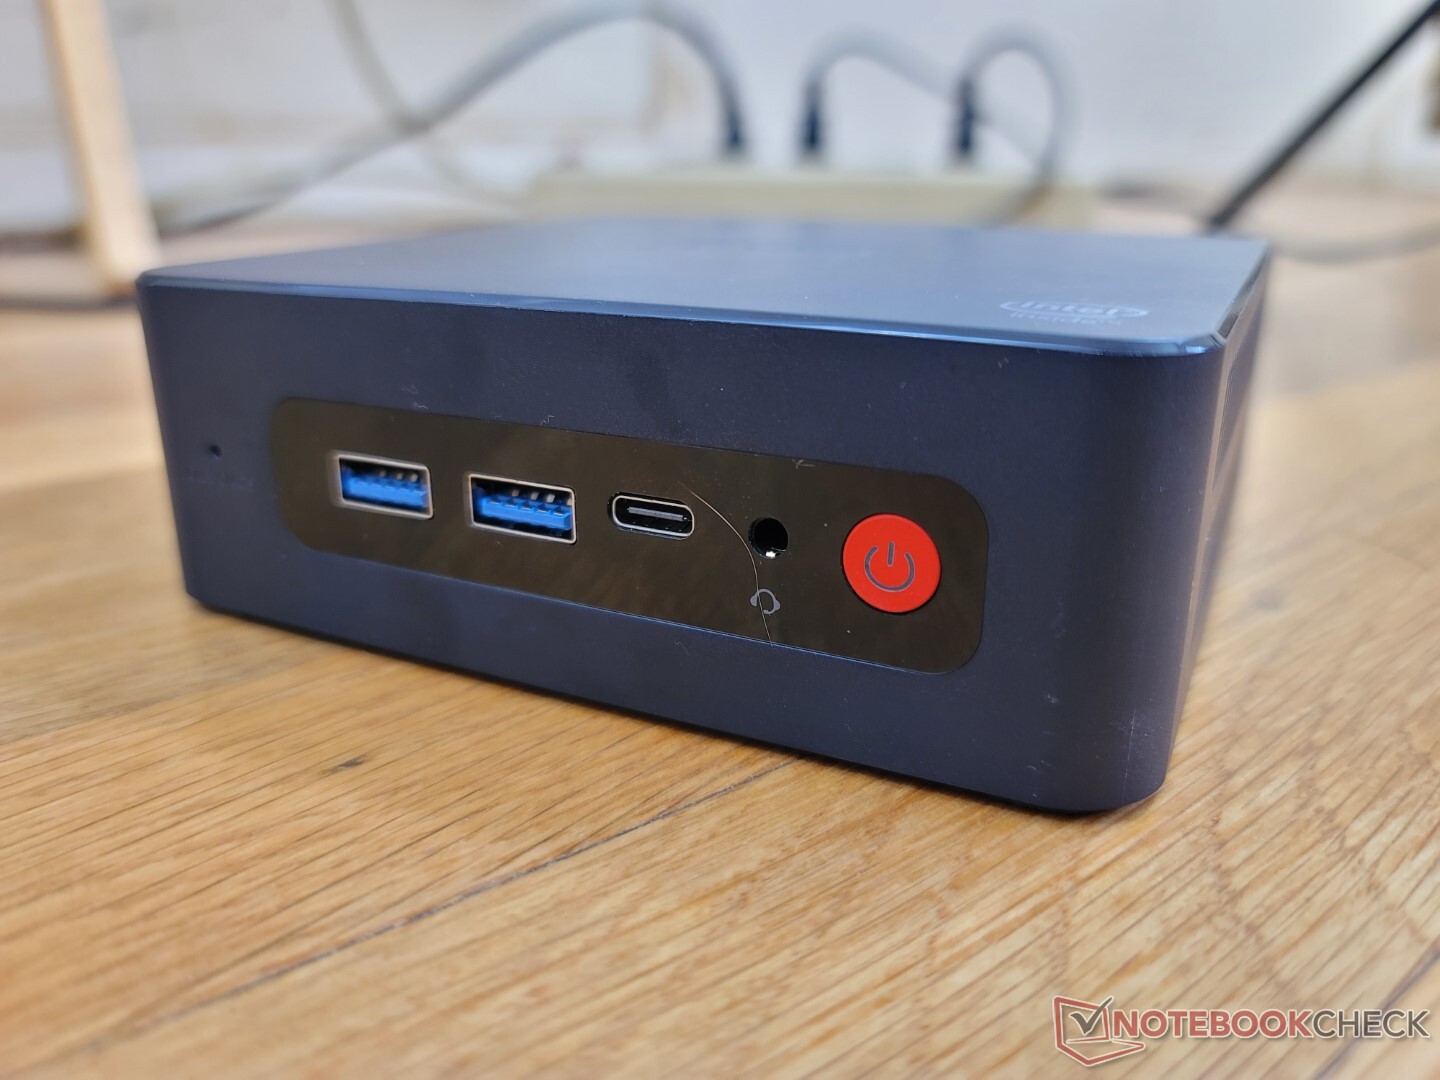
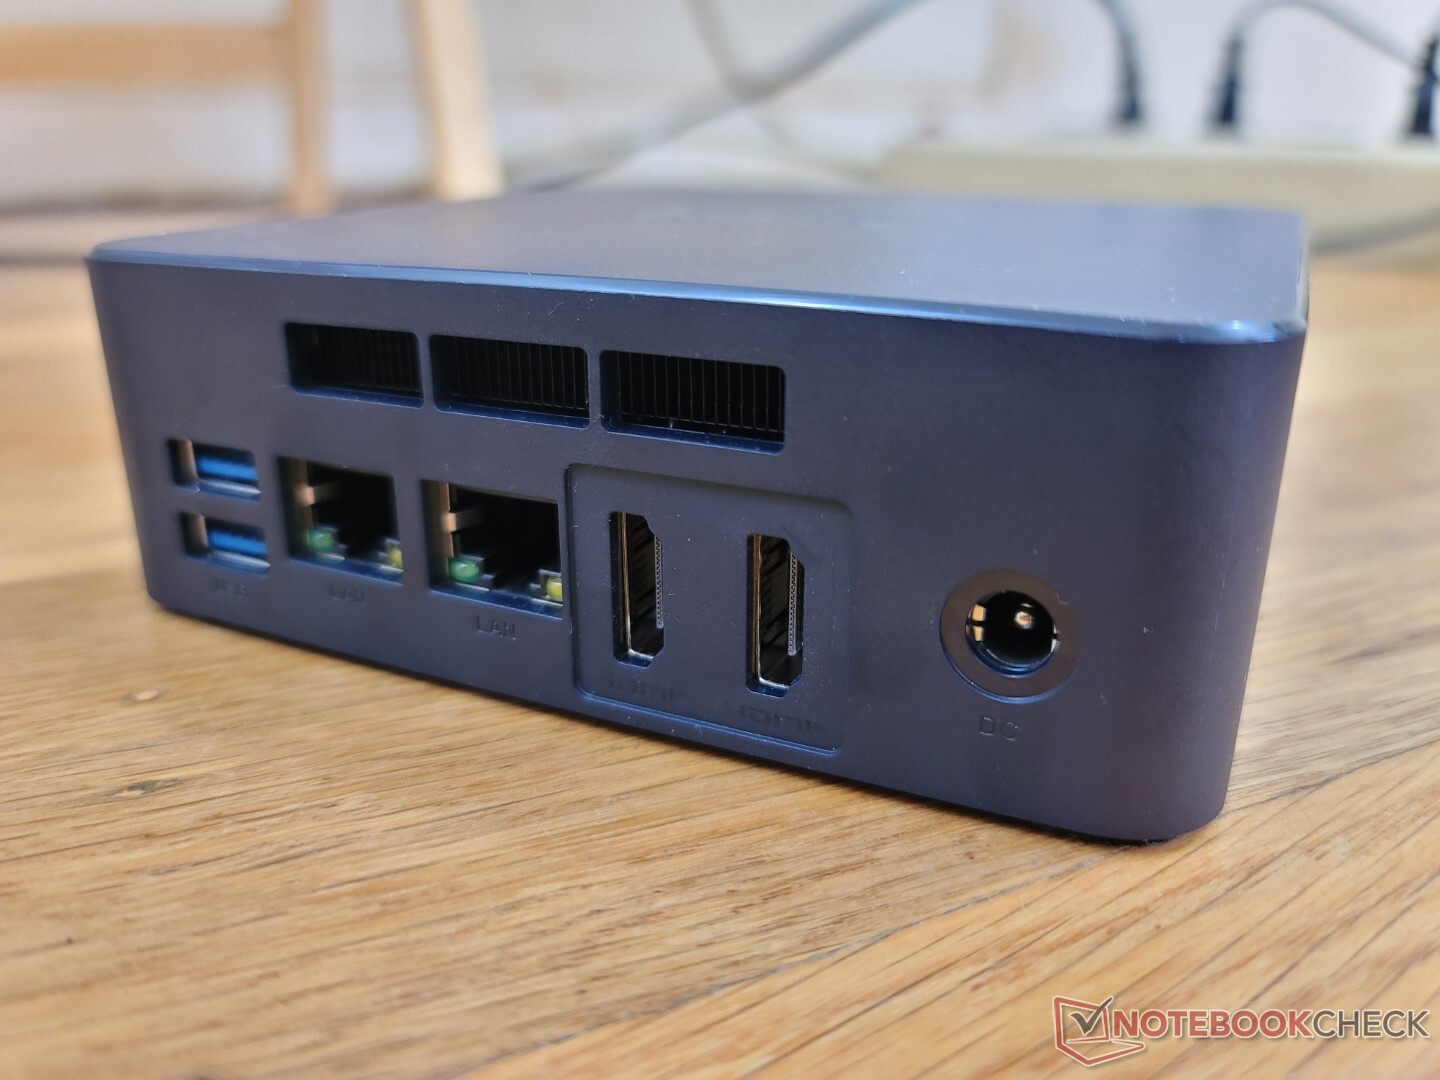
Port options are mostly identical to the original U59 including the USB-C port and lack of a Kensington Lock. For this newer model, however, the manufacturer has integrated a second RJ-45 port for a total of two. Note that the USB-C port here supports DisplayPort but not Power Delivery and so the system is reliant on its proprietary AC adapter for power.
Communication
The Intel 3165 WLAN module is removable unlike on the U59 Mini-S version. Though slow, we experienced no connectivity issues when streaming 4K content.

| Networking | |
| iperf3 transmit AX12 | |
| Intel NUC11TNKi5 | |
| Beelink SER4 | |
| Beelink SER3 | |
| iperf3 receive AX12 | |
| Intel NUC11TNKi5 | |
| Beelink SER4 | |
| Beelink SER3 | |
| iperf3 receive AXE11000 | |
| Beelink U59 N5105 | |
| Beelink U59 Mini-S | |
| iperf3 transmit AXE11000 | |
| Beelink U59 N5105 | |
| Beelink U59 Mini-S | |
Maintenance
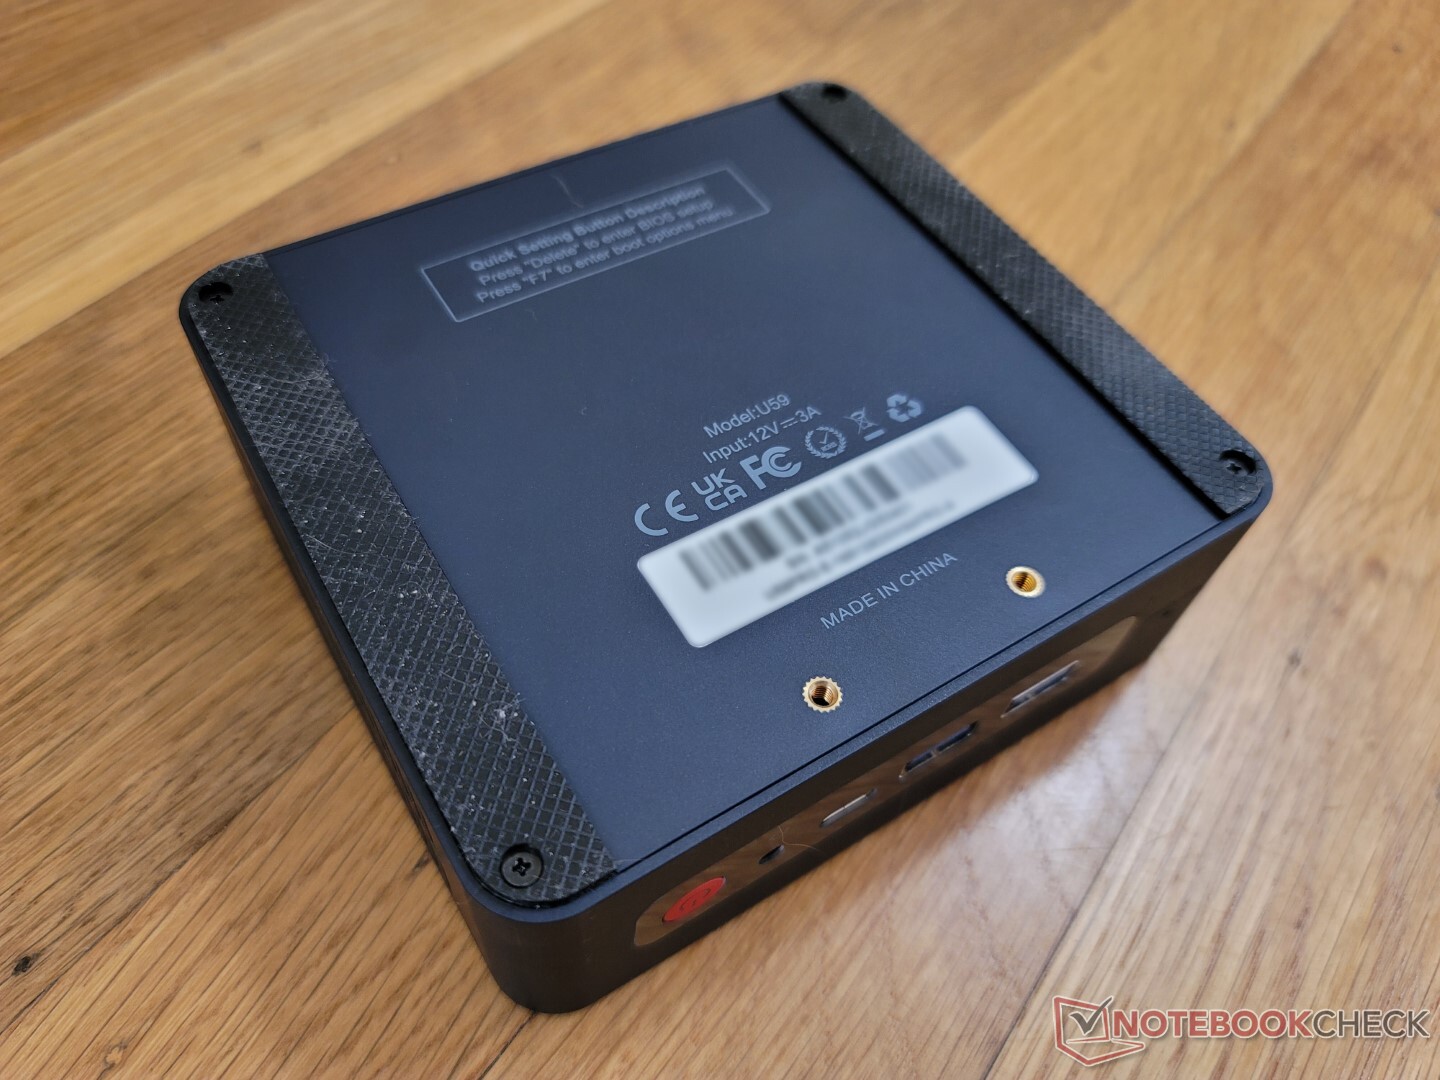
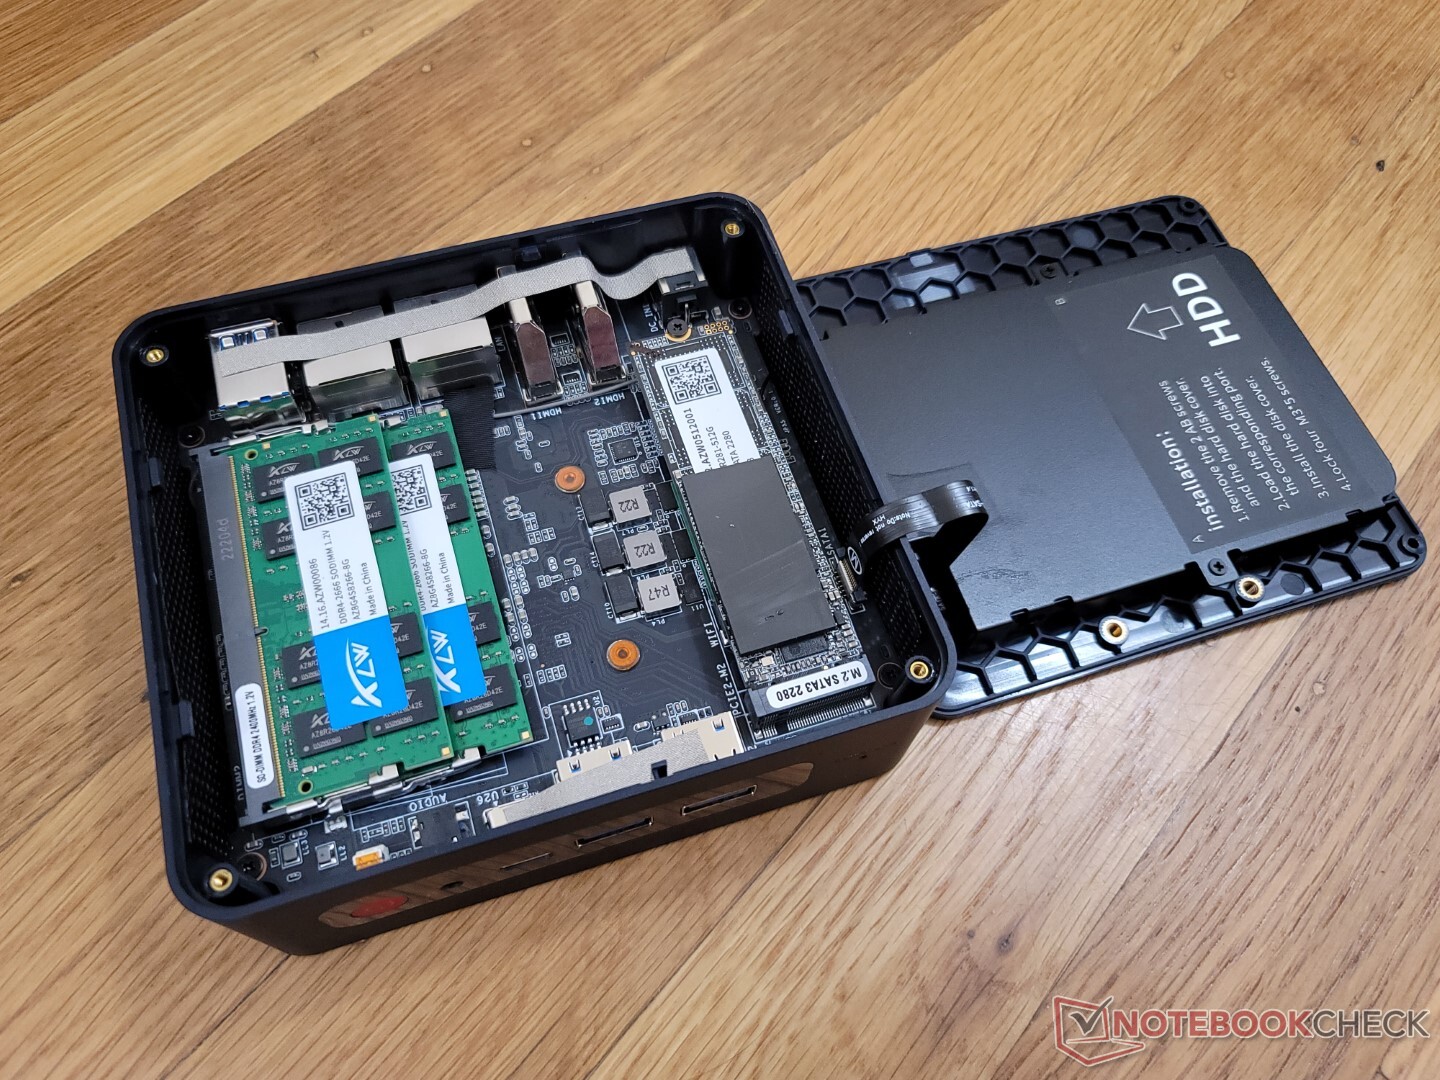
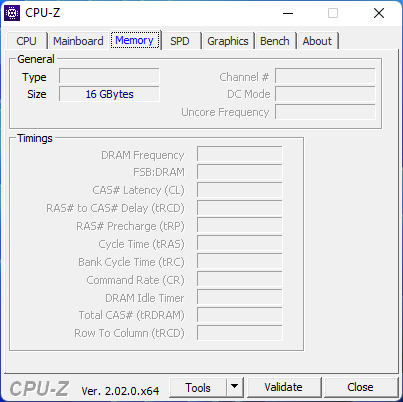
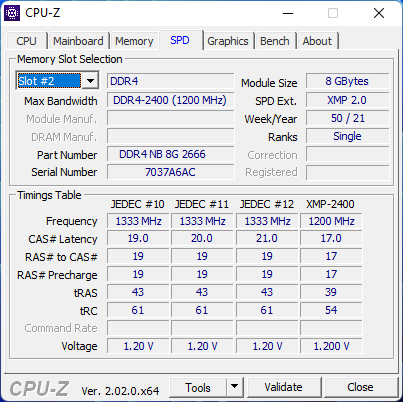
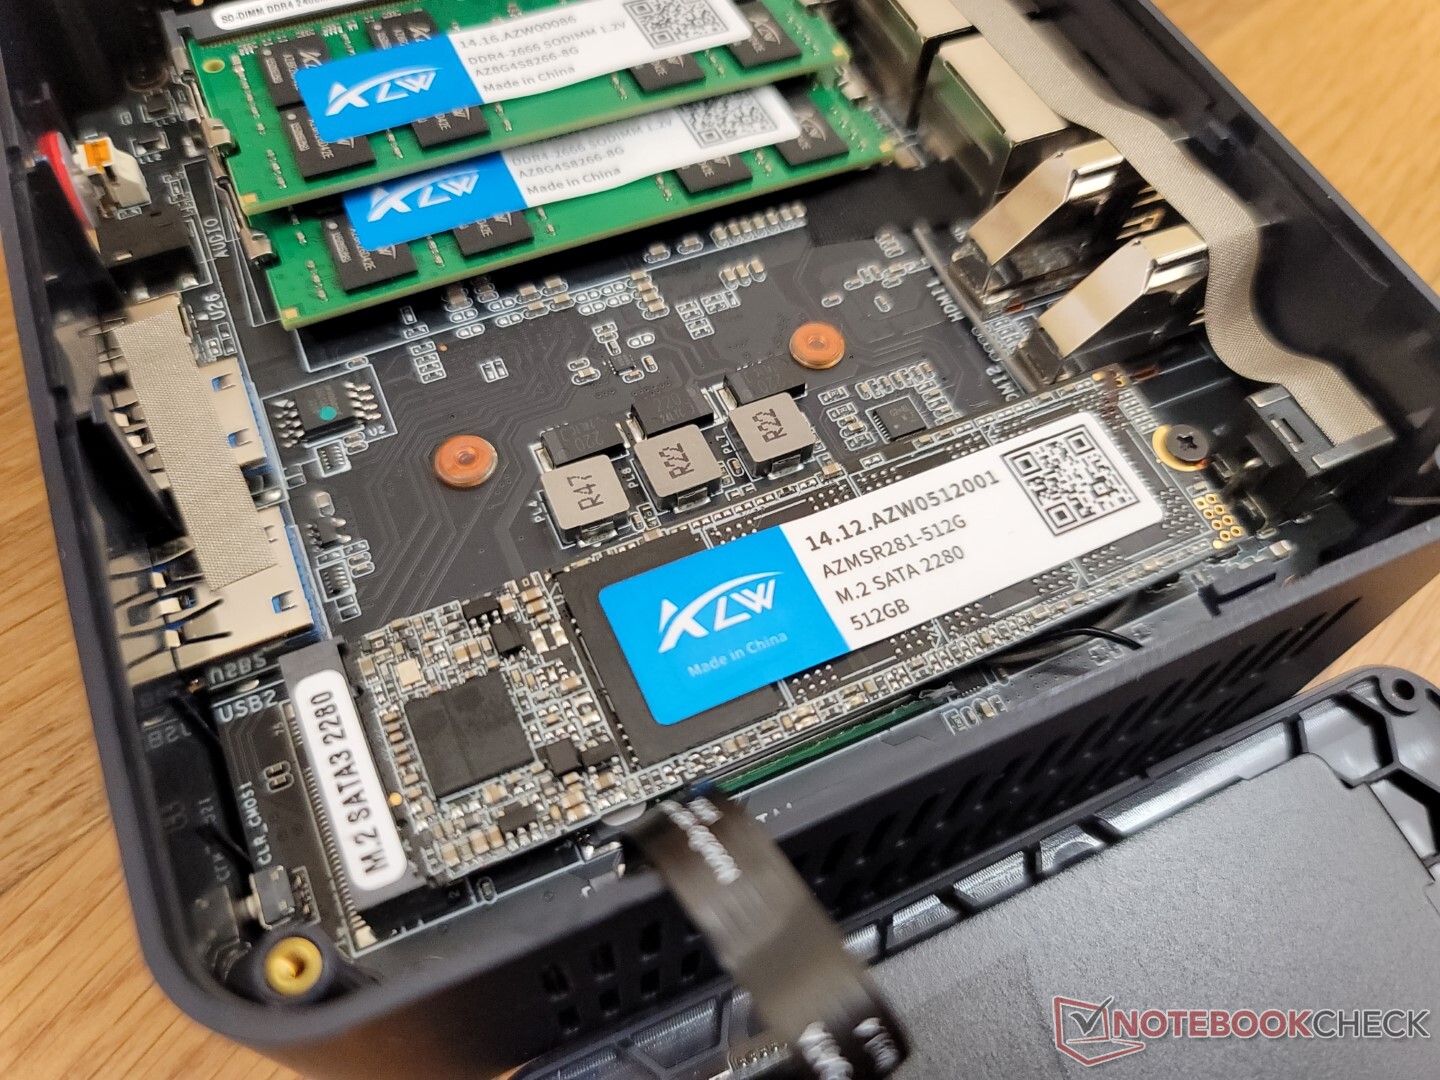
The bottom panel can be removed with just a Philips screwdriver to unveil 2x storage slots (M.2 SATA 2280 + 2.5-inch SATA III), 2x SODIMM slots, and the removable M.2 WLAN module. In comparison, the U59 Mini-S is limited to single-channel memory with its single SODIMM slot.
Accessories and Warranty
Included in the box are two HDMI cables, AC adapter, paperwork, and an adapter bracket for VESA mounting.
The standard one-year limited warranty applies if purchased from the US.
Performance


Testing Conditions
We set our test unit to Performance mode via Windows prior to running any benchmarks below. There are no manufacturer-specific programs or BIOS features related to the performance of the mini PC.
Processor
Raw CPU performance is only a hair faster than the N5095 in both single- and multi-threaded operations. The performance difference is so small that the two may as well be the same processor.
Cinebench R15 Multi Loop
Cinebench R23: Multi Core | Single Core
Cinebench R15: CPU Multi 64Bit | CPU Single 64Bit
Blender: v2.79 BMW27 CPU
7-Zip 18.03: 7z b 4 | 7z b 4 -mmt1
Geekbench 5.5: Multi-Core | Single-Core
HWBOT x265 Benchmark v2.2: 4k Preset
LibreOffice : 20 Documents To PDF
R Benchmark 2.5: Overall mean
| Cinebench R20 / CPU (Multi Core) | |
| Beelink SER4 | |
| Intel NUC11TNKi5 | |
| Beelink SER3 | |
| Lenovo IdeaPad 3 15ITL05 81X80074GE | |
| Beelink U59 N5105 | |
| Average Intel Celeron N5105 (n=1) | |
| Teclast TBOLT F15 Pro | |
| Beelink U59 Mini-S | |
| Beelink SEi8 | |
| HP 17-by2437ng | |
| Zotac ZBOX PI336 pico | |
| Cinebench R20 / CPU (Single Core) | |
| Lenovo IdeaPad 3 15ITL05 81X80074GE | |
| Intel NUC11TNKi5 | |
| Beelink SER4 | |
| Teclast TBOLT F15 Pro | |
| HP 17-by2437ng | |
| Beelink SER3 | |
| Beelink SEi8 | |
| Beelink U59 N5105 | |
| Average Intel Celeron N5105 (n=1) | |
| Beelink U59 Mini-S | |
| Zotac ZBOX PI336 pico | |
| Cinebench R23 / Multi Core | |
| Beelink SER4 | |
| Intel NUC11TNKi5 | |
| Beelink SER3 | |
| Lenovo IdeaPad 3 15ITL05 81X80074GE | |
| Beelink U59 N5105 | |
| Average Intel Celeron N5105 (n=1) | |
| Beelink U59 Mini-S | |
| Teclast TBOLT F15 Pro | |
| Beelink SEi8 | |
| Zotac ZBOX PI336 pico | |
| Cinebench R23 / Single Core | |
| Intel NUC11TNKi5 | |
| Lenovo IdeaPad 3 15ITL05 81X80074GE | |
| Beelink SER4 | |
| Teclast TBOLT F15 Pro | |
| Beelink SER3 | |
| Beelink SEi8 | |
| Beelink U59 N5105 | |
| Average Intel Celeron N5105 (n=1) | |
| Beelink U59 Mini-S | |
| Zotac ZBOX PI336 pico | |
| Cinebench R15 / CPU Multi 64Bit | |
| Beelink SER4 | |
| Intel NUC11TNKi5 | |
| Beelink SER3 | |
| Lenovo IdeaPad 3 15ITL05 81X80074GE | |
| Beelink U59 N5105 | |
| Average Intel Celeron N5105 (n=1) | |
| Beelink U59 Mini-S | |
| Teclast TBOLT F15 Pro | |
| Beelink SEi8 | |
| HP 17-by2437ng | |
| Zotac ZBOX PI336 pico | |
| Cinebench R15 / CPU Single 64Bit | |
| Intel NUC11TNKi5 | |
| Beelink SER4 | |
| HP 17-by2437ng | |
| Teclast TBOLT F15 Pro | |
| Beelink SER3 | |
| Lenovo IdeaPad 3 15ITL05 81X80074GE | |
| Beelink SEi8 | |
| Beelink U59 N5105 | |
| Average Intel Celeron N5105 (n=1) | |
| Beelink U59 Mini-S | |
| Zotac ZBOX PI336 pico | |
| Blender / v2.79 BMW27 CPU | |
| Zotac ZBOX PI336 pico | |
| Beelink U59 Mini-S | |
| Beelink U59 N5105 | |
| Average Intel Celeron N5105 (n=1) | |
| Teclast TBOLT F15 Pro | |
| HP 17-by2437ng | |
| Beelink SEi8 | |
| Lenovo IdeaPad 3 15ITL05 81X80074GE | |
| Beelink SER3 | |
| Intel NUC11TNKi5 | |
| Beelink SER4 | |
| 7-Zip 18.03 / 7z b 4 | |
| Beelink SER4 | |
| Intel NUC11TNKi5 | |
| Beelink SER3 | |
| Lenovo IdeaPad 3 15ITL05 81X80074GE | |
| Beelink U59 N5105 | |
| Average Intel Celeron N5105 (n=1) | |
| Beelink U59 Mini-S | |
| HP 17-by2437ng | |
| Teclast TBOLT F15 Pro | |
| Beelink SEi8 | |
| Zotac ZBOX PI336 pico | |
| 7-Zip 18.03 / 7z b 4 -mmt1 | |
| Intel NUC11TNKi5 | |
| Lenovo IdeaPad 3 15ITL05 81X80074GE | |
| Beelink SER4 | |
| HP 17-by2437ng | |
| Teclast TBOLT F15 Pro | |
| Beelink SER3 | |
| Beelink SEi8 | |
| Beelink U59 Mini-S | |
| Beelink U59 N5105 | |
| Average Intel Celeron N5105 (n=1) | |
| Zotac ZBOX PI336 pico | |
| Geekbench 5.5 / Multi-Core | |
| Beelink SER4 | |
| Intel NUC11TNKi5 | |
| Lenovo IdeaPad 3 15ITL05 81X80074GE | |
| Teclast TBOLT F15 Pro | |
| Beelink U59 N5105 | |
| Average Intel Celeron N5105 (n=1) | |
| HP 17-by2437ng | |
| Beelink U59 Mini-S | |
| Beelink SEi8 | |
| Zotac ZBOX PI336 pico | |
| Geekbench 5.5 / Single-Core | |
| Intel NUC11TNKi5 | |
| Lenovo IdeaPad 3 15ITL05 81X80074GE | |
| Beelink SER4 | |
| Teclast TBOLT F15 Pro | |
| HP 17-by2437ng | |
| Beelink SEi8 | |
| Beelink U59 N5105 | |
| Average Intel Celeron N5105 (n=1) | |
| Beelink U59 Mini-S | |
| Zotac ZBOX PI336 pico | |
| HWBOT x265 Benchmark v2.2 / 4k Preset | |
| Beelink SER4 | |
| Intel NUC11TNKi5 | |
| Beelink SER3 | |
| Lenovo IdeaPad 3 15ITL05 81X80074GE | |
| Beelink SEi8 | |
| HP 17-by2437ng | |
| Teclast TBOLT F15 Pro | |
| Beelink U59 N5105 | |
| Average Intel Celeron N5105 (n=1) | |
| Beelink U59 Mini-S | |
| Zotac ZBOX PI336 pico | |
| LibreOffice / 20 Documents To PDF | |
| Zotac ZBOX PI336 pico | |
| Beelink U59 Mini-S | |
| Beelink U59 N5105 | |
| Average Intel Celeron N5105 (n=1) | |
| Beelink SER3 | |
| Teclast TBOLT F15 Pro | |
| Beelink SEi8 | |
| HP 17-by2437ng | |
| Beelink SER4 | |
| Intel NUC11TNKi5 | |
| Lenovo IdeaPad 3 15ITL05 81X80074GE | |
| R Benchmark 2.5 / Overall mean | |
| Zotac ZBOX PI336 pico | |
| Beelink U59 Mini-S | |
| Beelink U59 N5105 | |
| Average Intel Celeron N5105 (n=1) | |
| Beelink SEi8 | |
| Teclast TBOLT F15 Pro | |
| HP 17-by2437ng | |
| Beelink SER3 | |
| Lenovo IdeaPad 3 15ITL05 81X80074GE | |
| Intel NUC11TNKi5 | |
| Beelink SER4 | |
* ... smaller is better
AIDA64: FP32 Ray-Trace | FPU Julia | CPU SHA3 | CPU Queen | FPU SinJulia | FPU Mandel | CPU AES | CPU ZLib | FP64 Ray-Trace | CPU PhotoWorxx
| Performance rating | |
| Beelink SER4 | |
| Intel NUC11TNKi5 | |
| Beelink SER3 | |
| Beelink U59 N5105 | |
| Beelink U59 Mini-S | |
| Zotac ZBOX PI336 pico | |
| AIDA64 / FP32 Ray-Trace | |
| Beelink SER4 | |
| Intel NUC11TNKi5 | |
| Beelink SER3 | |
| Beelink U59 Mini-S | |
| Beelink U59 N5105 | |
| Zotac ZBOX PI336 pico | |
| AIDA64 / FPU Julia | |
| Beelink SER4 | |
| Intel NUC11TNKi5 | |
| Beelink SER3 | |
| Beelink U59 N5105 | |
| Beelink U59 Mini-S | |
| Zotac ZBOX PI336 pico | |
| AIDA64 / CPU SHA3 | |
| Intel NUC11TNKi5 | |
| Beelink SER4 | |
| Beelink SER3 | |
| Beelink U59 N5105 | |
| Beelink U59 Mini-S | |
| Zotac ZBOX PI336 pico | |
| AIDA64 / CPU Queen | |
| Beelink SER4 | |
| Intel NUC11TNKi5 | |
| Beelink SER3 | |
| Beelink U59 N5105 | |
| Beelink U59 Mini-S | |
| Zotac ZBOX PI336 pico | |
| AIDA64 / FPU SinJulia | |
| Beelink SER4 | |
| Beelink SER3 | |
| Intel NUC11TNKi5 | |
| Beelink U59 Mini-S | |
| Beelink U59 N5105 | |
| Zotac ZBOX PI336 pico | |
| AIDA64 / FPU Mandel | |
| Beelink SER4 | |
| Intel NUC11TNKi5 | |
| Beelink SER3 | |
| Beelink U59 N5105 | |
| Beelink U59 Mini-S | |
| Zotac ZBOX PI336 pico | |
| AIDA64 / CPU AES | |
| Intel NUC11TNKi5 | |
| Beelink SER4 | |
| Beelink SER3 | |
| Beelink U59 N5105 | |
| Beelink U59 Mini-S | |
| Zotac ZBOX PI336 pico | |
| AIDA64 / CPU ZLib | |
| Beelink SER4 | |
| Intel NUC11TNKi5 | |
| Beelink SER3 | |
| Beelink U59 N5105 | |
| Beelink U59 Mini-S | |
| Zotac ZBOX PI336 pico | |
| AIDA64 / FP64 Ray-Trace | |
| Beelink SER4 | |
| Intel NUC11TNKi5 | |
| Beelink SER3 | |
| Beelink U59 N5105 | |
| Beelink U59 Mini-S | |
| Zotac ZBOX PI336 pico | |
| AIDA64 / CPU PhotoWorxx | |
| Beelink SER4 | |
| Intel NUC11TNKi5 | |
| Beelink U59 N5105 | |
| Beelink SER3 | |
| Beelink U59 Mini-S | |
| Zotac ZBOX PI336 pico | |
System Performance
CrossMark: Overall | Productivity | Creativity | Responsiveness
| PCMark 10 / Score | |
| Beelink SER4 | |
| Intel NUC11TNKi5 | |
| Beelink SER3 | |
| Beelink U59 N5105 | |
| Average Intel Celeron N5105, Intel UHD Graphics (Jasper Lake 24 EU) (n=1) | |
| Beelink U59 Mini-S | |
| PCMark 10 / Essentials | |
| Beelink SER4 | |
| Intel NUC11TNKi5 | |
| Beelink SER3 | |
| Beelink U59 N5105 | |
| Average Intel Celeron N5105, Intel UHD Graphics (Jasper Lake 24 EU) (n=1) | |
| Beelink U59 Mini-S | |
| PCMark 10 / Productivity | |
| Beelink SER4 | |
| Intel NUC11TNKi5 | |
| Beelink SER3 | |
| Beelink U59 N5105 | |
| Average Intel Celeron N5105, Intel UHD Graphics (Jasper Lake 24 EU) (n=1) | |
| Beelink U59 Mini-S | |
| PCMark 10 / Digital Content Creation | |
| Beelink SER4 | |
| Intel NUC11TNKi5 | |
| Beelink SER3 | |
| Beelink U59 N5105 | |
| Average Intel Celeron N5105, Intel UHD Graphics (Jasper Lake 24 EU) (n=1) | |
| Beelink U59 Mini-S | |
| CrossMark / Overall | |
| Beelink U59 N5105 | |
| Average Intel Celeron N5105, Intel UHD Graphics (Jasper Lake 24 EU) (n=1) | |
| Beelink U59 Mini-S | |
| CrossMark / Productivity | |
| Beelink U59 N5105 | |
| Average Intel Celeron N5105, Intel UHD Graphics (Jasper Lake 24 EU) (n=1) | |
| Beelink U59 Mini-S | |
| CrossMark / Creativity | |
| Beelink U59 N5105 | |
| Average Intel Celeron N5105, Intel UHD Graphics (Jasper Lake 24 EU) (n=1) | |
| Beelink U59 Mini-S | |
| CrossMark / Responsiveness | |
| Beelink U59 N5105 | |
| Average Intel Celeron N5105, Intel UHD Graphics (Jasper Lake 24 EU) (n=1) | |
| Beelink U59 Mini-S | |
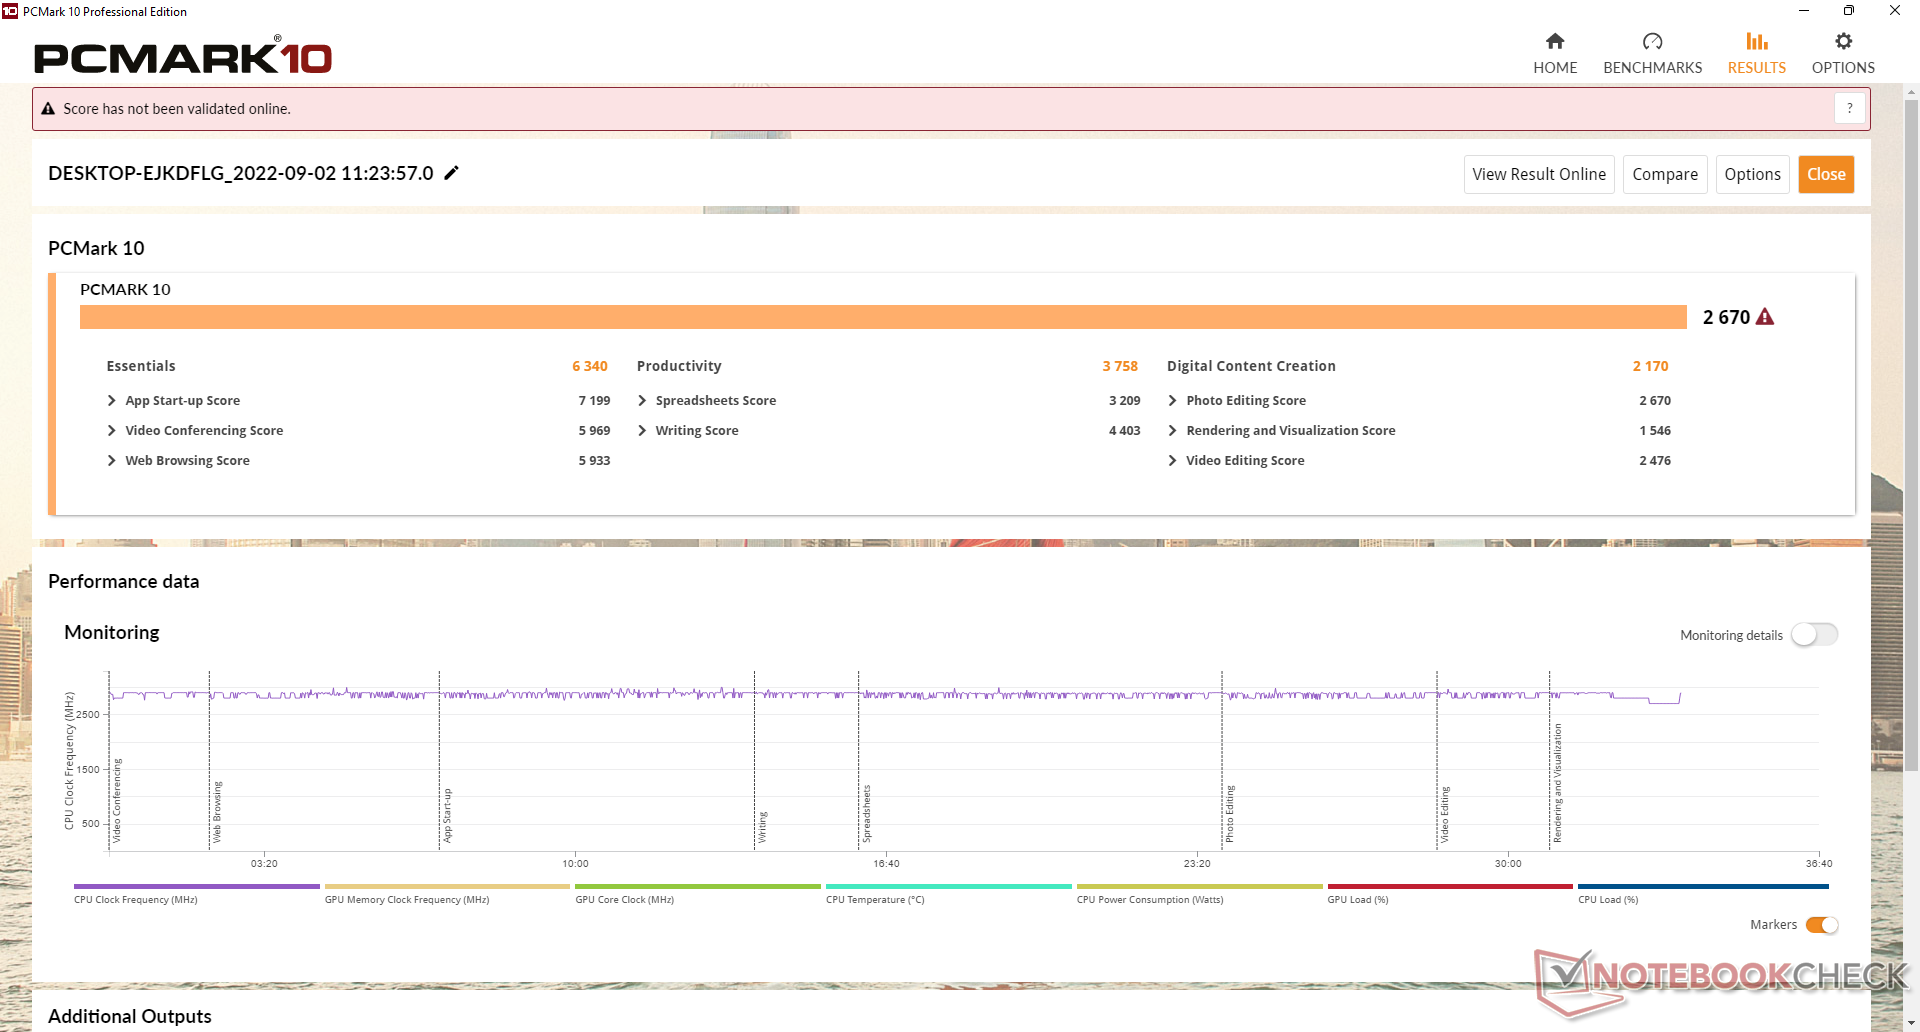
| PCMark 10 Score | 2670 points | |
Help | ||
| AIDA64 / Memory Copy | |
| Beelink SER4 | |
| Beelink U59 N5105 | |
| Intel NUC11TNKi5 | |
| Beelink U59 Mini-S | |
| Beelink SER3 | |
| Zotac ZBOX PI336 pico | |
| AIDA64 / Memory Read | |
| Beelink SER4 | |
| Intel NUC11TNKi5 | |
| Beelink SER3 | |
| Beelink U59 N5105 | |
| Beelink U59 Mini-S | |
| Zotac ZBOX PI336 pico | |
| AIDA64 / Memory Write | |
| Beelink SER4 | |
| Beelink U59 N5105 | |
| Intel NUC11TNKi5 | |
| Beelink U59 Mini-S | |
| Beelink SER3 | |
| Zotac ZBOX PI336 pico | |
| AIDA64 / Memory Latency | |
| Beelink SER3 | |
| Beelink SER4 | |
| Intel NUC11TNKi5 | |
| Zotac ZBOX PI336 pico | |
| Beelink U59 N5105 | |
| Beelink U59 Mini-S | |
* ... smaller is better
DPC Latency
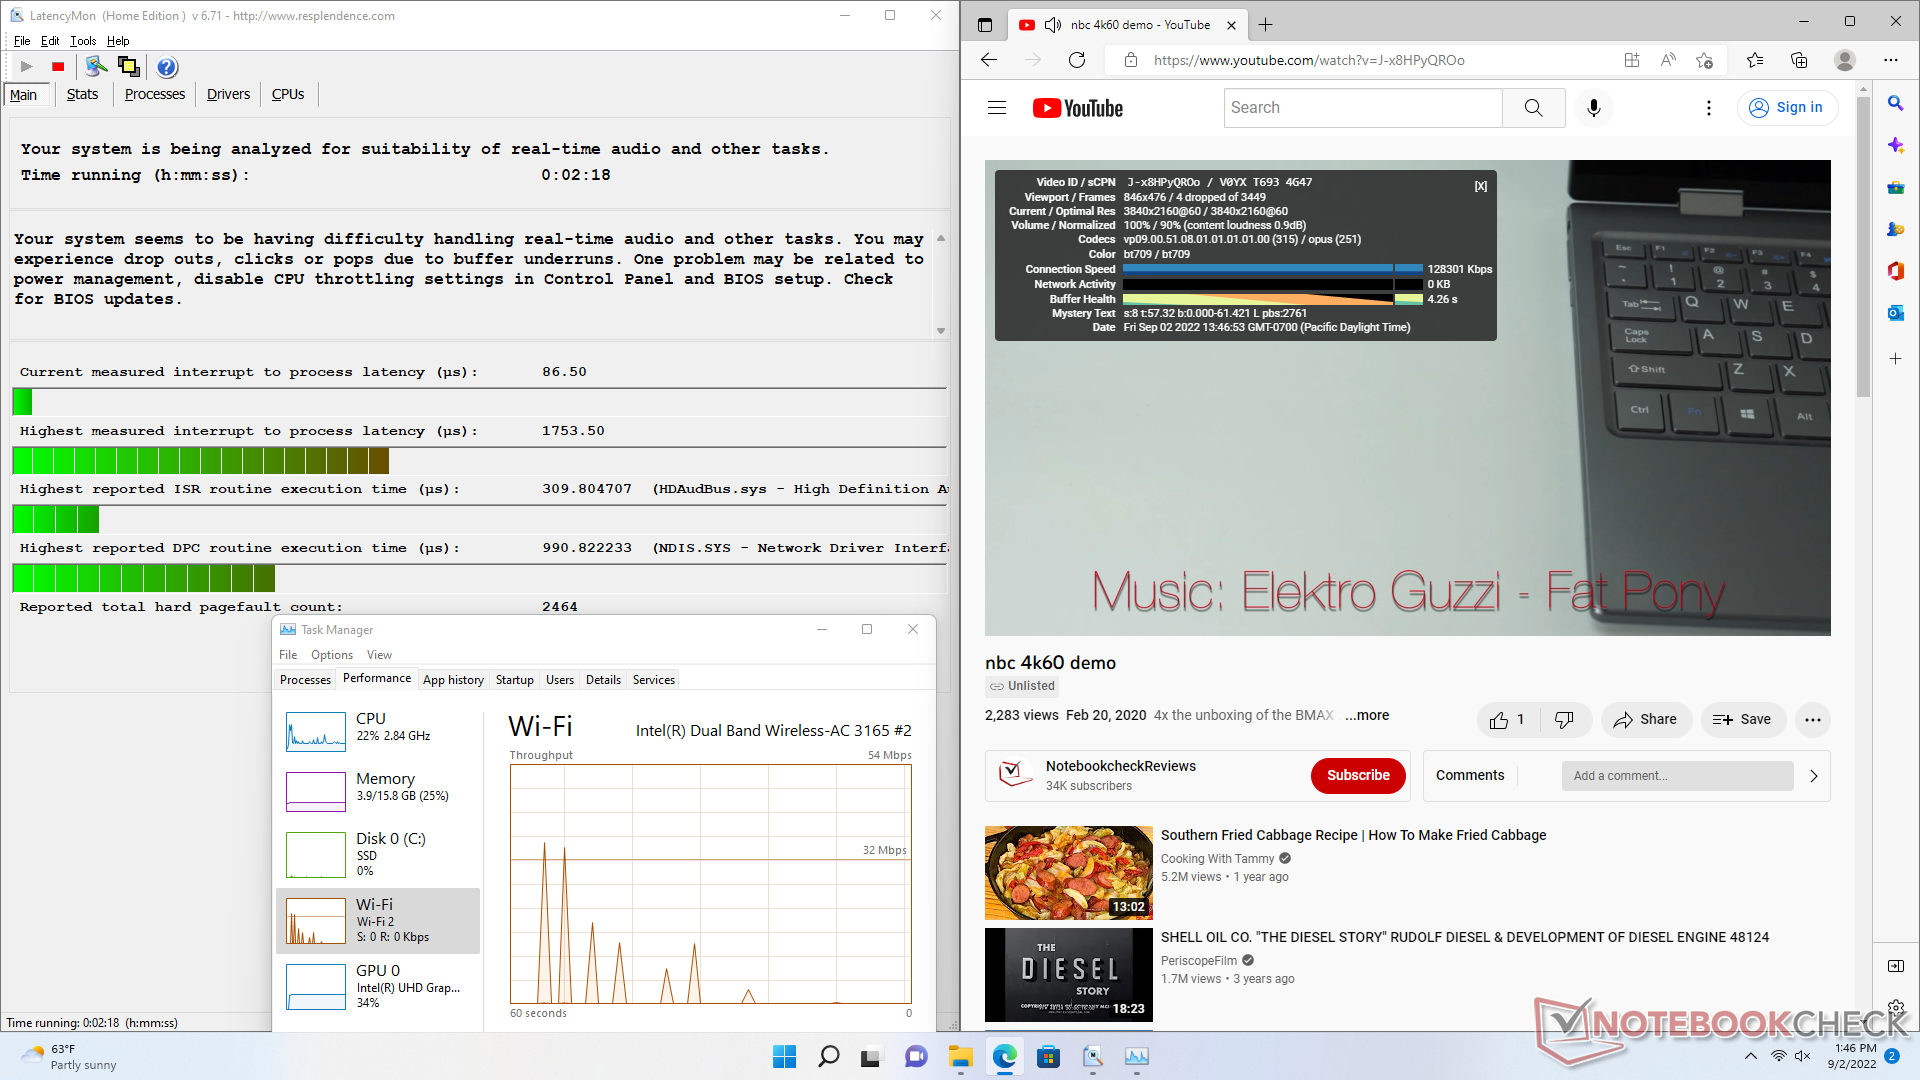
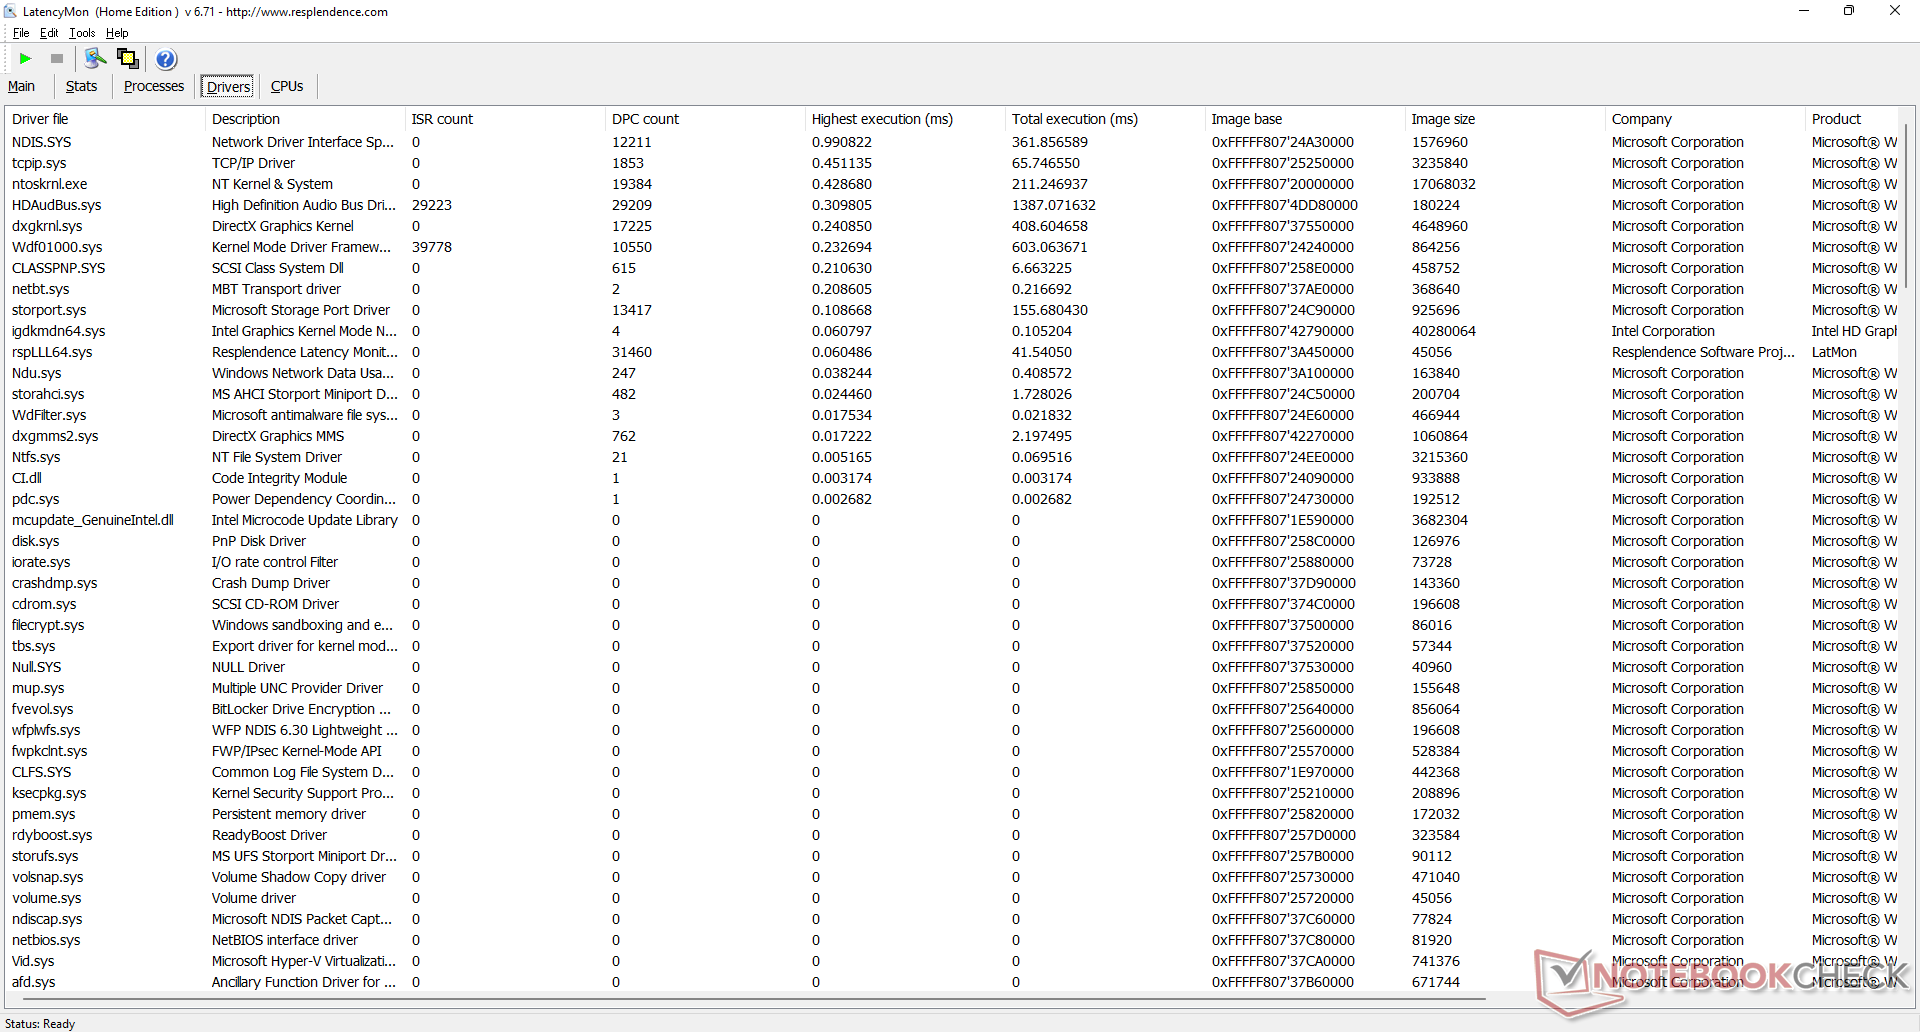
LatencyMon reveals DPC issues when opening multiple browser tabs of our homepage. 4K video playback at 60 FPS is almost perfect with just 4 dropped frames during our minute-long test video.
| DPC Latencies / LatencyMon - interrupt to process latency (max), Web, Youtube, Prime95 | |
| Beelink U59 N5105 | |
| Beelink U59 Mini-S | |
| Zotac ZBOX PI336 pico | |
| Beelink SER3 | |
| Intel NUC11TNKi5 | |
| Beelink SER4 | |
* ... smaller is better
Storage Devices
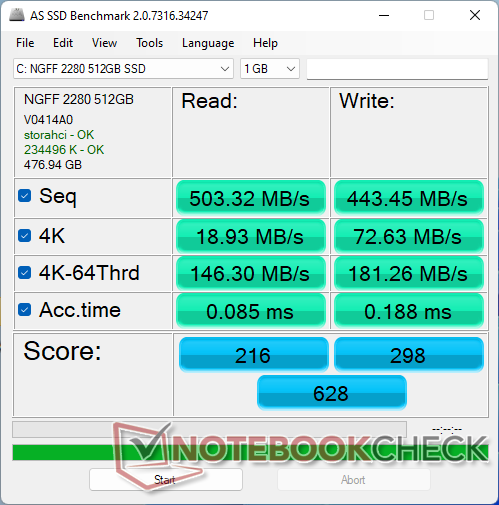
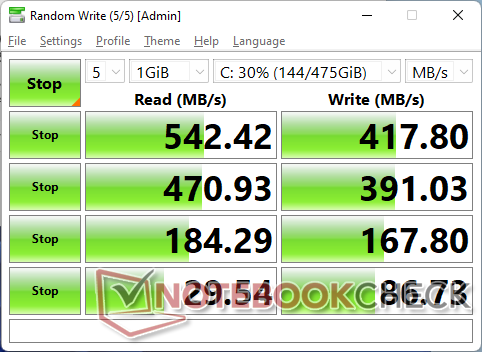
The model ships with an M.2 SATA III drive instead of NVMe likely to save on costs. Considering the CPU, however, a SATA III drive is acceptable. The Silicon Motion AZW drive in our test unit would return great sequential read and write rates north of 400 MB/s each.
A small thermal pad for the SSD is included which is surprising to see on a budget mini PC like the U59. The pad sits in between the SSD and the metal 2.5-inch SATA III enclosure that's attached to the top bottom panel.

| Drive Performance rating - Percent | |
| Beelink SER3 | |
| Beelink SER4 | |
| Intel NUC11TNKi5 | |
| Beelink U59 N5105 | |
| Beelink U59 Mini-S | |
| Zotac ZBOX PI336 pico | |
* ... smaller is better
Disk Throttling: DiskSpd Read Loop, Queue Depth 8
GPU Performance
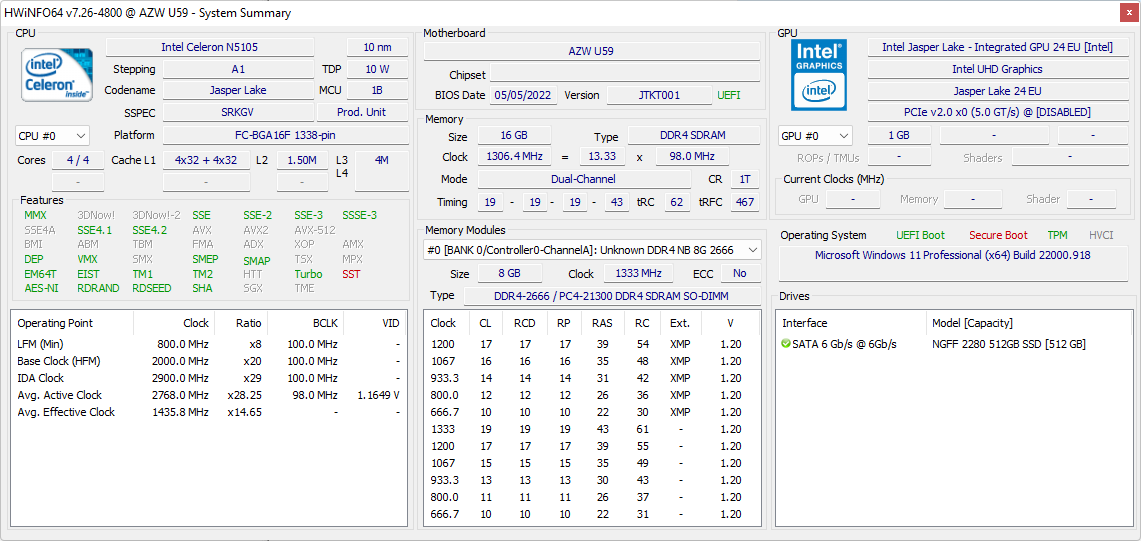
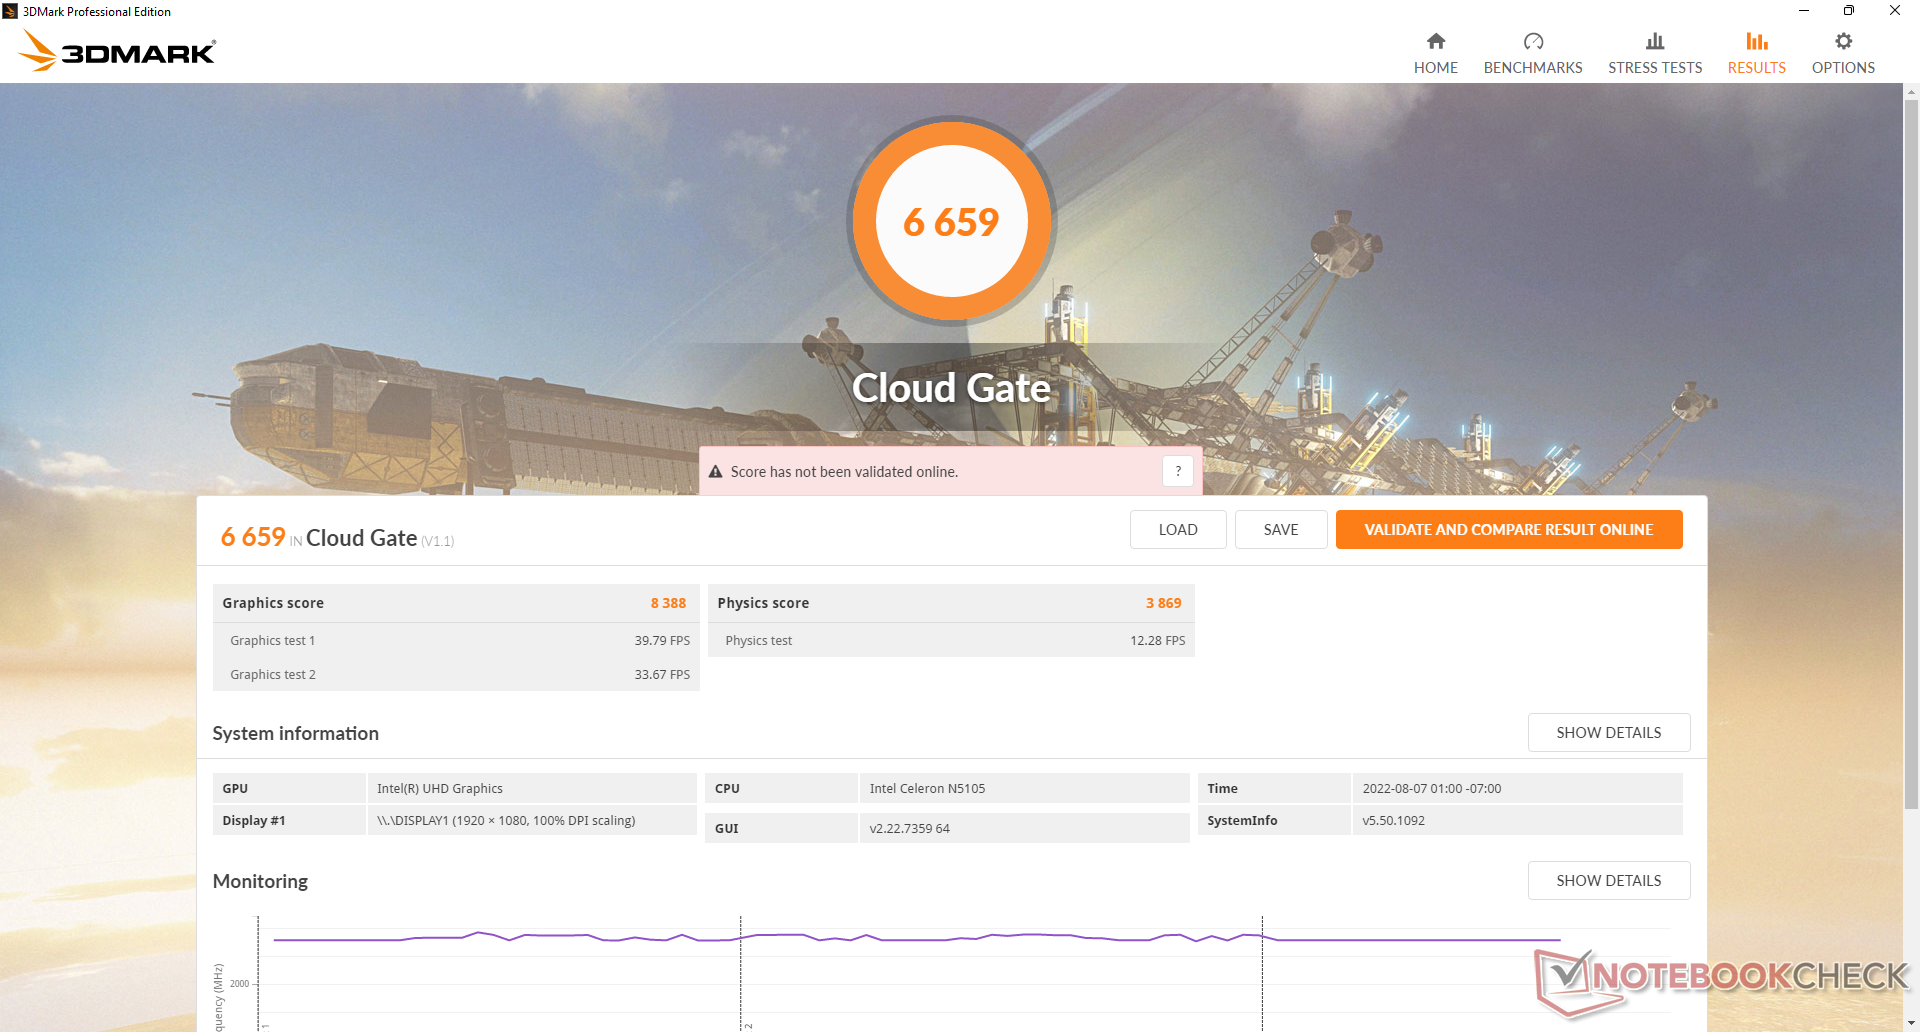
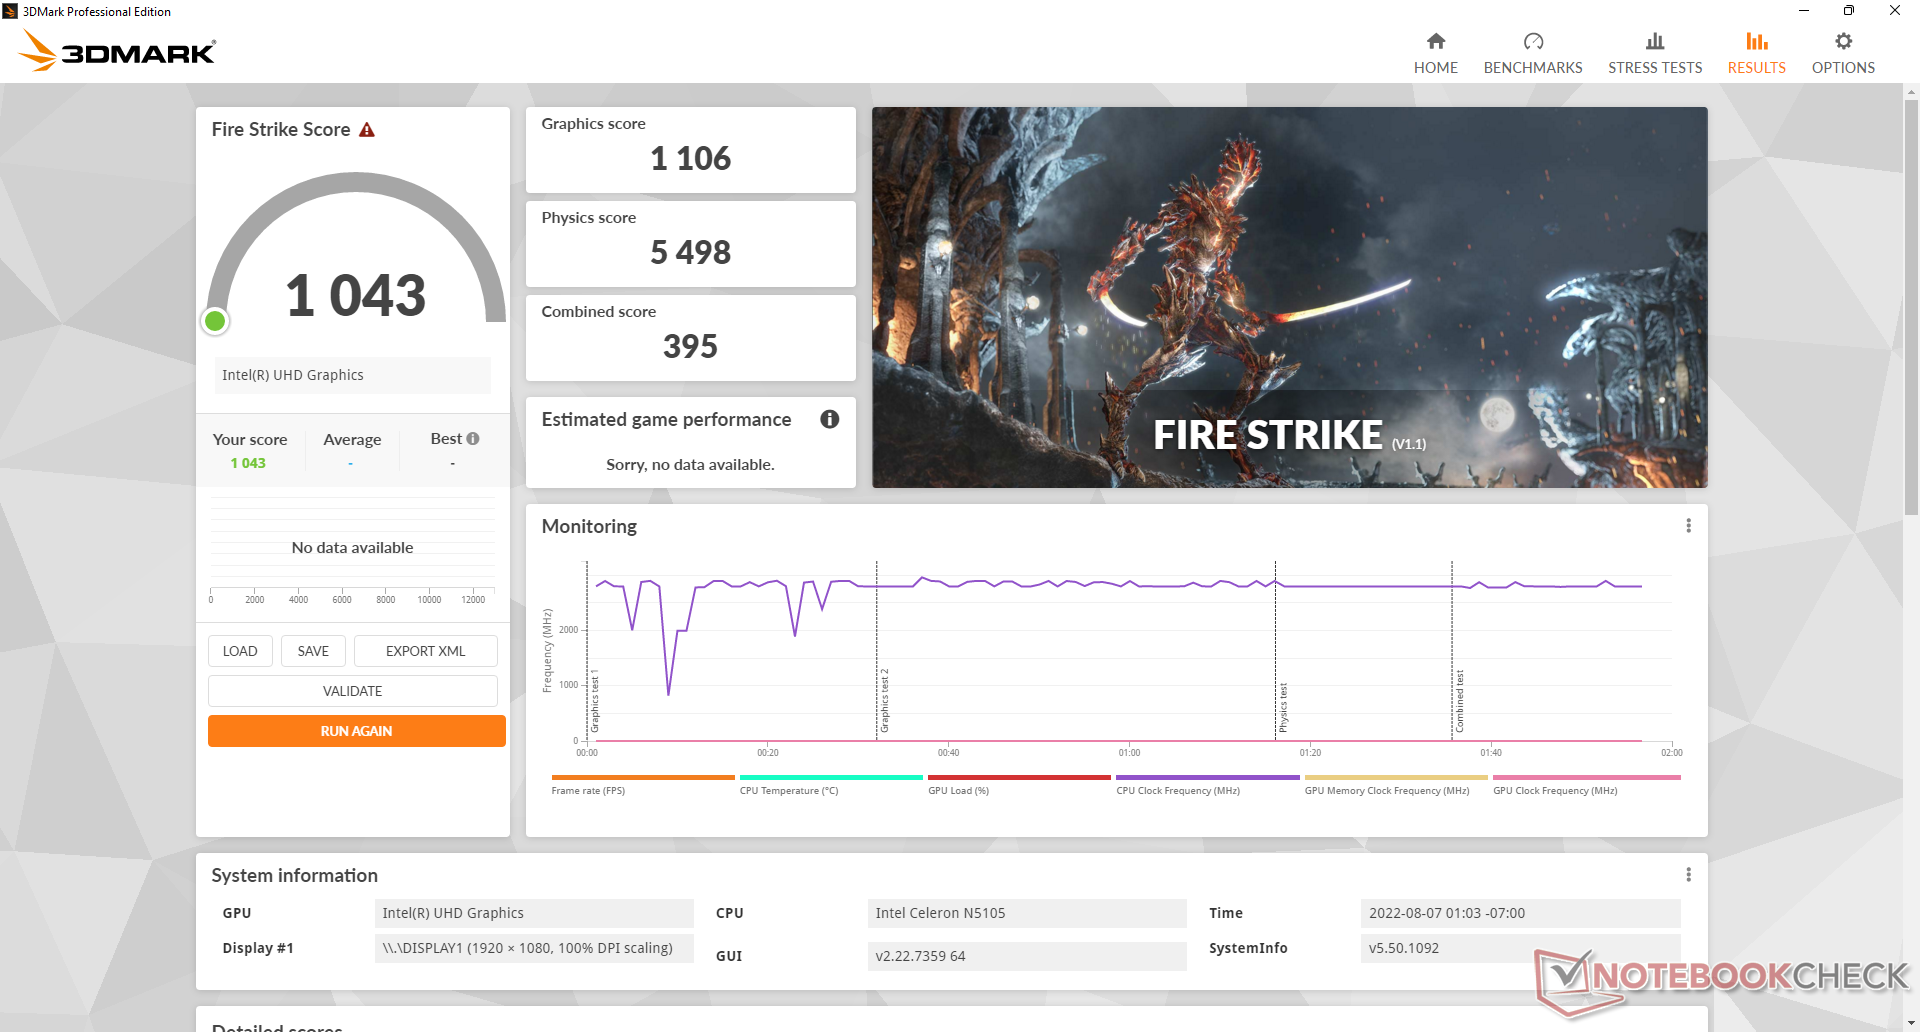
The integrated GPU gets an upgrade from the Jasper Lake 16 EUs on last year's Celeron N5095 to the Jasper Lake 24 EUs on this year's U59 N5105. 3DMark results are 80 percent faster on the newer GPU when compared to last year's U59 to represent a significant year-over-year boost. However, it's important to note that our U59 N5095 shipped with 8 GB of single-channel RAM compared to the 16 GB of dual-channel RAM in our U59 N5105. The dual-channel RAM alone likely accounts for 30 to 50 percent of that performance difference. Nonetheless, this is still one of the slower integrated GPU solutions out there and so it is unfit for most games new or old.
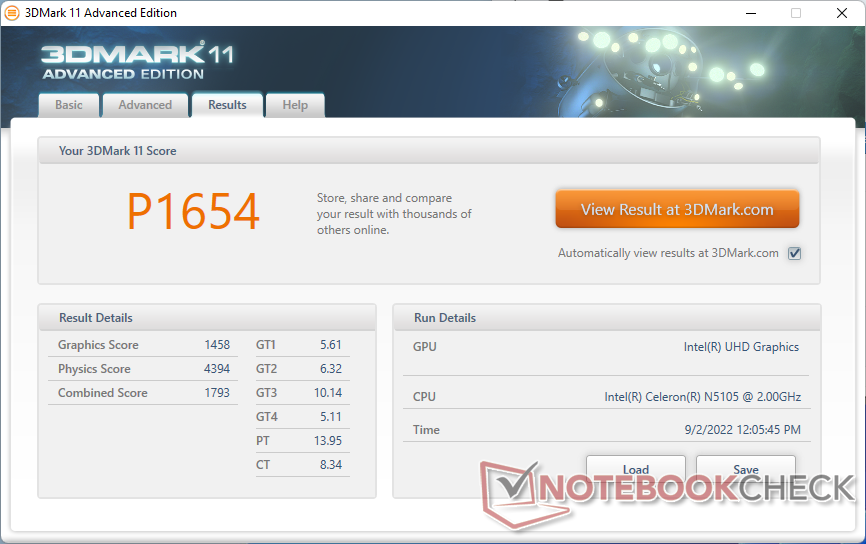
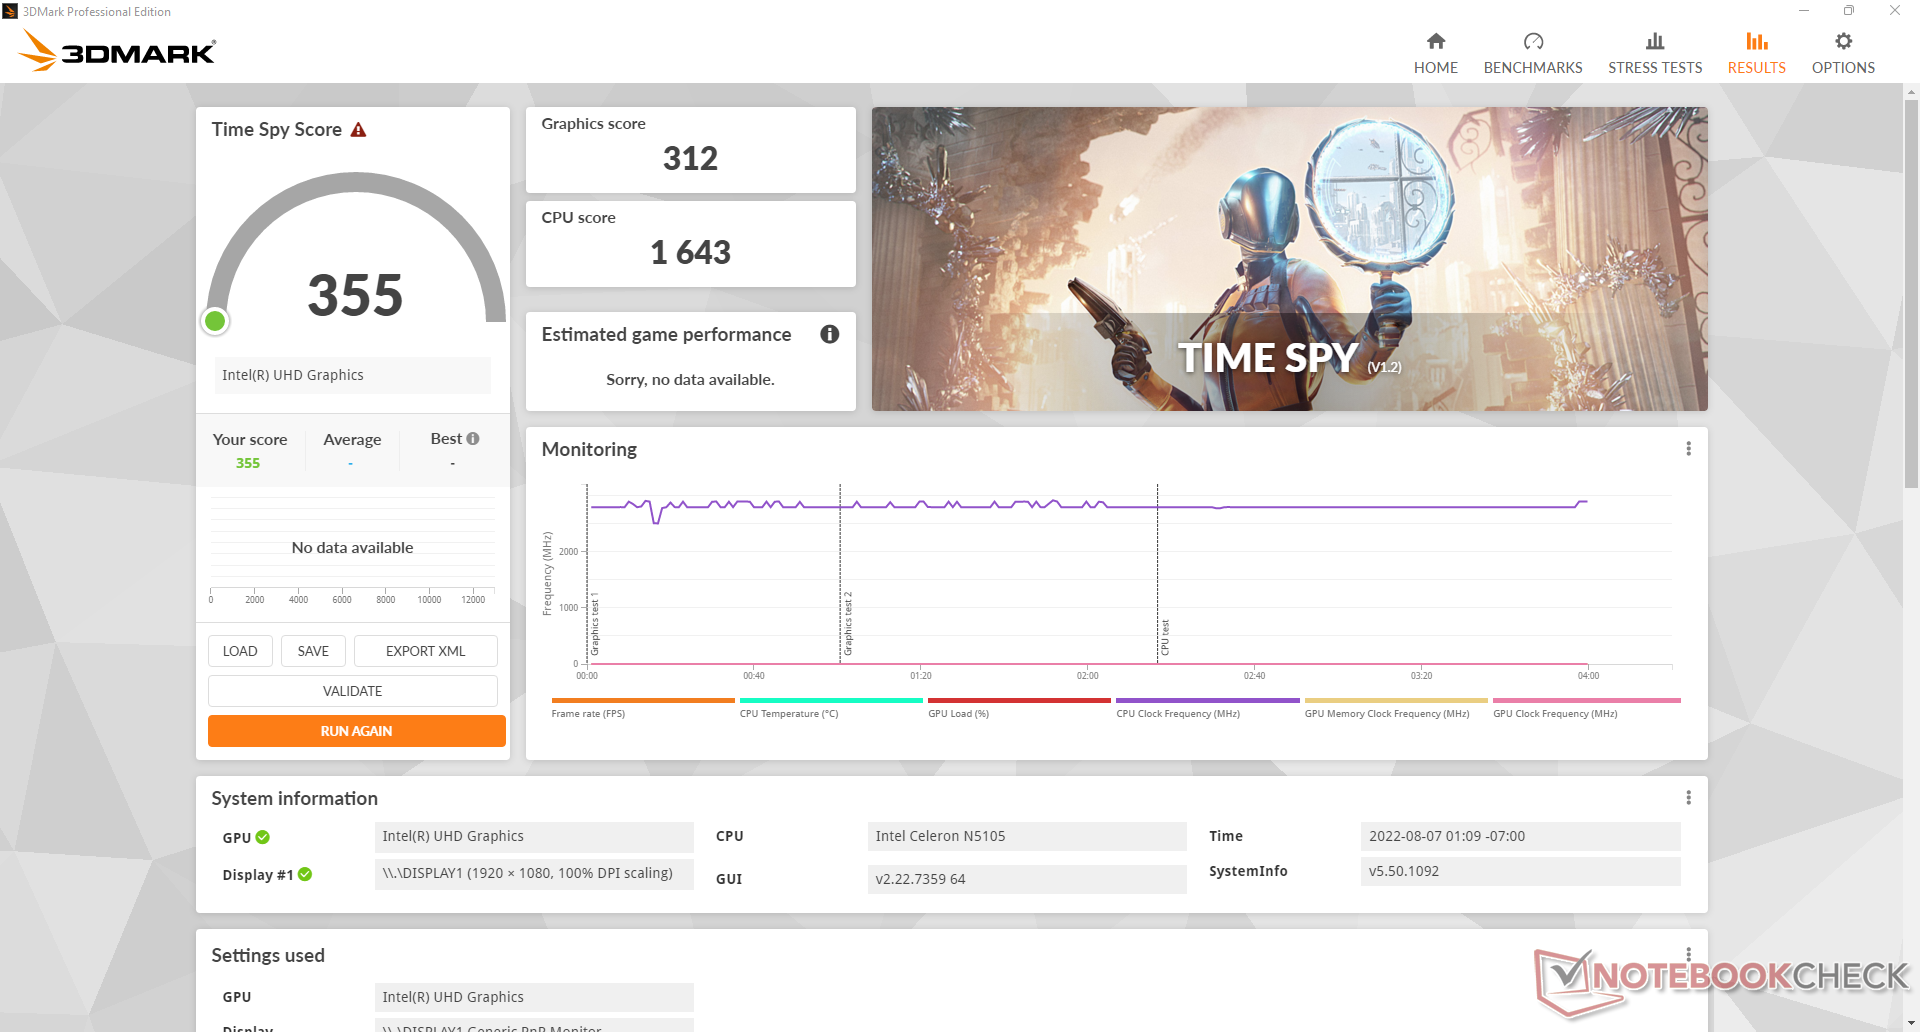
| 3DMark 11 Performance | 1654 points | |
| 3DMark Cloud Gate Standard Score | 6659 points | |
| 3DMark Fire Strike Score | 1043 points | |
| 3DMark Time Spy Score | 355 points | |
Help | ||
| The Witcher 3 | |
| 1024x768 Low Graphics & Postprocessing | |
| Beelink SER4 | |
| Intel NUC11TNKi5 | |
| Lenovo IdeaPad 3 15ITL05 81X80074GE | |
| Beelink SER3 | |
| Teclast TBOLT F15 Pro | |
| Beelink U59 N5105 | |
| Average Intel UHD Graphics (Jasper Lake 24 EU) (n=1) | |
| 1366x768 Medium Graphics & Postprocessing | |
| Beelink SER4 | |
| Lenovo IdeaPad 3 15ITL05 81X80074GE | |
| Beelink SER3 | |
| Teclast TBOLT F15 Pro | |
| Beelink U59 N5105 | |
| Average Intel UHD Graphics (Jasper Lake 24 EU) (n=1) | |
| 1920x1080 High Graphics & Postprocessing (Nvidia HairWorks Off) | |
| Beelink SER4 | |
| Lenovo IdeaPad 3 15ITL05 81X80074GE | |
| Beelink SER3 | |
| Teclast TBOLT F15 Pro | |
| Beelink U59 N5105 | |
| Average Intel UHD Graphics (Jasper Lake 24 EU) (n=1) | |
| 1920x1080 Ultra Graphics & Postprocessing (HBAO+) | |
| Beelink SER4 | |
| Lenovo IdeaPad 3 15ITL05 81X80074GE | |
| Beelink SER3 | |
| Beelink U59 N5105 | |
| Average Intel UHD Graphics (Jasper Lake 24 EU) (n=1) | |
| Final Fantasy XV Benchmark - 1280x720 Lite Quality | |
| Beelink SER4 | |
| Intel NUC11TNKi5 | |
| Lenovo IdeaPad 3 15ITL05 81X80074GE | |
| Beelink SER3 | |
| Beelink SEi8 | |
| Teclast TBOLT F15 Pro | |
| Beelink U59 N5105 | |
| Average Intel UHD Graphics (Jasper Lake 24 EU) (n=1) | |
| Beelink U59 Mini-S | |
| Zotac ZBOX PI336 pico | |
| low | med. | high | ultra | |
|---|---|---|---|---|
| The Witcher 3 (2015) | 21.6 | 14.4 | 7.8 | 3.9 |
| Dota 2 Reborn (2015) | 73.8 | 24.1 | 16.8 | 15.5 |
| Final Fantasy XV Benchmark (2018) | 13.7 | |||
| X-Plane 11.11 (2018) | 20.8 | 13.3 | 12.3 |
Emissions
System Noise
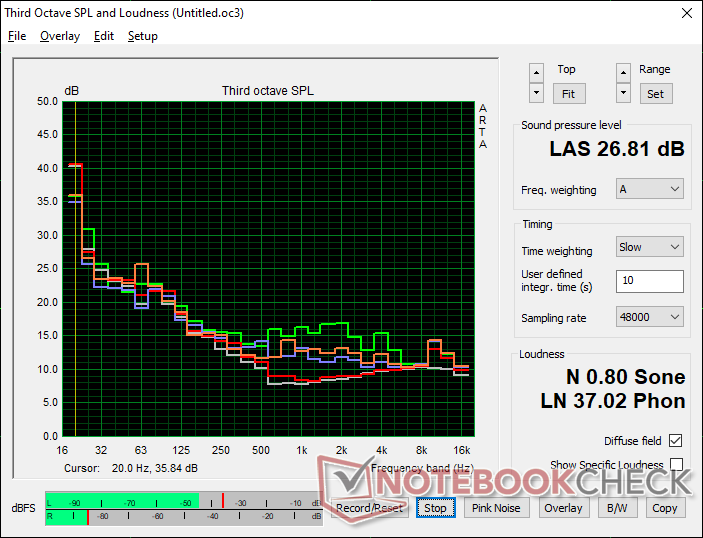
Fan noise is quiet no matter the load even when set to Performance mode. We're only able to record a maximum of just under 27 dB(A) against a silent background of 21.5 dB(A) compared to 34 dB(A) on last year's U59. This is one of the quietest mini PCs without opting for fanless models like the Zotac ZBOX PI336.
Our test unit would exhibit minor electronic noise or coil whine which helps explain our idling noise of 22.1 dB(A).
Noise level
| Idle |
| 22.1 / 22.1 / 22.1 dB(A) |
| Load |
| 23.9 / 26.8 dB(A) |
 | ||
30 dB silent 40 dB(A) audible 50 dB(A) loud |
||
min: | ||
| Beelink U59 N5105 UHD Graphics (Jasper Lake 24 EU), Celeron N5105, Silicon Motion AZW 512G NV428 | Beelink U59 Mini-S UHD Graphics (Jasper Lake 16 EU), Celeron N5095, Silicon Motion AZW 256G M.228 220426 C SATA 3 | Beelink SER4 Vega 8, R7 4800U, Intel SSD 660p SSDPEKNW512G8 | Beelink SER3 Vega 10, R7 3750H, GSemi AZW GSDFN512TS3F1OGCX | Intel NUC11TNKi5 Iris Xe G7 80EUs, i5-1135G7, Transcend M.2 SSD 430S TS512GMTS430S | Zotac ZBOX PI336 pico UHD Graphics (Elkhart Lake 16 EU), Celeron N6211, SanDisk DF4128 | |
|---|---|---|---|---|---|---|
| Noise | -12% | -48% | -31% | -55% | ||
| off / environment * (dB) | 21.5 | 23.3 -8% | 23.4 -9% | 23.4 -9% | 24.8 -15% | |
| Idle Minimum * (dB) | 22.1 | 24.2 -10% | 33.2 -50% | 23.4 -6% | 35.6 -61% | |
| Idle Average * (dB) | 22.1 | 24.2 -10% | 33.2 -50% | 23.4 -6% | 35.6 -61% | |
| Idle Maximum * (dB) | 22.1 | 24.2 -10% | 33.2 -50% | 29.4 -33% | 35.6 -61% | |
| Load Average * (dB) | 23.9 | 25.1 -5% | 38.6 -62% | 35.2 -47% | 36.2 -51% | |
| Witcher 3 ultra * (dB) | 24.4 | 39.2 -61% | 37.2 -52% | 38 -56% | ||
| Load Maximum * (dB) | 26.8 | 33.9 -26% | 40.8 -52% | 43.3 -62% | 47.6 -78% |
* ... smaller is better
Temperature
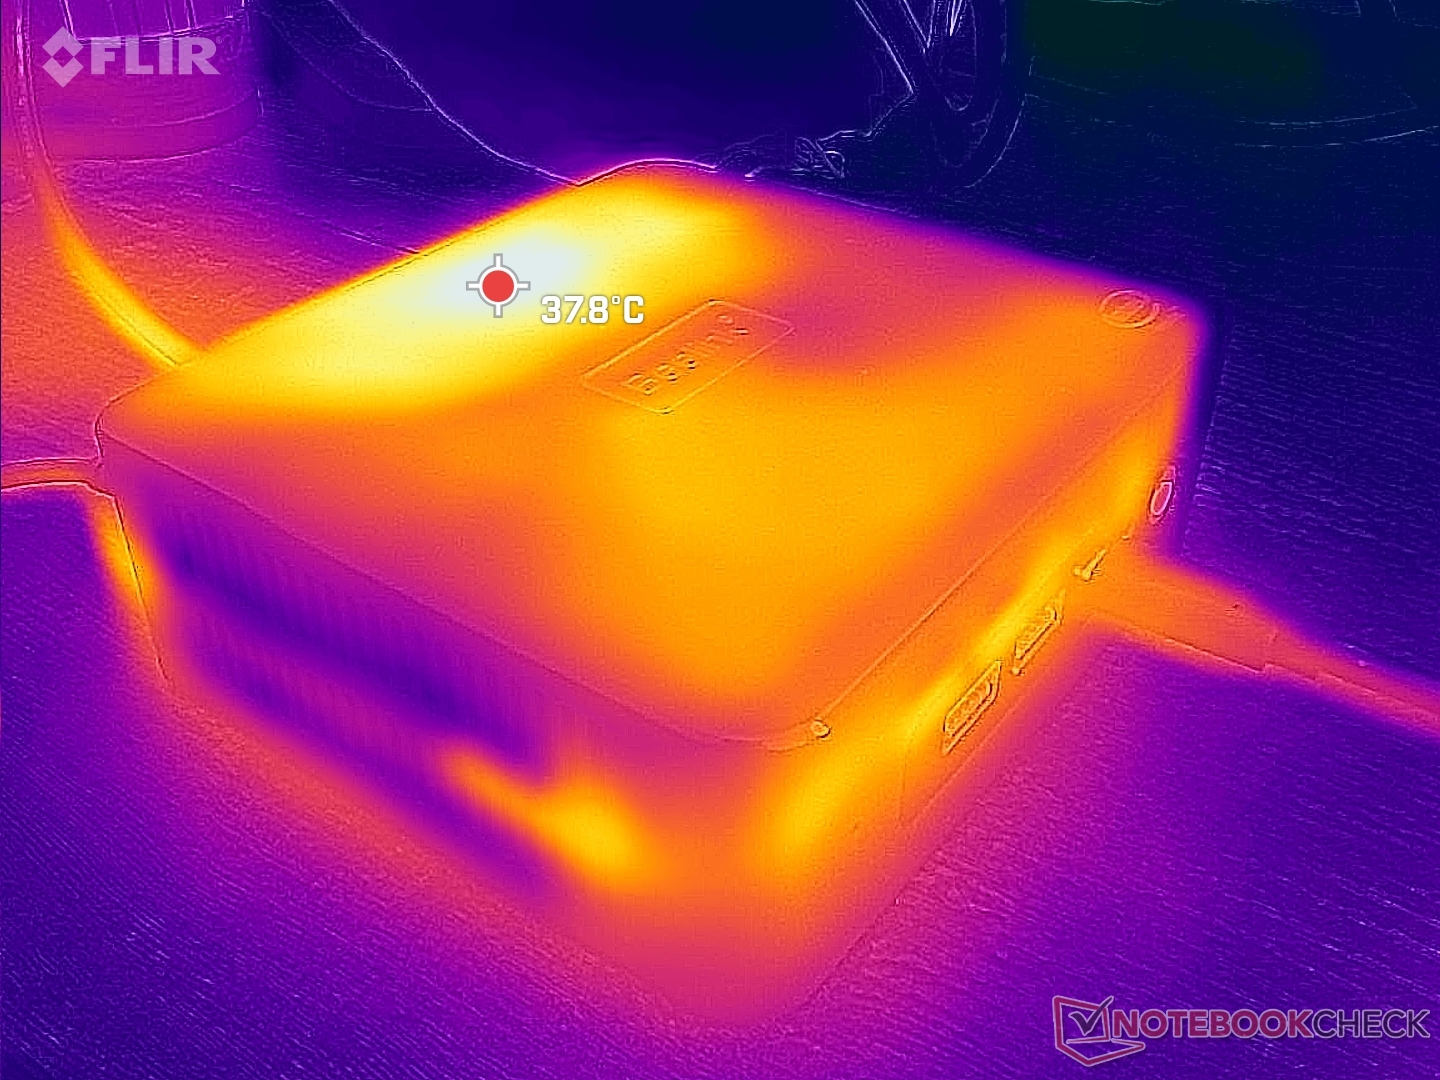
Surface temperatures are warm even when idling on desktop since the fan is so lethargic. The top of the unit can reach 32 C when not running any applications or up to 38 C when running stressful applications for long periods. Hot spots are toward the rear of the chassis nearest the rear ventilation grilles.

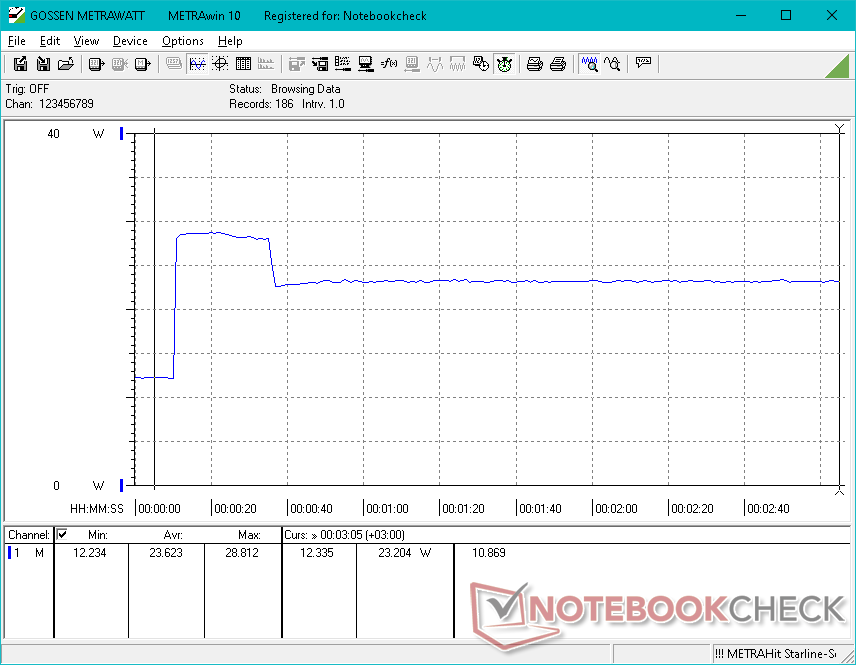
Stress Test
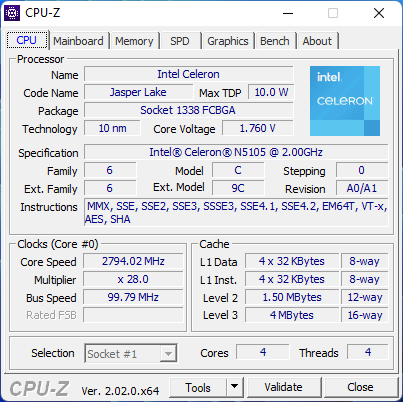
CPU clock rates, temperature, and board power draw would spike to 2.8 GHz, 86 C, and 20 W, respectively, when initiating Prime95 stress. After 20 seconds or so, however, clock rates and board power draw would drop to 2.4 GHz and 15 W, respectively, in order to maintain a cooler core temperature of 76 C as shown by the screenshot below. This is actually slower and cooler by 200 MHz and 9 C, respectively, than what we recorded on last year's U59 with the older N5095.
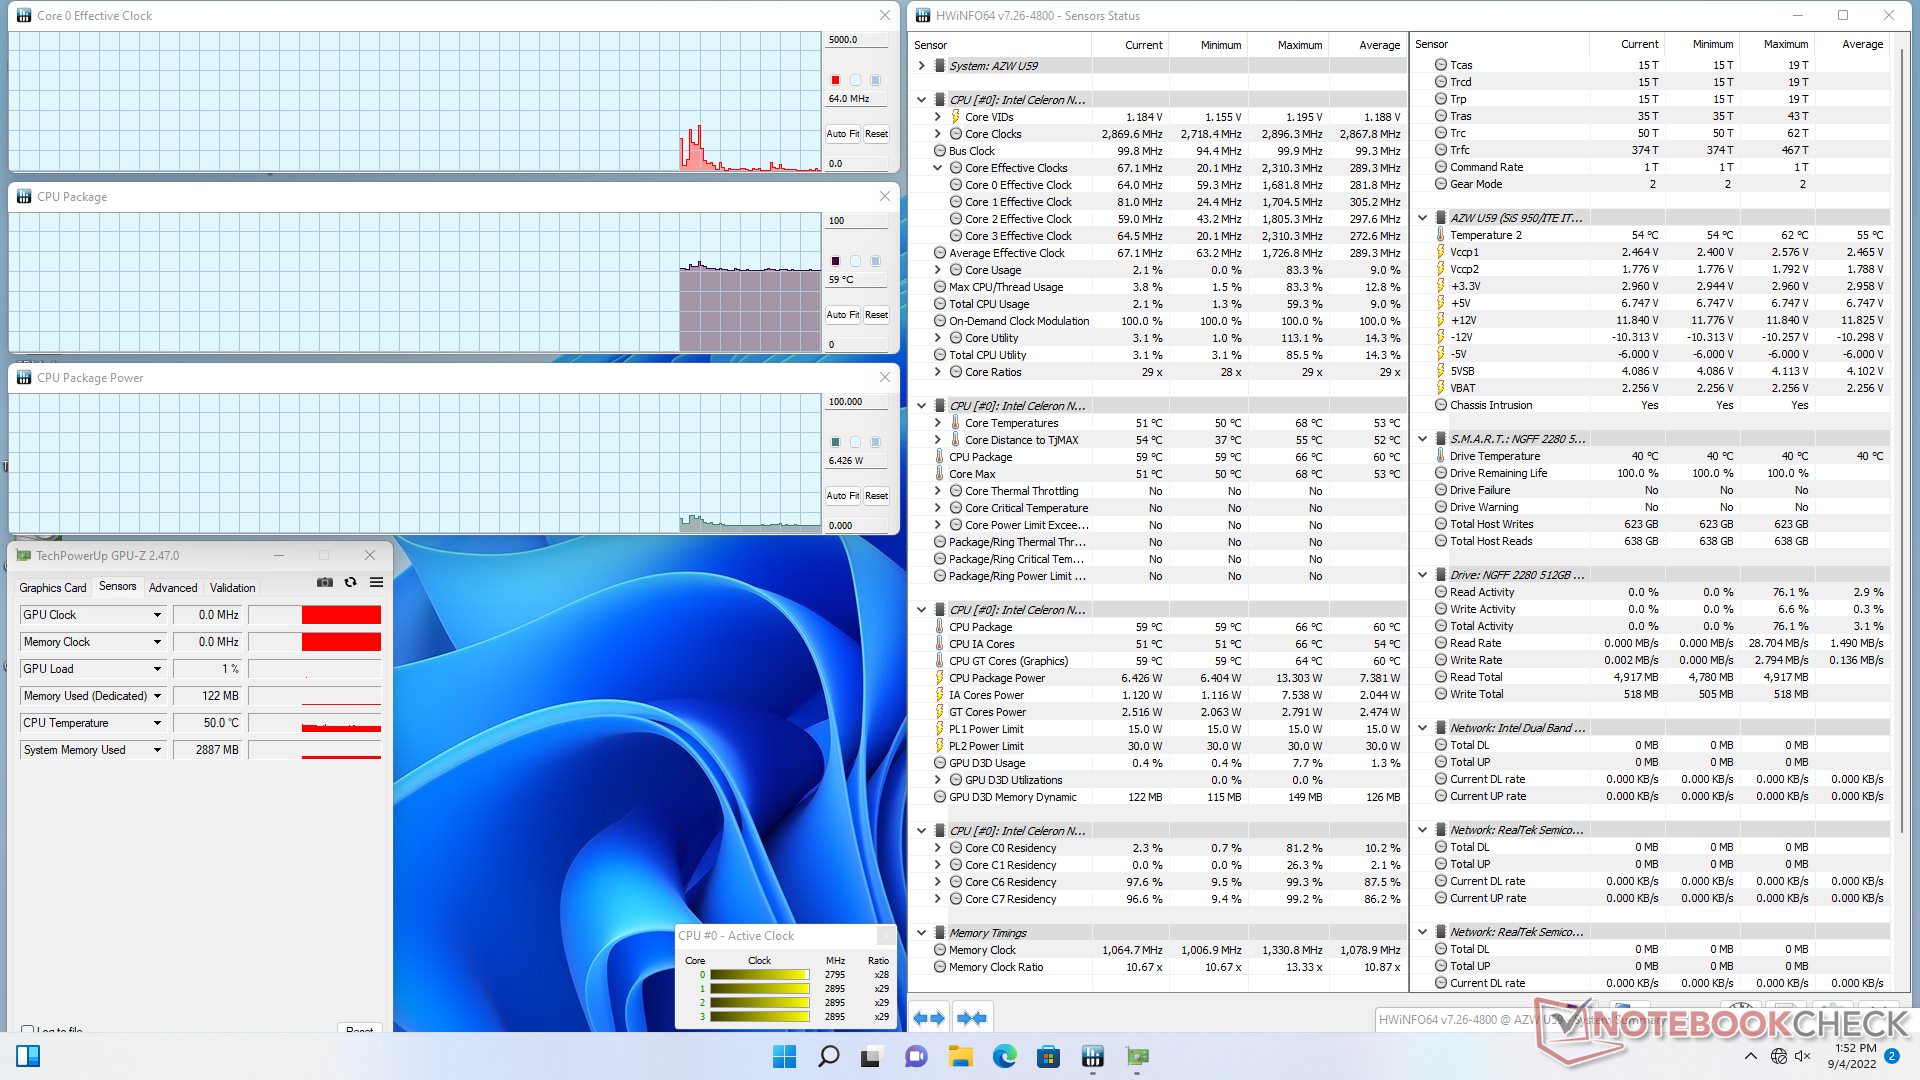
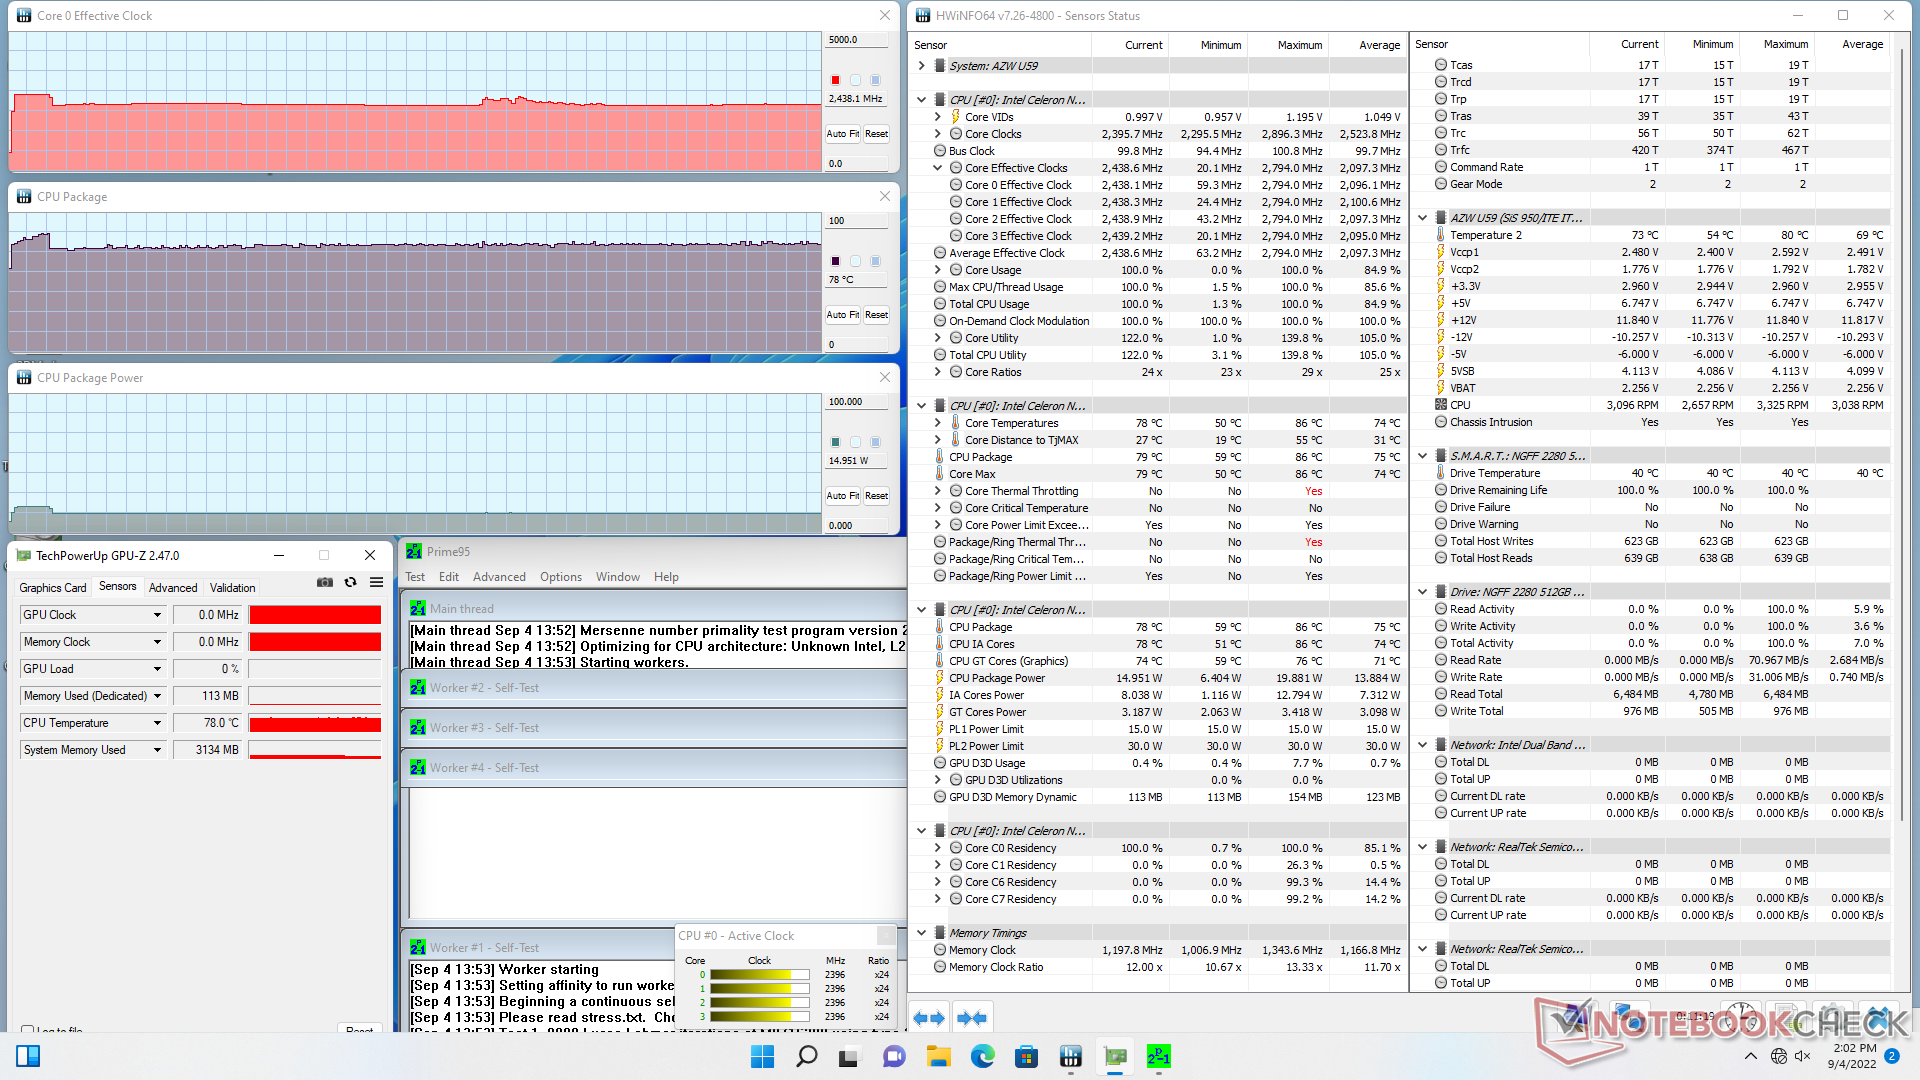
| CPU Clock (GHz) | GPU Clock (MHz) | Average CPU Temperature (°C) | |
| System Idle | -- | -- | 59 |
| Prime95 Stress | 2.4 | -- | 78 |
Energy Management
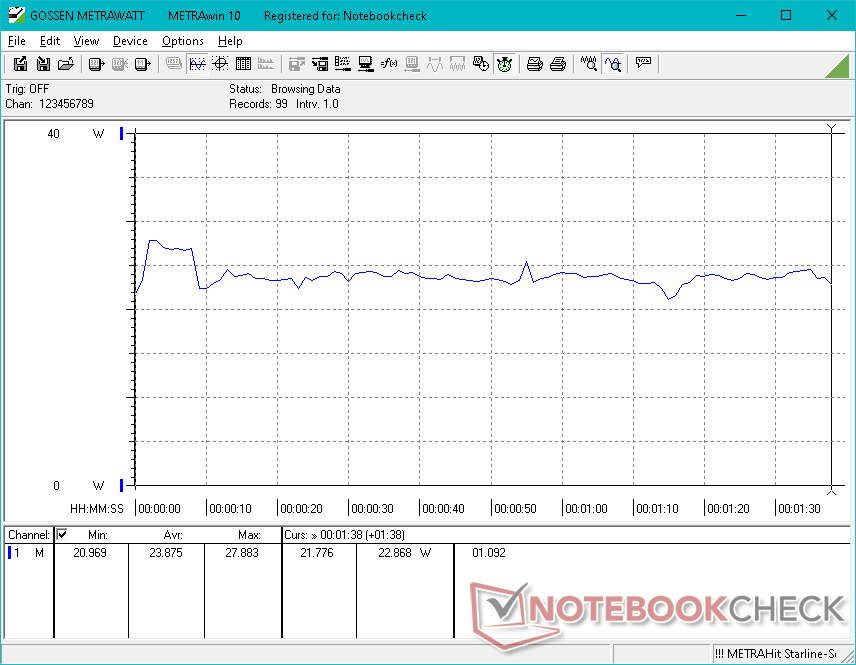
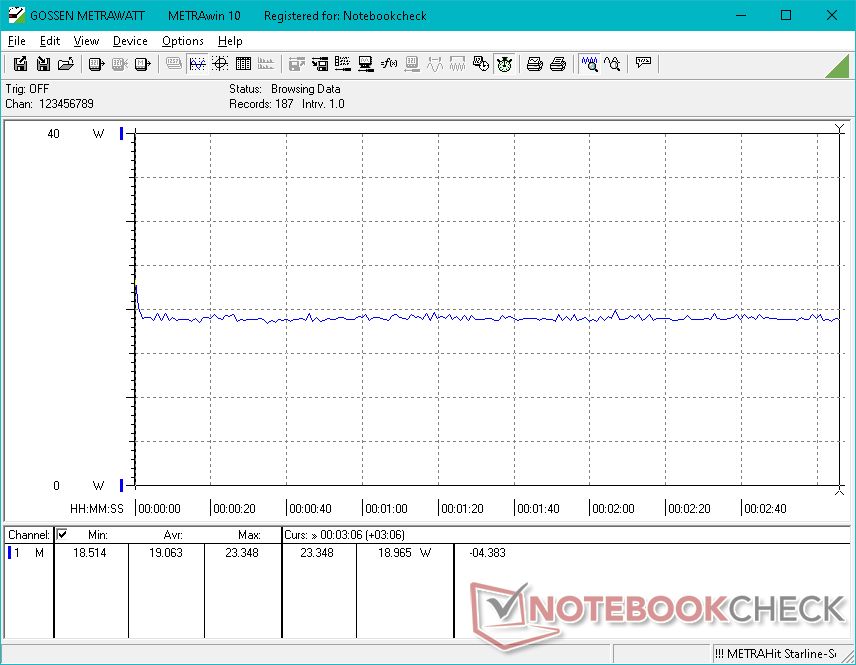
Power Consumption
The system is just slightly more demanding than on last year's U59 with the older Celeron N5095. The aforementioned GPU gains, however, are worth the extra couple of watts. Overall consumption is still much lower than mini PCs powered by Core U or Ryzen U CPUs like the Intel NUC11 or Beelink SER4.
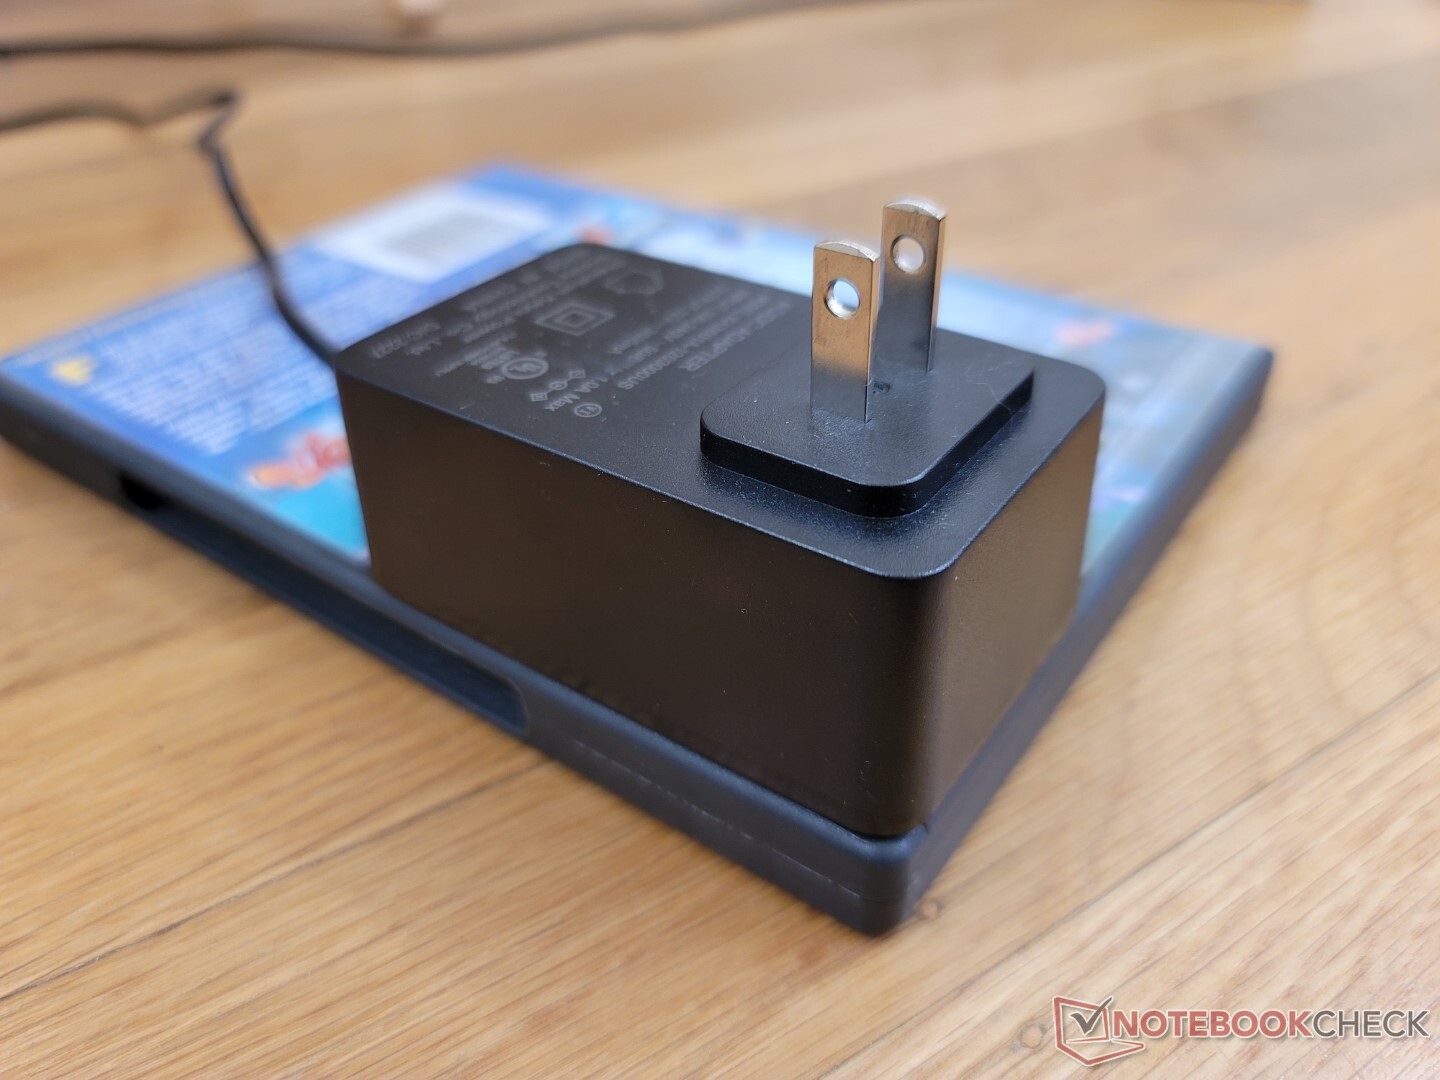
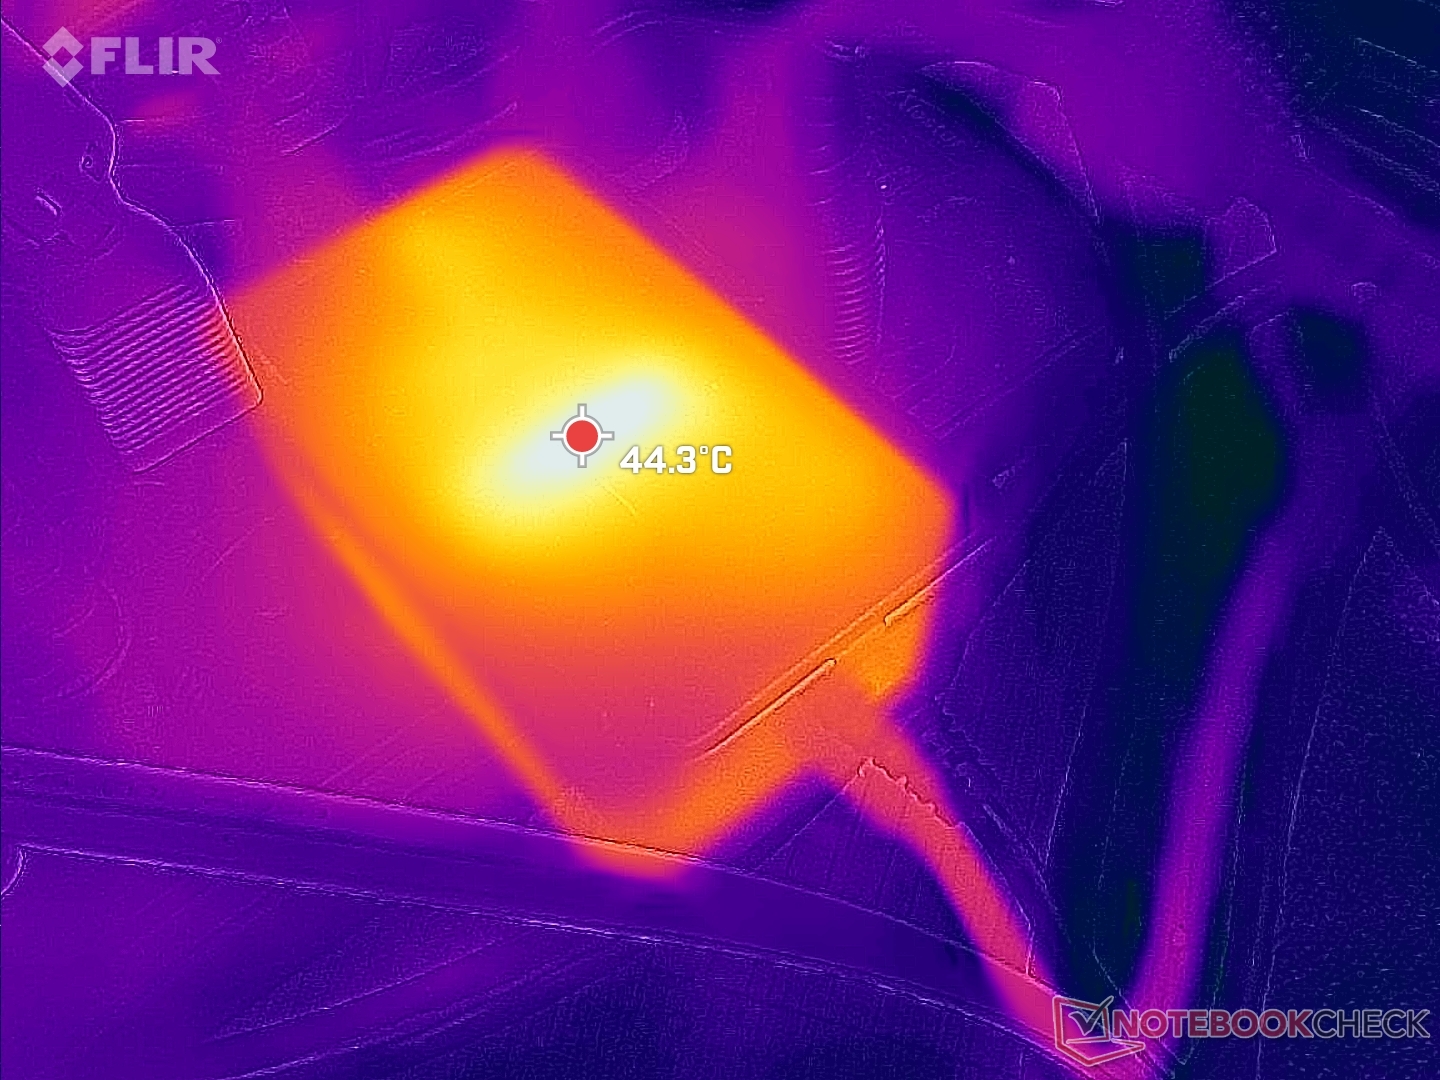
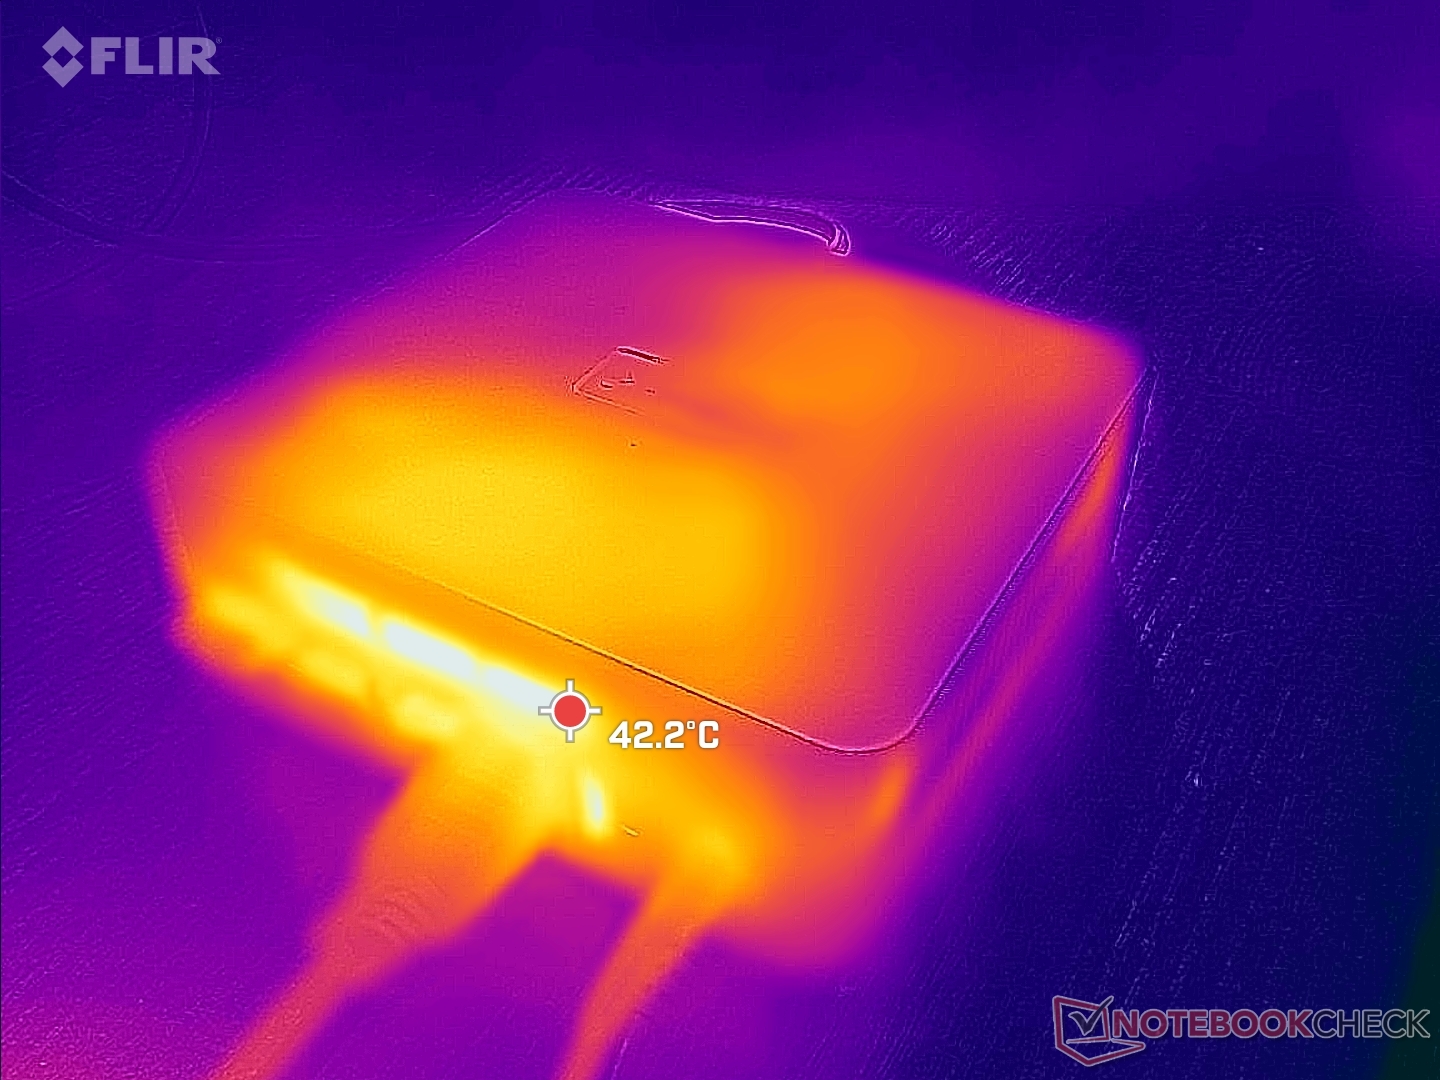
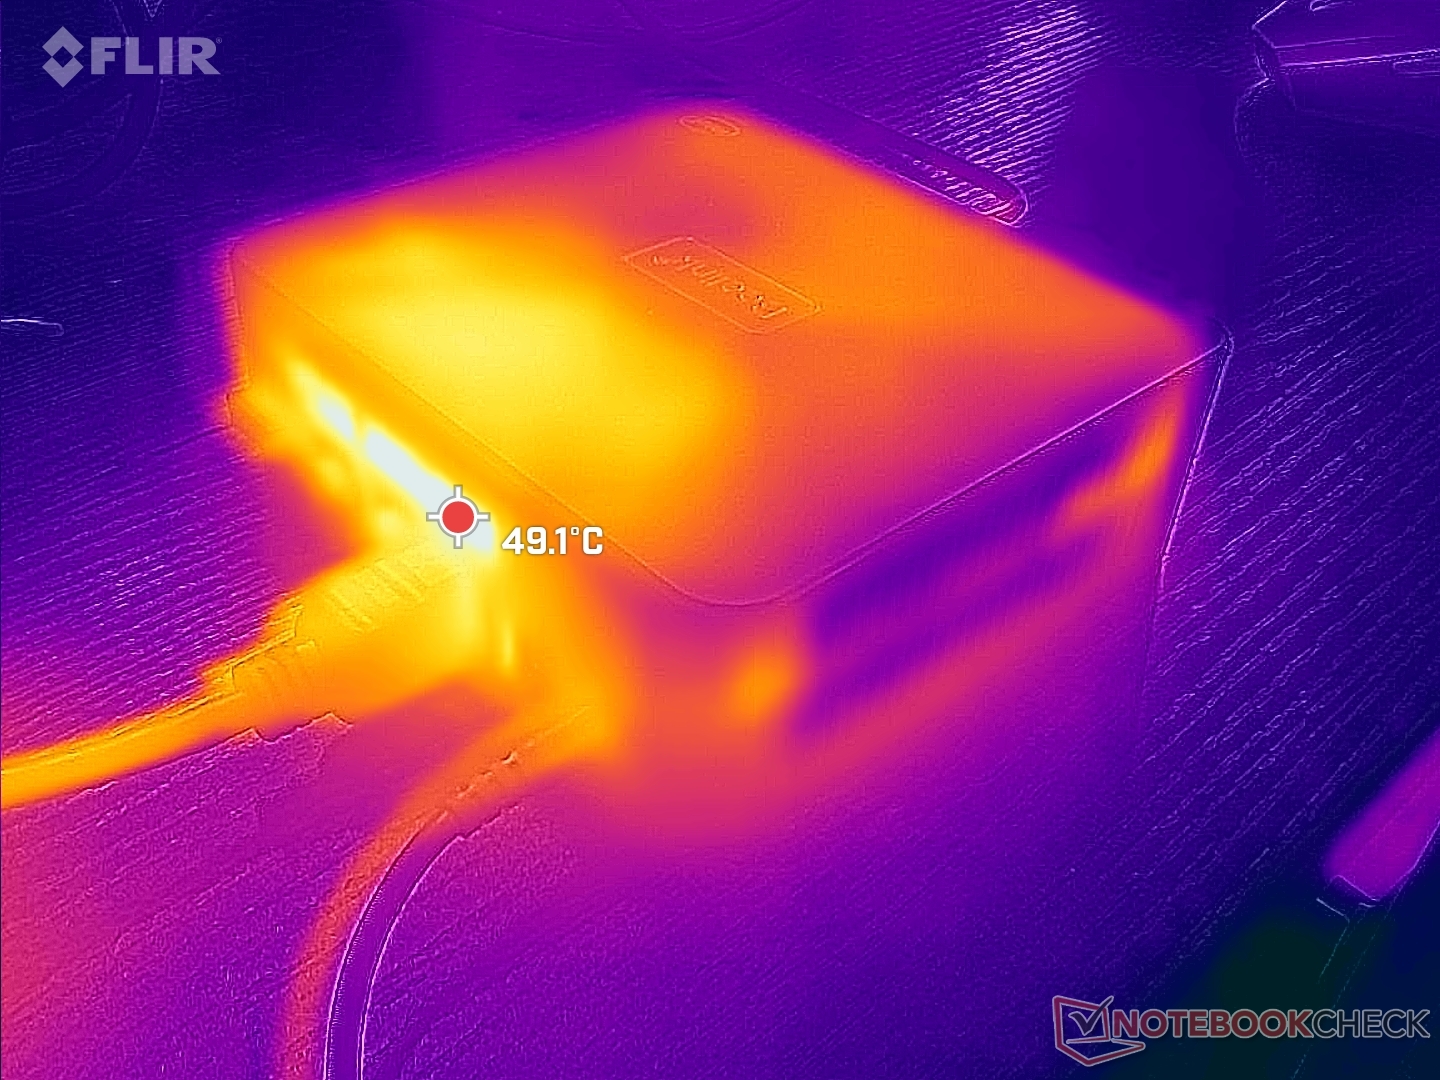
We're able to record a temporary maximum draw of 29 W from the small (~7.8 x 4.6 x 3.2 cm) 36 W AC adapter when running Prime95 stress.

| Off / Standby | |
| Idle | |
| Load |
|
Key:
min: | |
| Beelink U59 N5105 Celeron N5105, UHD Graphics (Jasper Lake 24 EU), Silicon Motion AZW 512G NV428, , x, | Beelink U59 Mini-S Celeron N5095, UHD Graphics (Jasper Lake 16 EU), Silicon Motion AZW 256G M.228 220426 C SATA 3, , x, | Beelink SER4 R7 4800U, Vega 8, Intel SSD 660p SSDPEKNW512G8, , x, | Beelink SER3 R7 3750H, Vega 10, GSemi AZW GSDFN512TS3F1OGCX, , x, | Intel NUC11TNKi5 i5-1135G7, Iris Xe G7 80EUs, Transcend M.2 SSD 430S TS512GMTS430S, , x, | Zotac ZBOX PI336 pico Celeron N6211, UHD Graphics (Elkhart Lake 16 EU), SanDisk DF4128, , x, | |
|---|---|---|---|---|---|---|
| Power Consumption | 15% | -4% | -27% | -82% | 42% | |
| Idle Minimum * (Watt) | 6.7 | 7 -4% | 4.1 39% | 7 -4% | 11.5 -72% | 5.4 19% |
| Idle Average * (Watt) | 8.1 | 7 14% | 4.1 49% | 9.1 -12% | 12.4 -53% | 5.5 32% |
| Idle Maximum * (Watt) | 11.6 | 7.6 34% | 4.6 60% | 9.7 16% | 12.9 -11% | 6.2 47% |
| Load Average * (Watt) | 23.9 | 18.3 23% | 35.6 -49% | 29.5 -23% | 40.7 -70% | 11.3 53% |
| Witcher 3 ultra * (Watt) | 19.1 | 35.6 -86% | 32.5 -70% | 43.9 -130% | ||
| Load Maximum * (Watt) | 28.8 | 27.1 6% | 39.9 -39% | 48.7 -69% | 73.5 -155% | 11.8 59% |
* ... smaller is better
Power Consumption Witcher 3 / Stresstest
Power Consumption external Monitor
Pros
Cons
Verdict — Same CPU, Faster GPU
If you're going for processing speed, then there's almost no reason to choose the Celeron N5105 over the N5095. The N5105 may run slightly cooler, but it doesn't offer any appreciable gains in single-thread or multi-thread performance. Its benefits instead lie in the integrated GPU which is faster than the integrated GPU in the N5095 by much wider margins.
Unfortunately, the GPU in the N5105 is still slow and so the Windows UI experience is still laggy when running more than one or two applications simultaneously. In this case, the streaming capabilities of the U59 N5105 are essentially the same as on the U59 N5095. It's recommended to find SKUs with dual-channel RAM whenever possible to maximize the performance of the integrated GPU.
As for the mini PC itself, the U59 has a fair amount of features considering its very low asking price. Configurations come pre-installed with Windows 11 and a very spacious 512 GB SSD with 16 GB of RAM for only around $200 USD whereas an Intel NUC could easily cost over two times as much without any RAM or storage. If all you're looking to do is basic 1080p streaming or browsing, then this U59 will do the job sufficiently. For heavier multi-tasking and more overhead, however, you'll want to invest in a mini PC with faster Core or Ryzen CPUs like the Bellink SEI or SER series.
Price and Availability
The Beelink U59 as configured in our review is currently available for $200 USD if purchased directly from the manufacturer. Alternatively, Amazon has the configuration in stock for $240 USD and $200 for the 16 GB and 8 GB SKUs, respectively.
Price comparison
