Blackview AceBook 1 laptop review: Good for low loads but not much else
Announced just a month ago, the AceBook1 is Blackview's first Windows laptop meaning there's a lot riding on its performance to potentially kickstart a series of different models. The company is well-known for its lineup of inexpensive rugged Android smartphones like the BL5000 model with 5G capabilities.
The 14-inch AceBook1 laptop is more down to earth with its low-profile Celeron N4120 CPU, 4 GB of RAM, and meager 128 GB SSD to keep prices under $500 or $400 USD when on sale. Competitors in this space include other affordable subnotebooks like the Chuwi CoreBook X, Infinix INBook X1 Pro, Honor MagicBook 14, or Teclast F7 Air.
More Blackview reviews:
potential competitors in comparison
Rating | Date | Model | Weight | Height | Size | Resolution | Price |
|---|---|---|---|---|---|---|---|
| 74.2 % v7 (old) | 08 / 2021 | Blackview AceBook 1 Celeron N4120, UHD Graphics 600 | 1.3 kg | 16.8 mm | 14.00" | 1920x1080 | |
| 79 % v7 (old) | 07 / 2021 | Chuwi CoreBook X i5-8259U, Iris Plus Graphics 655 | 1.5 kg | 20.6 mm | 14.00" | 2160x1440 | |
| 80.4 % v7 (old) | 06 / 2021 | Infinix INBook X1 Pro i7-1065G7, Iris Plus Graphics G7 (Ice Lake 64 EU) | 1.5 kg | 16.3 mm | 14.00" | 1920x1080 | |
| 84.9 % v7 (old) | 05 / 2021 | Honor Magicbook 14 i7-1165G7 i7-1165G7, Iris Xe G7 96EUs | 1.4 kg | 15.9 mm | 14.00" | 1920x1080 | |
| 75.4 % v7 (old) | 02 / 2021 | Teclast F7 Air Celeron N4120, UHD Graphics 600 | 1.2 kg | 17 mm | 14.00" | 1920x1080 | |
| 78.9 % v7 (old) | 07 / 2020 | Lenovo IdeaPad 3 14IIL05 i3-1005G1, UHD Graphics G1 (Ice Lake 32 EU) | 1.6 kg | 19.9 mm | 14.00" | 1920x1080 |
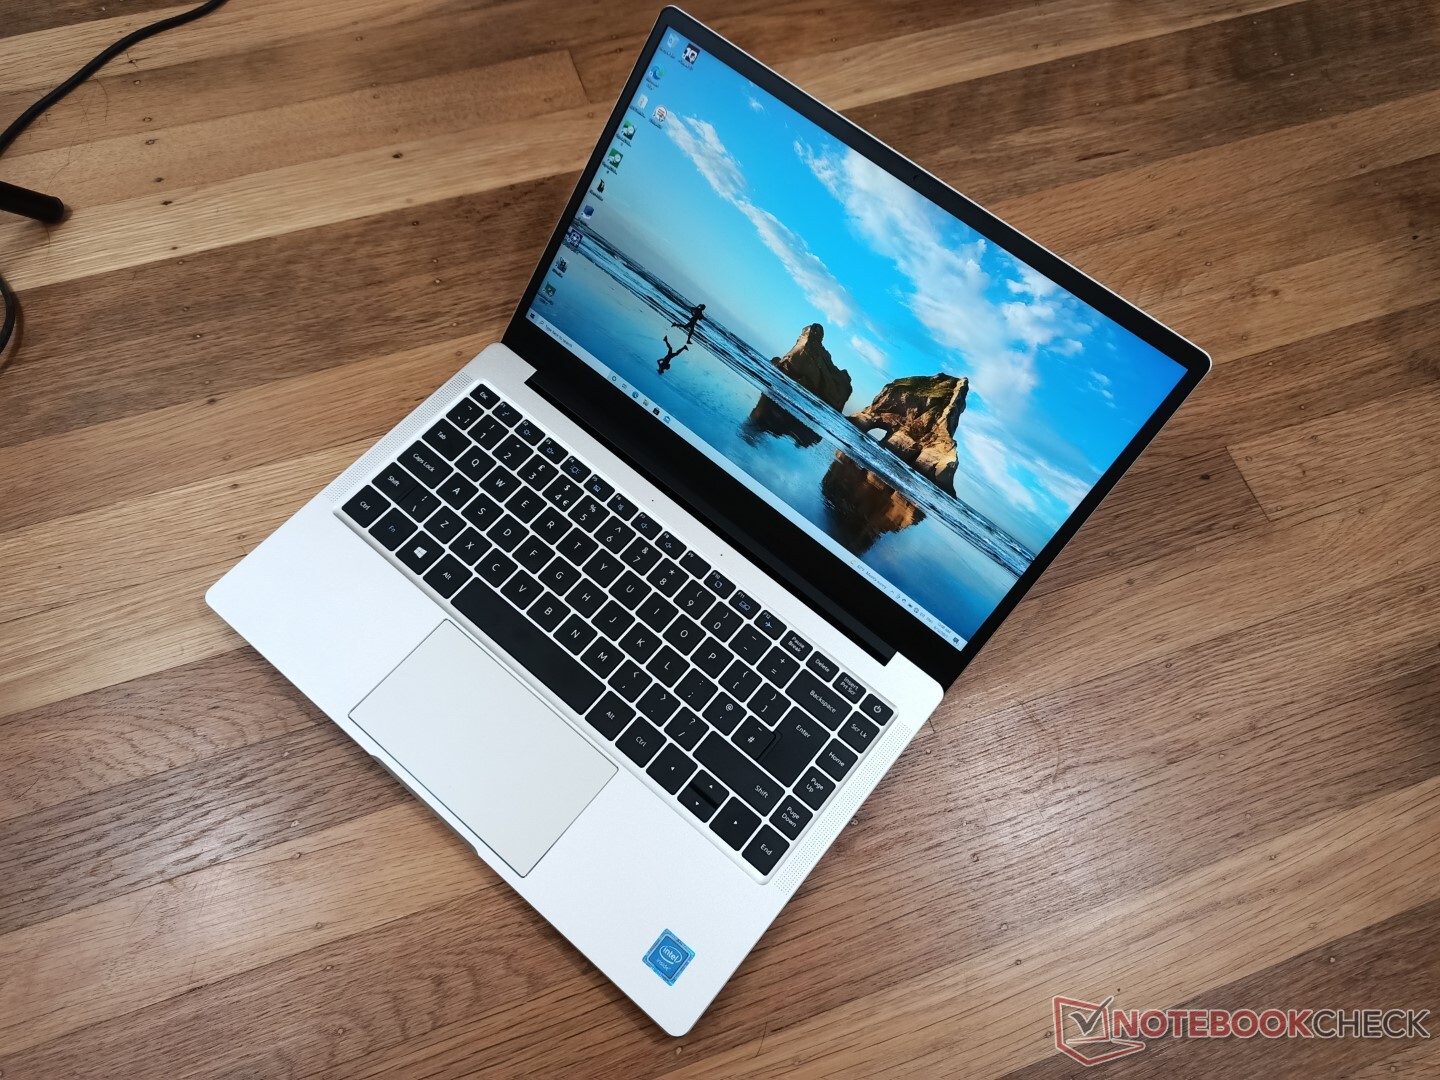
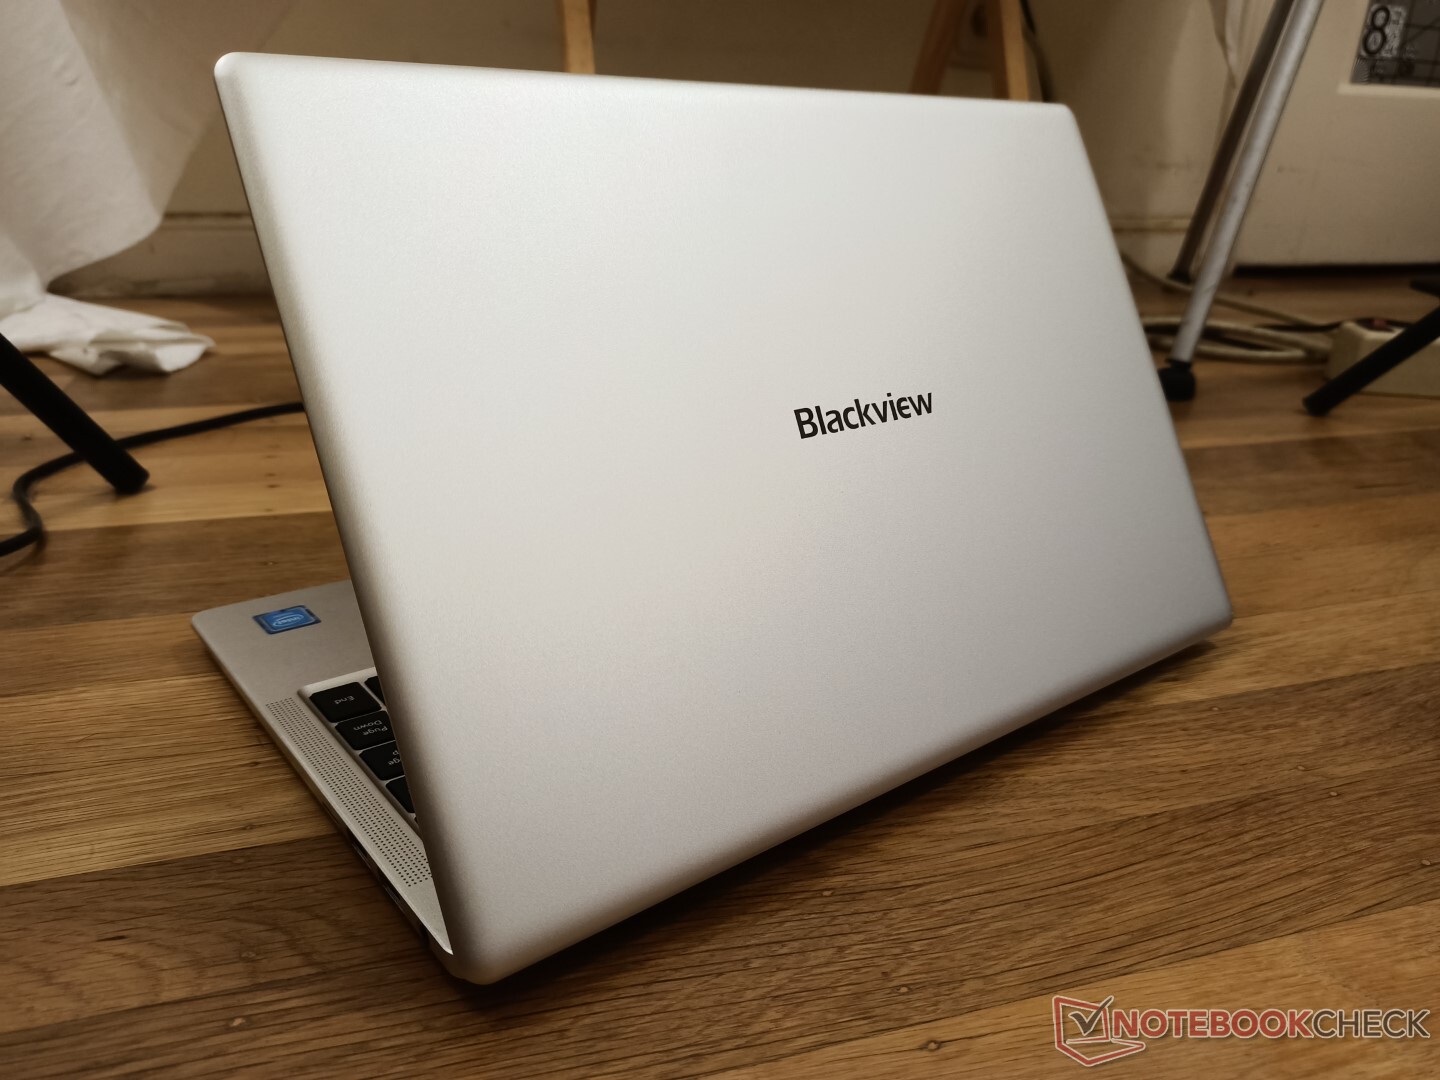
Case
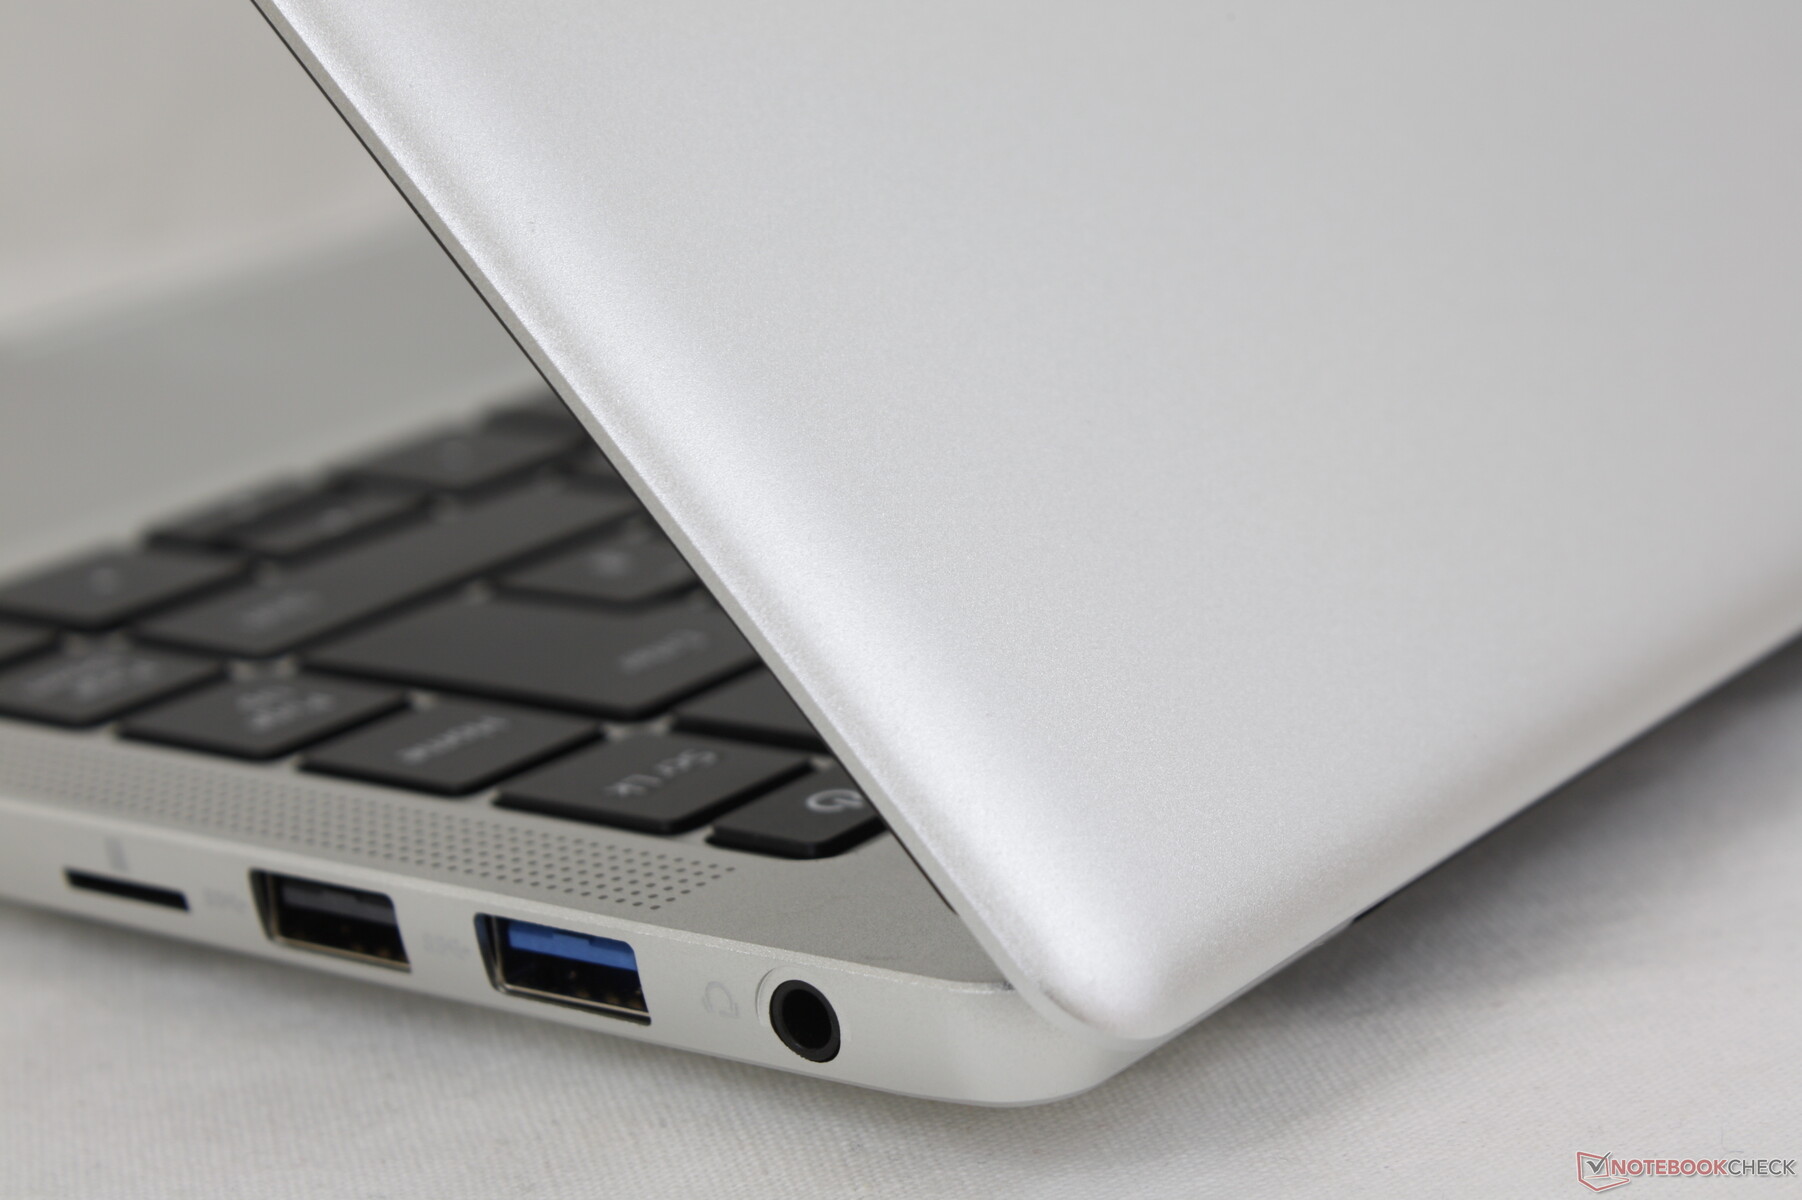
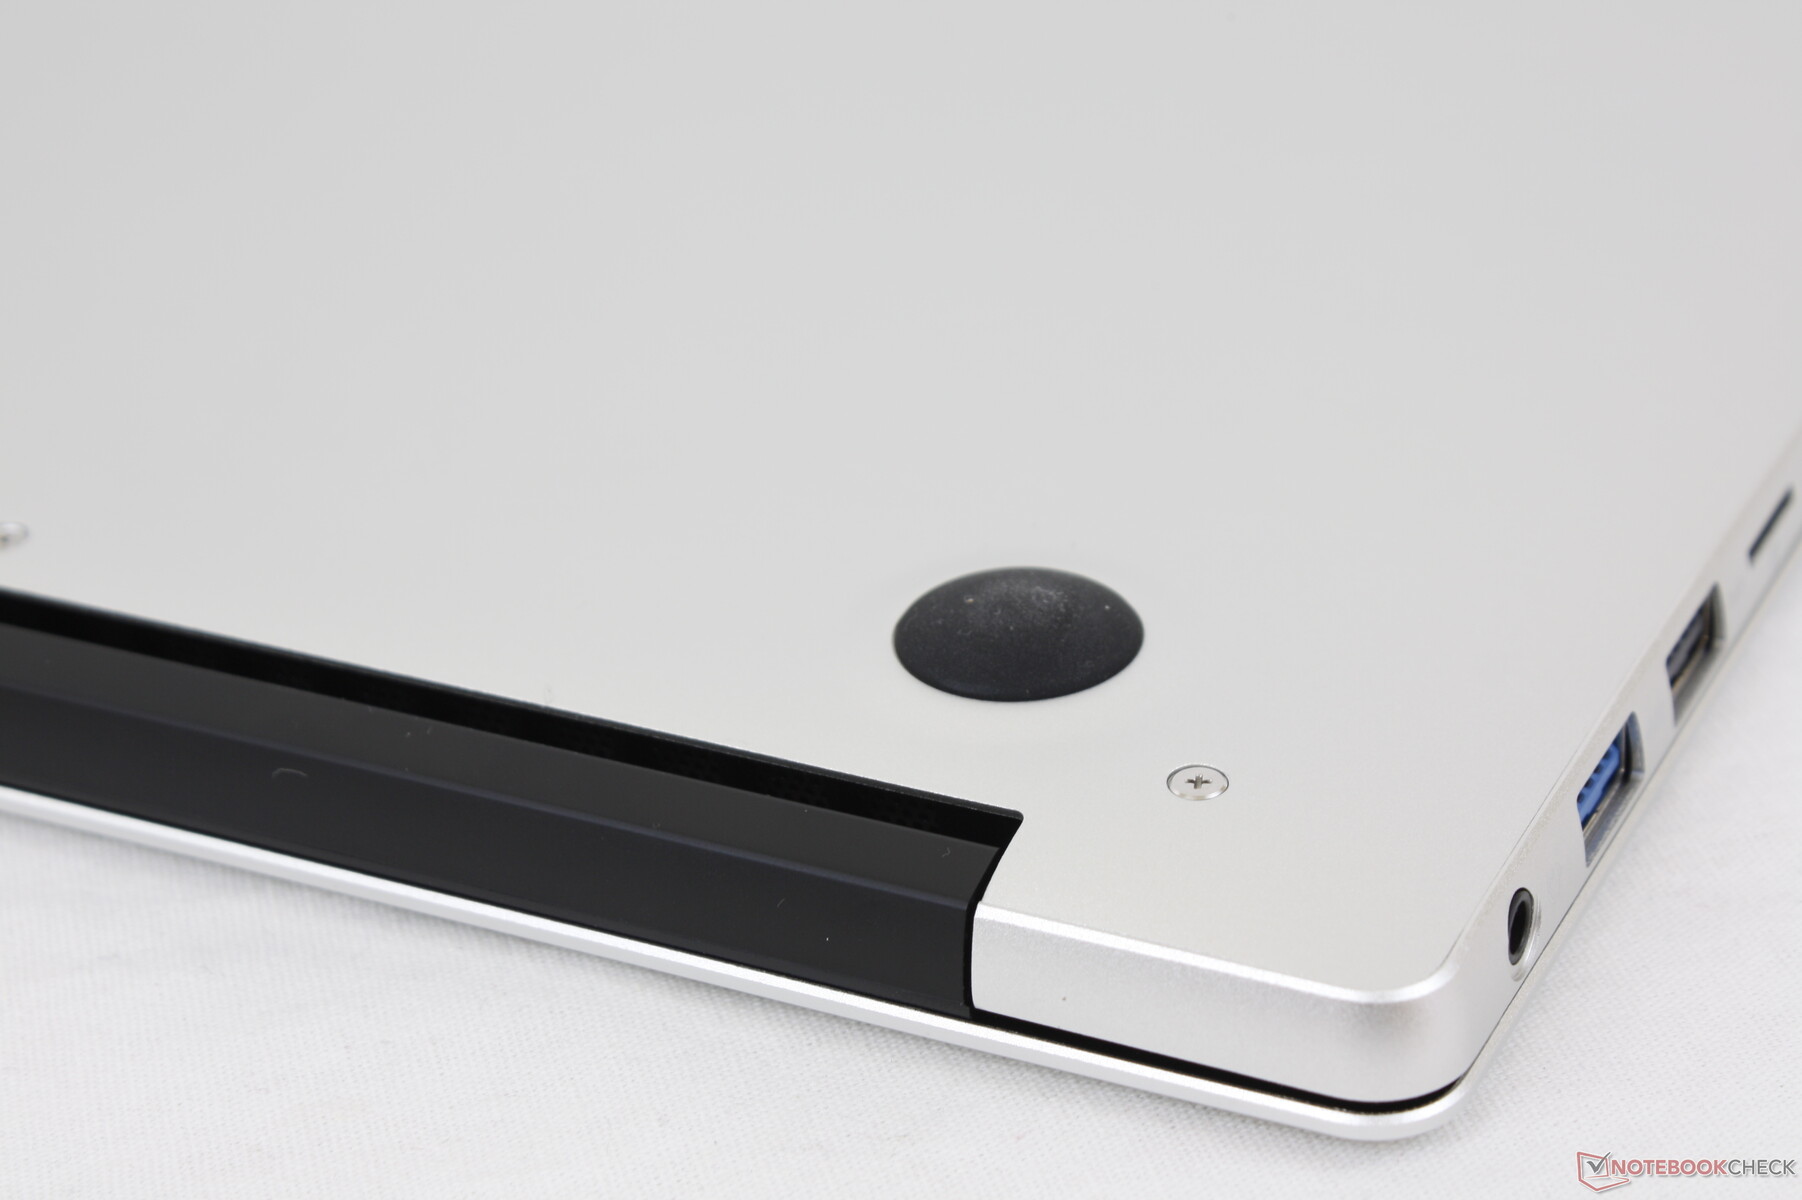
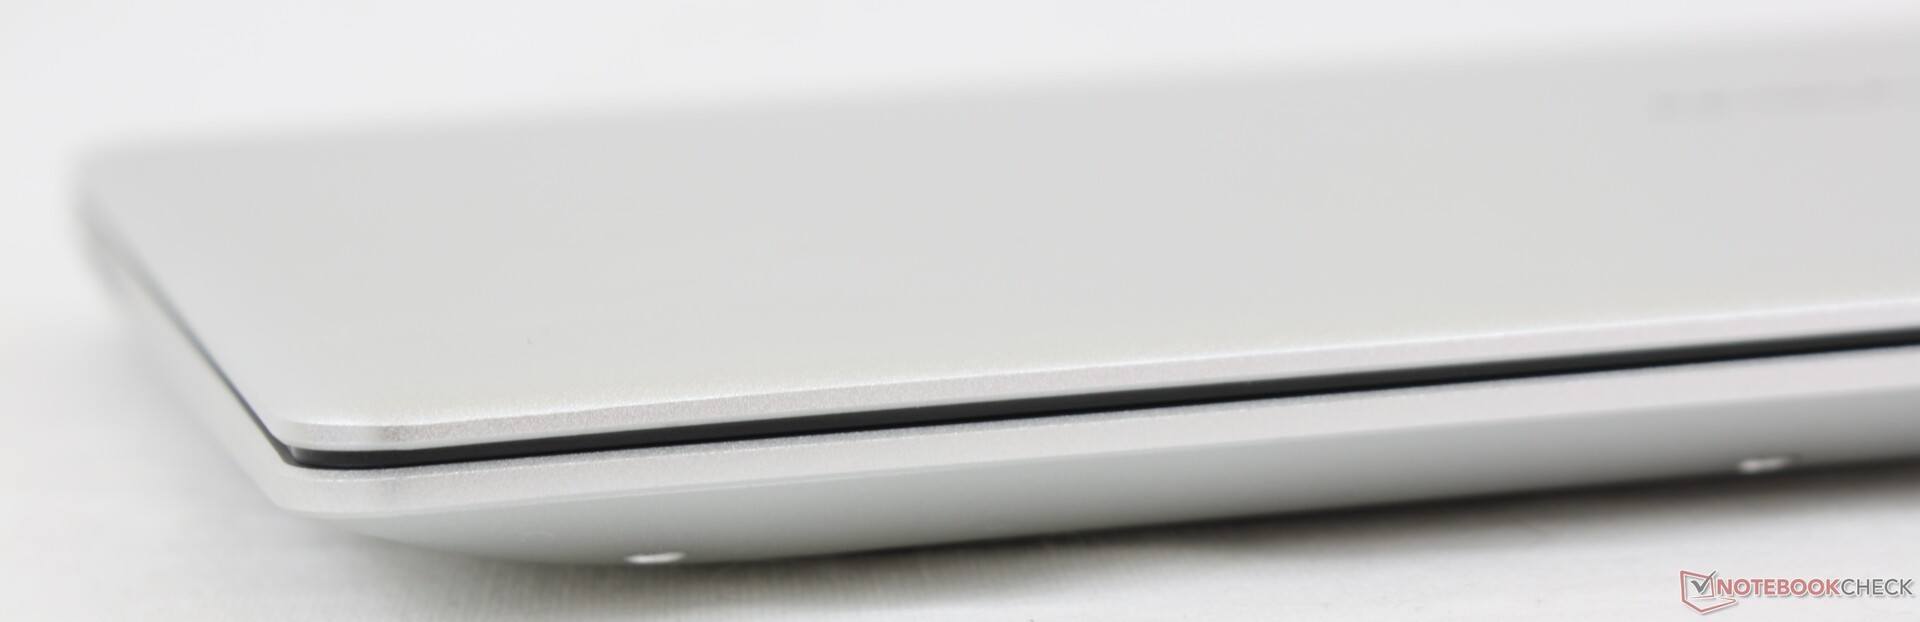
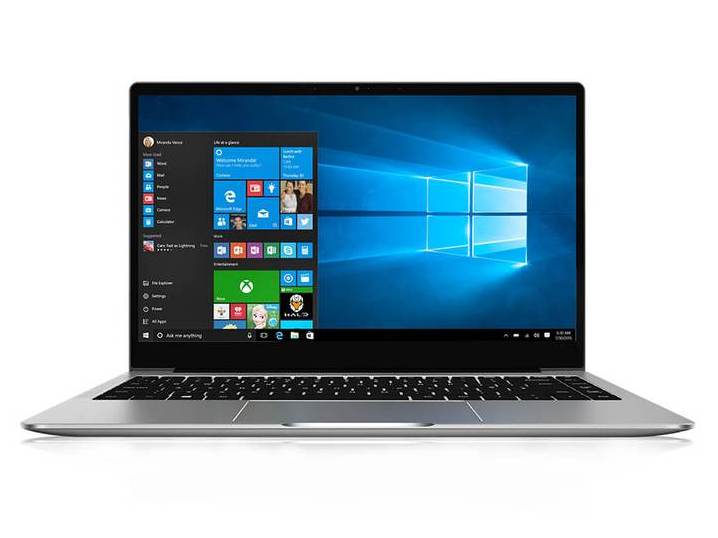
The metal base and lid are the main highlights of the AceBook 1. Visually, the system looks just as good as popular budget to mid-range Ultrabooks like the Asus VivoBook, Dell Inspiron, or HP Pavilion which often retail for more. Chassis rigidity is also better than expected; twisting the base or lid would result in no creaking and only minor warping.
Overall dimensions and weight are very close to the Infinix INBook X1 or Honor MagicBook 14. There is potential for the system to be smaller in length as its bottom bezel is still quite thick.
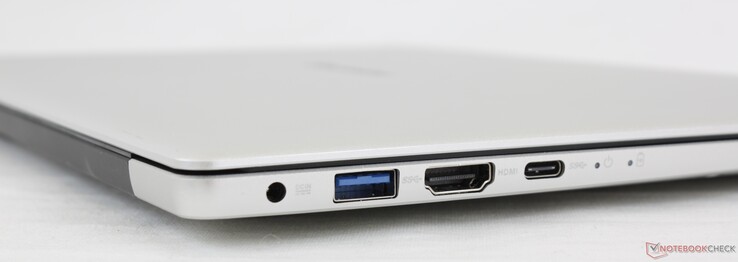
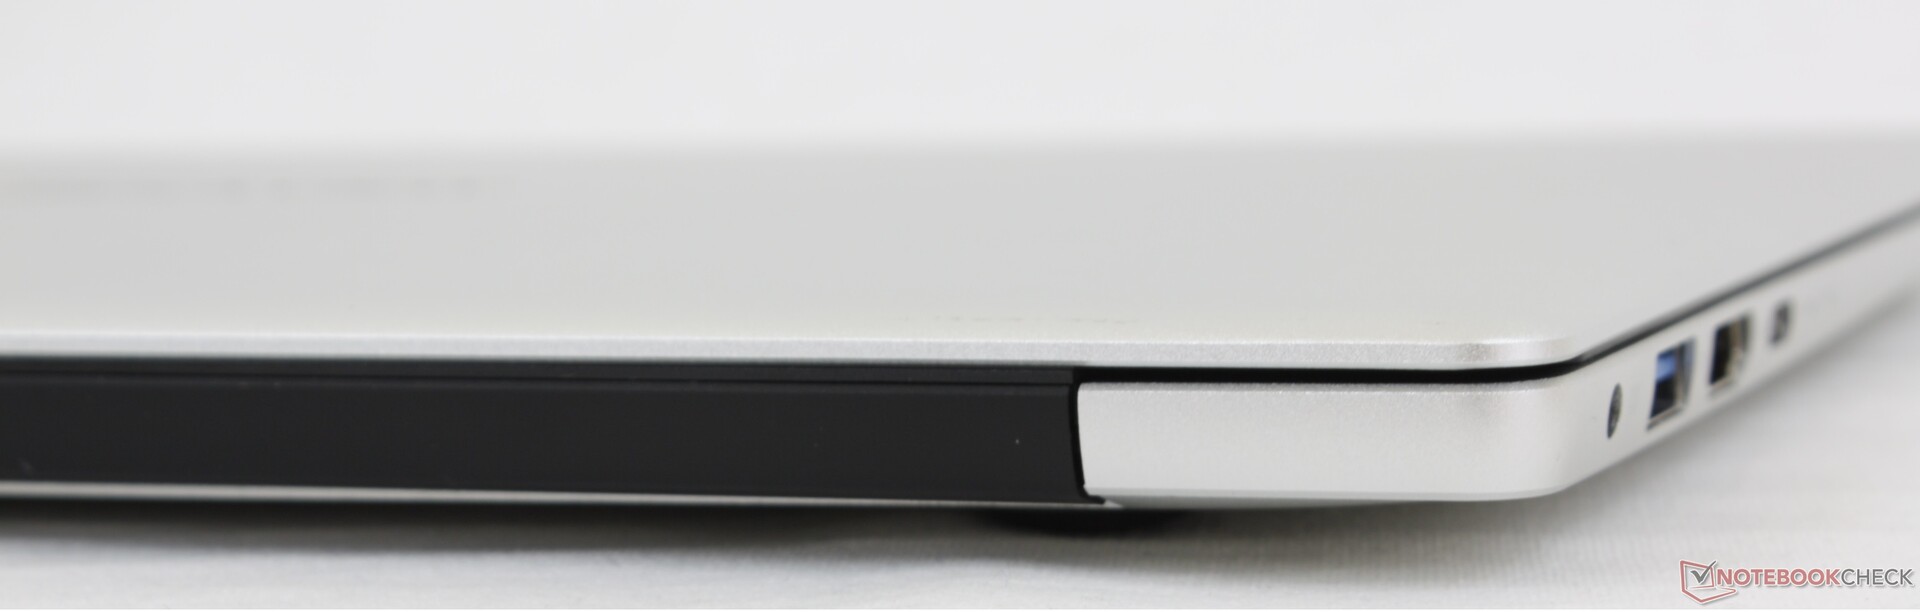
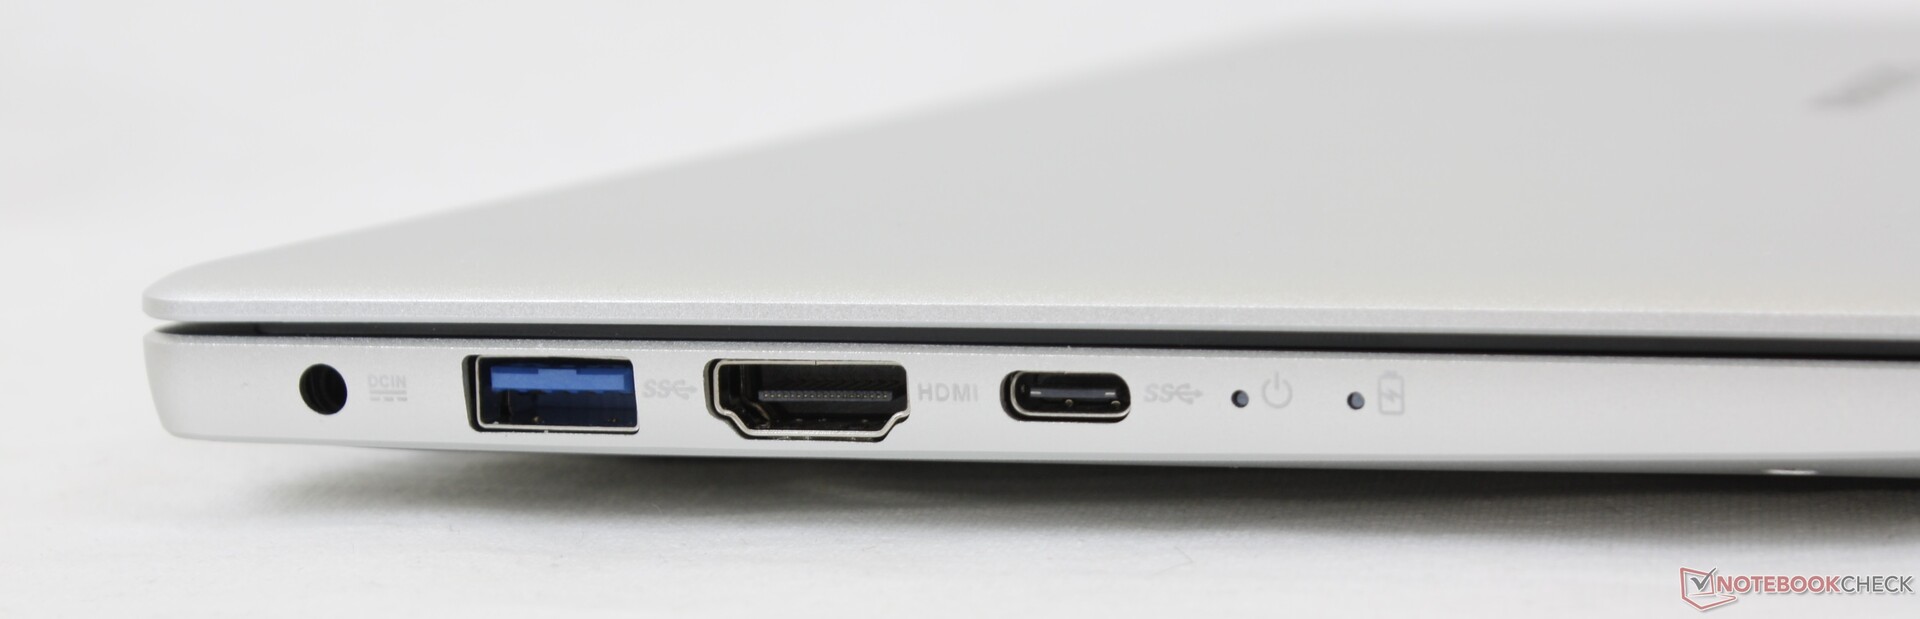
Connectivity
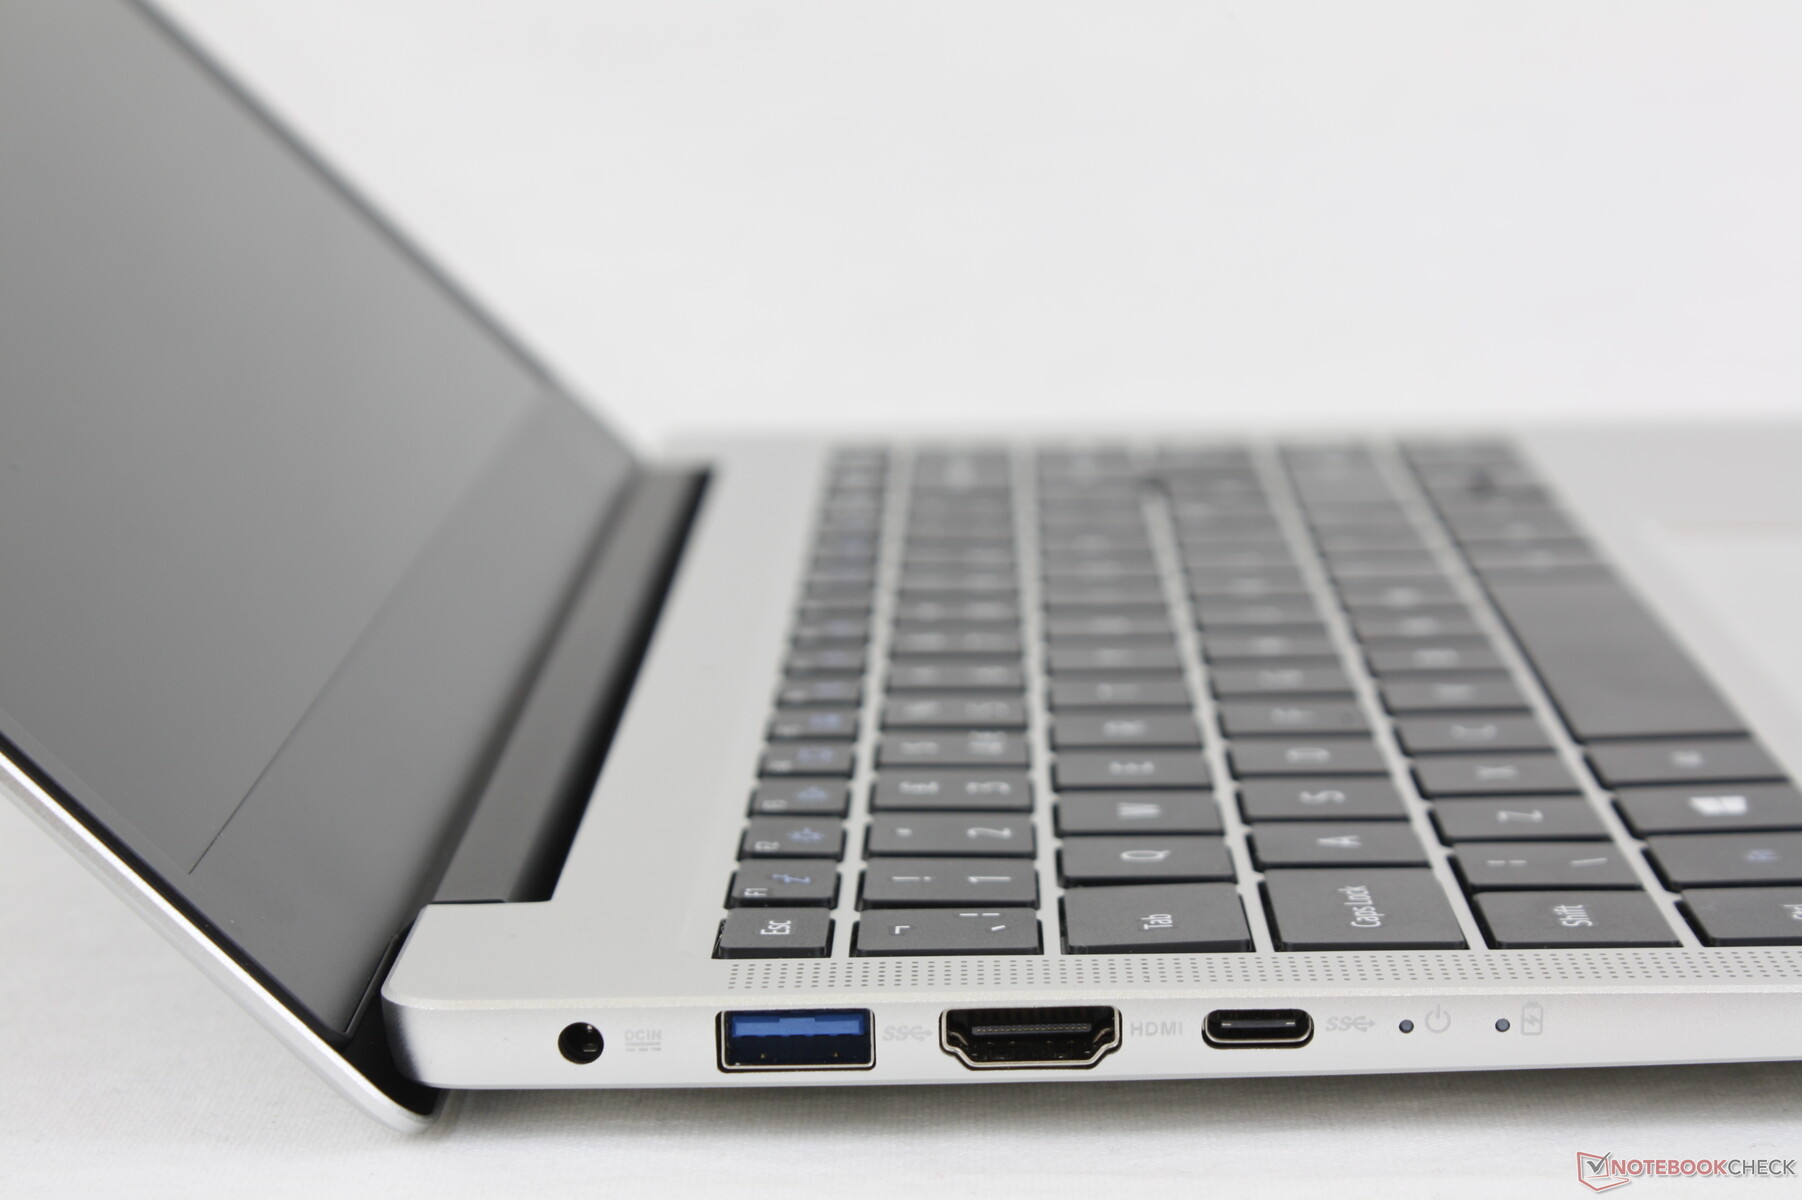
There are a lot of ports for such an inexpensive laptop. The USB-C and 3x USB-A ports will likely be sufficient for most home users. Both DisplayPort and Power Delivery are supported on the USB-C port meaning users can connect external monitors and charge via third-party USB-C adapters.
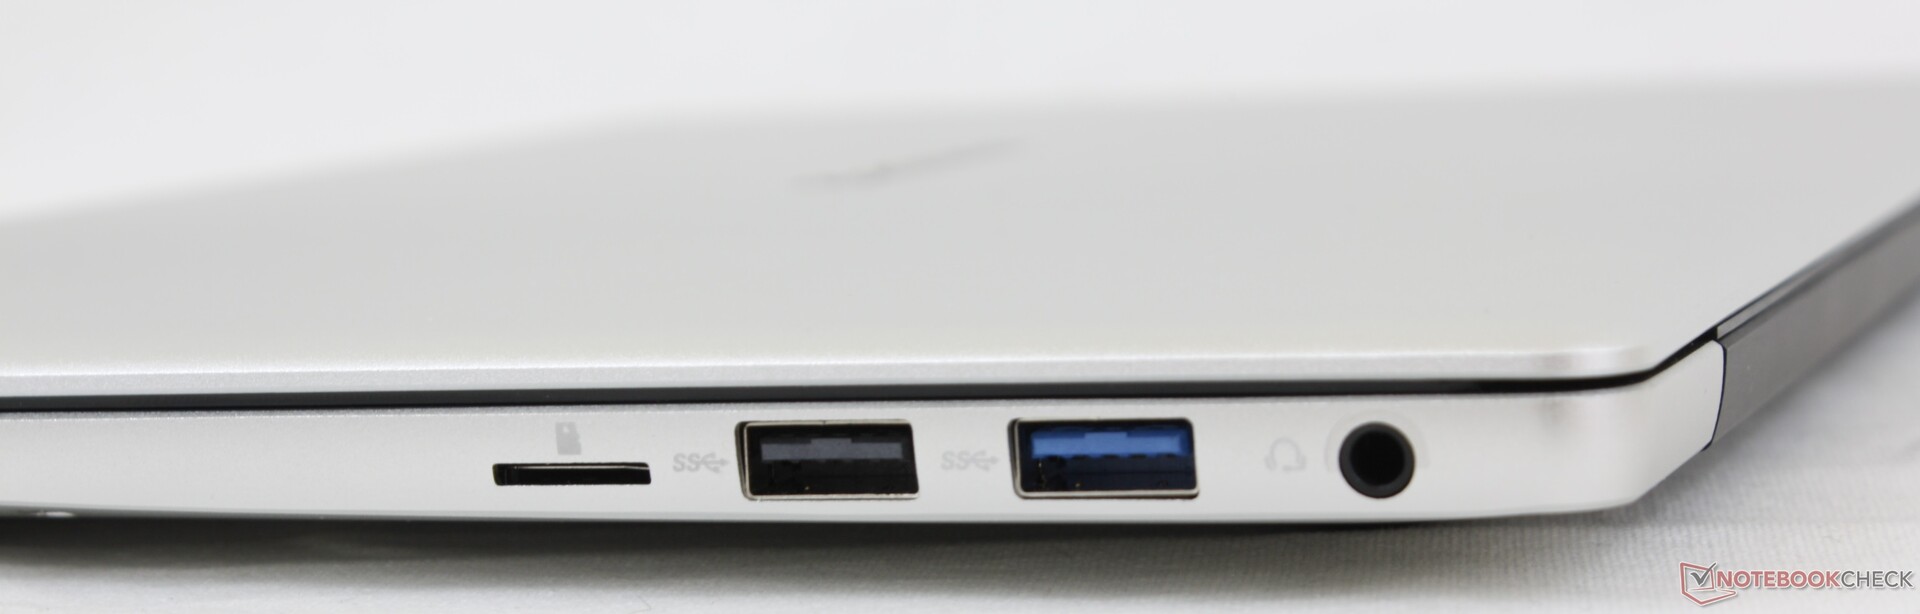
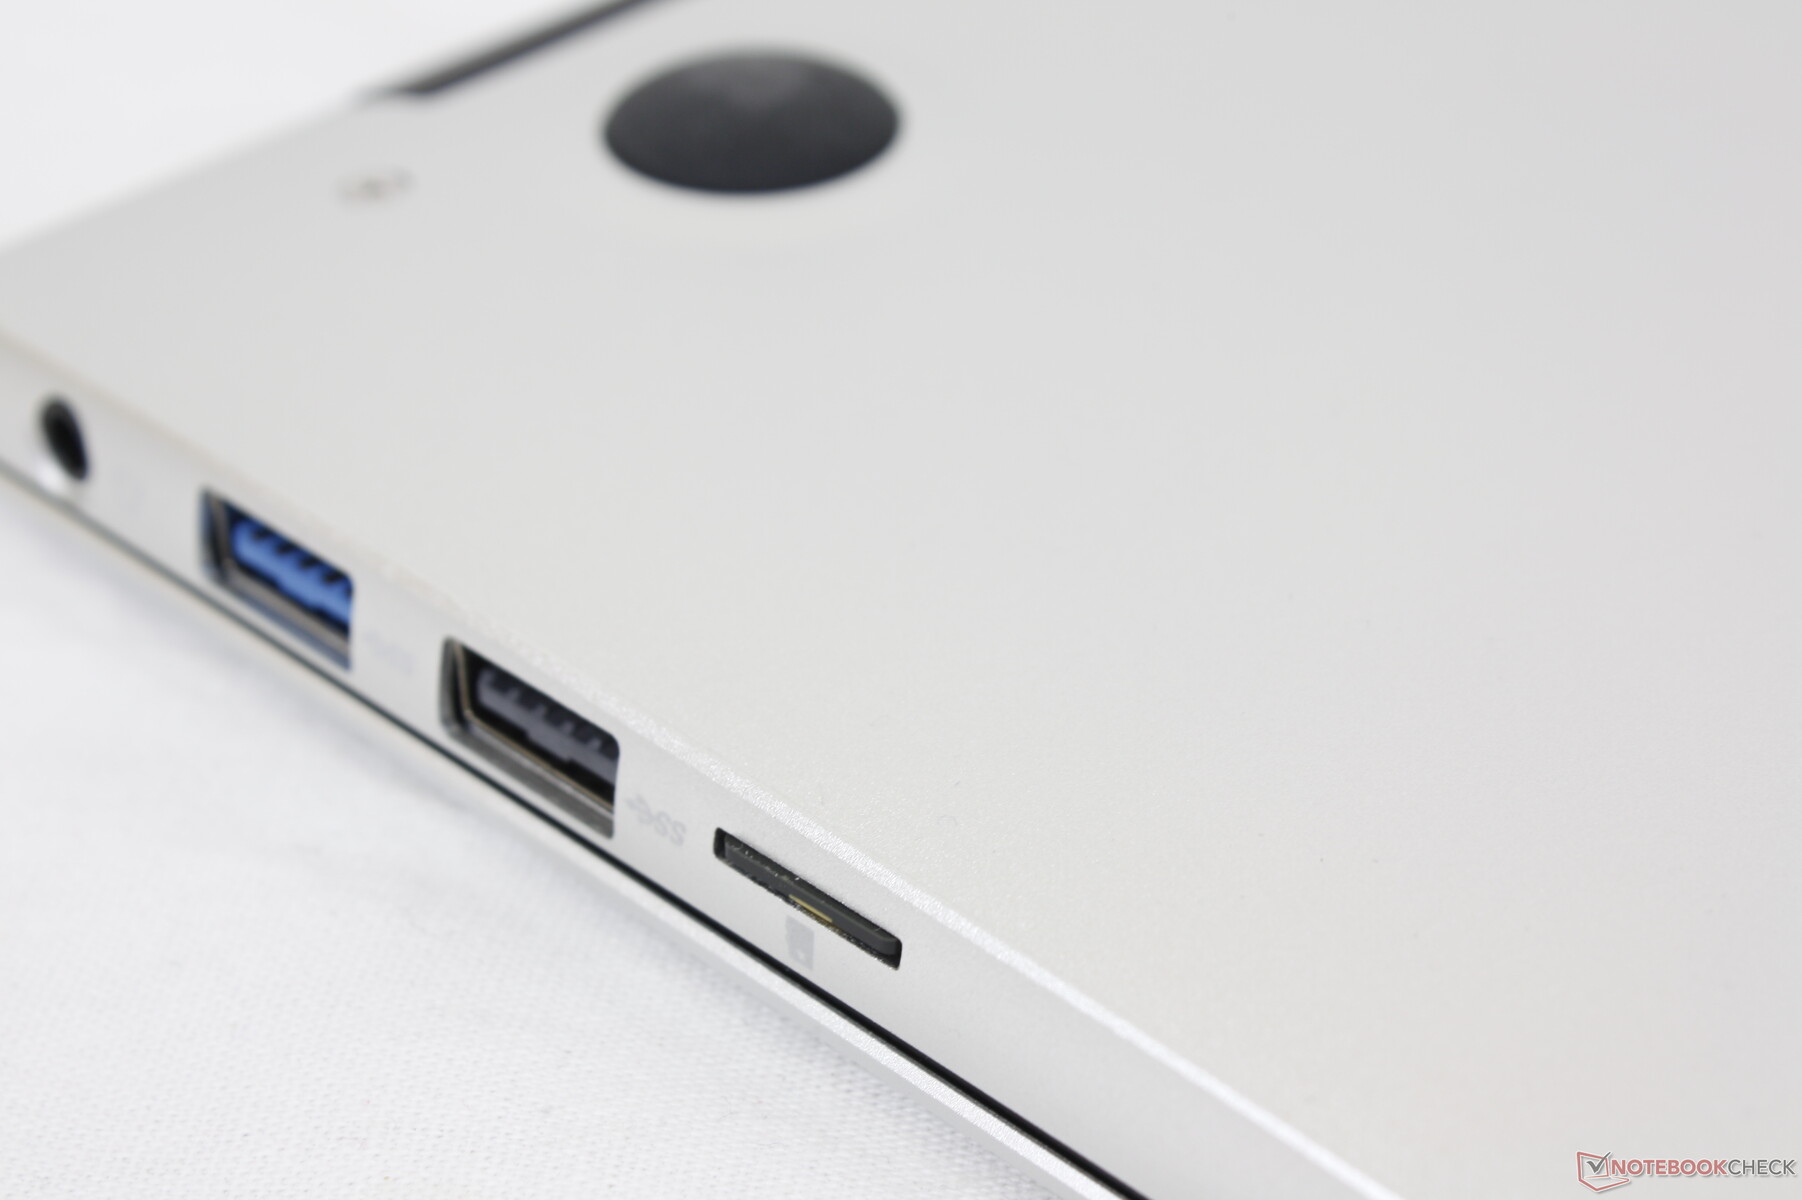
SD Card Reader
Transferring 1 GB of pictures from our UHS-II test card to desktop is very slow at over 50 seconds. Furthermore, inserting and ejecting the MicroSD card can be tricky since the card sits flush against the edge.
| SD Card Reader | |
| average JPG Copy Test (av. of 3 runs) | |
| Chuwi CoreBook X (AV PRO V60) | |
| Infinix INBook X1 Pro (AV Pro V60) | |
| Teclast F7 Air (Toshiba Exceria Pro M501 UHS-II) | |
| Blackview AceBook 1 (AV Pro V60) | |
| Lenovo IdeaPad 3 14IIL05 (Toshiba Exceria Pro SDXC 64 GB UHS-II) | |
| maximum AS SSD Seq Read Test (1GB) | |
| Lenovo IdeaPad 3 14IIL05 (Toshiba Exceria Pro SDXC 64 GB UHS-II) | |
| Infinix INBook X1 Pro (AV Pro V60) | |
| Chuwi CoreBook X (AV PRO V60) | |
| Teclast F7 Air (Toshiba Exceria Pro M501 UHS-II) | |
| Blackview AceBook 1 (AV Pro V60) | |
Communication
Wireless is slow but otherwise stable for reliable browsing and video streaming.
Webcam
The 720p webcam is poor much like on most other laptops. However, it's even worse on the AceBook 1 because colors appear much warmer than they normally would. There is no webcam shutter nor is there compatibility with Windows Hello.


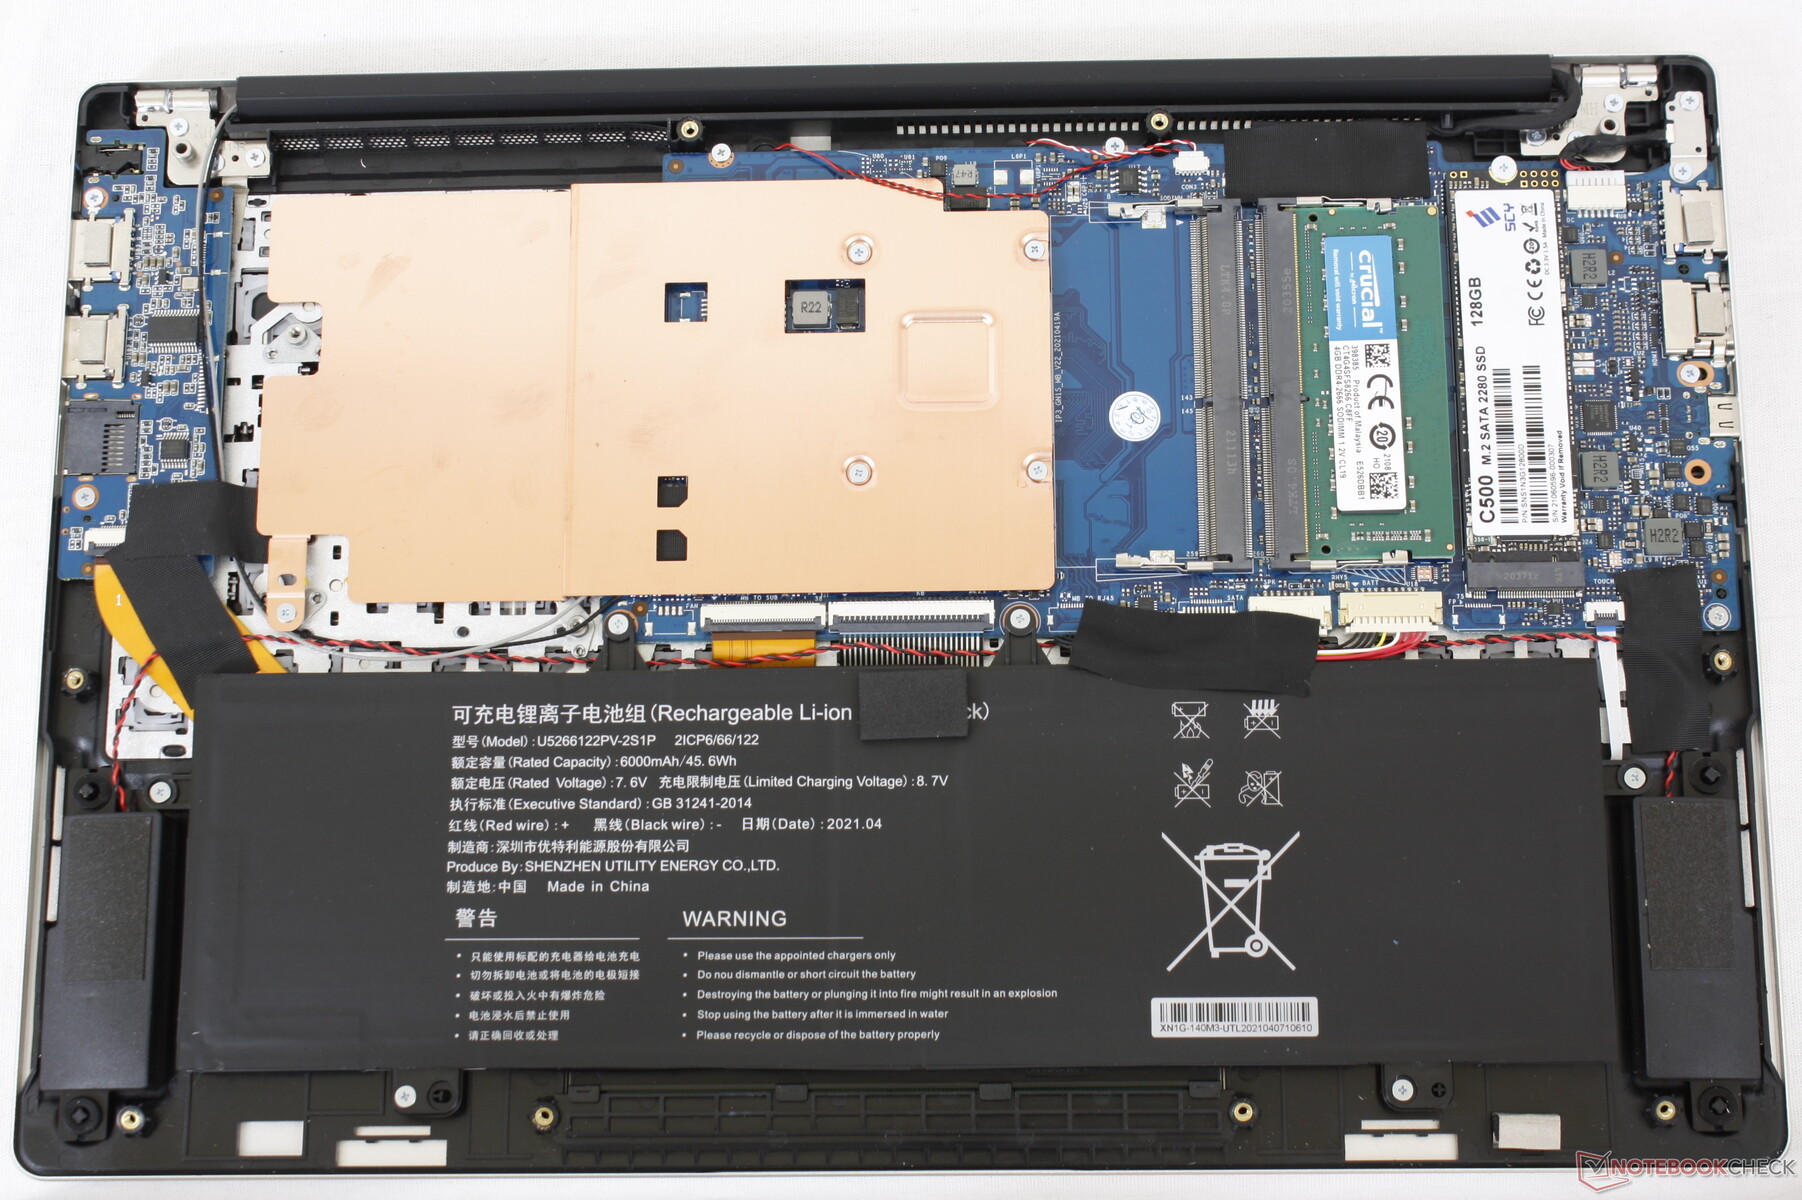
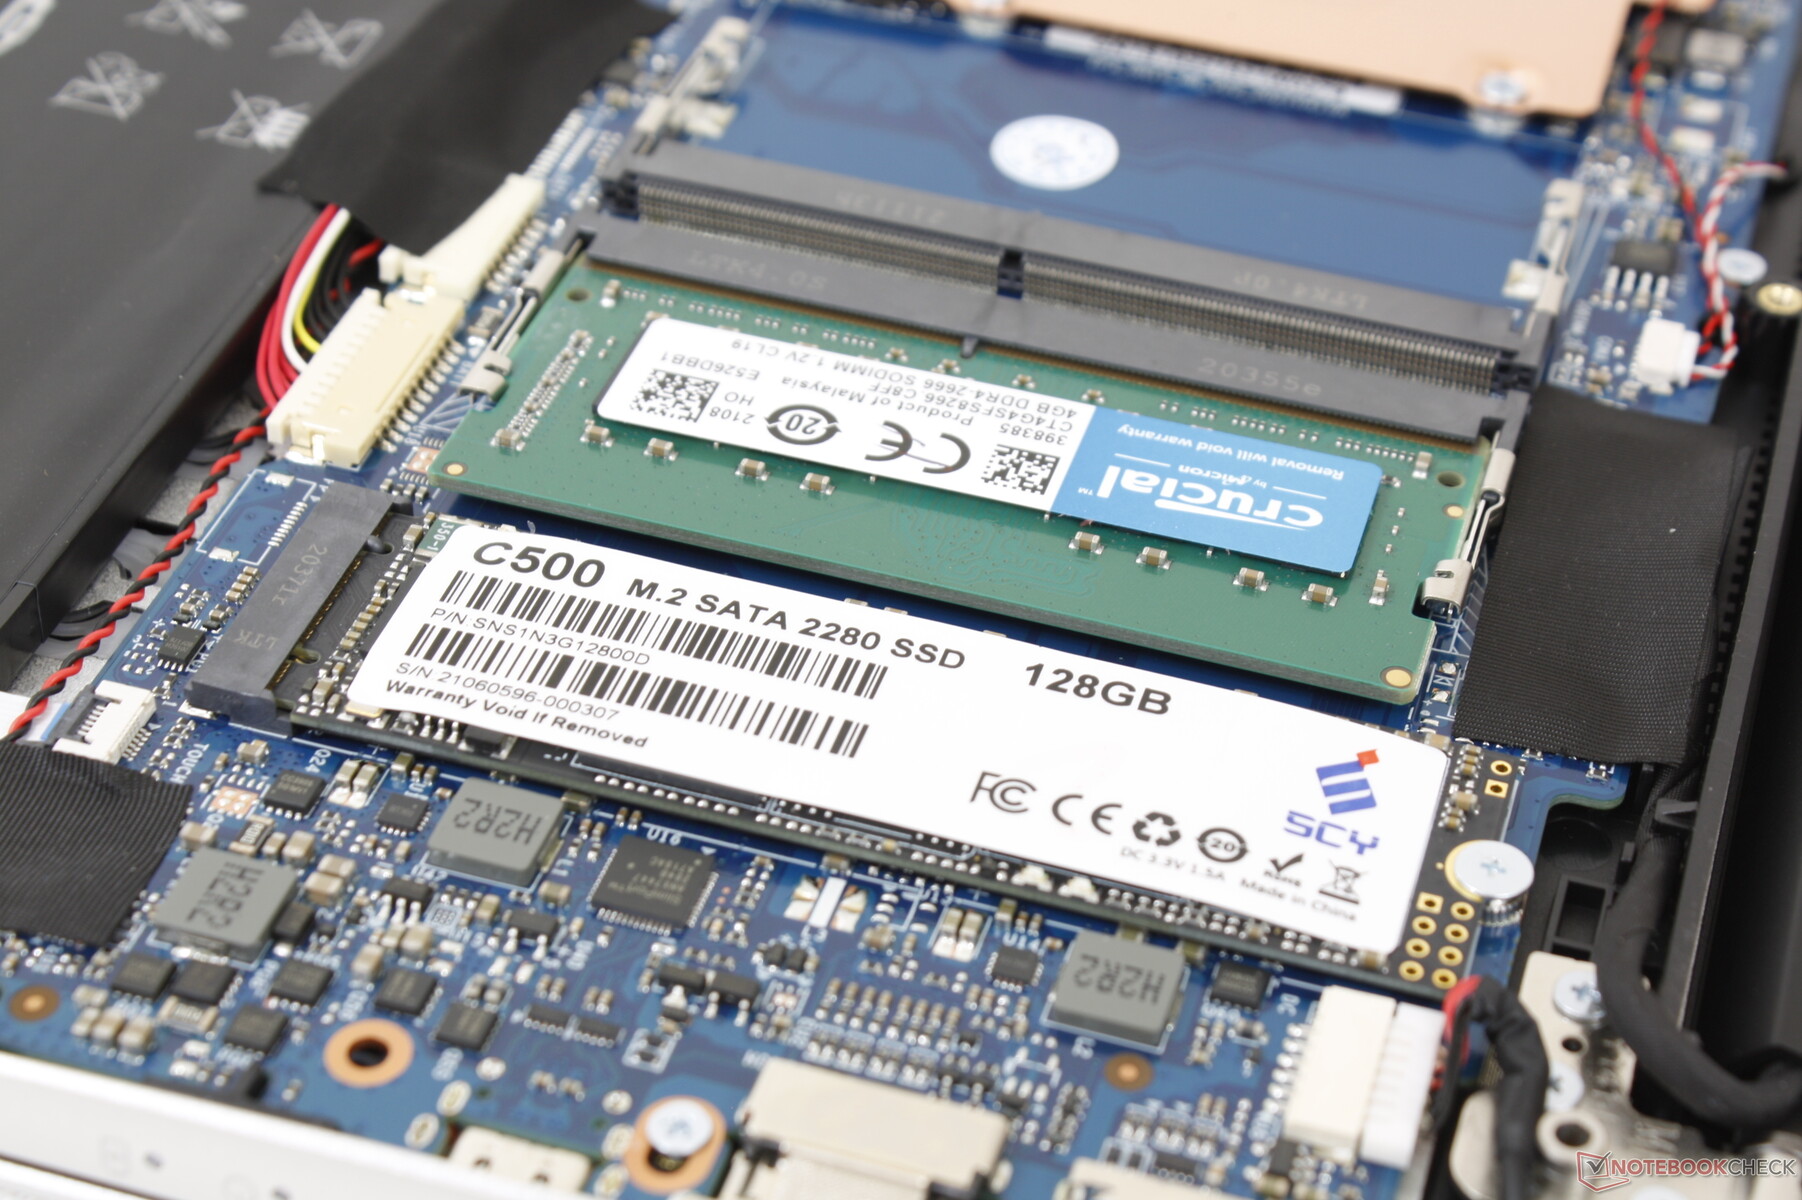
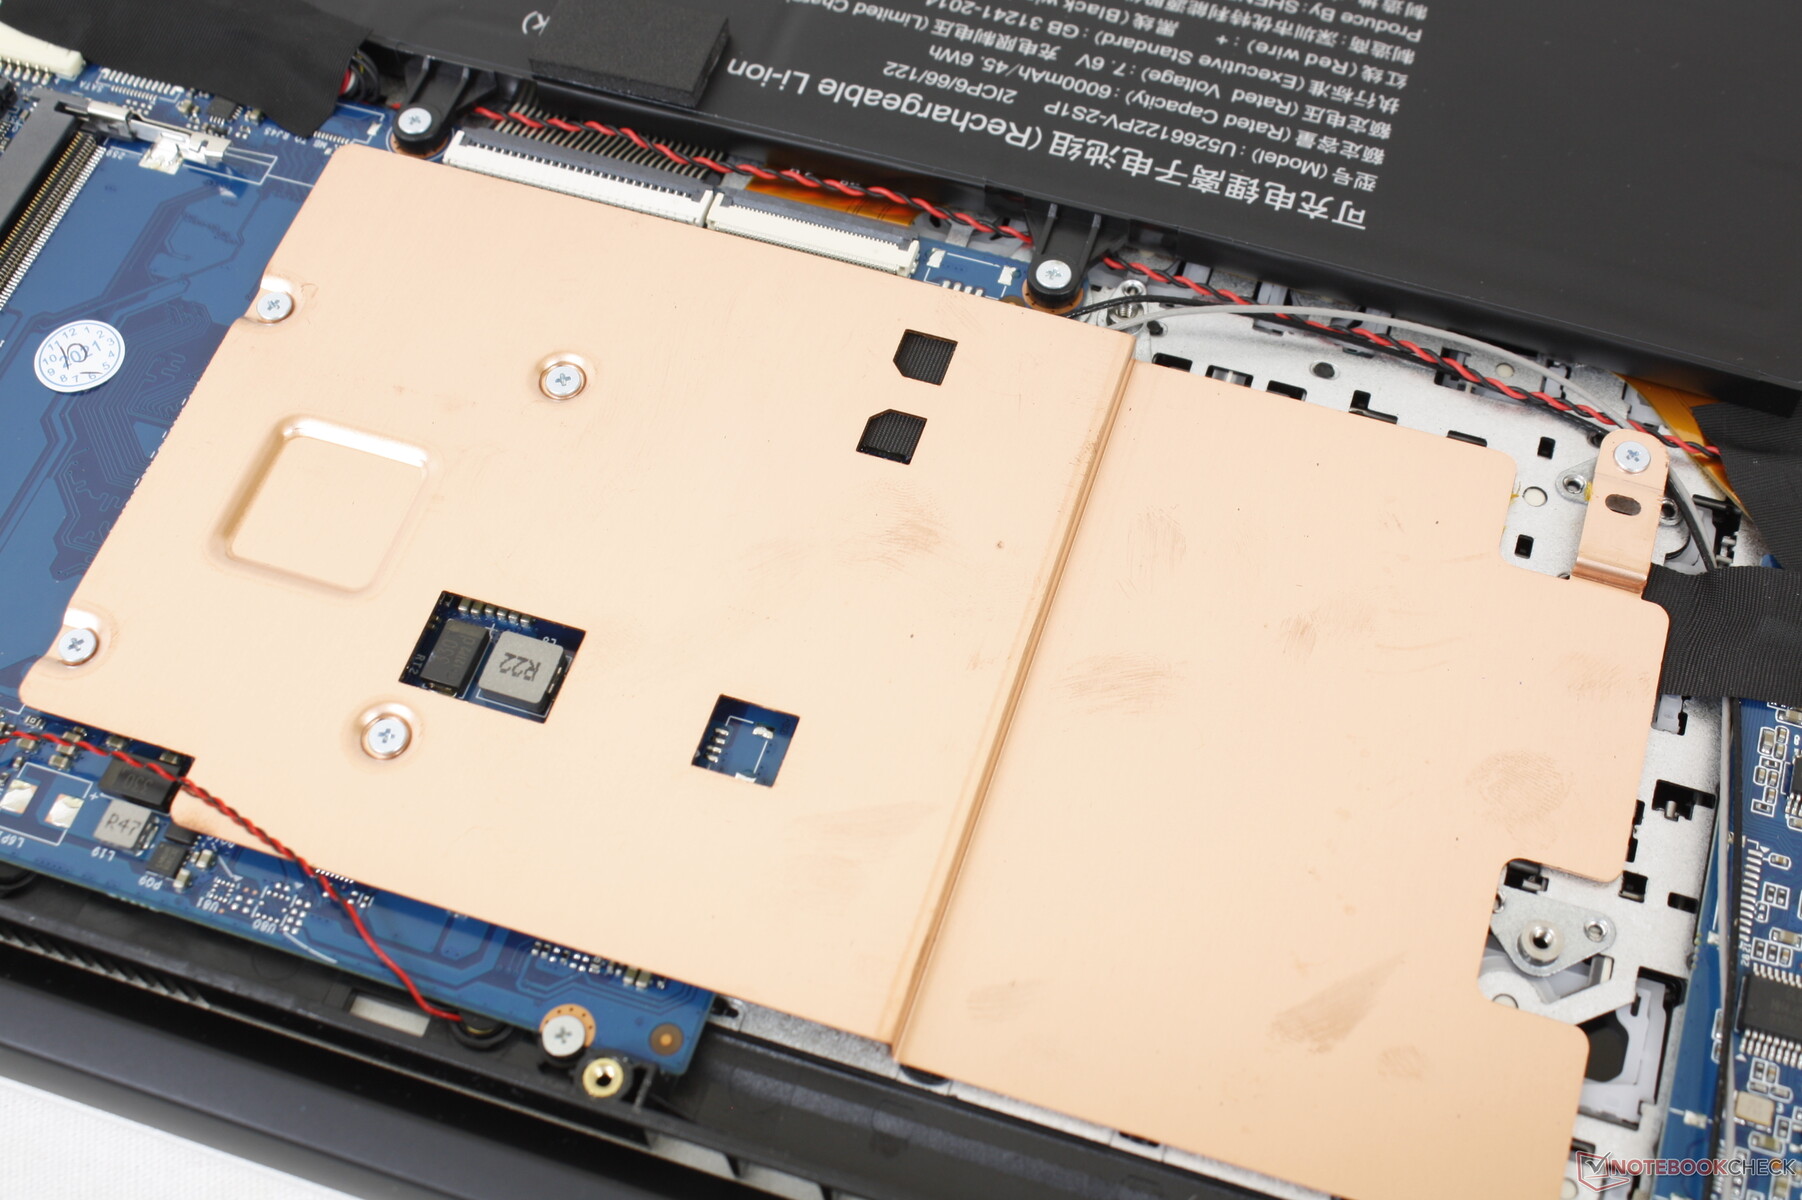
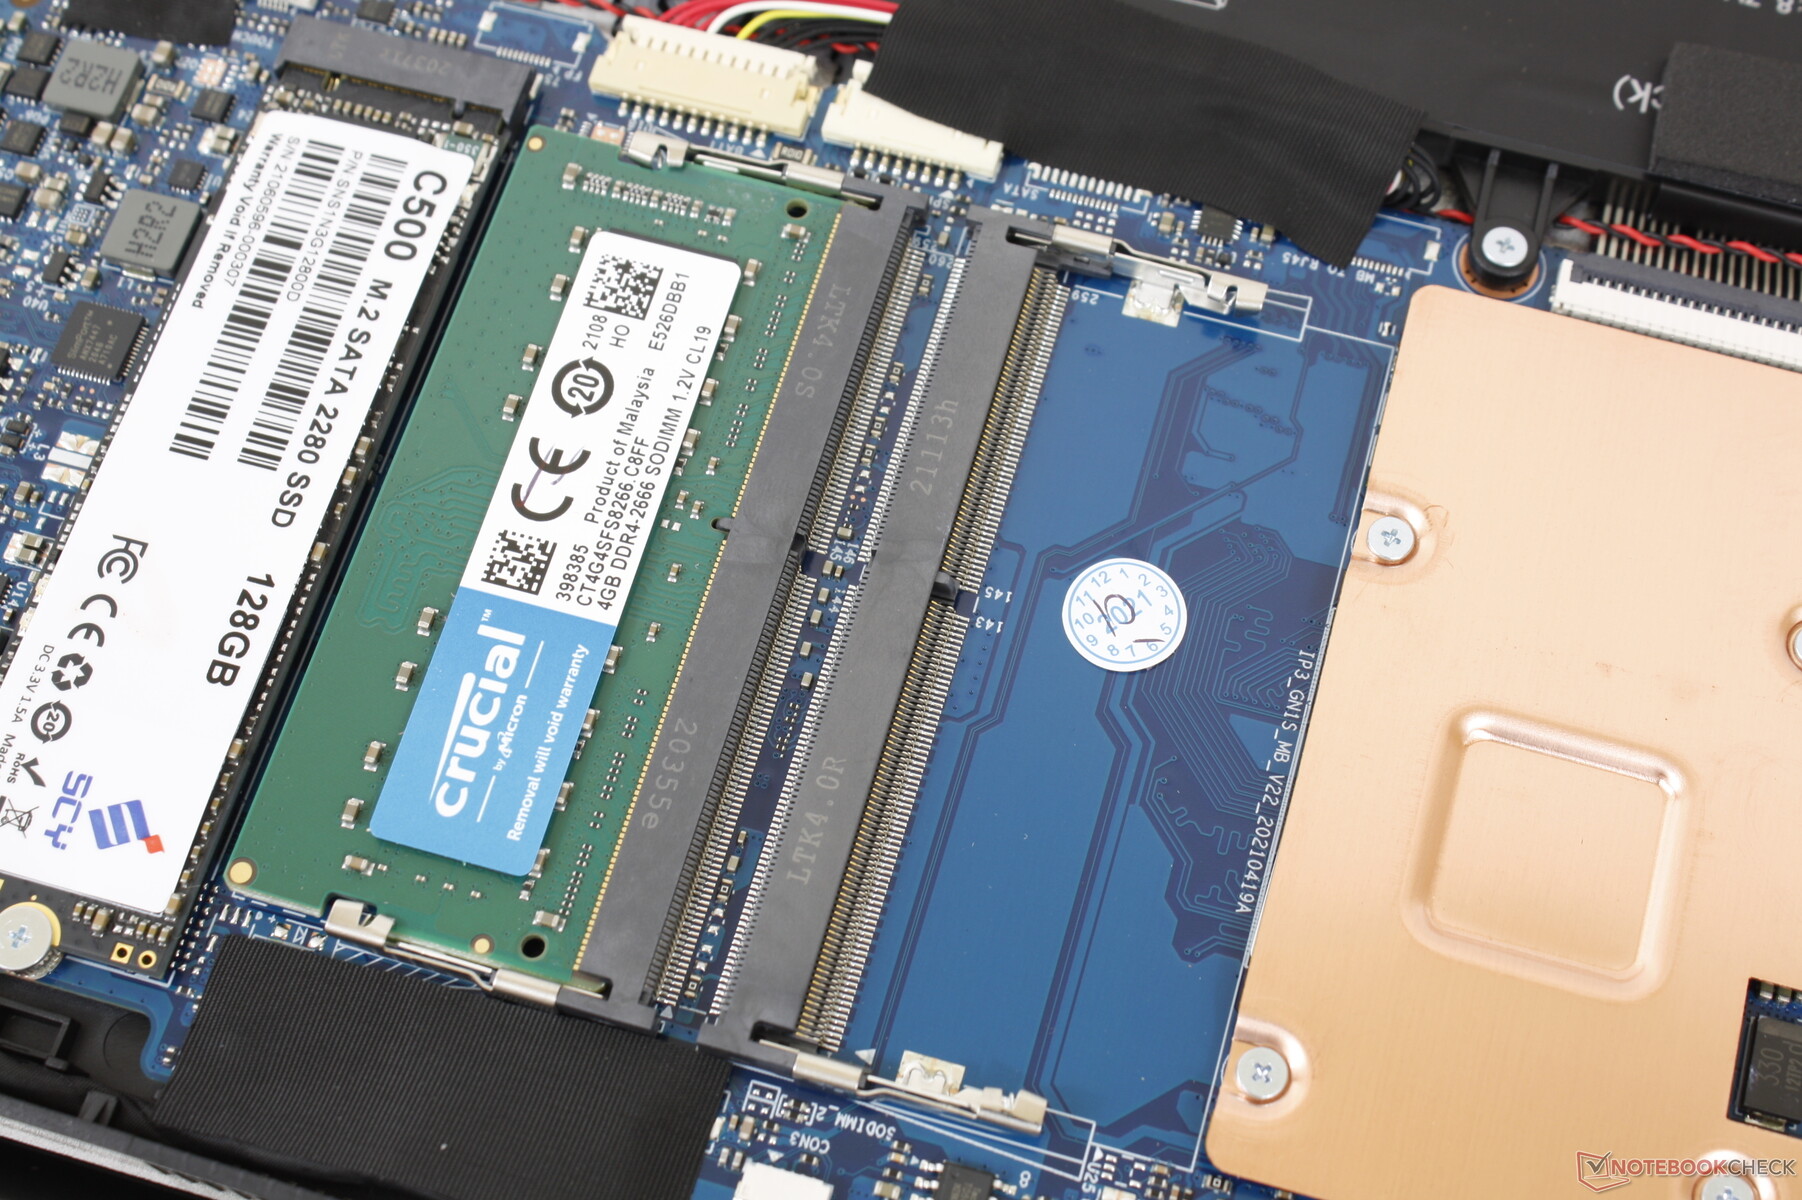
Maintenance
Users can service the M.2 2280 SSD or 2x SODIMM slots. The WLAN module is under the copper plate and it is likely soldered.
Accessories and Warranty
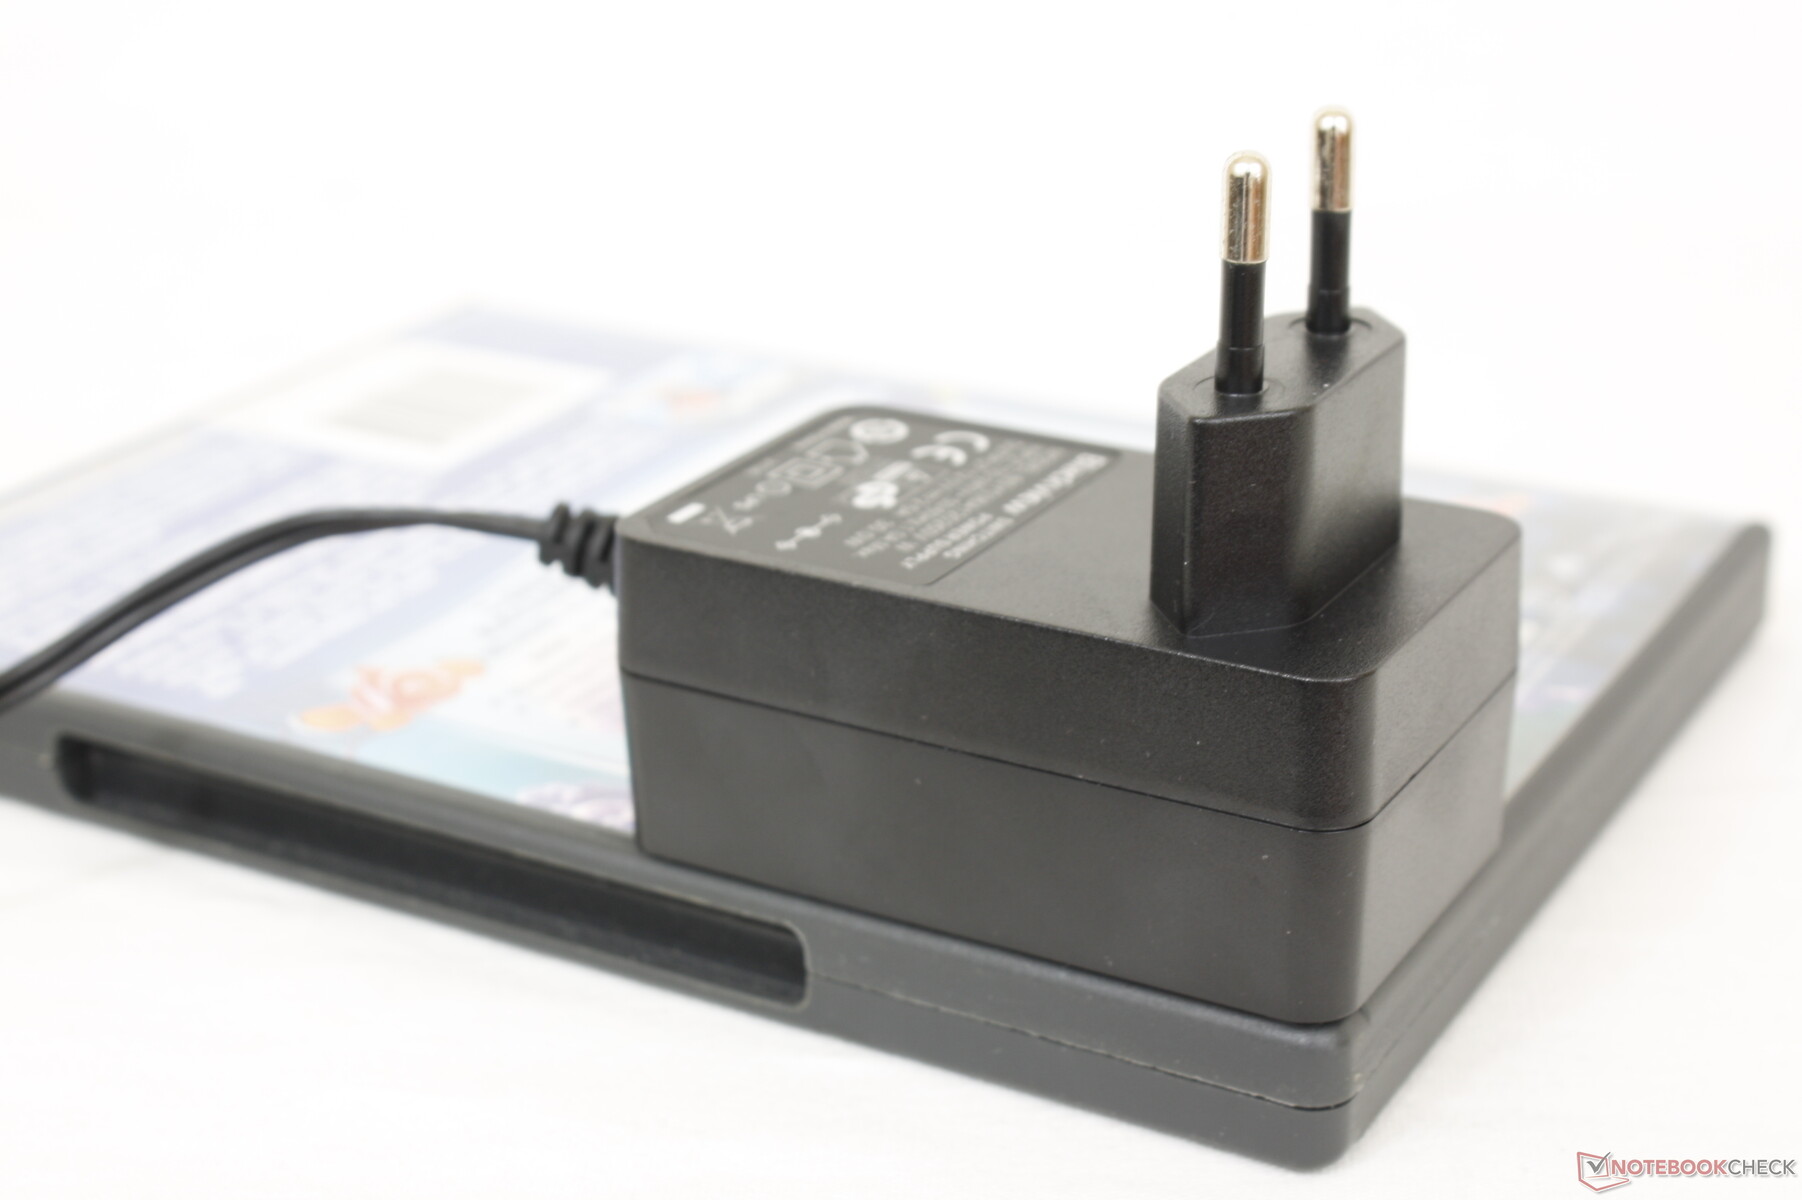
The retail box includes only paperwork and a European-style AC adapter. The standard one-year limited warranty applies, but buyers must pay for shipping.
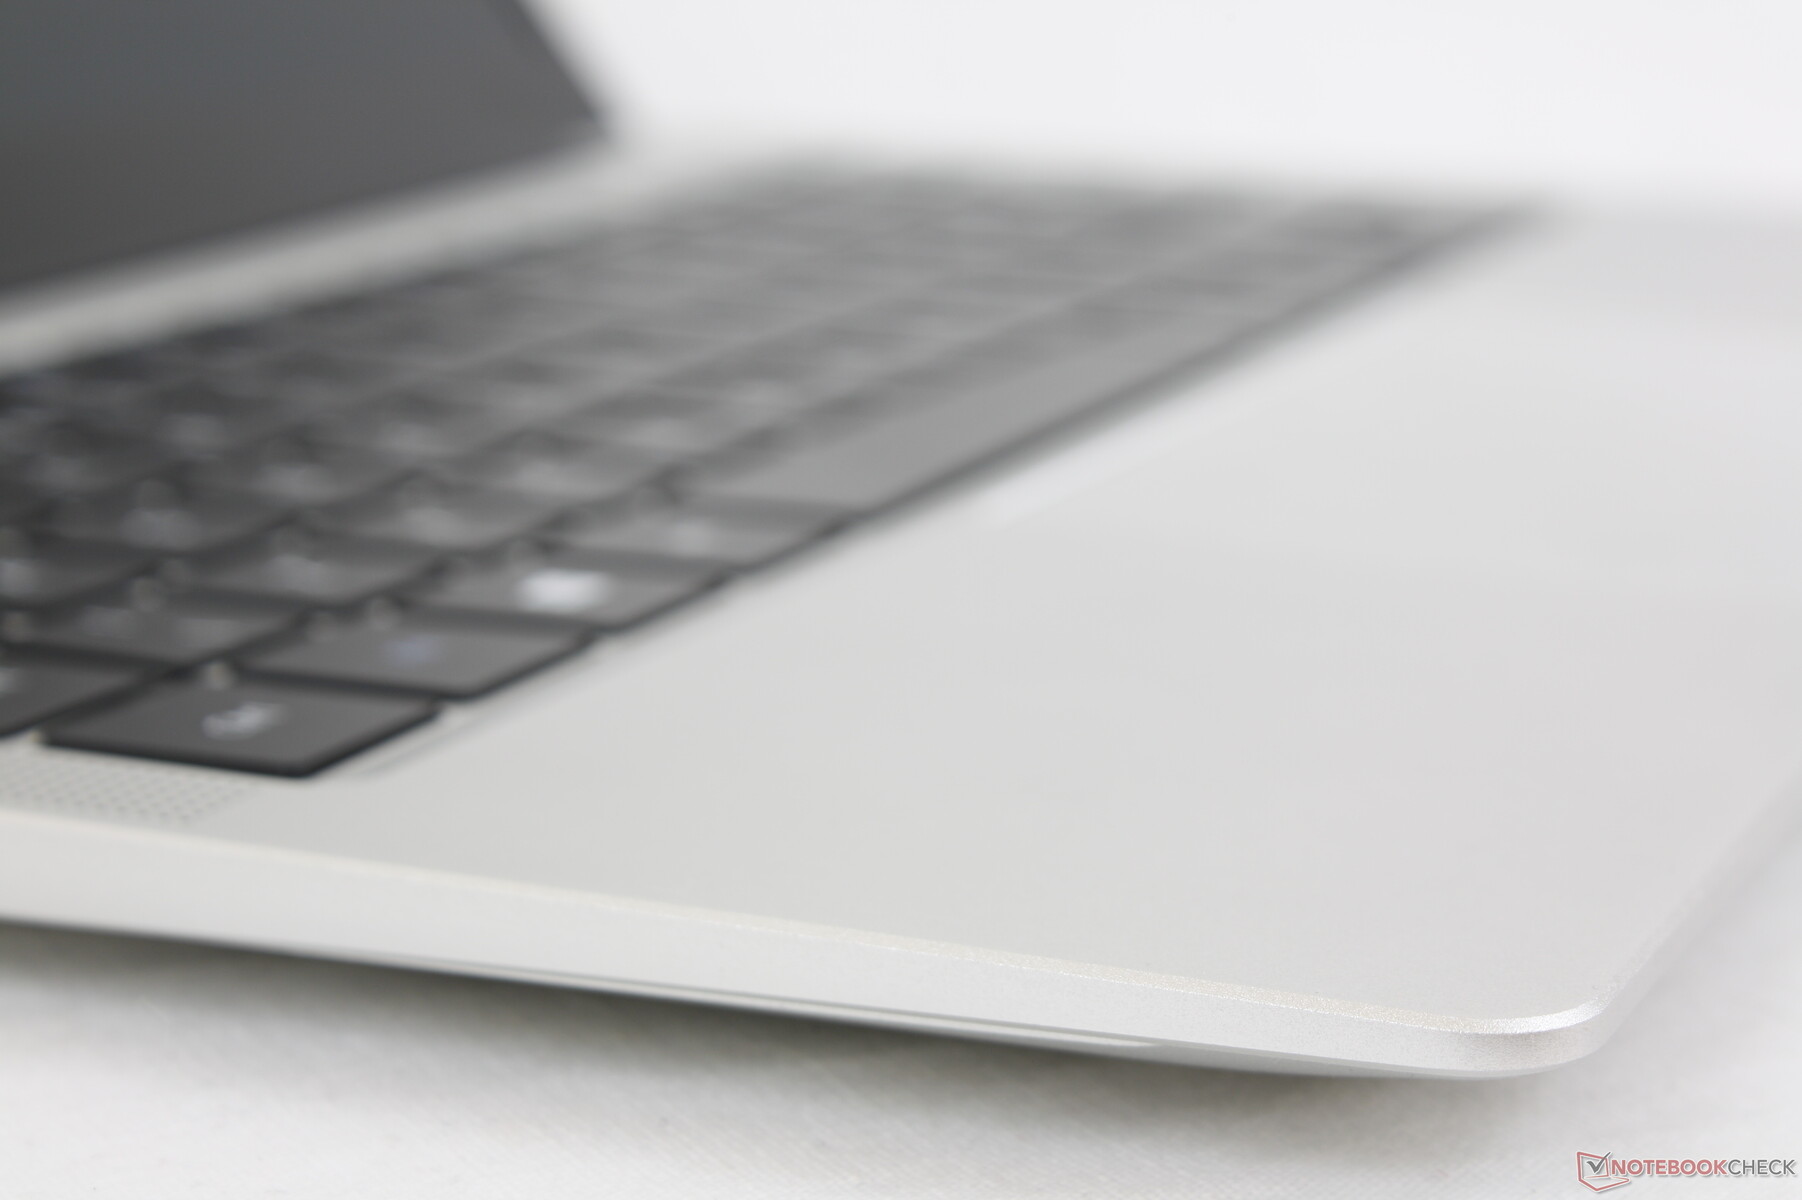
Input Devices
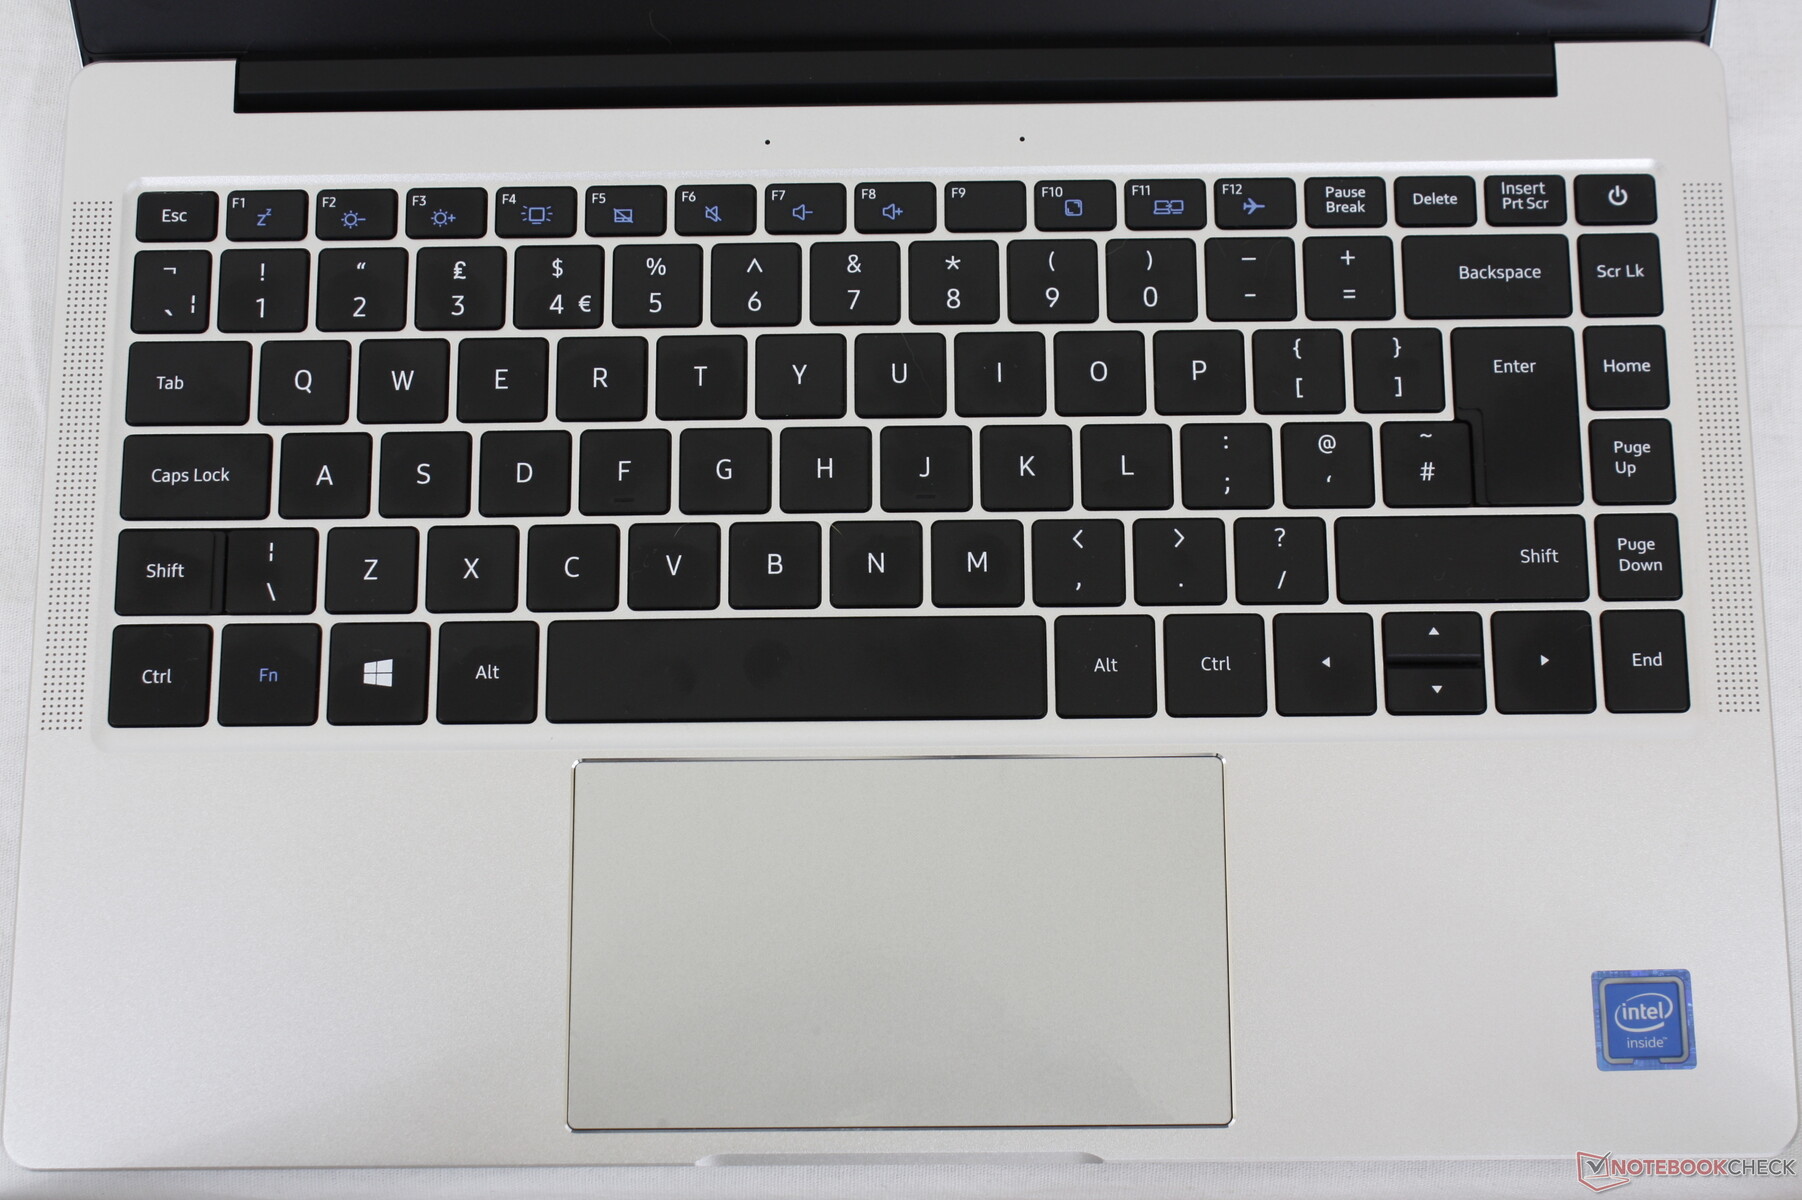
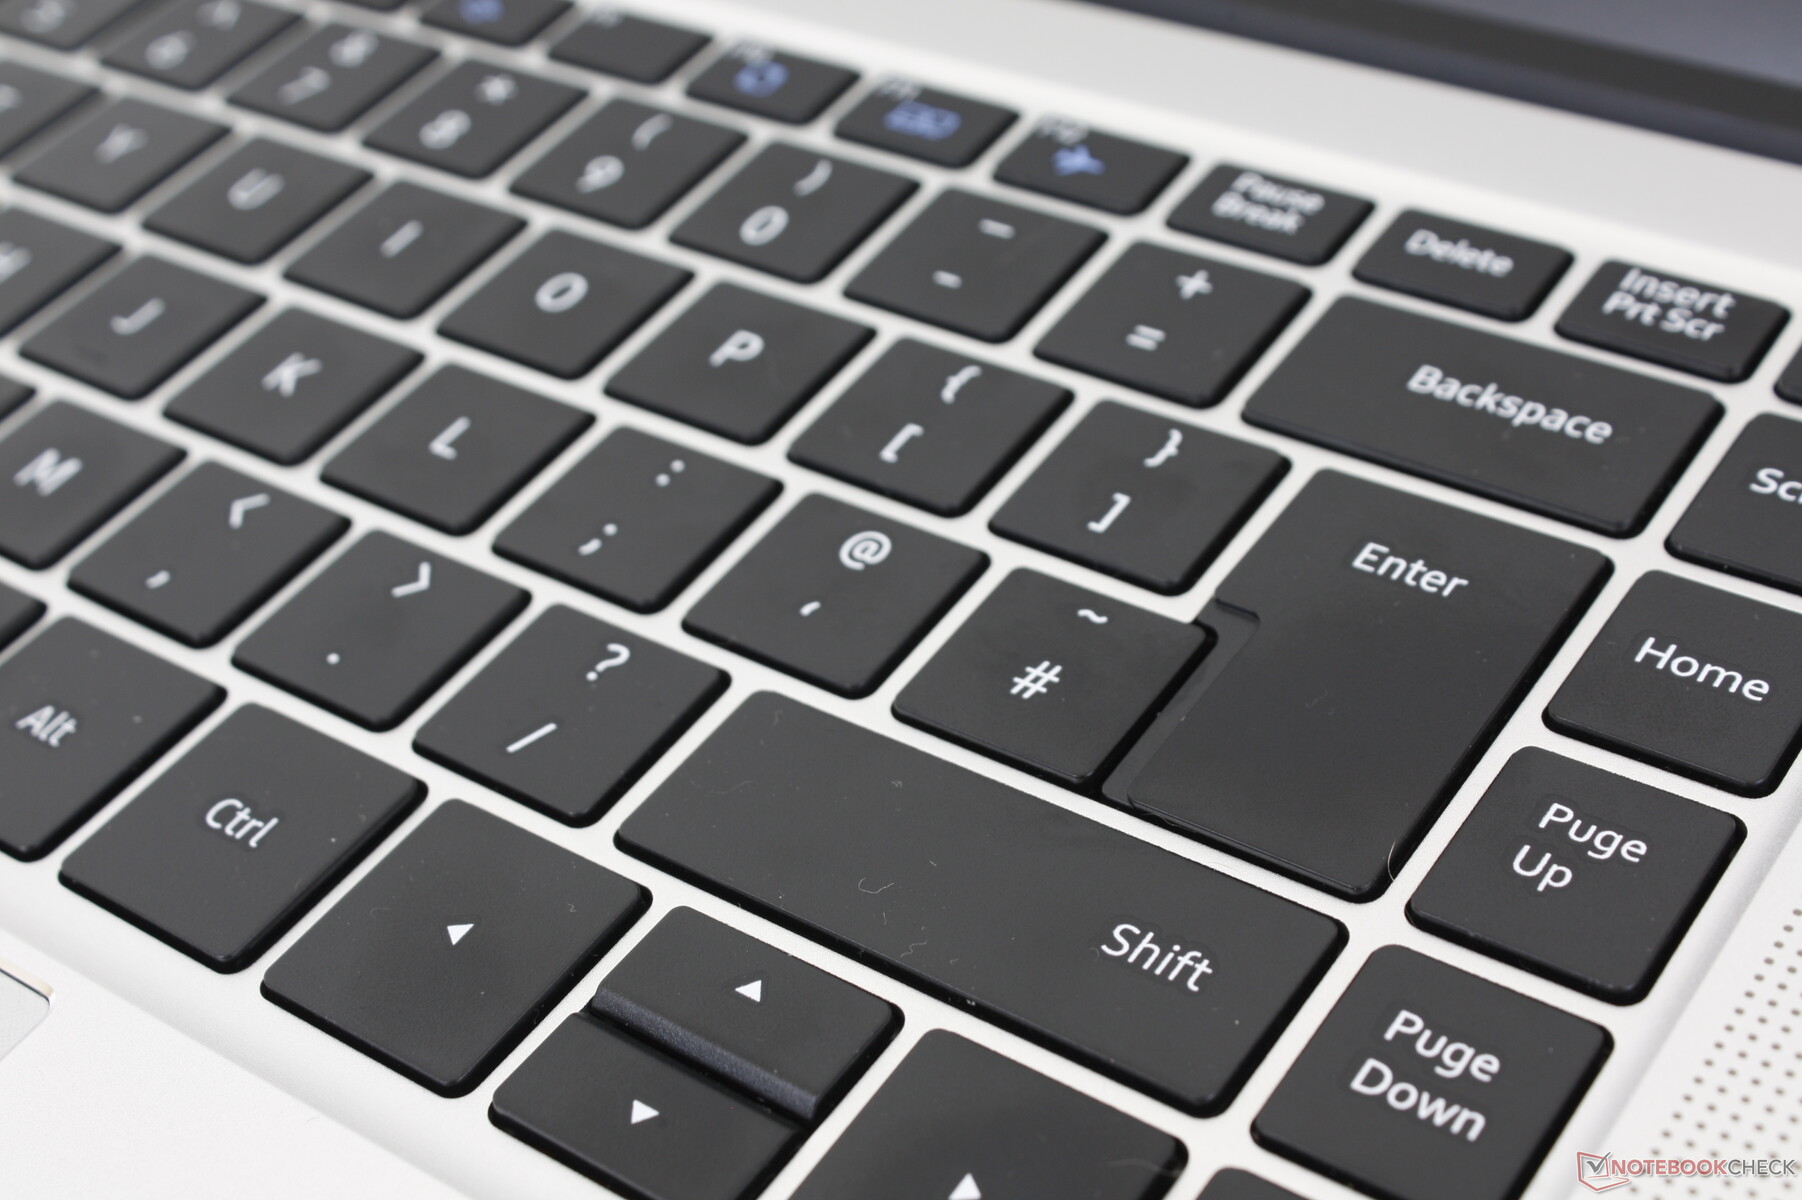
Keyboard
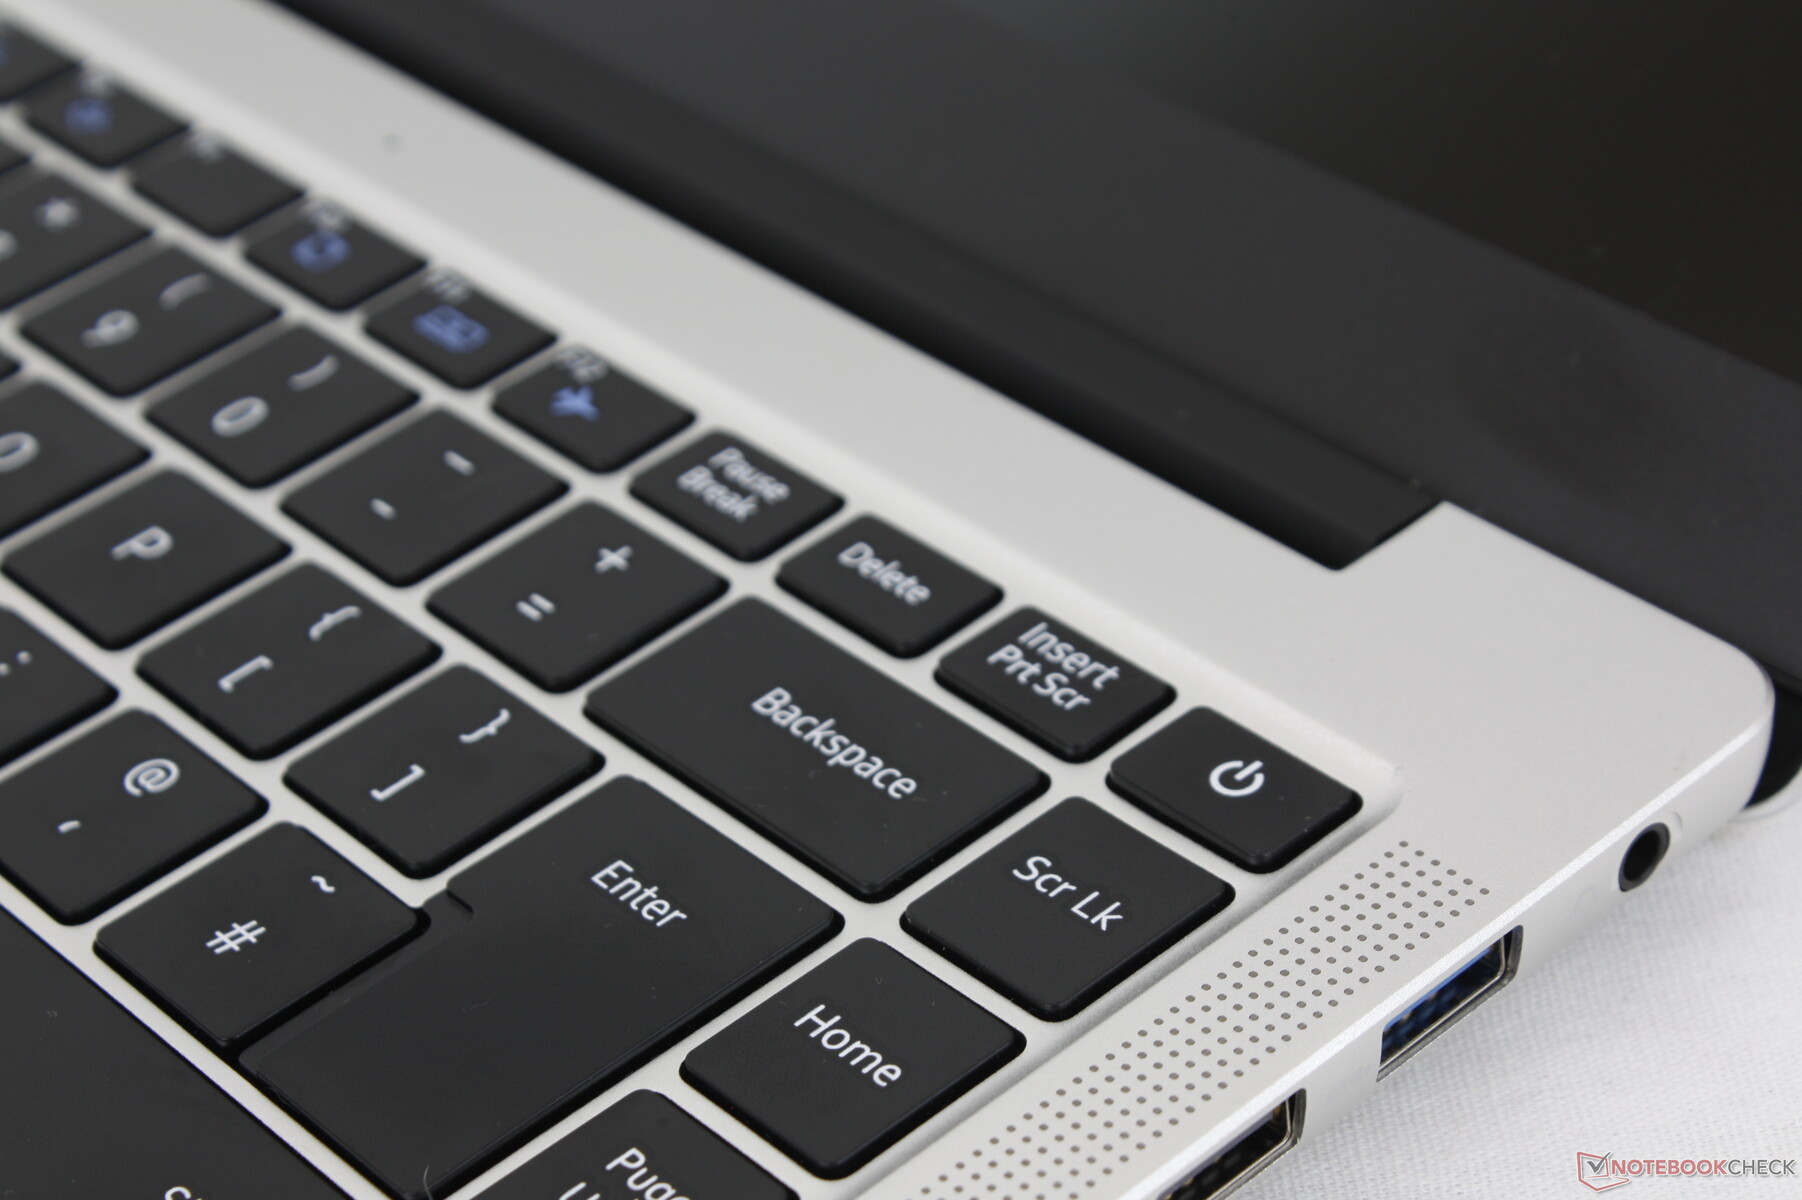
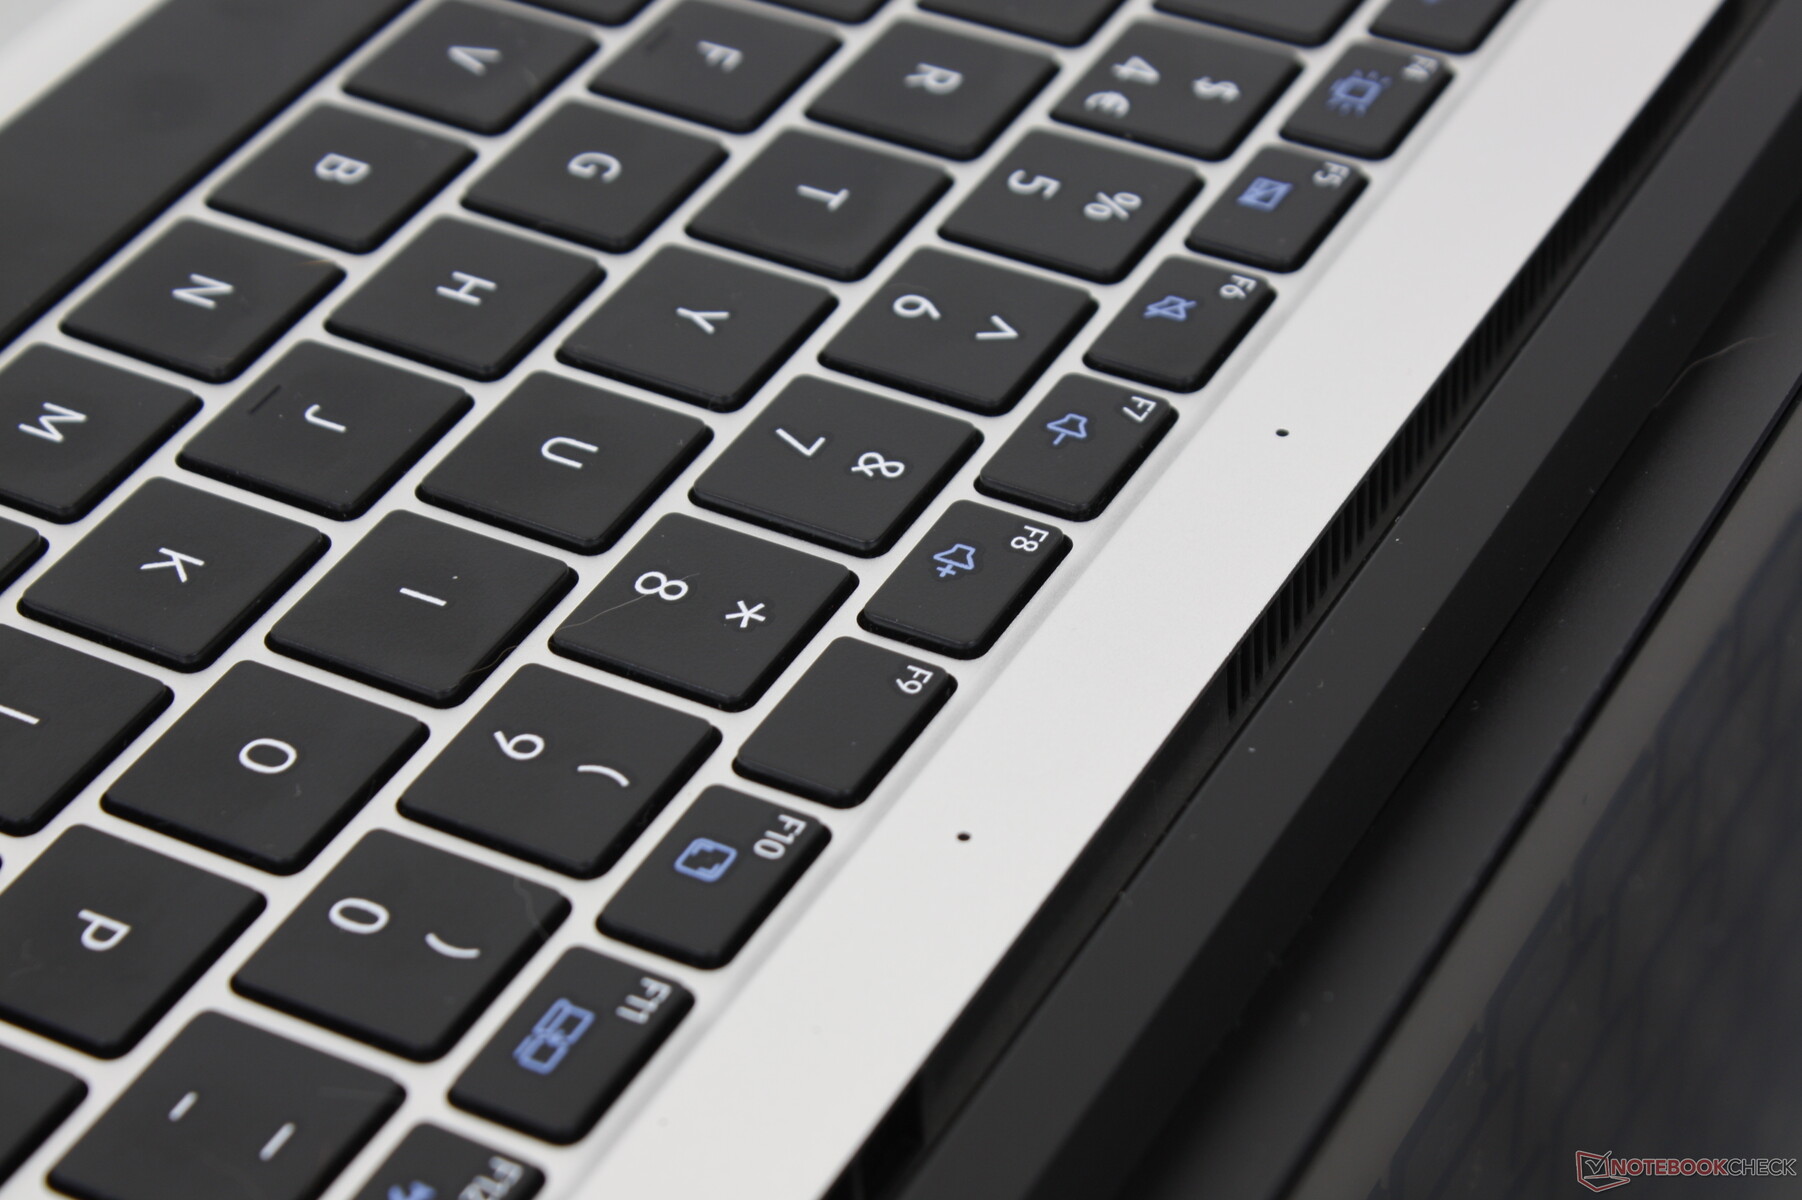
The typing experience is subpar as the keys are shallow with weak feedback. The Space and Enter keys are louder and stiffer than the rest of the keys for an uneven feel.
Touchpad
The Precision-enabled clickpad is larger than the one on the XPS 13 (12 x 6.8 cm vs. 11.2 x 6.5 cm) which should theoretically make for easier cursor control and multi-touch inputs. Unfortunately, this is not the case as its slightly roughened surface is very sticky. Gliding a finger across should feel effortless, but it's almost tiring on the AceBook 1. The onscreen cursor even tends to bounce to make accurate clicks frustrating. You're going to want an external mouse whenever possible.


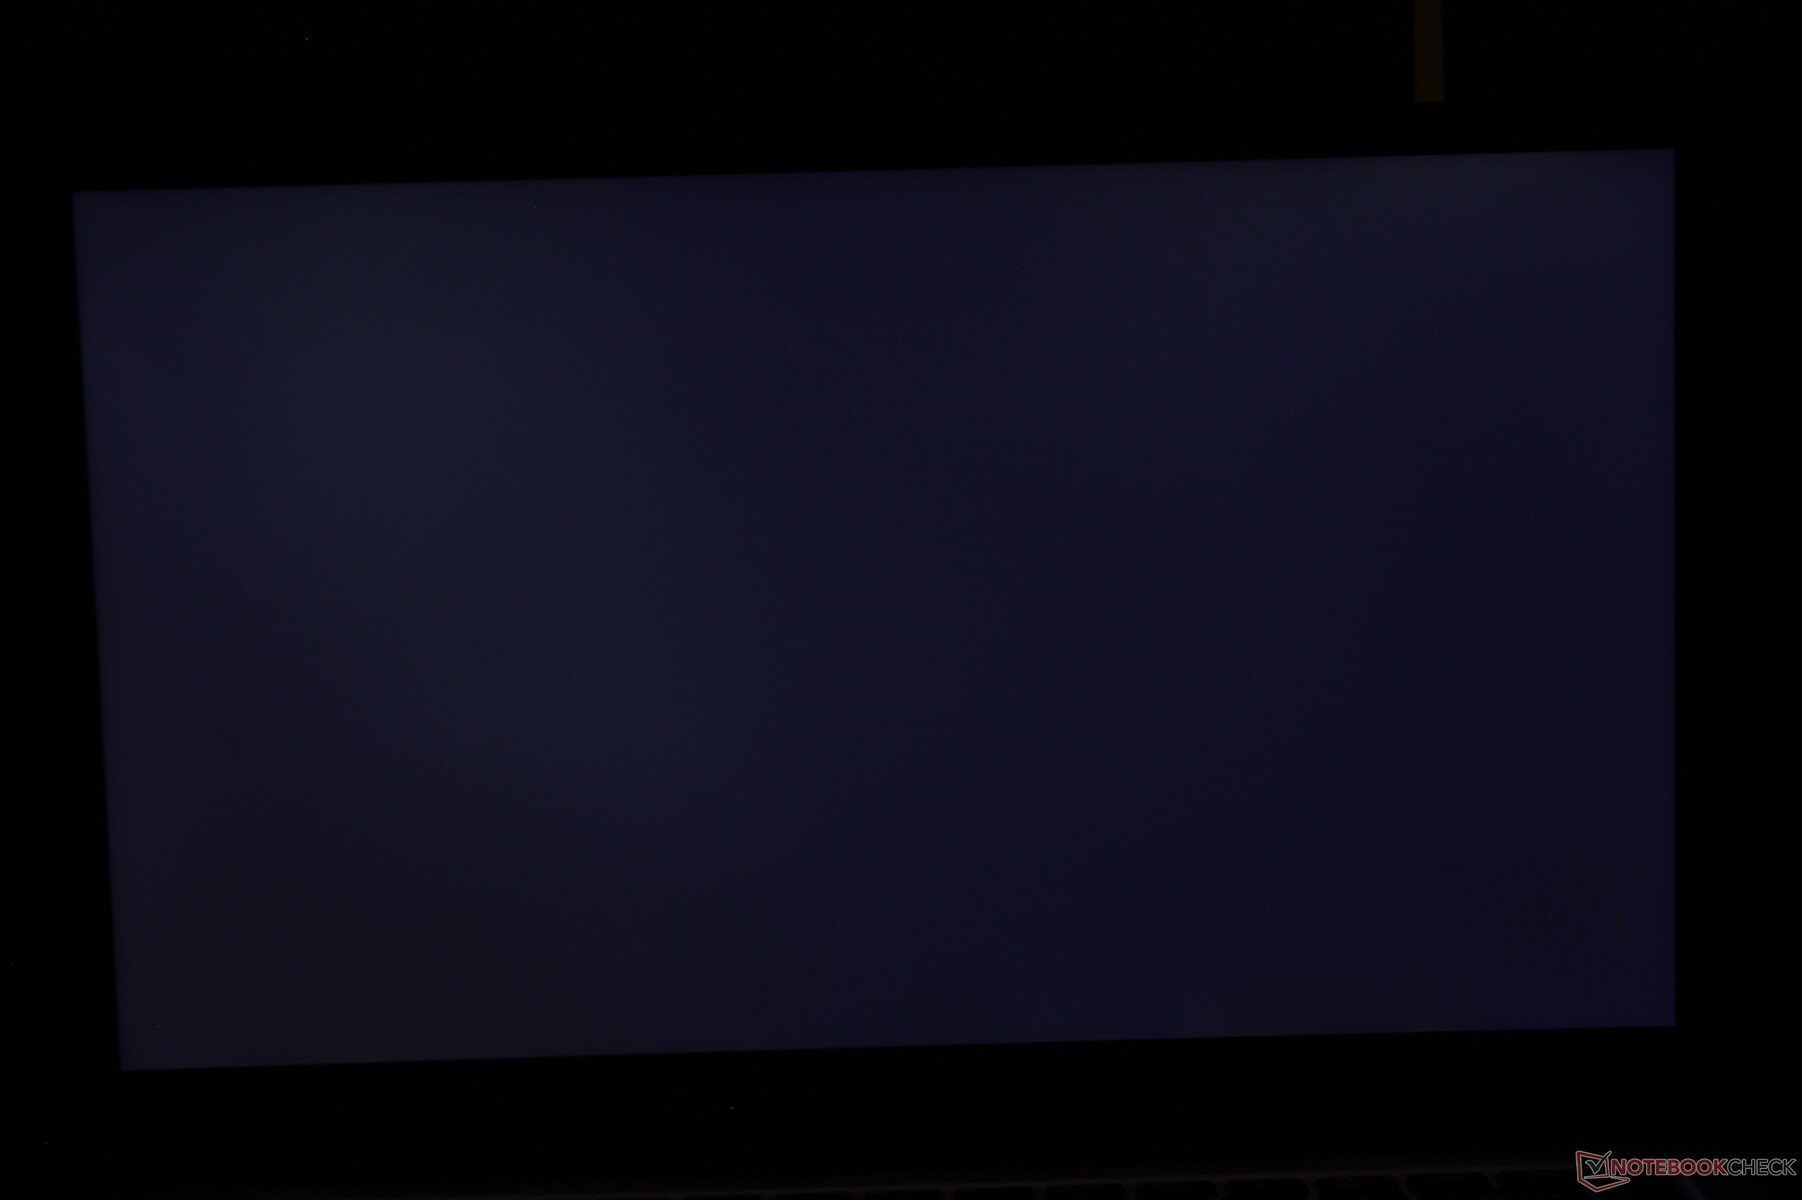
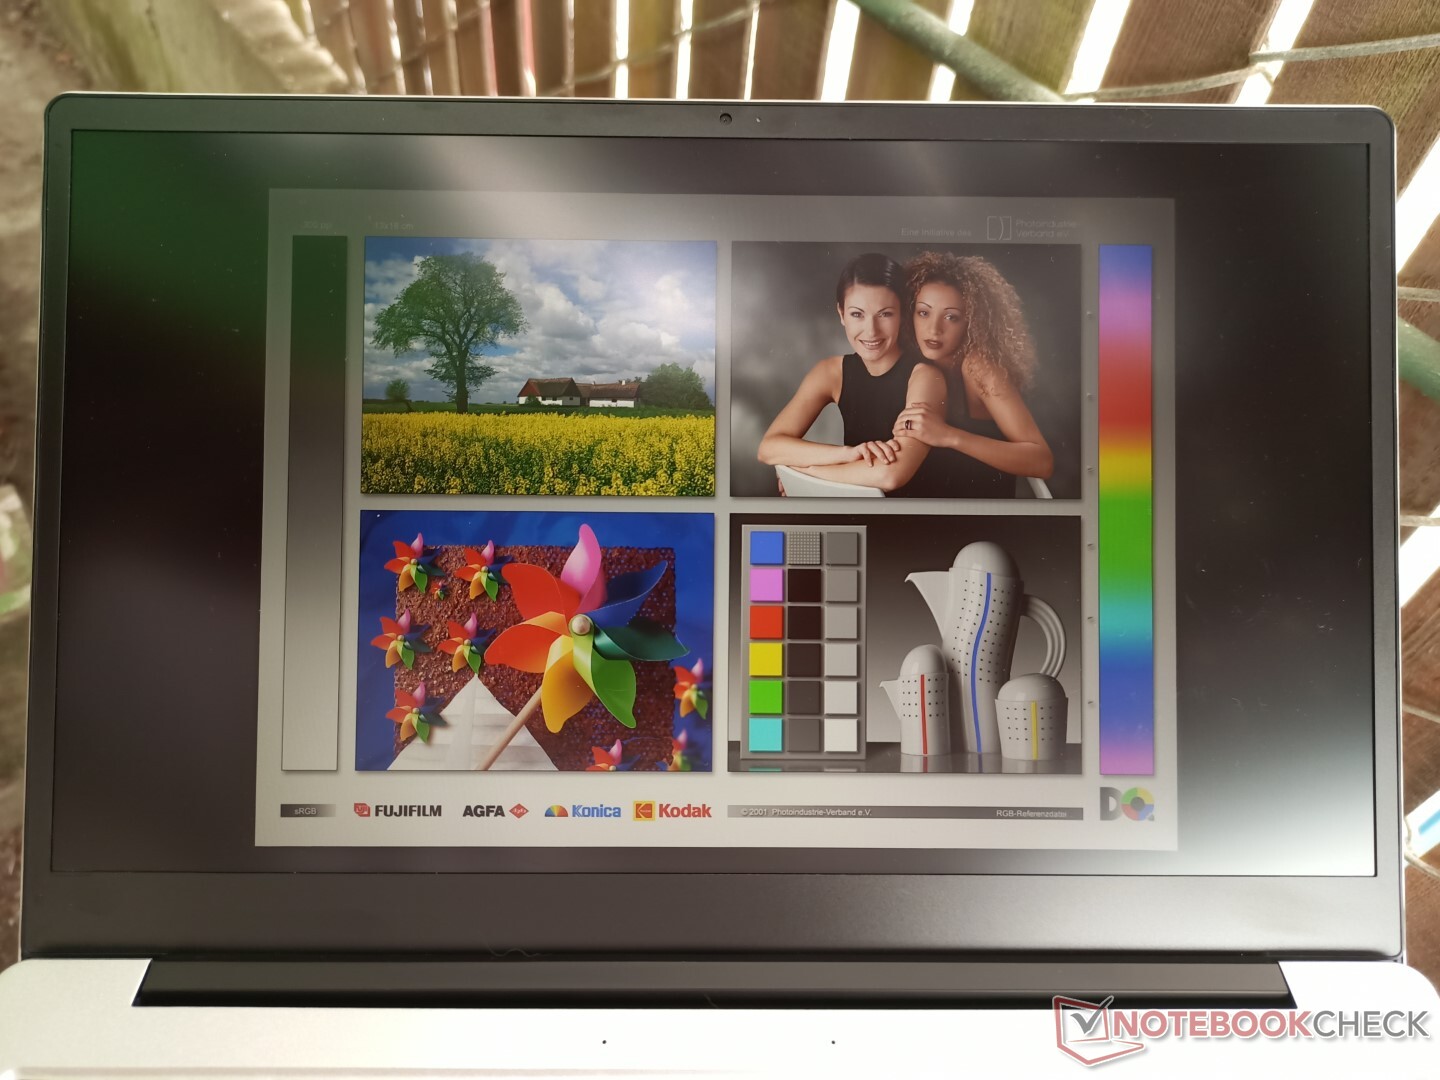
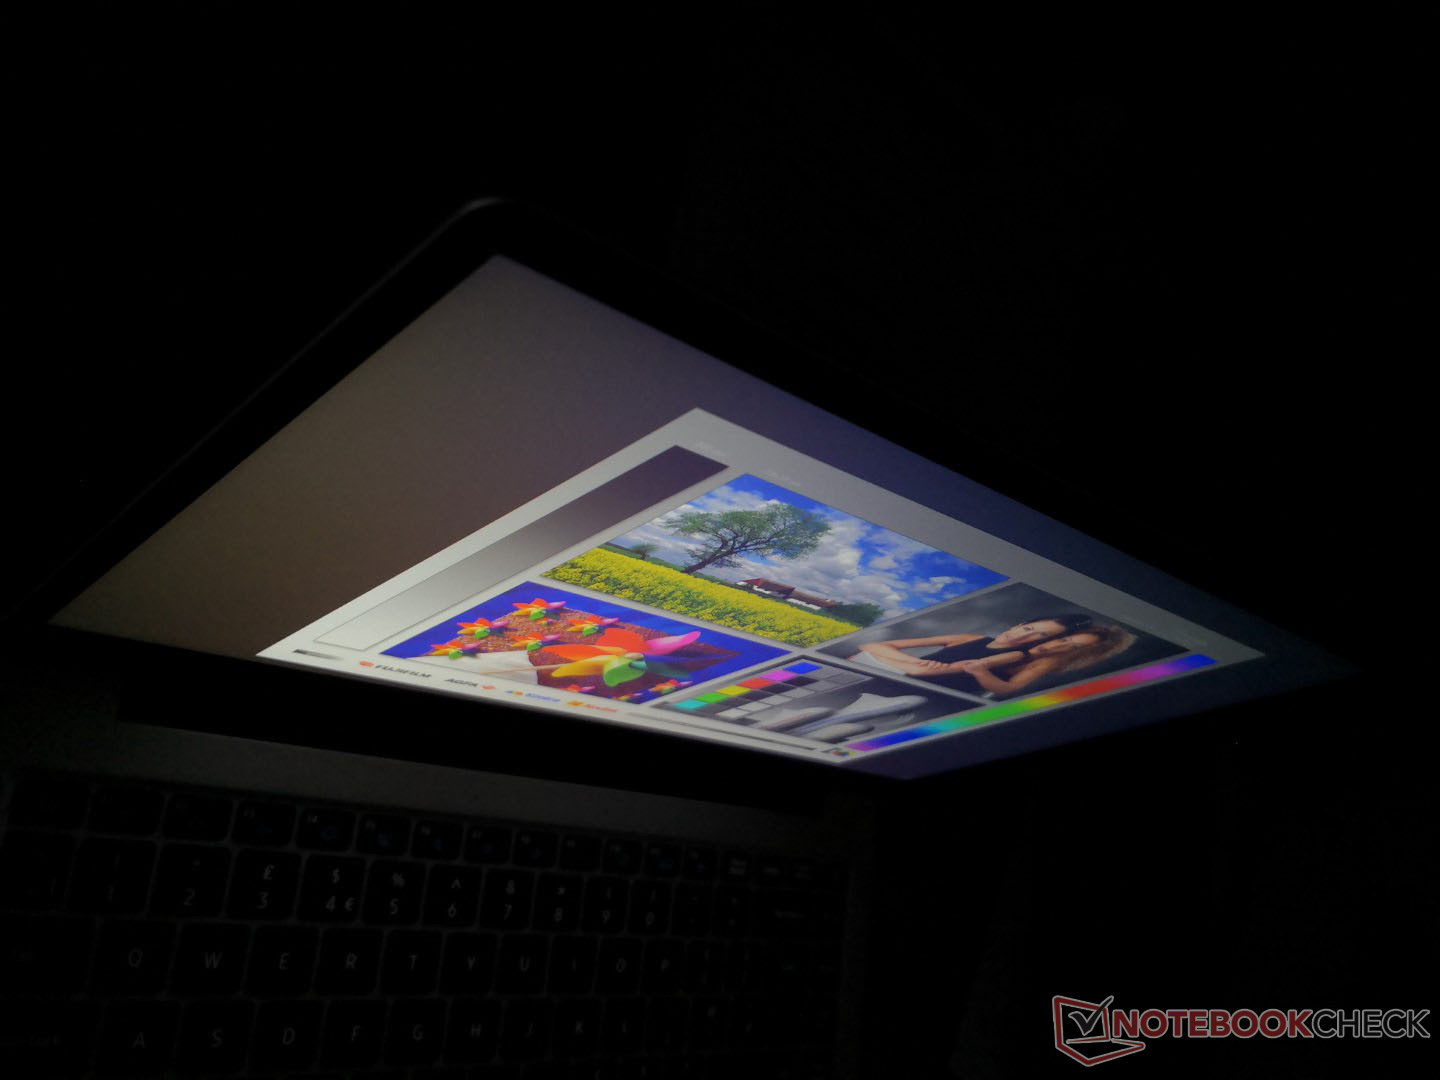
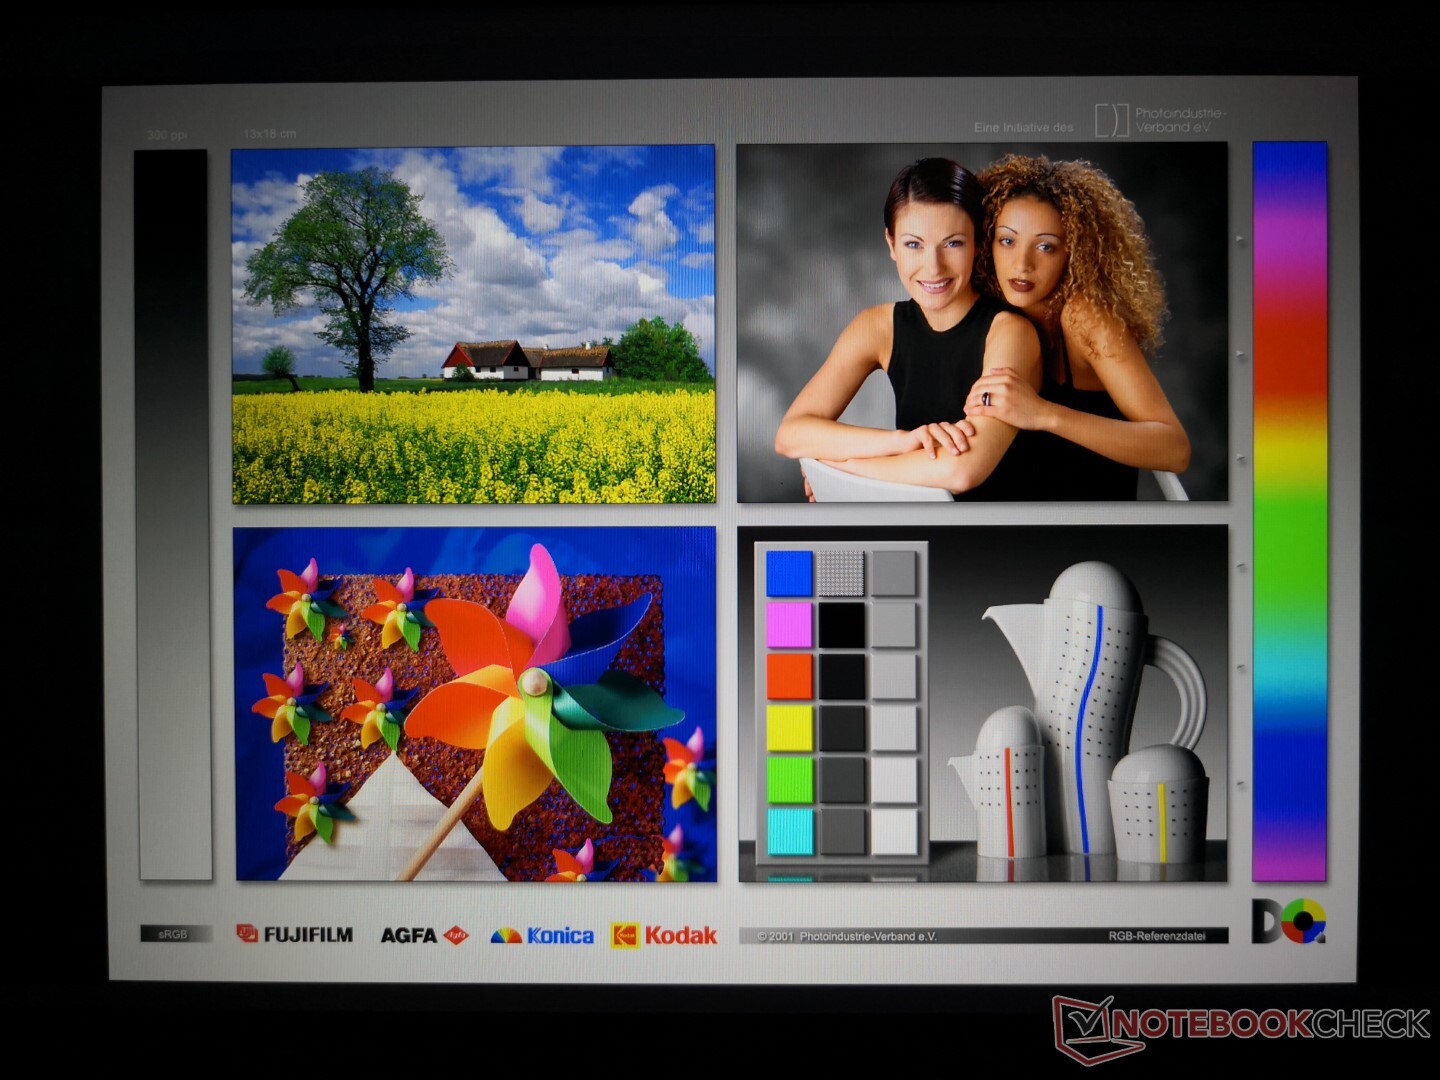
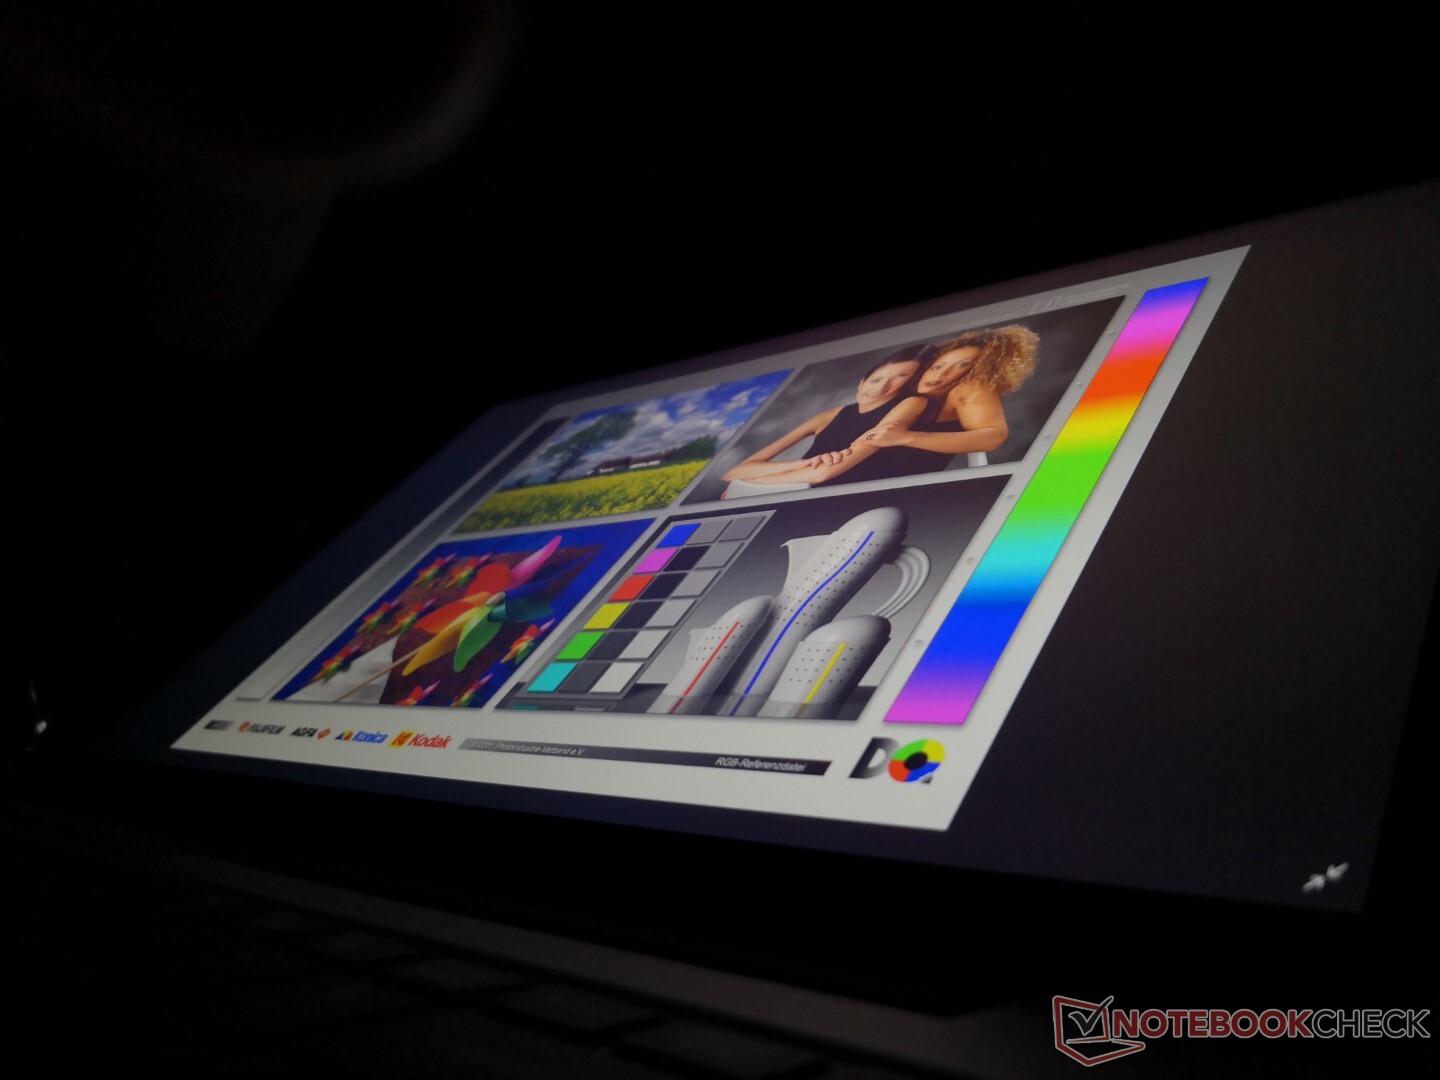
Display
The 14-inch IPS display is not bad considering the price. Though colors are narrow, contrast is excellent and brightness is decent enough for comfortable indoor use. Note that flickering is present at brightness levels 25 percent and under which can cause eyestrain to a small number of users.
The Chuwi CoreBook X and Honor Magicbook 14 each have better and more color accurate displays, but they are also a bit more expensive at retail.

| |||||||||||||||||||||||||
Brightness Distribution: 80 %
Center on Battery: 249.9 cd/m²
Contrast: 1470:1 (Black: 0.17 cd/m²)
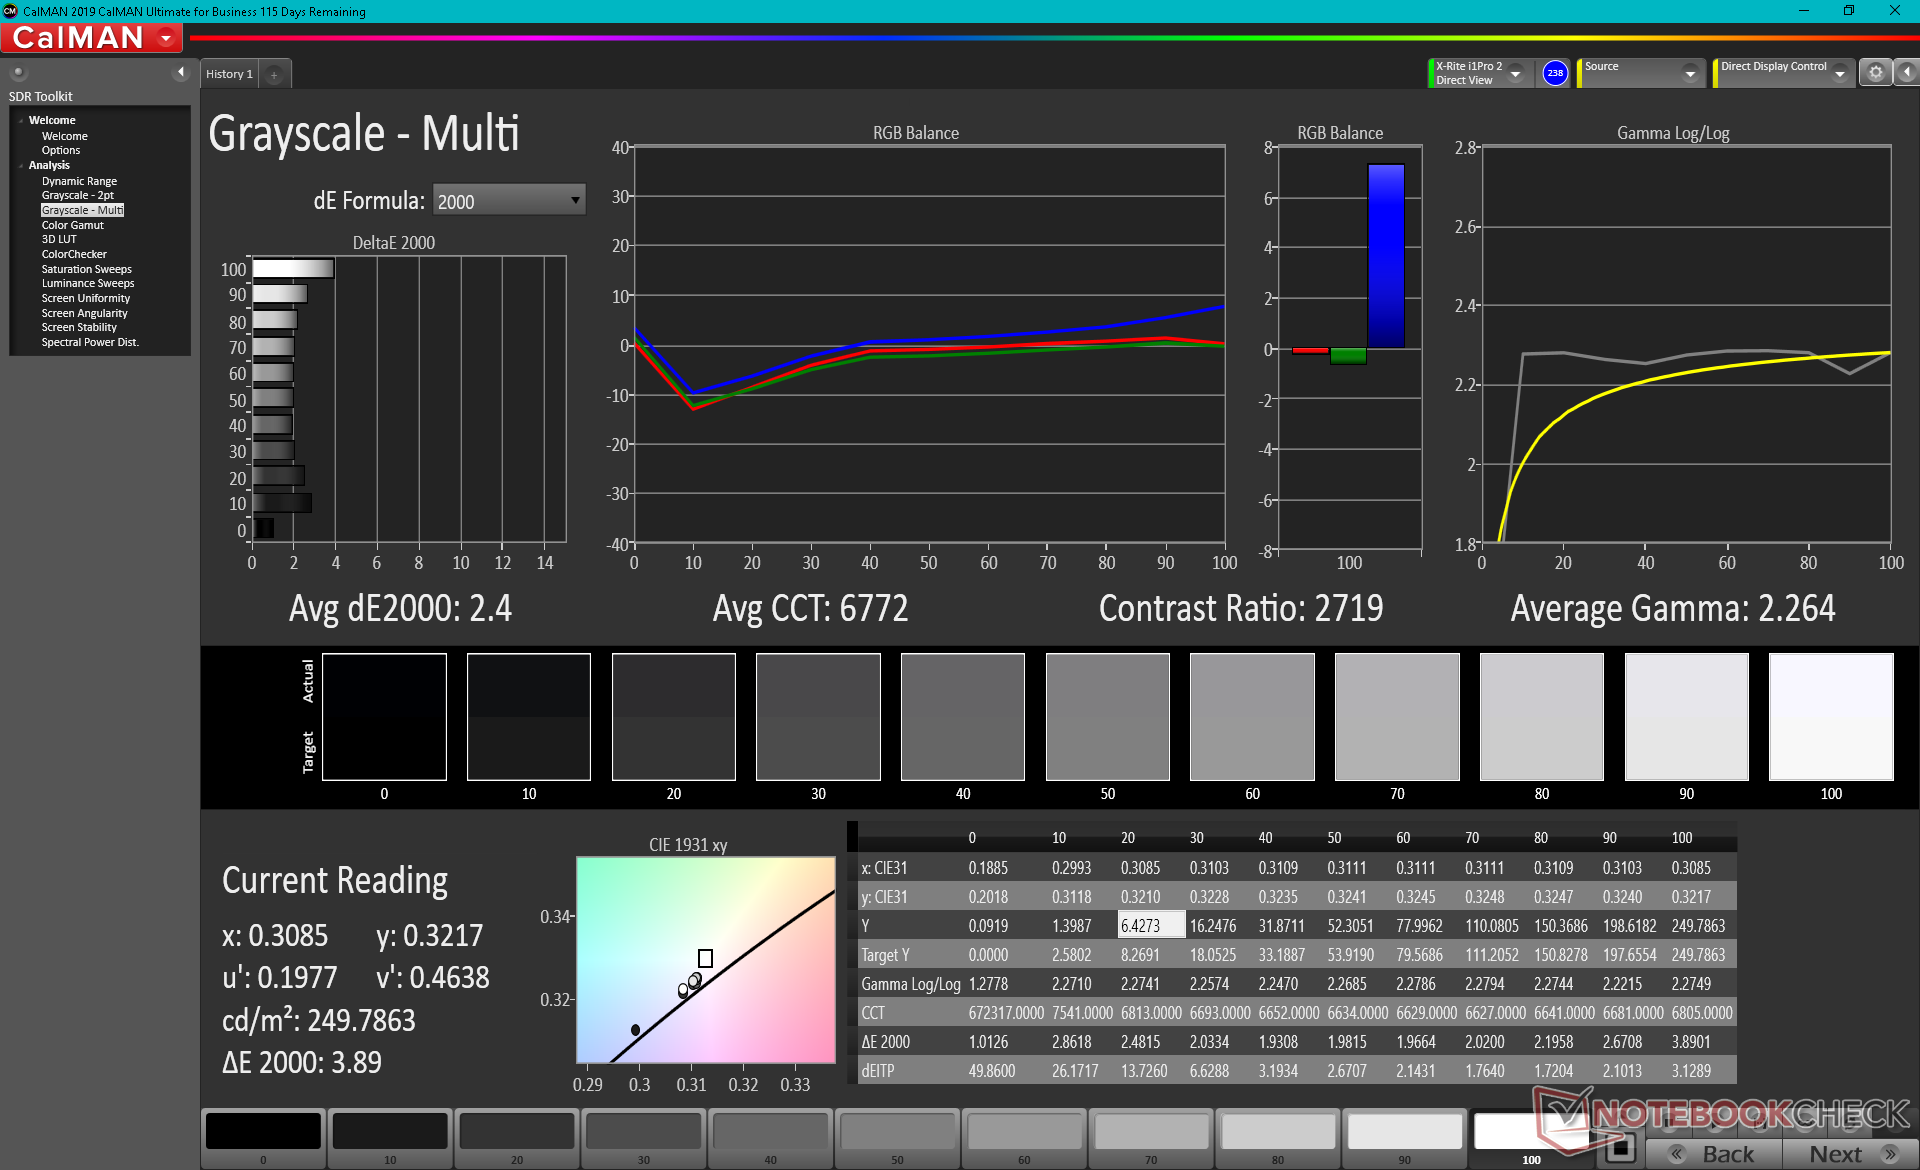
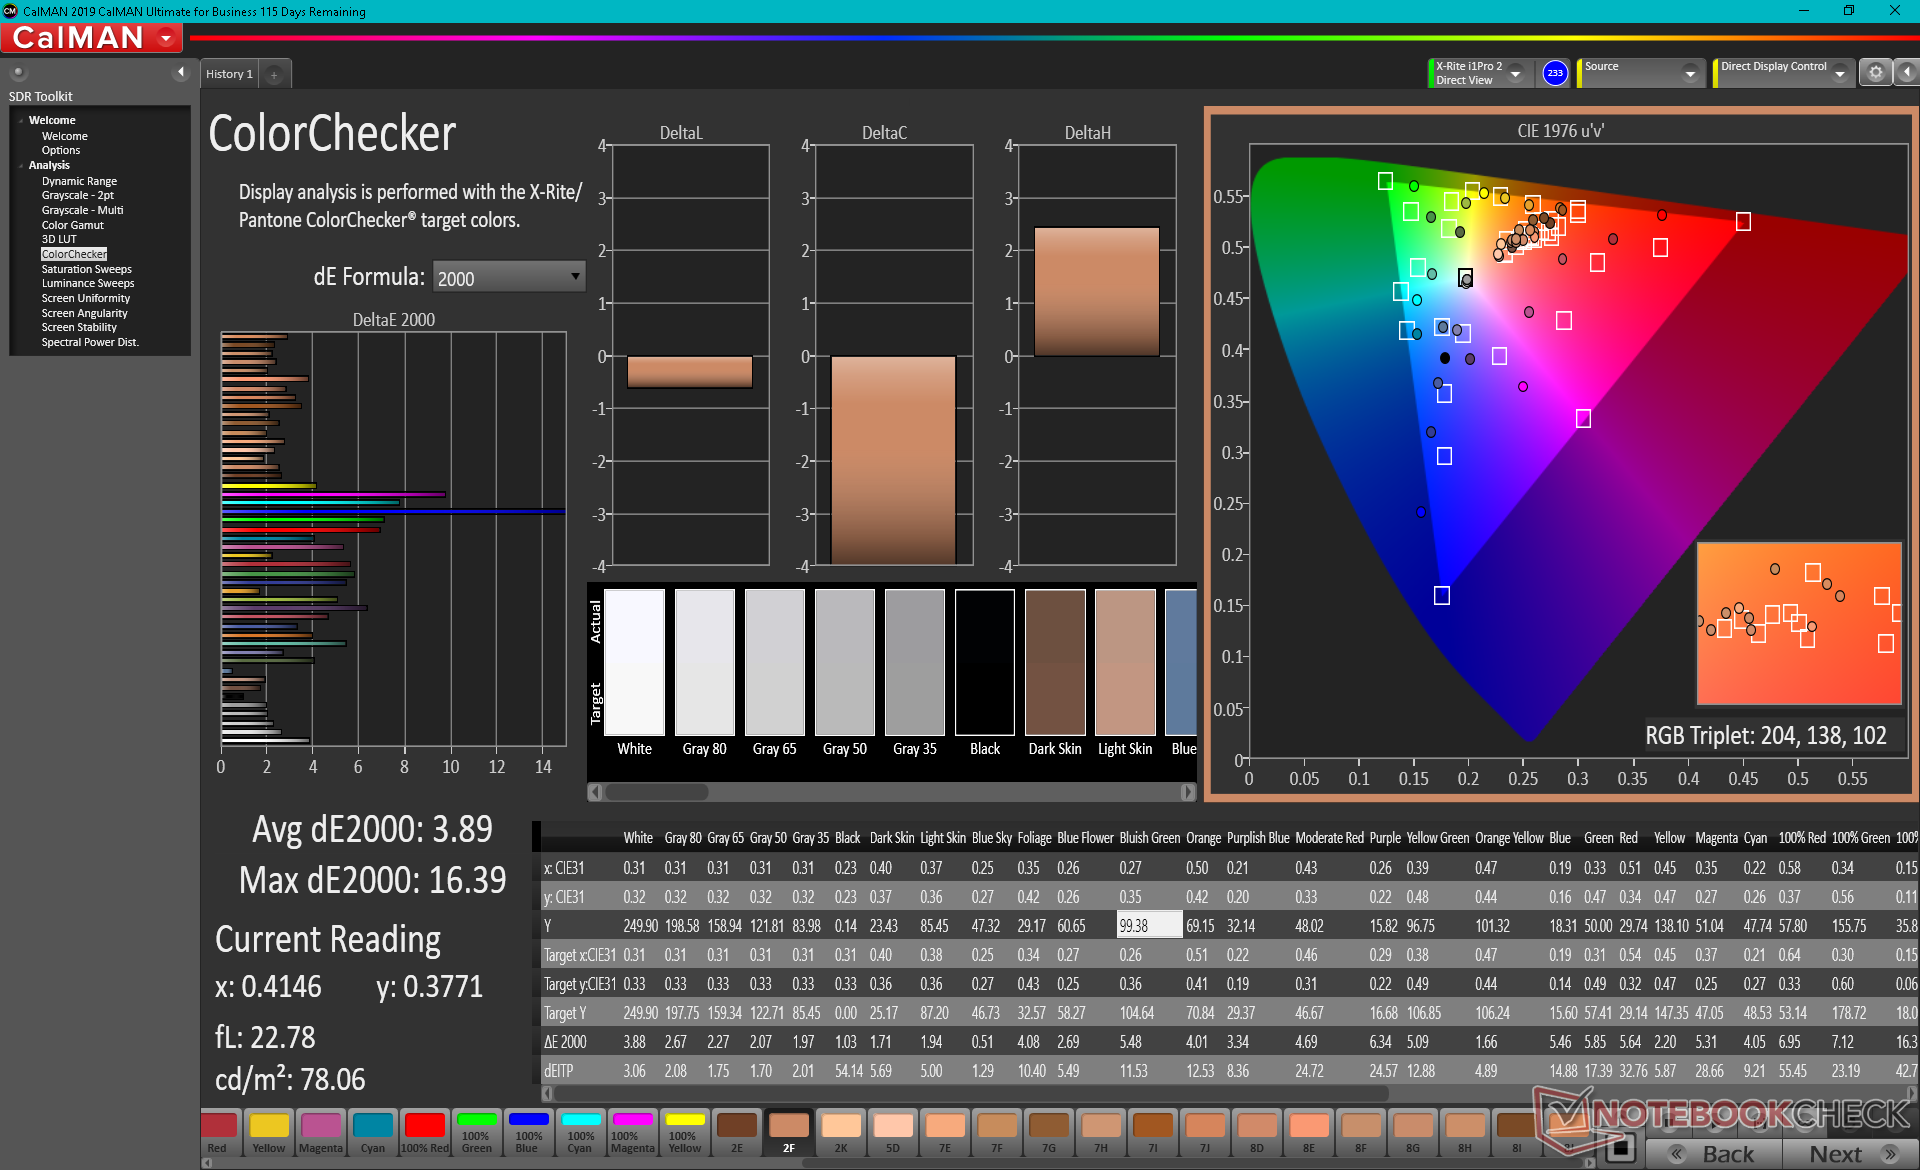
ΔE ColorChecker Calman: 3.89 | ∀{0.5-29.43 Ø4.72}
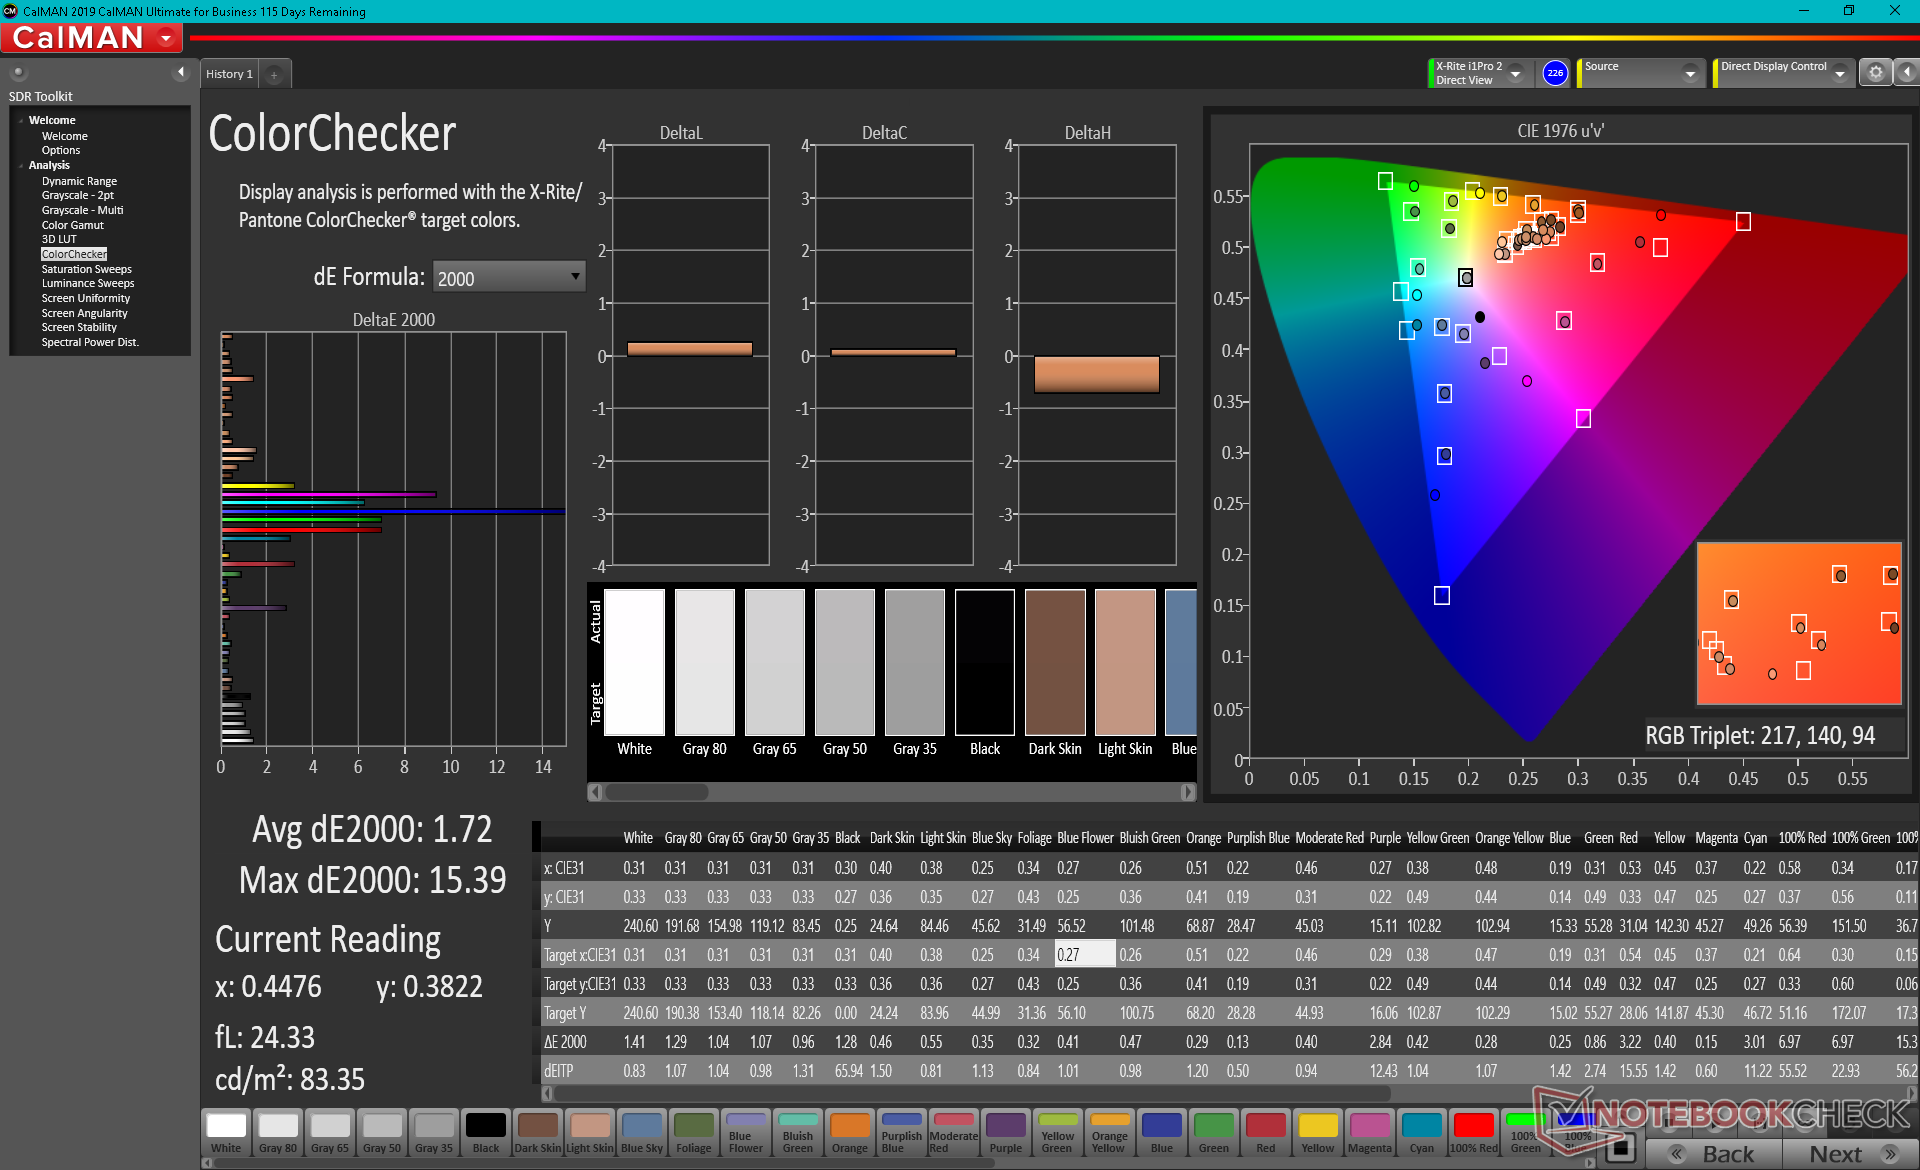
calibrated: 1.72
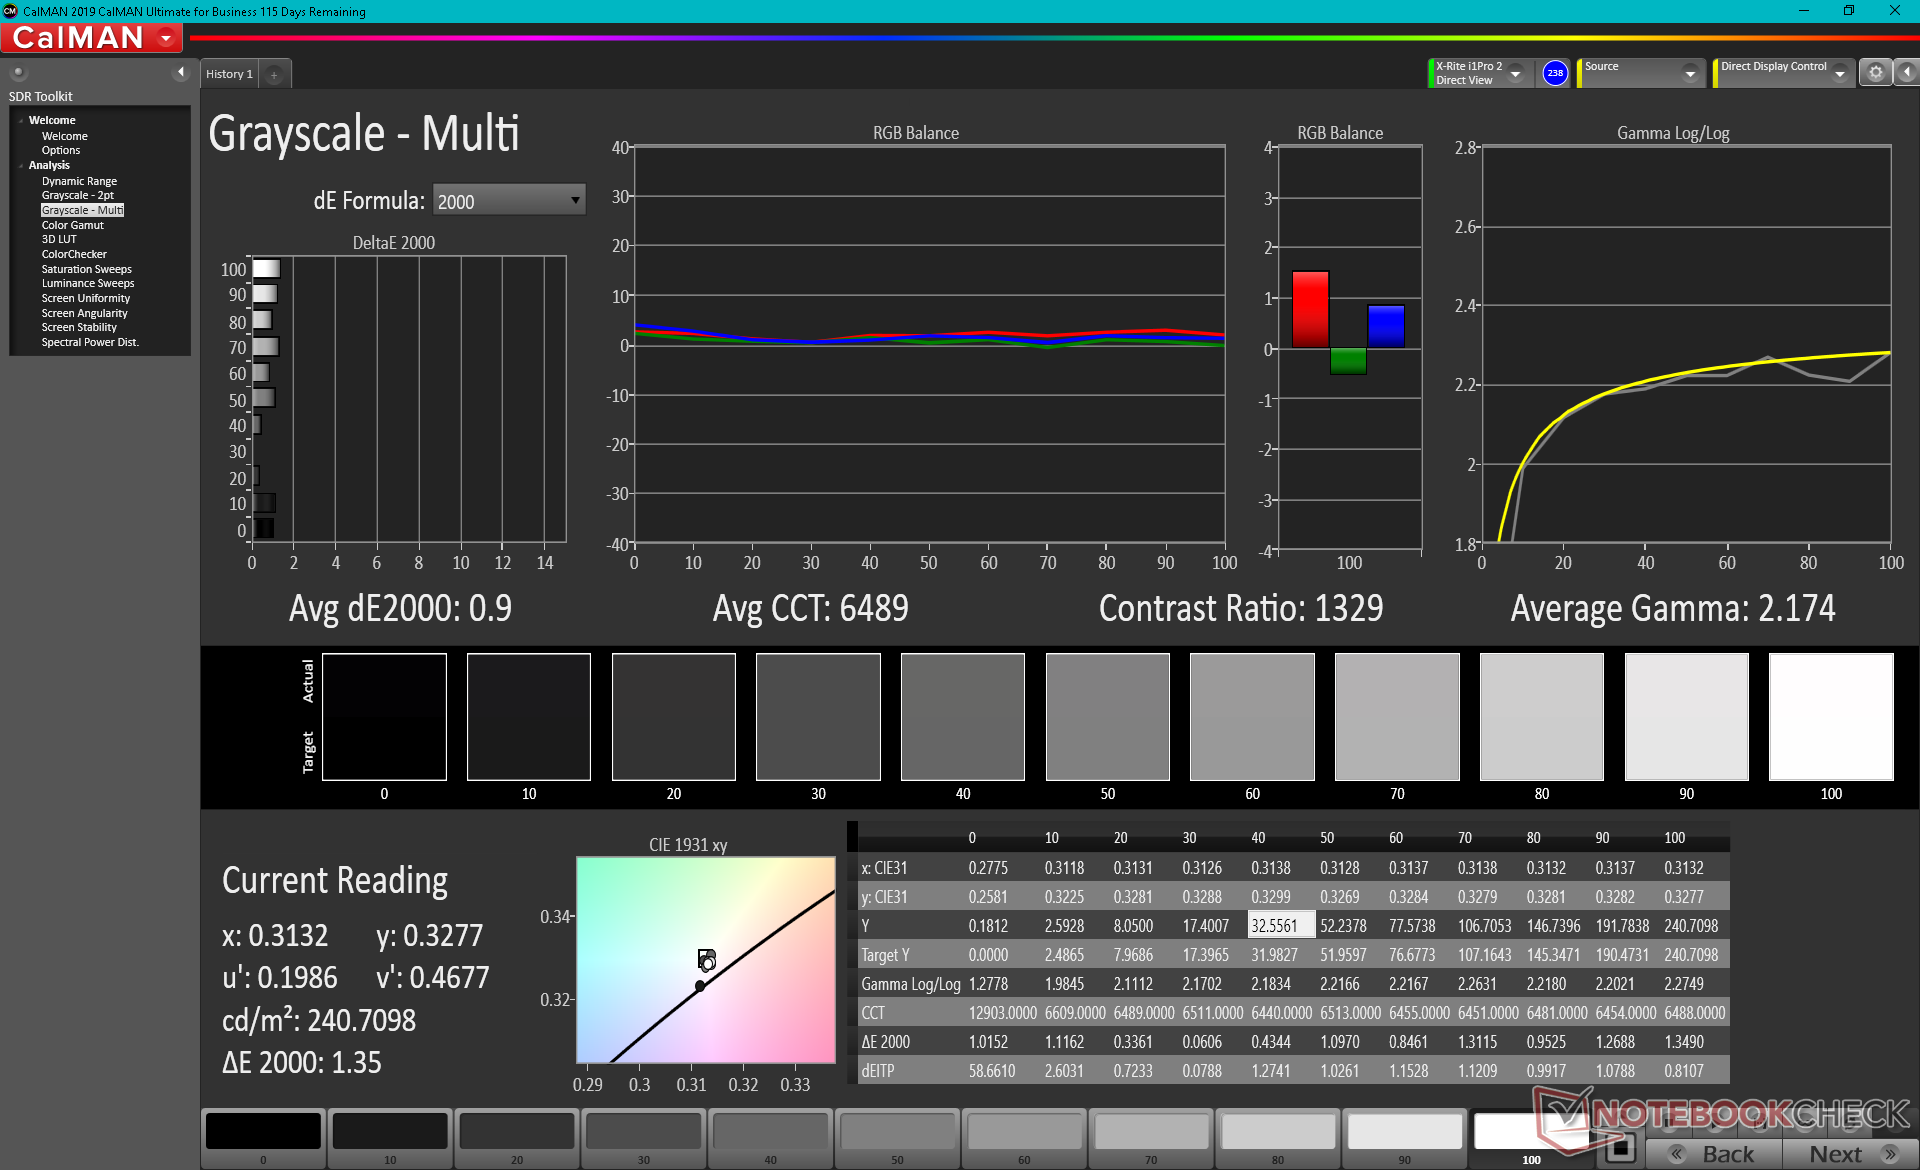
ΔE Greyscale Calman: 2.4 | ∀{0.09-98 Ø4.97}
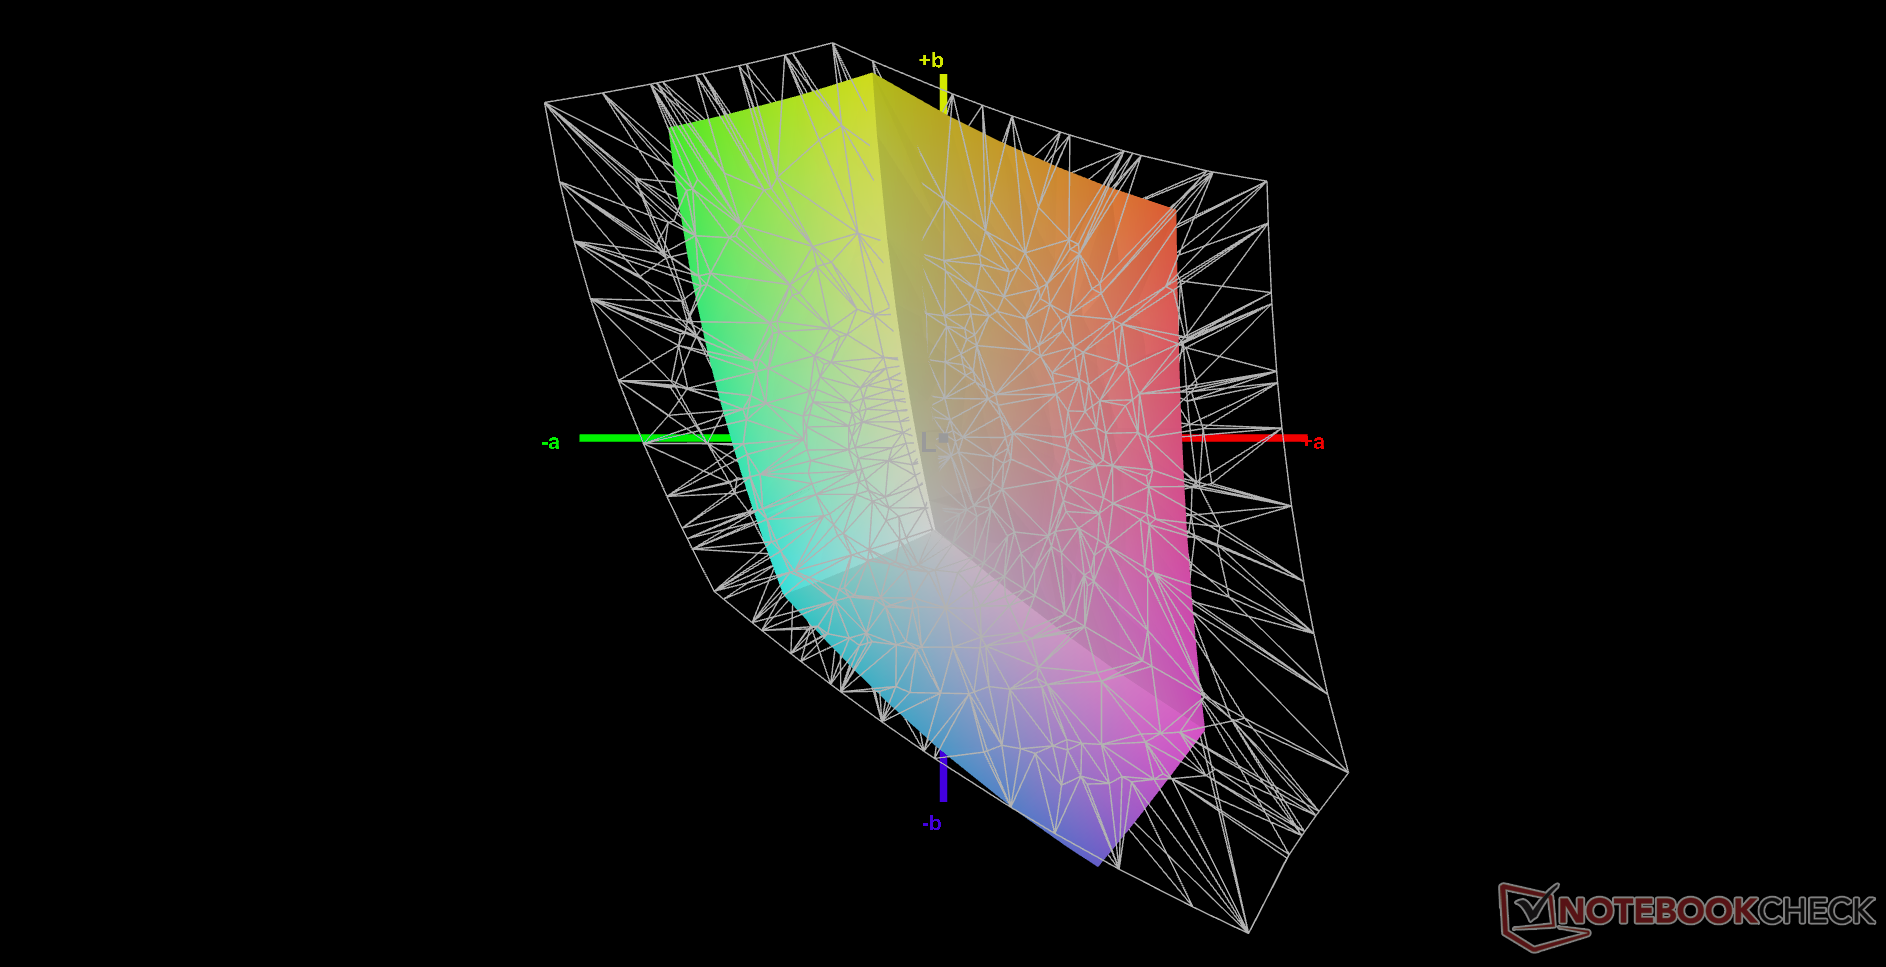
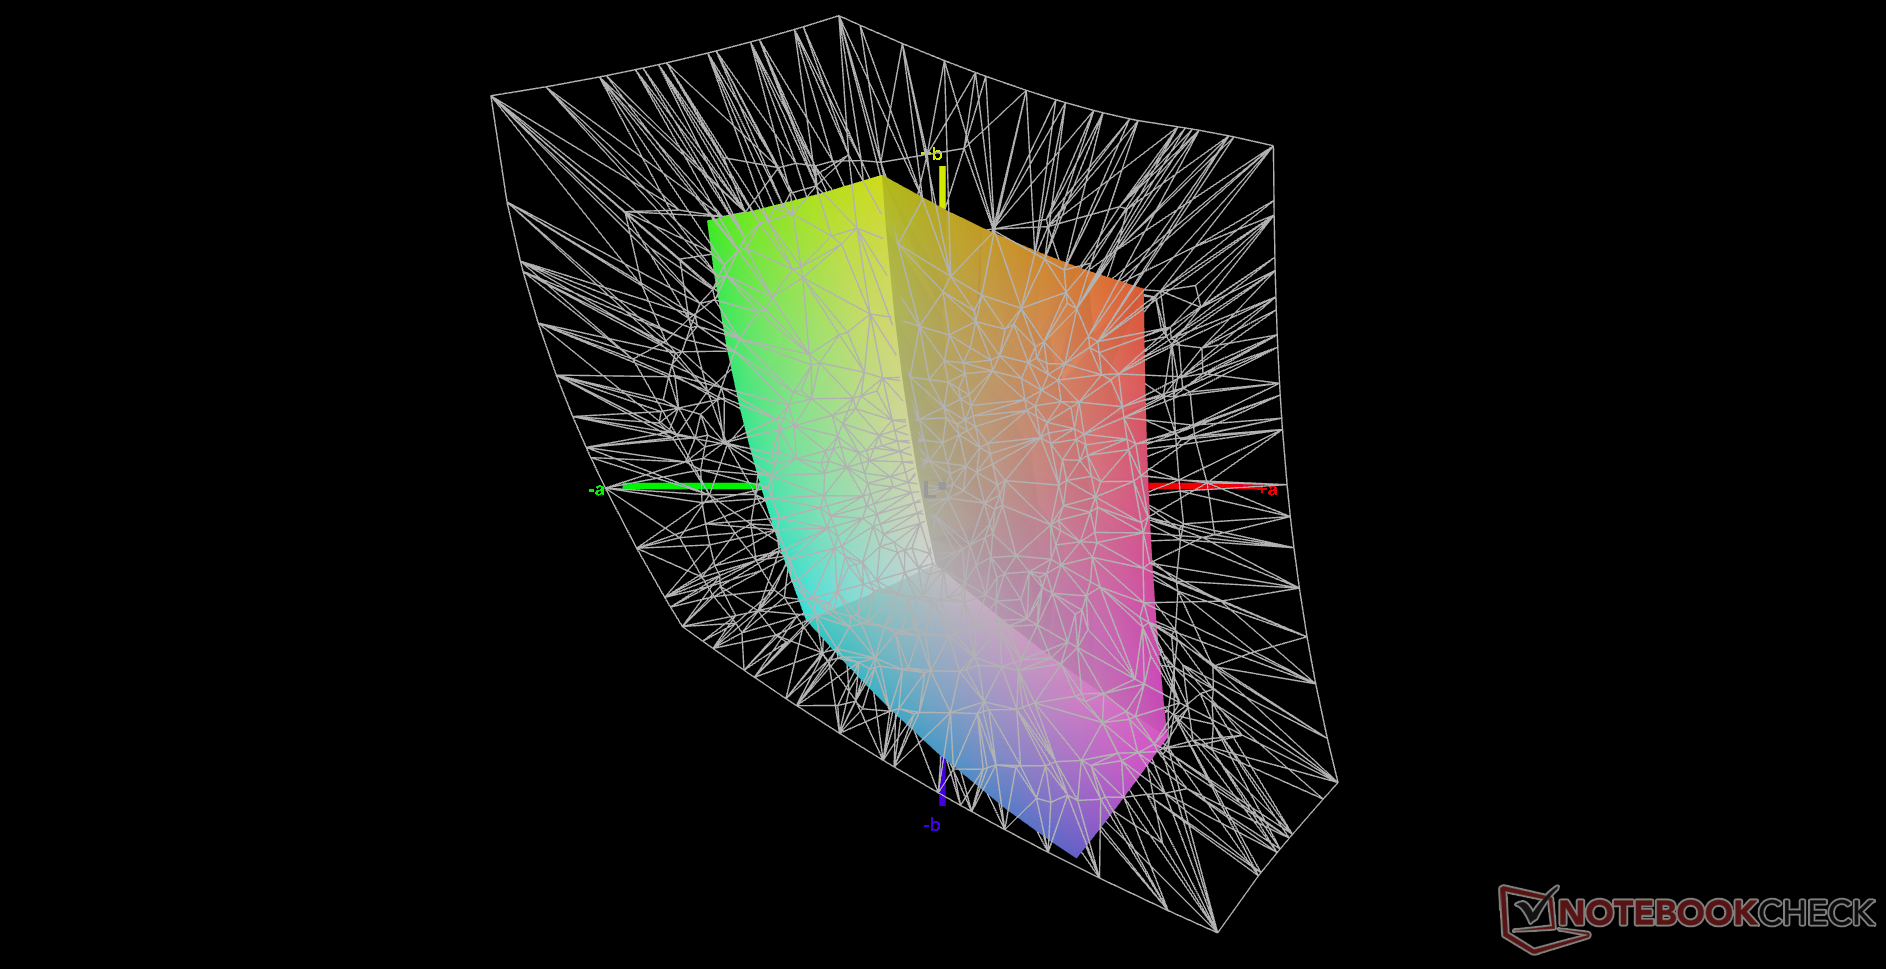
43% AdobeRGB 1998 (Argyll 3D)
62.4% sRGB (Argyll 3D)
41.6% Display P3 (Argyll 3D)
Gamma: 2.26
CCT: 6772 K
| Blackview AceBook 1 Panda 1402L01, IPS, 14", 1920x1080 | Chuwi CoreBook X Chi Mei P140ZKA-BZ1, IPS, 14", 2160x1440 | Infinix INBook X1 Pro BOE NV140FHM-N62, IPS, 14", 1920x1080 | Honor Magicbook 14 i7-1165G7 BOE092E, IPS, 14", 1920x1080 | Teclast F7 Air IPS, 14", 1920x1080 | Lenovo IdeaPad 3 14IIL05 LG Philips LP140WFA-SPD1, IPS, 14", 1920x1080 | |
|---|---|---|---|---|---|---|
| Display | 60% | 48% | 55% | 10% | -9% | |
| Display P3 Coverage (%) | 41.6 | 67.2 62% | 65.7 58% | 64.8 56% | 45.57 10% | 37.76 -9% |
| sRGB Coverage (%) | 62.4 | 98 57% | 86.6 39% | 96.3 54% | 68.7 10% | 56.6 -9% |
| AdobeRGB 1998 Coverage (%) | 43 | 68.8 60% | 63.3 47% | 66.1 54% | 47.08 9% | 39.05 -9% |
| Response Times | -11% | -33% | 12% | -8% | -11% | |
| Response Time Grey 50% / Grey 80% * (ms) | 30.8 ? | 36.4 ? -18% | 43.2 ? -40% | 31.2 ? -1% | 32.4 ? -5% | 39 ? -27% |
| Response Time Black / White * (ms) | 25.6 ? | 26.4 ? -3% | 32 ? -25% | 19.2 ? 25% | 28.4 ? -11% | 24 ? 6% |
| PWM Frequency (Hz) | 201.6 ? | 10000 ? | 200 ? | 1000 ? | ||
| Screen | -27% | -52% | 15% | -83% | -54% | |
| Brightness middle (cd/m²) | 249.9 | 355.3 42% | 282 13% | 341 36% | 235.6 -6% | 292 17% |
| Brightness (cd/m²) | 226 | 344 52% | 271 20% | 313 38% | 234 4% | 260 15% |
| Brightness Distribution (%) | 80 | 94 18% | 74 -7% | 87 9% | 78 -2% | 80 0% |
| Black Level * (cd/m²) | 0.17 | 0.34 -100% | 0.24 -41% | 0.27 -59% | 0.46 -171% | 0.36 -112% |
| Contrast (:1) | 1470 | 1045 -29% | 1175 -20% | 1263 -14% | 512 -65% | 811 -45% |
| Colorchecker dE 2000 * | 3.89 | 6.2 -59% | 6.1 -57% | 1.76 55% | 9.43 -142% | 6.92 -78% |
| Colorchecker dE 2000 max. * | 16.39 | 10.96 33% | 14.05 14% | 4.85 70% | 13.5 18% | 19.36 -18% |
| Colorchecker dE 2000 calibrated * | 1.72 | 1.23 28% | 3.94 -129% | 1.01 41% | 3.82 -122% | 5.13 -198% |
| Greyscale dE 2000 * | 2.4 | 7.9 -229% | 8.7 -263% | 3.3 -38% | 8.7 -263% | 3.94 -64% |
| Gamma | 2.26 97% | 2.02 109% | 2.14 103% | 2.26 97% | 1.983 111% | 2.83 78% |
| CCT | 6772 96% | 7450 87% | 8672 75% | 7233 90% | 8137 80% | 6737 96% |
| Color Space (Percent of AdobeRGB 1998) (%) | 66 | 44 | 36 | |||
| Color Space (Percent of sRGB) (%) | 89 | 69 | 56 | |||
| Total Average (Program / Settings) | 7% /
-6% | -12% /
-28% | 27% /
23% | -27% /
-53% | -25% /
-38% |
* ... smaller is better
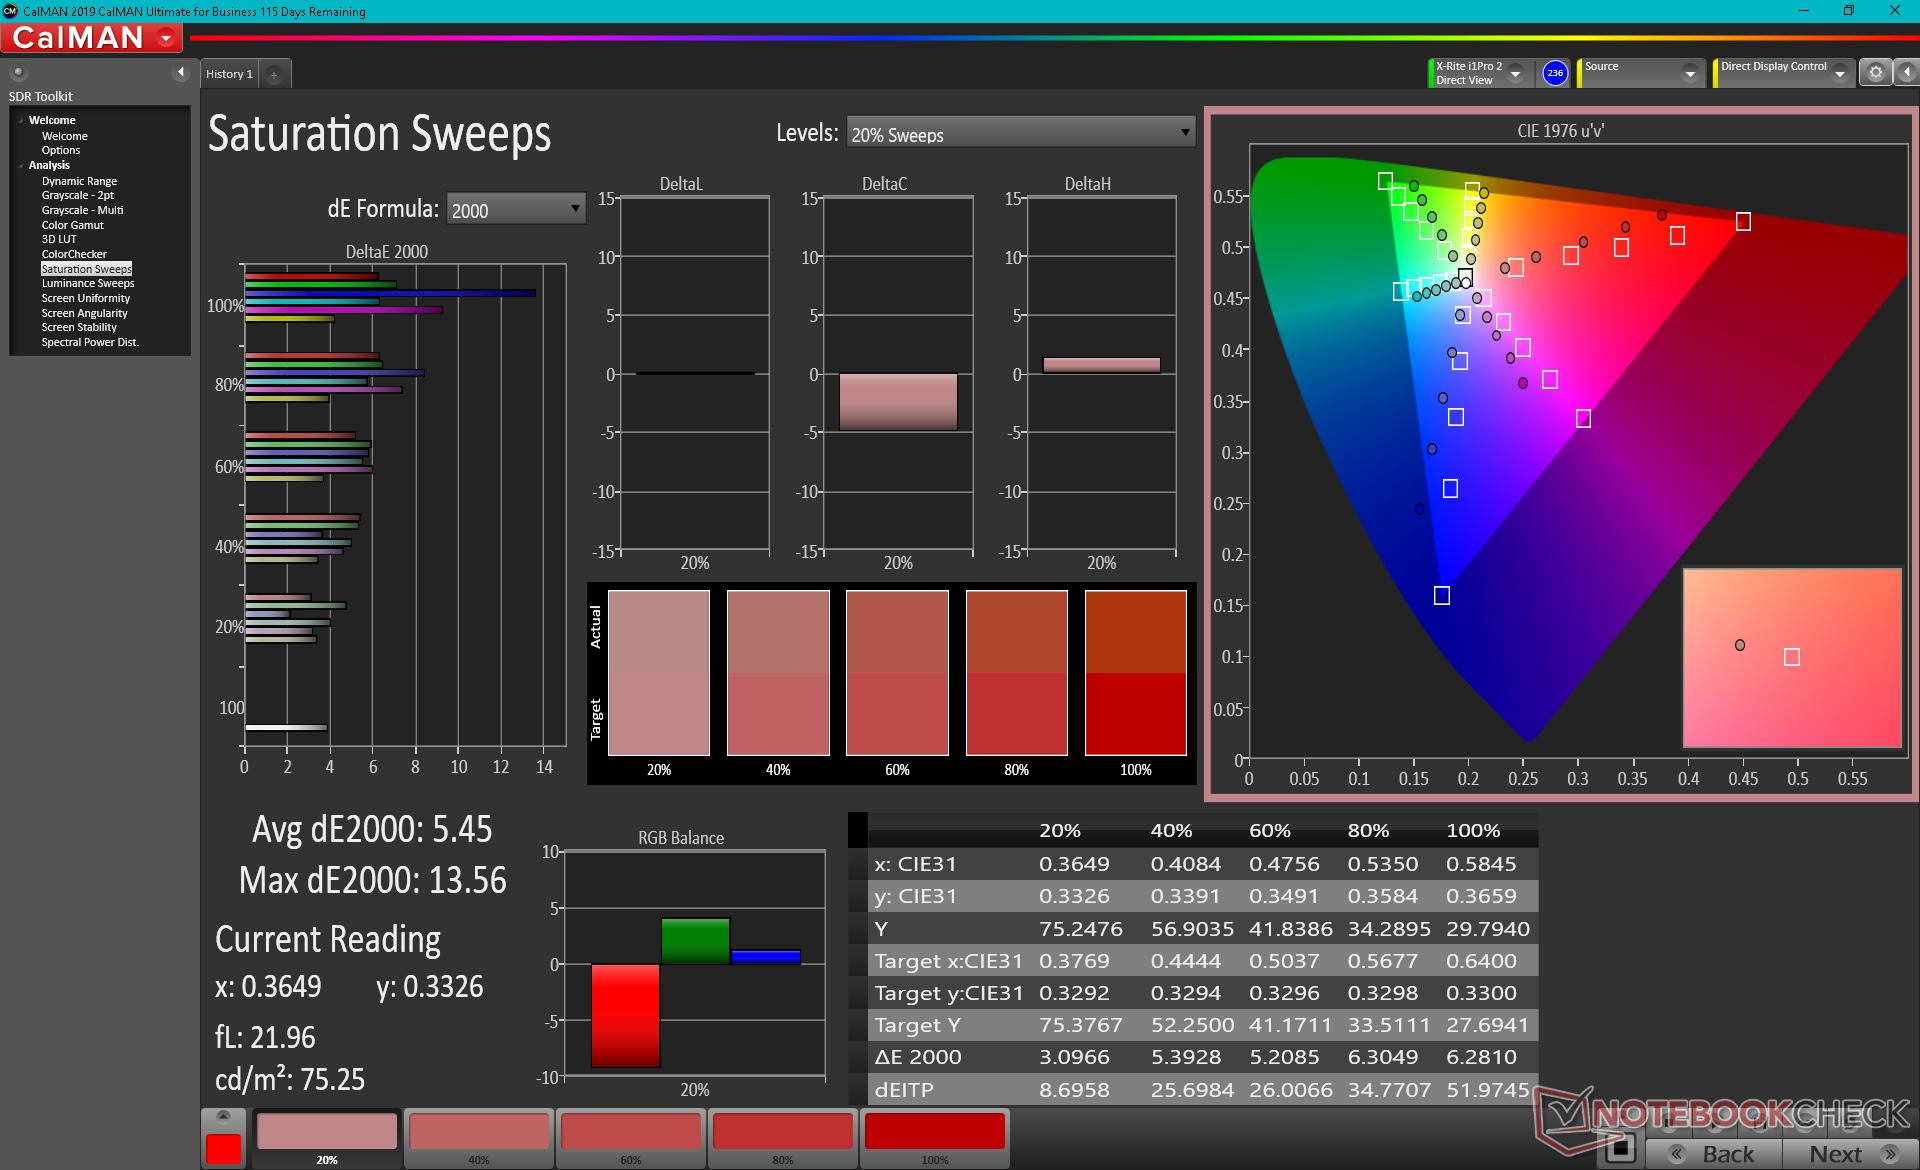
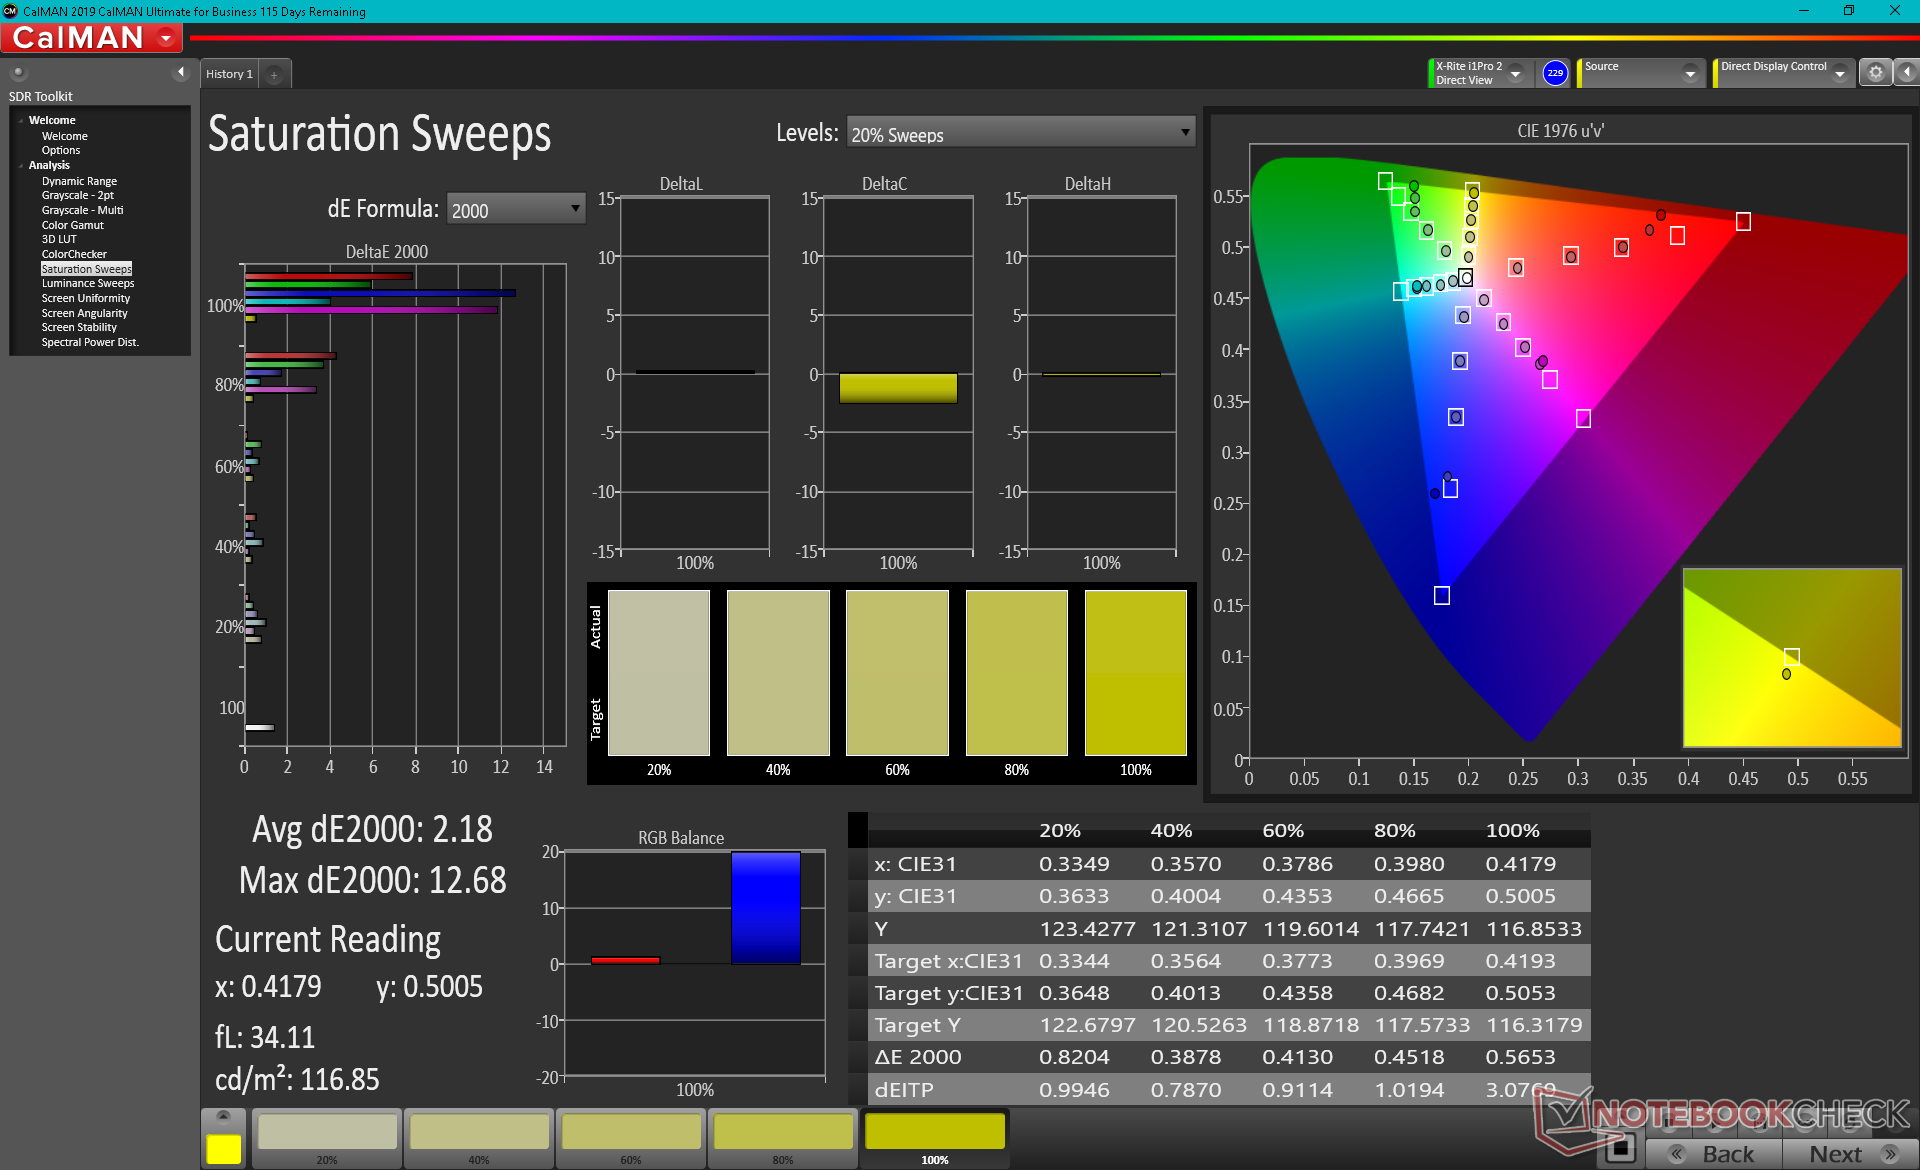
Color coverage is limited to just 62 percent of sRGB which is indicative of a budget panel. Most pricier Ultrabooks cover over 95 percent of sRGB for deeper and more accurate colors.
To our surprise, the display is decently calibrated out of the box which is unusual for cheap laptops. Average grayscale and color deltaE values sit at just 2.4 and 3.89, respectively. Blue appears to be represented much more inaccurately than other colors.
Display Response Times
| ↔ Response Time Black to White | ||
|---|---|---|
| 25.6 ms ... rise ↗ and fall ↘ combined | ↗ 13.2 ms rise | 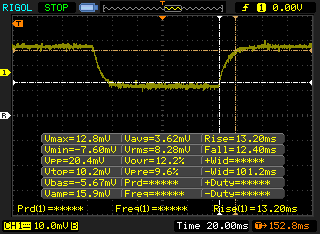 |
| ↘ 12.4 ms fall | ||
| The screen shows relatively slow response rates in our tests and may be too slow for gamers. In comparison, all tested devices range from 0.1 (minimum) to 240 (maximum) ms. » 61 % of all devices are better. This means that the measured response time is worse than the average of all tested devices (19.8 ms). | ||
| ↔ Response Time 50% Grey to 80% Grey | ||
| 30.8 ms ... rise ↗ and fall ↘ combined | ↗ 16 ms rise | 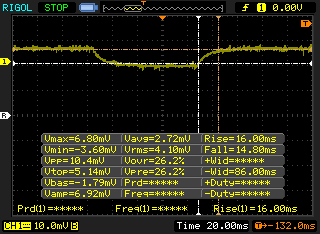 |
| ↘ 14.8 ms fall | ||
| The screen shows slow response rates in our tests and will be unsatisfactory for gamers. In comparison, all tested devices range from 0.165 (minimum) to 636 (maximum) ms. » 41 % of all devices are better. This means that the measured response time is similar to the average of all tested devices (31 ms). | ||
Screen Flickering / PWM (Pulse-Width Modulation)
| Screen flickering / PWM detected | 201.6 Hz | ≤ 25 % brightness setting | 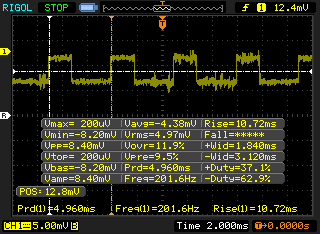 |
The display backlight flickers at 201.6 Hz (worst case, e.g., utilizing PWM) Flickering detected at a brightness setting of 25 % and below. There should be no flickering or PWM above this brightness setting. The frequency of 201.6 Hz is relatively low, so sensitive users will likely notice flickering and experience eyestrain at the stated brightness setting and below. In comparison: 52 % of all tested devices do not use PWM to dim the display. If PWM was detected, an average of 7747 (minimum: 5 - maximum: 343500) Hz was measured. | |||
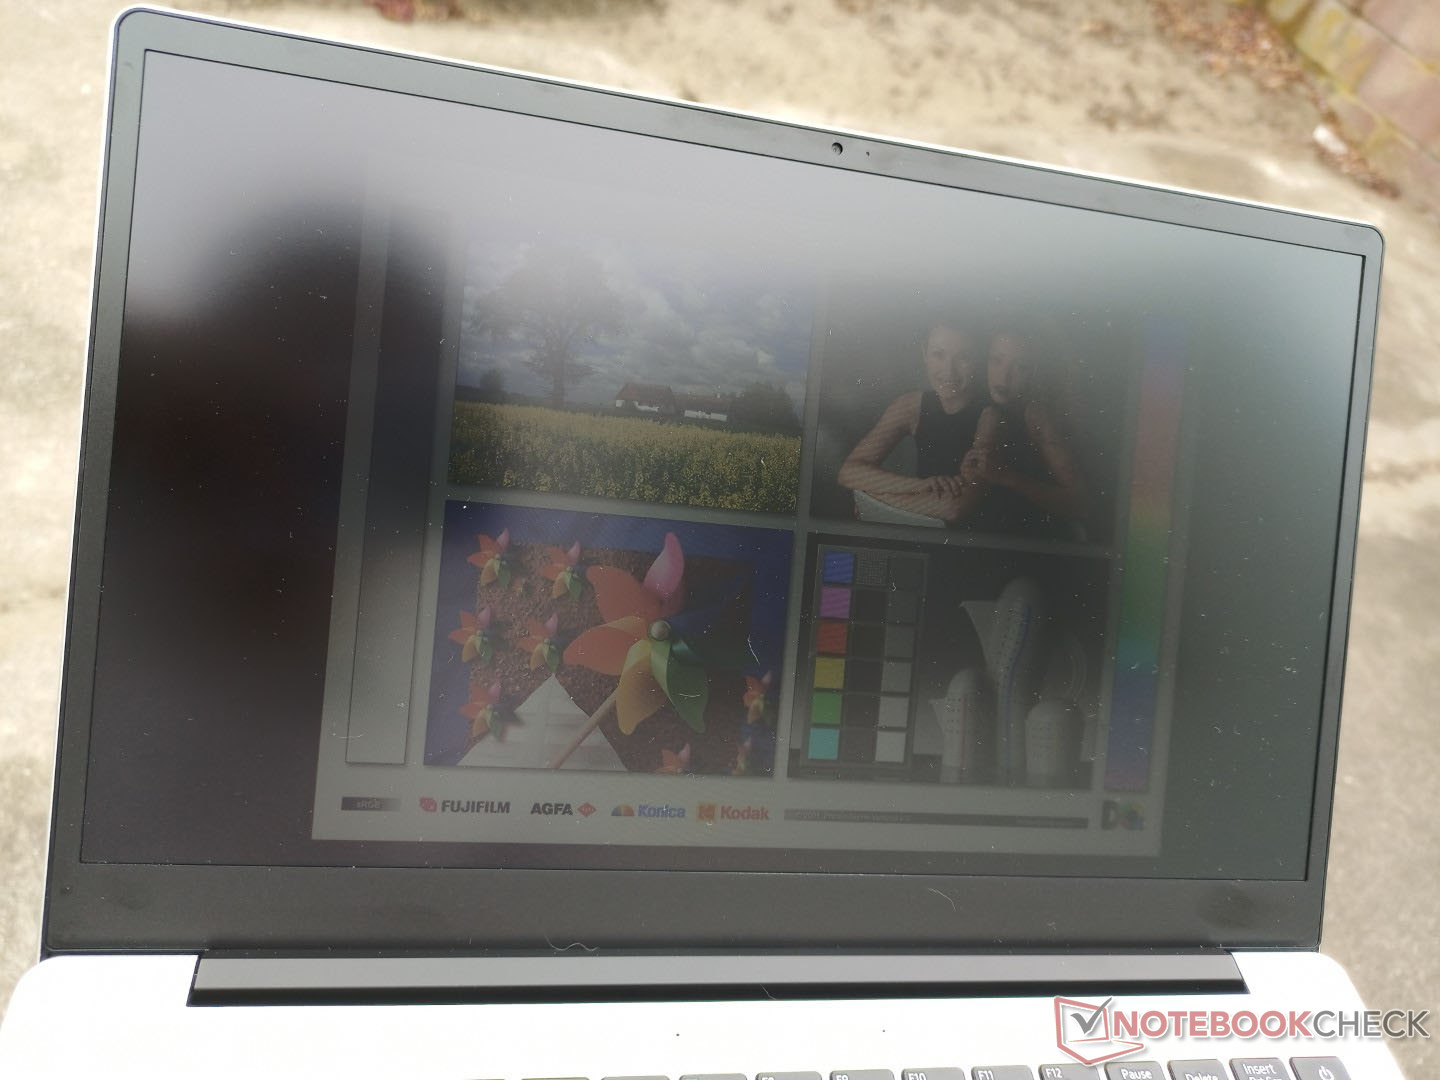
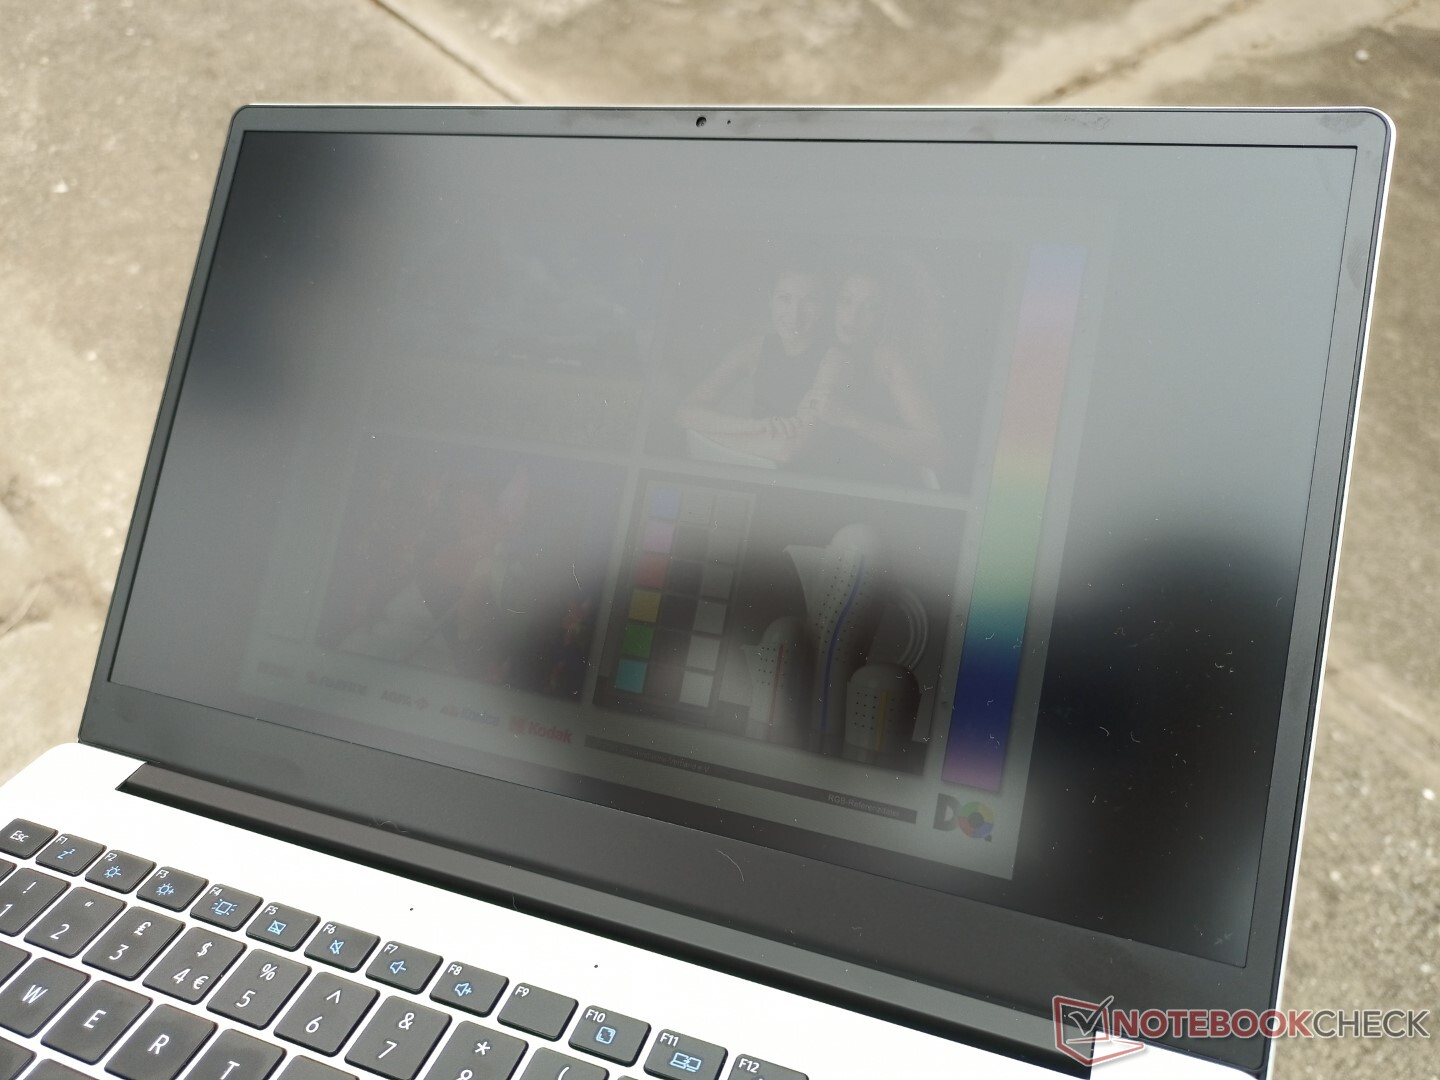
Expect glare and washed out colors if working outdoors. The display is simply not bright enough to mitigate the detrimental effects of ambient light even when under shade.
Performance
The Celeron N4120 is a passively-cooled processor commonly found on very cheap laptops including those from lesser-known manufacturers like Chuwi. It ranks well below Core i3 laptops and only slightly above the Atom series to be a passable solution only for undemanding browsing or word processing tasks.
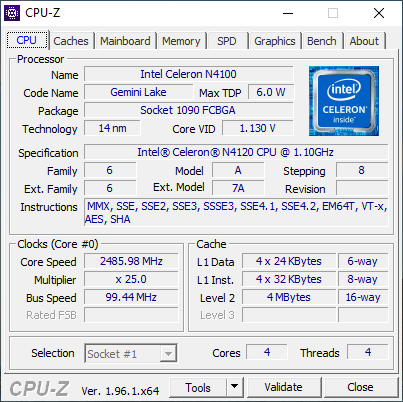
Processor
Raw CPU performance is most similar to the Core m3-6Y30 as found on the five-year-old MacBook 12. Even the entry-level 10th gen Core i3-1005G1 can run at least two times faster in most scenarios. This is a passively cooled machine, after all.
Cinebench R15 Multi Loop
Cinebench R20: CPU (Multi Core) | CPU (Single Core)
Cinebench R23: Multi Core | Single Core
Blender: v2.79 BMW27 CPU
7-Zip 18.03: 7z b 4 -mmt1 | 7z b 4
Geekbench 5.5: Single-Core | Multi-Core
HWBOT x265 Benchmark v2.2: 4k Preset
LibreOffice : 20 Documents To PDF
R Benchmark 2.5: Overall mean
| Cinebench R20 / CPU (Multi Core) | |
| Honor Magicbook 14 i7-1165G7 | |
| Infinix INBook X1 Pro | |
| Chuwi CoreBook X | |
| Lenovo IdeaPad 3 14IIL05 | |
| Teclast F7 Air | |
| Average Intel Celeron N4120 (376 - 516, n=3) | |
| Jumper Tech Ez Book X3 Air | |
| Blackview AceBook 1 | |
| Asus BR1100FKA-BP0109RA | |
| XIDU PhilBook Max | |
| Cinebench R20 / CPU (Single Core) | |
| Honor Magicbook 14 i7-1165G7 | |
| Infinix INBook X1 Pro | |
| Chuwi CoreBook X | |
| Lenovo IdeaPad 3 14IIL05 | |
| Asus BR1100FKA-BP0109RA | |
| Teclast F7 Air | |
| Average Intel Celeron N4120 (159 - 166, n=3) | |
| Blackview AceBook 1 | |
| Jumper Tech Ez Book X3 Air | |
| XIDU PhilBook Max | |
| Cinebench R23 / Multi Core | |
| Infinix INBook X1 Pro | |
| Chuwi CoreBook X | |
| Teclast F7 Air | |
| Average Intel Celeron N4120 (965 - 1253, n=3) | |
| Blackview AceBook 1 | |
| Asus BR1100FKA-BP0109RA | |
| Cinebench R23 / Single Core | |
| Infinix INBook X1 Pro | |
| Chuwi CoreBook X | |
| Asus BR1100FKA-BP0109RA | |
| Teclast F7 Air | |
| Average Intel Celeron N4120 (409 - 424, n=2) | |
| Blackview AceBook 1 | |
| Blender / v2.79 BMW27 CPU | |
| XIDU PhilBook Max | |
| Asus BR1100FKA-BP0109RA | |
| Jumper Tech Ez Book X3 Air | |
| Blackview AceBook 1 | |
| Average Intel Celeron N4120 (2558 - 2583, n=2) | |
| Teclast F7 Air | |
| Lenovo IdeaPad 3 14IIL05 | |
| Chuwi CoreBook X | |
| Infinix INBook X1 Pro | |
| Honor Magicbook 14 i7-1165G7 | |
| 7-Zip 18.03 / 7z b 4 -mmt1 | |
| Honor Magicbook 14 i7-1165G7 | |
| Infinix INBook X1 Pro | |
| Lenovo IdeaPad 3 14IIL05 | |
| Chuwi CoreBook X | |
| Asus BR1100FKA-BP0109RA | |
| Blackview AceBook 1 | |
| Average Intel Celeron N4120 (2145 - 2412, n=3) | |
| Jumper Tech Ez Book X3 Air | |
| Teclast F7 Air | |
| XIDU PhilBook Max | |
| 7-Zip 18.03 / 7z b 4 | |
| Honor Magicbook 14 i7-1165G7 | |
| Infinix INBook X1 Pro | |
| Chuwi CoreBook X | |
| Lenovo IdeaPad 3 14IIL05 | |
| Blackview AceBook 1 | |
| Jumper Tech Ez Book X3 Air | |
| Average Intel Celeron N4120 (5832 - 7436, n=3) | |
| Teclast F7 Air | |
| Asus BR1100FKA-BP0109RA | |
| XIDU PhilBook Max | |
| Geekbench 5.5 / Single-Core | |
| Honor Magicbook 14 i7-1165G7 | |
| Lenovo IdeaPad 3 14IIL05 | |
| Average Intel Celeron N4120 (438 - 449, n=3) | |
| Teclast F7 Air | |
| Jumper Tech Ez Book X3 Air | |
| Asus BR1100FKA-BP0109RA | |
| Geekbench 5.5 / Multi-Core | |
| Honor Magicbook 14 i7-1165G7 | |
| Lenovo IdeaPad 3 14IIL05 | |
| Average Intel Celeron N4120 (1505 - 1561, n=3) | |
| Teclast F7 Air | |
| Jumper Tech Ez Book X3 Air | |
| Asus BR1100FKA-BP0109RA | |
| HWBOT x265 Benchmark v2.2 / 4k Preset | |
| Honor Magicbook 14 i7-1165G7 | |
| Infinix INBook X1 Pro | |
| Chuwi CoreBook X | |
| Lenovo IdeaPad 3 14IIL05 | |
| Teclast F7 Air | |
| Jumper Tech Ez Book X3 Air | |
| Average Intel Celeron N4120 (1.02 - 1.38, n=3) | |
| Blackview AceBook 1 | |
| Asus BR1100FKA-BP0109RA | |
| XIDU PhilBook Max | |
| LibreOffice / 20 Documents To PDF | |
| Asus BR1100FKA-BP0109RA | |
| Blackview AceBook 1 | |
| Jumper Tech Ez Book X3 Air | |
| Average Intel Celeron N4120 (131 - 157, n=3) | |
| Teclast F7 Air | |
| Chuwi CoreBook X | |
| Infinix INBook X1 Pro | |
| Lenovo IdeaPad 3 14IIL05 | |
| Honor Magicbook 14 i7-1165G7 | |
| R Benchmark 2.5 / Overall mean | |
| Asus BR1100FKA-BP0109RA | |
| Jumper Tech Ez Book X3 Air | |
| Blackview AceBook 1 | |
| Teclast F7 Air | |
| Average Intel Celeron N4120 (1.642 - 1.649, n=3) | |
| Lenovo IdeaPad 3 14IIL05 | |
| Chuwi CoreBook X | |
| Infinix INBook X1 Pro | |
| Honor Magicbook 14 i7-1165G7 | |
Cinebench R20: CPU (Multi Core) | CPU (Single Core)
Cinebench R23: Multi Core | Single Core
Blender: v2.79 BMW27 CPU
7-Zip 18.03: 7z b 4 -mmt1 | 7z b 4
Geekbench 5.5: Single-Core | Multi-Core
HWBOT x265 Benchmark v2.2: 4k Preset
LibreOffice : 20 Documents To PDF
R Benchmark 2.5: Overall mean
* ... smaller is better
System Performance
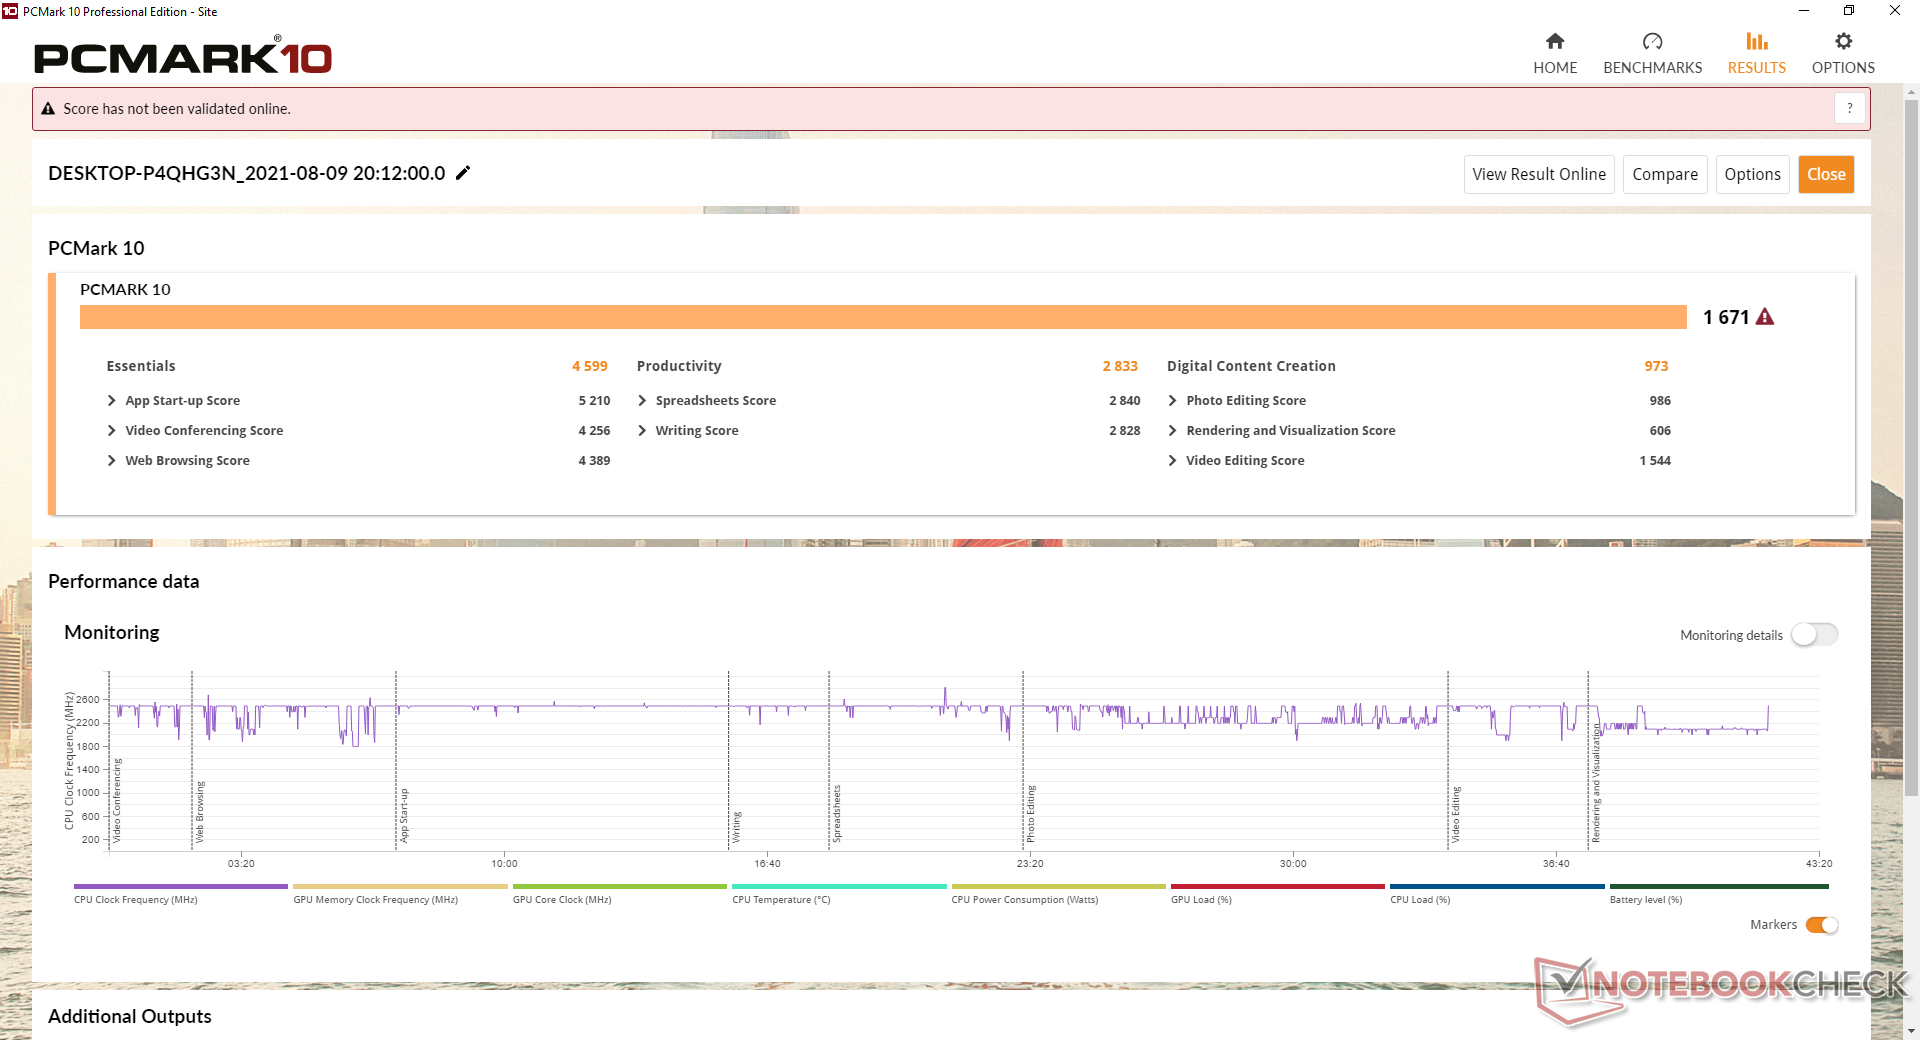
PCMark results are behind even the slowest last generation Core i3 laptops like the Lenovo V17. The difference is significant enough that there are noticeable delays when navigating Windows or multi-tasking between applications.
| PCMark 10 / Score | |
| Honor Magicbook 14 i7-1165G7 | |
| Infinix INBook X1 Pro | |
| Chuwi CoreBook X | |
| Lenovo IdeaPad 3 14IIL05 | |
| HP mt21 | |
| Teclast F7 Air | |
| Average Intel Celeron N4120, Intel UHD Graphics 600 (1671 - 1801, n=2) | |
| Blackview AceBook 1 | |
| PCMark 10 / Essentials | |
| Honor Magicbook 14 i7-1165G7 | |
| Infinix INBook X1 Pro | |
| Chuwi CoreBook X | |
| Lenovo IdeaPad 3 14IIL05 | |
| Teclast F7 Air | |
| Average Intel Celeron N4120, Intel UHD Graphics 600 (4599 - 5005, n=2) | |
| HP mt21 | |
| Blackview AceBook 1 | |
| PCMark 10 / Productivity | |
| Honor Magicbook 14 i7-1165G7 | |
| Chuwi CoreBook X | |
| Infinix INBook X1 Pro | |
| Lenovo IdeaPad 3 14IIL05 | |
| HP mt21 | |
| Blackview AceBook 1 | |
| Average Intel Celeron N4120, Intel UHD Graphics 600 (2813 - 2833, n=2) | |
| Teclast F7 Air | |
| PCMark 10 / Digital Content Creation | |
| Honor Magicbook 14 i7-1165G7 | |
| Infinix INBook X1 Pro | |
| Chuwi CoreBook X | |
| Lenovo IdeaPad 3 14IIL05 | |
| HP mt21 | |
| Teclast F7 Air | |
| Average Intel Celeron N4120, Intel UHD Graphics 600 (973 - 1126, n=2) | |
| Blackview AceBook 1 | |
| PCMark 10 Score | 1671 points | |
Help | ||
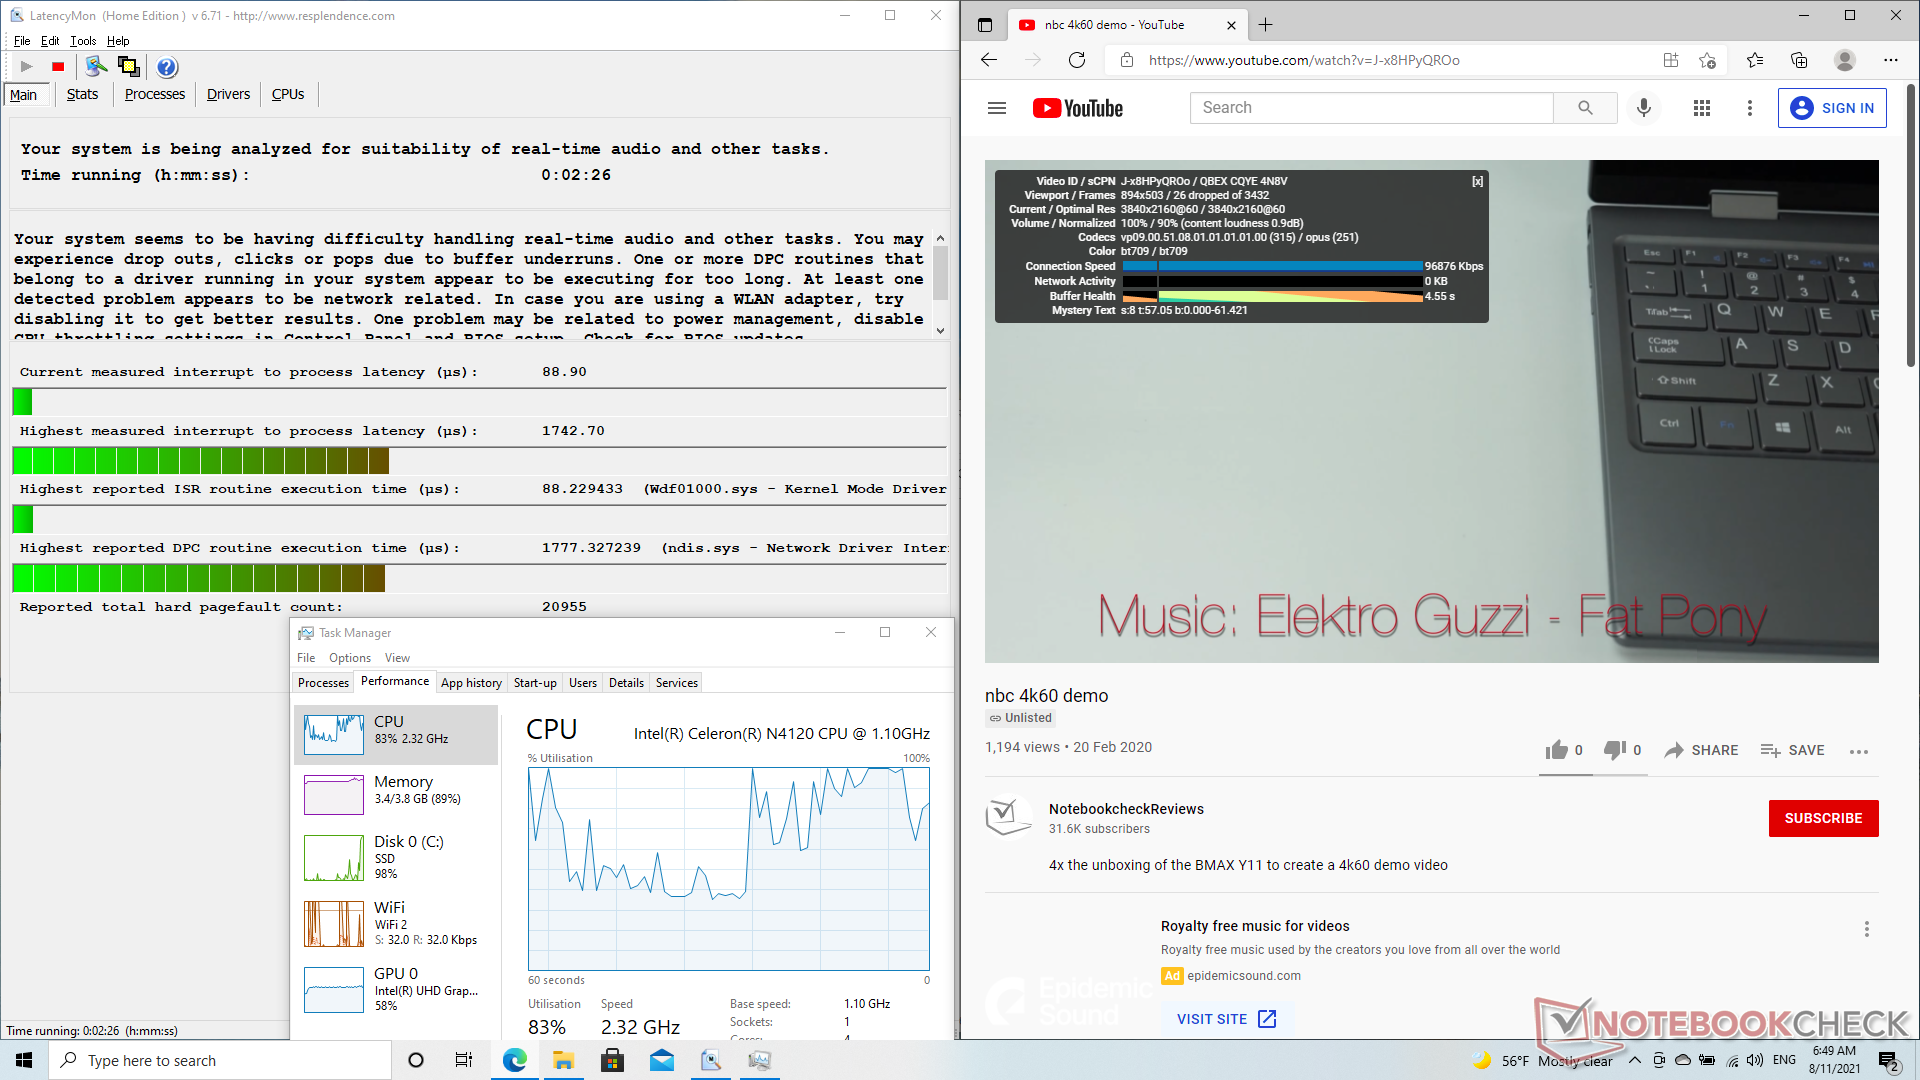
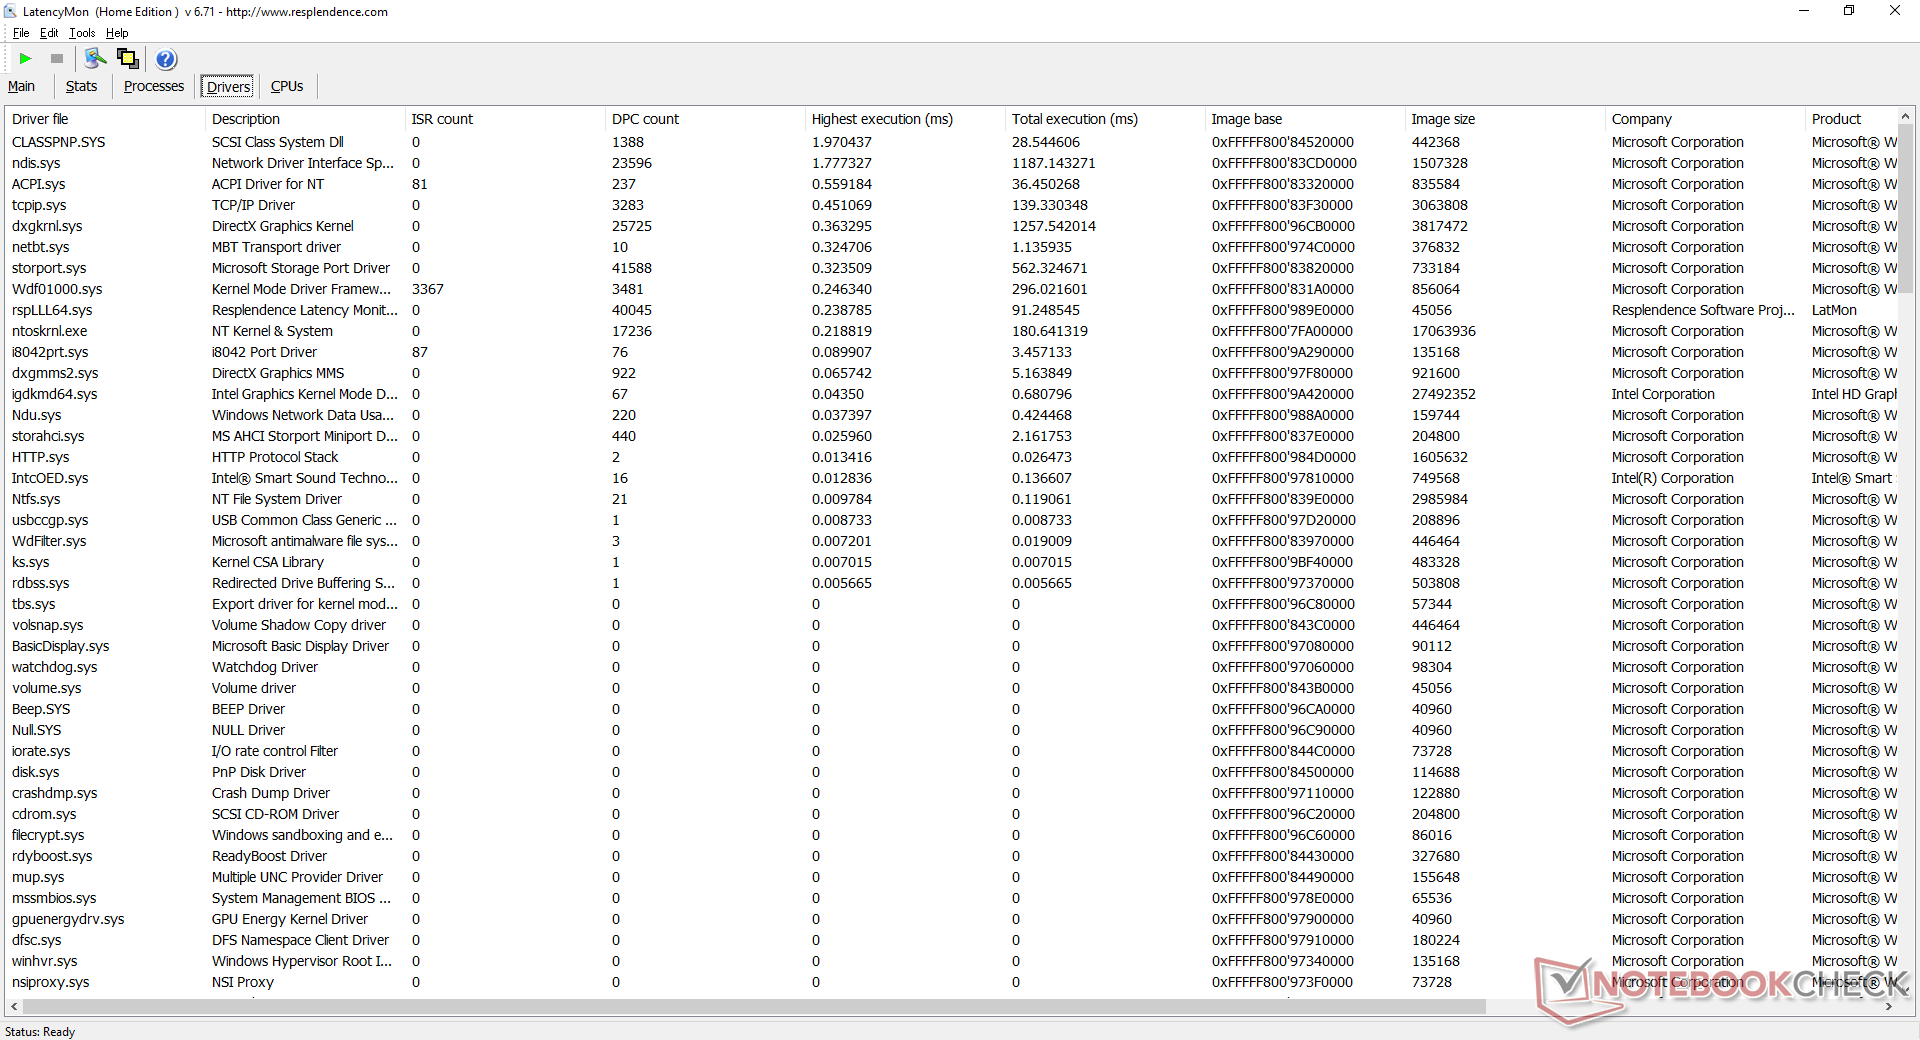
DPC Latency
LatencyMon shows DPC latency issues when opening multiple browser tabs on our homepage. Furthermore, 4K video playback at 60 FPS is not perfect as we're able to record 26 dropped frames during our minute-long video.
| DPC Latencies / LatencyMon - interrupt to process latency (max), Web, Youtube, Prime95 | |
| Teclast F7 Air | |
| Blackview AceBook 1 | |
| Chuwi CoreBook X | |
| Infinix INBook X1 Pro | |
| Lenovo IdeaPad 3 14IIL05 | |
| Honor Magicbook 14 i7-1165G7 | |
* ... smaller is better
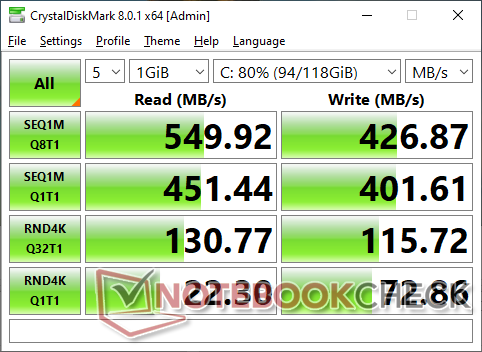
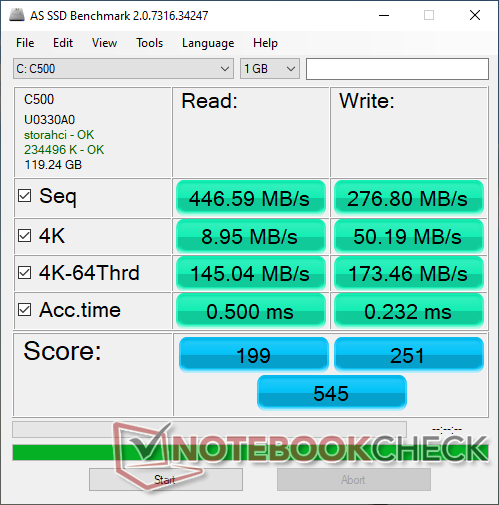
Storage Devices
Our test unit comes with the uncommon SCY C500 M.2 SATA III 2280 SSD as the system does not support PCIe 3 or NVMe drives. Sequential read and write rates are good for the category at around 550 MB/s and 430 MB/s, respectively. Owners will likely hit the 128 GB capacity quite quickly, however.
| Blackview AceBook 1 SCY C500 SNS1N3G12800D M.2 SATA | Chuwi CoreBook X Kingston RBUSNS8154P3512GJ | Infinix INBook X1 Pro Phison C-E80T512G4-P3D3B3E13 | Honor Magicbook 14 i7-1165G7 WDC PC SN730 SDBPNTY-512G | Teclast F7 Air faspeed K7N8-256G | Lenovo IdeaPad 3 14IIL05 WDC PC SN520 SDAPMUW-256G | |
|---|---|---|---|---|---|---|
| AS SSD | 262% | 322% | 591% | 24% | 177% | |
| Seq Read (MB/s) | 446.6 | 1393 212% | 2135 378% | 3021 576% | 430.2 -4% | 1535 244% |
| Seq Write (MB/s) | 276.8 | 954 245% | 1776 542% | 2341 746% | 412.3 49% | 1215 339% |
| 4K Read (MB/s) | 8.95 | 39.51 341% | 28.88 223% | 47.9 435% | 13.21 48% | 35.93 301% |
| 4K Write (MB/s) | 50.2 | 98.9 97% | 147.9 195% | 186.7 272% | 50.1 0% | 138.3 175% |
| 4K-64 Read (MB/s) | 145 | 834 475% | 712 391% | 1472 915% | 122.9 -15% | 467.7 223% |
| 4K-64 Write (MB/s) | 173.5 | 687 296% | 643 271% | 1829 954% | 215.6 24% | 399.6 130% |
| Access Time Read * (ms) | 0.5 | 0.066 87% | 0.052 90% | 0.06 88% | 0.151 70% | 0.104 79% |
| Access Time Write * (ms) | 0.232 | 0.044 81% | 0.092 60% | 0.021 91% | 0.17 27% | 0.029 87% |
| Score Read (Points) | 199 | 1013 409% | 954 379% | 1822 816% | 179 -10% | 657 230% |
| Score Write (Points) | 251 | 881 251% | 968 286% | 2249 796% | 307 22% | 659 163% |
| Score Total (Points) | 545 | 2399 340% | 2395 339% | 4973 812% | 581 7% | 1647 202% |
| Copy ISO MB/s (MB/s) | 360.9 | 983 172% | 1296 259% | 440.8 22% | 754 109% | |
| Copy Program MB/s (MB/s) | 115.1 | 643 459% | 900 682% | 193.4 68% | 253.1 120% | |
| Copy Game MB/s (MB/s) | 306.8 | 920 200% | 1588 418% | 396.8 29% | 546 78% | |
| CrystalDiskMark 5.2 / 6 | 172% | 338% | 471% | 5% | 226% | |
| Write 4K (MB/s) | 66.3 | 130.5 97% | 228.3 244% | 223.7 237% | 75 13% | 173.1 161% |
| Read 4K (MB/s) | 26.3 | 38.72 47% | 60.7 131% | 51.2 95% | 27.31 4% | 49.32 88% |
| Write Seq (MB/s) | 231.9 | 709 206% | 1895 717% | 2579 1012% | 1188 412% | |
| Read Seq (MB/s) | 466.8 | 717 54% | 1573 237% | 2553 447% | 1278 174% | |
| Write 4K Q32T1 (MB/s) | 117.3 | 510 335% | 476.6 306% | 671 472% | 120.1 2% | 457.4 290% |
| Read 4K Q32T1 (MB/s) | 138.1 | 554 301% | 592 329% | 761 451% | 135.2 -2% | 505 266% |
| Write Seq Q32T1 (MB/s) | 427.6 | 1037 143% | 2136 400% | 2721 536% | 469.2 10% | 1258 194% |
| Read Seq Q32T1 (MB/s) | 546 | 1609 195% | 2413 342% | 3358 515% | 555 2% | 1742 219% |
| Write 4K Q8T8 (MB/s) | 264.6 | |||||
| Read 4K Q8T8 (MB/s) | 135.6 | |||||
| Total Average (Program / Settings) | 217% /
229% | 330% /
328% | 531% /
540% | 15% /
18% | 202% /
195% |
* ... smaller is better

Disk Throttling: DiskSpd Read Loop, Queue Depth 8
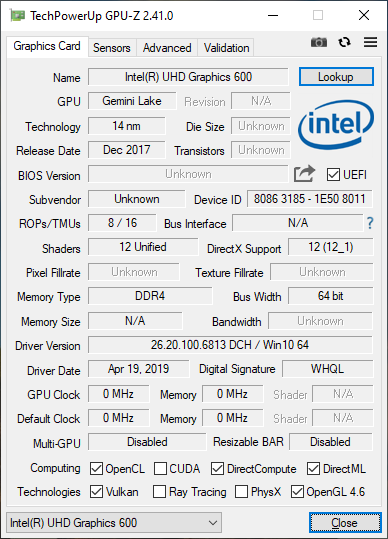
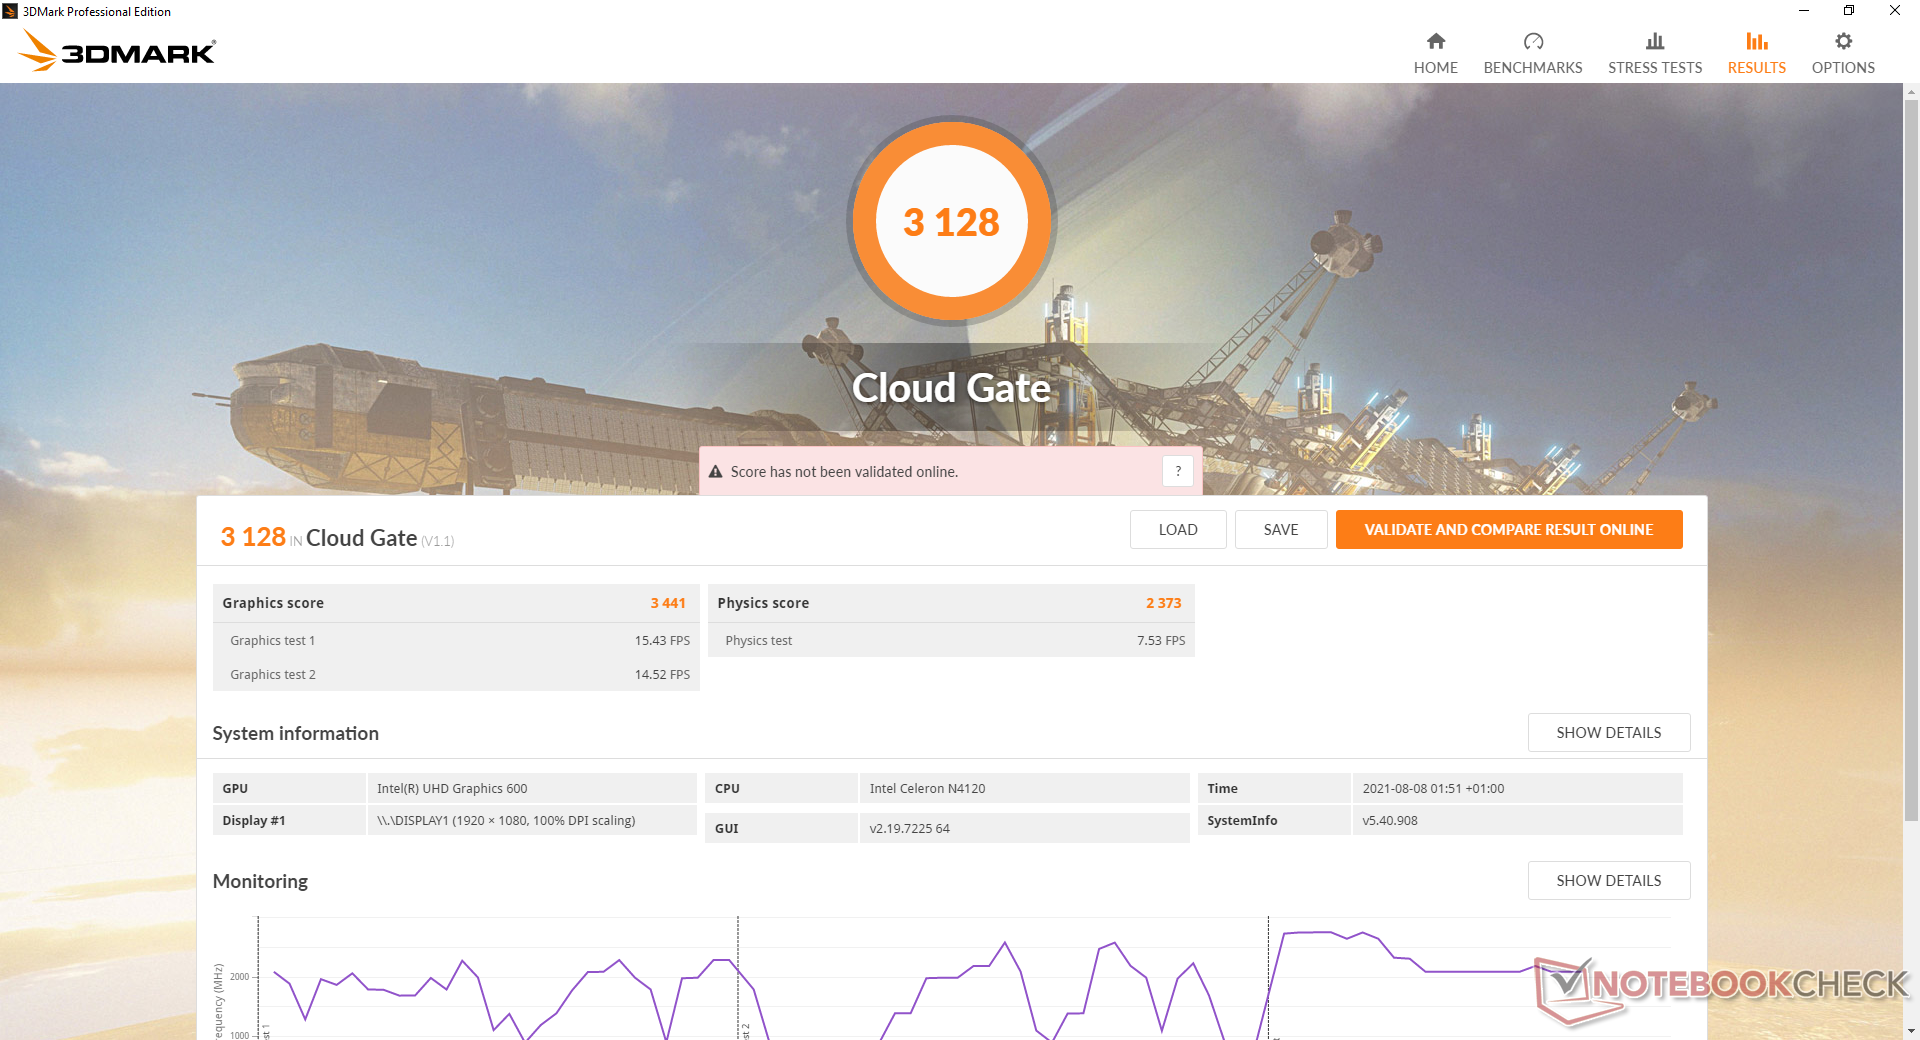
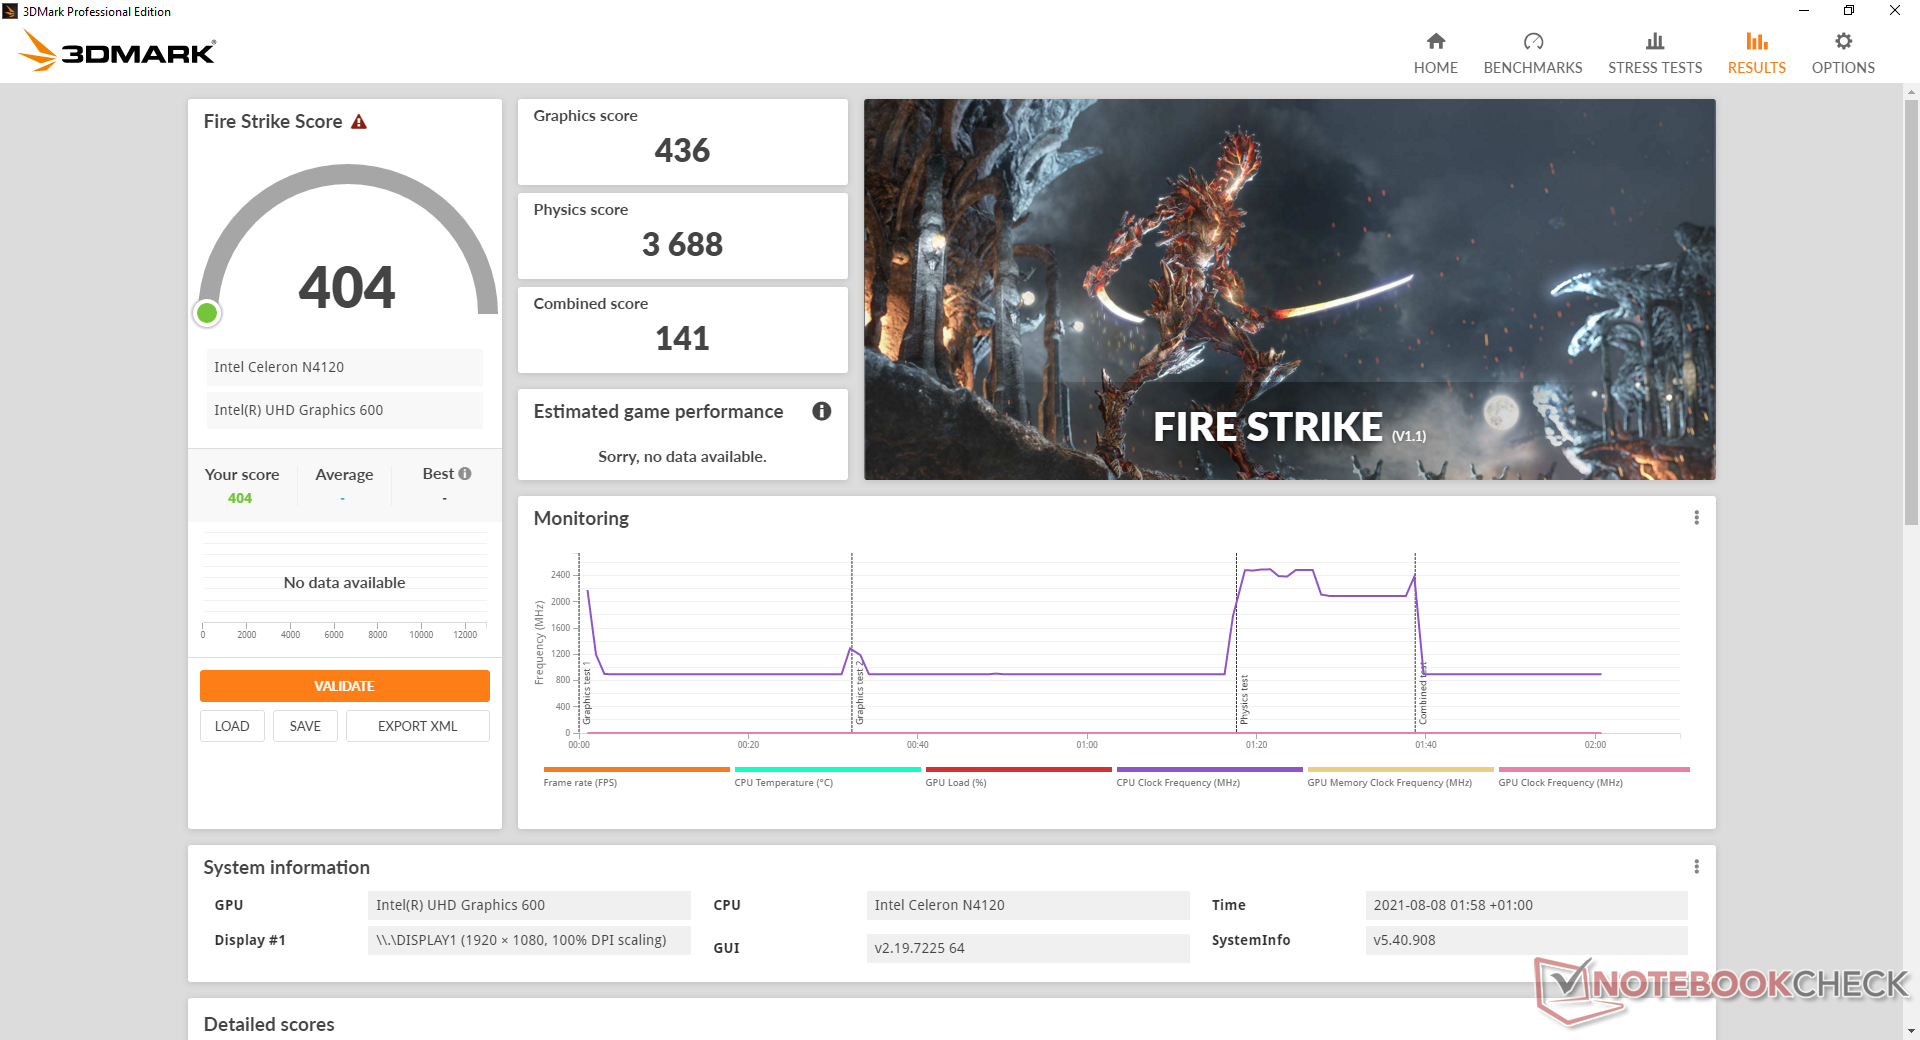
GPU Performance
The UHD Graphics 600 is slower than the already slow UHD Graphics 620. This is more of a browsing and 1080p streaming machine than a local gaming machine.
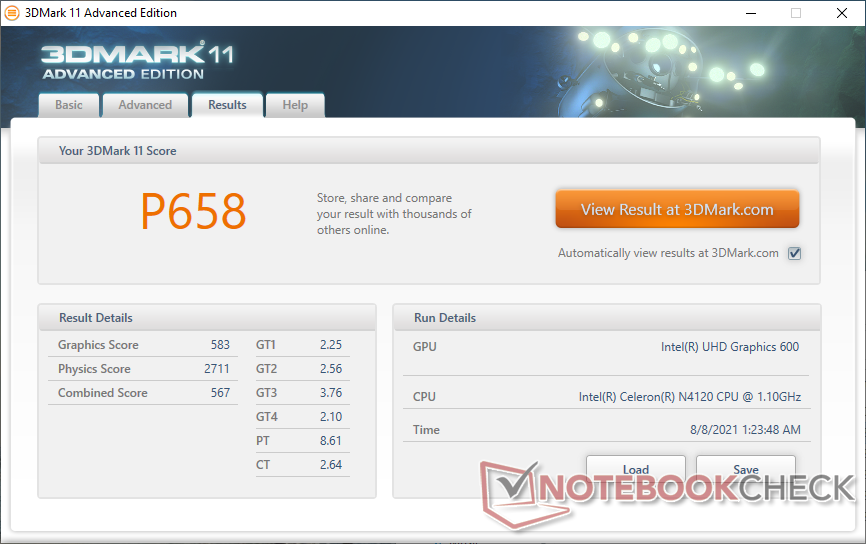
| 3DMark 11 Performance | 658 points | |
| 3DMark Cloud Gate Standard Score | 3128 points | |
| 3DMark Fire Strike Score | 404 points | |
Help | ||
| low | med. | high | ultra | |
|---|---|---|---|---|
| Dota 2 Reborn (2015) | 37.4 | 15.3 | 7.9 | 7.2 |
| X-Plane 11.11 (2018) | 6.35 | 4.18 | 3.79 |
Emissions
System Noise
Although technically silent because of the fanless design, our unit would sometimes exhibit noticeable coil whine or electronic noise when running high loads like 3DMark 06 or Prime95. This would also occur when video streaming but to a less noticeable degree. Very loud coil whine may indicate cheaper internal components.
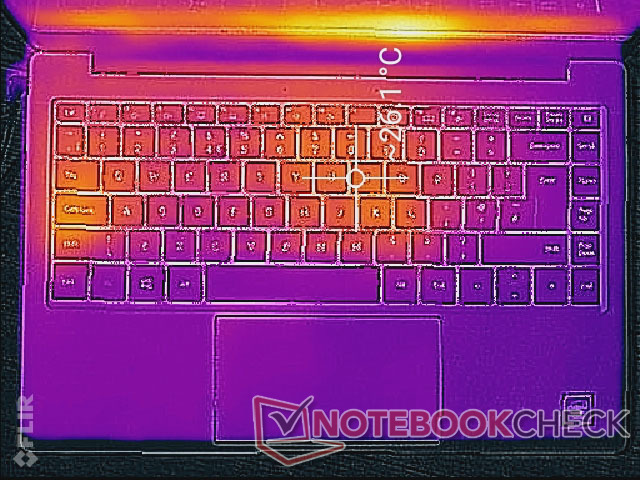
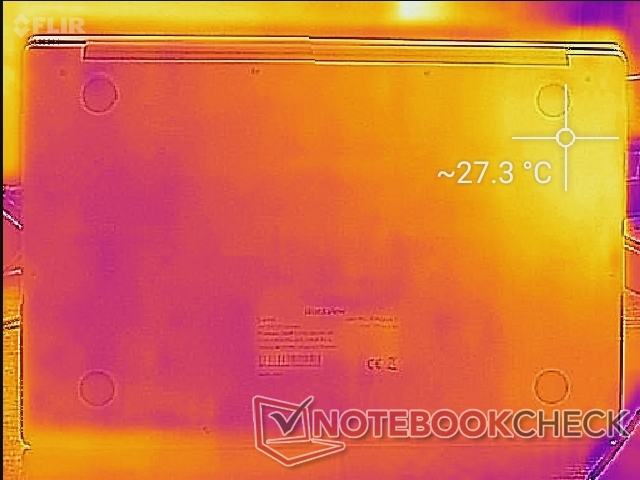
Temperature
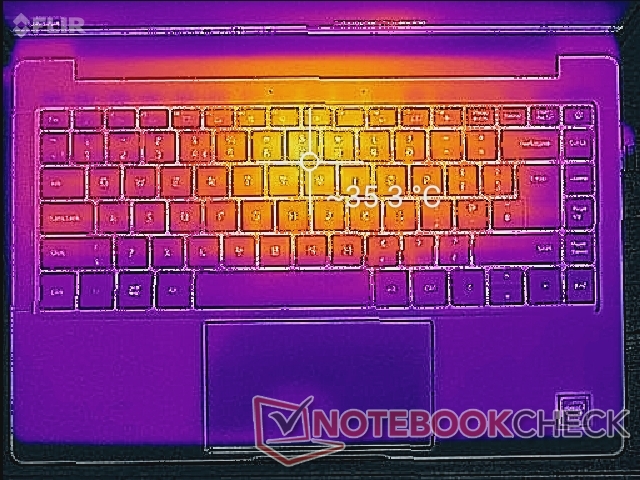
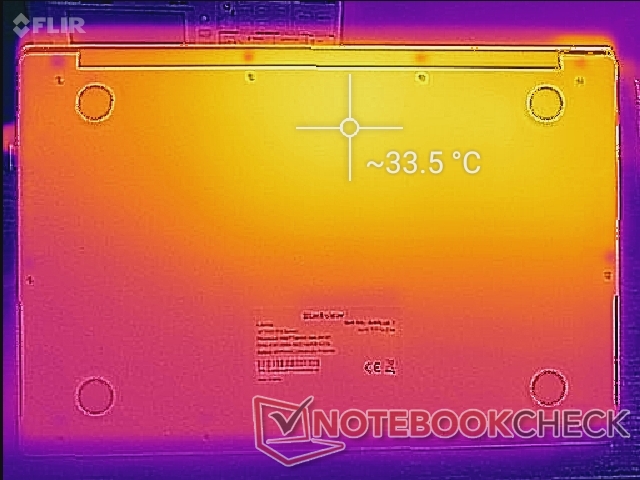
Surface temperatures are never exceedingly warm no matter the onscreen load. We're able to record a maximum of 35 C on the keyboard center compared to 42 C to 50 C on the competing Infinix INBook X1 Pro.
(+) The maximum temperature on the upper side is 35.8 °C / 96 F, compared to the average of 35.9 °C / 97 F, ranging from 21.4 to 59 °C for the class Subnotebook.
(+) The bottom heats up to a maximum of 33.6 °C / 92 F, compared to the average of 39.2 °C / 103 F
(+) In idle usage, the average temperature for the upper side is 24.7 °C / 76 F, compared to the device average of 30.8 °C / 87 F.
(+) The palmrests and touchpad are cooler than skin temperature with a maximum of 25.6 °C / 78.1 F and are therefore cool to the touch.
(+) The average temperature of the palmrest area of similar devices was 28.2 °C / 82.8 F (+2.6 °C / 4.7 F).
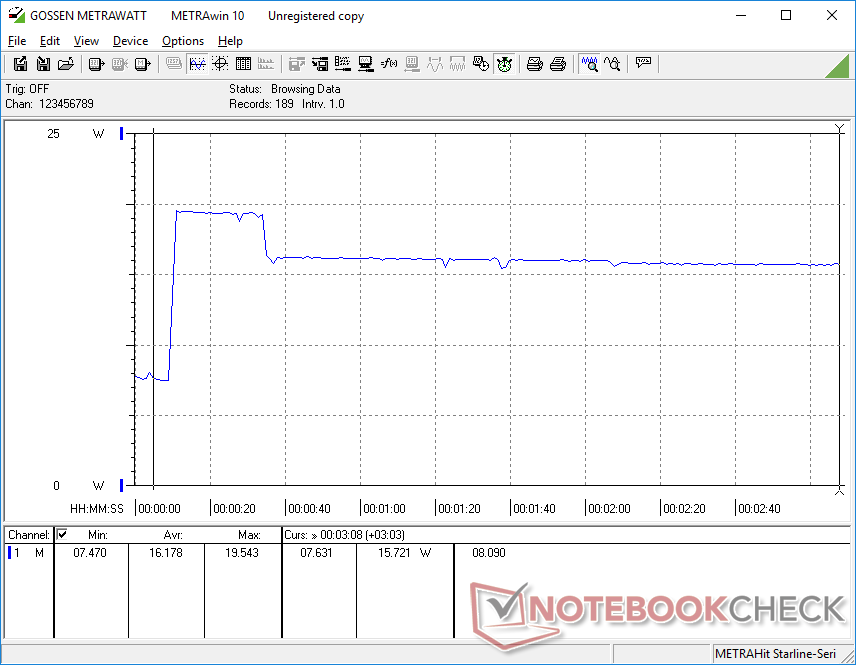
Stress Test
When running Prime95, the CPU would boost to 2.3 GHz for the first 10 seconds or so until core temperature reaches 80 C. Thereafter, the CPU would fall and stabilize at 2 GHz and 82 C. Noticeable coil whine would occur on and off during this period.
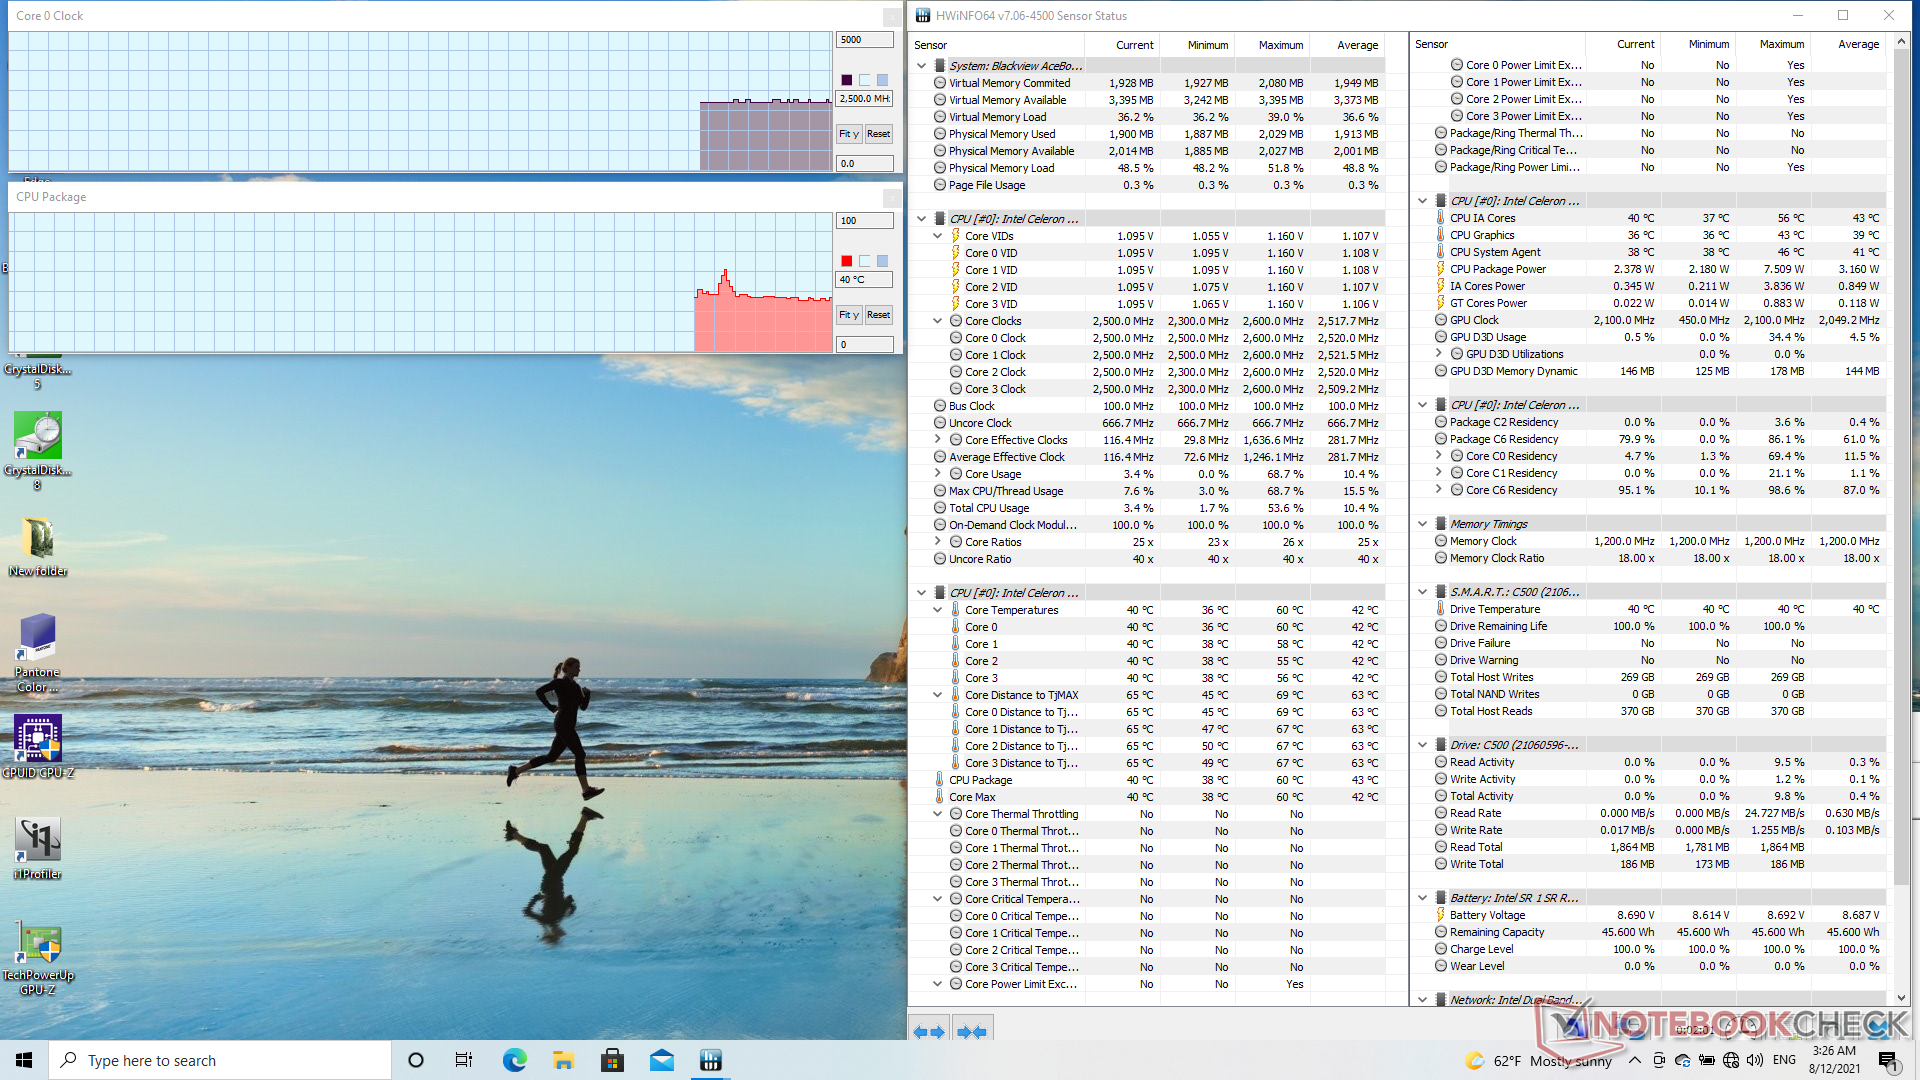
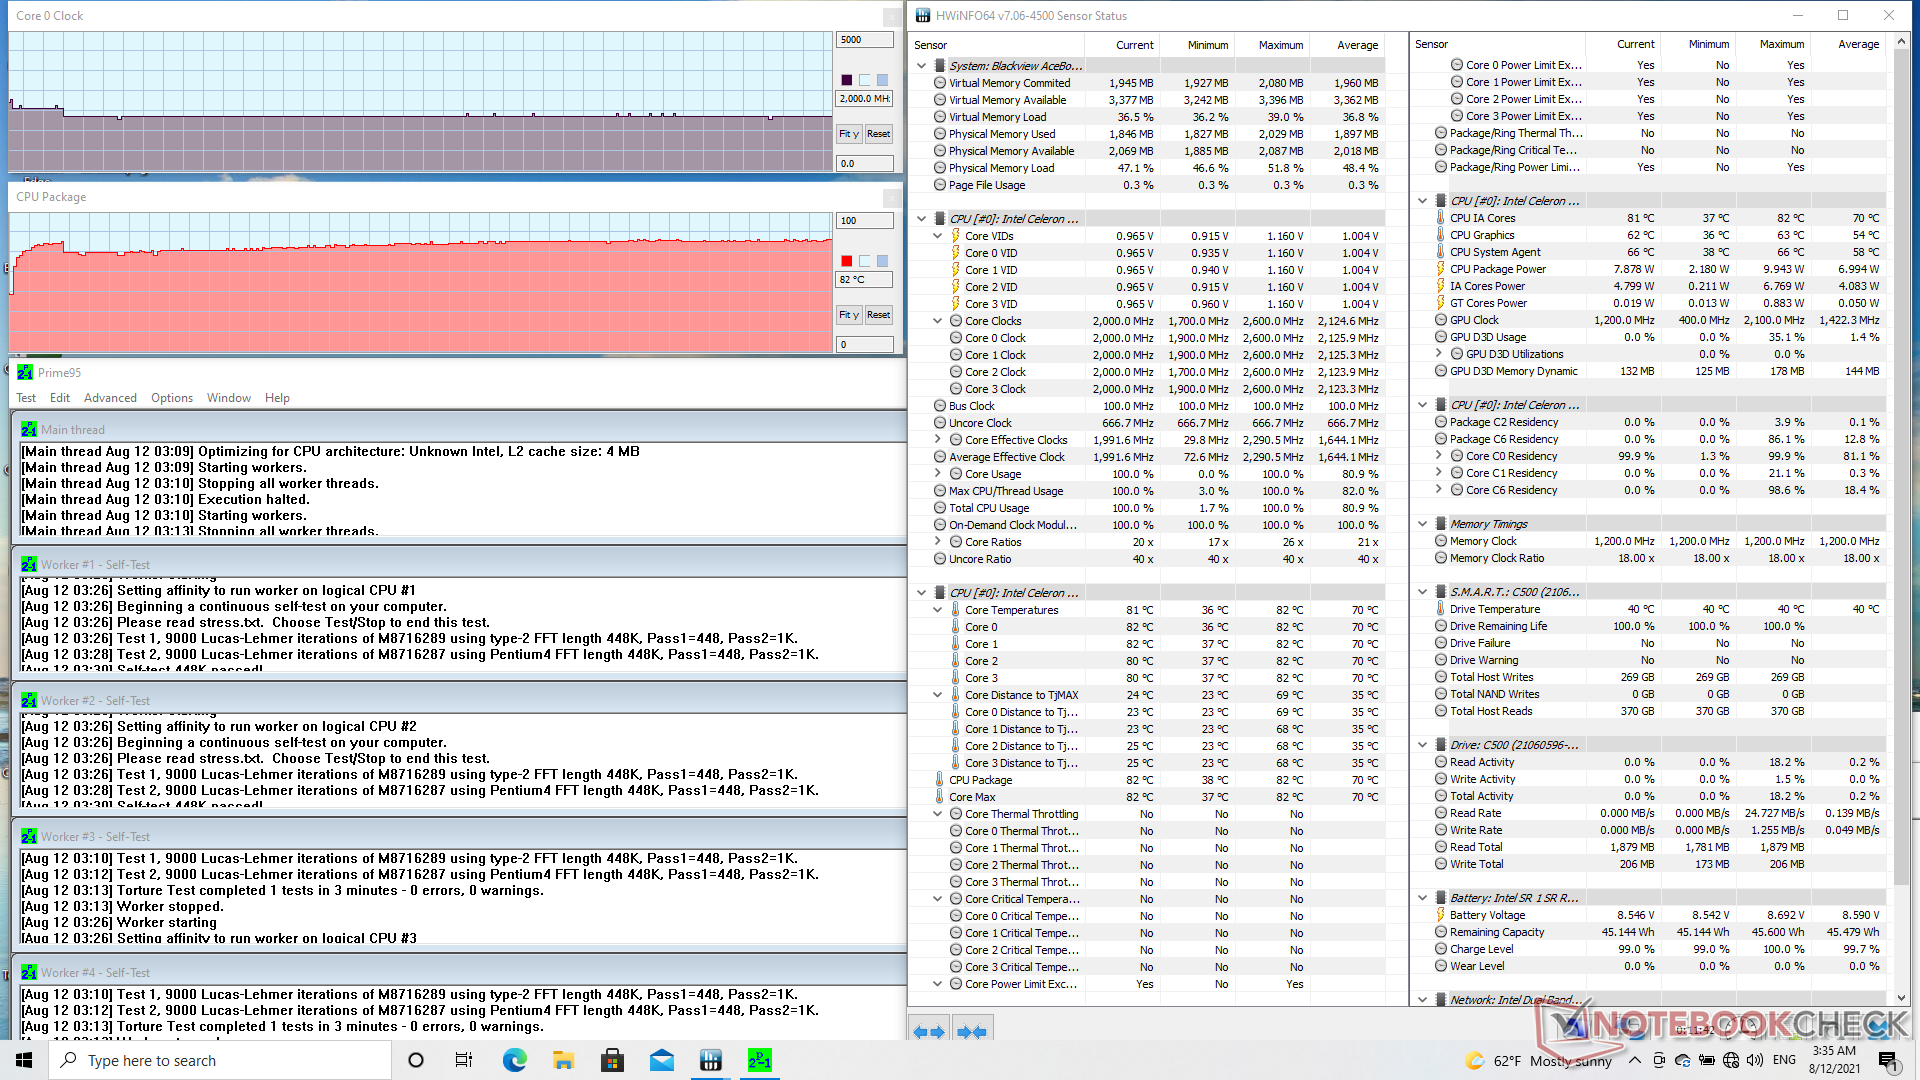
| CPU Clock (GHz) | GPU Clock (MHz) | Average CPU Temperature (°C) | |
| System Idle | -- | -- | 40 |
| Prime95 Stress | 2.0 | -- | 82 |
Speakers
The integrated speakers are relatively loud for the size, but quality is tinny. Our microphone shows a narrow pink noise curve to represent poor bass reproduction and a narrow range. The speakers are therefore better fit for virtual meetings than for multimedia playback.


Blackview AceBook 1 audio analysis
(±) | speaker loudness is average but good (78.2 dB)
Bass 100 - 315 Hz
(-) | nearly no bass - on average 34.5% lower than median
(+) | bass is linear (6.5% delta to prev. frequency)
Mids 400 - 2000 Hz
(±) | reduced mids - on average 5.6% lower than median
(±) | linearity of mids is average (9.2% delta to prev. frequency)
Highs 2 - 16 kHz
(±) | higher highs - on average 9.4% higher than median
(±) | linearity of highs is average (7.7% delta to prev. frequency)
Overall 100 - 16.000 Hz
(-) | overall sound is not linear (33.2% difference to median)
Compared to same class
» 95% of all tested devices in this class were better, 1% similar, 3% worse
» The best had a delta of 5%, average was 18%, worst was 53%
Compared to all devices tested
» 92% of all tested devices were better, 1% similar, 7% worse
» The best had a delta of 4%, average was 23%, worst was 134%
Apple MacBook 12 (Early 2016) 1.1 GHz audio analysis
(+) | speakers can play relatively loud (83.6 dB)
Bass 100 - 315 Hz
(±) | reduced bass - on average 11.3% lower than median
(±) | linearity of bass is average (14.2% delta to prev. frequency)
Mids 400 - 2000 Hz
(+) | balanced mids - only 2.4% away from median
(+) | mids are linear (5.5% delta to prev. frequency)
Highs 2 - 16 kHz
(+) | balanced highs - only 2% away from median
(+) | highs are linear (4.5% delta to prev. frequency)
Overall 100 - 16.000 Hz
(+) | overall sound is linear (10.2% difference to median)
Compared to same class
» 7% of all tested devices in this class were better, 2% similar, 90% worse
» The best had a delta of 5%, average was 18%, worst was 53%
Compared to all devices tested
» 5% of all tested devices were better, 1% similar, 94% worse
» The best had a delta of 4%, average was 23%, worst was 134%
Energy Management
Power Consumption
At most, the system will draw up to 20 W from the small (~7.3 x 4.3 x 3.2 cm) AC adapter when running high loads compared to over twice that on Core ix-powered laptops. Users can expect single-digit wattages when under more typical workloads. The low consumption rate is responsible for the long battery life recorded below.
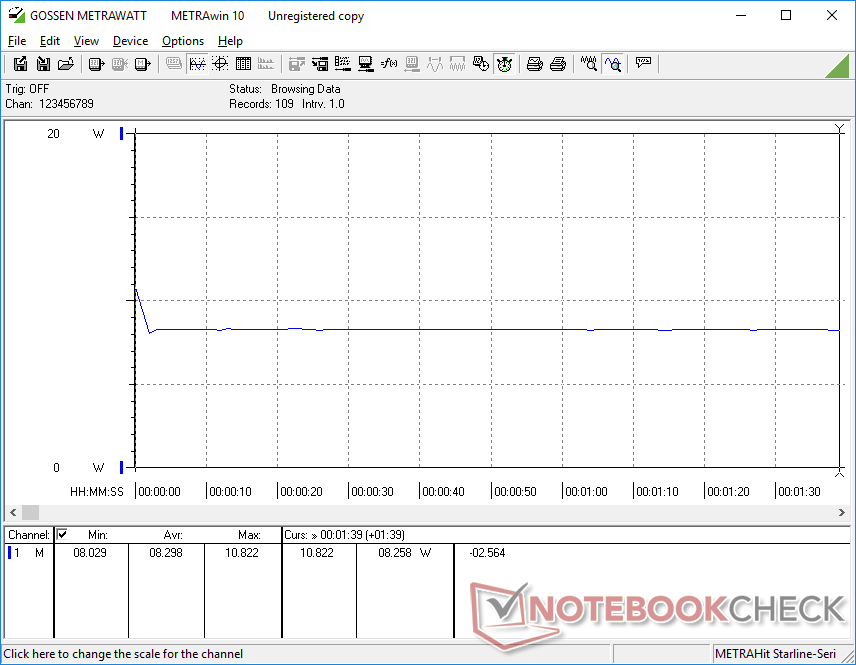
| Off / Standby | |
| Idle | |
| Load |
|
Key:
min: | |
| Blackview AceBook 1 Celeron N4120, UHD Graphics 600, SCY C500 SNS1N3G12800D M.2 SATA, IPS, 1920x1080, 14" | Chuwi CoreBook X i5-8259U, Iris Plus Graphics 655, Kingston RBUSNS8154P3512GJ, IPS, 2160x1440, 14" | Infinix INBook X1 Pro i7-1065G7, Iris Plus Graphics G7 (Ice Lake 64 EU), Phison C-E80T512G4-P3D3B3E13, IPS, 1920x1080, 14" | Honor Magicbook 14 i7-1165G7 i7-1165G7, Iris Xe G7 96EUs, WDC PC SN730 SDBPNTY-512G, IPS, 1920x1080, 14" | Teclast F7 Air Celeron N4120, UHD Graphics 600, faspeed K7N8-256G, IPS, 1920x1080, 14" | Lenovo IdeaPad 3 14IIL05 i3-1005G1, UHD Graphics G1 (Ice Lake 32 EU), WDC PC SN520 SDAPMUW-256G, IPS, 1920x1080, 14" | |
|---|---|---|---|---|---|---|
| Power Consumption | -152% | -186% | -128% | -78% | -87% | |
| Idle Minimum * (Watt) | 3.5 | 6.2 -77% | 5 -43% | 4 -14% | 6.7 -91% | 3.2 9% |
| Idle Average * (Watt) | 5.6 | 10.7 -91% | 11.5 -105% | 6 -7% | 9.6 -71% | 6.2 -11% |
| Idle Maximum * (Watt) | 6.2 | 12.5 -102% | 12 -94% | 10 -61% | 9.9 -60% | 7.2 -16% |
| Load Average * (Watt) | 8.3 | 40.5 -388% | 48.7 -487% | 34 -310% | 19.1 -130% | 30 -261% |
| Load Maximum * (Watt) | 19.6 | 39.2 -100% | 58.8 -200% | 68 -247% | 27.1 -38% | 50 -155% |
| Witcher 3 ultra * (Watt) | 39.4 | 46.4 |
* ... smaller is better
Power Consumption Prime95
Battery Life
Runtimes are long at 9.5 hours of real-world WLAN use to be comparable to the Honor MagicBook 14. Charging, however, is very slow at up to 4 hours from empty to full capacity.
| Blackview AceBook 1 Celeron N4120, UHD Graphics 600, 45 Wh | Chuwi CoreBook X i5-8259U, Iris Plus Graphics 655, 46.2 Wh | Infinix INBook X1 Pro i7-1065G7, Iris Plus Graphics G7 (Ice Lake 64 EU), 55 Wh | Honor Magicbook 14 i7-1165G7 i7-1165G7, Iris Xe G7 96EUs, 56 Wh | Teclast F7 Air Celeron N4120, UHD Graphics 600, 32.725 Wh | Lenovo IdeaPad 3 14IIL05 i3-1005G1, UHD Graphics G1 (Ice Lake 32 EU), 35 Wh | |
|---|---|---|---|---|---|---|
| Battery runtime | -29% | -10% | 3% | -53% | -36% | |
| WiFi v1.3 (h) | 9.4 | 6.7 -29% | 8.5 -10% | 9.7 3% | 4.4 -53% | 6 -36% |
| Load (h) | 1.8 |
Pros
Cons
Verdict
It's unrealistic to expect too much from a sub $400 laptop. At the very least, however, such models should be able to run Windows 10 and all the common applications smoothly. The Celeron N4120 here struggles to keep up with even light multitasking between browsers and videos for an overall slow and sometimes frustrating user experience.
The slow system performance and sticky clickpad bring down an otherwise inoffensive and decently built subnotebook.
A few aspects of the AceBook 1 could also use some updates. The sticky clickpad and loud coil whine in particular can be deal breakers for users looking for a quiet and comfortable subnotebook.
The long battery life, wide port options, and attractive metal skeleton are otherwise good starting points for Blackview's first ever laptop, but there's still a lot more that needs to be done before we can recommend the AceBook 1 over more established budget models like the CoreBook X, INBook X1, MagicBook 14, or IdeaPad 14.
Price and availability
Blackview is now selling the AceBook 1 directly for $499 USD or $389 when on sale.
Blackview AceBook 1
- 08/12/2021 v7 (old)
Allen Ngo
Price comparison
