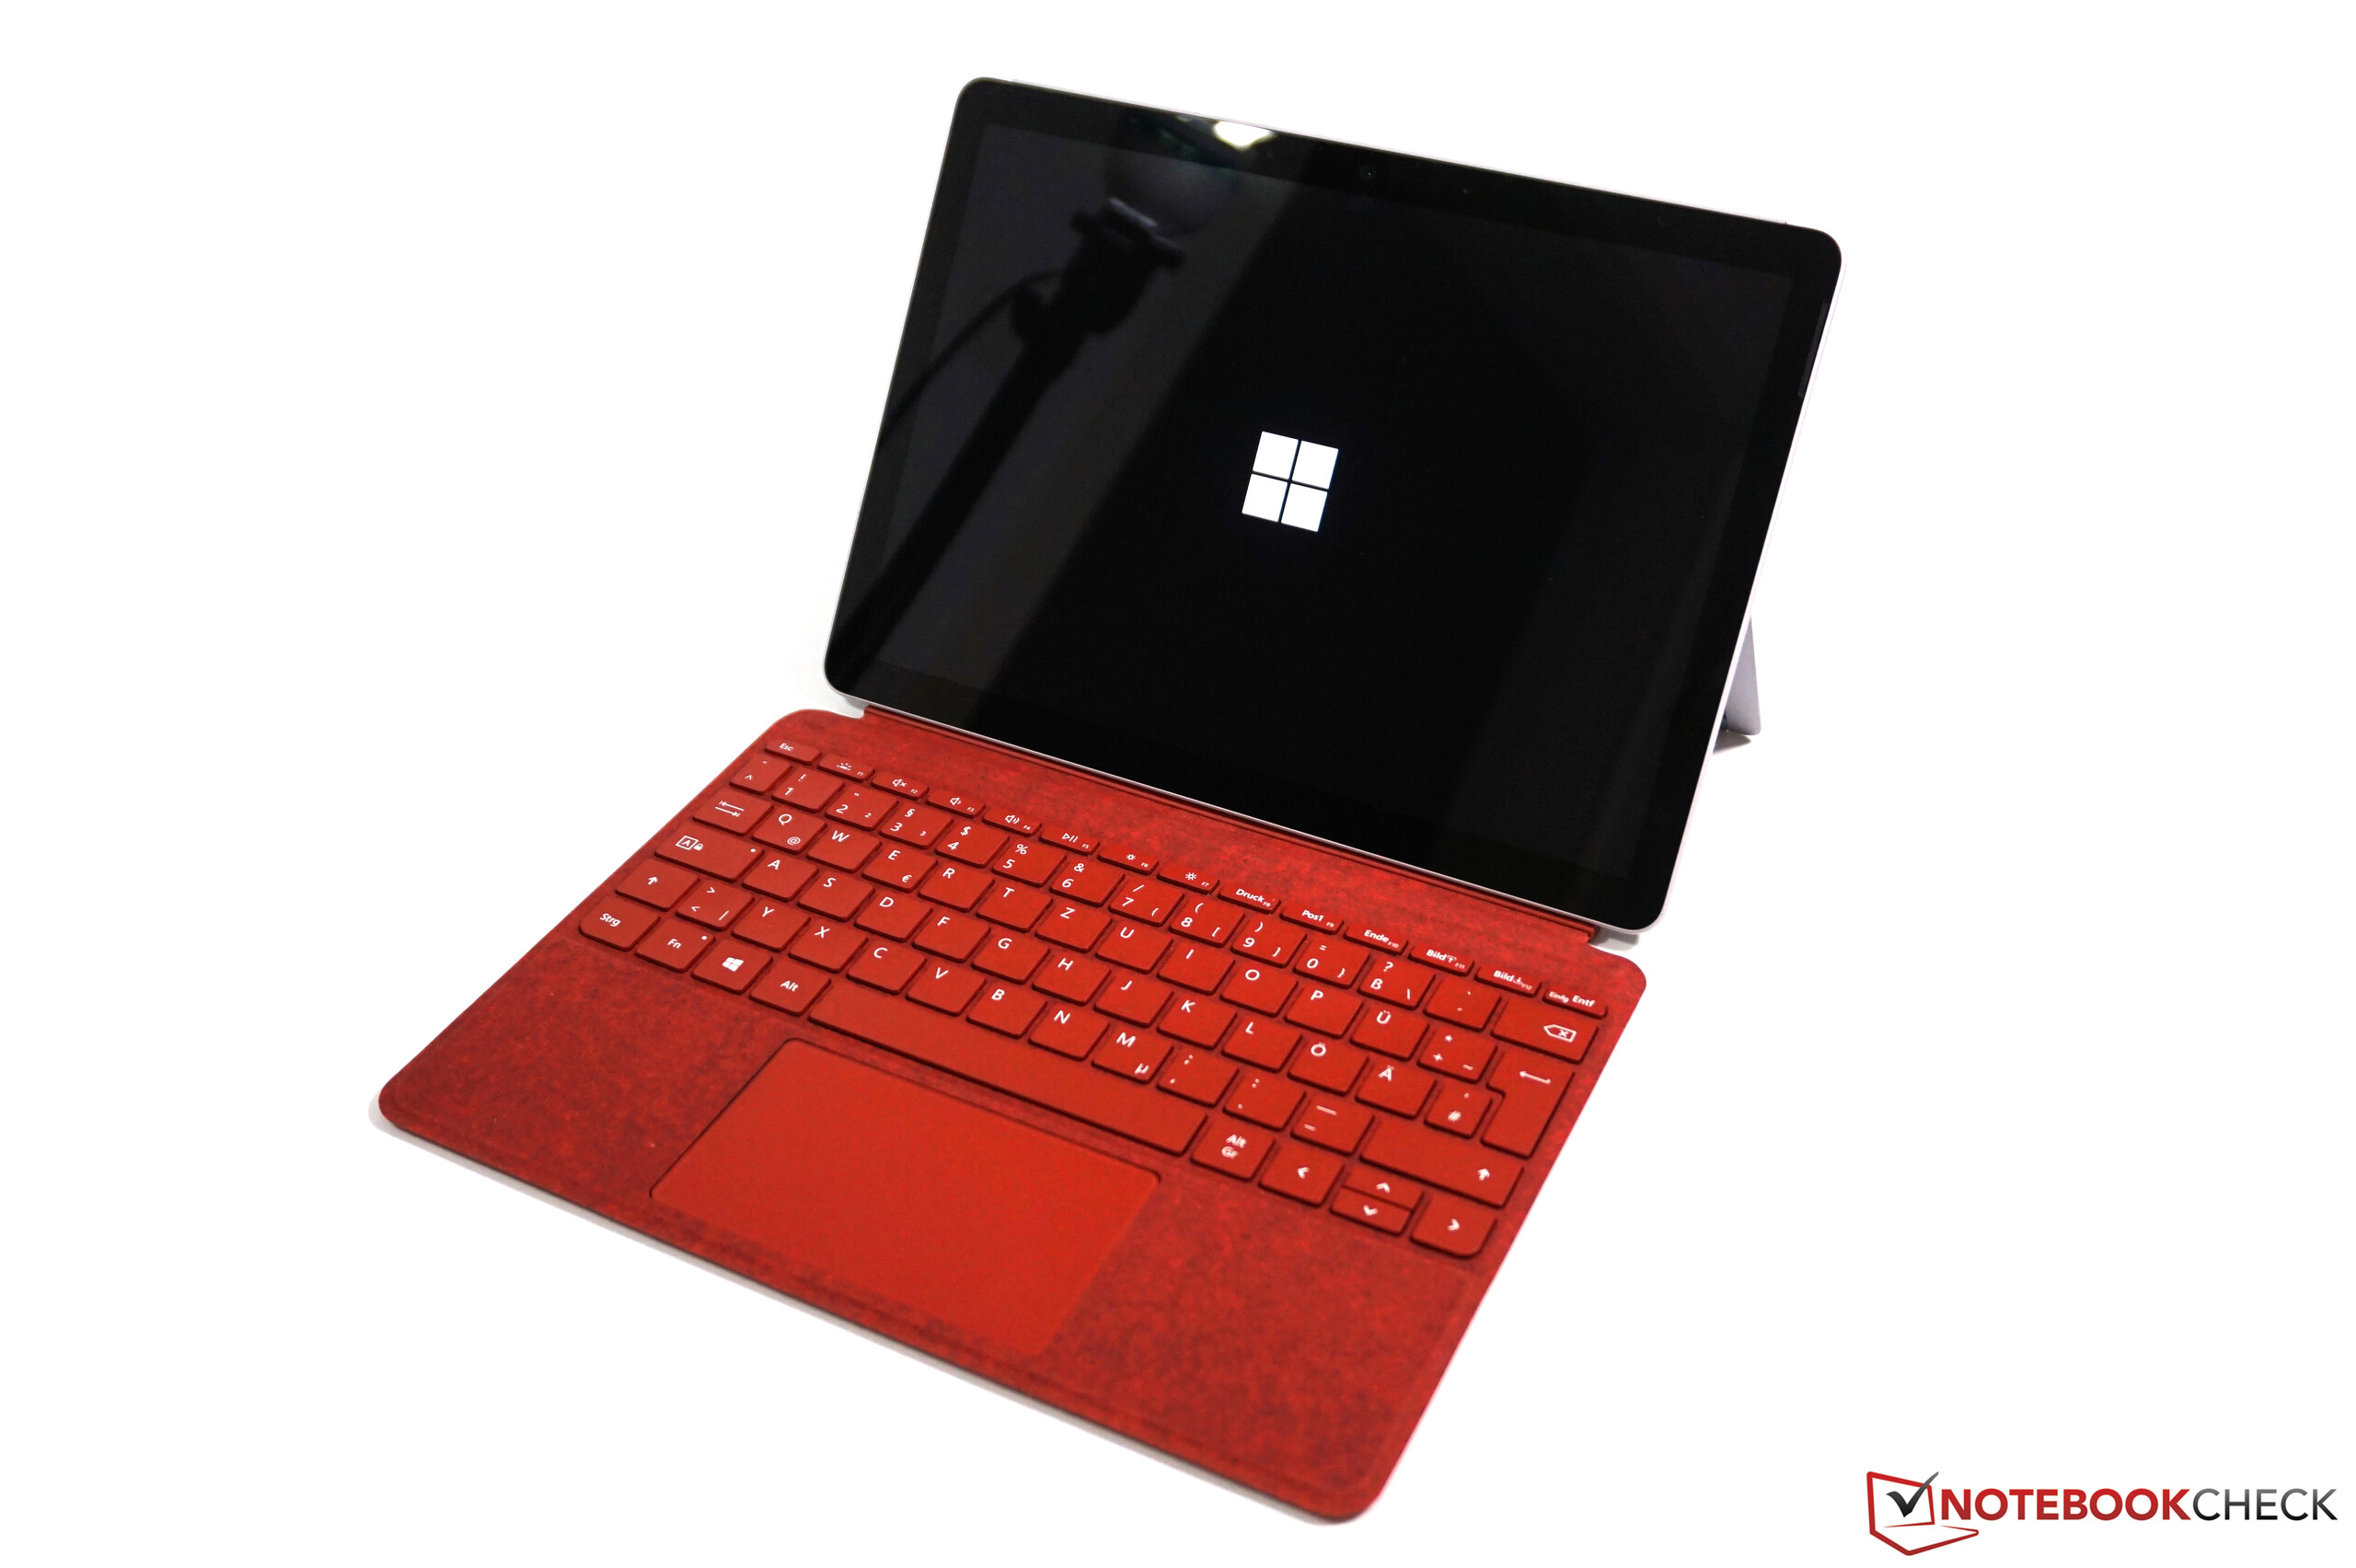
Microsoft Surface Go 3 in review - The compact convertible now with Windows 11
Possible competitors in comparison
Rating | Date | Model | Weight | Height | Size | Resolution | Price |
|---|---|---|---|---|---|---|---|
| 85.3 % v7 (old) | 10 / 2021 | Microsoft Surface Go 3 Core i3 i3-10100Y, UHD Graphics 615 | 783 g | 8.3 mm | 10.50" | 1920x1280 | |
| 85.4 % v7 (old) | 12 / 2020 | Microsoft Surface Go 2, m3-8100Y m3-8100Y, UHD Graphics 615 | 790 g | 8.3 mm | 10.50" | 1920x1280 | |
| 86.2 % v7 (old) | 04 / 2021 | Lenovo Tab P11 Pro SD 730G, Adreno 618 | 485 g | 5.8 mm | 11.50" | 2560x1600 | |
| 90.7 % v7 (old) | 11 / 2020 | Apple iPad Air 4 2020 A14, A14 Bionic GPU | 458 g | 6.1 mm | 10.90" | 2360x1640 | |
| 88.4 % v7 (old) | 11 / 2019 | Microsoft Surface Pro 7 Core i5-1035G4 i5-1035G4, Iris Plus Graphics G4 (Ice Lake 48 EU) | 1.1 kg | 8.5 mm | 12.30" | 2736x1824 |
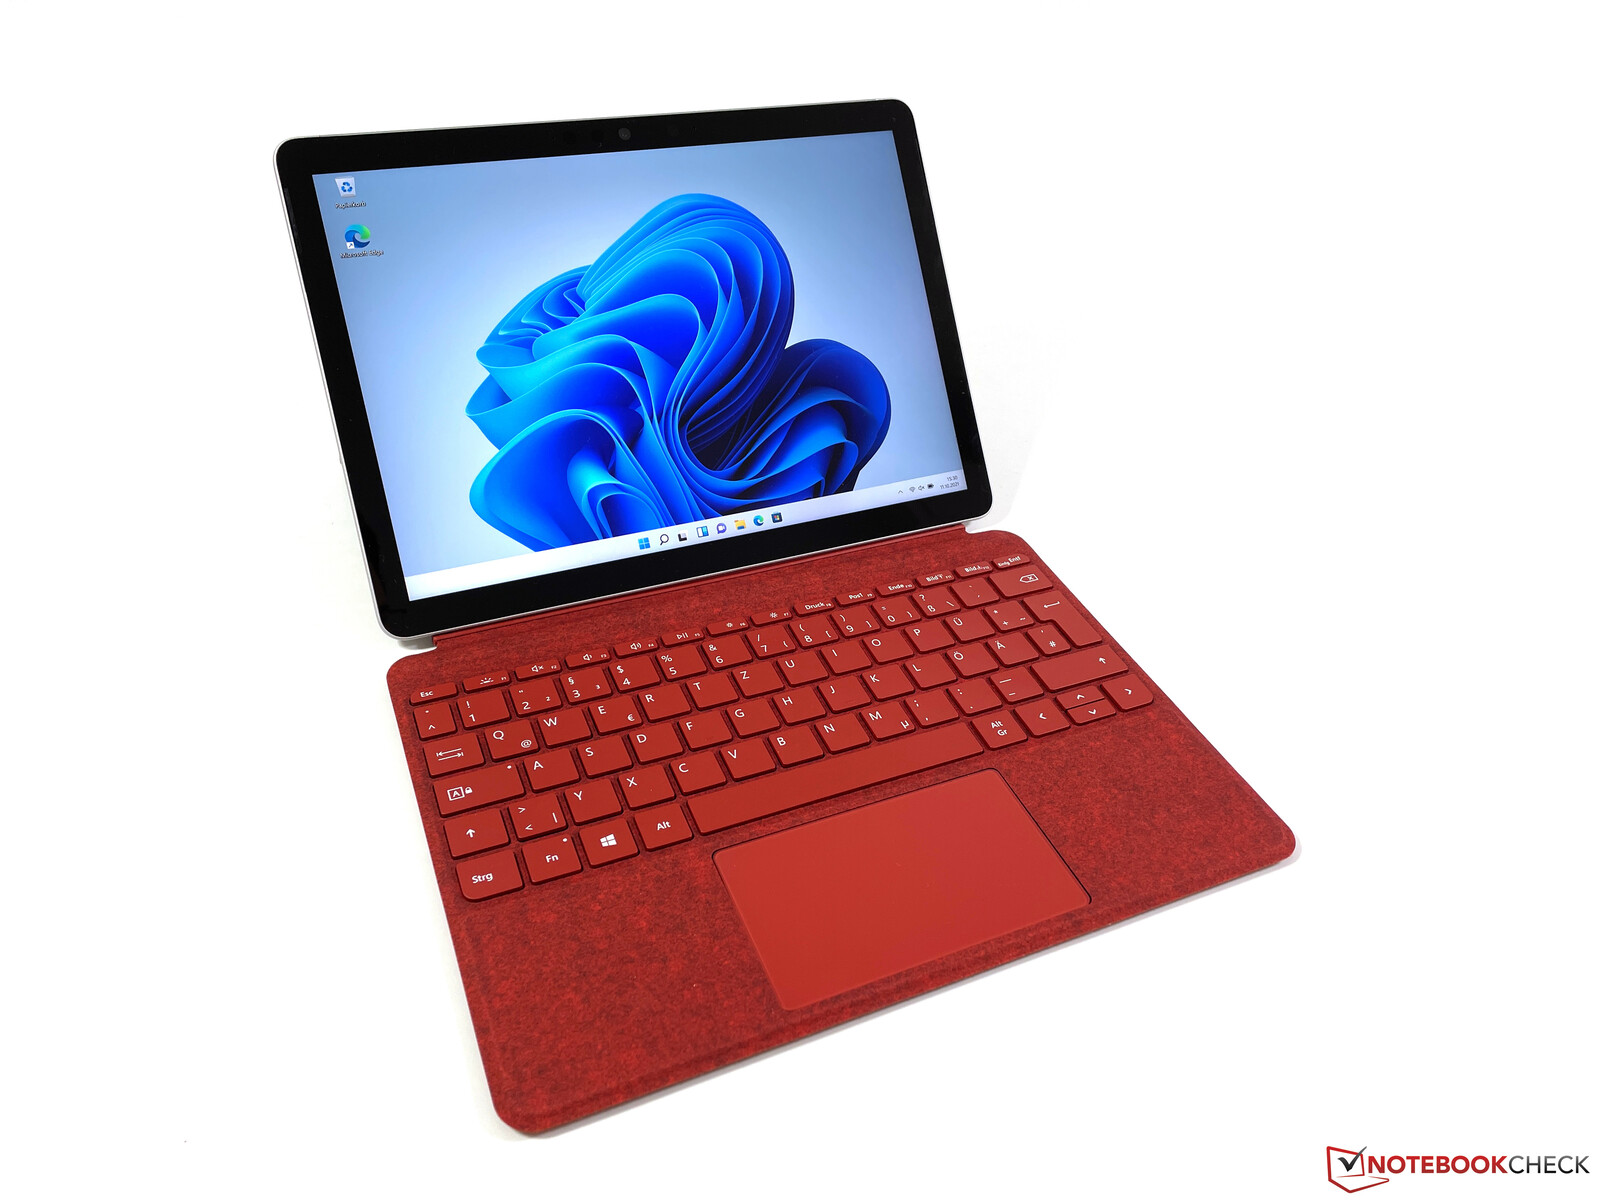
Case, equipment and input devices
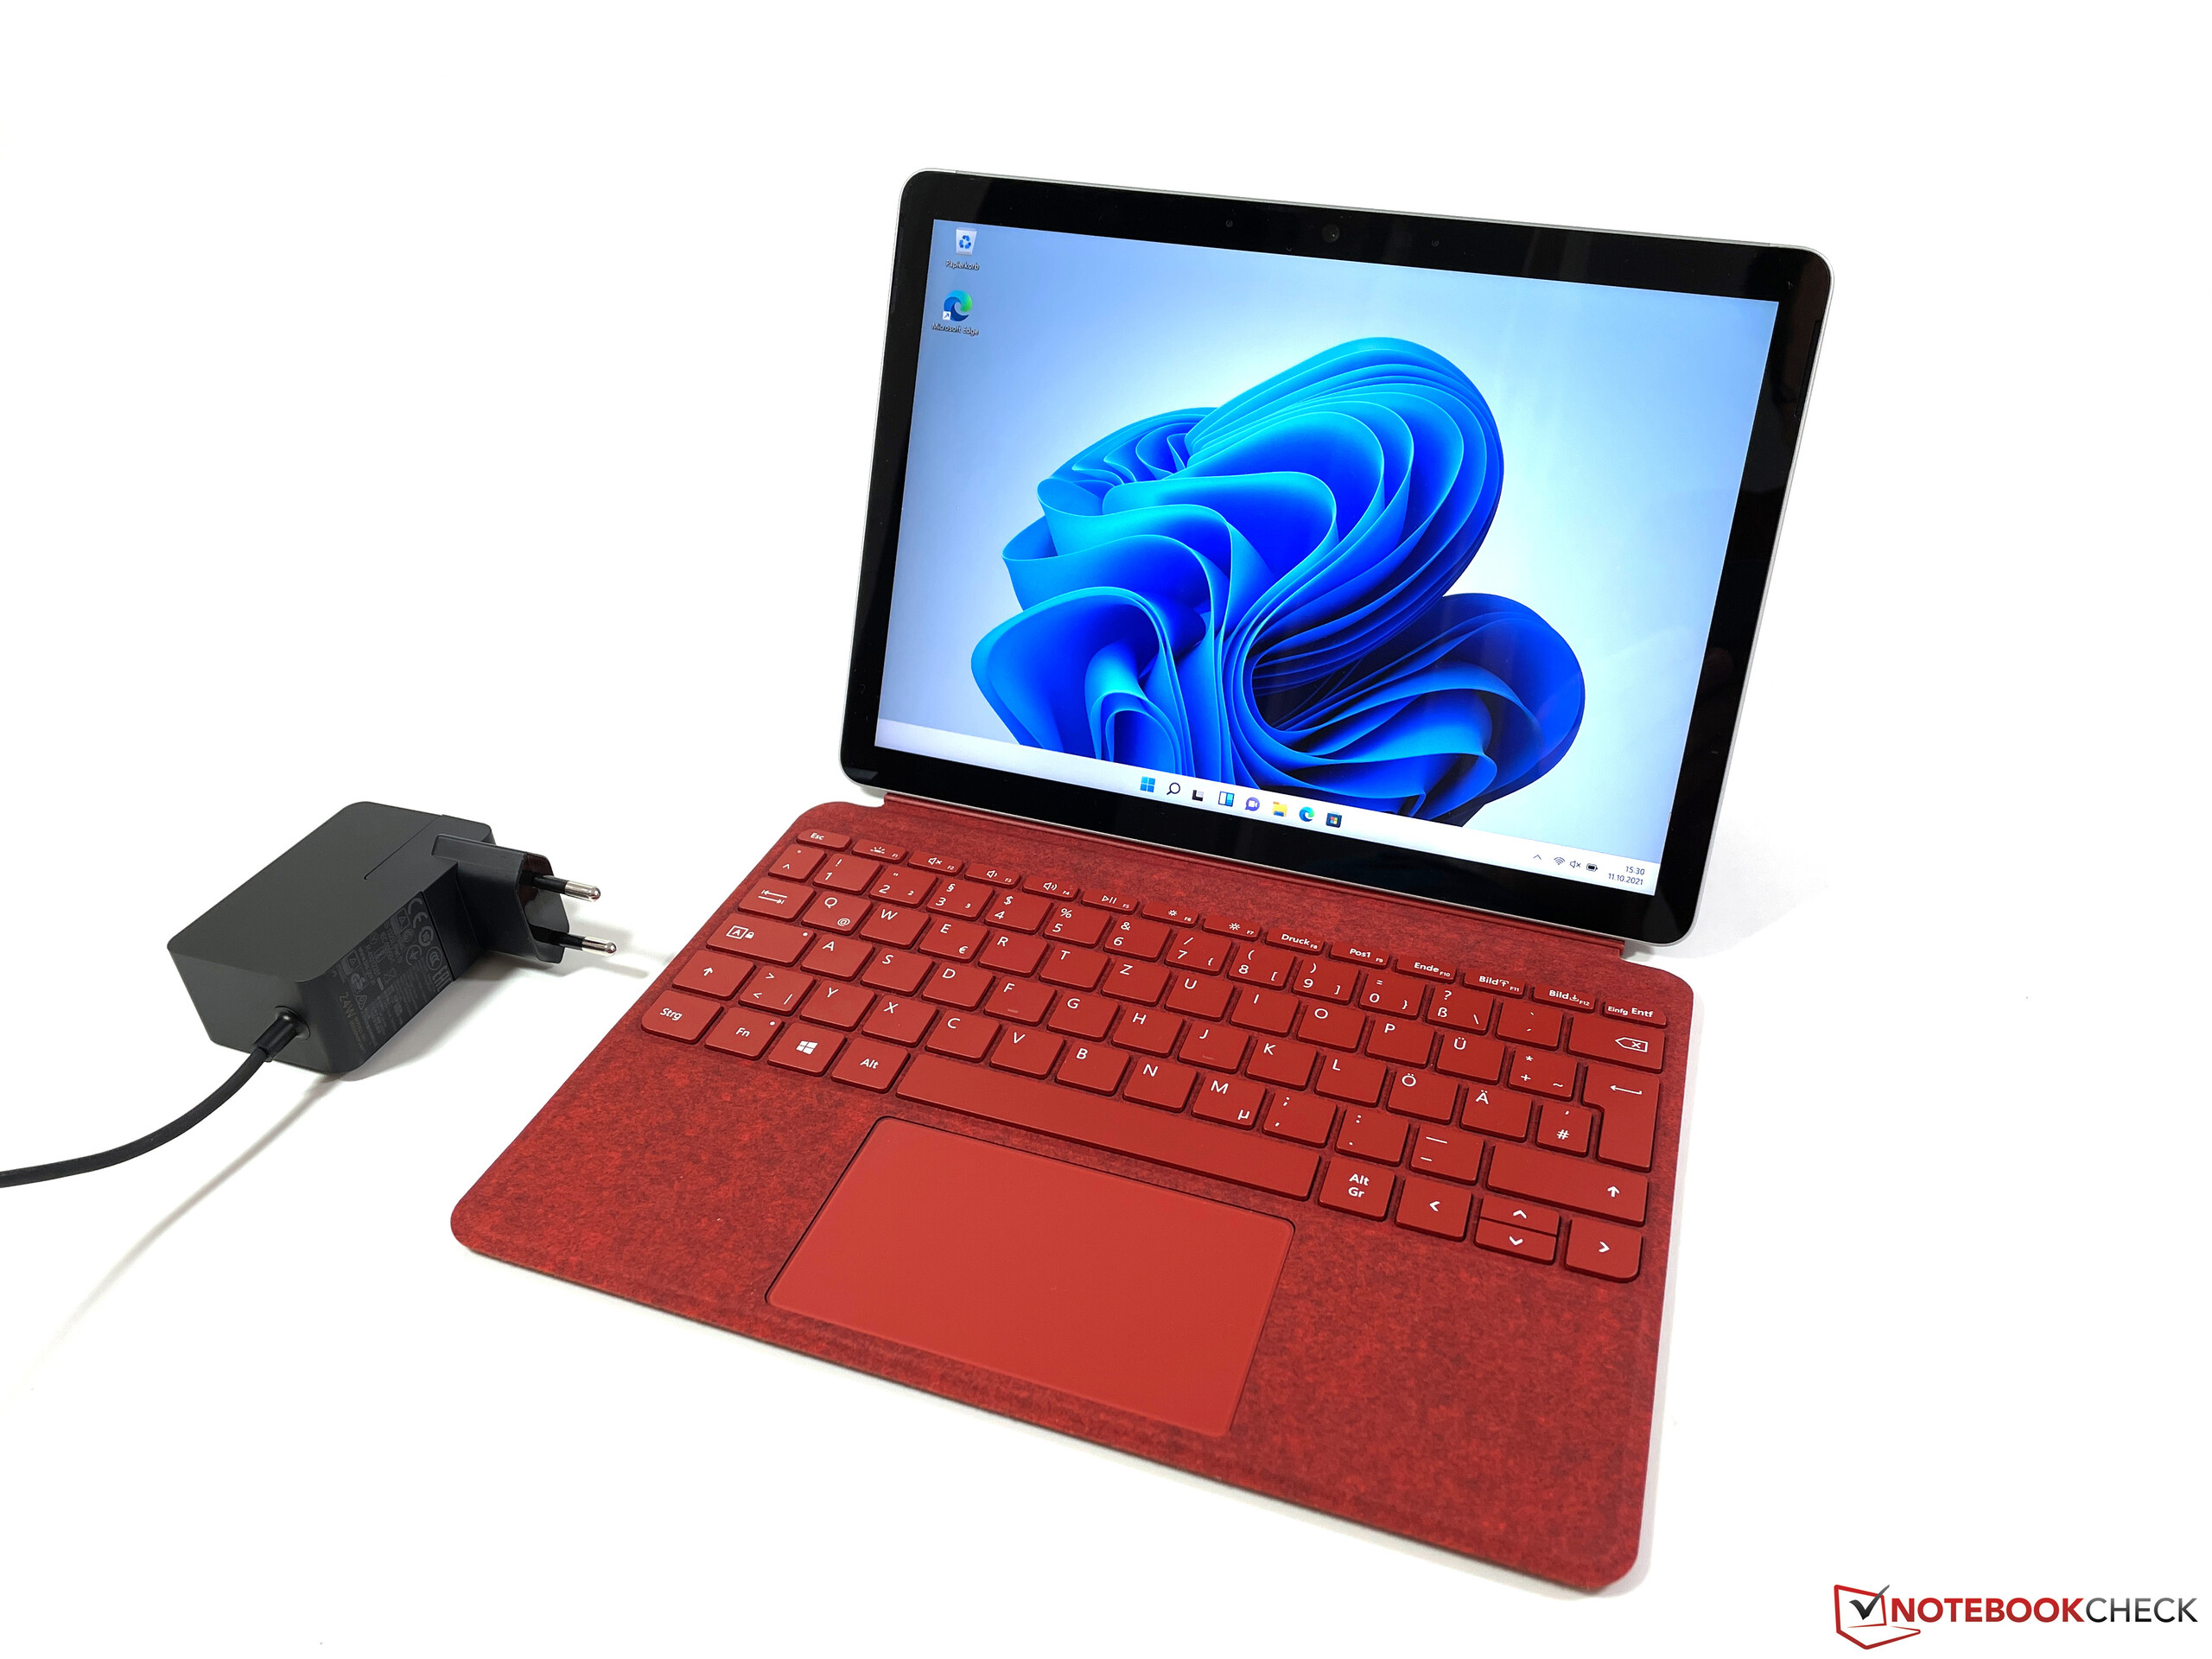
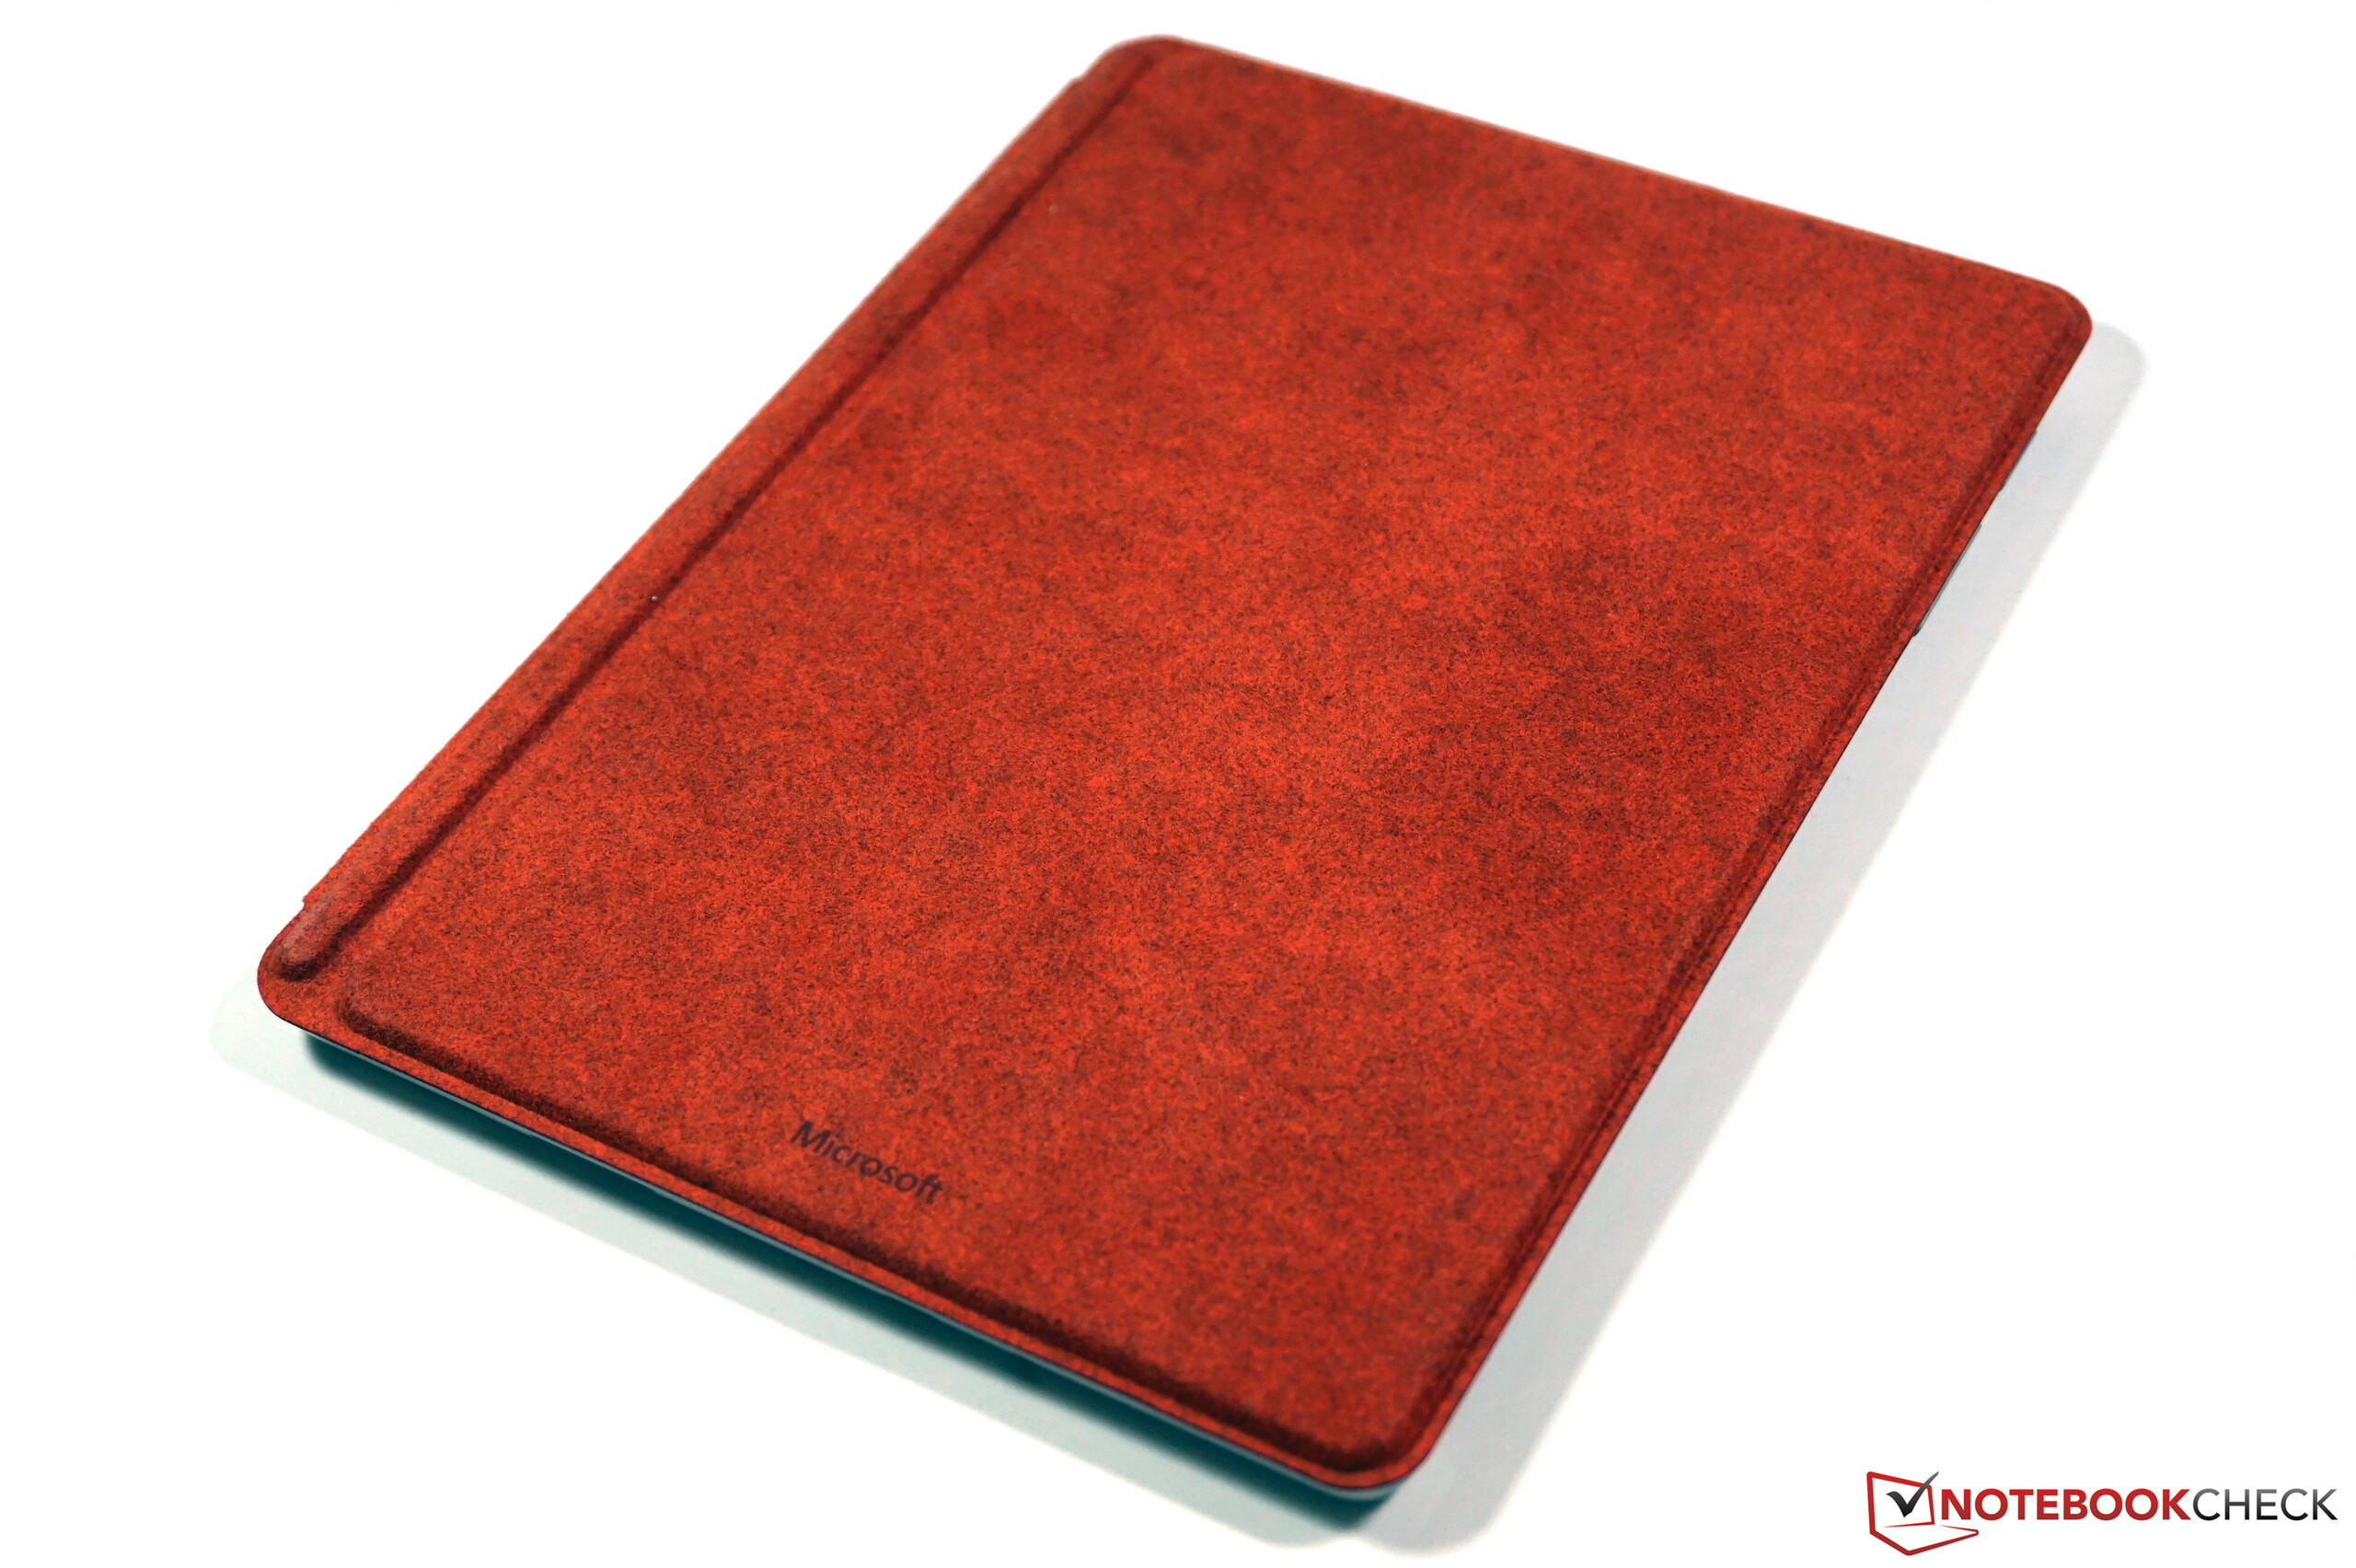
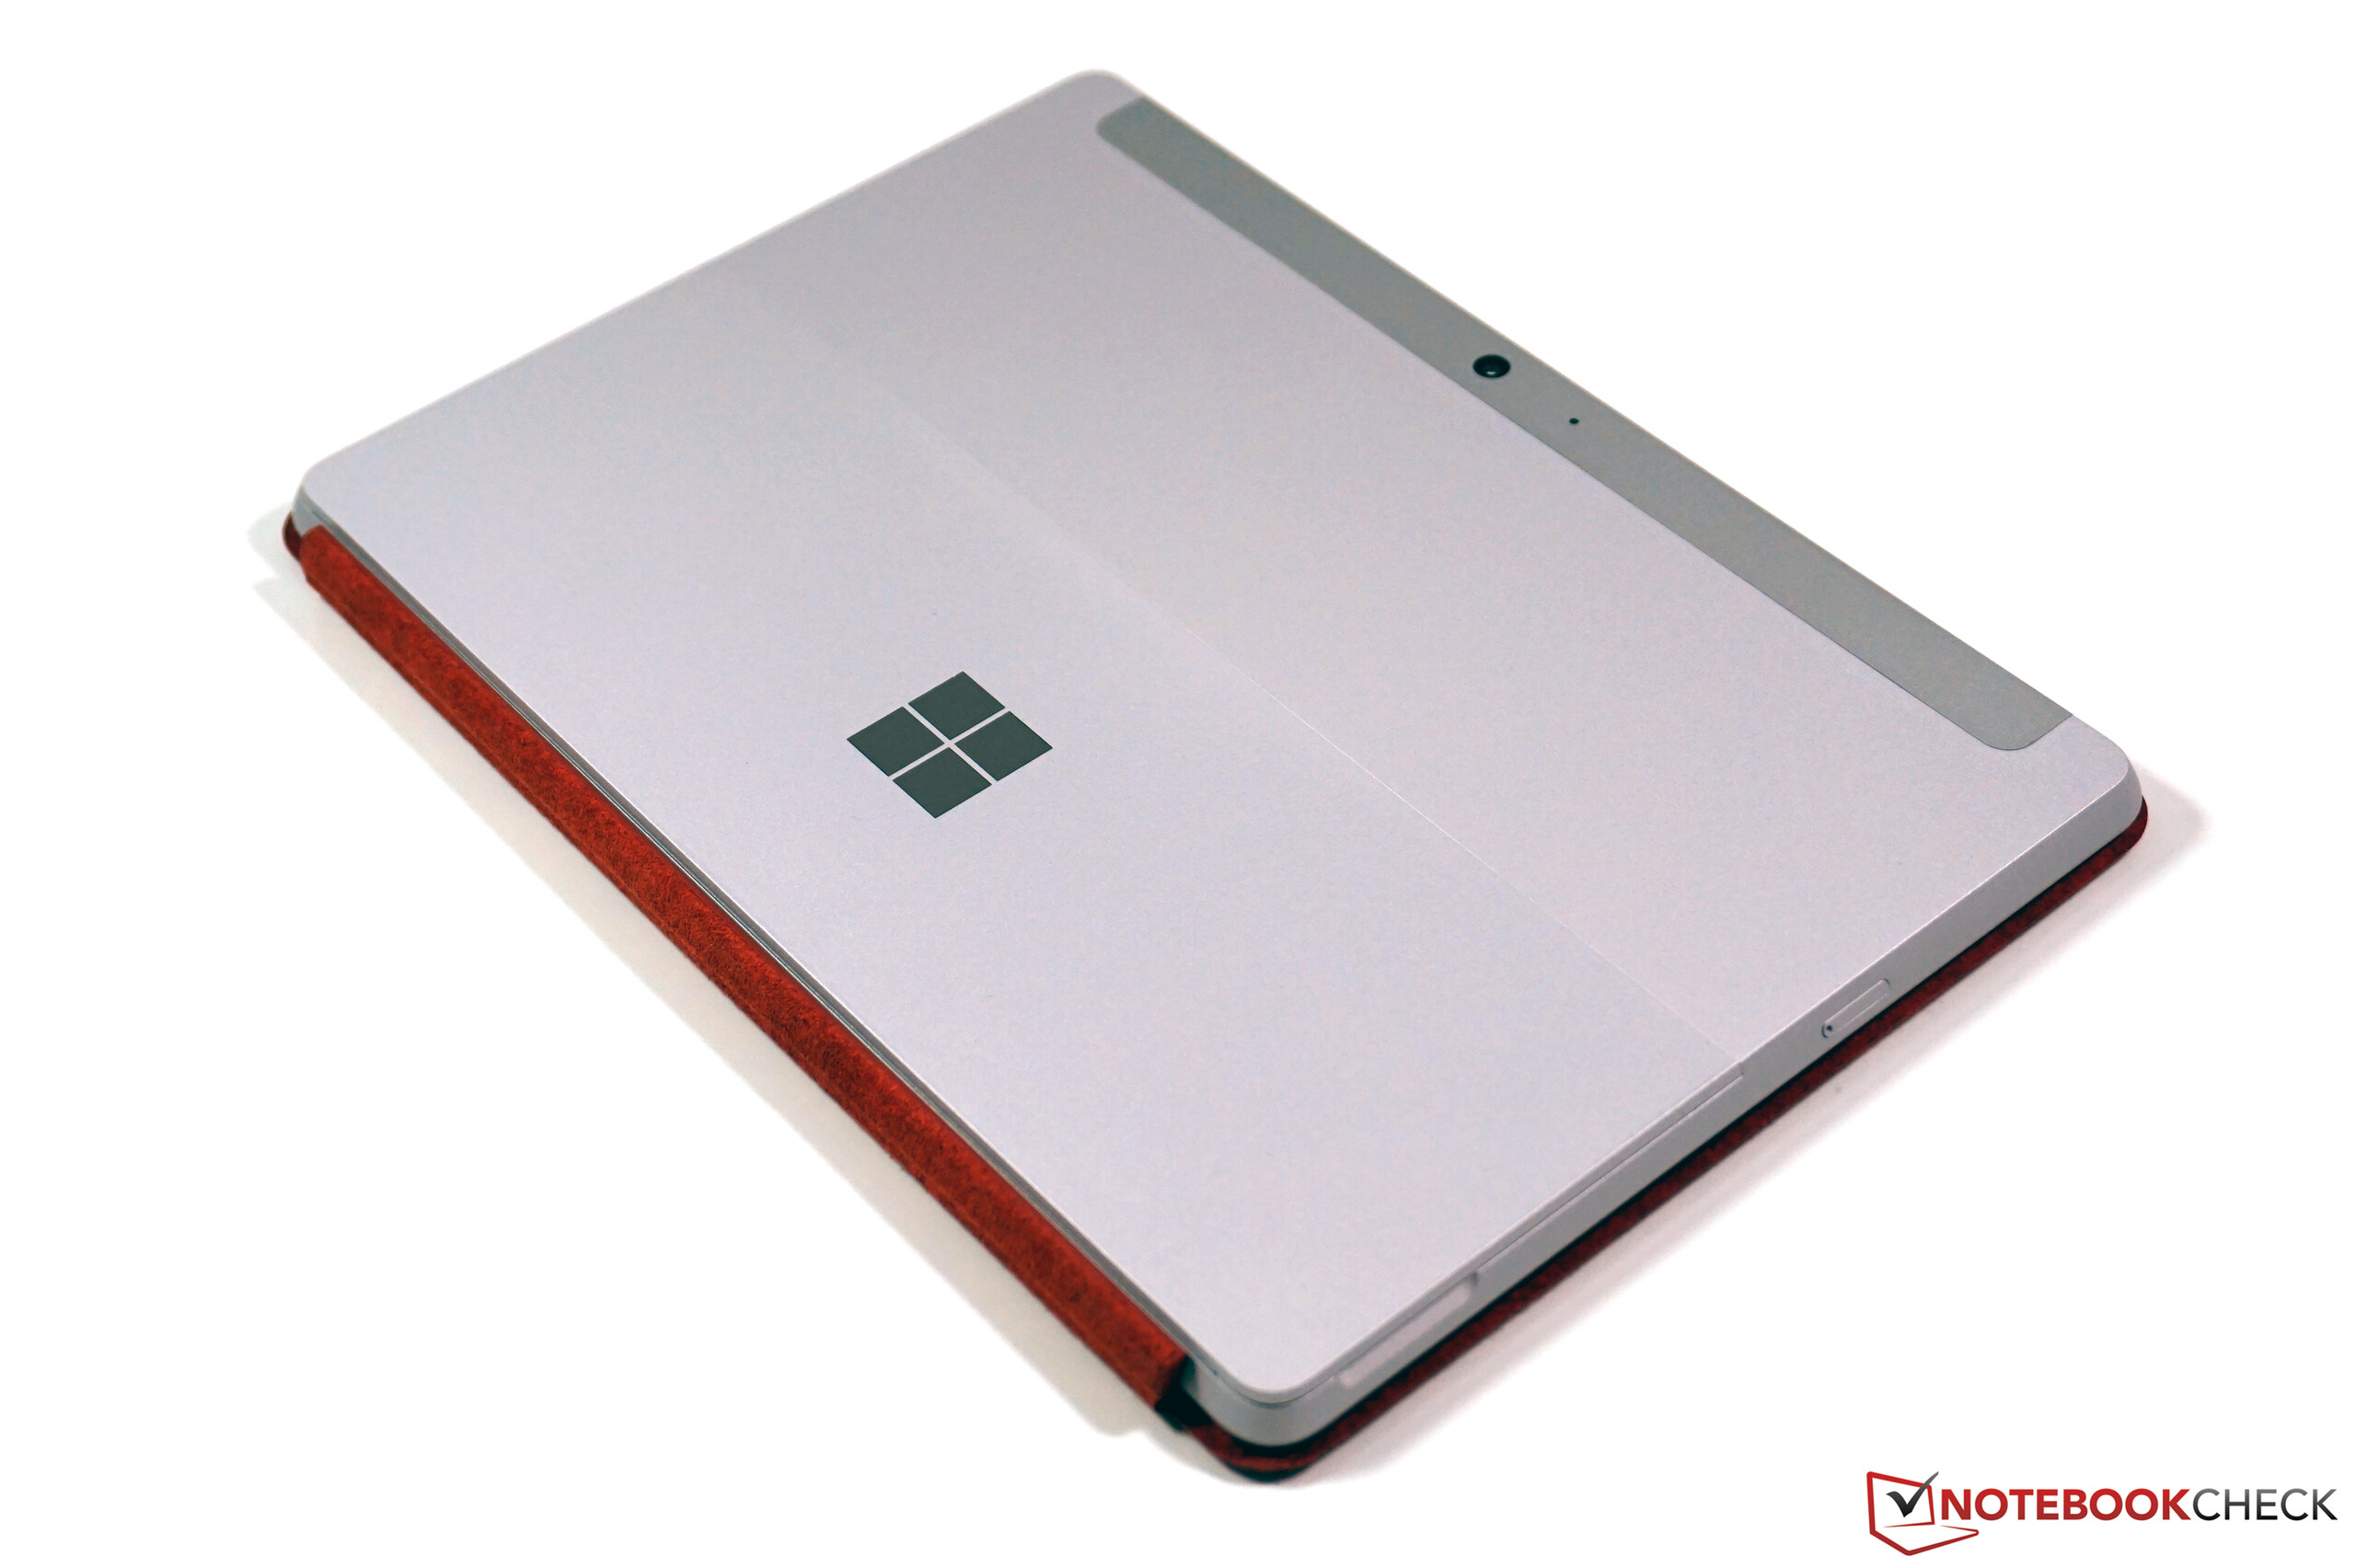
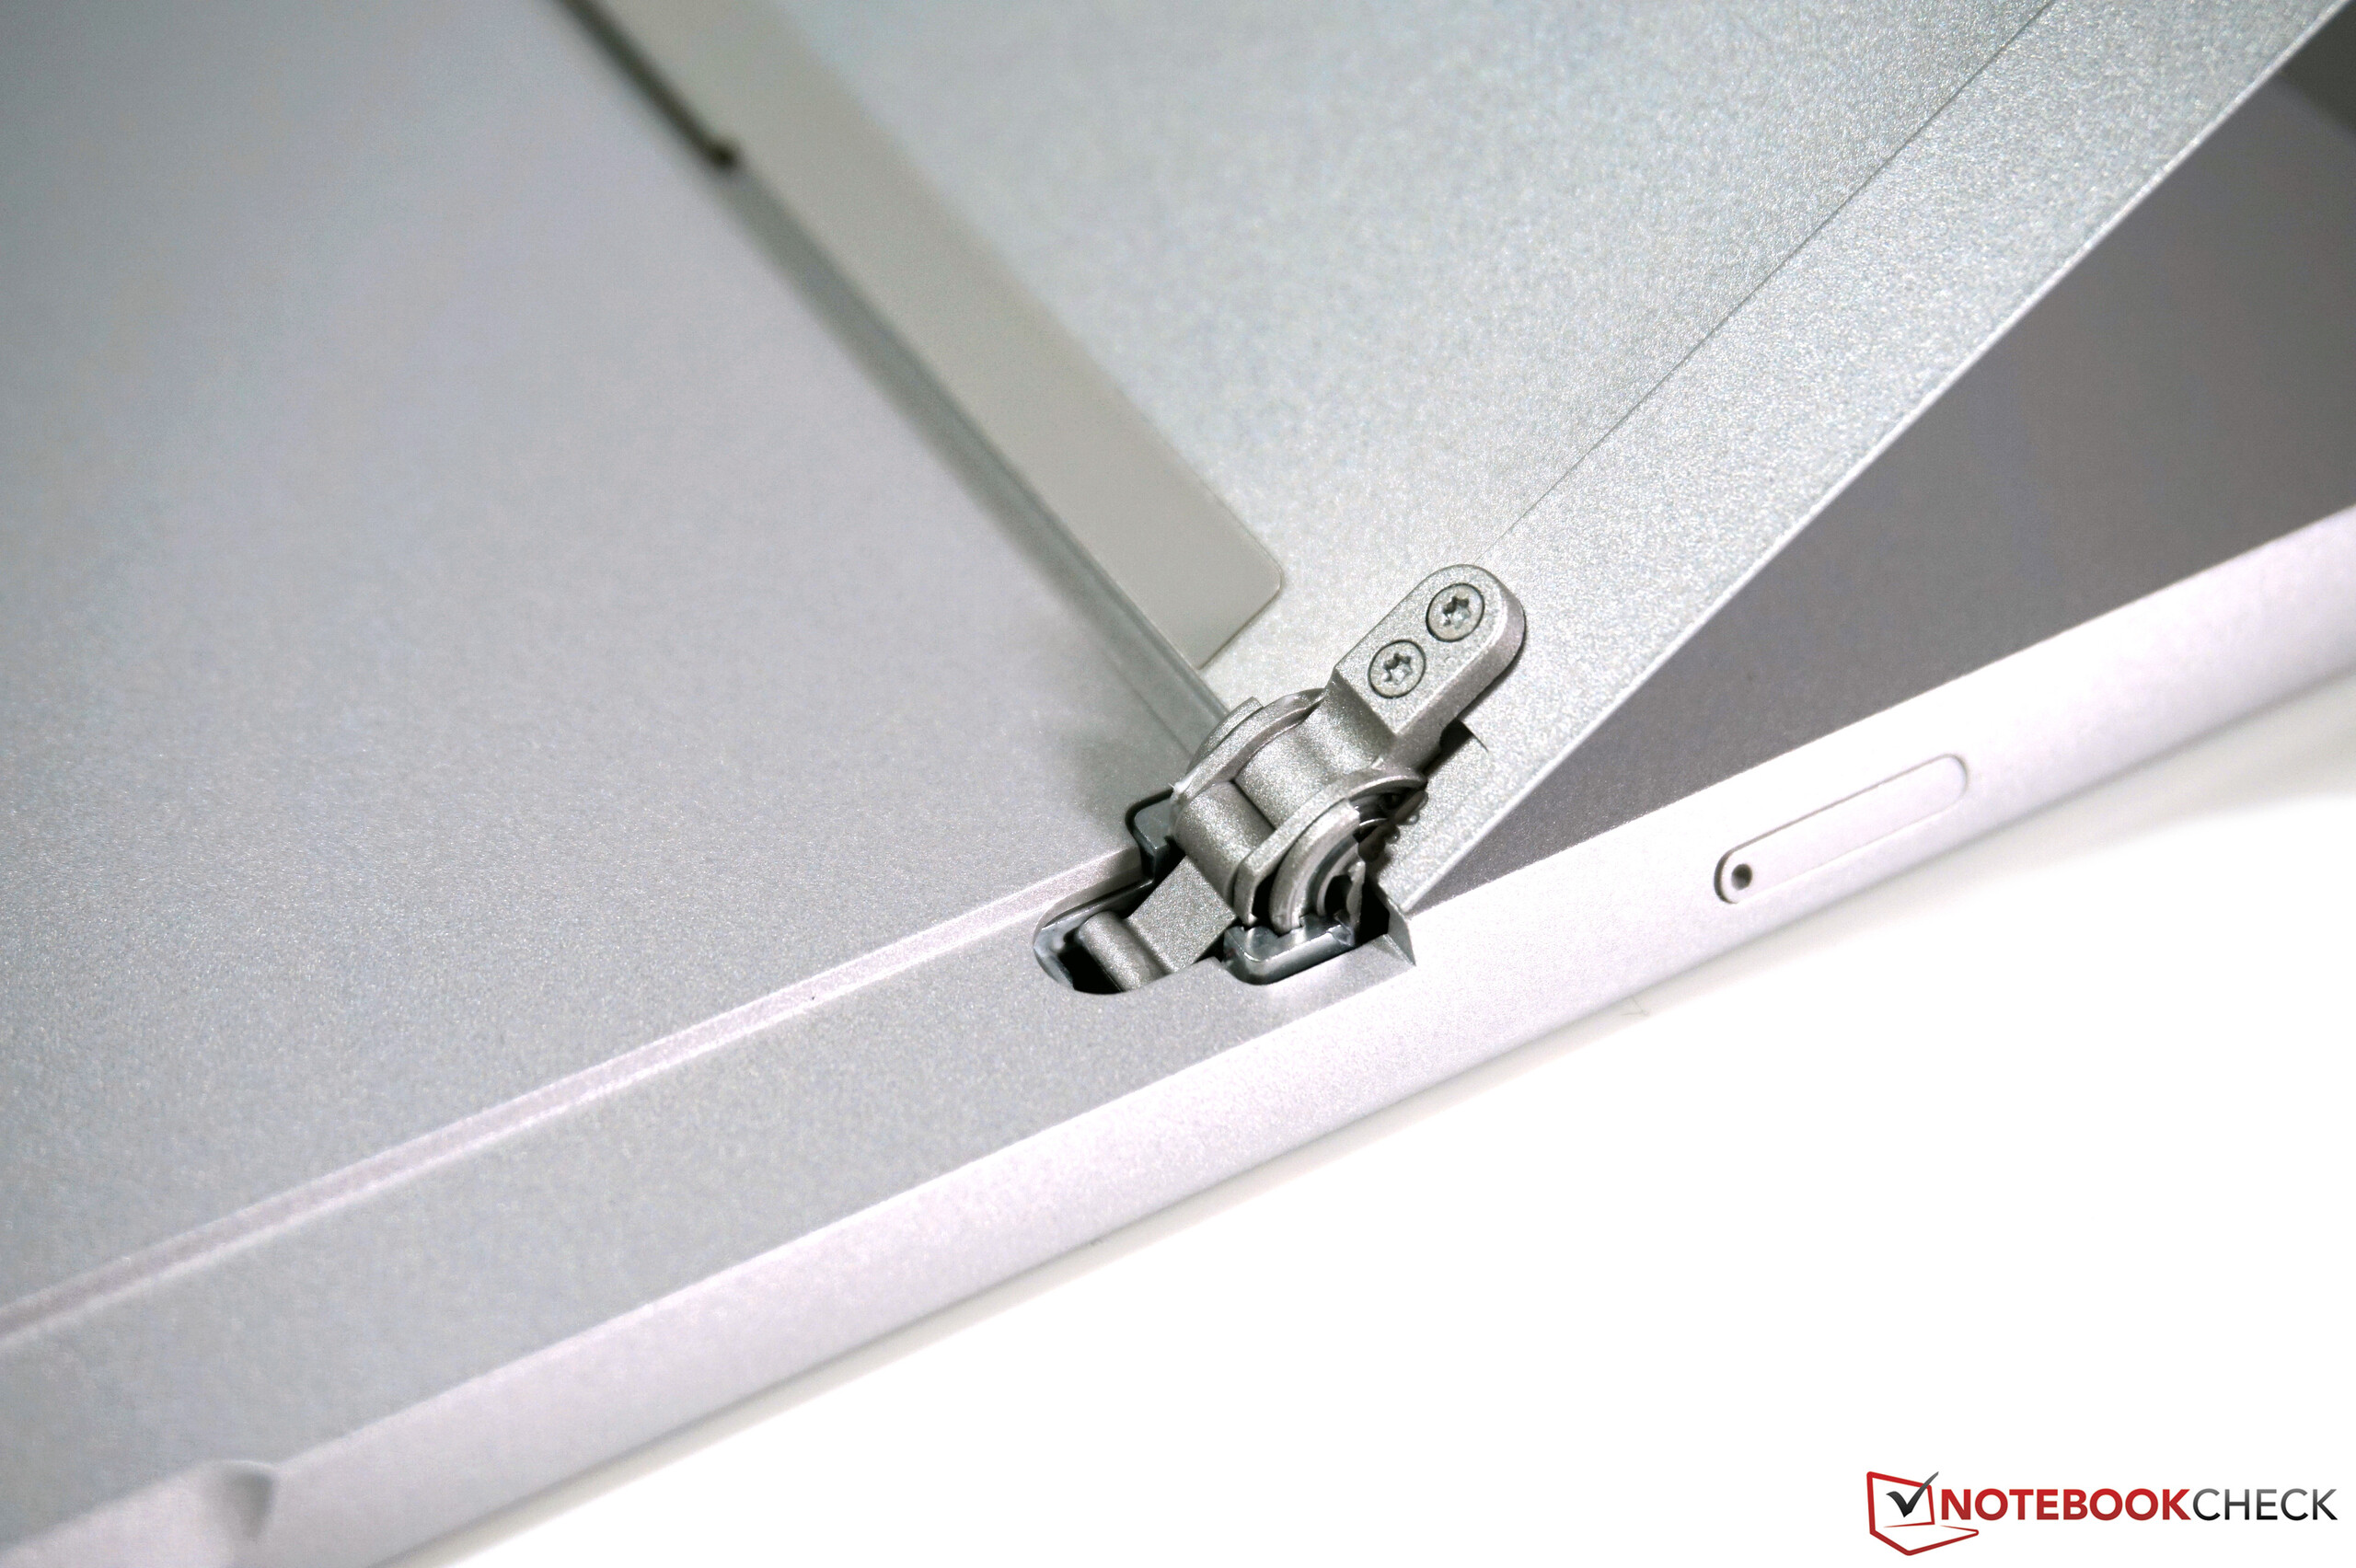
The case of the Surface Go has not been changed and still convinces with the high-quality workmanship. The magnesium casing is very sturdy and the various optional keyboard covers allow for a certain degree of customization. The red Alcantara cover of our review sample costs another 129 Euros (~$150). However, we still like the illuminated keyboard. Of course, the keys are relatively small due to the compact device, but the typing feel is crisp and precise.
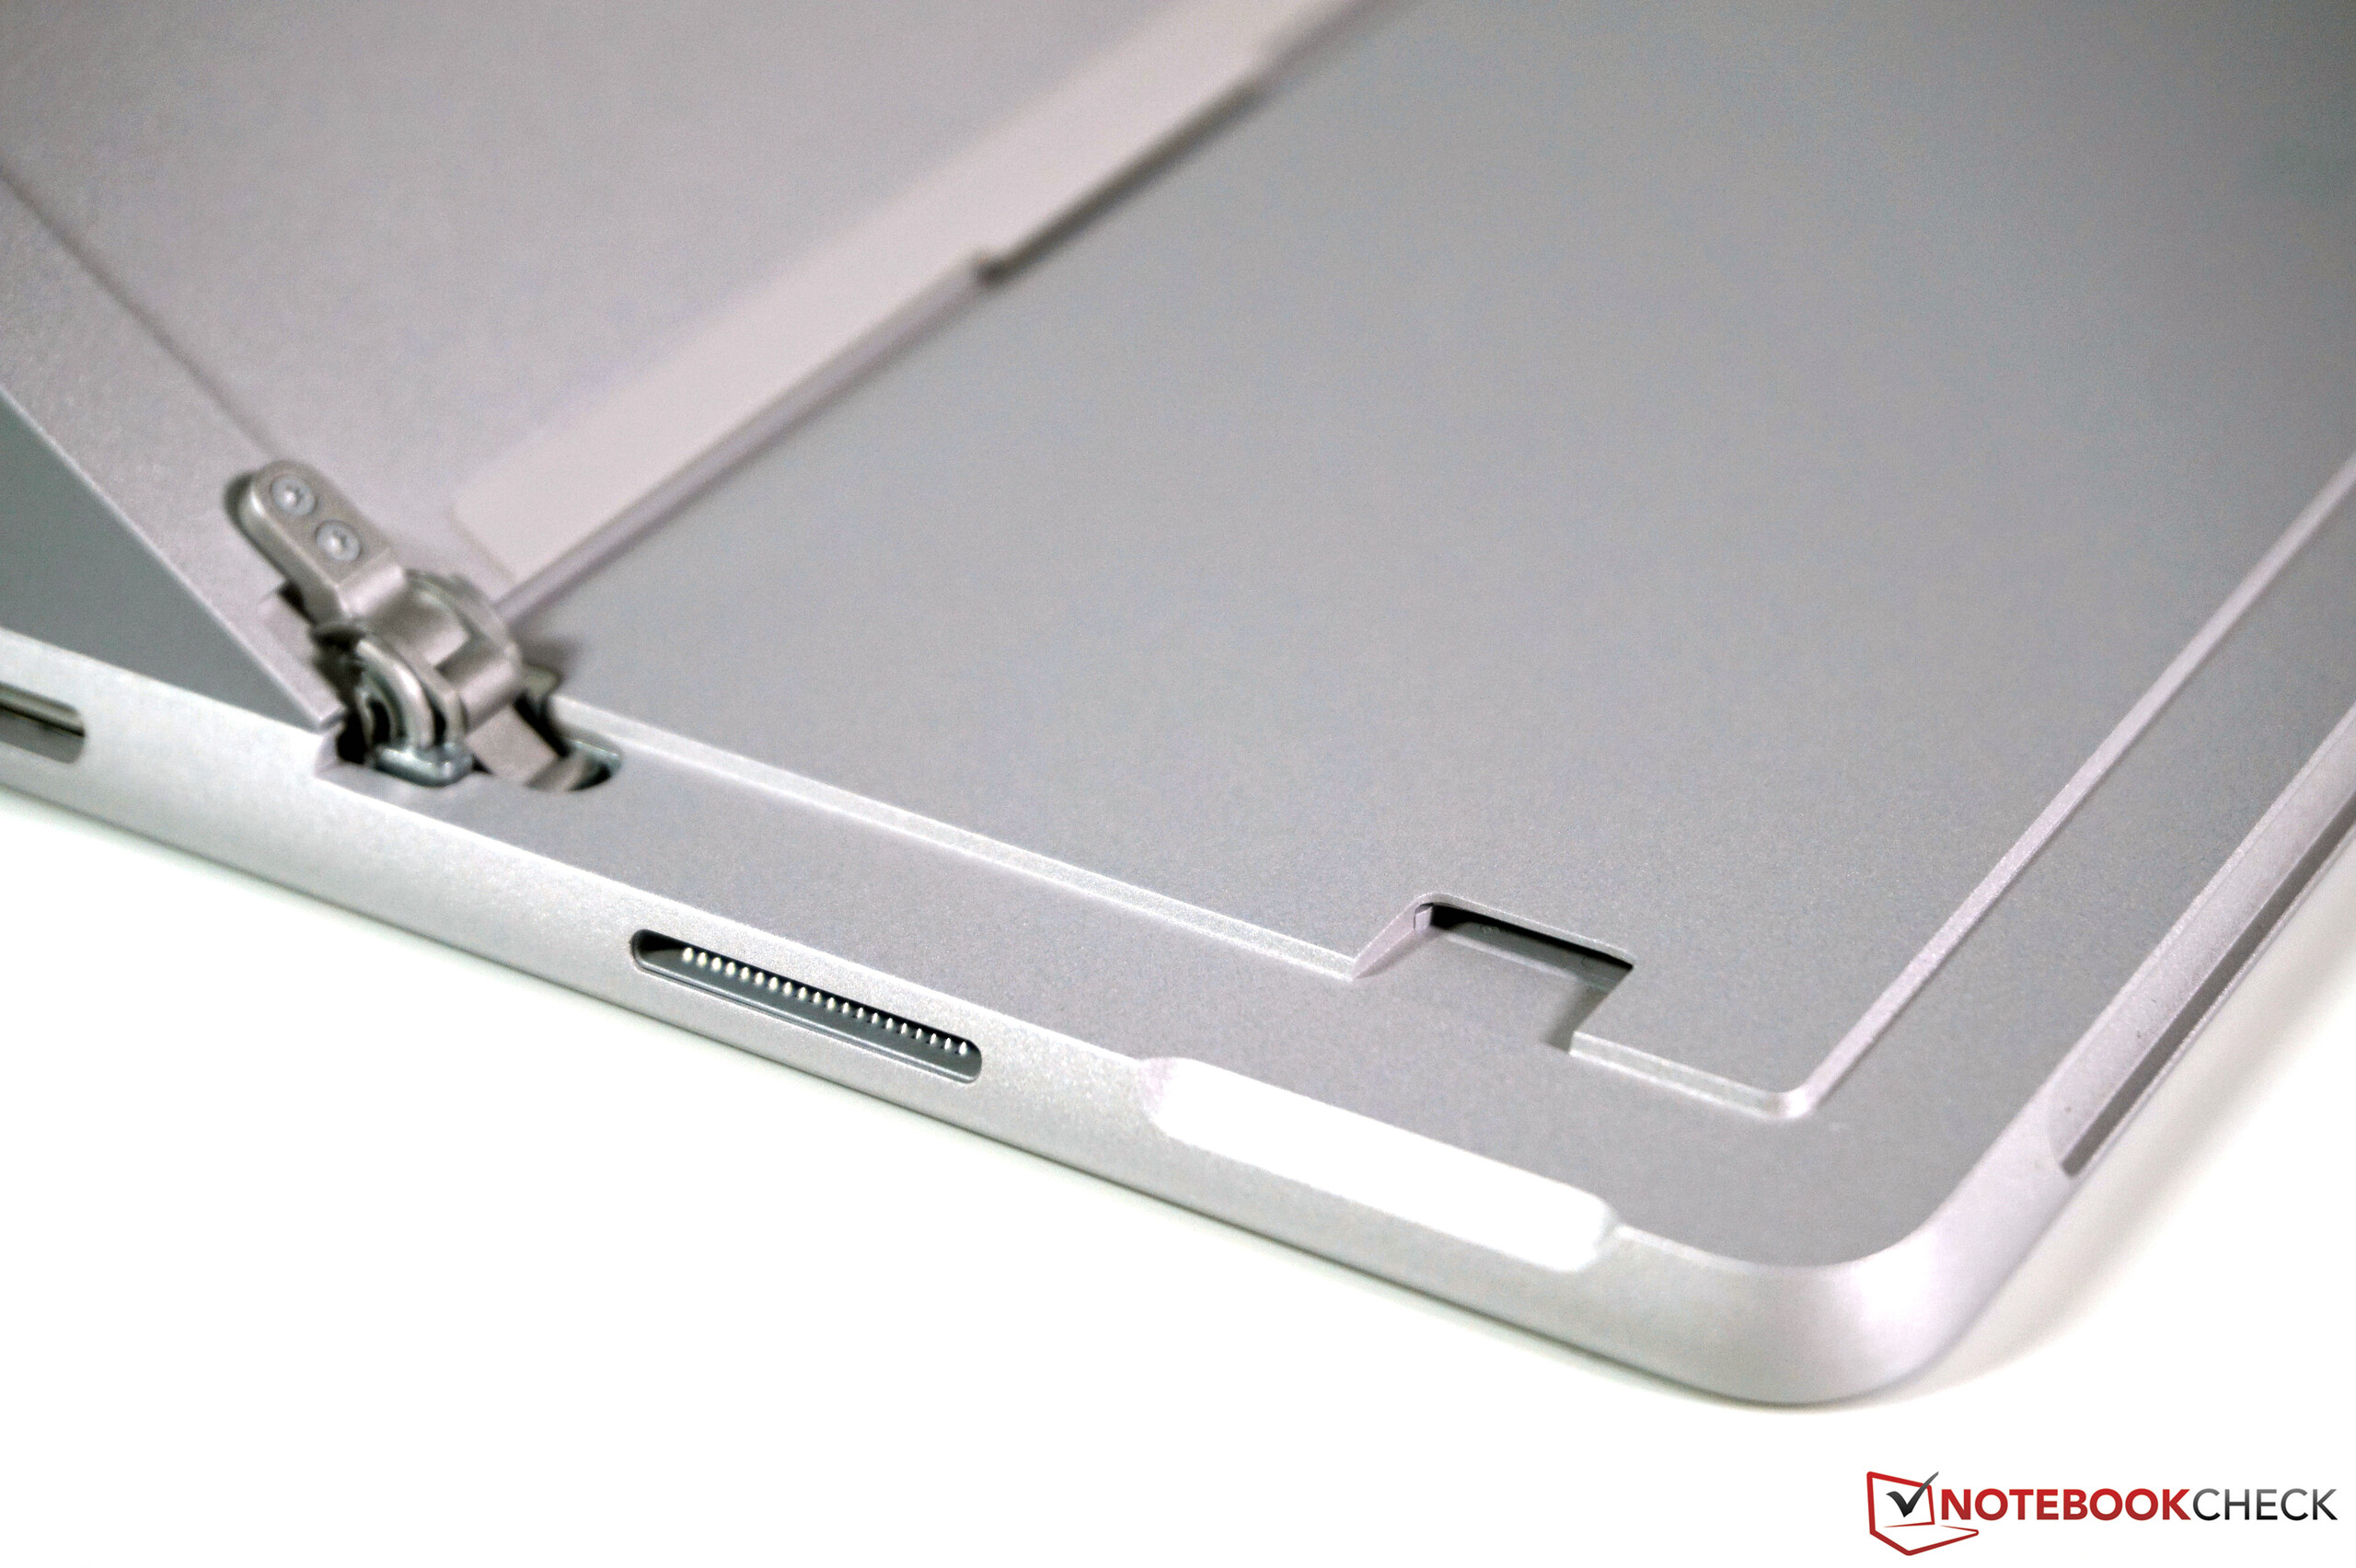
Besides the USB-C connector, which can also be used for charging, Microsoft still relies on its own Surface Connector, which is often a bit annoying in practice due to its orientation (cable either sticks upwards or hangs around the keyboard). The WLAN performance is very good and there is still a microSD card reader.
In terms of webcams, the Surface Go 3 has clear advantages over most notebooks because the image quality of the two built-in sensors (5 MP and 8 MP) is simply visibly better. A new feature is the additional IR camera, which now also supports facial recognition with Windows Hello. An LTE module is also available for business customers.
| SD Card Reader | |
| average JPG Copy Test (av. of 3 runs) | |
| Microsoft Surface Go 2, m3-8100Y (Toshiba Exceria Pro M501 64 GB UHS-II) | |
| Microsoft Surface Go 3 Core i3 (AV Pro V60) | |
| Microsoft Surface Pro 7 Core i5-1035G4 (Toshiba Exceria Pro M501 64 GB UHS-II) | |
| Average of class Convertible (28.1 - 197, n=23, last 2 years) | |
| Lenovo Tab P11 Pro (Toshiba Exceria Pro M501) | |
| maximum AS SSD Seq Read Test (1GB) | |
| Average of class Convertible (28.9 - 254, n=22, last 2 years) | |
| Microsoft Surface Go 2, m3-8100Y (Toshiba Exceria Pro M501 64 GB UHS-II) | |
| Microsoft Surface Pro 7 Core i5-1035G4 (Toshiba Exceria Pro M501 64 GB UHS-II) | |
| Microsoft Surface Go 3 Core i3 (AV Pro V60) | |


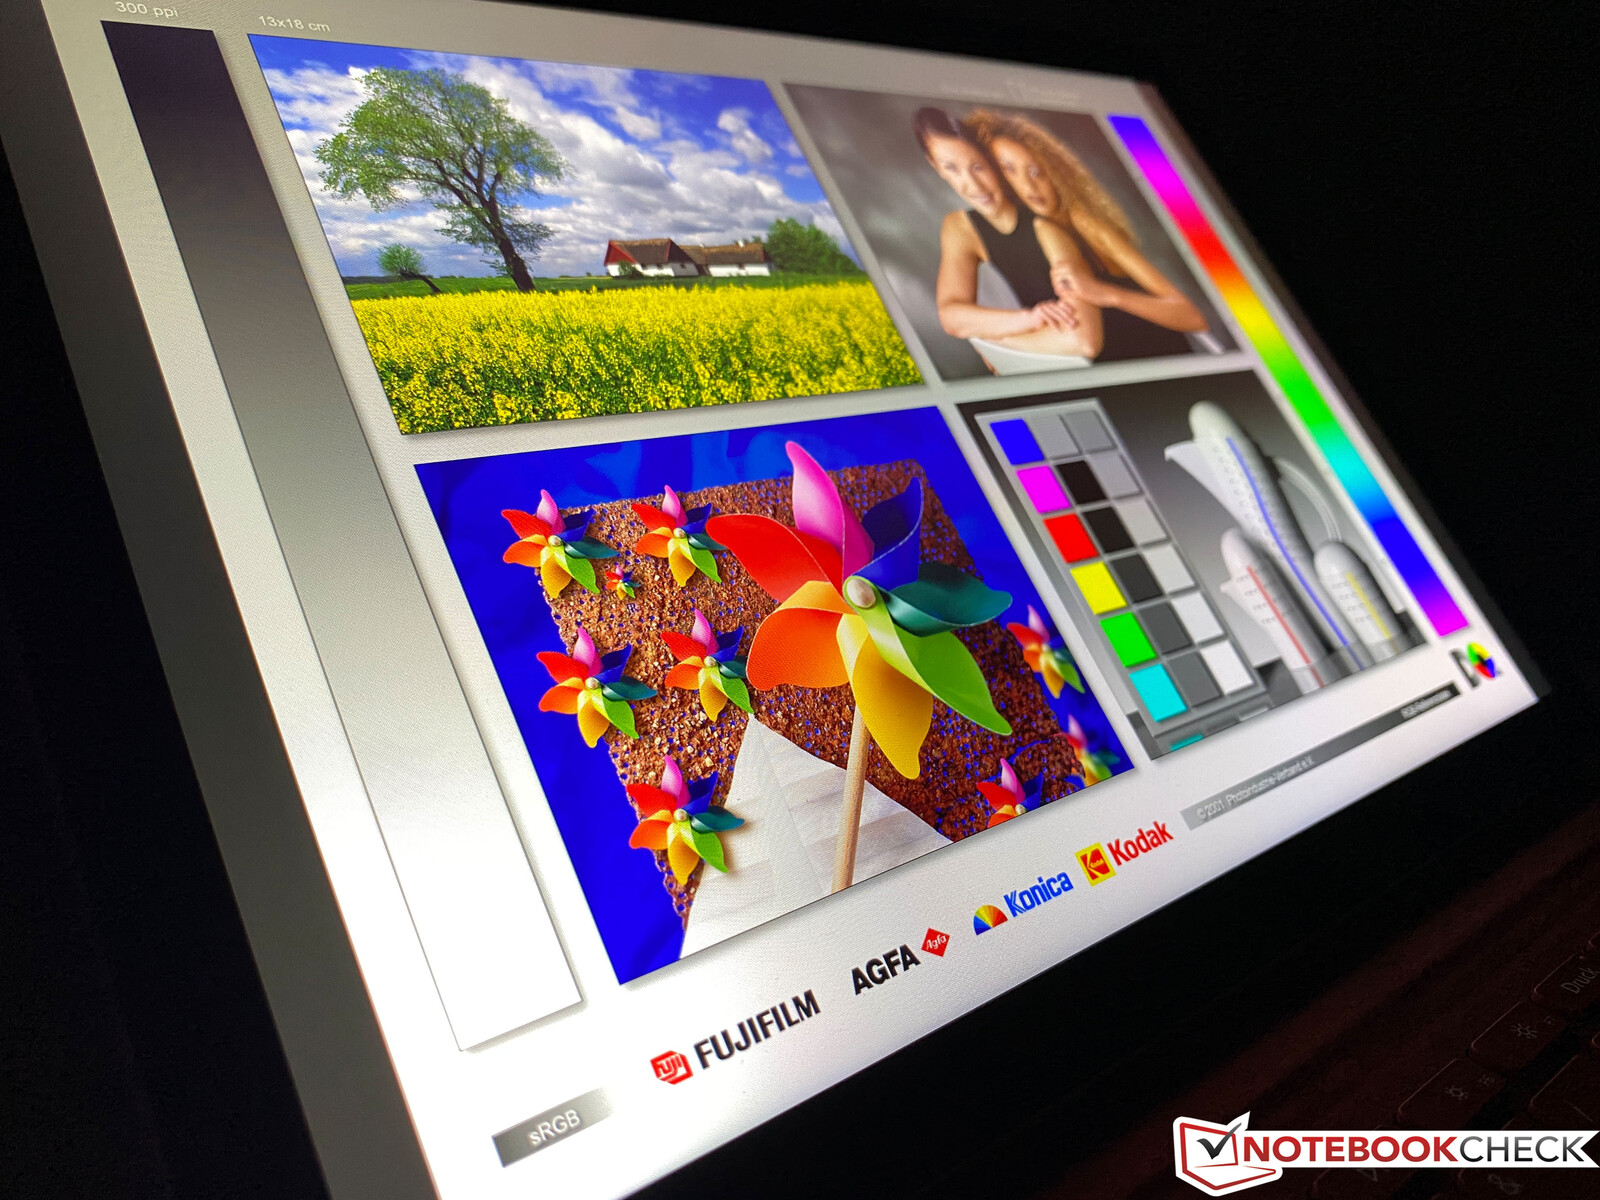
Display - Surface Go continues with 3:2 touchscreen
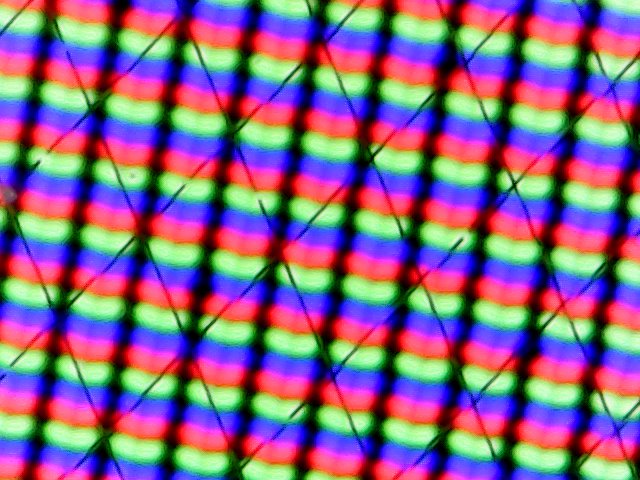
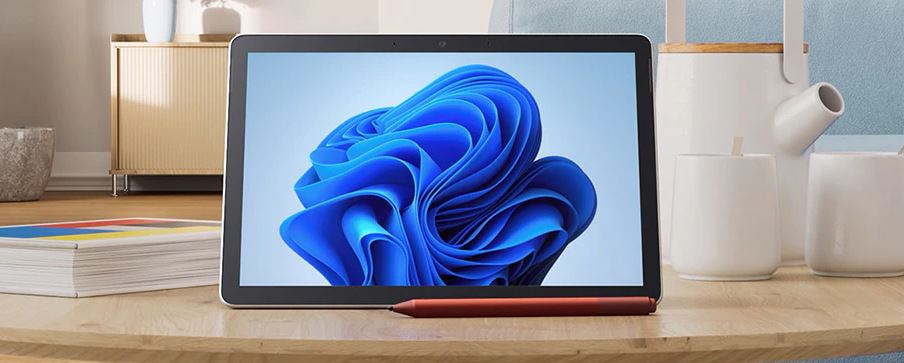
Microsoft also leaves the display untouched and even installs the same panel (NV105WAM-N31) with a resolution of 1,920 x 1,280 pixels in 3:2 format. This results in very sharp pictures on the compact 10.5-inch touchscreen and the panel's overall picture impression is very good. Clouding is also not a big problem.
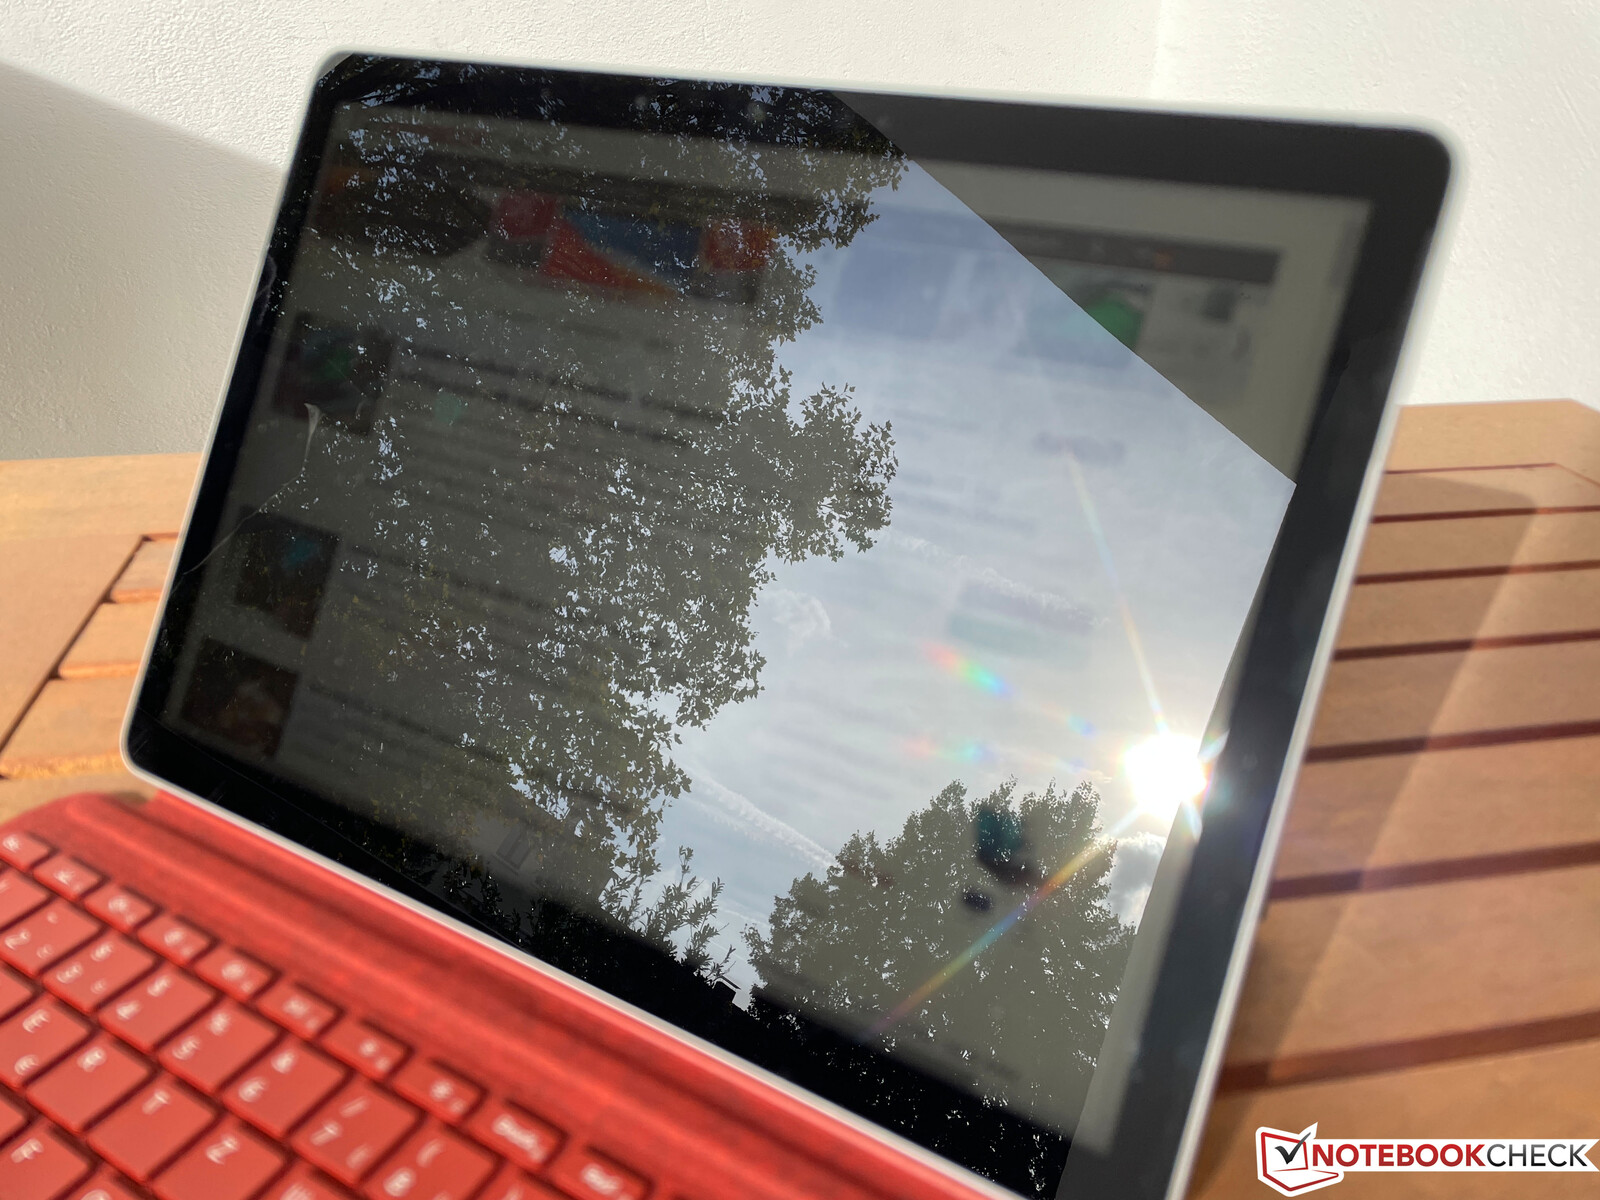
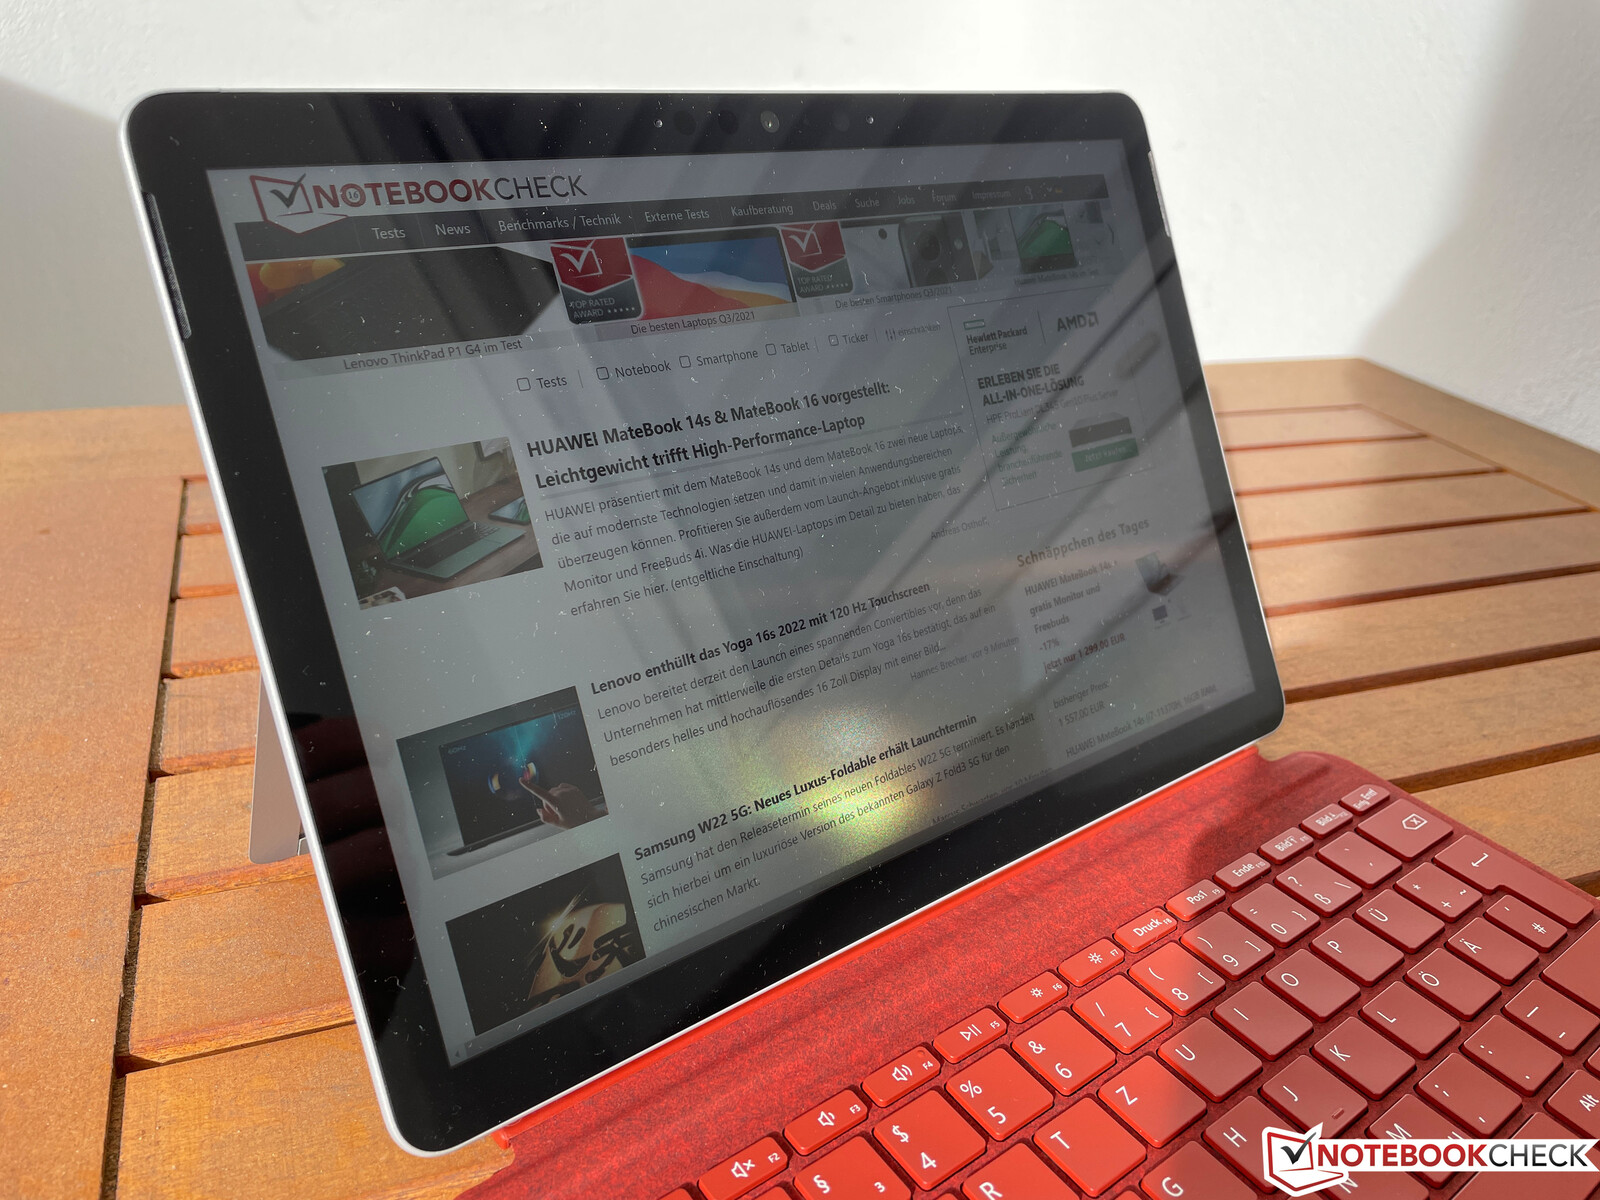
In terms of measurements, there are hardly any changes compared to the predecessor. The brightness of a bit more than 400 cd/m² is sufficient in many situations, but the small panel should be even brighter outdoors, since reflections are quickly visible.
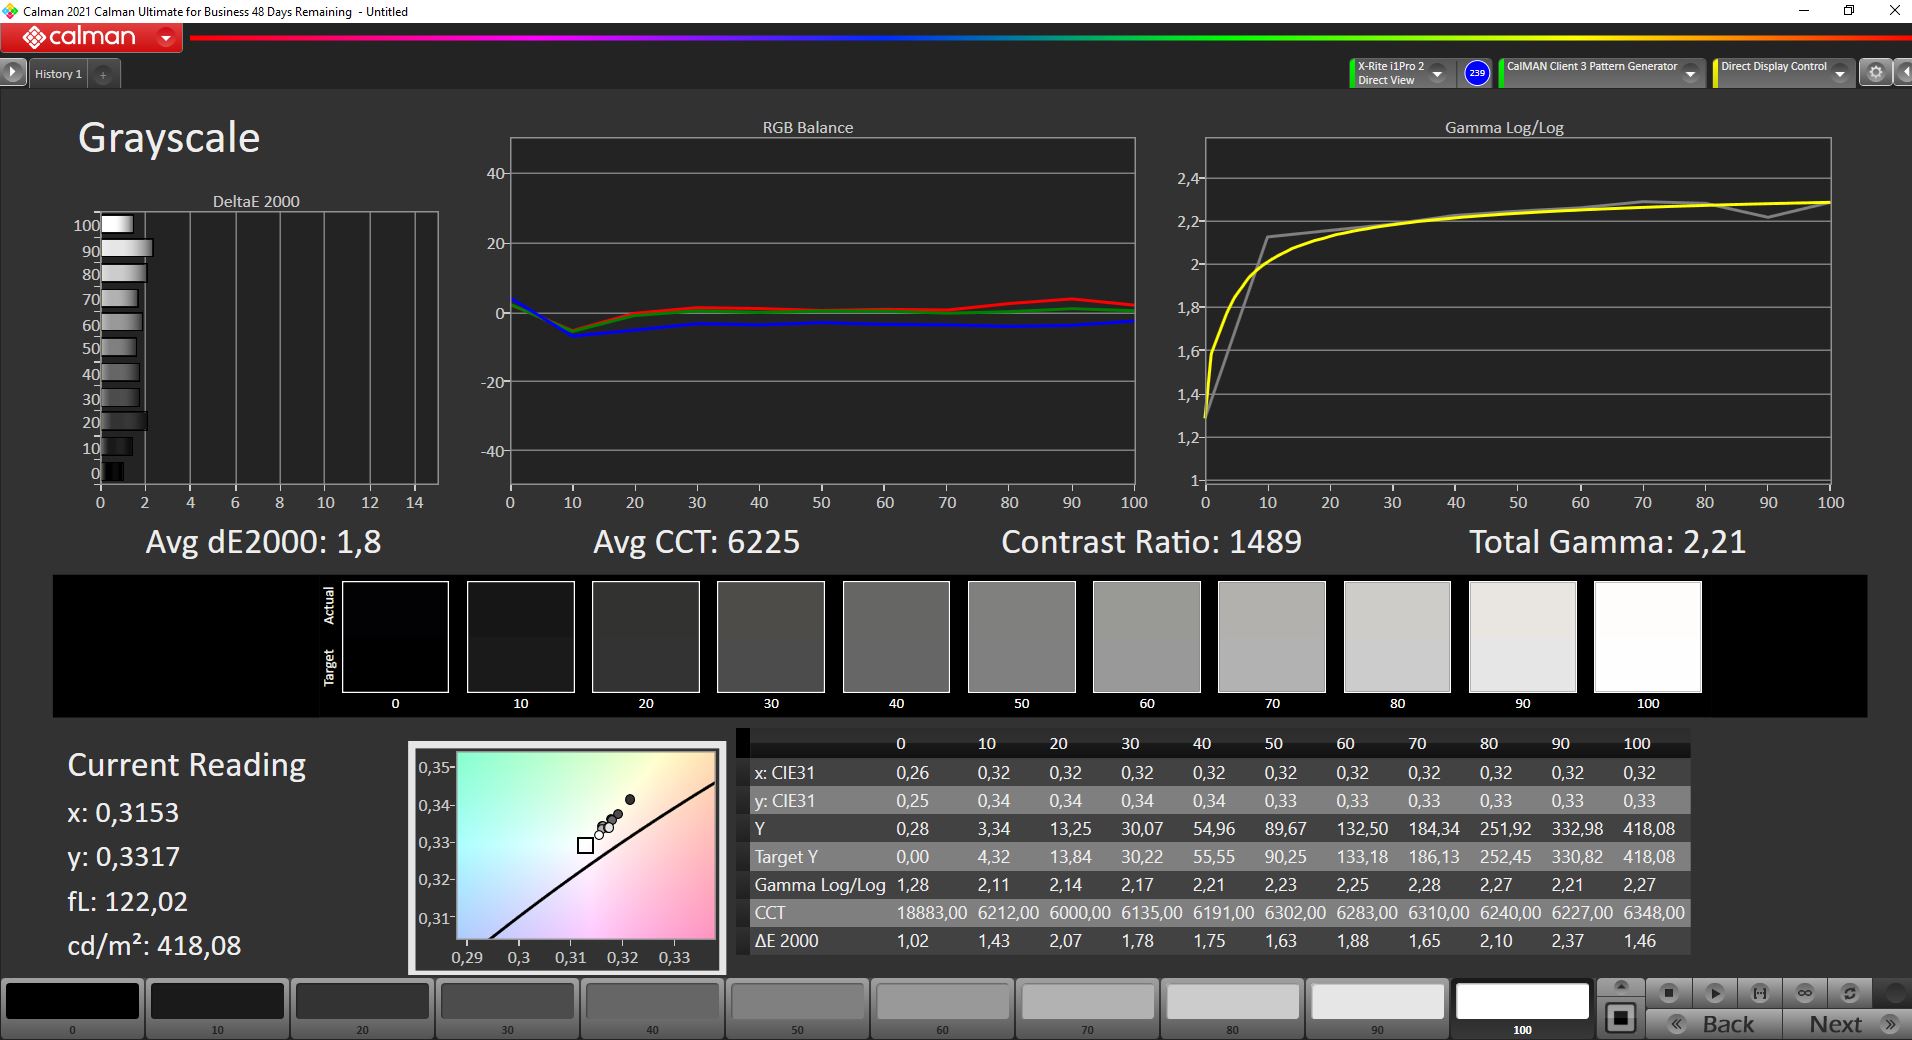
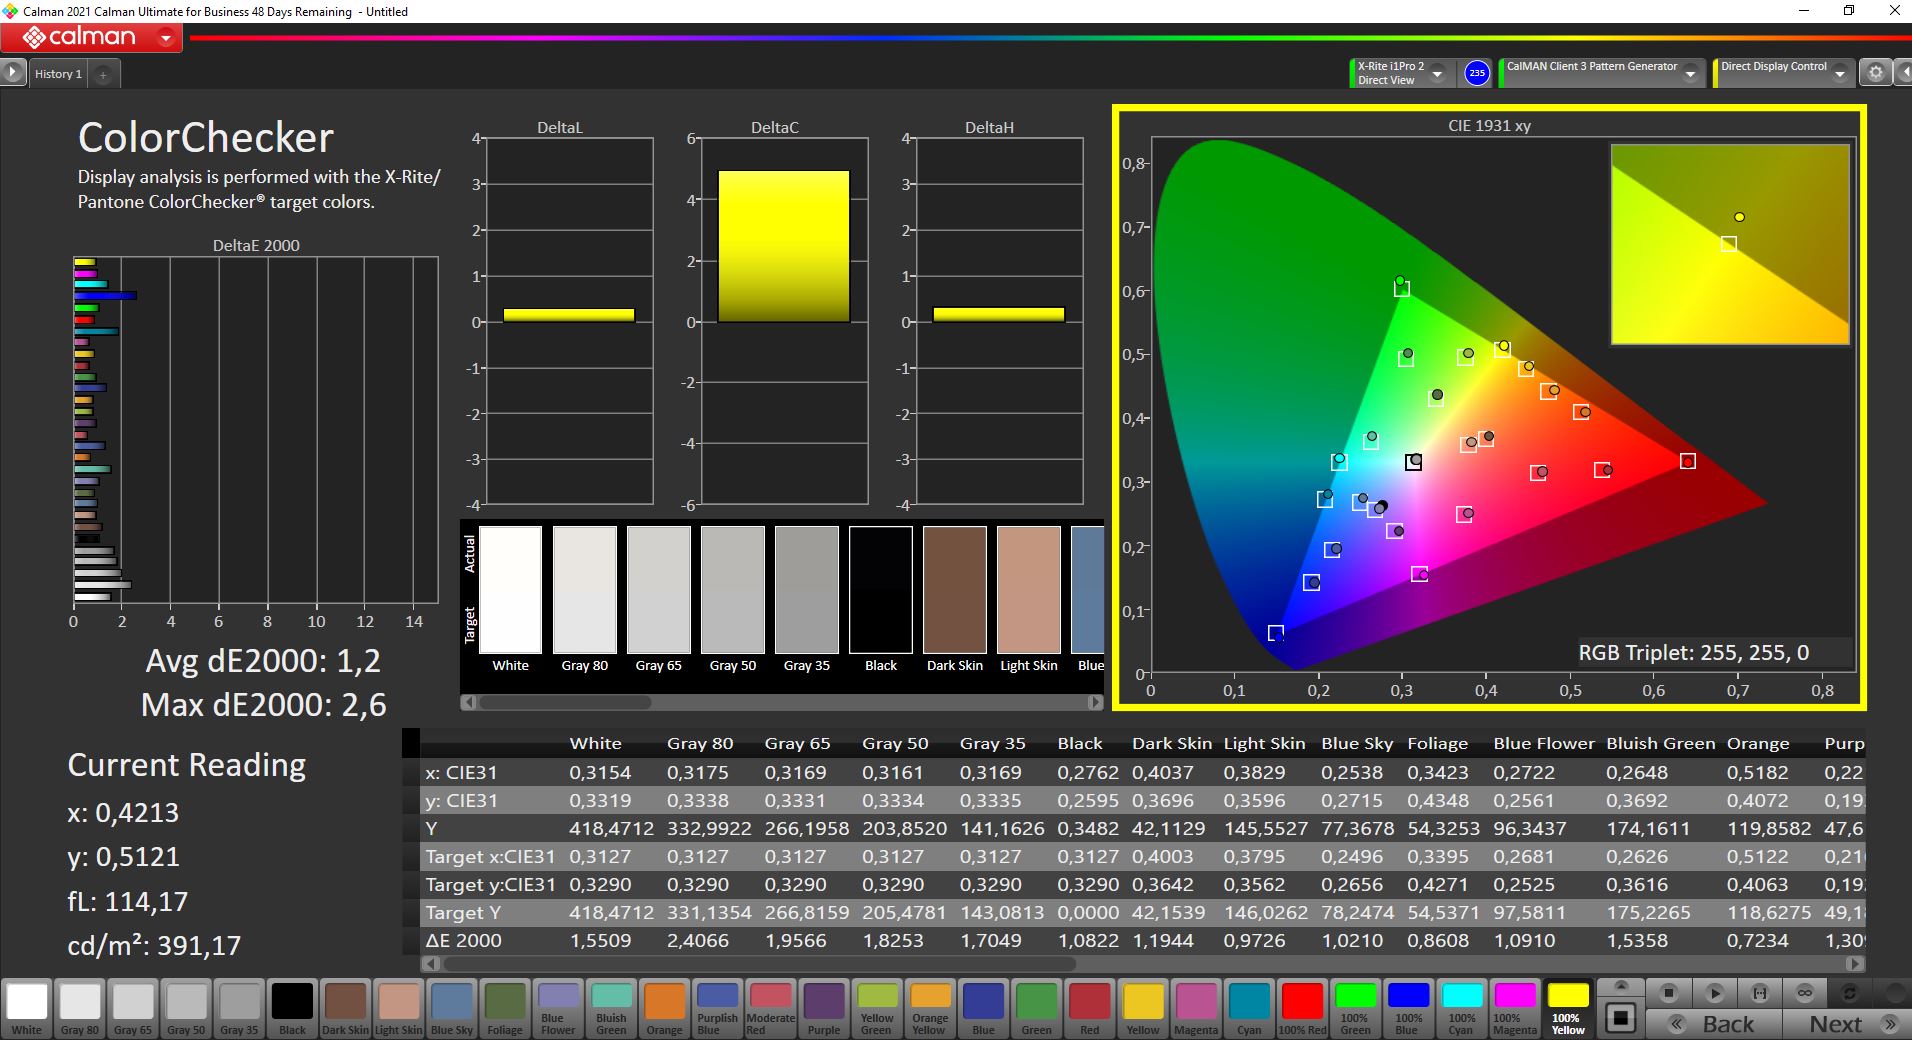
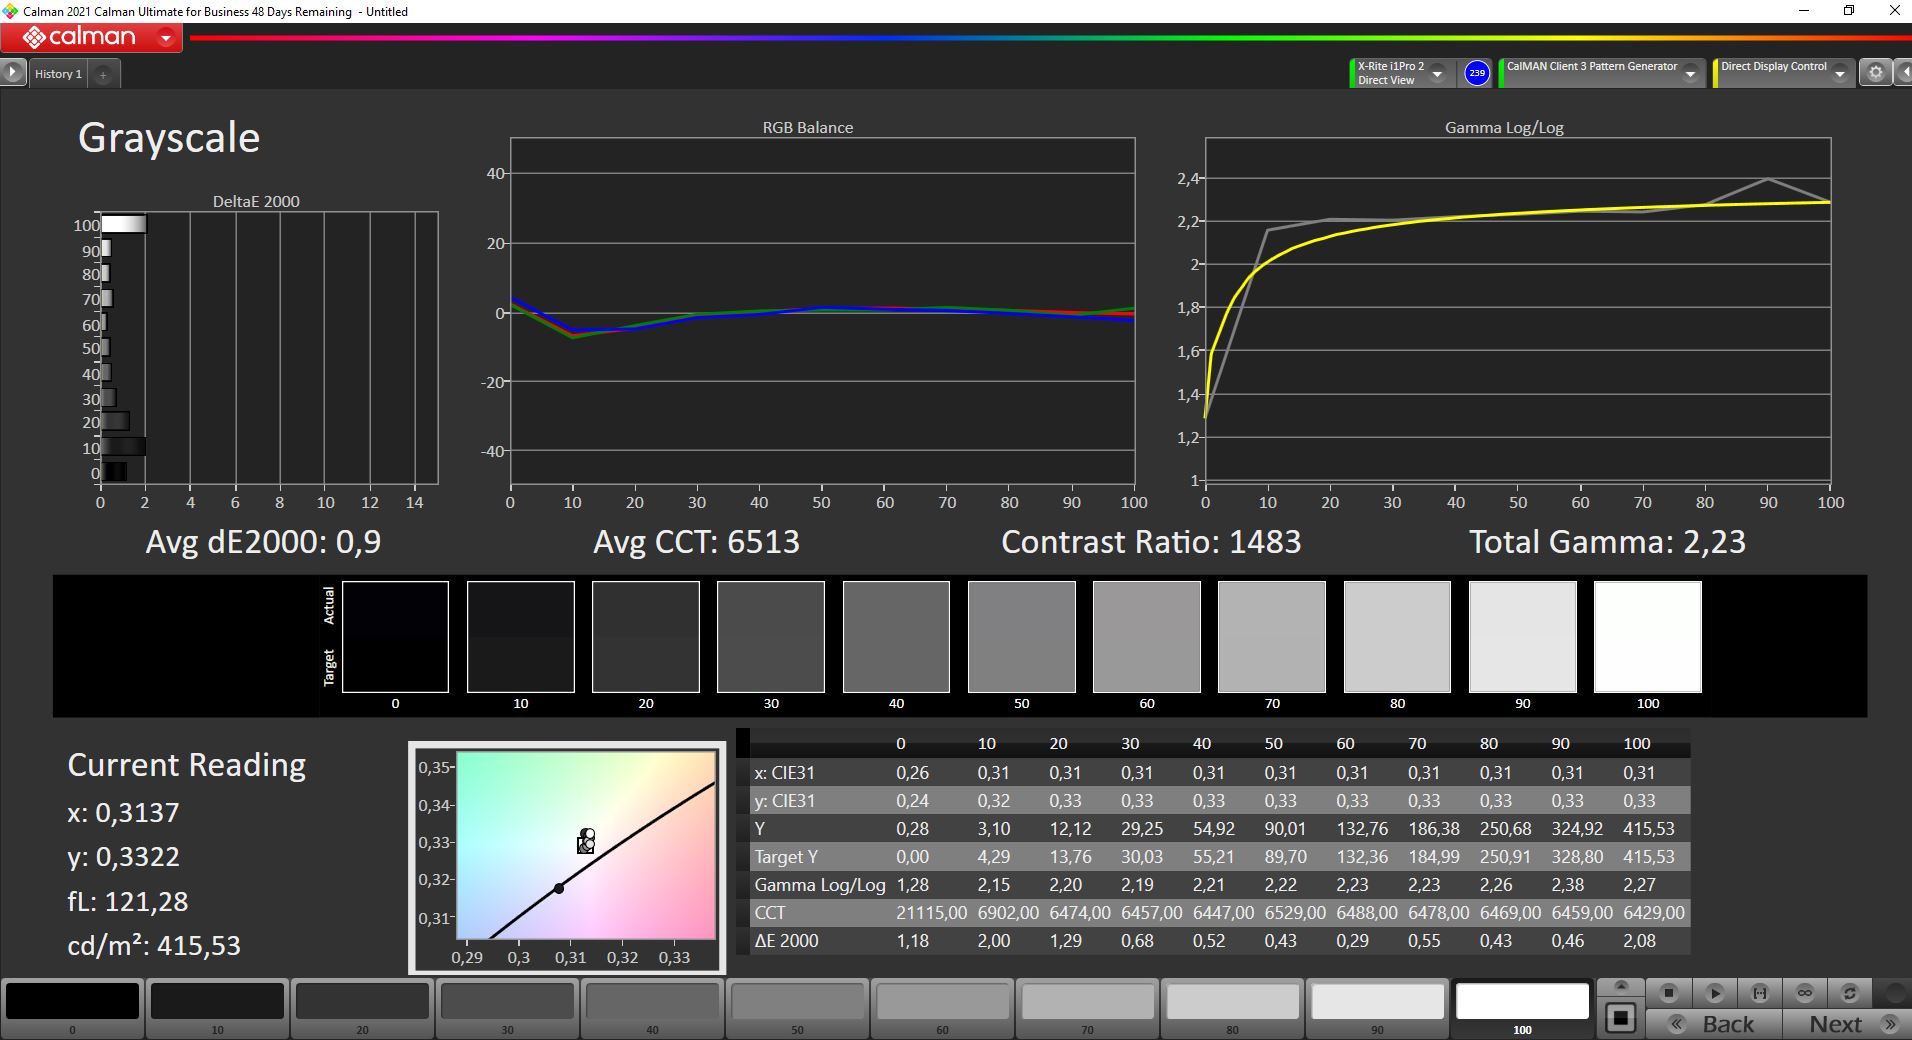
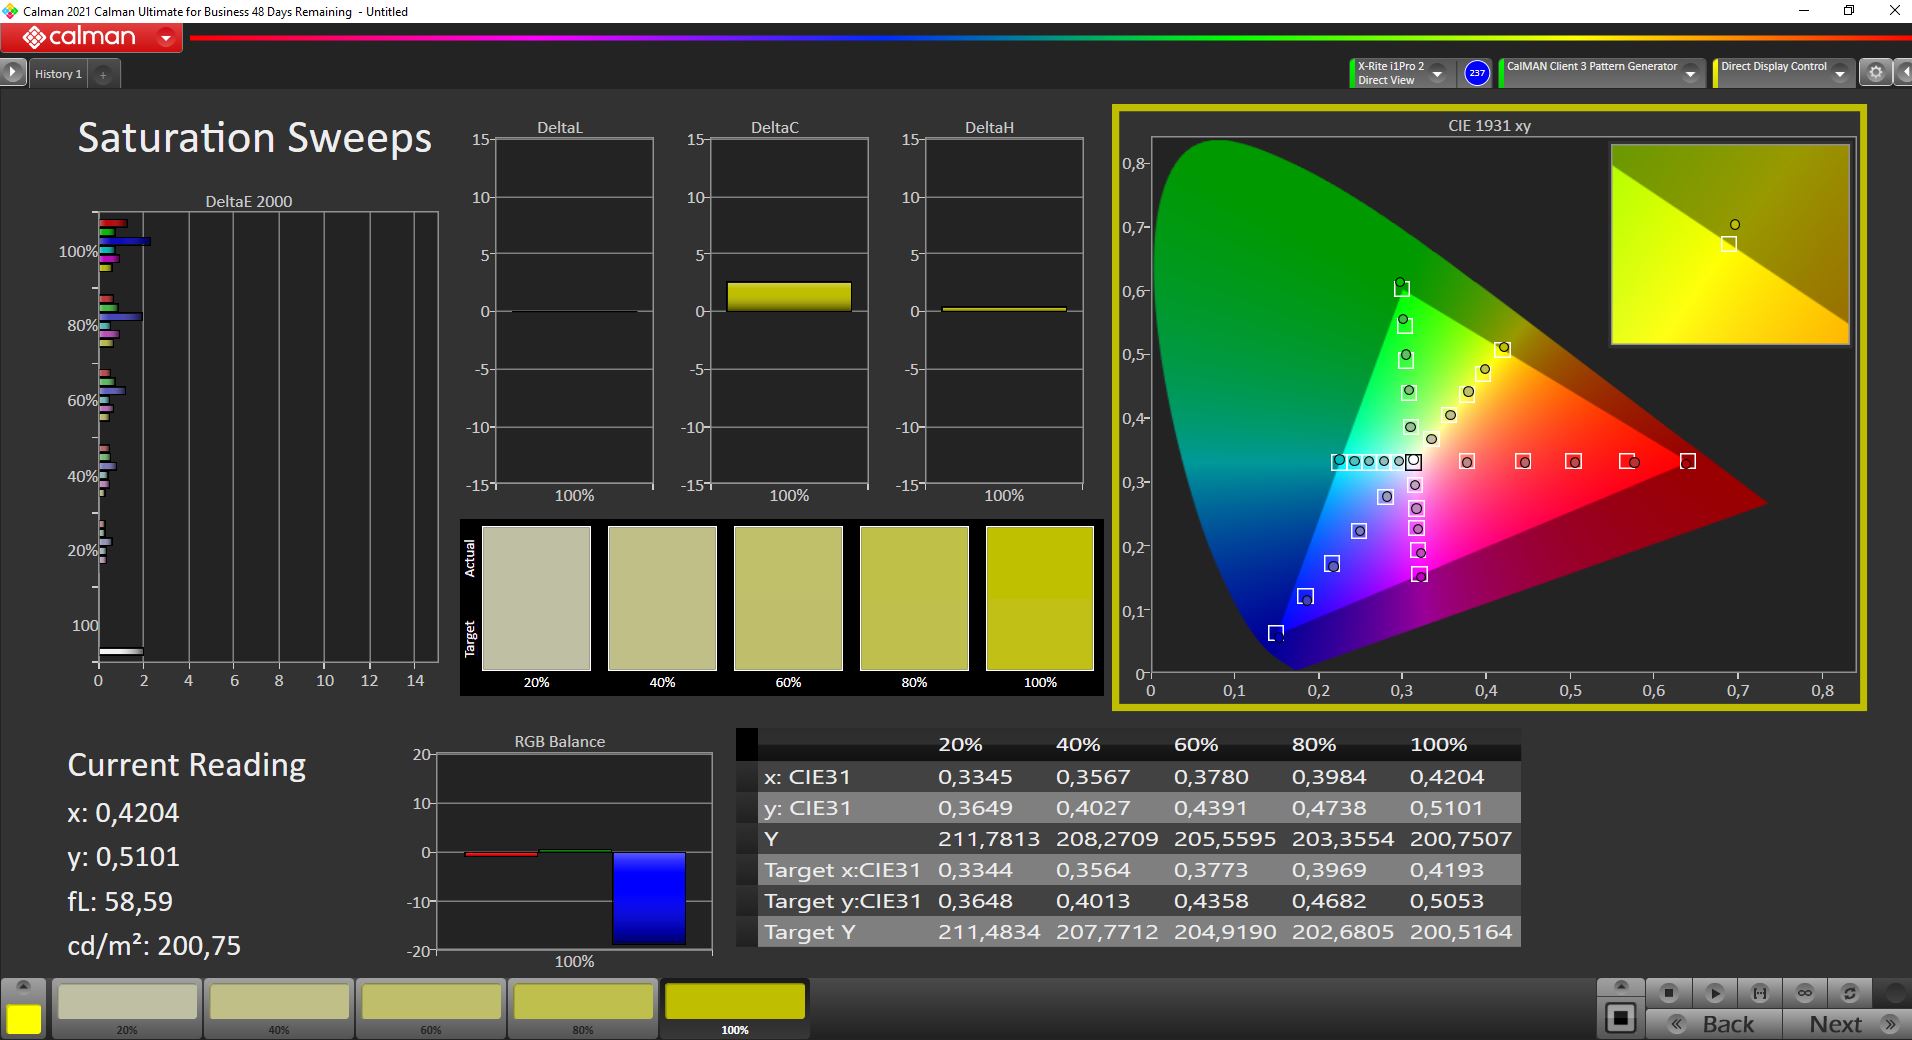
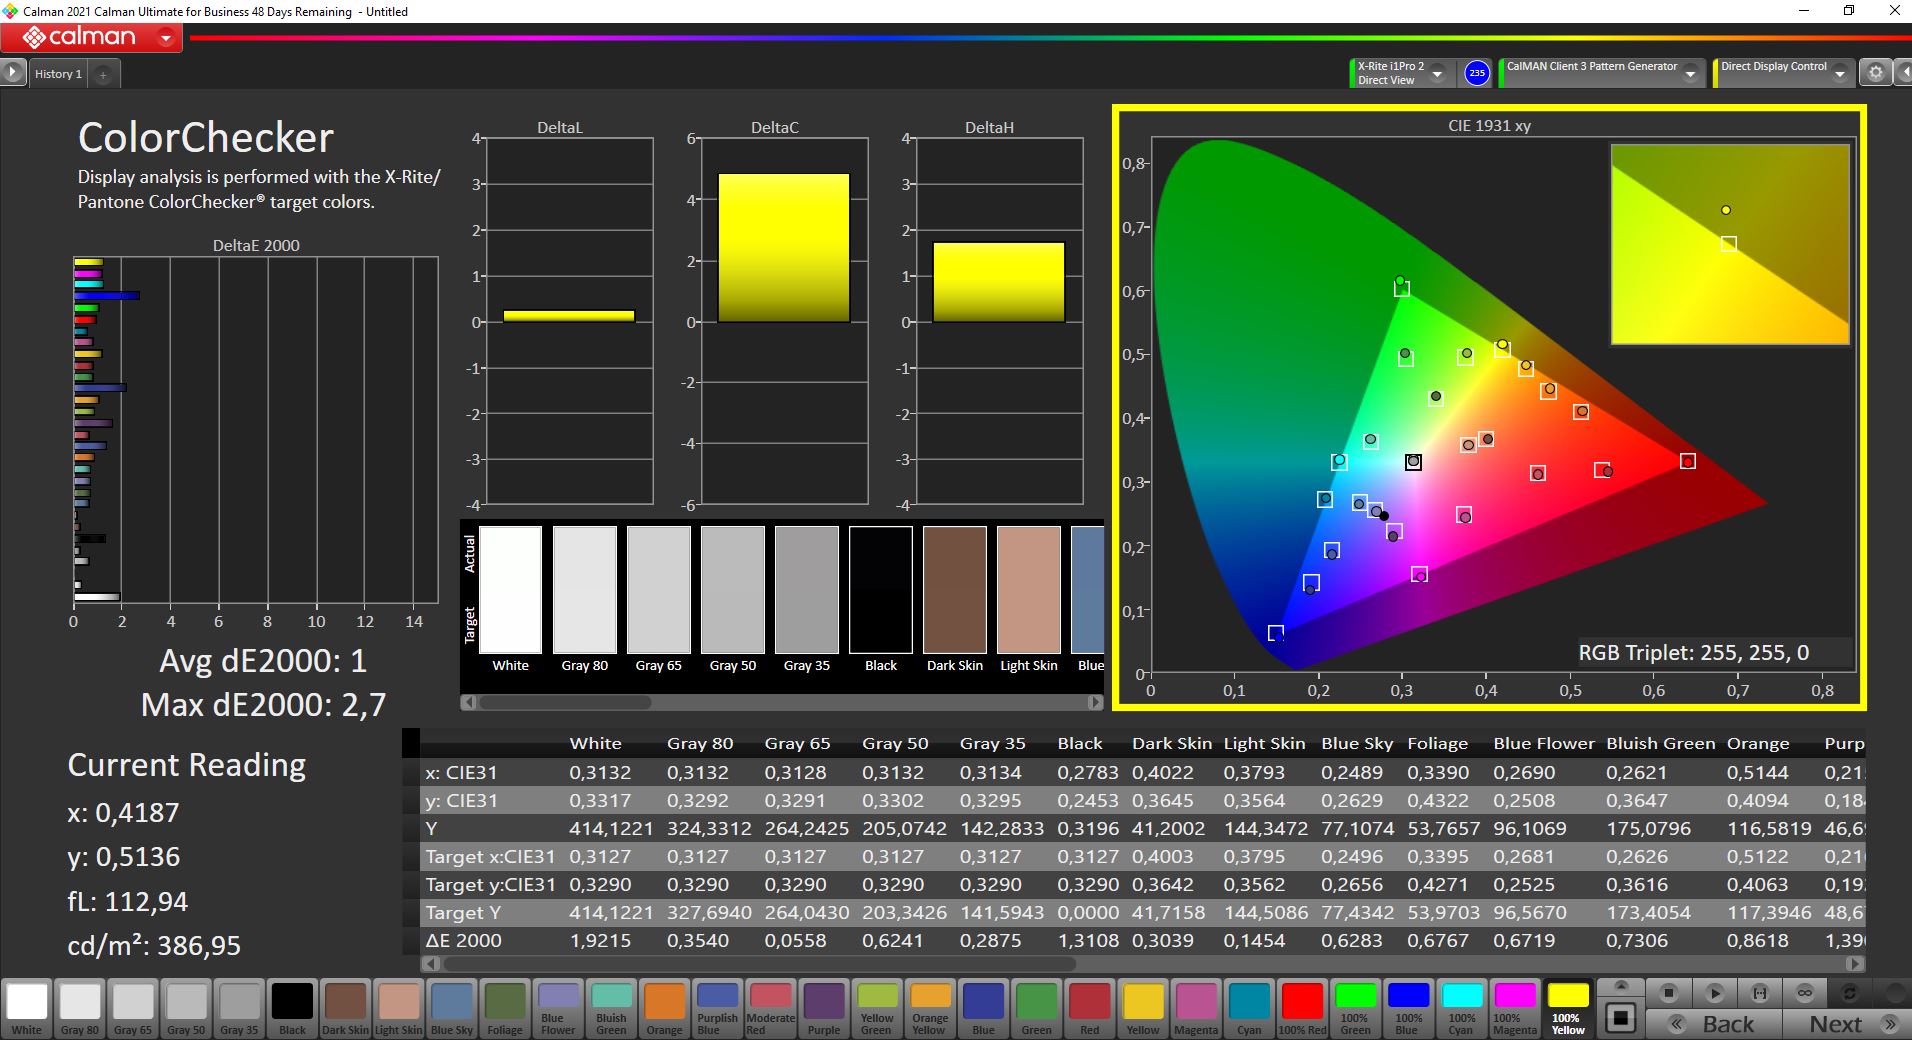
The small sRGB color space is completely covered and the panel is already very well calibrated in its factory state. We can improve the values a bit with our own calibration, but that is not really necessary. Thus, pictures/videos can also be edited reasonably on the Surface Go 3. The only drawback is still the PWM flickering at a brightness of 94 percent or less. However, the frequency of 916 Hz is relatively high and should not actually lead to problems.
| |||||||||||||||||||||||||
Brightness Distribution: 90 %
Center on Battery: 419 cd/m²
Contrast: 1493:1 (Black: 0.28 cd/m²)
ΔE ColorChecker Calman: 1.2 | ∀{0.5-29.43 Ø4.73}
calibrated: 1
ΔE Greyscale Calman: 1.8 | ∀{0.09-98 Ø4.97}
69.8% AdobeRGB 1998 (Argyll 3D)
99.1% sRGB (Argyll 3D)
69% Display P3 (Argyll 3D)
Gamma: 2.21
CCT: 6225 K
| Microsoft Surface Go 3 Core i3 NV105WAM-N31, IPS , 1920x1280, 10.5" | Lenovo Tab P11 Pro OLED, 2560x1600, 11.5" | Apple iPad Air 4 2020 IPS, 2360x1640, 10.9" | Microsoft Surface Pro 7 Core i5-1035G4 LG Philips LP123WQ112604, IPS, 2736x1824, 12.3" | Microsoft Surface Go 2, m3-8100Y NV105WAM-N31, IPS, 1920x1280, 10.5" | |
|---|---|---|---|---|---|
| Display | -4% | 0% | |||
| Display P3 Coverage (%) | 69 | 66 -4% | 68.7 0% | ||
| sRGB Coverage (%) | 99.1 | 93.8 -5% | 100 1% | ||
| AdobeRGB 1998 Coverage (%) | 69.8 | 66.9 -4% | 70.1 0% | ||
| Response Times | 85% | -19% | -5% | 0% | |
| Response Time Grey 50% / Grey 80% * (ms) | 37.2 ? | 4.4 ? 88% | 46.8 ? -26% | 34.8 ? 6% | 37.2 ? -0% |
| Response Time Black / White * (ms) | 22.8 ? | 4 ? 82% | 25.6 ? -12% | 26.4 ? -16% | 22.8 ? -0% |
| PWM Frequency (Hz) | 962 ? | 60.2 ? | 21550 ? | 962 ? | |
| Screen | -31% | -6% | -106% | 18% | |
| Brightness middle (cd/m²) | 418 | 372 -11% | 509 22% | 480.4 15% | 404 -3% |
| Brightness (cd/m²) | 415 | 375 -10% | 486 17% | 485 17% | 402 -3% |
| Brightness Distribution (%) | 90 | 95 6% | 93 3% | 91 1% | 88 -2% |
| Black Level * (cd/m²) | 0.28 | 0.39 -39% | 0.48 -71% | 0.28 -0% | |
| Contrast (:1) | 1493 | 1305 -13% | 1001 -33% | 1443 -3% | |
| Colorchecker dE 2000 * | 1.2 | 1.8 -50% | 1.3 -8% | 5 -317% | 0.7 42% |
| Colorchecker dE 2000 max. * | 2.6 | 4.2 -62% | 2.8 -8% | 7.72 -197% | 1.2 54% |
| Colorchecker dE 2000 calibrated * | 1 | 2.44 -144% | 0.7 30% | ||
| Greyscale dE 2000 * | 1.8 | 2.8 -56% | 2.2 -22% | 5.9 -228% | 1 44% |
| Gamma | 2.21 100% | 2.29 96% | 2.21 100% | 2.38 92% | 2.15 102% |
| CCT | 6225 104% | 6718 97% | 6833 95% | 7805 83% | 6485 100% |
| Color Space (Percent of AdobeRGB 1998) (%) | 99.3 | 60.3 | 64.5 | ||
| Color Space (Percent of sRGB) (%) | 93.2 | 99.7 | |||
| Total Average (Program / Settings) | 27% /
-2% | -13% /
-9% | -38% /
-70% | 6% /
11% |
* ... smaller is better
Display Response Times
| ↔ Response Time Black to White | ||
|---|---|---|
| 22.8 ms ... rise ↗ and fall ↘ combined | ↗ 10.4 ms rise | 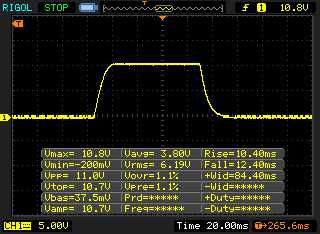 |
| ↘ 12.4 ms fall | ||
| The screen shows good response rates in our tests, but may be too slow for competitive gamers. In comparison, all tested devices range from 0.1 (minimum) to 240 (maximum) ms. » 51 % of all devices are better. This means that the measured response time is worse than the average of all tested devices (19.9 ms). | ||
| ↔ Response Time 50% Grey to 80% Grey | ||
| 37.2 ms ... rise ↗ and fall ↘ combined | ↗ 18.4 ms rise | 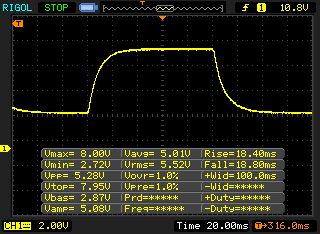 |
| ↘ 18.8 ms fall | ||
| The screen shows slow response rates in our tests and will be unsatisfactory for gamers. In comparison, all tested devices range from 0.165 (minimum) to 636 (maximum) ms. » 54 % of all devices are better. This means that the measured response time is worse than the average of all tested devices (31.1 ms). | ||
Screen Flickering / PWM (Pulse-Width Modulation)
| Screen flickering / PWM detected | 962 Hz | ≤ 94 % brightness setting | 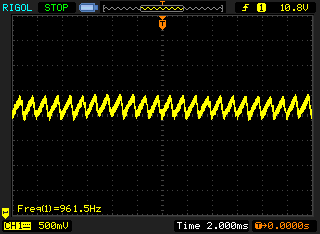 |
The display backlight flickers at 962 Hz (worst case, e.g., utilizing PWM) Flickering detected at a brightness setting of 94 % and below. There should be no flickering or PWM above this brightness setting. The frequency of 962 Hz is quite high, so most users sensitive to PWM should not notice any flickering. In comparison: 52 % of all tested devices do not use PWM to dim the display. If PWM was detected, an average of 7801 (minimum: 5 - maximum: 343500) Hz was measured. | |||

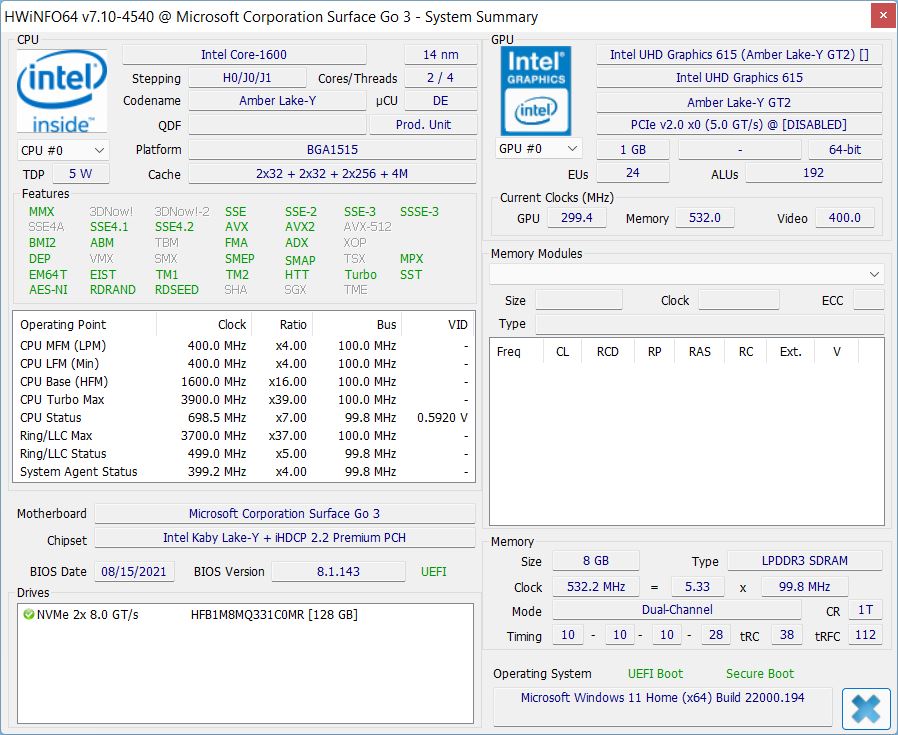
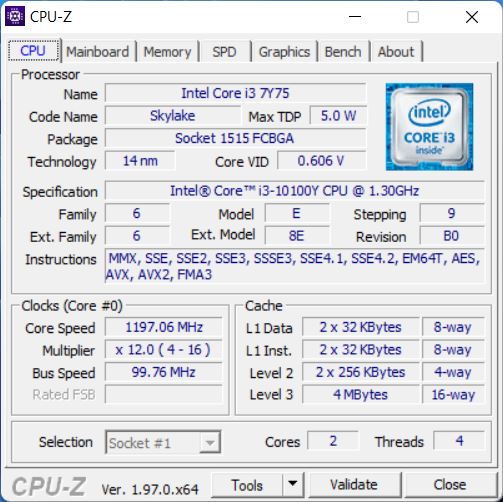
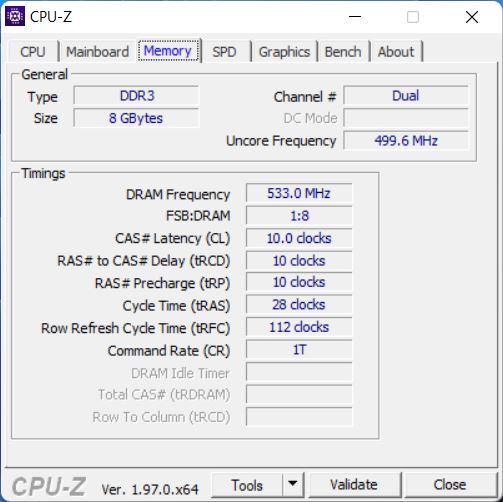
Performance, emissions and battery life
Instead of the Core m3-8100Y, the Core i3-10100Y is now optionally installed. It is still a passively cooled processor with two cores and four threads, but it can at least deliver stable performance. All in all, the performance level is not particularly high and Apple's iPad Air, for example, offers much more processing power. An advantage over the old m3-8100Y in the Surface Go 2 does not exist either.
The new Windows 11 at least runs quite smoothly, but the Surface Go 3 is clearly only suitable for simple tasks and multi-tasking quickly pushes the hardware to its limits. Particularly when starting applications, there are always short waiting times. Windows 11 offers more possibilities than Android or iOS, but you can now also work quite productively with these tablets. By default, the Surface Go 3 comes with Windows 11 in S-Mode (only apps from the Microsoft Store can be installed), but you can easily deactivate it.
Video playback is no problem (even high-resolution videos), but the Surface Go 3 is not suitable for gaming. Only very simple titles from the Microsoft Store (card games, etc.) run reasonably.
The convertible is completely passively cooled and is thus completely silent. The speakers are decent, but do not get particularly loud. The Android or iOS competition also has advantages in terms of battery life. The Surface Go 3 only manages 7 hours in the Wi-Fi test (or 4:41 hours in full brightness).
Cinebench R15 Multi Endurance test
Cinebench R20: CPU (Multi Core) | CPU (Single Core)
Cinebench R15: CPU Multi 64Bit | CPU Single 64Bit
Blender: v2.79 BMW27 CPU
7-Zip 18.03: 7z b 4 | 7z b 4 -mmt1
Geekbench 5.5: Multi-Core | Single-Core
HWBOT x265 Benchmark v2.2: 4k Preset
LibreOffice : 20 Documents To PDF
R Benchmark 2.5: Overall mean
| Cinebench R23 / Multi Core | |
| Average of class Convertible (1317 - 30959, n=49, last 2 years) | |
| Microsoft Surface Go 3 Core i3 | |
| Average Intel Core i3-10100Y (n=1) | |
| Cinebench R23 / Single Core | |
| Average of class Convertible (740 - 2188, n=49, last 2 years) | |
| Microsoft Surface Go 3 Core i3 | |
| Average Intel Core i3-10100Y (n=1) | |
| Cinebench R20 / CPU (Multi Core) | |
| Average of class Convertible (595 - 12102, n=49, last 2 years) | |
| Microsoft Surface Pro 7 Core i5-1035G4 | |
| Microsoft Surface Go 3 Core i3 | |
| Average Intel Core i3-10100Y (n=1) | |
| Microsoft Surface Go 2, m3-8100Y | |
| Cinebench R20 / CPU (Single Core) | |
| Average of class Convertible (273 - 834, n=49, last 2 years) | |
| Microsoft Surface Pro 7 Core i5-1035G4 | |
| Microsoft Surface Go 3 Core i3 | |
| Average Intel Core i3-10100Y (n=1) | |
| Microsoft Surface Go 2, m3-8100Y | |
| Cinebench R15 / CPU Multi 64Bit | |
| Average of class Convertible (478 - 4940, n=48, last 2 years) | |
| Microsoft Surface Pro 7 Core i5-1035G4 | |
| Microsoft Surface Go 2, m3-8100Y | |
| Microsoft Surface Go 3 Core i3 | |
| Average Intel Core i3-10100Y (n=1) | |
| Cinebench R15 / CPU Single 64Bit | |
| Average of class Convertible (149.8 - 317, n=48, last 2 years) | |
| Microsoft Surface Pro 7 Core i5-1035G4 | |
| Microsoft Surface Go 3 Core i3 | |
| Average Intel Core i3-10100Y (n=1) | |
| Microsoft Surface Go 2, m3-8100Y | |
| Blender / v2.79 BMW27 CPU | |
| Microsoft Surface Go 2, m3-8100Y | |
| Microsoft Surface Go 3 Core i3 | |
| Average Intel Core i3-10100Y (n=1) | |
| Microsoft Surface Pro 7 Core i5-1035G4 | |
| Average of class Convertible (105 - 1051, n=48, last 2 years) | |
| 7-Zip 18.03 / 7z b 4 | |
| Average of class Convertible (12977 - 121368, n=48, last 2 years) | |
| Microsoft Surface Pro 7 Core i5-1035G4 | |
| Microsoft Surface Go 3 Core i3 | |
| Average Intel Core i3-10100Y (n=1) | |
| Microsoft Surface Go 2, m3-8100Y | |
| 7-Zip 18.03 / 7z b 4 -mmt1 | |
| Average of class Convertible (3672 - 6655, n=48, last 2 years) | |
| Microsoft Surface Go 3 Core i3 | |
| Average Intel Core i3-10100Y (n=1) | |
| Microsoft Surface Go 2, m3-8100Y | |
| Microsoft Surface Pro 7 Core i5-1035G4 | |
| Geekbench 5.5 / Multi-Core | |
| Average of class Convertible (1608 - 22023, n=48, last 2 years) | |
| Apple iPad Air 4 2020 | |
| Microsoft Surface Go 3 Core i3 | |
| Average Intel Core i3-10100Y (n=1) | |
| Lenovo Tab P11 Pro | |
| Microsoft Surface Go 2, m3-8100Y | |
| Geekbench 5.5 / Single-Core | |
| Average of class Convertible (806 - 2275, n=48, last 2 years) | |
| Apple iPad Air 4 2020 | |
| Microsoft Surface Go 3 Core i3 | |
| Average Intel Core i3-10100Y (n=1) | |
| Microsoft Surface Go 2, m3-8100Y | |
| Lenovo Tab P11 Pro | |
| HWBOT x265 Benchmark v2.2 / 4k Preset | |
| Average of class Convertible (3.43 - 36.2, n=48, last 2 years) | |
| Microsoft Surface Pro 7 Core i5-1035G4 | |
| Microsoft Surface Go 3 Core i3 | |
| Average Intel Core i3-10100Y (n=1) | |
| Microsoft Surface Go 2, m3-8100Y | |
| LibreOffice / 20 Documents To PDF | |
| Microsoft Surface Go 3 Core i3 | |
| Average Intel Core i3-10100Y (n=1) | |
| Microsoft Surface Go 2, m3-8100Y | |
| Average of class Convertible (42.5 - 84.3, n=48, last 2 years) | |
| R Benchmark 2.5 / Overall mean | |
| Microsoft Surface Go 3 Core i3 | |
| Average Intel Core i3-10100Y (n=1) | |
| Microsoft Surface Go 2, m3-8100Y | |
| Average of class Convertible (0.3915 - 0.84, n=48, last 2 years) | |
* ... smaller is better
| PCMark 10 / Score | |
| Average of class Convertible (3229 - 10123, n=45, last 2 years) | |
| Microsoft Surface Pro 7 Core i5-1035G4 | |
| Microsoft Surface Go 2, m3-8100Y | |
| Microsoft Surface Go 3 Core i3 | |
| Average Intel Core i3-10100Y, Intel UHD Graphics 615 (n=1) | |
| DPC Latencies / LatencyMon - interrupt to process latency (max), Web, Youtube, Prime95 | |
| Microsoft Surface Go 3 Core i3 | |
| Microsoft Surface Go 2, m3-8100Y | |
* ... smaller is better
| Microsoft Surface Go 3 Core i3 SK hynix HFB1M8MQ331C0MR | Microsoft Surface Go 2, m3-8100Y Toshiba KBG30ZPZ128G | Microsoft Surface Go MHN-00003 64 GB eMMC Flash | Average SK hynix HFB1M8MQ331C0MR | Average of class Convertible | |
|---|---|---|---|---|---|
| CrystalDiskMark 5.2 / 6 | 38% | -71% | 0% | 281% | |
| Write 4K (MB/s) | 90.8 | 100.6 11% | 26.91 -70% | 90.8 ? 0% | 144.3 ? 59% |
| Read 4K (MB/s) | 41.13 | 51.1 24% | 19.72 -52% | 41.1 ? 0% | 67.3 ? 64% |
| Write Seq (MB/s) | 801 | 126.2 | 2614 ? | ||
| Read Seq (MB/s) | 1209 | 268 | 2957 ? | ||
| Write 4K Q32T1 (MB/s) | 199.4 | 270.8 36% | 62.9 -68% | 199.4 ? 0% | 454 ? 128% |
| Read 4K Q32T1 (MB/s) | 251.6 | 307.2 22% | 39.82 -84% | 252 ? 0% | 583 ? 132% |
| Write Seq Q32T1 (MB/s) | 372.9 | 853 129% | 131.3 -65% | 373 ? 0% | 4362 ? 1070% |
| Read Seq Q32T1 (MB/s) | 1639 | 1776 8% | 259.3 -84% | 1639 ? 0% | 5787 ? 253% |
| Write 4K Q8T8 (MB/s) | 234.8 | 235 ? 0% | 817 ? 248% | ||
| Read 4K Q8T8 (MB/s) | 316.7 | 317 ? 0% | 1237 ? 291% |
| low | med. | high | ultra | |
|---|---|---|---|---|
| The Witcher 3 (2015) | 9.3 | |||
| Dota 2 Reborn (2015) | 57.2 | 25.9 | 12.9 | 11.6 |
| X-Plane 11.11 (2018) | 8.06 | 6.26 | 6.09 |
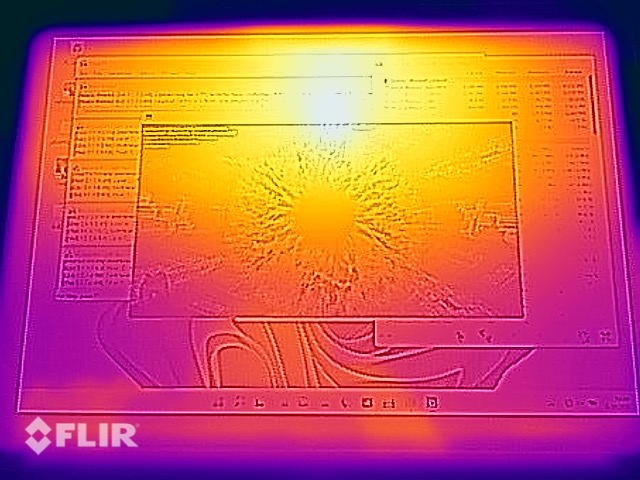
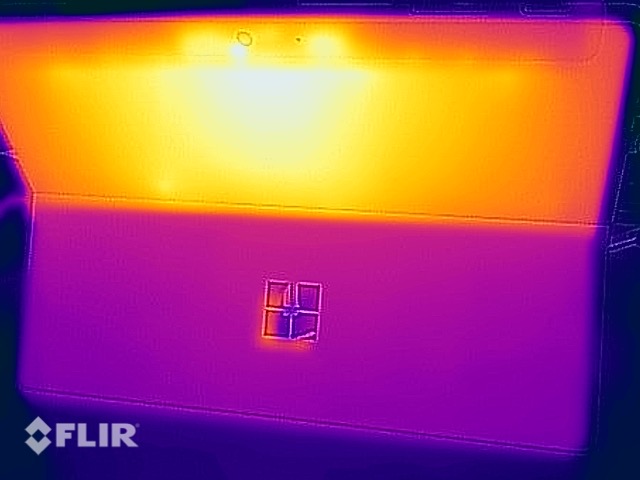
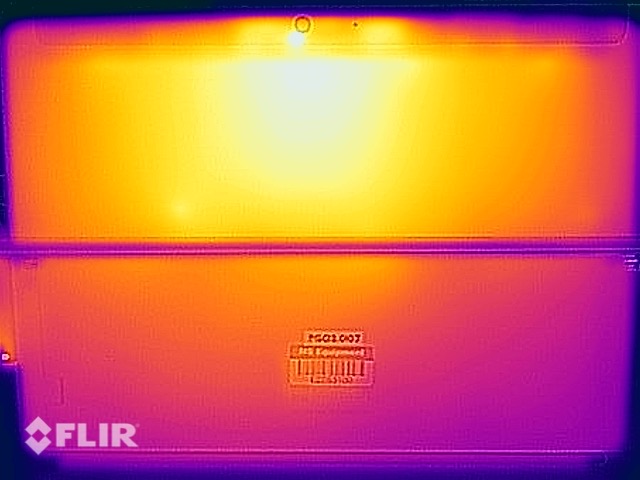
Temperature
(-) The maximum temperature on the upper side is 46.1 °C / 115 F, compared to the average of 35.4 °C / 96 F, ranging from 19.6 to 60 °C for the class Convertible.
(±) The bottom heats up to a maximum of 42.7 °C / 109 F, compared to the average of 36.9 °C / 98 F
(+) In idle usage, the average temperature for the upper side is 24.4 °C / 76 F, compared to the device average of 30.3 °C / 87 F.
(+) The palmrests and touchpad are reaching skin temperature as a maximum (35.2 °C / 95.4 F) and are therefore not hot.
(-) The average temperature of the palmrest area of similar devices was 28 °C / 82.4 F (-7.2 °C / -13 F).
Speaker
Microsoft Surface Go 3 Core i3 audio analysis
(±) | speaker loudness is average but good (75 dB)
Bass 100 - 315 Hz
(±) | reduced bass - on average 12% lower than median
(±) | linearity of bass is average (12.2% delta to prev. frequency)
Mids 400 - 2000 Hz
(±) | higher mids - on average 6.5% higher than median
(+) | mids are linear (4.1% delta to prev. frequency)
Highs 2 - 16 kHz
(+) | balanced highs - only 4.6% away from median
(+) | highs are linear (6.4% delta to prev. frequency)
Overall 100 - 16.000 Hz
(±) | linearity of overall sound is average (19.4% difference to median)
Compared to same class
» 47% of all tested devices in this class were better, 6% similar, 47% worse
» The best had a delta of 6%, average was 20%, worst was 57%
Compared to all devices tested
» 48% of all tested devices were better, 7% similar, 45% worse
» The best had a delta of 4%, average was 24%, worst was 134%
Apple iPad Air 4 2020 audio analysis
(+) | speakers can play relatively loud (86.3 dB)
Bass 100 - 315 Hz
(±) | reduced bass - on average 14.2% lower than median
(±) | linearity of bass is average (12.2% delta to prev. frequency)
Mids 400 - 2000 Hz
(+) | balanced mids - only 3.8% away from median
(+) | mids are linear (3.8% delta to prev. frequency)
Highs 2 - 16 kHz
(±) | higher highs - on average 5.3% higher than median
(+) | highs are linear (4.9% delta to prev. frequency)
Overall 100 - 16.000 Hz
(+) | overall sound is linear (12.9% difference to median)
Compared to same class
» 21% of all tested devices in this class were better, 4% similar, 74% worse
» The best had a delta of 7%, average was 20%, worst was 129%
Compared to all devices tested
» 12% of all tested devices were better, 3% similar, 85% worse
» The best had a delta of 4%, average was 24%, worst was 134%
Energy consumption
| Off / Standby | |
| Idle | |
| Load |
|
Key:
min: | |
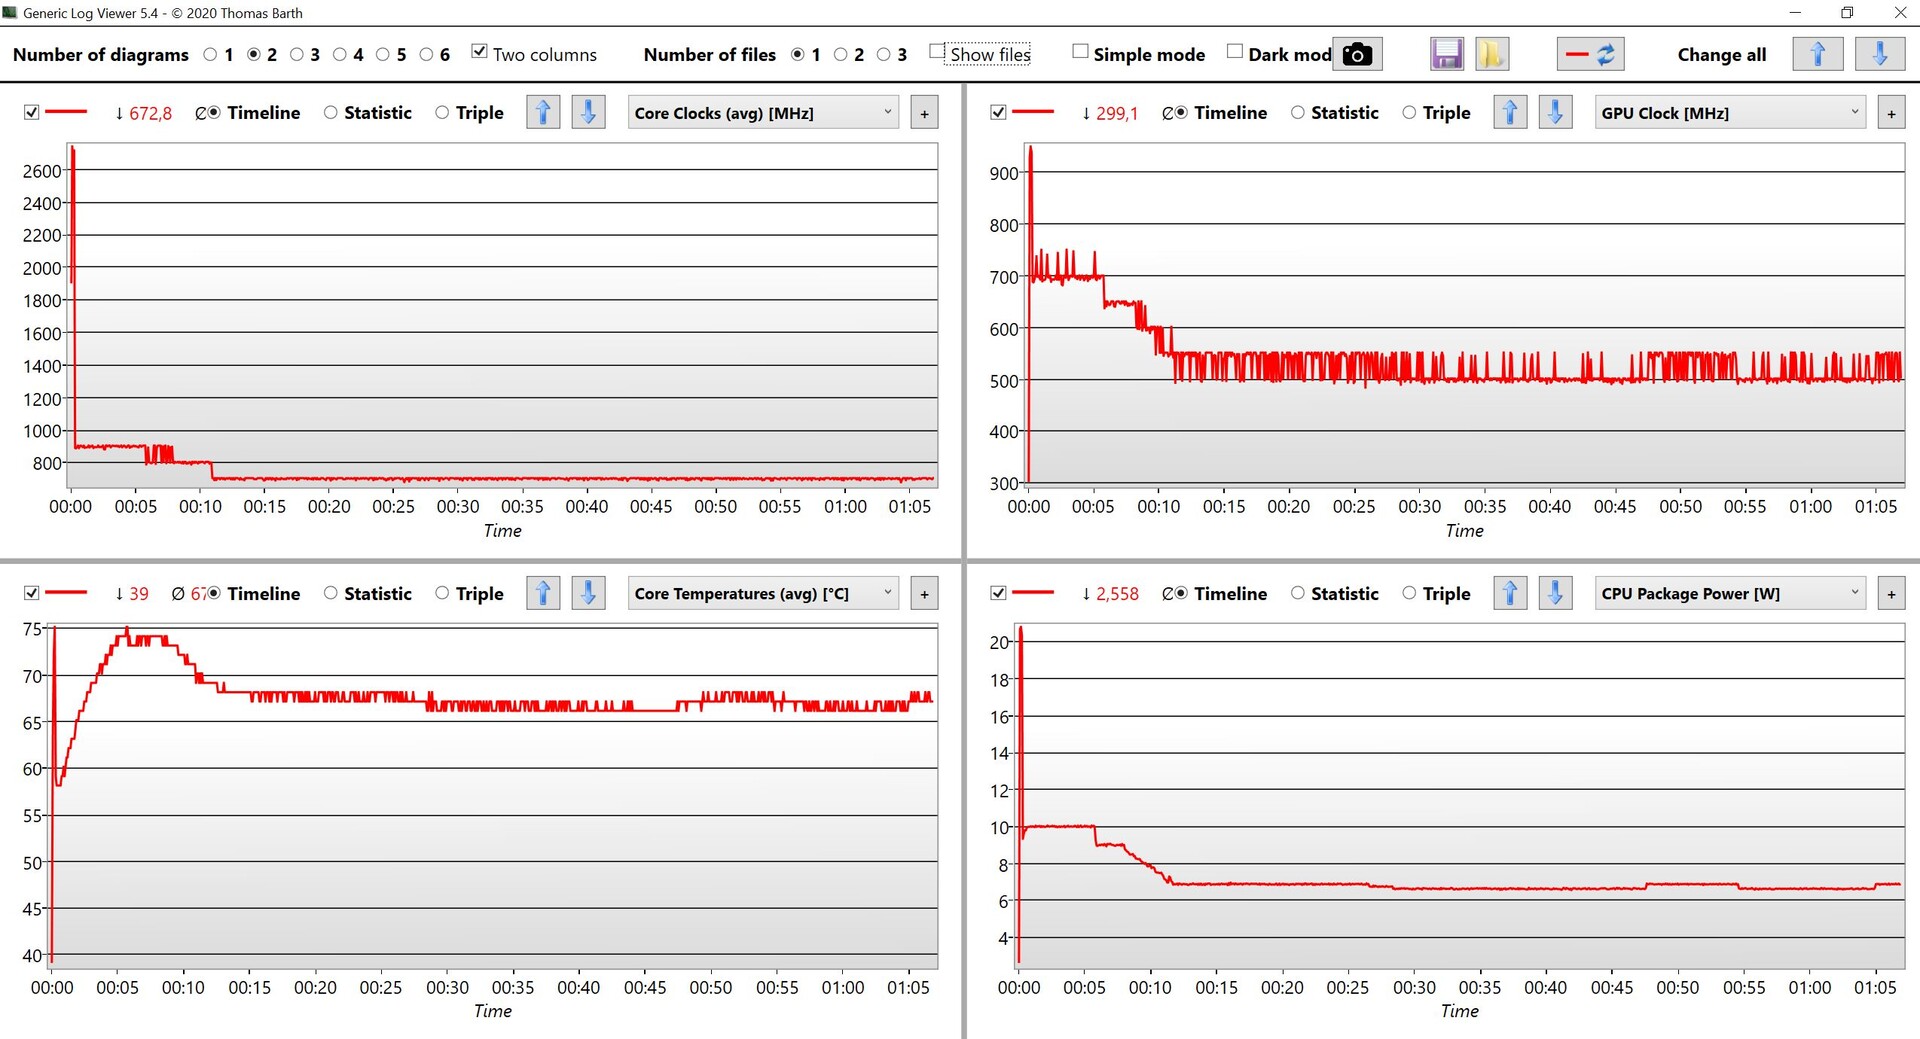
Energy consumption Stress test
Battery life
Pros
Cons
Verdict - The most compact version of Windows 11
The Surface Go 3 remains quite unrivaled, since there are hardly any Windows convertibles with such small displays. This device class is now dominated by Android and iOS tablets. Microsoft's small convertible is more versatile with the new Windows 11, but you should not expect too much because the overall performance is very low. The Surface Go 3 is sufficient for simple tasks like browsing the Internet, writing emails or watching videos, but that is also true for the Android or iOS tablets.
An upgrade from the Surface Go 2 is not worth it, because the new Core i3 processor does not offer any additional performance. This is due to the passive cooling, but the device is at least silent at all times. We also still like the compact keyboard.
Now with Windows 11, but otherwise no real innovations: The Surface Go 3 is only a mini update without performance advantages.
The new Windows 11 runs smoothly and all applications can be installed in normal mode (delivered in S-mode), but the total package is quite expensive at 800 Euros (~$928). For many users, current tablets from Lenovo, Samsung or Apple might be the better choice.
Price and availability
The Surface Go 3 can be configured at Microsoft and our test device costs €679 (+€129/~$788+~$150 for the keyboard). In online stores like Cyberport, only the slower models with the Pentium processor are currently available for €599 (~$695).
Microsoft Surface Go 3 Core i3
- 10/15/2021 v7 (old)
Andreas Osthoff
Price comparison

