Walmart Gateway GWTN141 laptop review: Potential $500 sweet spot
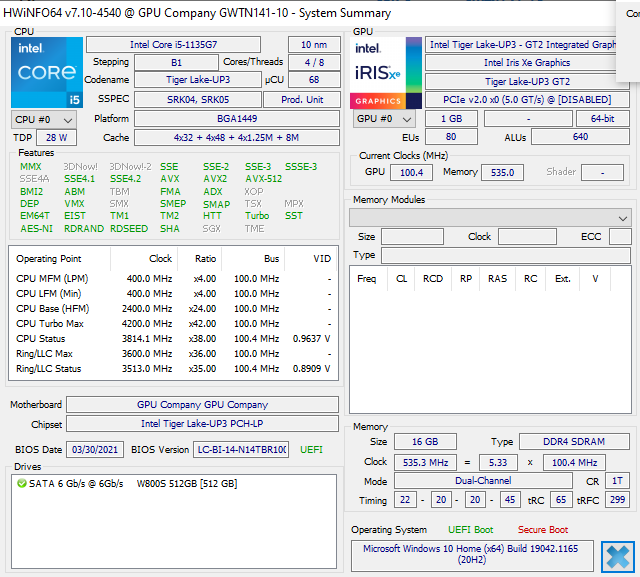
While ultra-budget laptops are plentiful, their performance levels and build quality can be questionable. Models from lesser-known manufacturers like Chuwi tend to have hardware issues that you might not otherwise find on similarly-priced laptops from Lenovo, Dell, or HP. The laptop we'll be looking at here is a 14.1-inch Gateway GWTN141 from Walmart retailing for just under $500 USD. This particular system is notable for carrying the latest Intel 11th gen Core U-series CPU with a spacious 16 GB and 512 GB of RAM and storage, respectively. It's specifications are a real bargain for the price, but let's see what else it's hiding underneath.
Direct competitors include other budget laptops like the HP 14s or Pavilion series, Dell Inspiron series, Lenovo IdeaPad 3 or 5 series, or the Chuwi CoreBook X.
More Walmart laptop reviews:
potential competitors in comparison
Rating | Date | Model | Weight | Height | Size | Resolution | Price |
|---|---|---|---|---|---|---|---|
| 79.2 % v7 (old) | 09 / 2021 | Gateway GWTN141-10GR i5-1135G7, Iris Xe G7 80EUs | 1.6 kg | 19.1 mm | 14.10" | 1920x1080 | |
| 76.9 % v7 (old) | 09 / 2021 | HP 14s-fq1357ng R5 5500U, Vega 7 | 1.5 kg | 17.9 mm | 14.00" | 1920x1080 | |
| 74.2 % v7 (old) | 08 / 2021 | Blackview AceBook 1 Celeron N4120, UHD Graphics 600 | 1.3 kg | 16.8 mm | 14.00" | 1920x1080 | |
| 87.6 % v7 (old) | 07 / 2021 | ADATA XPG Xenia 14 i7-1165G7, Iris Xe G7 96EUs | 996 g | 15 mm | 14.00" | 1920x1200 | |
| 79 % v7 (old) | 07 / 2021 | Chuwi CoreBook X i5-8259U, Iris Plus Graphics 655 | 1.5 kg | 20.6 mm | 14.00" | 2160x1440 | |
| 74.5 % v7 (old) | 01 / 2020 | Dell Inspiron 14 3493-4KWCF i7-1065G7, GeForce MX230 | 1.8 kg | 21 mm | 14.00" | 1920x1080 |
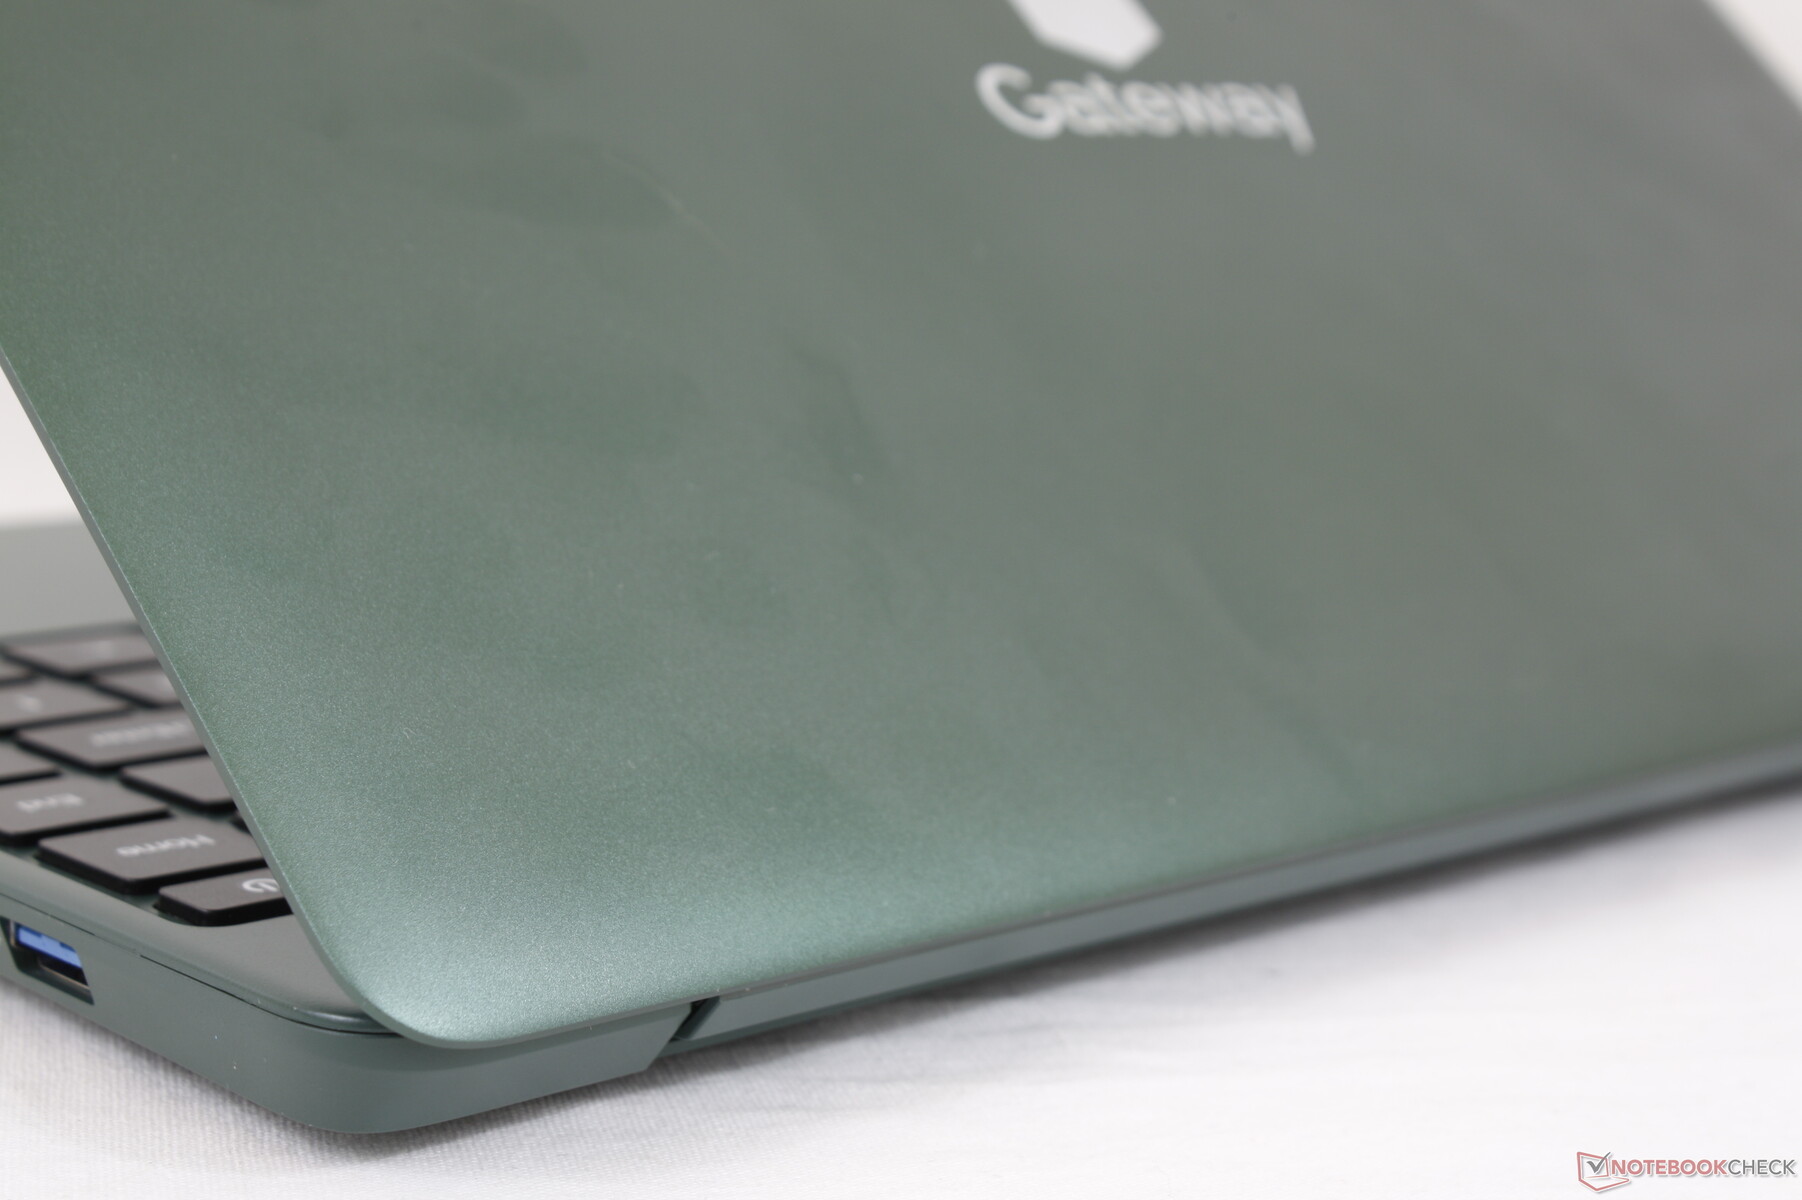
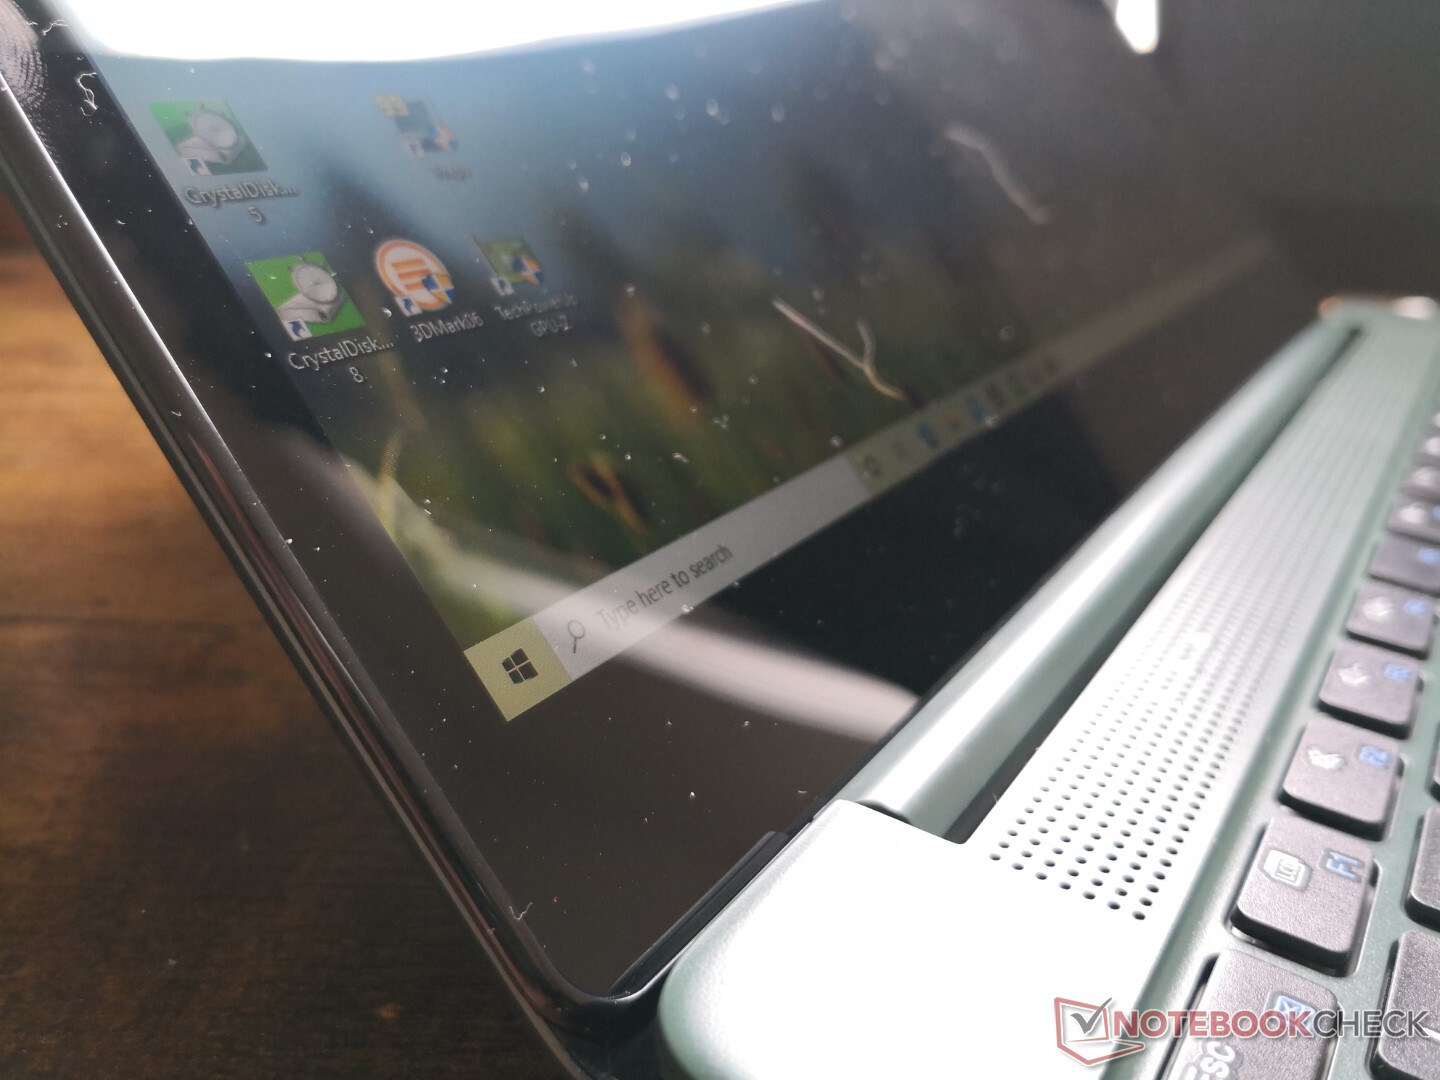
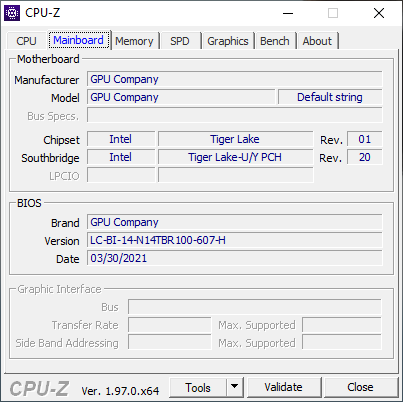
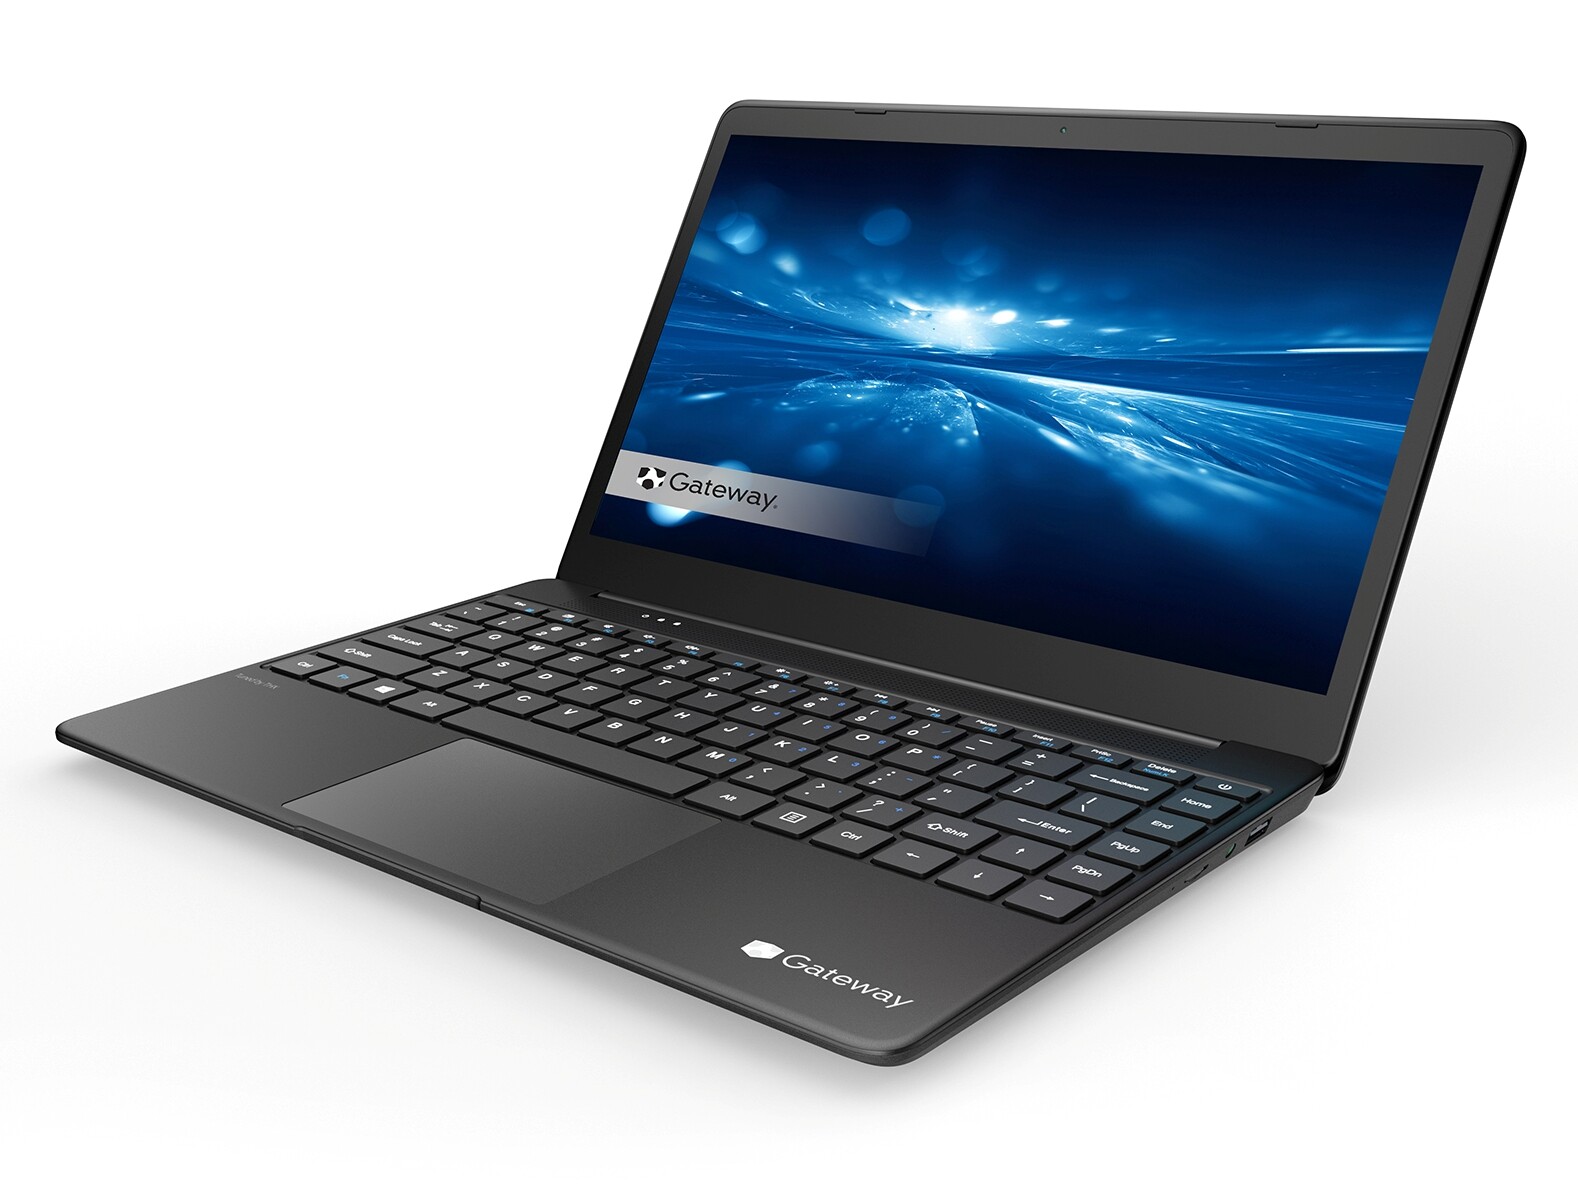
Case
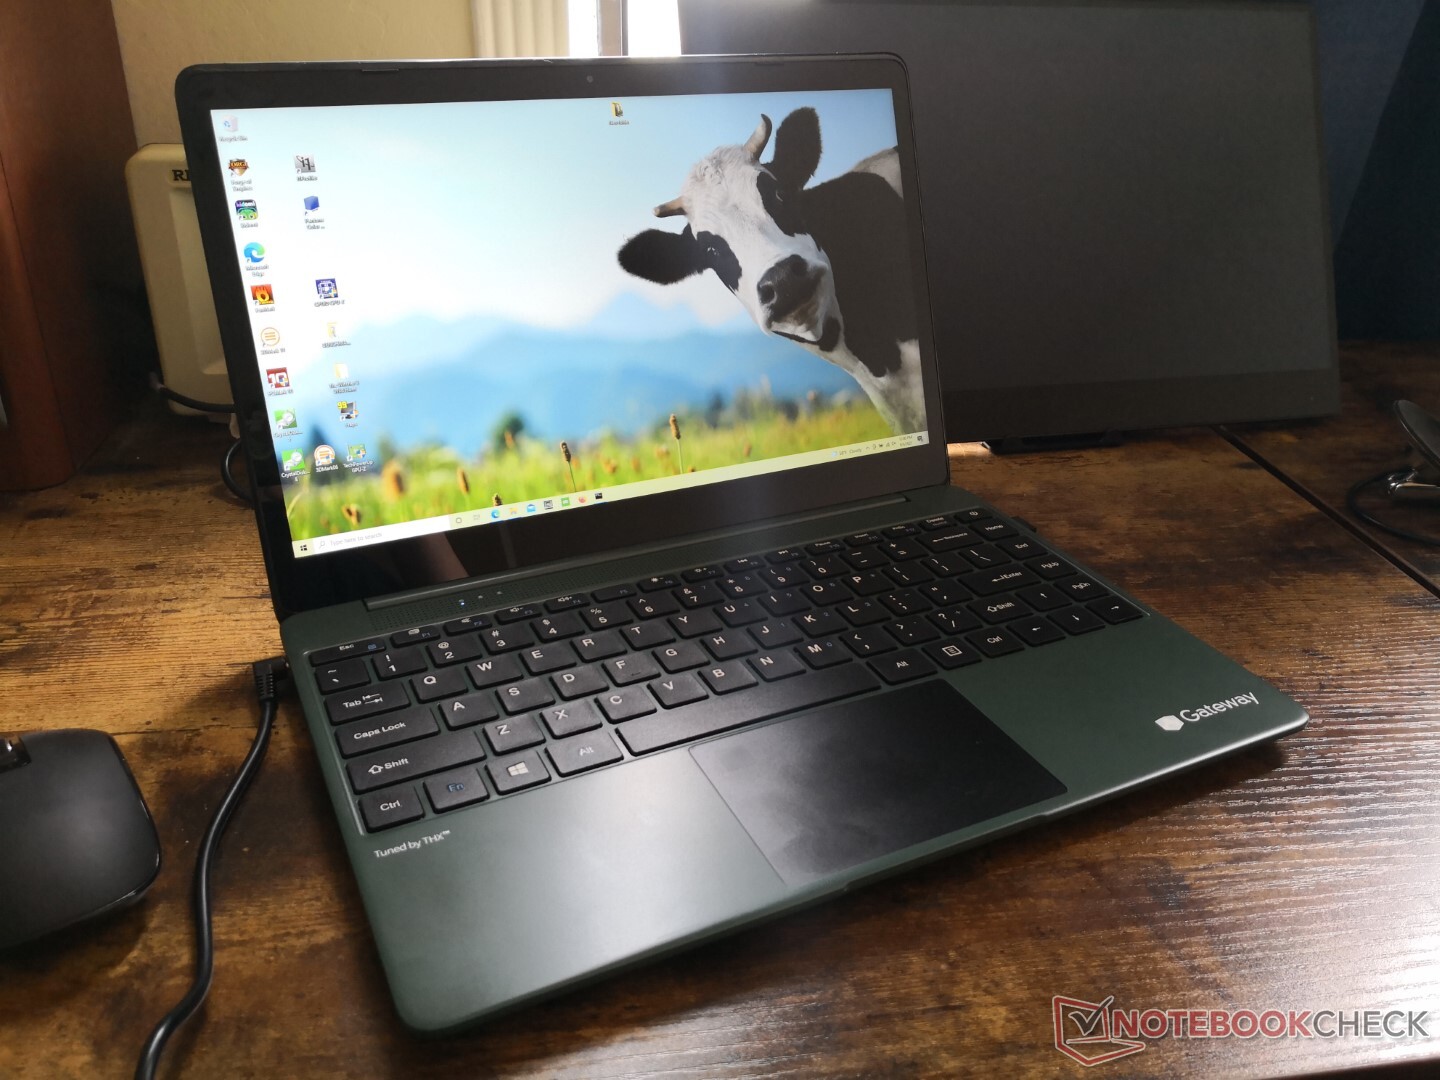
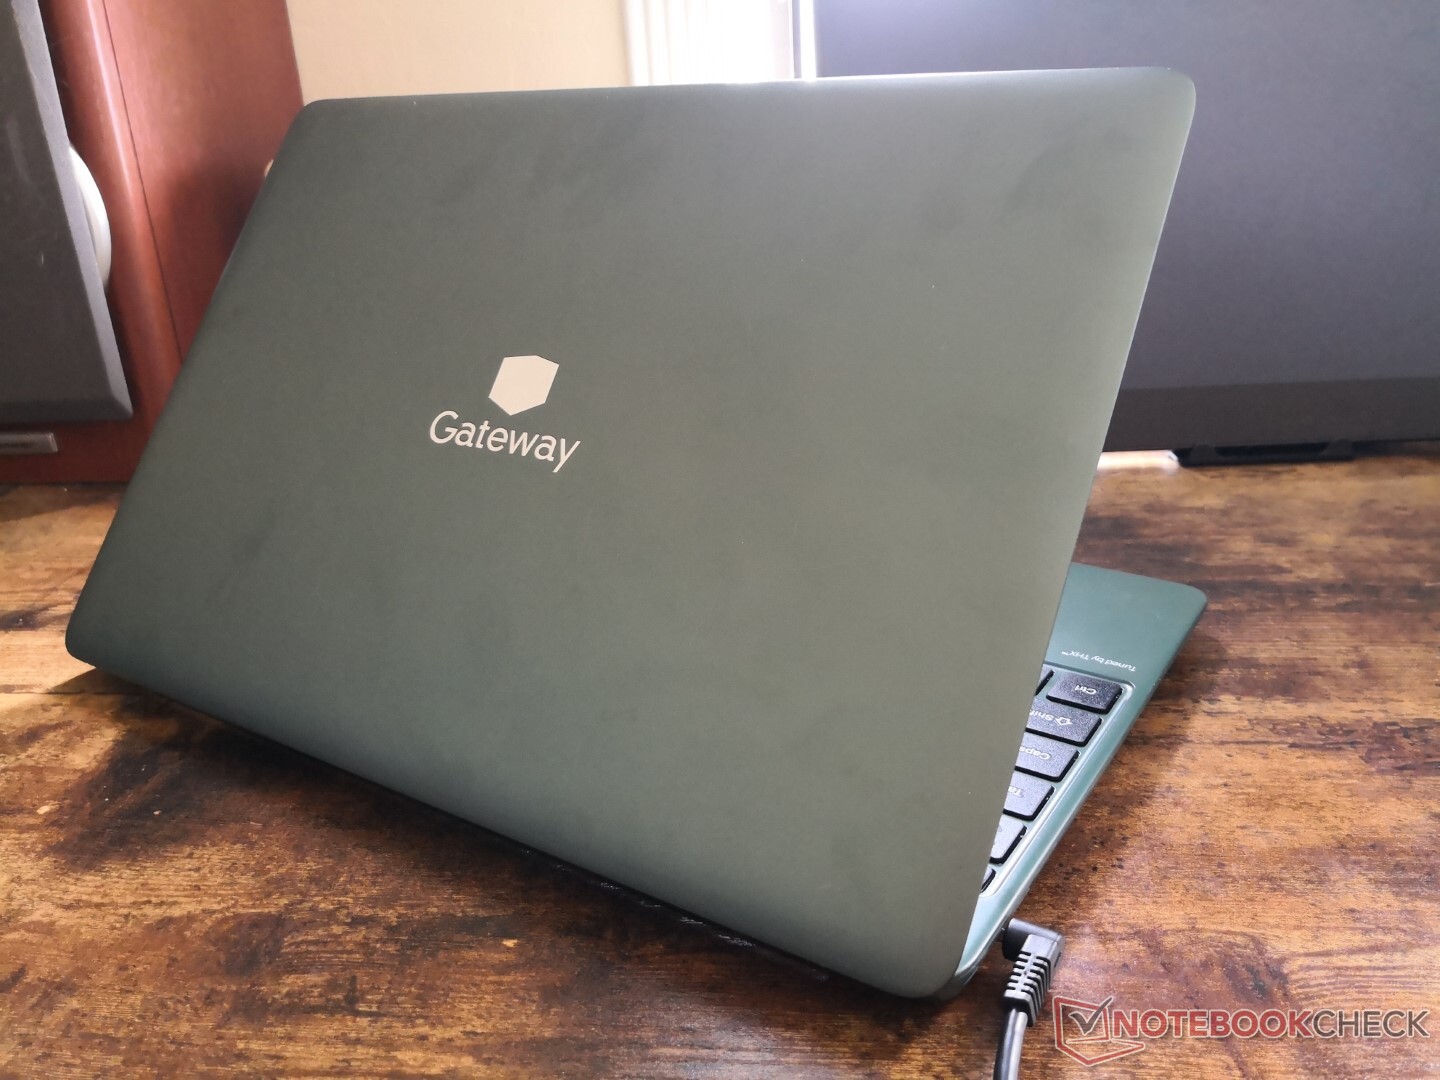
The chassis utilizes aluminum for the outer lid while the keyboard deck and base are plastic. There is a fair amount of creaking when handling the base or adjusting the angle of the lid which is reflective of the low price of the system.
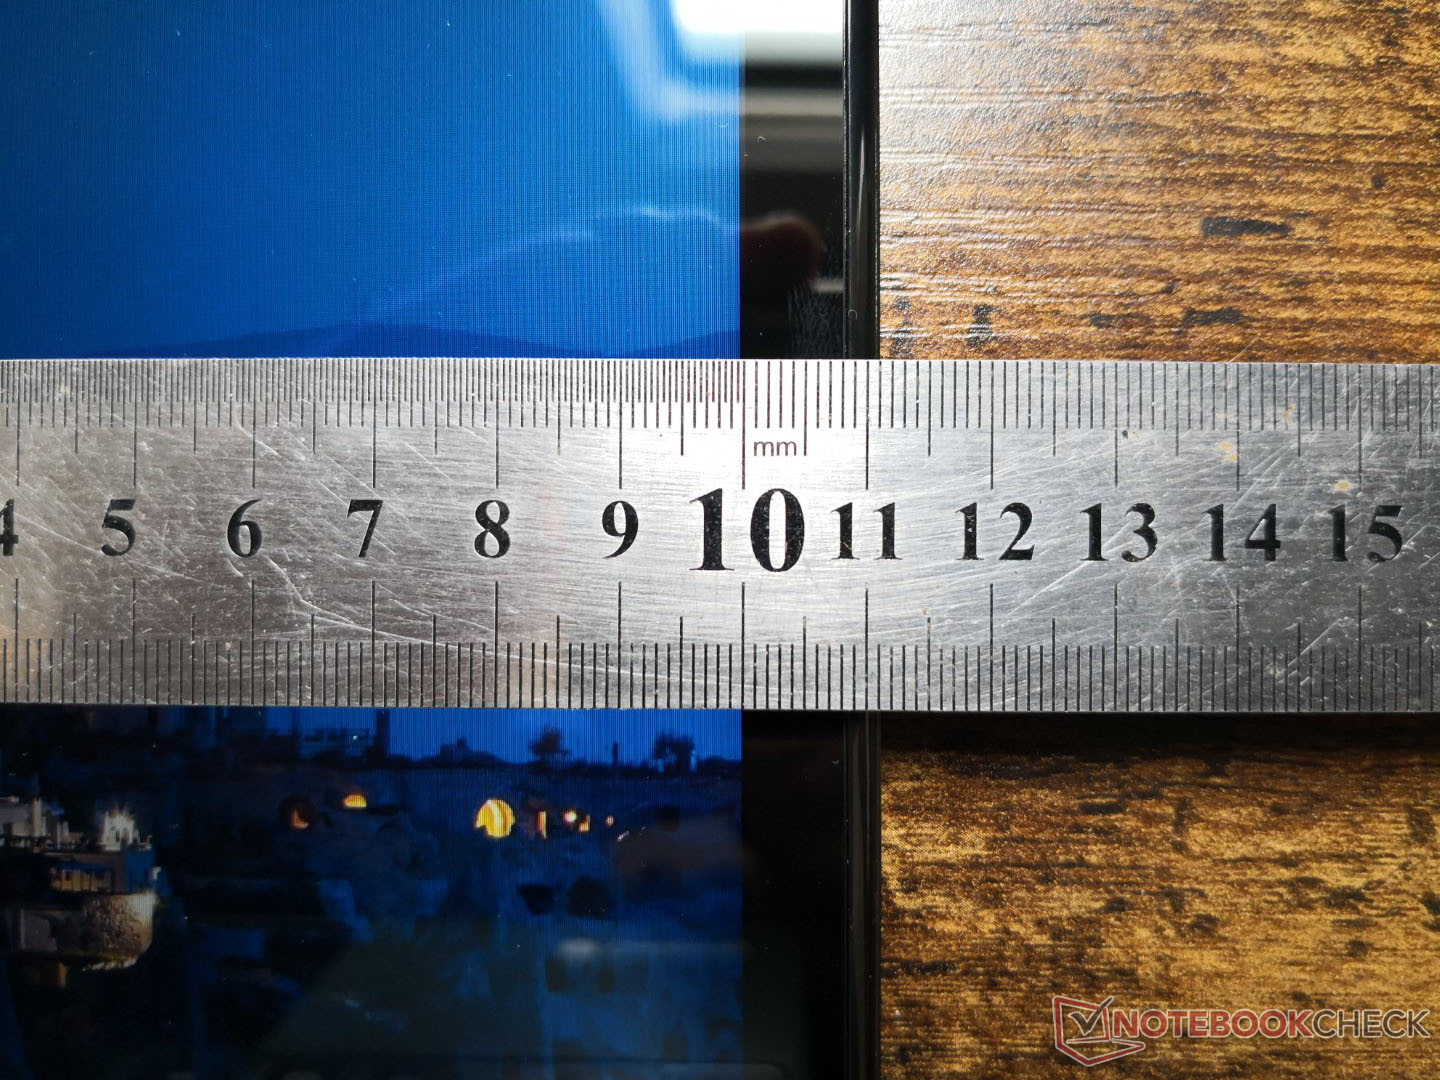
In terms of size and weight, the Gateway is thicker and heavier than many of the latest 14-inch laptops like the HP 14s or Xenia 14 due to its thicker bezels around the screen. It's a weighty system for the size at 1.6 kg or about 400 g heavier than the Asus Zenbook 14.
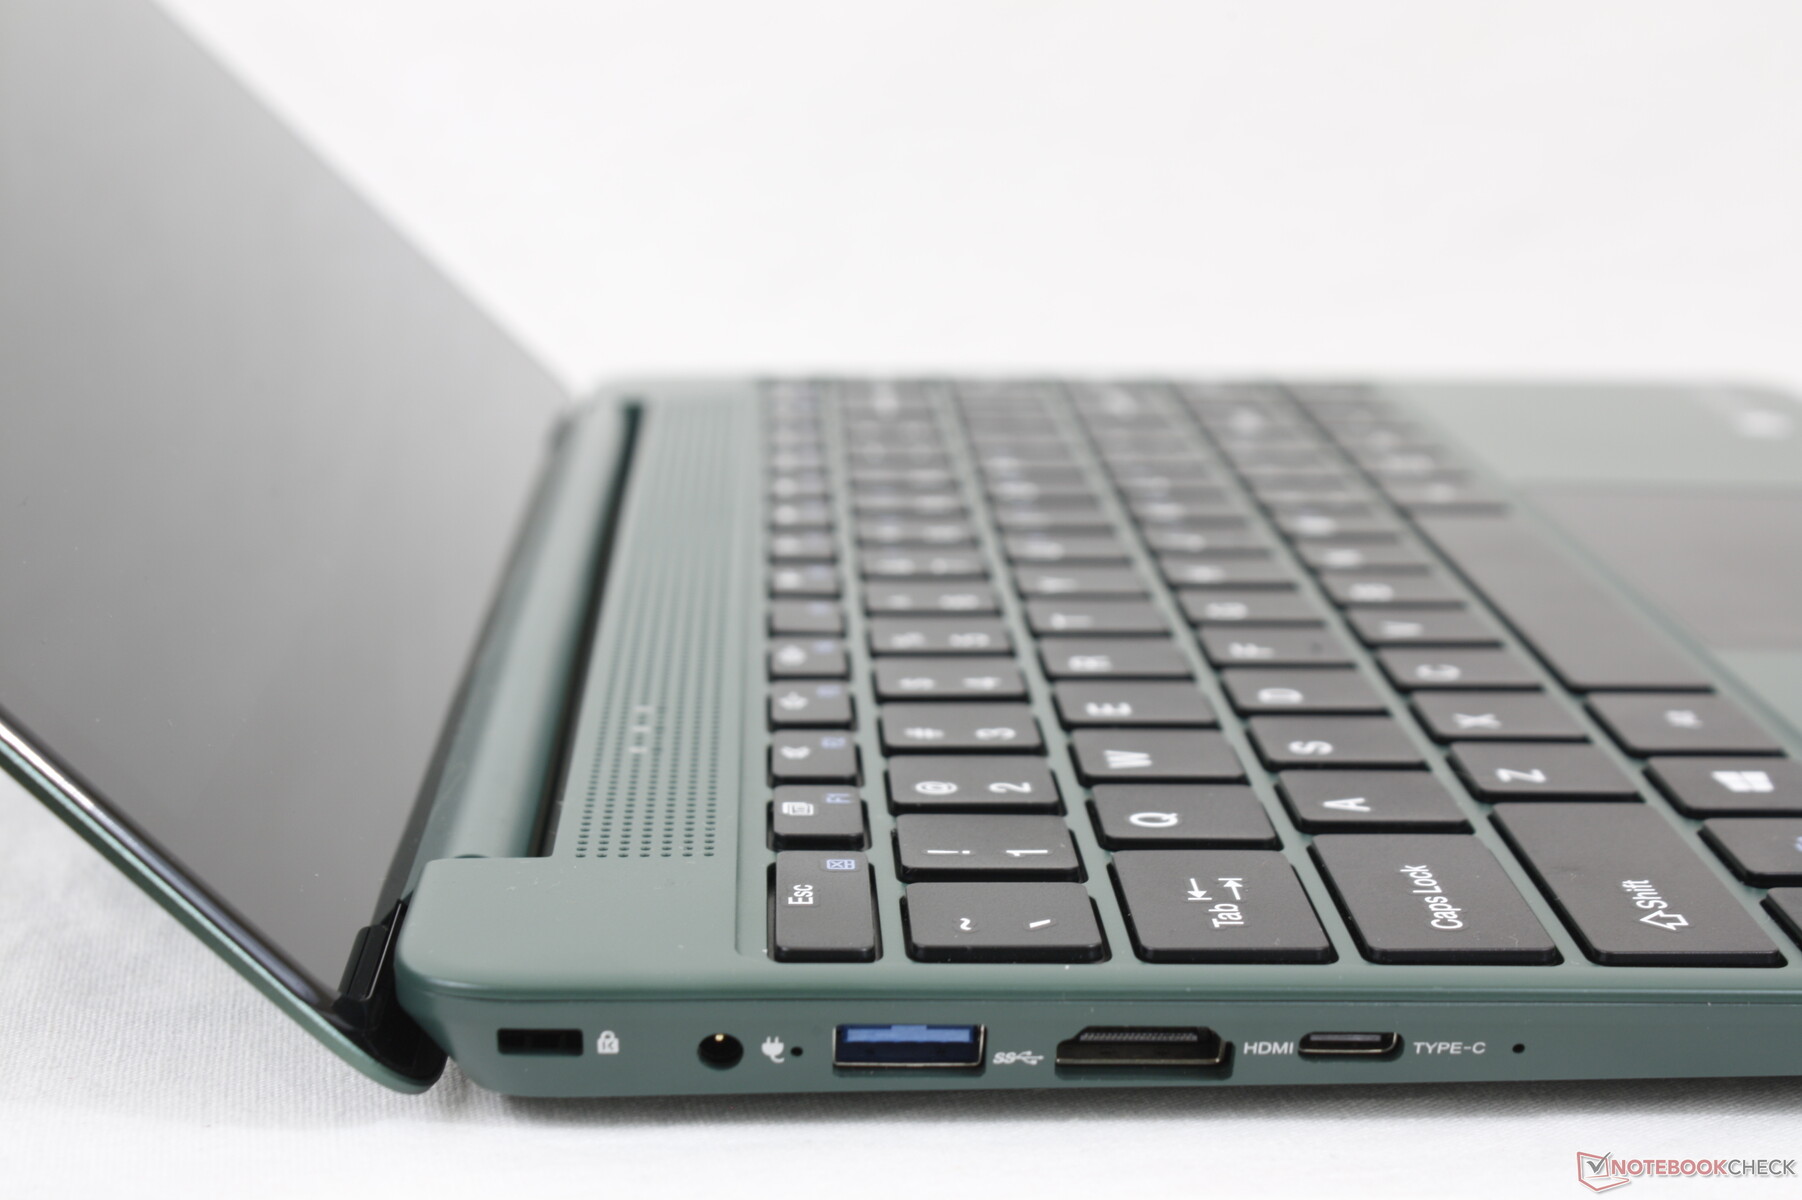
Connectivity
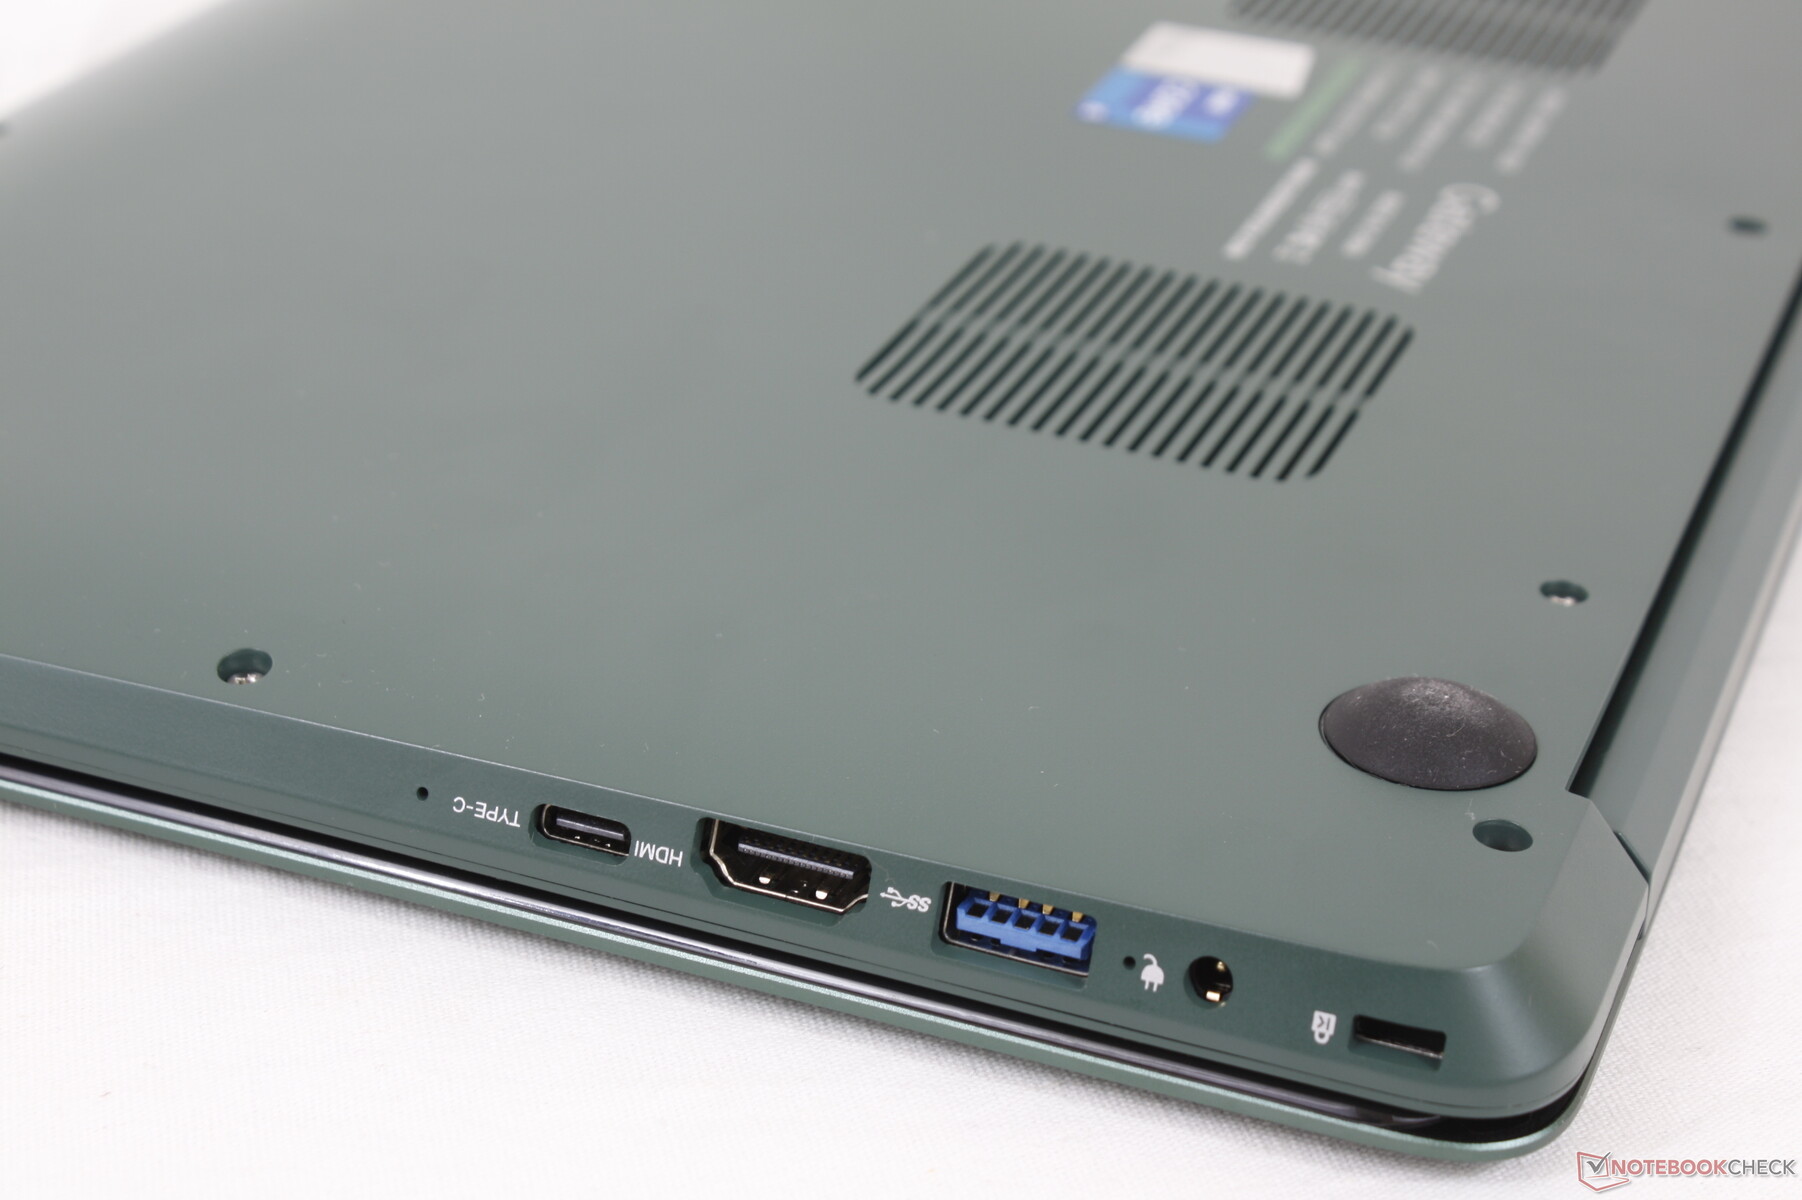
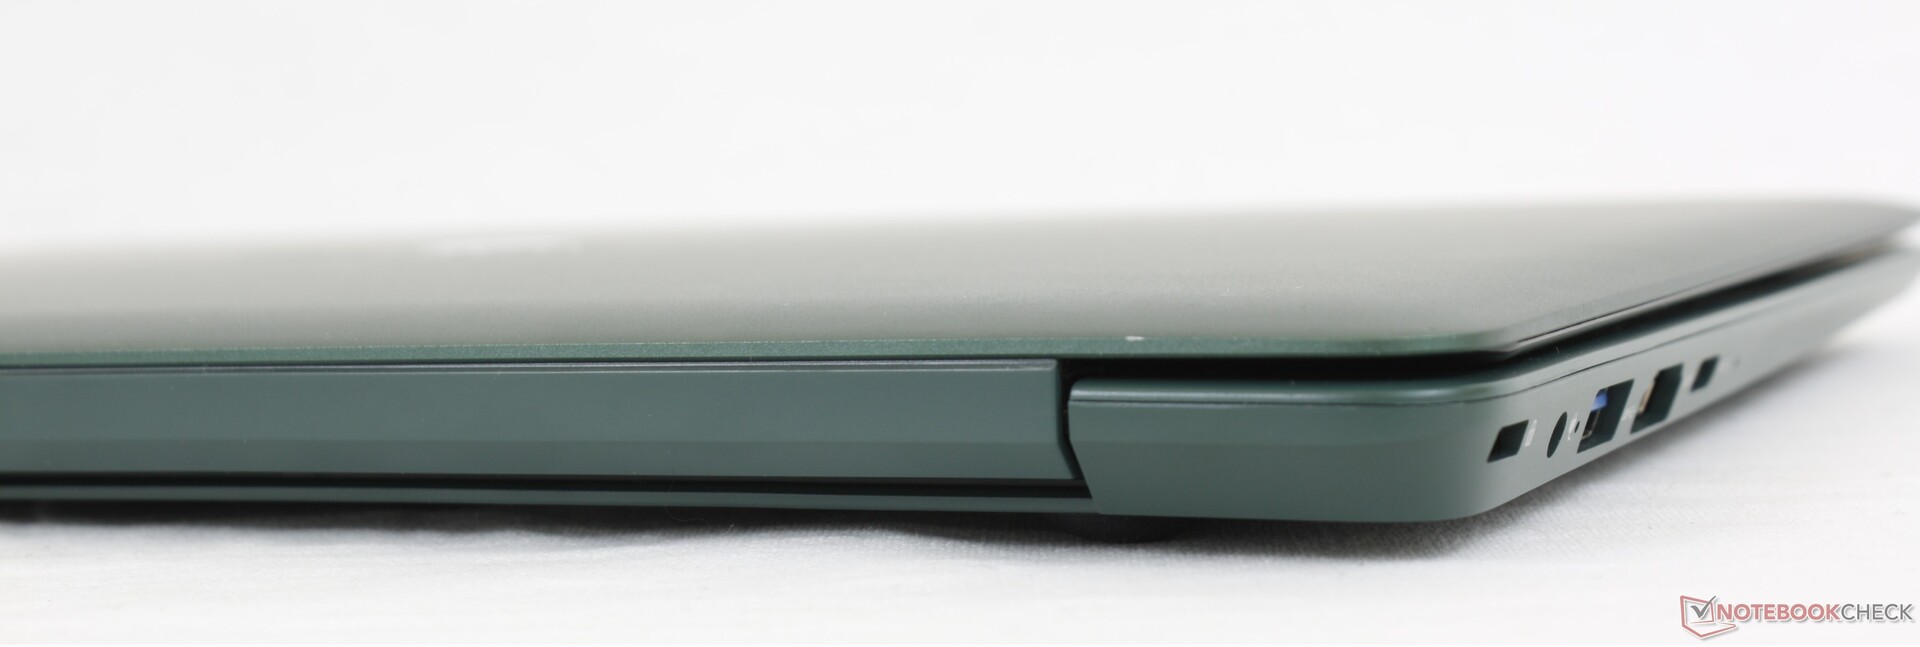
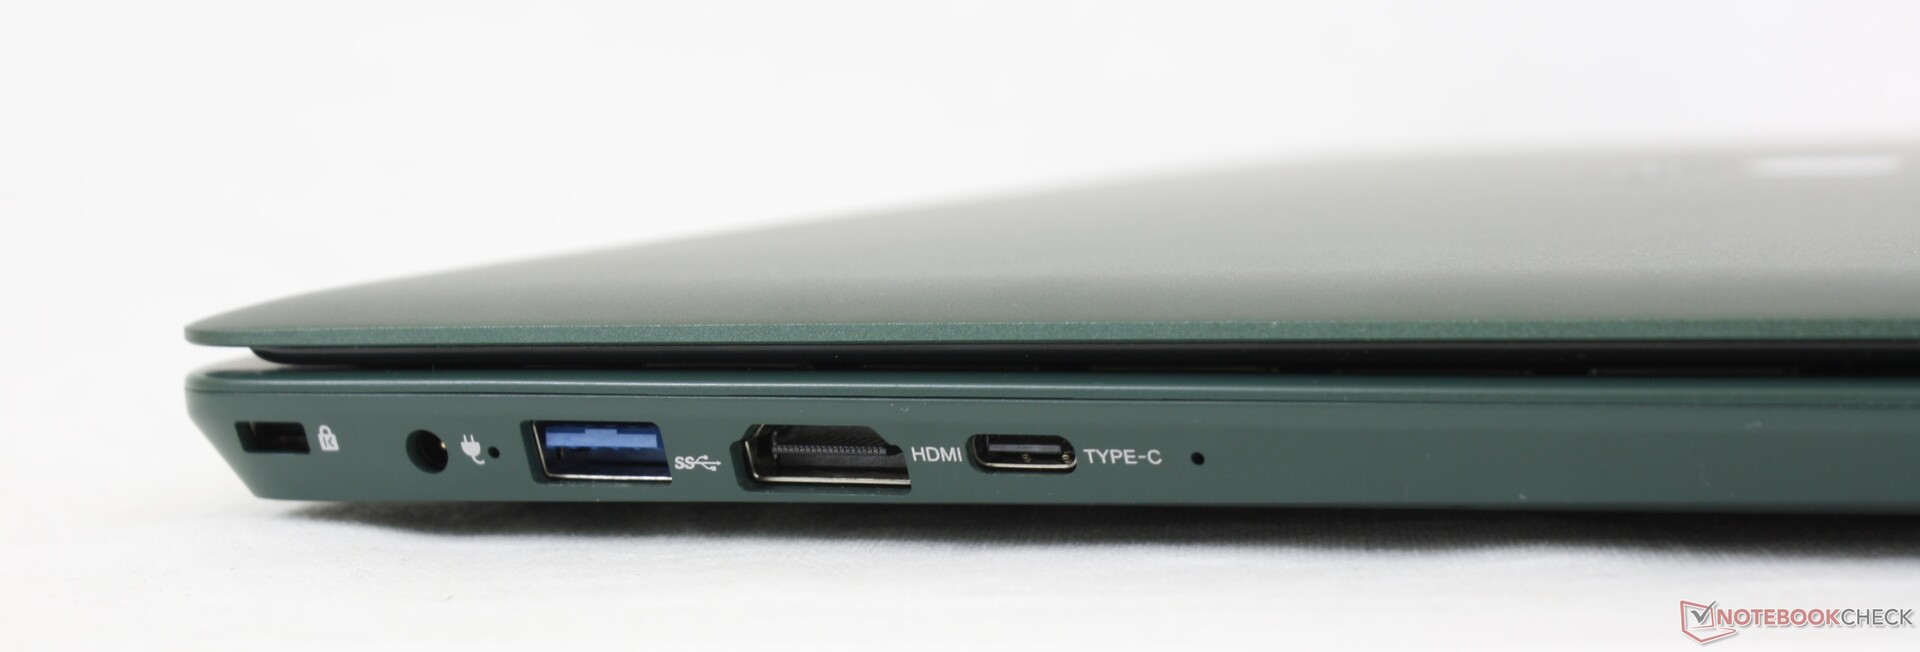
There are more ports than expected on such a cheap system including 2x USB-A, USB-C, HDMI, MicroSD, and even a Kensington lock. Thunderbolt is not supported here.
The USB-C port supports charging and video-out which can come in handy if you ever lose the proprietary barrel charger. However, it's worth mentioning that the USB-C port on our unit had issues powering our external SSD and outputting to an external monitor. Our external drive would constantly disconnect and reconnect while the picture on our external monitor would be unstable.
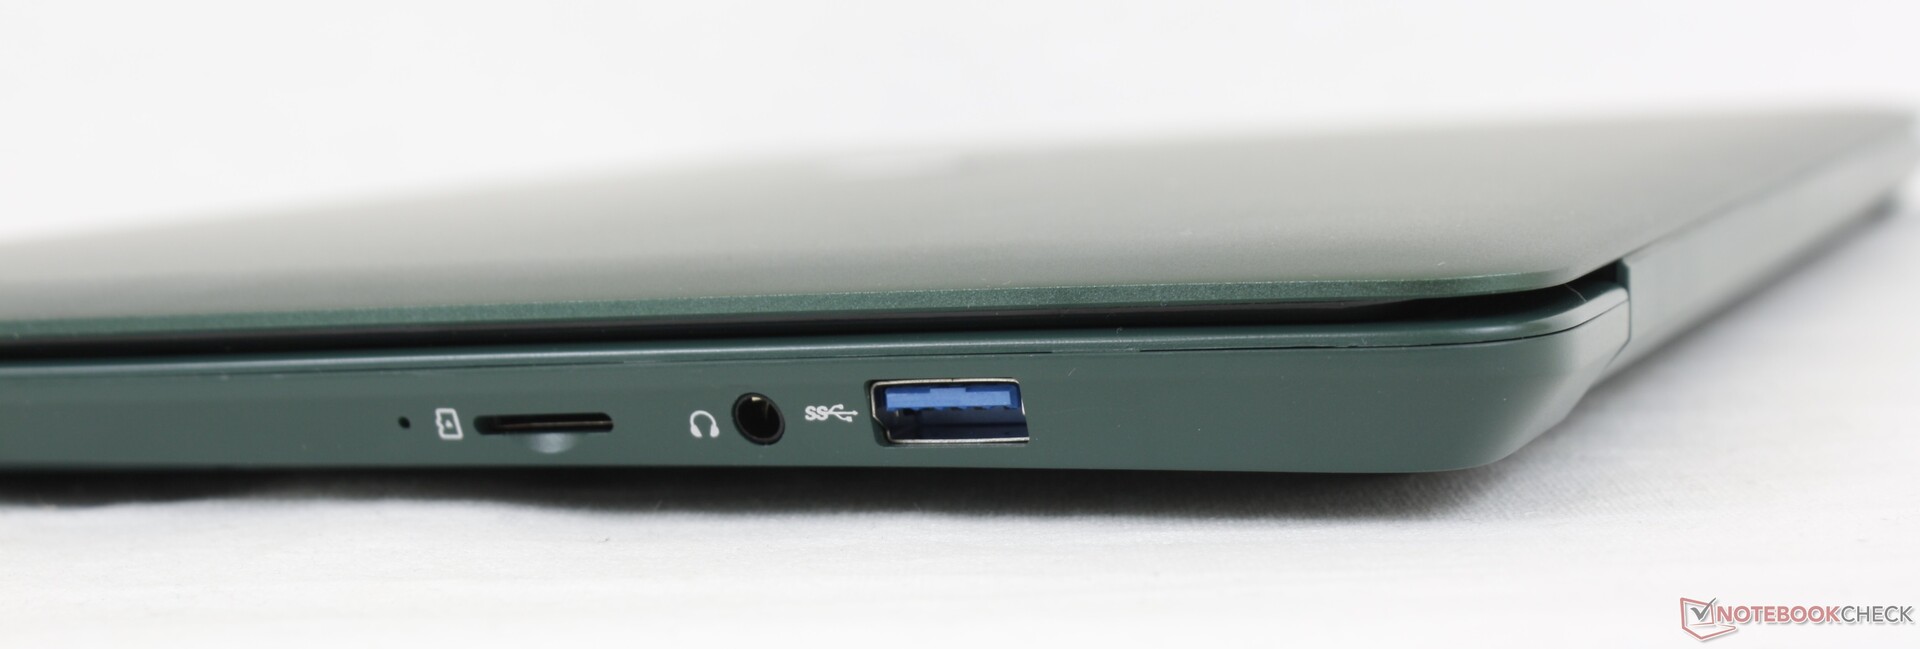
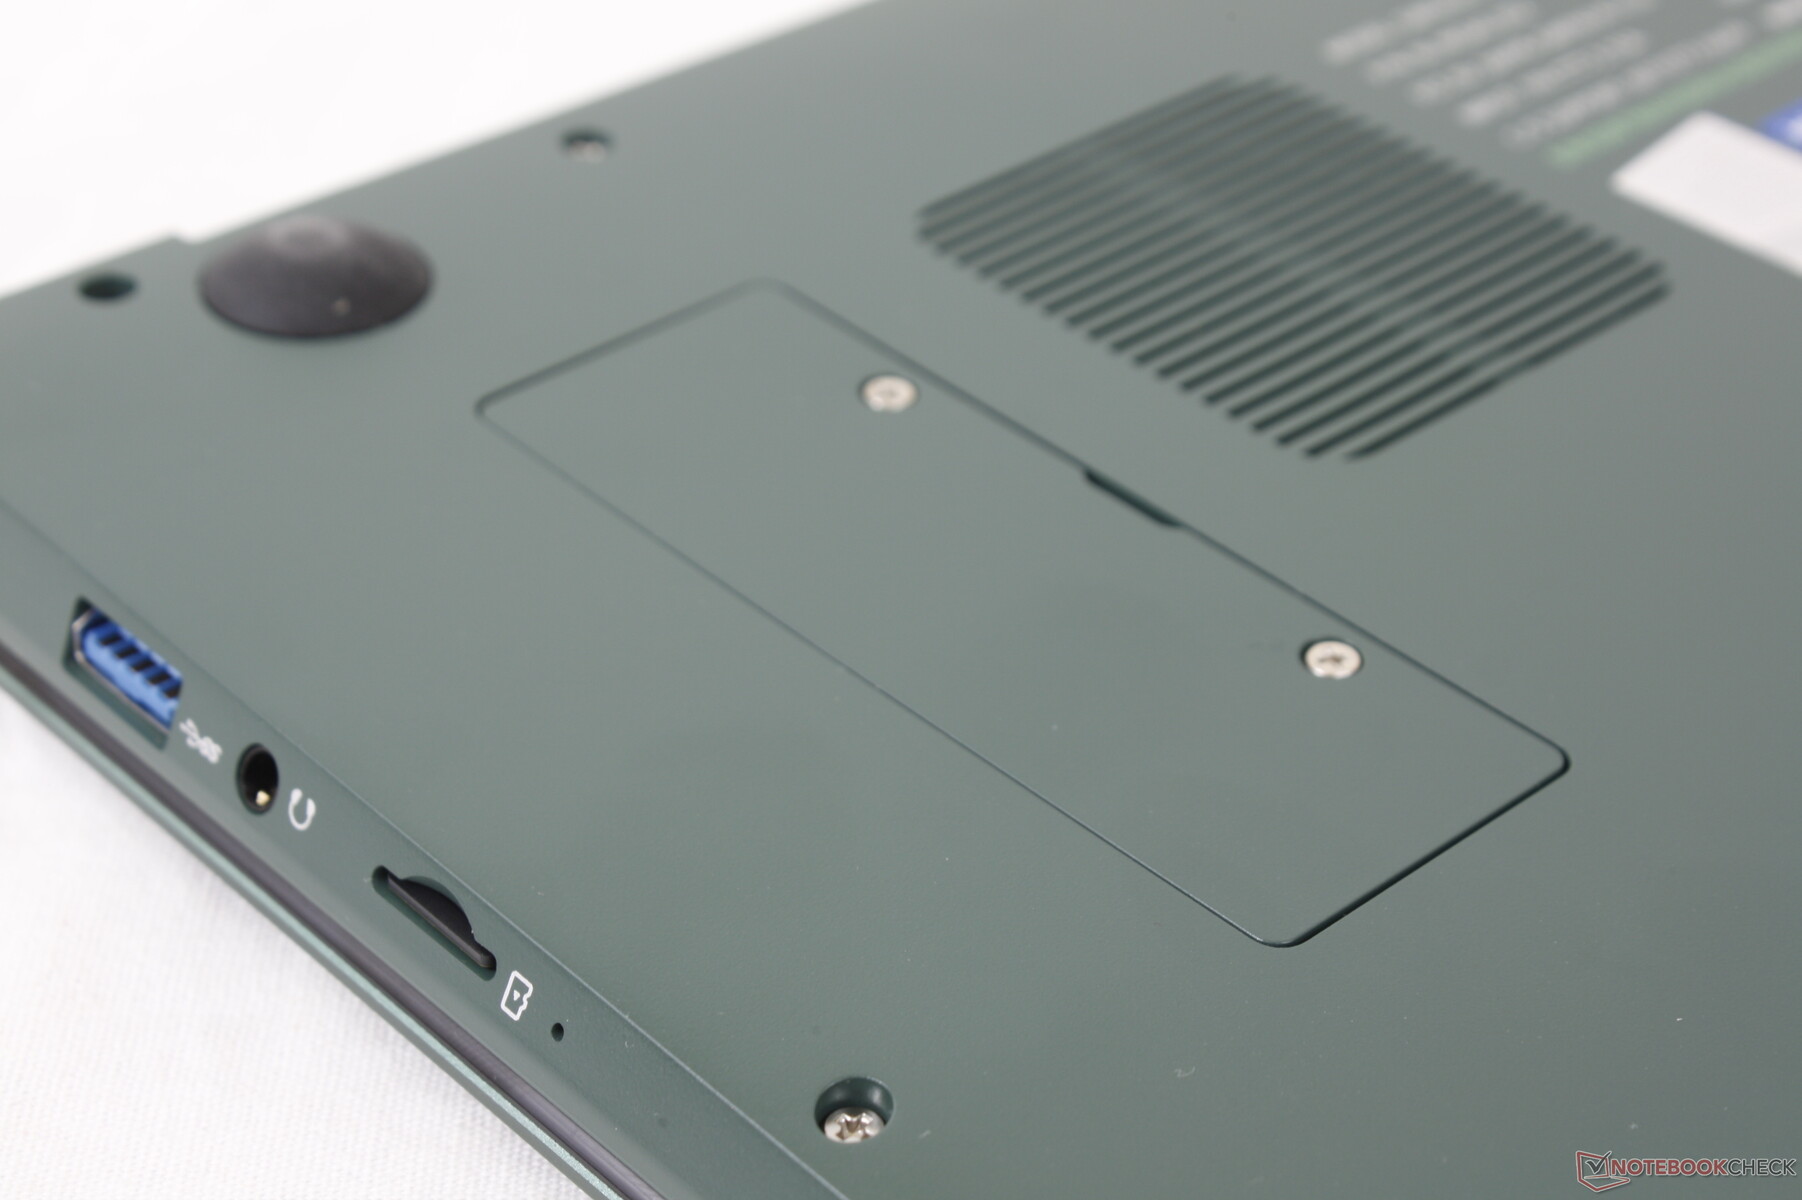
SD Card Reader
The spring-loaded MicroSD card reader is very slow at well under 20 MB/s. Moving 1 GB of files from our UHS-II test card to desktop takes almost 70 seconds.
| SD Card Reader | |
| average JPG Copy Test (av. of 3 runs) | |
| ADATA XPG Xenia 14 (AV Pro V60) | |
| HP 14s-fq1357ng (AV Pro SD microSD 128 GB V60) | |
| Chuwi CoreBook X (AV PRO V60) | |
| Blackview AceBook 1 (AV Pro V60) | |
| Gateway GWTN141-10GR (AV Pro V60) | |
| maximum AS SSD Seq Read Test (1GB) | |
| ADATA XPG Xenia 14 (AV Pro V60) | |
| HP 14s-fq1357ng (AV Pro SD microSD 128 GB V60) | |
| Chuwi CoreBook X (AV PRO V60) | |
| Blackview AceBook 1 (AV Pro V60) | |
| Gateway GWTN141-10GR (AV Pro V60) | |
Communication
The included Intel 9461 is an older Wi-Fi 5 module capable of only 1x1 speeds of up to 433 Mbps. Though nowhere near as fast current Wi-Fi 6 laptops, transfer rates are at least stable and reliable.
Webcam
Standard 1 MP webcam with no privacy shutter or IR features.


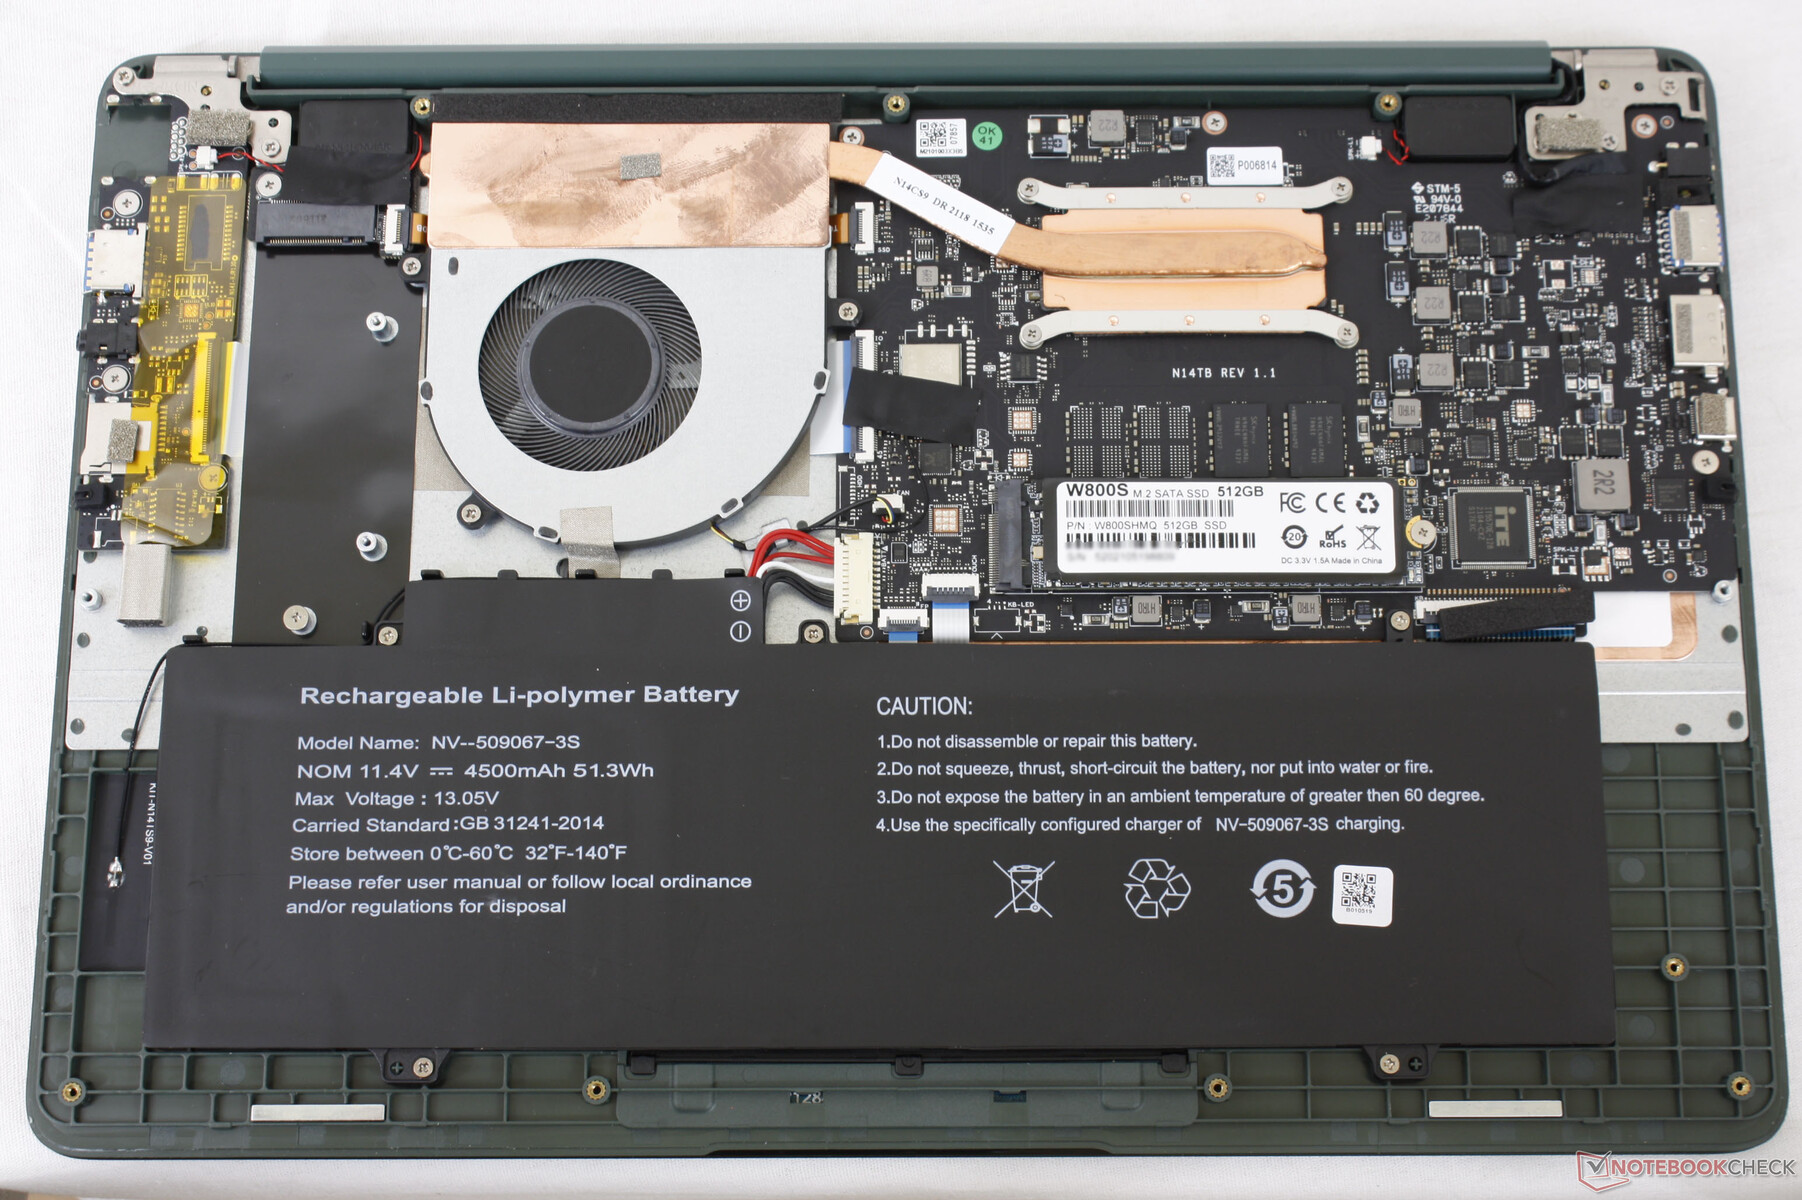
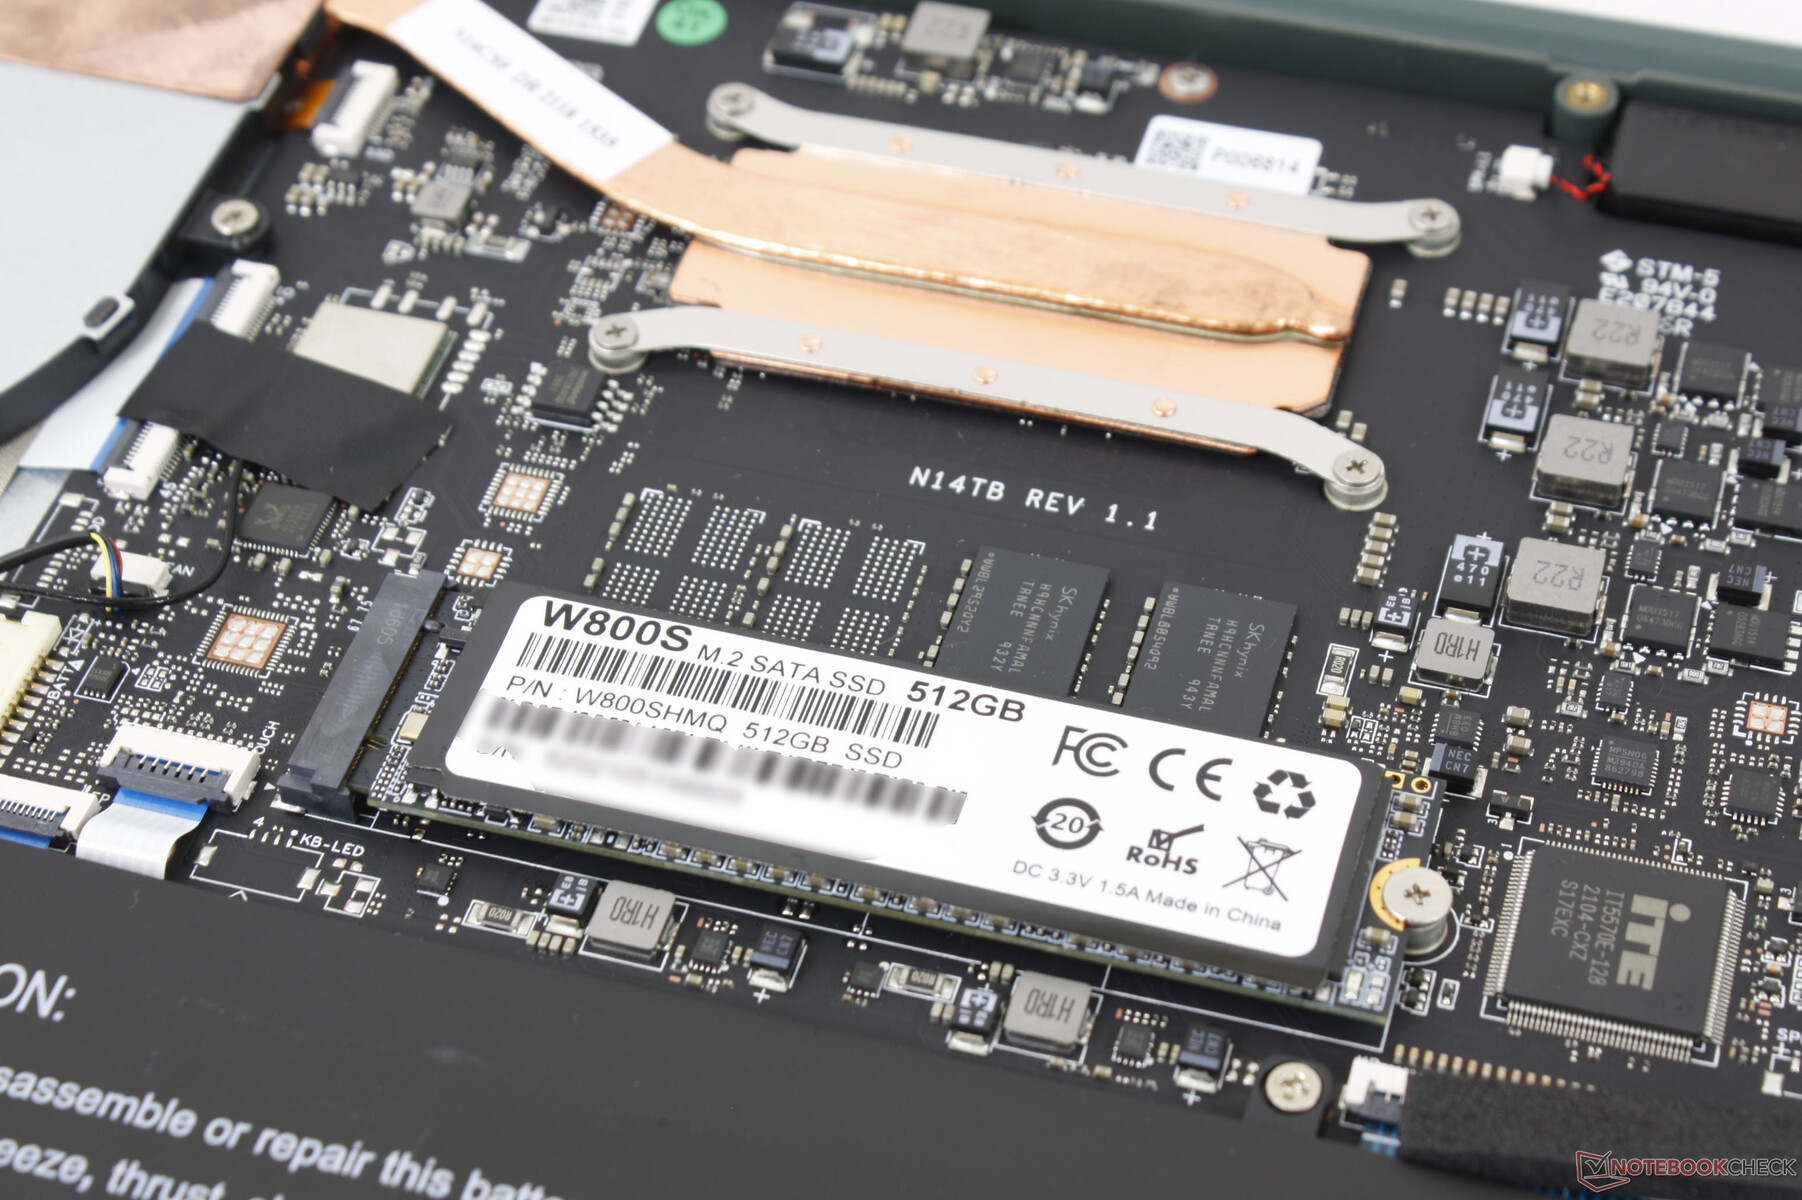
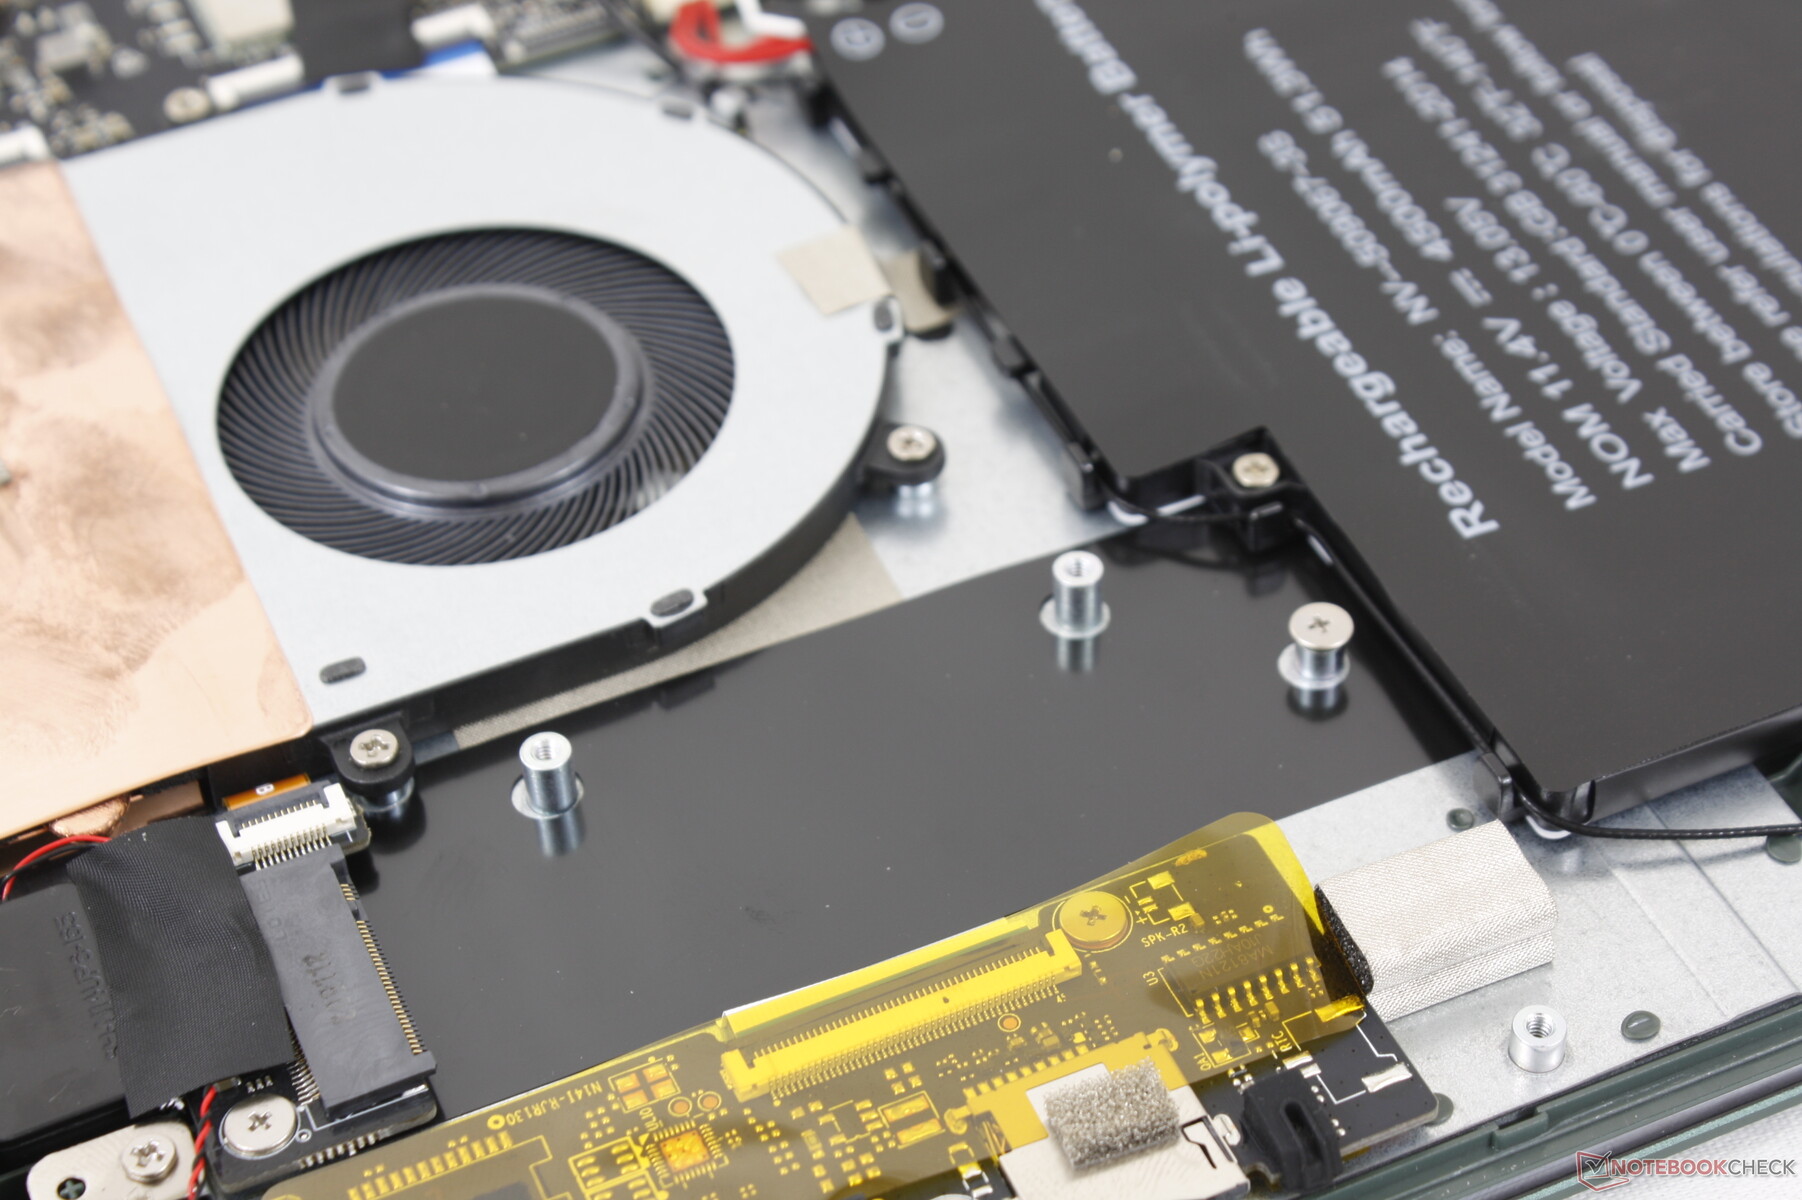
Maintenance
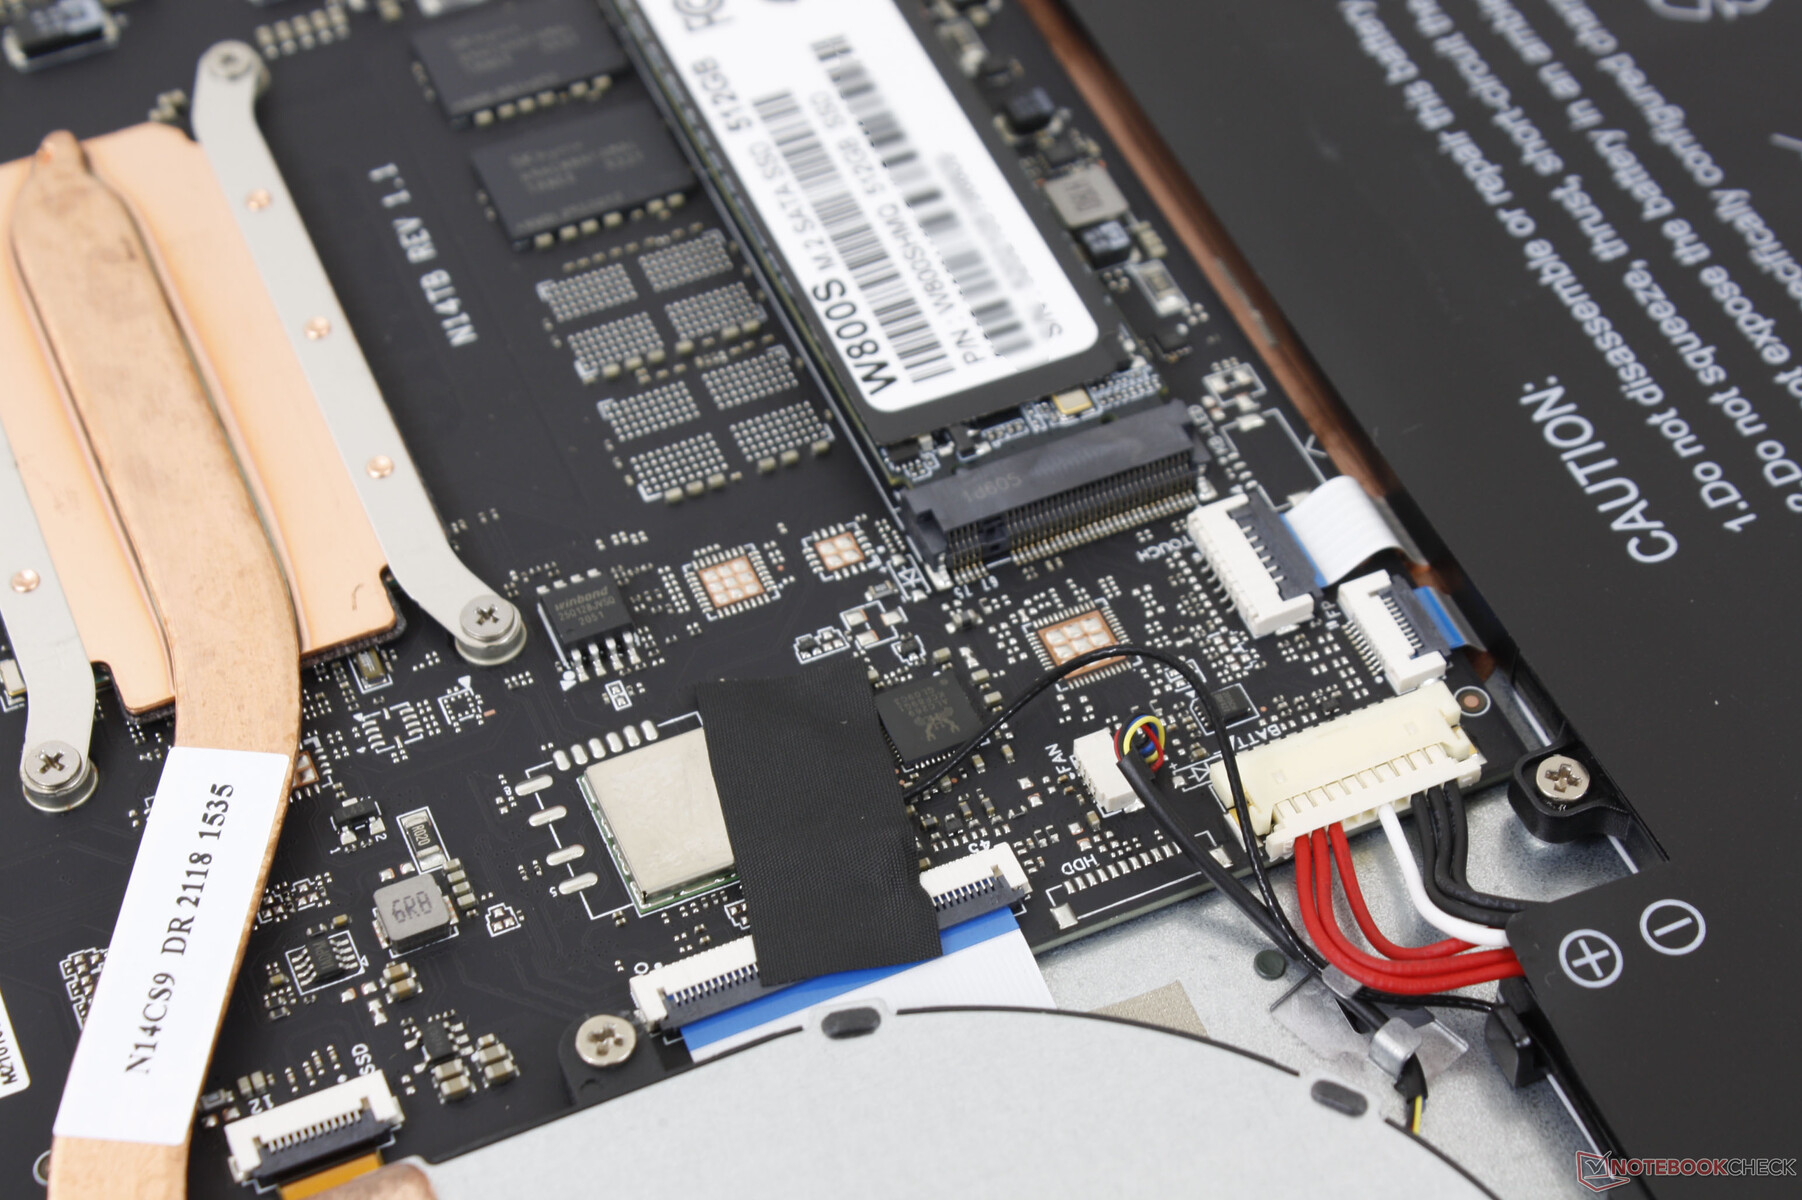
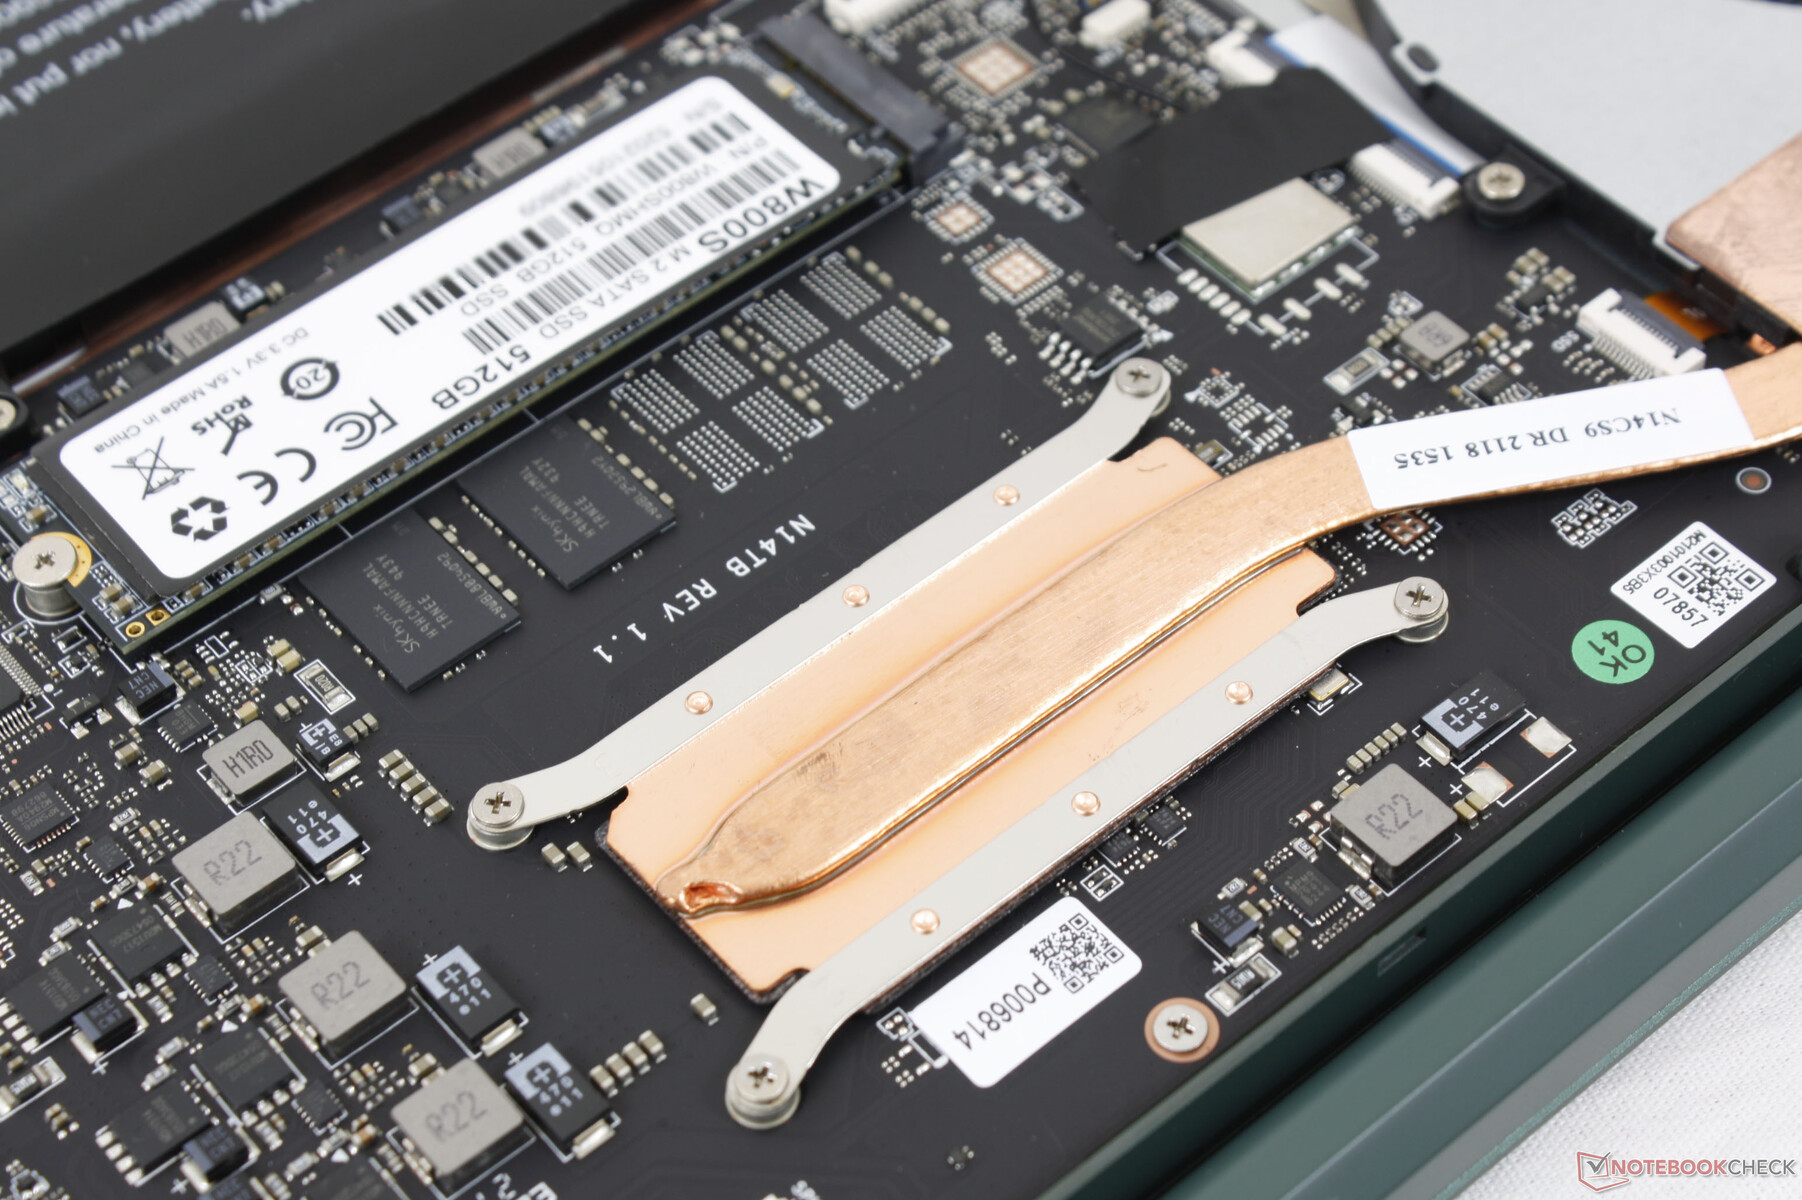
The bottom panel requires a Philips screwdriver and sharp edge to remove. Users can install up to two M.2 SATA III SSDs while both RAM and WLAN are fixed.
Accessories and Warranty
There are no extras in the box other than the proprietary barrel AC adapter and paperwork. The system can be recharged via third-party USB-C adapters should you ever lose the barrel charger.
The standard one-year warranty applies if purchased from Walmart. Claiming warranty should be much easier through the retailer than from makers overseas like Chuwi or Blackview.
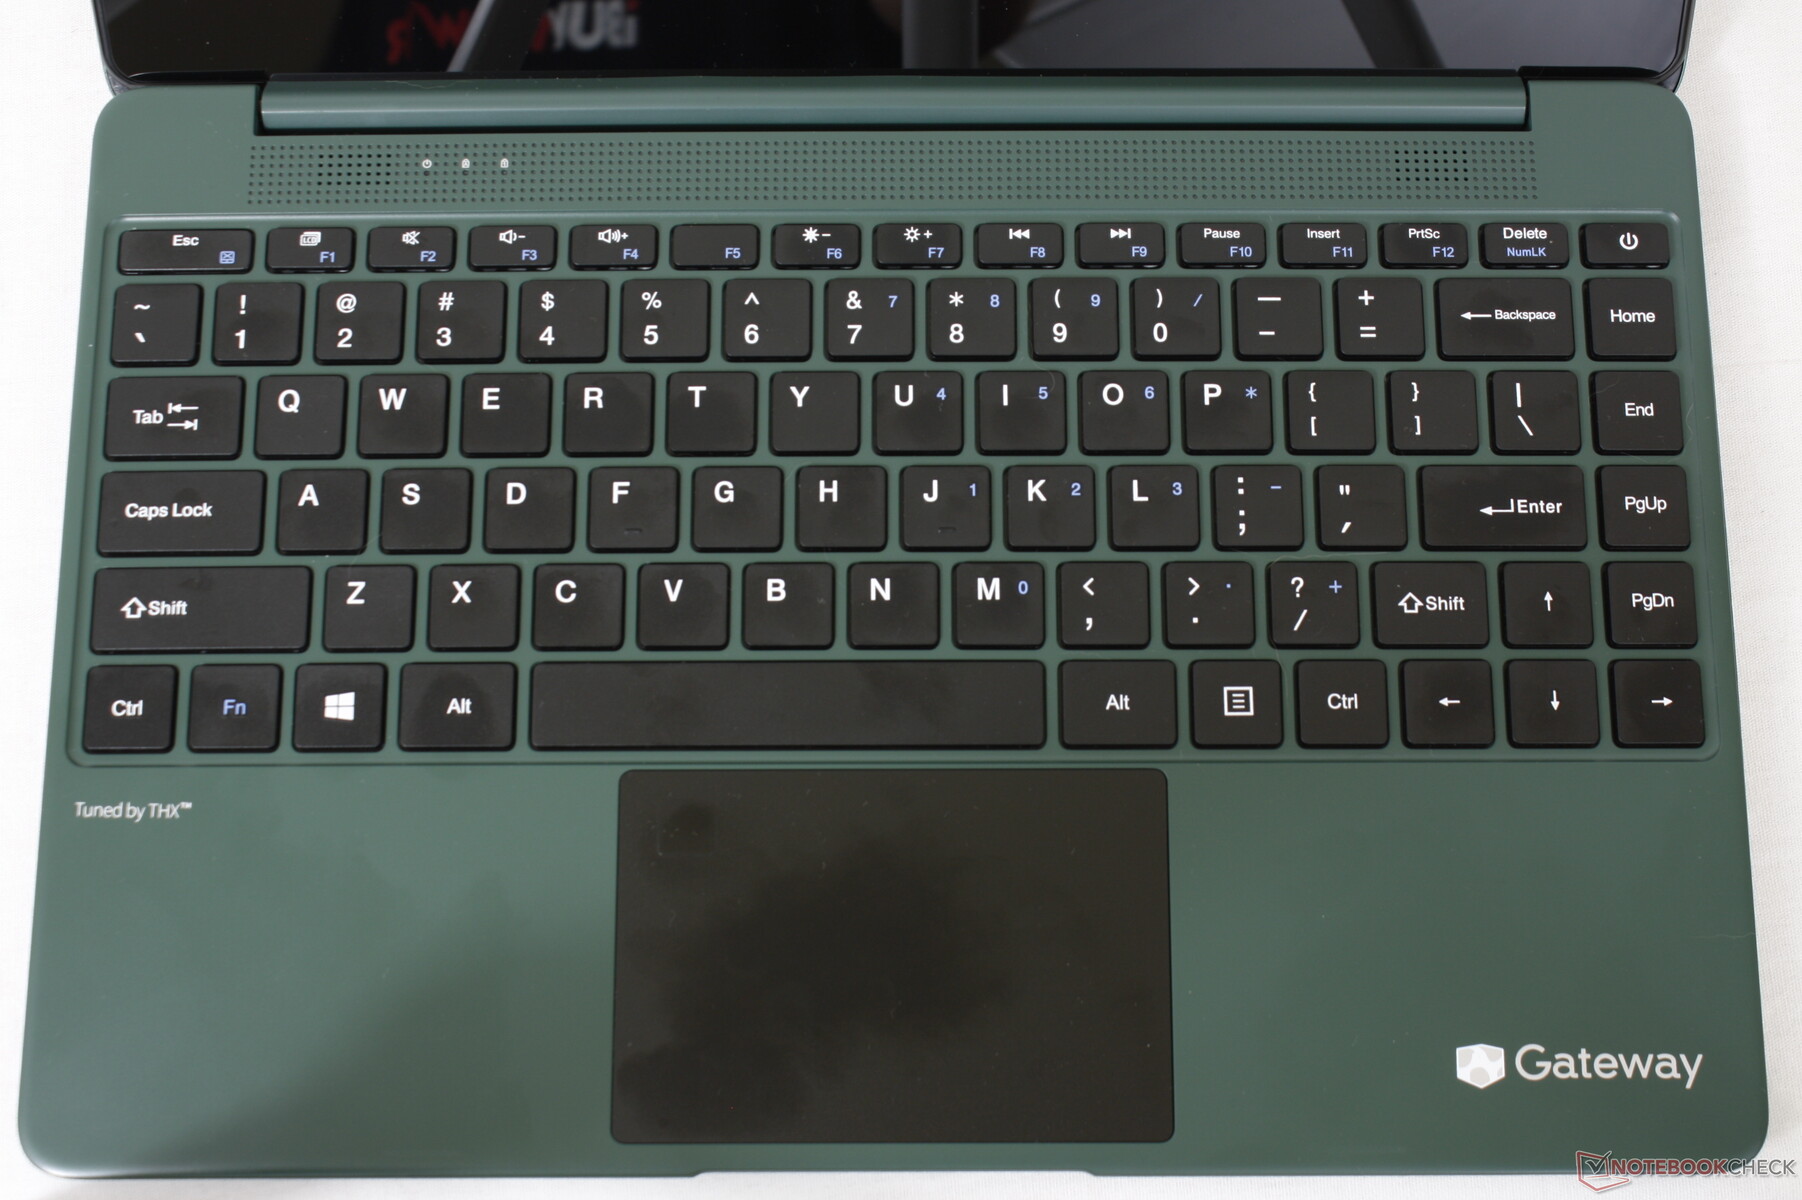
Input Devices
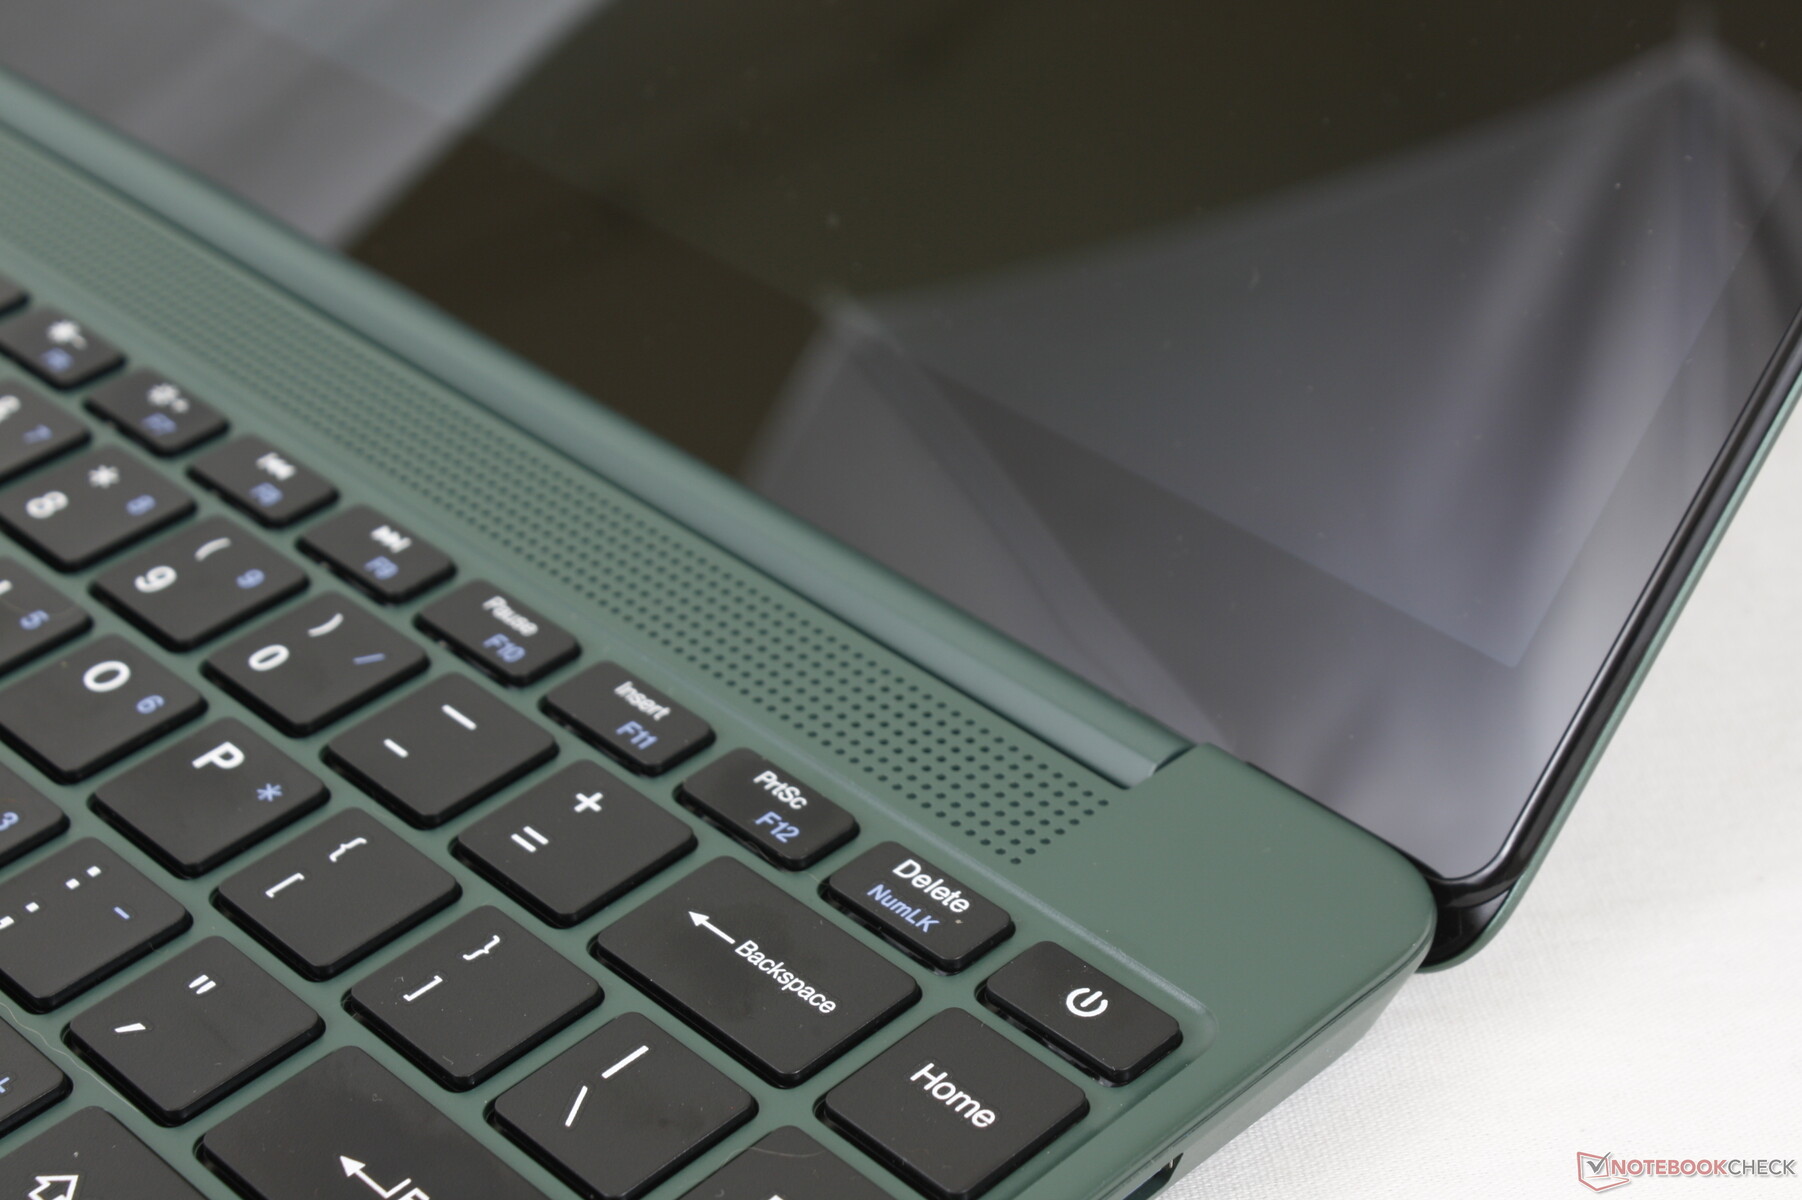
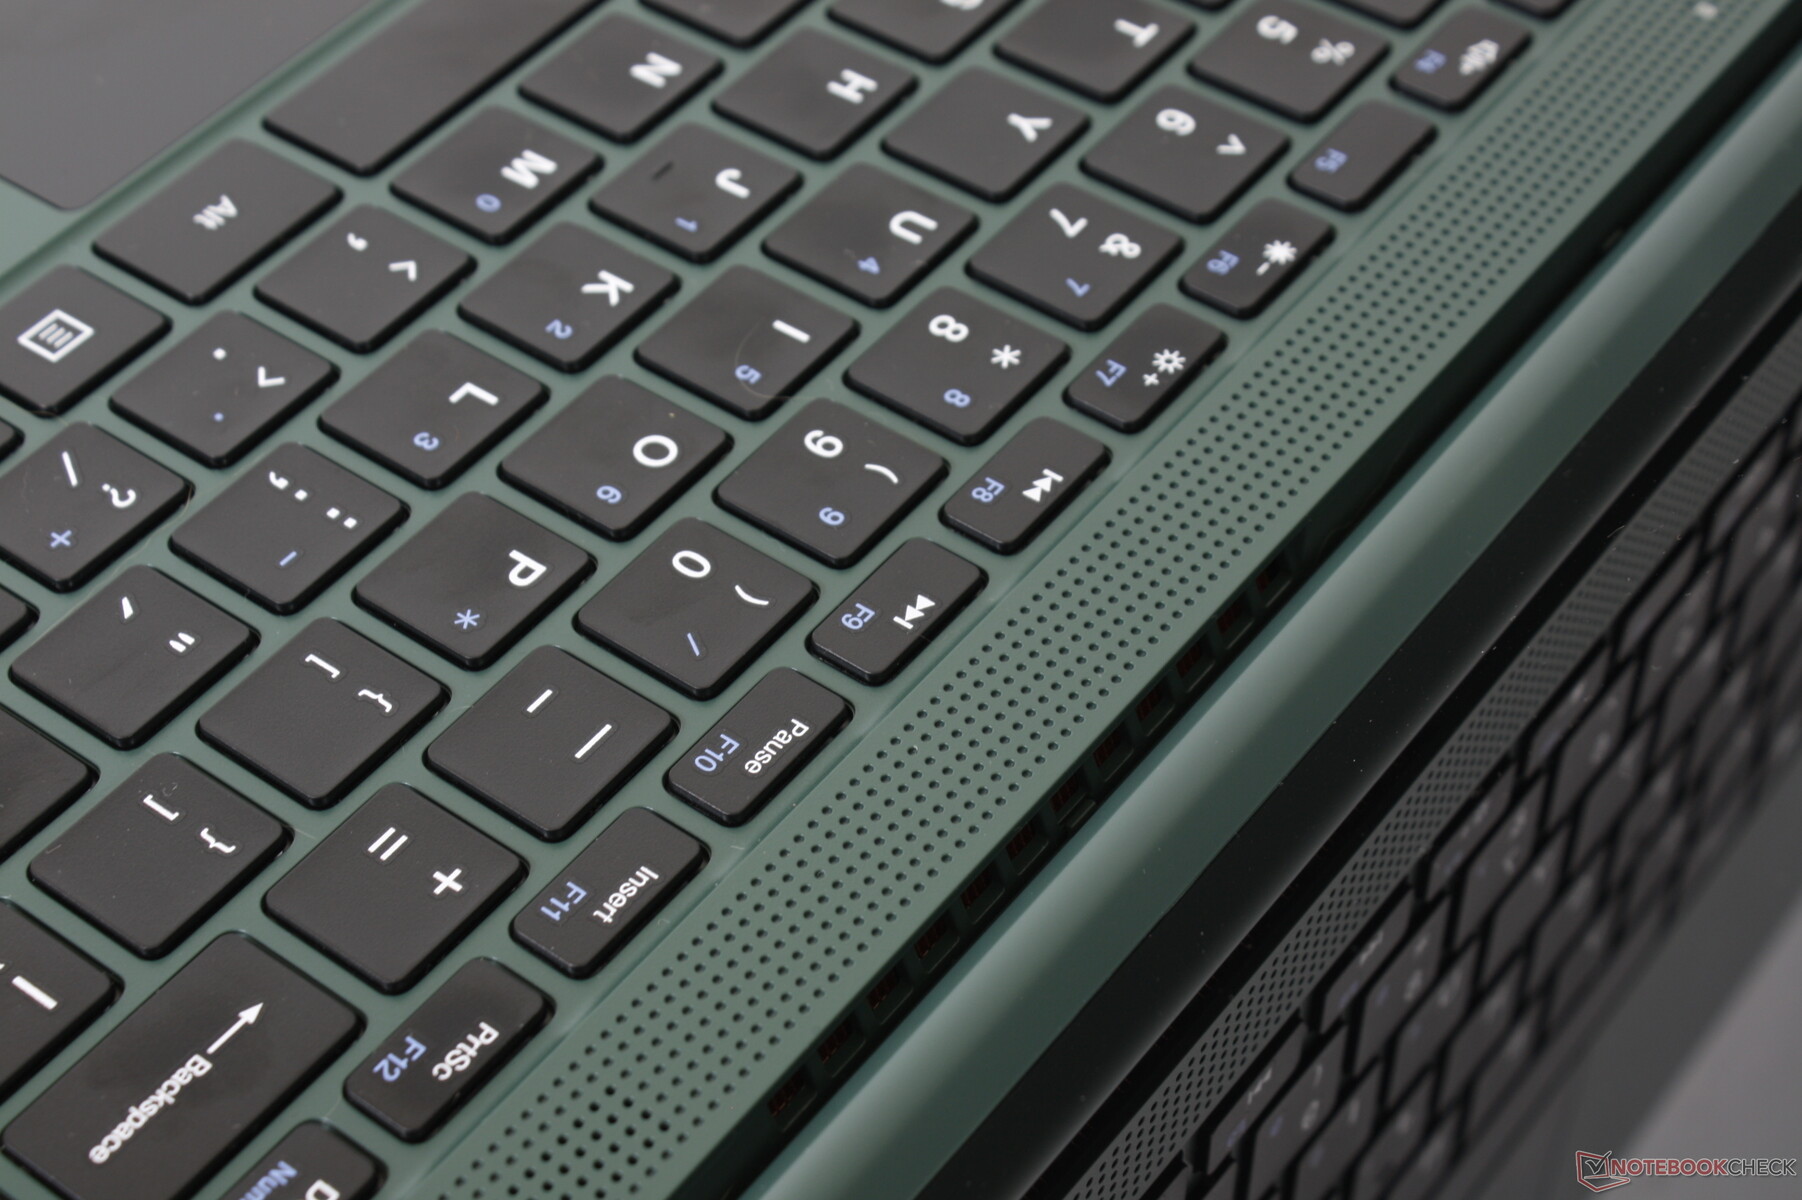
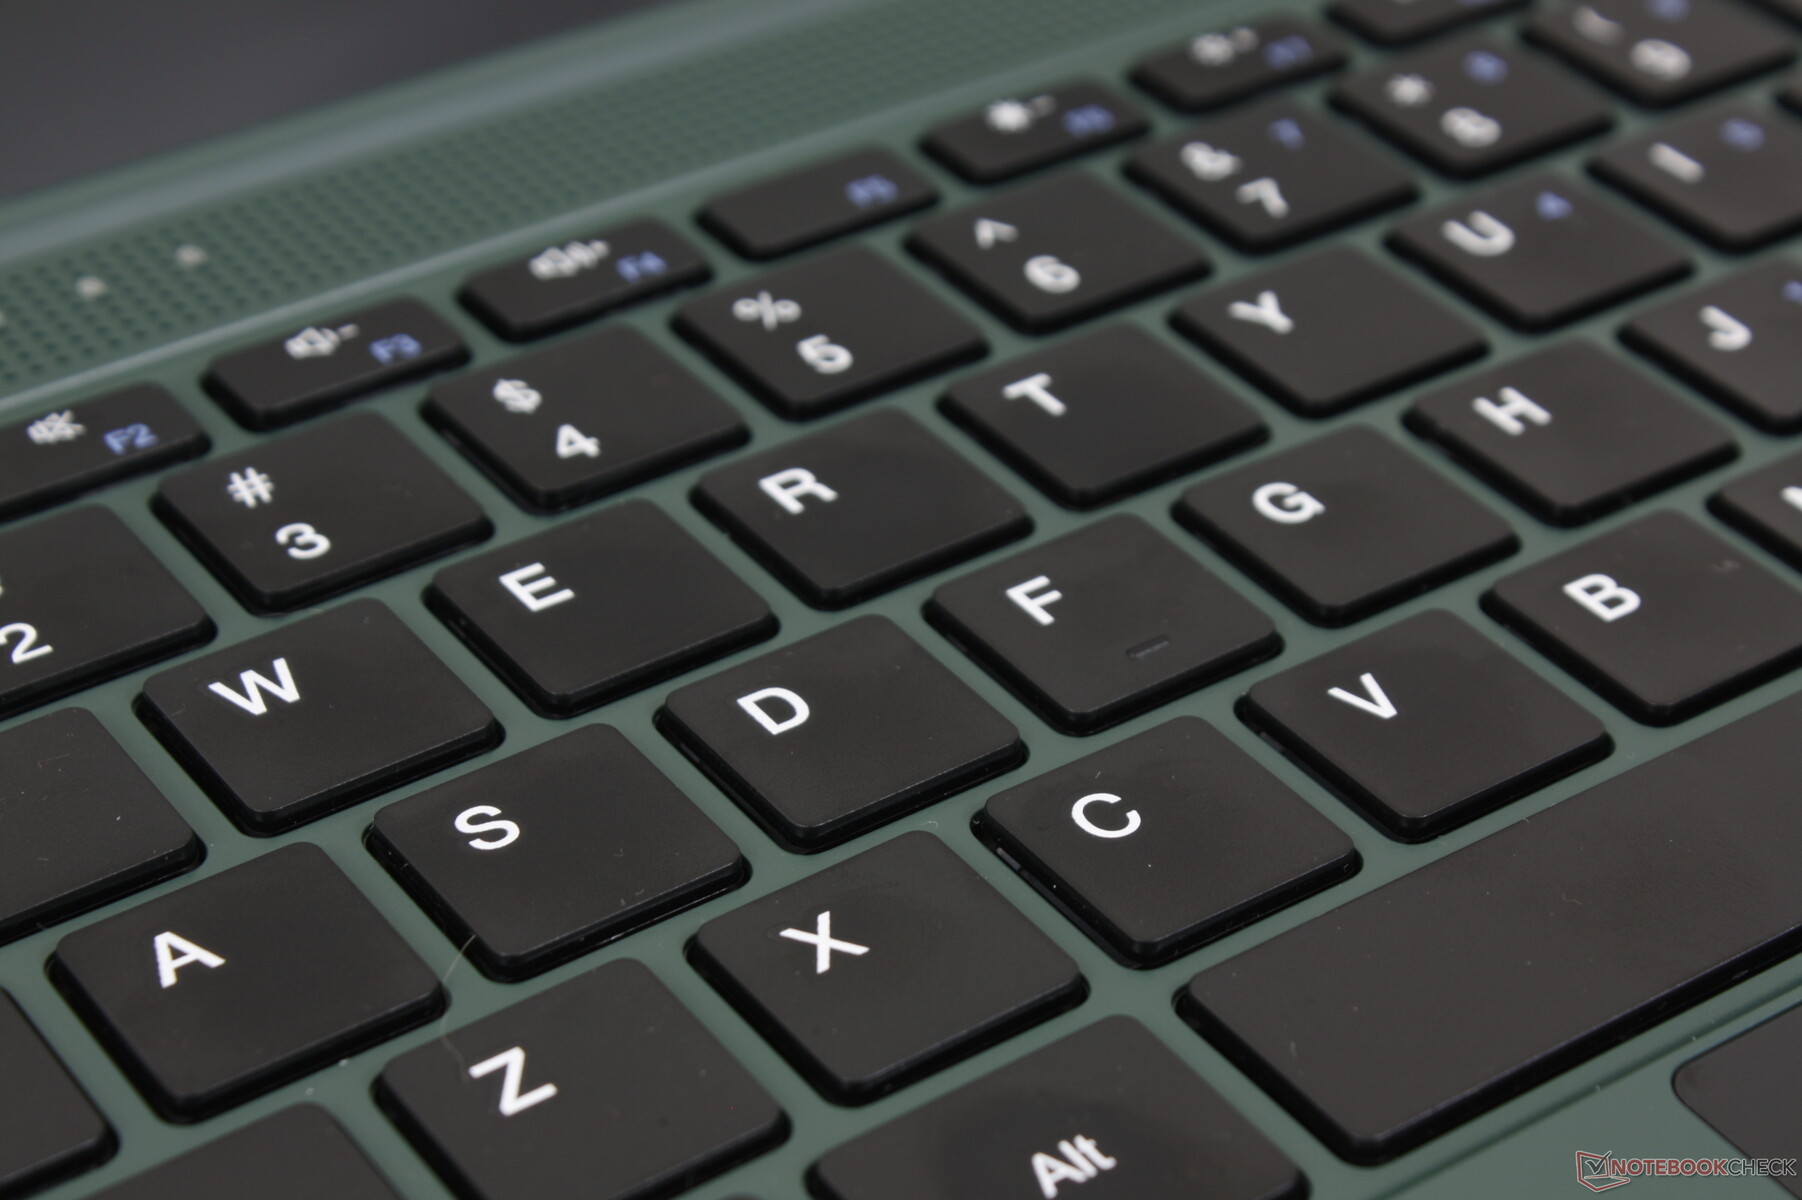
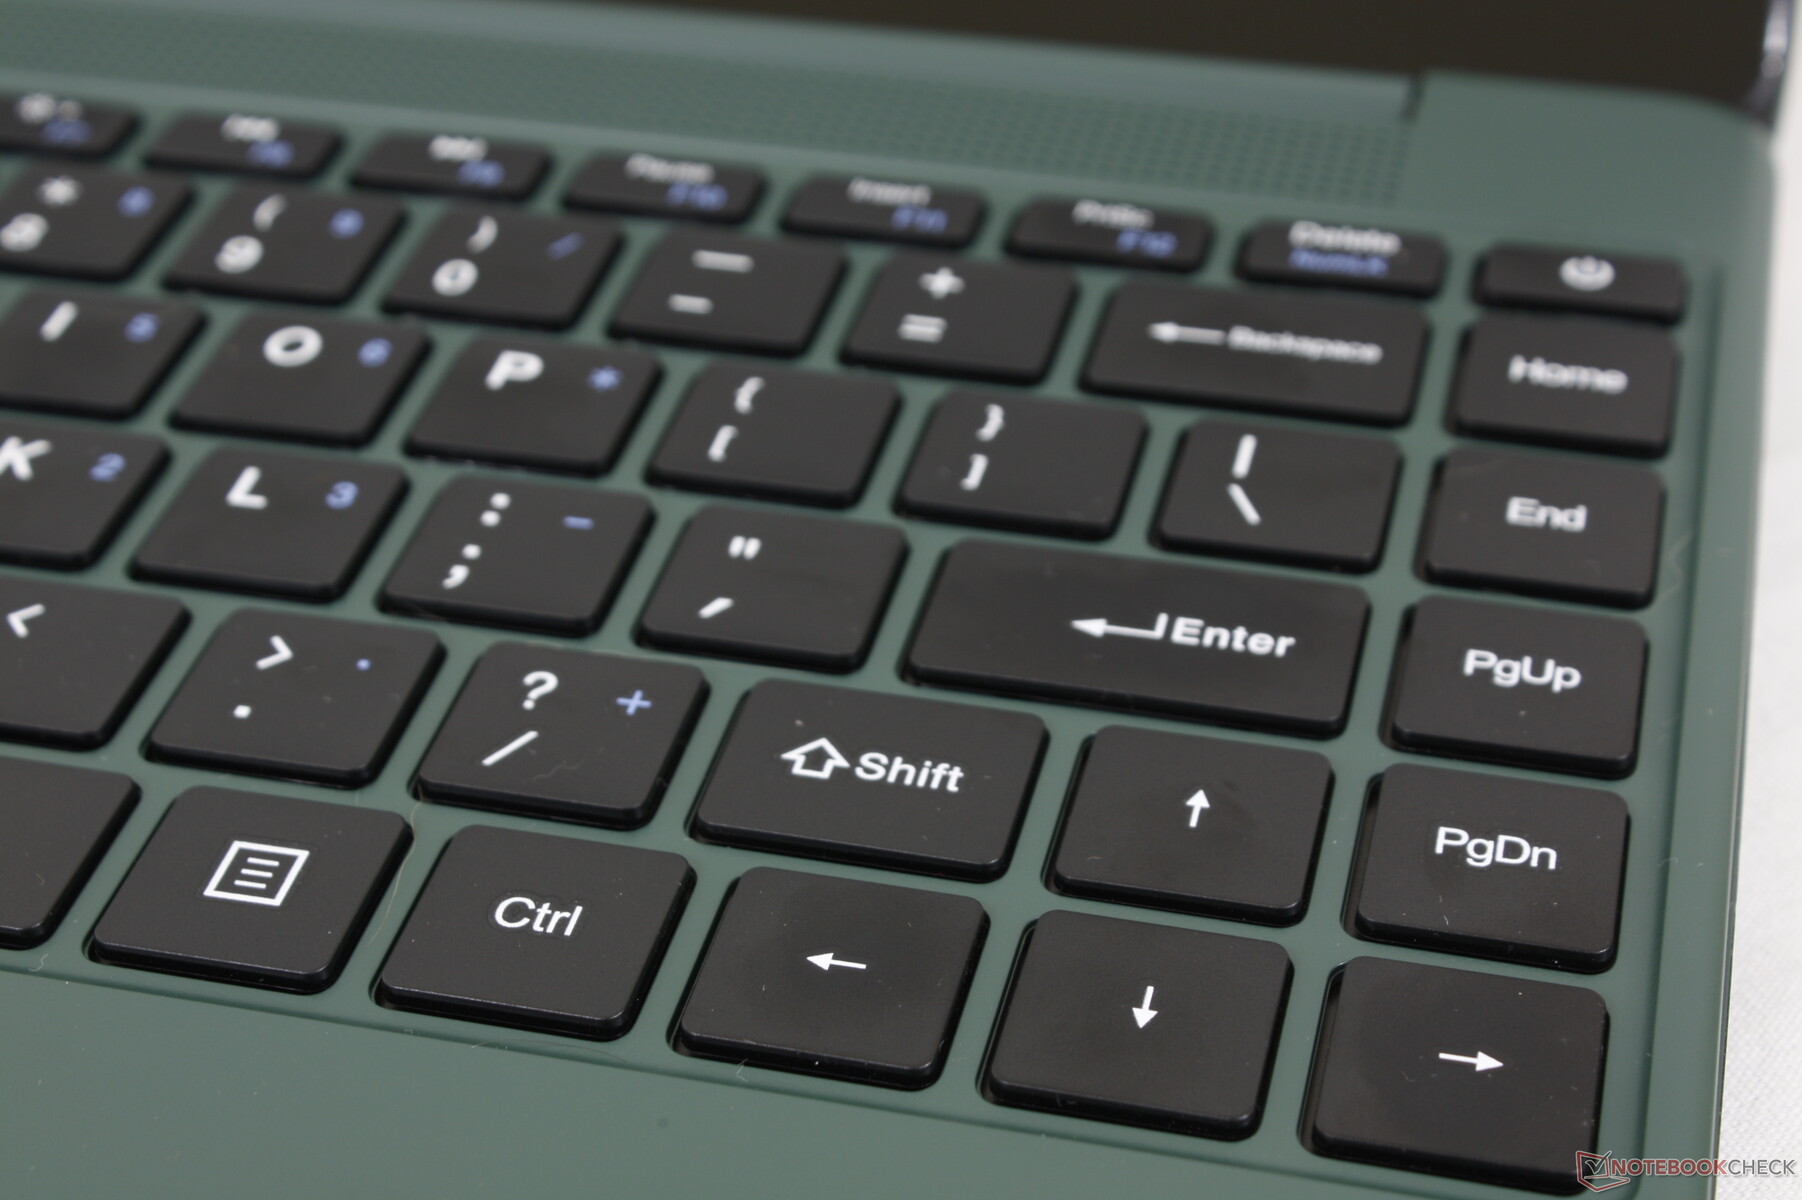
Keyboard
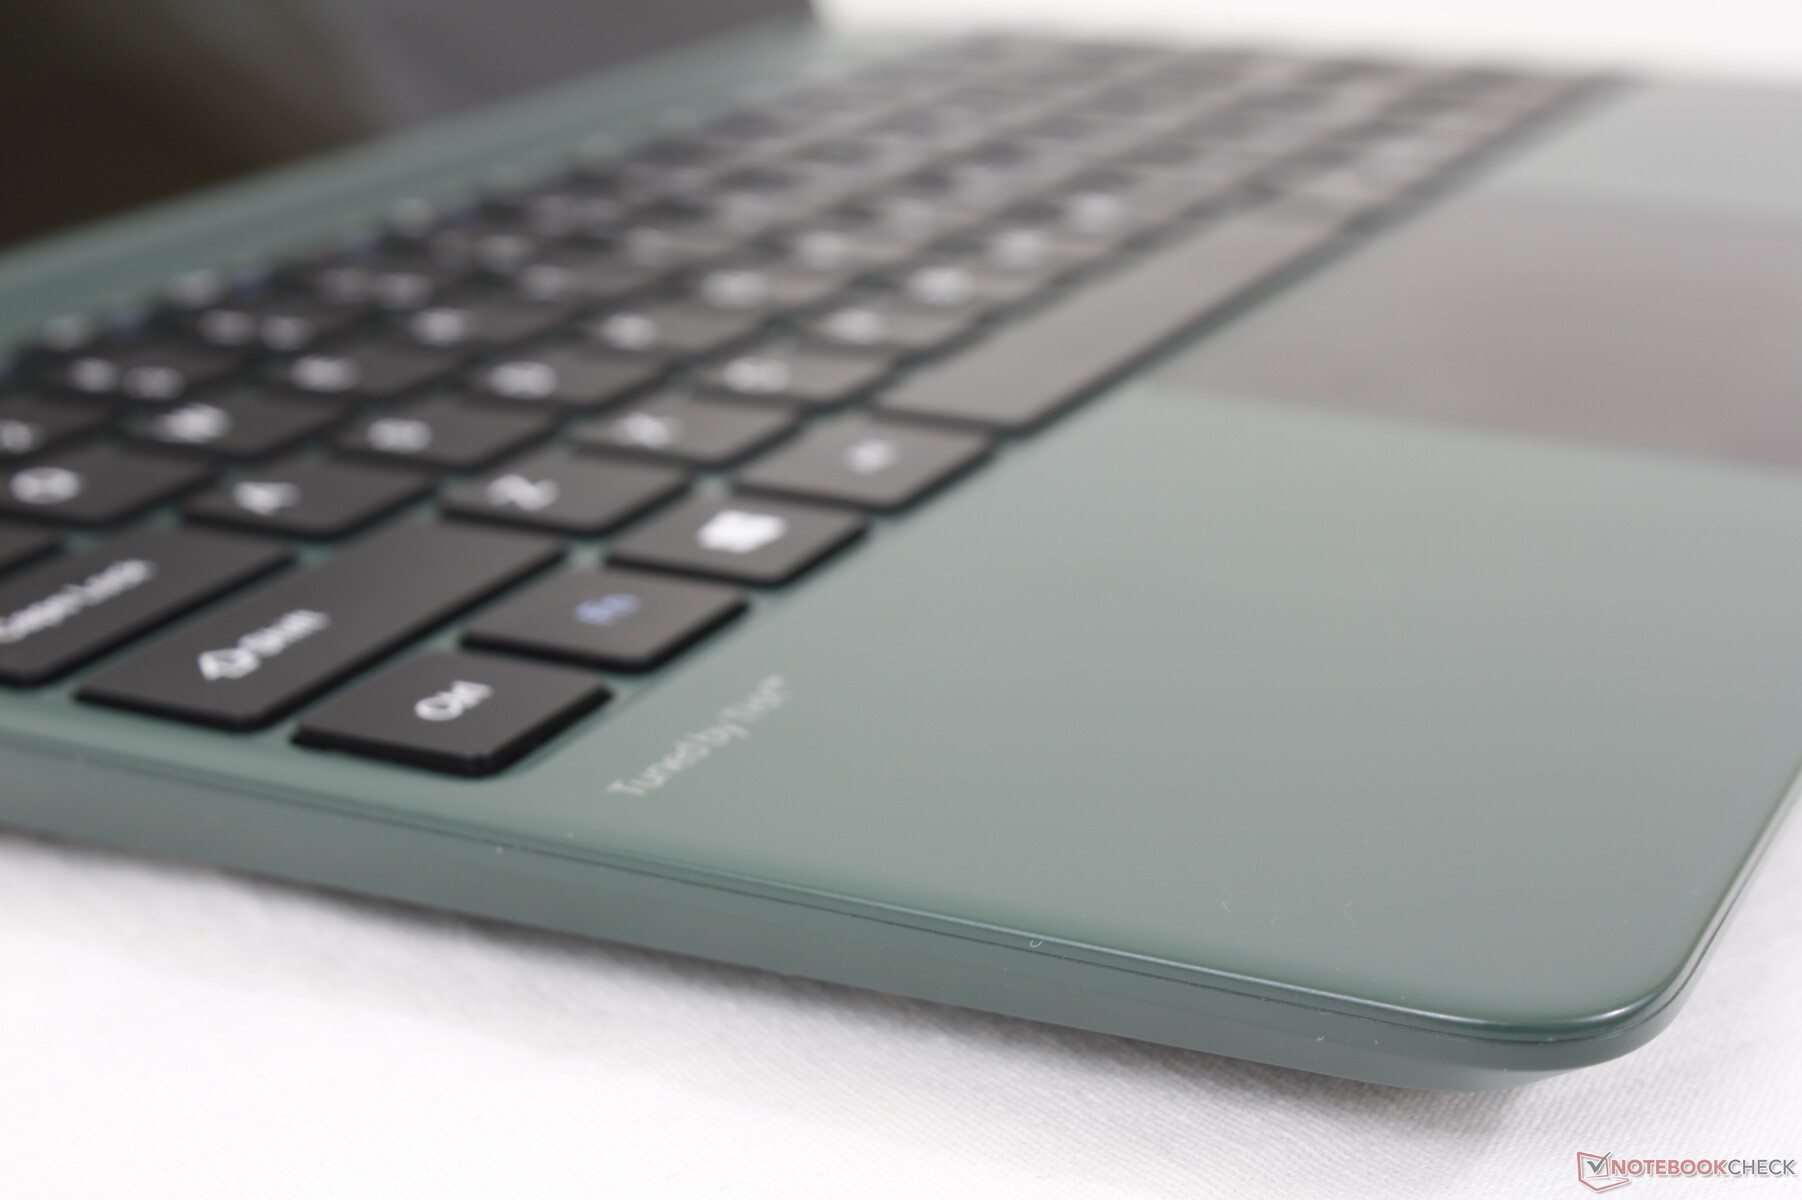
The keyboard keys have firm and uniform feedback at the cost of relatively loud clatter. Unfortunately, the Enter key is unreliable as it will often not register inputs. You have to press the Enter key directly at its center instead of its edge which is not usually the case when typing.
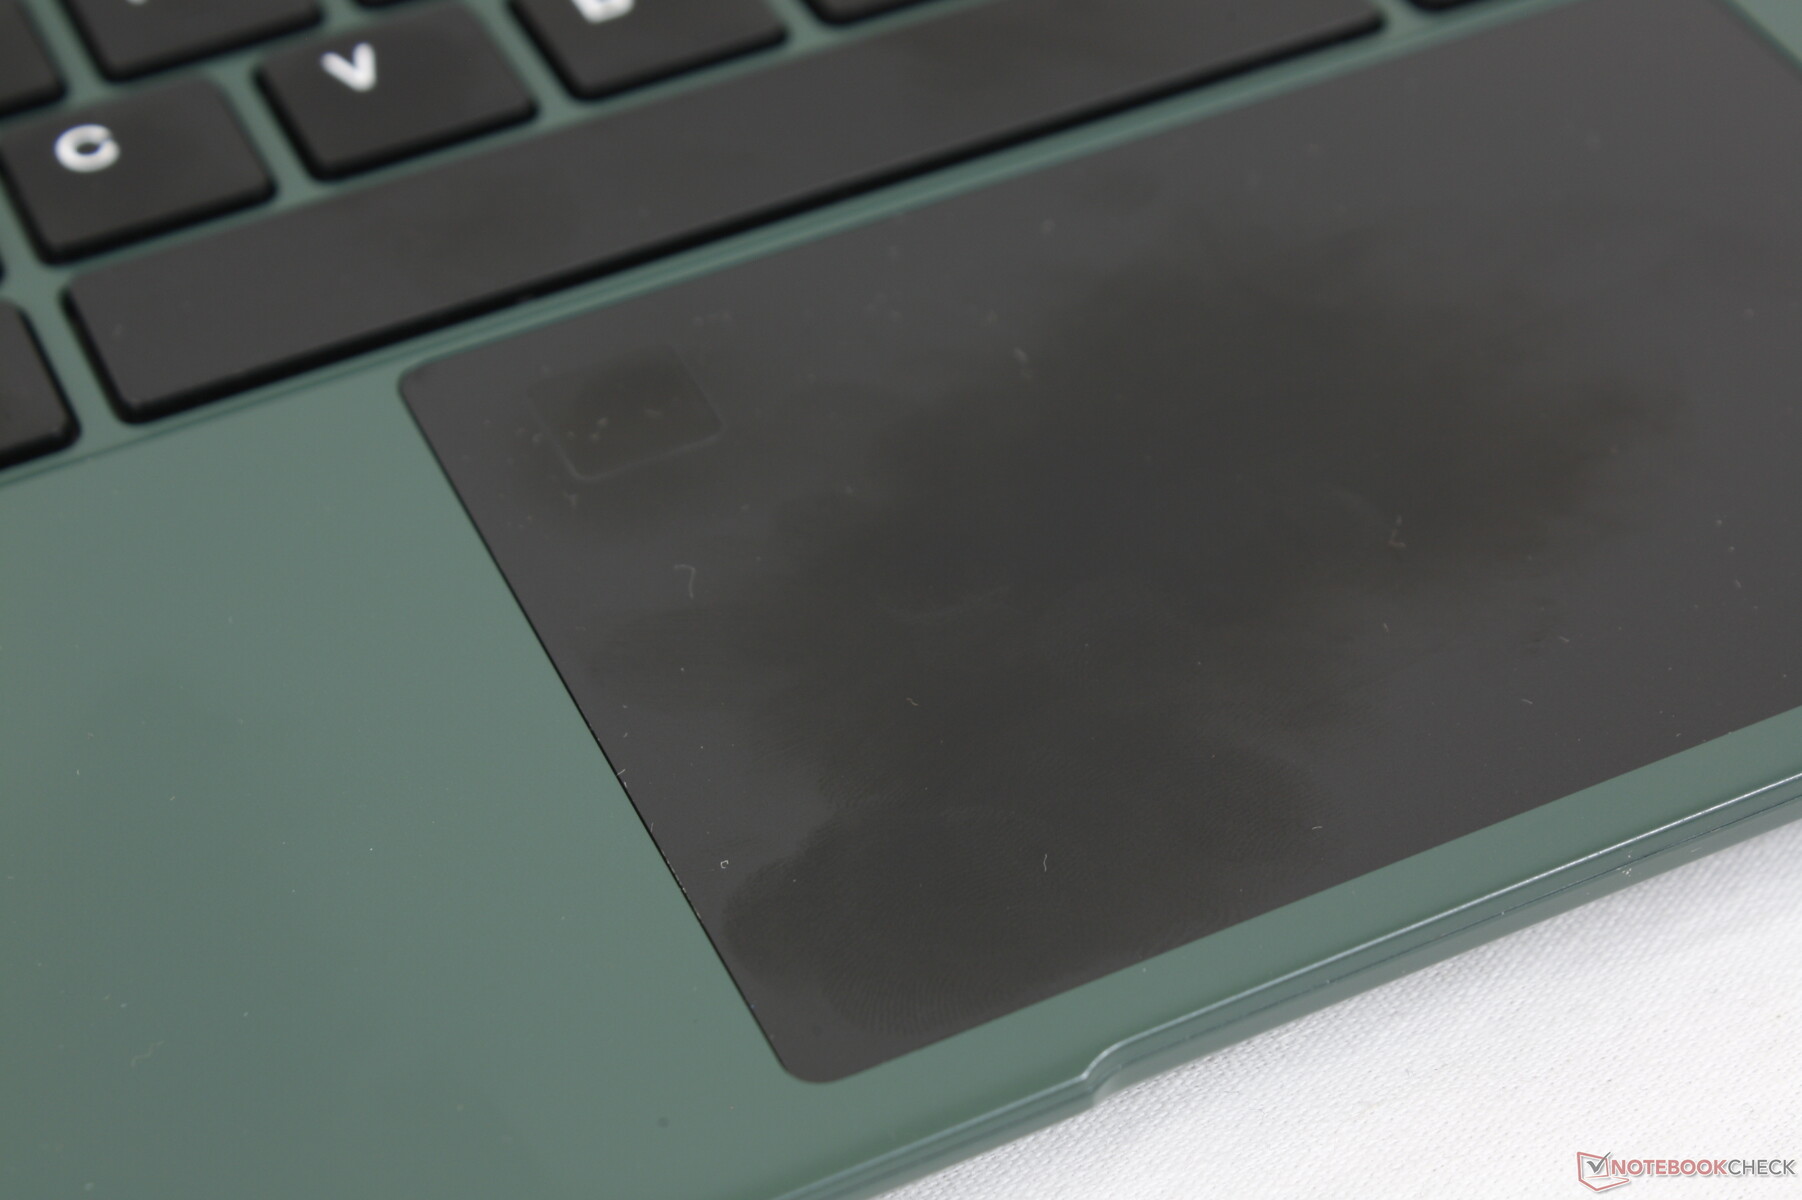
Touchpad
Unlike the keyboard, the Precision-enabled clickpad is actually reliable and without any issues. Glide is smooth when moving quickly while slow to slow-medium speeds will have a bit of sticking. The cursor never jumps unintentionally to make double-clicking more comfortable.
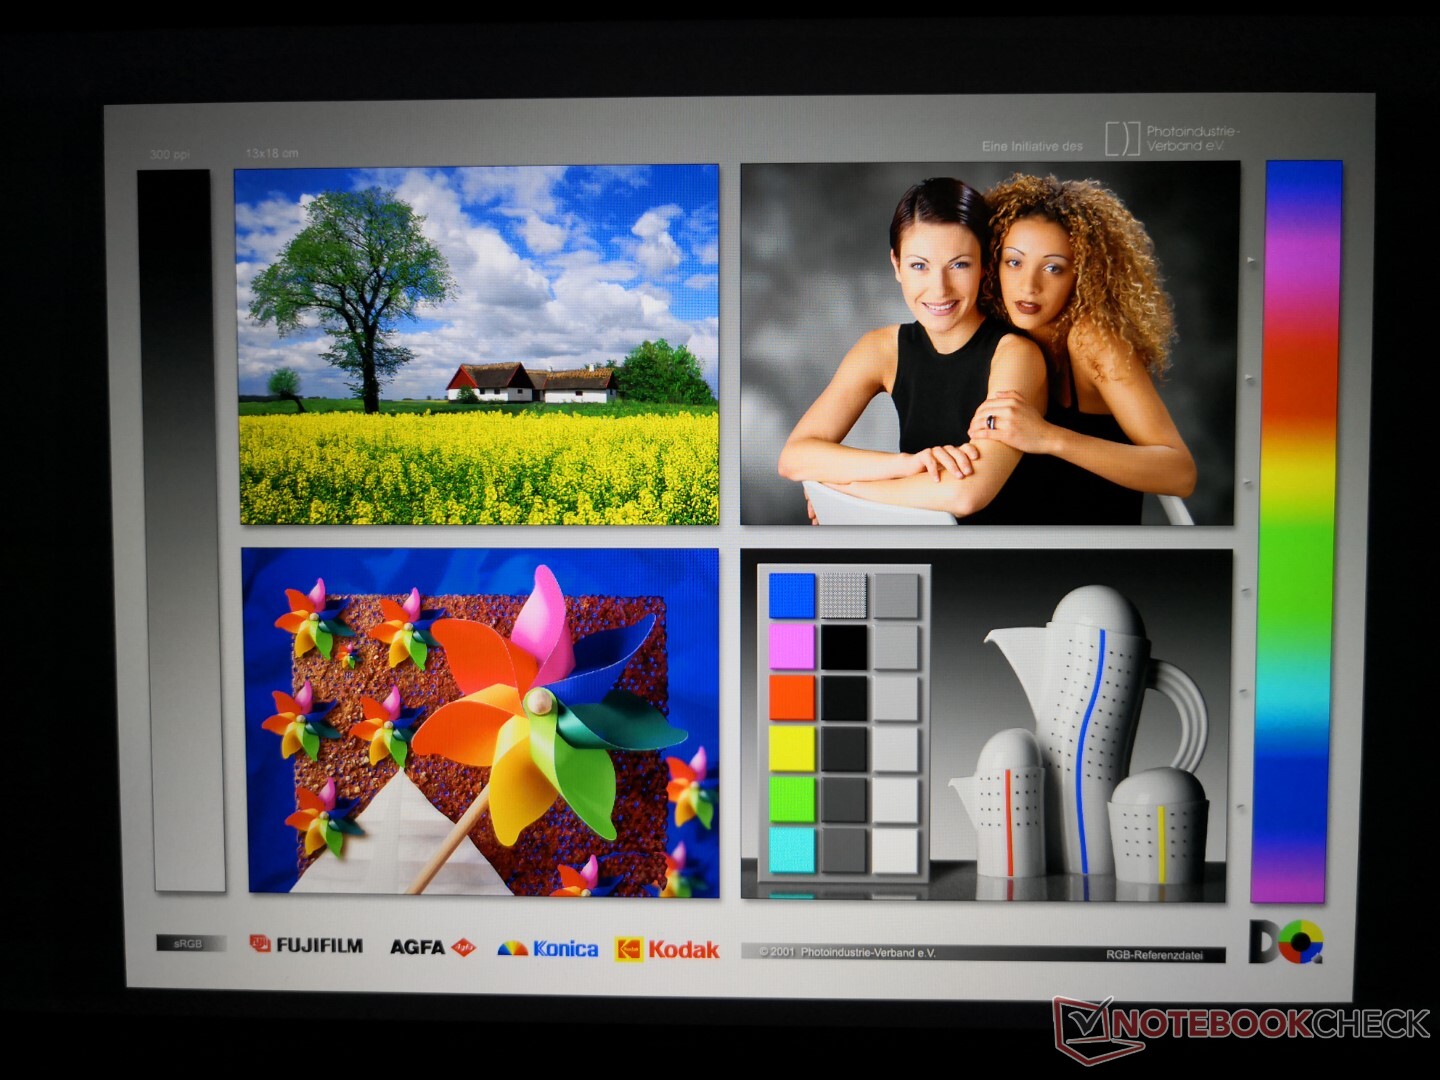
Display
The GWTN141 uses the same 1080p Panda 1402L01 IPS panel as found on the budget Blackview AceBook 1 for a similar viewing experience between them. Unfortunately, this means that they share similar disadvantages including the dim backlight and limited color space both of which are common on budget laptops. Contrast is thankfully excellent considering the price at almost 1000:1.


| |||||||||||||||||||||||||
Brightness Distribution: 83 %
Center on Battery: 195.6 cd/m²
Contrast: 978:1 (Black: 0.2 cd/m²)
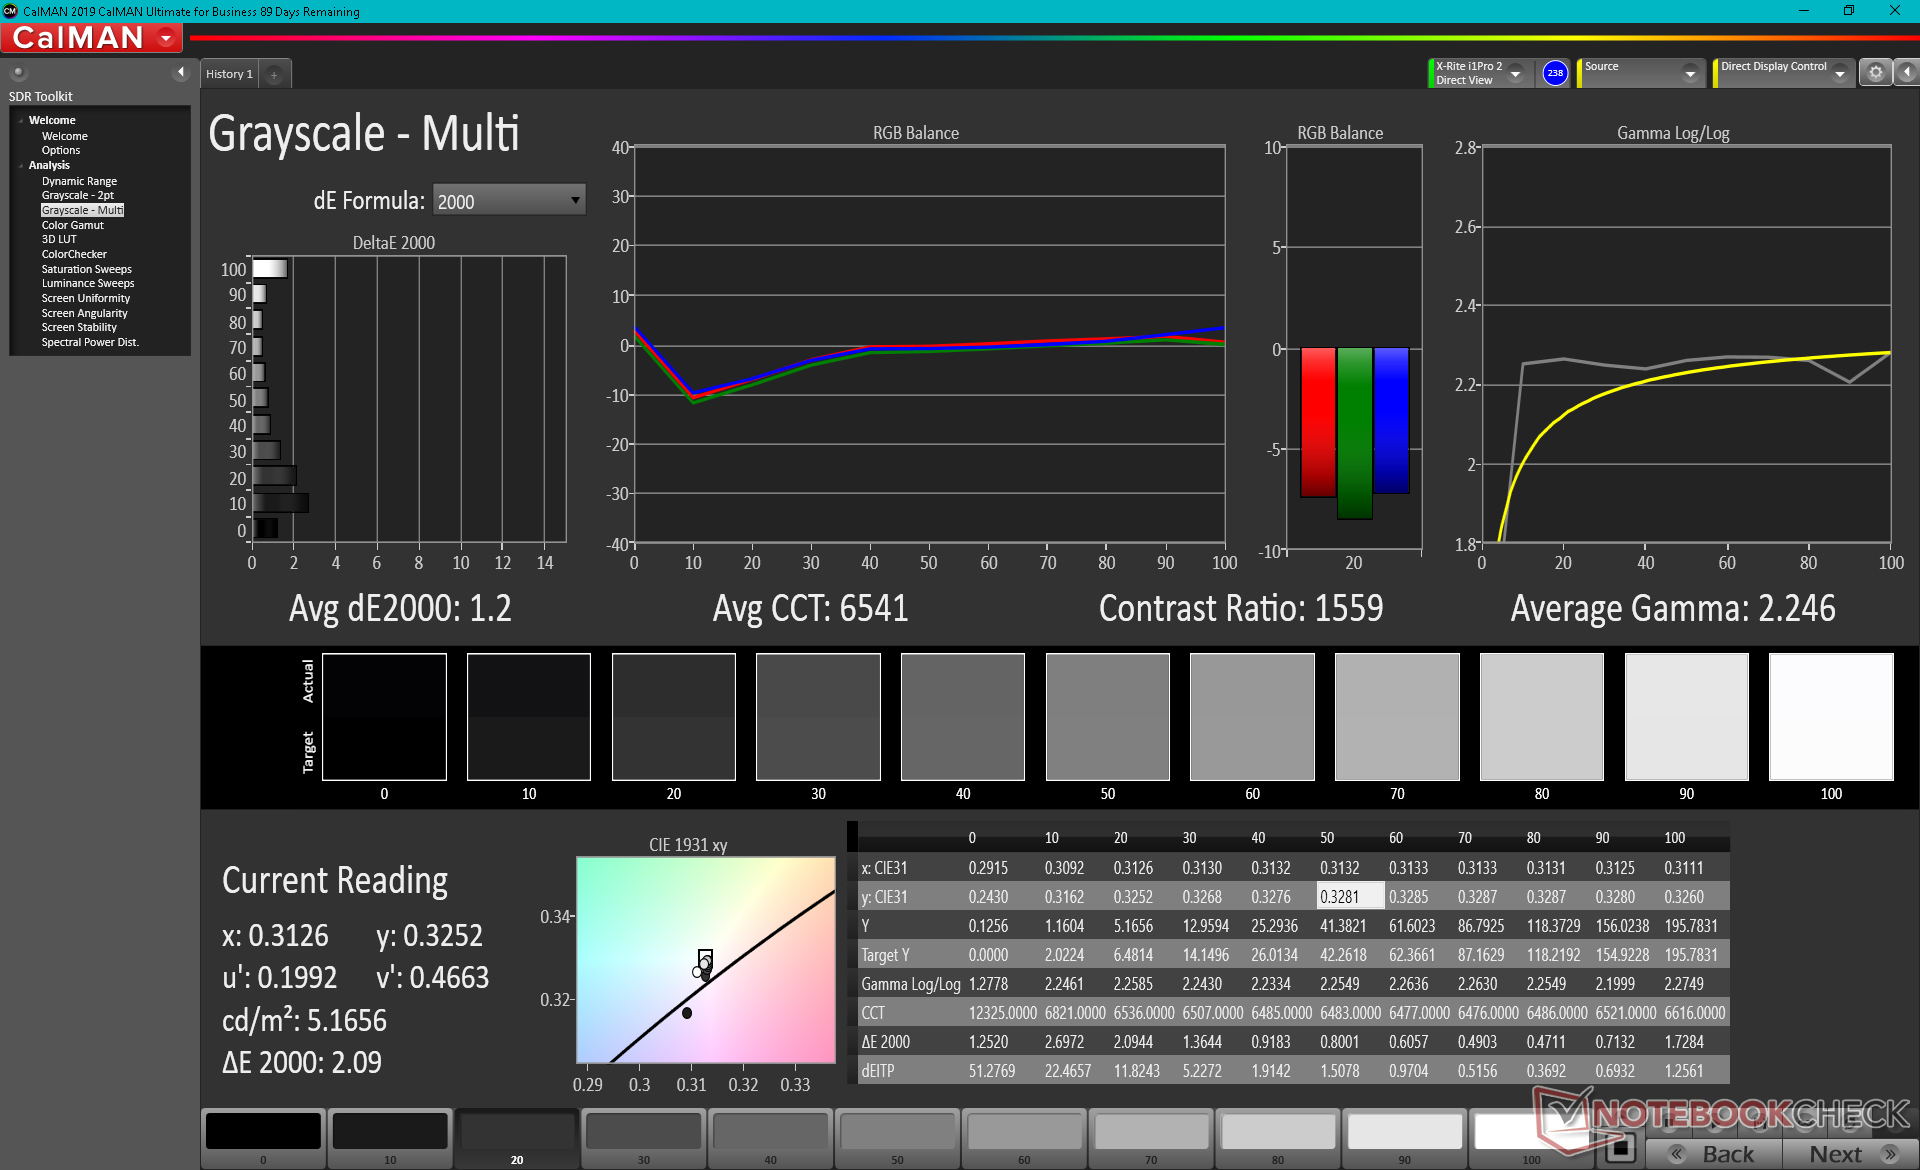
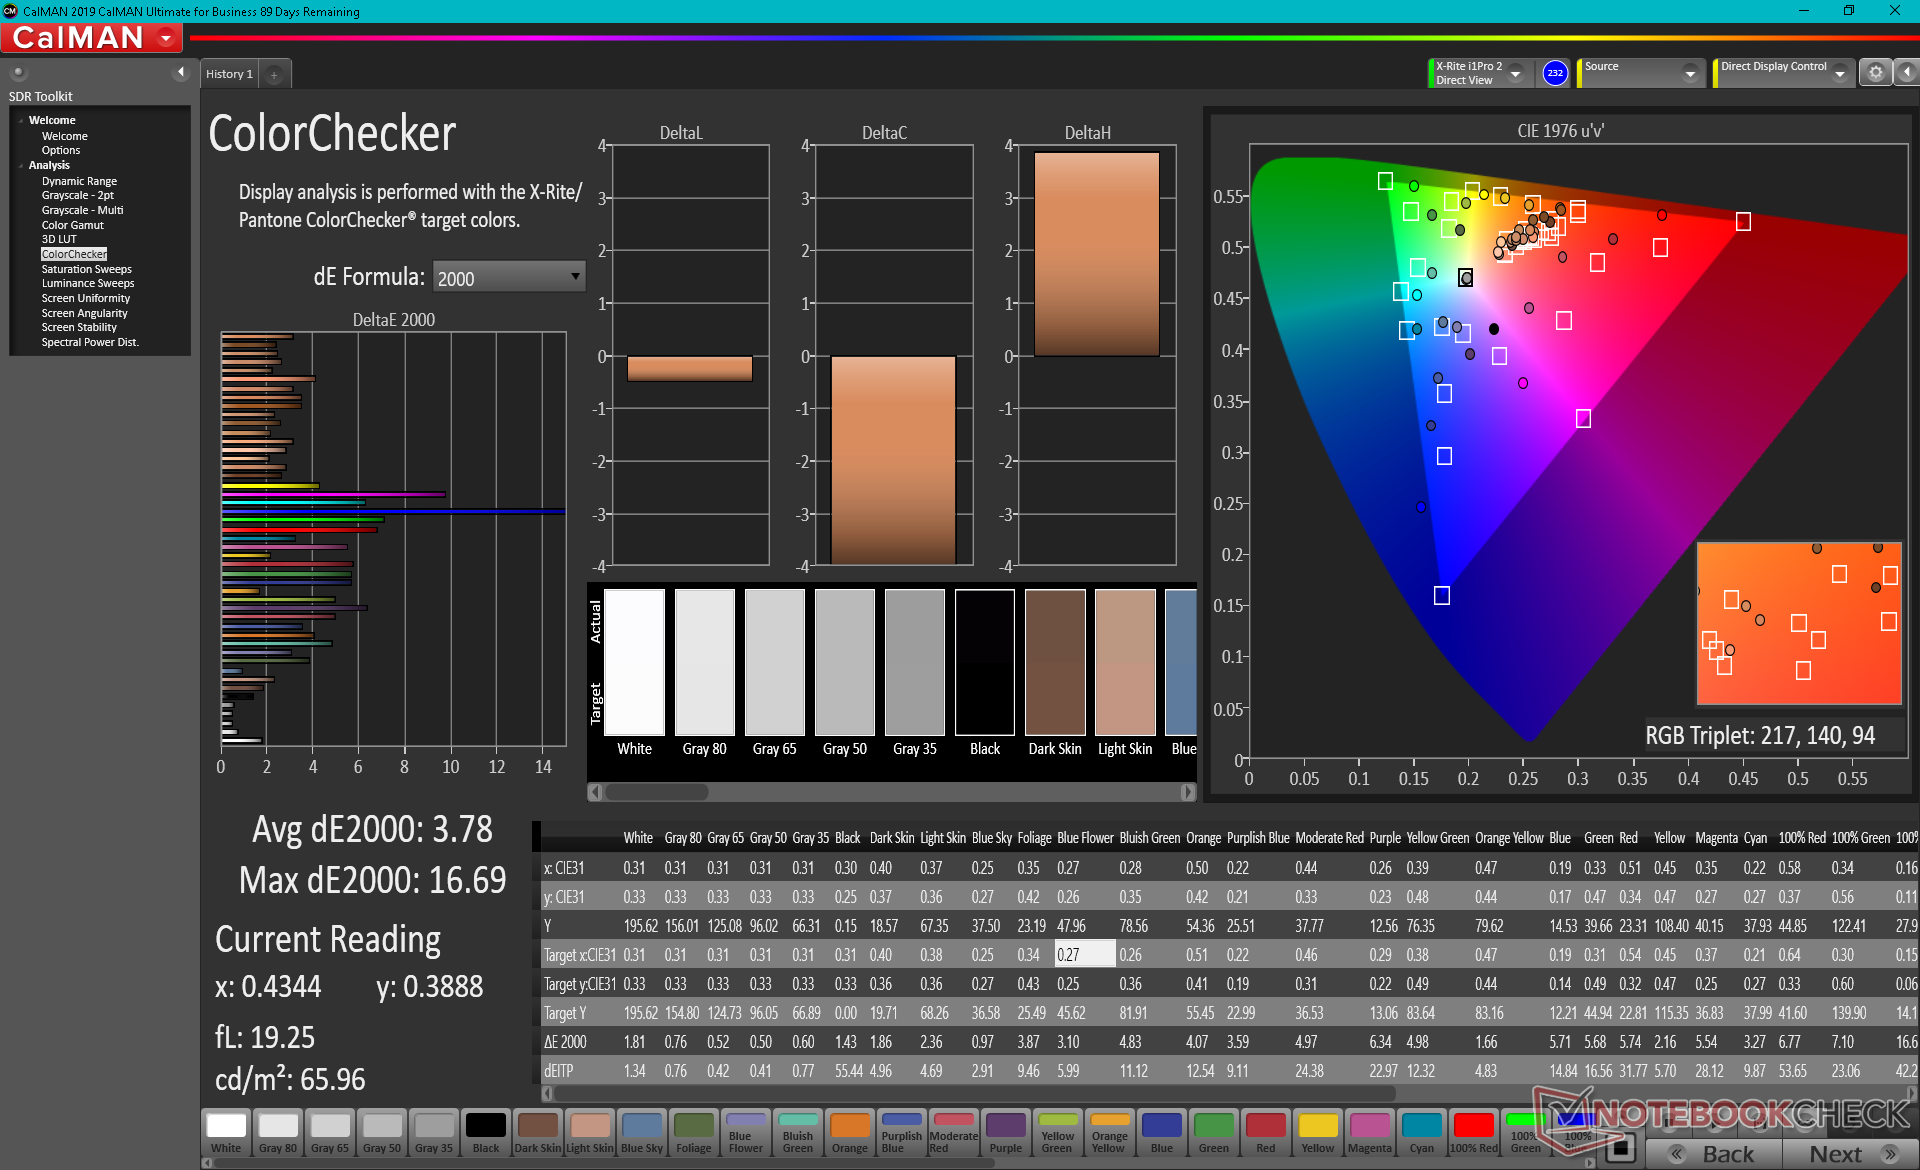
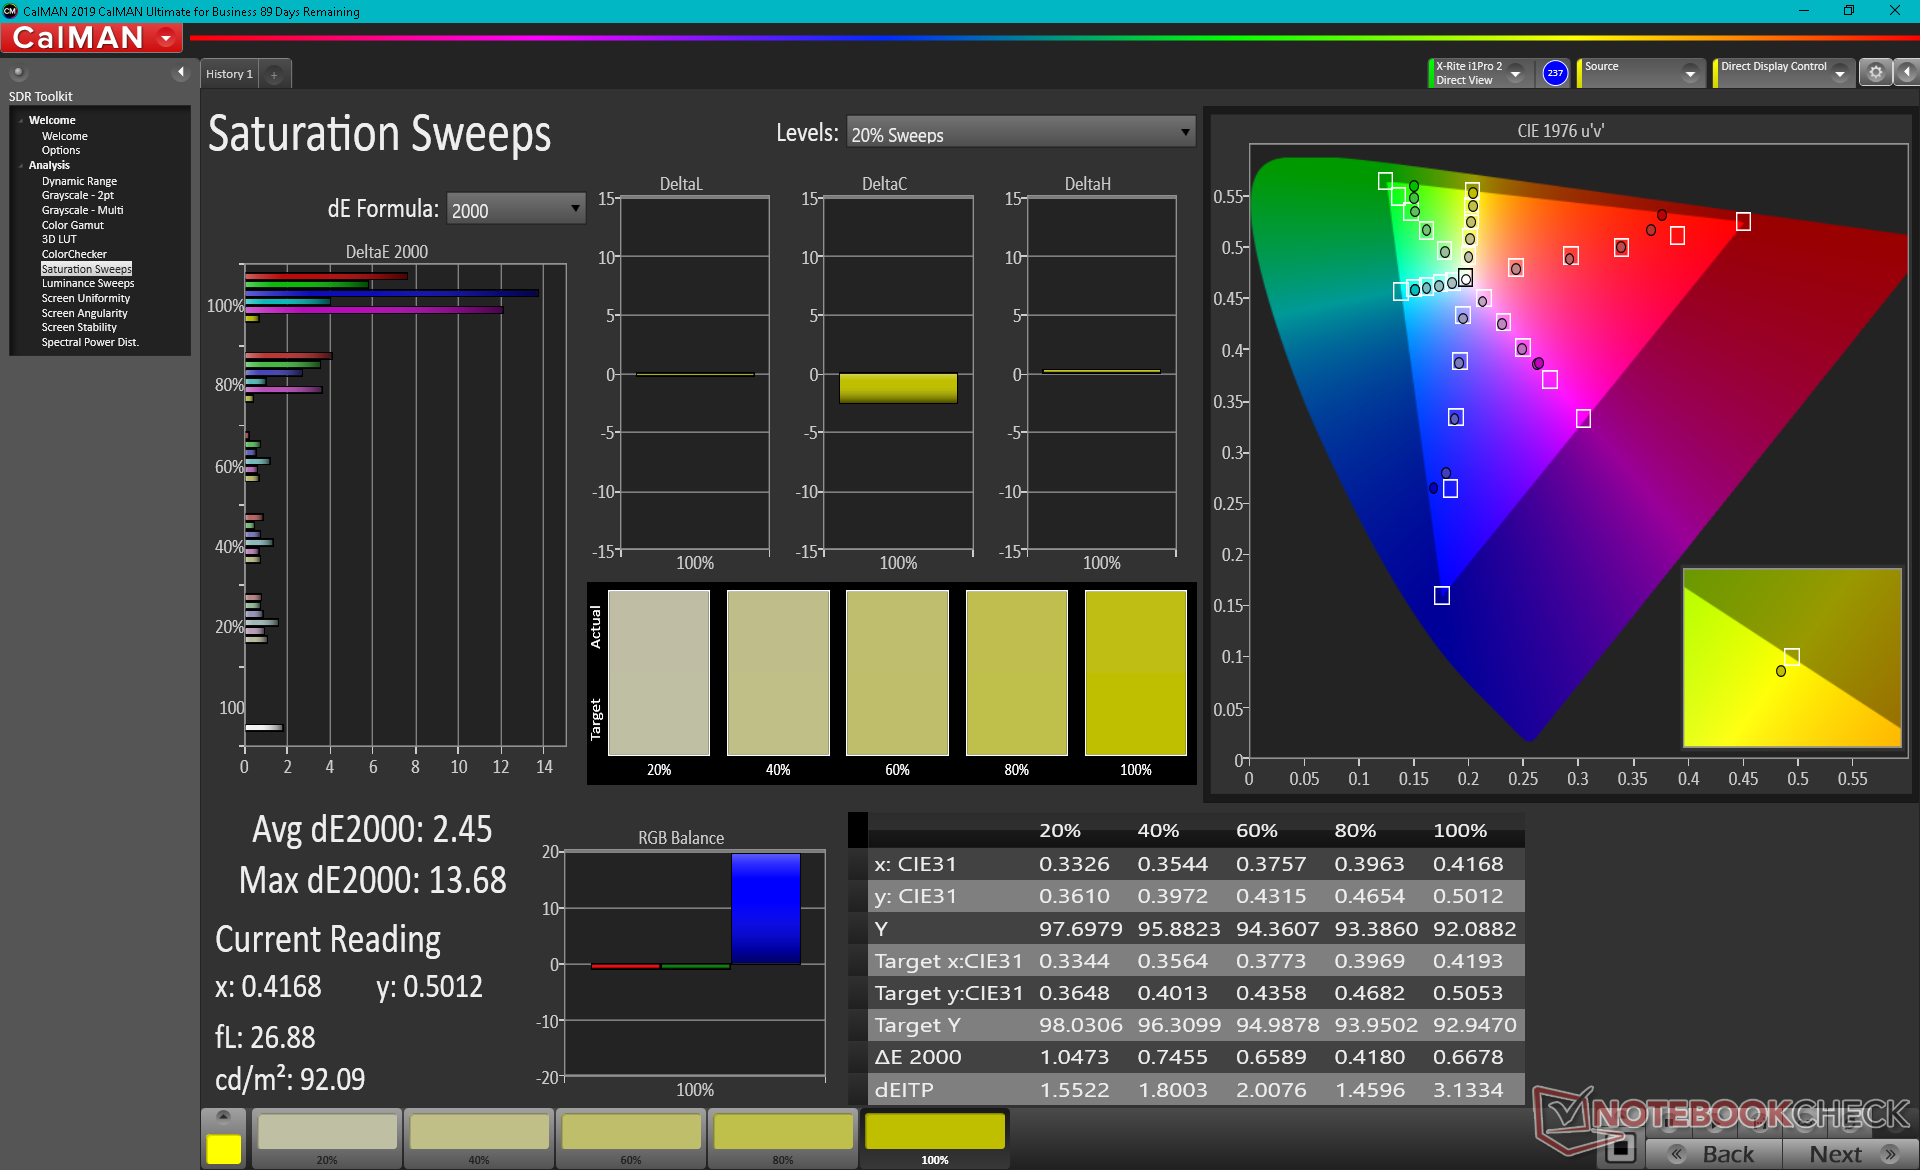
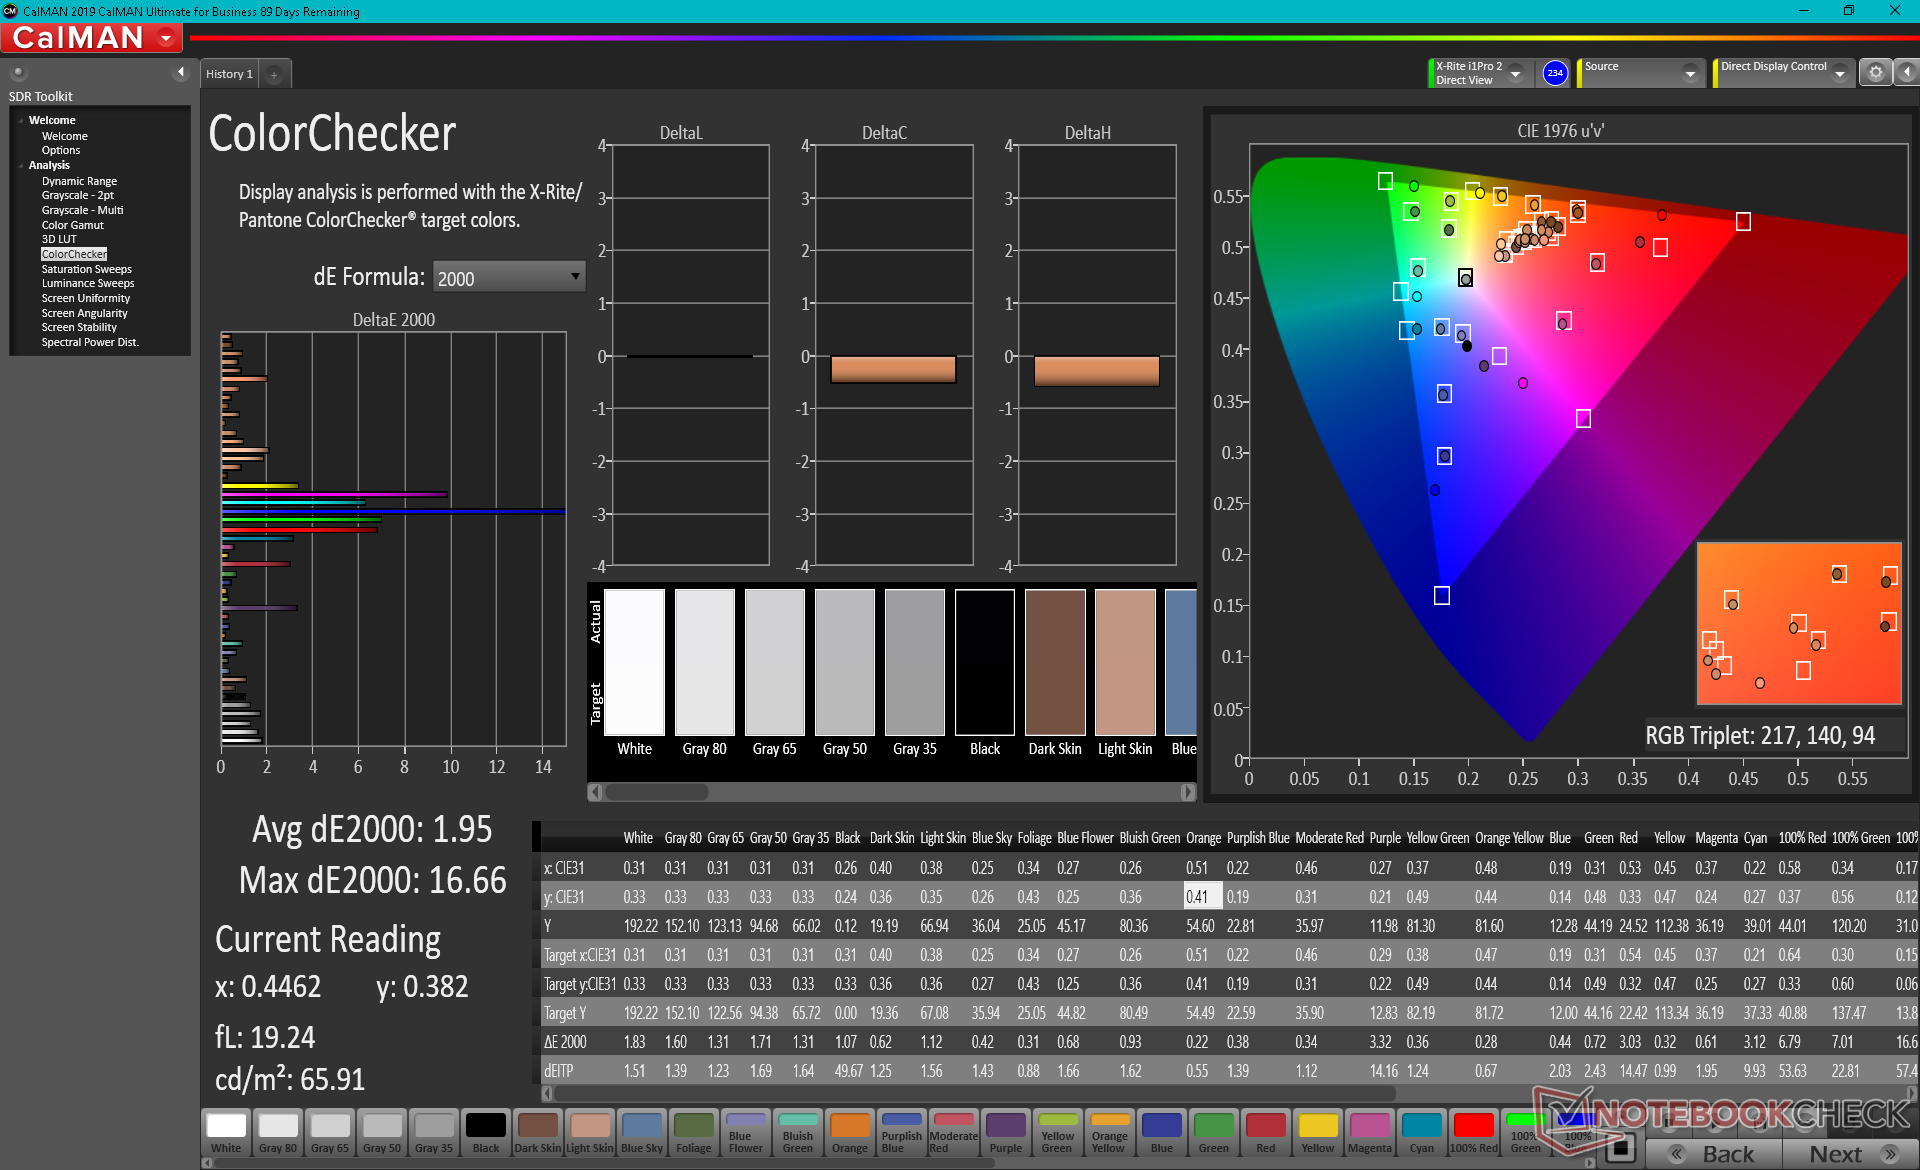
ΔE ColorChecker Calman: 3.78 | ∀{0.5-29.43 Ø4.73}
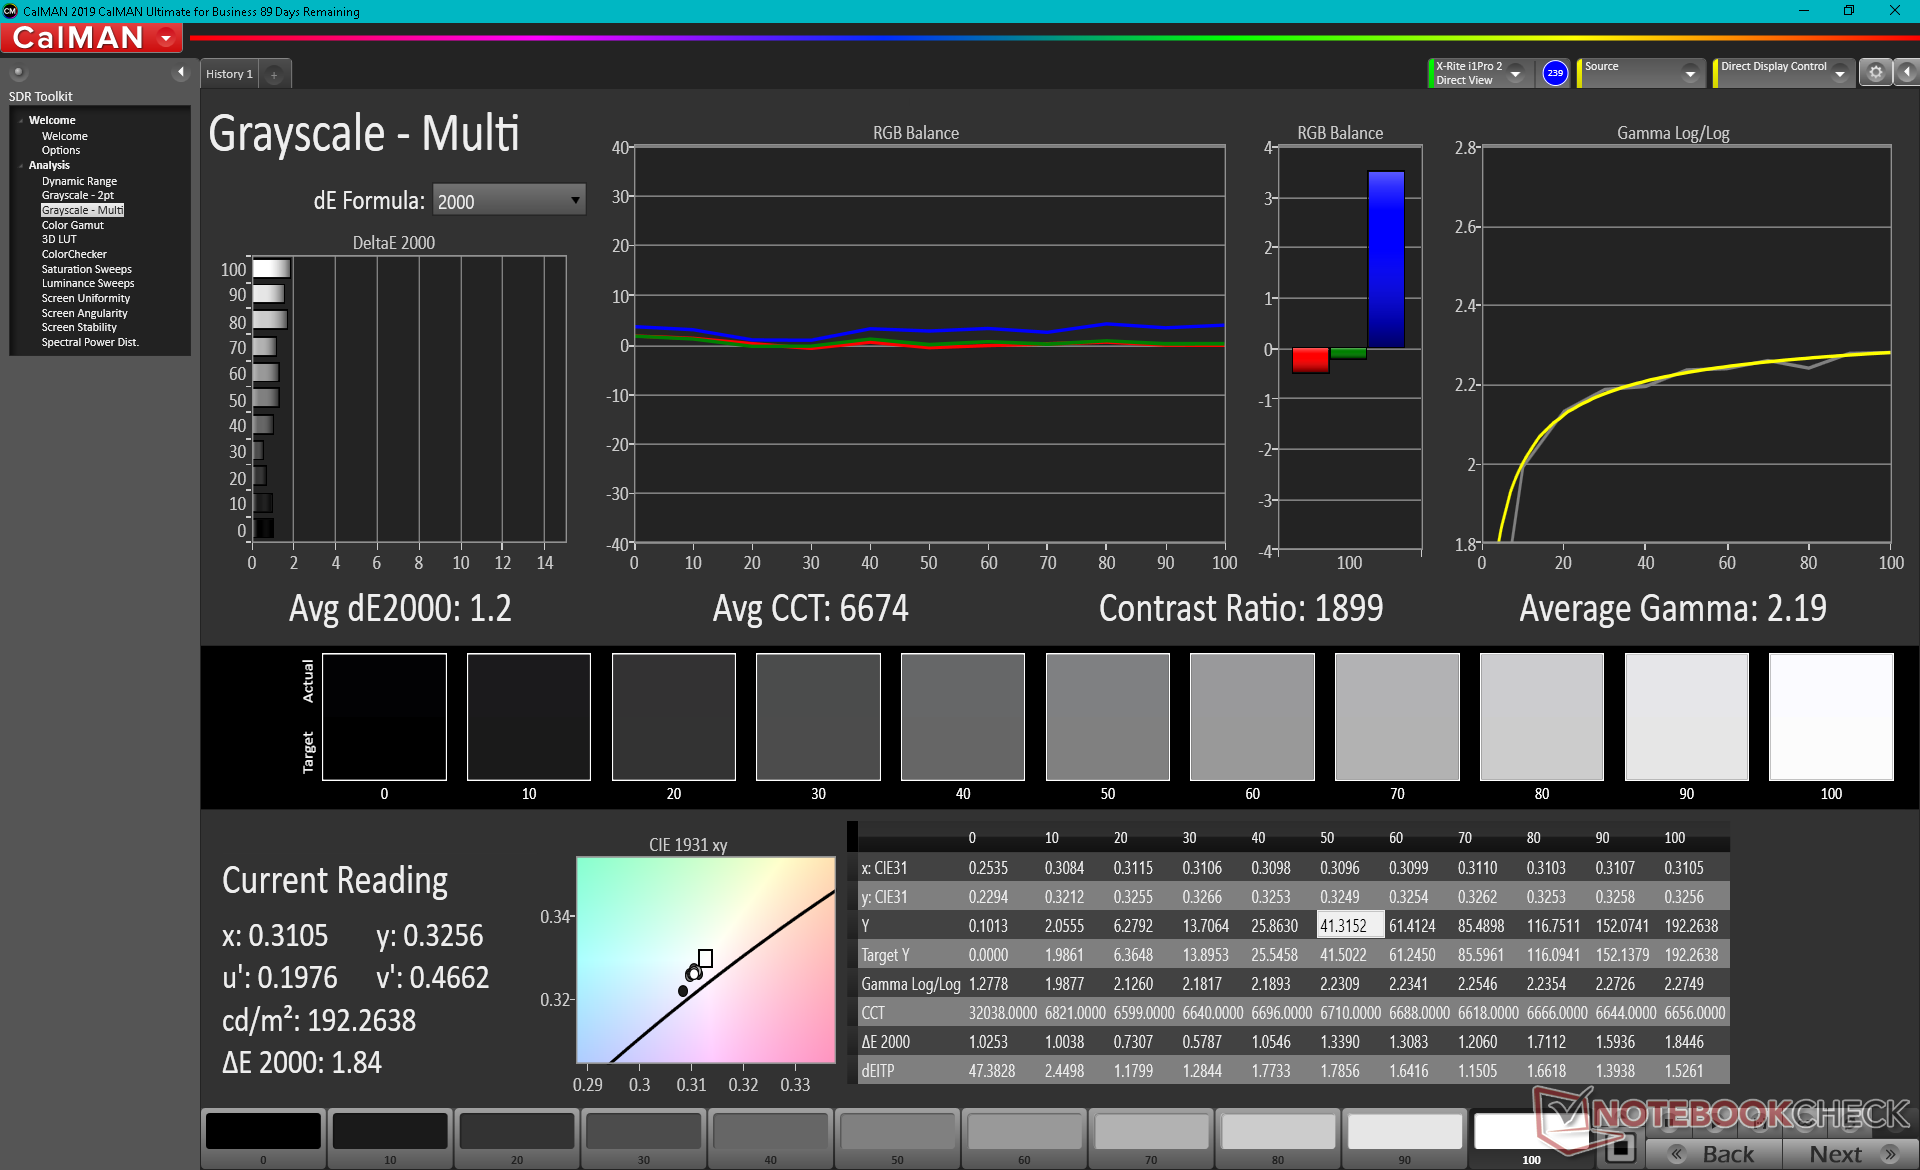
calibrated: 1.95
ΔE Greyscale Calman: 1.2 | ∀{0.09-98 Ø4.97}
42.7% AdobeRGB 1998 (Argyll 3D)
61.7% sRGB (Argyll 3D)
41.3% Display P3 (Argyll 3D)
Gamma: 2.25
CCT: 6541 K
| Gateway GWTN141-10GR Panda 1402L01, IPS, 14.1", 1920x1080 | HP 14s-fq1357ng AUO403D, IPS, 14", 1920x1080 | Blackview AceBook 1 Panda 1402L01, IPS, 14", 1920x1080 | ADATA XPG Xenia 14 BOE NE140WUM-N63, IPS, 14", 1920x1200 | Chuwi CoreBook X Chi Mei P140ZKA-BZ1, IPS, 14", 2160x1440 | Dell Inspiron 14 3493-4KWCF Chi Mei 140HCA, IPS, 14", 1920x1080 | |
|---|---|---|---|---|---|---|
| Display | -8% | 1% | 66% | 61% | 1% | |
| Display P3 Coverage (%) | 41.3 | 38.11 -8% | 41.6 1% | 70 69% | 67.2 63% | 41.84 1% |
| sRGB Coverage (%) | 61.7 | 57 -8% | 62.4 1% | 99.1 61% | 98 59% | 62.3 1% |
| AdobeRGB 1998 Coverage (%) | 42.7 | 39.37 -8% | 43 1% | 72 69% | 68.8 61% | 43.33 1% |
| Response Times | 5% | 21% | -12% | 13% | -1% | |
| Response Time Grey 50% / Grey 80% * (ms) | 36.4 ? | 41 ? -13% | 30.8 ? 15% | 50 ? -37% | 36.4 ? -0% | 41 ? -13% |
| Response Time Black / White * (ms) | 35.2 ? | 27 ? 23% | 25.6 ? 27% | 30.4 ? 14% | 26.4 ? 25% | 31 ? 12% |
| PWM Frequency (Hz) | 2016 ? | 201.6 ? | 10000 ? | 2500 ? | ||
| Screen | -4% | 3% | 40% | -48% | -31% | |
| Brightness middle (cd/m²) | 195.6 | 220 12% | 249.9 28% | 344.6 76% | 355.3 82% | 226 16% |
| Brightness (cd/m²) | 183 | 223 22% | 226 23% | 321 75% | 344 88% | 214 17% |
| Brightness Distribution (%) | 83 | 85 2% | 80 -4% | 89 7% | 94 13% | 92 11% |
| Black Level * (cd/m²) | 0.2 | 0.225 -13% | 0.17 15% | 0.22 -10% | 0.34 -70% | 0.17 15% |
| Contrast (:1) | 978 | 978 0% | 1470 50% | 1566 60% | 1045 7% | 1329 36% |
| Colorchecker dE 2000 * | 3.78 | 4.16 -10% | 3.89 -3% | 1.51 60% | 6.2 -64% | 5.21 -38% |
| Colorchecker dE 2000 max. * | 16.69 | 7.43 55% | 16.39 2% | 4.1 75% | 10.96 34% | 22.15 -33% |
| Colorchecker dE 2000 calibrated * | 1.95 | 1.72 12% | 0.52 73% | 1.23 37% | 4.43 -127% | |
| Greyscale dE 2000 * | 1.2 | 2.35 -96% | 2.4 -100% | 1.9 -58% | 7.9 -558% | 3.27 -173% |
| Gamma | 2.25 98% | 2.62 84% | 2.26 97% | 2.17 101% | 2.02 109% | 2.36 93% |
| CCT | 6541 99% | 6389 102% | 6772 96% | 6787 96% | 7450 87% | 6538 99% |
| Color Space (Percent of AdobeRGB 1998) (%) | 40 | |||||
| Color Space (Percent of sRGB) (%) | 62 | |||||
| Total Average (Program / Settings) | -2% /
-3% | 8% /
5% | 31% /
38% | 9% /
-16% | -10% /
-20% |
* ... smaller is better
Gamut is limited to just 62 percent of sRGB compared to >95 percent on most mid-range to high-end Ultrabooks. Users will want to connect an external monitor for any sort of graphics editing.
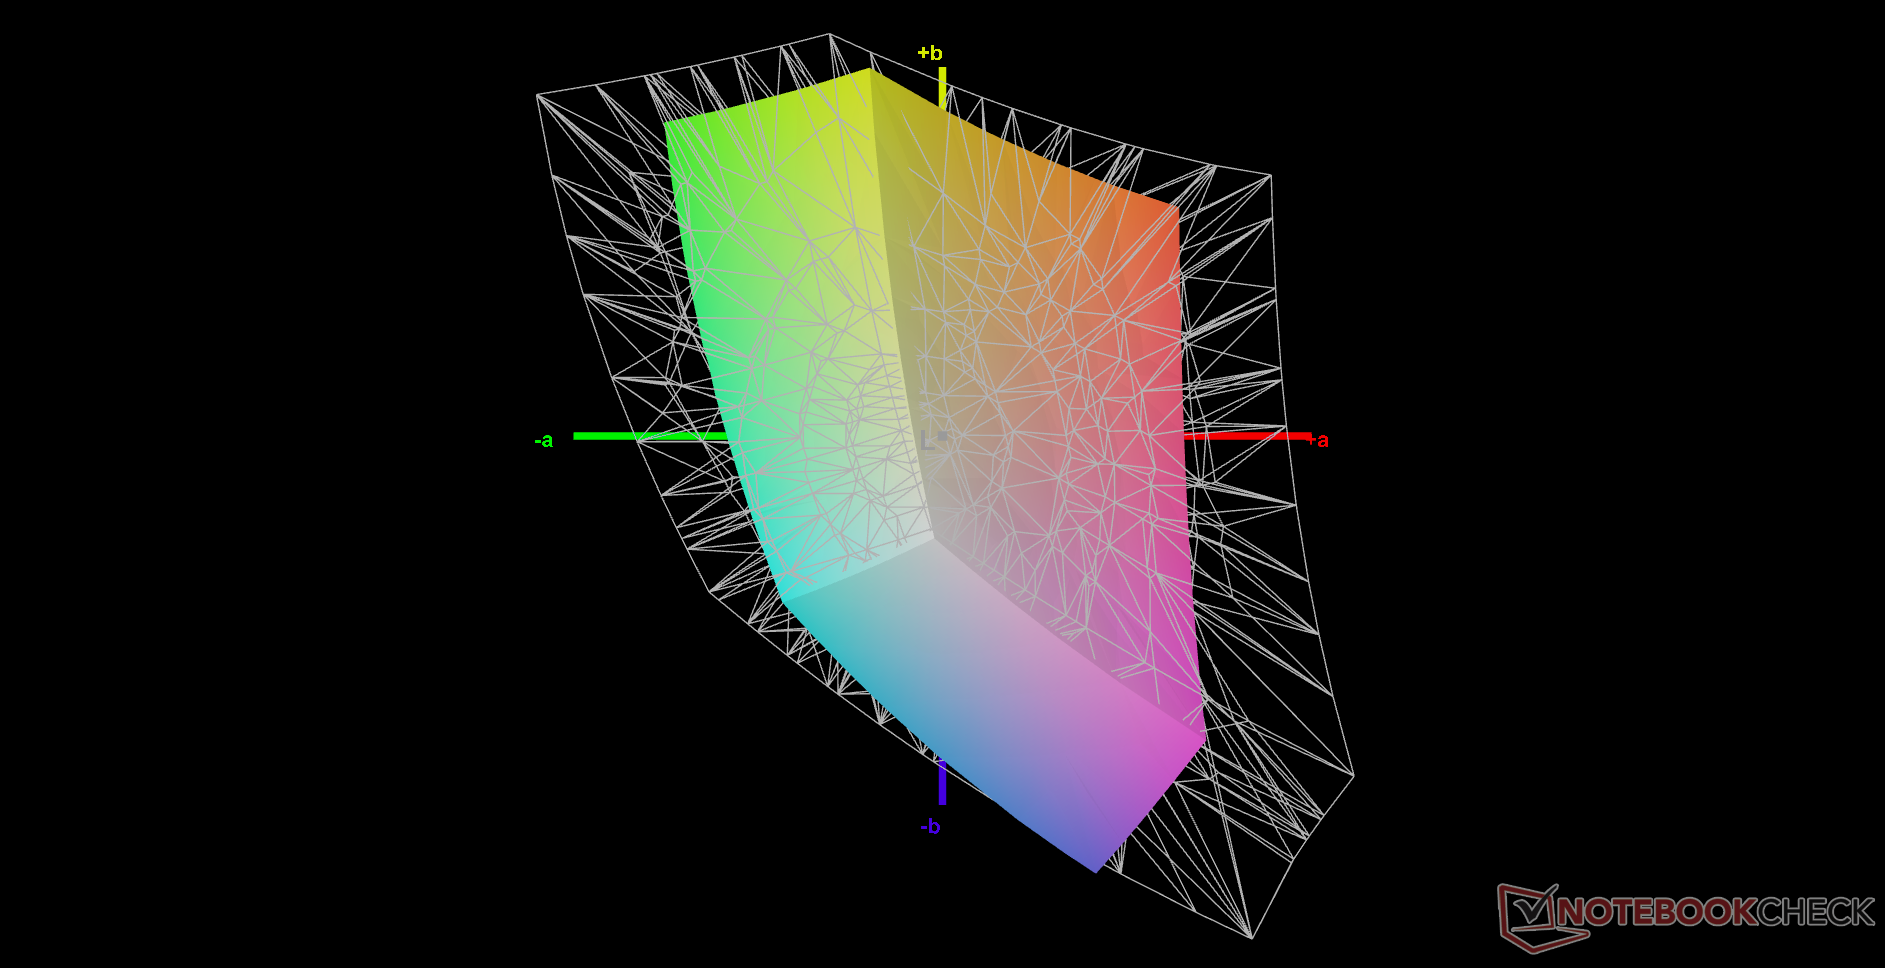
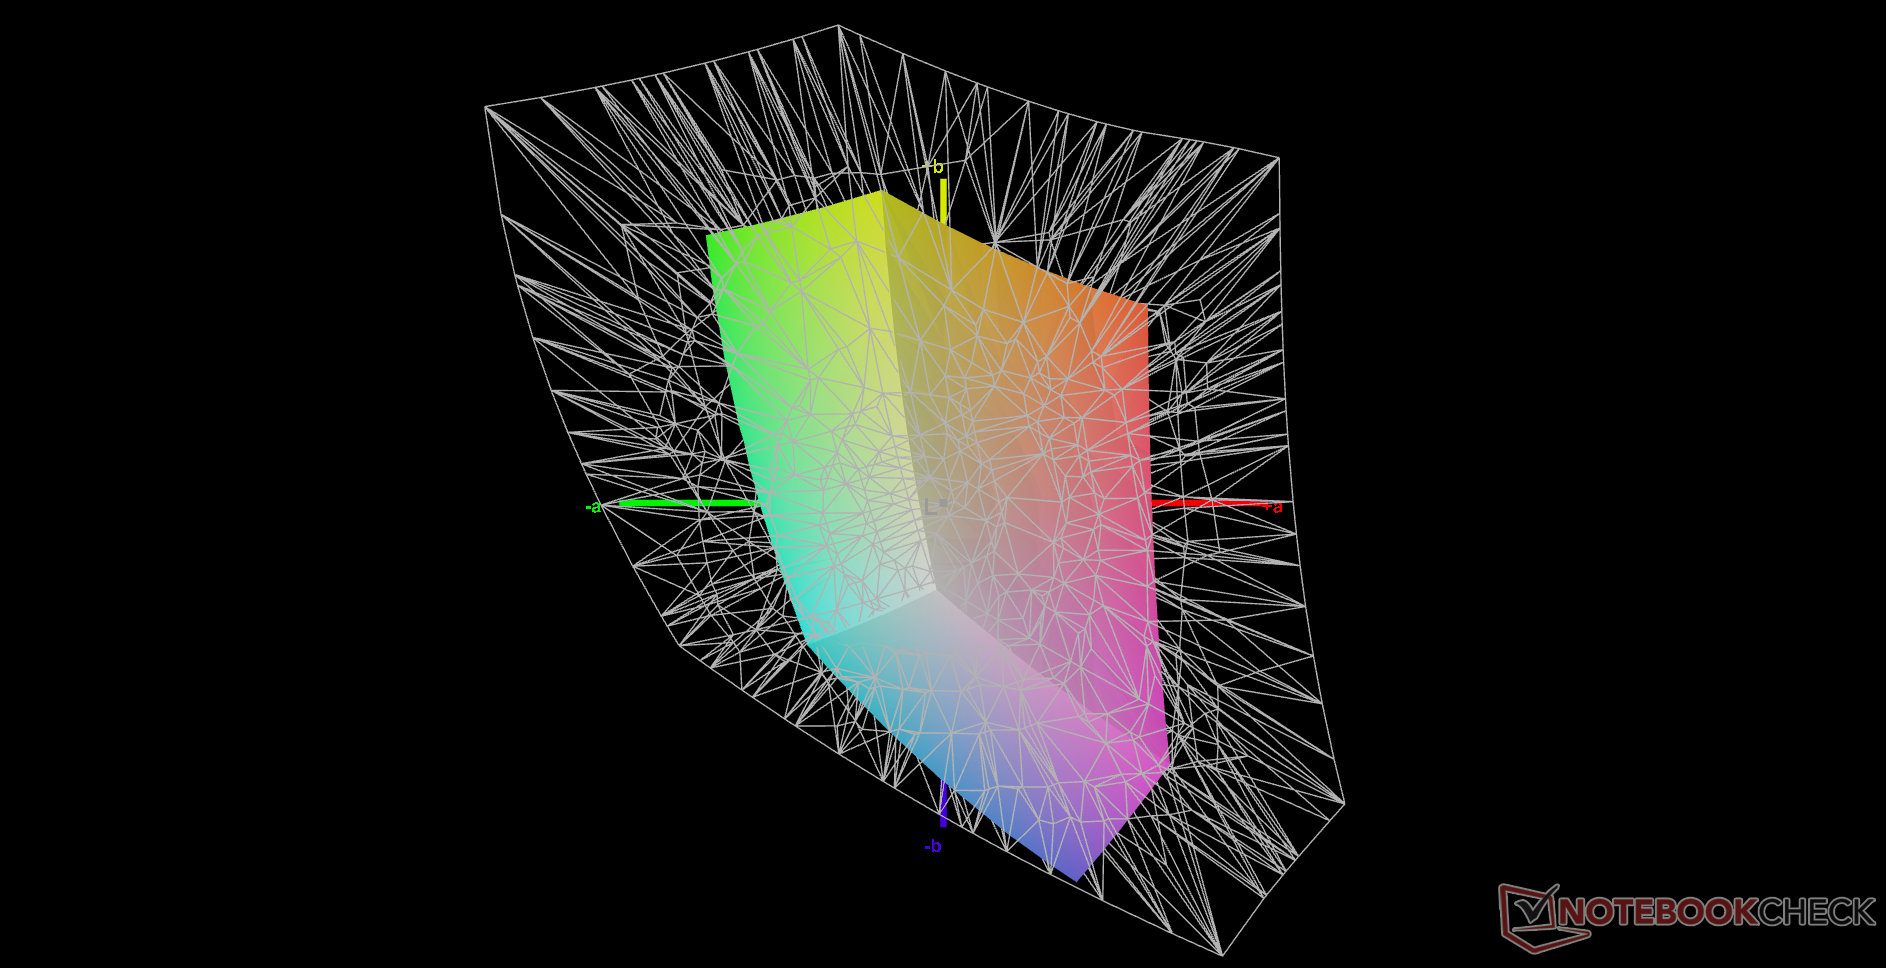
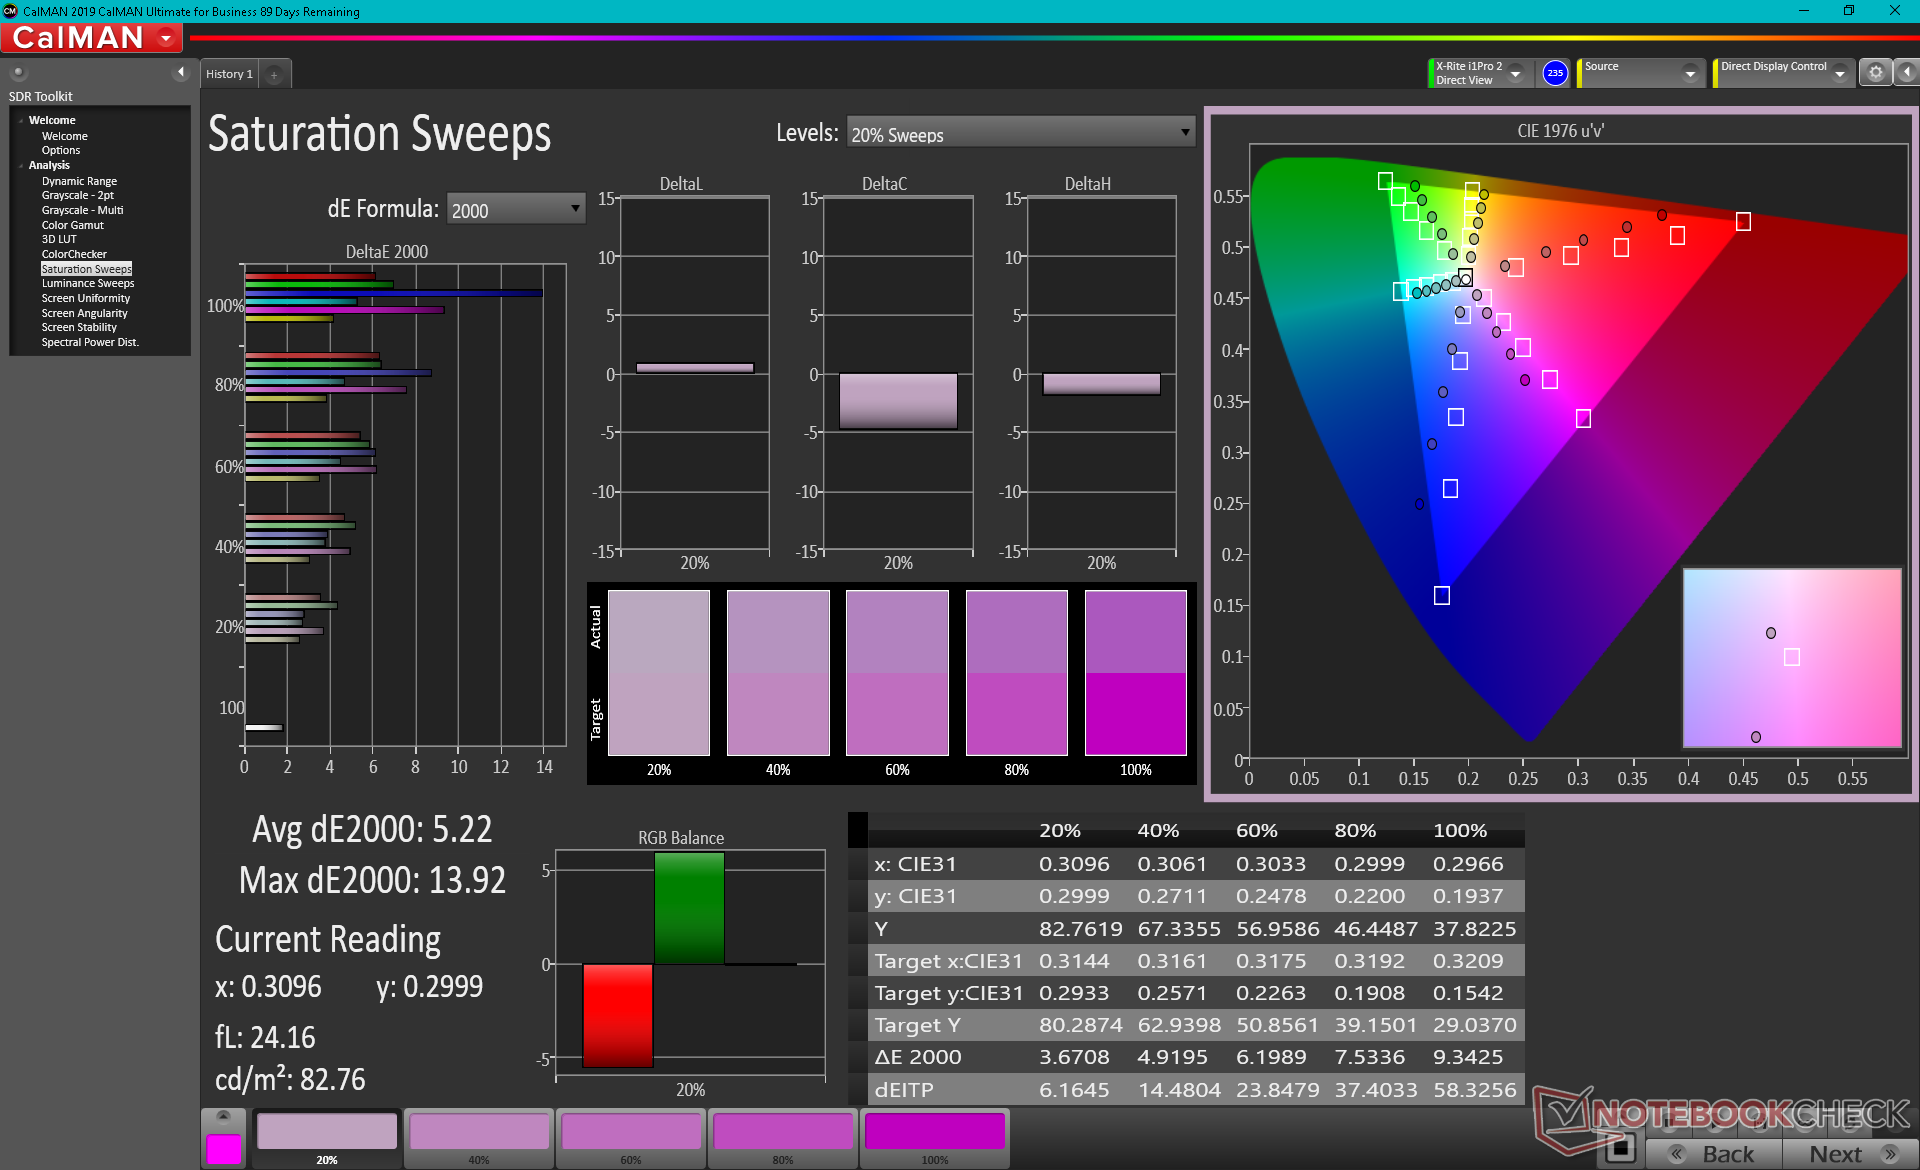
Colors and grayscale are actually not bad despite the low starting price and narrow color space. They become even better once calibrated with final average deltaE values of less than 2. Nonetheless, colors at higher saturation levels are not nearly as accurate due to the aforementioned limited color space.
Display Response Times
| ↔ Response Time Black to White | ||
|---|---|---|
| 35.2 ms ... rise ↗ and fall ↘ combined | ↗ 21.2 ms rise | 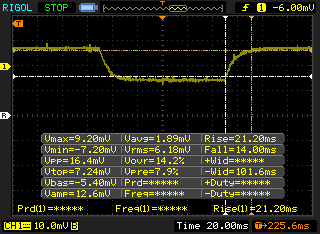 |
| ↘ 14 ms fall | ||
| The screen shows slow response rates in our tests and will be unsatisfactory for gamers. In comparison, all tested devices range from 0.1 (minimum) to 240 (maximum) ms. » 93 % of all devices are better. This means that the measured response time is worse than the average of all tested devices (19.9 ms). | ||
| ↔ Response Time 50% Grey to 80% Grey | ||
| 36.4 ms ... rise ↗ and fall ↘ combined | ↗ 17.6 ms rise | 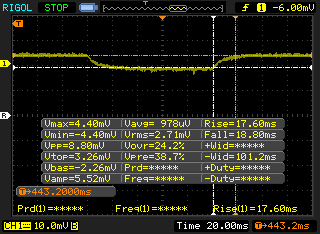 |
| ↘ 18.8 ms fall | ||
| The screen shows slow response rates in our tests and will be unsatisfactory for gamers. In comparison, all tested devices range from 0.165 (minimum) to 636 (maximum) ms. » 52 % of all devices are better. This means that the measured response time is worse than the average of all tested devices (31.1 ms). | ||
Screen Flickering / PWM (Pulse-Width Modulation)
| Screen flickering / PWM detected | 2016 Hz | ≤ 21 % brightness setting | 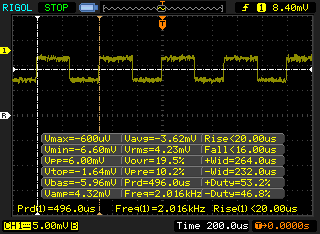 |
The display backlight flickers at 2016 Hz (worst case, e.g., utilizing PWM) Flickering detected at a brightness setting of 21 % and below. There should be no flickering or PWM above this brightness setting. The frequency of 2016 Hz is quite high, so most users sensitive to PWM should not notice any flickering. In comparison: 52 % of all tested devices do not use PWM to dim the display. If PWM was detected, an average of 7798 (minimum: 5 - maximum: 343500) Hz was measured. | |||
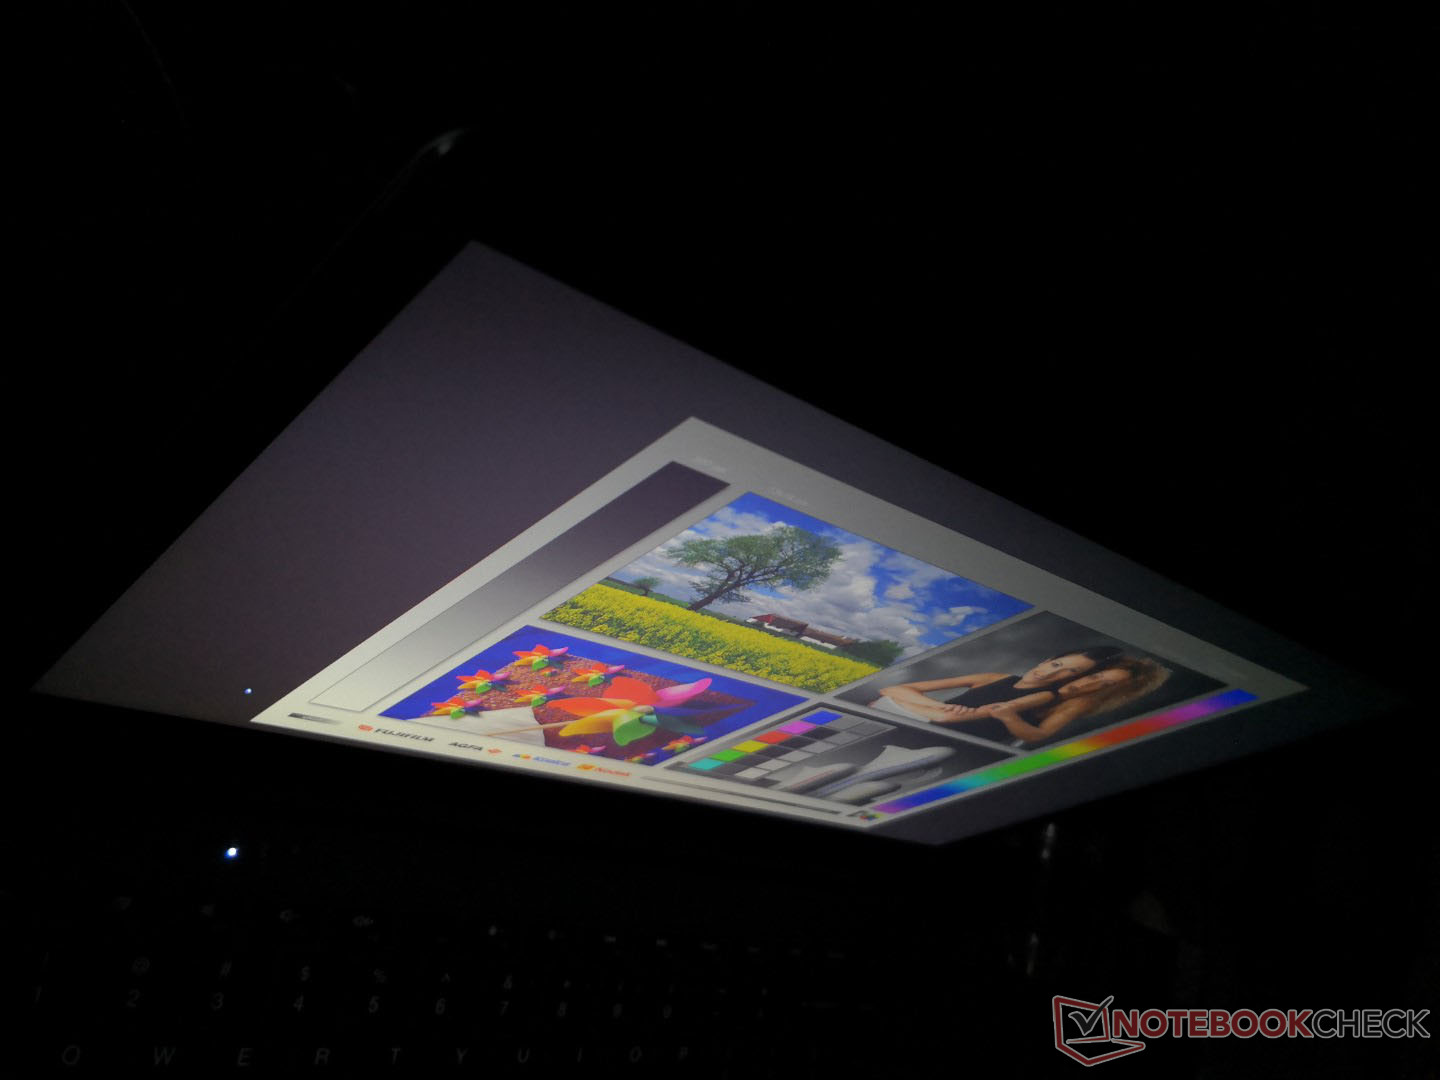
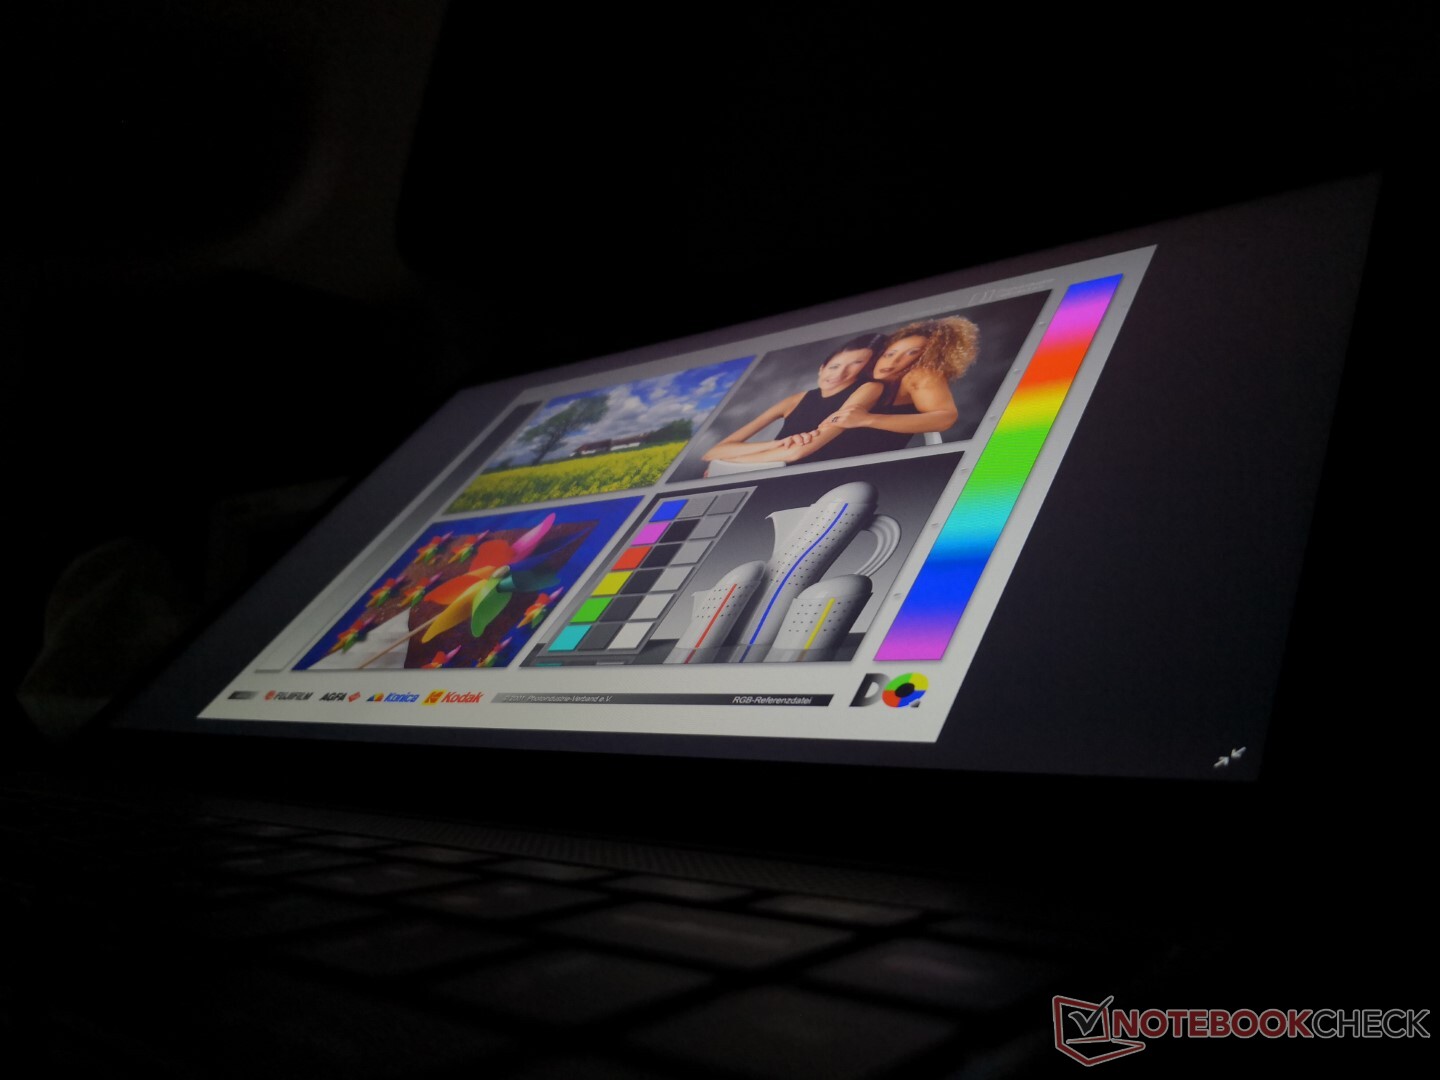
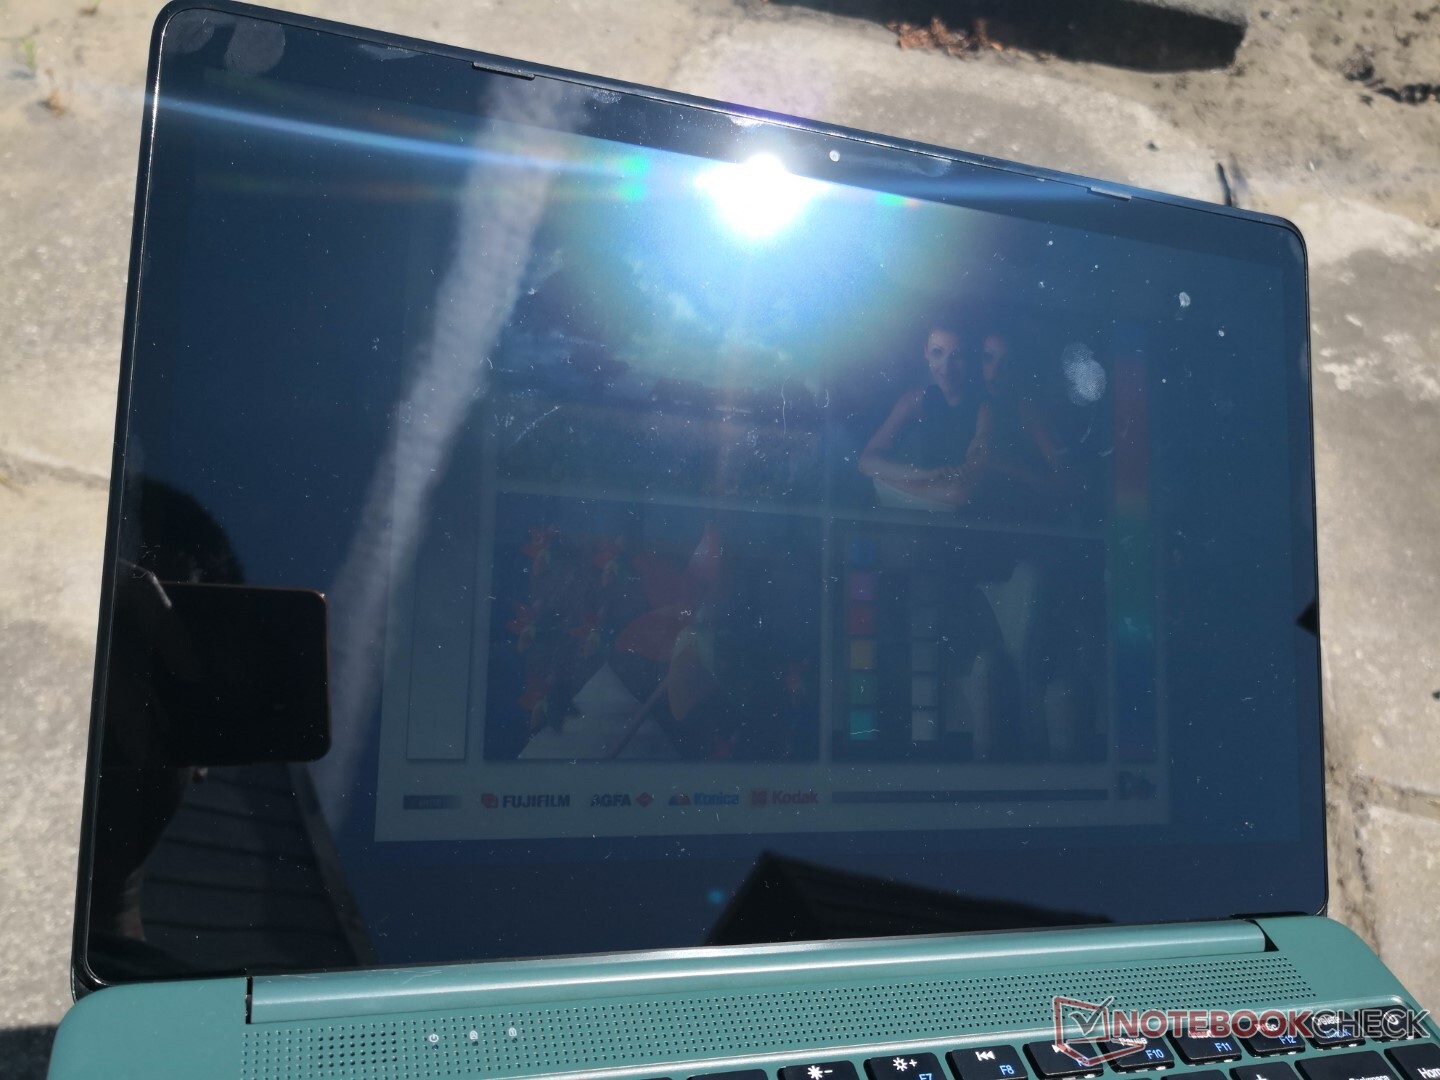
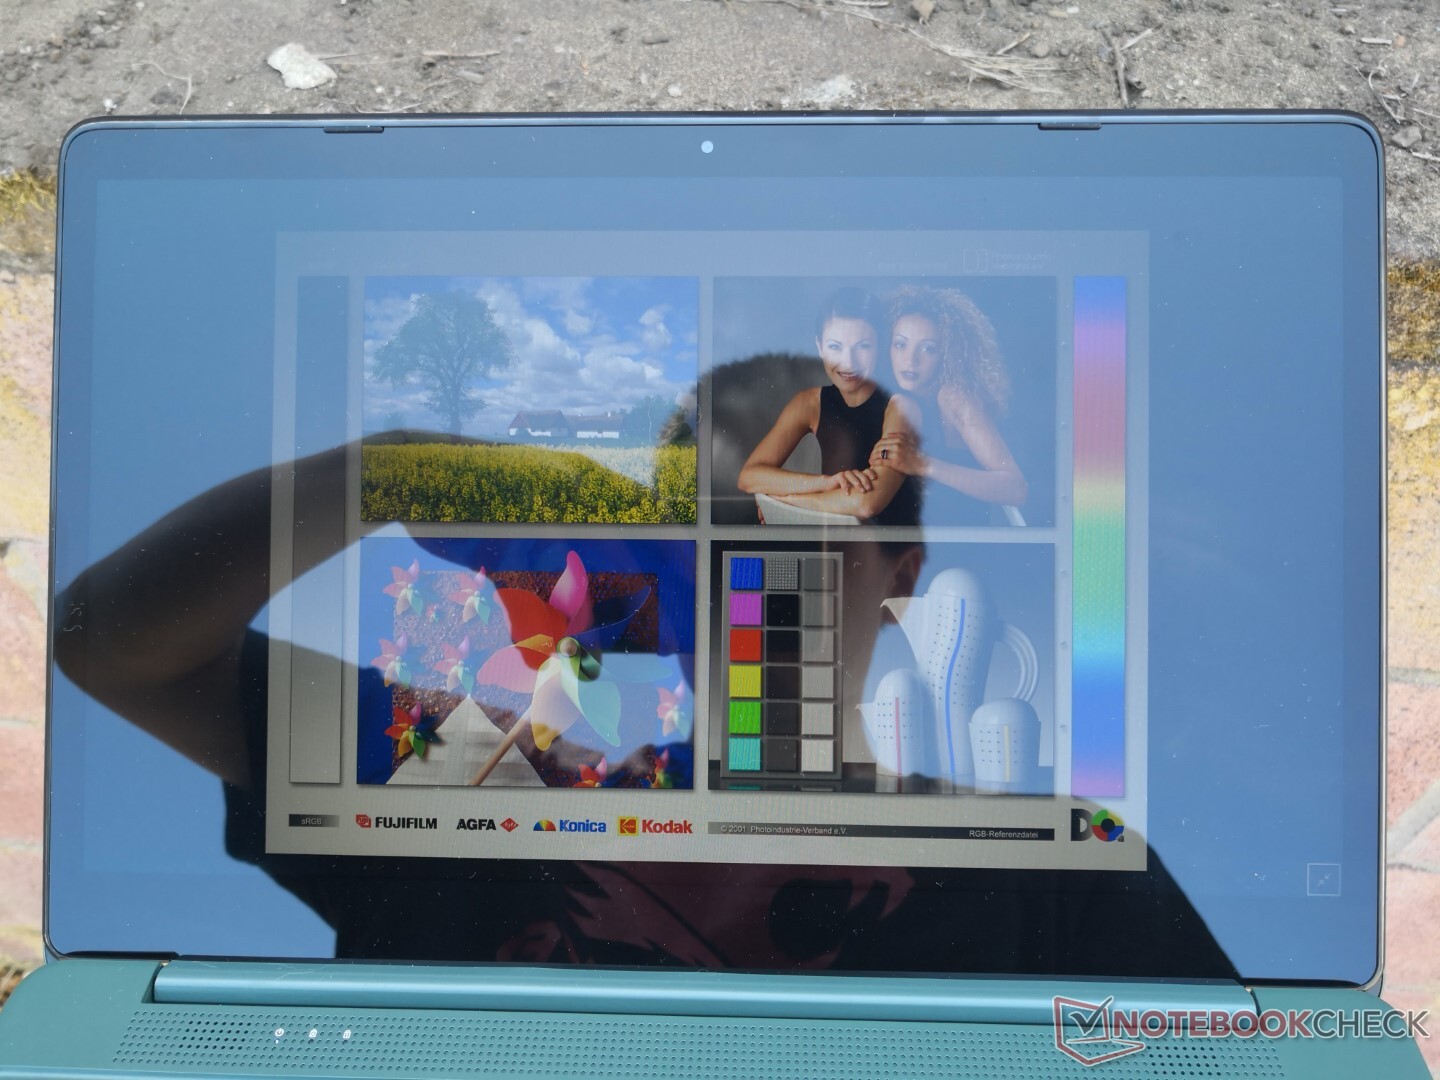
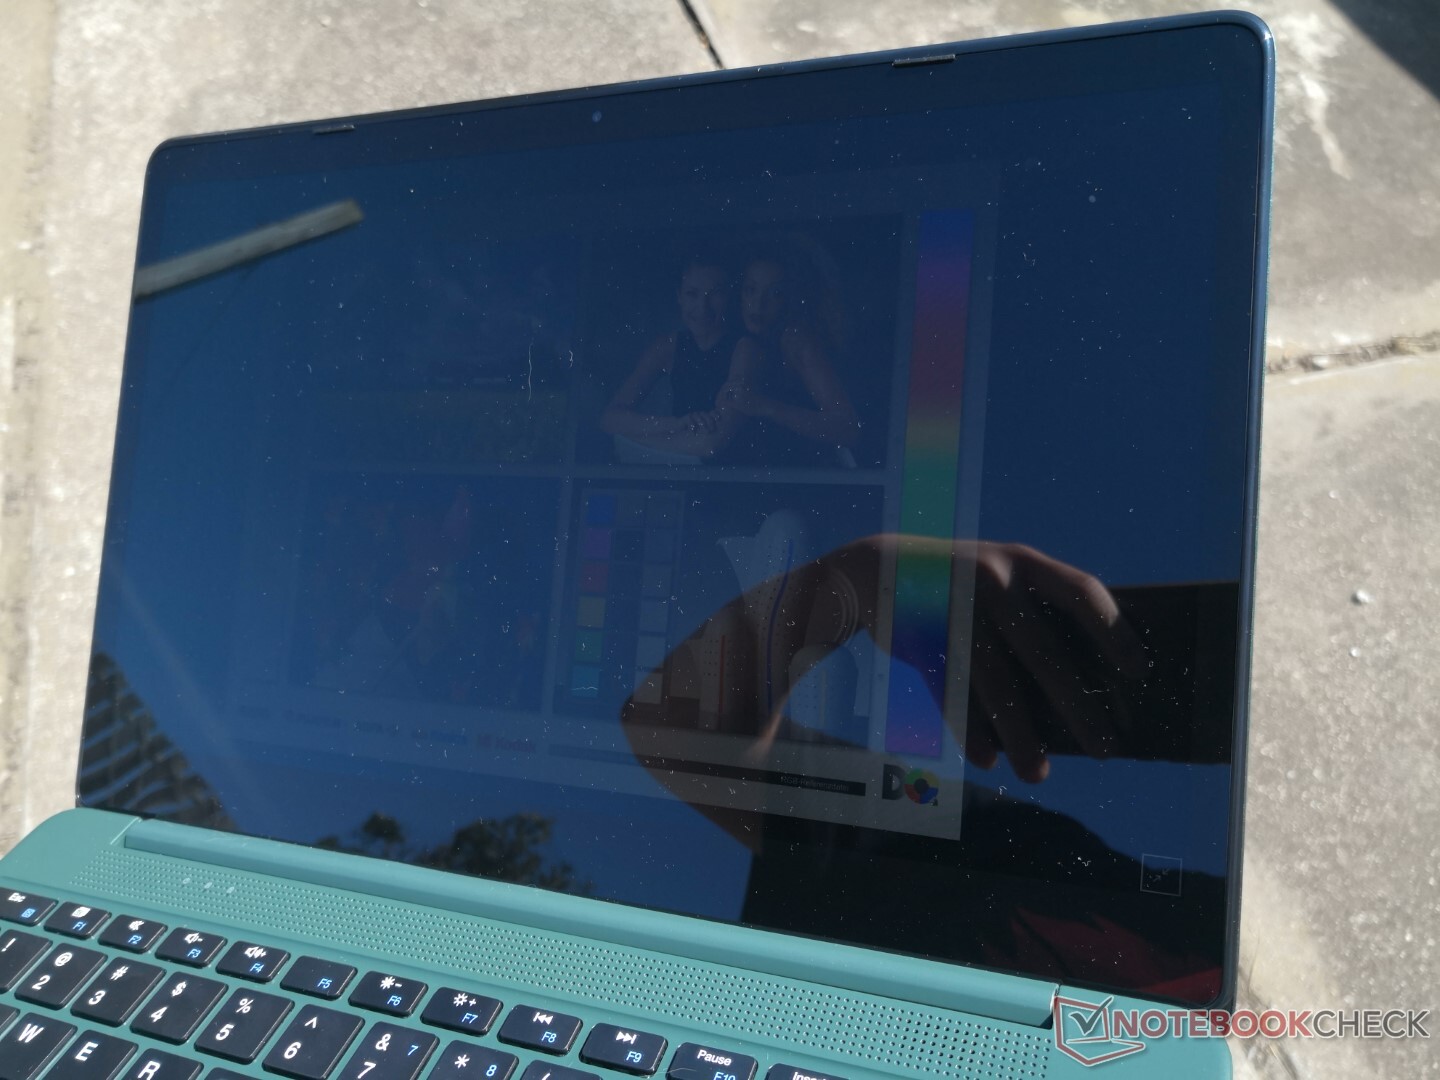
Outdoor visibility is limited due to the dim backlight and glossy display for unavoidable glare. Pricier laptops like the XPS 13 can be two times brighter than our Gateway for easier visibility under bright ambient conditions. When indoors, however, the brightness of the Gateway is sufficient.
Performance
Processor
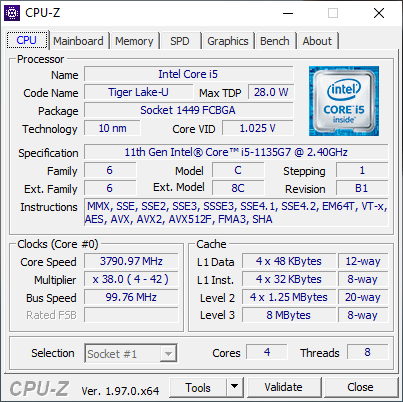
Multi-thread performance is roughly 10 to 20 percent slower than the average laptop in our database equipped with the same Core i5-1135G7 CPU. The deficit is wide enough that certain 10th gen Ice Lake laptops like the Infinix INBook X1 Pro Core i7-1065G7 can slightly outperform the 11th gen Core i5 CPU in our Gateway. Though a bit disappointing, users upgrading from an older 8th gen or 7th gen system will still see significant performance gains.
Cinebench R15 Multi Loop
Cinebench R23: Multi Core | Single Core
Cinebench R15: CPU Multi 64Bit | CPU Single 64Bit
Blender: v2.79 BMW27 CPU
7-Zip 18.03: 7z b 4 -mmt1 | 7z b 4
Geekbench 5.5: Single-Core | Multi-Core
HWBOT x265 Benchmark v2.2: 4k Preset
LibreOffice : 20 Documents To PDF
R Benchmark 2.5: Overall mean
| Cinebench R23 / Multi Core | |
| Lenovo IdeaPad Flex 5 14ALC05 82HU002YUS | |
| Lenovo Yoga Slim 7-14ARE | |
| HP 14s-fq1357ng | |
| ADATA XPG Xenia 14 | |
| Average Intel Core i5-1135G7 (2786 - 6136, n=55) | |
| Infinix INBook X1 Pro | |
| Gateway GWTN141-10GR | |
| Acer Spin 3 SP314-54N-56S5 | |
| Kuu LeBook 12.6 Core i7-8550U | |
| Cinebench R23 / Single Core | |
| ADATA XPG Xenia 14 | |
| Gateway GWTN141-10GR | |
| Average Intel Core i5-1135G7 (1062 - 1373, n=53) | |
| Lenovo IdeaPad Flex 5 14ALC05 82HU002YUS | |
| Lenovo Yoga Slim 7-14ARE | |
| Infinix INBook X1 Pro | |
| HP 14s-fq1357ng | |
| Acer Spin 3 SP314-54N-56S5 | |
| Kuu LeBook 12.6 Core i7-8550U | |
| Geekbench 5.5 / Single-Core | |
| Average Intel Core i5-1135G7 (1147 - 1428, n=58) | |
| Acer Spin 3 SP314-54N-56S5 | |
| Lenovo IdeaPad Flex 5 14ALC05 82HU002YUS | |
| Asus ZenBook 14 UX434FL-DB77 | |
| Asus VivoBook Flip 14 TM420IA | |
| Lenovo Yoga Slim 7-14ARE | |
| Lenovo Yoga Slim 7-14ARE | |
| HP 14s-fq1357ng | |
| Lenovo IdeaPad 5 14ARE05 | |
| Geekbench 5.5 / Multi-Core | |
| Lenovo Yoga Slim 7-14ARE | |
| Lenovo Yoga Slim 7-14ARE | |
| Lenovo IdeaPad Flex 5 14ALC05 82HU002YUS | |
| HP 14s-fq1357ng | |
| Asus VivoBook Flip 14 TM420IA | |
| Average Intel Core i5-1135G7 (3475 - 5472, n=58) | |
| Lenovo IdeaPad 5 14ARE05 | |
| Acer Spin 3 SP314-54N-56S5 | |
| Asus ZenBook 14 UX434FL-DB77 | |
* ... smaller is better
System Performance
| PCMark 10 / Score | |
| ADATA XPG Xenia 14 | |
| HP 14s-fq1357ng | |
| Average Intel Core i5-1135G7, Intel Iris Xe Graphics G7 80EUs (4026 - 4952, n=53) | |
| Gateway GWTN141-10GR | |
| Chuwi CoreBook X | |
| Dell Inspiron 14 3493-4KWCF | |
| Blackview AceBook 1 | |
| PCMark 10 / Essentials | |
| ADATA XPG Xenia 14 | |
| Average Intel Core i5-1135G7, Intel Iris Xe Graphics G7 80EUs (8149 - 9917, n=53) | |
| HP 14s-fq1357ng | |
| Gateway GWTN141-10GR | |
| Dell Inspiron 14 3493-4KWCF | |
| Chuwi CoreBook X | |
| Blackview AceBook 1 | |
| PCMark 10 / Productivity | |
| ADATA XPG Xenia 14 | |
| Dell Inspiron 14 3493-4KWCF | |
| HP 14s-fq1357ng | |
| Chuwi CoreBook X | |
| Average Intel Core i5-1135G7, Intel Iris Xe Graphics G7 80EUs (5040 - 6619, n=53) | |
| Gateway GWTN141-10GR | |
| Blackview AceBook 1 | |
| PCMark 10 / Digital Content Creation | |
| ADATA XPG Xenia 14 | |
| HP 14s-fq1357ng | |
| Average Intel Core i5-1135G7, Intel Iris Xe Graphics G7 80EUs (3548 - 5255, n=53) | |
| Gateway GWTN141-10GR | |
| Chuwi CoreBook X | |
| Dell Inspiron 14 3493-4KWCF | |
| Blackview AceBook 1 | |
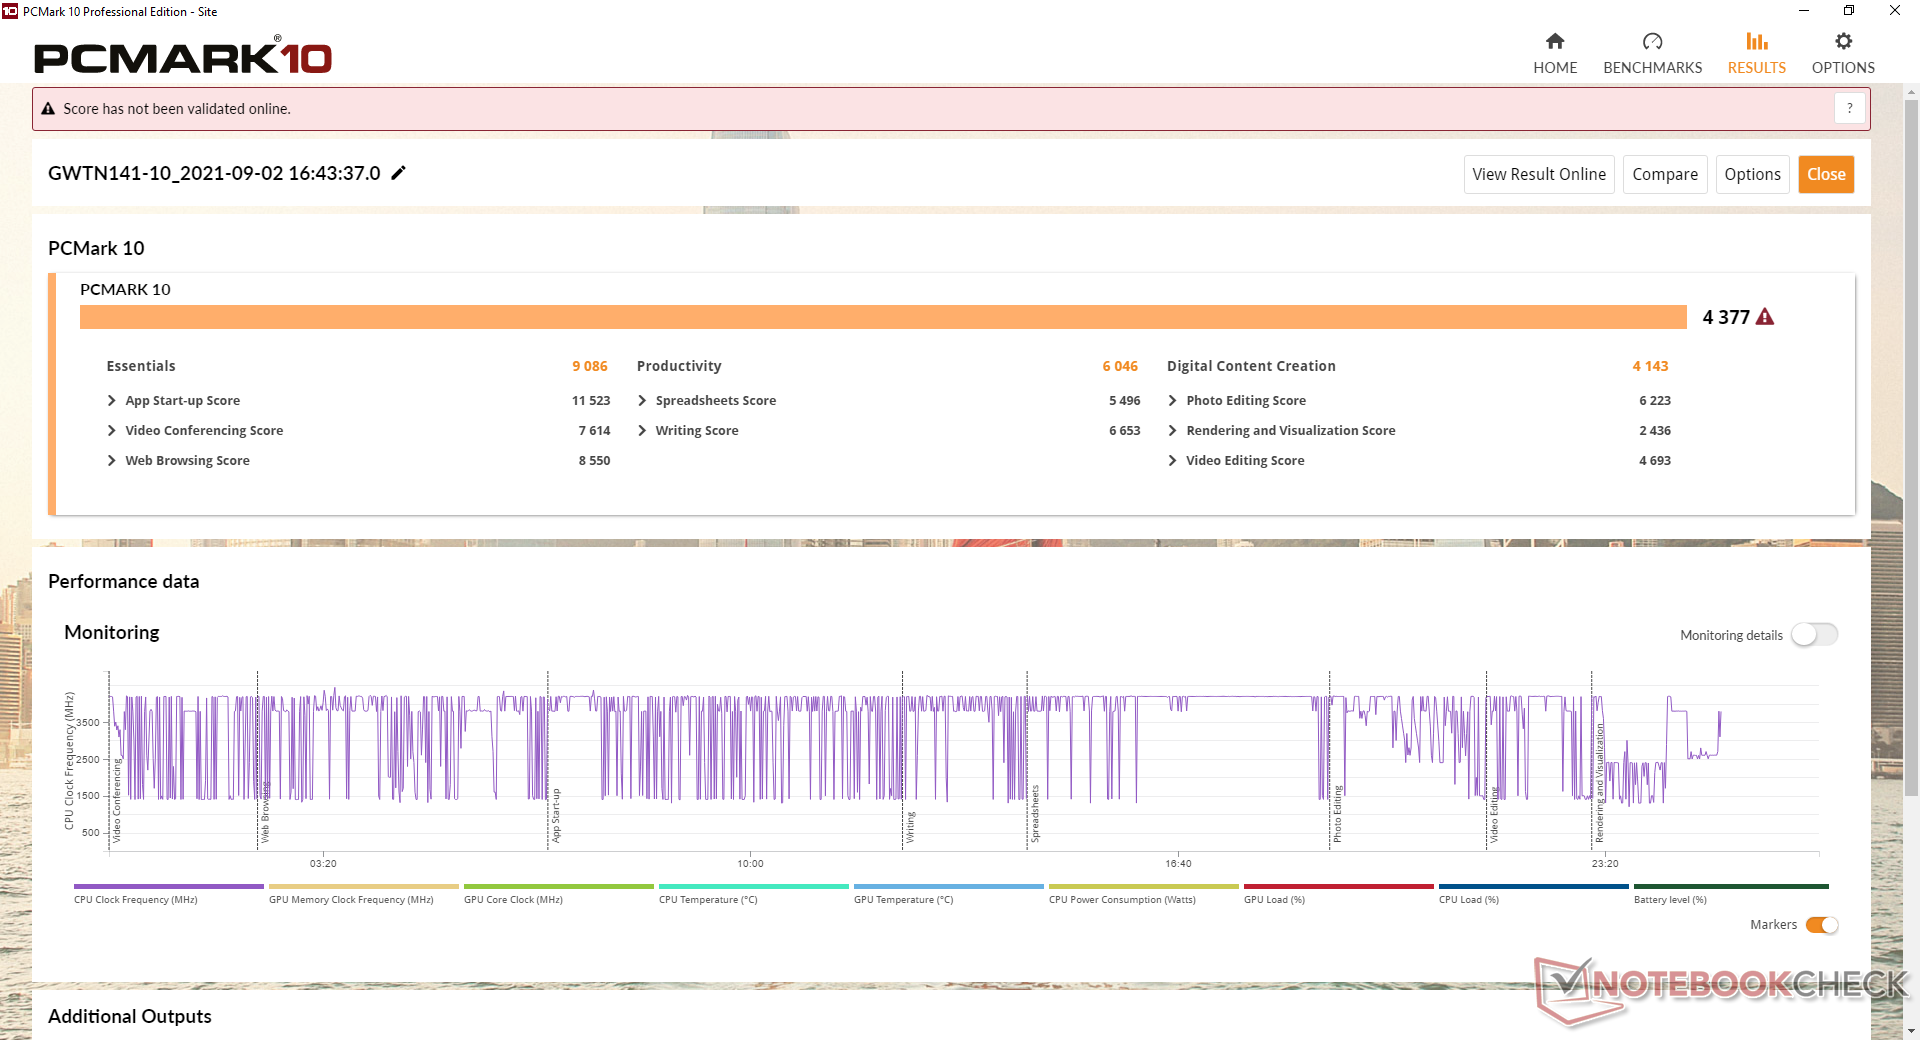
| PCMark 10 Score | 4377 points | |
Help | ||
DPC Latency
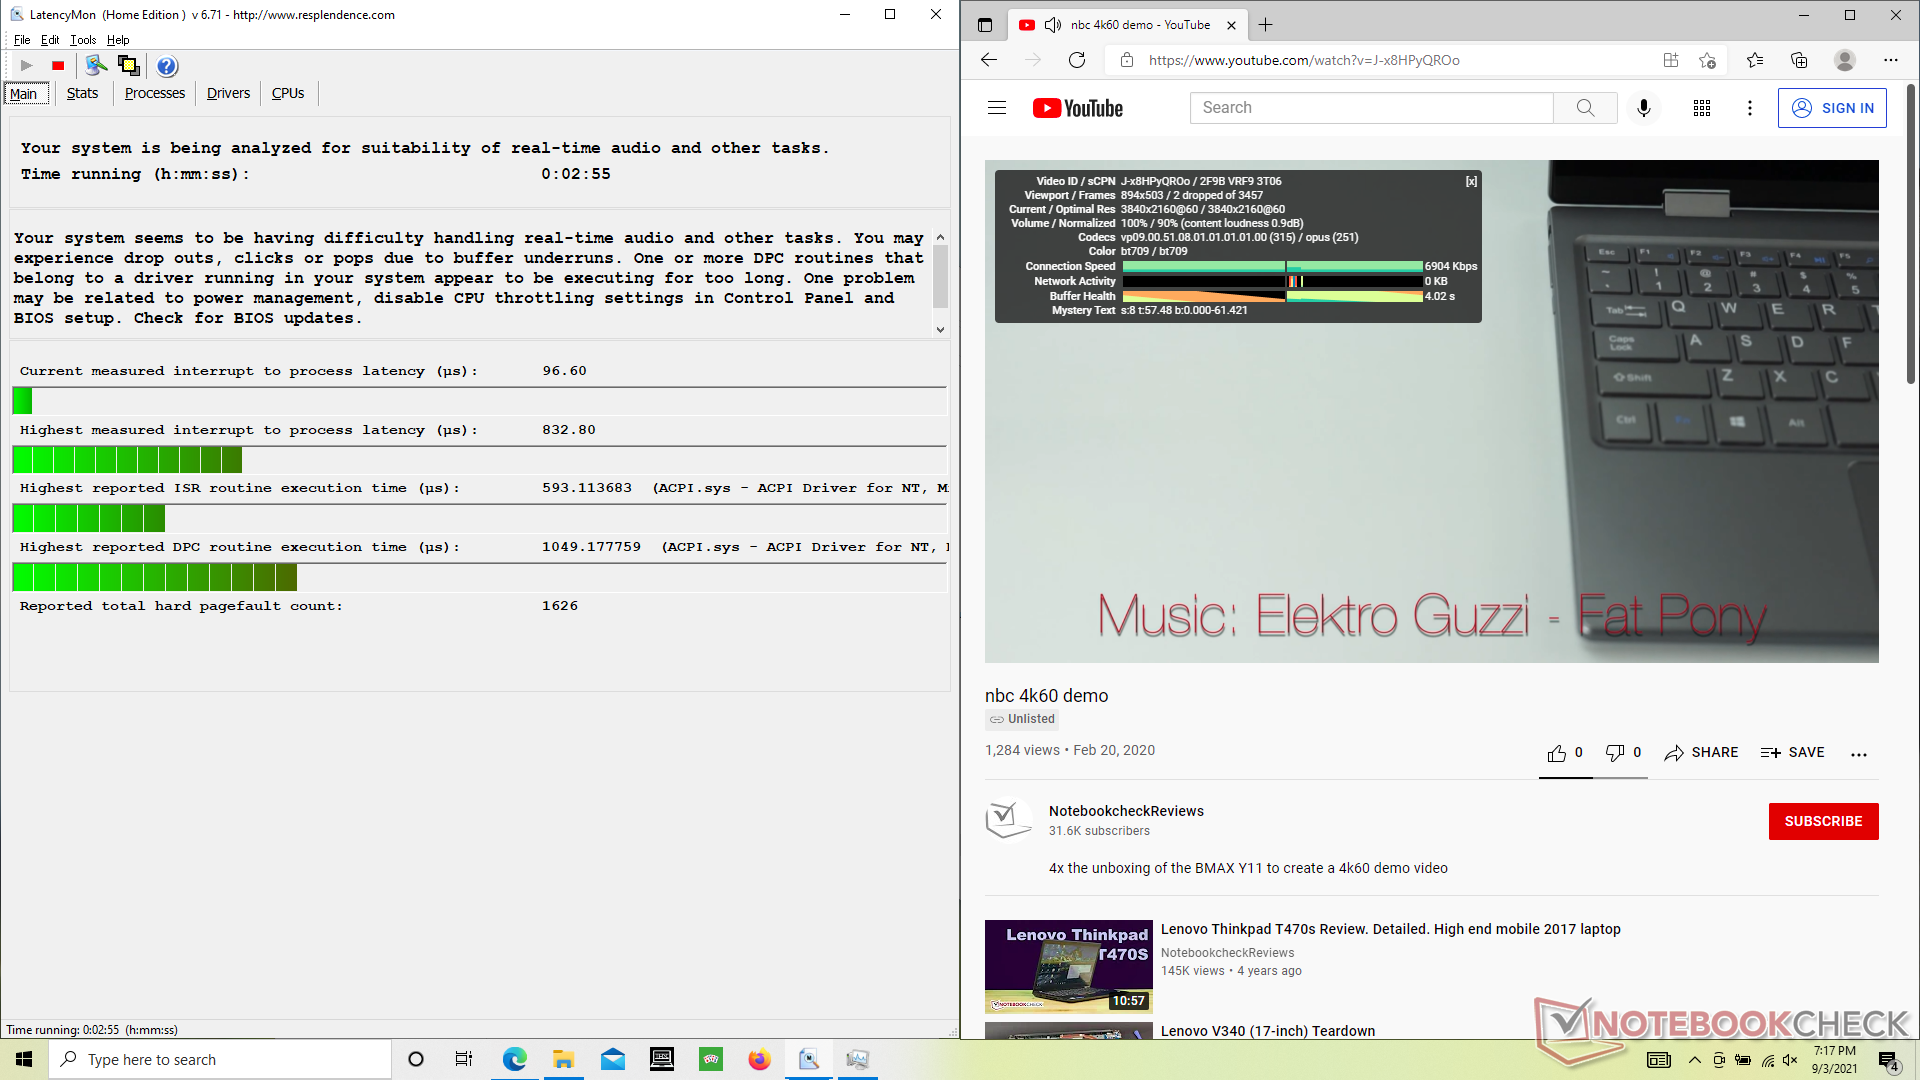
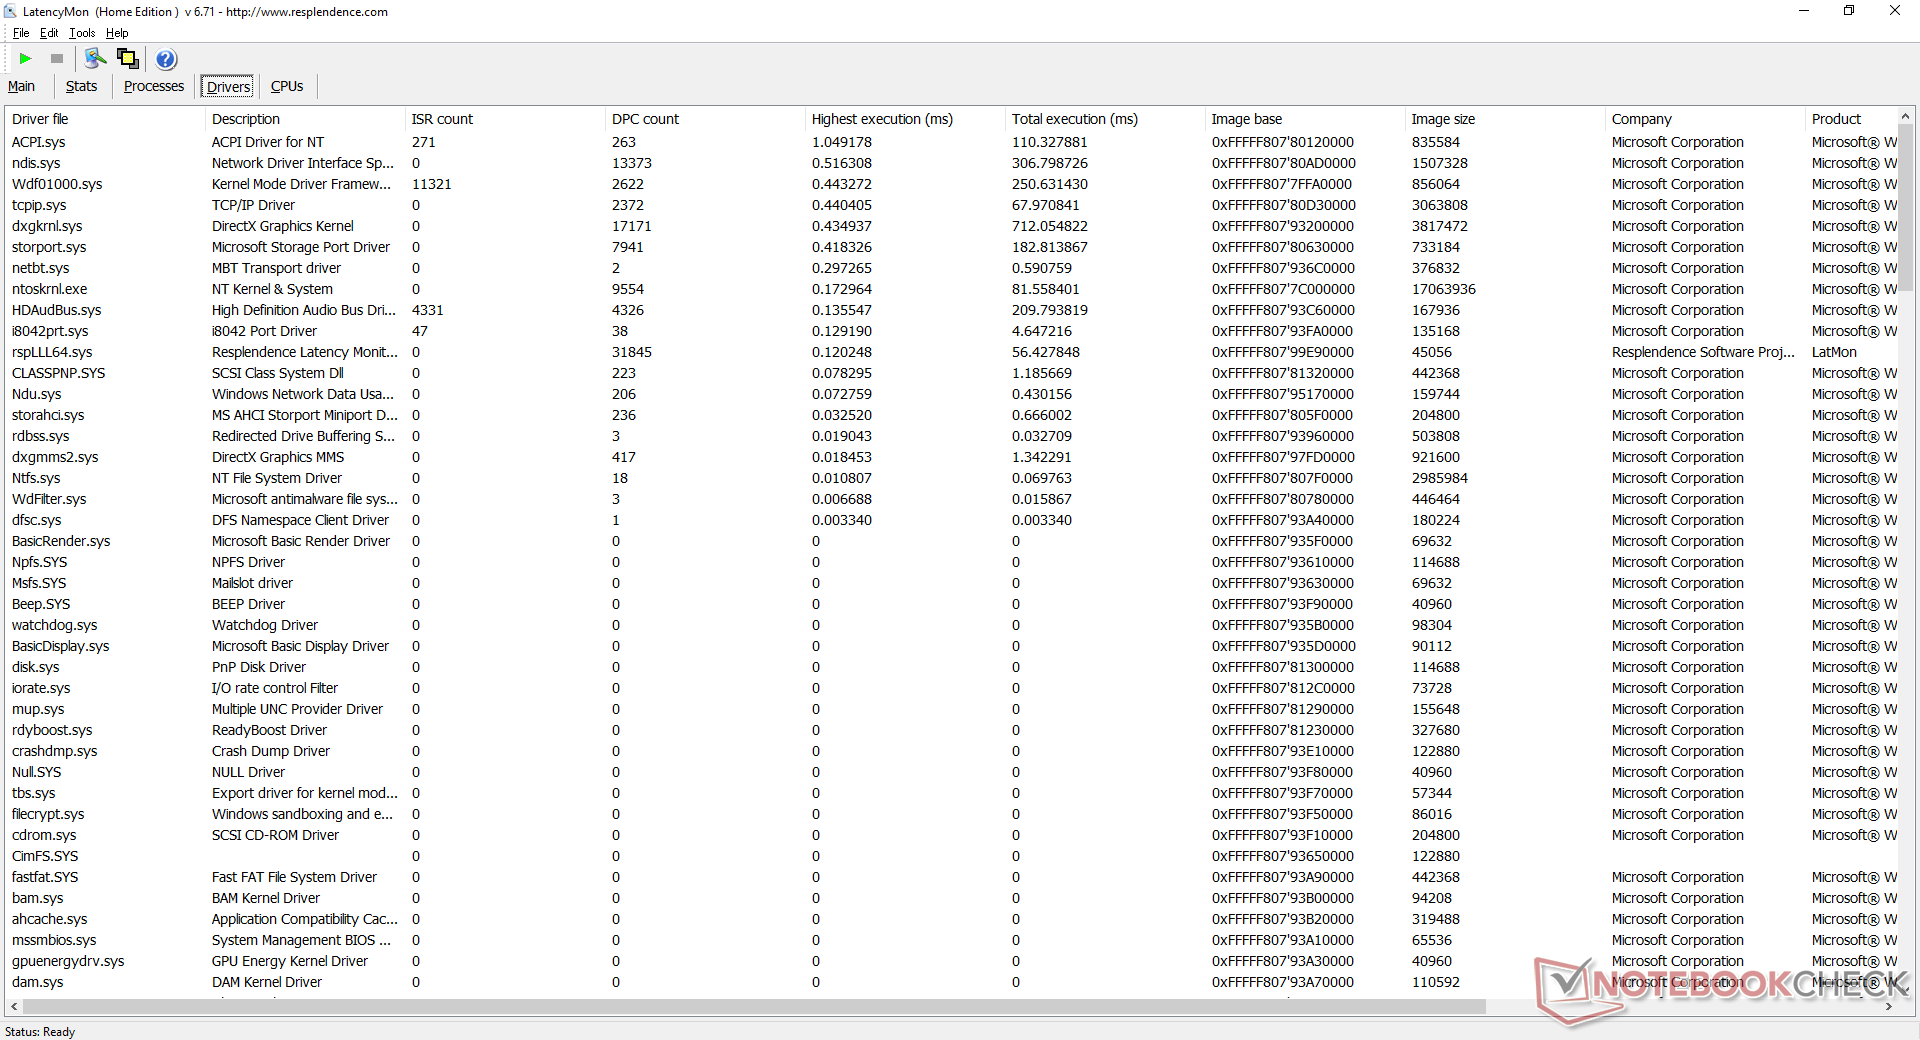
LatencyMon reveals latency issues when opening multiple browser tabs on our homepage. 4K video playback at 60 FPS is otherwise smooth and with just 2 dropped frames during our minute-long video test.
| DPC Latencies / LatencyMon - interrupt to process latency (max), Web, Youtube, Prime95 | |
| HP 14s-fq1357ng | |
| Blackview AceBook 1 | |
| Chuwi CoreBook X | |
| Gateway GWTN141-10GR | |
| ADATA XPG Xenia 14 | |
* ... smaller is better
Storage Devices
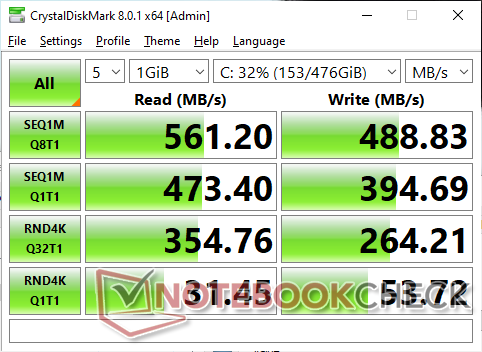
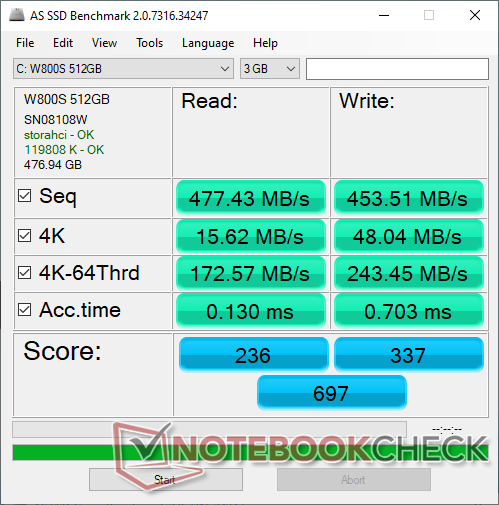
The system does not ship with NVMe or PCIe SSDs likely to save on costs. Instead, it comes with a lesser-known W800S M.2 SATA III SSD with good sequential read and write rates of just over 450 MB/s each which should be more than sufficient considering the hardware surrounding it.
| Gateway GWTN141-10GR W800S W800SHMQ 512GB SSD | HP 14s-fq1357ng Micron 2210 MTFDHBA512QFD | Blackview AceBook 1 SCY C500 SNS1N3G12800D M.2 SATA | ADATA XPG Xenia 14 ADATA XPG Gammix S50 Lite 512GB | Chuwi CoreBook X Kingston RBUSNS8154P3512GJ | Dell Inspiron 14 3493-4KWCF Toshiba KBG40ZNS512G NVMe | |
|---|---|---|---|---|---|---|
| AS SSD | 199% | -35% | 383% | 175% | 179% | |
| Seq Read (MB/s) | 477.4 | 1784 274% | 446.6 -6% | 3043 537% | 1393 192% | 2074 334% |
| Seq Write (MB/s) | 453.5 | 742 64% | 276.8 -39% | 1462 222% | 954 110% | 775 71% |
| 4K Read (MB/s) | 15.62 | 58.3 273% | 8.95 -43% | 66.6 326% | 39.51 153% | 37.81 142% |
| 4K Write (MB/s) | 48.04 | 141.9 195% | 50.2 4% | 217.6 353% | 98.9 106% | 101.3 111% |
| 4K-64 Read (MB/s) | 172.6 | 582 237% | 145 -16% | 732 324% | 834 383% | 1265 633% |
| 4K-64 Write (MB/s) | 243.4 | 1047 330% | 173.5 -29% | 1706 601% | 687 182% | 383.5 58% |
| Access Time Read * (ms) | 0.13 | 0.052 60% | 0.5 -285% | 0.039 70% | 0.066 49% | 0.081 38% |
| Access Time Write * (ms) | 0.703 | 0.046 93% | 0.232 67% | 0.063 91% | 0.044 94% | 0.263 63% |
| Score Read (Points) | 236 | 819 247% | 199 -16% | 1103 367% | 1013 329% | 1510 540% |
| Score Write (Points) | 337 | 1263 275% | 251 -26% | 2069 514% | 881 161% | 562 67% |
| Score Total (Points) | 697 | 2469 254% | 545 -22% | 3678 428% | 2399 244% | 2781 299% |
| Copy ISO MB/s (MB/s) | 375.3 | 1067 184% | 360.9 -4% | 3306 781% | 983 162% | 716 91% |
| Copy Program MB/s (MB/s) | 317.1 | 597 88% | 115.1 -64% | 1087 243% | 643 103% | 335.4 6% |
| Copy Game MB/s (MB/s) | 327.8 | 1019 211% | 306.8 -6% | 1988 506% | 920 181% | 484.8 48% |
| CrystalDiskMark 5.2 / 6 | 174% | -7% | 388% | 126% | 212% | |
| Write 4K (MB/s) | 67 | 94.8 41% | 66.3 -1% | 182.5 172% | 130.5 95% | 159.6 138% |
| Read 4K (MB/s) | 23.12 | 48.93 112% | 26.3 14% | 69.4 200% | 38.72 67% | 53.5 131% |
| Write Seq (MB/s) | 286.7 | 1059 269% | 231.9 -19% | 2171 657% | 709 147% | 1174 309% |
| Read Seq (MB/s) | 372.9 | 1620 334% | 466.8 25% | 2924 684% | 717 92% | 1648 342% |
| Write 4K Q32T1 (MB/s) | 266.3 | 400 50% | 117.3 -56% | 486.5 83% | 510 92% | 420.8 58% |
| Read 4K Q32T1 (MB/s) | 292.5 | 377.2 29% | 138.1 -53% | 506 73% | 554 89% | 564 93% |
| Write Seq Q32T1 (MB/s) | 401.8 | 1136 183% | 427.6 6% | 2832 605% | 1037 158% | 1231 206% |
| Read Seq Q32T1 (MB/s) | 436.6 | 2073 375% | 546 25% | 3177 628% | 1609 269% | 2274 421% |
| Total Average (Program / Settings) | 187% /
190% | -21% /
-25% | 386% /
385% | 151% /
157% | 196% /
191% |
* ... smaller is better

Disk Throttling: DiskSpd Read Loop, Queue Depth 8
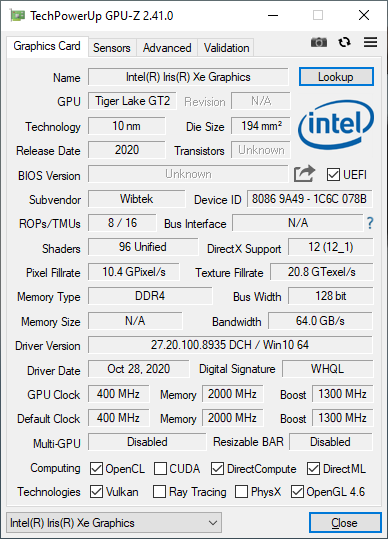
GPU Performance
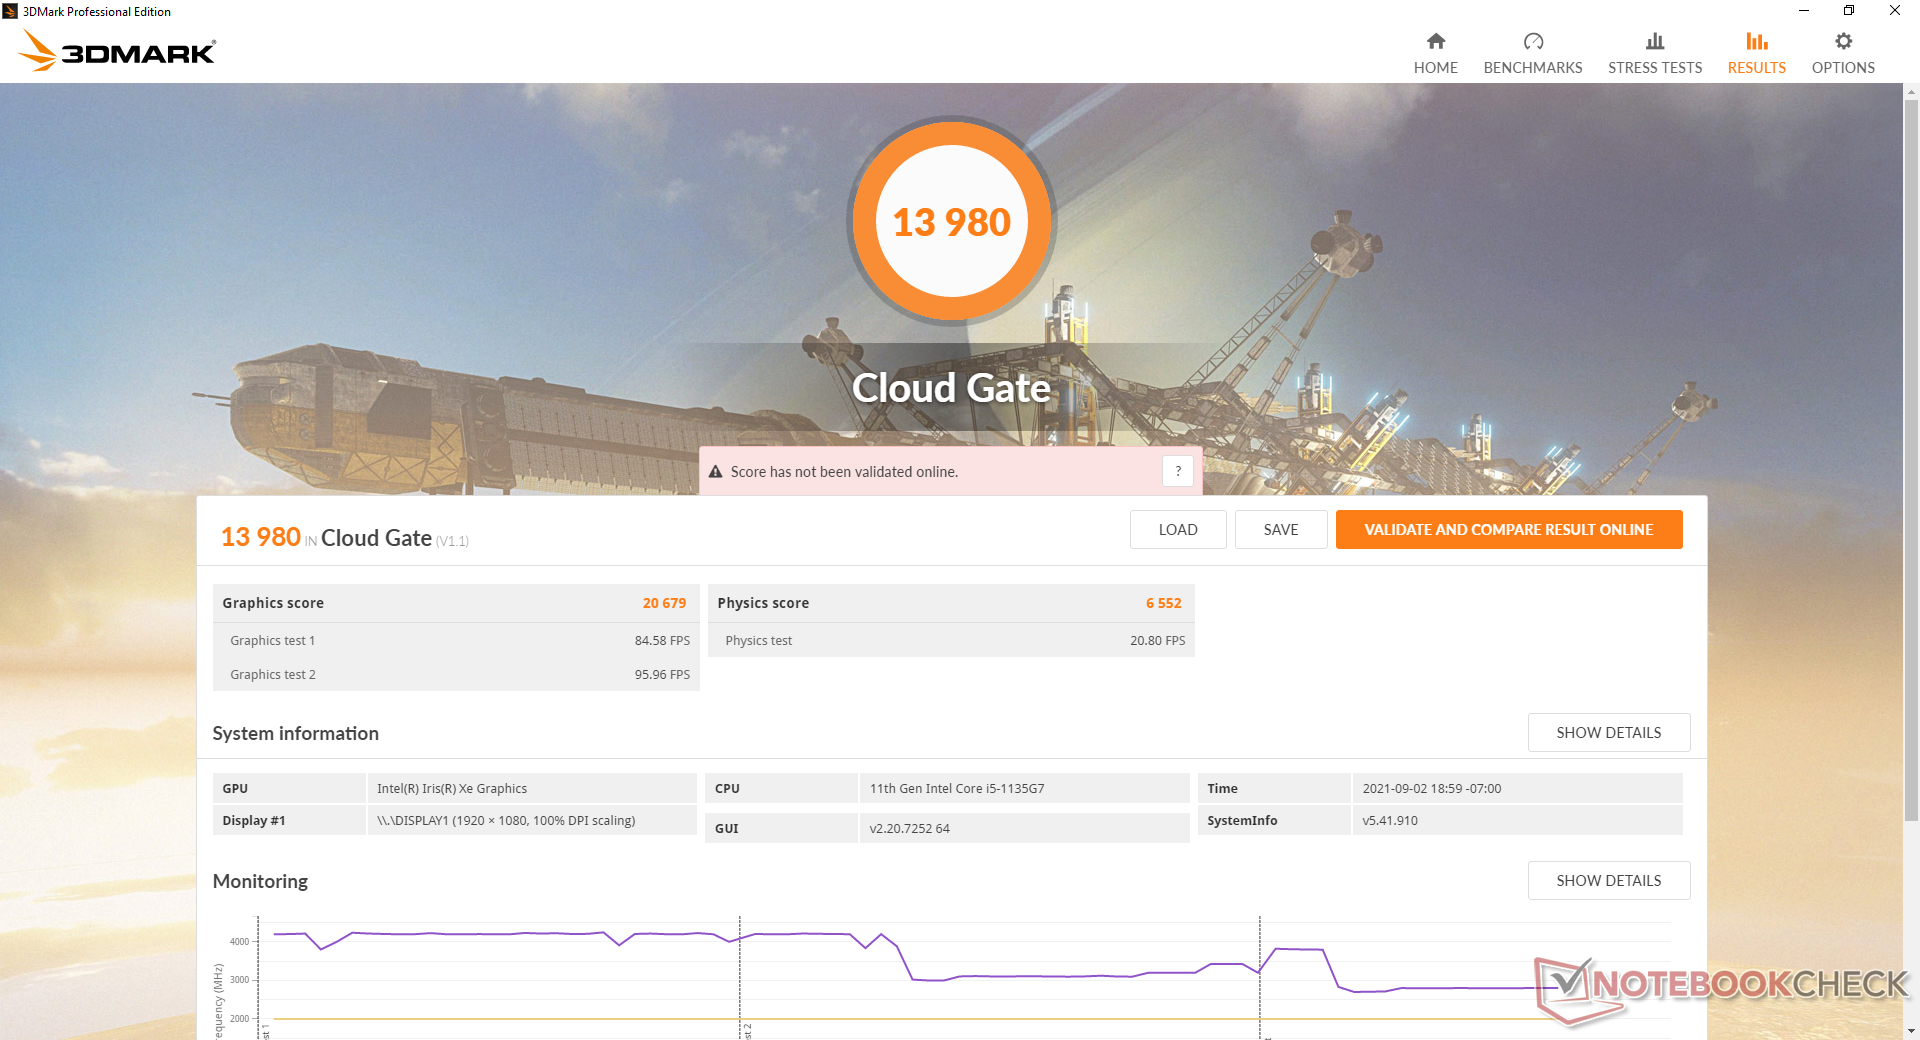
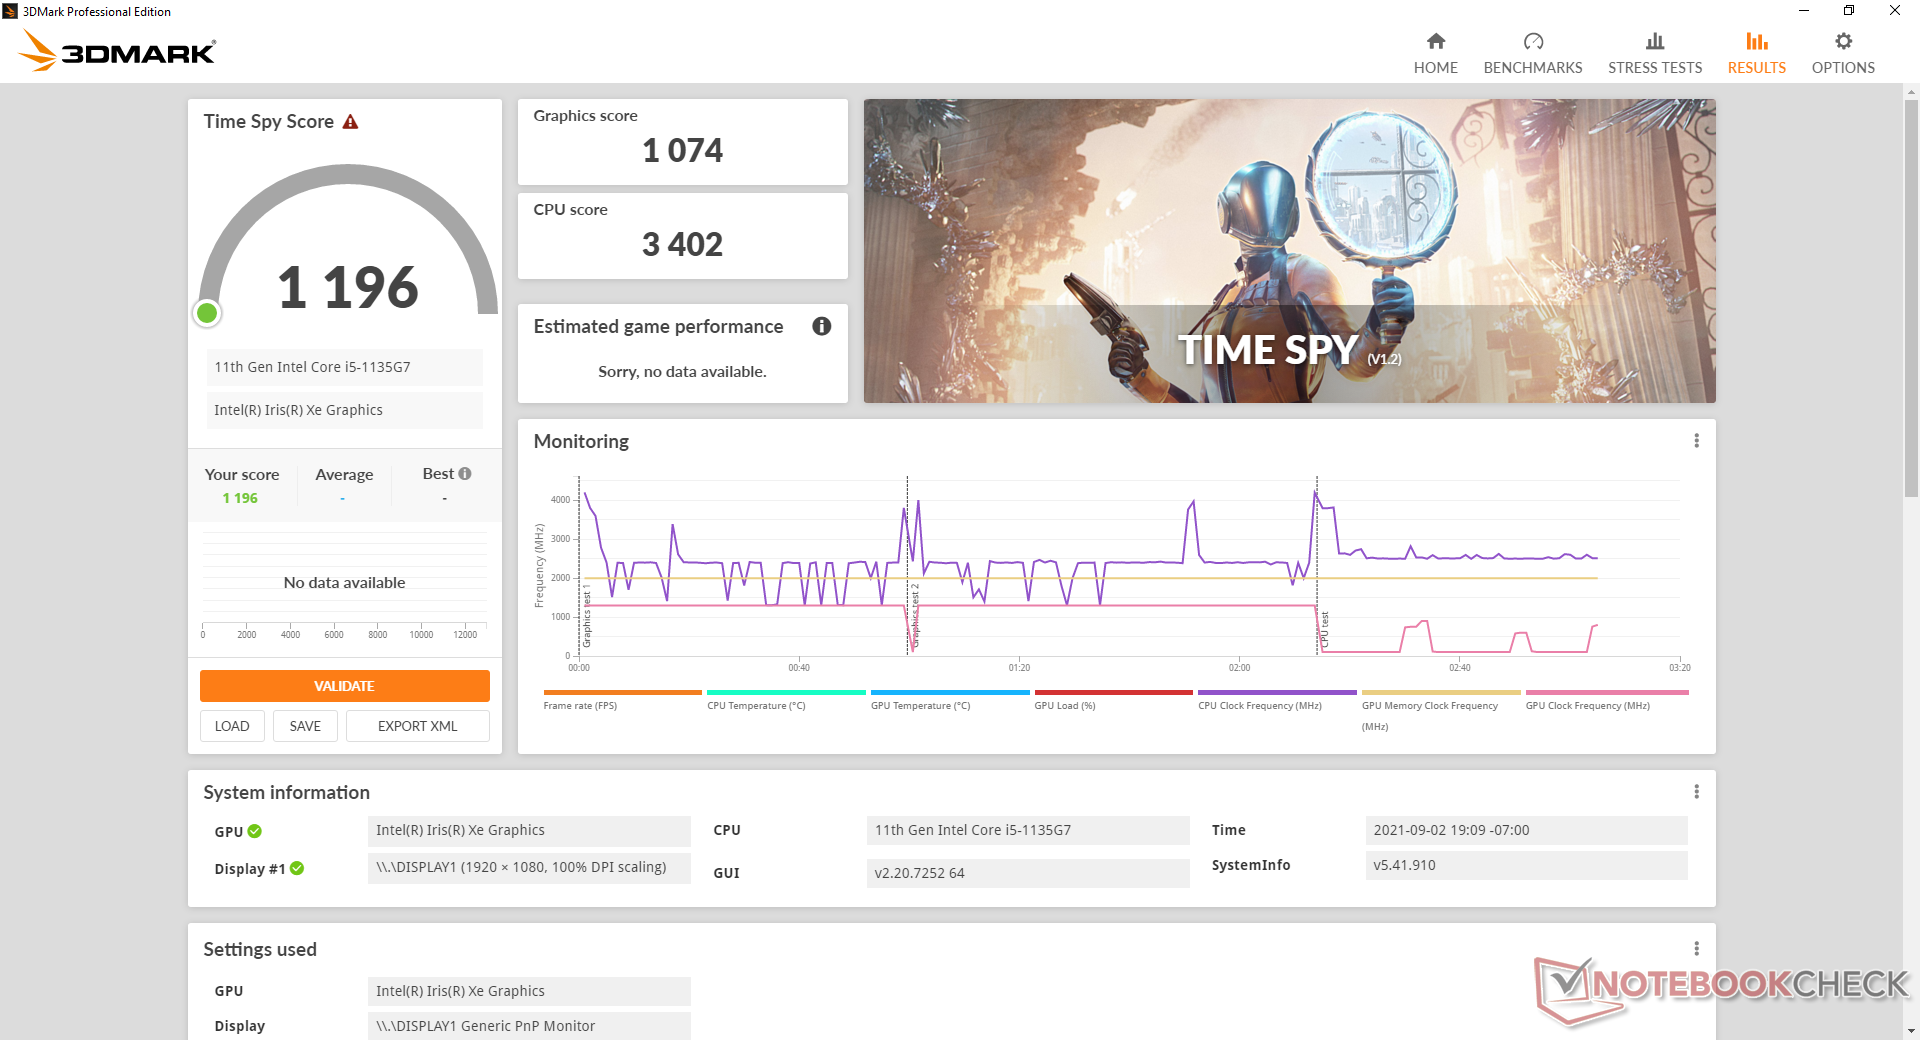
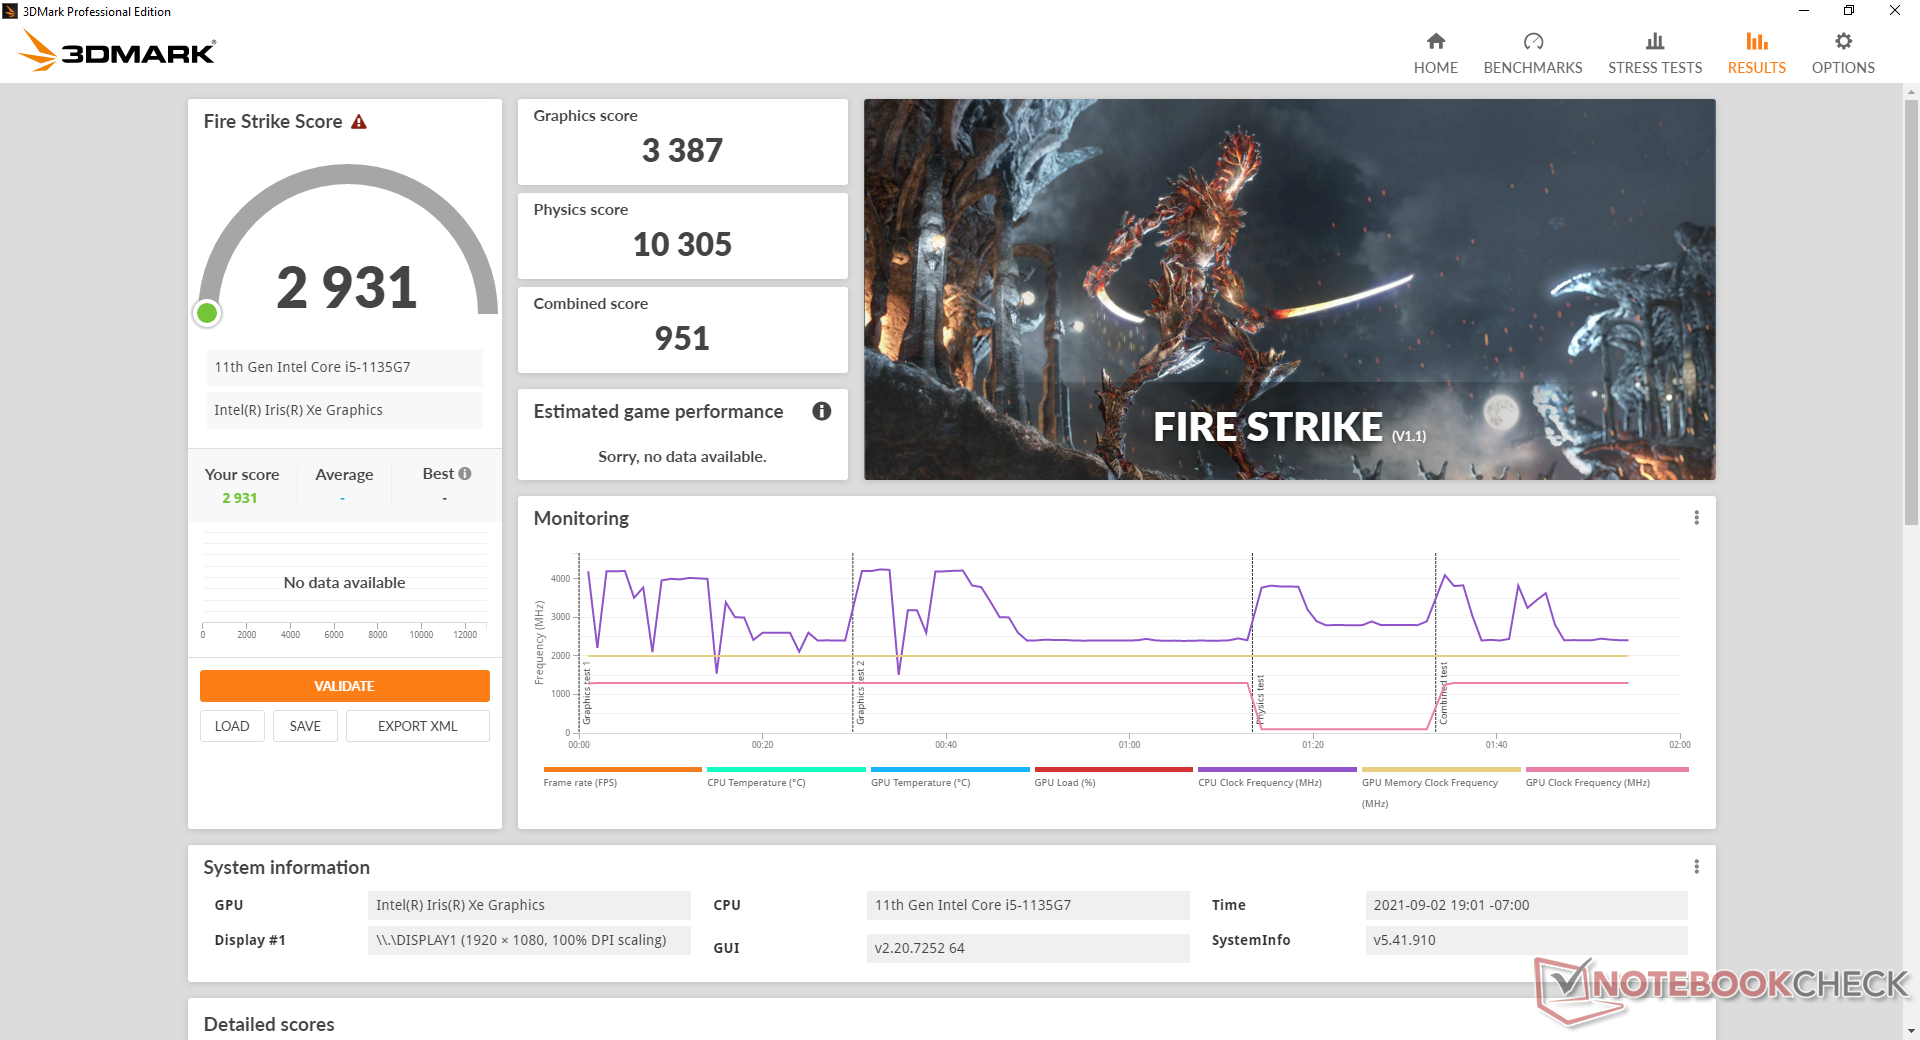
Graphics performance is about 10 percent slower than the average Iris Xe 80 EUs in our database. Light games like DOTA 2 or Rocket League still run better than expected for such an inexpensive system. The boost in graphics when compared to the older UHD Graphics 620 is enormous.
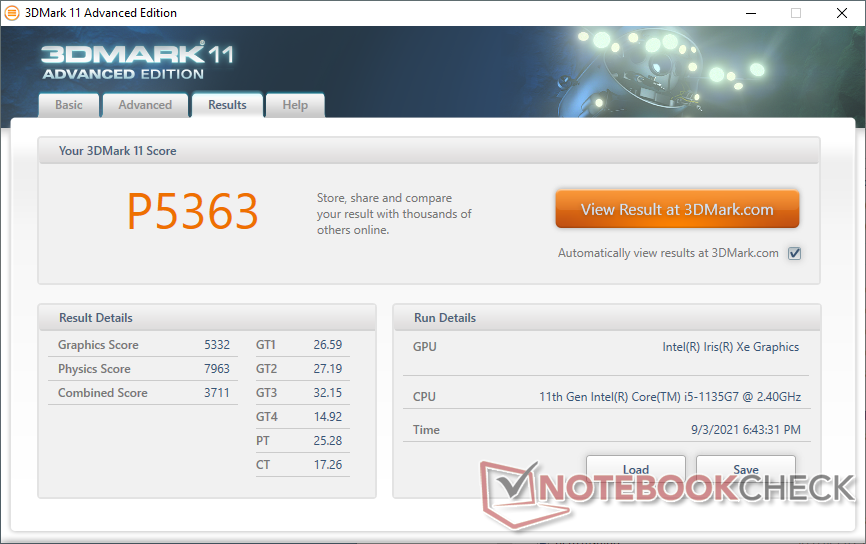
| 3DMark 11 Performance | 5363 points | |
| 3DMark Cloud Gate Standard Score | 13980 points | |
| 3DMark Fire Strike Score | 2931 points | |
| 3DMark Time Spy Score | 1196 points | |
Help | ||
Witcher 3 FPS Chart
| low | med. | high | ultra | |
|---|---|---|---|---|
| The Witcher 3 (2015) | 56.4 | 38.7 | 20.6 | 10.2 |
| Dota 2 Reborn (2015) | 76.4 | 50.2 | 34.8 | 33.2 |
| Final Fantasy XV Benchmark (2018) | 27.3 | 15.5 | 12.5 | |
| X-Plane 11.11 (2018) | 35.3 | 24.9 | 22.3 |
Emissions
System Noise
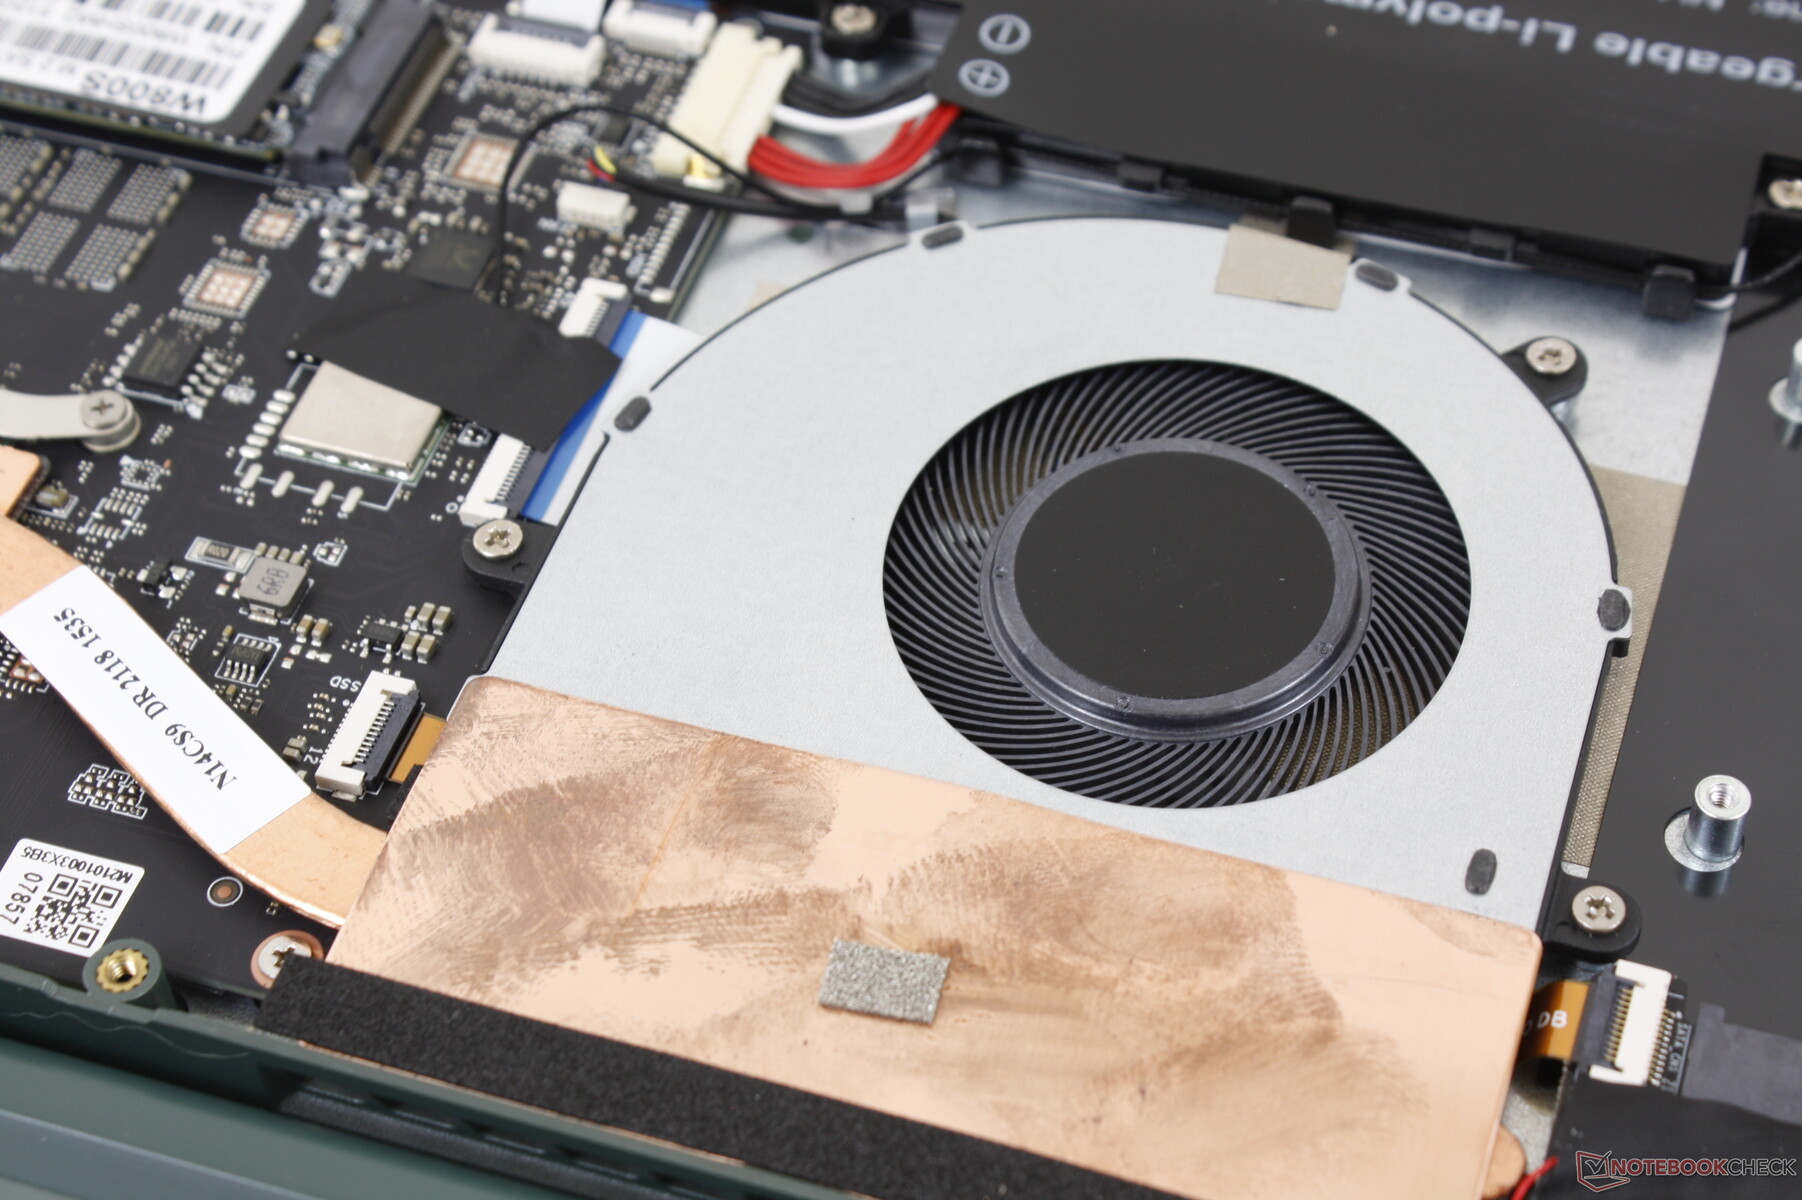
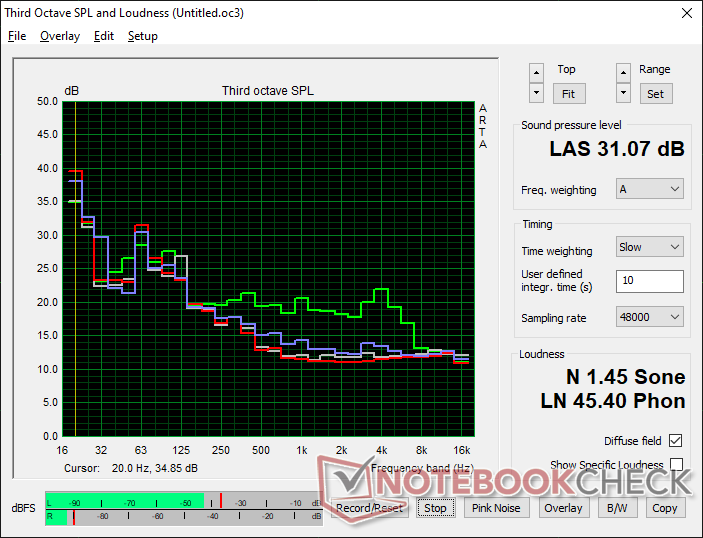
Fan noise is quiet under most circumstances including gaming. Running Witcher 3 would induce a fan noise of just 31.1 dB(A) compared to 37 dB(A) or higher on the CoreBook X or Inspiron 14. Our Gateway is subsequently one of the quietest Tiger Lake-U laptops we've tested thus far.
| Gateway GWTN141-10GR Iris Xe G7 80EUs, i5-1135G7, W800S W800SHMQ 512GB SSD | HP 14s-fq1357ng Vega 7, R5 5500U, Micron 2210 MTFDHBA512QFD | ADATA XPG Xenia 14 Iris Xe G7 96EUs, i7-1165G7, ADATA XPG Gammix S50 Lite 512GB | Chuwi CoreBook X Iris Plus Graphics 655, i5-8259U, Kingston RBUSNS8154P3512GJ | Dell Inspiron 14 3493-4KWCF GeForce MX230, i7-1065G7, Toshiba KBG40ZNS512G NVMe | |
|---|---|---|---|---|---|
| Noise | -24% | -16% | -16% | -34% | |
| off / environment * (dB) | 24.4 | 26 -7% | 25.2 -3% | 24.9 -2% | 30.3 -24% |
| Idle Minimum * (dB) | 24.4 | 26 -7% | 25.2 -3% | 25.5 -5% | 30.3 -24% |
| Idle Average * (dB) | 24.4 | 26 -7% | 26.5 -9% | 25.5 -5% | 30.3 -24% |
| Idle Maximum * (dB) | 24.4 | 31.6 -30% | 26.5 -9% | 29.1 -19% | 30.3 -24% |
| Load Average * (dB) | 25.8 | 41 -59% | 30.9 -20% | 36.8 -43% | 42.9 -66% |
| Load Maximum * (dB) | 31.1 | 41 -32% | 46.7 -50% | 37.1 -19% | 43.3 -39% |
| Witcher 3 ultra * (dB) | 37.4 | 37.2 |
* ... smaller is better
Noise level
| Idle |
| 24.4 / 24.4 / 24.4 dB(A) |
| Load |
| 25.8 / 31.1 dB(A) |
 | ||
30 dB silent 40 dB(A) audible 50 dB(A) loud |
||
min: | ||
Temperature
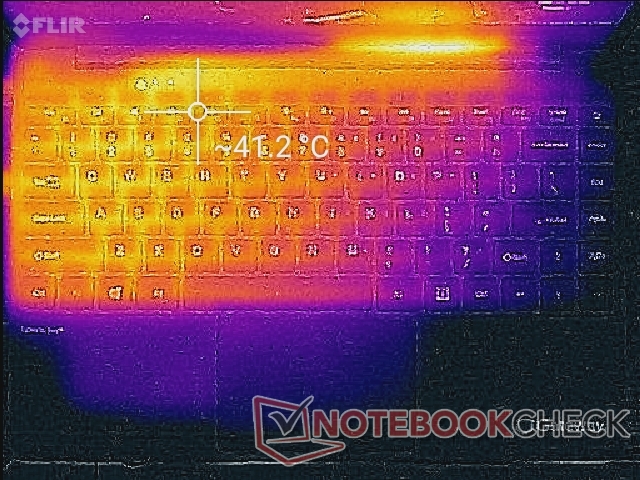
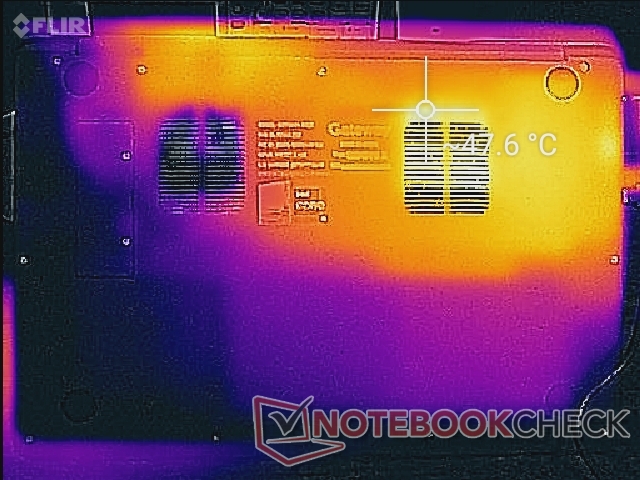
Surface temperatures are noticeably warmer on the left half of the system than the right half. Hot spots can reach 42 C and 48 C near the WASD keys and bottom ventilation, respectively, when running high loads like games. These temperatures are comparable to the Xenia 14, but we would have preferred the hot spots to be further away toward the rear of the chassis where fingers and skin are less likely to touch.
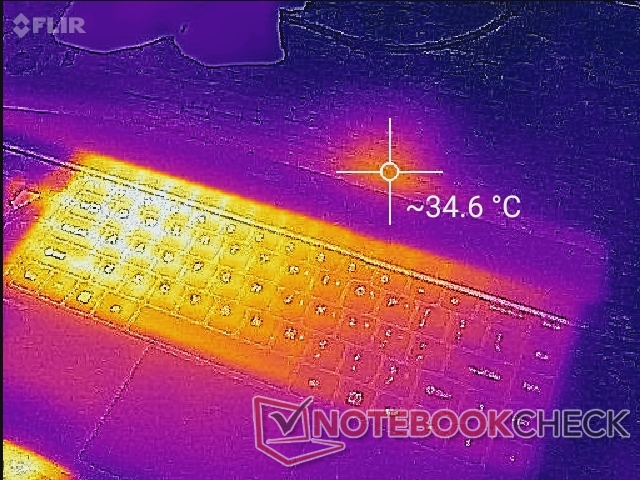
(±) The maximum temperature on the upper side is 42 °C / 108 F, compared to the average of 35.9 °C / 97 F, ranging from 21.4 to 59 °C for the class Subnotebook.
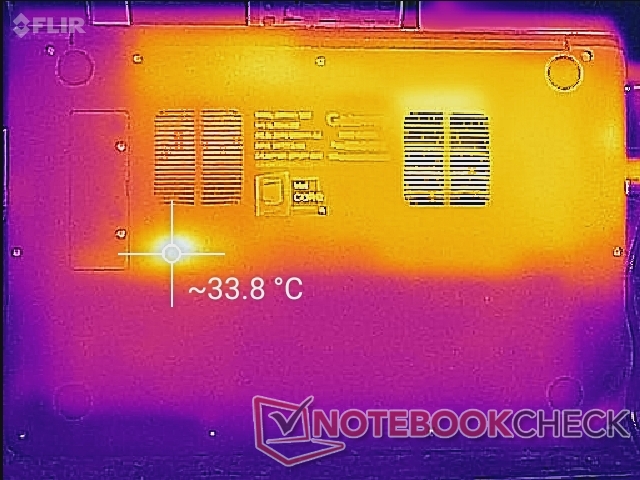
(-) The bottom heats up to a maximum of 47.6 °C / 118 F, compared to the average of 39.2 °C / 103 F
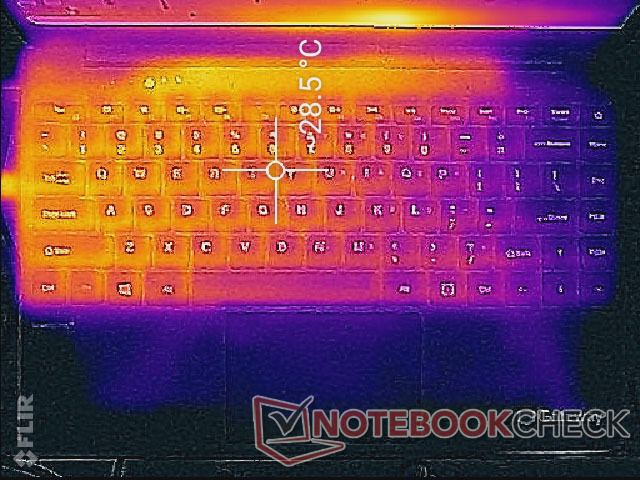
(+) In idle usage, the average temperature for the upper side is 26.7 °C / 80 F, compared to the device average of 30.8 °C / 87 F.
(+) The palmrests and touchpad are cooler than skin temperature with a maximum of 25 °C / 77 F and are therefore cool to the touch.
(+) The average temperature of the palmrest area of similar devices was 28.2 °C / 82.8 F (+3.2 °C / 5.8 F).
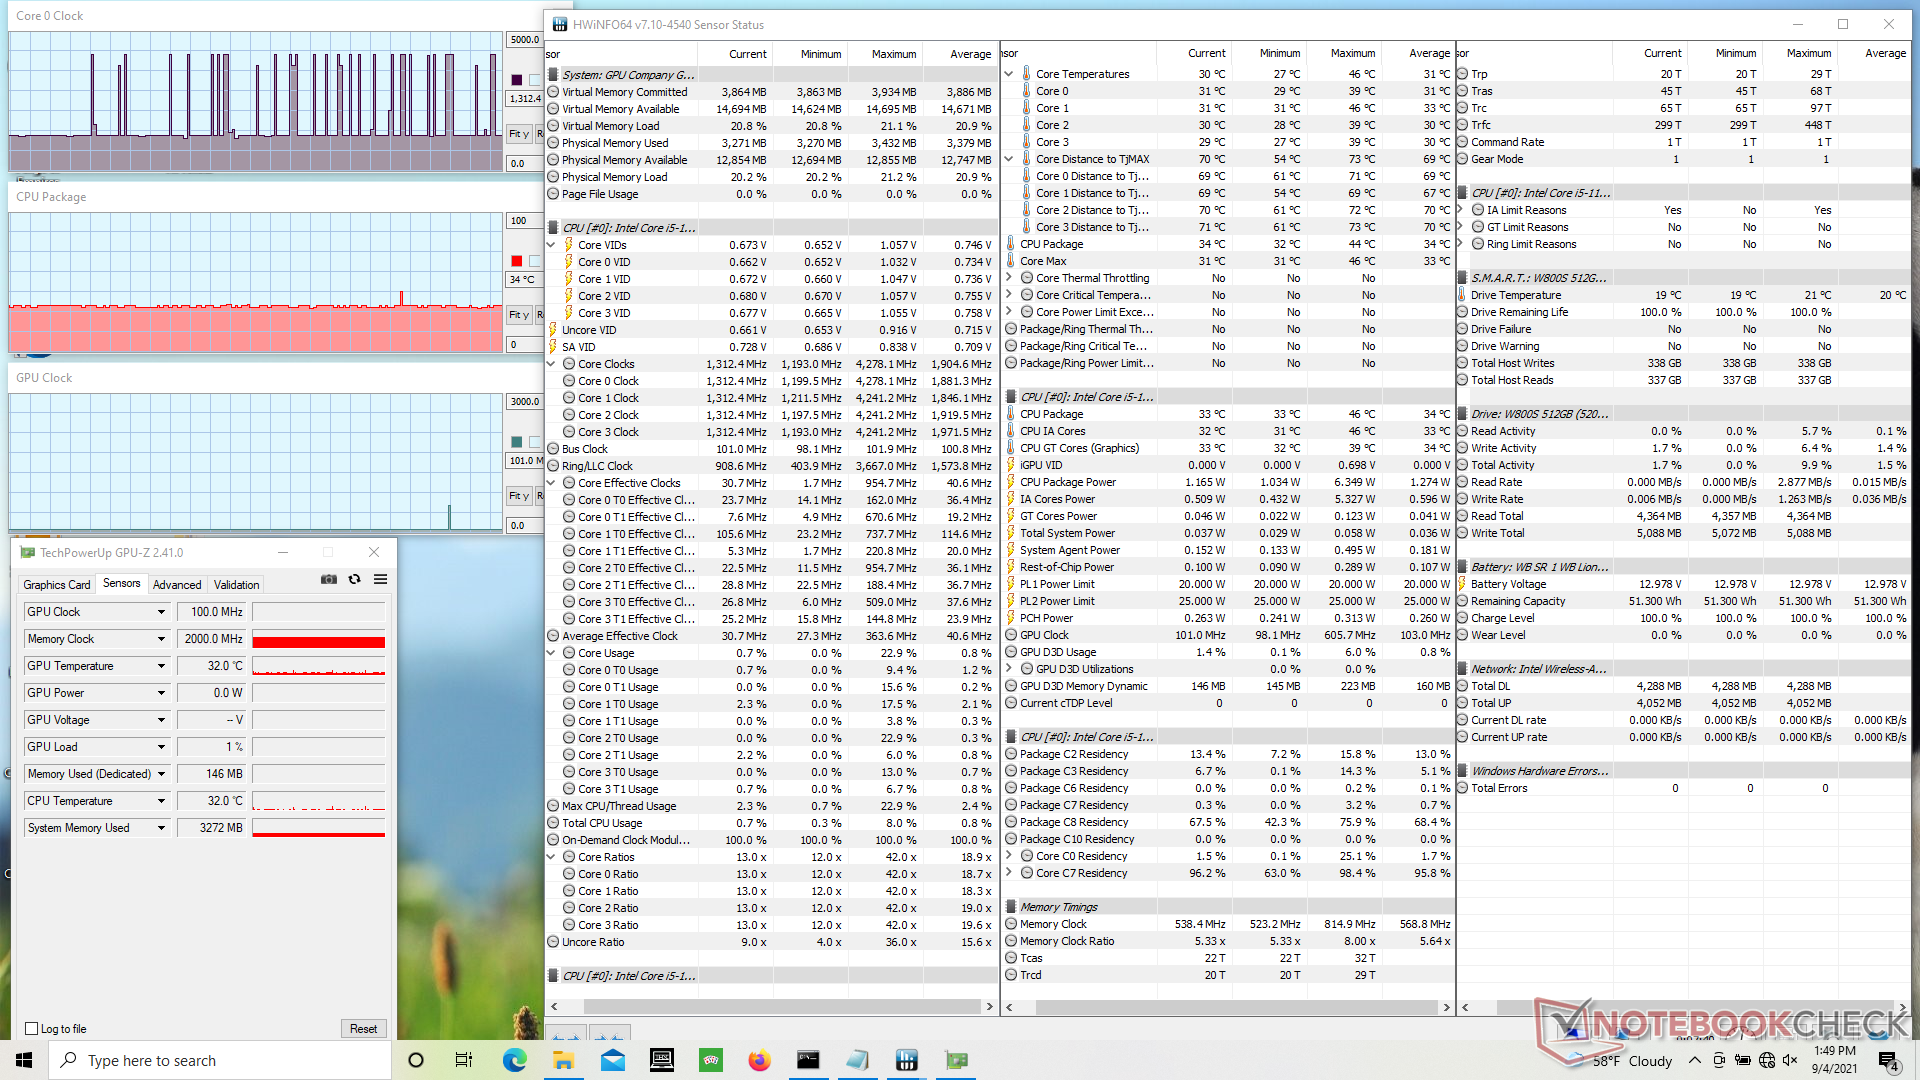
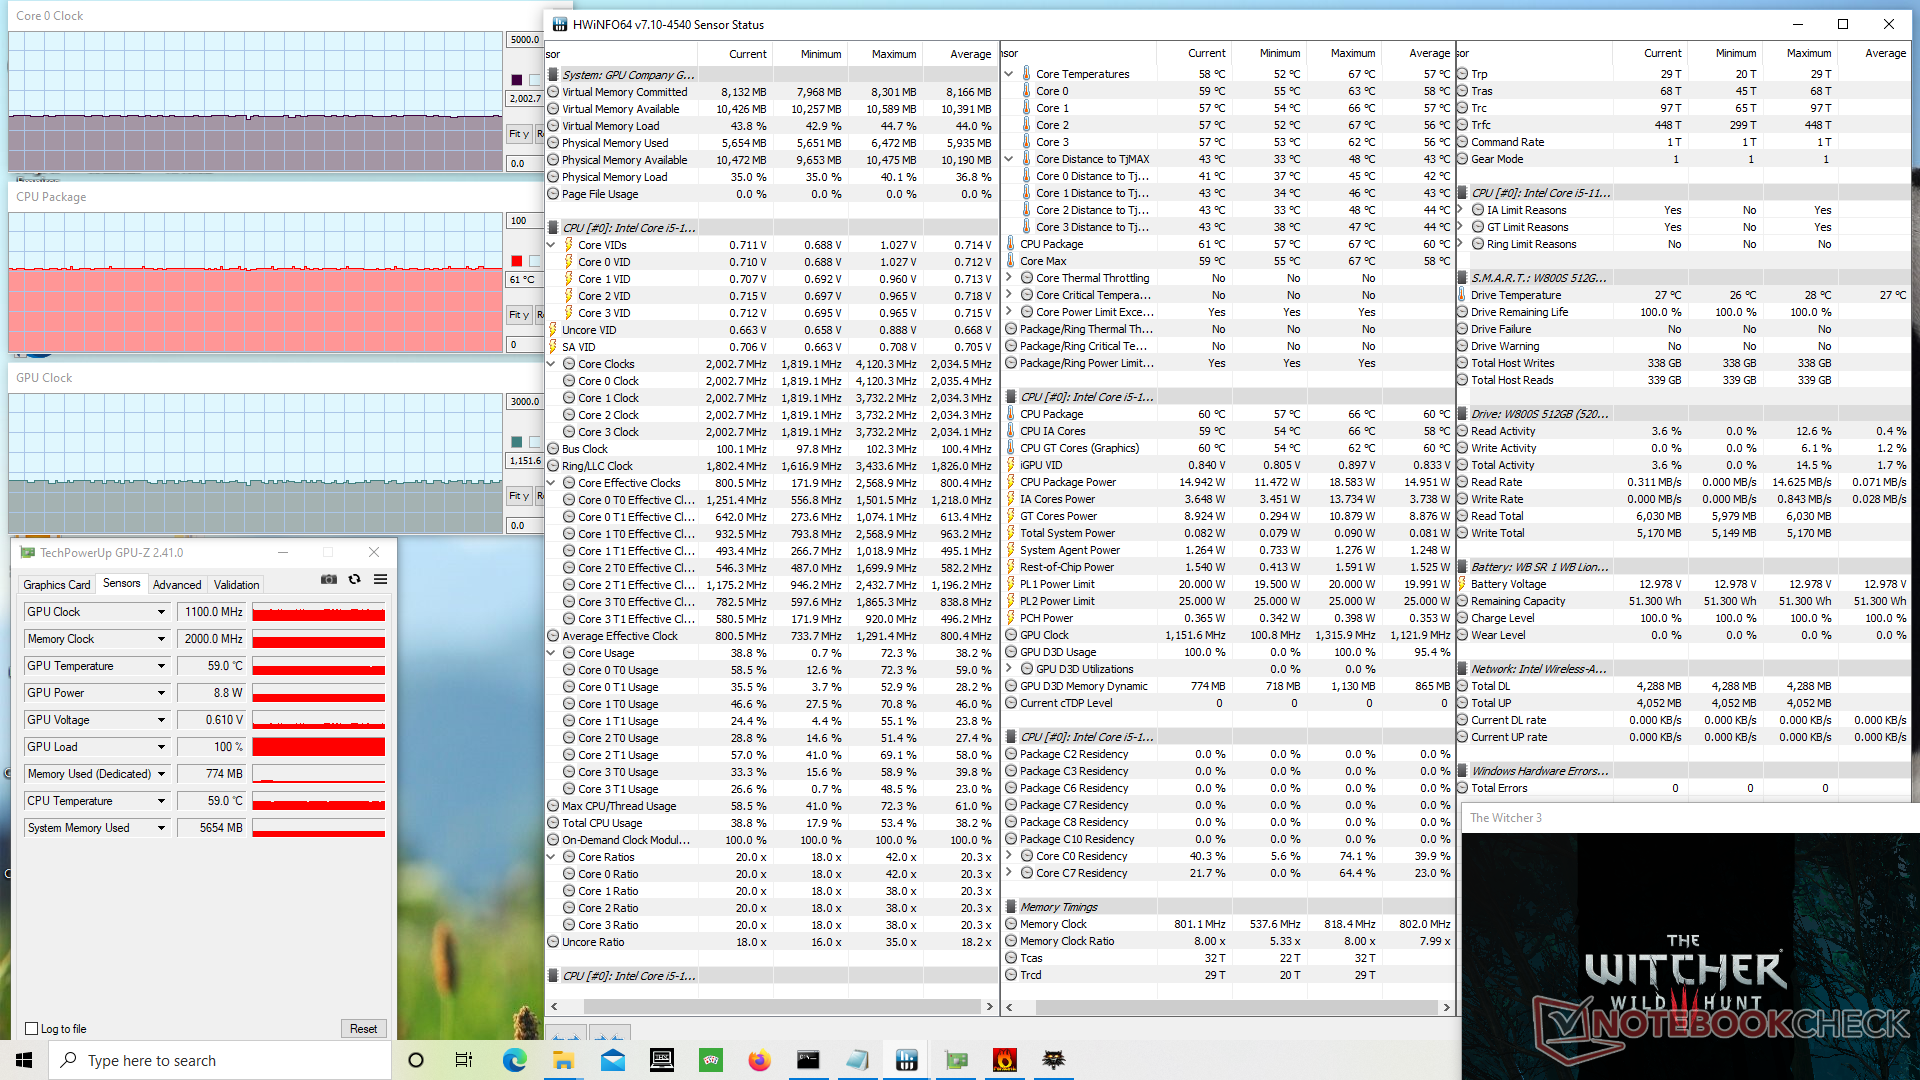
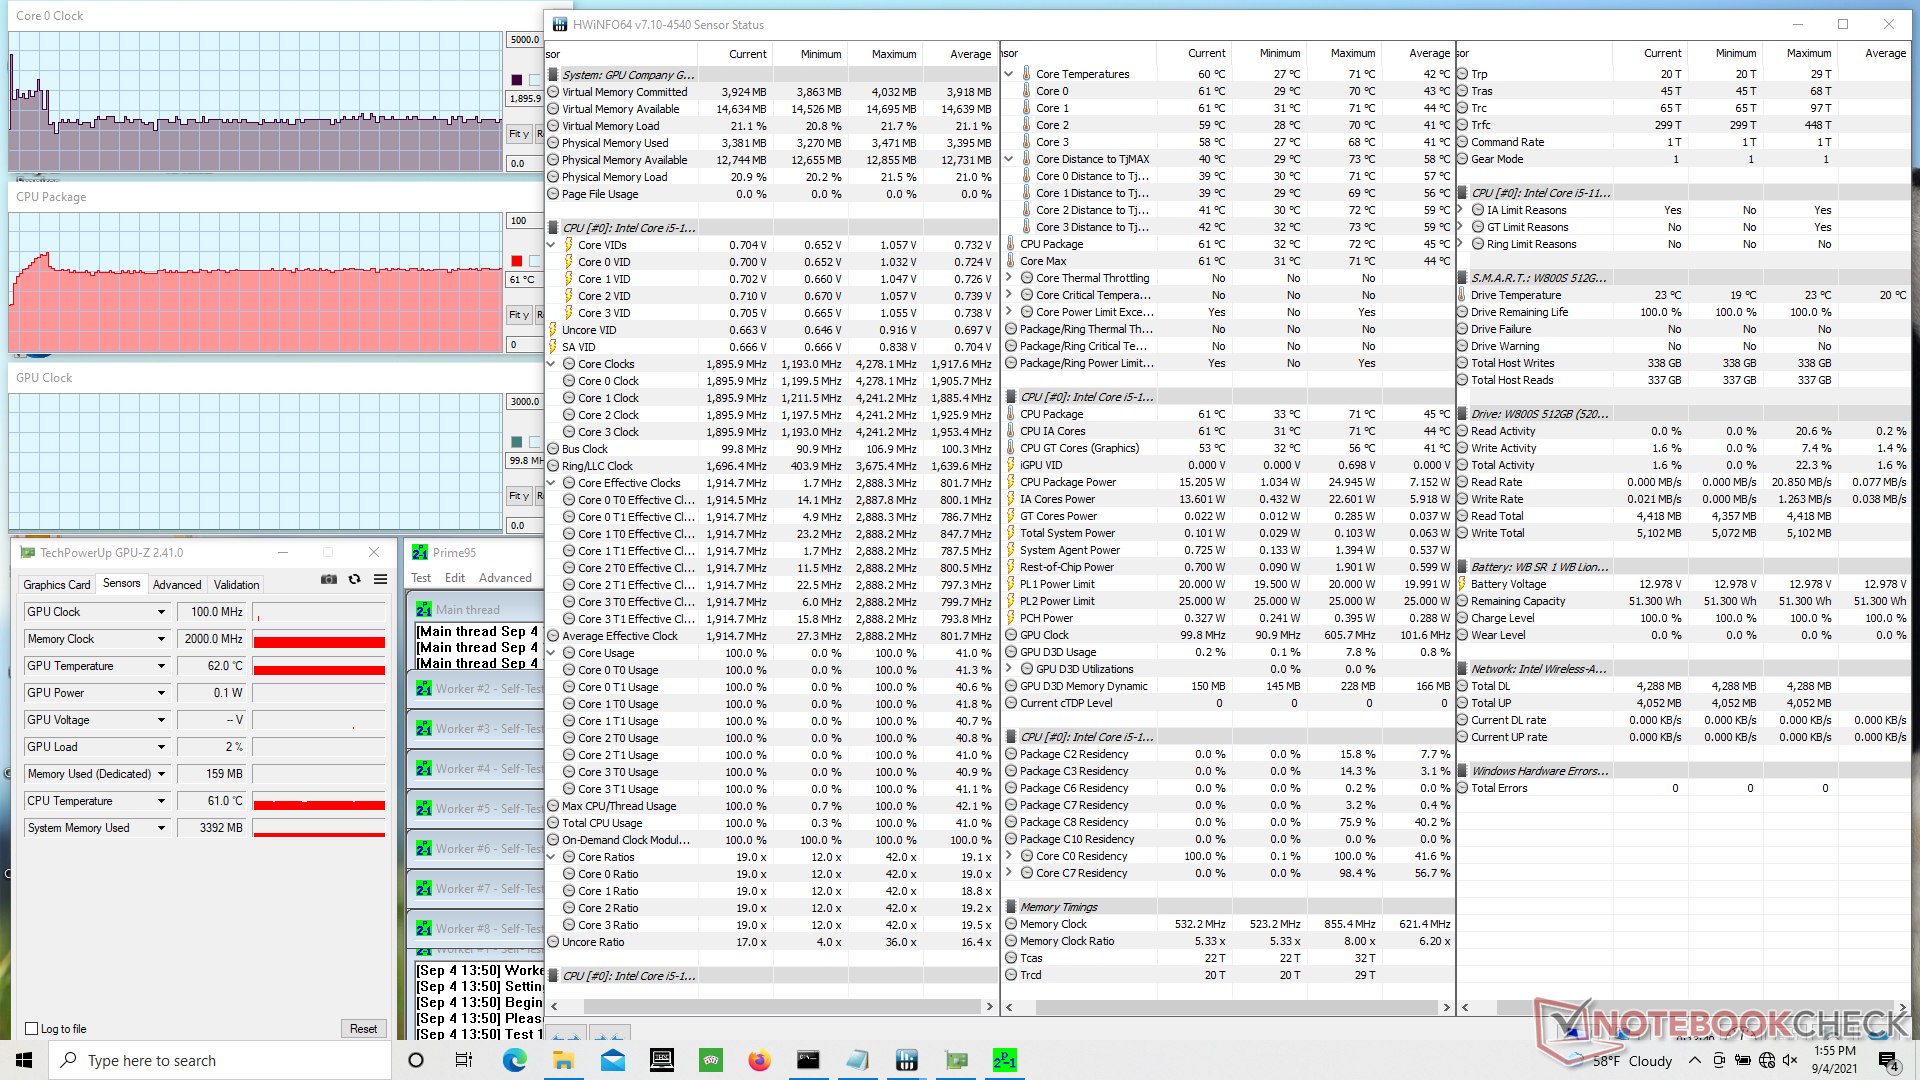
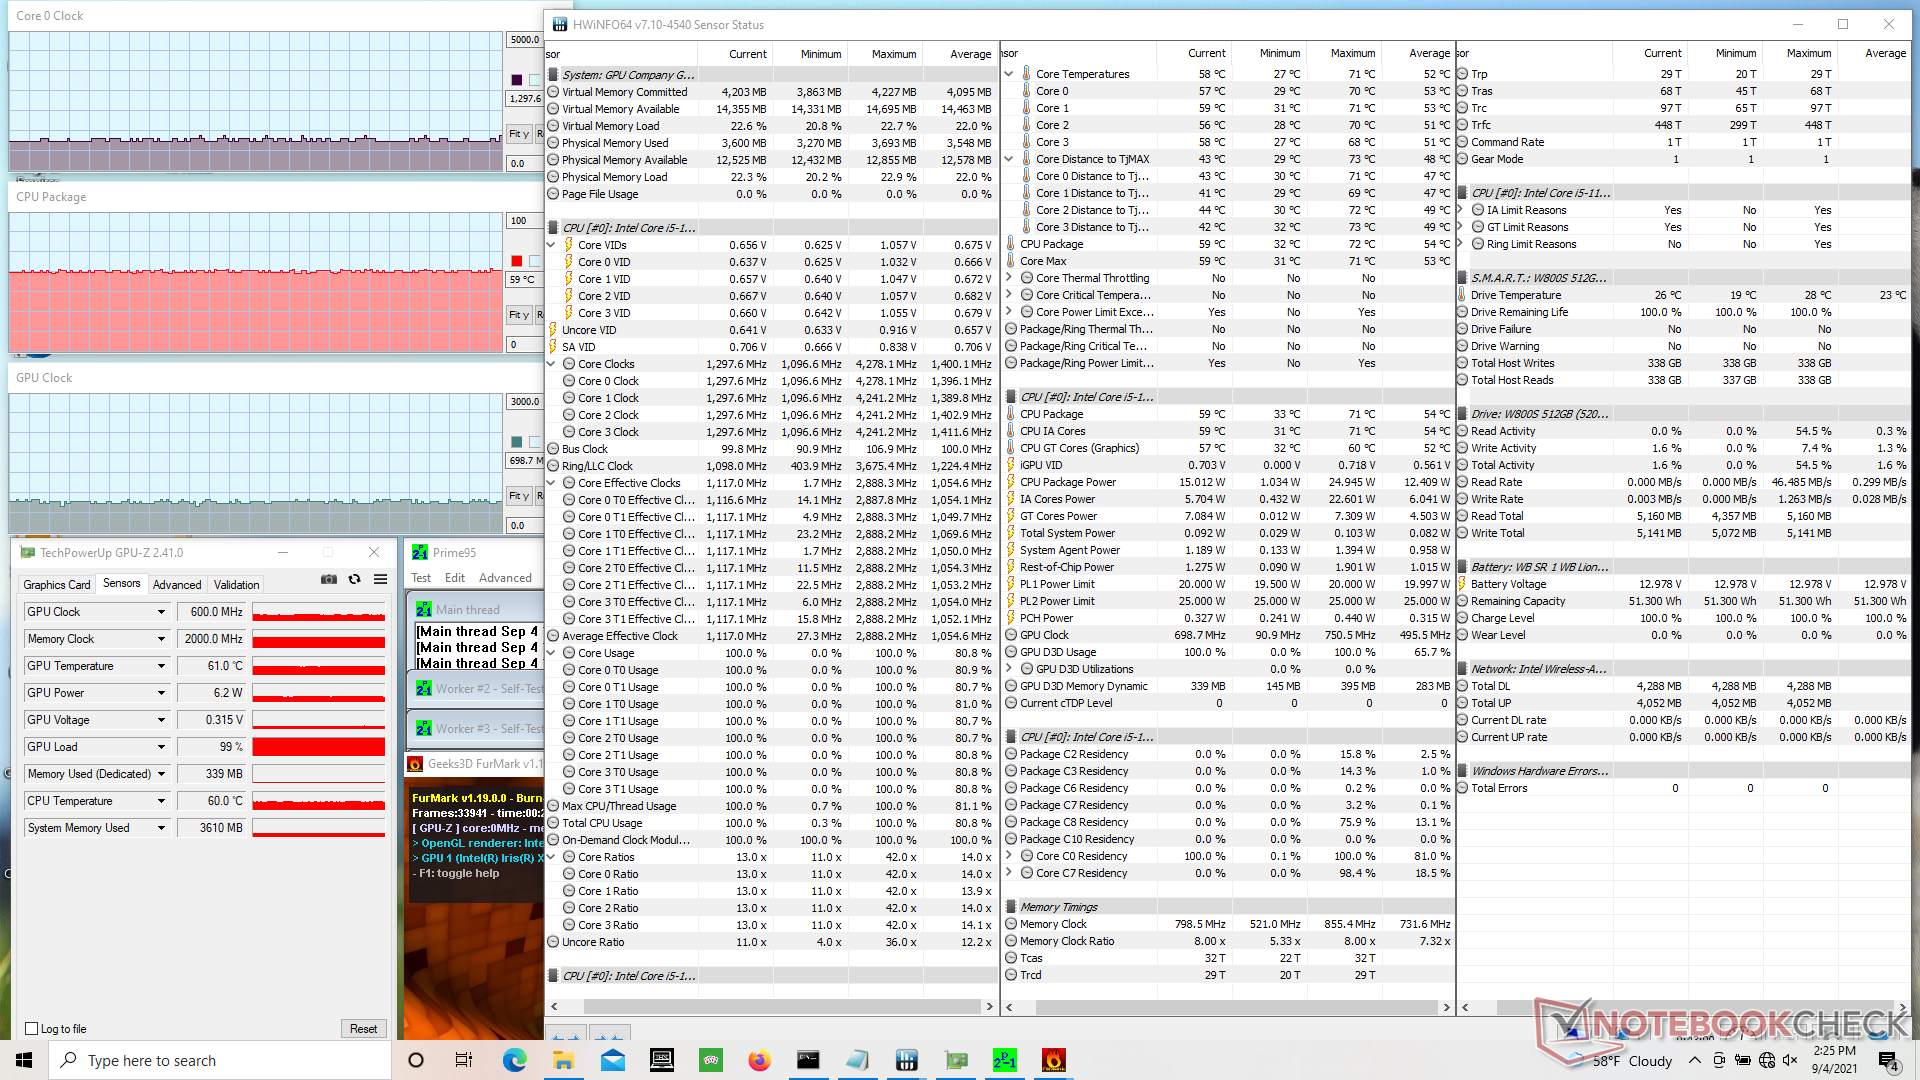
Stress Test
When running Prime95 to stress the CPU, clock rates would boost to 2.7 GHz for the first 20 seconds or so until reaching a core temperature of 72 C. Clock rates would then fall to 1.9 GHz in order to maintain a cooler core temperature of 60 C. The base clock rate of the i5-1135G7 is higher at 2.4 GHz meaning the processor in our Gateway will run much slower than expected when under stressful conditions.
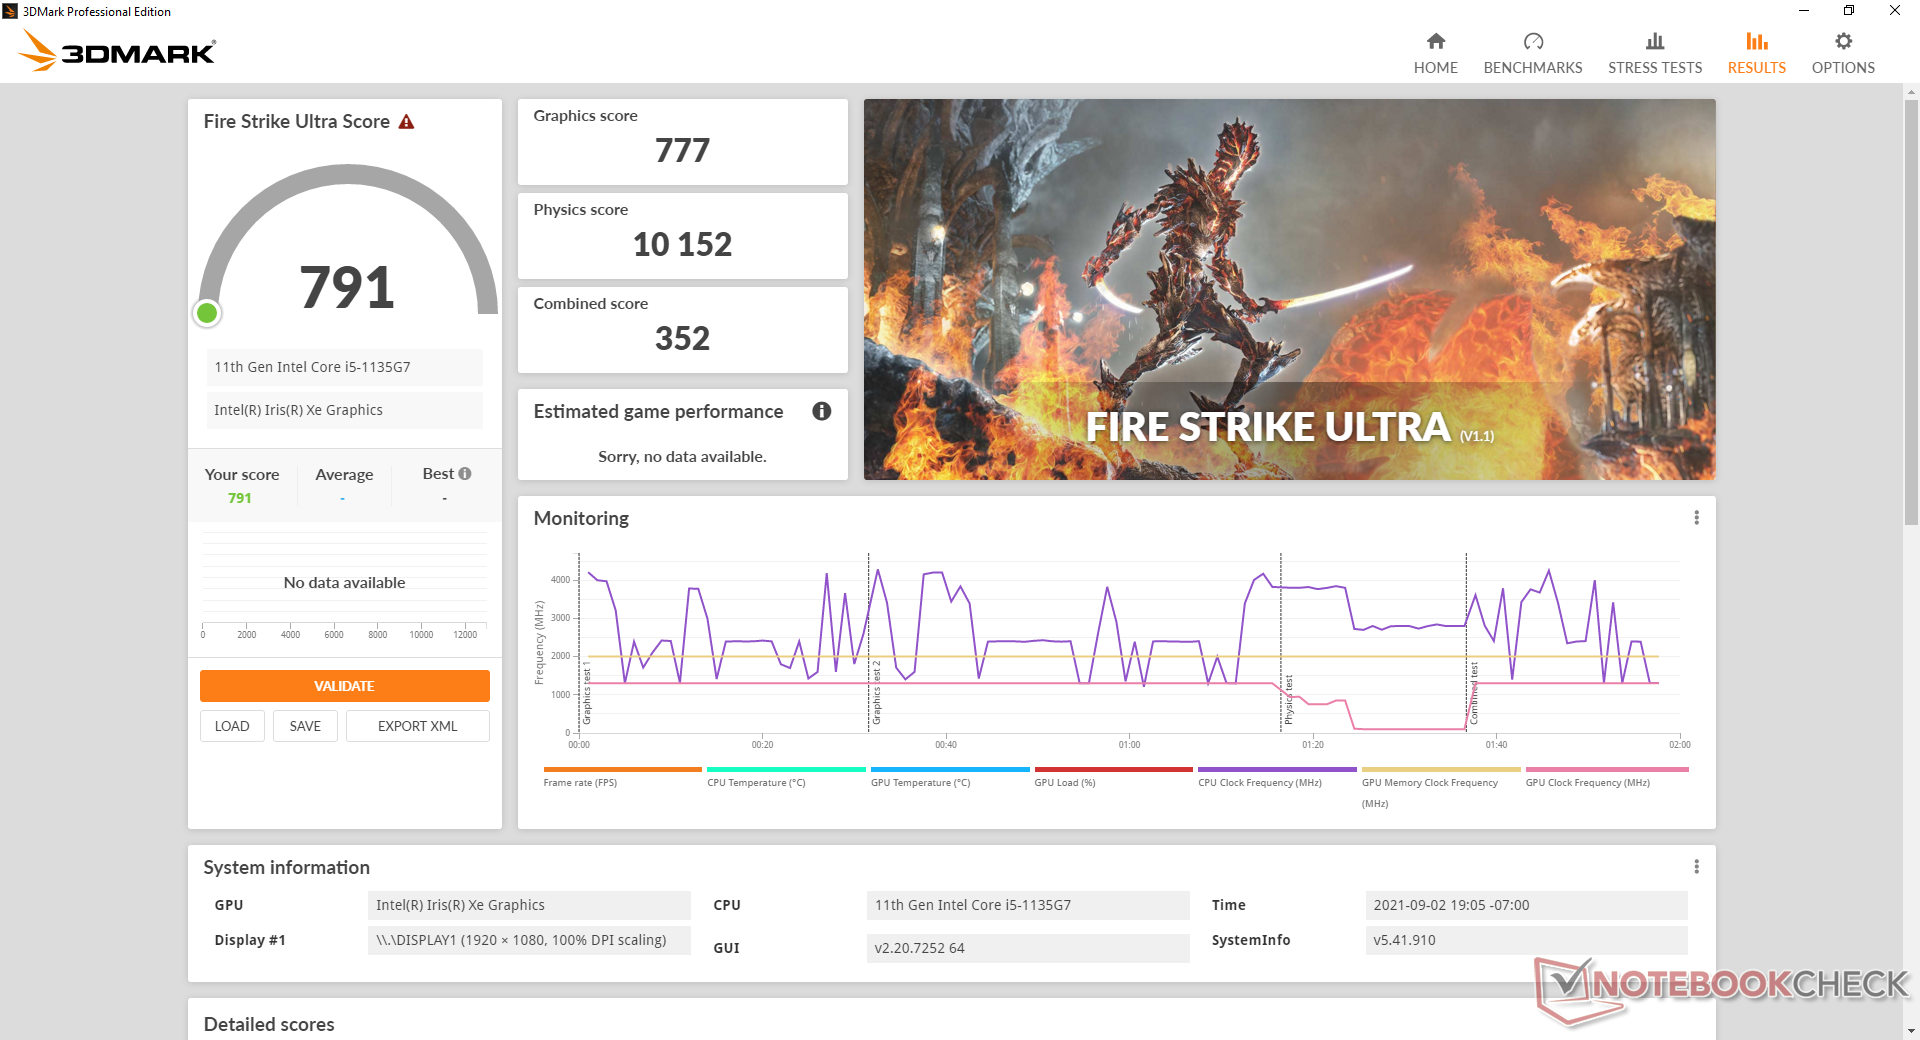
Running on battery power will not limit performance. A 3DMark 11 test on batteries would return Physics and Graphics scores of 8055 and 5123 points, respectively, compared to 7963 and 5332 points when on mains.
| CPU Clock (GHz) | GPU Clock (MHz) | Average CPU Temperature (°C) | |
| System Idle | -- | -- | 34 |
| Prime95 Stress | 1.8 - 1.9 | -- | 61 |
| Prime95 + FurMark Stress | 1.1 - 1.3 | 600 - 700 | 59 |
| Witcher 3 Stress | 2.0 | 1100 - 1151 | 61 |
Speakers

Gateway GWTN141-10GR audio analysis
(±) | speaker loudness is average but good (77.6 dB)
Bass 100 - 315 Hz
(-) | nearly no bass - on average 29.1% lower than median
(+) | bass is linear (5.7% delta to prev. frequency)
Mids 400 - 2000 Hz
(±) | higher mids - on average 6.7% higher than median
(±) | linearity of mids is average (8.3% delta to prev. frequency)
Highs 2 - 16 kHz
(+) | balanced highs - only 3.2% away from median
(+) | highs are linear (5.8% delta to prev. frequency)
Overall 100 - 16.000 Hz
(±) | linearity of overall sound is average (24.9% difference to median)
Compared to same class
» 84% of all tested devices in this class were better, 4% similar, 12% worse
» The best had a delta of 5%, average was 18%, worst was 53%
Compared to all devices tested
» 76% of all tested devices were better, 5% similar, 19% worse
» The best had a delta of 4%, average was 24%, worst was 134%
Apple MacBook 12 (Early 2016) 1.1 GHz audio analysis
(+) | speakers can play relatively loud (83.6 dB)
Bass 100 - 315 Hz
(±) | reduced bass - on average 11.3% lower than median
(±) | linearity of bass is average (14.2% delta to prev. frequency)
Mids 400 - 2000 Hz
(+) | balanced mids - only 2.4% away from median
(+) | mids are linear (5.5% delta to prev. frequency)
Highs 2 - 16 kHz
(+) | balanced highs - only 2% away from median
(+) | highs are linear (4.5% delta to prev. frequency)
Overall 100 - 16.000 Hz
(+) | overall sound is linear (10.2% difference to median)
Compared to same class
» 7% of all tested devices in this class were better, 2% similar, 91% worse
» The best had a delta of 5%, average was 18%, worst was 53%
Compared to all devices tested
» 5% of all tested devices were better, 1% similar, 94% worse
» The best had a delta of 4%, average was 24%, worst was 134%
Energy Management
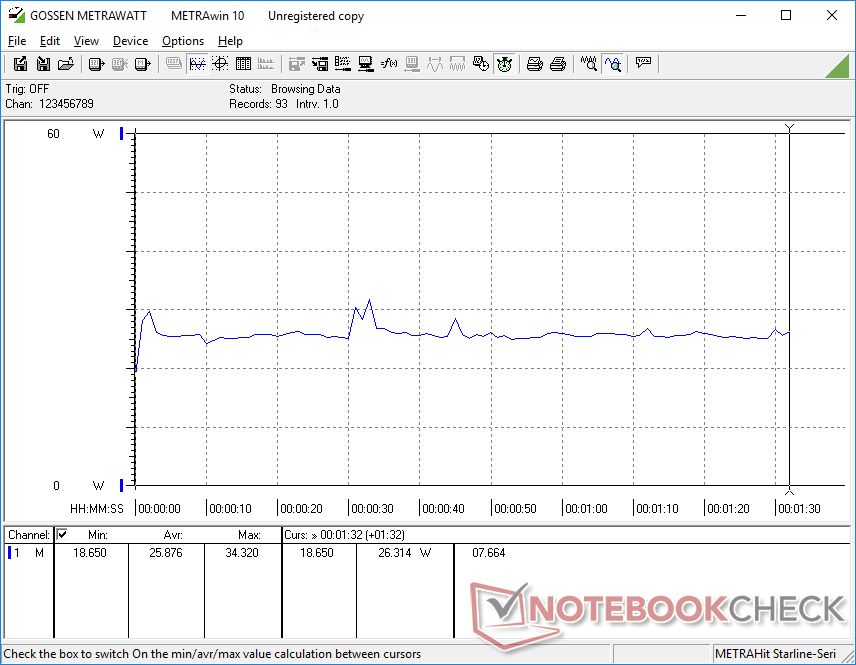
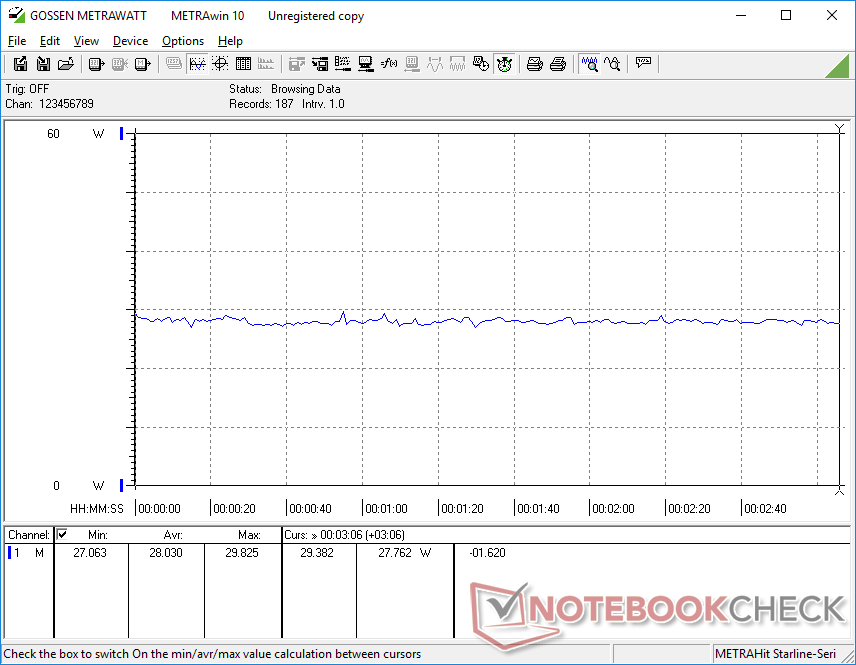
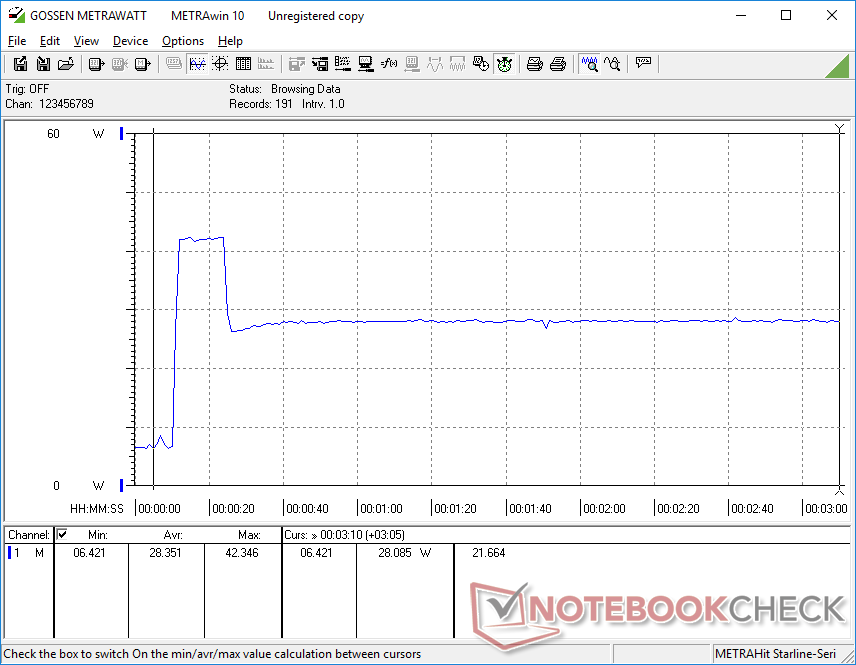
Power Consumption
The Gateway is more power efficient than many of its ULV peers likely due in part to its lower Turbo Boost potential and relatively dim display. Idling on desktop consumes between 3 W and 7 W depending on the brightness and power profile while gaming will only draw around 27 W compared to 45 W on the Xenia 14.
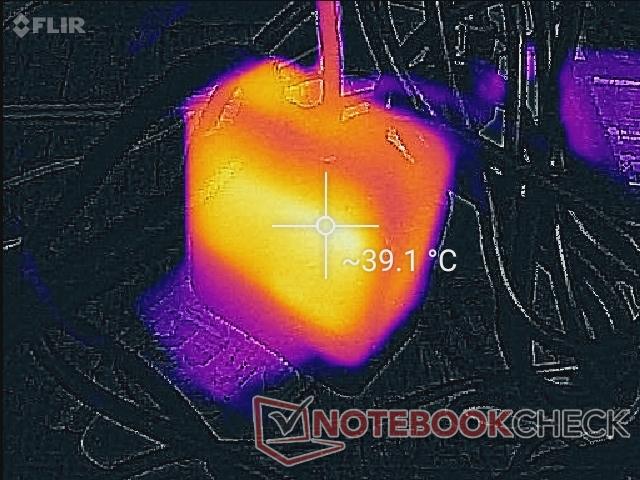
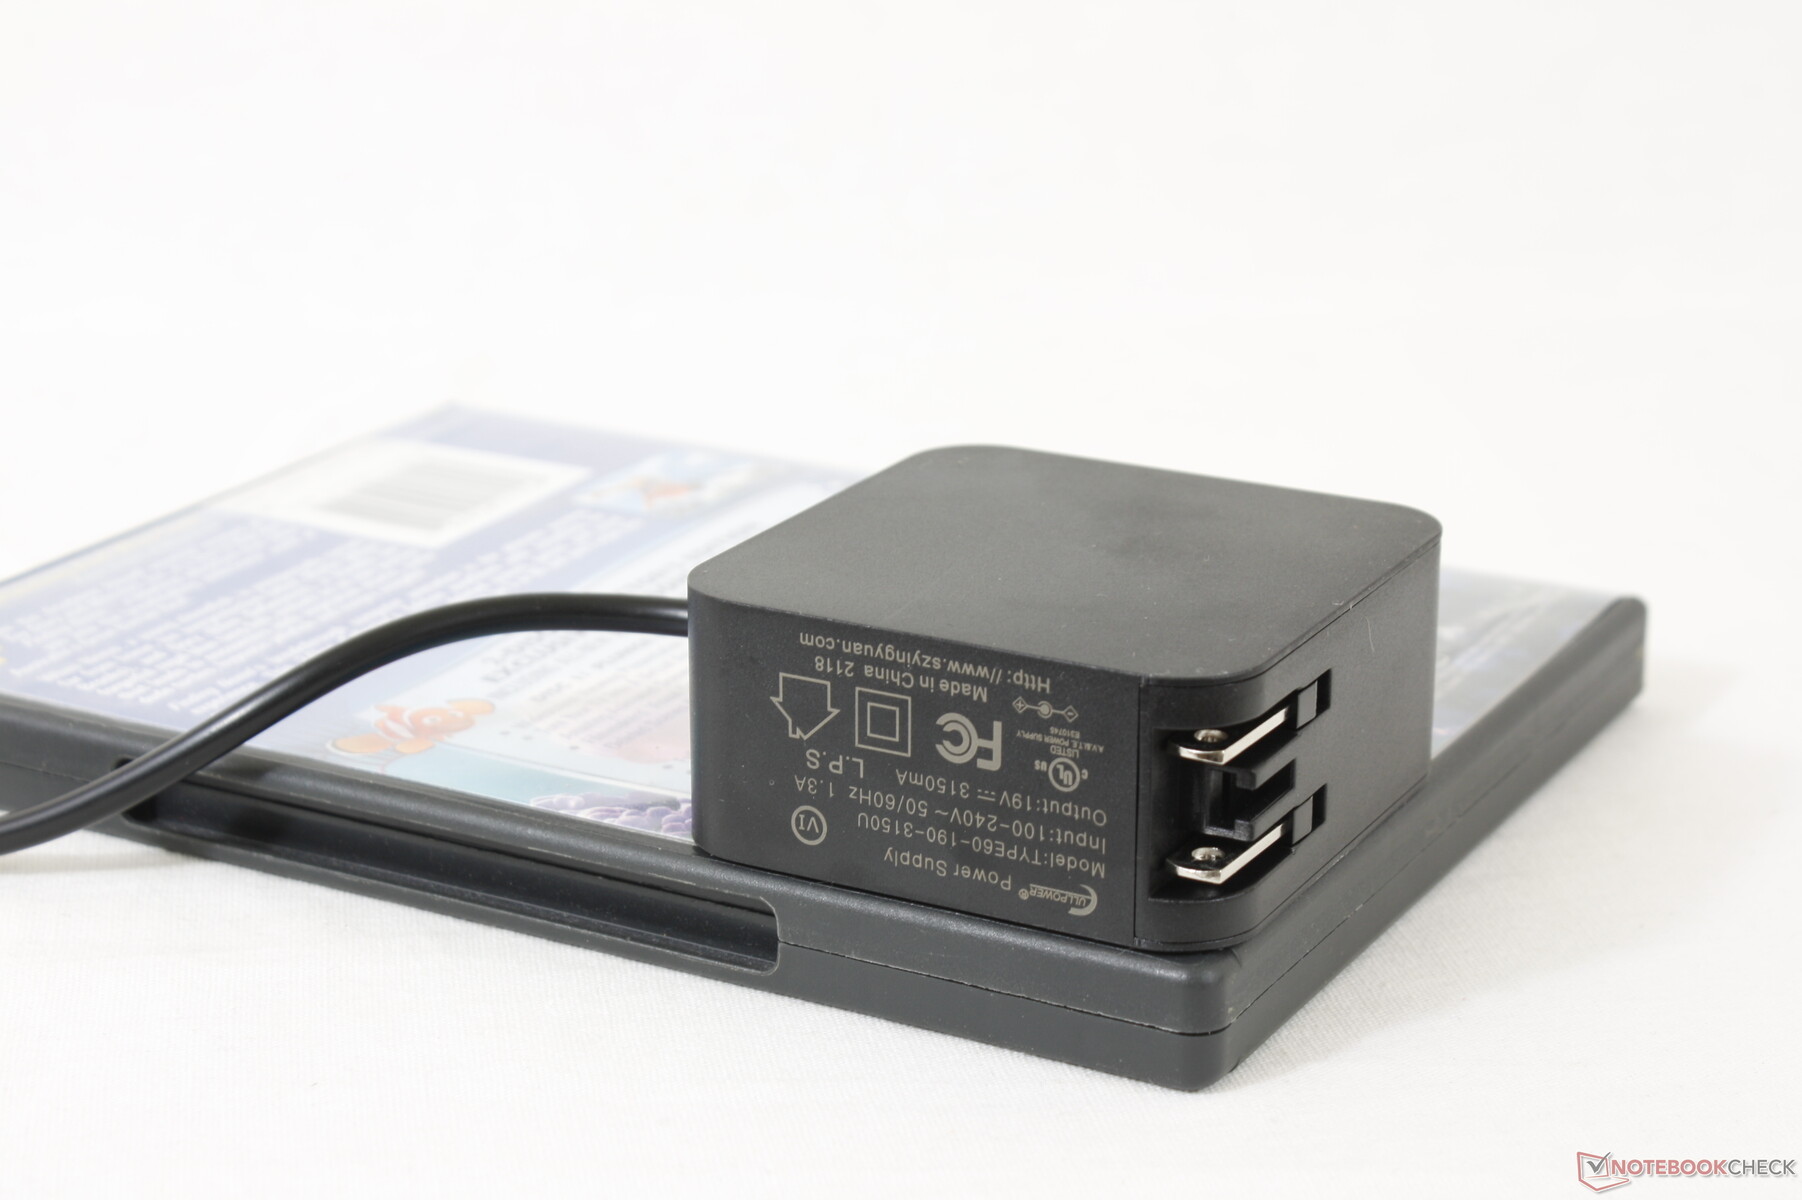
We're able to measure a temporary maximum draw of 42.4 W from the small (~6.6 x 6.6 x 2.9 cm) AC adapter when running extreme loads.
| Off / Standby | |
| Idle | |
| Load |
|
Key:
min: | |
| Gateway GWTN141-10GR i5-1135G7, Iris Xe G7 80EUs, W800S W800SHMQ 512GB SSD, IPS, 1920x1080, 14.1" | HP 14s-fq1357ng R5 5500U, Vega 7, Micron 2210 MTFDHBA512QFD, IPS, 1920x1080, 14" | Blackview AceBook 1 Celeron N4120, UHD Graphics 600, SCY C500 SNS1N3G12800D M.2 SATA, IPS, 1920x1080, 14" | ADATA XPG Xenia 14 i7-1165G7, Iris Xe G7 96EUs, ADATA XPG Gammix S50 Lite 512GB, IPS, 1920x1200, 14" | Chuwi CoreBook X i5-8259U, Iris Plus Graphics 655, Kingston RBUSNS8154P3512GJ, IPS, 2160x1440, 14" | Dell Inspiron 14 3493-4KWCF i7-1065G7, GeForce MX230, Toshiba KBG40ZNS512G NVMe, IPS, 1920x1080, 14" | |
|---|---|---|---|---|---|---|
| Power Consumption | -10% | 23% | -33% | -62% | -44% | |
| Idle Minimum * (Watt) | 3.2 | 4.2 -31% | 3.5 -9% | 2.9 9% | 6.2 -94% | 4.7 -47% |
| Idle Average * (Watt) | 5.2 | 6.3 -21% | 5.6 -8% | 5.5 -6% | 10.7 -106% | 6.6 -27% |
| Idle Maximum * (Watt) | 6.9 | 7 -1% | 6.2 10% | 5.9 14% | 12.5 -81% | 5.9 14% |
| Load Average * (Watt) | 25.9 | 27.7 -7% | 8.3 68% | 44.4 -71% | 40.5 -56% | 56 -116% |
| Witcher 3 ultra * (Watt) | 28 | 27.7 1% | 46.6 -66% | 39.4 -41% | ||
| Load Maximum * (Watt) | 42.4 | 42 1% | 19.6 54% | 76.4 -80% | 39.2 8% | 60.2 -42% |
* ... smaller is better
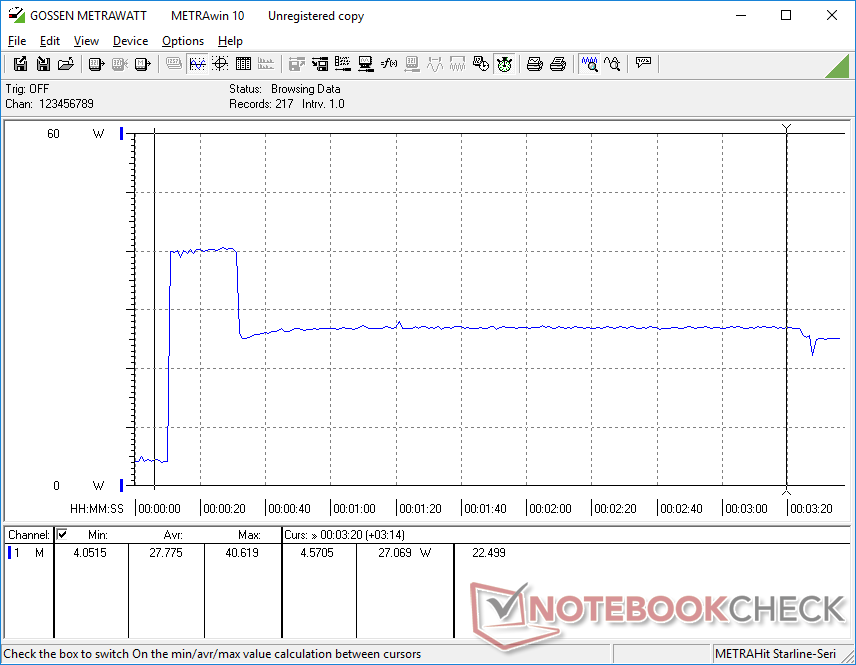
Power Consumption Witcher 3 / Stresstest
Battery Life
Battery capacity is decent at 51 Wh for a respectable WLAN runtime of over 9 hours. Charging from empty to full takes three full hours, however, which is two times longer than on most other laptops.
| Gateway GWTN141-10GR i5-1135G7, Iris Xe G7 80EUs, 51 Wh | HP 14s-fq1357ng R5 5500U, Vega 7, 41 Wh | Blackview AceBook 1 Celeron N4120, UHD Graphics 600, 45 Wh | ADATA XPG Xenia 14 i7-1165G7, Iris Xe G7 96EUs, 53 Wh | Chuwi CoreBook X i5-8259U, Iris Plus Graphics 655, 46.2 Wh | Dell Inspiron 14 3493-4KWCF i7-1065G7, GeForce MX230, 42 Wh | |
|---|---|---|---|---|---|---|
| Battery runtime | -7% | 3% | 9% | -26% | -29% | |
| WiFi v1.3 (h) | 9.1 | 8.5 -7% | 9.4 3% | 9.9 9% | 6.7 -26% | 6.5 -29% |
| Reader / Idle (h) | 11.3 | 13.8 | ||||
| Witcher 3 ultra (h) | 1.5 | |||||
| Load (h) | 1.6 |
Pros
Cons
Verdict — Surprisingly Quiet with Long Battery Life
The inexpensive Gateway GWTN141 excels at maximizing performance per dollar with lots of RAM and storage, super-quiet fan, and a long battery life. It can even house up to two M.2 SSDs which we weren't expecting from such a cheap system. However, the iffy reliability of the keyboard and USB-C port on our test unit means users should double-check for these potential issues immediately after purchasing.
Performance, ports, and battery life are better than expected considering the low asking price. You may want to hang on to that warranty in case if you run into any problems with the keyboard or USB ports, however.
The dim display, narrow color space, lack of keyboard lighting, and relatively heavy weight are drawbacks that users will have to live with in this particular price range. The HP 14s and Lenovo IdeaPad 5 are potential alternatives, but the former is more difficult to service than our Gateway while the latter is noticeably more expensive.
Price and availability
Our exact Gateway configuration can be found on Walmart for $499 USD.
Gateway GWTN141-10GR
- 09/06/2021 v7 (old)
Allen Ngo
Price comparison
