KUU LeBook 12.6 2-in-1 convertible review: A cheaper Microsoft Surface Pro alternative
(September 28, 2021 update: The LeBook 12.6 is now shipping on Amazon starting at $799 USD)
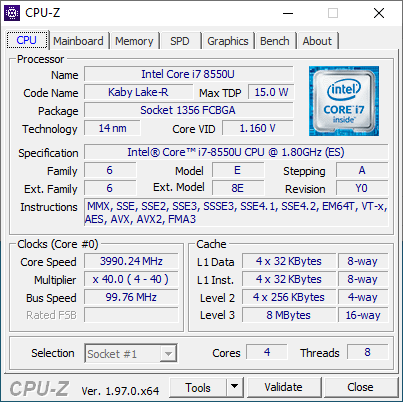
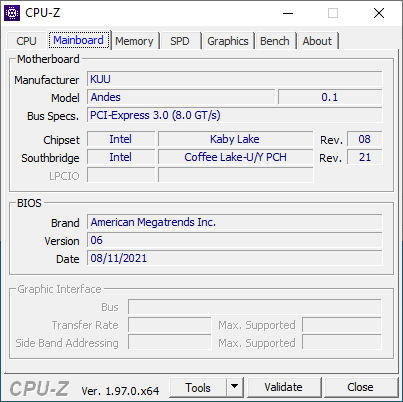
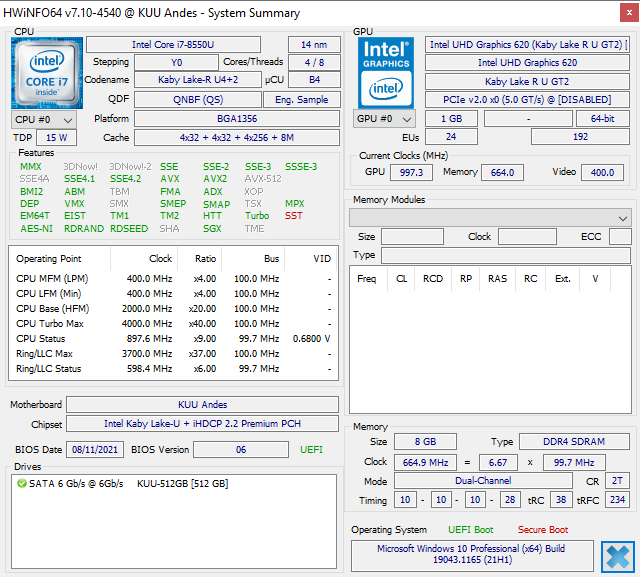
The KUU LeBook 12.6 is a Windows 10 detachable in the same vein as the Surface Pro series. Its design and features are clearly inspired by the successful Microsoft tablets with certain changes and cut corners in order to keep prices significantly lower. One of these changes is the use of an older Intel 8th gen Core U-series CPU instead of the latest 11th gen versions currently found on most PCs in the market today. This review will explore all the other differences users can expect if purchasing the cheaper LeBook instead of a more traditional Surface Pro.
Competitors to the LeBook include other Windows 10 tablets or detachables like the Microsoft Surface, Lenovo ThinkPad X12, or Dell Latitude 12 7210 2-in-1 all of which retail for higher prices. However, the LeBook is unique with its slightly larger 3:2 12.6-inch display instead of the usual 12.3-inch or 12.5-inch screens. The manufacturer has yet to finalize the price of the LeBook as it is not yet widely available at the time of publishing.
potential competitors in comparison
Rating | Date | Model | Weight | Height | Size | Resolution | Price |
|---|---|---|---|---|---|---|---|
| 75.3 % v7 (old) | 09 / 2021 | Kuu LeBook 12.6 Core i7-8550U i5-8550U, UHD Graphics 620 | 859 g | 9.5 mm | 12.60" | 2160x1440 | |
| 88.5 % v7 (old) | 04 / 2021 | Lenovo ThinkPad X12 20UVS03G00 i7-1160G7, Iris Xe G7 96EUs | 1.1 kg | 14.5 mm | 12.30" | 1920x1280 | |
| 88.5 % v7 (old) | 03 / 2021 | Microsoft Surface Pro 7 Plus i5-1135G7, Iris Xe G7 80EUs | 796 g | 8.5 mm | 12.30" | 2736x1824 | |
| 89.5 % v7 (old) | 03 / 2021 | Dell Latitude 12 7210 2-in-1 i7-10610U, UHD Graphics 620 | 850 g | 9.35 mm | 12.30" | 1920x1280 | |
| 84.6 % v7 (old) | 10 / 2020 | Microsoft Surface Laptop Go Core i5 i5-1035G1, UHD Graphics G1 (Ice Lake 32 EU) | 1.1 kg | 15.69 mm | 12.40" | 1536x1024 | |
| 77.1 % v6 (old) | 01 / 2019 | NuVision Encite Book 12 Plus Celeron N3350, HD Graphics 500 | 1 kg | 15 mm | 12.50" | 2560x1440 |
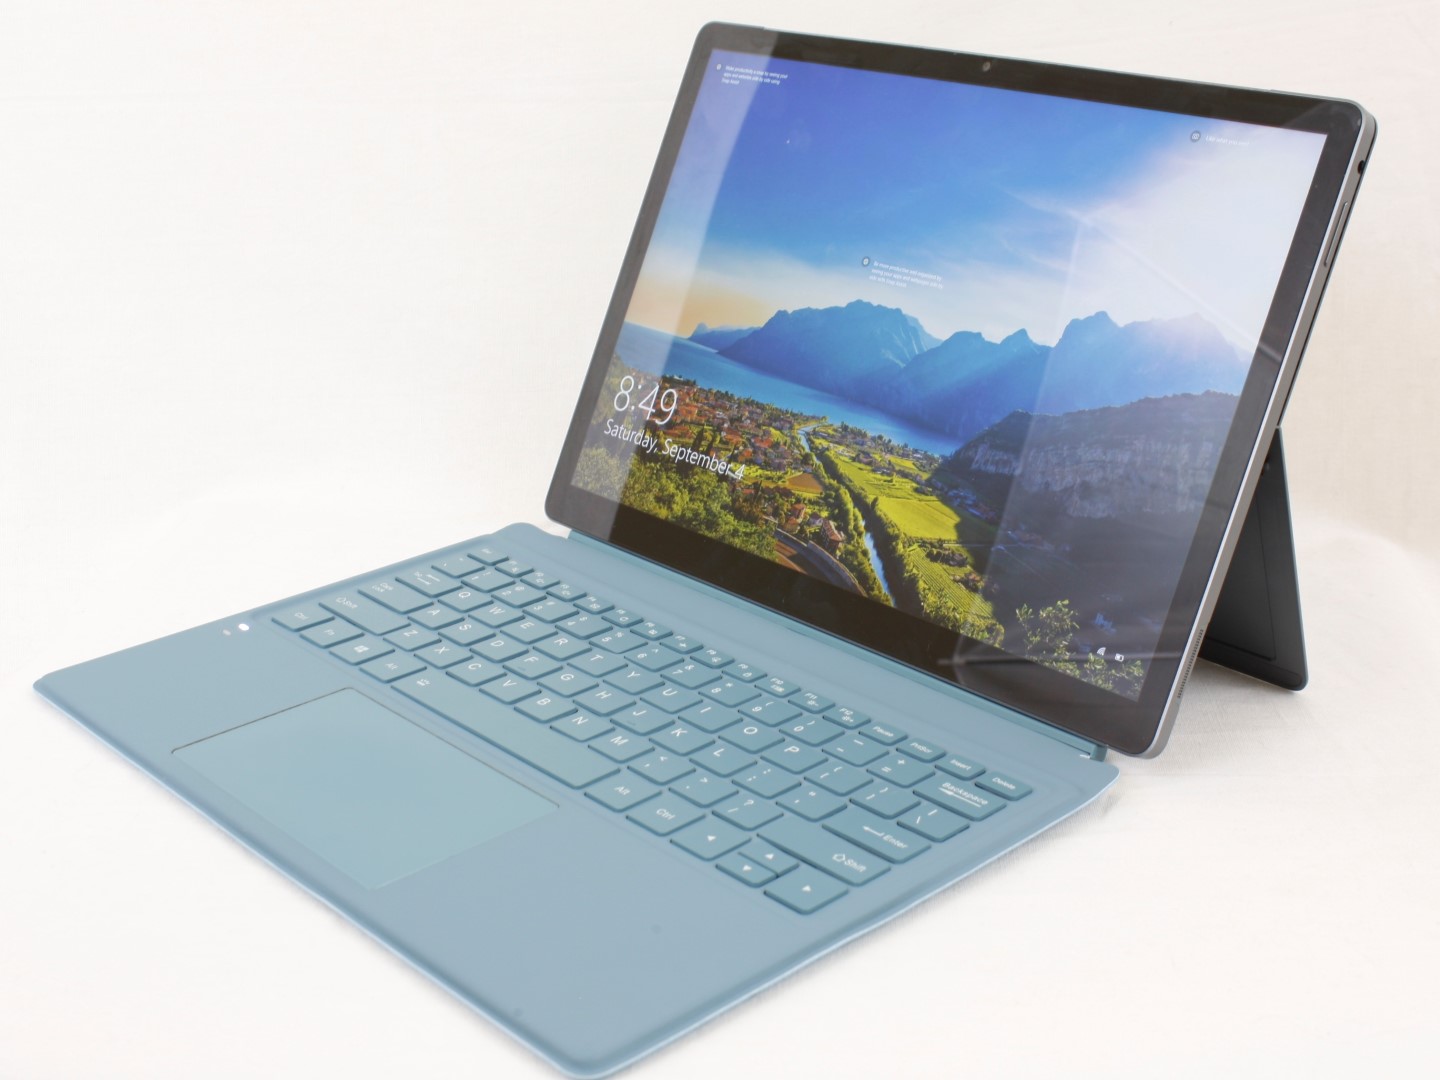
Case
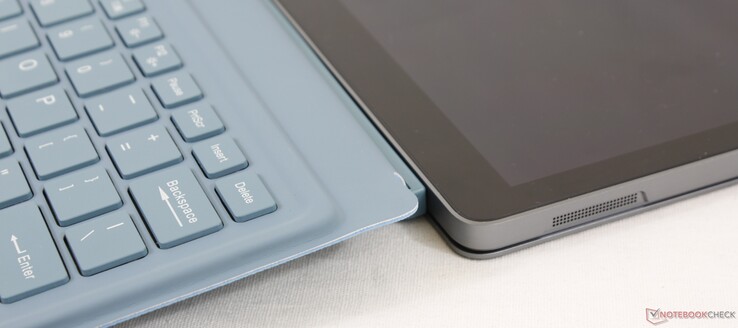
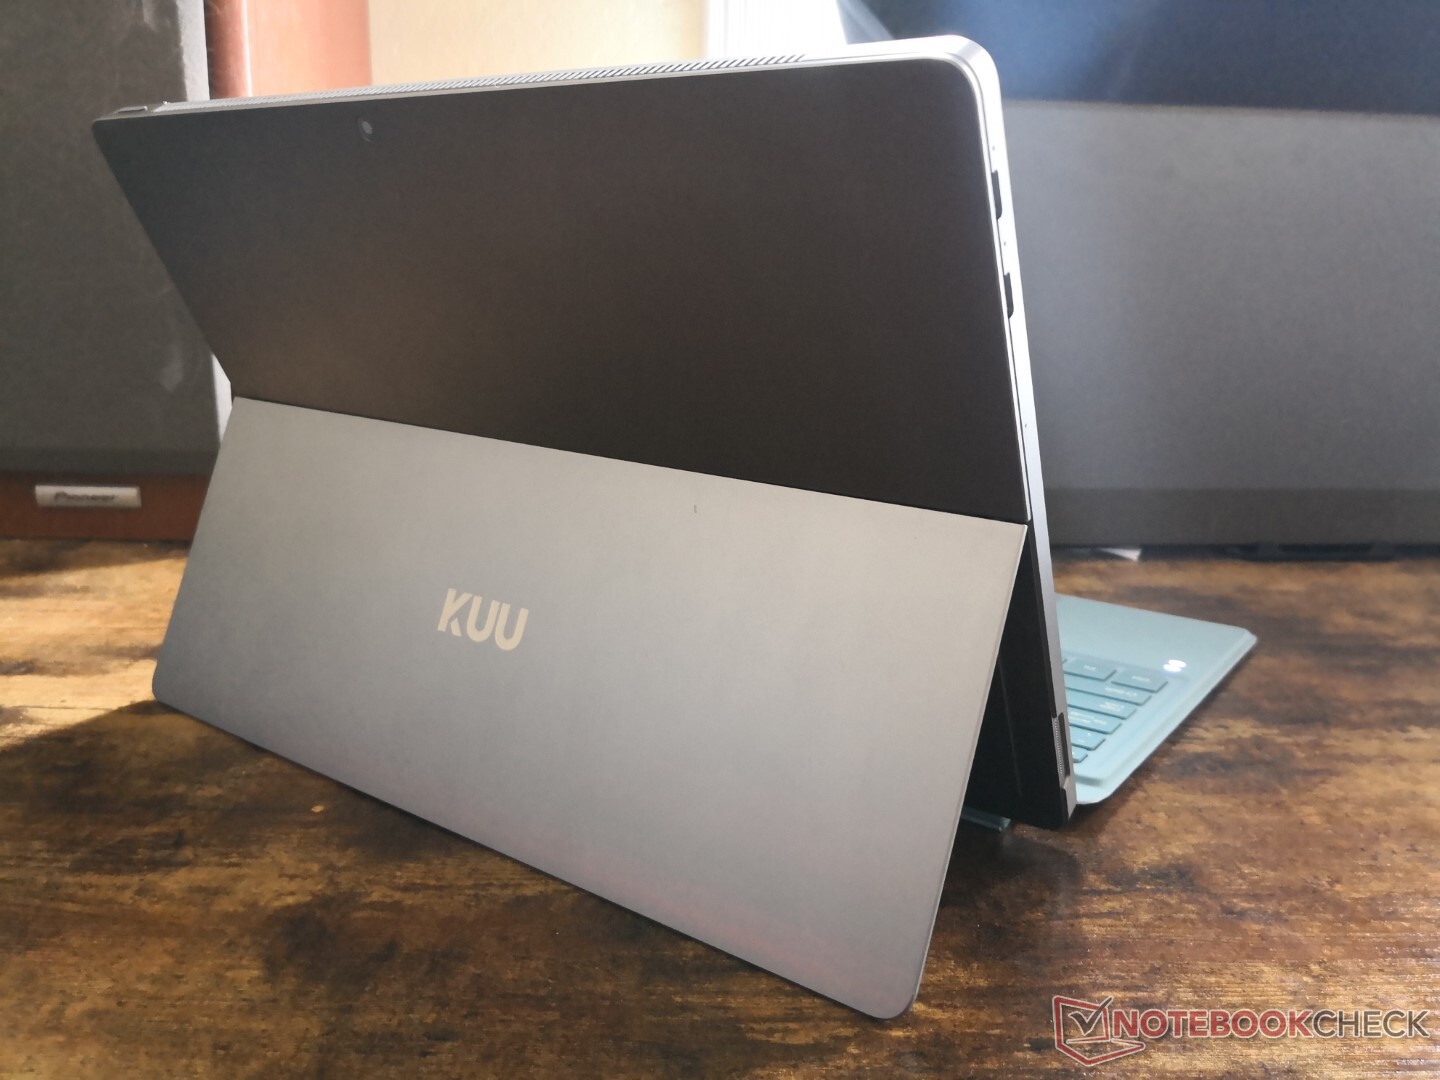
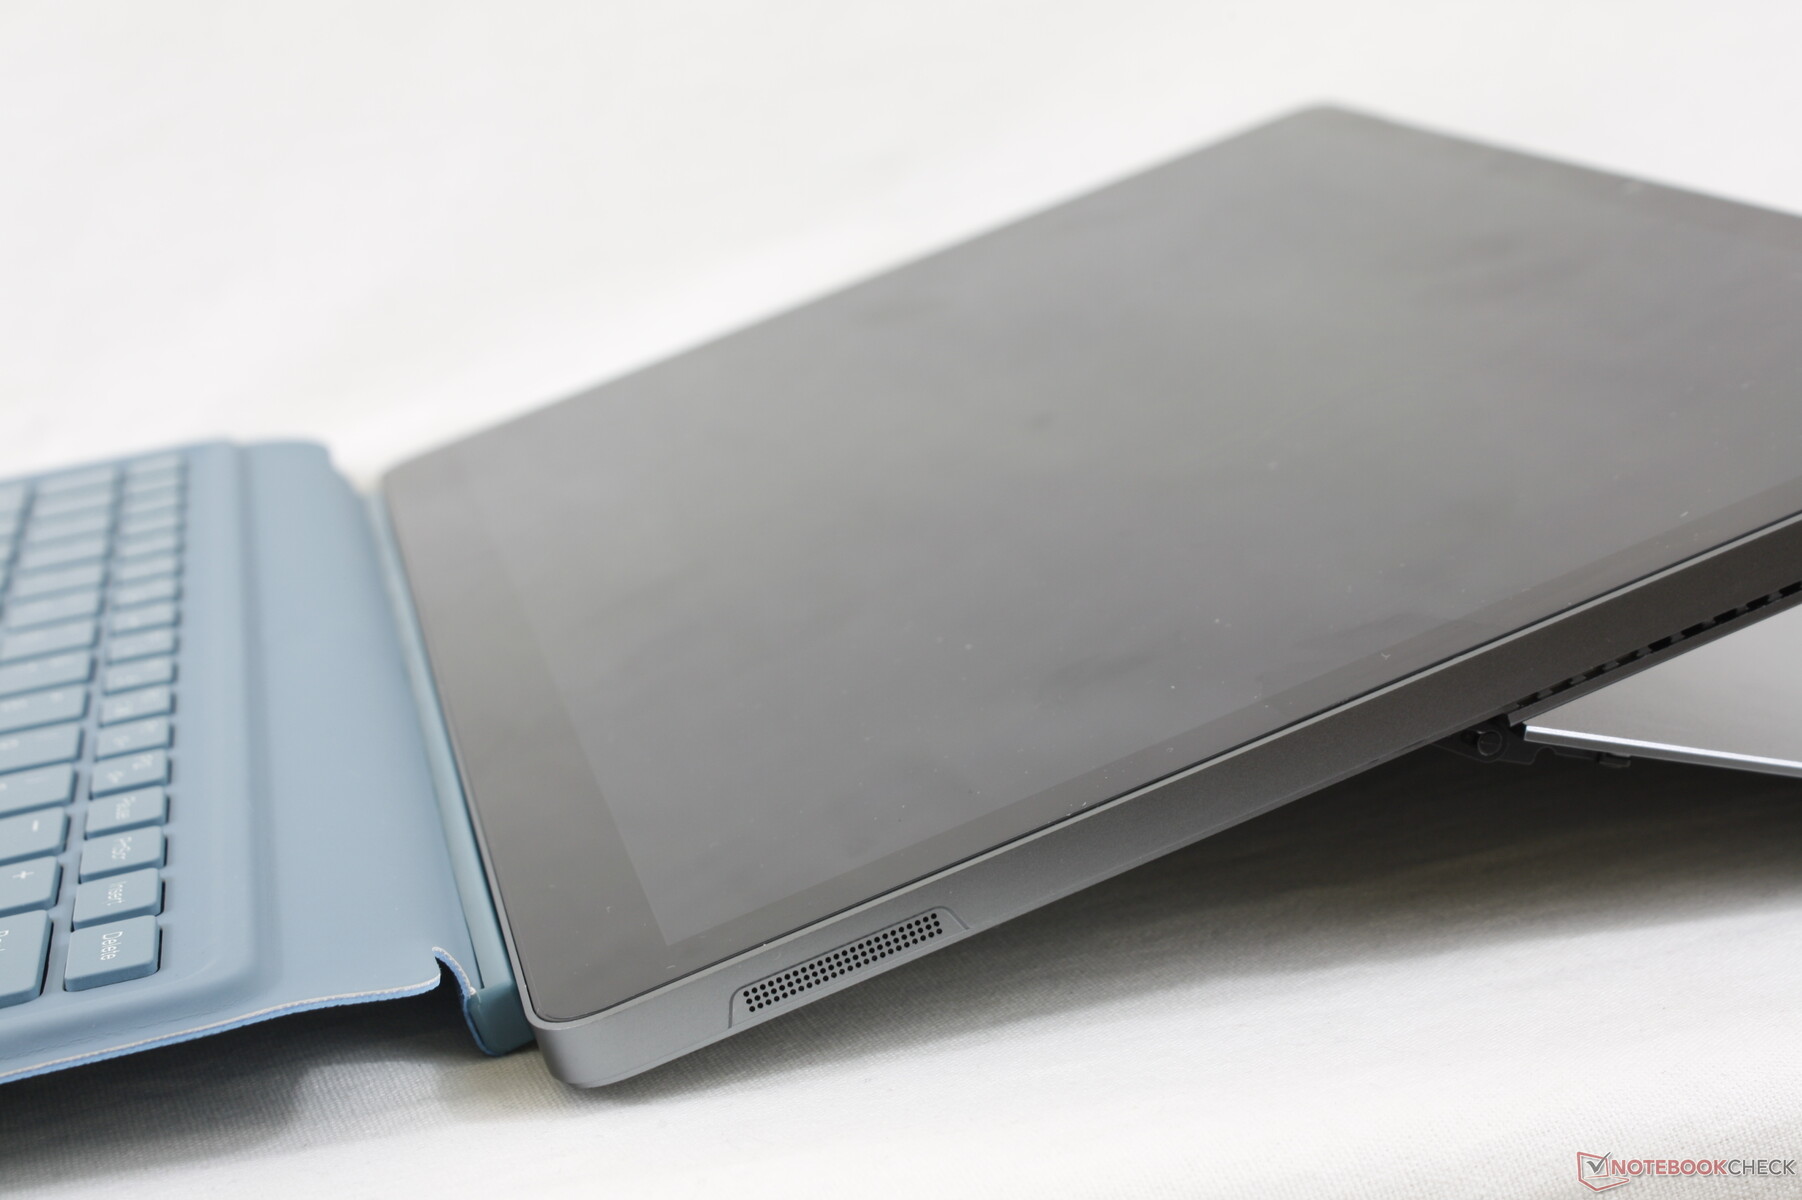
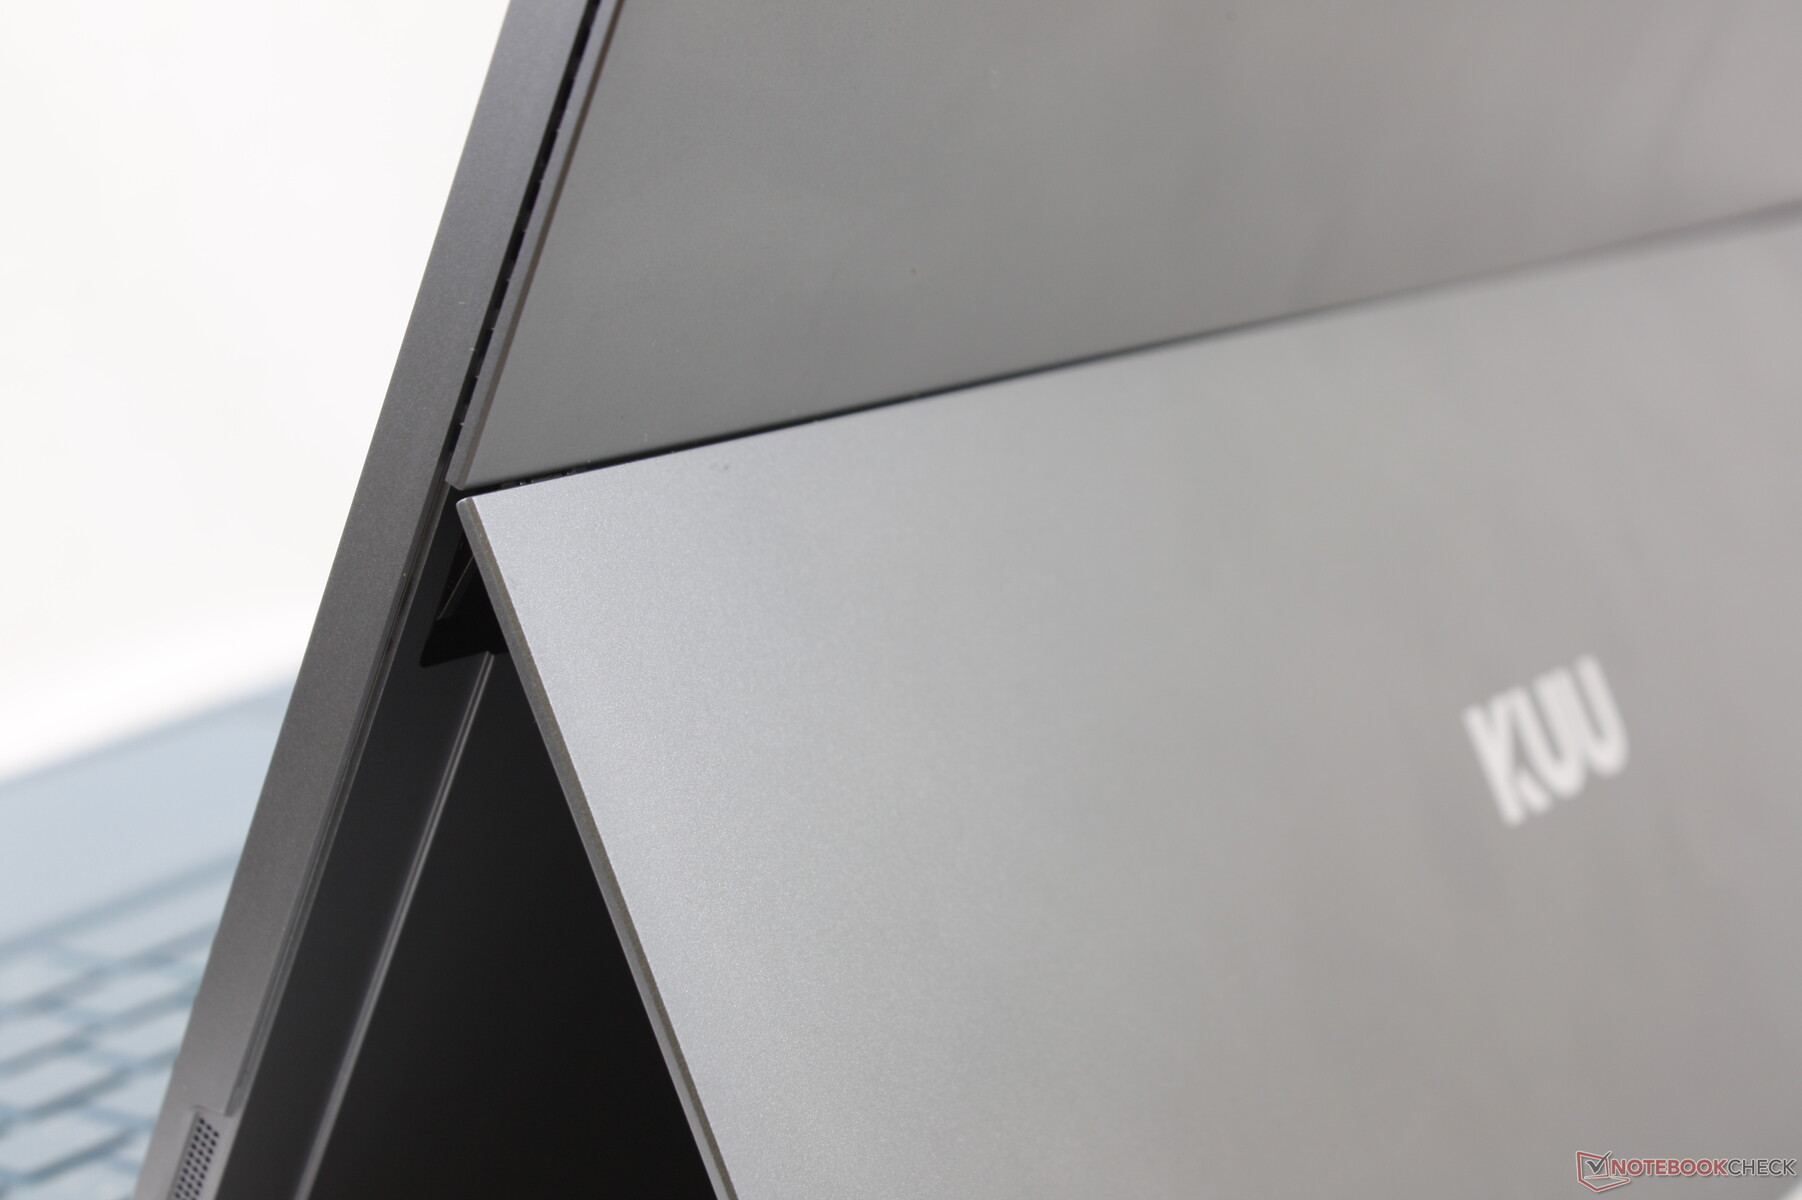
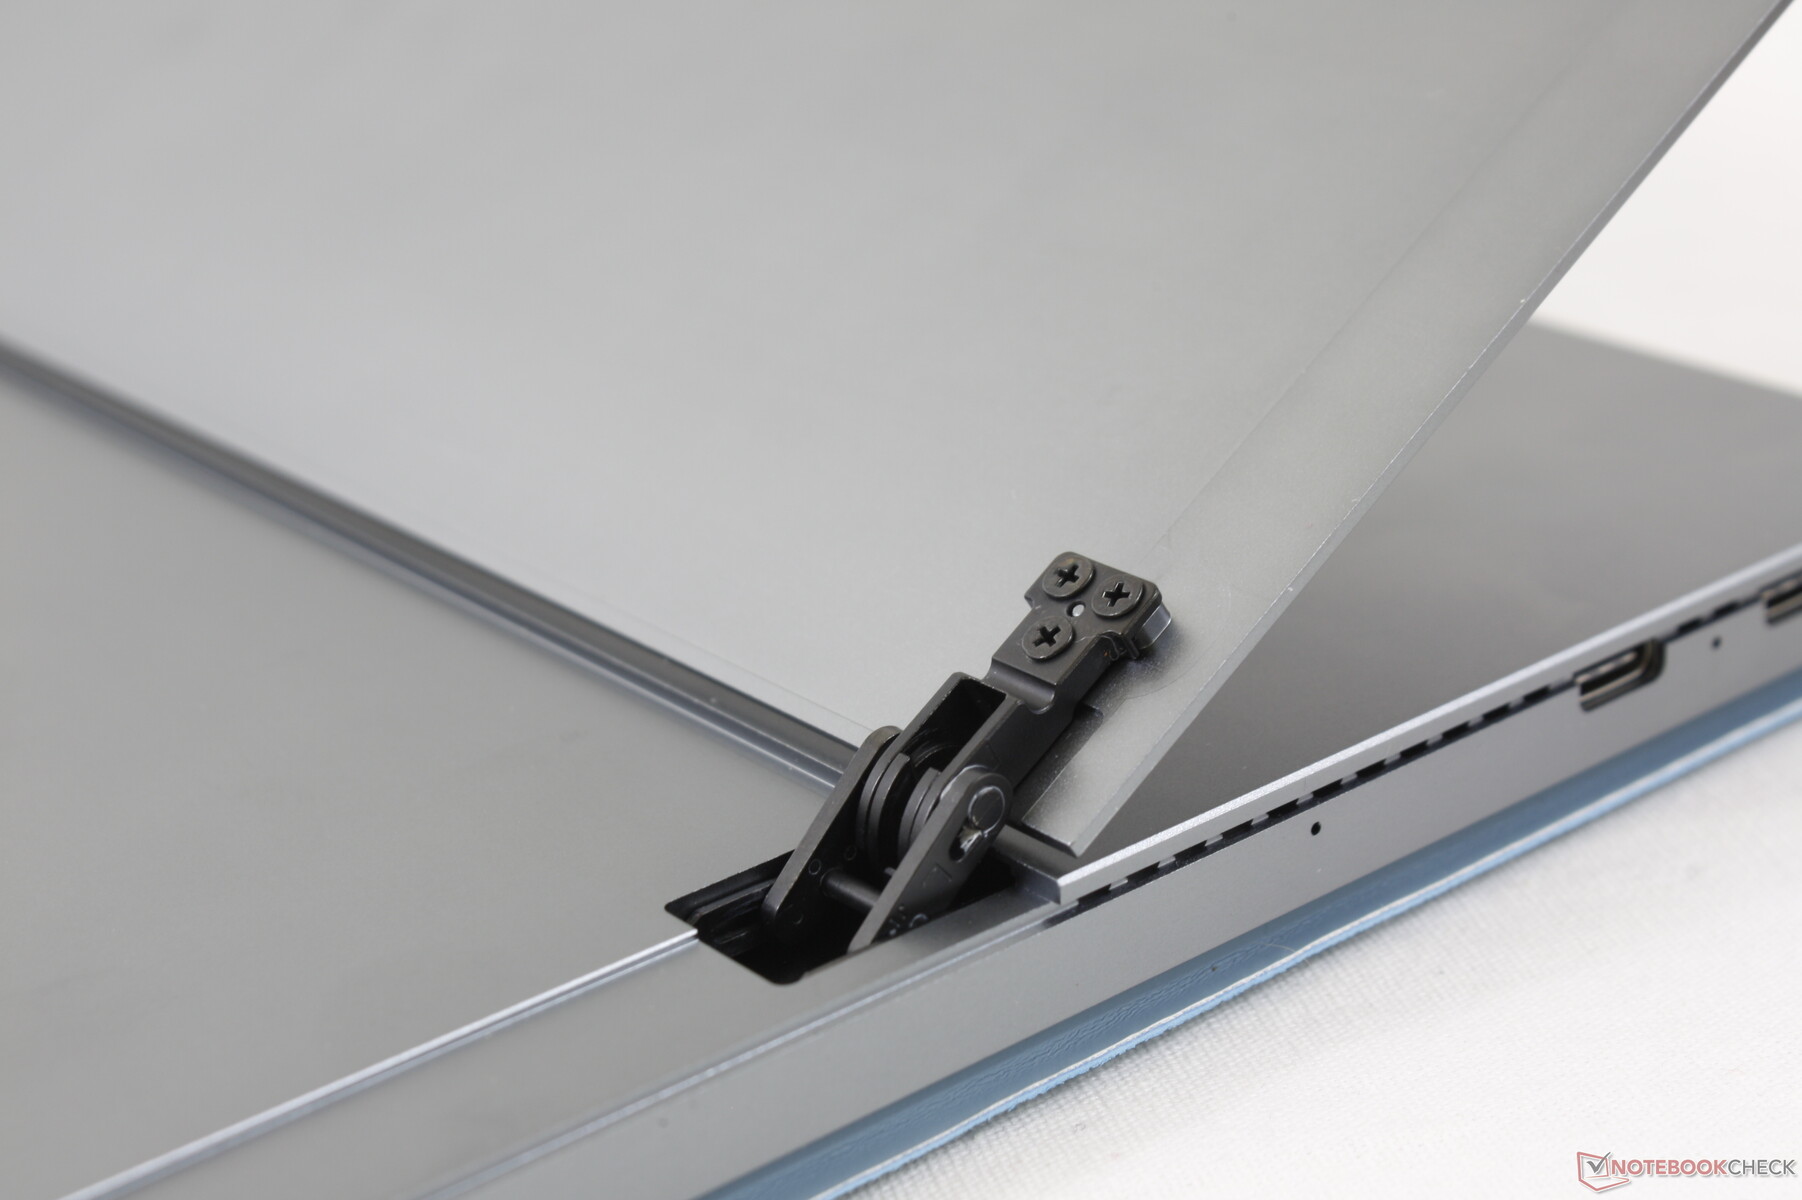
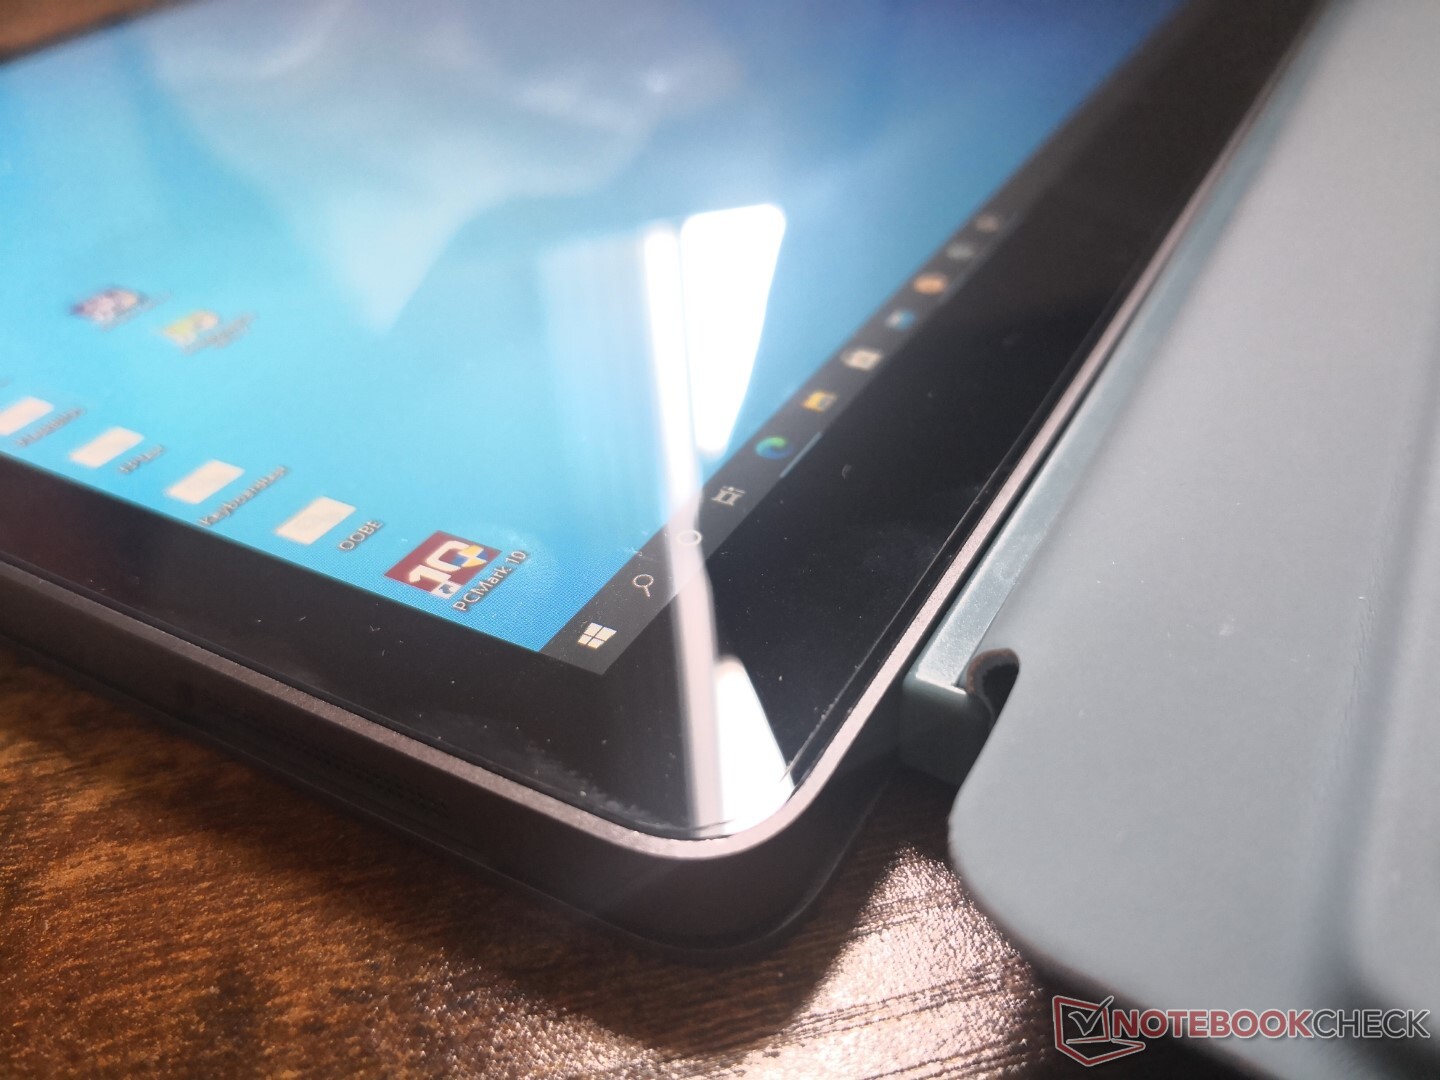
The metal chassis is a highlight of the LeBook as it feels close to the quality of a pricier Surface Pro. The metal stand on the back could have been more rigid or thicker, however, as it warps somewhat easily.
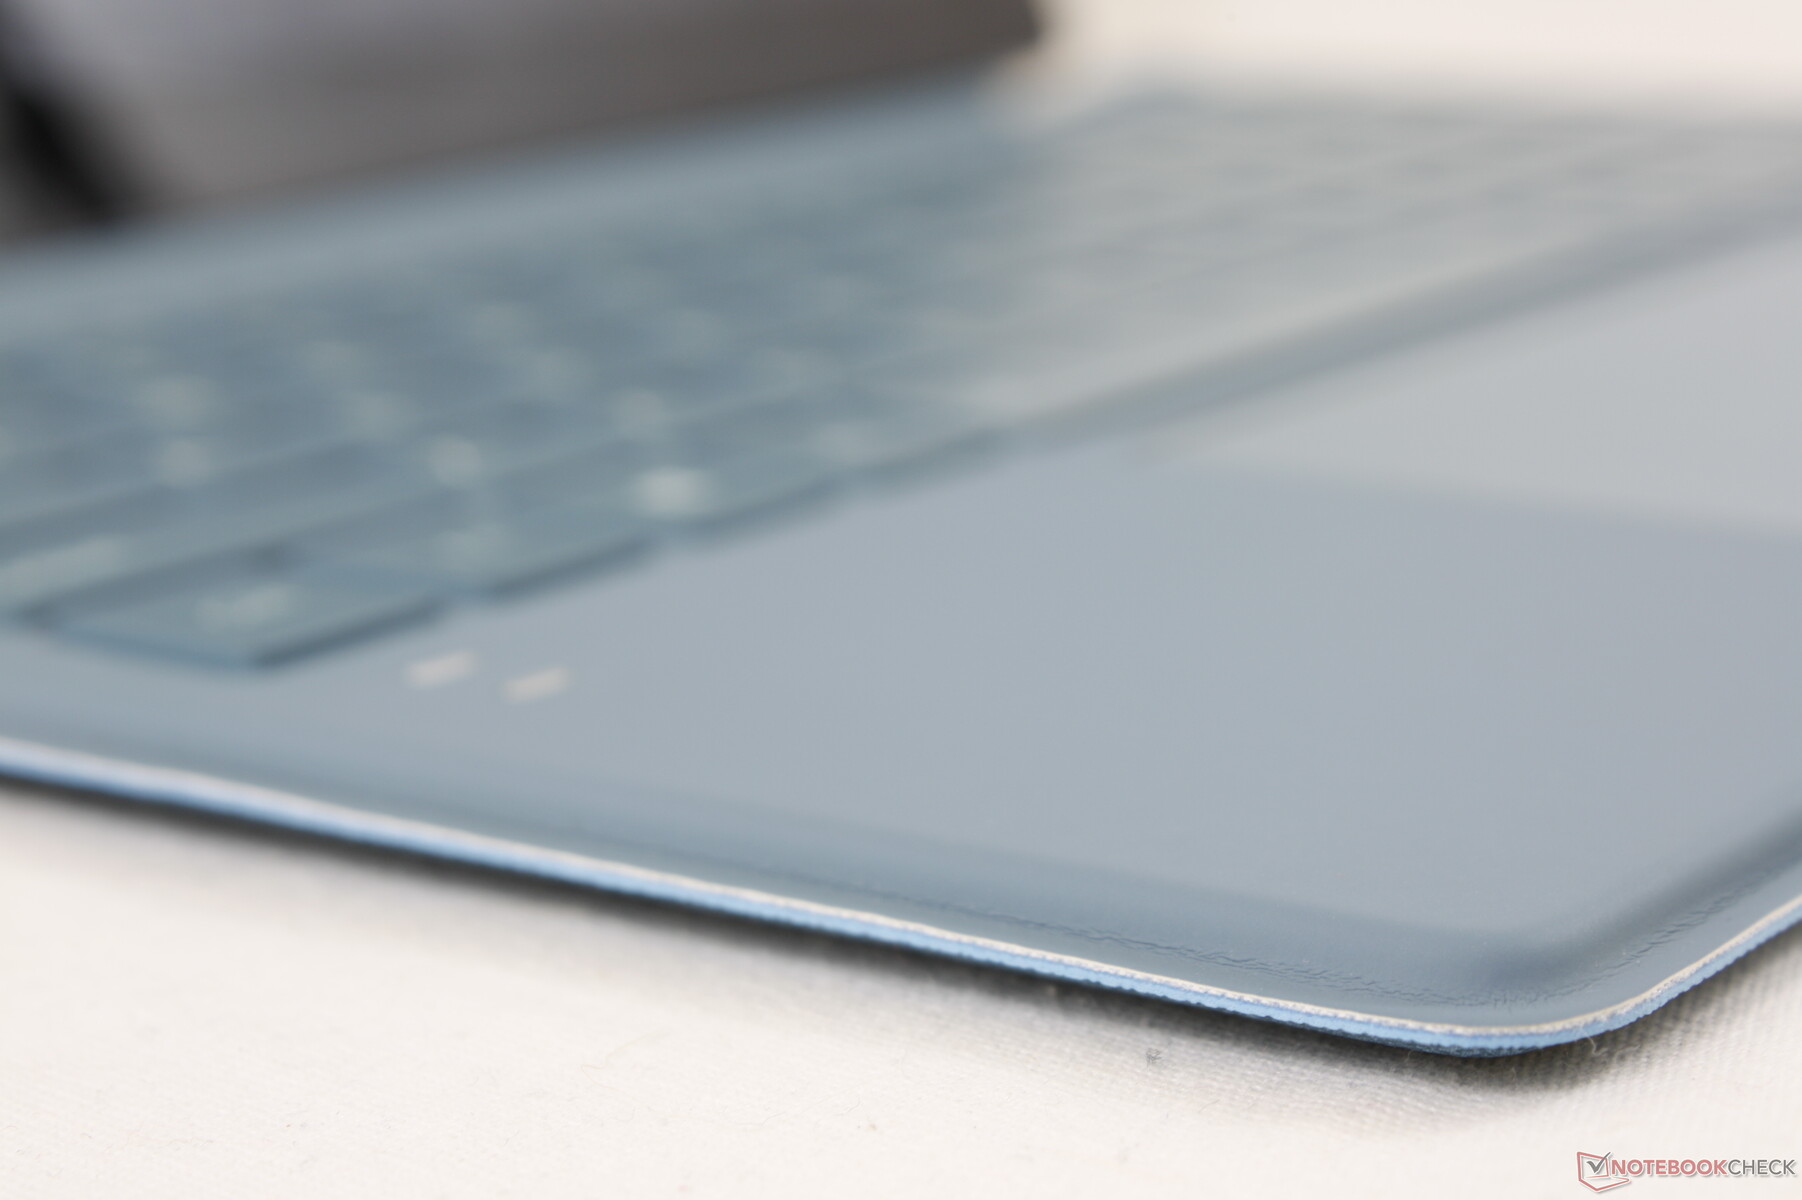
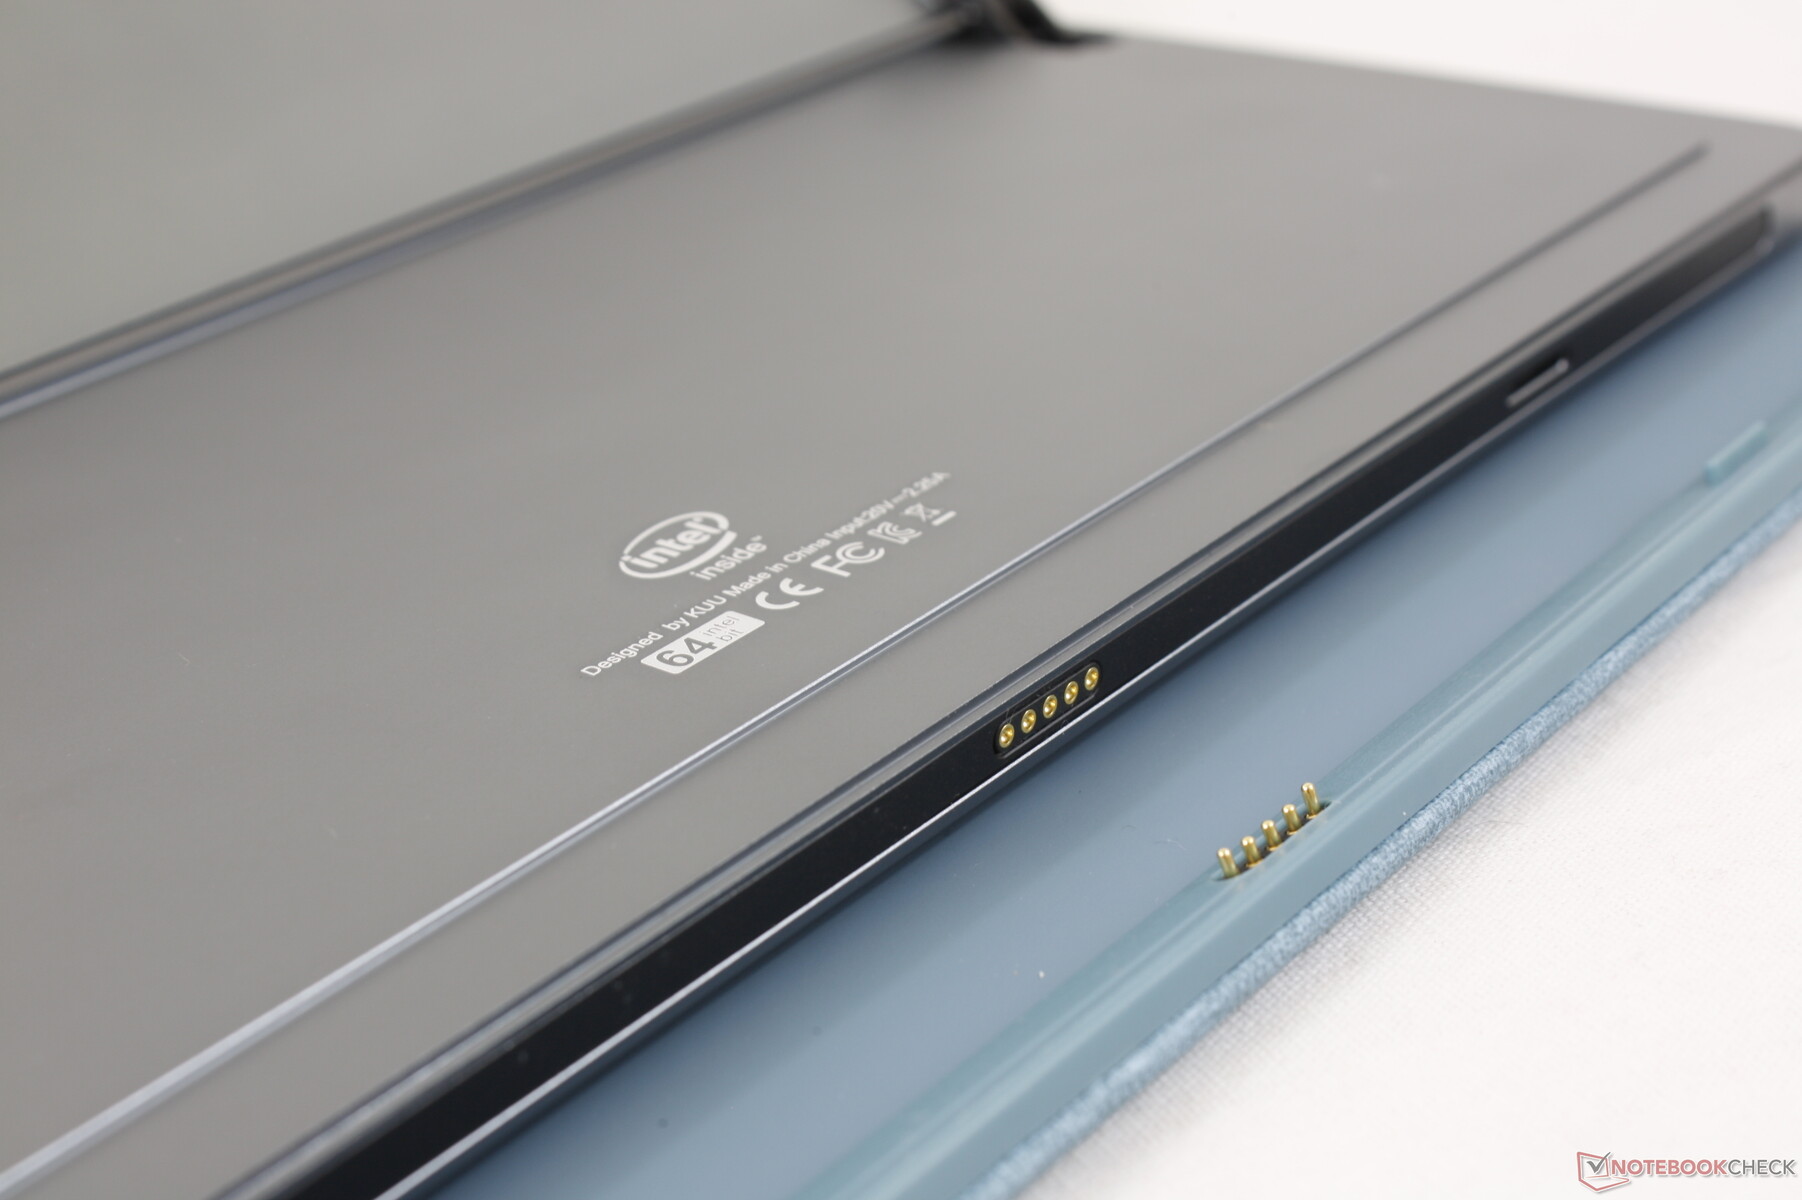
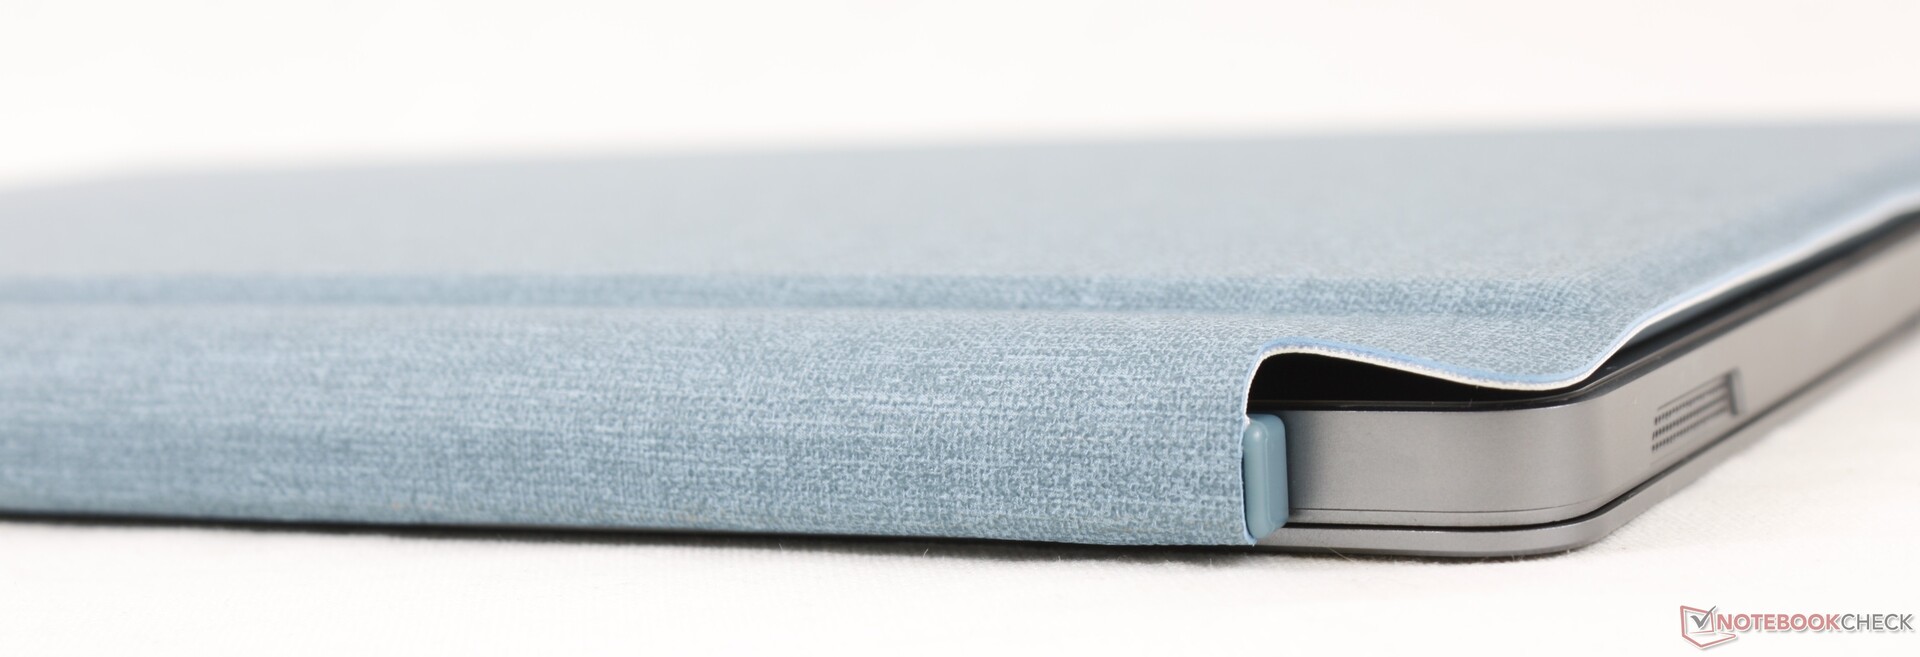
The base consists of Alcantara and a faux leather bottom texture. Though it looks good with a high quality feel, It's too flexible and susceptible to twisting which negatively impacts the typing experience. A firmer and more solid keyboard deck would have been better.
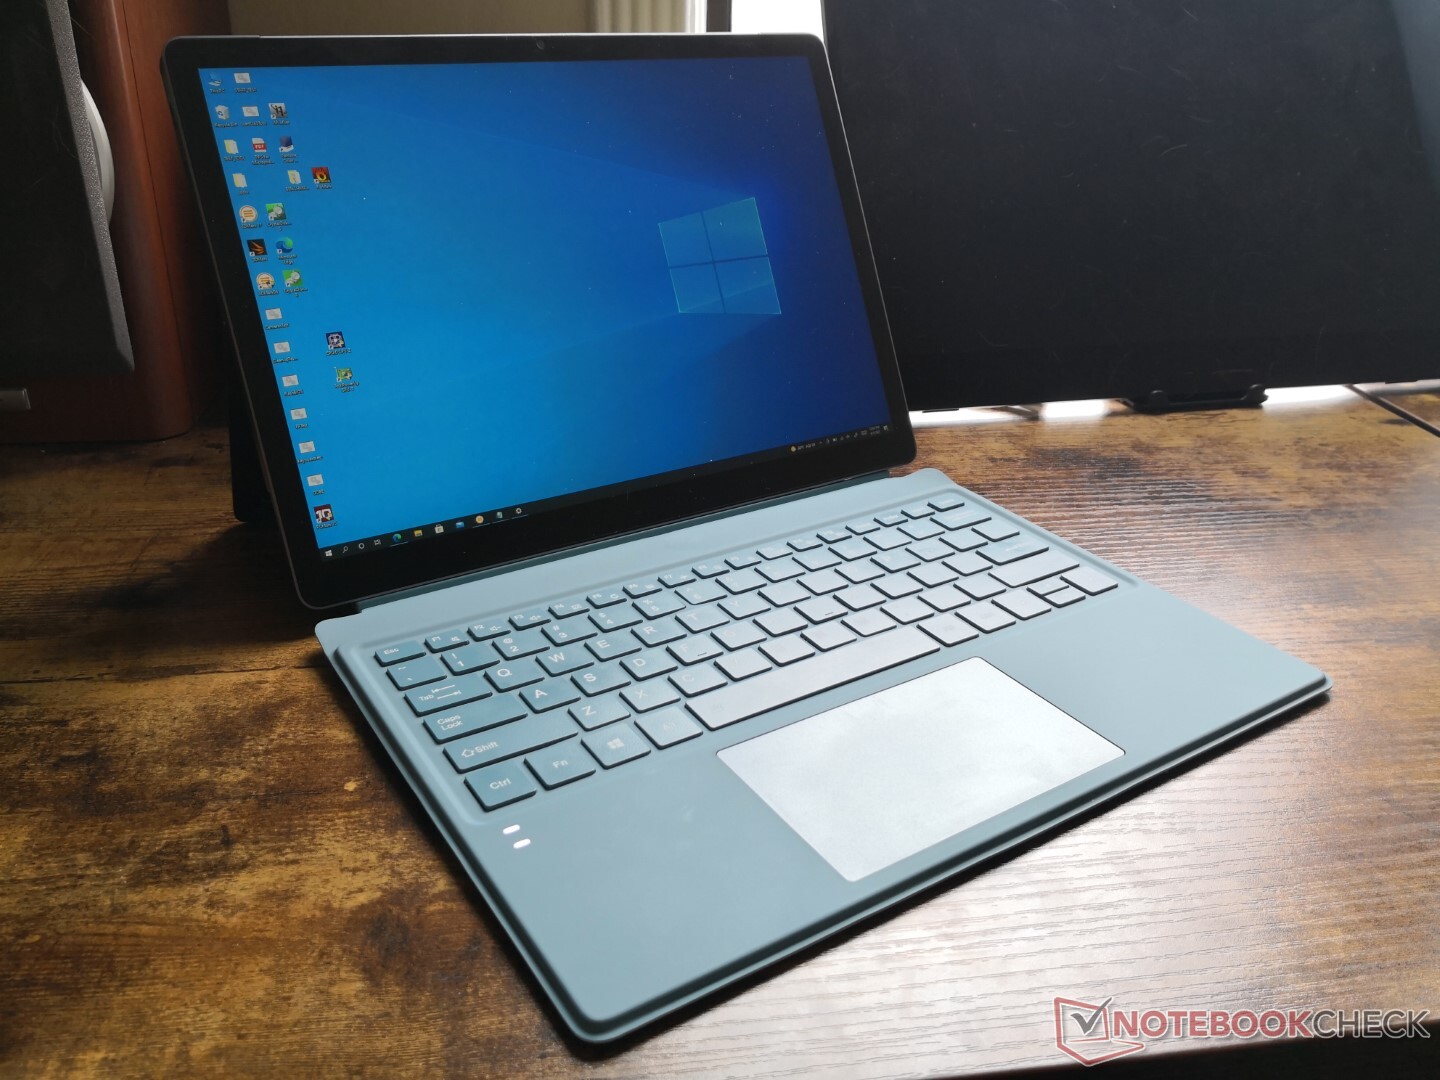
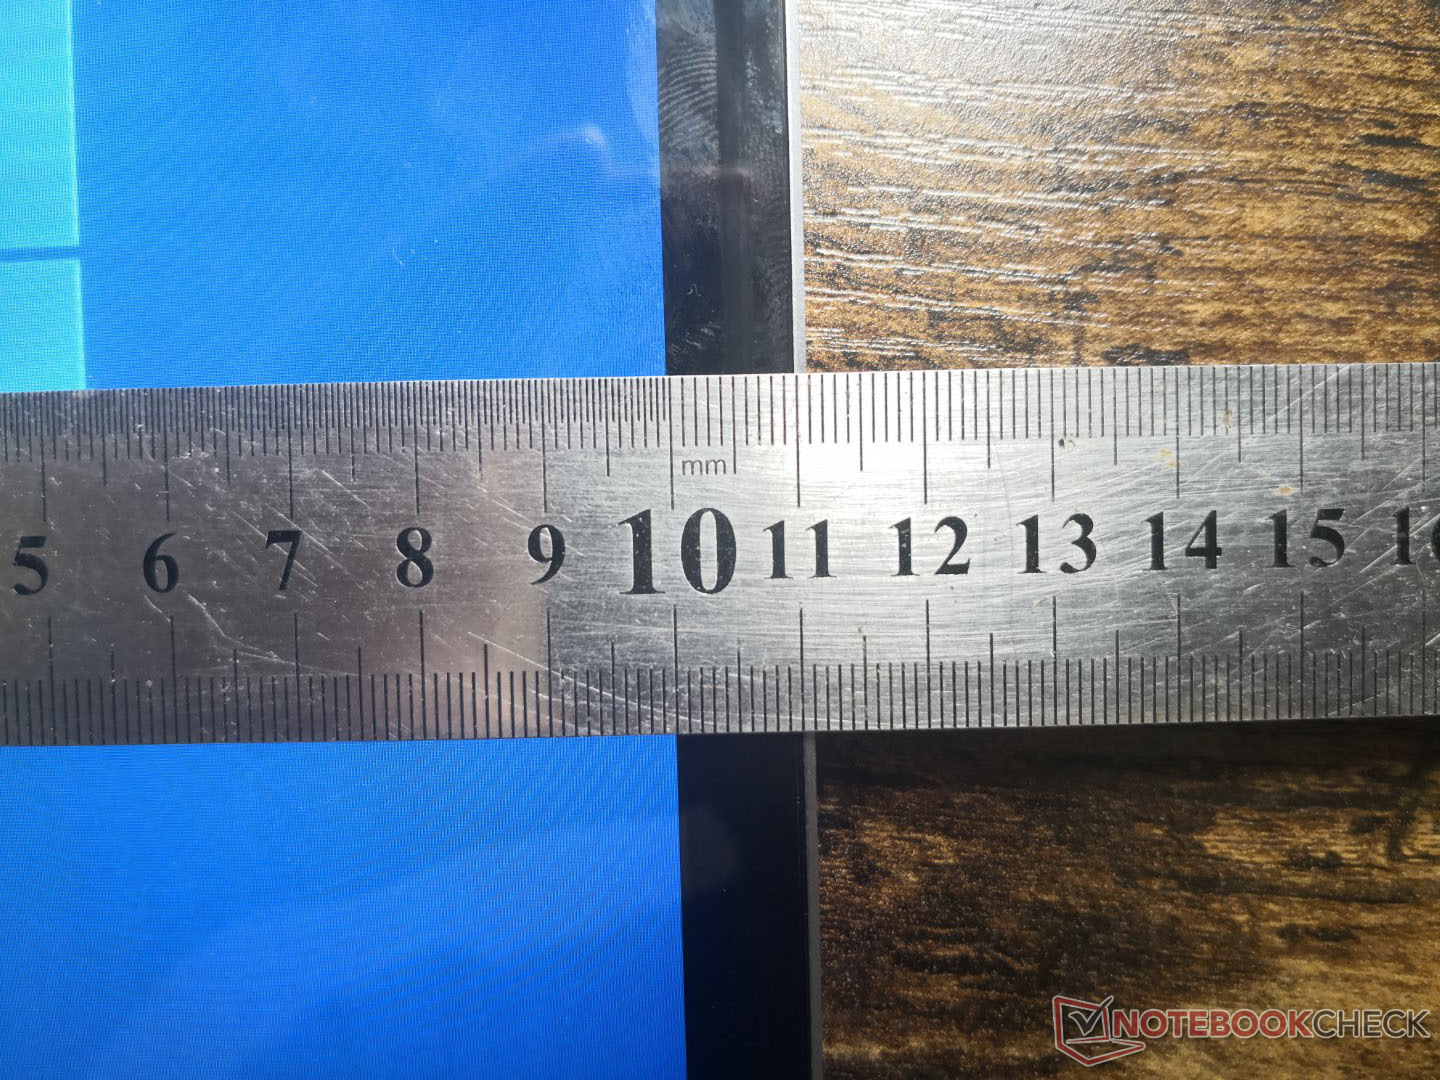
Size and weight are ever-so-slightly larger and heavier than the Surface Pro 7 which correlates with the slightly larger 12.6-inch display. The screen-to-body ratio is higher on the KUU regardless. Using the keyboard base adds about 308 g to the weight of the tablet.
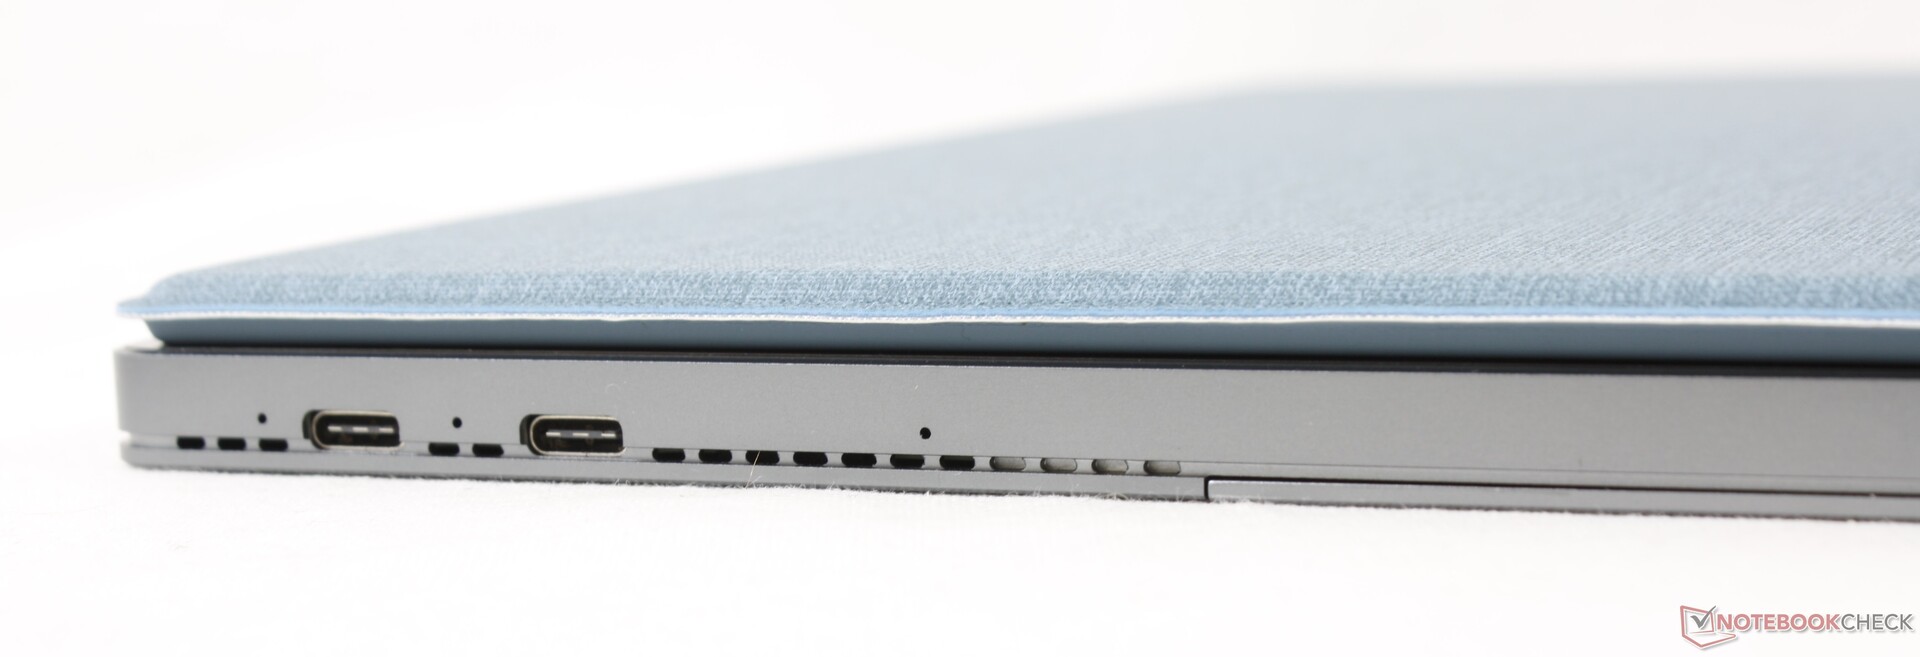
Connectivity
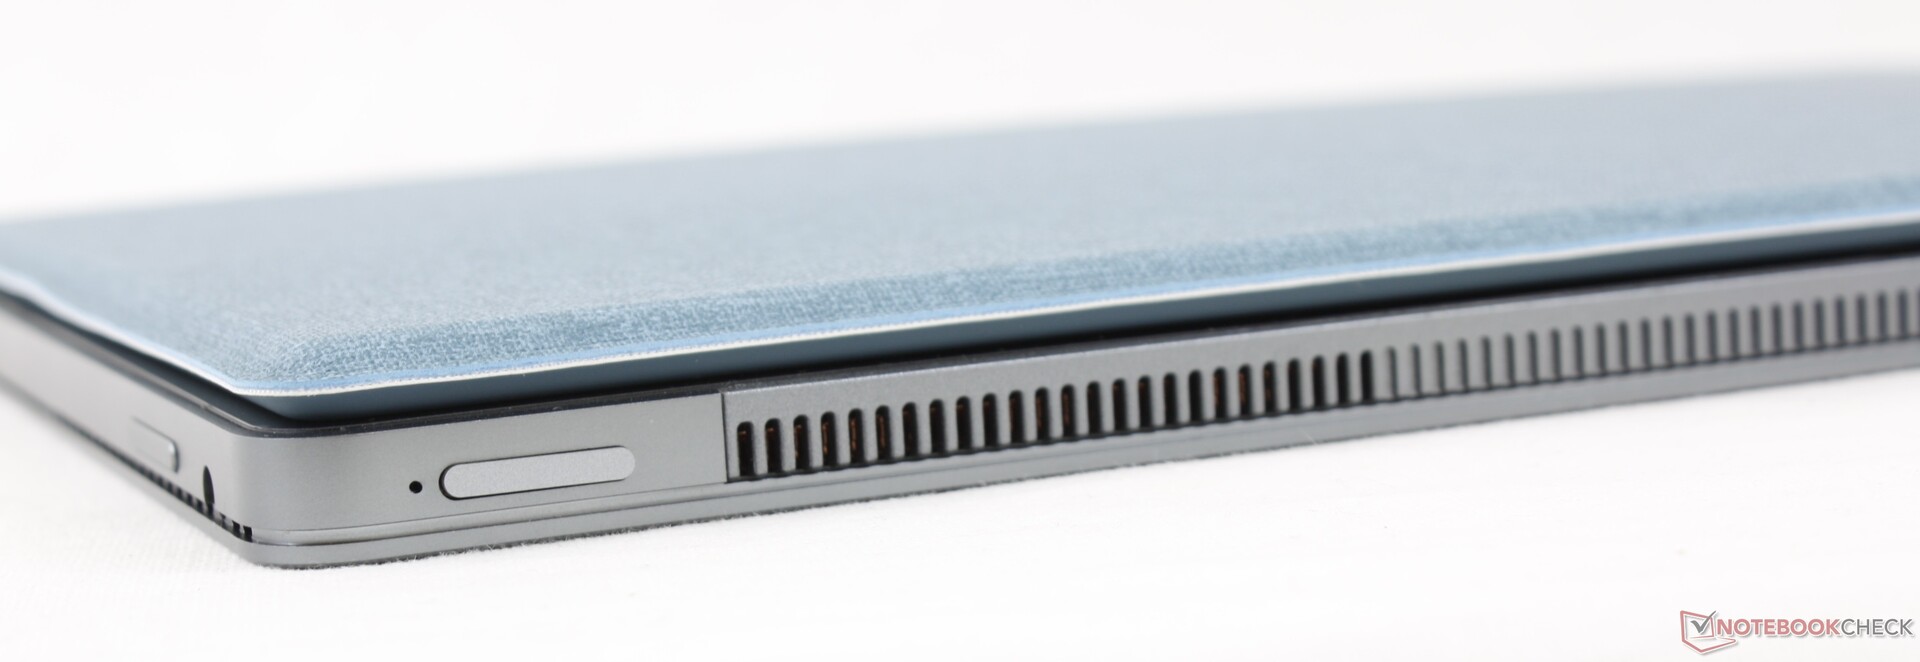
The two USB-C ports each support charging and external monitors. There are unfortunately no integrated USB-A ports unlike on the Surface Pro series.
Communication
There is no Wi-Fi 6 support likely to save on costs. The integrated 1x1 Intel 3168 offers real-world transfer rates of only around 350 Mbps to be over 4x slower than pricier laptops with the Intel AX200 or AX201.
Webcam


Accessories and Warranty
The retail box includes the AC adapter, detachable keyboard dock, and an active pen stylus. The standard one-year limited manufacturer warranty applies.
Input Devices
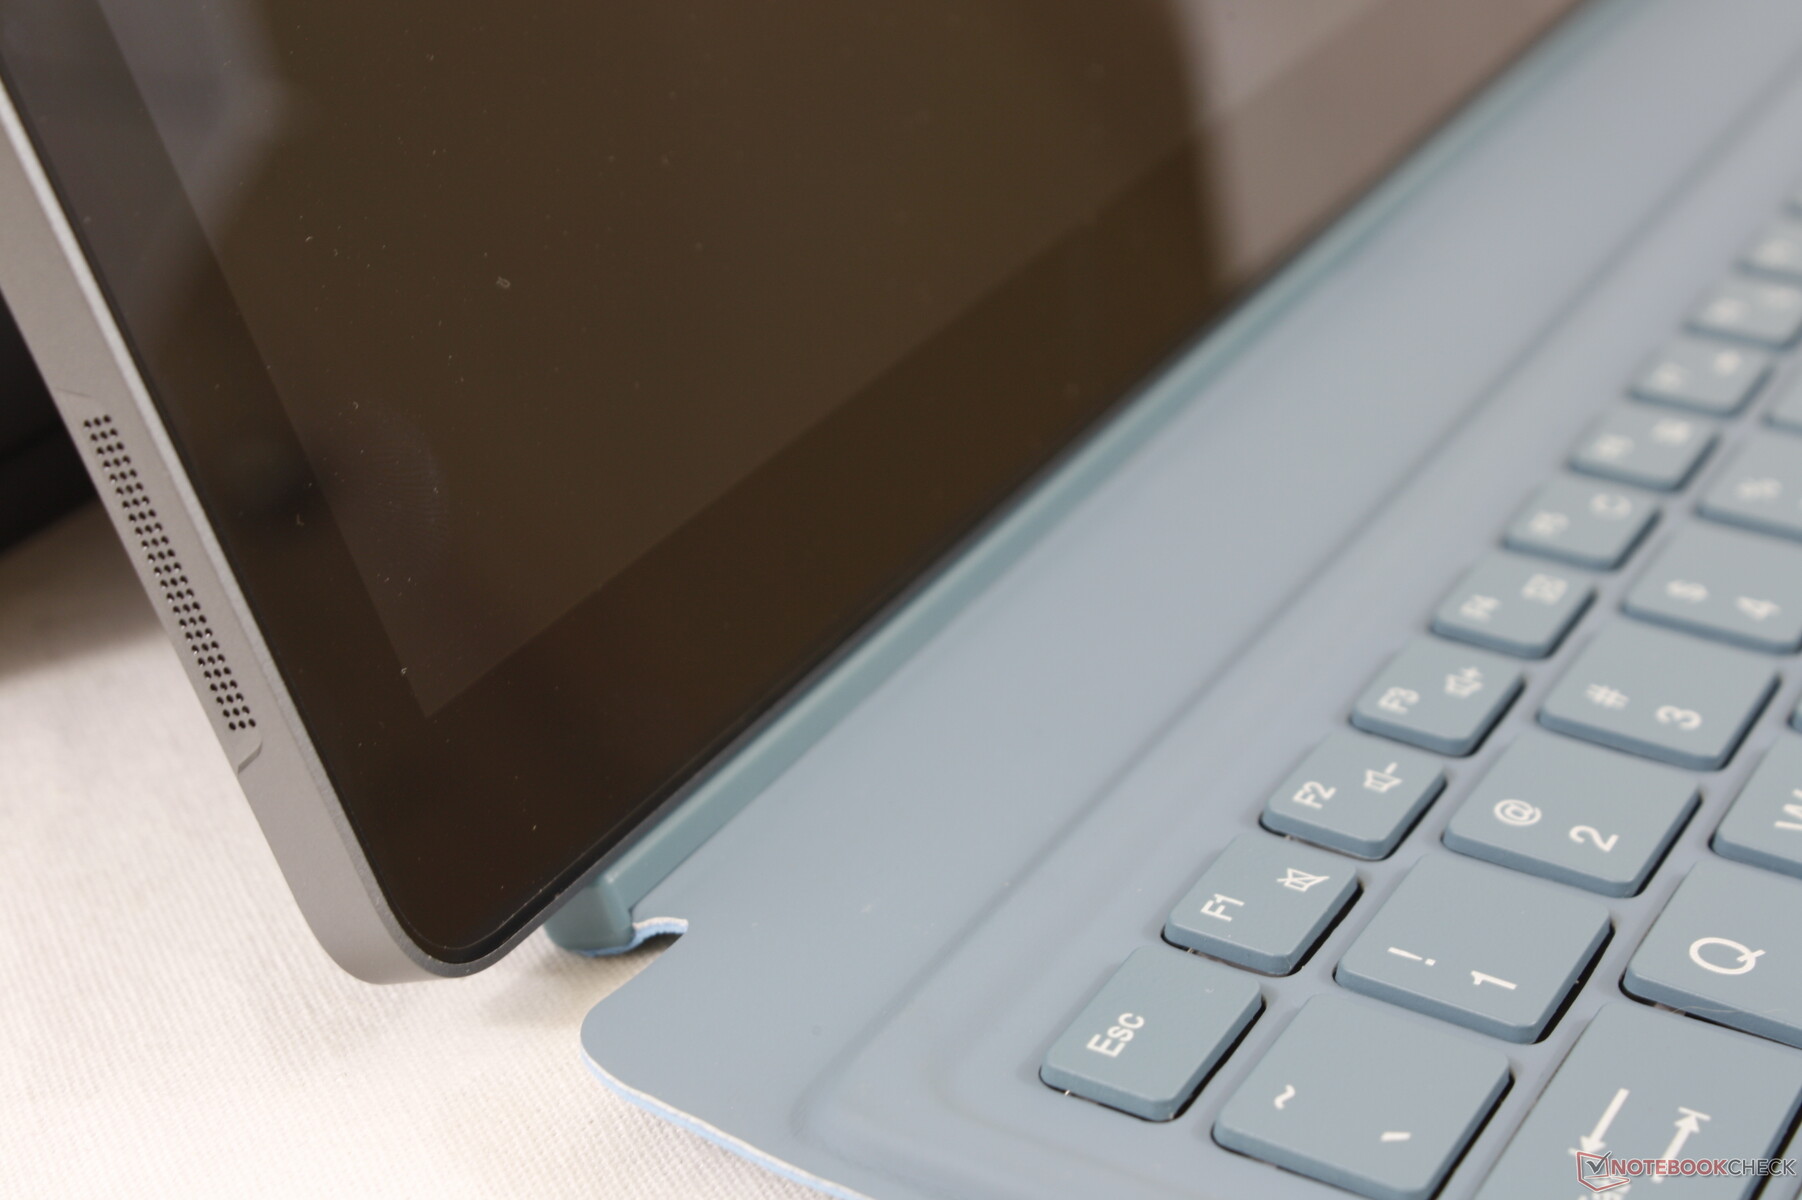
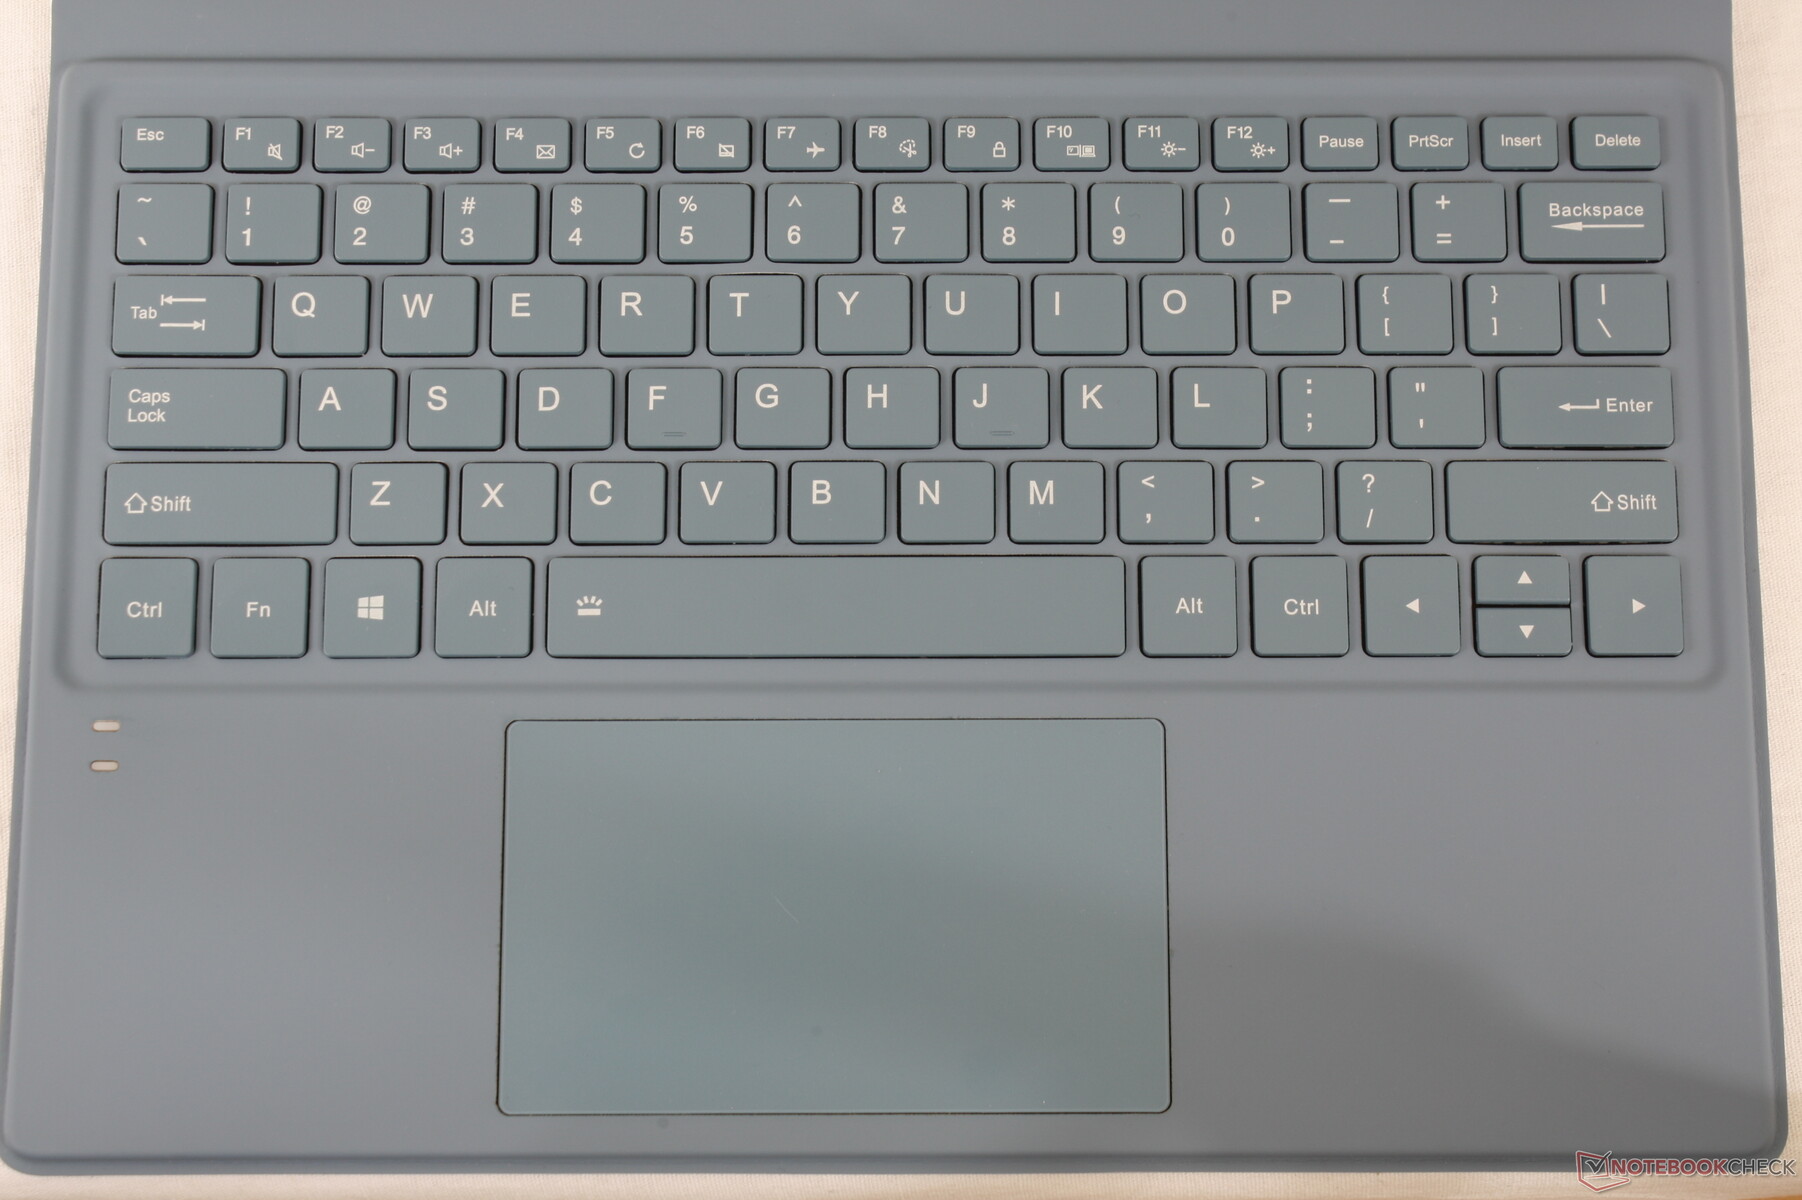
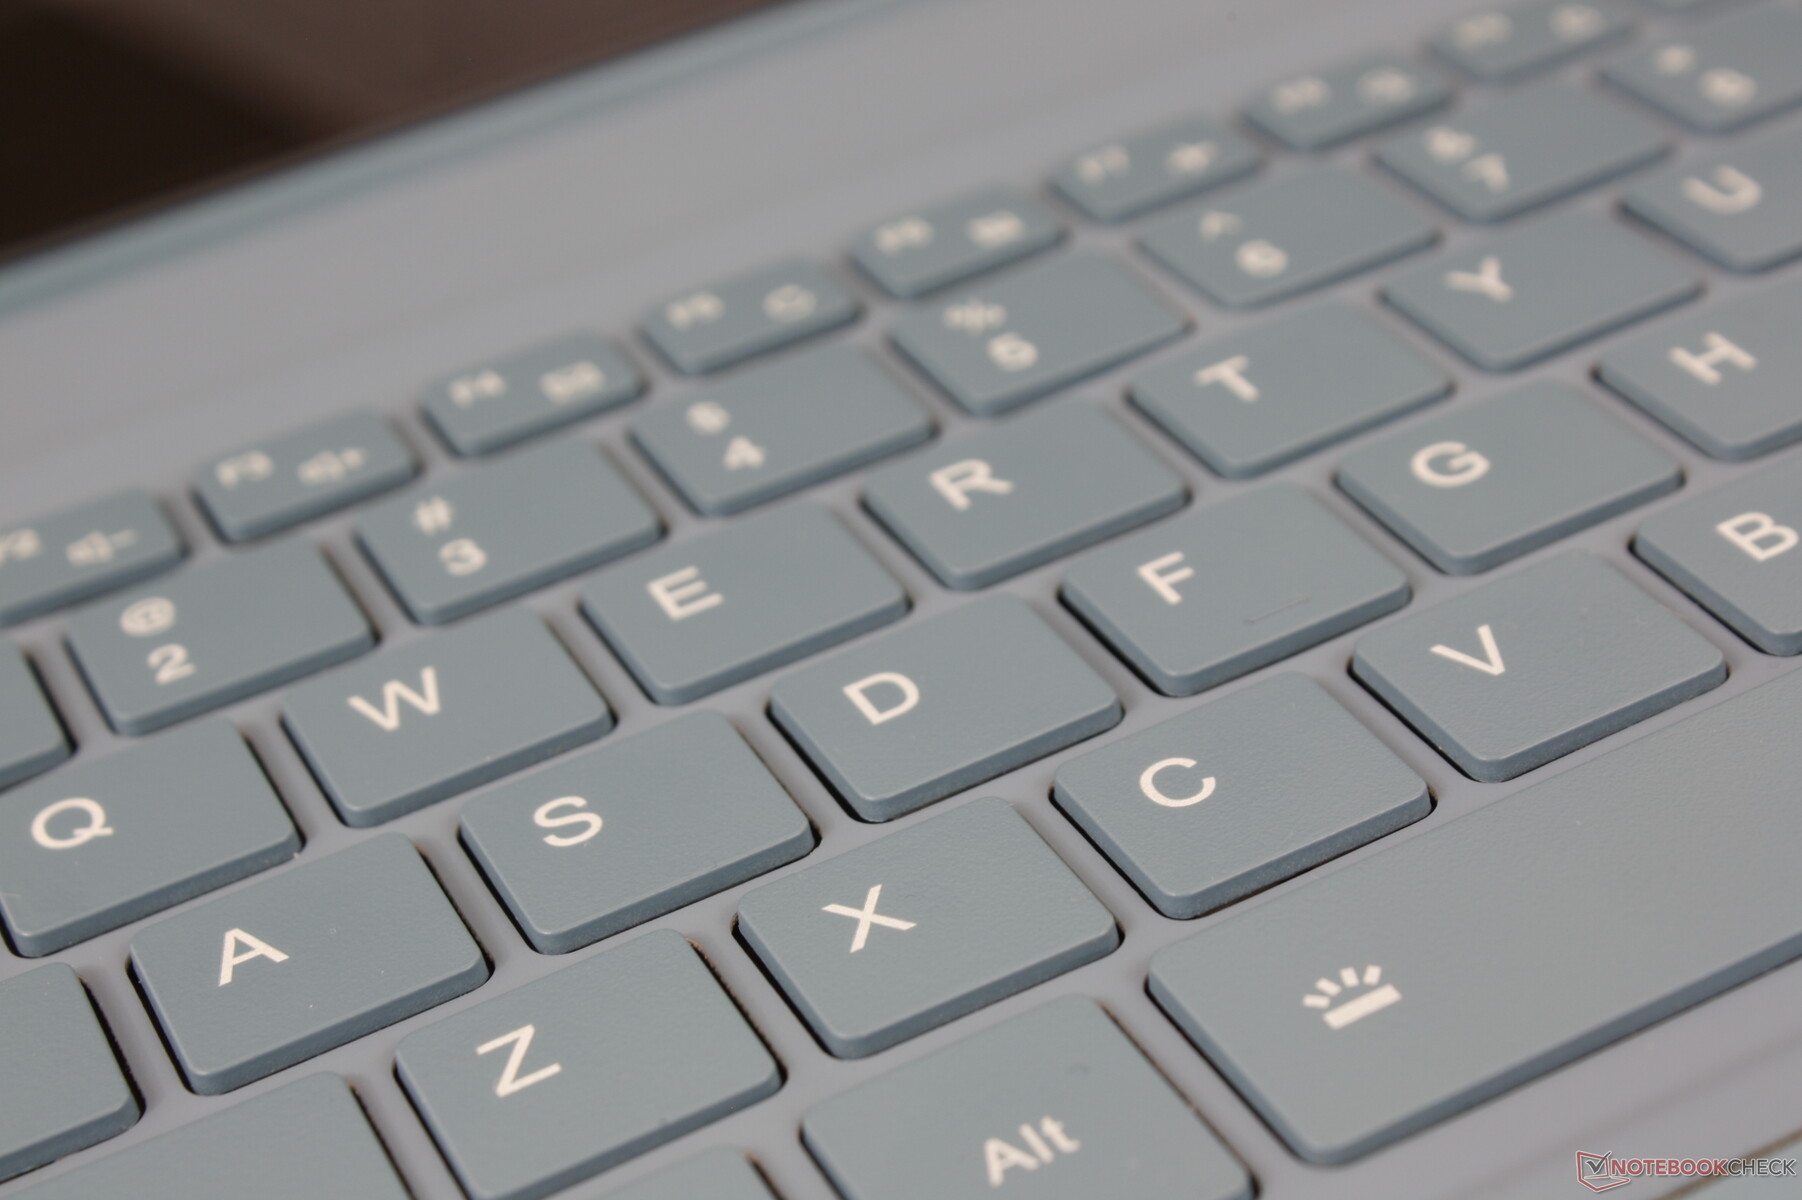
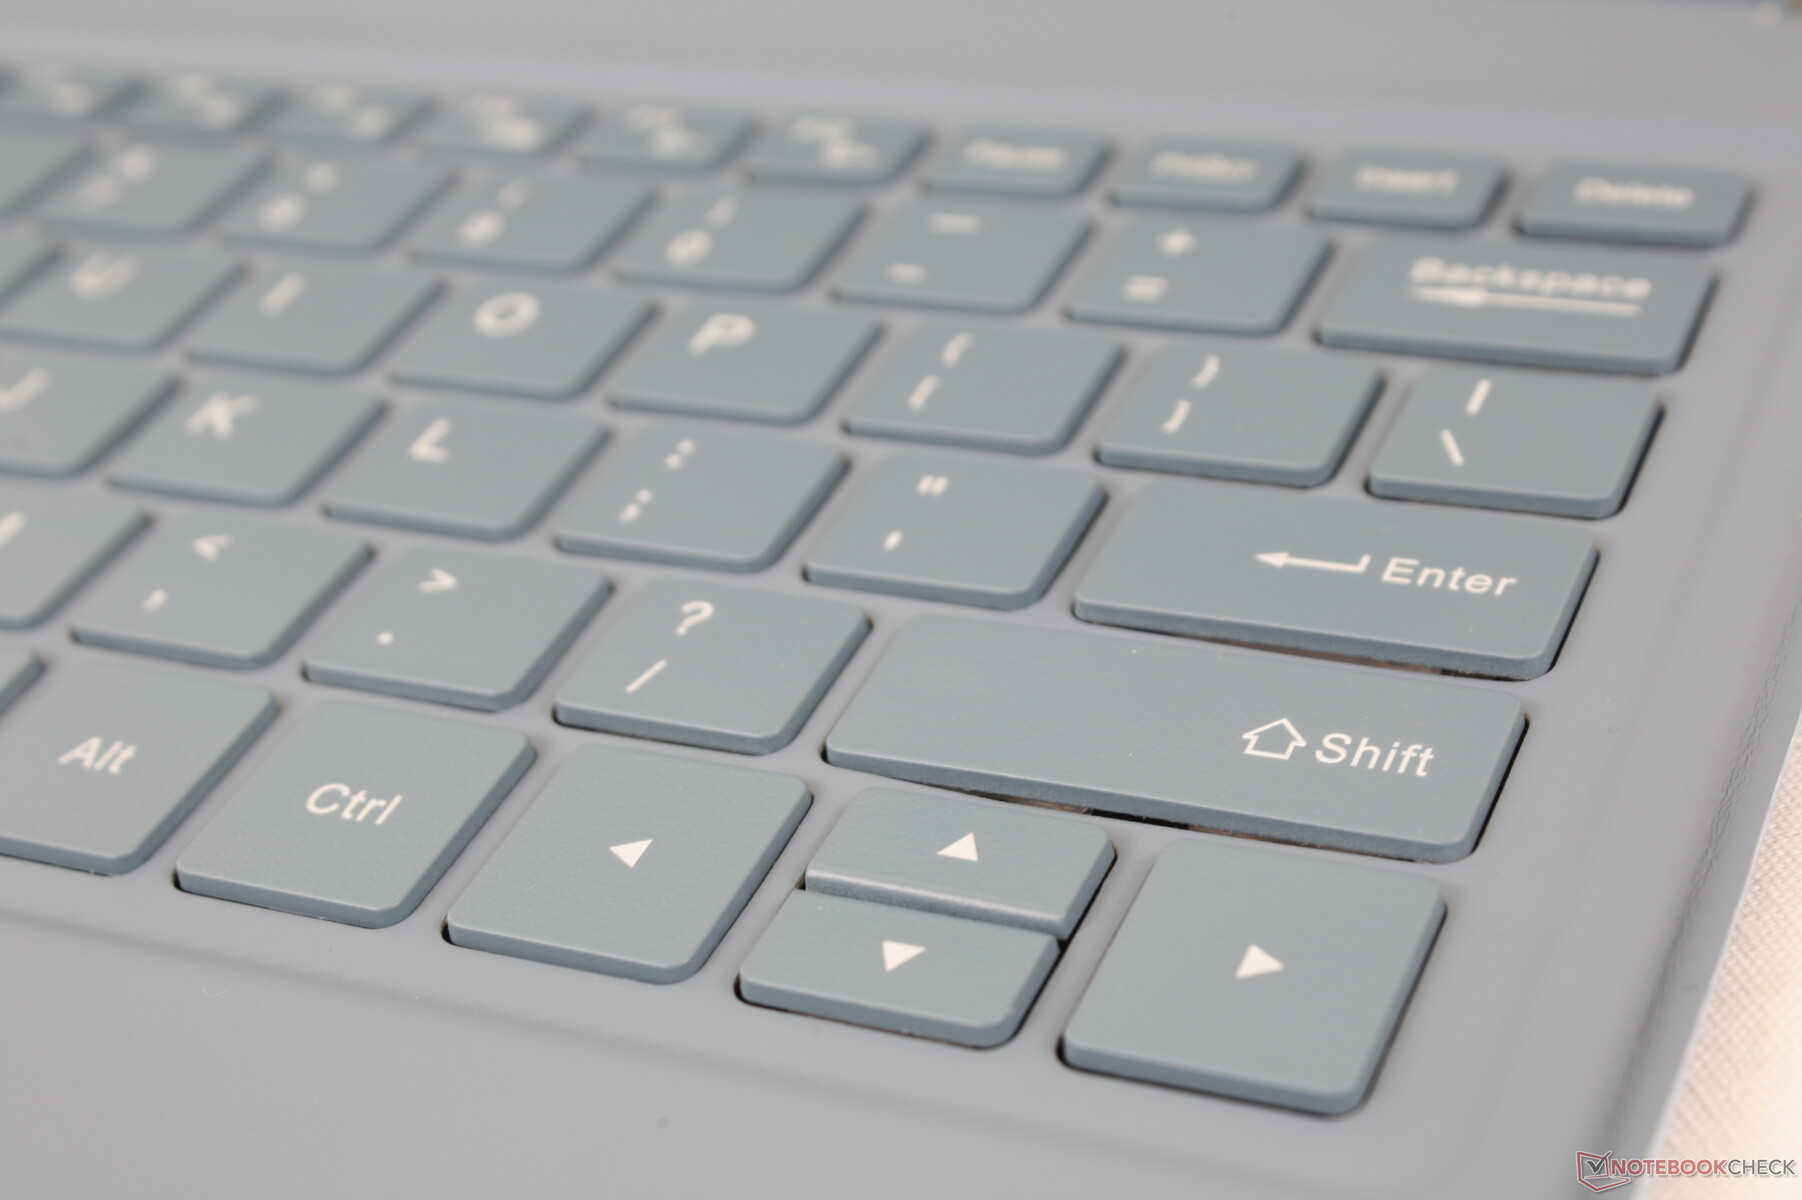
Keyboard
The typing experience is worse than on the Surface Pro series mostly because of one drawback: the base doesn't sit completely flat on the table. As a result, the back of the keyboard base will always bounce up and down when typing which impacts the feedback of the keyboard keys. Typing feels spongy since you're pushing down on the whole base with each key press.
There are two LED indicators on the left palm rest of the keyboard base. These lights are relatively bright and we wish they could have been a bit smaller to be less visually obtrusive.
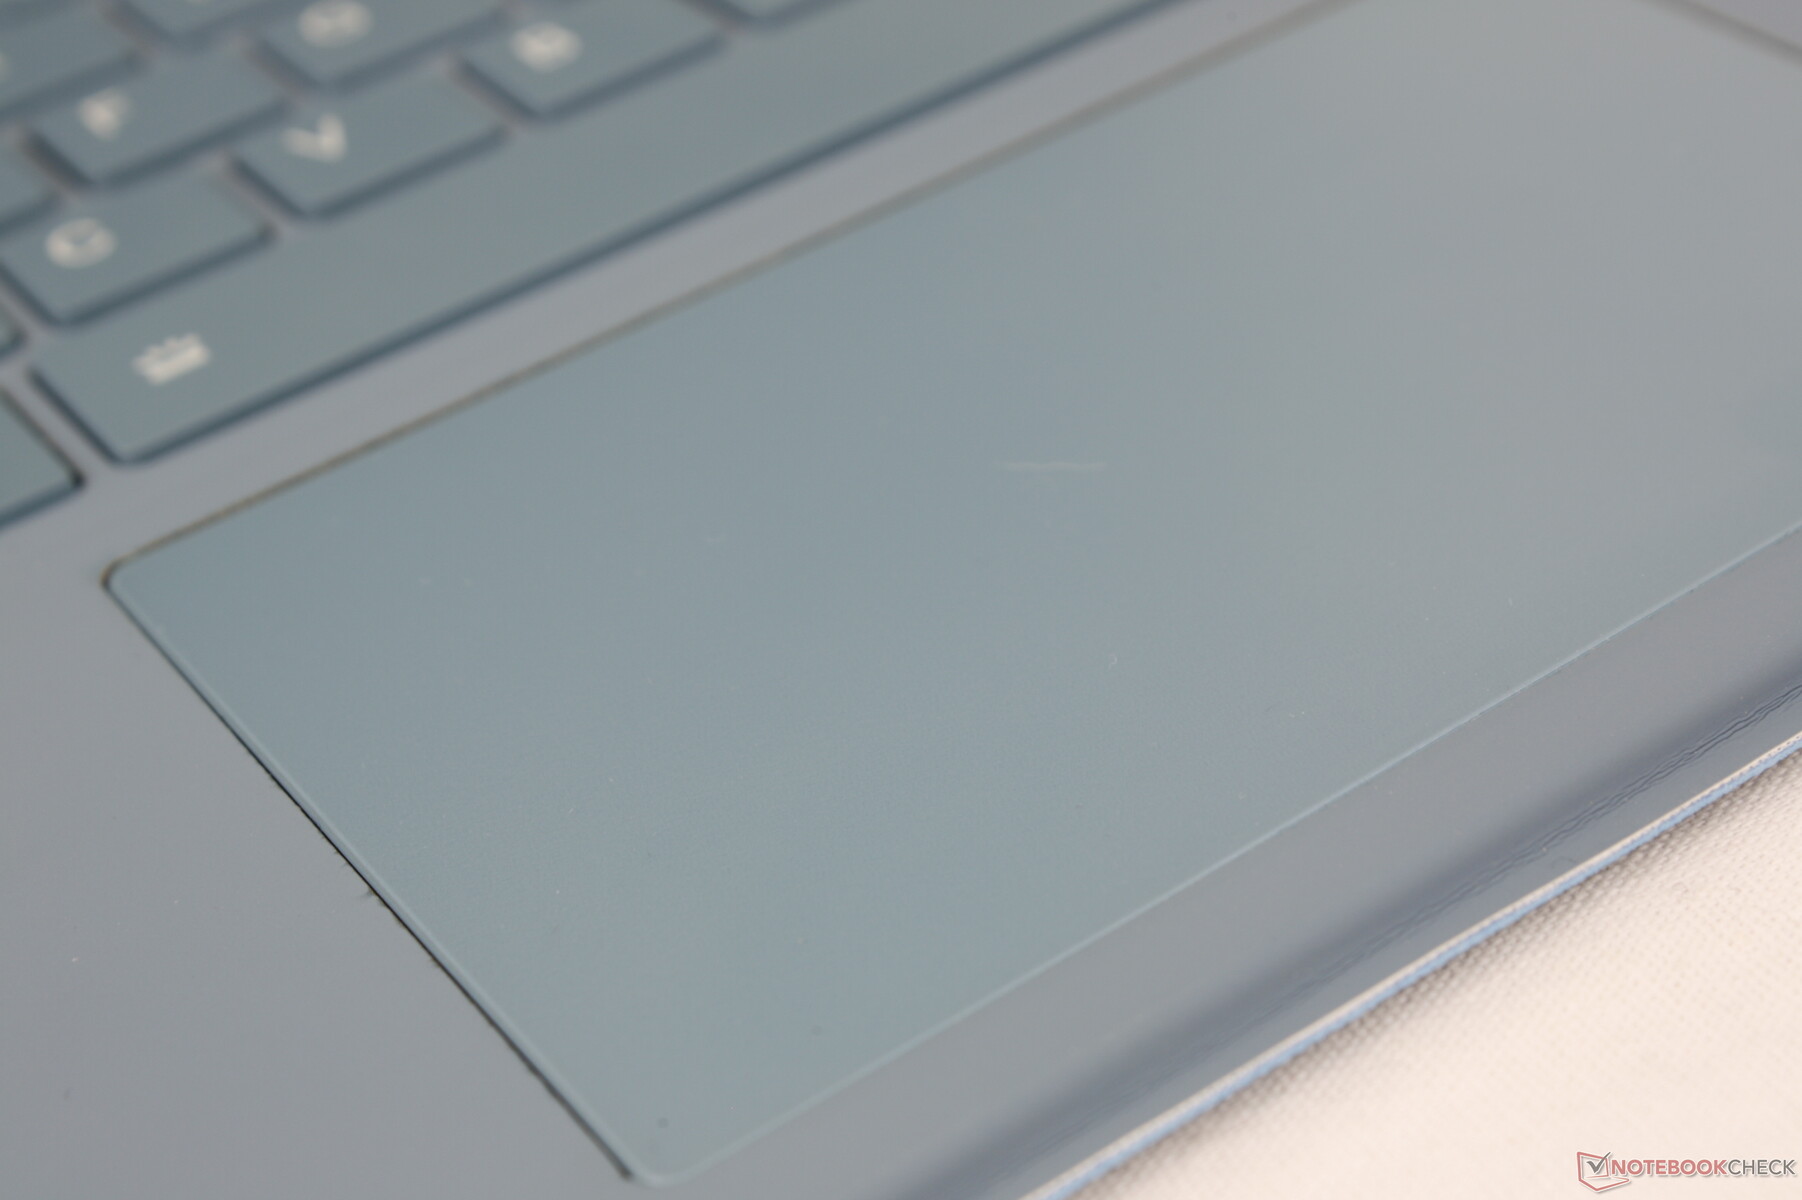
Touchpad
The clickpad is larger than the clickpad on the Surface Pro 7 (10.8 x 6.4 cm vs. 10.2 x 5.3 cm). Its advantages end there, however, as almost everything else about the LeBook clickpad is worse. Its surface is sticky when gliding at slower speeds which leads to a jumpy cursor. Multi-touch inputs are also finicky, unresponsive, and oftentimes inaccurate. When trying to drag and drop, for example, the system would frequently register our actions as zooming in or out instead. The integrated clickpad buttons, while loud and clicky, take a lot of force to actually press. And finally, the clickpad is not Precision-enabled meaning any Microsoft Precision features are out of the question.
Display
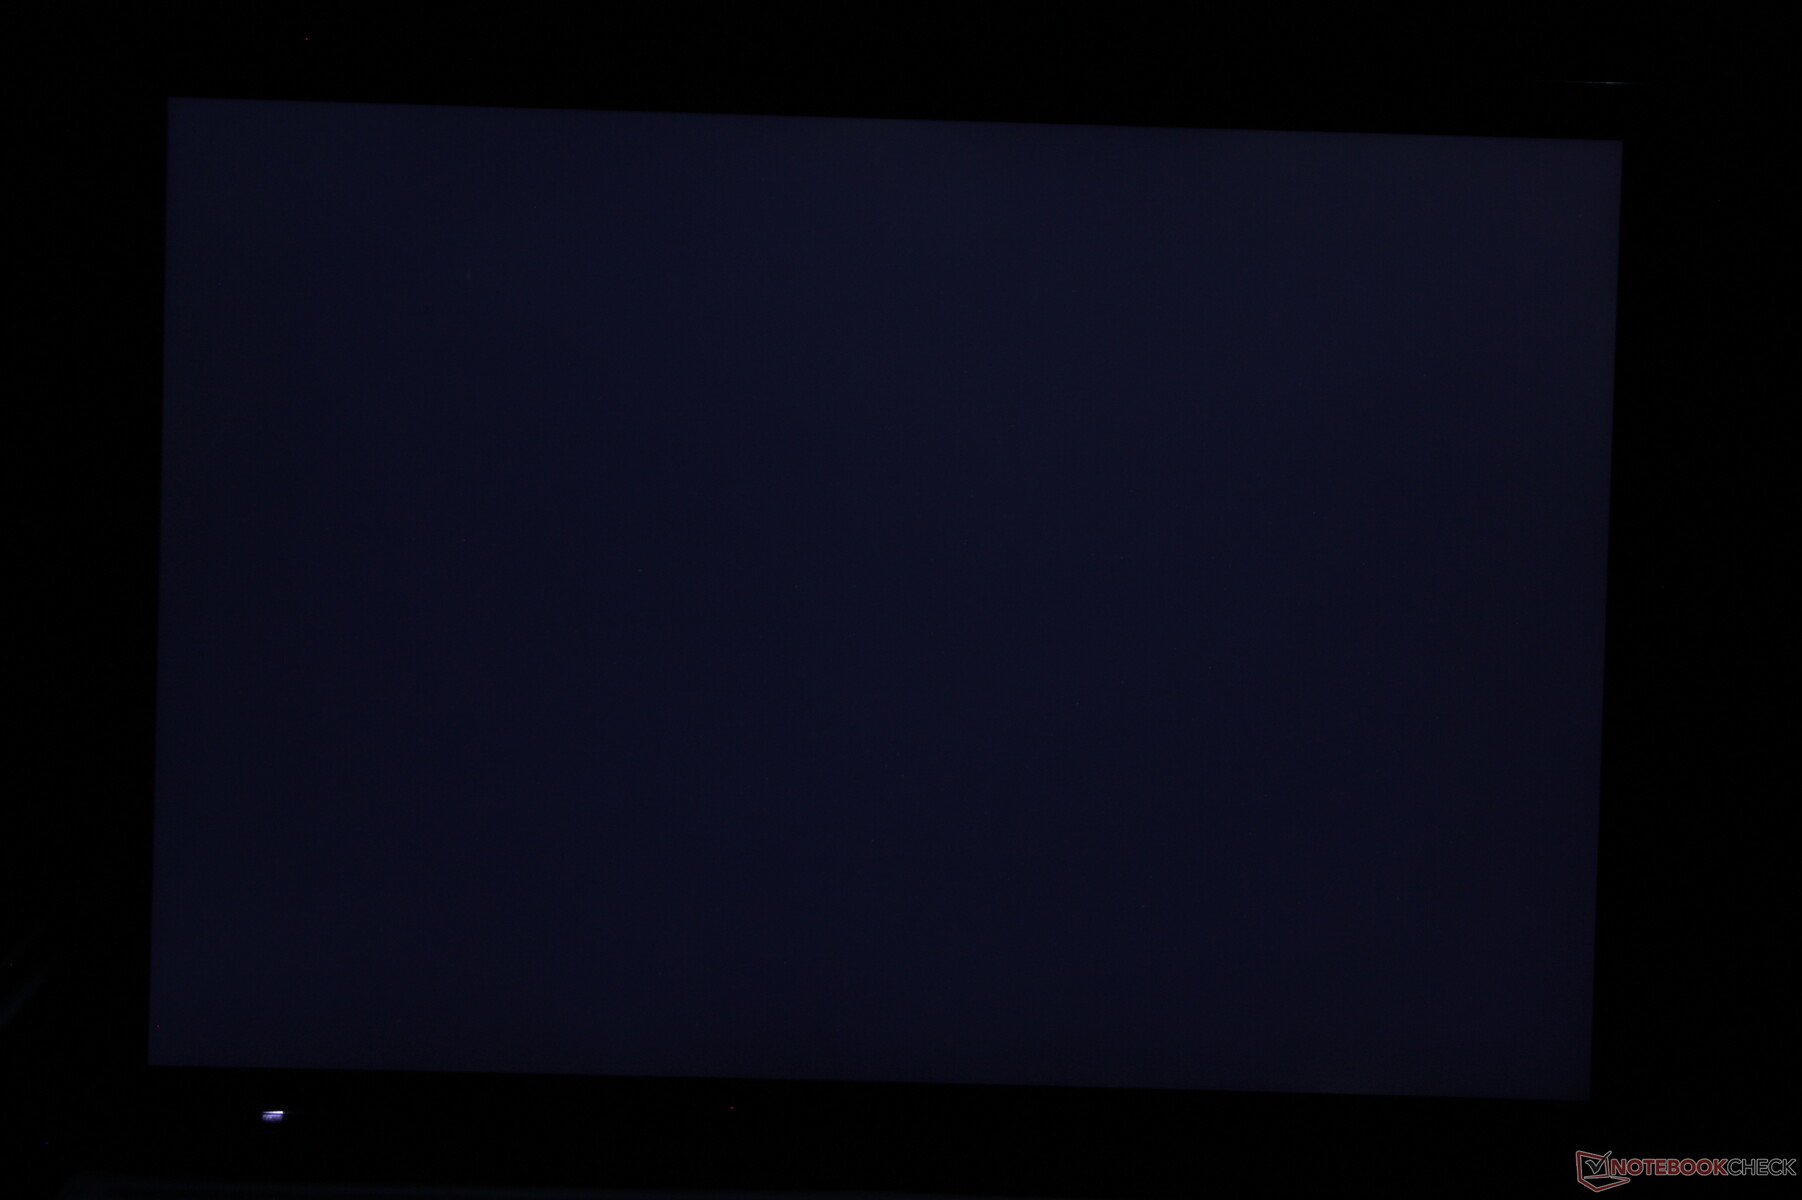
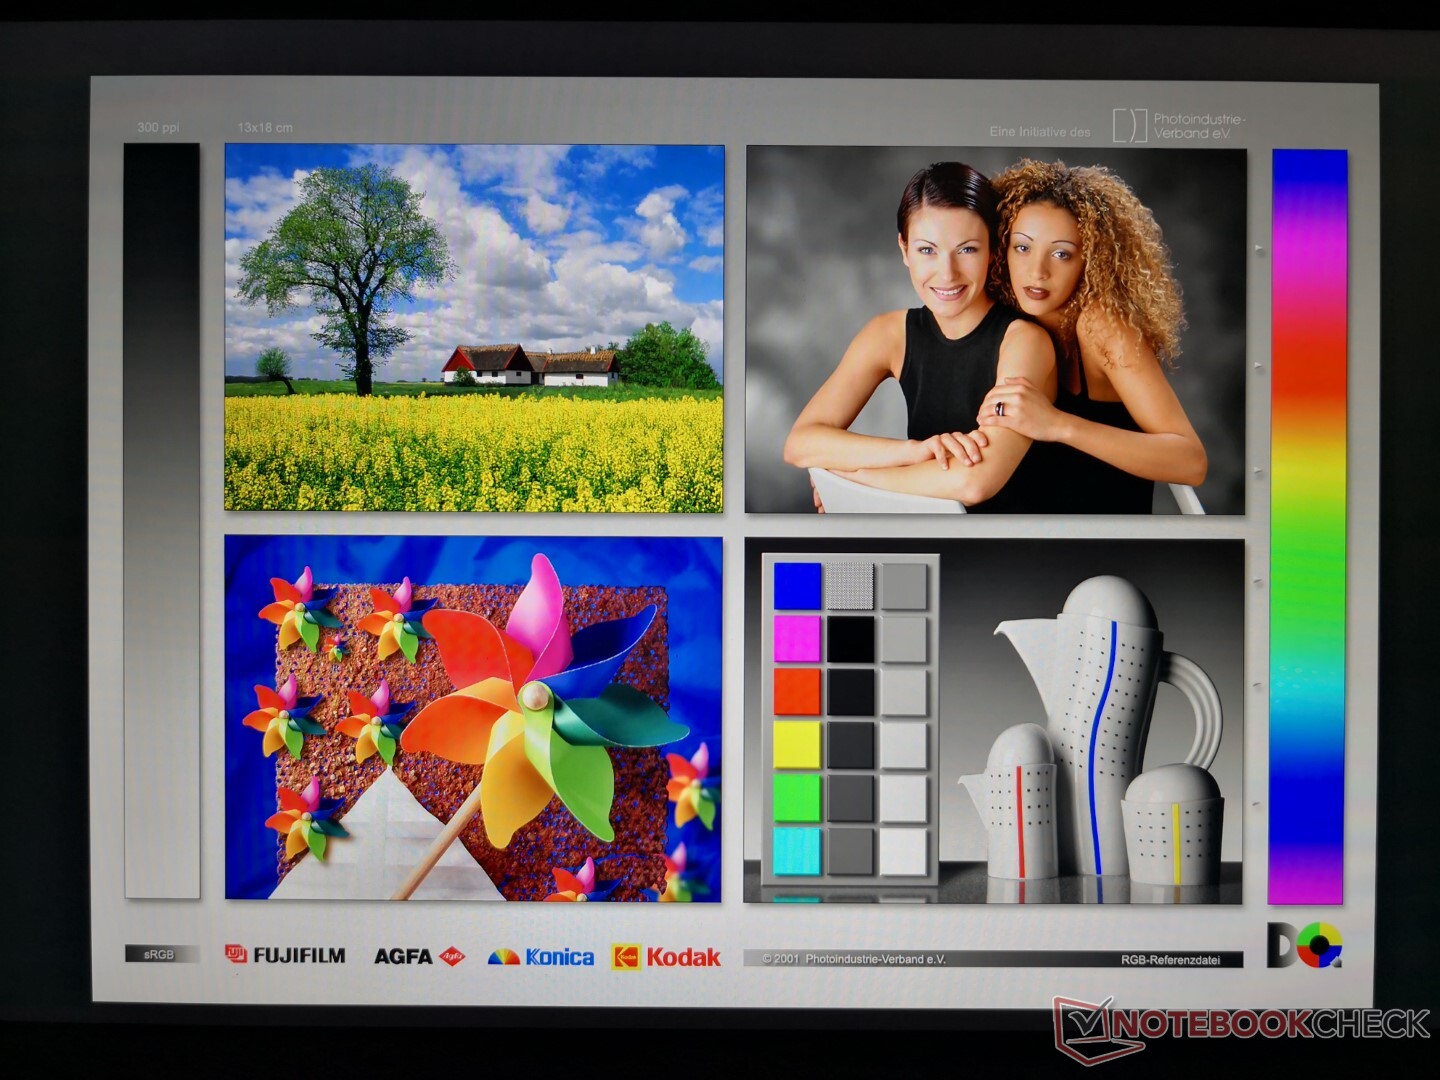
The 12.6-inch BOE TV126WTM-NU0 IPS panel is the first to appear on our database. Certain attributes like response times and color coverage are slightly worse than on the Surface Pro which thankfully won't matter very much when web browsing. Other attributes like contrast ratio and maximum brightness are meager and representative of a budget panel.

| |||||||||||||||||||||||||
Brightness Distribution: 87 %
Center on Battery: 269.7 cd/m²
Contrast: 586:1 (Black: 0.46 cd/m²)
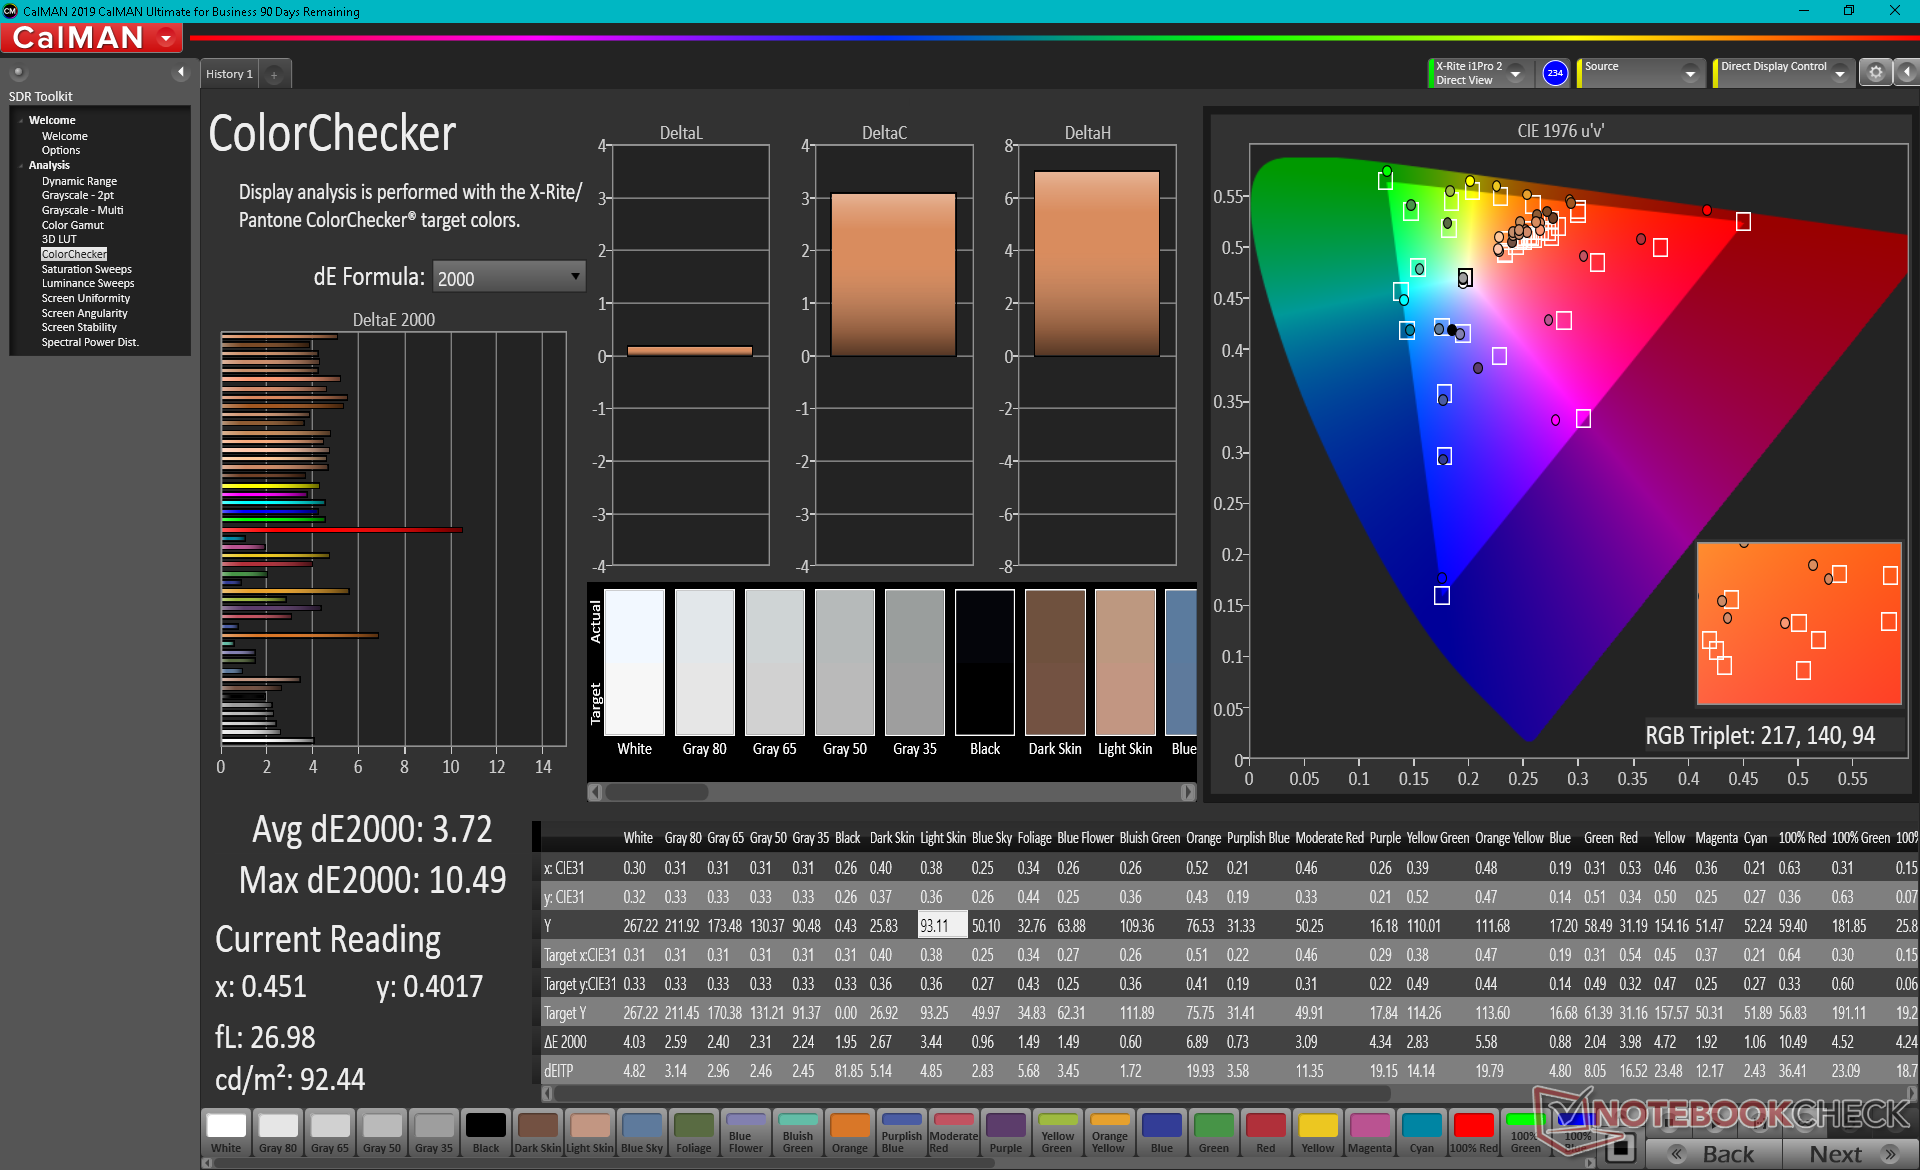
ΔE ColorChecker Calman: 3.72 | ∀{0.5-29.43 Ø4.71}
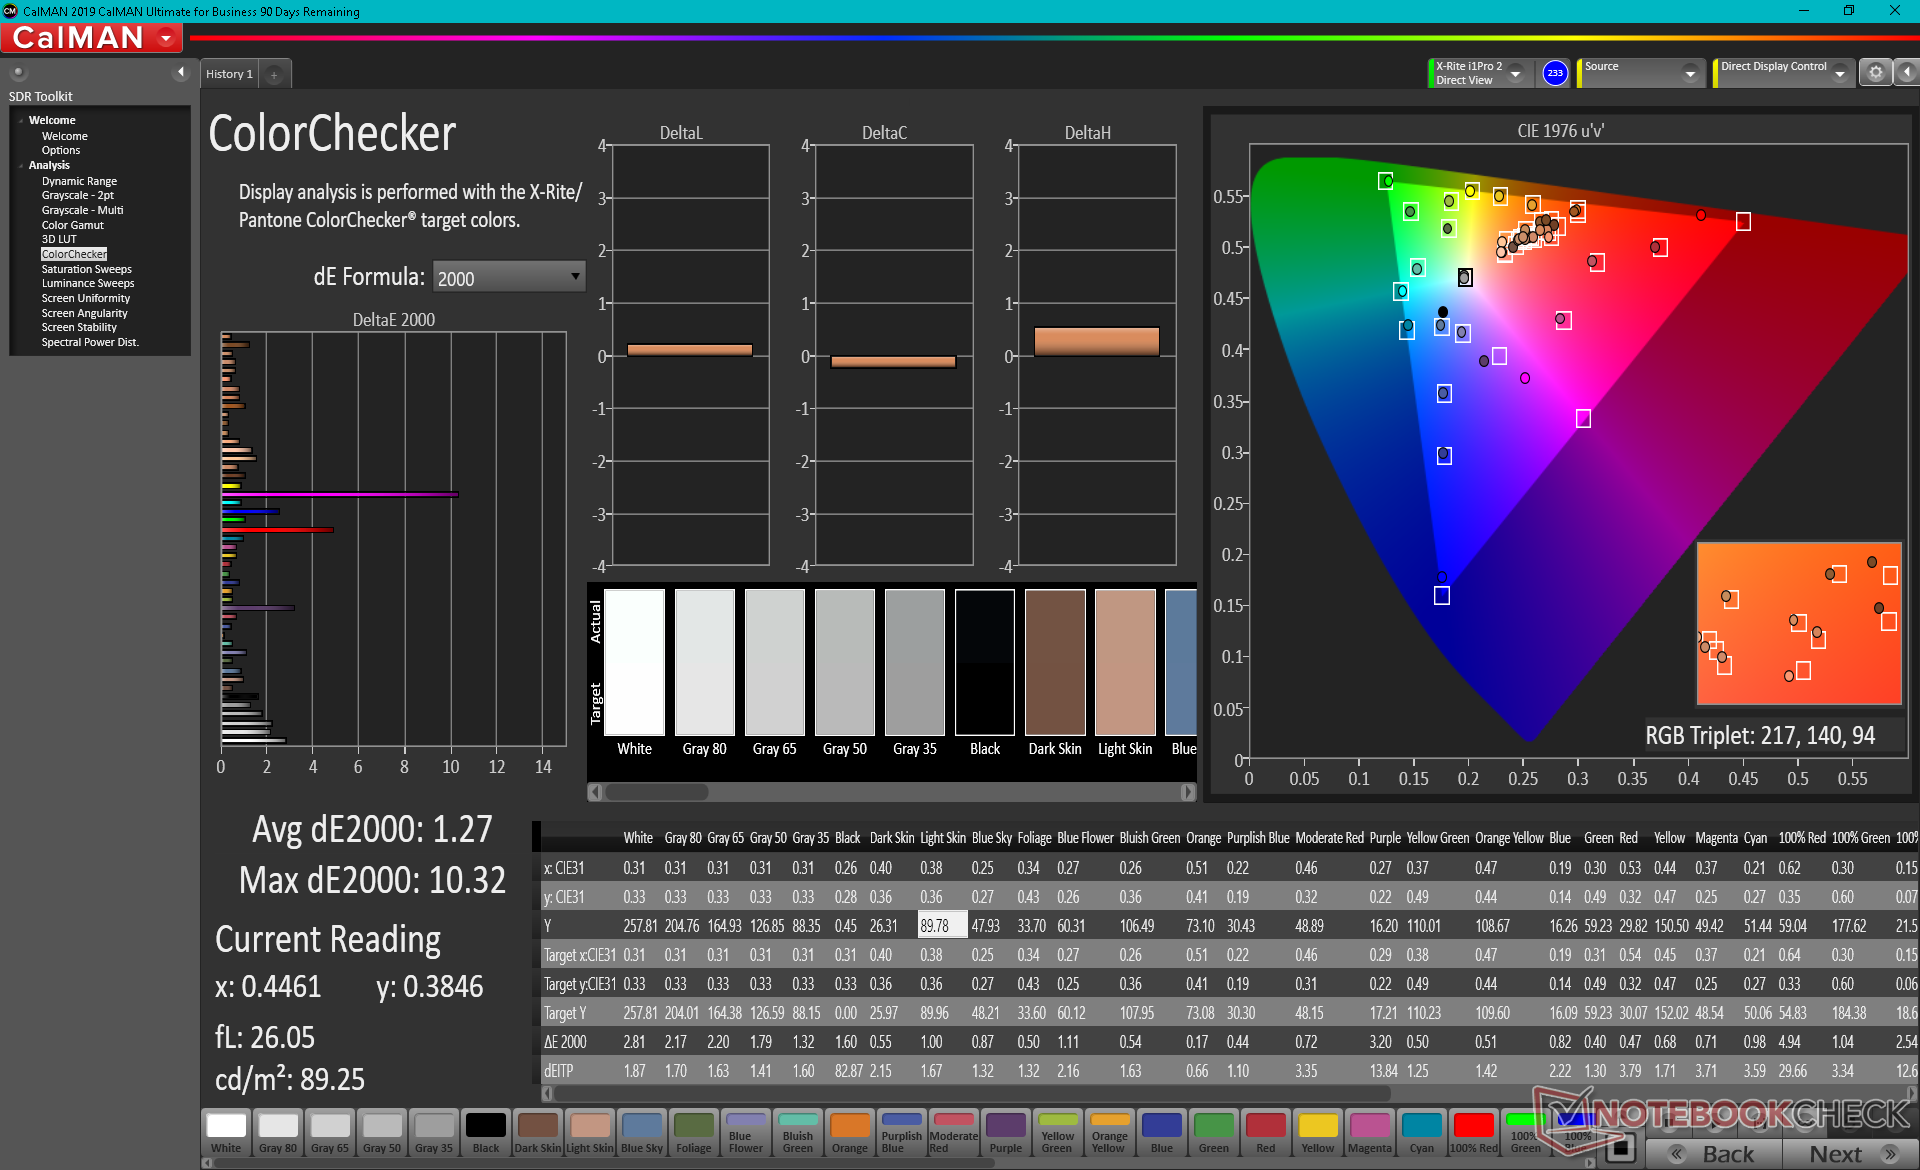
calibrated: 1.27
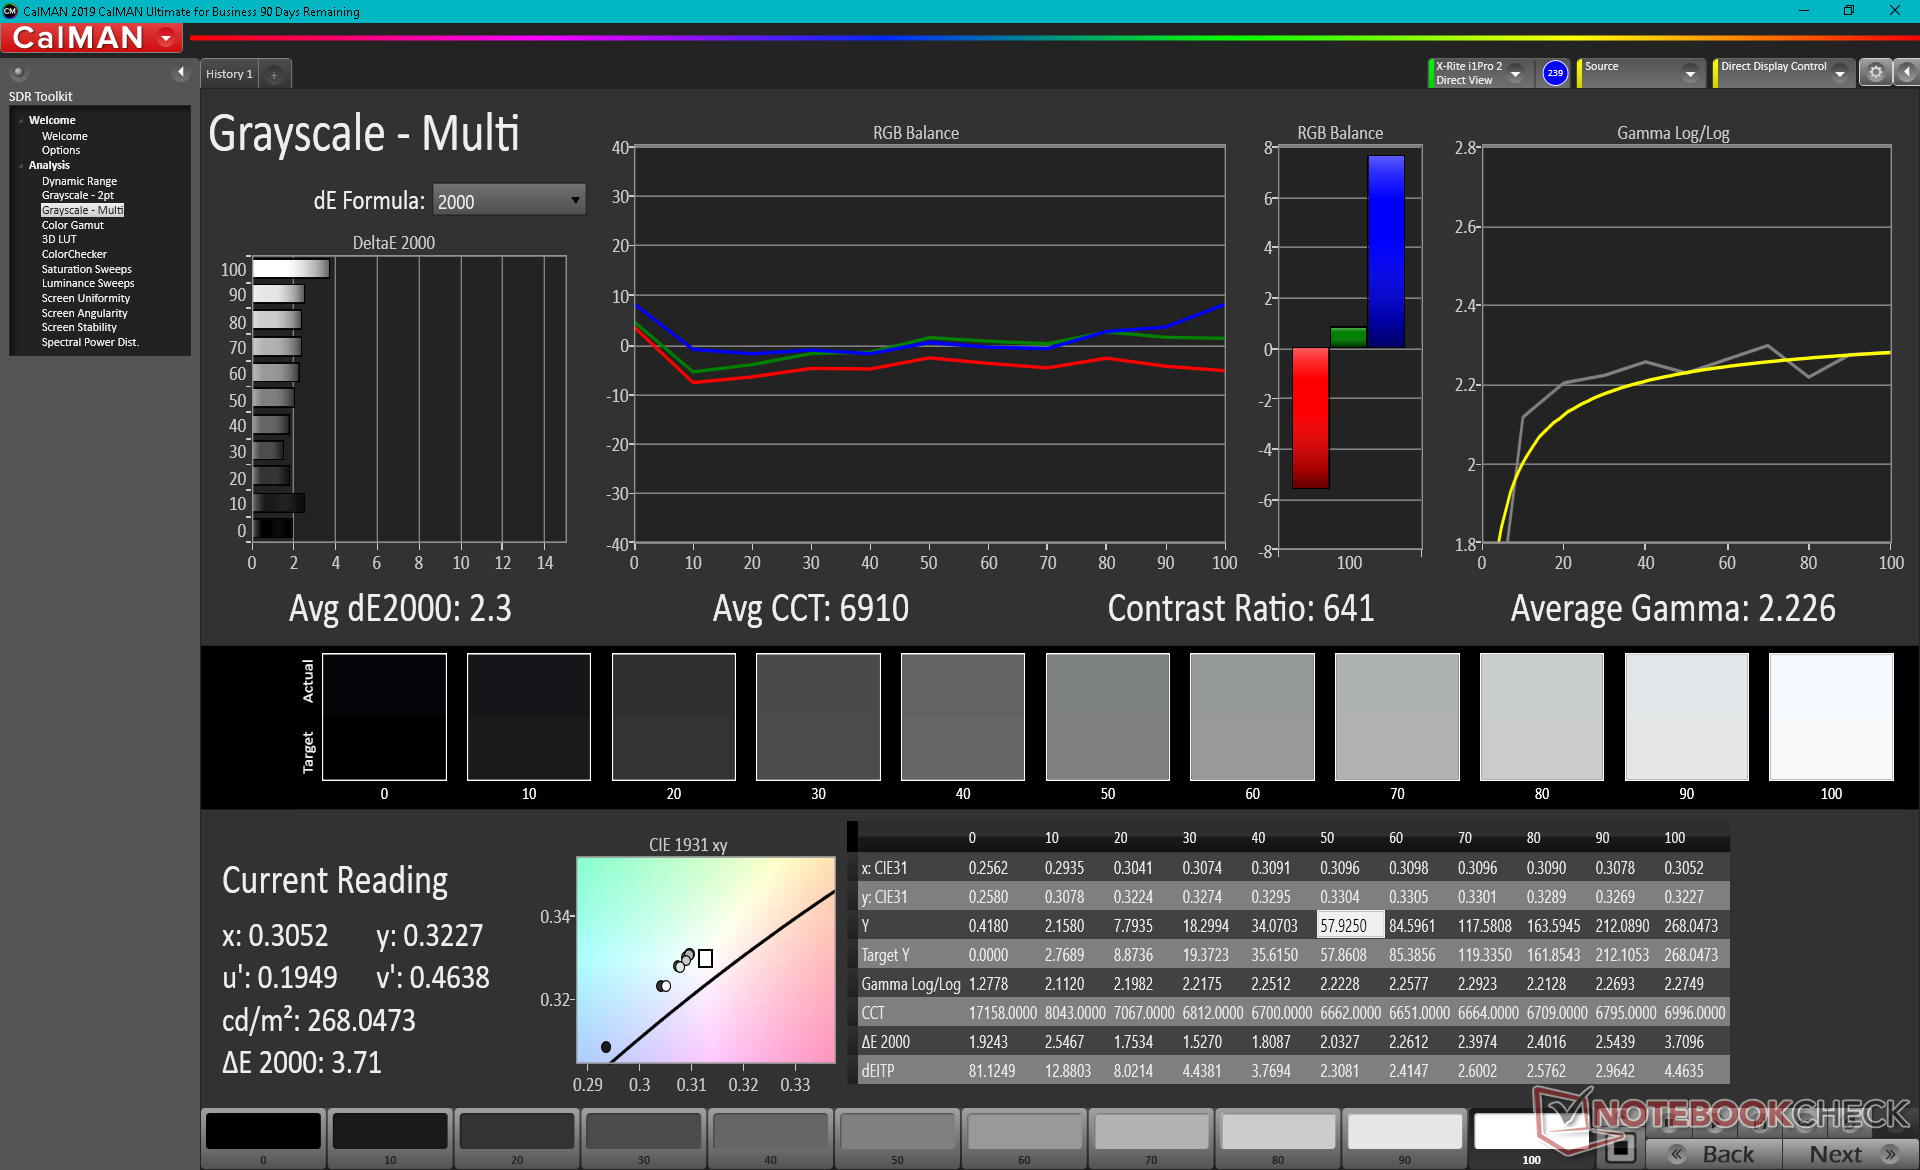
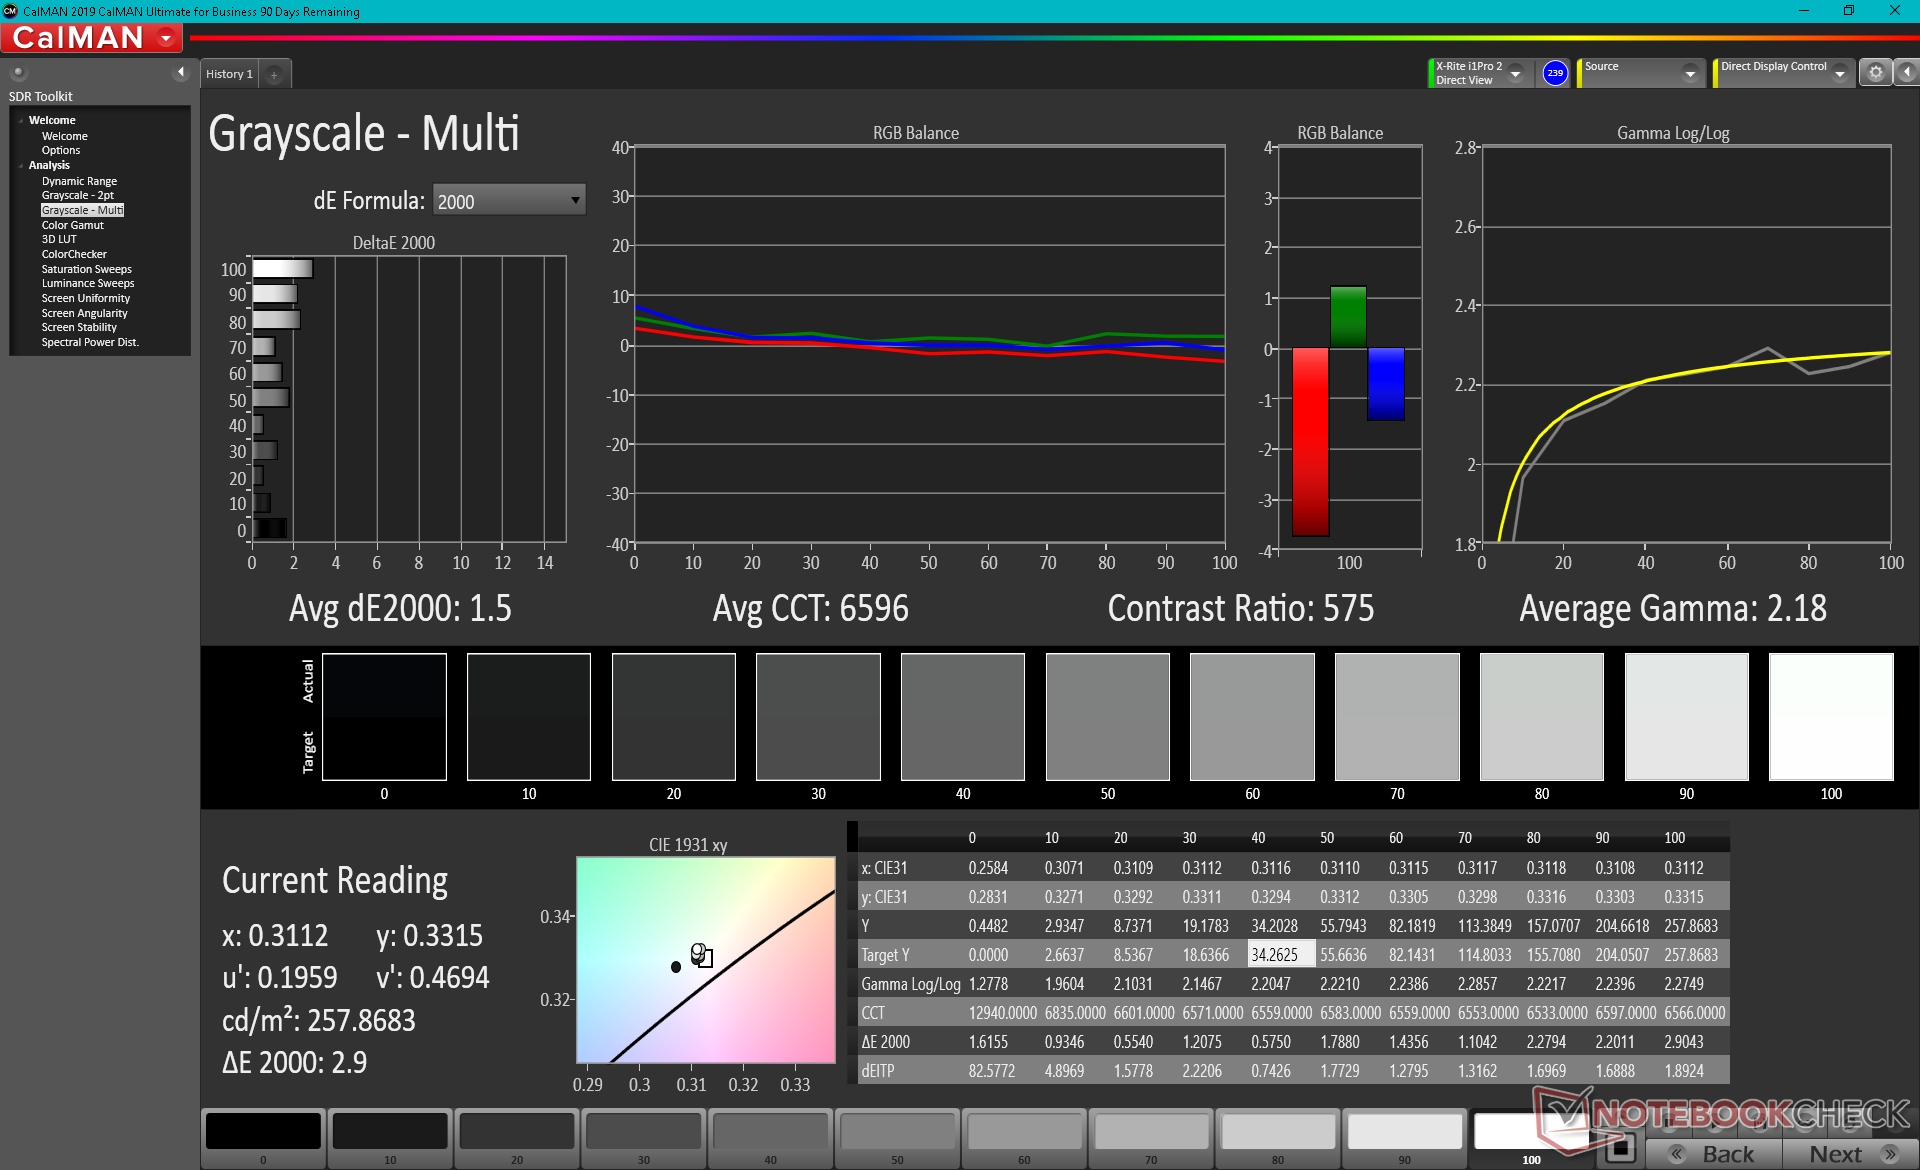
ΔE Greyscale Calman: 2.3 | ∀{0.09-98 Ø4.96}
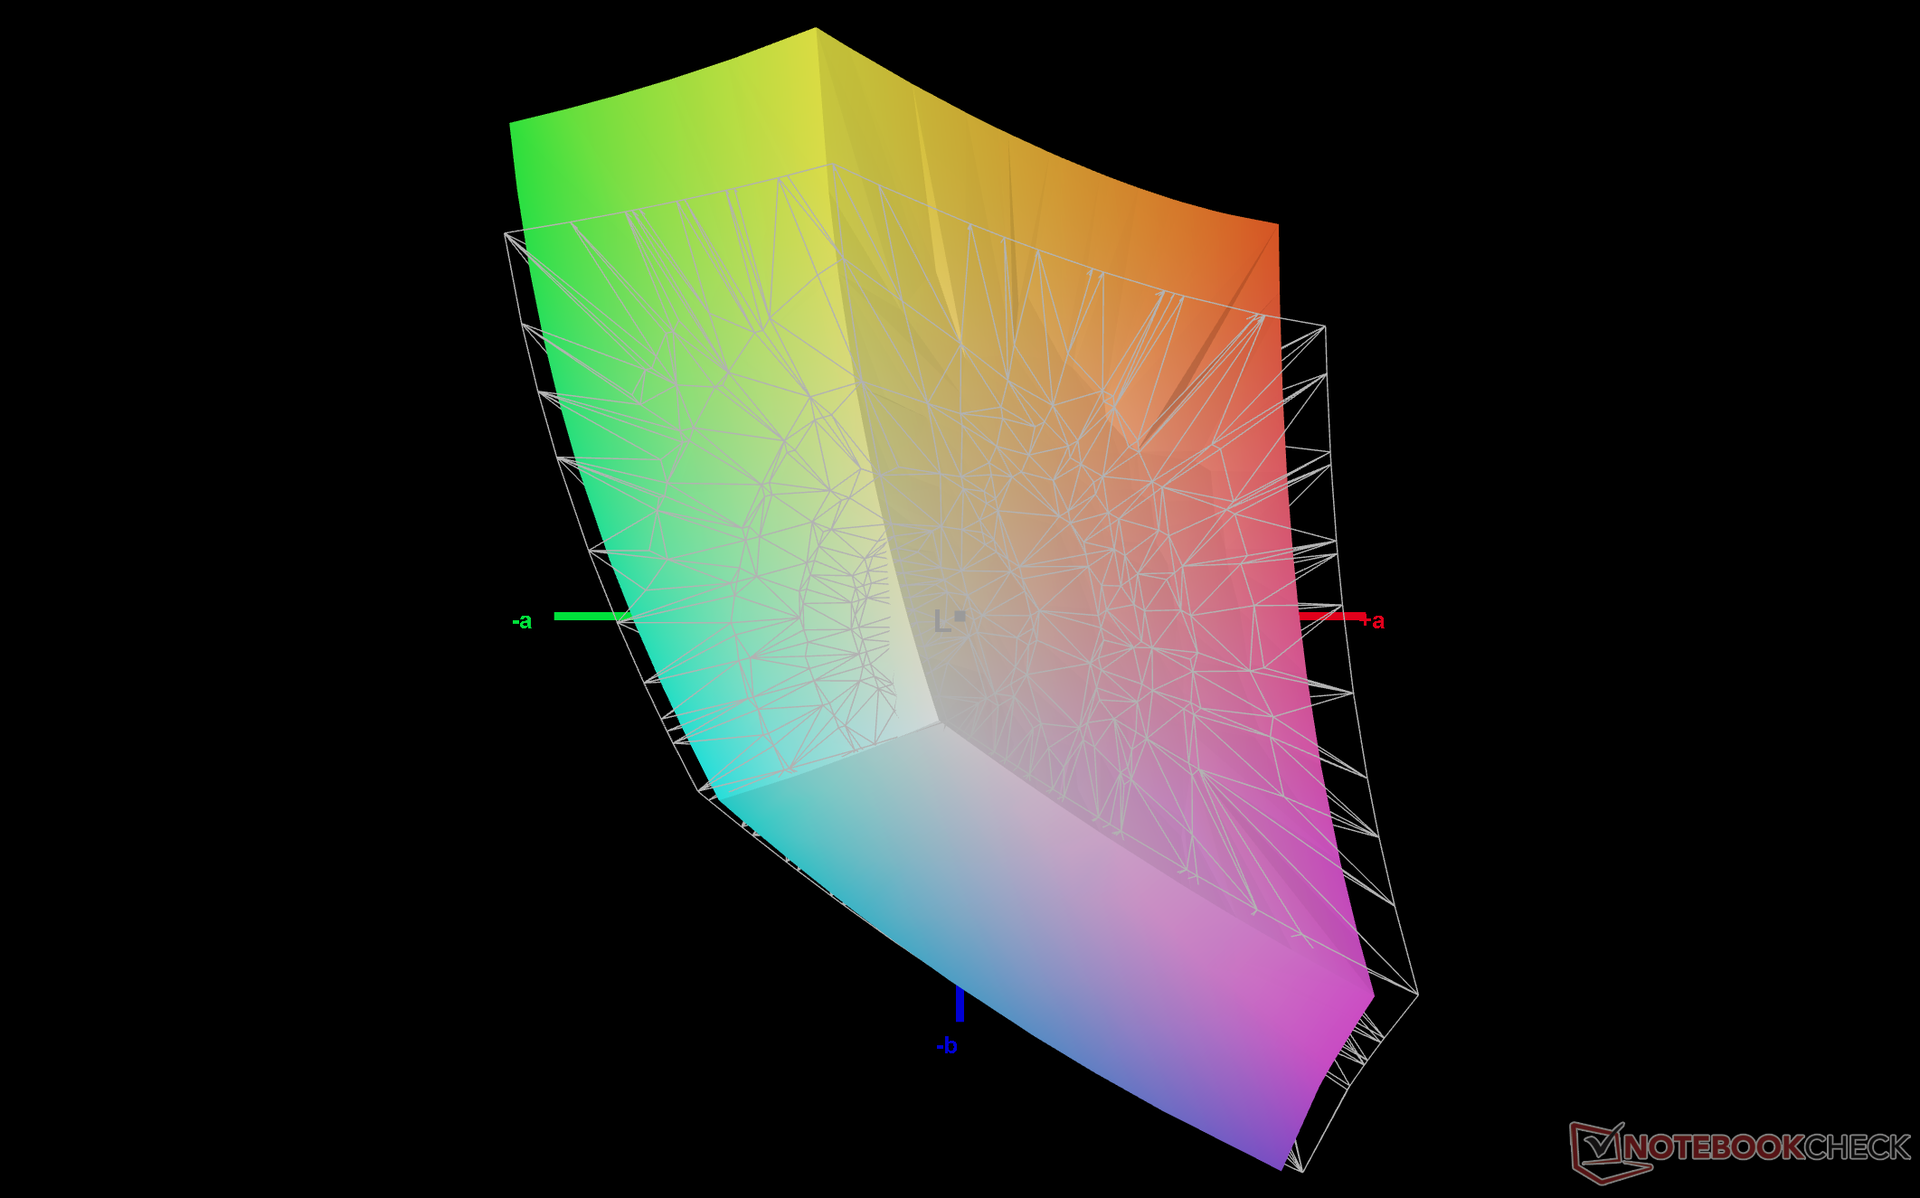
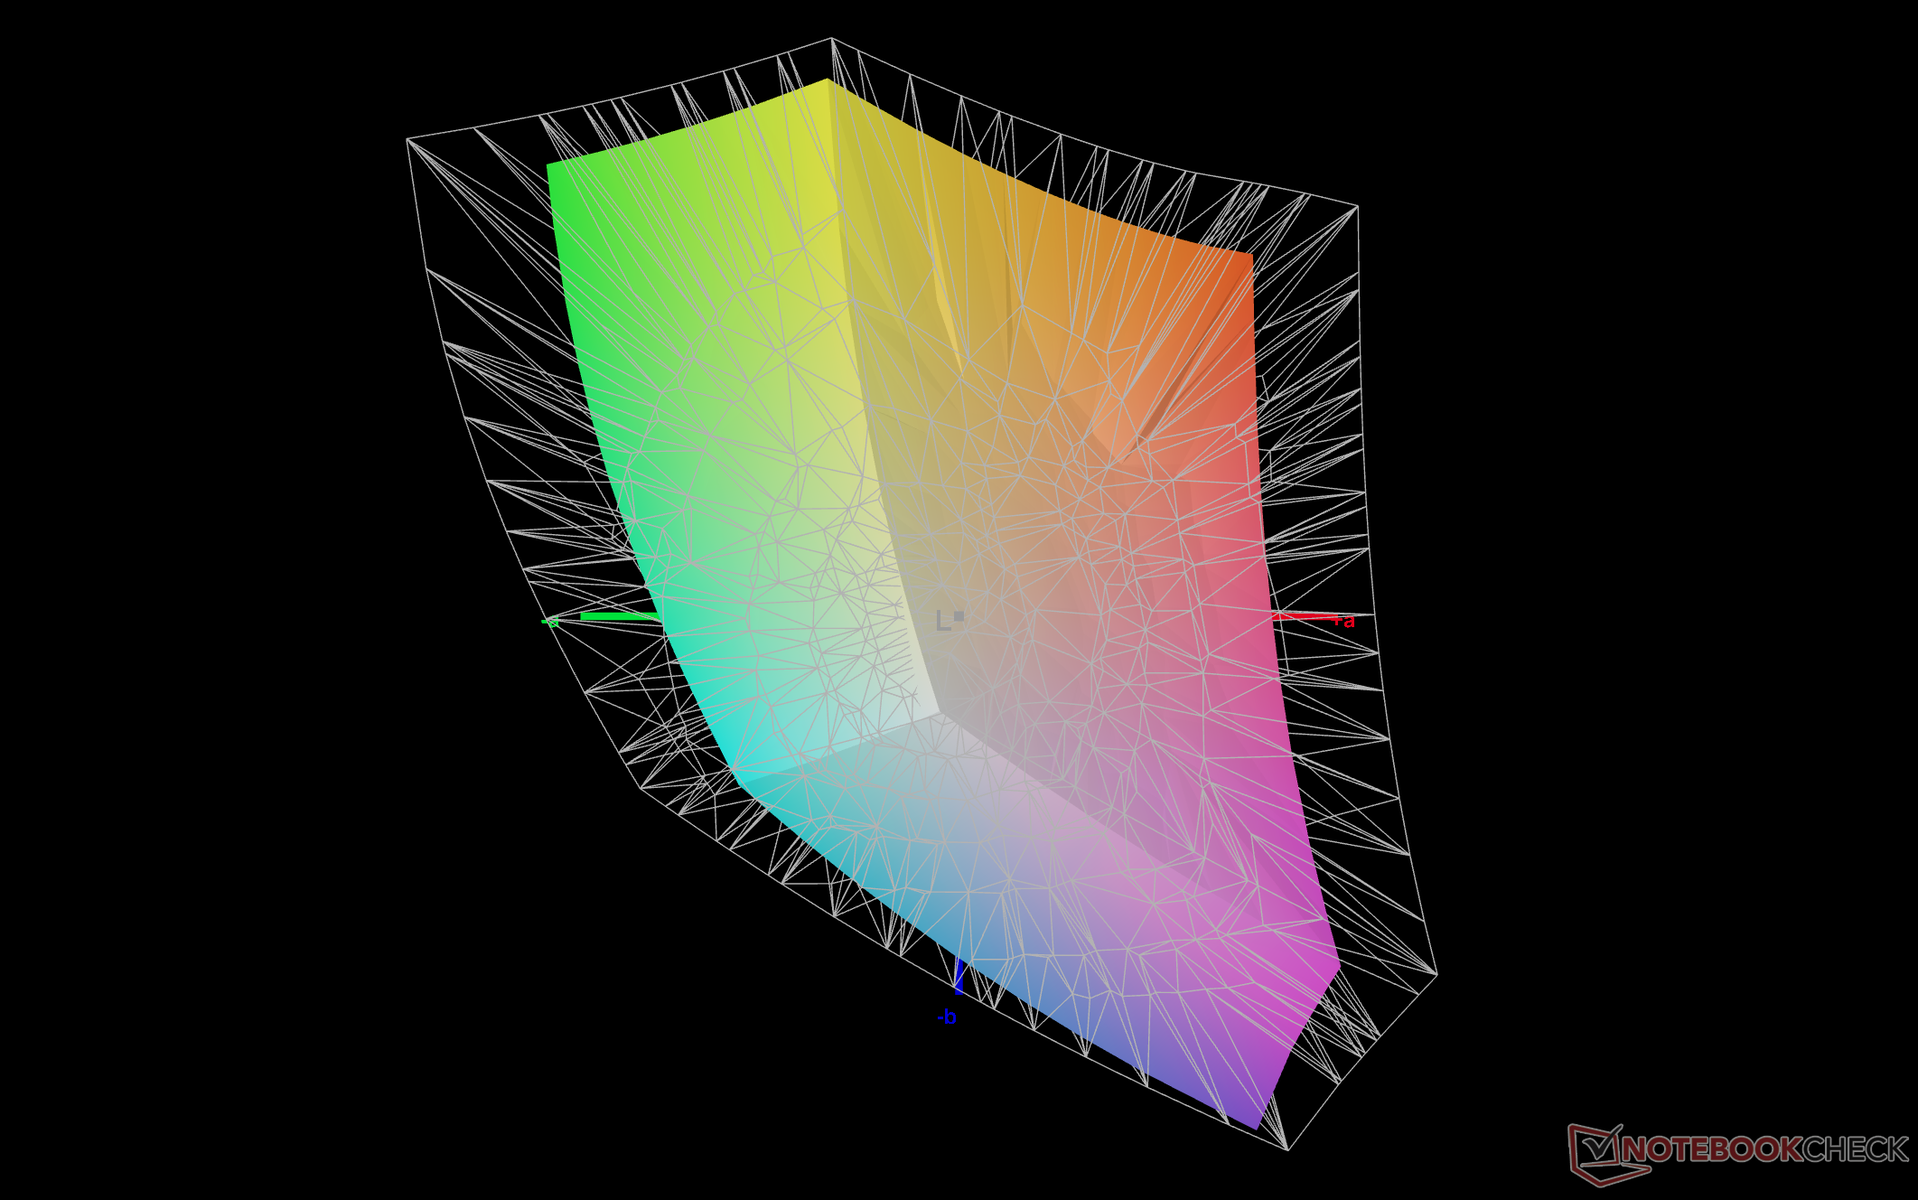
65.3% AdobeRGB 1998 (Argyll 3D)
89.1% sRGB (Argyll 3D)
68.8% Display P3 (Argyll 3D)
Gamma: 2.23
CCT: 6910 K
| Kuu LeBook 12.6 Core i7-8550U BOE TV126WTM-NU0, IPS, 12.6", 2160x1440 | Lenovo ThinkPad X12 20UVS03G00 N123NCA-GS1, a-Si IPS LED, 12.3", 1920x1280 | Microsoft Surface Pro 7 Plus LG Philips LP123WQ332684, IPS, 12.3", 2736x1824 | Dell Latitude 12 7210 2-in-1 Sharp LQ123N1, IPS, 12.3", 1920x1280 | Microsoft Surface Laptop Go Core i5 LG Philips LP125WX112403, IPS, 12.4", 1536x1024 | NuVision Encite Book 12 Plus Sharp SHP142C, IPS, 12.5", 2560x1440 | |
|---|---|---|---|---|---|---|
| Display | 4% | 4% | 4% | 0% | 12% | |
| Display P3 Coverage (%) | 68.8 | 67 -3% | 66.9 -3% | 67.9 -1% | 64.4 -6% | 74.8 9% |
| sRGB Coverage (%) | 89.1 | 99.2 11% | 96.7 9% | 96.8 9% | 94.6 6% | 98.9 11% |
| AdobeRGB 1998 Coverage (%) | 65.3 | 68.8 5% | 69.1 6% | 68.8 5% | 65.7 1% | 75.6 16% |
| Response Times | -29% | -11% | 42% | 15% | 8% | |
| Response Time Grey 50% / Grey 80% * (ms) | 42 ? | 63.2 ? -50% | 50.8 ? -21% | 29 ? 31% | 34.8 ? 17% | 37.6 ? 10% |
| Response Time Black / White * (ms) | 33.2 ? | 36 ? -8% | 33.6 ? -1% | 16 ? 52% | 29.2 ? 12% | 31.6 ? 5% |
| PWM Frequency (Hz) | 199.2 ? | 1250 ? | 21930 ? | 198.4 ? | ||
| Screen | 70% | 45% | 38% | 44% | 4% | |
| Brightness middle (cd/m²) | 269.7 | 419 55% | 408 51% | 380 41% | 354.3 31% | 431.5 60% |
| Brightness (cd/m²) | 256 | 406 59% | 425 66% | 378 48% | 353 38% | 406 59% |
| Brightness Distribution (%) | 87 | 94 8% | 85 -2% | 86 -1% | 95 9% | 80 -8% |
| Black Level * (cd/m²) | 0.46 | 0.23 50% | 0.34 26% | 0.31 33% | 0.29 37% | 0.43 7% |
| Contrast (:1) | 586 | 1822 211% | 1200 105% | 1226 109% | 1222 109% | 1003 71% |
| Colorchecker dE 2000 * | 3.72 | 1.1 70% | 1.5 60% | 2.28 39% | 1.41 62% | 3.56 4% |
| Colorchecker dE 2000 max. * | 10.49 | 2.2 79% | 2.5 76% | 3.93 63% | 2.96 72% | 7 33% |
| Colorchecker dE 2000 calibrated * | 1.27 | 0.5 61% | 1.4 -10% | 0.97 24% | 1.44 -13% | 3.34 -163% |
| Greyscale dE 2000 * | 2.3 | 1.5 35% | 1.6 30% | 2.56 -11% | 1.2 48% | 2.9 -26% |
| Gamma | 2.23 99% | 2.06 107% | 2.05 107% | 2.32 95% | 2.26 97% | 2.2 100% |
| CCT | 6910 94% | 6524 100% | 6432 101% | 6130 106% | 6600 98% | 6572 99% |
| Color Space (Percent of AdobeRGB 1998) (%) | 62.8 | 63.7 | 63 | 60.2 | 66.7 | |
| Color Space (Percent of sRGB) (%) | 99.2 | 96.8 | 97 | 94.4 | 98.9 | |
| Total Average (Program / Settings) | 15% /
42% | 13% /
28% | 28% /
32% | 20% /
30% | 8% /
6% |
* ... smaller is better
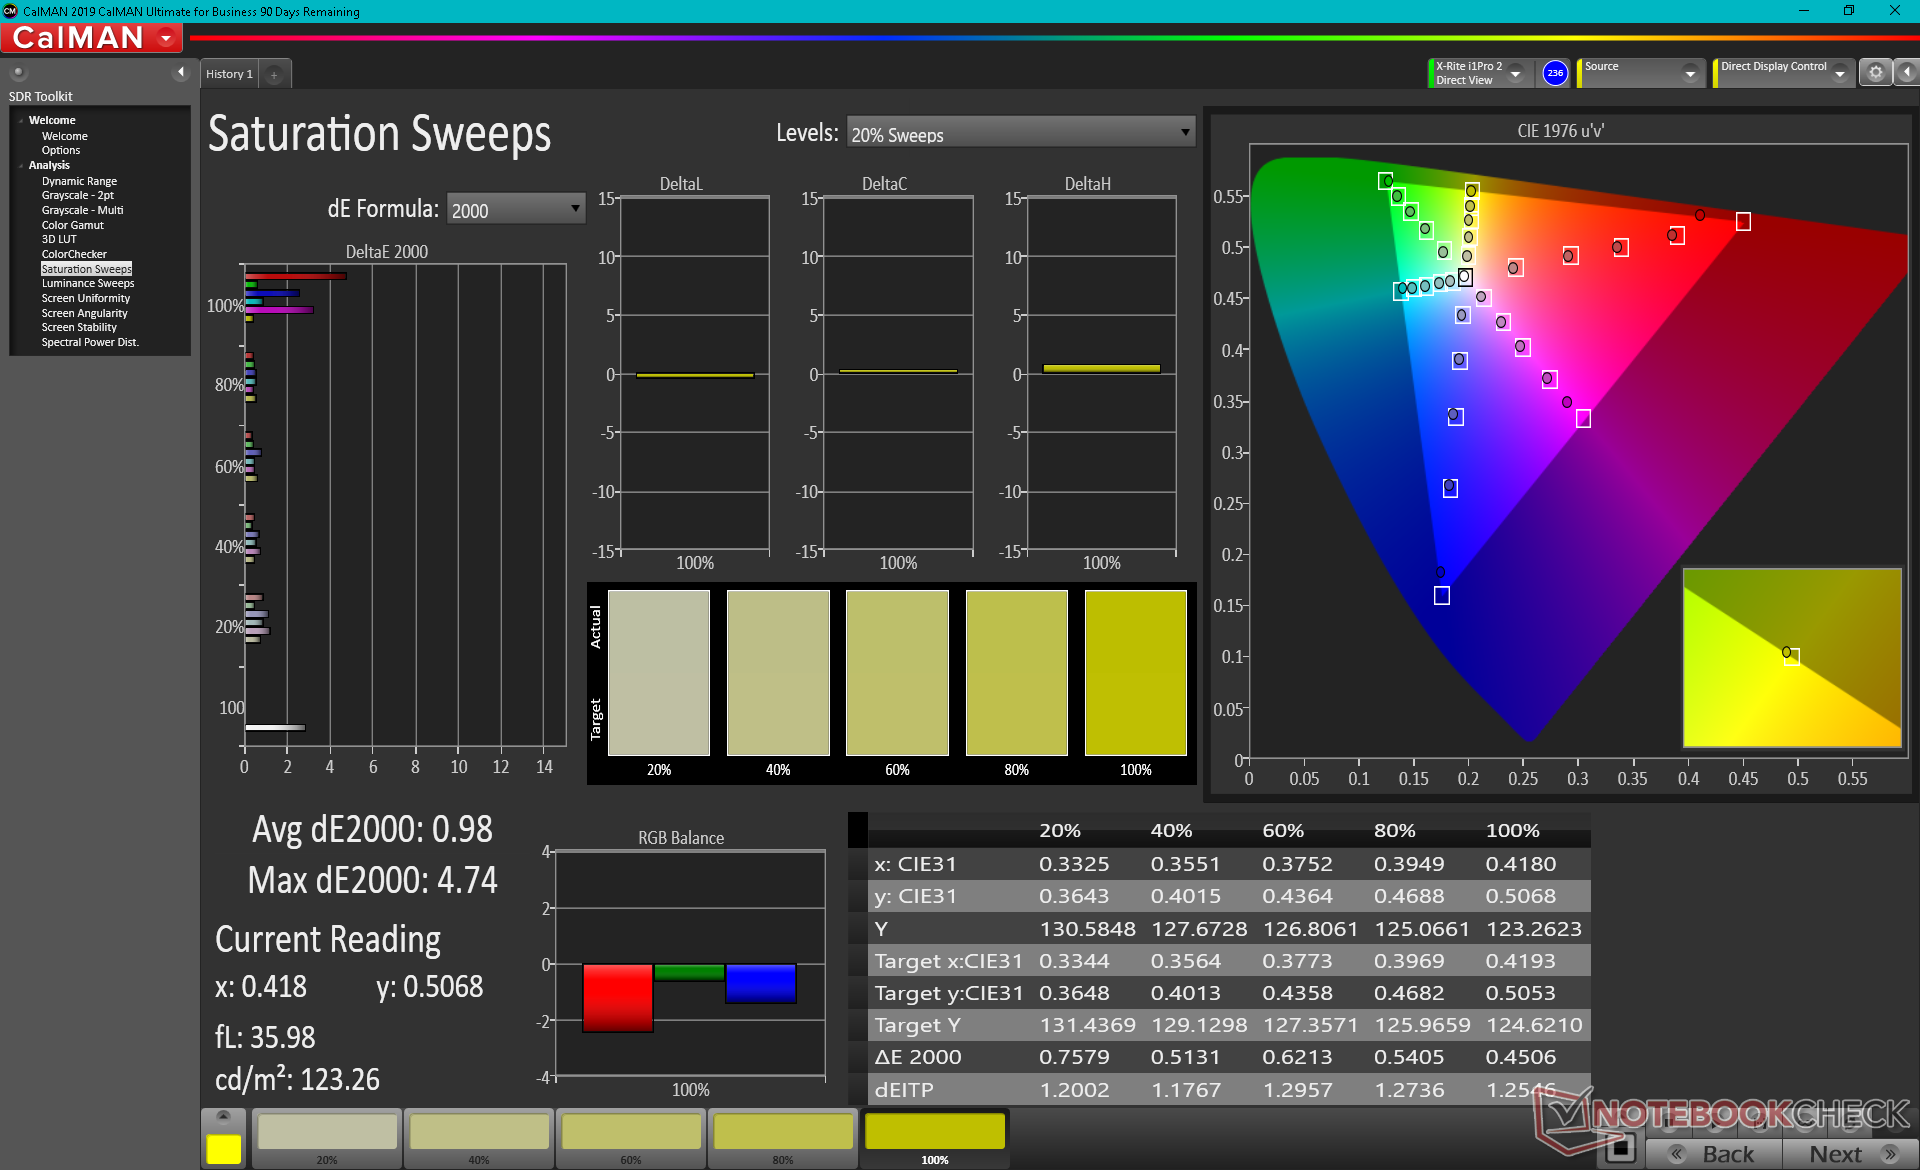
Color space is wide at approximately 89 percent of sRGB compared to >95 percent on pricier Ultrabooks and tablets. Color reproduction is roughly comparable to the display on the Surface Laptop Go.
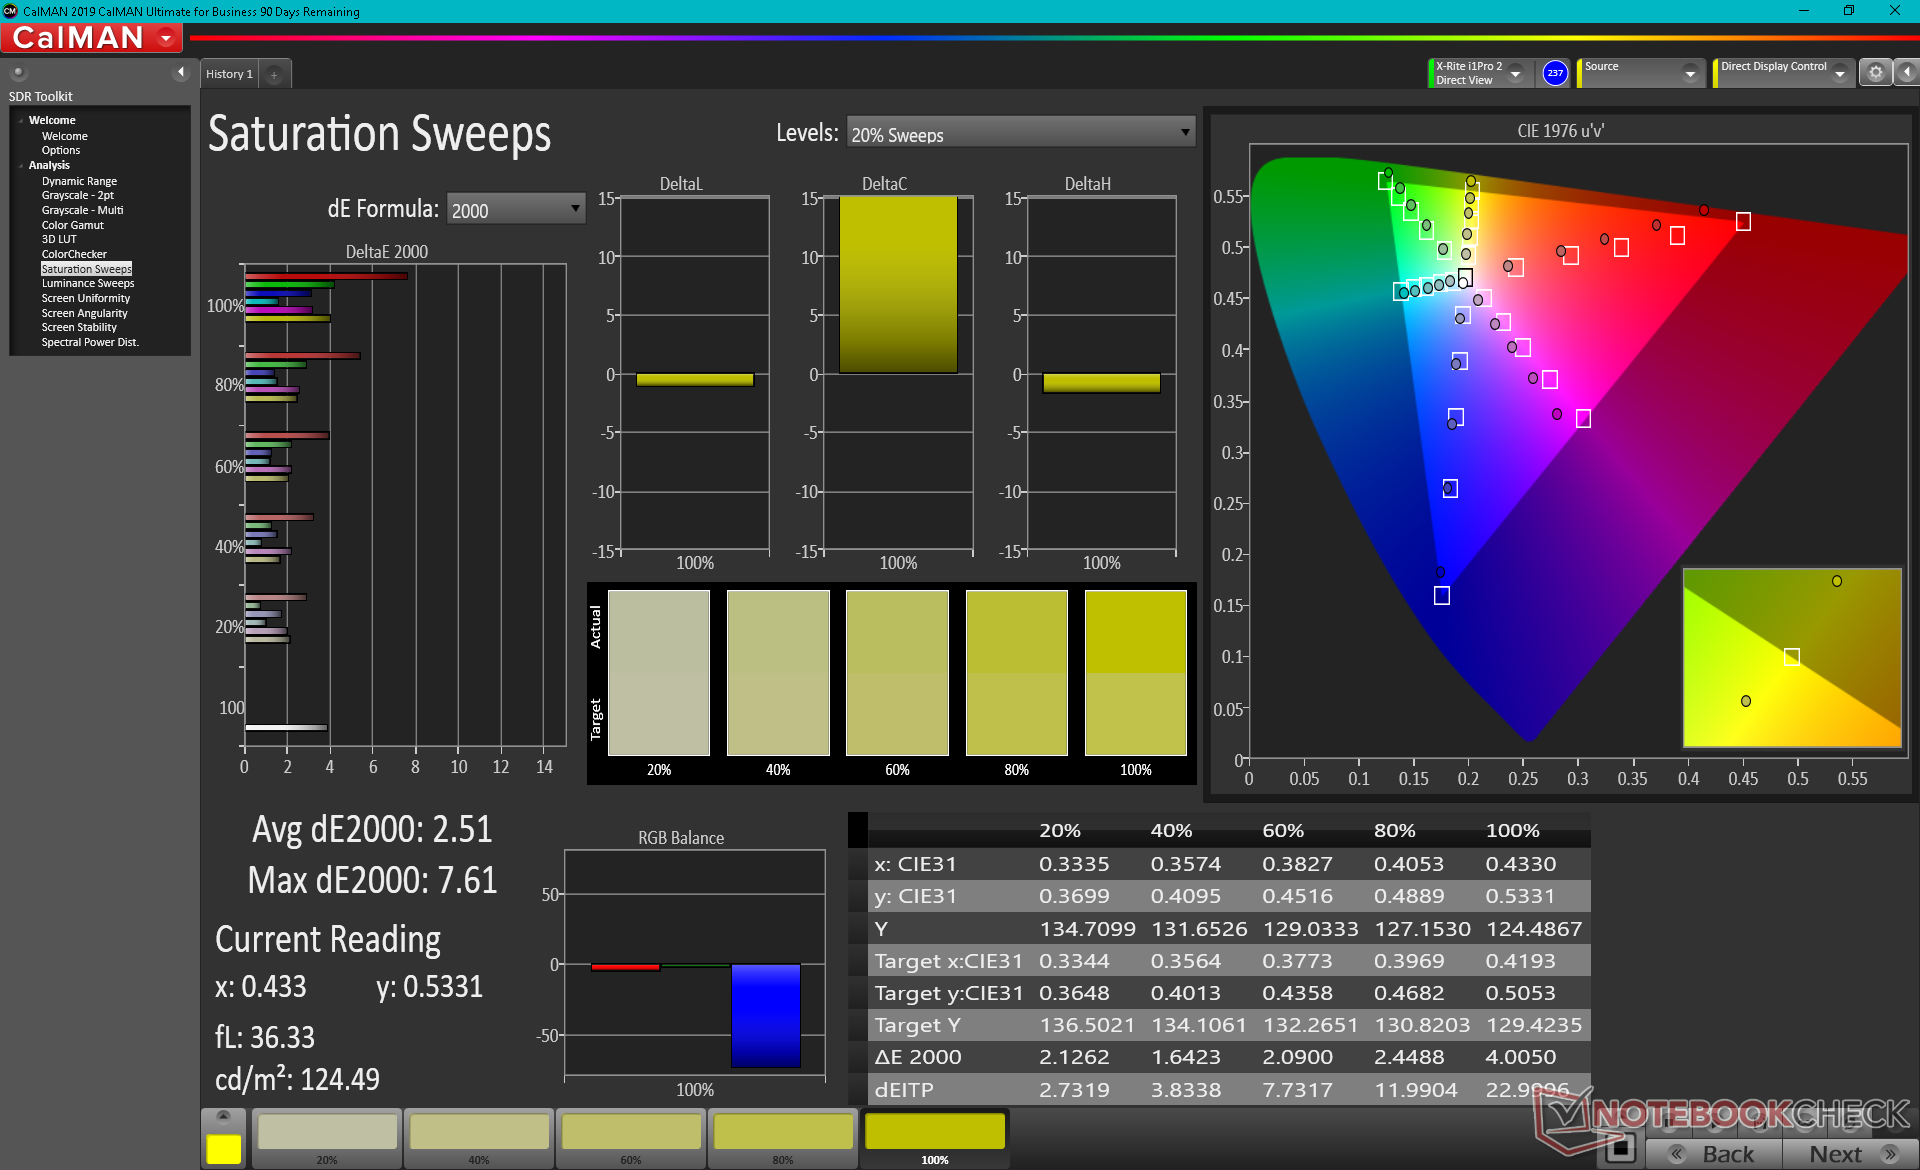
The display is decently calibrated out of the box despite the cheap starting price. Color temperature is slightly too cool, but a calibration addresses this without any issues. The final average grayscale and ColorChecker deltaE values of just 1.5 and 1.27, respectively, are better than we had initially expected. Shades of magenta may be more inaccurate than other colors, however.
Display Response Times
| ↔ Response Time Black to White | ||
|---|---|---|
| 33.2 ms ... rise ↗ and fall ↘ combined | ↗ 19.2 ms rise | 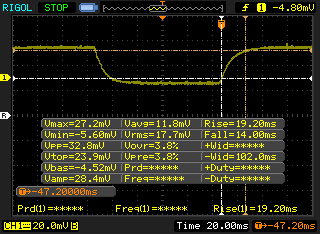 |
| ↘ 14 ms fall | ||
| The screen shows slow response rates in our tests and will be unsatisfactory for gamers. In comparison, all tested devices range from 0.1 (minimum) to 240 (maximum) ms. » 90 % of all devices are better. This means that the measured response time is worse than the average of all tested devices (19.8 ms). | ||
| ↔ Response Time 50% Grey to 80% Grey | ||
| 42 ms ... rise ↗ and fall ↘ combined | ↗ 22.4 ms rise |  |
| ↘ 19.6 ms fall | ||
| The screen shows slow response rates in our tests and will be unsatisfactory for gamers. In comparison, all tested devices range from 0.165 (minimum) to 636 (maximum) ms. » 67 % of all devices are better. This means that the measured response time is worse than the average of all tested devices (30.9 ms). | ||
Screen Flickering / PWM (Pulse-Width Modulation)
| Screen flickering / PWM not detected | 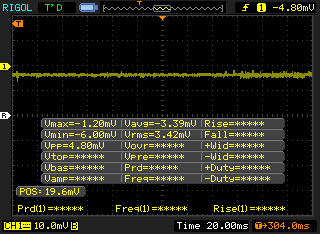 | ||
In comparison: 52 % of all tested devices do not use PWM to dim the display. If PWM was detected, an average of 7741 (minimum: 5 - maximum: 343500) Hz was measured. | |||
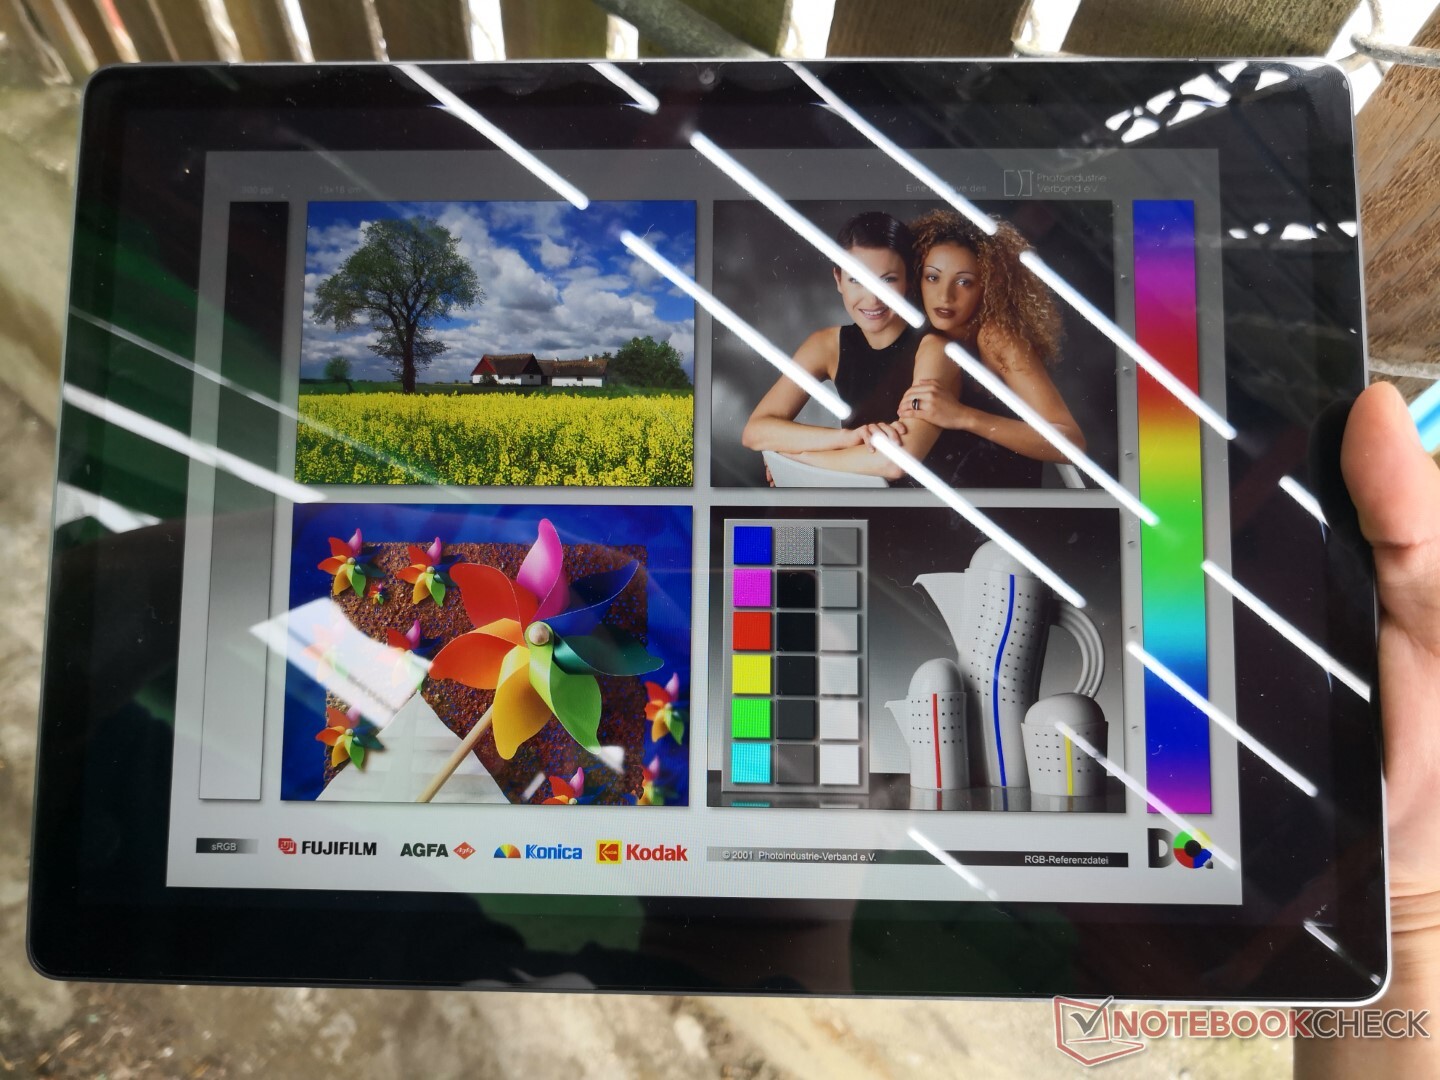
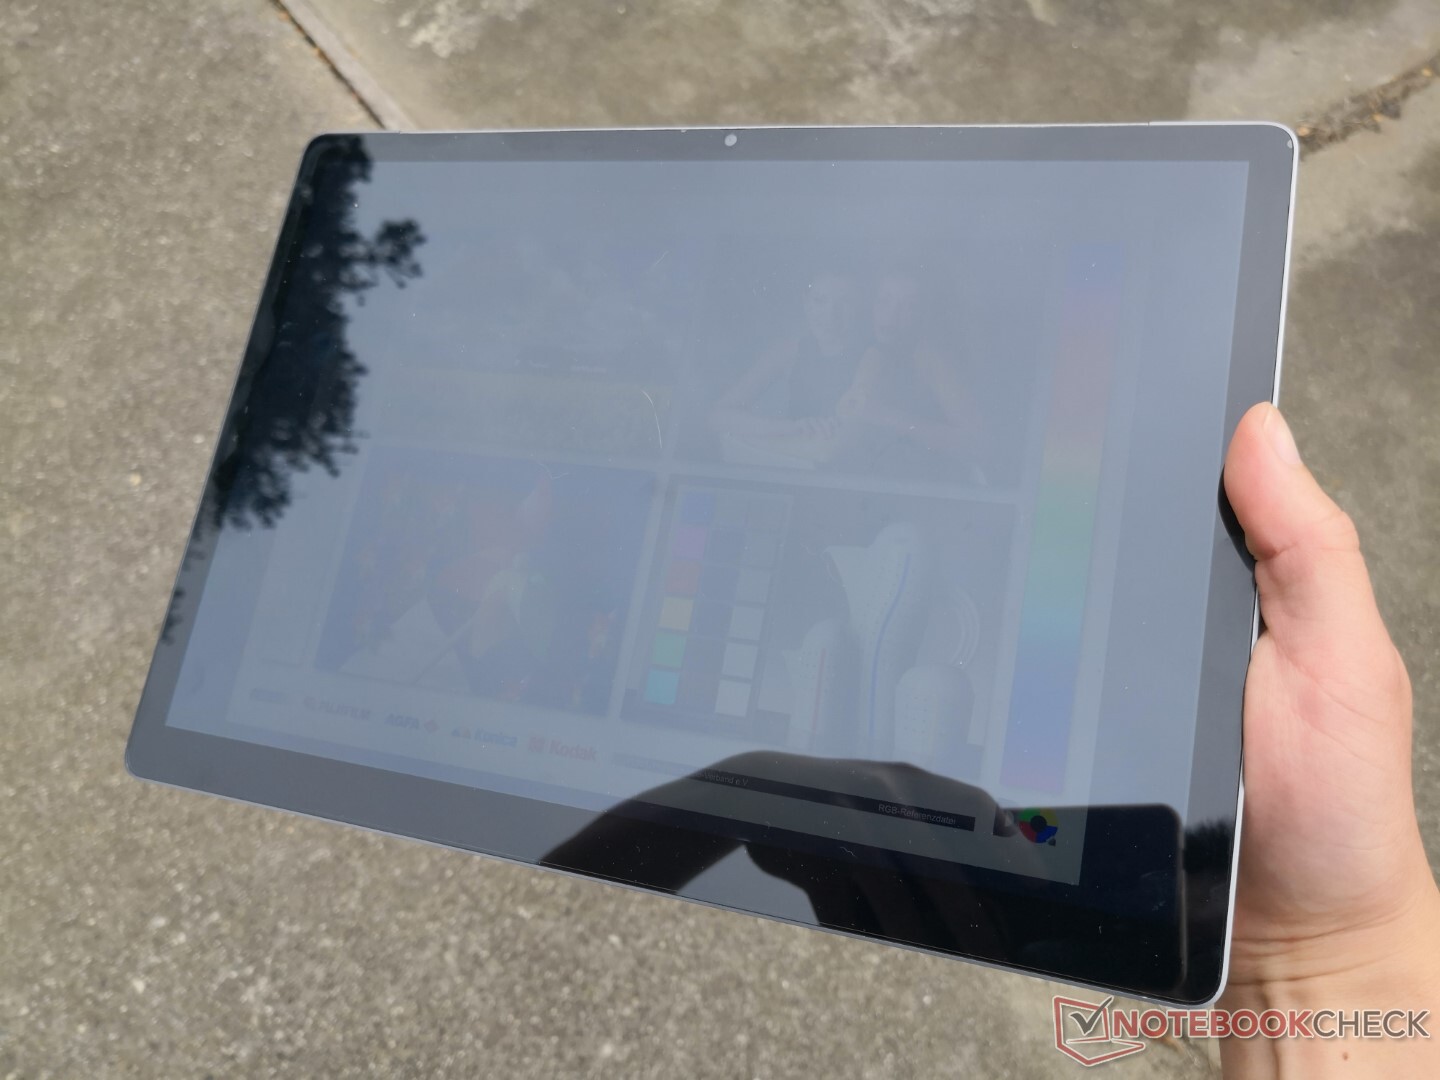
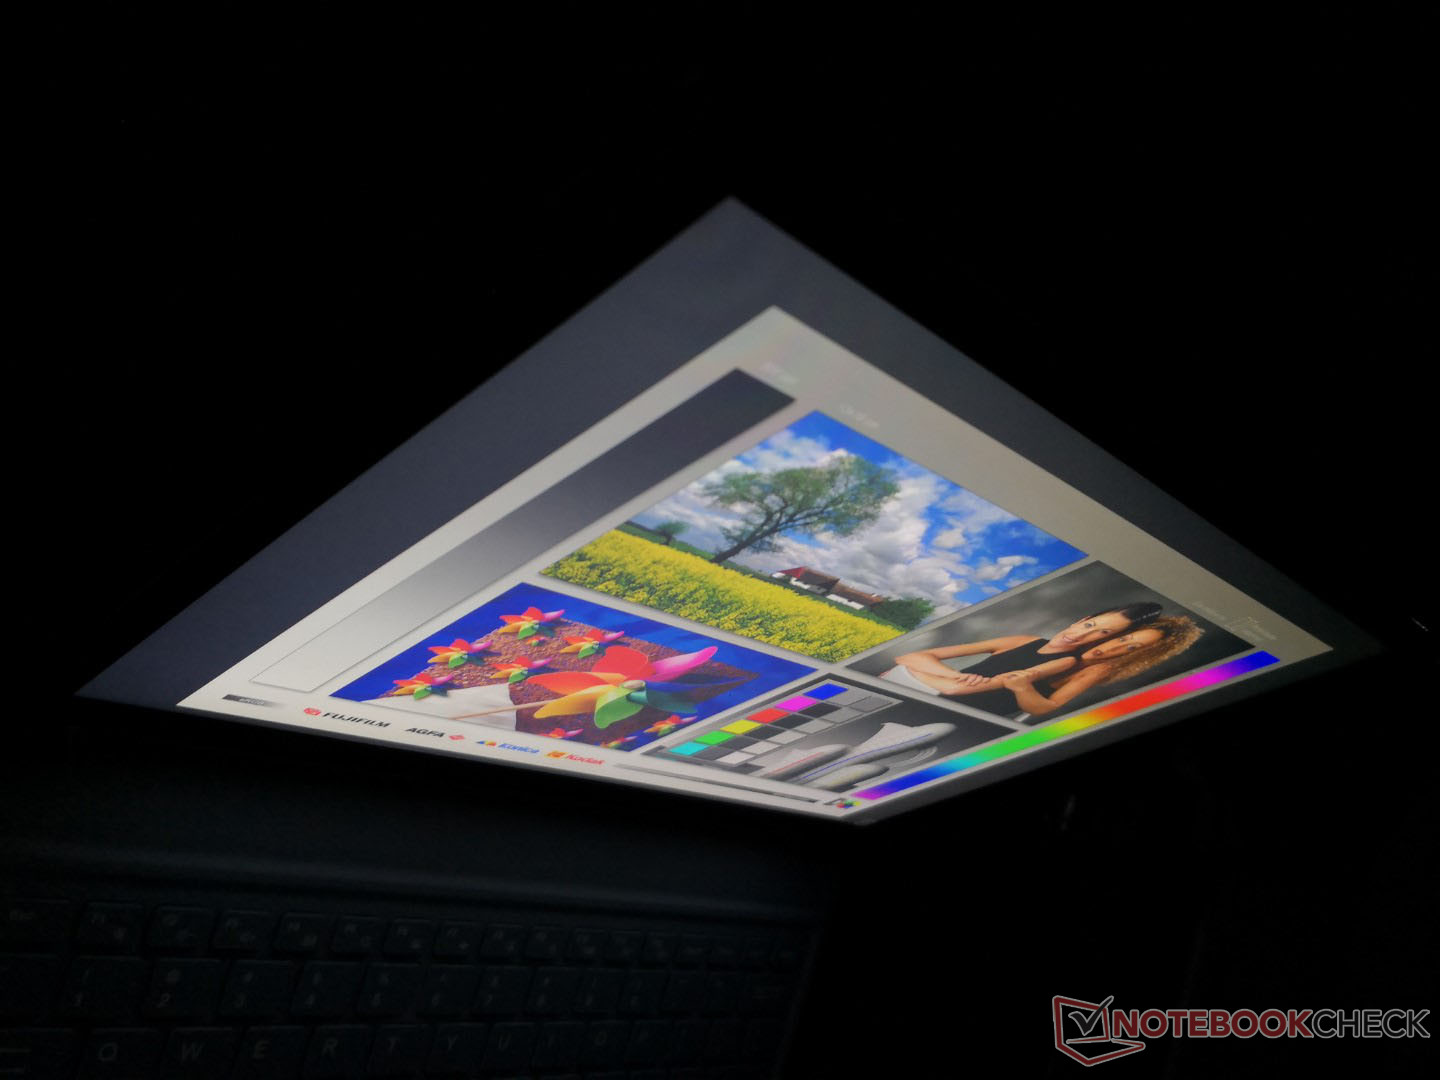
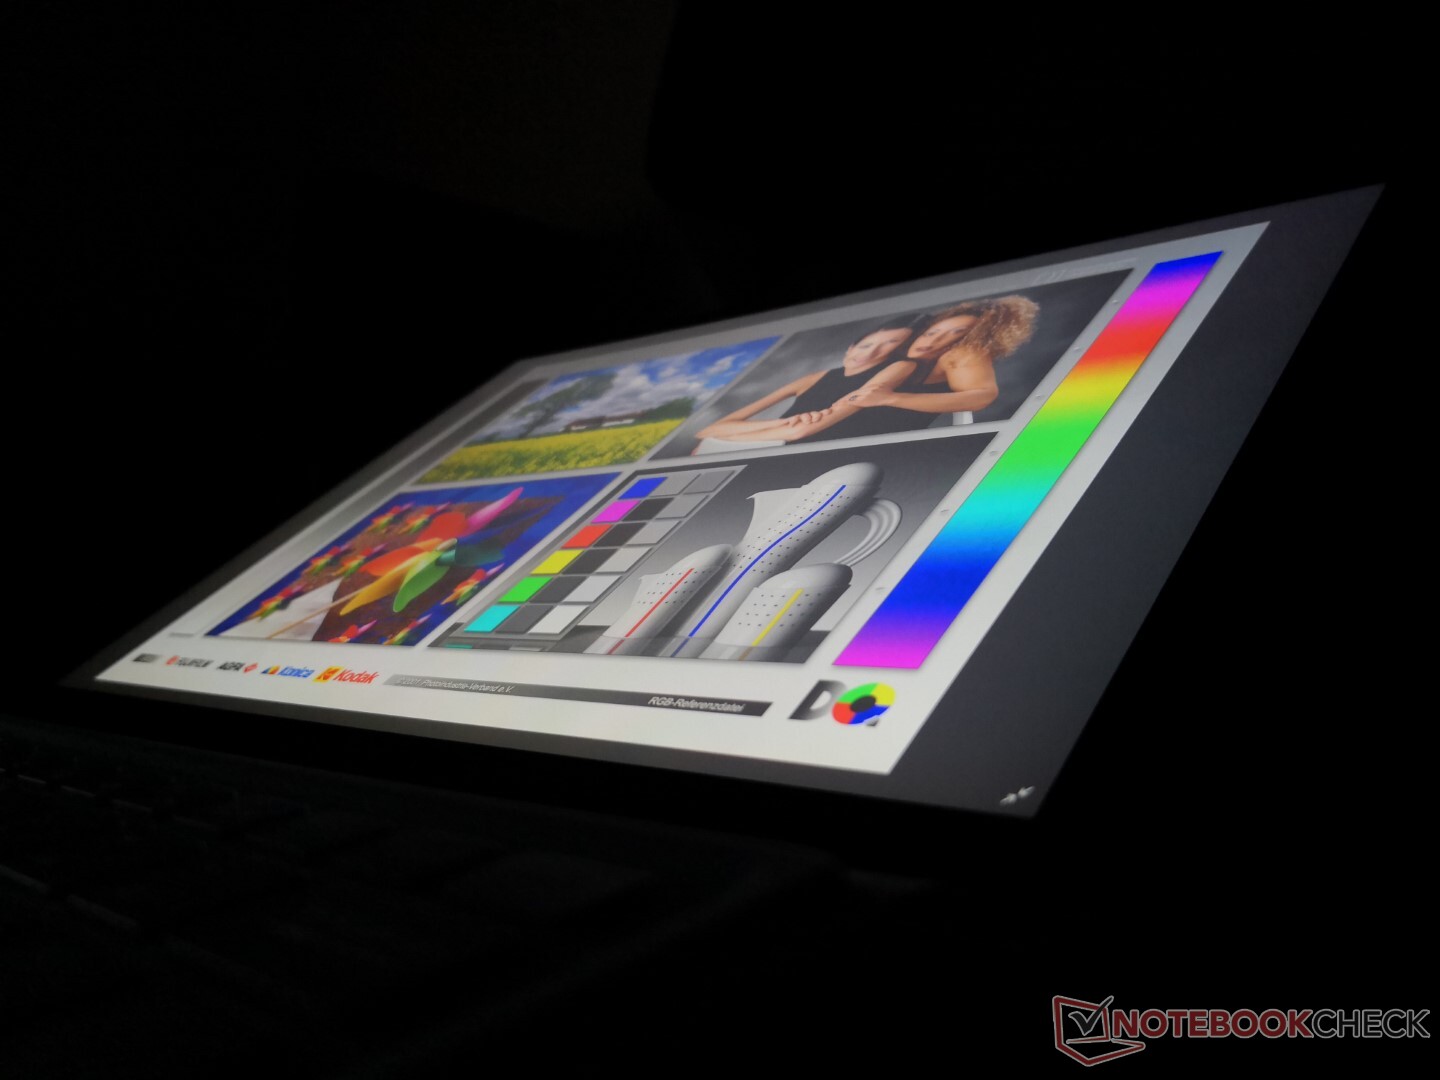
Outdoor visibility is poorer than on most other tablets since the display is dimmer. Expect a lot of unavoidable glare when under most outdoor conditions.

Performance
Processor
CPU performance is roughly 30 percent and 45 percent slower than the latest Core i7-1165G7 in single-threaded and multi-threaded workloads, respectively. Though significant, the difference is not very noticeable for simpler tasks like web browsing or word processing. It's certainly still leagues better than a Celeron or Atom system where applications take much longer to launch or navigate through.
Cinebench R15 Multi Loop
Cinebench R23: Multi Core | Single Core
Cinebench R15: CPU Multi 64Bit | CPU Single 64Bit
Blender: v2.79 BMW27 CPU
7-Zip 18.03: 7z b 4 -mmt1 | 7z b 4
Geekbench 5.5: Single-Core | Multi-Core
HWBOT x265 Benchmark v2.2: 4k Preset
LibreOffice : 20 Documents To PDF
R Benchmark 2.5: Overall mean
| Cinebench R23 / Multi Core | |
| Framework Laptop 13.5 | |
| Microsoft Surface Pro 7 Plus | |
| Dell Latitude 12 7210 2-in-1 | |
| Lenovo ThinkPad X12 20UVS03G00 | |
| Kuu LeBook 12.6 Core i7-8550U | |
| Average Intel Core i7-8550U (n=1) | |
| Teclast F7 Air | |
| Cinebench R23 / Single Core | |
| Framework Laptop 13.5 | |
| Microsoft Surface Pro 7 Plus | |
| Dell Latitude 12 7210 2-in-1 | |
| Lenovo ThinkPad X12 20UVS03G00 | |
| Kuu LeBook 12.6 Core i7-8550U | |
| Average Intel Core i7-8550U (n=1) | |
| Teclast F7 Air | |
Cinebench R23: Multi Core | Single Core
Cinebench R15: CPU Multi 64Bit | CPU Single 64Bit
Blender: v2.79 BMW27 CPU
7-Zip 18.03: 7z b 4 -mmt1 | 7z b 4
Geekbench 5.5: Single-Core | Multi-Core
HWBOT x265 Benchmark v2.2: 4k Preset
LibreOffice : 20 Documents To PDF
R Benchmark 2.5: Overall mean
* ... smaller is better
System Performance
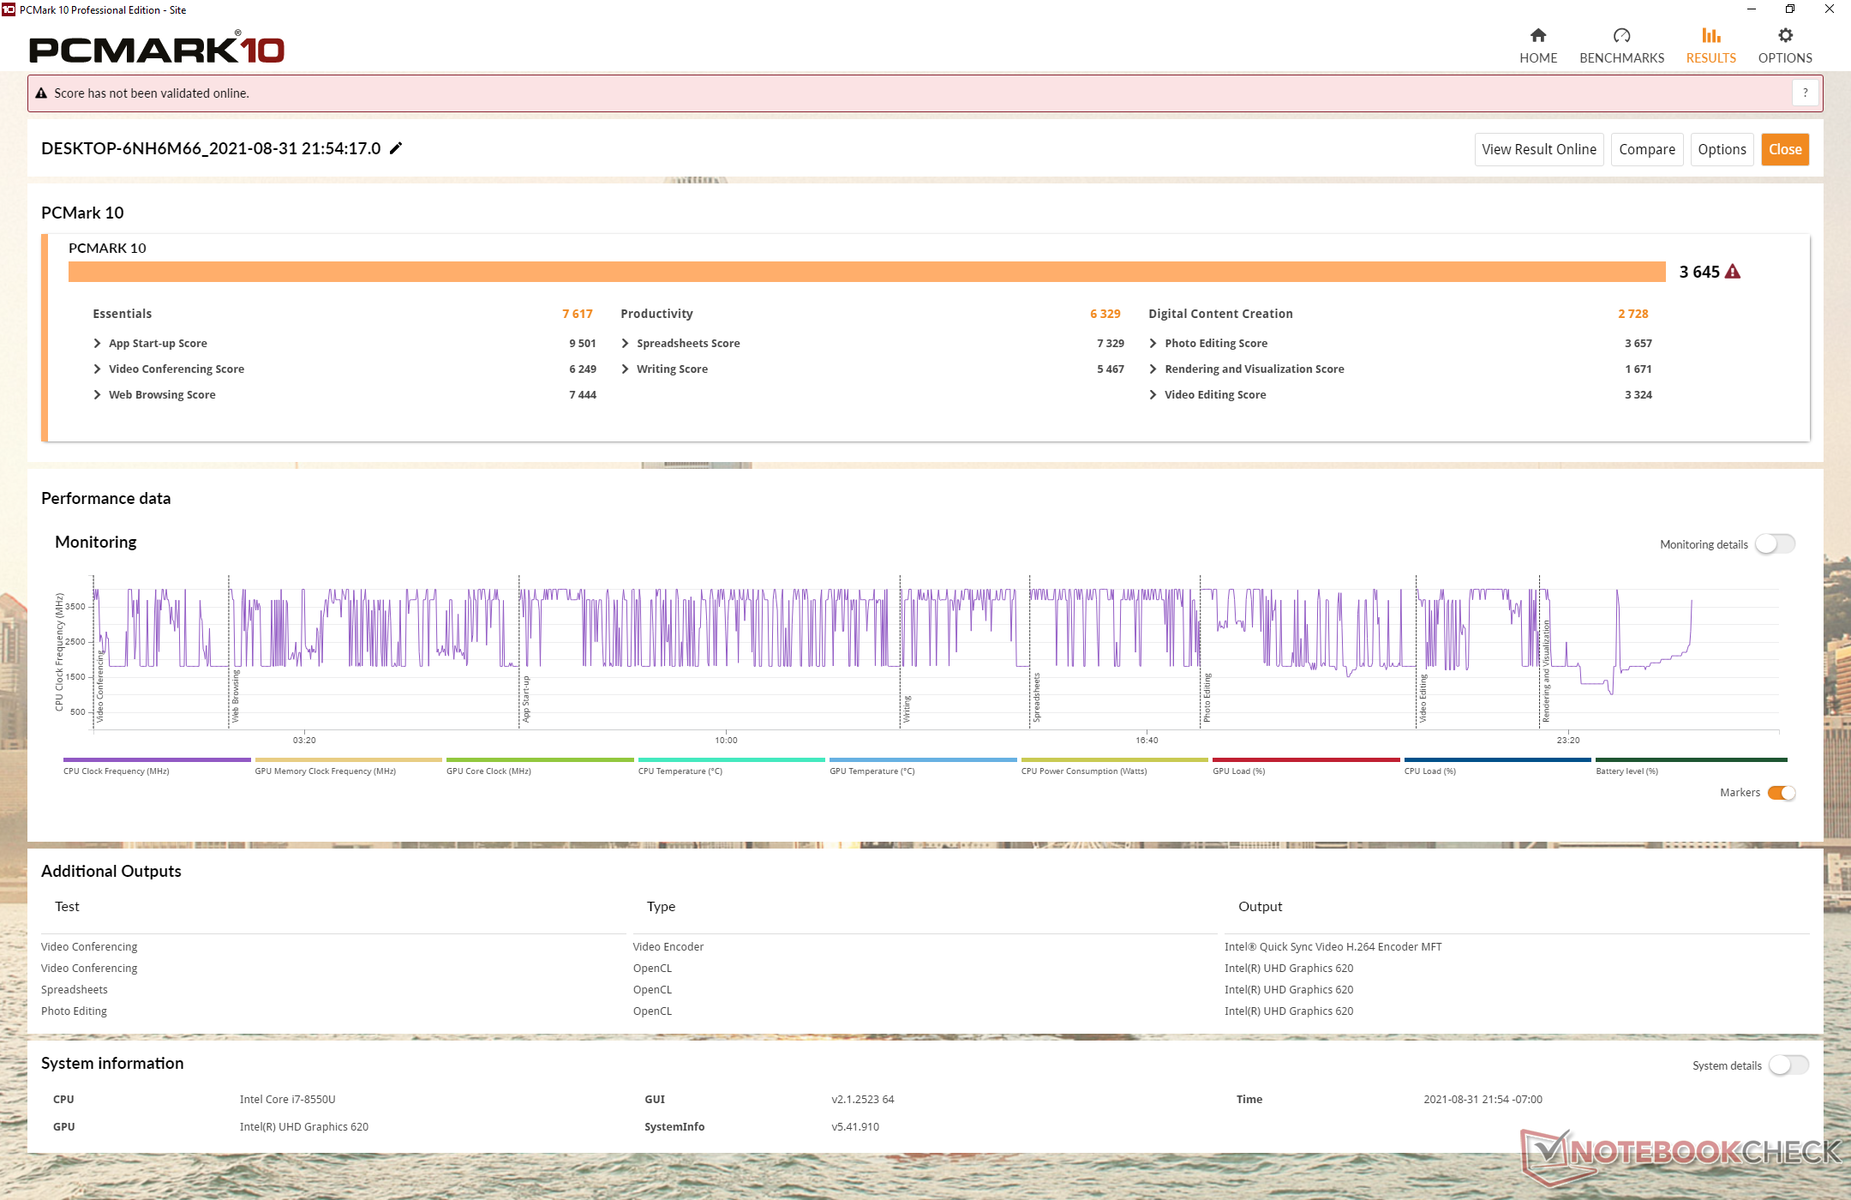
PCMark results are where we expect them to be relative to other models with the same Core i7-8550U CPU. We appreciate the fact there the system comes with no manufacturer bloatware for a clean Windows 10 experience.
| PCMark 10 / Score | |
| Lenovo ThinkPad X12 20UVS03G00 | |
| Dell Latitude 12 7210 2-in-1 | |
| Microsoft Surface Pro 7 Plus | |
| Kuu LeBook 12.6 Core i7-8550U | |
| Average Intel Core i7-8550U, Intel UHD Graphics 620 (2629 - 4072, n=31) | |
| Microsoft Surface Laptop Go Core i5 | |
| NuVision Encite Book 12 Plus | |
| PCMark 10 / Essentials | |
| Lenovo ThinkPad X12 20UVS03G00 | |
| Dell Latitude 12 7210 2-in-1 | |
| Microsoft Surface Pro 7 Plus | |
| Microsoft Surface Laptop Go Core i5 | |
| Average Intel Core i7-8550U, Intel UHD Graphics 620 (6628 - 9291, n=29) | |
| Kuu LeBook 12.6 Core i7-8550U | |
| NuVision Encite Book 12 Plus | |
| PCMark 10 / Productivity | |
| Dell Latitude 12 7210 2-in-1 | |
| Kuu LeBook 12.6 Core i7-8550U | |
| Average Intel Core i7-8550U, Intel UHD Graphics 620 (4889 - 7006, n=29) | |
| Lenovo ThinkPad X12 20UVS03G00 | |
| Microsoft Surface Pro 7 Plus | |
| Microsoft Surface Laptop Go Core i5 | |
| NuVision Encite Book 12 Plus | |
| PCMark 10 / Digital Content Creation | |
| Lenovo ThinkPad X12 20UVS03G00 | |
| Microsoft Surface Pro 7 Plus | |
| Dell Latitude 12 7210 2-in-1 | |
| Microsoft Surface Laptop Go Core i5 | |
| Average Intel Core i7-8550U, Intel UHD Graphics 620 (1506 - 3160, n=29) | |
| Kuu LeBook 12.6 Core i7-8550U | |
| NuVision Encite Book 12 Plus | |
| PCMark 10 Score | 3645 points | |
Help | ||
DPC Latency
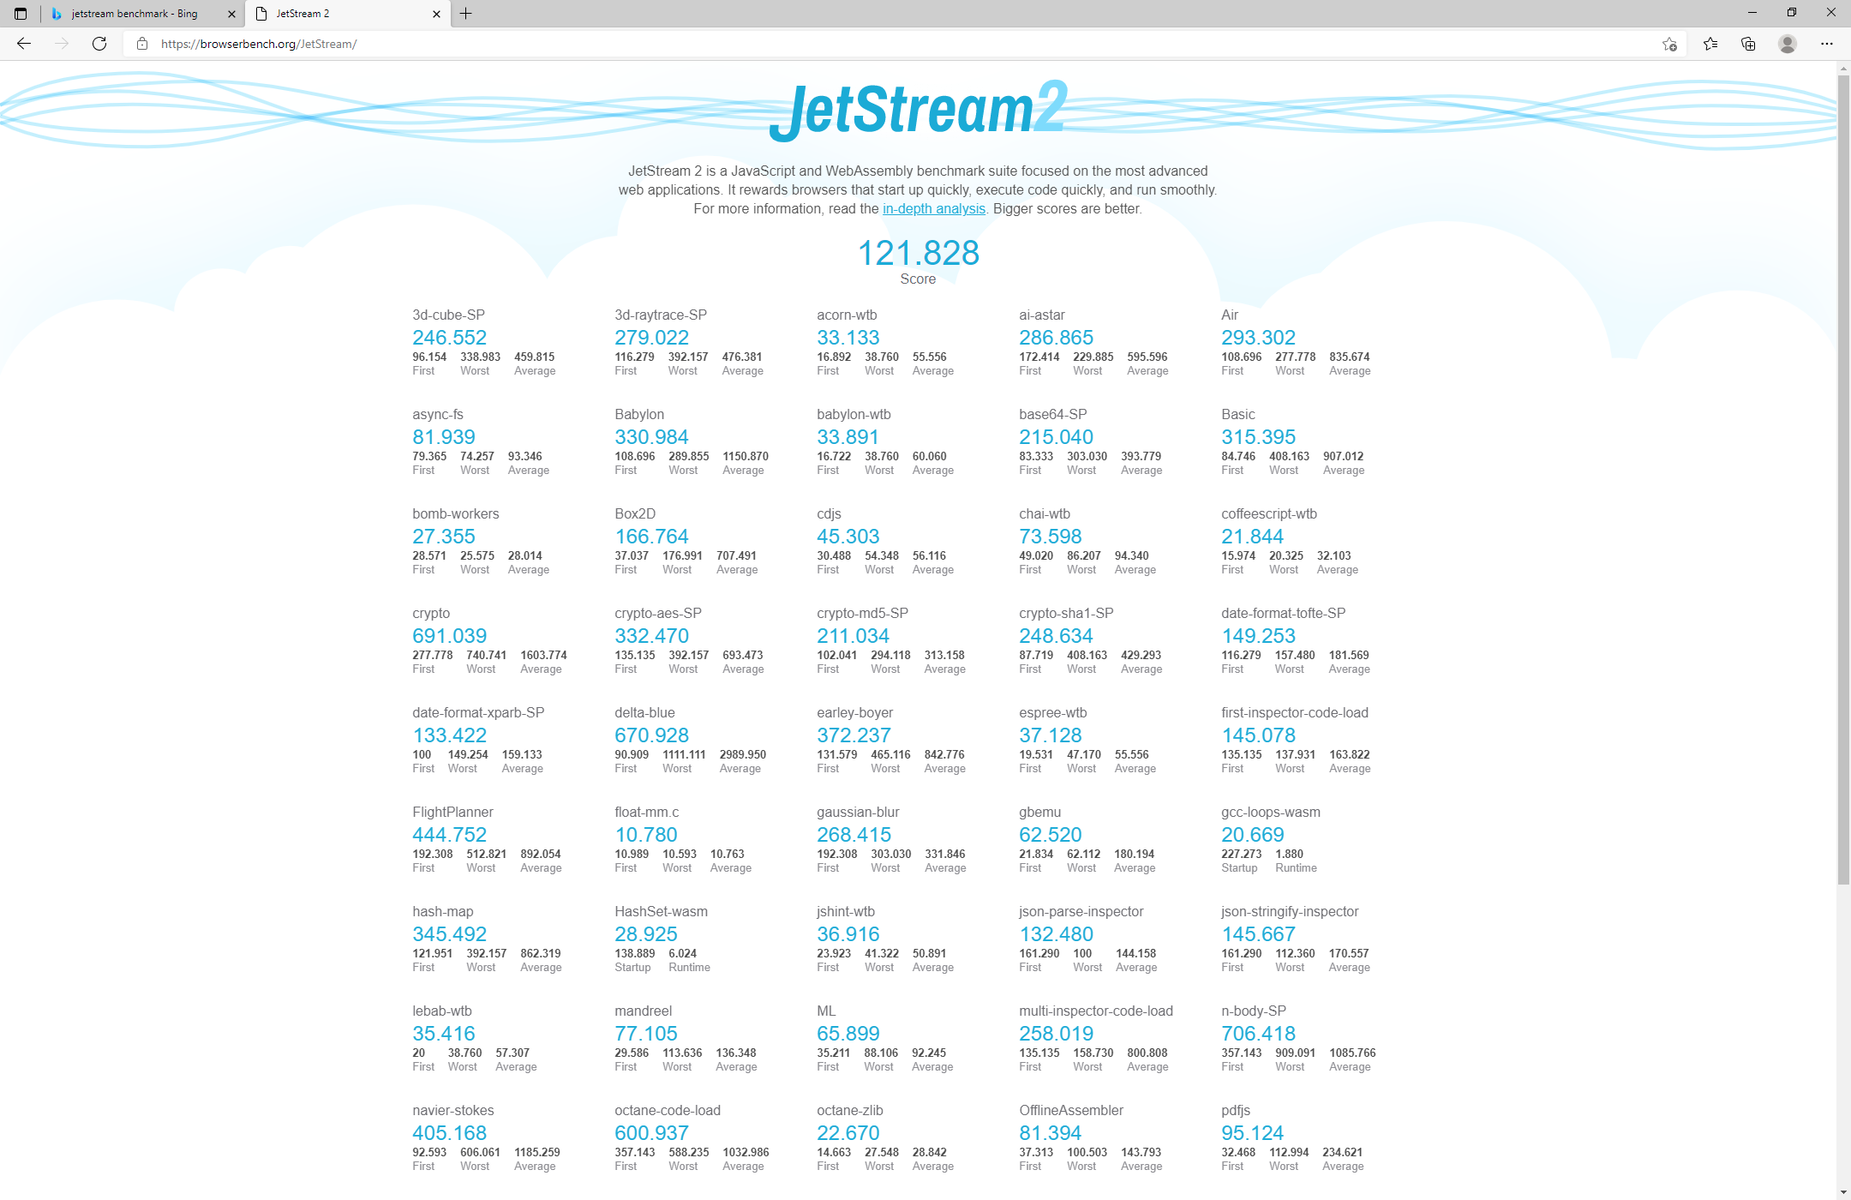
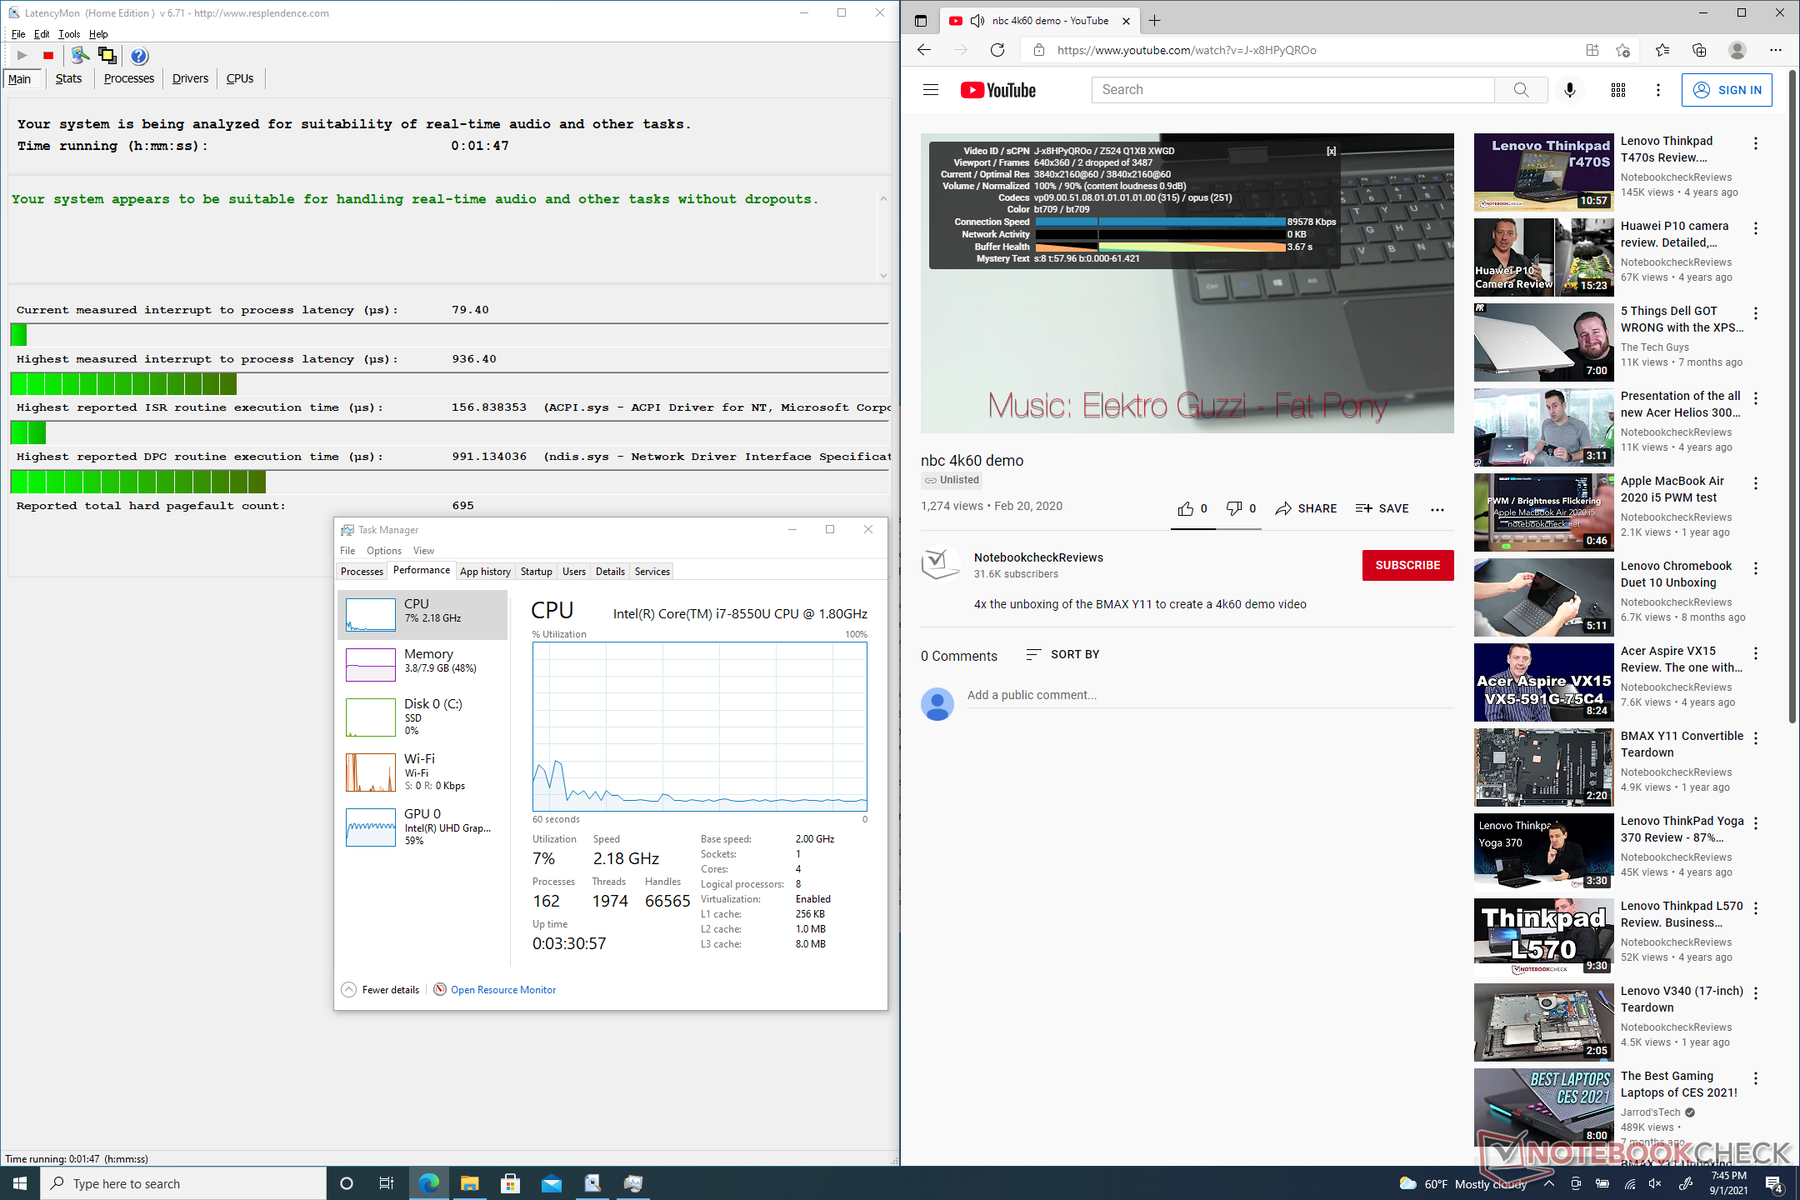
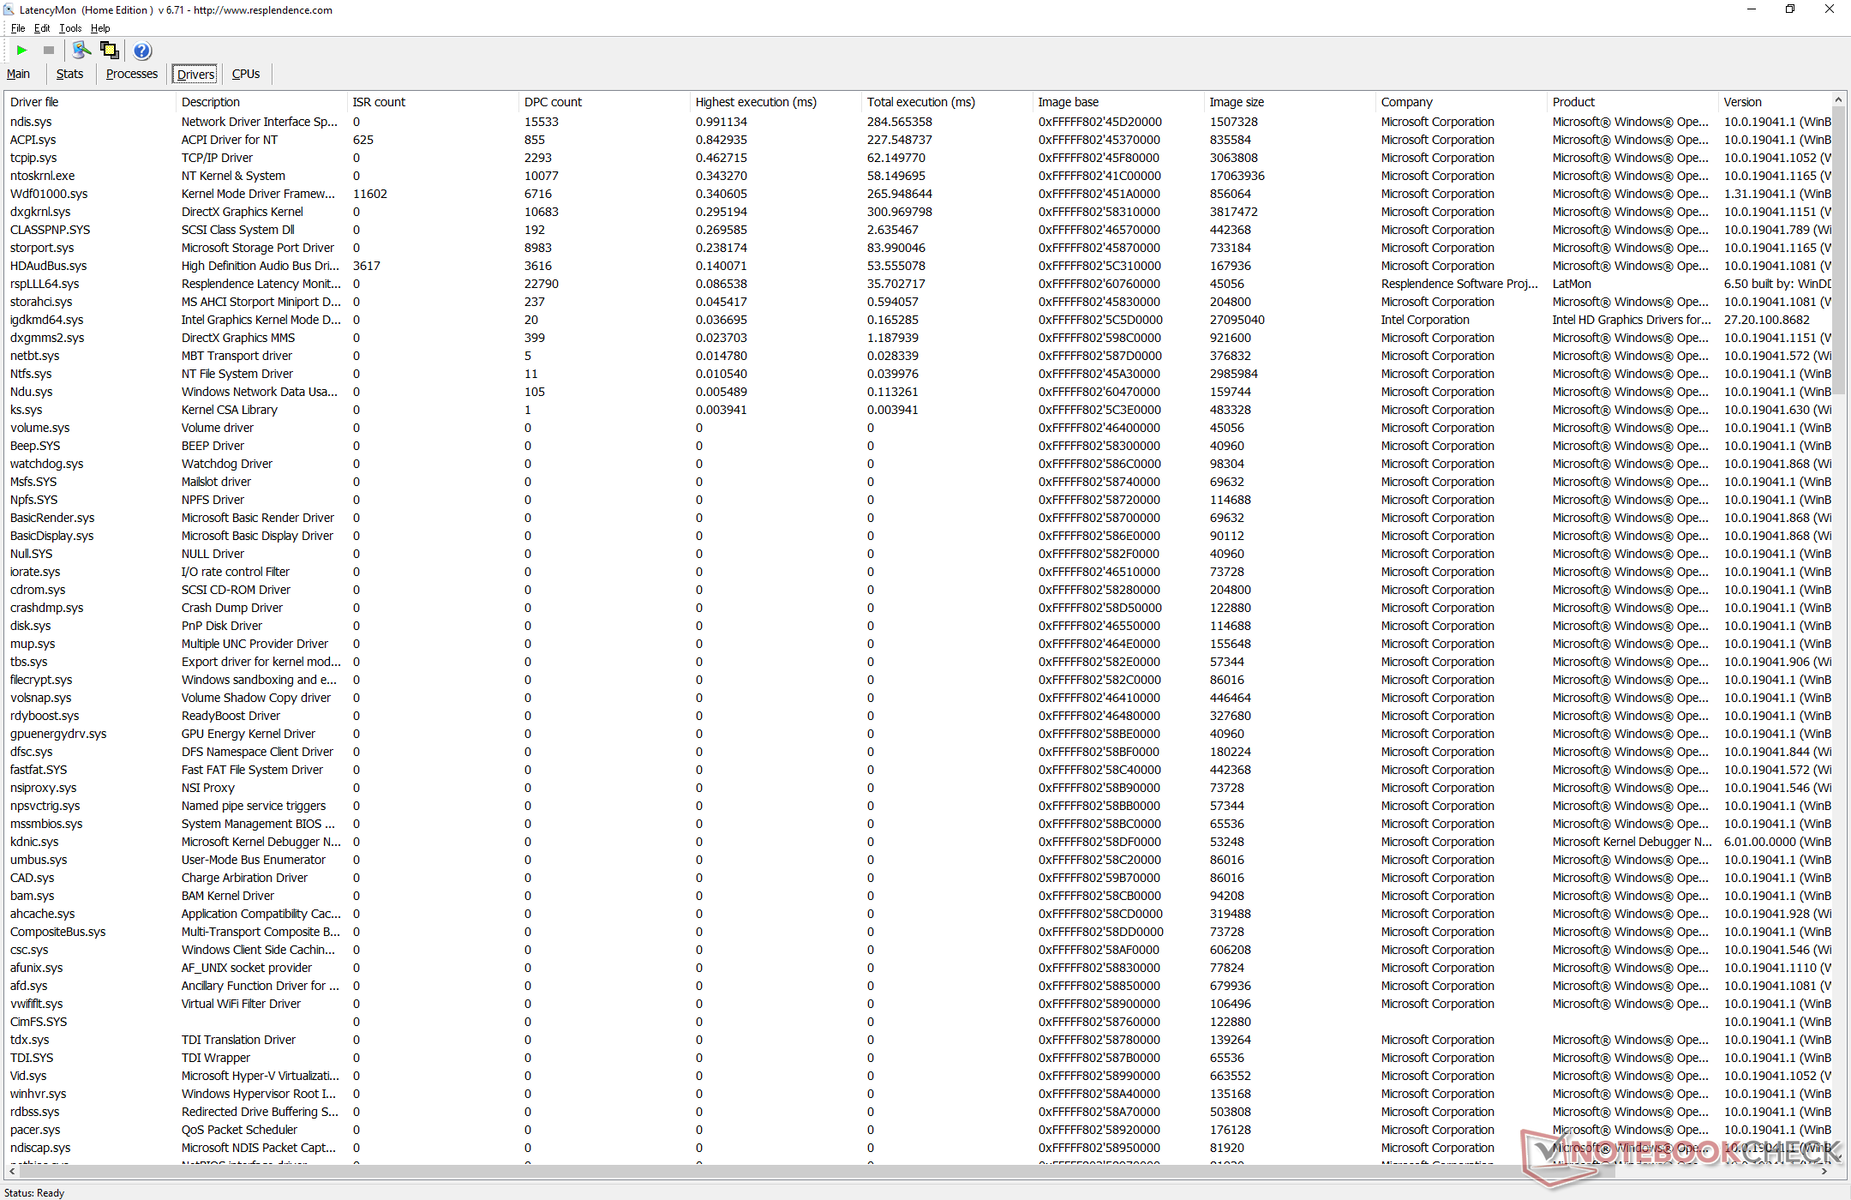
LatencyMon reveals no major latency issues when opening multiple browser tabs on our homepage. 4K video playback at 60 FPS is also without any issues despite the outdated Intel CPU.
| DPC Latencies / LatencyMon - interrupt to process latency (max), Web, Youtube, Prime95 | |
| Dell Latitude 12 7210 2-in-1 | |
| Kuu LeBook 12.6 Core i7-8550U | |
| Microsoft Surface Laptop Go Core i5 | |
| Lenovo ThinkPad X12 20UVS03G00 | |
| Microsoft Surface Pro 7 Plus | |
* ... smaller is better
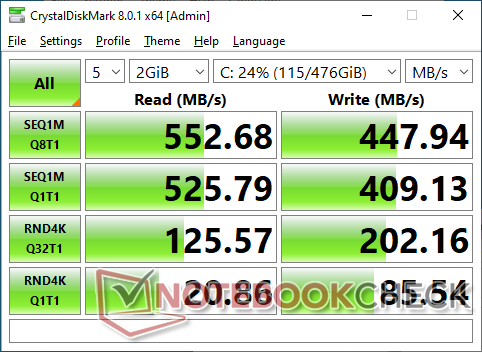
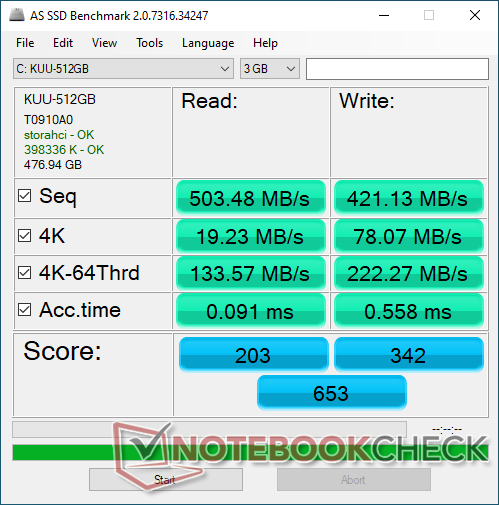
Storage Devices
Internal storage is spacious at 512 GB with transfer rates similar to most SATA III SSDs. The lack of an SD card reader means is less of an issue when the internal drive is as large as most laptop drives.
| Kuu LeBook 12.6 Core i7-8550U KUU-512GB | Lenovo ThinkPad X12 20UVS03G00 Toshiba BG4 KBG40ZNT512G | Microsoft Surface Pro 7 Plus Samsung PM991 MZ9LQ256HBJQ | Dell Latitude 12 7210 2-in-1 WDC PC SN530 SDBPTPZ-512G | Microsoft Surface Laptop Go Core i5 SK hynix BC501 HFM256GDGTNG | NuVision Encite Book 12 Plus SanDisk DF4064 | |
|---|---|---|---|---|---|---|
| AS SSD | 121% | 171% | 268% | 85% | -127% | |
| Seq Read (MB/s) | 503 | 1760 250% | 1725 243% | 2185 334% | 1347 168% | 154 -69% |
| Seq Write (MB/s) | 421.1 | 761 81% | 931 121% | 1731 311% | 491 17% | 102.4 -76% |
| 4K Read (MB/s) | 19.23 | 47.68 148% | 50.1 161% | 46.28 141% | 38.08 98% | 5.07 -74% |
| 4K Write (MB/s) | 78.1 | 176 125% | 136.9 75% | 161.6 107% | 98.2 26% | 8.42 -89% |
| 4K-64 Read (MB/s) | 133.6 | 581 335% | 870 551% | 1021 664% | 483.1 262% | 27.74 -79% |
| 4K-64 Write (MB/s) | 222.3 | 118.5 -47% | 762 243% | 1125 406% | 350.9 58% | 12.15 -95% |
| Access Time Read * (ms) | 0.091 | 0.155 -70% | 0.279 -207% | 0.069 24% | 0.057 37% | 0.747 -721% |
| Access Time Write * (ms) | 0.558 | 0.188 66% | 0.028 95% | 0.046 92% | 0.105 81% | 1.136 -104% |
| Score Read (Points) | 203 | 805 297% | 1093 438% | 1286 533% | 656 223% | 48 -76% |
| Score Write (Points) | 342 | 371 8% | 992 190% | 1460 327% | 498 46% | 31 -91% |
| Score Total (Points) | 653 | 1551 138% | 2616 301% | 3389 419% | 1458 123% | 103 -84% |
| Copy ISO MB/s (MB/s) | 433.4 | 1174 171% | 1555 259% | 765 77% | 119.7 -72% | |
| Copy Program MB/s (MB/s) | 365.8 | 262.8 -28% | 468.5 28% | 299.6 -18% | 72.8 -80% | |
| Copy Game MB/s (MB/s) | 409.2 | 562 37% | 841 106% | 371.5 -9% | 116.5 -72% | |
| CrystalDiskMark 5.2 / 6 | 98% | 156% | 211% | 93% | -77% | |
| Write 4K (MB/s) | 85.8 | 72.8 -15% | 165.3 93% | 182.7 113% | 87.6 2% | 7.837 -91% |
| Read 4K (MB/s) | 19.22 | 26.35 37% | 42.95 123% | 51.4 167% | 40.41 110% | 7.689 -60% |
| Write Seq (MB/s) | 412.7 | 823 99% | 955 131% | 1303 216% | 601 46% | 104.9 -75% |
| Read Seq (MB/s) | 518 | 1169 126% | 867 67% | 1450 180% | 1033 99% | 167.8 -68% |
| Write 4K Q32T1 (MB/s) | 201 | 112.6 -44% | 423.5 111% | 342.9 71% | 269.1 34% | 13.64 -93% |
| Read 4K Q32T1 (MB/s) | 125.6 | 327.2 161% | 479.2 282% | 523 316% | 261.4 108% | 32.95 -74% |
| Write Seq Q32T1 (MB/s) | 451.1 | 1039 130% | 1060 135% | 1776 294% | 818 81% | 99.5 -78% |
| Read Seq Q32T1 (MB/s) | 556 | 2176 291% | 2251 305% | 2378 328% | 2025 264% | 128.8 -77% |
| Total Average (Program / Settings) | 110% /
111% | 164% /
165% | 240% /
247% | 89% /
88% | -102% /
-109% |
* ... smaller is better

Disk Throttling: DiskSpd Read Loop, Queue Depth 8
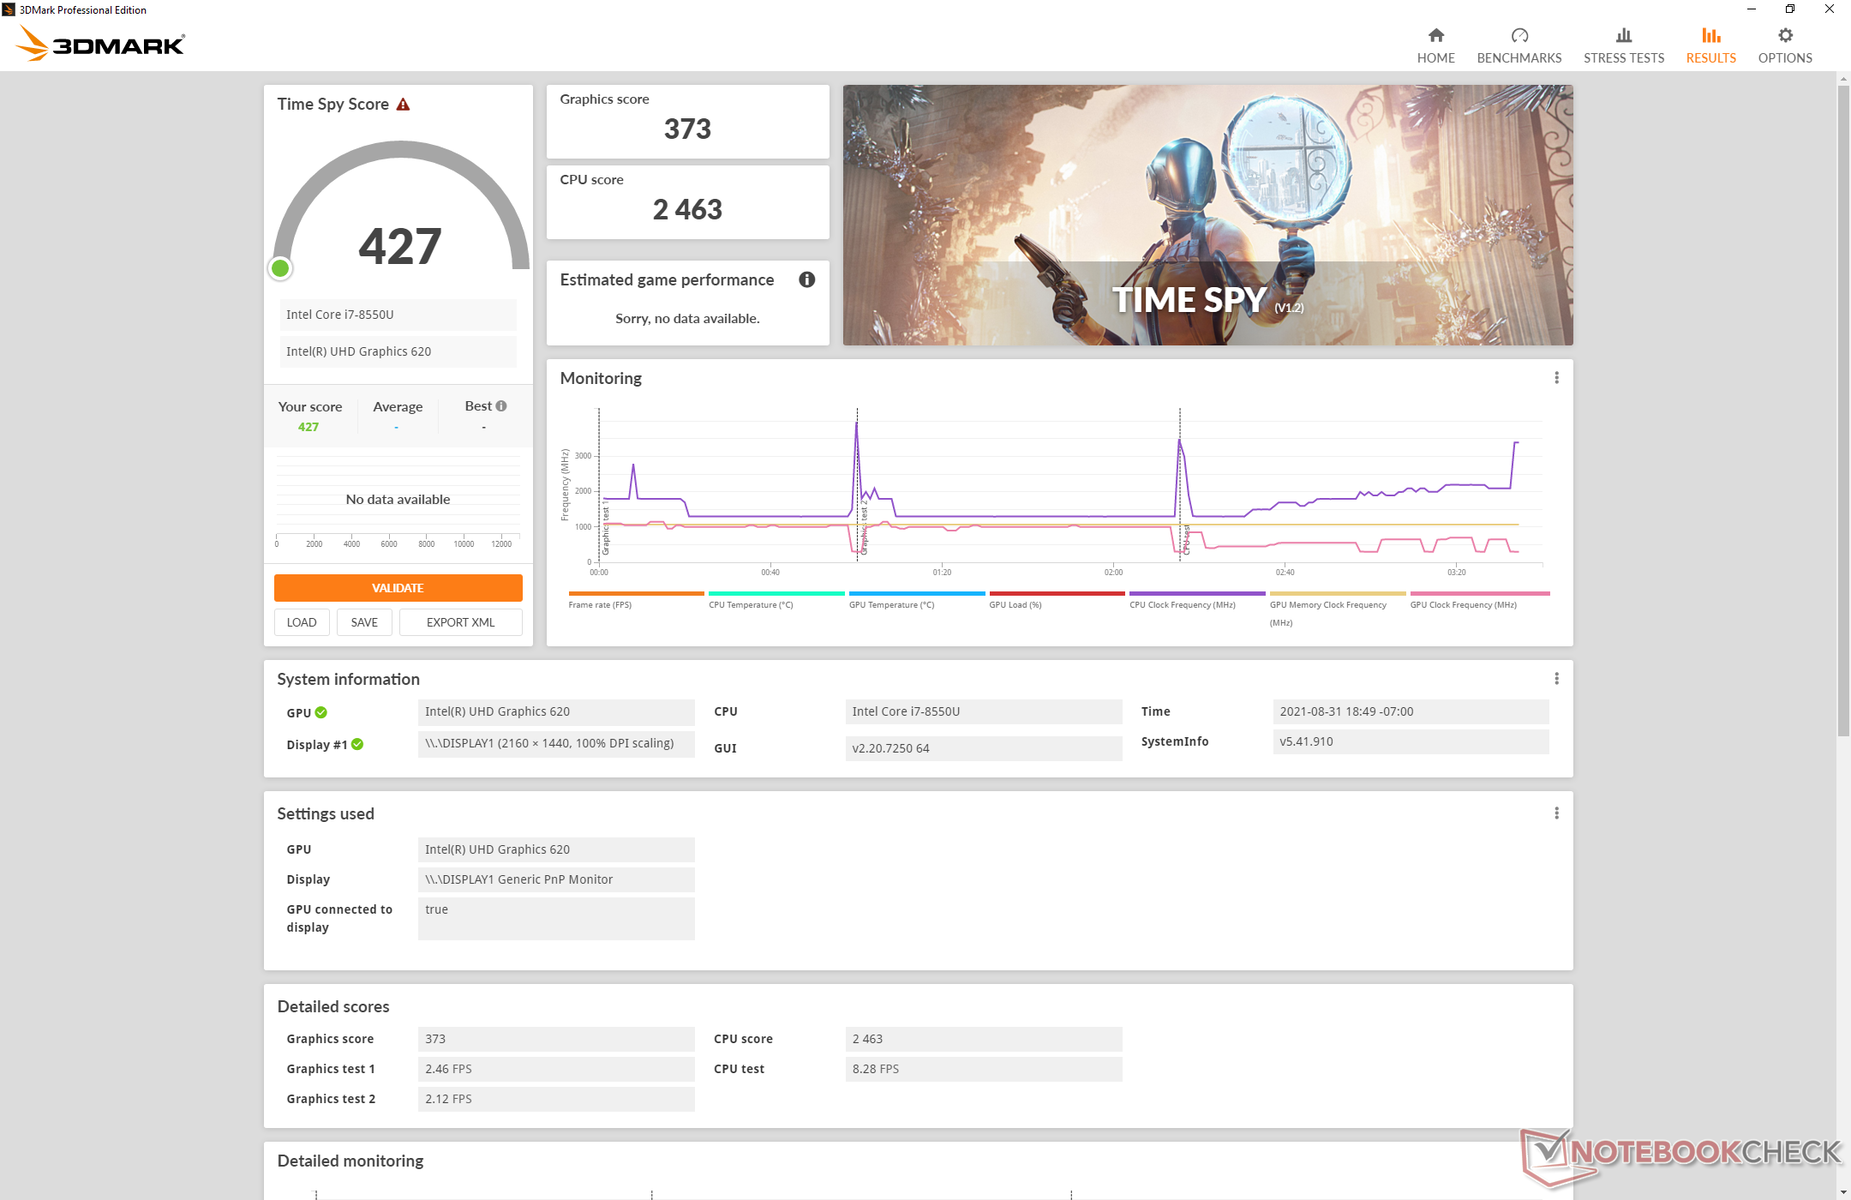
GPU Performance
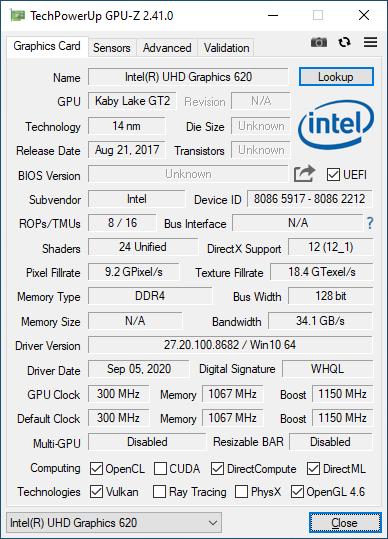
The UHD Graphics 620 is poor by today's standards where Radeon RX Vega and Iris Xe models reign supreme. This won't be an issue for 4K streaming or non-gamers, but even the slightest bit of editing or gaming will benefit significantly from upgrading to the Surface tablet or any other device with AMD Zen or 11th Intel Tiger Lake CPUs.
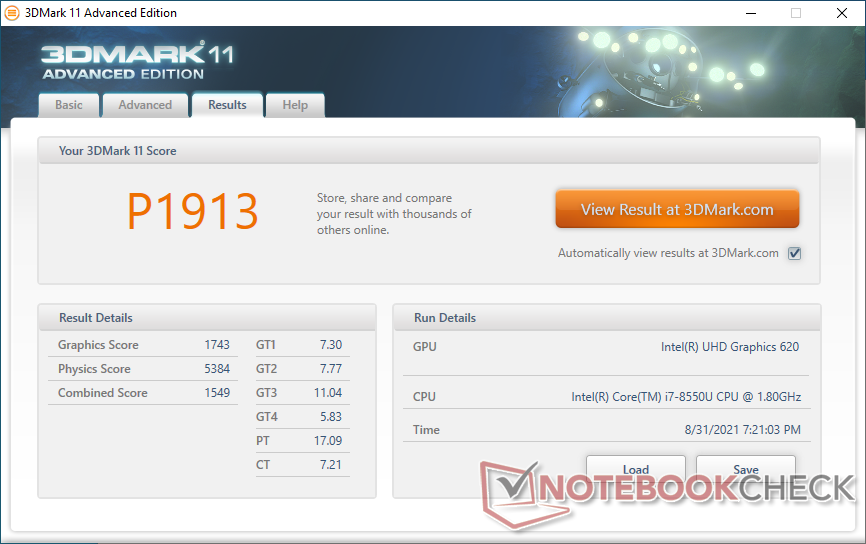
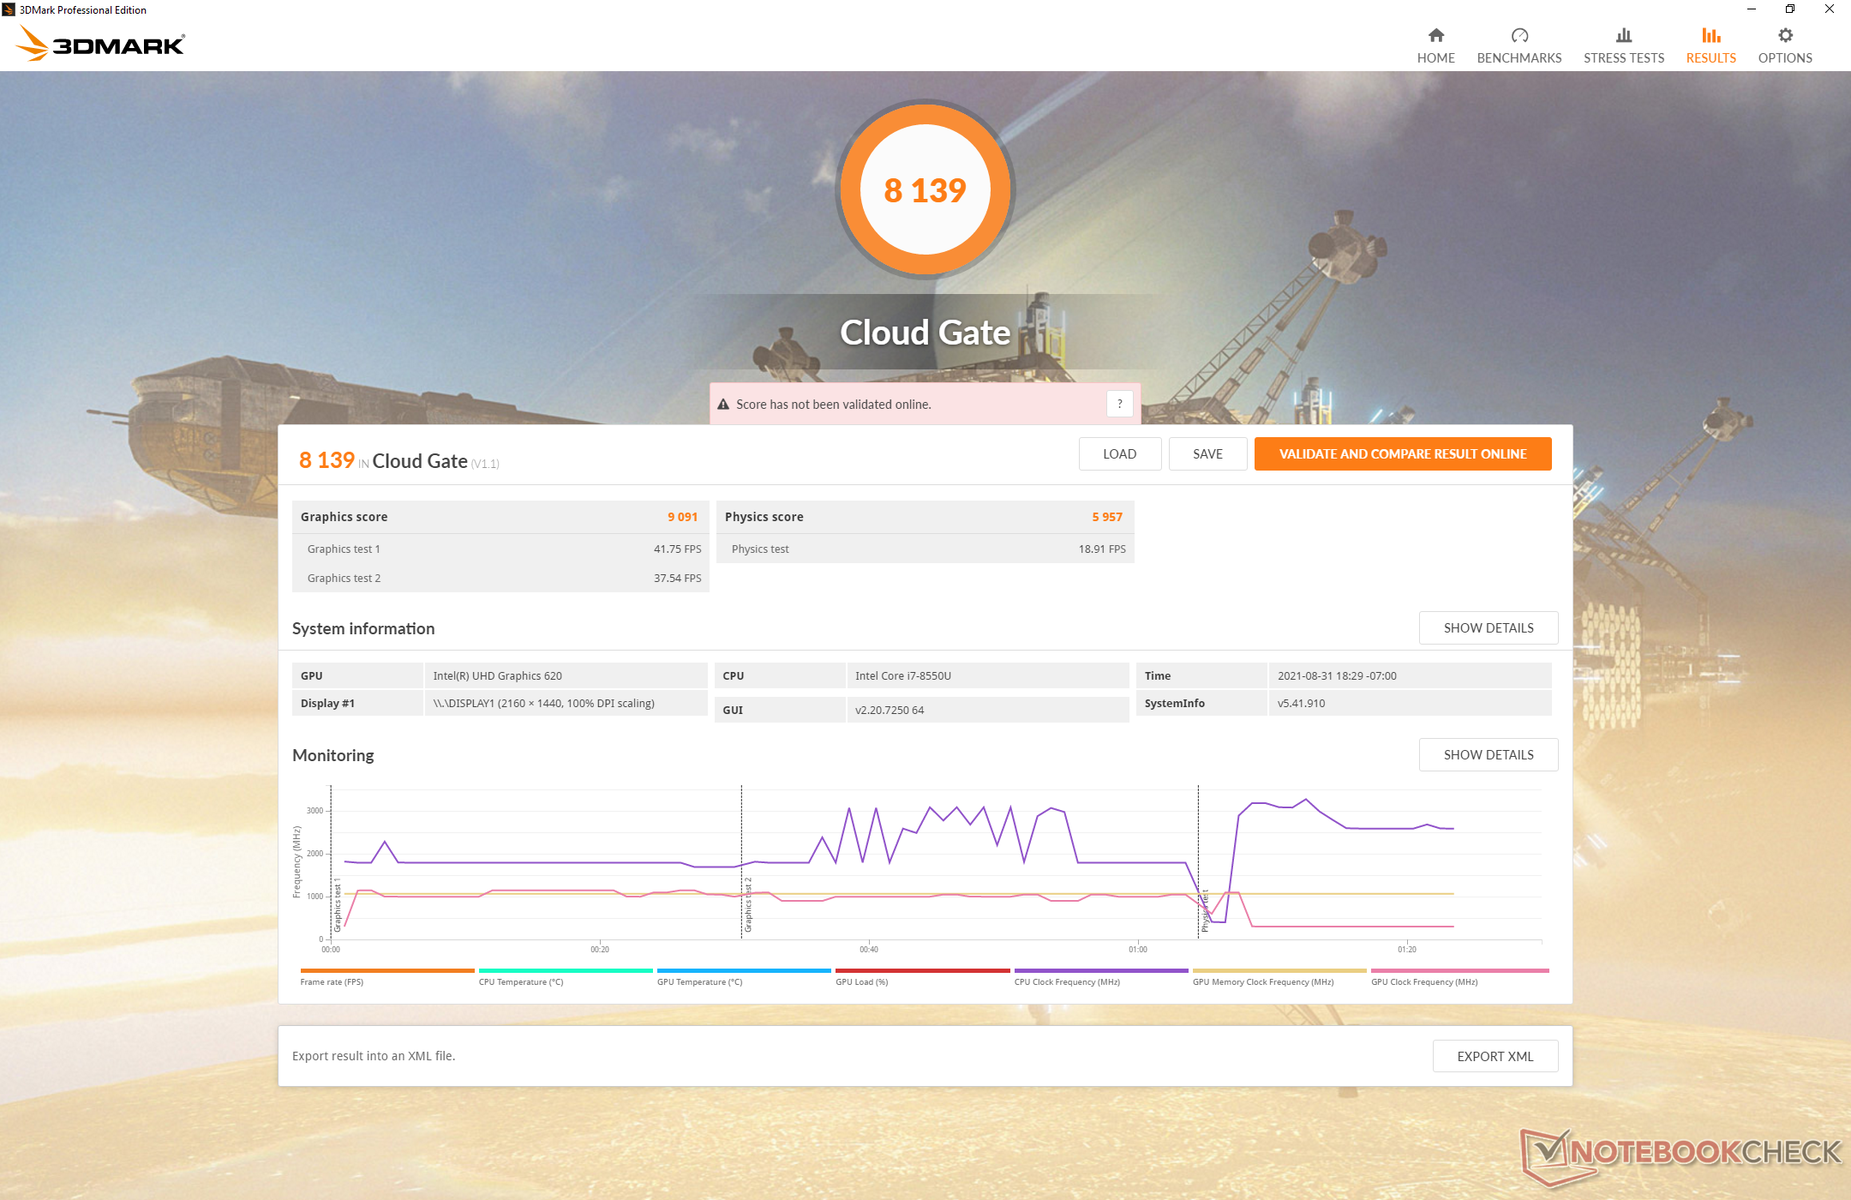
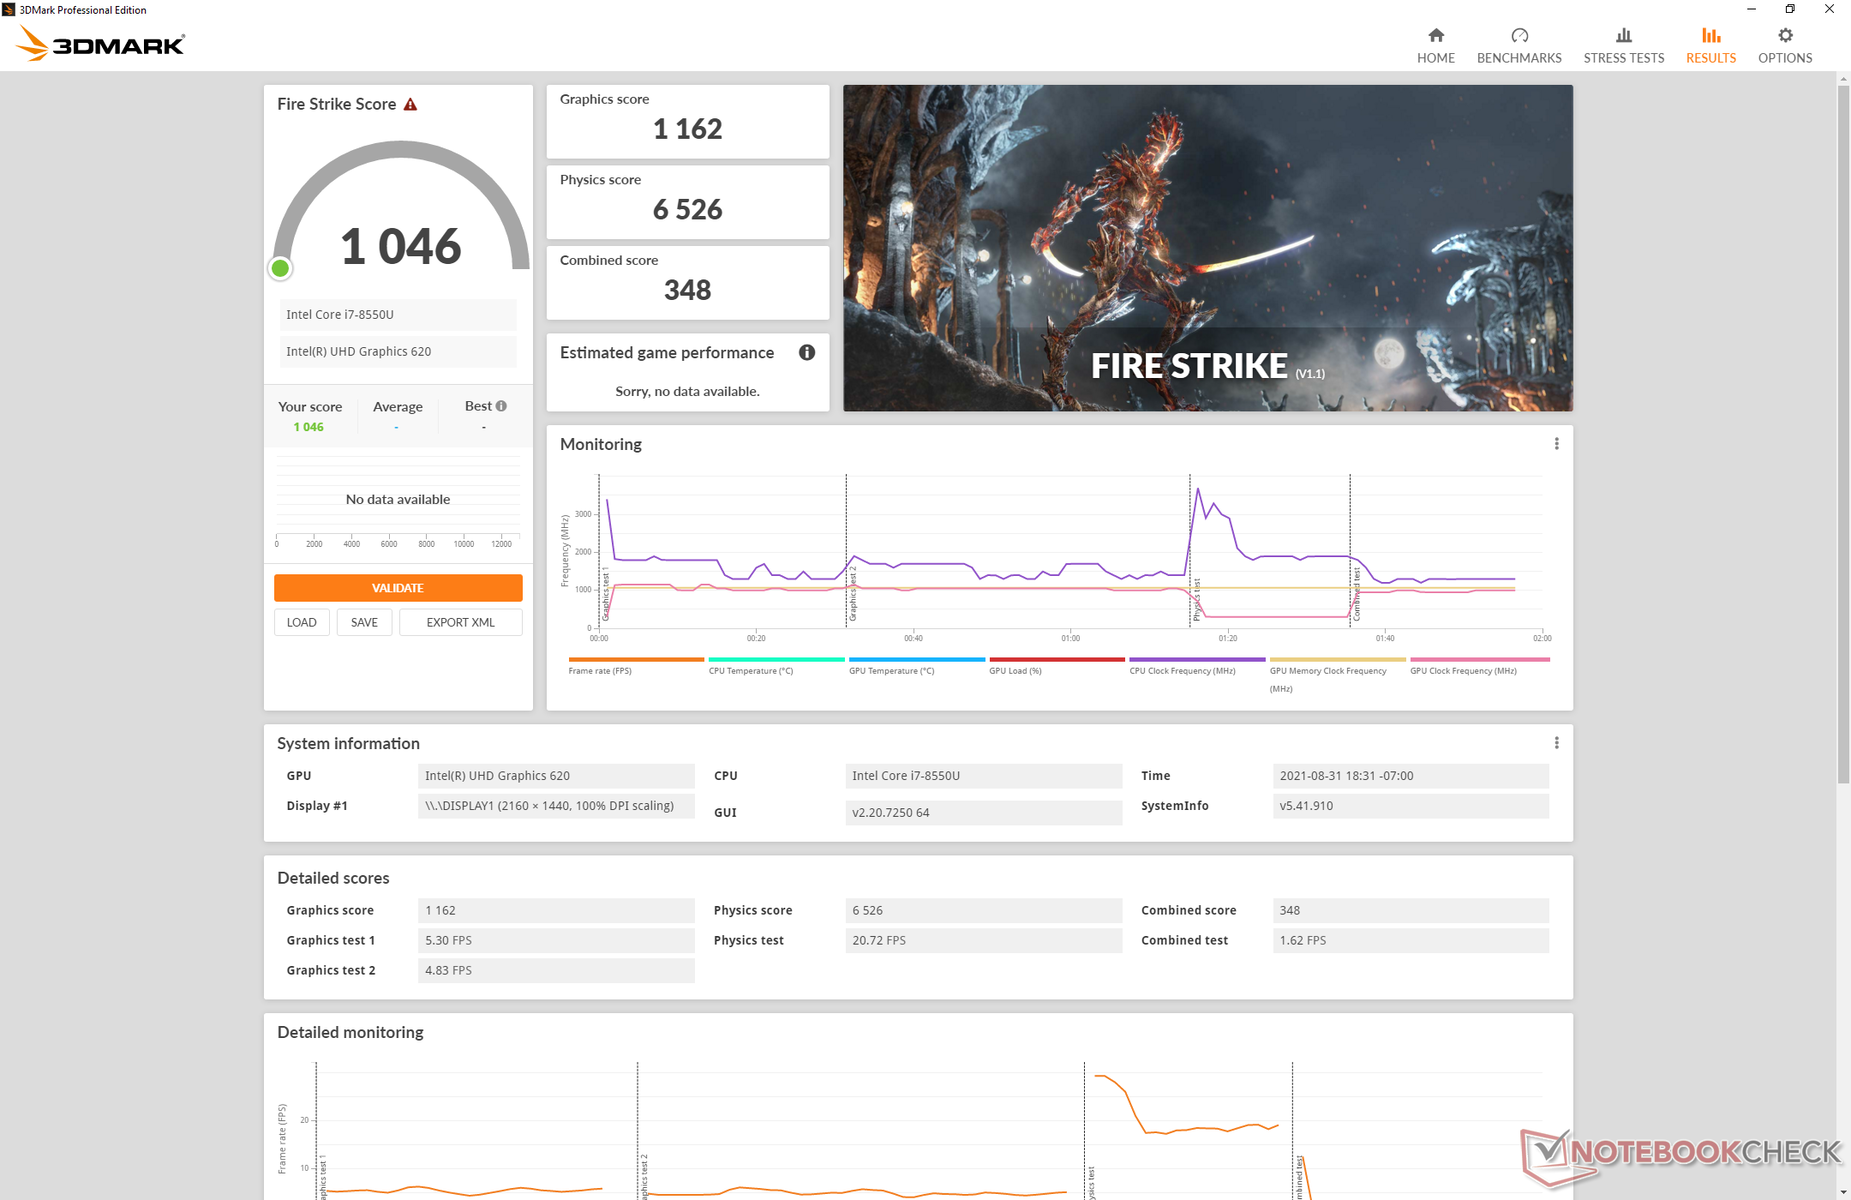
| 3DMark 11 Performance | 1913 points | |
| 3DMark Cloud Gate Standard Score | 8139 points | |
| 3DMark Fire Strike Score | 1046 points | |
| 3DMark Time Spy Score | 427 points | |
Help | ||
| low | med. | high | ultra | |
|---|---|---|---|---|
| Dota 2 Reborn (2015) | 75.3 | 40.9 | 17.9 | 16 |
| Final Fantasy XV Benchmark (2018) | 11.7 | 5.39 | 5.39 | |
| X-Plane 11.11 (2018) | 11.3 | 9.73 | 9.11 |
Emissions
System Noise
The internal fan is noisy and it pulsates frequently. Even simple actions like web browsing will initiate the fan whereas it would remain silent on most other tablets and ULV laptops. Expect the fan to pulse in the 36 to 41 dB(A) range under most conditions or up to 45 dB(A) when running higher loads like games.
| Kuu LeBook 12.6 Core i7-8550U UHD Graphics 620, i5-8550U, KUU-512GB | Lenovo ThinkPad X12 20UVS03G00 Iris Xe G7 96EUs, i7-1160G7, Toshiba BG4 KBG40ZNT512G | Microsoft Surface Pro 7 Plus Iris Xe G7 80EUs, i5-1135G7, Samsung PM991 MZ9LQ256HBJQ | Dell Latitude 12 7210 2-in-1 UHD Graphics 620, i7-10610U, WDC PC SN530 SDBPTPZ-512G | Microsoft Surface Laptop Go Core i5 UHD Graphics G1 (Ice Lake 32 EU), i5-1035G1, SK hynix BC501 HFM256GDGTNG | |
|---|---|---|---|---|---|
| Noise | 10% | 14% | 4% | ||
| off / environment * (dB) | 23.8 | 25.1 -5% | 25 -5% | 26.4 -11% | |
| Idle Minimum * (dB) | 23.8 | 25.1 -5% | 25 -5% | 26.4 -11% | |
| Idle Average * (dB) | 23.8 | 25.1 -5% | 25 -5% | 26.4 -11% | |
| Idle Maximum * (dB) | 41.1 | 26 37% | 25 39% | 26.4 36% | |
| Load Average * (dB) | 44.5 | 34.6 22% | 28.7 36% | 36.9 17% | |
| Load Maximum * (dB) | 45 | 37 18% | 34.5 23% | 44.2 2% | |
| Witcher 3 ultra * (dB) | 34.6 |
* ... smaller is better
Noise level
| Idle |
| 23.8 / 23.8 / 41.1 dB(A) |
| Load |
| 44.5 / 45 dB(A) |
 | ||
30 dB silent 40 dB(A) audible 50 dB(A) loud |
||
min: | ||
Temperature
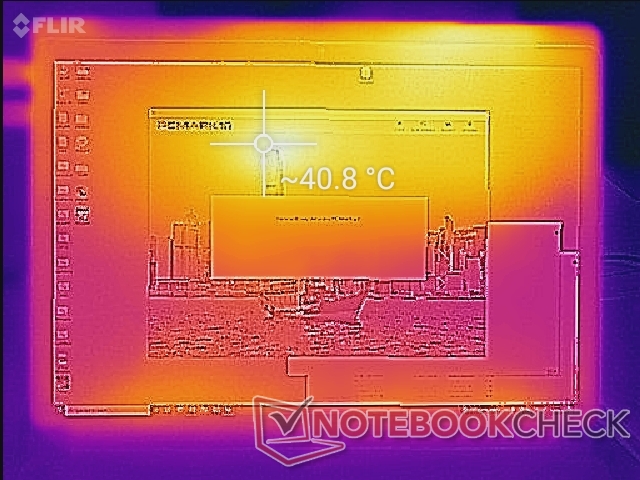
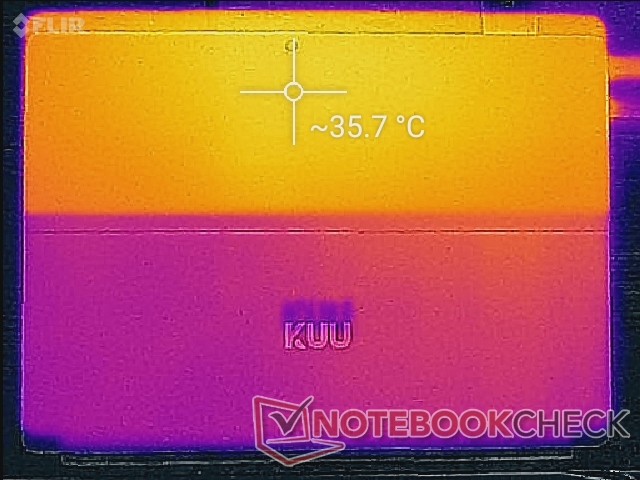
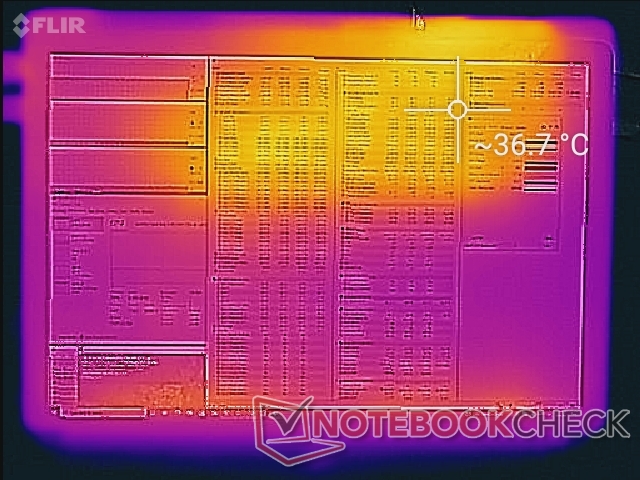
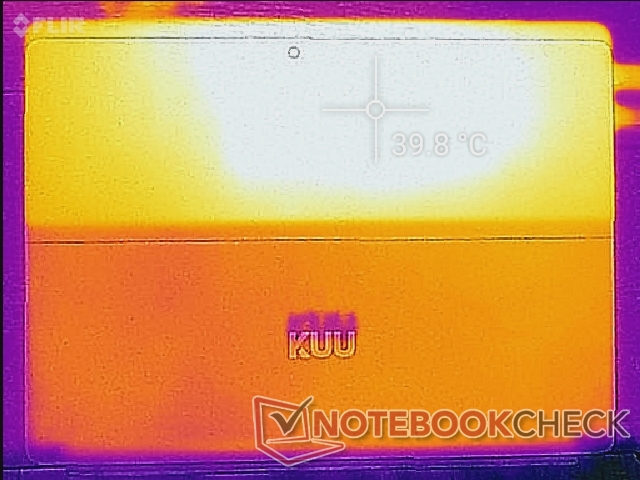
Surface temperatures when idling on desktop are warmer than expected at up to 41 C and 36 C on the front and back hot spots, respectively. Running higher loads will kickstart the internal fan leading to a slightly cooler hot spot of 37 C on the front while the back will be slightly warmer at 40 C. The warmth is noticeable when handling the tablet, but it's thankfully cooler around the edges and corners to not be distracting.
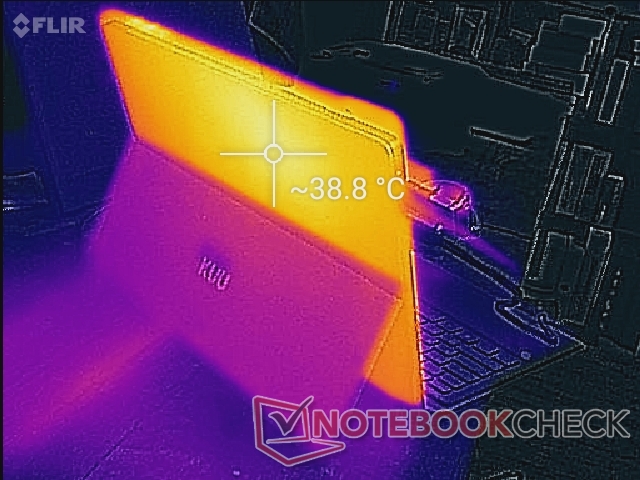
(+) The maximum temperature on the upper side is 36.8 °C / 98 F, compared to the average of 35.4 °C / 96 F, ranging from 19.6 to 60 °C for the class Convertible.
(+) The bottom heats up to a maximum of 39.8 °C / 104 F, compared to the average of 36.9 °C / 98 F
(±) In idle usage, the average temperature for the upper side is 34.5 °C / 94 F, compared to the device average of 30.3 °C / 87 F.
(+) The palmrests and touchpad are reaching skin temperature as a maximum (32.6 °C / 90.7 F) and are therefore not hot.
(-) The average temperature of the palmrest area of similar devices was 28 °C / 82.4 F (-4.6 °C / -8.3 F).
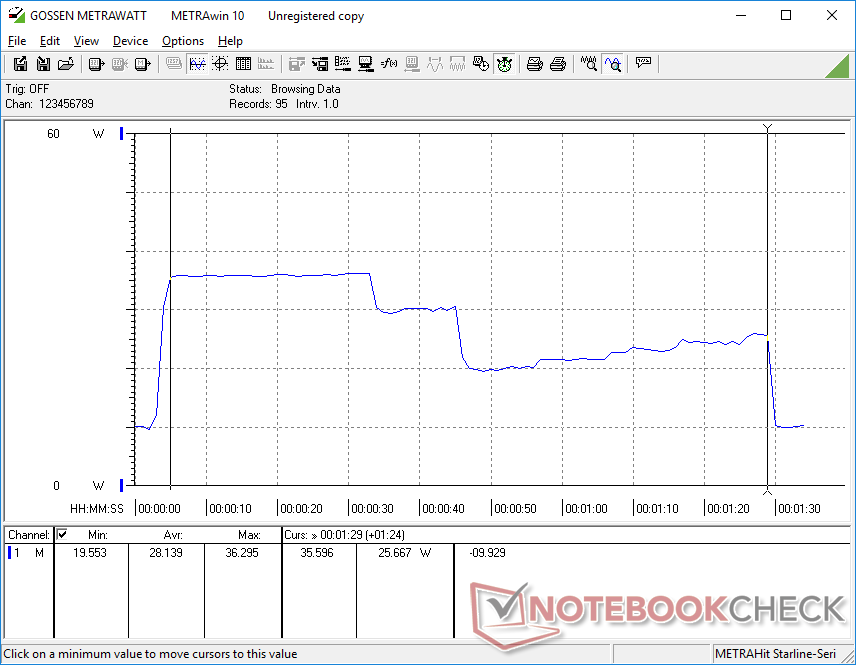
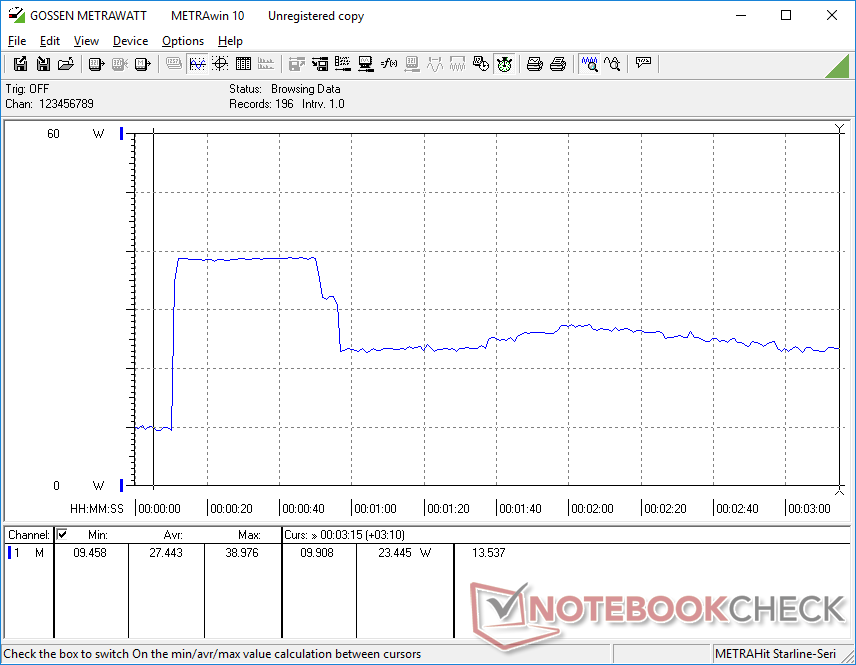
Stress Test
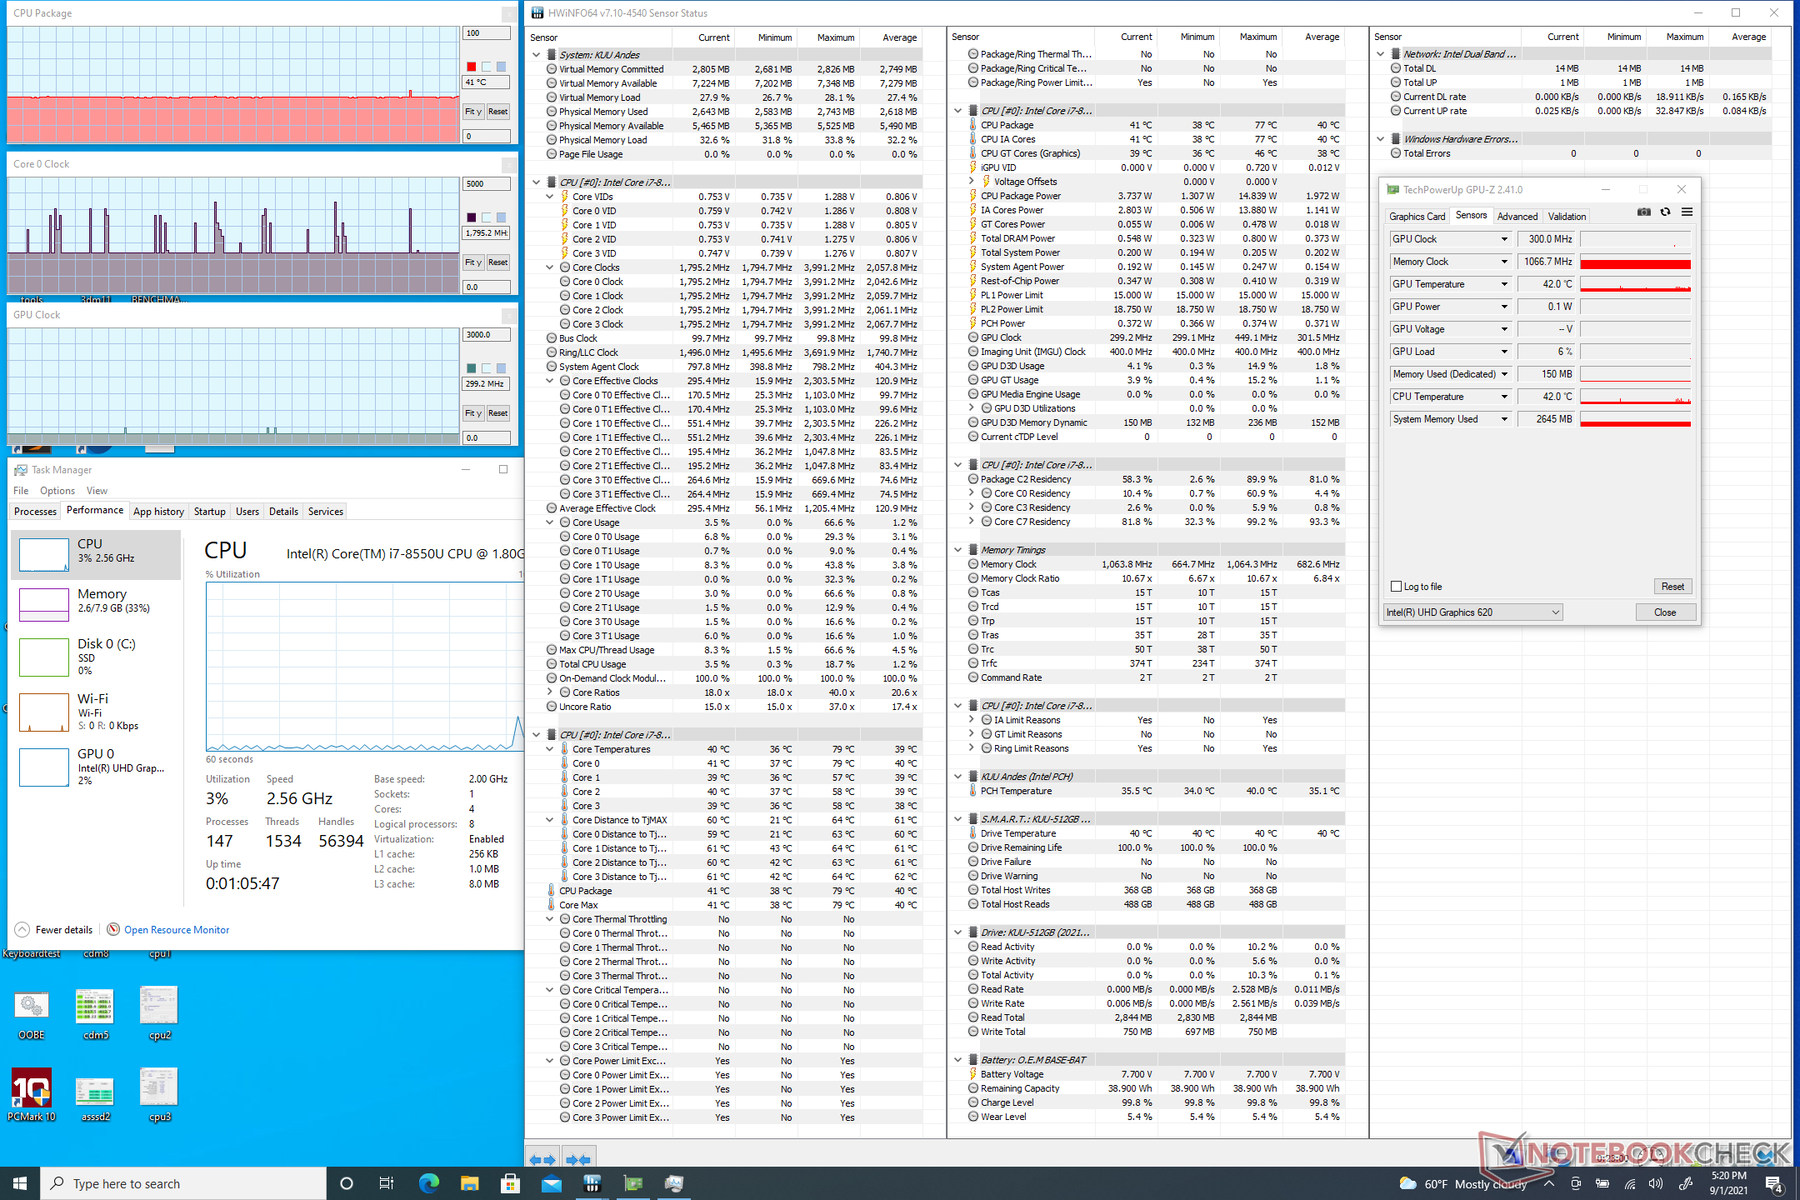
When running Prime95, the CPU would boost to 2.4 GHz for about 30 seconds until hitting a core temperature of 77 C. Thereafter, clock rates would fall and cycle between 1 GHz and 1.7 GHz in order to maintain a cooler temperature in the 60 C to 65 C range. Turbo Boost sustainability is therefore limited on the LeBook since it is a tablet, after all.
Running on battery power will not limit performance. A 3DMark 11 run on batteries would return Physics and Graphics scores of 6186 and 1689 points, respectively, compared to 5384 and 1743 points when on mains.
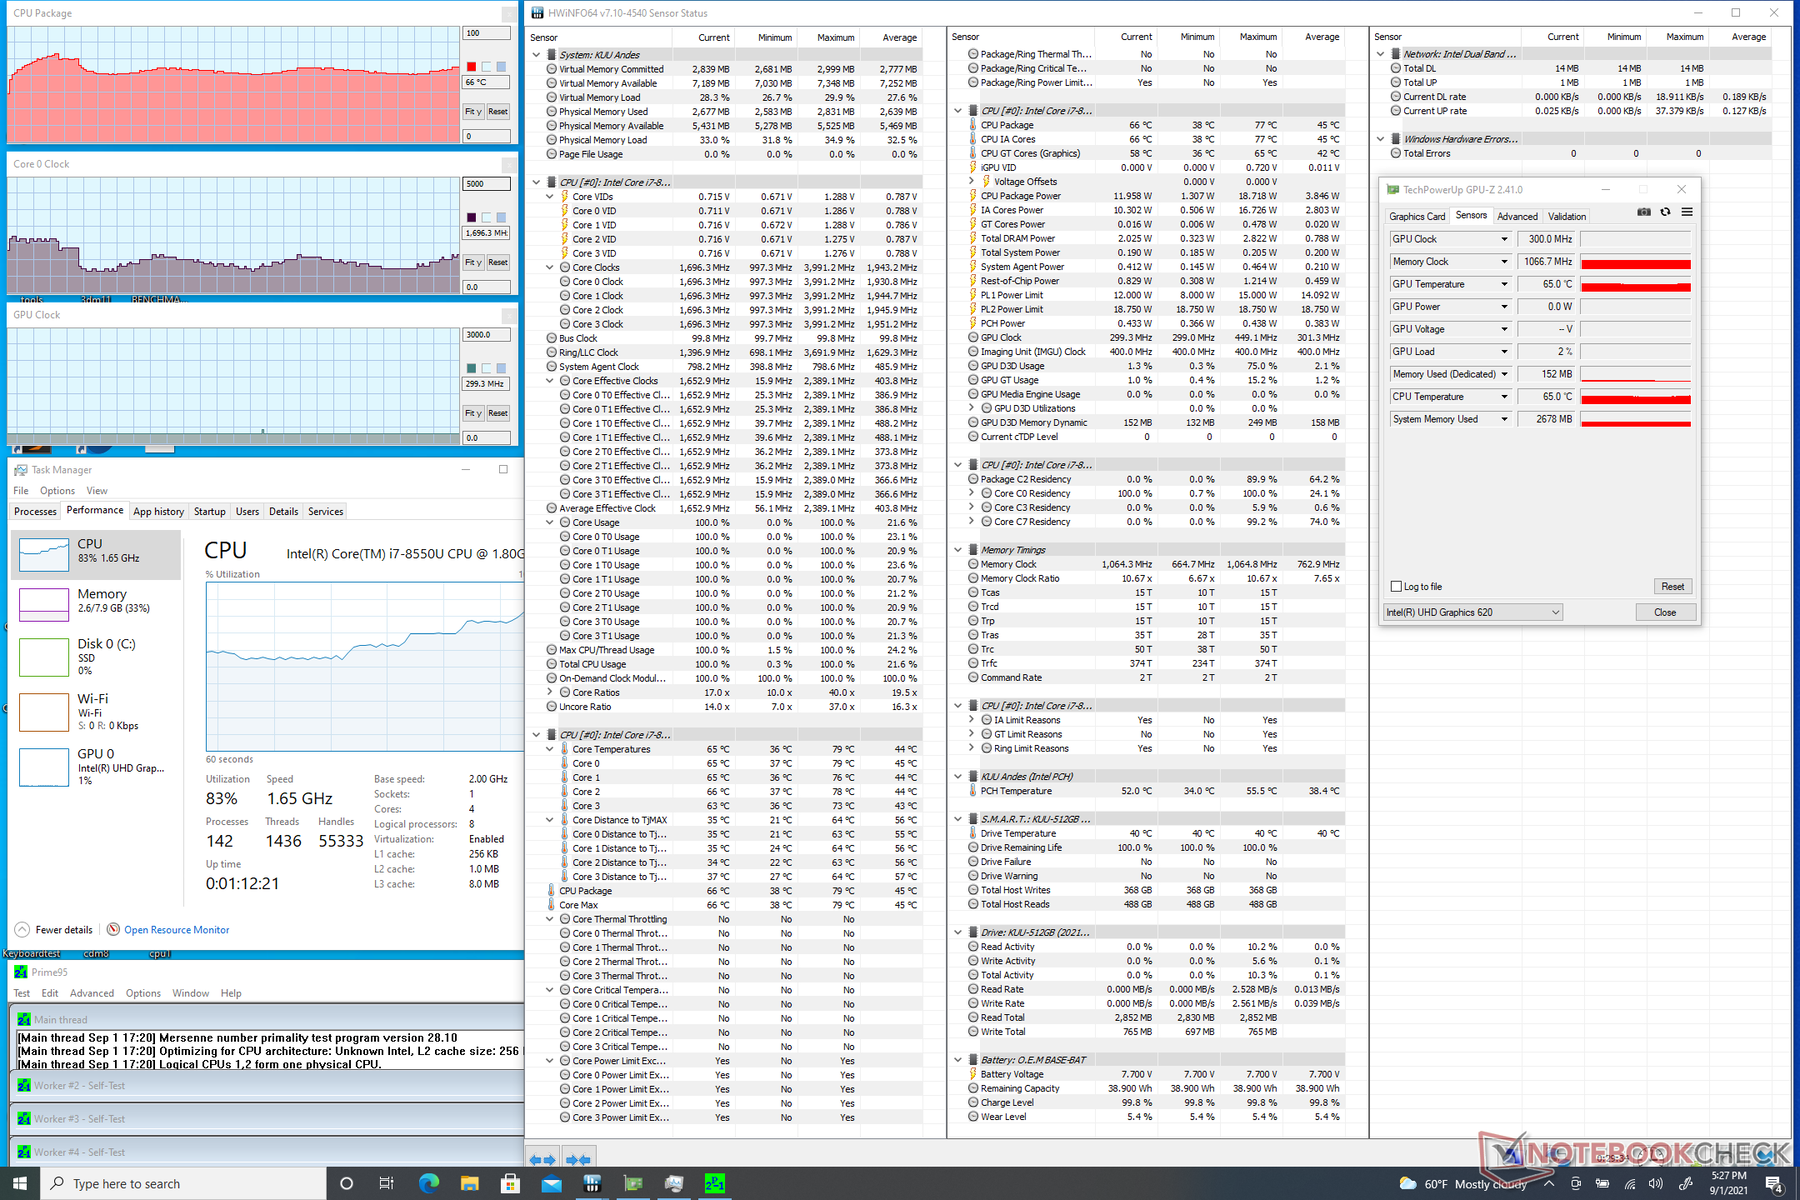
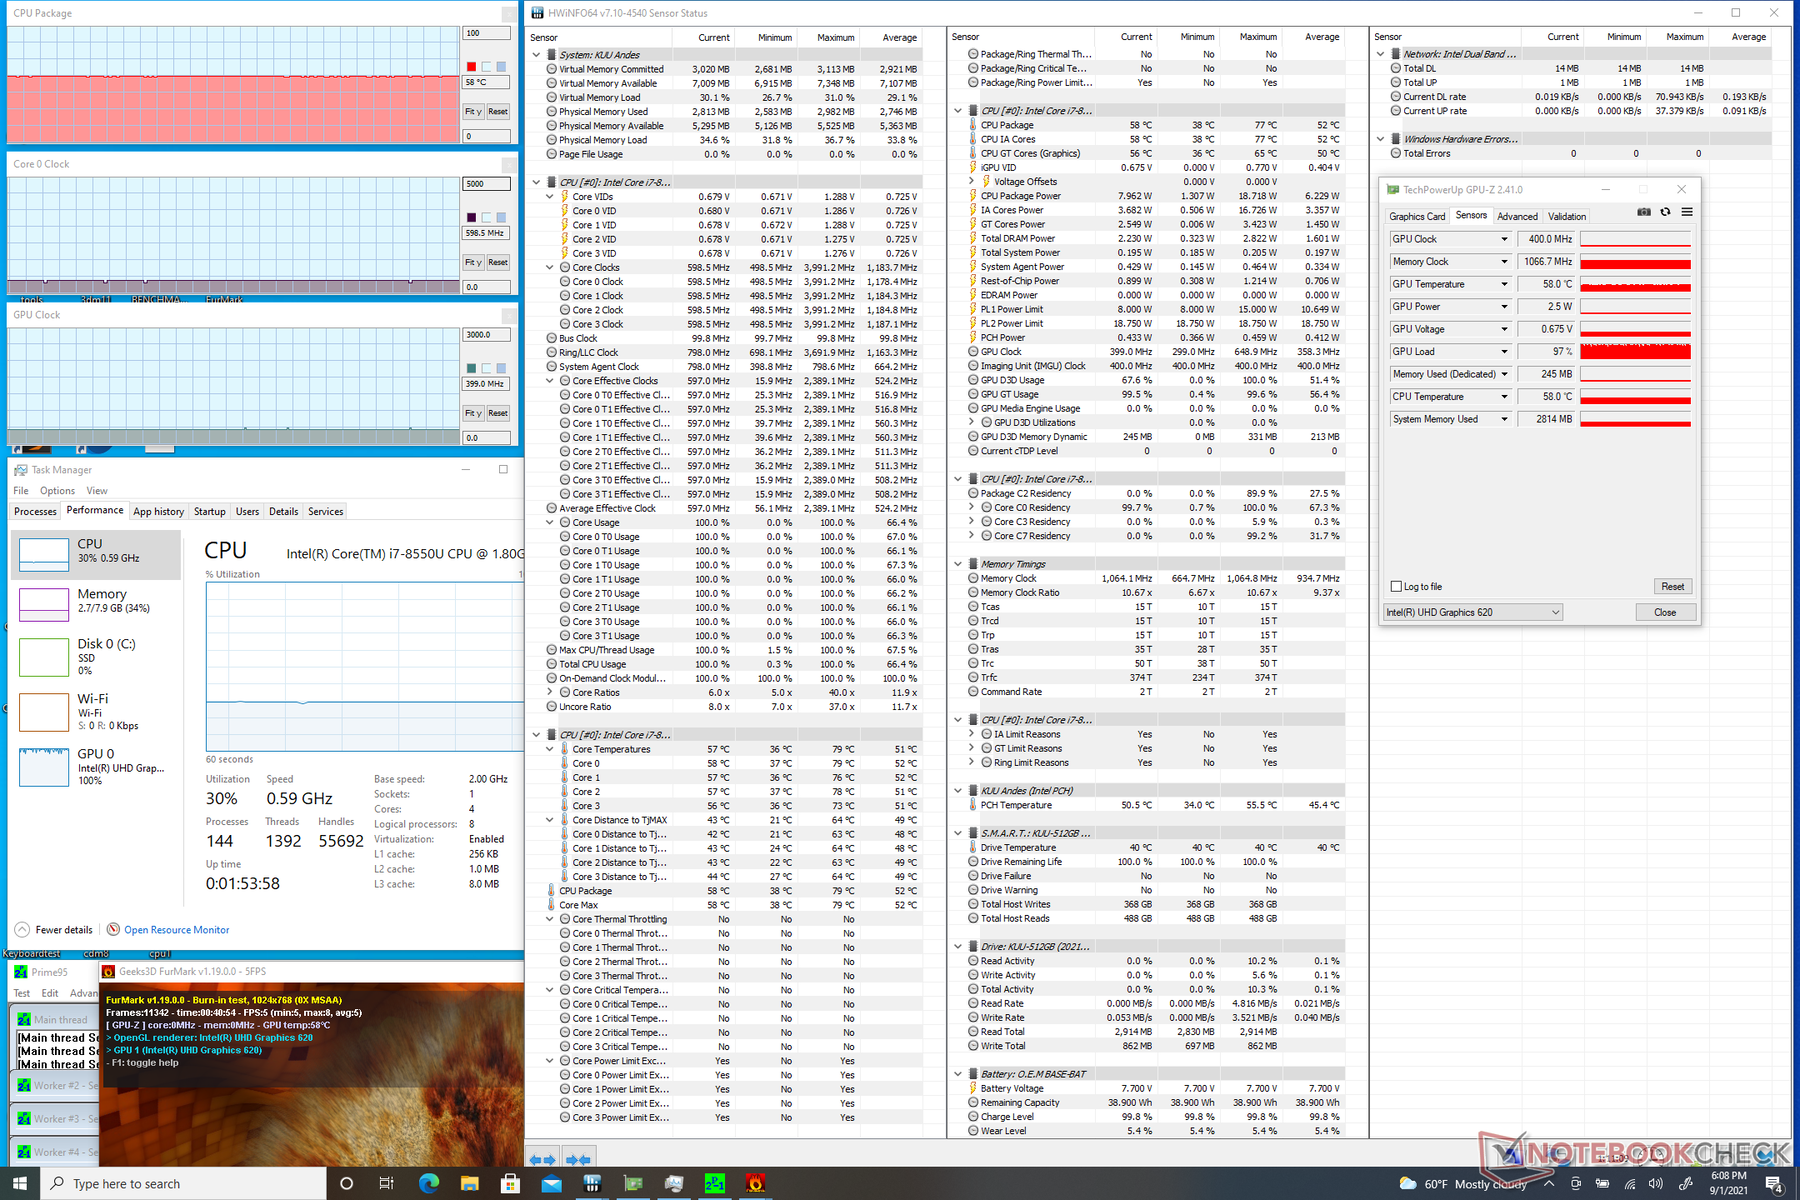
| CPU Clock (GHz) | GPU Clock (MHz) | Average CPU Temperature (°C) | |
| System Idle | -- | -- | 41 |
| Prime95 Stress | 1.0 - 1.7 | -- | 60 - 65 |
| Prime95 + FurMark Stress | 600 | 400 | 58 |
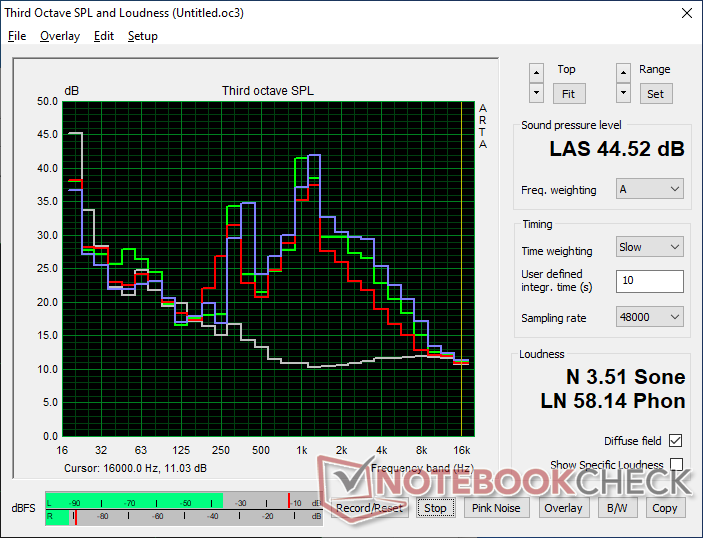
Speakers


Kuu LeBook 12.6 Core i7-8550U audio analysis
(±) | speaker loudness is average but good (72.2 dB)
Bass 100 - 315 Hz
(-) | nearly no bass - on average 28.8% lower than median
(±) | linearity of bass is average (7.9% delta to prev. frequency)
Mids 400 - 2000 Hz
(±) | higher mids - on average 5.4% higher than median
(±) | linearity of mids is average (9.7% delta to prev. frequency)
Highs 2 - 16 kHz
(±) | higher highs - on average 5.5% higher than median
(±) | linearity of highs is average (9% delta to prev. frequency)
Overall 100 - 16.000 Hz
(±) | linearity of overall sound is average (29.5% difference to median)
Compared to same class
» 87% of all tested devices in this class were better, 3% similar, 10% worse
» The best had a delta of 6%, average was 20%, worst was 57%
Compared to all devices tested
» 88% of all tested devices were better, 3% similar, 10% worse
» The best had a delta of 4%, average was 23%, worst was 134%
Apple MacBook 12 (Early 2016) 1.1 GHz audio analysis
(+) | speakers can play relatively loud (83.6 dB)
Bass 100 - 315 Hz
(±) | reduced bass - on average 11.3% lower than median
(±) | linearity of bass is average (14.2% delta to prev. frequency)
Mids 400 - 2000 Hz
(+) | balanced mids - only 2.4% away from median
(+) | mids are linear (5.5% delta to prev. frequency)
Highs 2 - 16 kHz
(+) | balanced highs - only 2% away from median
(+) | highs are linear (4.5% delta to prev. frequency)
Overall 100 - 16.000 Hz
(+) | overall sound is linear (10.2% difference to median)
Compared to same class
» 7% of all tested devices in this class were better, 2% similar, 90% worse
» The best had a delta of 5%, average was 18%, worst was 53%
Compared to all devices tested
» 5% of all tested devices were better, 1% similar, 94% worse
» The best had a delta of 4%, average was 23%, worst was 134%
Energy Management
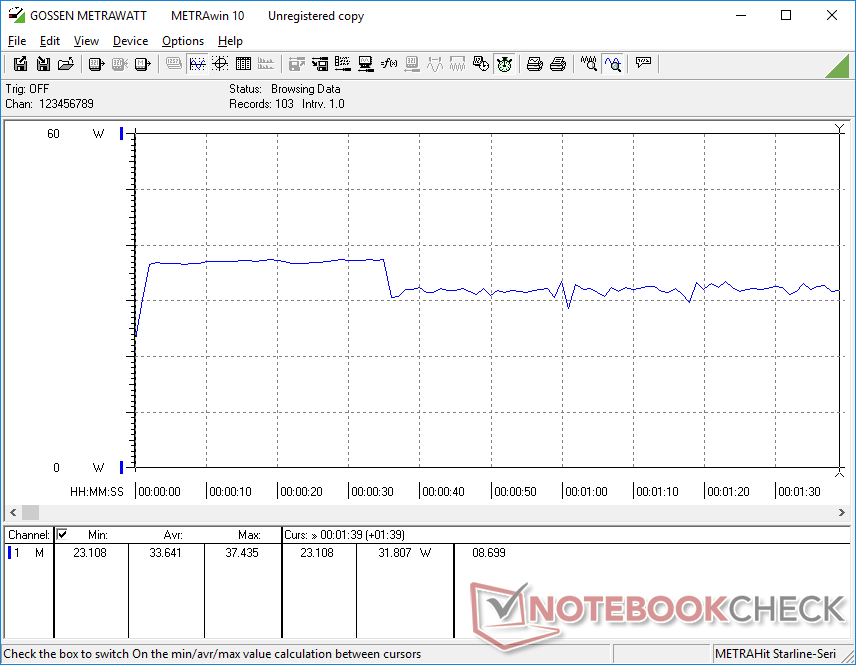
Power Consumption
The system consumes slightly less power than on the Surface Pro 7 Plus when running comparable applications. However, the savings of just a few watts pale in comparison to the tremendous gains in performance that the Microsoft tablet is able to offer over the LeBook.
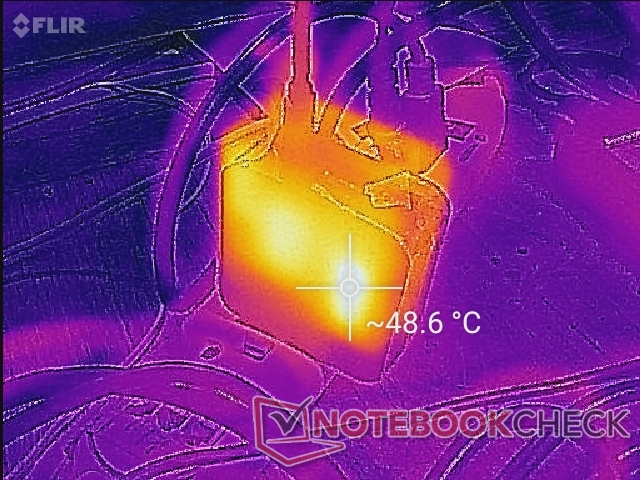
We're able to measure a temporary maximum draw of 38.9 W from the small (~6.3 x 6.3 x 3 cm) 45 W AC adapter when running Prime95 and FurMark simultaneously before thermal limitations kick in. The aforementioned Surface Pro 7 Plus can draw significantly more at up to 62.5 W due to the higher Turbo Boost potential of its newer processor.

| Off / Standby | |
| Idle | |
| Load |
|
Key:
min: | |
| Kuu LeBook 12.6 Core i7-8550U i5-8550U, UHD Graphics 620, KUU-512GB, IPS, 2160x1440, 12.6" | Lenovo ThinkPad X12 20UVS03G00 i7-1160G7, Iris Xe G7 96EUs, Toshiba BG4 KBG40ZNT512G, a-Si IPS LED, 1920x1280, 12.3" | Microsoft Surface Pro 7 Plus i5-1135G7, Iris Xe G7 80EUs, Samsung PM991 MZ9LQ256HBJQ, IPS, 2736x1824, 12.3" | Dell Latitude 12 7210 2-in-1 i7-10610U, UHD Graphics 620, WDC PC SN530 SDBPTPZ-512G, IPS, 1920x1280, 12.3" | Microsoft Surface Laptop Go Core i5 i5-1035G1, UHD Graphics G1 (Ice Lake 32 EU), SK hynix BC501 HFM256GDGTNG, IPS, 1536x1024, 12.4" | NuVision Encite Book 12 Plus Celeron N3350, HD Graphics 500, SanDisk DF4064, IPS, 2560x1440, 12.5" | |
|---|---|---|---|---|---|---|
| Power Consumption | 7% | -18% | 19% | 9% | 29% | |
| Idle Minimum * (Watt) | 6.4 | 4 37% | 5.5 14% | 3.2 50% | 2.8 56% | 4.7 27% |
| Idle Average * (Watt) | 8.8 | 5.9 33% | 9.1 -3% | 5.3 40% | 6.8 23% | 7 20% |
| Idle Maximum * (Watt) | 8.9 | 8.3 7% | 10.8 -21% | 8.4 6% | 8 10% | 8 10% |
| Load Average * (Watt) | 33.6 | 30.1 10% | 39.2 -17% | 27 20% | 37.2 -11% | 14.1 58% |
| Load Maximum * (Watt) | 38.9 | 59 -52% | 62.5 -61% | 46.9 -21% | 51.6 -33% | 27.1 30% |
| Witcher 3 ultra * (Watt) | 30.8 |
* ... smaller is better
Power Consumption Prime95 Stress Test
Battery Life
Battery capacity is in between that of the Surface Pro 7 and Latitude 12 7210 2-in-1. WLAN runtime, however, is nonetheless roughly two hours shorter on the KUU model for a total of almost 6.5 hours.
Charging from empty to full capacity takes about two full hours.
| Kuu LeBook 12.6 Core i7-8550U i5-8550U, UHD Graphics 620, 42 Wh | Lenovo ThinkPad X12 20UVS03G00 i7-1160G7, Iris Xe G7 96EUs, 42 Wh | Microsoft Surface Pro 7 Plus i5-1135G7, Iris Xe G7 80EUs, 48.9 Wh | Dell Latitude 12 7210 2-in-1 i7-10610U, UHD Graphics 620, 38 Wh | Microsoft Surface Laptop Go Core i5 i5-1035G1, UHD Graphics G1 (Ice Lake 32 EU), 39 Wh | NuVision Encite Book 12 Plus Celeron N3350, HD Graphics 500, 31.9 Wh | |
|---|---|---|---|---|---|---|
| Battery runtime | 28% | 27% | 28% | 25% | 6% | |
| WiFi v1.3 (h) | 6.4 | 8.2 28% | 8.1 27% | 8.2 28% | 8 25% | 6.8 6% |
| Load (h) | 2 | 3.9 | 1.9 | 2 | 3.6 | |
| Reader / Idle (h) | 13.6 | 22.8 | 35 | 11.3 |
Pros
Cons
Verdict — One of the Better Windows Tablets on a Budget
The strength of the KUU LeBook are visual and tangible. It's a solidly built tablet that could pass as a pricier flagship model like the Surface Pro or HP ElitePad. We also have to applaud the manufacturer for sticking to a Core U-series CPU instead of the much weaker Atom, Celeron, or Pentium part a la the Surface Go or many other cheaper Windows tablets in the budget range. The roomy 12.6-inch touchscreen and relatively narrow bezels help make the LeBook even more attractive.
It looks and feels like a high quality tablet with respectable performance from its Core U-series CPU. However, the bouncy keyboard base and high-pitched fan noise are hard to ignore.
The benefits of the KUU are mostly skin deep as the pulsing high-pitched fan, dimmer display, shorter battery, and spongy keyboard keys all hinder the user experience despite how sleek and smooth the chassis may be. Though the LeBook can't compare to the Surface Pro in these specific areas, it is still generally better than other budget Windows tablets including the Asus Transformer Book or Surface Go especially in terms of display size and performance.
Price and availability
The LeBook 12.6 is not yet widely available and with no solid launch date at the time of publishing.
Kuu LeBook 12.6 Core i7-8550U
- 09/04/2021 v7 (old)
Allen Ngo
Price comparison
