NuVision Encite Book 12 Plus (N3350, QHD) Laptop Review

The Nuvision Encite Book 12 Plus is an affordable 12.5-inch subnotebook retailing for $350 USD or roughly one-third the price of a standard Ultrabook. In order to differentiate itself from the sea of ultra-cheap 1080p or 768p subnotebooks, however, the Encite is equipped with a high resolution 2560 x 1440 display for crisper text and significantly more screen real estate.
Core specifications are otherwise run-of-the-mill for its category if not slightly worse as our review below will show. The passively-cooled Celeron N3350, 8 GB RAM, and embedded 64 GB SSD are comparable to competitors like the Acer Switch 3 SW312, Lenovo Flex 6 11, Lenovo Ideapad 120s, Trekstor Yourbook C11B, and even some Chromebooks like the Dell Chromebook 11 3181.
Case
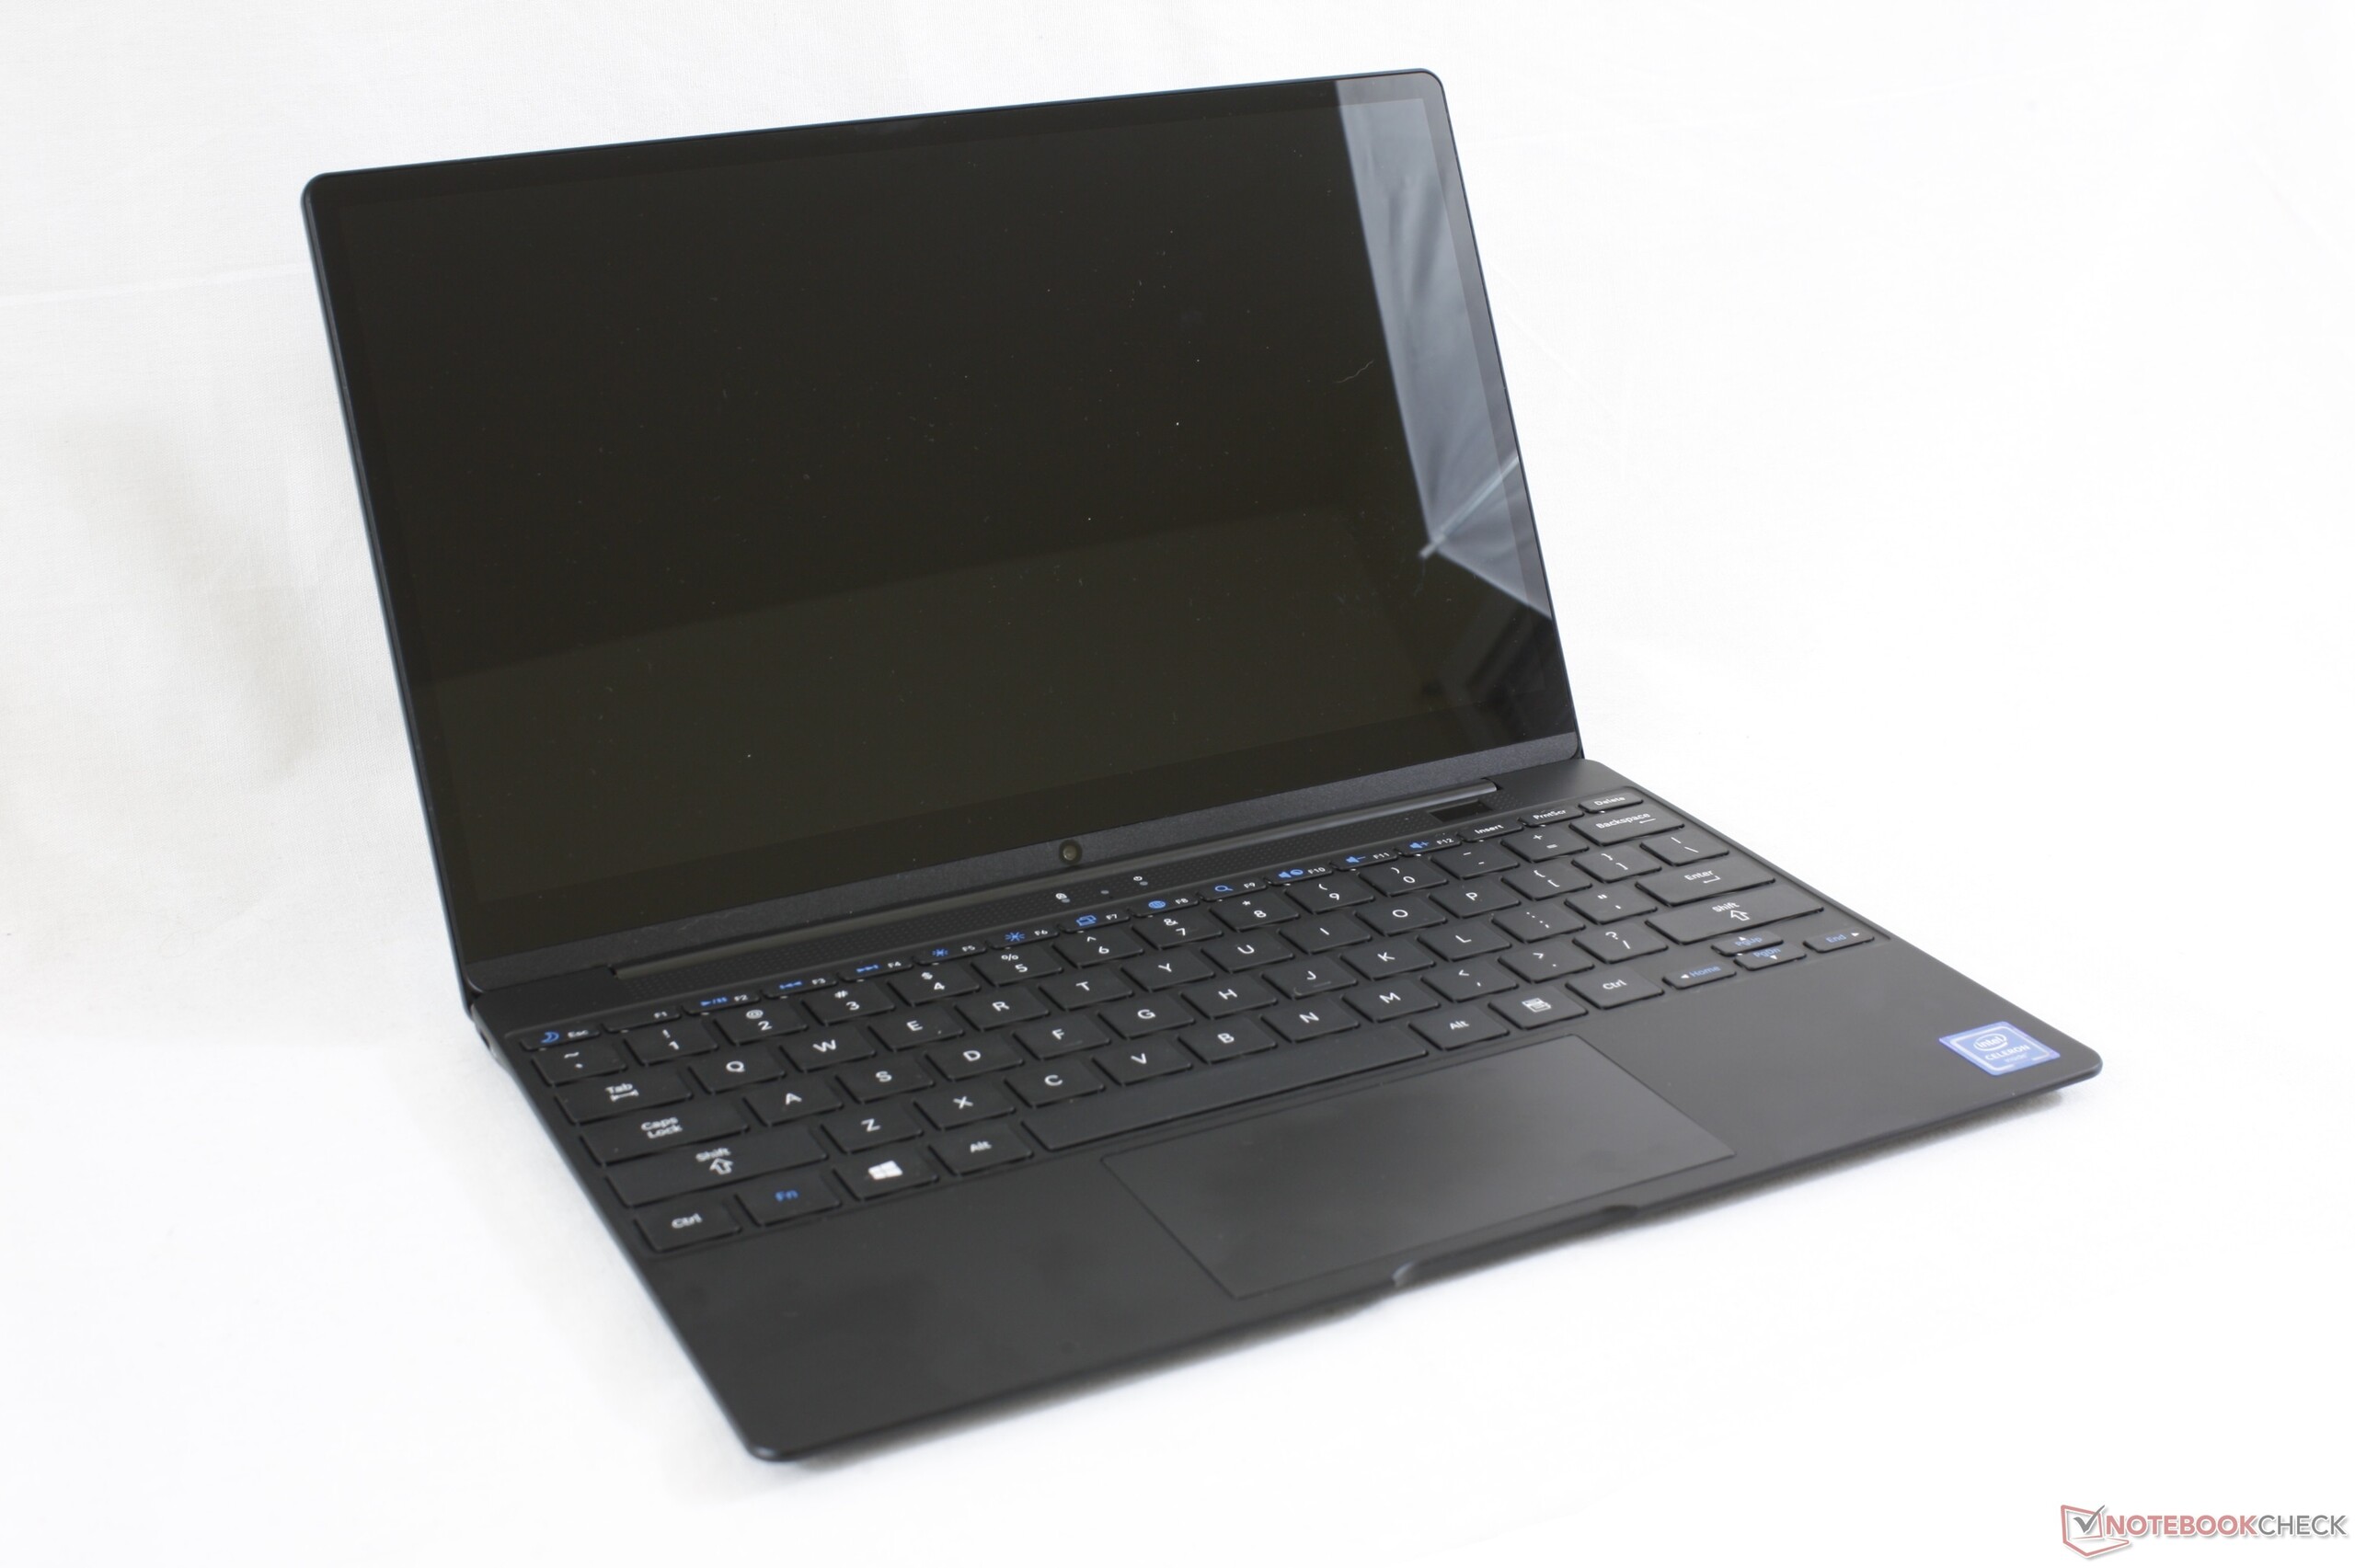
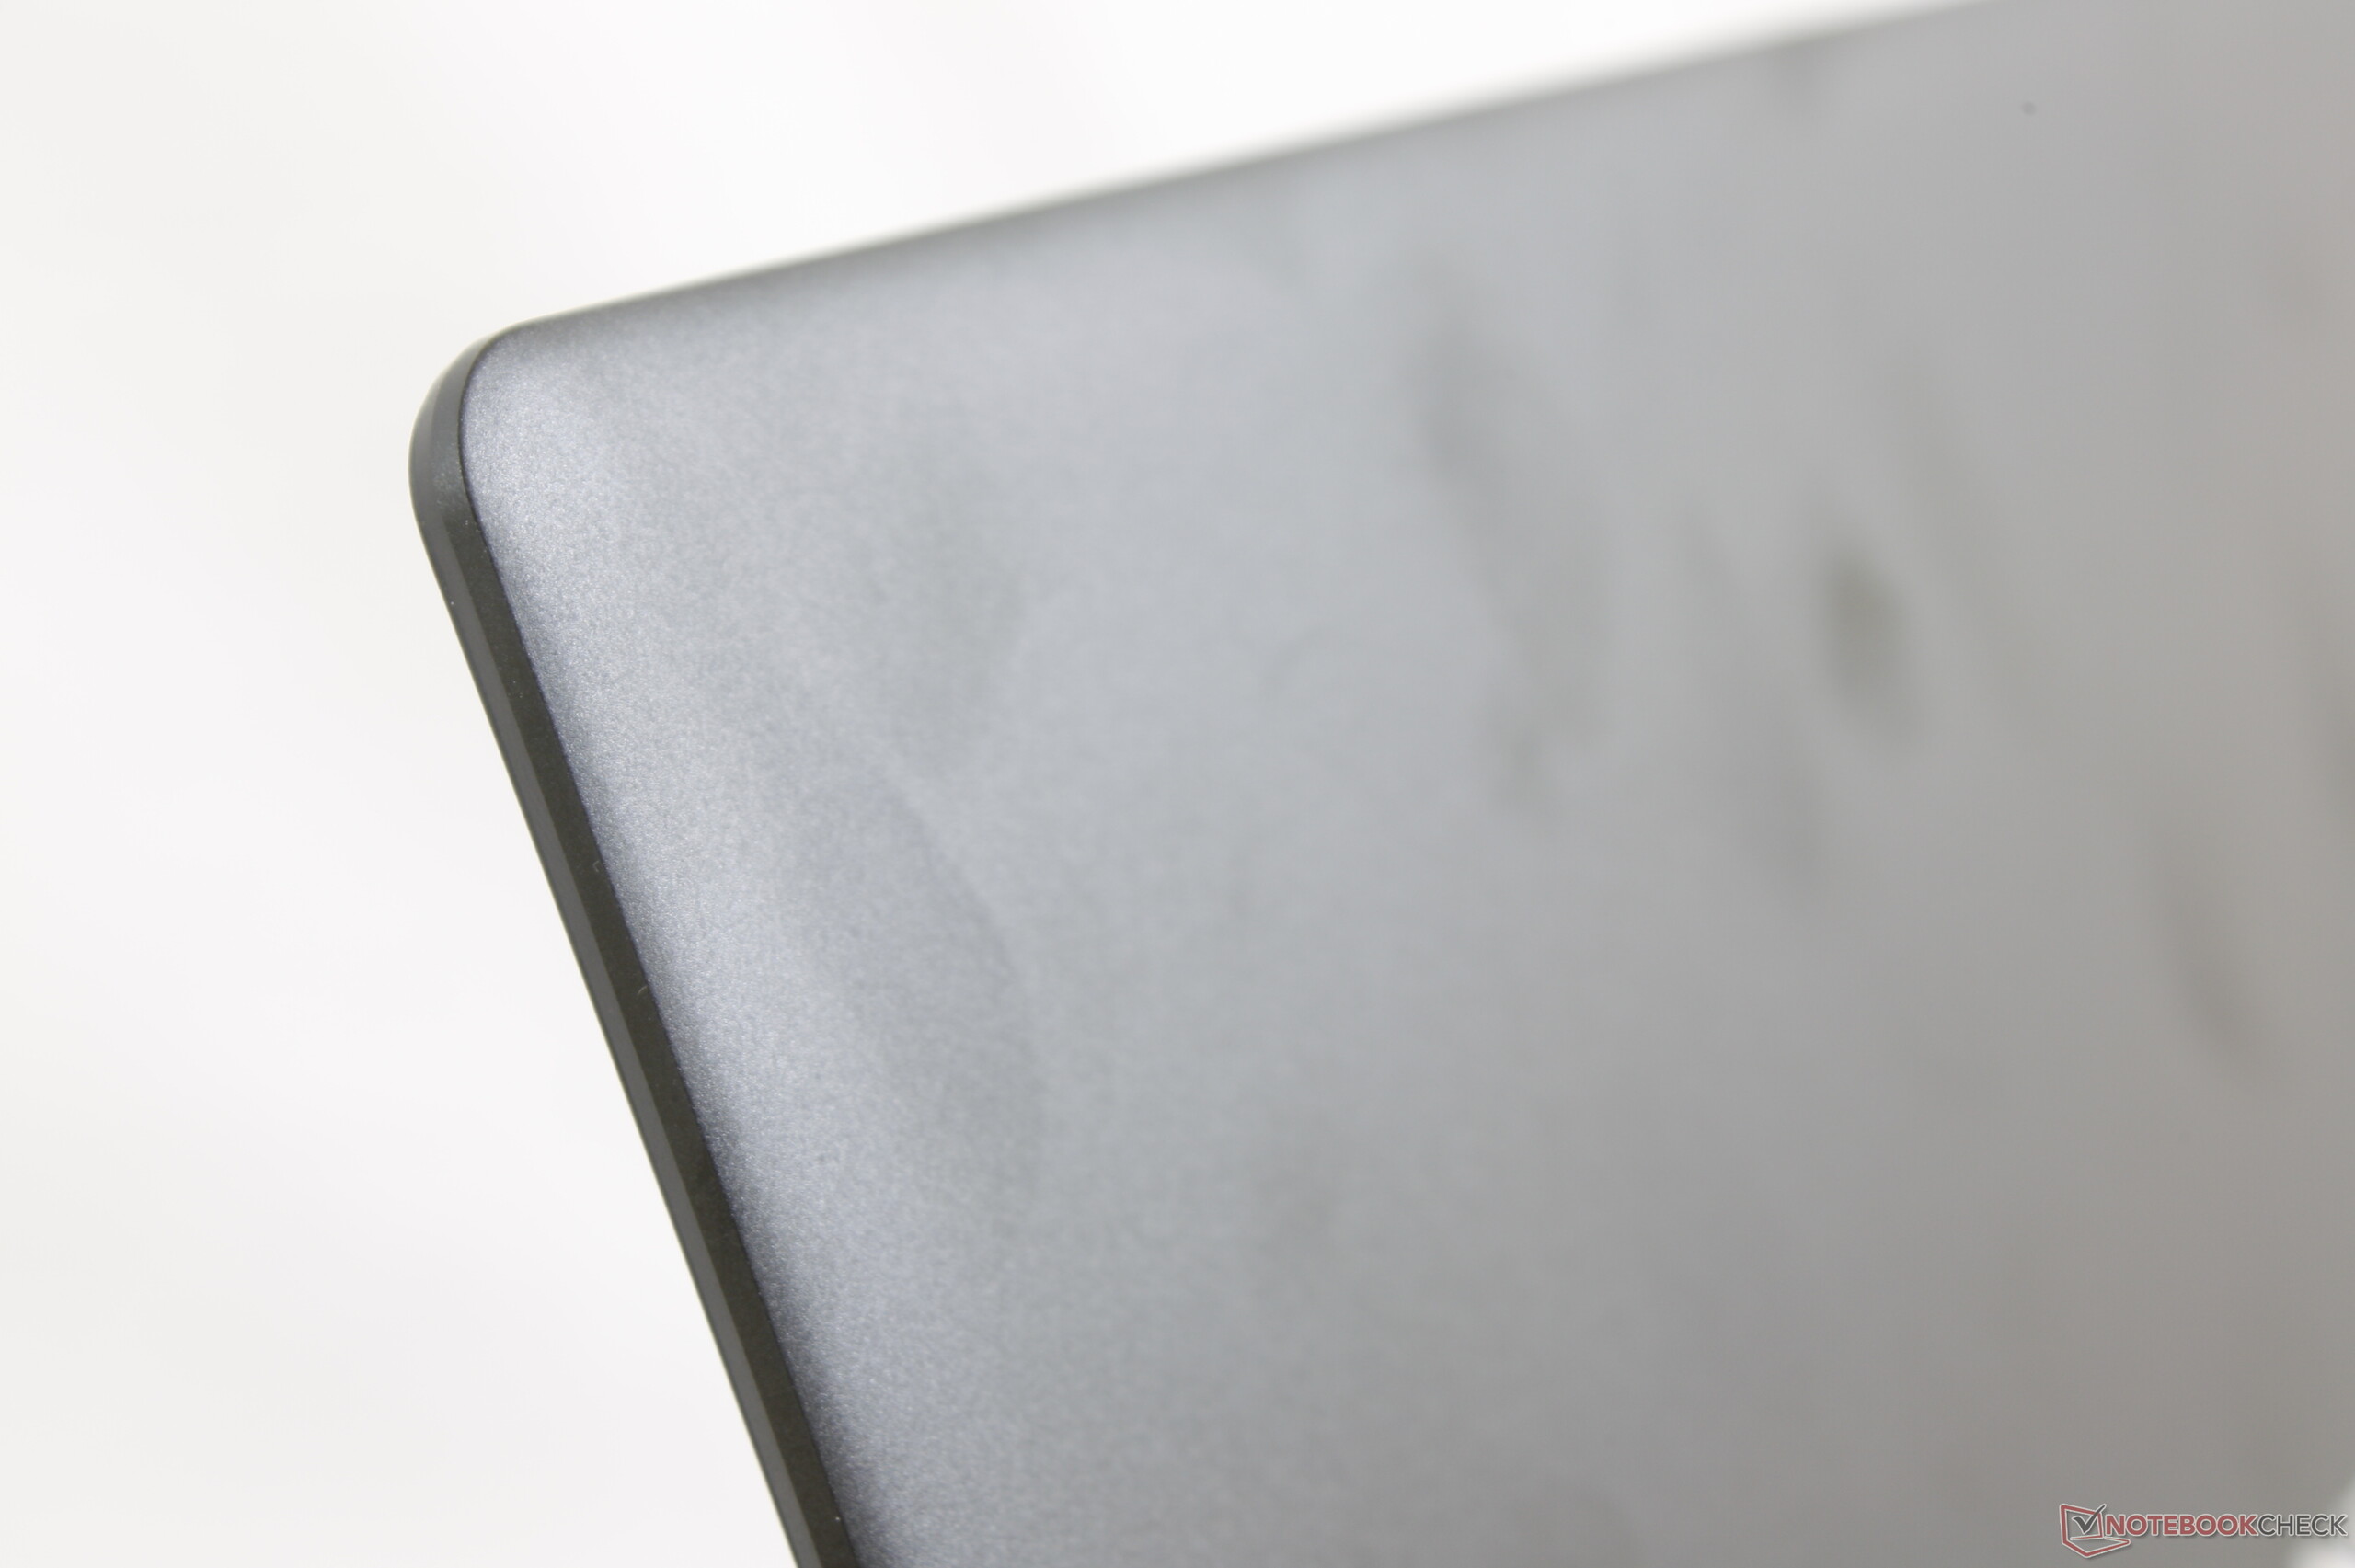
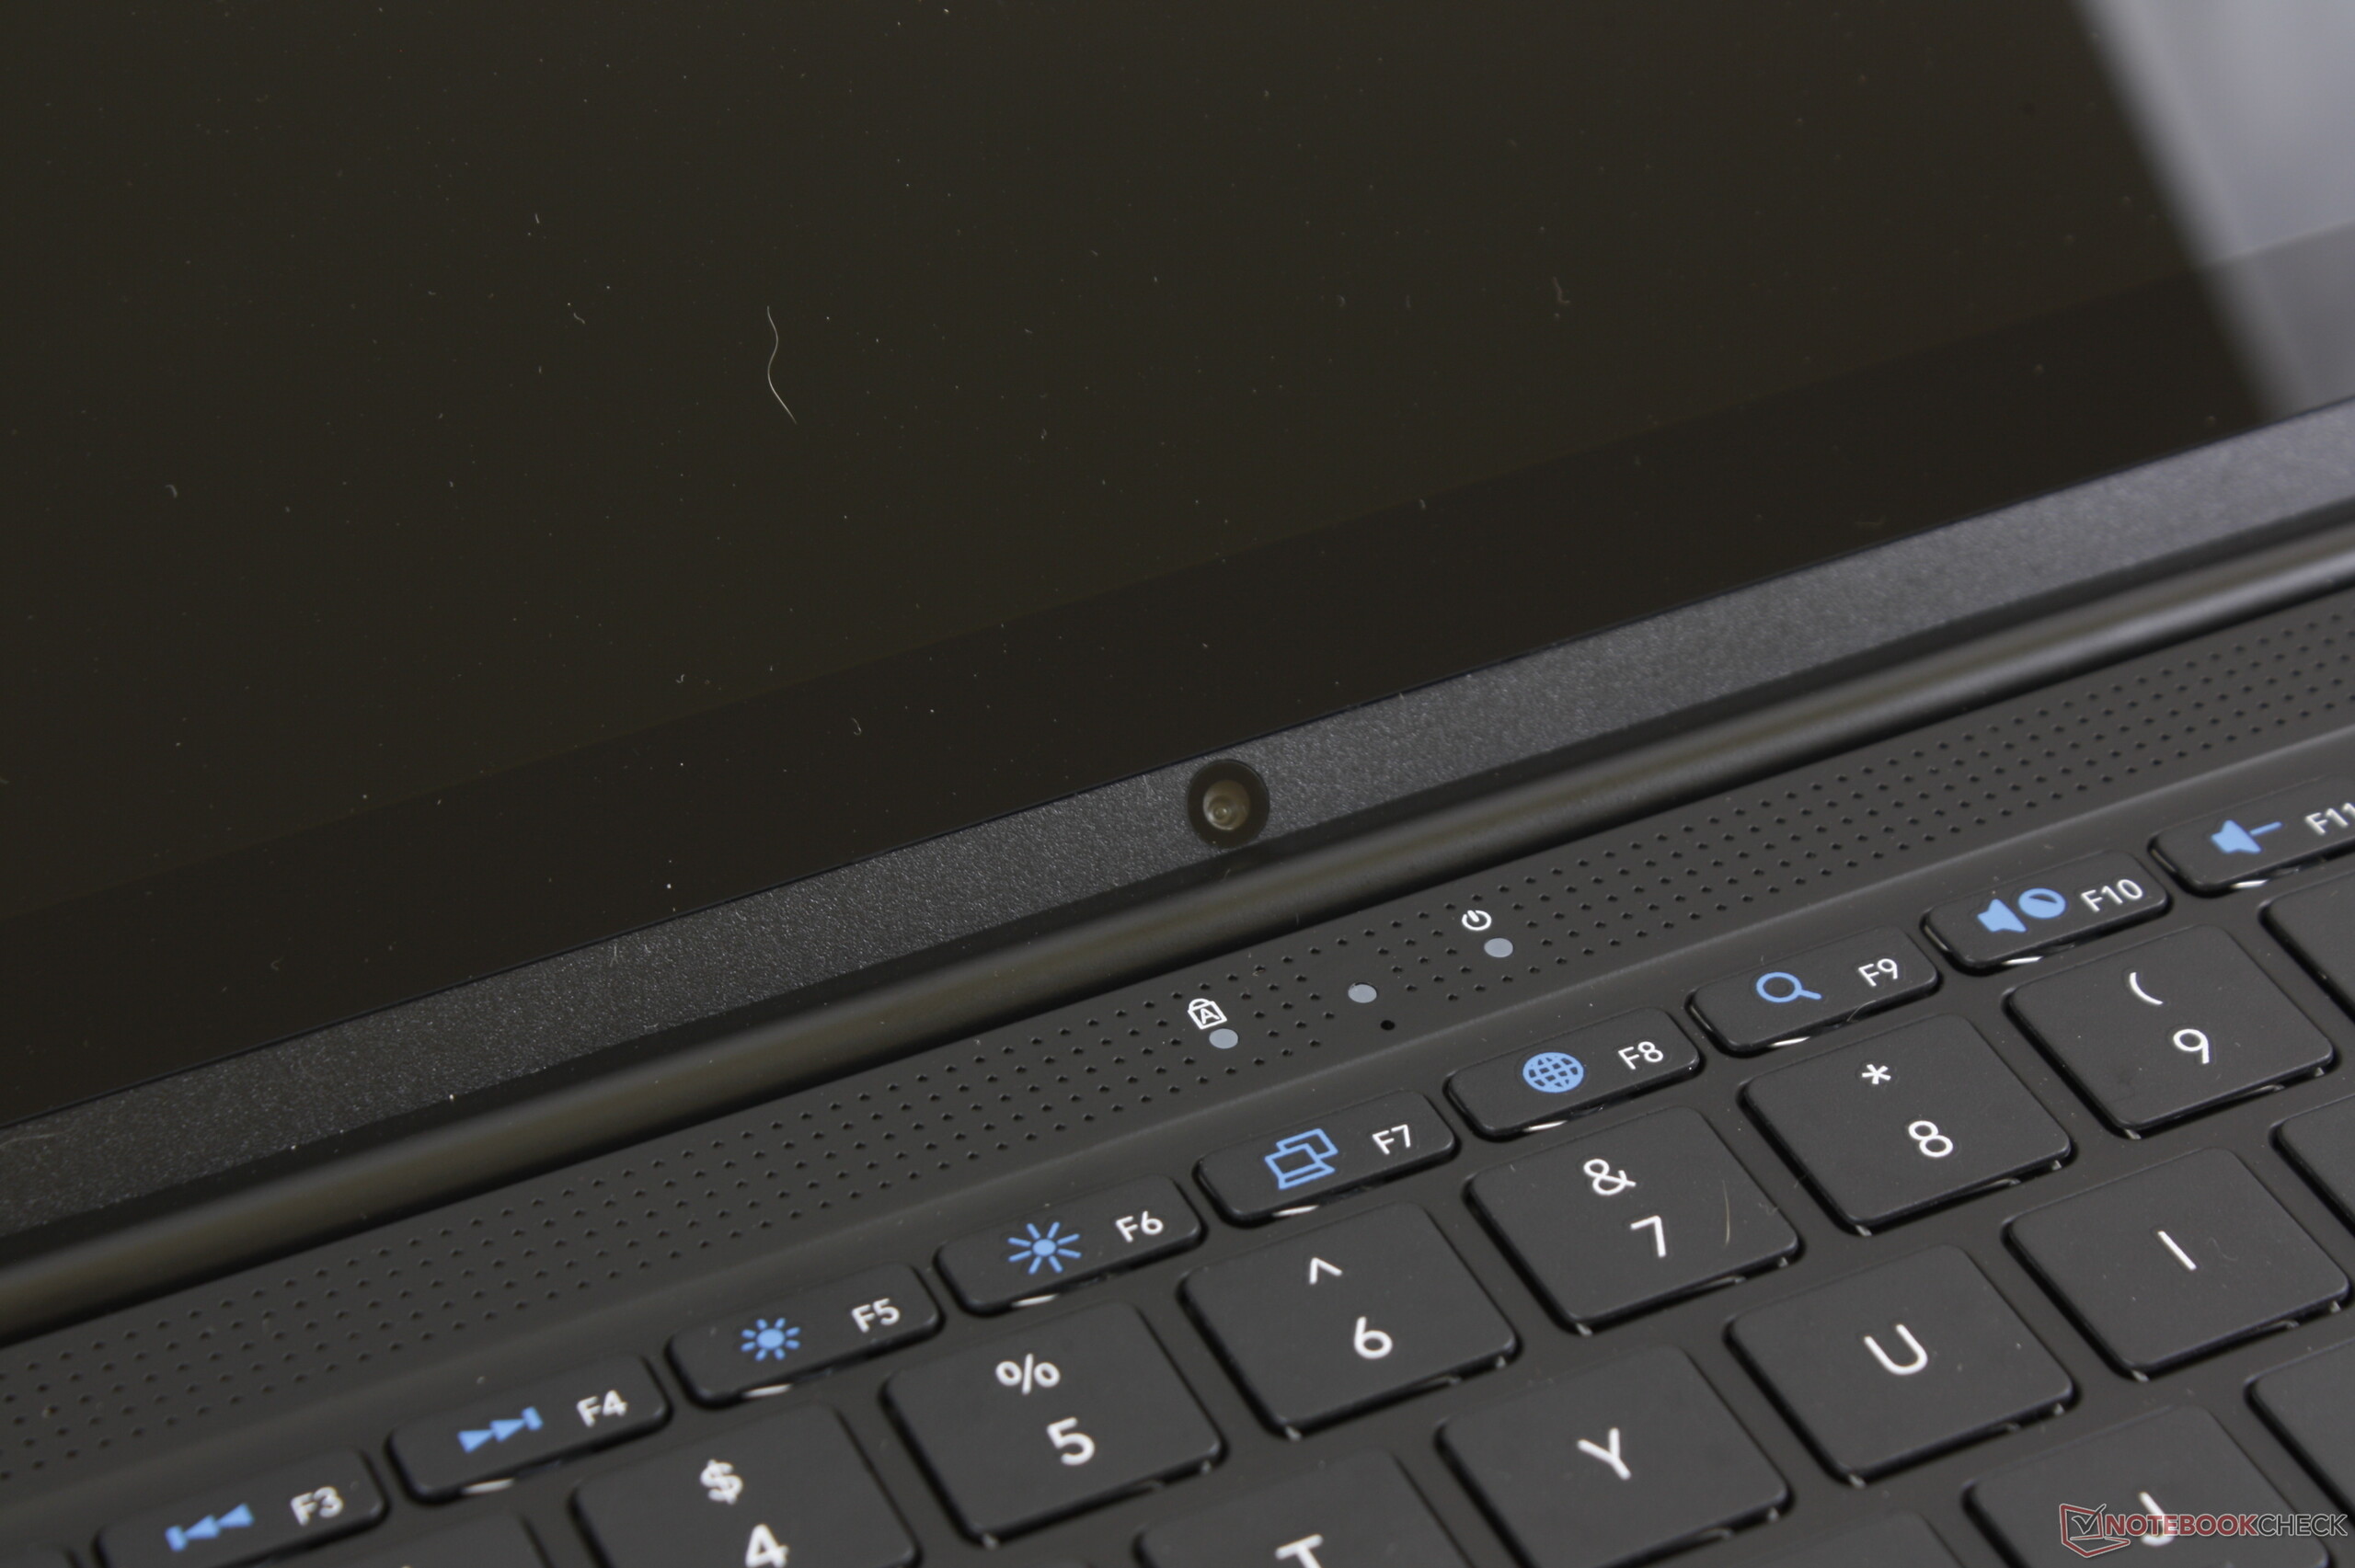
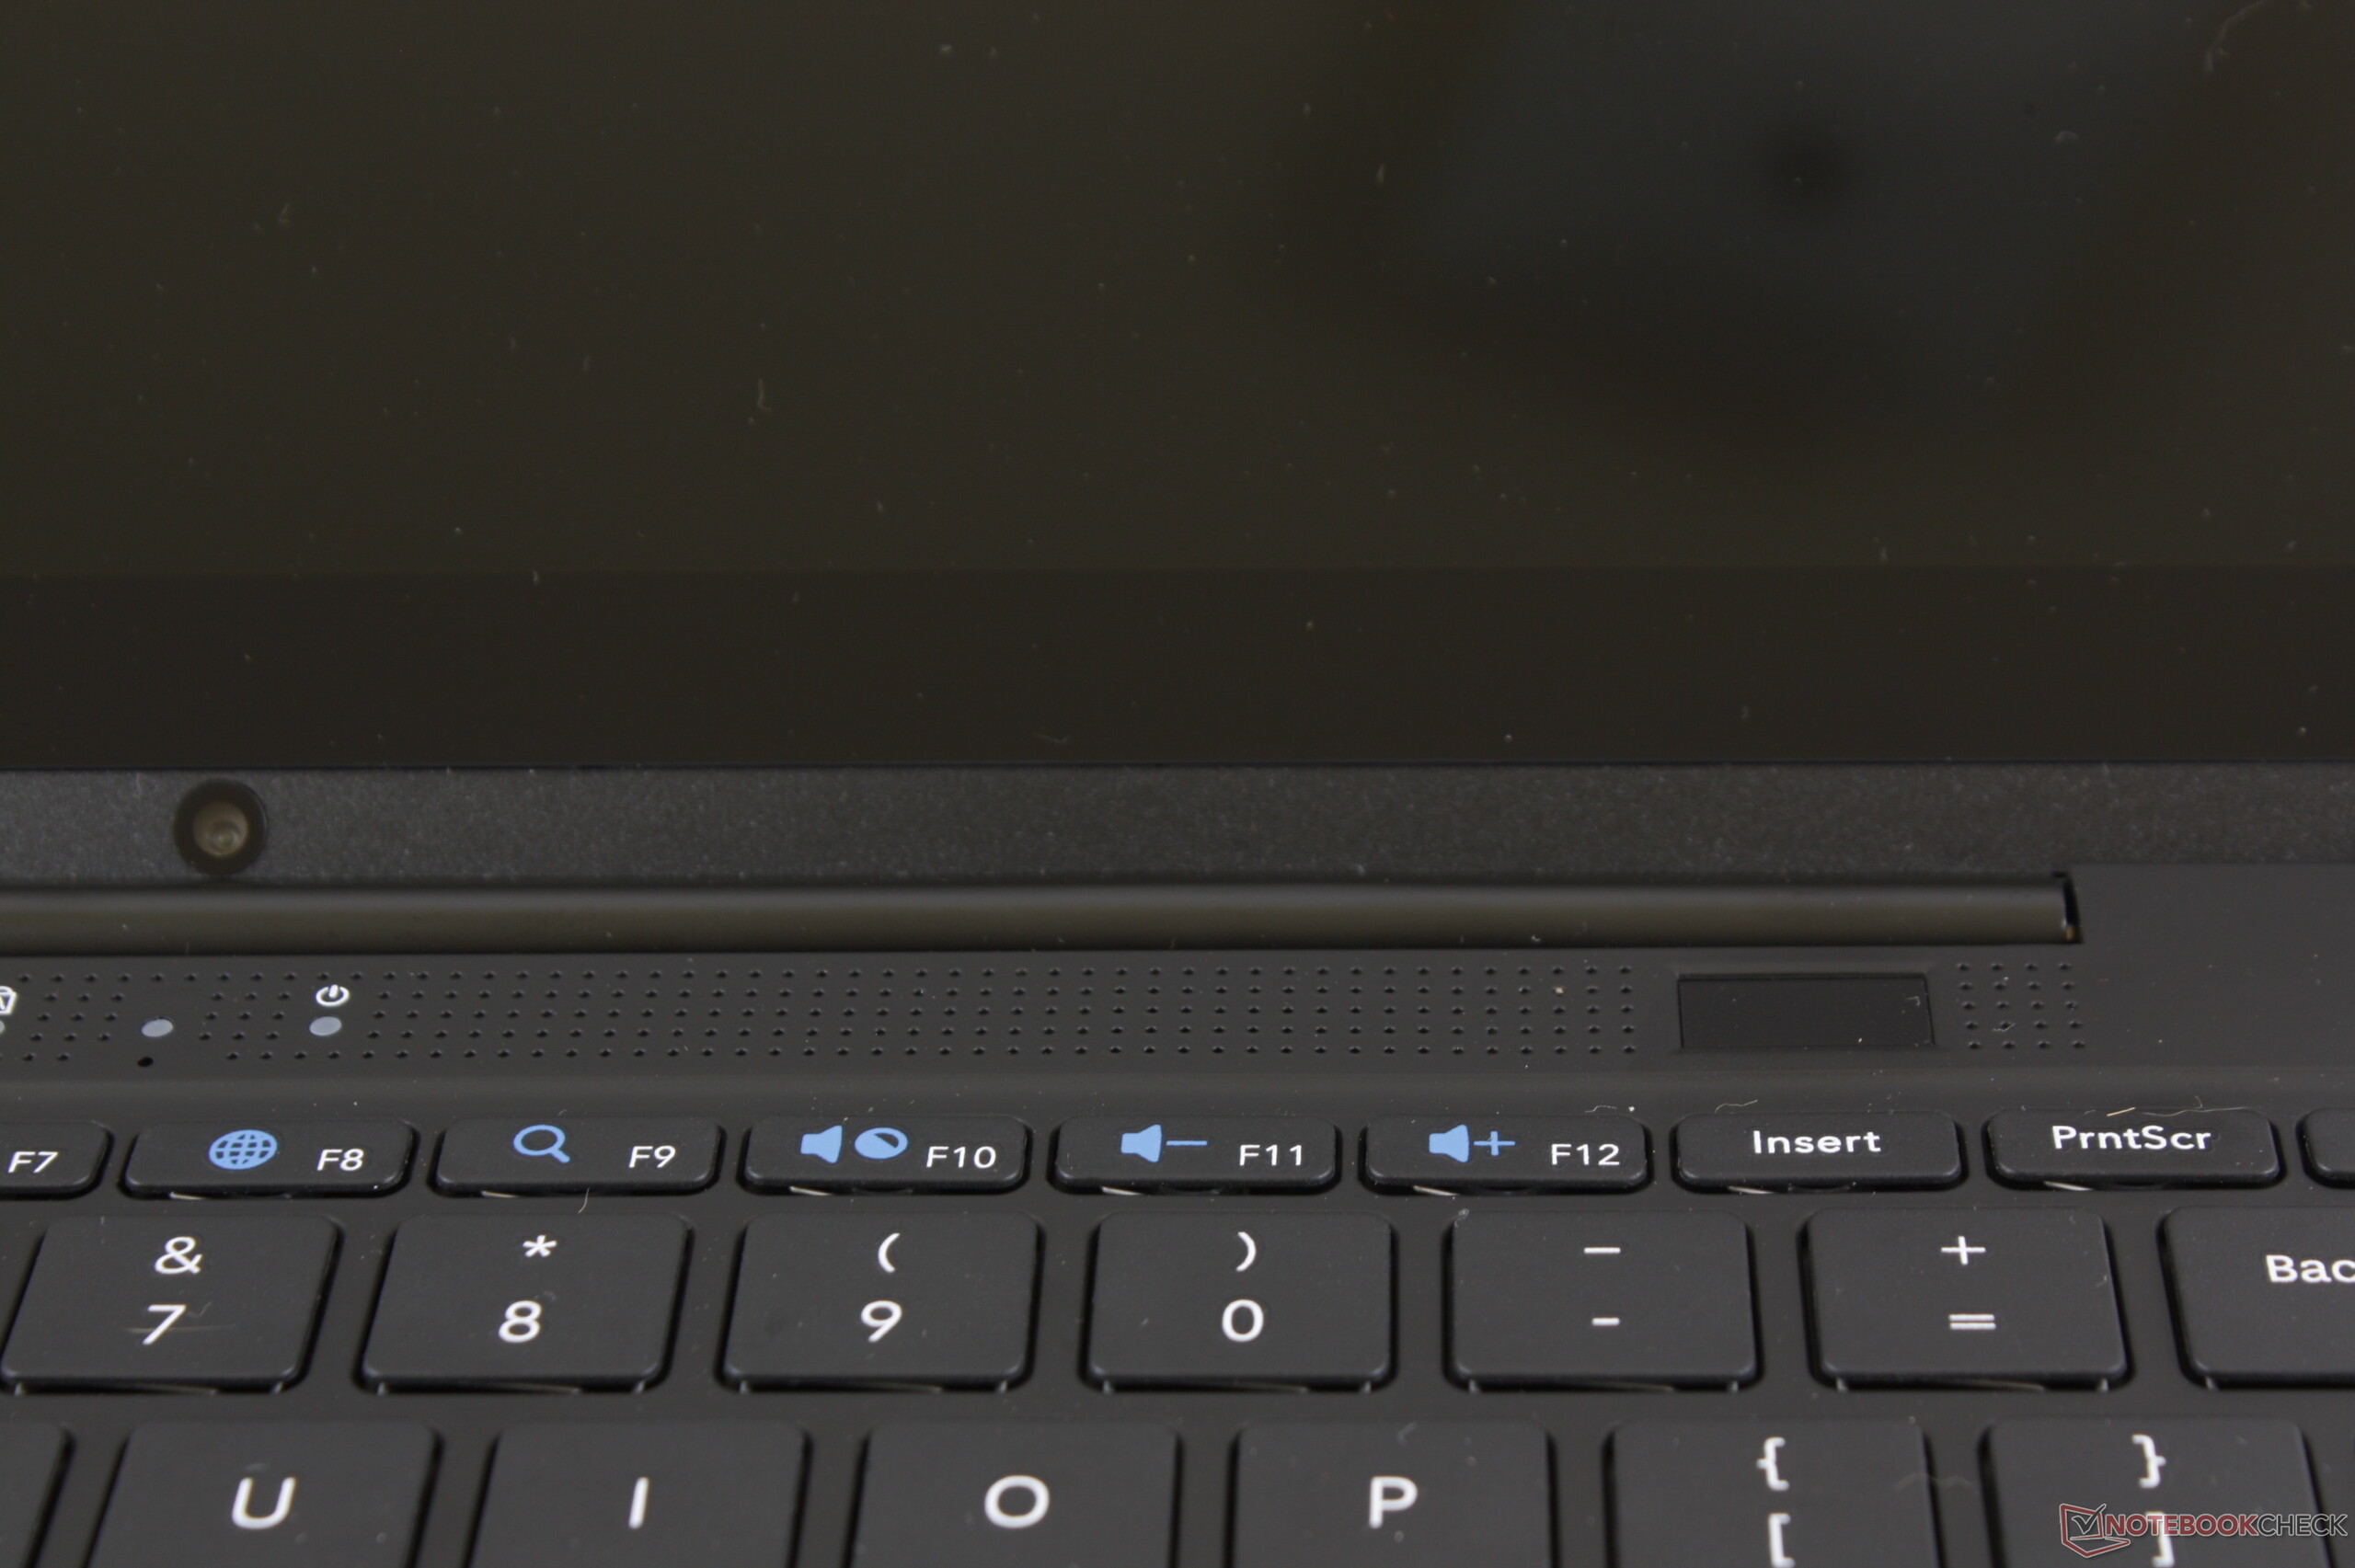
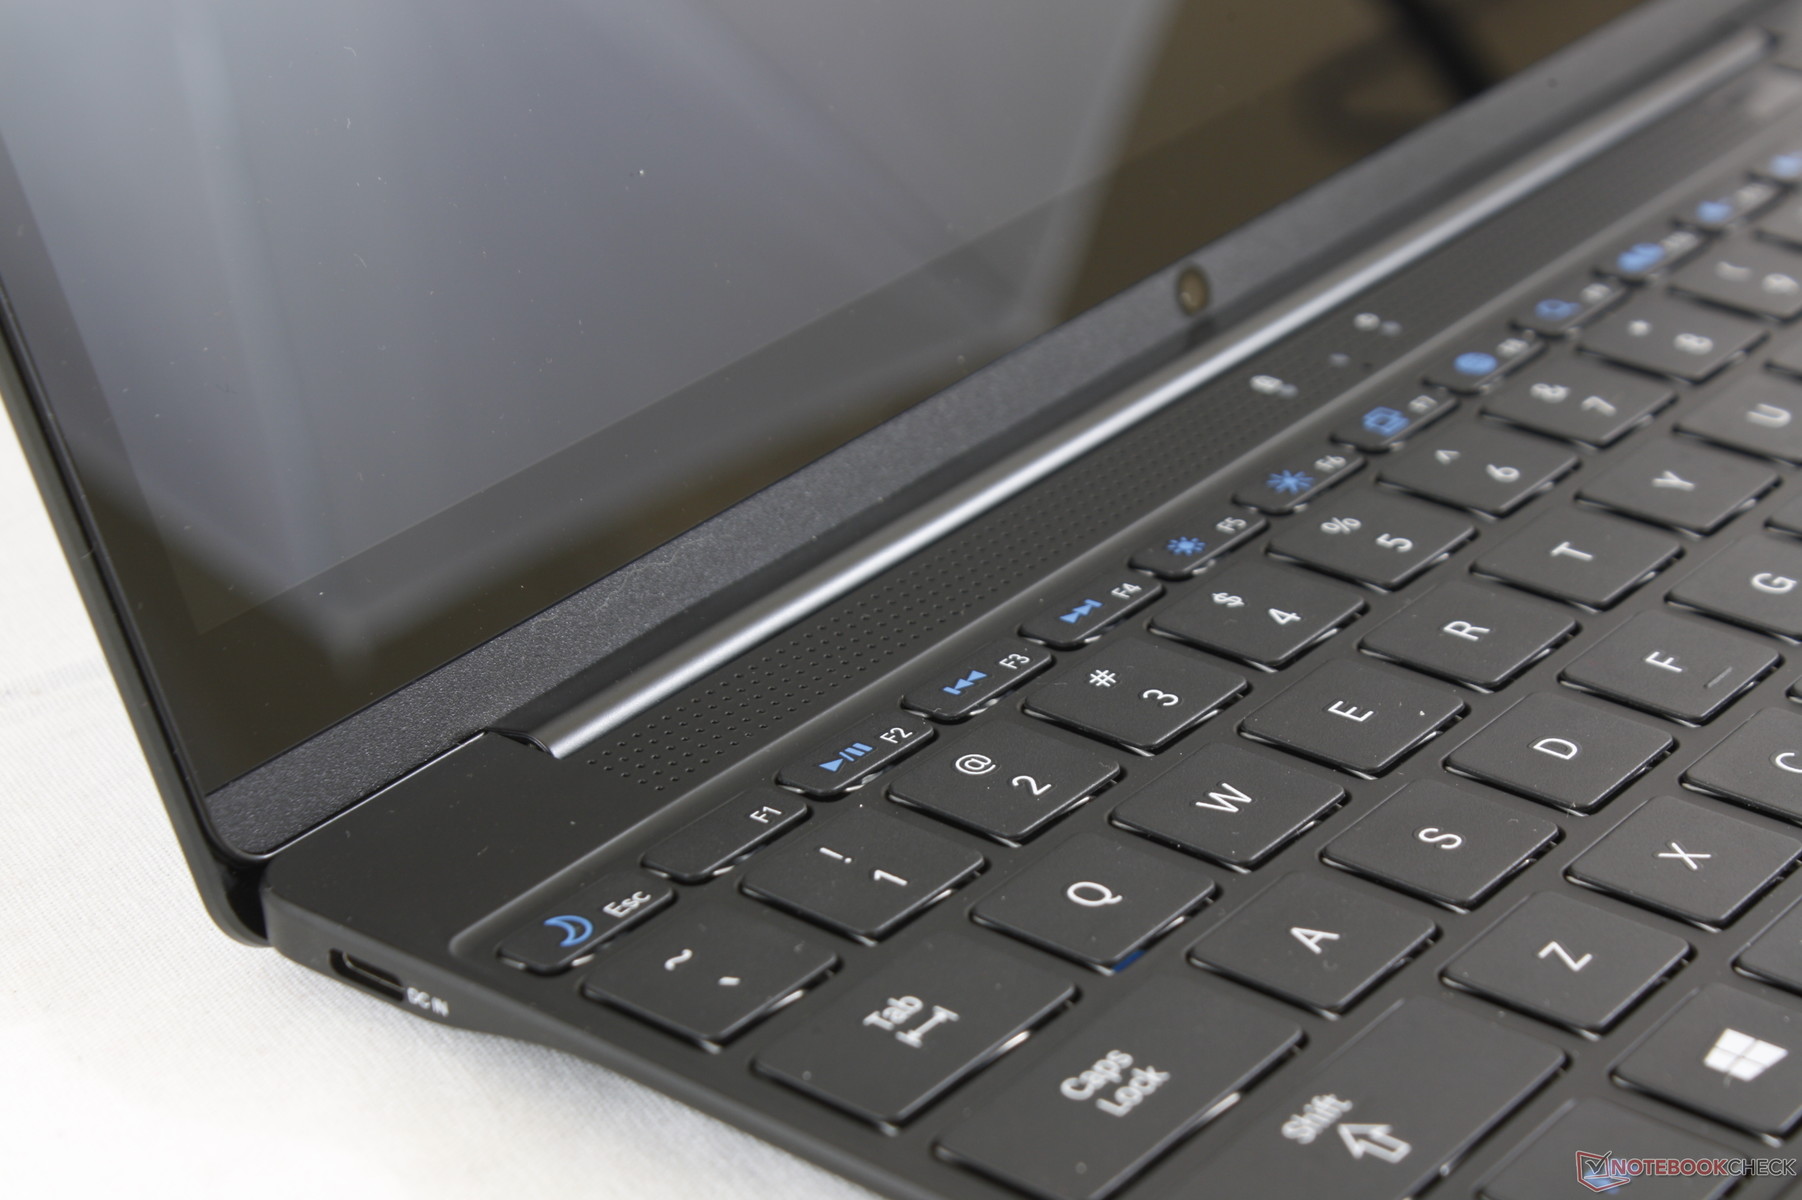
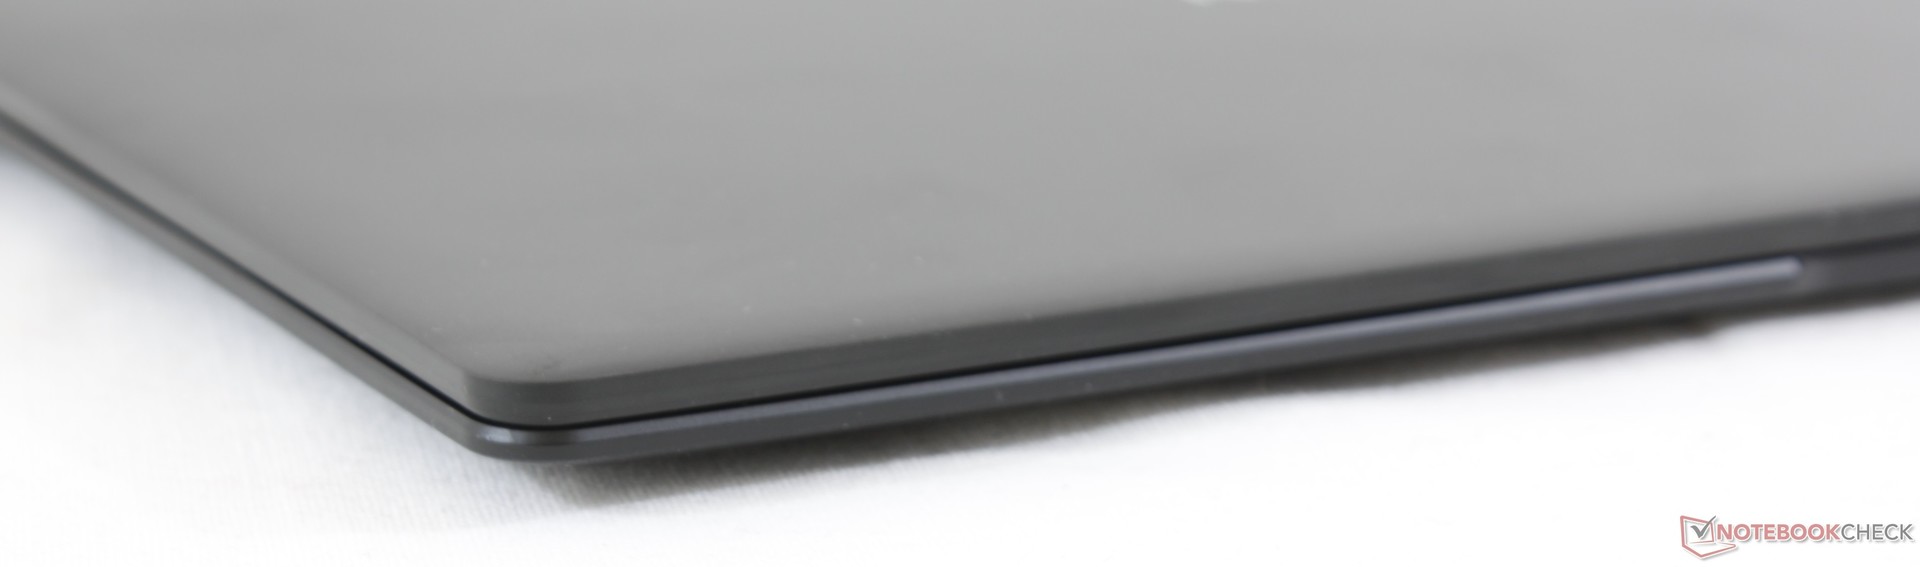
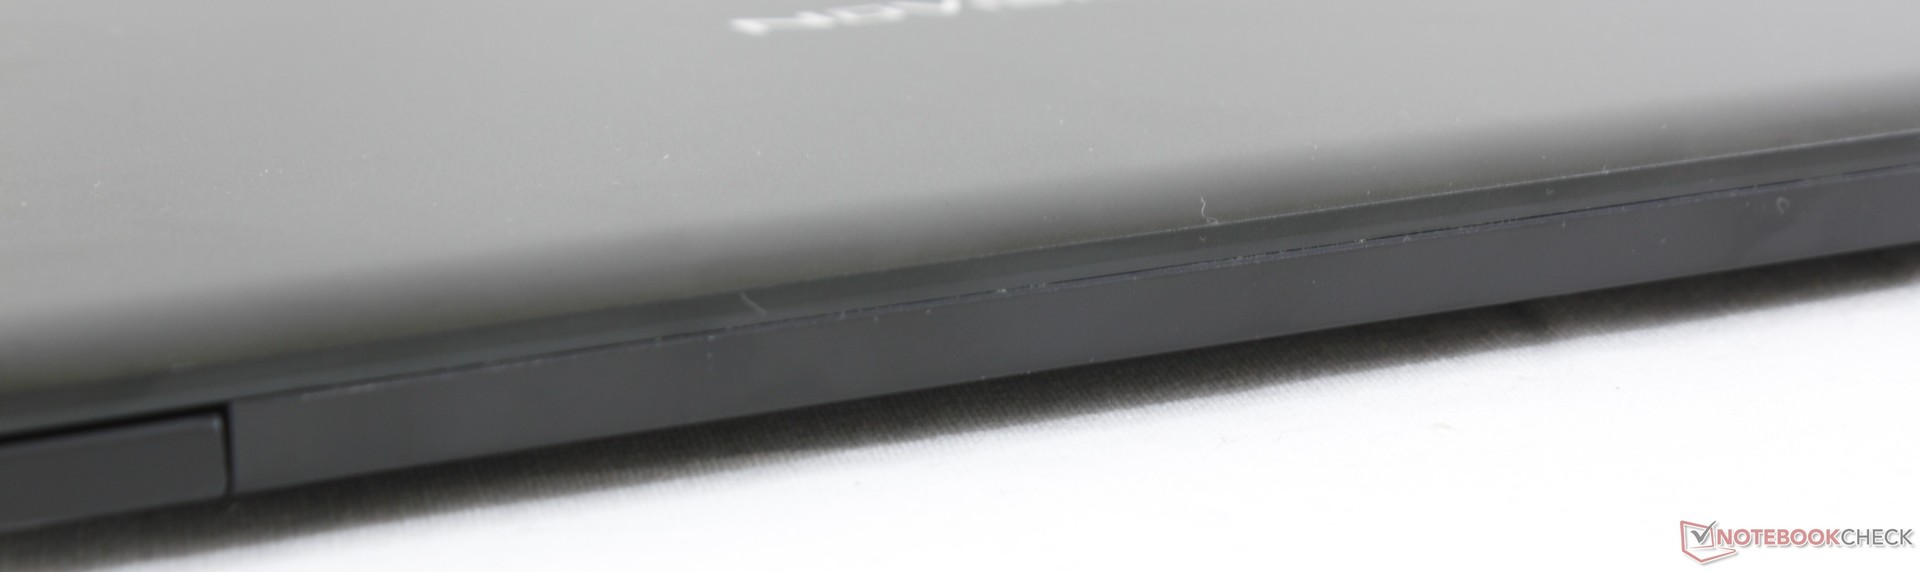
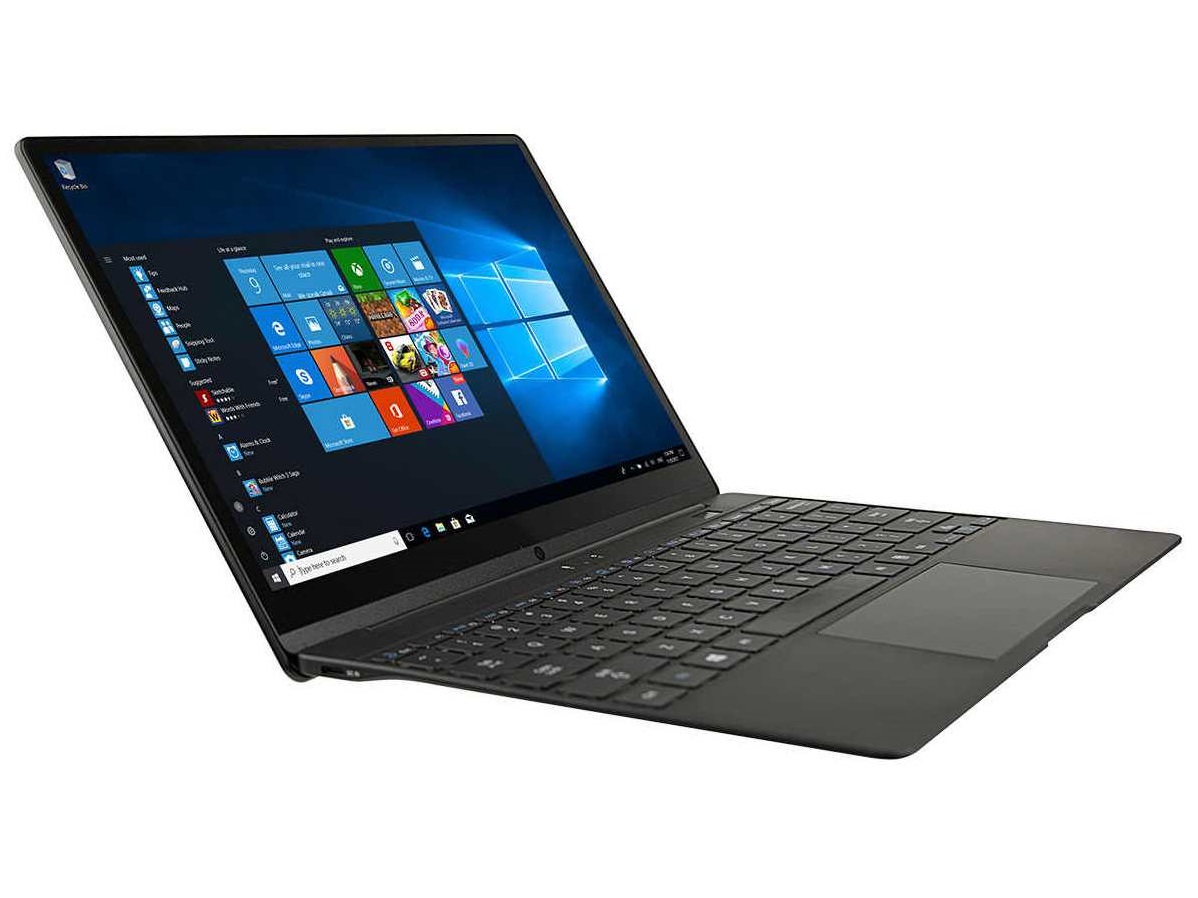
At first glance, the NuVision laptop looks more expensive than it retails for. It's super thin and lightweight with smooth aluminum surfaces not typically found on cheap subnotebooks where plastic is predominant. The devil is in the details, however, as weaknesses become apparent when actually handling the device. Attempting to twist the base results in audible creaking and the hinge could have been more rigid. Fingerprints accumulate very quickly especially on the trackpad to be an instant eyesore. Webcam placement is subpar and the maximum hinge angle is narrower than on many other laptops. Thus, while the Nuvision looks better than most $300 to $400 laptops, it doesn't necessarily feel any stronger to hold.
Build quality is otherwise excellent on our test unit as we can notice no uneven gaps or defects. The lid is perhaps its strongest characteristic as it's quite resistant to any twisting or depressions relative to the more flexible base.
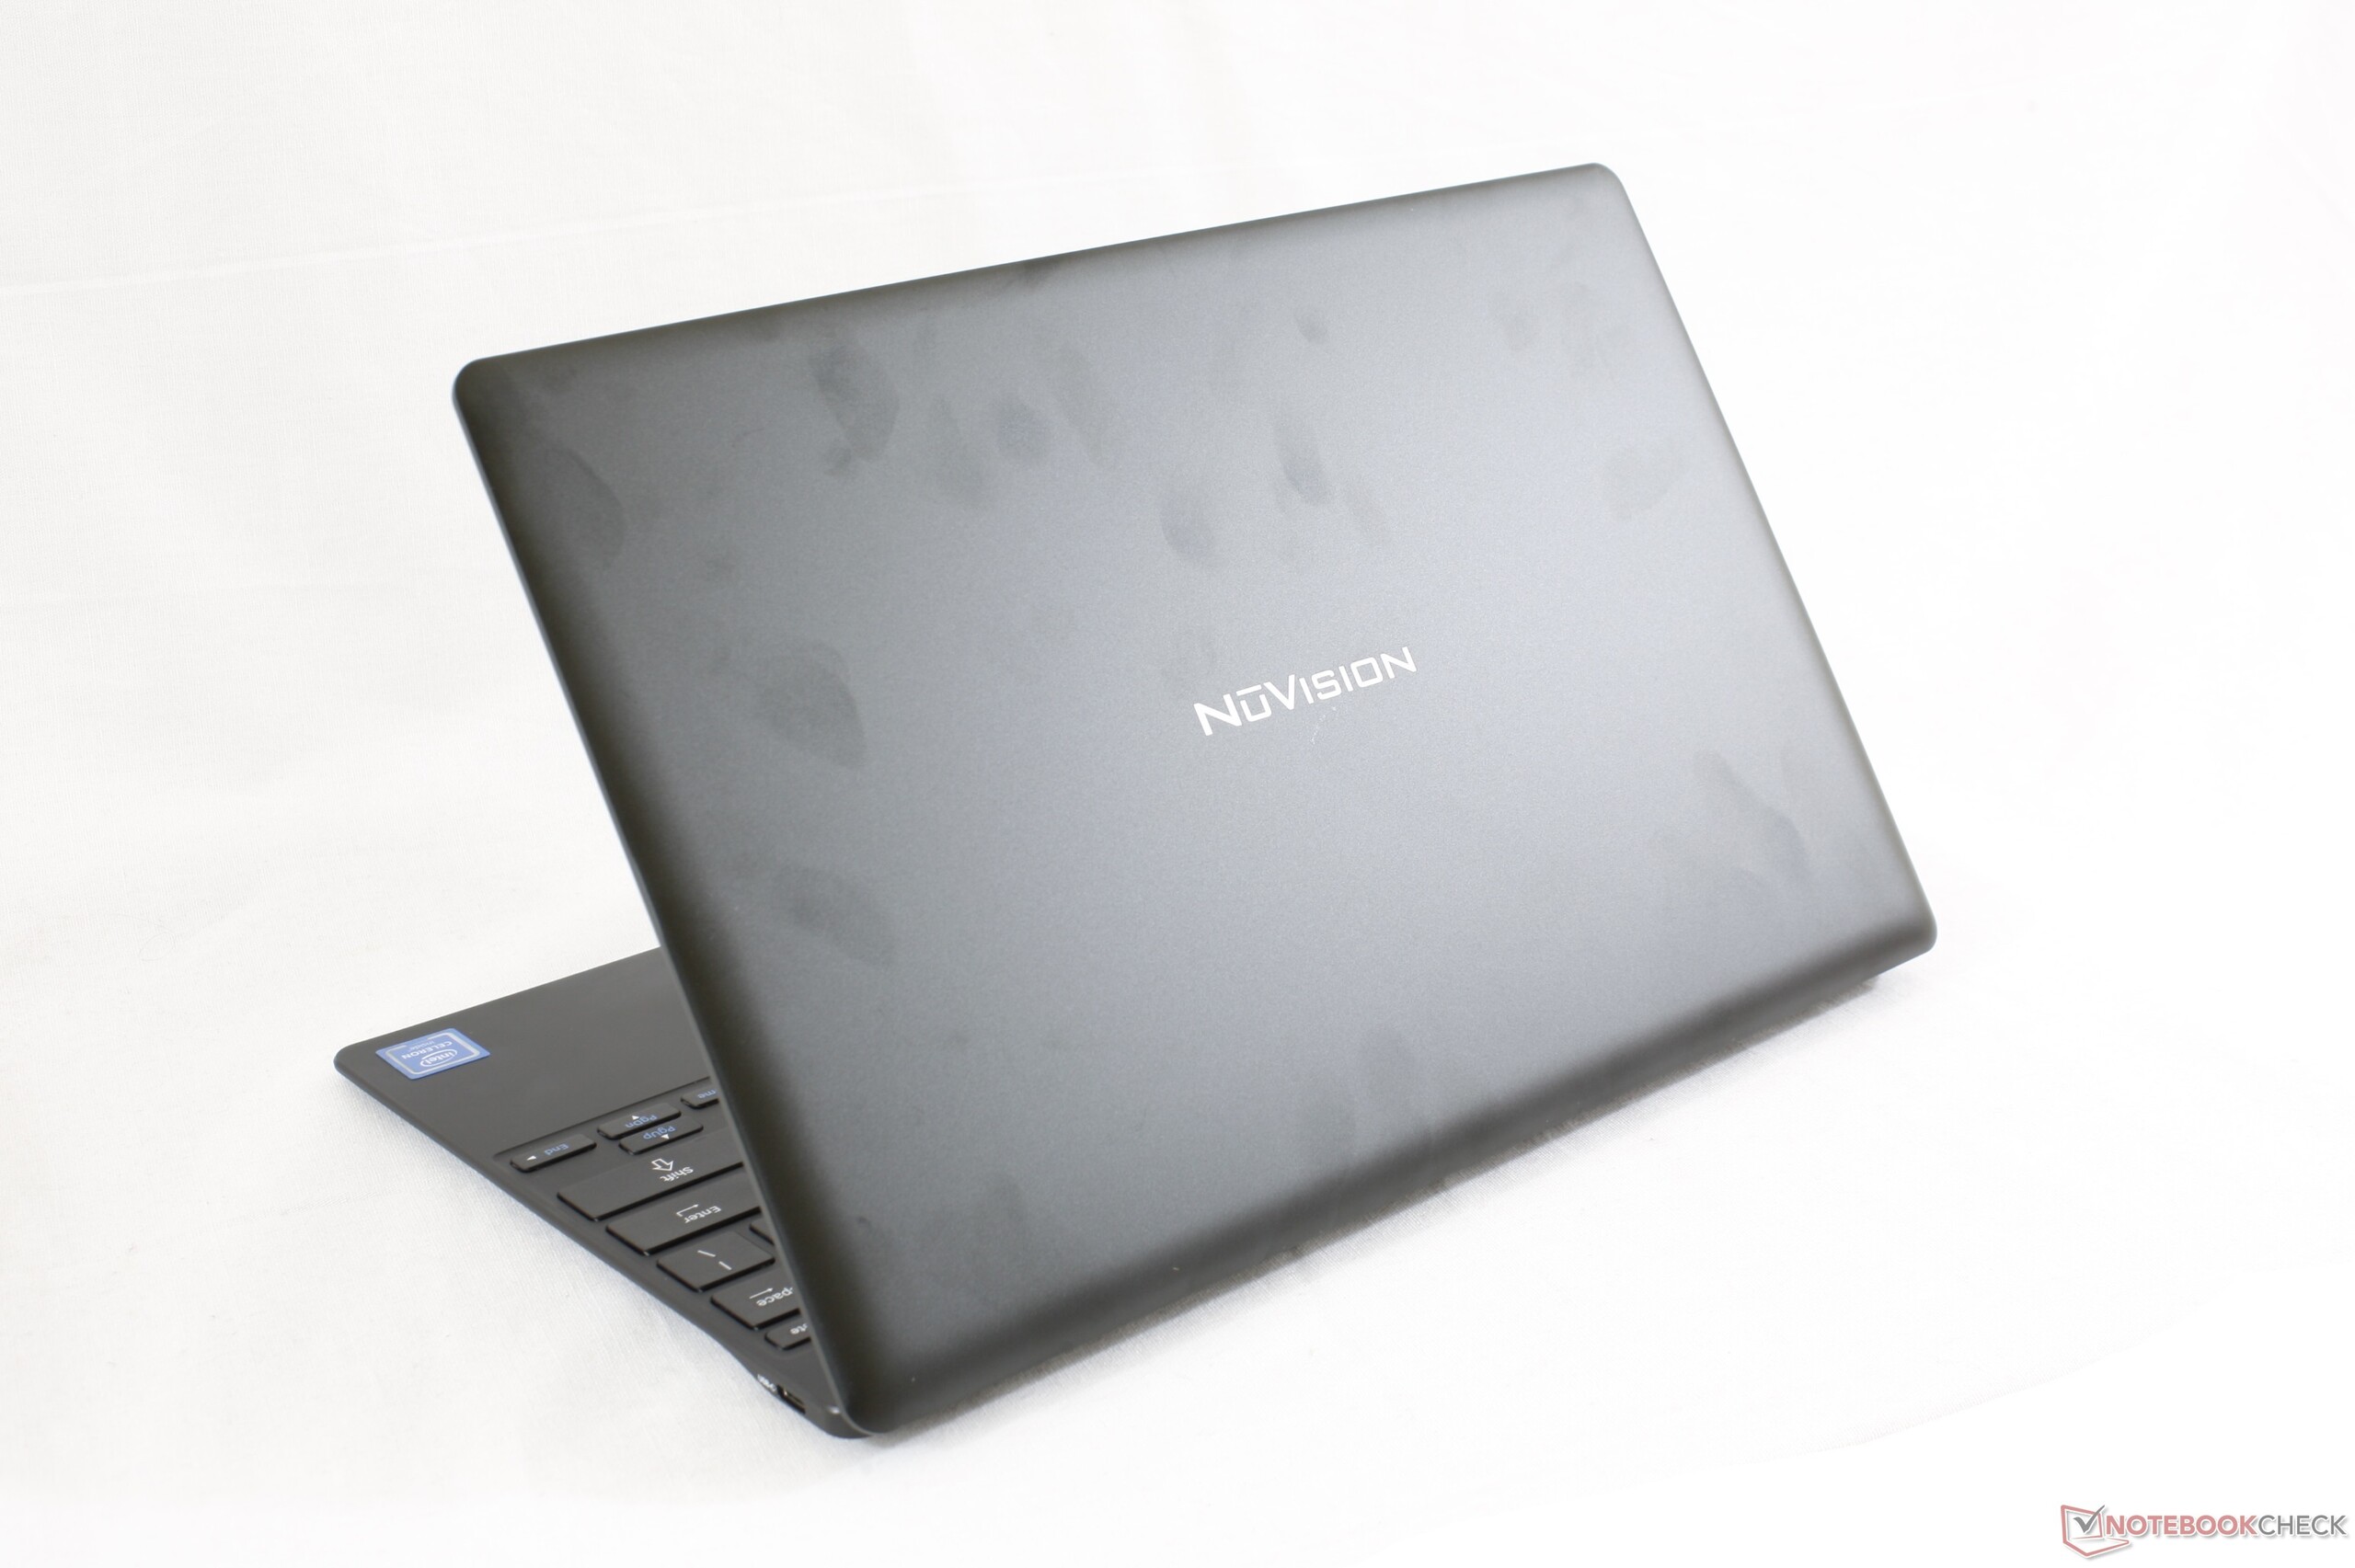
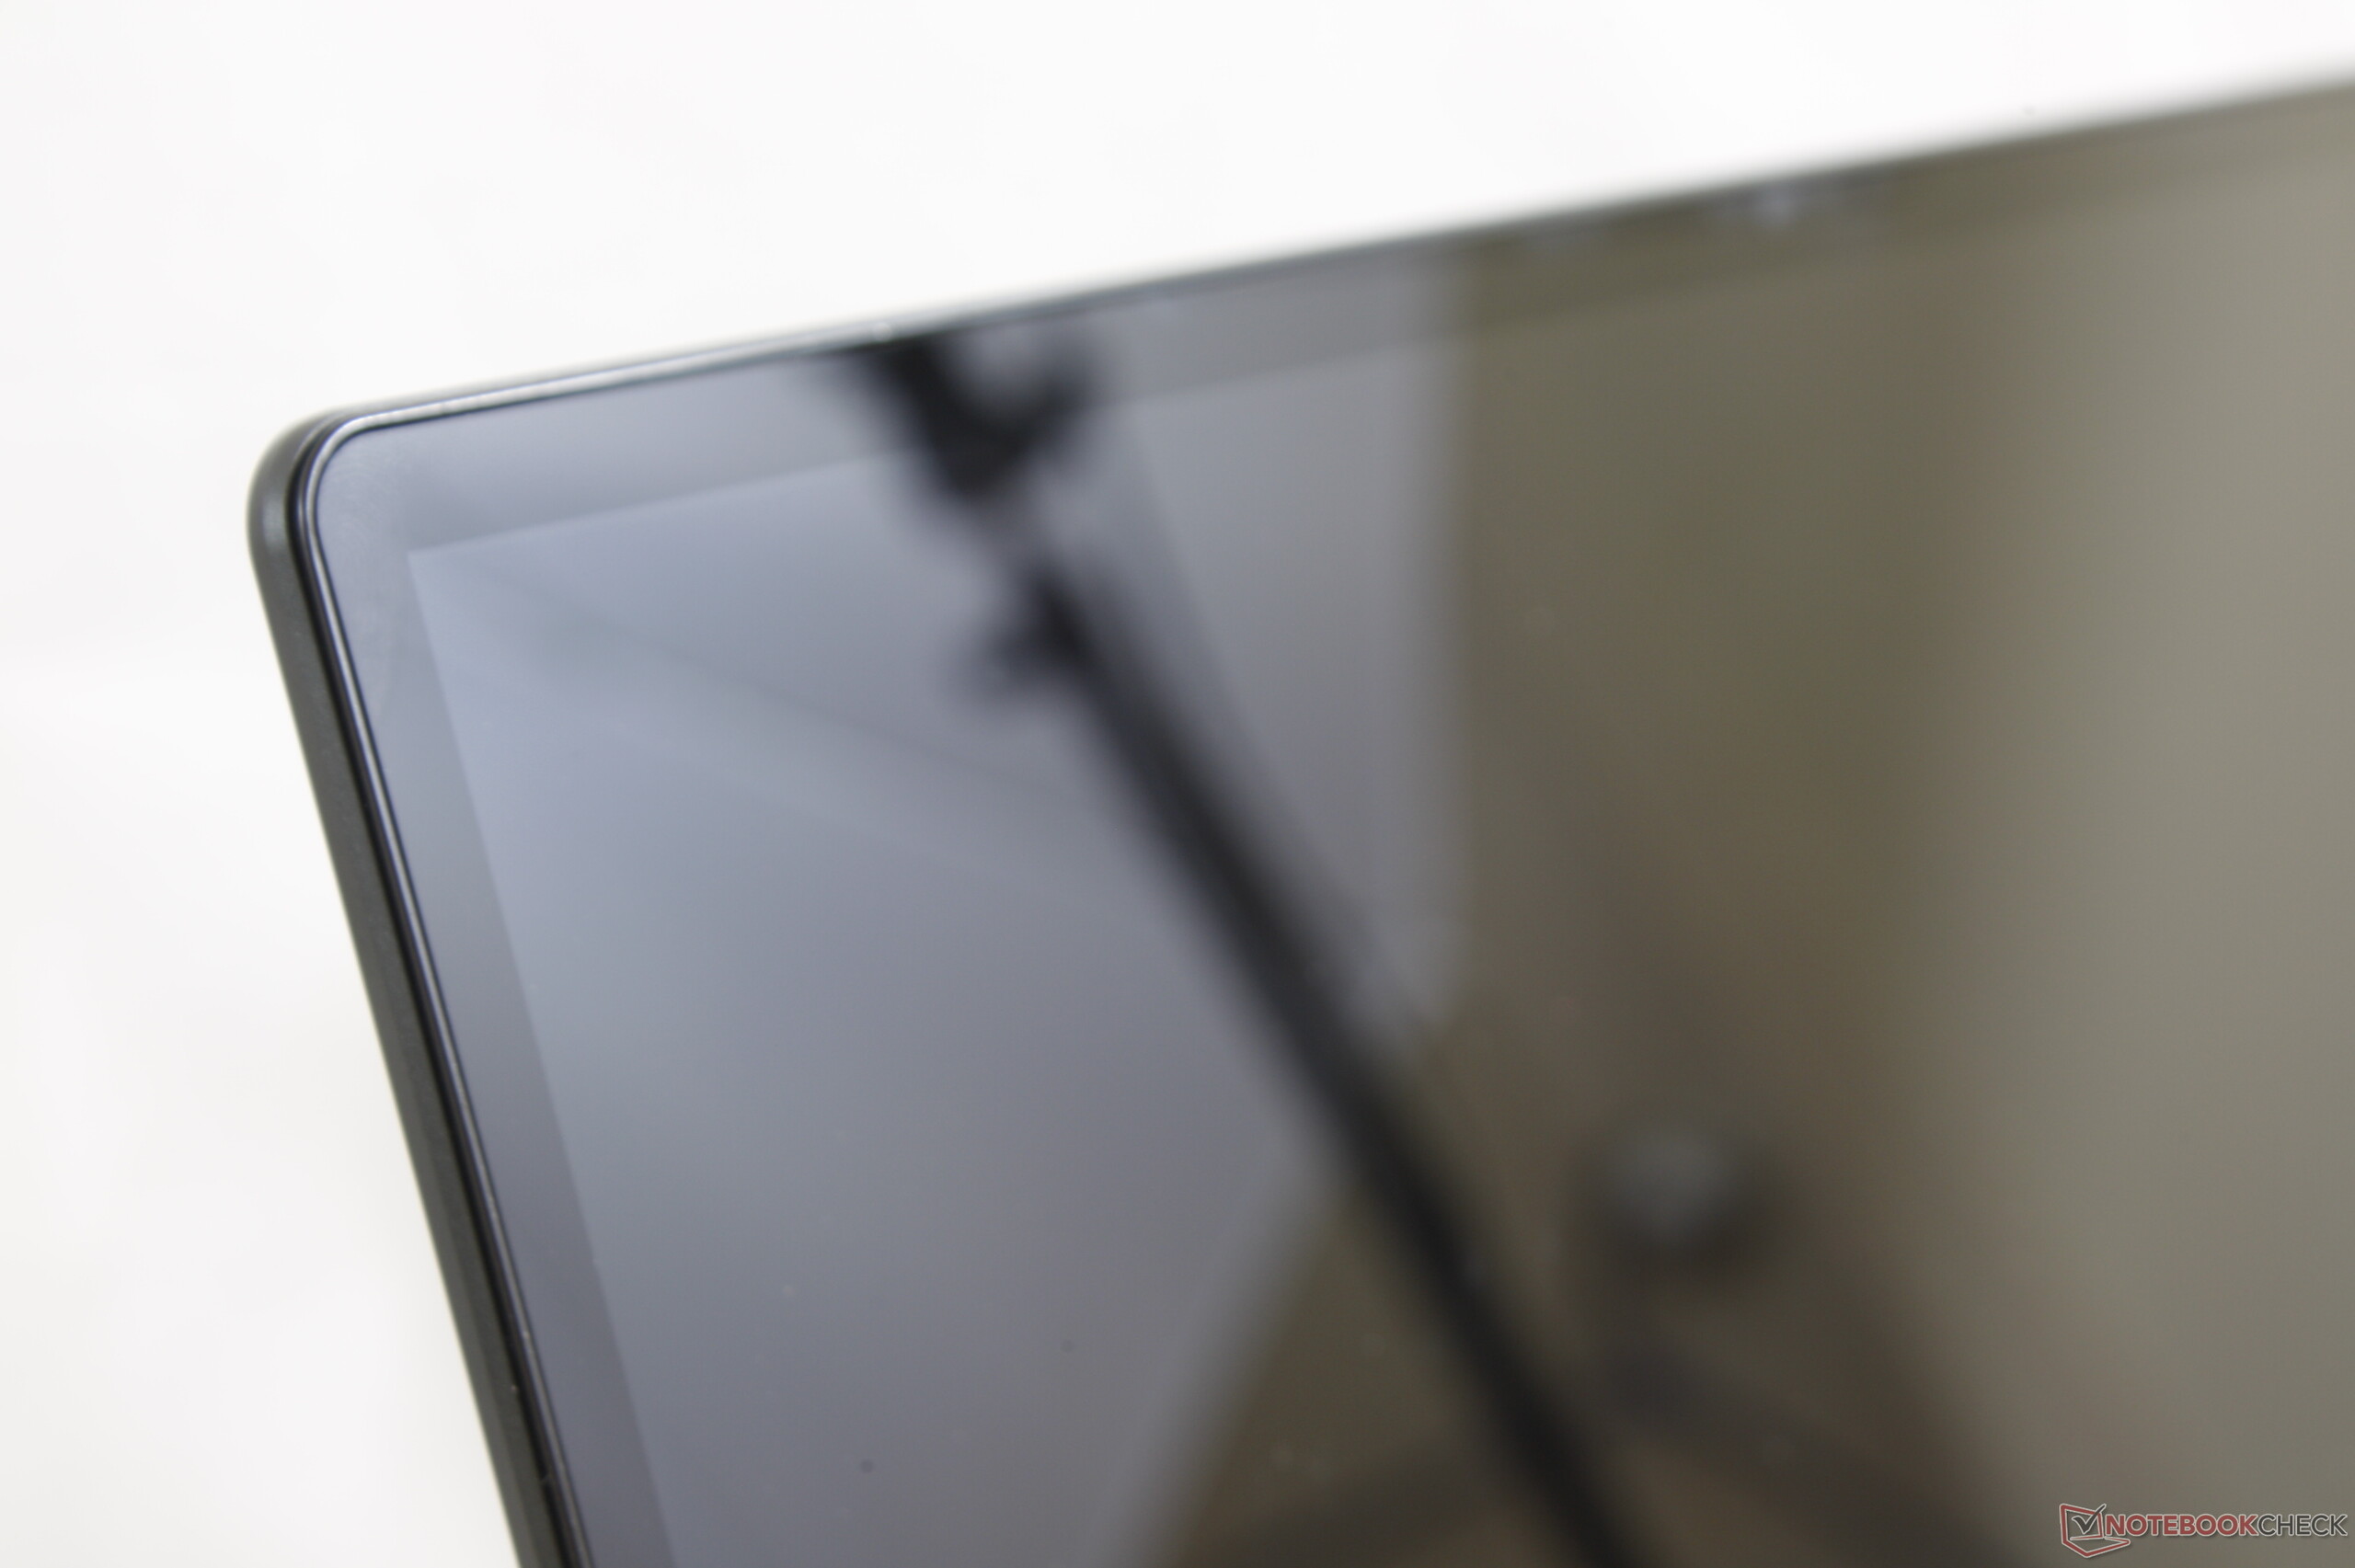
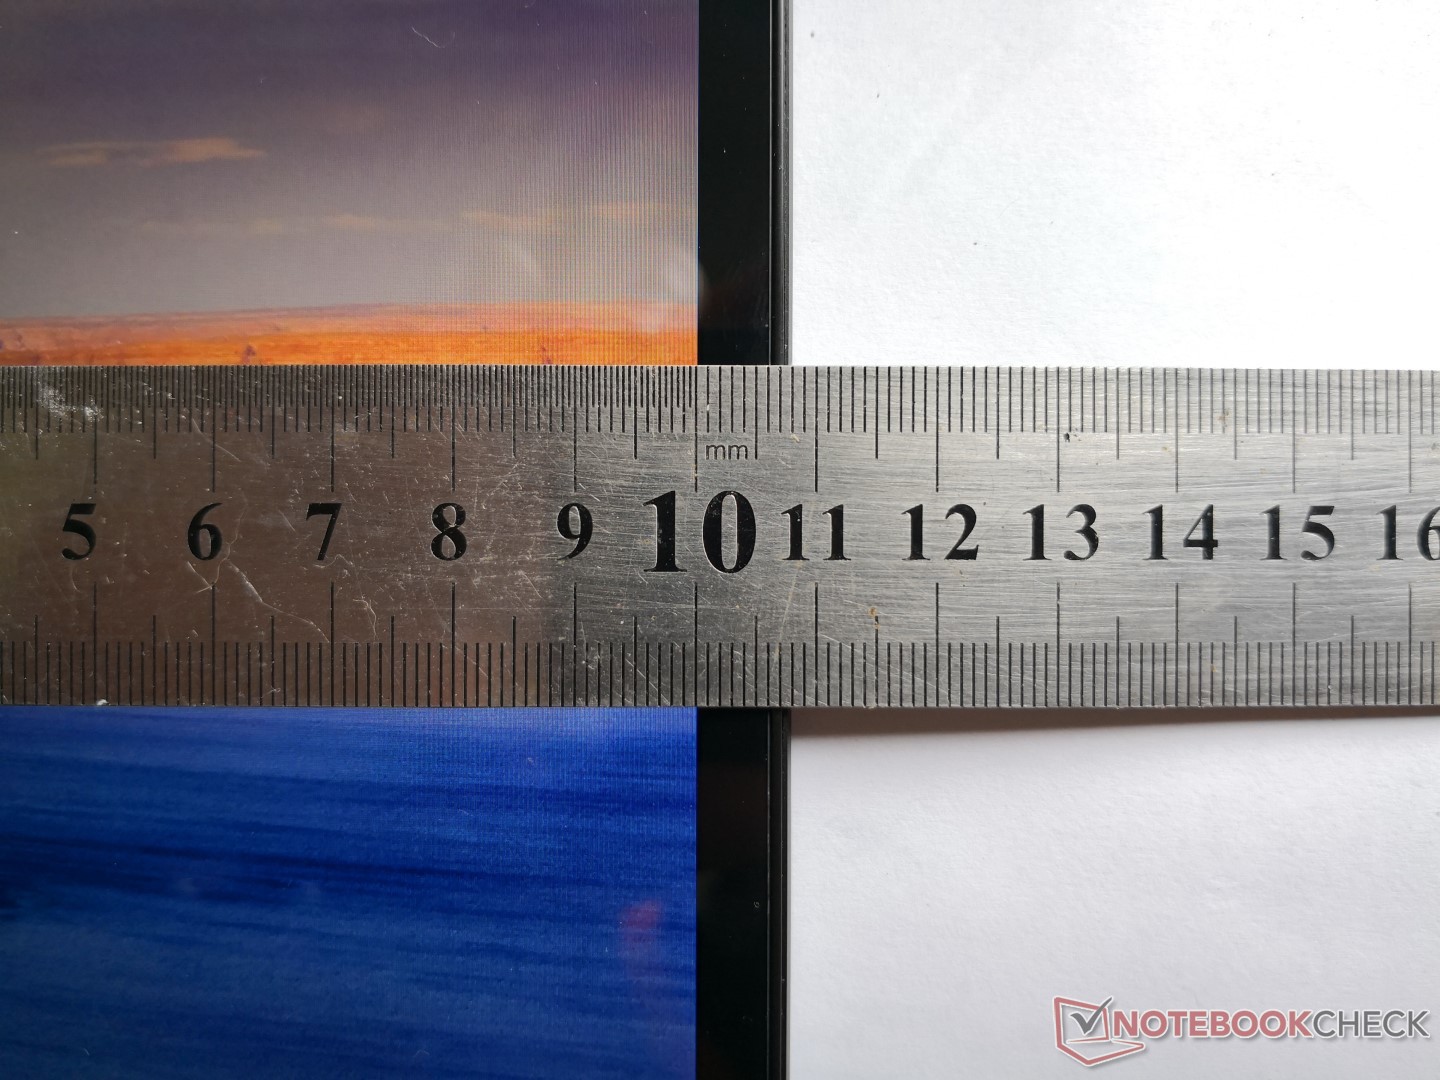
The NuVision benefits from something that most inexpensive subnotebooks don't have: narrow bezels. As a result, the system is lighter and has a smaller footprint than many other 12-inch and 13-inch laptops. Dimensions and weight are very nearly identical to the pricier EliteBook x360 1020 G2 for a very compact first impression.
Connectivity
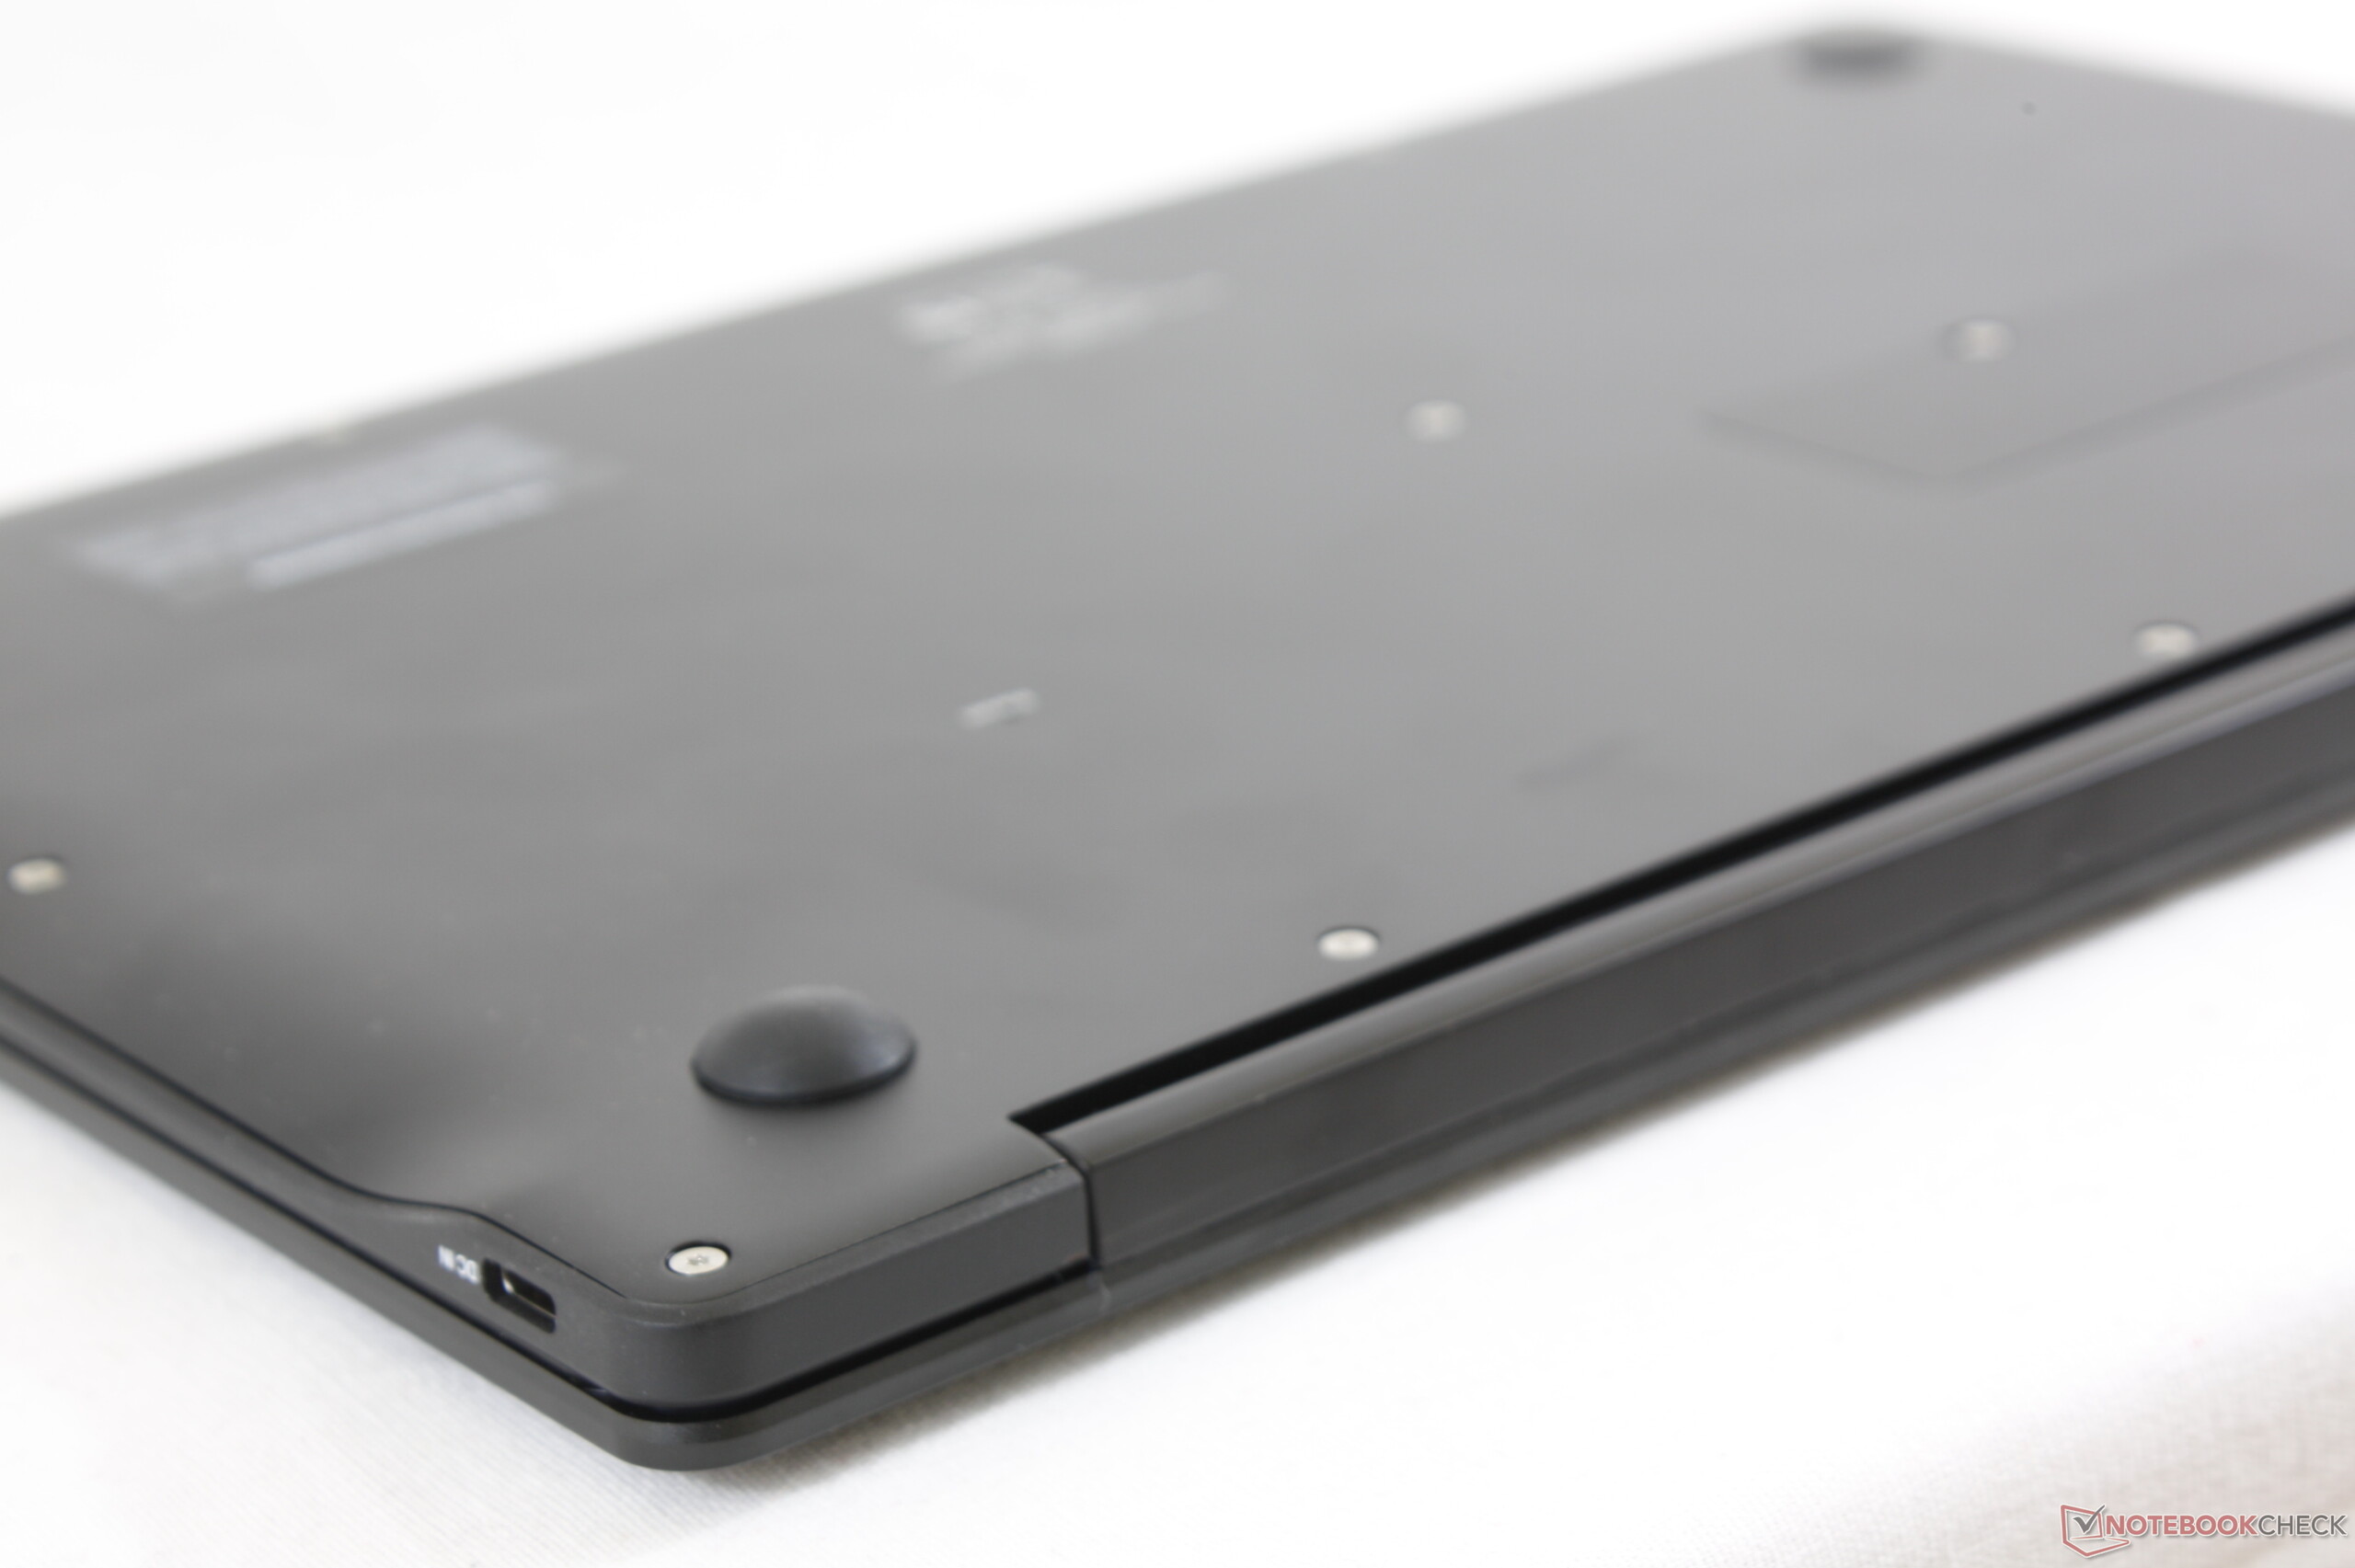
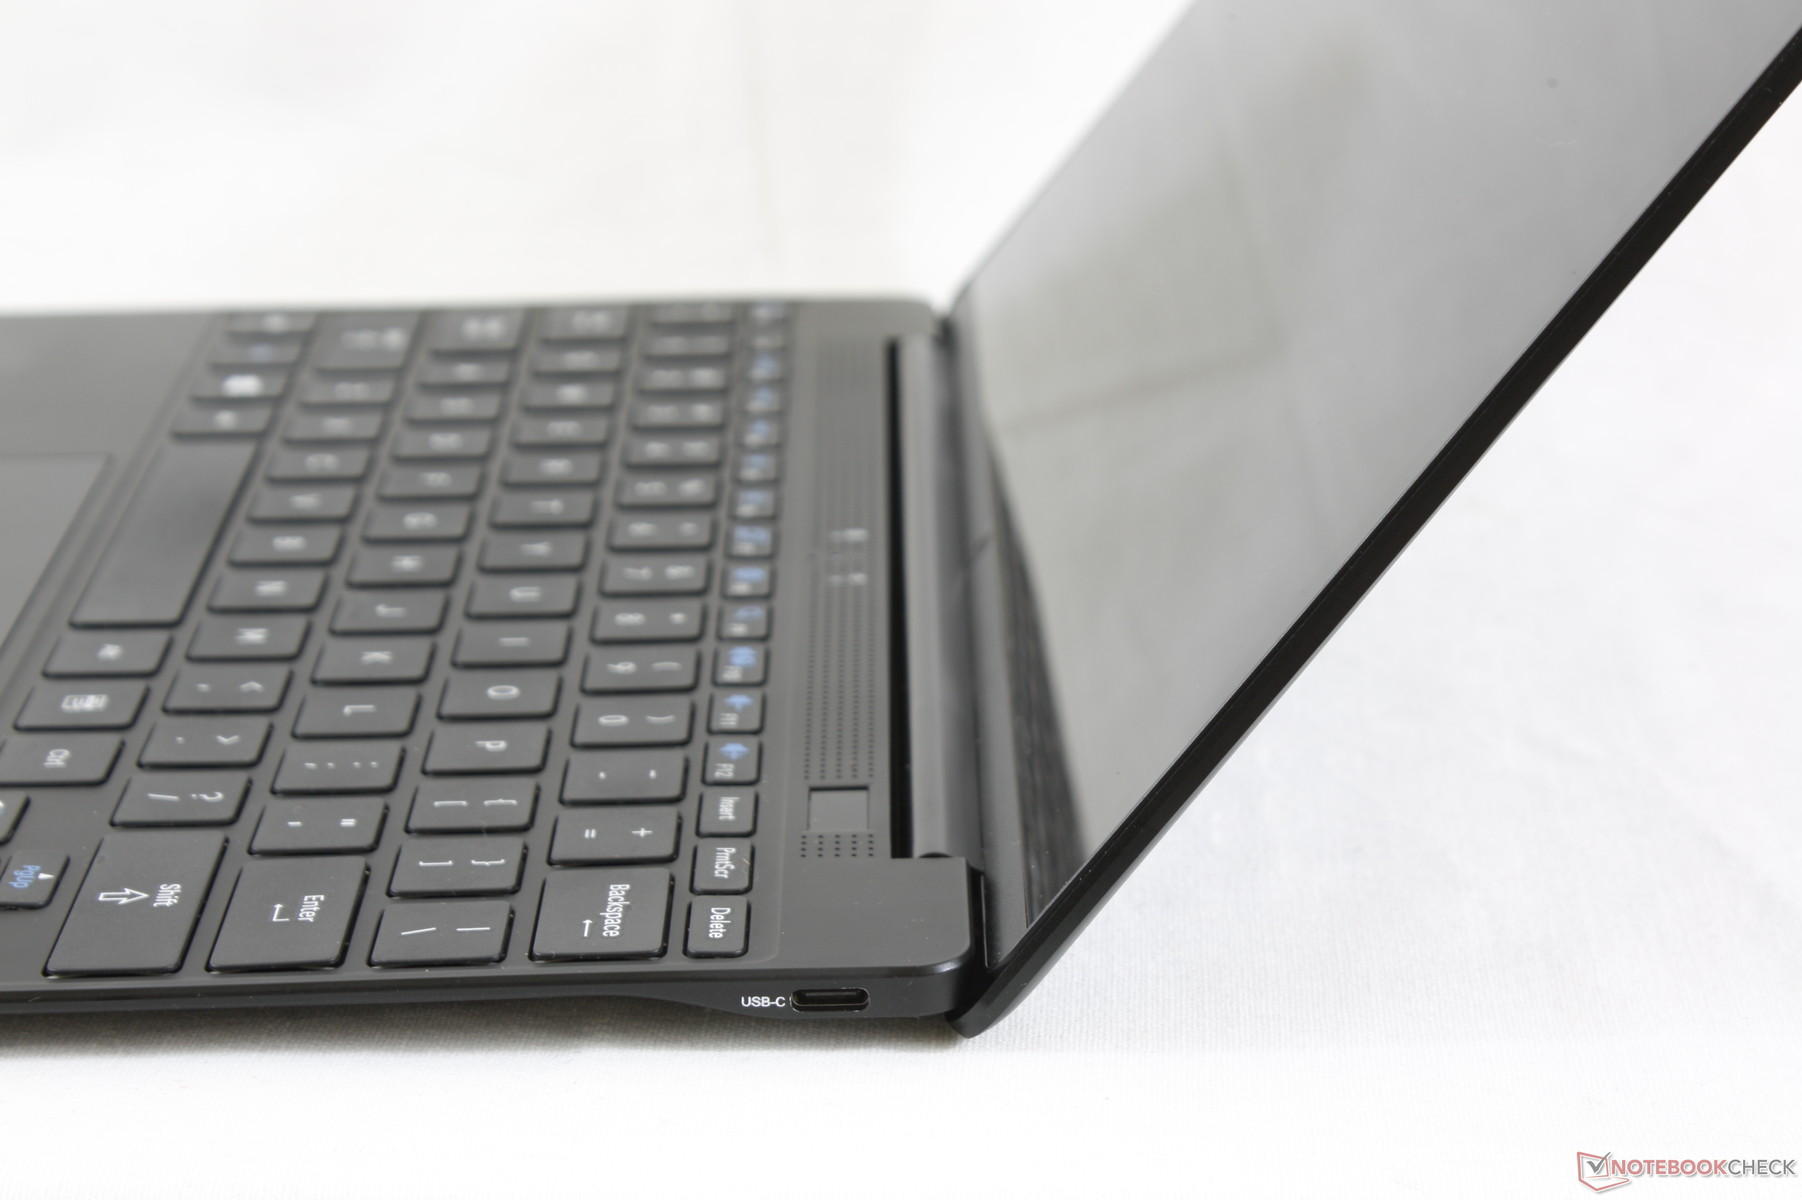
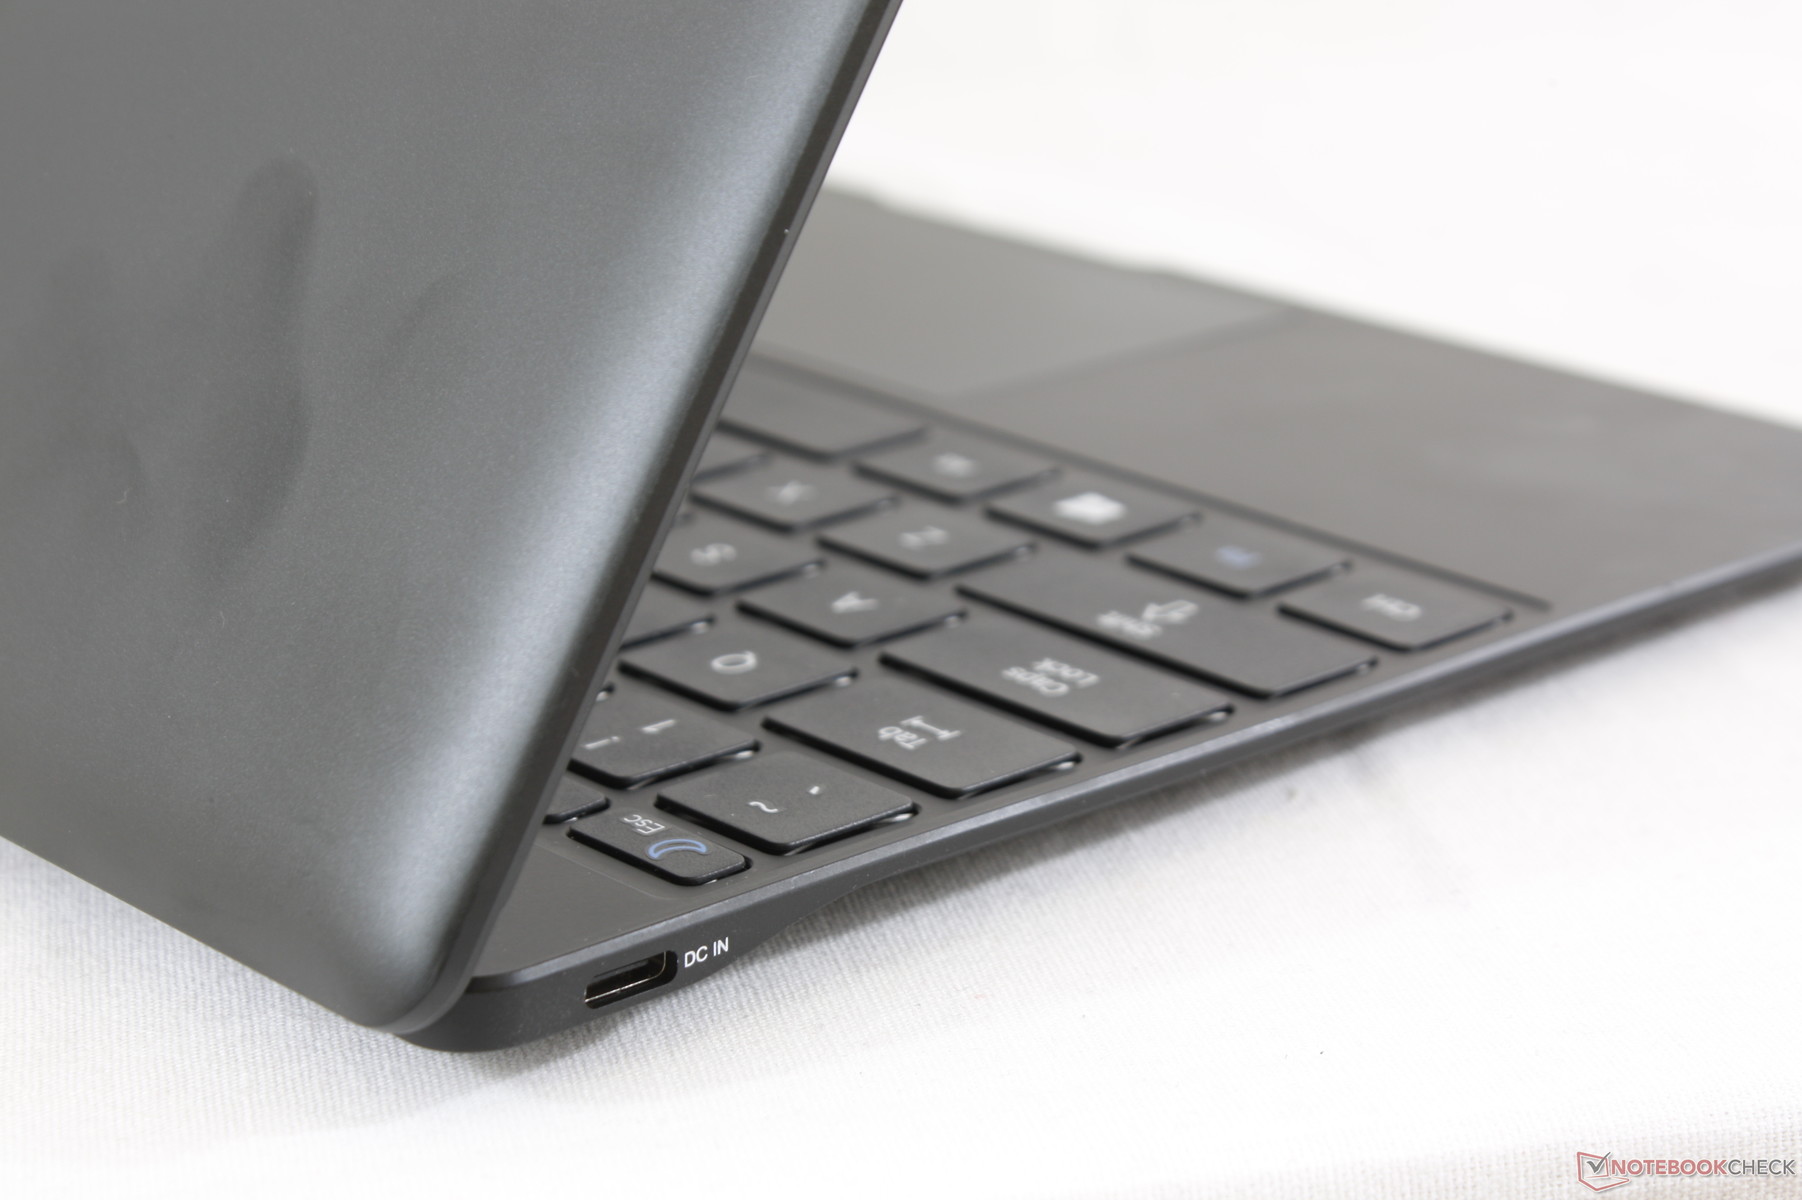
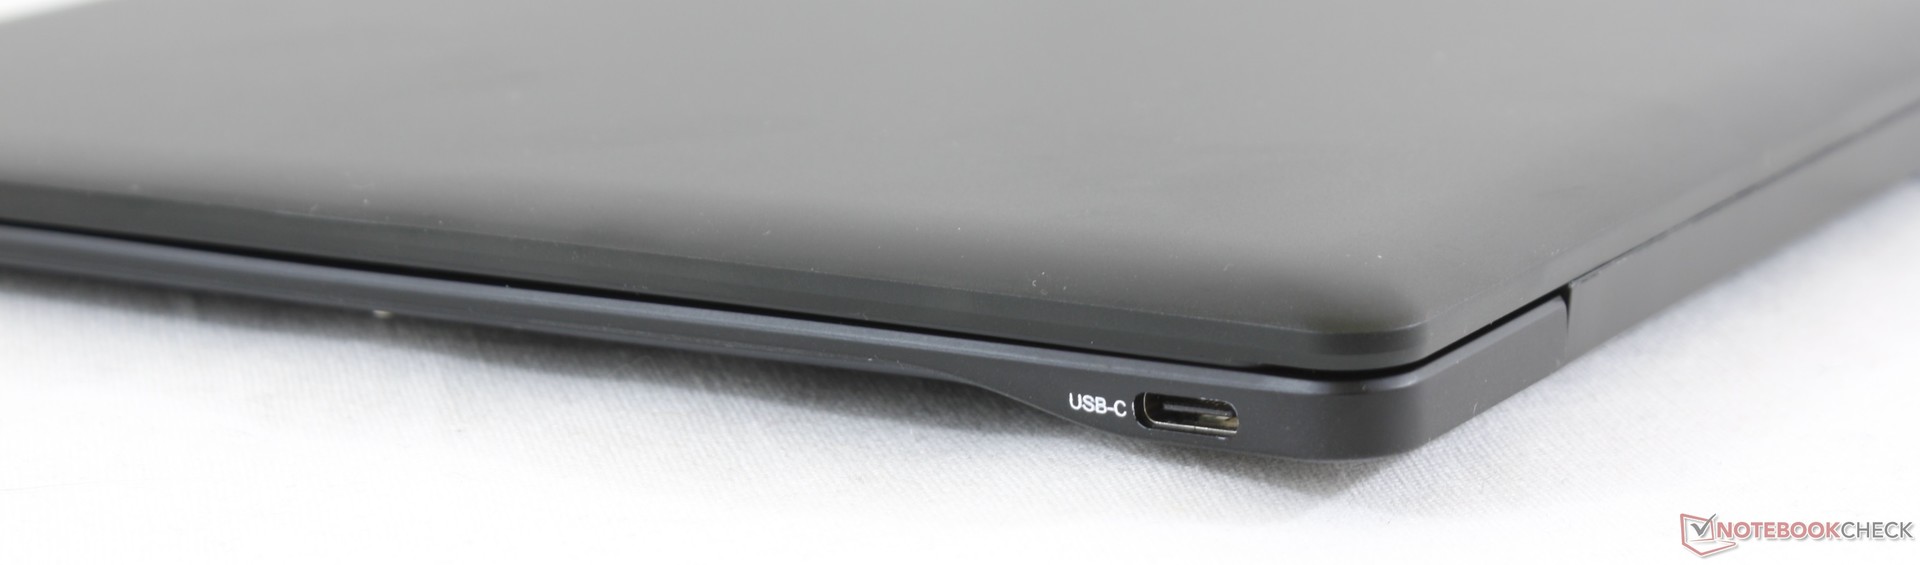
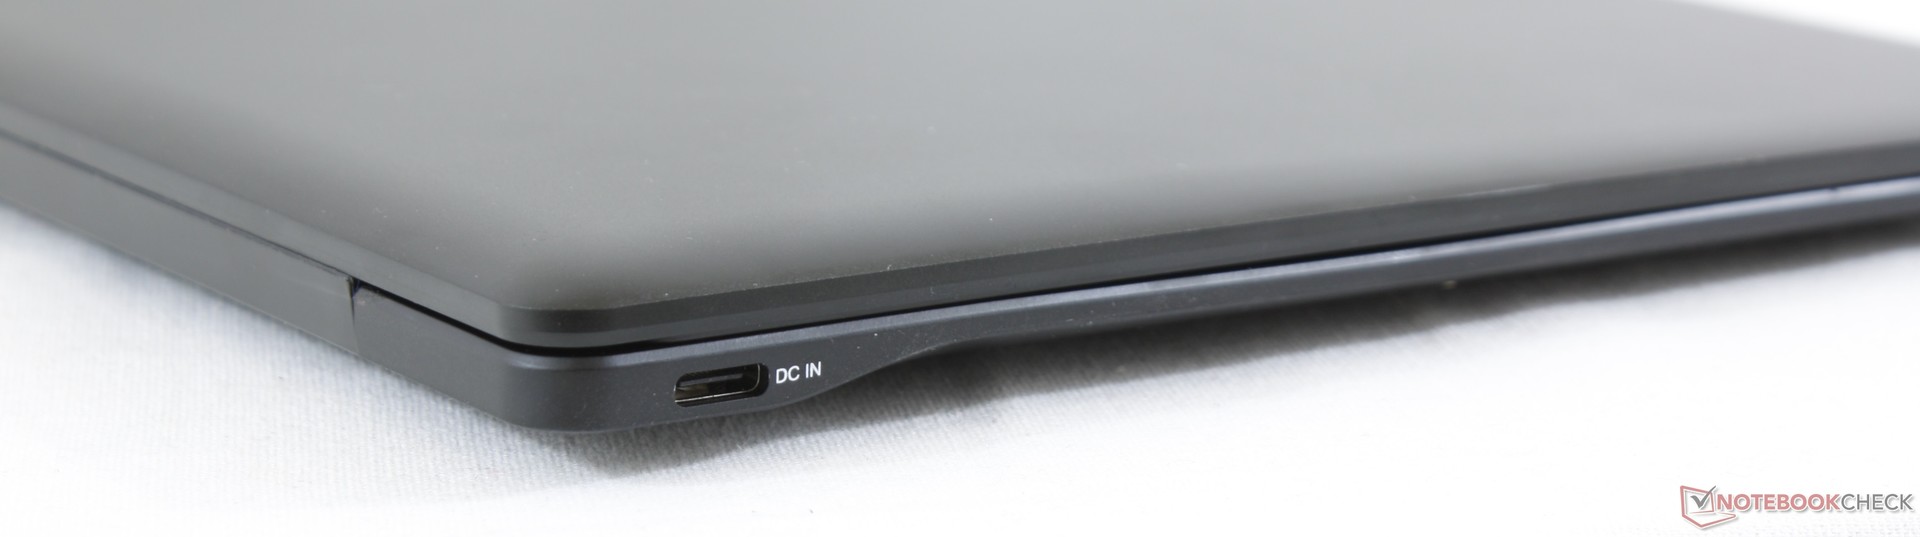
Available ports are limited to just 2x USB Type-C of which just one can be used to charge the laptop. The system does not even integrate a 3.5 mm audio jack. In comparison, the competing Lenovo Flex 6 11 has USB Type-A, HDMI, and a SD reader.
We encountered performance issues on the USB Type-C ports as well. When attempting to plug in a USB-powered external HDD, the drive would suddenly disconnect when transferring large files. This behavior suggests that the ports are not capable of powering some external devices.
Communication
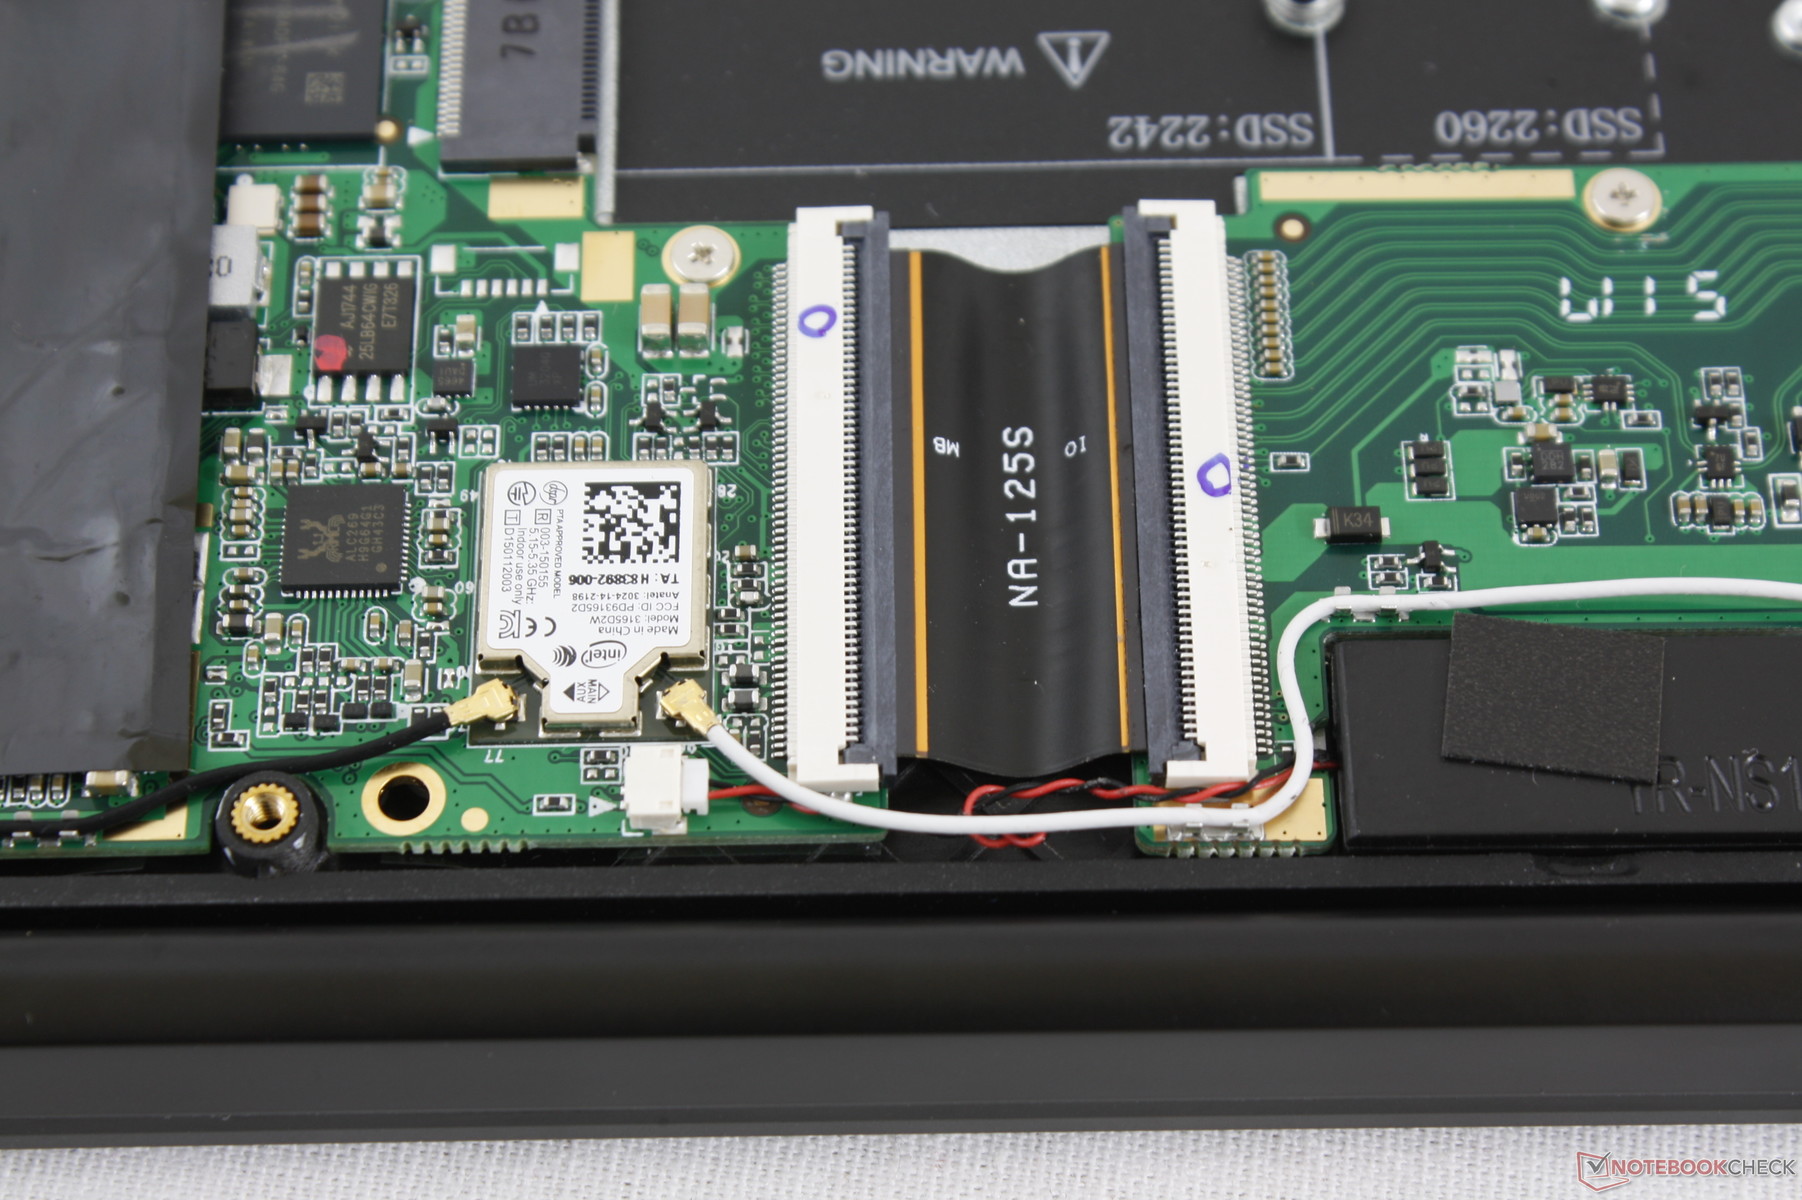
WLAN is provided by an old 1x1 Intel 3165 with integrated Bluetooth 4.2. The module offers one-fourth the theoretical transfer rate of most modern Ultrabooks now that 1.73 Gbps options are becoming mainstream. We didn't experience any connectivity issues during our time with the test unit.
Security
The Power button is a fingerprint reader with absolutely no tactile feedback in contrast to the Power buttons on the XPS 13 or MateBook X Pro. The lack of any feedback feels very strange as it takes some getting used to.
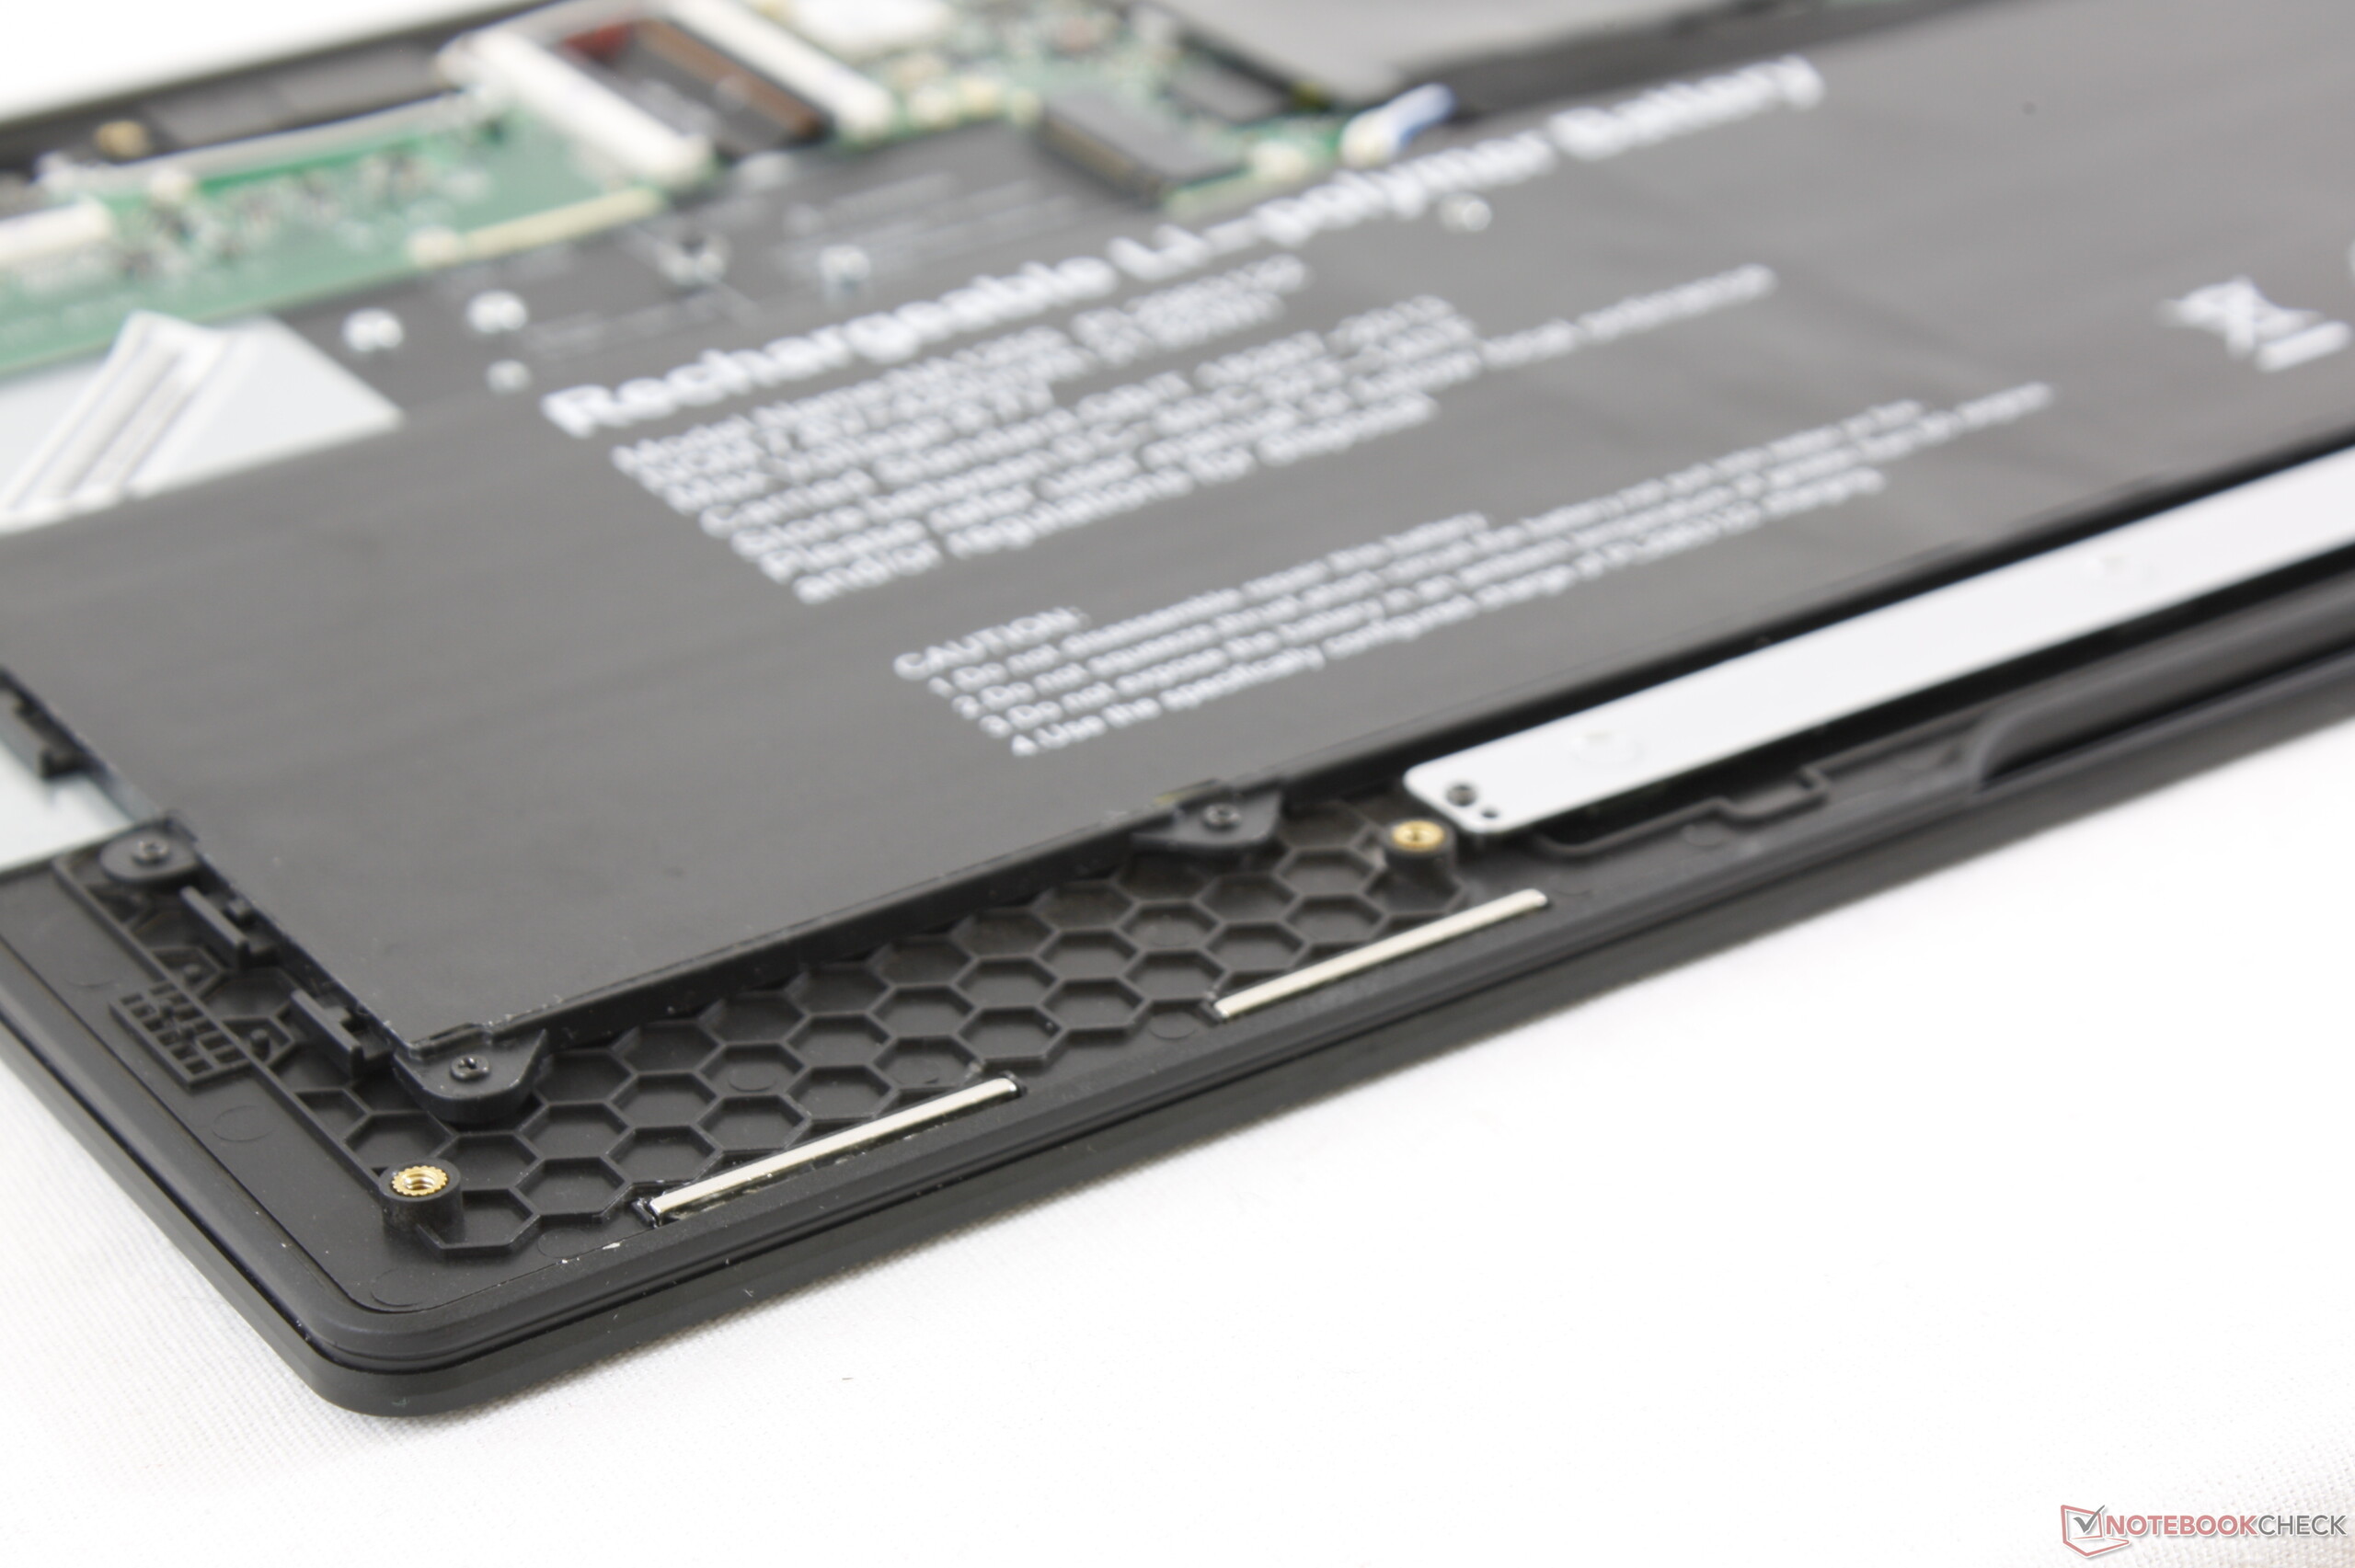
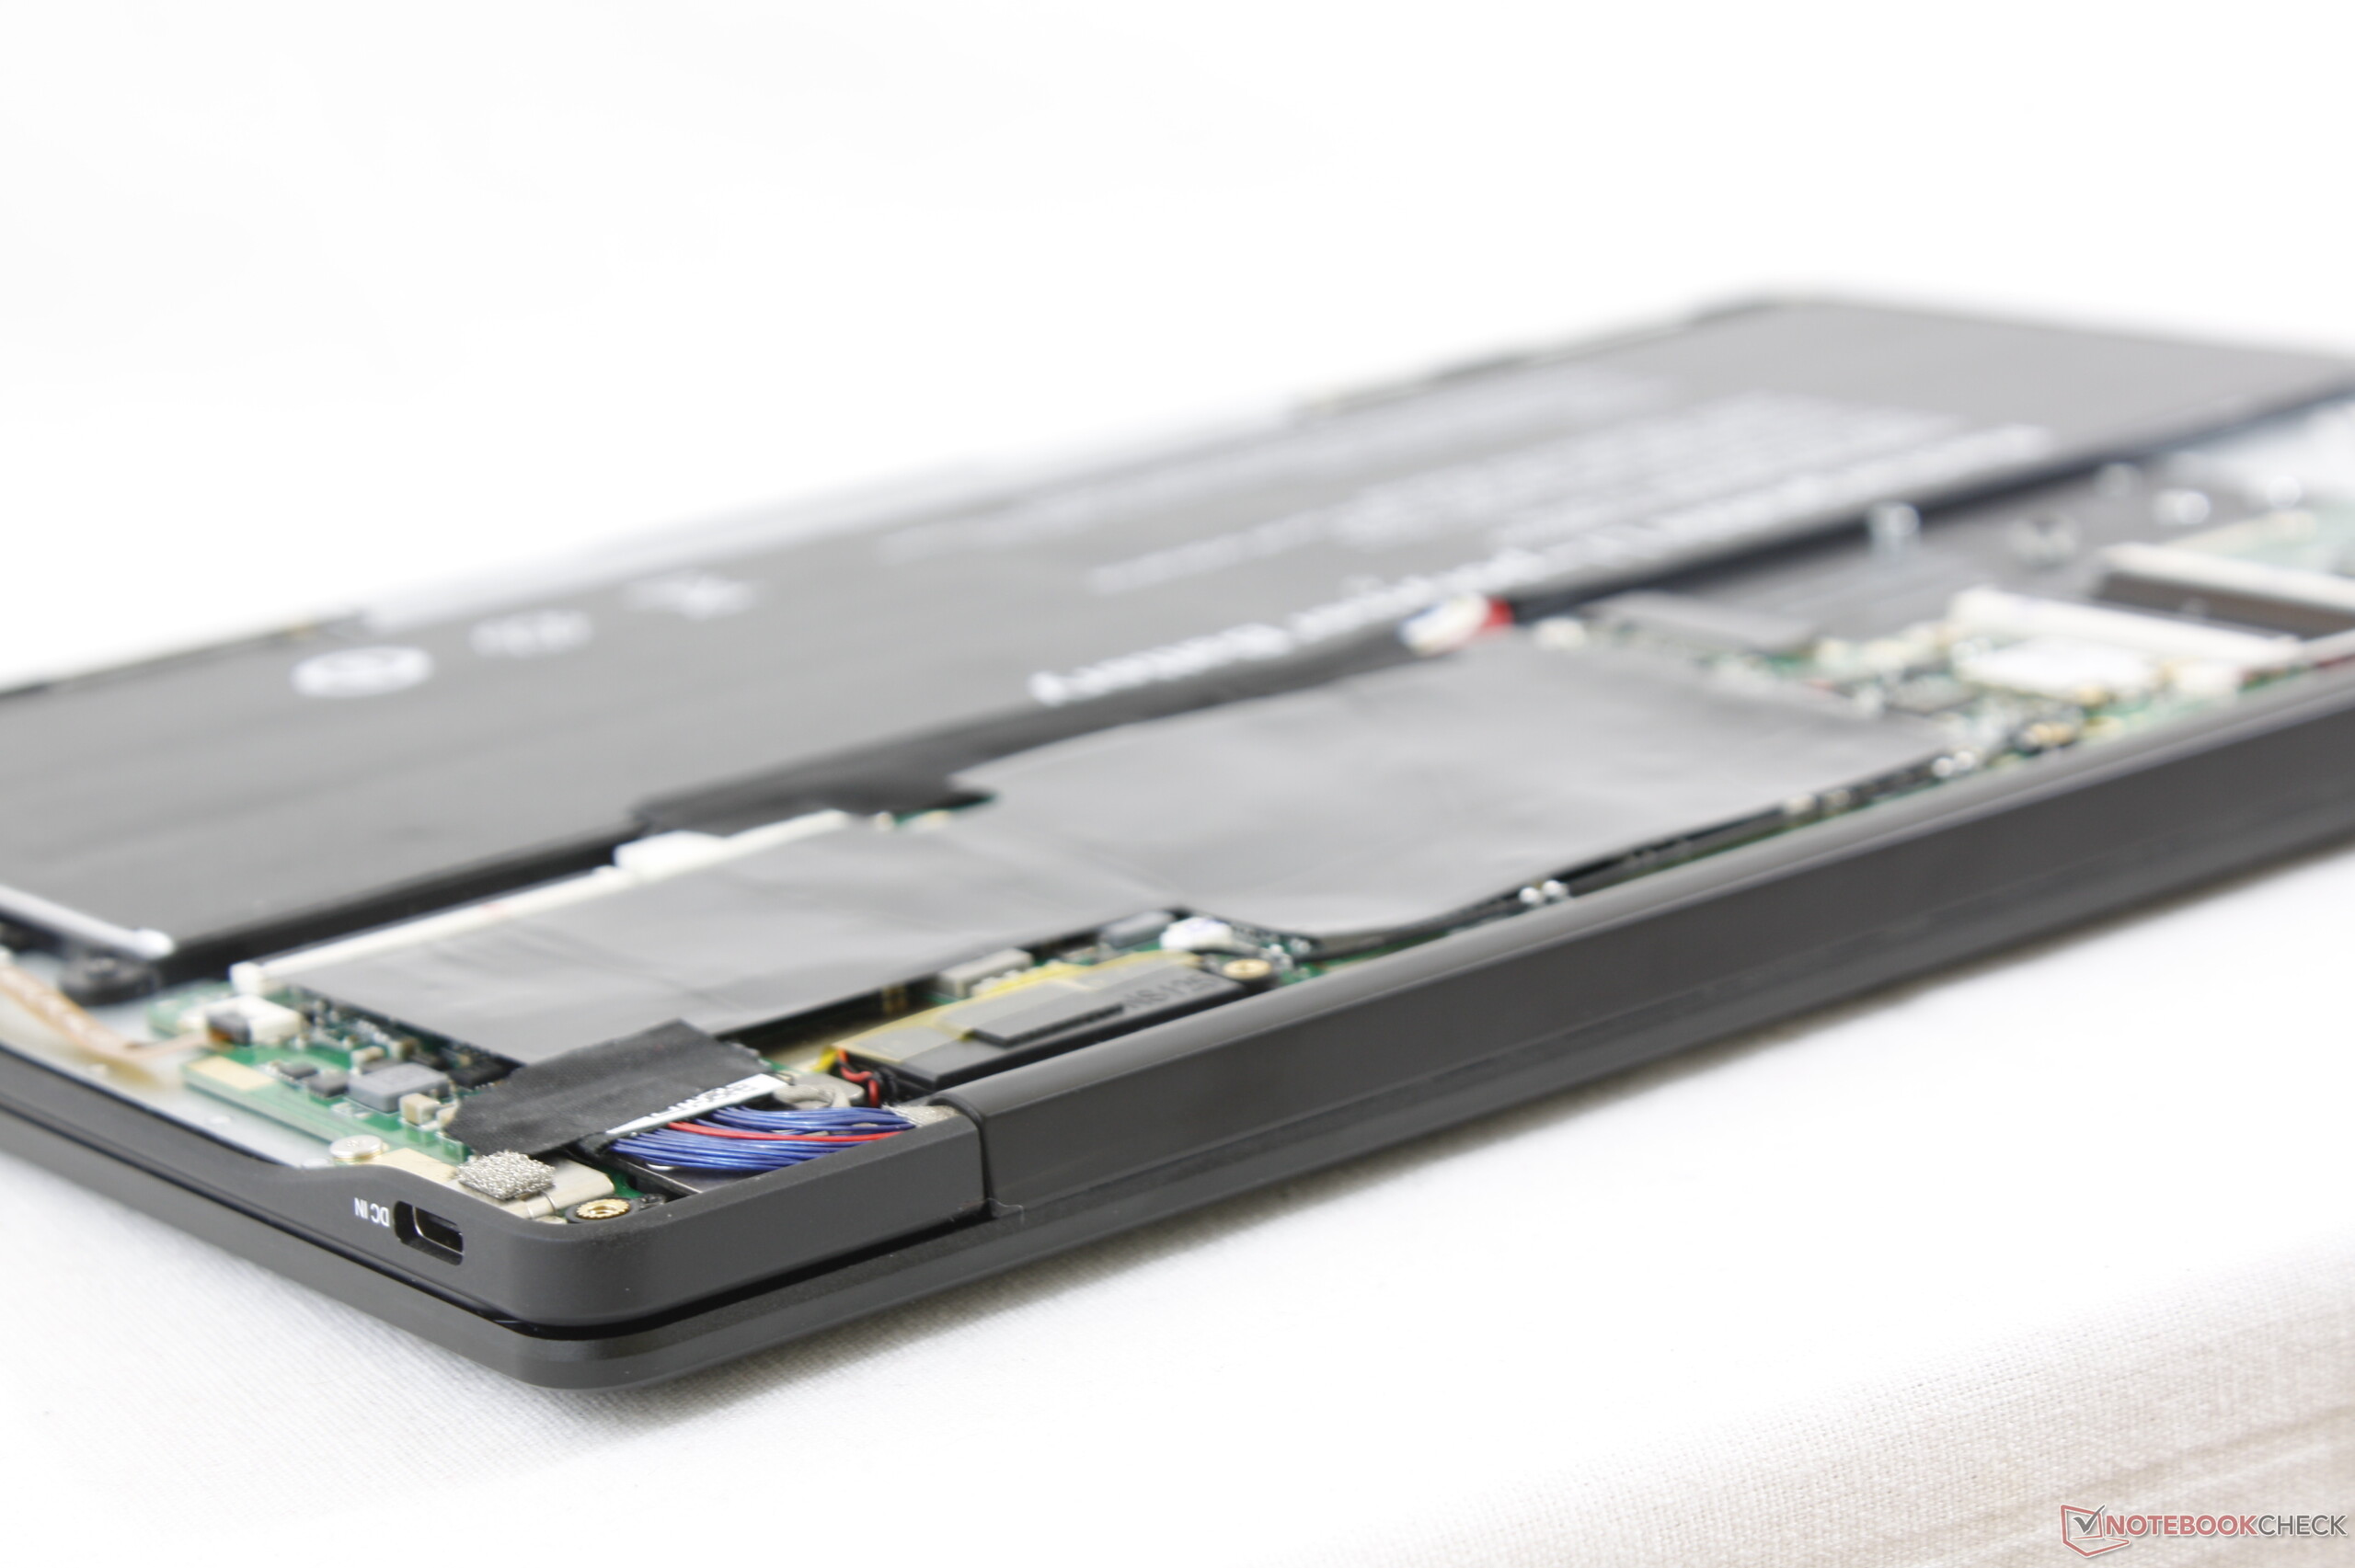
Maintenance
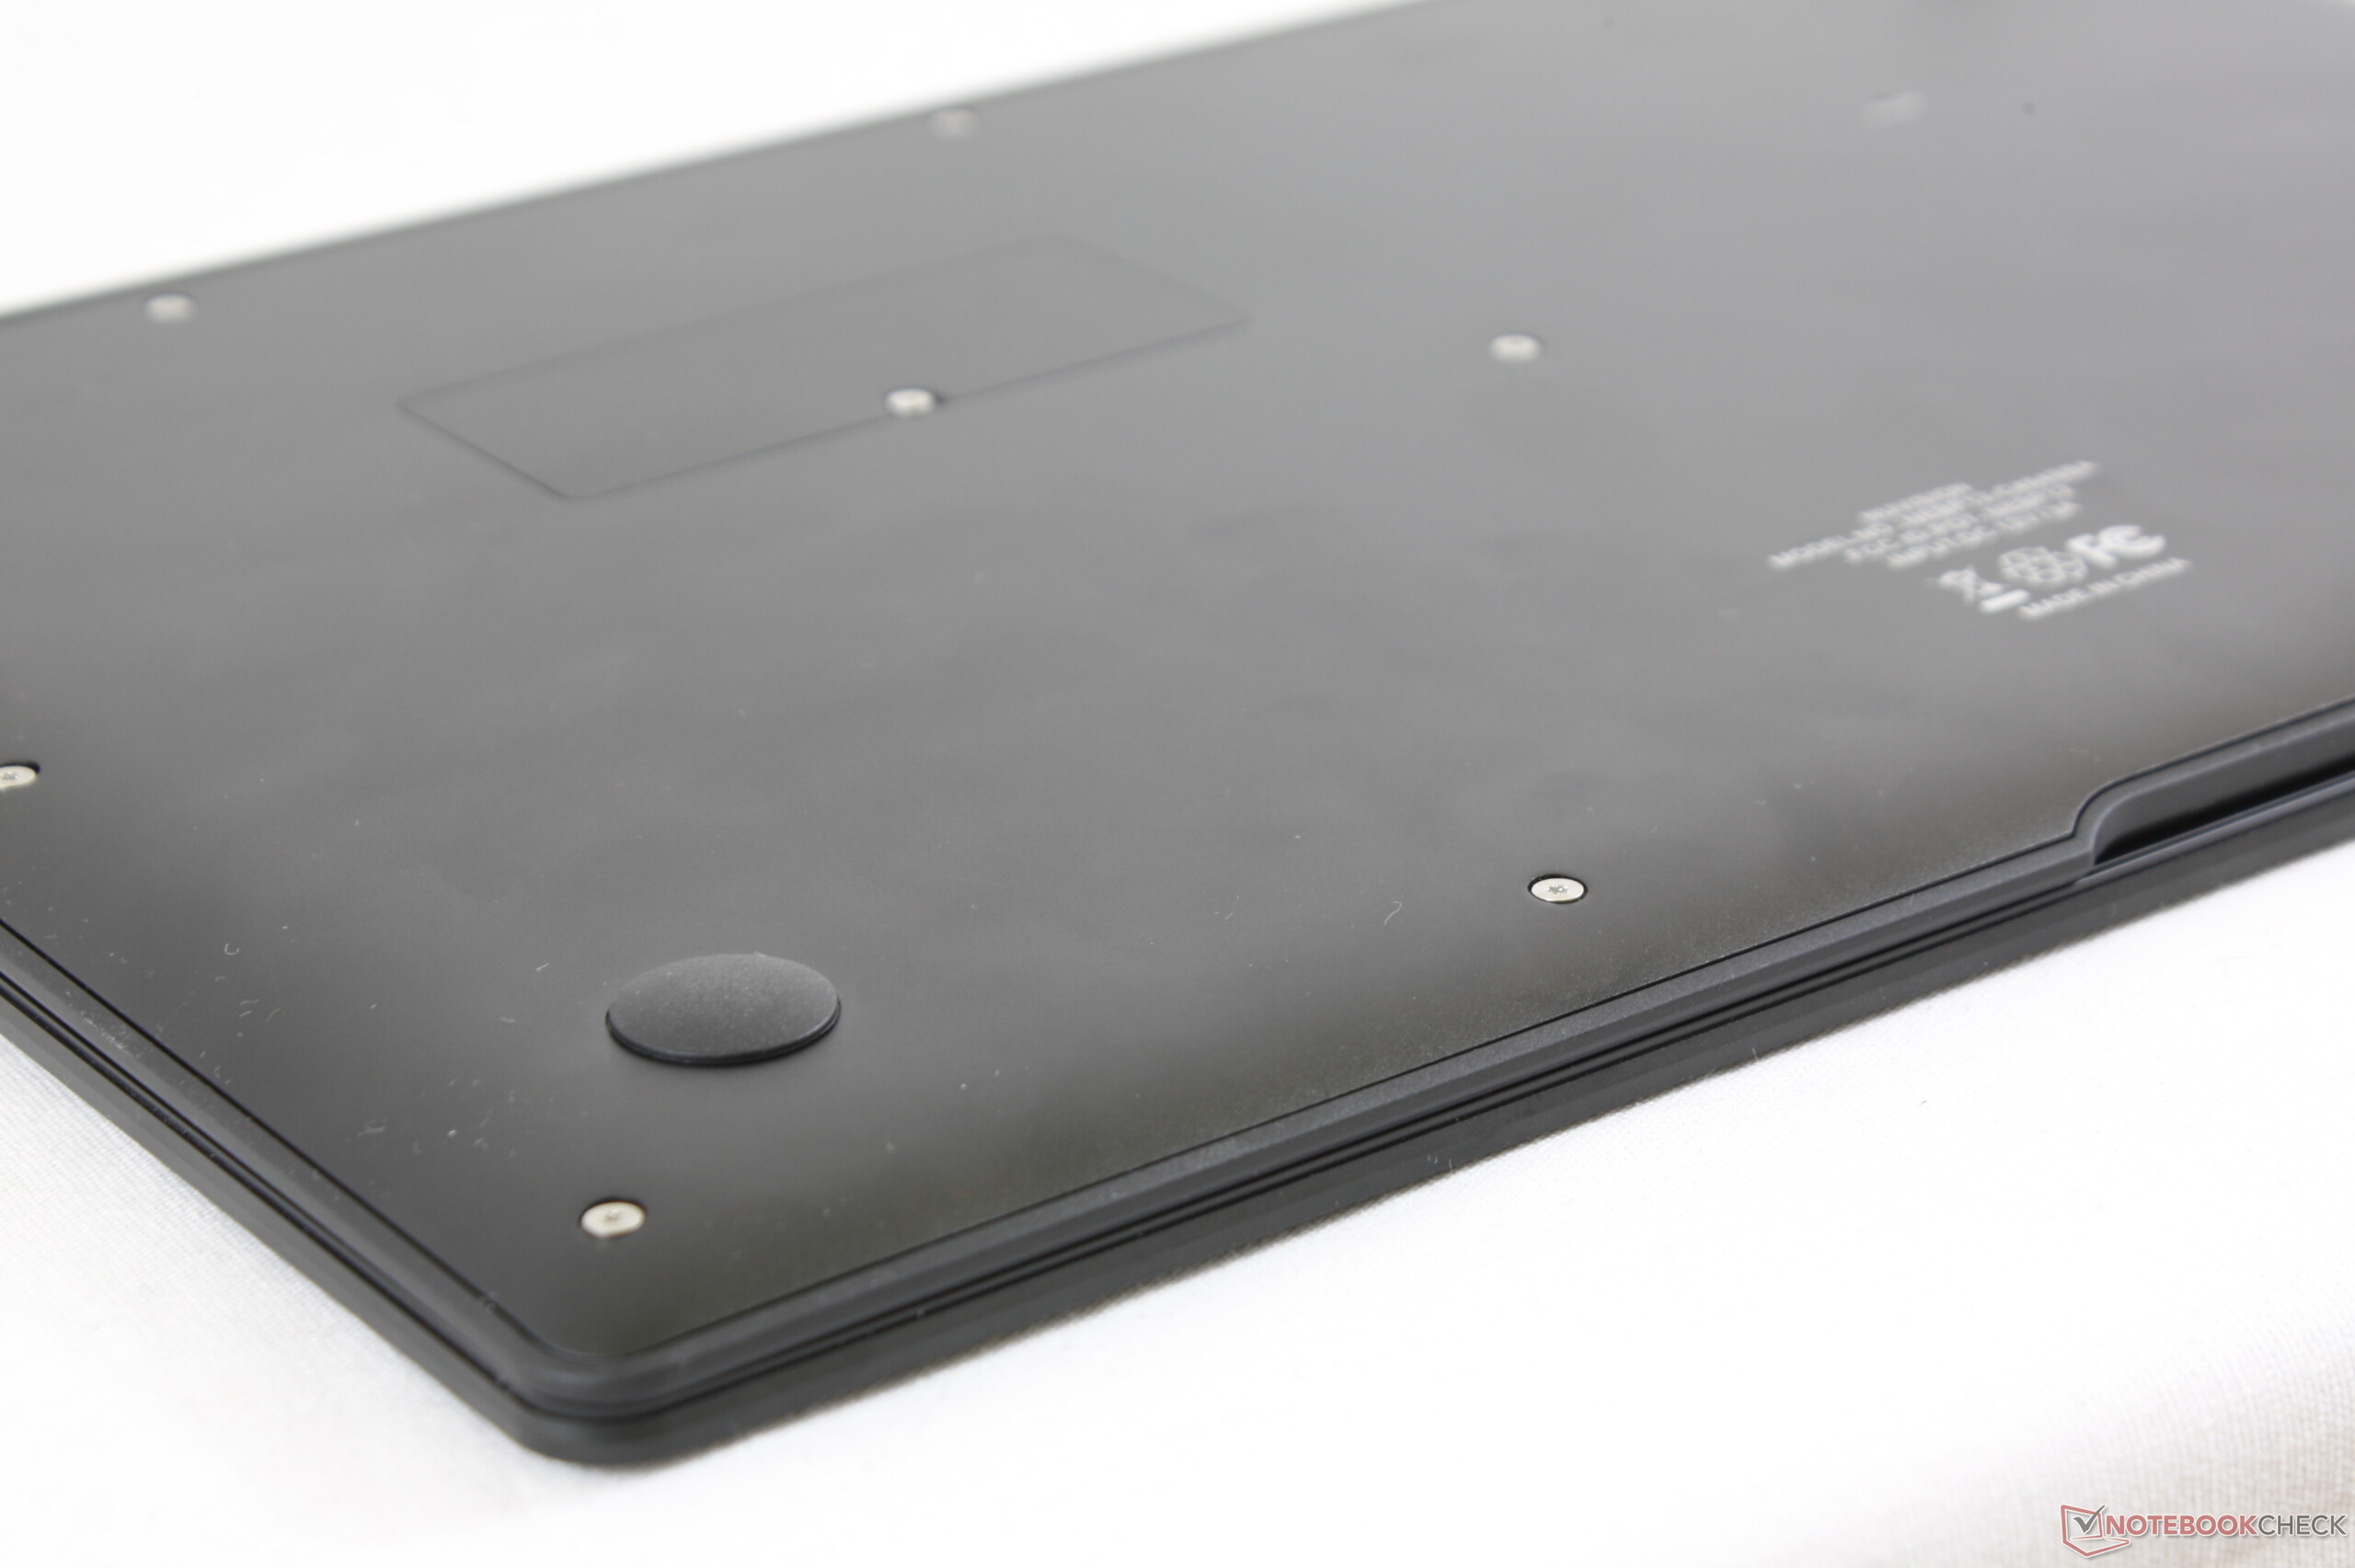
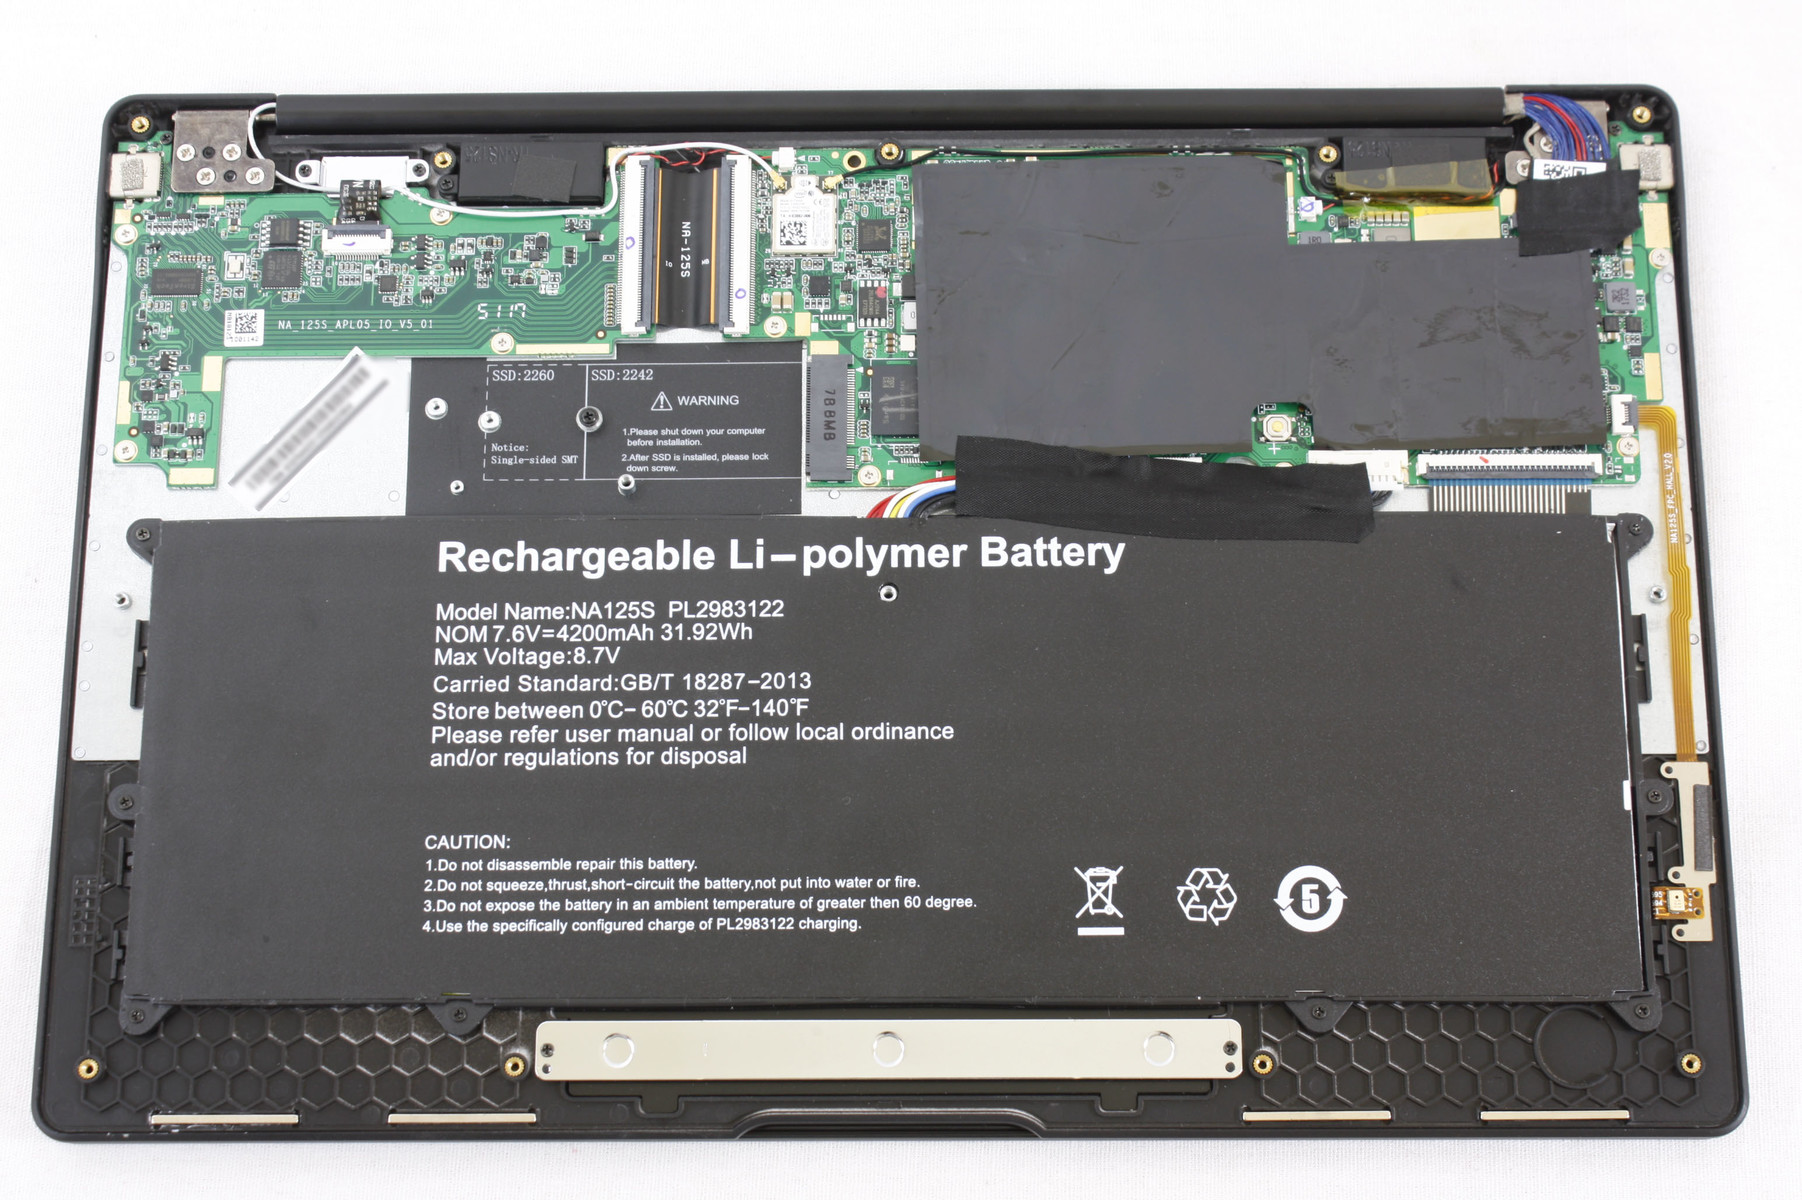
The bottom panel is secured by 12 T5 Torx screws plus 1 Philips screw. It pops off surprisingly easily since there are no latches around the edges or corners.
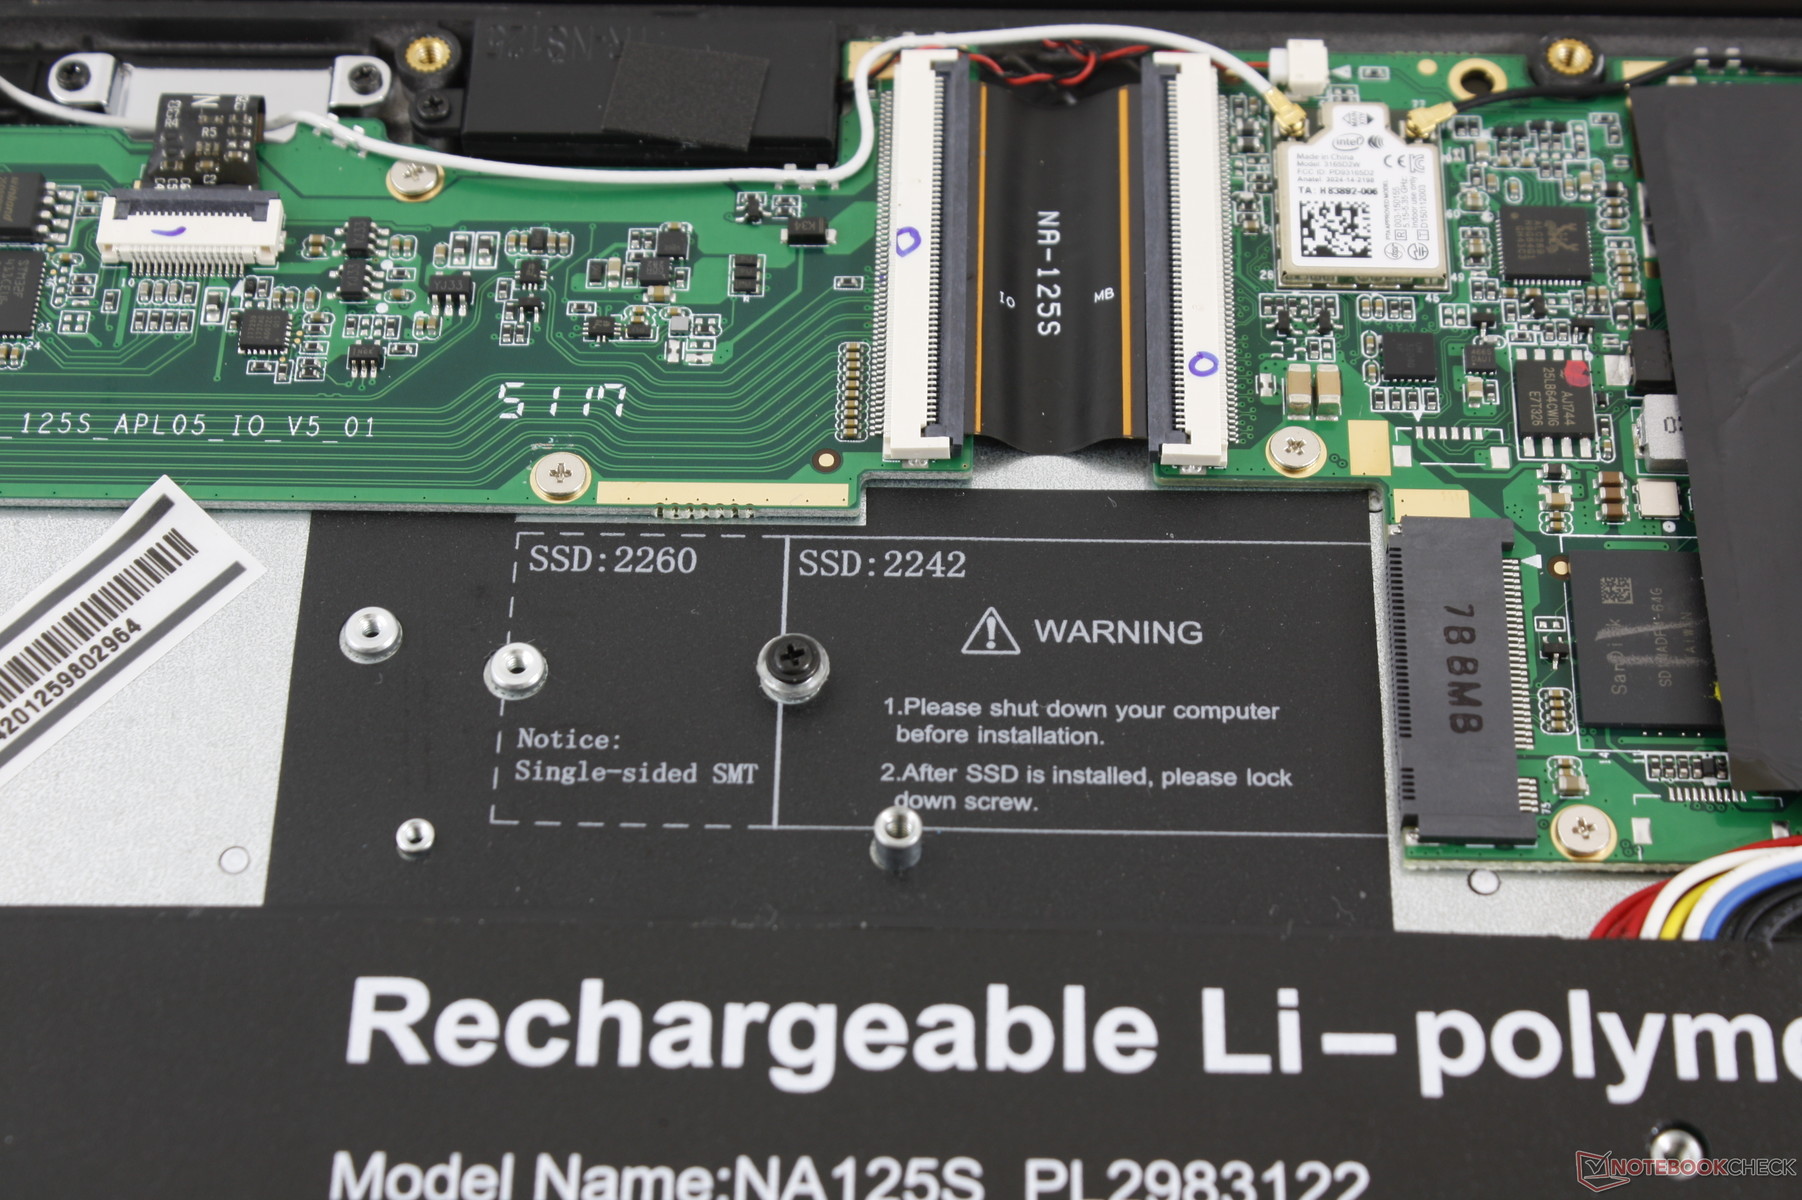
There are no upgrade options aside from the empty M.2 slot. Primary storage and system RAM are both soldered.
Accessories and Warranty
NuVision throws in a free USB Type-C hub to make up for the lack of integrated ports. The hub includes USB Type-A, HDMI, and a 3.5 mm audio jack.
The standard one-year limited manufacturer warranty applies. Please see our Guarantees, Return policies and Warranties article for country-specific information.
Input Devices
Keyboard
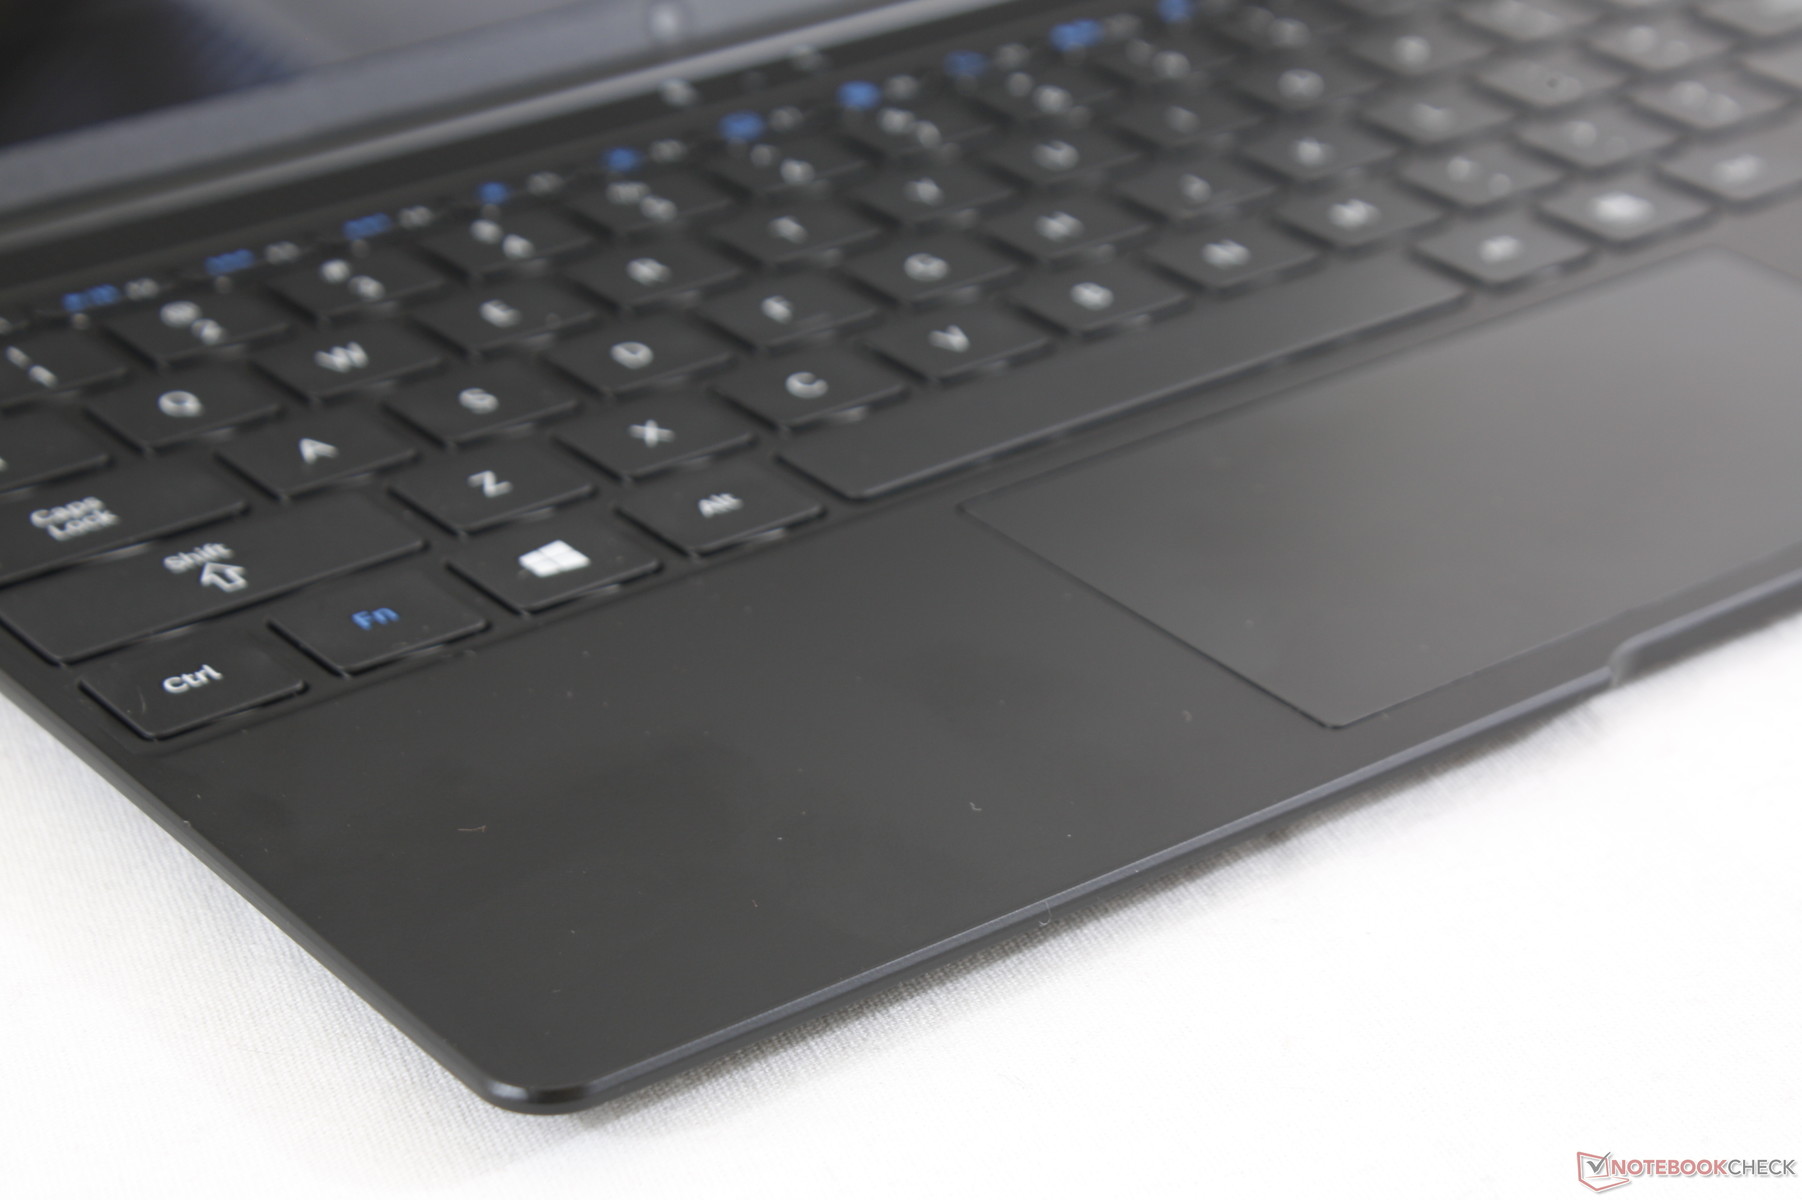
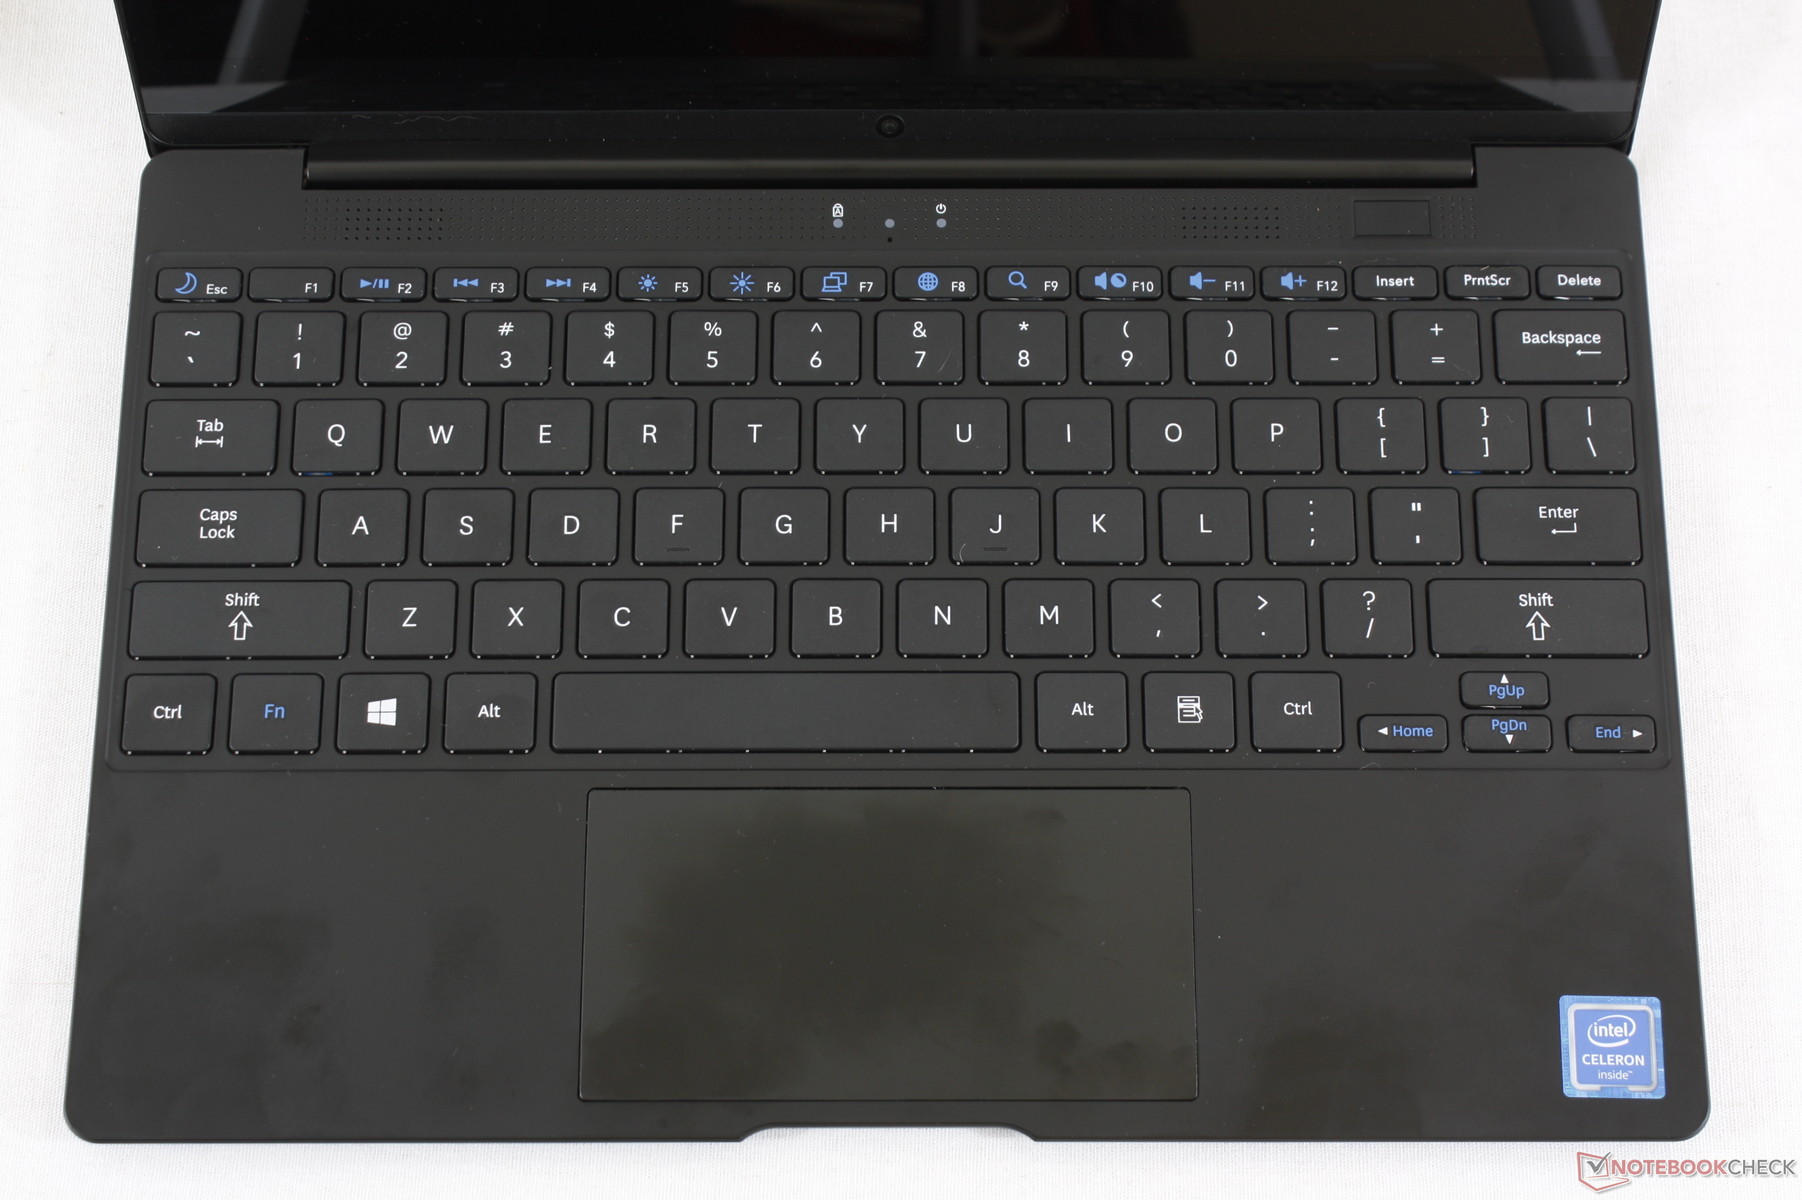
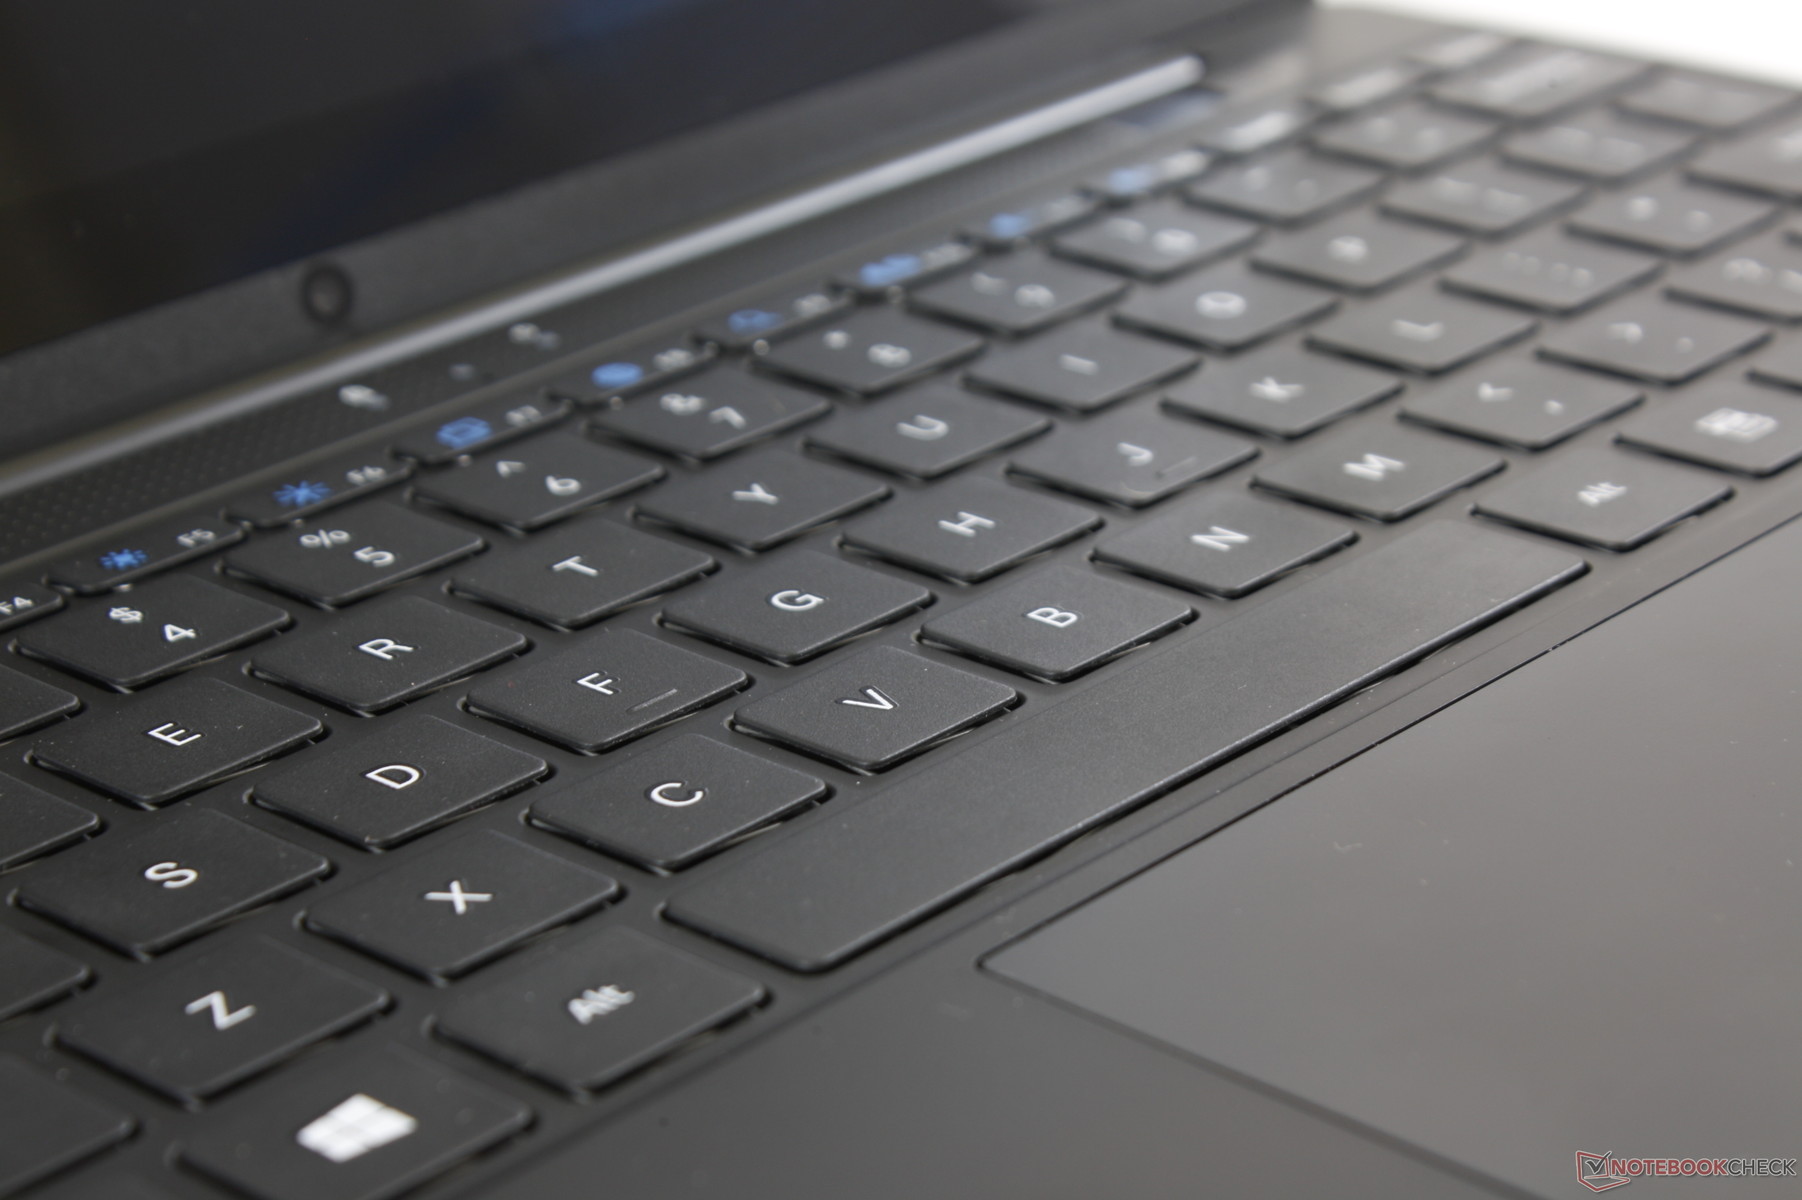
The keyboard keys are very shallow and spongy even for an Ultrabook with no backlight available. They have softer feedback than the XPS 13, Spectre 13, and MateBook 13 for an inferior typing experience. Perhaps the only positive attribute is its quiet clatter as a direct result of the soft actuation point. Additionally, we suspect that the printed letters on each key will eventually fade over time.
Touchpad
The roomy trackpad (11.0 x 5.5 cm) is almost as large as the trackpad on the XPS 13 (10.5 x 6 cm) for hassle-free cursor control. Glide is smooth with almost no sticking when moving slowly or quickly.
Trouble arises during multi-touch inputs or when using the integrated click keys. Pinch-to-zoom is slow, laggy, and unreliable while the click keys are spongy and difficult to press. Accuracy is an issue as well because the cursor will likely jump when clicking.
Display
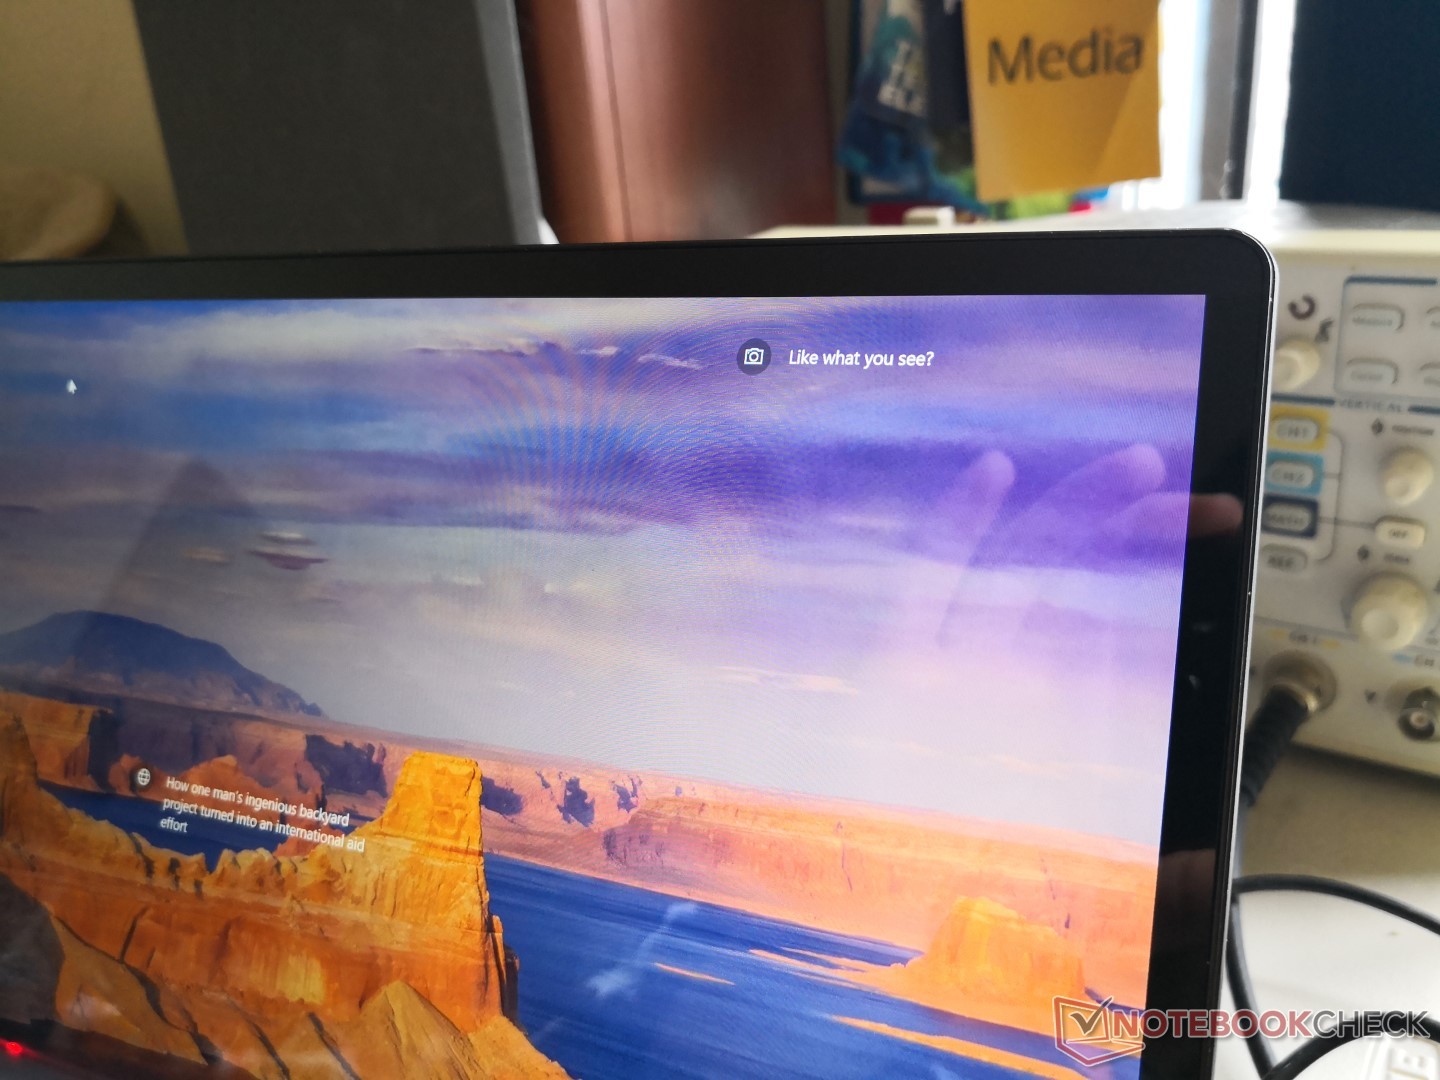
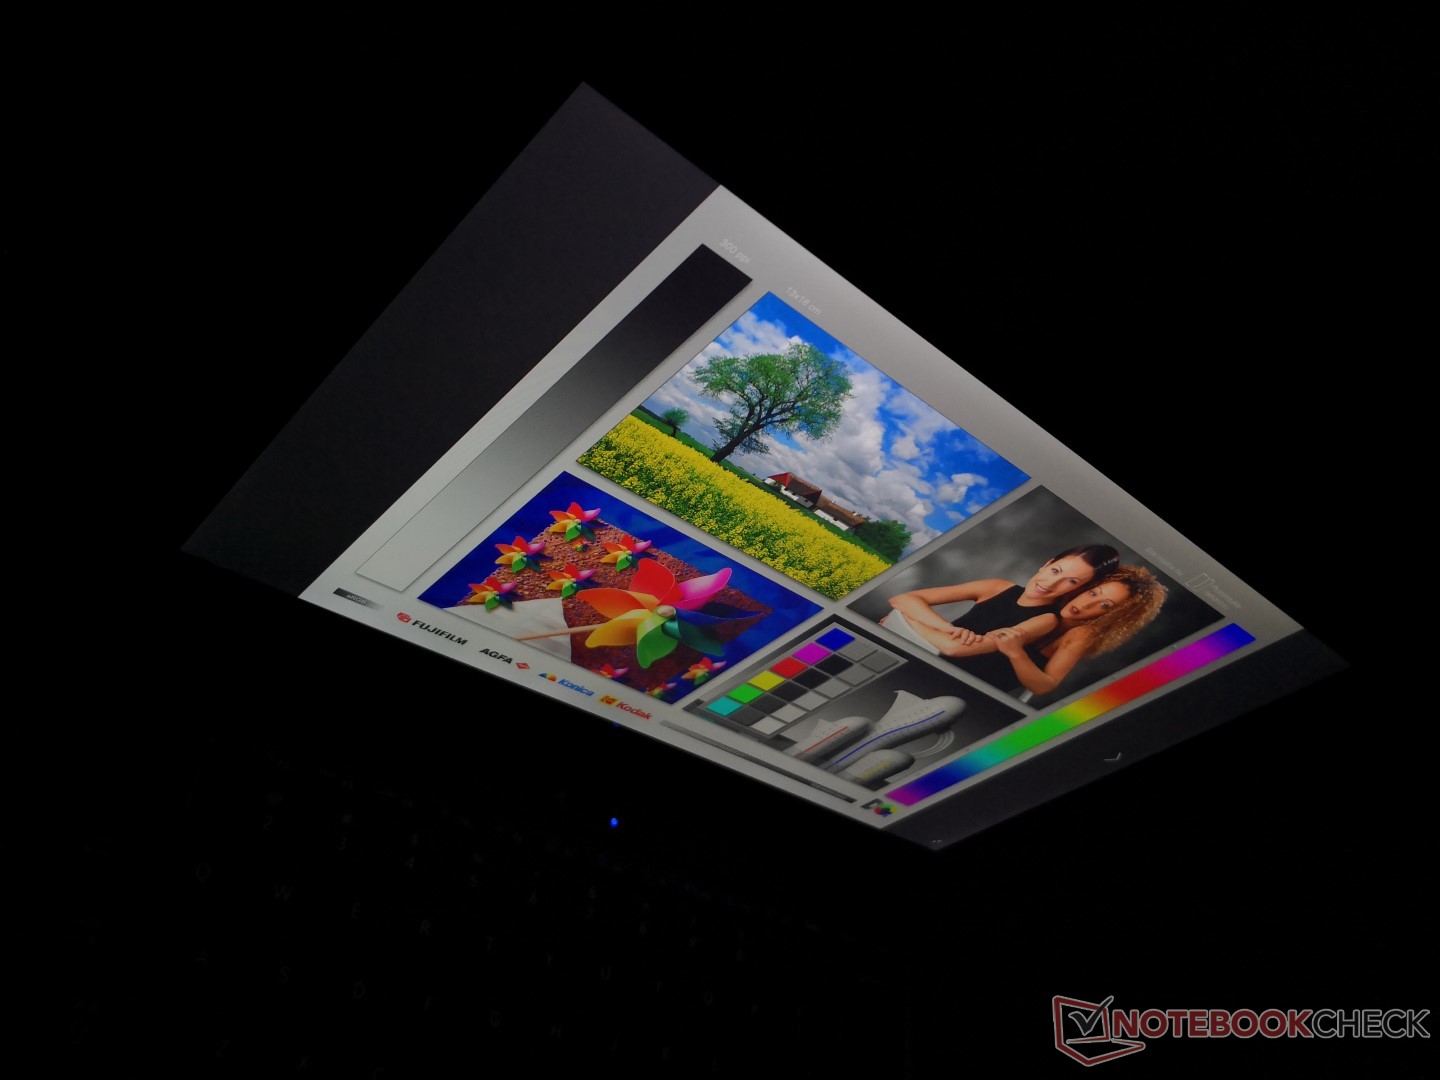
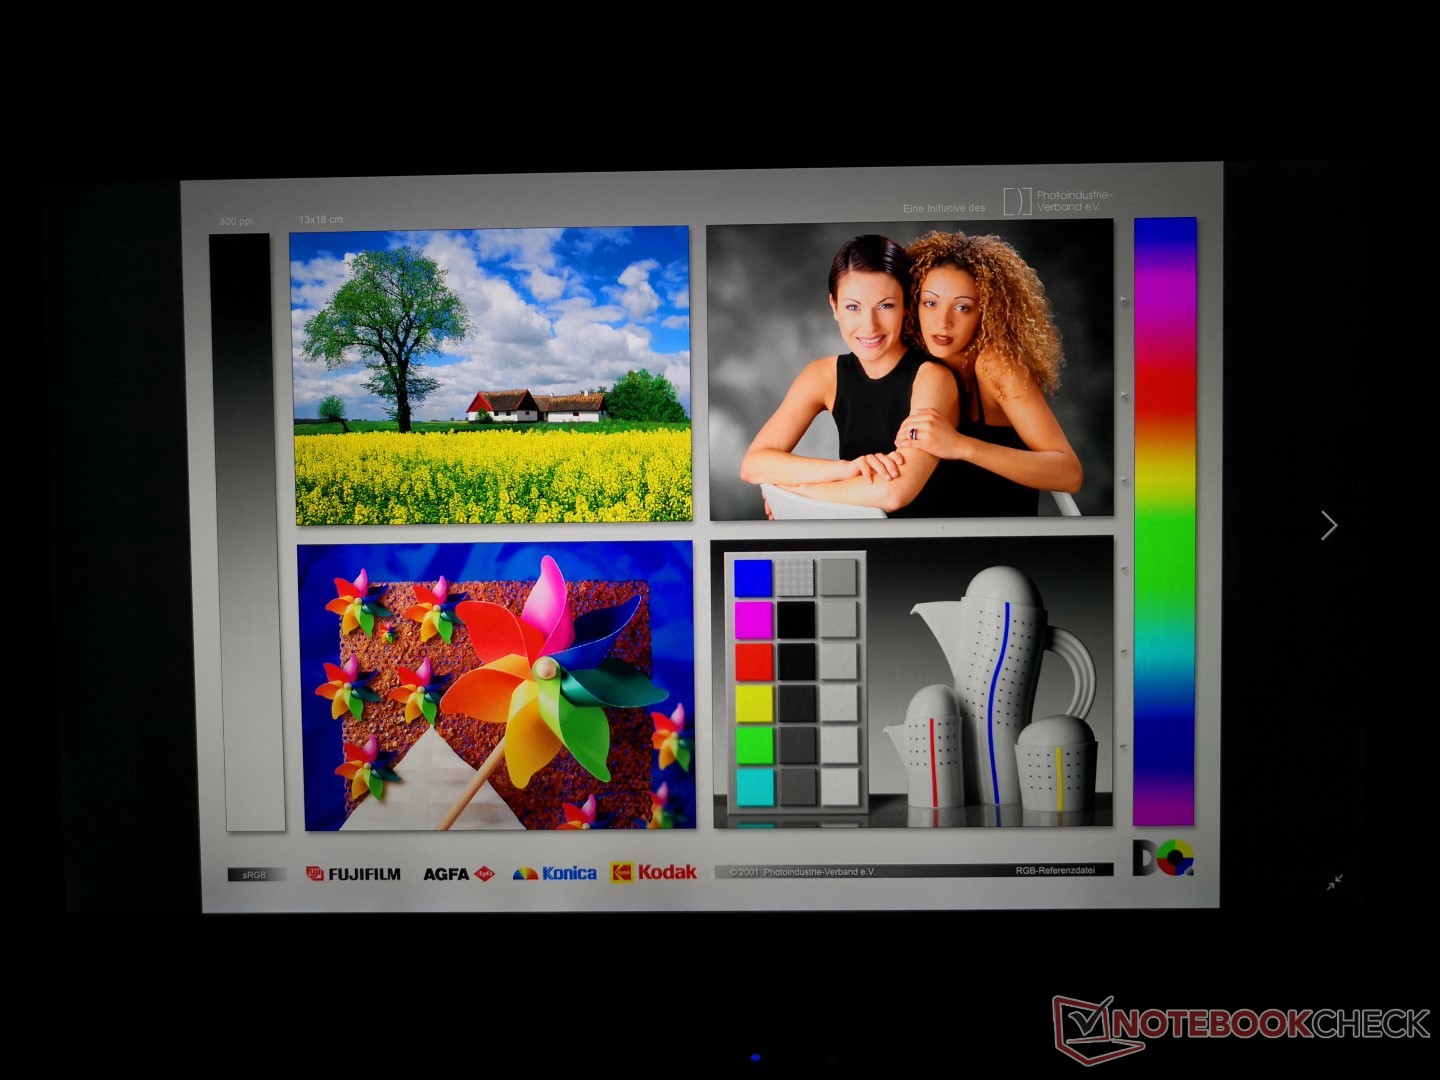
The Encite Book 12 Plus is notable for its high quality 12.5-inch QHD display as most other subnotebooks in this price range are limited to lower resolution 1080p or even 768p panels. In this regard, the NuVision is able to offer a brighter, sharper, and higher contrast viewing experience that's surprisingly comparable to most mainstream Ultrabooks over twice the price. The glossy overlay is fixed despite having no touchscreen features.
It's worth noting that the Sharp LQ125T1JX03 IPS panel in use here can also be found on the four-year old Asus Transformer Book T300 Chi convertible. We praised its display back then and it still holds up very well to this day.
We are able to detect pulse-width modulation on brightness levels 25 percent and under. Its frequency is low enough that users susceptible to onscreen flickering may want to avoid using the laptop at low brightness settings.
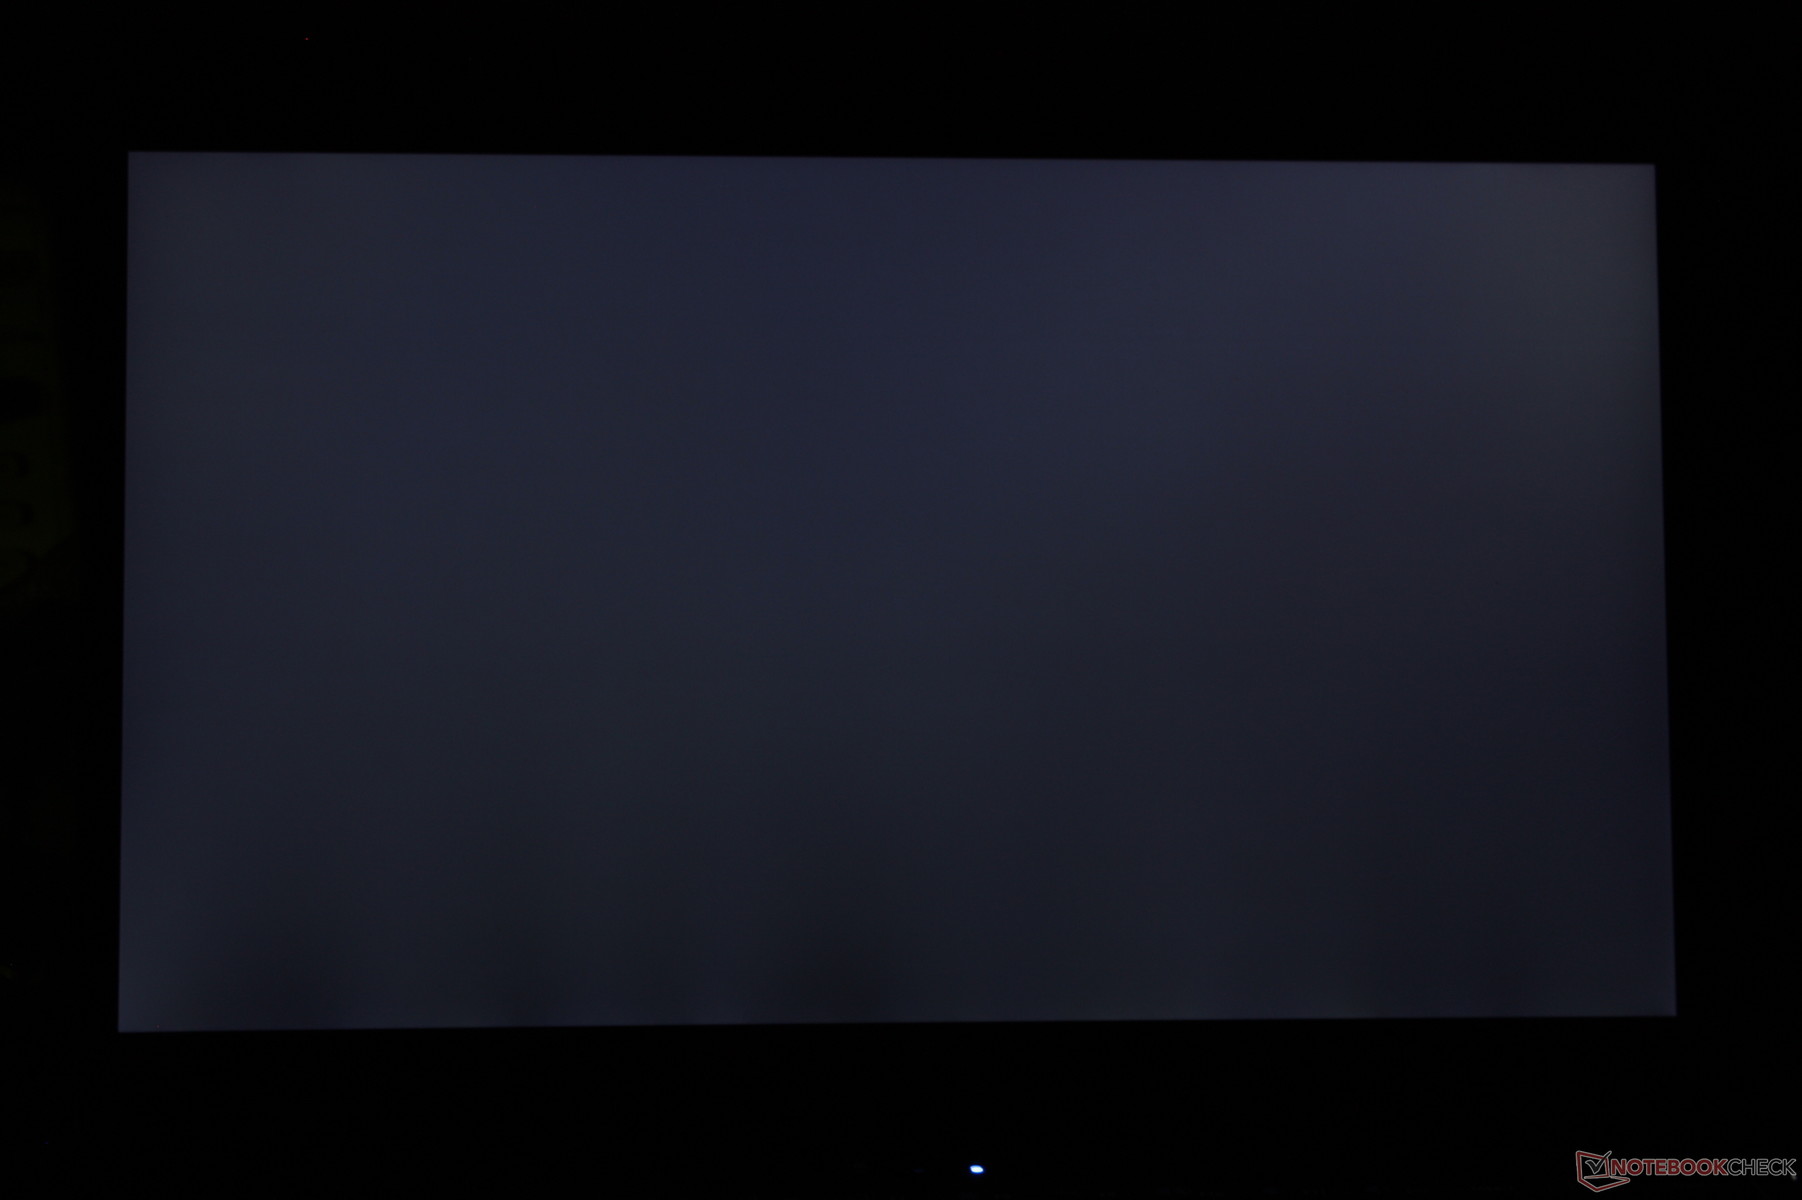
Backlight bleeding is minimal along the bottom edge of the screen. It's thankfully mostly unnoticeable even during video playback with black borders.
| |||||||||||||||||||||||||
Brightness Distribution: 80 %
Center on Battery: 431.5 cd/m²
Contrast: 1003:1 (Black: 0.43 cd/m²)
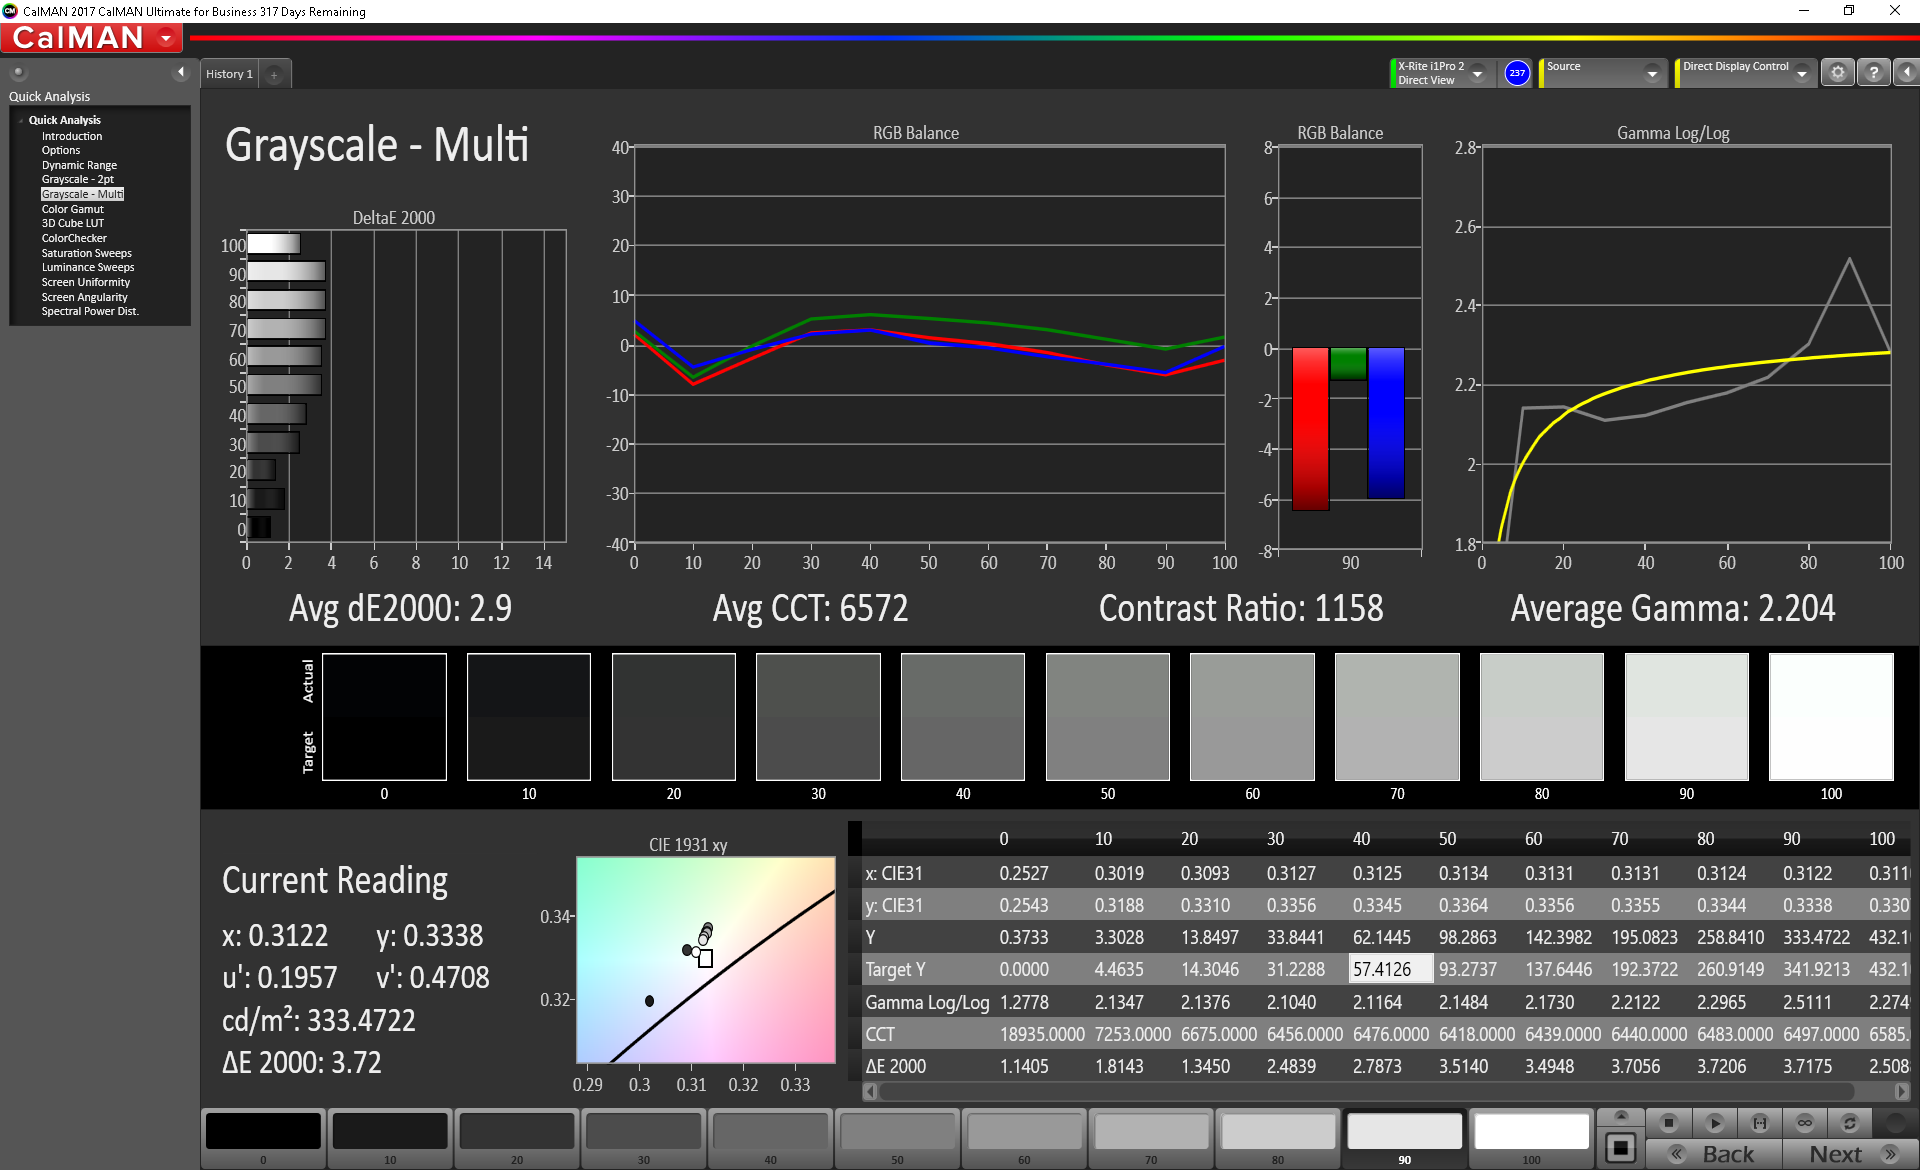
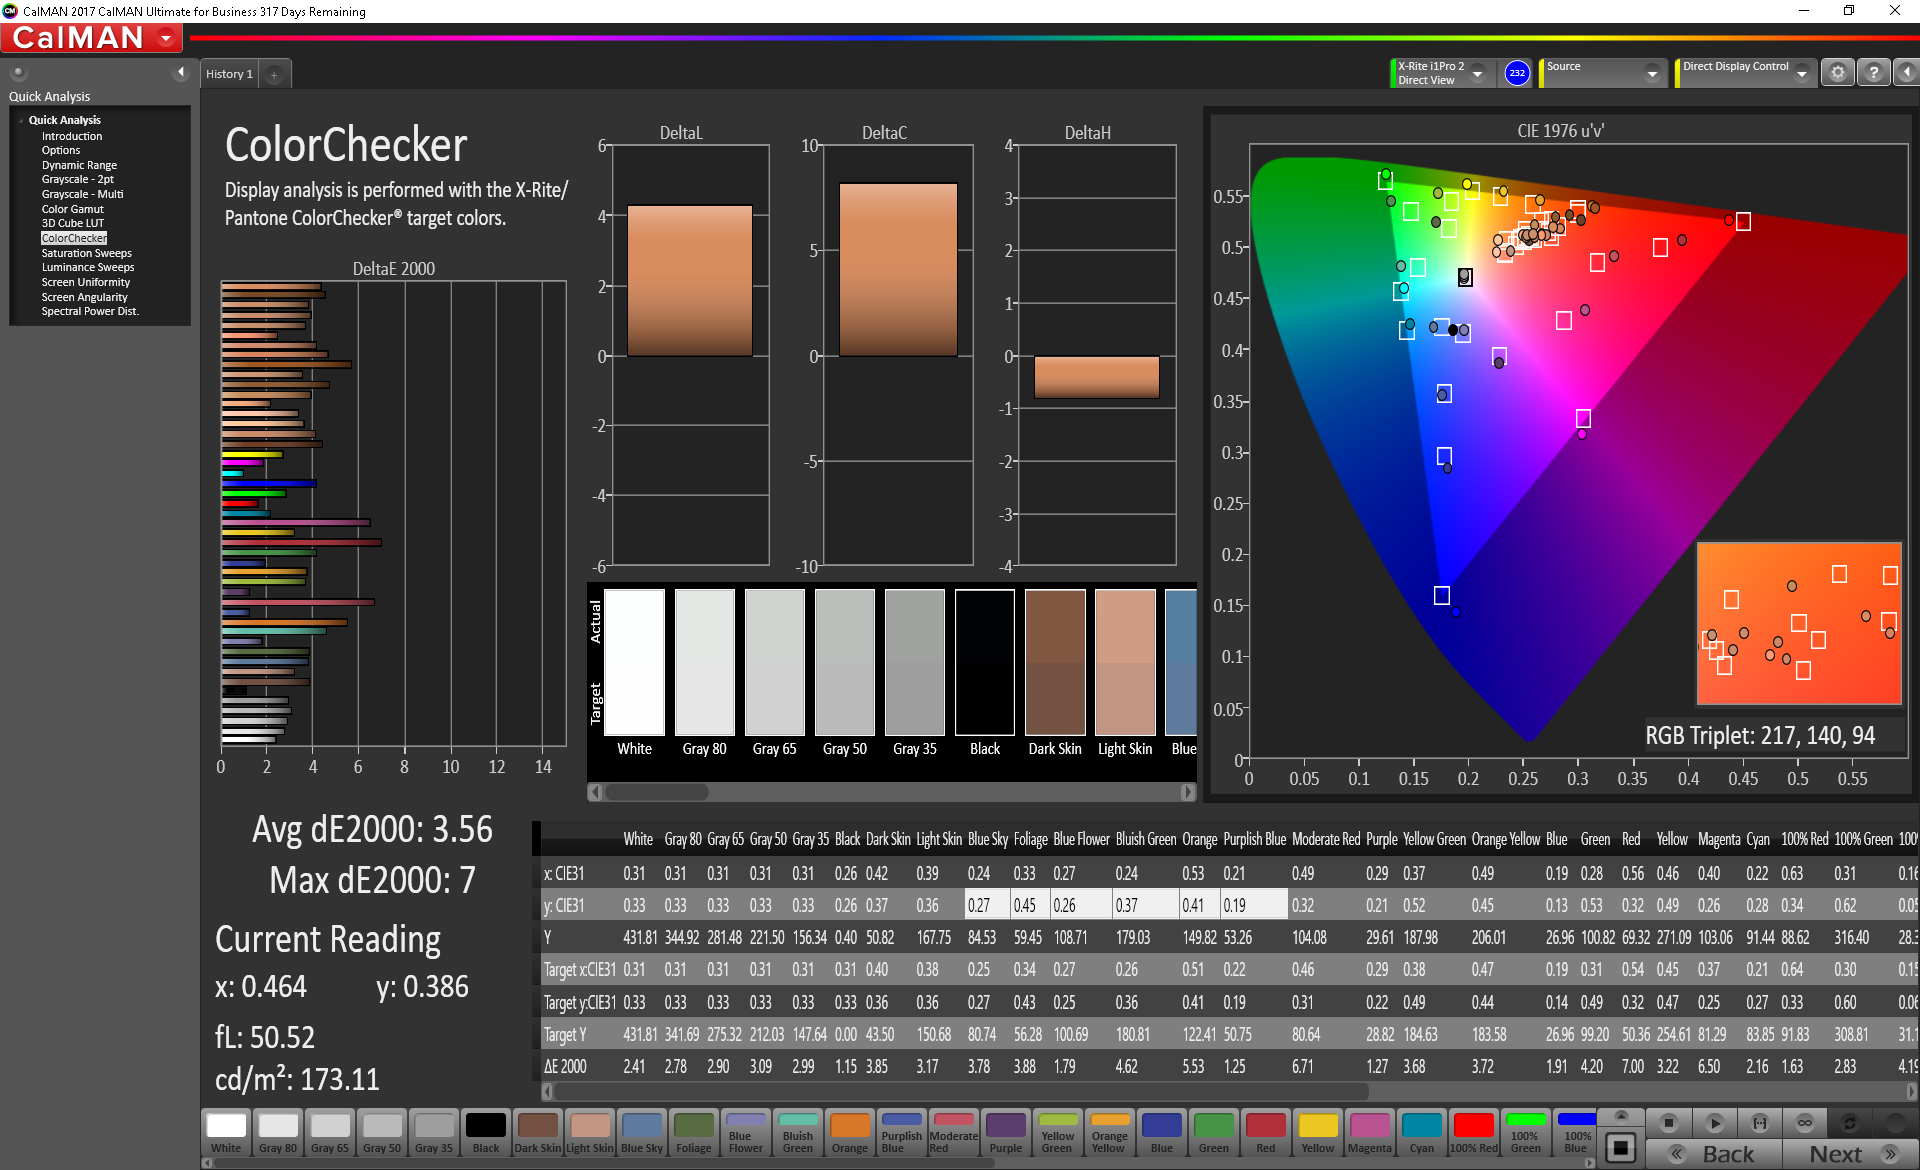
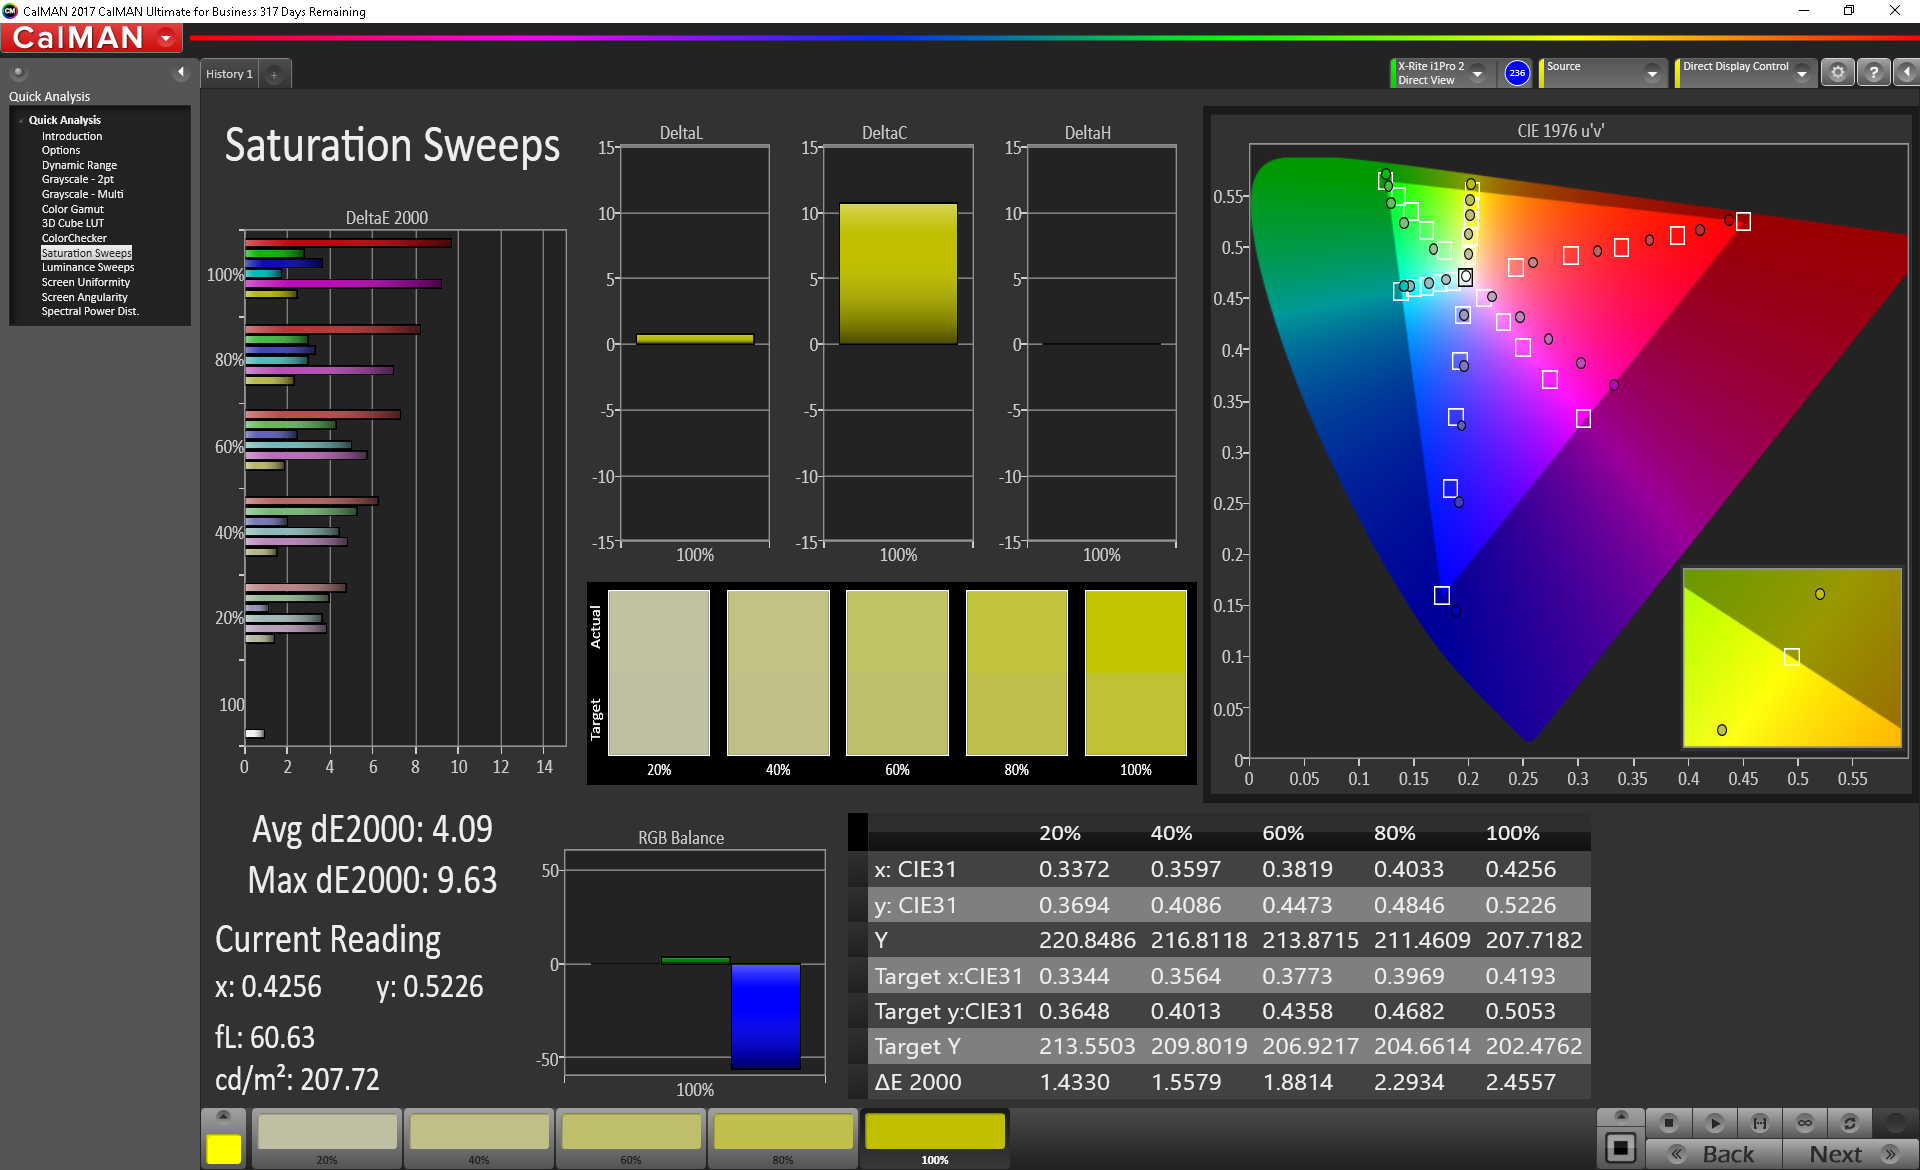
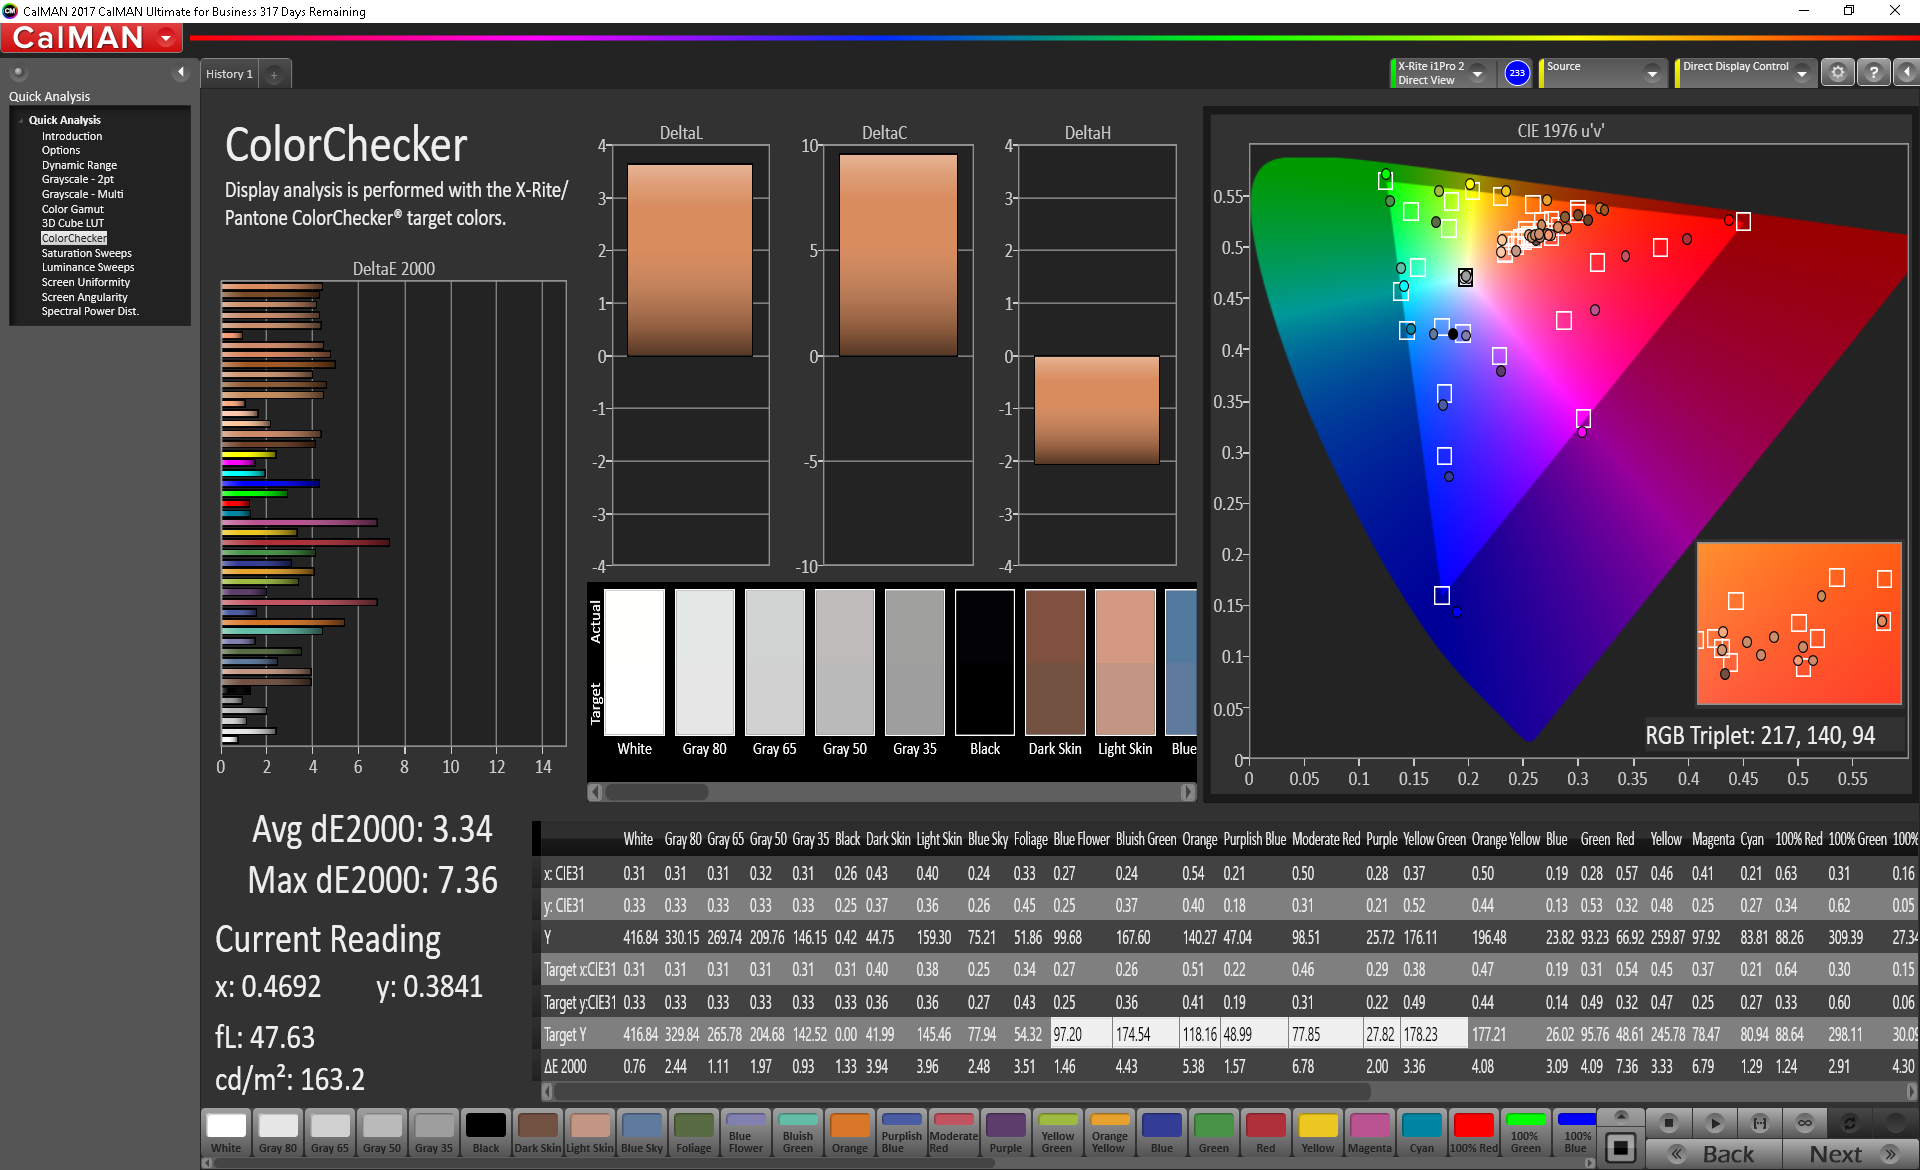
ΔE ColorChecker Calman: 3.56 | ∀{0.5-29.43 Ø4.72}
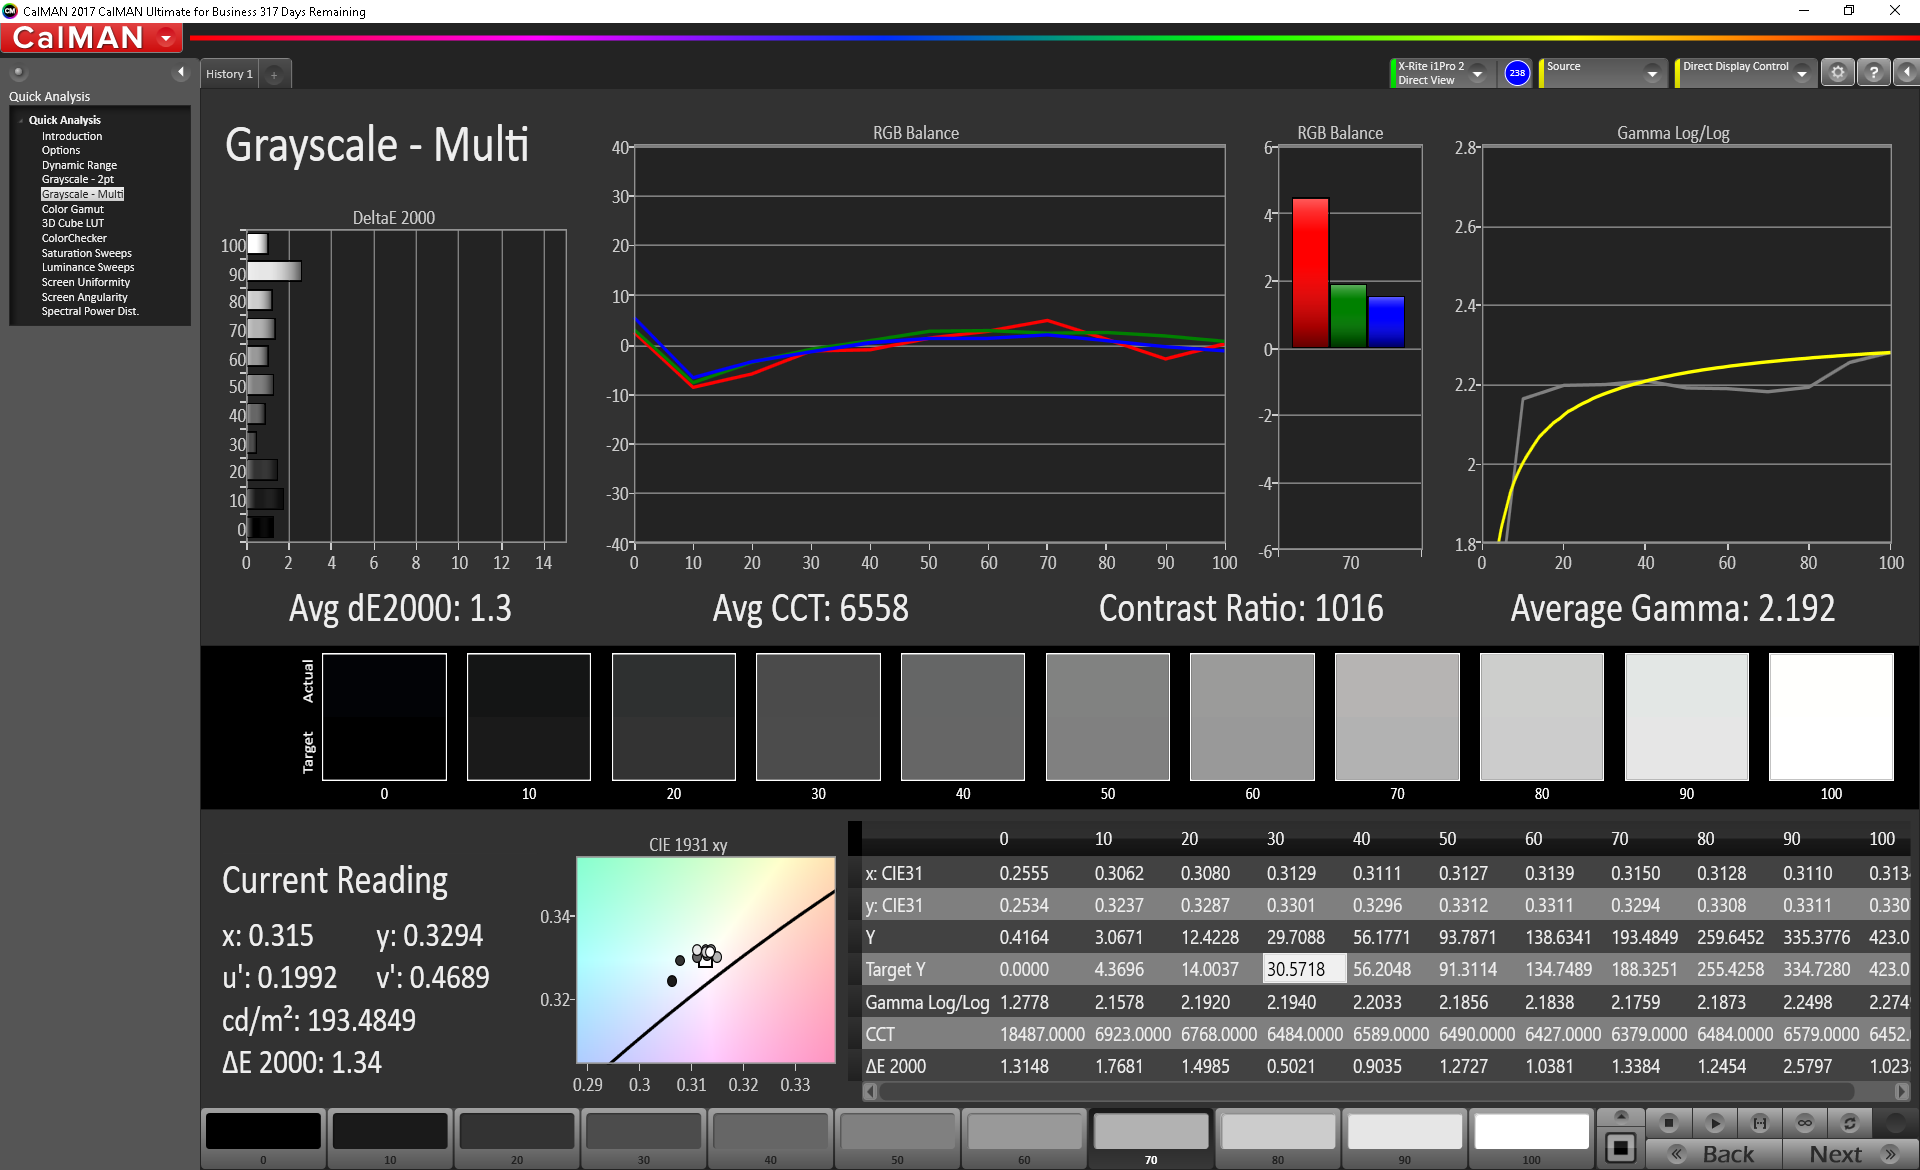
calibrated: 3.34
ΔE Greyscale Calman: 2.9 | ∀{0.09-98 Ø4.97}
98.9% sRGB (Argyll 1.6.3 3D)
66.7% AdobeRGB 1998 (Argyll 1.6.3 3D)
75.6% AdobeRGB 1998 (Argyll 3D)
98.9% sRGB (Argyll 3D)
74.8% Display P3 (Argyll 3D)
Gamma: 2.2
CCT: 6572 K
| NuVision Encite Book 12 Plus Sharp SHP142C, IPS, 12.5", 2560x1440 | Microsoft Surface Go MHN-00003 Sharp SHP14A6, IPS, 10", 1800x1200 | Dell Latitude 5290 AUO B125XW01-V0, TN LED, 12.5", 1366x768 | Lenovo ThinkPad A275 Len40E0, TN, 12.5", 1366x768 | Chuwi LapBook SE 13.3", 1920x1080 | Apple MacBook Air 2018 APPA039, IPS, 13.3", 2560x1600 | |
|---|---|---|---|---|---|---|
| Display | -8% | -45% | -41% | -10% | -7% | |
| Display P3 Coverage (%) | 74.8 | 66.5 -11% | 39.22 -48% | 42.05 -44% | 65 -13% | 67.8 -9% |
| sRGB Coverage (%) | 98.9 | 97.5 -1% | 59 -40% | 62.8 -37% | 94.8 -4% | 96.1 -3% |
| AdobeRGB 1998 Coverage (%) | 75.6 | 67.5 -11% | 40.56 -46% | 43.48 -42% | 66.5 -12% | 69.8 -8% |
| Response Times | 1% | 18% | 9% | 4% | 3% | |
| Response Time Grey 50% / Grey 80% * (ms) | 37.6 ? | 44 ? -17% | 46.8 ? -24% | 41 ? -9% | 39.2 ? -4% | 39.6 ? -5% |
| Response Time Black / White * (ms) | 31.6 ? | 25.6 ? 19% | 12.8 ? 59% | 23 ? 27% | 27.7 ? 12% | 28 ? 11% |
| PWM Frequency (Hz) | 198.4 ? | 1020 ? | 800 ? | 200 ? | 113600 ? | |
| Screen | 30% | -101% | -79% | -47% | 26% | |
| Brightness middle (cd/m²) | 431.5 | 456 6% | 232 -46% | 255 -41% | 227 -47% | 320 -26% |
| Brightness (cd/m²) | 406 | 426 5% | 218 -46% | 244 -40% | 210 -48% | 315 -22% |
| Brightness Distribution (%) | 80 | 88 10% | 86 8% | 87 9% | 89 11% | 95 19% |
| Black Level * (cd/m²) | 0.43 | 0.31 28% | 0.54 -26% | 0.52 -21% | 0.44 -2% | 0.29 33% |
| Contrast (:1) | 1003 | 1471 47% | 430 -57% | 490 -51% | 516 -49% | 1103 10% |
| Colorchecker dE 2000 * | 3.56 | 1.3 63% | 11.8 -231% | 9.76 -174% | 6.6 -85% | 1.2 66% |
| Colorchecker dE 2000 max. * | 7 | 3 57% | 23.2 -231% | 14.53 -108% | 12.2 -74% | 3.2 54% |
| Colorchecker dE 2000 calibrated * | 3.34 | 1.1 67% | 3.9 -17% | 1.9 43% | 0.5 85% | |
| Greyscale dE 2000 * | 2.9 | 1.4 52% | 13.9 -379% | 11.13 -284% | 7.9 -172% | 0.8 72% |
| Gamma | 2.2 100% | 2.24 98% | 2.13 103% | 2.38 92% | 2.16 102% | 2.2 100% |
| CCT | 6572 99% | 6687 97% | 16629 39% | 12214 53% | 8879 73% | 6548 99% |
| Color Space (Percent of AdobeRGB 1998) (%) | 66.7 | 62.3 -7% | 37.6 -44% | 40 -40% | 62.1 -7% | |
| Color Space (Percent of sRGB) (%) | 98.9 | 96.8 -2% | 59.2 -40% | 63 -36% | 96 -3% | |
| Total Average (Program / Settings) | 8% /
19% | -43% /
-76% | -37% /
-59% | -18% /
-32% | 7% /
17% |
* ... smaller is better
Color space covers sRGB almost in its entirety for deep colors. Gamut is much wider than we were expecting for such a cheap laptop. The TN panel on the ThinkPad A275, for example, covers just 63 percent of sRGB in comparison.
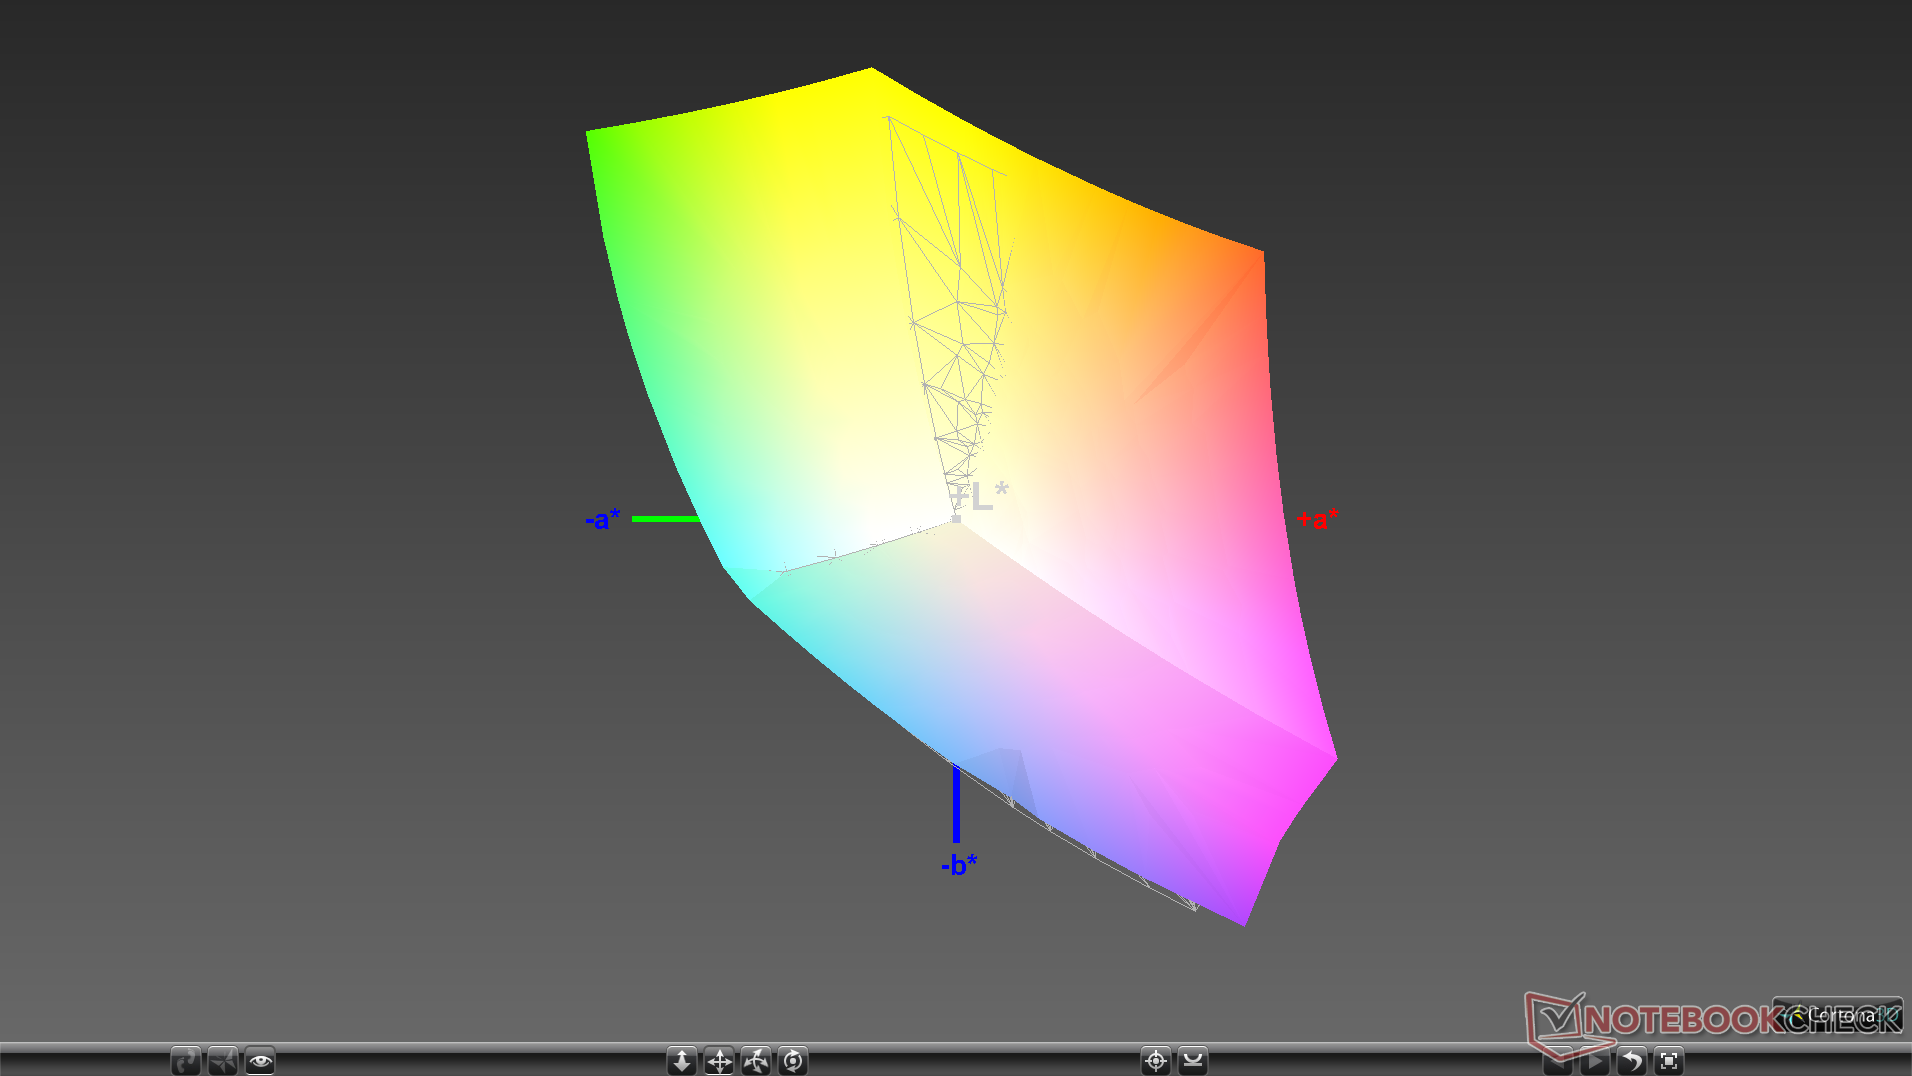
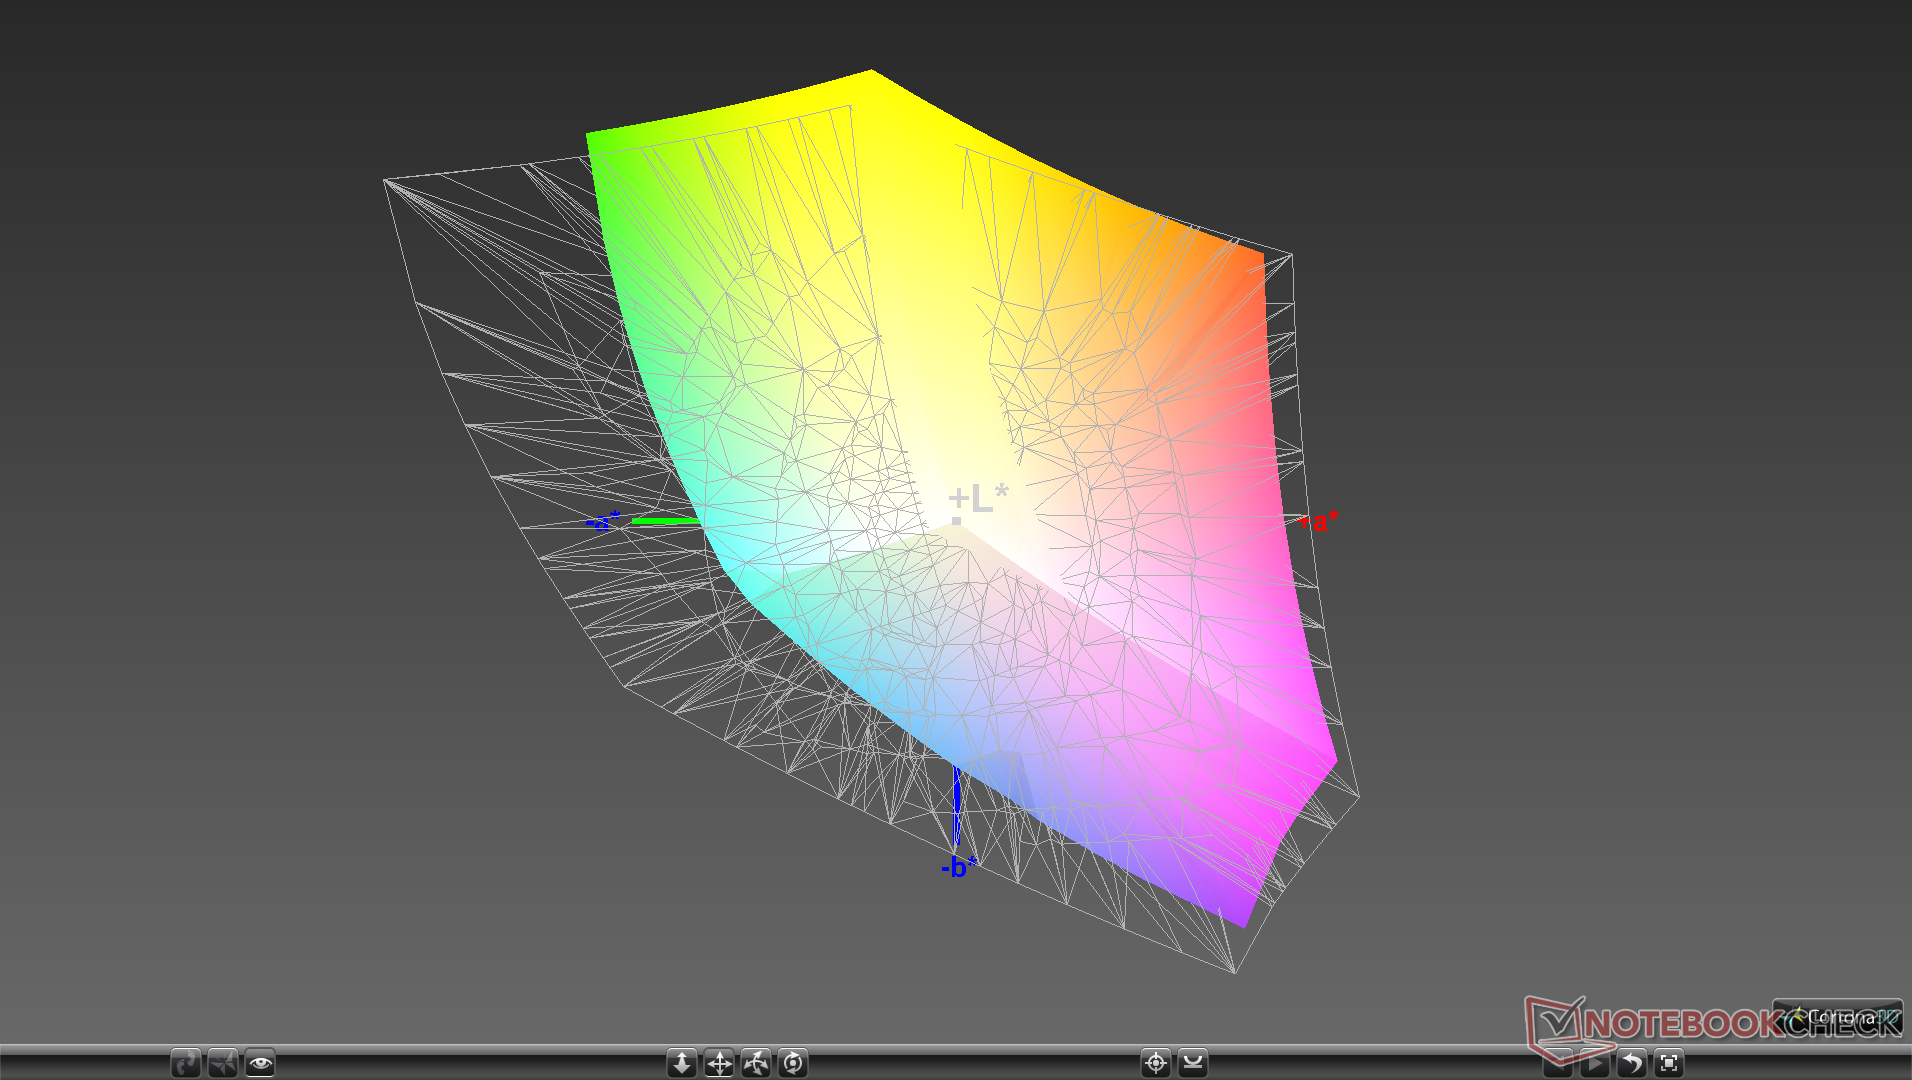
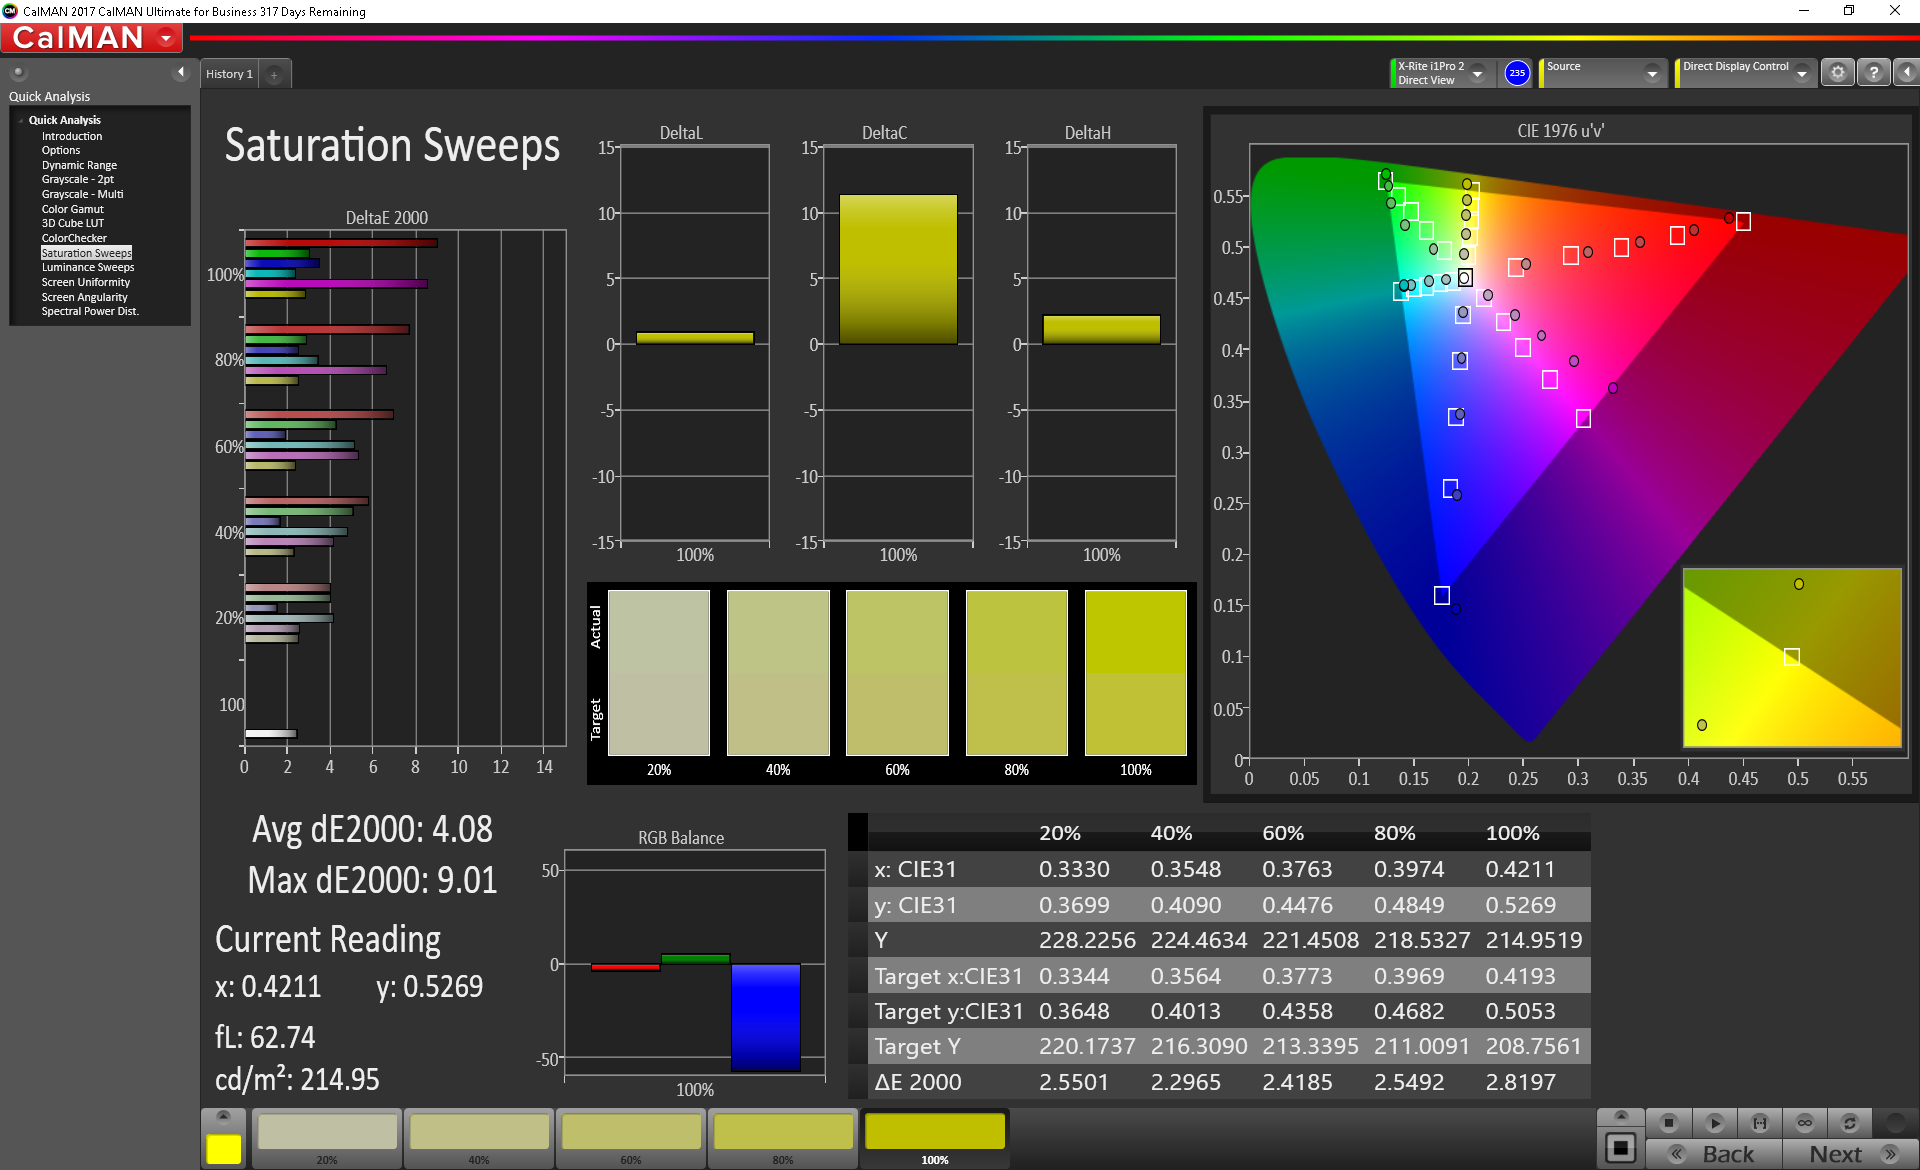
While color space is impressive, color accuracy is another story. Red and magenta colors in particular become more inaccurate at higher saturation levels even after calibration. Finer calibration is likely required for users who want the most accurate colors possible. Grayscale is otherwise excellent out of the box.
Display Response Times
| ↔ Response Time Black to White | ||
|---|---|---|
| 31.6 ms ... rise ↗ and fall ↘ combined | ↗ 16.8 ms rise | 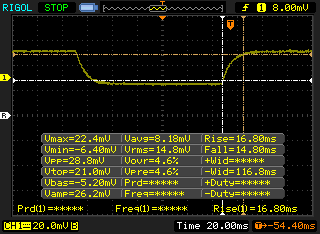 |
| ↘ 14.8 ms fall | ||
| The screen shows slow response rates in our tests and will be unsatisfactory for gamers. In comparison, all tested devices range from 0.1 (minimum) to 240 (maximum) ms. » 85 % of all devices are better. This means that the measured response time is worse than the average of all tested devices (19.8 ms). | ||
| ↔ Response Time 50% Grey to 80% Grey | ||
| 37.6 ms ... rise ↗ and fall ↘ combined | ↗ 20.4 ms rise | 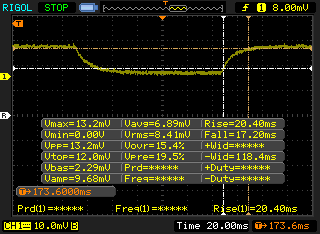 |
| ↘ 17.2 ms fall | ||
| The screen shows slow response rates in our tests and will be unsatisfactory for gamers. In comparison, all tested devices range from 0.165 (minimum) to 636 (maximum) ms. » 55 % of all devices are better. This means that the measured response time is worse than the average of all tested devices (31 ms). | ||
Screen Flickering / PWM (Pulse-Width Modulation)
| Screen flickering / PWM detected | 198.4 Hz | ≤ 25 % brightness setting | 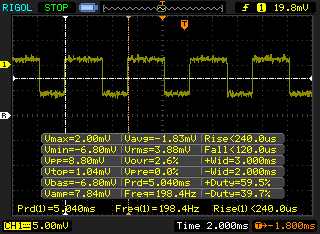 |
The display backlight flickers at 198.4 Hz (worst case, e.g., utilizing PWM) Flickering detected at a brightness setting of 25 % and below. There should be no flickering or PWM above this brightness setting. The frequency of 198.4 Hz is relatively low, so sensitive users will likely notice flickering and experience eyestrain at the stated brightness setting and below. In comparison: 52 % of all tested devices do not use PWM to dim the display. If PWM was detected, an average of 7747 (minimum: 5 - maximum: 343500) Hz was measured. | |||
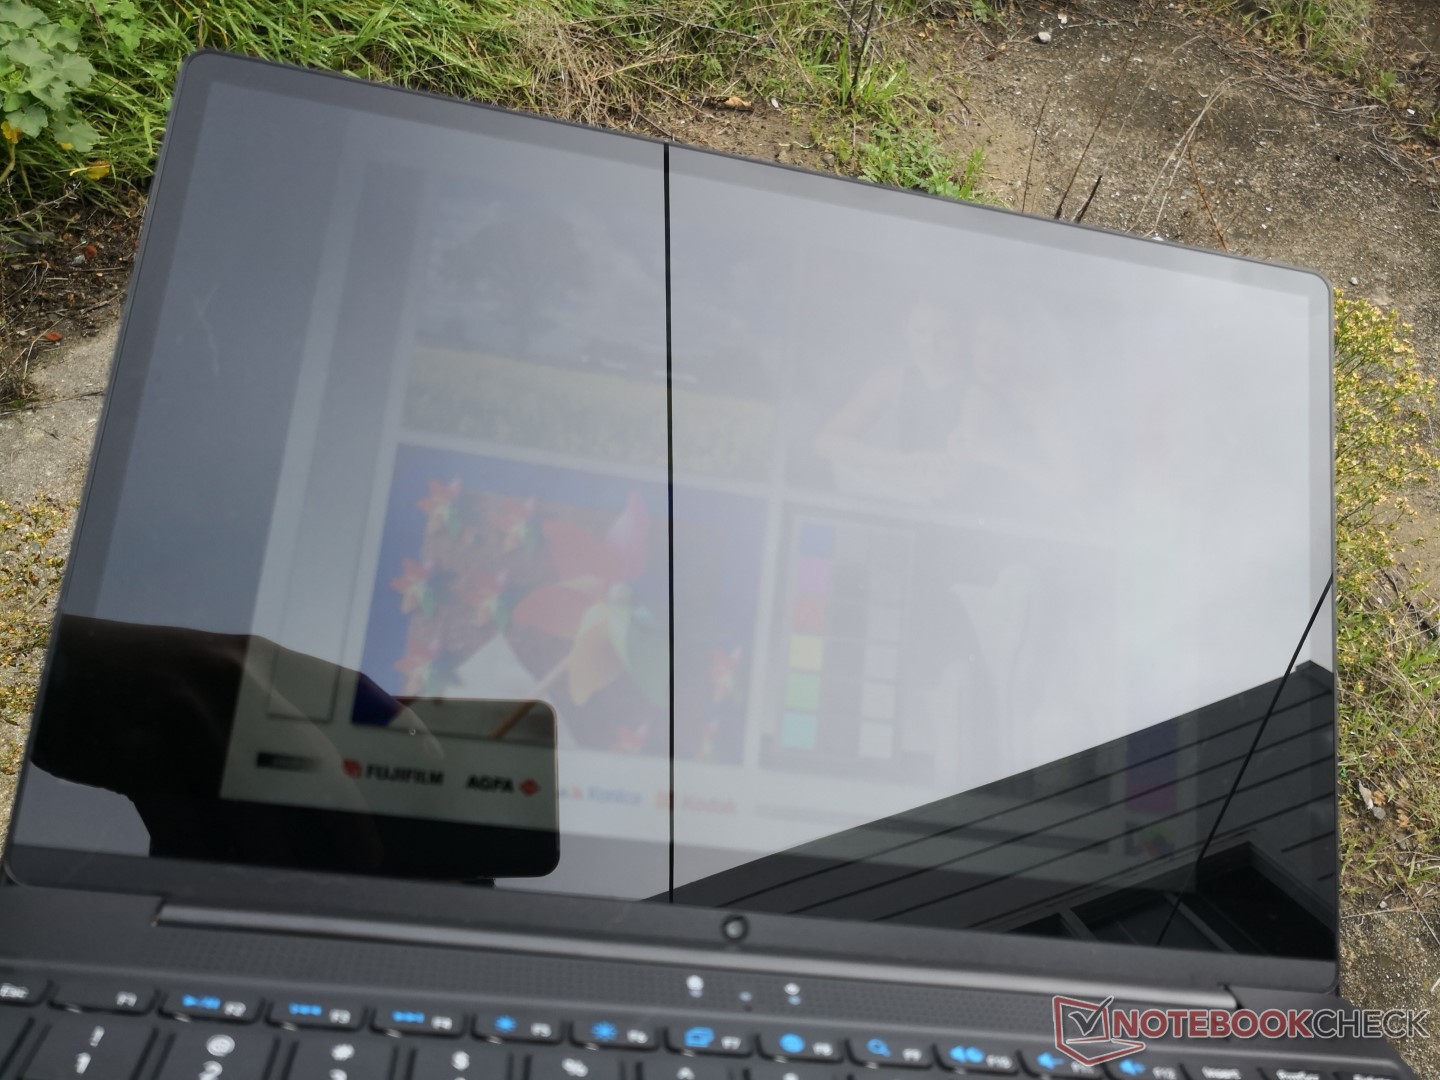
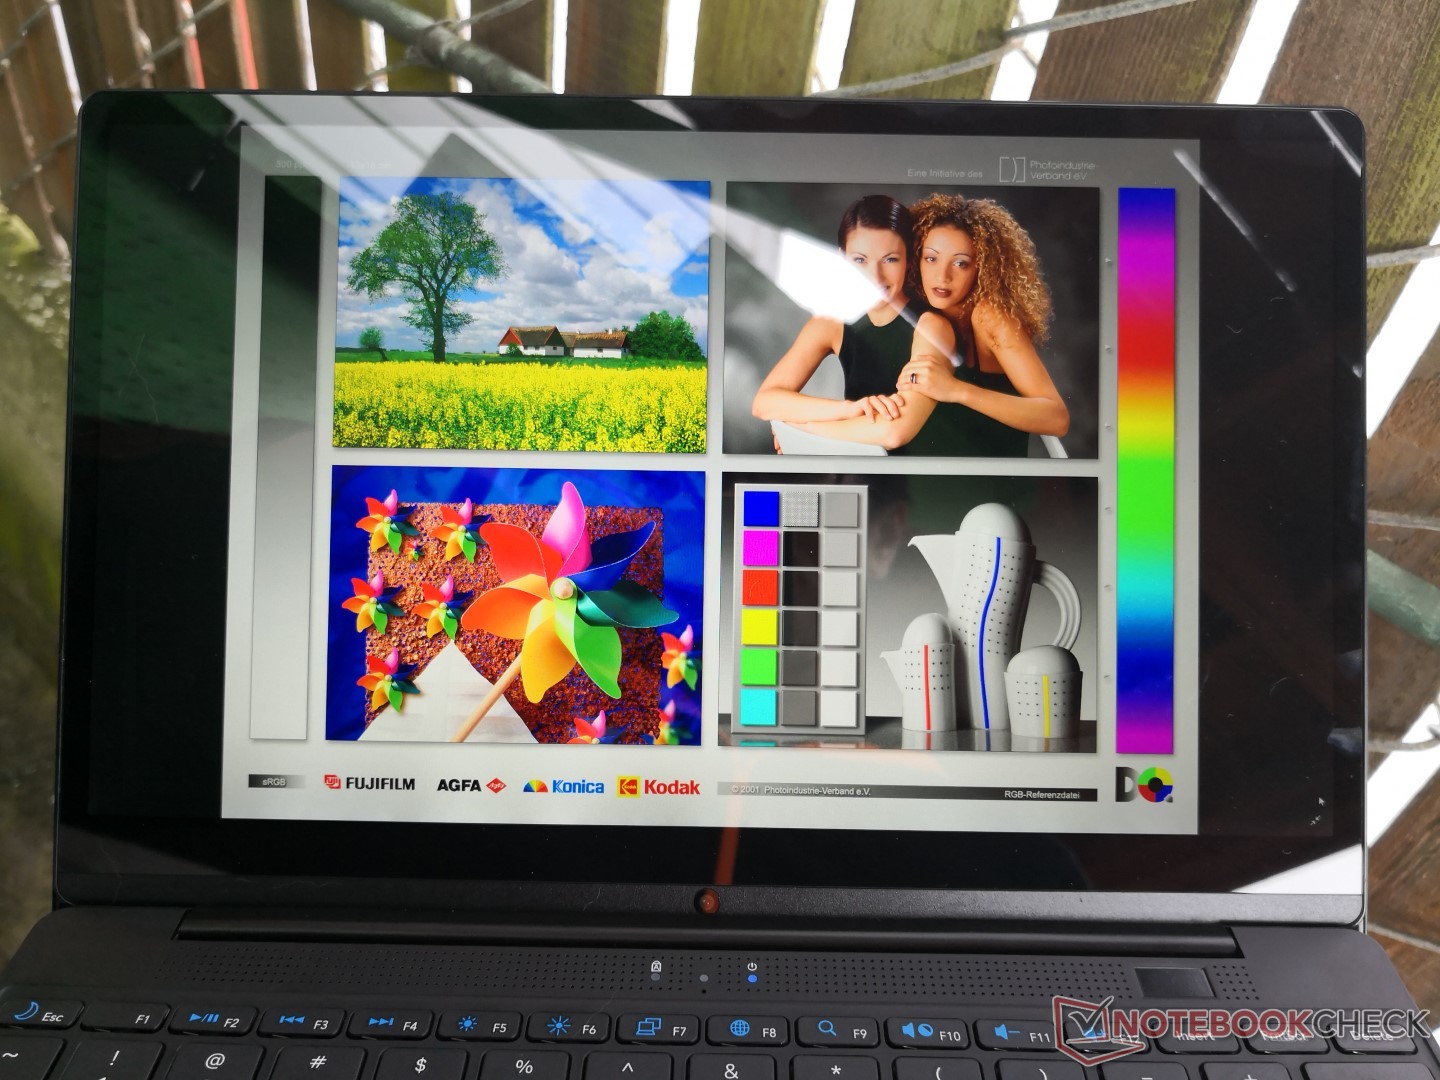
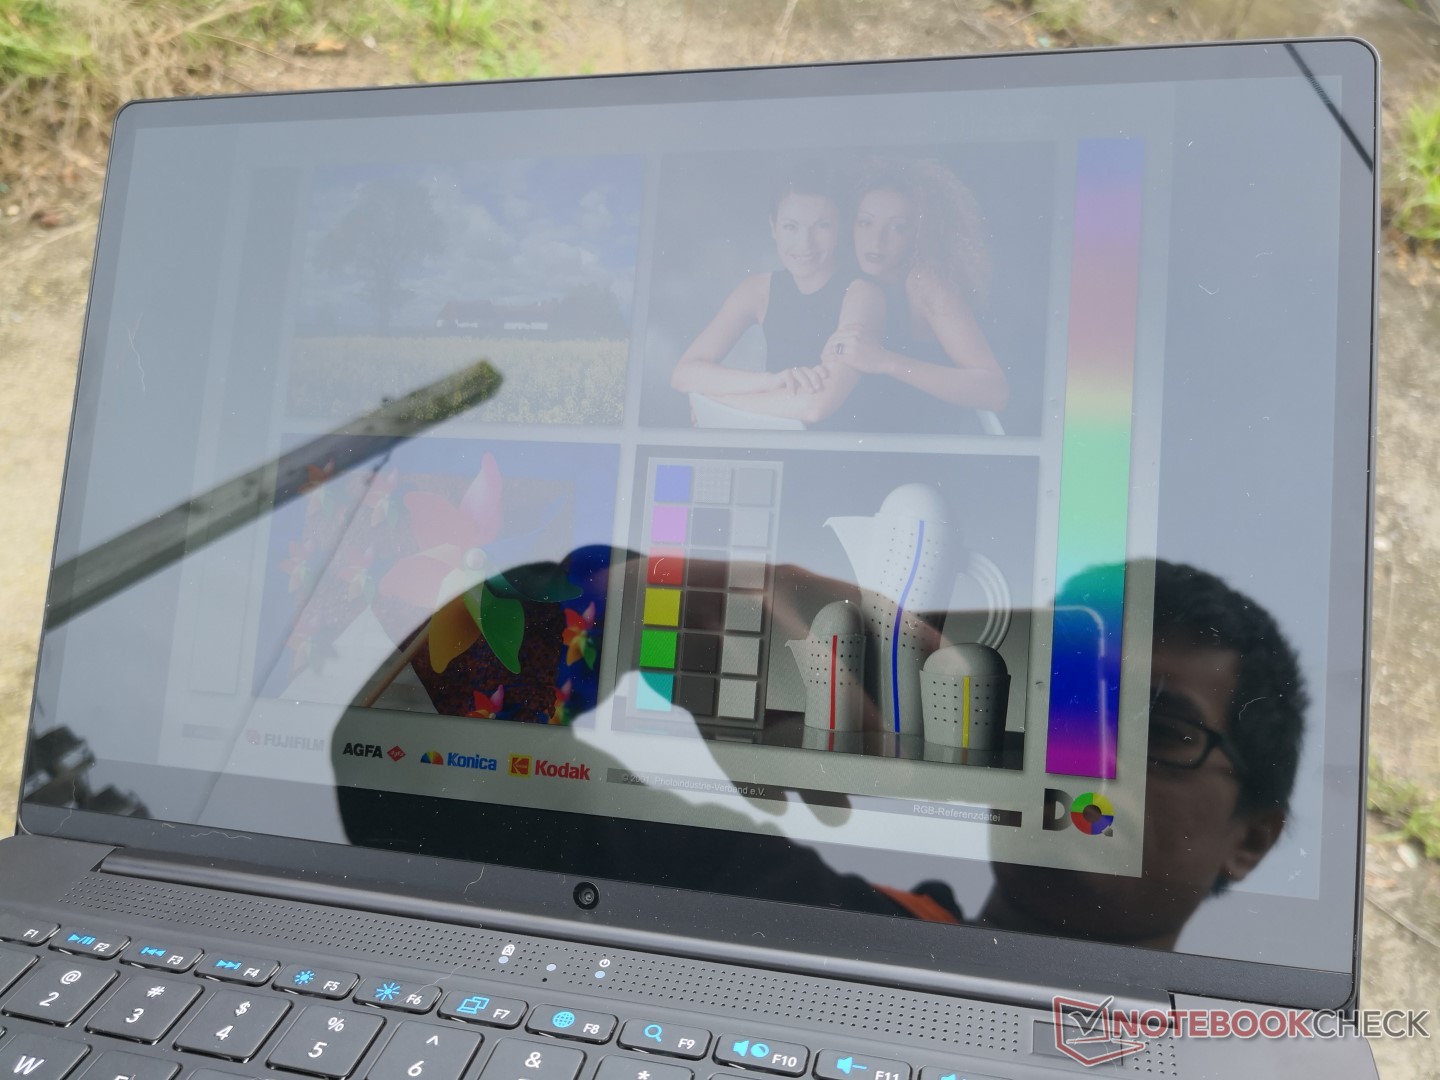
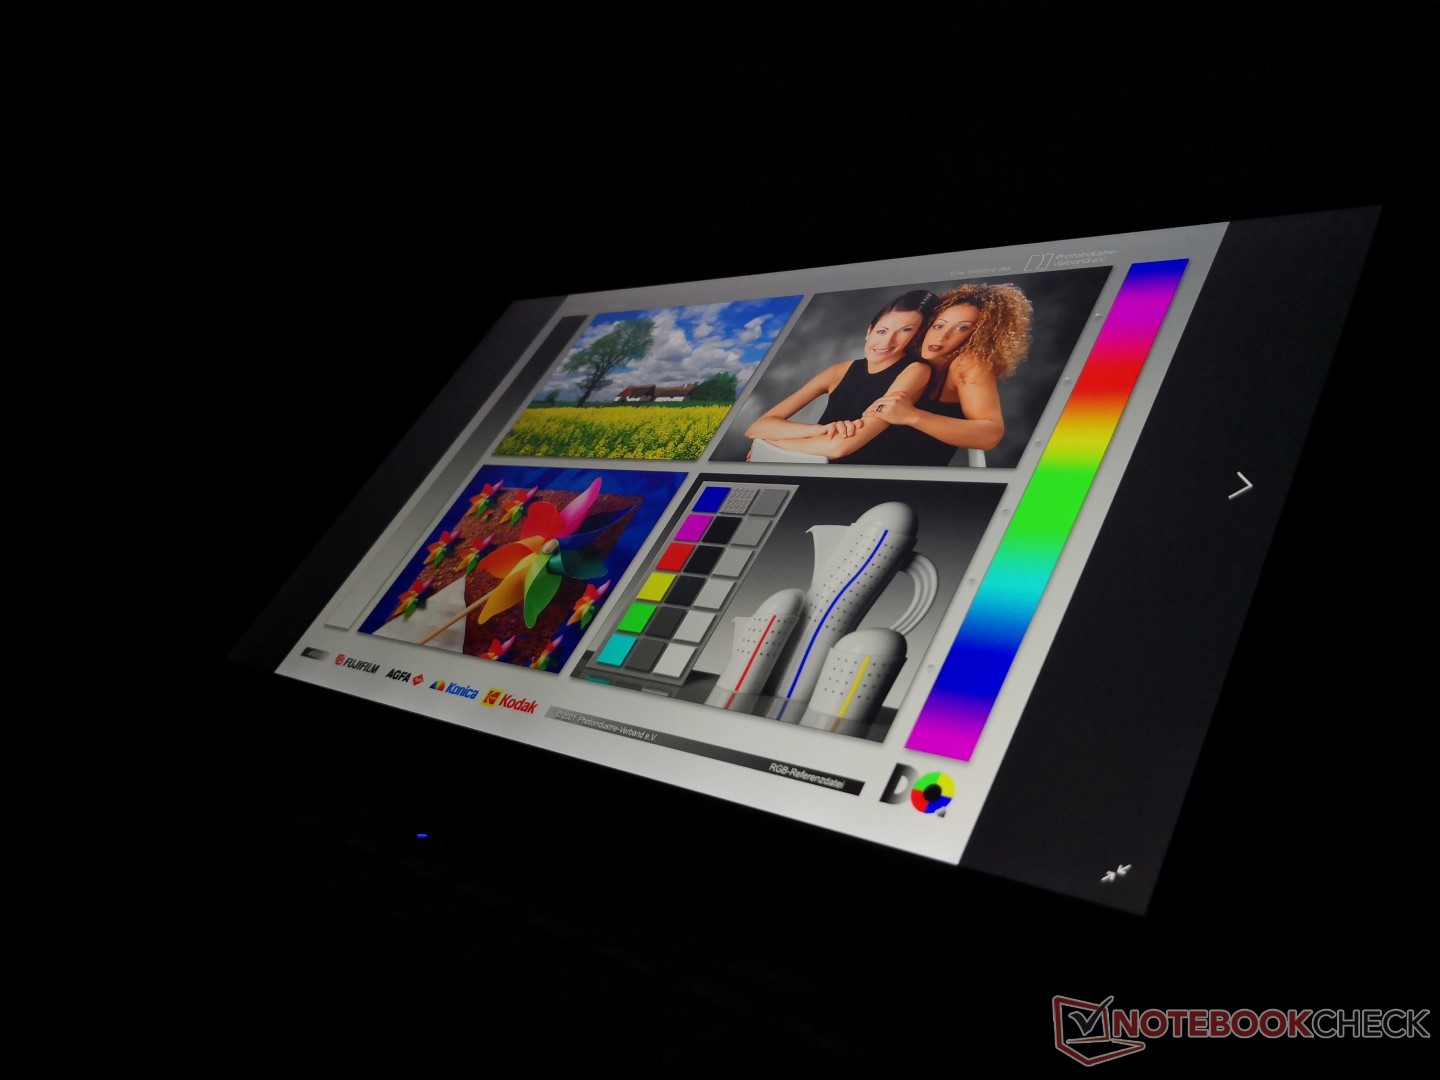
Outdoor visibility is better than most every cheap subnotebooks out there since the backlight on the Nuvision is so much brighter. Even so, prepare for some glare from the glossy overlay. Direct sunlight will still overwhelm the screen as one would expect. Viewing angles are very wide and significantly better than the cheaper TN panels found on most other laptops in this price range.
Performance
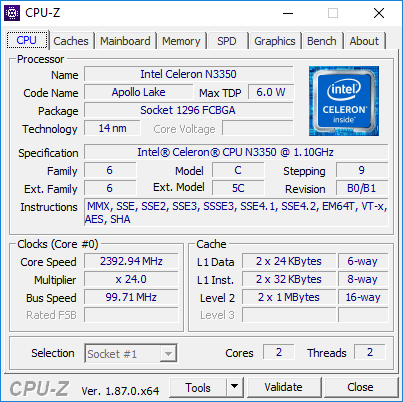
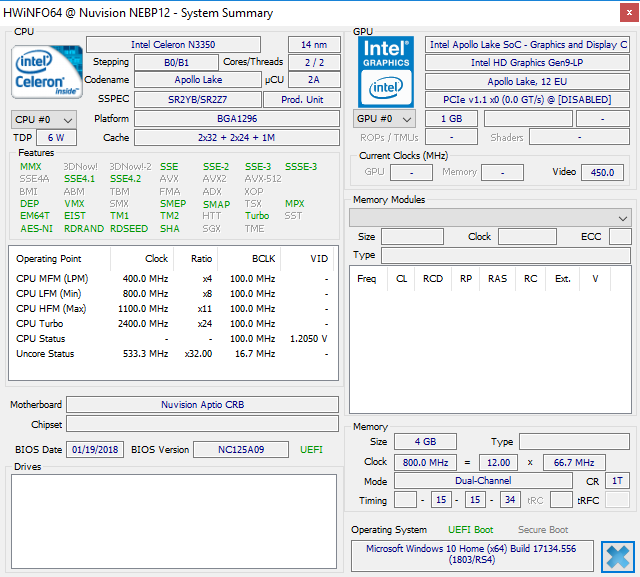
The dual-core Celeron N3350 is a low-power 6 W processor based on the Apollo Lake platform. It's generally reserved for inexpensive subnotebooks, tablets, and mini PCs where passive cooling is desired.
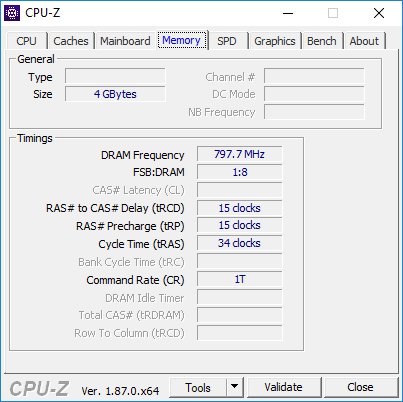
System RAM is fixed at 4 GB with no options to upgrade.
Processor
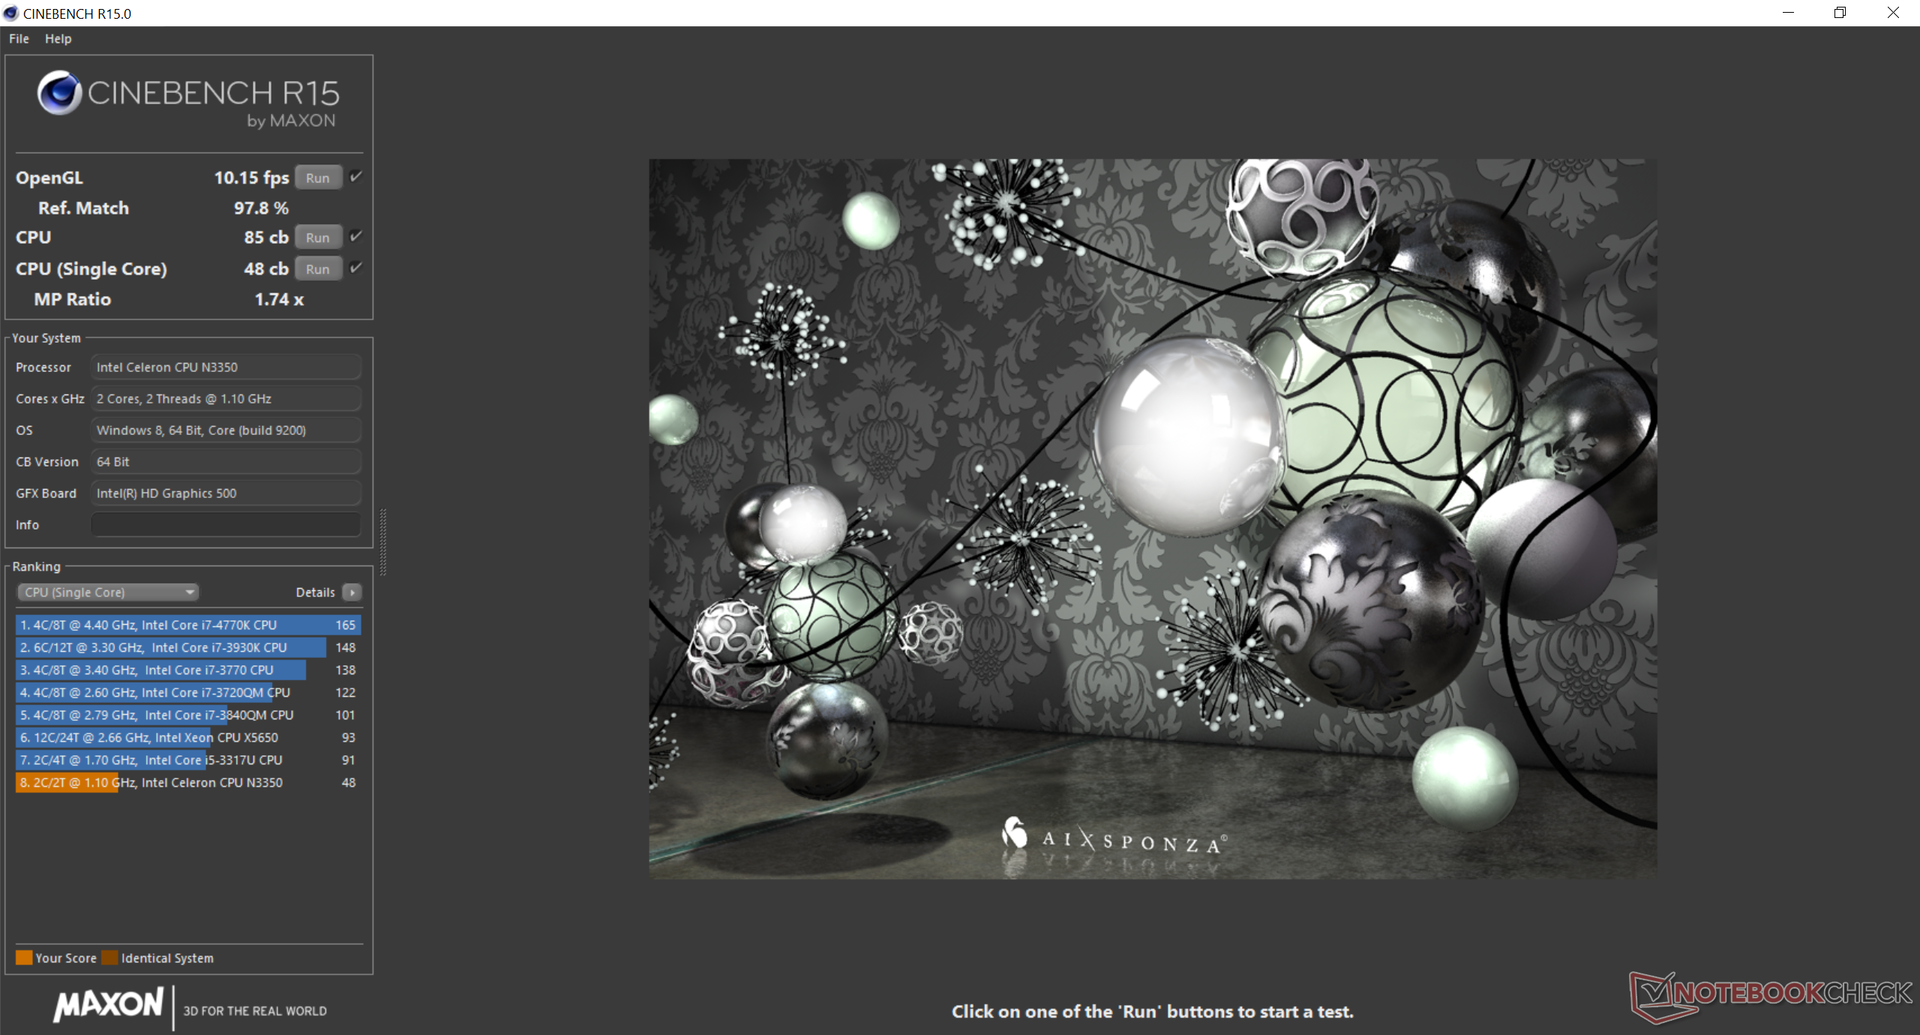
CPU performance is where we expect it to be at just within 1 percent of the average Celeron N3350 in our database taken from 7 other laptops. Multi-thread performance is disappointing as even the Atom x5-Z8350 is able to outperform it by almost 15 percent in CineBench R15. Single-thread performance is much faster, however, due in part to its higher TDP when compared to the Atom (6 W vs. 4.5 W). The dual-core Pentium Gold 4415Y in the Surface Go is almost twice as fast as our Celeron since it supports Hyper-Threading.
Performance is stable when running CineBench R15 Multi-Thread in a loop to suggest no major throttling. In comparison, many Ultrabooks like the MateBook X Pro based on 15 W ULV Core ix CPUs tend to exhibit dips in performance over time when running the same CineBench loop test.
See our dedicated page on the Celeron N3350 for more technical information and benchmark comparisons.
System Performance
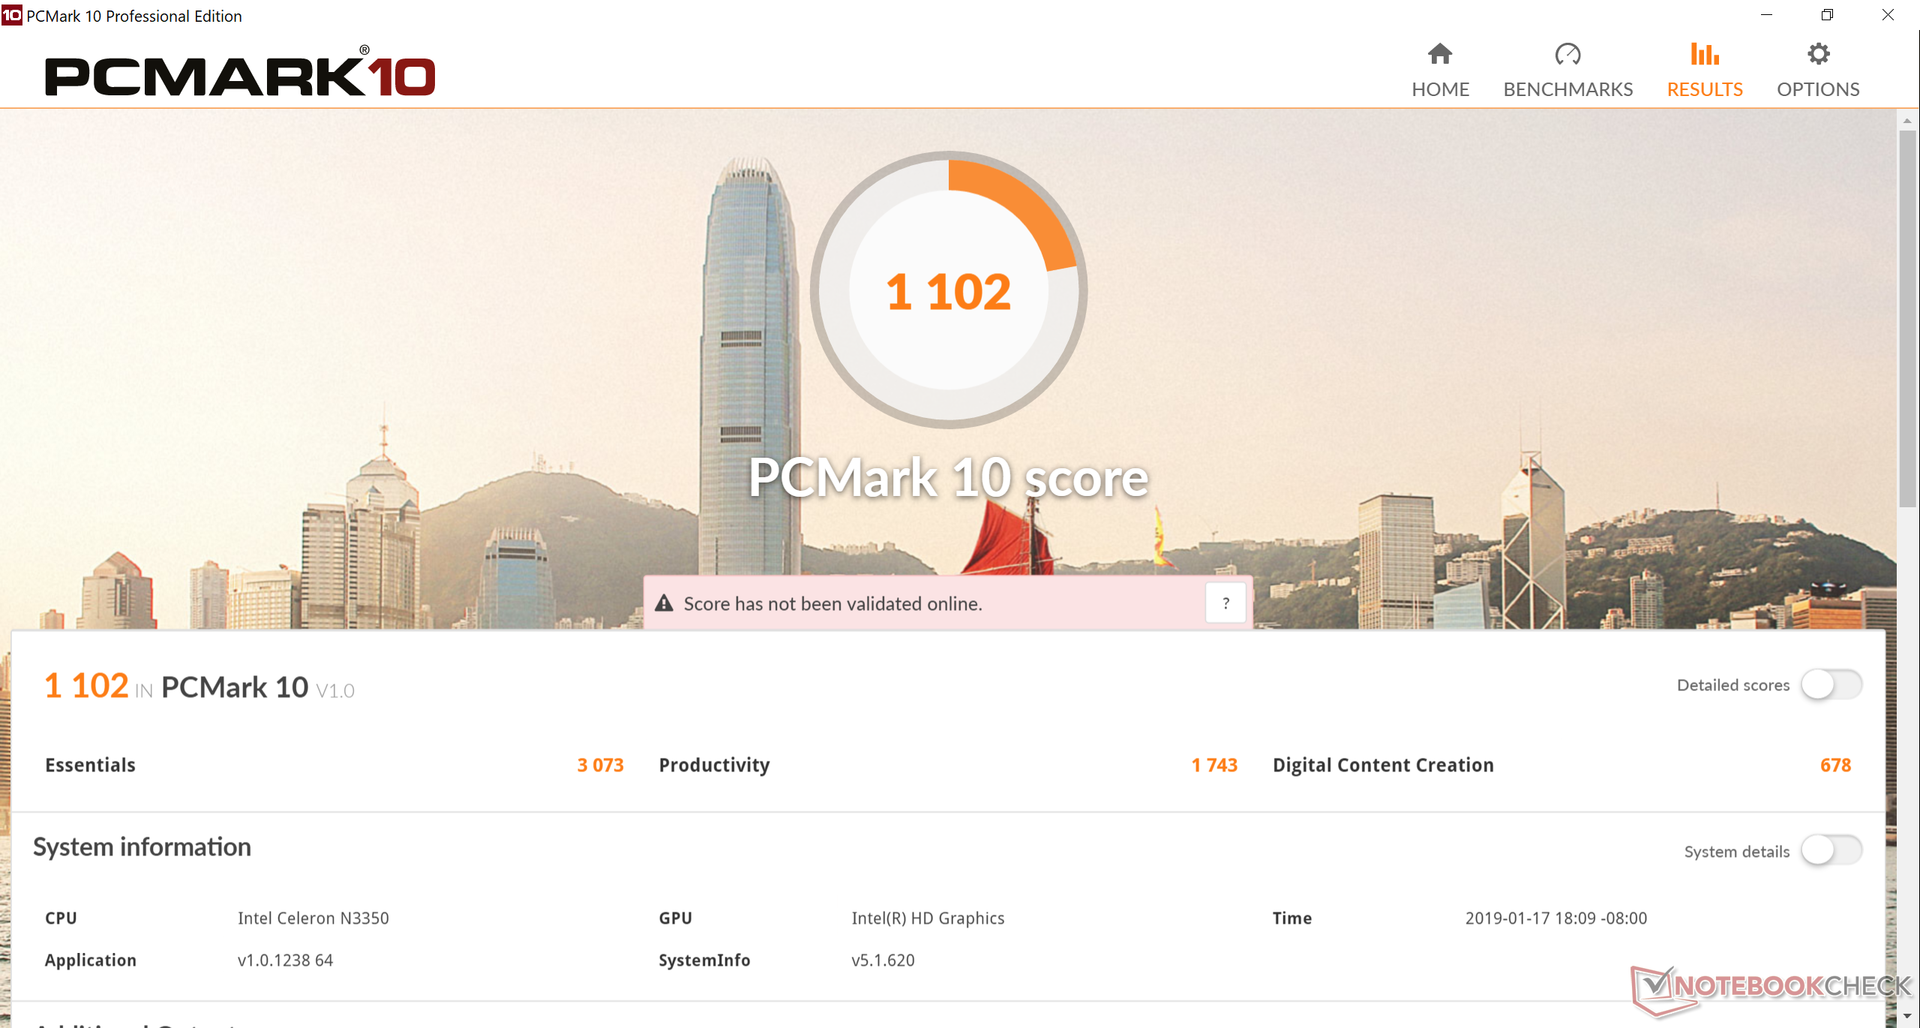
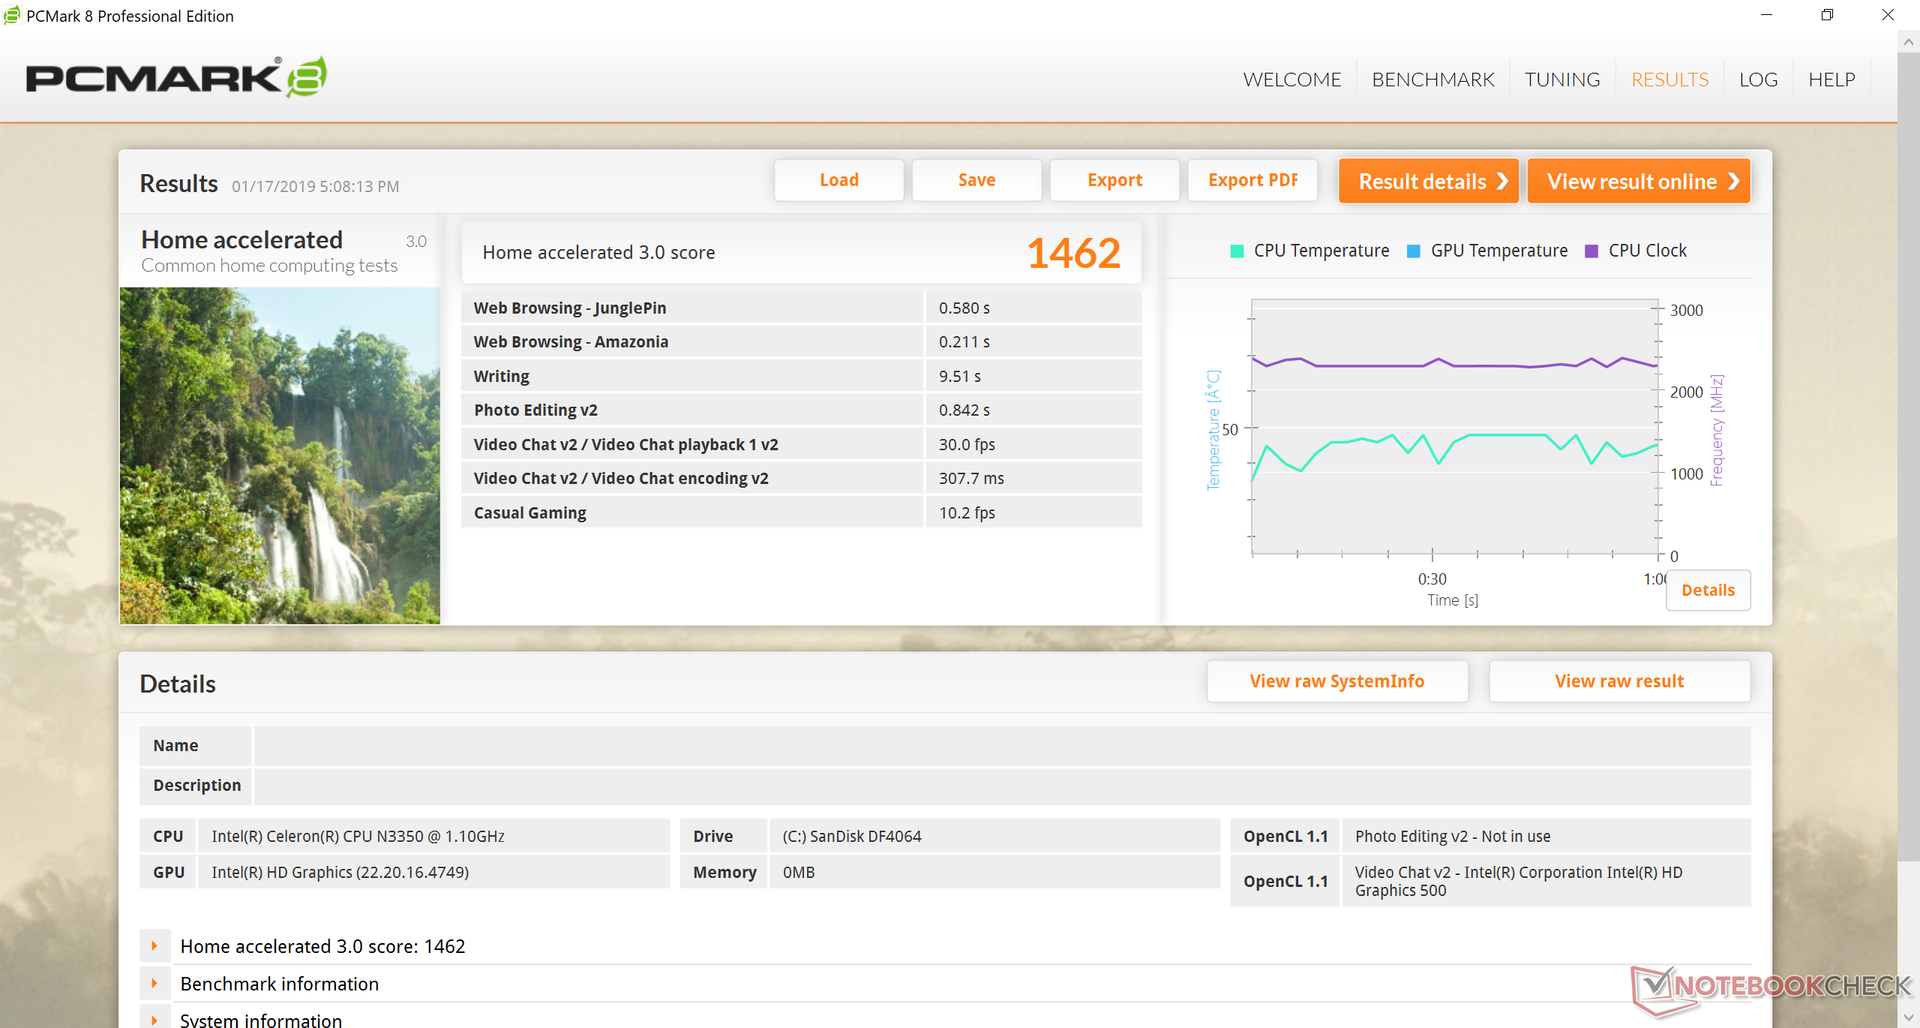
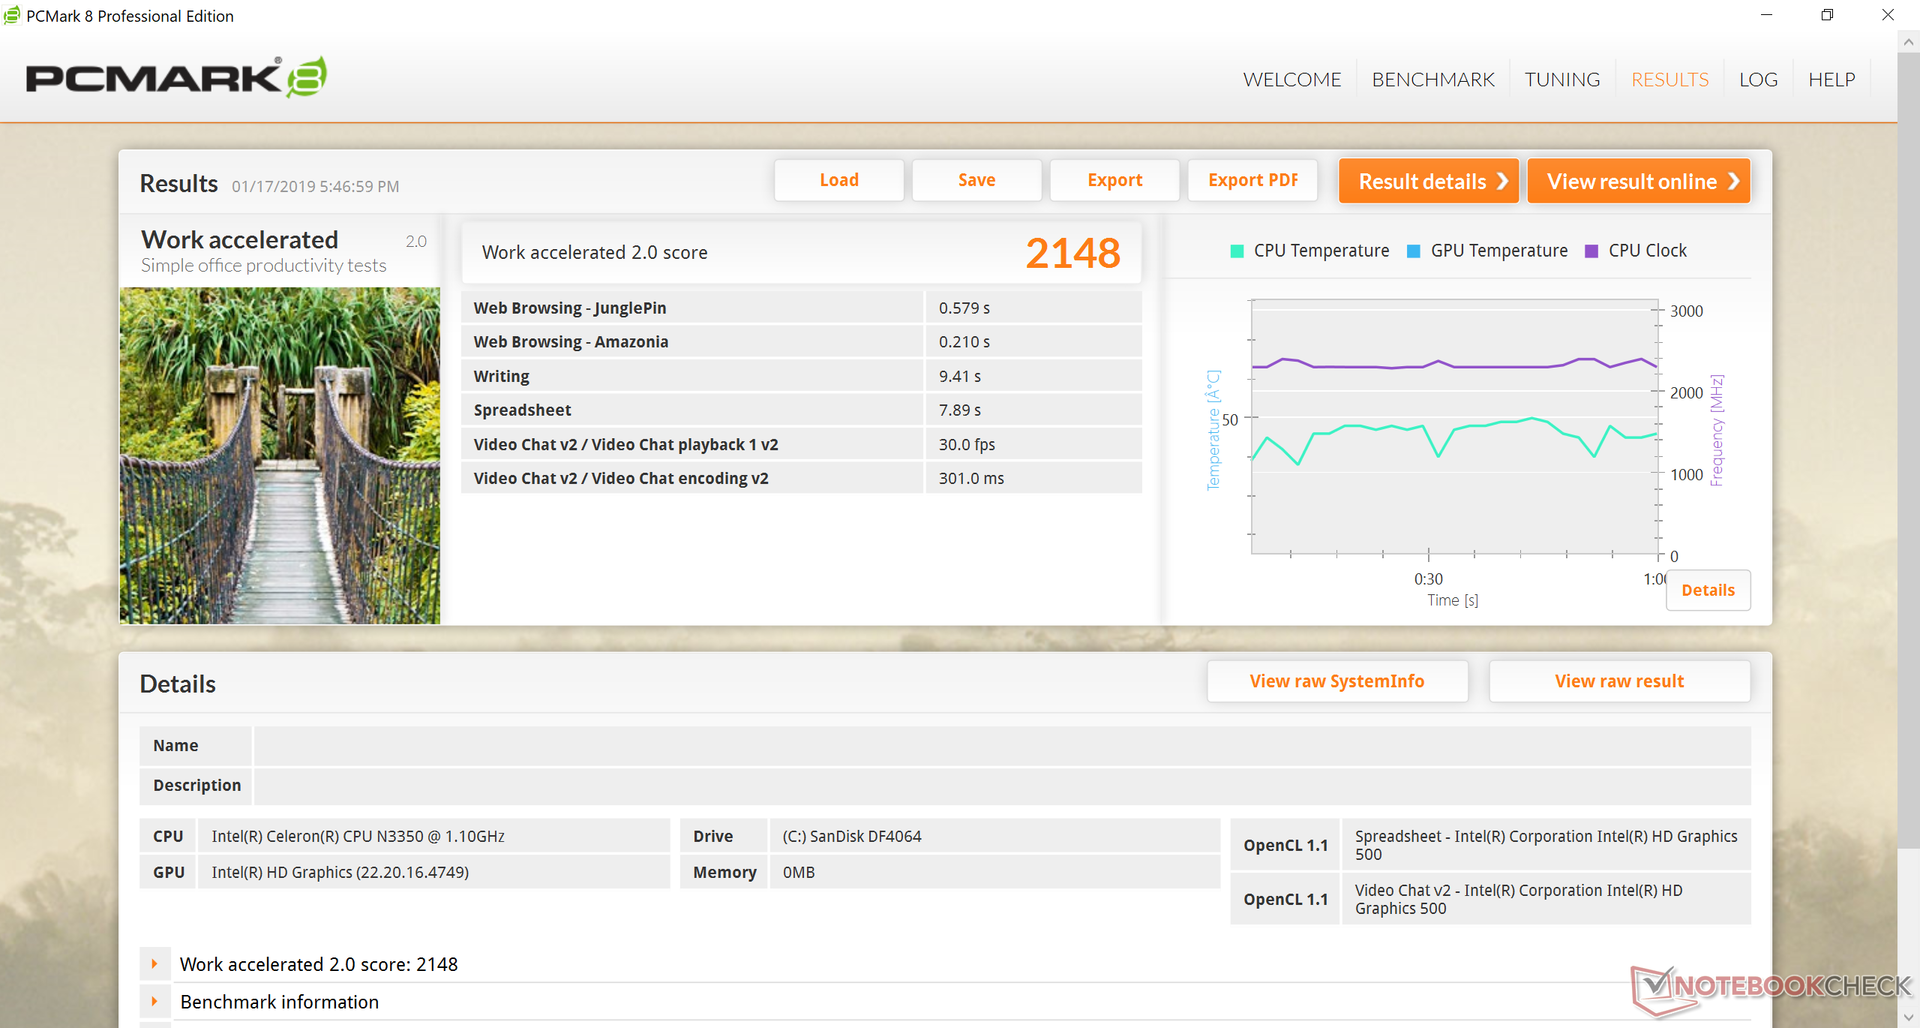
PCMark benchmarks rank the NuVision slower than the Celeron-powered Intel NUC7CJYH mini PC and the cheap Chinese-branded Chuwi LapBook SE. Indeed, the laptop feels very sluggish to use for even low-power tasks like word processing and web browsing. Overall performance feels like a netbook from a decade ago.
We experienced no crashes or software issues in spite of the molasses-like responsiveness.
| PCMark 8 | |
| Home Score Accelerated v2 | |
| Lenovo ThinkPad A275 | |
| Intel NUC7CJYH | |
| Average Intel Celeron N3350, Intel HD Graphics 500 (1462 - 1816, n=8) | |
| NuVision Encite Book 12 Plus | |
| Chuwi Hi12 | |
| Microsoft Surface Go MHN-00003 | |
| Work Score Accelerated v2 | |
| Lenovo ThinkPad A275 | |
| Intel NUC7CJYH | |
| Average Intel Celeron N3350, Intel HD Graphics 500 (2148 - 2703, n=6) | |
| NuVision Encite Book 12 Plus | |
| Chuwi Hi12 | |
| Creative Score Accelerated v2 | |
| Intel NUC7CJYH | |
| Average Intel Celeron N3350, Intel HD Graphics 500 (1814 - 1935, n=3) | |
| PCMark 8 Home Score Accelerated v2 | 1462 points | |
| PCMark 8 Work Score Accelerated v2 | 2148 points | |
| PCMark 10 Score | 1102 points | |
Help | ||
Storage Devices
Storage options include the embedded 64 GB SanDisk DF4064 SSD and a secondary M.2 2242/2260 slot. This same SanDisk SSD can also be found on the competing Lenovo Flex 6 11. It's unfortunate that the more common M.2 2280 form factor is not supported.
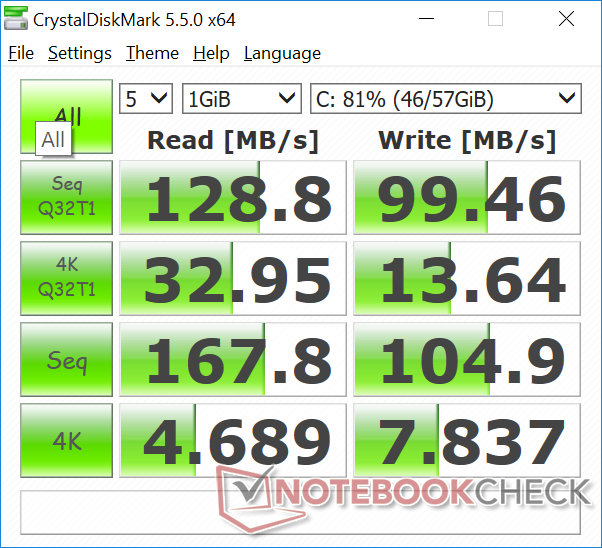
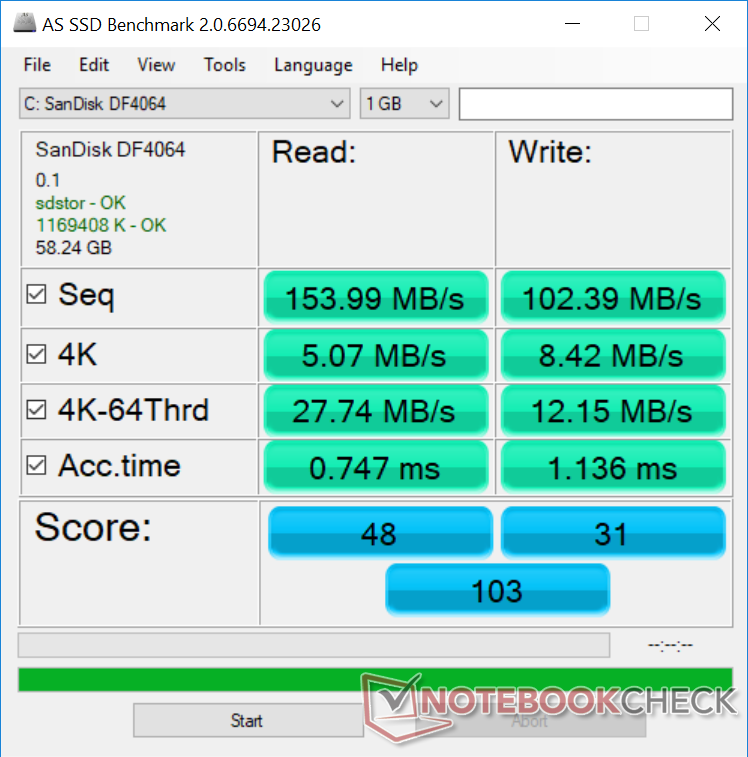
Performance is very slow even for a solid-state drive. Sequential read and write rates are just 168 MB/s and 105 MB/s, respectively, to be slower than even SATA II SSDs.
See our table of SSDs and HDDs for more benchmark comparisons.
| NuVision Encite Book 12 Plus SanDisk DF4064 | Microsoft Surface Go MHN-00003 64 GB eMMC Flash | Lenovo ThinkPad A275 Samsung PM961 MZVLW256HEHP | Chuwi LapBook SE SanDisk DF4032 | Chuwi GBox CWI560 SanDisk DA4064 | |
|---|---|---|---|---|---|
| AS SSD | 105% | 619% | 19% | ||
| Seq Read (MB/s) | 154 | 289.8 88% | 1289 737% | 264.1 71% | |
| Seq Write (MB/s) | 102.4 | 126.7 24% | 350 242% | 131.8 29% | |
| 4K Read (MB/s) | 5.07 | 18.29 261% | 21.53 325% | 6.3 24% | |
| 4K Write (MB/s) | 8.42 | 35.07 317% | 1.24 -85% | 13.6 62% | |
| 4K-64 Read (MB/s) | 27.74 | 40.27 45% | 556 1904% | 25.65 -8% | |
| 4K-64 Write (MB/s) | 12.15 | 44.48 266% | 117 863% | 9.11 -25% | |
| Access Time Read * (ms) | 0.747 | 0.151 80% | 0.094 87% | 0.671 10% | |
| Access Time Write * (ms) | 1.136 | 0.233 79% | 1.929 -70% | 1.233 -9% | |
| Score Read (Points) | 48 | 88 83% | 707 1373% | 58 21% | |
| Score Write (Points) | 31 | 92 197% | 153 394% | 36 16% | |
| Score Total (Points) | 103 | 225 118% | 1177 1043% | 120 17% | |
| Copy ISO MB/s (MB/s) | 119.7 | 99.1 -17% | |||
| Copy Program MB/s (MB/s) | 72.8 | 44.34 -39% | |||
| Copy Game MB/s (MB/s) | 116.5 | 76.5 -34% | |||
| CrystalDiskMark 5.2 / 6 | 124% | 804% | 8% | 142% | |
| Write 4K (MB/s) | 7.837 | 26.91 243% | 76.4 875% | 11.17 43% | 38 385% |
| Read 4K (MB/s) | 7.689 | 19.72 156% | 36.38 373% | 7.2 -6% | 23.84 210% |
| Write Seq (MB/s) | 104.9 | 126.2 20% | 1208 1052% | 87.7 -16% | 226.7 116% |
| Read Seq (MB/s) | 167.8 | 268 60% | 1191 610% | 247 47% | 271.8 62% |
| Write 4K Q32T1 (MB/s) | 13.64 | 62.9 361% | 101 640% | 12.29 -10% | 44.74 228% |
| Read 4K Q32T1 (MB/s) | 32.95 | 39.82 21% | 133.9 306% | 32.46 -1% | 53.2 61% |
| Write Seq Q32T1 (MB/s) | 99.5 | 131.3 32% | 1381 1288% | 92 -8% | 129.4 30% |
| Read Seq Q32T1 (MB/s) | 128.8 | 259.3 101% | 1785 1286% | 150.1 17% | 189.4 47% |
| Write 4K Q8T8 (MB/s) | 12.36 | ||||
| Read 4K Q8T8 (MB/s) | 31.66 | ||||
| Total Average (Program / Settings) | 115% /
112% | 712% /
697% | 14% /
14% | 142% /
142% |
* ... smaller is better

GPU Performance
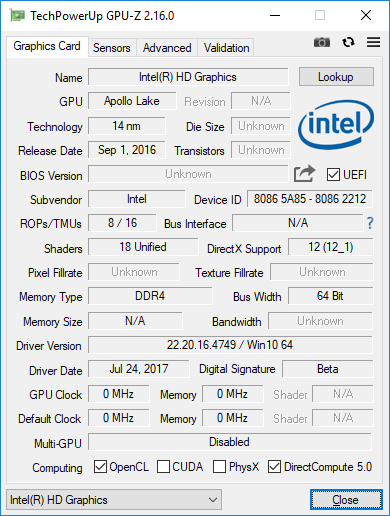
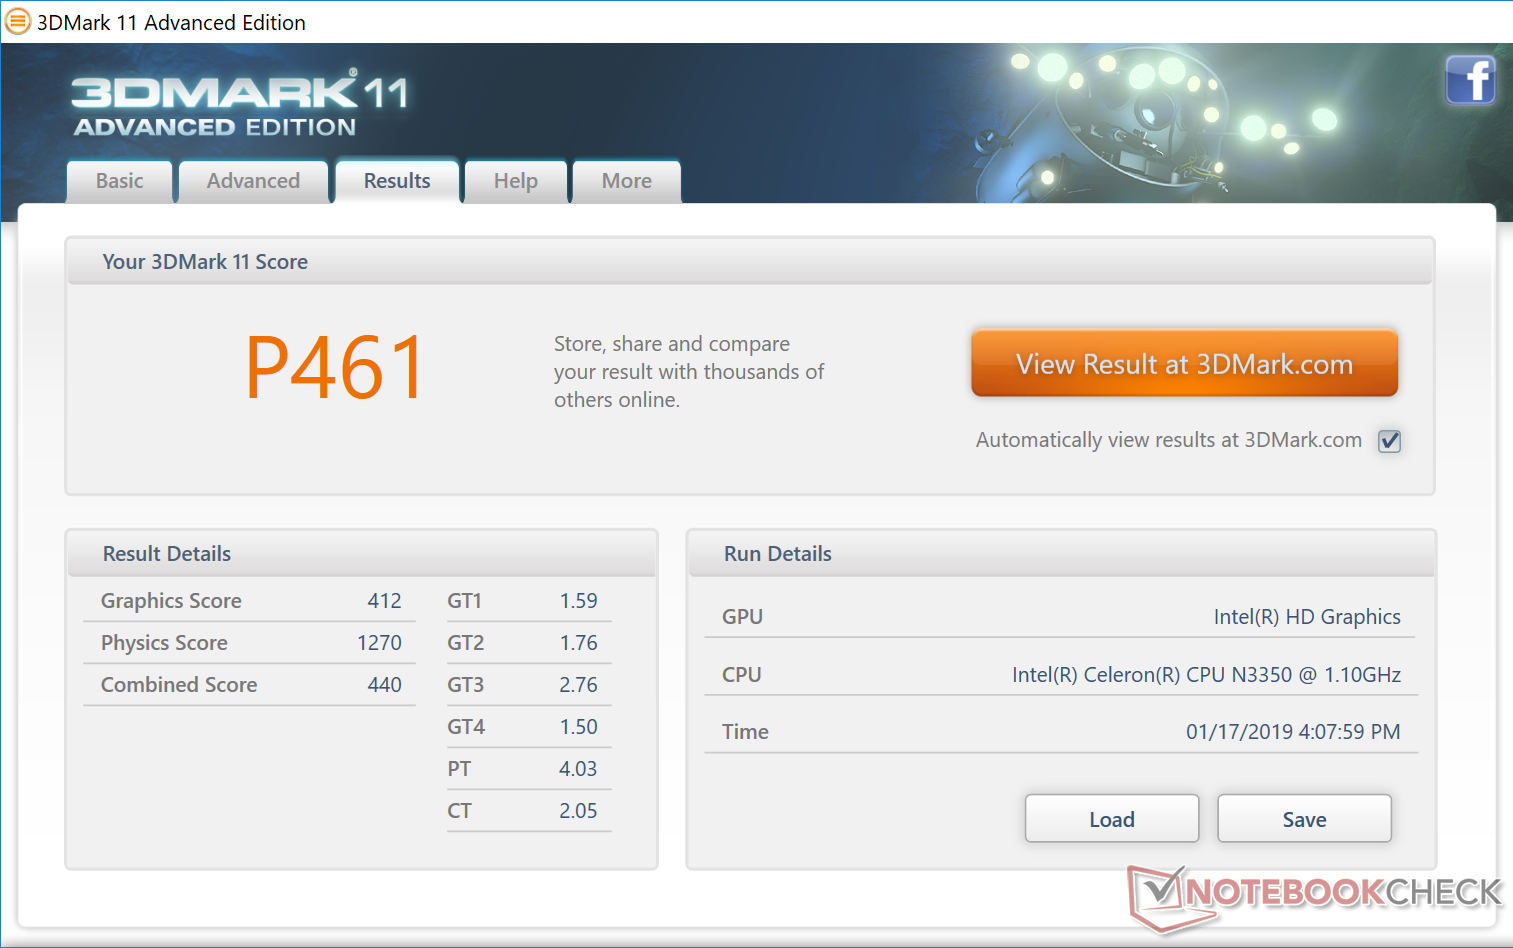
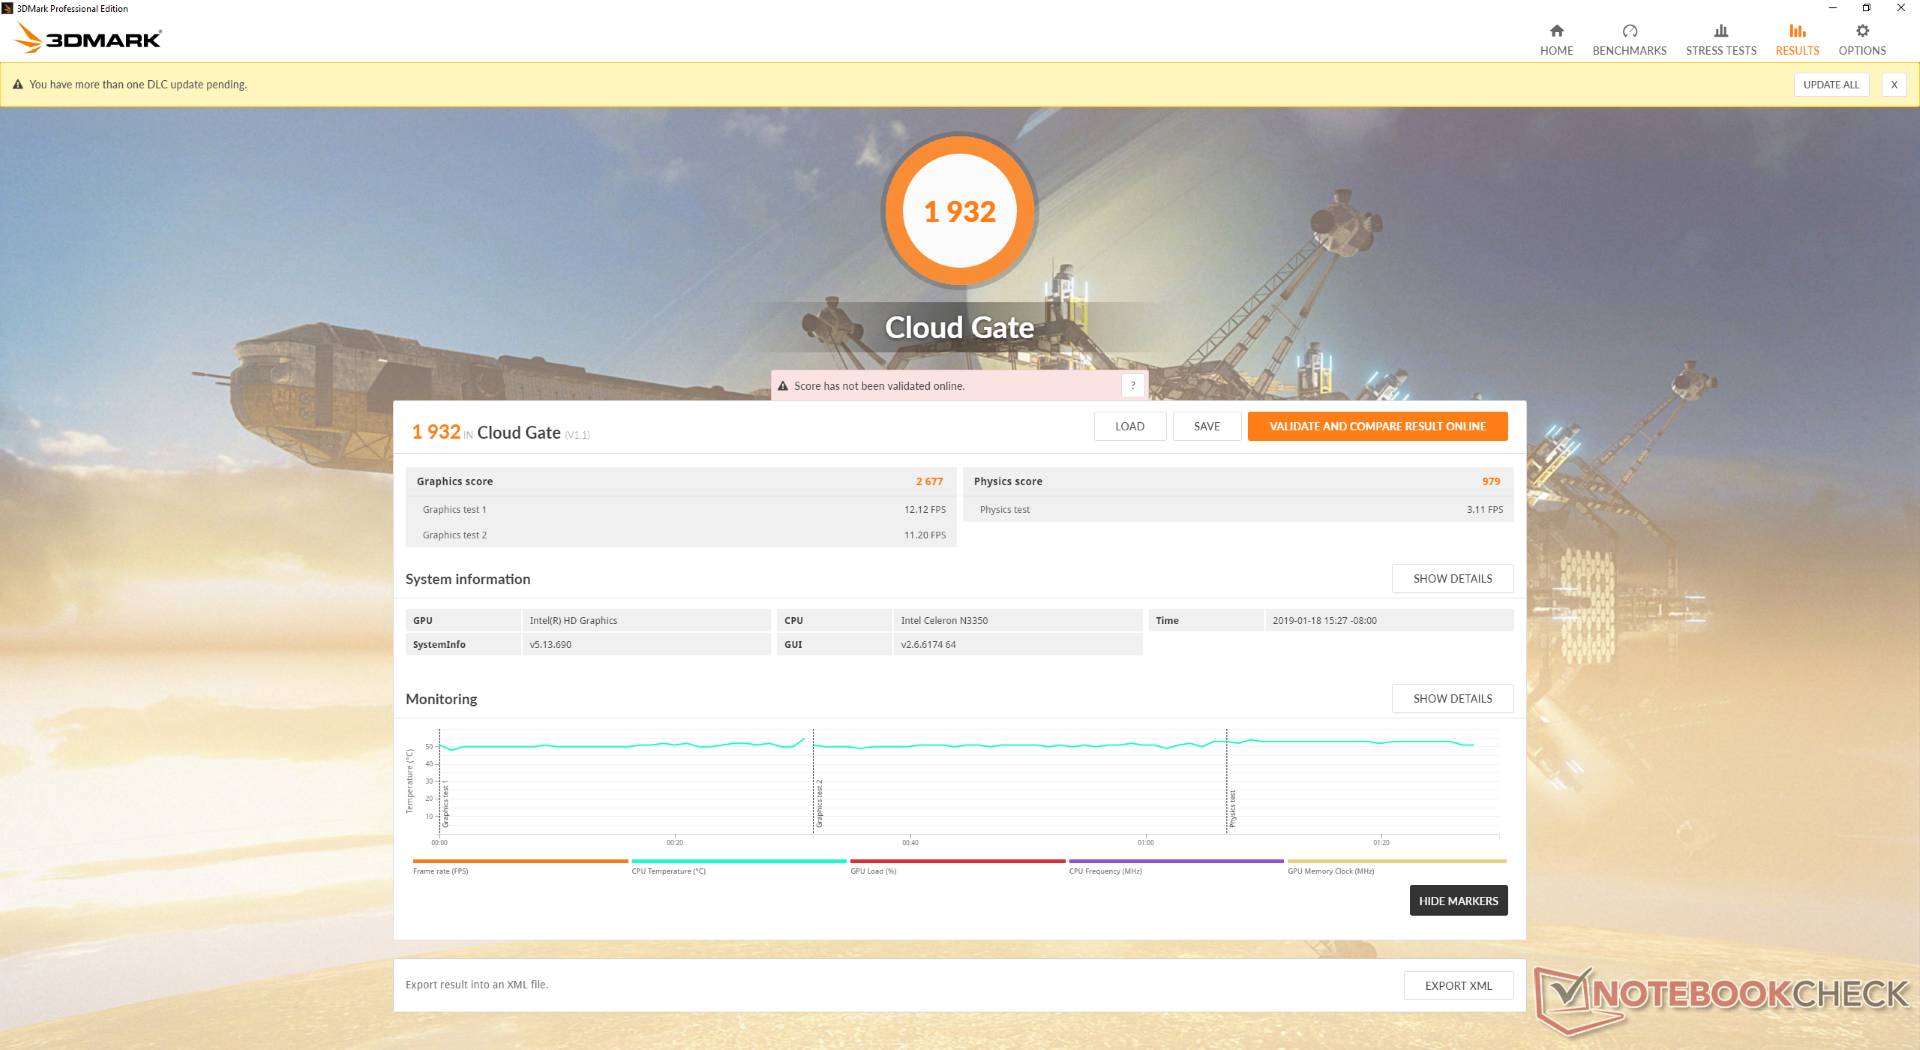
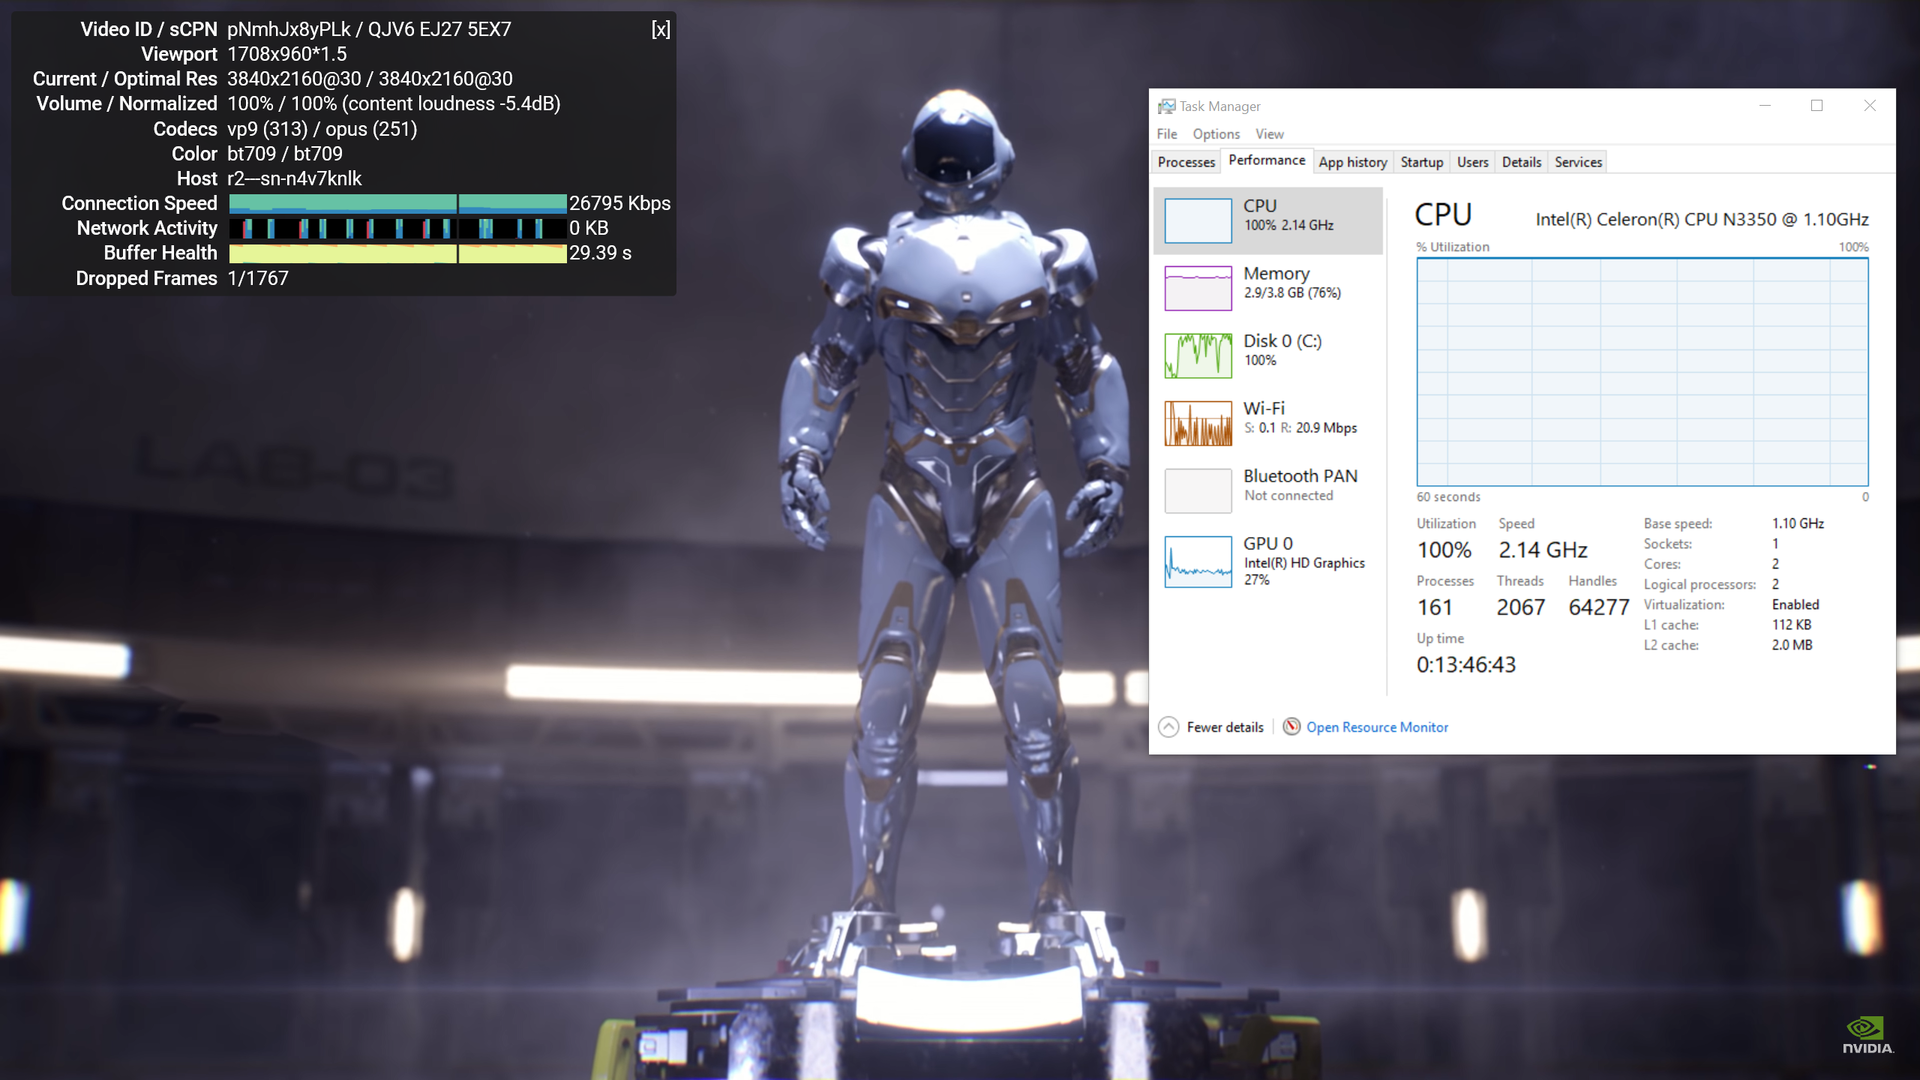
The integrated GPU is not designed for gaming. 3DMark benchmarks rank it 75 percent slower than the common UHD Graphics 620 found on most Ultrabooks. 4K streaming at 30 FPS on YouTube is possible with no dropped frames albeit with CPU utilization at 100 percent. Thus, don't expect to multi-task smoothly if playing any sort of high quality video.
See our dedicated page on the HD Graphics 500 for more technical information and benchmark comparisons.
| 3DMark | |
| 1280x720 Cloud Gate Standard Graphics | |
| Dell Latitude 5290 | |
| Apple MacBook Air 2018 | |
| Microsoft Surface Go MHN-00003 | |
| Lenovo ThinkPad A275 | |
| Intel NUC7CJYH | |
| Average Intel HD Graphics 500 (2578 - 3693, n=8) | |
| Chuwi LapBook SE | |
| NuVision Encite Book 12 Plus | |
| HP x2 210 G2 | |
| Chuwi Hi12 | |
| 1920x1080 Fire Strike Graphics | |
| Dell Latitude 5290 | |
| Apple MacBook Air 2018 | |
| Microsoft Surface Go MHN-00003 | |
| Intel NUC7CJYH | |
| Average Intel HD Graphics 500 (293 - 444, n=8) | |
| HP x2 210 G2 | |
| Chuwi Hi12 | |
| 1920x1080 Ice Storm Extreme Graphics | |
| Microsoft Surface Go MHN-00003 | |
| Intel NUC7CJYH | |
| Average Intel HD Graphics 500 (12299 - 18200, n=3) | |
| 2560x1440 Time Spy Graphics | |
| Apple MacBook Air 2018 | |
| Chuwi LapBook SE | |
| 3DMark 11 Performance | 461 points | |
| 3DMark Cloud Gate Standard Score | 1932 points | |
Help | ||
Emissions
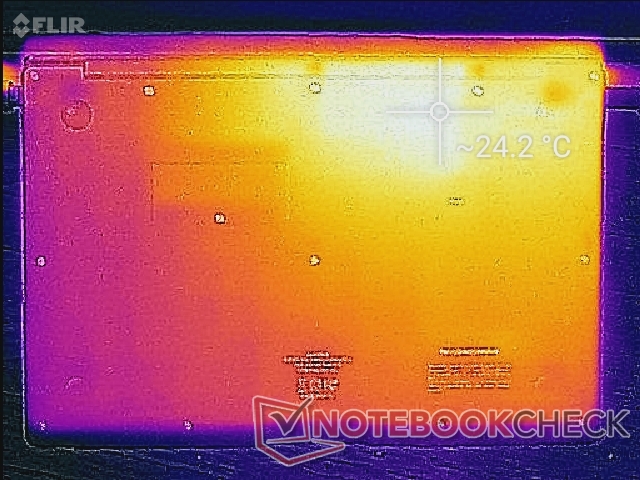
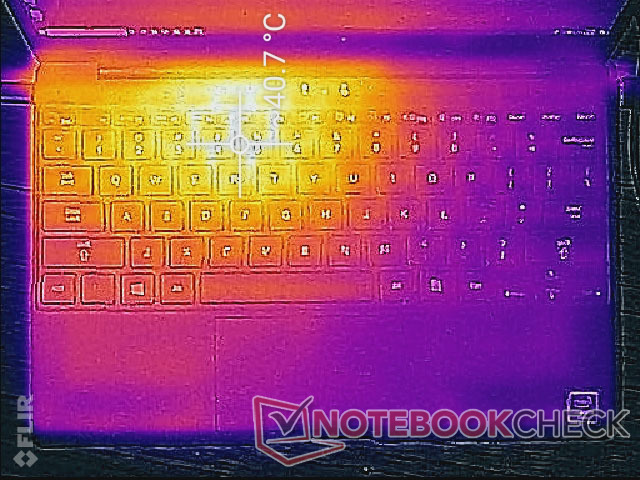
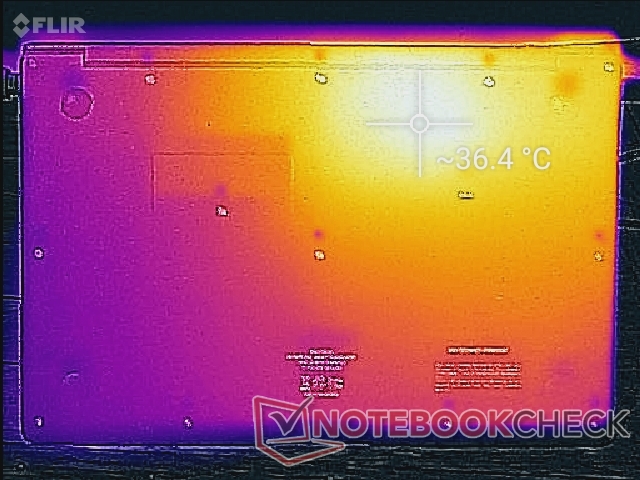
Temperature
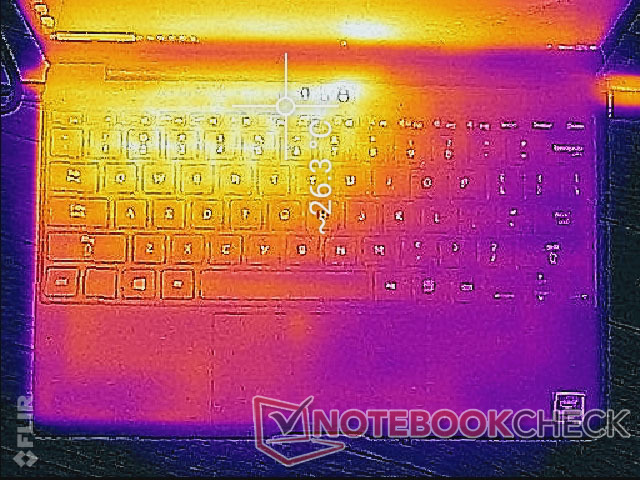
Surface temperatures are warmest toward the top left quadrants of the notebook since that is where the processor is positioned. When under extreme loads, this area can become as warm as 40 C. In comparison, the MacBook Air 2018 is warmer at up to 46 C when subjected to similar conditions. The palm rest and main QWERTY keys never become uncomfortably hot.
Stress Test
We stress the laptop to identify for any potential throttling or stability issues. When subjected to Prime95 stress, the CPU can be observed running at 2.3 GHz for the first few seconds before dropping and stabilizing at 2.0 GHz. Core temperature plateaus at about 65 C. Clock rates are well above the 1.1 GHz base clock rate of the Celeron N3350.
Running on battery power will not impact performance. A 3DMark 11 run on batteries returns essentially the same scores as when connected to mains.

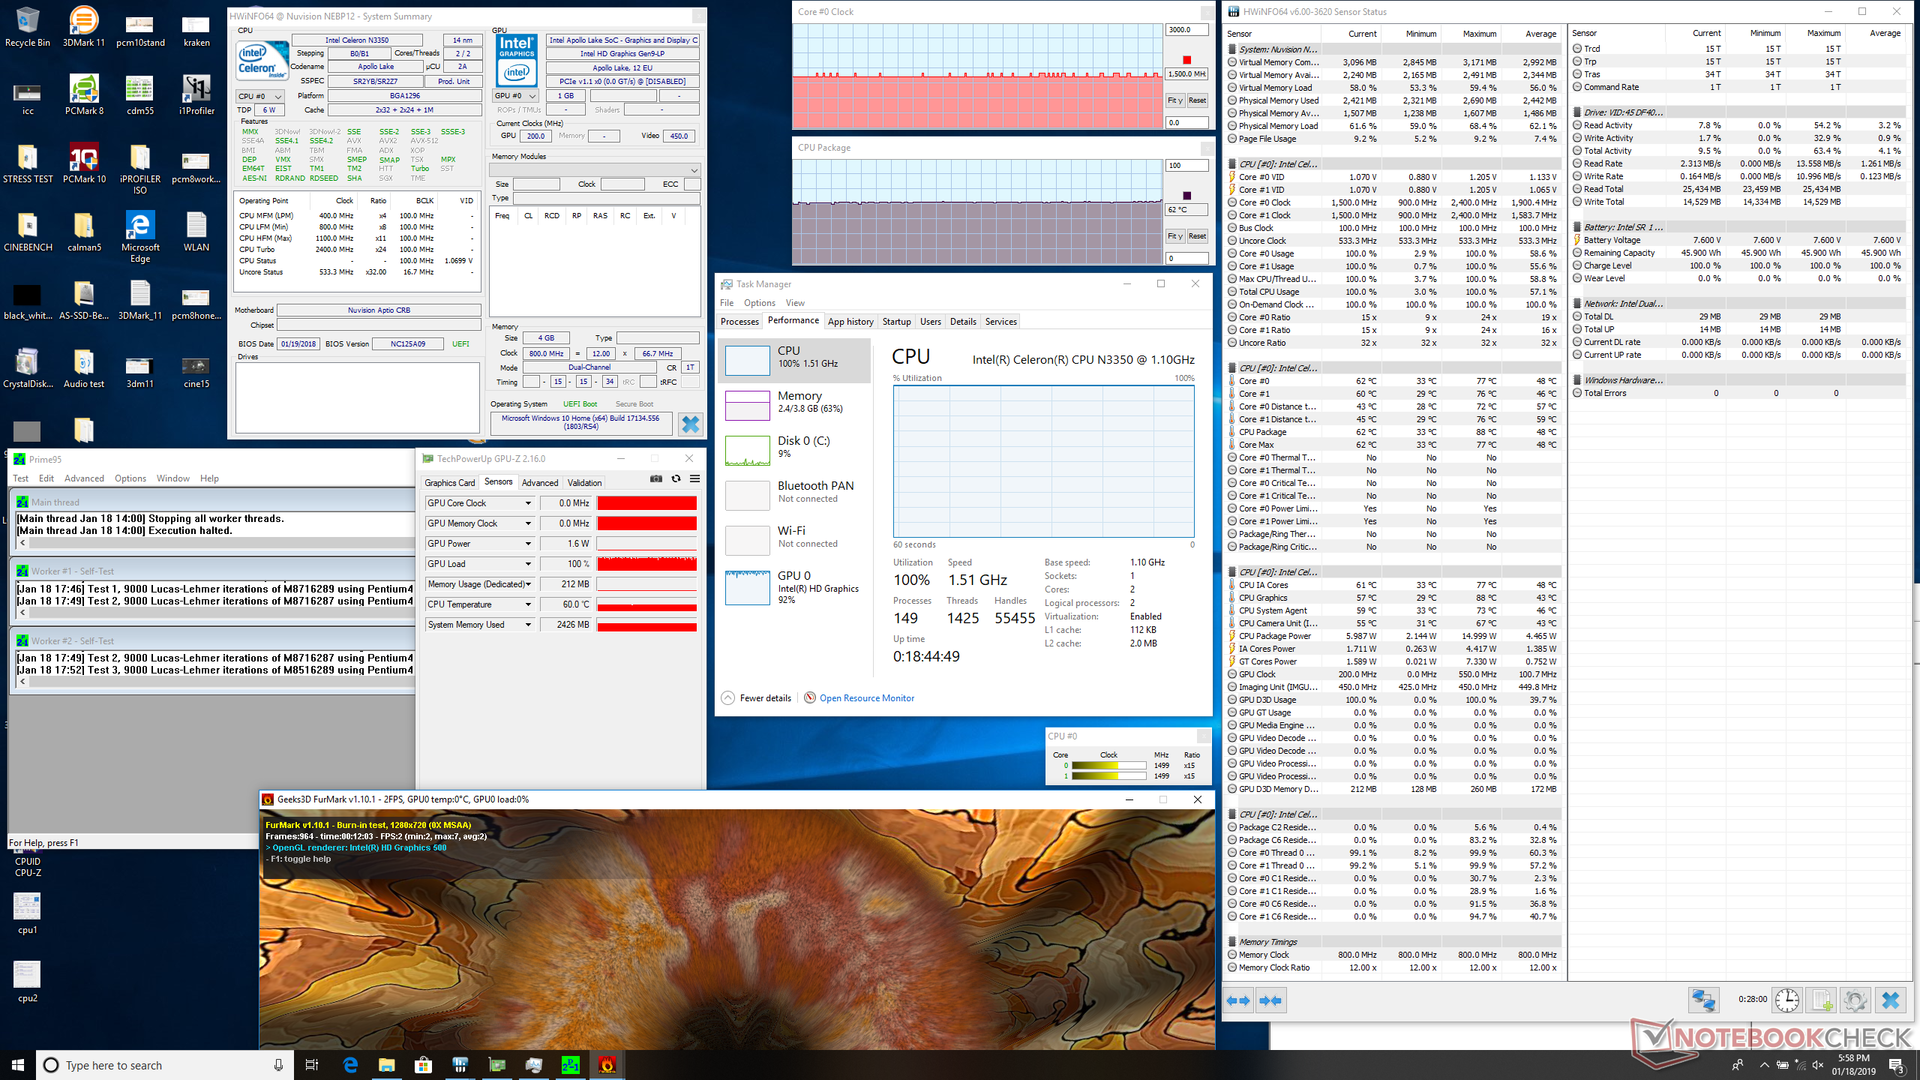
| CPU Clock (GHz) | Average CPU Temperature (°C) | |
| System Idle | -- | 33 |
| Prime95 Stress | 2.0 - 2.1 | 65 |
| Prime95 + FurMark Stress | 1.5 | 62 |
(±) The maximum temperature on the upper side is 41 °C / 106 F, compared to the average of 35.9 °C / 97 F, ranging from 21.4 to 59 °C for the class Subnotebook.
(+) The bottom heats up to a maximum of 36.4 °C / 98 F, compared to the average of 39.2 °C / 103 F
(+) In idle usage, the average temperature for the upper side is 23.2 °C / 74 F, compared to the device average of 30.8 °C / 87 F.
(+) The palmrests and touchpad are cooler than skin temperature with a maximum of 27 °C / 80.6 F and are therefore cool to the touch.
(±) The average temperature of the palmrest area of similar devices was 28.2 °C / 82.8 F (+1.2 °C / 2.2 F).
Speakers
Unsurprisingly, the integrated stereo speakers are lacking in bass as shown by our pink noise graph below. Maximum volume is lower than expected as well and not loud enough to sufficiently fill a small conference room.


NuVision Encite Book 12 Plus audio analysis
(-) | not very loud speakers (61.1 dB)
Bass 100 - 315 Hz
(-) | nearly no bass - on average 19.5% lower than median
(+) | bass is linear (5.6% delta to prev. frequency)
Mids 400 - 2000 Hz
(±) | higher mids - on average 7.8% higher than median
(-) | mids are not linear (17.4% delta to prev. frequency)
Highs 2 - 16 kHz
(±) | higher highs - on average 7.8% higher than median
(±) | linearity of highs is average (8.2% delta to prev. frequency)
Overall 100 - 16.000 Hz
(-) | overall sound is not linear (47.8% difference to median)
Compared to same class
» 99% of all tested devices in this class were better, 0% similar, 0% worse
» The best had a delta of 5%, average was 18%, worst was 53%
Compared to all devices tested
» 96% of all tested devices were better, 0% similar, 4% worse
» The best had a delta of 4%, average was 23%, worst was 134%
Apple MacBook 12 (Early 2016) 1.1 GHz audio analysis
(+) | speakers can play relatively loud (83.6 dB)
Bass 100 - 315 Hz
(±) | reduced bass - on average 11.3% lower than median
(±) | linearity of bass is average (14.2% delta to prev. frequency)
Mids 400 - 2000 Hz
(+) | balanced mids - only 2.4% away from median
(+) | mids are linear (5.5% delta to prev. frequency)
Highs 2 - 16 kHz
(+) | balanced highs - only 2% away from median
(+) | highs are linear (4.5% delta to prev. frequency)
Overall 100 - 16.000 Hz
(+) | overall sound is linear (10.2% difference to median)
Compared to same class
» 7% of all tested devices in this class were better, 2% similar, 90% worse
» The best had a delta of 5%, average was 18%, worst was 53%
Compared to all devices tested
» 5% of all tested devices were better, 1% similar, 94% worse
» The best had a delta of 4%, average was 23%, worst was 134%
Energy Management
Power Consumption
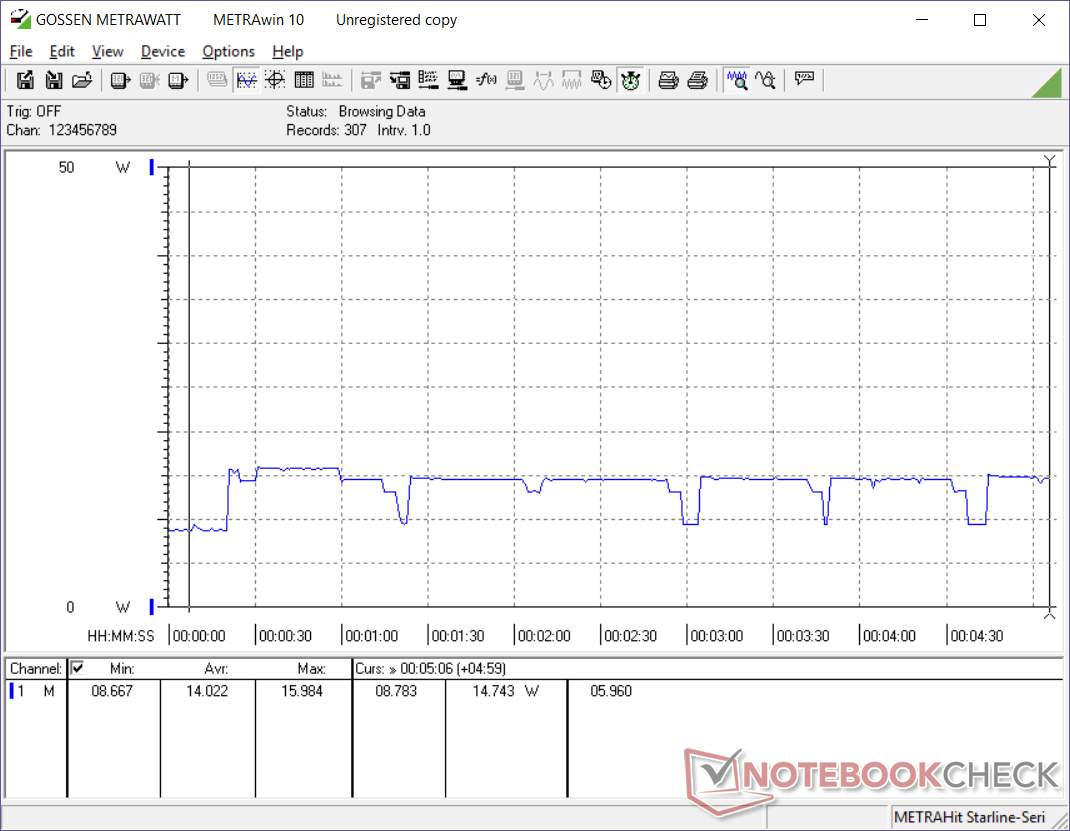
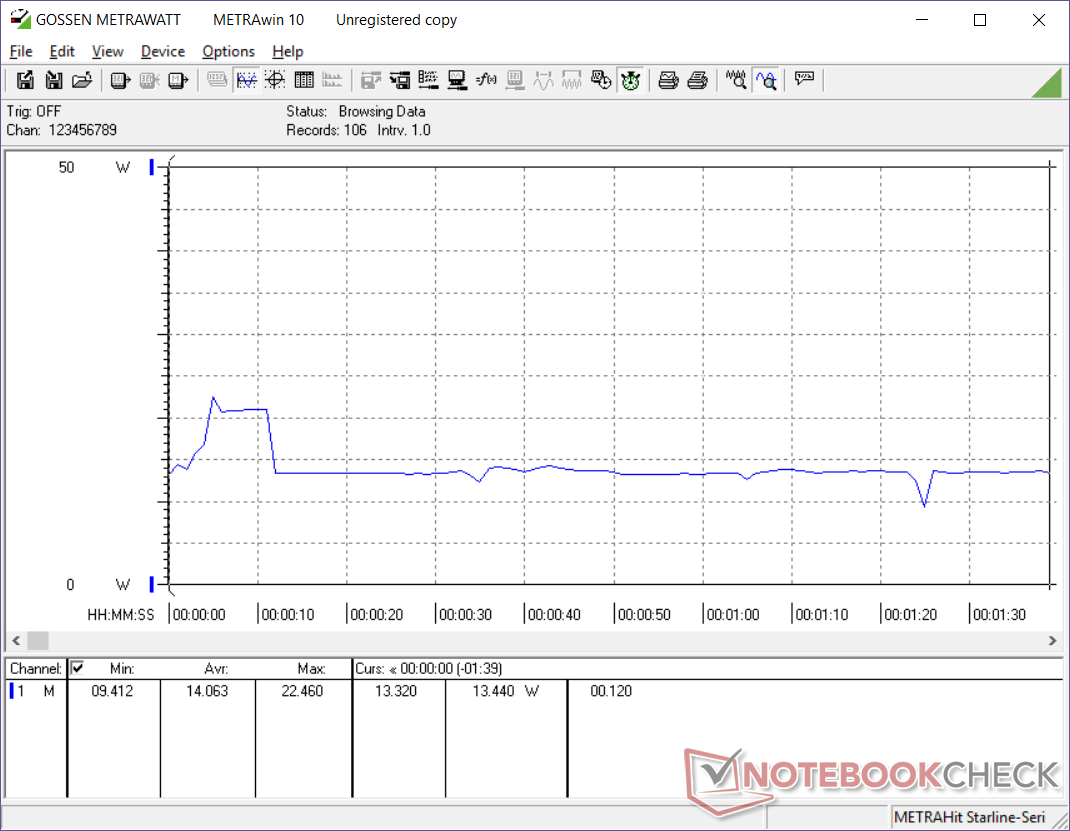
Idling on desktop demands anywhere between 4 W and 8 W depending on the power profile and brightness setting. This jumps to about 14 W if streaming online content. We are able to record a maximum draw of 27 W, but this is short-lived due to the limited Turbo Boost.
The small (~8.0 x 4.8 x 3.4 cm) USB Type-C AC adapter can output up to 36 W and it can be used to charge other USB Type-C devices including smartphones and tablets.
| Off / Standby | |
| Idle | |
| Load |
|
Key:
min: | |
| NuVision Encite Book 12 Plus Celeron N3350, HD Graphics 500, SanDisk DF4064, IPS, 2560x1440, 12.5" | Microsoft Surface Go MHN-00003 Pentium 4415Y, UHD Graphics 615, 64 GB eMMC Flash, IPS, 1800x1200, 10" | Dell Latitude 5290 i5-8250U, UHD Graphics 620, Micron 1100 MTFDDAV256TBN, TN LED, 1366x768, 12.5" | Lenovo ThinkPad A275 PRO A12-9800B, Radeon R7 (Bristol Ridge), Samsung PM961 MZVLW256HEHP, TN, 1366x768, 12.5" | Chuwi LapBook SE Celeron N4100, UHD Graphics 600, SanDisk DF4032, , 1920x1080, 13.3" | Apple MacBook Air 2018 i5-8210Y, UHD Graphics 617, Apple SSD AP0256, IPS, 2560x1600, 13.3" | Apple MacBook 12 (Early 2016) 1.1 GHz 6Y30, HD Graphics 515, Apple SSD AP0256, IPS, 2304x1440, 12" | |
|---|---|---|---|---|---|---|---|
| Power Consumption | 14% | -44% | -43% | 16% | -10% | 16% | |
| Idle Minimum * (Watt) | 4.7 | 2.88 39% | 2.68 43% | 4.2 11% | 2.7 43% | 2.2 53% | 2.7 43% |
| Idle Average * (Watt) | 7 | 4.8 31% | 4.3 39% | 8.2 -17% | 6.3 10% | 5.7 19% | 2.7 61% |
| Idle Maximum * (Watt) | 8 | 7.5 6% | 5.2 35% | 10 -25% | 7.6 5% | 10.3 -29% | 7.2 10% |
| Load Average * (Watt) | 14.1 | 16.9 -20% | 40.3 -186% | 34.5 -145% | 12.6 11% | 25.6 -82% | 22 -56% |
| Load Maximum * (Watt) | 27.1 | 23.8 12% | 68 -151% | 37 -37% | 24.6 9% | 30.6 -13% | 20.5 24% |
* ... smaller is better
Battery Life
Battery life is respectable at just under 7 hours of real-world WLAN use. This is still shorter relative to other subnotebooks mostly due to the very small 31.9 Wh battery capacity.
Charging with the included AC adapter is extremely slow at about 3 hours from empty to full capacity. In comparison, most laptops takes 1.5 to 2 hours.
| NuVision Encite Book 12 Plus Celeron N3350, HD Graphics 500, 31.9 Wh | Microsoft Surface Go MHN-00003 Pentium 4415Y, UHD Graphics 615, 28 Wh | Dell Latitude 5290 i5-8250U, UHD Graphics 620, 51 Wh | Lenovo ThinkPad A275 PRO A12-9800B, Radeon R7 (Bristol Ridge), 71 Wh | Chuwi LapBook SE Celeron N4100, UHD Graphics 600, 37 Wh | Apple MacBook Air 2018 i5-8210Y, UHD Graphics 617, 50.3 Wh | Apple MacBook 12 (Early 2016) 1.1 GHz 6Y30, HD Graphics 515, 41.4 Wh | |
|---|---|---|---|---|---|---|---|
| Battery runtime | 2% | 49% | 29% | 35% | 12% | 16% | |
| Reader / Idle (h) | 11.3 | 12.9 14% | 16 42% | ||||
| WiFi v1.3 (h) | 6.8 | 7.5 10% | 10.1 49% | 9 32% | 7.4 9% | 11.1 63% | 8.4 24% |
| Load (h) | 3.6 | 3 -17% | 4.1 14% | 5.8 61% | 2.2 -39% | 3.9 8% |
Verdict
Pros
Cons
The NuVision Encite Book 12 Plus is an unbalanced machine. We applaud its focus on delivering a bright high resolution display and attractively thin aluminum chassis for under $400, but this comes at the cost of almost everything else. Port options are severely limited, webcam placement is not optimal, keyboard keys and trackpad are spongy, base and hinge ridigity could be better, charging is very slow, and SSD performance is not all that better than a standard mechanical drive. The crisp display and deep colors aren't enough to make up for the rest of the laptop.
Users intrigued by the small form factor and price would be better off investing in a last generation Core i3 Ultrabook. Older models of the Dell XPS, HP Spectre or Envy, Lenovo Ideapad 720s, or even the Chuwi LapBook are able to offer much more than the NuVision in almost every aspect.
A great display hindered by spongy keys and super-slow system performance. NuVision had to make a lot of noticeable cuts in order to offer a QHD display at this low of a price range.
NuVision Encite Book 12 Plus
- 01/21/2019 v6 (old)
Allen Ngo
Price comparison
