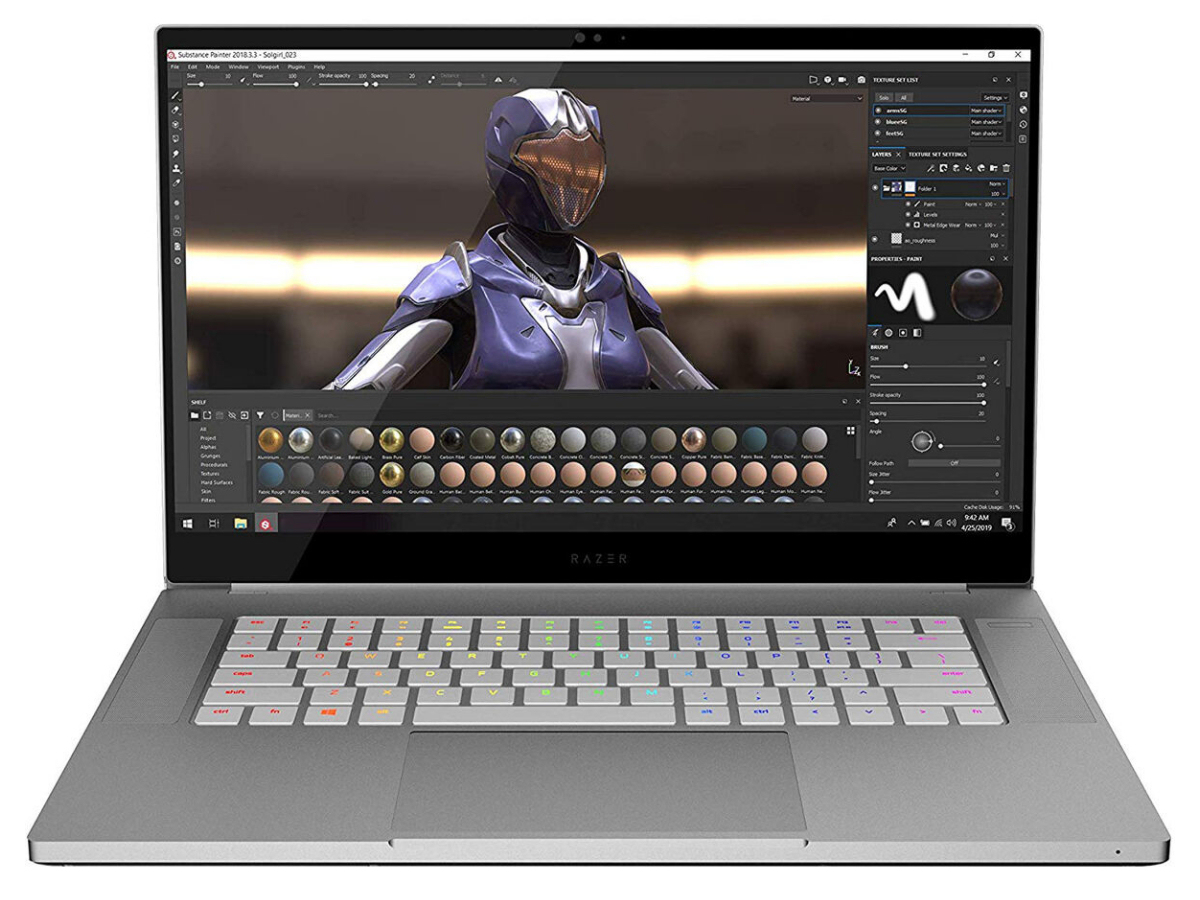
Razer Blade 15 Studio Edition in Review: Solid Workstation with a Lot of Performance

We are not unfamiliar with Razer's workstation. Today's test model is identical in construction to the Blade 15 Advanced Model. The Studio Edition is equipped with the Core i7-9750H processor and the Quadro RTX 5000 Max-Q GPU to be able to deliver the required performance. Competitors include other workstations such as the Lenovo ThinkPad P53, Dell Precision 5540, Fujitsu Celsius H780 and the HP ZBook Studio G5.
Rating | Date | Model | Weight | Height | Size | Resolution | Price |
|---|---|---|---|---|---|---|---|
| 86.6 % v7 (old) | 12 / 2019 | Razer Blade 15 Studio Edition i7-9750H, Quadro RTX 5000 Max-Q | 2.2 kg | 17.8 mm | 15.60" | 3840x2160 | |
| 88.8 % v6 (old) | 05 / 2019 | Razer Blade 15 RTX 2080 Max-Q i7-9750H, GeForce RTX 2080 Max-Q | 2.2 kg | 17.8 mm | 15.60" | 1920x1080 | |
| 89.8 % v7 (old) | 11 / 2019 | Lenovo ThinkPad P53-20QN000YGE i7-9850H, Quadro RTX 5000 Max-Q | 2.7 kg | 29.4 mm | 15.60" | 1920x1080 | |
| 85 % v7 (old) | 06 / 2019 | MSI P65 Creator 9SF-657 i9-9880H, GeForce RTX 2070 Max-Q | 1.9 kg | 18 mm | 15.60" | 3840x2160 | |
| 86.9 % v7 (old) | 11 / 2019 | Dell Precision 5540 i9-9980HK, Quadro T2000 Max-Q | 2 kg | 17 mm | 15.60" | 3840x2160 | |
| 85.6 % v6 (old) | 04 / 2019 | Fujitsu Celsius H780 i7-8850H, Quadro P2000 | 2.8 kg | 31.9 mm | 15.60" | 1920x1080 | |
| 84.4 % v7 (old) | 11 / 2018 | HP ZBook Studio G5-4QH10EA i7-8750H, Quadro P1000 | 2.1 kg | 18.9 mm | 15.60" | 3840x2160 |
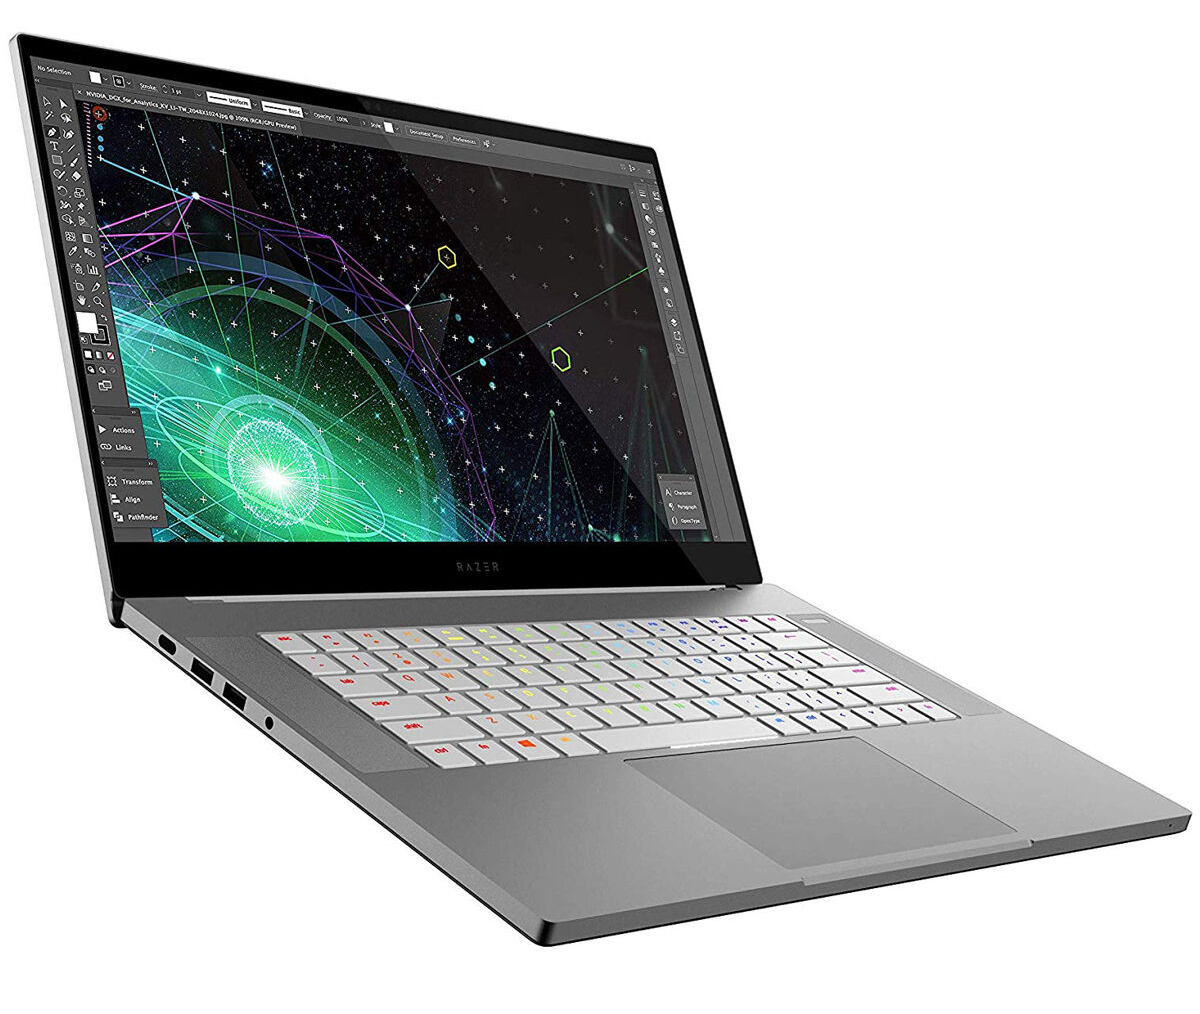
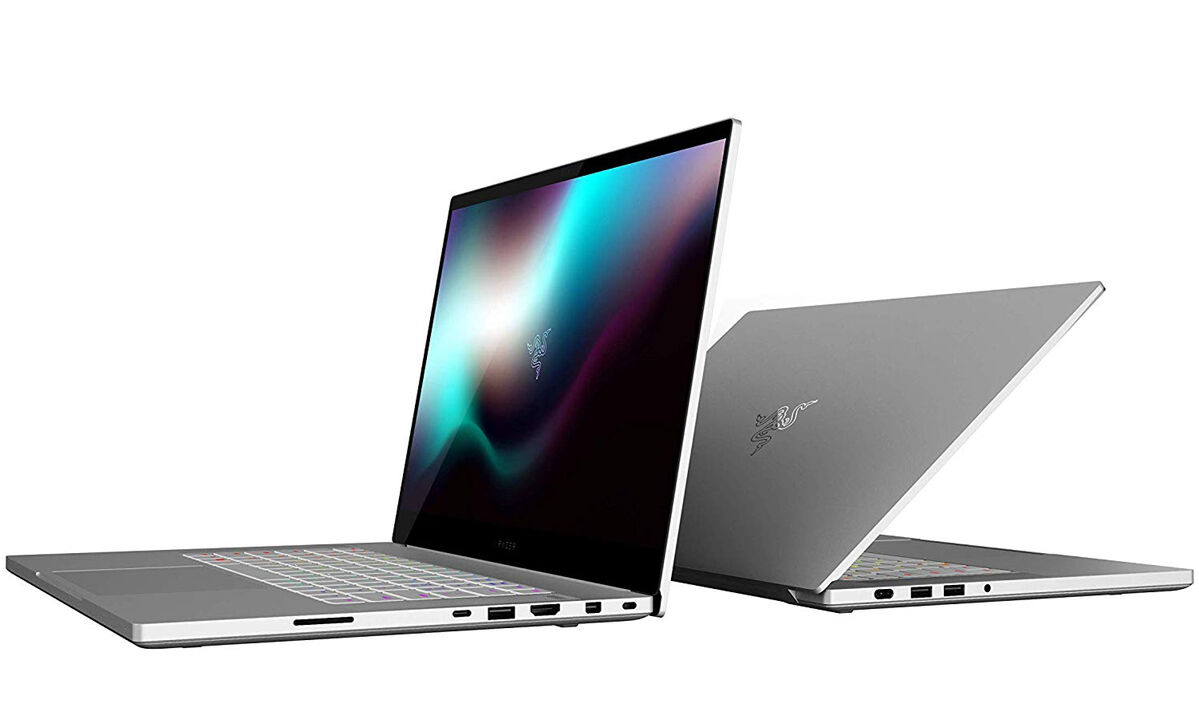
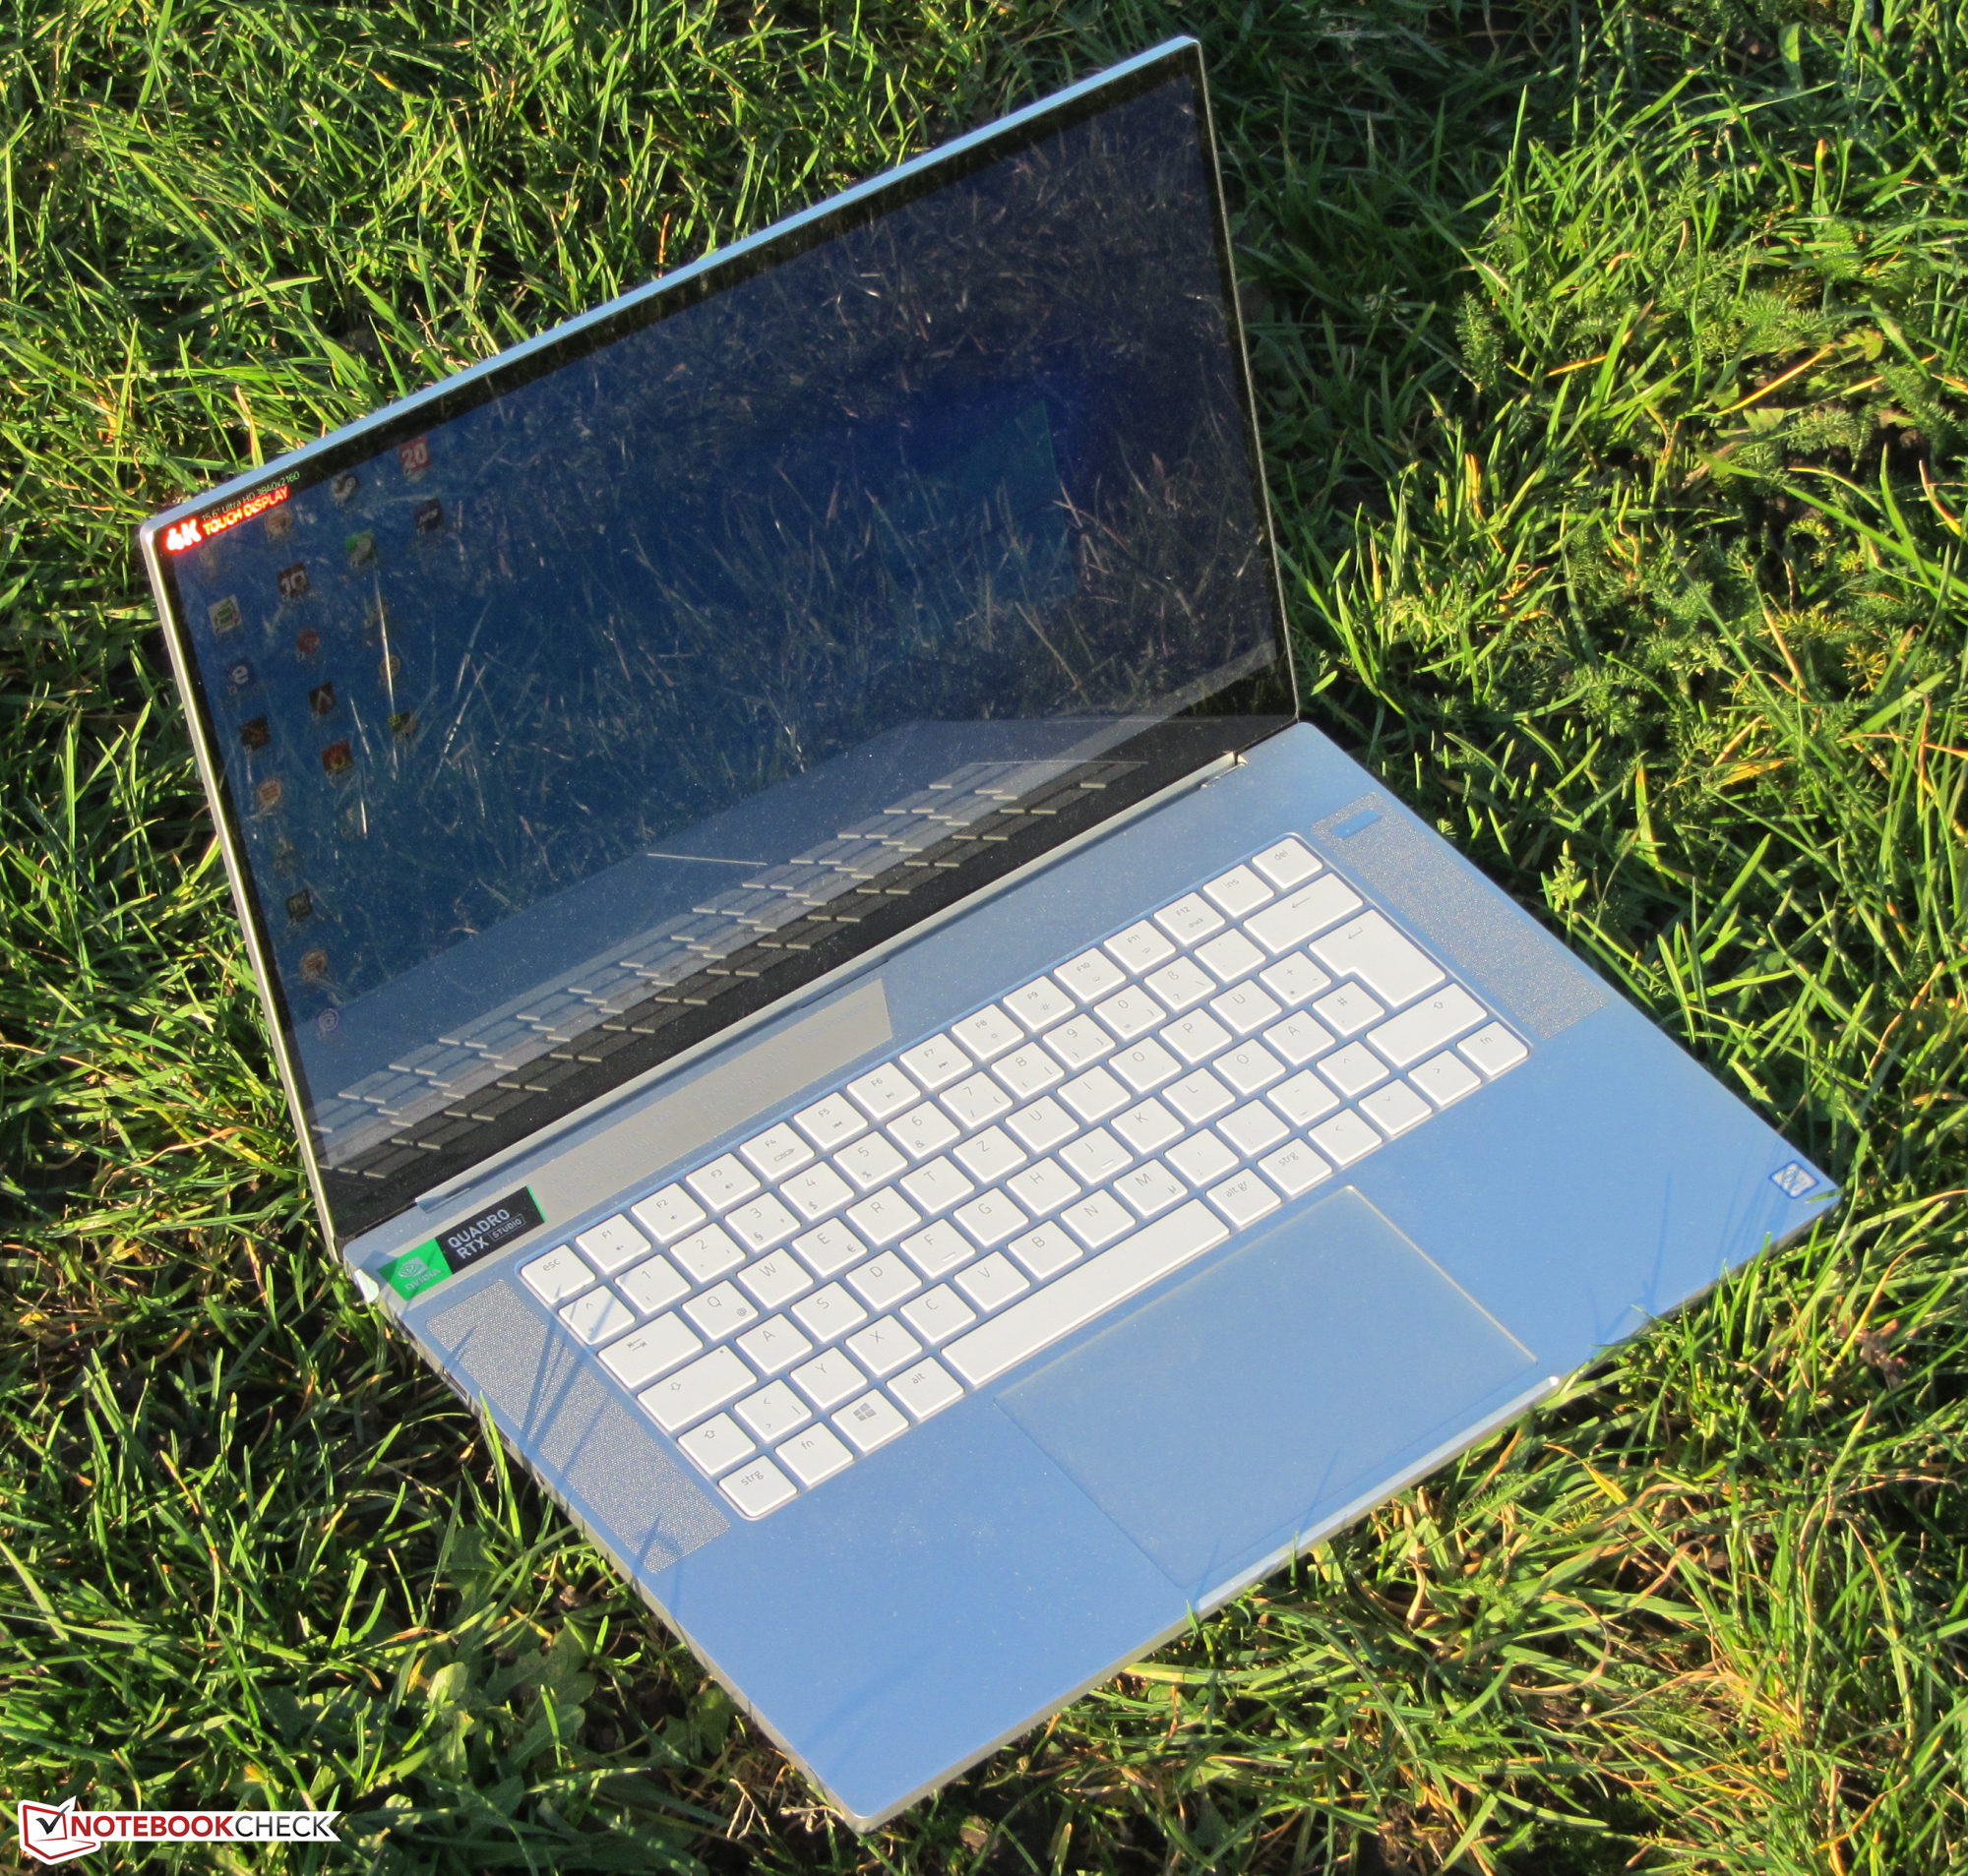
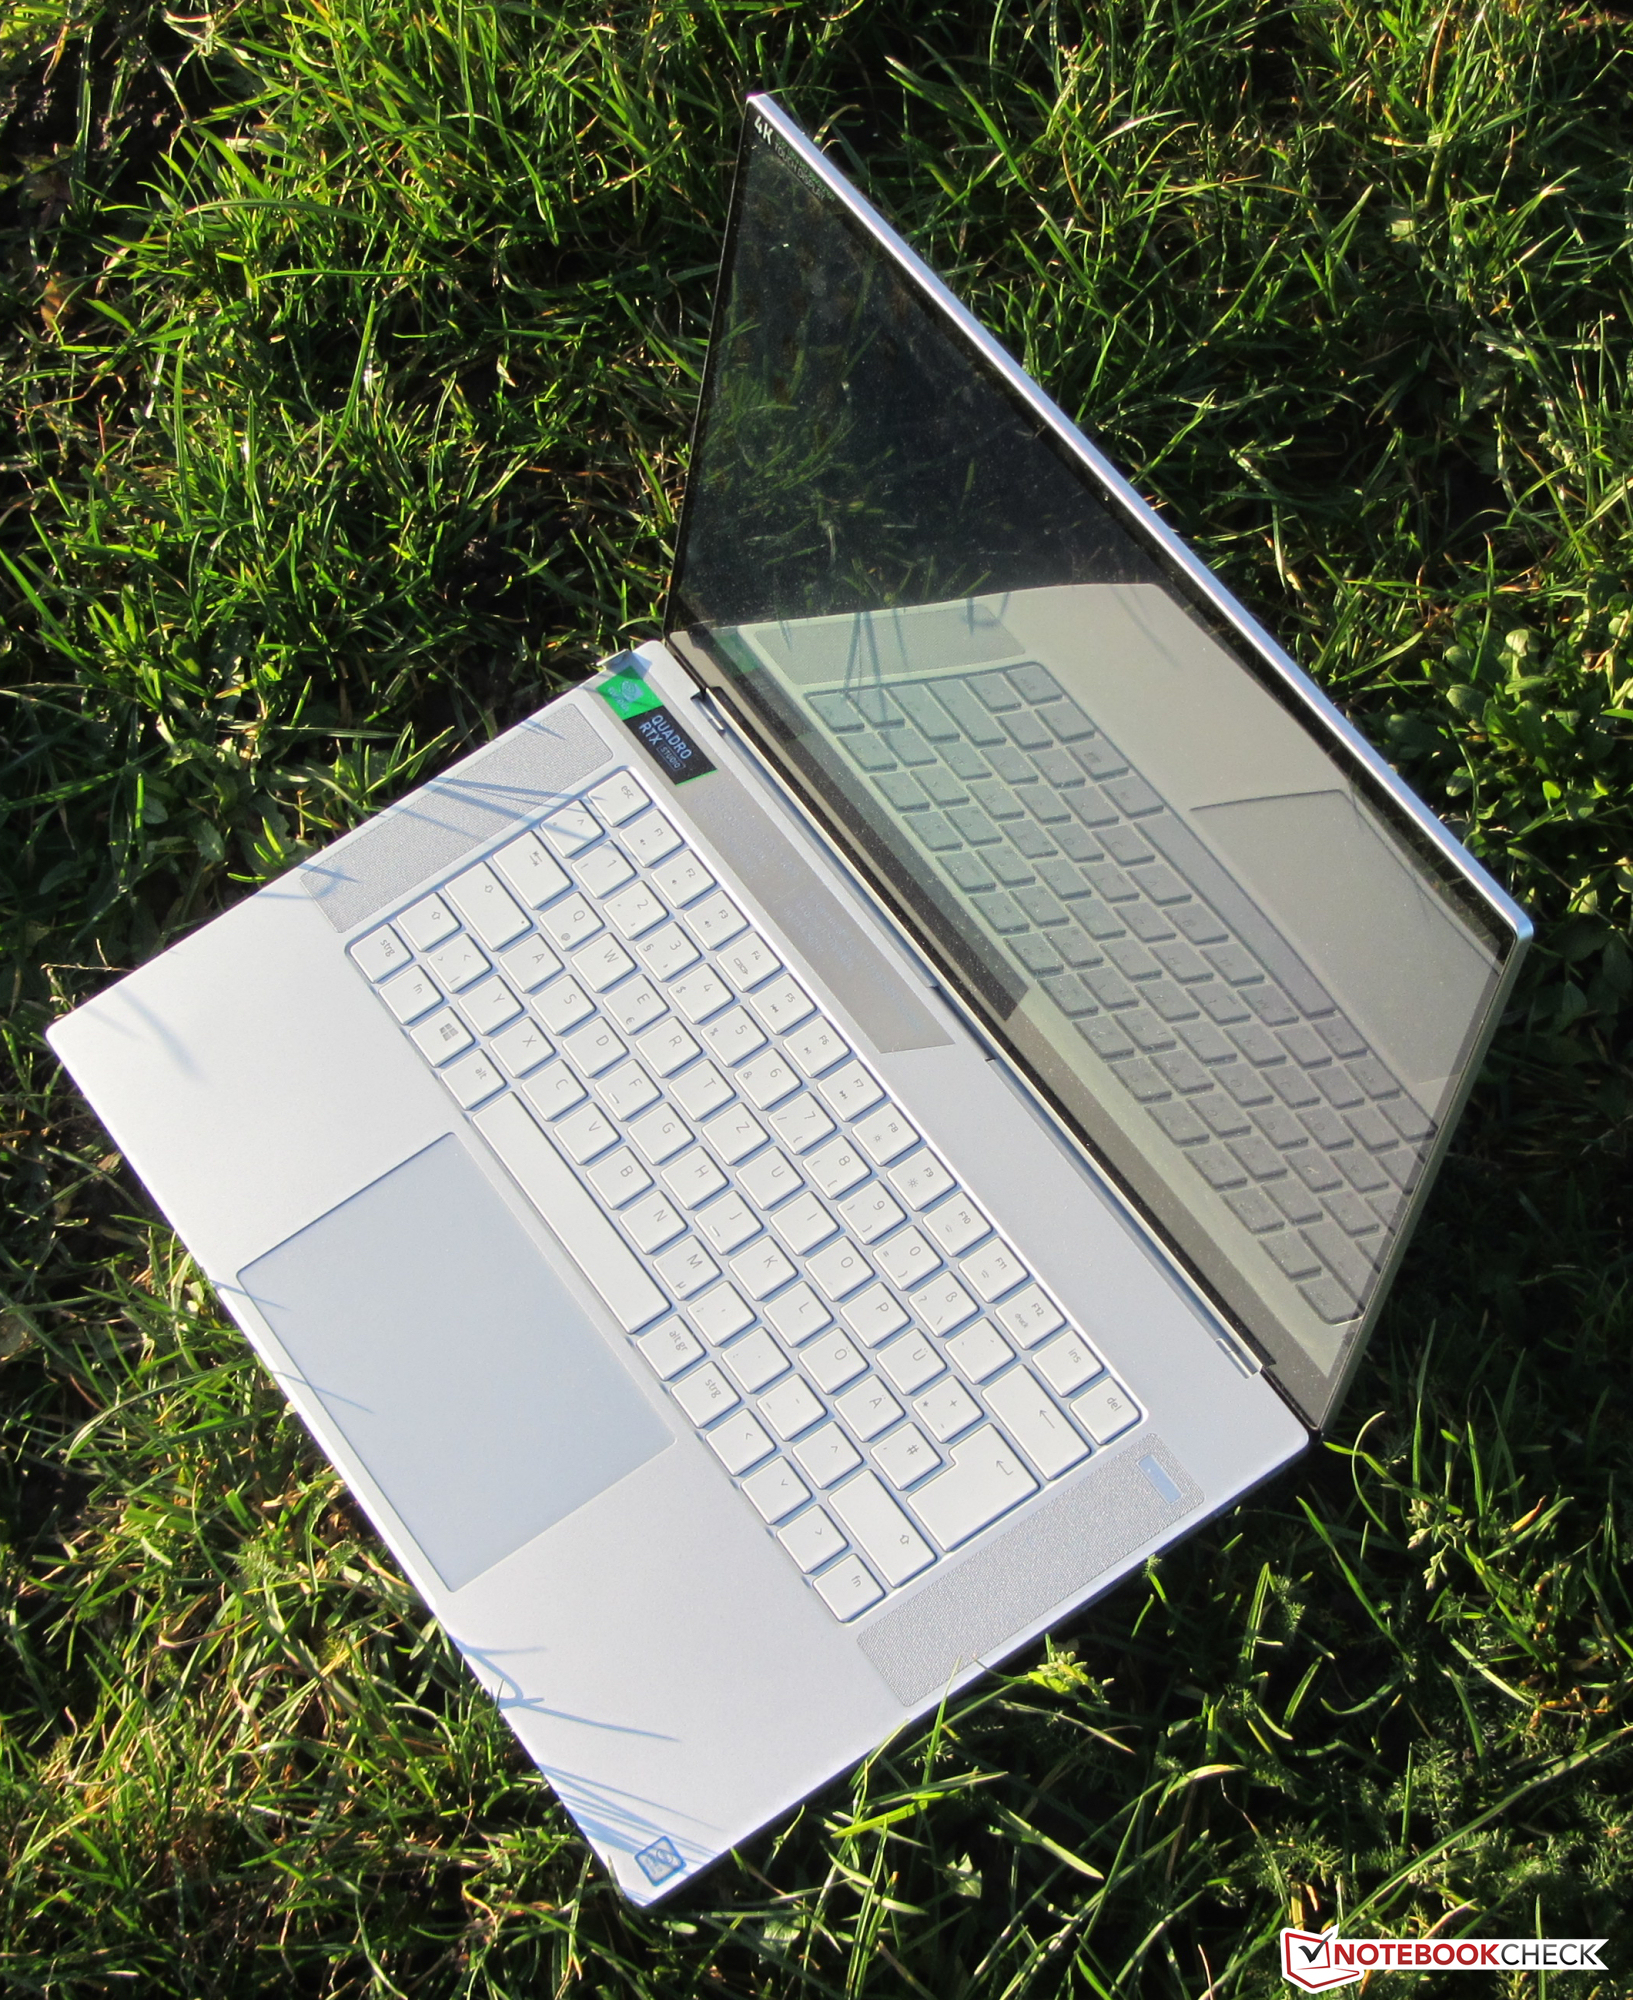
Case - Razer Blade 15 Studio Edition with Robust Chassis
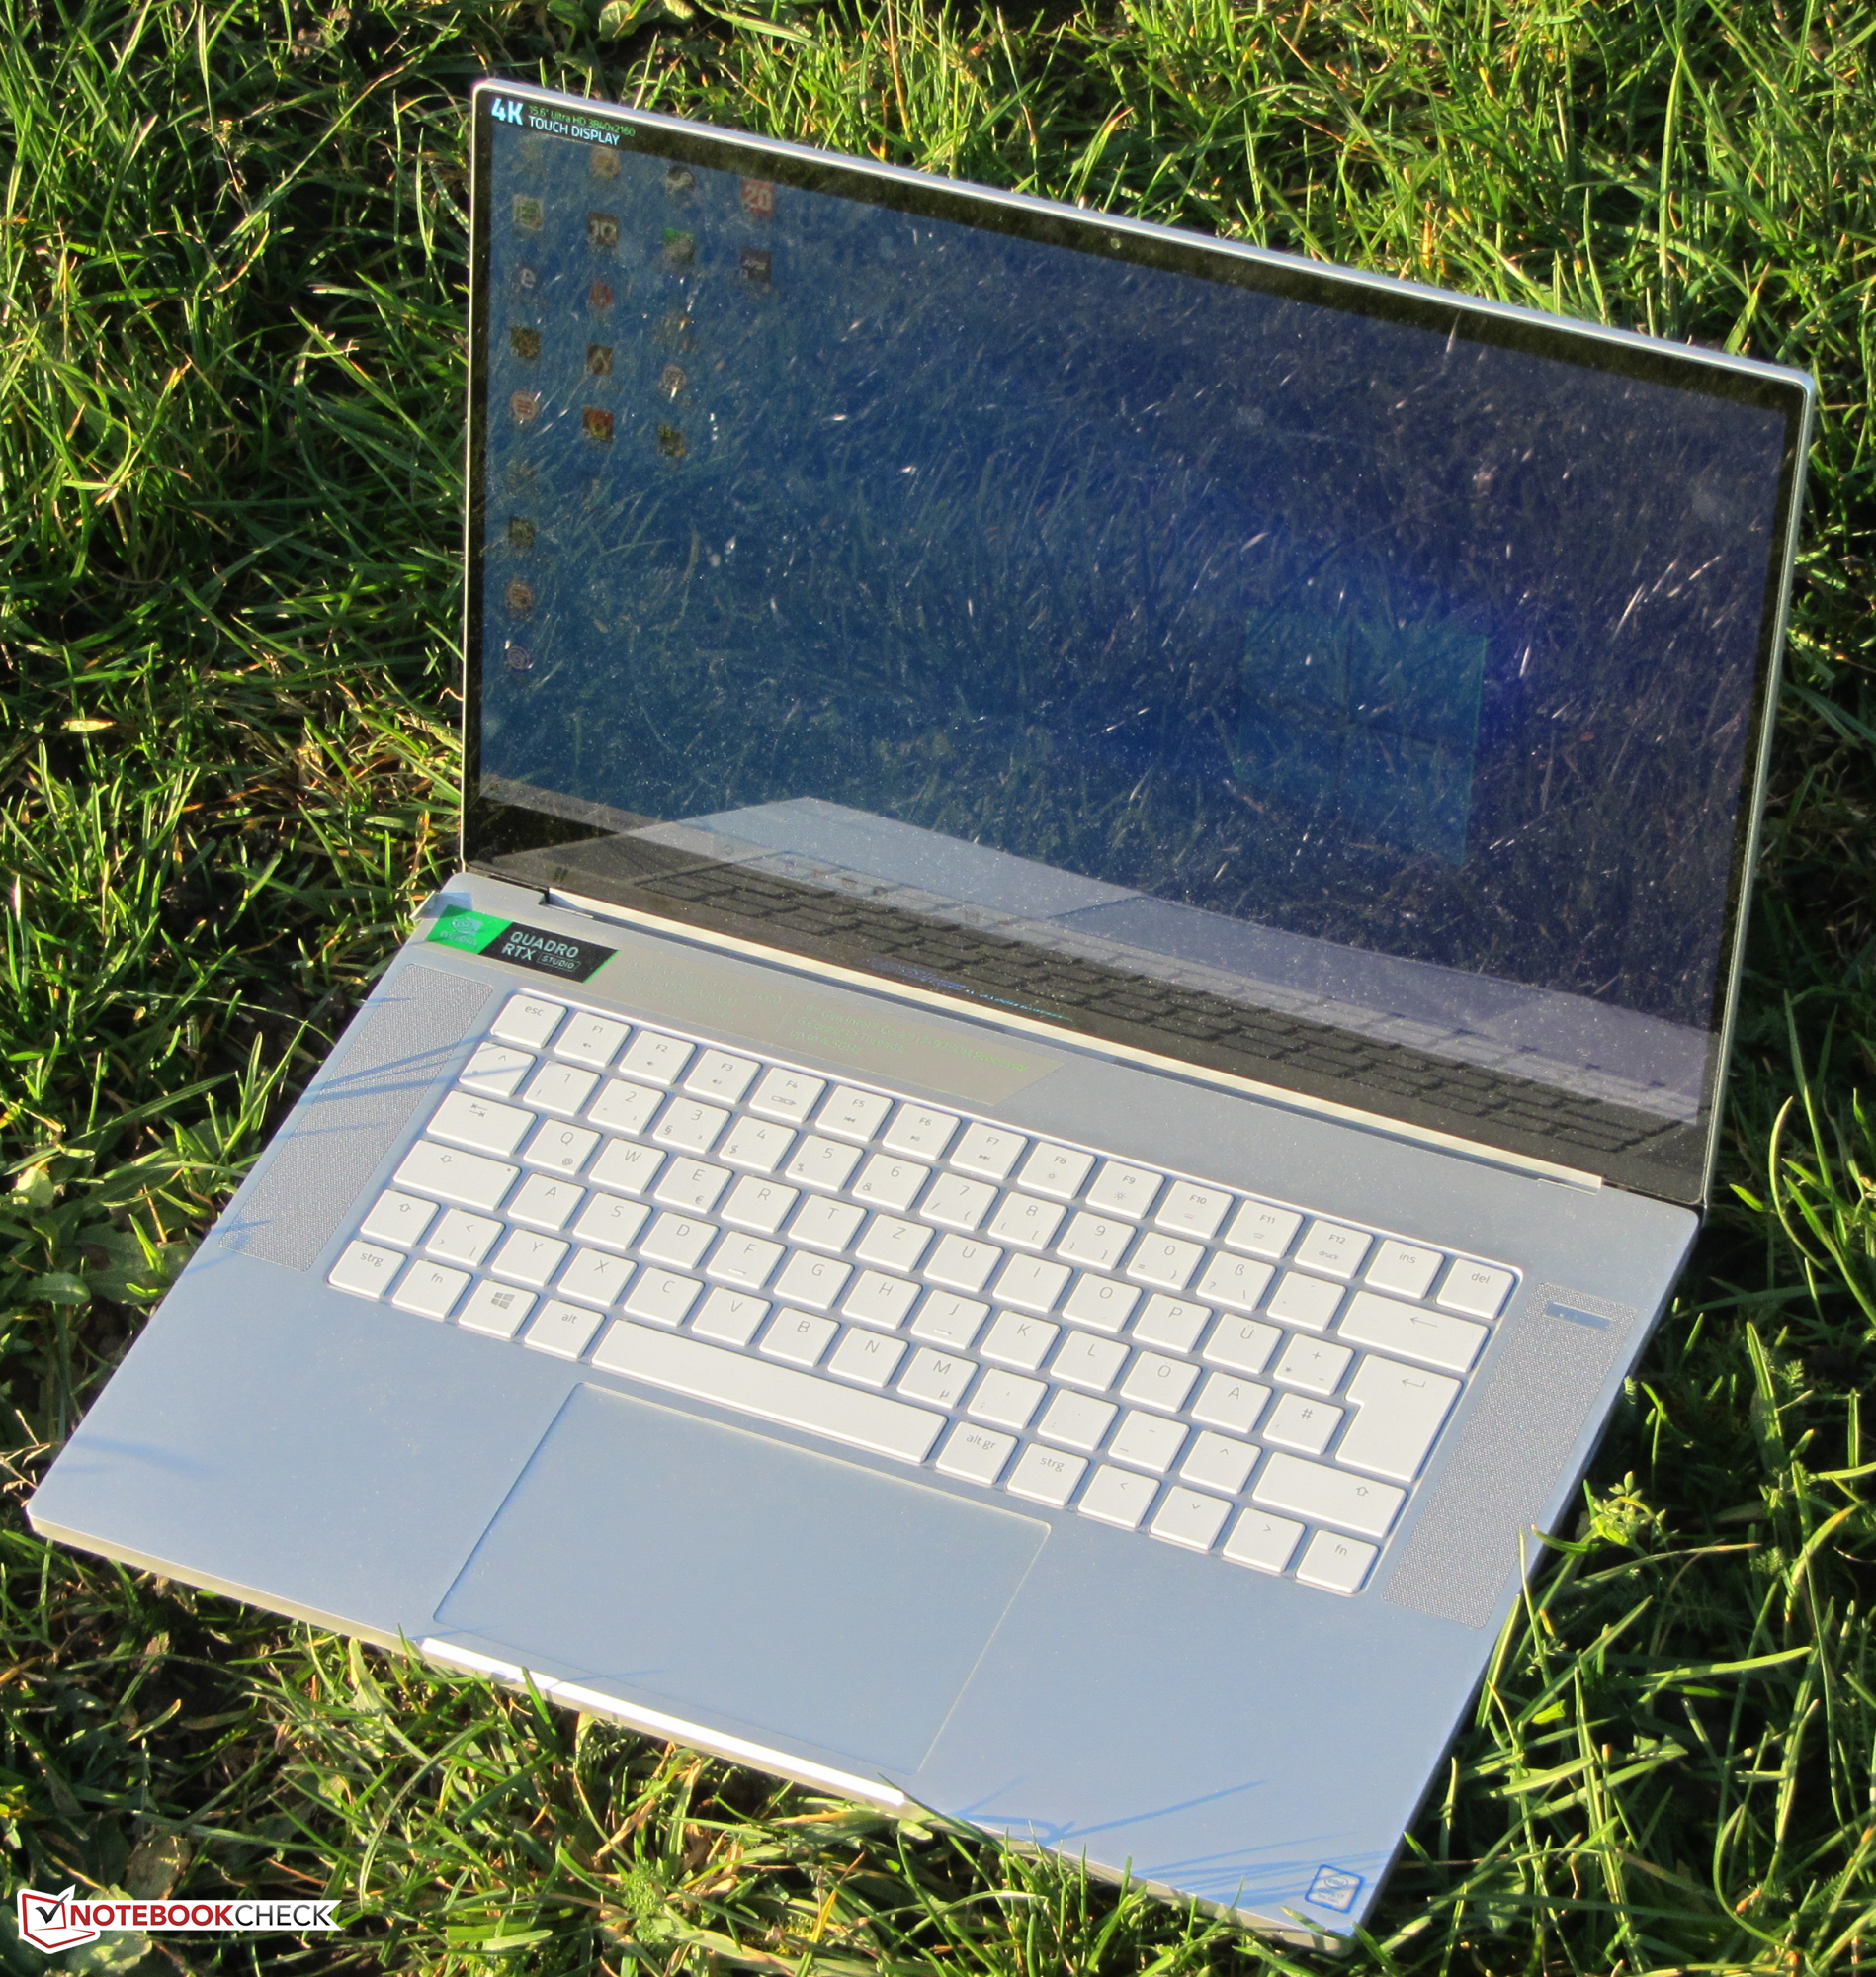
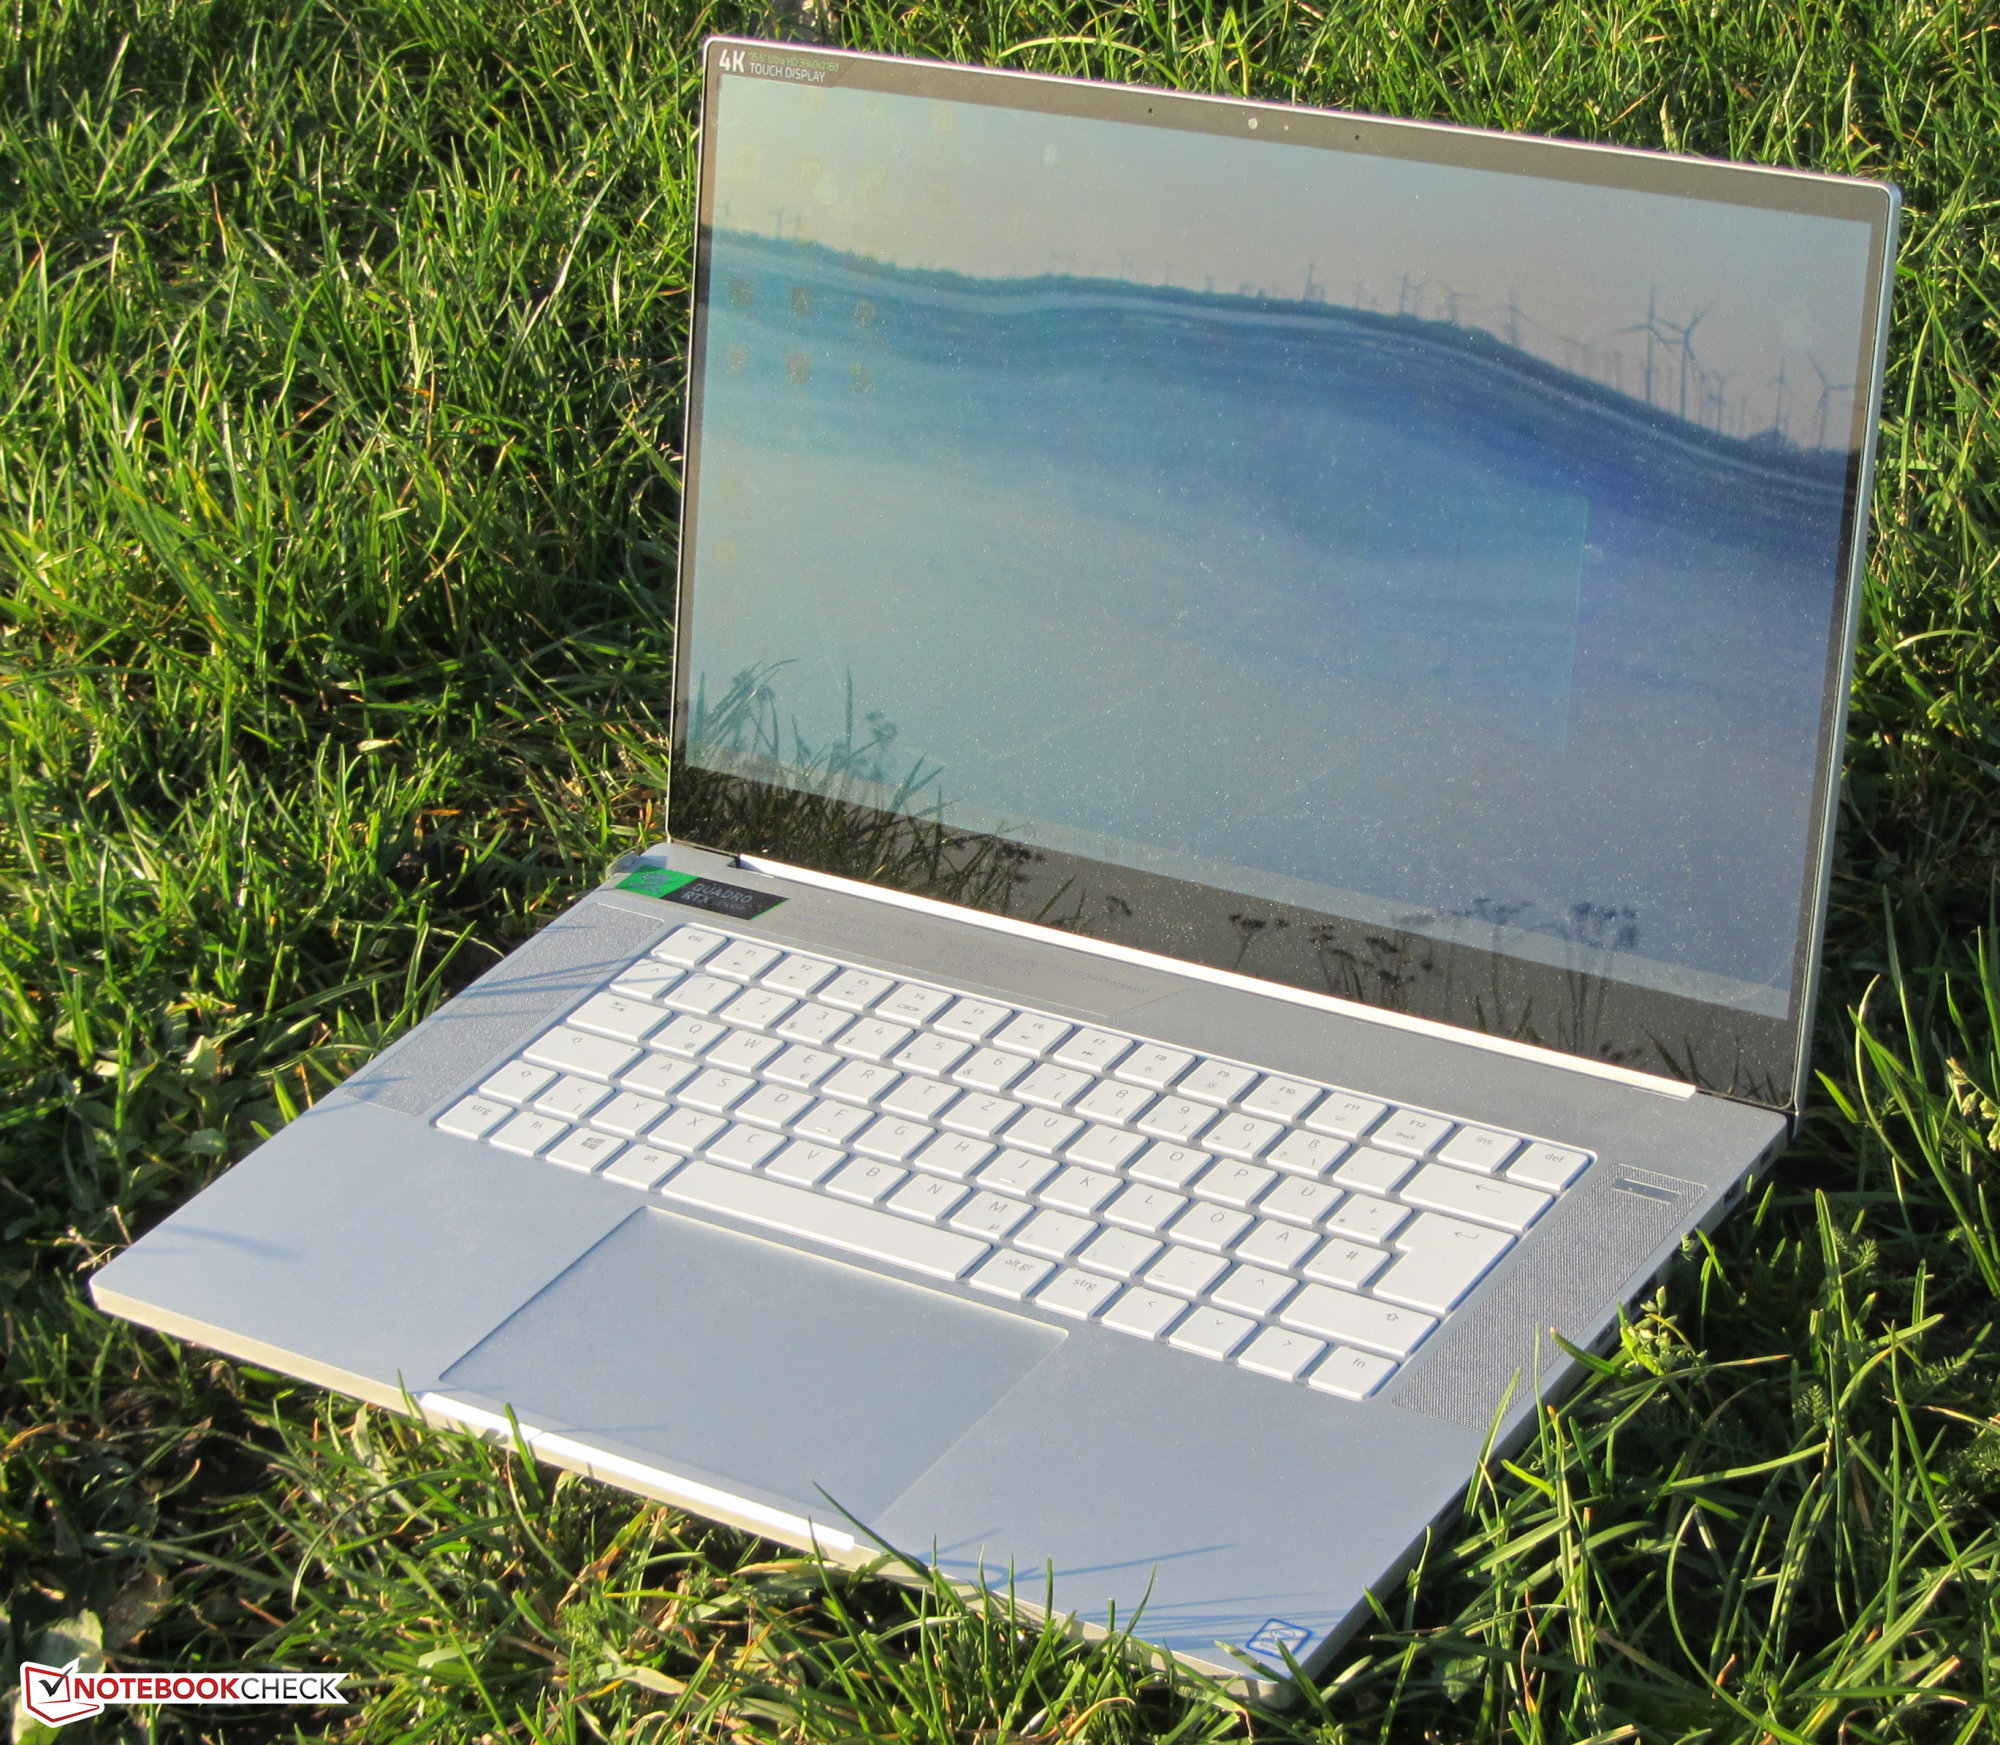
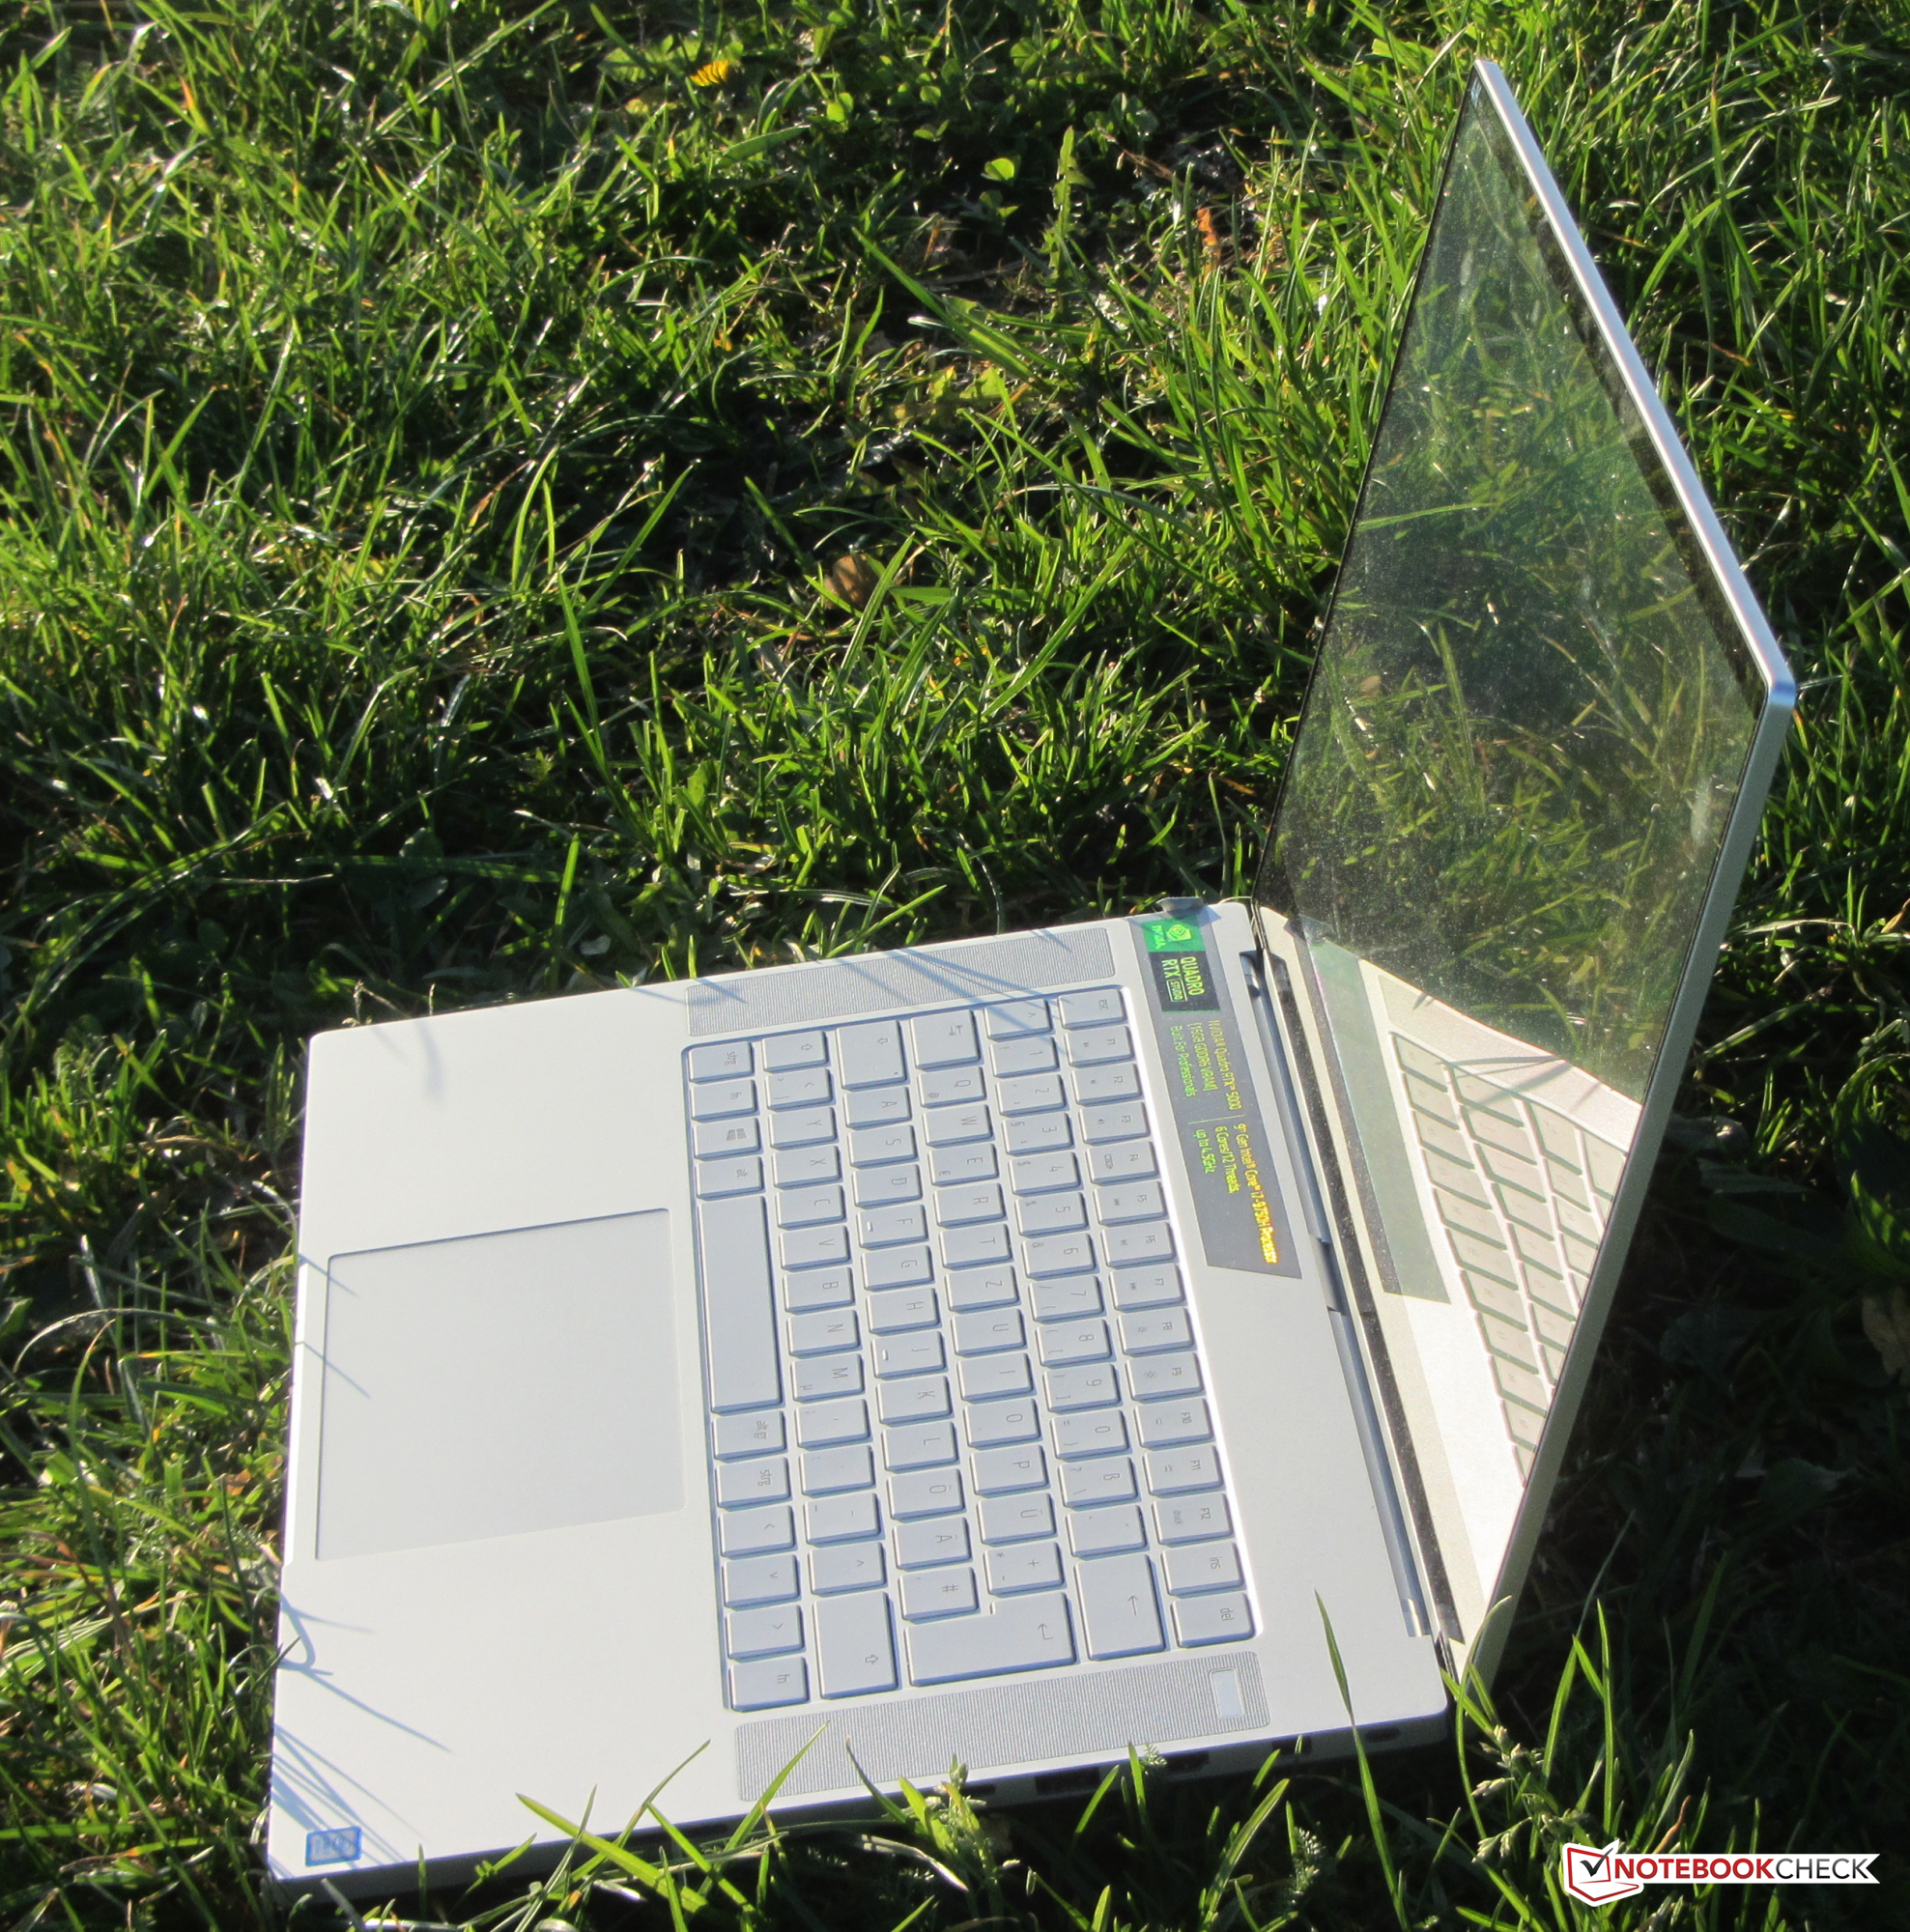
Razer's Studio Edition of the Blade 15 relies on an identical metal chassis as the Advanced Model. The fairly angular chassis comes with rounded-off corners. The minimalist design does not include a lot of bells and whistles. The color variation is called Mercury White - a light silver-gray shade. An optical drive does not exist - there is no option to upgrade the laptop with one, either. In order to get to the inside, the bottom plate has to be removed. More on this later. The battery is non-removable.
The chassis shows no flaws in terms of build quality. The clearances are even and there are no sharp edges. Additionally, the case is very robust. Both the lid and the base unit have a high rigidity. Twisting the unit is very difficult. Warping the surfaces of the base unit would require a large amount of force. Furthermore, applying pressure to the back of the lid does not result in image distortions. The hinges hold the lid firmly in place with minimal teetering. The display can be opened to a maximum angle of around 130 degrees. The lid can be opened with just one hand.
The Blade 15 is the most compact 15.6-inch workstation in our comparison. Most of the competing devices have a larger footprint. In terms of weight, the Blade comes in somewhere in the middle.
Connectivity - Razer Laptop with Thunderbolt 3
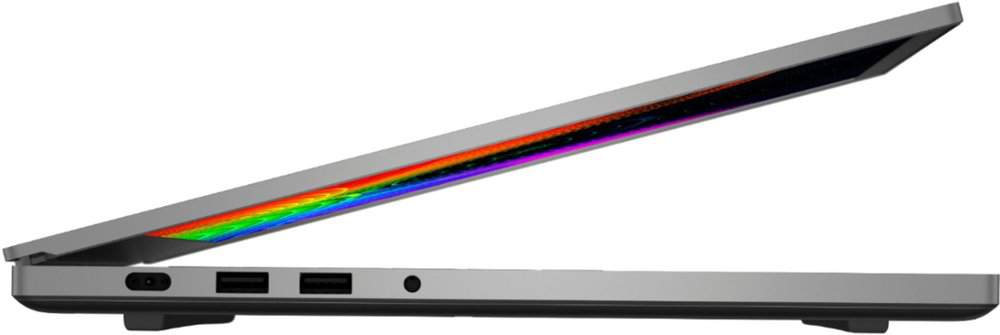
Razer's workstation offers a well-rounded port selection. The three USB Type-A ports adhere to the USB 3.2 Gen 1 standard. Furthermore, there are two video outputs (HDMI, Mini-DisplayPort). A third video output is available in the form of the Thunderbolt 3 port (DisplayPort via USB Type-C). The latter also allows users to connect docking stations or an external GPU. However, the laptop cannot be powered via USB Type-C. Thunderbolt 3 can only provide up to 100 watts. Under load, the consumption of the Blade is far higher.
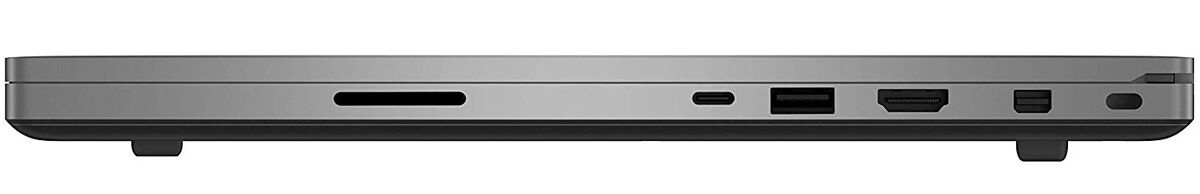
SD Card Reader
Unlike the Advanced Model, the Studio Edition of the Blade 15 has a built-in card reader. It was able to transfer 250 jpg image files (around 5 MB each) at a rate of 78.3 MB/s. Thus, this card reader is one of the faster models. That being said, card readers of the competing devices achieve even higher transfer rates. We test all card readers with our reference card (Toshiba Exceria Pro SDXC 64 GB UHS-II).
| SD Card Reader | |
| average JPG Copy Test (av. of 3 runs) | |
| Lenovo ThinkPad P53-20QN000YGE (Toshiba Exceria Pro SDXC 64 GB UHS-II) | |
| HP ZBook Studio G5-4QH10EA (Toshiba Exceria Pro SDXC 64 GB UHS-II) | |
| Dell Precision 5540 (Toshiba Exceria Pro SDXC 64 GB UHS-II) | |
| Fujitsu Celsius H780 (Toshiba Exceria Pro SDXC 64 GB UHS-II) | |
| Average of class Workstation (49.6 - 681, n=14, last 2 years) | |
| Razer Blade 15 Studio Edition (Toshiba Exceria Pro SDXC 64 GB UHS-II) | |
| maximum AS SSD Seq Read Test (1GB) | |
| Average of class Workstation (87.6 - 1455, n=14, last 2 years) | |
| HP ZBook Studio G5-4QH10EA (Toshiba Exceria Pro SDXC 64 GB UHS-II) | |
| Lenovo ThinkPad P53-20QN000YGE (Toshiba Exceria Pro SDXC 64 GB UHS-II) | |
| Dell Precision 5540 (Toshiba Exceria Pro SDXC 64 GB UHS-II) | |
| Fujitsu Celsius H780 (Toshiba Exceria Pro SDXC 64 GB UHS-II) | |
Communication
The Blade 15's Wi-Fi module stems from Intel (Wi-Fi 6 AX200). It not only supports the established Wi-Fi standards 802.11a/b/g/n/ac but also the new ax standard (= Wi-Fi 6). The test results we gathered under optimal conditions (no other Wi-Fi devices in proximity, short distance between the laptop and the server) were excellent. The workstation does not provide an Ethernet port. Users who need this particular interface will have to rely on an appropriate USB adapter.
| Networking | |
| iperf3 transmit AX12 | |
| Razer Blade 15 Studio Edition (iperf 3.1.3) | |
| Lenovo ThinkPad P53-20QN000YGE (Intel X550-T2) | |
| Lenovo ThinkPad P53-20QN000YGE (Killer E2500) | |
| Razer Blade 15 RTX 2080 Max-Q | |
| Fujitsu Celsius H780 (iperf 3.1.3) | |
| MSI P65 Creator 9SF-657 | |
| HP ZBook Studio G5-4QH10EA (iperf 3.1.3) | |
| Dell Precision 5540 (Killer E2500) | |
| iperf3 receive AX12 | |
| Lenovo ThinkPad P53-20QN000YGE (Intel X550-T2) | |
| Lenovo ThinkPad P53-20QN000YGE (Killer E2500) | |
| Razer Blade 15 Studio Edition (iperf 3.1.3) | |
| Razer Blade 15 RTX 2080 Max-Q | |
| HP ZBook Studio G5-4QH10EA (iperf 3.1.3) | |
| Fujitsu Celsius H780 (iperf 3.1.3) | |
| Dell Precision 5540 (Killer E2500) | |
| MSI P65 Creator 9SF-657 (iperf 3.1.3) | |
Webcam
The installed webcam can capture images at a maximum resolution of 1280x720 pixels. The results are somewhat washed-out and lacking in terms of sharpness.
Accessories
Aside from the usual paperwork (quick-start guide, warranty information), the accessories also include a cleaning cloth.
Maintenance
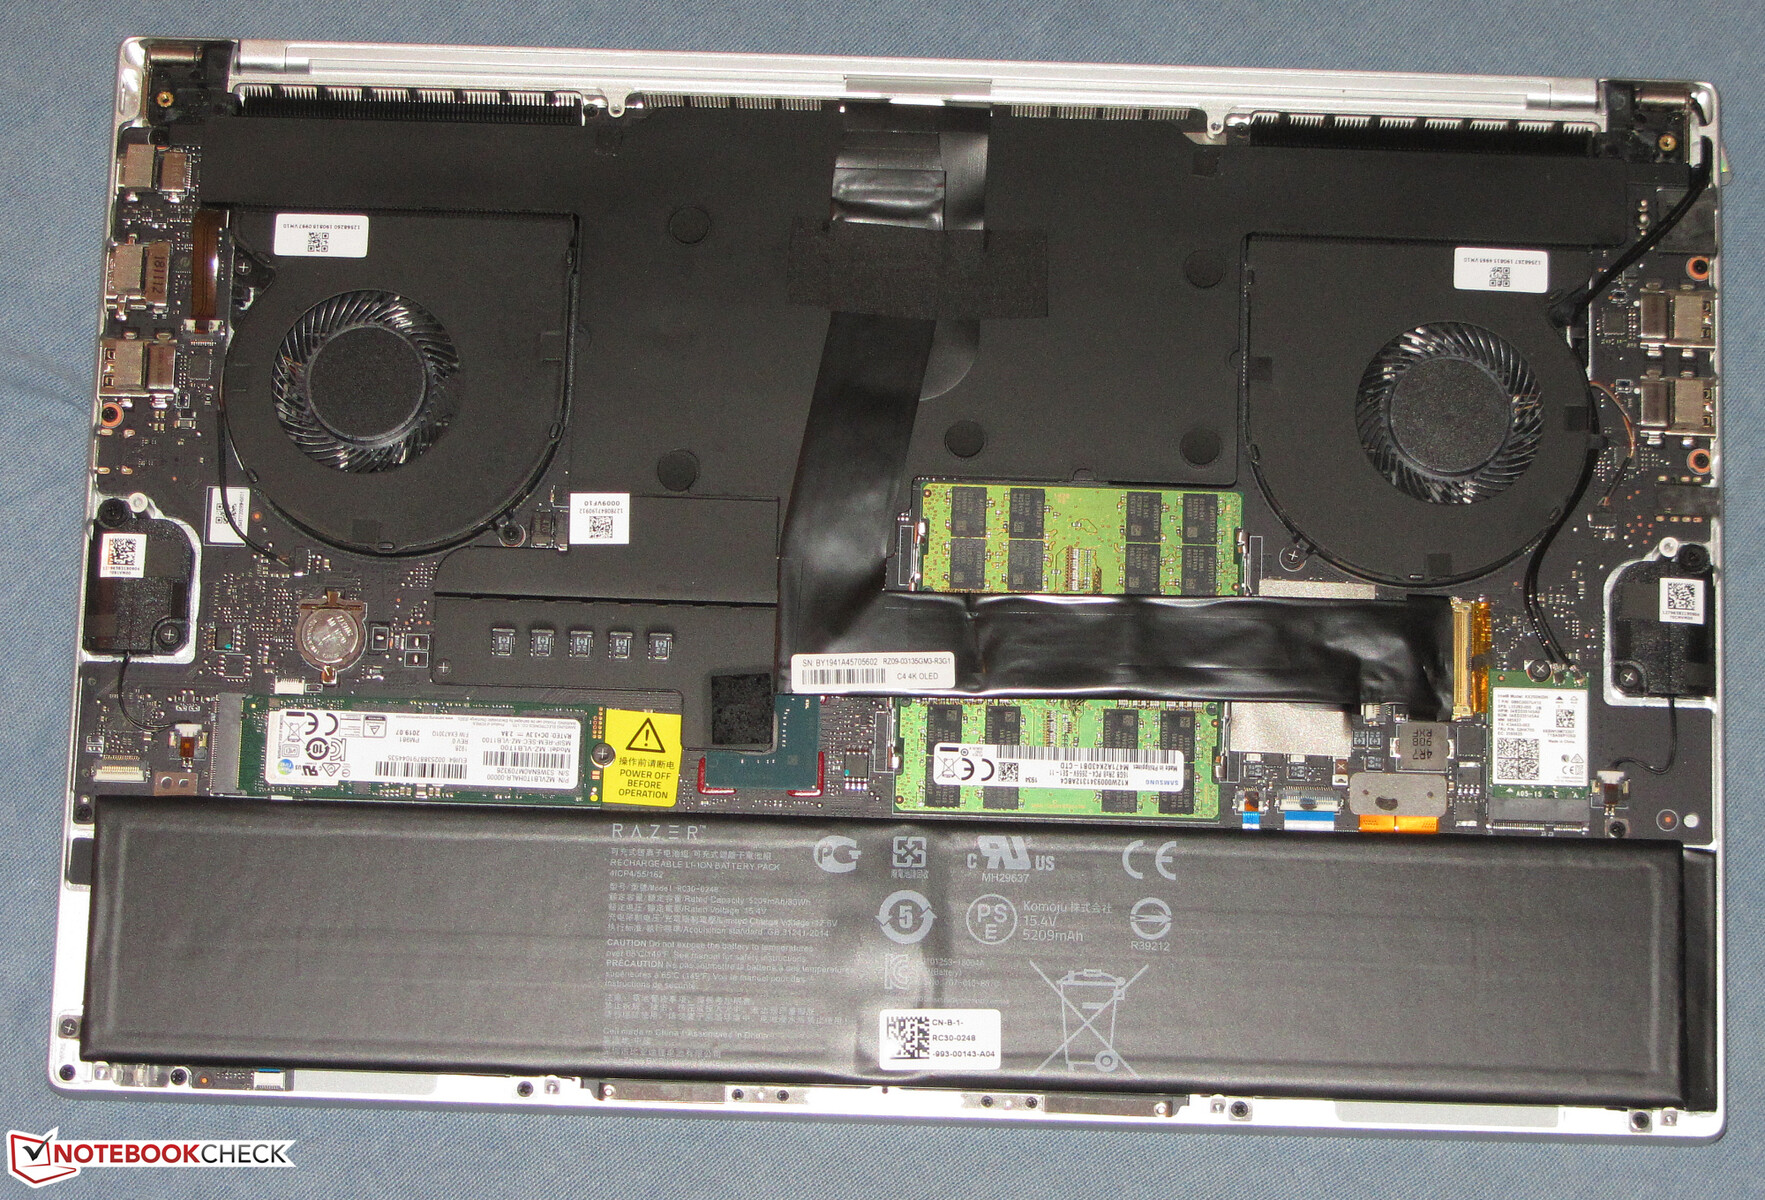
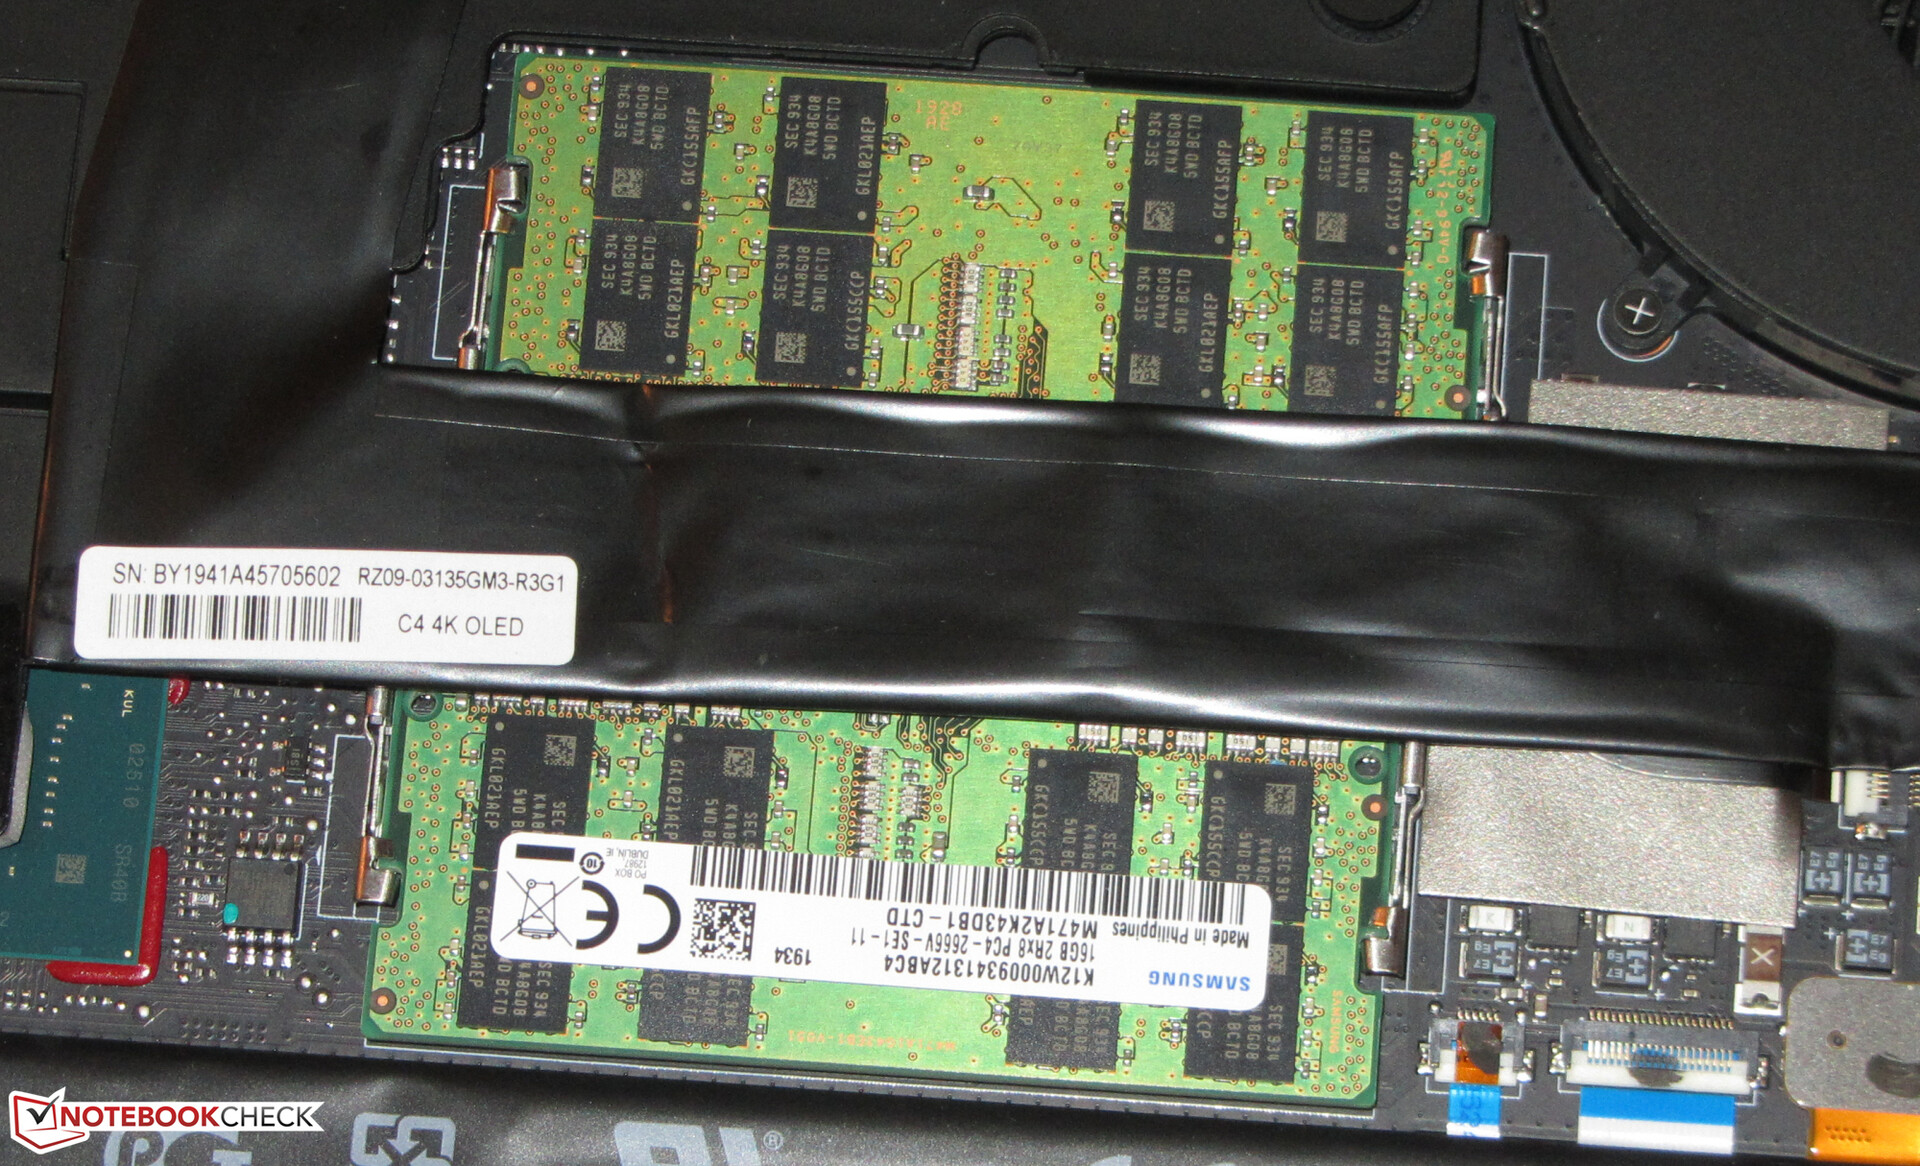
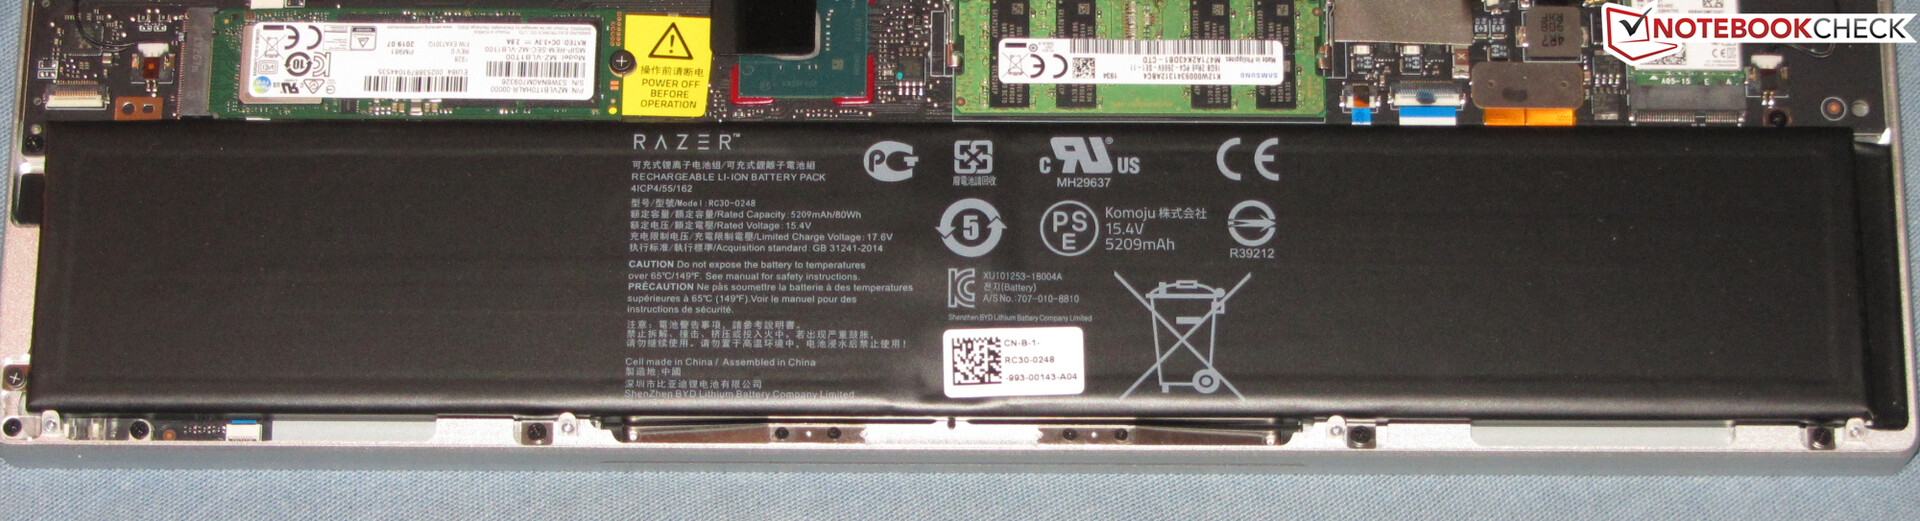
There is no maintenance hatch on this laptop. In order to reach the components, the bottom panel needs to be removed - this does not require a lot of effort, however. After loosening all of the Torx screws on the bottom, the bottom panel can be easily removed. Subsequently, users have access to the RAM, SSD, battery, fans and the Wi-Fi module.
Warranty
The laptop comes with a 12-month warranty. It is possible to extend this time frame to three years (including accidental damage protection; RazerCare Elite) for 300 Euros (~$333).
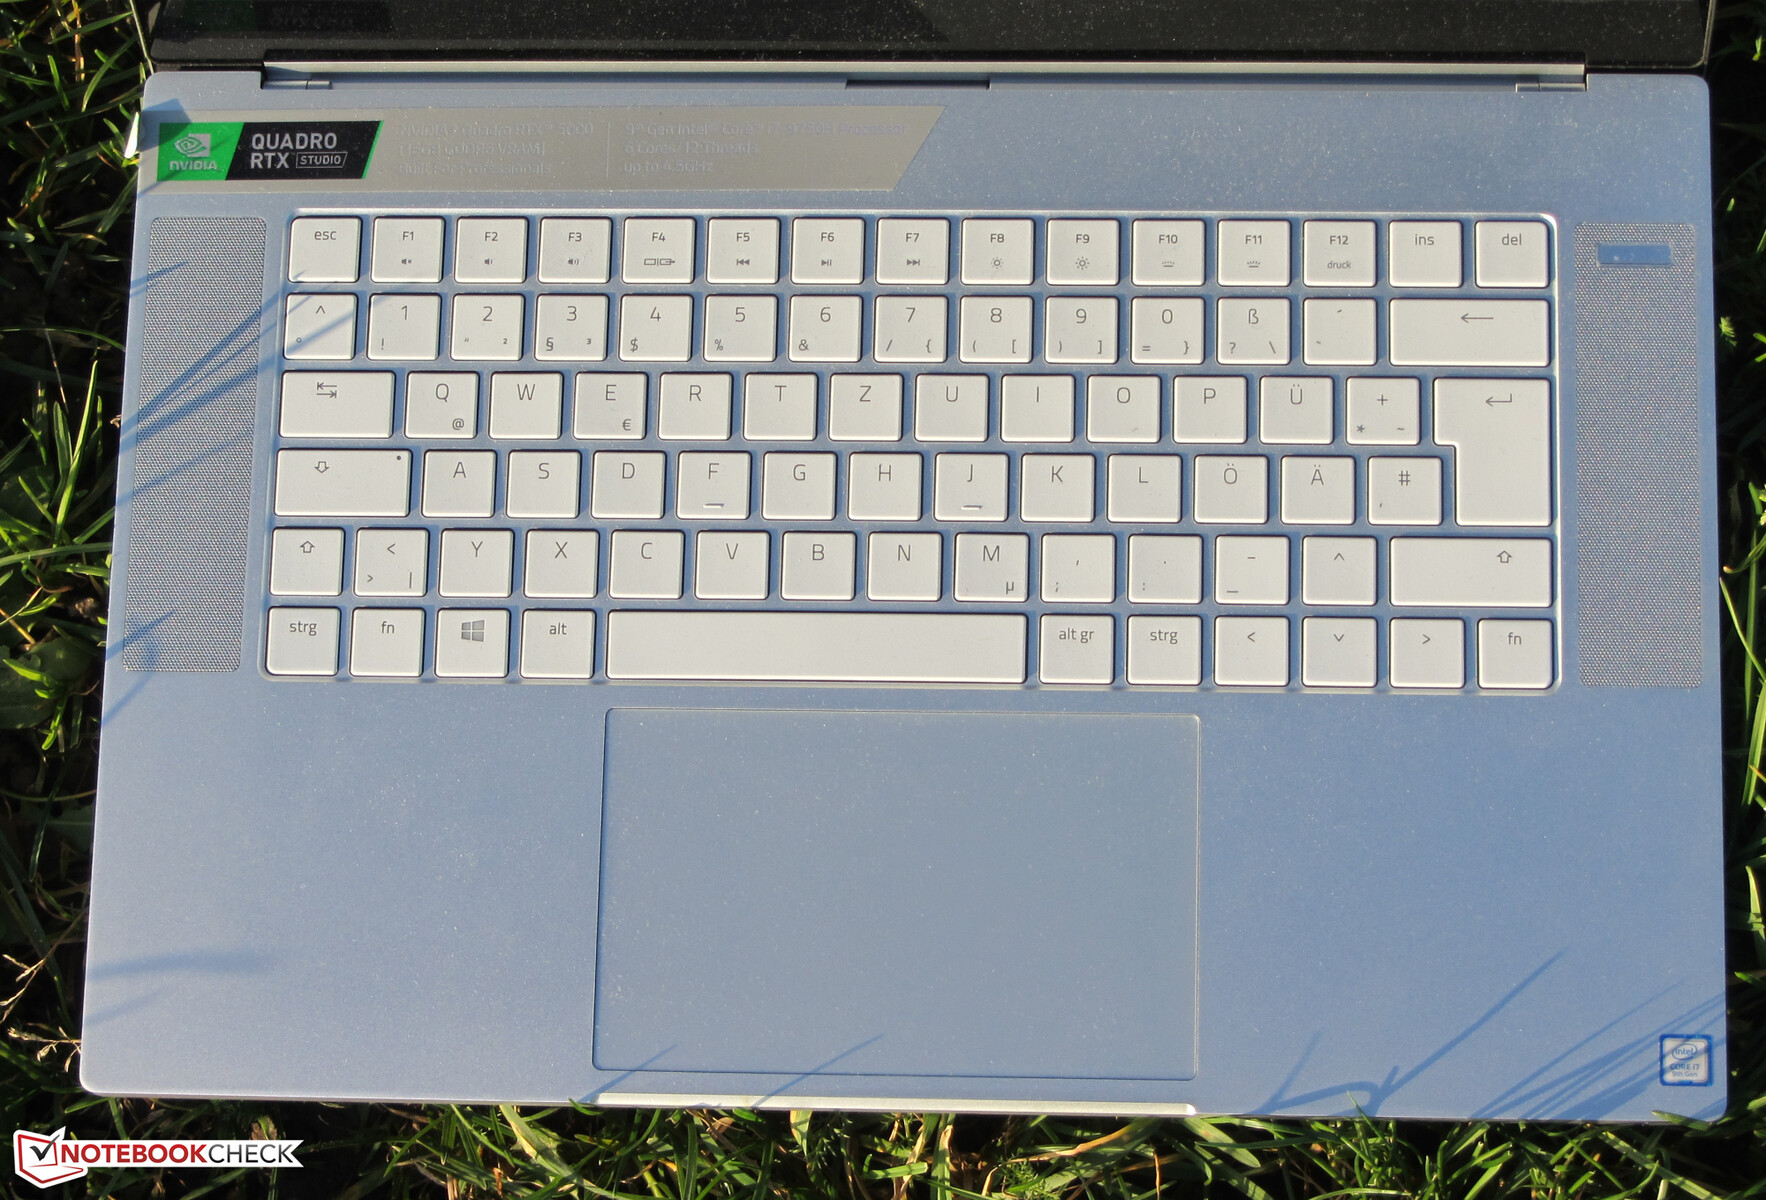
Input Devices - The Workstation's Keyboard Could Be Better
Keyboard
Razer equips the Blade 15 with an illuminated chiclet keyboard. The even, slightly roughened keys offer shallow key travel and a crisp feedback. However, resistance of the keys is slightly less pronounced than we would like. Two function keys are used to control the backlight, which has multiple intensity levels. Overall, Razer delivers a keyboard suitable for daily use. That being said, the keyboard is not well-suited to large, regular typing tasks.
Touchpad
The multi-touch enabled ClickPad occupies an area of around 13 x 8 cm. Thus, there is a lot of space for gesture controls. The touchpad also has good gliding properties and a surface that is responsive all the way to the edges. The touchpad offers short travel and a crisp feedback.
Touchscreen
The capacitive touchscreen of the Blade supports 10 multi-touch points and quickly reacts to inputs. We did not encounter any issues with it during our tests.
Display - Deep Blacks Thanks to OLED

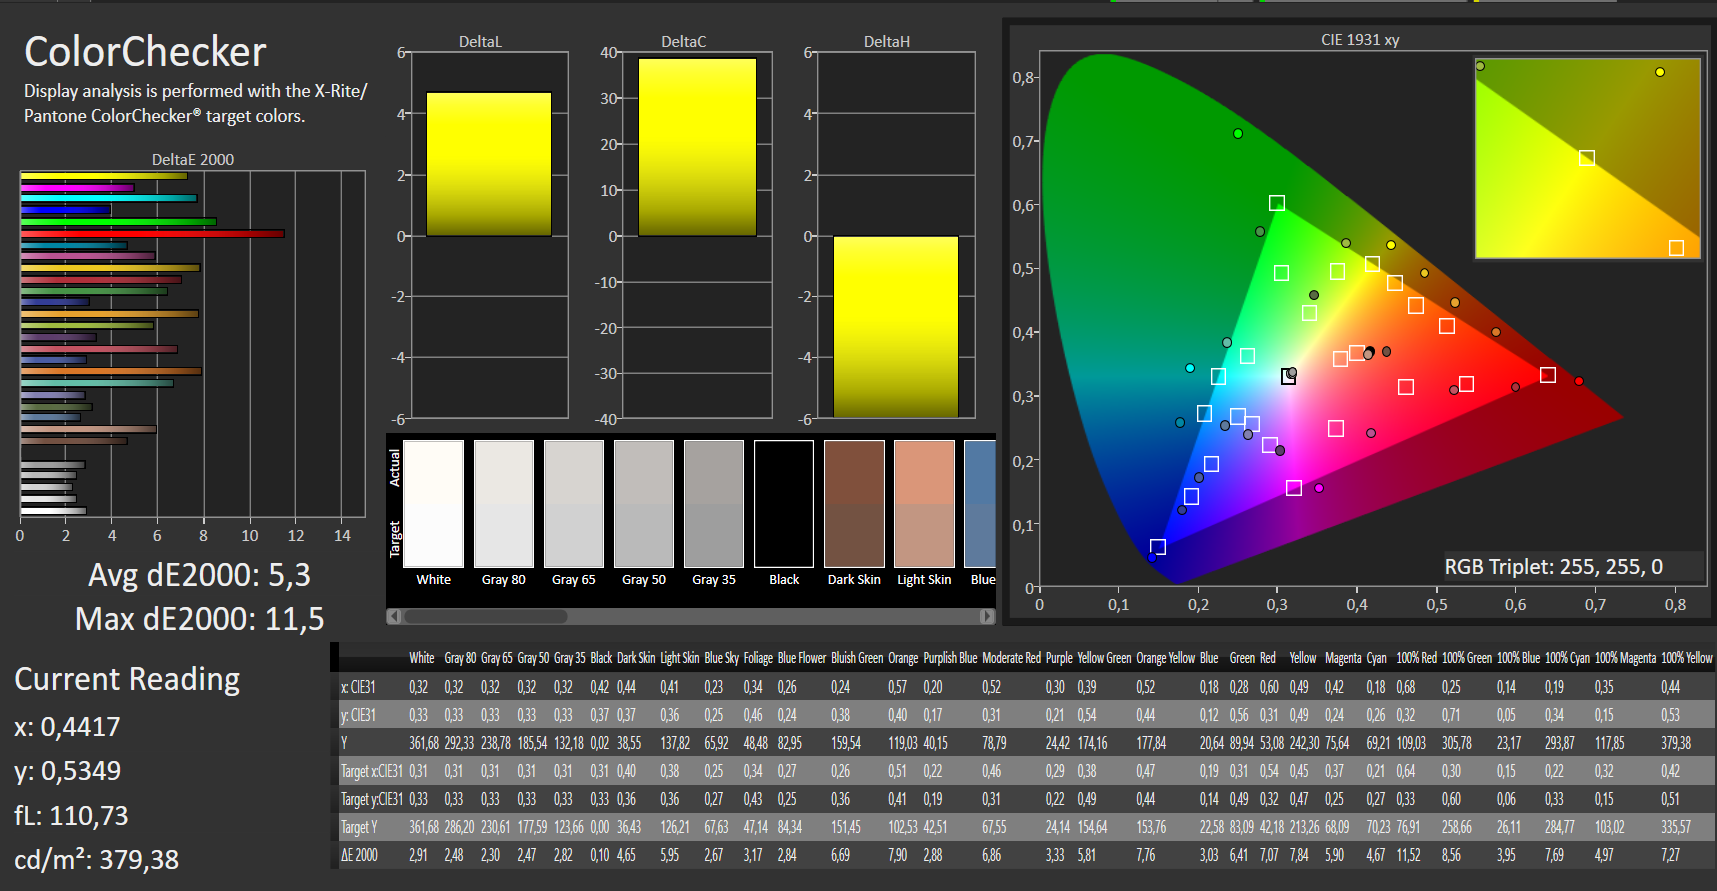
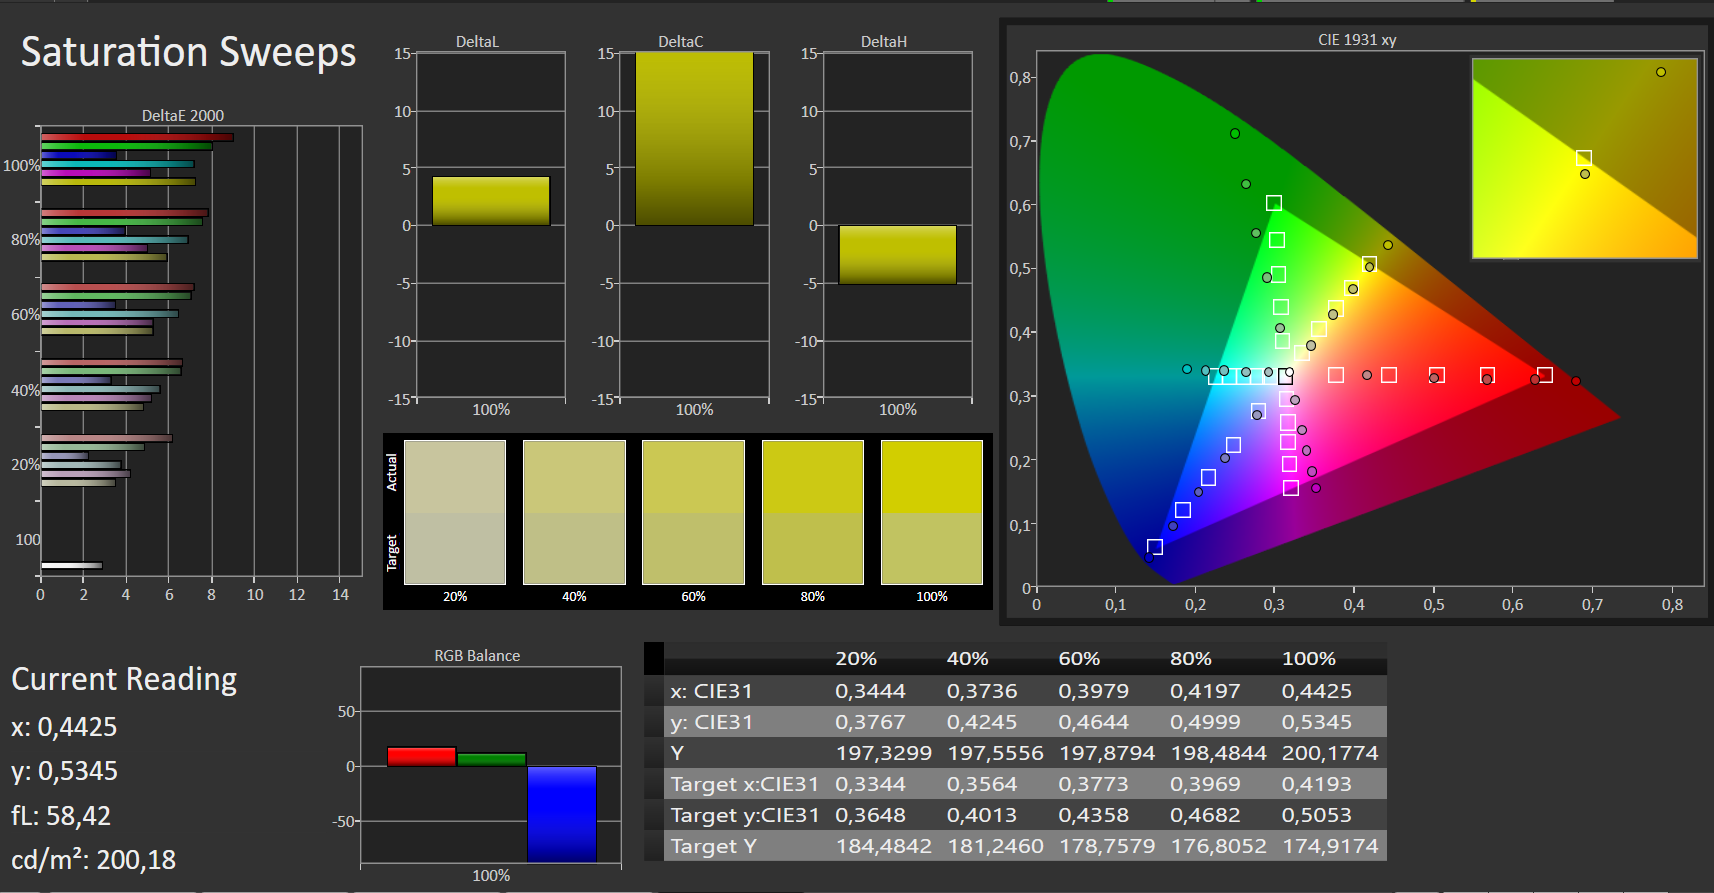
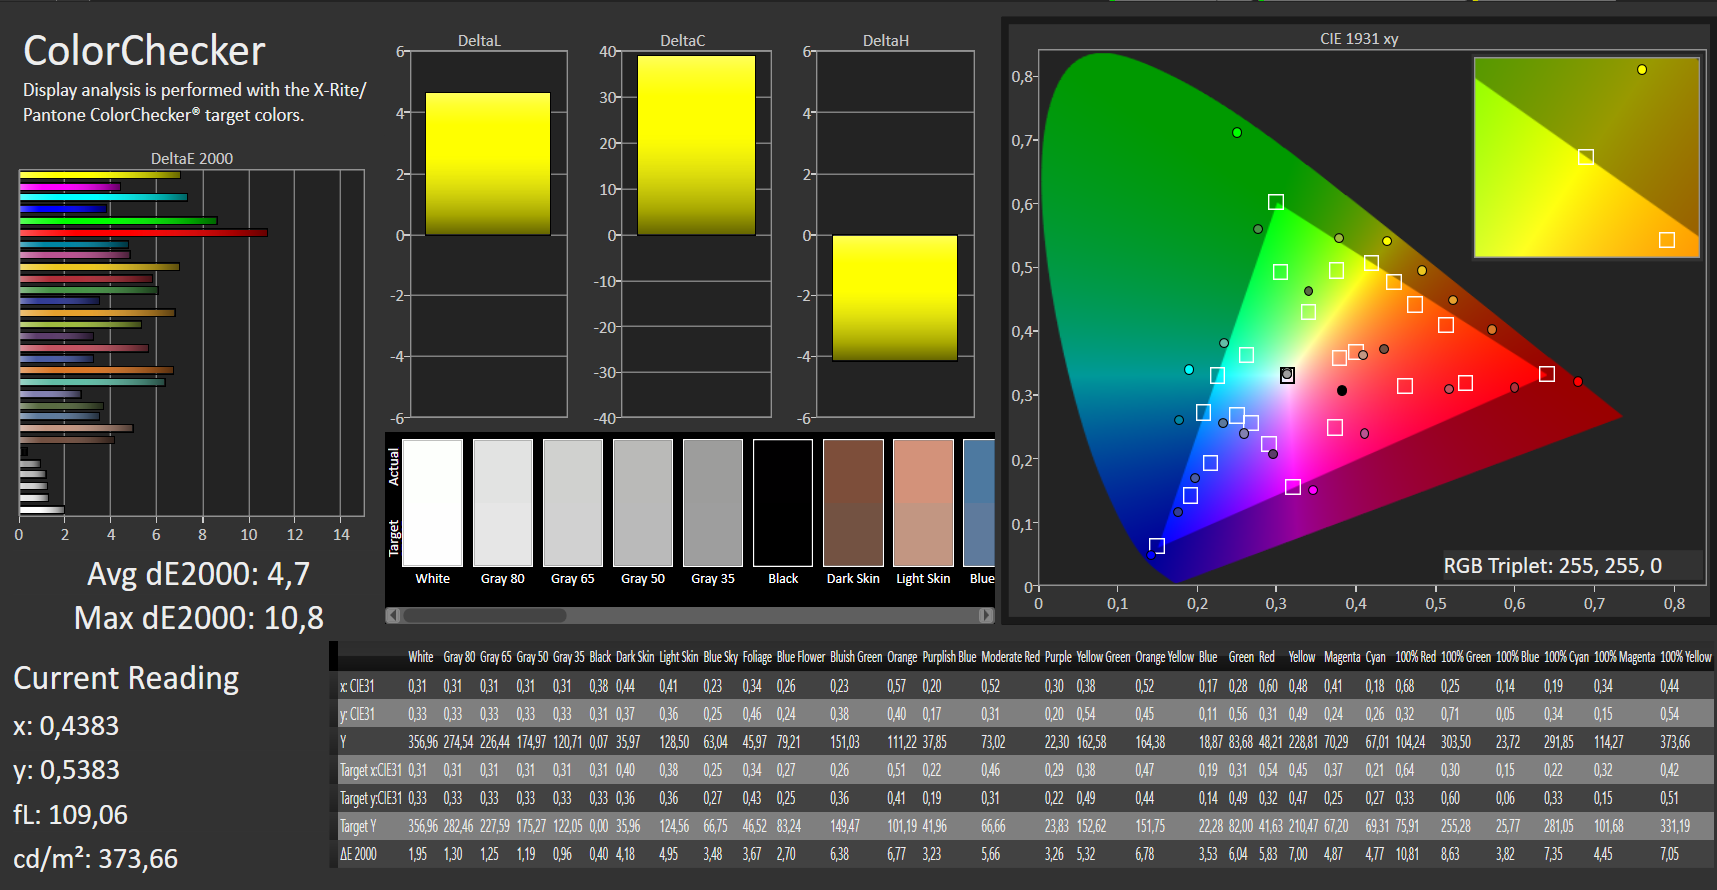
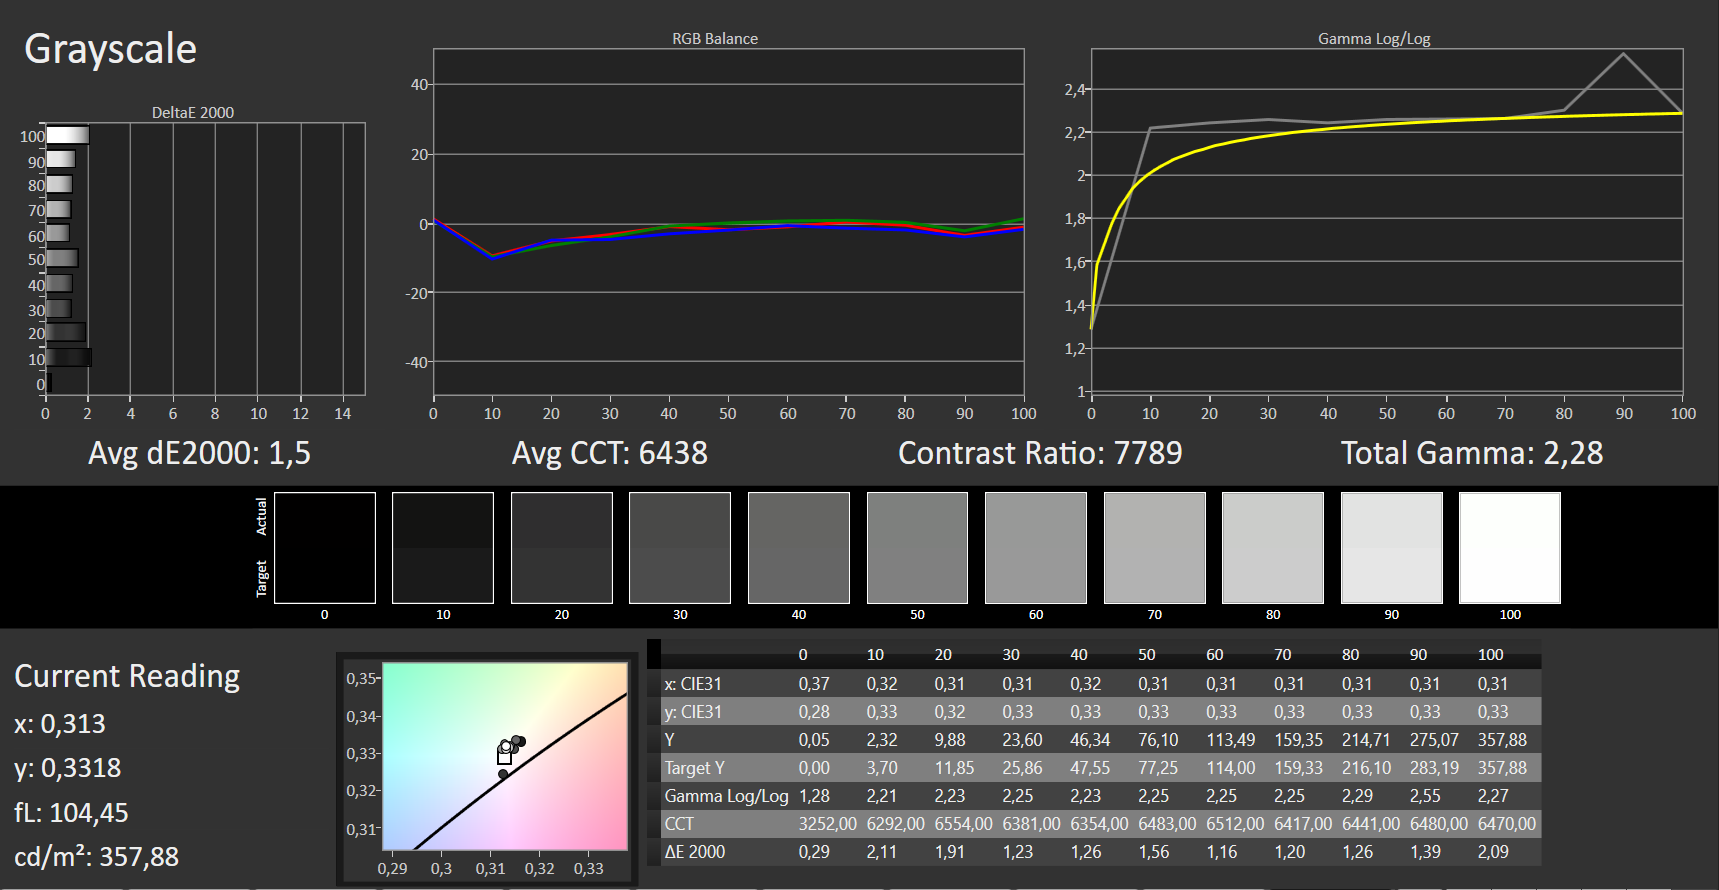
The 15.6-inch OLED touchscreen display of the Blade 15 has a native resolution of 3840x2160 pixels. The screen shines with an excellent contrast ratio (24,067:1), black value (0.015) and a good brightness level (356.7 cd/m²). Furthermore, the response times are fast. Positive: The display does not exhibit PWM flickering.
| |||||||||||||||||||||||||
Brightness Distribution: 89 %
Center on Battery: 361 cd/m²
Contrast: 24067:1 (Black: 0.015 cd/m²)
ΔE ColorChecker Calman: 5.3 | ∀{0.5-29.43 Ø4.72}
calibrated: 4.7
ΔE Greyscale Calman: 2.1 | ∀{0.09-98 Ø4.97}
100% sRGB (Argyll 1.6.3 3D)
86% AdobeRGB 1998 (Argyll 1.6.3 3D)
96.4% AdobeRGB 1998 (Argyll 3D)
100% sRGB (Argyll 3D)
99.9% Display P3 (Argyll 3D)
Gamma: 2.14
CCT: 6149 K
| Razer Blade 15 Studio Edition OLED, 3840x2160, 15.6" | Razer Blade 15 RTX 2080 Max-Q IPS, 1920x1080, 15.6" | Lenovo ThinkPad P53-20QN000YGE IPS, 1920x1080, 15.6" | MSI P65 Creator 9SF-657 IPS, 3840x2160, 15.6" | Dell Precision 5540 OLED, 3840x2160, 15.6" | Fujitsu Celsius H780 IPS LED, 1920x1080, 15.6" | HP ZBook Studio G5-4QH10EA IPS LED, 3840x2160, 15.6" | |
|---|---|---|---|---|---|---|---|
| Display | -21% | -26% | -5% | 0% | -28% | -22% | |
| Display P3 Coverage (%) | 99.9 | 66.9 -33% | 63.2 -37% | 84.4 -16% | 99.9 0% | 66.3 -34% | 68.2 -32% |
| sRGB Coverage (%) | 100 | 98.1 -2% | 92.9 -7% | 100 0% | 100 0% | 85.9 -14% | 96.2 -4% |
| AdobeRGB 1998 Coverage (%) | 96.4 | 68.5 -29% | 64.3 -33% | 98.5 2% | 97.3 1% | 62.8 -35% | 68.8 -29% |
| Response Times | -244% | -855% | -1138% | 14% | -869% | -1324% | |
| Response Time Grey 50% / Grey 80% * (ms) | 3 ? | 12.8 ? -327% | 38.4 ? -1180% | 51 ? -1600% | 2.8 ? 7% | 38 ? -1167% | 60.8 ? -1927% |
| Response Time Black / White * (ms) | 4 ? | 10.4 ? -160% | 25.2 ? -530% | 31 ? -675% | 3.2 ? 20% | 26.8 ? -570% | 32.8 ? -720% |
| PWM Frequency (Hz) | 23810 ? | 26040 ? | 240.9 ? | 20830 ? | |||
| Screen | -164% | -203% | -336% | 17% | -180% | -177% | |
| Brightness middle (cd/m²) | 361 | 293 -19% | 510 41% | 445 23% | 427 18% | 271 -25% | 417 16% |
| Brightness (cd/m²) | 357 | 270 -24% | 468 31% | 462 29% | 411 15% | 260 -27% | 412 15% |
| Brightness Distribution (%) | 89 | 87 -2% | 89 0% | 83 -7% | 89 0% | 86 -3% | 85 -4% |
| Black Level * (cd/m²) | 0.015 | 0.29 -1833% | 0.36 -2300% | 0.5 -3233% | 0.29 -1833% | 0.29 -1833% | |
| Contrast (:1) | 24067 | 1010 -96% | 1417 -94% | 890 -96% | 934 -96% | 1438 -94% | |
| Colorchecker dE 2000 * | 5.3 | 1.69 68% | 2.3 57% | 4.75 10% | 3.2 40% | 3.9 26% | 4.4 17% |
| Colorchecker dE 2000 max. * | 11.5 | 3.37 71% | 5.5 52% | 7.79 32% | 8.4 27% | 10.2 11% | 6.7 42% |
| Colorchecker dE 2000 calibrated * | 4.7 | 1.24 74% | 1.2 74% | 2.8 40% | 2.9 38% | 1.9 60% | |
| Greyscale dE 2000 * | 2.1 | 2.3 -10% | 3.2 -52% | 4.49 -114% | 1.8 14% | 2.6 -24% | 5 -138% |
| Gamma | 2.14 103% | 2.3 96% | 2.34 94% | 2.49 88% | 2.15 102% | 2.29 96% | 2.28 96% |
| CCT | 6149 106% | 6758 96% | 7036 92% | 7374 88% | 6176 105% | 6517 100% | 7575 86% |
| Color Space (Percent of AdobeRGB 1998) (%) | 86 | 63 -27% | 59.4 -31% | 87 1% | 86.8 1% | 56.1 -35% | 62.3 -28% |
| Color Space (Percent of sRGB) (%) | 100 | 98.5 -1% | 93.1 -7% | 100 0% | 100 0% | 85.8 -14% | 96 -4% |
| Total Average (Program / Settings) | -143% /
-147% | -361% /
-251% | -493% /
-376% | 10% /
13% | -359% /
-238% | -508% /
-291% |
* ... smaller is better
The screen displays a good color accuracy ex-factory. At a DeltaE-2000 color deviation of 5.3, it does not reach the ideal value (DeltaE of less than 3), however. The display does not suffer from a blue tint. Our calibration only marginally improved the display's accuracy. Here, the color deviation dropped to 4.7 and the grayscale was depicted in a slightly more balanced manner. In terms of color-space coverage, the display achieves good results. More specifically, it reaches color-space coverage of 86% (AdobeRGB) and 100% (sRGB), respectively.


Display Response Times
| ↔ Response Time Black to White | ||
|---|---|---|
| 4 ms ... rise ↗ and fall ↘ combined | ↗ 2 ms rise |  |
| ↘ 2 ms fall | ||
| The screen shows very fast response rates in our tests and should be very well suited for fast-paced gaming. In comparison, all tested devices range from 0.1 (minimum) to 240 (maximum) ms. » 16 % of all devices are better. This means that the measured response time is better than the average of all tested devices (19.8 ms). | ||
| ↔ Response Time 50% Grey to 80% Grey | ||
| 3 ms ... rise ↗ and fall ↘ combined | ↗ 1 ms rise | 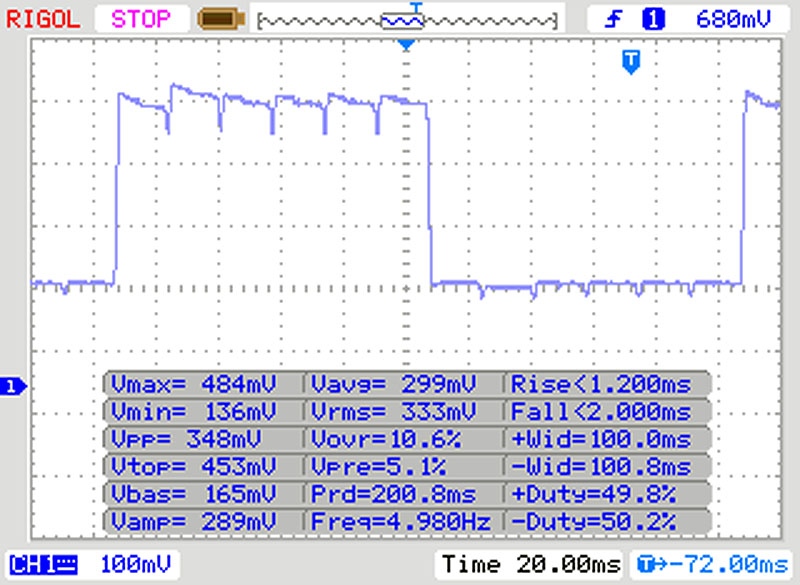 |
| ↘ 2 ms fall | ||
| The screen shows very fast response rates in our tests and should be very well suited for fast-paced gaming. In comparison, all tested devices range from 0.165 (minimum) to 636 (maximum) ms. » 13 % of all devices are better. This means that the measured response time is better than the average of all tested devices (31 ms). | ||
Screen Flickering / PWM (Pulse-Width Modulation)
| Screen flickering / PWM not detected | 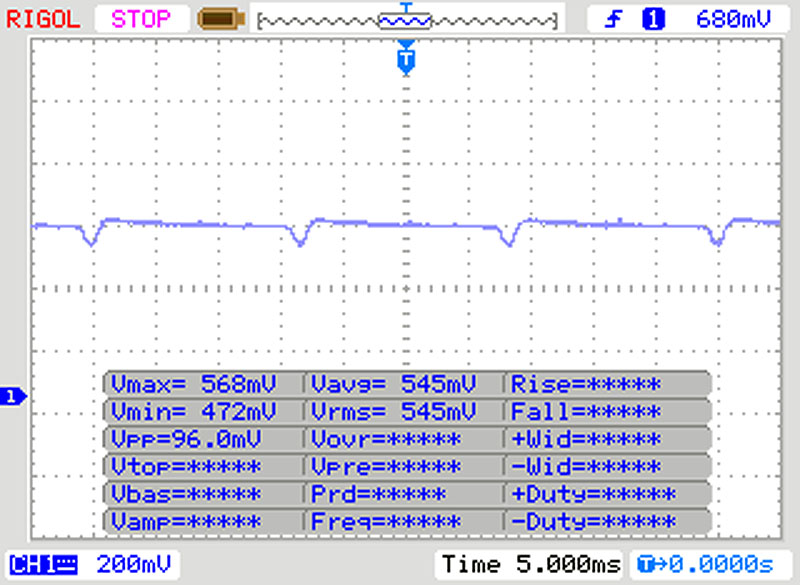 | ||
In comparison: 52 % of all tested devices do not use PWM to dim the display. If PWM was detected, an average of 7763 (minimum: 5 - maximum: 343500) Hz was measured. | |||
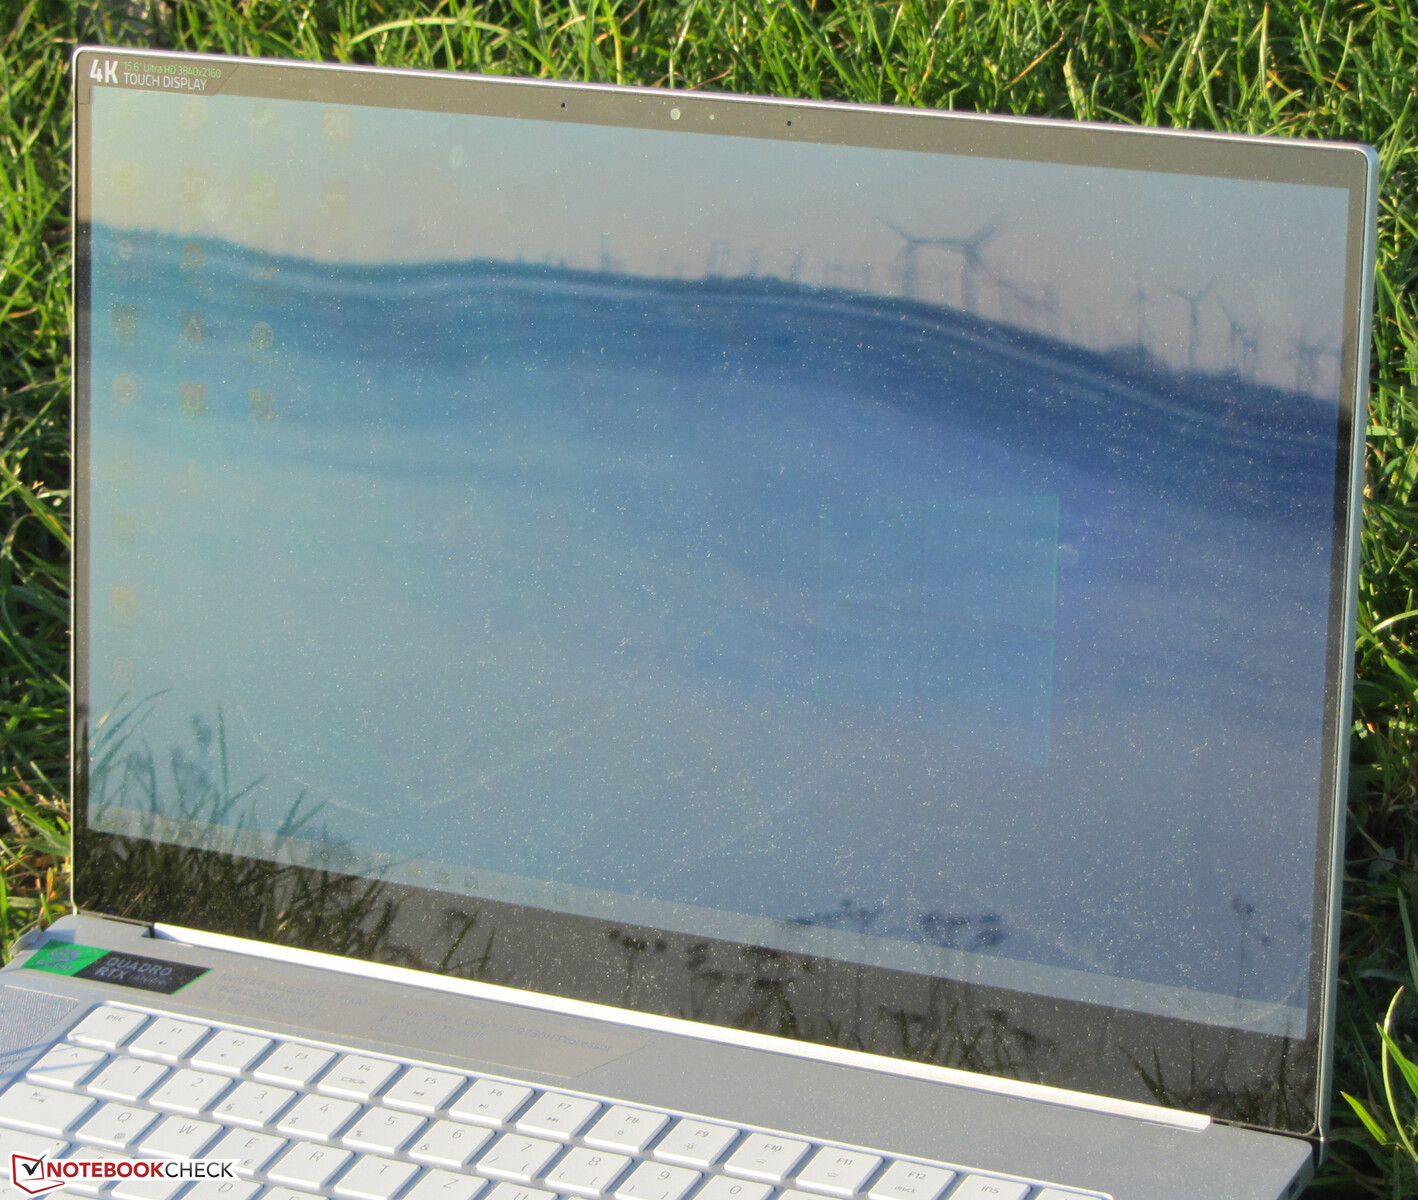
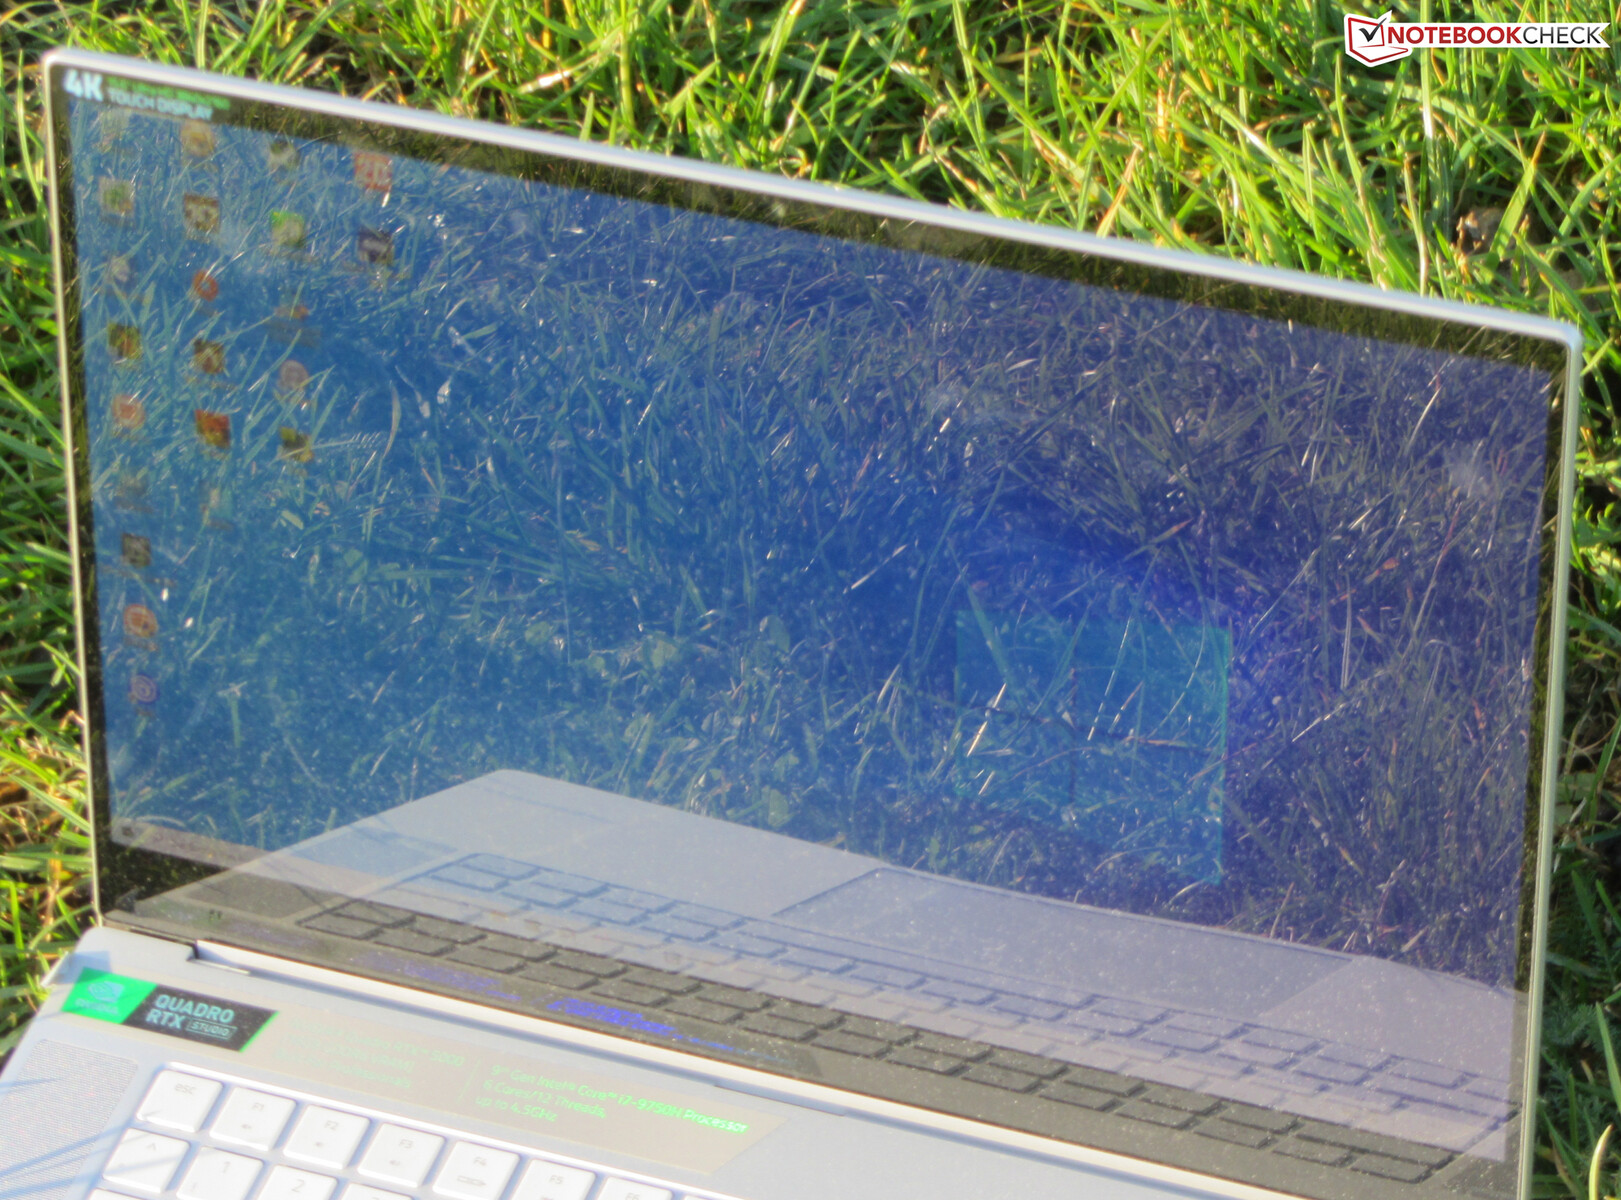
Razer uses an OLED panel with good viewing angles in this version of the Blade. Display content is discernible from any position. This also applies to outdoor use, as long as the sun does not shine too brightly. Otherwise, the glossy display negatively impacts the visual experience.
Performance - Sufficient for All Use Cases
With the Blade 15 Studio Edition, Razer has created a 15.6-inch workstation with more than enough performance for all common usage scenarios. Our test configuration can be purchased for approximately 4,400 Euros (~$4,878). There are no other configurations available at this time.

Test Conditions
The preinstalled Razer Synapse Software gives users control over the fan speeds as well as the CPU and GPU performance. All of our tests have been performed using the automatic fan control and the power profile "Balanced". We also performed some benchmarks with the CPU and GPU performance set to their maximum levels. The results can be found in the comparison tables and we will point out non-default settings if applicable.
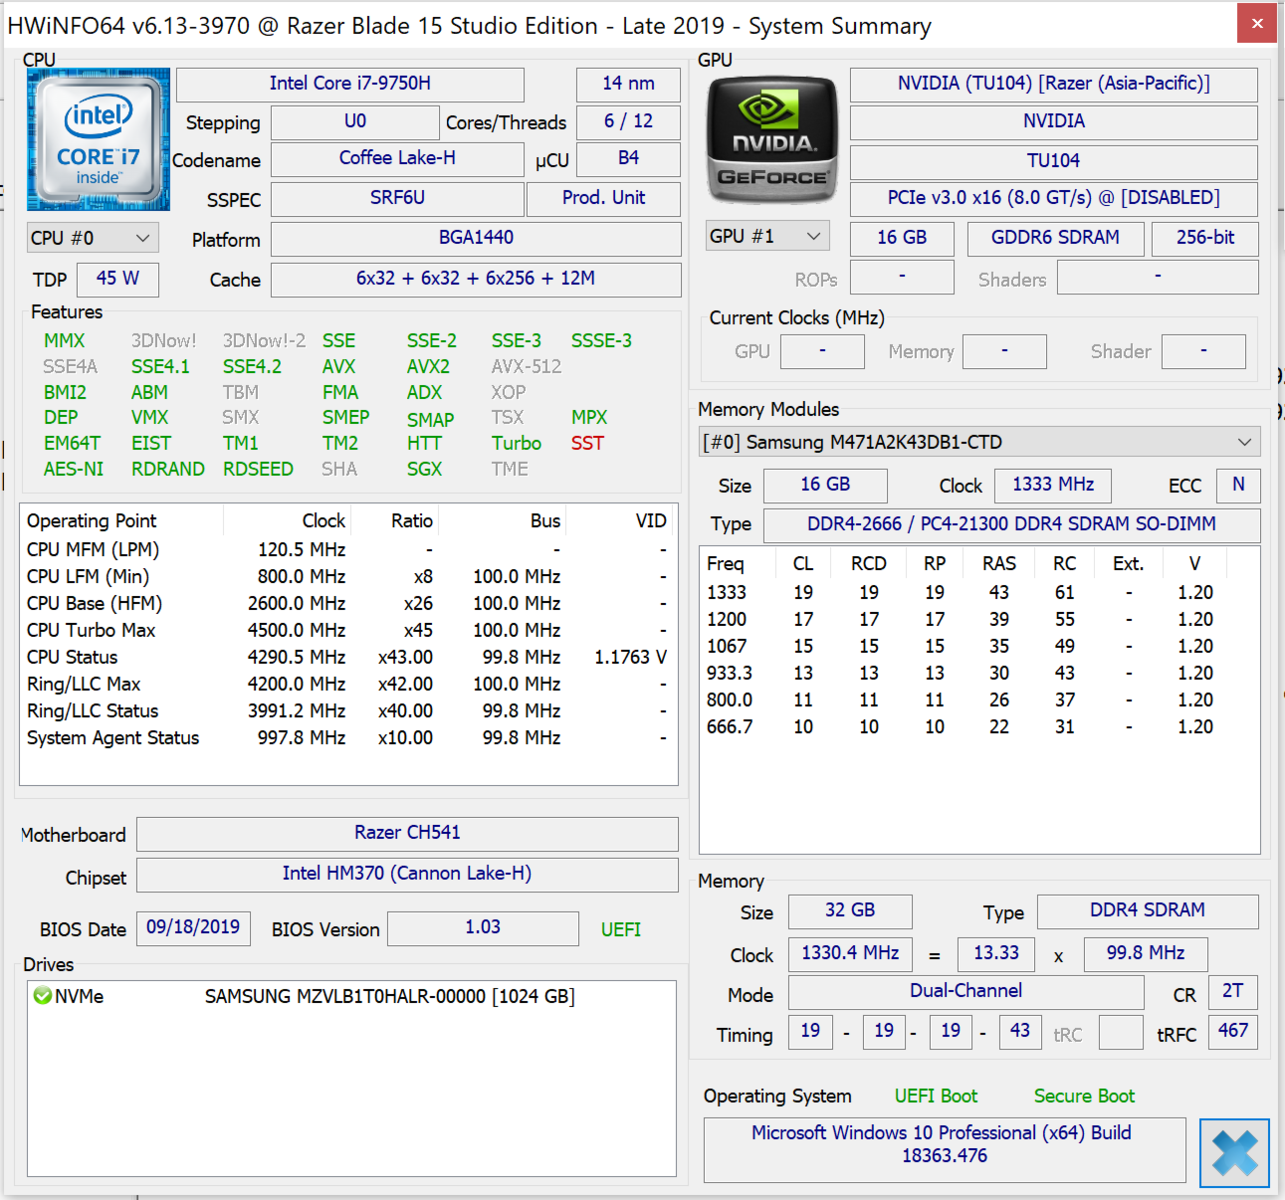
Processor
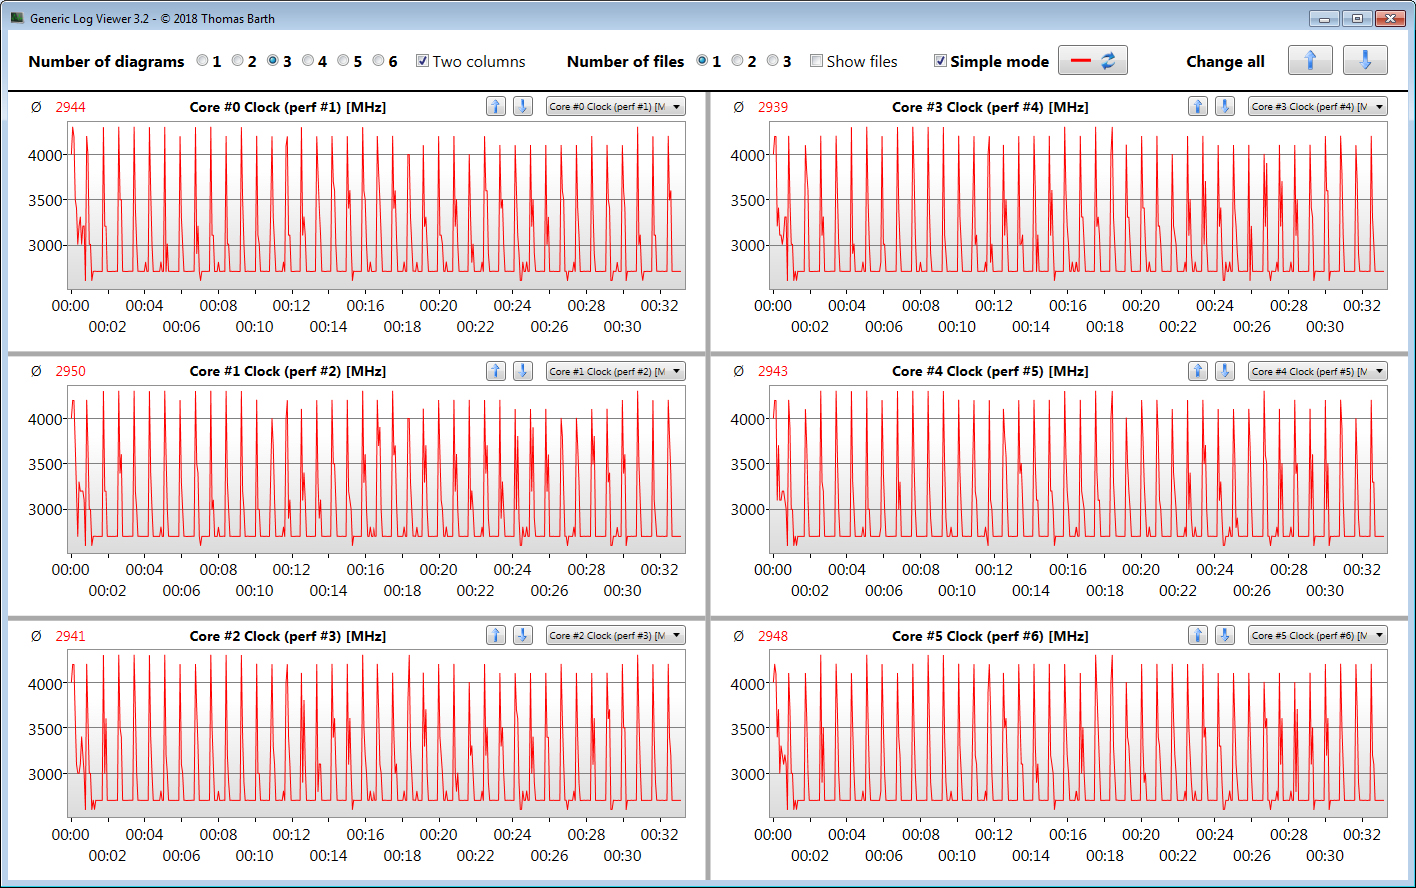
The Blade 15 is powered by a six-core Core-i7-9750H (Coffee Lake refresh). The CPU runs at a base clock of 2.6 GHz. The maximum Turbo Boost frequencies are 4 GHz (on all six cores), 4.1 GHz (five cores), 4.2 (four cores), 4.3 GHz (three cores) or 4.5 GHz (one core).
During the Cinebench R15 multithread test, we recorded clock speeds between 2.9 and 3.4 GHz. Subsequently, the clock rate drops to 2.7 GHz. During the single-thread test, the processor runs at 4 to 4.3 GHz. In battery mode, these values are reduced to 2.5 to 2.6 GHz (multithread) or 2.1 to 2.9 GHz (single-thread).
By running the Cinebench R15 multithread benchmark in a loop for at least 30 minutes, we test the CPU's ability to maintain its Turbo Boost indefinitely. The results begin to drop by the third loop and then stabilize at a relatively consistent level. During this, a frequency slightly above the base clock is maintained.
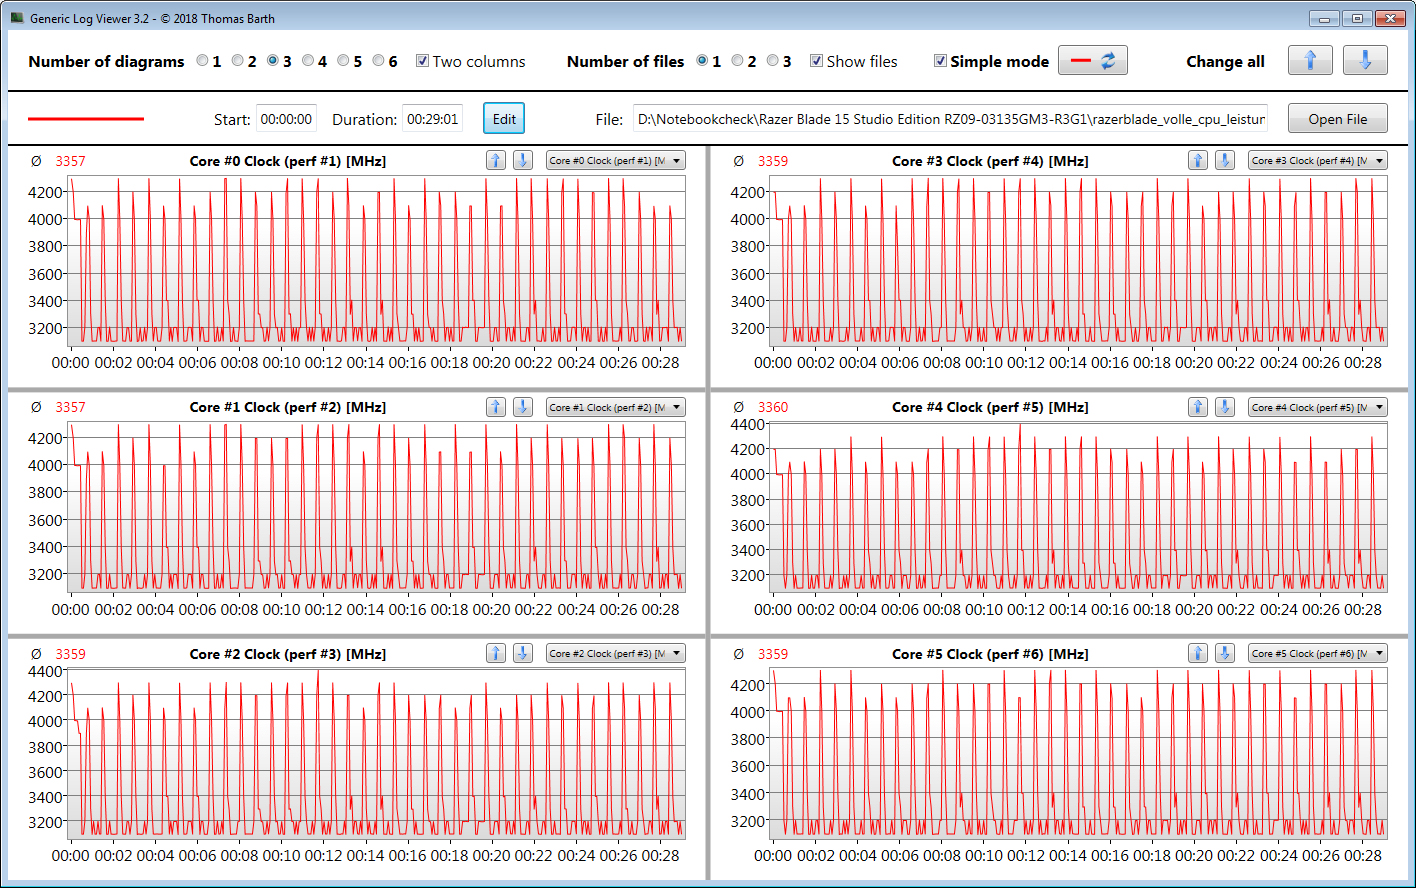
The results of the Cinebench R15 loop are disappointing. Here, the processor does not exhaust its capabilities. This can be fixed, however. After setting the CPU performance to its maximum in Razer's Synapse software, the Studio Edition of the Blade 15 achieves scores that are almost identical to those of the Advanced Model, which is equipped with the same CPU.
| Cinebench R15 | |
| CPU Single 64Bit | |
| Average of class Workstation (191.4 - 328, n=24, last 2 years) | |
| Lenovo ThinkPad P53-20QN000YGE | |
| MSI P65 Creator 9SF-657 | |
| Dell Precision 5540 | |
| Fujitsu Celsius H780 | |
| Average Intel Core i7-9750H (170 - 194, n=82) | |
| Razer Blade 15 Studio Edition (Max. CPU-Leistung) | |
| Razer Blade 15 Studio Edition | |
| HP ZBook Studio G5-4QH10EA | |
| Razer Blade 15 RTX 2080 Max-Q | |
| CPU Multi 64Bit | |
| Average of class Workstation (2489 - 5810, n=24, last 2 years) | |
| MSI P65 Creator 9SF-657 | |
| Dell Precision 5540 | |
| Lenovo ThinkPad P53-20QN000YGE | |
| Average Intel Core i7-9750H (952 - 1306, n=85) | |
| Razer Blade 15 RTX 2080 Max-Q | |
| Razer Blade 15 Studio Edition (Max. CPU-Leistung) | |
| HP ZBook Studio G5-4QH10EA | |
| Fujitsu Celsius H780 | |
| Razer Blade 15 Studio Edition | |
| Cinebench R10 | |
| Rendering Single 32Bit | |
| Dell Precision 5540 | |
| Average of class Workstation (n=1last 2 years) | |
| Average Intel Core i7-9750H (6659 - 7214, n=13) | |
| Razer Blade 15 Studio Edition | |
| Rendering Multiple CPUs 32Bit | |
| Average of class Workstation (n=1last 2 years) | |
| Dell Precision 5540 | |
| Average Intel Core i7-9750H (28251 - 36304, n=13) | |
| Razer Blade 15 Studio Edition | |
| Cinebench R20 | |
| CPU (Single Core) | |
| Average of class Workstation (671 - 857, n=24, last 2 years) | |
| Average Intel Core i7-9750H (416 - 486, n=55) | |
| Razer Blade 15 Studio Edition (Max. CPU-Leistung) | |
| Razer Blade 15 Studio Edition | |
| CPU (Multi Core) | |
| Average of class Workstation (5760 - 15043, n=24, last 2 years) | |
| Average Intel Core i7-9750H (2017 - 3133, n=55) | |
| Razer Blade 15 Studio Edition (Max. CPU-Leistung) | |
| Razer Blade 15 Studio Edition | |
| Geekbench 3 | |
| 32 Bit Multi-Core Score | |
| Average Intel Core i7-9750H (21185 - 23587, n=8) | |
| Razer Blade 15 Studio Edition | |
| 32 Bit Single-Core Score | |
| Razer Blade 15 Studio Edition | |
| Average Intel Core i7-9750H (4137 - 4428, n=8) | |
| Mozilla Kraken 1.1 - Total | |
| HP ZBook Studio G5-4QH10EA (Edge) | |
| Razer Blade 15 RTX 2080 Max-Q (Edge 44.17763.1.0) | |
| Razer Blade 15 Studio Edition (Edge 44) | |
| Average Intel Core i7-9750H (845 - 1713, n=54) | |
| Lenovo ThinkPad P53-20QN000YGE (Edge 44.18362.387.0) | |
| Dell Precision 5540 | |
| Average of class Workstation (411 - 538, n=24, last 2 years) | |
| Octane V2 - Total Score | |
| Average of class Workstation (92715 - 129420, n=4, last 2 years) | |
| Dell Precision 5540 | |
| Lenovo ThinkPad P53-20QN000YGE (Edge 44.18362.387.0) | |
| Razer Blade 15 RTX 2080 Max-Q (Edge 44.17763.1.0) | |
| Average Intel Core i7-9750H (22874 - 39708, n=47) | |
| Razer Blade 15 Studio Edition (Edge 44) | |
| HP ZBook Studio G5-4QH10EA (Edge) | |
| JetStream 1.1 - 1.1 Total | |
| Lenovo ThinkPad P53-20QN000YGE (Edge 44.18362.387.0) | |
| Razer Blade 15 RTX 2080 Max-Q (Edge 44.17763.1.0) | |
| Fujitsu Celsius H780 (Edge) | |
| Average Intel Core i7-9750H (212 - 280, n=47) | |
| Dell Precision 5540 | |
| Razer Blade 15 Studio Edition (Edge 44) | |
| HP ZBook Studio G5-4QH10EA (Edge) | |
* ... smaller is better
System Performance
The 15.6-inch device does not lack system performance. A strong six-core processor, dual-channel memory and a fast NVMe SSD ensure smooth, responsive system operation. On top of that, the laptop contains a high-end GPU. As the very good PCMark benchmark scores show, the laptop's performance is high enough for all common use cases.
| PCMark 8 Home Score Accelerated v2 | 3551 points | |
| PCMark 8 Creative Score Accelerated v2 | 3820 points | |
| PCMark 8 Work Score Accelerated v2 | 4454 points | |
| PCMark 10 Score | 5317 points | |
Help | ||
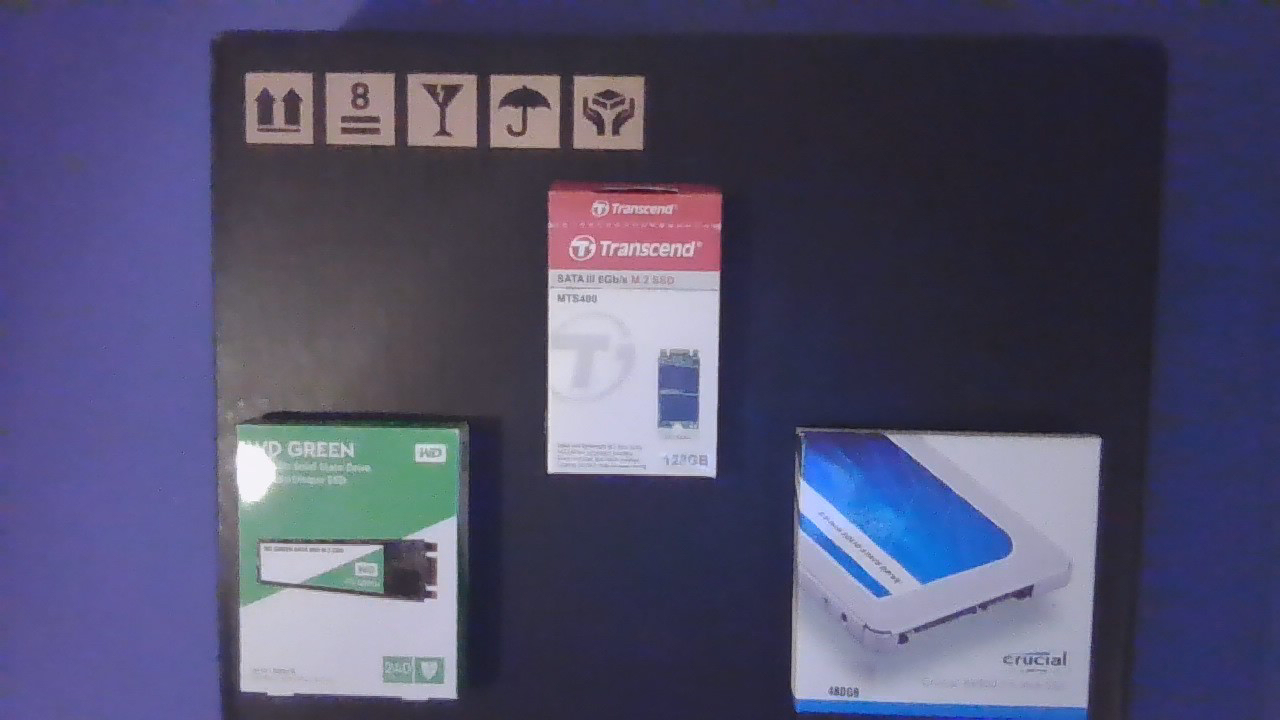
Storage Solution
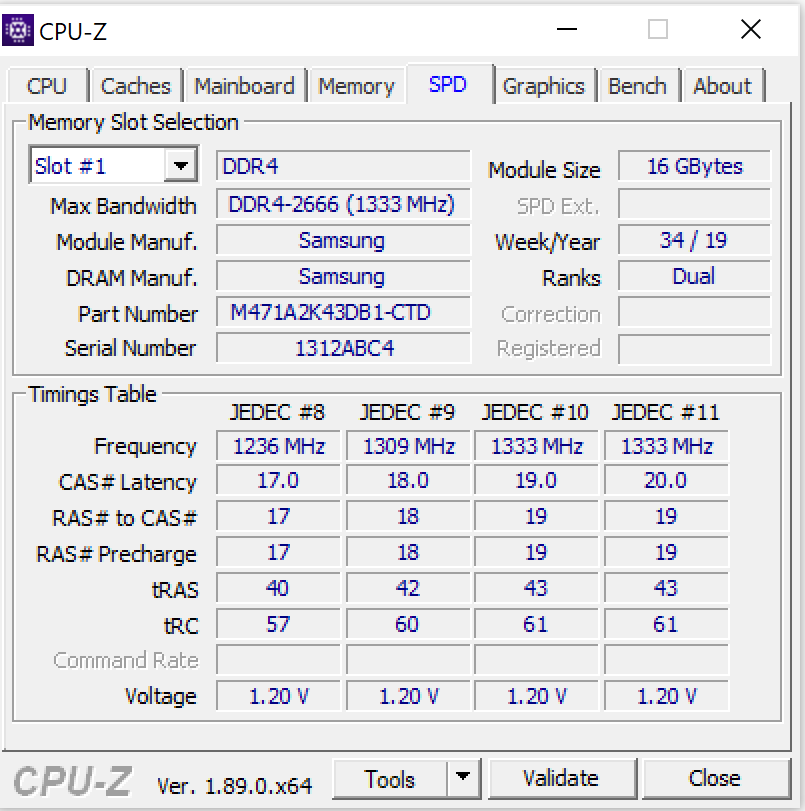
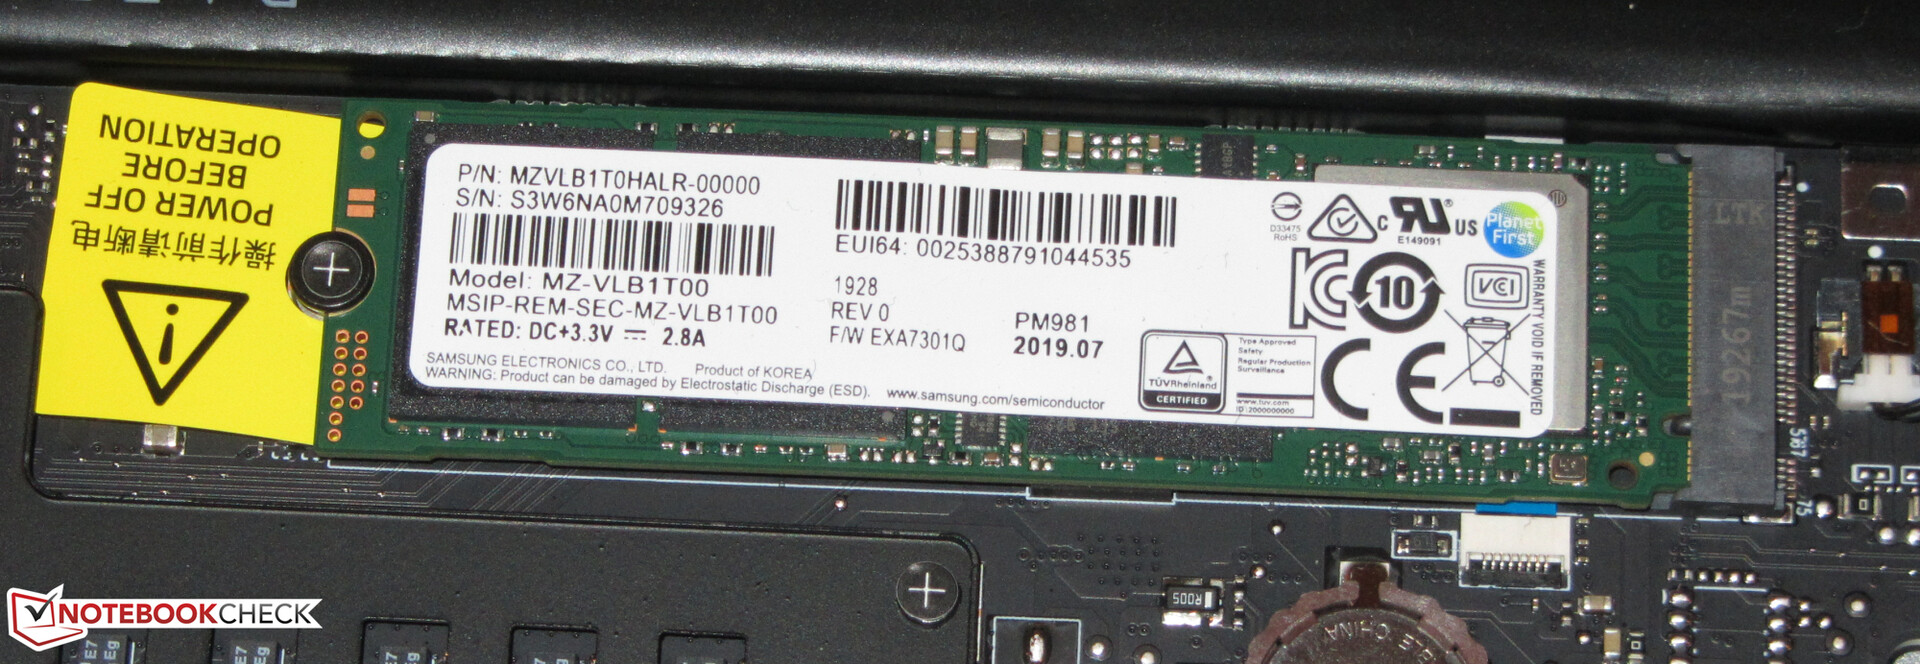
A Samsung NVMe SSD serves as the system drive. This particular model comes in the M.2-2280 form factor and offers 1 TB of storage space. Around 887 GB is available to users ex-factory. The remaining storage space is occupied by the recovery partition and Windows files. Thanks to the PCI Express interface, the SSD achieves outstanding data transfer rates.

| Razer Blade 15 Studio Edition Samsung SSD PM981 MZVLB1T0HALR | Razer Blade 15 RTX 2080 Max-Q Samsung SSD PM981 MZVLB512HAJQ | Lenovo ThinkPad P53-20QN000YGE Samsung PM981a MZVLB1T0HBLR | MSI P65 Creator 9SF-657 2x Samsung SSD PM981 MZVLB512HAJQ (RAID 0) | Dell Precision 5540 SK hynix PC400 512 GB | Fujitsu Celsius H780 Samsung SSD PM981 MZVLB512HAJQ | HP ZBook Studio G5-4QH10EA Samsung SSD PM981 MZVLB512HAJQ | Average Samsung SSD PM981 MZVLB1T0HALR | |
|---|---|---|---|---|---|---|---|---|
| CrystalDiskMark 5.2 / 6 | 16% | 26% | 56% | -4% | -2% | -4% | 25% | |
| Write 4K (MB/s) | 100.4 | 137.2 37% | 147 46% | 105.6 5% | 98 -2% | 98.3 -2% | 102.7 2% | 165.7 ? 65% |
| Read 4K (MB/s) | 42.03 | 46.82 11% | 48.3 15% | 46.32 10% | 41.25 -2% | 40.18 -4% | 38.32 -9% | 44.6 ? 6% |
| Write Seq (MB/s) | 1185 | 1221 3% | 1402 18% | 2910 146% | 1295 9% | 1777 50% | 1417 20% | 1982 ? 67% |
| Read Seq (MB/s) | 1132 | 1217 8% | 1503 33% | 2820 149% | 1441 27% | 1247 10% | 1289 14% | 1764 ? 56% |
| Write 4K Q32T1 (MB/s) | 371.4 | 527 42% | 475.2 28% | 545 47% | 429.2 16% | 344.7 -7% | 278.9 -25% | 395 ? 6% |
| Read 4K Q32T1 (MB/s) | 422.6 | 614 45% | 581 37% | 632 50% | 400.1 -5% | 383.1 -9% | 348.8 -17% | 434 ? 3% |
| Write Seq Q32T1 (MB/s) | 2379 | 1986 -17% | 2936 23% | 3349 41% | 1366 -43% | 2019 -15% | 1895 -20% | 2351 ? -1% |
| Read Seq Q32T1 (MB/s) | 3222 | 3234 0% | 3539 10% | 3333 3% | 2201 -32% | 2076 -36% | 3352 4% | 3234 ? 0% |
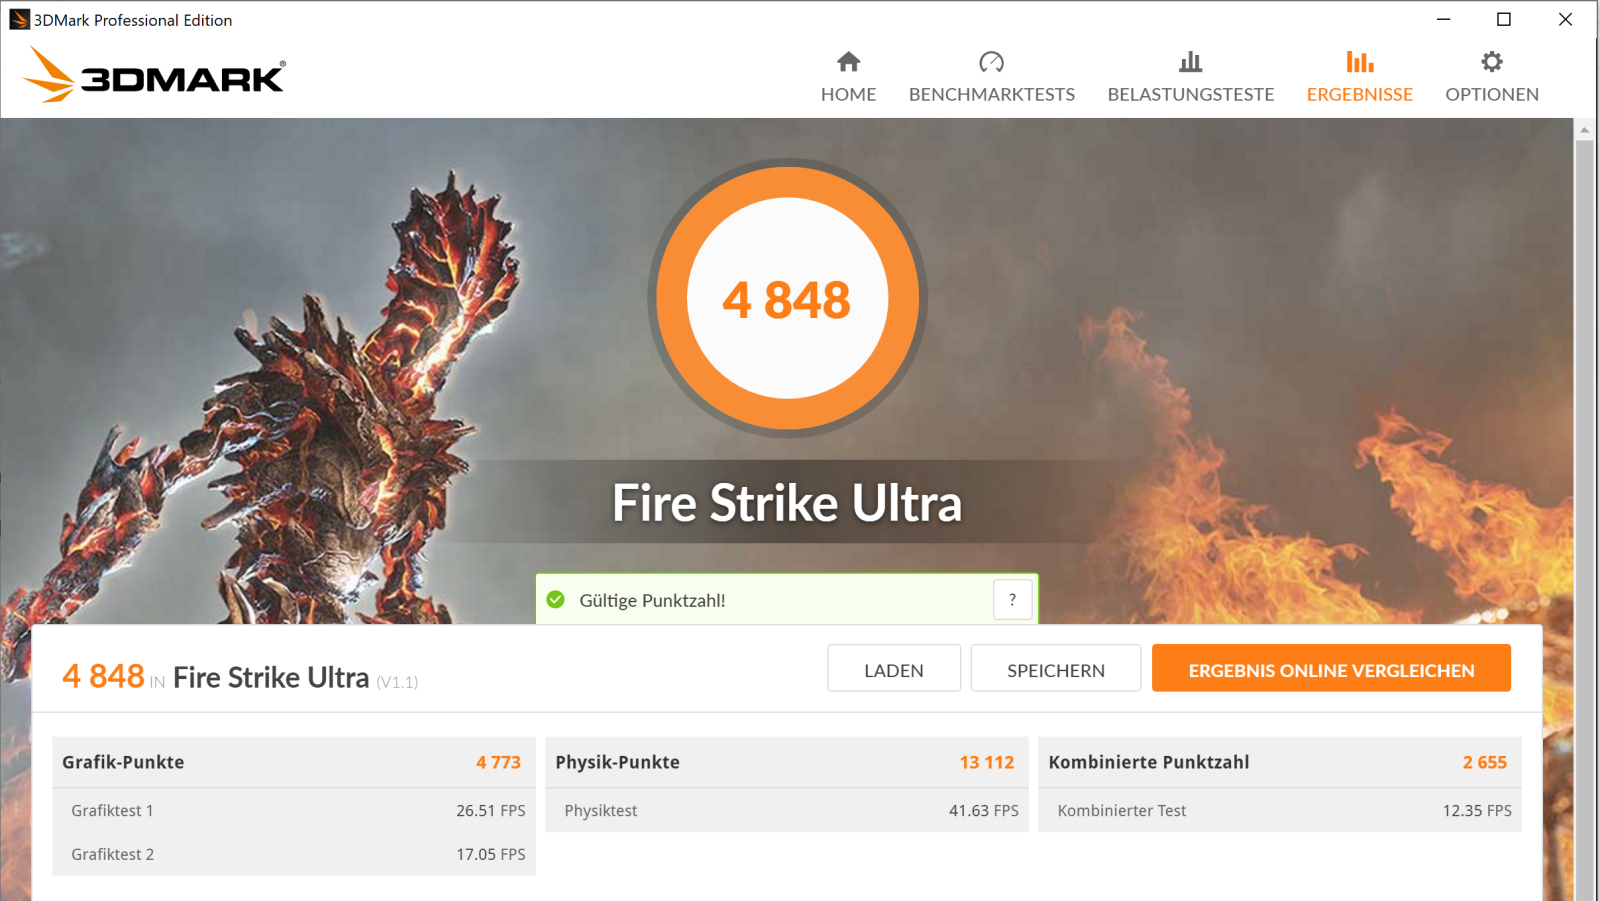
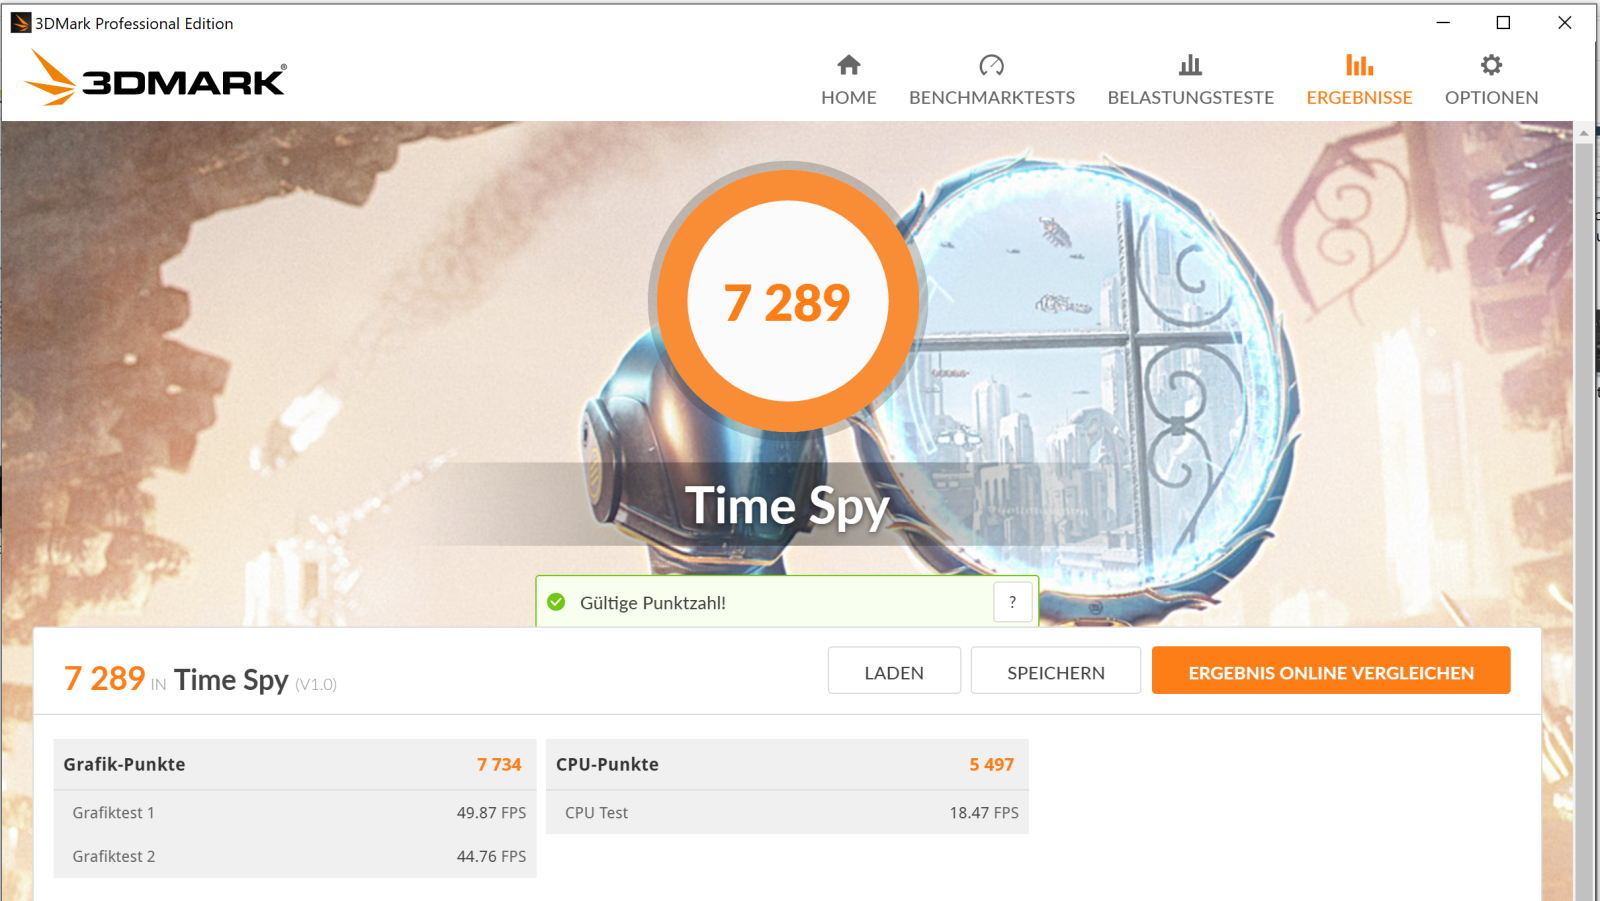
GPU Performance
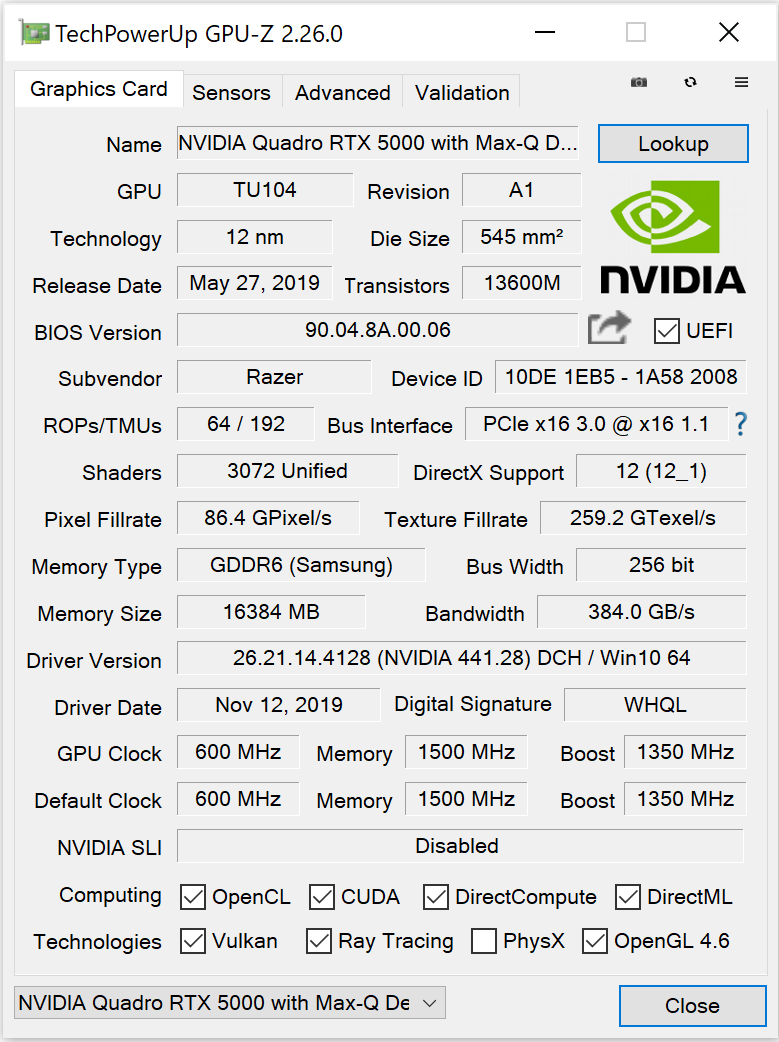
The Blade is equipped with a Quadro RTX 5000 Max-Q GPU from Nvidia. This version of the regular RTX 5000 has been optimized for efficiency, making it a particularly good fit for thin and light laptops. The GPU is based on the Turing architecture and is the professional counterpart of the GeForce RTX 2080 Max-Q GPU. It has access to fast GDDR6 memory (16.384 GB).
The RTX 5000 Max-Q has a base clock of 600 MHz. This clock rate can be increased to up to 1,350 MHz via Turbo Boost. While the GPU remains below a predefined temperature or energy threshold, even higher frequencies are possible. We measured a maximum clock speed of 1,815 MHz. The GPU runs with an average clock speed of 1,180 MHz during our The Witcher 3 test.
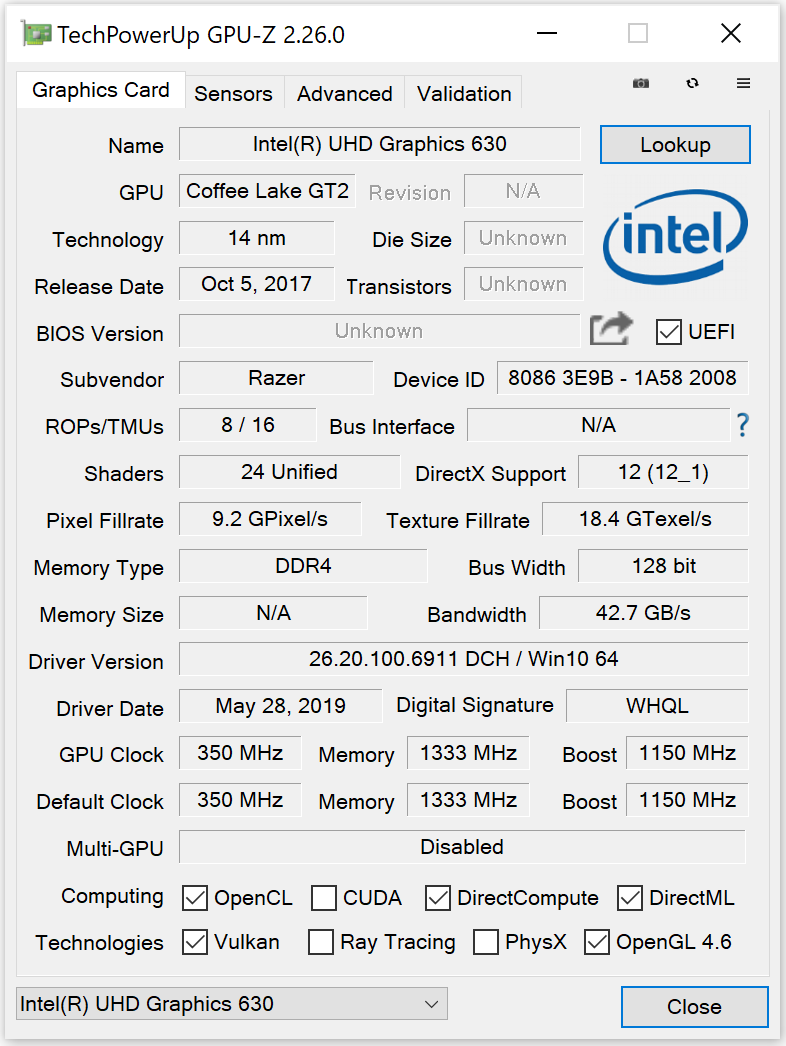
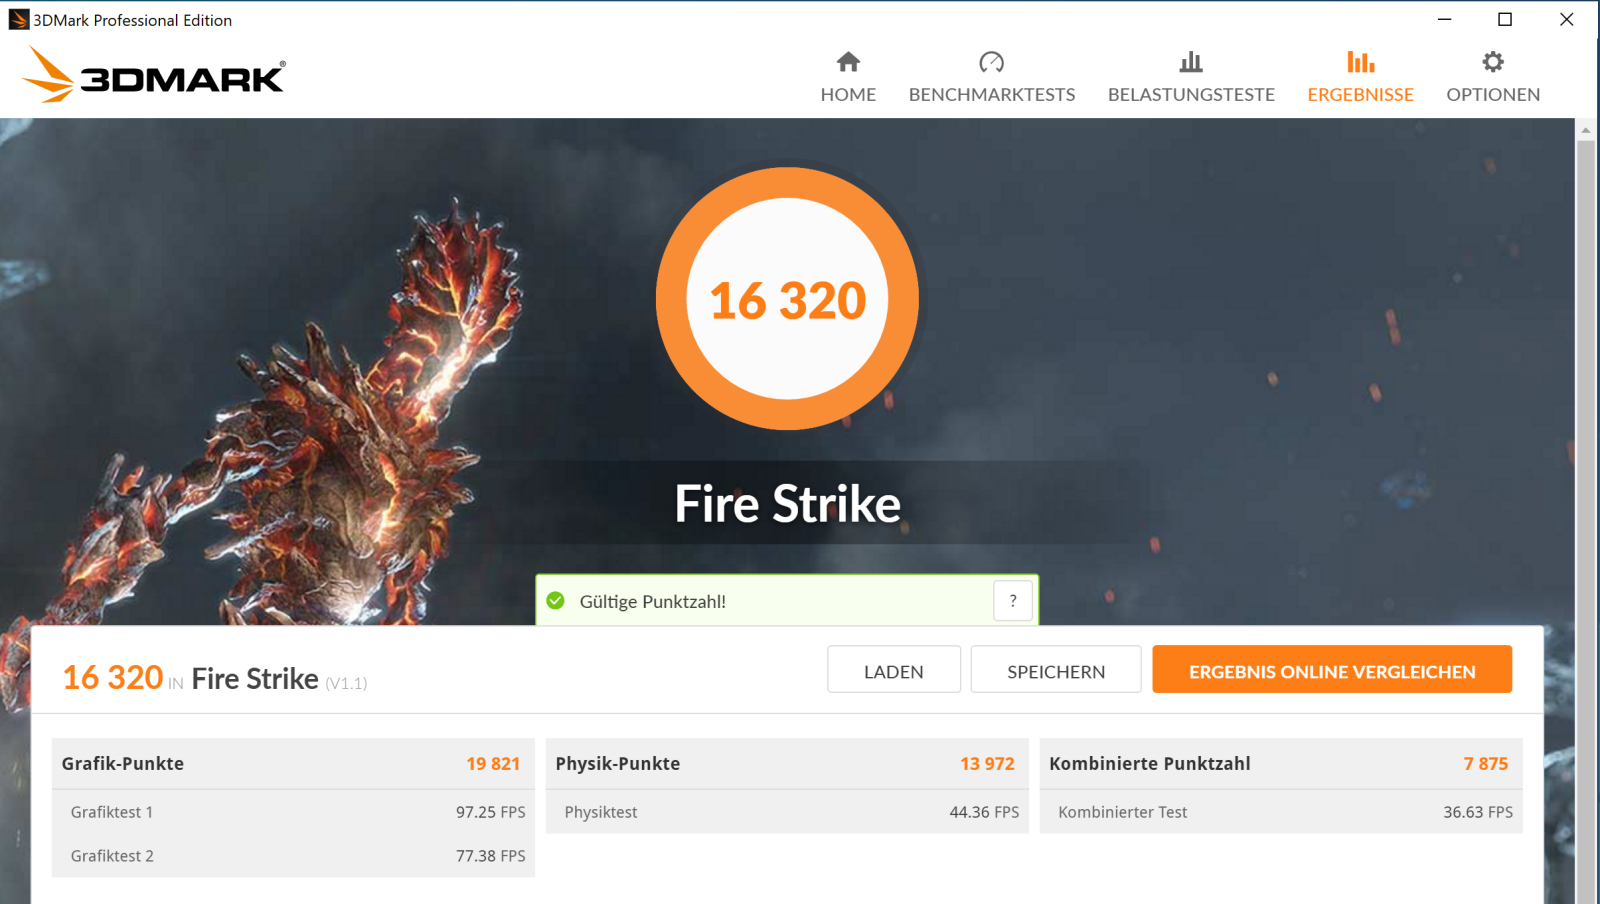
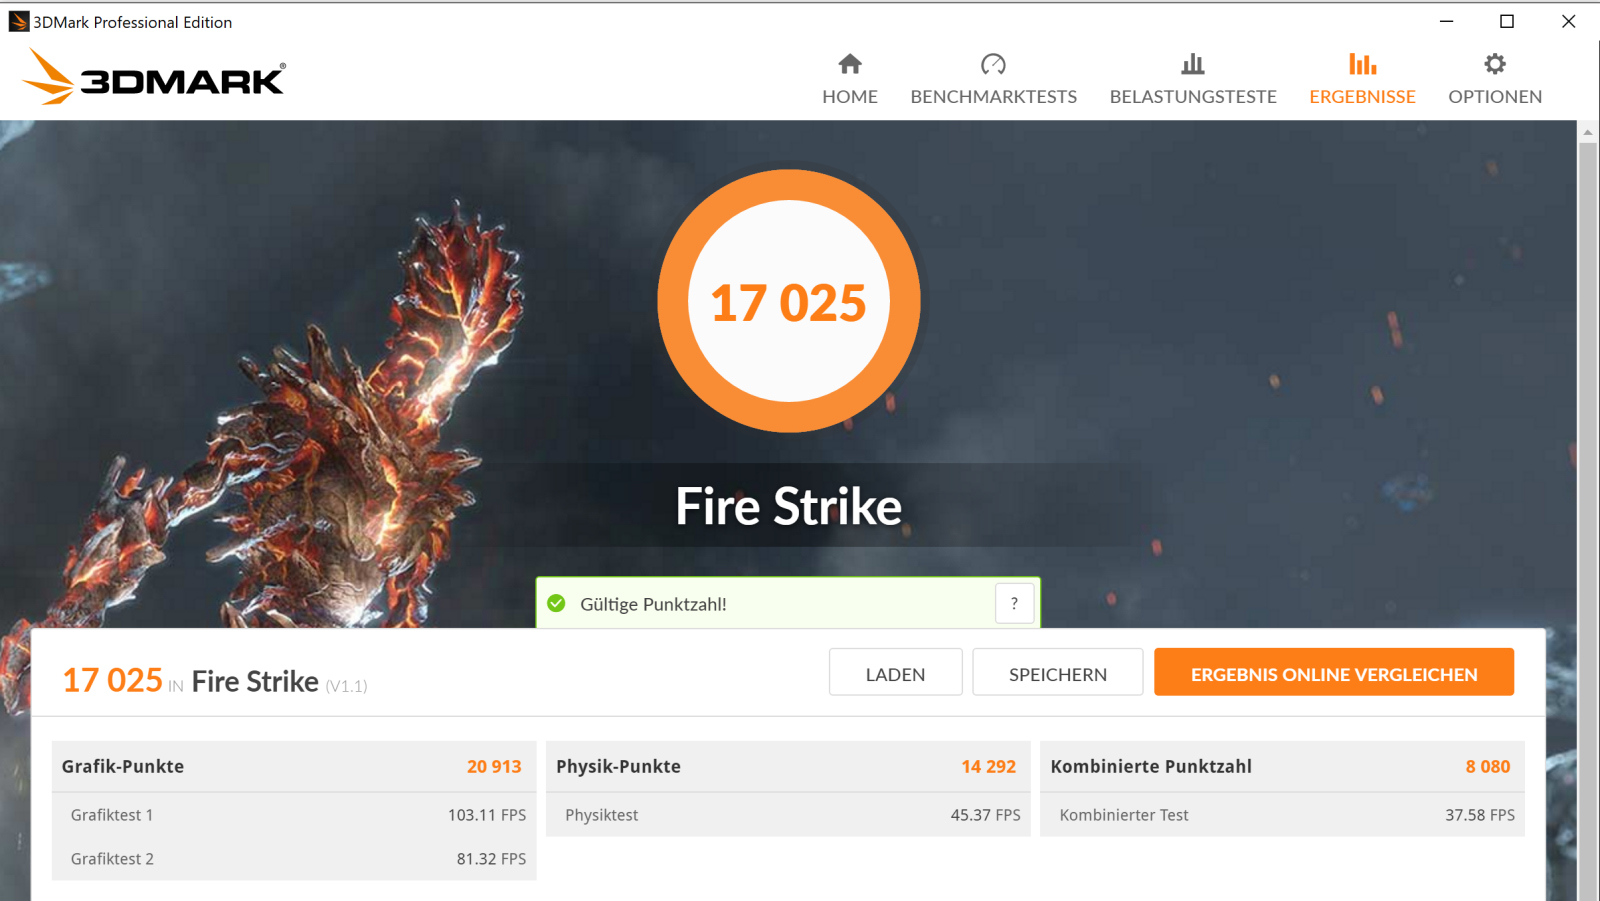
The 3DMark results match our expectations. The processor's integrated UHD Graphics 630 GPU is active and the laptop uses Nvidia's graphics-switching technology, Optimus.
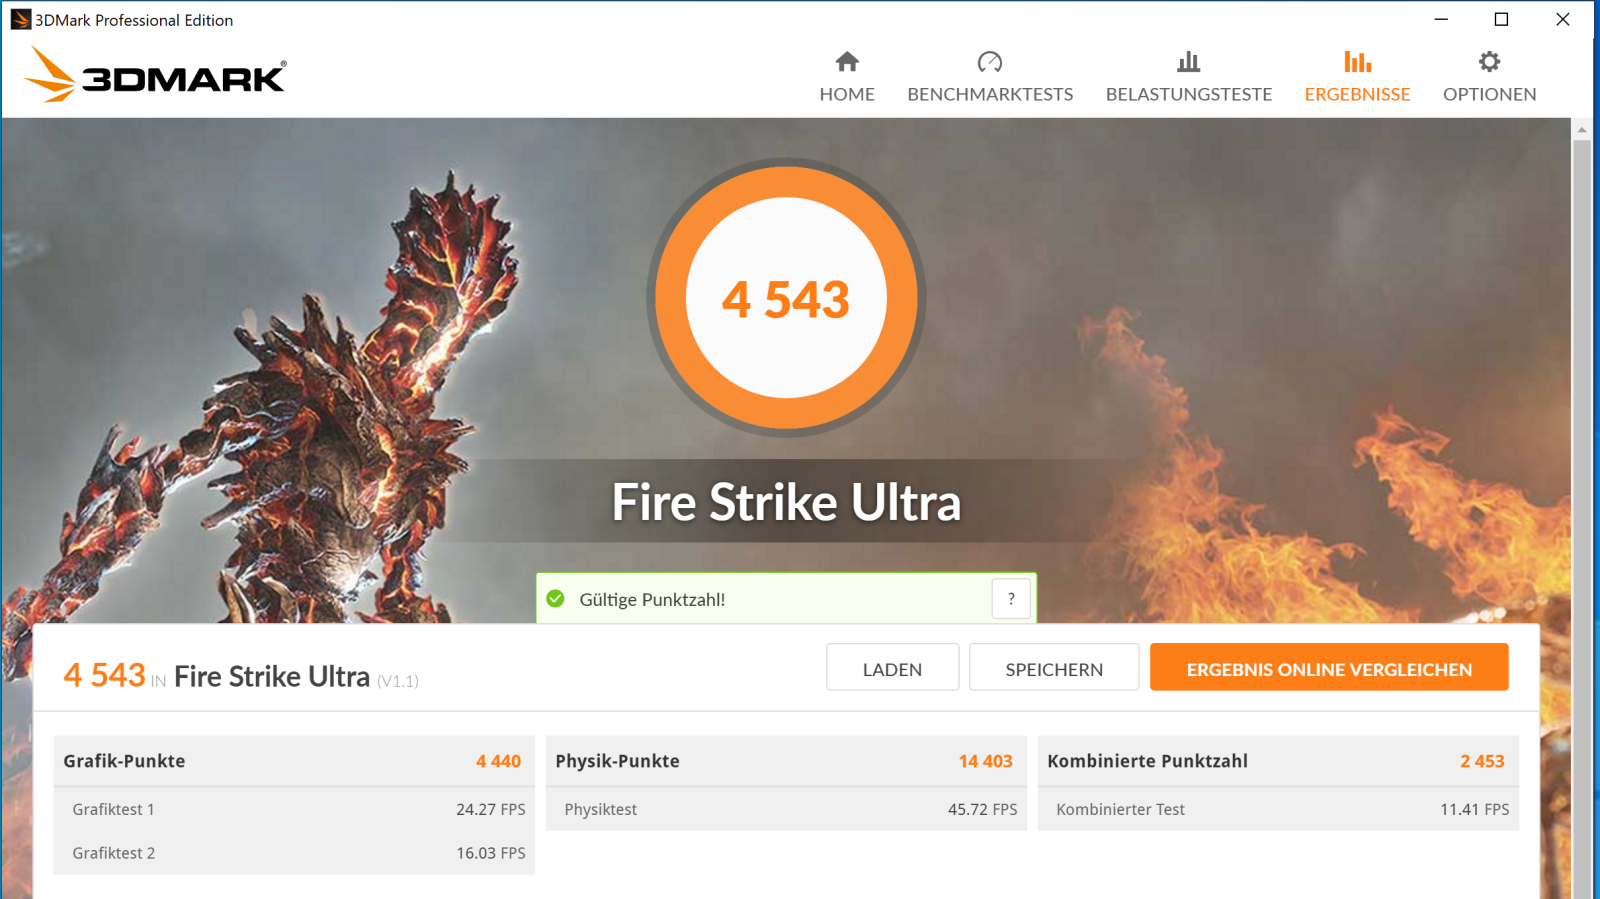
There are three variants of the RTX 5000 Max-Q GPU with TGPs of 80, 85, and 90 watts. Our test device is equipped with the 80-watt model. If maximum GPU performance is selected from within the Razer Synapse software, the TGP is increased to 85 watts. As a result, the performance is slightly increased and the benchmark scores are slightly improved. Our The Witcher 3 test below illustrates this.


| 3DMark Vantage P Result | 52289 points | |
| 3DMark 11 Performance | 19787 points | |
| 3DMark Ice Storm Standard Score | 66054 points | |
| 3DMark Cloud Gate Standard Score | 25769 points | |
| 3DMark Fire Strike Score | 16320 points | |
| 3DMark Time Spy Score | 6801 points | |
Help | ||
Gaming Performance
The Razer laptop is able to display all of the games in our database smoothly. Usually, high to maximum quality settings can be chosen at Full HD resolution. The GPU can also handle resolutions above Full HD. However, the quality settings then may have to be reduced - particularly at 4K.
| The Witcher 3 - 1920x1080 Ultra Graphics & Postprocessing (HBAO+) | |
| Razer Blade 15 Studio Edition (Max. CPU, max. GPU) | |
| Razer Blade 15 Studio Edition | |
| Average NVIDIA Quadro RTX 5000 Max-Q (71 - 88.5, n=10) | |
| MSI P65 Creator 9SF-657 | |
| Razer Blade 15 RTX 2080 Max-Q | |
| Average of class Workstation (51 - 91.7, n=2, last 2 years) | |
| Lenovo ThinkPad P53-20QN000YGE | |
| Dell Precision 5540 | |
| Fujitsu Celsius H780 | |
| HP ZBook Studio G5-4QH10EA | |
| BioShock Infinite - 1920x1080 Ultra Preset, DX11 (DDOF) | |
| Razer Blade 15 RTX 2080 Max-Q | |
| Average NVIDIA Quadro RTX 5000 Max-Q (167.2 - 174.3, n=3) | |
| Razer Blade 15 Studio Edition | |
| MSI P65 Creator 9SF-657 | |
| Dell Precision 5540 | |
| HP ZBook Studio G5-4QH10EA | |
| Dirt Rally 2.0 - 1920x1080 Ultra Preset AA:T AF:16x | |
| Razer Blade 15 Studio Edition | |
| Average NVIDIA Quadro RTX 5000 Max-Q (89.3 - 90.7, n=2) | |
| Lenovo ThinkPad P53-20QN000YGE | |
| Total War: Three Kingdoms - 1920x1080 Ultra (incl textures) | |
| Razer Blade 15 Studio Edition | |
| Average NVIDIA Quadro RTX 5000 Max-Q (57.5 - 64.9, n=2) | |
| The Division 2 - 1920x1080 Ultra Preset | |
| Razer Blade 15 Studio Edition | |
| Average NVIDIA Quadro RTX 5000 Max-Q (n=1) | |
| Anno 1800 - 1920x1080 Ultra Graphics Quality (DX11) | |
| Lenovo ThinkPad P53-20QN000YGE | |
| Average NVIDIA Quadro RTX 5000 Max-Q (37.4 - 38.9, n=2) | |
| Razer Blade 15 Studio Edition | |
In order to test whether the frame rates remain consistent over a prolonged period of time, we ran The Witcher 3 for around 60 minutes at Full HD and maximum graphics settings. The character portrayed by the player was not moved for the entire duration of the test. While the frame rates did vary slightly, they consistently remained on a playable level.

| low | med. | high | ultra | QHD | 4K | |
|---|---|---|---|---|---|---|
| BioShock Infinite (2013) | 320.5 | 283.2 | 265 | 167.2 | ||
| GTA V (2015) | 169.1 | 163.4 | 132.3 | 72 | 89.1 | |
| The Witcher 3 (2015) | 286.9 | 229.5 | 144.8 | 83.3 | 49.2 | |
| Rainbow Six Siege (2015) | 254.8 | 226.7 | 191.8 | 183.4 | 86.9 | |
| Ashes of the Singularity (2016) | 84.4 | 77.7 | 75.4 | 42.3 | ||
| For Honor (2017) | 246.1 | 162.1 | 156 | 123.2 | 48.1 | |
| Ghost Recon Wildlands (2017) | 130.4 | 91.9 | 85.7 | 58.7 | 38.6 | |
| Middle-earth: Shadow of War (2017) | 113 | 108 | 98 | 86 | 38 | |
| Final Fantasy XV Benchmark (2018) | 87 | 82.3 | 65.8 | 30.6 | ||
| X-Plane 11.11 (2018) | 96.3 | 84.9 | 72.2 | 56.6 | ||
| World of Tanks enCore (2018) | 595 | 367.5 | 175.5 | 109.6 | 52.3 | |
| Assassin´s Creed Odyssey (2018) | 95 | 80 | 75 | 54 | 47 | 30 |
| Battlefield V (2018) | 139.4 | 130.8 | 120.4 | 112.1 | 91.6 | 53.5 |
| Apex Legends (2019) | 144 | 144 | 144 | 142.8 | 104.9 | 53.4 |
| Far Cry New Dawn (2019) | 104 | 90 | 88 | 81 | 74 | 43 |
| Metro Exodus (2019) | 115.2 | 87.8 | 66.9 | 55.4 | 25.4 | 25.2 |
| Dirt Rally 2.0 (2019) | 241.2 | 169.4 | 153 | 90.7 | 70.2 | 39.8 |
| The Division 2 (2019) | 144 | 112 | 97 | 56 | 51 | 27 |
| Anno 1800 (2019) | 95.8 | 90.9 | 69.3 | 37.4 | 34.7 | 21.2 |
| Rage 2 (2019) | 224 | 114.8 | 96.4 | 94.3 | 59.4 | 28.7 |
| Total War: Three Kingdoms (2019) | 218.6 | 120.2 | 87.3 | 64.9 | 43.5 | 21.5 |
| F1 2019 (2019) | 192 | 165 | 131 | 118 | 86 | 56 |
| Control (2019) | 223.5 | 93.2 | 66.5 | 42.7 | 19.1 | |
| Borderlands 3 (2019) | 118.8 | 99.9 | 78.4 | 62.5 | 42.9 | 22.8 |
| Ghost Recon Breakpoint (2019) | 117 | 96 | 92 | 68 | 49 | 28 |
| GRID 2019 (2019) | 131.5 | 107.8 | 96.2 | 87.2 | 62.7 | 38.6 |
| Call of Duty Modern Warfare 2019 (2019) | 185.2 | 130.6 | 103.6 | 91.8 | 65.2 | 35.2 |
| Need for Speed Heat (2019) | 92.3 | 84.4 | 77.5 | 72.1 | 65.4 | 36.9 |
| Star Wars Jedi Fallen Order (2019) | 88.5 | 83.1 | 80.4 | 64 | 33.5 |
Emissions - Razer 15 Studio with Moderate Noise Levels and Temperatures
System Noise
Despite the powerful hardware on the inside, the noise levels of the Blade can be described as moderate. During idle, the fans often stand still and the system makes no noise at all. In less-demanding applications the fans mostly remain passive as well. By contrast, they are more present when the system is under medium and heavy load. During the stress test, for example, we register a sound pressure level of 41 dB(A). In the 3DMark06 benchmark, the noise level averages 43 dB(A).
Noise level
| Idle |
| 30.6 / 30.6 / 30.6 dB(A) |
| Load |
| 43 / 41 dB(A) |
 | ||
30 dB silent 40 dB(A) audible 50 dB(A) loud |
||
min: | ||
| Razer Blade 15 Studio Edition i7-9750H, Quadro RTX 5000 Max-Q | Razer Blade 15 RTX 2080 Max-Q i7-9750H, GeForce RTX 2080 Max-Q | Lenovo ThinkPad P53-20QN000YGE i7-9850H, Quadro RTX 5000 Max-Q | MSI P65 Creator 9SF-657 i9-9880H, GeForce RTX 2070 Max-Q | Dell Precision 5540 i9-9980HK, Quadro T2000 Max-Q | Fujitsu Celsius H780 i7-8850H, Quadro P2000 | HP ZBook Studio G5-4QH10EA i7-8750H, Quadro P1000 | Average NVIDIA Quadro RTX 5000 Max-Q | Average of class Workstation | |
|---|---|---|---|---|---|---|---|---|---|
| Noise | 6% | 12% | -4% | 10% | -6% | 5% | 3% | 9% | |
| off / environment * (dB) | 30.6 | 28.3 8% | 28.3 8% | 30.2 1% | 28.6 7% | 29.6 3% | 28.6 7% | 27.5 ? 10% | 24.1 ? 21% |
| Idle Minimum * (dB) | 30.6 | 28.8 6% | 28.3 8% | 32.8 -7% | 28.6 7% | 29.6 3% | 28.6 7% | 28.7 ? 6% | 24.8 ? 19% |
| Idle Average * (dB) | 30.6 | 28.8 6% | 28.3 8% | 32.8 -7% | 28.6 7% | 32.2 -5% | 28.6 7% | 28.7 ? 6% | 25.4 ? 17% |
| Idle Maximum * (dB) | 30.6 | 29 5% | 28.3 8% | 33.6 -10% | 28.6 7% | 37 -21% | 30 2% | 28.7 ? 6% | 26.7 ? 13% |
| Load Average * (dB) | 43 | 33.5 22% | 29.8 31% | 40.9 5% | 33.3 23% | 40.3 6% | 38.1 11% | 41 ? 5% | 39.2 ? 9% |
| Load Maximum * (dB) | 41 | 45.2 -10% | 38.3 7% | 42.7 -4% | 38 7% | 49.4 -20% | 42.5 -4% | 46.7 ? -14% | 50.6 ? -23% |
| Witcher 3 ultra * (dB) | 45 | 38.3 | 34.7 | 35 |
* ... smaller is better
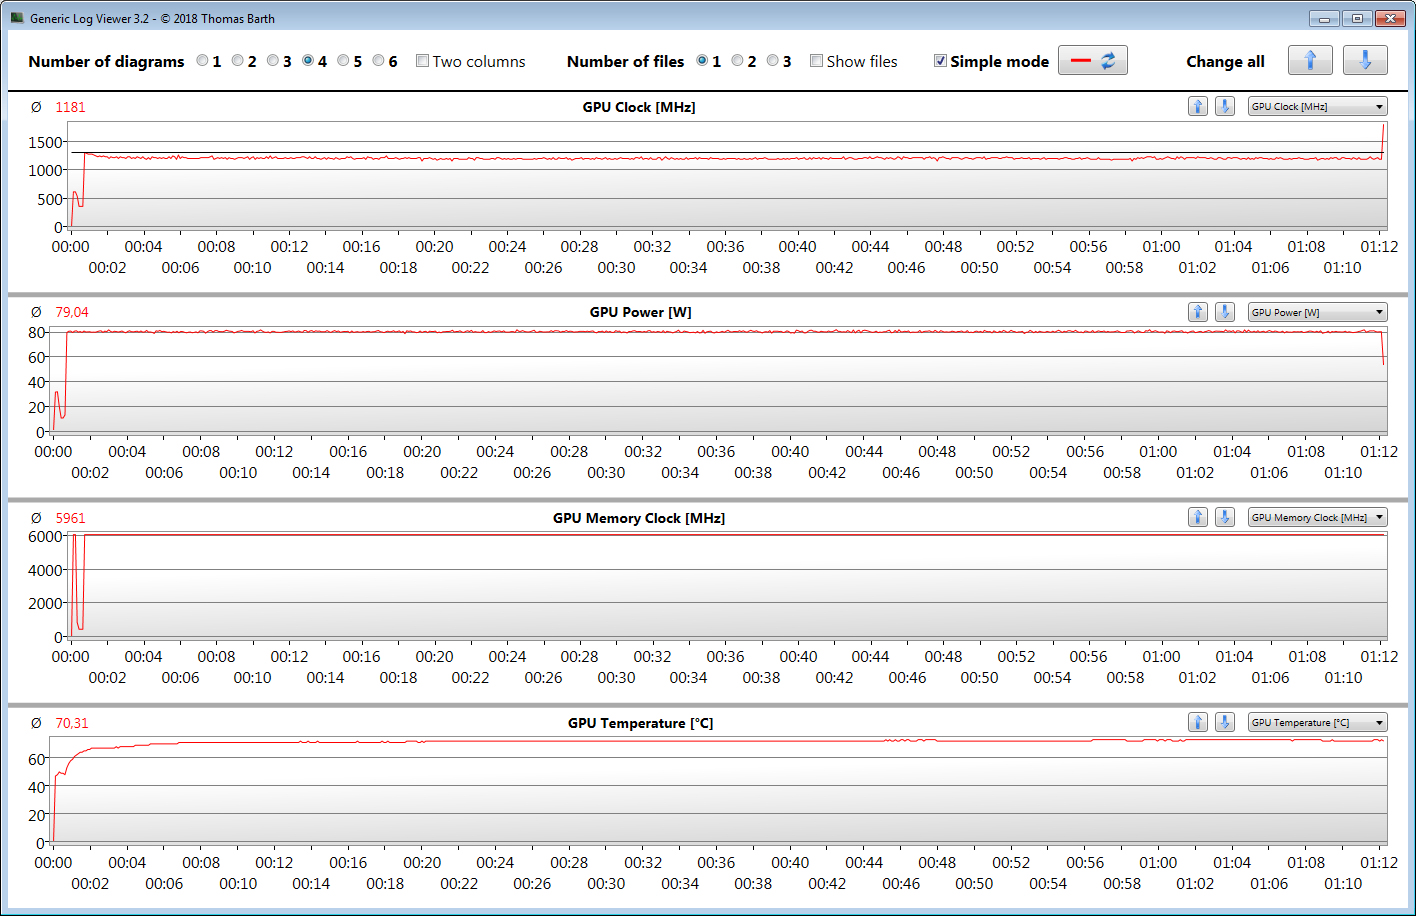
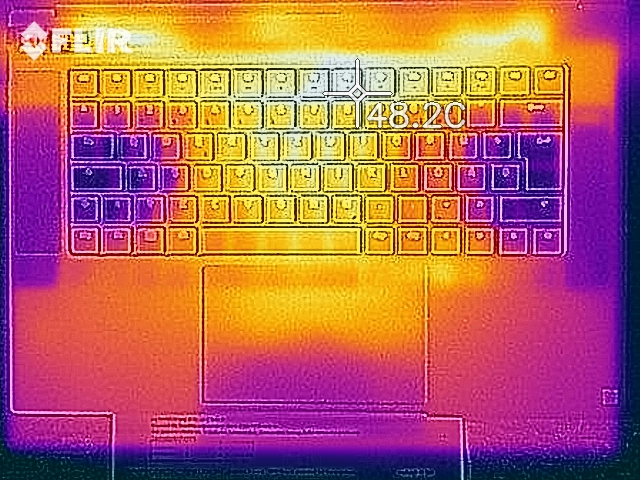
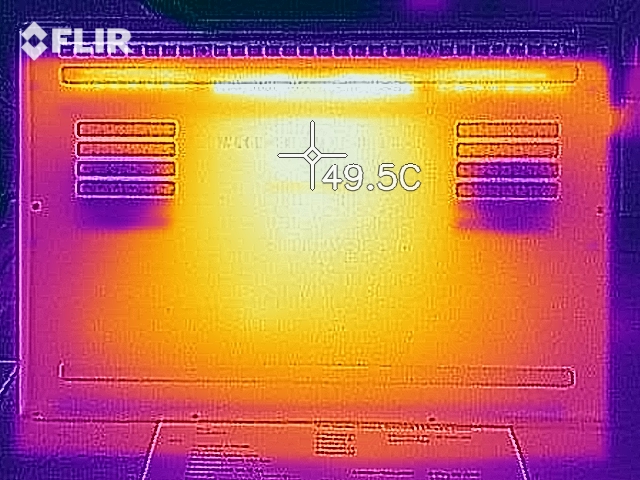
Temperature
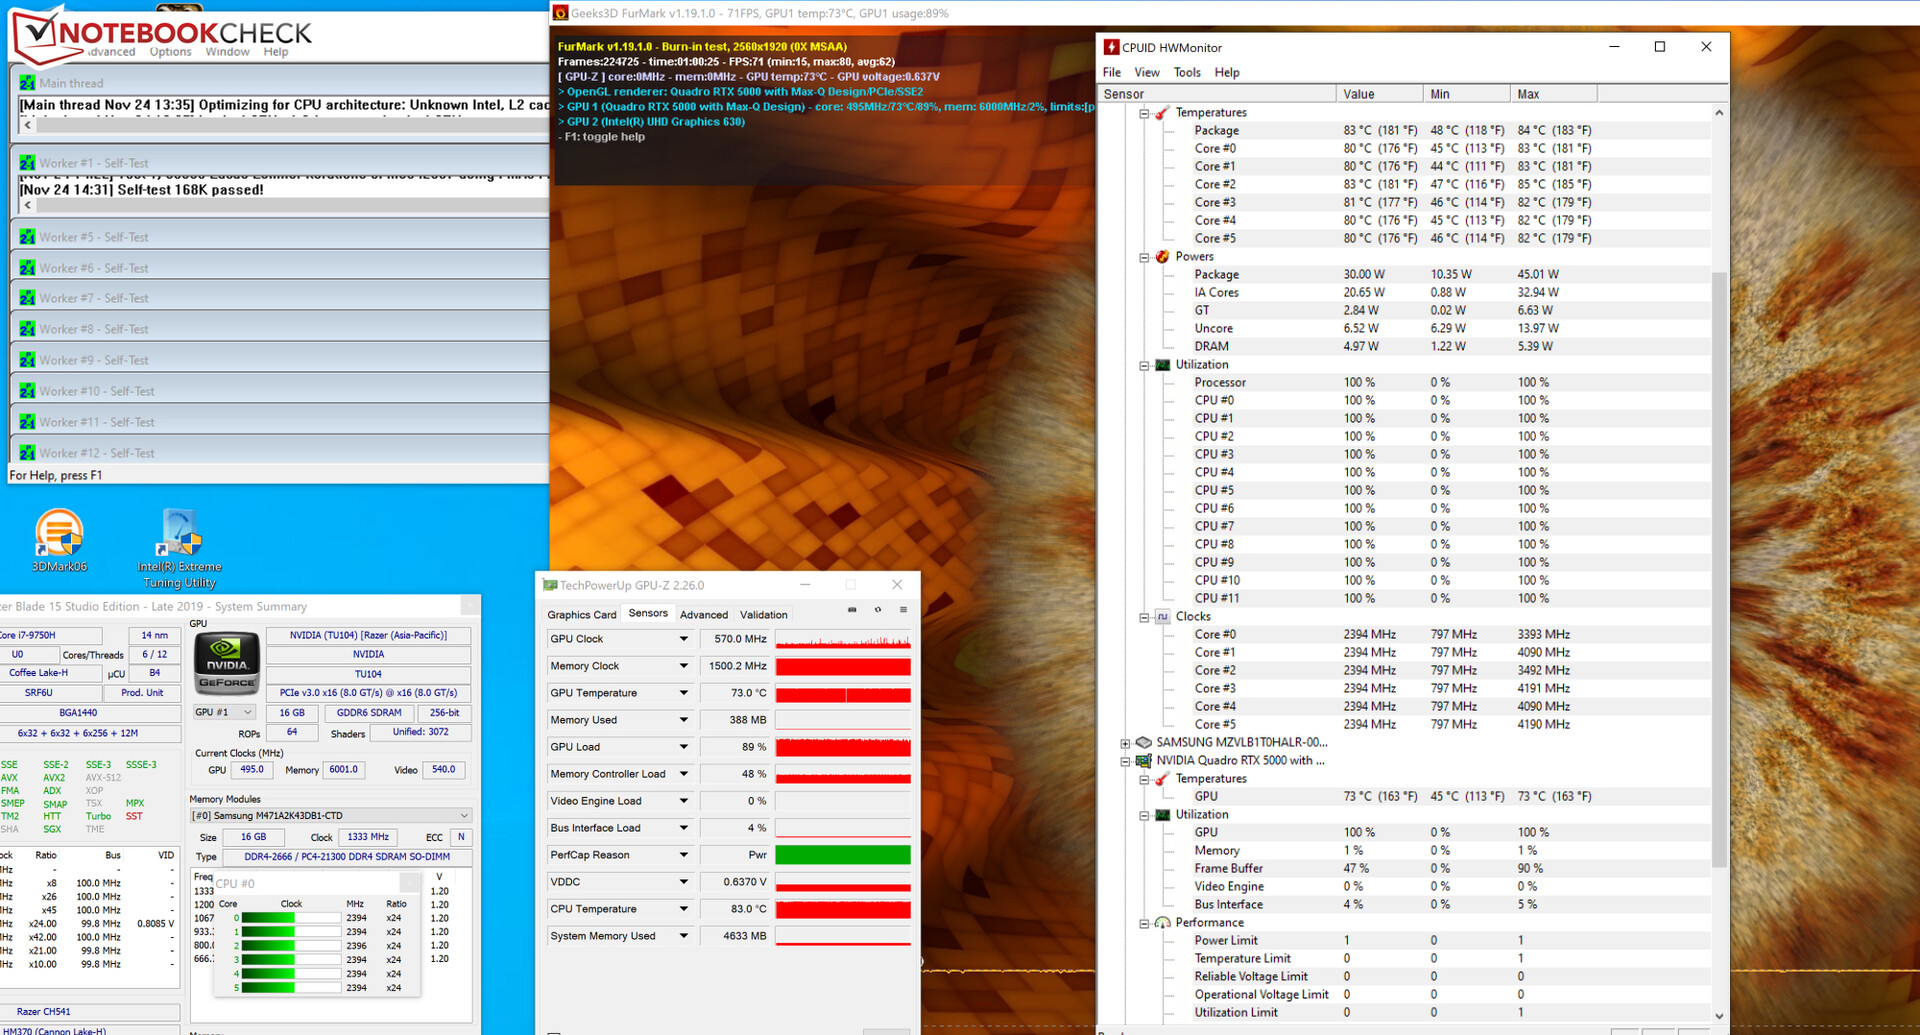
The results of our stress test (Prime95 and FurMark run for at least one hour) vary, depending on whether the workstation is connected to an outlet or running in battery mode. The processor's initial clock speed of 2.5 to 2.6 GHz eventually drops to 2.4 GHz, where it stabilizes. For the majority of time, the graphics chip runs at 500 to 600 MHz. In battery mode, the CPU clock usually runs at 800 MHz with a single core occasionally spiking to 1.9 GHz. The GPU operates at speeds of around 1,100 MHz. The stress test represents an extreme scenario that does not occur during daily use. We use this test to determine whether the system remains stable at 100% CPU/GPU load.
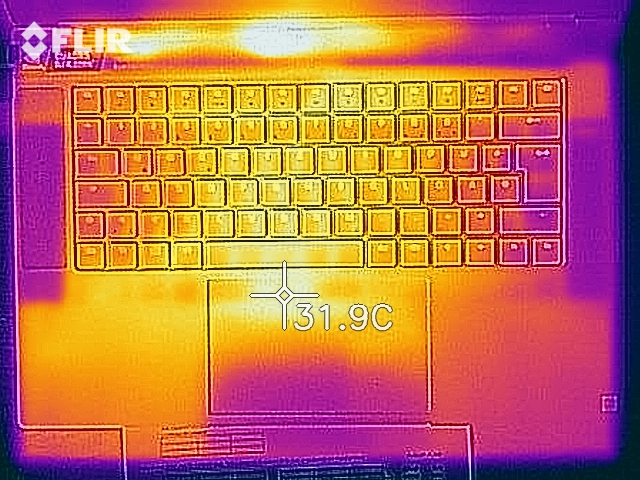
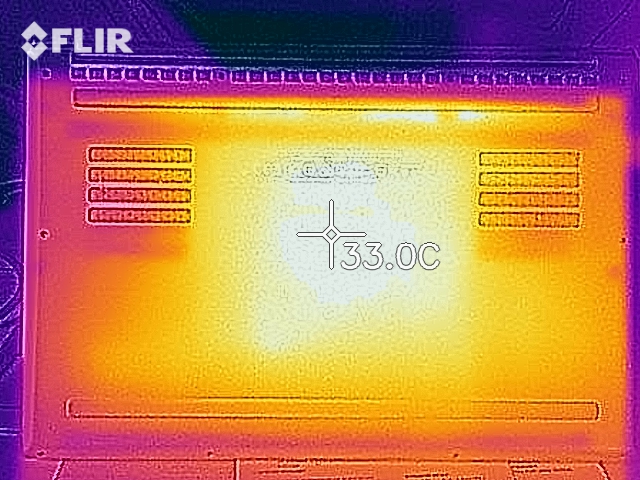
For the most part, the heat development remains reasonable. During the stress test, we recorded maximum temperatures in the 45 °C (113 °F) range. Temperatures of above 50 °C (122 °F) would not be unreasonable considering the hardware inside of the laptop. The temperatures during daily use are also well within reasonable limits.
(-) The maximum temperature on the upper side is 46.1 °C / 115 F, compared to the average of 38.2 °C / 101 F, ranging from 22.2 to 69.8 °C for the class Workstation.
(-) The bottom heats up to a maximum of 45.2 °C / 113 F, compared to the average of 41.1 °C / 106 F
(+) In idle usage, the average temperature for the upper side is 27.9 °C / 82 F, compared to the device average of 32 °C / 90 F.
(+) The palmrests and touchpad are reaching skin temperature as a maximum (35.7 °C / 96.3 F) and are therefore not hot.
(-) The average temperature of the palmrest area of similar devices was 27.8 °C / 82 F (-7.9 °C / -14.3 F).
| Razer Blade 15 Studio Edition i7-9750H, Quadro RTX 5000 Max-Q | Razer Blade 15 RTX 2080 Max-Q i7-9750H, GeForce RTX 2080 Max-Q | Lenovo ThinkPad P53-20QN000YGE i7-9850H, Quadro RTX 5000 Max-Q | MSI P65 Creator 9SF-657 i9-9880H, GeForce RTX 2070 Max-Q | Dell Precision 5540 i9-9980HK, Quadro T2000 Max-Q | Fujitsu Celsius H780 i7-8850H, Quadro P2000 | HP ZBook Studio G5-4QH10EA i7-8750H, Quadro P1000 | Average NVIDIA Quadro RTX 5000 Max-Q | Average of class Workstation | |
|---|---|---|---|---|---|---|---|---|---|
| Heat | -4% | 13% | -10% | 3% | 8% | 12% | -7% | -2% | |
| Maximum Upper Side * (°C) | 46.1 | 47 -2% | 41.8 9% | 49.7 -8% | 46.2 -0% | 43.7 5% | 42.3 8% | 49.4 ? -7% | 43.8 ? 5% |
| Maximum Bottom * (°C) | 45.2 | 49.2 -9% | 46.1 -2% | 60.4 -34% | 45.7 -1% | 45.3 -0% | 43.1 5% | 53 ? -17% | 45.1 ? -0% |
| Idle Upper Side * (°C) | 28.9 | 28.6 1% | 22.2 23% | 28.4 2% | 27.4 5% | 25.2 13% | 24.2 16% | 28.6 ? 1% | 30.6 ? -6% |
| Idle Bottom * (°C) | 29.6 | 31.4 -6% | 23 22% | 29.2 1% | 27.8 6% | 25.9 13% | 24.7 17% | 30.5 ? -3% | 31.6 ? -7% |
* ... smaller is better
Speakers
The stereo speakers are located to the sides of the keyboard. While they emit more than acceptable, voluminous sound, they lack bass. Furthermore, the maximum volume level could be higher. For a better audio experience, users will have to rely on headphones or external speakers.
Razer Blade 15 Studio Edition audio analysis
(-) | not very loud speakers (67.5 dB)
Bass 100 - 315 Hz
(-) | nearly no bass - on average 16.4% lower than median
(±) | linearity of bass is average (12.1% delta to prev. frequency)
Mids 400 - 2000 Hz
(±) | higher mids - on average 5.9% higher than median
(+) | mids are linear (6.9% delta to prev. frequency)
Highs 2 - 16 kHz
(+) | balanced highs - only 1.9% away from median
(+) | highs are linear (5.6% delta to prev. frequency)
Overall 100 - 16.000 Hz
(±) | linearity of overall sound is average (22.3% difference to median)
Compared to same class
» 82% of all tested devices in this class were better, 2% similar, 16% worse
» The best had a delta of 7%, average was 17%, worst was 35%
Compared to all devices tested
» 65% of all tested devices were better, 6% similar, 29% worse
» The best had a delta of 4%, average was 23%, worst was 134%
Lenovo ThinkPad P53-20QN000YGE audio analysis
(±) | speaker loudness is average but good (72.8 dB)
Bass 100 - 315 Hz
(±) | reduced bass - on average 11.6% lower than median
(±) | linearity of bass is average (13.6% delta to prev. frequency)
Mids 400 - 2000 Hz
(±) | higher mids - on average 7.8% higher than median
(±) | linearity of mids is average (7.5% delta to prev. frequency)
Highs 2 - 16 kHz
(+) | balanced highs - only 1.9% away from median
(+) | highs are linear (4.8% delta to prev. frequency)
Overall 100 - 16.000 Hz
(±) | linearity of overall sound is average (23.1% difference to median)
Compared to same class
» 83% of all tested devices in this class were better, 3% similar, 14% worse
» The best had a delta of 7%, average was 17%, worst was 35%
Compared to all devices tested
» 69% of all tested devices were better, 5% similar, 26% worse
» The best had a delta of 4%, average was 23%, worst was 134%
Energy Management - Razer Laptop with Good Battery Life
Energy Consumption
The Razer system's energy consumption is nothing out of the ordinary. During idle, we recorded a maximum consumption of 17.4 watts. In our stress test, this value only increased to a maximum of 148 watts. This stems from the fact that both the CPU and GPU run at relatively slow speeds during the test. The AC adapter is rated for 230 watts.
| Off / Standby | |
| Idle | |
| Load |
|
Key:
min: | |
| Razer Blade 15 Studio Edition i7-9750H, Quadro RTX 5000 Max-Q | Razer Blade 15 RTX 2080 Max-Q i7-9750H, GeForce RTX 2080 Max-Q | Lenovo ThinkPad P53-20QN000YGE i7-9850H, Quadro RTX 5000 Max-Q | MSI P65 Creator 9SF-657 i9-9880H, GeForce RTX 2070 Max-Q | Dell Precision 5540 i9-9980HK, Quadro T2000 Max-Q | Fujitsu Celsius H780 i7-8850H, Quadro P2000 | HP ZBook Studio G5-4QH10EA i7-8750H, Quadro P1000 | Average NVIDIA Quadro RTX 5000 Max-Q | Average of class Workstation | |
|---|---|---|---|---|---|---|---|---|---|
| Power Consumption | -10% | 8% | -10% | 20% | 13% | 25% | -12% | 4% | |
| Idle Minimum * (Watt) | 13.2 | 12.5 5% | 7.9 40% | 9.4 29% | 7.4 44% | 9.1 31% | 6.8 48% | 10.4 ? 21% | 9.04 ? 32% |
| Idle Average * (Watt) | 15 | 15.3 -2% | 11.8 21% | 17.4 -16% | 12.1 19% | 13.2 12% | 11.3 25% | 16.1 ? -7% | 13.8 ? 8% |
| Idle Maximum * (Watt) | 17.4 | 20.7 -19% | 14.9 14% | 19.6 -13% | 12.7 27% | 14.04 19% | 14.3 18% | 23.8 ? -37% | 17.7 ? -2% |
| Load Average * (Watt) | 99 | 90.2 9% | 96 3% | 103 -4% | 98 1% | 78.8 20% | 78 21% | 109.5 ? -11% | 96.2 ? 3% |
| Load Maximum * (Watt) | 148 | 209.3 -41% | 207.8 -40% | 216 -46% | 135.1 9% | 172.5 -17% | 126 15% | 189.5 ? -28% | 178.5 ? -21% |
| Witcher 3 ultra * (Watt) | 162 | 149 | 89.9 | 64 |
* ... smaller is better
Battery Life
In our Wi-Fi test, which aims to mirror real-world conditions, the laptop lasts for 5:31 h. In the aforementioned test, we simulate a web-browsing load with the help of a script. Here, we selected the profile "Balanced" and reduced the display brightness to around 150 cd/m². In our video test, the 15.6-inch device shuts off after 7:38 h. It consists of playing the short film Big Buck Bunny (H.264 encoding, 1920x1080 pixels) in a loop. For this test, we selected the "Energy Saver" profile, deactivated the wireless module and reduced the brightness to 150 cd/m² beforehand.
Overall, the runtimes of the workstation are more than solid. It is no surprise that they are not quite as high as on the Blade 15 Advanced Model, since the latter is only equipped with a Full HD display.
| Razer Blade 15 Studio Edition i7-9750H, Quadro RTX 5000 Max-Q, 80 Wh | Razer Blade 15 RTX 2080 Max-Q i7-9750H, GeForce RTX 2080 Max-Q, 80 Wh | Lenovo ThinkPad P53-20QN000YGE i7-9850H, Quadro RTX 5000 Max-Q, 90 Wh | MSI P65 Creator 9SF-657 i9-9880H, GeForce RTX 2070 Max-Q, 82 Wh | Dell Precision 5540 i9-9980HK, Quadro T2000 Max-Q, 97 Wh | Fujitsu Celsius H780 i7-8850H, Quadro P2000, 96 Wh | HP ZBook Studio G5-4QH10EA i7-8750H, Quadro P1000, 97 Wh | Average of class Workstation | |
|---|---|---|---|---|---|---|---|---|
| Battery runtime | 25% | 45% | -11% | 31% | 36% | 48% | 57% | |
| Reader / Idle (h) | 9.6 | 15.9 66% | 9.6 0% | 15 56% | 17.3 80% | 26.1 ? 172% | ||
| H.264 (h) | 7.6 | 9.8 29% | 10.6 39% | 9.1 20% | 9.51 ? 25% | |||
| WiFi v1.3 (h) | 5.5 | 6.6 20% | 11.1 102% | 6 9% | 7.7 40% | 7.5 36% | 9.7 76% | 8.52 ? 55% |
| Load (h) | 1.9 | 1.7 -11% | 2 5% | 1.1 -42% | 1.7 -11% | 2.2 16% | 1.429 ? -25% |
Pros
Cons
Verdict
With the Studio Edition of the Blade 15, Razer has created a mobile 15.6-inch workstation. It is based on the Blade 15 Advanced Model that we already tested and which it shares its chassis with. Due to this, it relies on the same, robust metal construction.
In terms of hardware, the laptop is equipped with the up-to-date Core i7-9750H processor and GeForce RTX 5000 Max-Q GPU. On default settings, neither component exhausts its capabilities fully. However, the full performance can be unlocked from within the Razer Synapse software. Positive: Despite the powerful hardware, the noise and temperature levels remain reasonable.
Razer's Blade 15 Studio is a workstation with excellent features that manages to leave us with an overall good impression in our tests.
An NVMe SSD ensures a smooth and responsive system and also provides users with a lot of storage space. However, there is no room for additional storage drives inside of the laptop. If more storage space is needed, the installed SSD will have to be swapped out.
The 4K OLED touchscreen display is the most notable feature of the laptop. Its great black value, the high brightness level, good viewing angles, fast response times and good color-space coverage culminate in an overall stunning visual experience. Only the color representation could be slightly better.
The backlit keyboard has proven to be suitable for daily use. However, it is not well-suited to typists. Furthermore, the battery life is quite good. Lastly, the Thunderbolt 3 port allows users to connect docking stations or an external GPU.
Razer Blade 15 Studio Edition
- 12/02/2019 v7 (old)
Sascha Mölck
Price comparison

