Schenker XMG Core 14 (Clevo NV40MB) laptop review: baby gamer
The Core 14 can be customized to personal need and budget on bestware.com.
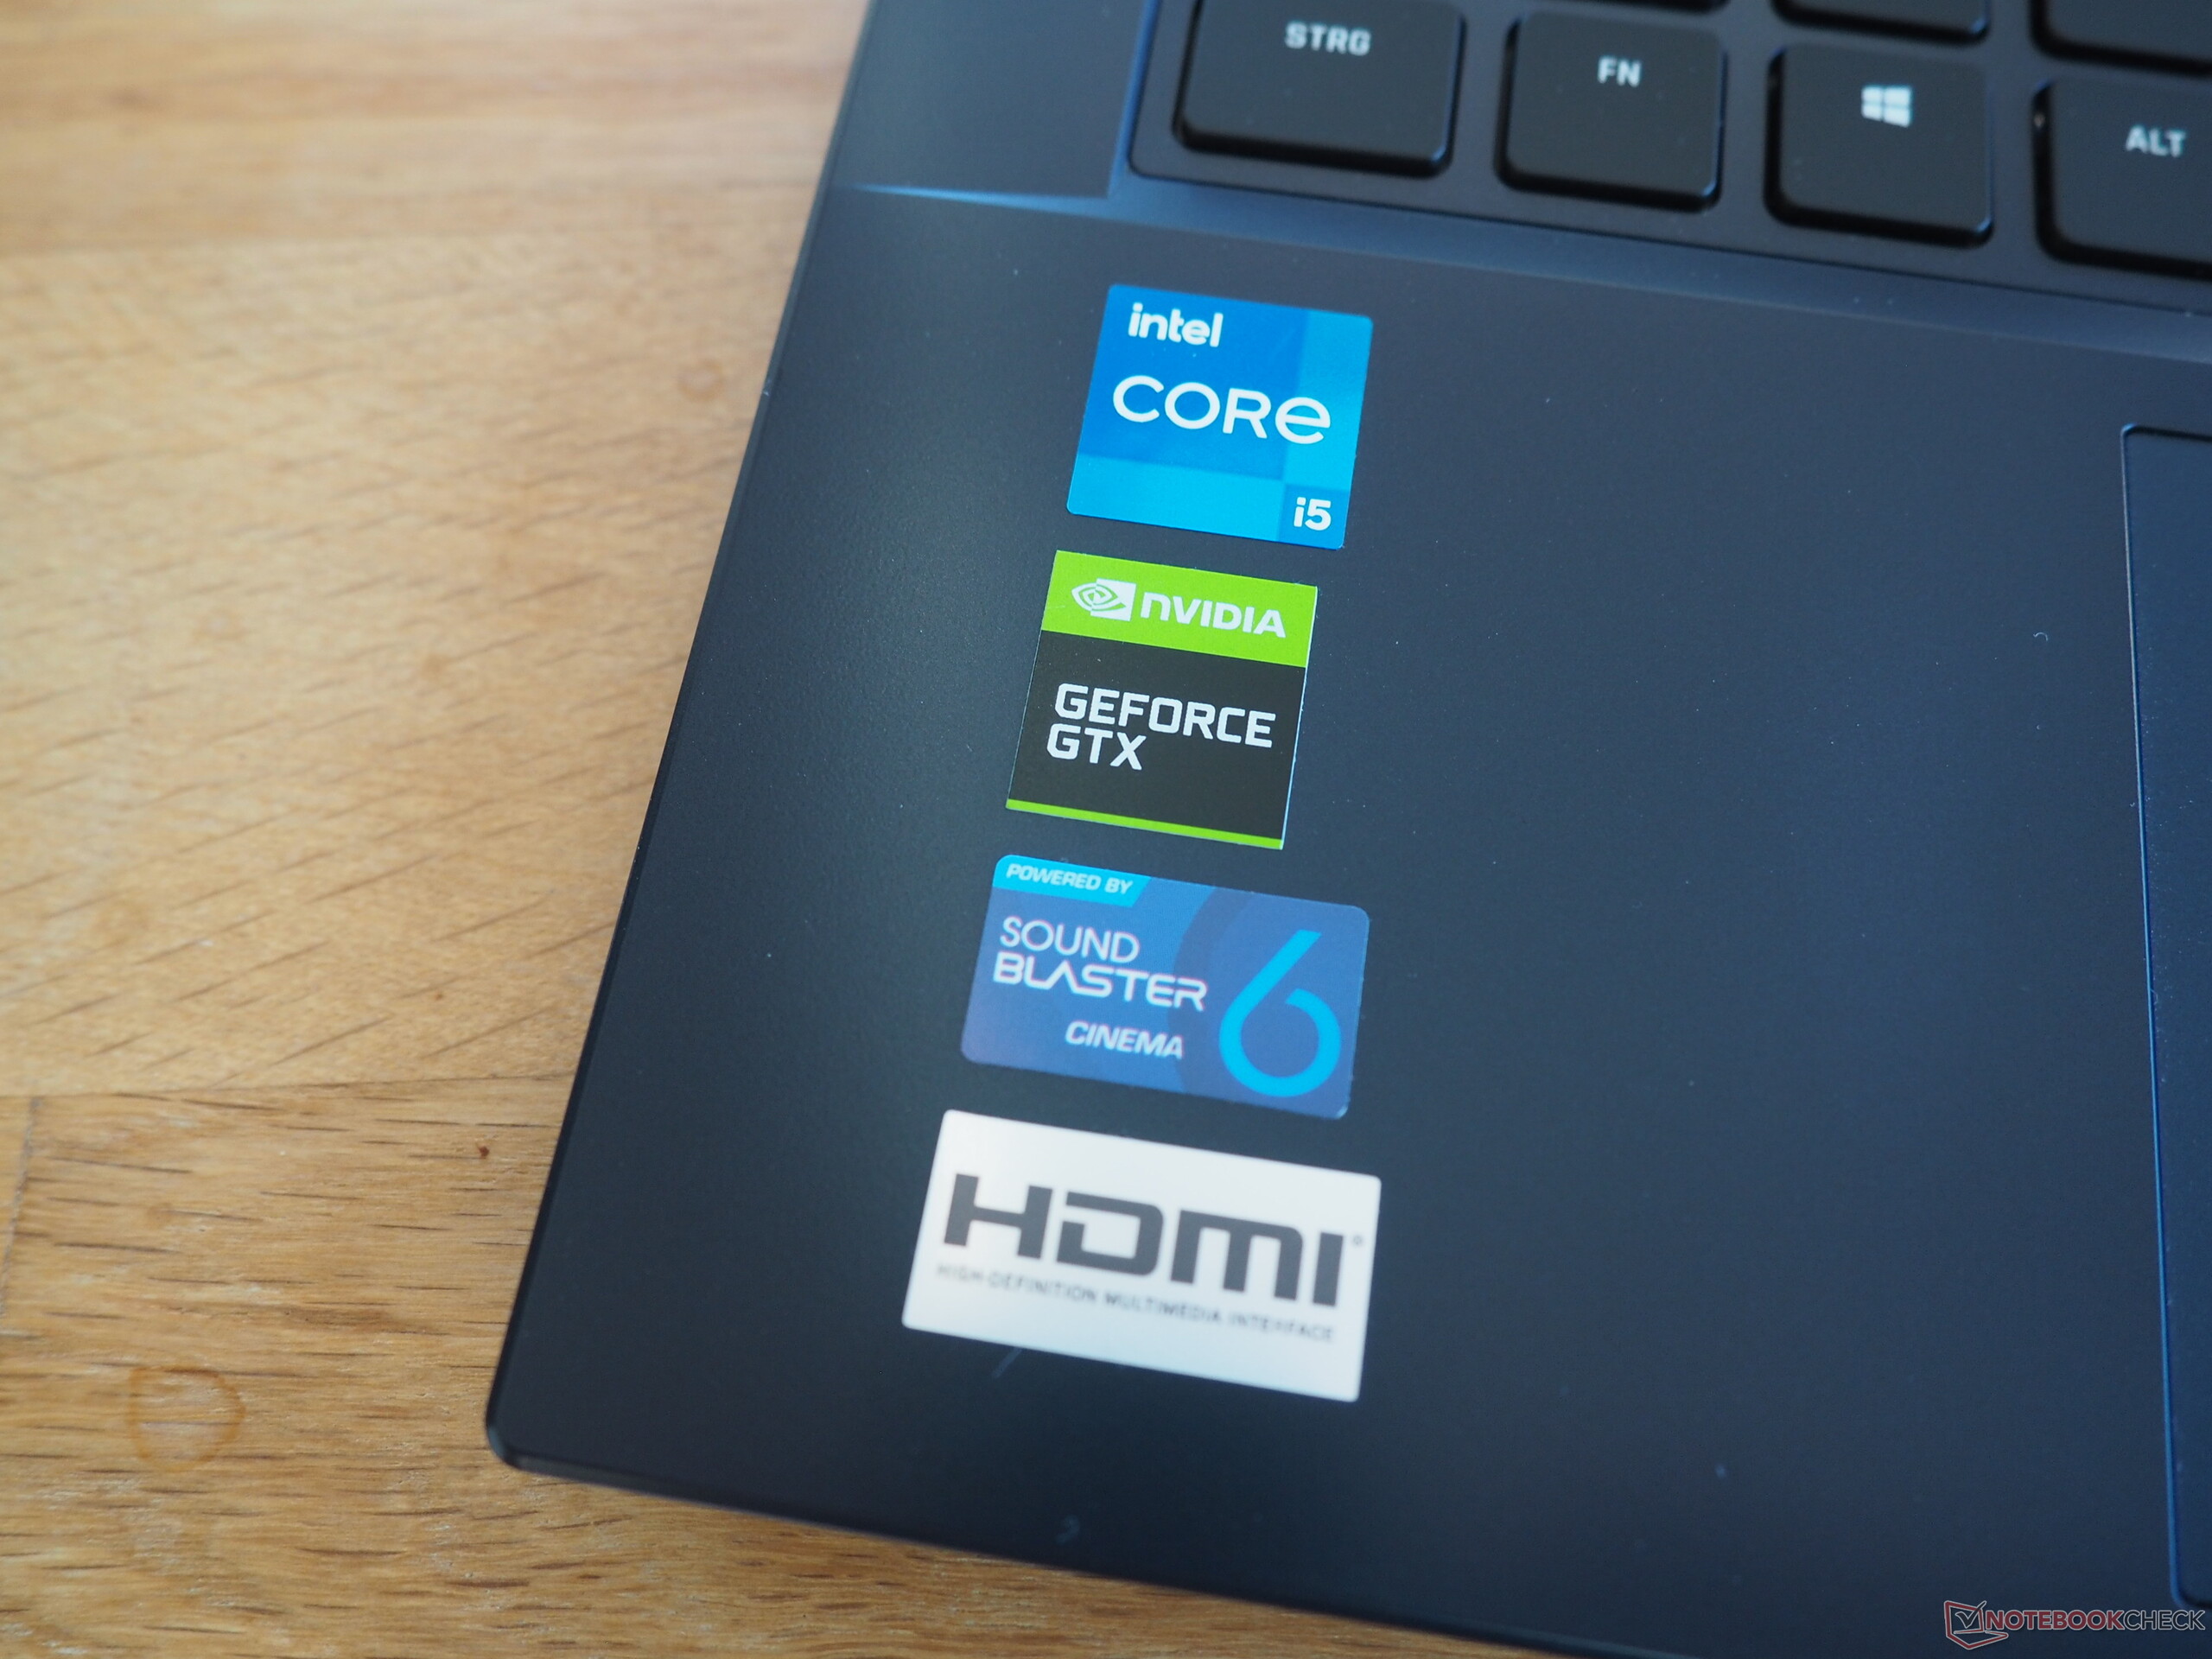
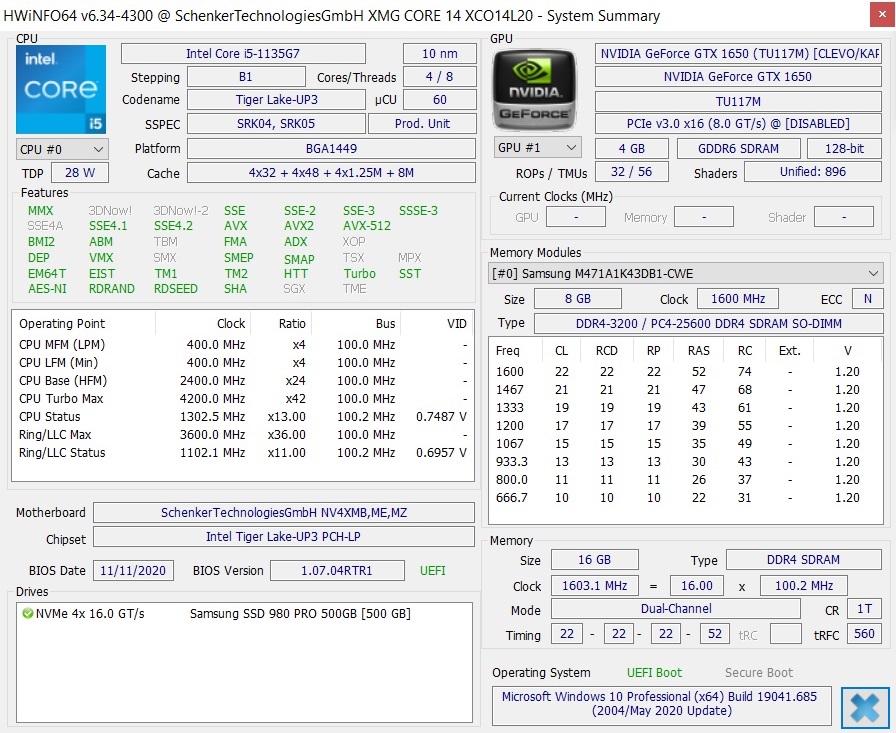
While a 120 Hz Full HD panel and the midrange GeForce GTX 1650 come standard, you have the choice between a Core i5-1135G7 with 8 MB cache or a Core i7-1165G7 with 12 MB cache for the CPU. Both processors are from Intel's brand new Tiger Lake generation. The DDR4 RAM ranges from 8 to 64 GB, and the M.2 SSD runs from 250 to 2,000 GB. Buyers can also influence the keyboard's language, the wireless card, and the operating system.
In terms of price, the Core 14 starts at around 920 Euros. Our review model with a Core i5-1135G7, 16 GB RAM (dual channel), 500 GB SSD and Windows 10 Pro 64 bit (without license) currently costs a bit over 1,100 Euros.
The Core 14's competitors include other gaming laptops with a power-efficient CPU and GTX 1650 Max-Q, such as the MSI Prestige 14, the Asus Zenbook 15, the MSI Prestige 15, and the LG Ultra 17. These notebooks appear in the comparison table below.
Competitors for comparison
Rating | Date | Model | Weight | Height | Size | Resolution | Price |
|---|---|---|---|---|---|---|---|
| 82.5 % v7 (old) | 12 / 2020 | Schenker XMG Core 14 i5-1135G7, GeForce GTX 1650 Mobile | 1.4 kg | 18 mm | 14.00" | 1920x1080 | |
| 84.2 % v7 (old) | 02 / 2020 | MSI Prestige 14 A10SC-009 i7-10710U, GeForce GTX 1650 Max-Q | 1.3 kg | 16 mm | 14.00" | 3840x2160 | |
| 85.2 % v7 (old) | 03 / 2020 | Asus ZenBook 15 UX534FTC-A8190T i7-10510U, GeForce GTX 1650 Max-Q | 1.6 kg | 18.9 mm | 15.60" | 1920x1080 | |
| 85.2 % v7 (old) | 11 / 2019 | MSI Prestige 15 A10SC i7-10710U, GeForce GTX 1650 Max-Q | 1.7 kg | 16 mm | 15.60" | 3840x2160 | |
| 82.8 % v7 (old) | 09 / 2020 | LG Ultra 17U70N i5-10210U, GeForce GTX 1650 Mobile | 2 kg | 20.4 mm | 17.00" | 2560x1600 |
Case
Schenker uses a barebones device from Clevo for the case. The NV40MB chassis is very simple and thus fits into any environment. While the lid is made of metal, the surfaces of the base are made of plastic. We would describe the stability as decent. The same applies to the hinges, which allow opening the screen with one hand (maximum opening angle about 140°).
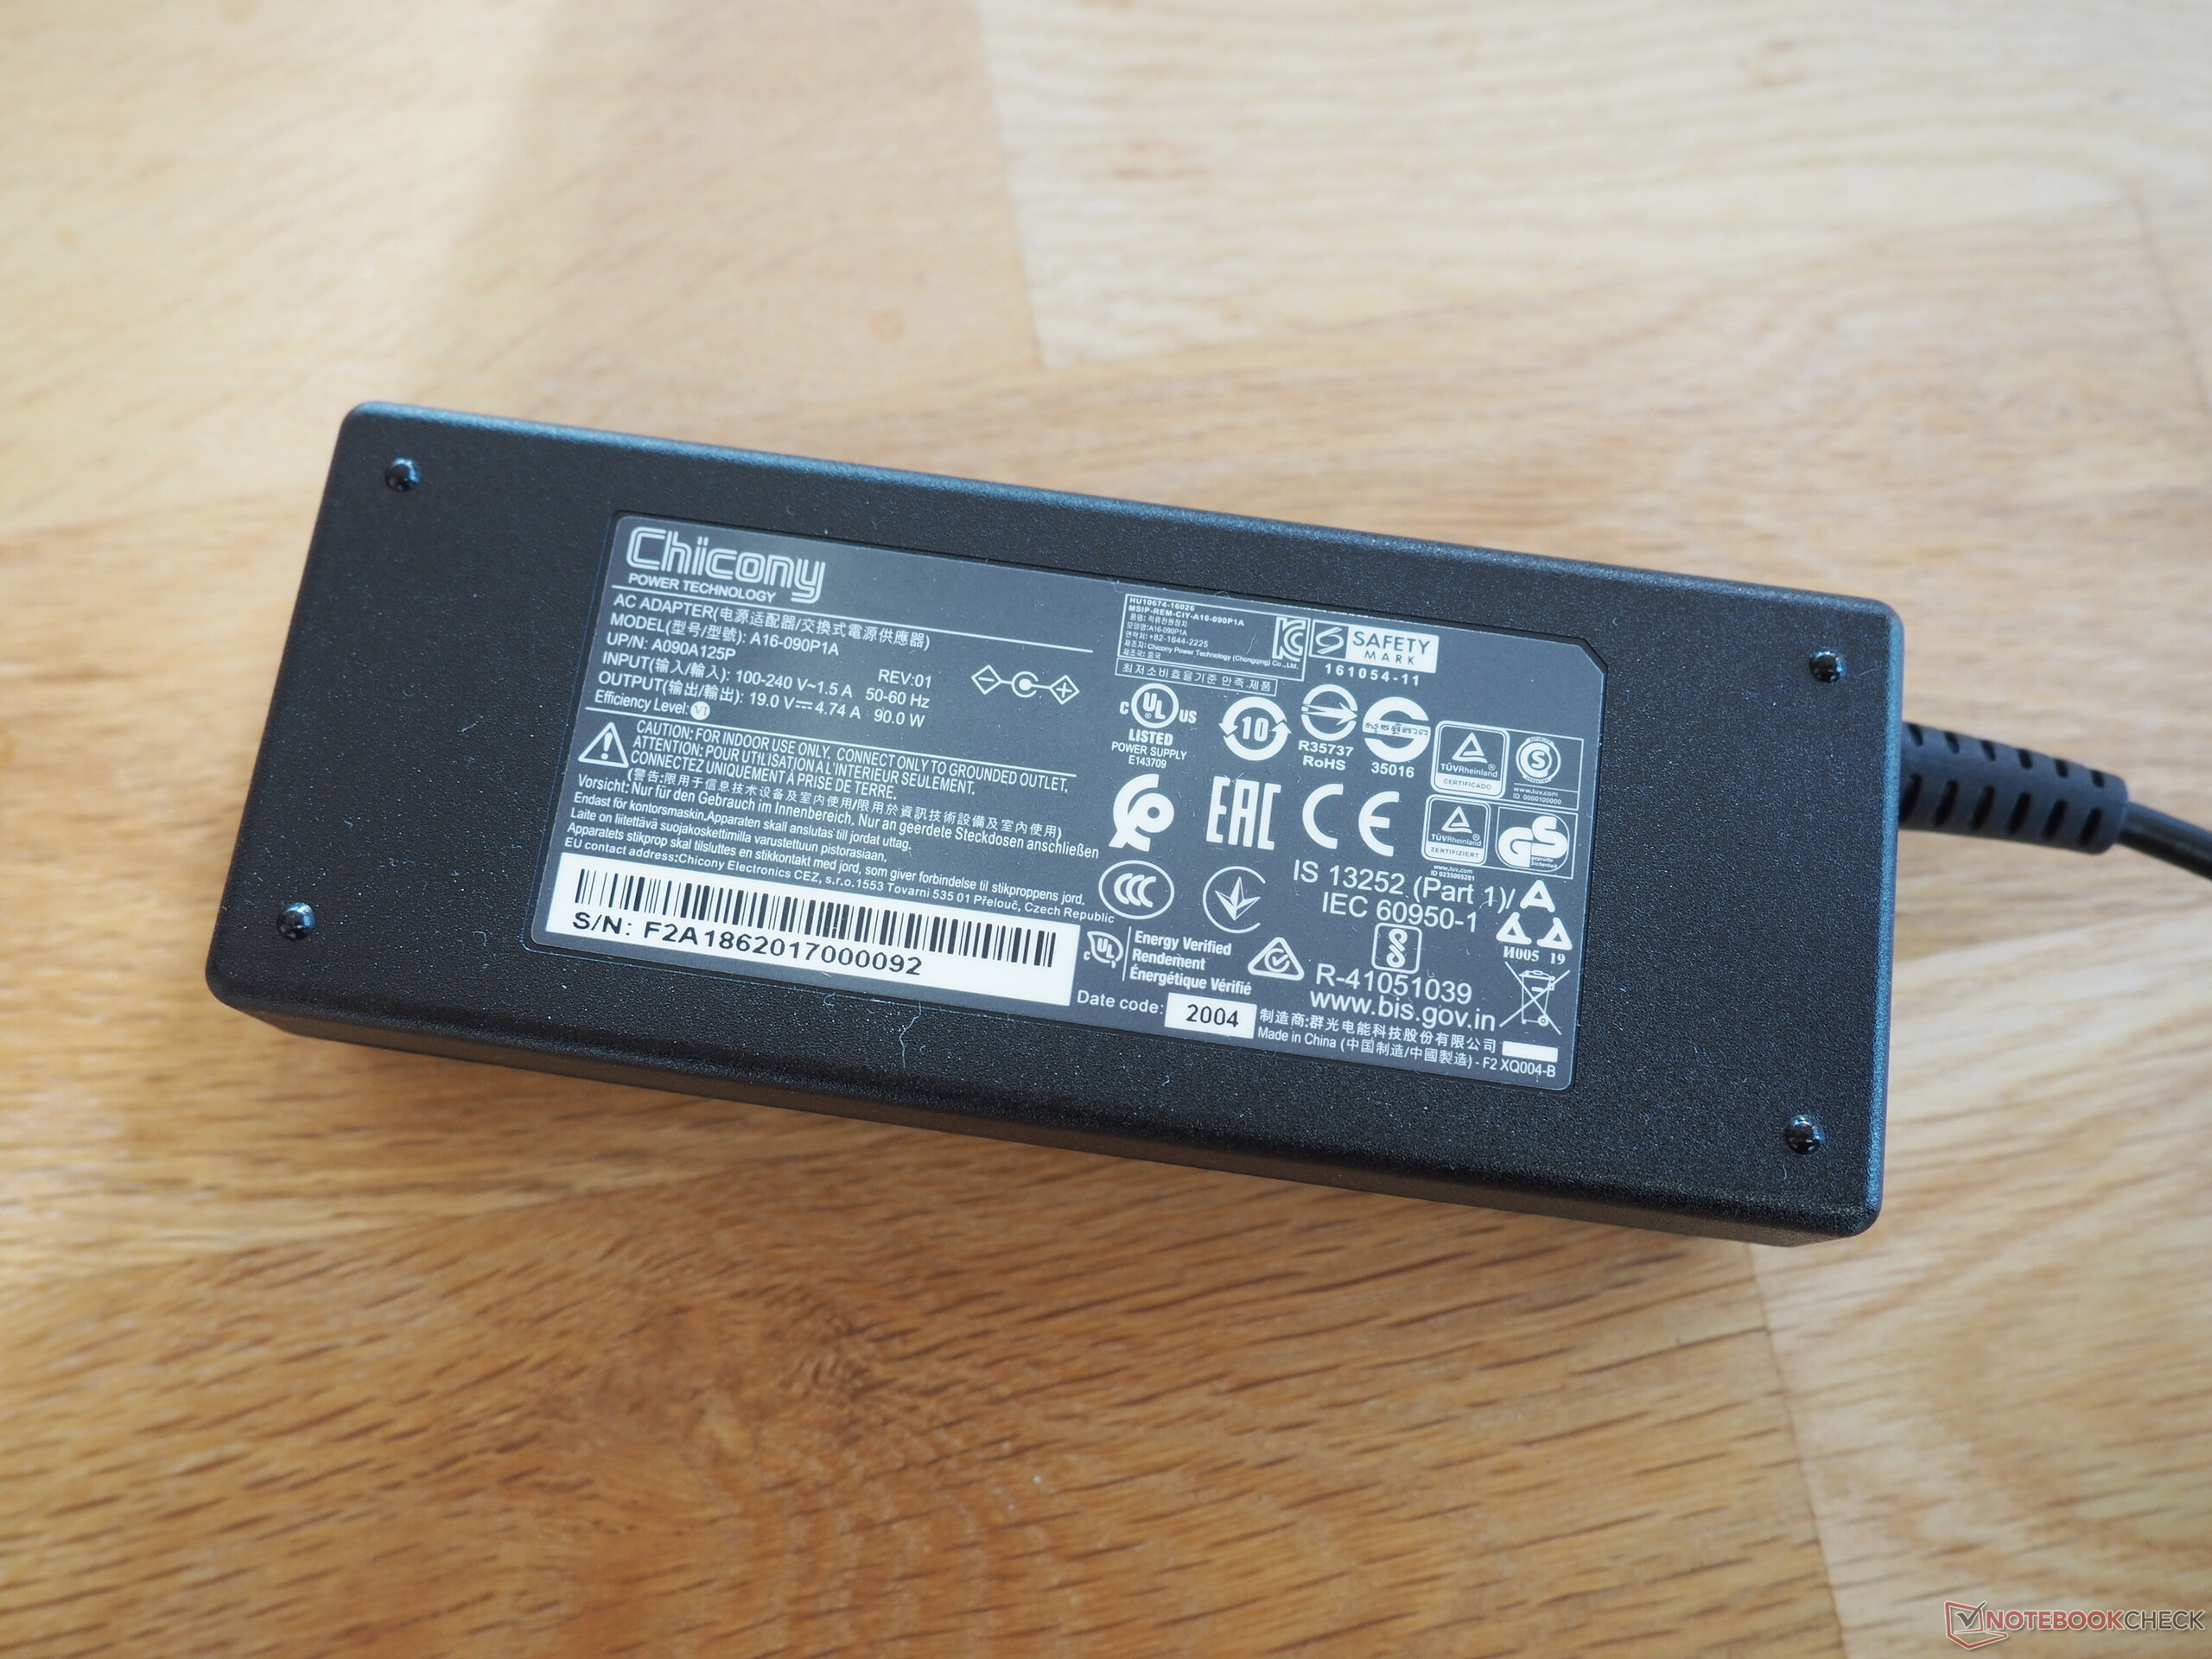
One of the biggest highlights of the Core 14 is its light weight. 1.4 kg is extremely light for a gaming notebook, although the MSI Prestige 14 is another 100 g lighter. In addition, the dimensions are very small. With a base area of 32.5 x 22.5 cm (slim bezel design) and a height of just under 1.8 cm, the 14 incher is extremely comfortable to carry around and transport. The small power supply also helps. The 90-watt power supply measures just 12.5 x 5 x 3 cm and weighs just under 300 g.
Connectivity
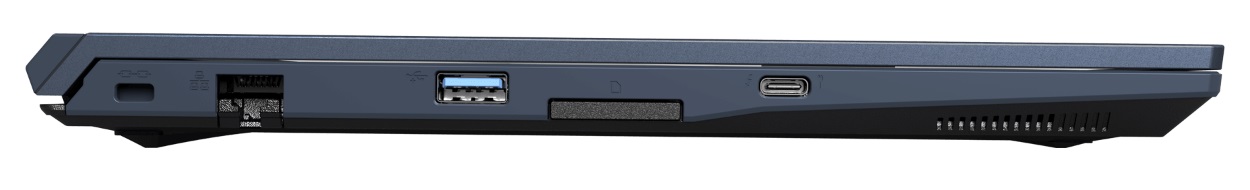
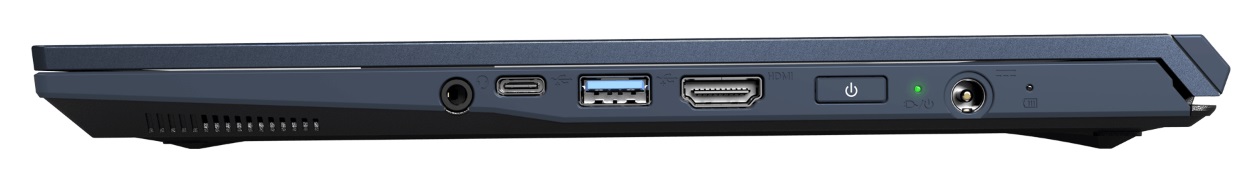
Further praise is given for the modern interface equipment. Clevo provides the NV40MB barebones with a USB-C 4.0 Gen3x2 port that supports DisplayPort 1.4 and Thunderbolt 4. The remaining USB ports are either 3.2 Gen2 (Type-C) or 3.2 Gen1 (2x Type-A). An RJ45 port and a card reader are not expected for such compact devices. The range of interfaces is rounded off by an HDMI 2.0 port, an audio jack, and a slot for Kensington Locks. The port placement is a bit sub-optimal in our eyes, since some ports are placed quite far in front and - depending on the amount of peripheral cables - can thus restrict the movement range of a mouse.
SD Card Reader
The card reader delivers mediocre performance. 87 MB/s for sequential reads and 76 MB/s for transferring photos are similar to the Asus Zenbook 15 and the LG Ultra 17. MSI's Prestige series has much faster card readers.
| SD Card Reader | |
| average JPG Copy Test (av. of 3 runs) | |
| MSI Prestige 15 A10SC (Toshiba Exceria Pro M501 UHS-II) | |
| MSI Prestige 14 A10SC-009 (Toshiba Exceria Pro M501 microSDXC 64GB) | |
| Average of class Multimedia (23 - 531, n=43, last 2 years) | |
| Schenker XMG Core 14 (Toshiba Exceria Pro SDXC 64 GB UHS-II) | |
| LG Ultra 17U70N (Toshiba Exceria Pro M501 microSDXC 64GB) | |
| Asus ZenBook 15 UX534FTC-A8190T (Toshiba Exceria Pro SDXC 64 GB UHS-II) | |
| maximum AS SSD Seq Read Test (1GB) | |
| MSI Prestige 15 A10SC (Toshiba Exceria Pro M501 UHS-II) | |
| Average of class Multimedia (27.9 - 1455, n=42, last 2 years) | |
| MSI Prestige 14 A10SC-009 (Toshiba Exceria Pro M501 microSDXC 64GB) | |
| Schenker XMG Core 14 (Toshiba Exceria Pro SDXC 64 GB UHS-II) | |
| LG Ultra 17U70N (Toshiba Exceria Pro M501 microSDXC 64GB) | |
Communication
There are no surprises in the WLAN test. Around 1,040 Mbps (receive) and 1,110 Mbps (transmit) from one meter away from the reference Netgear Nighthawk AX12 router translate to medium to good real-world performance. Schenker uses Intel's Wi-Fi 6 AX201 card as standard, which supports WLAN 802.11 a/b/g/n/ac/ax and Bluetooth 5.
Webcam
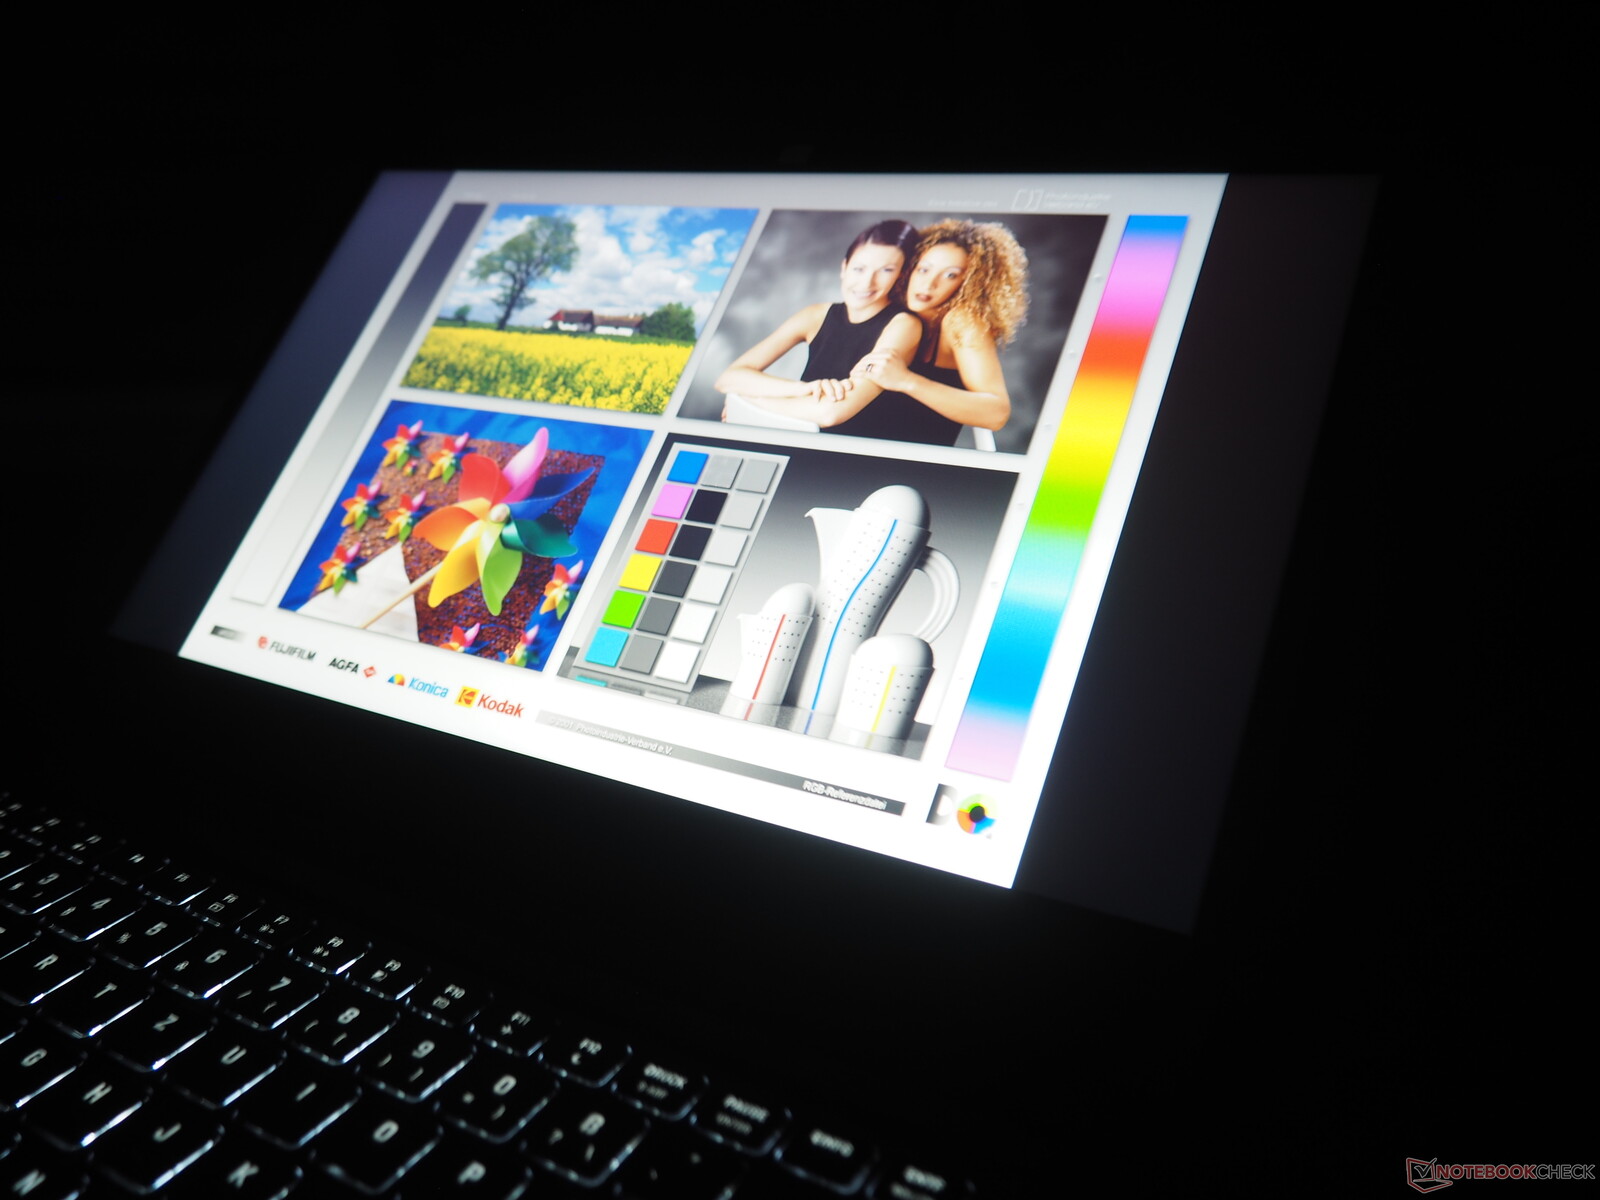
The webcam quality is rather modest, as is typical for notebooks. The image sharpness especially leaves a lot to be desired, as the lower of the two photos shows.


Accessories
Schenker includes a quick start guide, a giant mouse pad, a USB stick with software, a driver DVD, and a cleaning cloth.
Maintenance
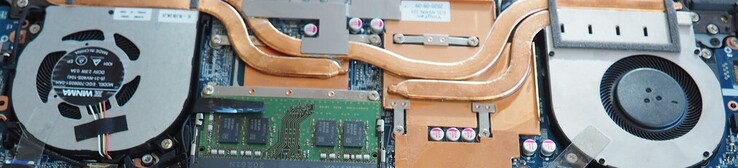
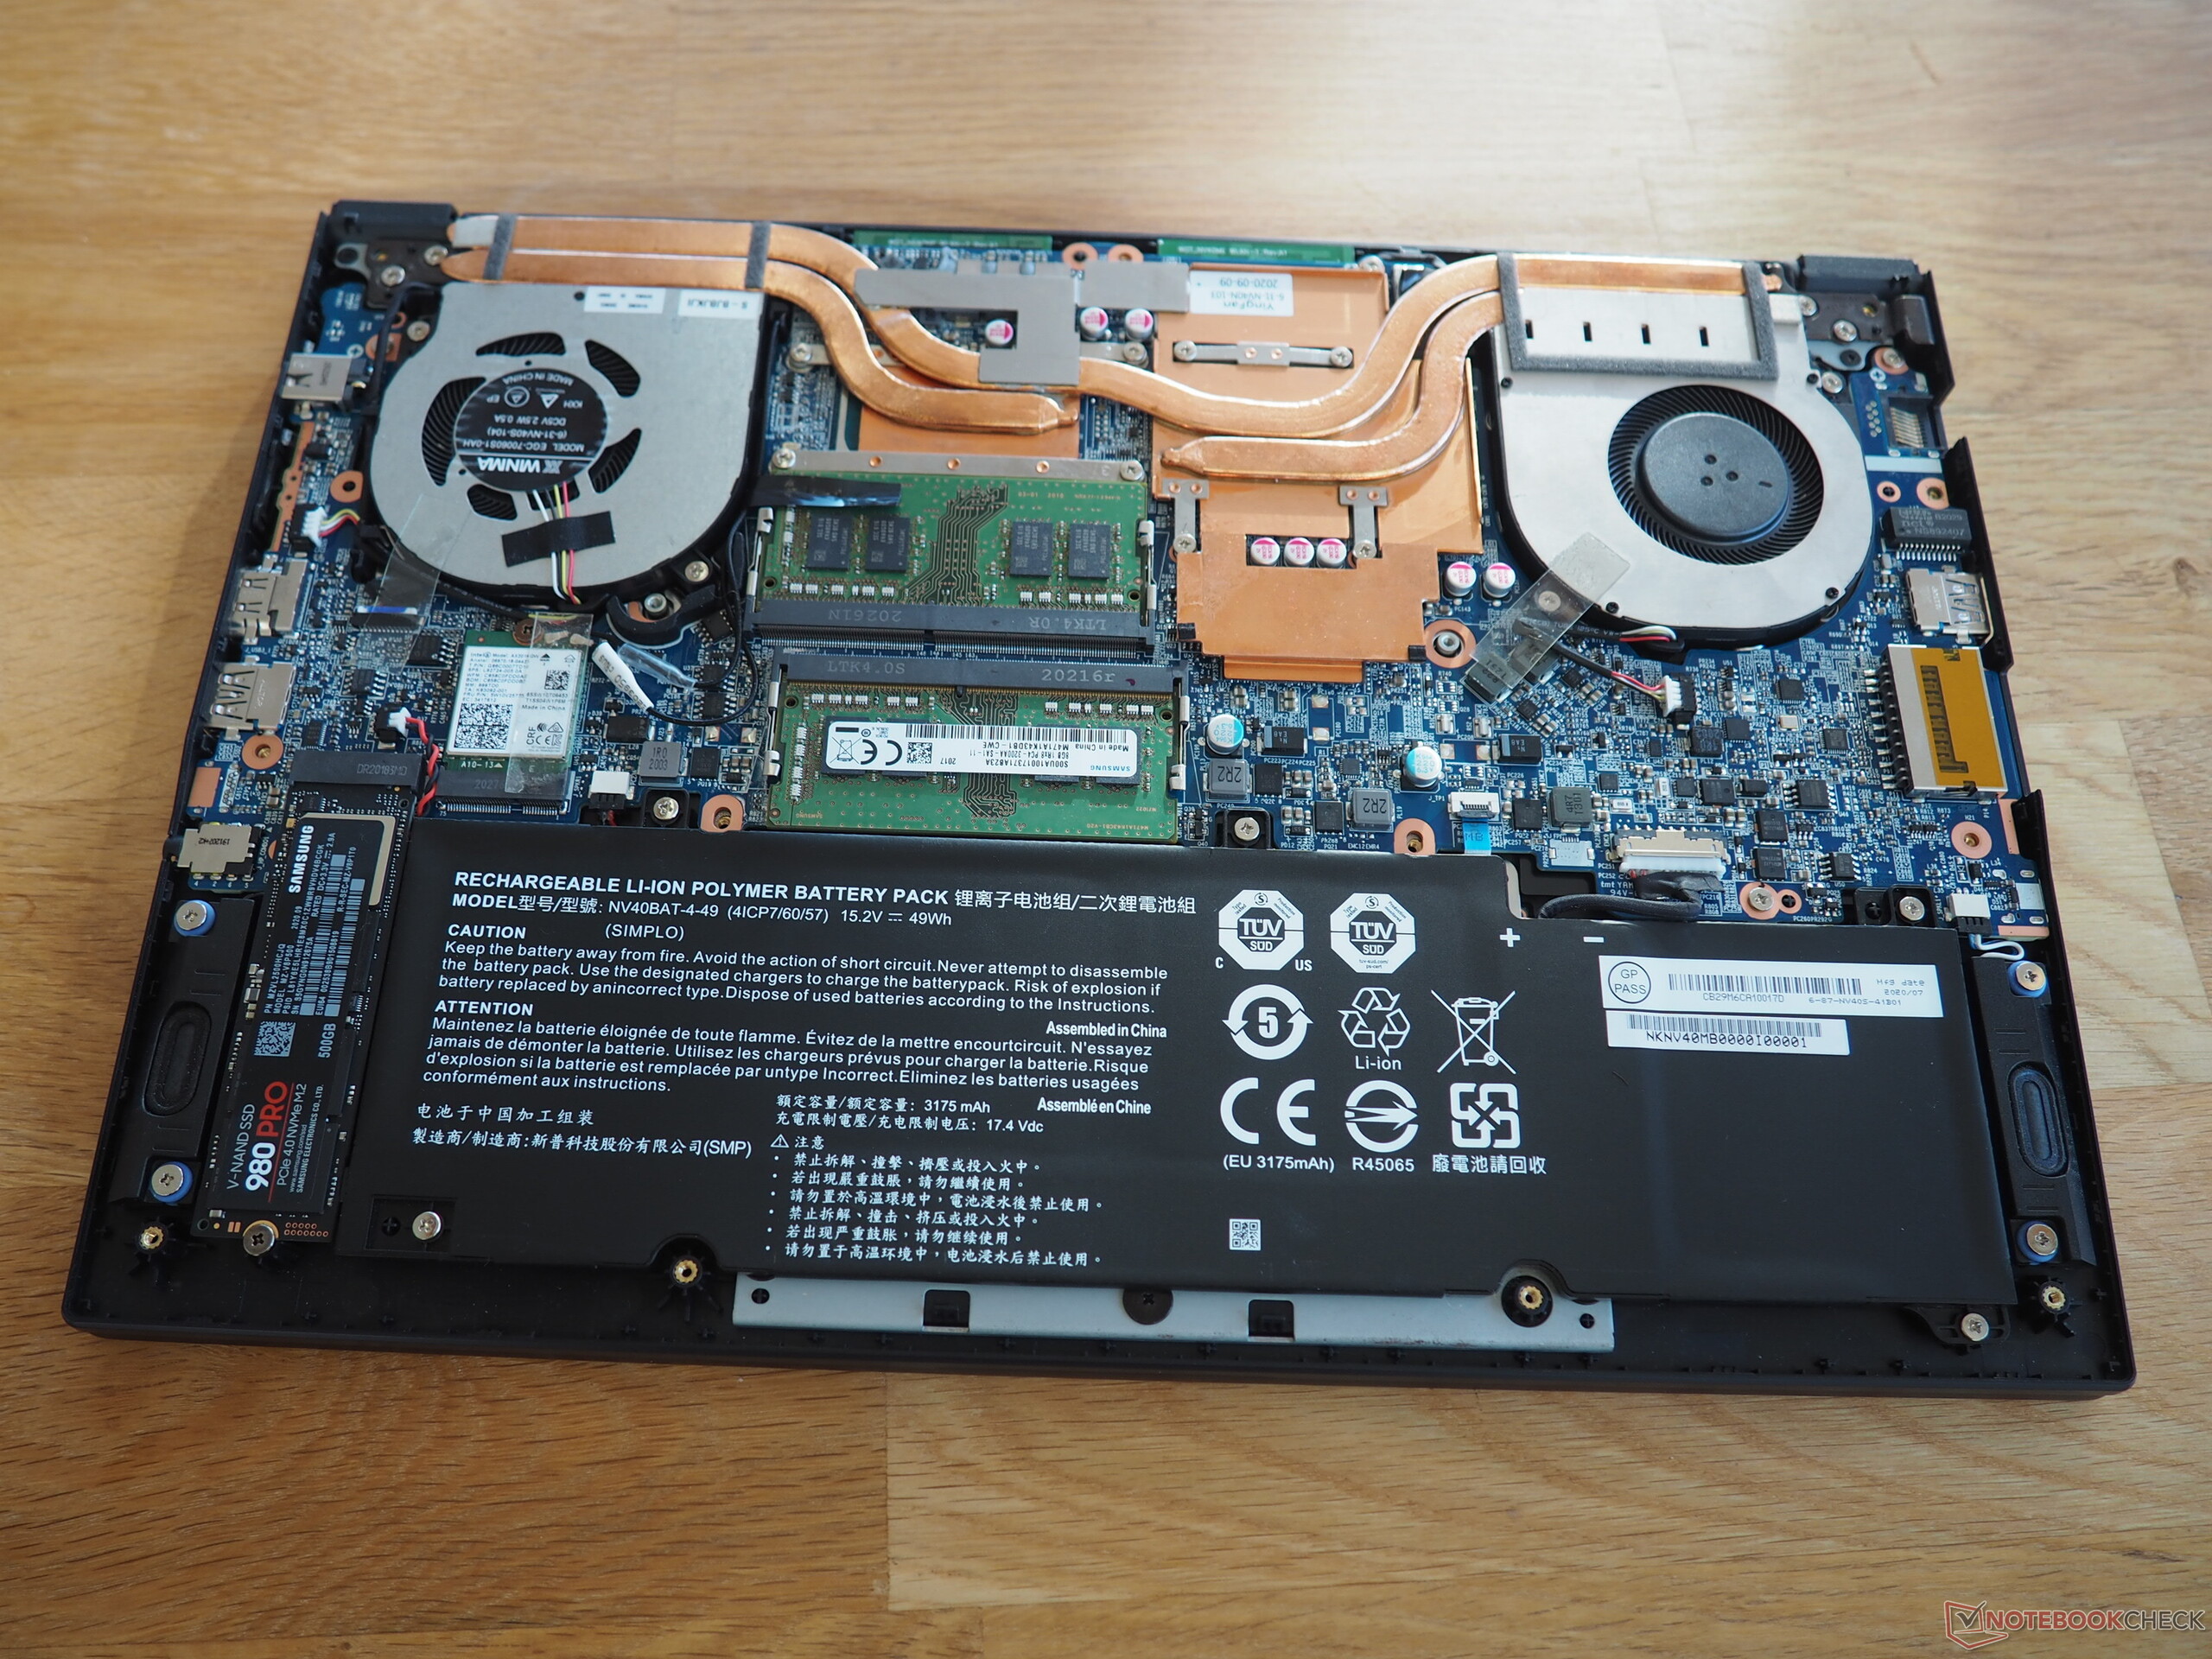
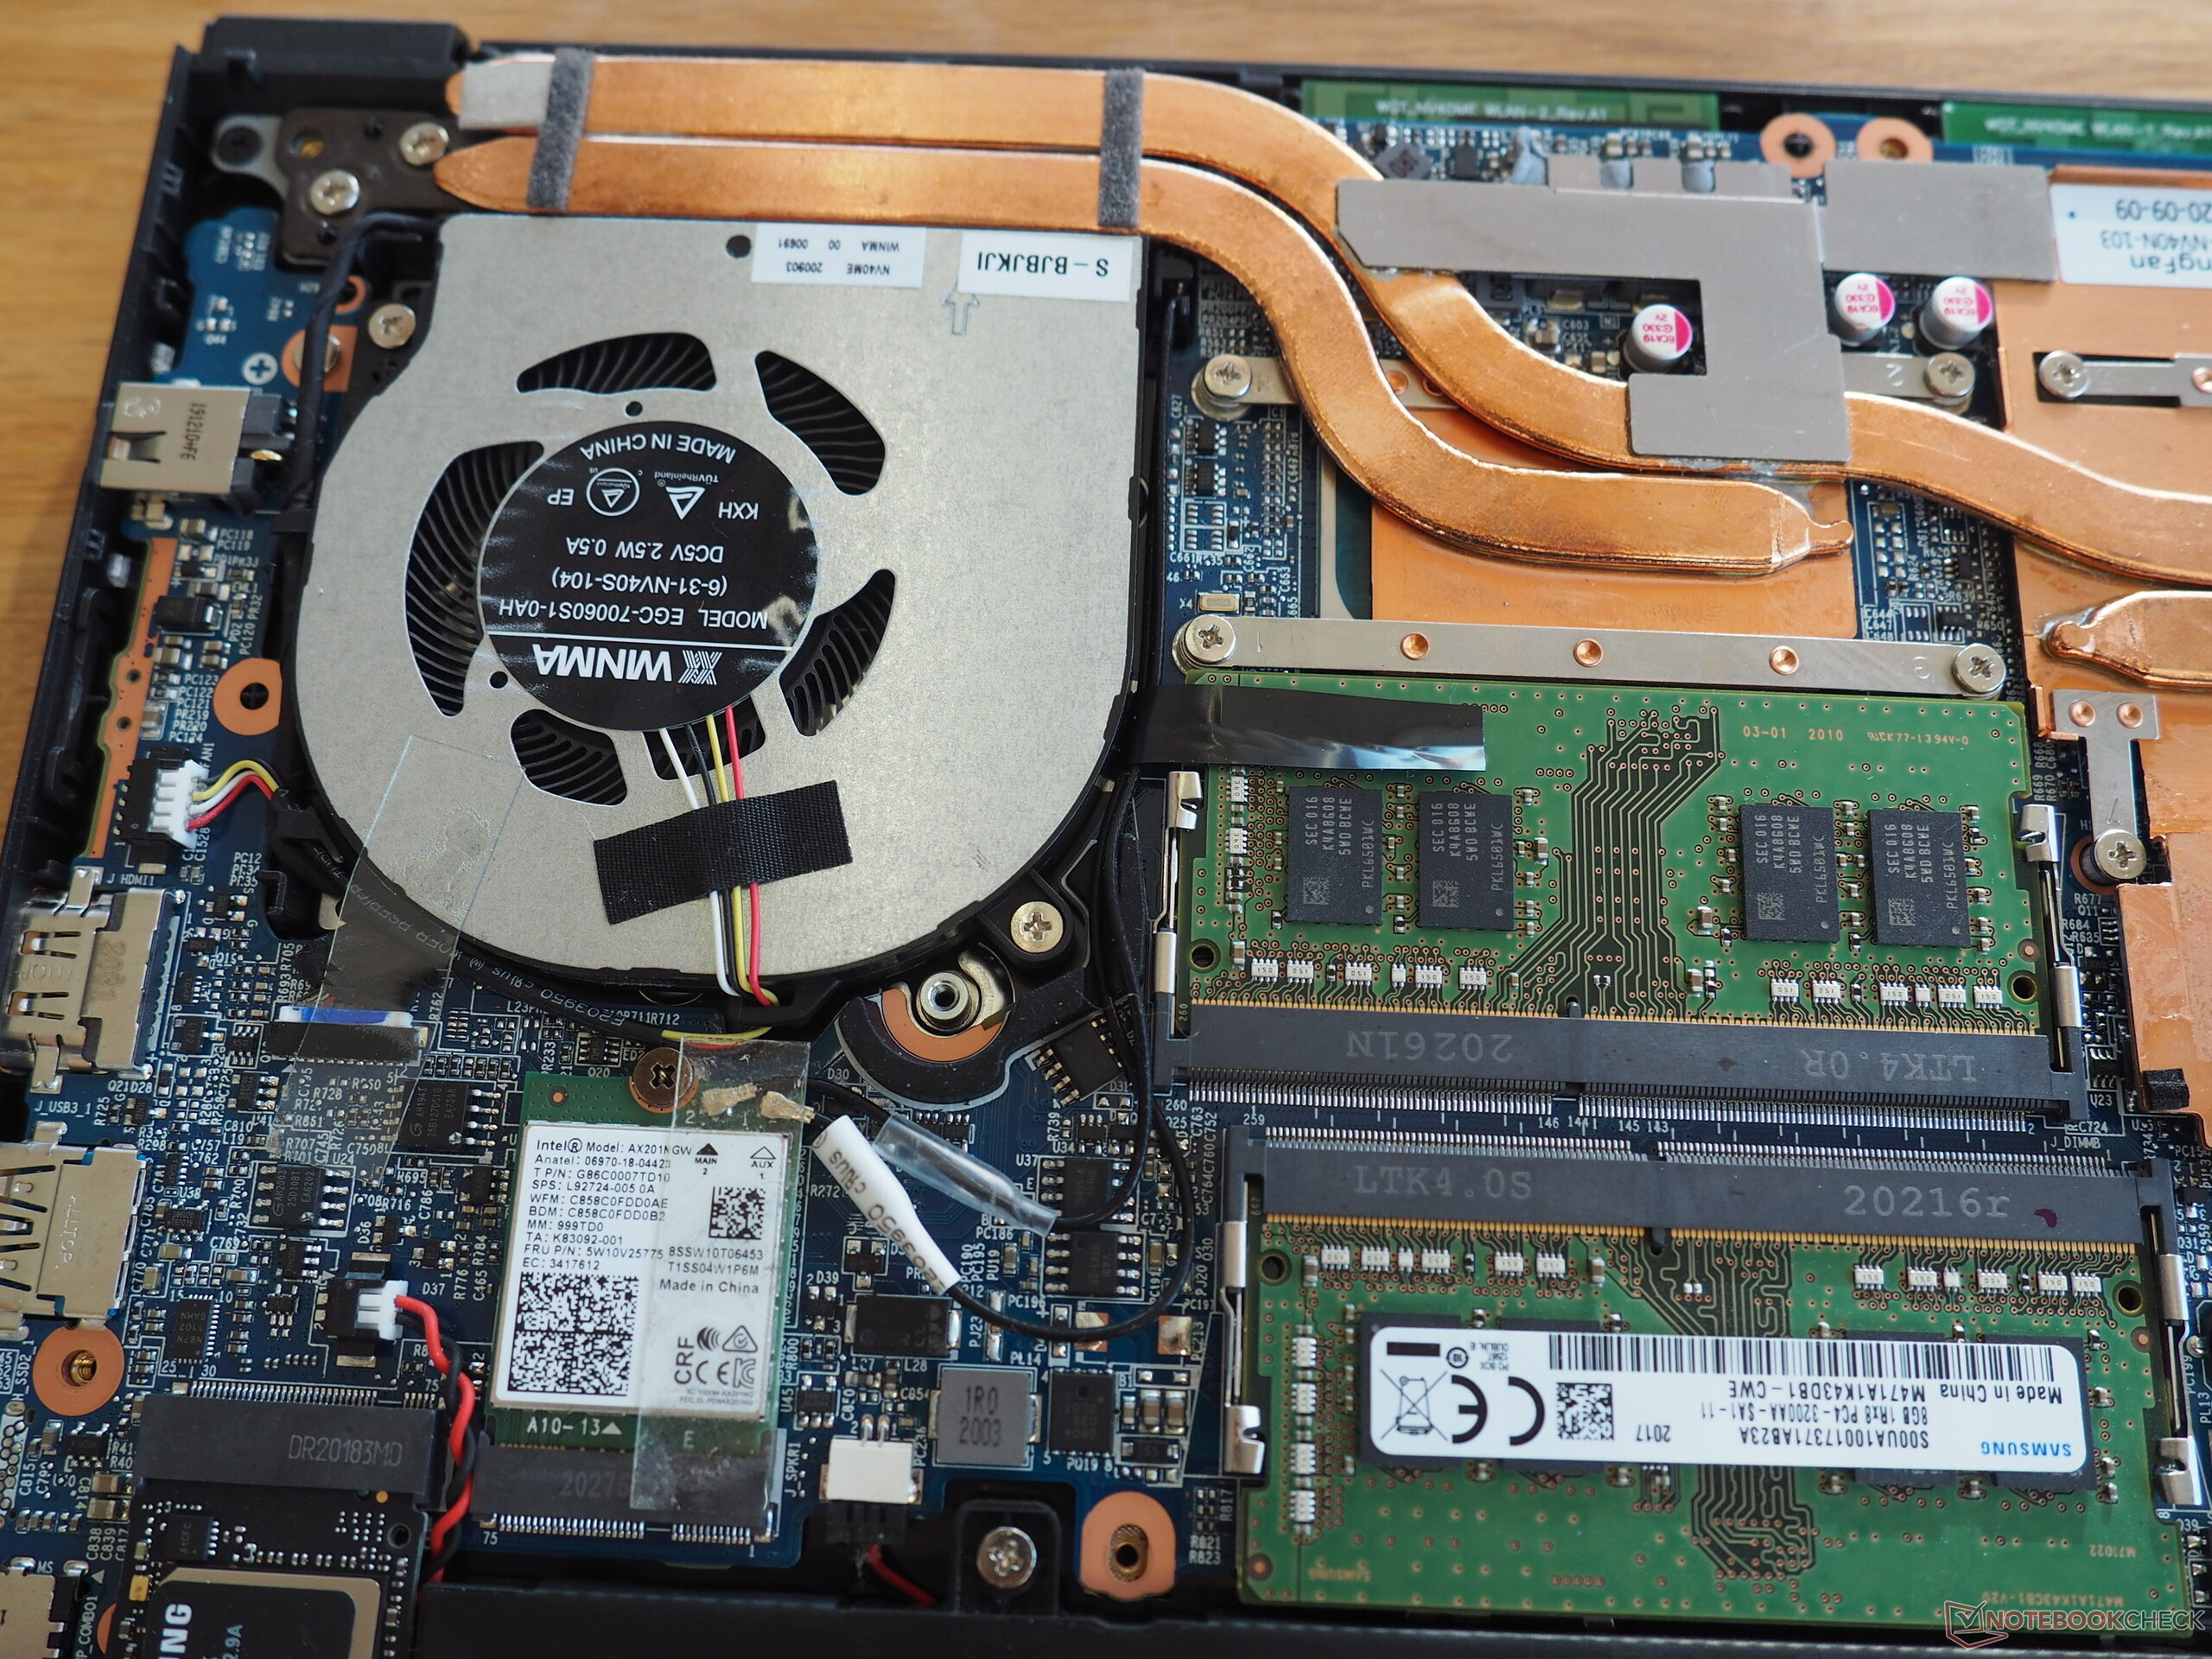
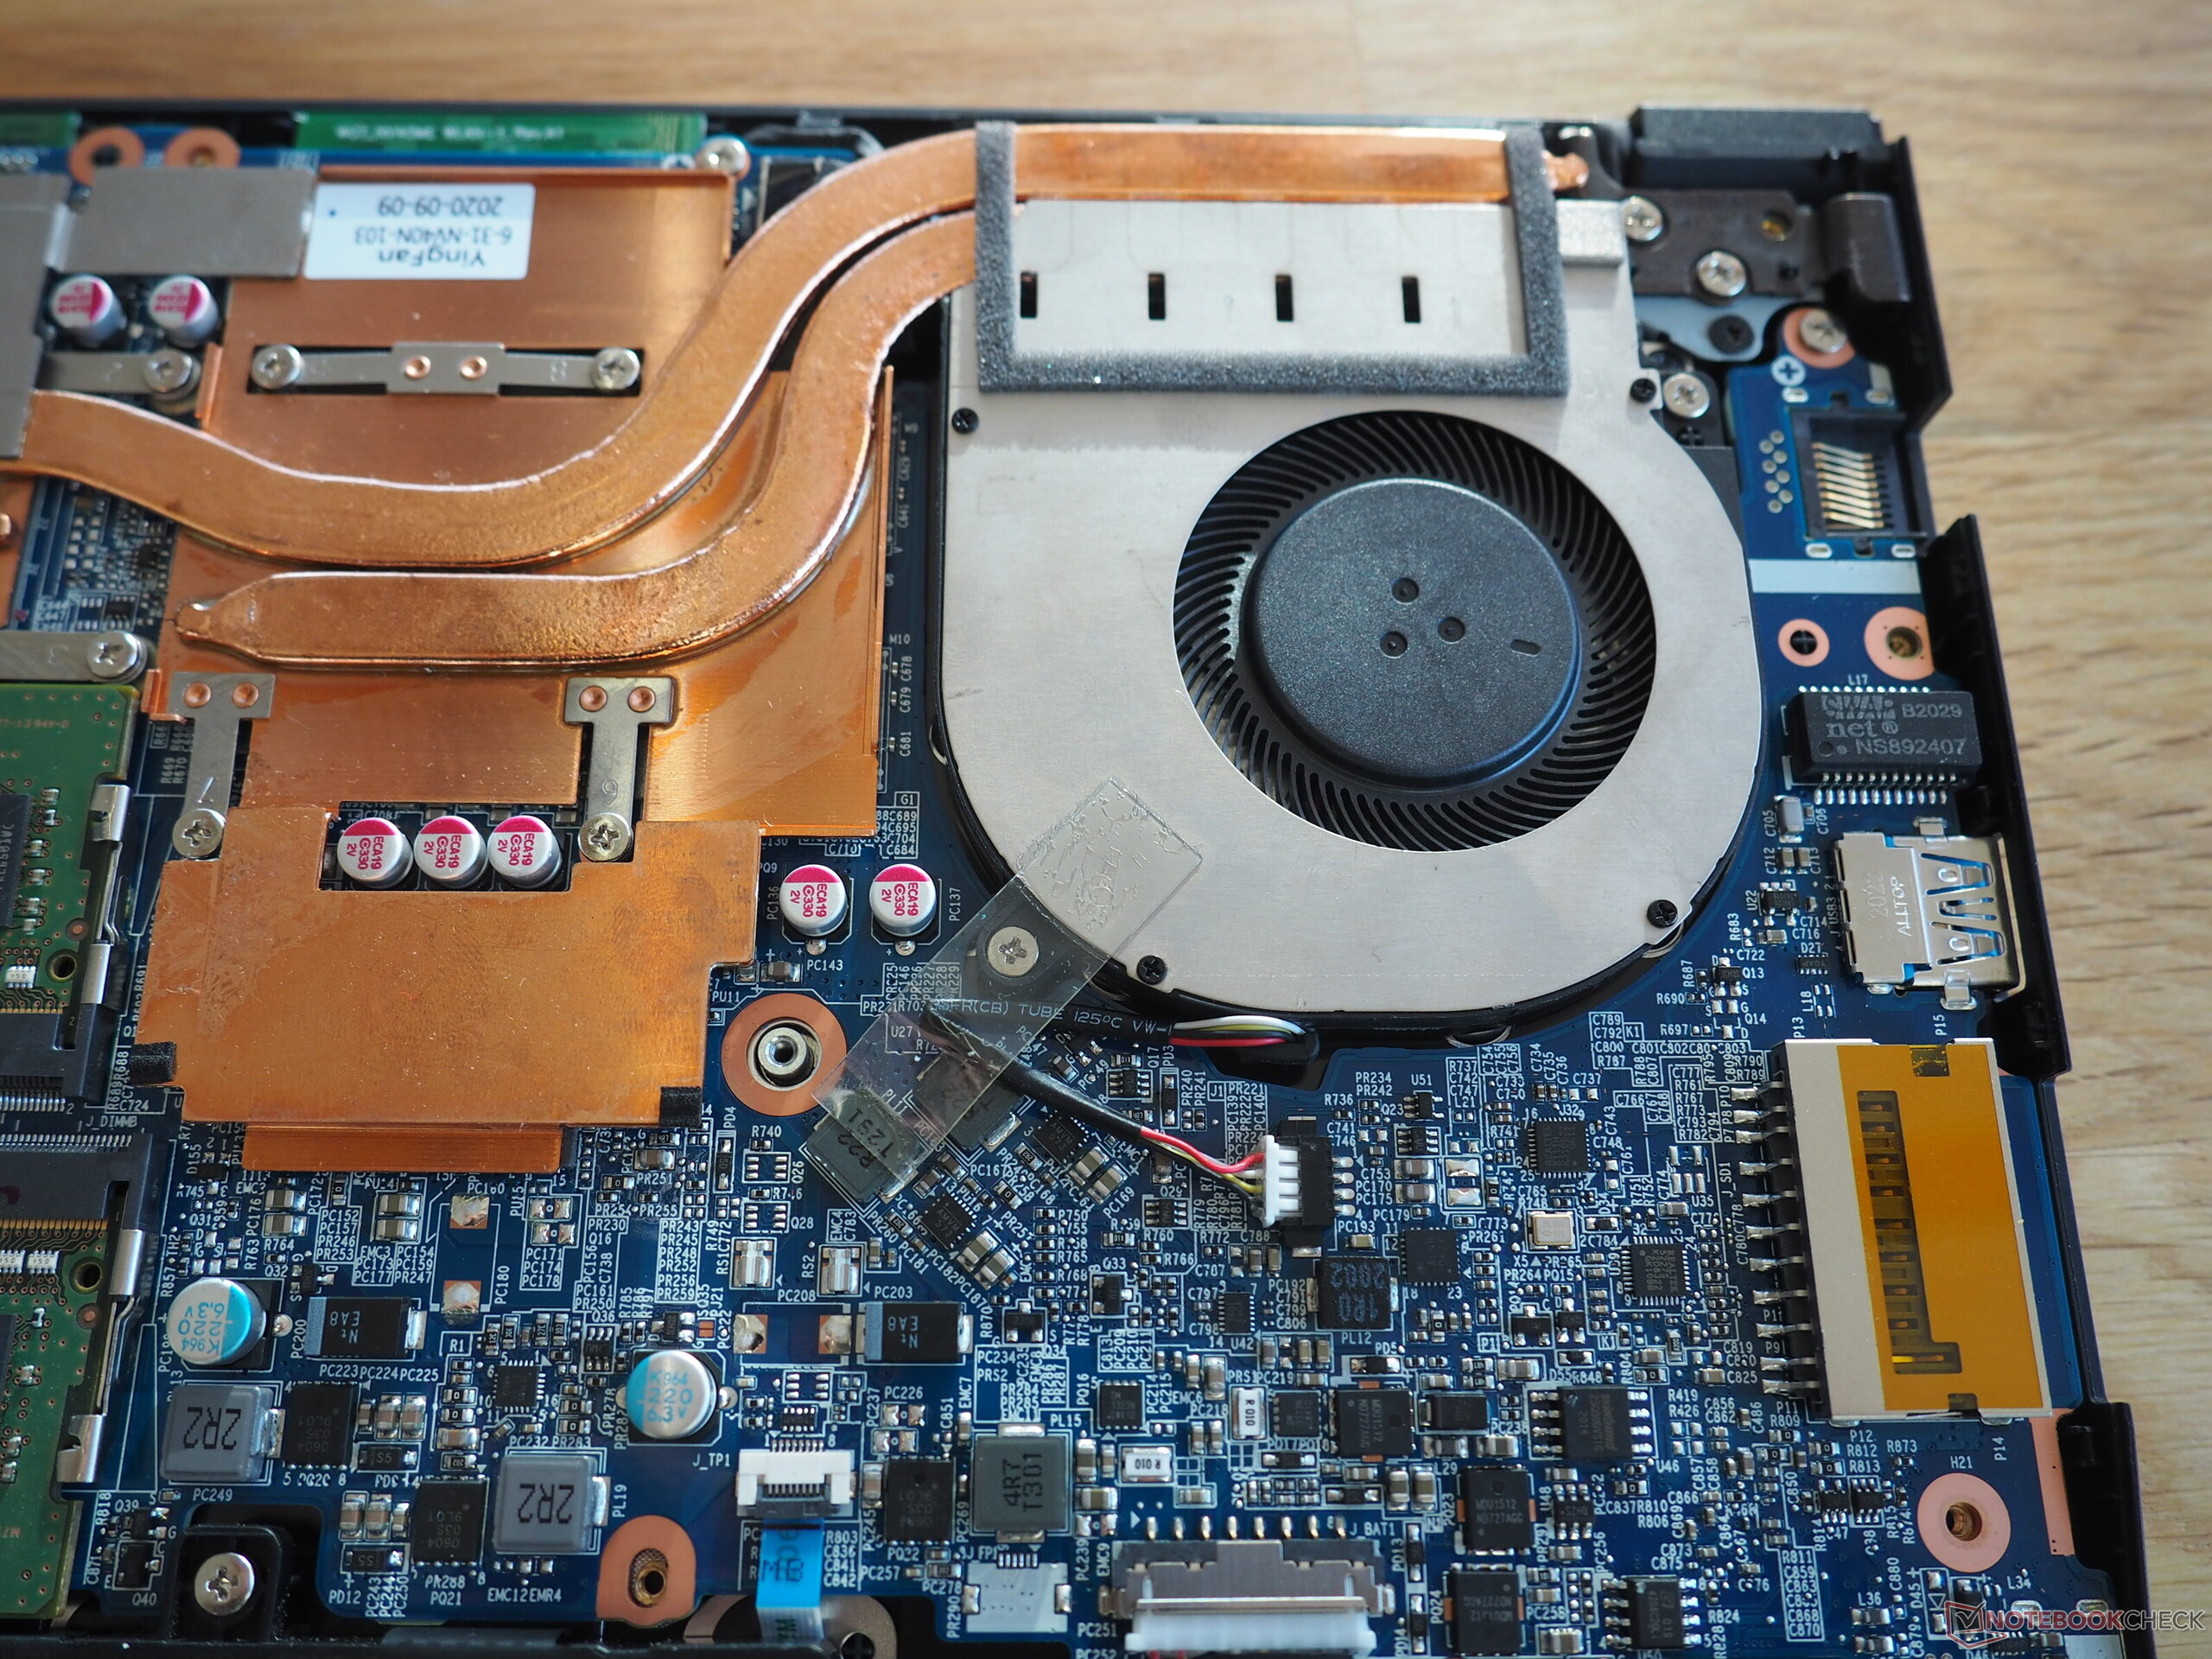
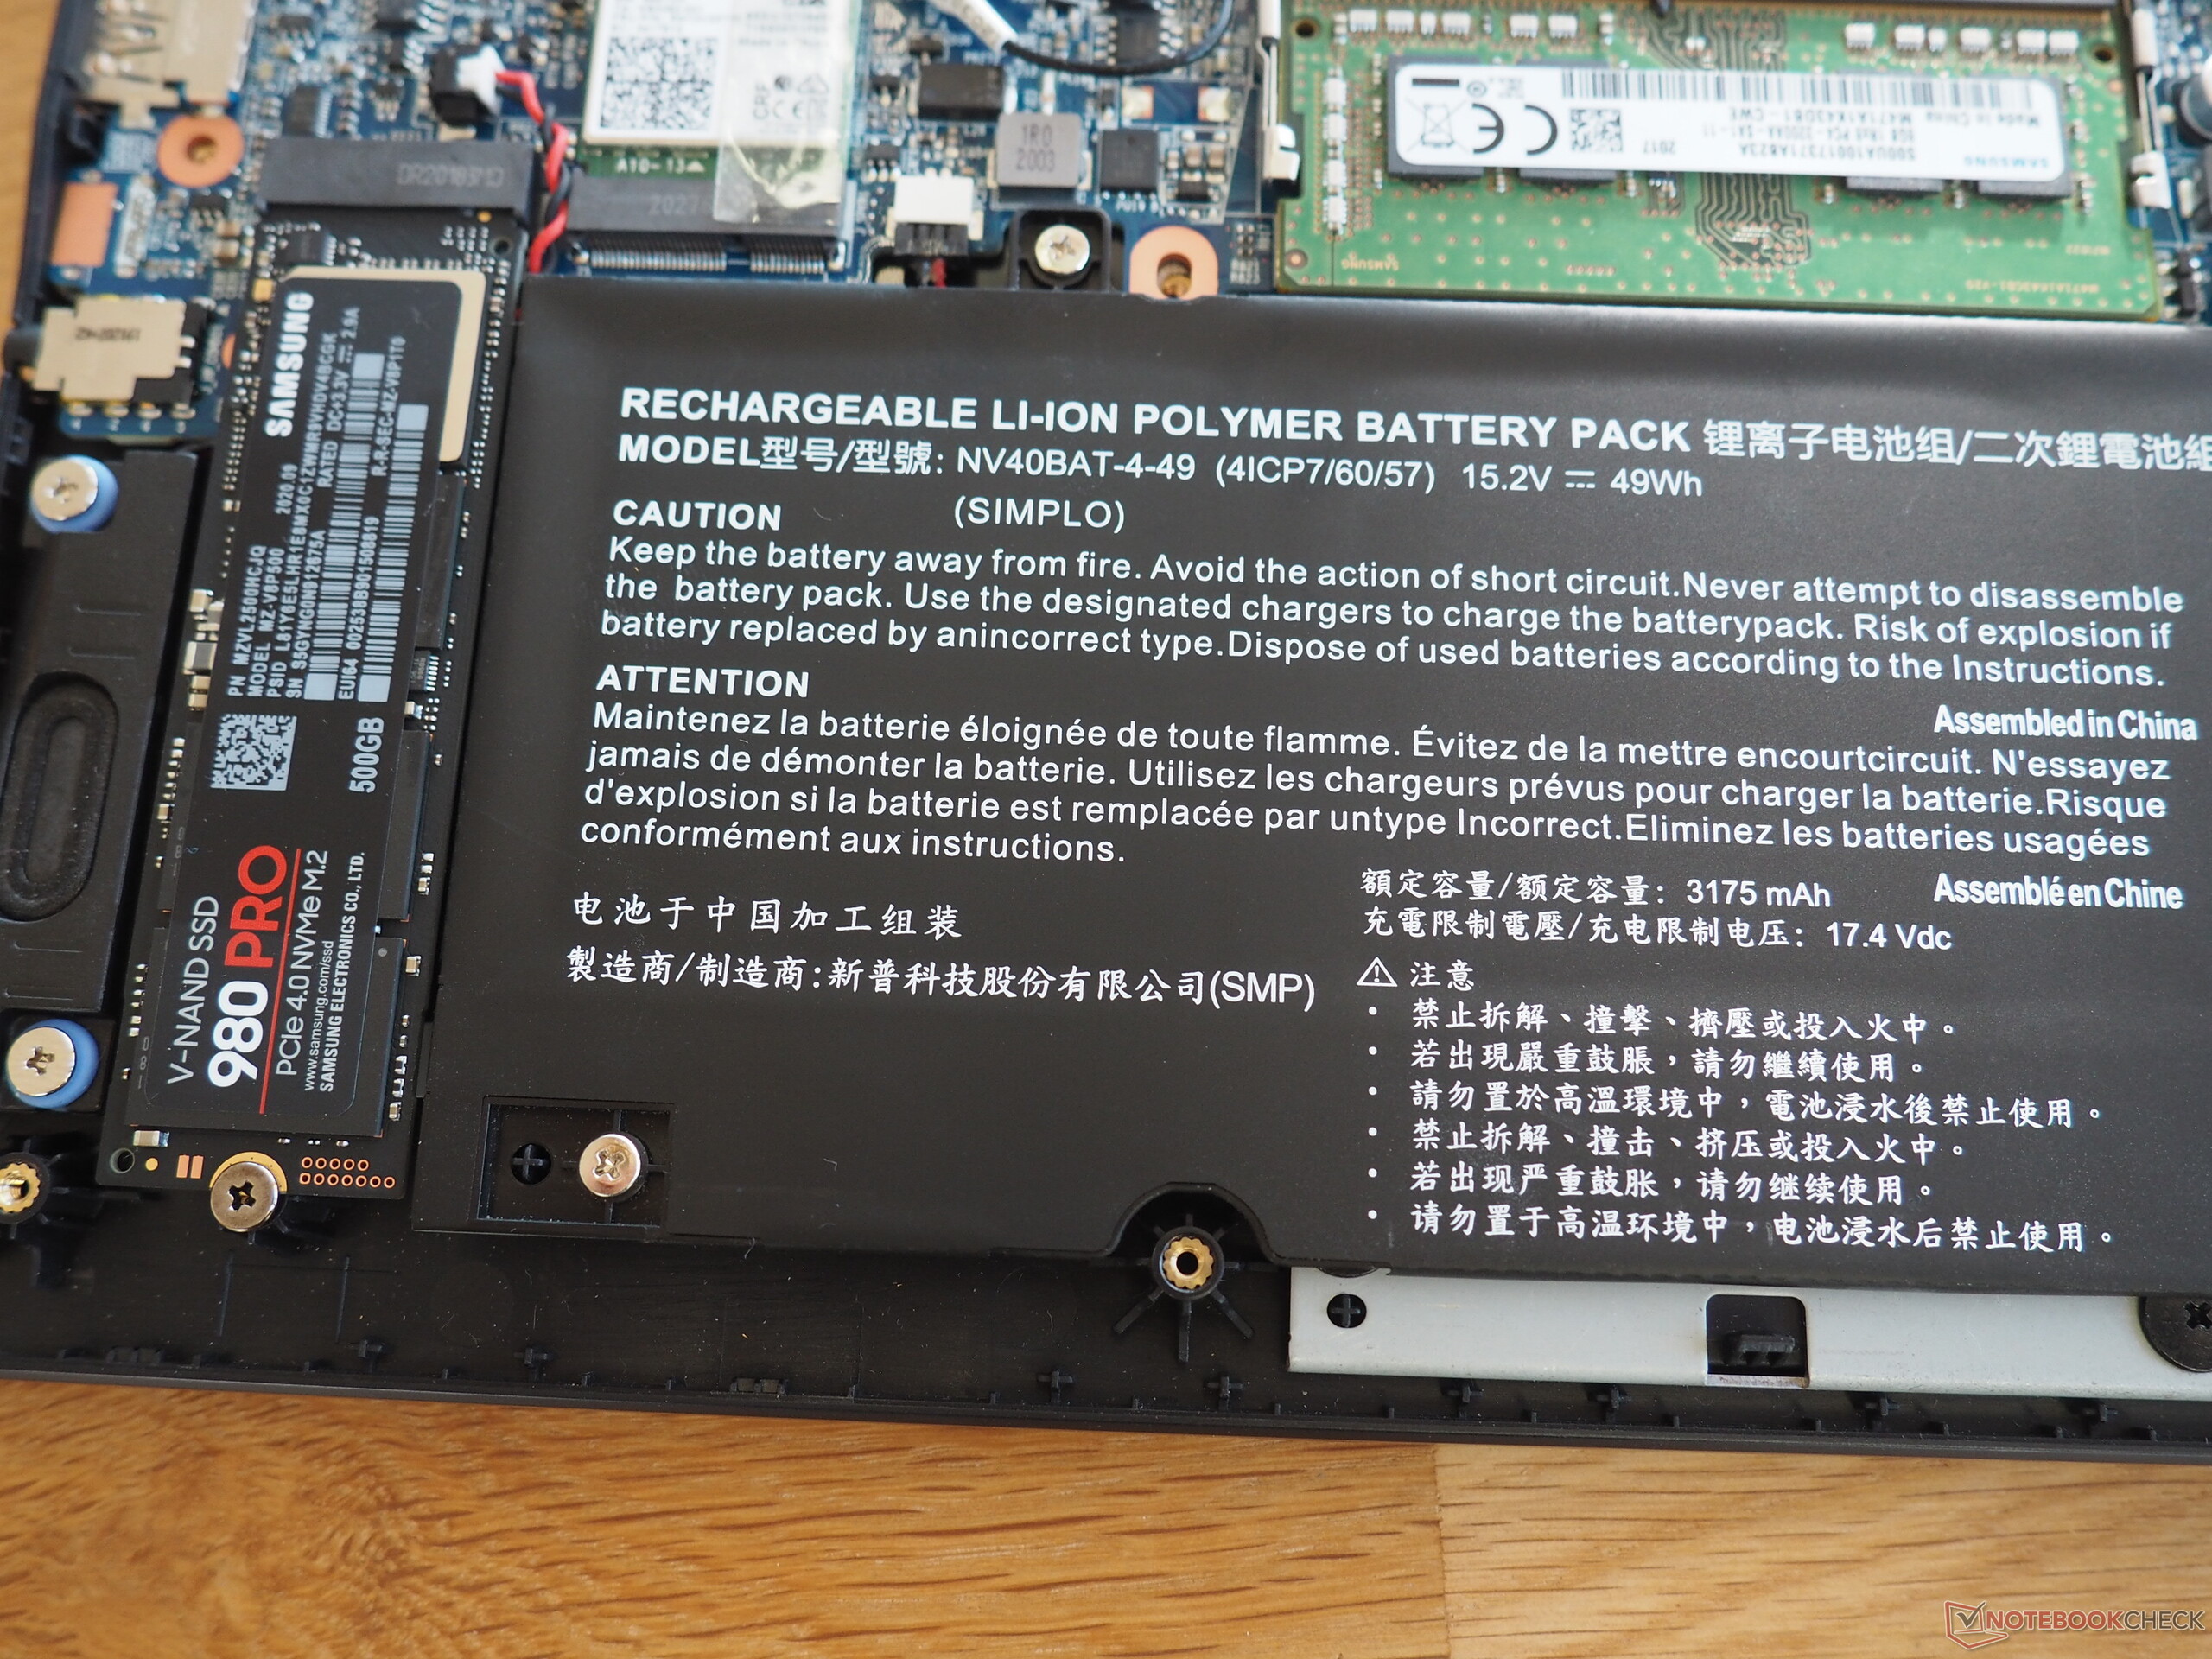
The bottom of the case is attached with a total of 14 Phillips screws. After removing the bottom panel, the components are easily accessible. Users can reach the battery, the M.2 slot, the two RAM slots, the wireless adapter, and the cooling system (which consists of two fans and several heat pipes). Since the CPU and GPU are soldered, upgrading these components is not possible.
Input devices
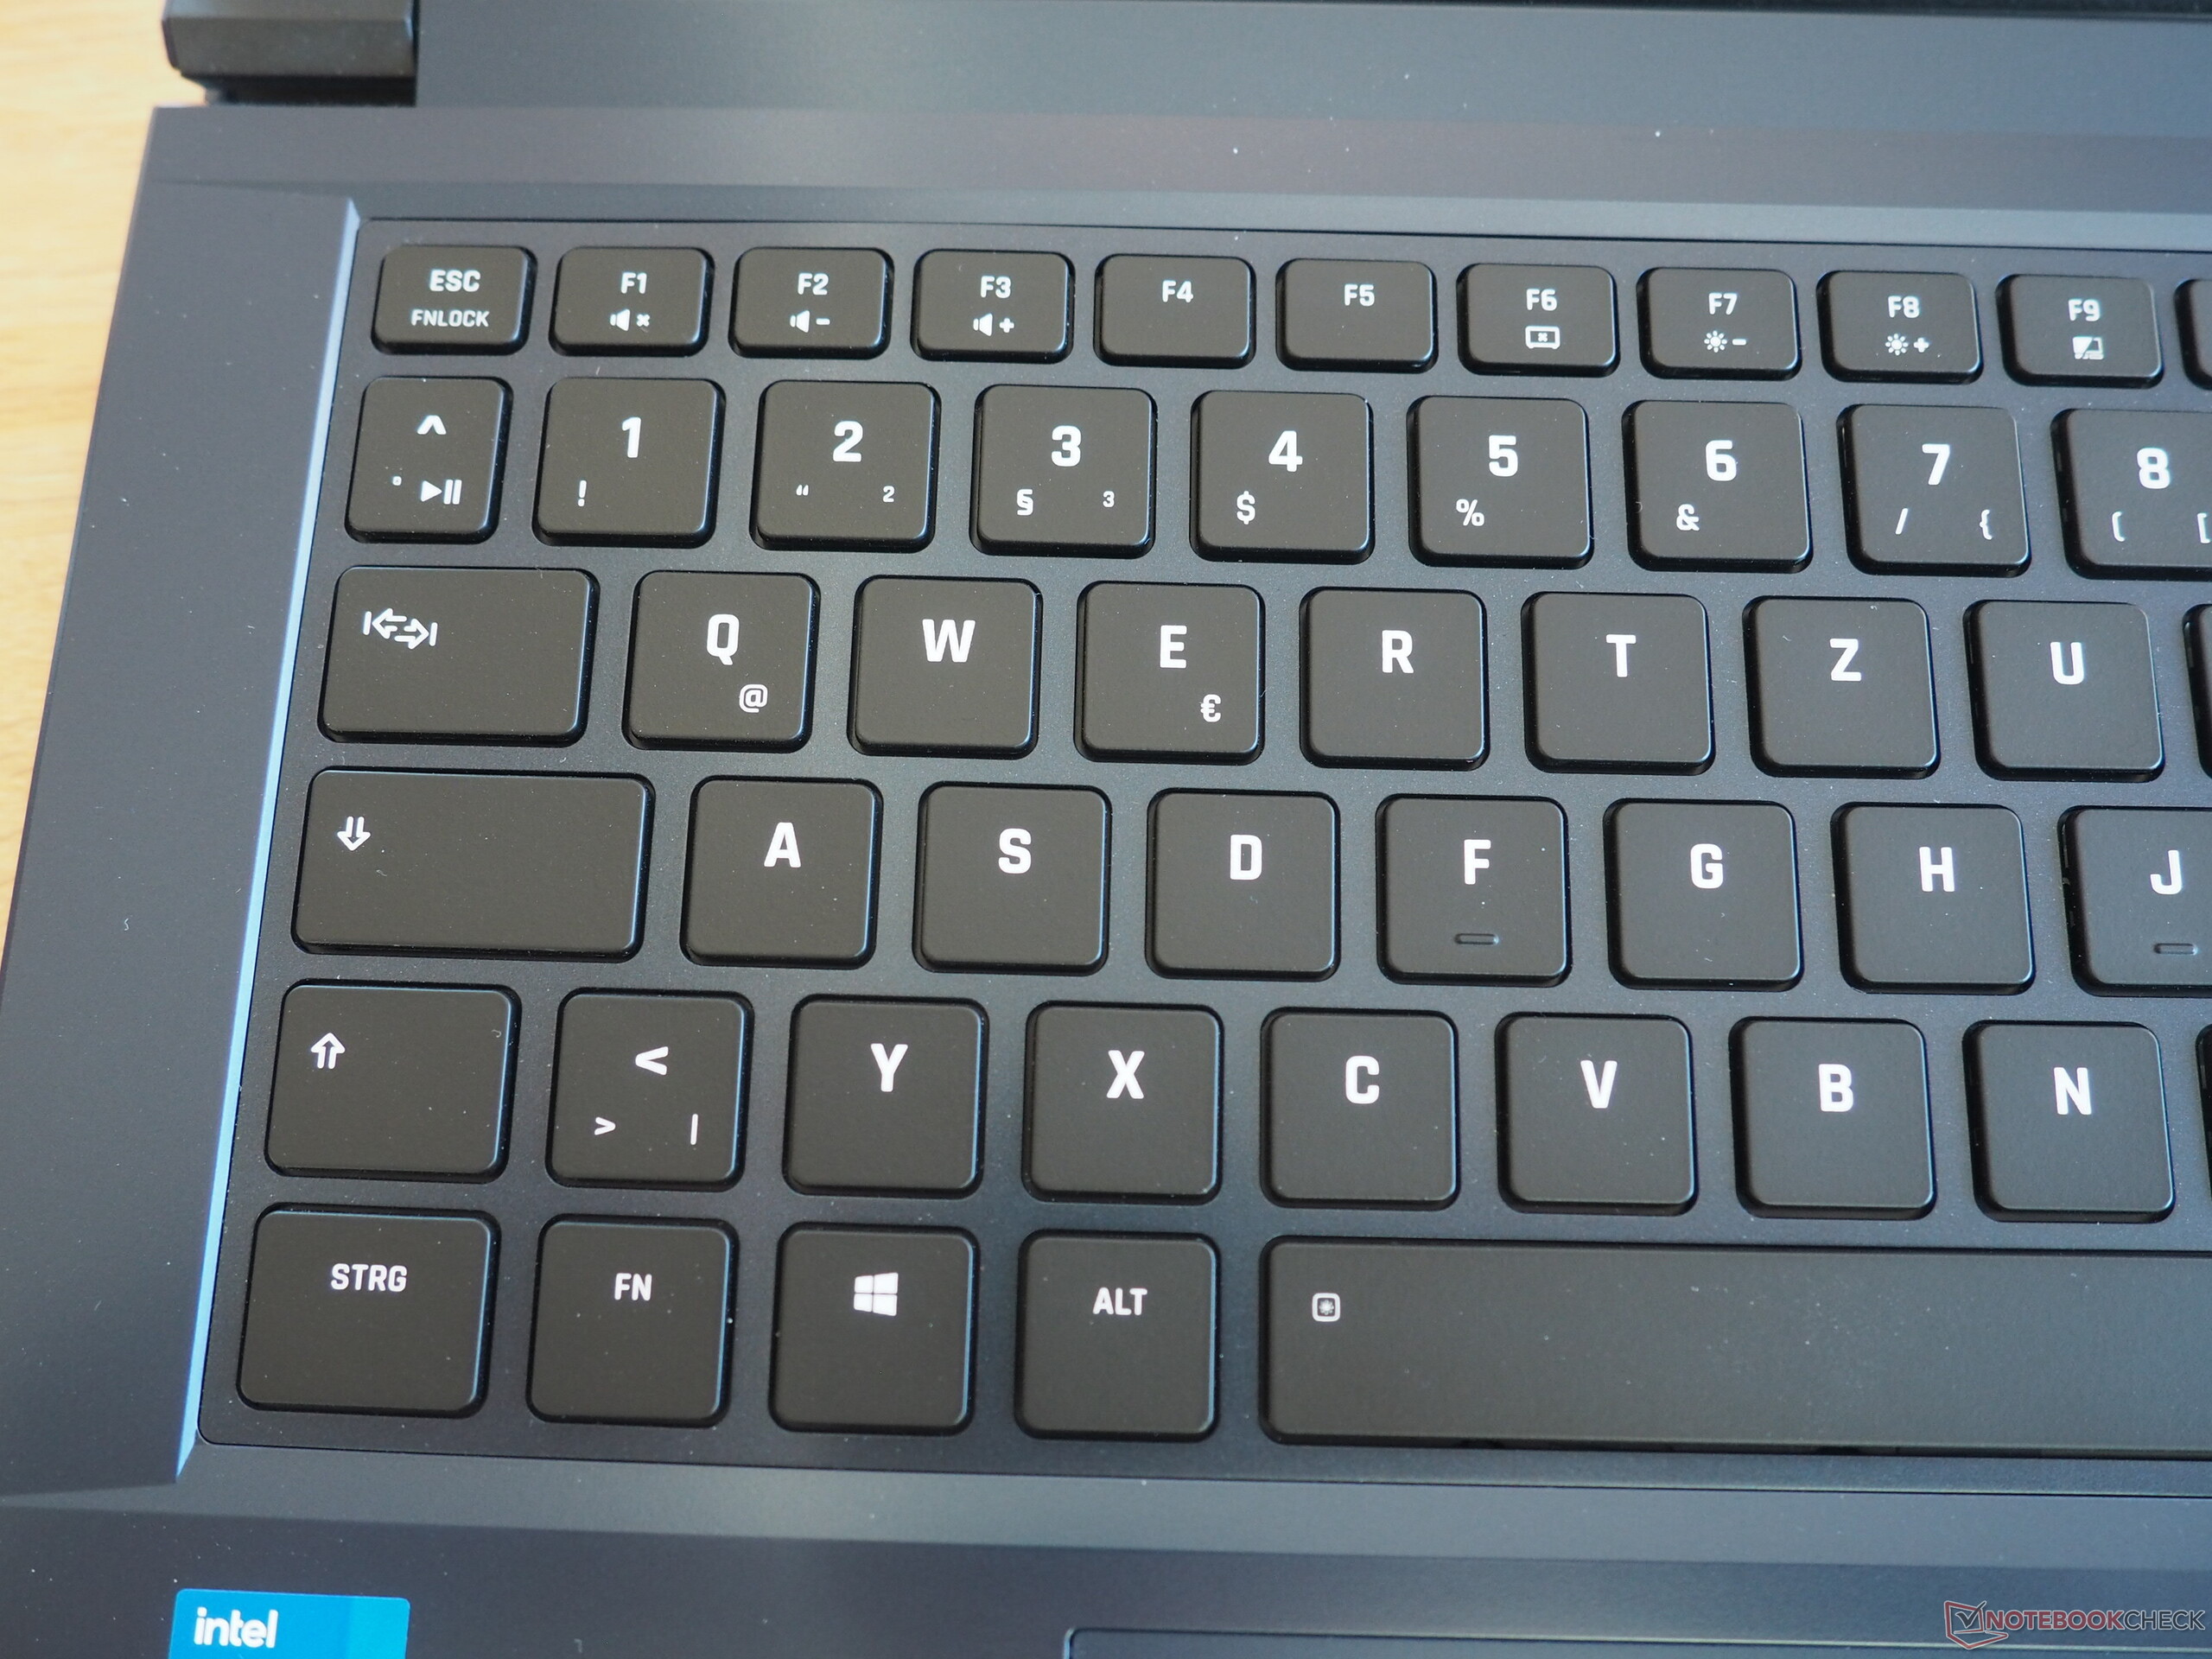
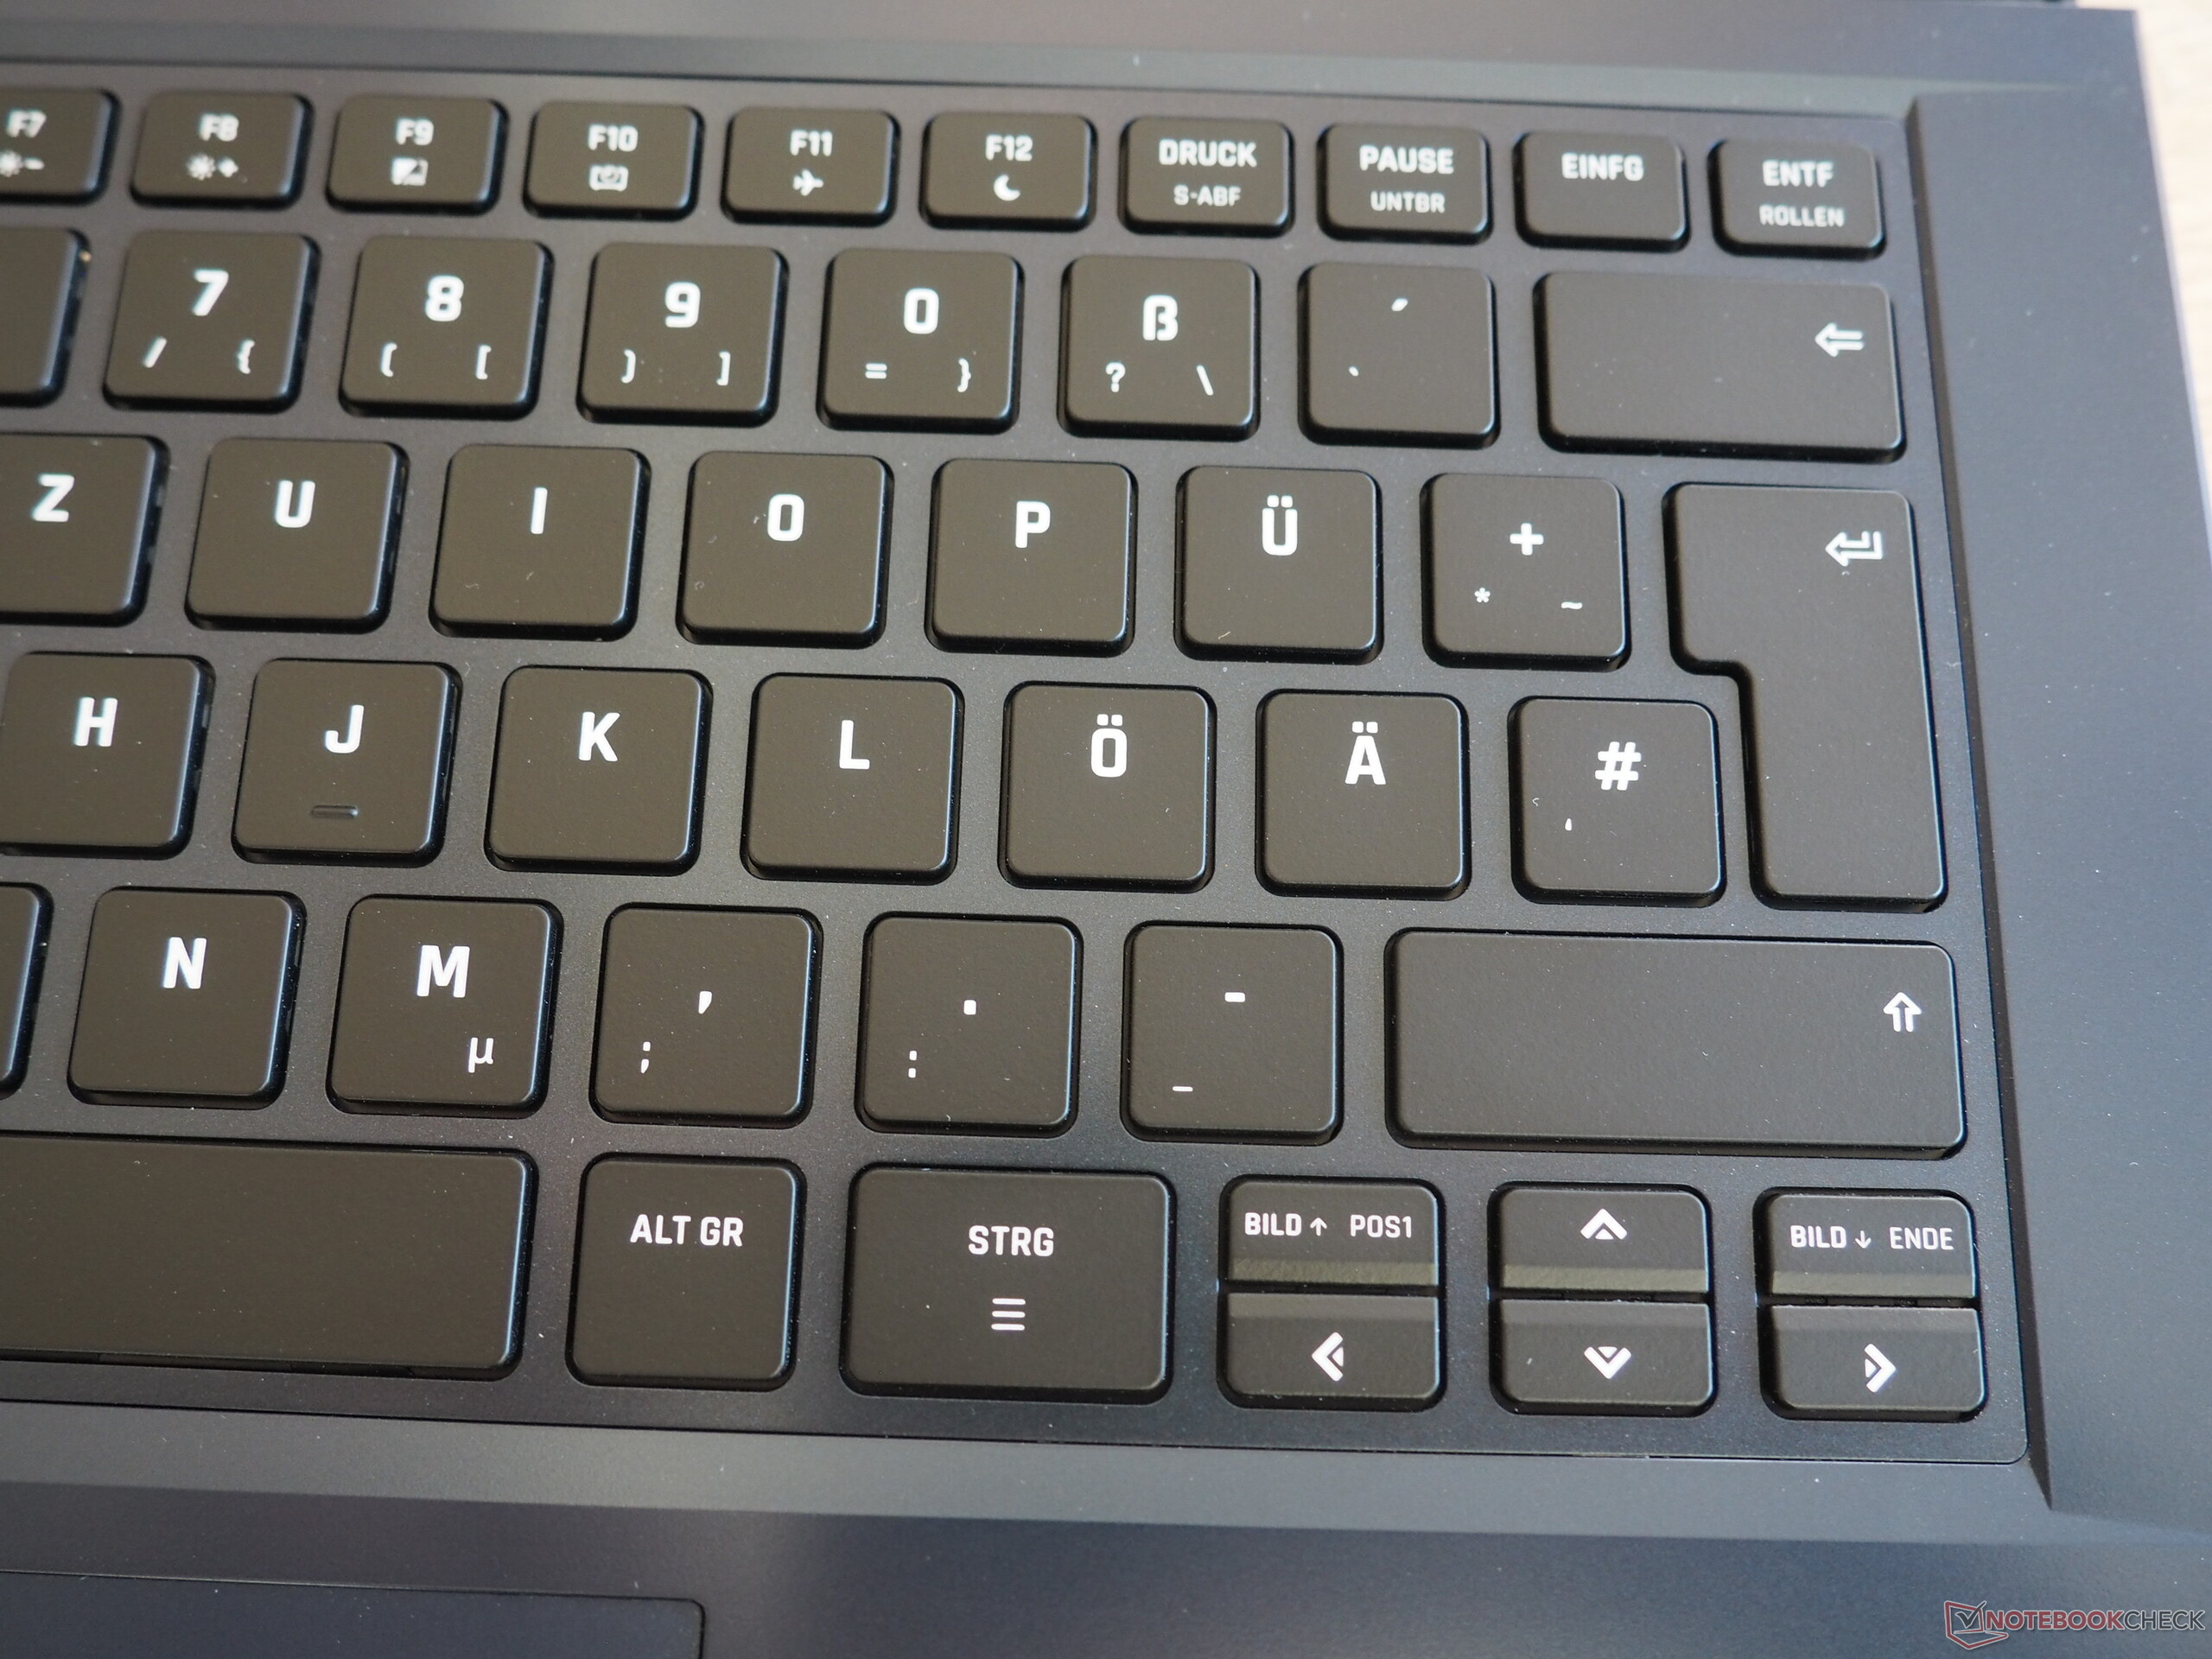
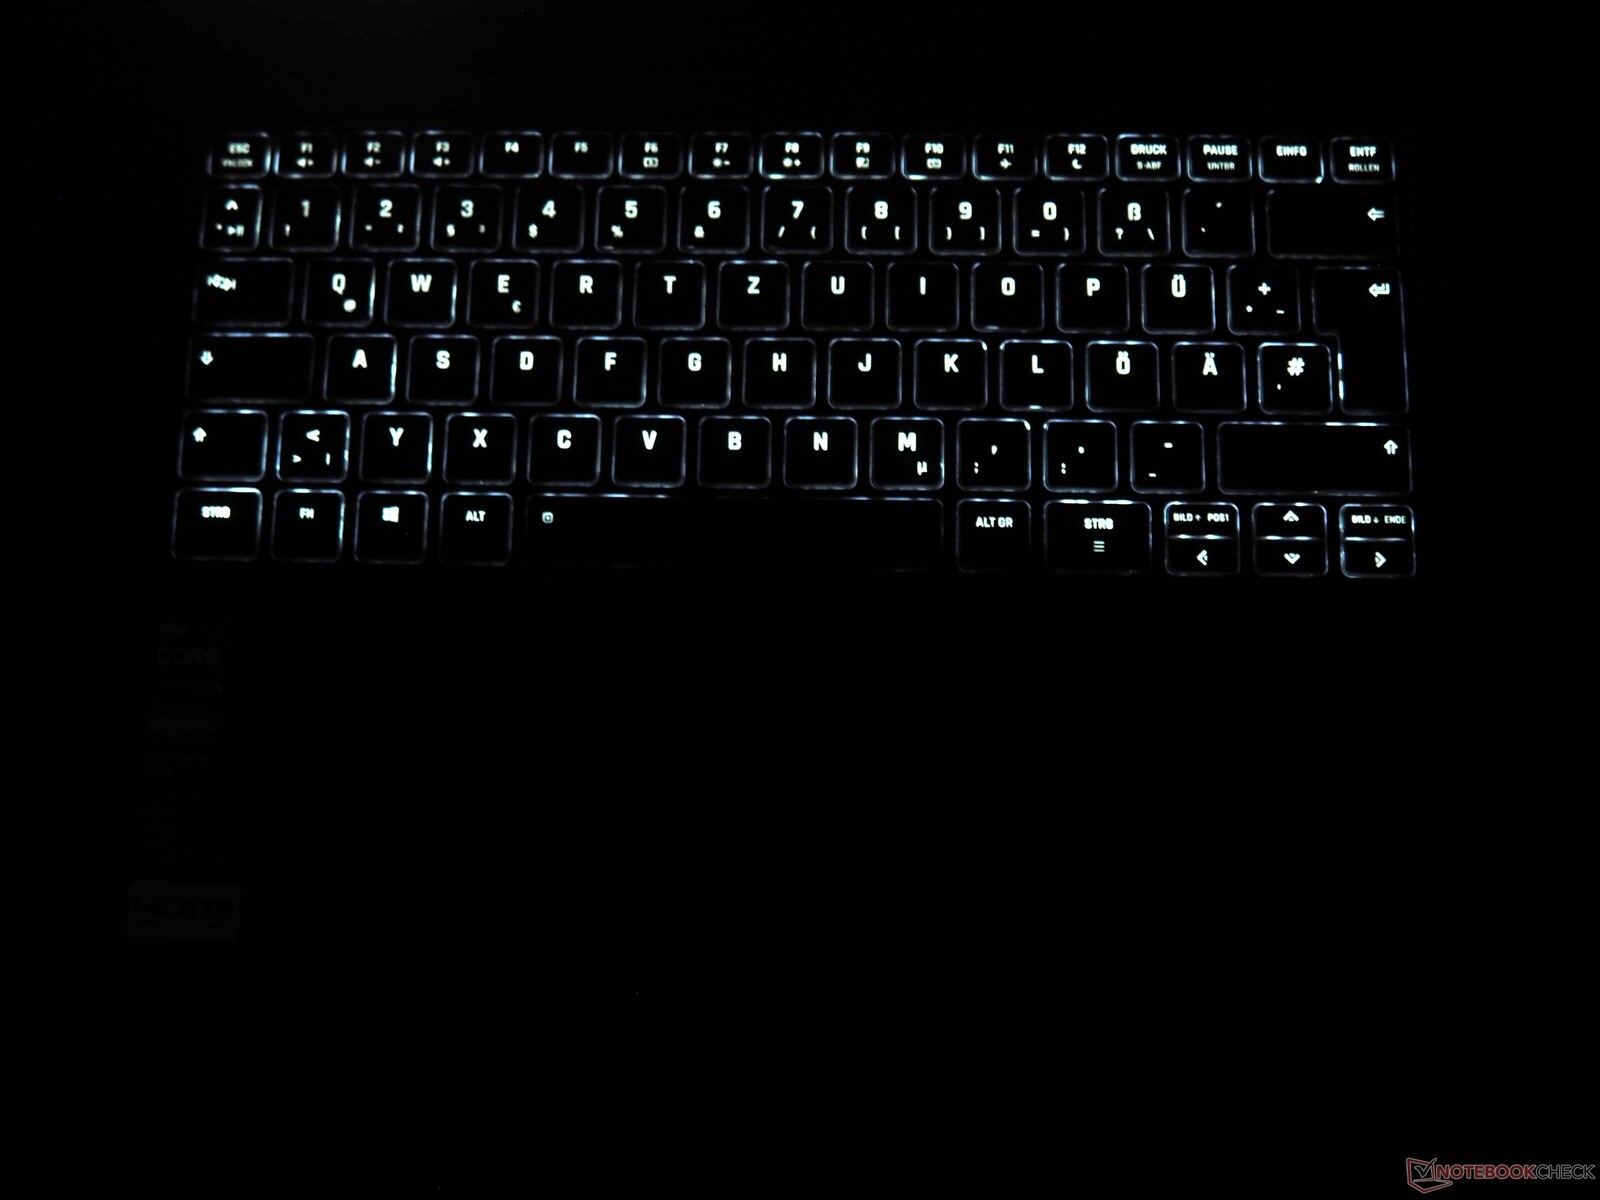
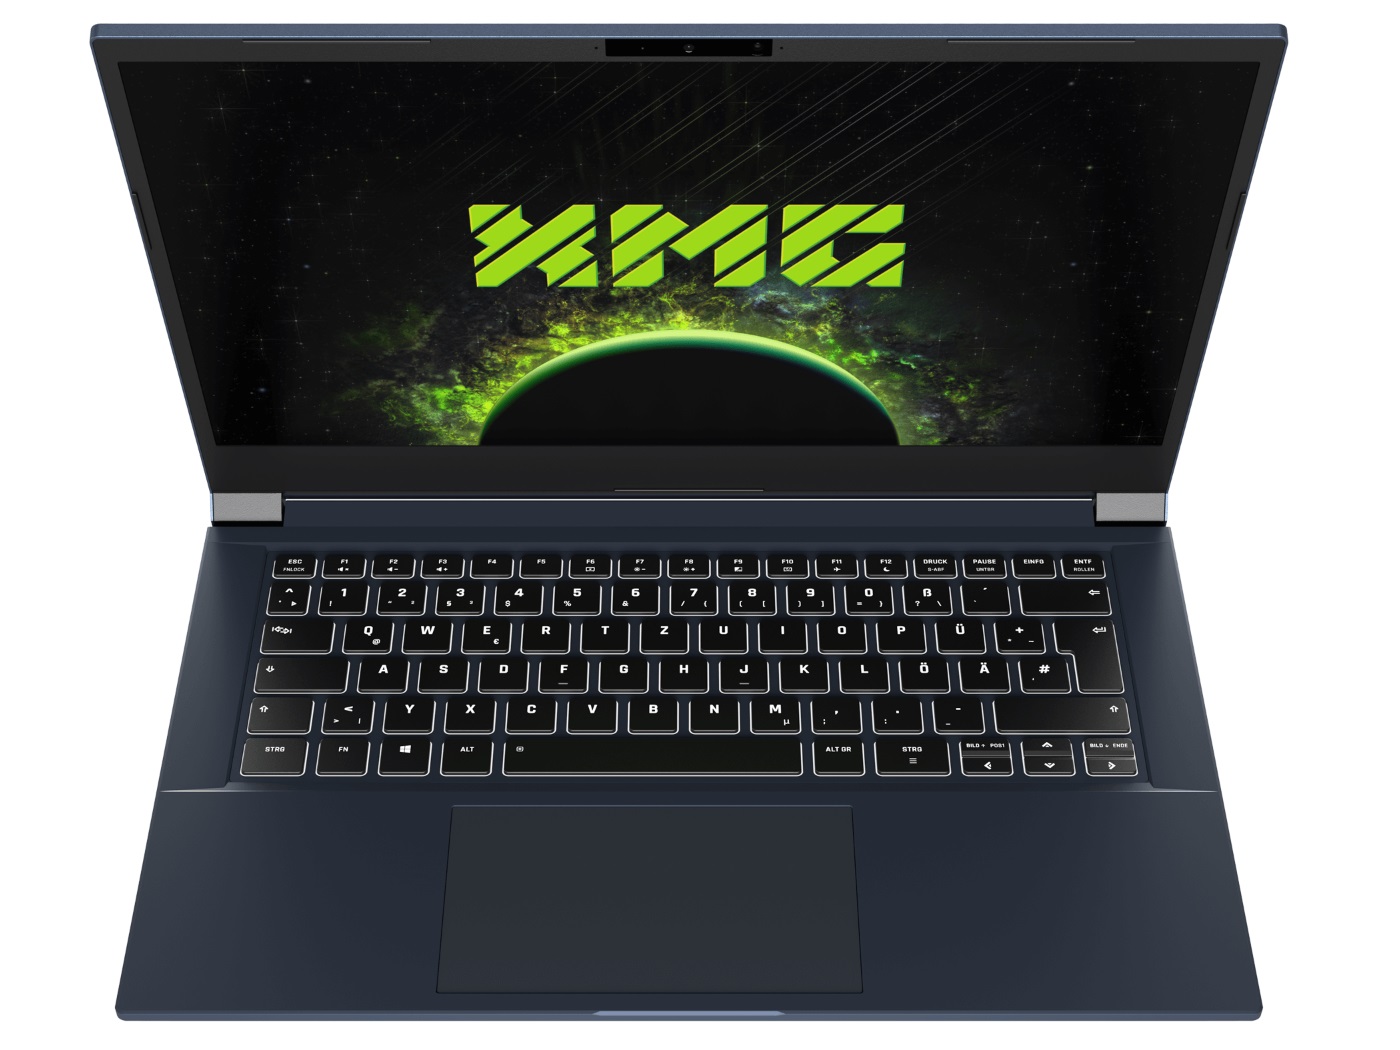
Keyboard
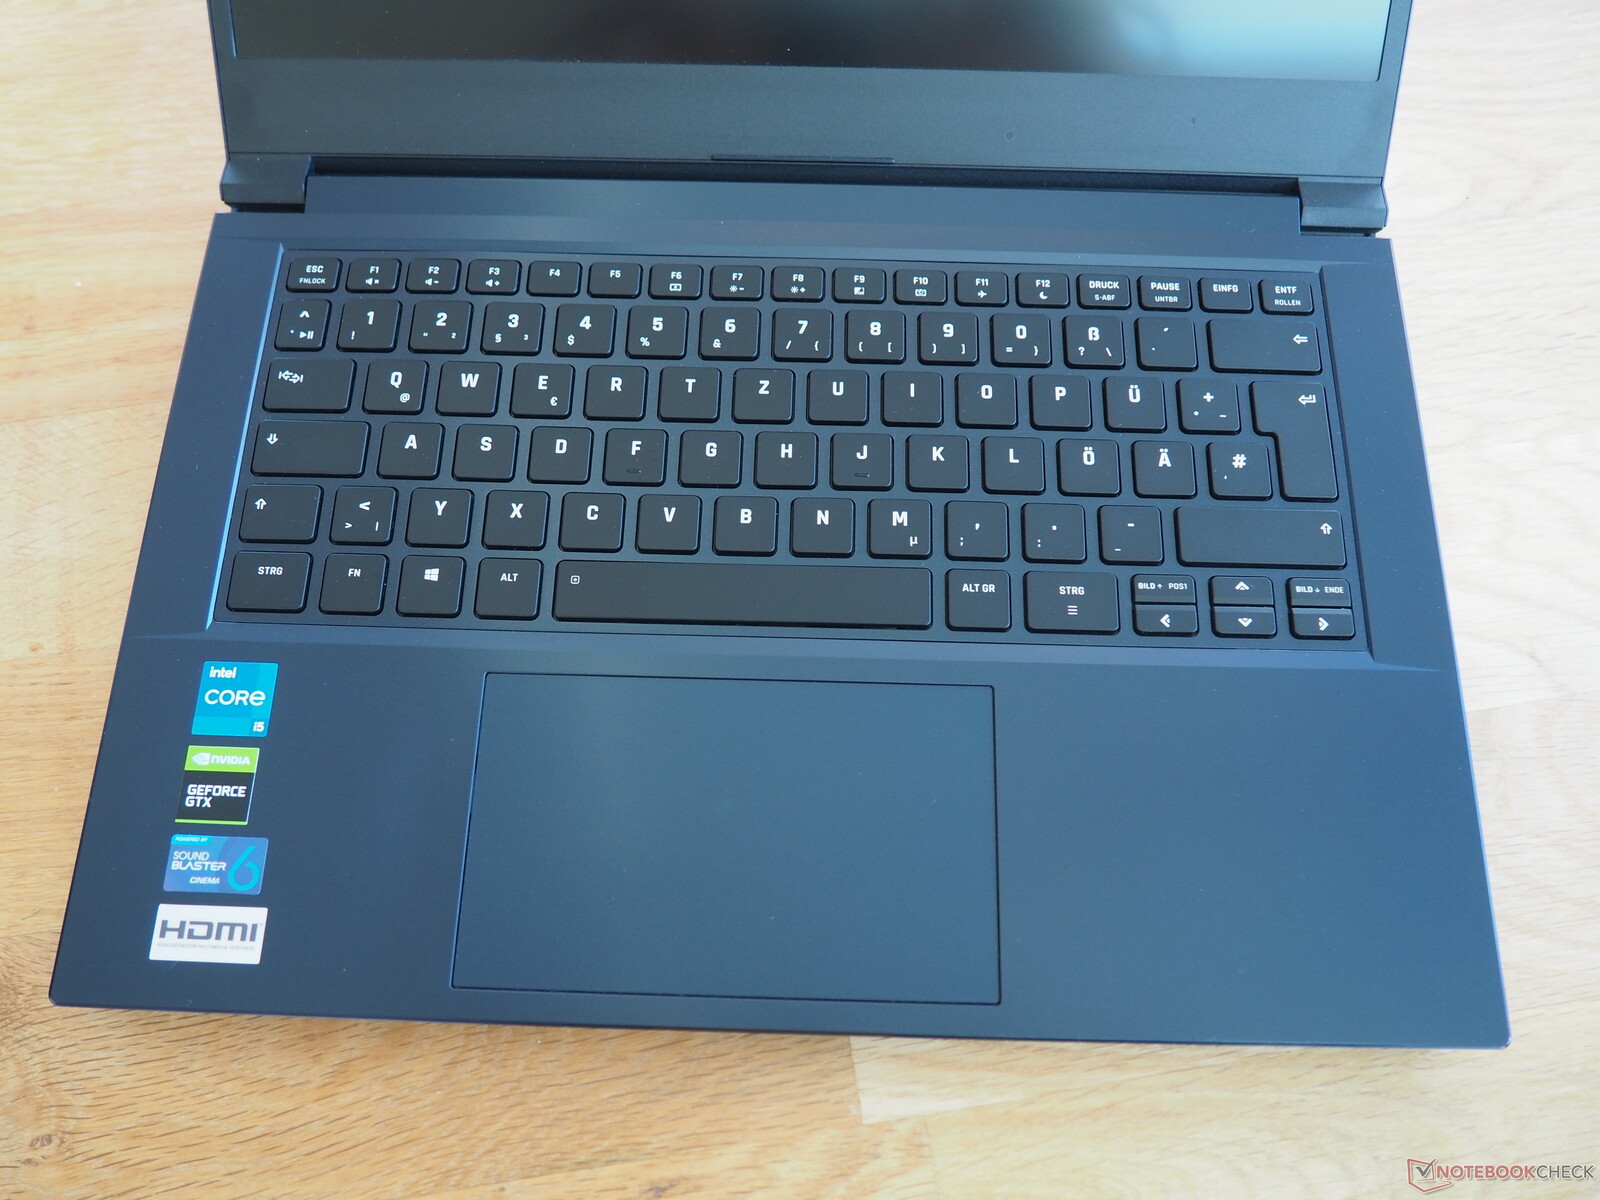
The keyboard leaves a somewhat ambivalent impression. While the chiclet layout is certainly suitable for gaming, experienced typists will tend to want a crisper typing feel. Key feedback is soft, which some users might find spongy. The almost tiny directional arrows are also not ideal.
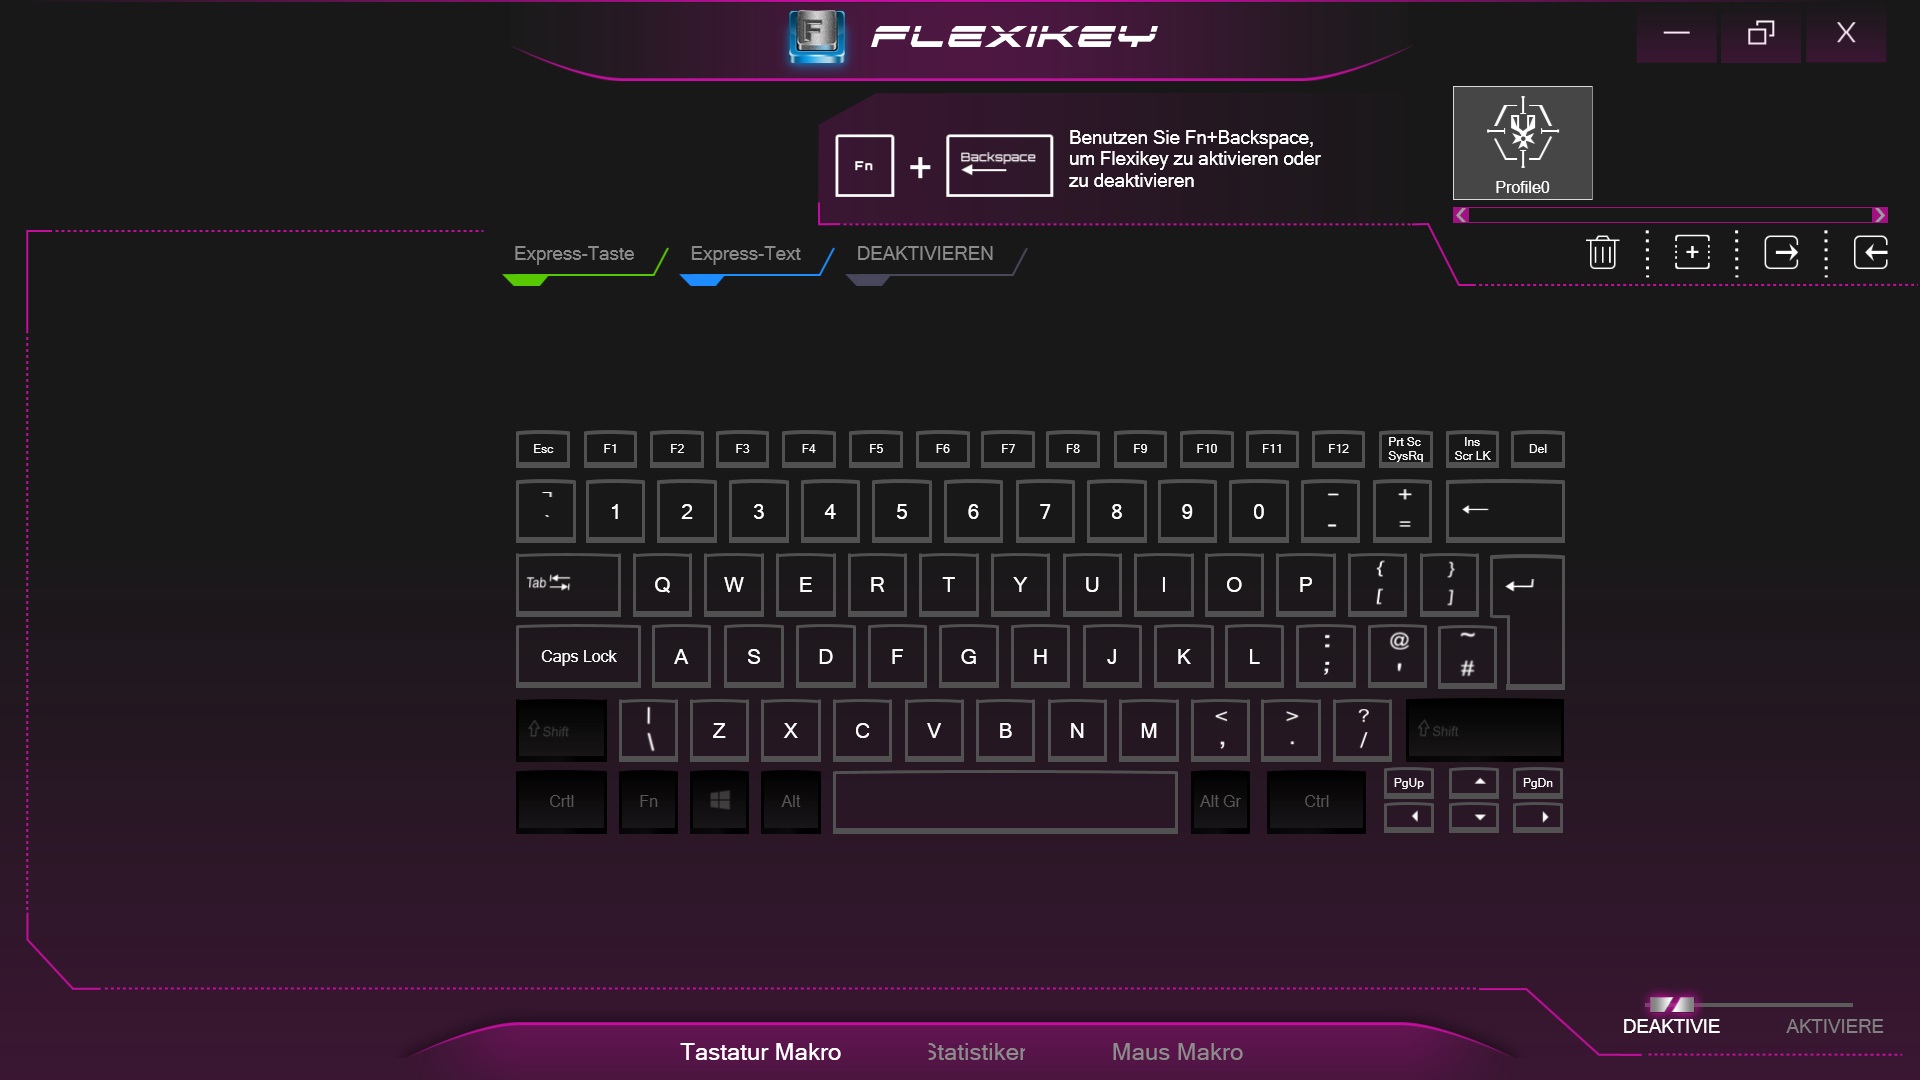
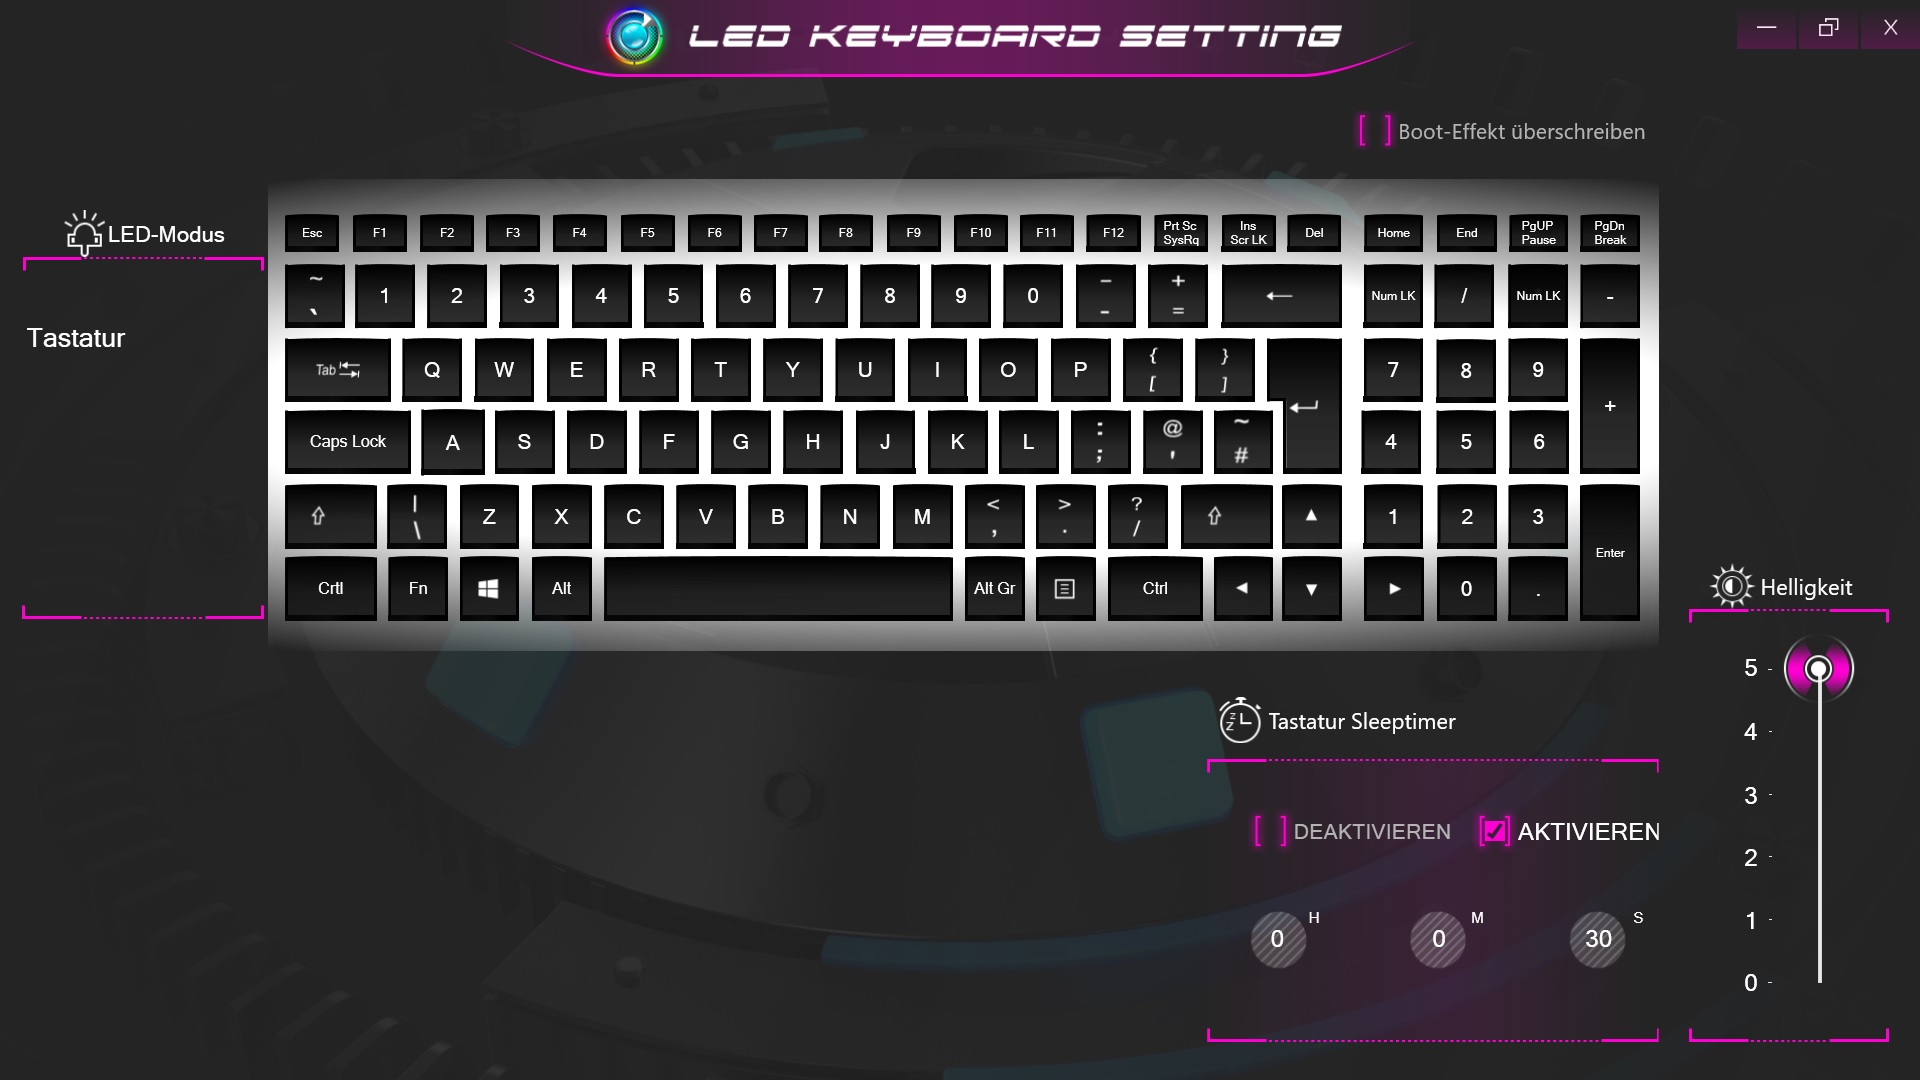
Otherwise, we like the layout, although buyers will have to do without a number pad due to the limited space. You will also look in vain for RGB lighting in the Core 14. The keys can only glow white. Despite the multi-level control, the light intensity is relatively weak. The illumination's duration can be adjusted via a timer. A default of 30 seconds is set by default.
Touchpad
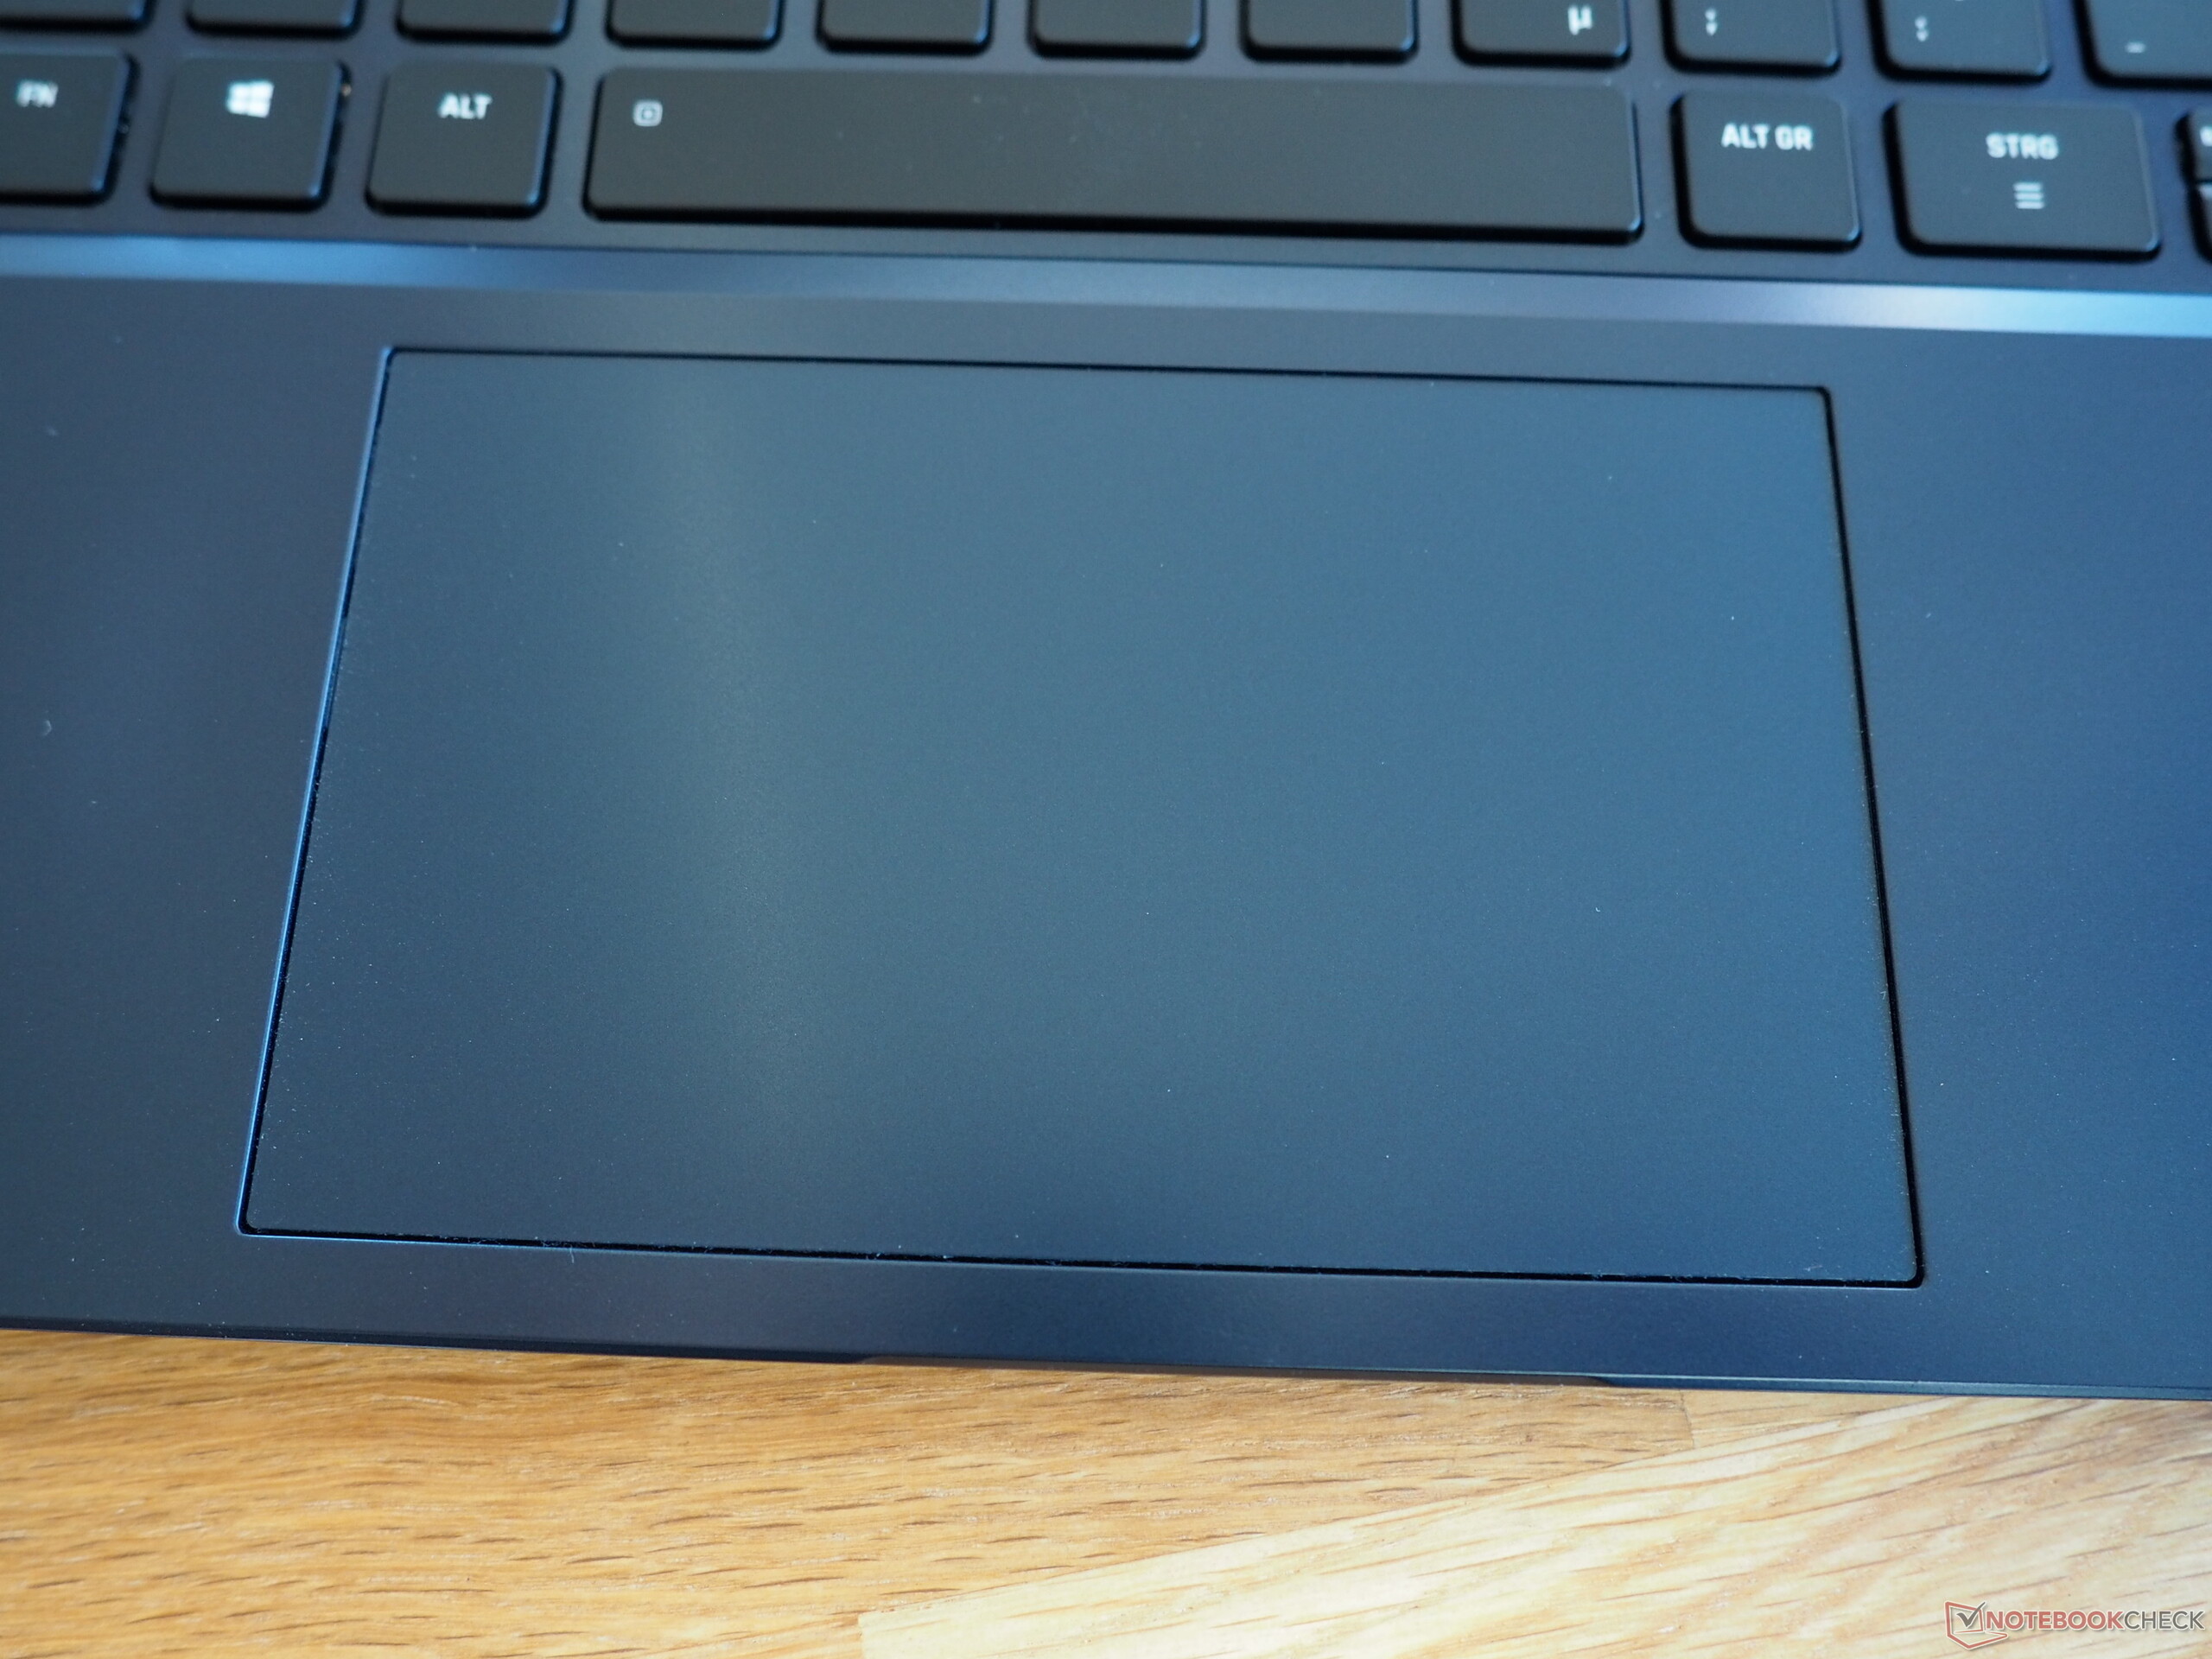
The touchpad has a decent size of 12 x 7.3 cm. Thanks to the smooth surface and the resultant glide, it is very pleasant to use. There is also little to complain about in terms of precision and gesture support (zooming and scrolling with 2 fingers). The absence of dedicated mouse buttons is a matter of taste.
Display
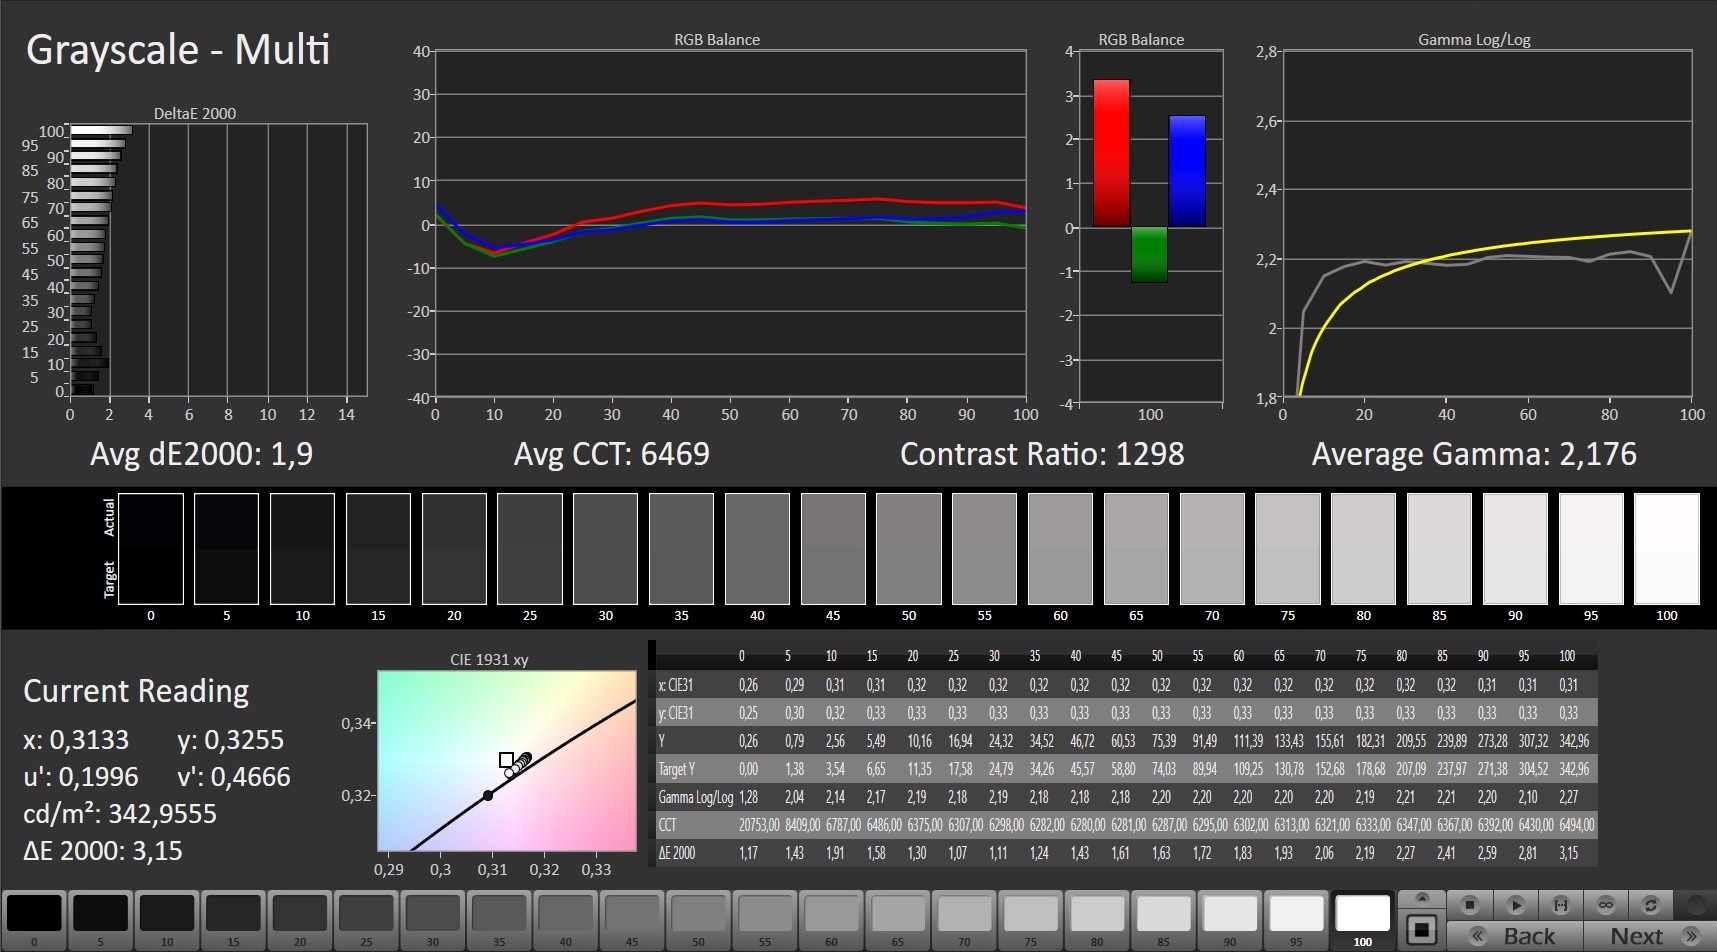
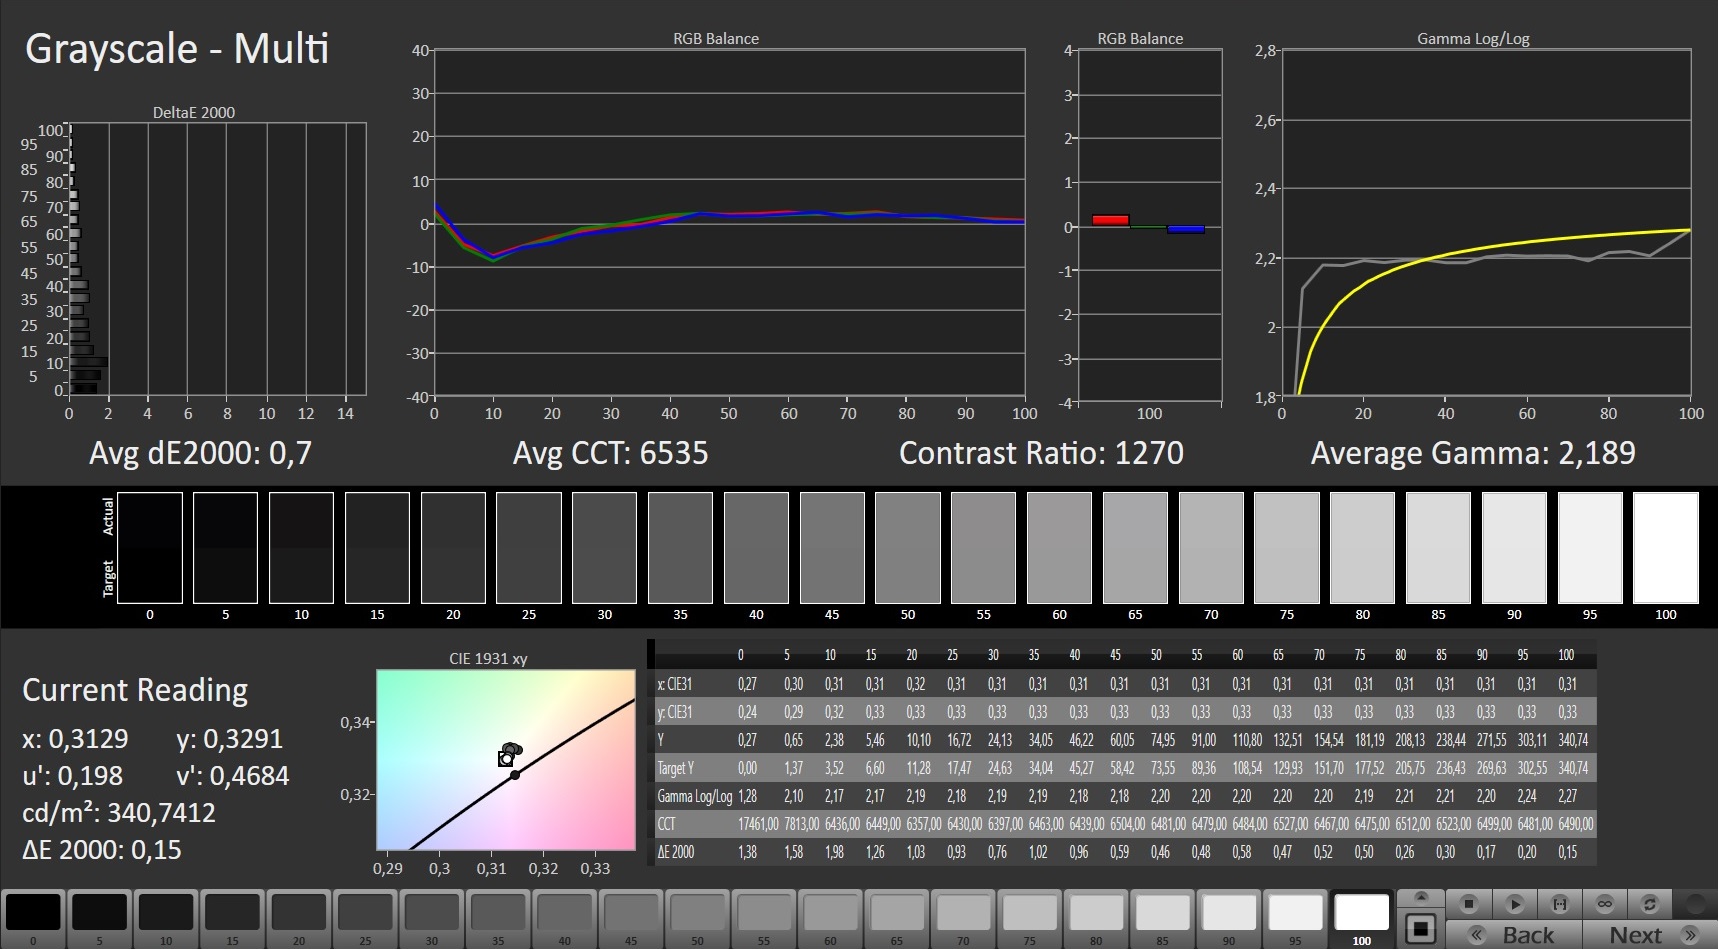
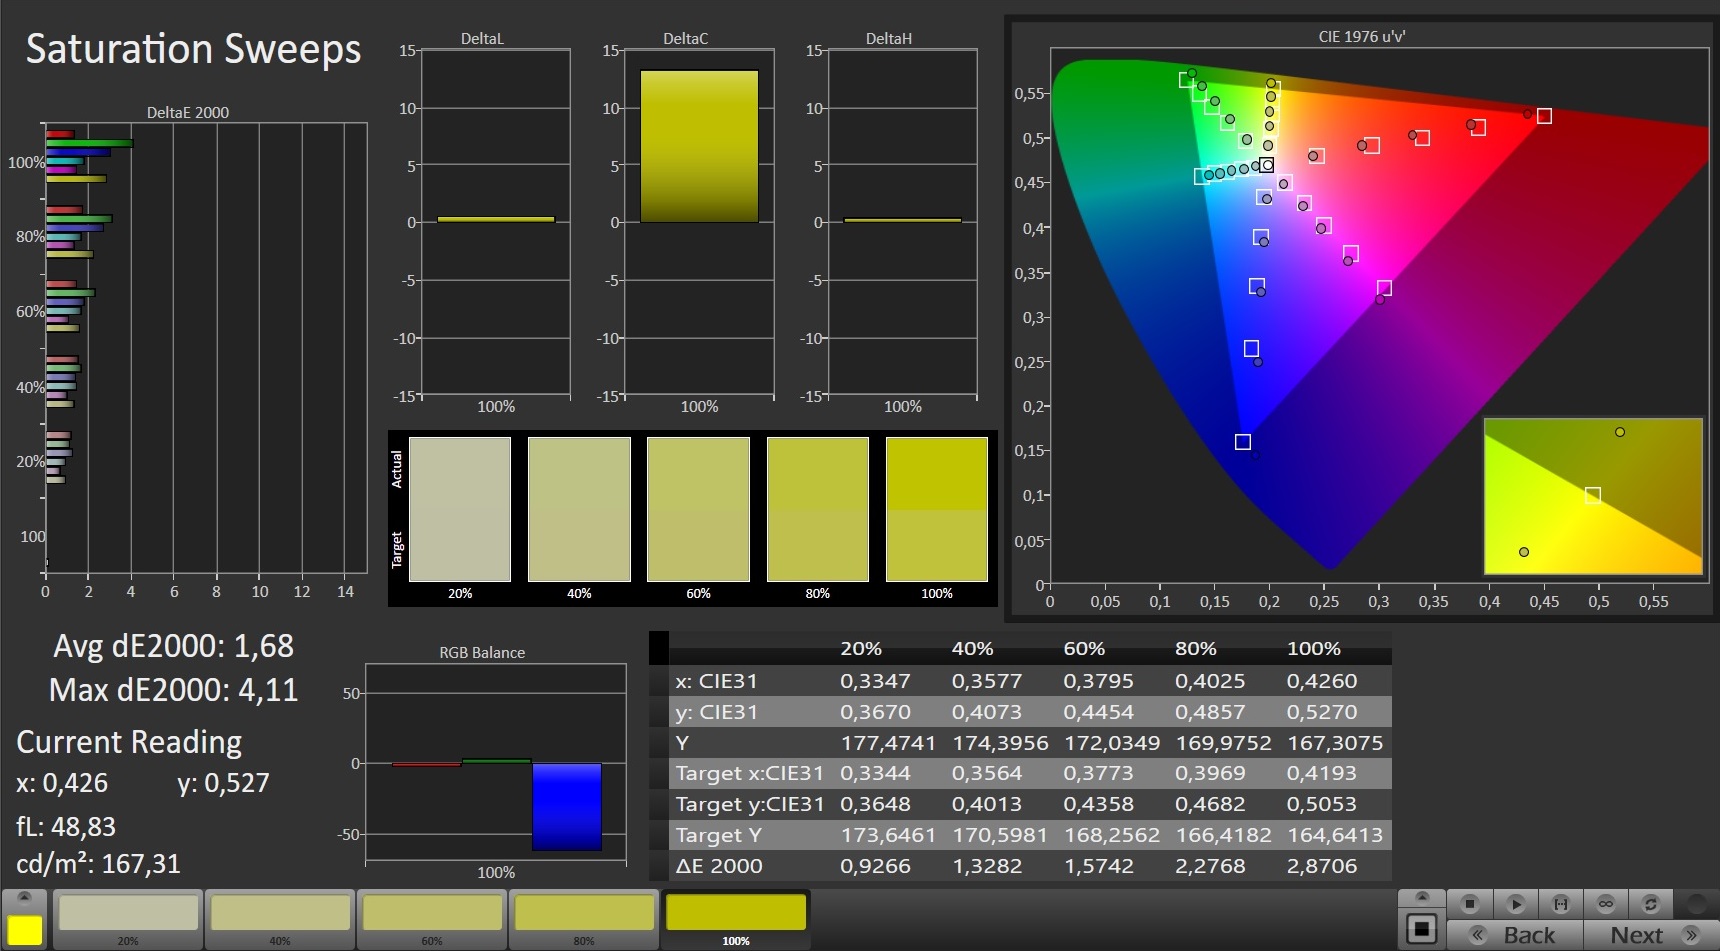
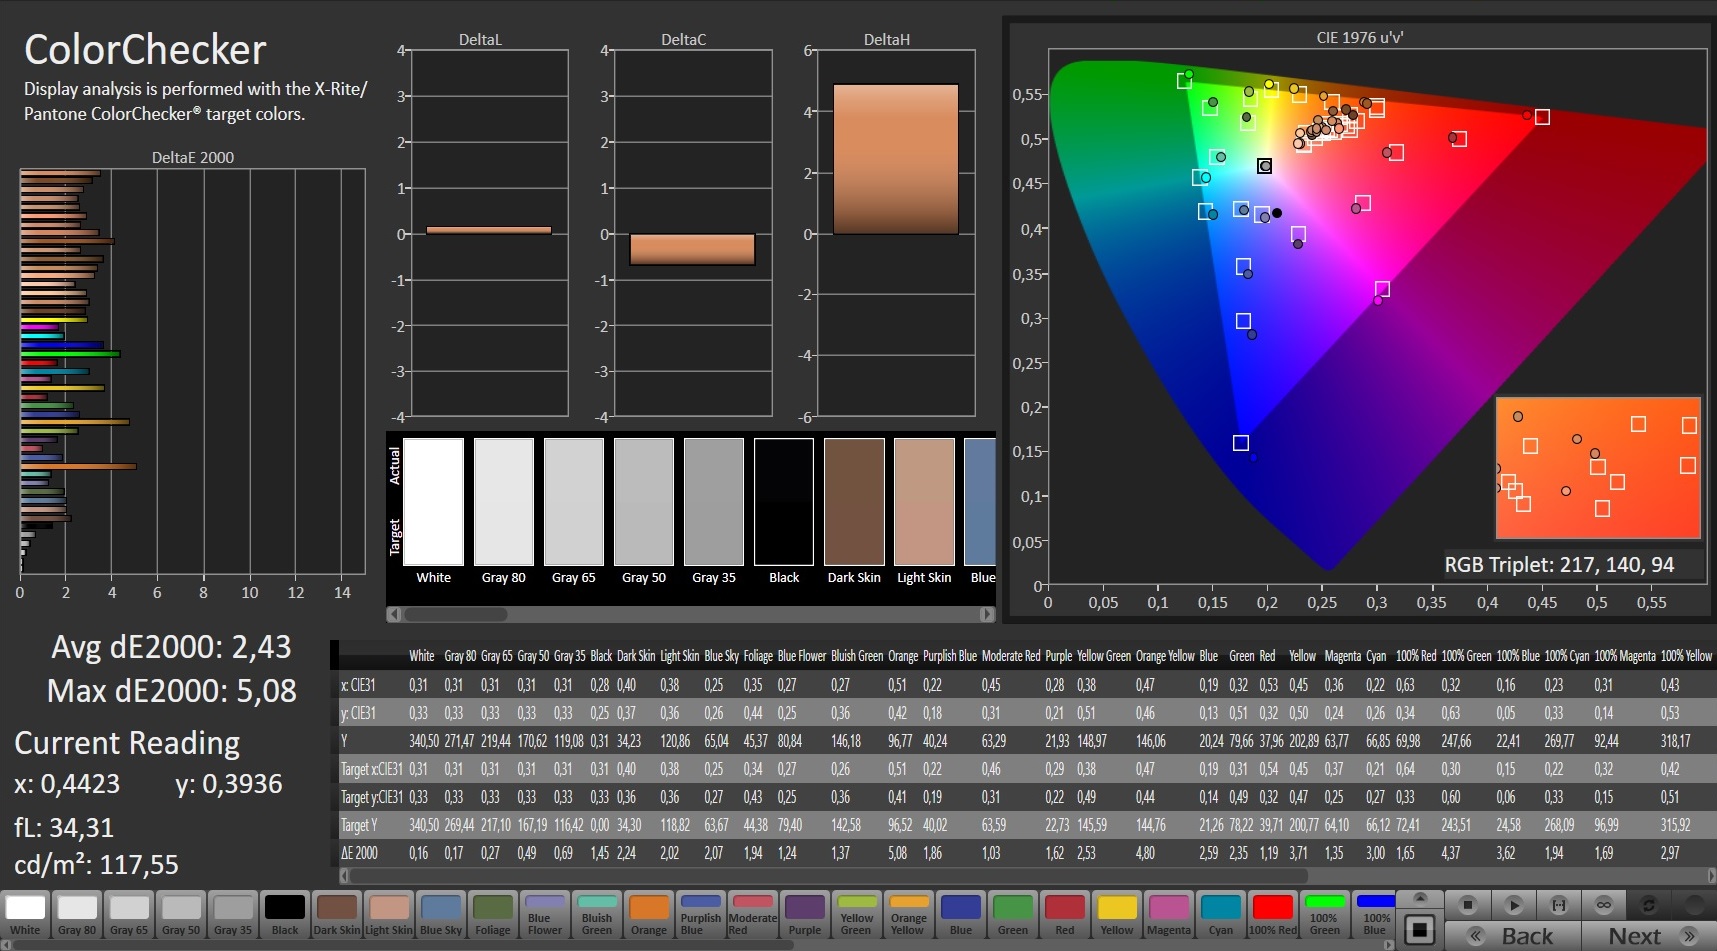
Schenker equips the Core 14 with a 120 Hz IPS-based display. The LM140LF-1F01 panel from Panda convinces with a low black value (0.27 cd/m²) and a more than solid contrast ratio (approx. 1,250:1).
| |||||||||||||||||||||||||
Brightness Distribution: 91 %
Center on Battery: 338 cd/m²
Contrast: 1252:1 (Black: 0.27 cd/m²)
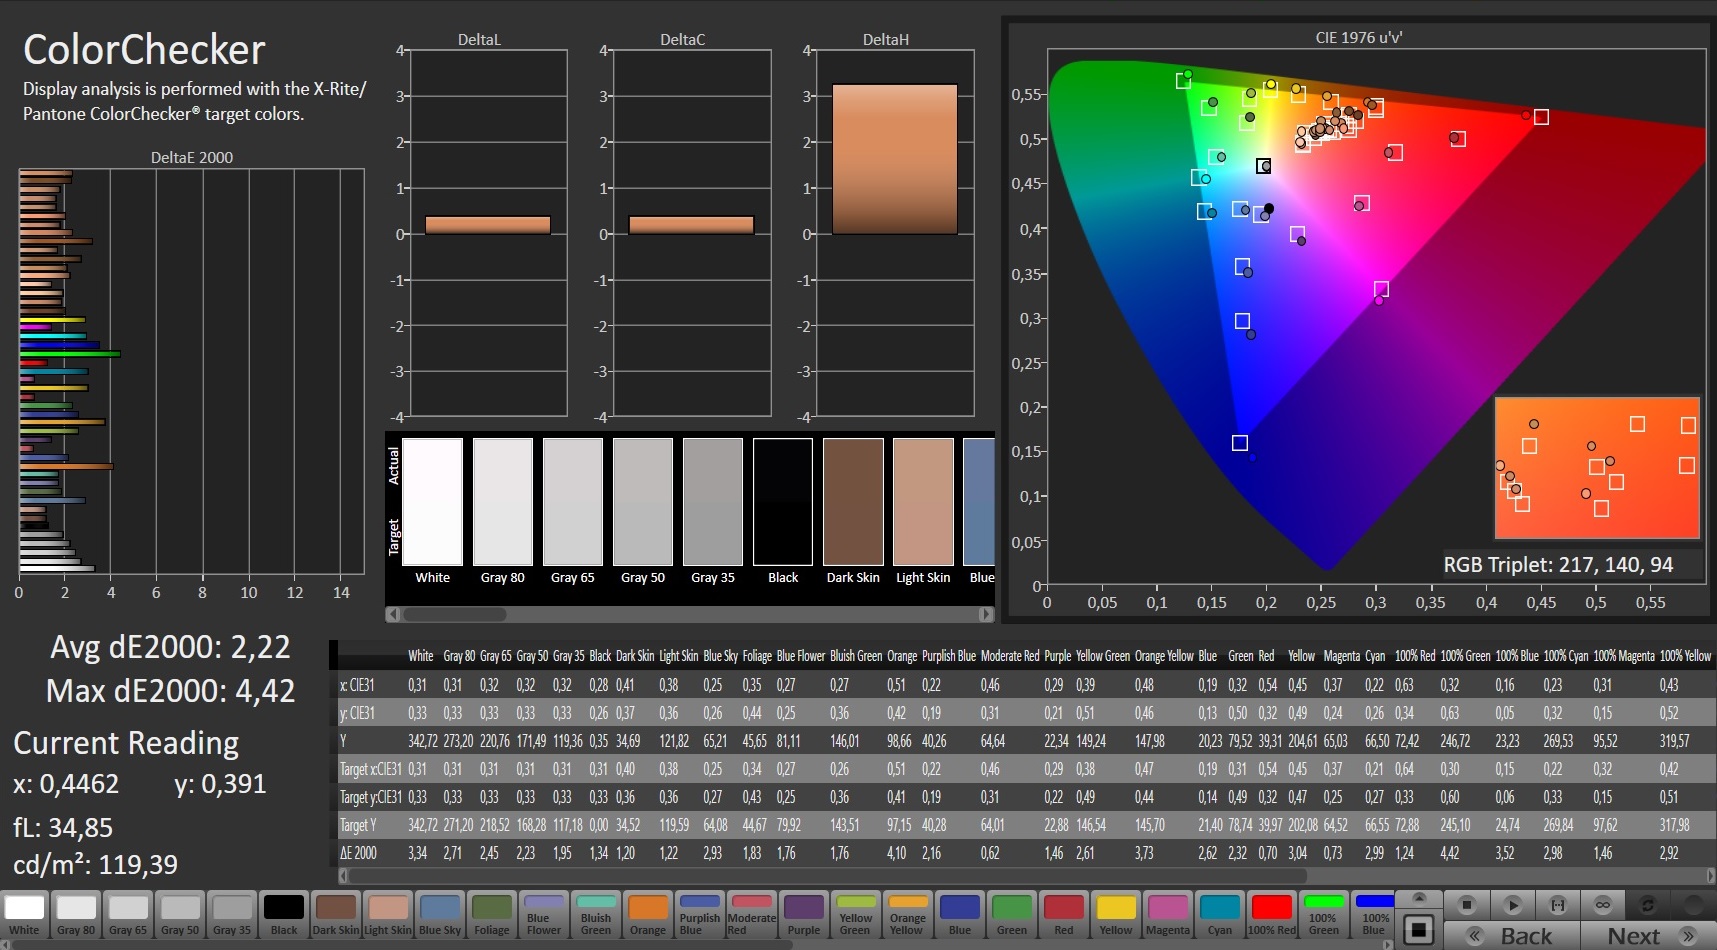
ΔE ColorChecker Calman: 2.22 | ∀{0.5-29.43 Ø4.73}
calibrated: 2.43
ΔE Greyscale Calman: 1.9 | ∀{0.09-98 Ø4.97}
91% sRGB (Argyll 1.6.3 3D)
67% AdobeRGB 1998 (Argyll 1.6.3 3D)
66.6% AdobeRGB 1998 (Argyll 3D)
91.1% sRGB (Argyll 3D)
66.3% Display P3 (Argyll 3D)
Gamma: 2.176
CCT: 6469 K
| Schenker XMG Core 14 Panda LM140LF-1F01, IPS, 1920x1080, 14" | MSI Prestige 14 A10SC-009 IPS, 3840x2160, 14" | Asus ZenBook 15 UX534FTC-A8190T BOE CQ NV156FHM-N63, IPS, 1920x1080, 15.6" | MSI Prestige 15 A10SC Sharp LQ156D1JW42, IPS, 3840x2160, 15.6" | LG Ultra 17U70N LG LP170WQ1-SPA1, IPS, 2560x1600, 17" | |
|---|---|---|---|---|---|
| Display | -4% | 25% | -0% | ||
| Display P3 Coverage (%) | 66.3 | 65 -2% | 82 24% | 64.2 -3% | |
| sRGB Coverage (%) | 91.1 | 86.2 -5% | 98.3 8% | 94.5 4% | |
| AdobeRGB 1998 Coverage (%) | 66.6 | 62.9 -6% | 96.2 44% | 65.2 -2% | |
| Response Times | -42% | -21% | -58% | -9% | |
| Response Time Grey 50% / Grey 80% * (ms) | 38 ? | 55 ? -45% | 45 ? -18% | 60 ? -58% | 41.2 ? -8% |
| Response Time Black / White * (ms) | 26 ? | 36 ? -38% | 32 ? -23% | 41.2 ? -58% | 28.4 ? -9% |
| PWM Frequency (Hz) | 26040 ? | ||||
| Screen | 16% | -31% | -10% | 3% | |
| Brightness middle (cd/m²) | 338 | 567 68% | 299 -12% | 464.5 37% | 415.4 23% |
| Brightness (cd/m²) | 316 | 516 63% | 280 -11% | 451 43% | 385 22% |
| Brightness Distribution (%) | 91 | 86 -5% | 89 -2% | 92 1% | 88 -3% |
| Black Level * (cd/m²) | 0.27 | 0.445 -65% | 0.21 22% | 0.5 -85% | 0.24 11% |
| Contrast (:1) | 1252 | 1274 2% | 1424 14% | 929 -26% | 1731 38% |
| Colorchecker dE 2000 * | 2.22 | 1.55 30% | 4.76 -114% | 3.36 -51% | 2.42 -9% |
| Colorchecker dE 2000 max. * | 4.42 | 5.14 -16% | 9 -104% | 7.06 -60% | 5.55 -26% |
| Colorchecker dE 2000 calibrated * | 2.43 | 1.24 49% | 3.42 -41% | 1.68 31% | |
| Greyscale dE 2000 * | 1.9 | 1.48 22% | 3.53 -86% | 1.3 32% | 2.9 -53% |
| Gamma | 2.176 101% | 2.19 100% | 2.3 96% | 2.14 103% | 2.21 100% |
| CCT | 6469 100% | 6741 96% | 7228 90% | 6596 99% | 6864 95% |
| Color Space (Percent of AdobeRGB 1998) (%) | 67 | 56 -16% | 84.8 27% | 60.2 -10% | |
| Color Space (Percent of sRGB) (%) | 91 | 86 -5% | 98.3 8% | 94.2 4% | |
| Total Average (Program / Settings) | -13% /
6% | -19% /
-25% | -14% /
-10% | -2% /
1% |
* ... smaller is better
The brightness is not bad either. At just under 316 cd/m², the screen can occasionally be used outdoors, although some contenders offer much more brightness. MSI's Prestige 15 achieves over 400 cd/m², and the Prestige 14 even cracks the 500 cd/m² mark.
In return, the competition has to make do with worse response times. The Core 14 takes the pole position against competitors with 26 ms black-to-white and 38 ms gray-to-grey.
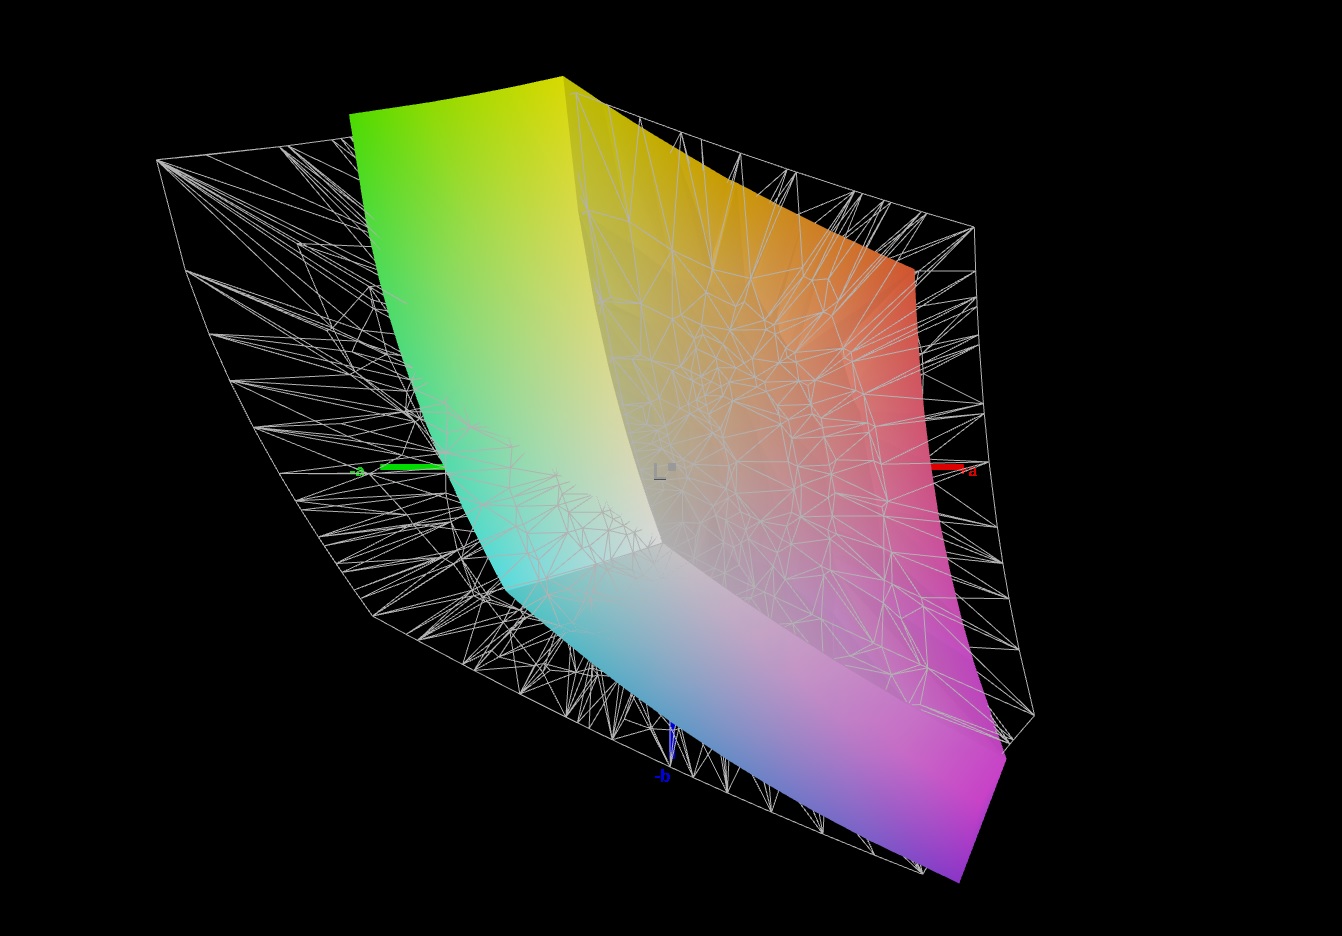
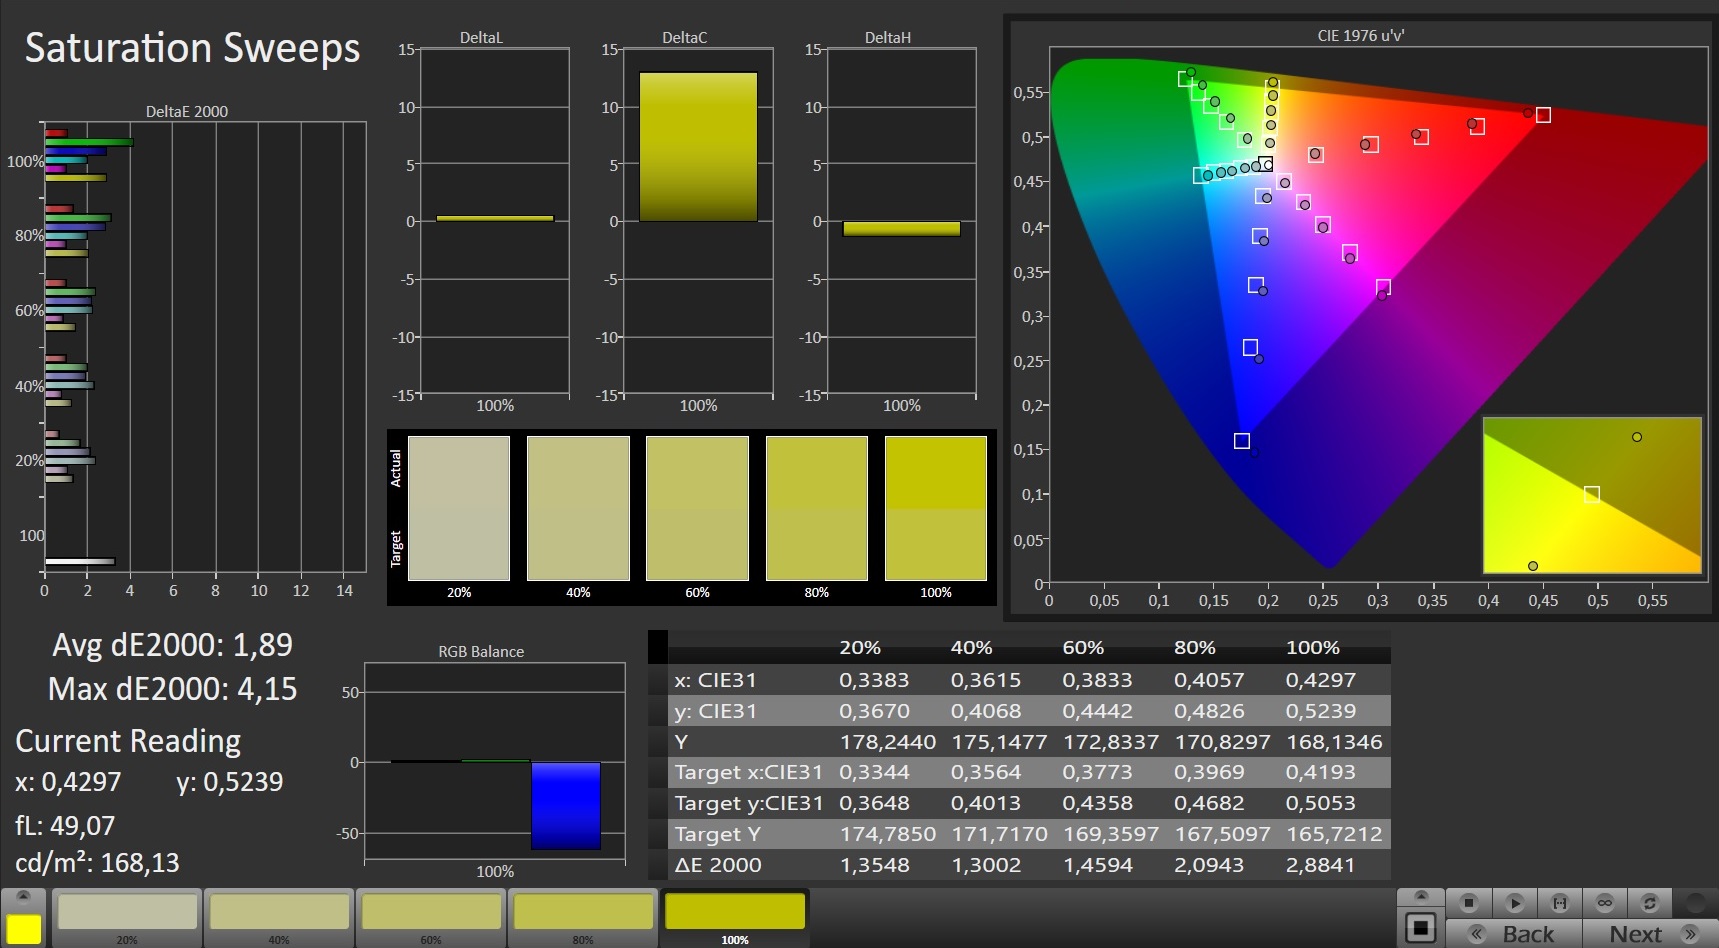
The color space should also satisfy most buyers. 91% sRGB coverage and 67% AdobeRGB coverage are sufficient for a gaming notebook. Thanks to the good color accuracy, the picture looks very authentic, even without calibration. We did not notice any display flicker (e.g. due to PWM).
Display Response Times
| ↔ Response Time Black to White | ||
|---|---|---|
| 26 ms ... rise ↗ and fall ↘ combined | ↗ 14 ms rise | 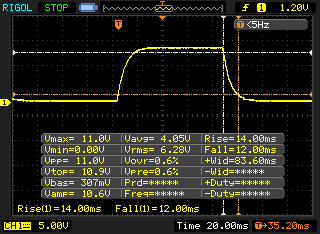 |
| ↘ 12 ms fall | ||
| The screen shows relatively slow response rates in our tests and may be too slow for gamers. In comparison, all tested devices range from 0.1 (minimum) to 240 (maximum) ms. » 62 % of all devices are better. This means that the measured response time is worse than the average of all tested devices (19.9 ms). | ||
| ↔ Response Time 50% Grey to 80% Grey | ||
| 38 ms ... rise ↗ and fall ↘ combined | ↗ 18 ms rise | 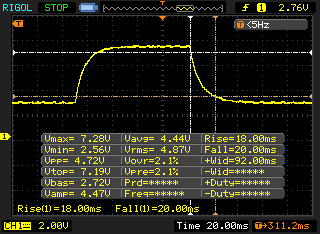 |
| ↘ 20 ms fall | ||
| The screen shows slow response rates in our tests and will be unsatisfactory for gamers. In comparison, all tested devices range from 0.165 (minimum) to 636 (maximum) ms. » 55 % of all devices are better. This means that the measured response time is worse than the average of all tested devices (31.1 ms). | ||
Screen Flickering / PWM (Pulse-Width Modulation)
| Screen flickering / PWM not detected | 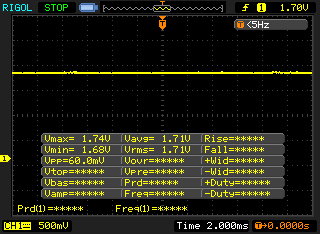 | ||
In comparison: 52 % of all tested devices do not use PWM to dim the display. If PWM was detected, an average of 7801 (minimum: 5 - maximum: 343500) Hz was measured. | |||
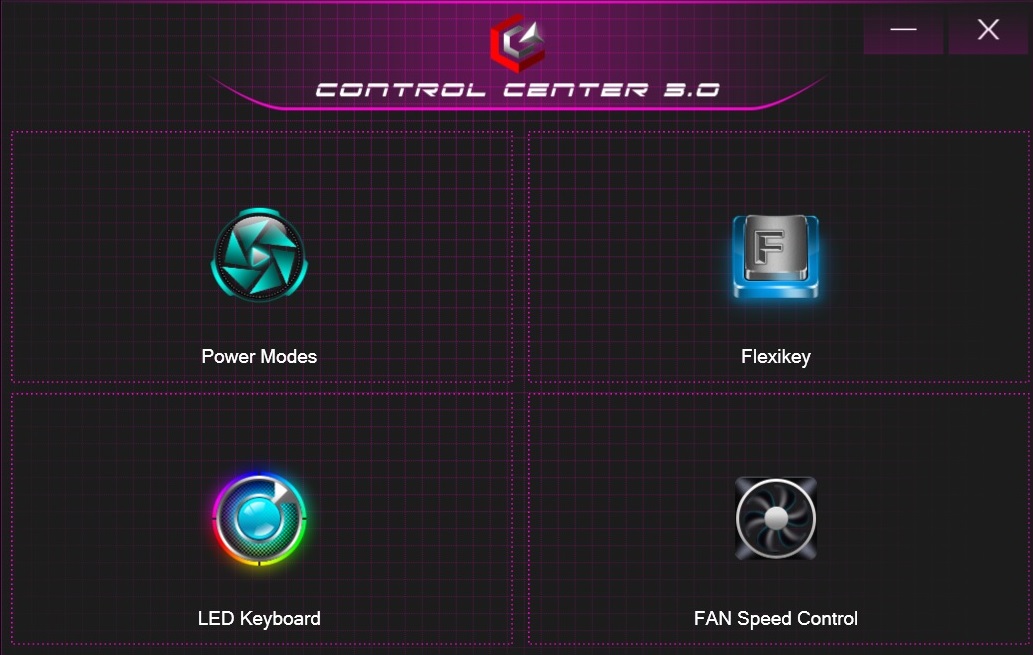
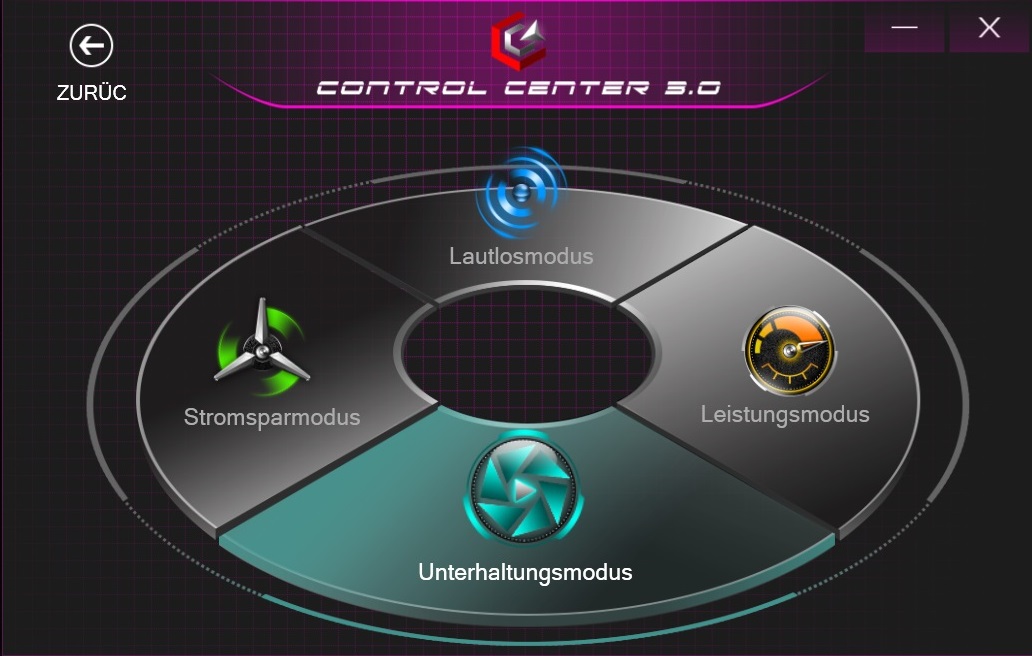
Software
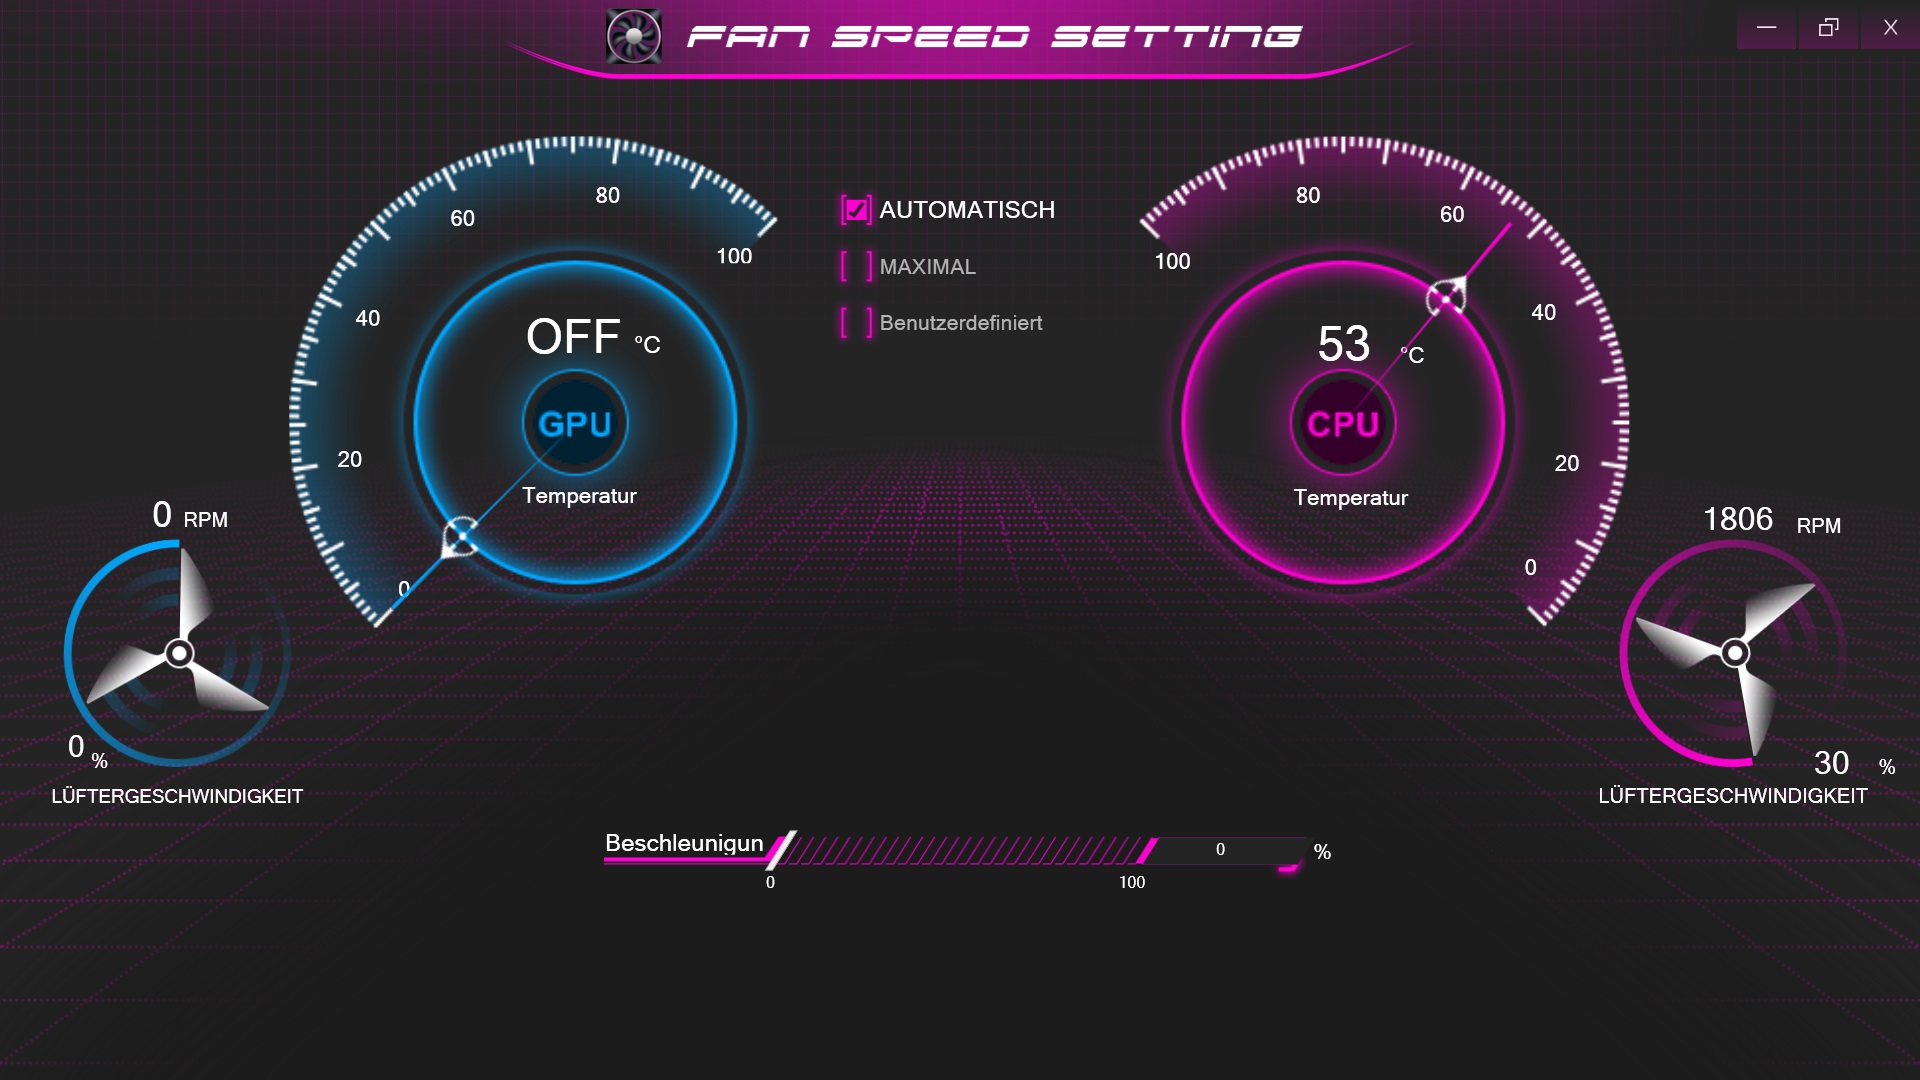
In the preinstalled Control Center software, users have the option to change various system settings. Our measurements were performed with the "Entertainment" preset unless mentioned otherwise. The fan speed was always set to automatic.
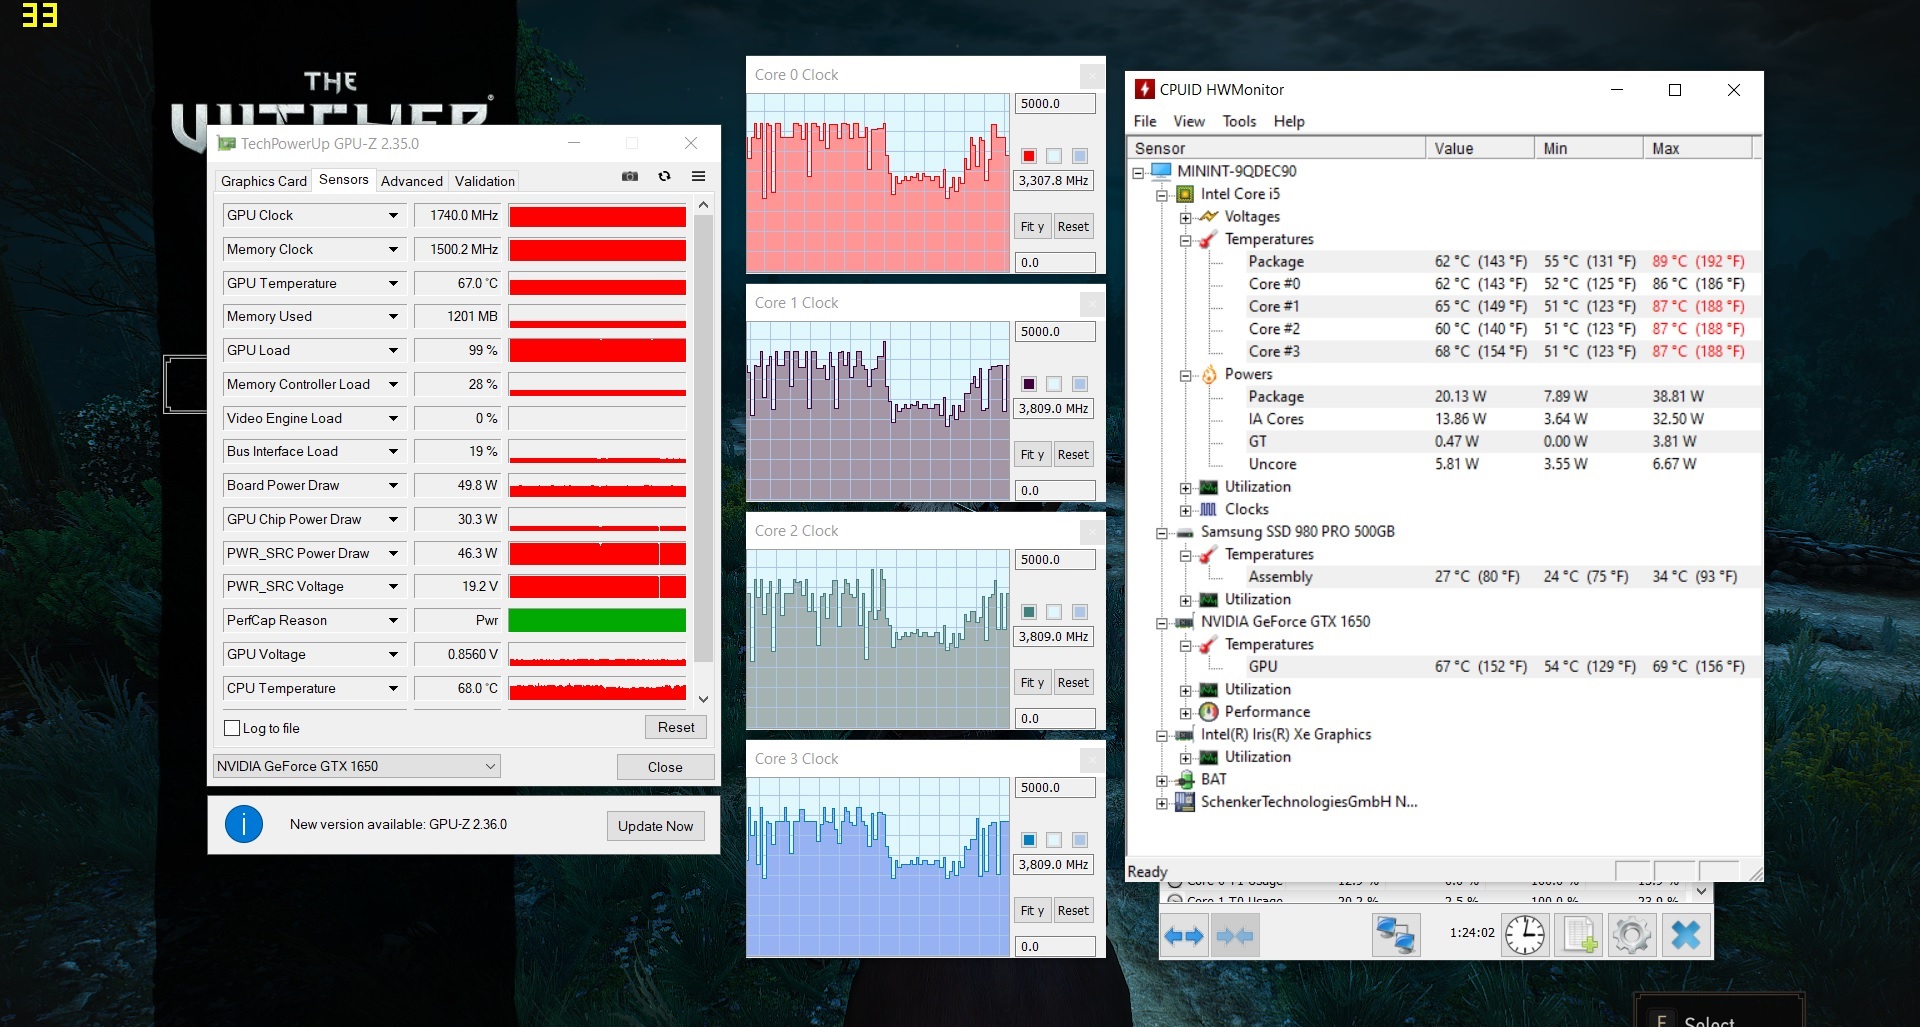
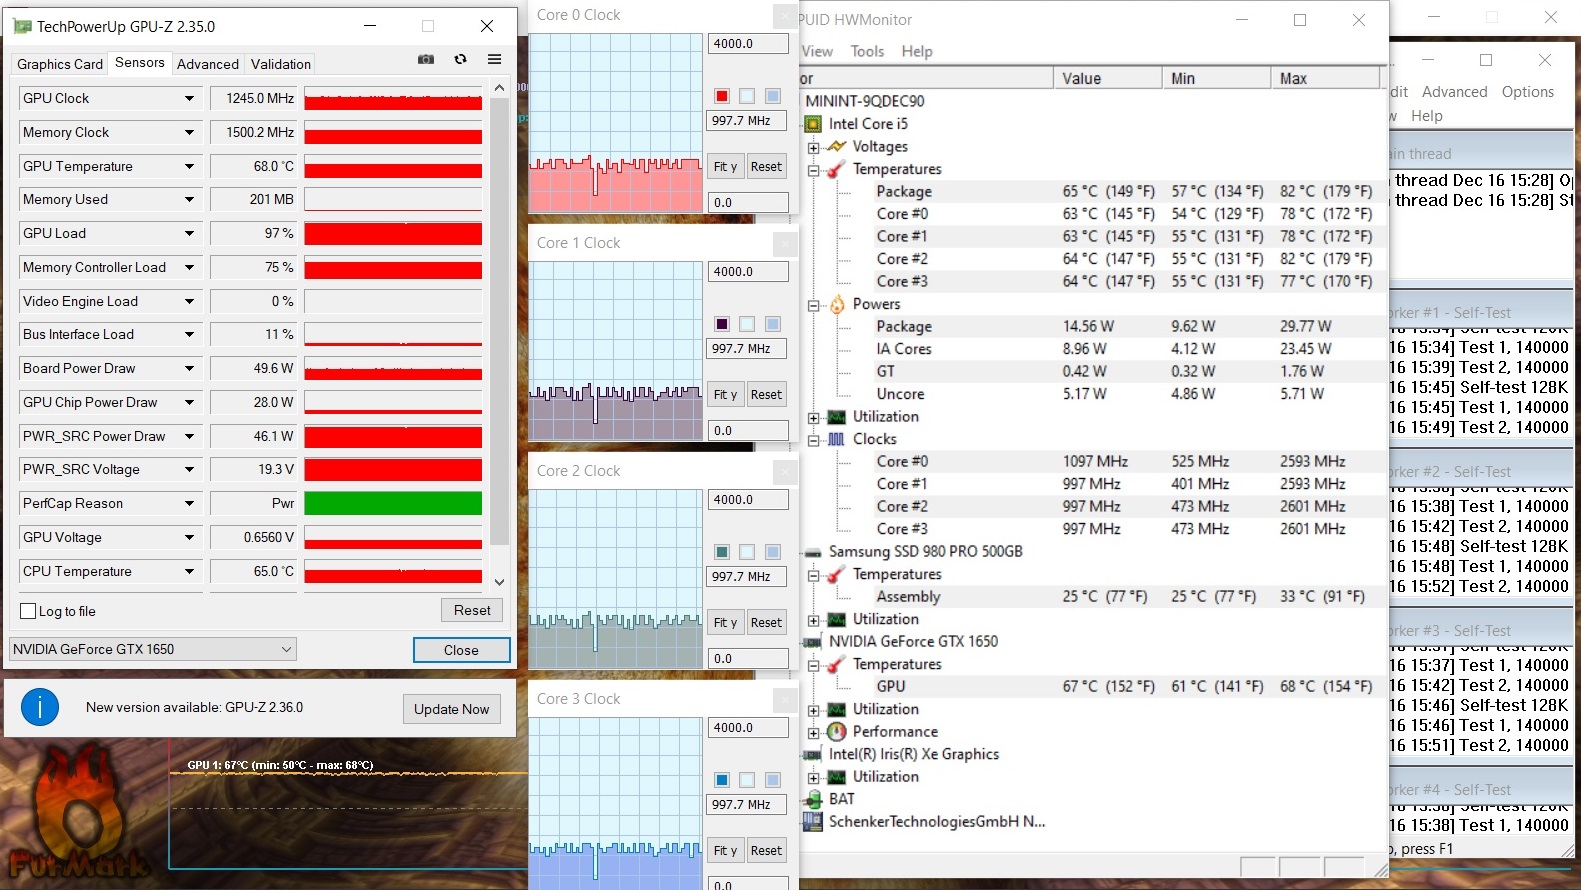
Performance
In terms of performance, the Core 14 belongs to the mid-range. The CPU and GPU can currently render almost all 3D applications well. However, users would have to reach for a (thicker and heavier) device from the high-end segment for a better future-proofing.
Processor
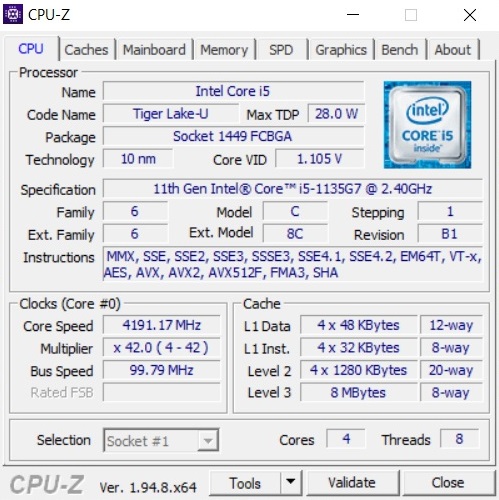
The Core i5-1335G7 installed in the review system offers - similar to the i7-1165G7 - four cores, whereby up to eight threads are possible in parallel via Hyperthreading. The two Tiger Lake chips have a TDP of 28 watts, which just about qualifies them for the energy-saving range.
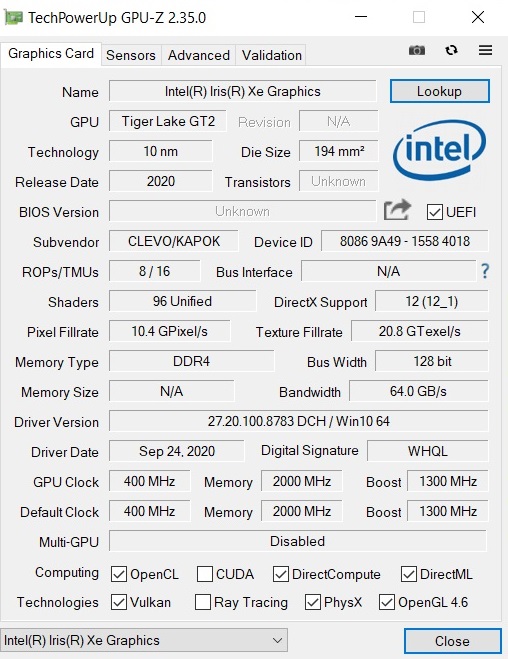
One of the biggest strengths compared to Intel's previous CPU generations is the significantly improved graphics unit. The Xe Graphics G7 does not have to hide behind AMD's competition. Since the Core 14 uses Nvidia's Optimus technology , the 14-incher can dynamically switch between the iGPU and the dedicated GeForce GPU.
But back to the CPU: The base clock of the Core i5-1135G7 is 2.4 GHz. Up to 4.2 GHz is theoretically achievable under load via Turbo Boost. Unfortunately, the Turbo utilization is not particularly good in the Core 14. As our Cinebench loop proves, the performance in entertainment mode (PL1 is limited to 15 watts) is not up to the rival devices that are still equipped with older Comet Lake CPUs. The situation improves considerably when the power mode is activated, but the Core 14 also gets noticeably louder. Buyers will have to choose between a poor CPU performance or very high noise.
| Blender - v2.79 BMW27 CPU | |
| Schenker XMG Core 14 | |
| LG Ultra 17U70N | |
| Average Intel Core i5-1135G7 (499 - 1044, n=60) | |
| Average of class Multimedia (100 - 557, n=65, last 2 years) | |
| HWBOT x265 Benchmark v2.2 - 4k Preset | |
| Average of class Multimedia (5.26 - 36.1, n=63, last 2 years) | |
| Average Intel Core i5-1135G7 (3.57 - 7.6, n=57) | |
| Schenker XMG Core 14 | |
| LG Ultra 17U70N | |
| LibreOffice - 20 Documents To PDF | |
| Schenker XMG Core 14 | |
| LG Ultra 17U70N | |
| Average Intel Core i5-1135G7 (44.2 - 62.9, n=60) | |
| Average of class Multimedia (23.9 - 146.7, n=64, last 2 years) | |
| R Benchmark 2.5 - Overall mean | |
| LG Ultra 17U70N | |
| Schenker XMG Core 14 | |
| Average Intel Core i5-1135G7 (0.619 - 0.727, n=59) | |
| Average of class Multimedia (0.3604 - 0.947, n=63, last 2 years) | |
* ... smaller is better
System performance
There were no conspicuous issues in terms of system performance. With 4,737 points in PCMark 10, the Core 14 makes itself comfortable in the middle of the competition.
| PCMark 10 Score | 4737 points | |
Help | ||
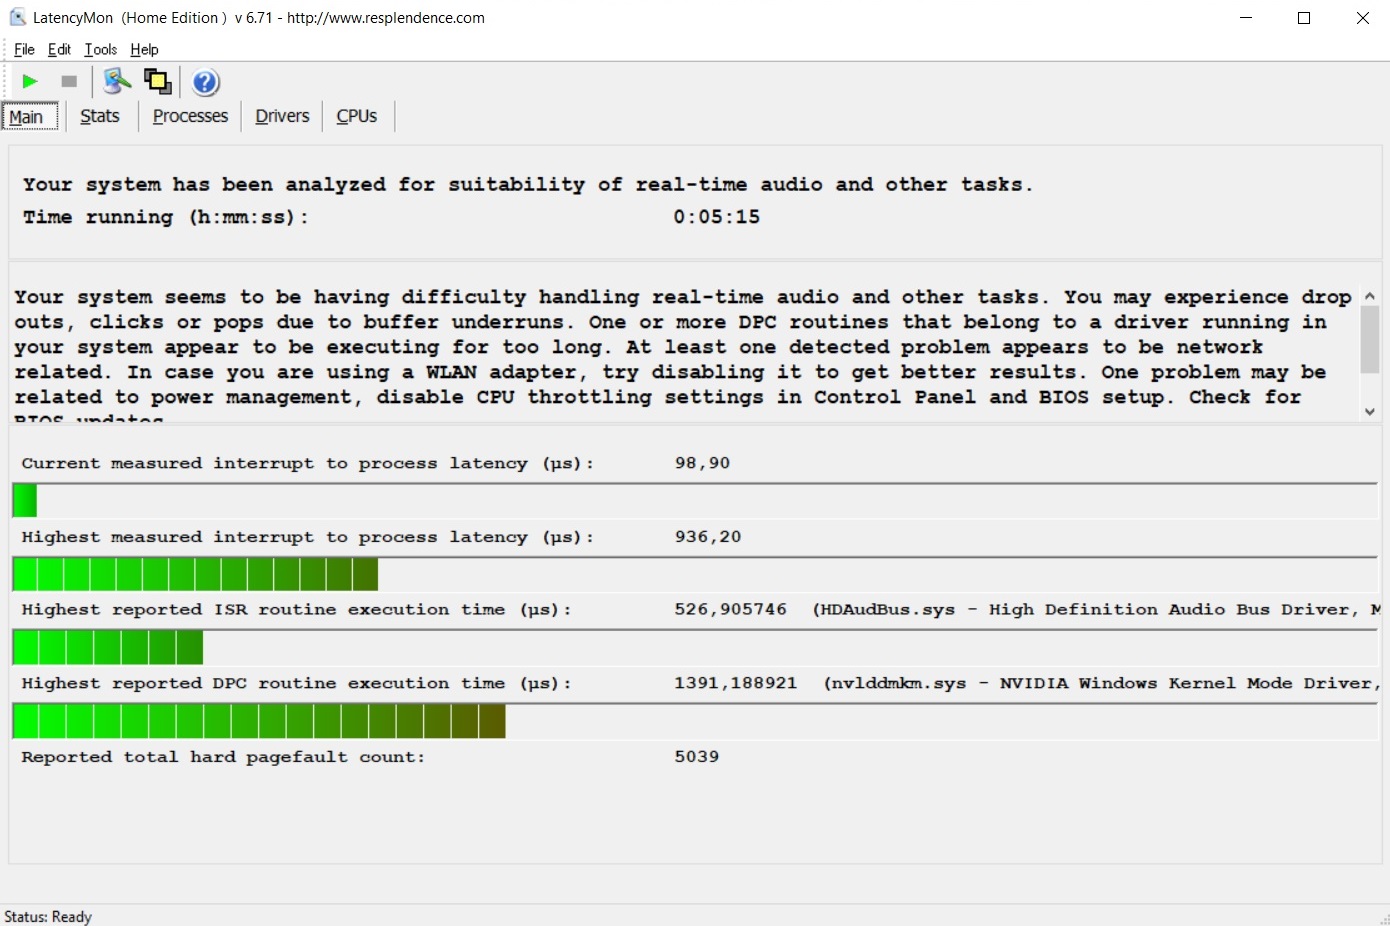
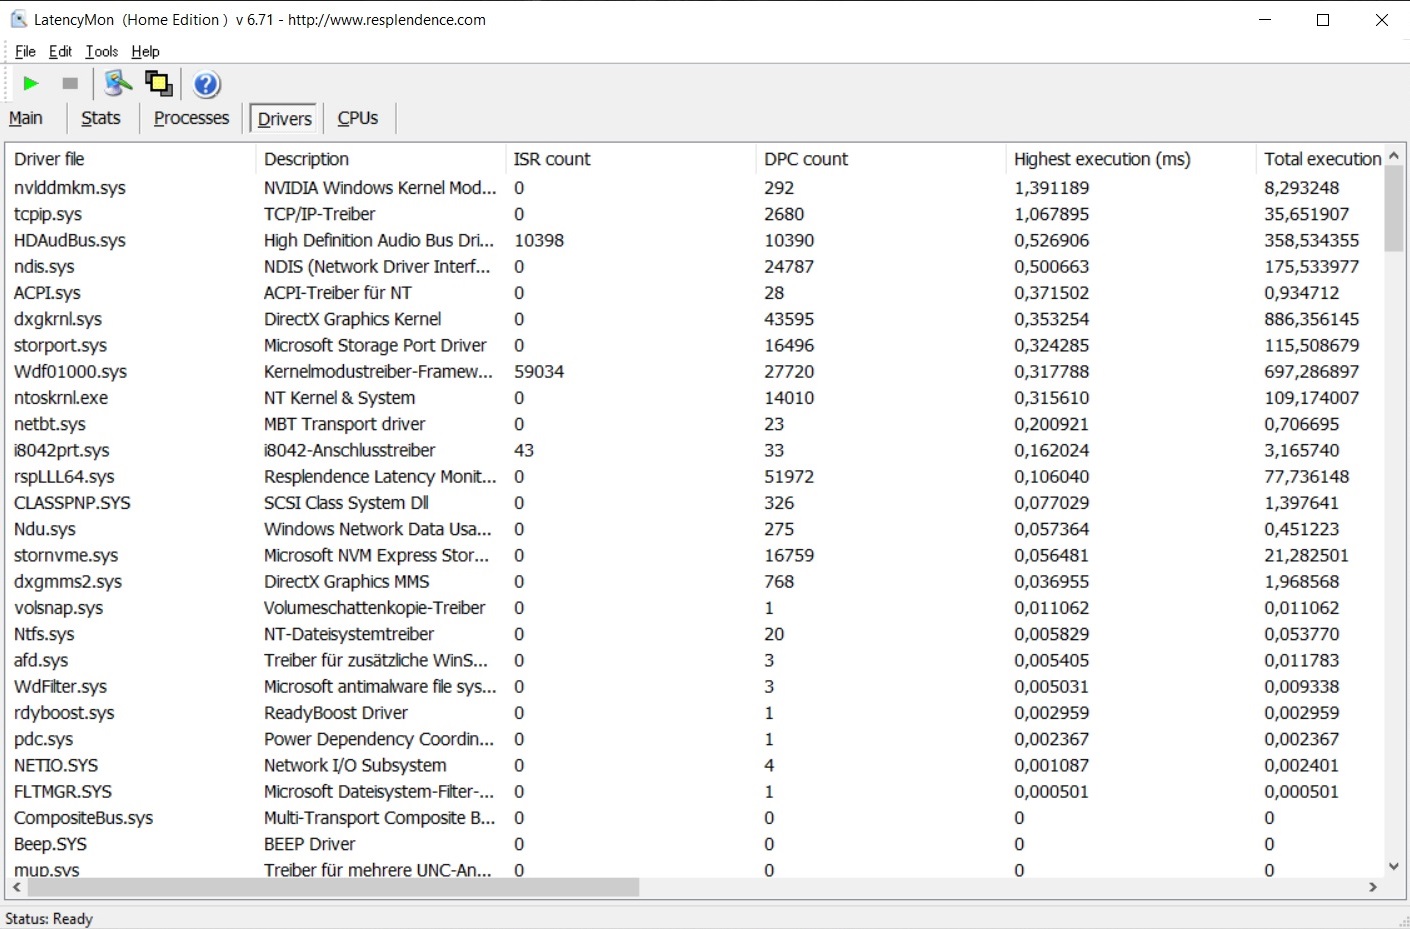
DPC latencies
The latencies are roughly in line with LG's Ultra 17. According to the tool LatencyMon, the Core 14 is only conditionally suitable for real-time audio and video editing.
| DPC Latencies / LatencyMon - interrupt to process latency (max), Web, Youtube, Prime95 | |
| Schenker XMG Core 14 | |
| LG Ultra 17U70N | |
* ... smaller is better
Mass storage
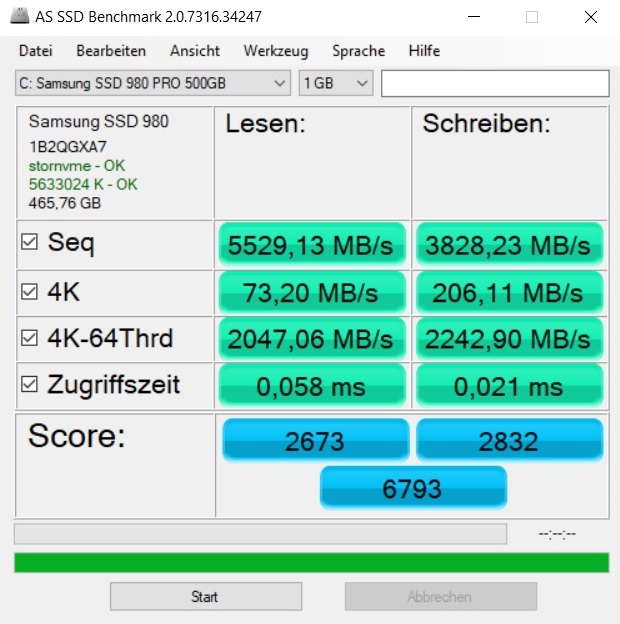
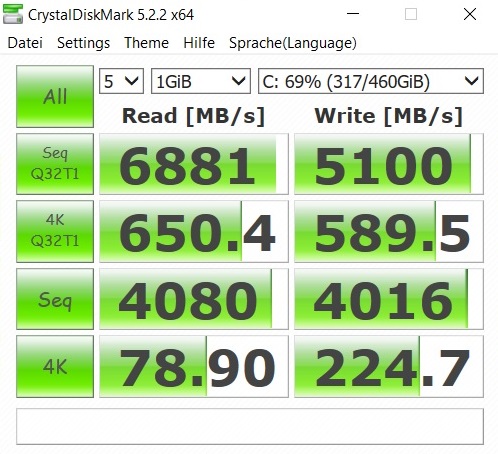
The mass storage of the test configuration is beyond reproach. The 500 GB version of the Samsung 980 Pro outperforms all other SSDs in the field - be it in CrystalDiskMark or in the AS-SSD benchmark. No matter if it is small files or large data blocks: The M.2 drive based on NVMe turns out to be as fast as an arrow. Unfortunately, those who want to expand the storage space have to remove the existing SSD. The chassis only contains a single M.2 slot.
| Schenker XMG Core 14 Samsung SSD 980 Pro 500GB MZ-V8P500BW | MSI Prestige 14 A10SC-009 Samsung SSD PM981 MZVLB1T0HALR | Asus ZenBook 15 UX534FTC-A8190T Samsung SSD PM981 MZVLB1T0HALR | MSI Prestige 15 A10SC Samsung SSD PM981 MZVLB1T0HALR | LG Ultra 17U70N Samsung SSD PM981a MZVLB512HBJQ | |
|---|---|---|---|---|---|
| CrystalDiskMark 5.2 / 6 | -45% | -43% | -52% | -39% | |
| Write 4K (MB/s) | 224.7 | 163.8 -27% | 138.1 -39% | 150.8 -33% | 162.7 -28% |
| Read 4K (MB/s) | 78.9 | 48.6 -38% | 45.89 -42% | 47.3 -40% | 65.2 -17% |
| Write Seq (MB/s) | 4016 | 2269 -44% | 2147 -47% | 981 -76% | 1680 -58% |
| Read Seq (MB/s) | 4080 | 1963 -52% | 2188 -46% | 976 -76% | 1754 -57% |
| Write 4K Q32T1 (MB/s) | 590 | 289.8 -51% | 427.8 -27% | 442.7 -25% | 380.8 -35% |
| Read 4K Q32T1 (MB/s) | 650 | 373.6 -43% | 404 -38% | 499.7 -23% | 496.2 -24% |
| Write Seq Q32T1 (MB/s) | 5100 | 2395 -53% | 2396 -53% | 1706 -67% | 2959 -42% |
| Read Seq Q32T1 (MB/s) | 6881 | 3479 -49% | 3454 -50% | 1758 -74% | 3548 -48% |
| AS SSD | -39% | -36% | -63% | -65% | |
| Seq Read (MB/s) | 5529 | 2300 -58% | 2643 -52% | 1274 -77% | 1977 -64% |
| Seq Write (MB/s) | 3828 | 2051 -46% | 1533 -60% | 1395 -64% | 2333 -39% |
| 4K Read (MB/s) | 73.2 | 46.23 -37% | 49.12 -33% | 50.3 -31% | 53.6 -27% |
| 4K Write (MB/s) | 206.1 | 84.6 -59% | 134.7 -35% | 119.8 -42% | 122.4 -41% |
| 4K-64 Read (MB/s) | 2047 | 1552 -24% | 1028 -50% | 1599 -22% | 1344 -34% |
| 4K-64 Write (MB/s) | 2243 | 1789 -20% | 1353 -40% | 1455 -35% | 1687 -25% |
| Access Time Read * (ms) | 0.058 | 0.049 16% | 0.033 43% | 0.044 24% | 0.054 7% |
| Access Time Write * (ms) | 0.021 | 0.045 -114% | 0.028 -33% | 0.092 -338% | 0.102 -386% |
| Score Read (Points) | 2673 | 1828 -32% | 1342 -50% | 1777 -34% | 1595 -40% |
| Score Write (Points) | 2832 | 2079 -27% | 1641 -42% | 1714 -39% | 2042 -28% |
| Score Total (Points) | 6793 | 4831 -29% | 3622 -47% | 4411 -35% | 4480 -34% |
| Total Average (Program / Settings) | -42% /
-41% | -40% /
-39% | -58% /
-58% | -52% /
-54% |
* ... smaller is better

Graphics card
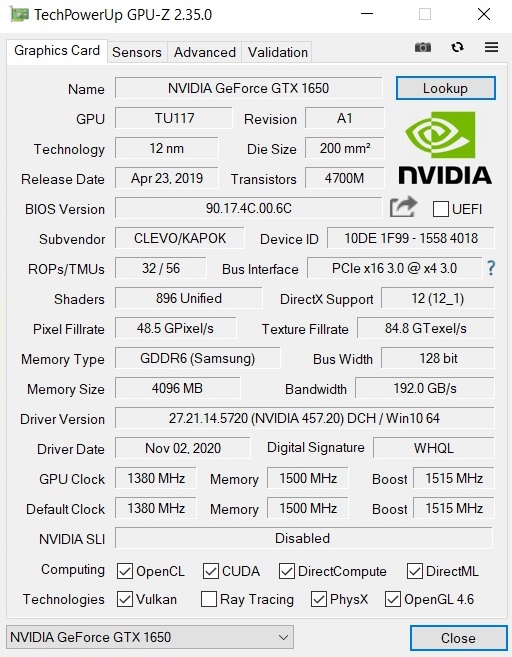
The GeForce GTX 1650 is intended for casual gamers who do not necessarily have to play every new title with maximum details. The DirectX-12 capable Turing model offers 4 GB GDDR6 VRAM (128 bit interface) and a base clock of 1,380 MHz (more via GPU boost).
| 3DMark 11 Performance | 9774 points | |
| 3DMark Cloud Gate Standard Score | 16775 points | |
| 3DMark Fire Strike Score | 7655 points | |
| 3DMark Time Spy Score | 3220 points | |
Help | ||
In contrast to the CPU, the GPU's Turbo utilization is much stronger, which can be seen very well in the benchmark results. In 3DMark, the Core 14 passes all rival devices, even though some opponents only have the Max-Q version.
We tested whether the performance is stable over a longer period of time with the role-playing game The Witcher 3 for about 60 minutes (Full-HD/Ultra). The frame rate remained very constant without drops or other issues.
Gaming performance
While pure GPU benchmarks are hardly affected by the CPU's meager performance, the situation looks less rosy in everyday gaming. Games that are not completely limited in terms of graphics sometimes run much worse with the energy-saving CPU than with a standard processor (45 watts TDP). It is best to compare framerates on our GPU page.
| The Witcher 3 | |
| 1920x1080 High Graphics & Postprocessing (Nvidia HairWorks Off) | |
| Average of class Multimedia (22 - 224, n=13, last 2 years) | |
| Average NVIDIA GeForce GTX 1650 Mobile (45 - 70.4, n=29) | |
| LG Ultra 17U70N | |
| MSI Prestige 15 A10SC | |
| Schenker XMG Core 14 | |
| Asus ZenBook 15 UX534FTC-A8190T | |
| 1920x1080 Ultra Graphics & Postprocessing (HBAO+) | |
| Average of class Multimedia (11 - 121, n=13, last 2 years) | |
| Average NVIDIA GeForce GTX 1650 Mobile (29.9 - 40.3, n=31) | |
| LG Ultra 17U70N | |
| Schenker XMG Core 14 | |
| MSI Prestige 15 A10SC | |
| Asus ZenBook 15 UX534FTC-A8190T | |
Otherwise, the GTX 1650 usually has enough power for medium to high settings. Only extremely demanding titles like Cyberpunk 2077 require minimum details and/or a resolution reduction.
| low | med. | high | ultra | |
|---|---|---|---|---|
| GTA V (2015) | 108 | 95.1 | 68 | 38.1 |
| The Witcher 3 (2015) | 139 | 89.7 | 53.6 | 32.1 |
| Dota 2 Reborn (2015) | 111 | 90.8 | 87.5 | 85.9 |
| X-Plane 11.11 (2018) | 61.1 | 54.8 | 49.4 | |
| Shadow of the Tomb Raider (2018) | 63 | 54 | 46 | 39 |
| Battlefield V (2018) | 75.3 | 54.2 | 51.3 | 44.3 |
| Borderlands 3 (2019) | 80.9 | 50.5 | 35.7 | 29 |
| Valorant (2020) | 126 | 125 | 105 | |
| Crysis Remastered (2020) | 110 | 58 | 31.1 | 23.3 |
| Star Wars Squadrons (2020) | 108 | 93 | 89 | 80.8 |
| Watch Dogs Legion (2020) | 54 | 47 | 39 | 14 |
| Dirt 5 (2020) | 90.7 | 46.8 | 36.3 | 22.2 |
| Assassin´s Creed Valhalla (2020) | 64 | 42 | 21 | 5 |
| Call of Duty Black Ops Cold War (2020) | 61 | 45.9 | 25.4 | 19.7 |
| Yakuza Like a Dragon (2020) | 57.1 | 45.2 | 38 | 35 |
| Immortals Fenyx Rising (2020) | 60 | 42 | 25 | 16 |
| Cyberpunk 2077 1.0 (2020) | 37.8 | 24.4 | 20.5 | 17.6 |
Emissions
System noise
When using the entertainment mode, the Core 14 remains surprisingly quiet in idle mode. The two case fans are either completely off or only rotate at a very decent level. There are hardly any intermittent spikes. Under load, however, the cooling draws attention to itself. At 51 to 52 dB(A), the fans are very insistent and necessitate the use of headphones. At this volume, the Core 14 is louder than all rivals.
Noise level
| Idle |
| 25 / 29 / 39 dB(A) |
| Load |
| 51 / 52 dB(A) |
 | ||
30 dB silent 40 dB(A) audible 50 dB(A) loud |
||
min: | ||
| Schenker XMG Core 14 i5-1135G7, GeForce GTX 1650 Mobile | MSI Prestige 14 A10SC-009 i7-10710U, GeForce GTX 1650 Max-Q | Asus ZenBook 15 UX534FTC-A8190T i7-10510U, GeForce GTX 1650 Max-Q | MSI Prestige 15 A10SC i7-10710U, GeForce GTX 1650 Max-Q | LG Ultra 17U70N i5-10210U, GeForce GTX 1650 Mobile | Average of class Multimedia | |
|---|---|---|---|---|---|---|
| Noise | 2% | 10% | 8% | 7% | 15% | |
| off / environment * (dB) | 25 | 30.3 -21% | 30.3 -21% | 29.3 -17% | 27 -8% | 24.2 ? 3% |
| Idle Minimum * (dB) | 25 | 30.3 -21% | 30.3 -21% | 30.1 -20% | 27.3 -9% | 24.4 ? 2% |
| Idle Average * (dB) | 29 | 30.3 -4% | 30.3 -4% | 30.2 -4% | 27.3 6% | 24.8 ? 14% |
| Idle Maximum * (dB) | 39 | 30.3 22% | 30.9 21% | 30.2 23% | 31.7 19% | 26.5 ? 32% |
| Load Average * (dB) | 51 | 40.2 21% | 31.3 39% | 31.5 38% | 43.6 15% | 37.6 ? 26% |
| Witcher 3 ultra * (dB) | 52 | 38.1 27% | 37 29% | 45.3 13% | ||
| Load Maximum * (dB) | 52 | 43.5 16% | 38.2 27% | 47 10% | 44.7 14% | 45.9 ? 12% |
* ... smaller is better
Temperature
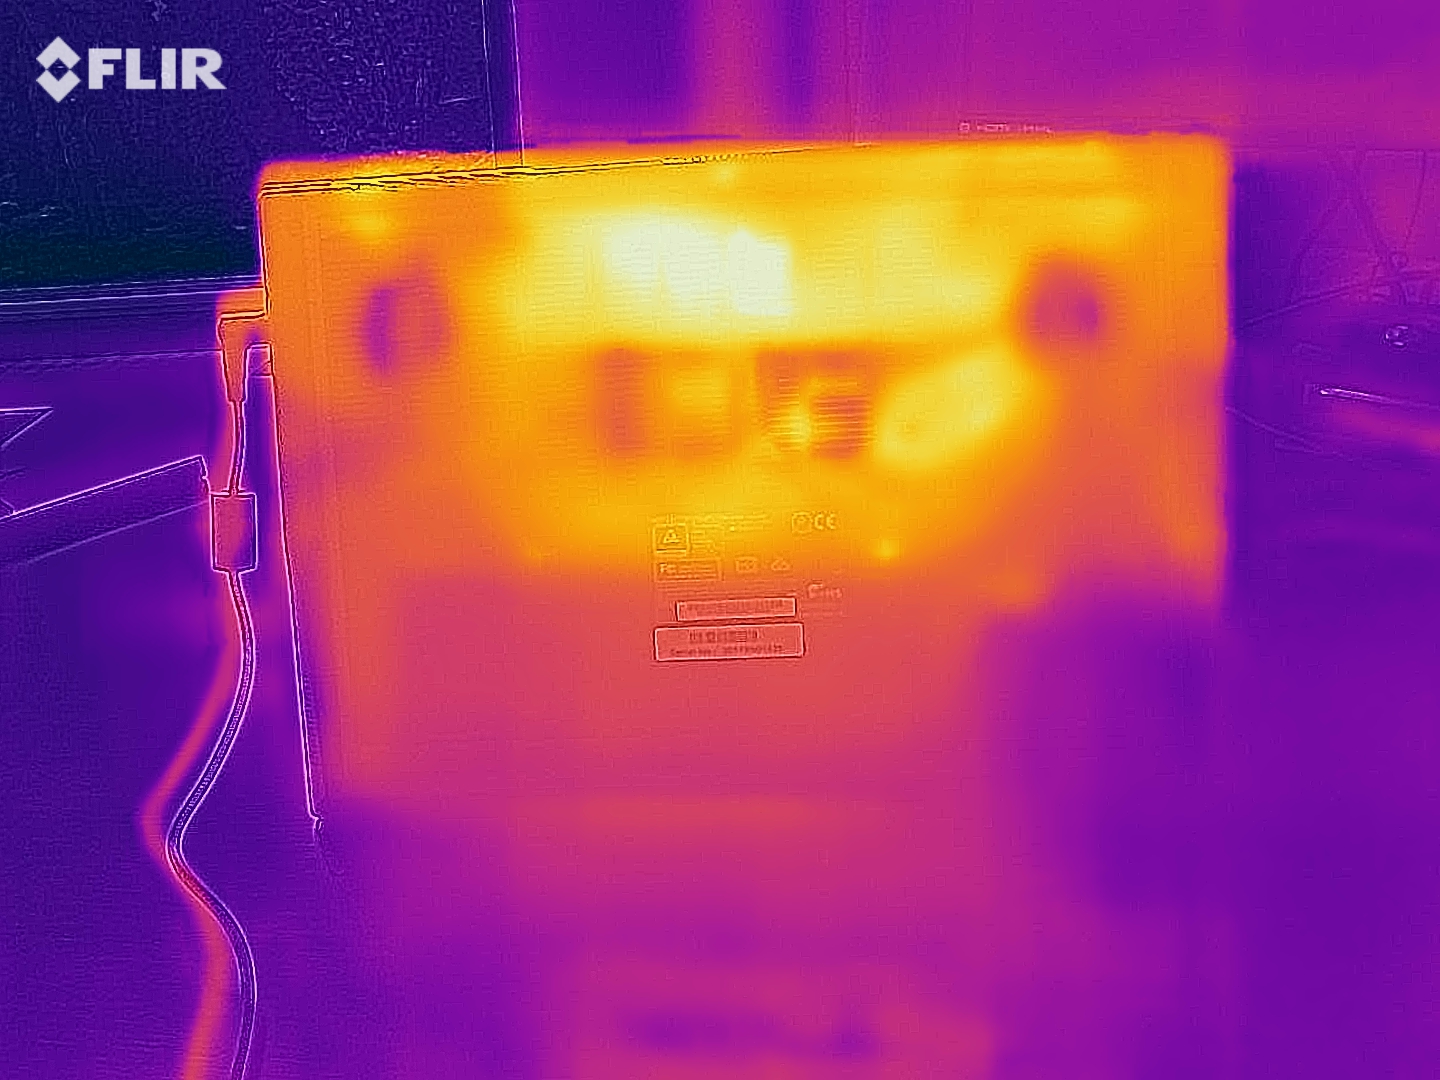
The behavior in the stress test also proves that the cooling system is ill-sized for the hardware. A simultaneous load of Furmark and Prime95 forces the laptop to throttle. In return, the components don't get particularly hot. After 60 minutes of full load, the CPU and GPU reached between 60 and 70 °C; stress testing with The Witcher 3 yields similar results. The case surfaces also do not get excessively warm. Thus, the chassis never climbs above the 50 °C mark on any area. The palm rest always stays quite cool. The temperatures are generally within the green zone when idle.
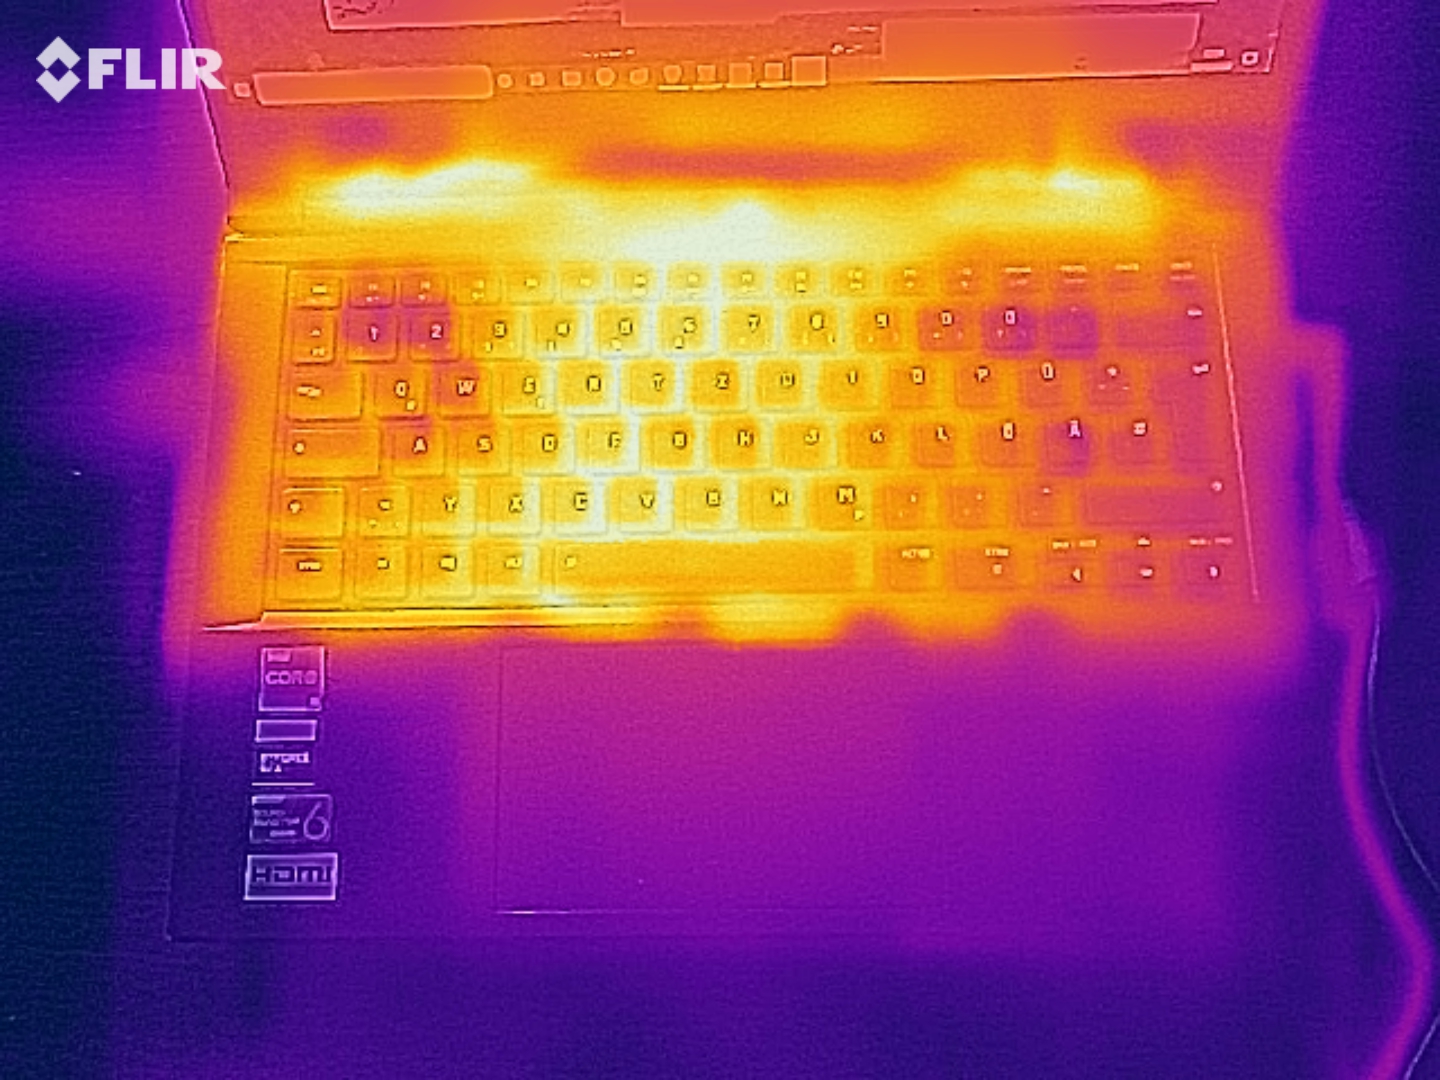
(±) The maximum temperature on the upper side is 42 °C / 108 F, compared to the average of 36.8 °C / 98 F, ranging from 21 to 71 °C for the class Multimedia.
(-) The bottom heats up to a maximum of 46 °C / 115 F, compared to the average of 39.1 °C / 102 F
(+) In idle usage, the average temperature for the upper side is 24.9 °C / 77 F, compared to the device average of 31.3 °C / 88 F.
(±) Playing The Witcher 3, the average temperature for the upper side is 34.8 °C / 95 F, compared to the device average of 31.3 °C / 88 F.
(+) The palmrests and touchpad are cooler than skin temperature with a maximum of 31 °C / 87.8 F and are therefore cool to the touch.
(-) The average temperature of the palmrest area of similar devices was 28.7 °C / 83.7 F (-2.3 °C / -4.1 F).
| Schenker XMG Core 14 i5-1135G7, GeForce GTX 1650 Mobile | MSI Prestige 14 A10SC-009 i7-10710U, GeForce GTX 1650 Max-Q | Asus ZenBook 15 UX534FTC-A8190T i7-10510U, GeForce GTX 1650 Max-Q | MSI Prestige 15 A10SC i7-10710U, GeForce GTX 1650 Max-Q | LG Ultra 17U70N i5-10210U, GeForce GTX 1650 Mobile | Average of class Multimedia | |
|---|---|---|---|---|---|---|
| Heat | -9% | 6% | -23% | -8% | 0% | |
| Maximum Upper Side * (°C) | 42 | 48 -14% | 41.4 1% | 56 -33% | 49.4 -18% | 41.5 ? 1% |
| Maximum Bottom * (°C) | 46 | 51 -11% | 40.3 12% | 60.6 -32% | 49.4 -7% | 44.1 ? 4% |
| Idle Upper Side * (°C) | 26 | 28.1 -8% | 25.7 1% | 29.6 -14% | 26.8 -3% | 27.1 ? -4% |
| Idle Bottom * (°C) | 28 | 28.2 -1% | 25.8 8% | 31.2 -11% | 28.8 -3% | 28 ? -0% |
* ... smaller is better
Speakers
The word "mediocre" fits the speakers. As usual, the 2.0 system has weak bass. Overall, the sound quality is on par with the Asus Zenbook 15. We would recommend a headset or external speakers for more frequent or longer media consumption.
Schenker XMG Core 14 audio analysis
(±) | speaker loudness is average but good (74 dB)
Bass 100 - 315 Hz
(-) | nearly no bass - on average 23.7% lower than median
(±) | linearity of bass is average (7.6% delta to prev. frequency)
Mids 400 - 2000 Hz
(+) | balanced mids - only 4.6% away from median
(+) | mids are linear (5.8% delta to prev. frequency)
Highs 2 - 16 kHz
(+) | balanced highs - only 2.3% away from median
(+) | highs are linear (6.2% delta to prev. frequency)
Overall 100 - 16.000 Hz
(±) | linearity of overall sound is average (20.5% difference to median)
Compared to same class
» 70% of all tested devices in this class were better, 7% similar, 23% worse
» The best had a delta of 5%, average was 17%, worst was 45%
Compared to all devices tested
» 54% of all tested devices were better, 8% similar, 38% worse
» The best had a delta of 4%, average was 24%, worst was 134%
Asus ZenBook 15 UX534FTC-A8190T audio analysis
(-) | not very loud speakers (63.8 dB)
Bass 100 - 315 Hz
(-) | nearly no bass - on average 16.8% lower than median
(±) | linearity of bass is average (13.7% delta to prev. frequency)
Mids 400 - 2000 Hz
(+) | balanced mids - only 4.9% away from median
(+) | mids are linear (6.1% delta to prev. frequency)
Highs 2 - 16 kHz
(+) | balanced highs - only 1.5% away from median
(+) | highs are linear (4.7% delta to prev. frequency)
Overall 100 - 16.000 Hz
(±) | linearity of overall sound is average (22.2% difference to median)
Compared to same class
» 79% of all tested devices in this class were better, 4% similar, 17% worse
» The best had a delta of 5%, average was 17%, worst was 45%
Compared to all devices tested
» 64% of all tested devices were better, 6% similar, 29% worse
» The best had a delta of 4%, average was 24%, worst was 134%
Power management
Power consumption
The power-saving CPU ensures low energy consumption when idle. 4 to 13 watts are very low by gaming standards. When the GTX 1650 is added under load, the Core 14 draws significantly more power from the socket, between 64 and 103 watts.
| Off / Standby | |
| Idle | |
| Load |
|
Key:
min: | |
| Schenker XMG Core 14 i5-1135G7, GeForce GTX 1650 Mobile | MSI Prestige 14 A10SC-009 i7-10710U, GeForce GTX 1650 Max-Q | Asus ZenBook 15 UX534FTC-A8190T i7-10510U, GeForce GTX 1650 Max-Q | MSI Prestige 15 A10SC i7-10710U, GeForce GTX 1650 Max-Q | LG Ultra 17U70N i5-10210U, GeForce GTX 1650 Mobile | Average of class Multimedia | |
|---|---|---|---|---|---|---|
| Power Consumption | -13% | 14% | -28% | -27% | -15% | |
| Idle Minimum * (Watt) | 4 | 5.2 -30% | 2.8 30% | 6.1 -53% | 3.7 7% | 5.71 ? -43% |
| Idle Average * (Watt) | 8 | 12.2 -53% | 7.7 4% | 13.2 -65% | 8.8 -10% | 10.1 ? -26% |
| Idle Maximum * (Watt) | 13 | 14.3 -10% | 9.4 28% | 19.2 -48% | 30.6 -135% | 12.4 ? 5% |
| Load Average * (Watt) | 64 | 67 -5% | 57 11% | 75 -17% | 67.4 -5% | 65 ? -2% |
| Witcher 3 ultra * (Watt) | 78 | 62 21% | 74 5% | 84.5 -8% | ||
| Load Maximum * (Watt) | 103 | 67 35% | 116 -13% | 89.7 13% | 114 -11% | 112.2 ? -9% |
* ... smaller is better
Battery life
Thanks to the energy-saving components, the 14-incher lasts quite a while without a power supply. In our WLAN test with the display brightness set to medium, the 49 Wh battery only gave up after a good 7 hours. In the ideal case (very low to no load, minimum brightness), more than 12 hours are possible. However, the Asus Zenbook 15, the MSI Prestige 15 and the LG Ultra 17, which can accommodate a bigger battery due to the larger space, show that battery runtimes can be even better.
| Schenker XMG Core 14 i5-1135G7, GeForce GTX 1650 Mobile, 49 Wh | MSI Prestige 14 A10SC-009 i7-10710U, GeForce GTX 1650 Max-Q, 52 Wh | Asus ZenBook 15 UX534FTC-A8190T i7-10510U, GeForce GTX 1650 Max-Q, 71 Wh | MSI Prestige 15 A10SC i7-10710U, GeForce GTX 1650 Max-Q, 82 Wh | LG Ultra 17U70N i5-10210U, GeForce GTX 1650 Mobile, 72 Wh | Average of class Multimedia | |
|---|---|---|---|---|---|---|
| Battery runtime | 1% | 86% | 35% | 62% | 63% | |
| Reader / Idle (h) | 12.3 | 9.9 -20% | 27.2 121% | 19.1 55% | 24.8 102% | 25.2 ? 105% |
| WiFi v1.3 (h) | 7 | 5.9 -16% | 12.4 77% | 7.6 9% | 13.7 96% | 12 ? 71% |
| Load (h) | 1.5 | 2.1 40% | 2.4 60% | 2.1 40% | 1.3 -13% | 1.675 ? 12% |
| H.264 (h) | 11.9 | 16.4 ? |
Pros
Cons
Verdict
If you are looking for an energy-efficient and light or compact gaming notebook, you might like the Schenker XMG Core 14.
In any case, there are hardly any devices in the 14-inch segment that can boast a comparable gaming performance.
The combination of the Core i5-1135G7 and GeForce GTX 1650 manages most titles - at least currently - with decent to good visuals, although the weak CPU Turbo often has a negative impact on framerates (in entertainment mode).
More FPS can be squeezed out by using the performance mode, but the fans become even louder than they already are under load. When idle and during light tasks, the Core 14 cuts a good figure. The notebook works quietly and stays pleasantly cool.
On the positive side, the good 120 Hz panel, the long battery life, and the modern ports (Thunderbolt 4!) should also be mentioned. The manufacturer should improve the sound system and the webcam in particular. A second M.2 slot would also be nice.
Price and availability
The Core 14 costs around 1,100 Euros in the reviewed configuration. The device can be configured on the manufacturer's homepage, bestware.com, or purchased in specified configuration variants from stores, e.g.:
Schenker XMG Core 14
- 12/22/2020 v7 (old)
Florian Glaser
Price comparison

