Dell Inspiron 13 7386 2-in-1 Black Edition (i7-8565U, 16 GB RAM, 512 GB SSD) Convertible Review

The Dell Inspiron 13 7386 2-in-1 is a compact convertible laptop with a 360 ° hinge and, as its name suggests, a 13-inch display. Dell markets the device as a home office laptop and currently sells four configurations on its website that range from $938.99 to $1,149.99. The company also sells an AMD version that starts at $738.99, and an Intel-powered Black Edition, which costs $1,458.99.
The device is part of Dell’s Inspiron 7000 2-in-1 series, which is positioned below the company’s XPS series but above the Inspiron 3000 and 5000 series. It is worth keeping in mind that all Inspiron 13 7000 2-in-1 series laptops support the Dell Active Pen regardless of their screen resolution, according to the Dell US website.
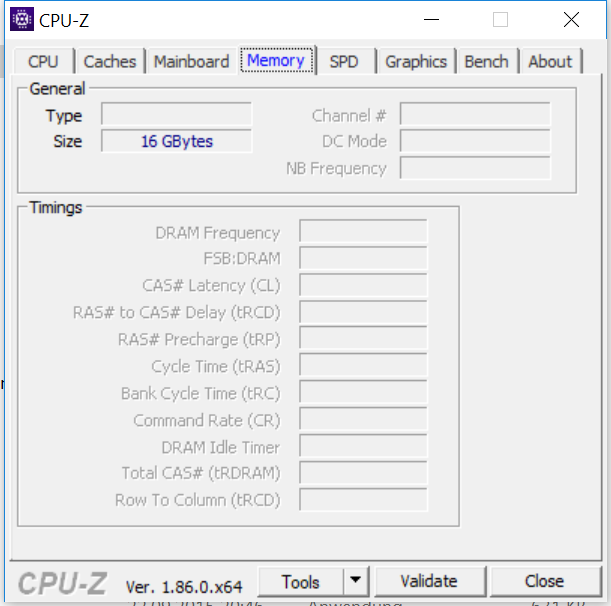
Our test unit is the UHD model, which is currently unlisted on Dell's German website. However, the company markets the device in the US as the Inspiron 13 7386 2-in-1 Black Edition. Our test device is powered by the quad-core Intel Core i7-8565U processor, which integrates an Intel UHD Graphics 620 GPU. Dell complements the processor with 16 GB of DDR4-2400 RAM and a 512 GB SSD. There is also a Trusted Platform Module (TPM) chip and a fingerprint sensor, while our test device has Windows 10 Home 64-bit preinstalled. You can upgrade to Windows 10 Pro 64-bit for $60 when configuring the device on Dell’s website. All non-Black Edition Inspiron 13 7386 laptops come with an FHD display, while Dell also sells a Core i5-8265U-powered variant that comes with 8 GB RAM and a 256 GB SSD. There are Core i7-8565U models that have less RAM and a smaller SSD than our test unit does too.
We have chosen to compare the Inspiron 13 7386 2-in-1 Black Edition against other 13.3-inch convertibles, but please keep in mind that our comparison devices are several hundred US dollars cheaper than our test device, which underlines how poor value for money the 7386 2-in-1 Black Edition is. Our comparison devices are the HP ProBook x360 440 G1, the Lenovo ThinkPad L380 Yoga and the Lenovo Yoga 530-14IKB; we have included an overview of the differences between our comparison devices in the table below too.
| HP ProBook x360 440 G1 | Lenovo ThinkPad L380 Yoga | Lenovo Yoga 530-14IKB | |
|---|---|---|---|
| CPU | Intel Core i5-8250U | Intel Core i5-8250U | Intel Core i5-8250U |
| GPU | Intel UHD Graphics 620 | Intel UHD Graphics 620 | Intel UHD Graphics 620 |
| Display | 13.3-inches: 1,920 x 1,080 | 13.3-inches: 1,920 x 1,080 | 14-inches: 1,920 x 1,080 |
| RAM | 16 GB DDR4-2400 | 8 GB DDR4-2400 | 8 GB DDR4-2400 |
| Storage | 256 GB NVMe SSD | 256 GB NVMe SSD | 256 GB NVMe SSD |
| Rating | 86% | 86% | 84% |
Case
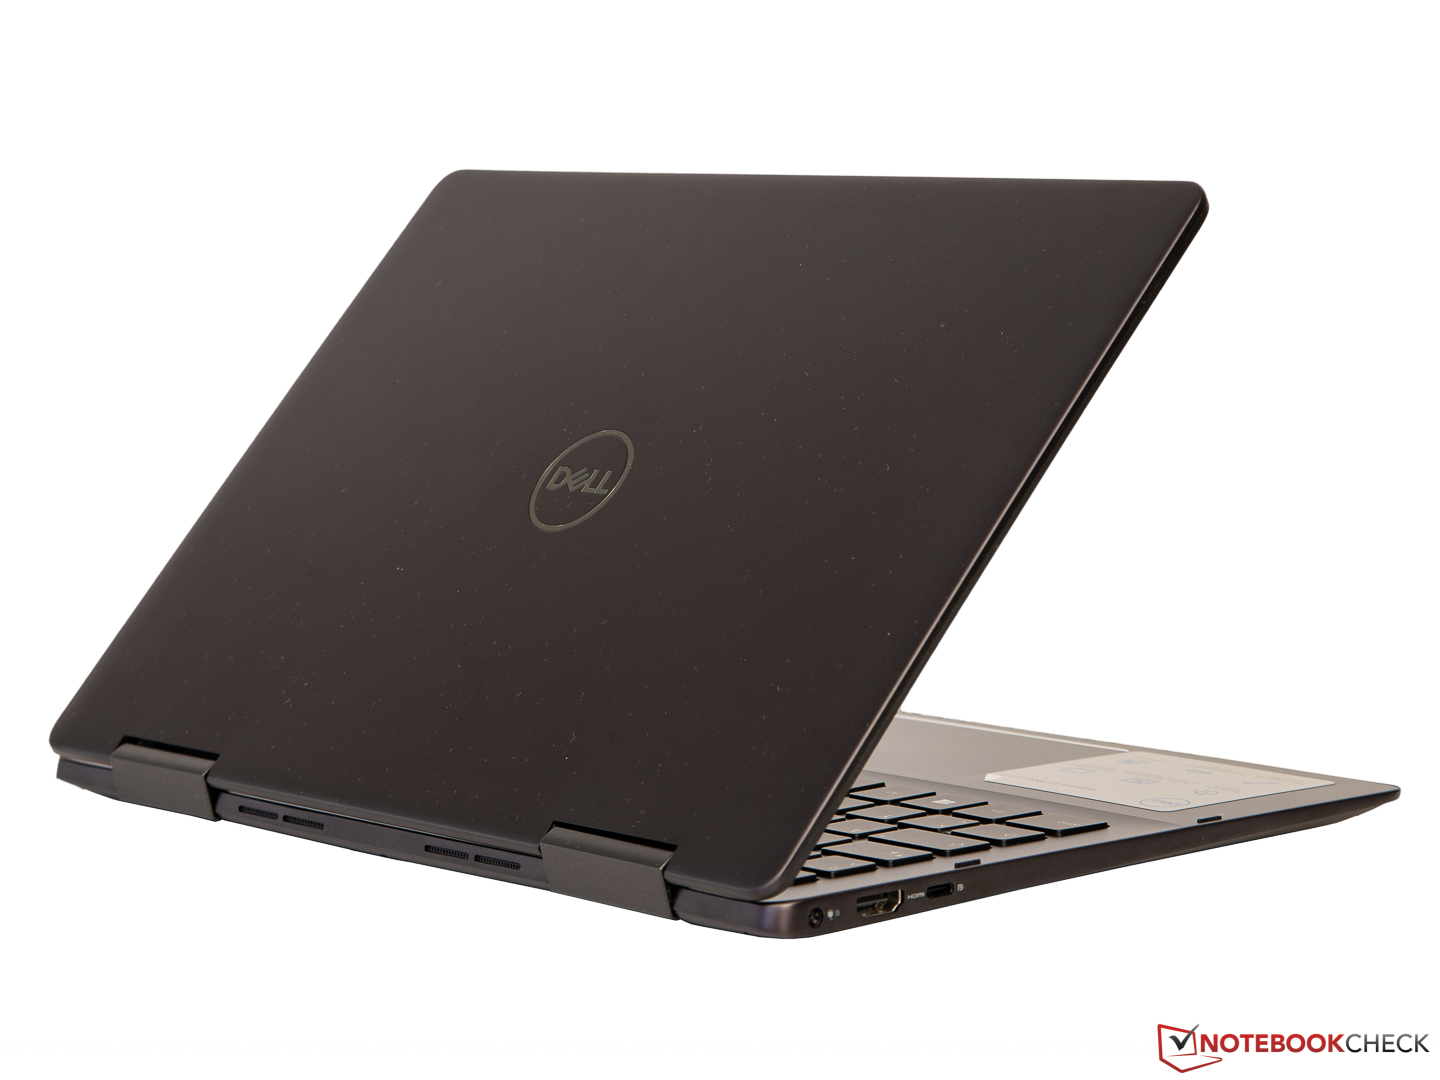
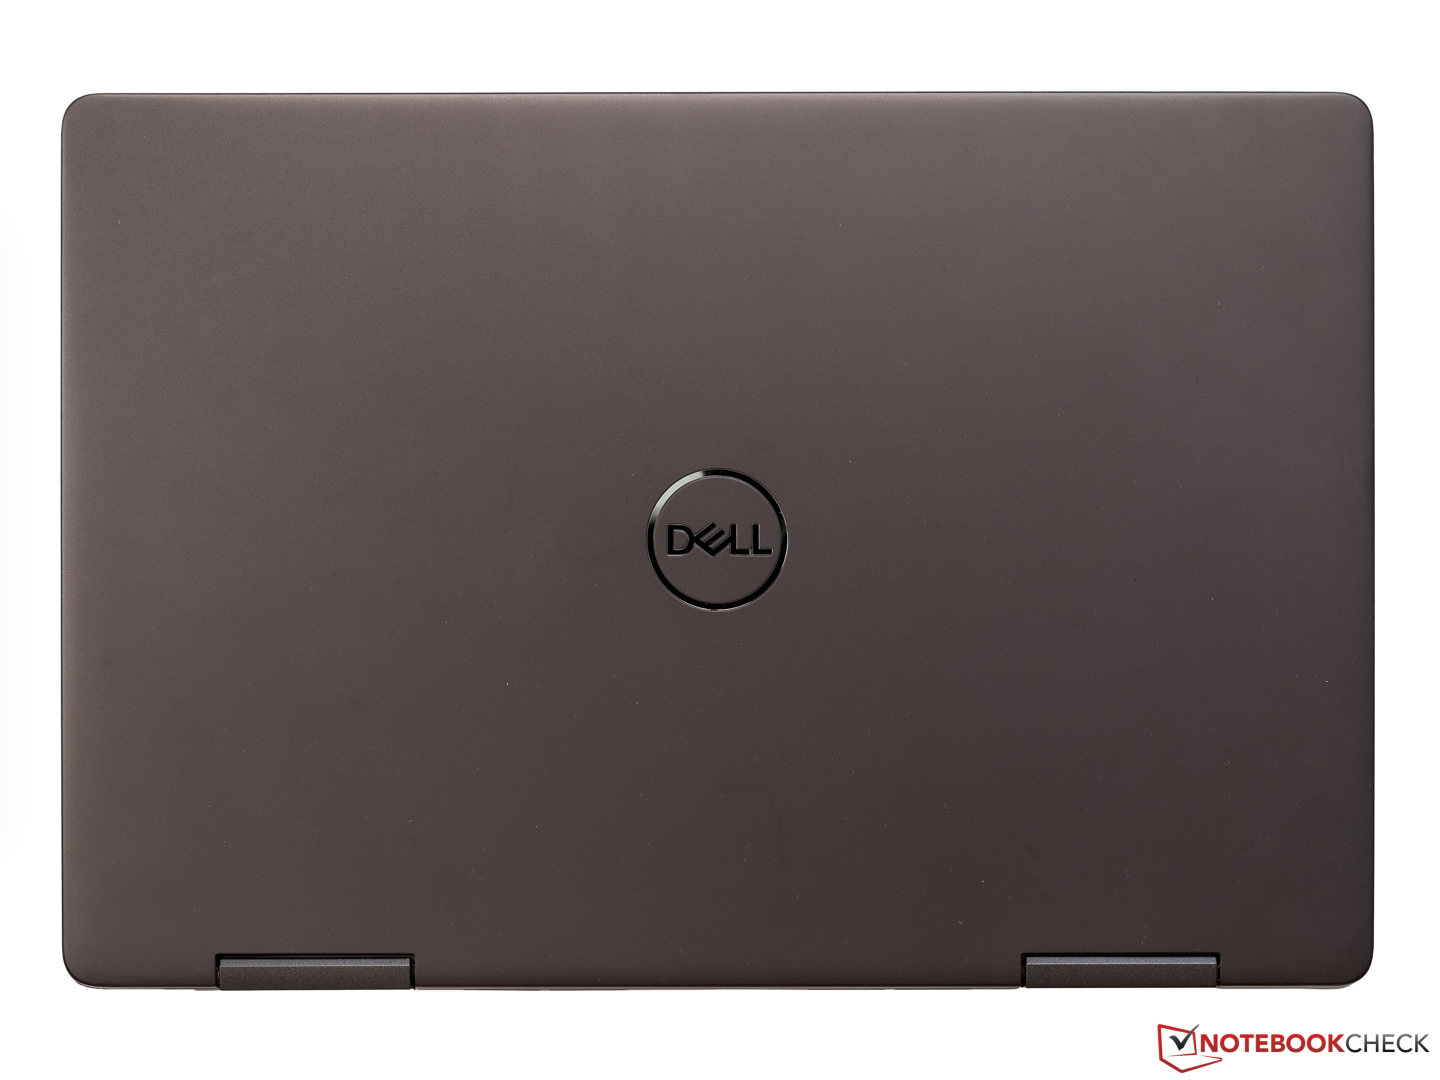
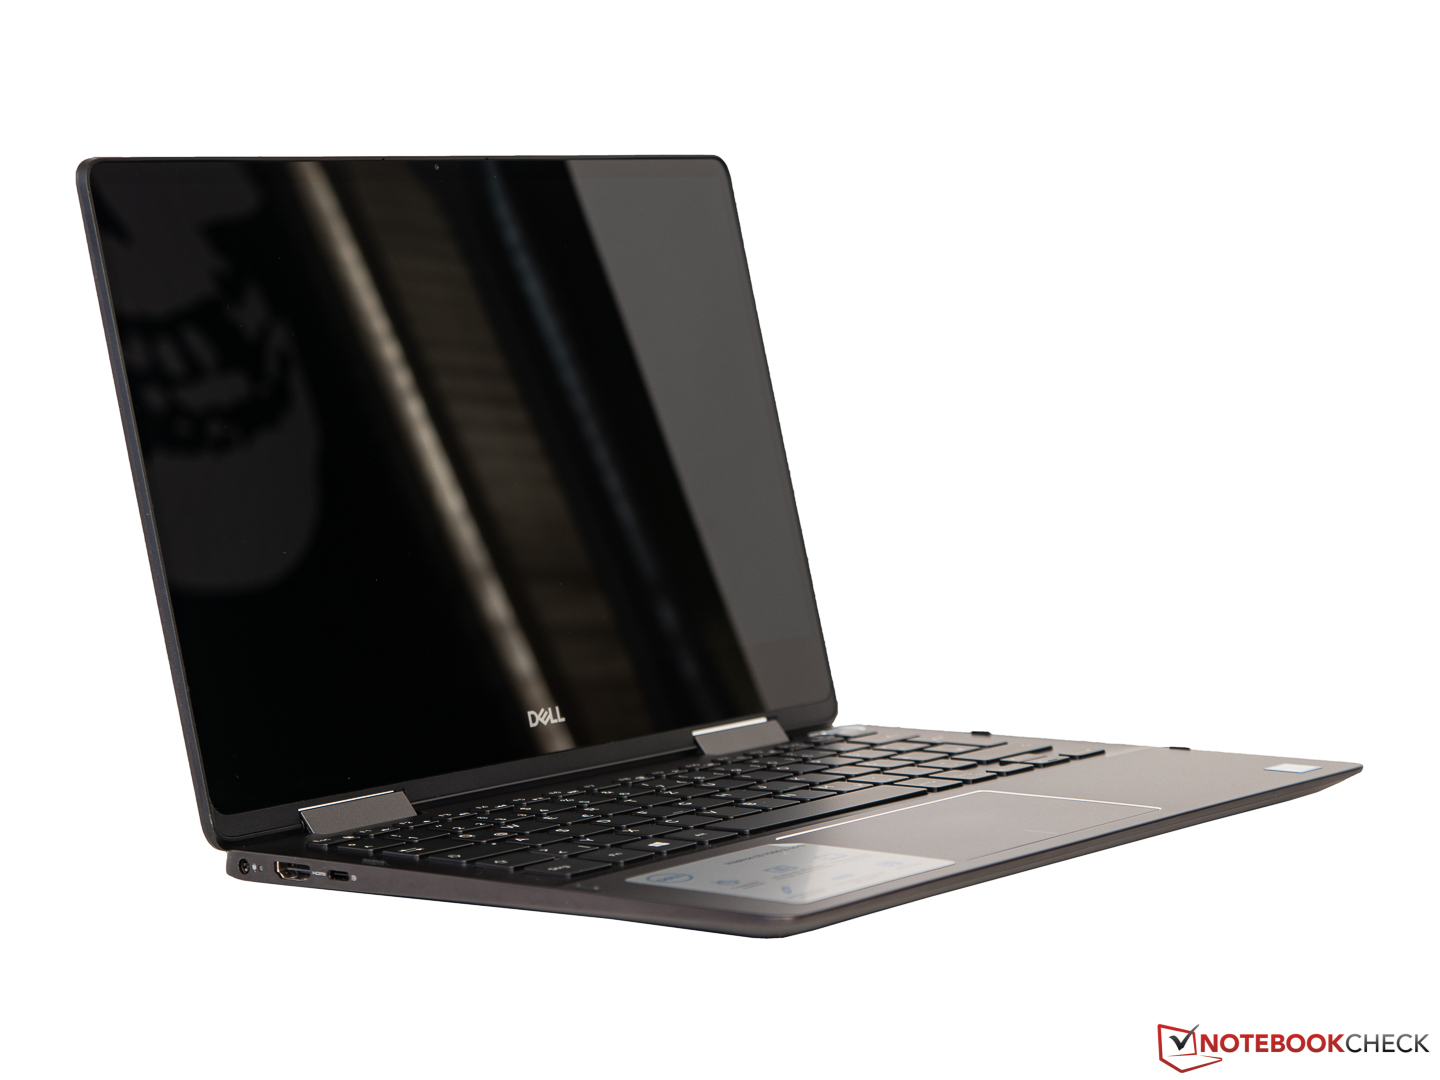
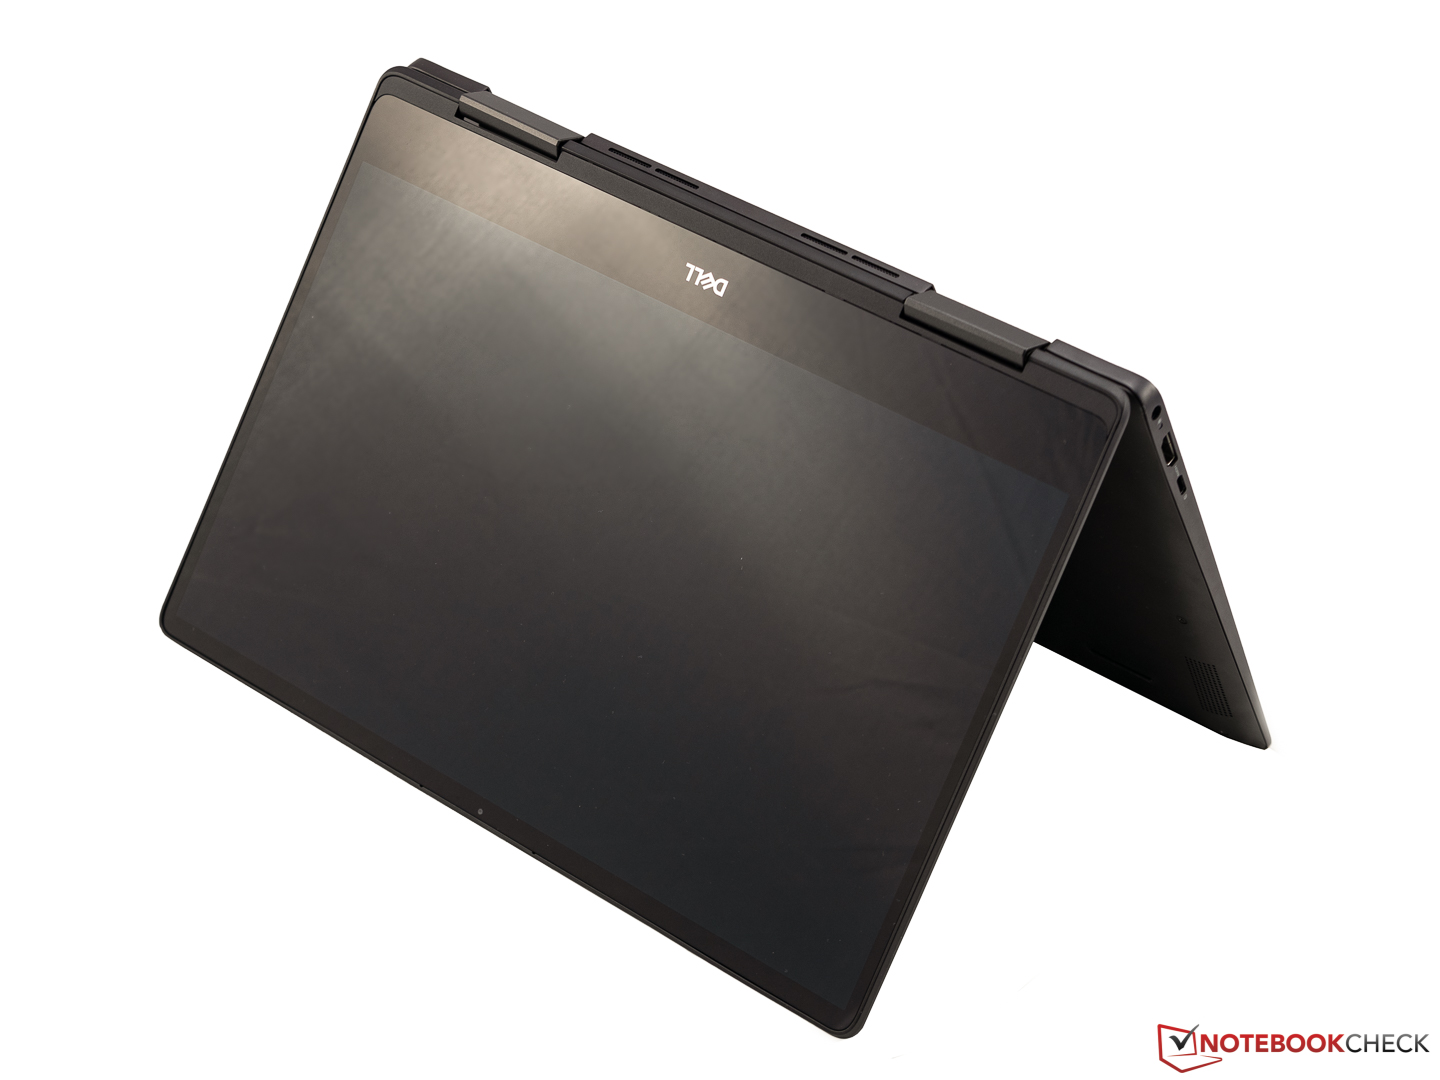
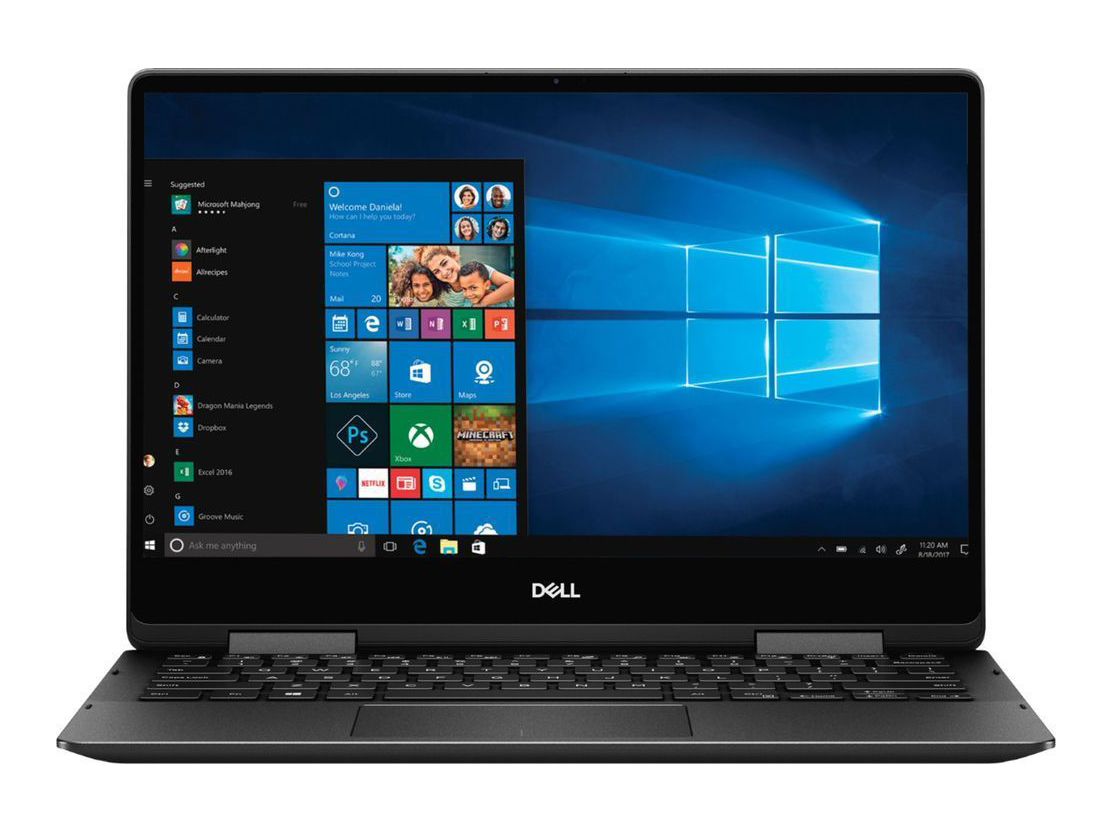
The 7386 Black Edition is mainly made of aluminium that has a pleasingly grippy feel to it, although it does make the device heavier than if it were made of a carbon-fibre composite like the XPS 13 9370 or a magnesium alloy like the Acer Swift 5 SF514. The increased weight helps keep the device sturdy though, and it weighs as much or less than our comparison devices. Our test unit is finished in a shimmering matte anthracite colour that looks understated and almost generic. By contrast, the standard Inspiron 13 7386 is almost entirely silver except for its dark grey display frame and black screen bezels. The anthracite case is accented by the silver finishing around the power button and the trackpad, while the Dell logo on the display cover shines subtly when the light catches it. The case also attracts fingerprints too easily for our liking and quickly starts looking like it needs cleaning.
The wedge-shaped frame has sharp edges too, which makes the 7386 Black Edition rather unpleasant to hold. We found the display lid difficult to hold with one hand too. Moreover, our test unit has a tight hinge that means we can only open the device with two hands, although it cannot prevent the screen from bouncing slightly when we are typing.
Our test device is well-built though with no processing defects or irregular gaps between materials. The display lid is stiff too, but we can twist the base slightly with our hands and cause it to emit a cracking sound. Overall, the Inspiron 13 7386 is a robust convertible laptop that should stand up to the rigours of daily use.
The Inspiron 13 7386 is practically the same size as the ThinkPad L380 Yoga, although it is 0.6 mm thicker. The device is thicker than the Lenovo Yoga 530-14IKB too, albeit it has a smaller overall footprint than the Yoga 530-14IKB and is around 100 g lighter. Moreover, the HP ProBook x360 440 G1 is approximately 200 g heavier than the Dell and is slightly larger too. In short, the Inspiron 13 7386 is lighter and more compact than most of our comparison devices, although keep in mind that the Yoga 530-14IKB has a larger display than the Dell.
Connectivity
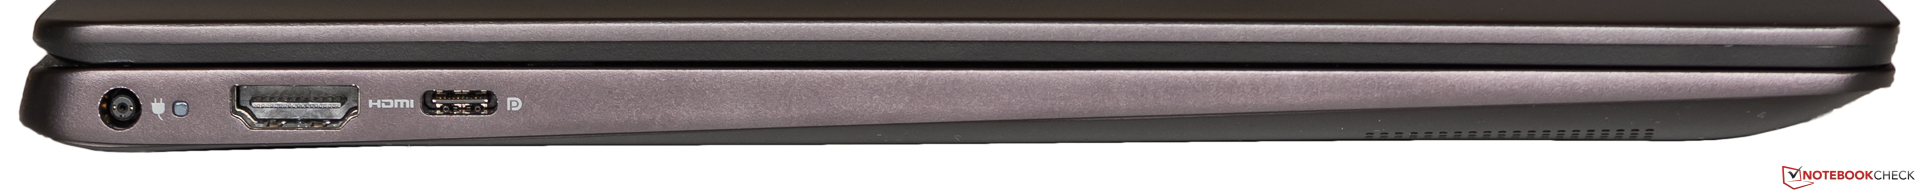
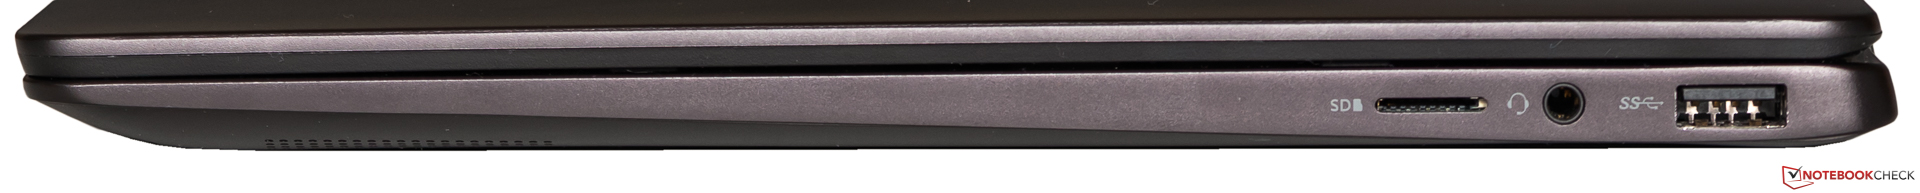
As with most compact convertibles, the Inspiron 13 7386 has few ports. Dell has included a USB 3.1 Gen1 Type-C port, a USB 3.0 Type-A port, an HDMI 1.4 port that can output in up to 4K at 60 Hz, a microSD card reader, a headphone jack and a proprietary power connector. The sparse selection ports are at least well placed, so no cables should get in the way when you are using an external mouse, for example.
SD Card Reader
Dell has equipped the Inspiron 13 7386 with a USB 2.0 microSD card reader that achieved disappointing transfers speeds in our tests. We used the Toshiba Exceria Pro SDXC 64 GB UHS-II reference microSD card when testing all the devices in our comparison table, which demonstrated that the reader in our unit is over 50% slower than those in the ThinkPad L380 Yoga and the ProBook x360 440 G1. The Inspiron 13 7386 achieved slightly faster transfer speeds than the Yoga 530-14IKB did, but the latter is less than half the price of our test device.
| SD Card Reader | |
| average JPG Copy Test (av. of 3 runs) | |
| HP ProBook x360 440 G1 (Toshiba Exceria Pro M501 microSDXC 64GB) | |
| Lenovo ThinkPad L380 Yoga-20M7001BGE (Toshiba Exceria Pro M501 microSDXC 64GB) | |
| Average of class Convertible (28.1 - 197, n=23, last 2 years) | |
| Lenovo Yoga 530-14IKB-81EK00CWGE (Toshiba Exceria Pro SDXC 64 GB UHS-II) | |
| maximum AS SSD Seq Read Test (1GB) | |
| Average of class Convertible (28.9 - 254, n=22, last 2 years) | |
| Lenovo ThinkPad L380 Yoga-20M7001BGE (Toshiba Exceria Pro M501 microSDXC 64GB) | |
| HP ProBook x360 440 G1 (Toshiba Exceria Pro M501 microSDXC 64GB) | |
| Dell Inspiron 13 7386 (Toshiba Exceria Pro M501 microSDXC 64GB) | |
| Lenovo Yoga 530-14IKB-81EK00CWGE (Toshiba Exceria Pro SDXC 64 GB UHS-II) | |
Communication
Dell has equipped the Inspiron 13 7386 with an Intel Wireless-AC 9560 chip that many OEMs have started putting in their new laptops. The Intel 9560 supports Bluetooth 5.0 and has a MIMO 2x2 antenna that reportedly helps the chip achieve up to 1.73 Gb/s download speeds. Our test device did not get close to those speeds when tested one metre away from our Linksys EA8500 reference router, but it did average a respectable 630 Mb/s in our iperf3 Client Wi-Fi tests. The Inspiron 13 7386 achieved 20% faster transfer speeds in the receive test than our best comparison device, but it fell 6% short of matching the ThinkPad L380 Yoga in the transmission test. The latter is equipped with an older Wireless-AC 8265 chip too, so the Dell should be doing better in this test, in our opinion.
Security
While Dell does not advertise the Inspiron 13 7386 as a business device, Microsoft requires all OEMs to equip their new devices with TPM 2.0 chips, which uses cryptographic keys to help keep your system secure. Dell has also integrated a fingerprint sensor within the power button that worked quickly and reliably throughout testing. The fingerprint sensor is Windows Hello-certified too, so it should work with apps like password managers that support biometric authentication. Our test unit does not have BitLocker disk encryption enabled though as Microsoft reserves this for Windows 10 Pro licences. You can upgrade to Windows 10 Pro for $60 when purchasing the Inspiron 13 7386 directly from Dell or pay $99 for a Pro licence from the Microsoft Store if you subsequently decide that you need BitLocker encryption and the other features that Windows 10 Pro brings. Dell has not included a Kensington lock slot though, which is disappointing.
Accessories
Dell only includes a 45 W charger in the box along with some safety instructions and a quick-start guide. The company also sells its Active Pen for $99.99 and a range of general laptop accessories on its website, although there are currently no Inspiron 13 7386 accessories available.
Maintenance
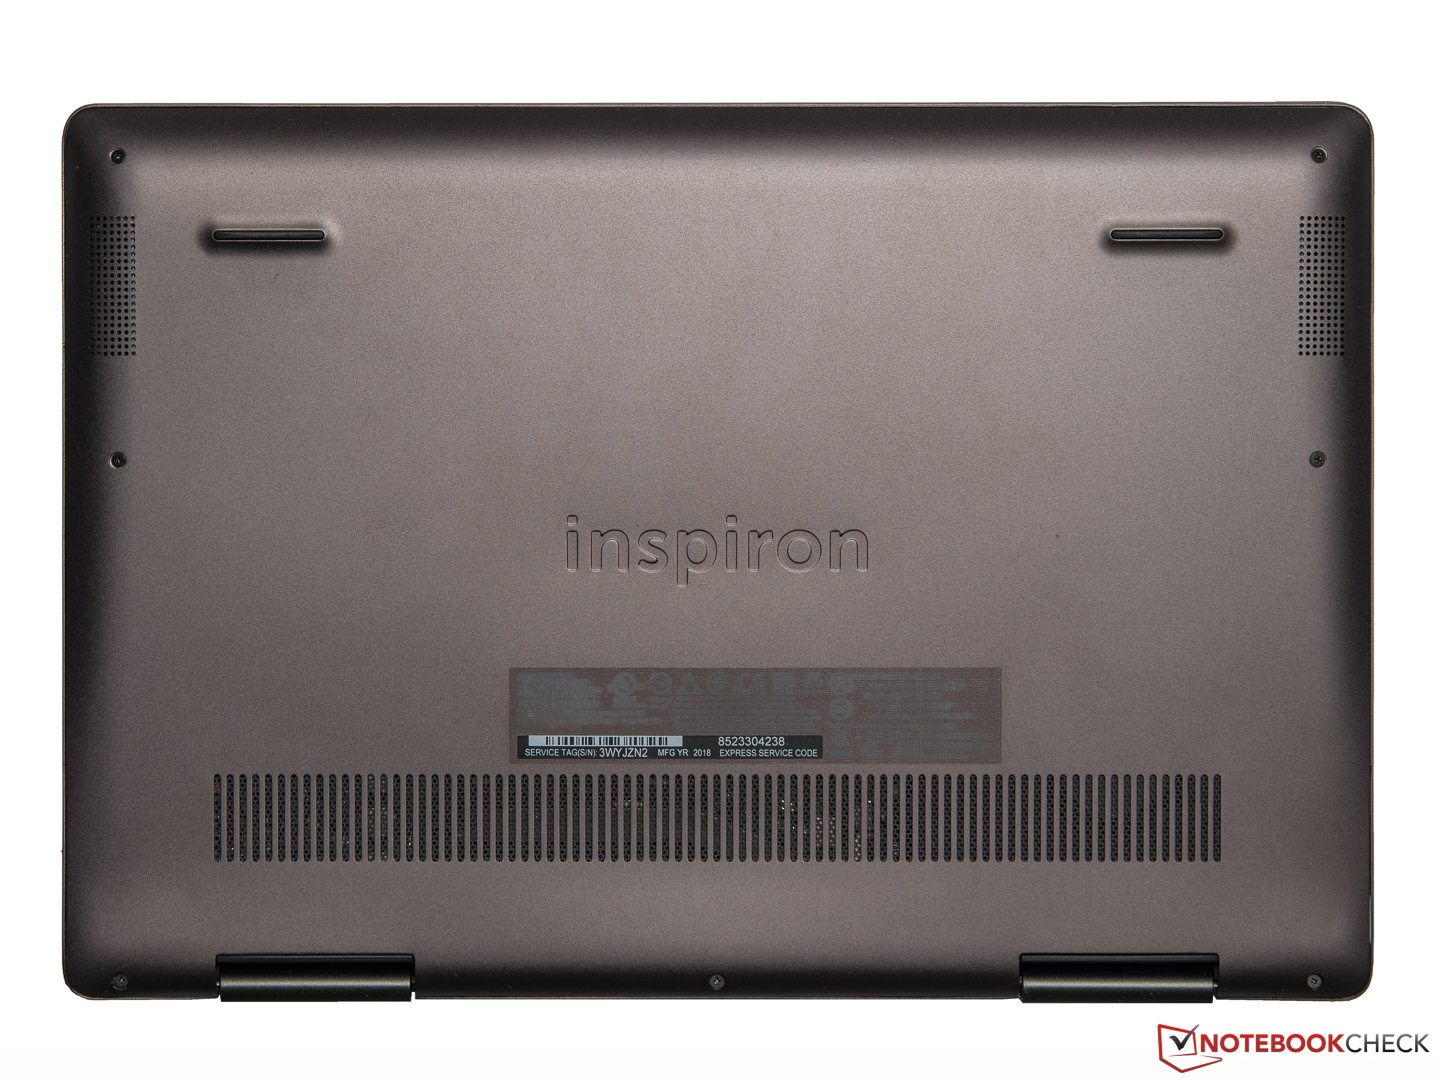
Carrying out your own maintenance work typically voids any manufacturer warranties but accessing the Inspiron 13 7386’s internal components only requires removing the bottom plate, which is attached to the frame with seven Phillips-head, or crosshead, screws.
We refrained from opening our test unit though as Cyberport graciously provided it to us on loan for this review. Dell describes the 13 7386 as having “onboard” RAM, which we suspect means that it is soldered to the motherboard and is irreplaceable. You should be able to clean the fan and replace components like the battery, Wi-Fi card and SSD if you remove the bottom cover.
Warranty
The Inspiron 13 7386 comes with 12 months manufacturer’s warranty, which can be upgraded and renewed for a fee. Dell includes its collect and return hardware support by default, but this can be upgraded up to four years premium support with onsite support if needed. You can buy up to one year’s accidental damage cover too. Full details and pricing are available on Dell’s website when configuring the Inspiron 13 7386 at checkout. Please see our Guarantees, Return policies and Warranties article for country-specific information.
Input Devices
Keyboard
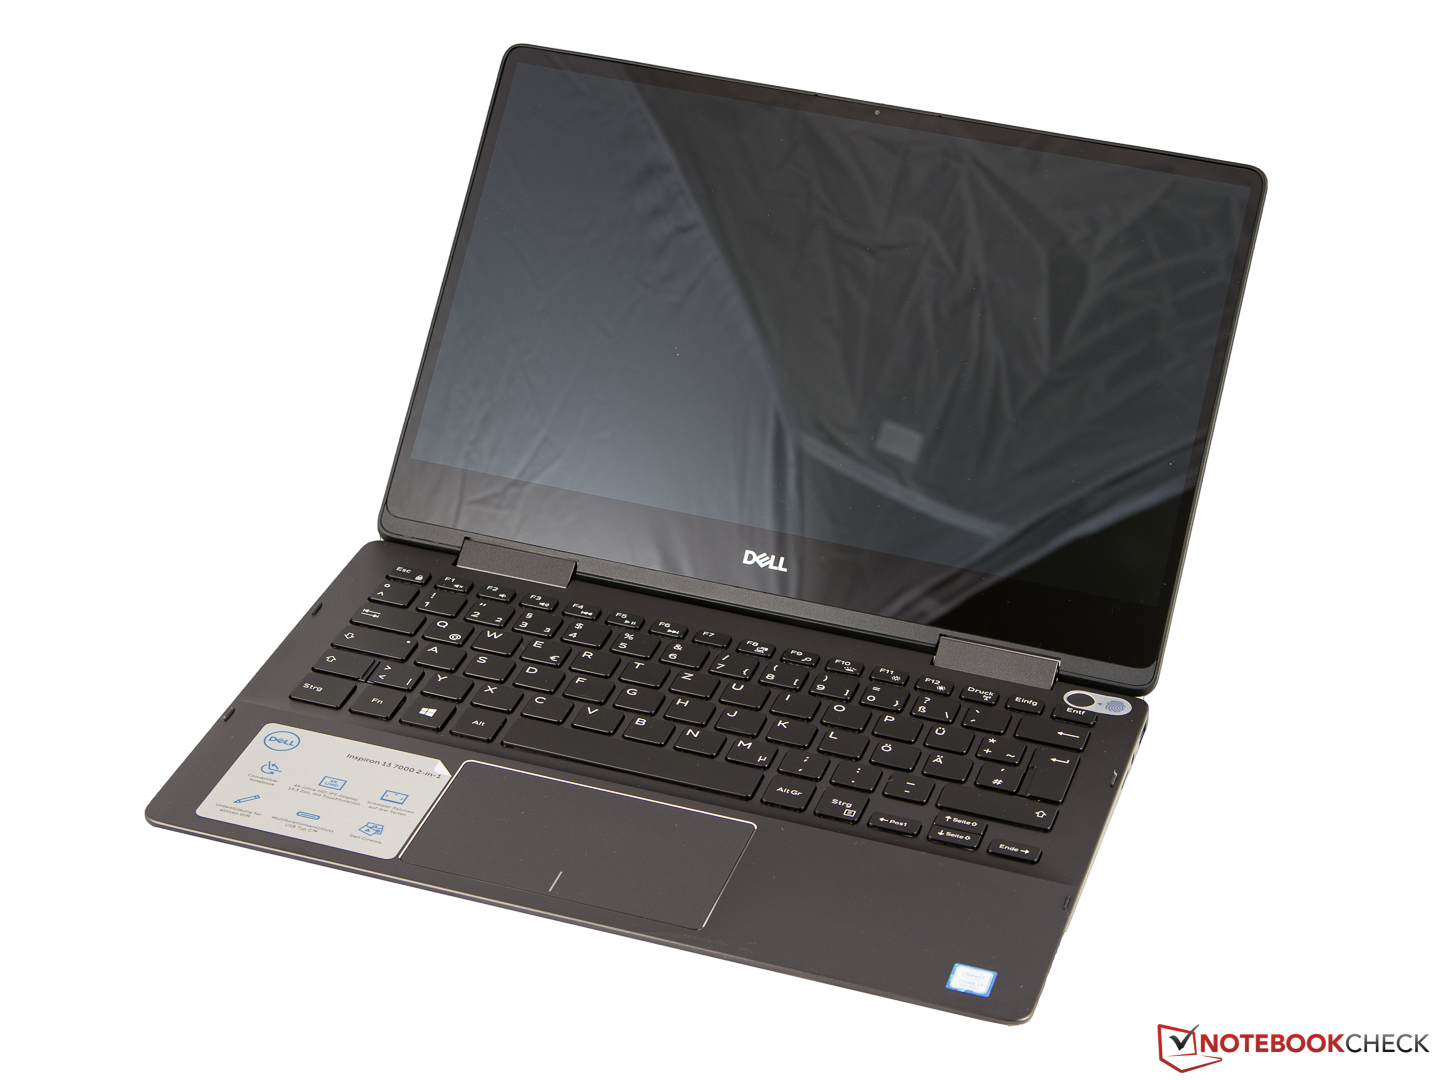
The Inspiron 13 7386 has a six-row chiclet keyboard that is a few millimetres narrower than a full-sized desktop keyboard. The keys are well spaced out and are clearly labelled even if they are a bit small for our liking. The layout is standard for a 13-inch laptop too, although the key layout will differ for US and UK models compared to our German test unit.
The keys on our test device are flat with short strokes and clear pressure points. The keys are well cushioned too, which should prevent your hands from feeling tired during a long typing session. Conversely, the keys may feel spongy to some people. The enter key and spacebar are also noisier than the other keys; so much so that we would suggest avoiding typing on the Inspiron 13 7386 in noise-sensitive environments where possible.
The keyboard deck is sturdy though, so it should not depress or flex when you are using the Inspiron 13 7386 as a conventional laptop. Dell has included a two-stage keyboard backlight too, which is pleasantly even and bright on our test unit. We can see the backlight shining from beneath the keys when we look at the device from acute angles though, which may be worth a consideration if you find that annoying. Overall, the Inspiron 13 7386 has a decent keyboard that should be good enough even for frequent typists, but you may find the keys too spongy if you are used to crisper-feeling keyboards like those in ThinkPad laptops.
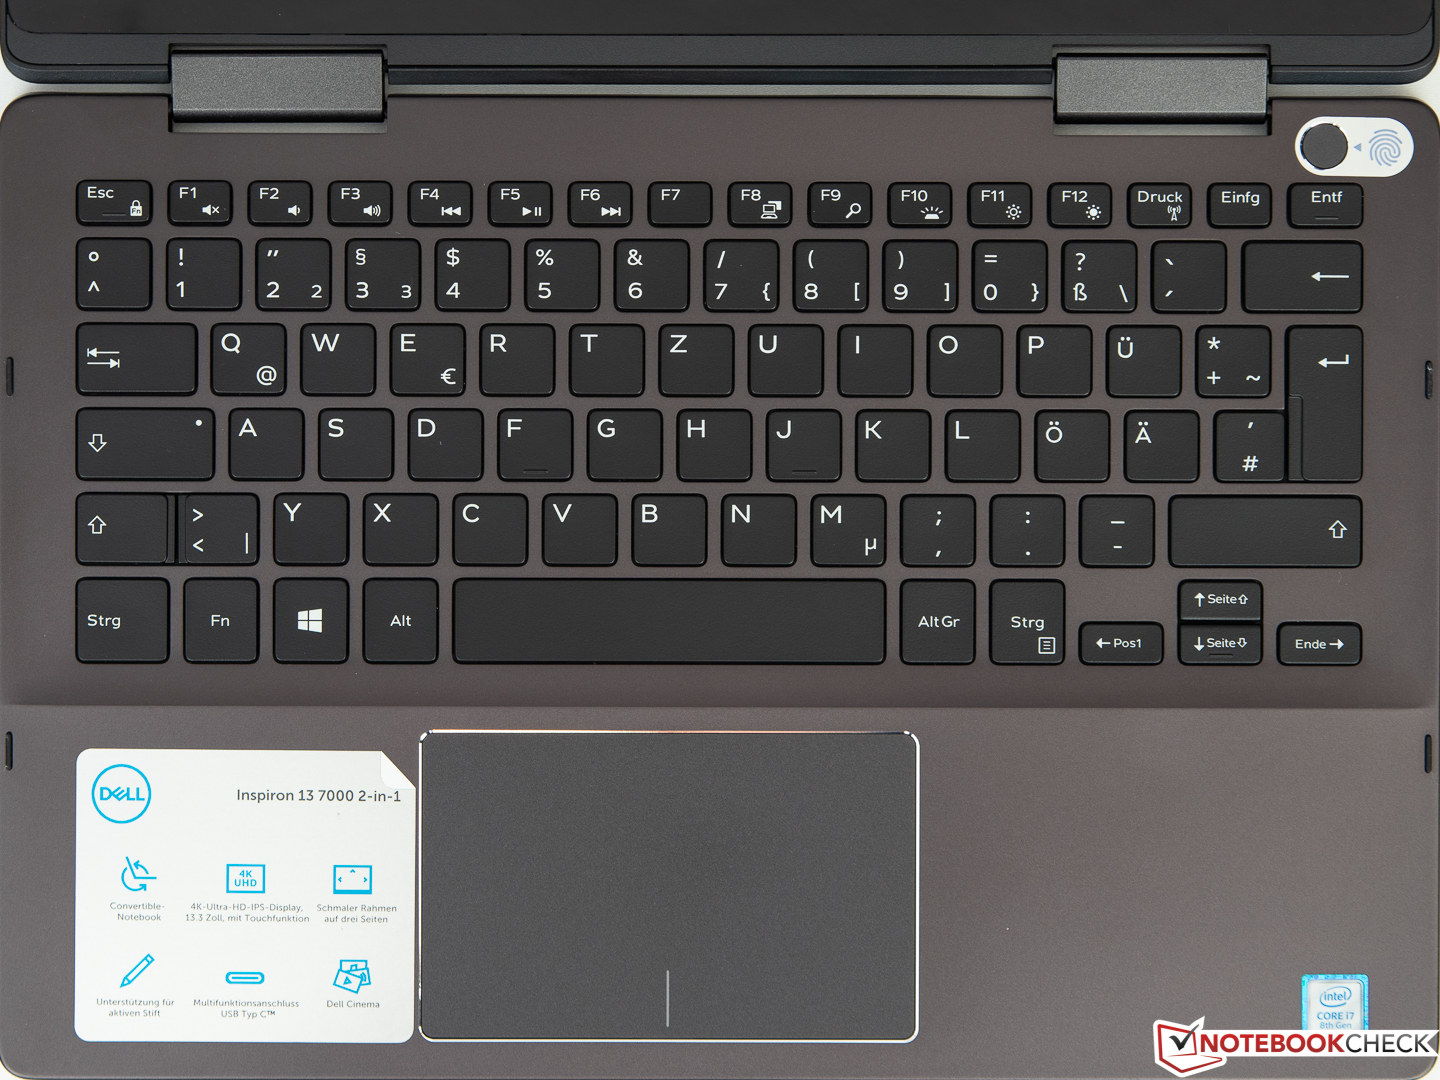
Trackpad
The Inspiron 13 7386 has a large trackpad with integrated mouse buttons. The roughened surface is easy to use, but you may struggle to move the onscreen mouse precisely if you have damp or sweaty hands. The trackpad responds accurately even at its outermost edges, and even fast gliding movements are reproduced promptly. The Inspiron 13 7386 supports Microsoft Precision drivers and up to four-finger gestures.
The trackpad integrates two mouse buttons that work well in theory, although our test unit has some issues. The right-click has a short stroke with a crisp pressure point and decent acoustic and haptic feedback. Unfortunately, the left-click does not work and makes a strange cracking sound when we press it. We suspect that this is just an issue with our device.
Touchscreen
We have no complaints about the touchscreen though, which worked perfectly throughout our tests. The Inspiron 13 7386 supports 10-point multitouch and recognises our inputs quickly even into the corners of the display. Damp fingers tend to stick to the glossy glass screen, but this is a problem with most modern touchscreen displays.
Display
The Inspiron 13 7386 has a 13.3-inch display that operates natively at 3840x2160. The screen has a 331 PPI pixel density, which should be high enough for you not to notice any individual pixels at typical viewing distances. However, Dell sets the display scaling to 150% by default, which makes buttons, fonts and icons look too small for our liking. This can be adjusted in Settings should you want to change it. The UHD display is currently only available on the Inspiron 13 7386 Black Edition, but the additional $200 surcharge between it and the equivalent FHD Inspiron 13 7386 is not worth it in our opinion. The FHD display is a touchscreen too and supports the Dell Active Pen, so the only benefit that the UHD display has is its increased resolution and pixel density.
Our test unit achieved an average maximum brightness of 278 cd/m², according to X-Rite i1Pro 2, which will win no awards. The display is considerably darker than the UHD version of the XPS 13 9370, but it is on par with most of our comparison devices. The ProBook X360 440 G1 has a much brighter display at 375 cd/m² though. Our test unit also has a comparatively unevenly lit screen, with the centre of the display being significantly brighter than the rest of the panel.
| |||||||||||||||||||||||||
Brightness Distribution: 81 %
Center on Battery: 281 cd/m²
Contrast: 1767:1 (Black: 0.18 cd/m²)
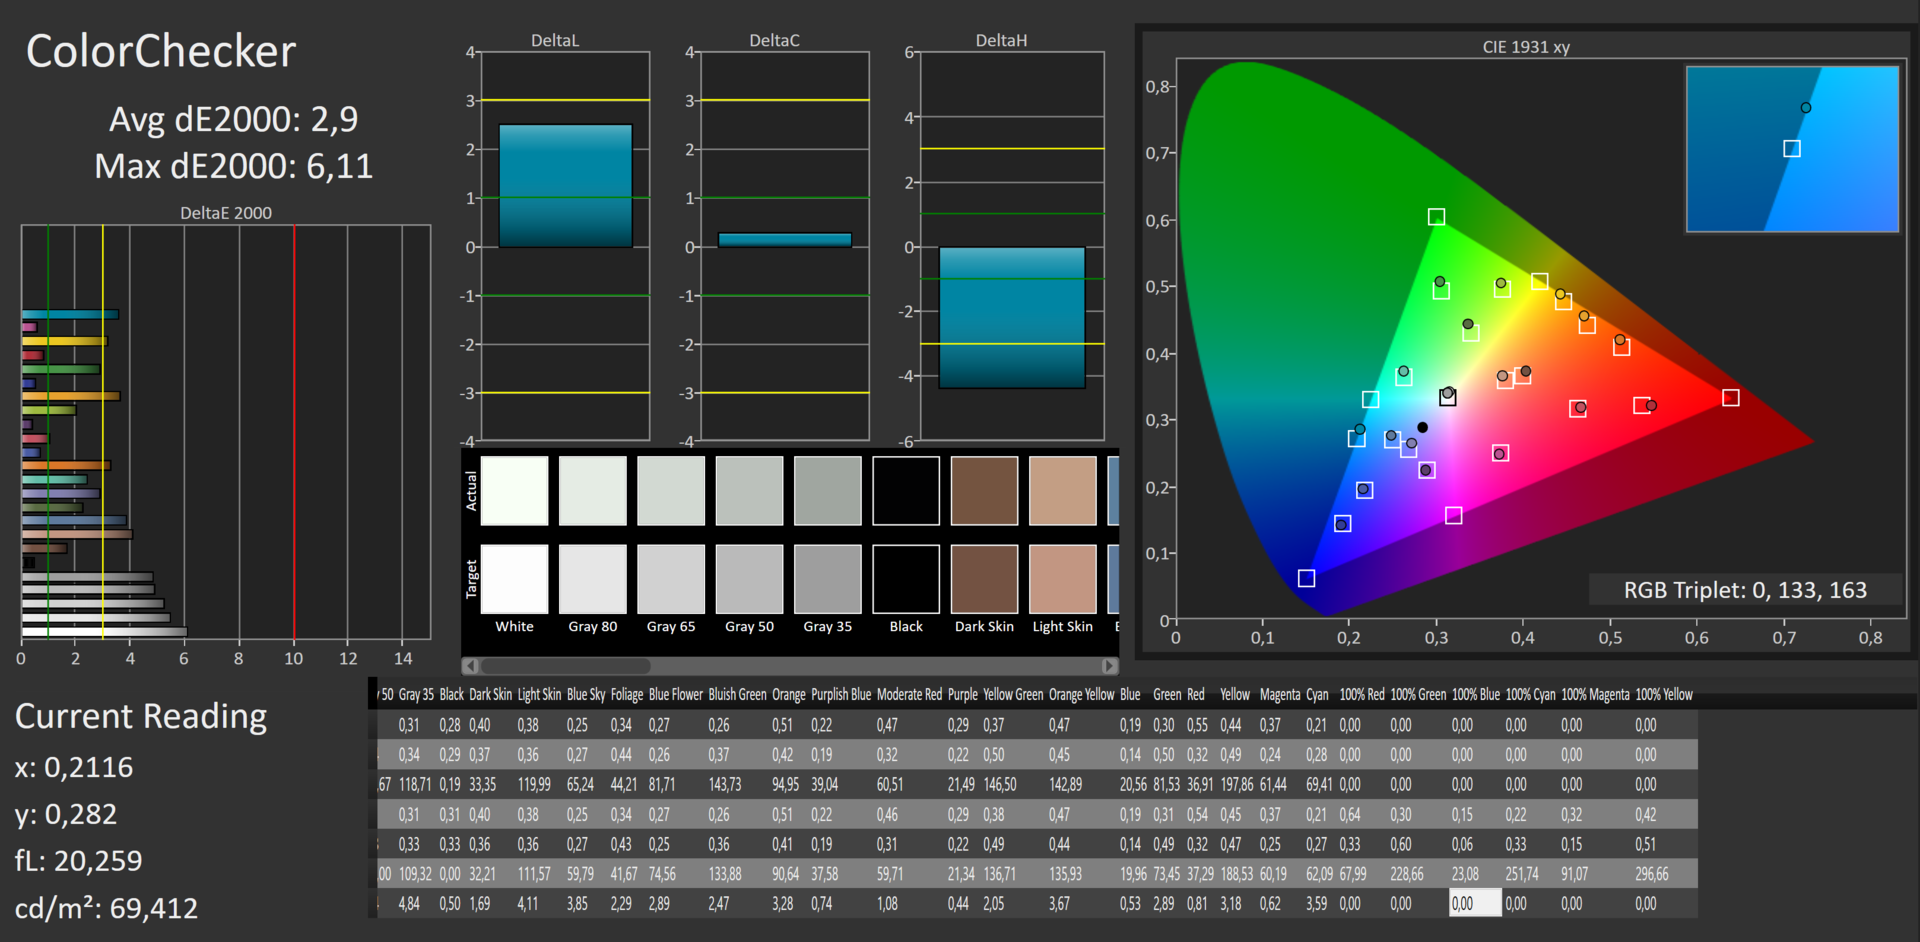
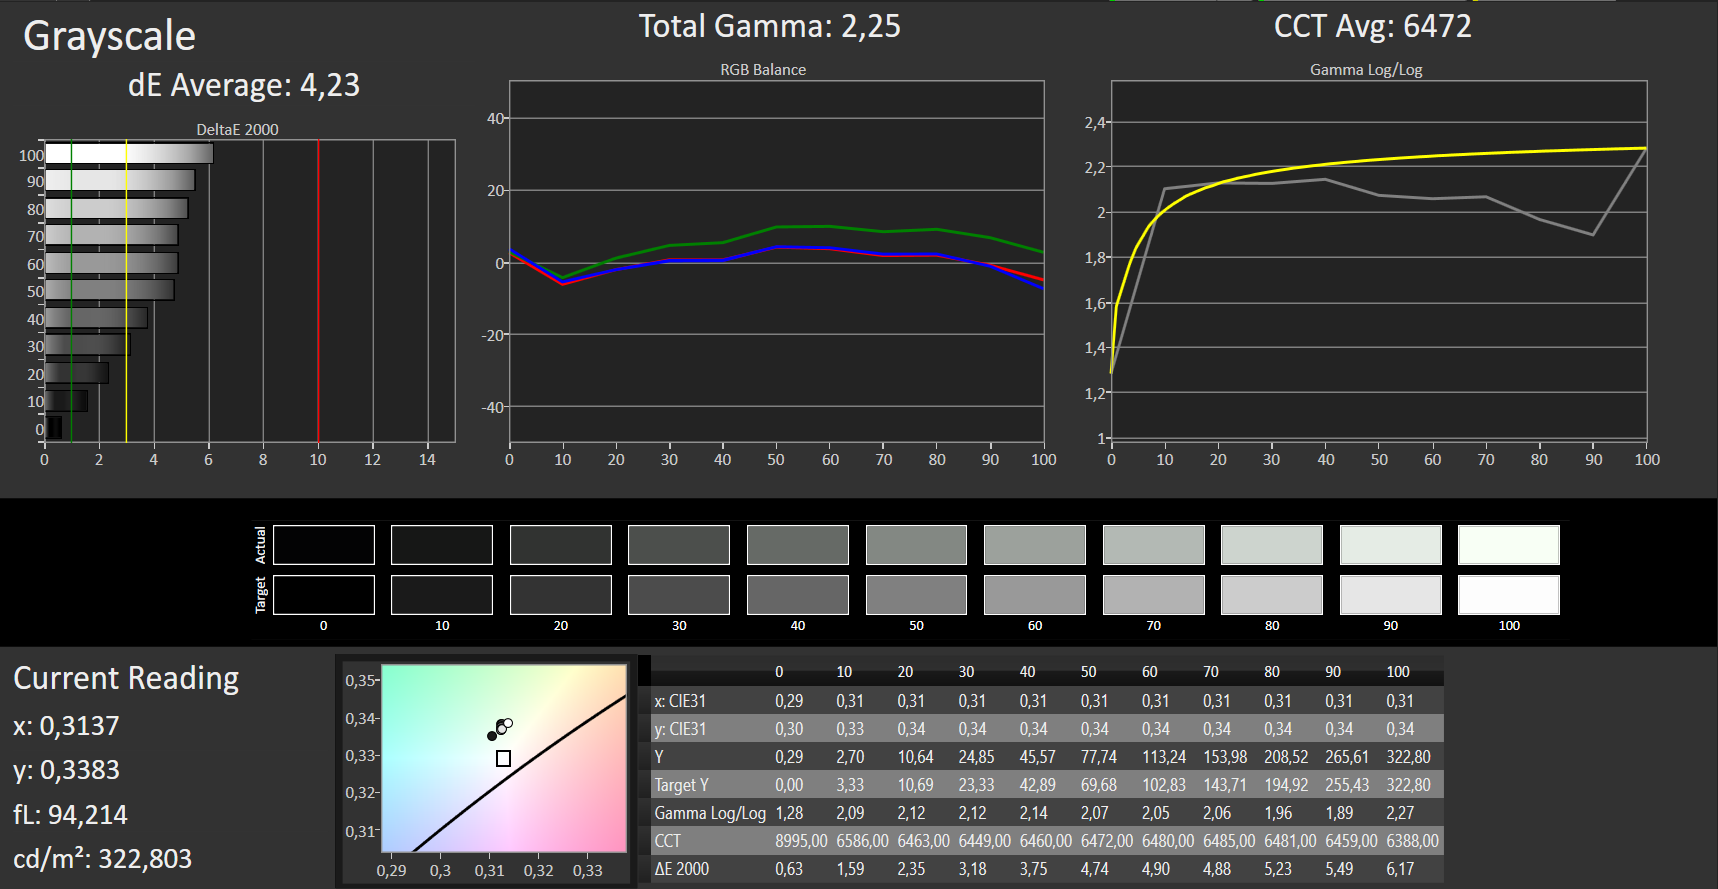
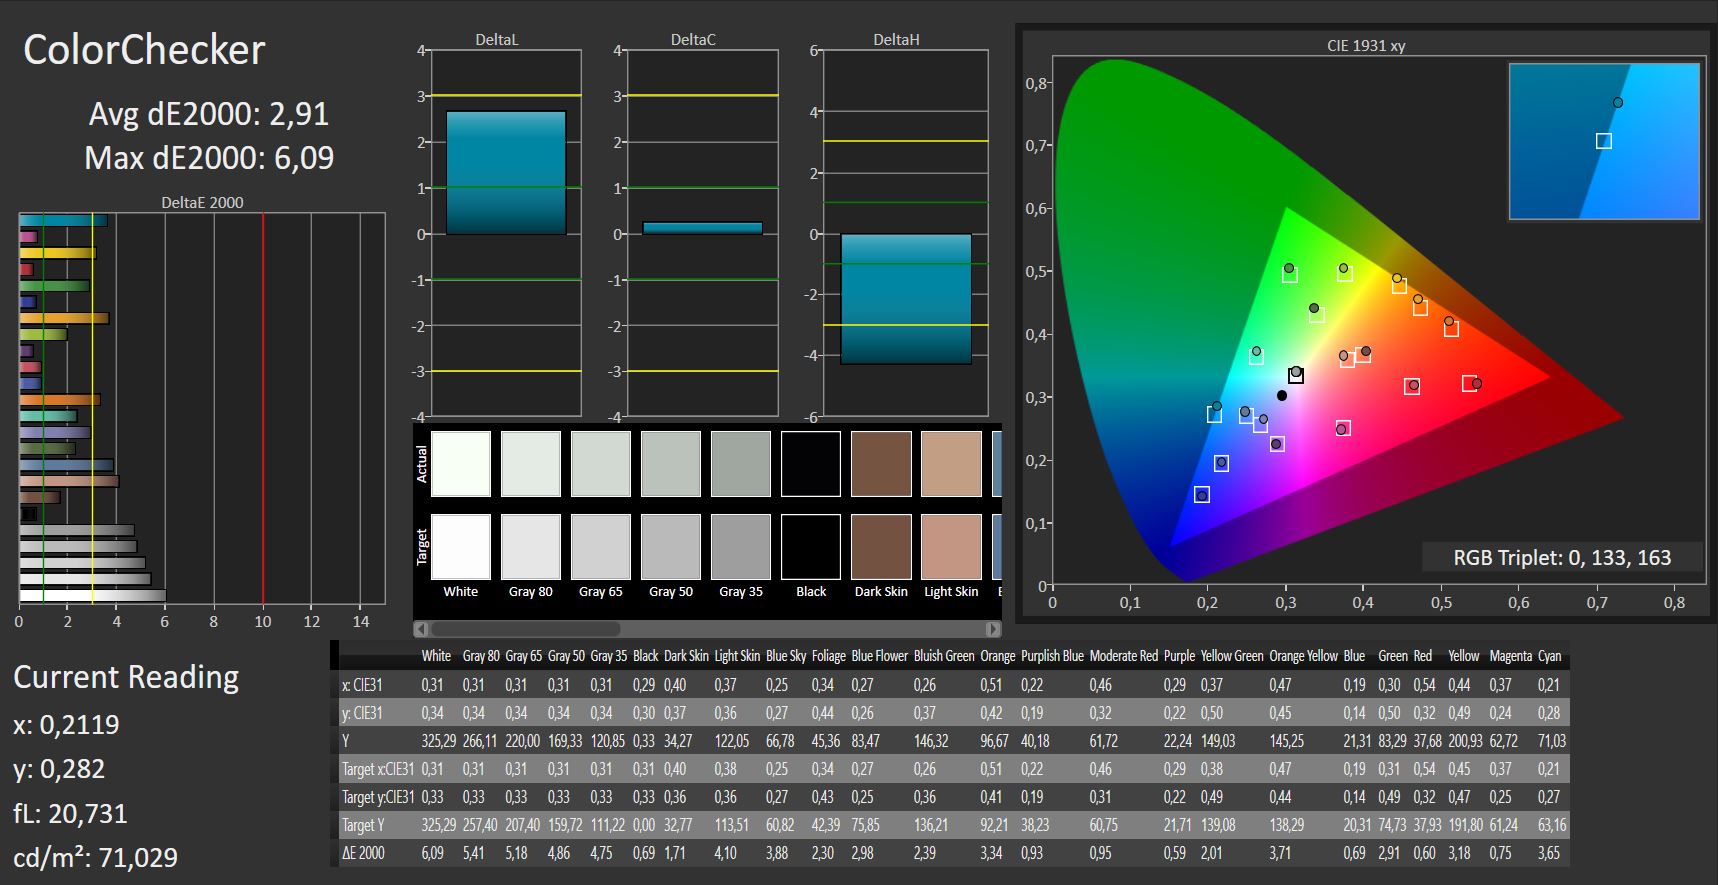
ΔE ColorChecker Calman: 2.91 | ∀{0.5-29.43 Ø4.72}
calibrated: 2.91
ΔE Greyscale Calman: 4.37 | ∀{0.09-98 Ø4.97}
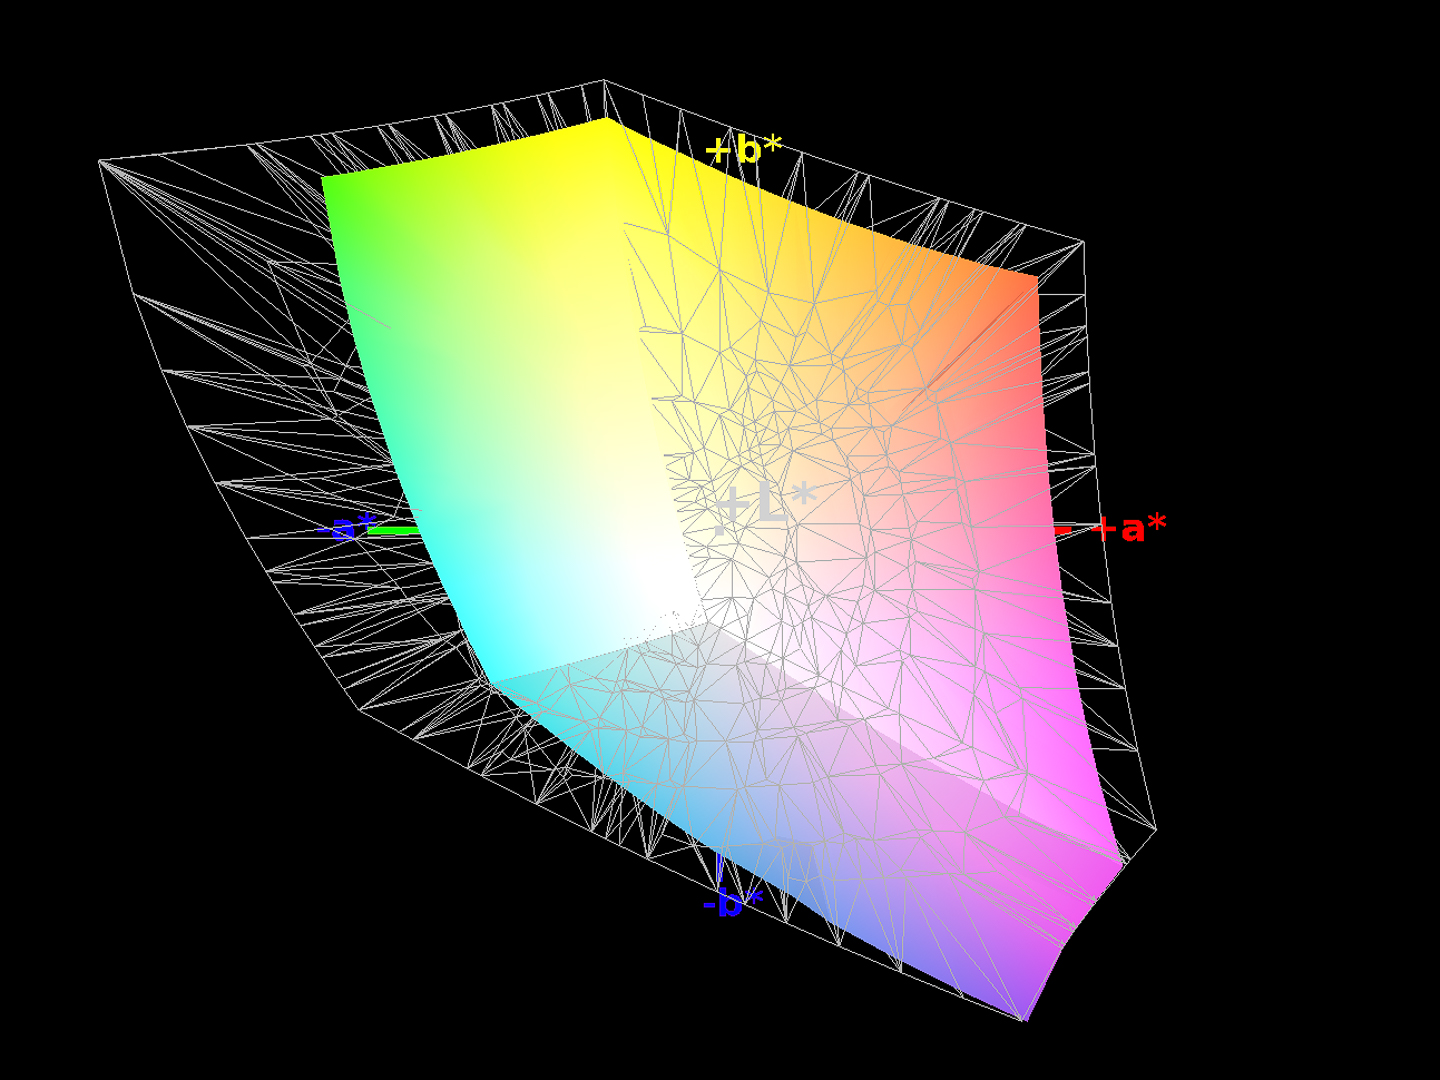
93% sRGB (Argyll 1.6.3 3D)
70% AdobeRGB 1998 (Argyll 1.6.3 3D)
70% AdobeRGB 1998 (Argyll 3D)
99.8% sRGB (Argyll 3D)
68.2% Display P3 (Argyll 3D)
Gamma: 2.26
CCT: 6448 K
| Dell Inspiron 13 7386 Chi Mei CMN1385 / 133DCE / Dell 3GRT6, , 3840x2160, 13.3" | Lenovo Yoga 530-14IKB-81EK00CWGE InfoVision M140NWF5 R2, , 1920x1080, 14" | HP ProBook x360 440 G1 Chi MEi, CMN14E0, , 1920x1080, 14" | Lenovo ThinkPad L380 Yoga-20M7001BGE M133NWF4-R3, , 1920x1080, 13.3" | |
|---|---|---|---|---|
| Display | -39% | -3% | -4% | |
| Display P3 Coverage (%) | 68.2 | 41.52 -39% | 65.8 -4% | 65.1 -5% |
| sRGB Coverage (%) | 99.8 | 62.1 -38% | 98.2 -2% | 95.5 -4% |
| AdobeRGB 1998 Coverage (%) | 70 | 42.92 -39% | 67.8 -3% | 66.9 -4% |
| Response Times | 11% | 37% | 13% | |
| Response Time Grey 50% / Grey 80% * (ms) | 57 ? | 45 ? 21% | 34 ? 40% | 47 ? 18% |
| Response Time Black / White * (ms) | 30 ? | 30 ? -0% | 20 ? 33% | 28 ? 7% |
| PWM Frequency (Hz) | 26000 ? | 520 ? | 26000 ? | 217 ? |
| Screen | -16% | 20% | -21% | |
| Brightness middle (cd/m²) | 318 | 240 -25% | 408 28% | 323 2% |
| Brightness (cd/m²) | 278 | 234 -16% | 375 35% | 310 12% |
| Brightness Distribution (%) | 81 | 93 15% | 87 7% | 88 9% |
| Black Level * (cd/m²) | 0.18 | 0.11 39% | 0.34 -89% | 0.22 -22% |
| Contrast (:1) | 1767 | 2182 23% | 1200 -32% | 1468 -17% |
| Colorchecker dE 2000 * | 2.91 | 4.98 -71% | 1.2 59% | 5 -72% |
| Colorchecker dE 2000 max. * | 6.11 | 10.75 -76% | 2.44 60% | 9.56 -56% |
| Colorchecker dE 2000 calibrated * | 2.91 | 3.33 -14% | 0.67 77% | |
| Greyscale dE 2000 * | 4.37 | 3.51 20% | 0.98 78% | 6.64 -52% |
| Gamma | 2.26 97% | 2.2 100% | 2.32 95% | 2.2 100% |
| CCT | 6448 101% | 6606 98% | 6485 100% | 6638 98% |
| Color Space (Percent of AdobeRGB 1998) (%) | 70 | 40 -43% | 62 -11% | 61 -13% |
| Color Space (Percent of sRGB) (%) | 93 | 62 -33% | 98 5% | 95 2% |
| Total Average (Program / Settings) | -15% /
-17% | 18% /
18% | -4% /
-13% |
* ... smaller is better
Our test device has an impressively low black value, which X-Rite i1Pro 2 determined at 0.18 cd/m², which helps the display achieve a respectable 1,767:1 contrast ratio. These values put the Inspiron 13 7386 second in our comparison table, but we should point out that our test unit suffers from noticeable backlight bleeding. We did not find this an issue in daily use, but we did notice it when using the device in a dark room or when we played a letterboxed video.
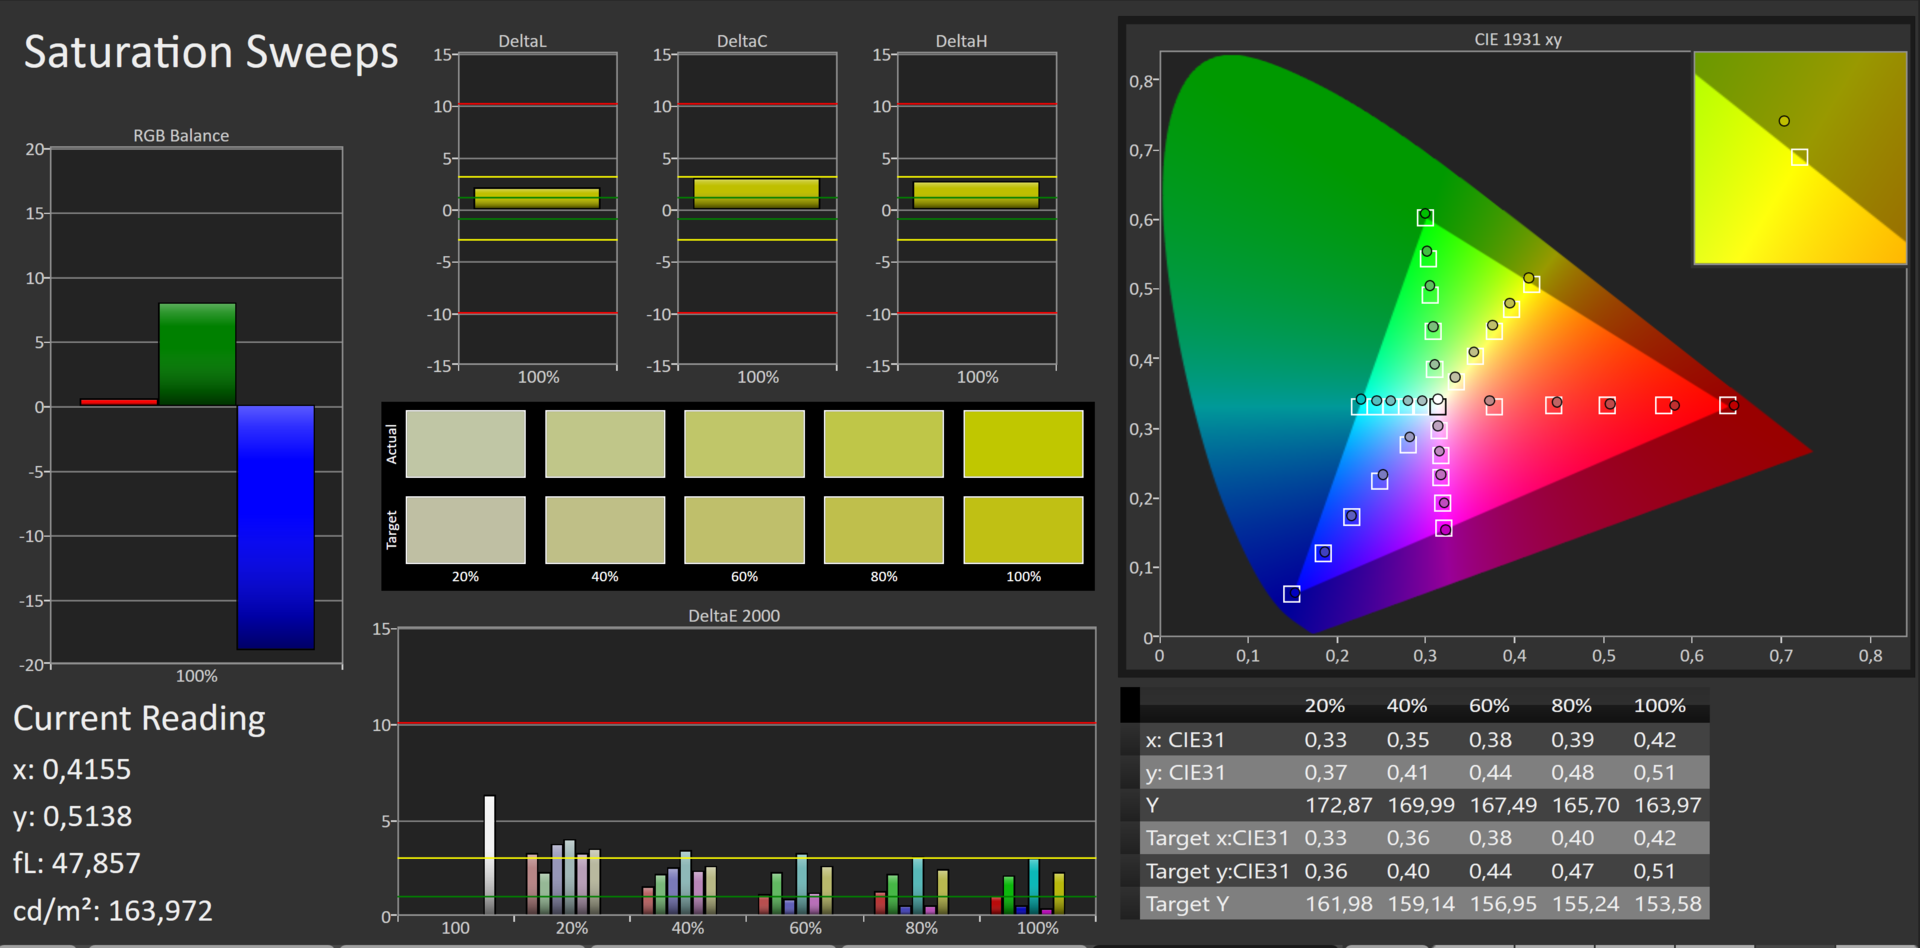
The Chi Mei CMN1385 display is reasonably colour accurate out of the box, but we would suggest that it falls short of being suitable for professional use. DeltaE deviations were close to the ideal value of 3 upon delivery, although we improved the display’s colour accuracy with further calibration. ColorChecker deviations dropped to below 3, but we could not improve greyscale inaccuracies. We have included our calibrated ICC profile in the box above our comparison table, but please only apply it to your device if it has the same Chi Mei CMN1385/133DCE panel like the one in our test unit. Applying the profile to a different display may have the opposite effect and worsen its colour accuracy.
The ProBook x360 440 G1 has a considerably more colour accurate display than the Inspiron 13 7386 and has a wider sRGB colour-space coverage too. Our test unit achieves 70% coverage of the AdobeRGB colour space though, which is over 10% more than our best comparison devices.


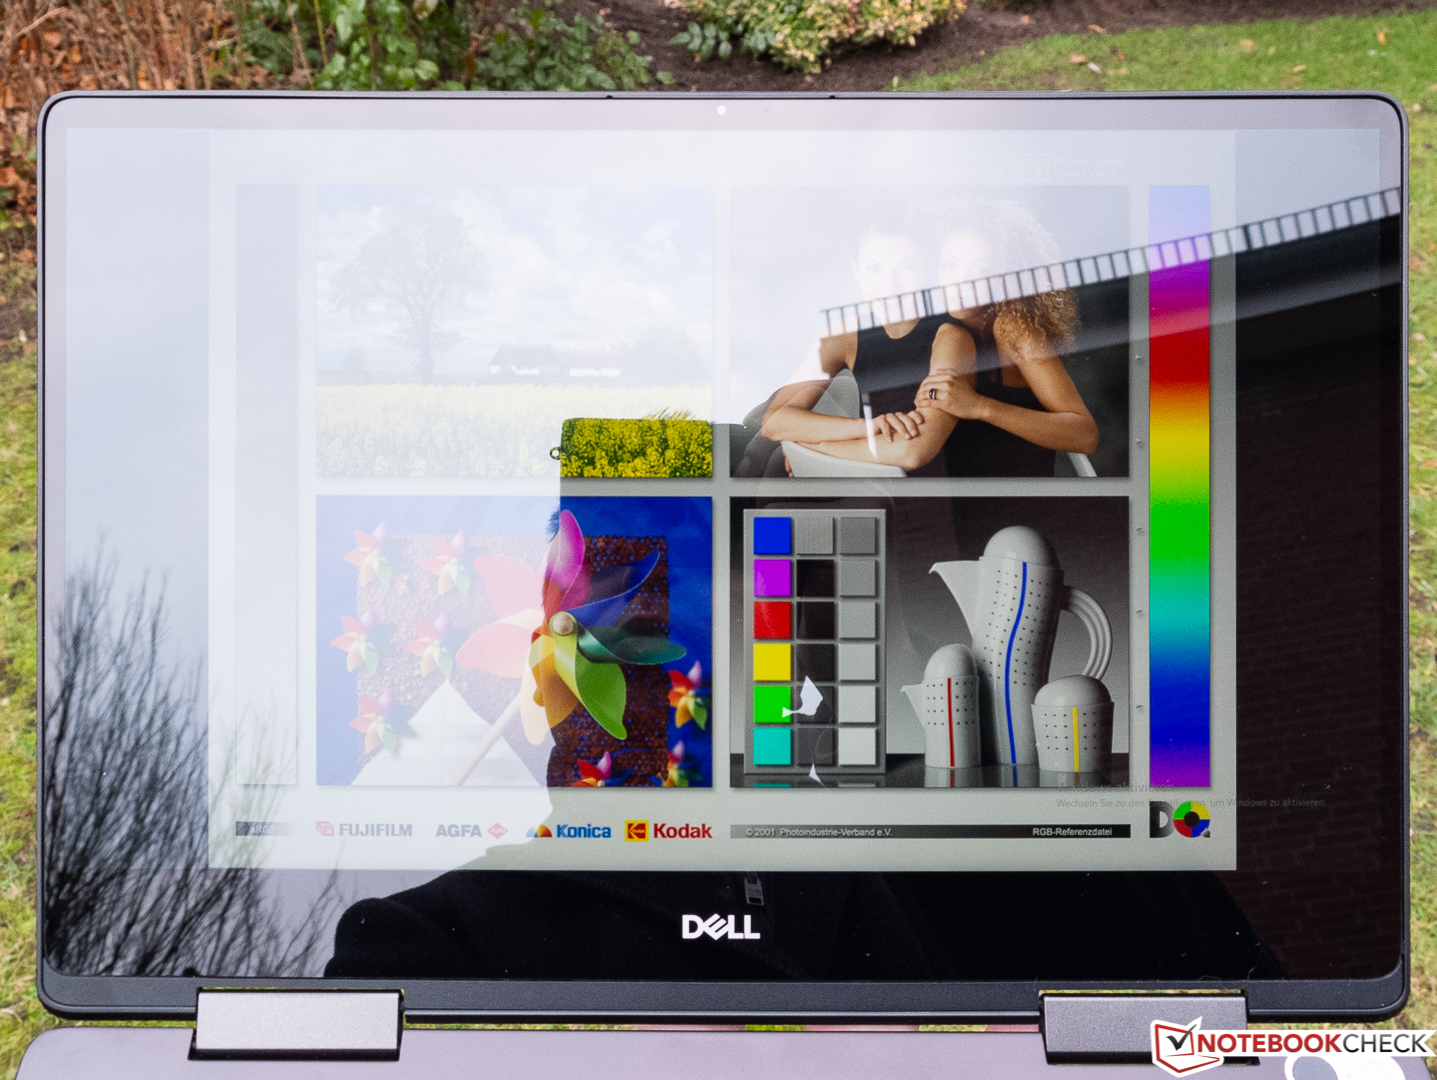
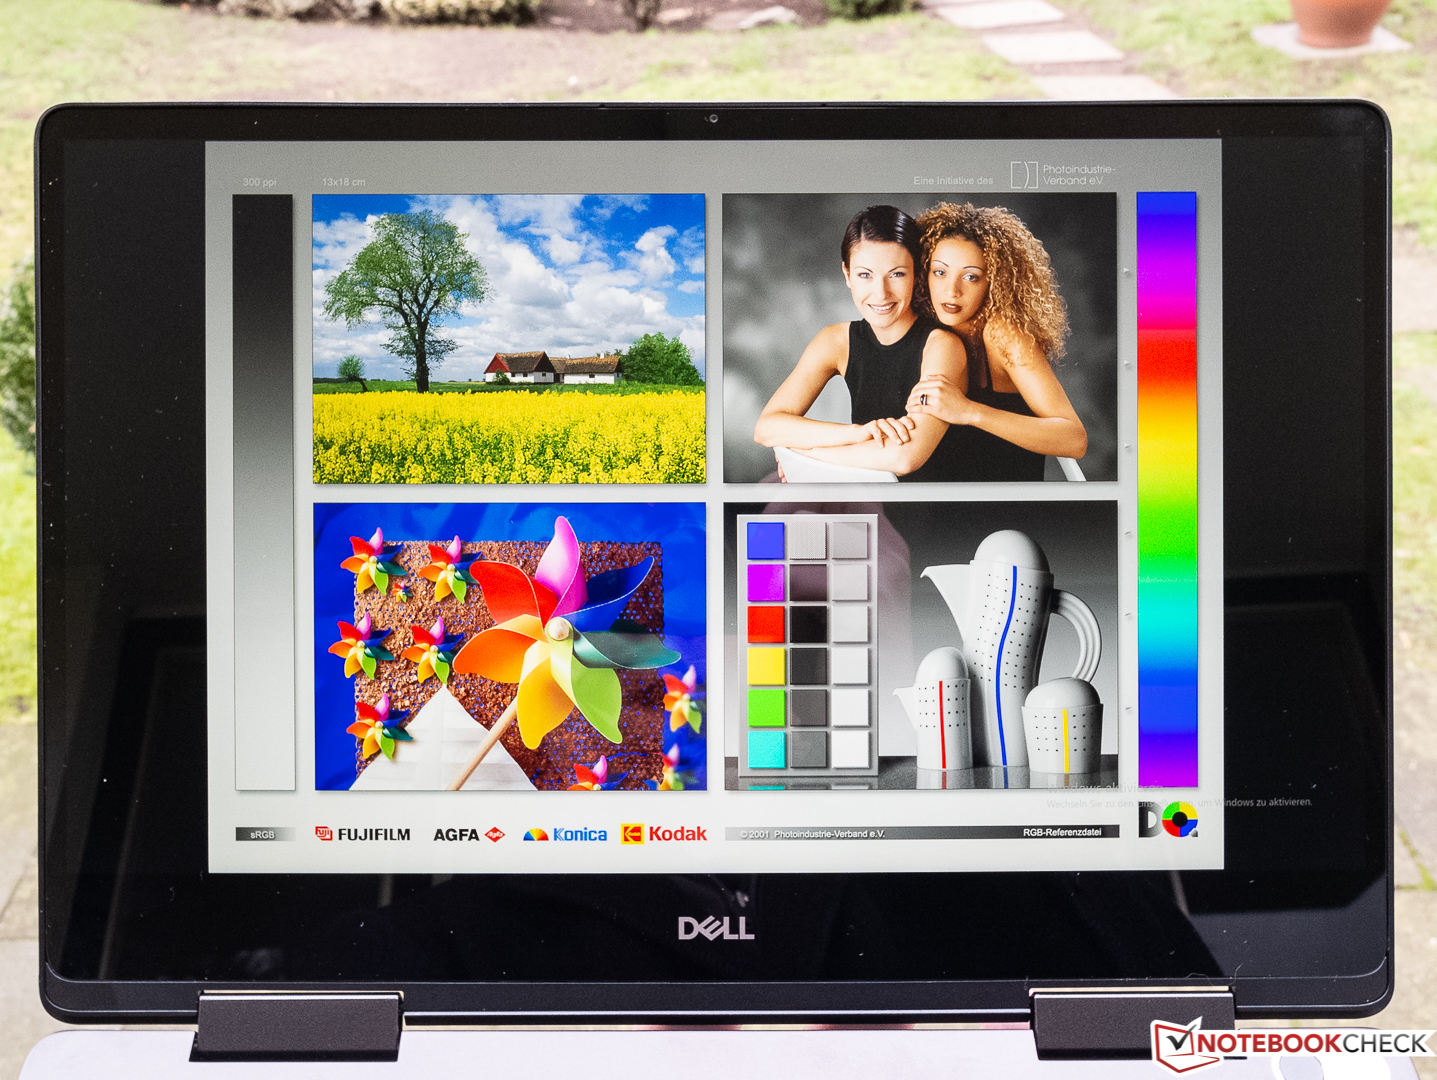
The Inspiron 13 7386 is difficult to use outdoors because of its reflective and dark display. The screen proved too reflective even on a winter’s day, as demonstrated by the first of the two photos to the right. The display is readable in the shade though, so we would recommend finding a darker spot if you must use the Inspiron 13 7386 outside on a sunny day.
Display Response Times
| ↔ Response Time Black to White | ||
|---|---|---|
| 30 ms ... rise ↗ and fall ↘ combined | ↗ 15 ms rise | 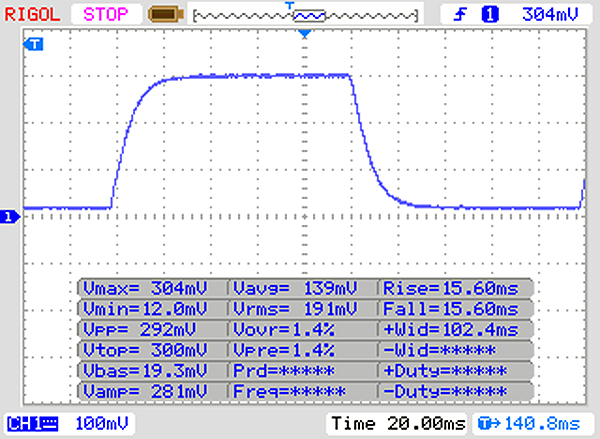 |
| ↘ 15 ms fall | ||
| The screen shows slow response rates in our tests and will be unsatisfactory for gamers. In comparison, all tested devices range from 0.1 (minimum) to 240 (maximum) ms. » 80 % of all devices are better. This means that the measured response time is worse than the average of all tested devices (19.8 ms). | ||
| ↔ Response Time 50% Grey to 80% Grey | ||
| 57 ms ... rise ↗ and fall ↘ combined | ↗ 27 ms rise | 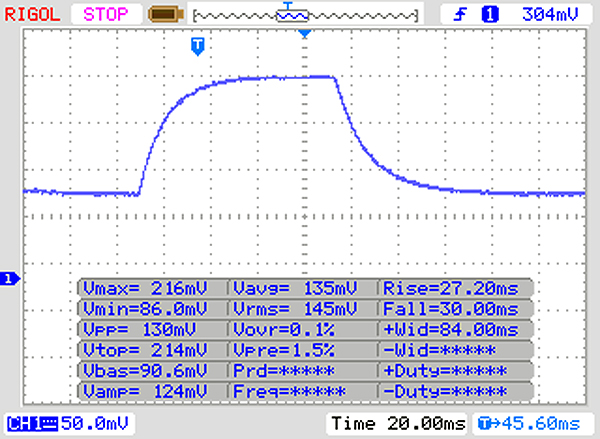 |
| ↘ 30 ms fall | ||
| The screen shows slow response rates in our tests and will be unsatisfactory for gamers. In comparison, all tested devices range from 0.165 (minimum) to 636 (maximum) ms. » 94 % of all devices are better. This means that the measured response time is worse than the average of all tested devices (31 ms). | ||
Screen Flickering / PWM (Pulse-Width Modulation)
| Screen flickering / PWM detected | 26000 Hz | ≤ 20 % brightness setting | 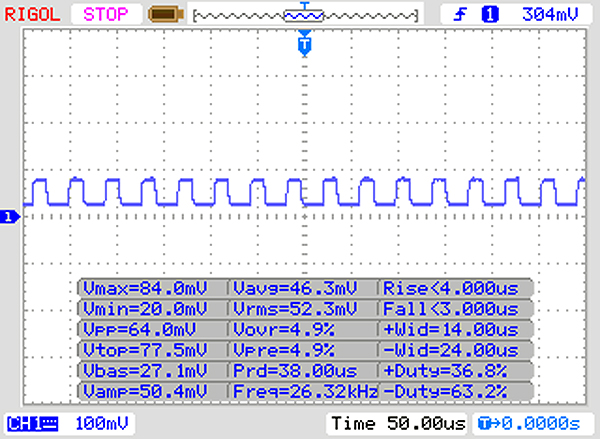 |
The display backlight flickers at 26000 Hz (worst case, e.g., utilizing PWM) Flickering detected at a brightness setting of 20 % and below. There should be no flickering or PWM above this brightness setting. The frequency of 26000 Hz is quite high, so most users sensitive to PWM should not notice any flickering. In comparison: 52 % of all tested devices do not use PWM to dim the display. If PWM was detected, an average of 7781 (minimum: 5 - maximum: 343500) Hz was measured. | |||
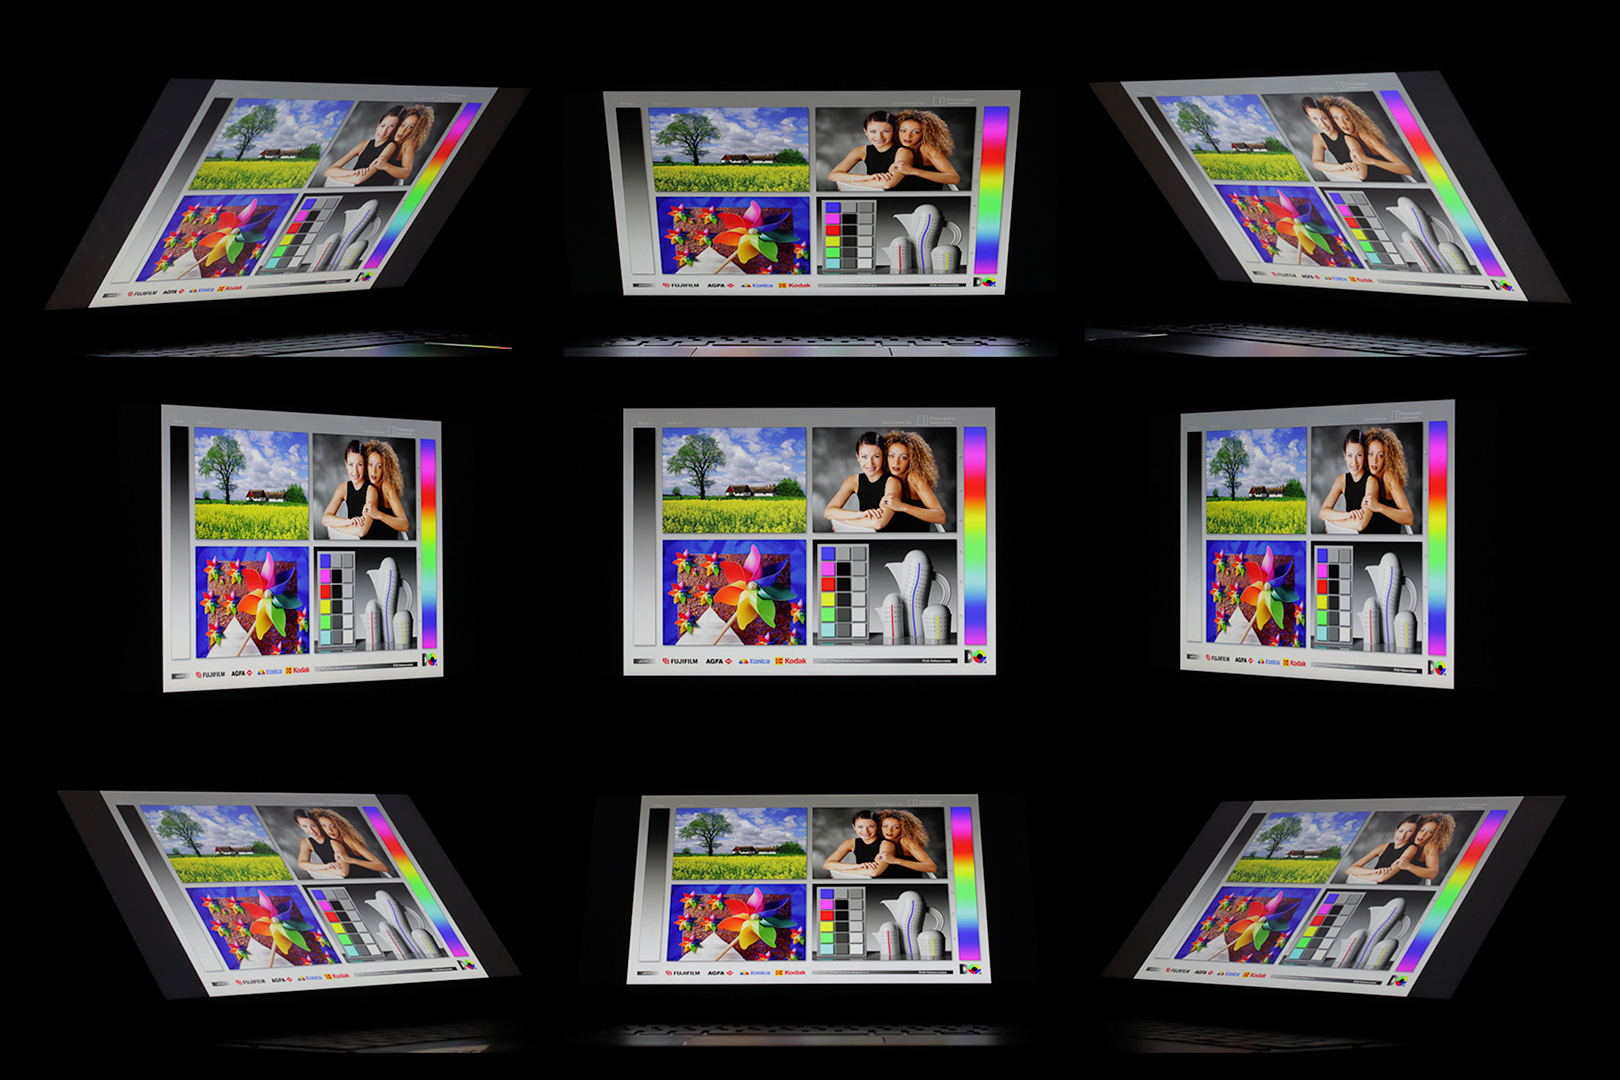
The Inspiron 13 7386 has good viewing angles, but we noticed drops in brightness and contrast when looking at our test device side-on from around 45 °. Vertical viewing angles are better though, and we noticed no colour distortions, which is good.
Performance
Dell has designed the Inspiron 13 7386 as a home-office convertible and as such it does not feature a dedicated GPU like the Nvidia GeForce MX150 that many OEMs have used in their multimedia laptops. This puts the Inspiron 13 7386 on par with our comparison devices though. Our test unit is powered by an Intel Core i7-8565U processor, which is more powerful on paper than the Core i5-8250U that our comparison devices are equipped with. The device also has 16 GB of RAM, which is double than what the two Lenovo convertibles have. In short, the Inspiron 13 7386 should be powerful enough for demanding tasks like video-rendering, but our benchmark results tell a different story, which we will discuss in the next section.
Processor
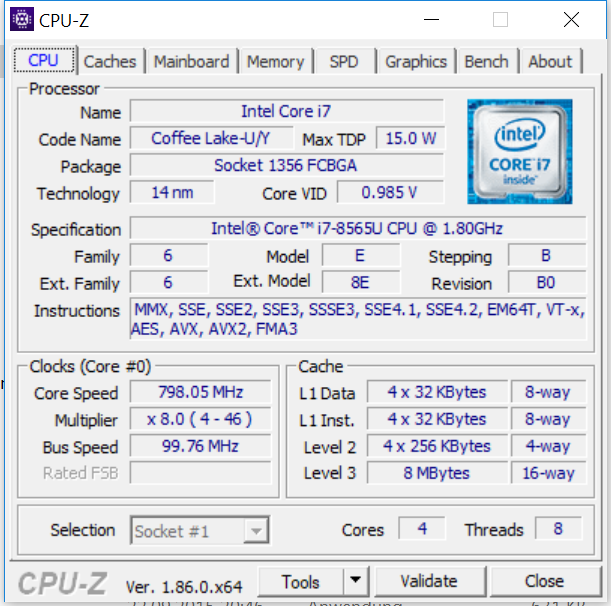
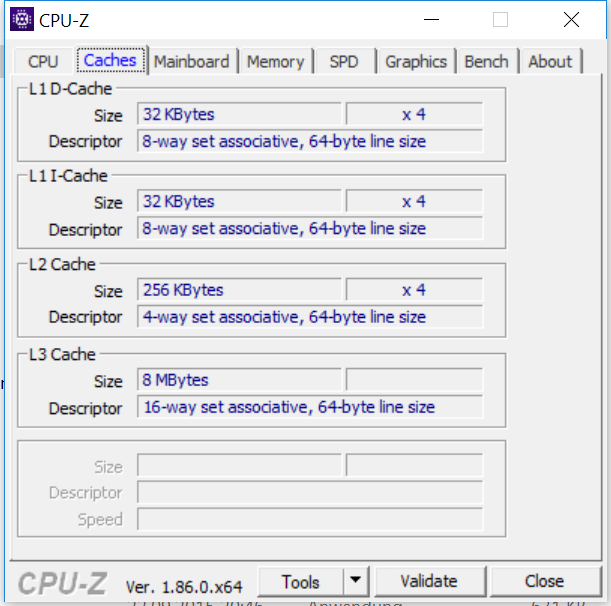
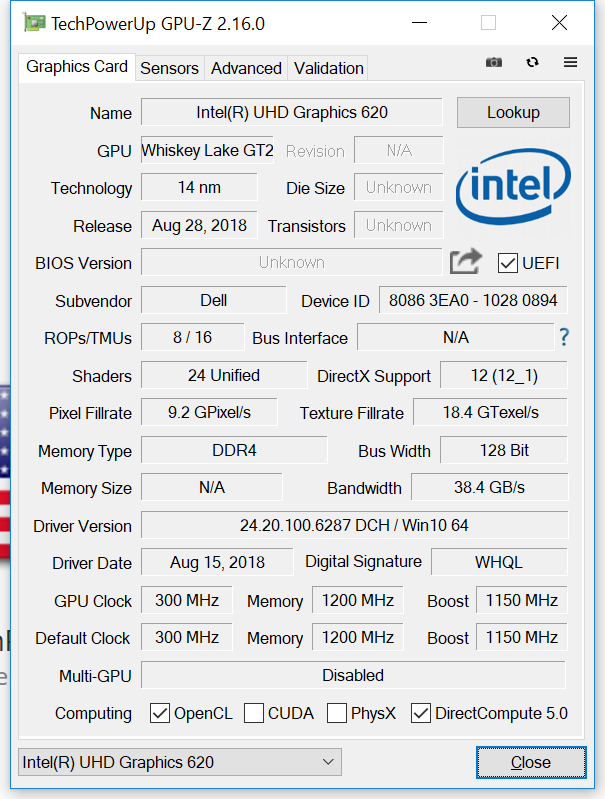
Intel introduced the Core i7-8565U in the third quarter of last year, and it is based on the company’s Whiskey Lake architecture. The CPU is a refinement of its predecessor, the Core i7-8550U, and it has a 1.8 GHz base clock speed across its four cores. The Core i7-8565U can clock up to 4.6 GHz when required thanks to Intel Turbo Boost technology and can execute up to 16 threads simultaneously with Intel Hyper-Threading technology. The CPU has a 15 W thermal design power (TDP) too, which briefly increases up to 25 W when its clock speed boosts to 4.6 GHz. The Core i7-8565U integrates an Intel UHD Graphics 620 GPU, with which it shares the same TDP and a DDR4 memory controller too.
Our test unit can hardly take advantage of its powerful CPU before thermal throttling. We subjected the Inspiron 13 7386 Black Edition to a looped Cinebench R15 multi-core benchmark to determine how it managed its CPU performance under sustained load. Most laptops eventually throttle their CPU clock speeds to prevent the system from overheating, but our test device does so in dramatic fashion. The Black Edition initially scored 555.24 points in CB R15, which is only just higher than the ProBook with its theoretically weaker Core i5-8250U processor. However, this score then plummeted to 465.9 points in the second benchmark pass through, which is almost a 20% loss in performance. The score dropped by a further 2 points in the next pass through before recovering to around 477 points. Our test device then throttled back to 458 points, after which it stabilised at 470/480 points.
In real terms, this means that the Black Edition performs worse than its cheaper and Core i5-8250U-powered competitors. Our test unit scored around 7% lower than our comparison devices by the end of our benchmark loop, which is disappointing. We would not discount the Inspiron 13 7386 entirely based on these results, but we would suggest considering the base model instead with its Core i5-8265U processor as it should not thermal throttle to the same extent and may even outperform its Core i7-8565U-powered siblings.
It should be noted that Dell limits performance when the Inspiron 13 7386 is running on battery. This is within reasonable limits though.
System Performance
We also subjected our test unit to PCMark 10 benchmarks and its three sub-benchmarks to determine its system performance. The Black Edition performed well in all three benchmarks, but it only outscored our comparison devices in the overall test and finished last in the Essentials benchmark. Moreover, our test device scored up to 31% lower than the average of Core i7-8565U-powered laptops that we have already tested.
Subjectively, our test unit felt snappy and loaded all programs and the OS quickly. Heavy multitasking is not a problem either thanks to its powerful CPU, its 16 GB of RAM and its fast SSD. Our comparison devices feel just as fast though even with their weaker processors and up to half the RAM that the Black Edition has.
Storage Devices
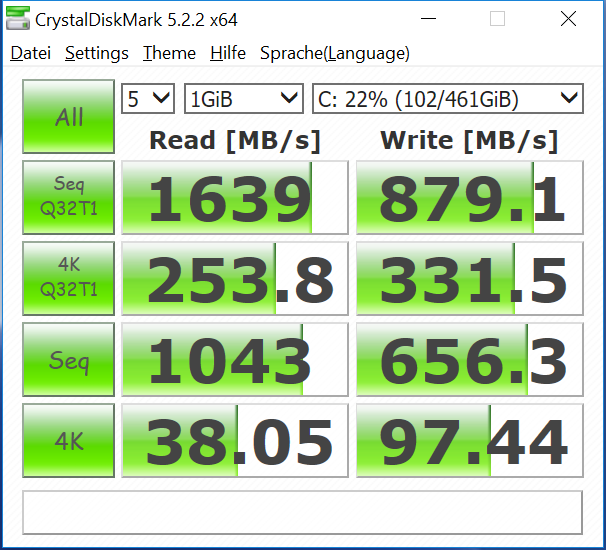
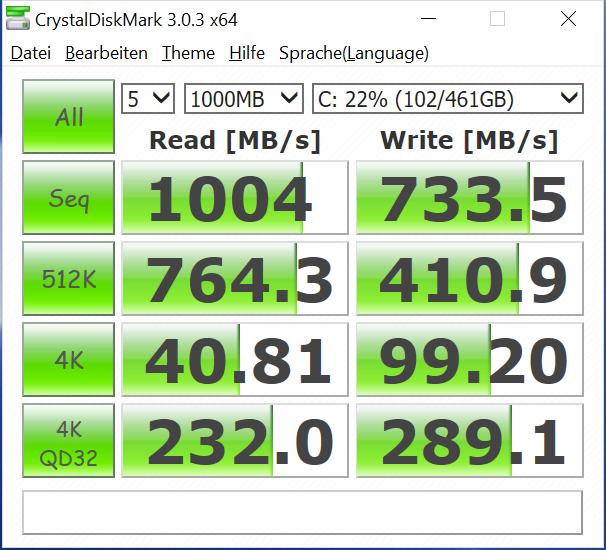
Dell has equipped our test device with a 512 GB PCIe SSD made by SK Hynix. The BC501 HFM512GDJTNG is an NVMe drive like the SSDs in our comparison devices, but it is considerably slower than the SK Hynix PC401 and the Samsung PM961 in the Yoga 530-14IKB and the ThinkPad L380 Yoga respectively, according to CrystalDiskMark 5.2/6. The BC501 achieved almost 40 MB/s in the 4K read benchmark though, which indicates that the drive should boot the OS and launch programs quickly.
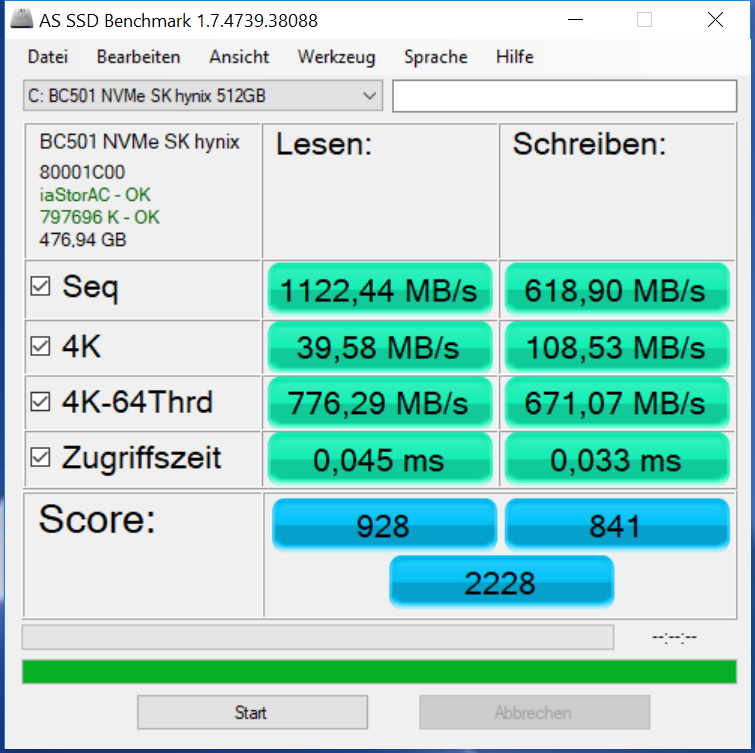
The BC501 performed better in AS SSD, especially in the “Score Write” benchmark. While the former test does not necessarily suggest how well a drive will perform in daily use, the BC501 finished second to the PM961 in the more indicative 4K Read and 4K Write tests. In short, our test device has a fast SSD, but there are faster drives available, especially one like the Samsung 970 Evo Plus.
| Dell Inspiron 13 7386 SK Hynix BC501 HFM512GDJTNG | Lenovo Yoga 530-14IKB-81EK00CWGE SK hynix PC401 HFS256GD9TNG | HP ProBook x360 440 G1 Toshiba KBG30ZMV256G | Lenovo ThinkPad L380 Yoga-20M7001BGE Samsung PM961 MZVLW256HEHP | Average SK Hynix BC501 HFM512GDJTNG | |
|---|---|---|---|---|---|
| CrystalDiskMark 5.2 / 6 | 23% | -8% | 55% | 5% | |
| Write 4K (MB/s) | 97.4 | 123.1 26% | 98.8 1% | 123.4 27% | 95.5 ? -2% |
| Read 4K (MB/s) | 38.05 | 43.24 14% | 44.32 16% | 42.24 11% | 38.3 ? 1% |
| Write Seq (MB/s) | 656 | 763 16% | 685 4% | 920 40% | 759 ? 16% |
| Read Seq (MB/s) | 1043 | 1632 56% | 665 -36% | 1991 91% | 1022 ? -2% |
| Write 4K Q32T1 (MB/s) | 331.5 | 268.6 -19% | 278 -16% | 531 60% | 303 ? -9% |
| Read 4K Q32T1 (MB/s) | 253.8 | 345.2 36% | 307.3 21% | 373.6 47% | 317 ? 25% |
| Write Seq Q32T1 (MB/s) | 879 | 800 -9% | 657 -25% | 1360 55% | 885 ? 1% |
| Read Seq Q32T1 (MB/s) | 1639 | 2620 60% | 1202 -27% | 3394 107% | 1803 ? 10% |
| Write 4K Q8T8 (MB/s) | 536 | 306 ? | |||
| Read 4K Q8T8 (MB/s) | 560 | 698 ? | |||
| AS SSD | -19% | -82% | 1% | -4% | |
| Seq Read (MB/s) | 1122 | 2071 85% | 1255 12% | 1609 43% | 1323 ? 18% |
| Seq Write (MB/s) | 619 | 721 16% | 625 1% | 859 39% | 697 ? 13% |
| 4K Read (MB/s) | 39.58 | 34.44 -13% | 42.09 6% | 49.34 25% | 40.4 ? 2% |
| 4K Write (MB/s) | 108.5 | 91 -16% | 96.1 -11% | 117 8% | 100.8 ? -7% |
| 4K-64 Read (MB/s) | 776 | 448.2 -42% | 624 -20% | 774 0% | 686 ? -12% |
| 4K-64 Write (MB/s) | 671 | 268.9 -60% | 298.3 -56% | 299.9 -55% | 660 ? -2% |
| Access Time Read * (ms) | 0.045 | 0.046 -2% | 0.122 -171% | 0.049 -9% | 0.06071 ? -35% |
| Access Time Write * (ms) | 0.033 | 0.054 -64% | 0.224 -579% | 0.031 6% | 0.037 ? -12% |
| Score Read (Points) | 928 | 690 -26% | 791 -15% | 984 6% | 858 ? -8% |
| Score Write (Points) | 841 | 432 -49% | 457 -46% | 503 -40% | 830 ? -1% |
| Score Total (Points) | 2228 | 1416 -36% | 1634 -27% | 1966 -12% | 2107 ? -5% |
| Total Average (Program / Settings) | 2% /
-1% | -45% /
-51% | 28% /
24% | 1% /
-0% |
* ... smaller is better

Graphics Card
The Intel UHD Graphics 620 handles graphics on the Inspiron 13 7386 and is effectively a rebranding of its predecessor, the Intel HD Graphics 620. The UHD Graphics 620 has a base clock speed of 300 MHz that can boost up to 1,150 MHz. The GPU handles 2D tasks easily, but it is not powerful enough for modern and demanding 3D games. The GPU benefits from our test unit’s dual-channel RAM too.
3DMark benchmark results look encouraging but keep in mind that all our comparison devices are powered by the nominally weaker Core i5-8250U that integrates the same GPU as the Core i7-8565U. The Inspiron 13 7386 also only beats the ProBook x360 440 G1 by a few percent in both benchmarks, which underlines how ineffectively out test unit utilises its CPU and GPU.
| 3DMark 11 Performance | 2073 points | |
| 3DMark Cloud Gate Standard Score | 8917 points | |
| 3DMark Fire Strike Score | 1218 points | |
Help | ||
Gaming Performance
Older games like BioShock Infinite are playable on the UHD Graphics 620, but only in 720p at minimum graphics. Our test device averages just less than 40 FPS when the resolution is set to 1366x768, but these frame rates are only just playable in our opinion. The Black Edition trades blows with the ProBook x360 440 G1 in our comparison table and is generally well ahead of our two Lenovo comparison devices. We also tested newer games like Rainbow Six Siege and Farming Simulator 19, and both were playable in 720p minimum graphics. In short, you can enjoy some light gaming on the Inspiron 13 7386, but it cannot compete with a multimedia or gaming laptop and their dedicated GPUs.
| Rainbow Six Siege | |
| 1024x768 Low Preset AA:T AF:Linear | |
| Dell Inspiron 13 7386 | |
| Average Intel UHD Graphics 620 (28.2 - 48.4, n=5) | |
| 1366x768 Medium Preset AA:T AF:2x | |
| Dell Inspiron 13 7386 | |
| Average Intel UHD Graphics 620 (16.1 - 29.4, n=5) | |
| 1920x1080 High Preset AA:T AF:4x | |
| Dell Inspiron 13 7386 | |
| Average Intel UHD Graphics 620 (14.5 - 16.2, n=2) | |
| Farming Simulator 19 | |
| 1280x720 Low Preset | |
| Dell Inspiron 13 7386 | |
| Average Intel UHD Graphics 620 (46.8 - 67.7, n=5) | |
| 1920x1080 Medium Preset | |
| Dell Inspiron 13 7386 | |
| Average Intel UHD Graphics 620 (17.4 - 60.9, n=5) | |
| 1920x1080 Very High Preset | |
| Dell Inspiron 13 7386 | |
| Average Intel UHD Graphics 620 (n=1) | |
| low | med. | high | ultra | |
|---|---|---|---|---|
| BioShock Infinite (2013) | 80.3 | 37.5 | 34.5 | 10.5 |
| Rainbow Six Siege (2015) | 47.1 | 29.4 | 16.2 | |
| Farming Simulator 19 (2018) | 67.7 | 60.9 | 25.2 | 12.9 |
Emissions
Fan Noise
Initially, we thought that our test unit had a hyperactive fan that liked to spin up for no apparent reason. The fan settled down during our tests, but it still occasionally acts erratically. The fan is usually silent when the system is idling, but it switches on during short bursts of CPU and GPU usage, like during the Kraken JavaScript v1.1 benchmark. However, it also did not spin up when we ran the same benchmark a further two times, although it would turn on after around 15/30 seconds of starting a Prime95 benchmark, so we are none the wiser about our test unit’s fan behaviour.
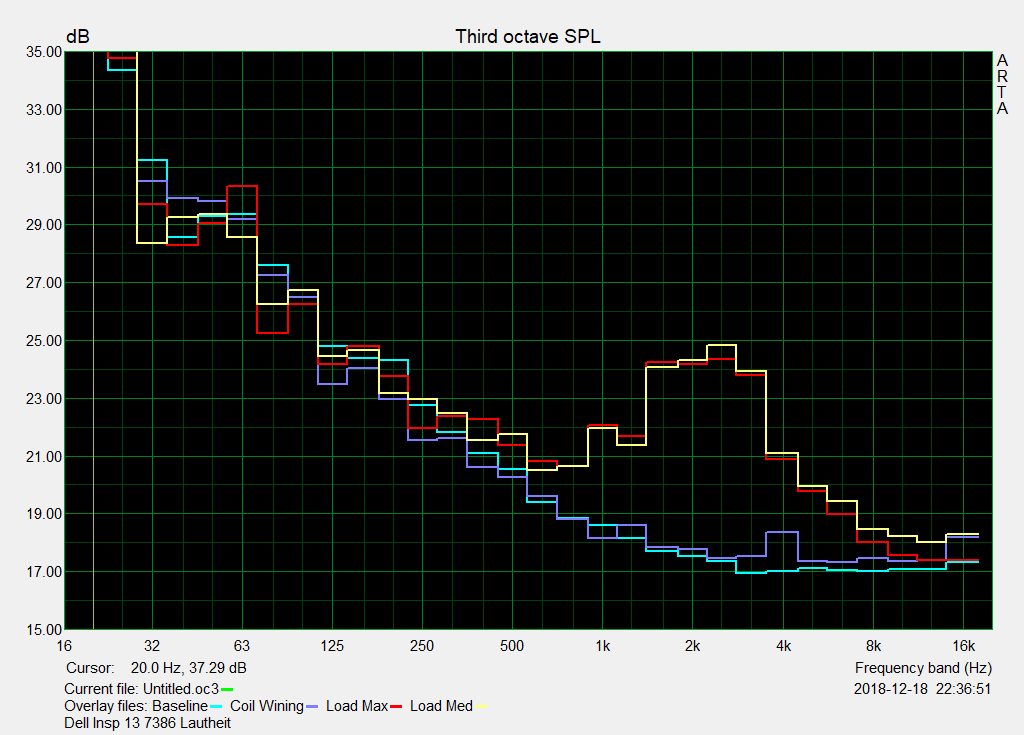
The fan reaches a maximum of 30.4 dB(A) at idle and 34.2 dB(A) under sustained load. The fan sounds relatively quiet even when the system is pushed hard, but unfortunately our test unit suffers from coil whine. The high-frequency whining is noticeable in daily use, which is why we have marked the Inspiron 13 7386 Black Edition down in this section.
Noise level
| Idle |
| 30.4 / 30.4 / 30.4 dB(A) |
| Load |
| 34.3 / 34.2 dB(A) |
 | ||
30 dB silent 40 dB(A) audible 50 dB(A) loud |
||
min: | ||
Temperature
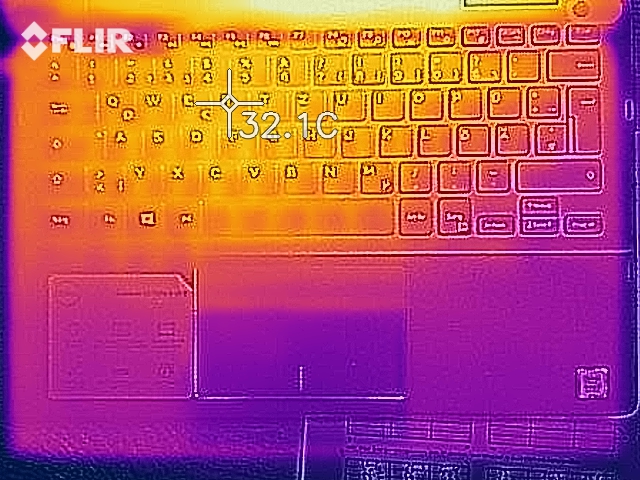
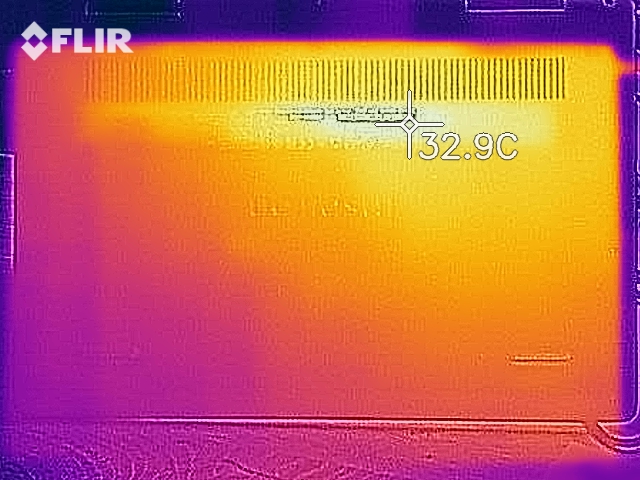
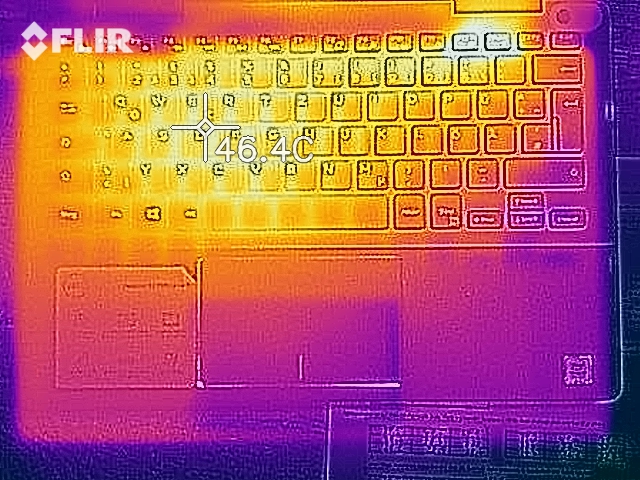
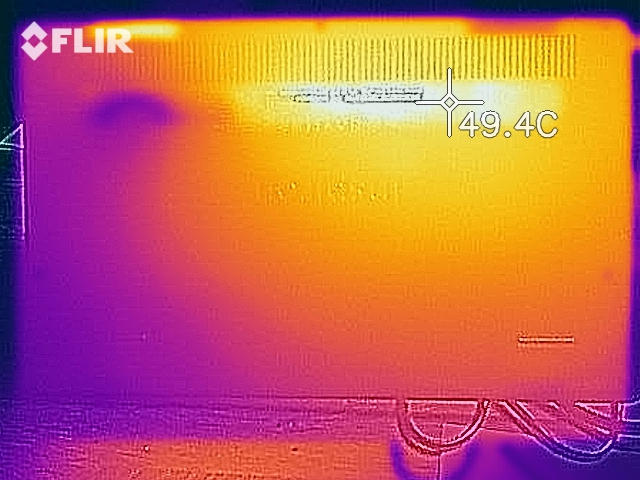
Our test unit manages its surface temperatures well at idle and only reaches a maximum of 26.3 °C. However, the area around the fan vent on the underside of the device heats up to 41.6 °C under sustained load. The palm rest remains a pleasantly cool sub-30°C though, so the device should remain usable even if you are pushing it hard.
We also subjected our test unit to an hour-long combined FurMark and Prime95 stress test. After launching Prime95 the CPU maintained 2.0/2.1 GHz, but it then downclocked to 1.3 GHz when we started FurMark. The CPU did boost back up to 1.6 GHz, although it settled at around 1.4 GHz by the end of the stress test with occasional dips down to 1.1 GHz. The GPU also fluctuated between 800 and 900 MHz, which is much closer to its peak clock speed.
Both the CPU and GPU core temperatures reached an almost critical 97 °C at the beginning of the stress test, which caused our test unit to thermal throttle heavily as it did during our looped CB R15 benchmark. The system then stabilised at around 67 °C for the remainder of the stress test, but it could not recover to its CPU base clock speed.
(±) The maximum temperature on the upper side is 40.5 °C / 105 F, compared to the average of 35.4 °C / 96 F, ranging from 19.6 to 60 °C for the class Convertible.
(±) The bottom heats up to a maximum of 41.6 °C / 107 F, compared to the average of 36.9 °C / 98 F
(+) In idle usage, the average temperature for the upper side is 24.8 °C / 77 F, compared to the device average of 30.3 °C / 87 F.
(+) The palmrests and touchpad are cooler than skin temperature with a maximum of 29.6 °C / 85.3 F and are therefore cool to the touch.
(±) The average temperature of the palmrest area of similar devices was 28 °C / 82.4 F (-1.6 °C / -2.9 F).
Speakers
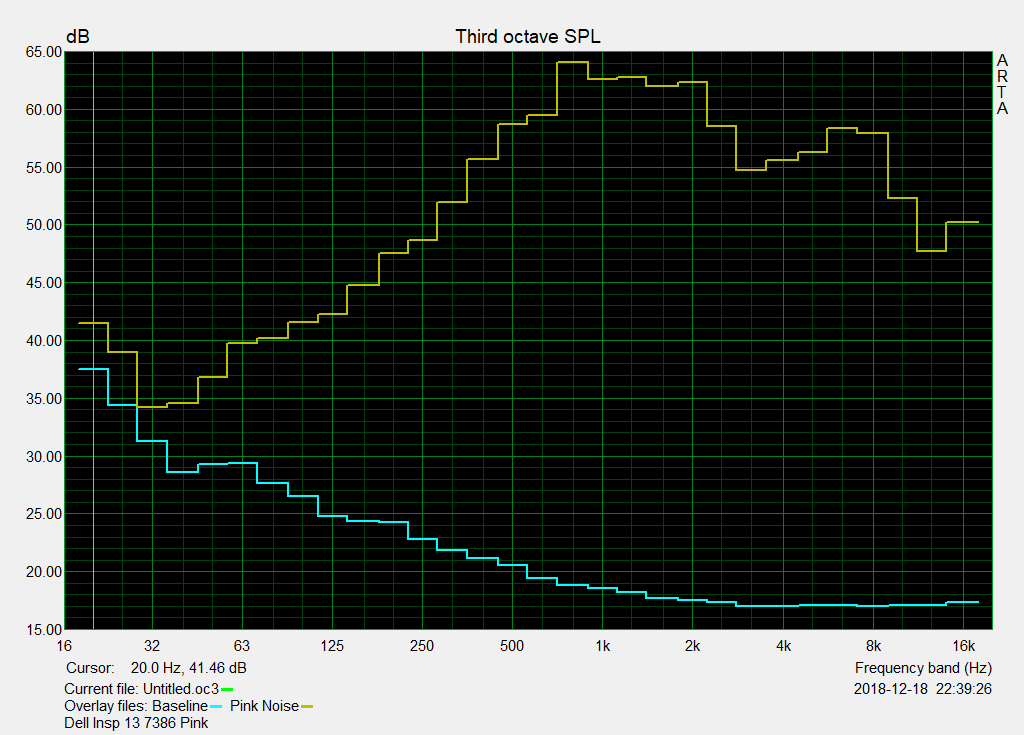
The Inspiron 13 7386 has stereo speakers on the underside of its case. The speakers are decent by laptop standards. We did not notice any distortions or volume fluctuations, which are things from which some laptops suffer. Overall, the speakers produce natural-sounding audio without any tinniness. There is some noticeable audio compression though and a lack of bass, although the latter is a common shortcoming of most laptops. In short, the speakers are good enough for listening to music, watching videos or playing games without needing to reach for headphones.
Dell Inspiron 13 7386 audio analysis
(-) | not very loud speakers (64.1 dB)
Bass 100 - 315 Hz
(±) | reduced bass - on average 9.5% lower than median
(+) | bass is linear (5.3% delta to prev. frequency)
Mids 400 - 2000 Hz
(±) | higher mids - on average 5.3% higher than median
(+) | mids are linear (5% delta to prev. frequency)
Highs 2 - 16 kHz
(+) | balanced highs - only 1.8% away from median
(+) | highs are linear (6.6% delta to prev. frequency)
Overall 100 - 16.000 Hz
(±) | linearity of overall sound is average (18.1% difference to median)
Compared to same class
» 39% of all tested devices in this class were better, 7% similar, 54% worse
» The best had a delta of 6%, average was 20%, worst was 57%
Compared to all devices tested
» 38% of all tested devices were better, 8% similar, 54% worse
» The best had a delta of 4%, average was 24%, worst was 134%
Lenovo Yoga 530-14IKB-81EK00CWGE audio analysis
(-) | not very loud speakers (69.9 dB)
Bass 100 - 315 Hz
(-) | nearly no bass - on average 23.6% lower than median
(±) | linearity of bass is average (13.4% delta to prev. frequency)
Mids 400 - 2000 Hz
(+) | balanced mids - only 3.5% away from median
(±) | linearity of mids is average (8.7% delta to prev. frequency)
Highs 2 - 16 kHz
(+) | balanced highs - only 2.6% away from median
(±) | linearity of highs is average (7.2% delta to prev. frequency)
Overall 100 - 16.000 Hz
(±) | linearity of overall sound is average (21.2% difference to median)
Compared to same class
» 57% of all tested devices in this class were better, 11% similar, 32% worse
» The best had a delta of 6%, average was 20%, worst was 57%
Compared to all devices tested
» 59% of all tested devices were better, 7% similar, 34% worse
» The best had a delta of 4%, average was 24%, worst was 134%
HP ProBook x360 440 G1 audio analysis
(±) | speaker loudness is average but good (73.3 dB)
Bass 100 - 315 Hz
(-) | nearly no bass - on average 26.8% lower than median
(±) | linearity of bass is average (8.9% delta to prev. frequency)
Mids 400 - 2000 Hz
(+) | balanced mids - only 3.7% away from median
(±) | linearity of mids is average (7.5% delta to prev. frequency)
Highs 2 - 16 kHz
(±) | higher highs - on average 5.6% higher than median
(±) | linearity of highs is average (7.1% delta to prev. frequency)
Overall 100 - 16.000 Hz
(±) | linearity of overall sound is average (24.6% difference to median)
Compared to same class
» 74% of all tested devices in this class were better, 6% similar, 19% worse
» The best had a delta of 6%, average was 20%, worst was 57%
Compared to all devices tested
» 75% of all tested devices were better, 5% similar, 20% worse
» The best had a delta of 4%, average was 24%, worst was 134%
Lenovo ThinkPad L380 Yoga-20M7001BGE audio analysis
(-) | not very loud speakers (66.7 dB)
Bass 100 - 315 Hz
(-) | nearly no bass - on average 17.5% lower than median
(±) | linearity of bass is average (13.8% delta to prev. frequency)
Mids 400 - 2000 Hz
(+) | balanced mids - only 2.9% away from median
(+) | mids are linear (5.1% delta to prev. frequency)
Highs 2 - 16 kHz
(+) | balanced highs - only 2.4% away from median
(±) | linearity of highs is average (8.7% delta to prev. frequency)
Overall 100 - 16.000 Hz
(±) | linearity of overall sound is average (17.3% difference to median)
Compared to same class
» 33% of all tested devices in this class were better, 8% similar, 59% worse
» The best had a delta of 6%, average was 20%, worst was 57%
Compared to all devices tested
» 32% of all tested devices were better, 8% similar, 59% worse
» The best had a delta of 4%, average was 24%, worst was 134%
Power Management
Power Consumption
The Inspiron 13 7386 Black Edition consumes considerably more power than our comparison devices and the class average. Our test unit consumes a minimum of 6.5 W and 12.2 W at idle, which is almost double the power consumption of our two Lenovo comparison devices. The Dell consumes slightly more than the ProBook x360 440 G1 under load too, but the Inspiron 13 7386 consumes up to 29% more than our Lenovo comparison devices.
We suspect that the increased power consumption is because of our test device’s higher resolution display and its more powerful processor. The 45 W power supply that Dell includes in the box will become overwhelmed if you push the device hard though.
| Off / Standby | |
| Idle | |
| Load |
|
Key:
min: | |
| Dell Inspiron 13 7386 i7-8565U, UHD Graphics 620, SK Hynix BC501 HFM512GDJTNG, IPS, 3840x2160, 13.3" | Lenovo Yoga 530-14IKB-81EK00CWGE i5-8250U, UHD Graphics 620, SK hynix PC401 HFS256GD9TNG, IPS, 1920x1080, 14" | HP ProBook x360 440 G1 i5-8250U, UHD Graphics 620, Toshiba KBG30ZMV256G, IPS, 1920x1080, 14" | Lenovo ThinkPad L380 Yoga-20M7001BGE i5-8250U, UHD Graphics 620, Samsung PM961 MZVLW256HEHP, IPS LED, 1920x1080, 13.3" | Average Intel UHD Graphics 620 | Average of class Convertible | |
|---|---|---|---|---|---|---|
| Power Consumption | 37% | 20% | 35% | 21% | 5% | |
| Idle Minimum * (Watt) | 6.5 | 3.3 49% | 4.6 29% | 3.44 47% | 3.81 ? 41% | 4.24 ? 35% |
| Idle Average * (Watt) | 12.2 | 5.8 52% | 7.5 39% | 6.9 43% | 6.94 ? 43% | 7.03 ? 42% |
| Idle Maximum * (Watt) | 12.7 | 8 37% | 9.6 24% | 9.2 28% | 8.75 ? 31% | 8.61 ? 32% |
| Load Average * (Watt) | 39 | 29.2 25% | 37 5% | 27.6 29% | 35 ? 10% | 43.9 ? -13% |
| Load Maximum * (Watt) | 39 | 31.1 20% | 38.8 1% | 29 26% | 47.5 ? -22% | 67.2 ? -72% |
* ... smaller is better
Battery Life
The Inspiron 13 7386 has a 38 Wh battery, which is between 7 and 10 Wh smaller than the batteries in our comparison devices. The reduced battery capacity and increased power consumption results in comparatively poor battery life. Our test unit lasted less than 4 hours in our practical Wi-Fi battery test and only 6:42 hours in our idle test. By contrast, our comparison devices achieve between 51% and 158% longer runtimes than our test device, which underlines how bad the Inspiron 13 7386 Black Edition’s battery life is. This alone makes it impossible for us to recommend our test device.
| Dell Inspiron 13 7386 i7-8565U, UHD Graphics 620, 38 Wh | Lenovo Yoga 530-14IKB-81EK00CWGE i5-8250U, UHD Graphics 620, 45 Wh | HP ProBook x360 440 G1 i5-8250U, UHD Graphics 620, 48 Wh | Lenovo ThinkPad L380 Yoga-20M7001BGE i5-8250U, UHD Graphics 620, 45 Wh | Average of class Convertible | |
|---|---|---|---|---|---|
| Battery runtime | 73% | 104% | 64% | 180% | |
| Reader / Idle (h) | 6.7 | 15.3 128% | 17.3 158% | 13.9 107% | 27.7 ? 313% |
| H.264 (h) | 5.5 | 9.1 65% | 8.3 51% | 8.5 55% | 15.3 ? 178% |
| WiFi v1.3 (h) | 3.9 | 7 79% | 8.9 128% | 7 79% | 12.1 ? 210% |
| Load (h) | 1.5 | 1.8 20% | 2.7 80% | 1.7 13% | 1.779 ? 19% |
Verdict
Pros
Cons
The Dell Inspiron 13 7386 2-in-1 Black Edition is a good laptop on paper. It packs in a powerful processor, plenty of RAM and a large SSD. Moreover, the convertible has a higher resolution display than our comparison devices, and its aluminium case looks premium.
Unfortunately, it all started to unravel when we put our review unit through our tests. The Core i7-8565U performs worse than the Core i5-8250U in our comparison devices, its SSD is not particularly fast, and its UHD display is not worth the additional $200 that Dell is currently charging for it compared to the FHD alternative. The case is a fingerprint magnet too, and the battery life is atrocious.
The Dell Inspiron 13 7386 2-in-1 Black Edition has the potential to be a fantastic convertible, but it is let down by its underwhelming battery life, its high power consumption, and its lacklustre performance.
To Dell’s credit, the 7386 is well-made, and it has solid input devices. The display is colour accurate too, although only enough for non-professional image work. The speakers pleasantly surprised us too, as they are impressive by laptop standards. There are also numerous configurations options to alter the device as you see fit.
Please keep in mind that some of our cons are specific to our test device, like the left mouse button not working. If you like the Inspiron 13 7000 2-in-1 series, then we would recommend considering the 7386 base model instead. It's better value for money, its Core i5-8265U processor will not thermal throttle as heavily, it should have longer battery life, and its FHD display should help reduce power consumption too.
Dell Inspiron 13 7386
- 01/22/2019 v6 (old)
Sven Kloevekorn
Price comparison

