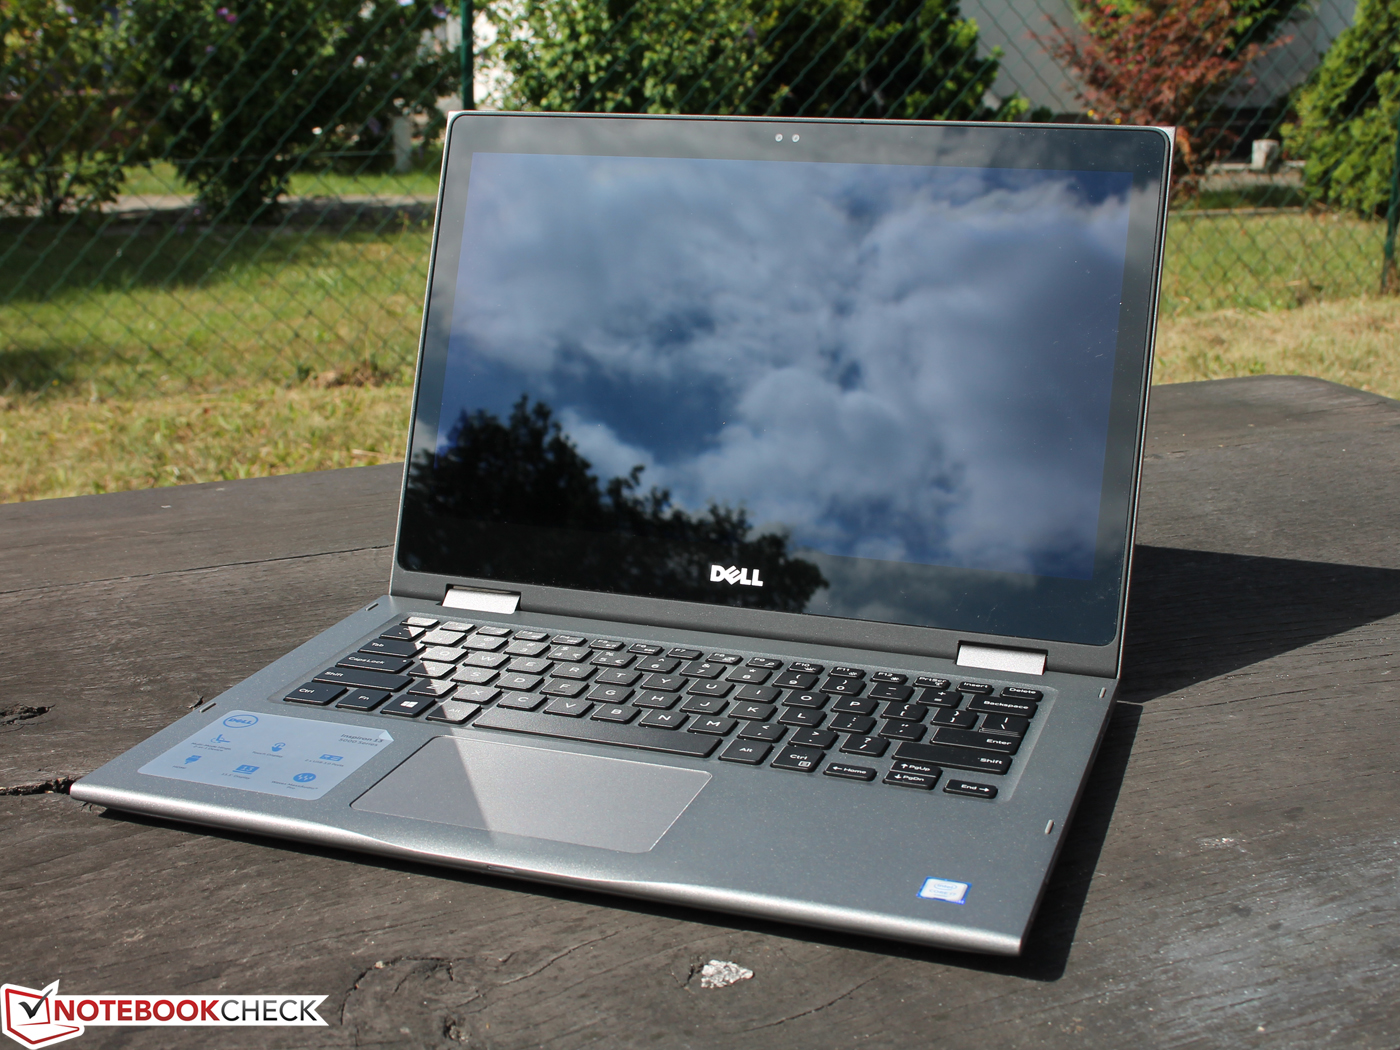
Dell Inspiron 13 5379 (i5-8250U, UHD 620) Convertible Review
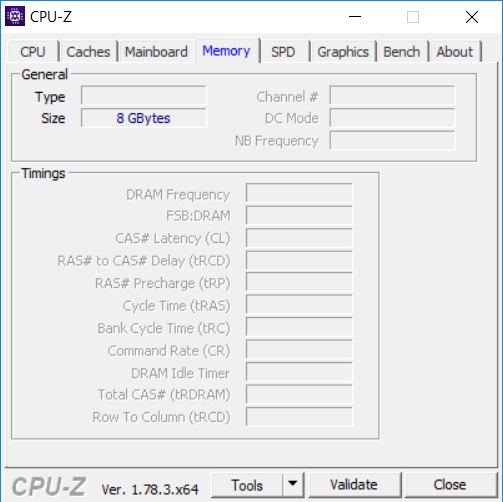
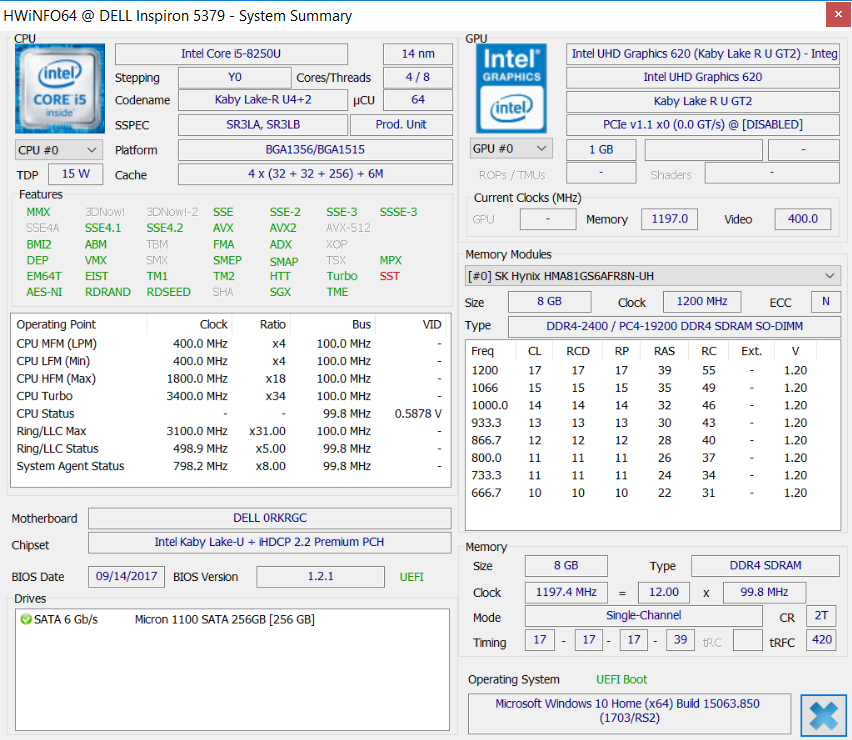
Our test device comes with an Intel Core-i5 8250U, Intel UHD Graphics 620, 8GB of RAM, and a 256 GB SSD. The Inspiron 13 5379 has a 1,920 x 1,080 touch enabled display too. Dell varies its pricing not only according to hardware, but also to what version of Windows 10 is chosen. Our test device came with Windows 10 Home pre-installed, but it is worth noting that for an additional charge Windows 10 Pro is available too.
We compare the Inspiron 13 5379 with similarly equipped devices and with its predecessor that comes with an i7-6500U processor. Our comparison devices are the Acer Spin 5 and the Lenovo Miix 520-12IKB, which are also equipped with an Intel Core i5-8250U.
We have also included a Yoga 720-13IKB in our comparison as it has a processor that is available for the Inspiron 13 5379 too.
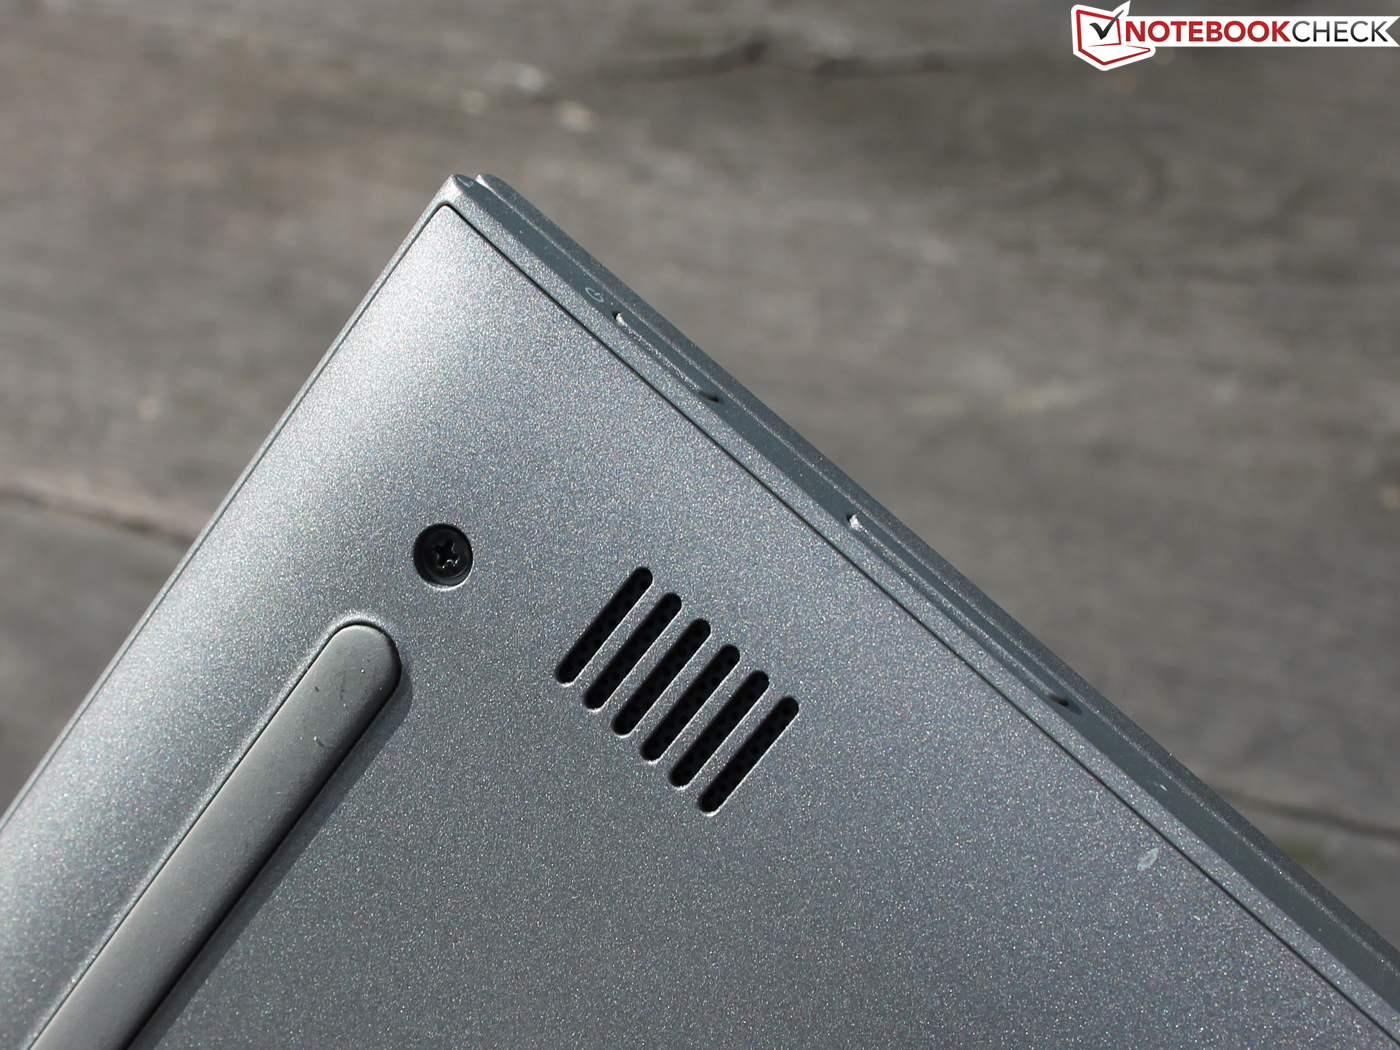
Case
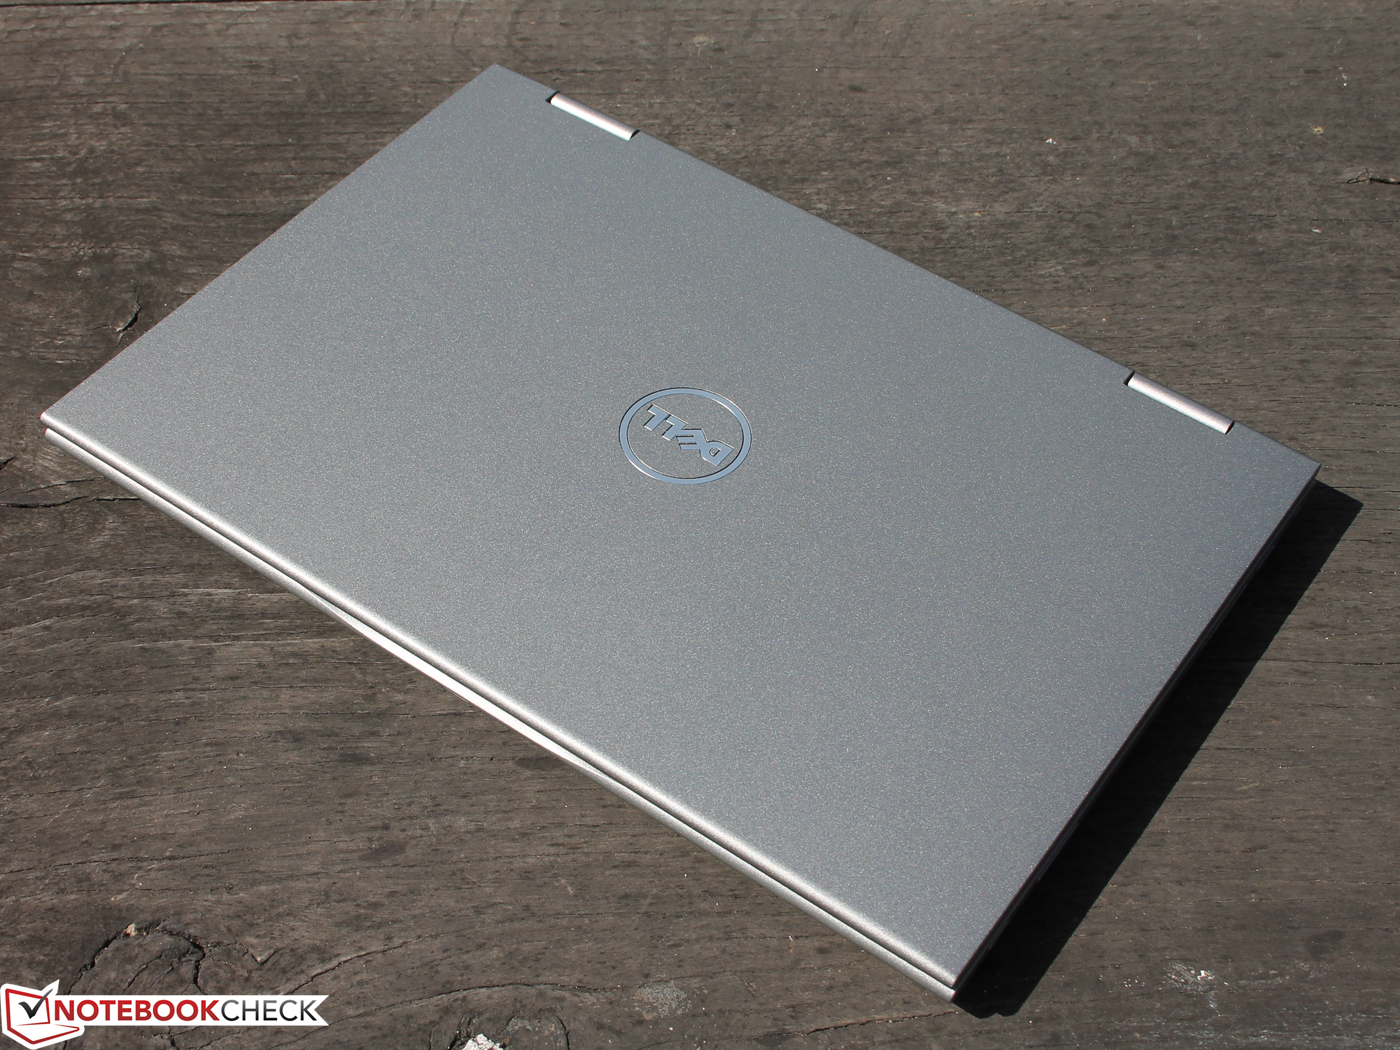
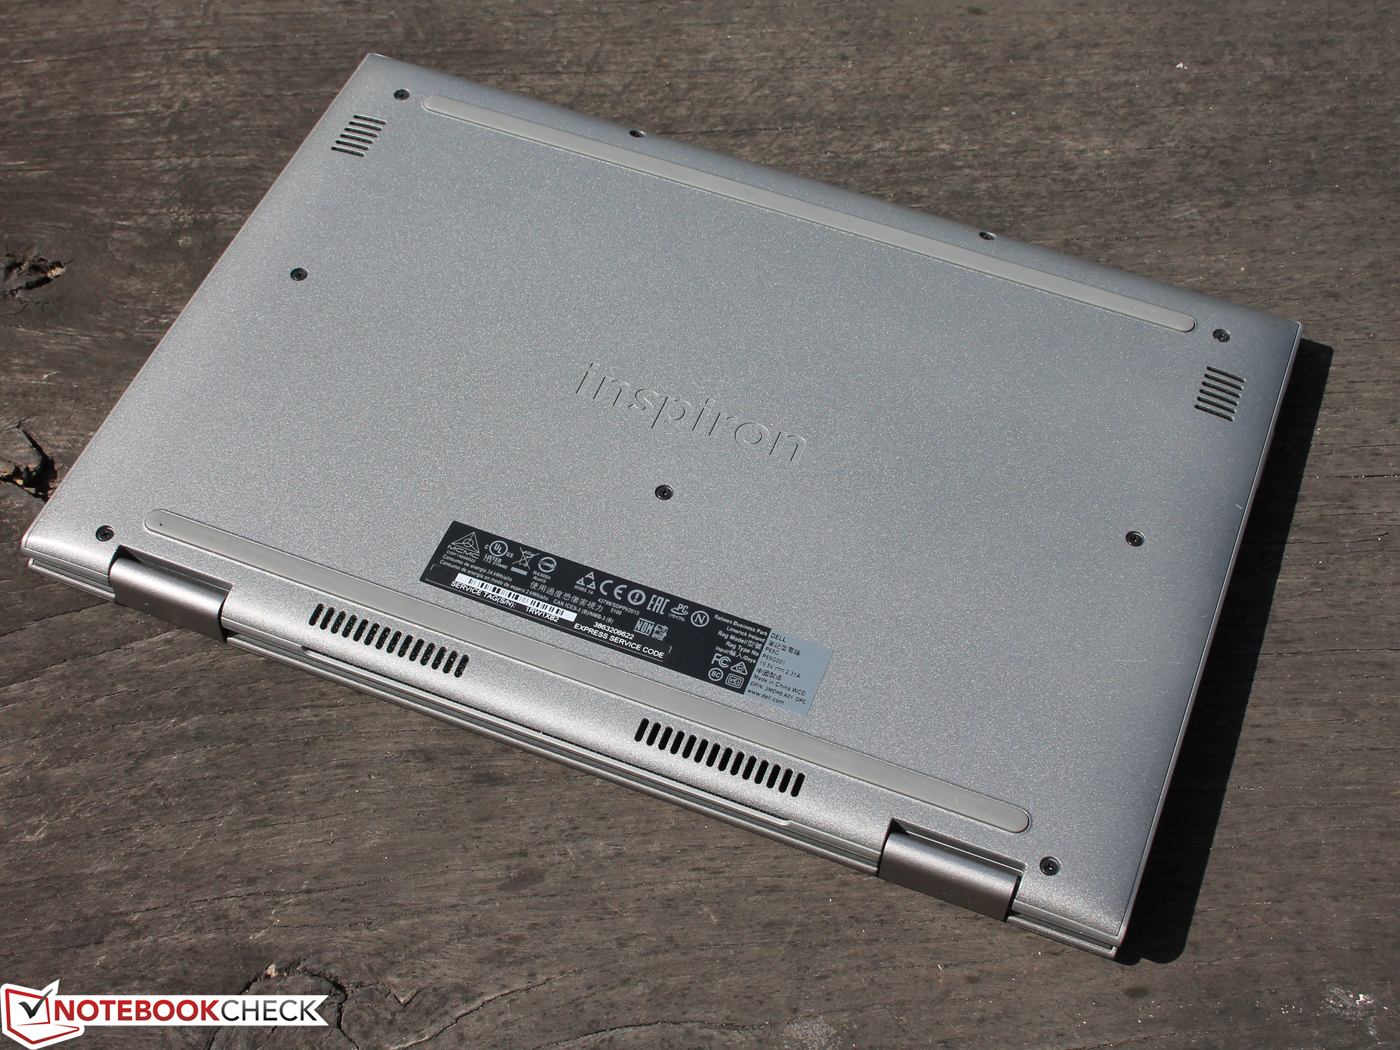
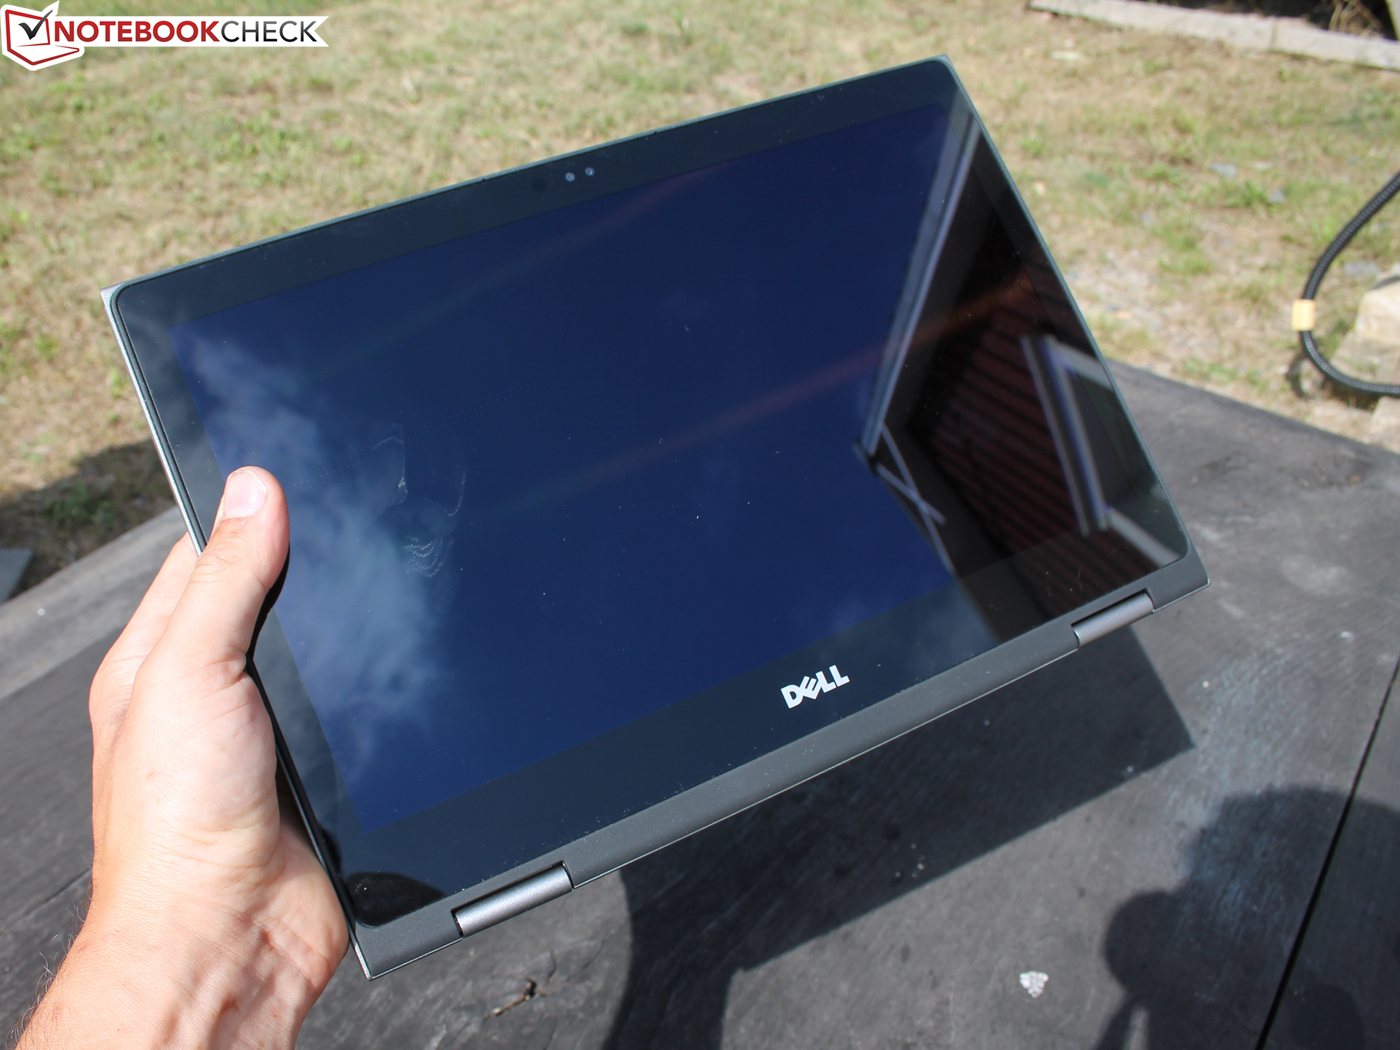
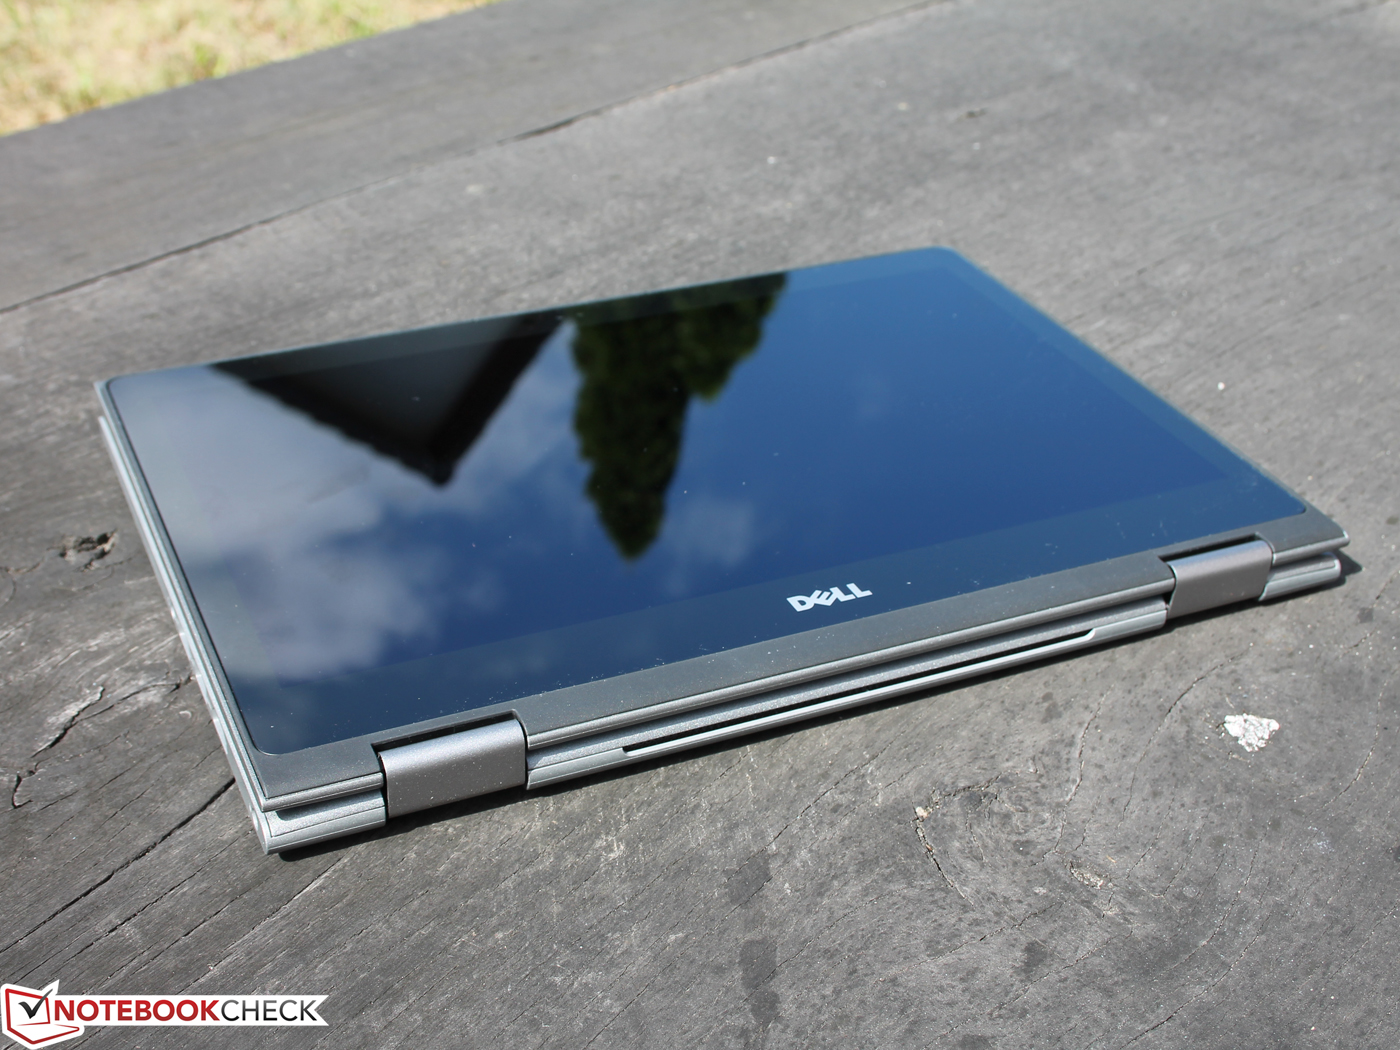
Since nothing has changed aesthetically compared to its predecessor, we instead refer you to our review of the Inspiron 13 5368. Our impression of the case in 2016 still stands today. The plastic case lacks rigidity while there is still a large gap between the display and the base when using the device in tablet mode. It is also worth noting that the device is both the heaviest and the thickest convertible among our comparison devices.
Connectivity
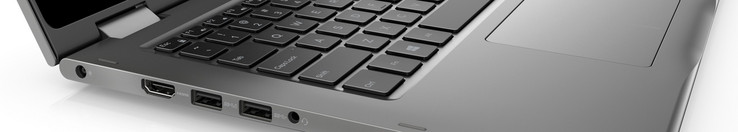
The Inspiron 13 5379 continues the basic and somewhat dated selection of ports reported in our review of its two-year-old predecessor. While USB-C would have been a nice addition, the device does come with a full-sized SD card reader and an HDMI port.
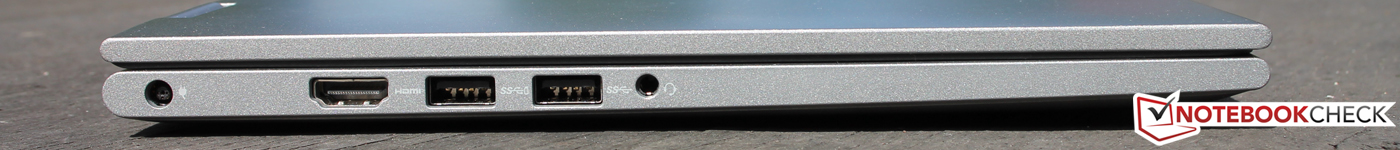
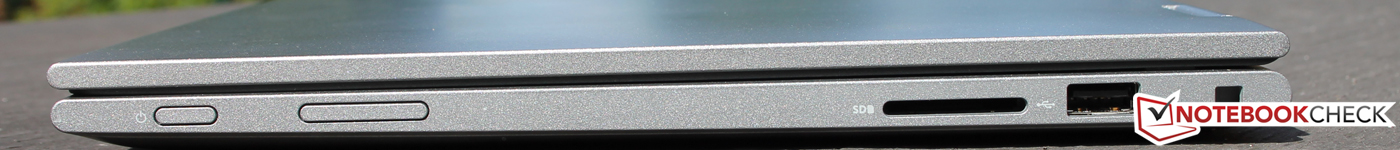
SD card reader
SD card performance has marginally improved compared with the Inspiron 13 5368. While performance is still average, it is at least on par with laptops in its class. SD cards protrude only 1 mm from the case too. During testing our reference card, the Toshiba Exceria Pro SDXC 64 GB UHS-II, achieved an average data transfer rate of just over 28 MB/s.
| SD Card Reader | |
| average JPG Copy Test (av. of 3 runs) | |
| Lenovo Miix 520-12IKB 81CG | |
| Dell Inspiron 13-5379-9573 (Toshiba Exceria Pro SDXC 64 GB UHS-II) | |
| Acer Spin 5 SP513-52N-54SF (Toshiba Exceria Pro SDXC 64 GB UHS-II) | |
| Dell Inspiron 13 5368 (Toshiba Exceria Pro SDXC 64 GB UHS-II) | |
| maximum AS SSD Seq Read Test (1GB) | |
| Lenovo Miix 520-12IKB 81CG | |
| Dell Inspiron 13-5379-9573 (Toshiba Exceria Pro SDXC 64 GB UHS-II) | |
| Acer Spin 5 SP513-52N-54SF (Toshiba Exceria Pro SDXC 64 GB UHS-II) | |
| Dell Inspiron 13 5368 (Toshiba Exceria Pro SDXC 64 GB UHS-II) | |
Communication
In terms of Wi-Fi performance, the Inspiron 13 5379 is definitively faster than its 2016 counterpart, offering send and receive speeds of almost 635 MBit/s and 600 MBit/s respectively. The Atheros/Qualcomm QCA6174 Wi-Fi card with 2 x 2 antennas is clearly well implemented here. The device comes with Bluetooth 4.2.
| Networking | |
| iperf3 transmit AX12 | |
| Lenovo Yoga 720-13IKB | |
| Dell Inspiron 13-5379-9573 | |
| Acer Spin 5 SP513-52N-54SF | |
| Lenovo Miix 520-12IKB 81CG | |
| iperf3 receive AX12 | |
| Dell Inspiron 13-5379-9573 | |
| Lenovo Yoga 720-13IKB | |
| Lenovo Miix 520-12IKB 81CG | |
| Acer Spin 5 SP513-52N-54SF | |
Accessories
Dell offers no accessories specifically for the Inspiron 13 5379. Every device comes with one year's worth of free Dropbox storage limited to 20 GB. Unfortunately, McAfee anti-virus comes pre-installed as a trial version, the lack of which we praised the Inspiron's predecessor for in our 2016 review. No other programs come pre-installed though.
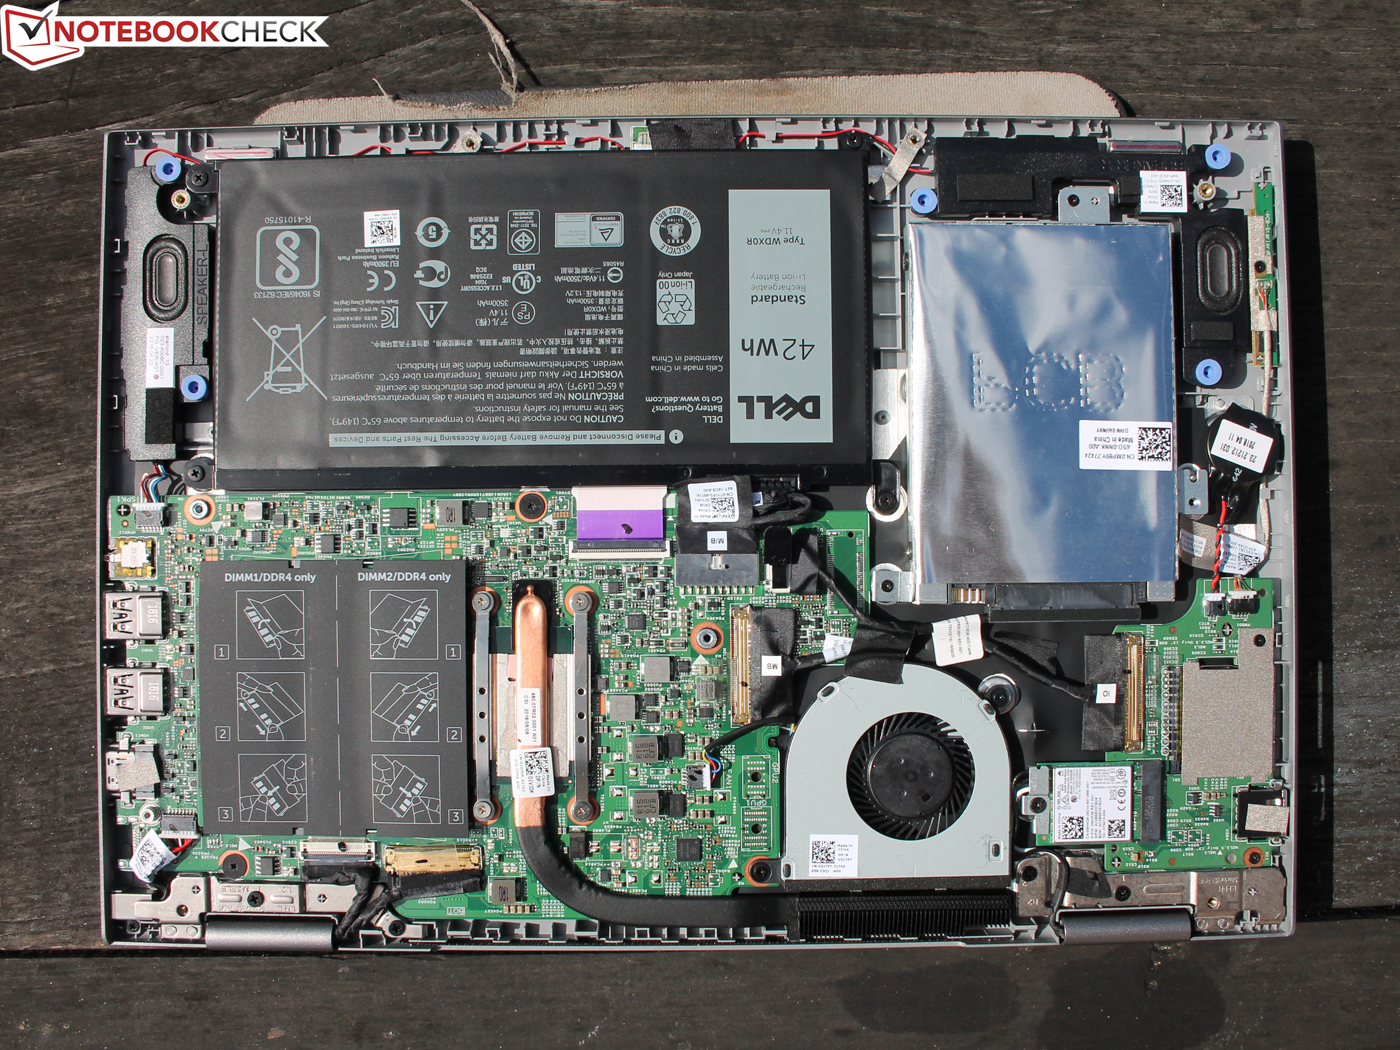
Maintenance
We refer to our review of the Dell Inspiron 13 5368 for an overview of maintenance options with the Inspiron 13 5379.
Warranty
Every Inspiron 13 5379 comes with one year's hardware support as standard; this includes collecting and repairing the device. The cover can also be extended to four years at an extra cost.
Please see our Guarantees, Return Policies and Warranties FAQ for country-specific information.
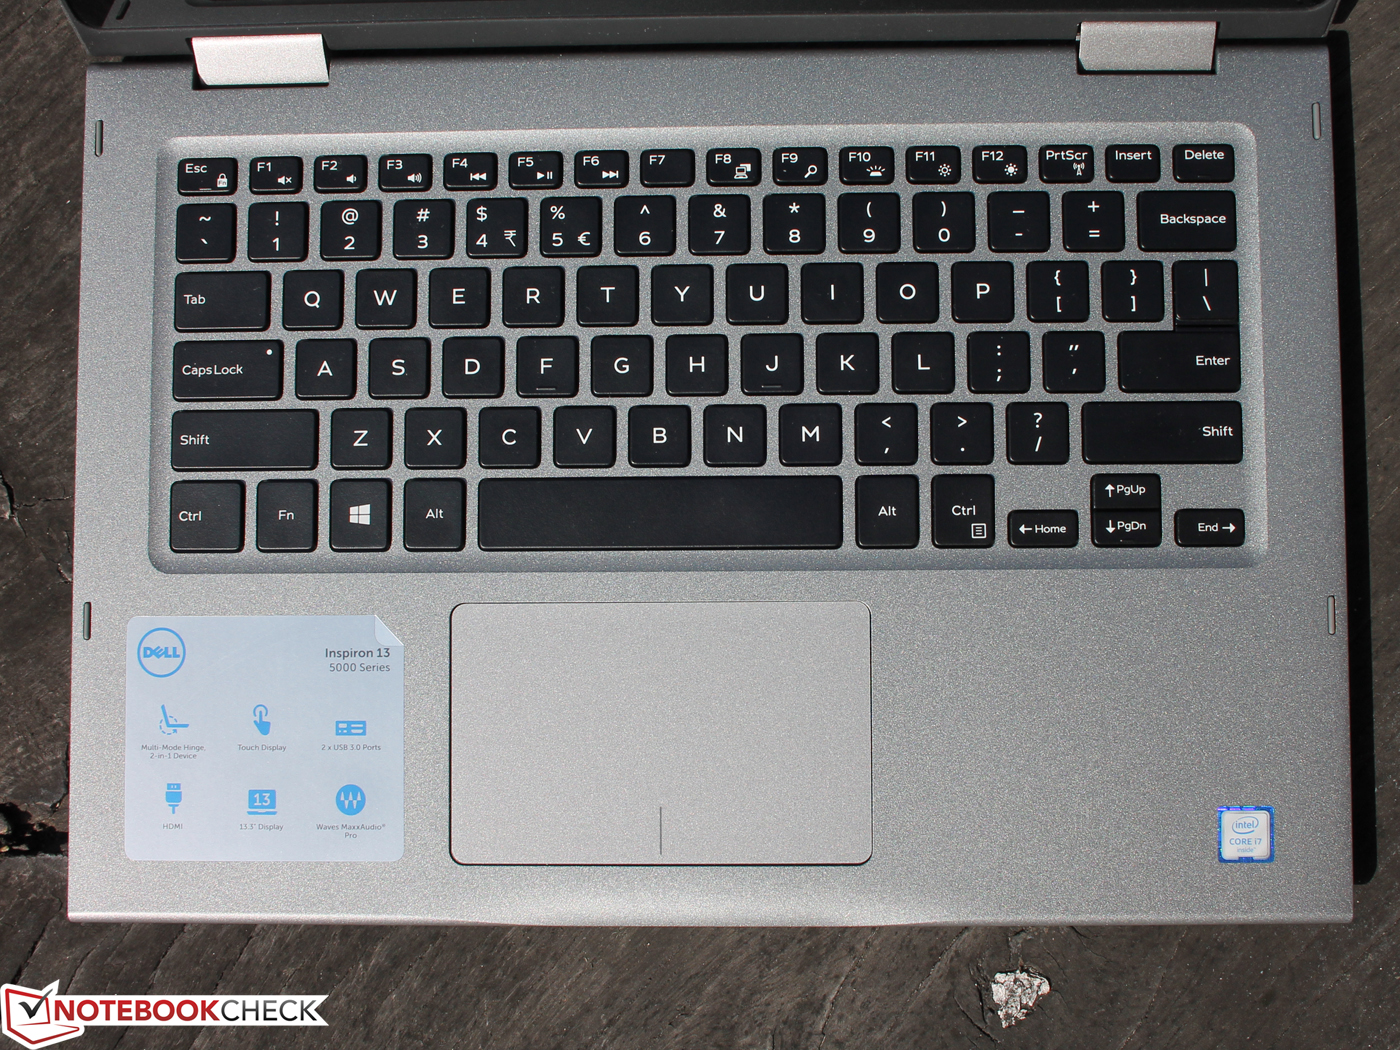
Input devices
Since Dell has left the Inspiron 13 5379's input devices unchanged too, we refer you again to our review of the Inspiron 13 5368.
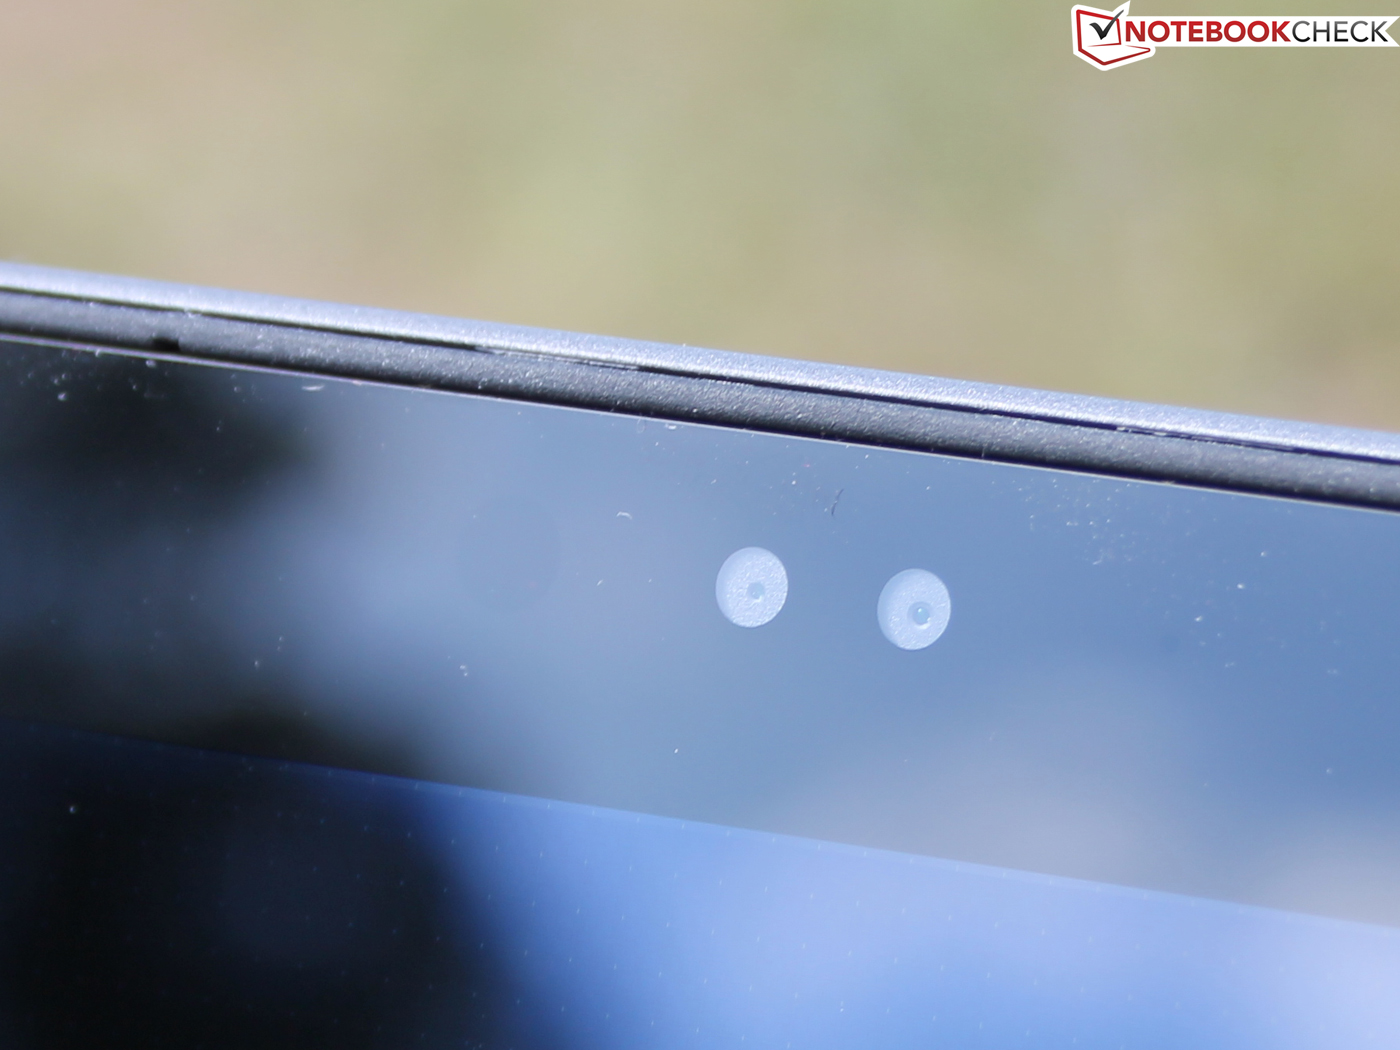
Display
The Inspiron 13 5379 comes with a glossy IPS touch display with a 1,920 x 1,080 resolution. The panel has ten-point multi-touch and palm rejection too. Matte screens are rare in this class, with most competition manufacturers opting for glossy displays. It is worth noting that Dell does not offer alternative displays for the Inspiron 13 5379 either.
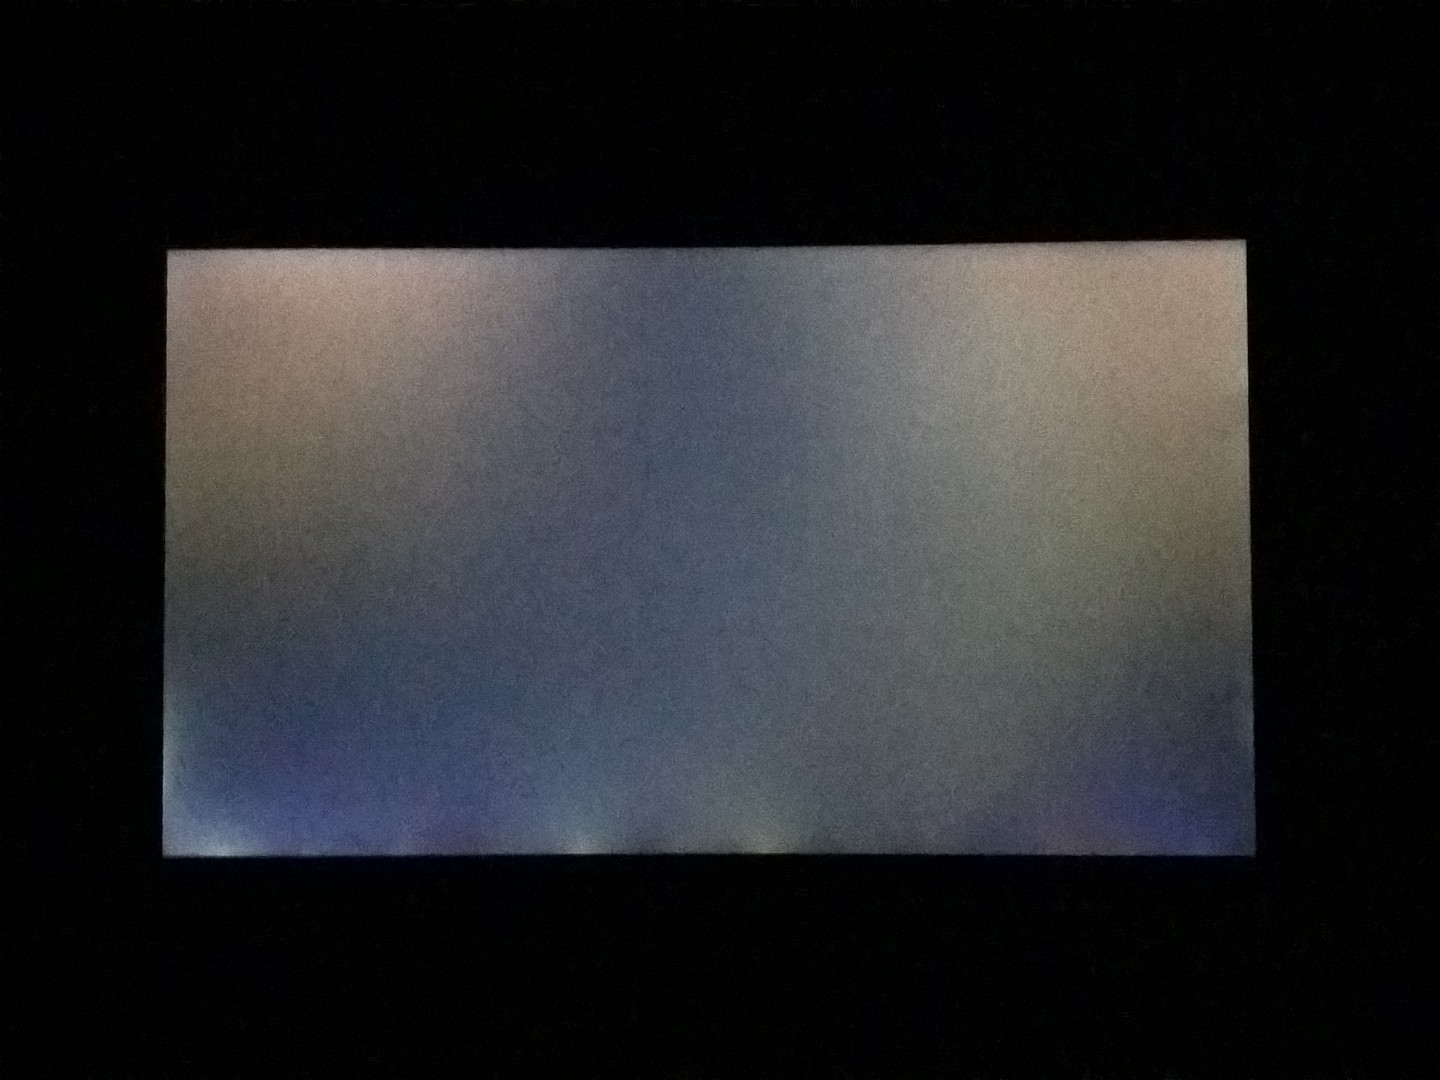
The average screen brightness is high enough for clear reading of whatever is on the screen, while reflections can be compensated for, especially when the device is being used indoors. The brightness is very uneven at the bottom of the screen, with significant backlight bleed obvious in dark rooms, although, this would be hardly noticeable in daily use.
| |||||||||||||||||||||||||
Brightness Distribution: 81 %
Center on Battery: 276 cd/m²
Contrast: 856:1 (Black: 0.32 cd/m²)
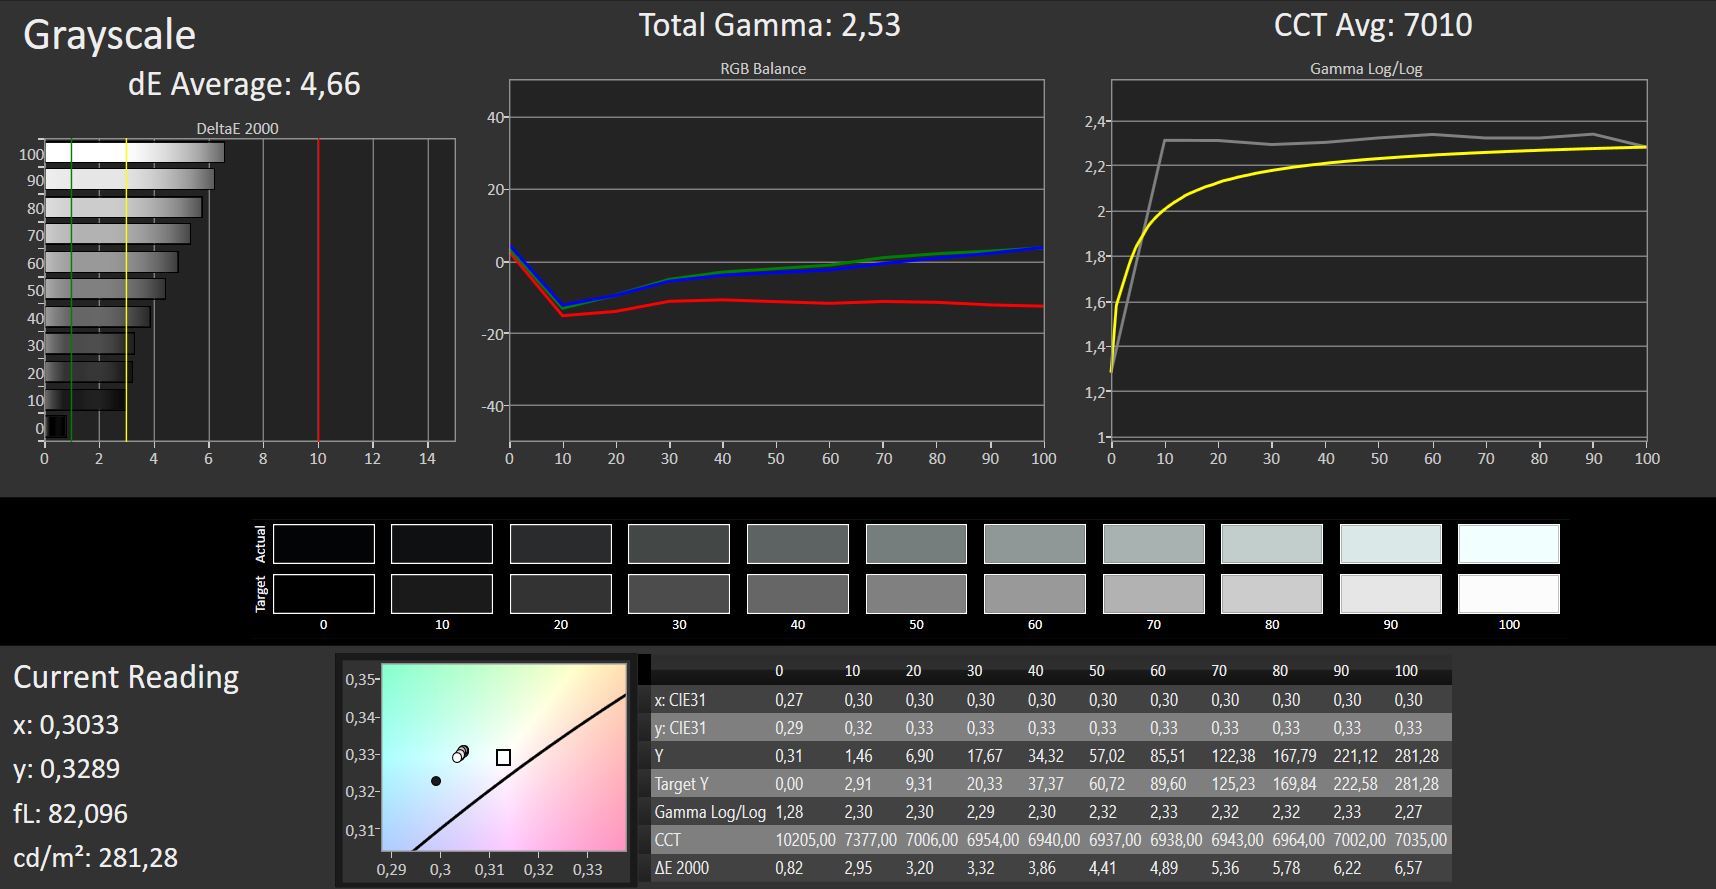
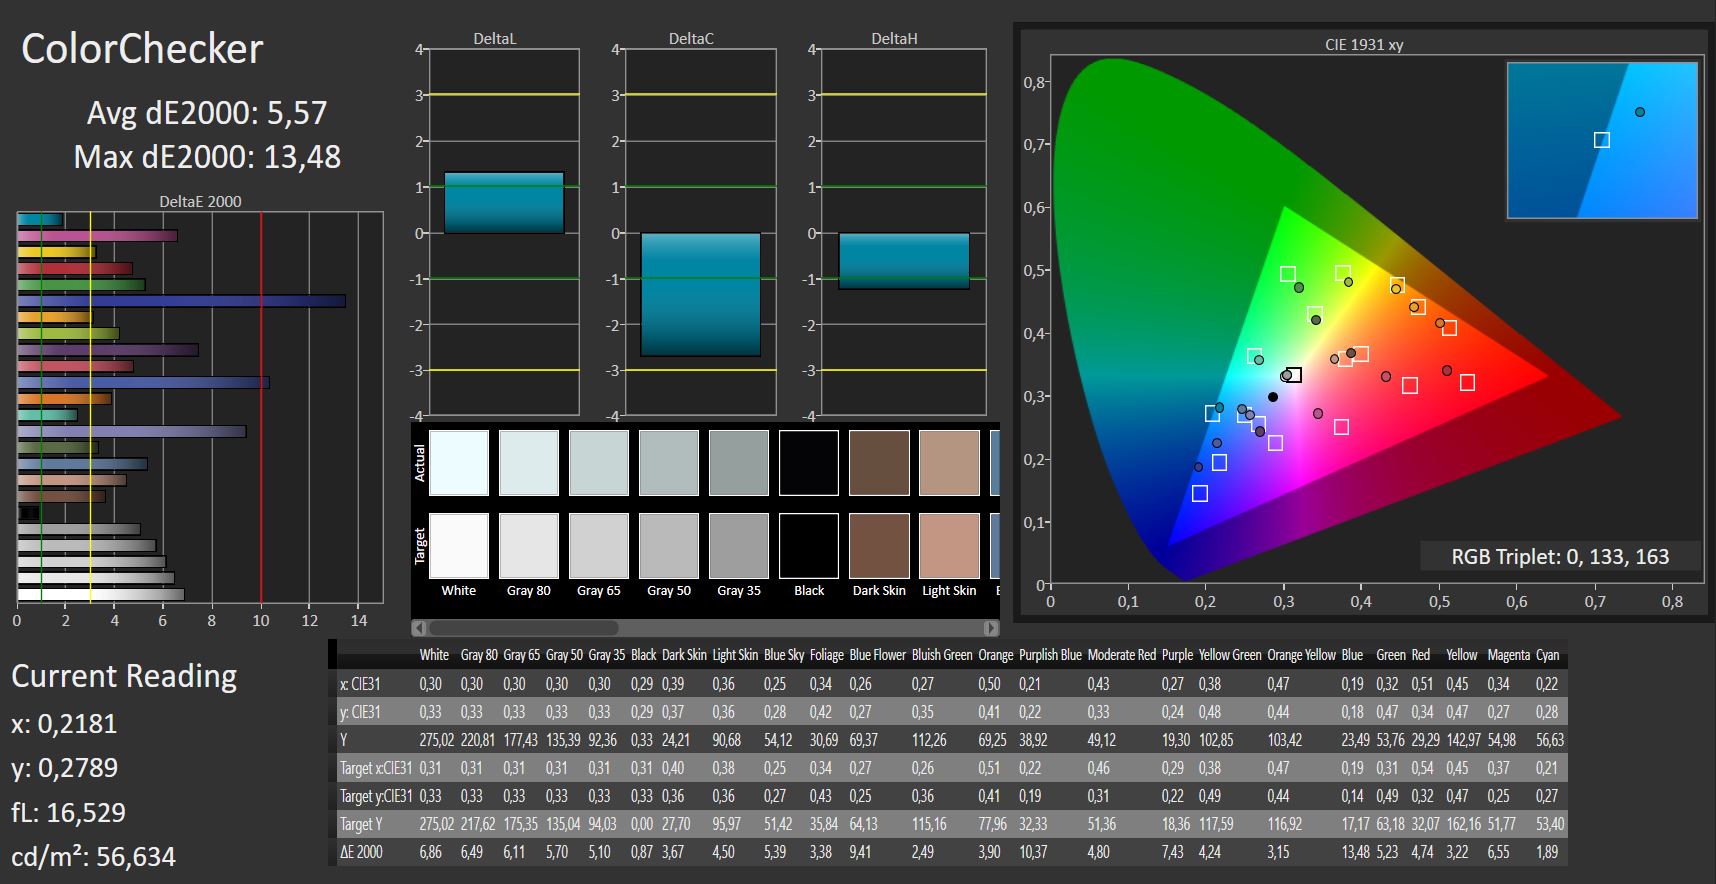
ΔE ColorChecker Calman: 5.57 | ∀{0.5-29.43 Ø4.71}
ΔE Greyscale Calman: 4.66 | ∀{0.09-98 Ø4.96}
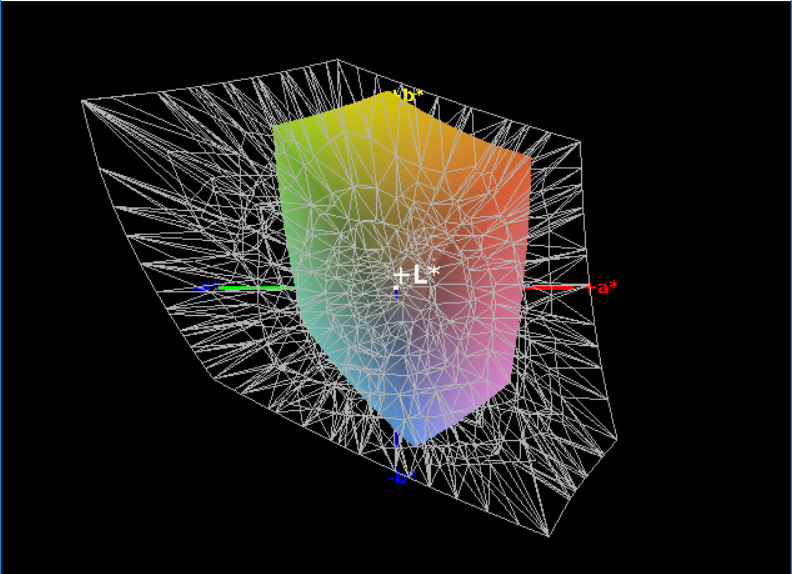
61% sRGB (Argyll 1.6.3 3D)
39% AdobeRGB 1998 (Argyll 1.6.3 3D)
42.6% AdobeRGB 1998 (Argyll 3D)
61.7% sRGB (Argyll 3D)
41.2% Display P3 (Argyll 3D)
Gamma: 2.53
CCT: 7010 K
| Dell Inspiron 13-5379-9573 BOE BOE06A7, , 1920x1080, 13.3" | Lenovo Yoga 720-13IKB BOE CQ NV133FHM-N61, , 1920x1080, 13.3" | Acer Spin 5 SP513-52N-54SF LC133LF102, , 1920x1080, 13.3" | Lenovo Miix 520-12IKB 81CG Unknown, , 1920x1200, 12.2" | Dell Inspiron 13 5368 AUO B133HAB, , 1920x1080, 13.3" | |
|---|---|---|---|---|---|
| Display | 53% | 62% | 52% | -6% | |
| Display P3 Coverage (%) | 41.2 | 67.8 65% | 69.8 69% | 64.4 56% | 38.88 -6% |
| sRGB Coverage (%) | 61.7 | 88.2 43% | 94.6 53% | 90.8 47% | 57.7 -6% |
| AdobeRGB 1998 Coverage (%) | 42.6 | 64.4 51% | 69.3 63% | 65.4 54% | 40.17 -6% |
| Response Times | -7% | 5% | 18% | 4% | |
| Response Time Grey 50% / Grey 80% * (ms) | 45 ? | 48 ? -7% | 49 ? -9% | 35.6 ? 21% | 44 ? 2% |
| Response Time Black / White * (ms) | 33 ? | 35 ? -6% | 27 ? 18% | 28 ? 15% | 31 ? 6% |
| PWM Frequency (Hz) | 192 ? | 350 ? | 1000 ? | 198.4 ? | |
| Screen | 16% | 31% | -3% | 7% | |
| Brightness middle (cd/m²) | 274 | 297 8% | 295 8% | 348.8 27% | 240 -12% |
| Brightness (cd/m²) | 272 | 277 2% | 276 1% | 339 25% | 229 -16% |
| Brightness Distribution (%) | 81 | 87 7% | 88 9% | 87 7% | 92 14% |
| Black Level * (cd/m²) | 0.32 | 0.33 -3% | 0.27 16% | 0.4 -25% | 0.24 25% |
| Contrast (:1) | 856 | 900 5% | 1093 28% | 872 2% | 1000 17% |
| Colorchecker dE 2000 * | 5.57 | 4.93 11% | 2.97 47% | 7 -26% | 4.75 15% |
| Colorchecker dE 2000 max. * | 13.48 | 8.39 38% | 5.67 58% | 16.2 -20% | 9.09 33% |
| Greyscale dE 2000 * | 4.66 | 4.84 -4% | 3.12 33% | 10.1 -117% | 4.3 8% |
| Gamma | 2.53 87% | 2.5 88% | 2.45 90% | 2.22 99% | 2.5 88% |
| CCT | 7010 93% | 6894 94% | 6676 97% | 9065 72% | 5893 110% |
| Color Space (Percent of AdobeRGB 1998) (%) | 39 | 58 49% | 62 59% | 58.7 51% | 36.79 -6% |
| Color Space (Percent of sRGB) (%) | 61 | 88 44% | 94 54% | 90.9 49% | 57.39 -6% |
| Total Average (Program / Settings) | 21% /
20% | 33% /
34% | 22% /
11% | 2% /
4% |
* ... smaller is better

Our test device keeps up with the average for its class. Colors look pale and blacks look slightly gray. While the black value and contrast levels are competitive, the Inspiron 13 5379 lags with respect to color reproduction. Dell has only minimally improved this compared with the Inspiron 13 5368. We detected PWM during our tests too, measured at 192 Hz when at 90 percent brightness. Display flicker at this frequency will quickly irritate most eyes.

Display Response Times
| ↔ Response Time Black to White | ||
|---|---|---|
| 33 ms ... rise ↗ and fall ↘ combined | ↗ 20 ms rise | 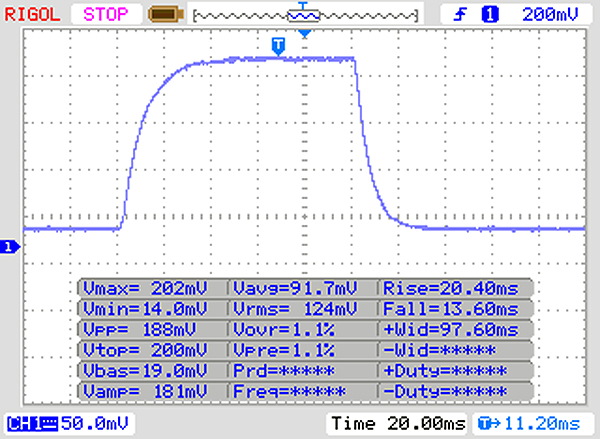 |
| ↘ 13 ms fall | ||
| The screen shows slow response rates in our tests and will be unsatisfactory for gamers. In comparison, all tested devices range from 0.1 (minimum) to 240 (maximum) ms. » 89 % of all devices are better. This means that the measured response time is worse than the average of all tested devices (19.8 ms). | ||
| ↔ Response Time 50% Grey to 80% Grey | ||
| 45 ms ... rise ↗ and fall ↘ combined | ↗ 24 ms rise | 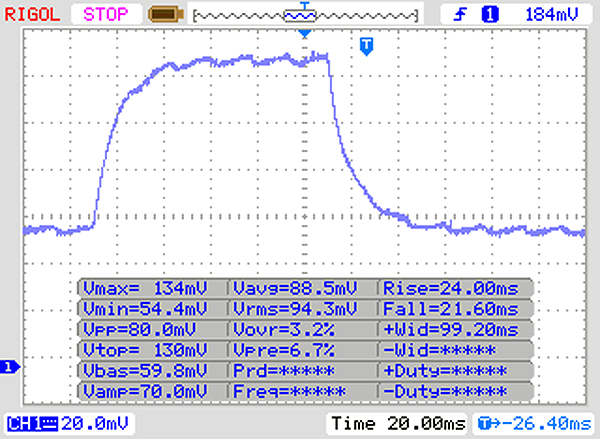 |
| ↘ 21 ms fall | ||
| The screen shows slow response rates in our tests and will be unsatisfactory for gamers. In comparison, all tested devices range from 0.165 (minimum) to 636 (maximum) ms. » 77 % of all devices are better. This means that the measured response time is worse than the average of all tested devices (30.9 ms). | ||
Screen Flickering / PWM (Pulse-Width Modulation)
| Screen flickering / PWM detected | 192 Hz | ≤ 90 % brightness setting | 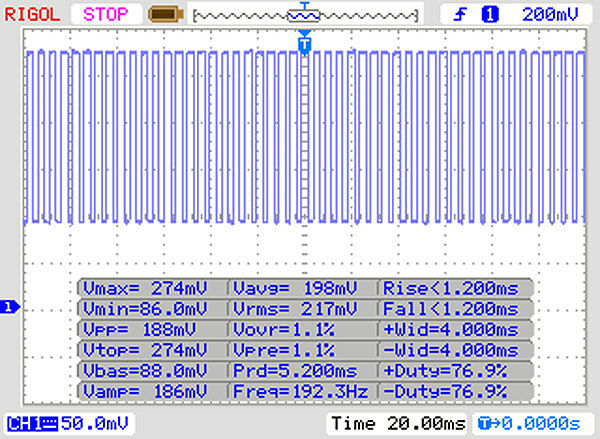 |
The display backlight flickers at 192 Hz (worst case, e.g., utilizing PWM) Flickering detected at a brightness setting of 90 % and below. There should be no flickering or PWM above this brightness setting. The frequency of 192 Hz is relatively low, so sensitive users will likely notice flickering and experience eyestrain at the stated brightness setting and below. In comparison: 52 % of all tested devices do not use PWM to dim the display. If PWM was detected, an average of 7741 (minimum: 5 - maximum: 343500) Hz was measured. | |||
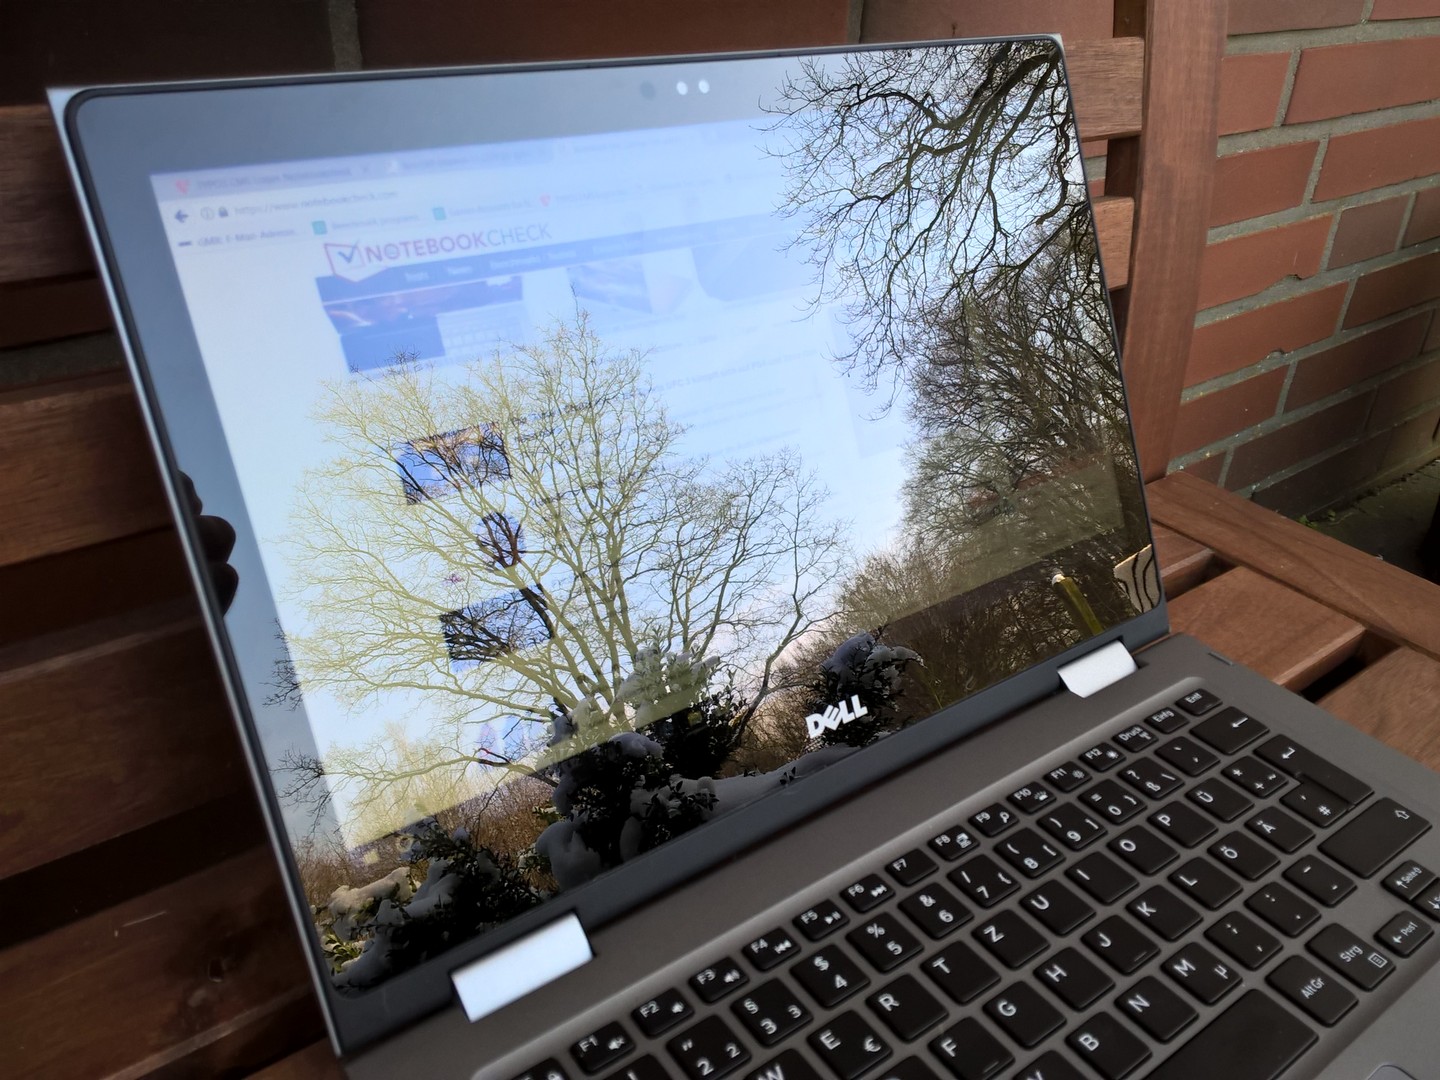
The Inspiron 13 5379 has good viewing angles. When used in a dark room the screen can be seen from practically any angle without picture or color distortions. The same cannot be said when using the Inspiron outside. The glossy reflection inducing screen inhibits being able to read content clearly. This lack of readability even extends to using the device in the shade. The highly reflective screen makes it difficult to recognize what is on the screen. We would therefore have concerns about effectively using the Inspiron 13 5379 outside on a sunny day.
Performance
Our test device is equipped with an Intel Kaby Lake 8th generation processor. The Core i5-8250U is supported by integrated Intel UHD Graphics 620, 8 GB of RAM and a 256 GB SSD. The combination of this hardware means the Inspiron 13 5379 is capable of more demanding tasks and could even be used to play older games to a good standard.


Processor
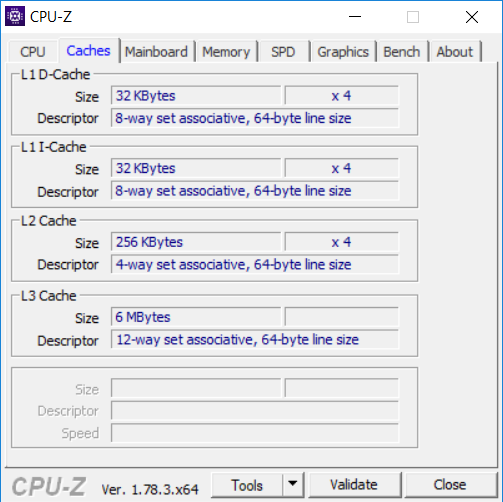
Our test device comes with Intel's quad-core Core i5-8250U. Processing power is limited by the Inspiron’s running temperature. The processor can turbo clock up to 3.5 GHz at 15 W thermal design power (TDP) and has a base clock speed of 1.6 GHz to save energy and reduce heat. The i5-8250U can also use Hyperthreading to process up to eight threads simultaneously.
The Inspiron 13 5379 achieved above average results in a single pass of Cinebench R15. It is just over ten percent ahead of its predecessor in a single pass, with the lead extending to almost fifty percent on multiple passes. Not everything is rosy though as our endurance tests show the limitations of having a 15 W quad-core CPU in a laptop case. Performance falls sharply after a short time before dropping further to an average after about fifteen minutes of testing. This throttling is not an issue exclusive to the Inspiron 13 5379 though as this behavior is consistent across our comparison devices with Core i5-8250U's onboard.
System Performance
The Inspiron 13 5379's system performance has not drastically improved over our two-year-old 5368 test devices. It is only fifty points ahead of its predecessor in the PCMark 8 Work benchmark, while the older model even marginally beats its successor in the PCMark 8 Home benchmark. Results do fall within an expected margin though, with the real advantage of 8th generation Kaby Lake chips being their energy efficiency and power per-watt.
The Inspiron 13 5379 runs smoothly in daily use with no visible lag or overly long load times. The performance of the Core i5-8250U in other systems can be found on our CPU benchmark page.
| PCMark 8 | |
| Home Score Accelerated v2 | |
| Lenovo Yoga 720-13IKB | |
| Lenovo Miix 520-12IKB 81CG | |
| Dell Inspiron 13 5368 | |
| Dell Inspiron 13-5379-9573 | |
| Acer Spin 5 SP513-52N-54SF | |
| Work Score Accelerated v2 | |
| Lenovo Yoga 720-13IKB | |
| Dell Inspiron 13-5379-9573 | |
| Dell Inspiron 13 5368 | |
| Acer Spin 5 SP513-52N-54SF | |
| Lenovo Miix 520-12IKB 81CG | |
| PCMark 8 Home Score Accelerated v2 | 3592 points | |
| PCMark 8 Work Score Accelerated v2 | 4621 points | |
Help | ||
Storage Devices
Dell has installed a slow Micron-1100 SSD in our test device, and as such, comparative performance is correspondingly poor. This performance gap is relative though, as programs still open quickly and the SSD is still faster than traditional HDD's
The relative performance of the Micron-1100 SSD can be found on our HDD / SSD benchmark page.
| Dell Inspiron 13-5379-9573 Micron 1100 MTFDDAV256TBN | Lenovo Yoga 720-13IKB Toshiba XG4 NVMe (THNSN5512GPUK) | Acer Spin 5 SP513-52N-54SF Micron 1100 MTFDDAV256TBN | Dell Inspiron 13 5368 Toshiba THNSNK256GCS8 | |
|---|---|---|---|---|
| CrystalDiskMark 3.0 | 167% | 58% | 43% | |
| Read Seq (MB/s) | 447.9 | 1345 200% | 462.7 3% | 479 7% |
| Write Seq (MB/s) | 304.8 | 569 87% | 439.9 44% | 270.1 -11% |
| Read 512 (MB/s) | 293.7 | 1041 254% | 325.2 11% | 428.3 46% |
| Write 512 (MB/s) | 157 | 547 248% | 361.9 131% | 267.9 71% |
| Read 4k (MB/s) | 14.03 | 38.42 174% | 27.52 96% | 23.77 69% |
| Write 4k (MB/s) | 63.3 | 127.1 101% | 91.6 45% | 81.4 29% |
| Read 4k QD32 (MB/s) | 165.9 | 416.4 151% | 247.3 49% | 333.6 101% |
| Write 4k QD32 (MB/s) | 155.1 | 337.5 118% | 292 88% | 200.9 30% |

Graphics card
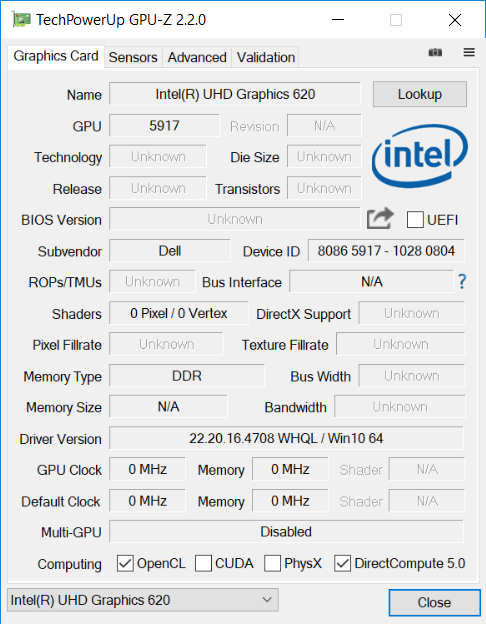
The Inspiron 13 5379 only comes with one option for graphics, that being Intel's integrated UHD Graphics 620. The available video memory and processing speed rely heavily on the RAM with which the UHD Graphics 620 is equipped; dual-channel RAM reaps huge benefits. Our test device only comes with single-channel though, which means that the GPU will not perform at the peak of its powers. This could be rectified through retrofitting dual-channel RAM.
The Inspiron 13 5379 is well behind the competition in the 3DMark benchmarks. The GPU performance gap that single and dual-channel RAM causes is clear when comparing the device to the Acer Spin 5 or the Lenovo Miix 520. While the gap is not huge, the effect that the choice of RAM has on GPU performance is striking. It is therefore worth bearing in mind that the 5379's GPU performance could be improved with a simple change of RAM. The performance of Intel's UHD Graphics 620 can be compared on our GPU benchmark page.
| 3DMark 11 - 1280x720 Performance GPU | |
| Lenovo Yoga 720-13IKB | |
| Lenovo Miix 520-12IKB 81CG | |
| Acer Spin 5 SP513-52N-54SF | |
| Dell Inspiron 13-5379-9573 | |
| Dell Inspiron 13 5368 | |
| 3DMark | |
| 1280x720 Cloud Gate Standard Graphics | |
| Lenovo Yoga 720-13IKB | |
| Acer Spin 5 SP513-52N-54SF | |
| Lenovo Miix 520-12IKB 81CG | |
| Dell Inspiron 13-5379-9573 | |
| Dell Inspiron 13 5368 | |
| 1920x1080 Fire Strike Graphics | |
| Lenovo Yoga 720-13IKB | |
| Acer Spin 5 SP513-52N-54SF | |
| Lenovo Miix 520-12IKB 81CG | |
| Dell Inspiron 13-5379-9573 | |
| 3DMark 11 Performance | 1643 points | |
| 3DMark Cloud Gate Standard Score | 7244 points | |
| 3DMark Fire Strike Score | 876 points | |
Help | ||
Gaming Performance
The Inspiron 13 5379 performs as expected when gaming. Old games, such as Bioshock Infinite, will run smoothly at medium quality. Casual games found on the Windows Store also proved no problem for our test device. Our test results further demonstrate the issue of pairing the UHD Graphics 620 with single-channel RAM. Our comparison devices equipped with dual-channel RAM achieve up to fifteen percent better FPS when gaming than the Inspiron 13 5379.
The performance of Intel's UHD Graphics 620 in other games can be compared on our games benchmark page.
| BioShock Infinite | |
| 1920x1080 Ultra Preset, DX11 (DDOF) | |
| Lenovo Yoga 720-13IKB | |
| Acer Spin 5 SP513-52N-54SF | |
| Dell Inspiron 13-5379-9573 | |
| Lenovo Miix 520-12IKB 81CG | |
| 1366x768 High Preset | |
| Dell Inspiron 13 5368 | |
| Lenovo Yoga 720-13IKB | |
| Acer Spin 5 SP513-52N-54SF | |
| Lenovo Miix 520-12IKB 81CG | |
| Dell Inspiron 13-5379-9573 | |
| 1366x768 Medium Preset | |
| Dell Inspiron 13 5368 | |
| Lenovo Yoga 720-13IKB | |
| Acer Spin 5 SP513-52N-54SF | |
| Lenovo Miix 520-12IKB 81CG | |
| Dell Inspiron 13-5379-9573 | |
| 1280x720 Very Low Preset | |
| Lenovo Yoga 720-13IKB | |
| Dell Inspiron 13 5368 | |
| Acer Spin 5 SP513-52N-54SF | |
| Lenovo Miix 520-12IKB 81CG | |
| Dell Inspiron 13-5379-9573 | |
| Thief | |
| 1366x768 High Preset AA:FXAA & Low SS AF:4x | |
| Dell Inspiron 13 5368 | |
| 1366x768 Normal Preset AA:FX | |
| Dell Inspiron 13 5368 | |
| Dell Inspiron 13-5379-9573 | |
| 1024x768 Very Low Preset | |
| Dell Inspiron 13 5368 | |
| Dell Inspiron 13-5379-9573 | |
| Rise of the Tomb Raider | |
| 1366x768 Medium Preset AF:2x | |
| Dell Inspiron 13-5379-9573 | |
| Dell Inspiron 13 5368 | |
| Lenovo Miix 520-12IKB 81CG | |
| 1024x768 Lowest Preset | |
| Lenovo Miix 520-12IKB 81CG | |
| Dell Inspiron 13-5379-9573 | |
| Dell Inspiron 13 5368 | |
| low | med. | high | ultra | |
|---|---|---|---|---|
| BioShock Infinite (2013) | 49.4 | 27.1 | 21.8 | 7.6 |
| Thief (2014) | 22.8 | 11.5 | ||
| Rise of the Tomb Raider (2016) | 20.8 | 11.7 |
Emissions
System Noise
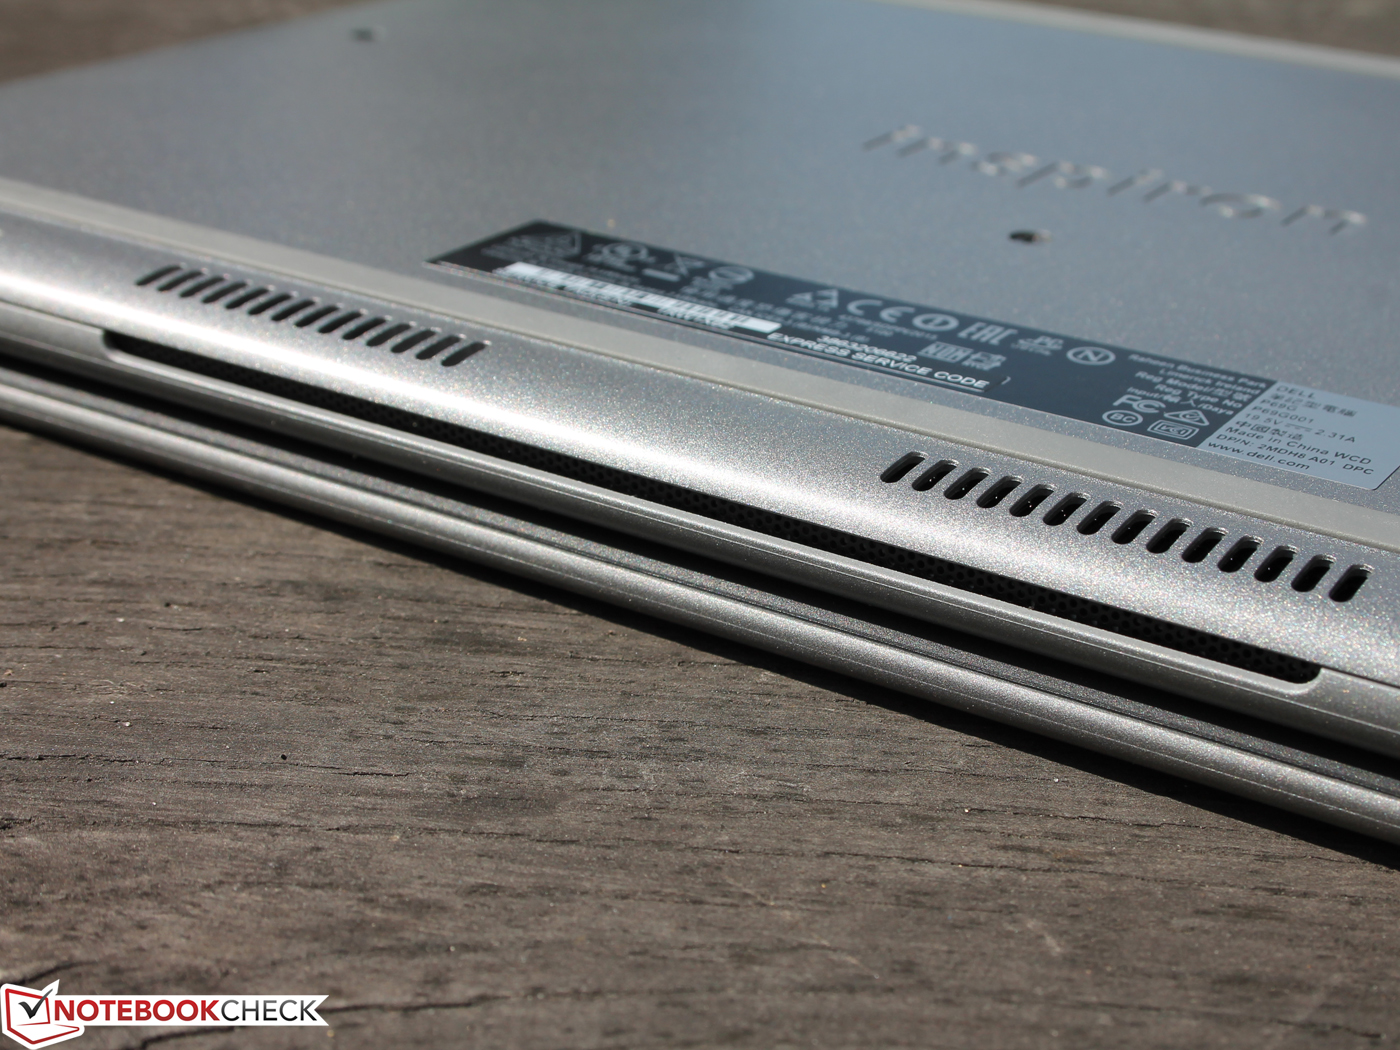
The fan in our test device is silent in normal use. Accordingly, our microphone will only measure ambient sounds. The fan only comes on when needed and turns off as soon as the device has cooled down. The fan also adjusts its running time according to the time needed to cool the device and does not just stay on for a fixed amount of time. While the fan remains quiet at 35 dB(A), its whirring sound could be annoying for some.
Noise level
| Idle |
| 30.1 / 30.1 / 30.1 dB(A) |
| Load |
| 33 / 35 dB(A) |
 | ||
30 dB silent 40 dB(A) audible 50 dB(A) loud |
||
min: | ||
Temperature
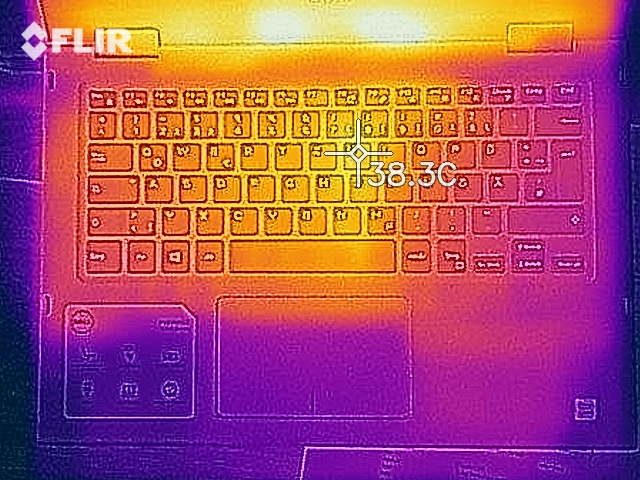
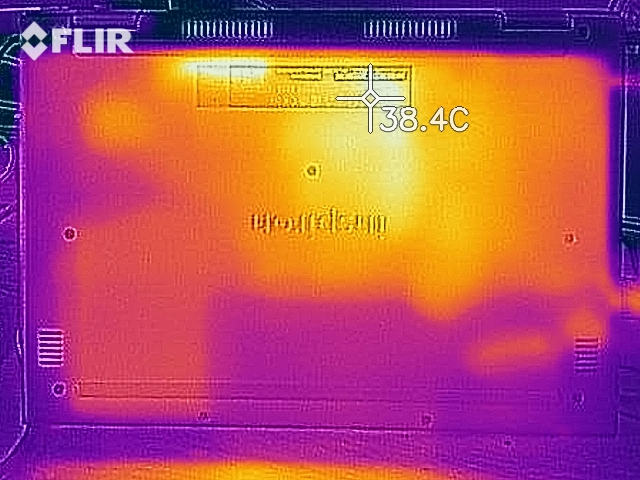
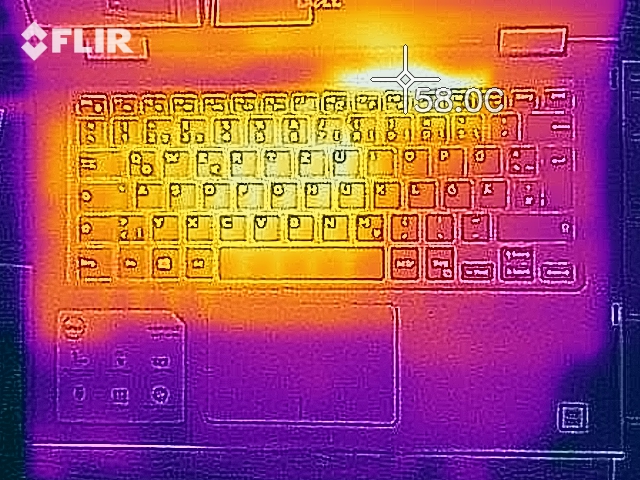
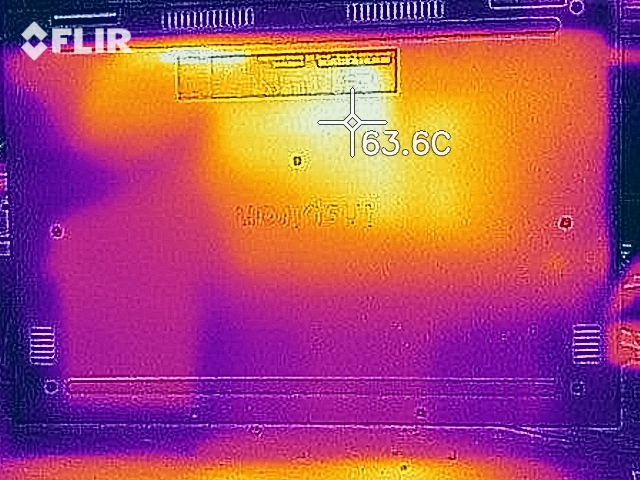
Surface temperatures always remain reasonable. When idle, the hottest area of the device measured at just under 35 °C (95 °F), with the same area reaching 60 °C (140 °F) under load. We found the hottest area to be on the rear of the device next to the middle of the display hinge. Happily, the palm rest remain pleasantly cool in both situations.
In our one stress test, the system is subjected to extreme workloads relatively quickly. The system throttles heavily until the fan starts to cool the device. Core temperatures then settle at just under 80 °C (176 °F). It is worth bearing in mind that this is an extreme stress test and not something that would normally occur. The system should not throttle due to heat from daily use.
(±) The maximum temperature on the upper side is 43.2 °C / 110 F, compared to the average of 35.4 °C / 96 F, ranging from 19.6 to 60 °C for the class Convertible.
(-) The bottom heats up to a maximum of 57.8 °C / 136 F, compared to the average of 36.9 °C / 98 F
(+) In idle usage, the average temperature for the upper side is 29.9 °C / 86 F, compared to the device average of 30.3 °C / 87 F.
(+) The palmrests and touchpad are cooler than skin temperature with a maximum of 28.7 °C / 83.7 F and are therefore cool to the touch.
(±) The average temperature of the palmrest area of similar devices was 28 °C / 82.4 F (-0.7 °C / -1.3 F).
Speakers
The Inspiron 13 5379 has a relatively balanced sound, but one which has no bass, and a low maximum volume. Our editorial staff was left with the impression that the sound tended to become tinny when listening to the device for extended periods of time. In daily use, the device could still easily be used for occasional audio playback though.
Dell Inspiron 13-5379-9573 audio analysis
(-) | not very loud speakers (64.1 dB)
Bass 100 - 315 Hz
(±) | reduced bass - on average 10.2% lower than median
(±) | linearity of bass is average (7.6% delta to prev. frequency)
Mids 400 - 2000 Hz
(±) | higher mids - on average 5.3% higher than median
(±) | linearity of mids is average (7.7% delta to prev. frequency)
Highs 2 - 16 kHz
(±) | higher highs - on average 5.1% higher than median
(+) | highs are linear (6% delta to prev. frequency)
Overall 100 - 16.000 Hz
(±) | linearity of overall sound is average (21.3% difference to median)
Compared to same class
» 57% of all tested devices in this class were better, 12% similar, 32% worse
» The best had a delta of 6%, average was 20%, worst was 57%
Compared to all devices tested
» 60% of all tested devices were better, 7% similar, 33% worse
» The best had a delta of 4%, average was 23%, worst was 134%
Apple MacBook 12 (Early 2016) 1.1 GHz audio analysis
(+) | speakers can play relatively loud (83.6 dB)
Bass 100 - 315 Hz
(±) | reduced bass - on average 11.3% lower than median
(±) | linearity of bass is average (14.2% delta to prev. frequency)
Mids 400 - 2000 Hz
(+) | balanced mids - only 2.4% away from median
(+) | mids are linear (5.5% delta to prev. frequency)
Highs 2 - 16 kHz
(+) | balanced highs - only 2% away from median
(+) | highs are linear (4.5% delta to prev. frequency)
Overall 100 - 16.000 Hz
(+) | overall sound is linear (10.2% difference to median)
Compared to same class
» 7% of all tested devices in this class were better, 2% similar, 90% worse
» The best had a delta of 5%, average was 18%, worst was 53%
Compared to all devices tested
» 5% of all tested devices were better, 1% similar, 94% worse
» The best had a delta of 4%, average was 23%, worst was 134%
Frequency diagram comparison - checkboxes are selectable and de-selectable
Power Management
Energy consumption
The Inspiron 13 5379's energy consumption is on par with comparable devices. When idle the maximum power consumption is under 9 W. This rises to just above 42 W under load. While this is close to the maximum wattage of the bundled 45 W power supply, there should be no issues when charging the device when it is operating under load.
| Off / Standby | |
| Idle | |
| Load |
|
Key:
min: | |
| Dell Inspiron 13-5379-9573 i5-8250U, UHD Graphics 620, Micron 1100 MTFDDAV256TBN, IPS, 1920x1080, 13.3" | Lenovo Yoga 720-13IKB i5-8550U, UHD Graphics 620, Toshiba XG4 NVMe (THNSN5512GPUK), IPS, 1920x1080, 13.3" | Acer Spin 5 SP513-52N-54SF i5-8250U, UHD Graphics 620, Micron 1100 MTFDDAV256TBN, IPS, 1920x1080, 13.3" | Lenovo Miix 520-12IKB 81CG i5-8250U, UHD Graphics 620, Samsung PM961 MZVLW256HEHP, IPS, 1920x1200, 12.2" | Dell Inspiron 13 5368 6500U, HD Graphics 520, Toshiba THNSNK256GCS8, IPS, 1920x1080, 13.3" | |
|---|---|---|---|---|---|
| Power Consumption | -14% | -5% | -31% | 3% | |
| Idle Minimum * (Watt) | 3.2 | 3.8 -19% | 3.9 -22% | 5.5 -72% | 4.4 -38% |
| Idle Average * (Watt) | 5.9 | 8.4 -42% | 8.2 -39% | 8.3 -41% | 6.1 -3% |
| Idle Maximum * (Watt) | 8.8 | 9.7 -10% | 8.8 -0% | 11.5 -31% | 6.8 23% |
| Load Average * (Watt) | 31.2 | 36 -15% | 28.5 9% | 38.3 -23% | 29 7% |
| Load Maximum * (Watt) | 42.2 | 36 15% | 30.7 27% | 37.7 11% | 31.9 24% |
* ... smaller is better
Battery life
While the Inspiron 13 5379 has markedly improved battery life over its predecessor, it still is only average compared to the competition. The more energy efficient Core i5-8250U helps the 13 5379 last five and a half hours in our Wi-Fi test, an improvement of ninety minutes over the Inspiron 13 5368. On the other hand, the Lenovo Yoga 720 and the Acer Spin 5 last significantly longer than the Inspiron 13 5379.
| Dell Inspiron 13-5379-9573 i5-8250U, UHD Graphics 620, 42 Wh | Lenovo Yoga 720-13IKB i5-8550U, UHD Graphics 620, 48 Wh | Acer Spin 5 SP513-52N-54SF i5-8250U, UHD Graphics 620, 53.9 Wh | Lenovo Miix 520-12IKB 81CG i5-8250U, UHD Graphics 620, 38 Wh | Dell Inspiron 13 5368 6500U, HD Graphics 520, 42 Wh | |
|---|---|---|---|---|---|
| Battery runtime | 44% | 54% | -16% | -22% | |
| Reader / Idle (h) | 15.3 | 12.3 -20% | 11.2 -27% | ||
| WiFi v1.3 (h) | 5.4 | 7.8 44% | 8.3 54% | 5.6 4% | 4 -26% |
| Load (h) | 1.6 | 1.1 -31% | 1.4 -13% |
Verdict
Pros
Cons
The Inspiron 13 5379 is more of a laptop than a tablet. The Inspiron's dimensions add to this impression. Folding the display 360° creates an extremely thick tablet, the use of which is frequently disturbed by the gap between the display and the base. While our review sample looks outdated, everything is up to date internally.
"If you only use tablet mode occasionally, or you would like to use a laptop supplemented by a touch screen, then the Inspiron 13 5379 would be a good choice. Overall, a powerful and maintainable convertible with an Intel 8th generation Kaby Lake processor."
The Inspiron 13 5379 is a capable device that performs all office tasks smoothly. It is also suitable for occasional games too, but only those that are older or from the Windows Store. The ease with which the device can be maintained or repaired ensures good long-term system performance.
Dell Inspiron 13-5379-9573
- 02/12/2018 v6 (old)
Mike Wobker
Price comparison

