Lenovo Miix 520 (i5-8250U, FHD) Convertible Review
Lenovo introduced the Miix 520 with Kaby Lake-R back in August to supplant the Miix 510 carrying Skylake and Kaby Lake CPUs. While the refresh was said to carry both Core i5-8250U and i5-8350U options and LTE connectivity, current SKUs of the Miix 520 are limited to the i5-8250U with no LTE for now. Nearly everything else about the tablet has remained unchanged from the Miix 510 including the 12.2-inch 16:10 FHD touchscreen, 8 GB LPDDR4 2133 MHz RAM, battery capacity, and Yoga-inspired hinge stand.
The tablet detachable is now available in just a single configuration for $999 USD with double the internal storage capacity of the Miix 510. It is one of the first Windows tablets to ship with Kaby Lake-R and it competes directly with the Surface Pro series, HP Elite x2 1012, Dell Latitude 7285, XPS 13 9365, and the Asus Transformer 4 Pro. More manufacturers are expected to unveil Kaby Lake-R Windows tablets at CES 2018.
The Miix 520 is an internal update over the Miix 510. Thus, we recommend checking out our existing Miix 510 Pro review as they both carry identical chassis features and keyboard docks.
Case
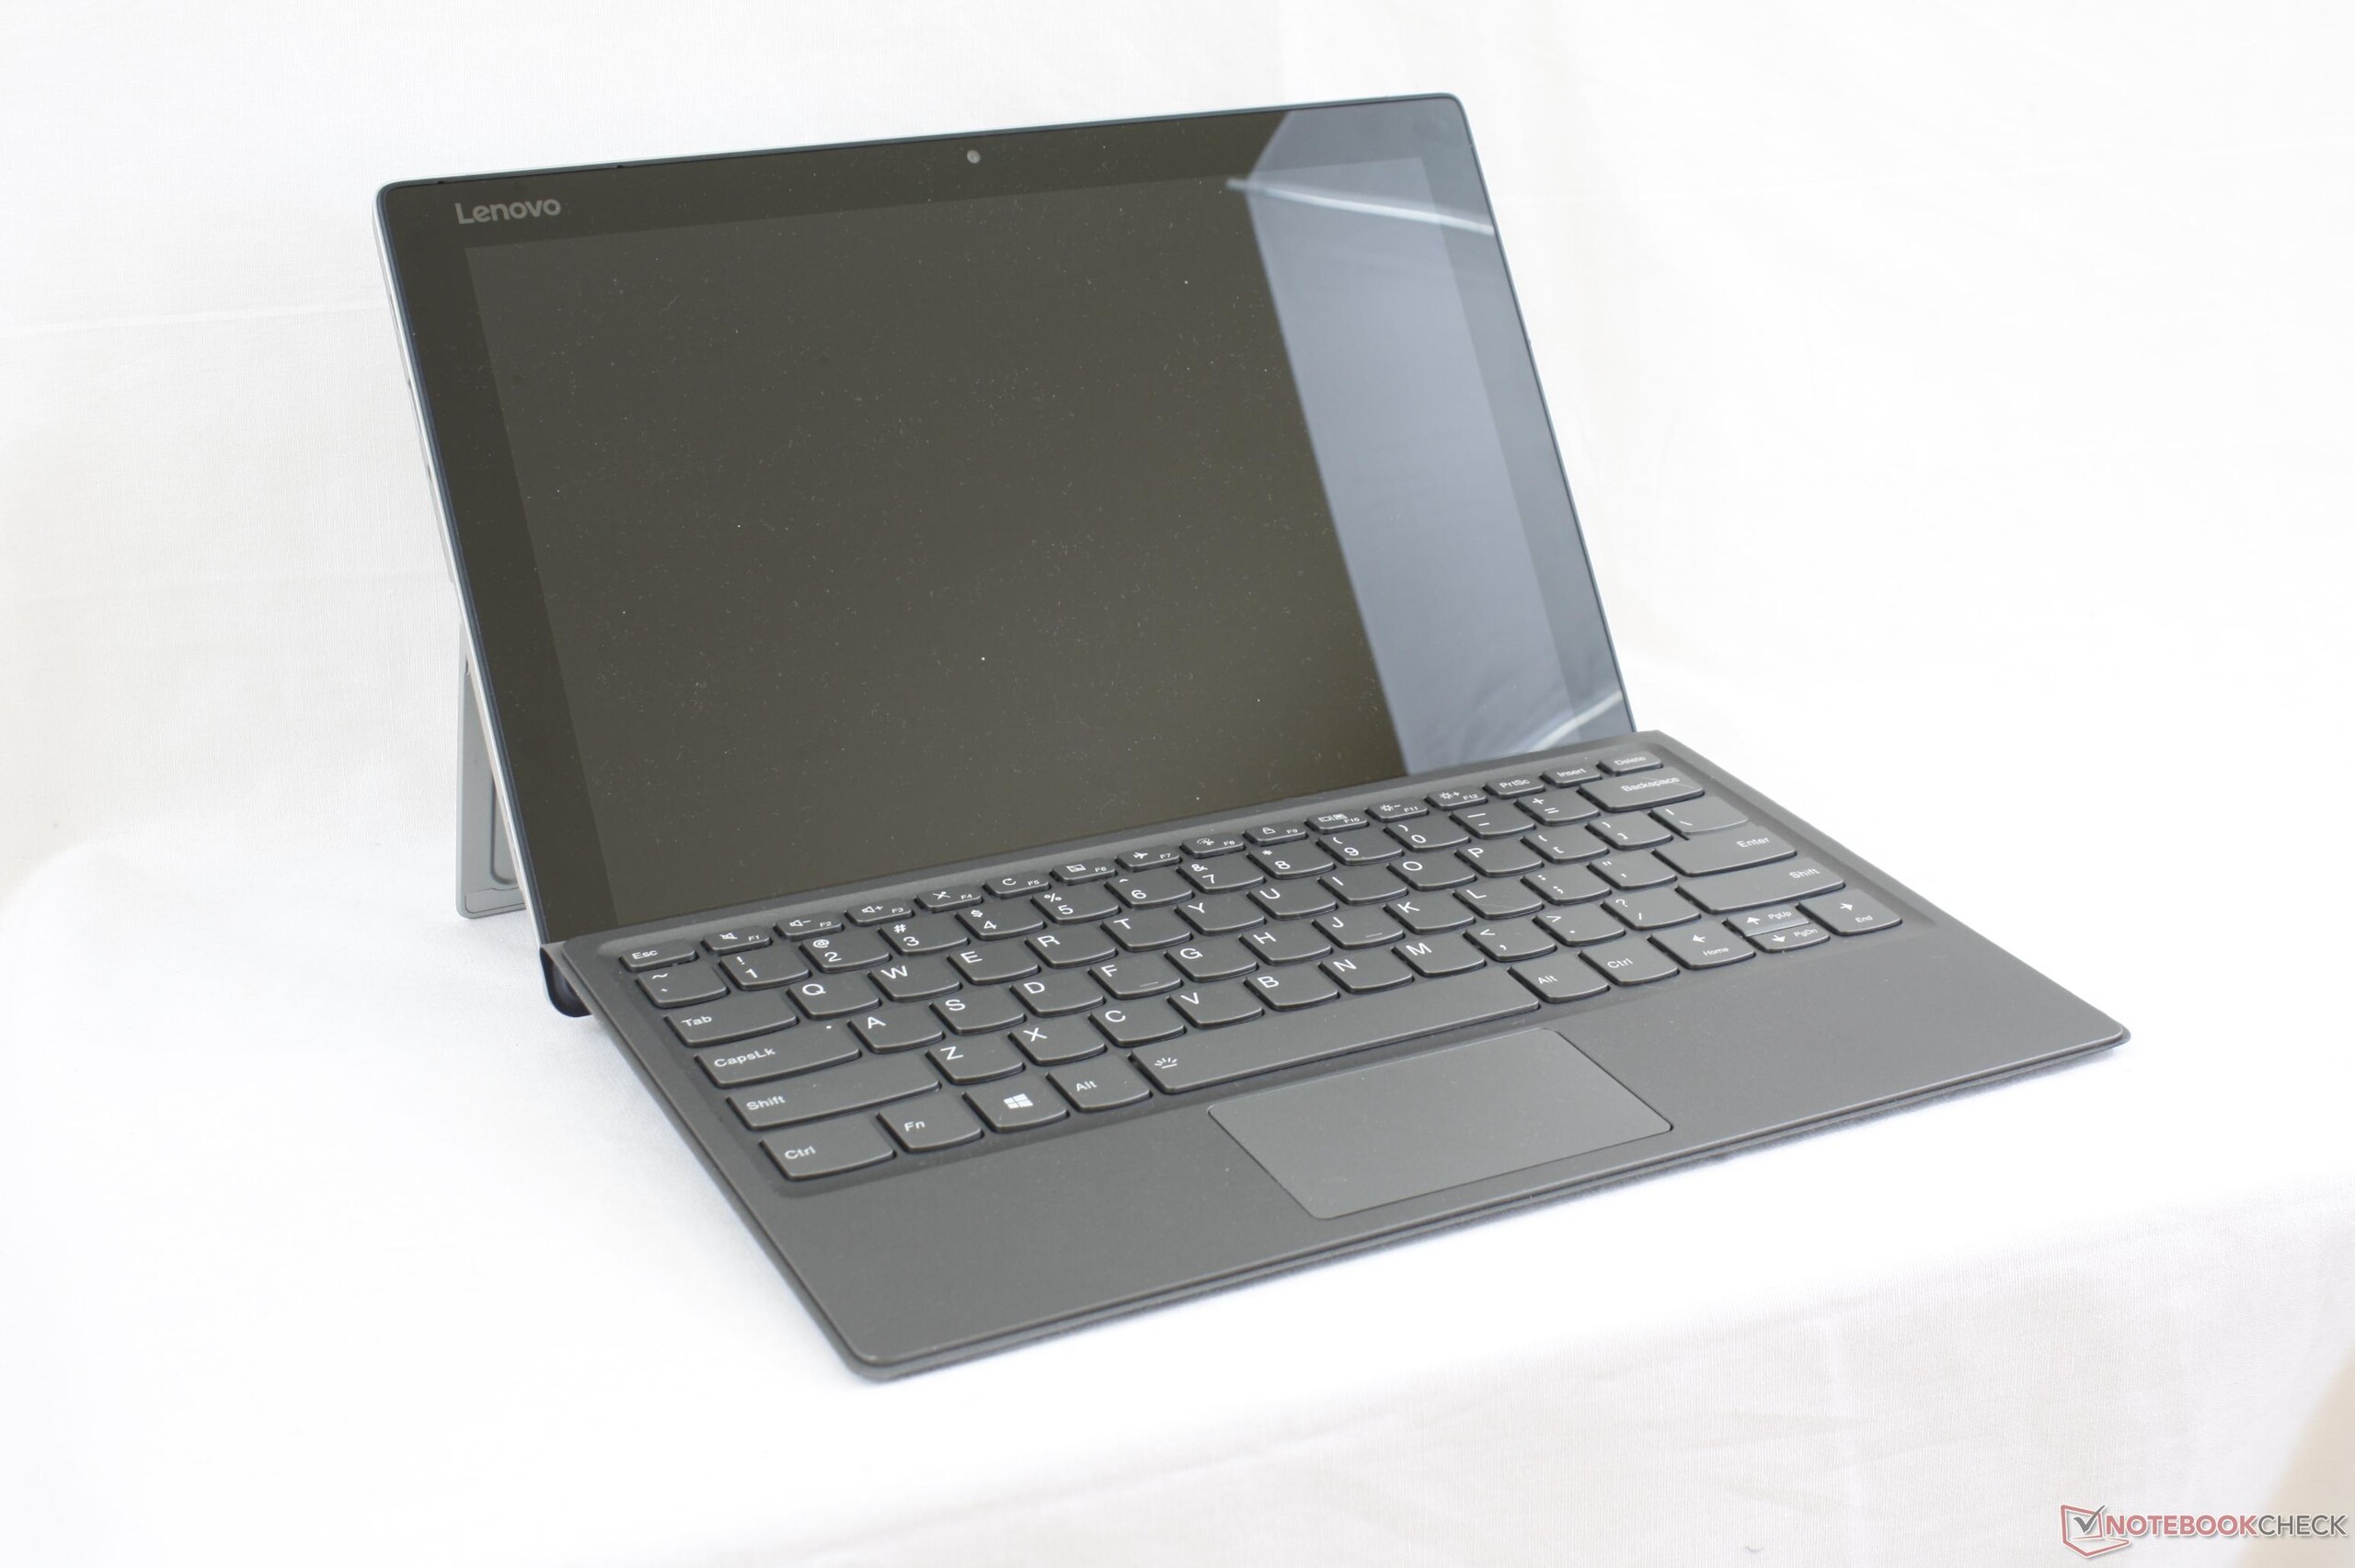
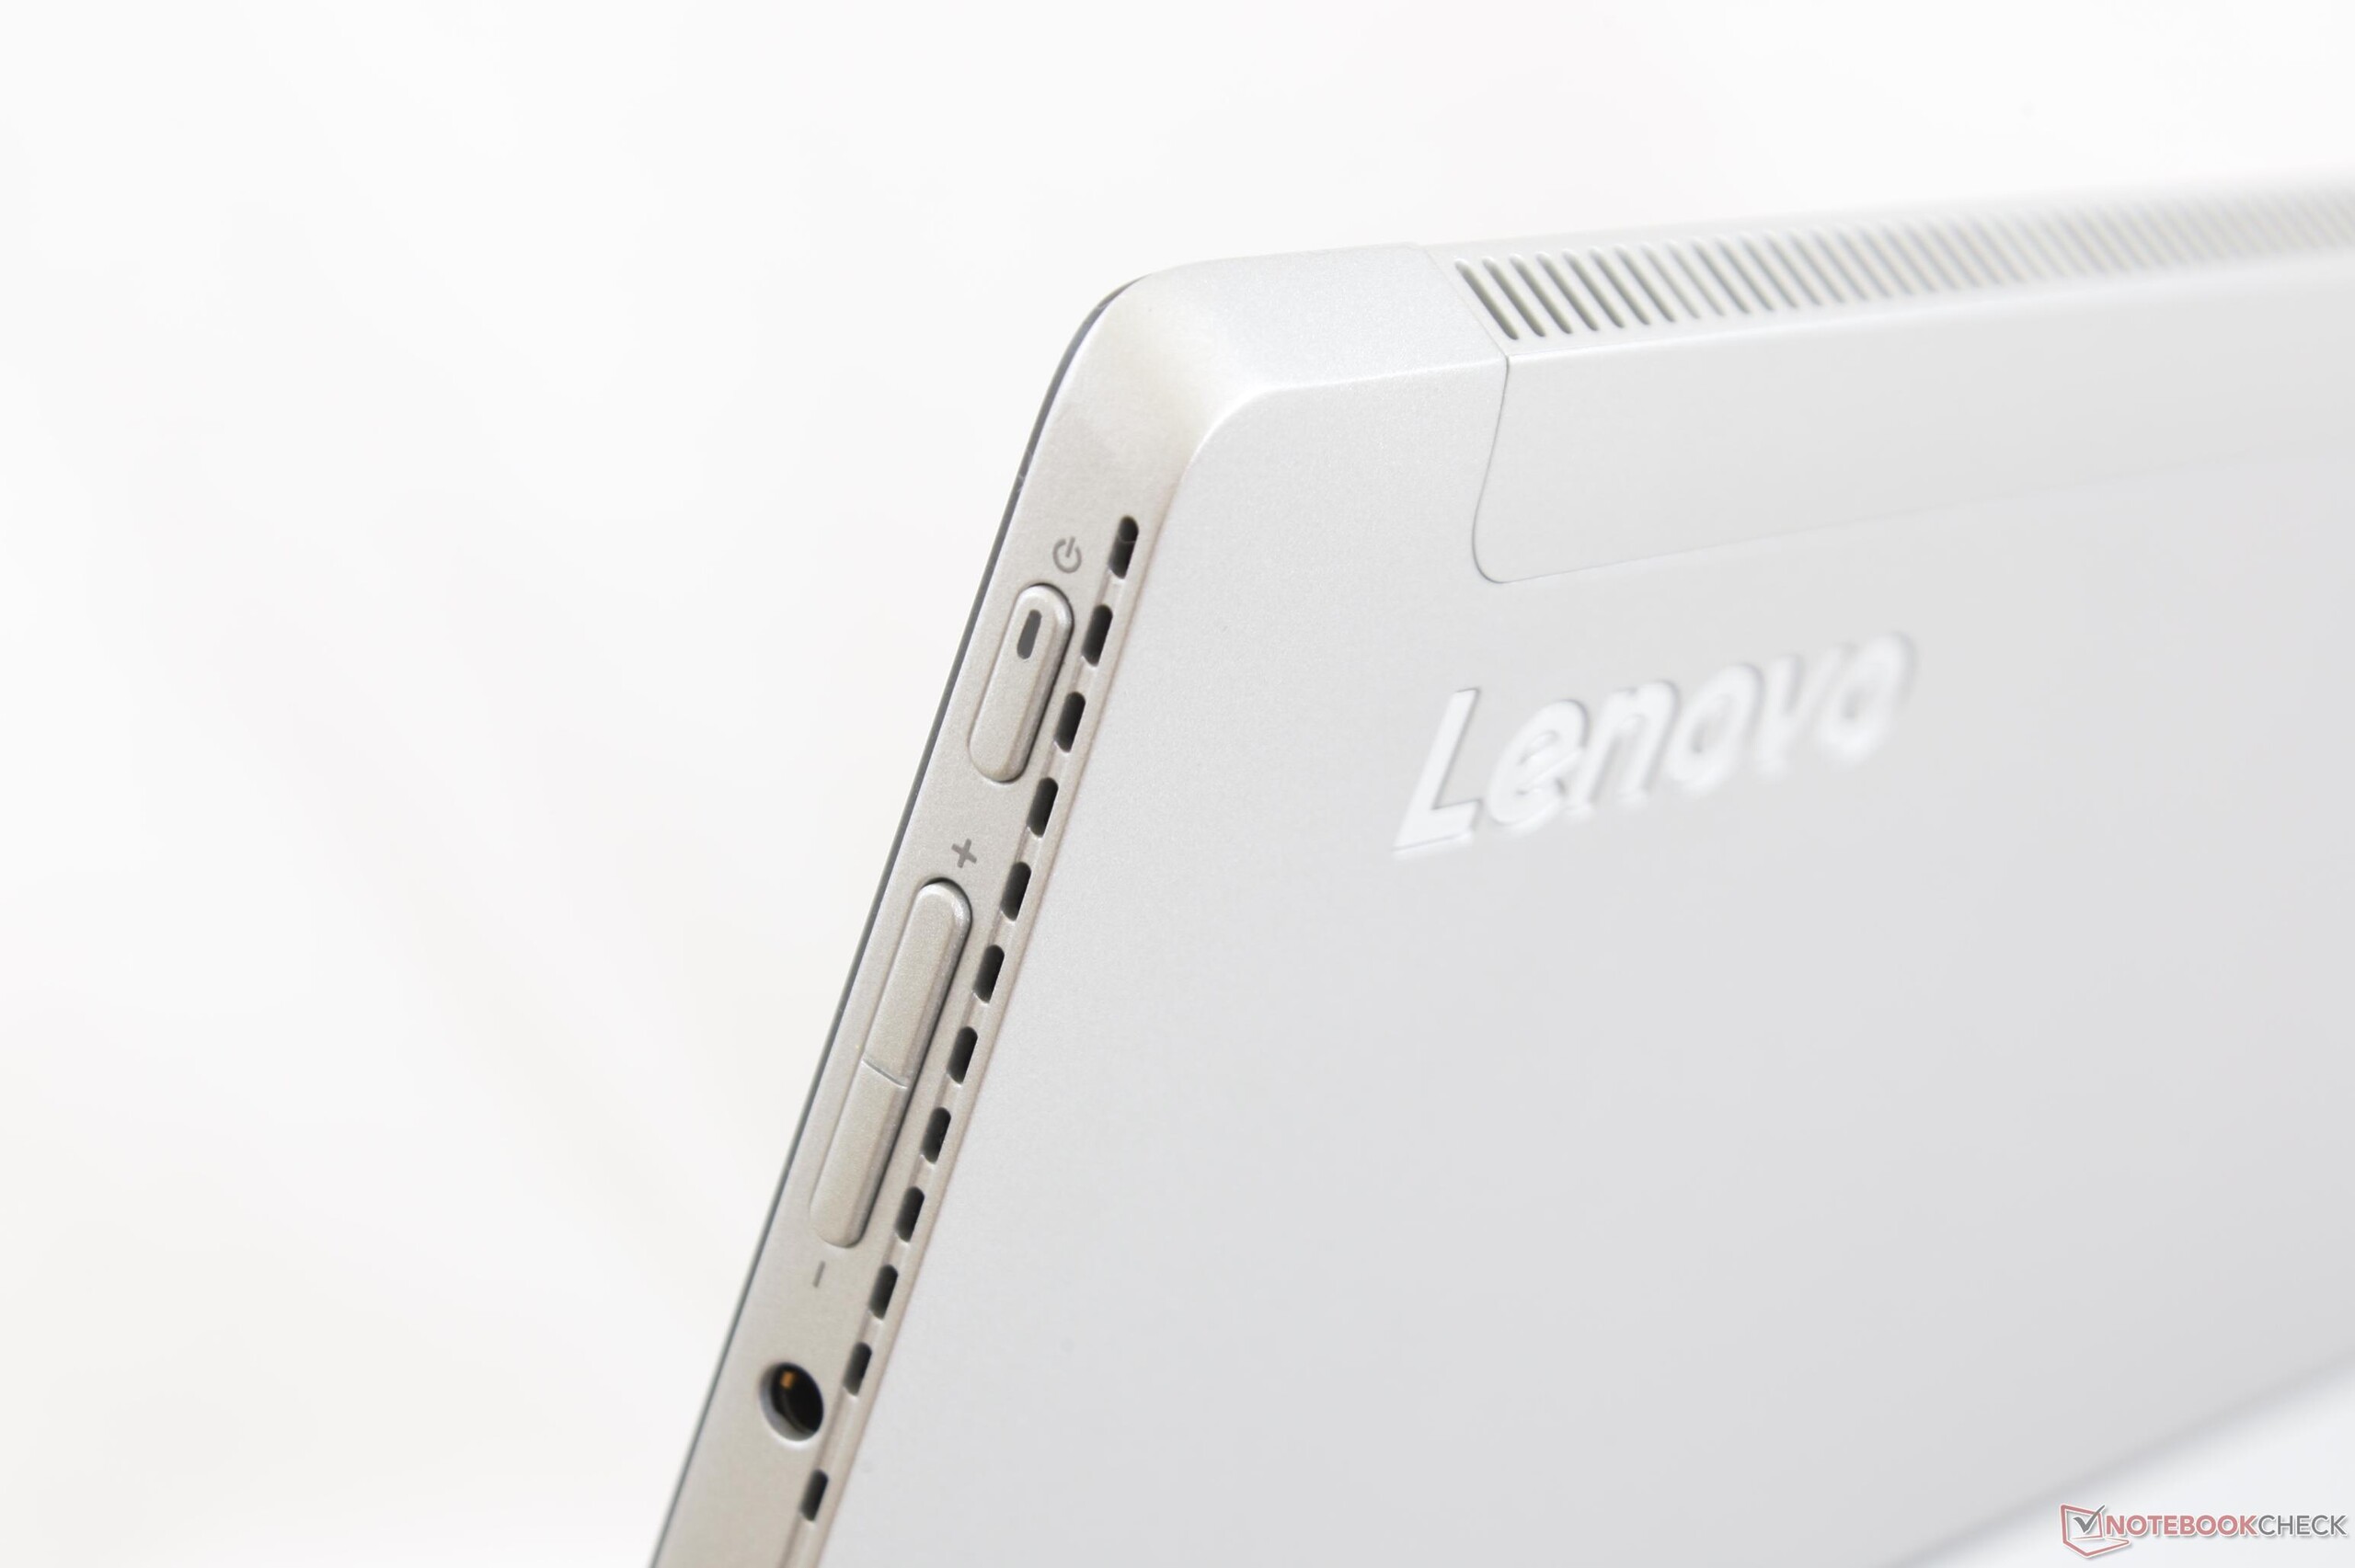
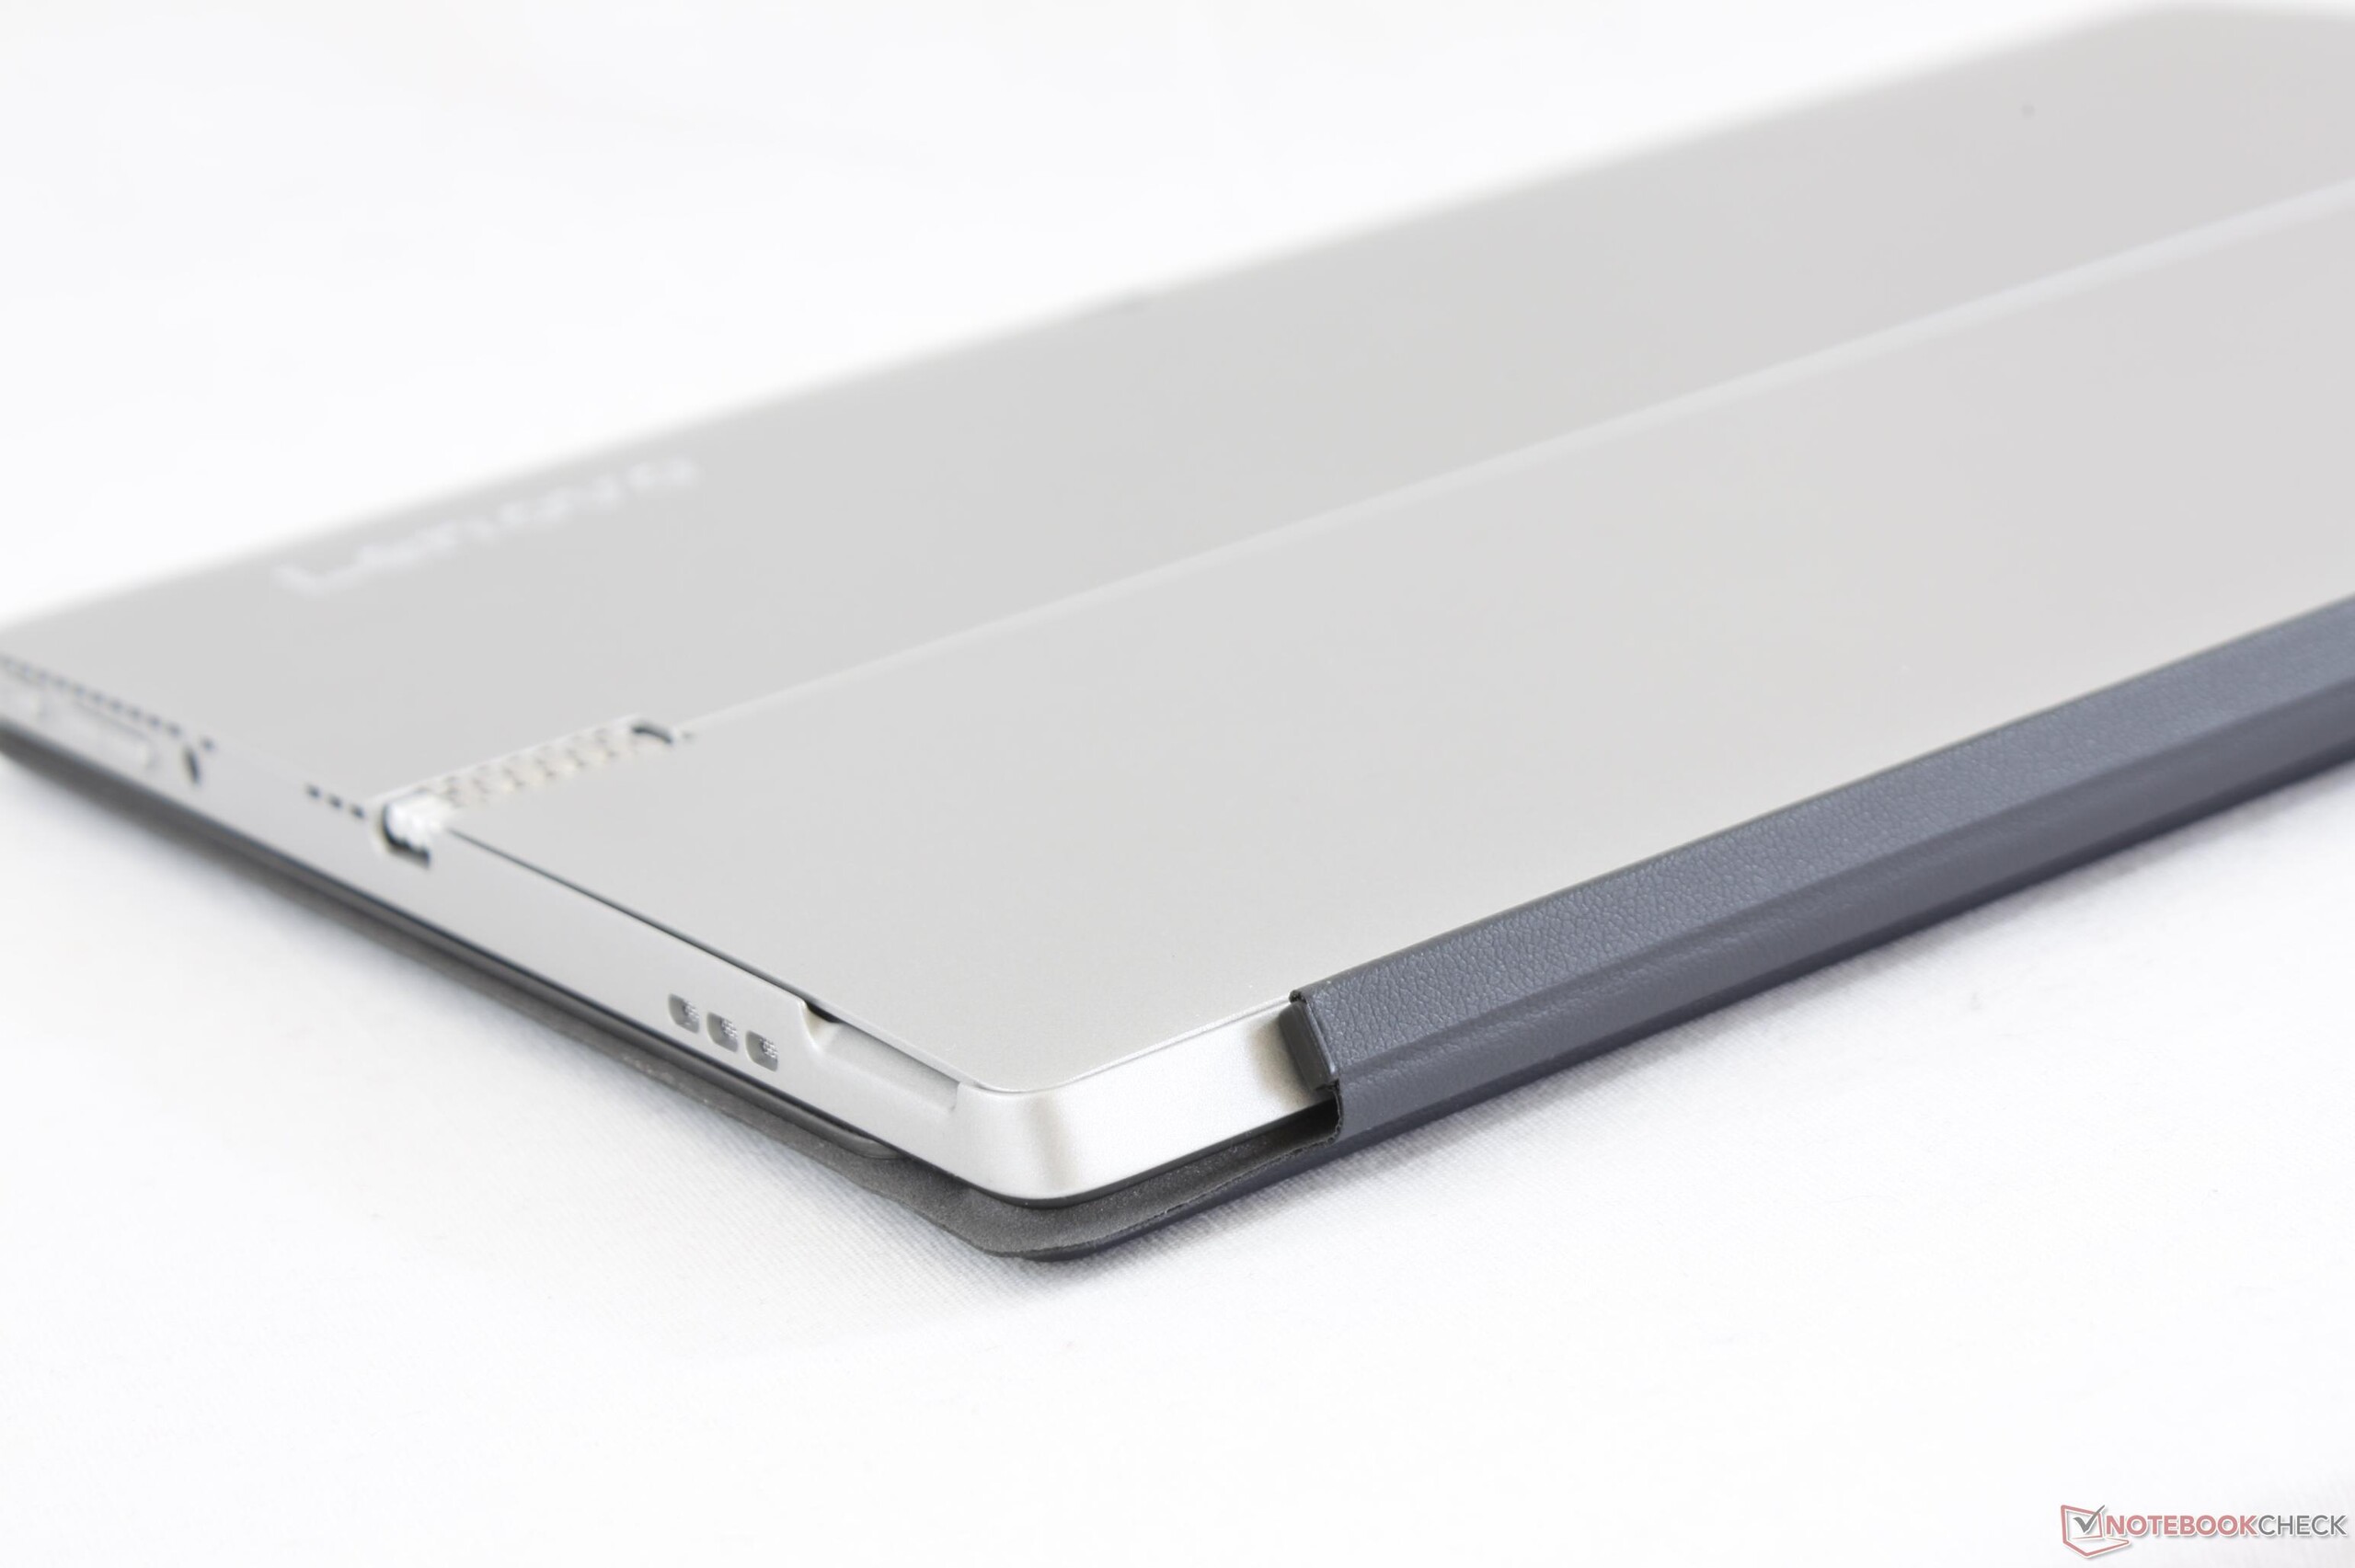
As described in our review of the Miix 510, the aluminum chassis of the Miix 520 feels tight and representative of the high four-digit starting price. It's not perfectly rigid, however, as attempting to twist the tablet from its sides will result in slight creaking and visible bending. Fortunately, the degree by which this occurs is minimal and doesn't detract from the build quality of the tablet. Nonetheless, users who want something firmer and more unyielding may want to look at the Surface Pro or Latitude 7285 as they feel stronger in the hand.
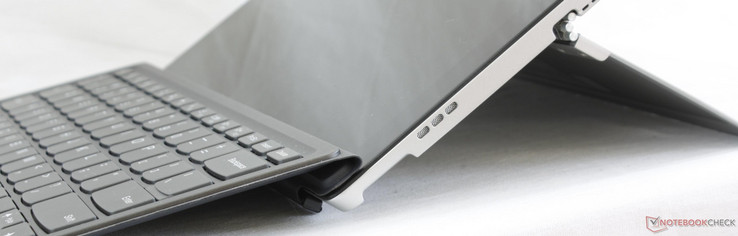
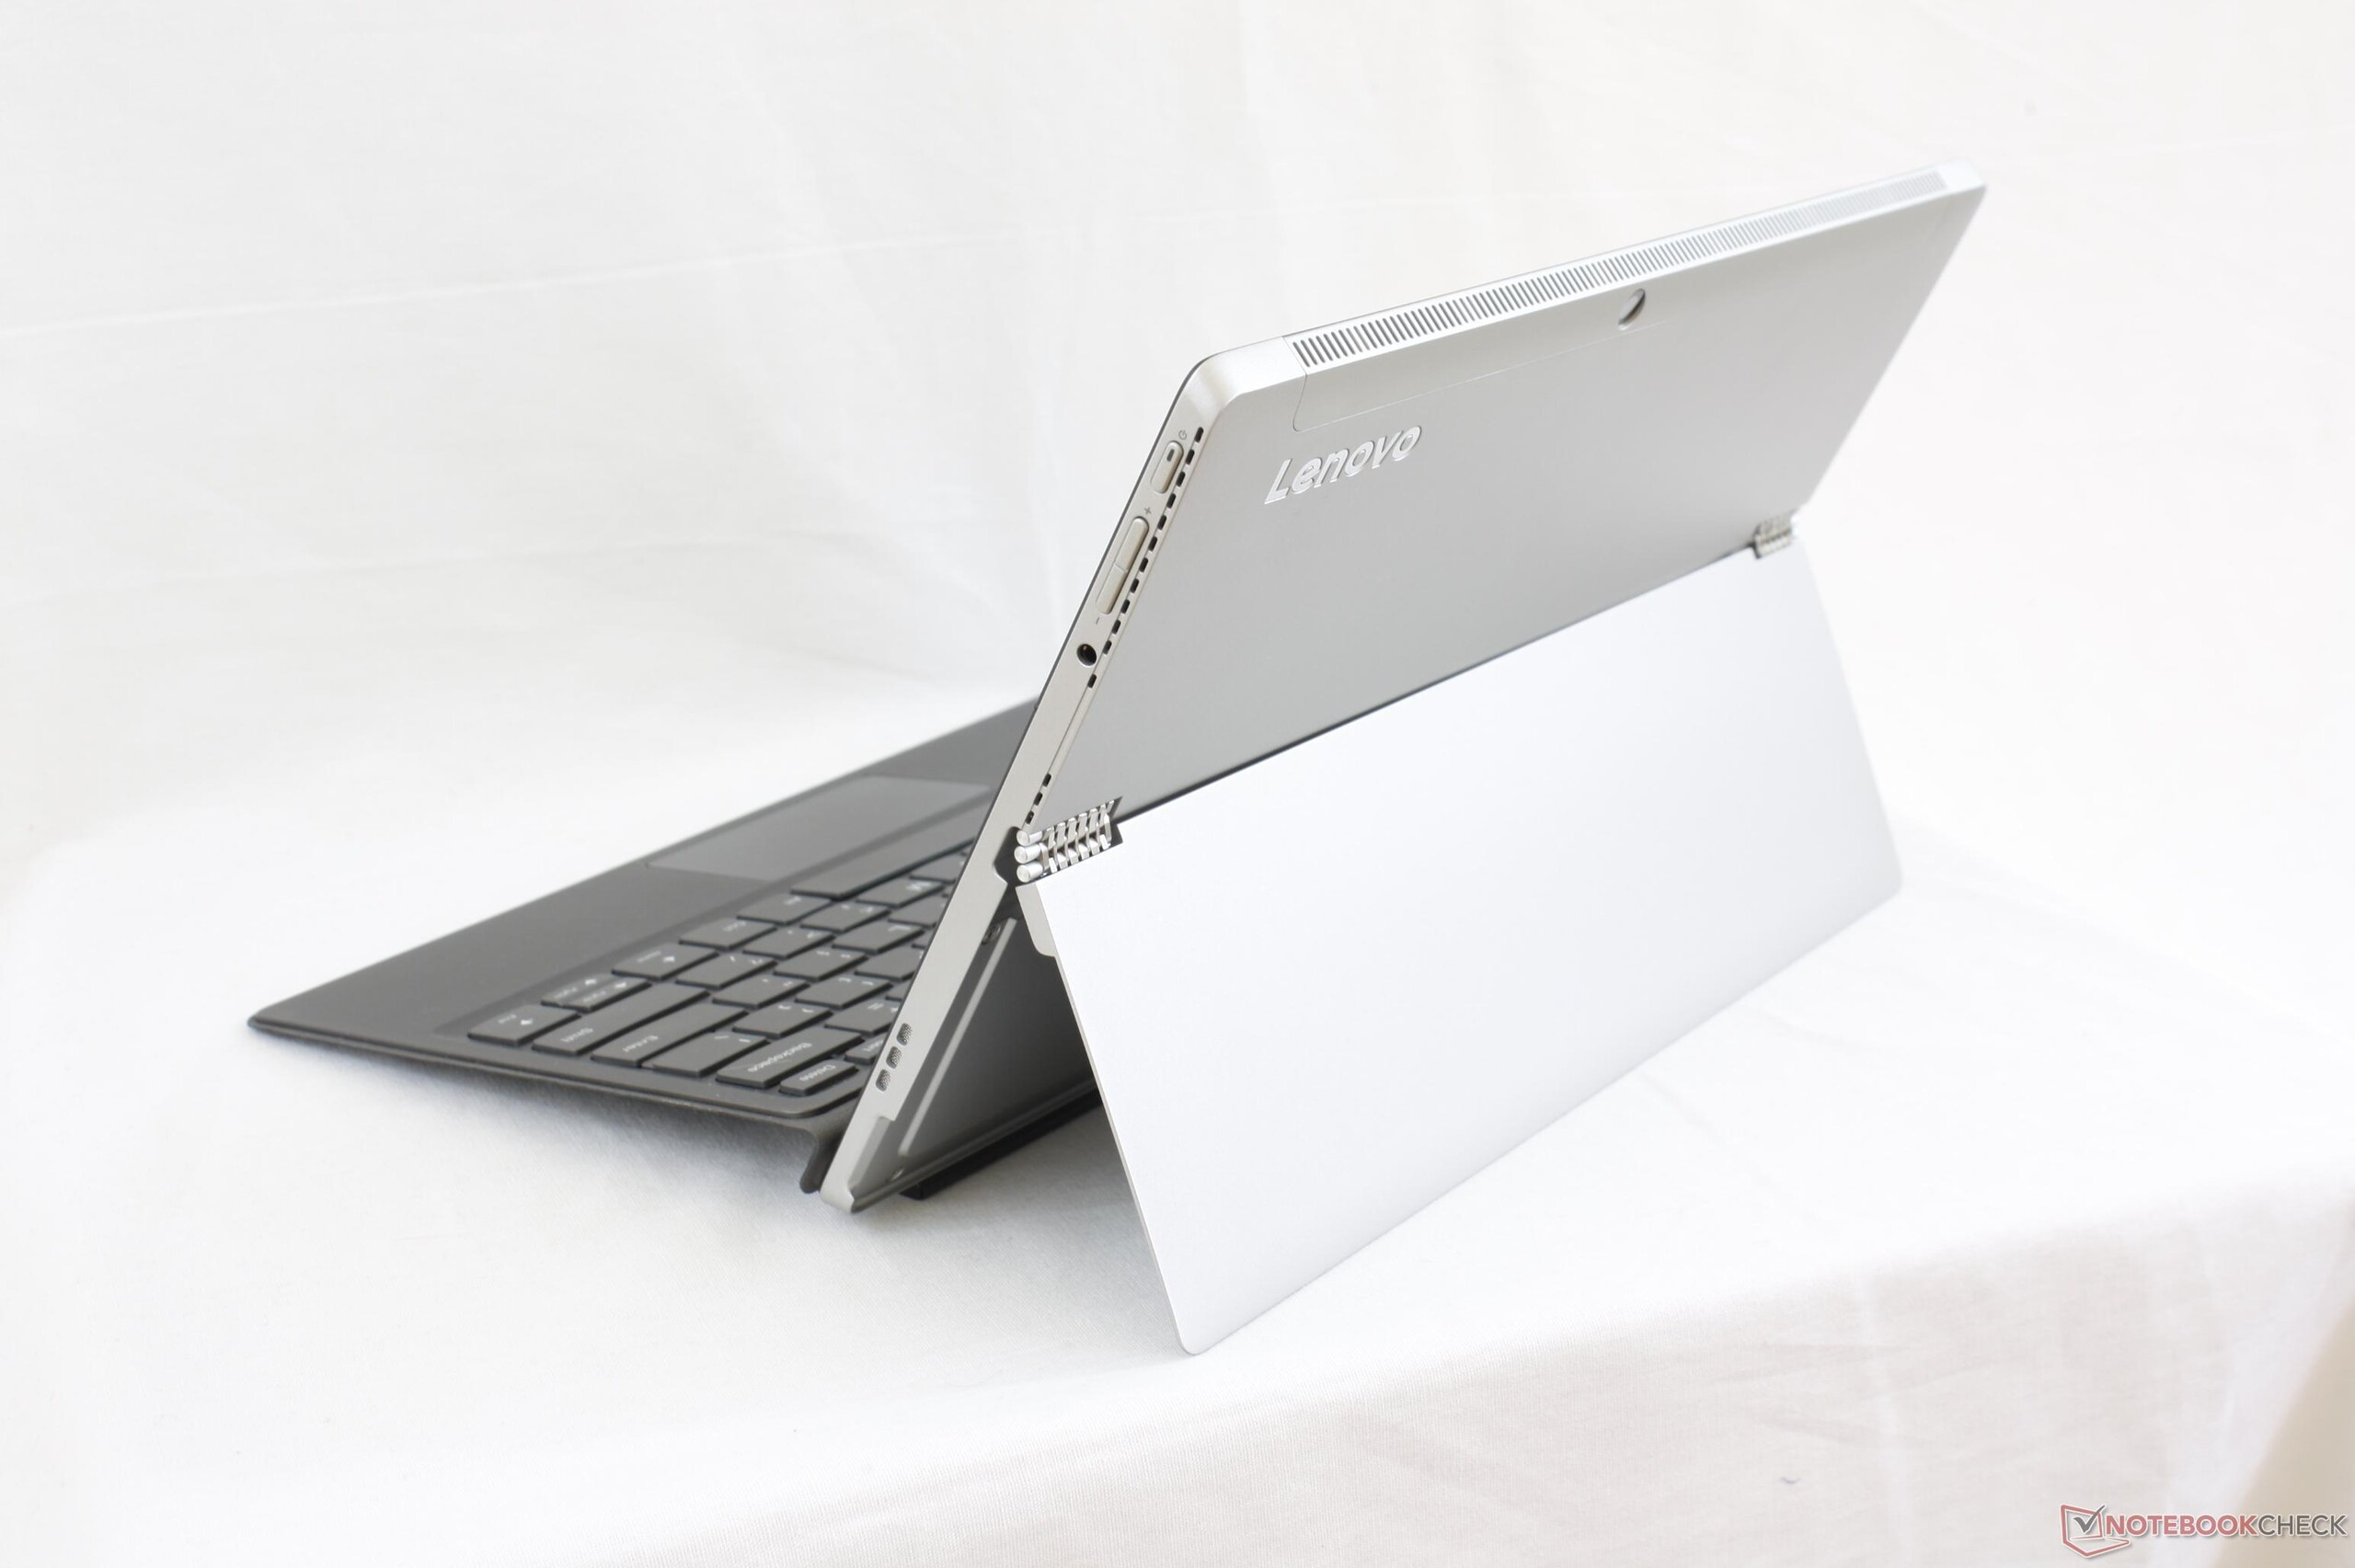
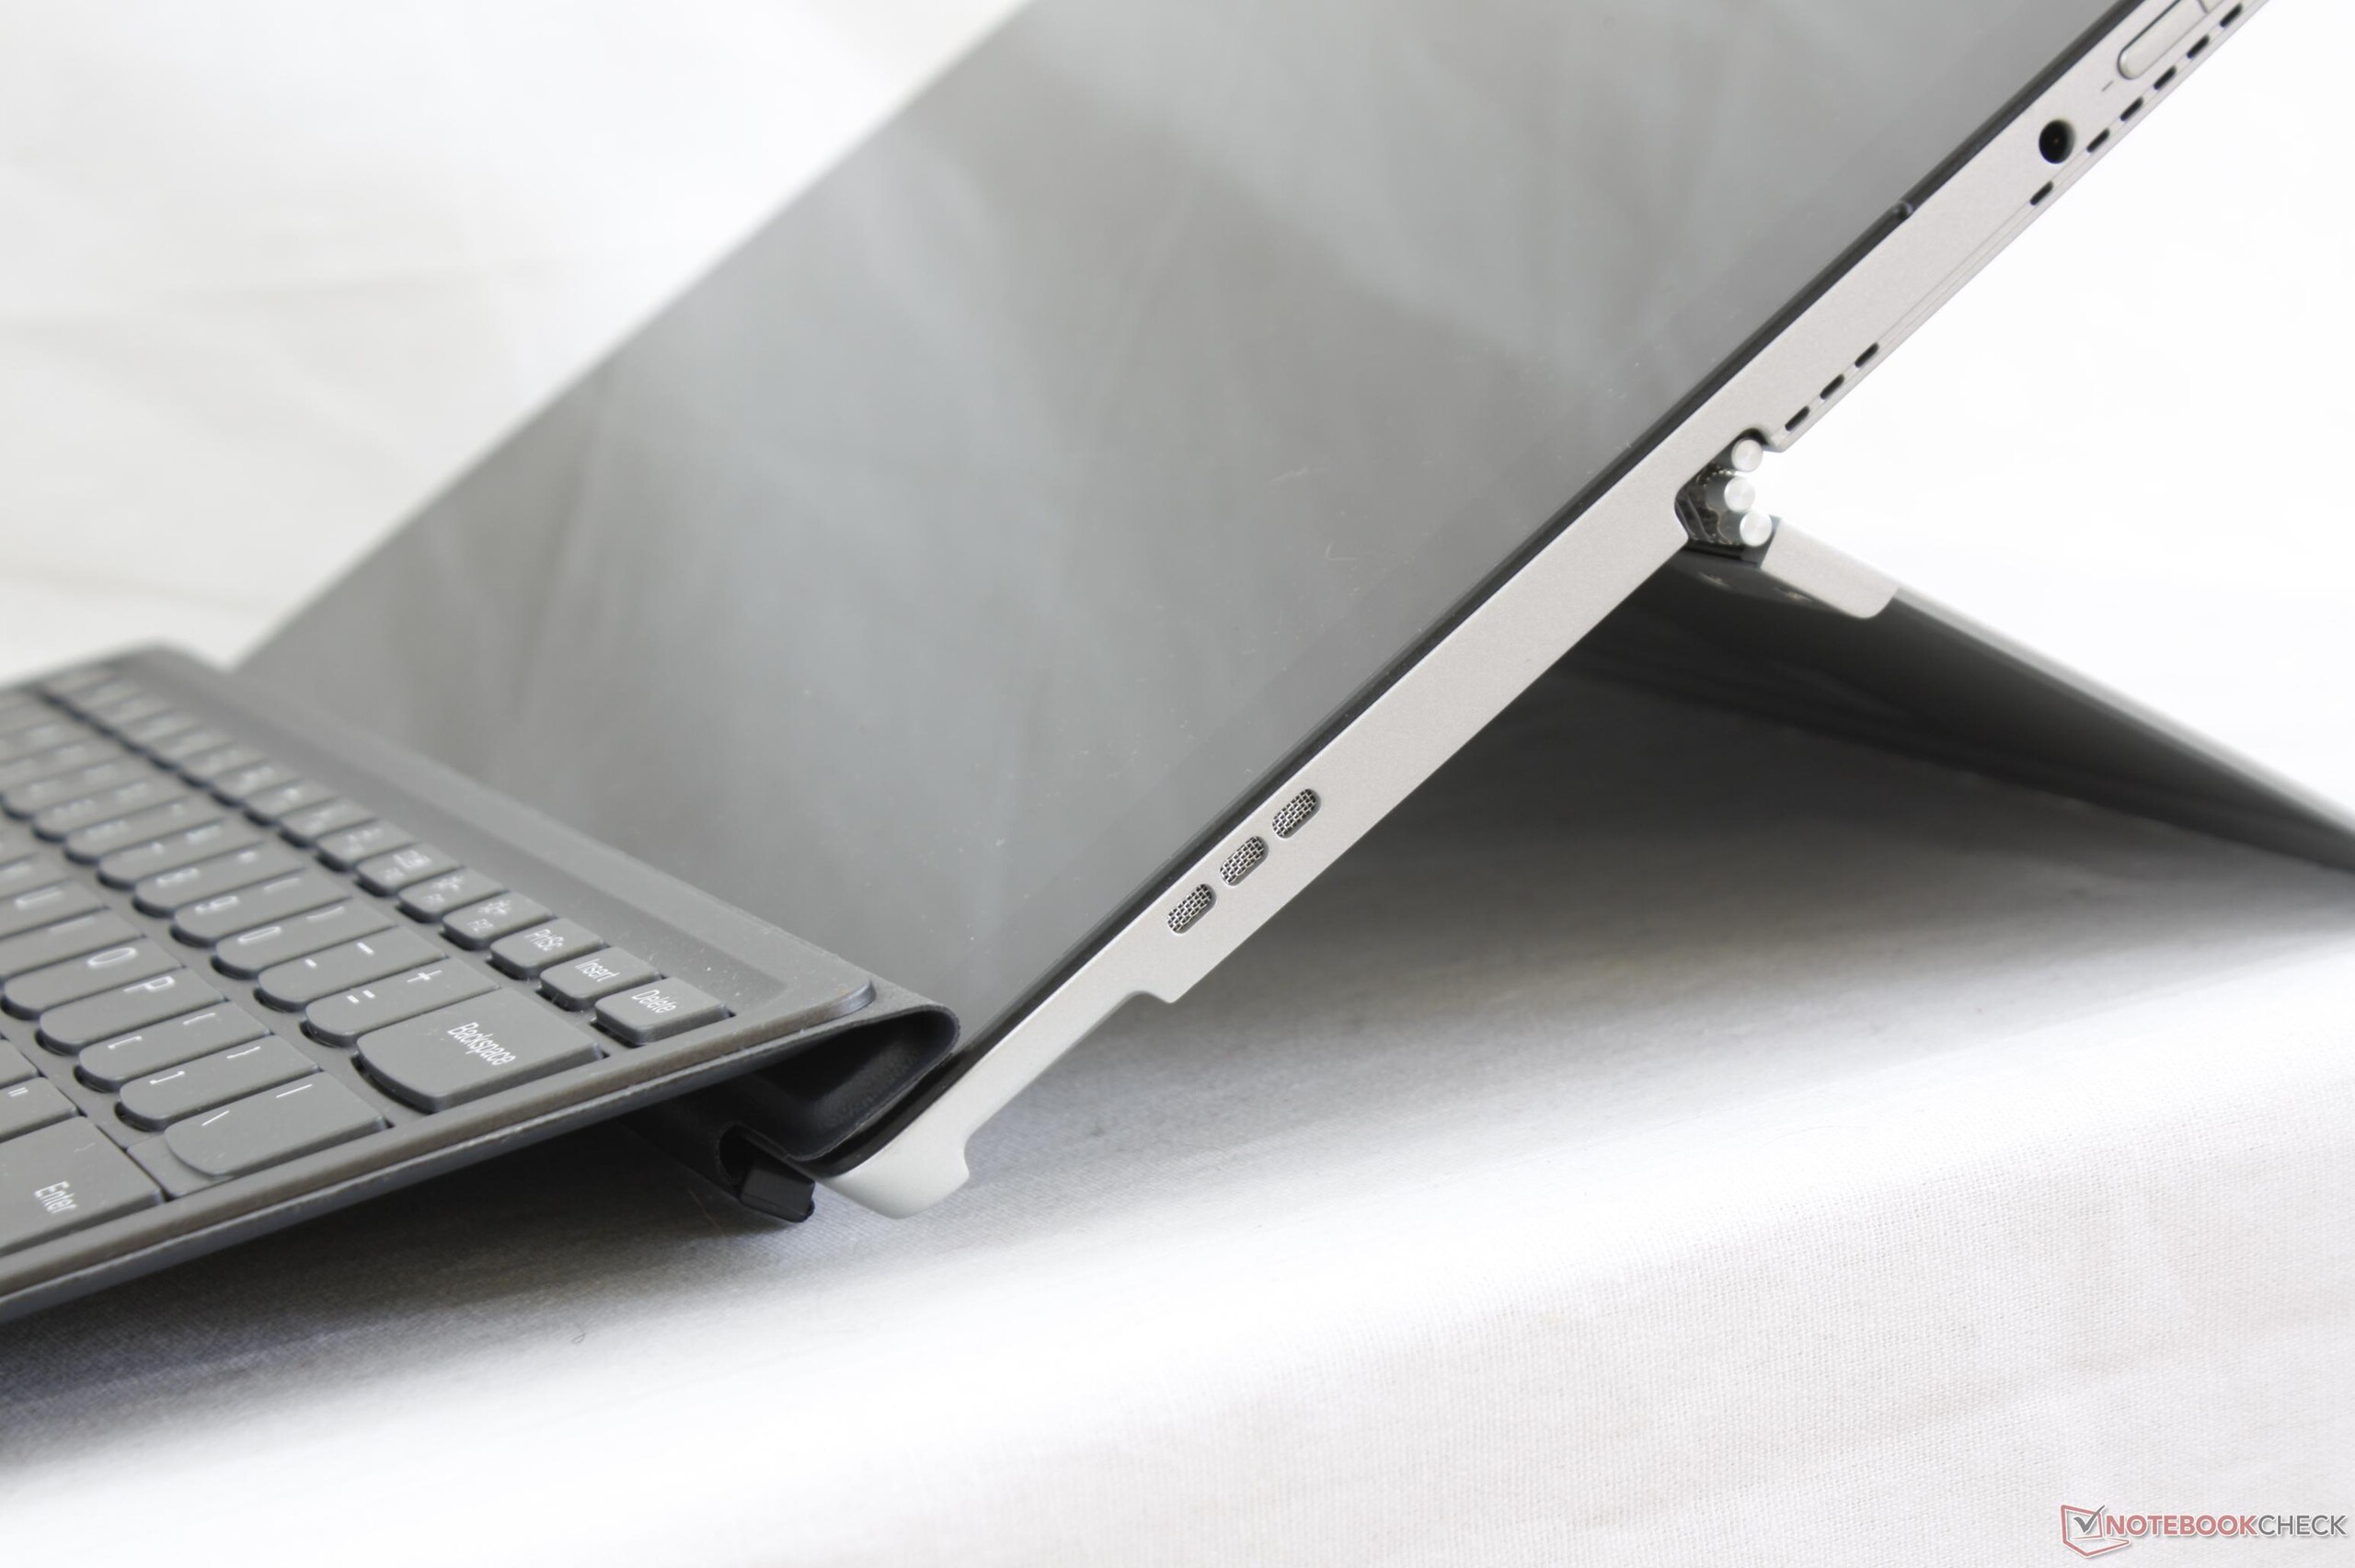
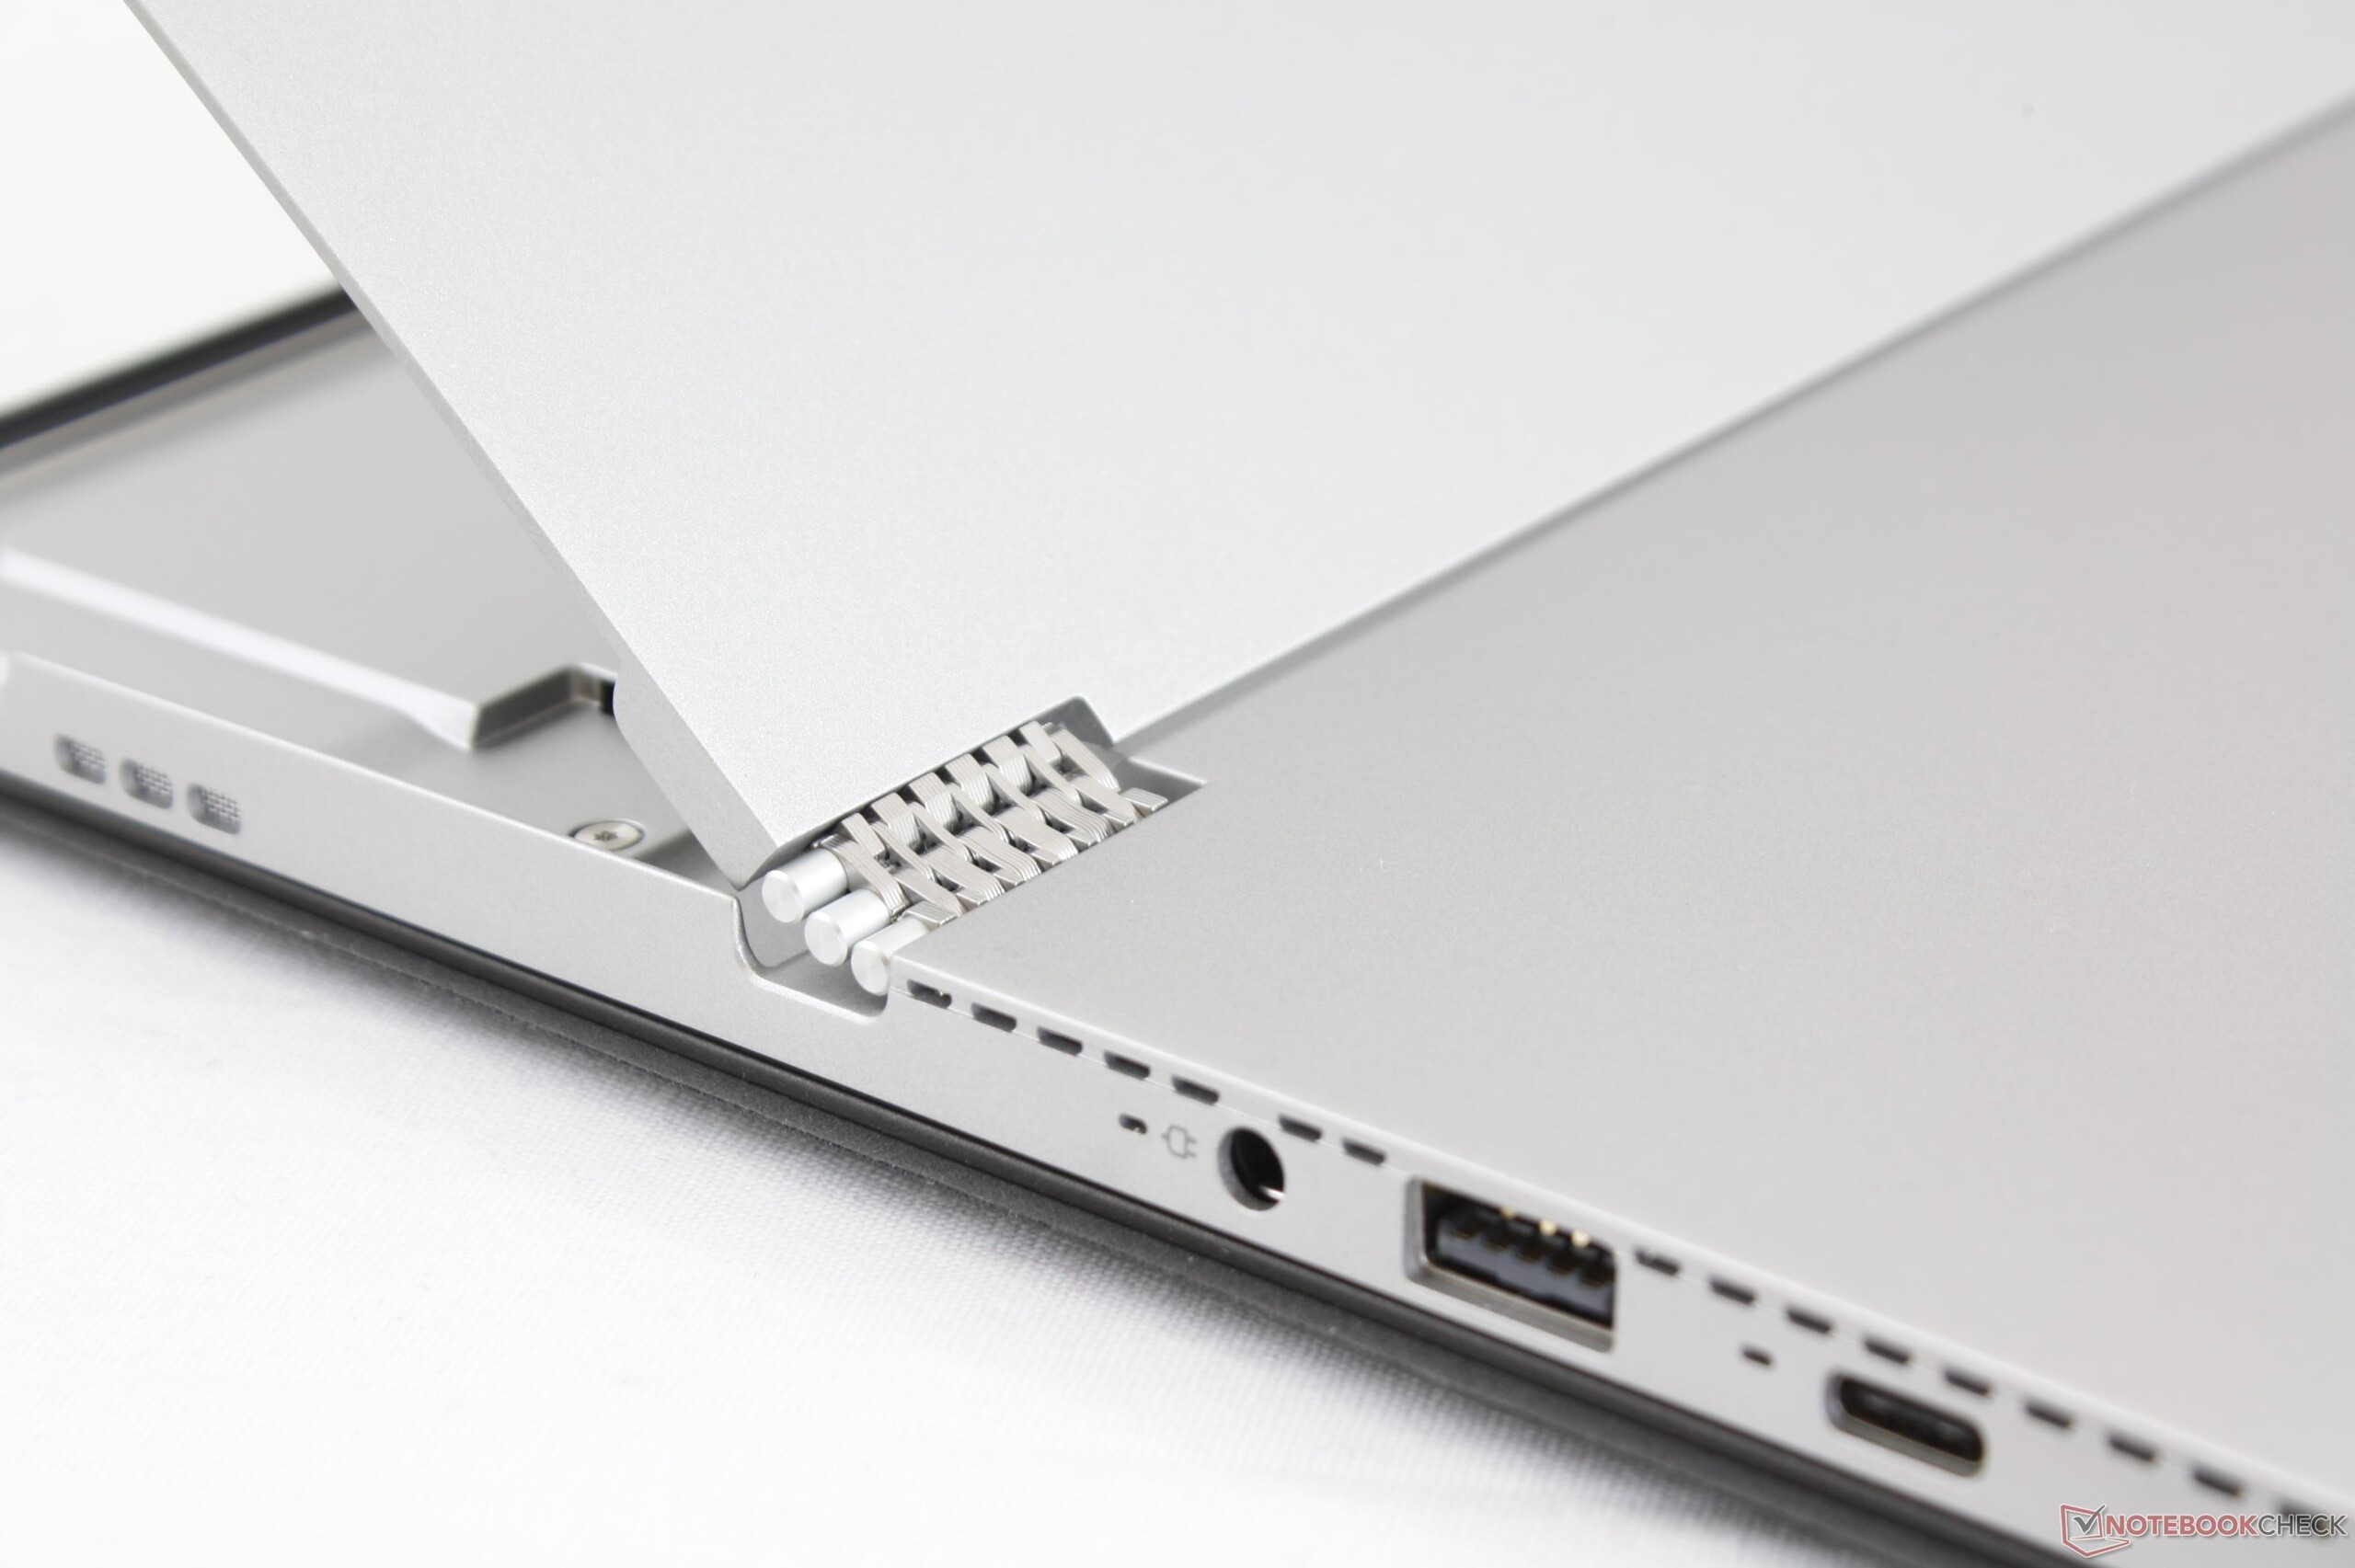
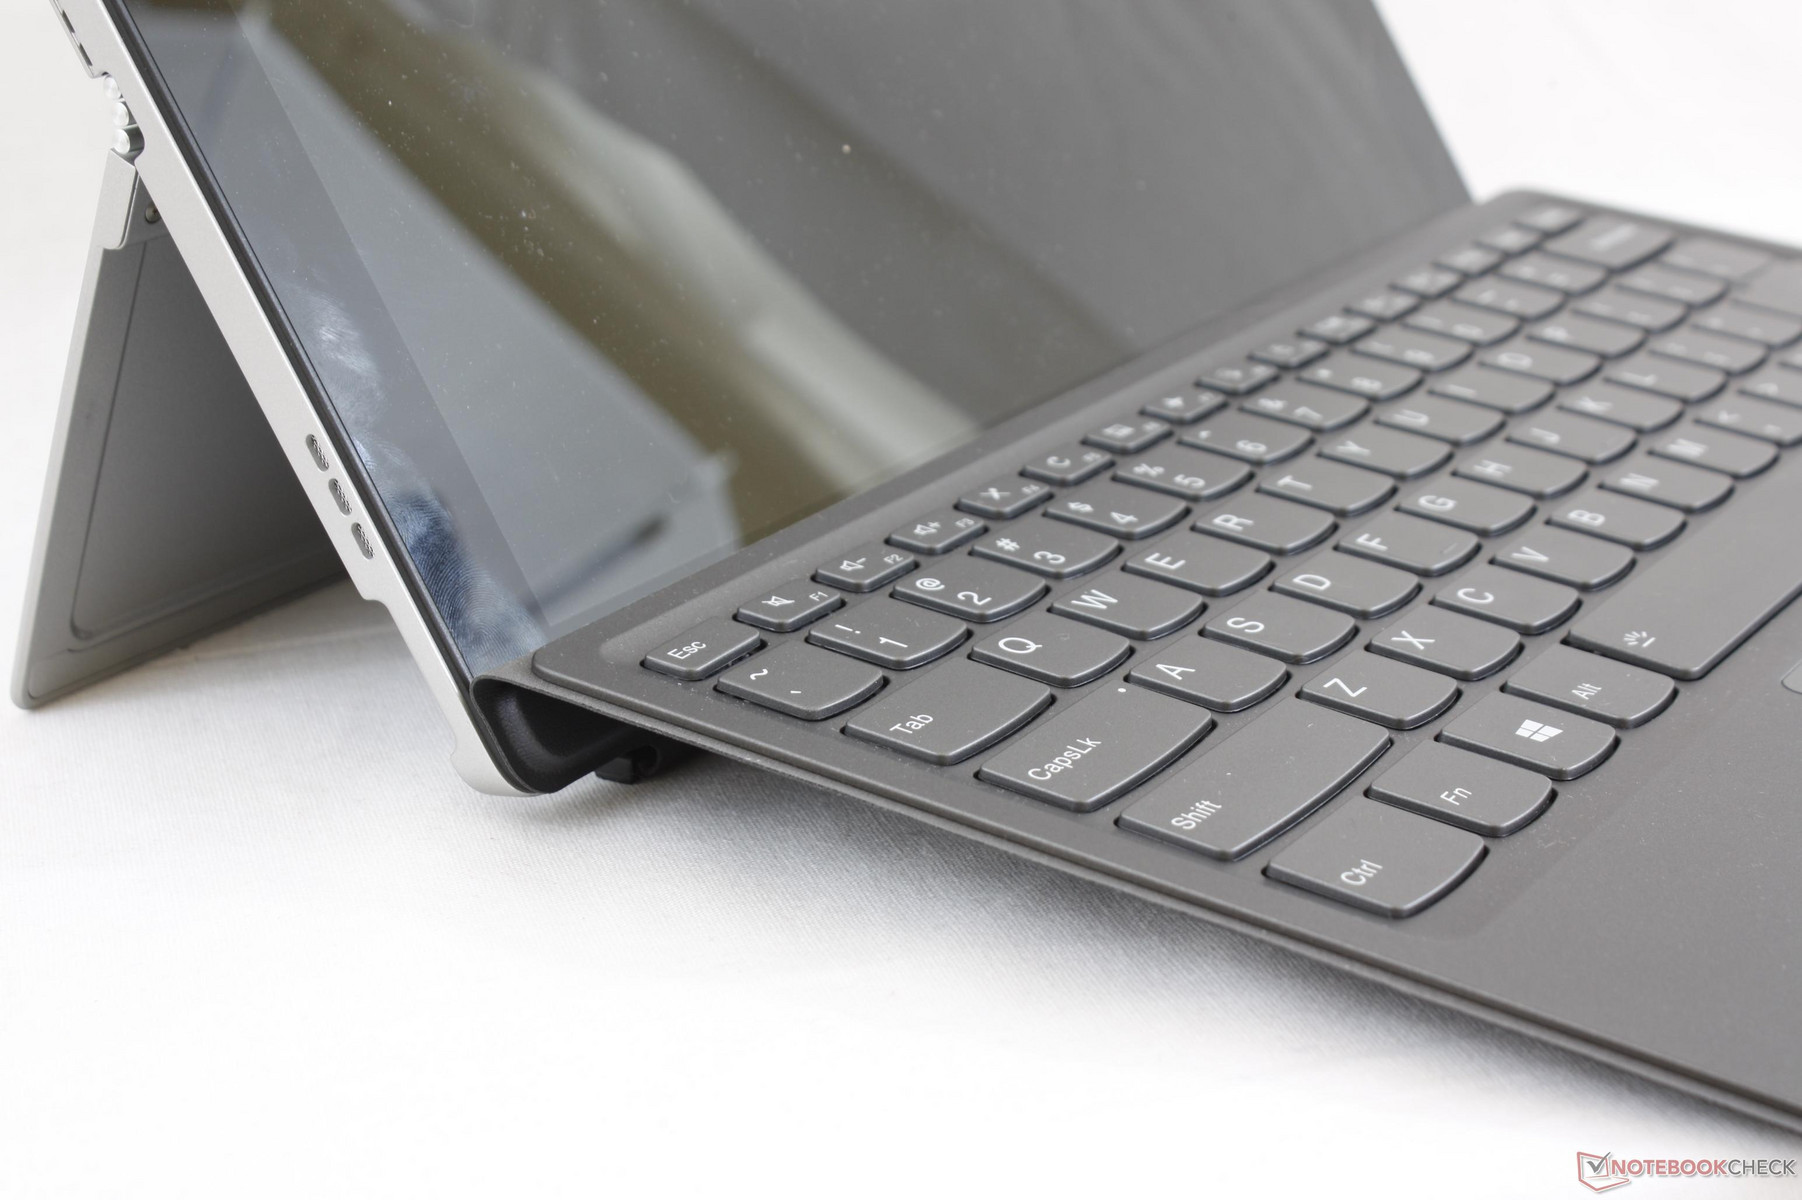
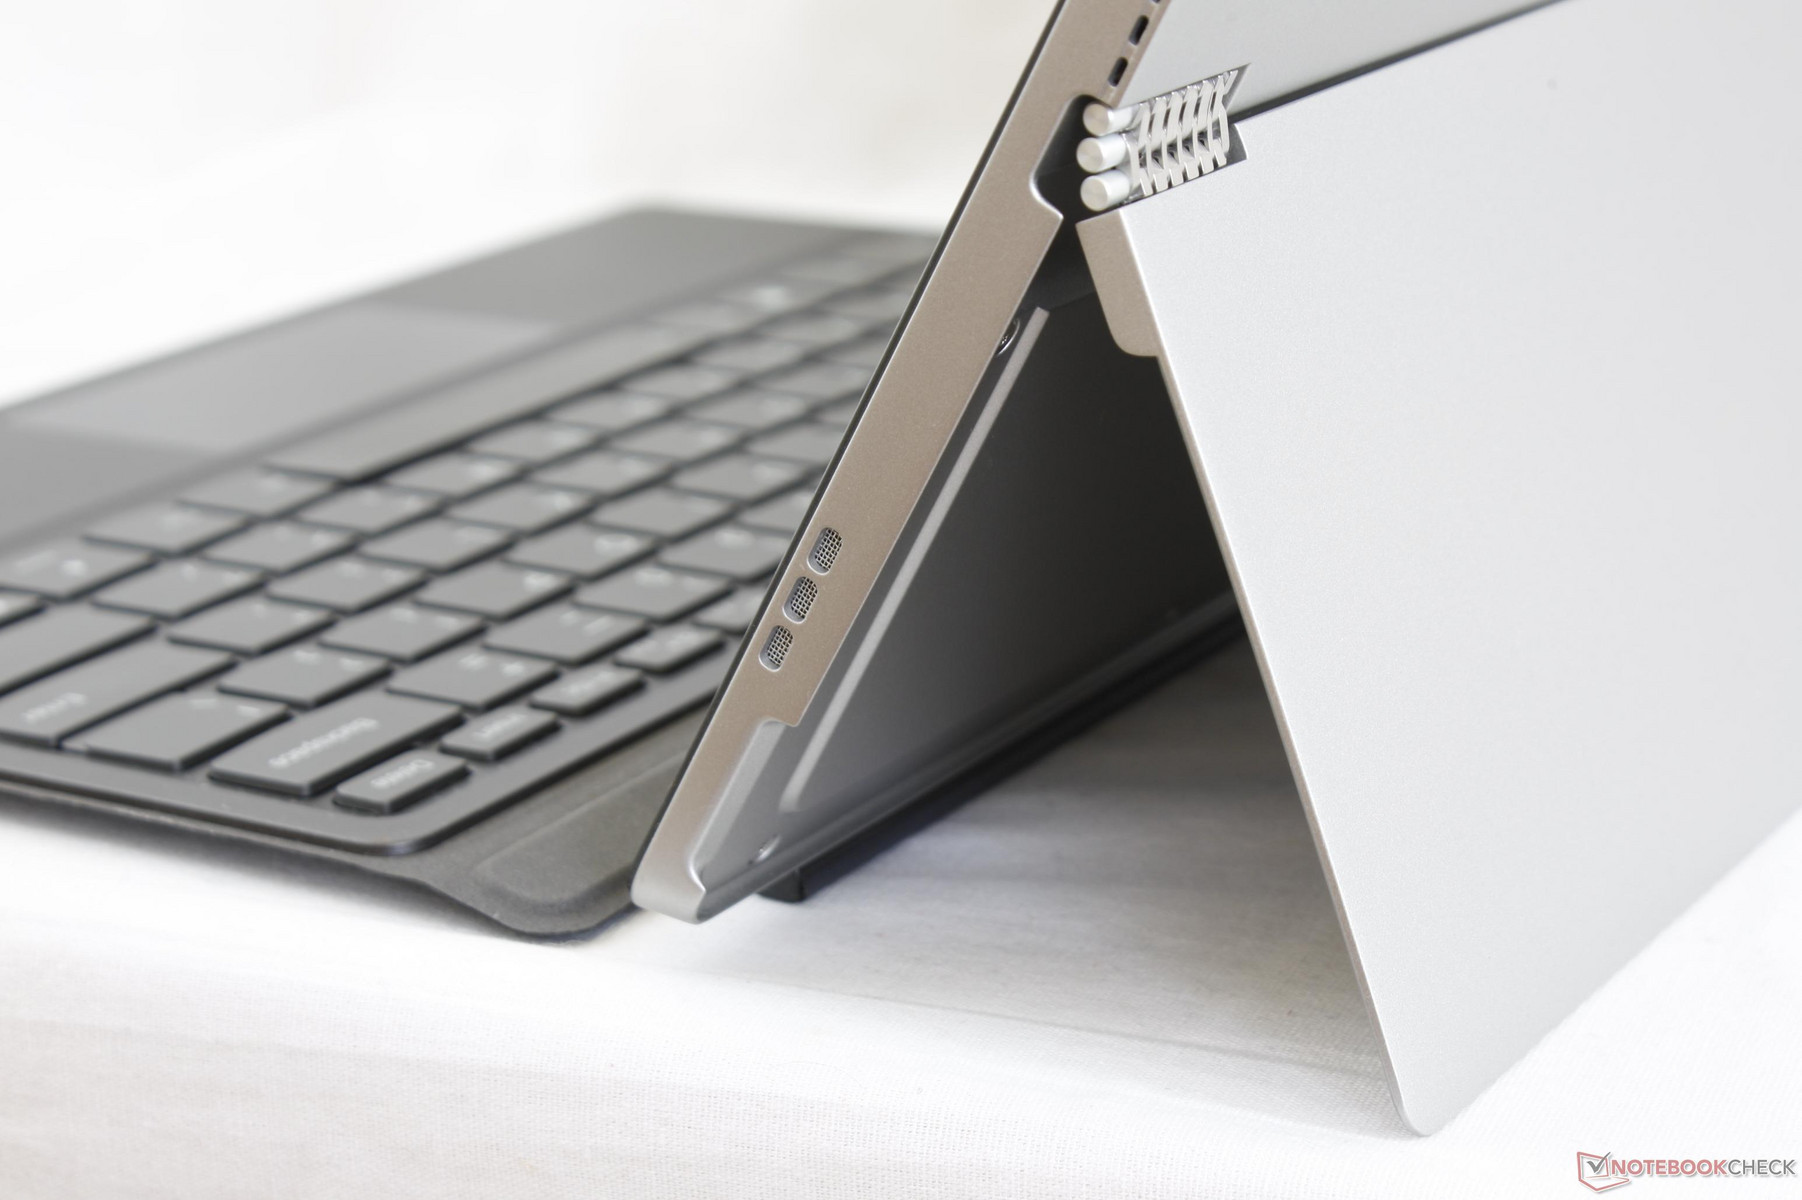
The wristband hinge-stand has translated well from Lenovo's high-end Yoga 900 series. The stand is uniformly firm at all angles up to its 150-degree maximum with no teetering when typing or transporting. If we are to nitpick, the stand can be difficult to deploy since it sits tightly against the tablet when closed and its opening notch is a bit too small for users with larger hands.
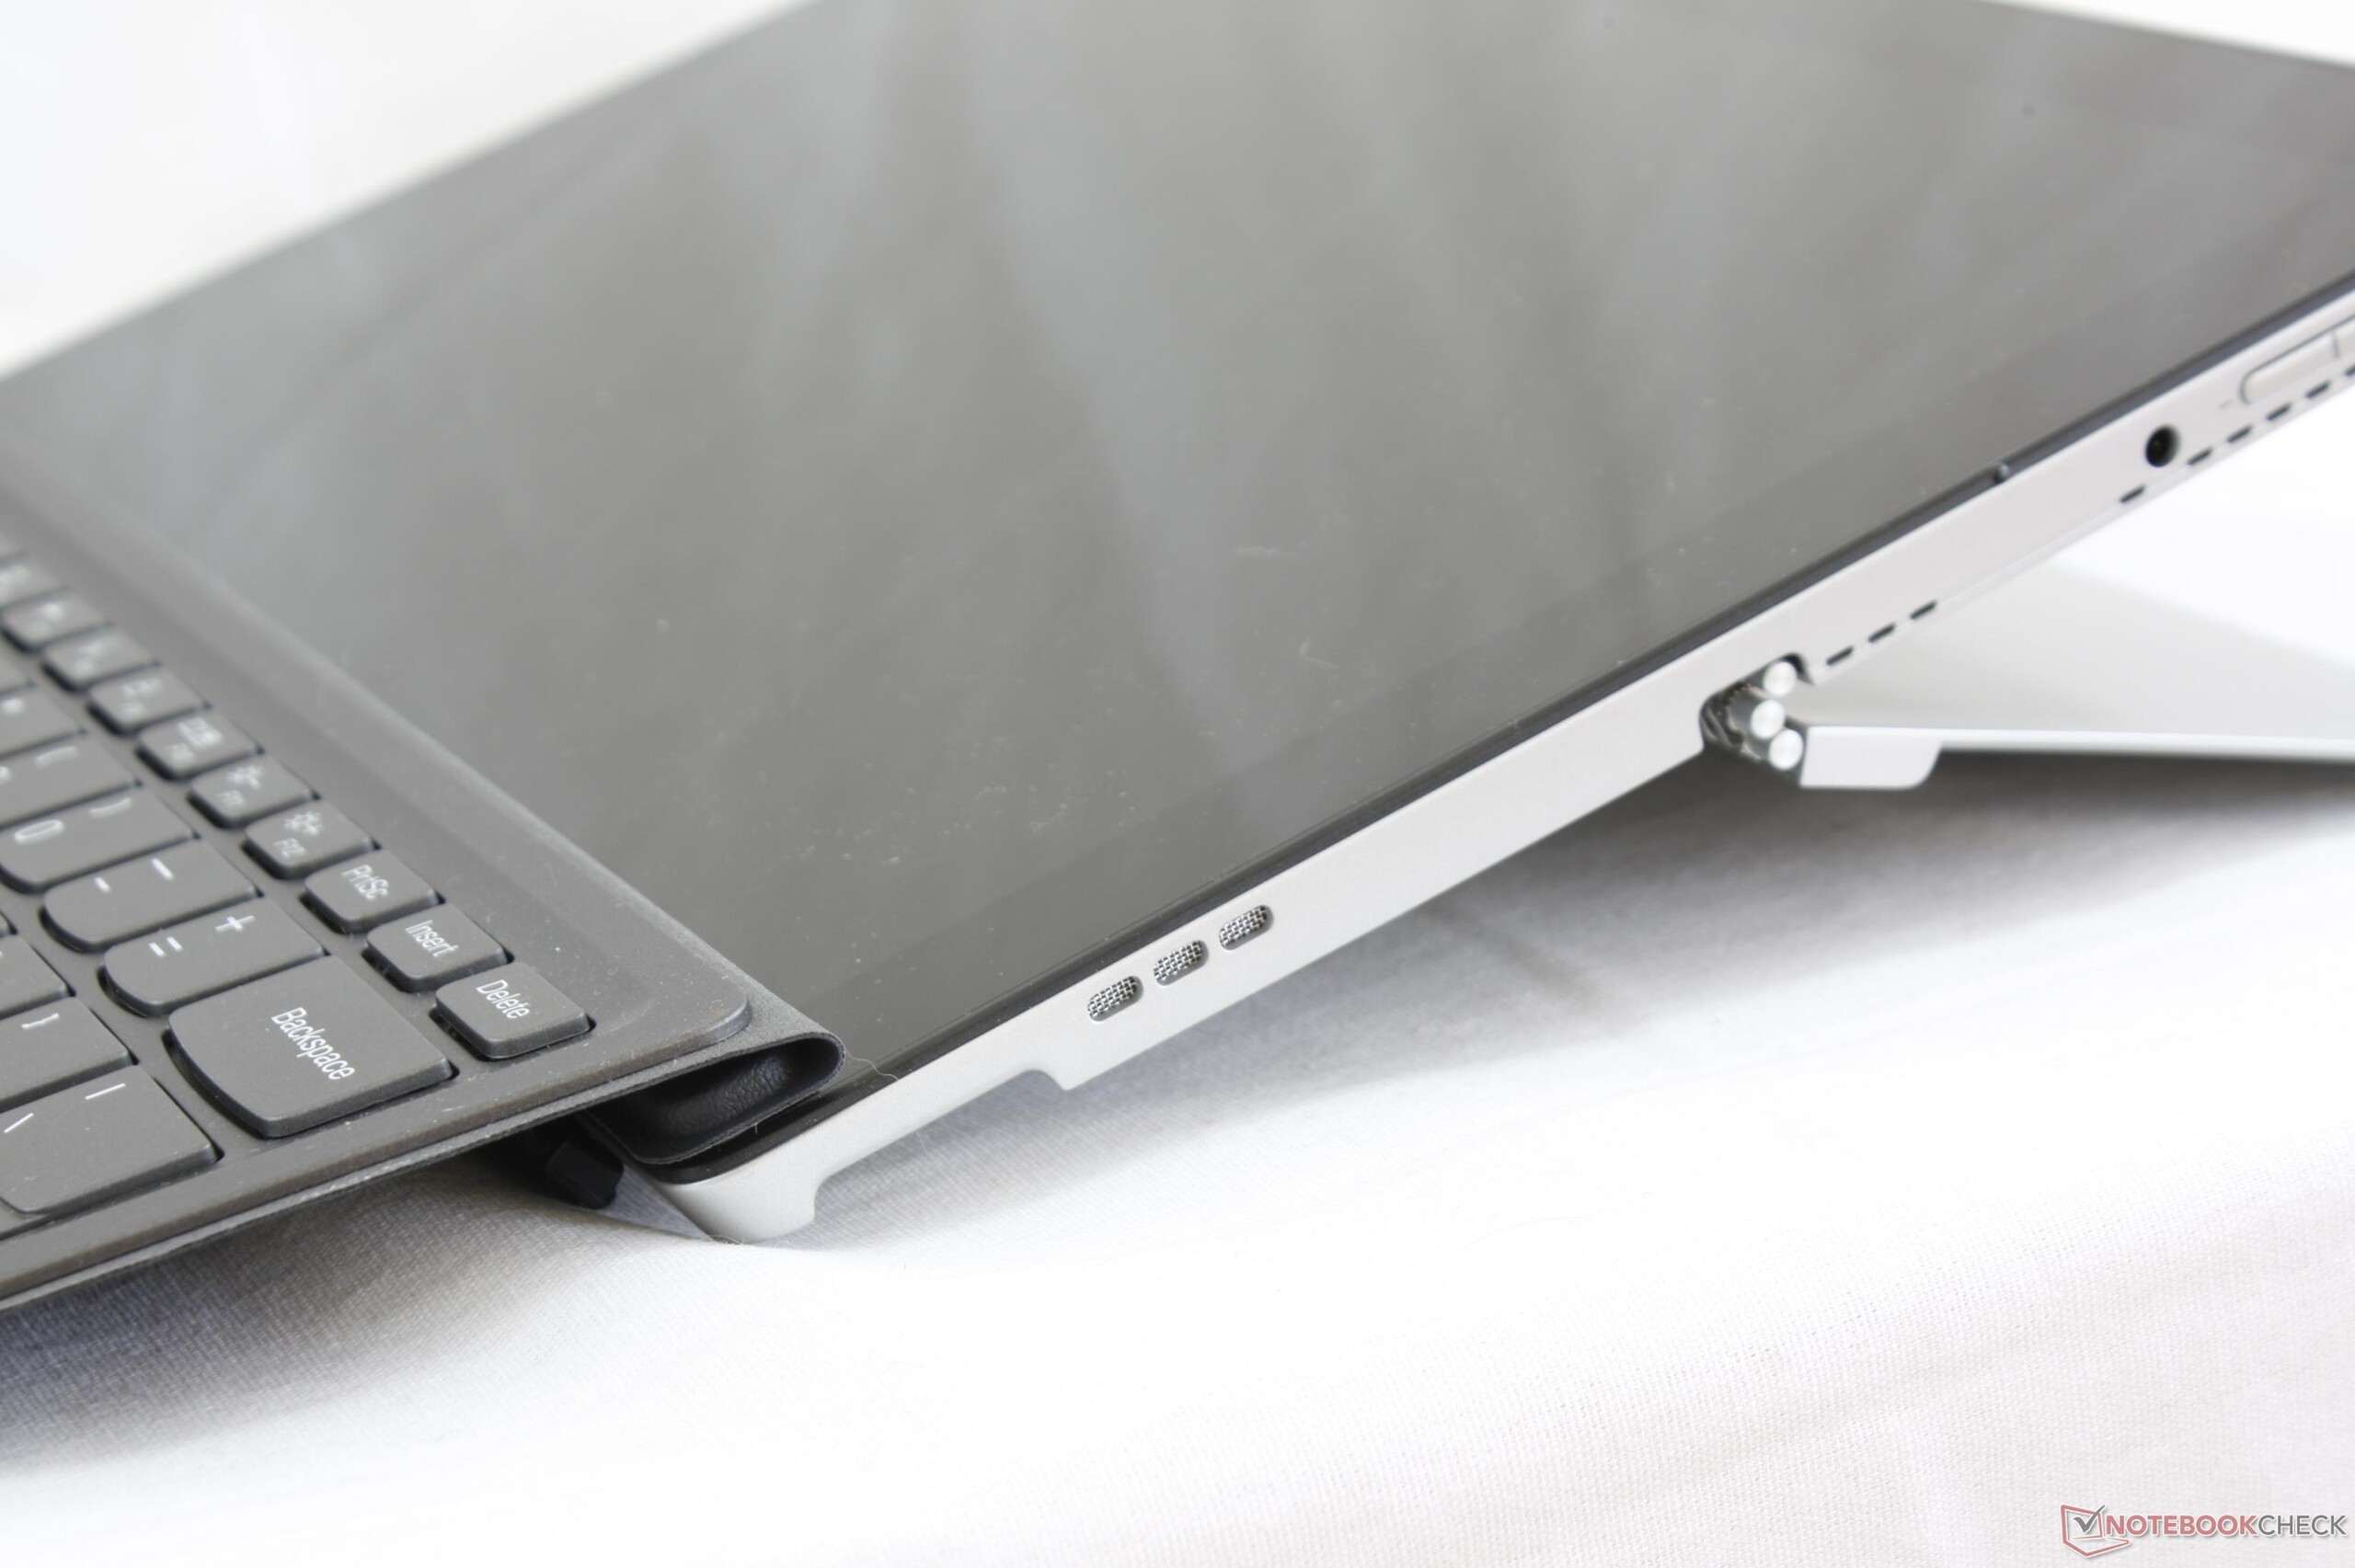

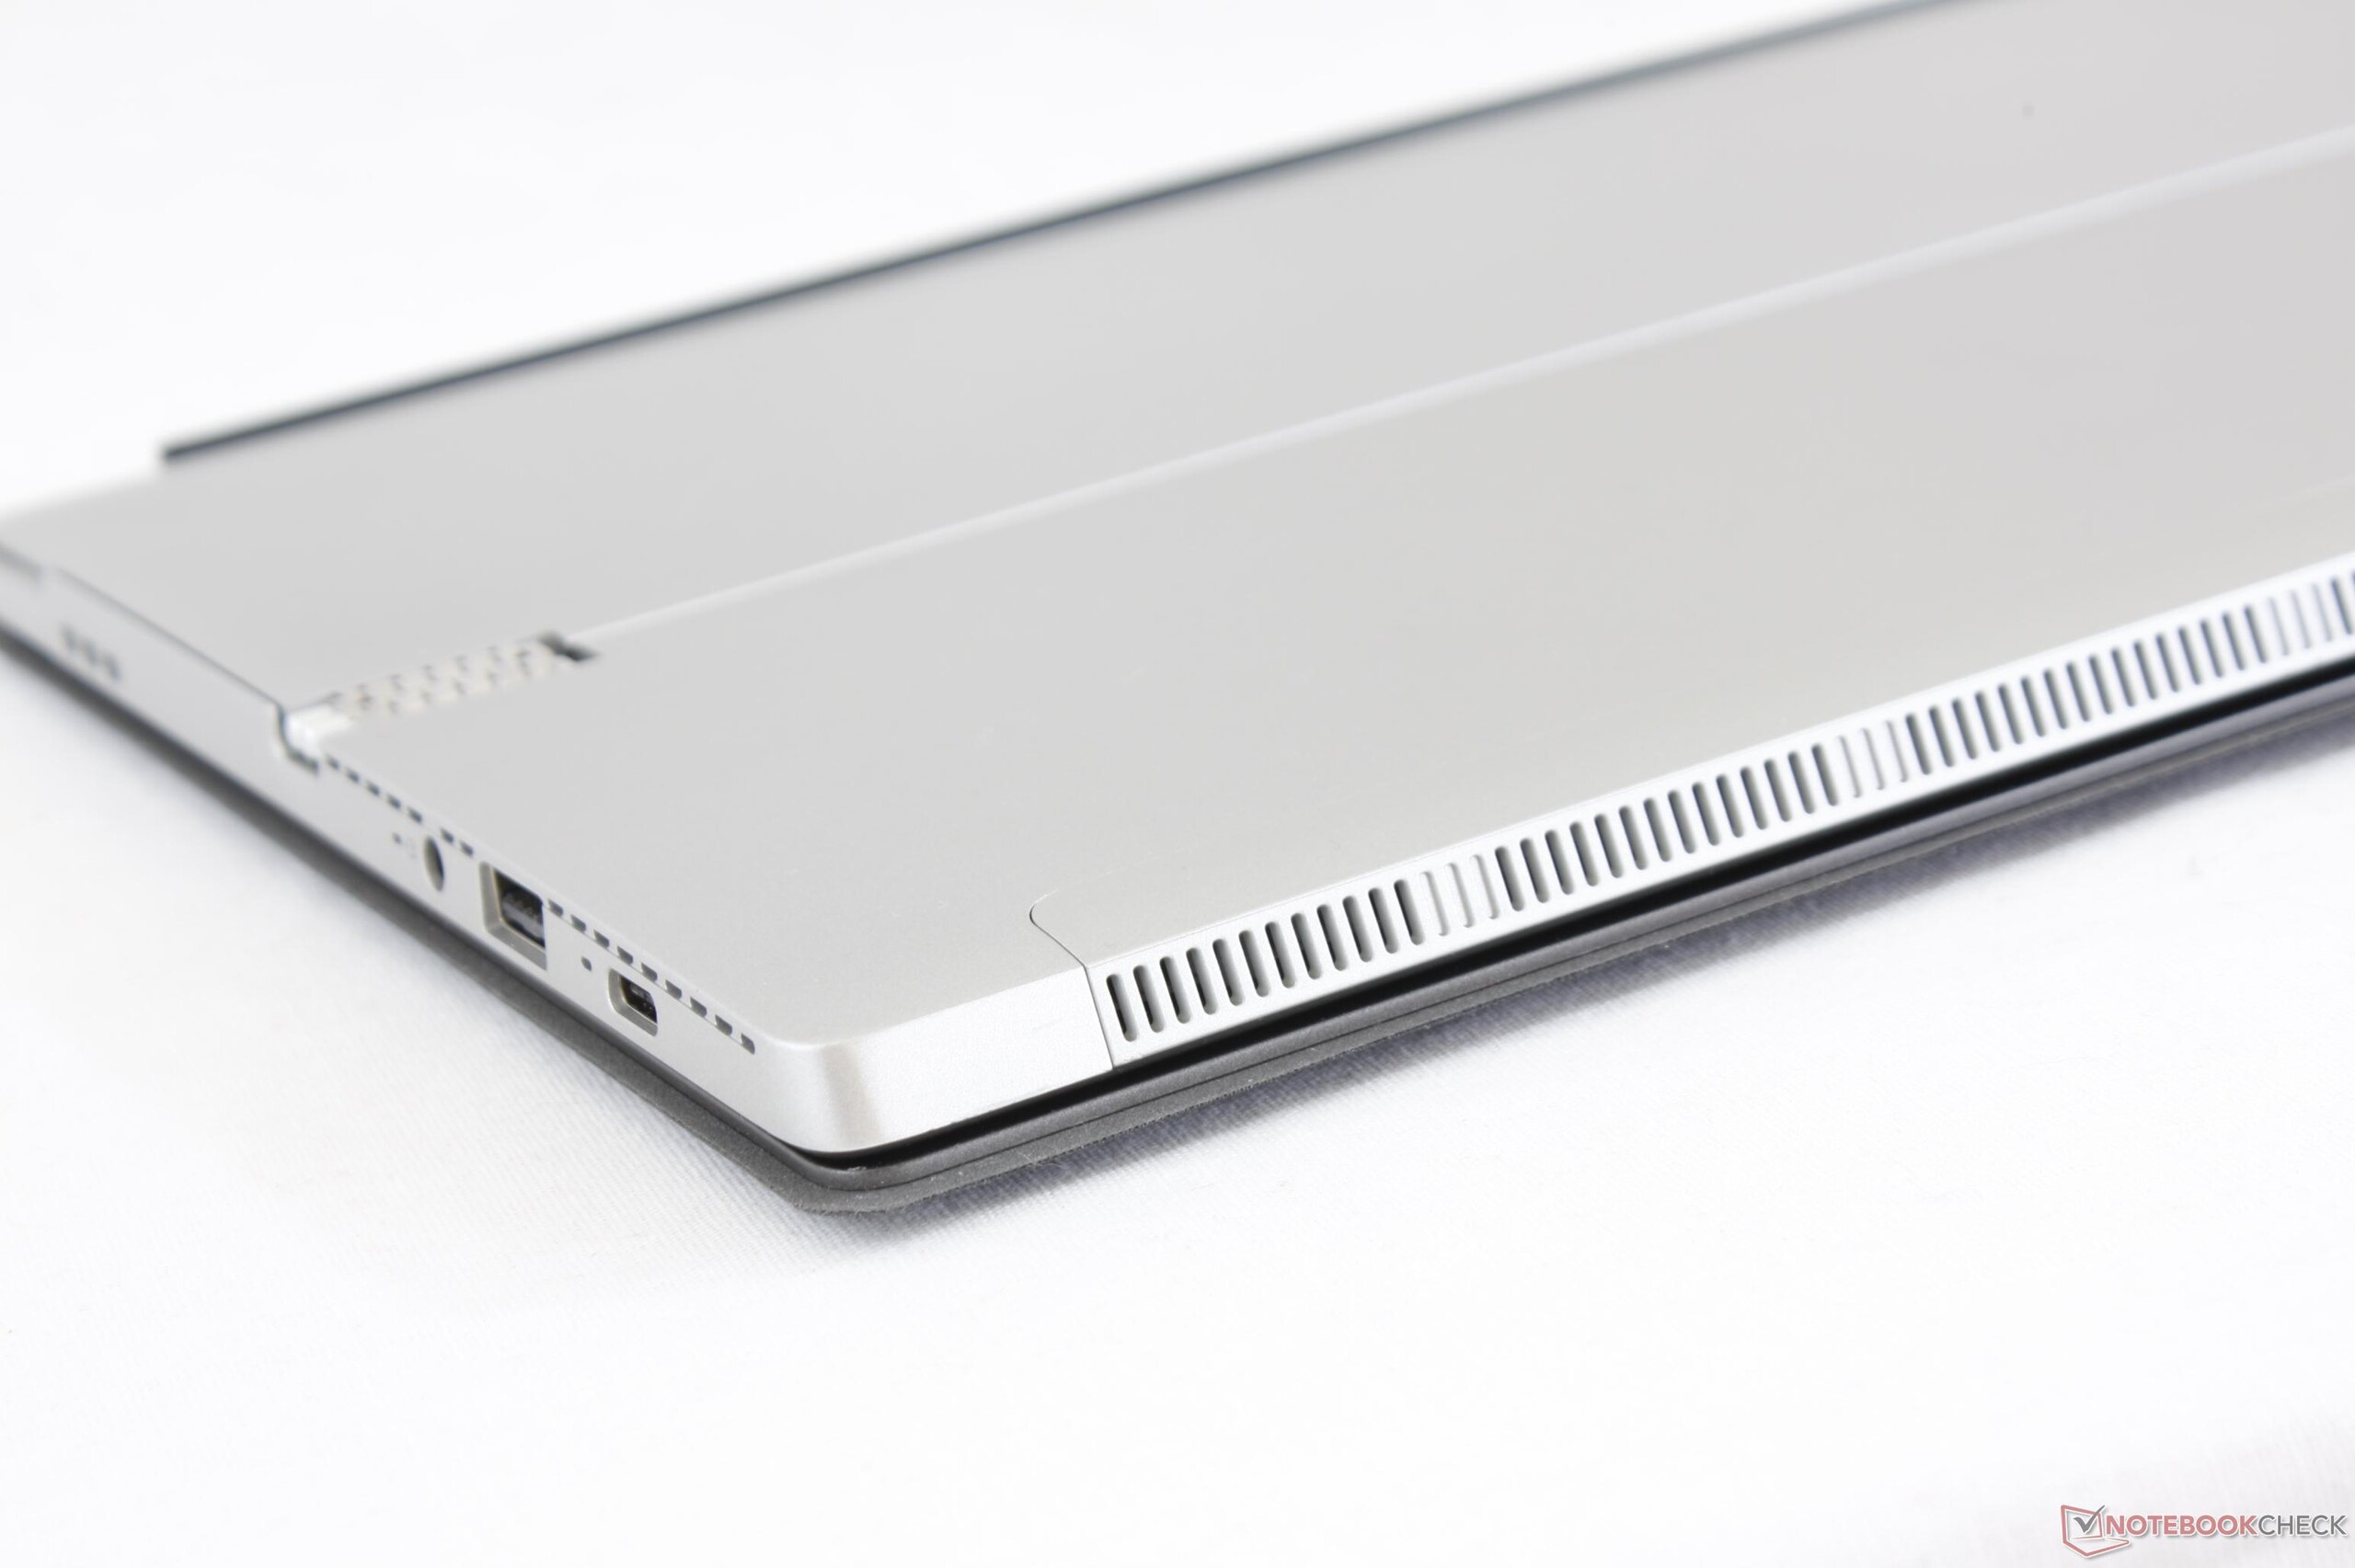
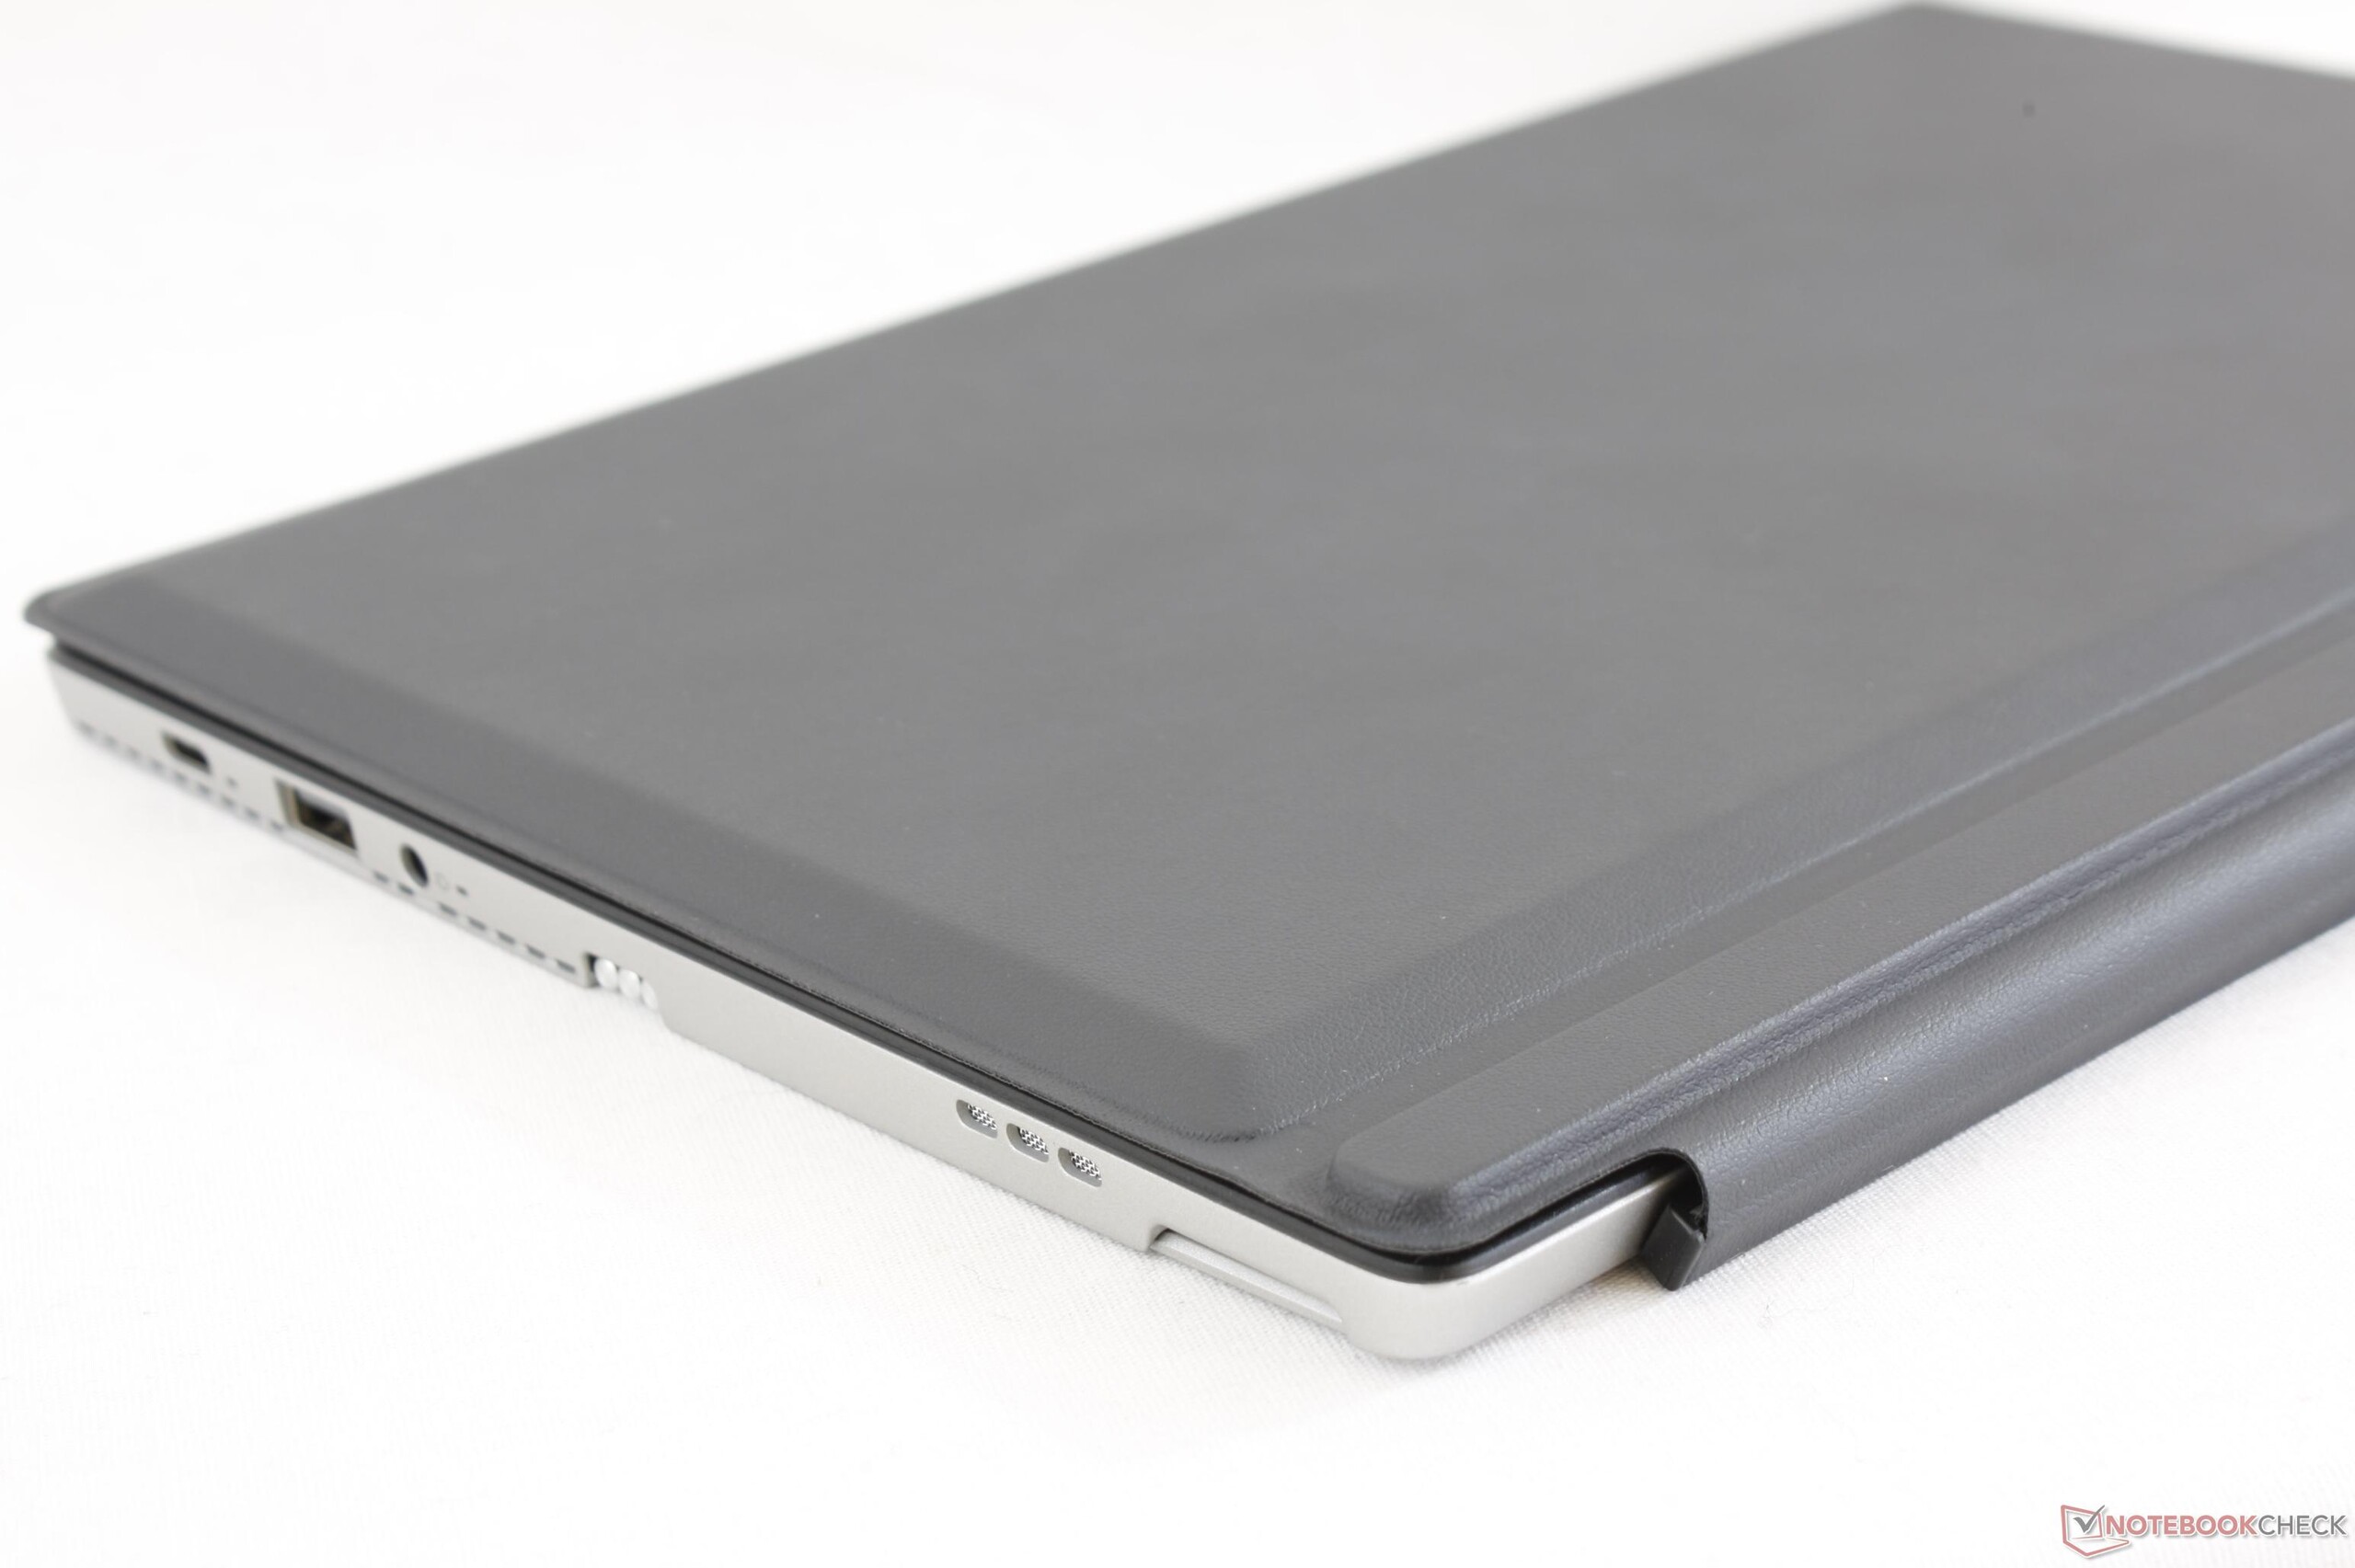
At a combined weight of 1.2 kg (900 g tablet + 300 g keyboard dock), the Miix 520 is not significantly heavier or lighter than most competitors with the tougher Latitude 7285 being a notable exception. The Surface Pro is slightly thinner at 13.5 mm (8.5 mm tablet + 5 mm Type Cover) compared to the Miix 520 at 15.9 mm (9.9 mm tablet + 6 mm keyboard base). In practice, however, the minute differences are essentially negligible as both systems are very compact and easy to carry.
Connectivity
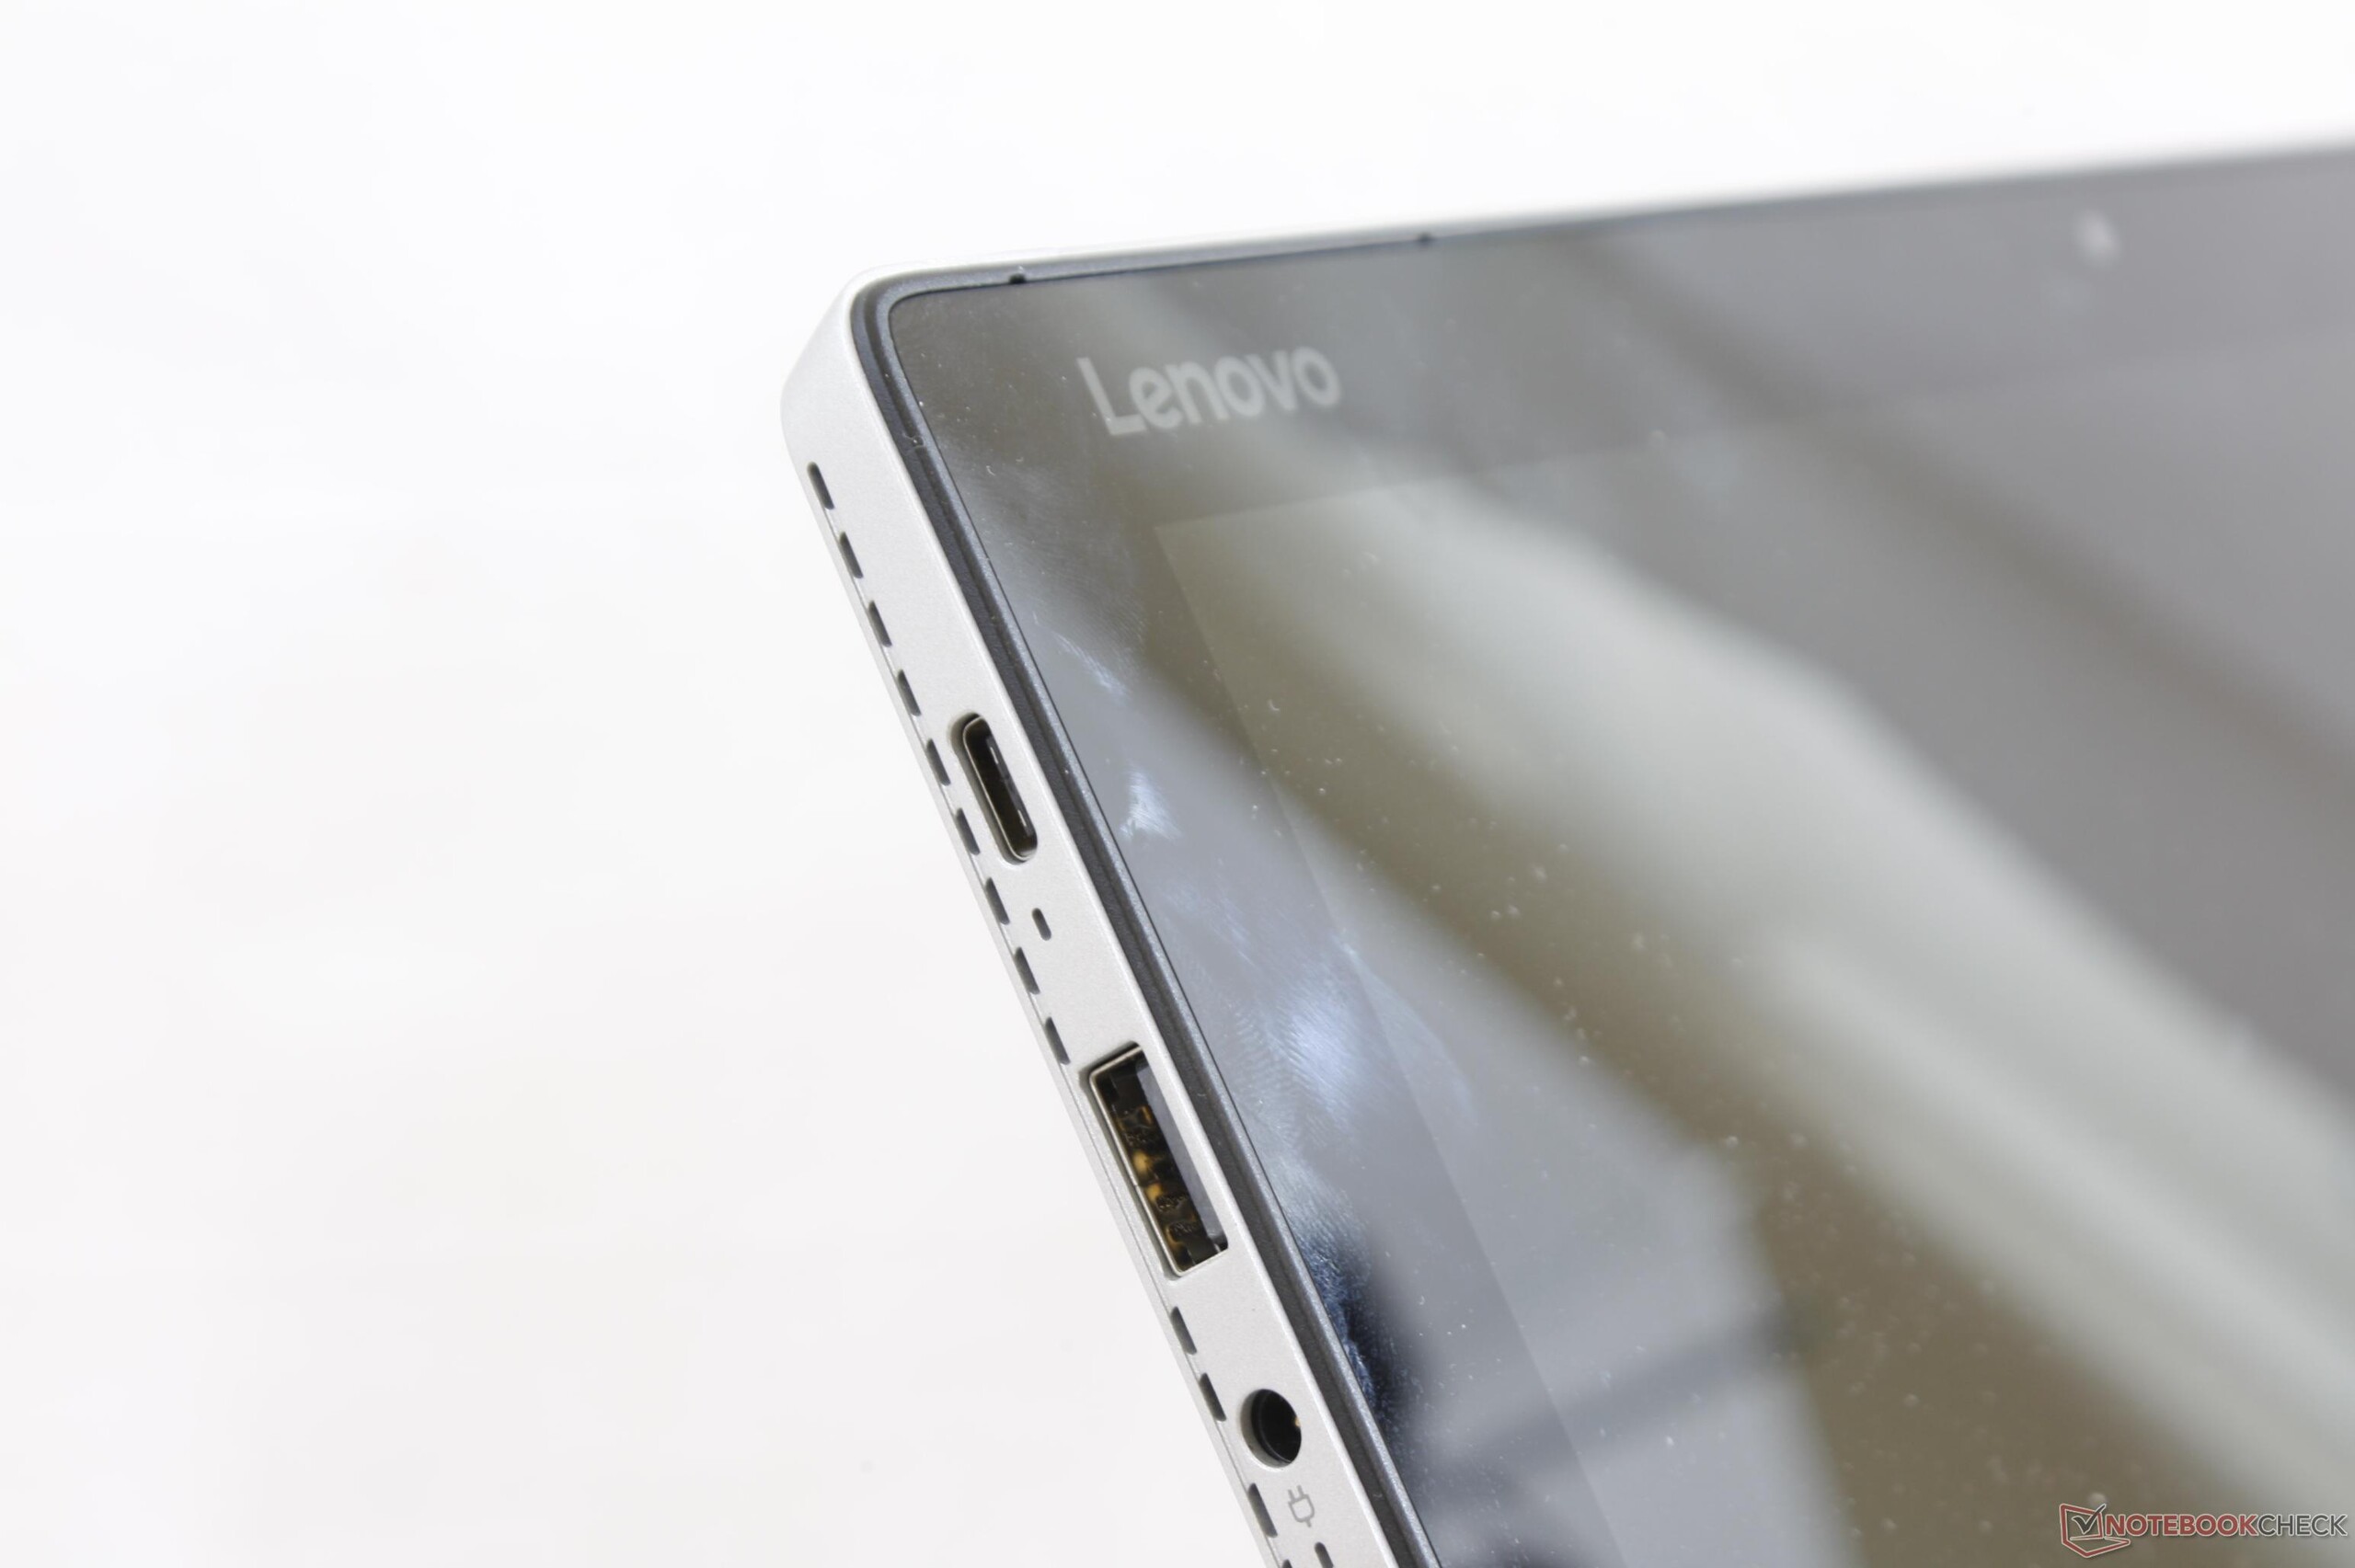
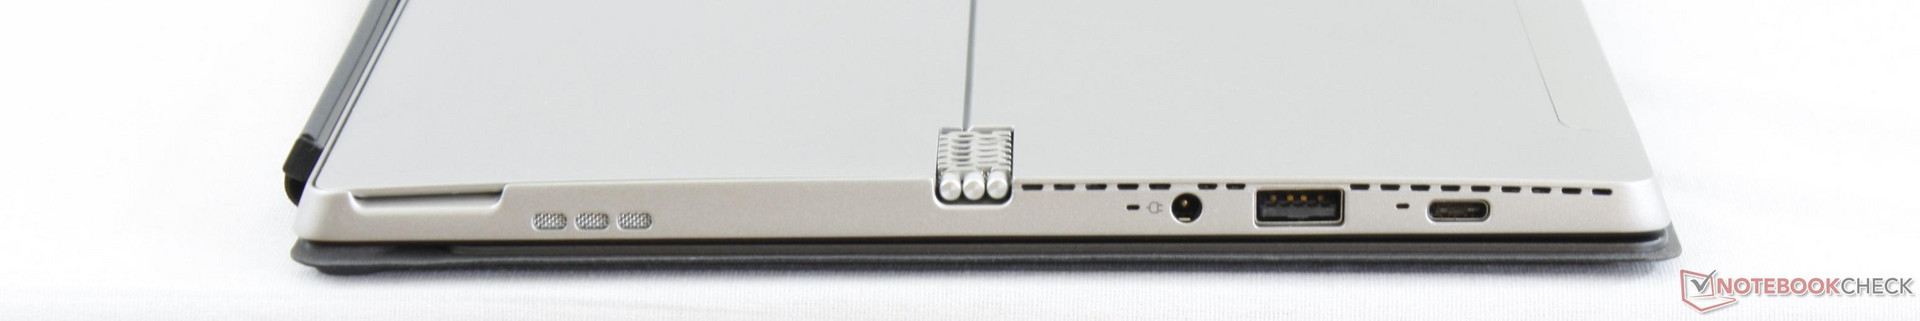
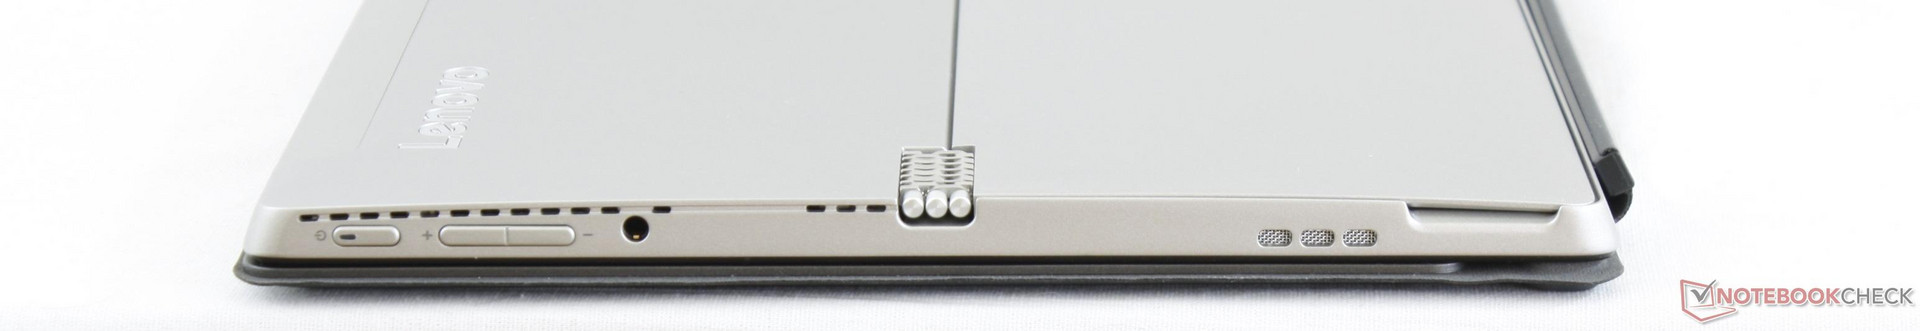
No changes have been made to the ports from the last generation Miix 510. Still, it would have been great to see the USB Type-C Gen. 1 port be upgraded to Thunderbolt 3 as Lenovo recently did the same to the Yoga 920. Competing convertibles like the XPS 13 9365 and HP Elite x2 both offer Thunderbolt 3 while the Surface Pro notoriously omits it.
SD Card Reader
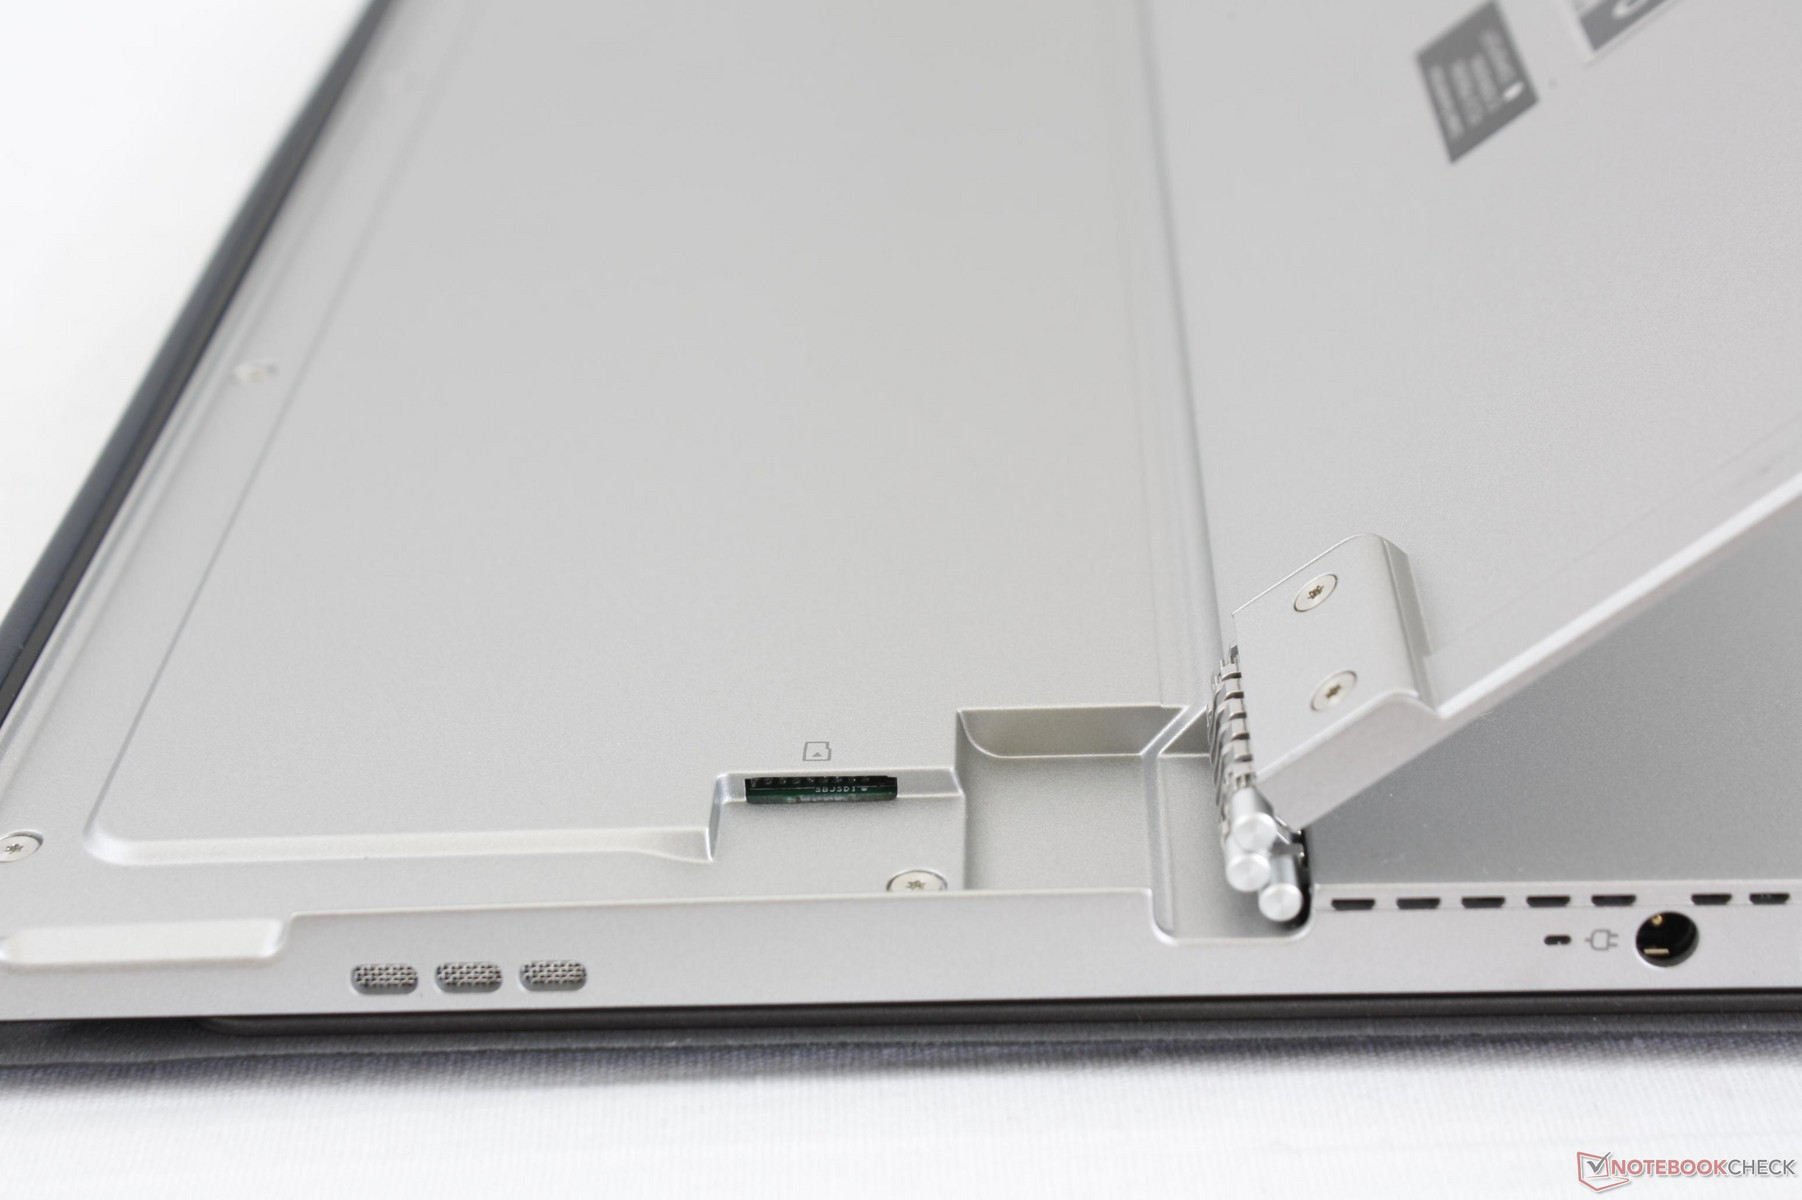
The spring-loaded MicroSD card reader is tucked underneath the flap for easy access when needed. Transfer rates average about 86 MB/s with our Toshiba THN-M401S0640E2 MicroSD card to be comparable to the MicroSD slots of the HP Elite x2 and ThinkPad X1 tablet. Copying 1 GB worth of photos from the card to desktop will take about 14 seconds.
| SD Card Reader | |
| average JPG Copy Test (av. of 3 runs) | |
| HP Elite x2 1012 G2-1LV76EA | |
| Lenovo Miix 520-12IKB 81CG | |
| Lenovo ThinkPad X1 Tablet Gen 2 | |
| maximum AS SSD Seq Read Test (1GB) | |
| Lenovo ThinkPad X1 Tablet Gen 2 | |
| HP Elite x2 1012 G2-1LV76EA | |
| Lenovo Miix 520-12IKB 81CG | |
Communication
WLAN and Bluetooth 4.2 are provided by a 2x2 Intel 8265 module commonly found on mainstream Ultrabooks. We are able to record a real-world average transfer rate of 528 Mbps when standing one meter away from our Linksys EA8500 test router. Connectivity is steady and with no dropout issues.
4G LTE options are supposedly in the works and are not yet available for sale at the time of writing. There are no plans to incorporate NFC.
| Networking | |
| iperf3 transmit AX12 | |
| Lenovo Miix 520-12IKB 81CG | |
| Lenovo Miix 510 Pro 80U10006GE (jseb) | |
| Dell XPS 13-9365 2-in-1 | |
| HP Elite x2 1012 G2-1LV76EA | |
| iperf3 receive AX12 | |
| Lenovo Miix 510 Pro 80U10006GE (jseb) | |
| HP Elite x2 1012 G2-1LV76EA | |
| Lenovo Miix 520-12IKB 81CG | |
| Dell XPS 13-9365 2-in-1 | |
Accessories
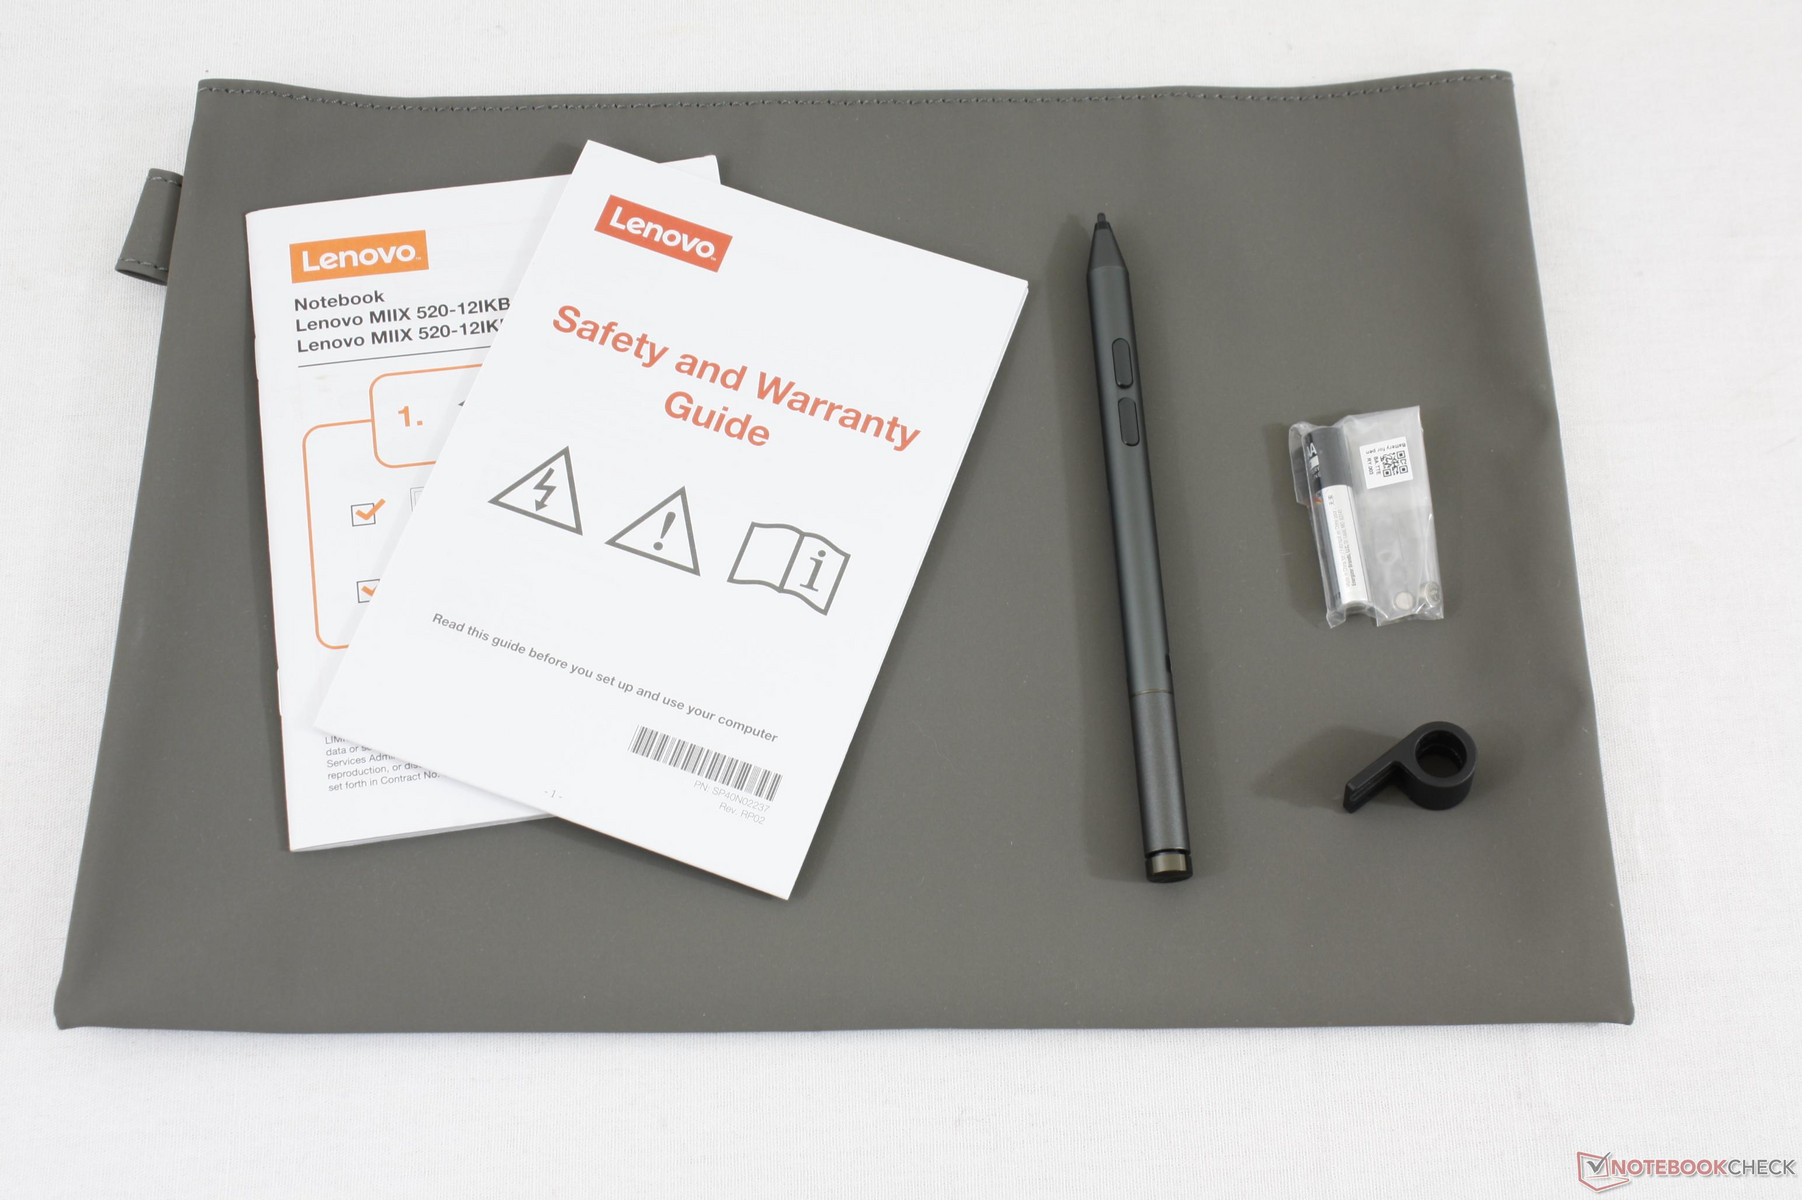
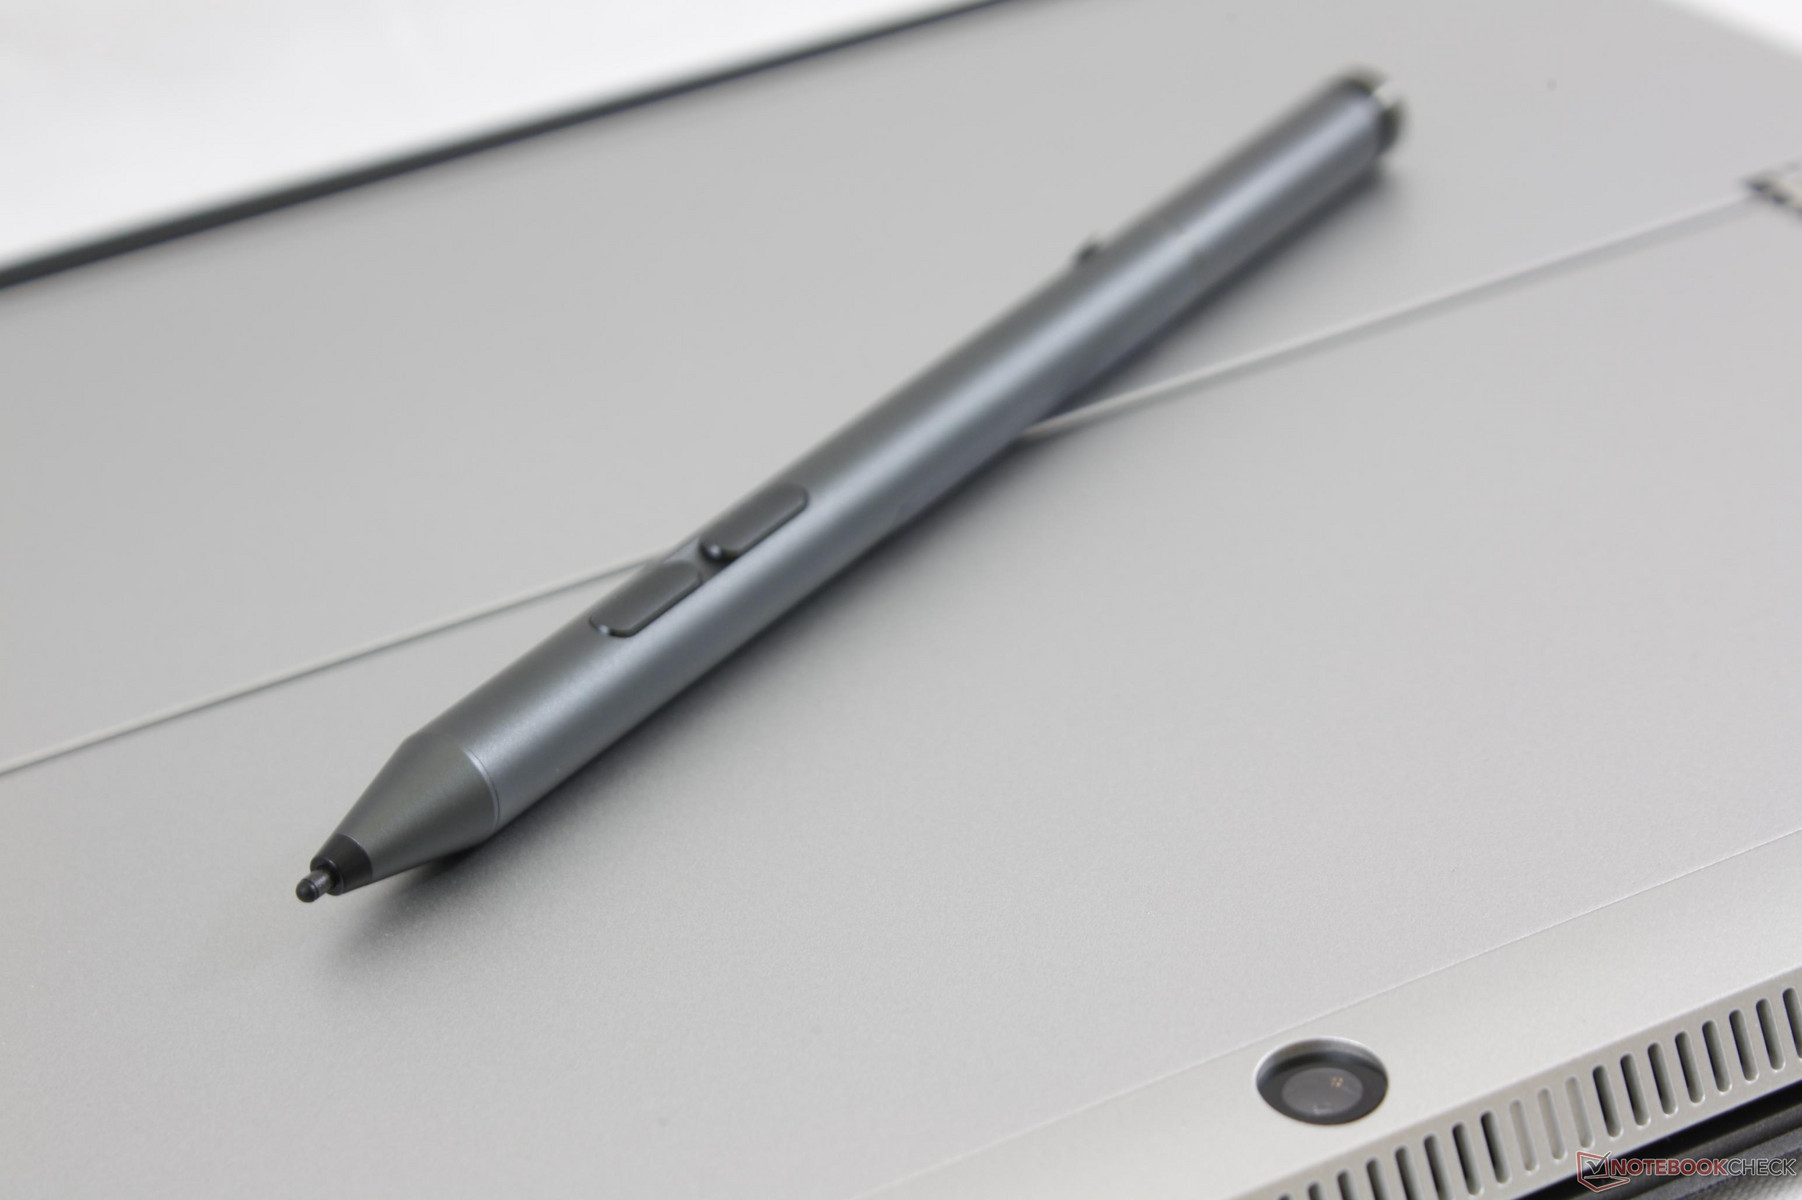
Included extras are a carrying bag, Active Pen 2 WACOM stylus, pen holder, AAAA battery, two button batteries, and the detachable keyboard dock. Lenovo bundles all Miix 520 systems with the keyboard dock which is more than what we can say for the Surface Pro series. Docking stations based on Thunderbolt 3 will not be fully compatible with the system.
Maintenance
There is a set of T5 Hex screws along the bottom half of the back plate. Even with these removed, however, the plating is latched tightly around the edges and corners and it is very difficult to safely remove for the end user. In comparison, the HP Elite x2 tablet was designed to be more easily serviceable while the Surface Pro series has even poorer serviceability.
Warranty
The standard one-year limited warranty applies. Strangely enough, Lenovo is not offering additional warranty options for the Miix 520 when ordered through Lenovo.com at this time.
Please see our Guarantees, Return Policies and Warranties FAQ for country-specific information.
Input Devices
Keyboard
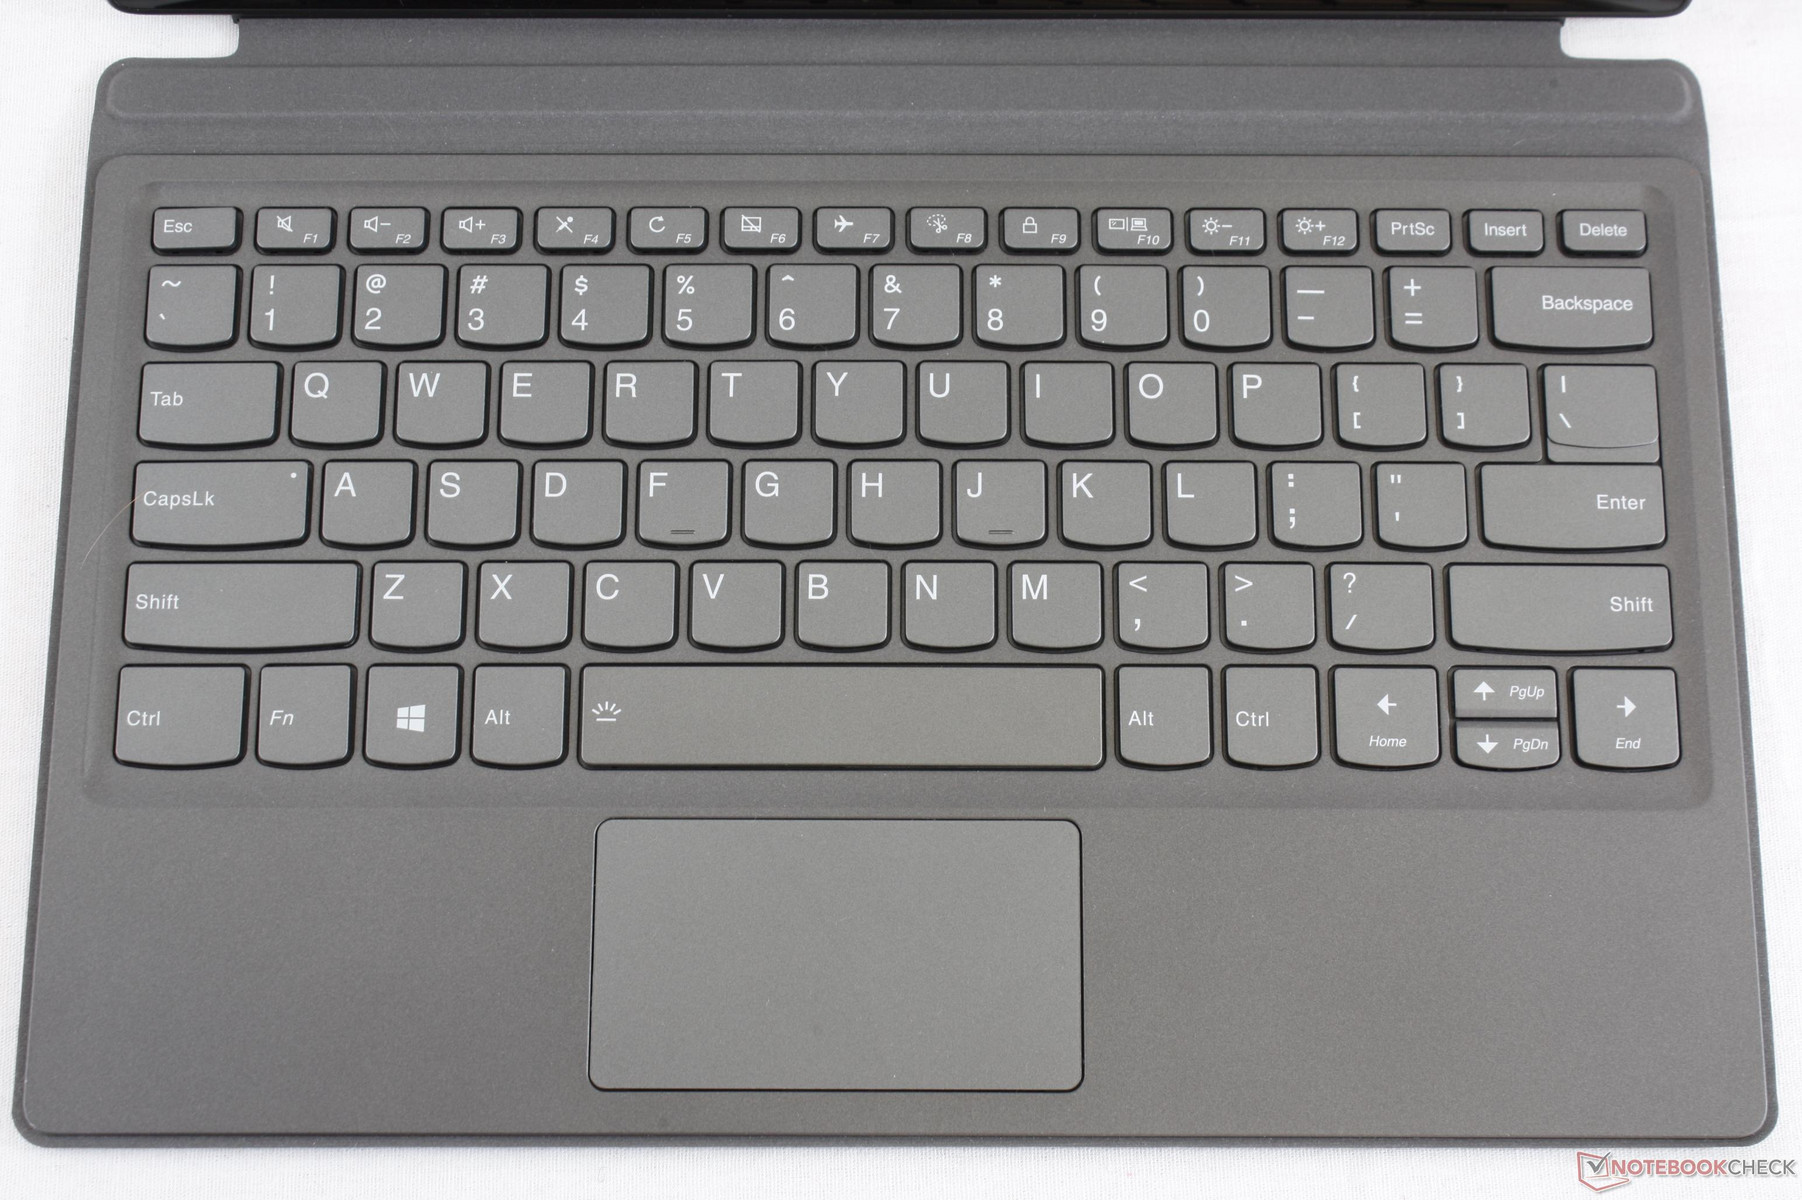
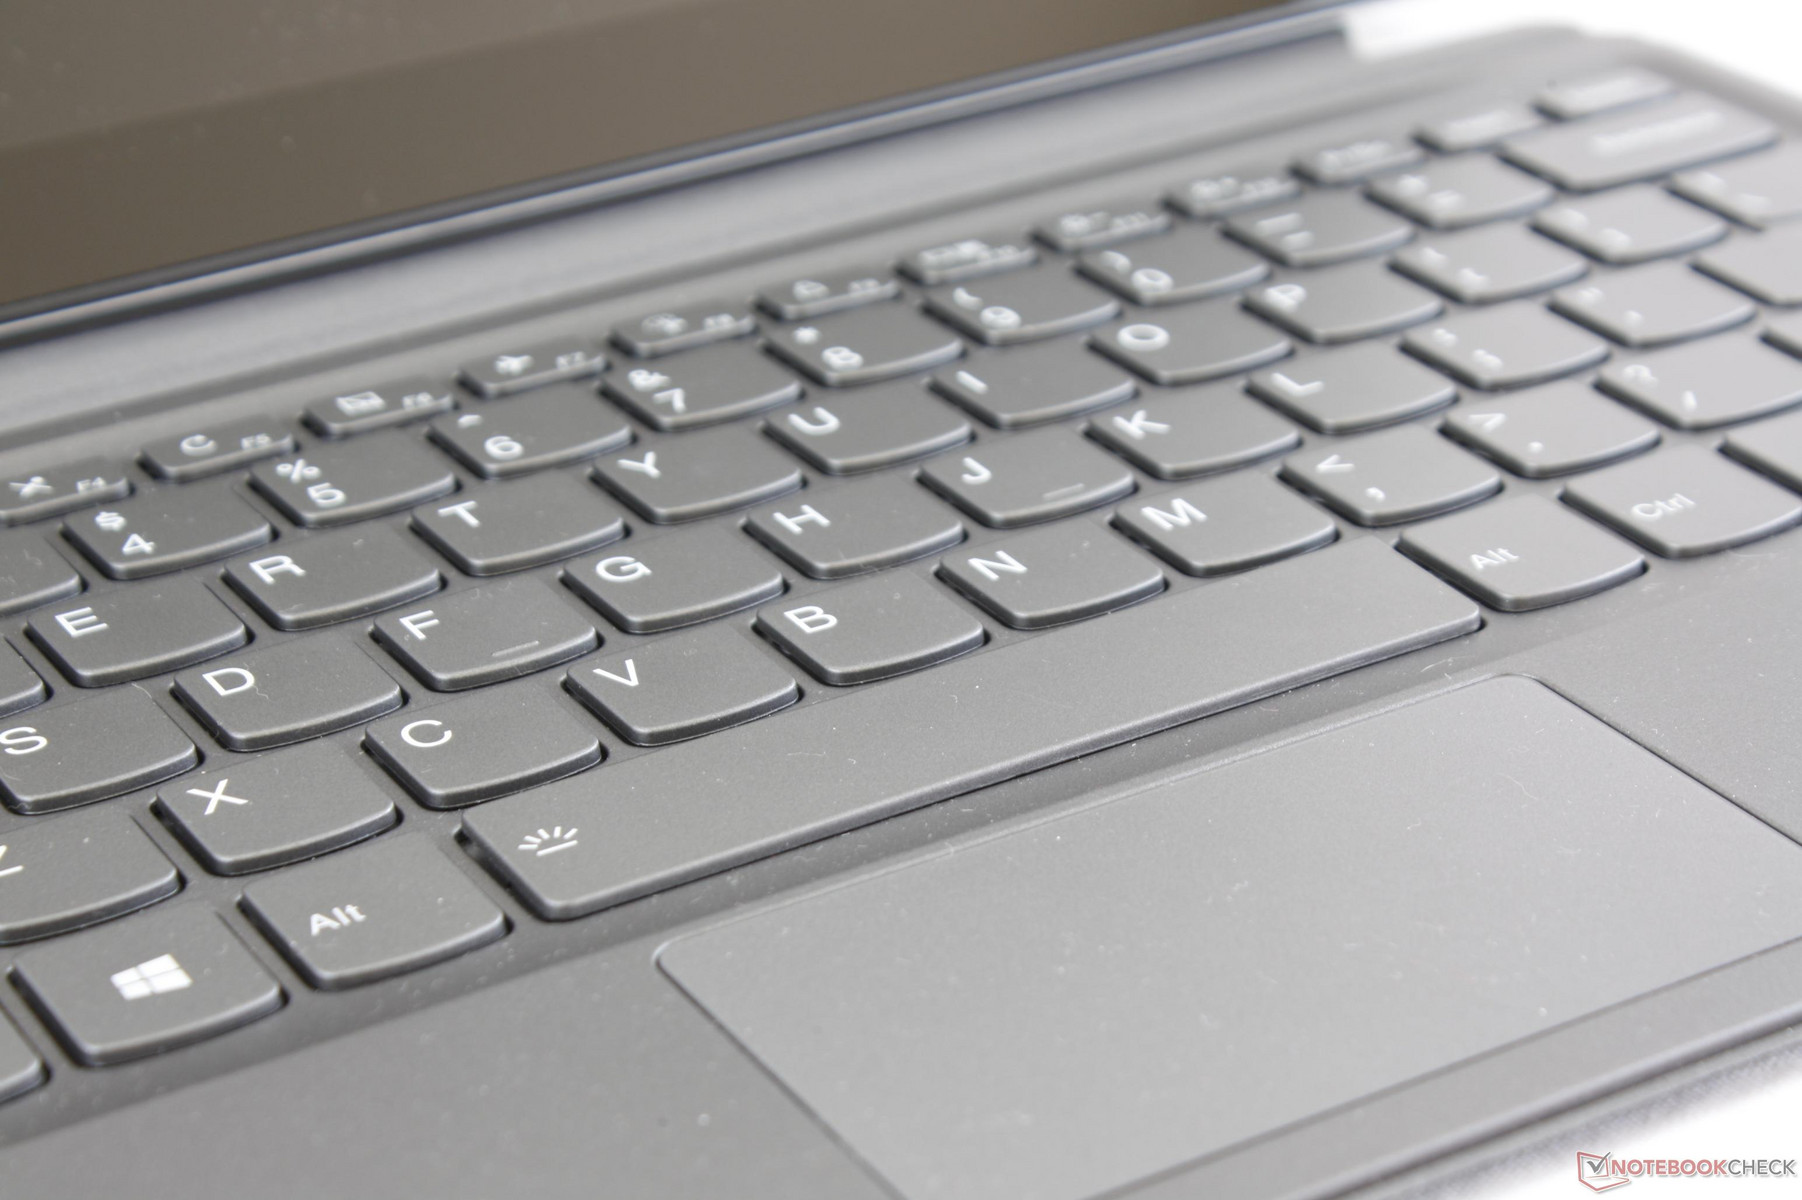
The backlit keyboard (~28.0 x 10.5 cm) provides a key travel of 1.5 mm with the Precision visual style reminiscent of the Ideapad series. Keystroke is firm but uneven because the entire surface of the keyboard dock will rock or shake slightly every time a key is pressed. The instability of the keyboard base compared to a "proper" laptop keyboard means that the center keys of the Miix 520 can feel softer relative to the edge keys because the center keys will rock the keyboard base much more intensely. While not a deal breaker, it can take some getting used to and is a potential area for improvement on future model revisions.
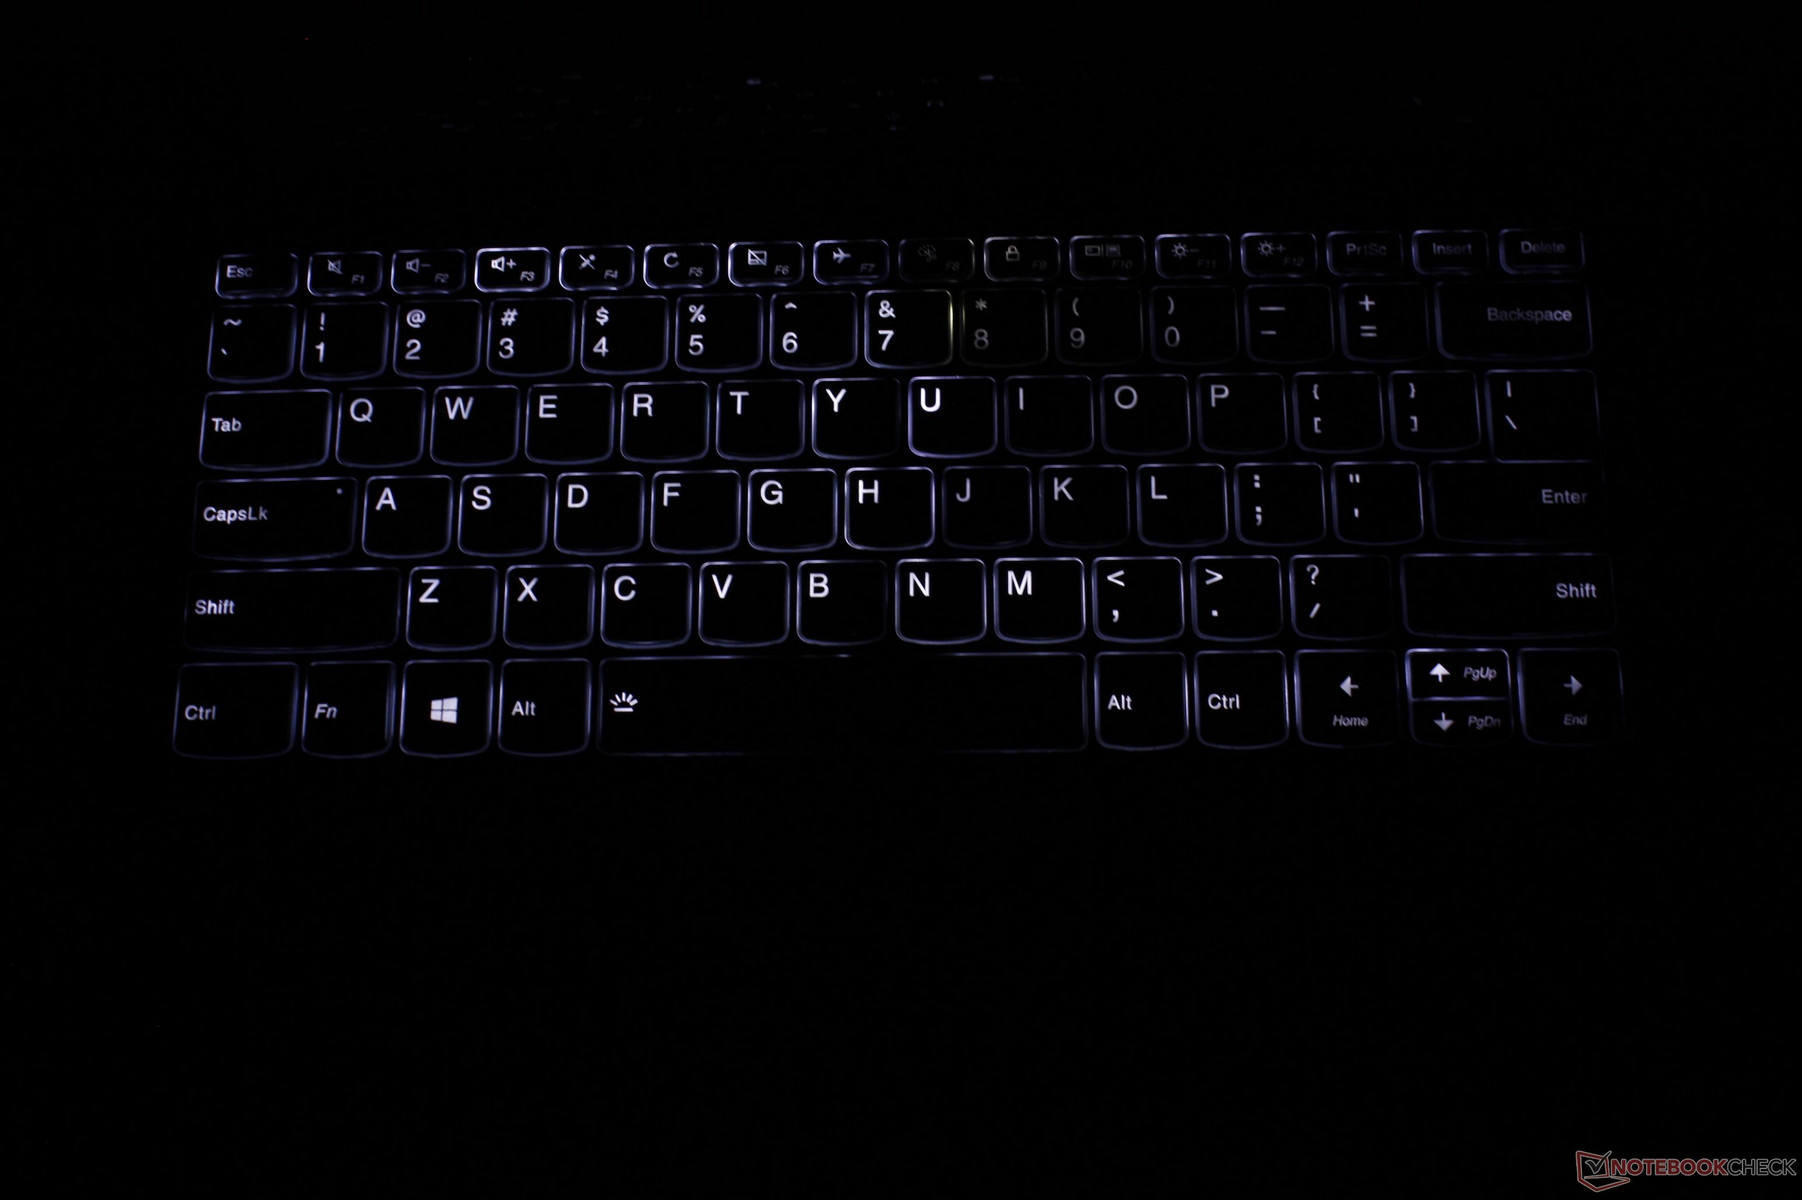
Another more minor complaint relates to the backlight itself. The light can only be toggled on or off not unlike on the HP Spectre series, but the glow is very uneven around the keys as shown by our image below. The center keys are noticeably brighter whereas nearly every other notebook will have a more uniform light.
Touchpad
The trackpad (8.5 x 4.8 cm) is disappointing not only because of its small surface area but also for its cursor tracking and feedback. First, our onscreen cursor would sometimes stop or jump for seemingly no apparent reason when simply gliding along the smooth surface of the trackpad. We're not sure if this is a series-wide bug or an issue with our specific unit, but it is very annoying and not something we experienced on the Miix 510. Even if the trackpad is working as intended, its integrated mouse keys are far too spongy and with very weak feedback for an unsatisfying feel when pressed. It definitely seems like an afterthought compared to the otherwise reliable touchscreen and WACOM pen.
Display
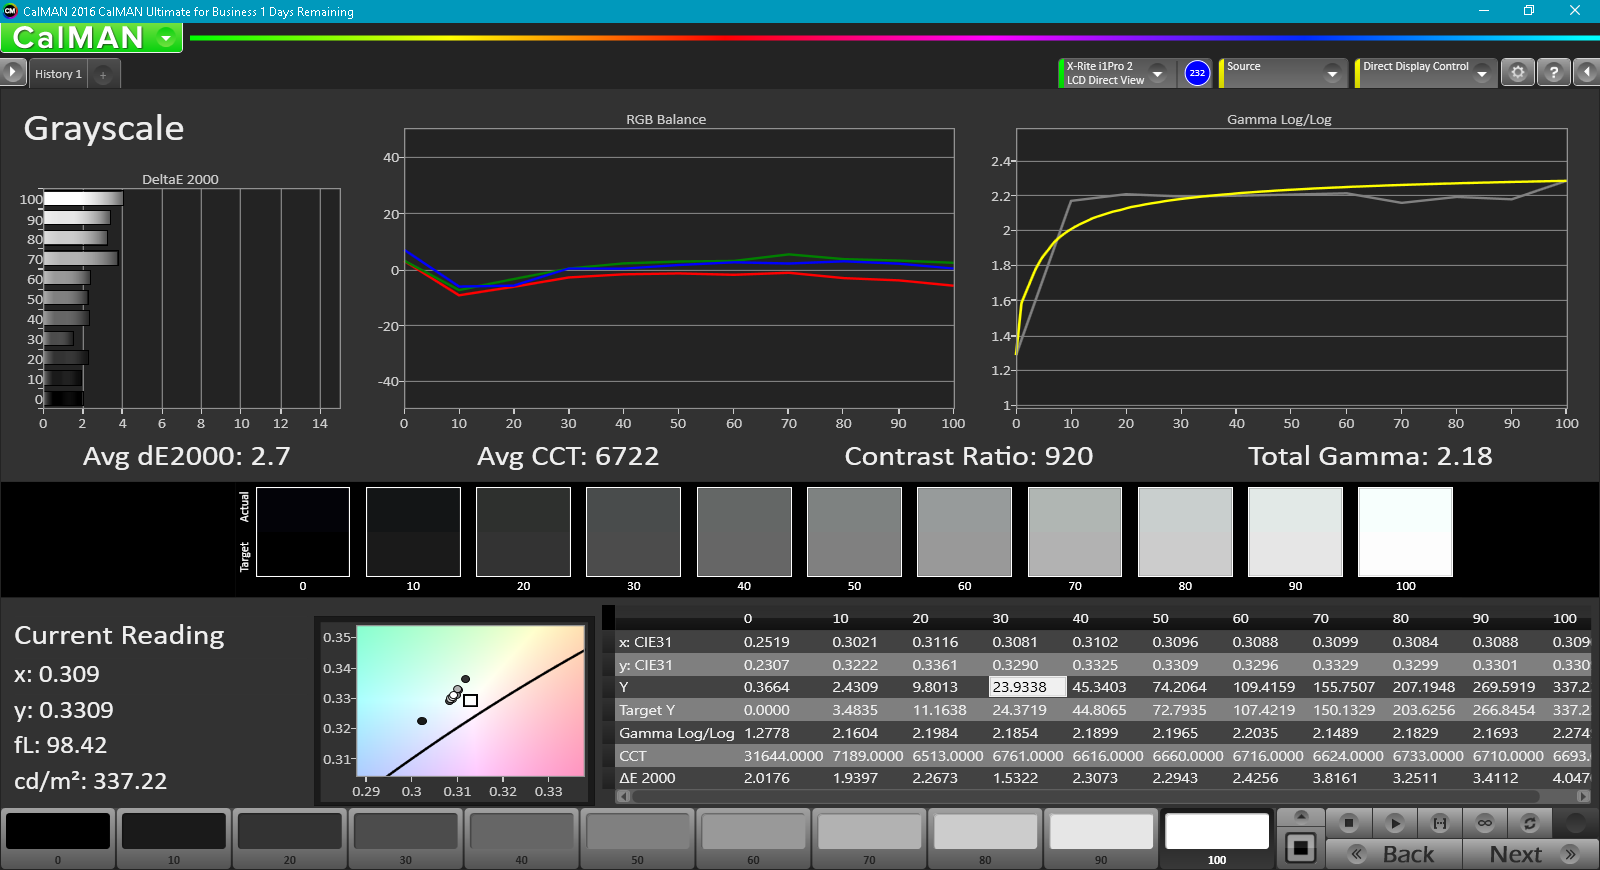
The 16:10 FHD touchscreen carries no other resolution options and has a lower PPI than both the Surface Pro and ThinkPad X1 tablet as a result. We're also convinced that Lenovo is utilizing the exact same IPS panel as on the Miix 510 for the Miix 520 based on our measurements below. We can record no significant improvements in terms of brightness, contrast, color accuracy, or even response times between the two generations. Interestingly enough, utility programs like HWiNFO or AIDA are unable to pull the panel ID or supplier for the Miix tablet two generations in a row.
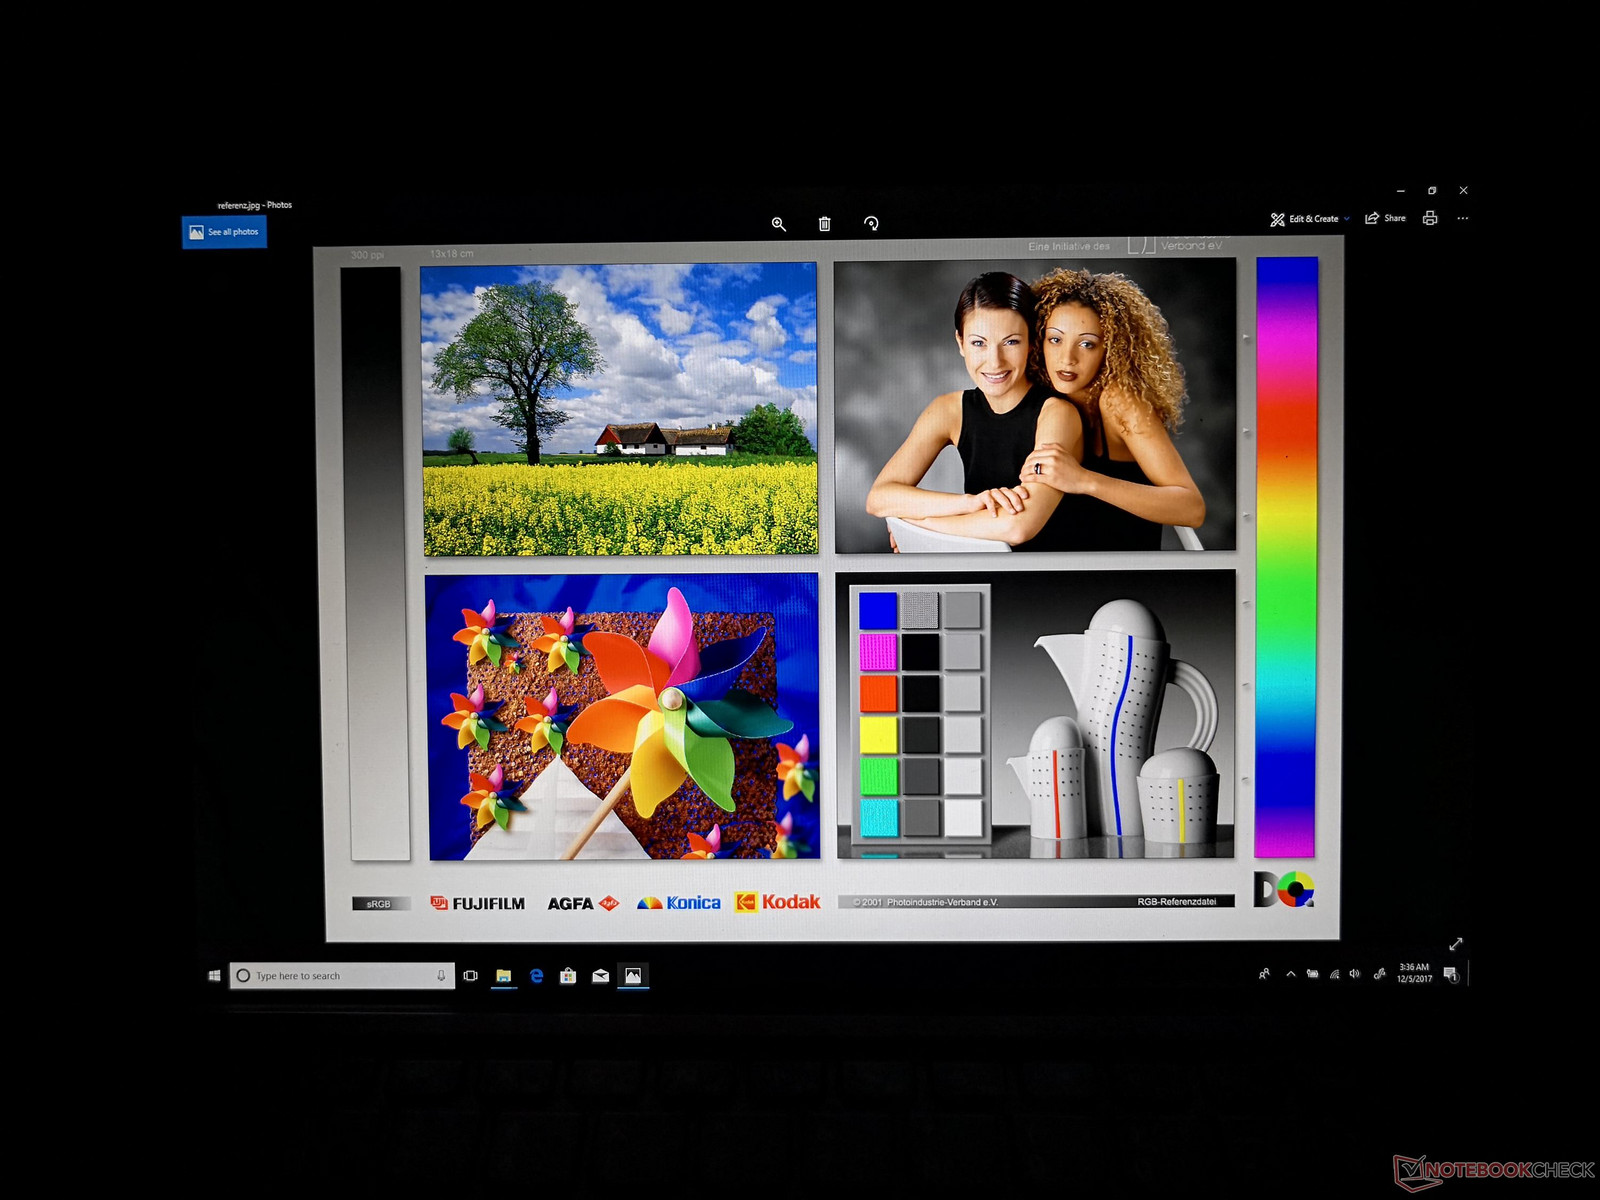
While contrast and brightness levels are both respectable, the latest Surface Pro and HP Elite x2 have even brighter backlighting, more accurate colors, deeper black levels, and wider gamuts for a more vivid viewing experience. The Miix 520 falls a bit short in this regard even though it is still a sharp display with only minimal graininess.
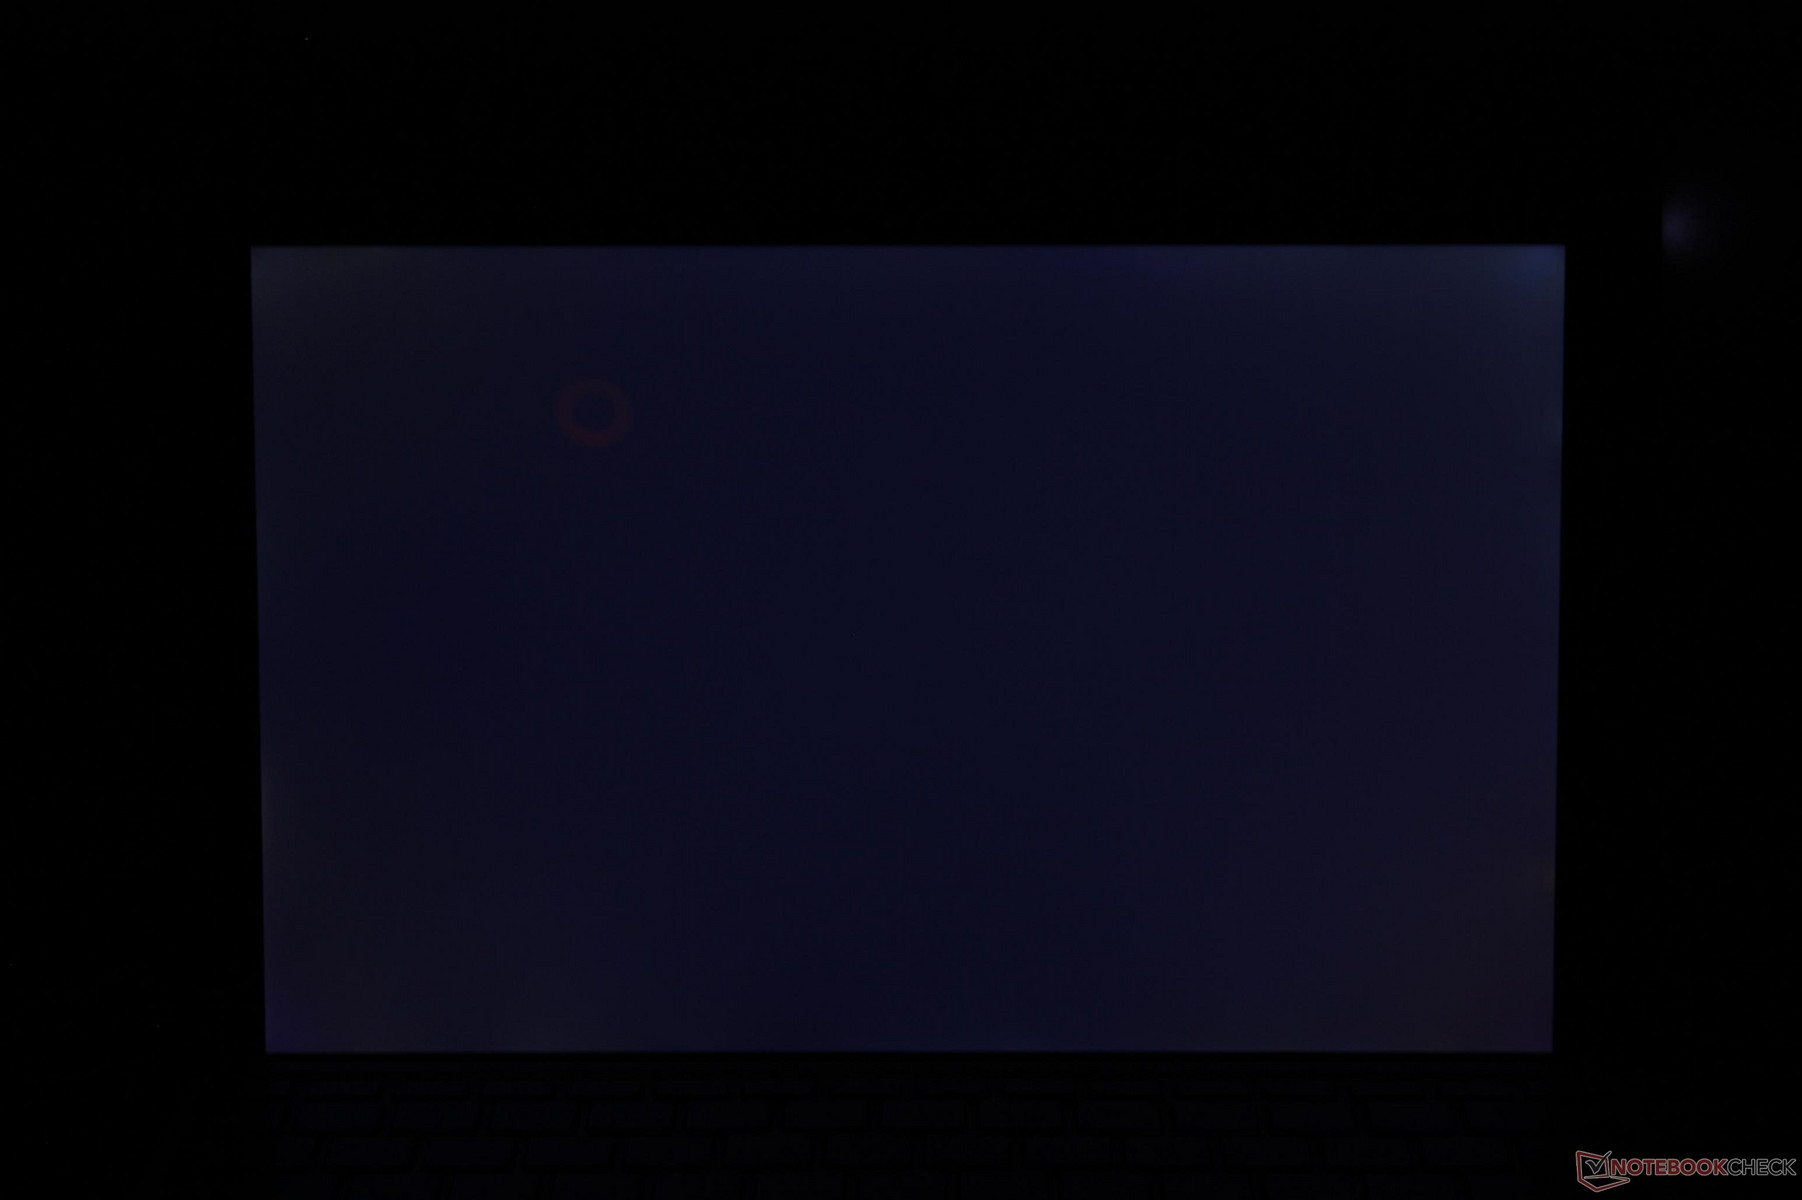
Uneven backlight bleeding is present on our unit and is most pronounced around the corners of the screen. The clouding is thankfully not noticeable during day-to-day use, but it is visible if the screen is darkened.
Pulse-width modulation can be detected on all brightness levels except when on the maximum setting. Users sensitive to onscreen flickering may want to avoid the Miix 520 as a result.

| |||||||||||||||||||||||||
Brightness Distribution: 87 %
Center on Battery: 348.8 cd/m²
Contrast: 872:1 (Black: 0.4 cd/m²)
ΔE ColorChecker Calman: 7 | ∀{0.5-29.43 Ø4.71}
ΔE Greyscale Calman: 10.1 | ∀{0.09-98 Ø4.96}
90.9% sRGB (Argyll 1.6.3 3D)
58.7% AdobeRGB 1998 (Argyll 1.6.3 3D)
65.4% AdobeRGB 1998 (Argyll 3D)
90.8% sRGB (Argyll 3D)
64.4% Display P3 (Argyll 3D)
Gamma: 2.22
CCT: 9065 K
| Lenovo Miix 520-12IKB 81CG Unknown, IPS, 12.2", 1920x1200 | Microsoft Surface Pro (2017) m3 LG Display LP123WQ112604, IPS, 12.3", 2736x1826 | Lenovo Miix 510 Pro 80U10006GE Unknown, IPS, 12.2", 1920x1200 | HP Elite x2 1012 G2-1LV76EA Samsung SDC4A49, IPS, 12.3", 2716x1824 | Dell XPS 13 9365-4537 2-in-1 Sharp LQ133Z1, IPS, 13.3", 3200x1800 | Lenovo ThinkPad X1 Tablet Gen 2 LSN120QL01L01, IPS, 12", 2160x1440 | |
|---|---|---|---|---|---|---|
| Display | 7% | 0% | 6% | 1% | ||
| Display P3 Coverage (%) | 64.4 | 68.5 6% | 64.5 0% | 66.7 4% | 64.4 0% | |
| sRGB Coverage (%) | 90.8 | 99.2 9% | 92 1% | 98 8% | 92.9 2% | |
| AdobeRGB 1998 Coverage (%) | 65.4 | 70.1 7% | 65.5 0% | 68.7 5% | 66.1 1% | |
| Response Times | -9% | 13% | -3% | -18% | 20% | |
| Response Time Grey 50% / Grey 80% * (ms) | 35.6 ? | 42 ? -18% | 33 ? 7% | 45.6 ? -28% | 48 ? -35% | 28.4 ? 20% |
| Response Time Black / White * (ms) | 28 ? | 28 ? -0% | 23 ? 18% | 21.6 ? 23% | 28 ? -0% | 22.8 ? 19% |
| PWM Frequency (Hz) | 198.4 ? | 125 ? | 2119 ? | 221.2 ? | ||
| Screen | 35% | 3% | 31% | 33% | 14% | |
| Brightness middle (cd/m²) | 348.8 | 461 32% | 327 -6% | 443 27% | 348 0% | 388.1 11% |
| Brightness (cd/m²) | 339 | 444 31% | 324 -4% | 446 32% | 306 -10% | 344 1% |
| Brightness Distribution (%) | 87 | 93 7% | 88 1% | 88 1% | 78 -10% | 78 -10% |
| Black Level * (cd/m²) | 0.4 | 0.34 15% | 0.35 13% | 0.41 -2% | 0.2 50% | 0.39 2% |
| Contrast (:1) | 872 | 1356 56% | 934 7% | 1080 24% | 1740 100% | 995 14% |
| Colorchecker dE 2000 * | 7 | 3.43 51% | 6.54 7% | 2.6 63% | 2.79 60% | 4.6 34% |
| Colorchecker dE 2000 max. * | 16.2 | 5.55 66% | 15.59 4% | 4 75% | 5.53 66% | 9.1 44% |
| Greyscale dE 2000 * | 10.1 | 3.08 70% | 9.52 6% | 3 70% | 3.47 66% | 6.1 40% |
| Gamma | 2.22 99% | 3.03 73% | 2.35 94% | 2.38 92% | 2.54 87% | 2.07 106% |
| CCT | 9065 72% | 7014 93% | 8802 74% | 6780 96% | 6564 99% | 7104 91% |
| Color Space (Percent of AdobeRGB 1998) (%) | 58.7 | 64 9% | 59 1% | 62.6 7% | 60 2% | 59 1% |
| Color Space (Percent of sRGB) (%) | 90.9 | 99 9% | 92 1% | 98 8% | 93 2% | 91 0% |
| Total Average (Program / Settings) | 11% /
23% | 5% /
4% | 11% /
21% | 5% /
20% | 17% /
15% |
* ... smaller is better
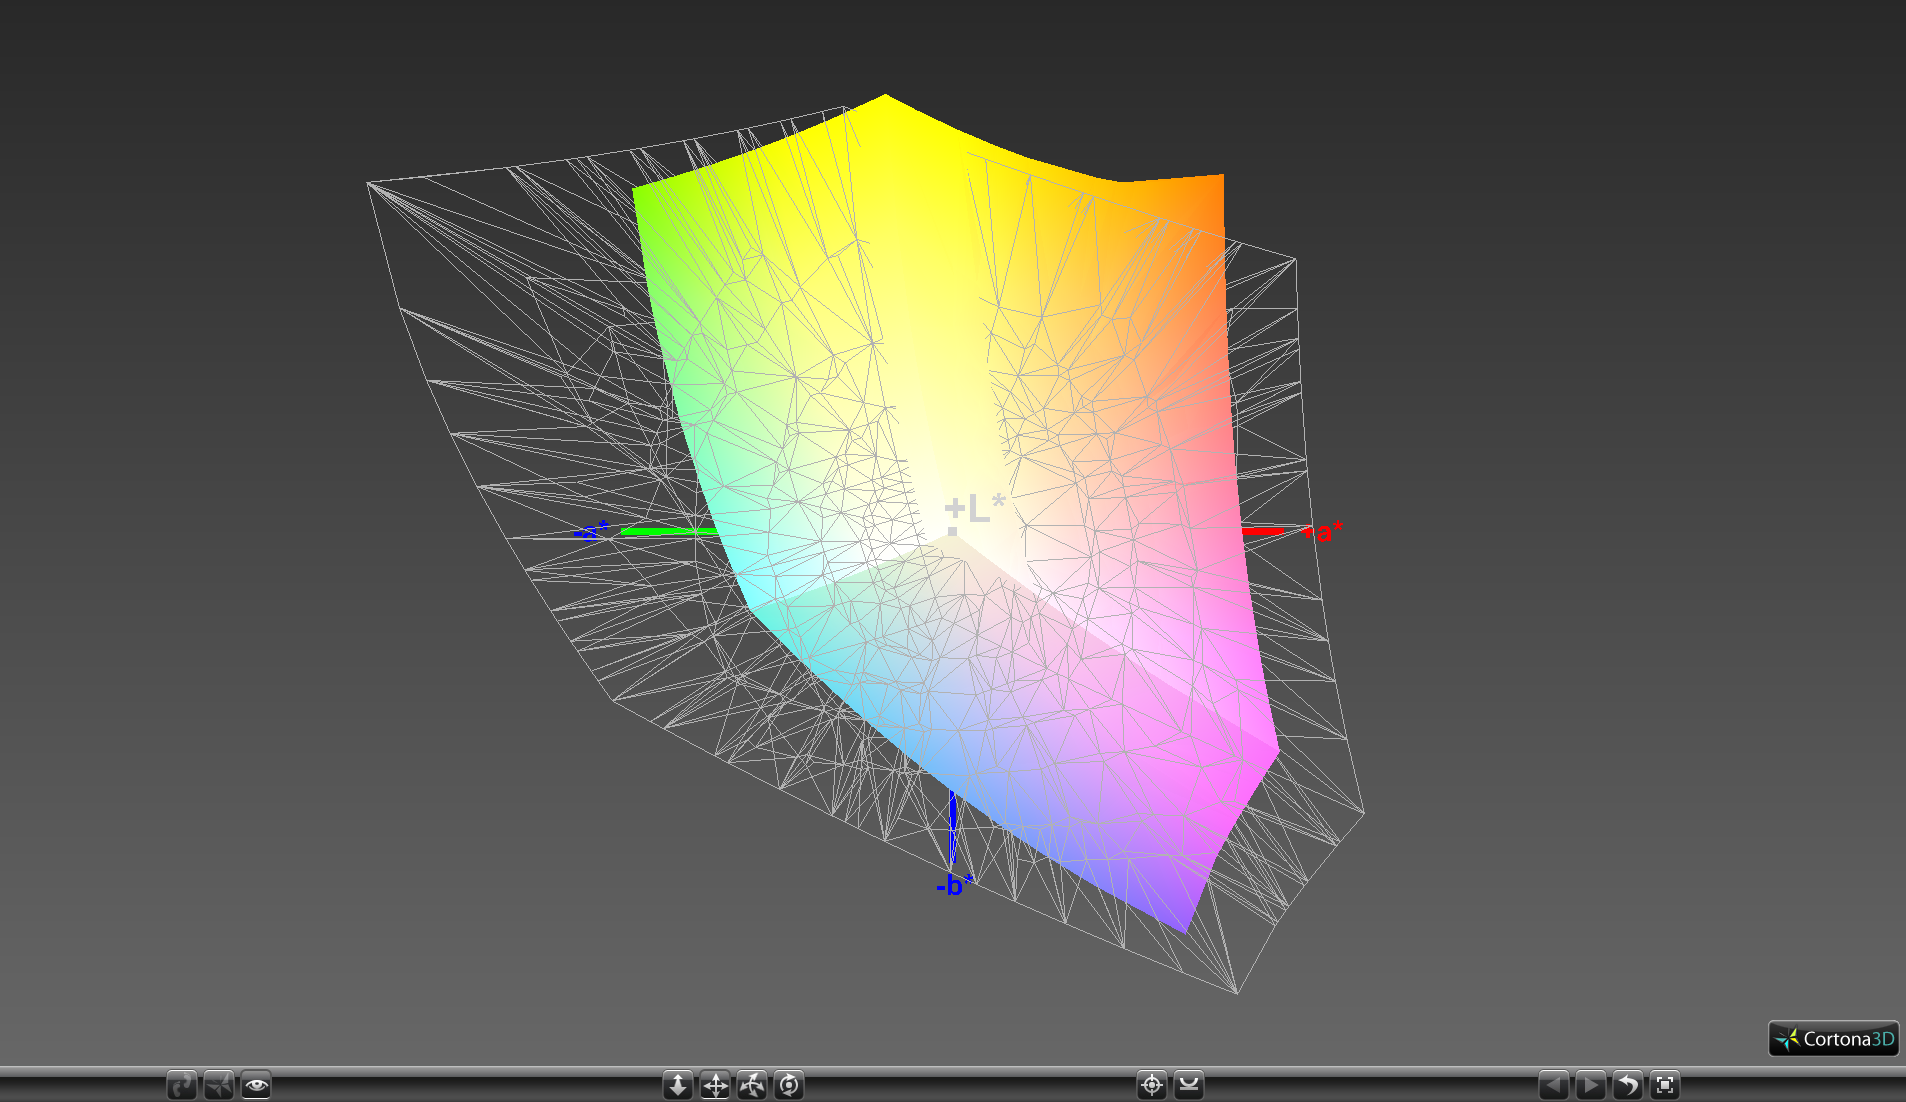
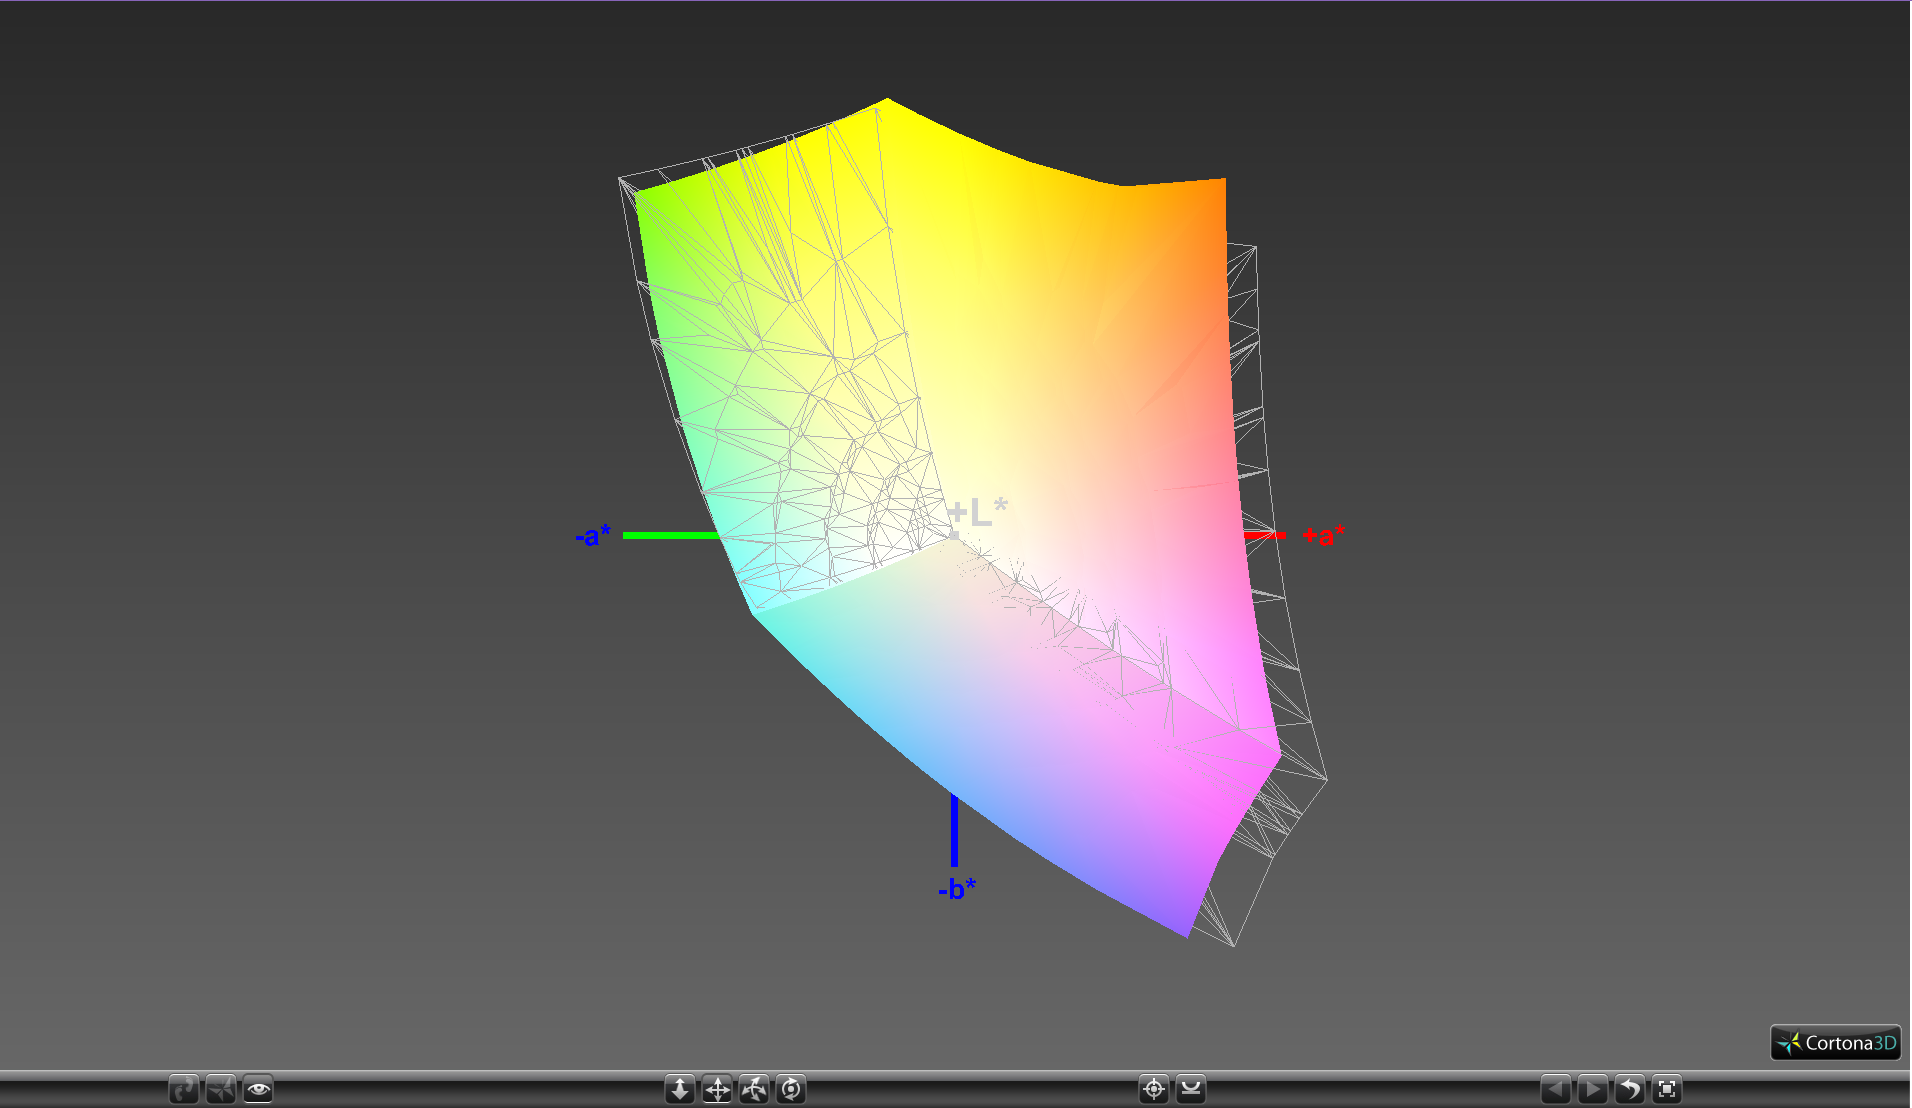
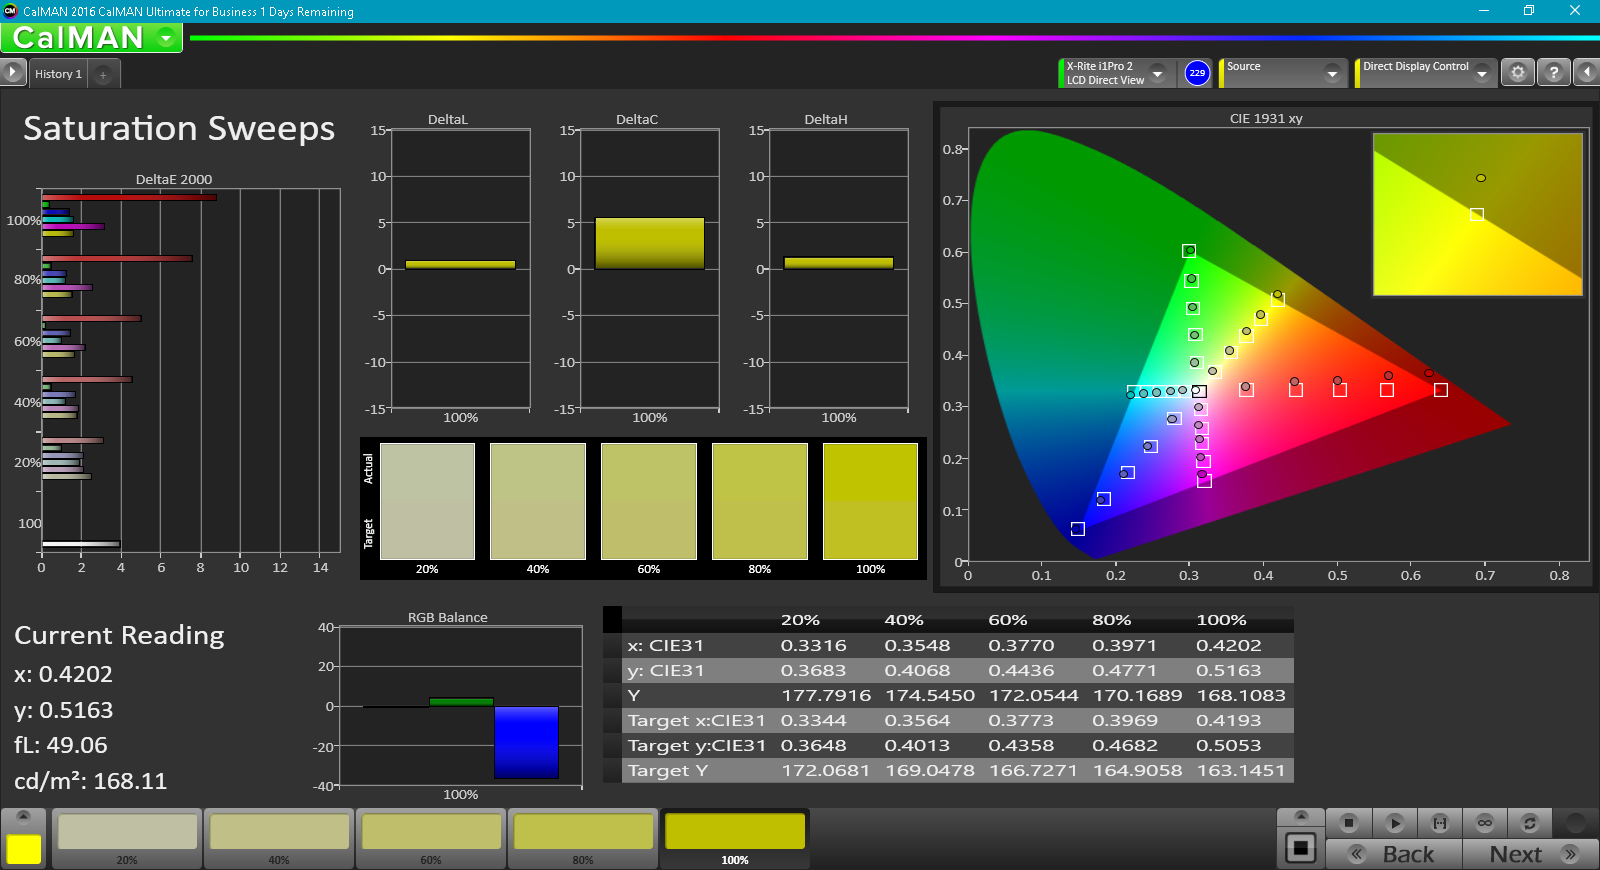
Color space is approximately 91 percent and 59 percent of sRGB and AdobeRGB standards, respectively, to be comparable to the displays of the Dell XPS 9365 and ThinkPad X1 tablet. Artists who demand full sRGB coverage, however, may want to consider the Surface Pro or HP Elite x2 yet again. Gamut is still wider than on many Ultrabooks where <90 percent sRGB coverage is a common occurrence.

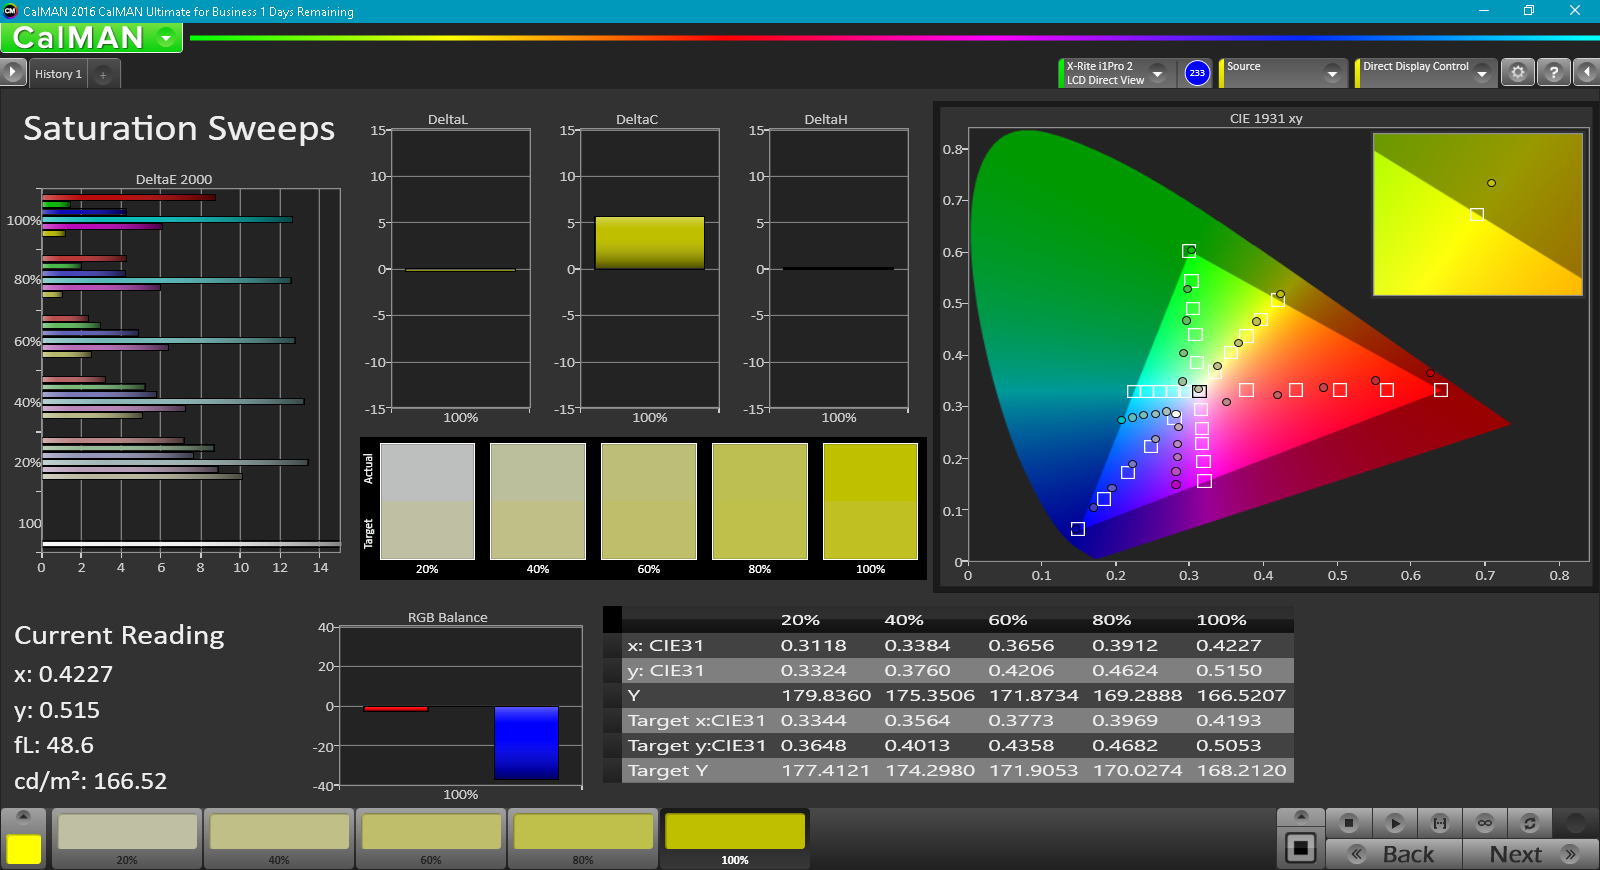
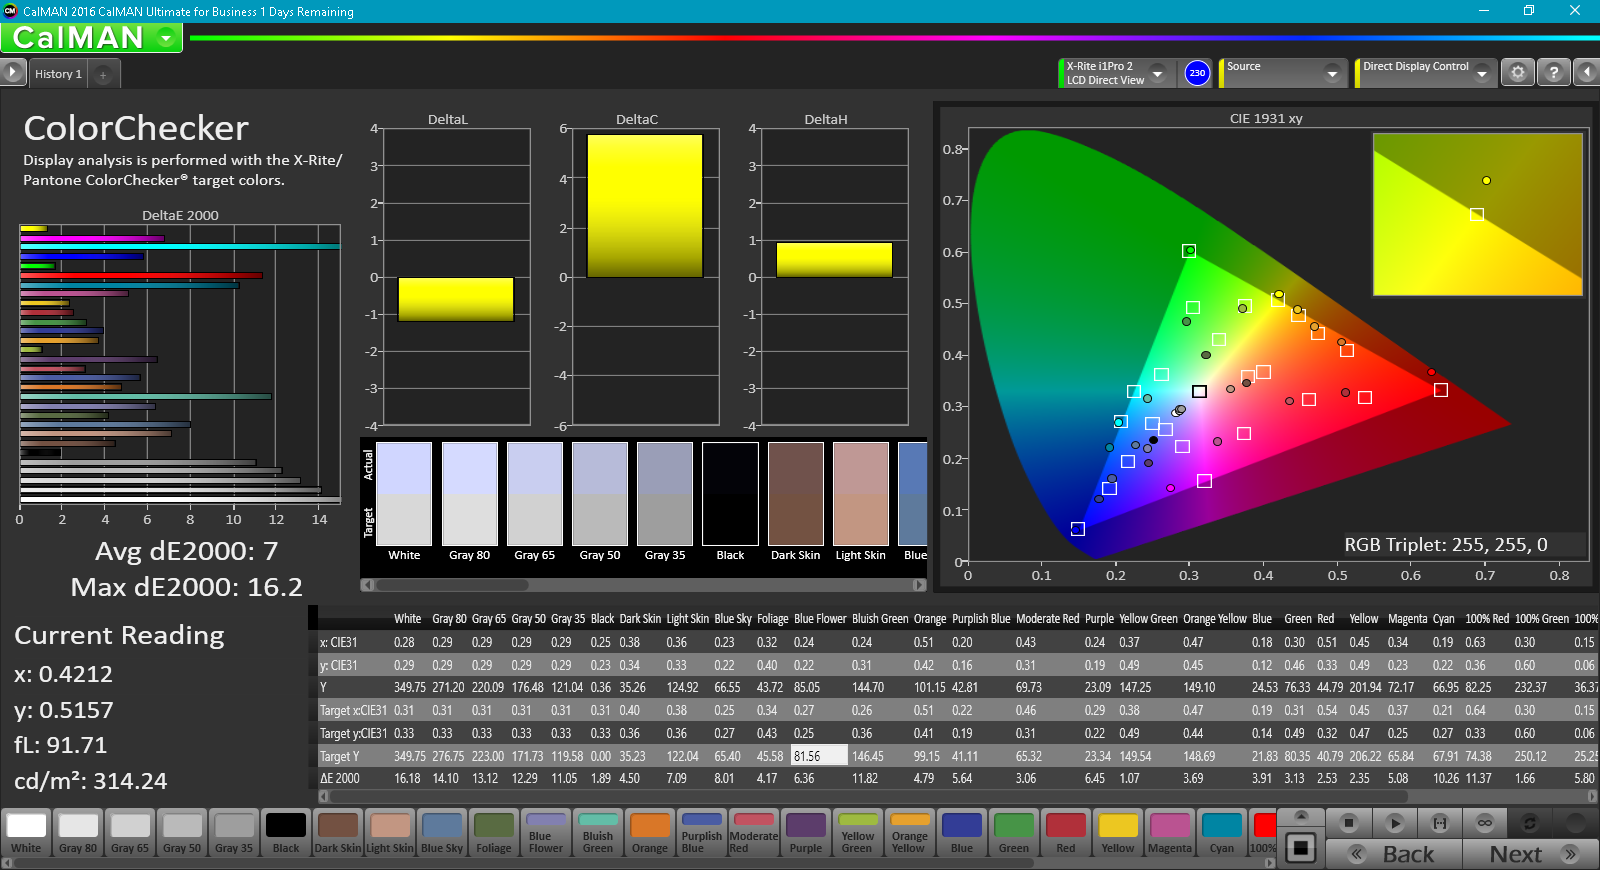
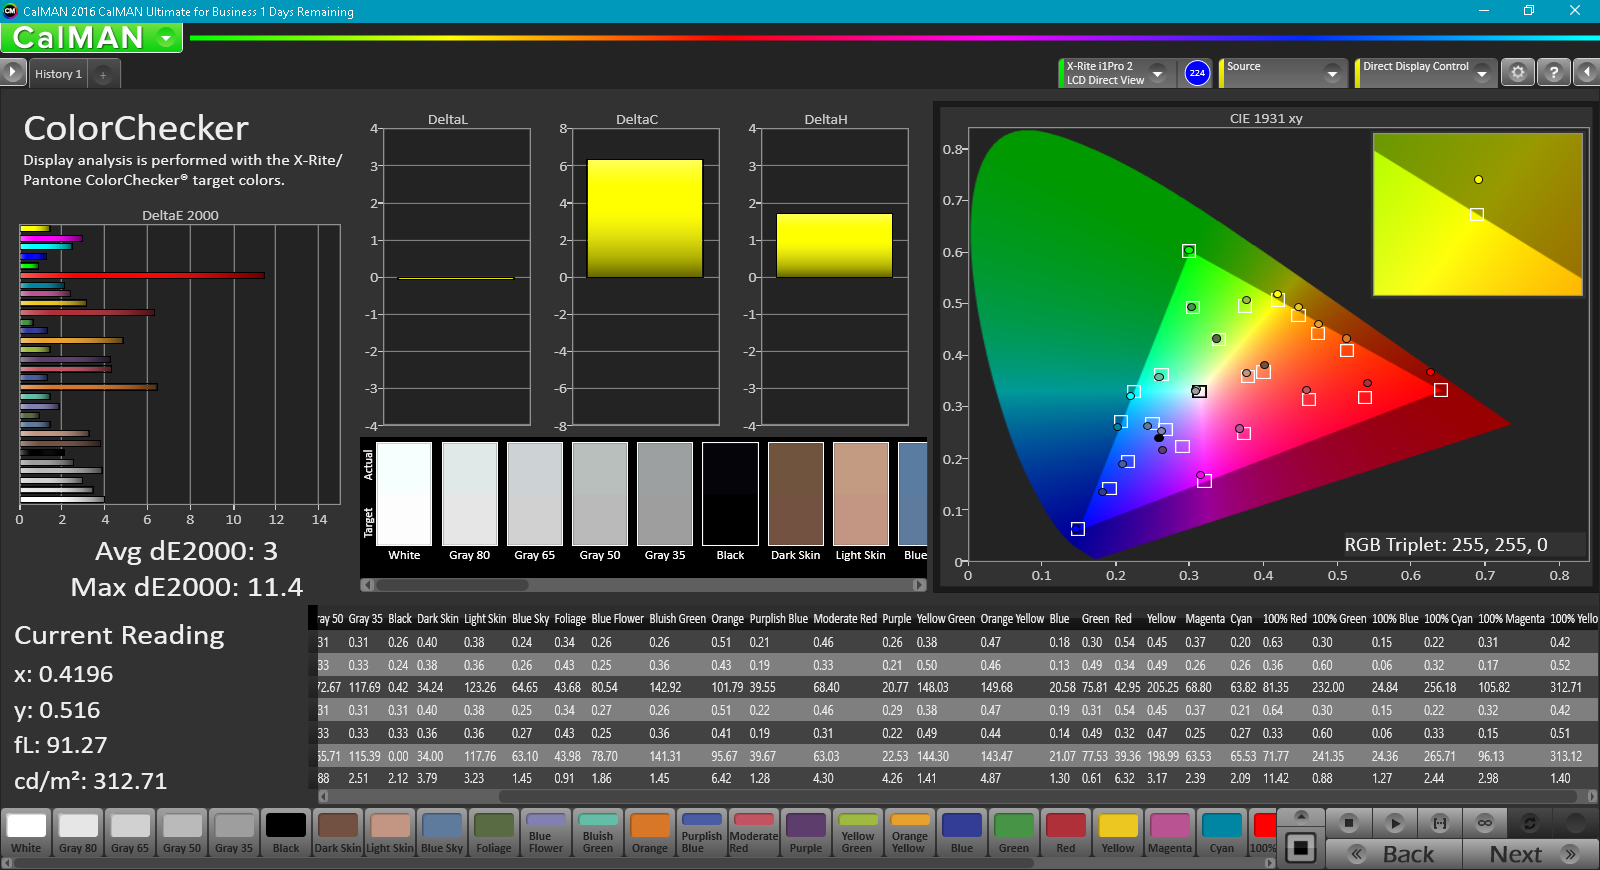
Further analyses with a X-Rite spectrophotometer reveal very inaccurate colors and grayscale out of the box. Color temperature is far too cool at about 9000K and both Teal and Red are especially imbalanced across all tested saturation levels. Our calibration efforts improve grayscale and colors significantly whilst creating a more even RGB balance, but Red continues to be a thorn on an otherwise color accurate panel.

Display Response Times
| ↔ Response Time Black to White | ||
|---|---|---|
| 28 ms ... rise ↗ and fall ↘ combined | ↗ 14.8 ms rise | 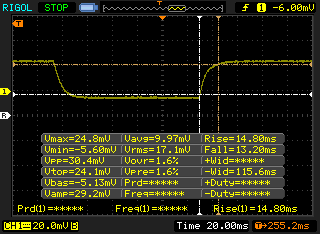 |
| ↘ 13.2 ms fall | ||
| The screen shows relatively slow response rates in our tests and may be too slow for gamers. In comparison, all tested devices range from 0.1 (minimum) to 240 (maximum) ms. » 71 % of all devices are better. This means that the measured response time is worse than the average of all tested devices (19.8 ms). | ||
| ↔ Response Time 50% Grey to 80% Grey | ||
| 35.6 ms ... rise ↗ and fall ↘ combined | ↗ 17.2 ms rise | 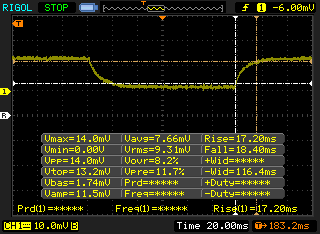 |
| ↘ 18.4 ms fall | ||
| The screen shows slow response rates in our tests and will be unsatisfactory for gamers. In comparison, all tested devices range from 0.165 (minimum) to 636 (maximum) ms. » 50 % of all devices are better. This means that the measured response time is worse than the average of all tested devices (31 ms). | ||
Screen Flickering / PWM (Pulse-Width Modulation)
| Screen flickering / PWM detected | 198.4 Hz | ≤ 99 % brightness setting | 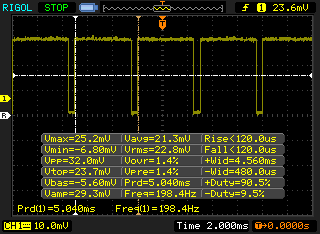 |
The display backlight flickers at 198.4 Hz (worst case, e.g., utilizing PWM) Flickering detected at a brightness setting of 99 % and below. There should be no flickering or PWM above this brightness setting. The frequency of 198.4 Hz is relatively low, so sensitive users will likely notice flickering and experience eyestrain at the stated brightness setting and below. In comparison: 52 % of all tested devices do not use PWM to dim the display. If PWM was detected, an average of 7757 (minimum: 5 - maximum: 343500) Hz was measured. | |||
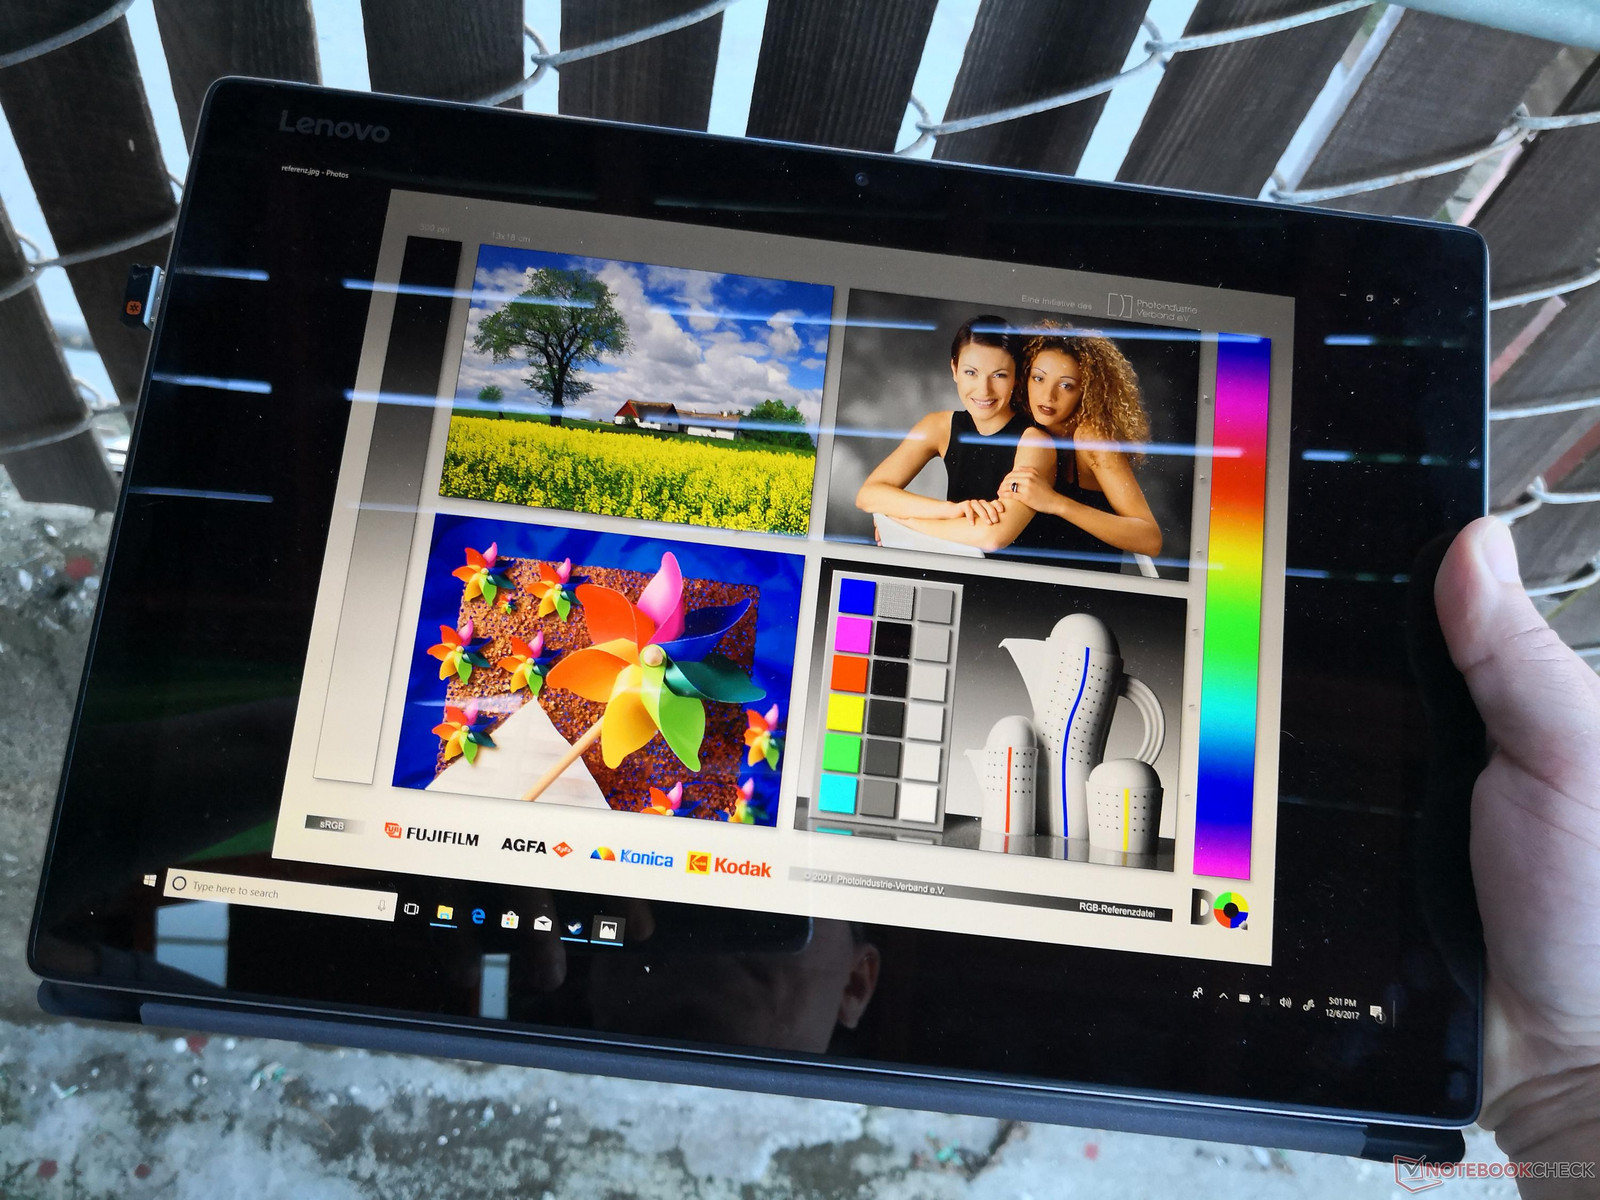
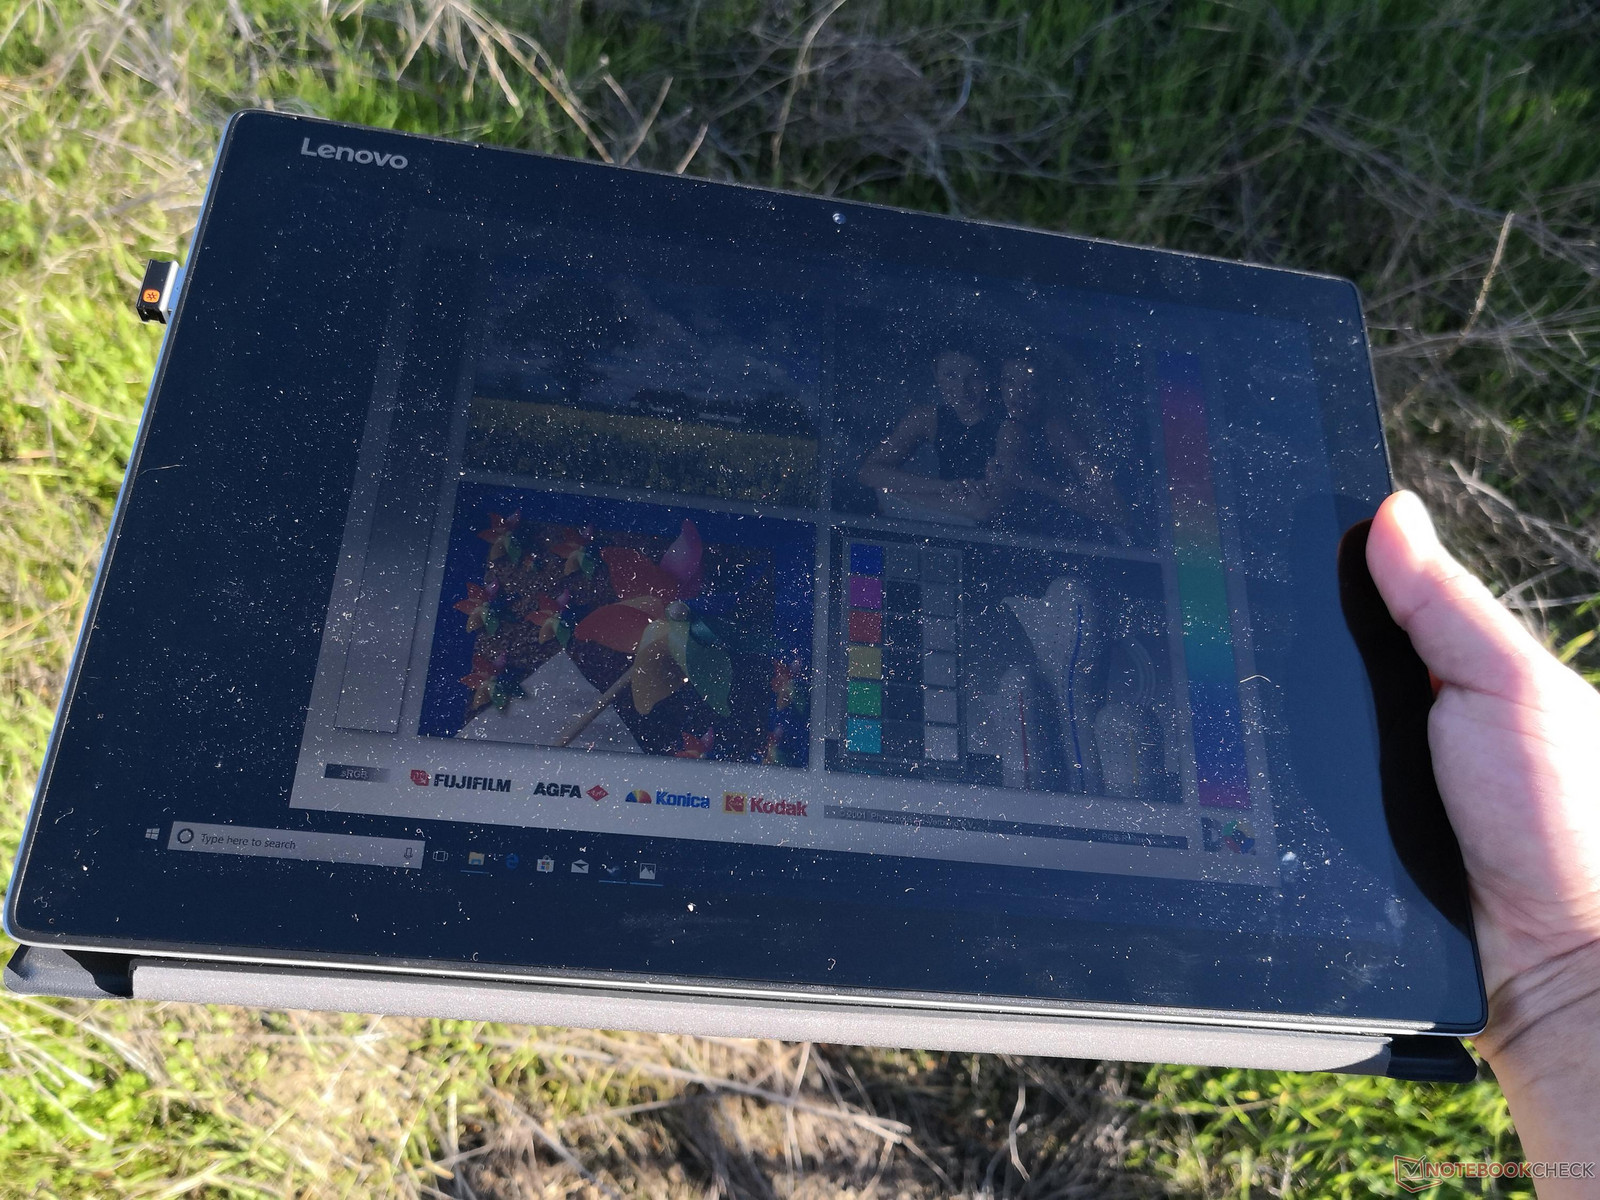
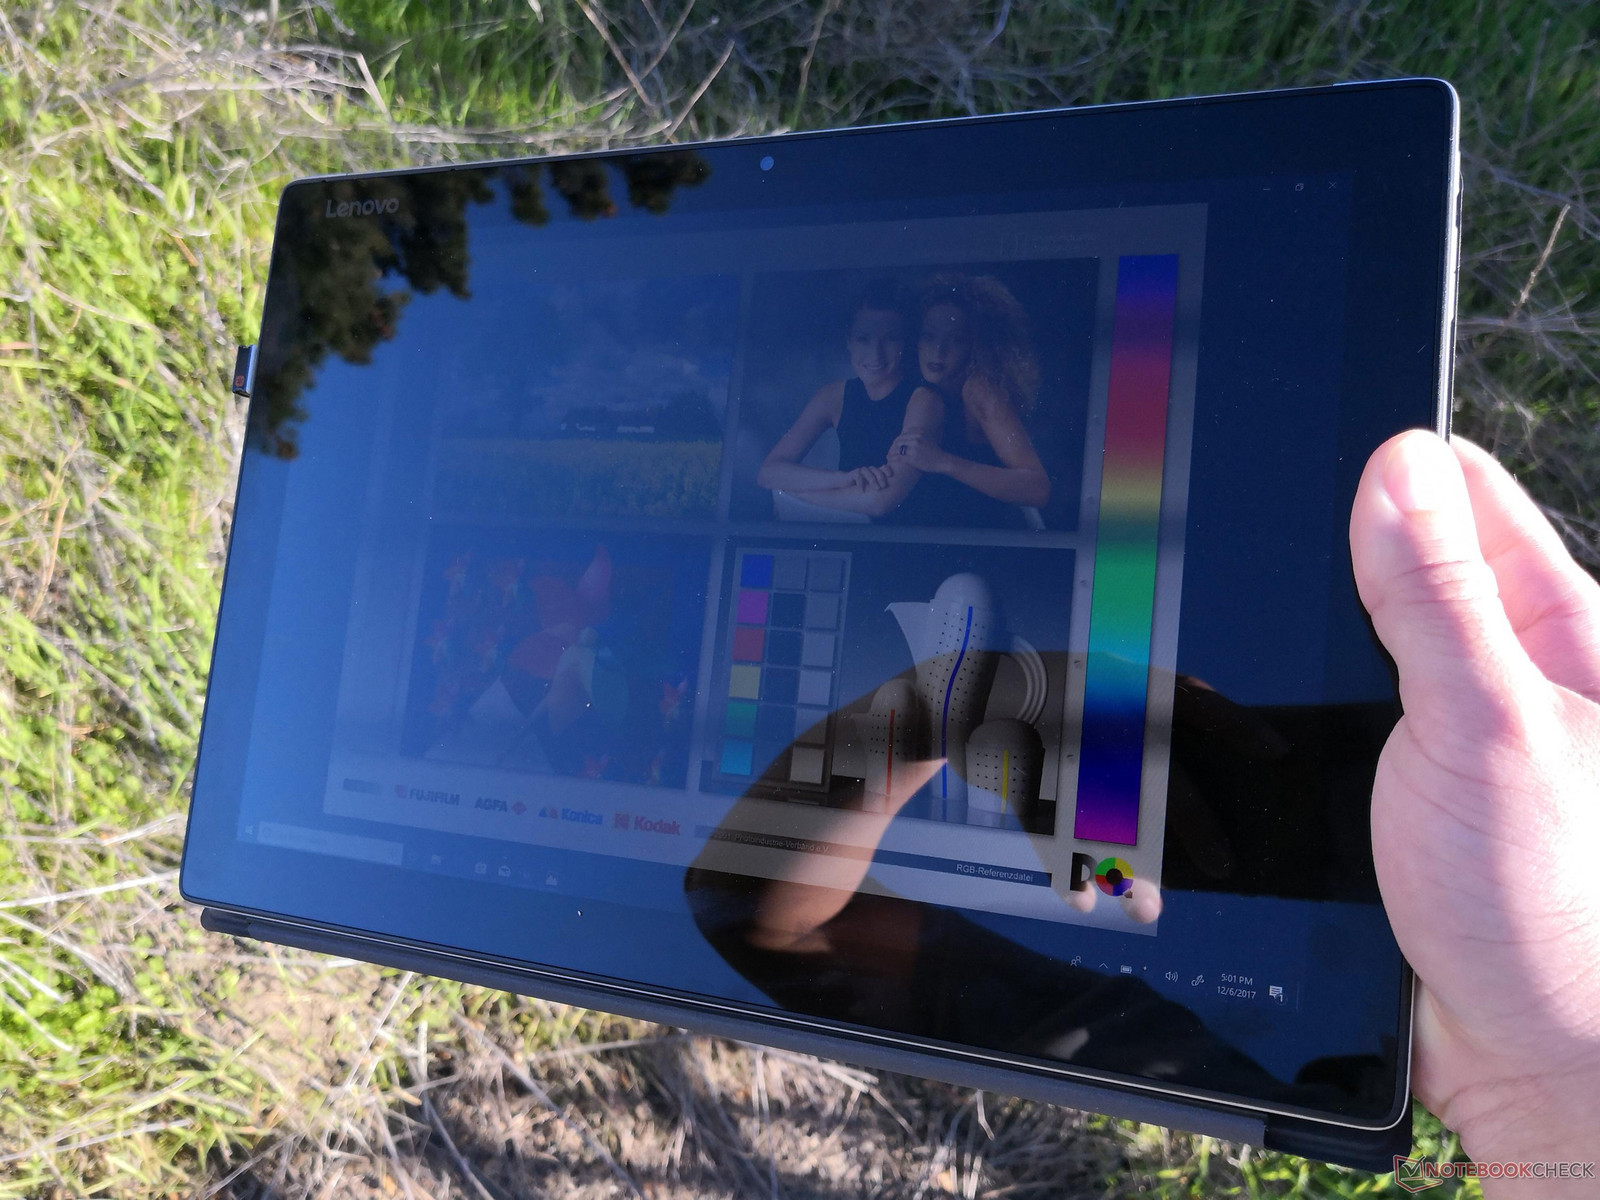
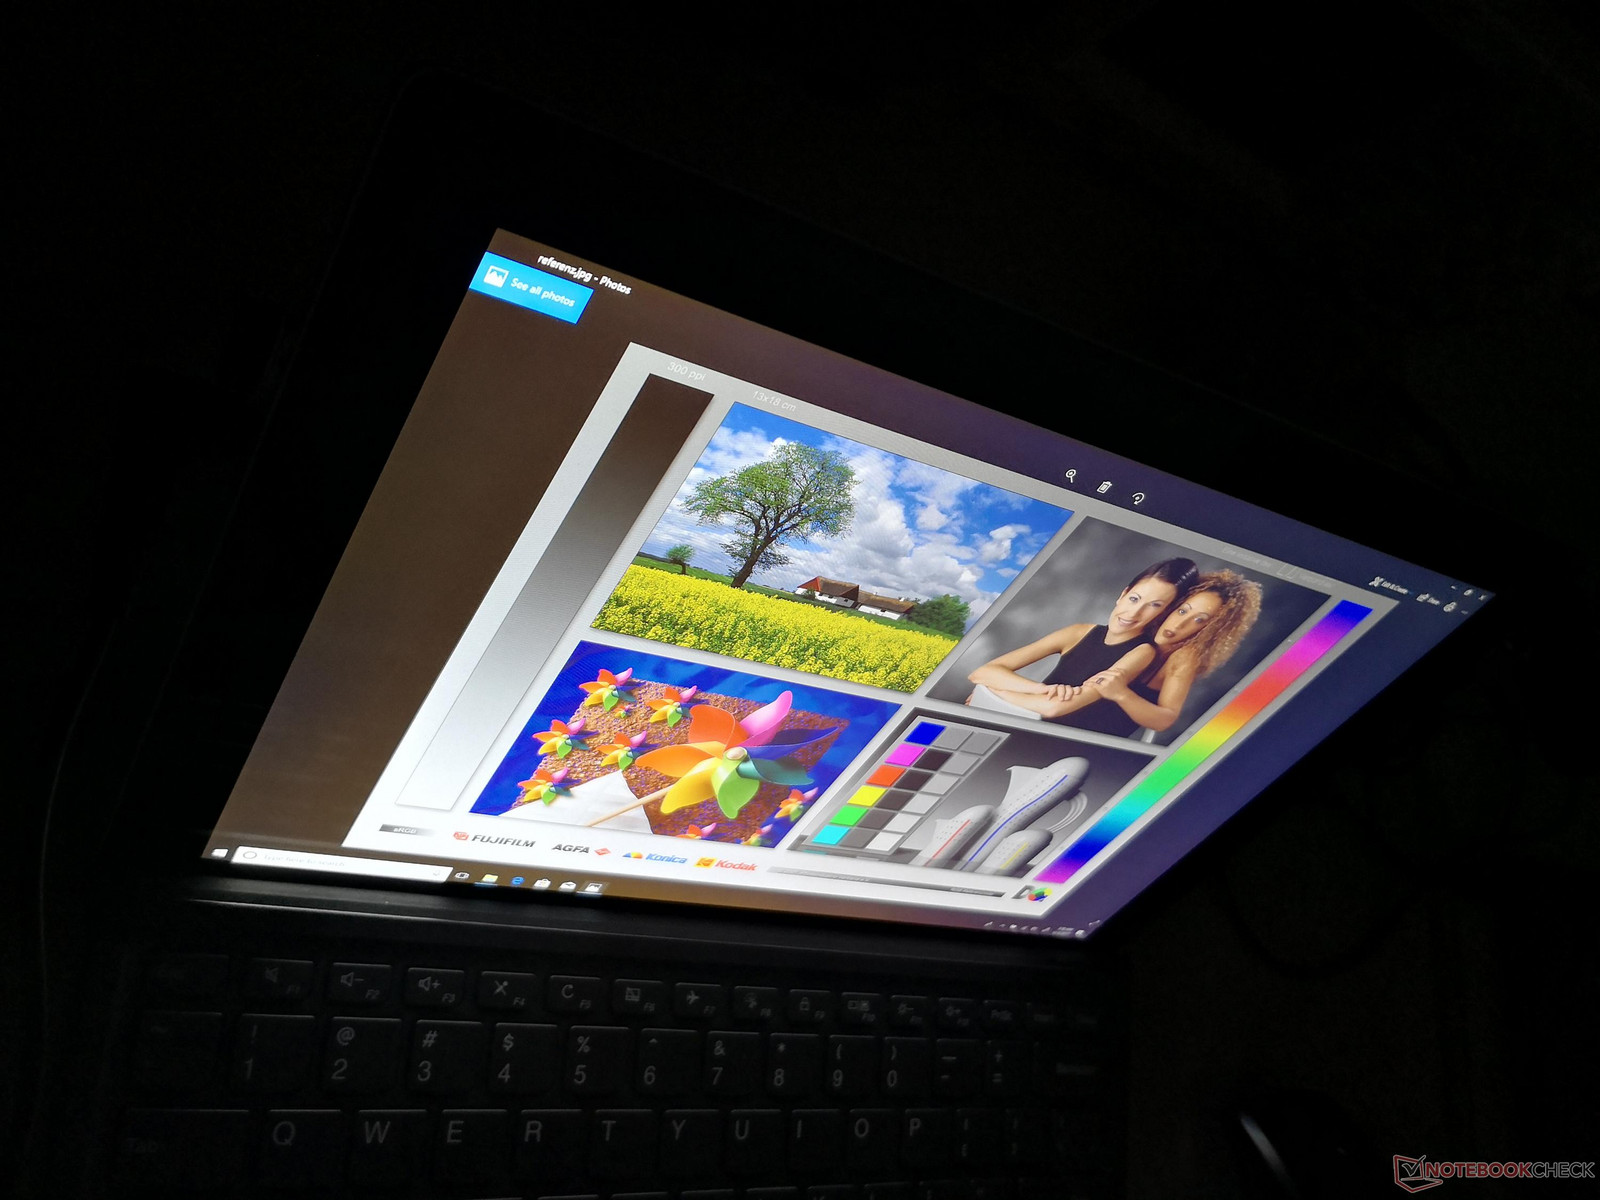
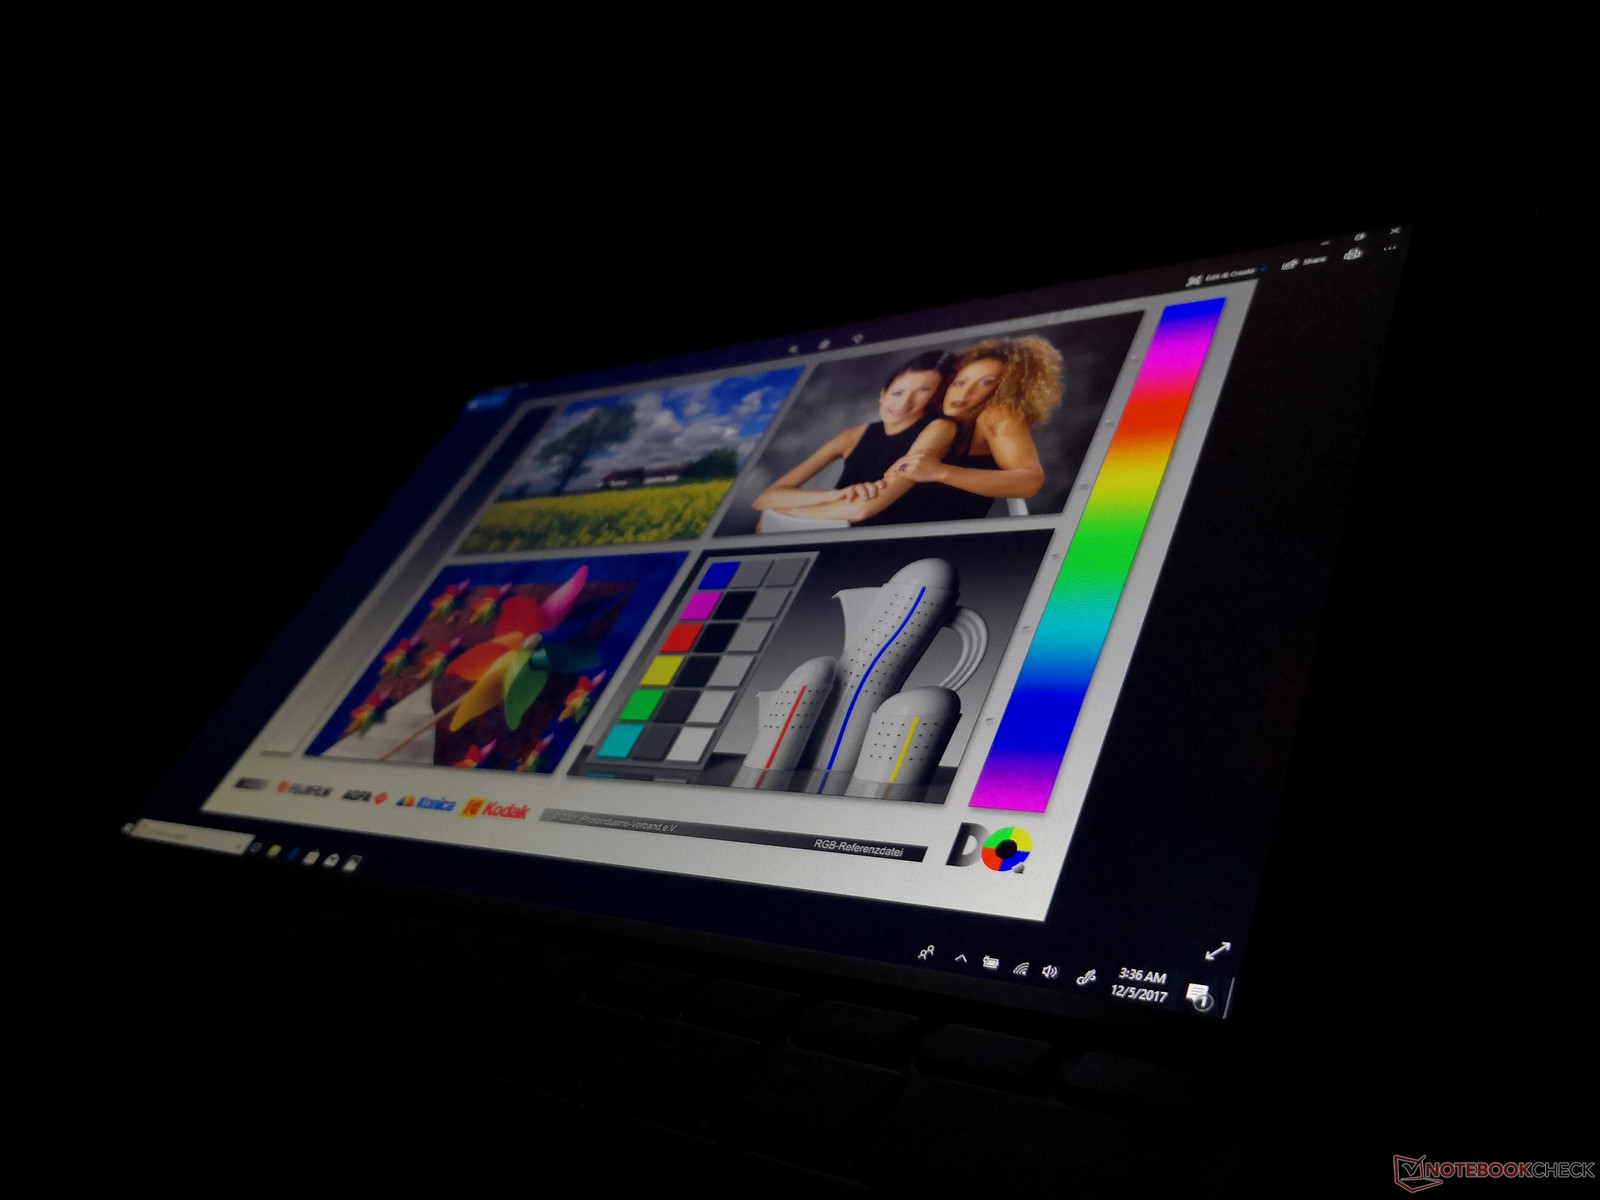
Outdoor visibility is acceptable when under shade but below average when under sunlight or on an overcast day. The backlight is not powerful enough to significantly reduce or overcome glare from the glossy display. Viewing angles are as expected from an IPS panel with no major color shifting. Apparent brightness, however, decreases if viewing from obtuse angles to further reduce the effectiveness of the tablet in outdoor conditions.
Performance
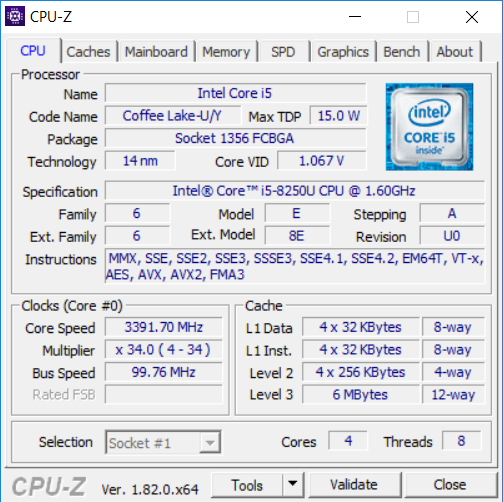
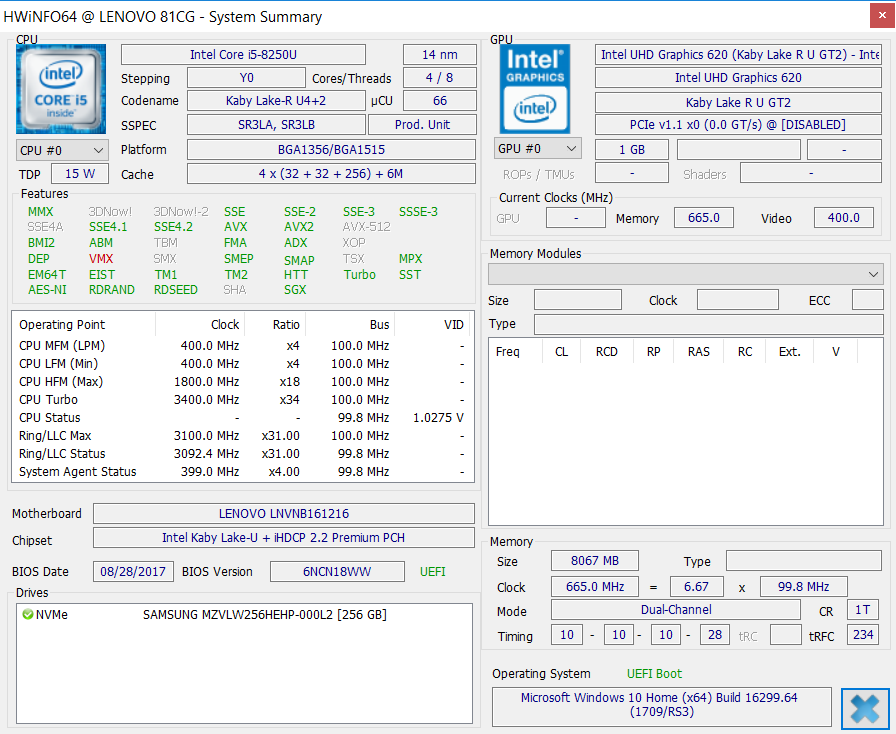
The Core i5-8250U may be considered an 8th generation Core product, but its Kaby Lake-R architecture is more closely related to last generation of Kaby Lake CPUs than to the current Coffee Lake series. Nonetheless, its advantages in sheer core count should give it the edge over the dual-core i5-7200U and i5-6200U found in the older generation Miix 510. Most Windows tablets have not yet made the jump to Kaby Lake-R as of late 2017 and Lenovo can be considered ahead of the curve in this regard.
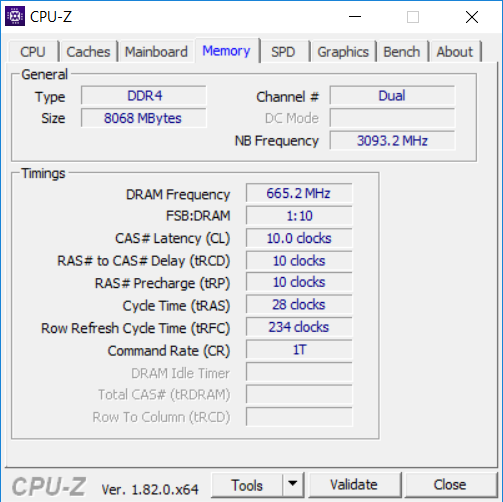
RAM has not changed as it is still soldered at 8 GB DDR4 2133.
Processor
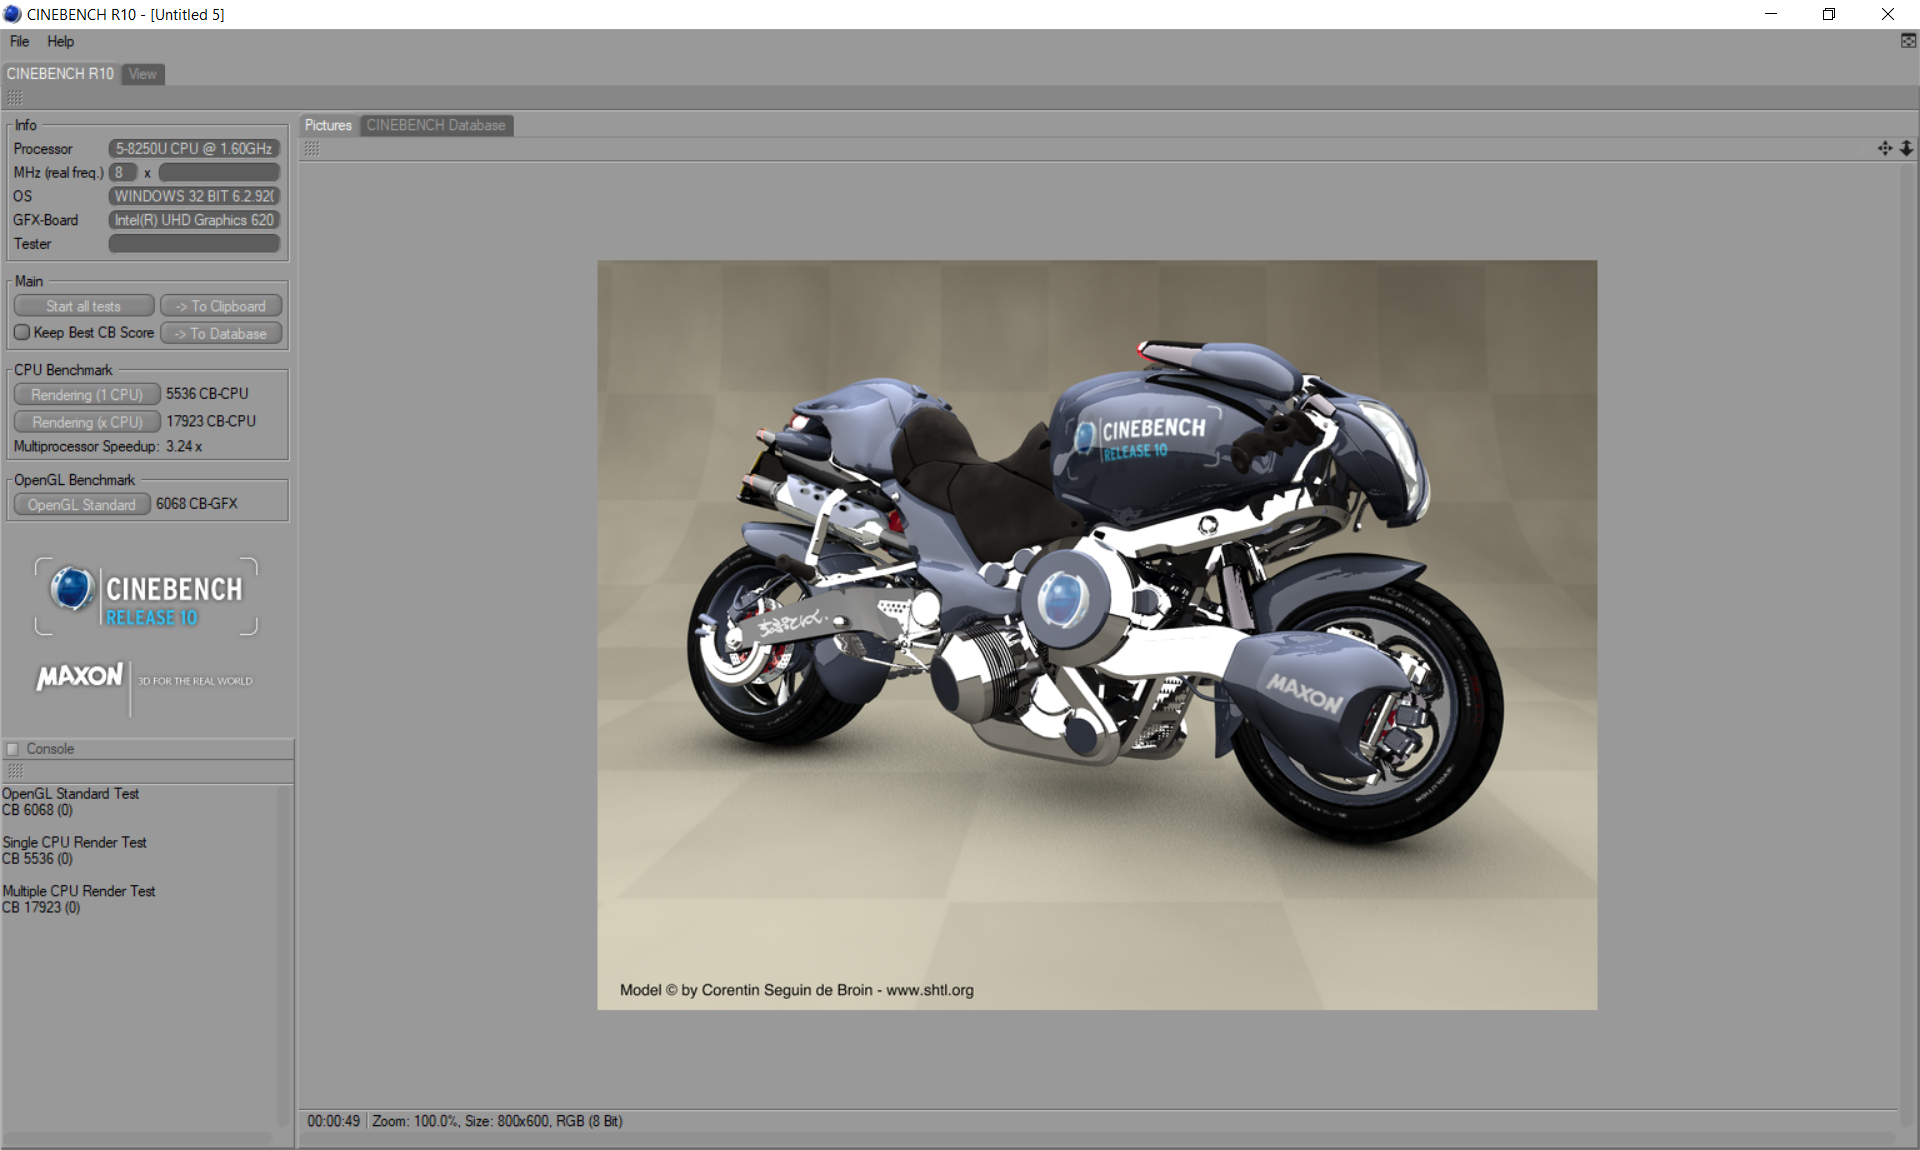
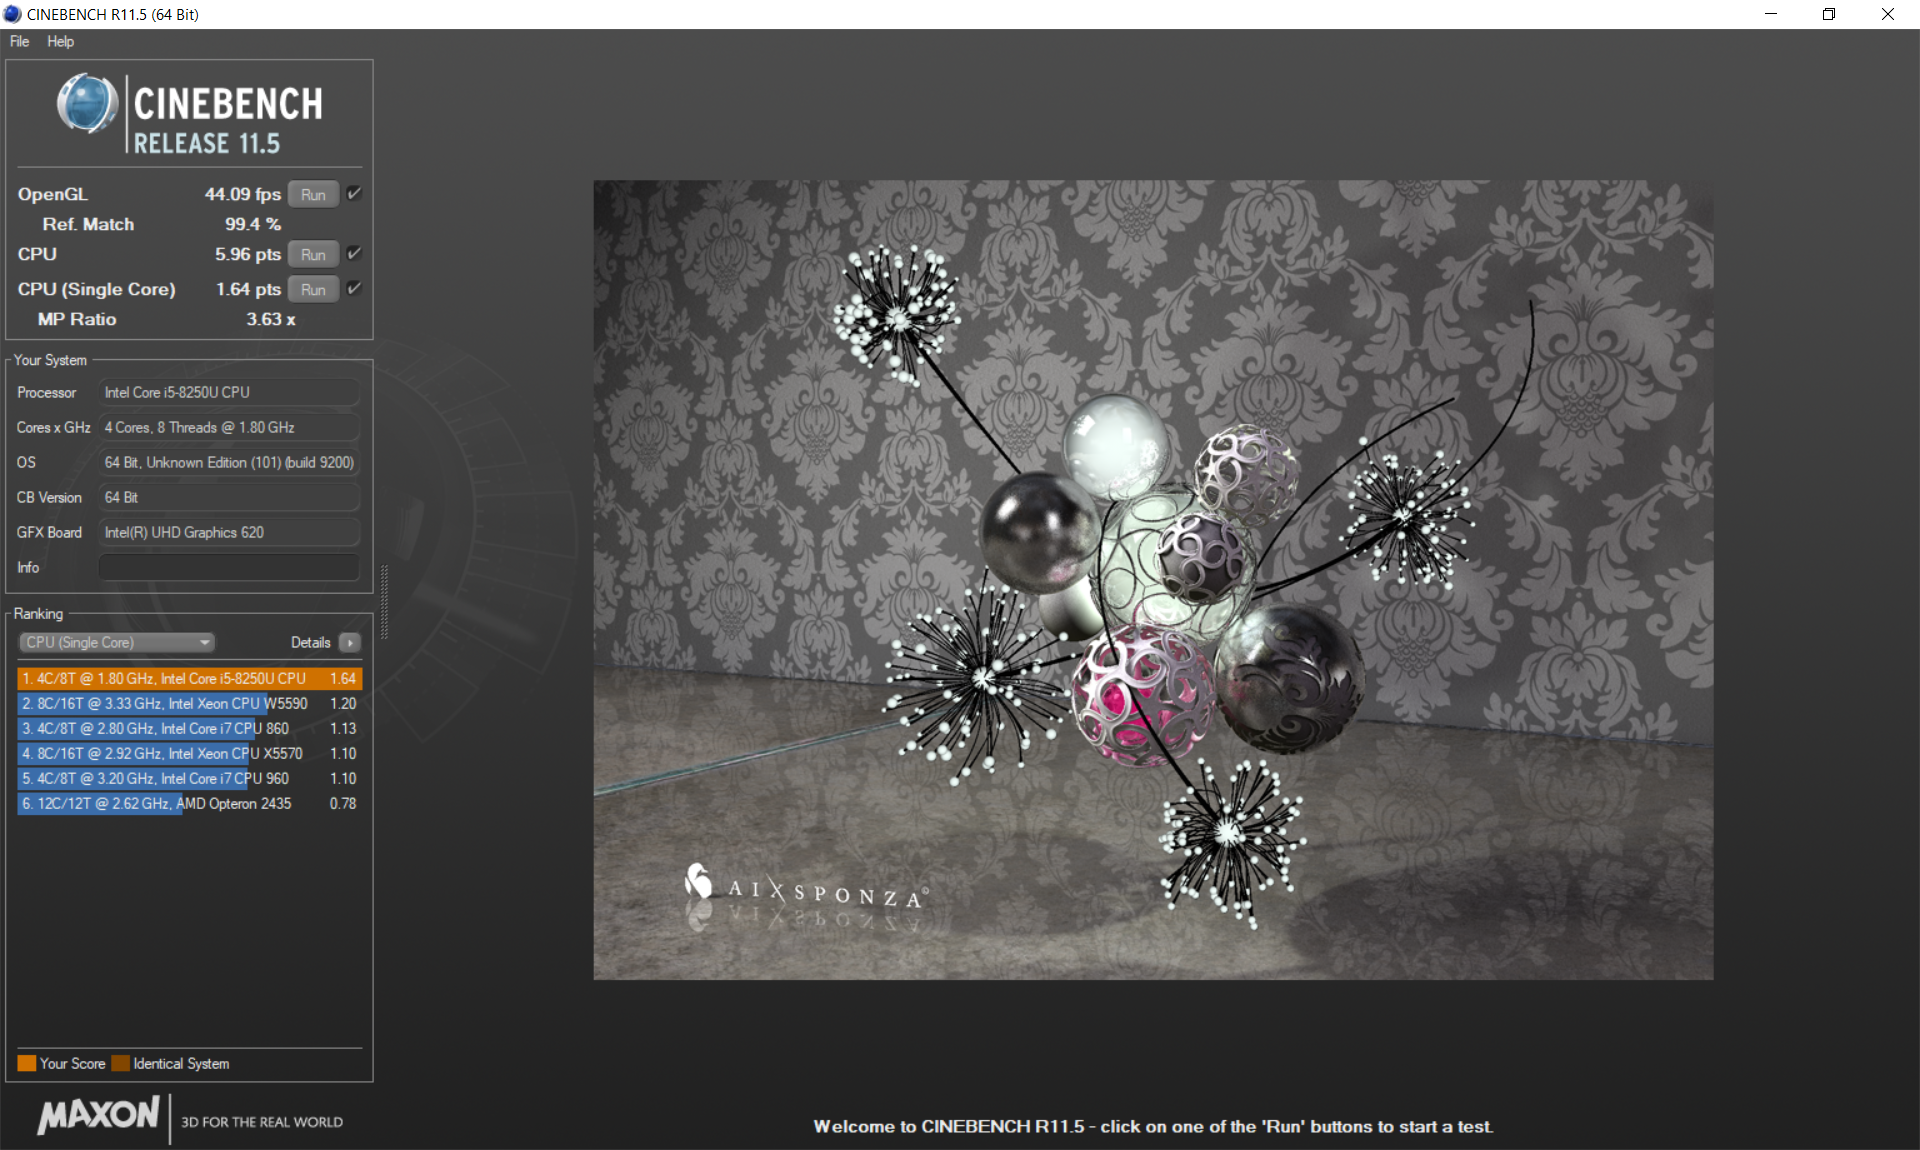
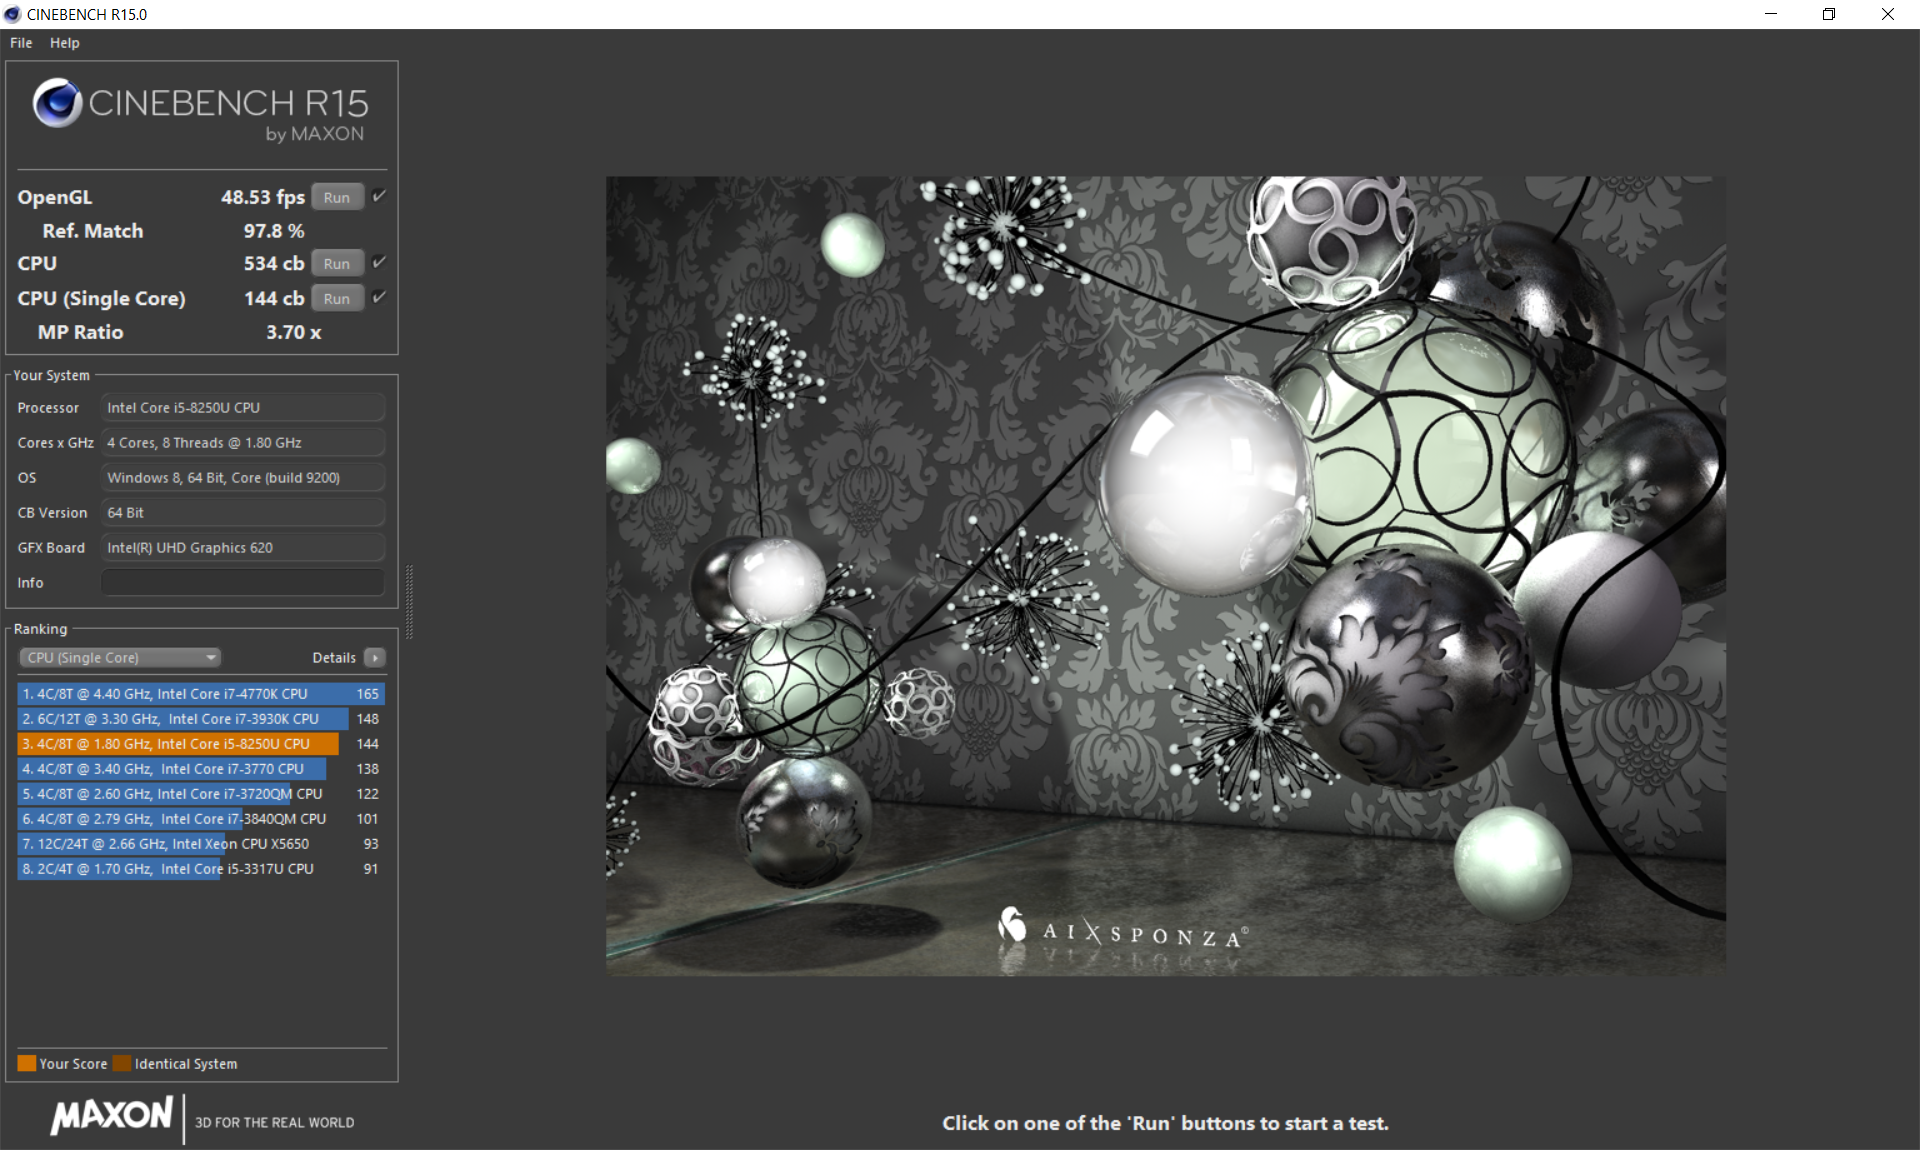
CPU performance is similar to the Acer Swift 3 notebook equipped with an identical Core i5-8250U CPU. Users can expect a massive raw performance boost of more than 100 percent over the Skylake i5-6200U in the last generation Miix 510 during multi-thread operations. As noted in our existing preview of the Kaby Lake-R series, the i5-8250U is a generational leap in processing power over the ULV Kaby Lake due largely to the quad-core architecture. The highest-end Surface Pro with the i7-7660U clocks in over 20 percent slower than the Miix 520 in multi-threaded operations while being about 15 percent faster in single-threaded operations according to CineBench R15.
Running CineBench R15 Multi-Thread in a loop reveals that the tablet is unable to sustain maximum Turbo Boost for very long. The initial score of 566 points falls to 532 points by the second run and the system never recovers throughout the loop test. The 6 percent drop shouldn't be noticeable when browsing or word processing and is relatively minor compared to the throttling that Microsoft imposes on its Surface Pro series.
See our dedicated CPU page on the Core i5-8250U for more technical information and benchmark comparisons.
| wPrime 2.10 - 1024m | |
| Microsoft Surface Pro (2017) i7 | |
| HP Spectre x360 15t-bl100 | |
| Dell Inspiron 15 7000 7577 | |
| Lenovo Miix 520-12IKB 81CG | |
| HP Envy x360 15m-bq121dx | |
| MSI GF62VR 7RF-877 | |
* ... smaller is better
System Performance
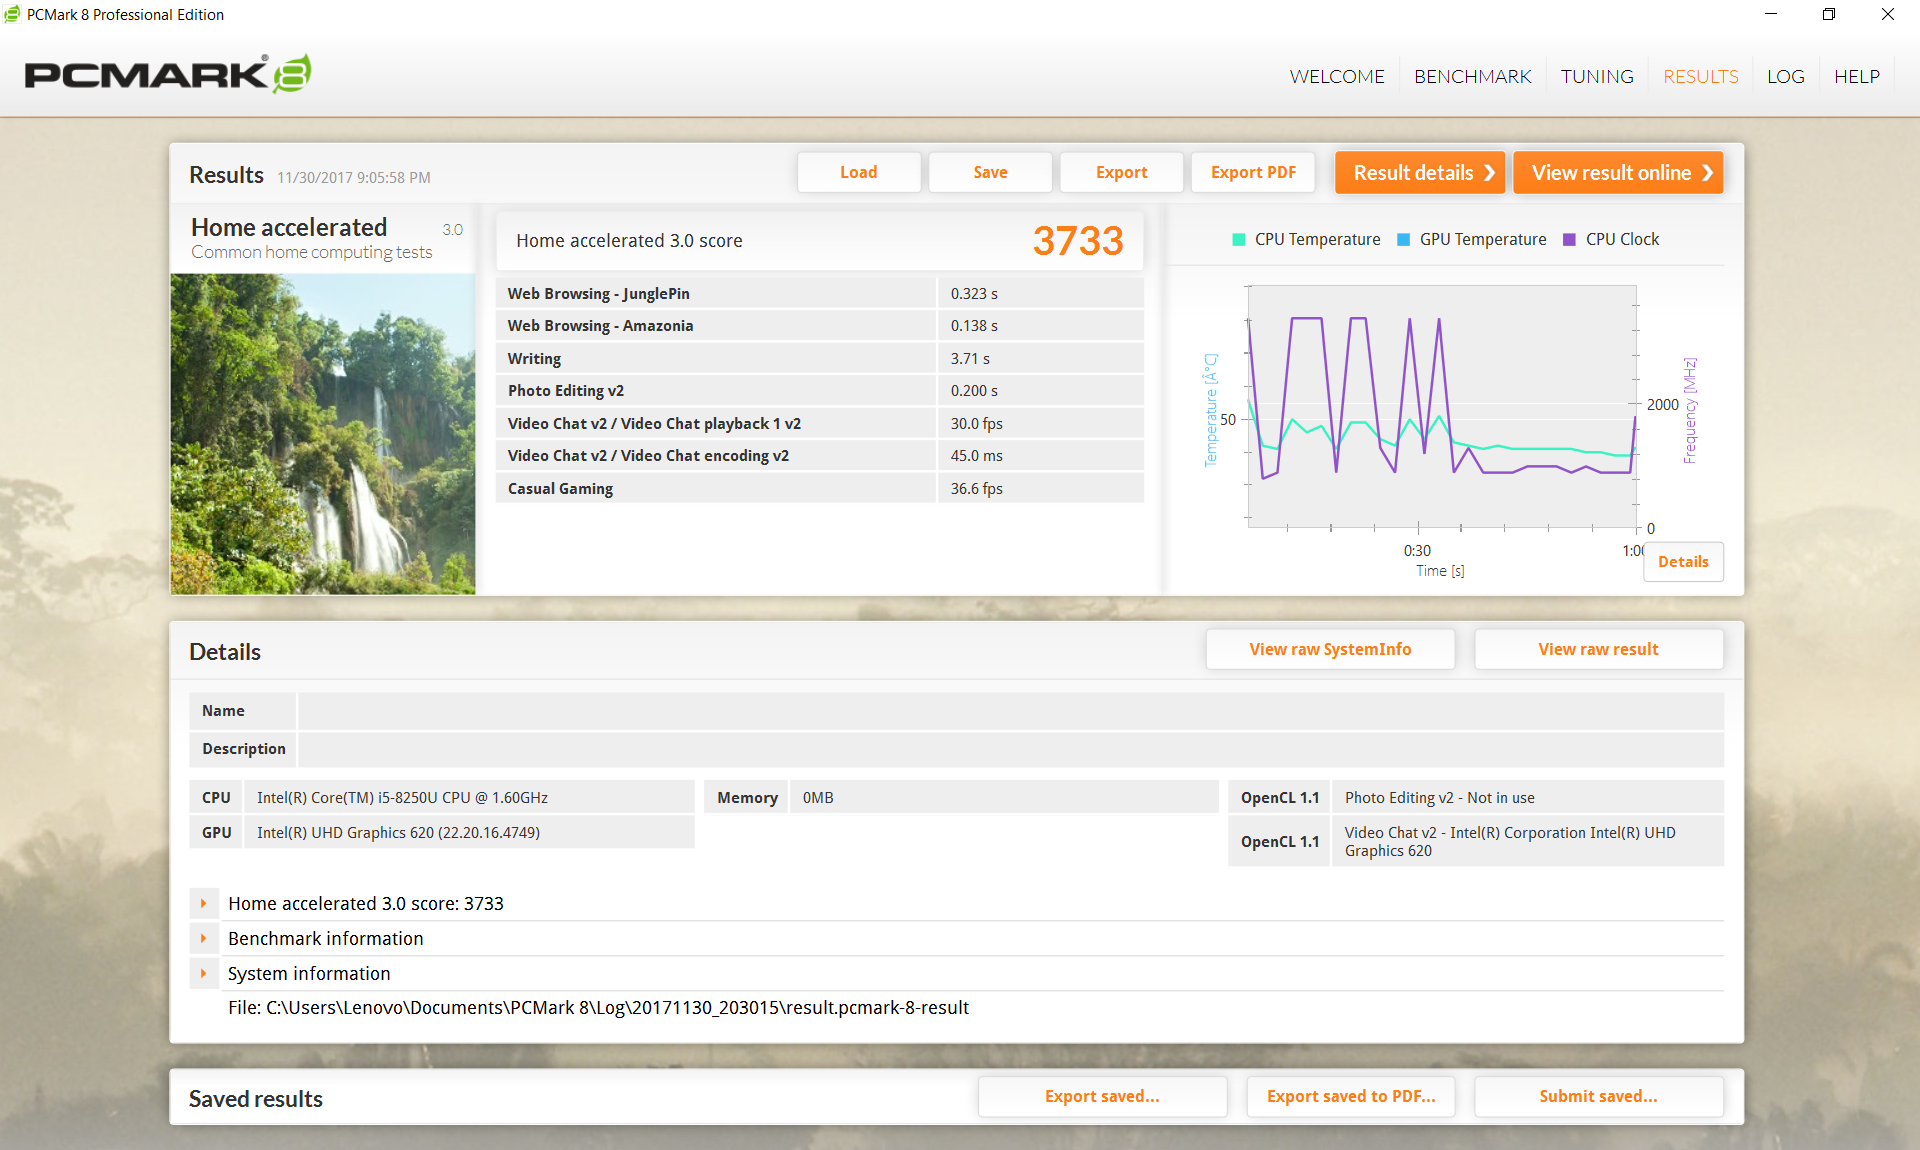
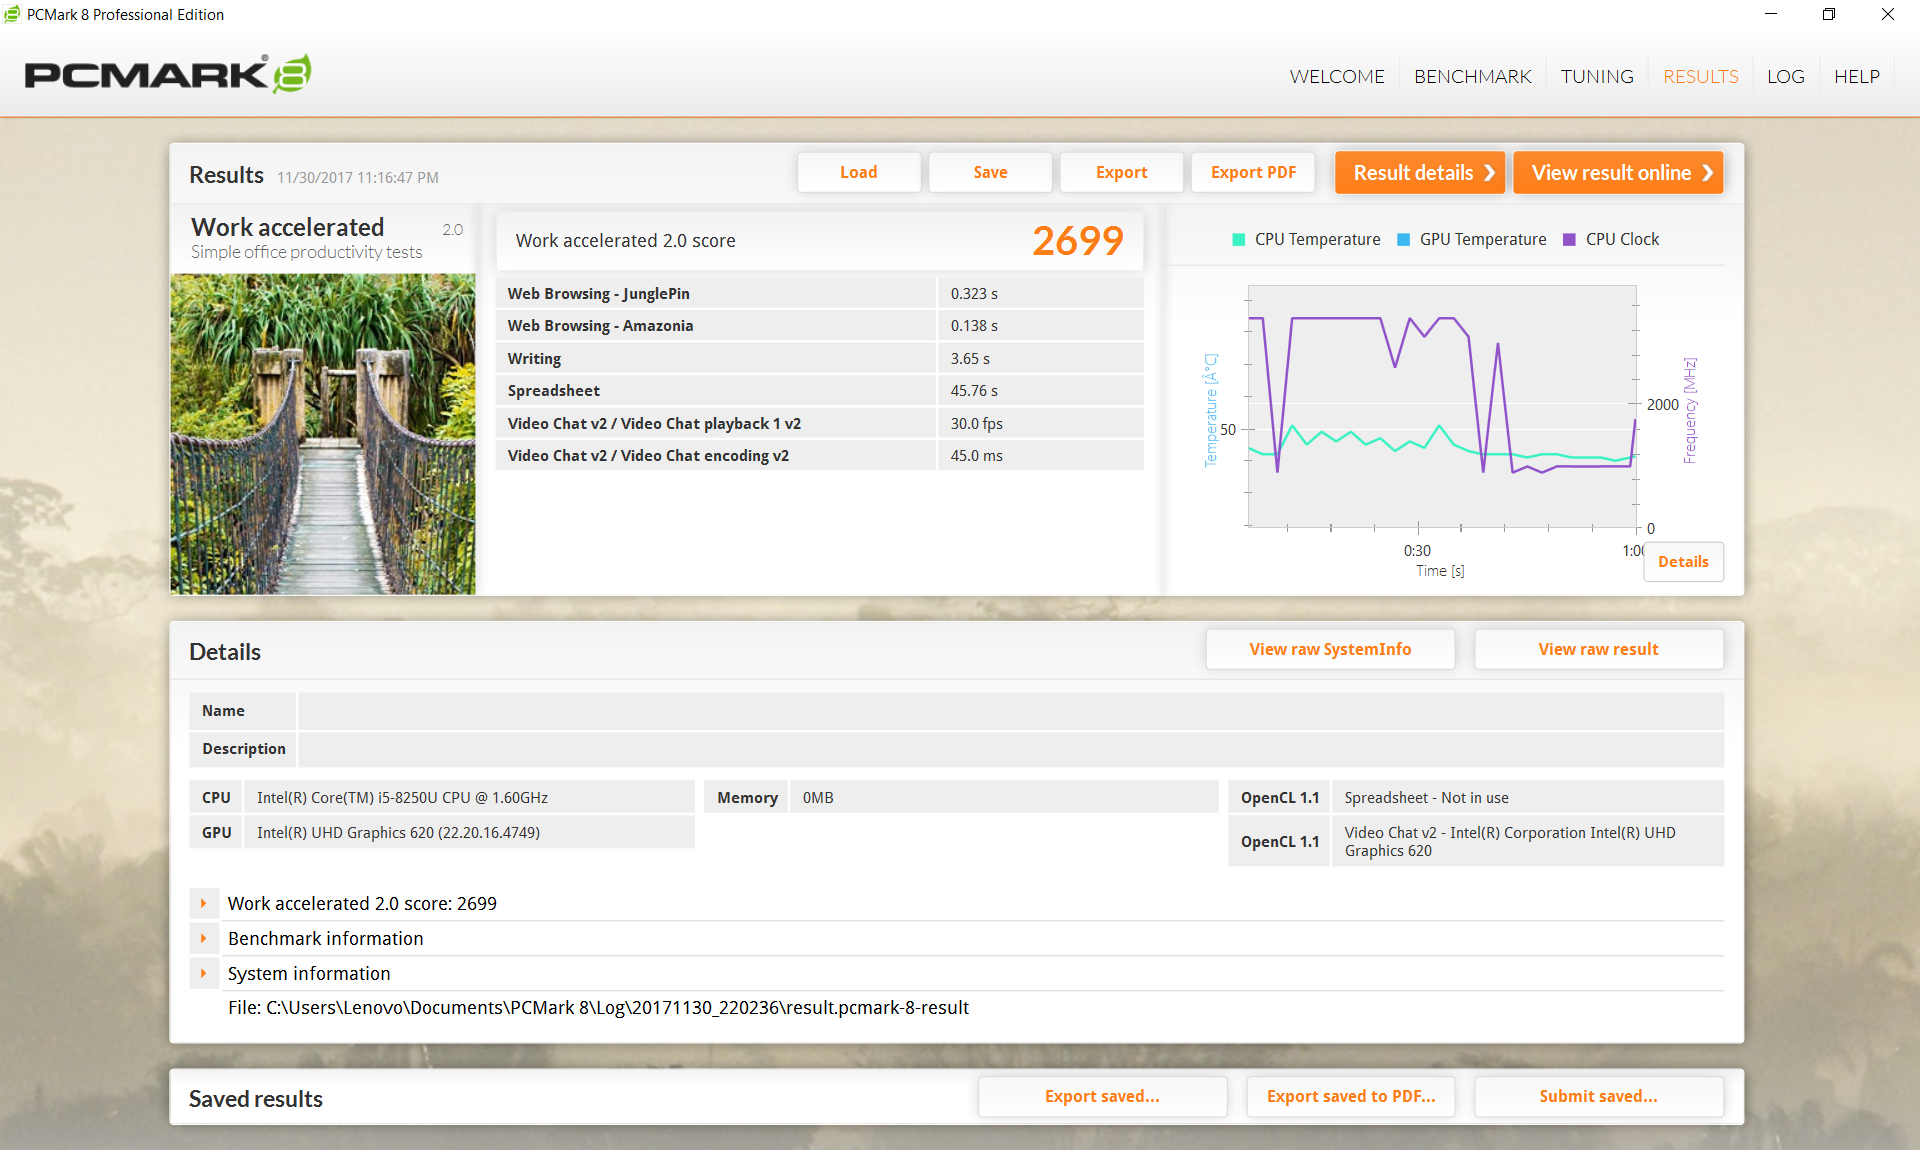
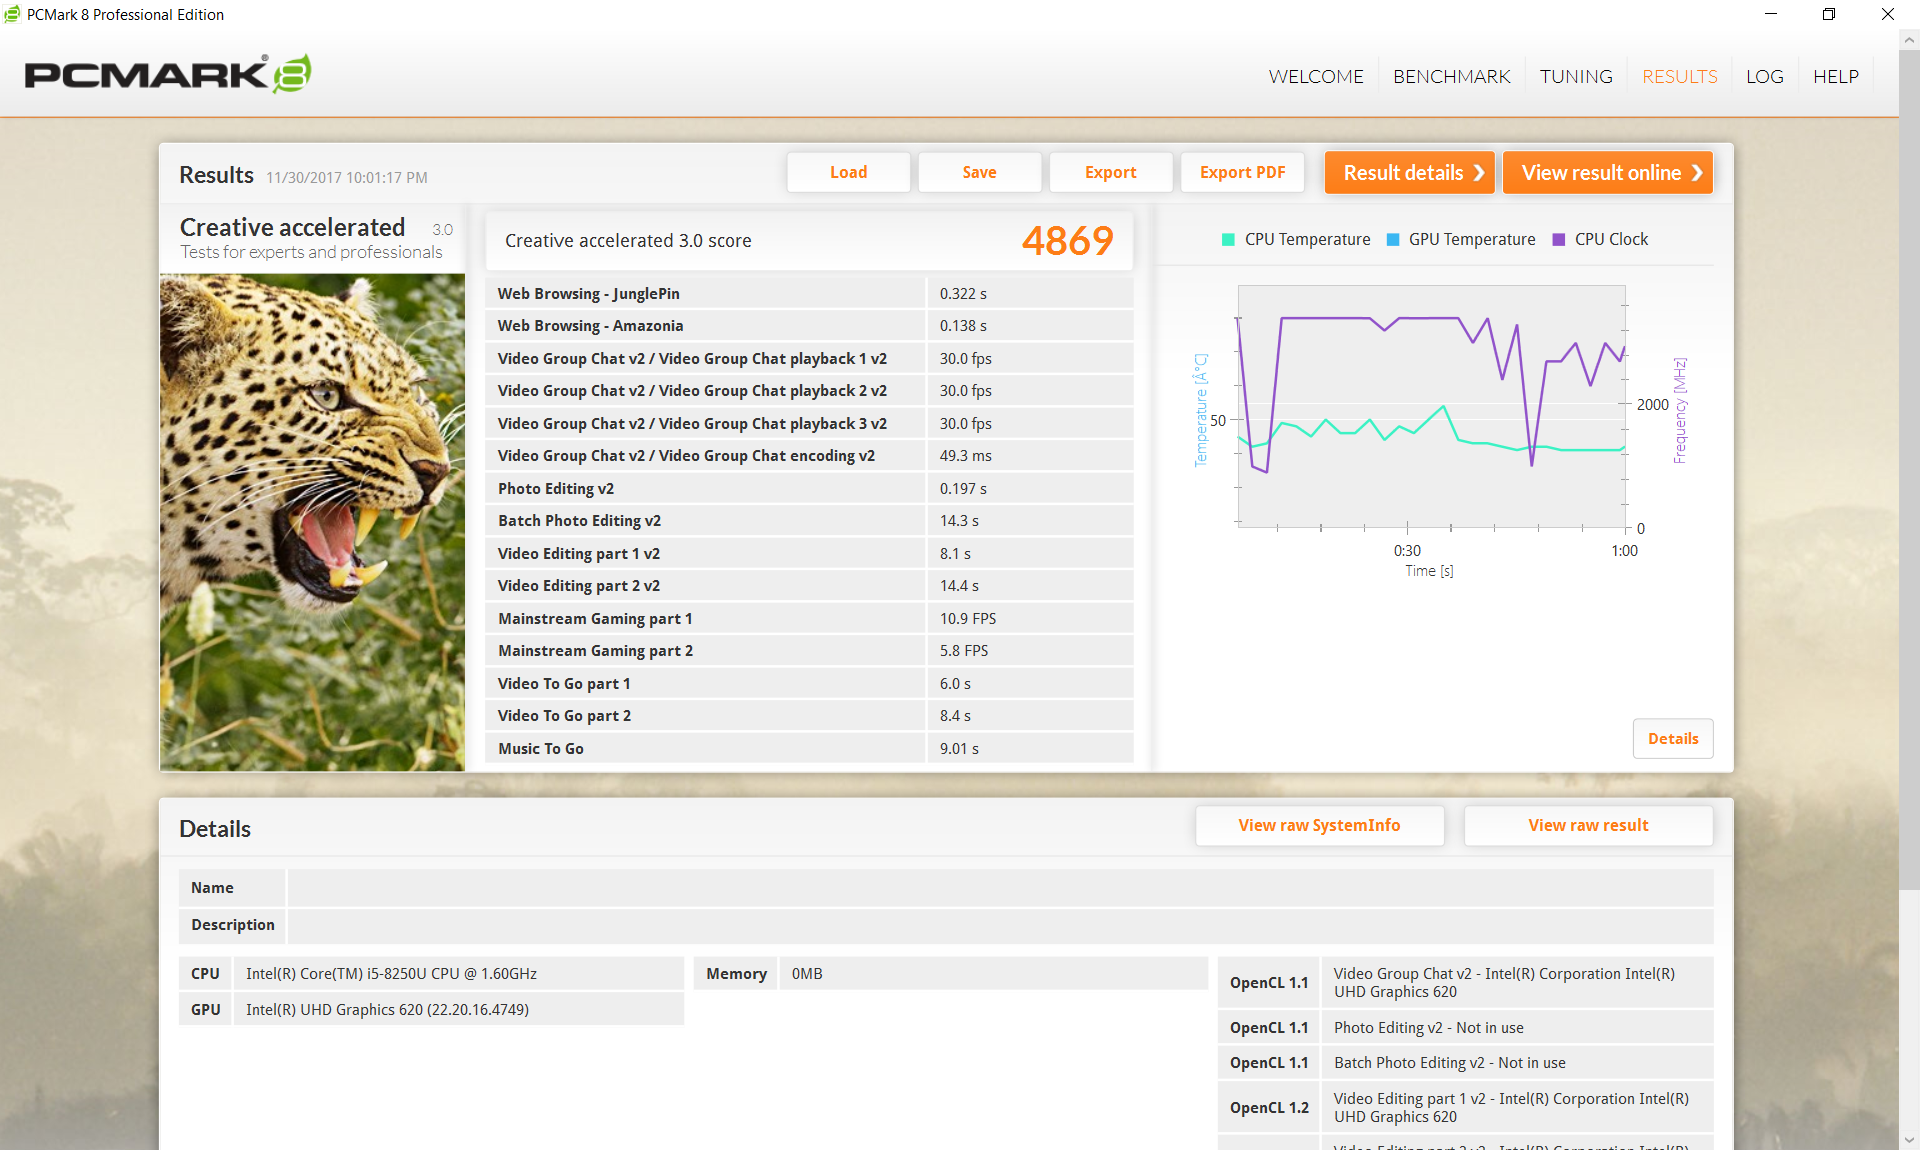
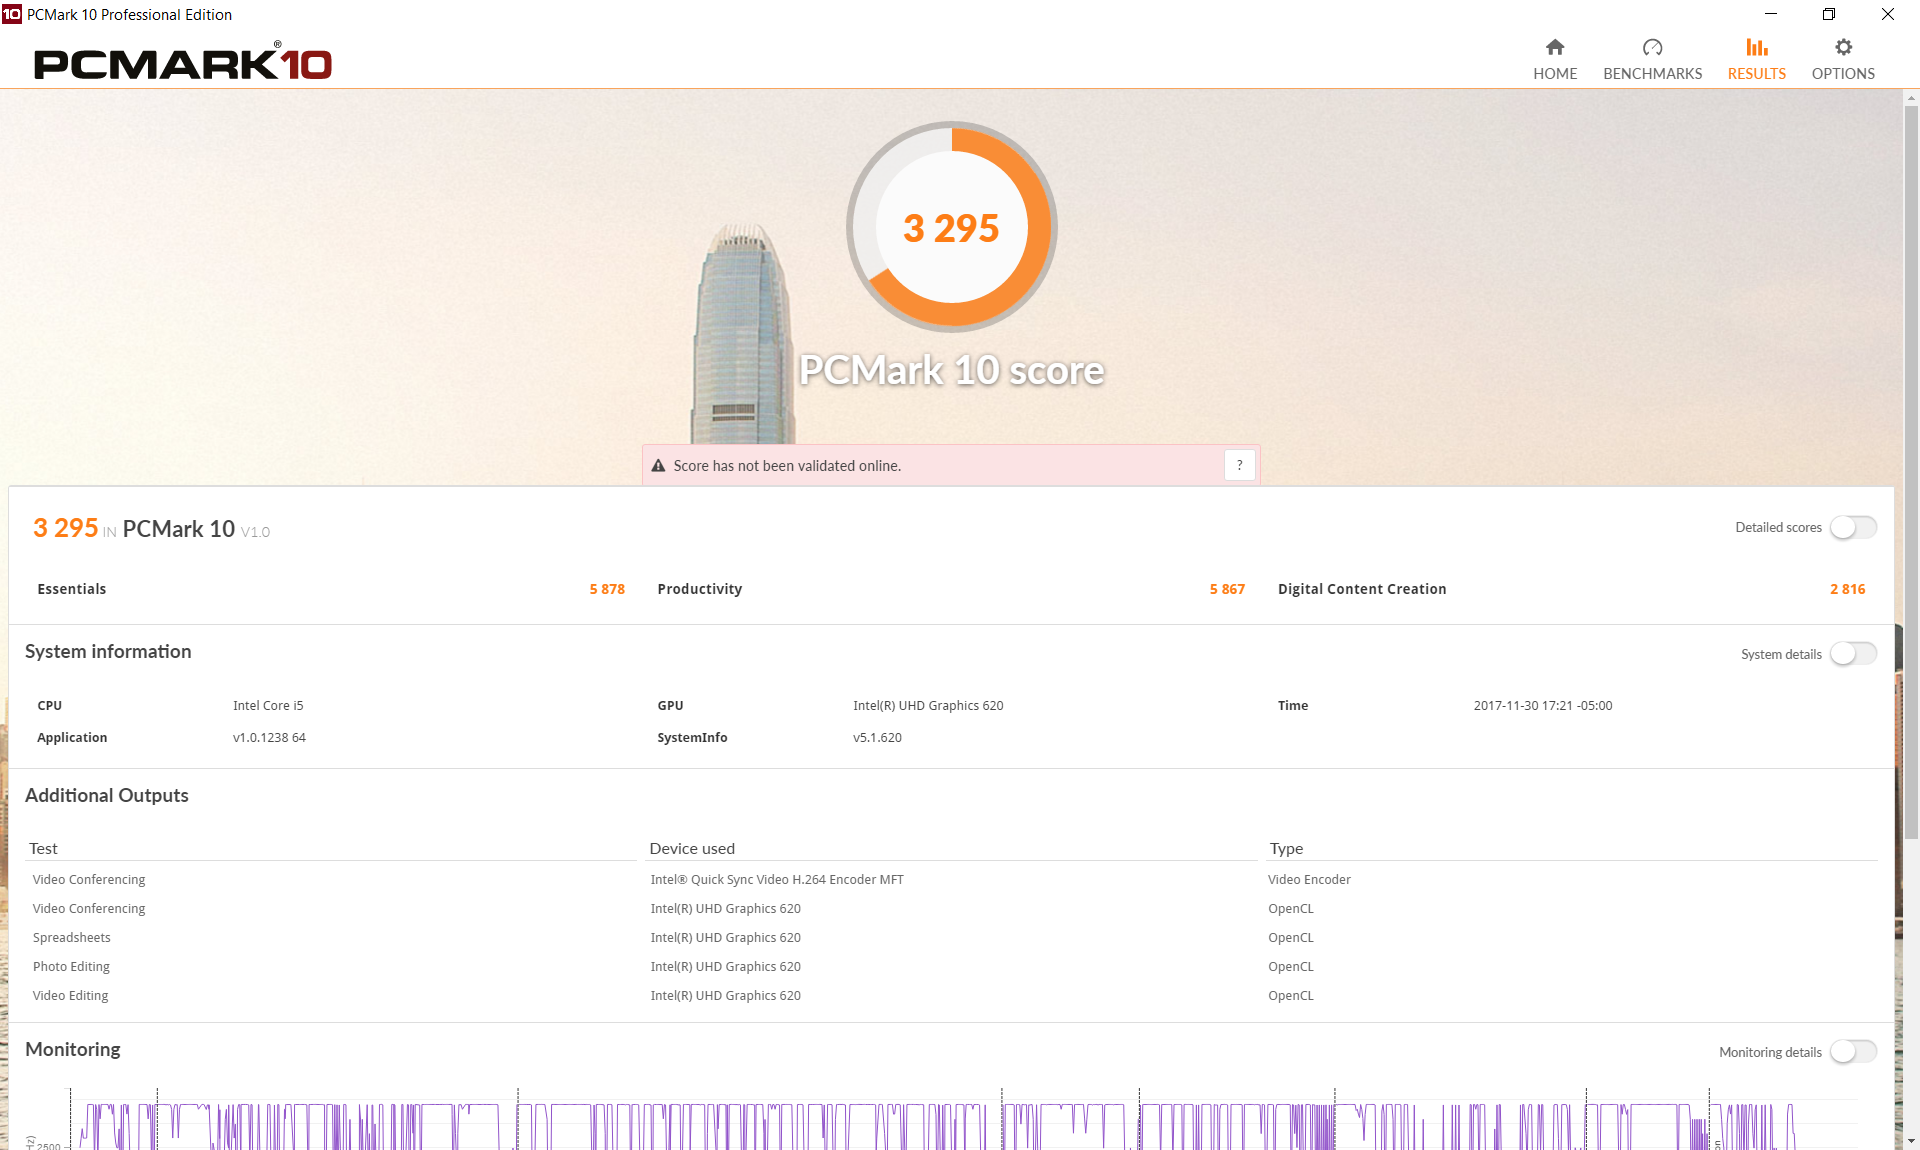
PCMark benchmarks rank the tablet in the same ballpark as the Elite x2 and passively-cooled Surface Pro. Its PCMark 8 Work score is notably lower than expected despite running the benchmark twice, but its score is provided below regardless. In practice, we experienced no software or hardware issues during our time with the review unit.
| PCMark 8 | |
| Home Score Accelerated v2 | |
| Lenovo Miix 520-12IKB 81CG | |
| HP Elite x2 1012 G2-1LV76EA | |
| Lenovo Miix 510 Pro 80U10006GE | |
| Microsoft Surface Pro (2017) m3 | |
| Work Score Accelerated v2 | |
| Lenovo Miix 510 Pro 80U10006GE | |
| HP Elite x2 1012 G2-1LV76EA | |
| Microsoft Surface Pro (2017) m3 | |
| Lenovo Miix 520-12IKB 81CG | |
| Creative Score Accelerated v2 | |
| Lenovo Miix 520-12IKB 81CG | |
| HP Elite x2 1012 G2-1LV76EA | |
| Microsoft Surface Pro (2017) m3 | |
| PCMark 10 - Score | |
| Lenovo Miix 520-12IKB 81CG | |
| HP Elite x2 1012 G2-1LV76EA | |
| Microsoft Surface Pro (2017) m3 | |
| PCMark 8 Home Score Accelerated v2 | 3733 points | |
| PCMark 8 Creative Score Accelerated v2 | 4869 points | |
| PCMark 8 Work Score Accelerated v2 | 2699 points | |
| PCMark 10 Score | 3295 points | |
Help | ||
Storage Devices
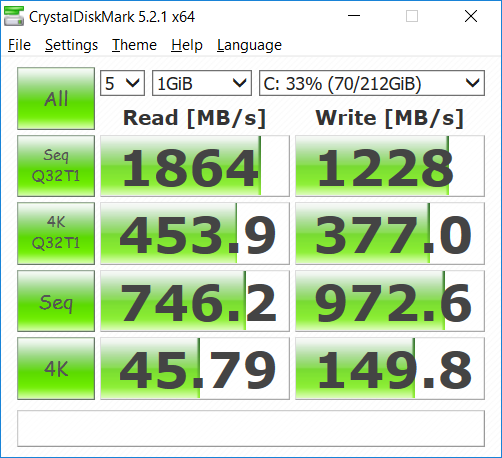
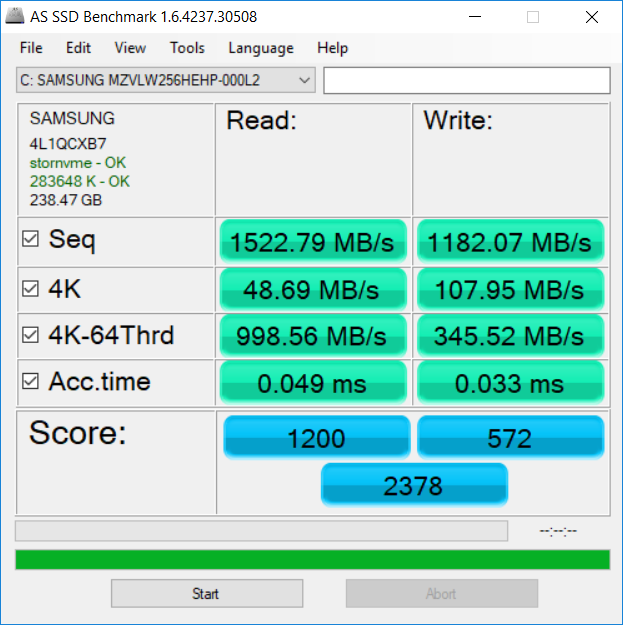
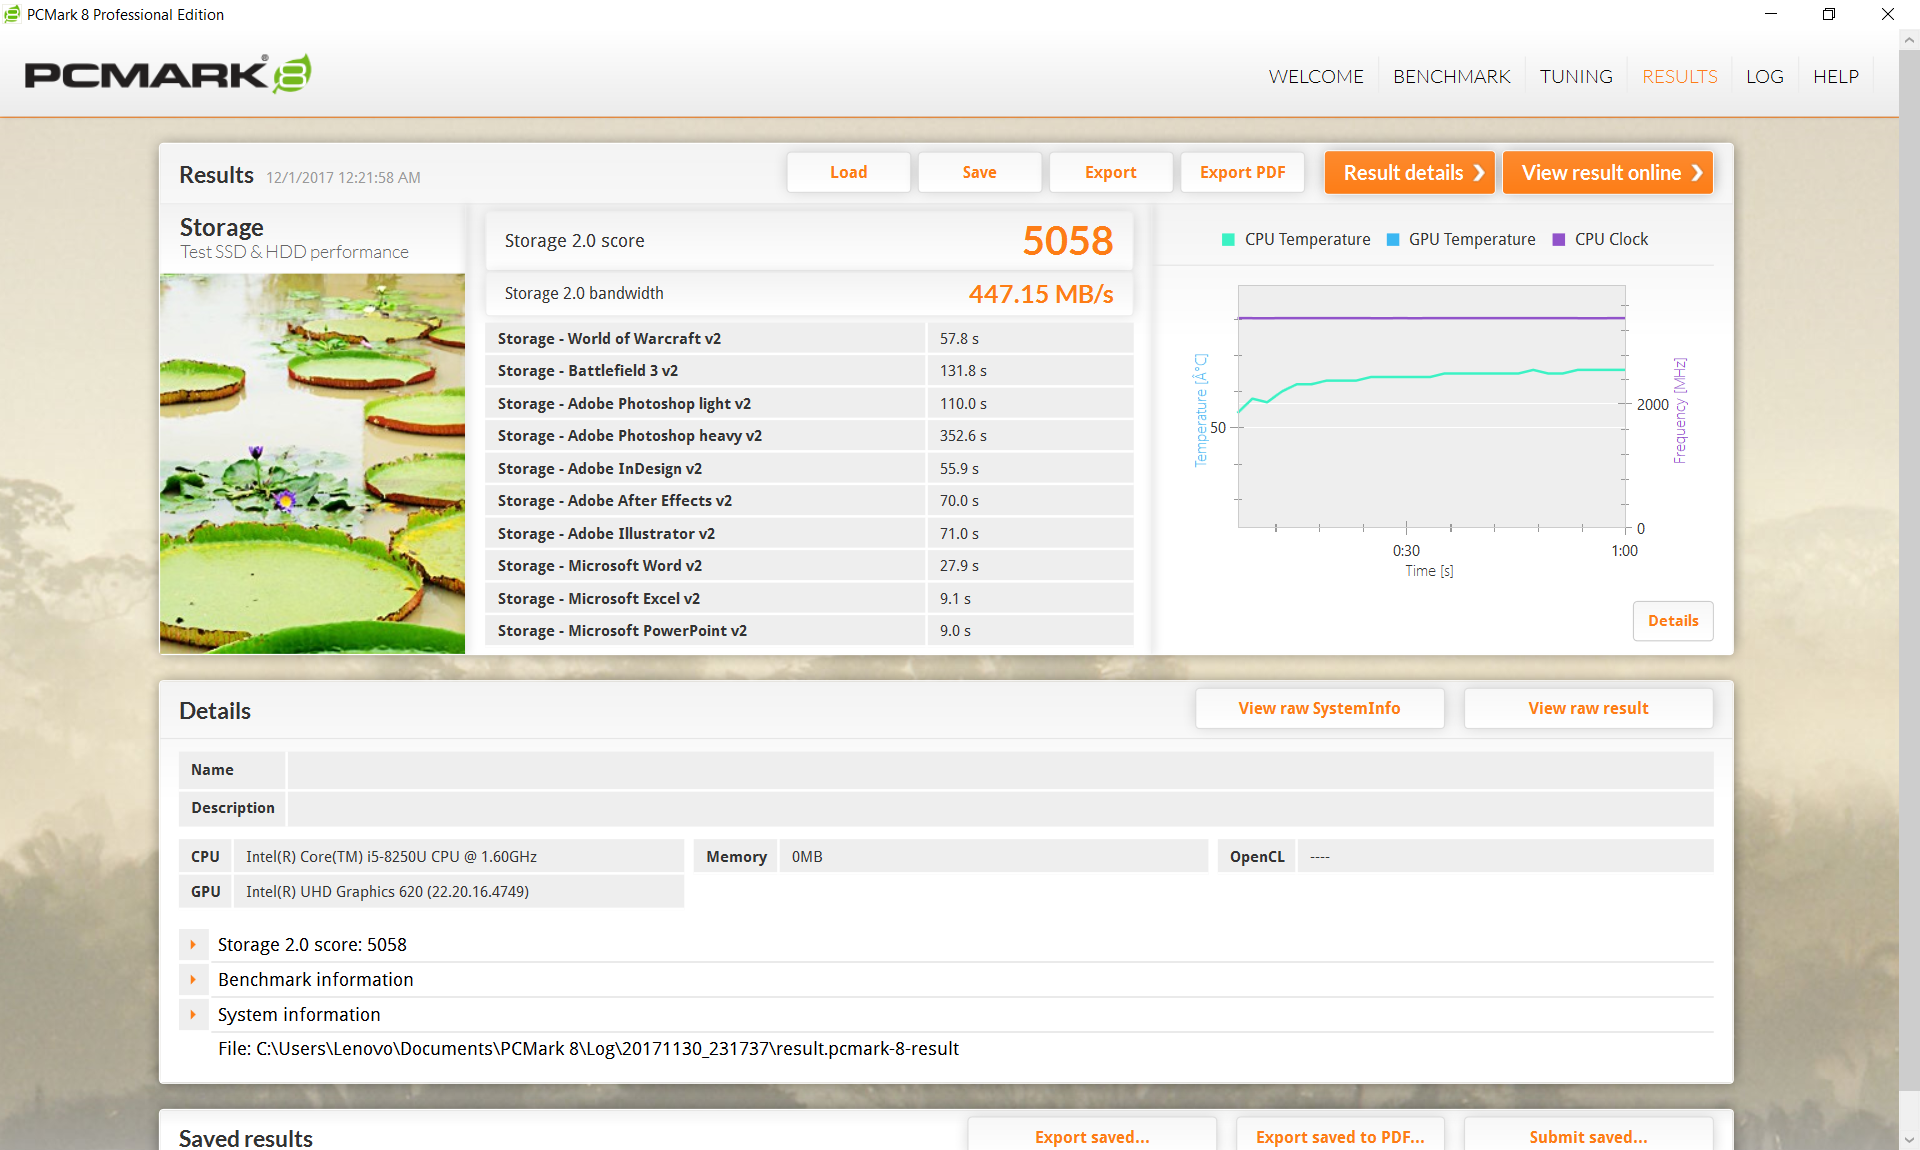
Lenovo has swapped out the 128 GB Samsung PM951 on the Miix 510 for the 256 GB Samsung PM961 on its latest Miix refresh. The biggest difference from the older NVMe PM951 is the theoretical sequential write advantage that the PM961 brings to the table - a whopping 1100 MB/s compared to 280 MB/s on the PM951 according to Samsung. Our AS SSD results reflect this disparity and so users should see significantly faster saves and installations on the Miix 520. The PM971 in the Microsoft tablet is measurably slower than our Lenovo likely due to its small BGA form factor and subsequently narrower performance bandwidth.
Sequential write rates are slower than the same PM961 SSD in the HP Elite x2, but double-checking with CrystalDiskMark 5 shows results that are much closer to the theoretical maximum between the two devices.
See our table of HDDs and SSDs for more benchmark comparisons.
| Lenovo Miix 520-12IKB 81CG Samsung PM961 MZVLW256HEHP | Microsoft Surface Pro (2017) m3 Samsung PM971 KUS020203M | Lenovo Miix 510 Pro 80U10006GE Samsung PM951 NVMe MZVLV256 | HP Elite x2 1012 G2-1LV76EA Samsung PM961 MZVLW256HEHP | Dell XPS 13 9365-4537 2-in-1 Toshiba NVMe THNSN5256GPUK | |
|---|---|---|---|---|---|
| AS SSD | -22% | -146% | 48% | -11% | |
| Copy Game MB/s (MB/s) | 410.8 | 140.7 -66% | 379.9 -8% | 457.8 11% | |
| Copy Program MB/s (MB/s) | 310.4 | 83.8 -73% | 198.2 -36% | 264.7 -15% | |
| Copy ISO MB/s (MB/s) | 659 | 173.2 -74% | 791 20% | 714 8% | |
| Score Total (Points) | 2378 | 1847 -22% | 1190 -50% | 4653 96% | 1388 -42% |
| Score Write (Points) | 572 | 284 -50% | 60 -90% | 879 54% | 389 -32% |
| Score Read (Points) | 1200 | 1053 -12% | 777 -35% | 2545 112% | 681 -43% |
| Access Time Write * (ms) | 0.33 | 0.04 88% | 4.206 -1175% | 0.027 92% | 0.041 88% |
| Access Time Read * (ms) | 0.49 | 0.074 85% | 0.053 89% | 0.041 92% | 0.169 66% |
| 4K-64 Write (MB/s) | 345.5 | 144.3 -58% | 43.14 -88% | 657 90% | 249.4 -28% |
| 4K-64 Read (MB/s) | 999 | 891 -11% | 611 -39% | 2280 128% | 512 -49% |
| 4K Write (MB/s) | 107.9 | 88.6 -18% | 0.96 -99% | 132.2 23% | 85.8 -20% |
| 4K Read (MB/s) | 48.69 | 38.82 -20% | 39.6 -19% | 45.24 -7% | 34.77 -29% |
| Seq Write (MB/s) | 1182 | 514 -57% | 158.3 -87% | 897 -24% | 543 -54% |
| Seq Read (MB/s) | 1523 | 1226 -20% | 1260 -17% | 2197 44% | 1342 -12% |
* ... smaller is better

GPU Performance
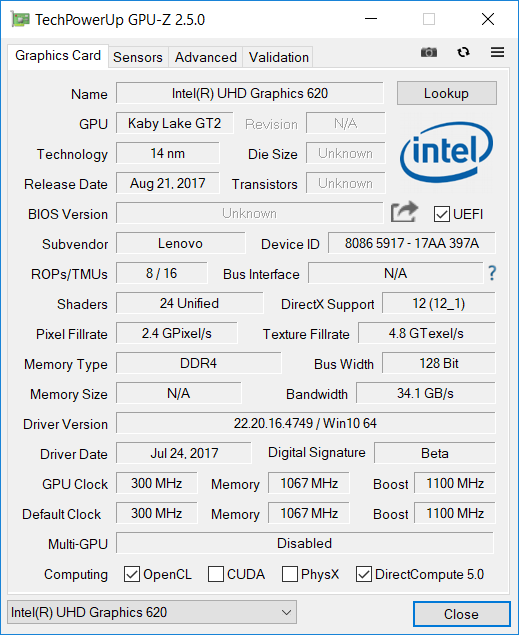
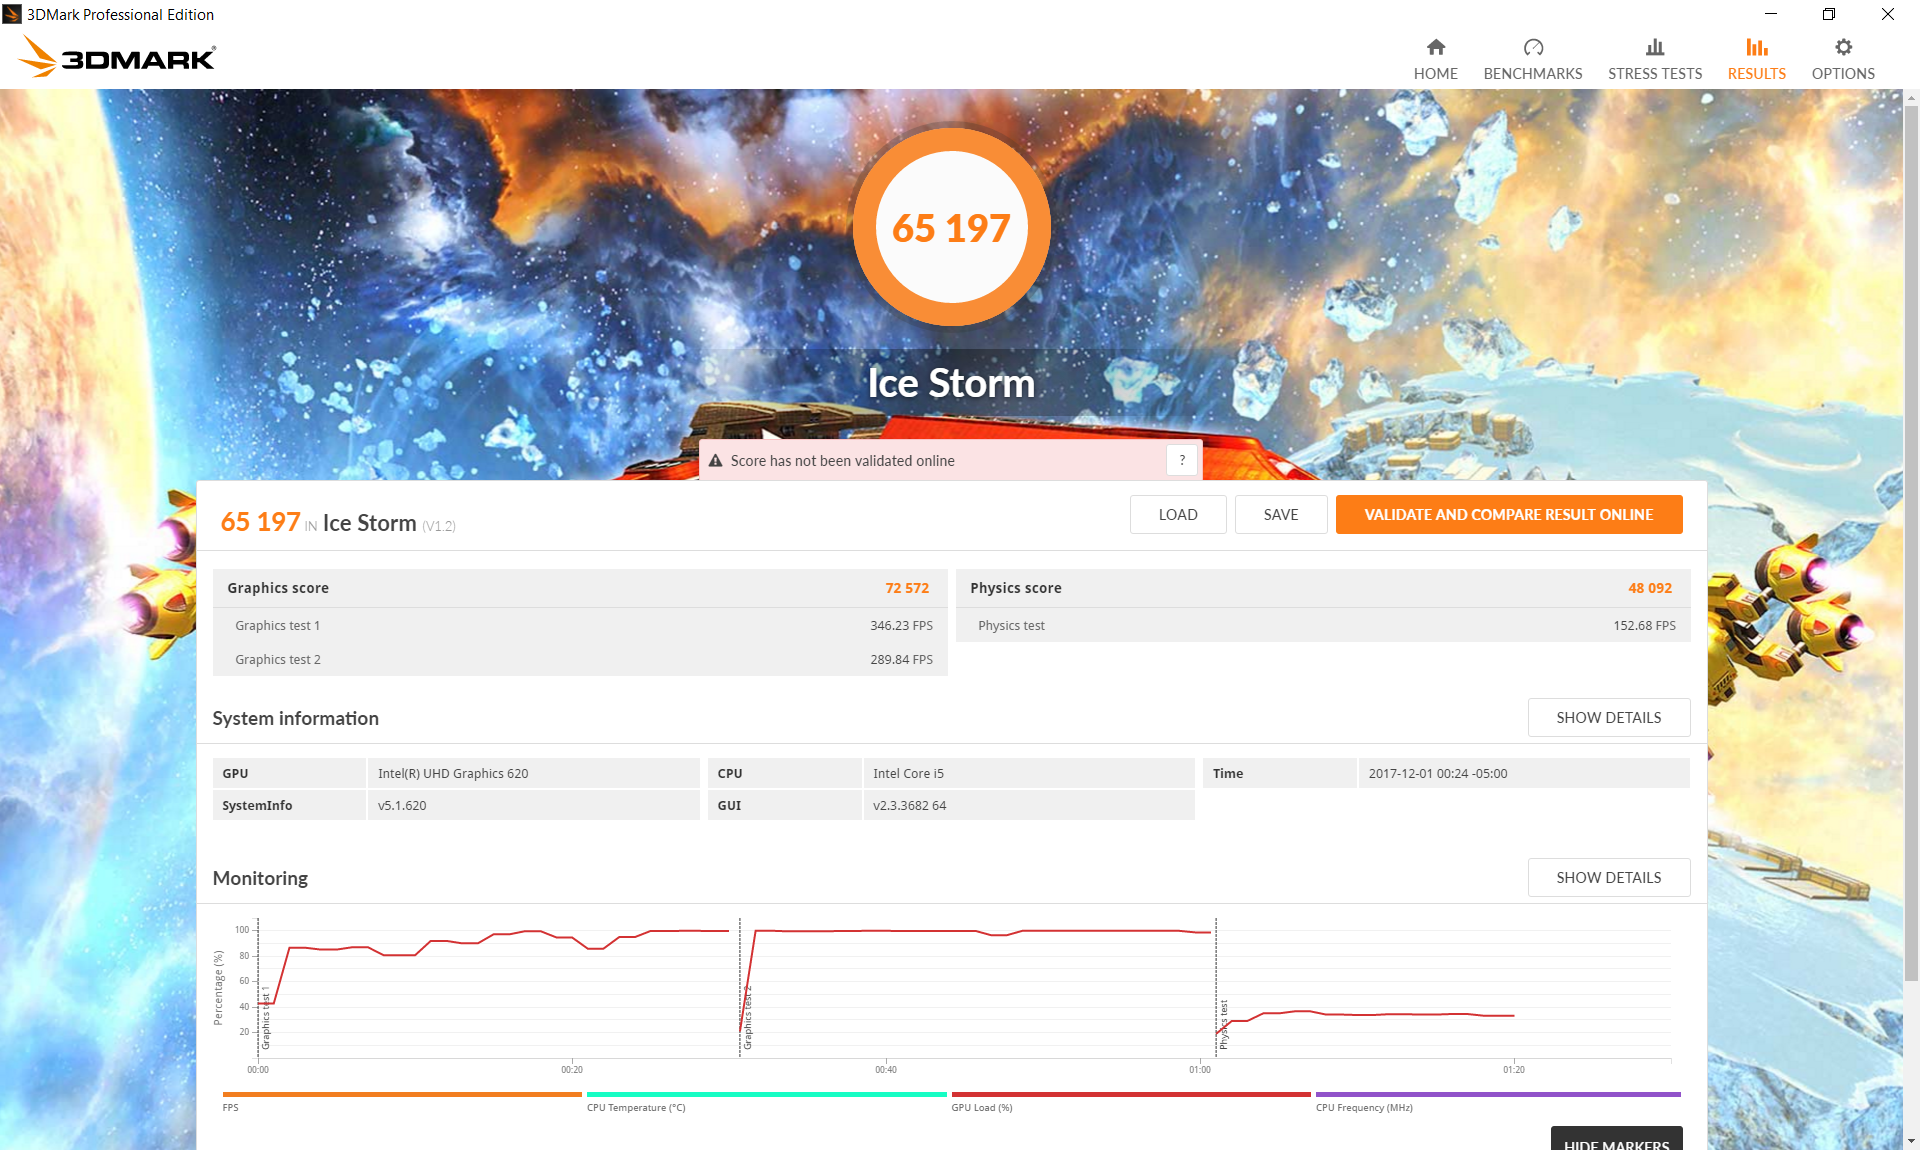
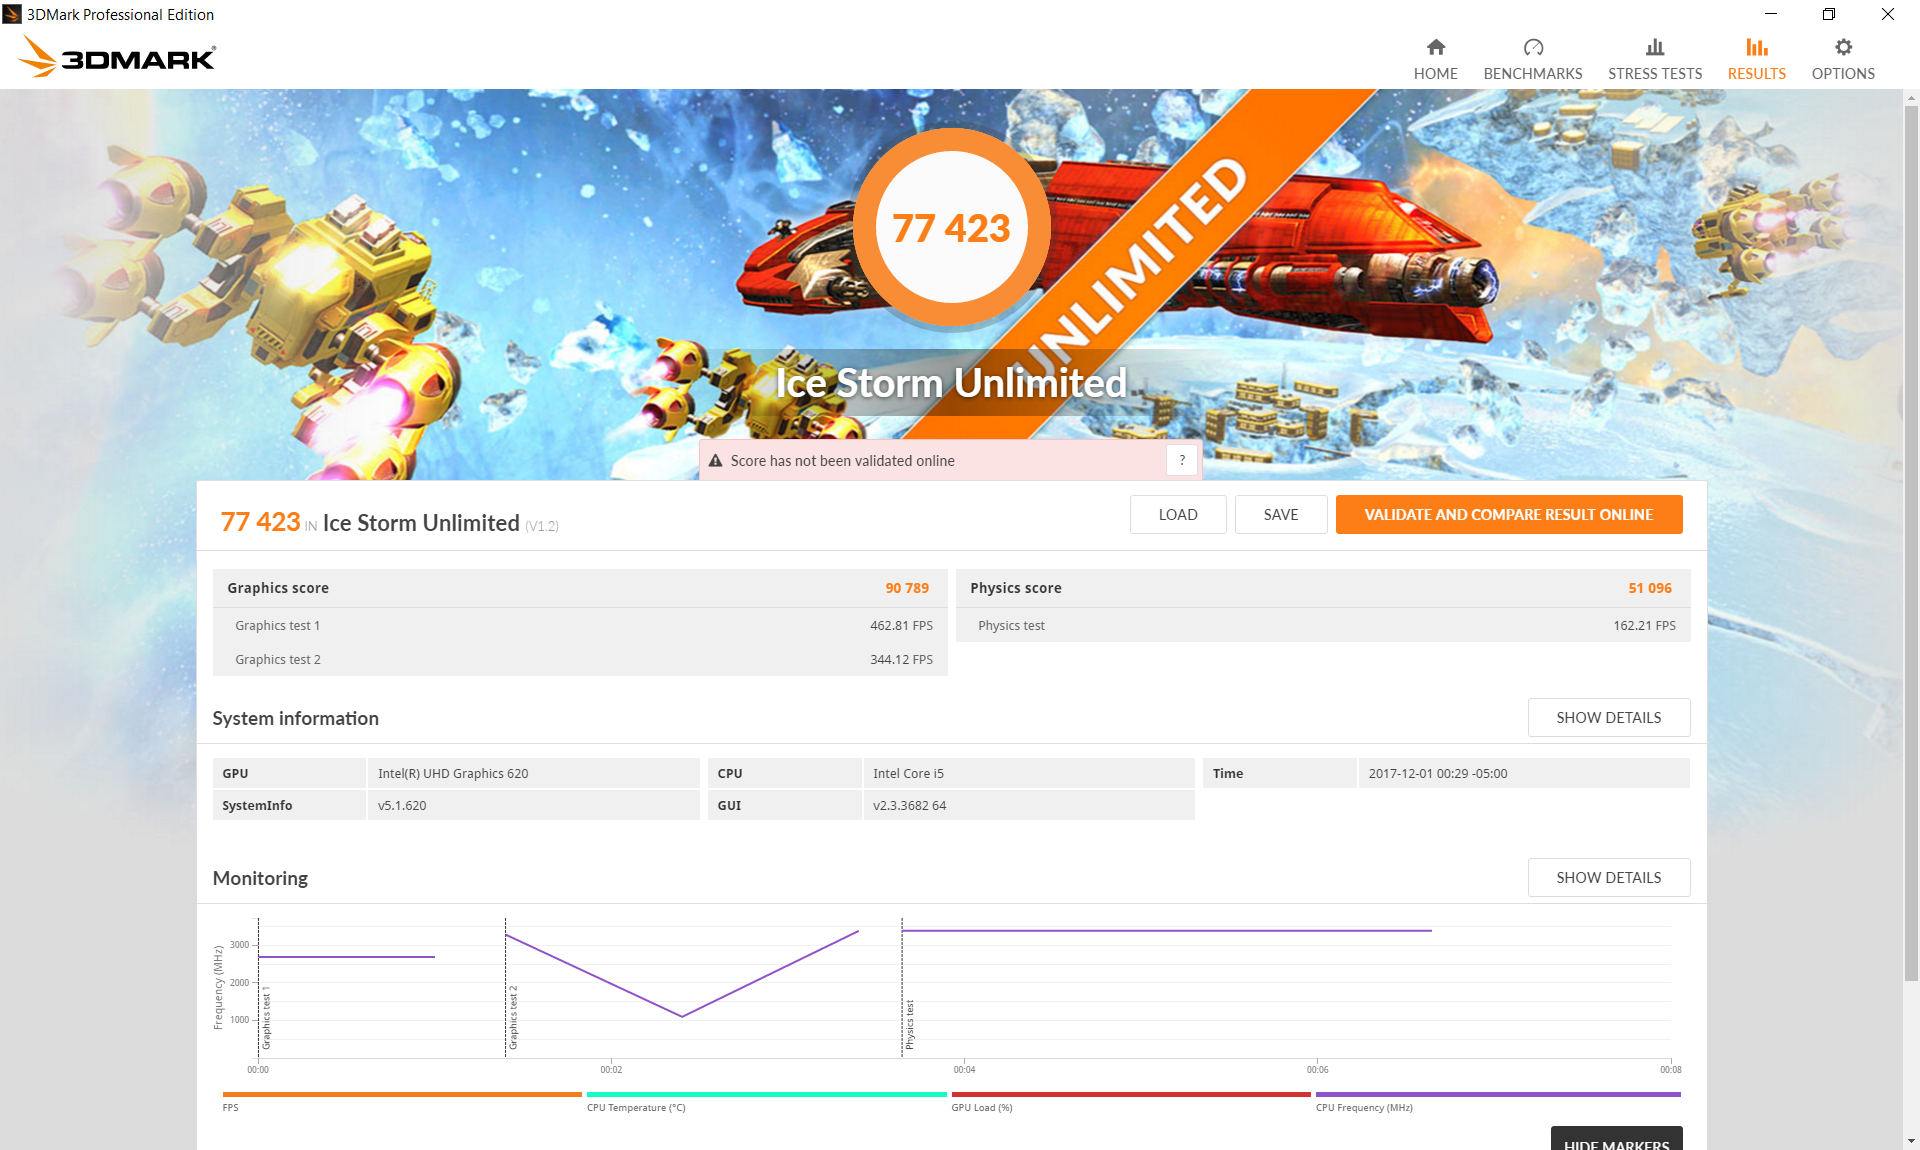
The integrated UHD Graphics 620 is identical to the HD Graphics 620 except in name. As shown by our benchmarks below, there is are only minor graphical advantages when compared to notebooks sporting 7th generation ULV Intel CPUs. Even the HD Graphics 520 in last year's Miix 510 is only about 20 percent slower than the UHD Graphics 620 compared to the monumental CPU advantages between the two generations.
See our dedicated GPU page on the UHD Graphics 620 for more technical information and benchmark comparisons.
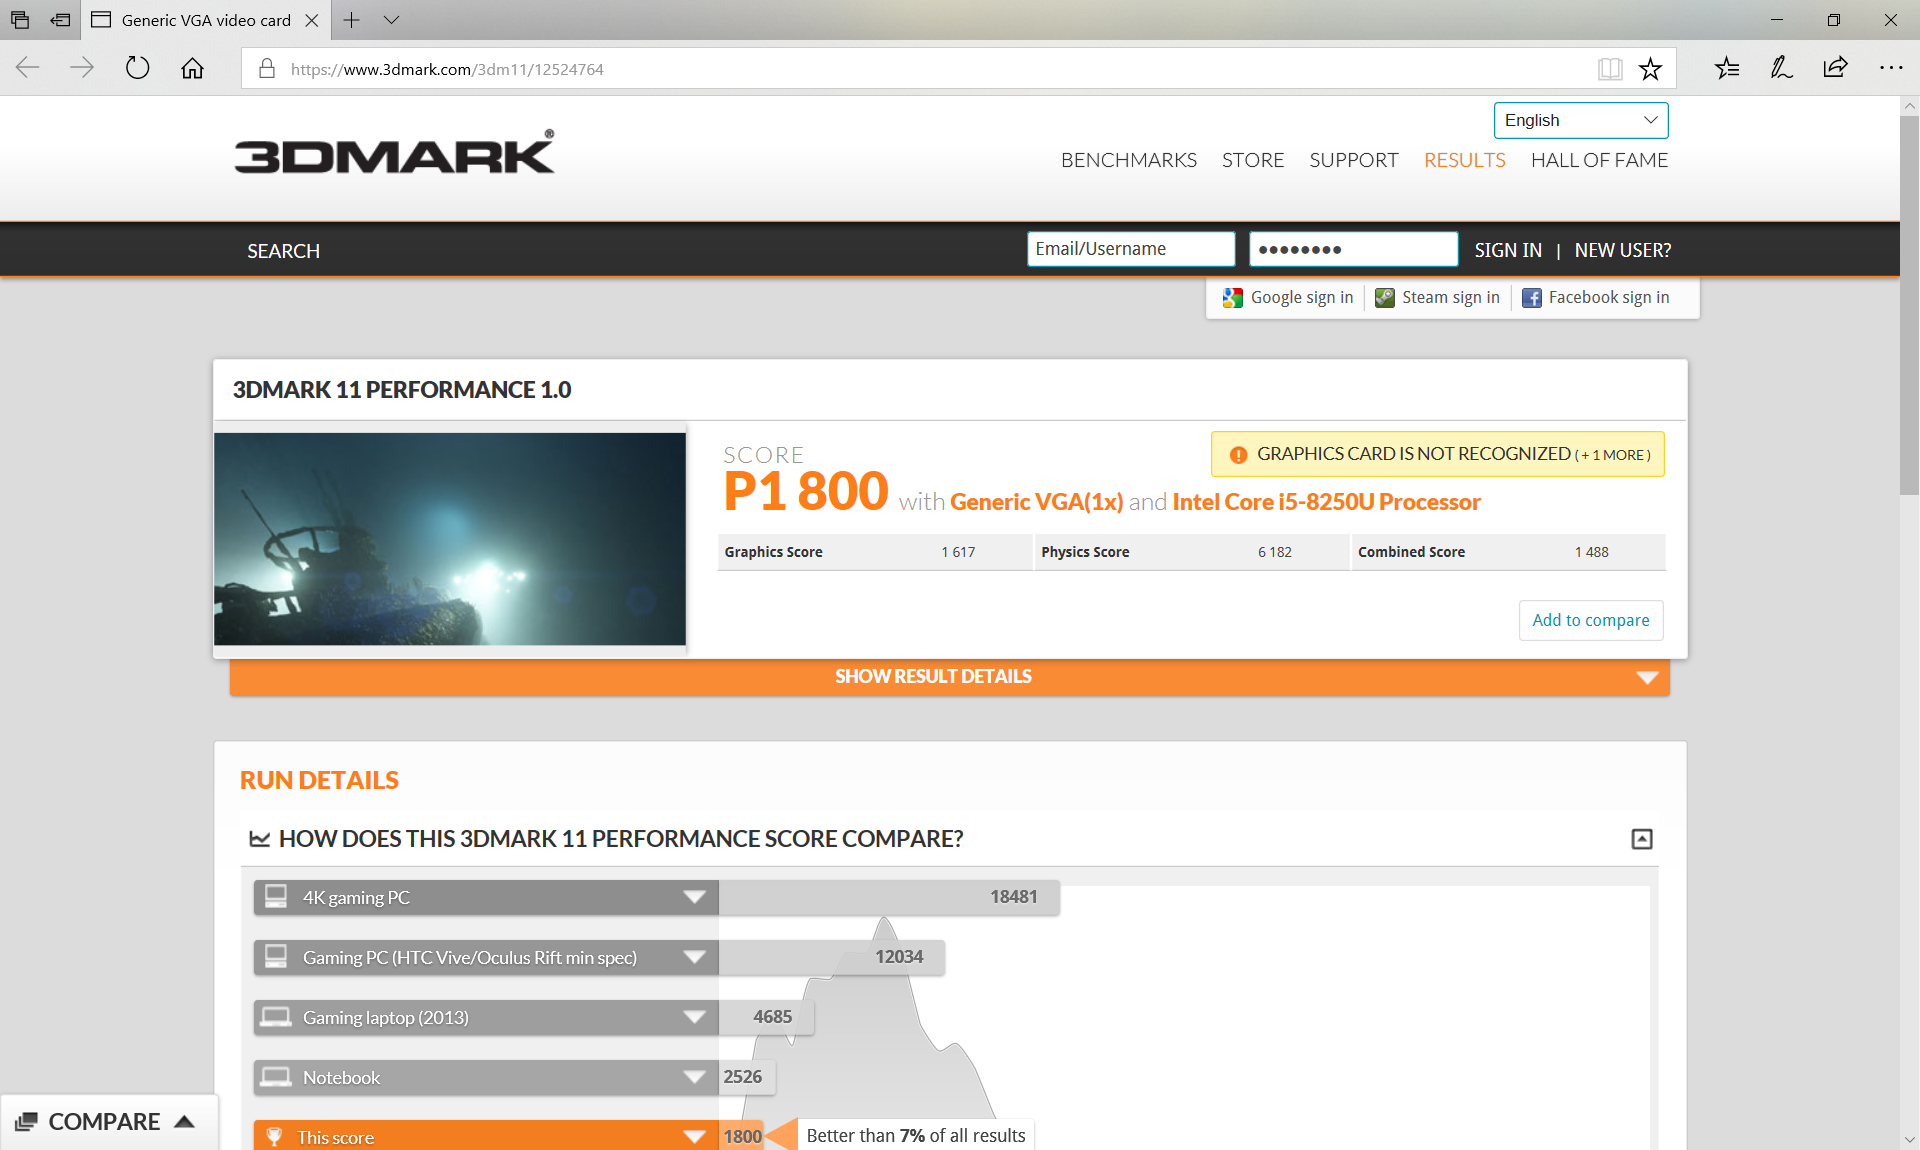
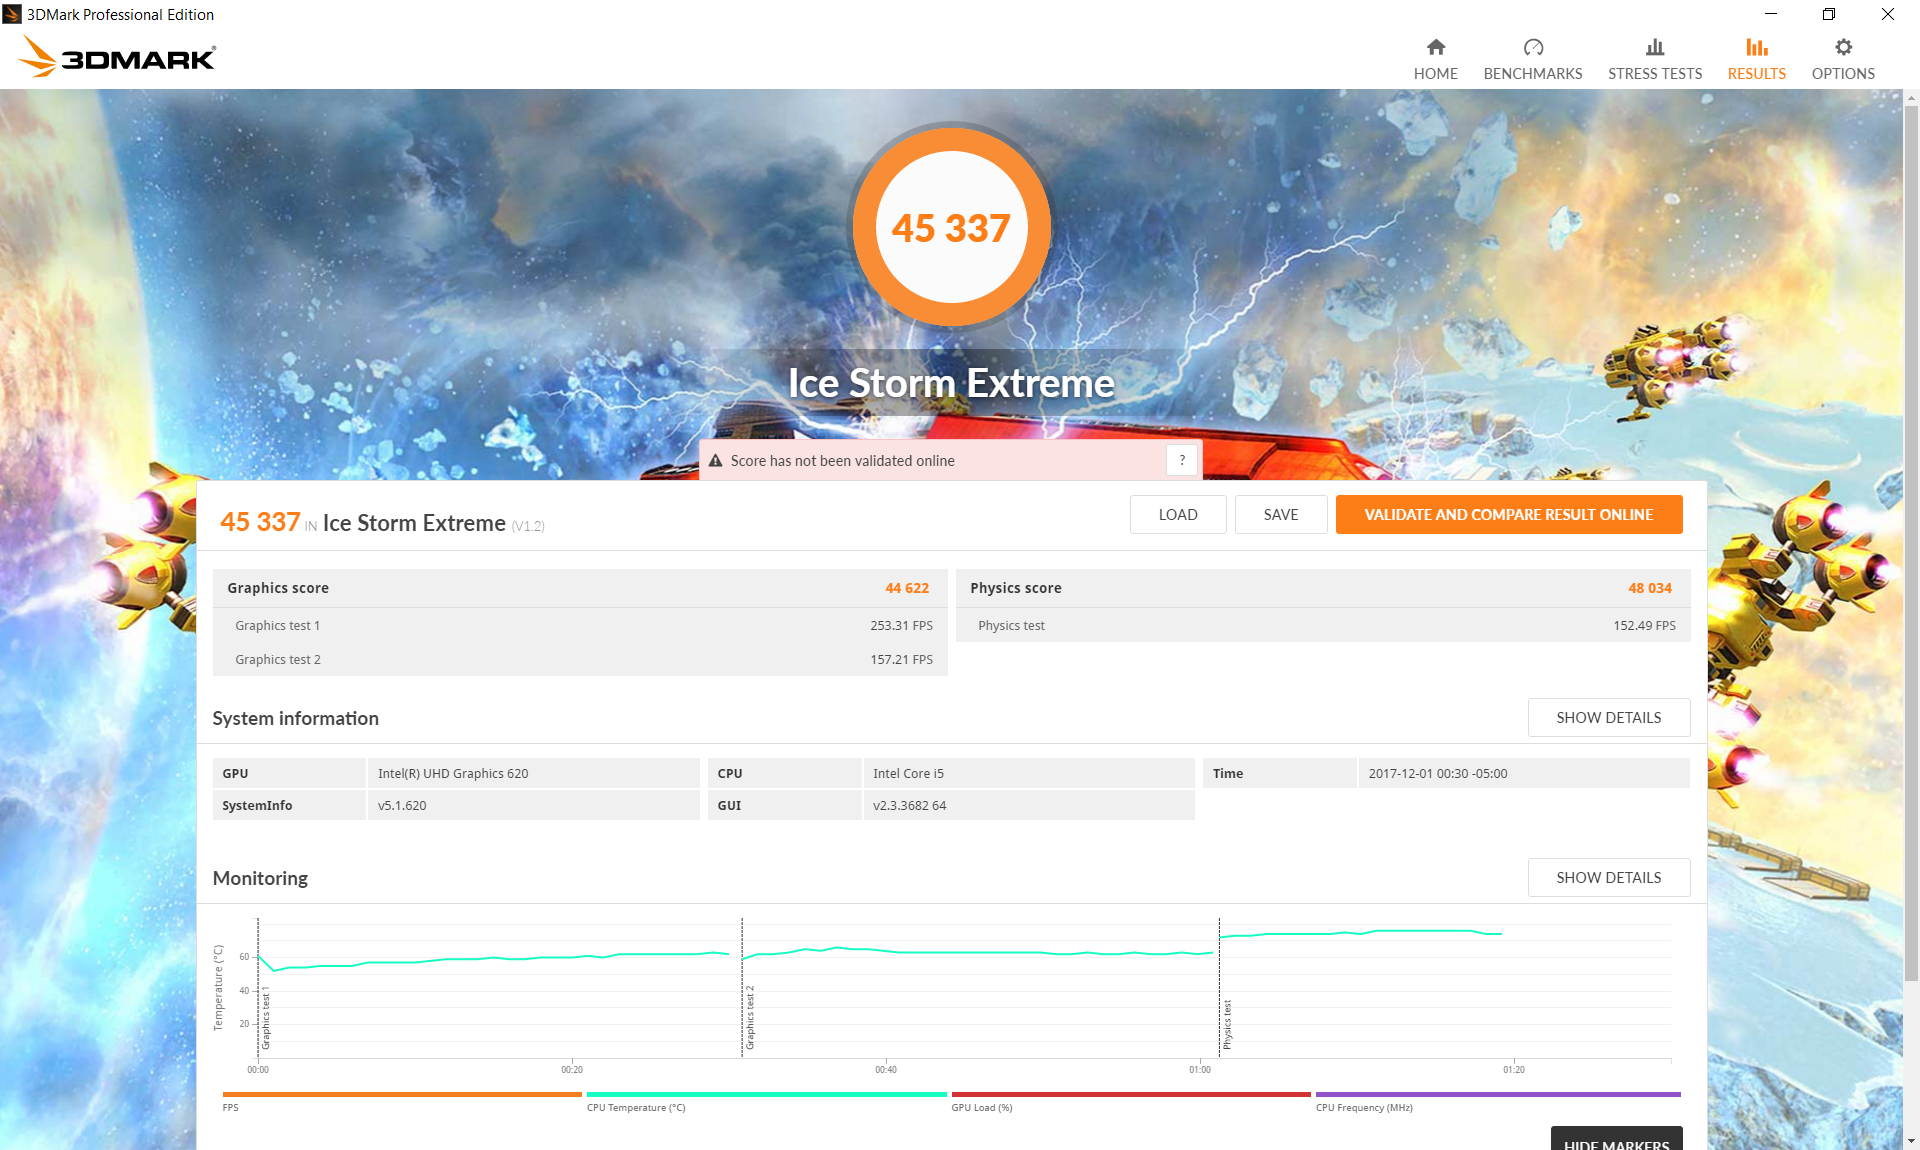
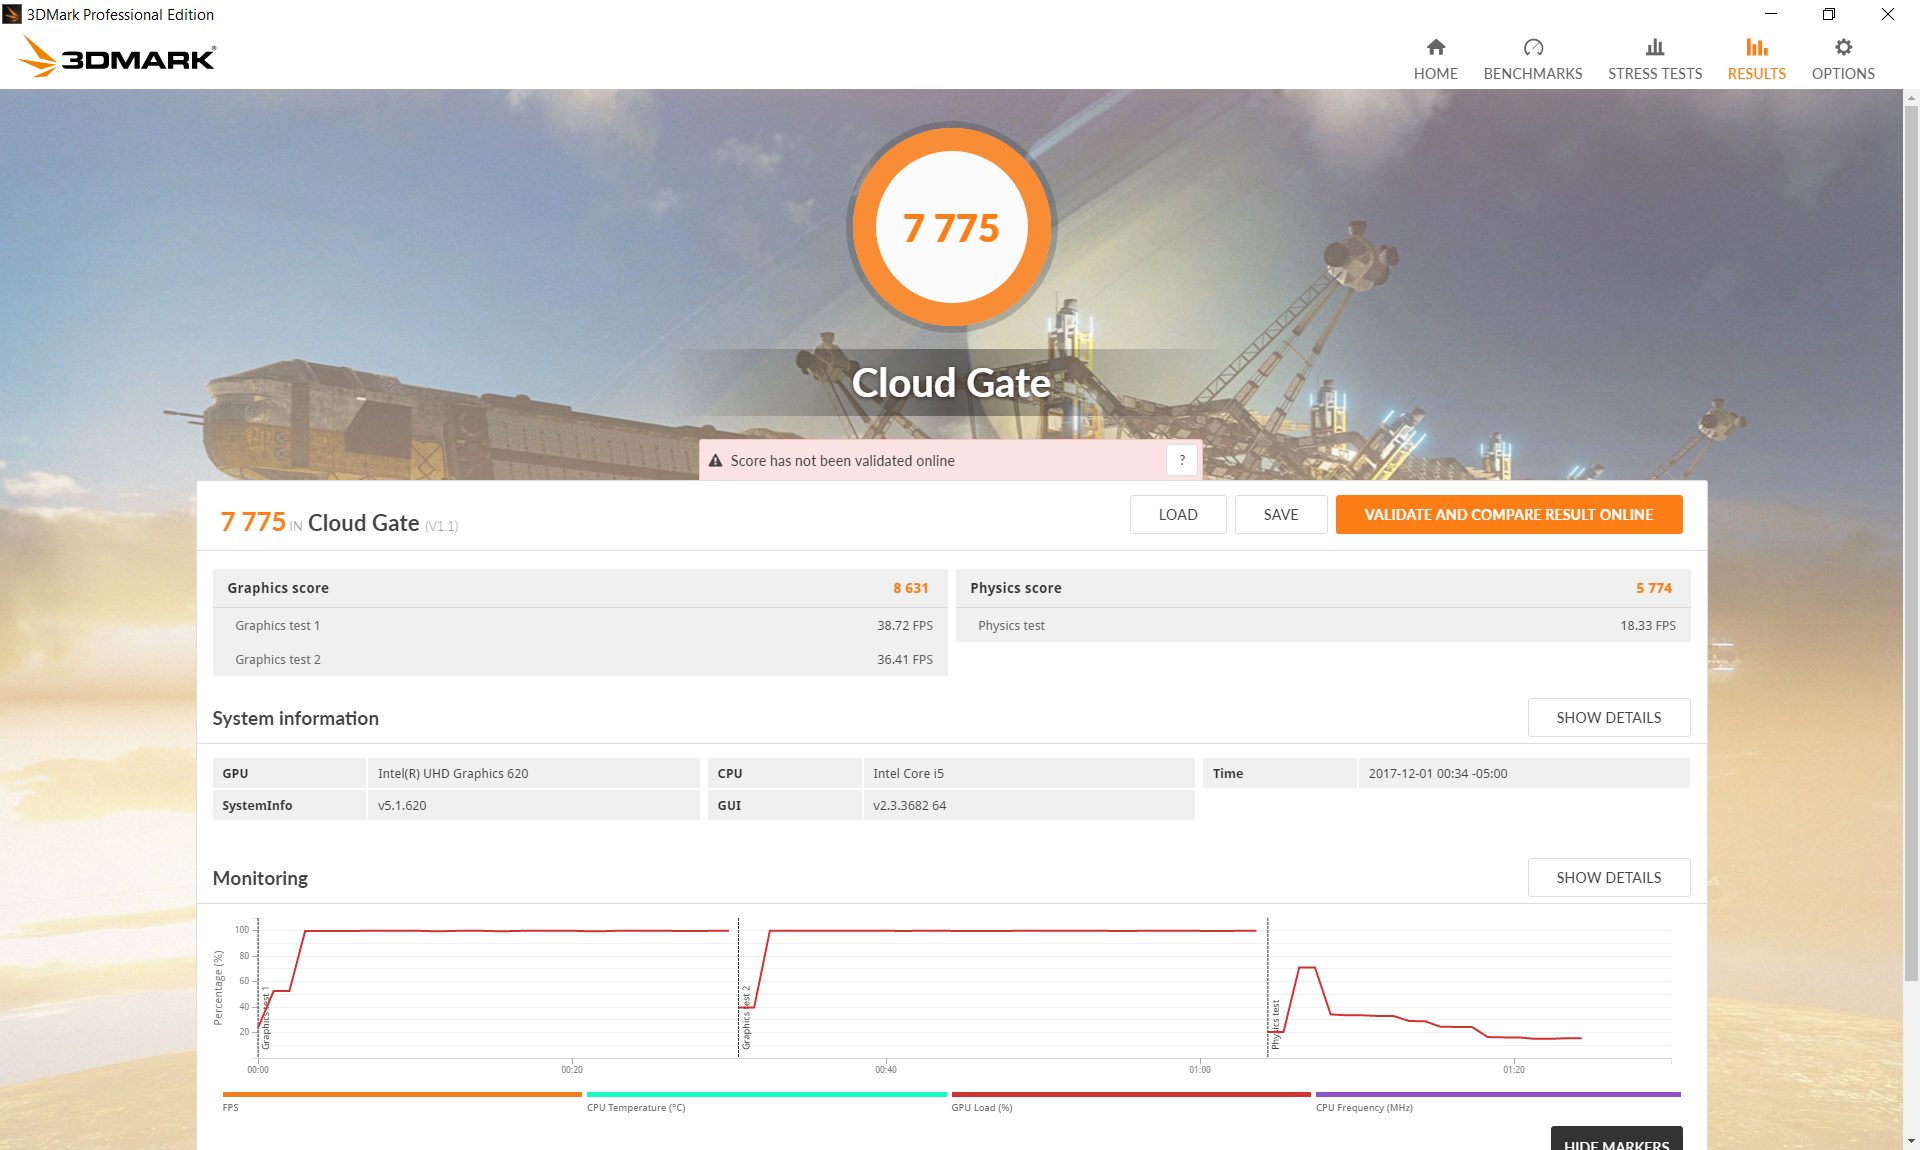
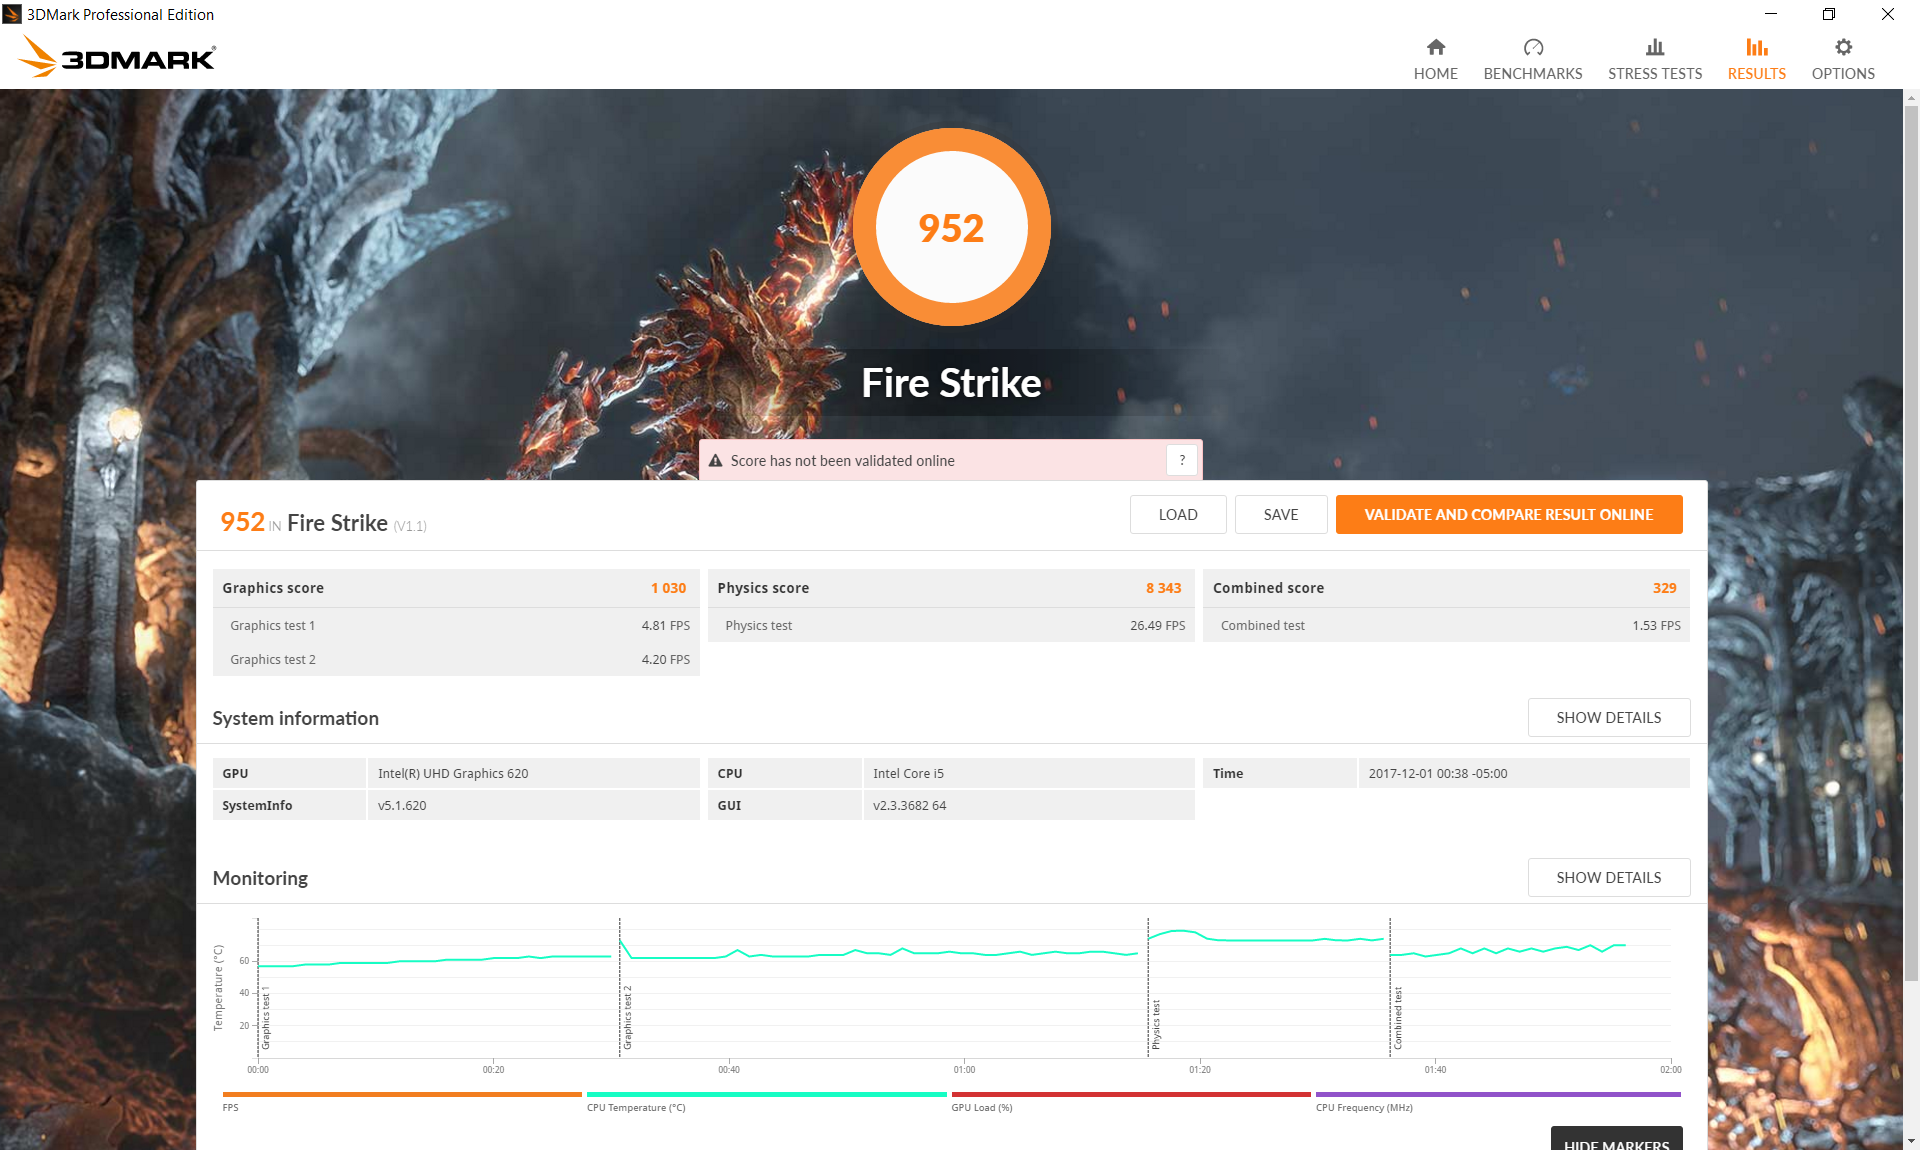
| 3DMark 11 Performance | 1800 points | |
| 3DMark Ice Storm Standard Score | 65197 points | |
| 3DMark Cloud Gate Standard Score | 7775 points | |
| 3DMark Fire Strike Score | 952 points | |
| 3DMark Fire Strike Extreme Score | 437 points | |
Help | ||
| low | med. | high | ultra | |
|---|---|---|---|---|
| BioShock Infinite (2013) | 54.3 | 29.3 | 24.1 | 7.4 |
| Rise of the Tomb Raider (2016) | 21.3 | 11 |
Stress Test
We stress the tablet with synthetic benchmarks to test for potential throttling or stability issues. With only Prime95 active, the CPU can be observed running as fast as 3.2 for the first few seconds of the test before stabilizing in the 2.1 to 2.4 GHz range as shown by the image below. The results match with our CineBench R15 loop test from above as the first score is the highest while subsequent scores are slightly slower. It's disappointing that the i5-8250U is unable to maintain its maximum Turbo Boost clock rates for very long, but it's not exactly surprising considering the tablet form factor. Core temperature peaks and averages at around 72 C.
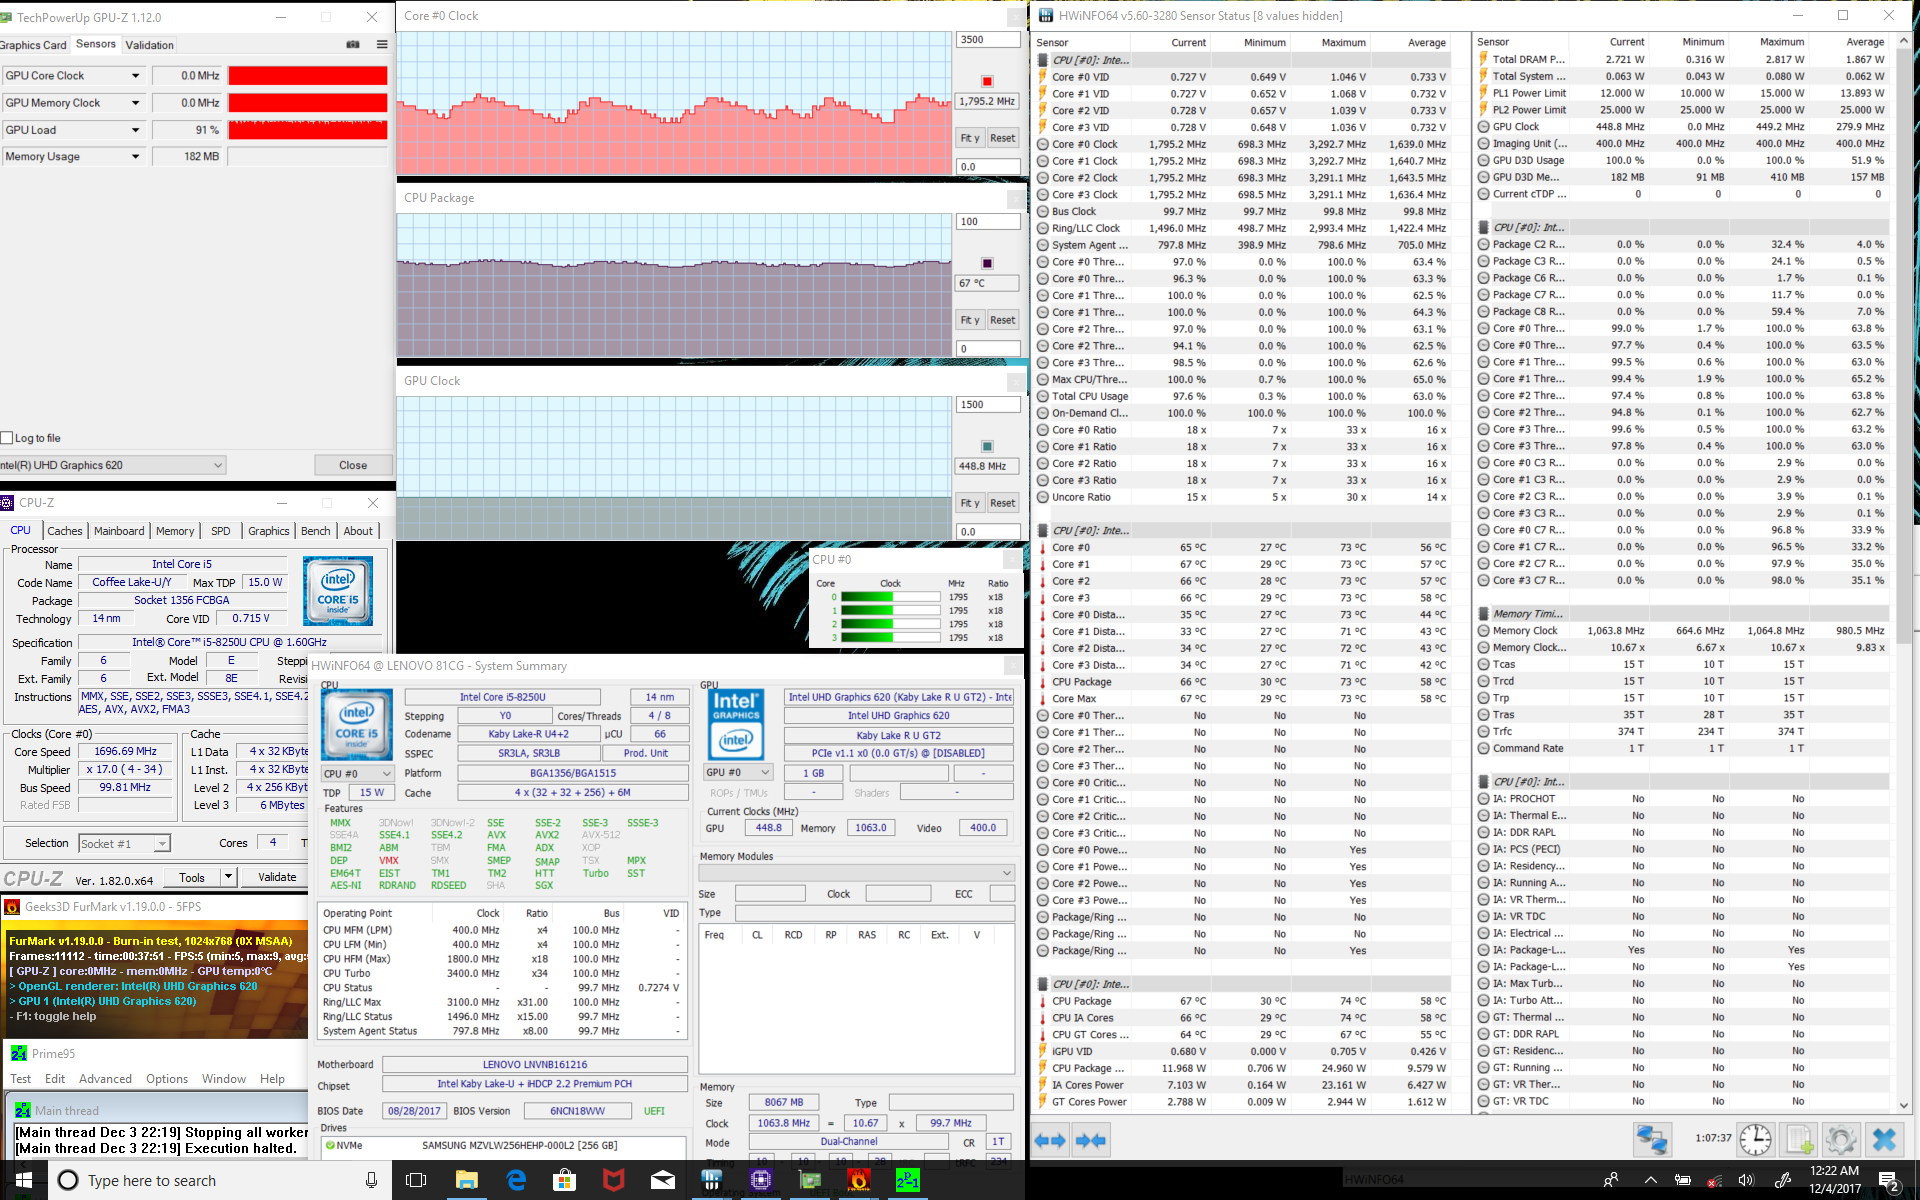
Running both Prime95 and FurMark simultaneously will throttle the CPU down to the 1.3 to 1.9 GHz range compared to its base clock rate of 1.6 GHz. Core temperature appears to plateau in the low 70 C range compared to 80 C on the Surface Pro with i7-7660U CPU.
Running on battery power will not throttle CPU or GPU performance. A 3DMark 11 run on batteries returns Physics and Graphics scores of 6095 and 1601 points, respectively, compared to 6182 and 1617 points when on mains. Users can get the full performance of the tablet when on the road and away from a power outlet.
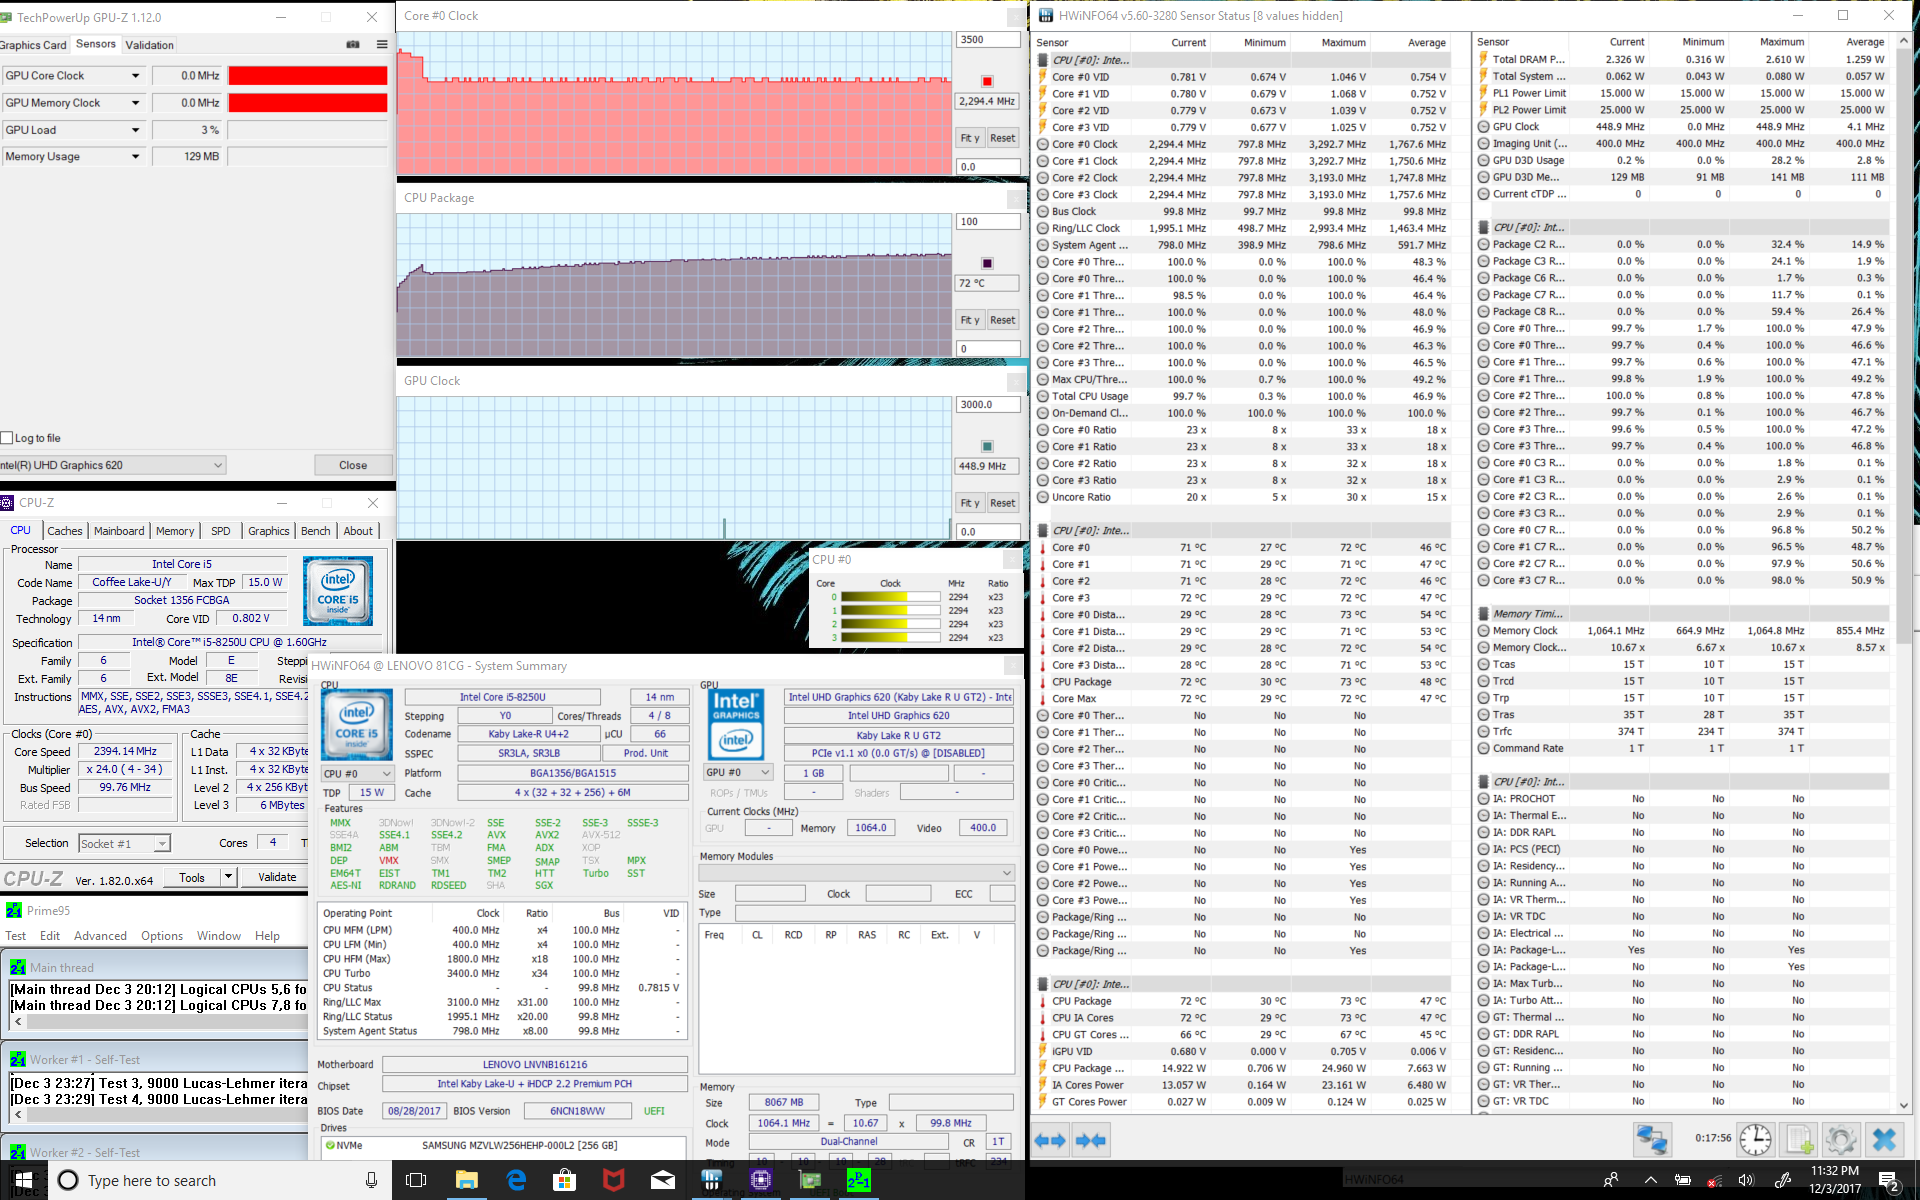
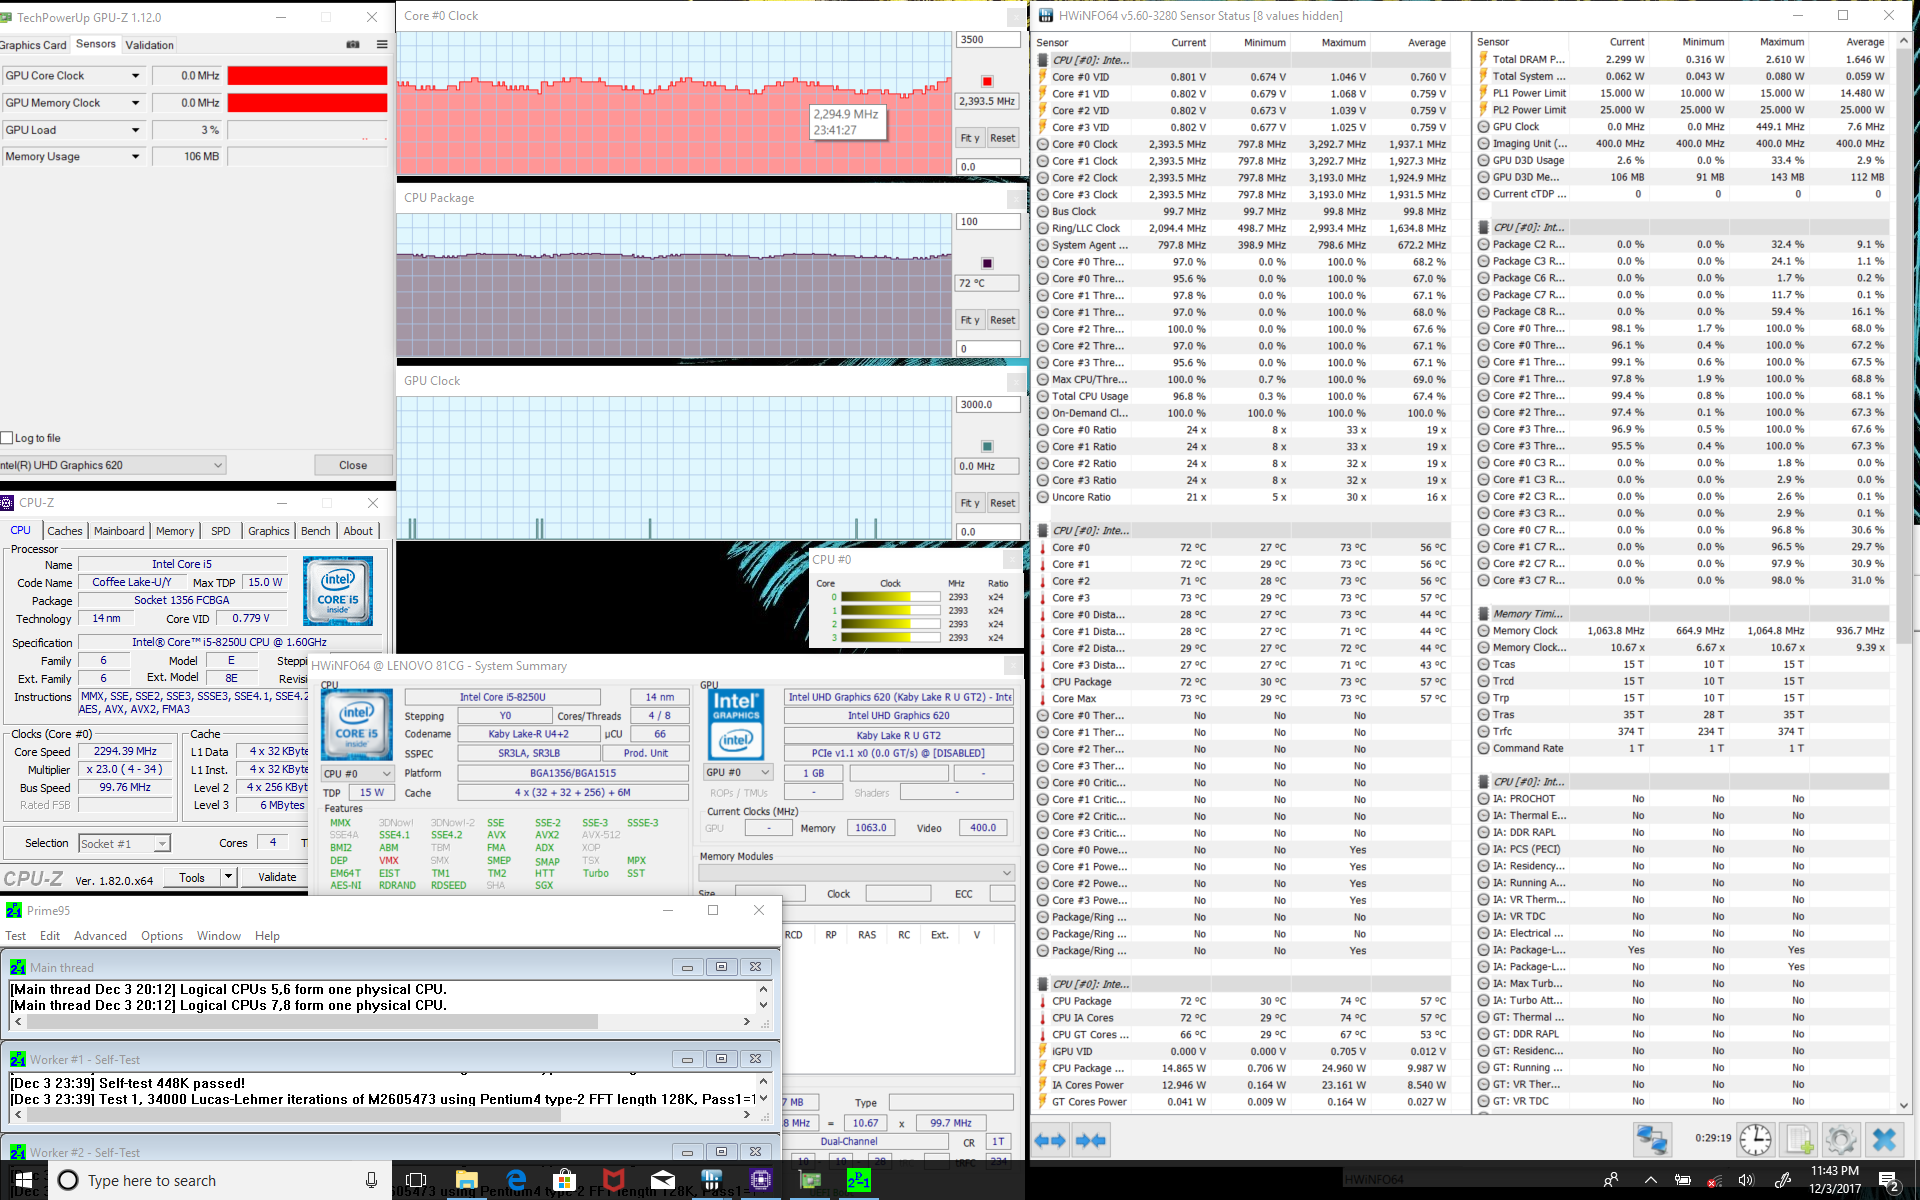
| CPU Clock (GHz) | GPU Clock (MHz) | Average CPU Temperature (°C) | |
| Prime95 Stress | 2.1 - 2.4 | -- | ~73 |
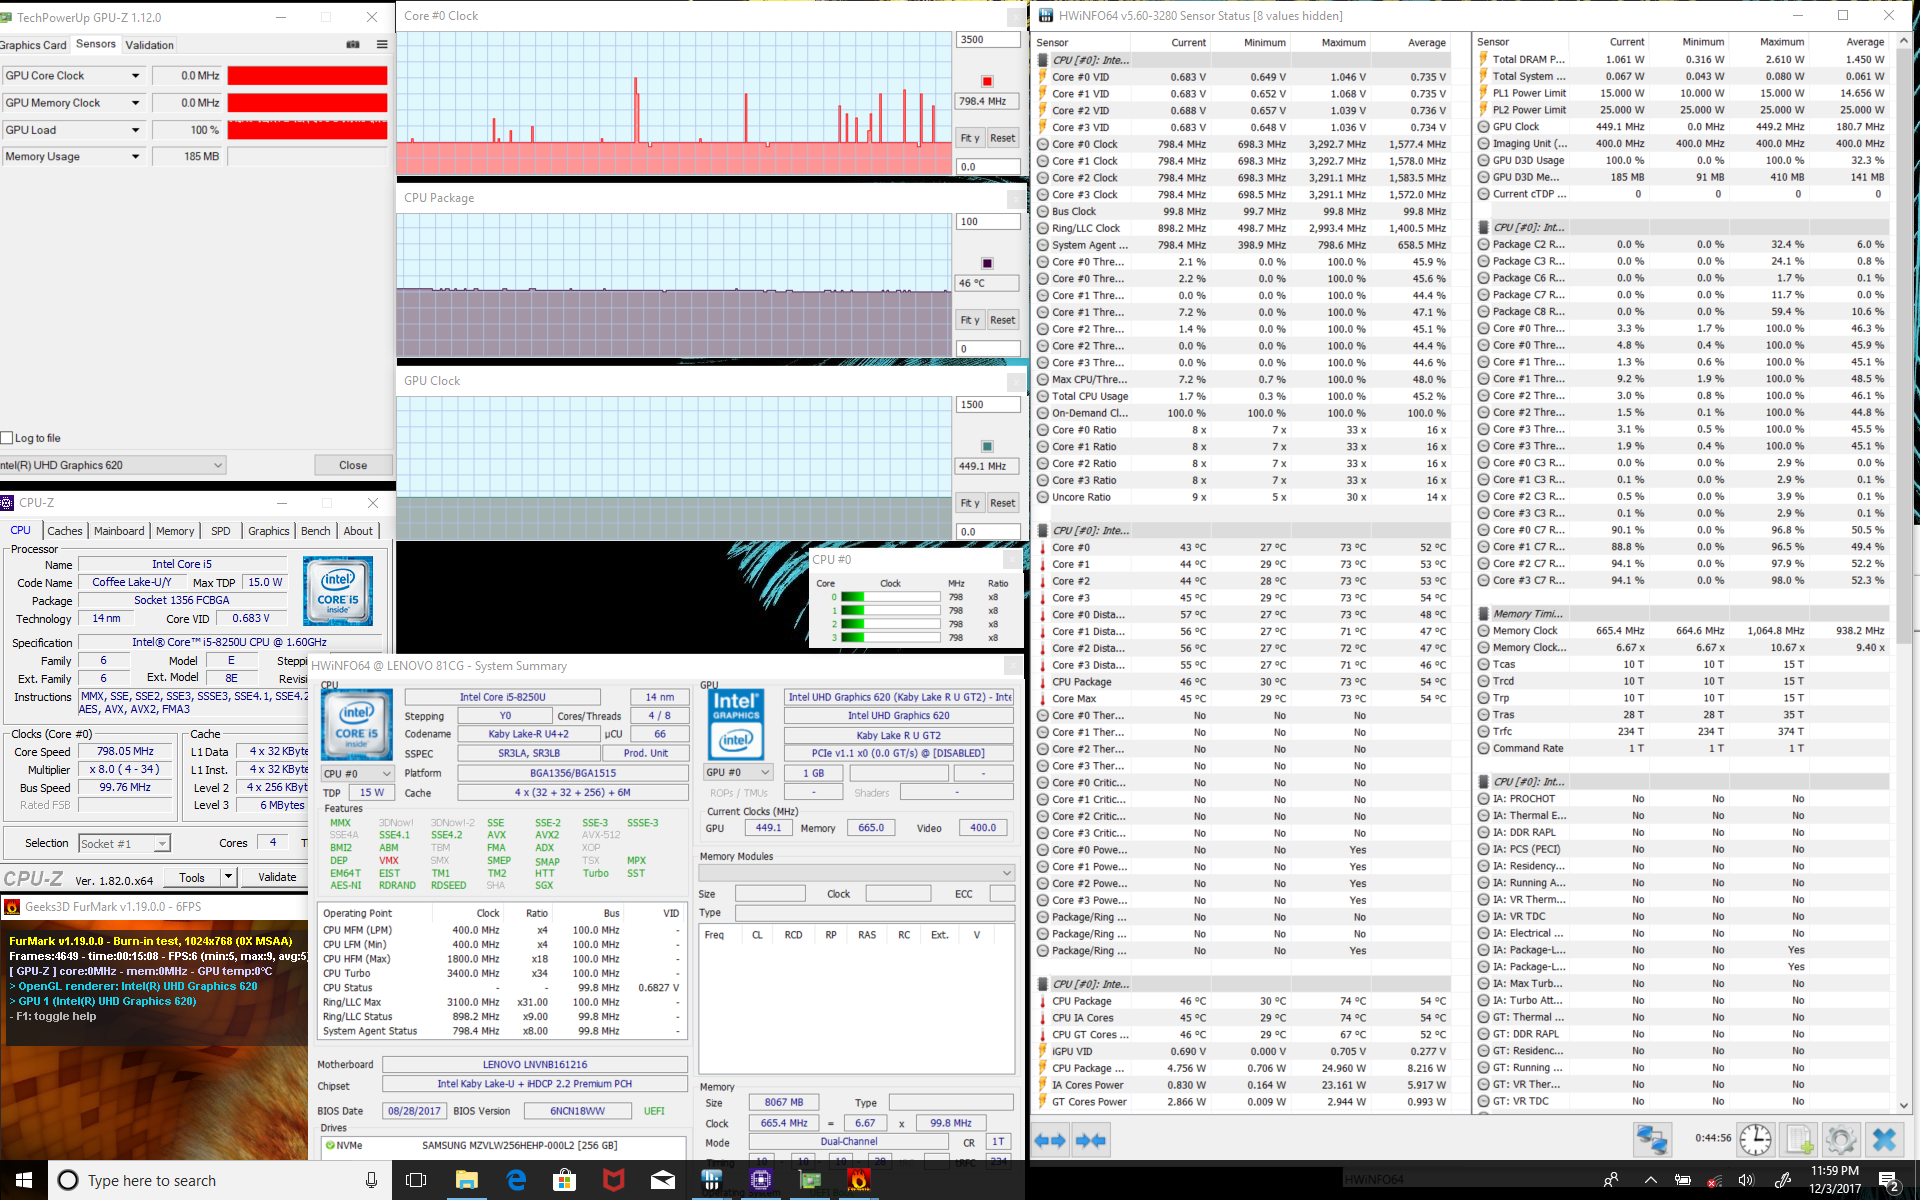
| FurMark Stress | -- | 449 | 46 |
| Prime95 + FurMark Stress | 1.3 - 1.9 | 449 | ~67 |
Emissions
System Noise
Like most devices sporting 15 W ULV Intel processors, the Miix 520 utilizes an active fan whereas the slower Core m versions of the Surface Pro and XPS 13 9365 are passively cooled. Our main gripe with the fan in the Lenovo is that it's very sensitive to onscreen loads. Although the fan is inactive when the tablet is idling on desktop or performing word processing tasks, slightly heavier loads like browsing or video playback will be enough to get it spinning.
The Lenovo tablet is slightly louder than the highest-end Surface Pro SKU when under medium (3DMark06) or heavier loads and its tendency to pulse makes it more conspicuous than it should be. When compared to the older Miix 510, fan behavior hasn't improved by noticeable margins.
Our test unit exhibits no audible coil whining or electronic noise.
Noise level
| Idle |
| 28.2 / 28.2 / 29.6 dB(A) |
| Load |
| 34 / 36 dB(A) |
 | ||
30 dB silent 40 dB(A) audible 50 dB(A) loud |
||
min: | ||
| Lenovo Miix 520-12IKB 81CG UHD Graphics 620, i5-8250U, Samsung PM961 MZVLW256HEHP | Microsoft Surface Pro (2017) i7 Iris Plus Graphics 640, i7-7660U, Samsung PM971 KUS040202M | Lenovo Miix 510 Pro 80U10006GE HD Graphics 520, 6200U, Samsung PM951 NVMe MZVLV256 | HP Elite x2 1012 G2-1LV76EA HD Graphics 620, i5-7200U, Samsung PM961 MZVLW256HEHP | Dell XPS 13 9365-4537 2-in-1 HD Graphics 615, i5-7Y54, Toshiba NVMe THNSN5256GPUK | Lenovo ThinkPad X1 Tablet Gen 2 HD Graphics 615, i5-7Y54, Samsung PM961 MZVLW256HEHP | |
|---|---|---|---|---|---|---|
| Noise | -1% | -5% | 1% | |||
| off / environment * (dB) | 28.2 | 29.6 -5% | 30.15 -7% | 29.5 -5% | ||
| Idle Minimum * (dB) | 28.2 | 29.6 -5% | 30.15 -7% | 29.5 -5% | ||
| Idle Average * (dB) | 28.2 | 29.6 -5% | 30.8 -9% | 29.5 -5% | ||
| Idle Maximum * (dB) | 29.6 | 29.6 -0% | 31 -5% | 29.5 -0% | ||
| Load Average * (dB) | 34 | 33.4 2% | 36.8 -8% | 30.6 10% | ||
| Load Maximum * (dB) | 36 | 34.1 5% | 33.8 6% | 32.5 10% | ||
| Witcher 3 ultra * (dB) | 33.4 |
* ... smaller is better
Temperature
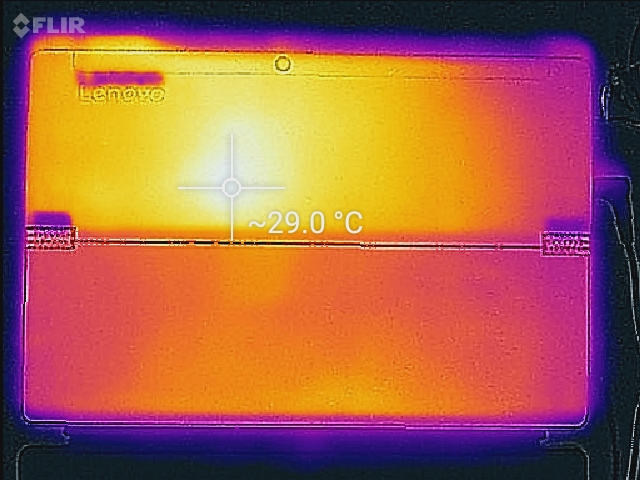
Surface temperatures are flat on both sides of the tablet when idling except for the very bottom where the keyboard dock attaches to the unit. This particular edge is always a few degrees warmer than the rest of the tablet as shown by the temperature maps below. The general location of the processor can also be spotted on the back of the unit where the hot spot can be observed.
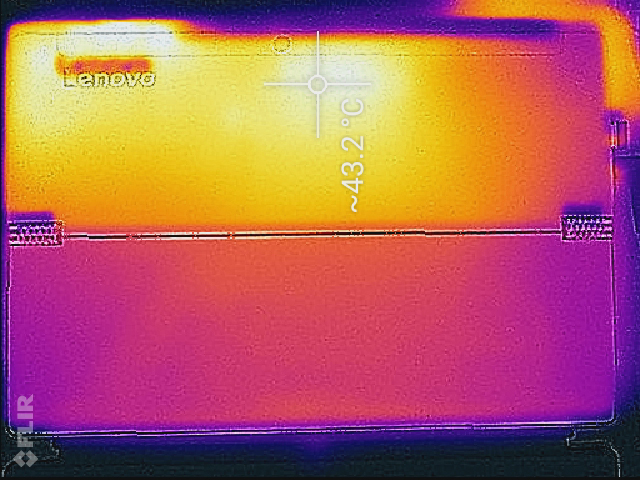
The system grows warm very quickly when under heavier processing loads. Certain areas can be as warm as 45 C after an hour of extreme stress testing, but these surfaces are thankfully near the top half of the tablet adjacent to the ventilation grilles where users are less likely to touch. The general temperature gradient is steeper compared to the Surface Pro and so users can feel more of a temperature difference when handling the Lenovo. Using the tablet in landscape orientation is never uncomfortably warm so long as the user is holding onto the tablet from its bottom half where airflow cannot be constricted.
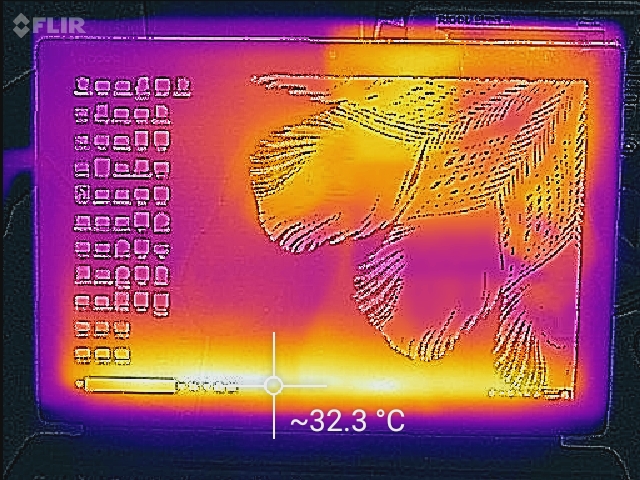
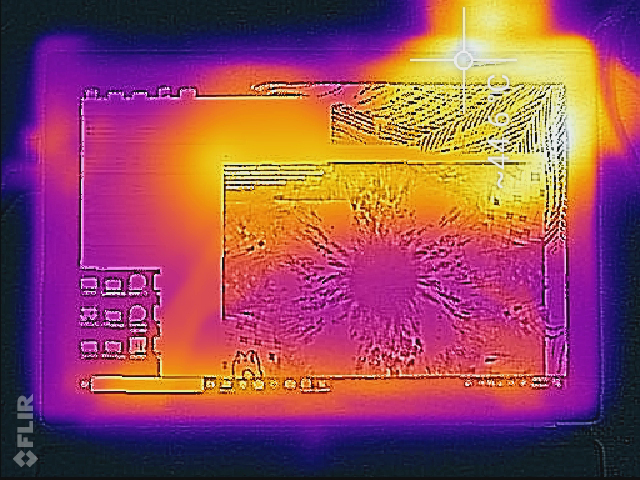
(±) The maximum temperature on the upper side is 44.8 °C / 113 F, compared to the average of 35.4 °C / 96 F, ranging from 19.6 to 60 °C for the class Convertible.
(±) The bottom heats up to a maximum of 44.2 °C / 112 F, compared to the average of 36.9 °C / 98 F
(+) In idle usage, the average temperature for the upper side is 28 °C / 82 F, compared to the device average of 30.3 °C / 87 F.
(+) The palmrests and touchpad are reaching skin temperature as a maximum (35 °C / 95 F) and are therefore not hot.
(-) The average temperature of the palmrest area of similar devices was 28 °C / 82.4 F (-7 °C / -12.6 F).
Speakers
The stereo speakers are nothing special and are average in quality as one would expect from a tablet form factor. Bass is severely lacking for a "tinny" audio experience. Maximum volume is satisfactory for personal use, but it is too low for conference meetings and medium-sized rooms where an audience may be present. The chassis reverberates slightly when on higher volume settings, but it will thankfully not rattle or introduce any static.
")


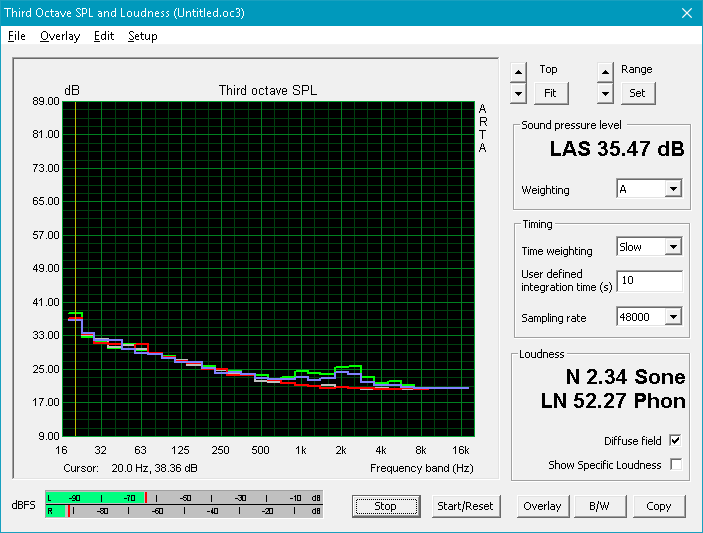
Lenovo Miix 520-12IKB 81CG audio analysis
(-) | not very loud speakers (61.3 dB)
Bass 100 - 315 Hz
(-) | nearly no bass - on average 18.1% lower than median
(±) | linearity of bass is average (12.5% delta to prev. frequency)
Mids 400 - 2000 Hz
(+) | balanced mids - only 4% away from median
(±) | linearity of mids is average (9.9% delta to prev. frequency)
Highs 2 - 16 kHz
(±) | higher highs - on average 5.1% higher than median
(±) | linearity of highs is average (10.9% delta to prev. frequency)
Overall 100 - 16.000 Hz
(-) | overall sound is not linear (31% difference to median)
Compared to same class
» 90% of all tested devices in this class were better, 2% similar, 8% worse
» The best had a delta of 6%, average was 20%, worst was 57%
Compared to all devices tested
» 90% of all tested devices were better, 2% similar, 8% worse
» The best had a delta of 4%, average was 23%, worst was 134%
Apple MacBook 12 (Early 2016) 1.1 GHz audio analysis
(+) | speakers can play relatively loud (83.6 dB)
Bass 100 - 315 Hz
(±) | reduced bass - on average 11.3% lower than median
(±) | linearity of bass is average (14.2% delta to prev. frequency)
Mids 400 - 2000 Hz
(+) | balanced mids - only 2.4% away from median
(+) | mids are linear (5.5% delta to prev. frequency)
Highs 2 - 16 kHz
(+) | balanced highs - only 2% away from median
(+) | highs are linear (4.5% delta to prev. frequency)
Overall 100 - 16.000 Hz
(+) | overall sound is linear (10.2% difference to median)
Compared to same class
» 7% of all tested devices in this class were better, 2% similar, 90% worse
» The best had a delta of 5%, average was 18%, worst was 53%
Compared to all devices tested
» 5% of all tested devices were better, 1% similar, 94% worse
» The best had a delta of 4%, average was 23%, worst was 134%
Frequency Comparison (Checkbox selectable!)
Graph 1: Pink Noise 100% Vol.; Graph 2: Audio off
Energy Management
Power Consumption
Idling on desktop will draw about 5 W to 12 W depending on the power profile and screen brightness setting similar to the Miix 510 Pro. Heavier loads like 3DMark06 will demand about 38 W to be comparable to the Surface Pro with the more powerful Iris Plus Graphics 640. The Microsoft tablet offers a 20 to 40 percent graphics boost over the Miix 520 without necessarily drawing more from the outlet.
Maximum load with Prime95 and FurMark will also draw around 38 W from the small (~6.5 x 6.5 x 3.0 cm) 45 W AC adapter.
| Off / Standby | |
| Idle | |
| Load |
|
Key:
min: | |
| Lenovo Miix 520-12IKB 81CG i5-8250U, UHD Graphics 620, Samsung PM961 MZVLW256HEHP, IPS, 1920x1200, 12.2" | Microsoft Surface Pro (2017) i7 i7-7660U, Iris Plus Graphics 640, Samsung PM971 KUS040202M, IPS, 2736x1824, 12.3" | Microsoft Surface Pro (2017) i5 i5-7300U, HD Graphics 620, Samsung PM971 KUS030202M, IPS, 2736x1824, 12.3" | Lenovo Miix 510 Pro 80U10006GE 6200U, HD Graphics 520, Samsung PM951 NVMe MZVLV256, IPS, 1920x1200, 12.2" | HP Elite x2 1012 G2-1LV76EA i5-7200U, HD Graphics 620, Samsung PM961 MZVLW256HEHP, IPS, 2716x1824, 12.3" | Dell XPS 13 9365-4537 2-in-1 i5-7Y54, HD Graphics 615, Toshiba NVMe THNSN5256GPUK, IPS, 3200x1800, 13.3" | |
|---|---|---|---|---|---|---|
| Power Consumption | -2% | 26% | 6% | -0% | -3% | |
| Idle Minimum * (Watt) | 5.5 | 4.2 24% | 3.6 35% | 4.2 24% | 4.1 25% | 8.2 -49% |
| Idle Average * (Watt) | 8.3 | 10.1 -22% | 8.1 2% | 11.5 -39% | 9.2 -11% | 10.8 -30% |
| Idle Maximum * (Watt) | 11.5 | 14 -22% | 8.7 24% | 11.7 -2% | 11.1 3% | 12.7 -10% |
| Load Average * (Watt) | 38.3 | 37.4 2% | 25.5 33% | 31 19% | 33.8 12% | 22.6 41% |
| Load Maximum * (Watt) | 37.7 | 34 10% | 23.5 38% | 27.4 27% | 49.2 -31% | 24.6 35% |
| Witcher 3 ultra * (Watt) | 38.1 |
* ... smaller is better
Battery Life
The internal 38 Wh battery is similar to the one in the Miix 510 but significantly smaller than the 50 Wh battery in the Miix 510 Pro and many other convertibles in this size category. Its WLAN runtime of just 5.5 hours pale in comparison to the Elite x2 1012 and especially the Surface Pro when under similar testing conditions. Lenovo advertises a battery life of 7.5 hours and so our WLAN conditions are likely more demanding than Lenovo's battery testing methodologies.
Despite the differences in battery capacity between them, average runtimes are actually still very similar to the Miix 510 Pro.
Charging from near empty to full capacity will take about 1 hour and 45 minutes.
| Lenovo Miix 520-12IKB 81CG i5-8250U, UHD Graphics 620, 38 Wh | Microsoft Surface Pro (2017) i5 i5-7300U, HD Graphics 620, 45 Wh | Lenovo Miix 510 Pro 80U10006GE 6200U, HD Graphics 520, 50 Wh | HP Elite x2 1012 G2-1LV76EA i5-7200U, HD Graphics 620, 47 Wh | Dell XPS 13 9365-4537 2-in-1 i5-7Y54, HD Graphics 615, 46 Wh | Lenovo ThinkPad X1 Tablet Gen 2 i5-7Y54, HD Graphics 615, 37 Wh | |
|---|---|---|---|---|---|---|
| Battery runtime | 106% | 21% | 45% | 21% | 40% | |
| Reader / Idle (h) | 12.3 | 17.6 43% | 11.6 -6% | 13.9 13% | 11 -11% | |
| WiFi v1.3 (h) | 5.6 | 12.4 121% | 5.4 -4% | 6.3 13% | 6.8 21% | 7.4 32% |
| Load (h) | 1.1 | 2.8 155% | 1.9 73% | 2.3 109% | 2.2 100% |
Pros
Cons
Verdict
The best aspects of the Miix 520 are its processor performance, SSD performance, port versatility, and price. Its performance-per-Dollar is one of the best in the market at the moment as most other Windows tablets are still stuck with Core Y or 7th generation options. Users who can exploit the additional horsepower will find the Miix 520 to be a suitable faux-Ultrabook for traveling.
Everything else about the Lenovo detachable is not necessarily bad or even average, but there is definitely room to improve when compared to some close alternatives. The Surface Pro and Elite x2 are more robust in design, have brighter and higher resolution displays, more accurate colors, and longer battery life. The HP tablet in particular also carries Thunderbolt 3 for an even wider range of connectivity options. A firmer keyboard base for the Lenovo would have improved the spongy typing experience relative to the keyboards on most Ultrabooks.
The most noticeable drawback of the faster processor performance is the fan noise. The fan is slightly louder than on the Surface Pro and will cycle much more frequently during day-to-day use. It's not nearly as loud as the HP Spectre series of convertibles, but it's noticeable nonetheless especially for a tablet form factor.
The Miix 520 is a great buy so long as users are aware of its disadvantages. The fast CPU performance comes at the cost of louder and more frequent fan noise. We're hoping that future revisions will update the display and incorporate Thunderbolt 3 to make the Miix series even more competitive against Microsoft.
Lenovo Miix 520-12IKB 81CG
- 12/10/2017 v6 (old)
Allen Ngo
Price comparison
