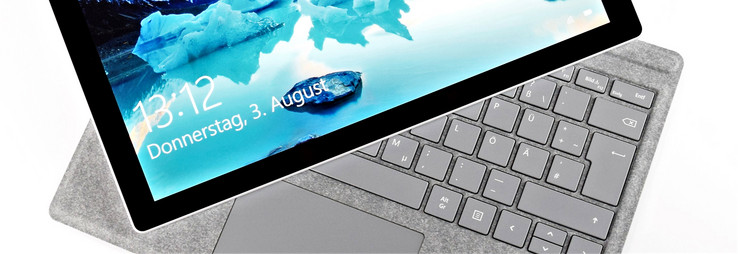
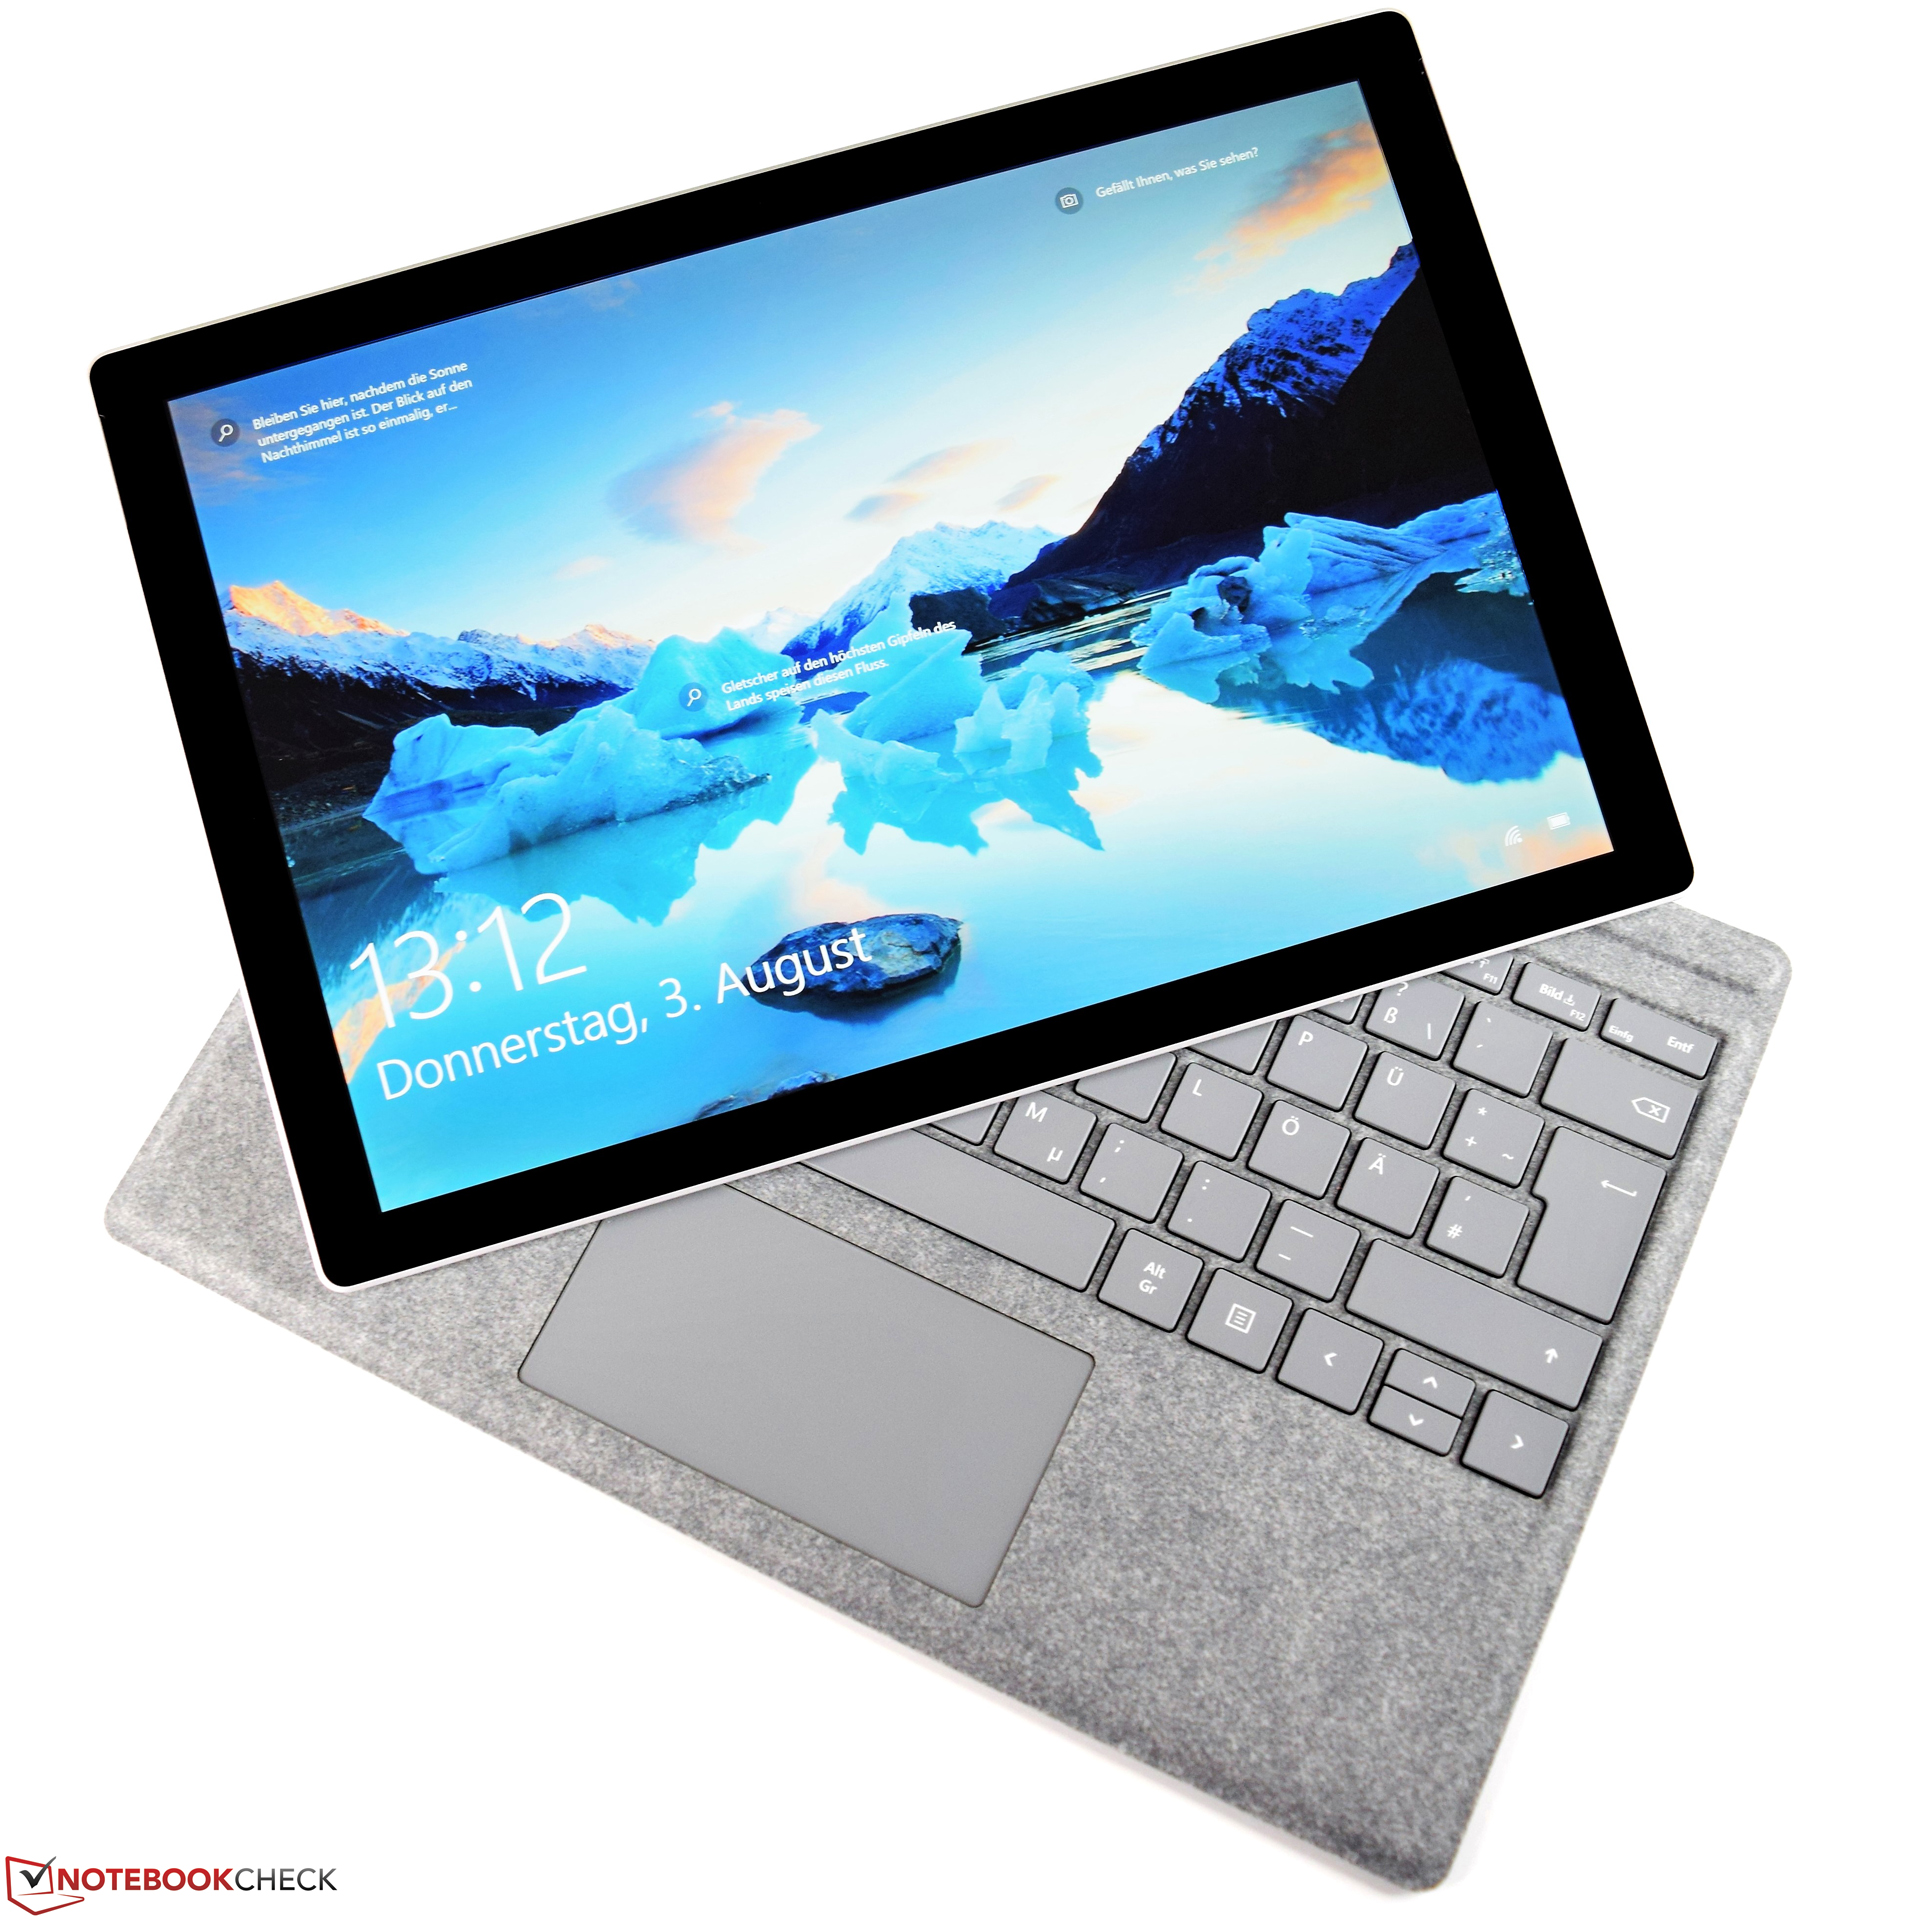
Microsoft Surface Pro (2017) (Core m3, 128GB, 4GB) Convertible Review
For the original German review, see here.
After testing the Core i7 and Core i5 devices, Microsoft's Surface Pro (2017) with Intel's Core m3 7Y30 has to pass our test course and show its aptitudes.
The Surface Pro (2017) in our test configuration is sold for 879 Euros (~$1039) on the Internet. However, only a matching power supply is included. There are no alternative configurations for the components. The accessories have to be bought (Surface Pen (79 Euros, ~$93), Signature Type Cover (150 Euros, ~$177), USB 3.0 dock (160 Euros, ~$189)) when required. This lets the device seem considerably less expensive than the comparison devices at first, but some retailers offer a complete package including stylus and backlit keyboard for 1145 Euros/$1269 (Lenovo IdeaPad Miix 720-12IKB).
We will uncover how our present Surface Pro (2017) scores against the competition in the course of this review. The identically built Microsoft Surface Pro 2017 convertibles with a Core i5 and Core i7 processor are the main comparison devices. However, we did not exclusively select Microsoft products for comparison. We compiled an overview of all devices in the following chart.
| Microsoft Surface Pro (2017) | Microsoft Surface Pro (2017) | Lenovo Ideapad Miix 720 | HP Elite x2 1012 G1 | Lenovo ThinkPad X1 | Samsung Galaxy Tab Pro S | Acer Aspire Switch 12 Alpha | |
| CPU | Intel Core i7-7660U | Intel Core i5-7300U | Intel Core i7-7500U | Intel Core m5-6Y54 | Intel Core i5-m7Y54 | Intel Core m3-6Y30 | Intel Core i5-6200U |
| GPU | Intel Iris Plus Graphics 640 | Intel HD Graphics 620 | Intel HD Graphics 620 | Intel HD Graphics 515 | Intel HD Graphics 615 | Intel HD Graphics 515 | Intel HD Graphics 520 |
| Panel | 12.3-inch 2736 x 1824 | 12.3-inch 2736 x 1824 | 12-inch 2880 x 1920 | 12.1-inch 1920 x 1080 | 12-inch 2160 x 1440 | 12.1-inch 2160 x 1440 | 12-inch 2160 x 1440 |
| RAM | 16 GB | 8 GB | 16 GB | 8 GB | 8 GB | 4 GB | 4 GB |
| SSD | 512 GB, NVMe | 256 GB, NVMe | 1 TB, NVMe | 256 GB | 256 GB, NVMe | 128 GB | 256 GB |
| Rating | 90% | 90% | 85% | 87% | 86% | 85% | 86% |
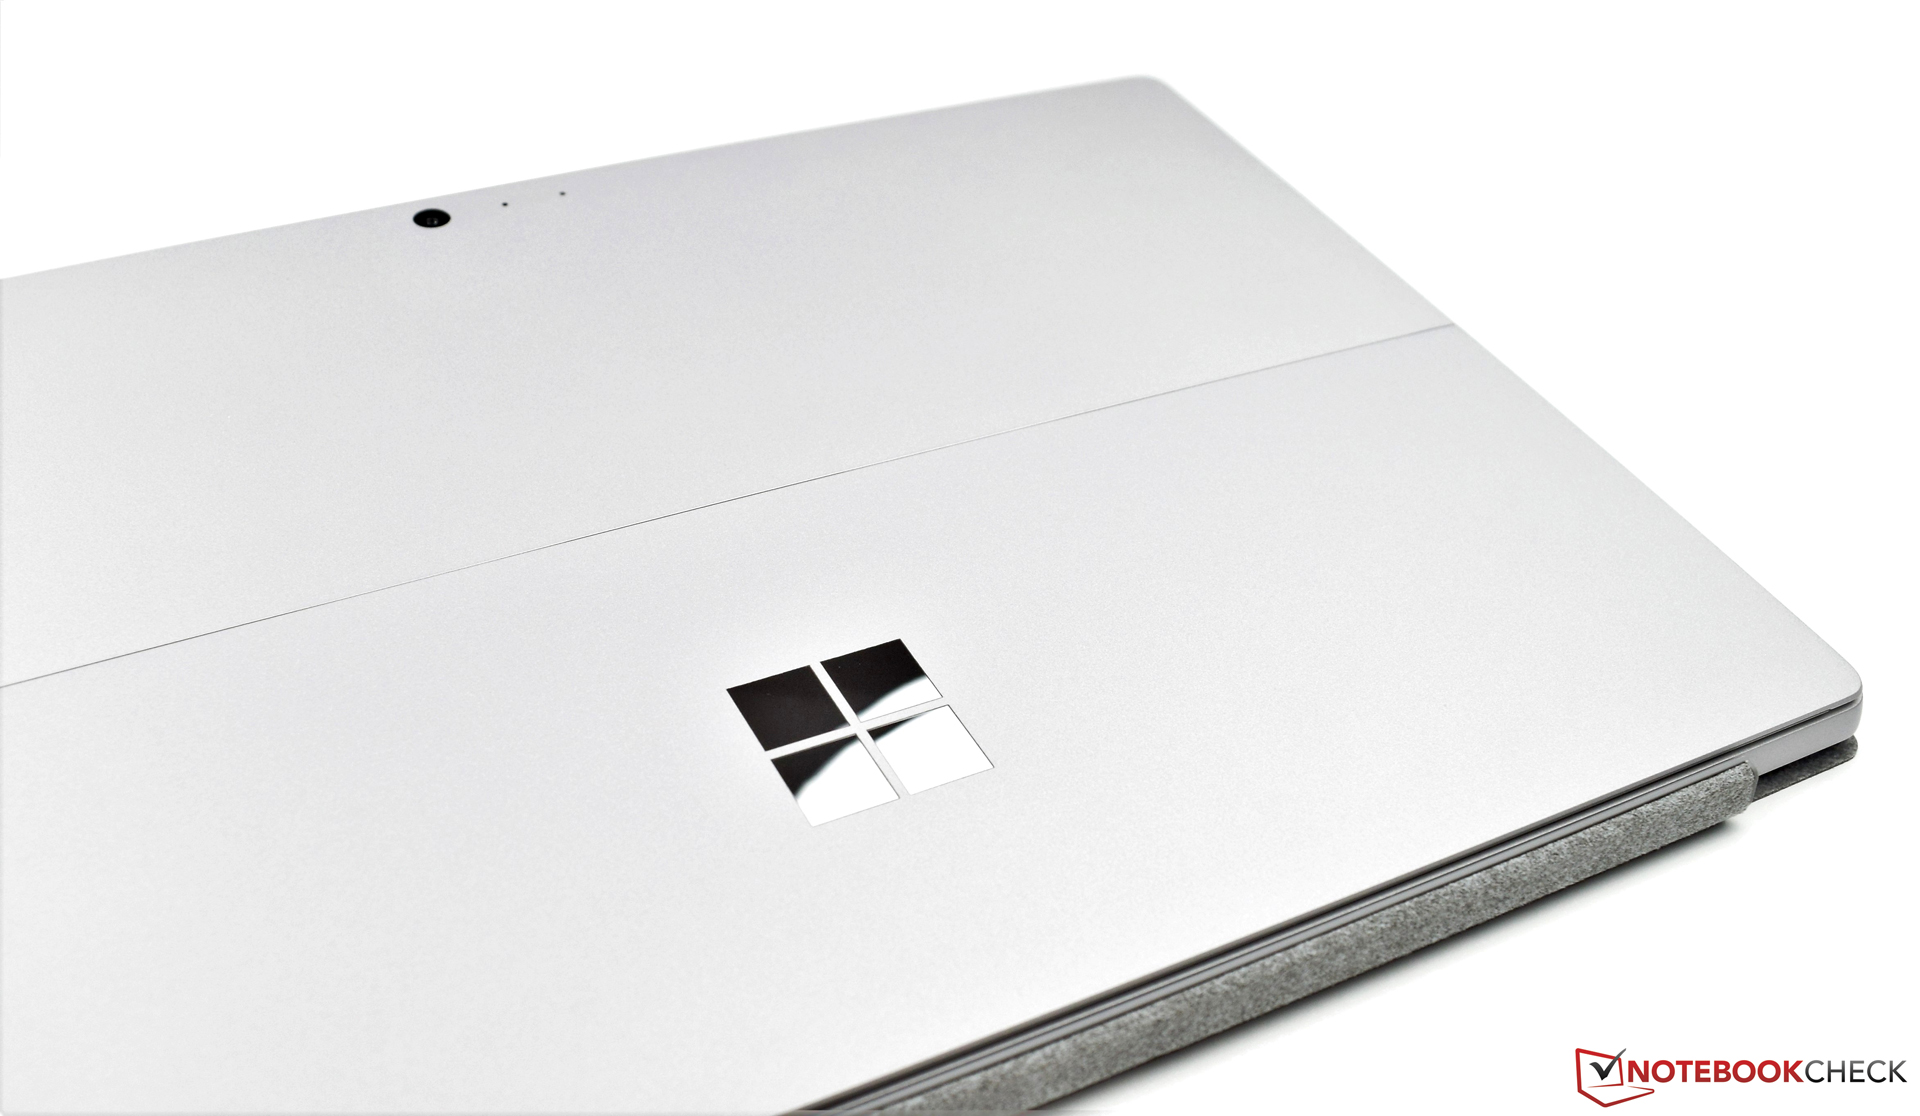
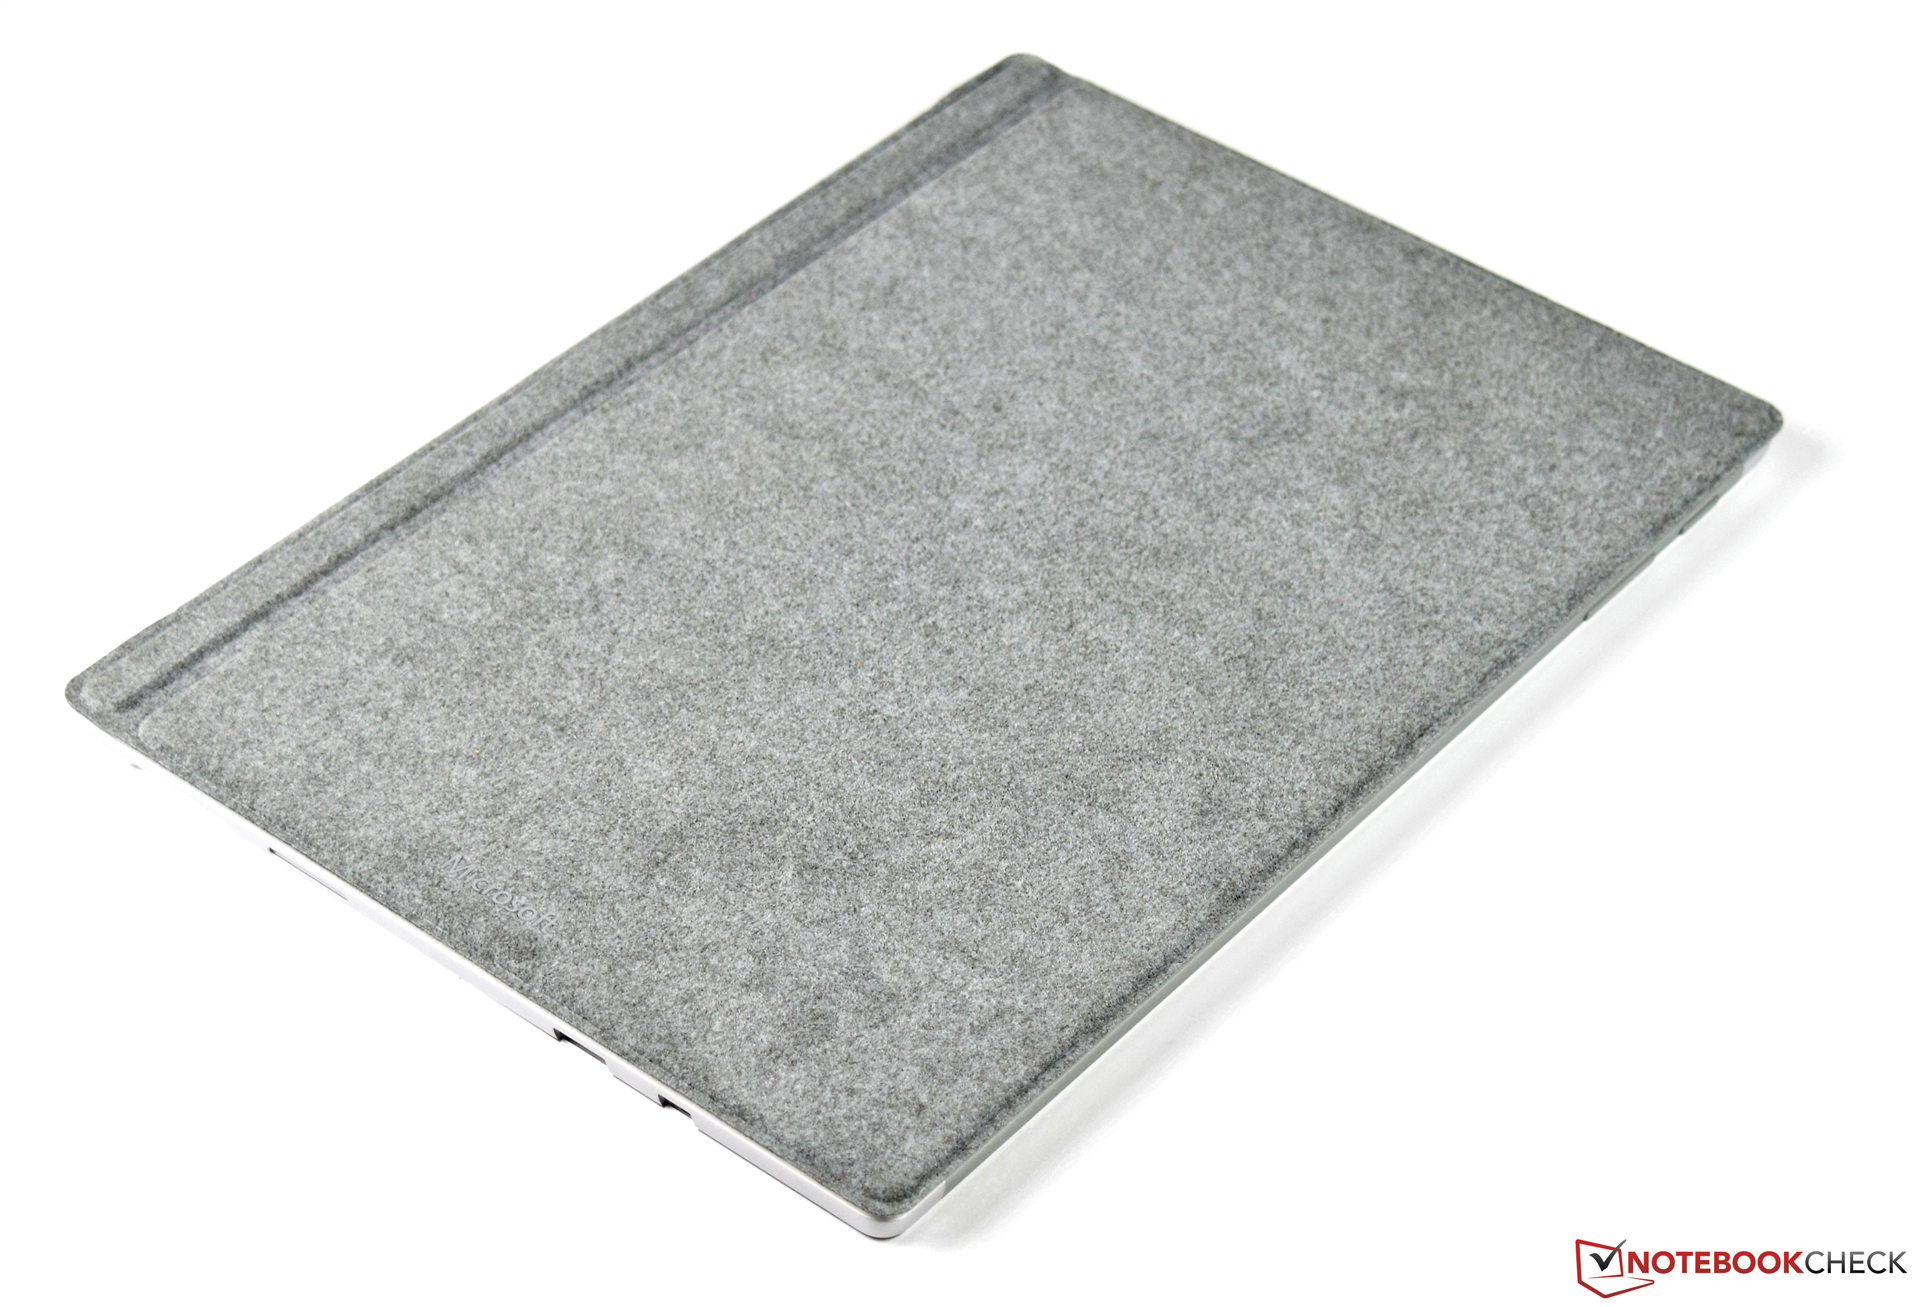
Case
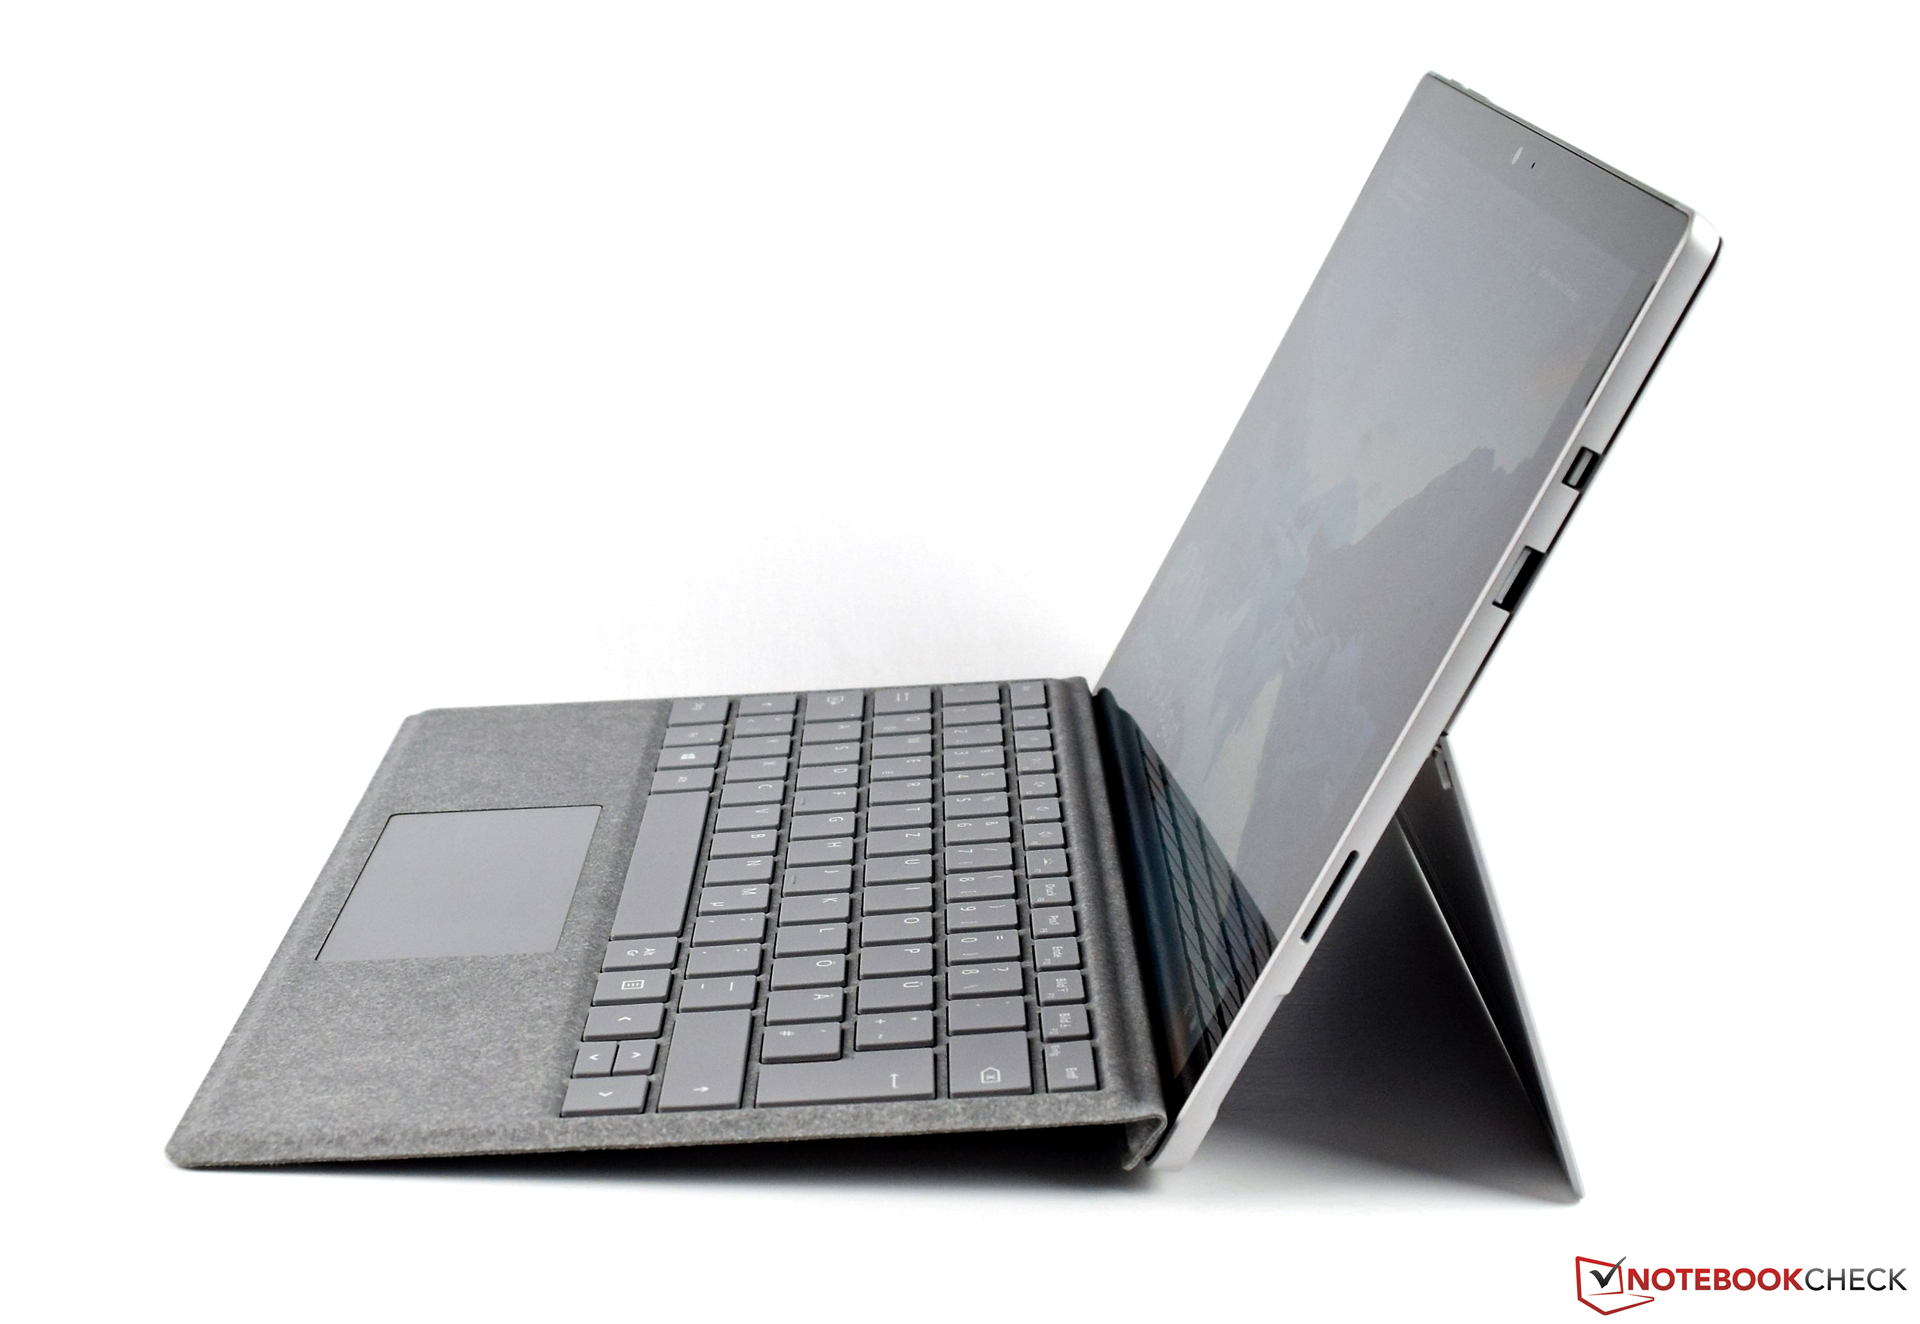
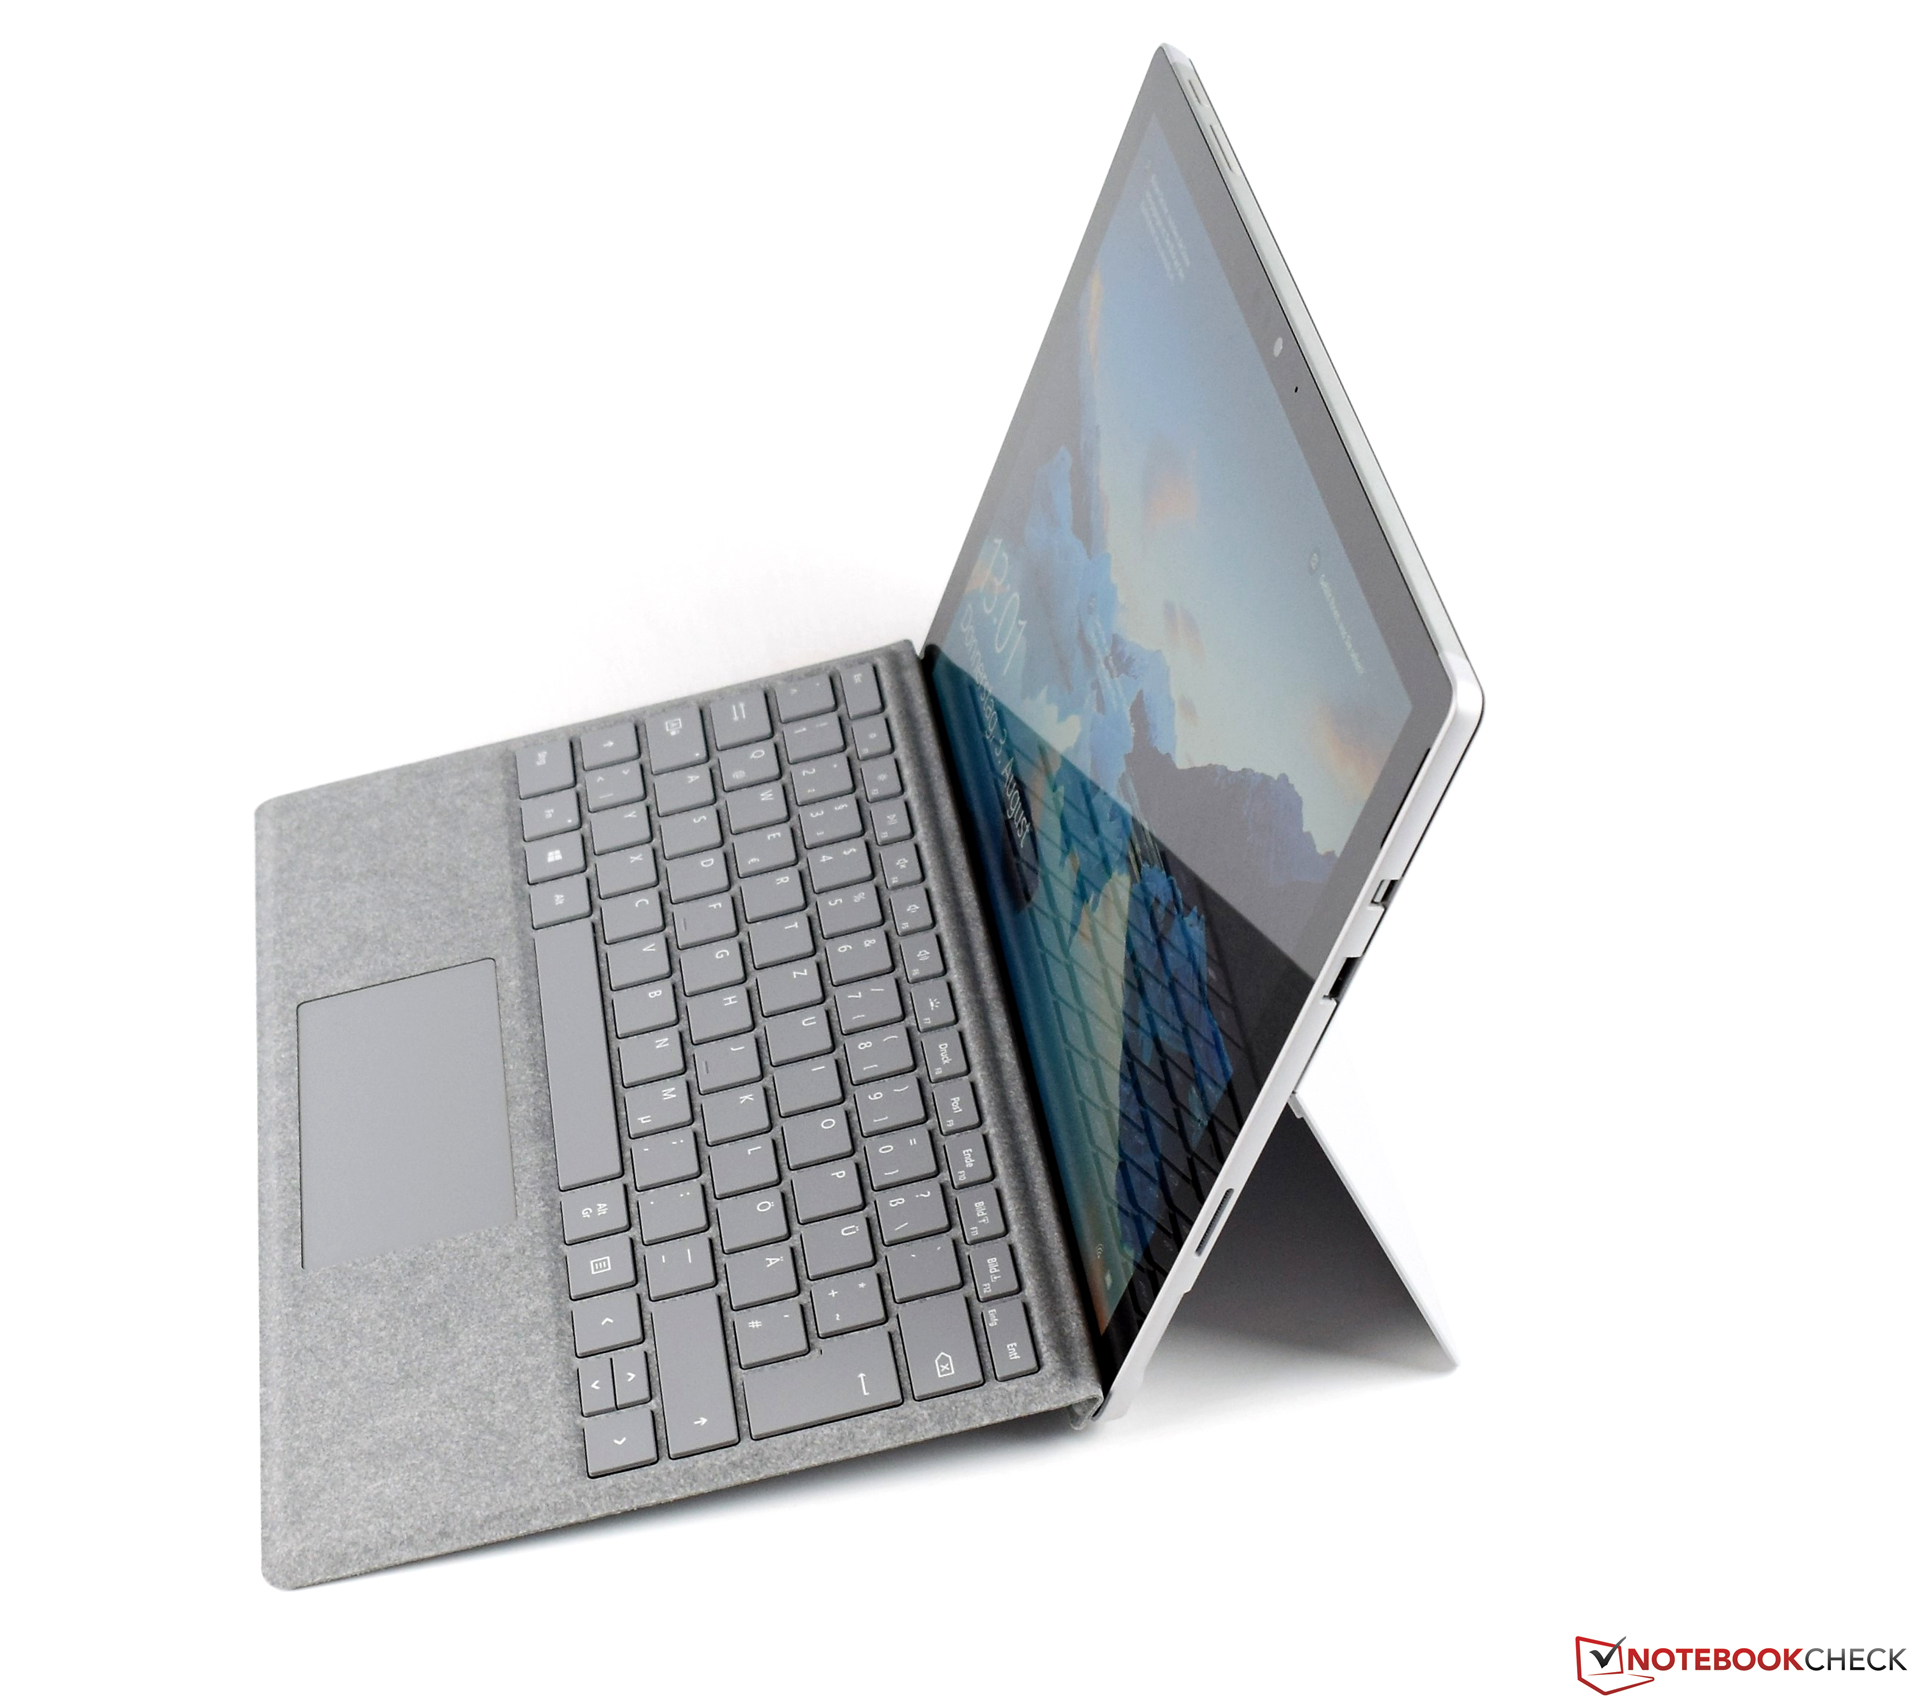
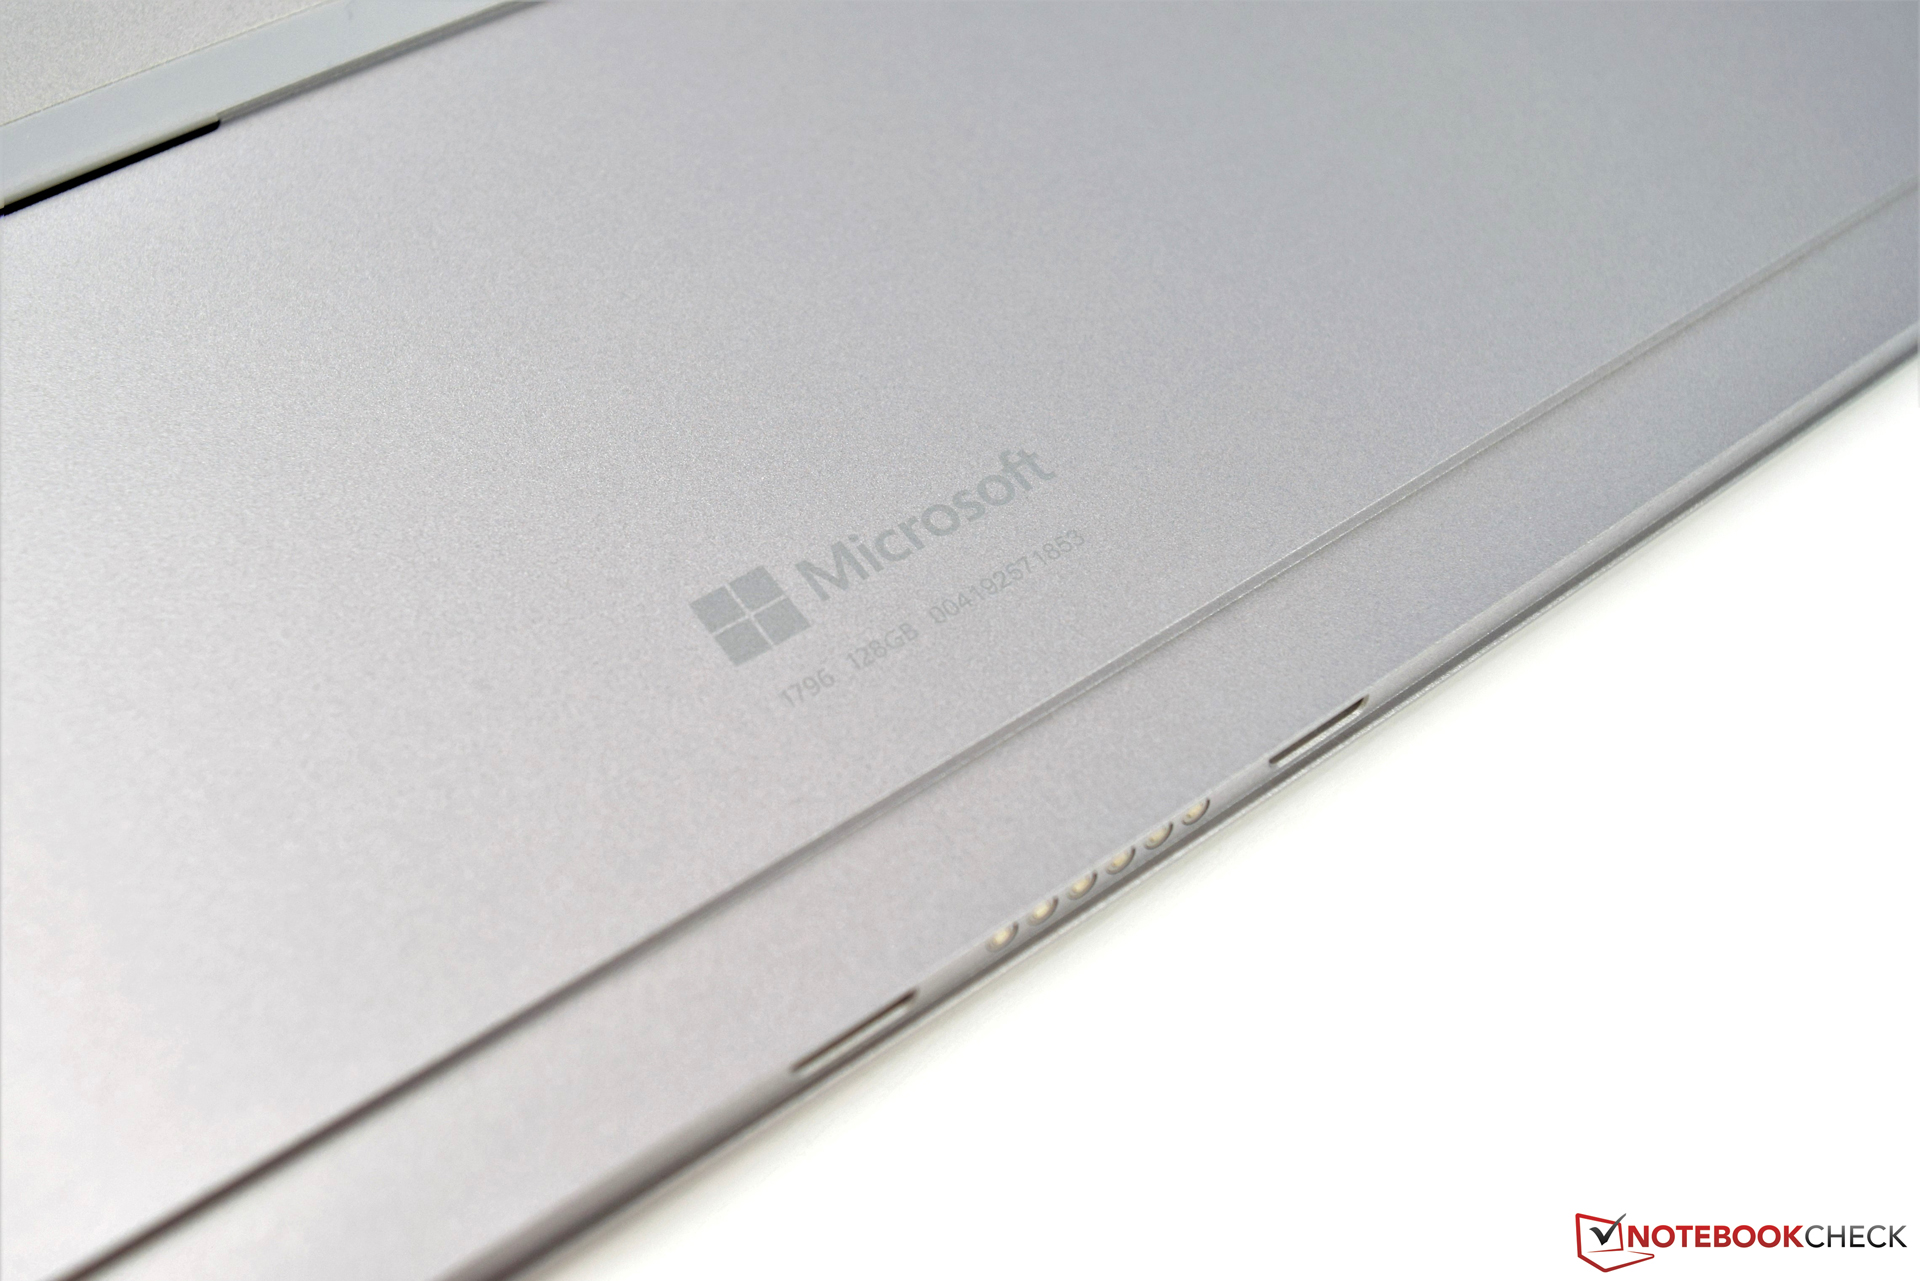
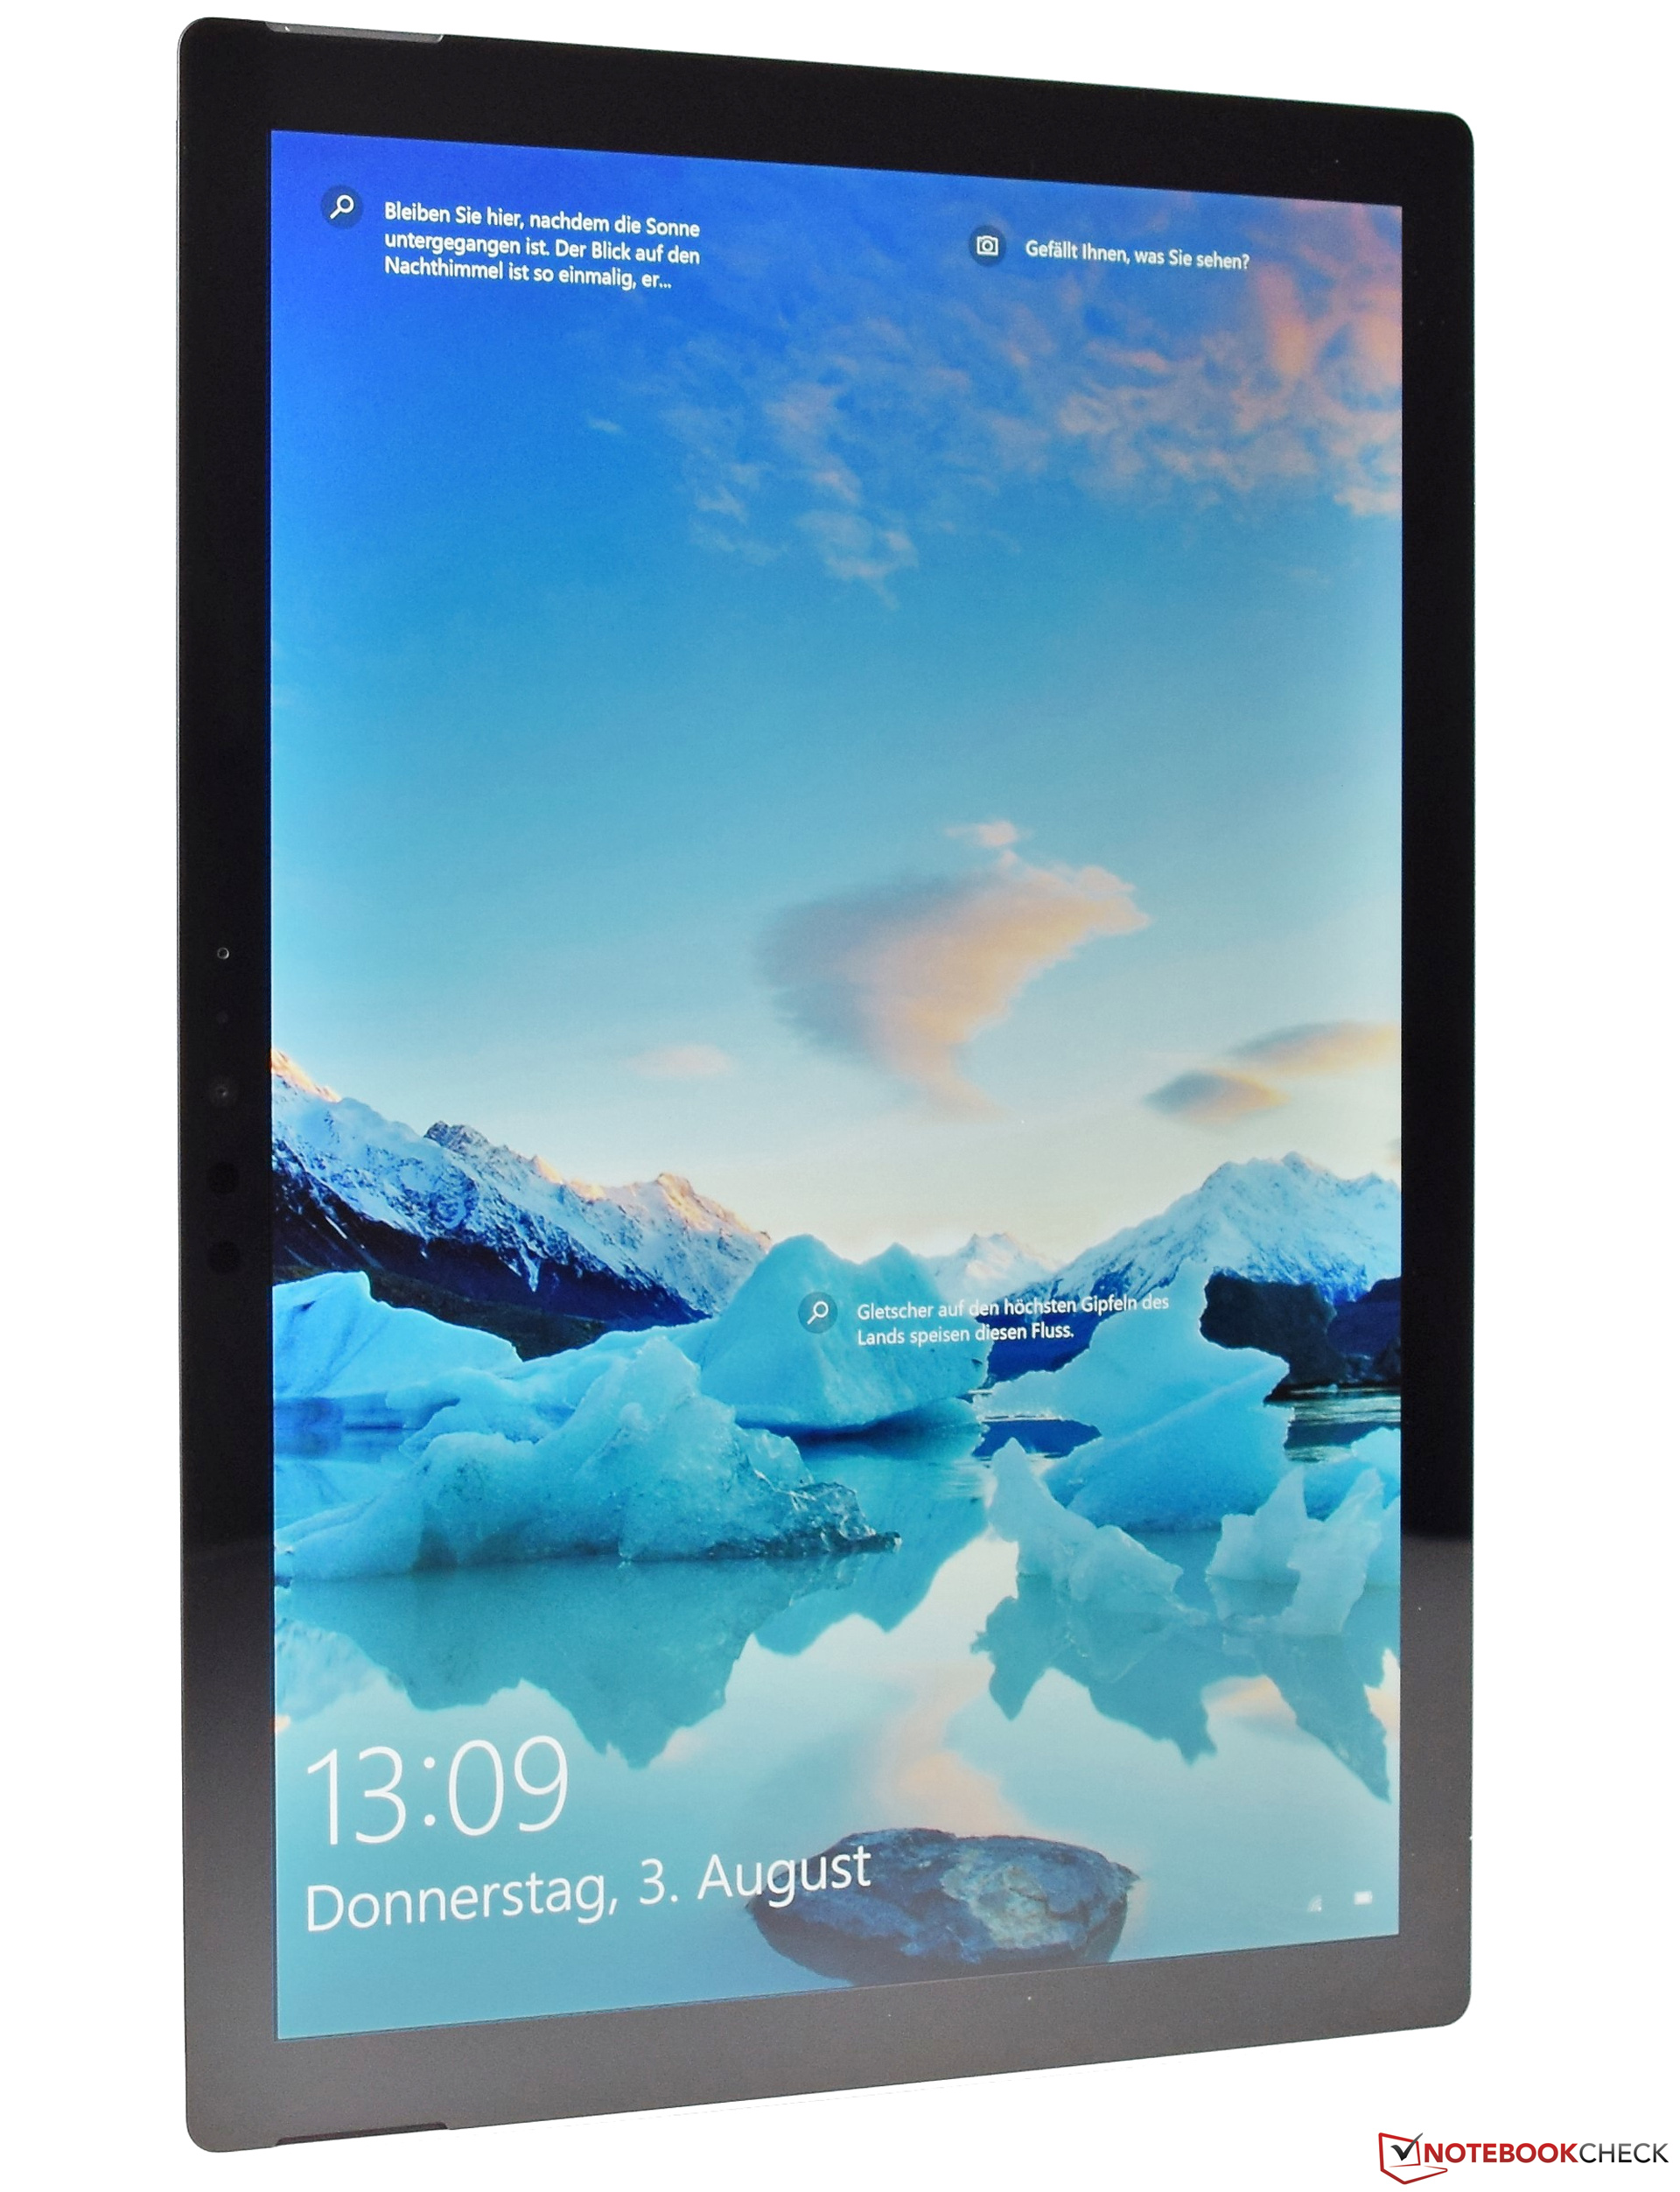
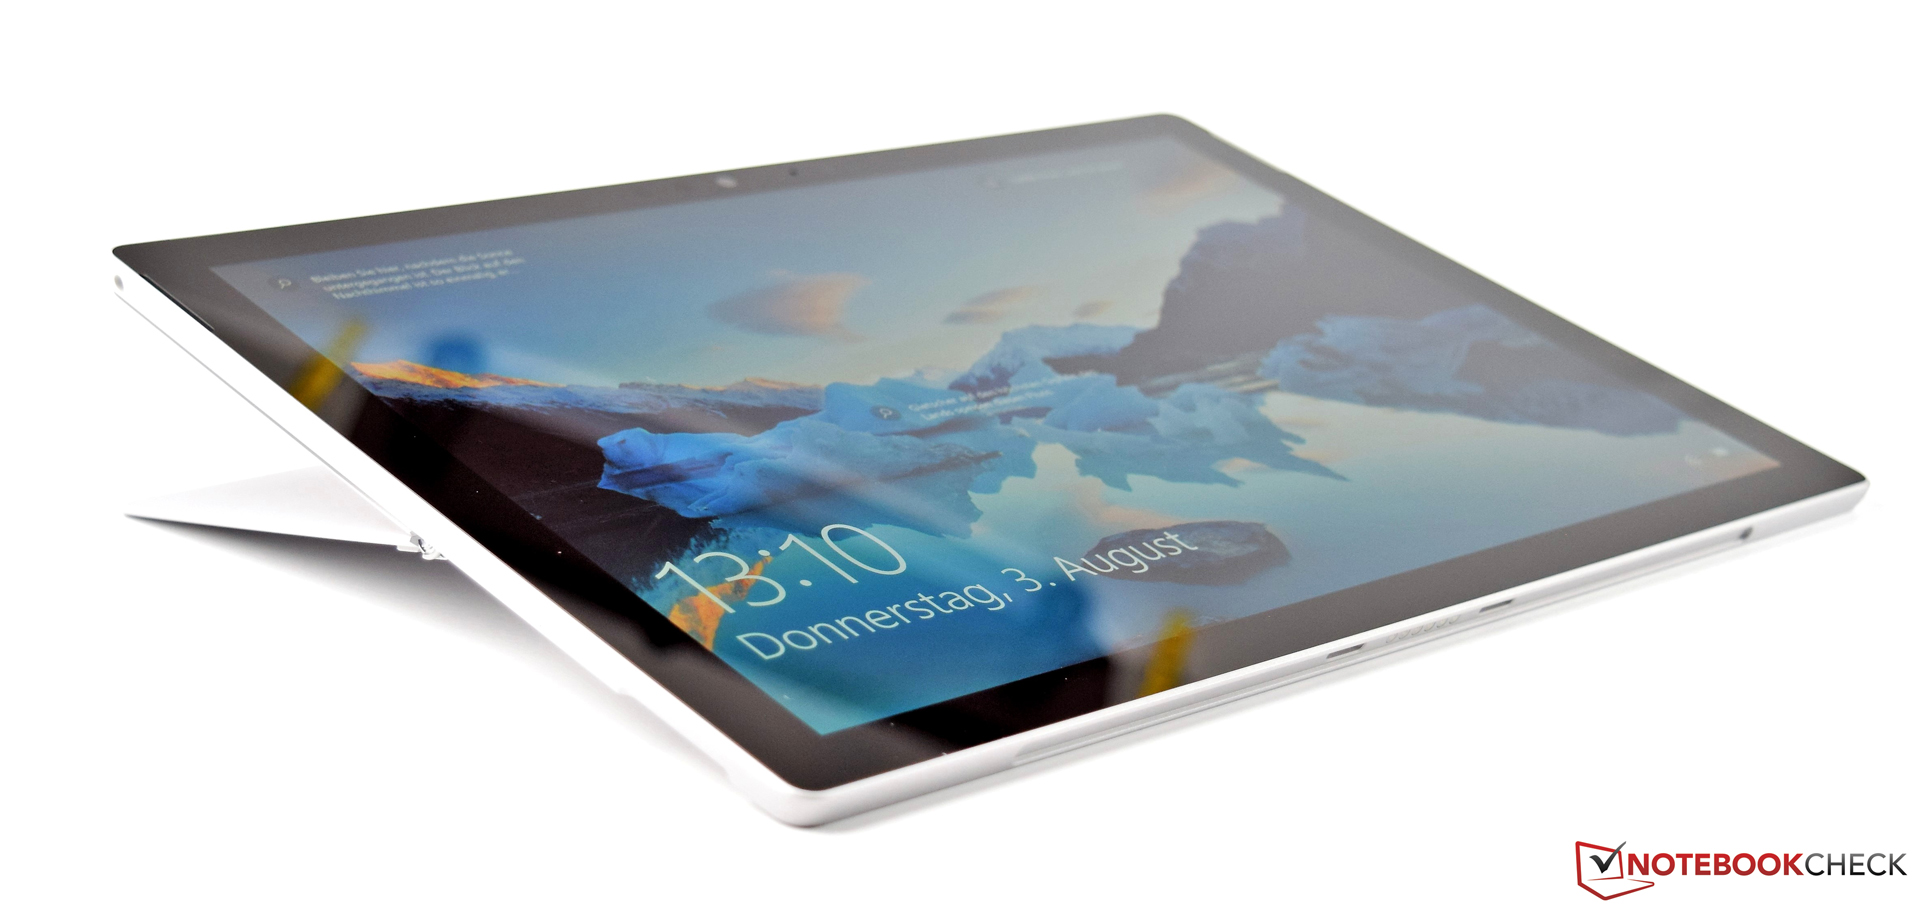
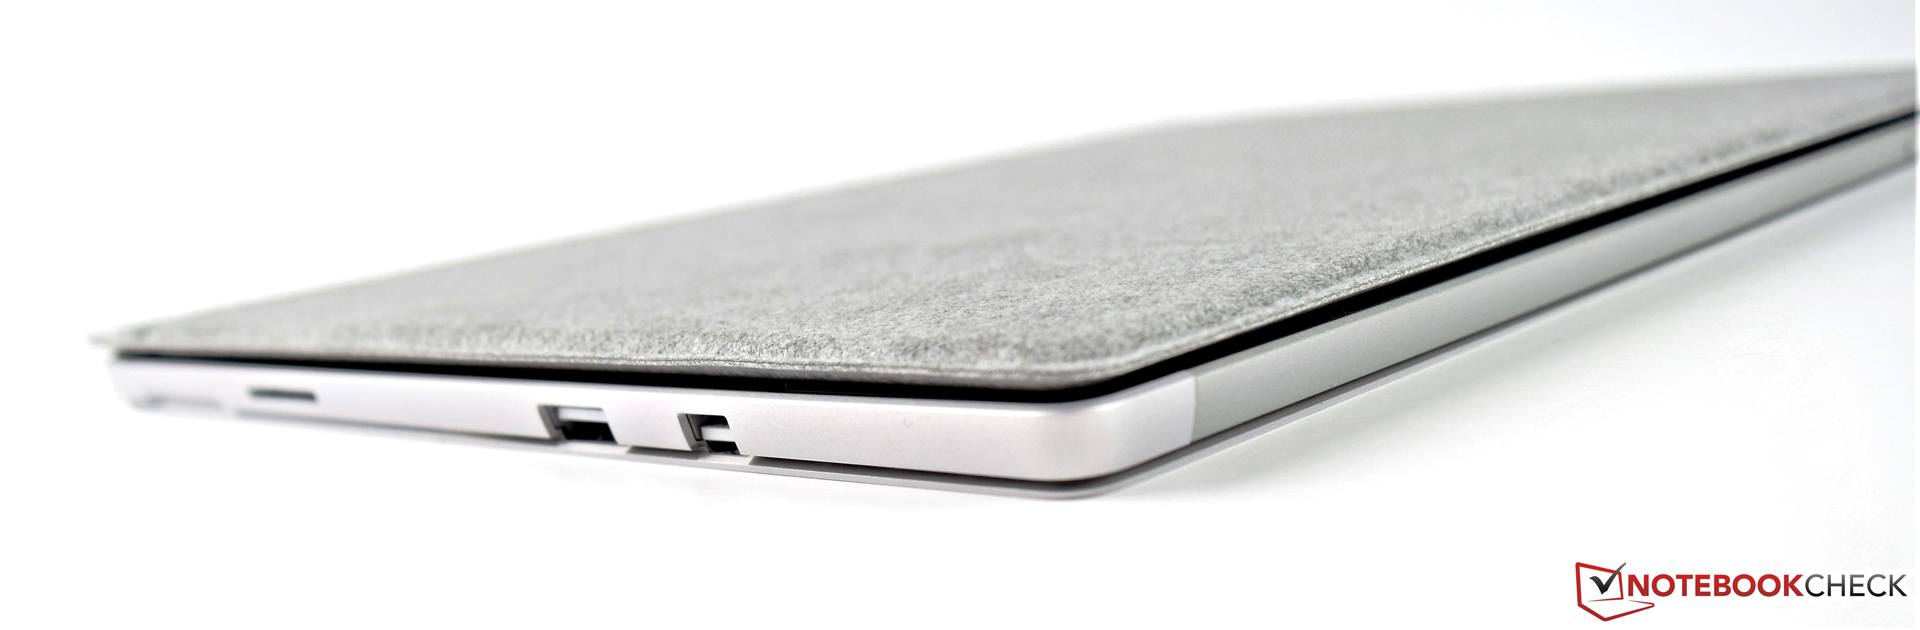
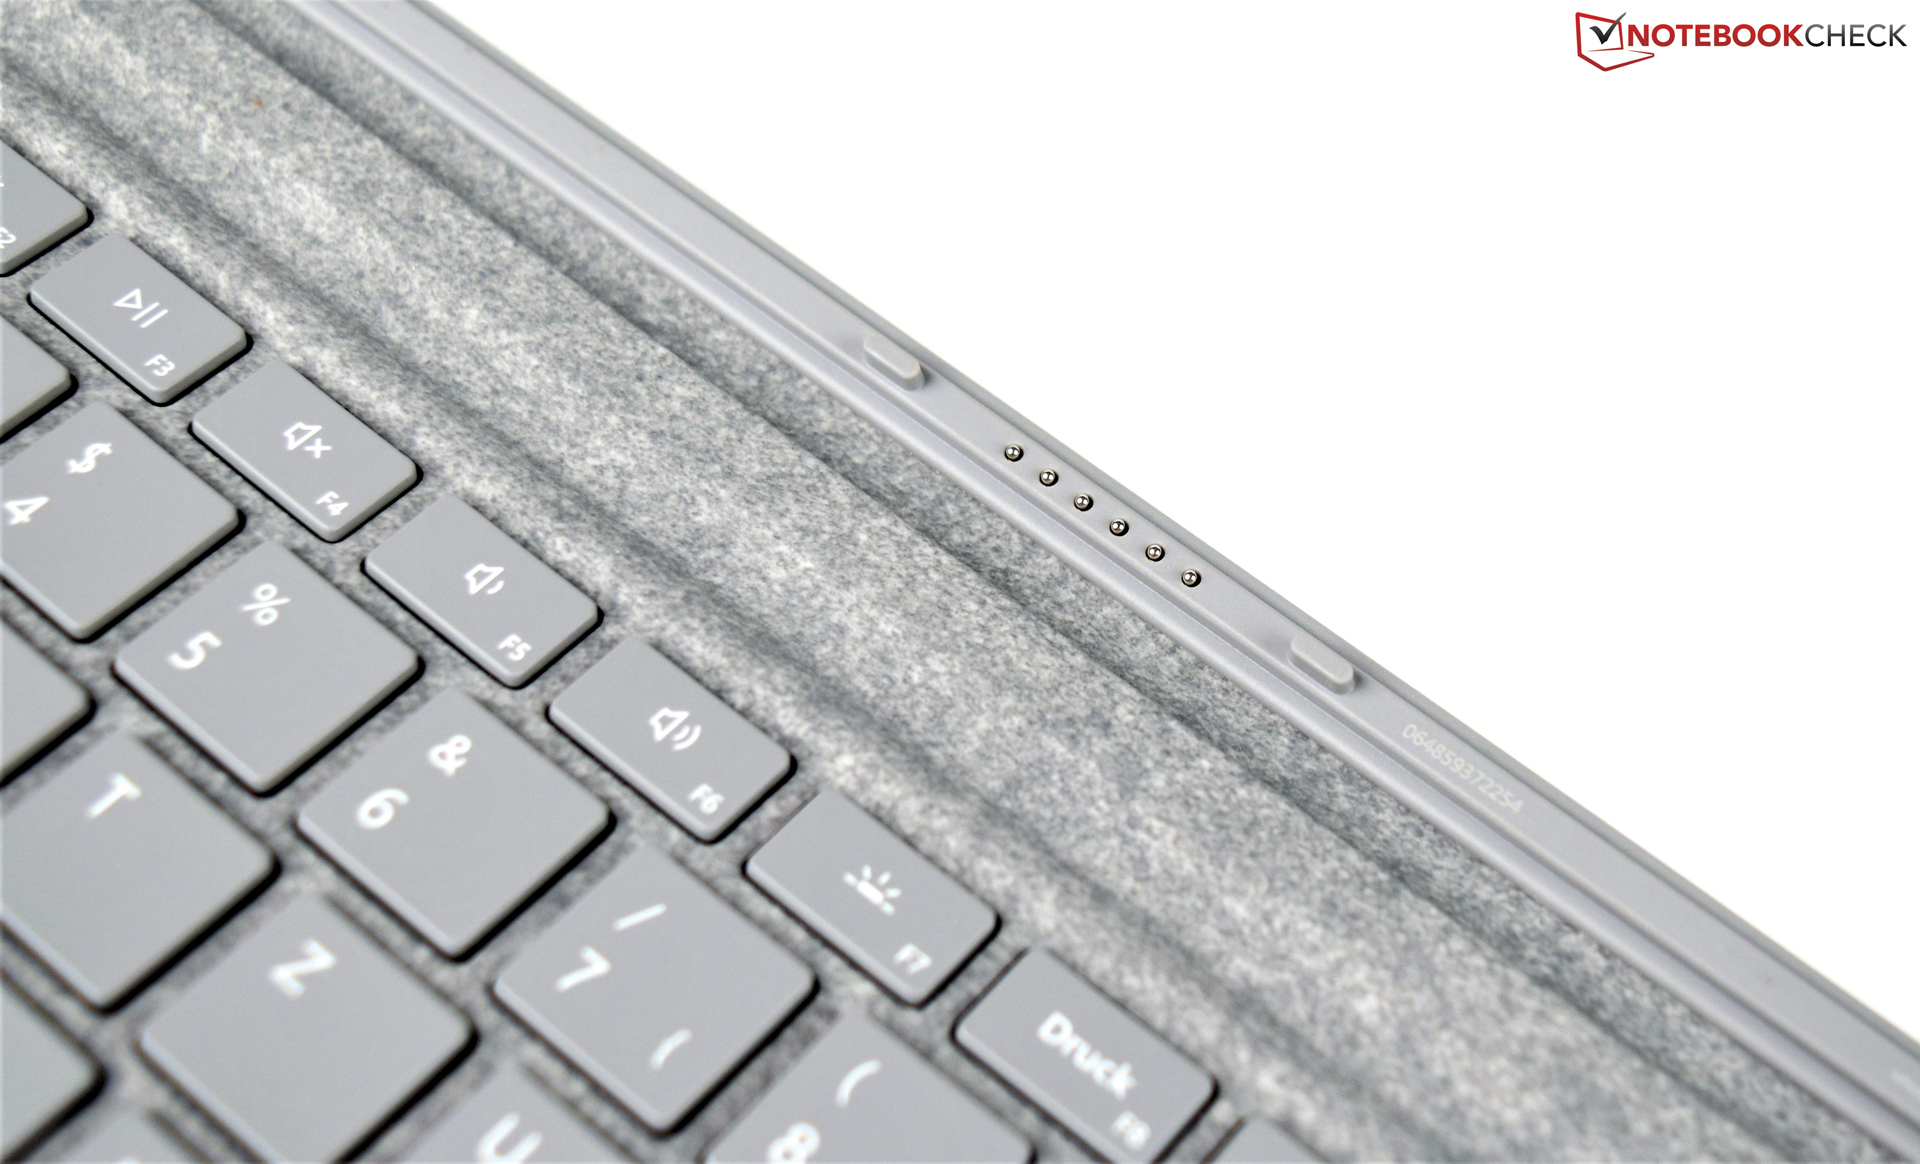
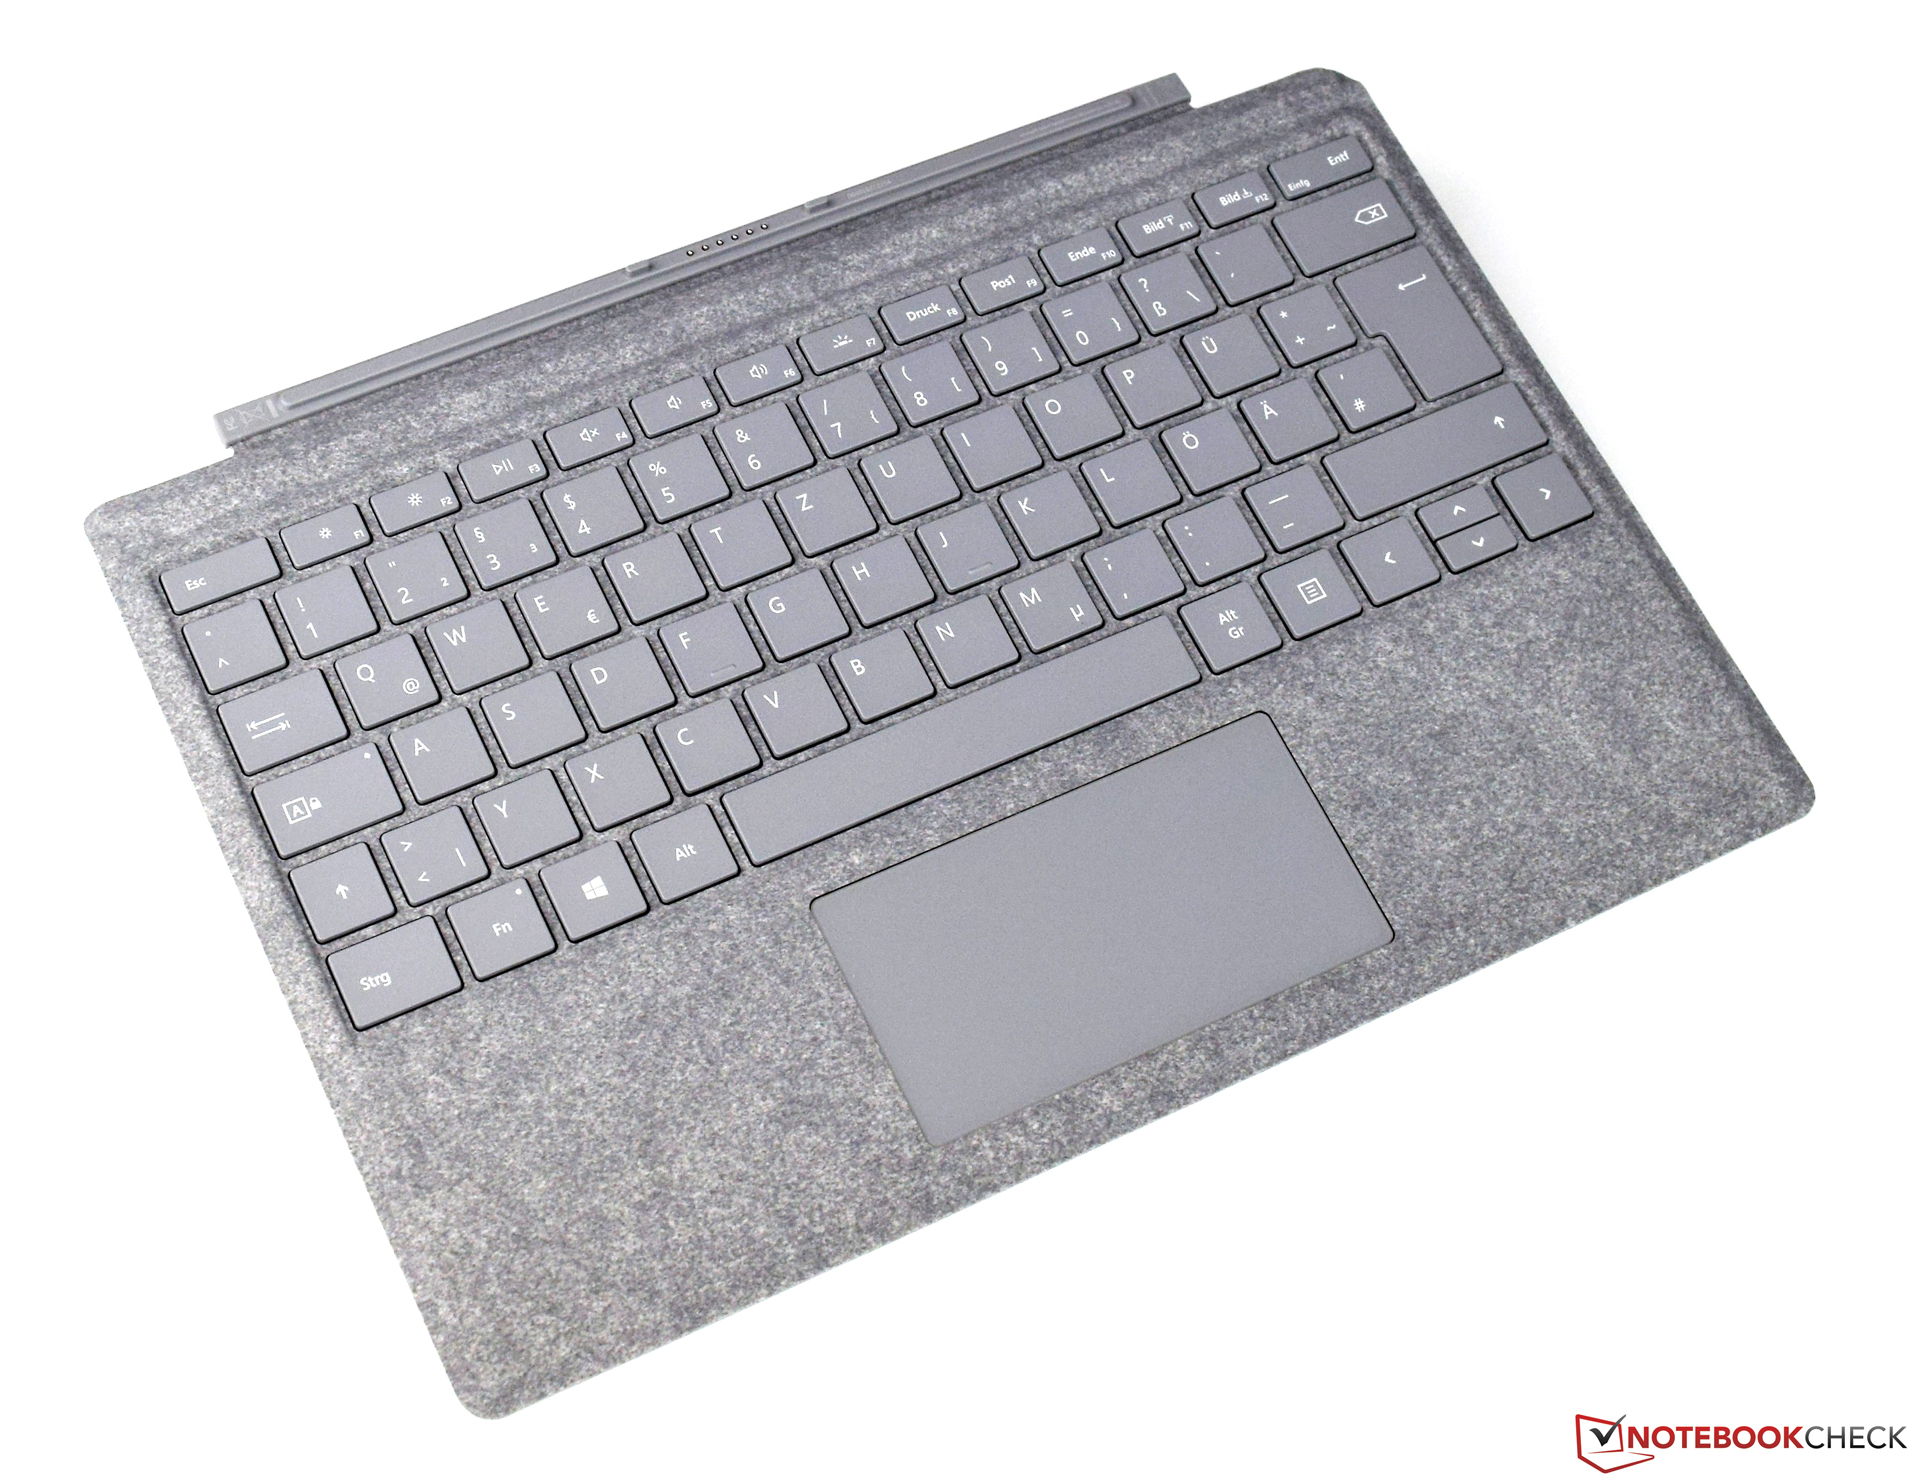
Our Microsoft Surface Pro 2017 review sample features the same build as the previously tested Microsoft Surface Pro 2017 (i5-7300U, 256 GB), and thus we refer to that review at this point.


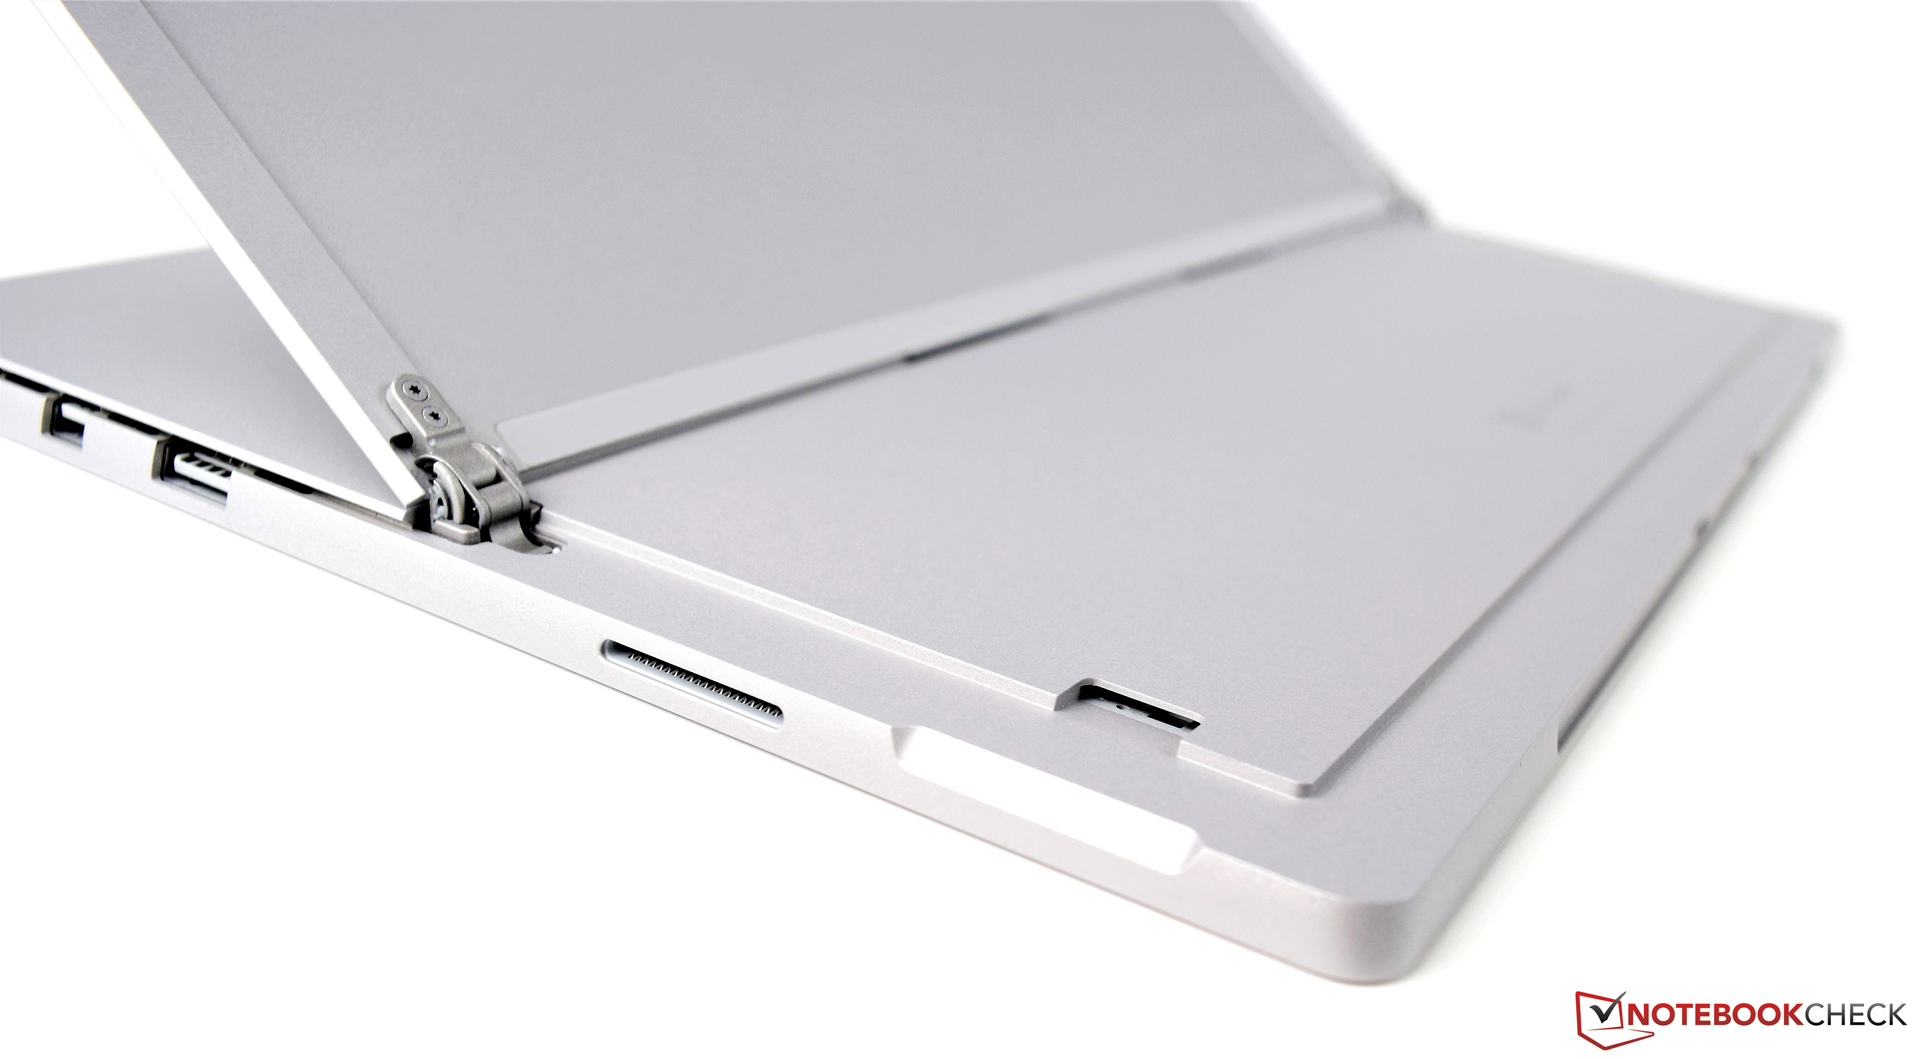

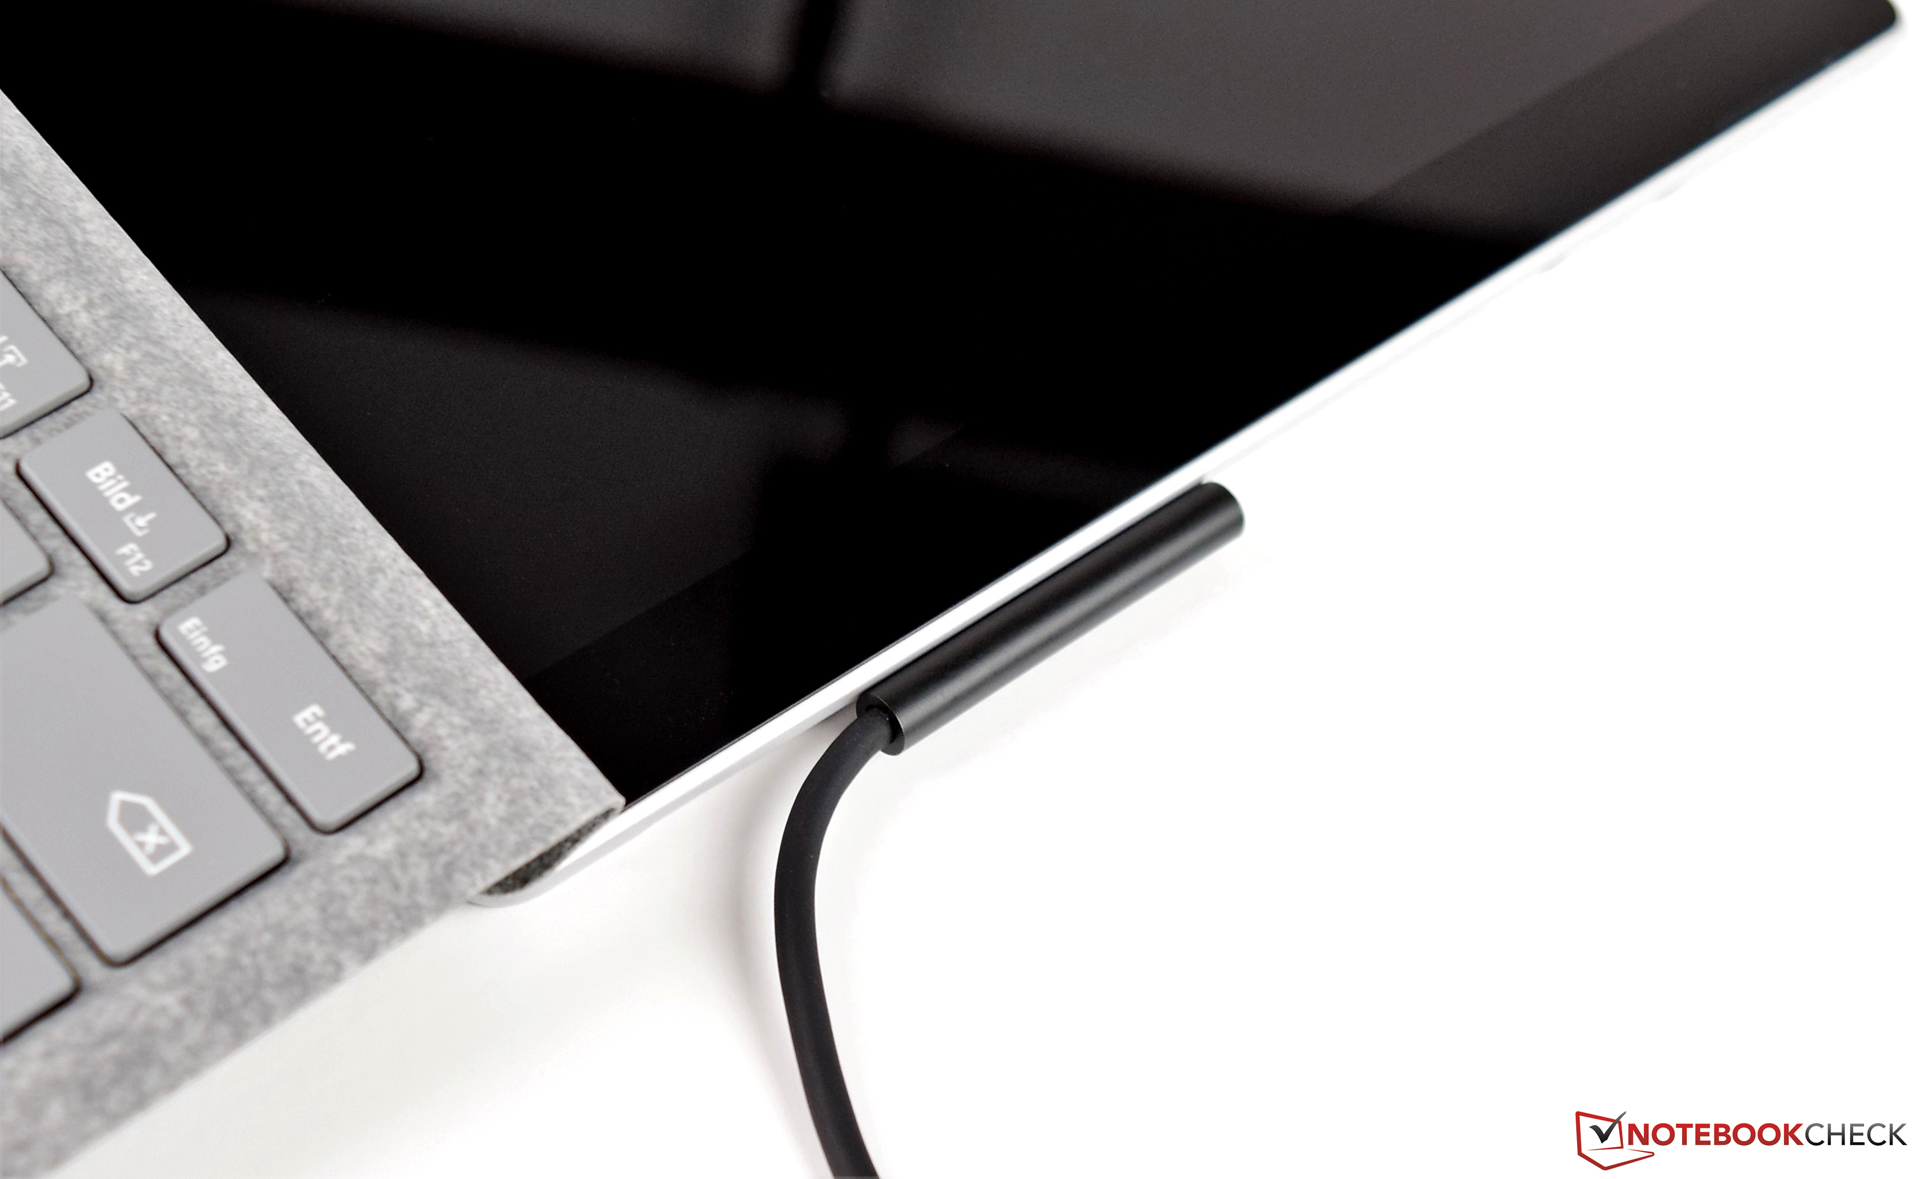
Connectivity


| SD Card Reader | |
| average JPG Copy Test (av. of 3 runs) | |
| Lenovo ThinkPad X1 Tablet Gen 2 (Toshiba Exceria Pro SDXC 64 GB UHS-II) | |
| Microsoft Surface Pro (2017) m3 (Toshiba Exceria Pro M401 64 GB) | |
| Microsoft Surface Pro (2017) i7 (Toshiba Exceria Pro M401 64 GB) | |
| maximum AS SSD Seq Read Test (1GB) | |
| Lenovo ThinkPad X1 Tablet Gen 2 (Toshiba Exceria Pro SDXC 64 GB UHS-II) | |
| Microsoft Surface Pro (2017) i7 (Toshiba Exceria Pro M401 64 GB) | |
| Microsoft Surface Pro (2017) m3 (Toshiba Exceria Pro M401 64 GB) | |
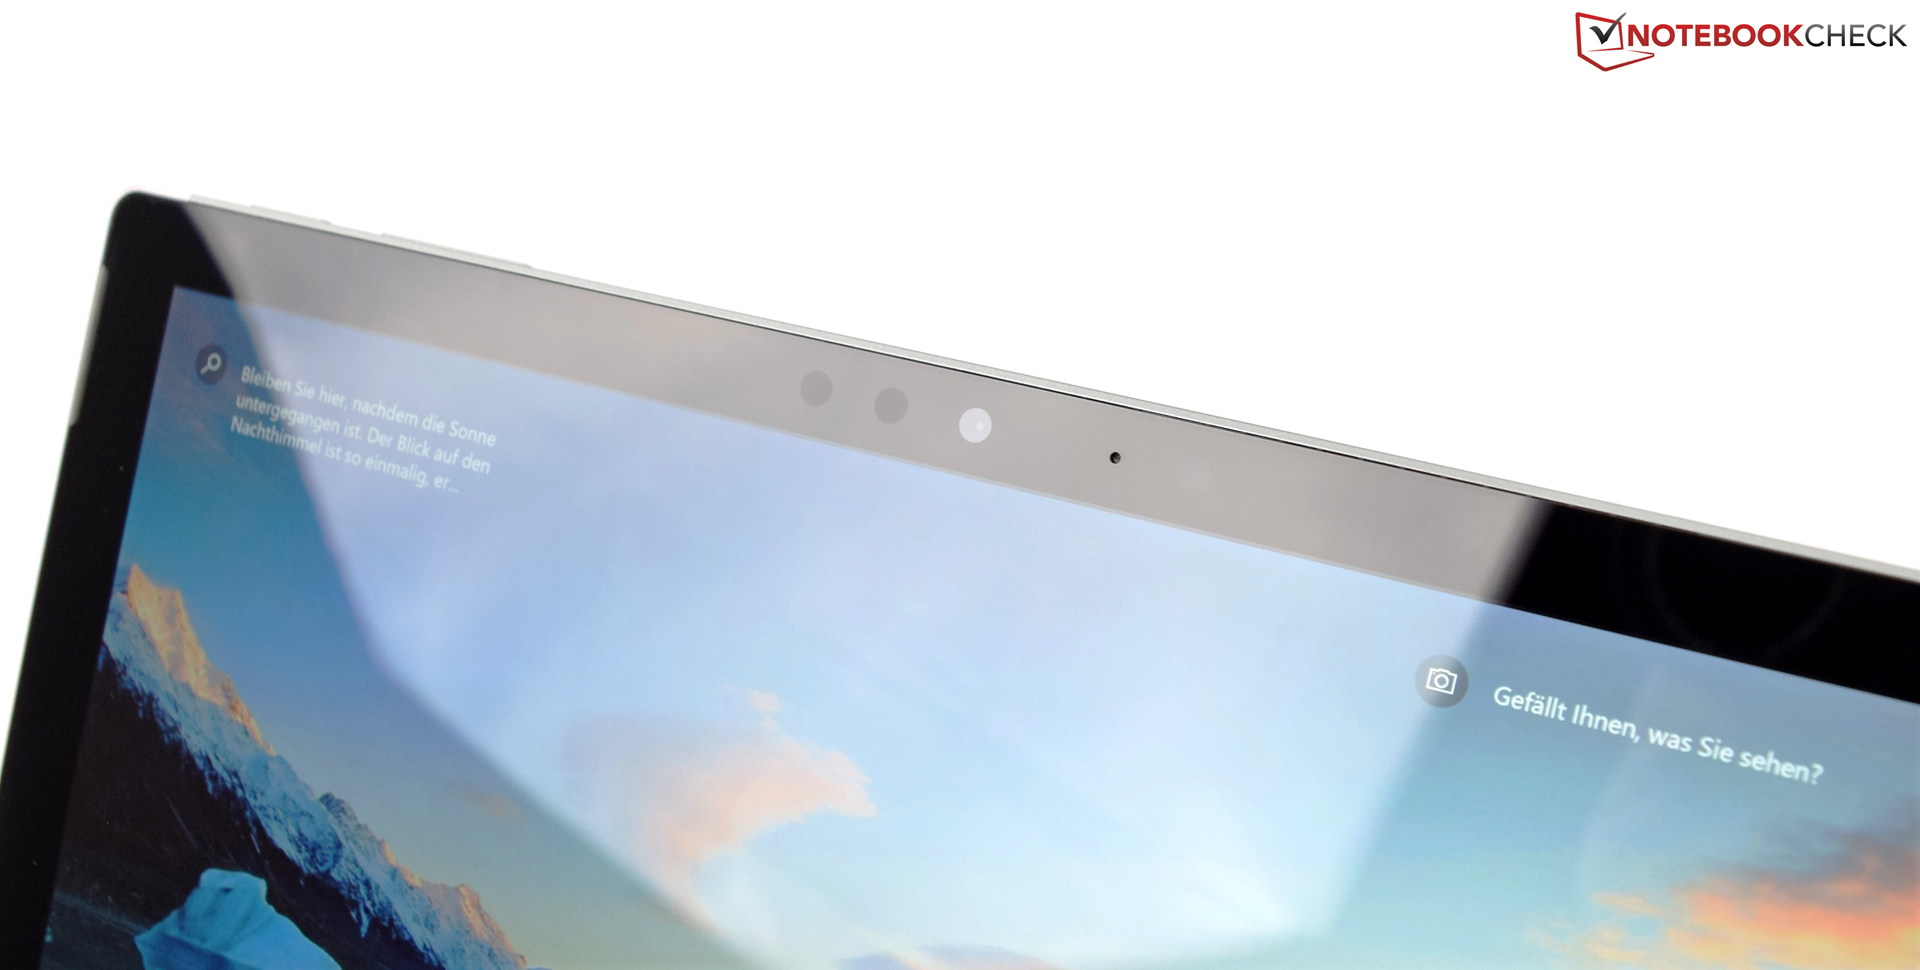
Display
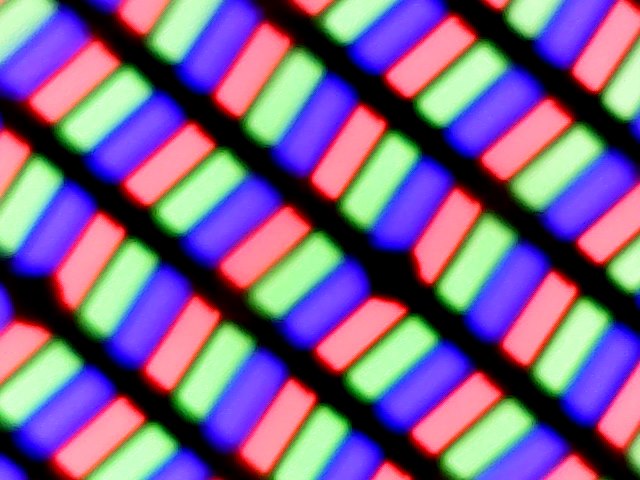
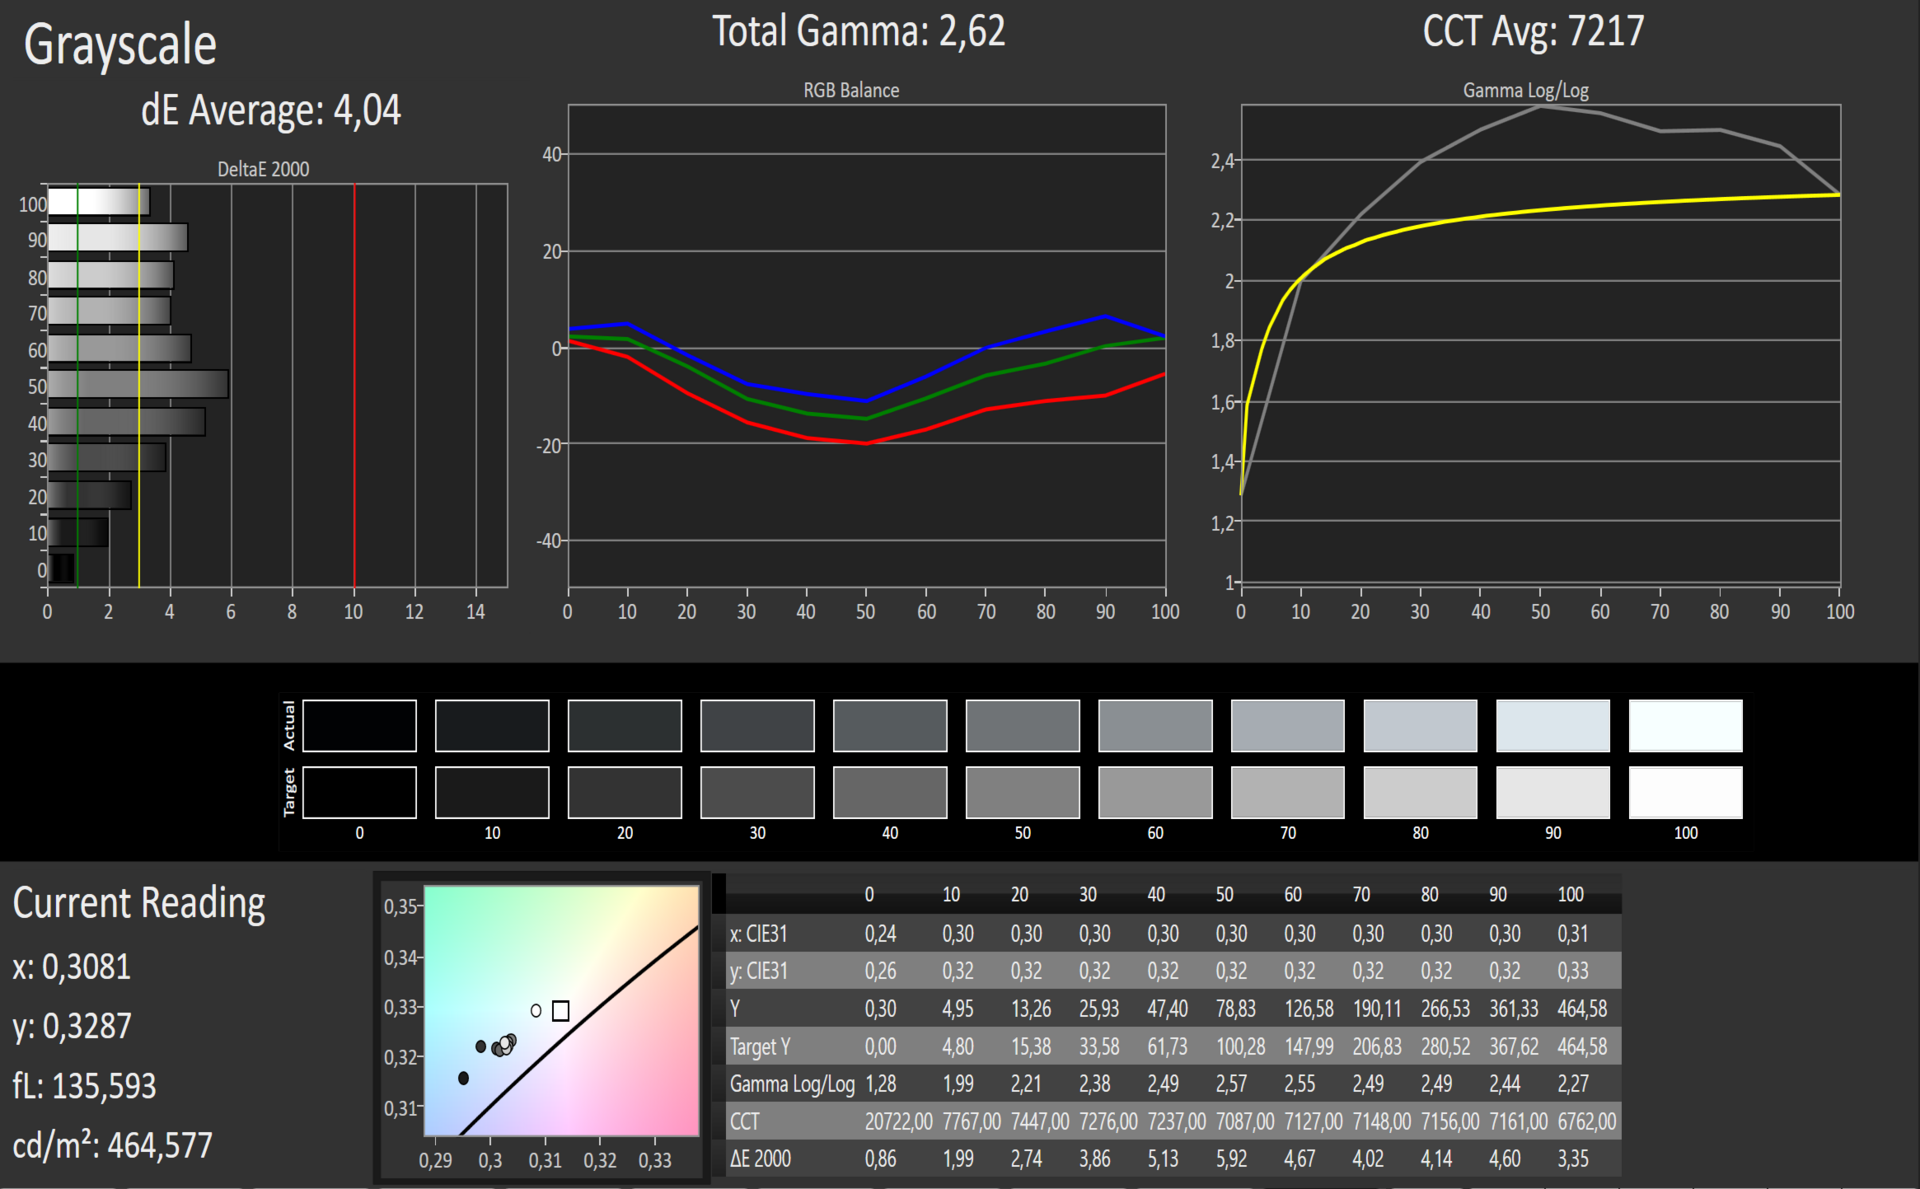
The installed screen is the same panel that we know from both other 2017 models. We did not find the measured differences that we discovered in Microsoft's Surface Pro 2017 i7 model. Instead, the rates are much closer to those of Microsoft's Surface Pro 2017 i5 model. It is absolutely normal that the rates are not completely the same for production reasons. The 12.3-inch, 10-point multitouch screen has a resolution of 2736x1824 pixels (267 PPI).
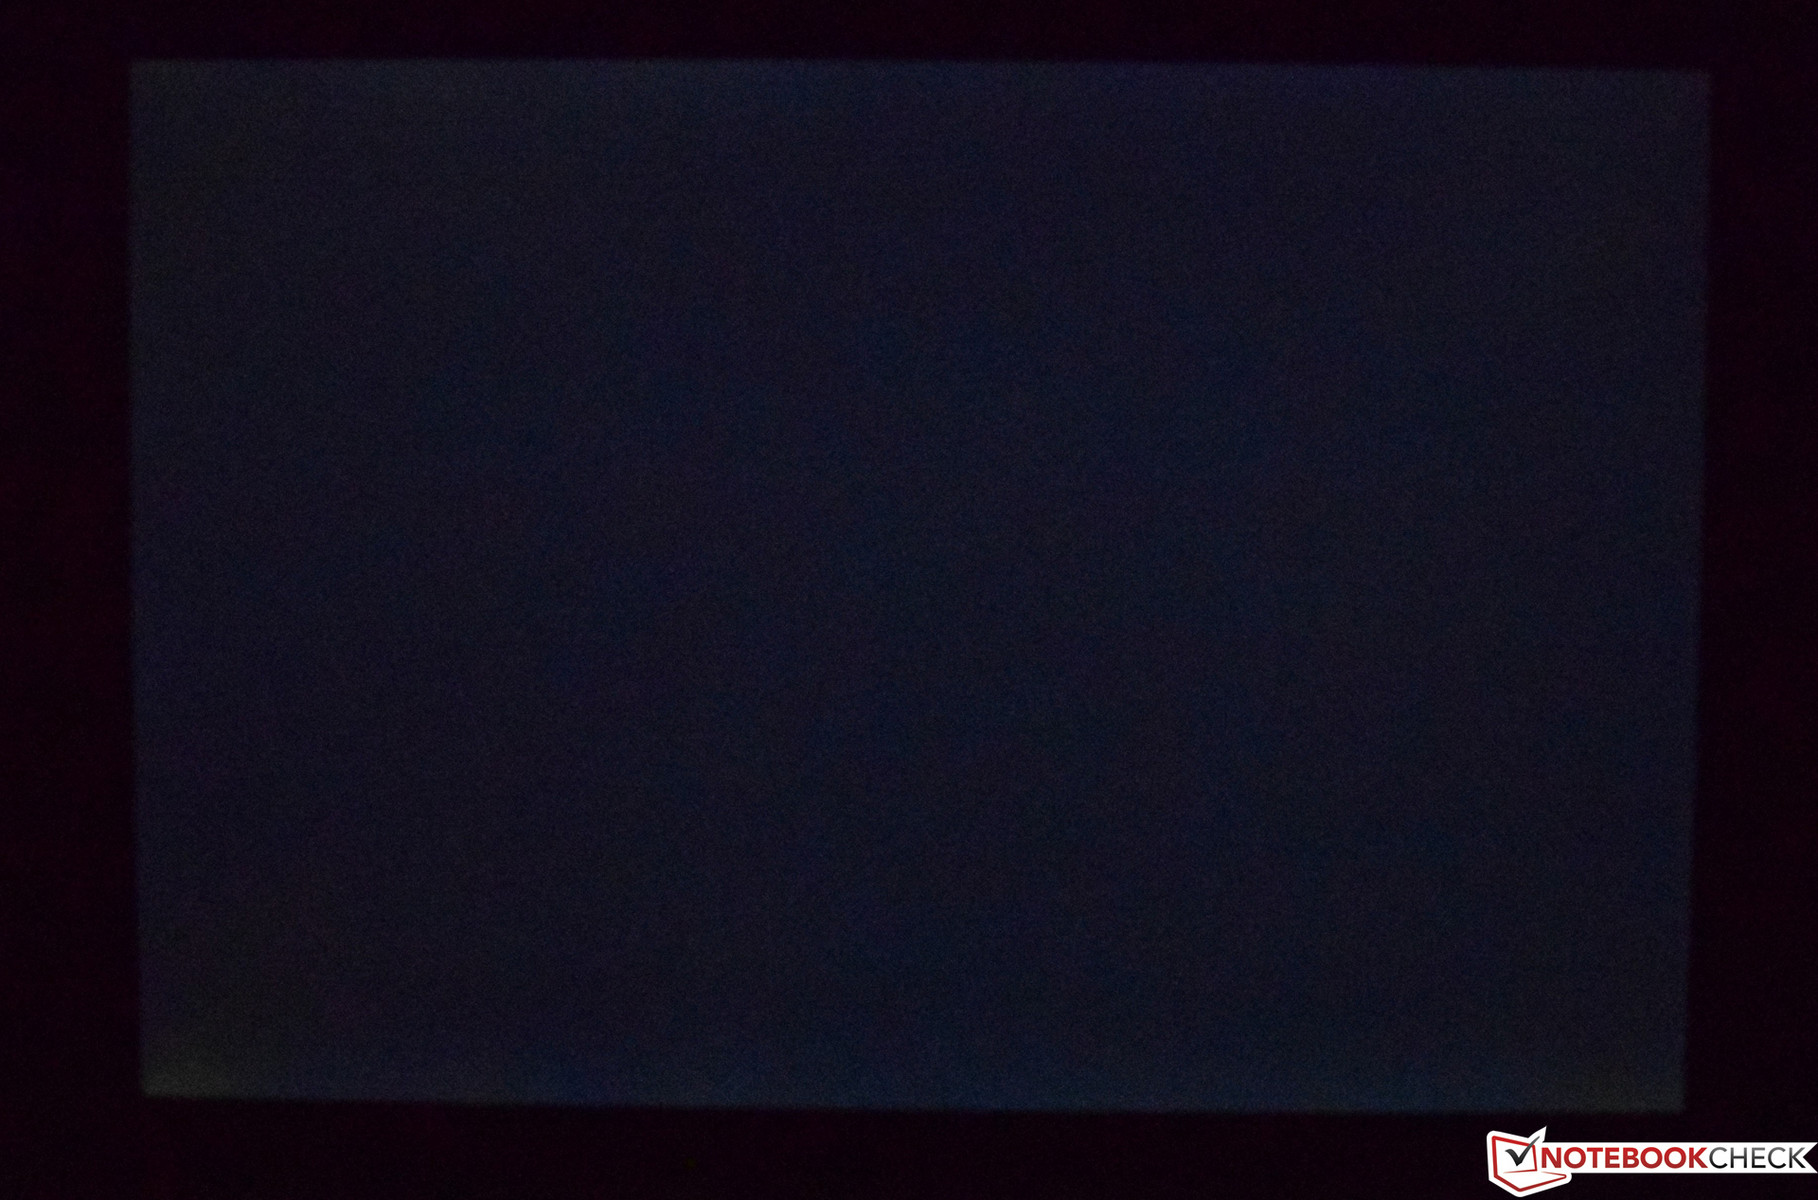
With an average brightness of 444 cd/m², the screen in Microsoft's Surface Pro 2017 is among the brightest in the comparison field. The illumination of 93% is very good. Clouding is not a big issue, either and it is not distracting in dark scenes. We did not determine PWM-flickering for controlling the screen's brightness in our review sample.
| |||||||||||||||||||||||||
Brightness Distribution: 93 %
Center on Battery: 461 cd/m²
Contrast: 1356:1 (Black: 0.34 cd/m²)
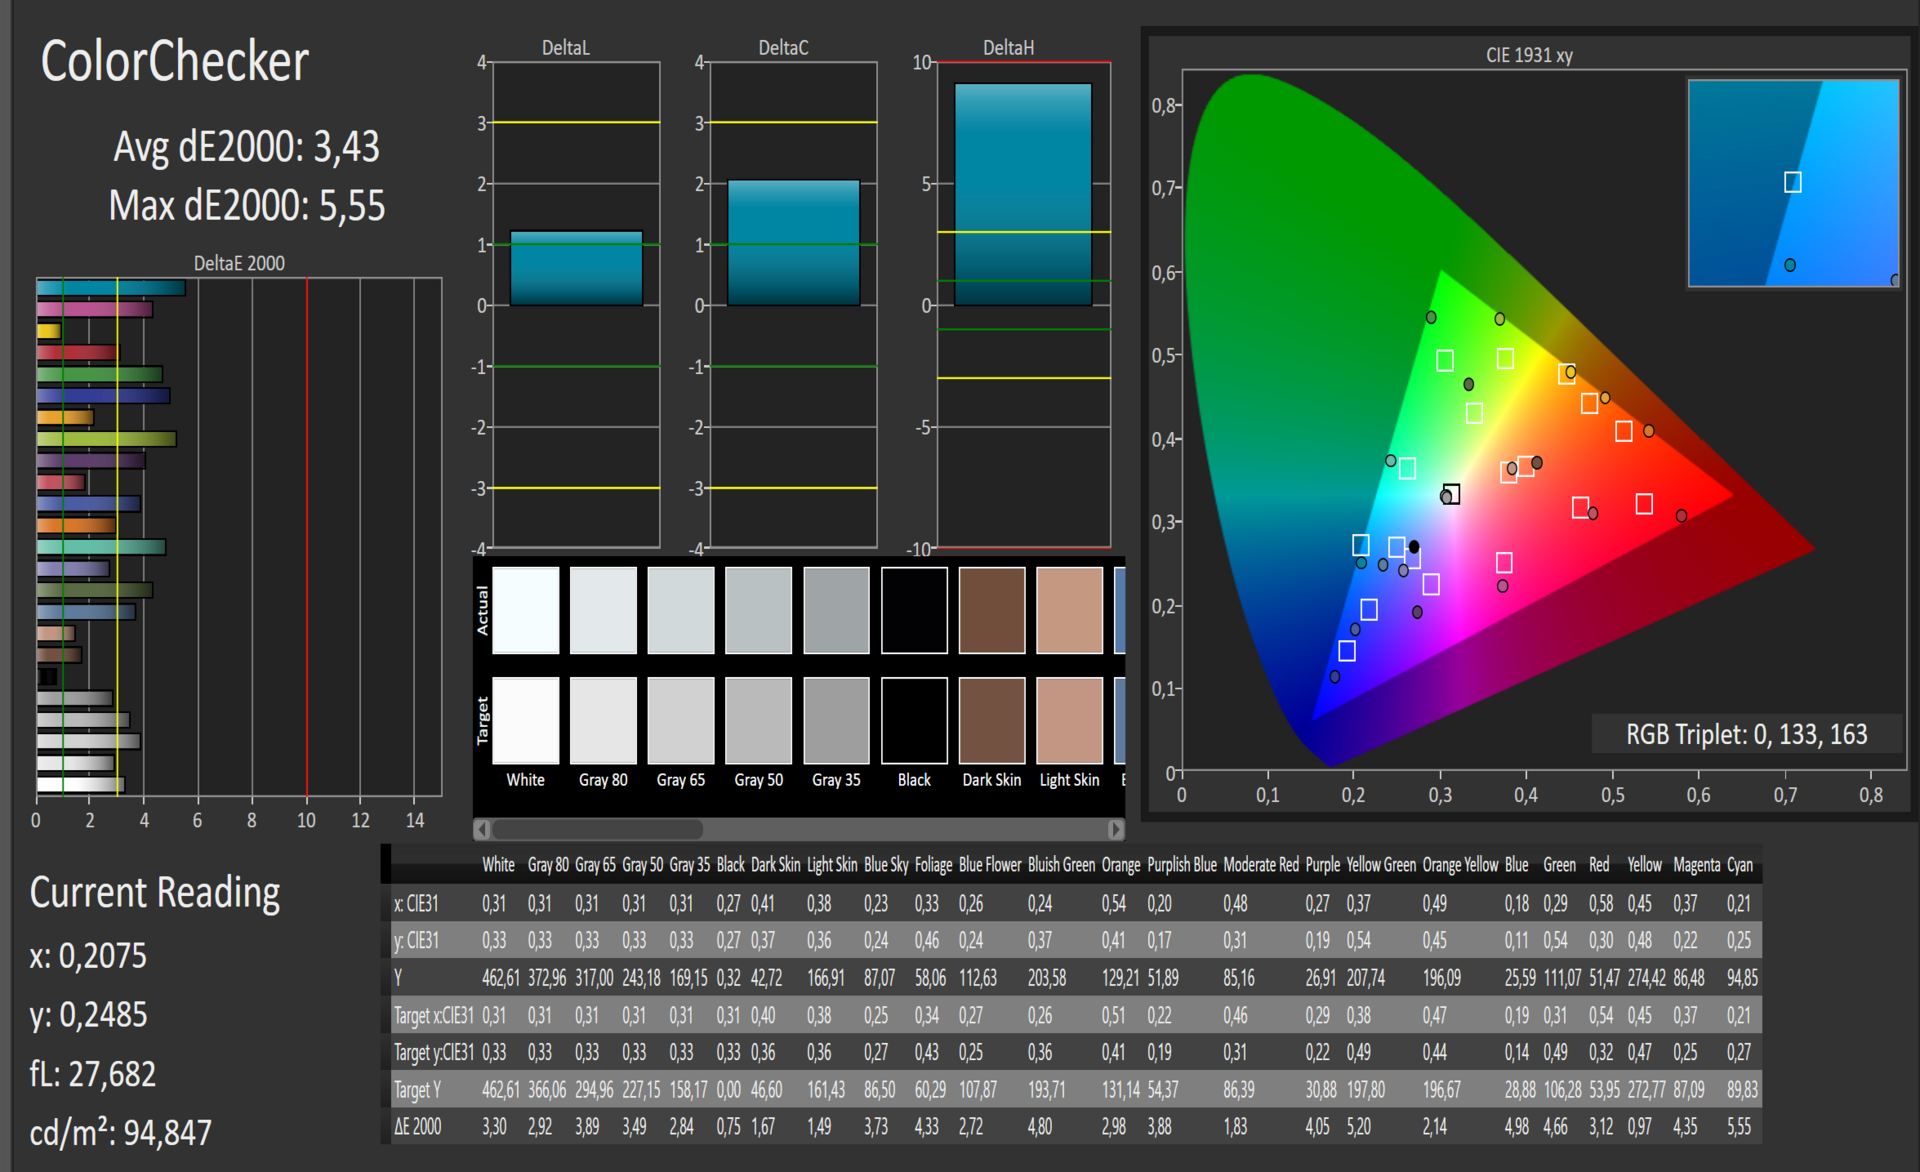
ΔE ColorChecker Calman: 3.43 | ∀{0.5-29.43 Ø4.72}
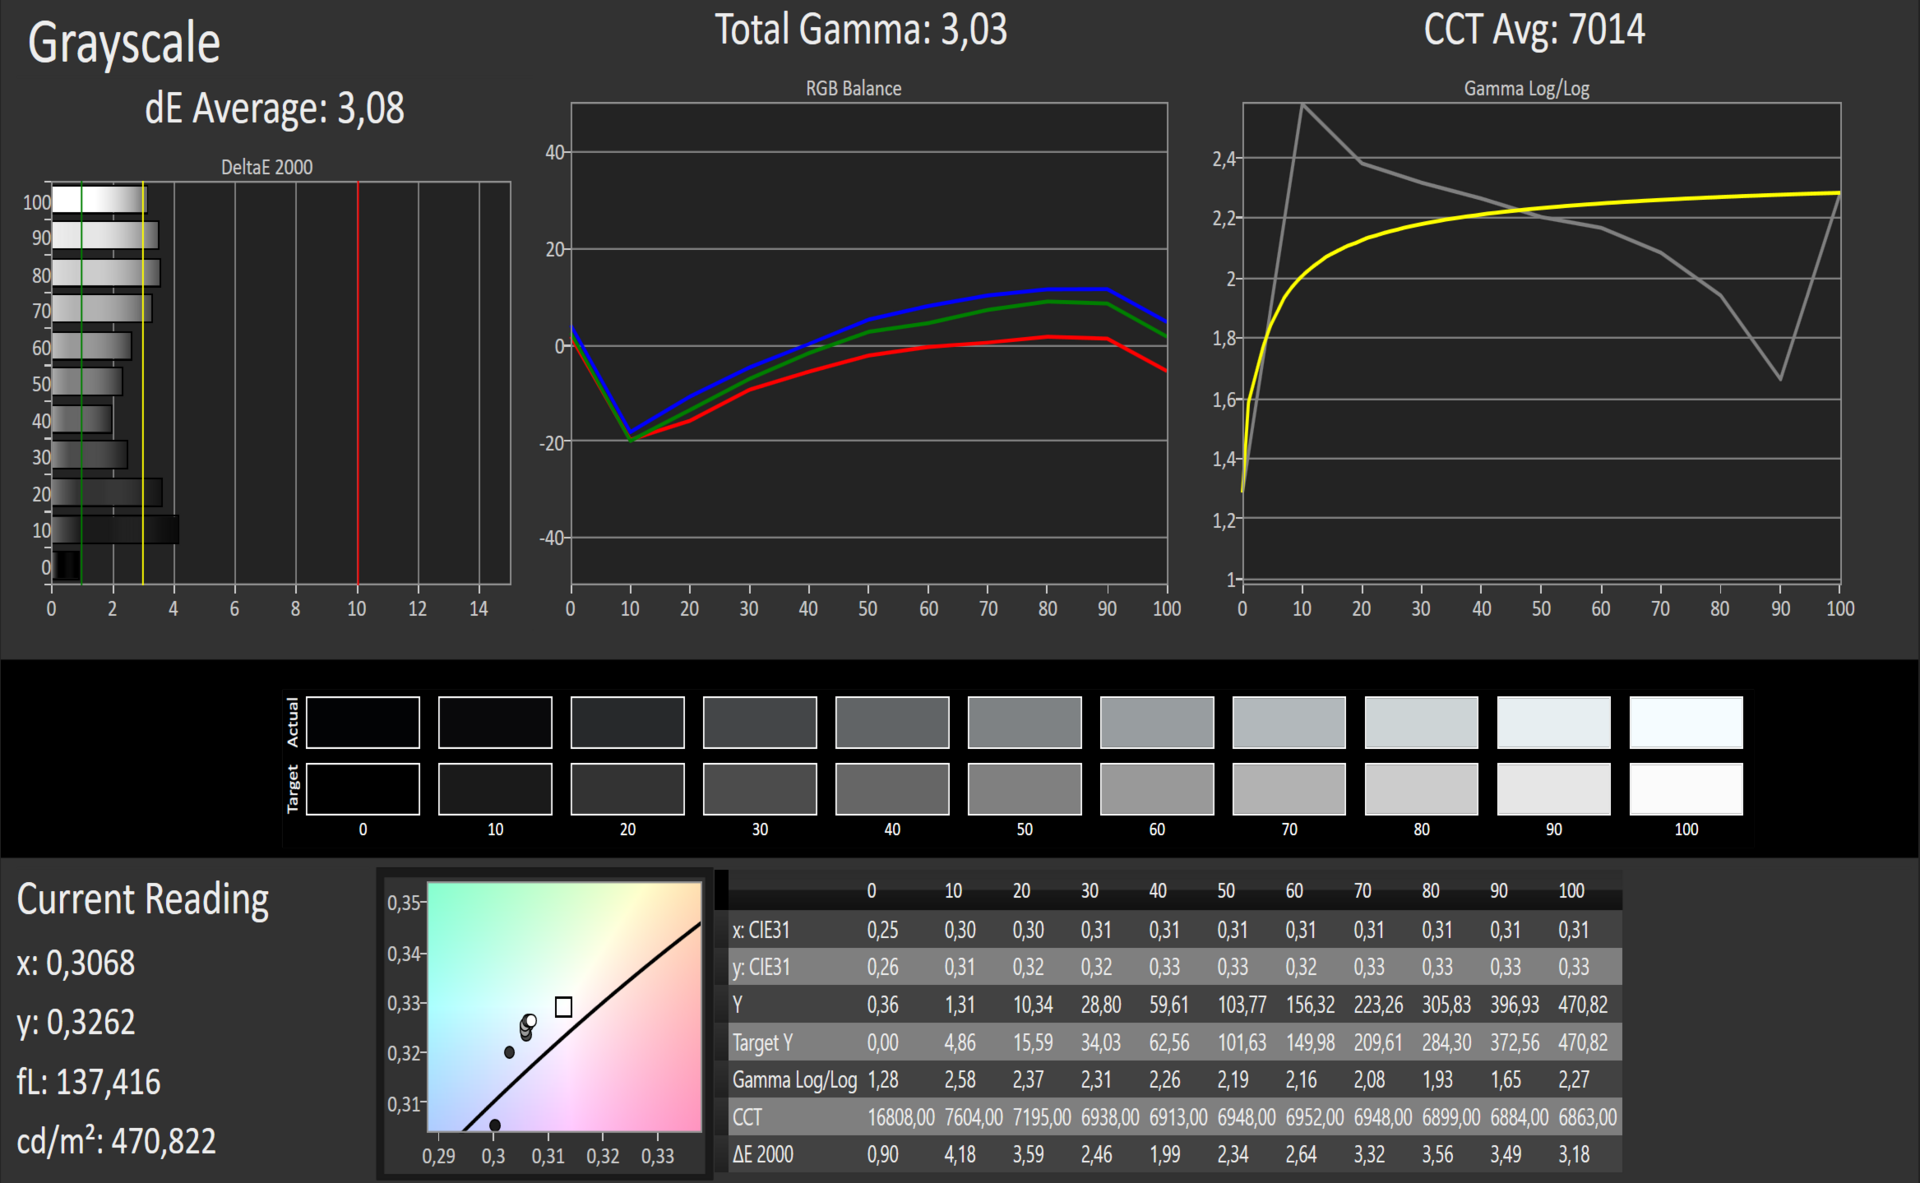
ΔE Greyscale Calman: 3.08 | ∀{0.09-98 Ø4.97}
99% sRGB (Argyll 1.6.3 3D)
64% AdobeRGB 1998 (Argyll 1.6.3 3D)
70.1% AdobeRGB 1998 (Argyll 3D)
99.2% sRGB (Argyll 3D)
68.5% Display P3 (Argyll 3D)
Gamma: 3.03
CCT: 7014 K
| Microsoft Surface Pro (2017) m3 LG Display LP123WQ112604, , 2736x1826, 12.3" | Microsoft Surface Pro (2017) i7 LG Display LP123WQ112604, , 2736x1824, 12.3" | Microsoft Surface Pro (2017) i5 LG Display LP123WQ112604, , 2736x1824, 12.3" | Lenovo Ideapad Miix 720-12IKB AUO B120YAN01 / AUO106F, , 2880x1920, 12" | HP Elite x2 1012 G1 LG Philips, , 1920x1280, 12.1" | Lenovo ThinkPad X1 Tablet Gen 2 LSN120QL01L01, , 2160x1440, 12" | Samsung Galaxy Tab Pro S W700N Digital Flat Panel (NoName), , 2160x1440, 12.1" | Acer Aspire Switch Alpha 12 SA5-271-56HM Panasonic VVX12T041N00, , 2160x1440, 12" | |
|---|---|---|---|---|---|---|---|---|
| Screen | -16% | -0% | -28% | -43% | -31% | 81% | -44% | |
| Brightness middle (cd/m²) | 461 | 482 5% | 417 -10% | 406 -12% | 322 -30% | 388.1 -16% | 363 -21% | 345 -25% |
| Brightness (cd/m²) | 444 | 466 5% | 401 -10% | 396 -11% | 319 -28% | 344 -23% | 378 -15% | 328 -26% |
| Brightness Distribution (%) | 93 | 92 -1% | 88 -5% | 88 -5% | 97 4% | 78 -16% | 90 -3% | 91 -2% |
| Black Level * (cd/m²) | 0.34 | 0.395 -16% | 0.29 15% | 0.3 12% | 0.42 -24% | 0.39 -15% | 0.03 91% | 0.38 -12% |
| Contrast (:1) | 1356 | 1220 -10% | 1438 6% | 1353 0% | 767 -43% | 995 -27% | 12100 792% | 908 -33% |
| Colorchecker dE 2000 * | 3.43 | 4 -17% | 3.63 -6% | 5.28 -54% | 6.02 -76% | 4.6 -34% | 4.8 -40% | 8.4 -145% |
| Colorchecker dE 2000 max. * | 5.55 | 7.2 -30% | 6.74 -21% | 9.83 -77% | 10.06 -81% | 9.1 -64% | 6.91 -25% | 11.9 -114% |
| Greyscale dE 2000 * | 3.08 | 5.7 -85% | 2.18 29% | 6.71 -118% | 6.29 -104% | 6.1 -98% | 5.04 -64% | 4.3 -40% |
| Gamma | 3.03 73% | 2.28 96% | 3.09 71% | 2.29 96% | 2.4 92% | 2.07 106% | 2.57 86% | 2.63 84% |
| CCT | 7014 93% | 7950 82% | 6767 96% | 6532 100% | 7712 84% | 7104 91% | 7255 90% | 7368 88% |
| Color Space (Percent of AdobeRGB 1998) (%) | 64 | 62 -3% | 63 -2% | 59 -8% | 47.8 -25% | 59 -8% | 73 14% | 62 -3% |
| Color Space (Percent of sRGB) (%) | 99 | 96 -3% | 99 0% | 91 -8% | 73.2 -26% | 91 -8% |
* ... smaller is better
Display Response Times
| ↔ Response Time Black to White | ||
|---|---|---|
| 28 ms ... rise ↗ and fall ↘ combined | ↗ 18 ms rise | 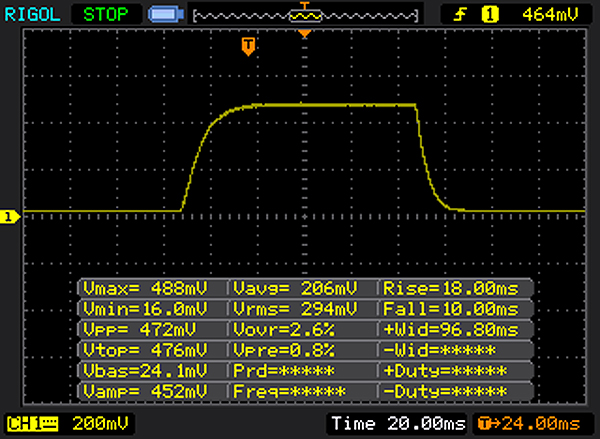 |
| ↘ 10 ms fall | ||
| The screen shows relatively slow response rates in our tests and may be too slow for gamers. In comparison, all tested devices range from 0.1 (minimum) to 240 (maximum) ms. » 71 % of all devices are better. This means that the measured response time is worse than the average of all tested devices (19.8 ms). | ||
| ↔ Response Time 50% Grey to 80% Grey | ||
| 42 ms ... rise ↗ and fall ↘ combined | ↗ 20 ms rise | 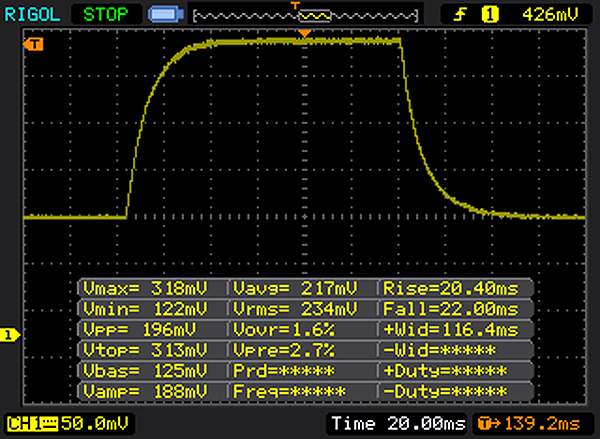 |
| ↘ 22 ms fall | ||
| The screen shows slow response rates in our tests and will be unsatisfactory for gamers. In comparison, all tested devices range from 0.165 (minimum) to 636 (maximum) ms. » 67 % of all devices are better. This means that the measured response time is worse than the average of all tested devices (31 ms). | ||
Screen Flickering / PWM (Pulse-Width Modulation)
| Screen flickering / PWM not detected | ||
In comparison: 52 % of all tested devices do not use PWM to dim the display. If PWM was detected, an average of 7747 (minimum: 5 - maximum: 343500) Hz was measured. | ||
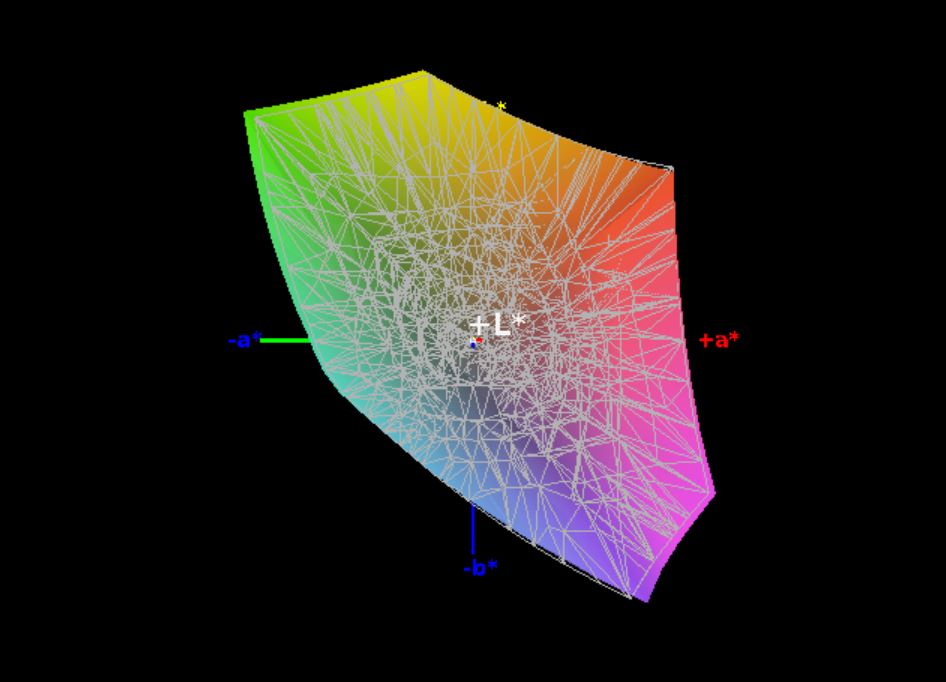

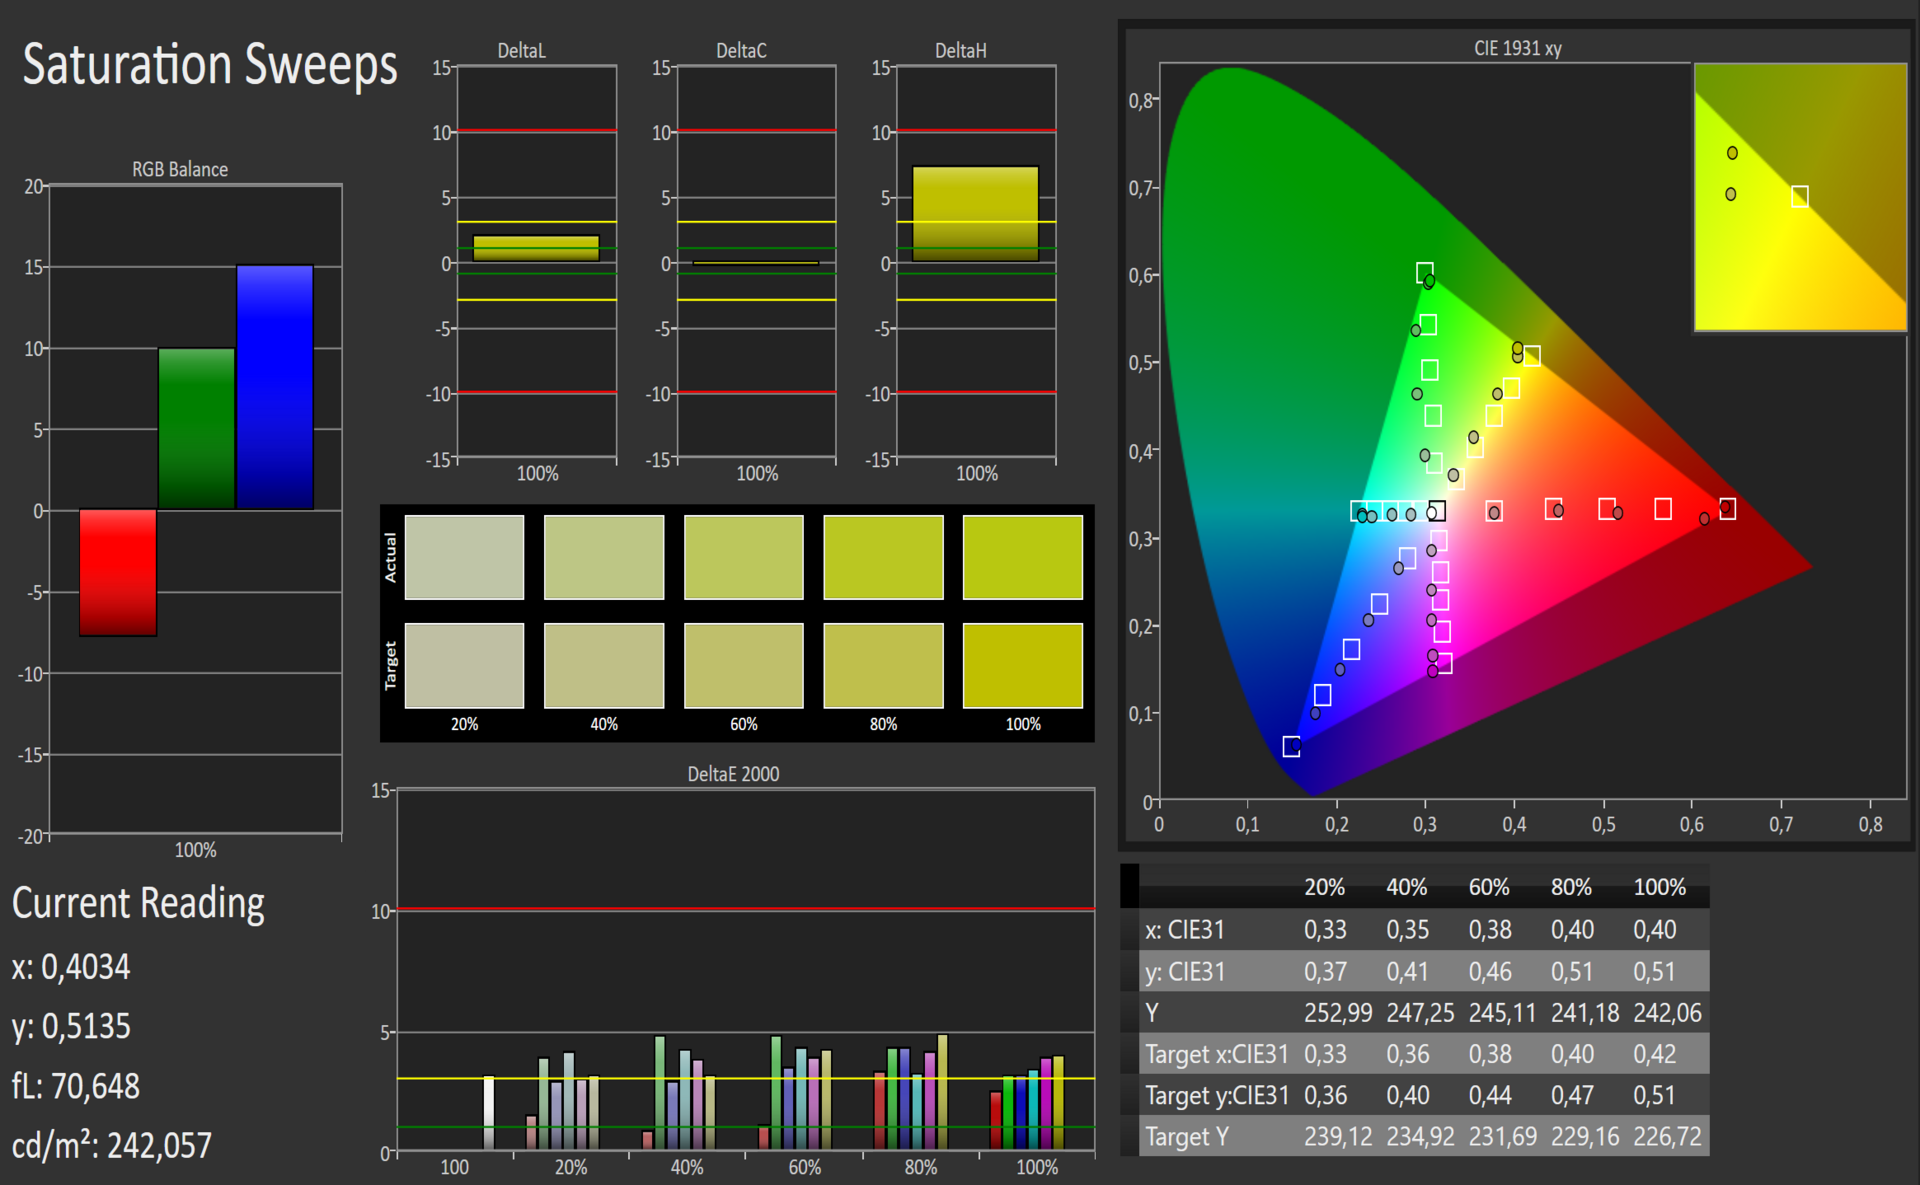
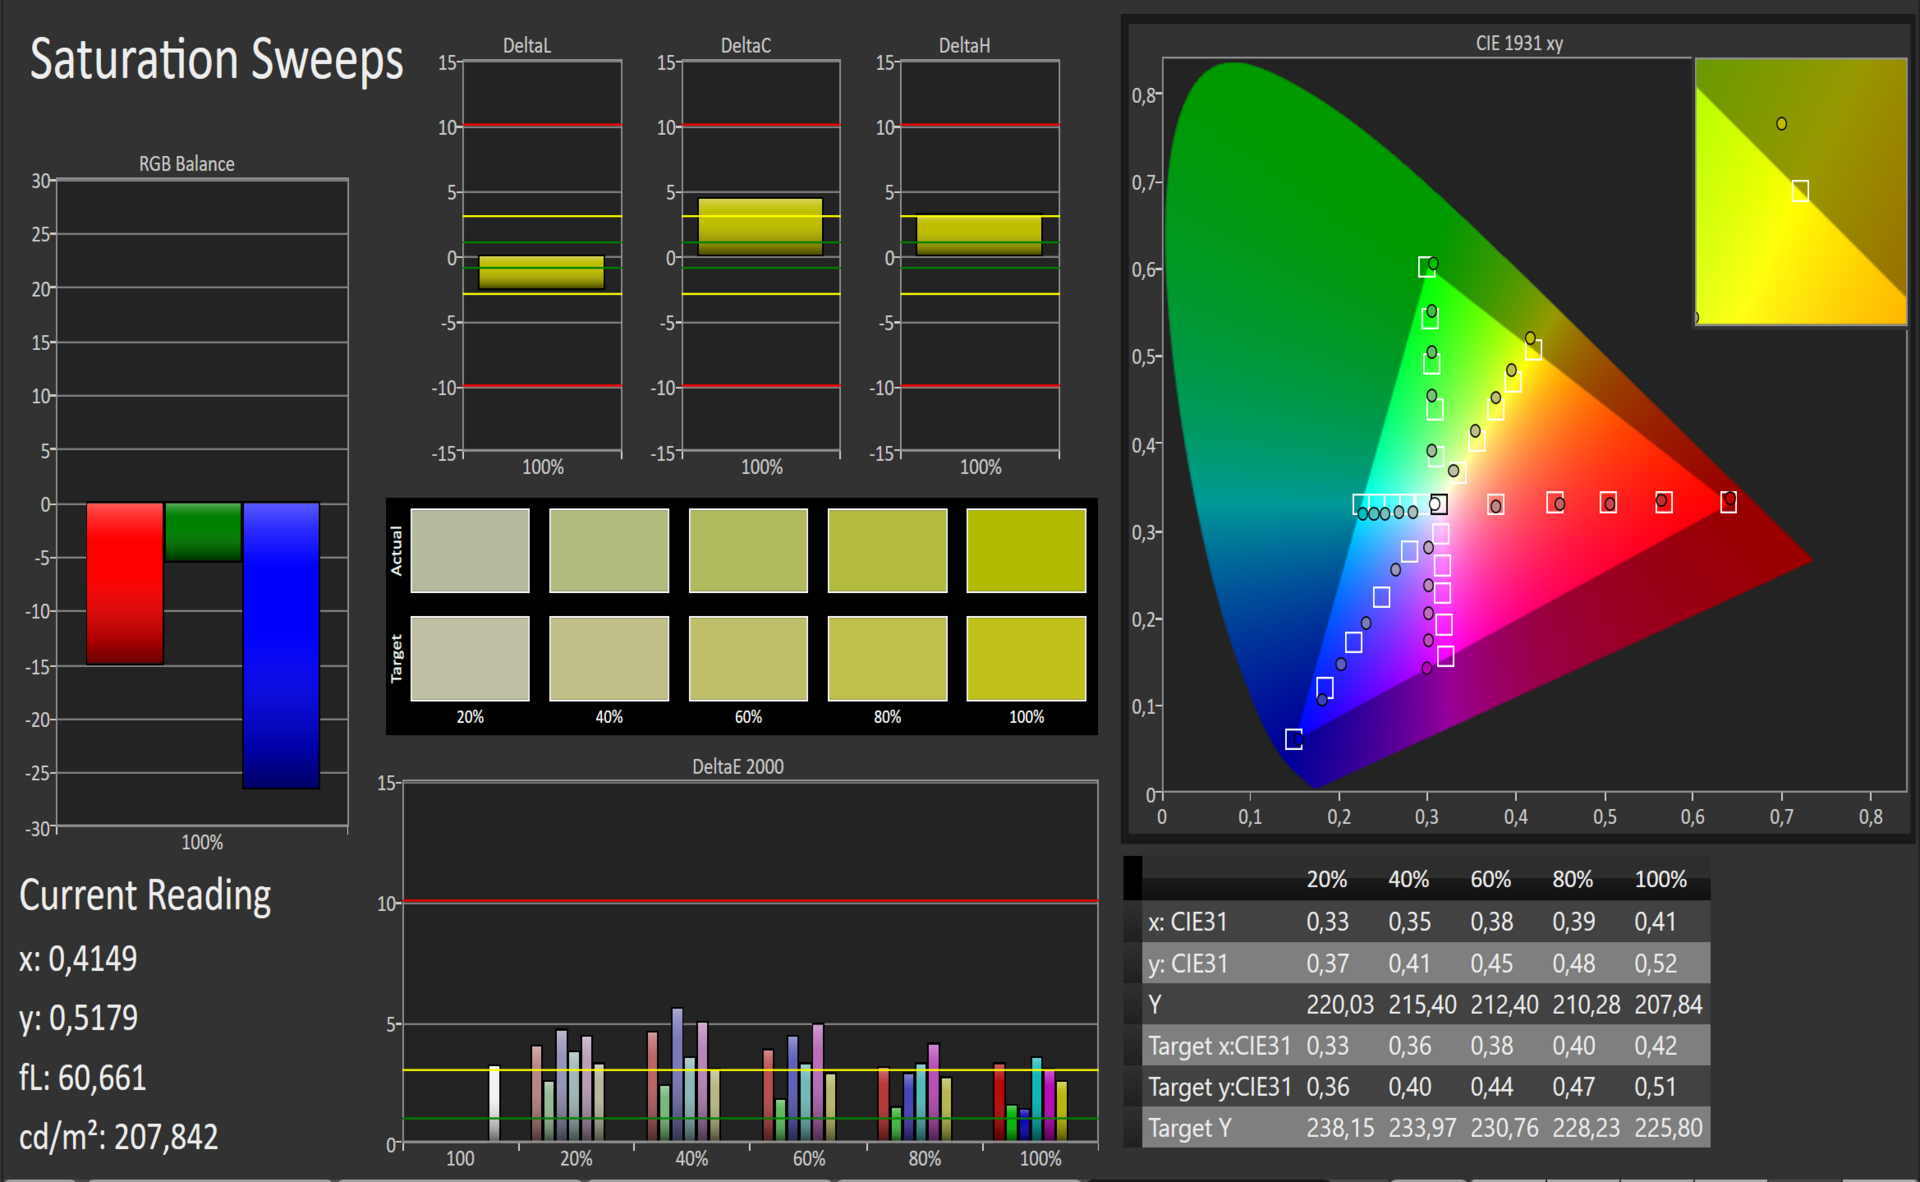
As before, the color-space coverage rates are very good (99% sRGB and 64% AdobeRGB). Samsung's Galaxy Tab Pro S even tops this and achieves an outstanding 73% (AdobeRGB). These good rates alongside the screen's high resolution make Microsoft's Surface Pro 2017 suitable for semi-professional image-editing.
Microsoft delivers the Surface Pro 2017 with a predefined color profile that only presents minor color shifts. The color-space shifts increase slightly when the screen is calibrated and an individual color profile is created. Thus, the outcome becomes worse, so the user should preferably use the preset color profile.

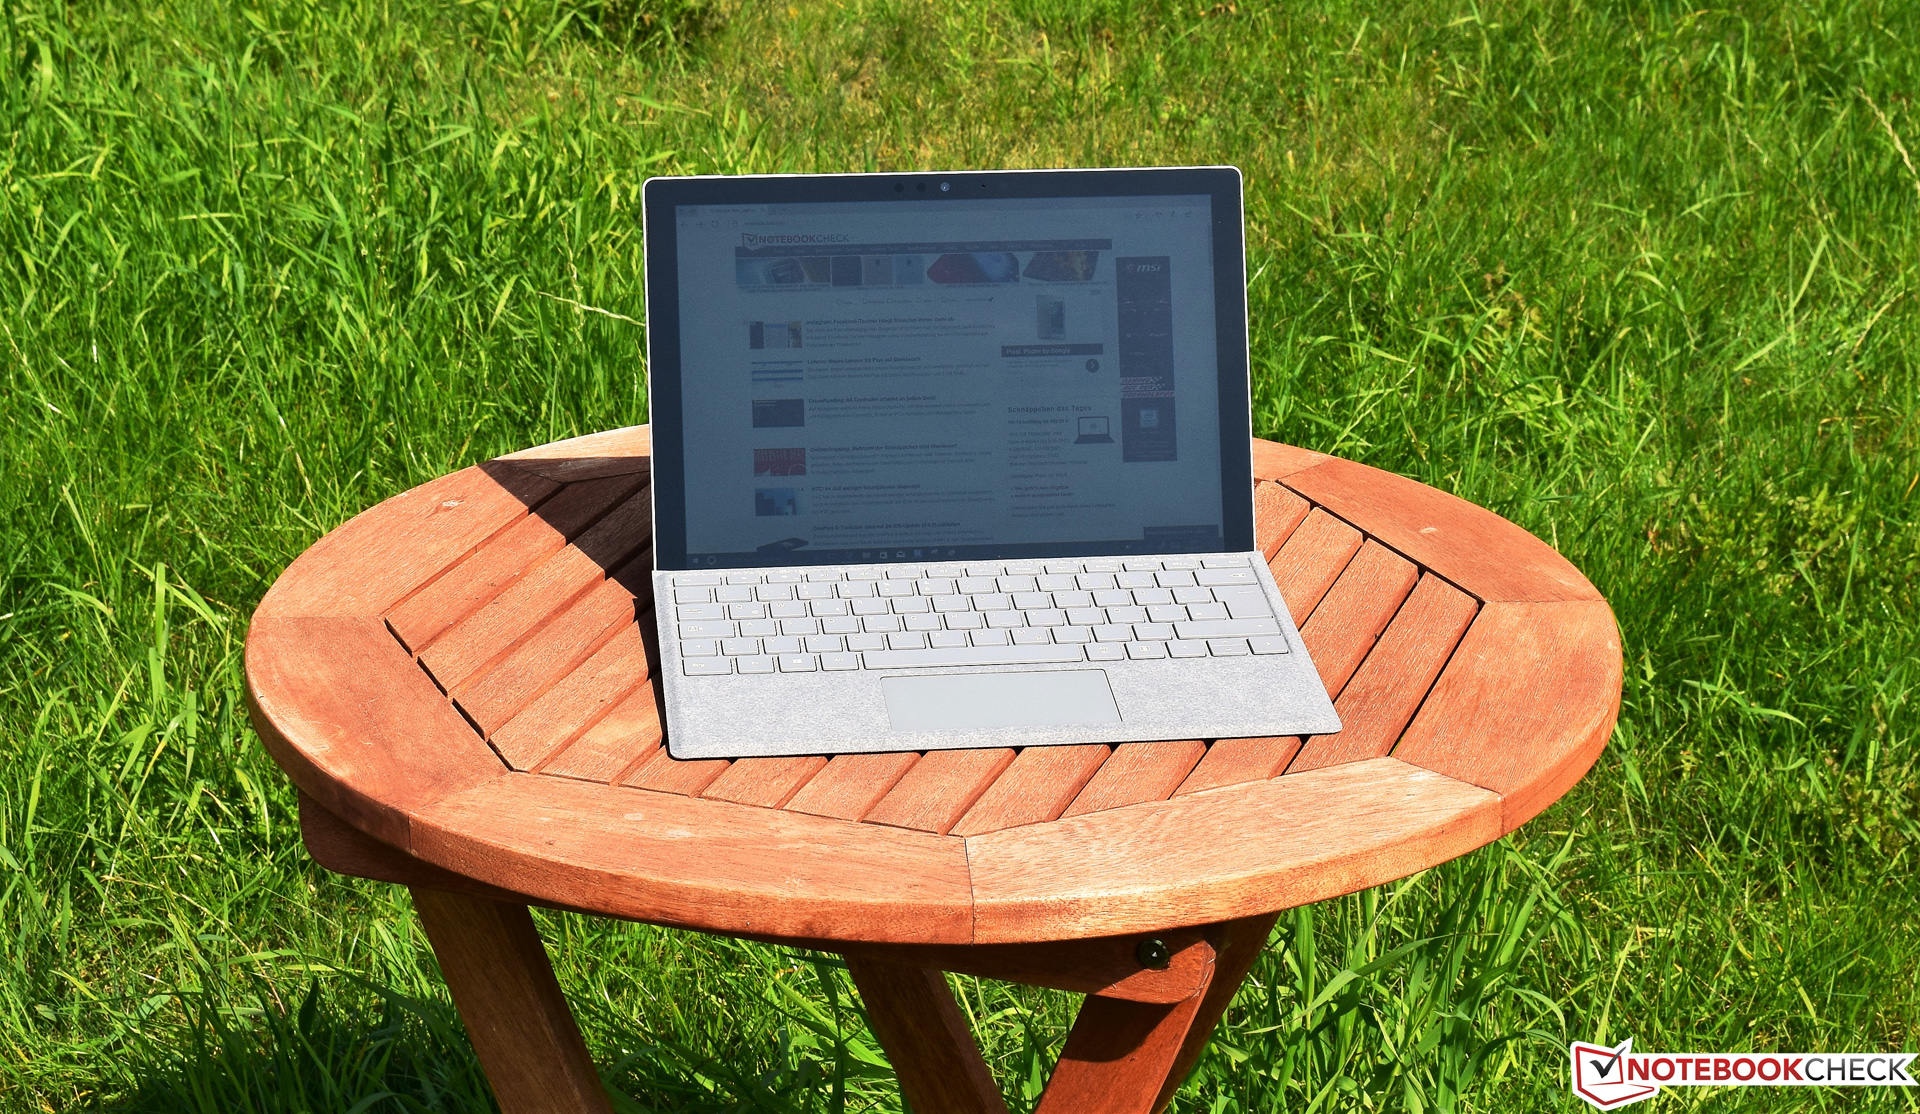
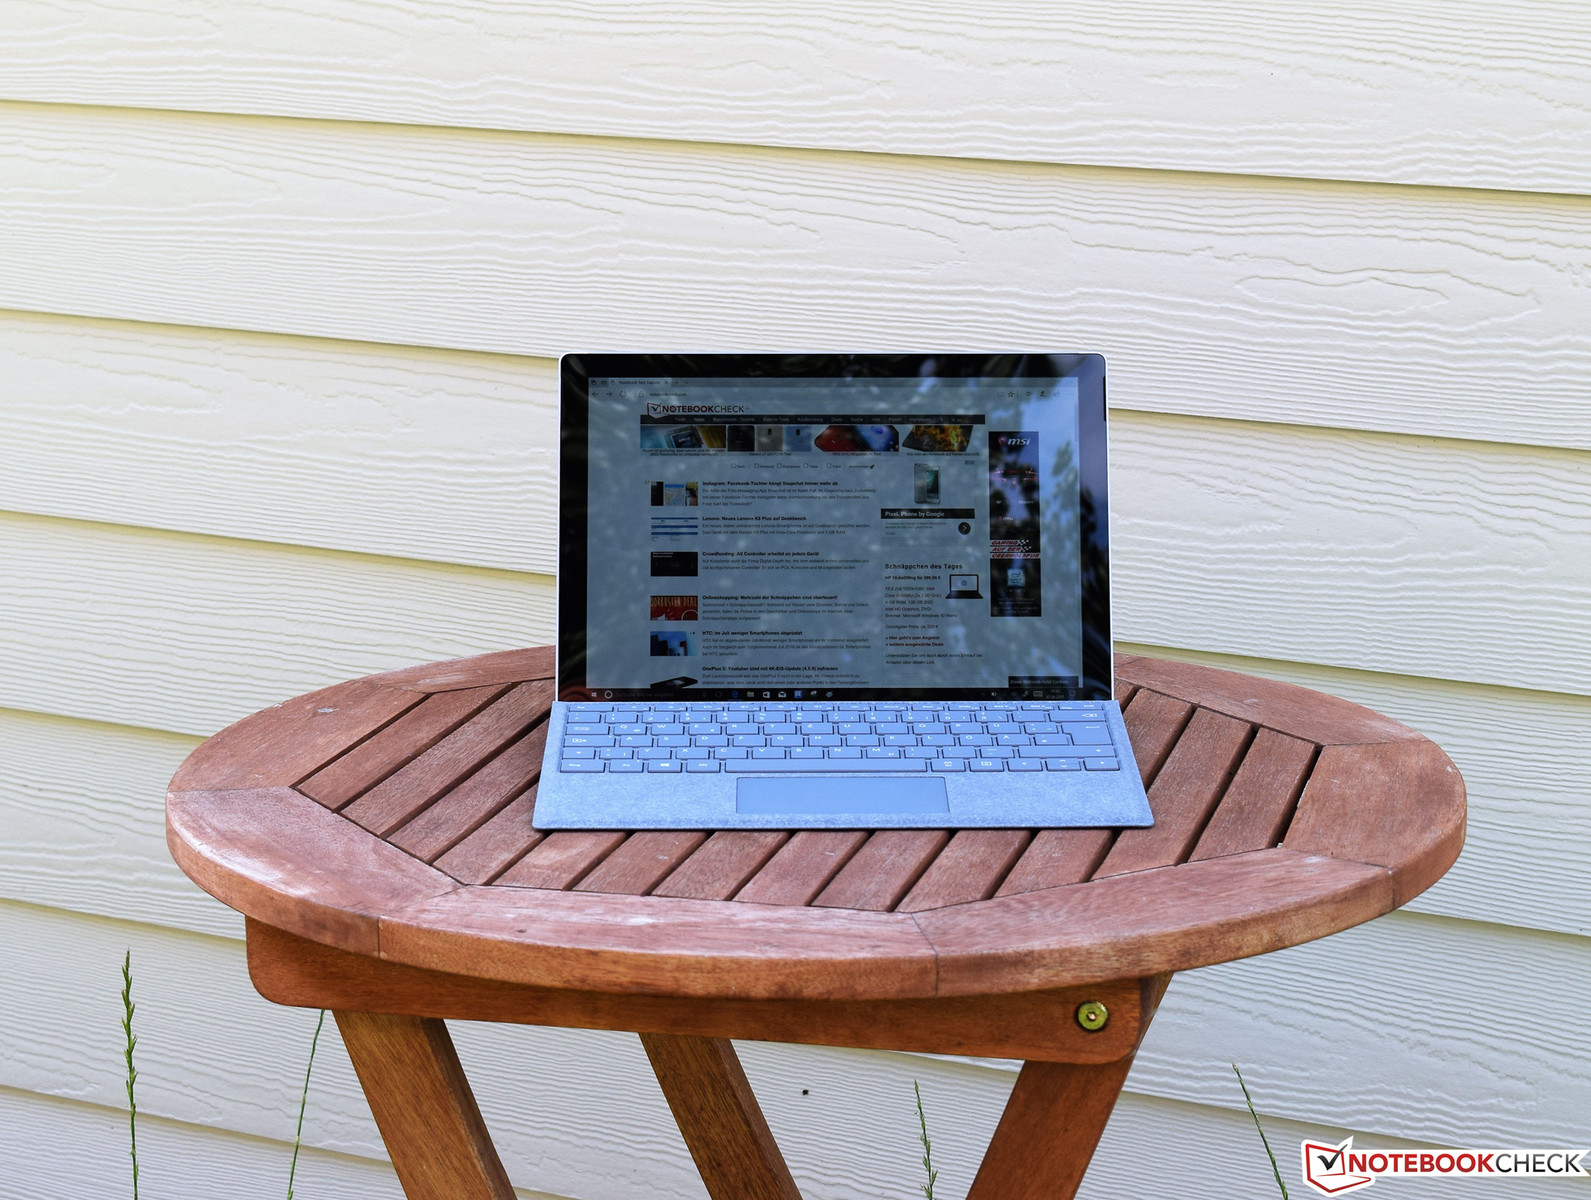
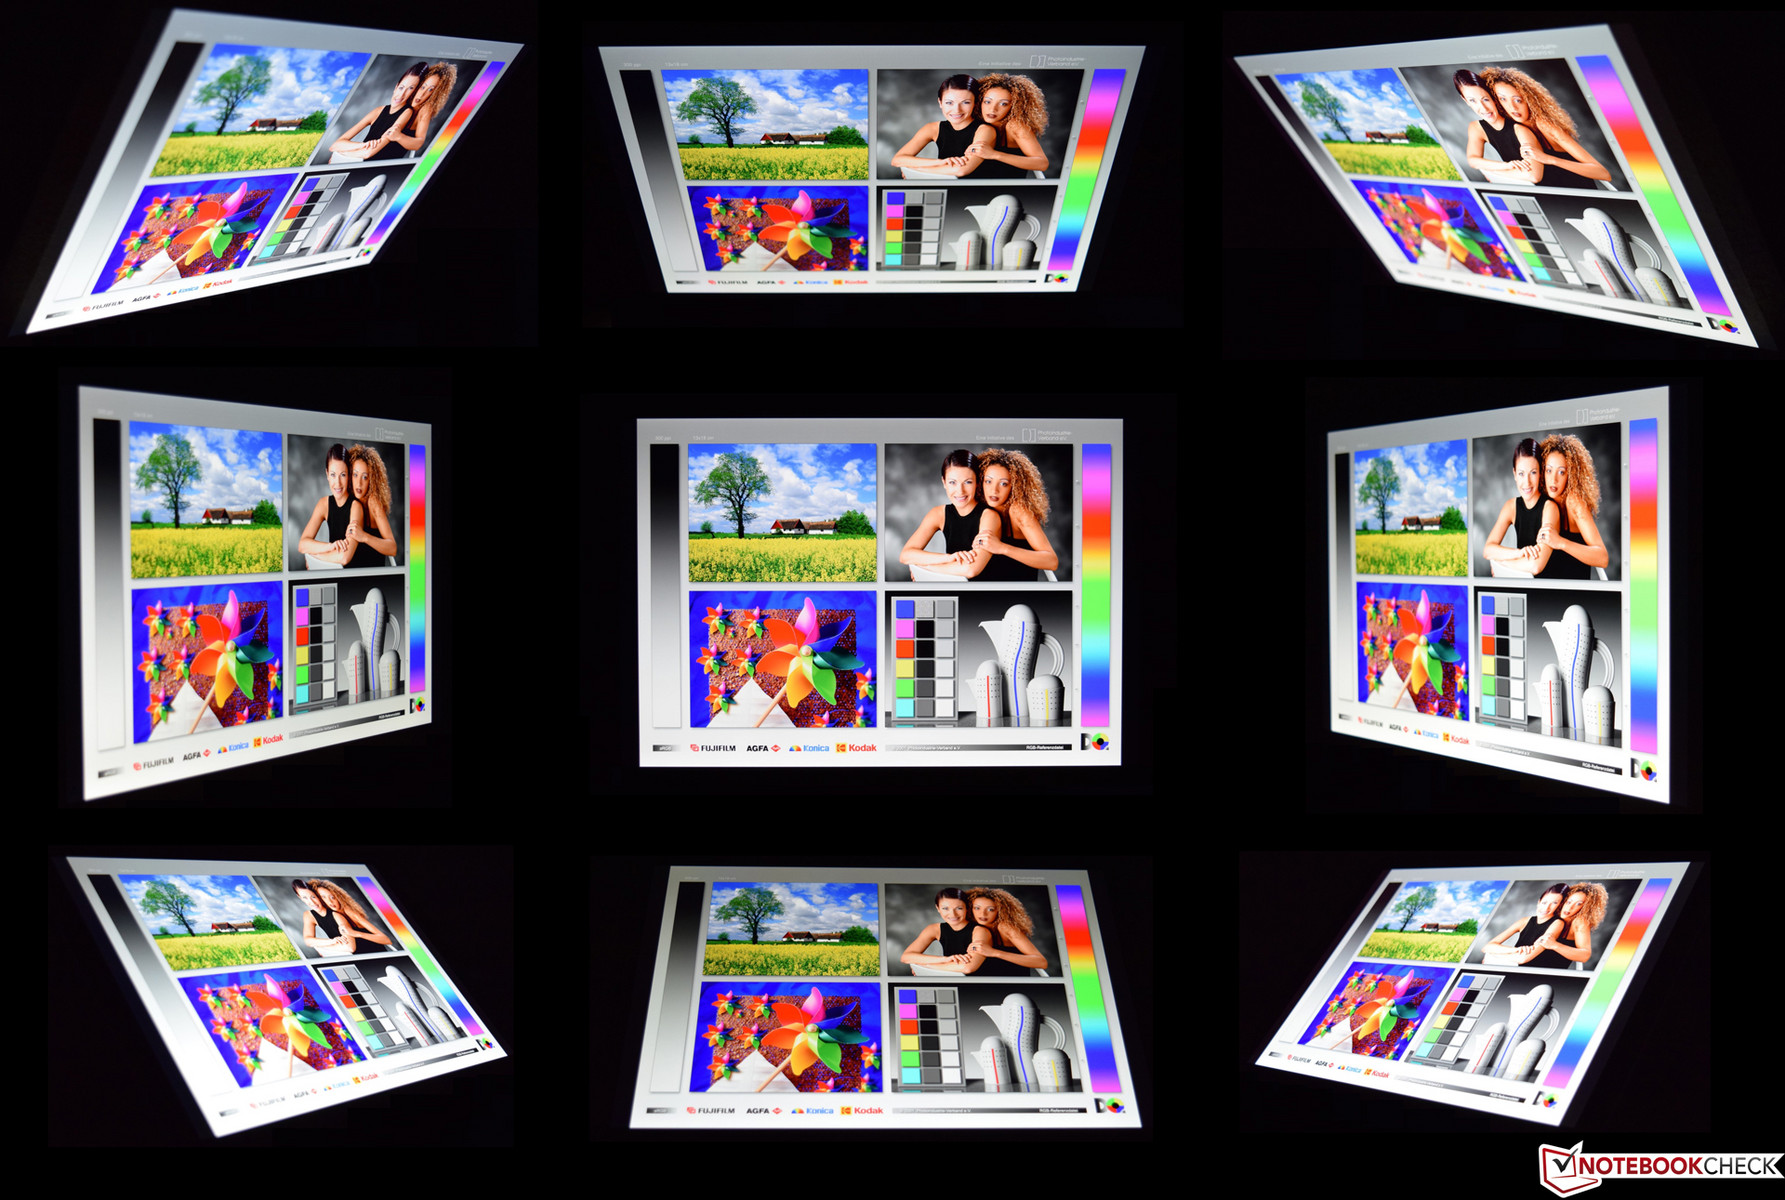
The screen's high average brightness of 444 cd/m² reads as very good on paper and should speak for outdoor suitability. However, it looks different in reality since the highly reflective panel involves clear limitations. Thus, a place in the shade is a must when working outdoors. The review sample scores well in our viewing-angle test. All test photos are perfectly legible from all positions.
Performance
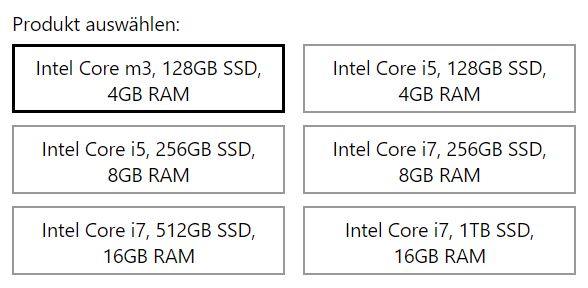
Roughly speaking, Microsoft's Surface Pro 2017 is available in six different versions. The buyer can choose among three SoCs (m3, i5, i7) and four SSD capacities (128, 256, 512, 1024 GB). A RAM configuration of 4, 8, and 16 GB can be selected. Unfortunately, the manufacturer does not provide the option of configuring the device freely. The available configurations can be seen in the overview. The prices start at 950 Euros (~$1123) (our review sample) and stop at 3100 Euros ($3666) for the flagship model with Intel's Core i7 on Microsoft's website. An LTE version has been announced.


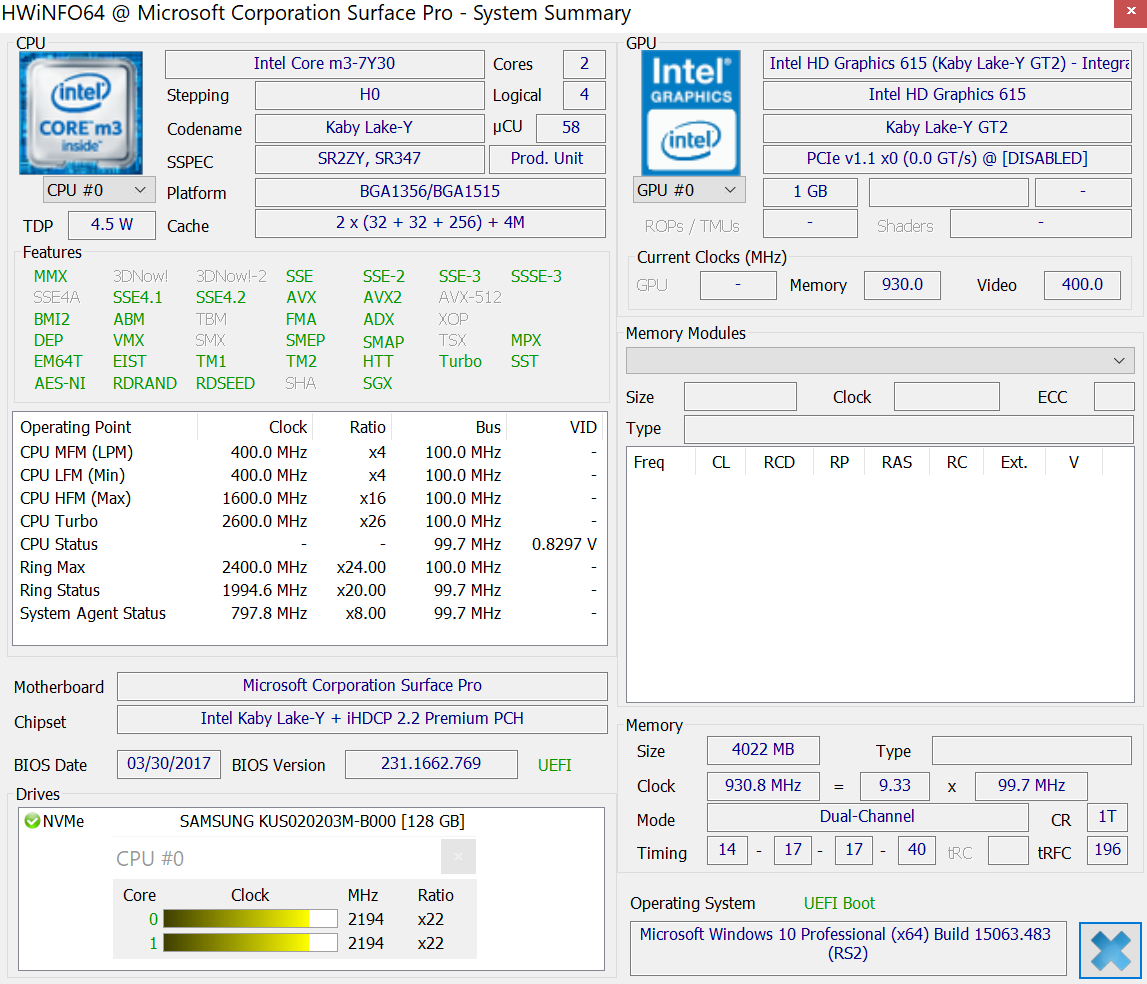
Processor
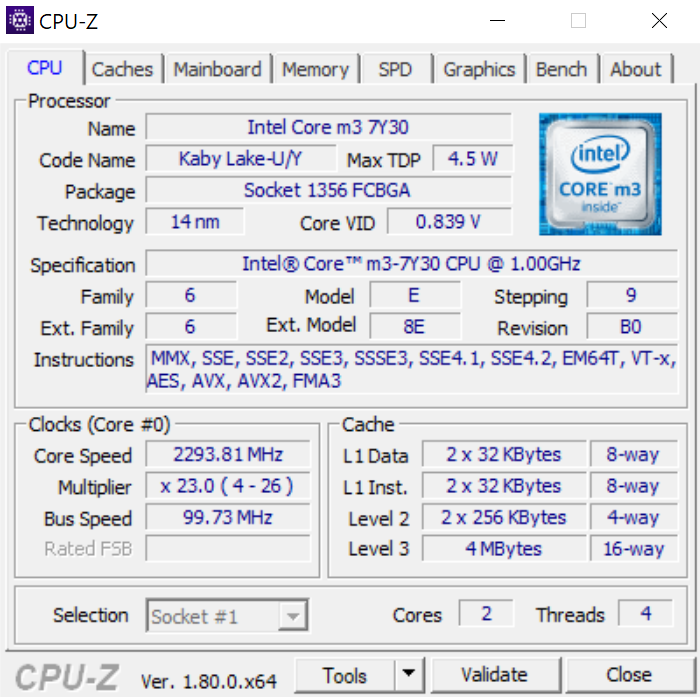
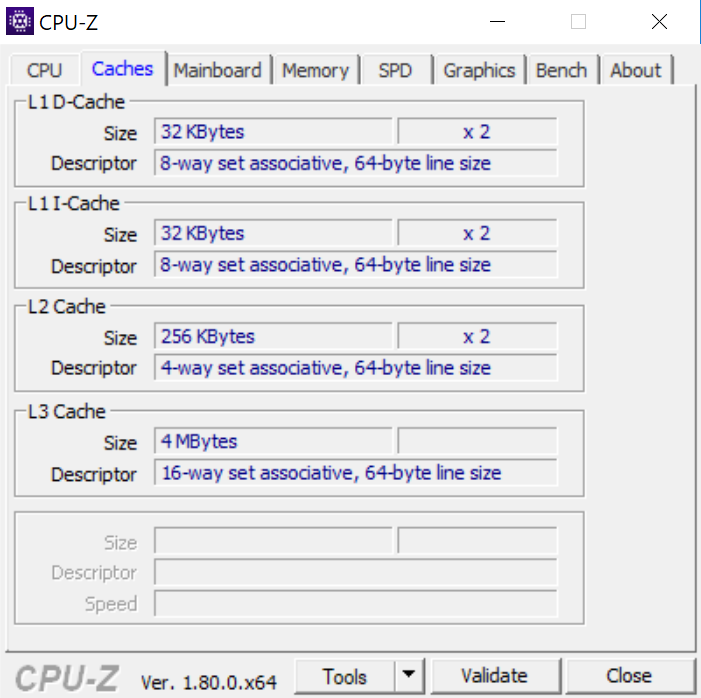
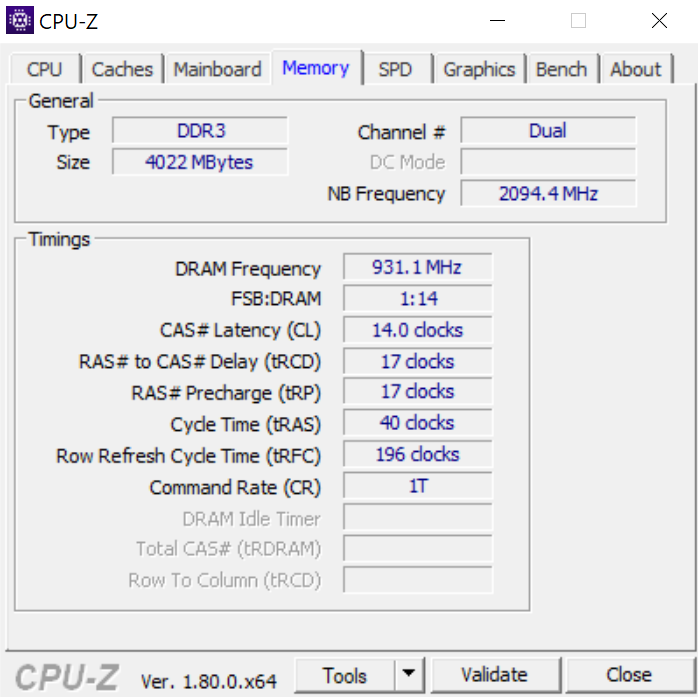
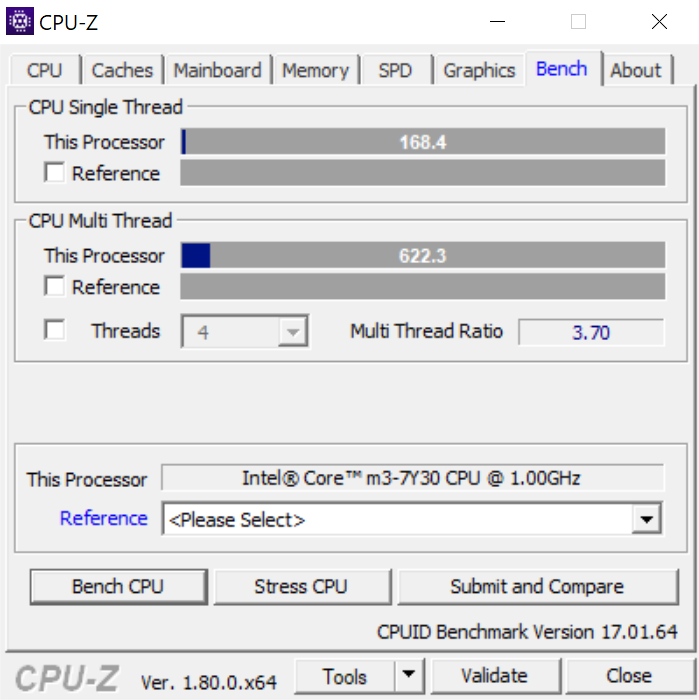
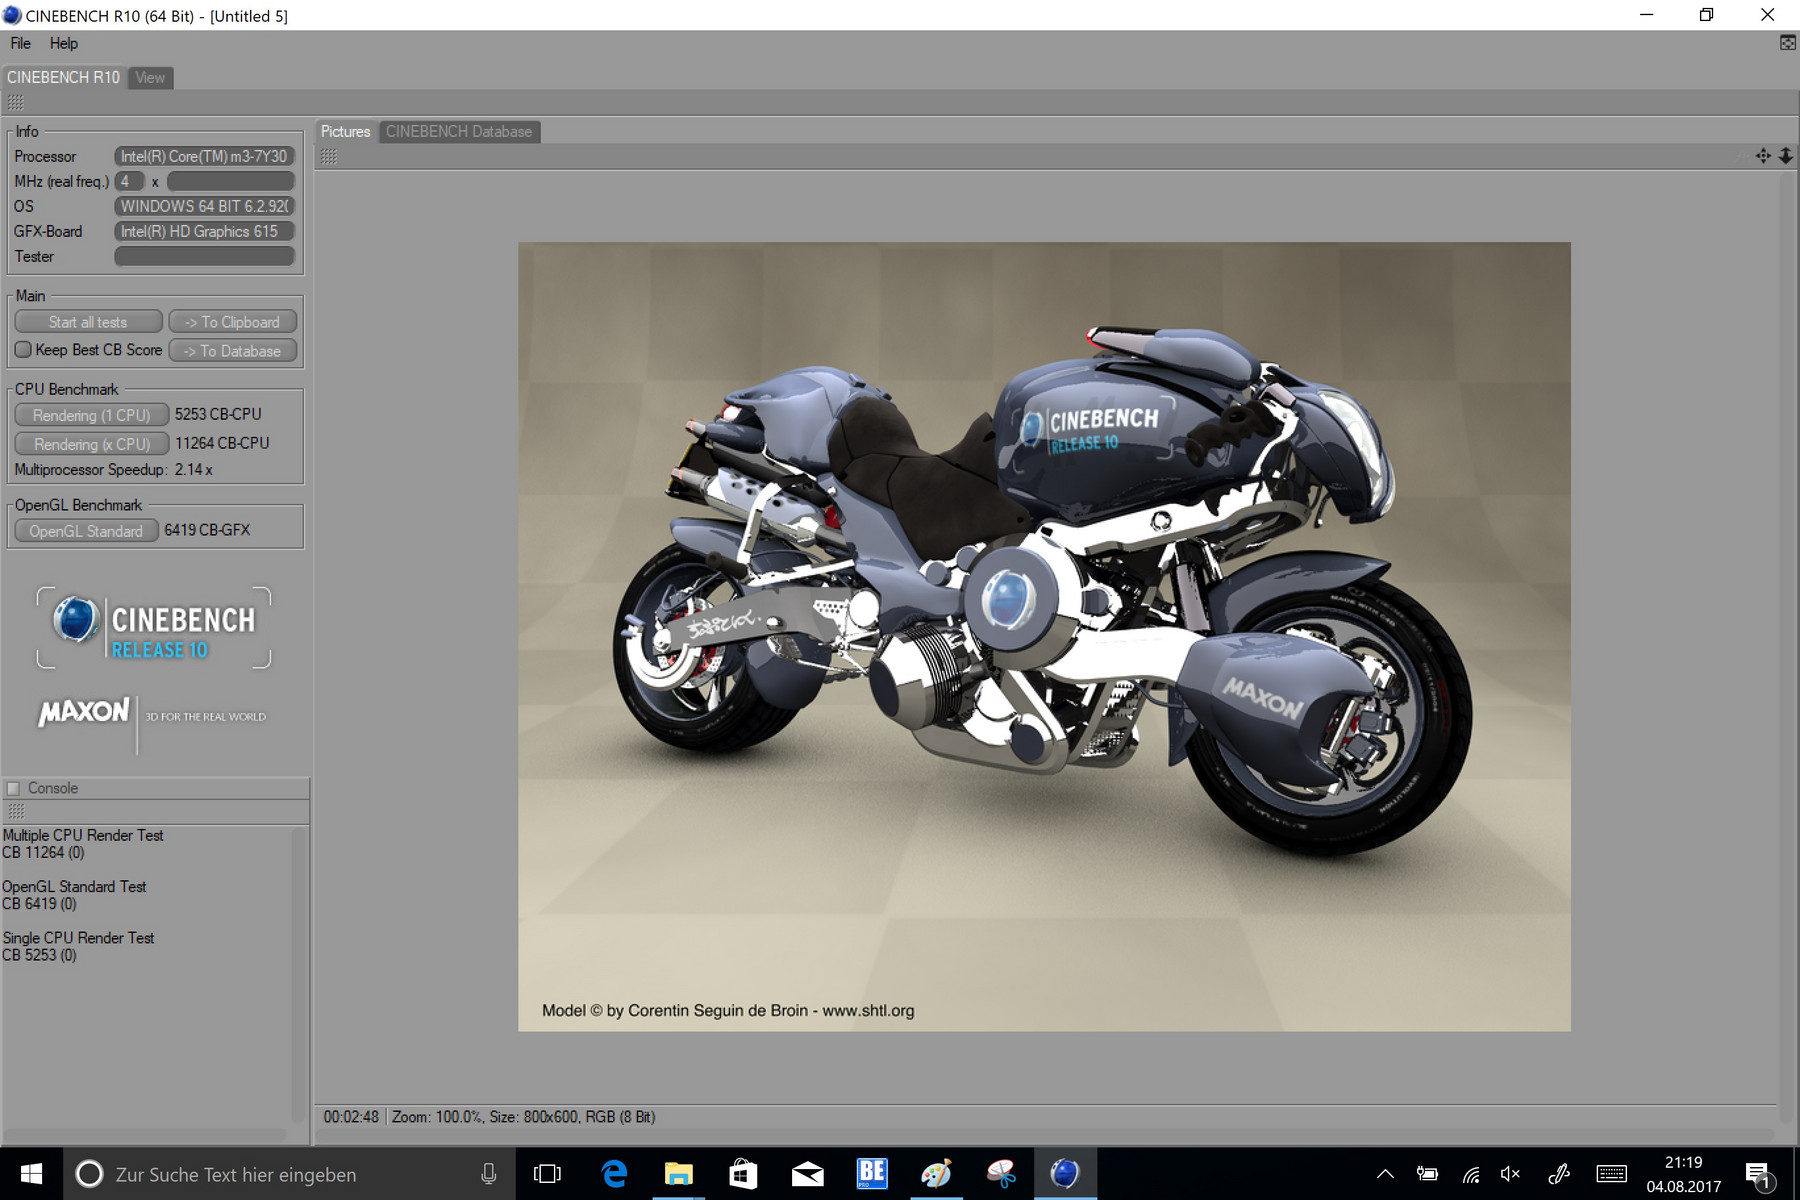
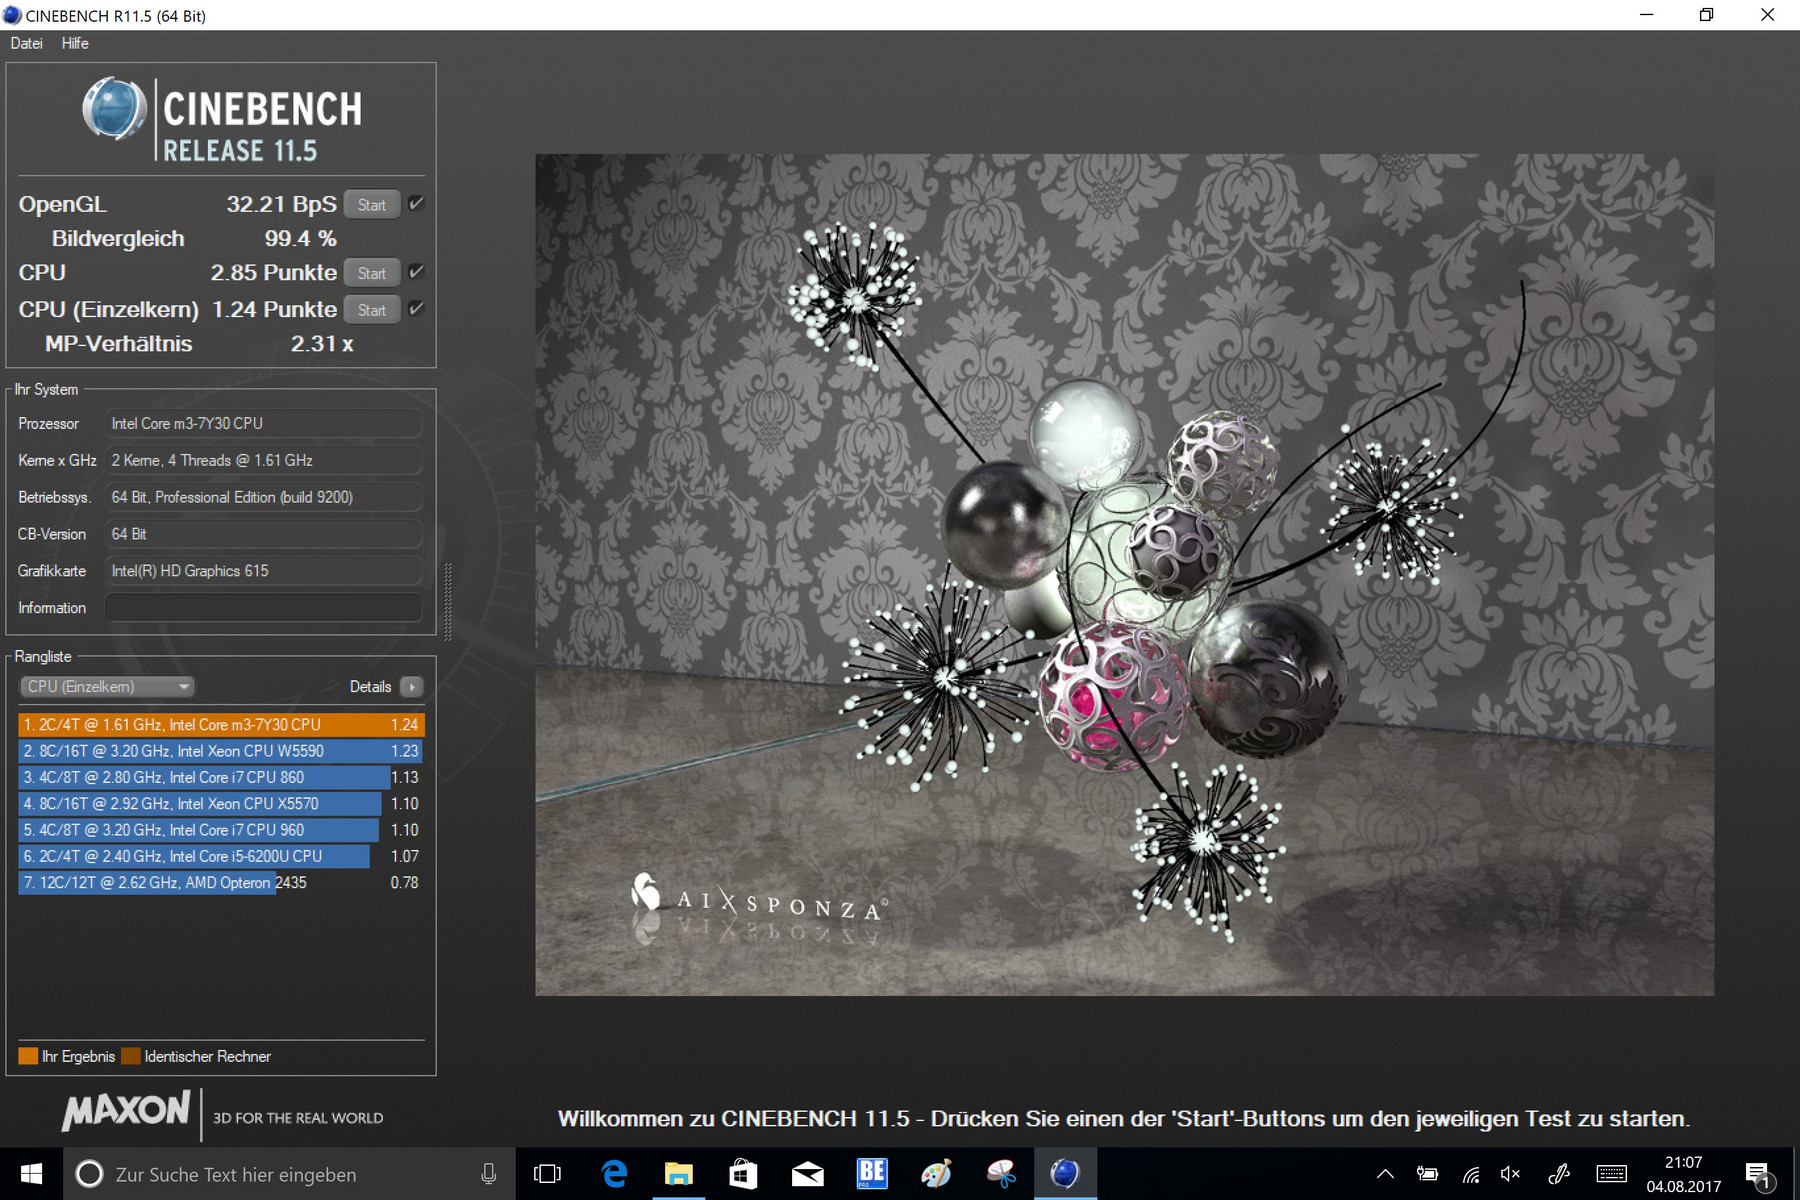
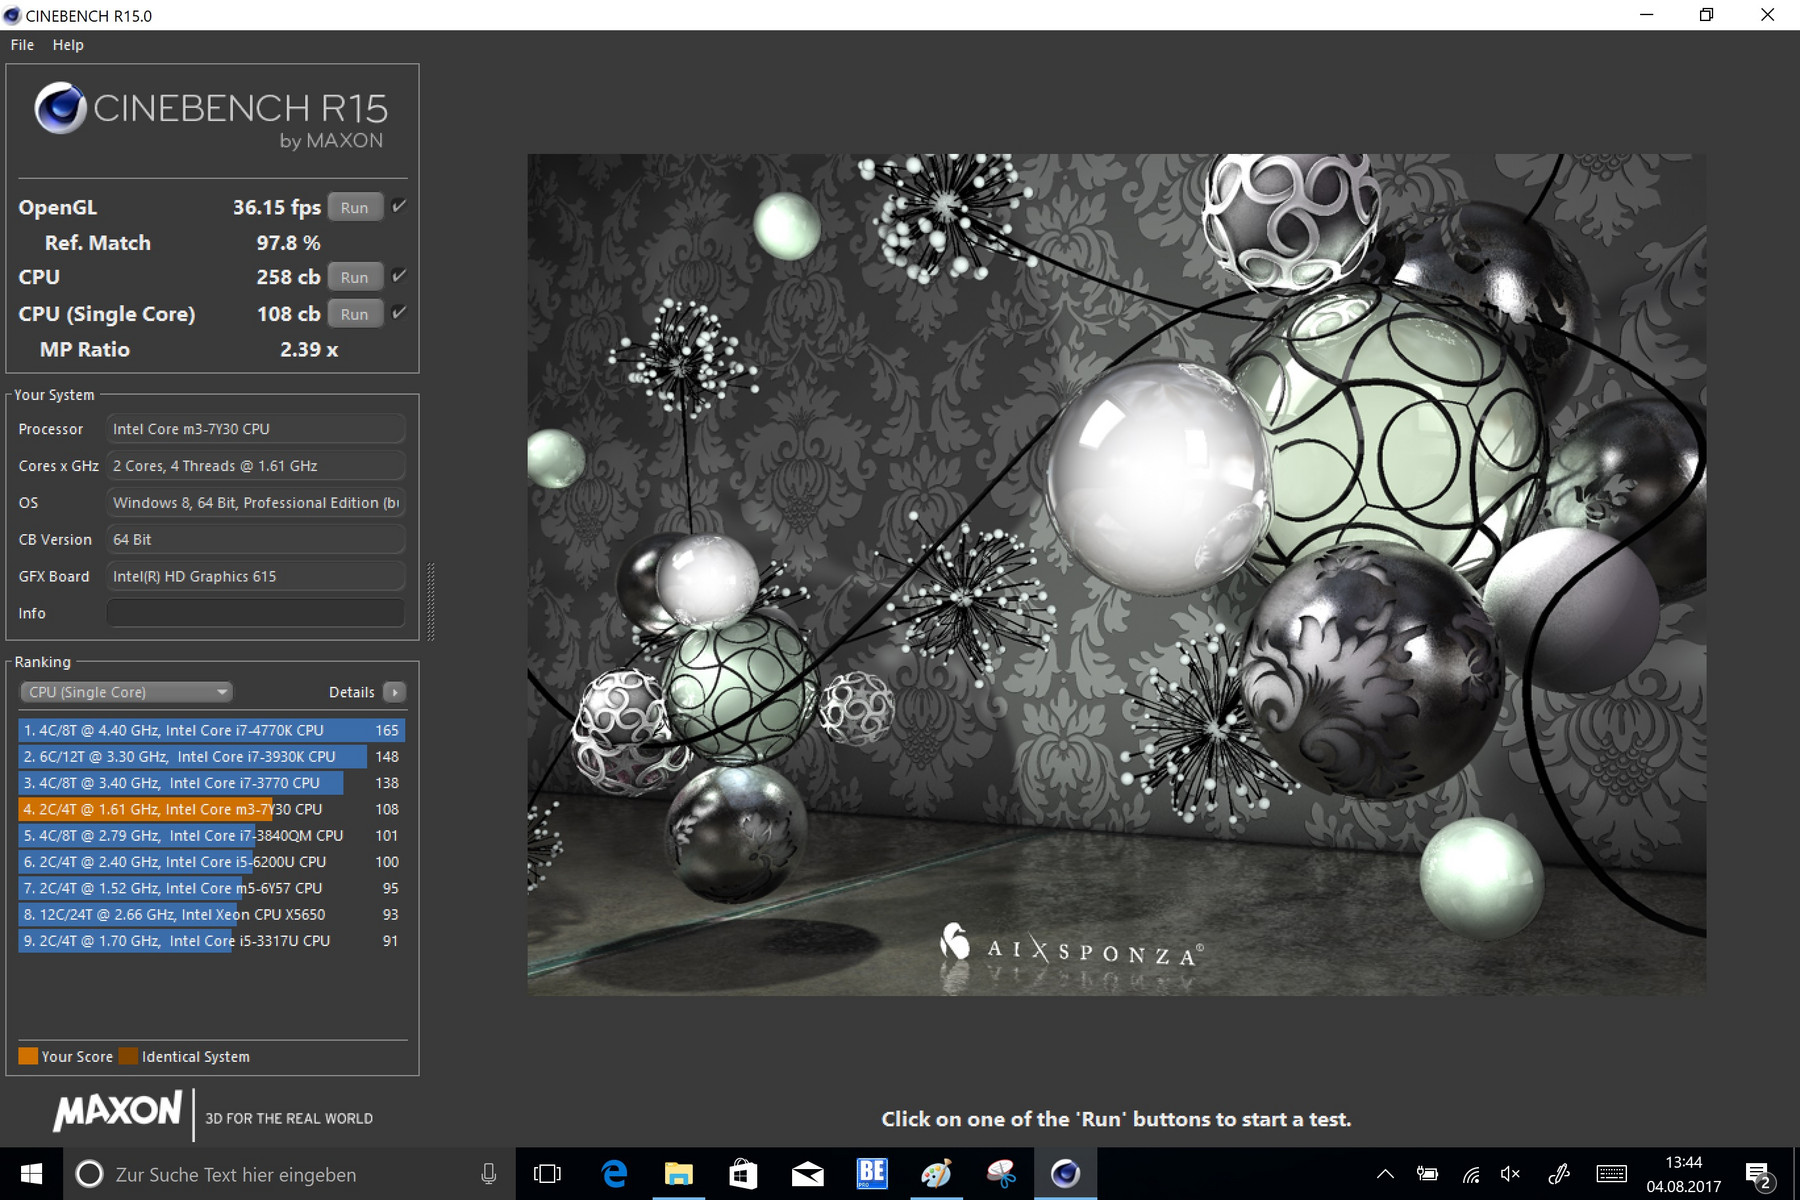
Intel's Core m3 7Y30 is a member of the Kaby Lake family, and it is an extremely efficient dual-core SoC (TDP: 4.5 watts). Thus, this processor is perfectly suitable for tablets and passively cooled laptops. Both processing cores have a base clock of 1.0 GHz that can be boosted to 2.6 GHz (Turbo). Intel's Core m3 7Y30 does not stand a chance against the much faster Intel Core i5 and Core i7 models. However, its multi-core performance is enough for a place in the midfield in Cinebench R15.
More benchmarks concerning Intel's Core m3 7Y30 can be found here.
The clock speed can be maintained quite well at the beginning of the Cinebench R15 loop. The temperature limit of 62 °C of Intel's Core m3 7Y30 is first reached in the sixth run and the scores drop more evidently. From the initial 250 points, the Microsoft Surface Pro 2017's score drops down to 160 points but stabilizes again to 200 points in the further runs.
* ... smaller is better
System Performance
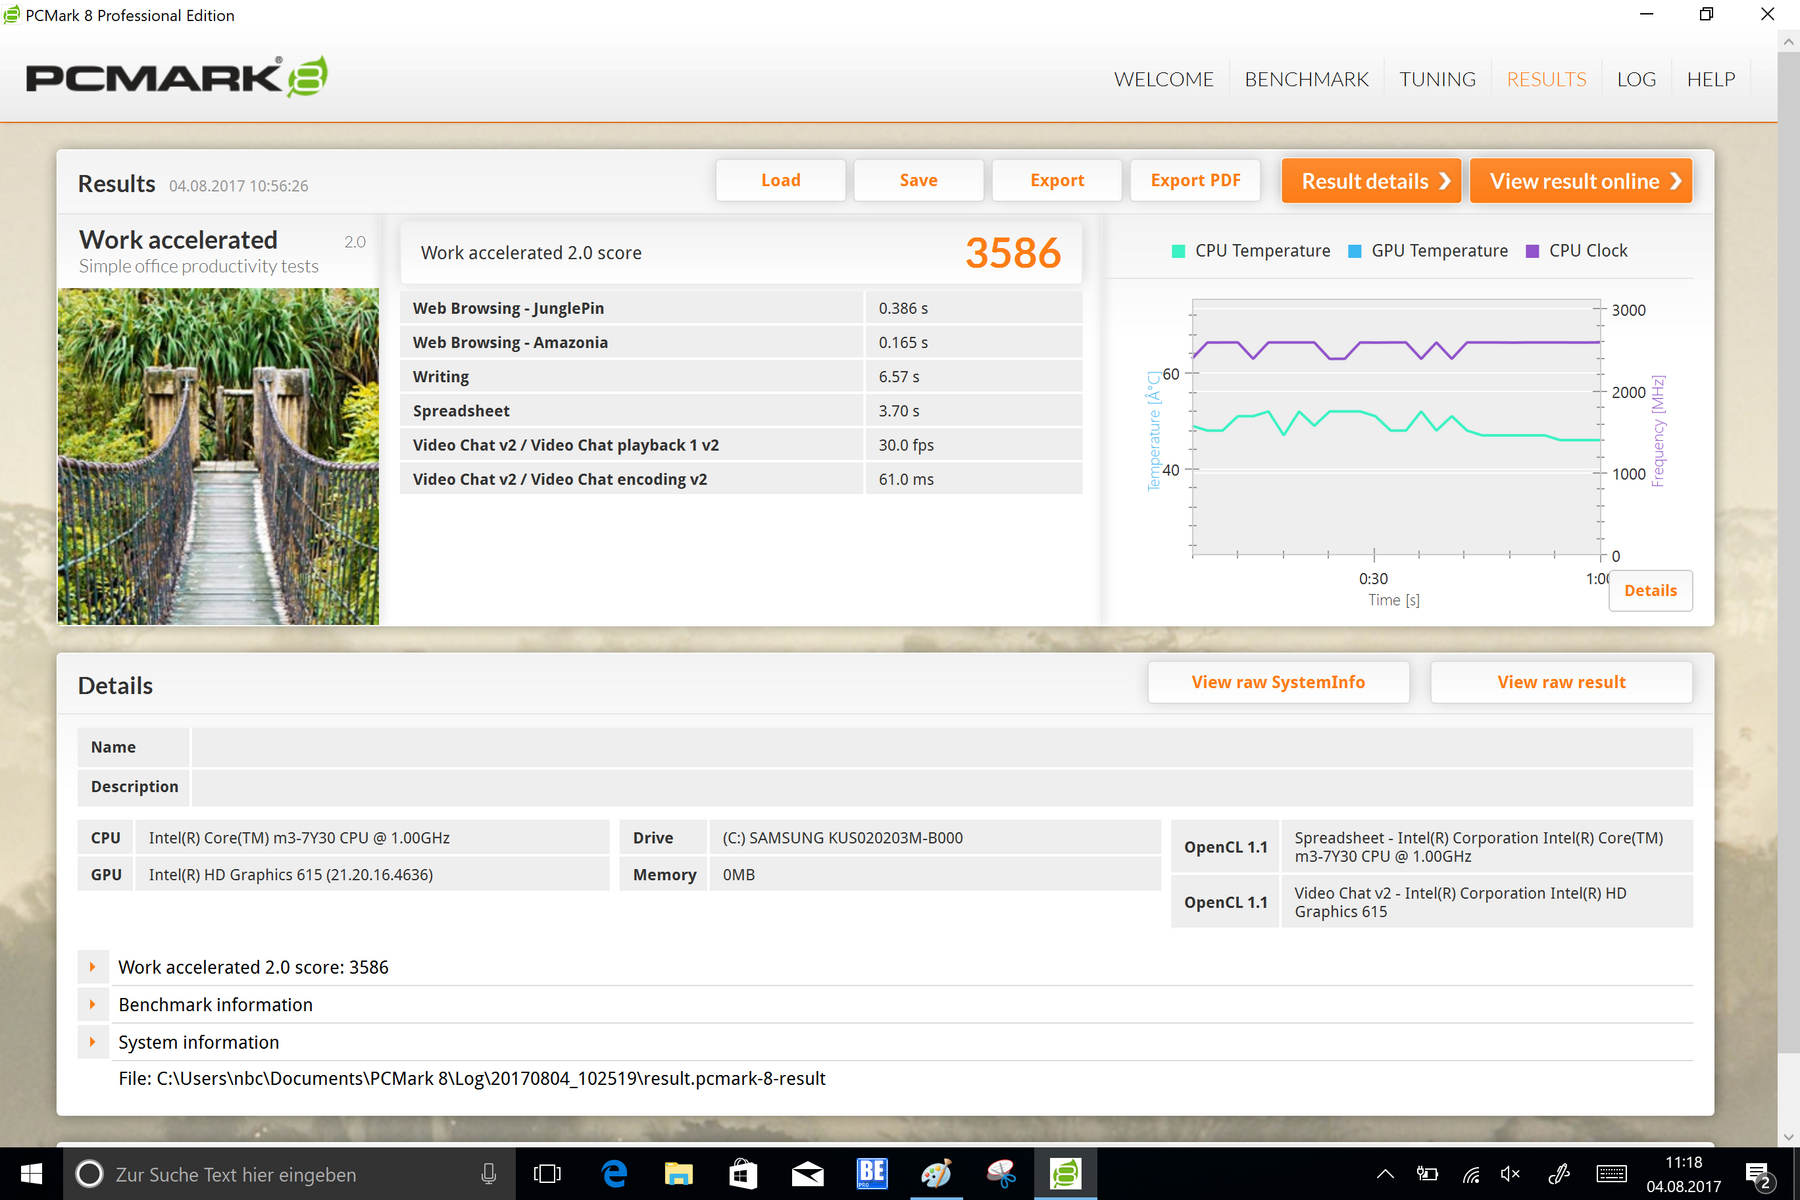
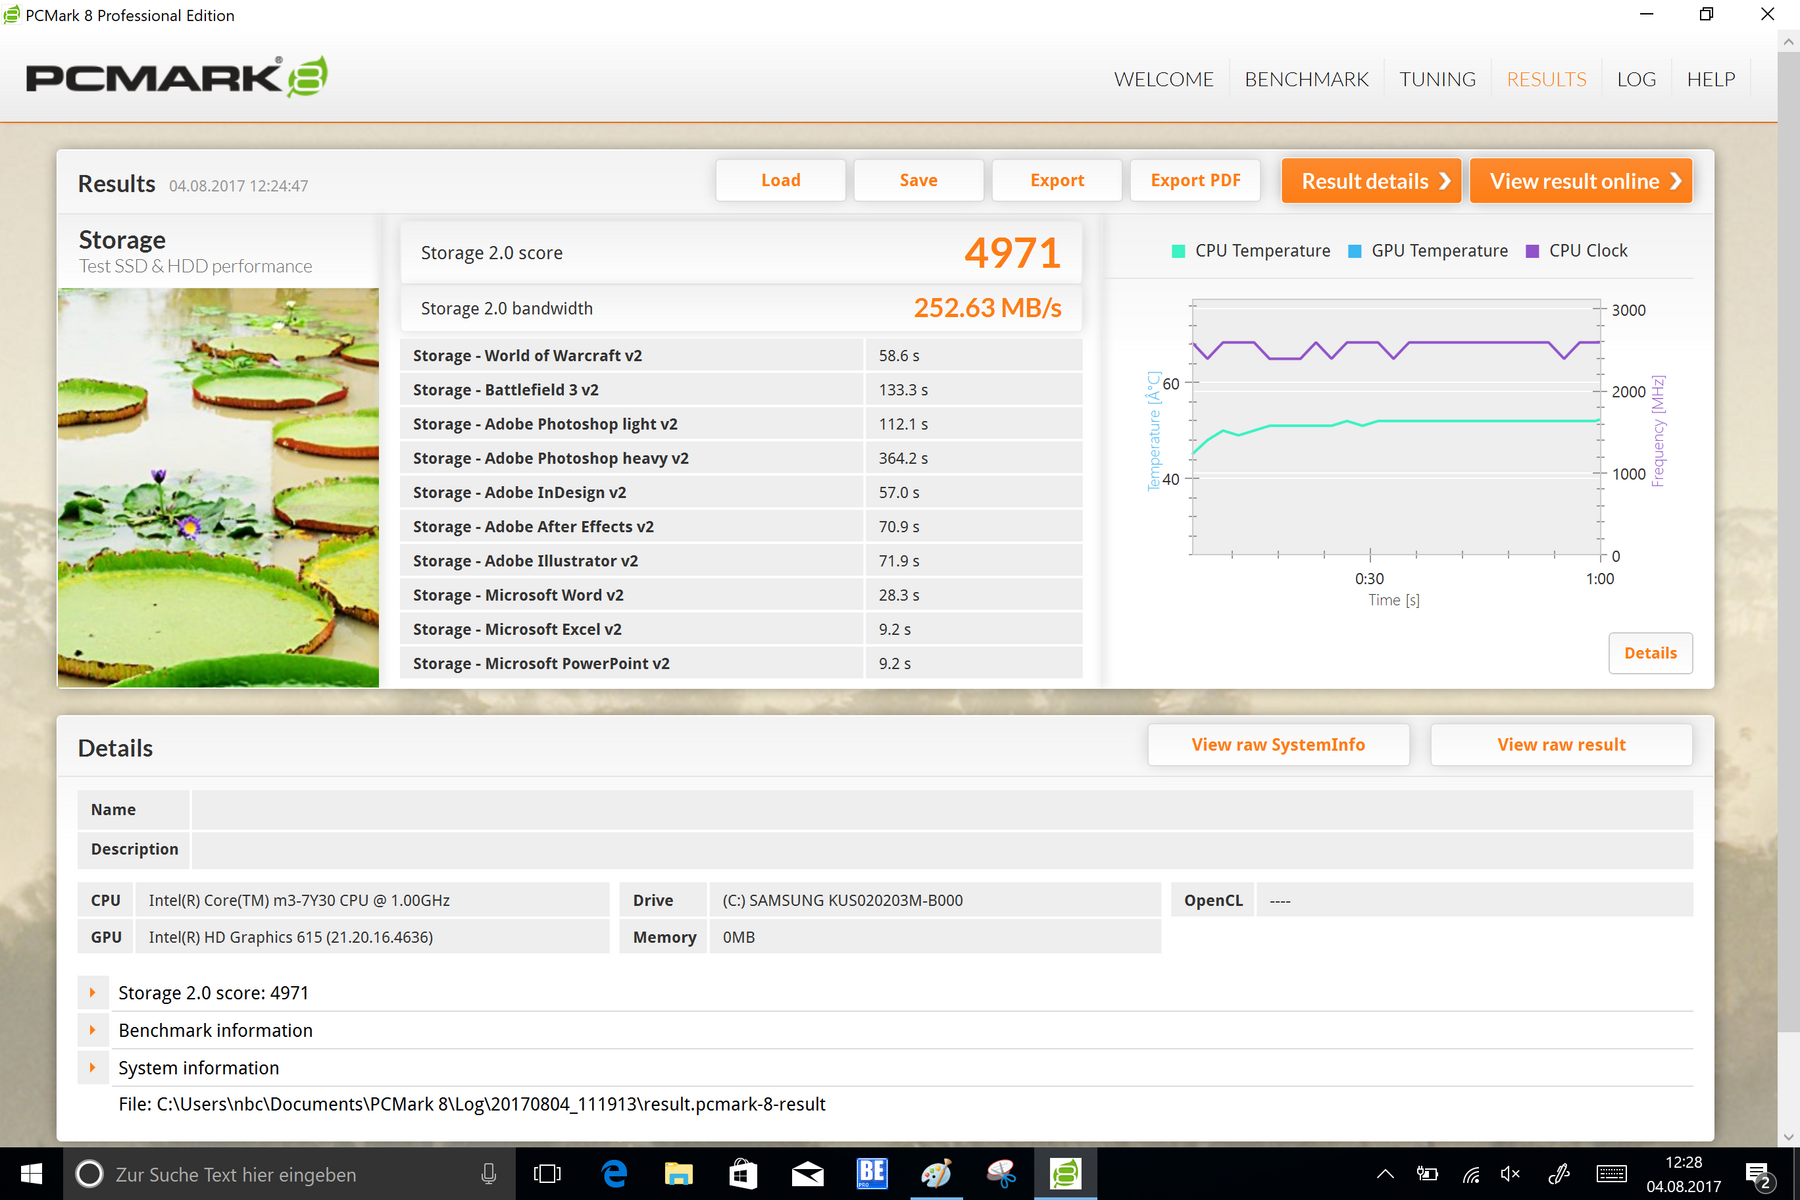
Our review sample positions itself exclusively in the second last place in the PCMark 8 benchmarks, as was expected in view of the CPU's low performance. Nevertheless, Microsoft's frugal Surface Pro 2017 does a good job and the difference to the top places is often just a few percentage points.
Seen subjectively, the review sample runs quickly and smoothly. The installed components are very well-balanced, which speaks for high quality.
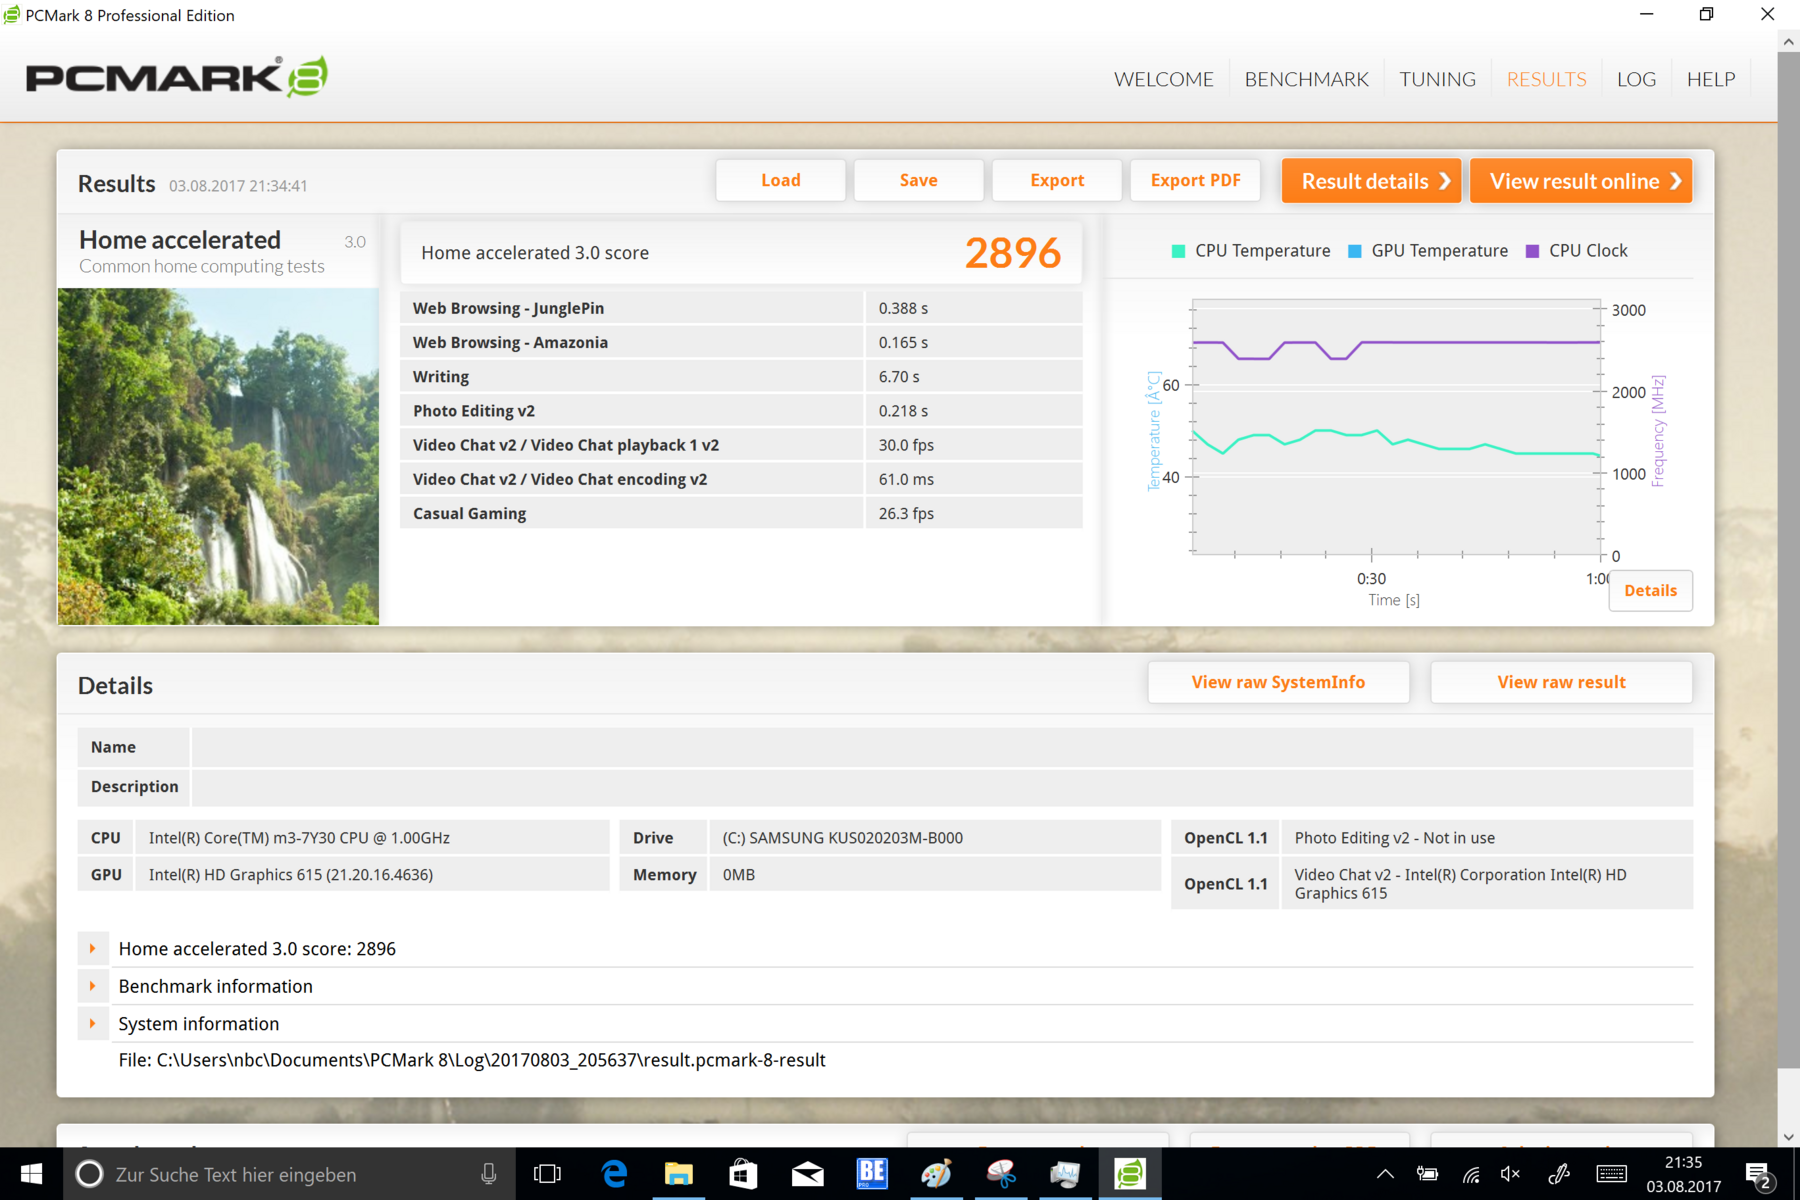
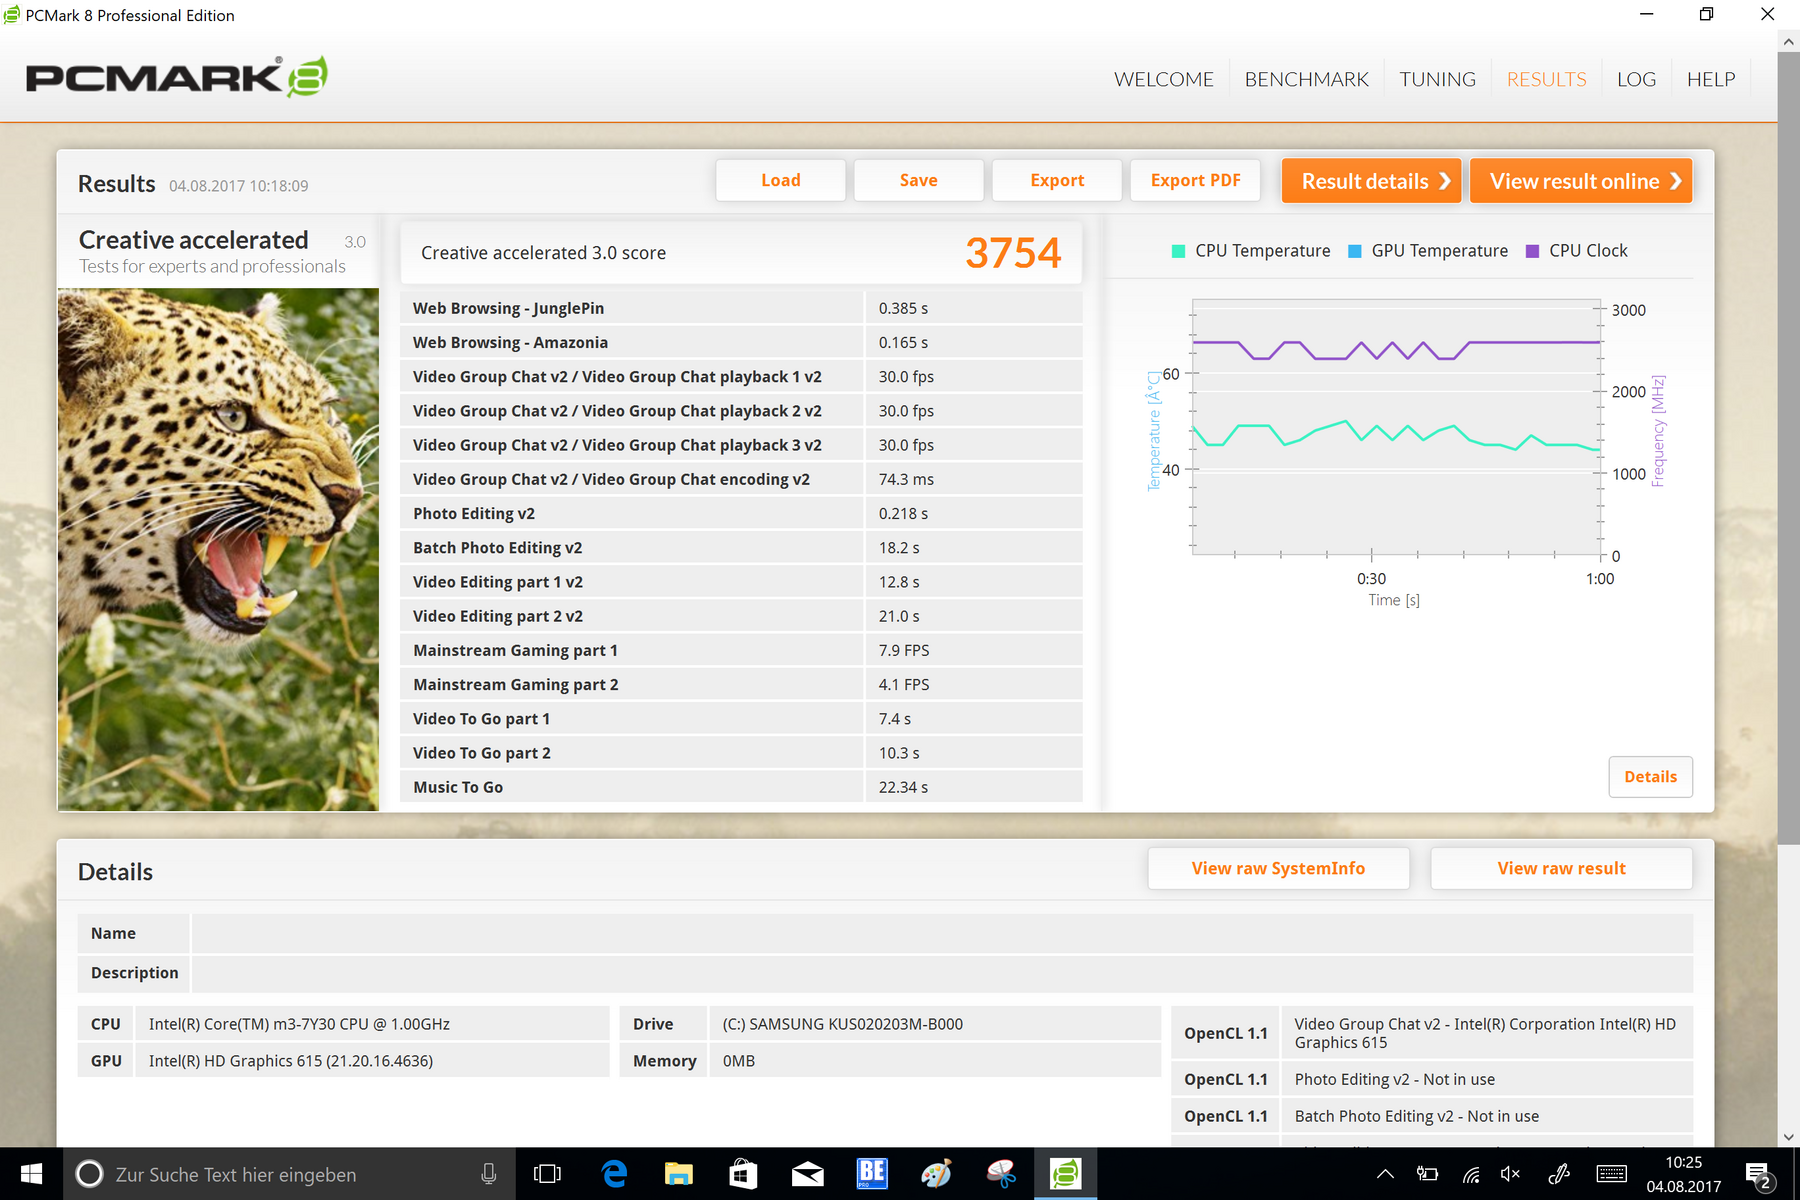
| PCMark 8 Home Score Accelerated v2 | 2896 points | |
| PCMark 8 Creative Score Accelerated v2 | 3754 points | |
| PCMark 8 Work Score Accelerated v2 | 3586 points | |
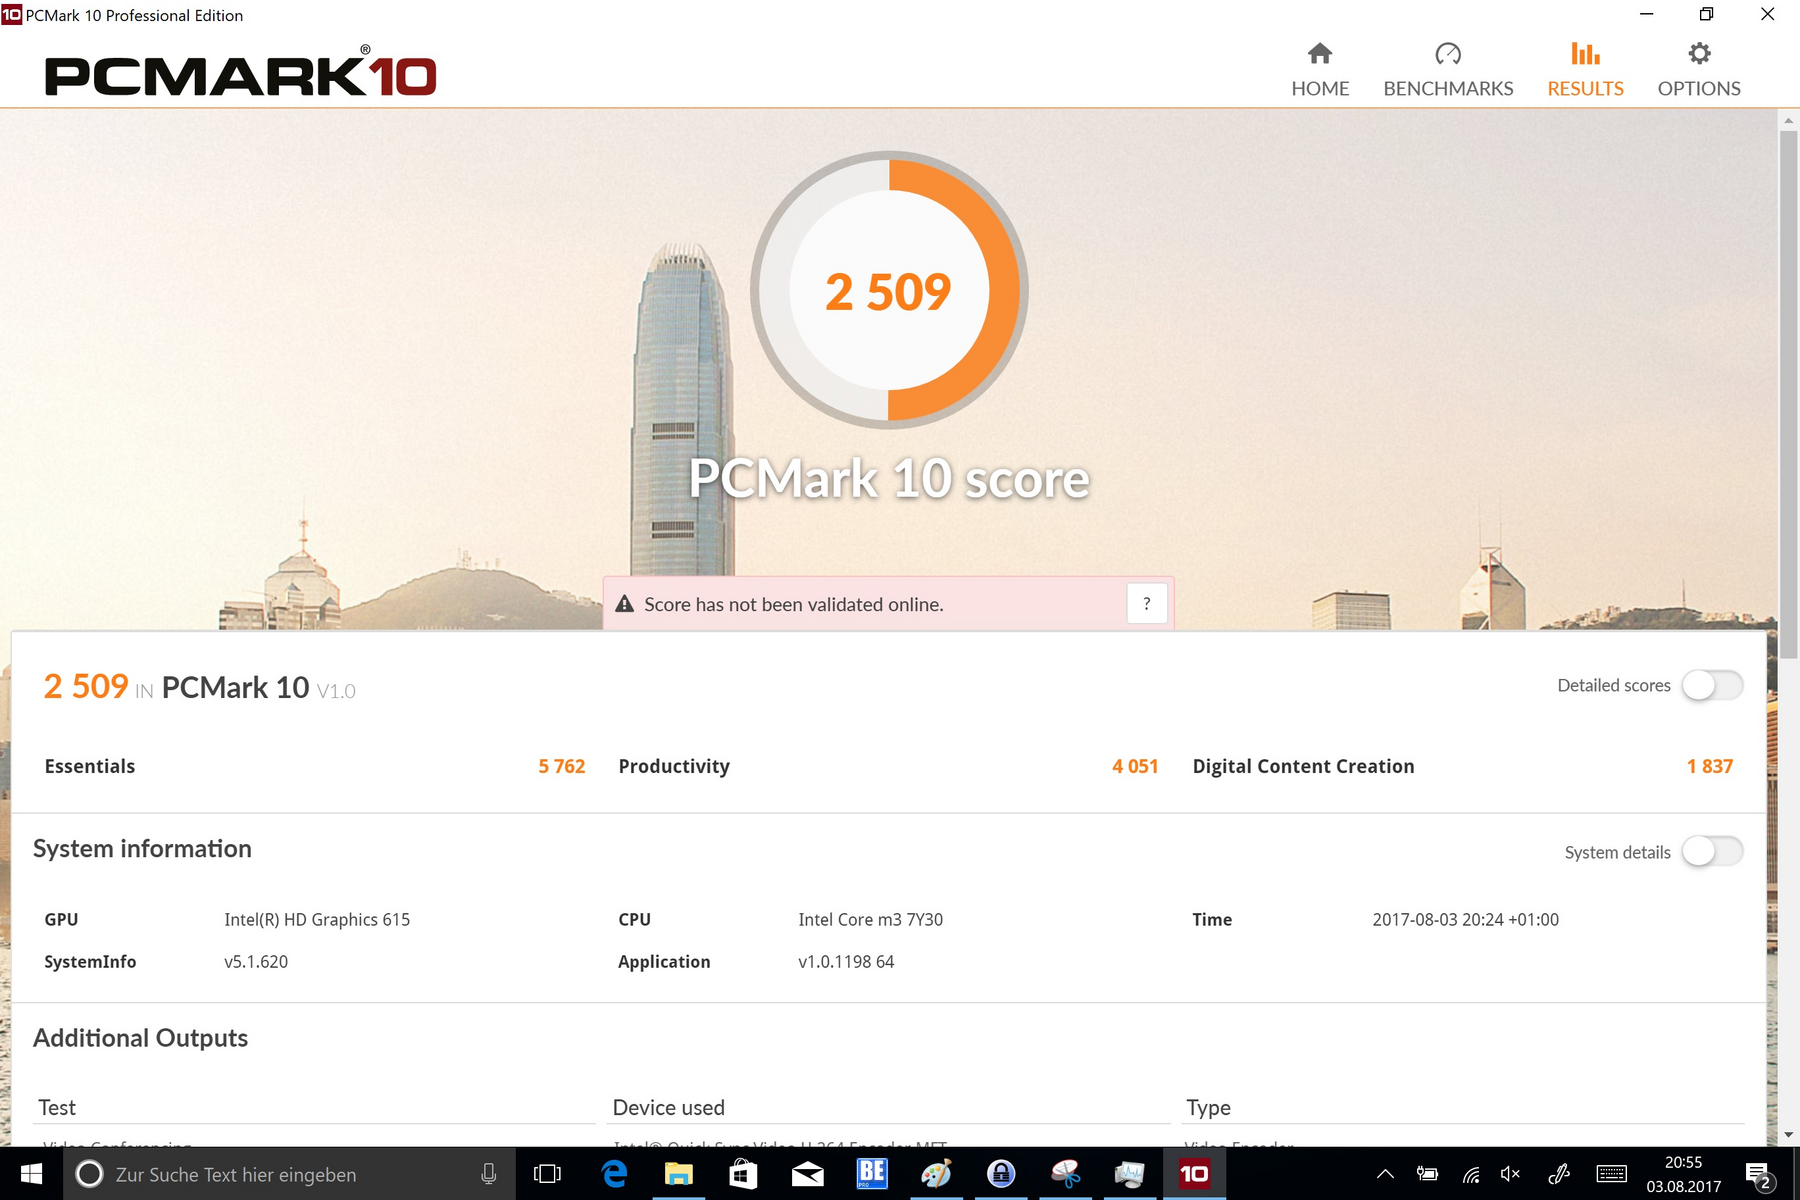
| PCMark 10 Score | 2509 points | |
Help | ||
Storage Device
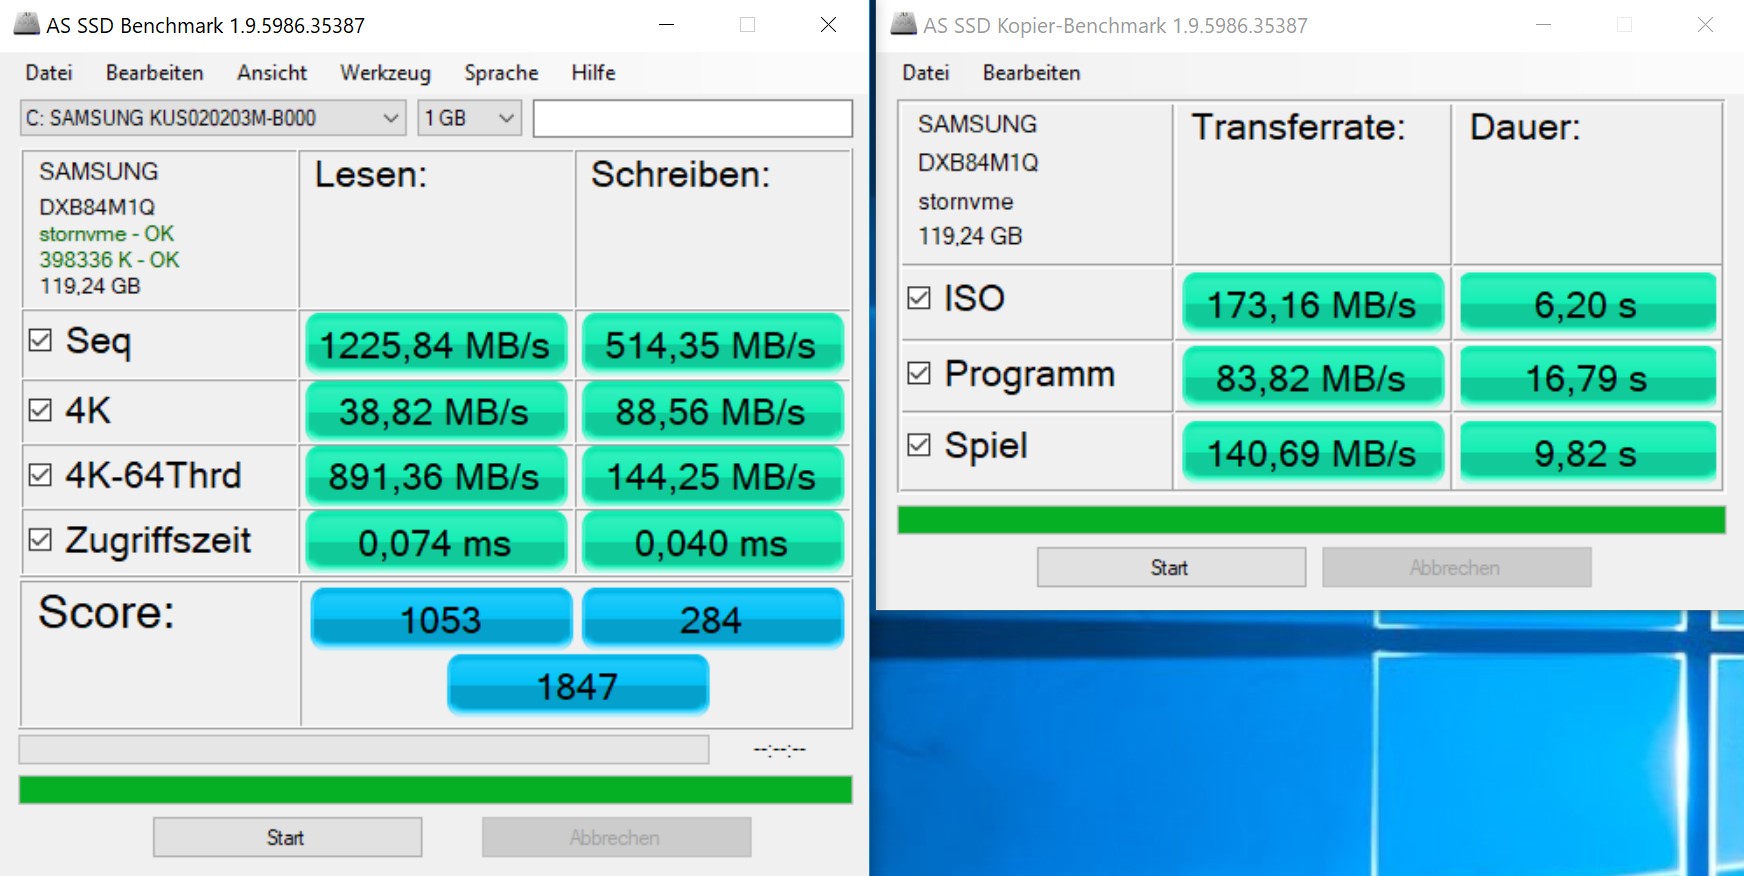
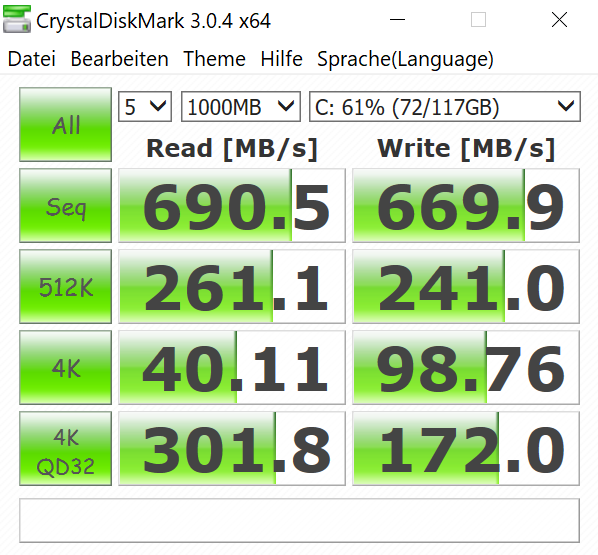
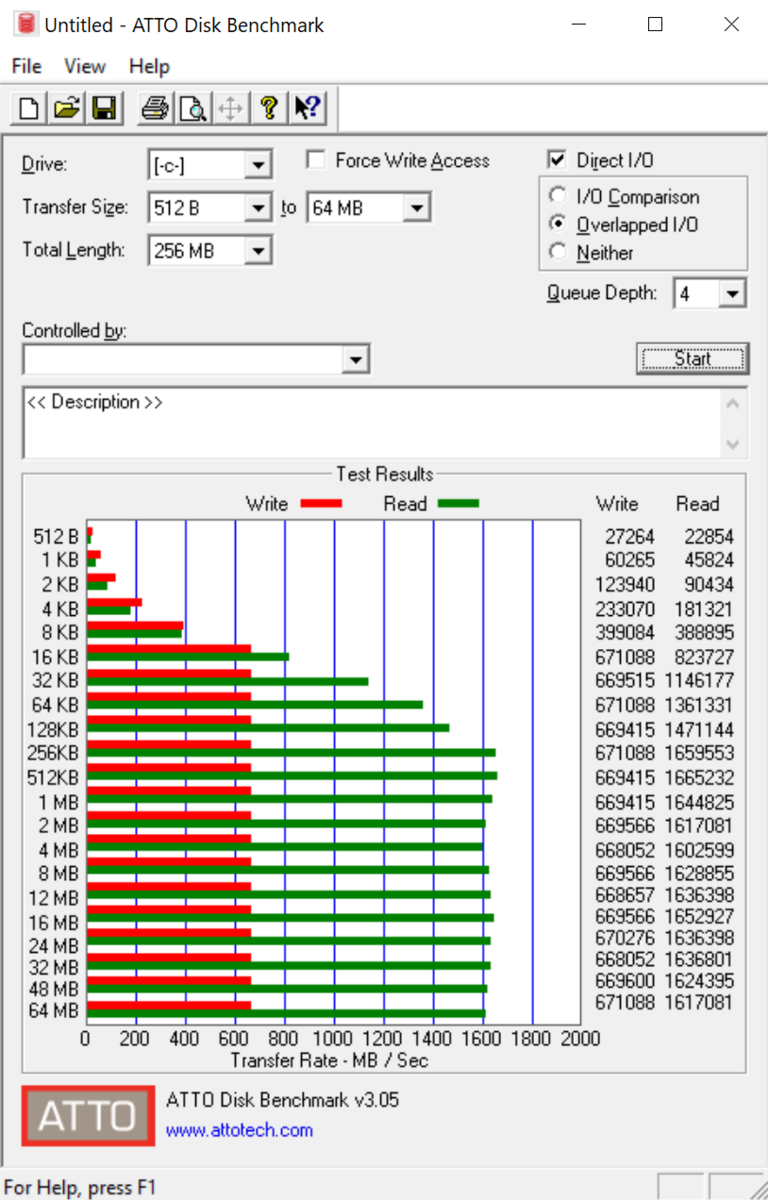
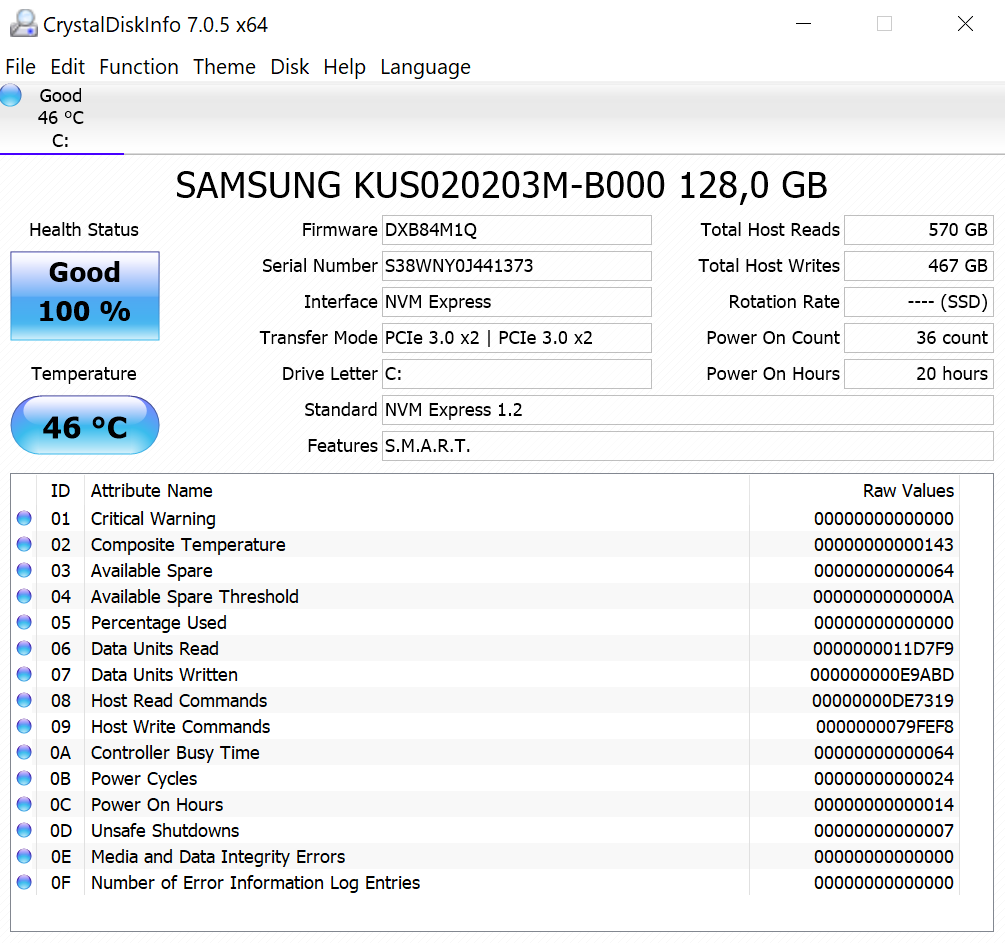
The storage device is a 128 GB SSD by Samsung. According to the spec sheet, the PM971 achieves a sequential read speed of up to 1400 MB/s and a sequential write speed of up to 500 MB/s. We check these specs with the AS SSD tool and almost reach Samsung's factory specs. In particular, the 4K read rate of 40 MB/s is very good and ensures very fast system booting among other things.
The storage device cannot be replaced, which is unfortunately user-unfriendly. As usual, the alternatives are the USB port or a micro-SD card.
| Microsoft Surface Pro (2017) m3 HD Graphics 615, m3-7Y30, Samsung PM971 KUS020203M | Microsoft Surface Pro (2017) i7 Iris Plus Graphics 640, i7-7660U, Samsung PM971 KUS040202M | Microsoft Surface Pro (2017) i5 HD Graphics 620, i5-7300U, Samsung PM971 KUS030202M | Lenovo Ideapad Miix 720-12IKB HD Graphics 620, i7-7500U, Samsung SSD PM961 1TB M.2 PCIe 3.0 x4 NVMe (MZVLW1T0) | HP Elite x2 1012 G1 HD Graphics 515, 6Y54, Liteon L8H-256V2G | Lenovo ThinkPad X1 Tablet Gen 2 HD Graphics 615, i5-7Y54, Samsung PM961 MZVLW256HEHP | Samsung Galaxy Tab Pro S W700N HD Graphics 515, 6Y30, Lite-On CV1-8B128 | Acer Aspire Switch Alpha 12 SA5-271-56HM HD Graphics 520, 6200U, Kingston RBU-SNS8152S3256GG2 | |
|---|---|---|---|---|---|---|---|---|
| CrystalDiskMark 3.0 | 78% | 38% | 193% | -2% | 94% | -33% | -14% | |
| Read Seq (MB/s) | 691 | 1308 89% | 723 5% | 2408 248% | 501 -27% | 1739 152% | 419.8 -39% | 518 -25% |
| Write Seq (MB/s) | 670 | 961 43% | 853 27% | 1702 154% | 297.2 -56% | 1259 88% | 162.9 -76% | 199.9 -70% |
| Read 512 (MB/s) | 261.1 | 227.5 -13% | 225 -14% | 1301 398% | 351.7 35% | 698 167% | 298.7 14% | 374.9 44% |
| Write 512 (MB/s) | 241 | 792 229% | 445 85% | 1288 434% | 295.7 23% | 869 261% | 160.9 -33% | 201 -17% |
| Read 4k (MB/s) | 40.11 | 53.6 34% | 46 15% | 53.6 34% | 28.31 -29% | 52.3 30% | 27.49 -31% | 29.3 -27% |
| Write 4k (MB/s) | 98.8 | 136.3 38% | 125 27% | 162.2 64% | 90.3 -9% | 120 21% | 48.44 -51% | 76.8 -22% |
| Read 4k QD32 (MB/s) | 301.8 | 485.6 61% | 423 40% | 504 67% | 285 -6% | 247.9 -18% | 236.2 -22% | 272 -10% |
| Write 4k QD32 (MB/s) | 172 | 421.5 145% | 373 117% | 420.8 145% | 268.4 56% | 259 51% | 135 -22% | 197.1 15% |

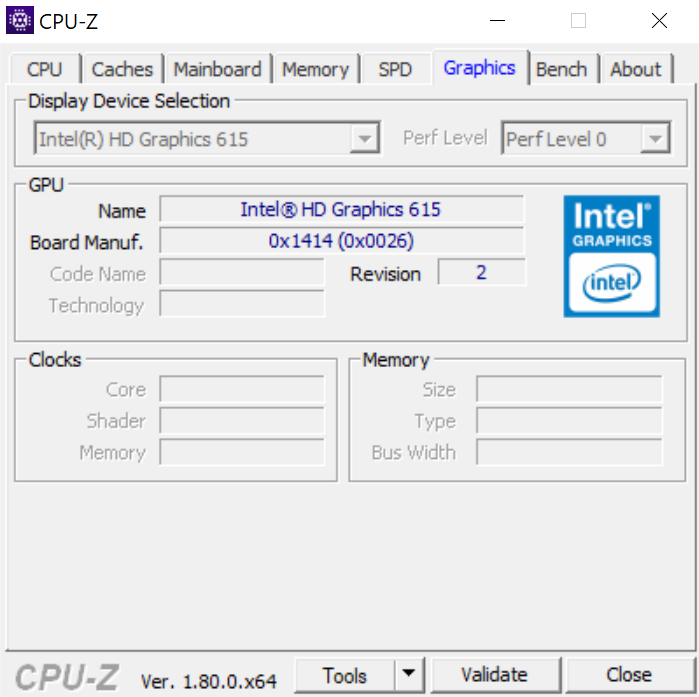
Graphics Card
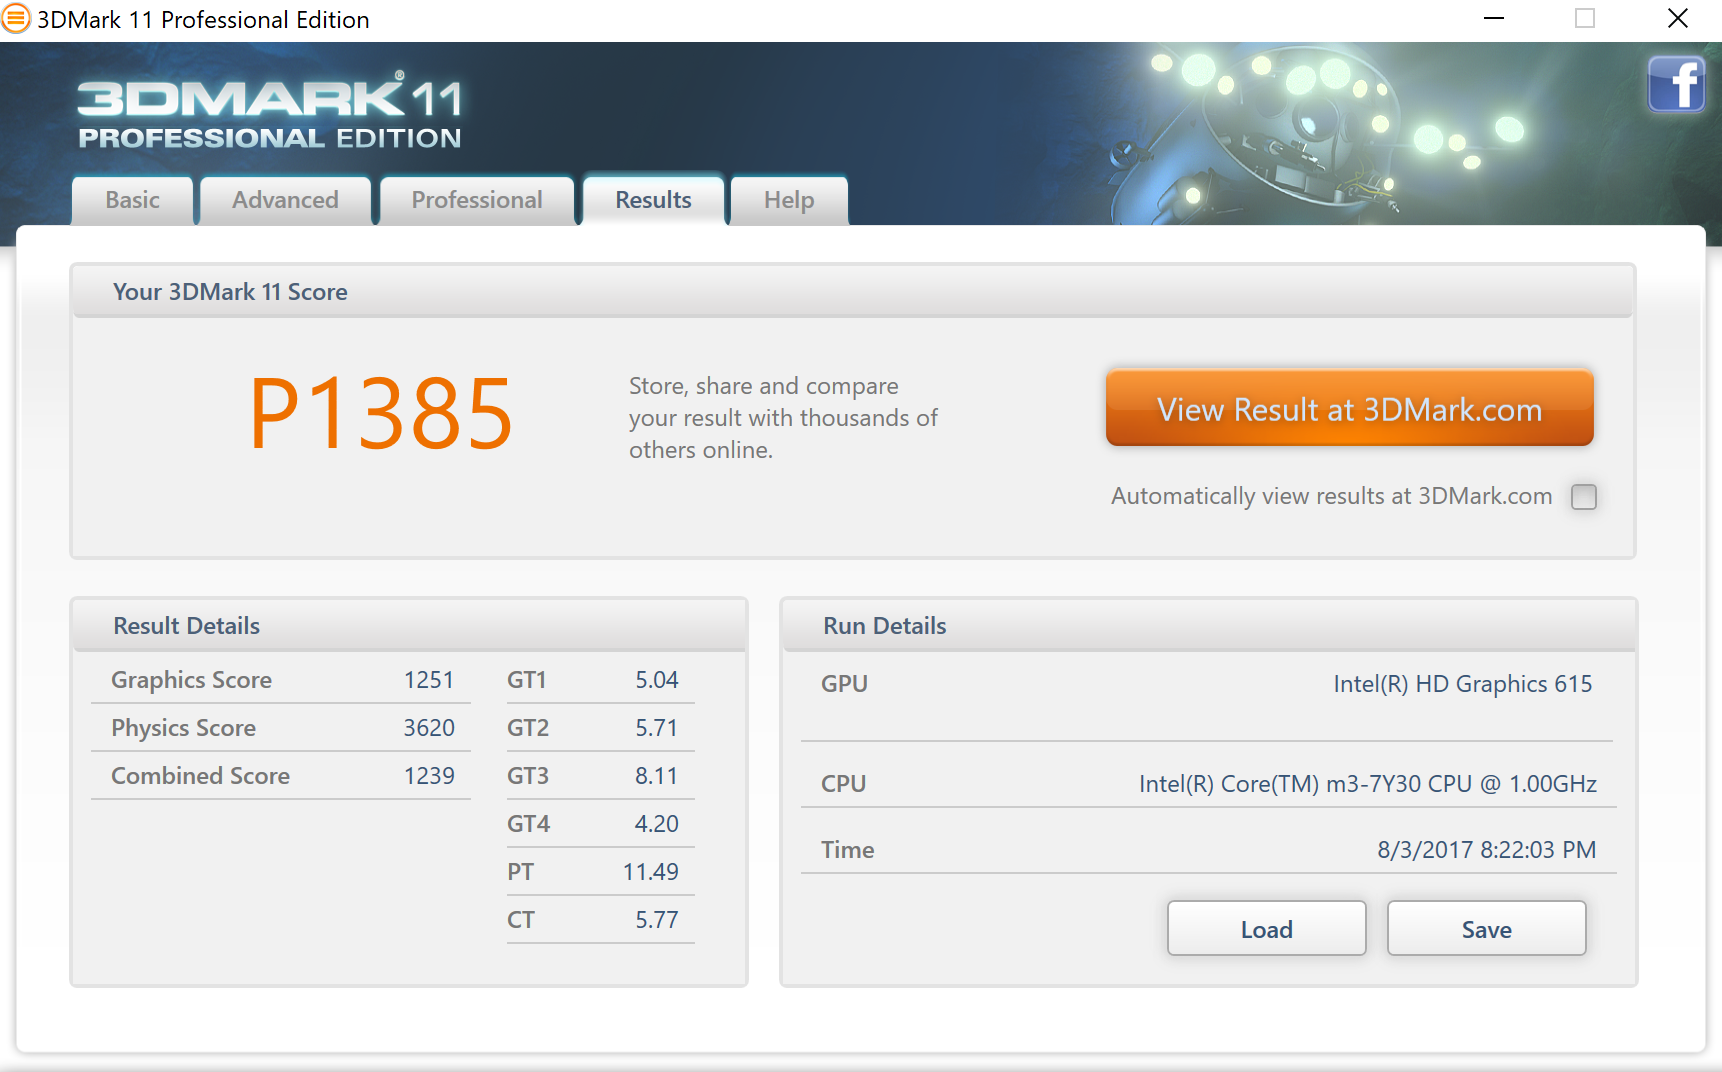
| 3DMark 11 Performance | 1385 points | |
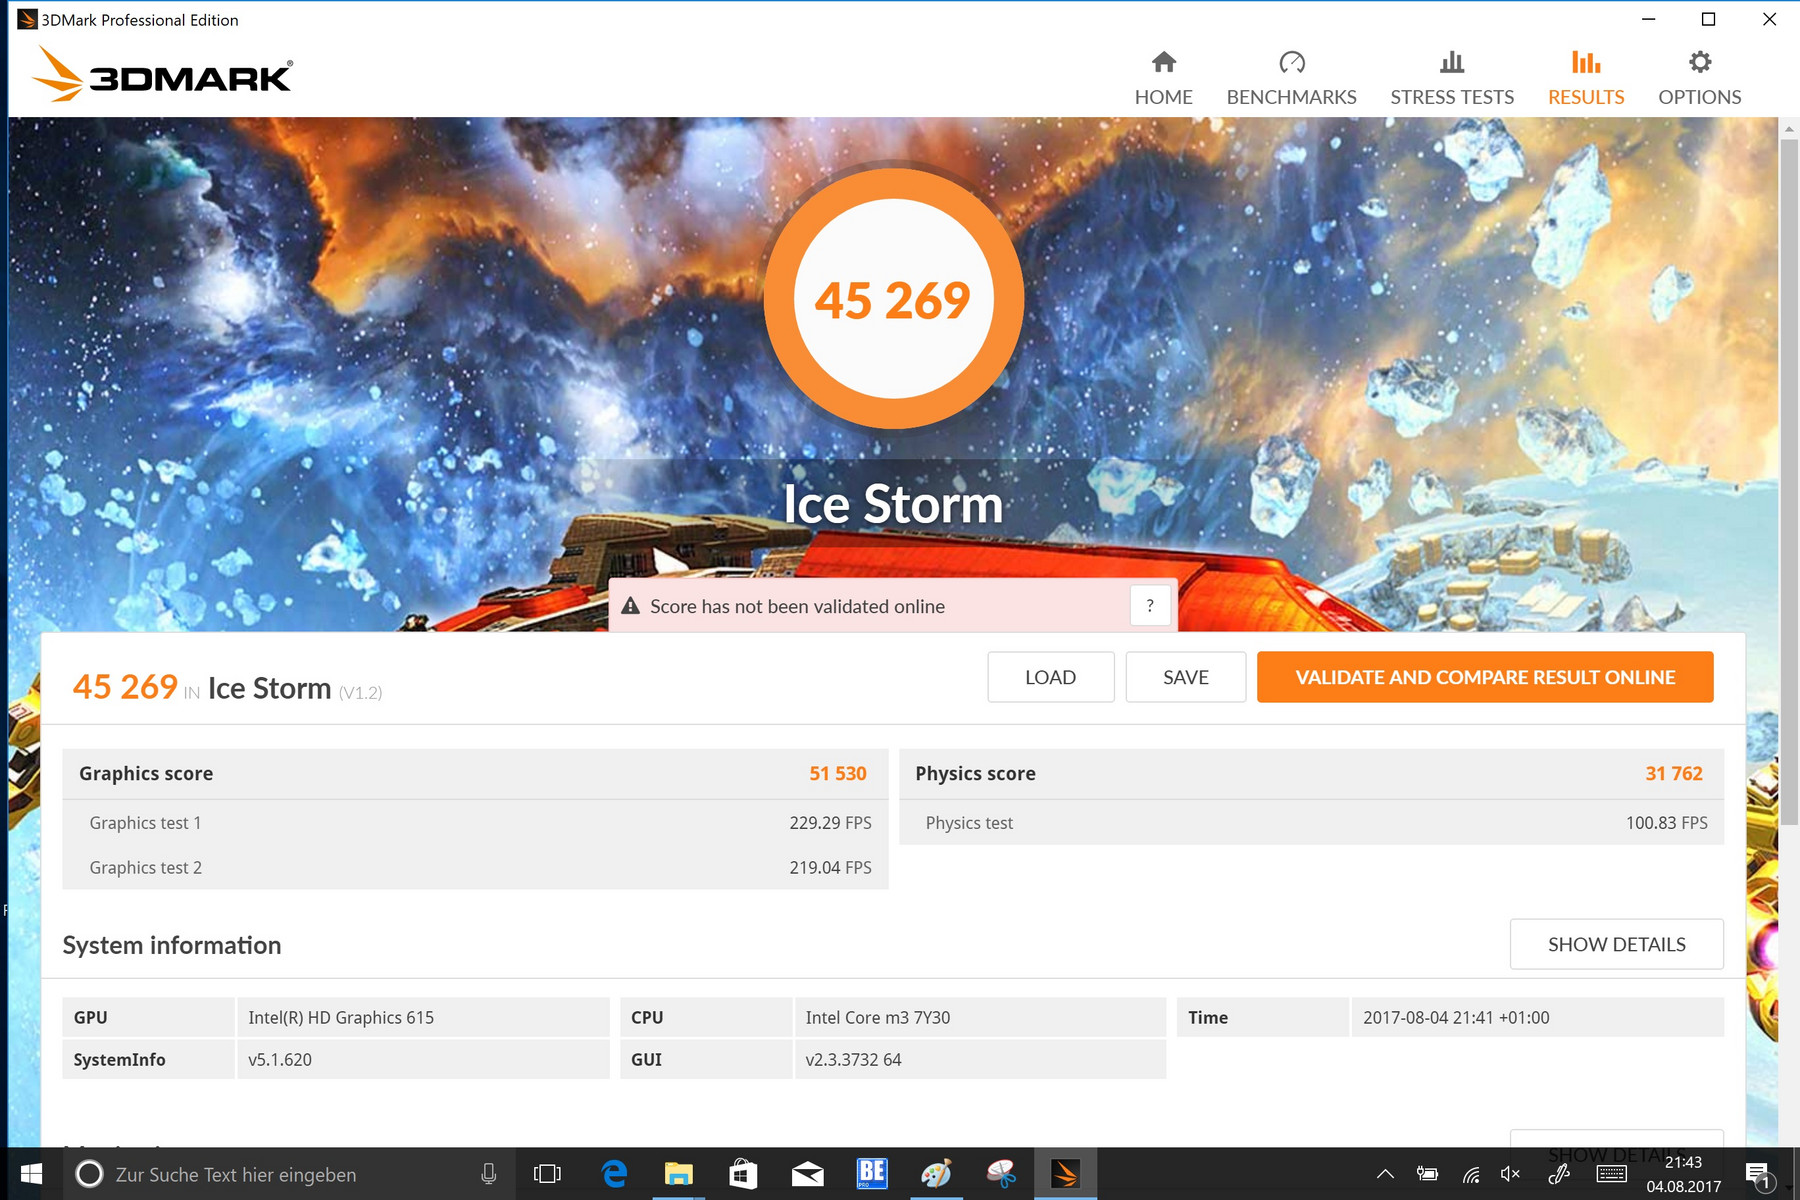
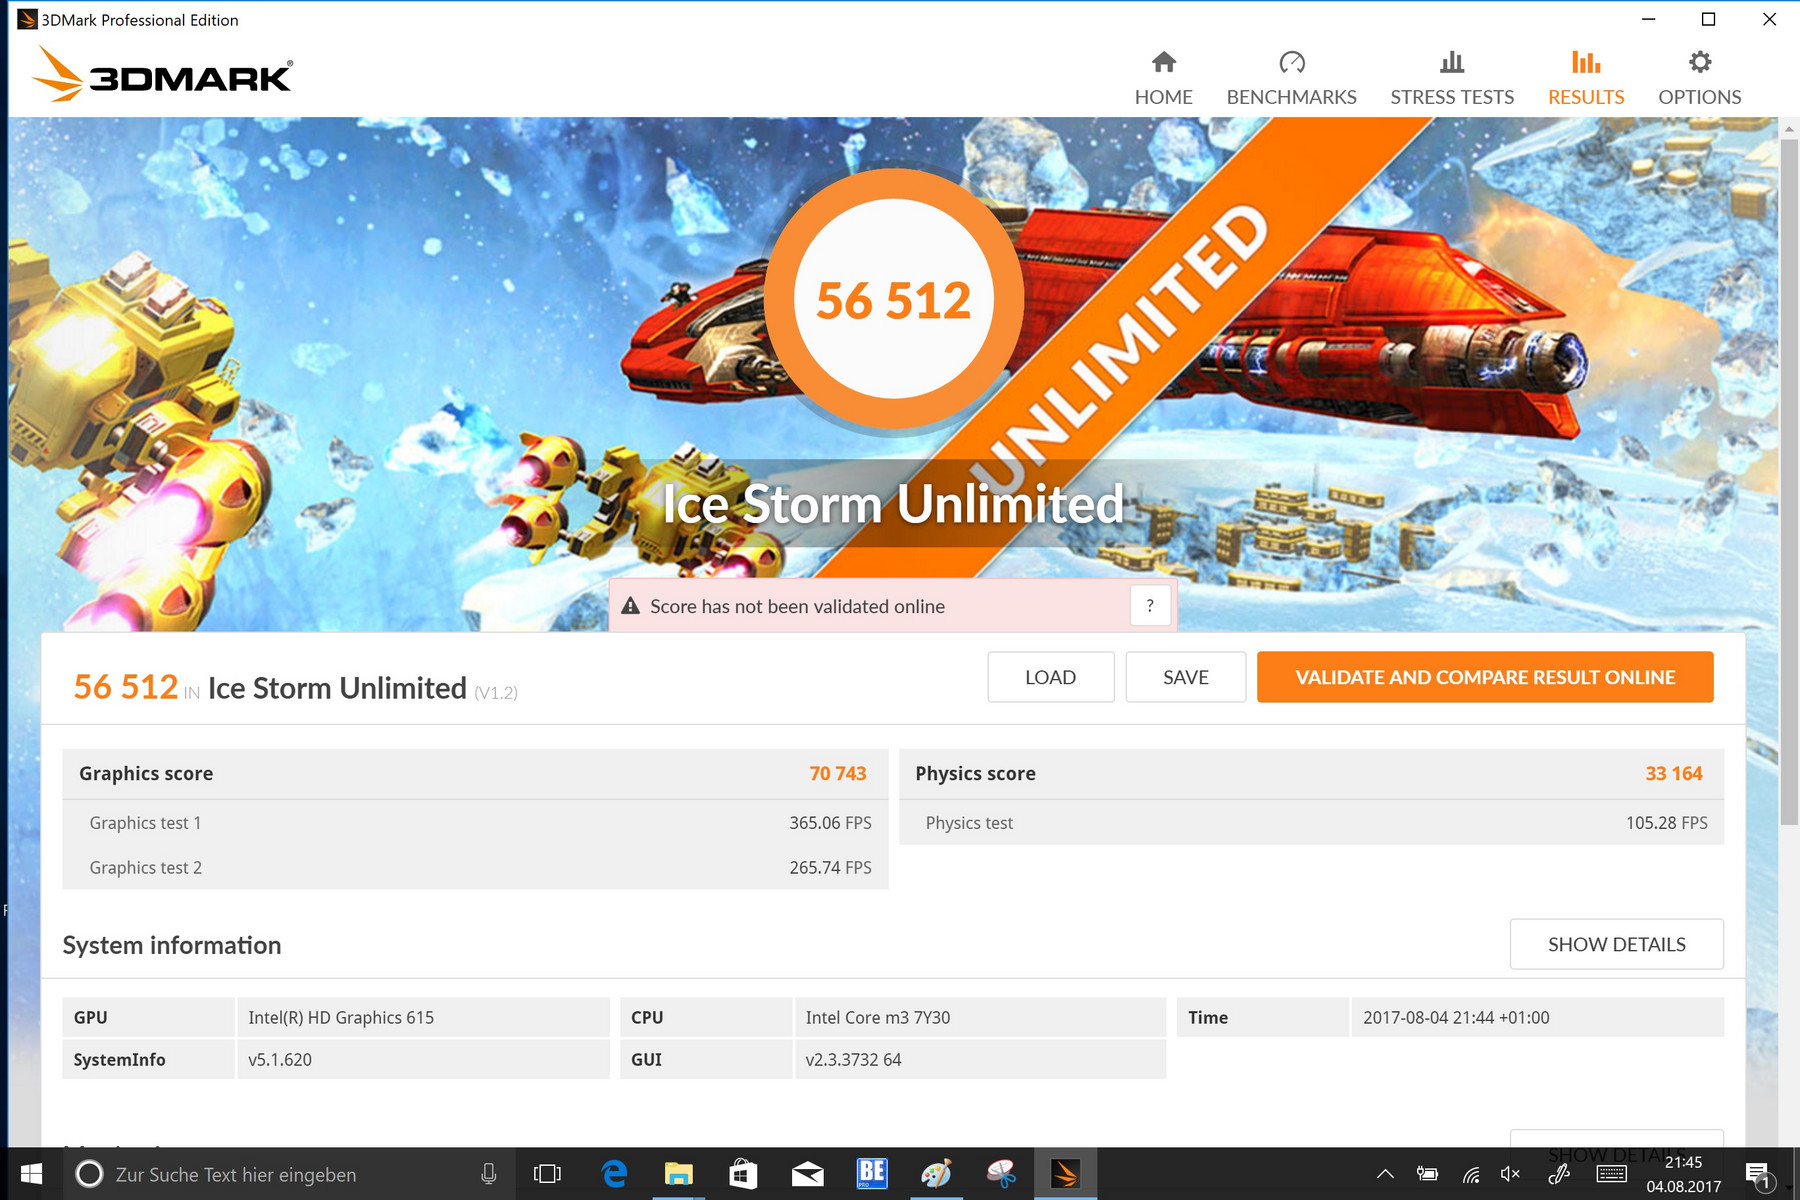
| 3DMark Ice Storm Standard Score | 45269 points | |
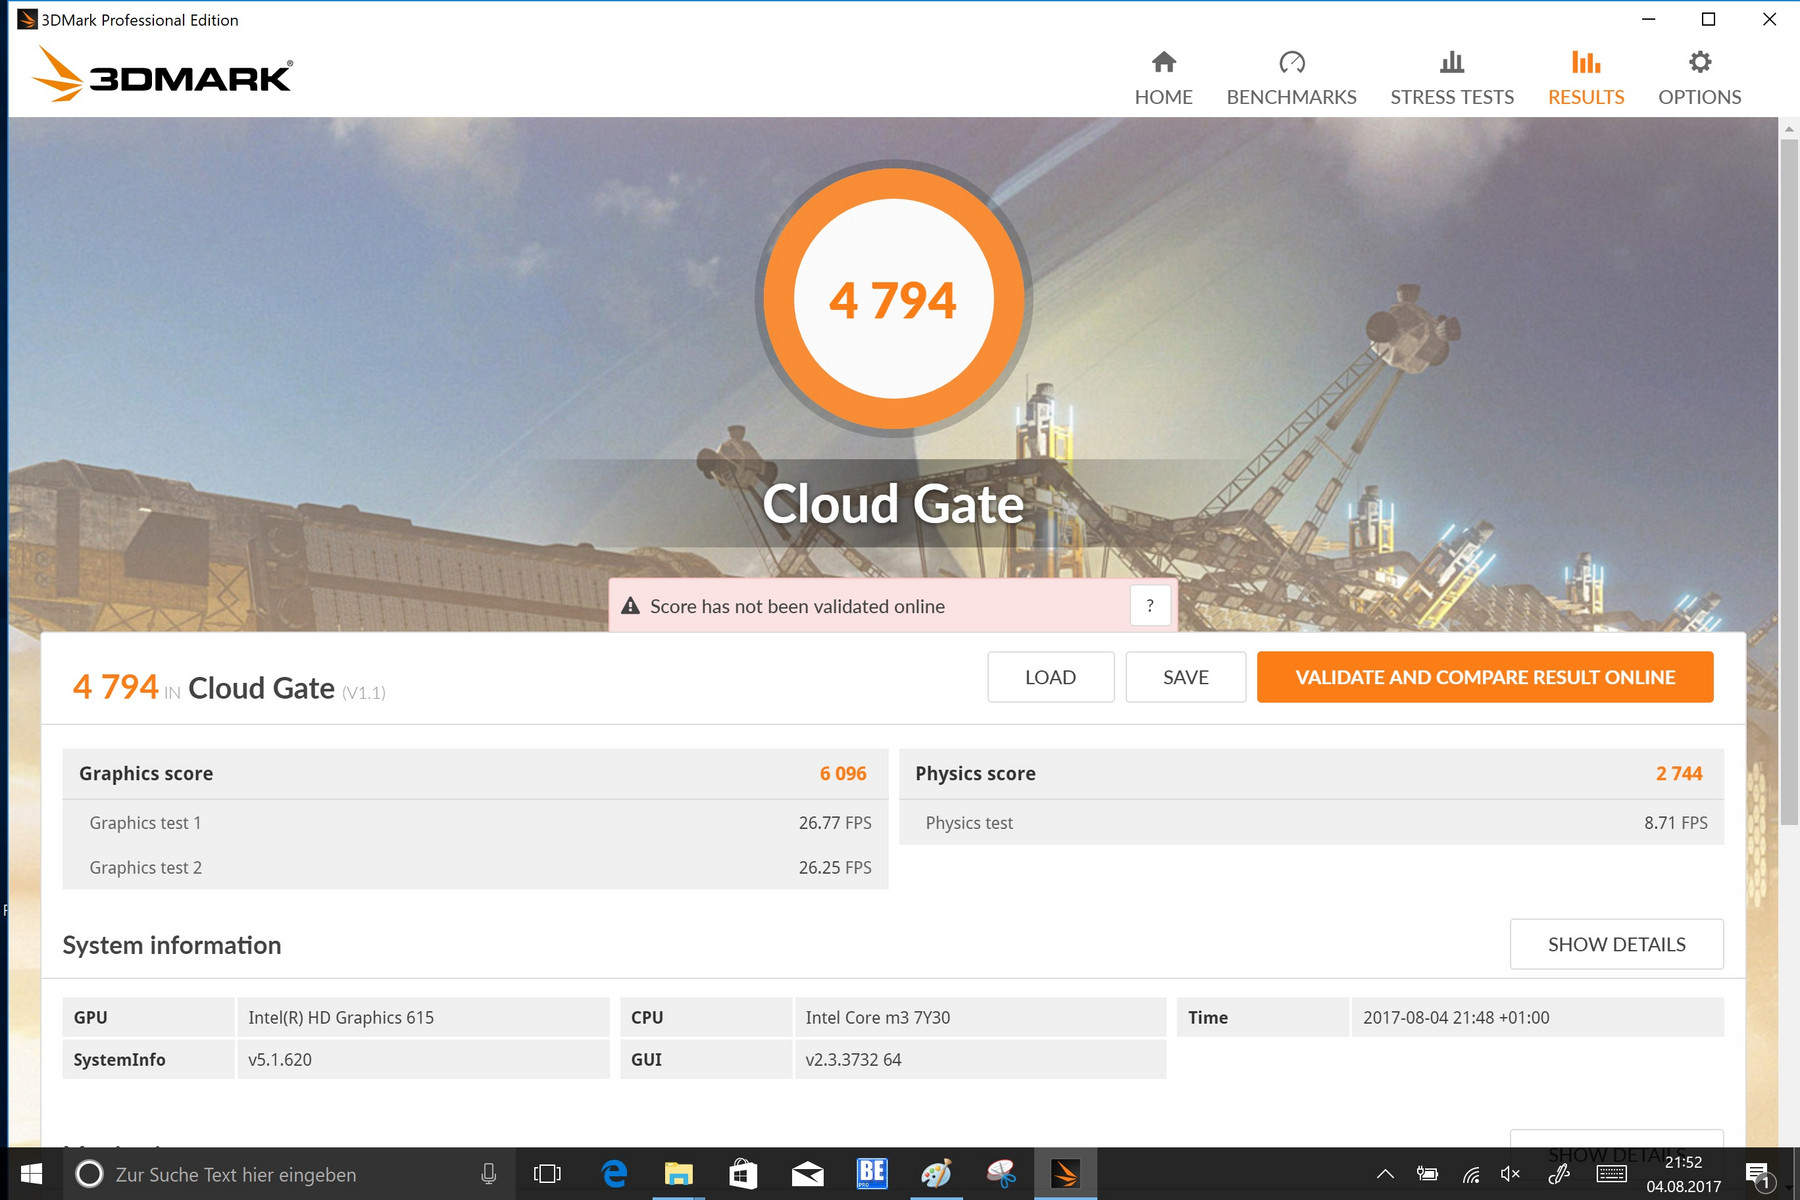
| 3DMark Cloud Gate Standard Score | 4794 points | |
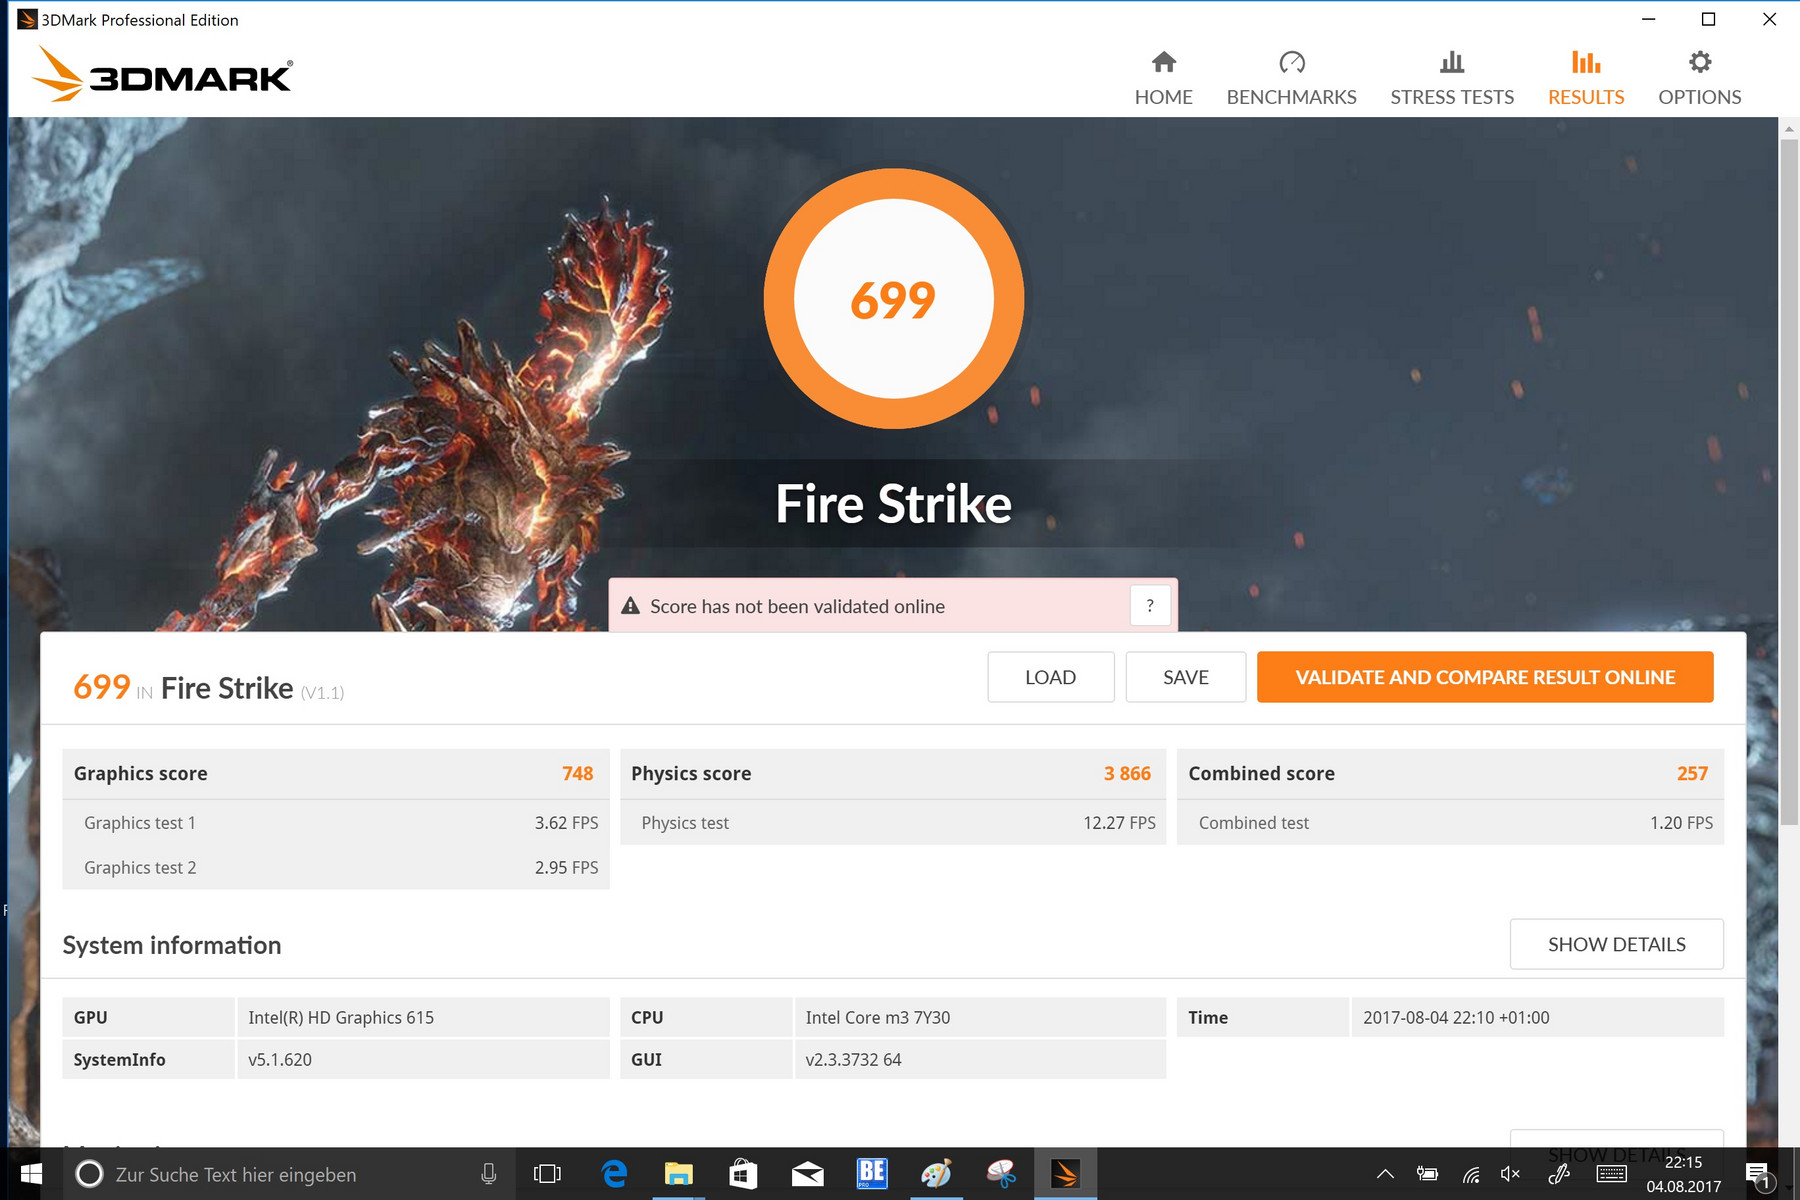
| 3DMark Fire Strike Score | 699 points | |
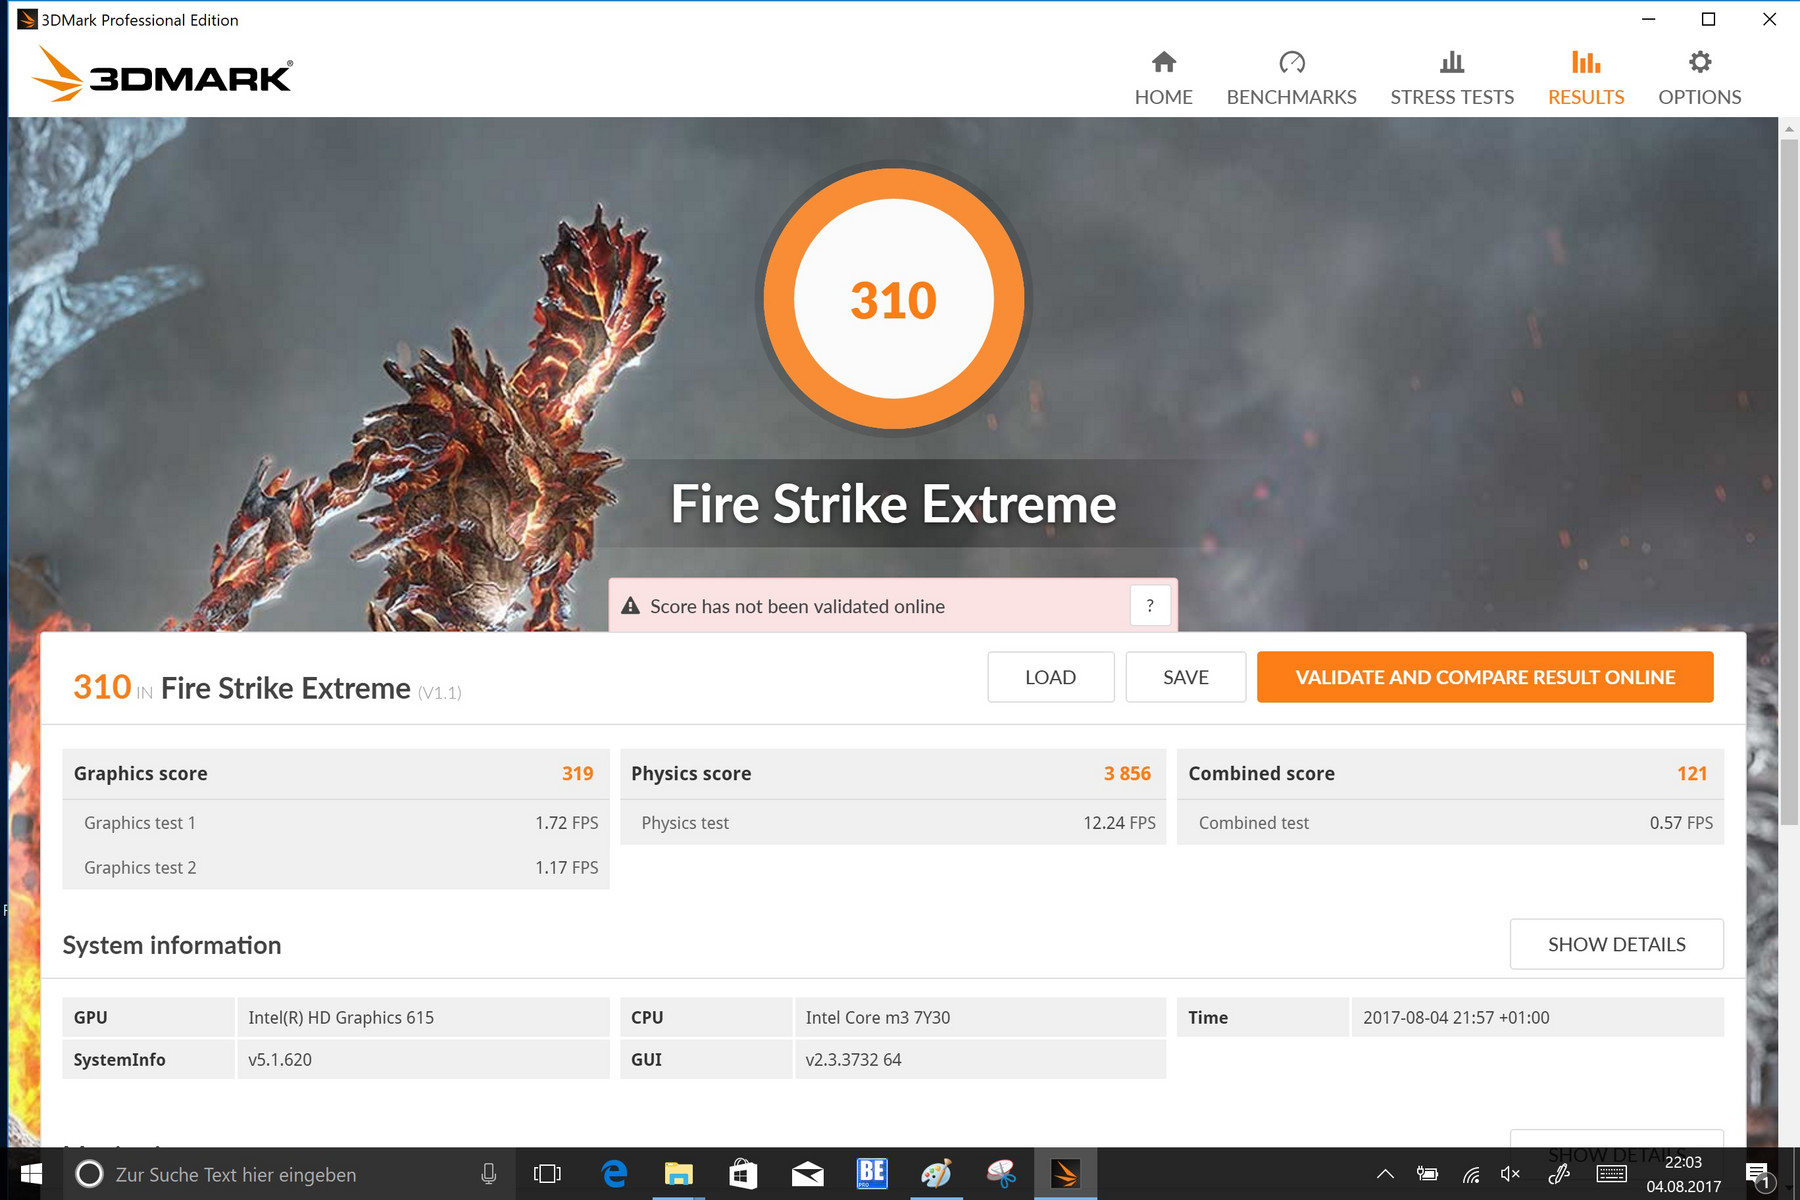
| 3DMark Fire Strike Extreme Score | 310 points | |
Help | ||
Gaming Performance
The convertible is not made for gaming, and thus the frame rates are mostly within an unplayable range. Simpler games from the Windows Store or browser games can be enjoyed, though. The performance is simply not high enough for other PC games. Compared with the competition, our review sample still does a relatively good job here.
| low | med. | high | ultra | |
|---|---|---|---|---|
| BioShock Infinite (2013) | 42.6 | 25.2 | 20.8 | 4.6 |
| Battlefield 4 (2013) | 31.2 | 22.7 | 18.9 | |
| Rise of the Tomb Raider (2016) | 14.2 | 9.4 |
Emissions & Energy Management
System Noise
The device does not have an active fan. Instead, it uses heat-pipes and its casing to discharge the heat. Thus, it does not produce noise and the device operates absolutely silently. We did not perceive any electronic noises or the like even when accessing data.
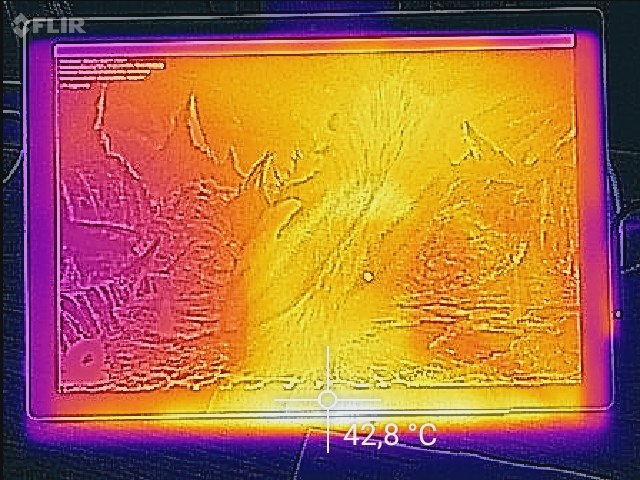
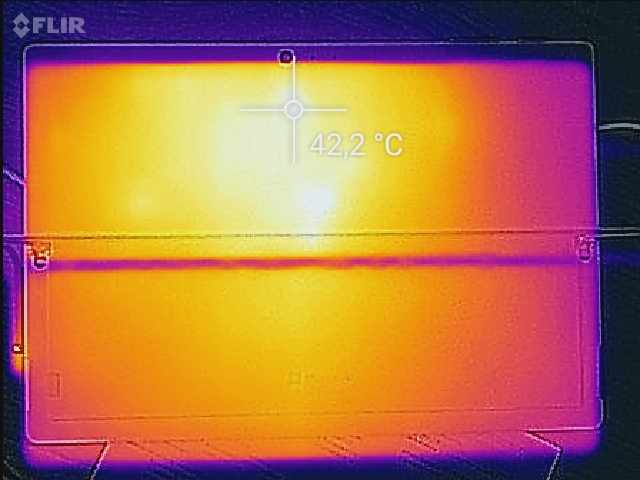
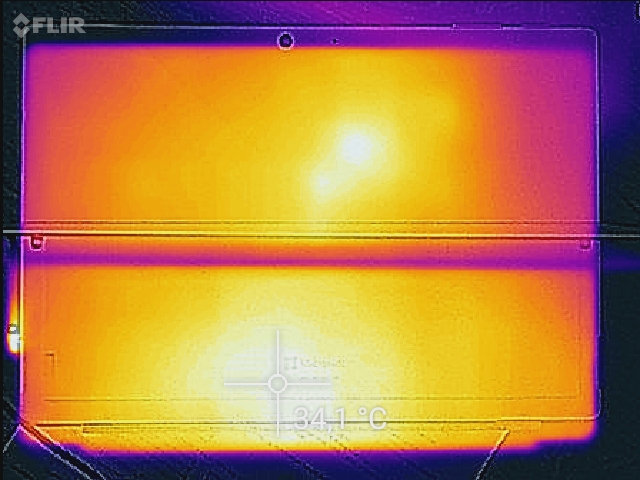
Temperature
The casing's temperatures are similar to those of Microsoft's Surface Pro 2017 i5 model. Both have a passive cooling system that discharges heat from the components. At a maximum of 40.6 °C, the casing does not heat up excessively. Acer's Aspire Switch Alpha 12 is the leader with 51 °C during load.
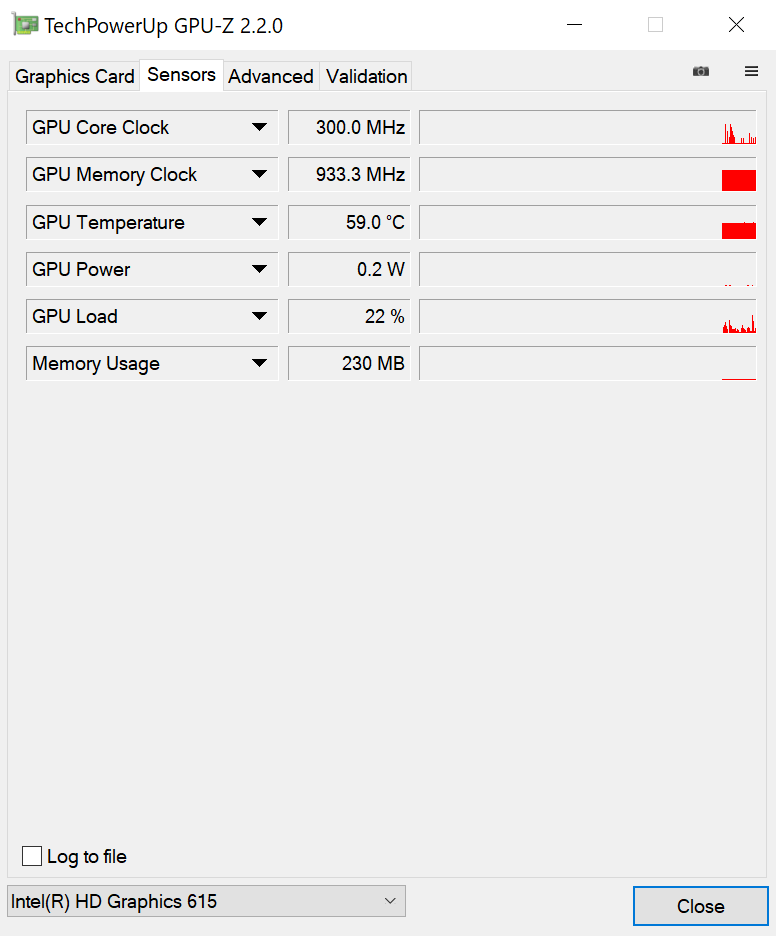
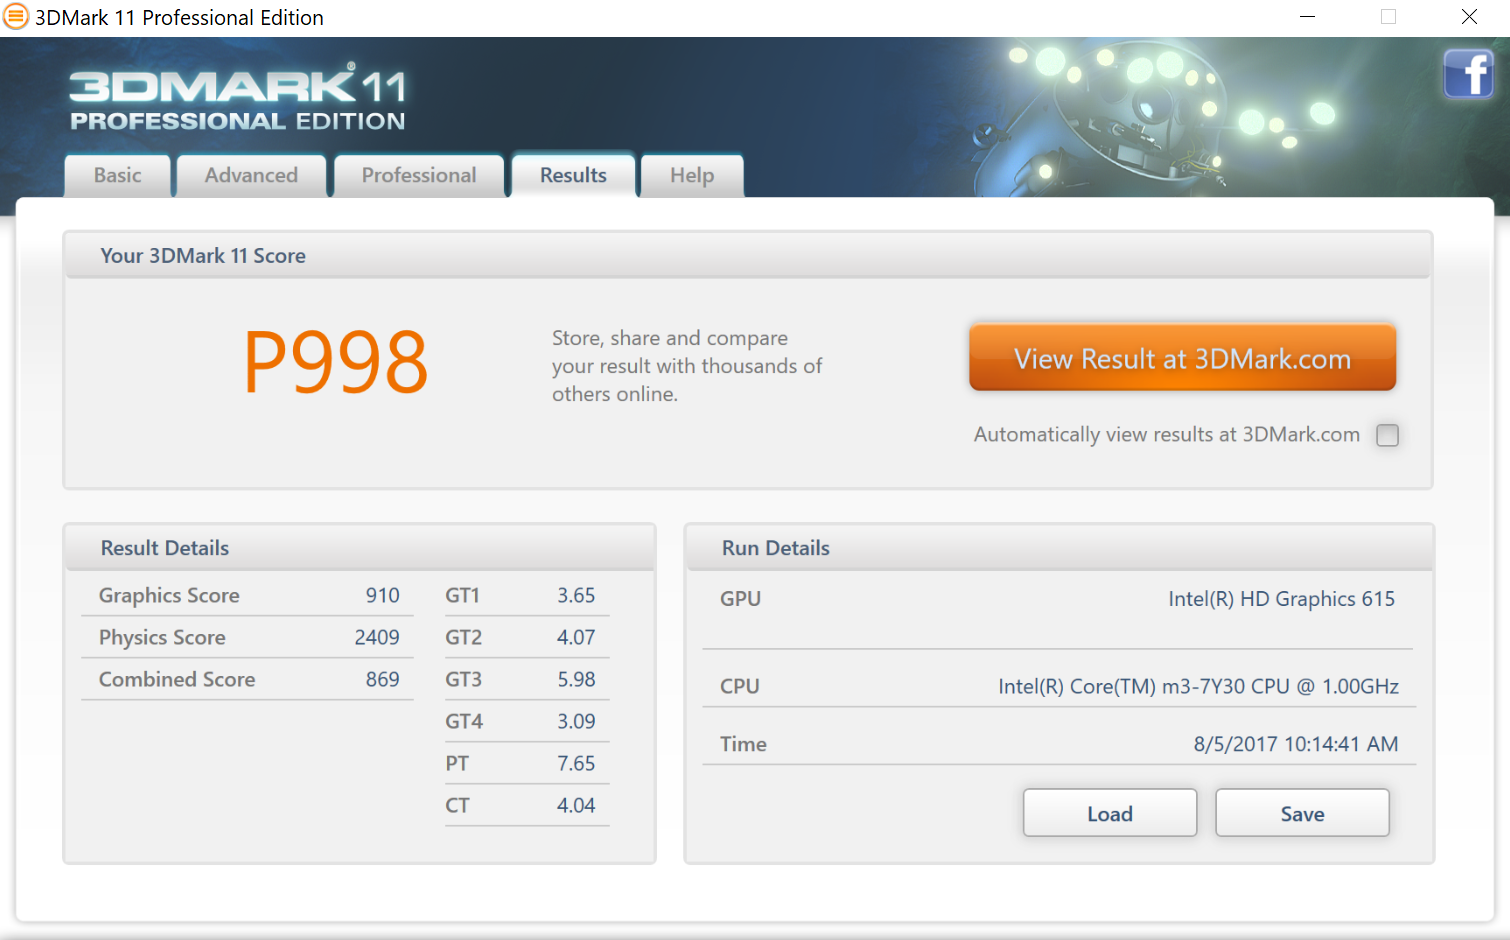
The small SoC reaches a temperature of 62 °C during load (Prime95) and clocks at an average of 1.4 GHz in the one-hour stress test. The heavy throttling discovered with Intel's Core i5 is not the main issue of our review sample with the considerably more frugal Intel Core m3. The cooling system of Microsoft's Surface Pro 2017 copes much better with its TDP of just 4.5 watts. However, the performance is still throttled at a CPU temperature of 62 °C to prevent damage due to overheating and too high surface temperatures.
The 3DMark 11 performed afterward presented a much lower score than compared with a cold start. Since stable gaming performance is not the prime issue here, this test should not be considered too heavily. Evident performance losses due to overheating will not occur during normal everyday use.
| Microsoft Surface Pro (2017) m3 HD Graphics 615, m3-7Y30, Samsung PM971 KUS020203M | Microsoft Surface Pro (2017) i5 HD Graphics 620, i5-7300U, Samsung PM971 KUS030202M | Microsoft Surface Pro (2017) i7 Iris Plus Graphics 640, i7-7660U, Samsung PM971 KUS040202M | Lenovo Ideapad Miix 720-12IKB HD Graphics 620, i7-7500U, Samsung SSD PM961 1TB M.2 PCIe 3.0 x4 NVMe (MZVLW1T0) | HP Elite x2 1012 G1 HD Graphics 515, 6Y54, Liteon L8H-256V2G | Lenovo ThinkPad X1 Tablet Gen 2 HD Graphics 615, i5-7Y54, Samsung PM961 MZVLW256HEHP | Samsung Galaxy Tab Pro S W700N HD Graphics 515, 6Y30, Lite-On CV1-8B128 | Acer Aspire Switch Alpha 12 SA5-271-56HM HD Graphics 520, 6200U, Kingston RBU-SNS8152S3256GG2 | |
|---|---|---|---|---|---|---|---|---|
| Heat | 1% | 6% | -3% | 8% | -3% | -8% | -2% | |
| Maximum Upper Side * (°C) | 40.5 | 39.2 3% | 42 -4% | 42 -4% | 39 4% | 47.2 -17% | 42.5 -5% | 46.7 -15% |
| Maximum Bottom * (°C) | 40.6 | 40.3 1% | 42 -3% | 43.6 -7% | 41.2 -1% | 49.8 -23% | 44.6 -10% | 51 -26% |
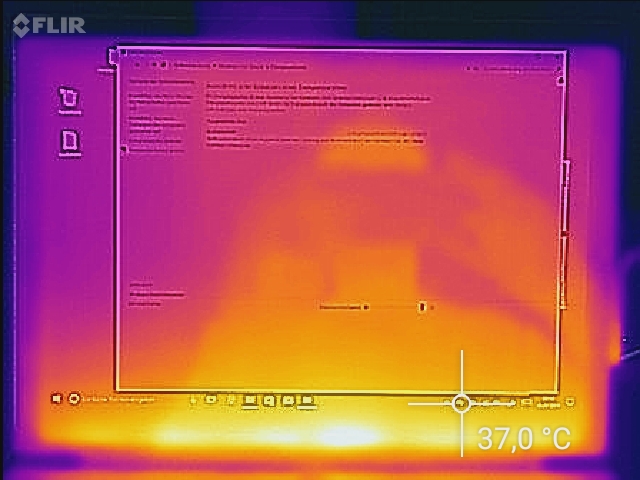
| Idle Upper Side * (°C) | 37.8 | 37 2% | 31 18% | 32.8 13% | 29.5 22% | 30.8 19% | 36.6 3% | 29.5 22% |
| Idle Bottom * (°C) | 32 | 32.3 -1% | 28 12% | 36.4 -14% | 29.8 7% | 29.2 9% | 38.6 -21% | 28.6 11% |
* ... smaller is better
(±) The maximum temperature on the upper side is 40.5 °C / 105 F, compared to the average of 35.4 °C / 96 F, ranging from 19.6 to 60 °C for the class Convertible.
(±) The bottom heats up to a maximum of 40.6 °C / 105 F, compared to the average of 36.9 °C / 98 F
(±) In idle usage, the average temperature for the upper side is 33 °C / 91 F, compared to the device average of 30.3 °C / 87 F.
(-) The palmrests and touchpad can get very hot to the touch with a maximum of 40.5 °C / 104.9 F.
(-) The average temperature of the palmrest area of similar devices was 28 °C / 82.4 F (-12.5 °C / -22.5 F).
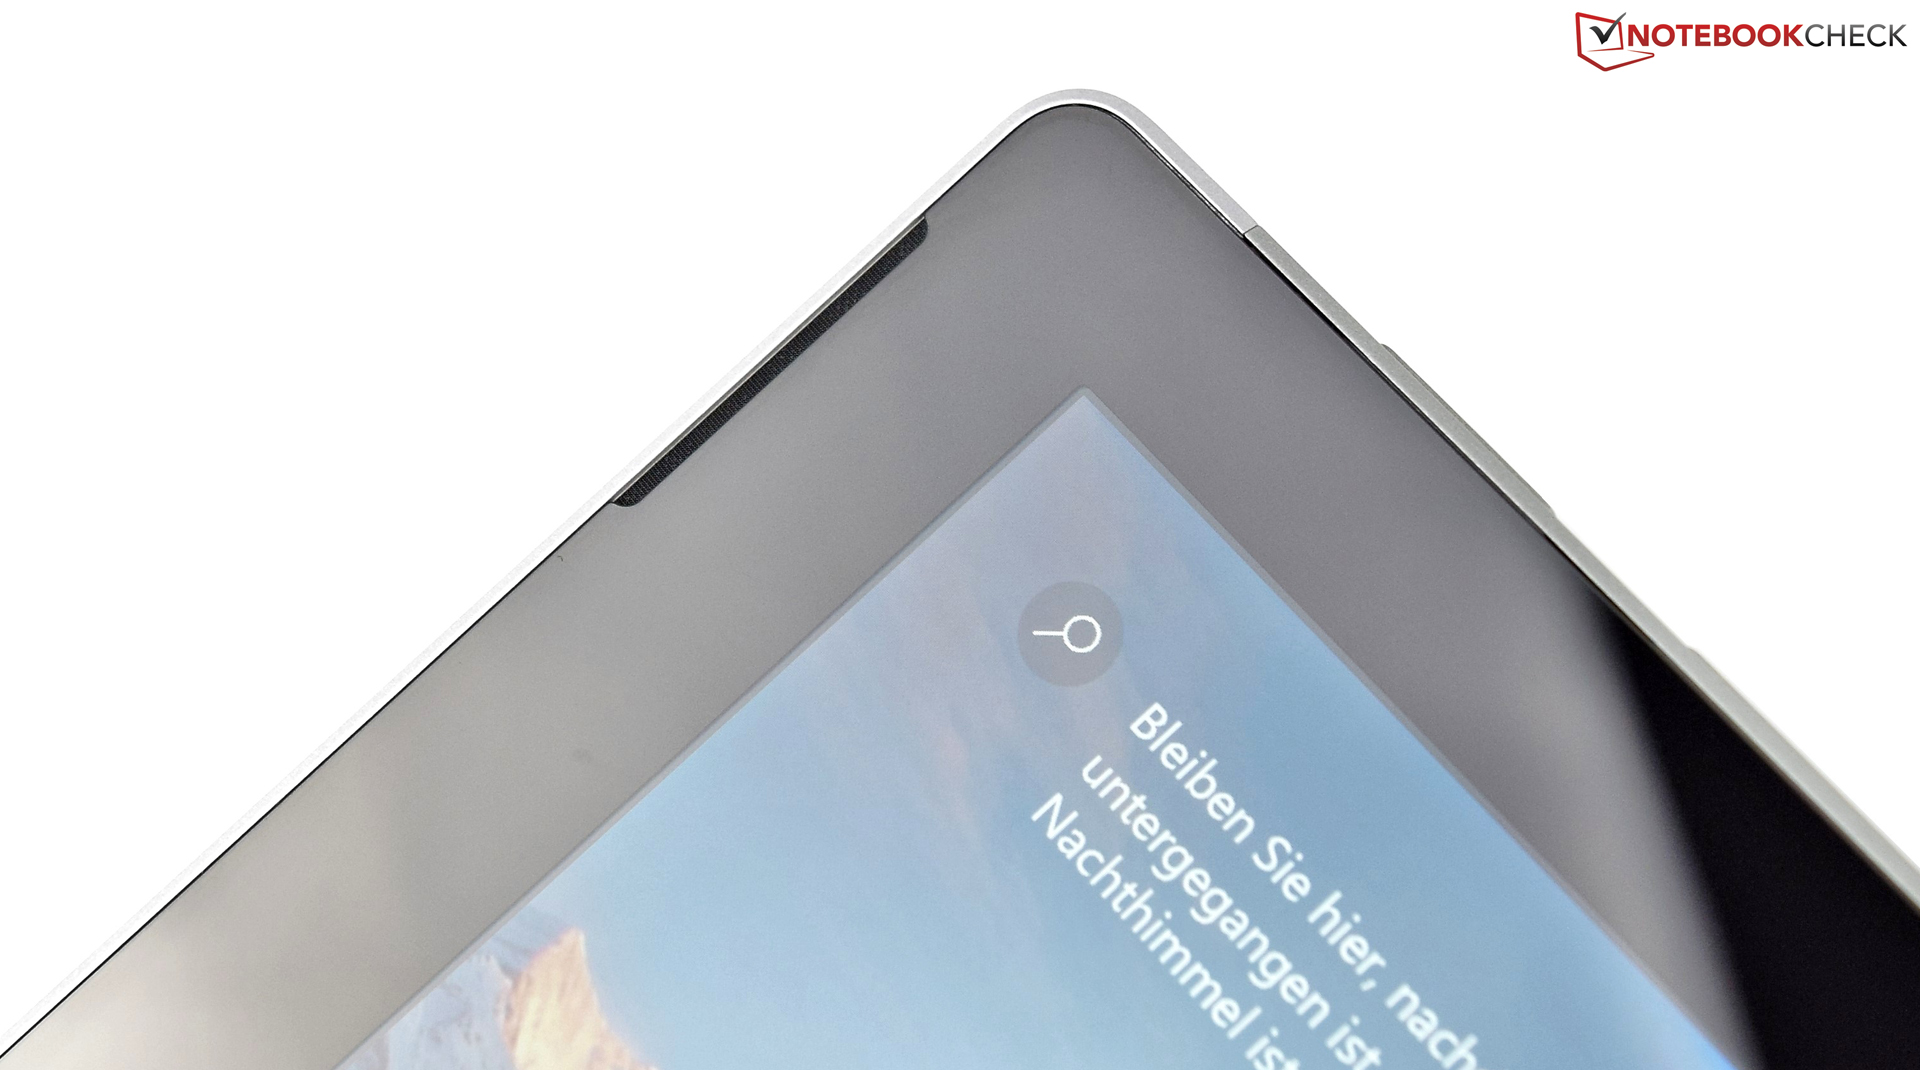
Speakers
The installed speakers are identical with those of the previously tested Microsoft Surface Pro 2017. Only marginal differences can be measured and are related to production. The sound of both speakers is decent for a convertible and can compete against good laptop speakers despite the compact size. However, the speakers have to admit defeat against external sound solutions.
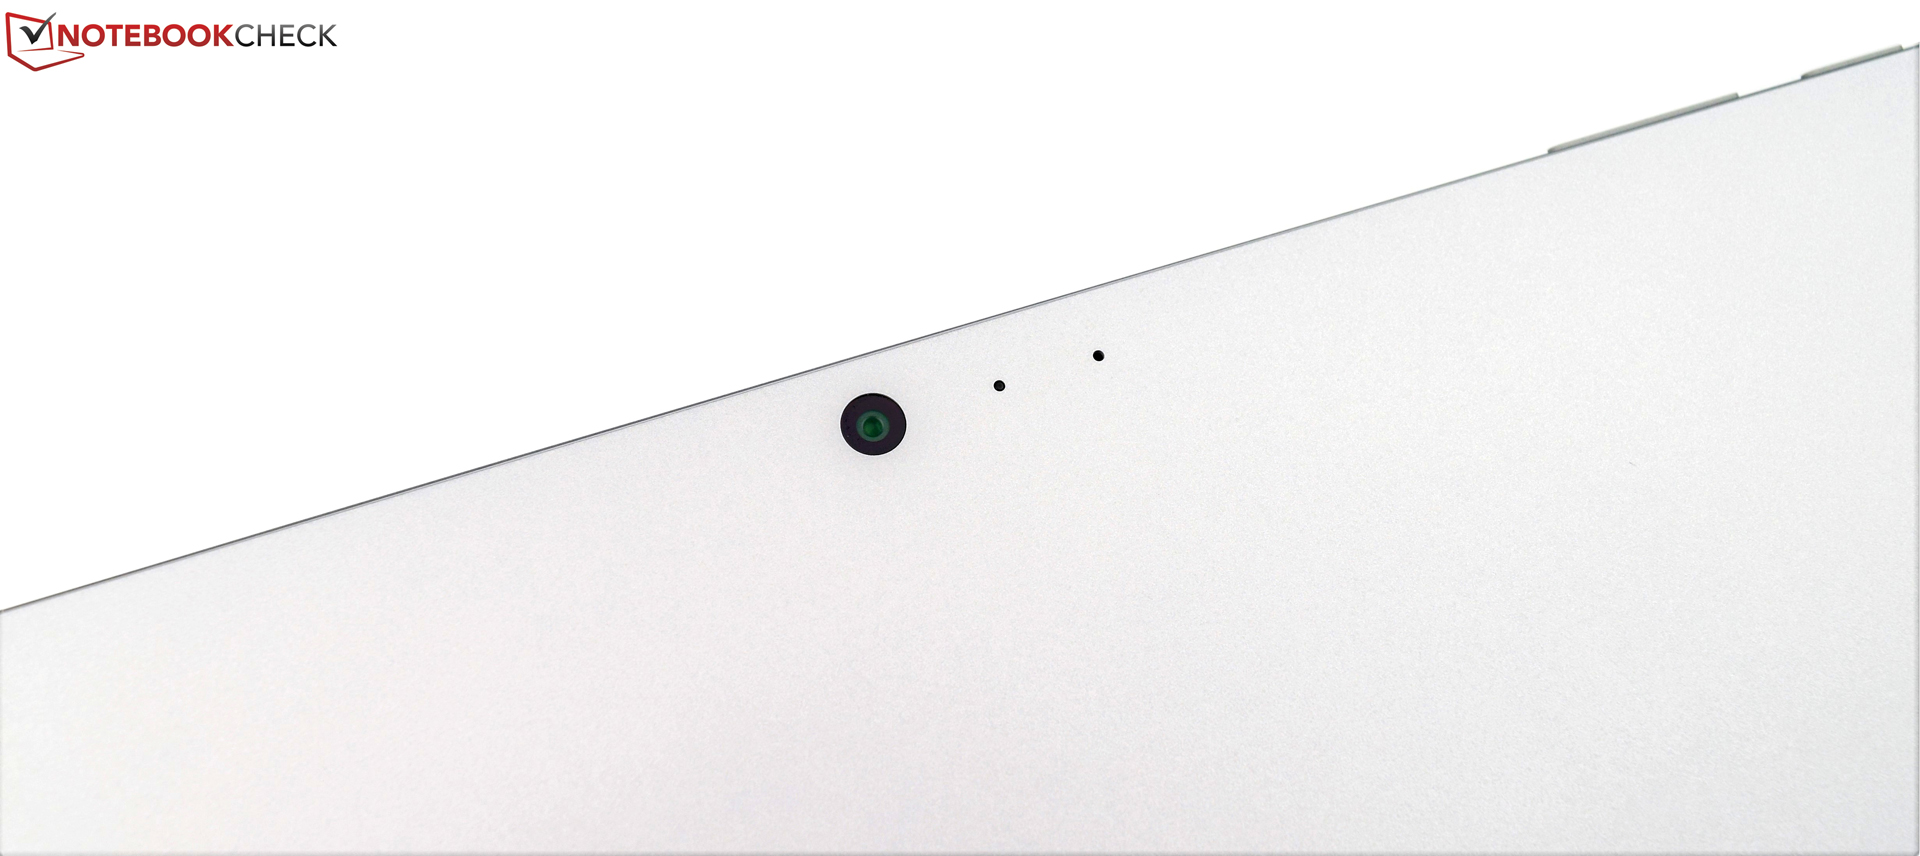
Speech and music are loud and clear and the microphone records speech indoors very well. However, wind noise causes minor interference when recording outdoors.
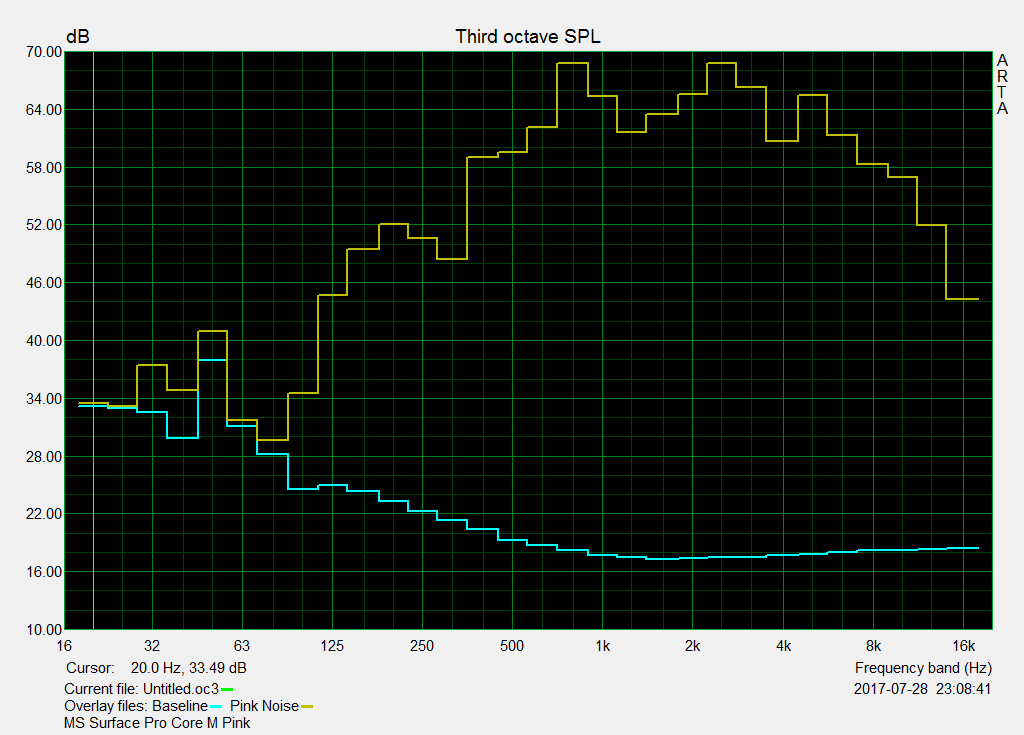
Microsoft Surface Pro (2017) m3 audio analysis
(-) | not very loud speakers (68.8 dB)
Bass 100 - 315 Hz
(±) | reduced bass - on average 12.9% lower than median
(±) | linearity of bass is average (10.5% delta to prev. frequency)
Mids 400 - 2000 Hz
(+) | balanced mids - only 3.7% away from median
(±) | linearity of mids is average (9.6% delta to prev. frequency)
Highs 2 - 16 kHz
(+) | balanced highs - only 4.1% away from median
(±) | linearity of highs is average (8.6% delta to prev. frequency)
Overall 100 - 16.000 Hz
(±) | linearity of overall sound is average (19.1% difference to median)
Compared to same class
» 46% of all tested devices in this class were better, 7% similar, 48% worse
» The best had a delta of 6%, average was 20%, worst was 57%
Compared to all devices tested
» 46% of all tested devices were better, 7% similar, 47% worse
» The best had a delta of 4%, average was 23%, worst was 134%
Microsoft Surface Pro (2017) i5 audio analysis
(-) | not very loud speakers (68 dB)
Bass 100 - 315 Hz
(±) | reduced bass - on average 9.7% lower than median
(±) | linearity of bass is average (7% delta to prev. frequency)
Mids 400 - 2000 Hz
(+) | balanced mids - only 4.6% away from median
(+) | mids are linear (6.3% delta to prev. frequency)
Highs 2 - 16 kHz
(+) | balanced highs - only 2.1% away from median
(+) | highs are linear (5.2% delta to prev. frequency)
Overall 100 - 16.000 Hz
(±) | linearity of overall sound is average (18.2% difference to median)
Compared to same class
» 40% of all tested devices in this class were better, 7% similar, 53% worse
» The best had a delta of 6%, average was 20%, worst was 57%
Compared to all devices tested
» 39% of all tested devices were better, 8% similar, 53% worse
» The best had a delta of 4%, average was 23%, worst was 134%
Frequency diagram comparison (checkboxes above can be turned on/off!)
Power Consumption
Our review sample can absolutely illustrate the virtues of the economic SoC in power consumption, although the advantage over the Core i5 Surface is only marginal. In return, the energy advantage over Microsoft's Surface Pro 2017 i7 flagship increases to 40%. A look at the comparison chart shows that only Lenovo's ThinkPad X1 and Samsung's Galaxy Tab Pro S are even more energy-efficient.
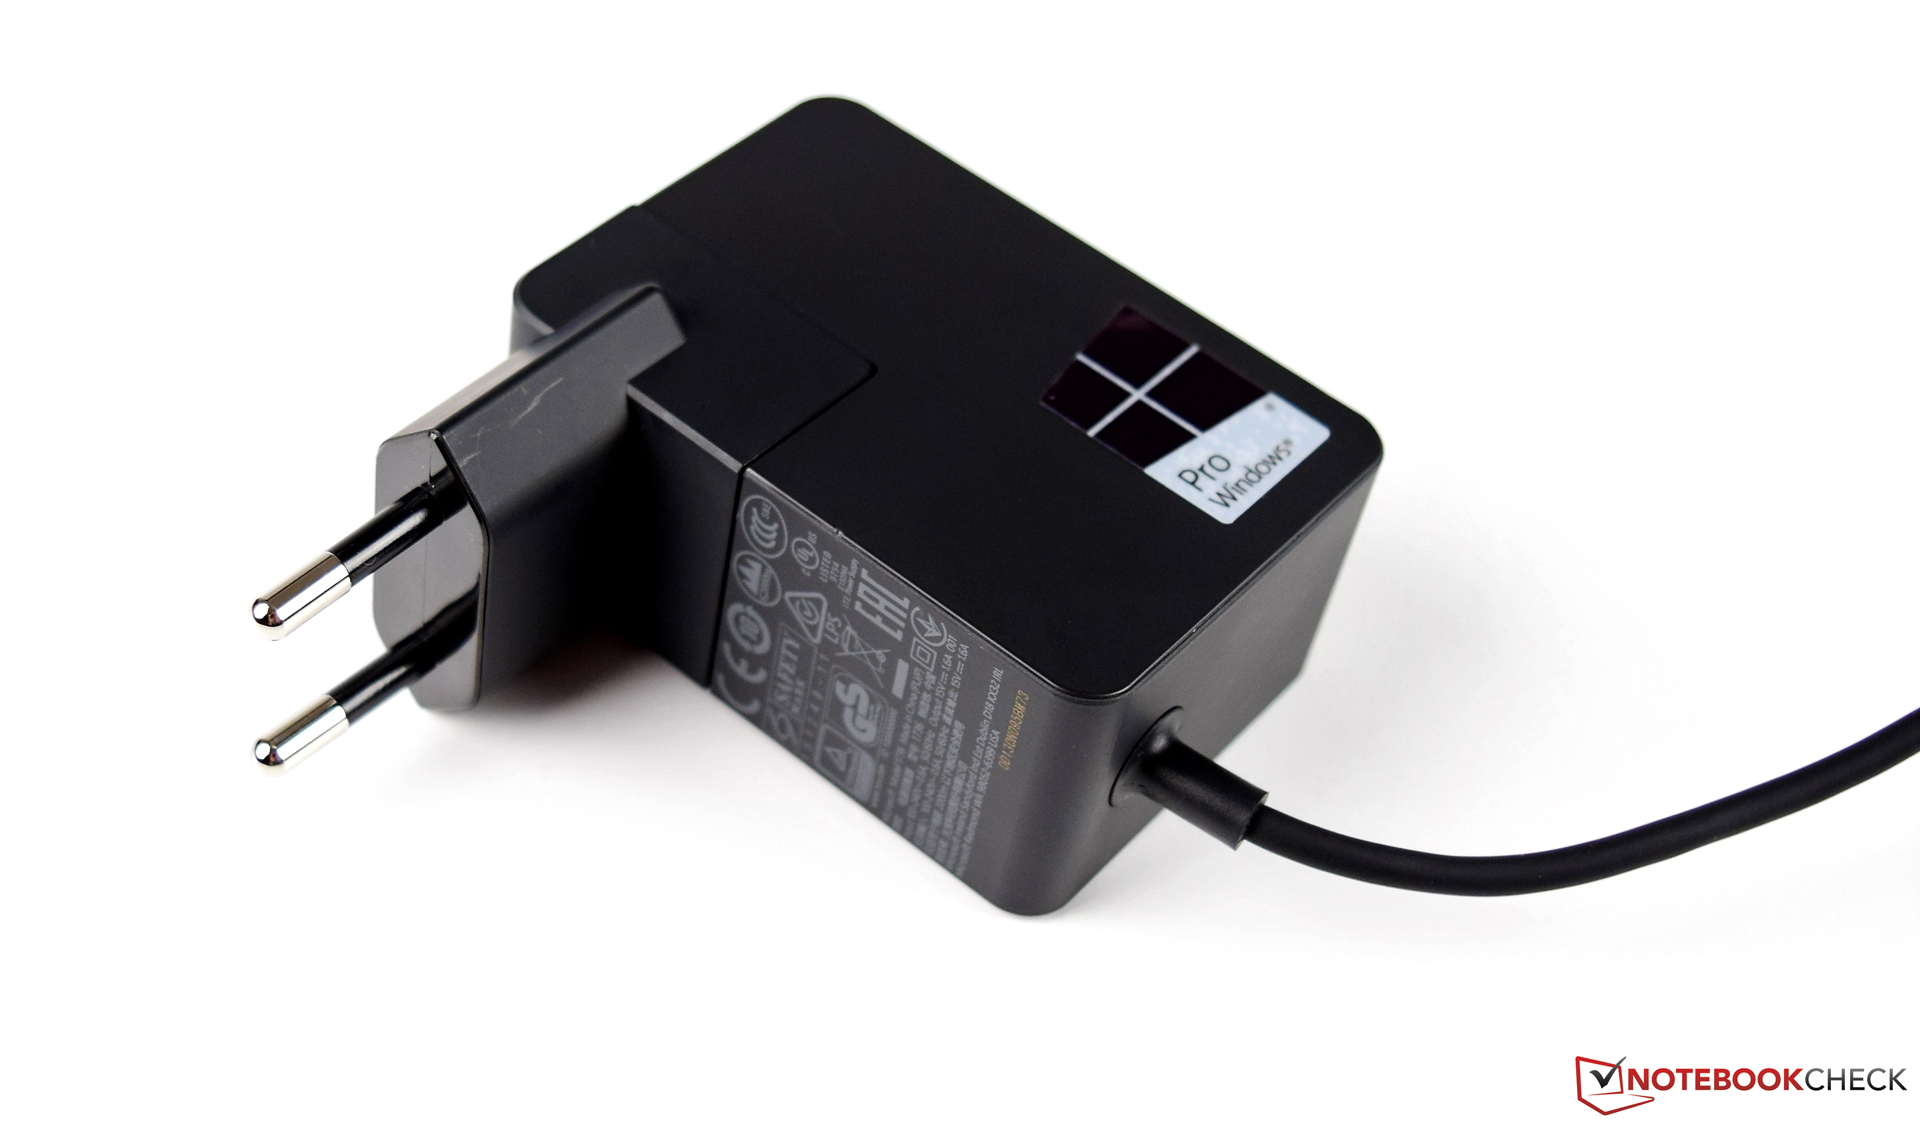
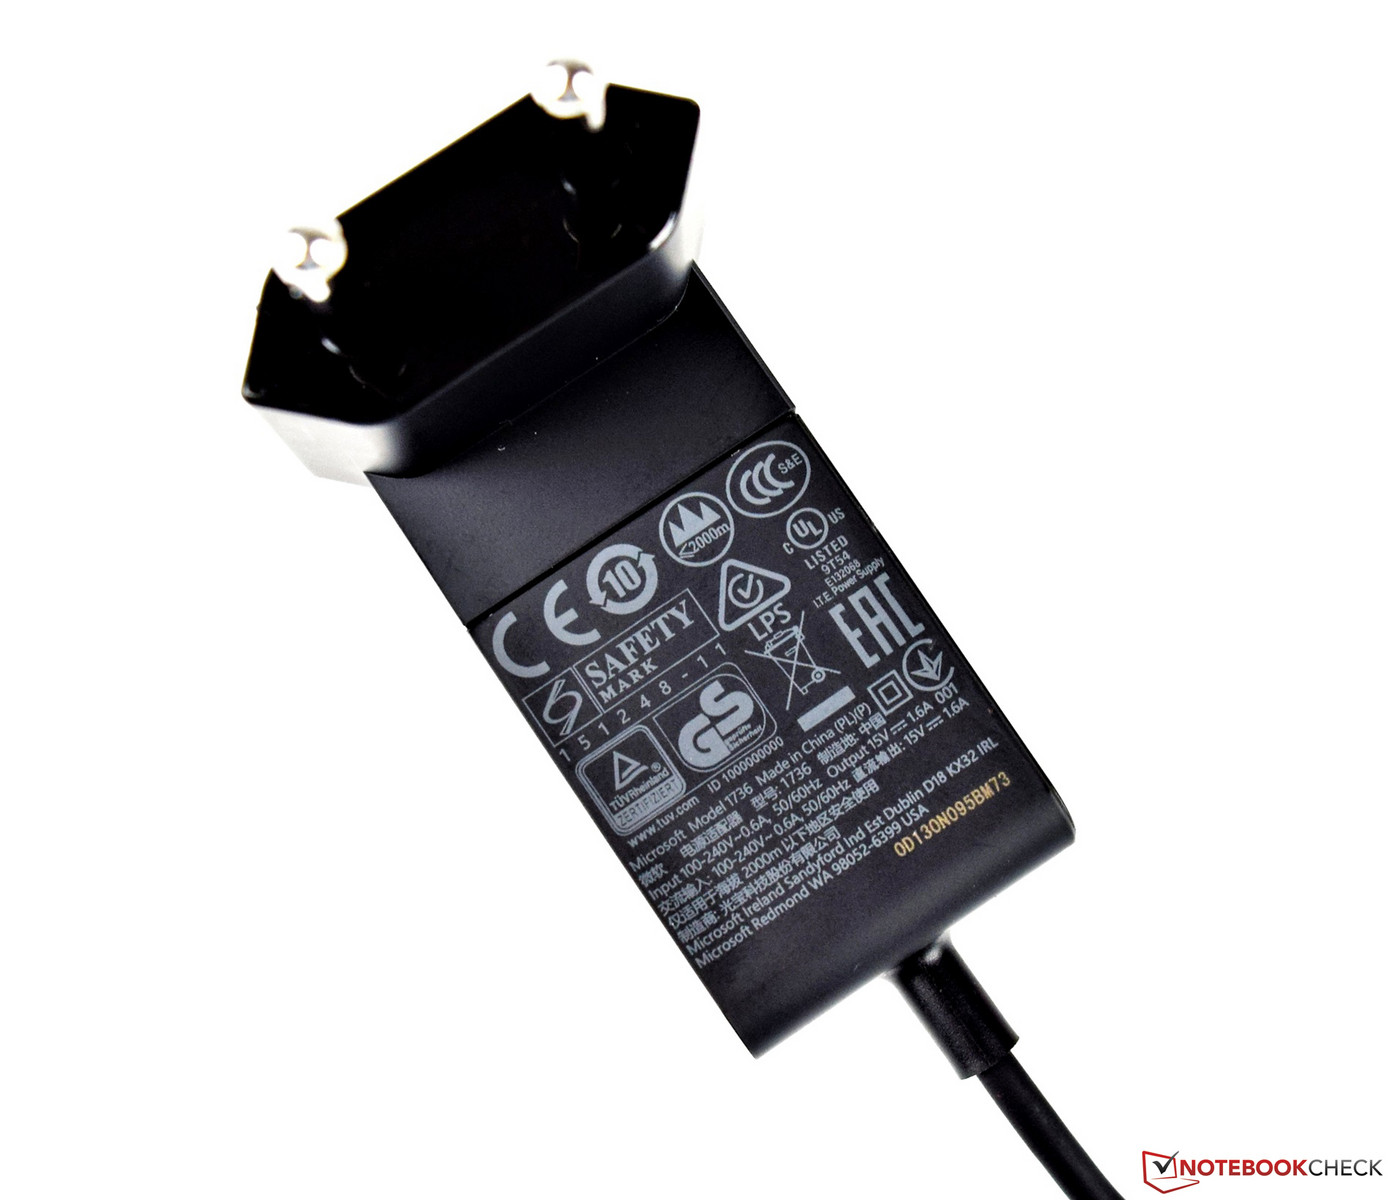
Our review sample does not consume much with 3.1 - 9.9 watts without load. The power supply only has to output 23.6 watts during load. The compact power supply has enough capacity with a maximum output of 24 watts. Although there is not much elbowroom in view of the maximum measured power consumption of 23.6 watts, it is only reached for a very short time if at all. Of course, the power supply is a bit smaller than that of the i5 model, but an additional USB port for recharging smartphones and co. is no longer present.
| Off / Standby | |
| Idle | |
| Load |
|
Key:
min: | |
| Microsoft Surface Pro (2017) m3 m3-7Y30, HD Graphics 615, Samsung PM971 KUS020203M, IPS, 2736x1826, 12.3" | Microsoft Surface Pro (2017) i5 i5-7300U, HD Graphics 620, Samsung PM971 KUS030202M, IPS, 2736x1824, 12.3" | Microsoft Surface Pro (2017) i7 i7-7660U, Iris Plus Graphics 640, Samsung PM971 KUS040202M, IPS, 2736x1824, 12.3" | Lenovo Ideapad Miix 720-12IKB i7-7500U, HD Graphics 620, Samsung SSD PM961 1TB M.2 PCIe 3.0 x4 NVMe (MZVLW1T0), IPS, 2880x1920, 12" | HP Elite x2 1012 G1 6Y54, HD Graphics 515, Liteon L8H-256V2G, IPS, 1920x1280, 12.1" | Lenovo ThinkPad X1 Tablet Gen 2 i5-7Y54, HD Graphics 615, Samsung PM961 MZVLW256HEHP, IPS, 2160x1440, 12" | Samsung Galaxy Tab Pro S W700N 6Y30, HD Graphics 515, Lite-On CV1-8B128, sAMOLED, 2160x1440, 12.1" | Acer Aspire Switch Alpha 12 SA5-271-56HM 6200U, HD Graphics 520, Kingston RBU-SNS8152S3256GG2, IPS, 2160x1440, 12" | |
|---|---|---|---|---|---|---|---|---|
| Power Consumption | -2% | -40% | -7% | -4% | 4% | 17% | -38% | |
| Idle Minimum * (Watt) | 3.1 | 3.6 -16% | 4.2 -35% | 3.5 -13% | 3.7 -19% | 5 -61% | 3.4 -10% | 7.3 -135% |
| Idle Average * (Watt) | 8.8 | 8.1 8% | 10.1 -15% | 7.2 18% | 6.8 23% | 6.3 28% | 8 9% | 10 -14% |
| Idle Maximum * (Watt) | 9.8 | 8.7 11% | 14 -43% | 7.9 19% | 7.6 22% | 7.8 20% | 9 8% | 10.15 -4% |
| Load Average * (Watt) | 22.7 | 25.5 -12% | 37.4 -65% | 29.6 -30% | 22.5 1% | 19.5 14% | 12 47% | 25.2 -11% |
| Load Maximum * (Watt) | 23.6 | 23.5 -0% | 34 -44% | 30.8 -31% | 34.5 -46% | 19.6 17% | 16.1 32% | 29.3 -24% |
| Witcher 3 ultra * (Watt) | 38.1 |
* ... smaller is better
Battery Runtime
The 45-Wh lithium-ion battery is no stranger and is also used in both faster Microsoft Surface Pro 2017 models. Our review sample with a considerably more efficient processor can improve the already very good load runtimes. It first shut down after 198 minutes. Microsoft's Surface Pro 2017 also makes a very good impression in the Wi-Fi test. With a battery life of 11:22 hours, a fully charged battery easily lasts a full workday. None of the competitors can compete with Microsoft's Surface Pro 2017 in terms of battery life.

| Microsoft Surface Pro (2017) m3 m3-7Y30, HD Graphics 615, 45 Wh | Microsoft Surface Pro (2017) i5 i5-7300U, HD Graphics 620, 45 Wh | Microsoft Surface Pro (2017) i7 i7-7660U, Iris Plus Graphics 640, 45 Wh | Lenovo Ideapad Miix 720-12IKB i7-7500U, HD Graphics 620, 41 Wh | HP Elite x2 1012 G1 6Y54, HD Graphics 515, 37 Wh | Lenovo ThinkPad X1 Tablet Gen 2 i5-7Y54, HD Graphics 615, 37 Wh | Samsung Galaxy Tab Pro S W700N 6Y30, HD Graphics 515, 39.5 Wh | Acer Aspire Switch Alpha 12 SA5-271-56HM 6200U, HD Graphics 520, 37 Wh | |
|---|---|---|---|---|---|---|---|---|
| Battery runtime | 2% | -26% | -38% | -31% | -32% | -9% | -39% | |
| Reader / Idle (h) | 15.6 | 17.6 13% | 11.9 -24% | 12.2 -22% | 11 -29% | 18.5 19% | 10.7 -31% | |
| H.264 (h) | 11.1 | 10.2 -8% | 7.2 -35% | 8.6 -23% | 7.8 -30% | |||
| WiFi v1.3 (h) | 11.4 | 12.4 9% | 8.2 -28% | 5.8 -49% | 7.4 -35% | 7.4 -35% | 8.8 -23% | 5.4 -53% |
| Load (h) | 3.3 | 2.8 -15% | 1.9 -42% | 1.9 -42% | 2.2 -33% | 2.2 -33% | 1.9 -42% | |
| Witcher 3 ultra (h) | 1.9 |
Verdict
Pros
Cons
Microsoft's Surface Pro 2017 that is based on Intel's Core m3 Y7Y30 here does many things right and the installed hardware is very well-balanced. The efficient components could improve the already long battery life considerably. However, this is at the expense of computing power. Intel's Core m3 7Y30 provides enough for everyday work but cannot compete against the faster i5 and i7 Surface Pro 2017 convertibles. The system performance nevertheless has to be rated as good and the distance to the faster competition was often only a few percentage points.
Microsoft's Surface Pro 2017 entry-level configuration primarily attracts attention with its appealing price design. It is just too bad that the manufacturer does not offer other hardware configurations on this basis.
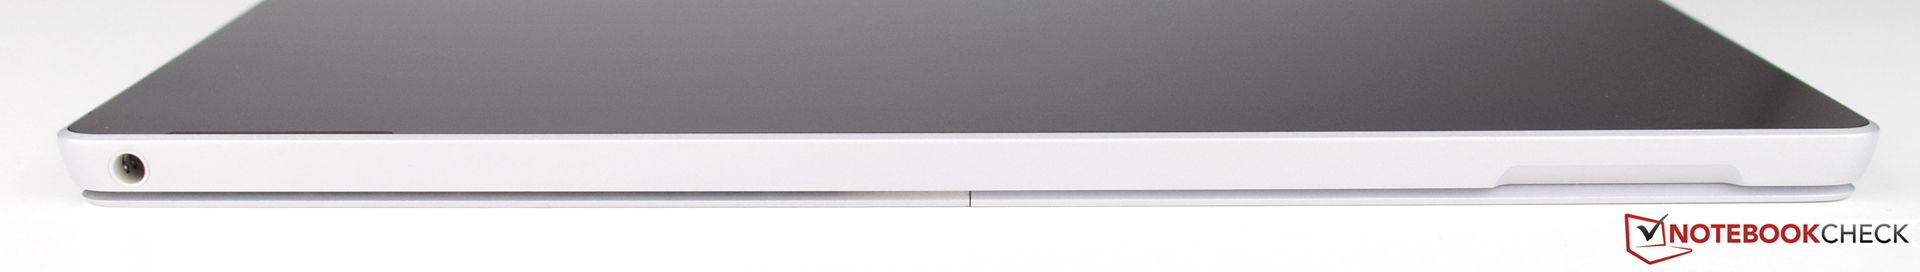
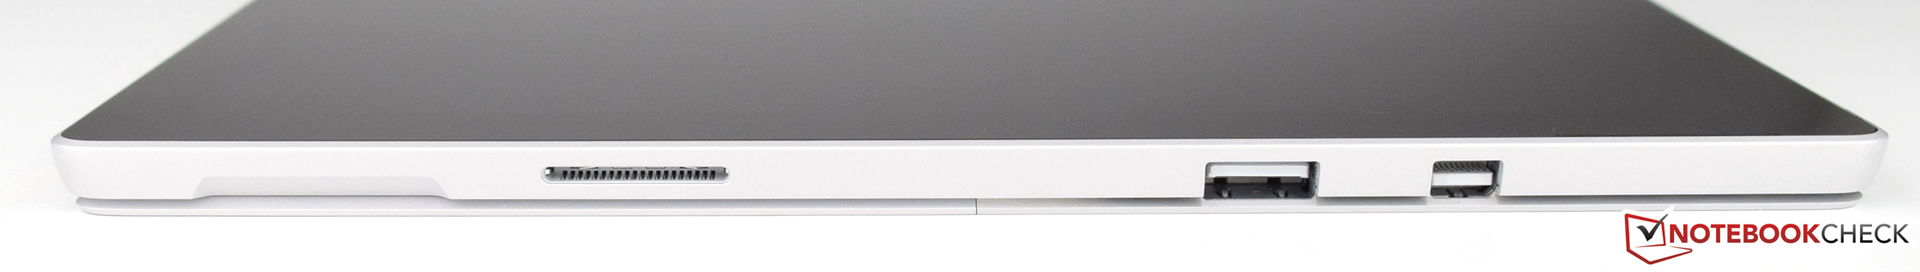
The very good screen particularly impressed us. Its high color-space coverage and high screen resolution are certainly suitable for the semi-professional sector. However, the panel has to accept criticism since its highly reflective surface clearly limits its outdoor suitability. The biggest point of criticism remains to be the limited configuration options. 128 GB of SSD storage is quickly filled and it is not possible to replace the storage device. Furthermore, it is inconceivable why the appearance is kept modern but the connectivity is not. At least a USB Type-C port with Thunderbolt support should be present in 2017.
Microsoft Surface Pro (2017) m3
- 08/07/2017 v6 (old)
Sebastian Bade
Price comparison
