Dell Inspiron 17-5770-0357 (8250U, SSD, HDD, FHD) Laptop Review
The Dell Inspiron 17-5770 is a midrange multimedia device. With an up-to-date 8th generation Intel Core processor, it delivers a solid performance, even though the lowest-priced device (618 Euros/~$760) is equipped with a no longer recommendable Intel Core i3-6006U. Our test version of the Dell Inspiron 17-5770 is available for 749 Euros (~$922). With the Intel Core i5-8250U, it has a cutting-edge SoC with 8 GB of DDR4 RAM and two storage devices (a 128-GB SSD and a 1-TB HDD). However, in the two lower-priced configurations, Dell has refrained from installing a dedicated graphics card, which is only available in combination with the slightly faster Intel Core i7-8550U, in the form of an AMD Radeon 530 with 4 GB of VRAM. In this configuration with the same memory setup, the purchase price rises to 950 Euros ($1170). Users who would like to double the amount of memory (RAM, SSD and HDD) have to expect a price of about 1100 Euros (~$1355) for the high-end configuration.
We have used recent multimedia devices as comparison devices. Please see our table below for a list including the most important technical details.
| Dell Inspiron 17-7773 | Acer Aspire 5 A517 | HP Pavilion 17z | HP Omen 17 | Acer Aspire F17 F5 | Acer Swift 3 SF315 | |
| CPU | Intel Core i7-8550U | Intel Core i7-8550U | AMD A12-9720P | Intel Core i7-7700HQ | Intel Core i5-7200U | Ryzen 5 2500U |
| GPU | Nvidia GeForce MX150 | Nvidia GeForce MX150 | AMD Radeon R7 M340 | Nvidia GeForce GTX 1050Ti | Nvidia GeForce GTX 950M | AMD Radeon RX Vega 8 |
| Display | 17.3 inch 1920 x 1080 (IPS) | 17.3 inch 1920 x 1080 (IPS) | 17.3 inch 1920 x 1080 (IPS) | 17.3 inch 1920 x 1080 (IPS) | 17.3 inch 1920 x 1080 (TN) | 15.6 inch 1920 x 1080 (IPS) |
| RAM | 16 GB | 8 GB | 8 GB | 16 GB | 8 GB | 8 GB |
| Storage | 128 GB SSD + 1 TB HDD | 256 GB SSD + 1 TB HDD | 1 TB HDD | 256 GB SSD + 1 TB HDD | 1 TB HDD | 256 GB SSD |
| Rating | 84% | 85% | 76% | 81% | 80% | 82% |
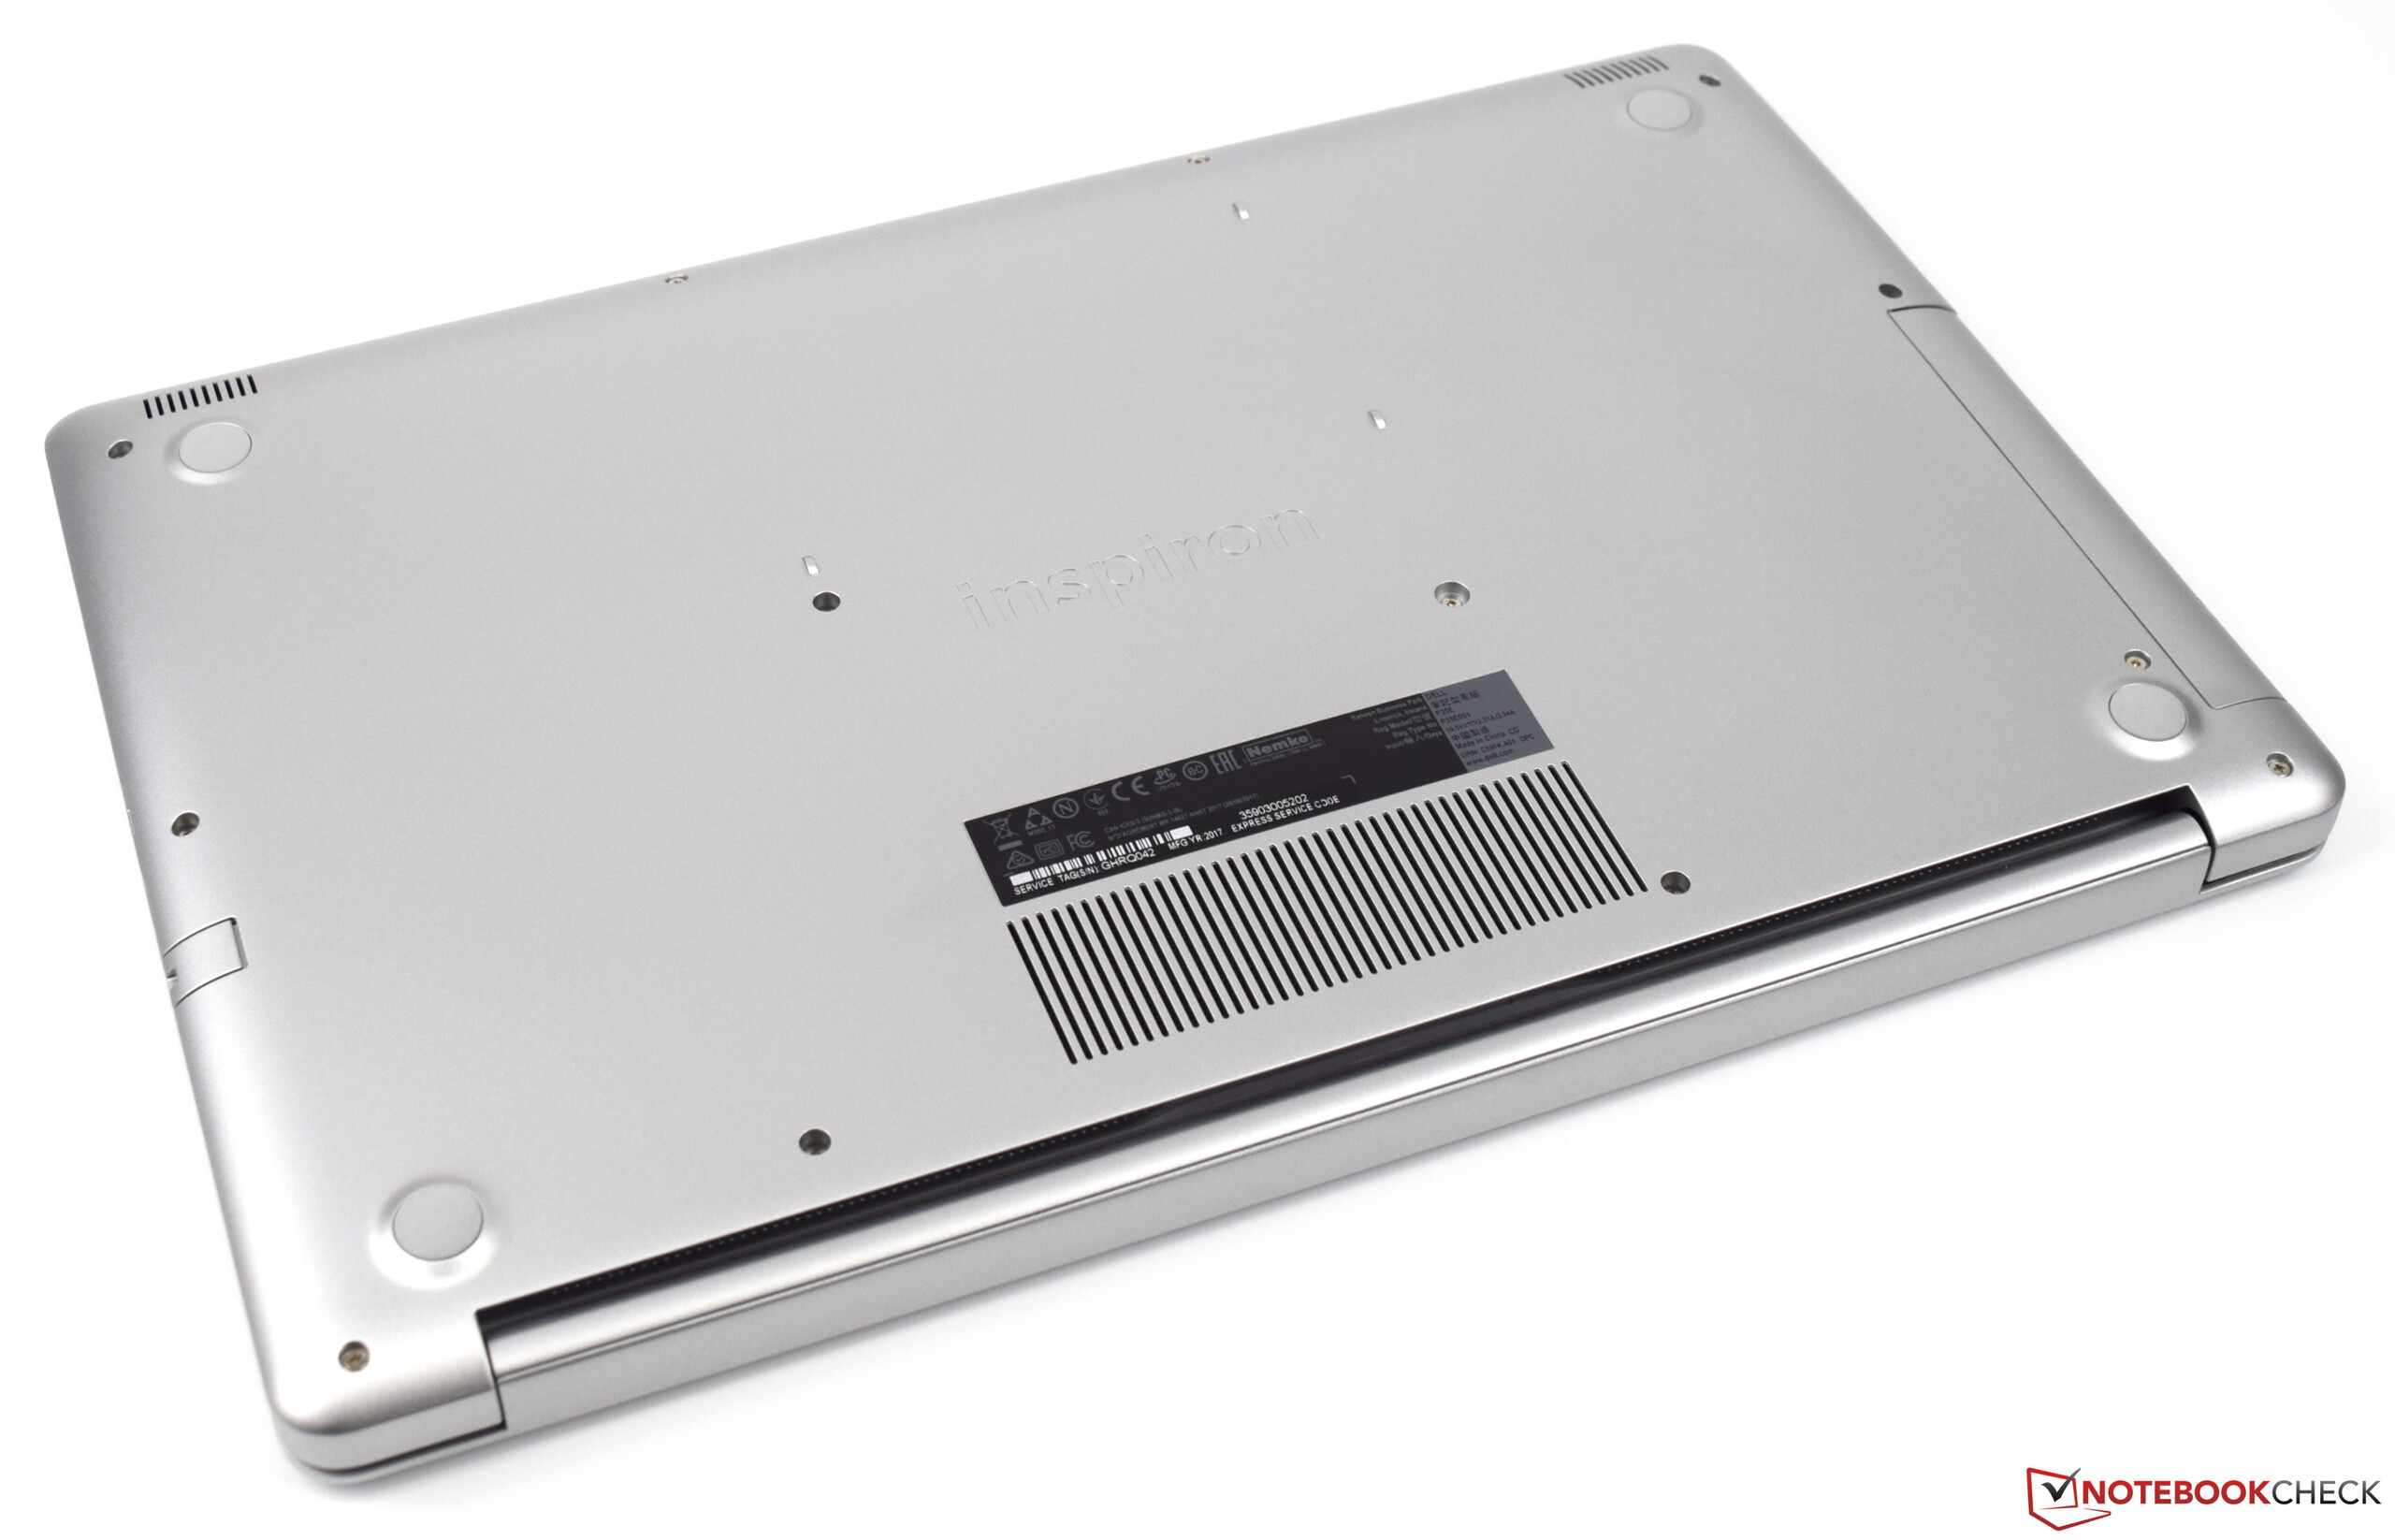
Case
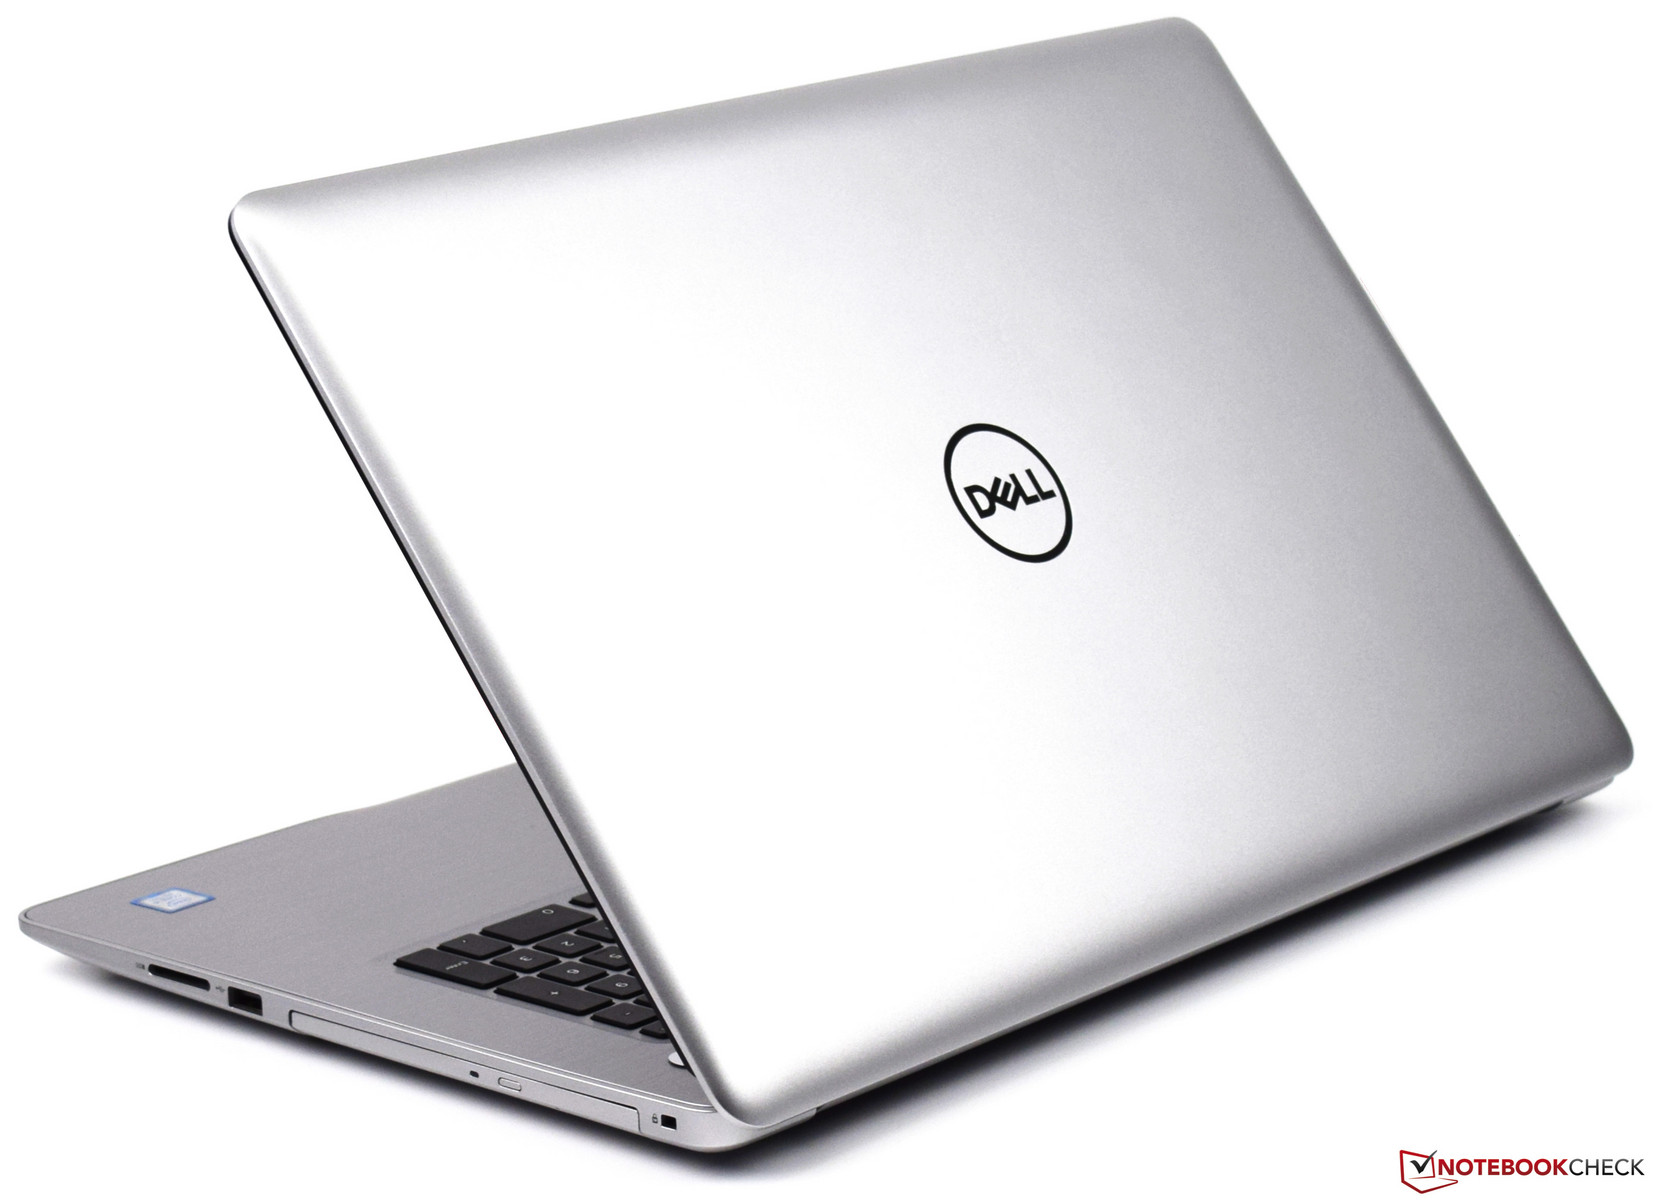
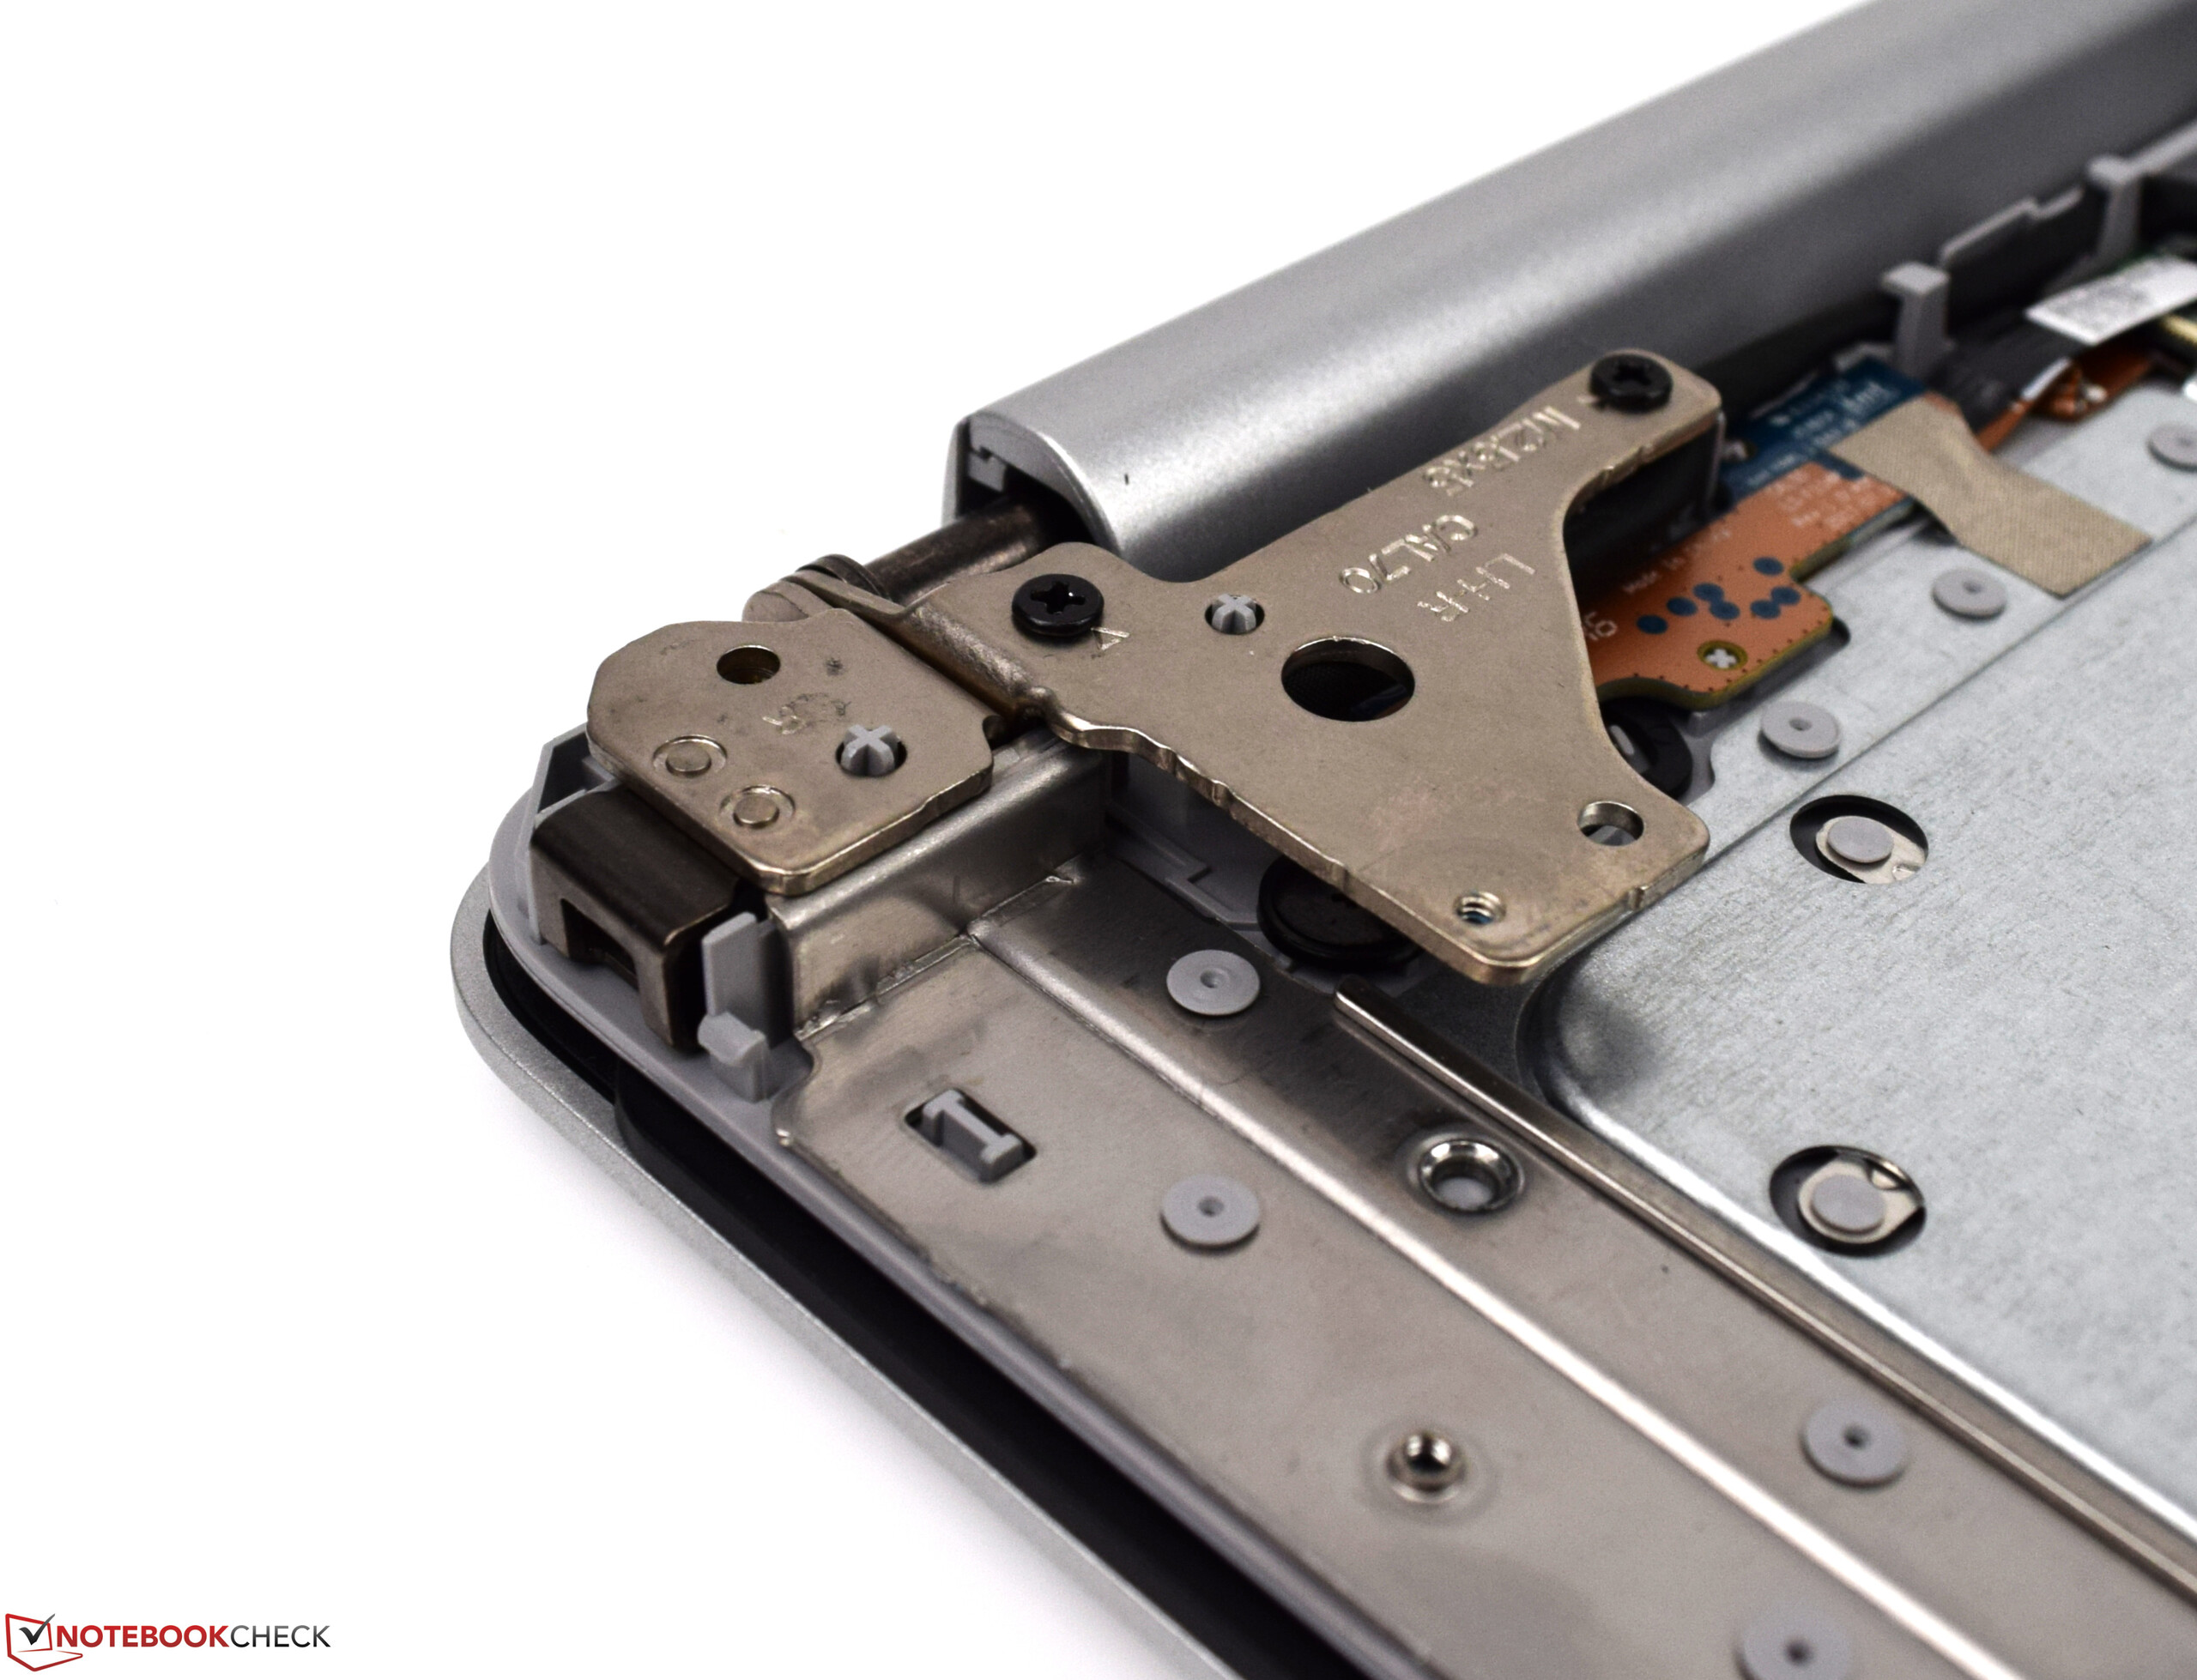
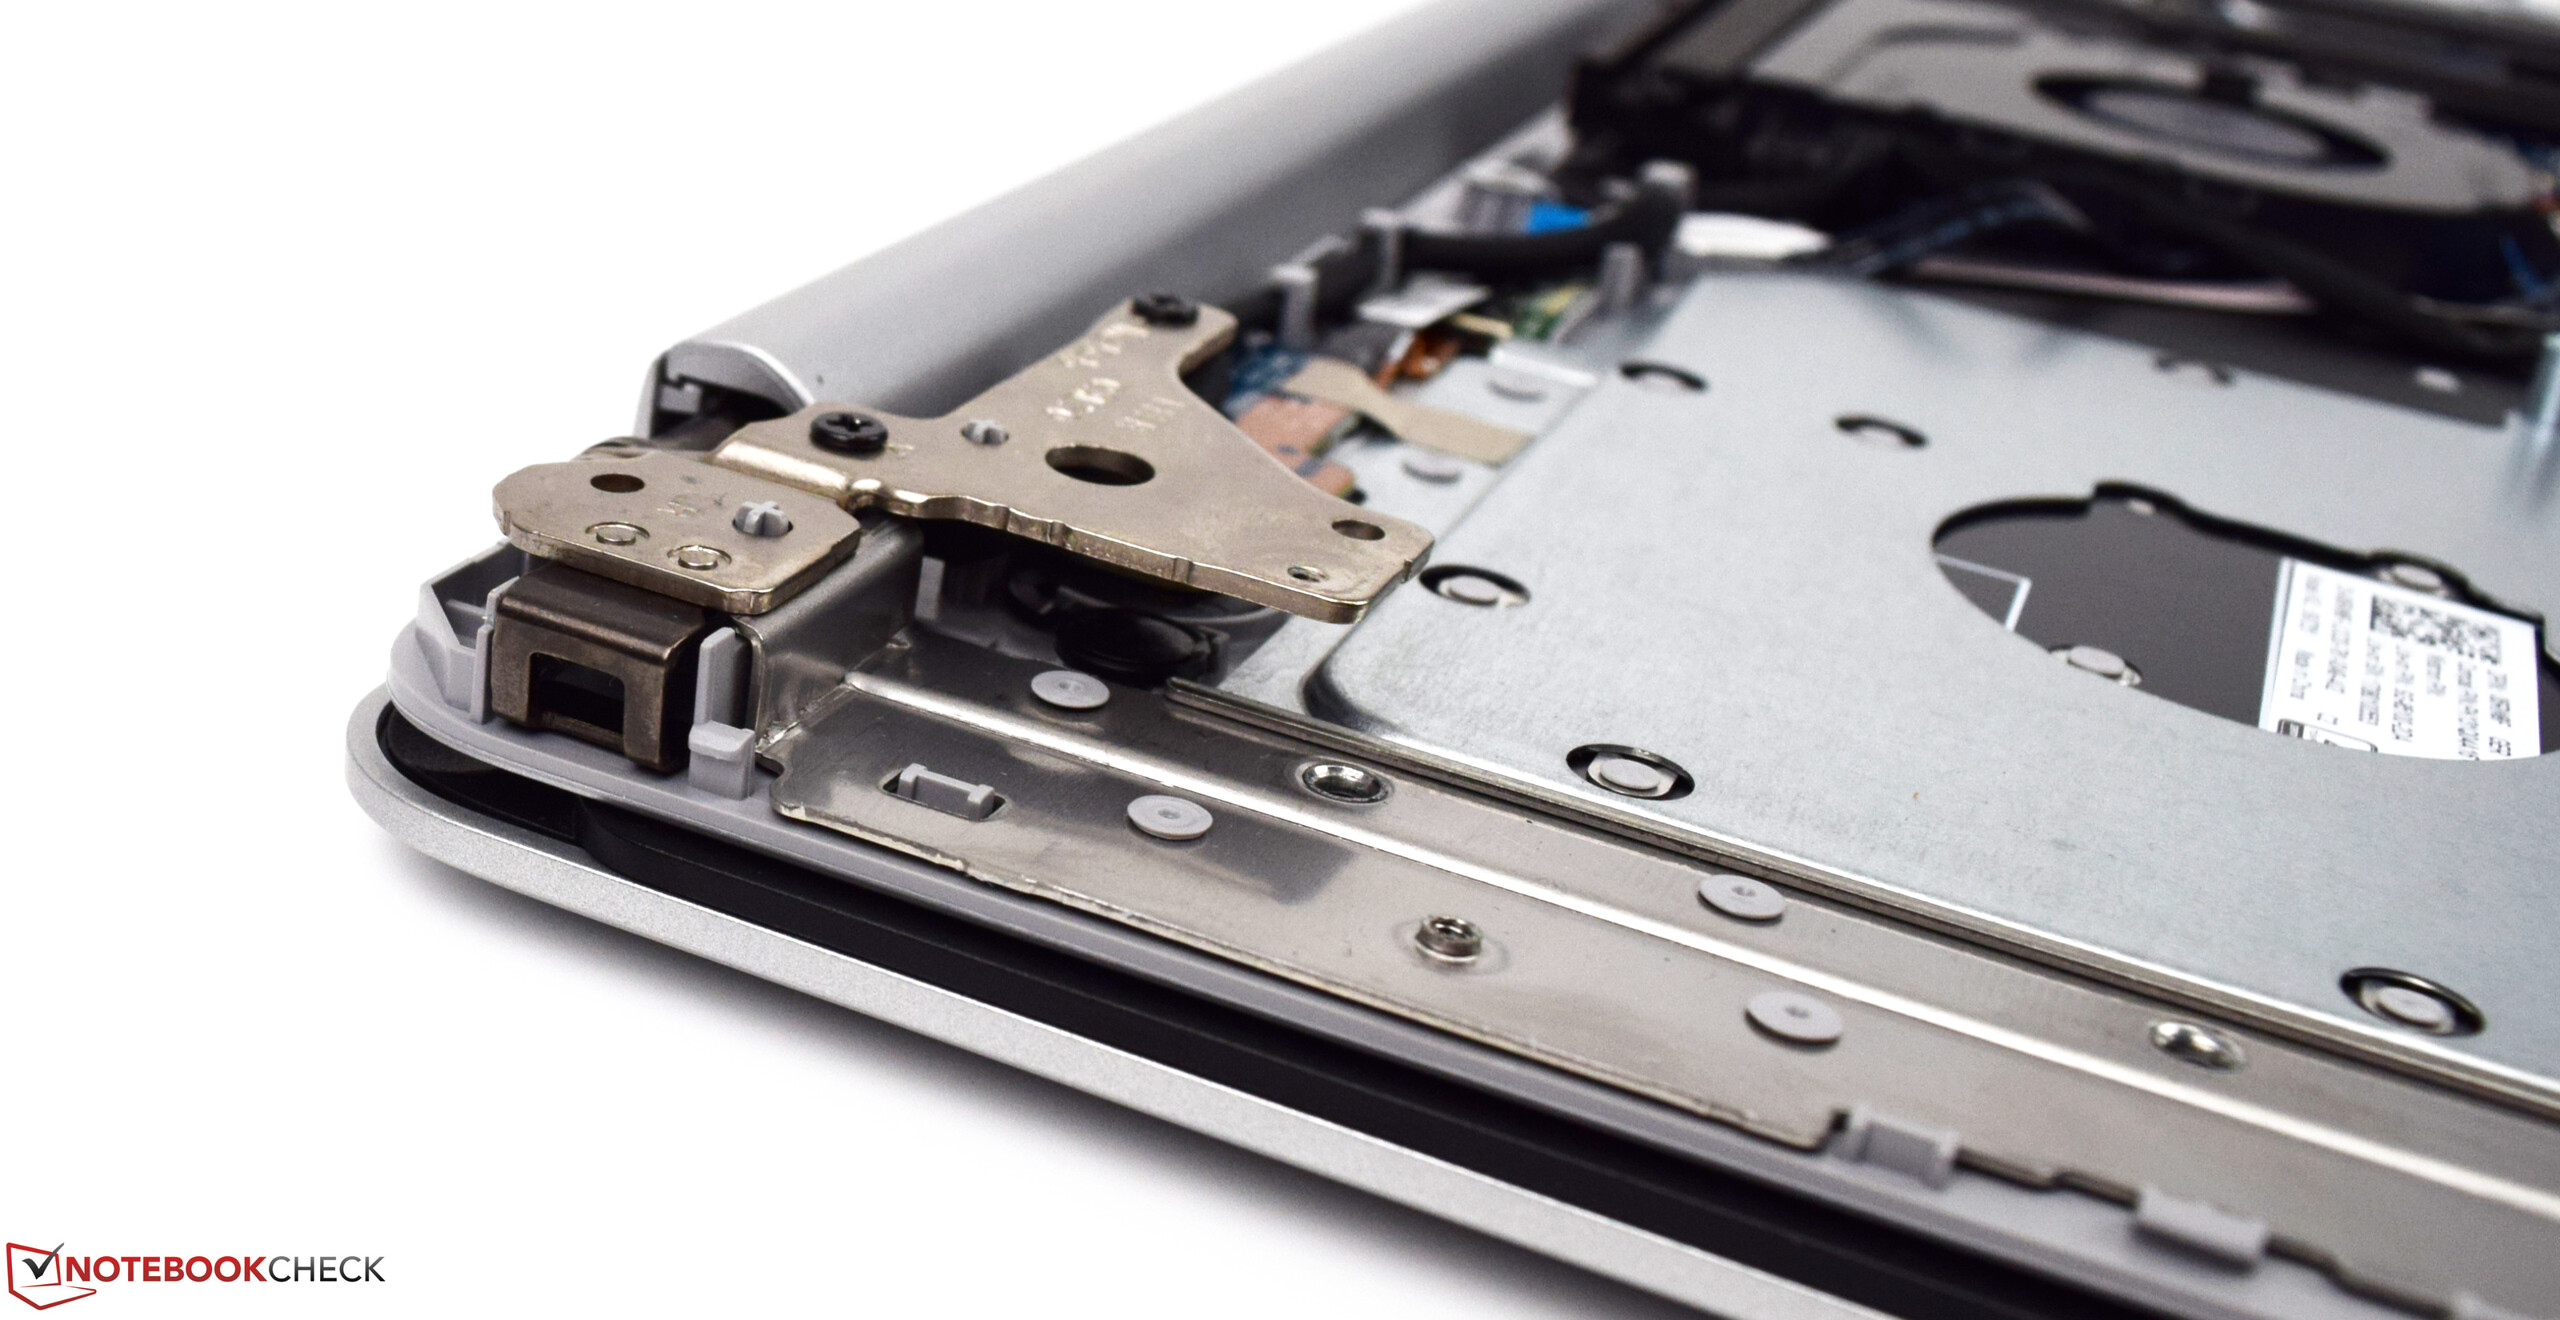
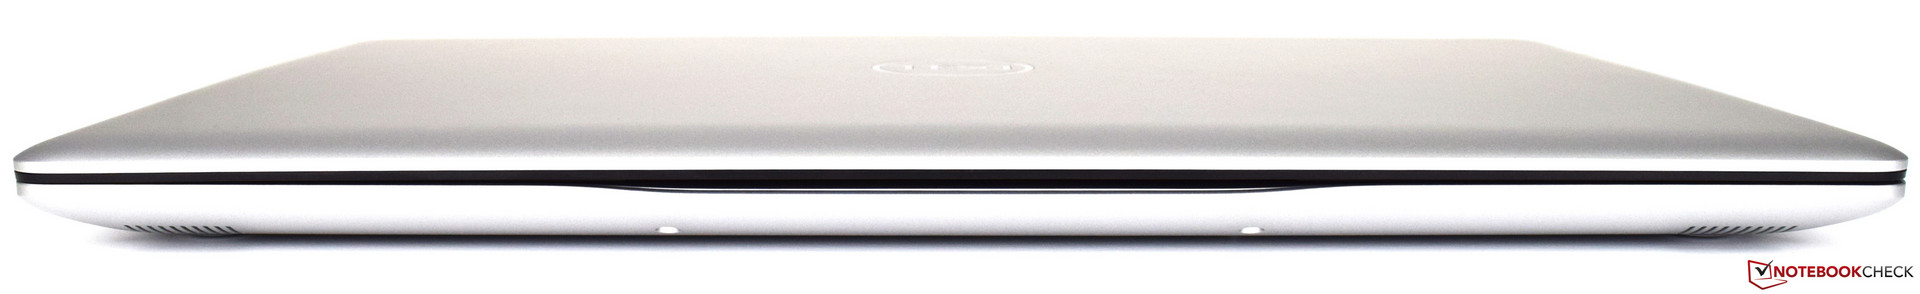
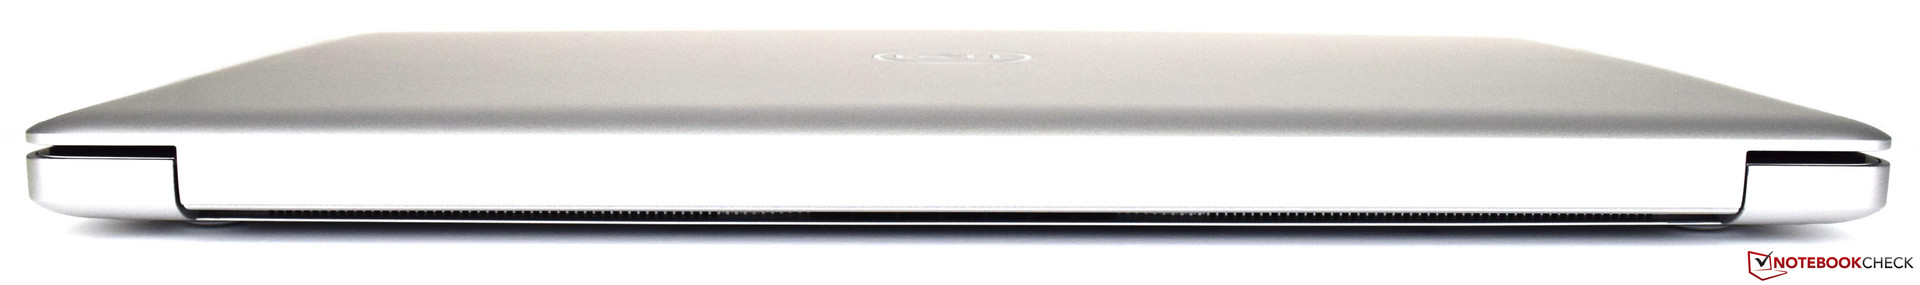
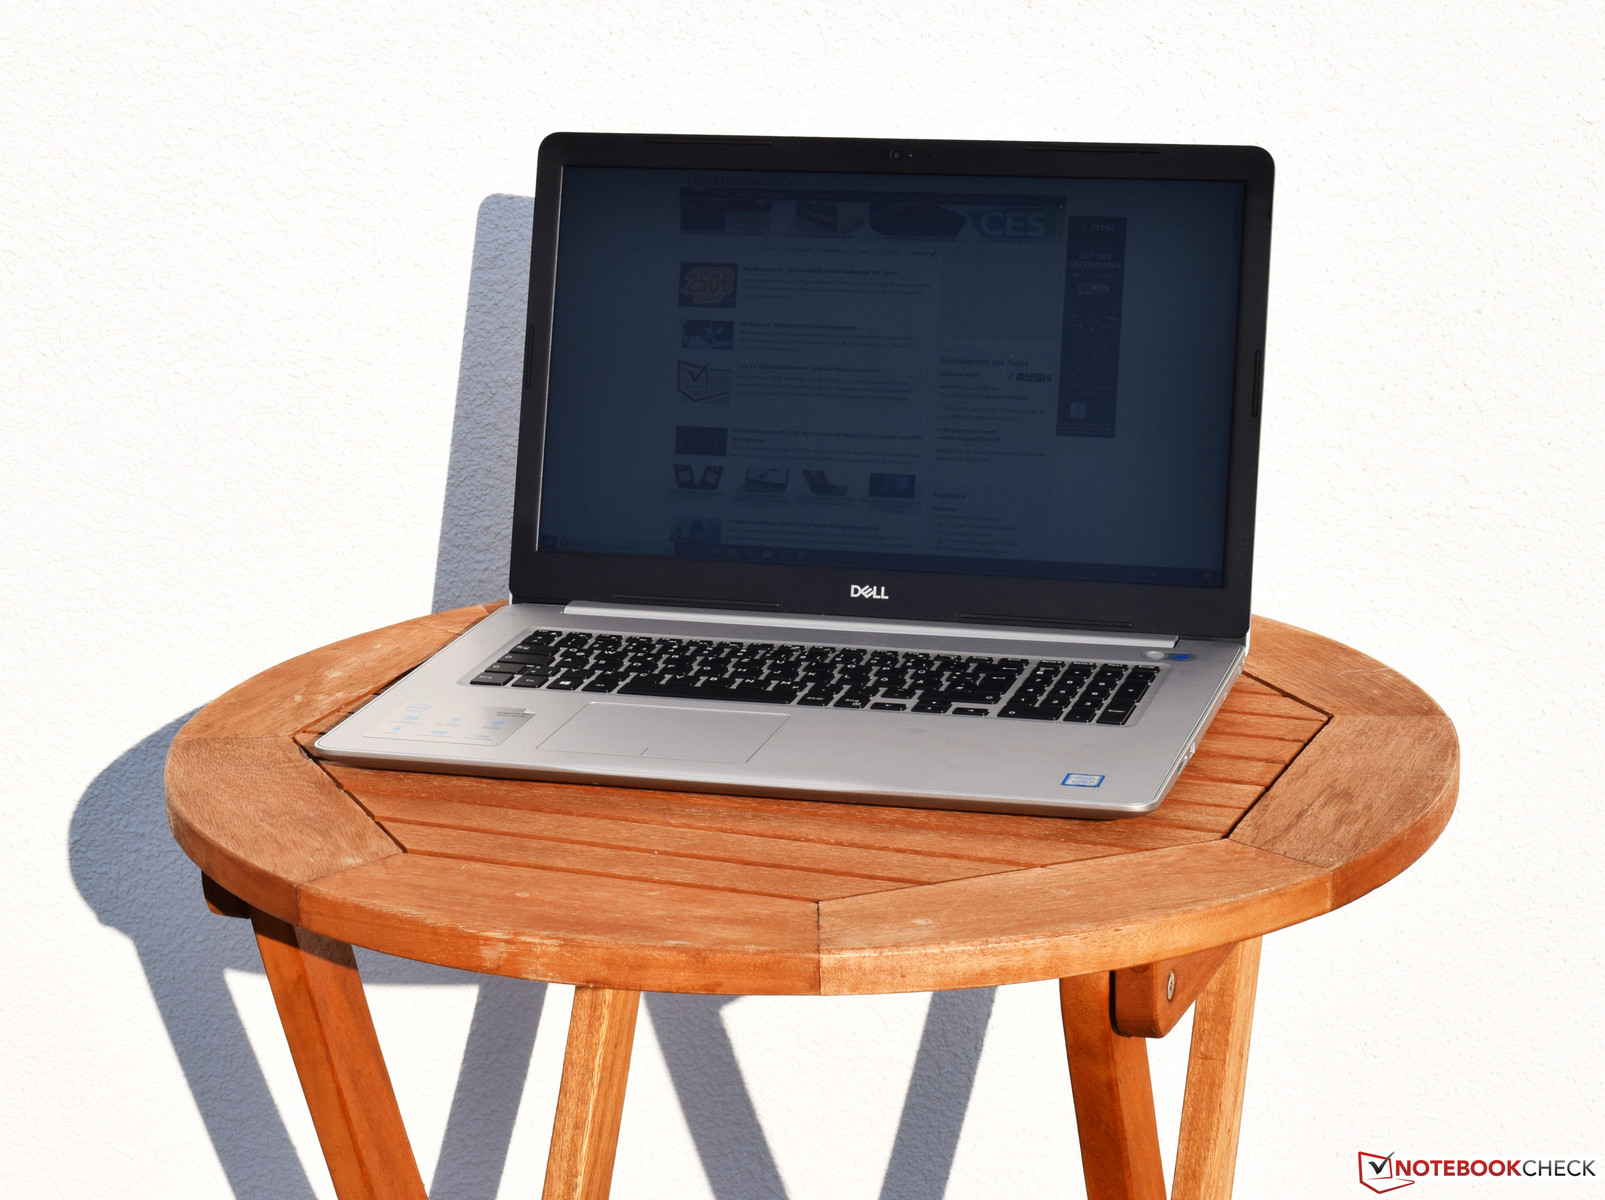
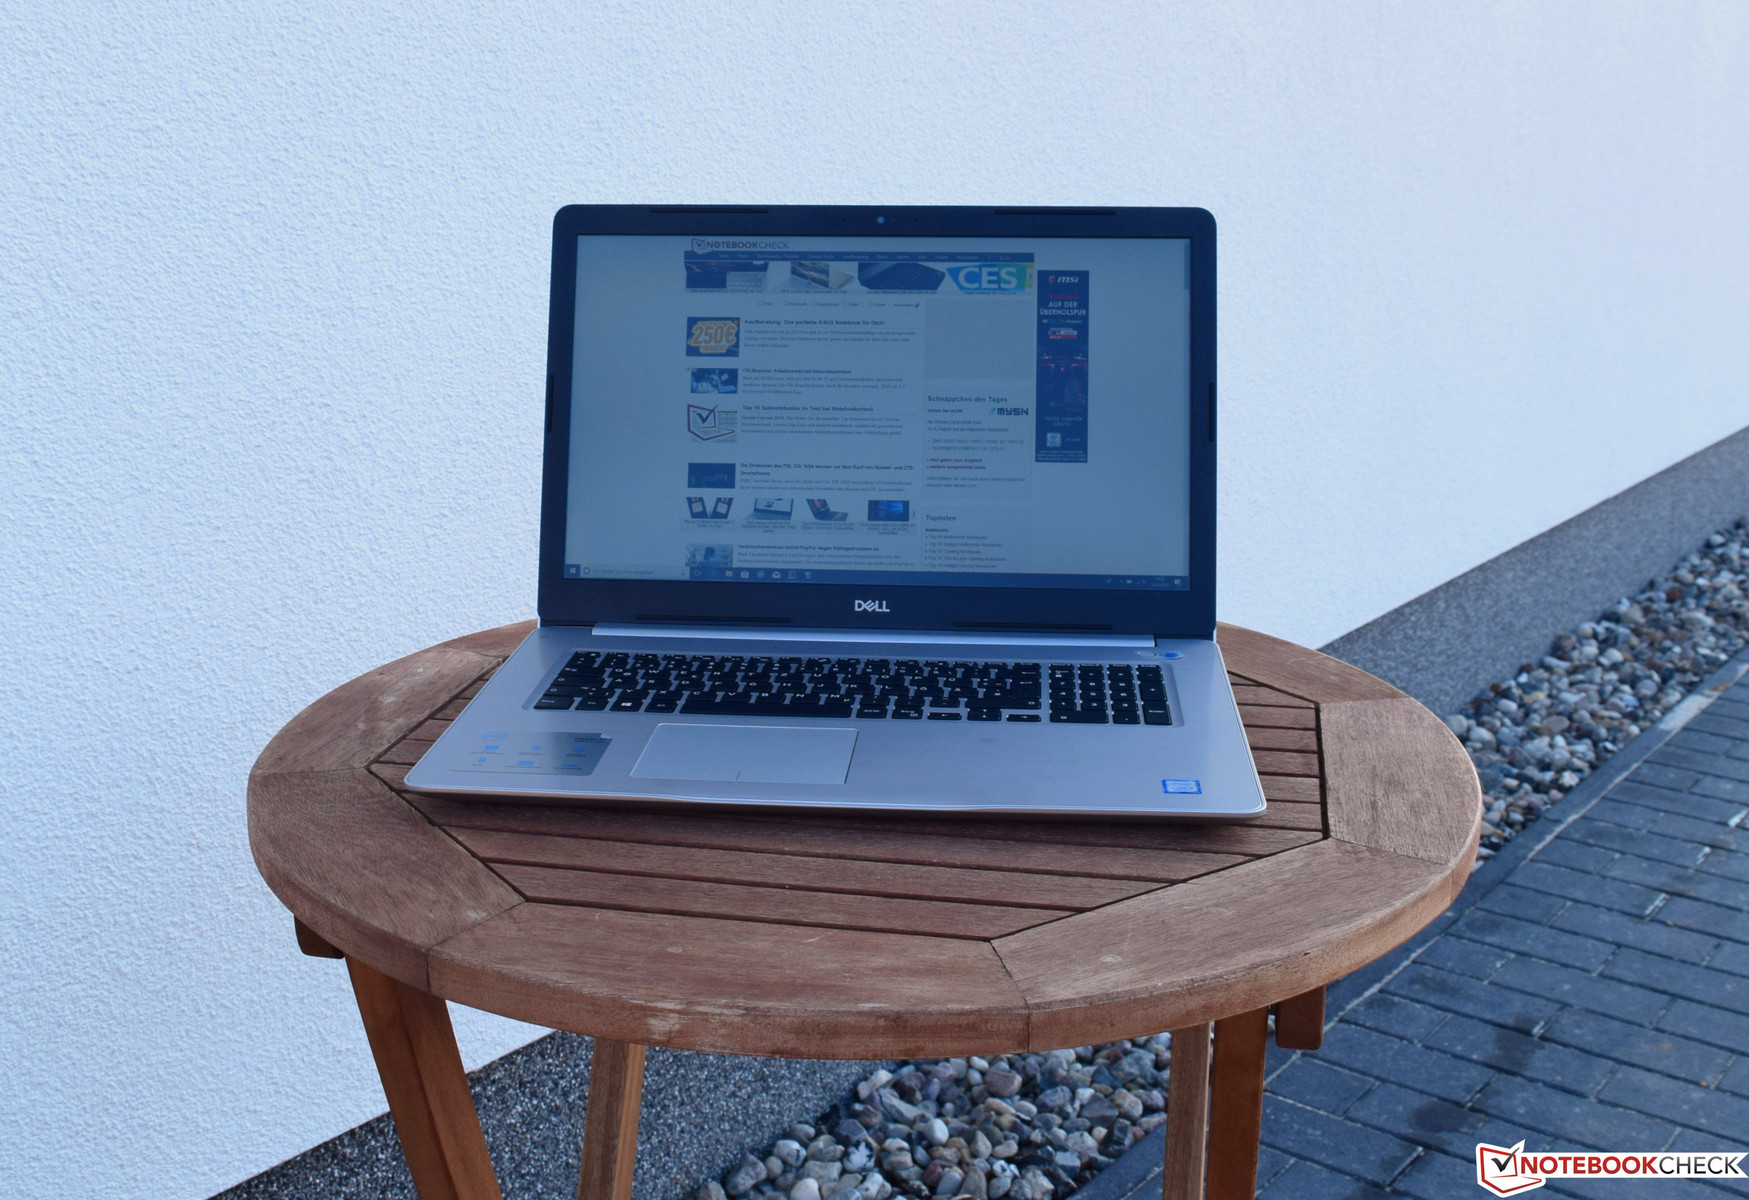
The case is convincing in its simplicity and the matte silver surfaces give a high-quality impression. Users who prefer a black display lid can choose this option during the ordering process for a surcharge of 4 Euros (~$5). There are no other configuration options available for the case of the Dell Inspiron 17-5770. The base is robust and cannot be twisted much despite its size, even though the display lid could have been a bit more solid. Nevertheless, it performed very well in our pressure test, as there were no visible ripples on the panel. The base, however, revealed its weak point in the middle where it yielded slightly during our pressure test. The case cannot be opened with one hand because the hinges are simply too stiff for that. They prevent any bouncing with vibrations, though. The manufacturer advertizes the device's long-lasting functionality with a series of stress tests. Overall, the case and the flawless build quality were very convincing.
Size Comparison
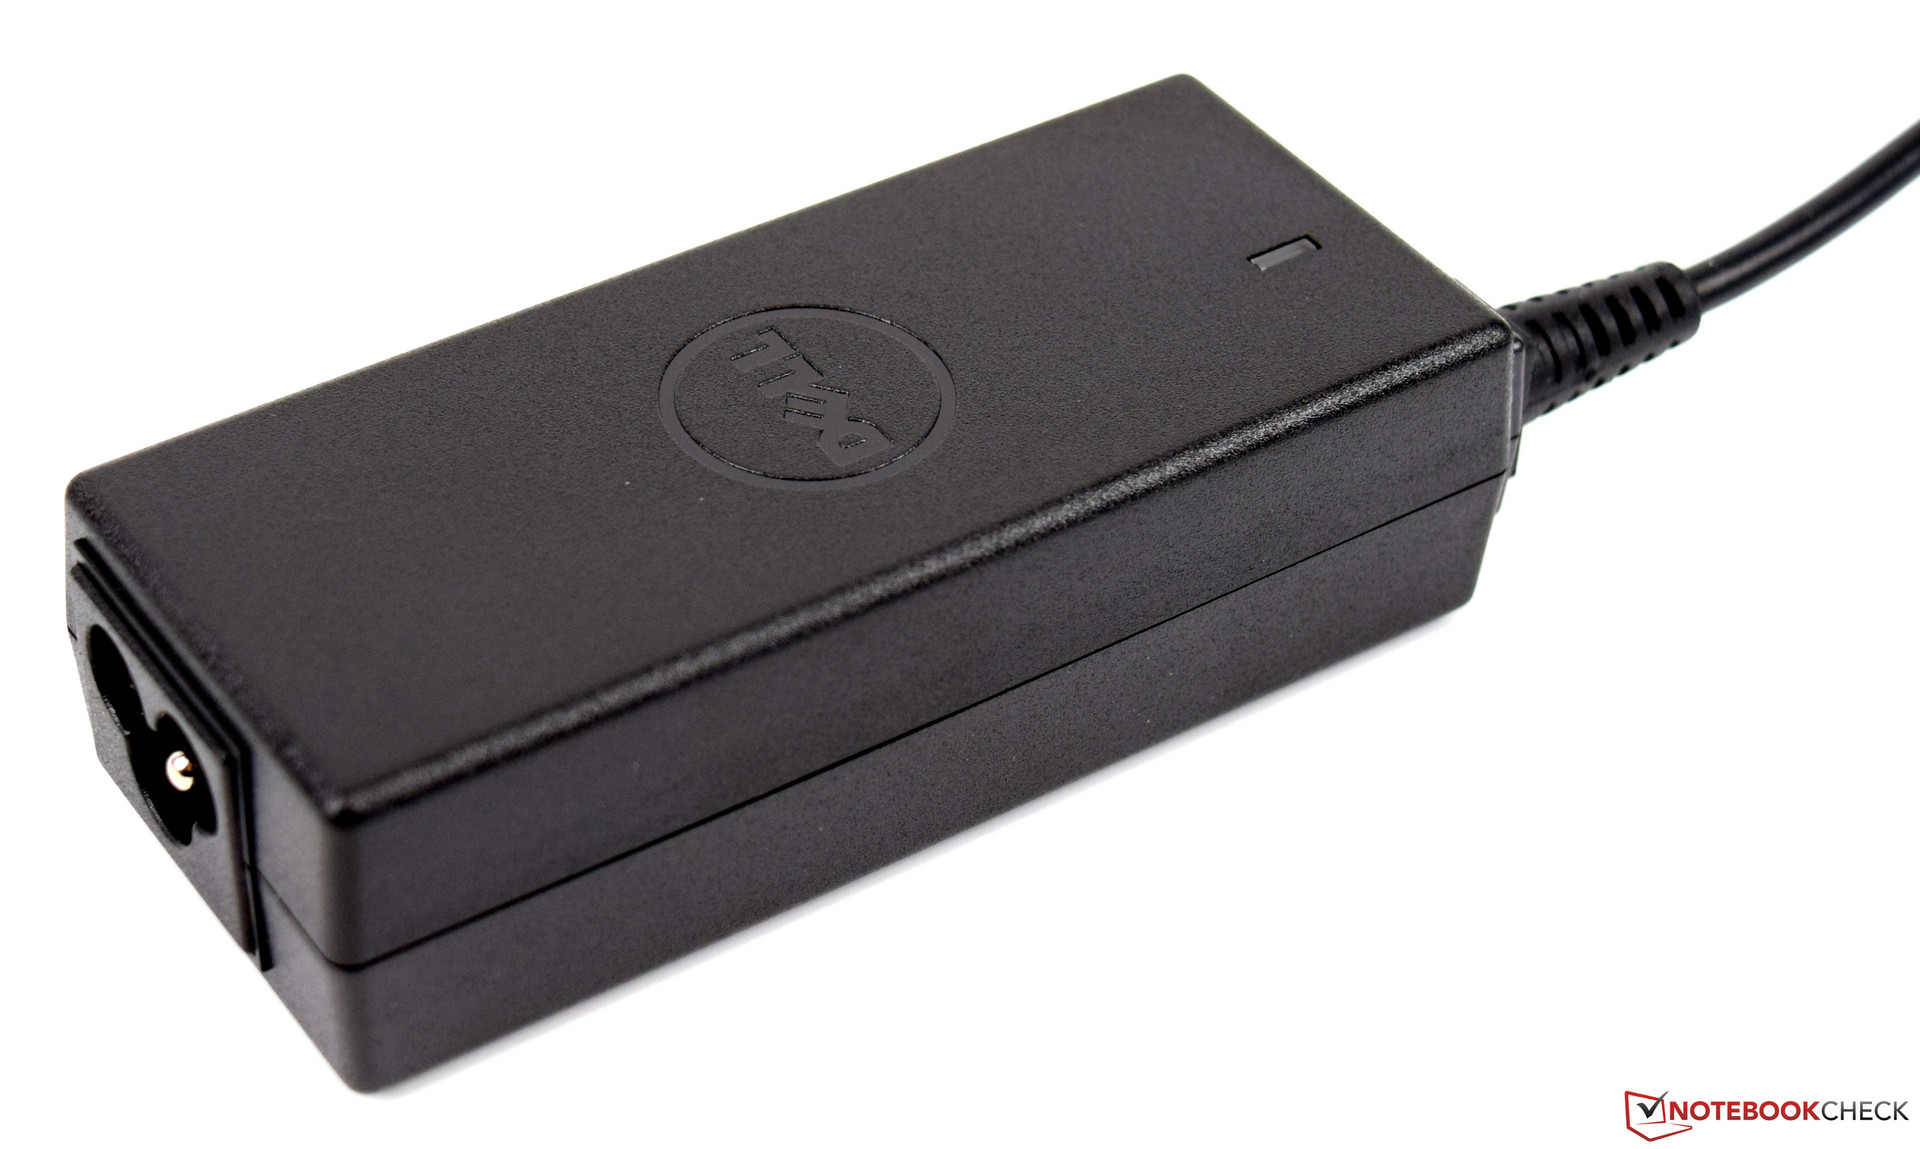
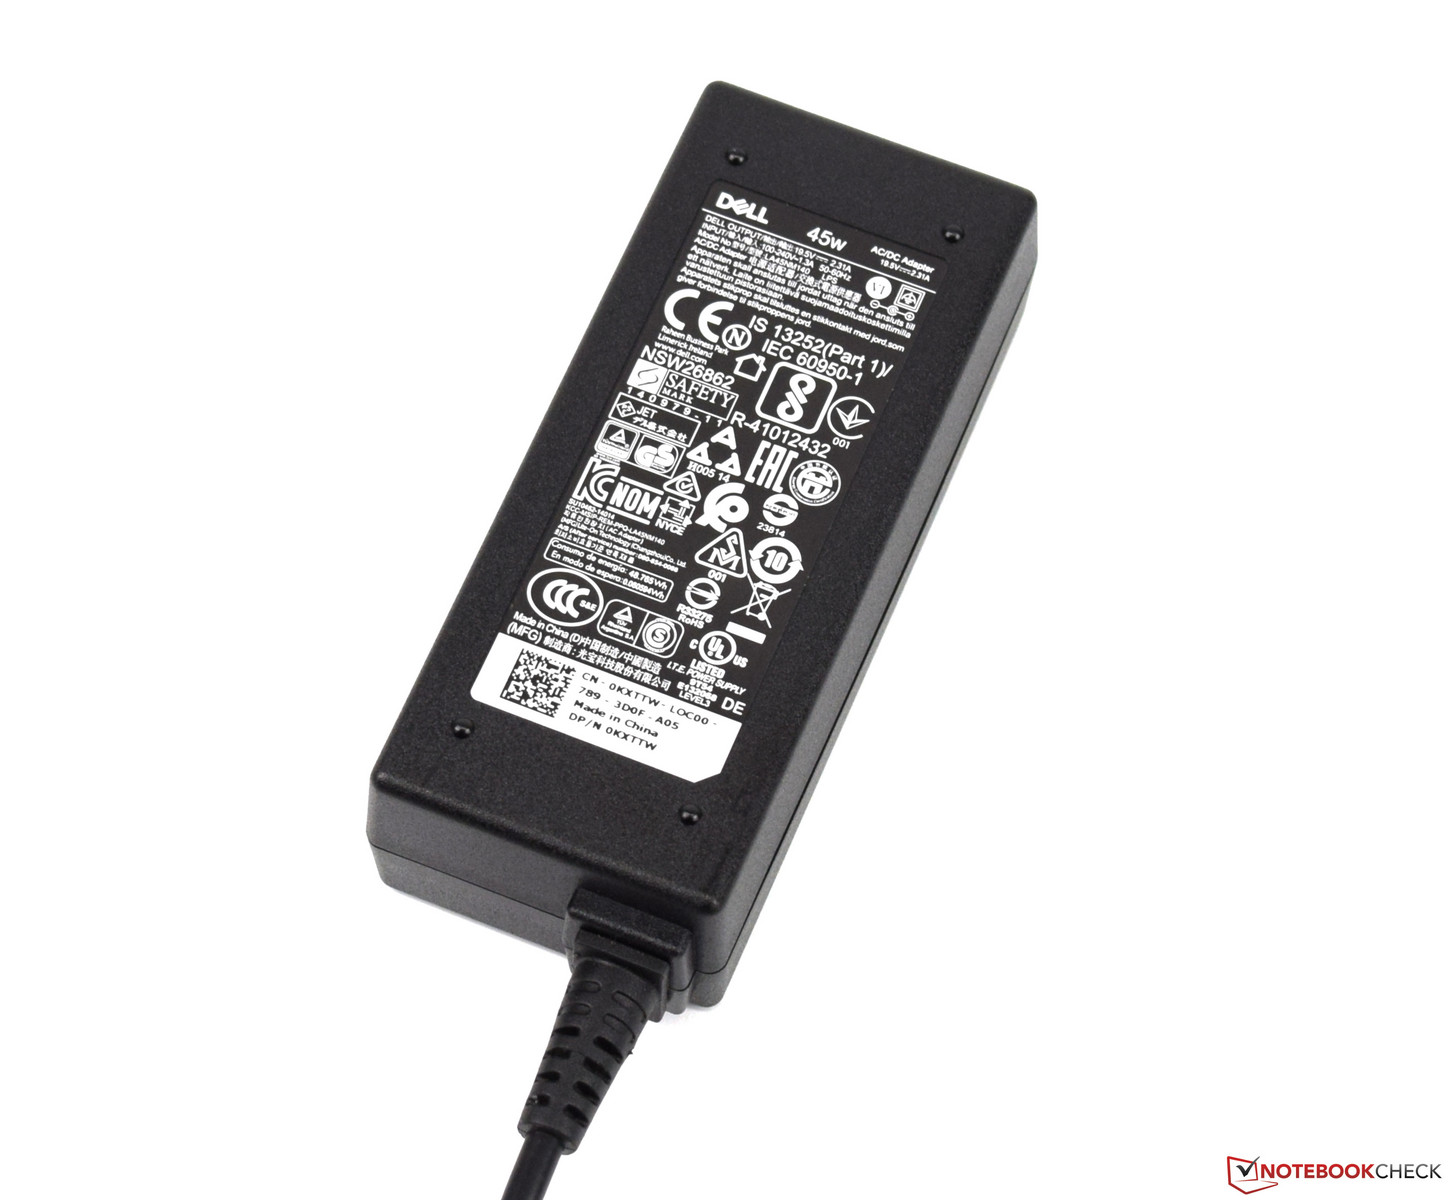
The Dell Inspiron 17-5770 has a size of 415 x 279 millimeters (~16.3 x 11 in), which places it in the midfield of comparison devices. Its thickness of 25 millimeters (~1 in) does not stand out negatively either. The Inspiron 17-5770 can score with its weight of just 2.7 kilograms (~6 lb). Only the HP Pavilion 17z can keep up, having the same weight of 2.7 kilograms (~6 lb). All of the other competitors are heavier in comparison. The small 45-watt power adapter is rather lightweight at 271 grams (~9.6 oz) as well.
Connectivity
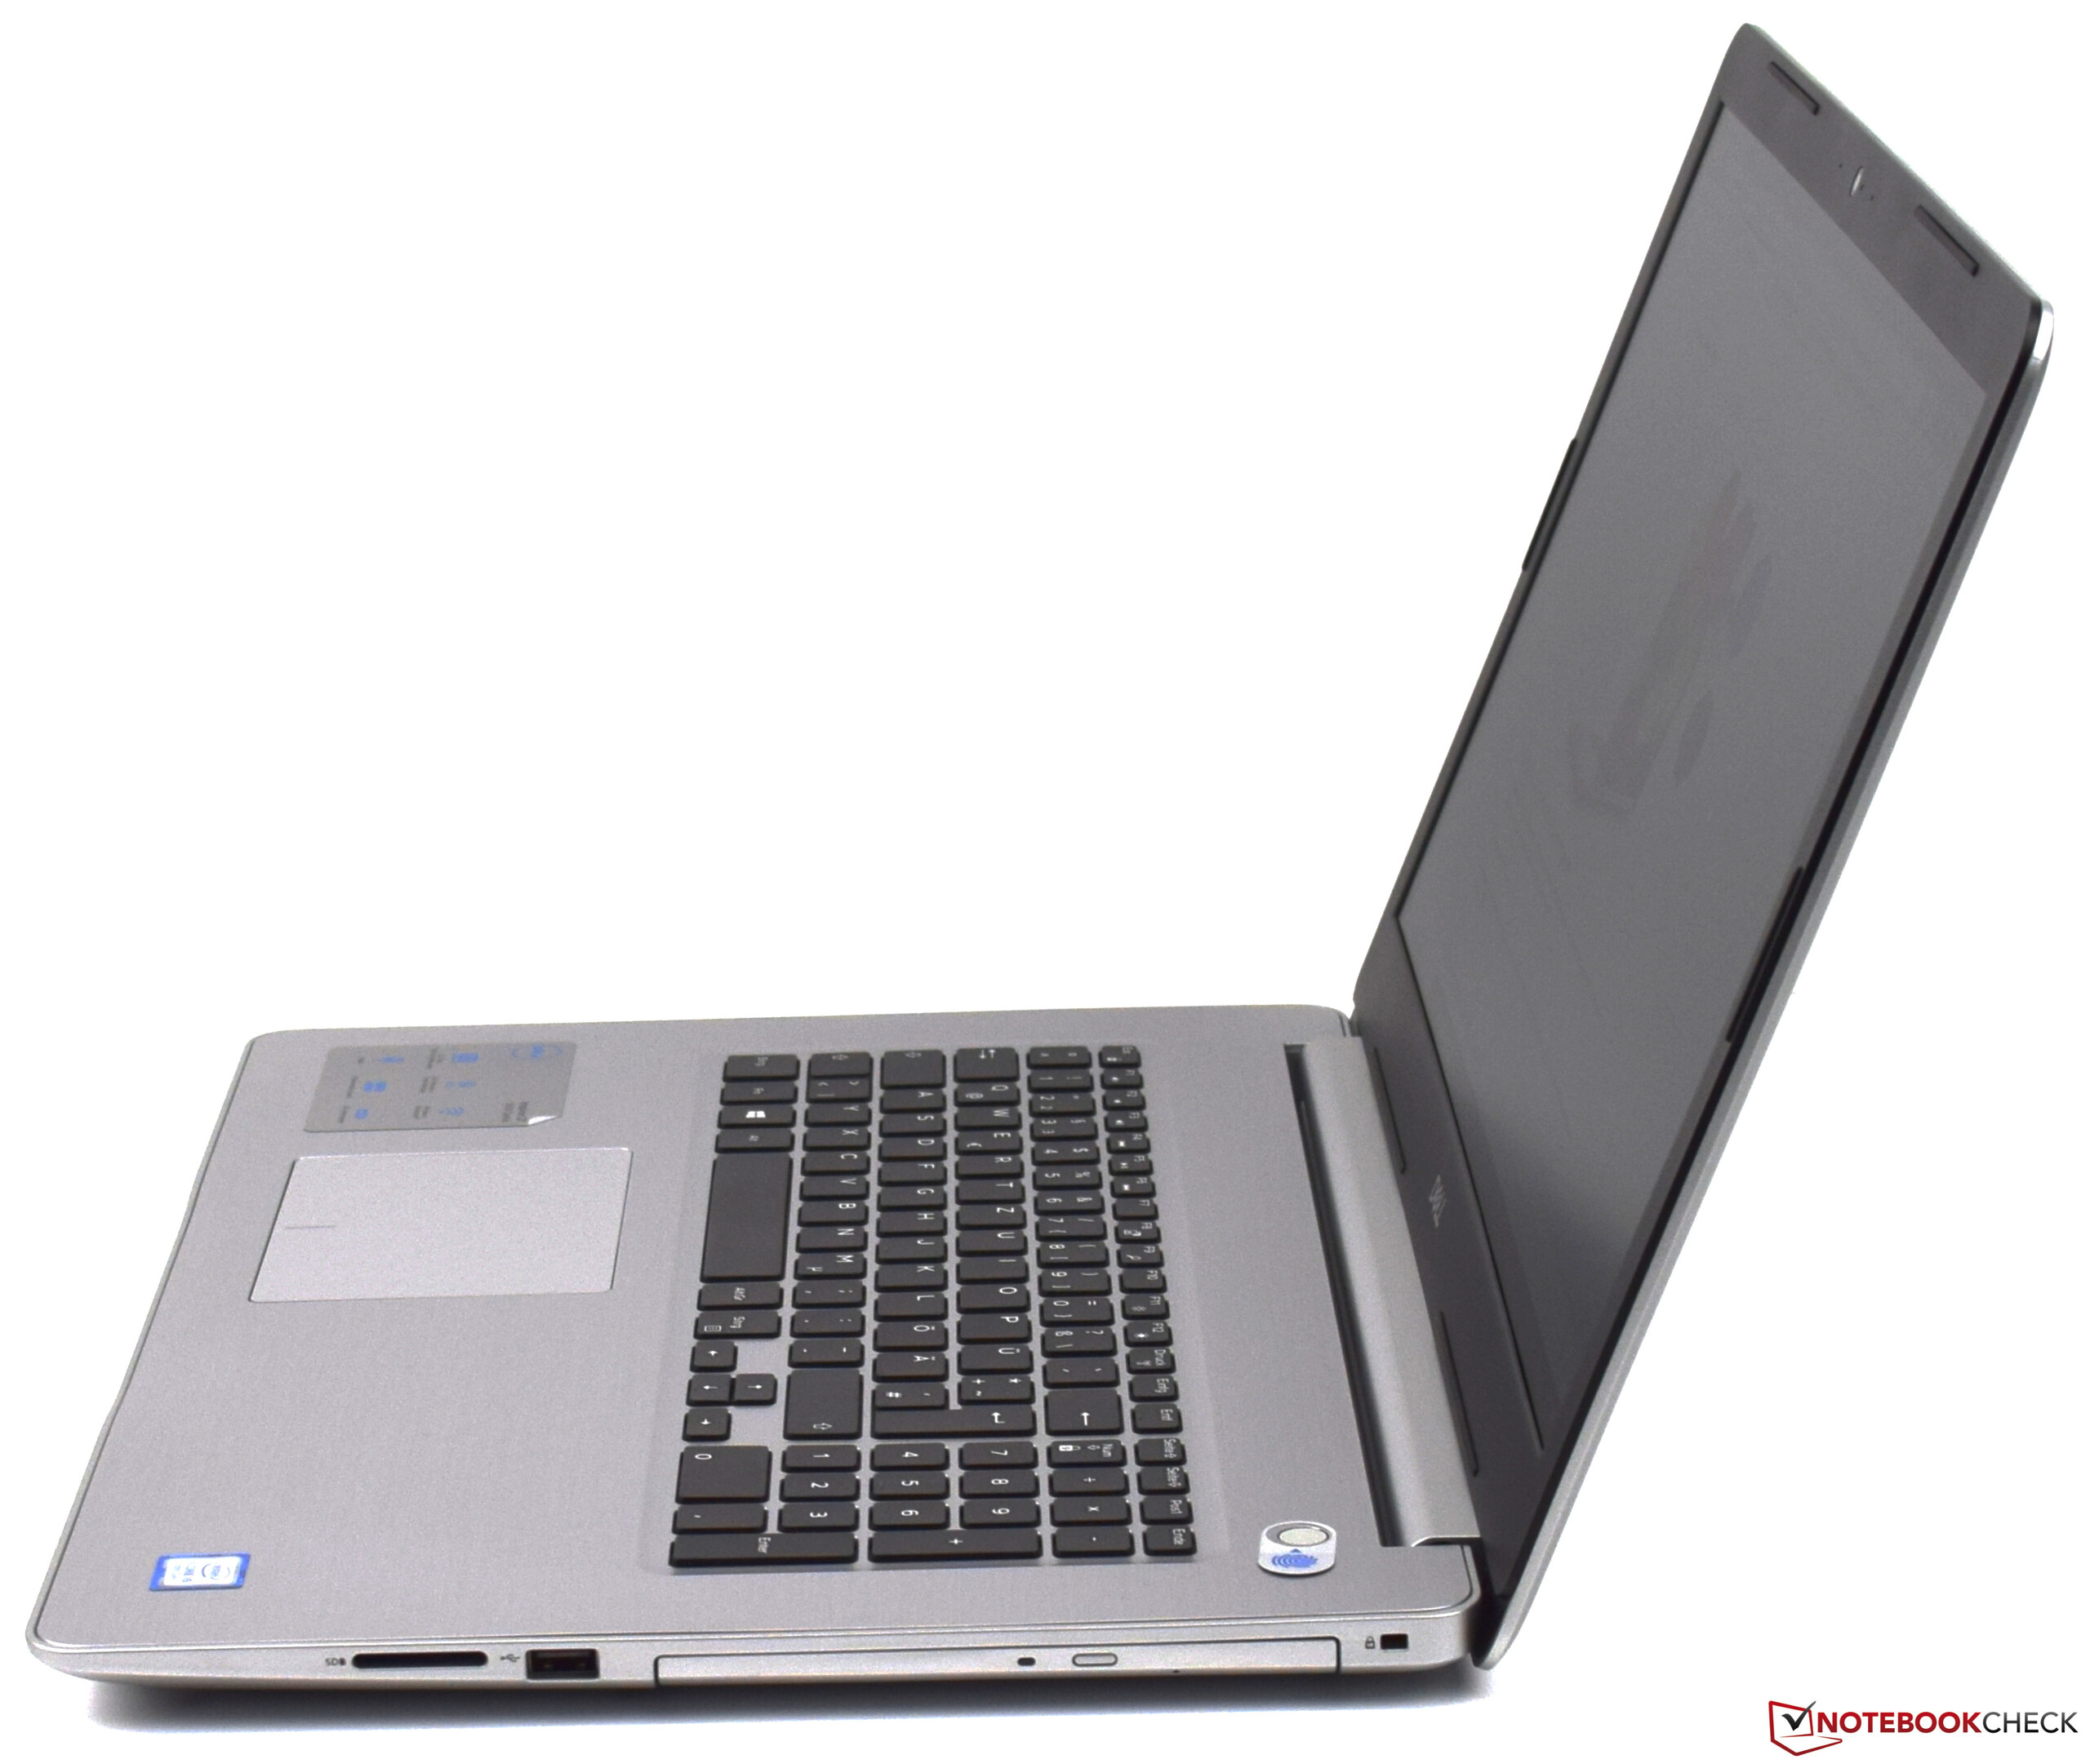
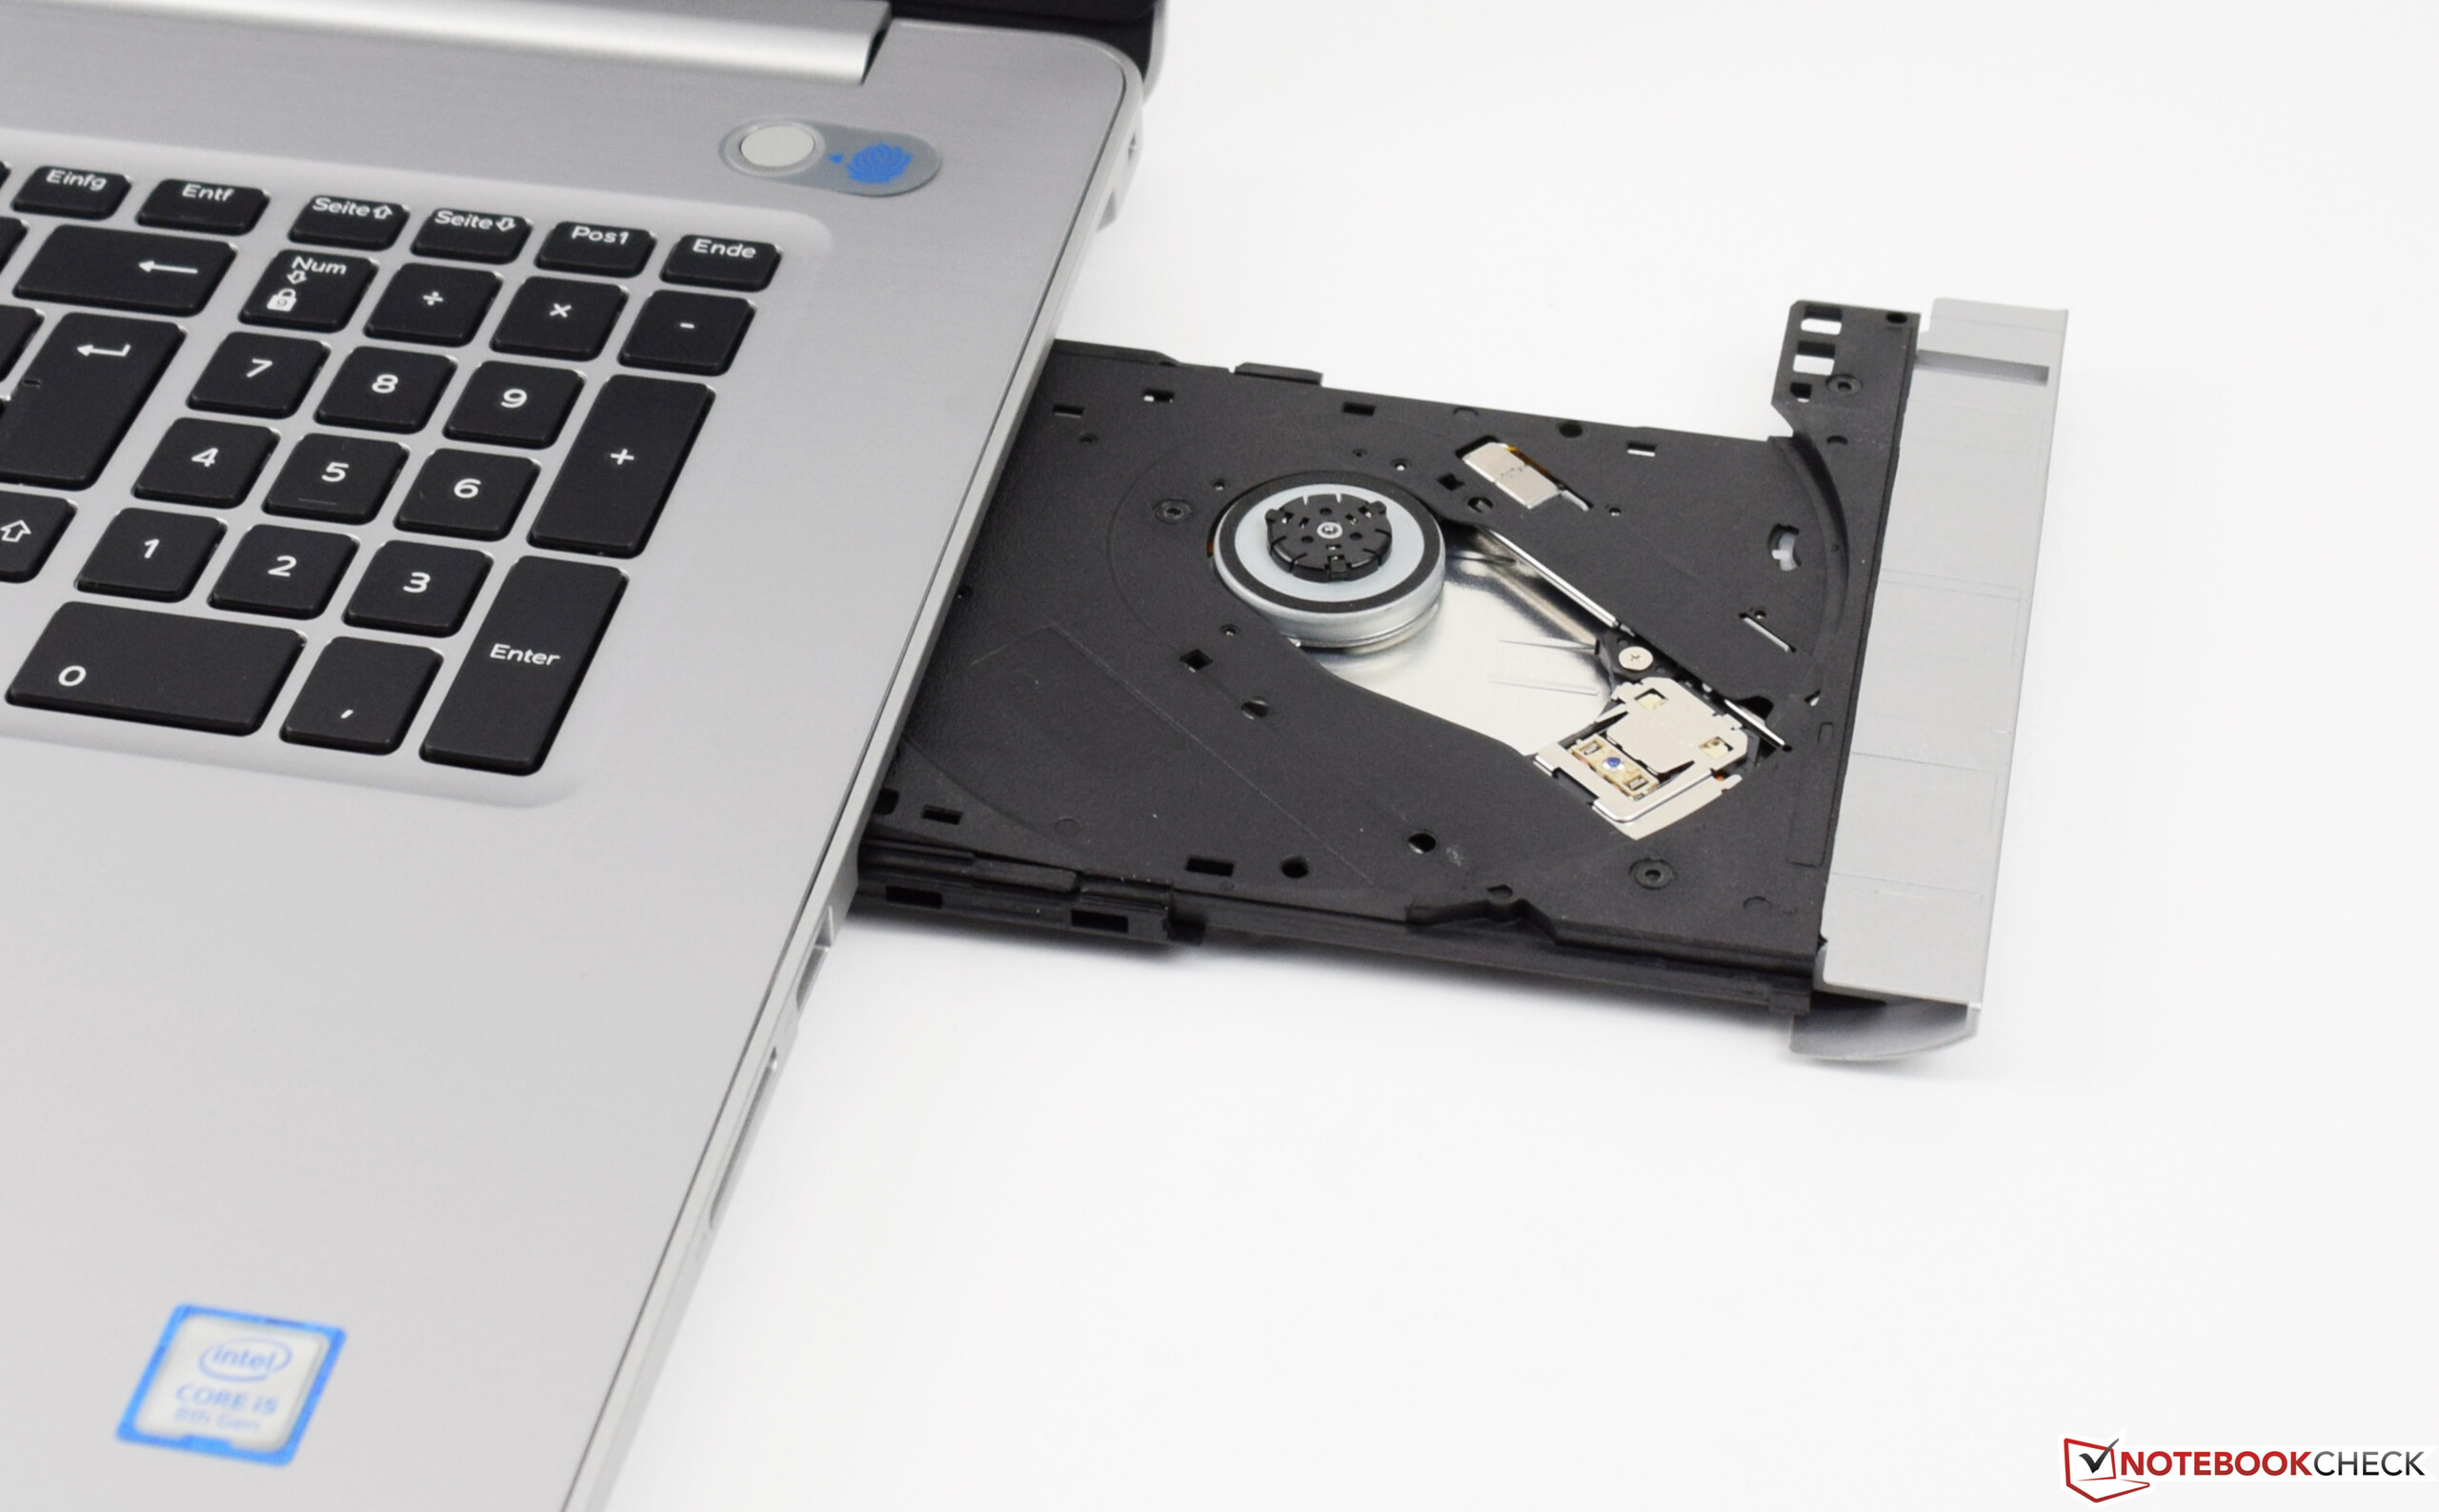
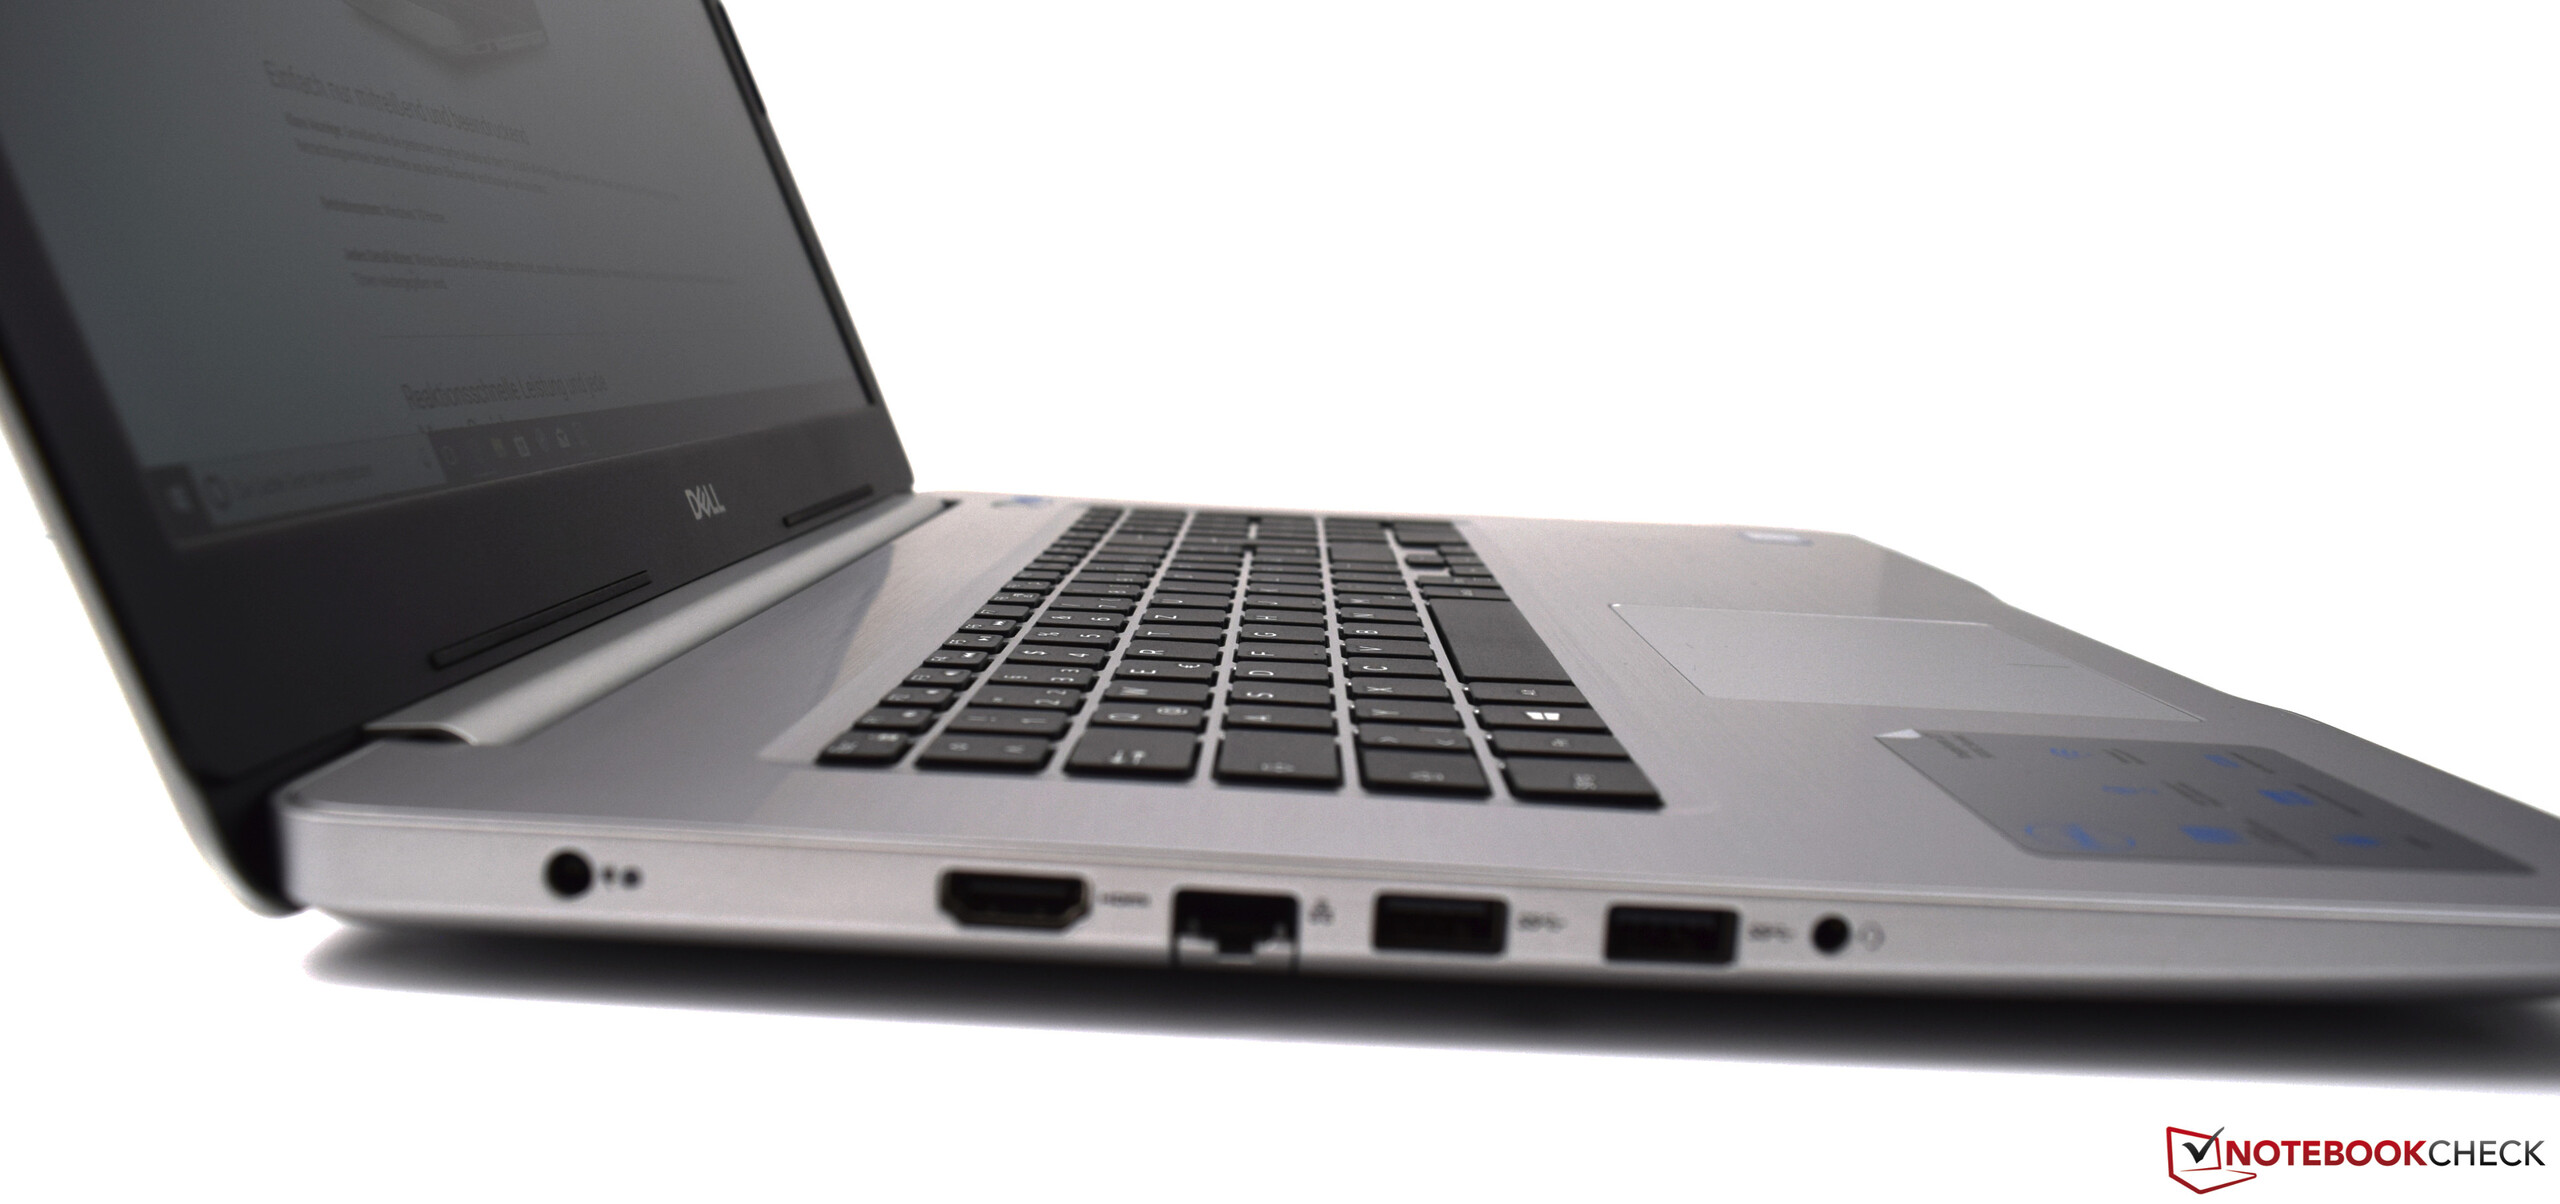
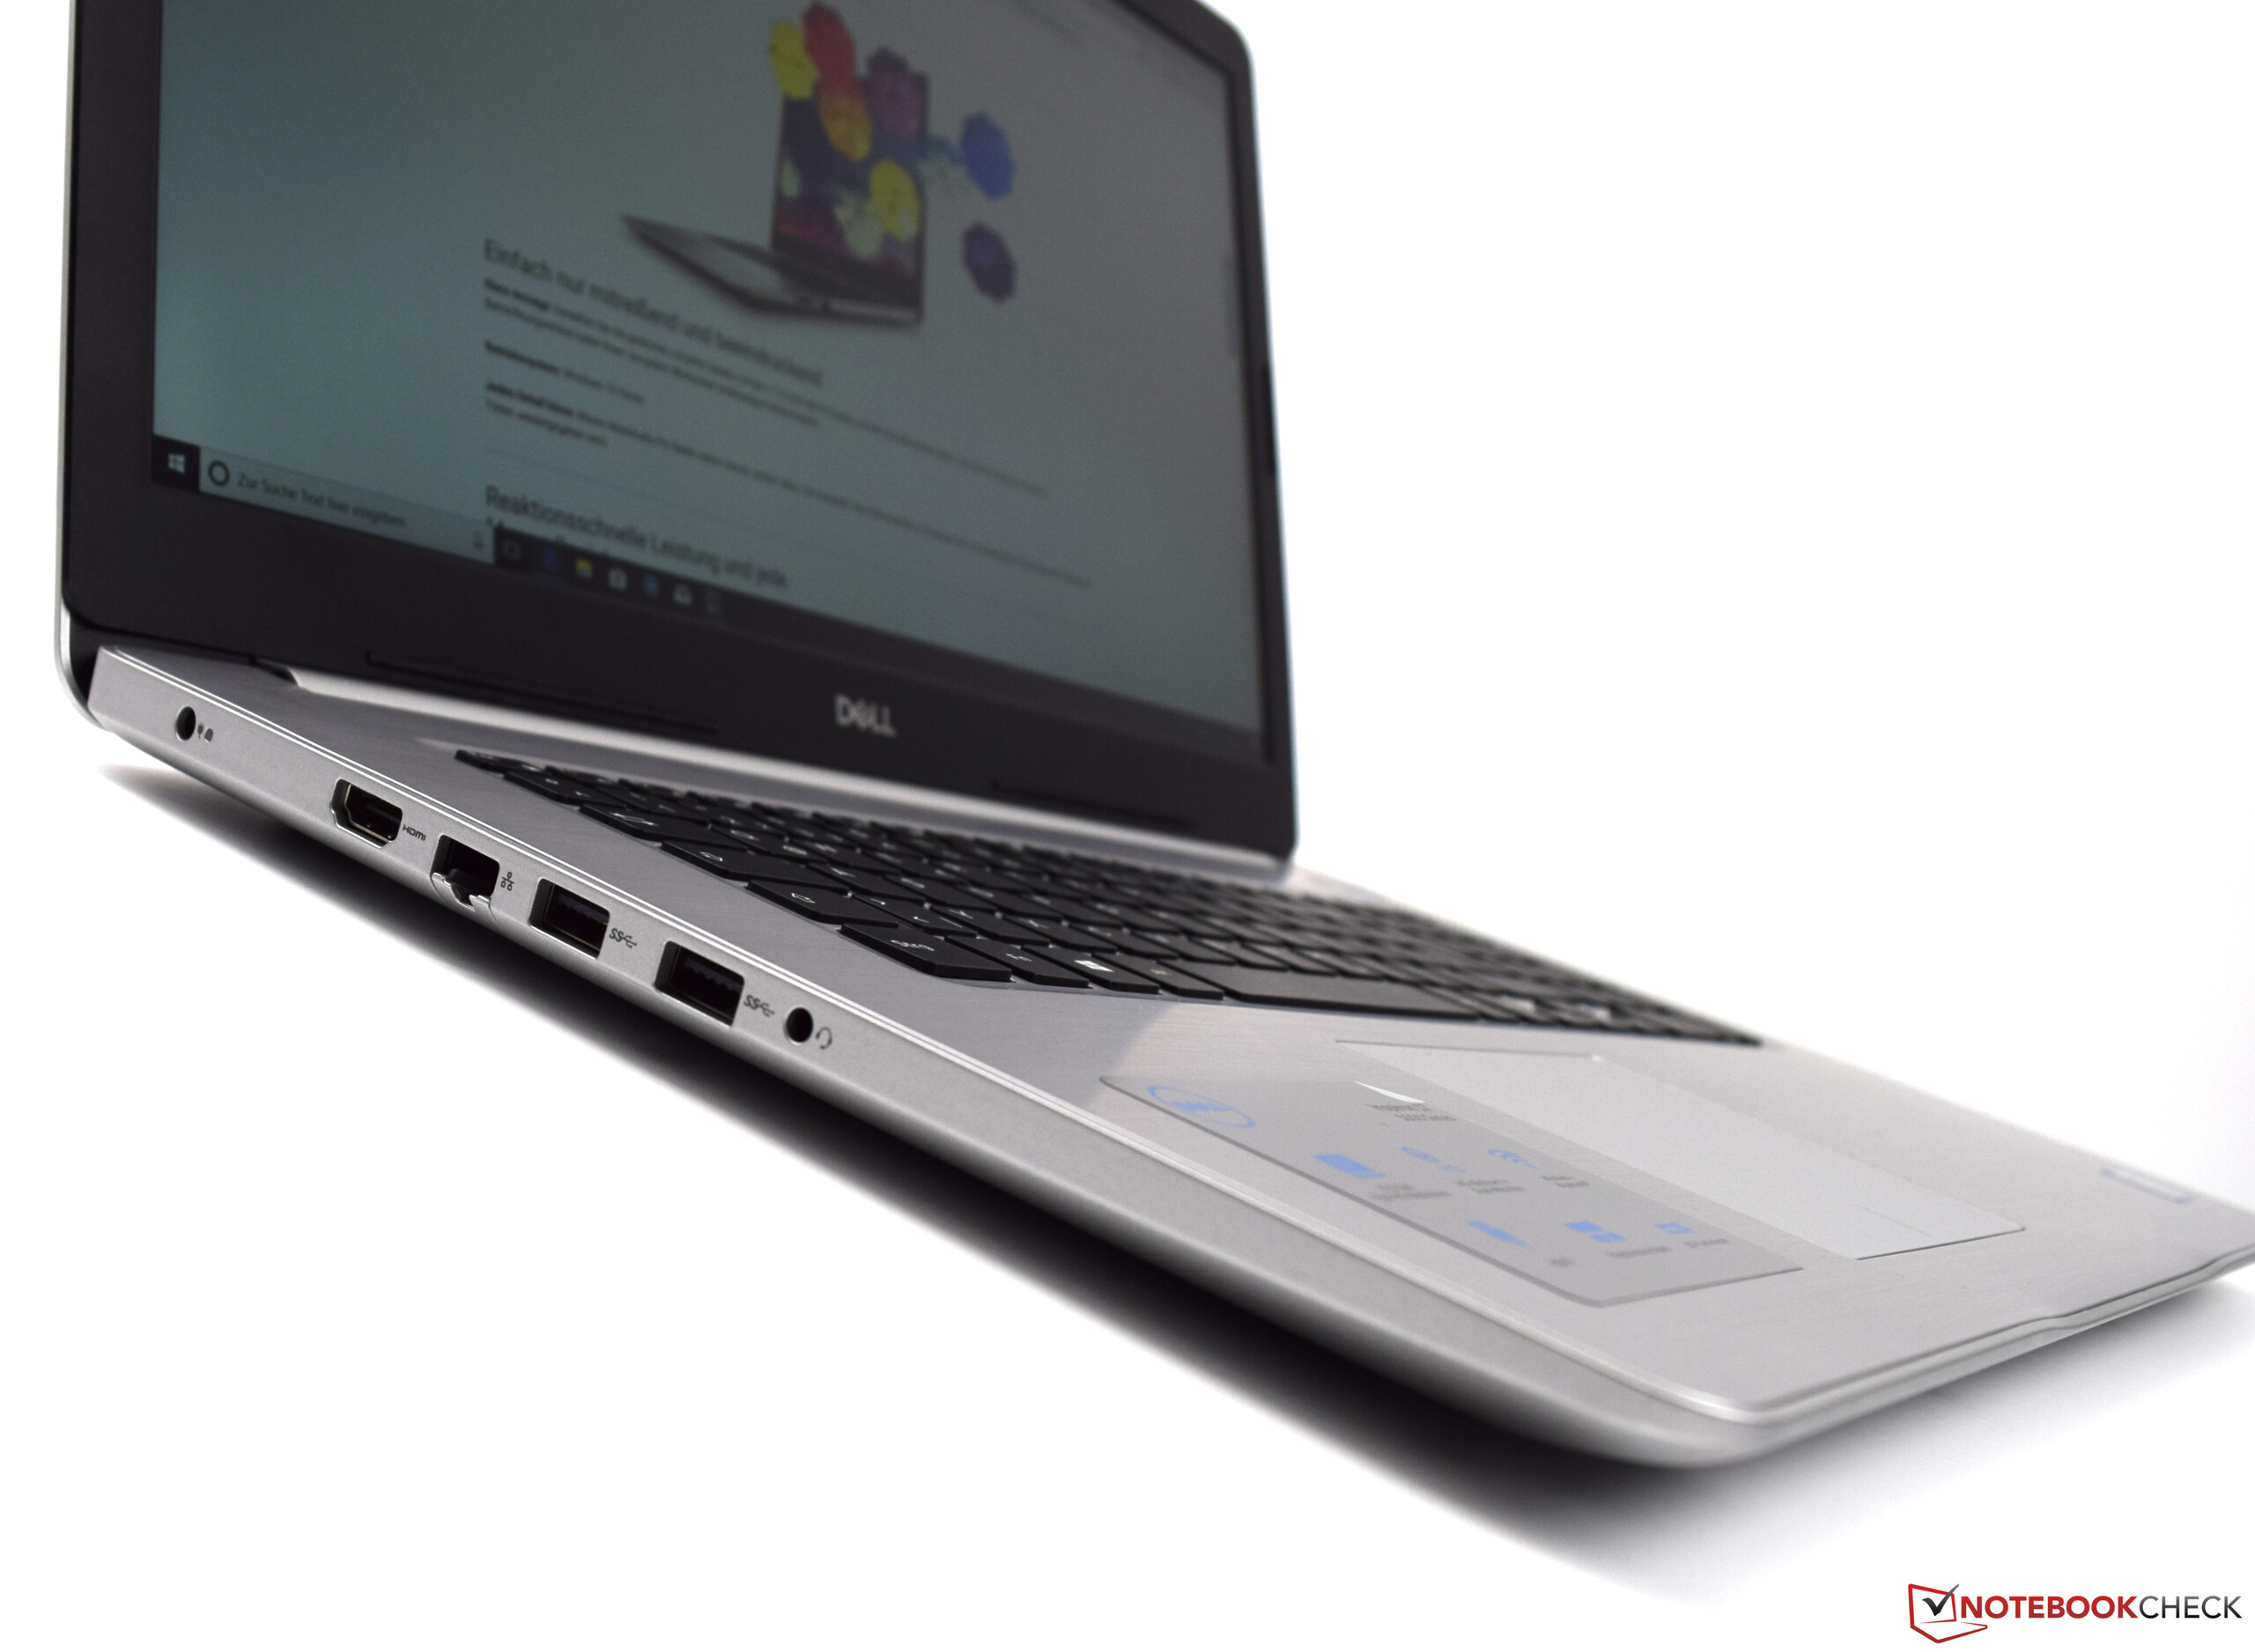
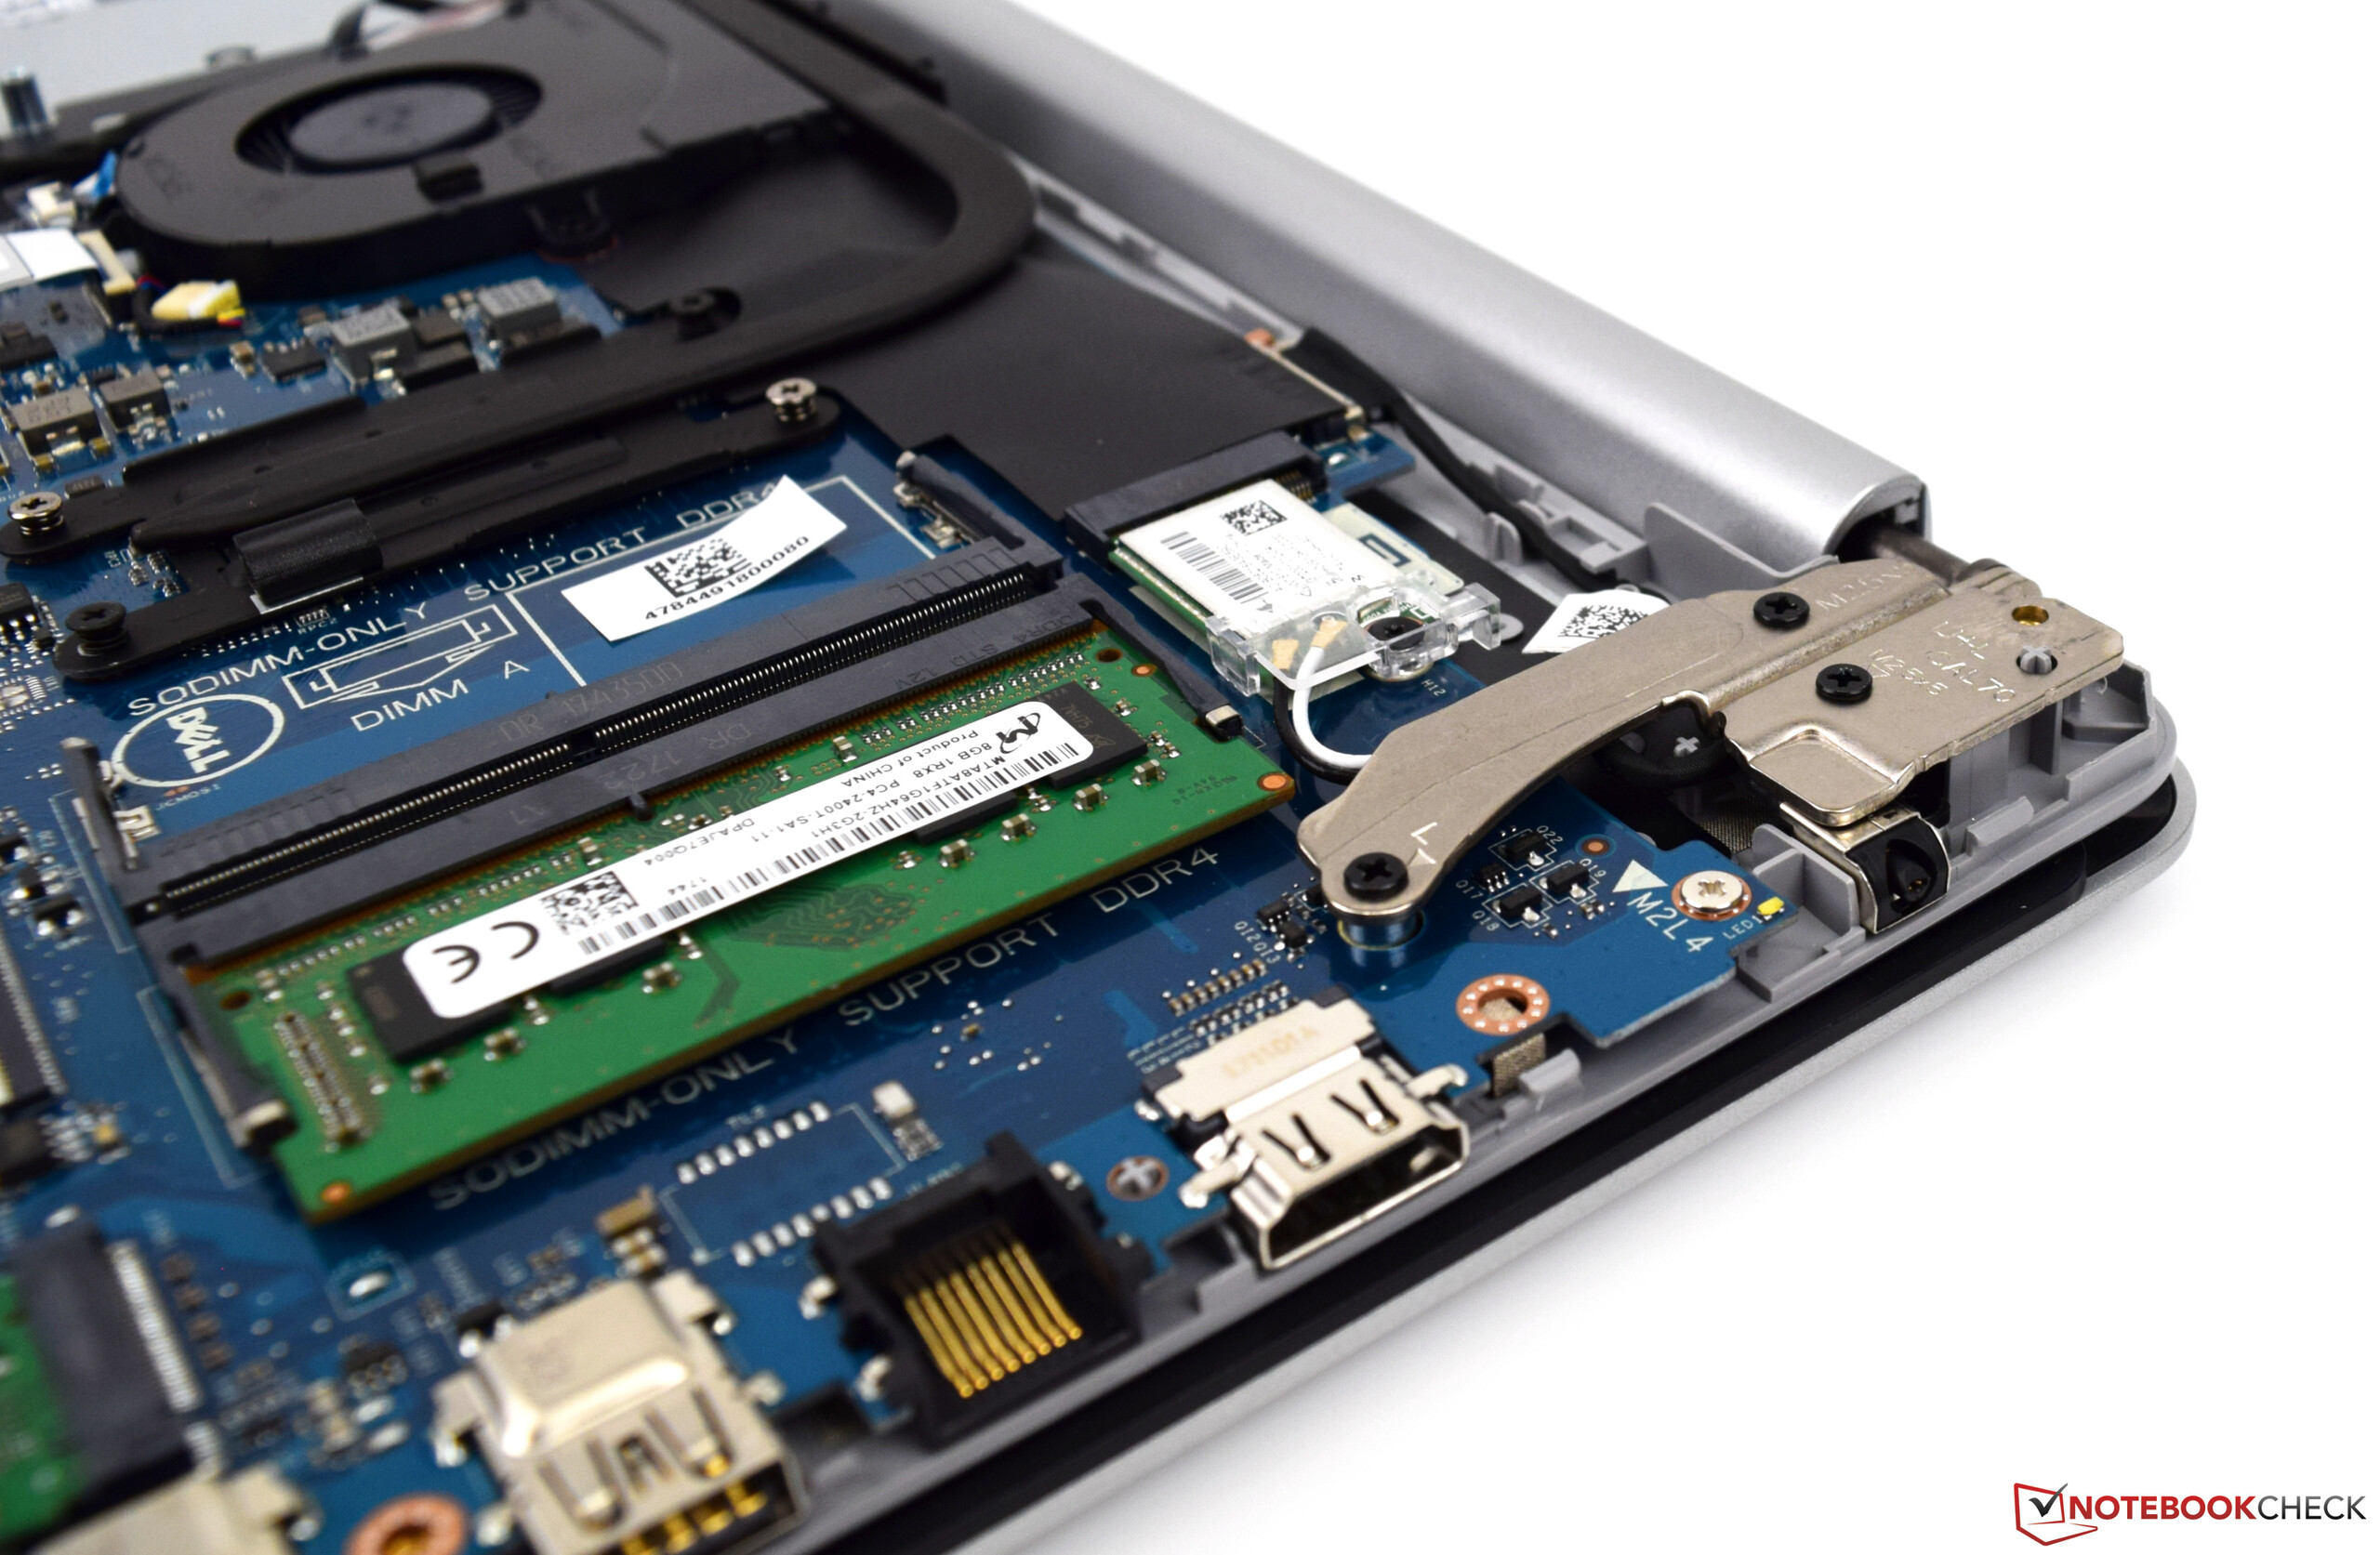
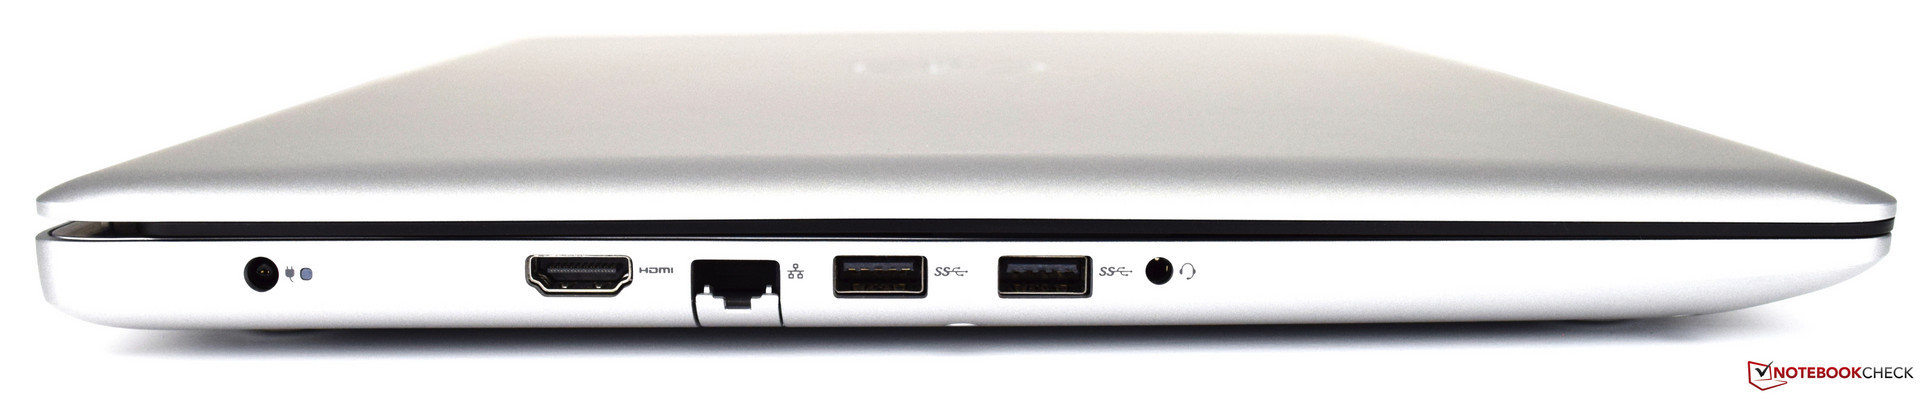
The Dell Inspiron 17-5770 did not convince us in terms of its connectivity. It is simply no longer up-to-date to offer only three USB ports, of which only one supports the 2.0 standard. A fourth USB port should be a given. Unfortunately, our test device also does not offer a USB 3.1 Gen 1 Type-C port, even though it was listed on the manufacturer's website at first glance. A closer look at the descriptions of the different configurations revealed that this port is optional. Only the configuration variant with dedicated graphics card offers the up-to-date port. Other than the aforementioned ports, there is also an HDMI output, a memory card reader as well as an RJ45 connector and an optical drive, which is not necessarily standard any longer. The positioning of the ports is good and leaves enough space in between.
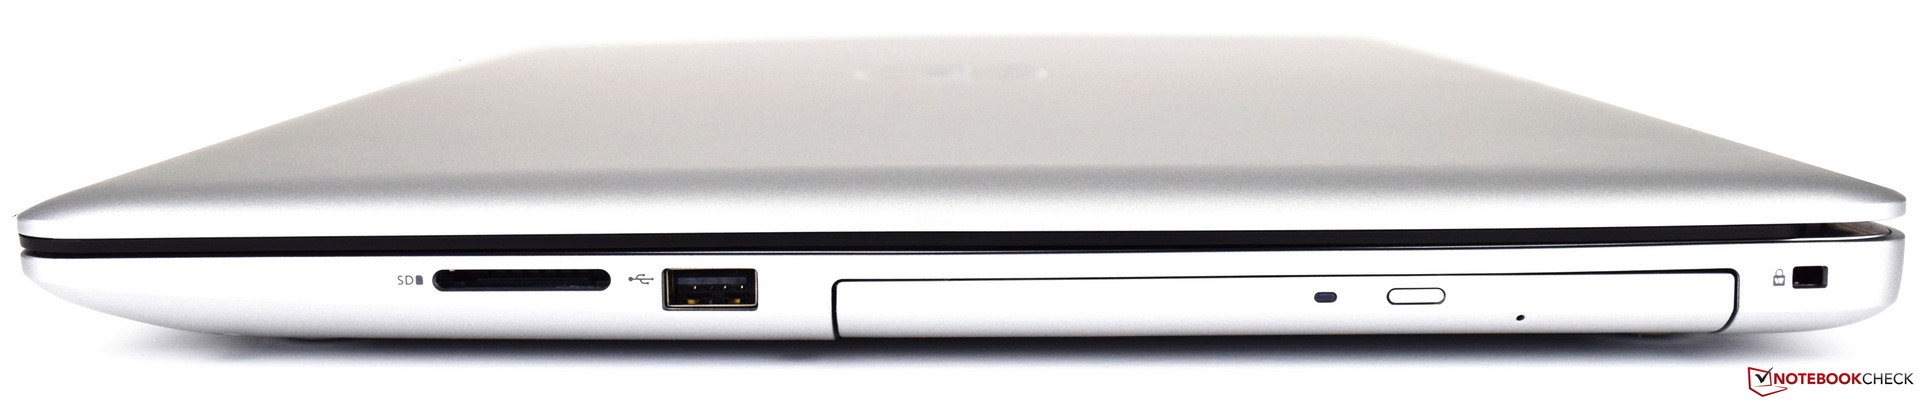
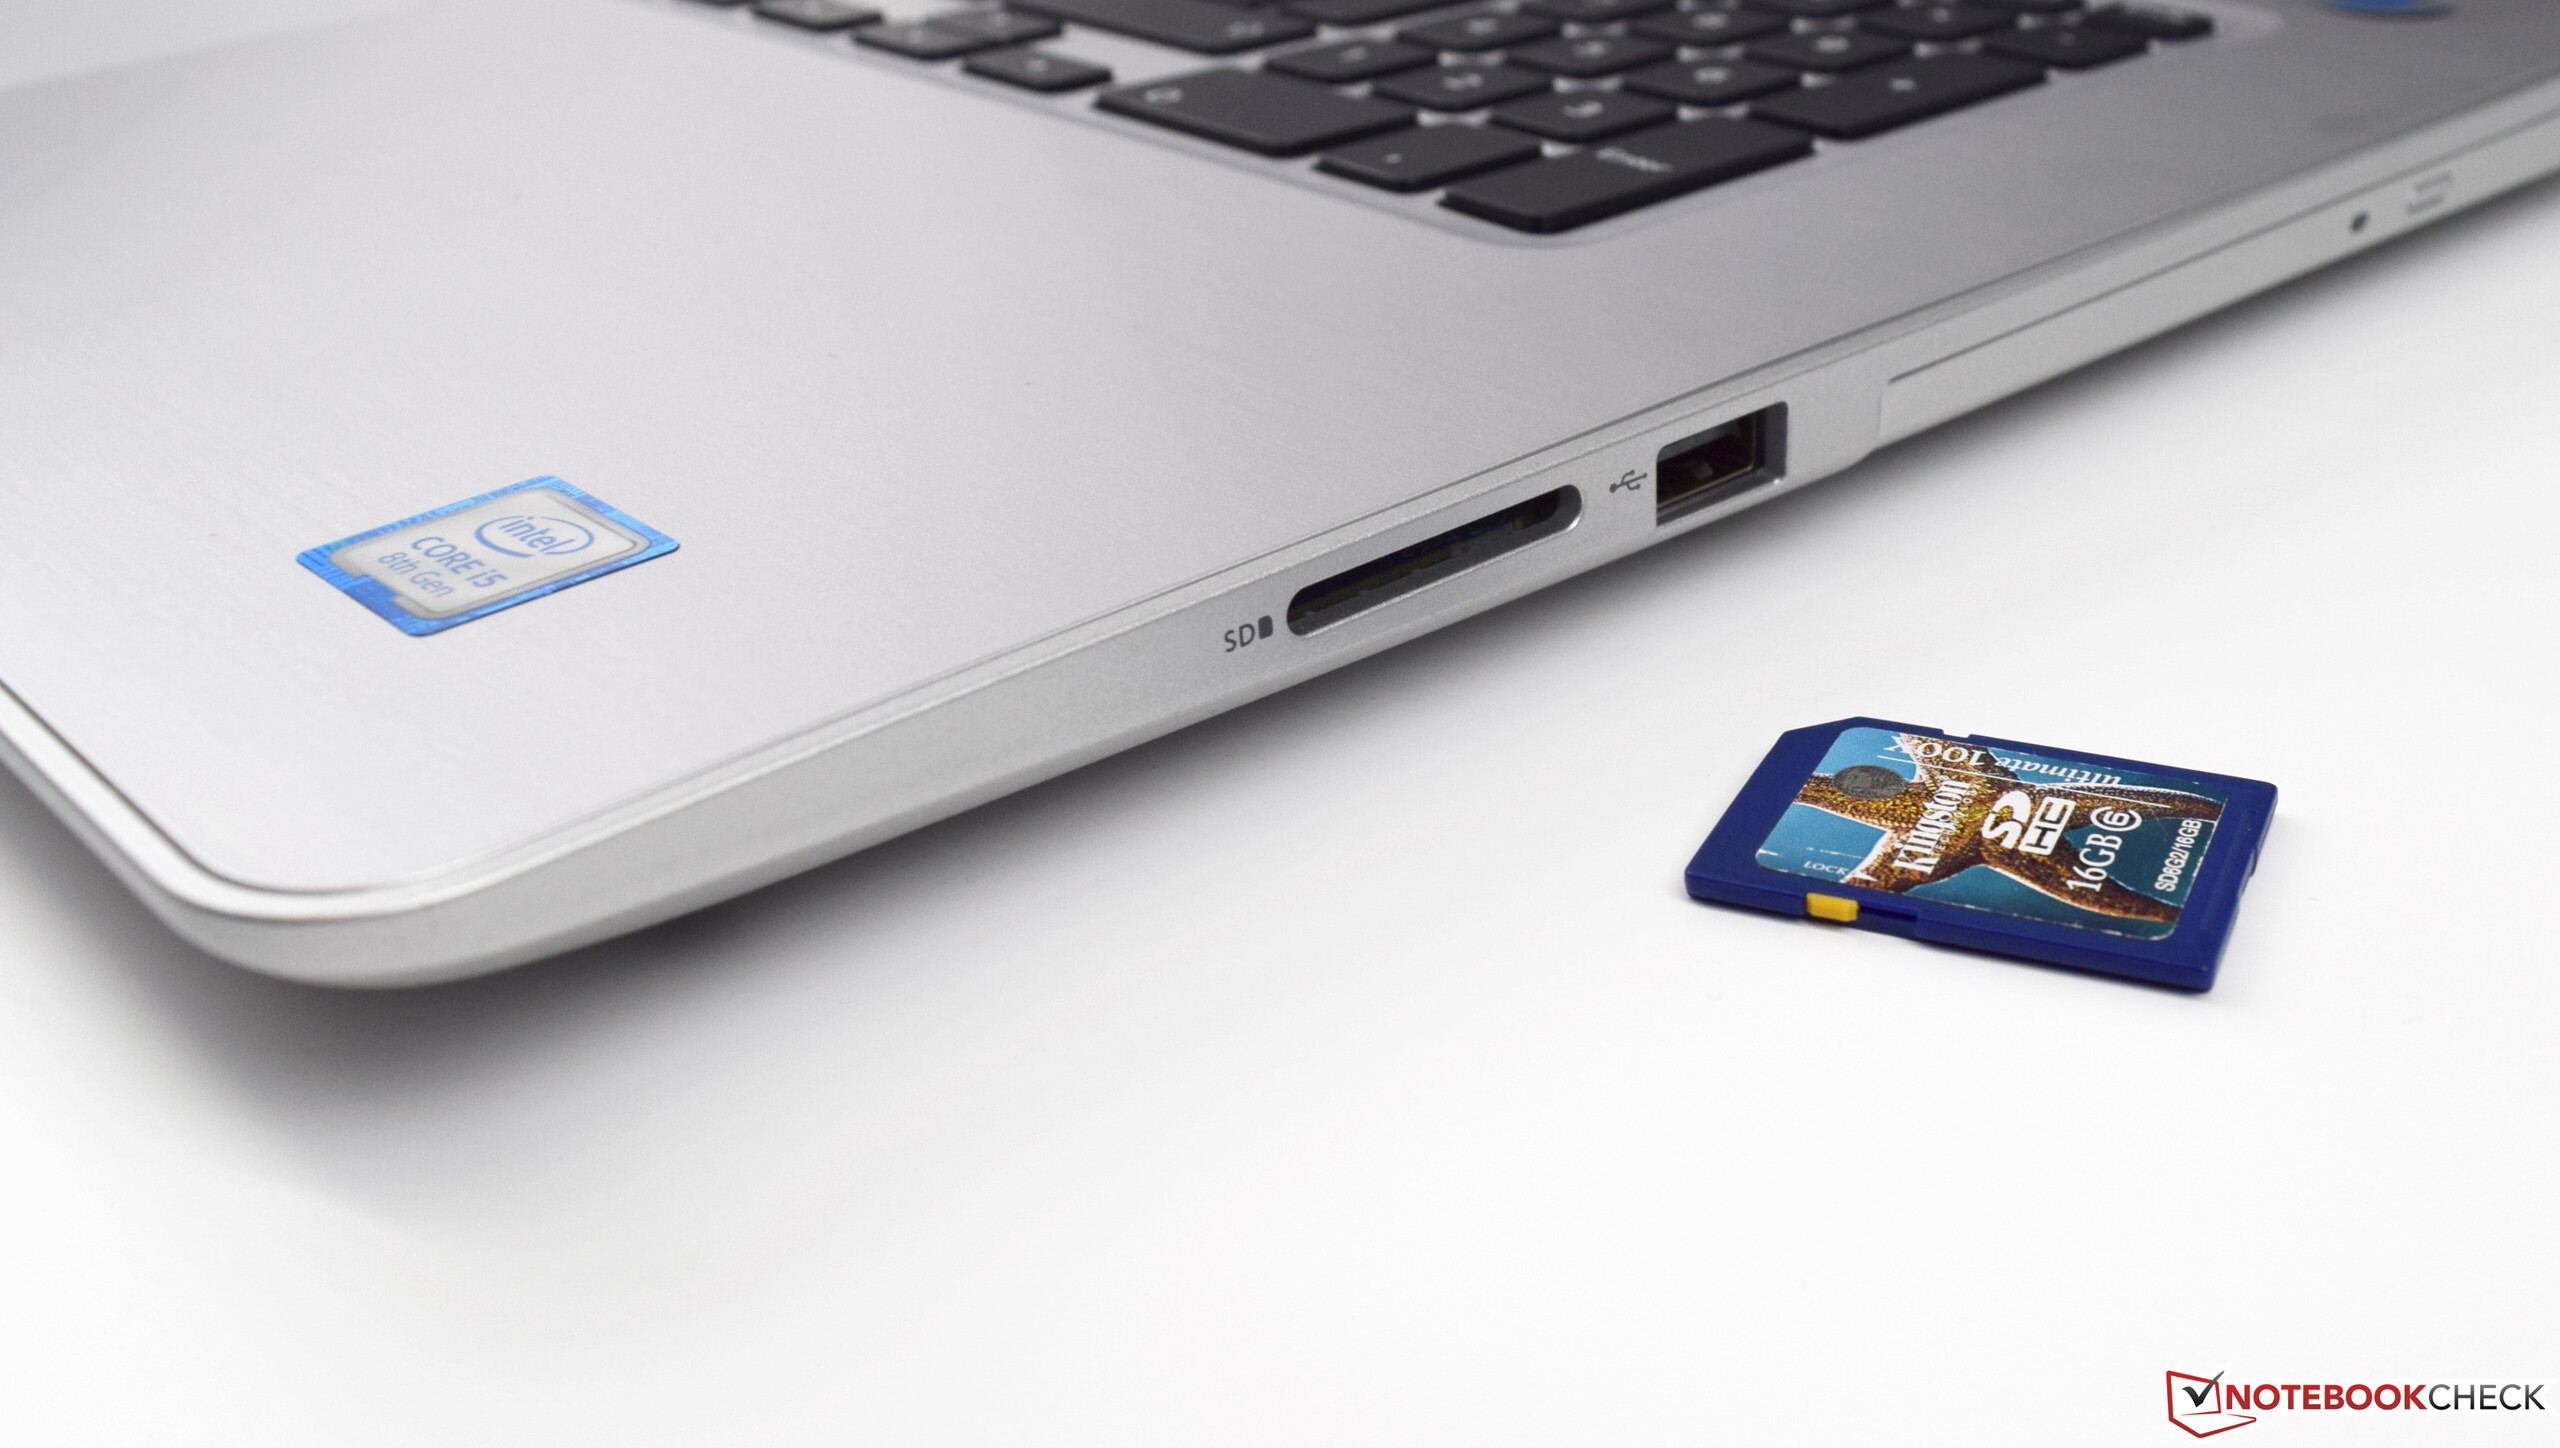
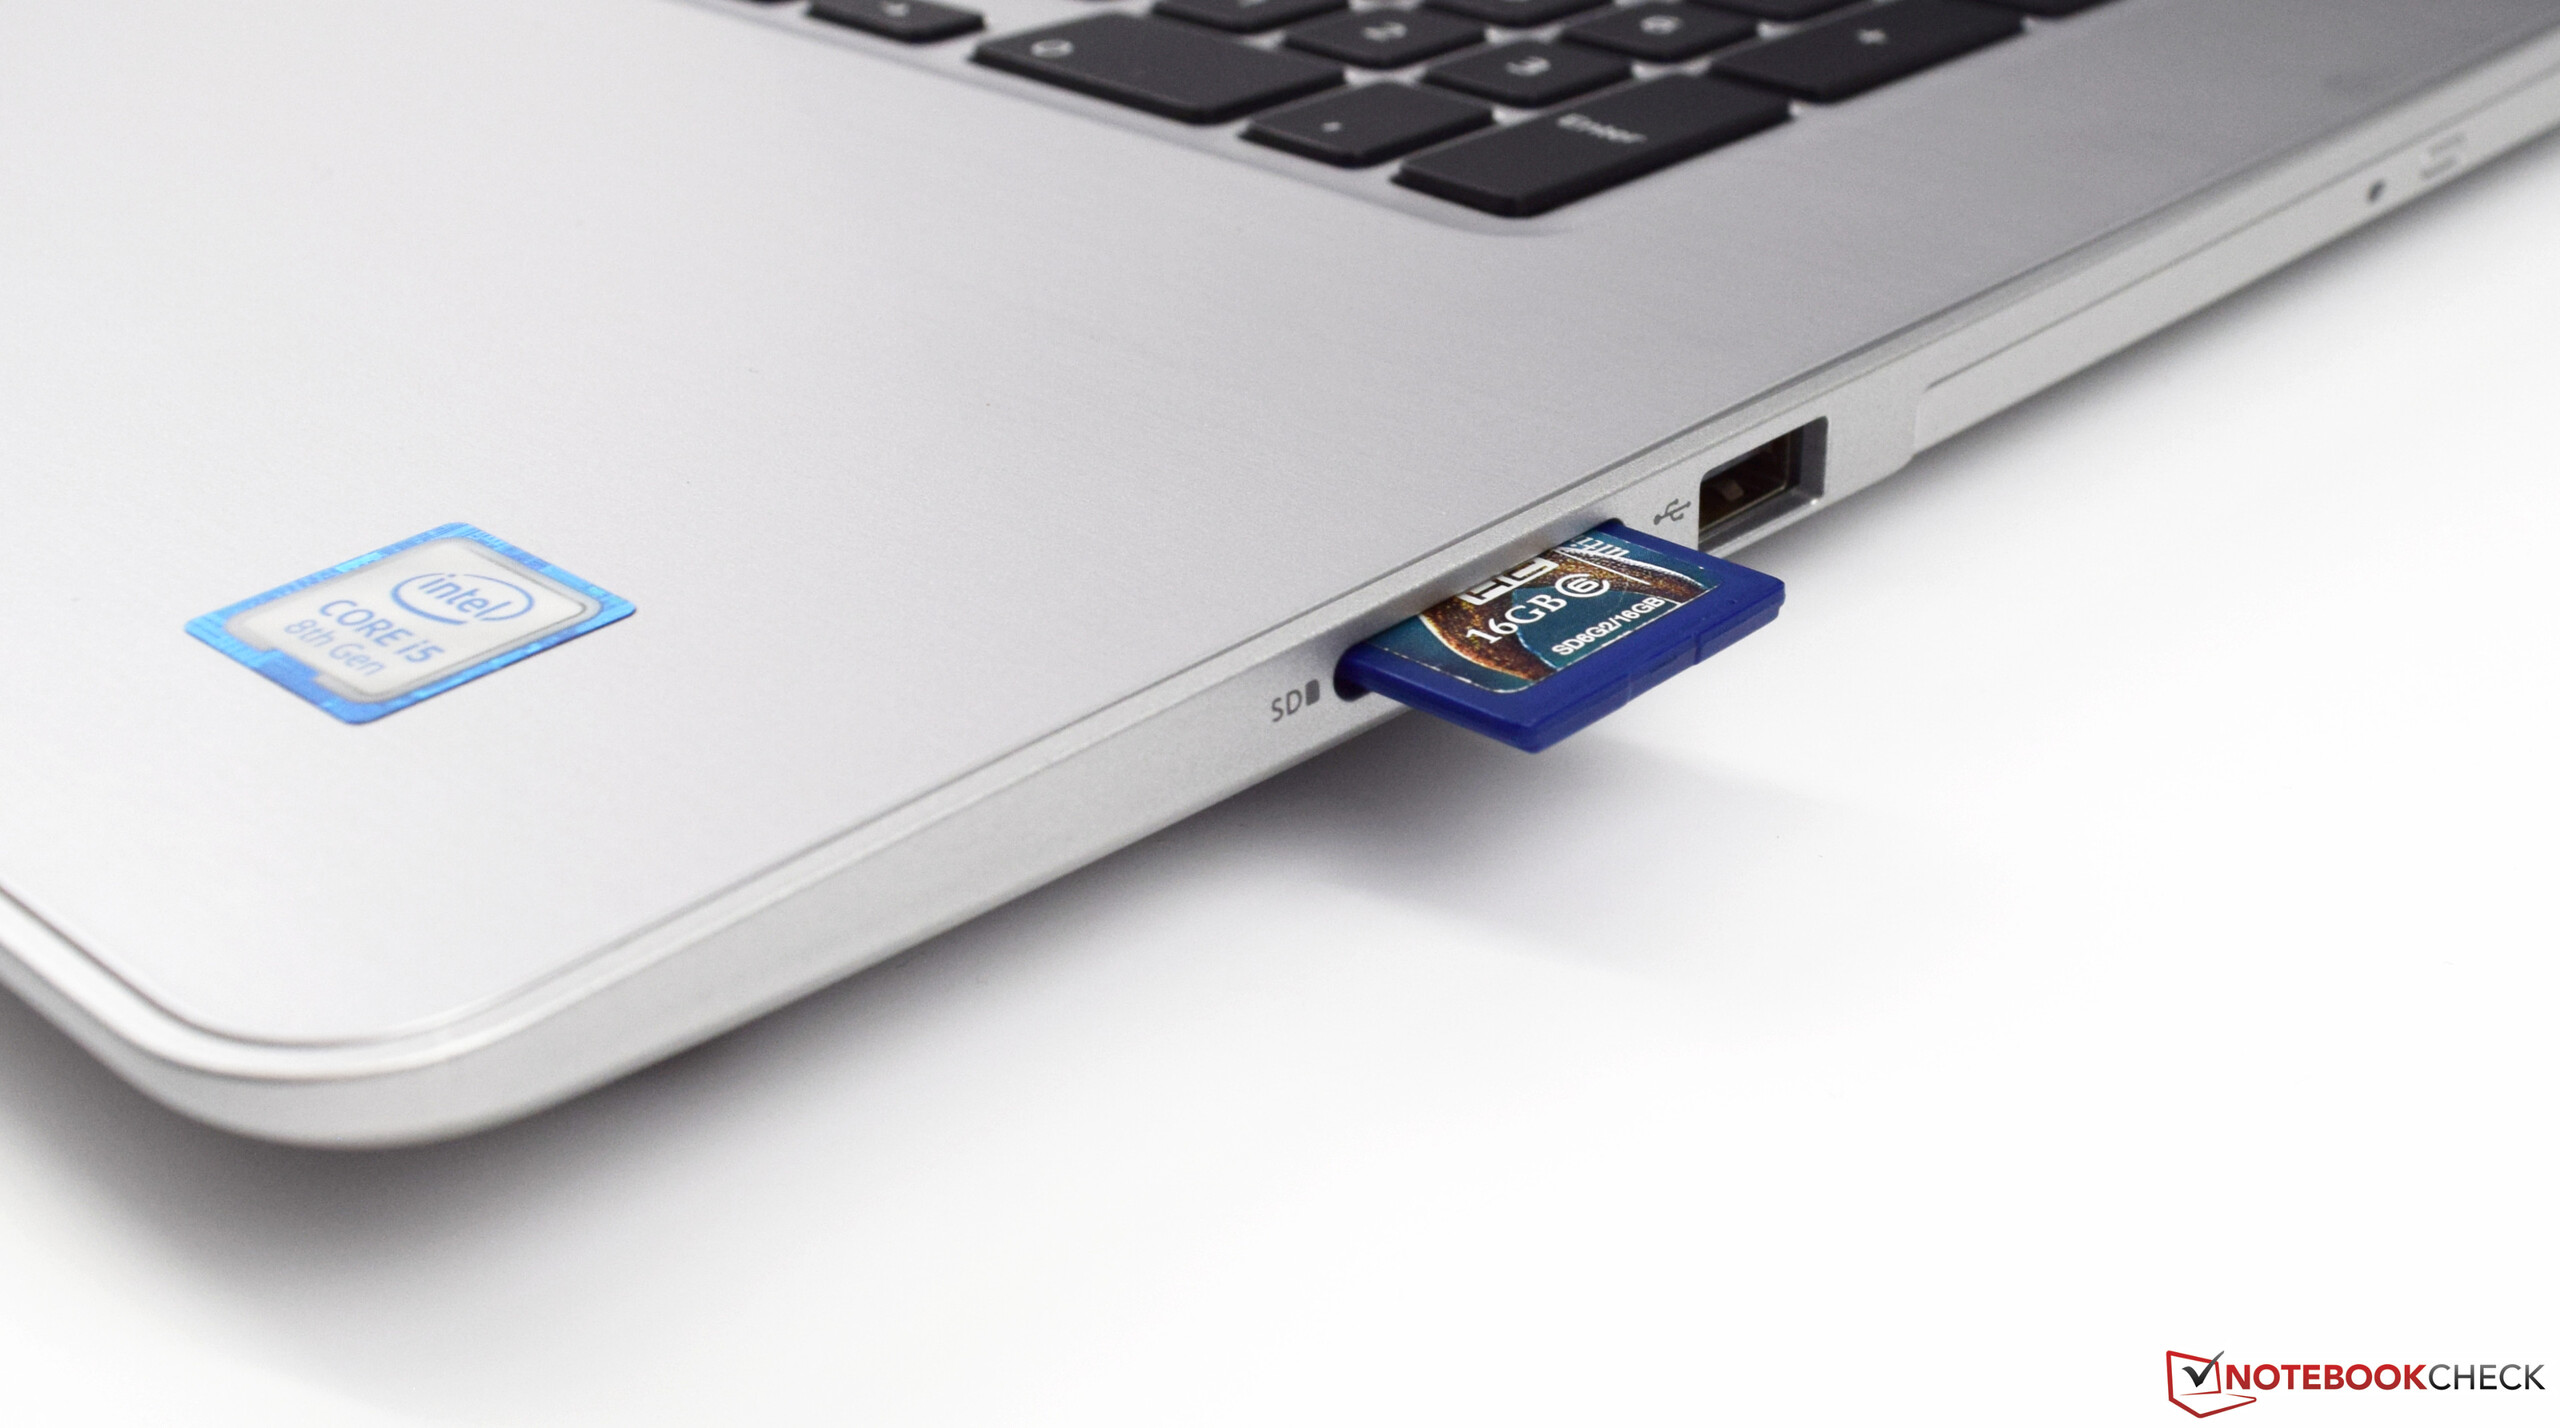
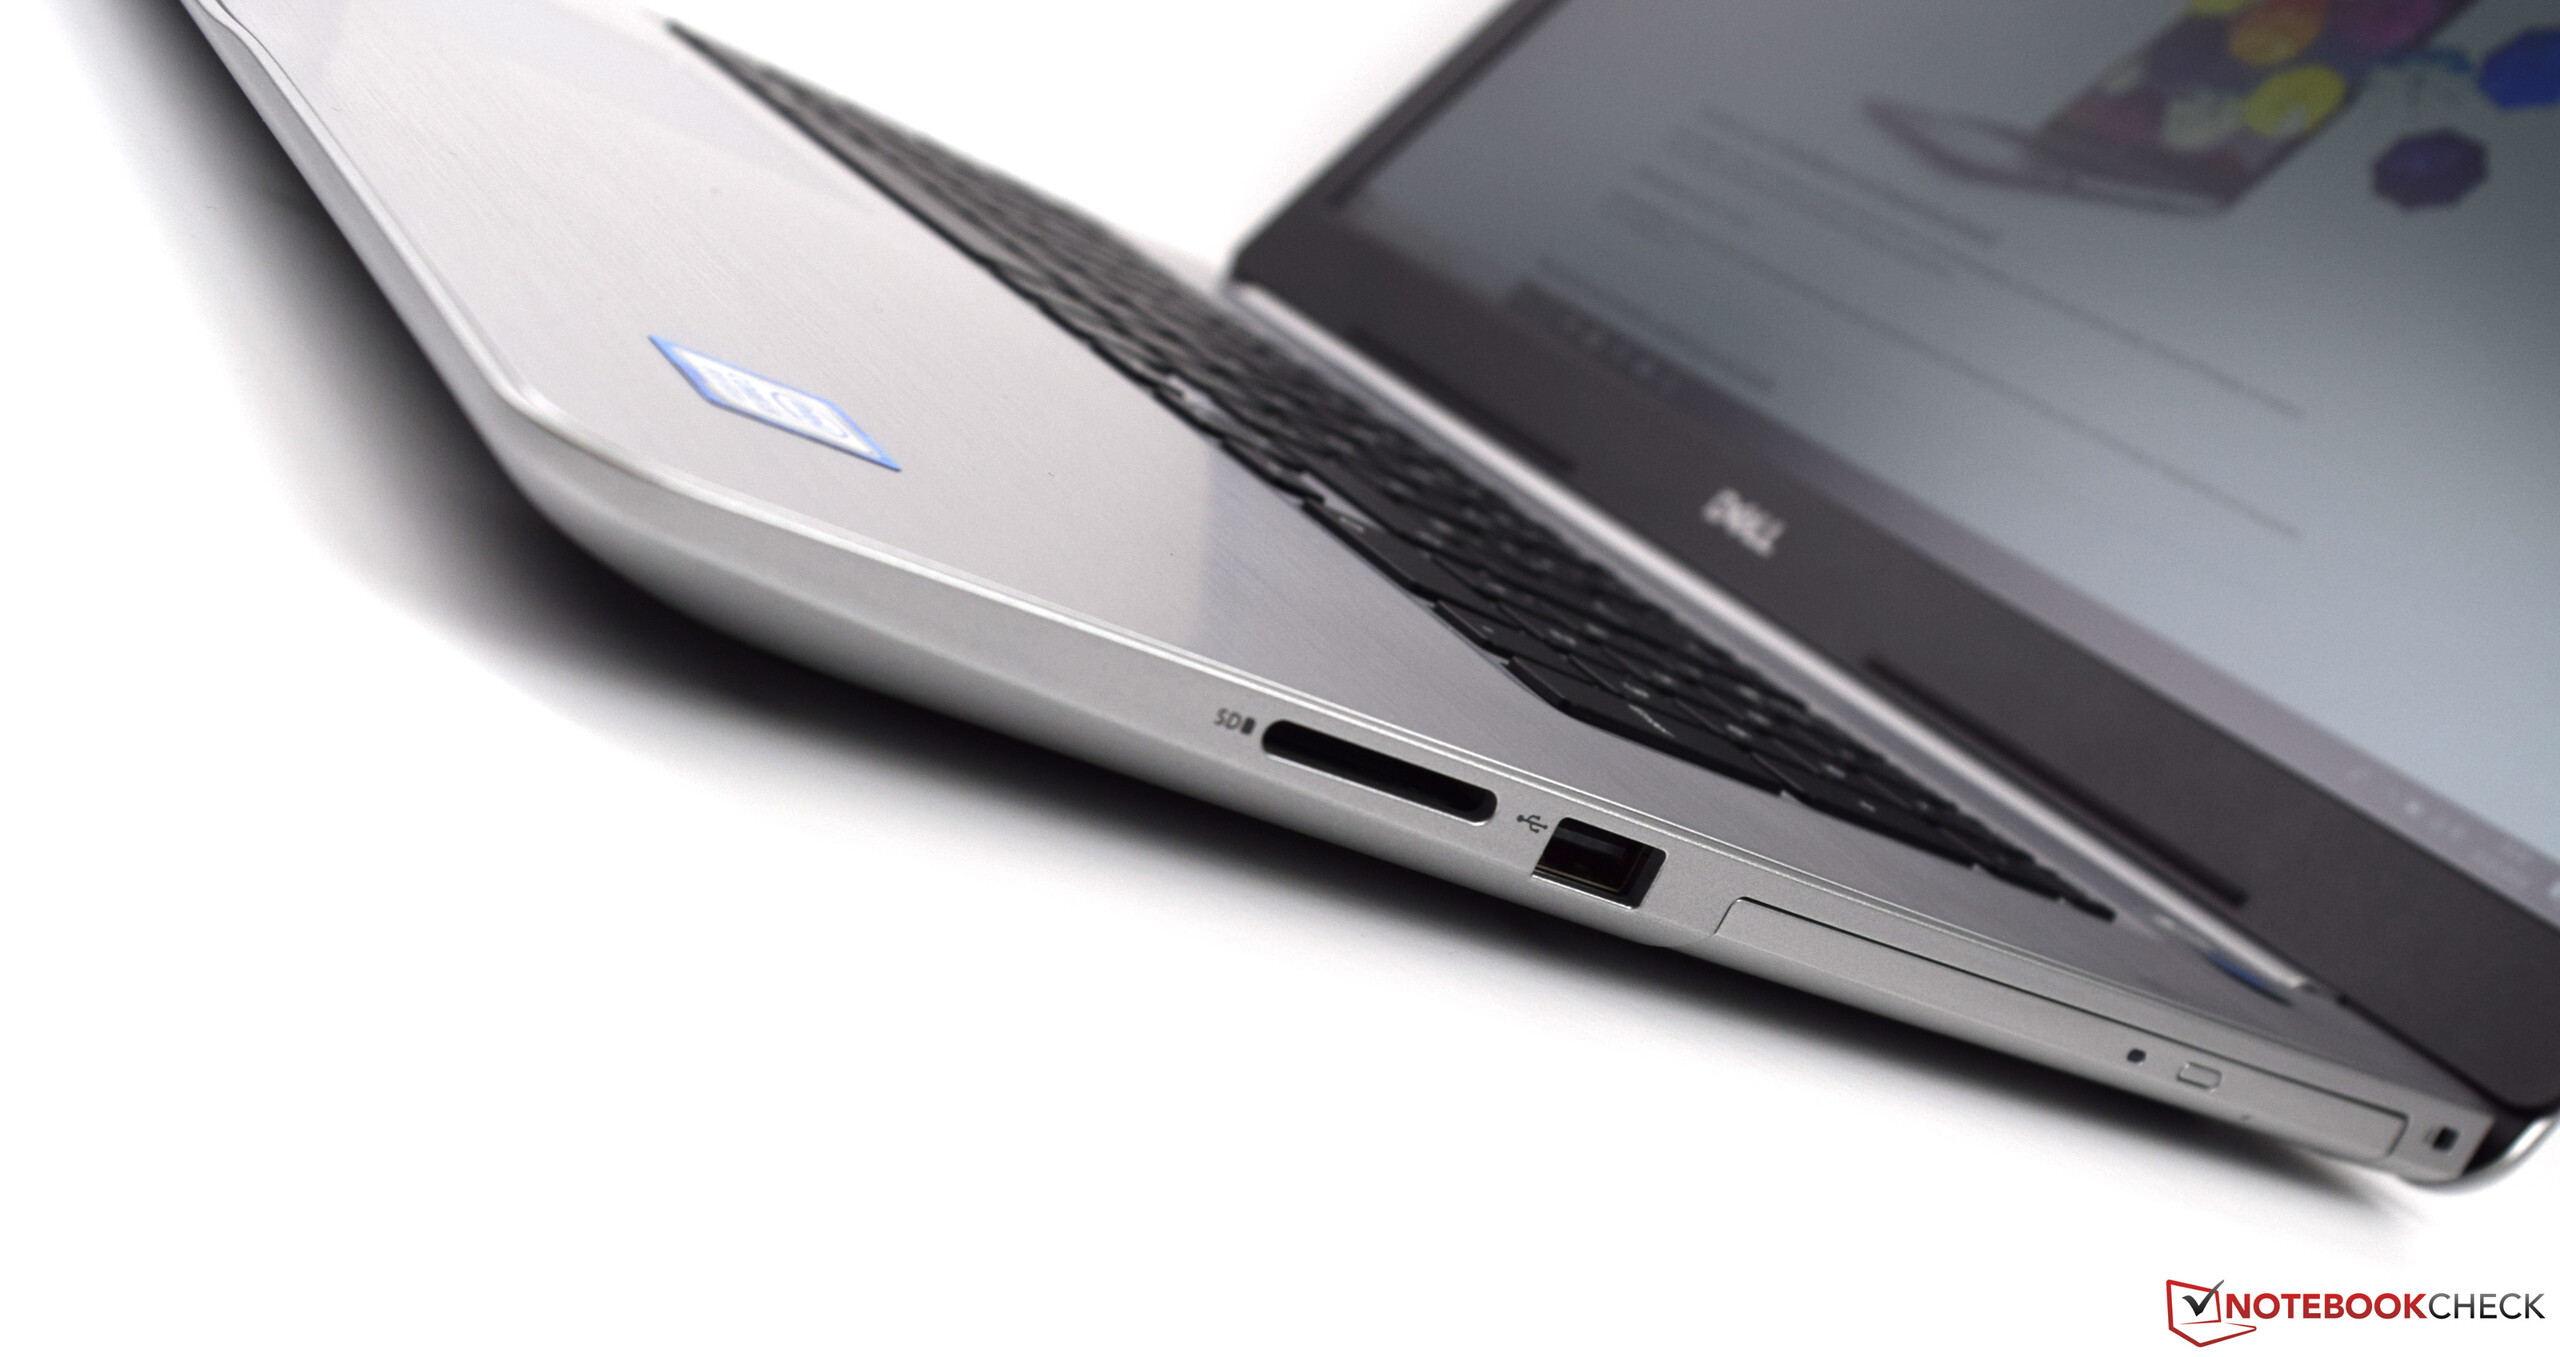
SD Card Reader
The positioning already shows that the installed memory card reader works at only the USB 2.0 speed. Our measurement results confirm this, as our test device sadly ranks last with 24.1 and 16.9 MB/s. For this test, we used our reference card Toshiba Exceria Pro SDXC 64 GB UHS-II. We recommend an adapter for the USB 3 port for users who want to transfer large amounts of data via the memory card reader frequently. Inserted data storage devices protrude clearly from the slot, which is not good either.
| SD Card Reader | |
| average JPG Copy Test (av. of 3 runs) | |
| HP Omen 17-w206ng (Toshiba Exceria Pro SDXC 64 GB UHS-II) | |
| Acer Aspire 5 A517-51G-80L (Toshiba Exceria Pro SDXC 64 GB UHS-II) | |
| Acer Aspire F5-771G-50RD (Toshiba Exceria Pro SDXC 64 GB UHS-II) | |
| Acer Swift 3 SF315-41-R4W1 | |
| HP Pavilion 17z 1EX13AV (Toshiba Exceria Pro SDXC 64 GB UHS-II) | |
| Dell Inspiron 17-7773-0043 (Toshiba Exceria Pro SDXC 64 GB UHS-II) | |
| Dell Inspiron 17-5770-0357 (Toshiba Exceria Pro SDXC 64 GB UHS-II) | |
| maximum AS SSD Seq Read Test (1GB) | |
| Acer Aspire F5-771G-50RD (Toshiba Exceria Pro SDXC 64 GB UHS-II) | |
| HP Omen 17-w206ng (Toshiba Exceria Pro SDXC 64 GB UHS-II) | |
| Acer Aspire 5 A517-51G-80L (Toshiba Exceria Pro SDXC 64 GB UHS-II) | |
| HP Pavilion 17z 1EX13AV (Toshiba Exceria Pro SDXC 64 GB UHS-II) | |
| Acer Swift 3 SF315-41-R4W1 | |
| Dell Inspiron 17-7773-0043 (Toshiba Exceria Pro SDXC 64 GB UHS-II) | |
| Dell Inspiron 17-5770-0357 (Toshiba Exceria Pro SDXC 64 GB UHS-II) | |
Communication
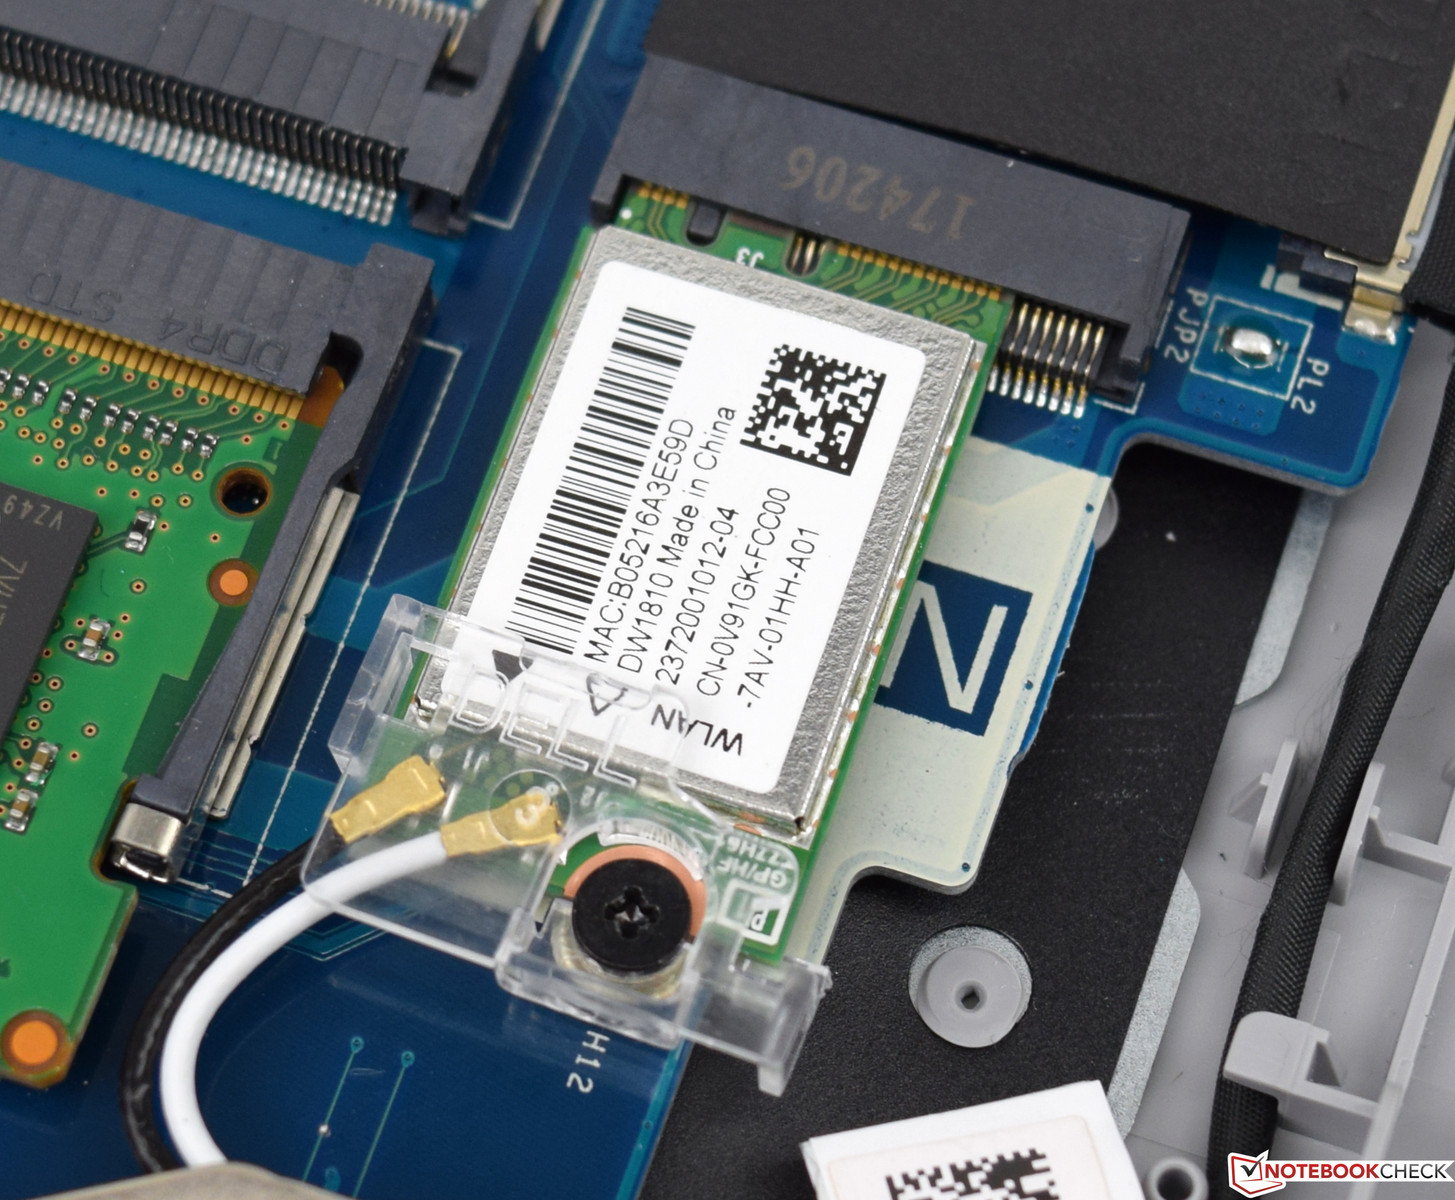
For external communication, the Dell Inspiron 17-5570 utilizes a 1x1 dual band AC Wi-Fi module by Qualcomm, which also offers Bluetooth in the version 4.1. During our measurements, the Dell Inspiron 17-5570 achieved a transfer rate of 308 MBit/s for data transmission and 338 MBit/s for data reception. Our test device had to acknowledge defeat against most competitors in this area, even though the HP Pavilion 17z comes in last by a large margin. Users might now speculate about being able to transfer more data via the Ethernet port, but sadly this is not possible because Dell has installed just a 10/100 NIC. Only a USB 3 to RJ45 adapter can provide a remedy to be able to reach transfer speeds in the GBit range.
Security
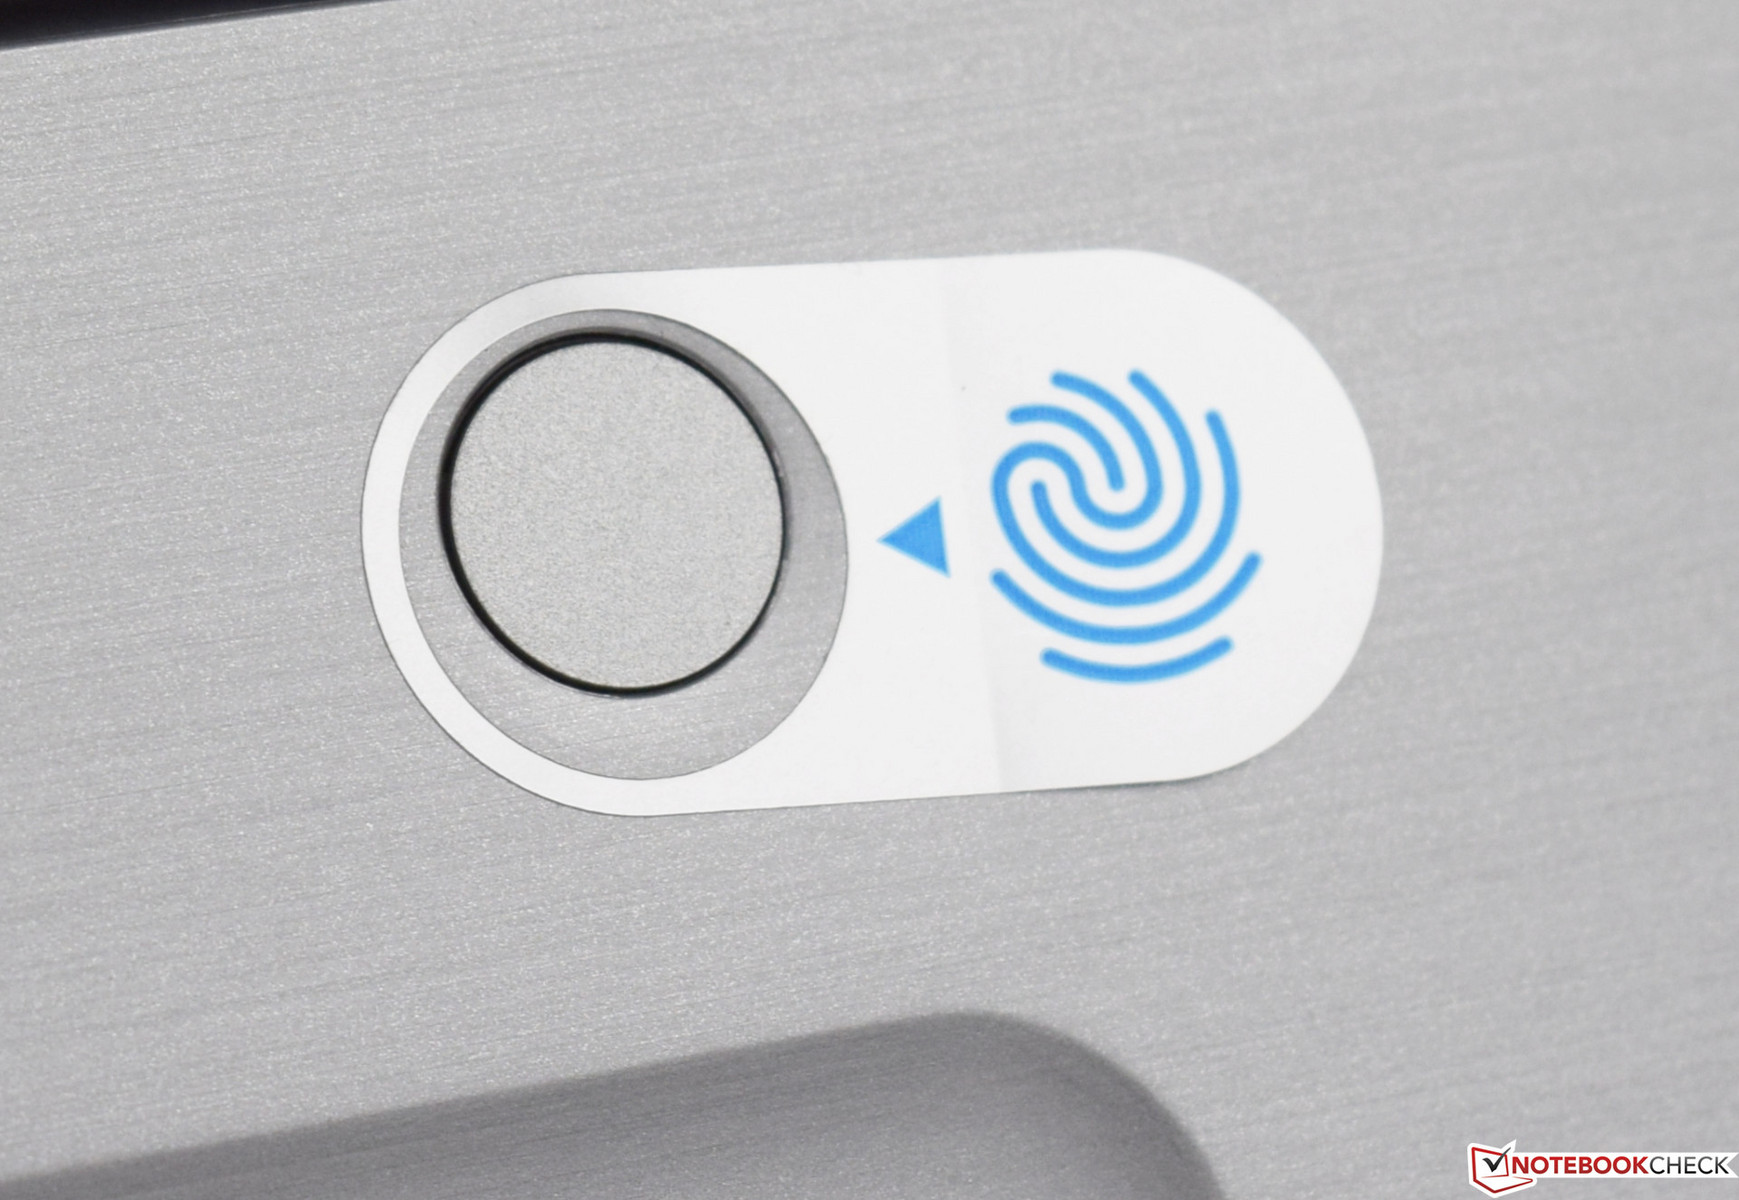
Even though the Dell Inspiron 17-5770 is a multimedia laptop, it still offers some security features. There is a Trusted Platform Module (TPM 2.0) and a mechanism to secure the laptop with a Noble lock. We liked the fingerprint sensor that is integrated into the power-on button. After a quick adjustment of the settings, the user can conveniently sign in to Windows with the touch of a finger (Windows Hello). MacAfee LiveSafe is the device's software solution for security and is already pre-installed. A 12-month subscription for private users is included in the purchase price and the subscription can be renewed for up to 36 months for a one-time surcharge of 29 Euros (~$36). This information stems from the Dell Shop.
Accessories
When purchasing a Dell Inspiron 17-5770, the included accessories are a power adapter as well as a quick-start guide and the mandatory safety instructions. Optional accessories can be selected on the manufacturer's website during the ordering process. For example, a laptop backpack, a separate mouse, or a powerful USB headset can be ordered with the device.
Maintenance
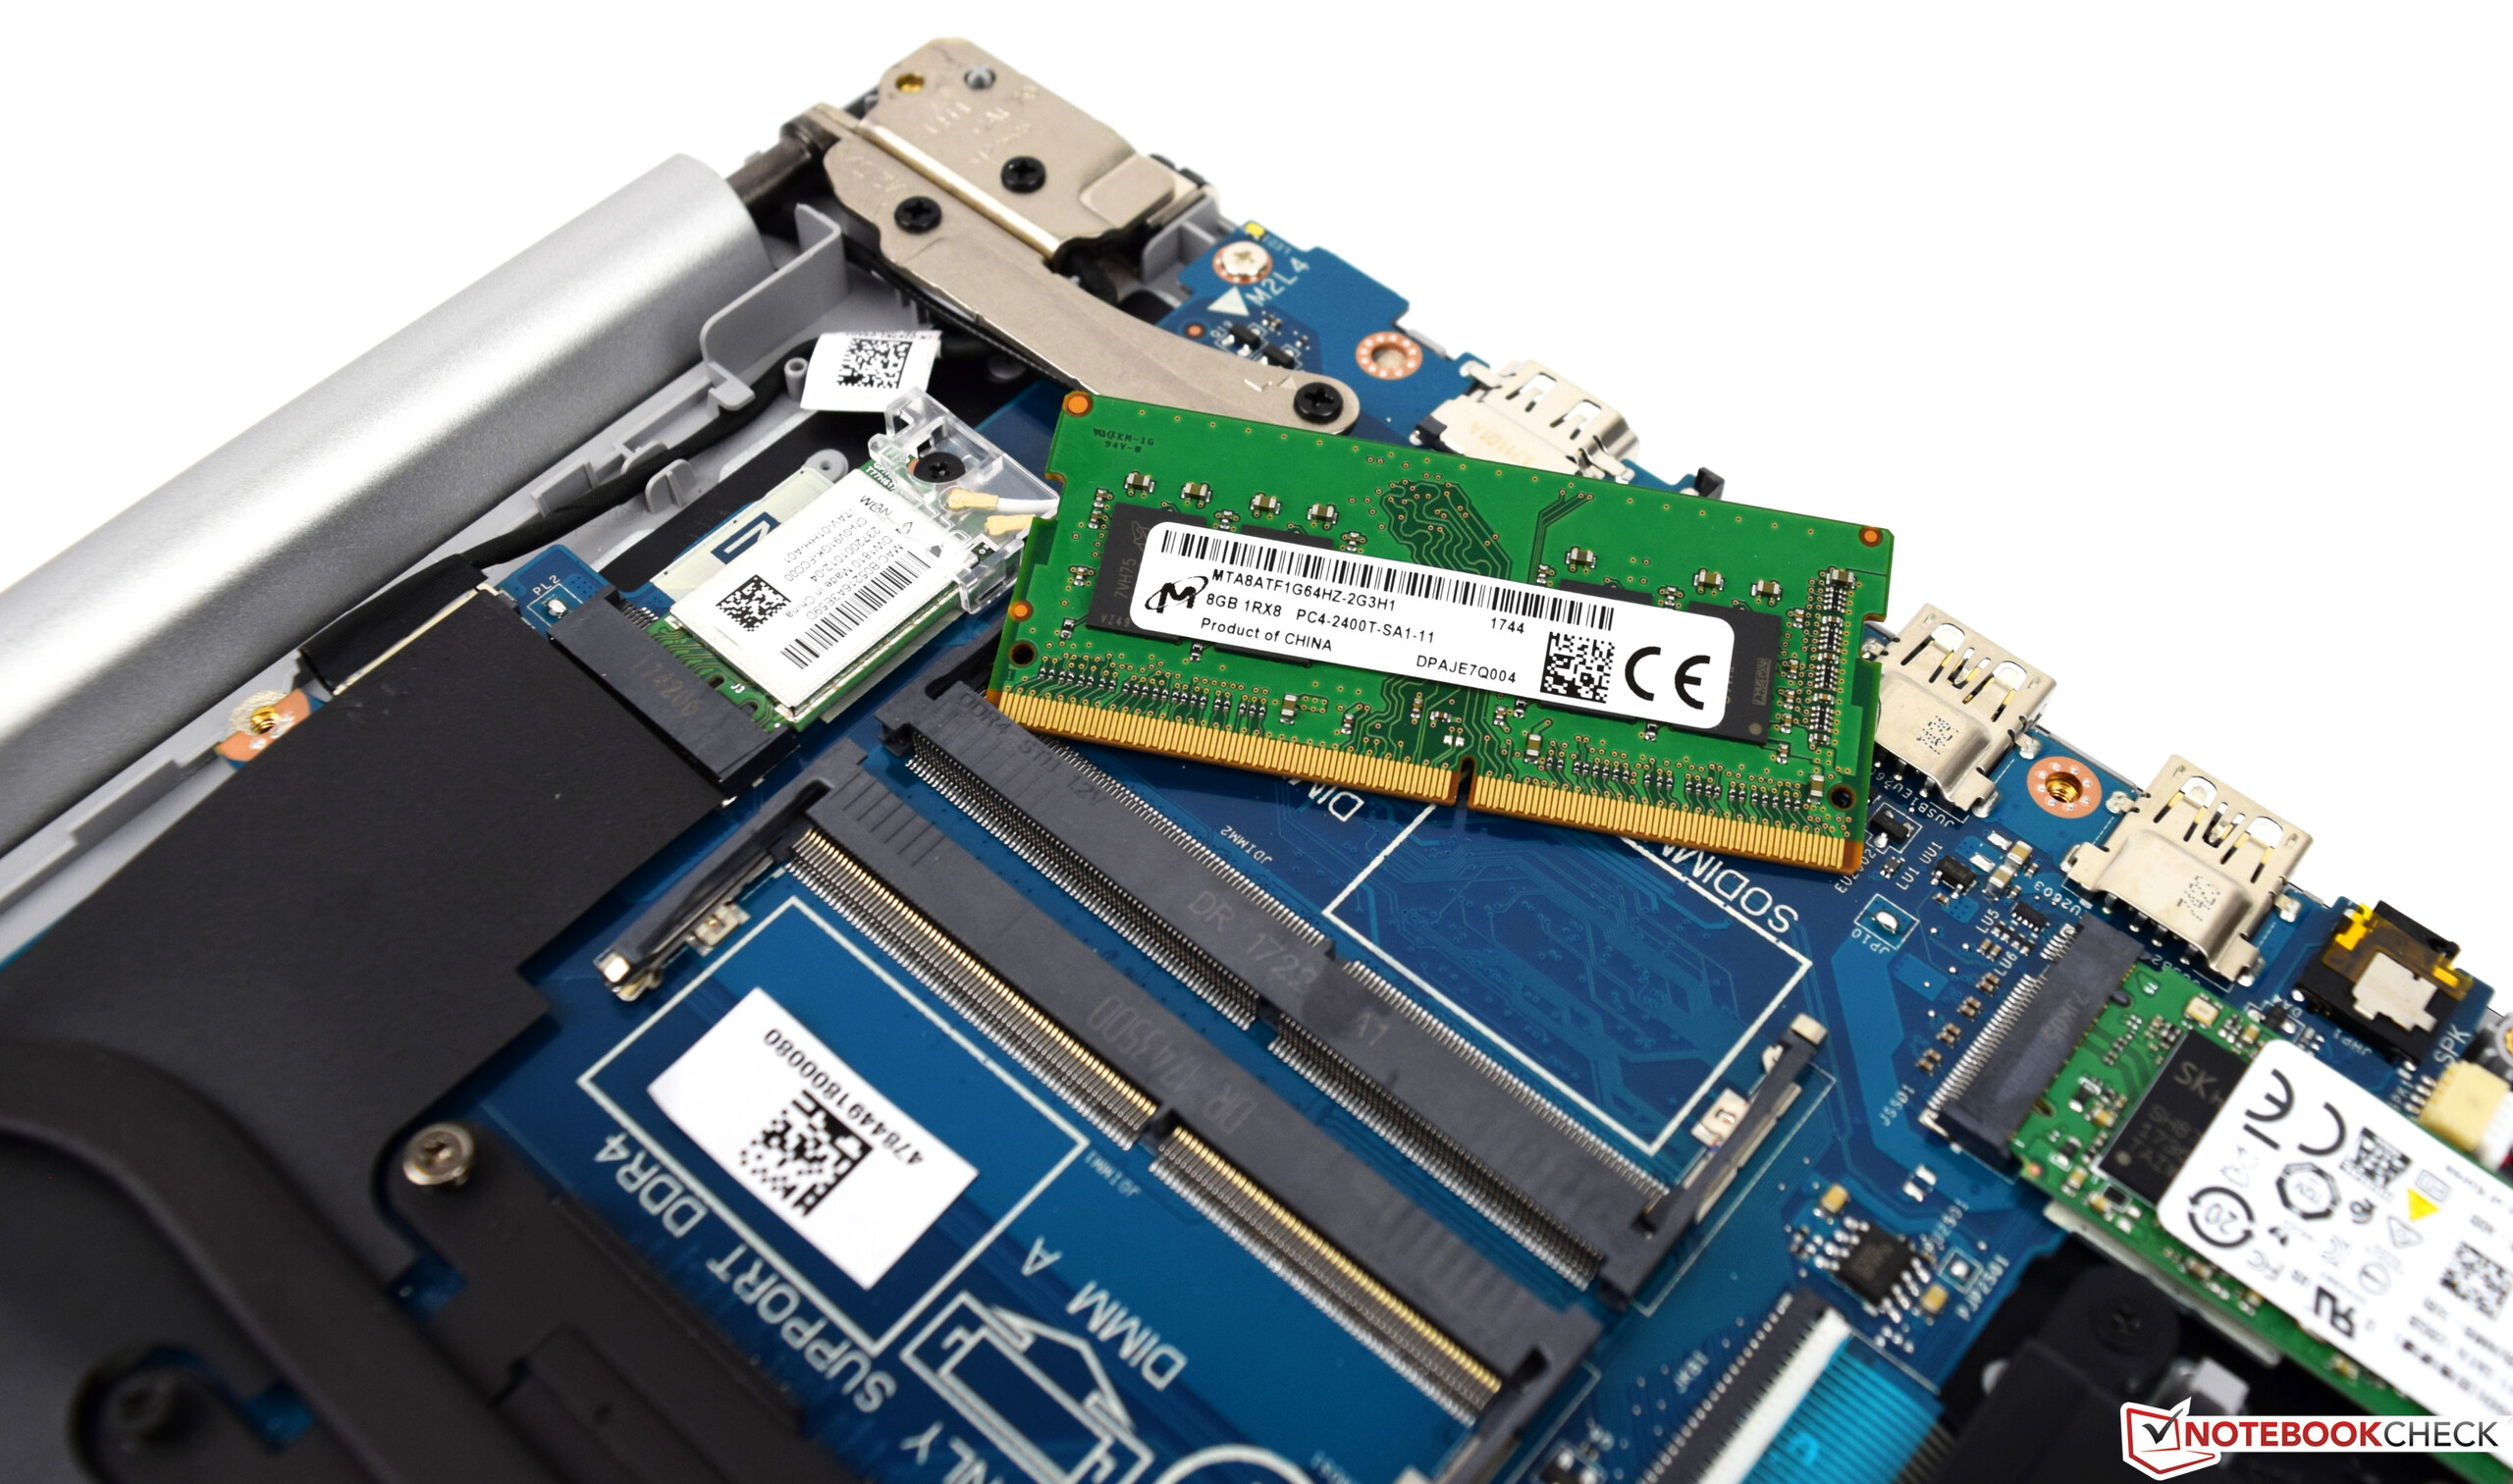
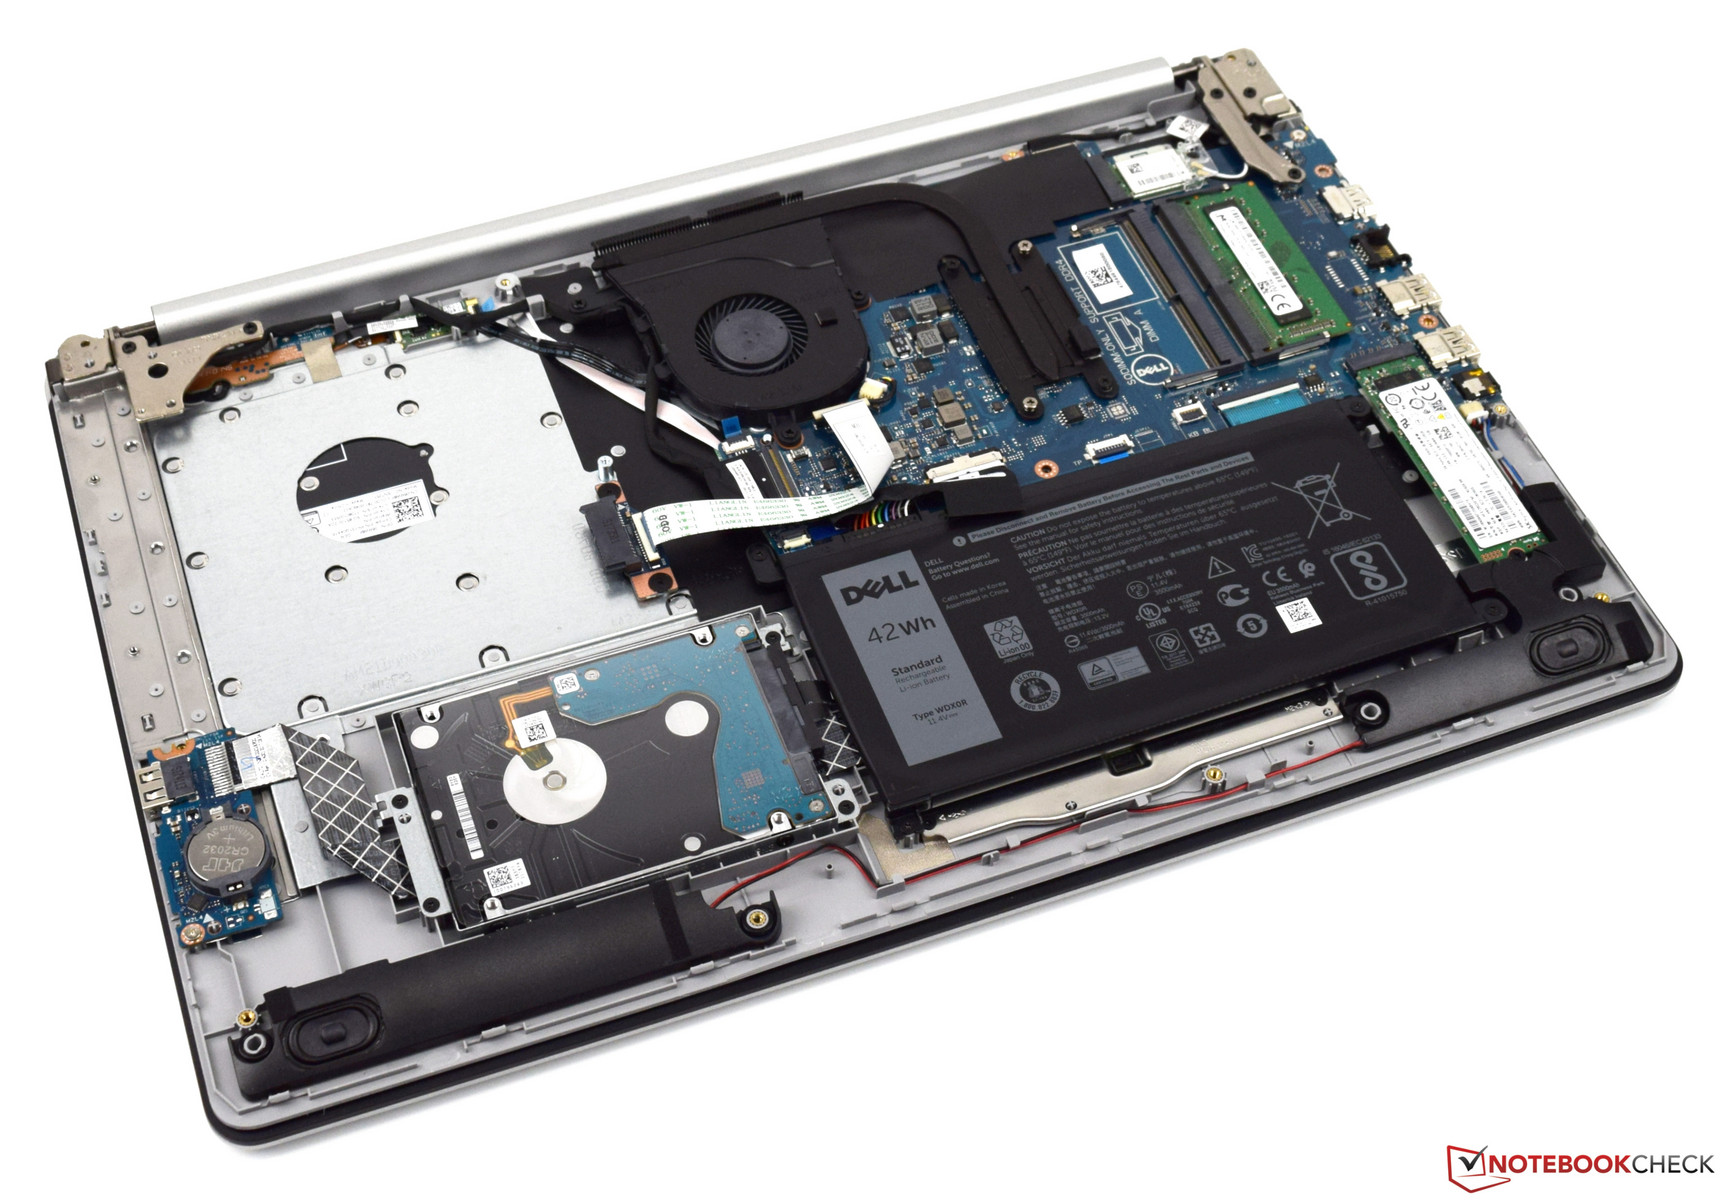
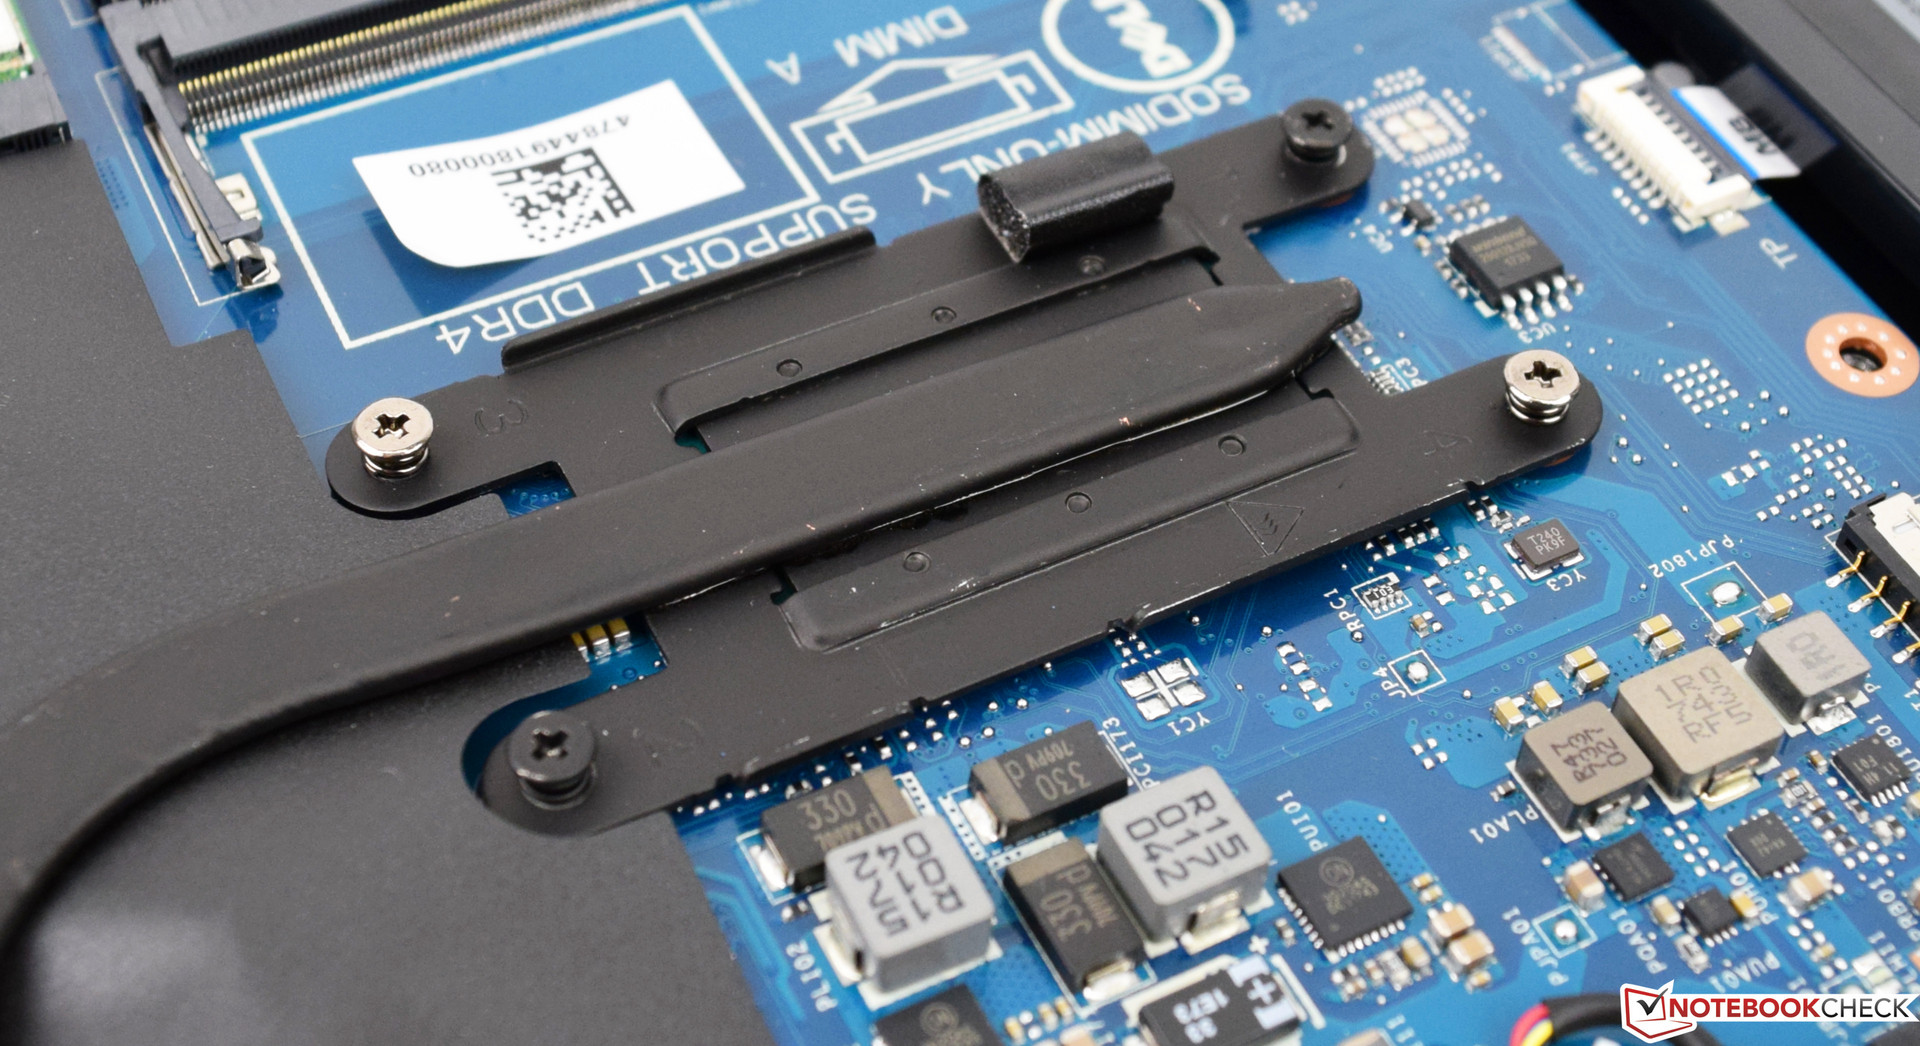
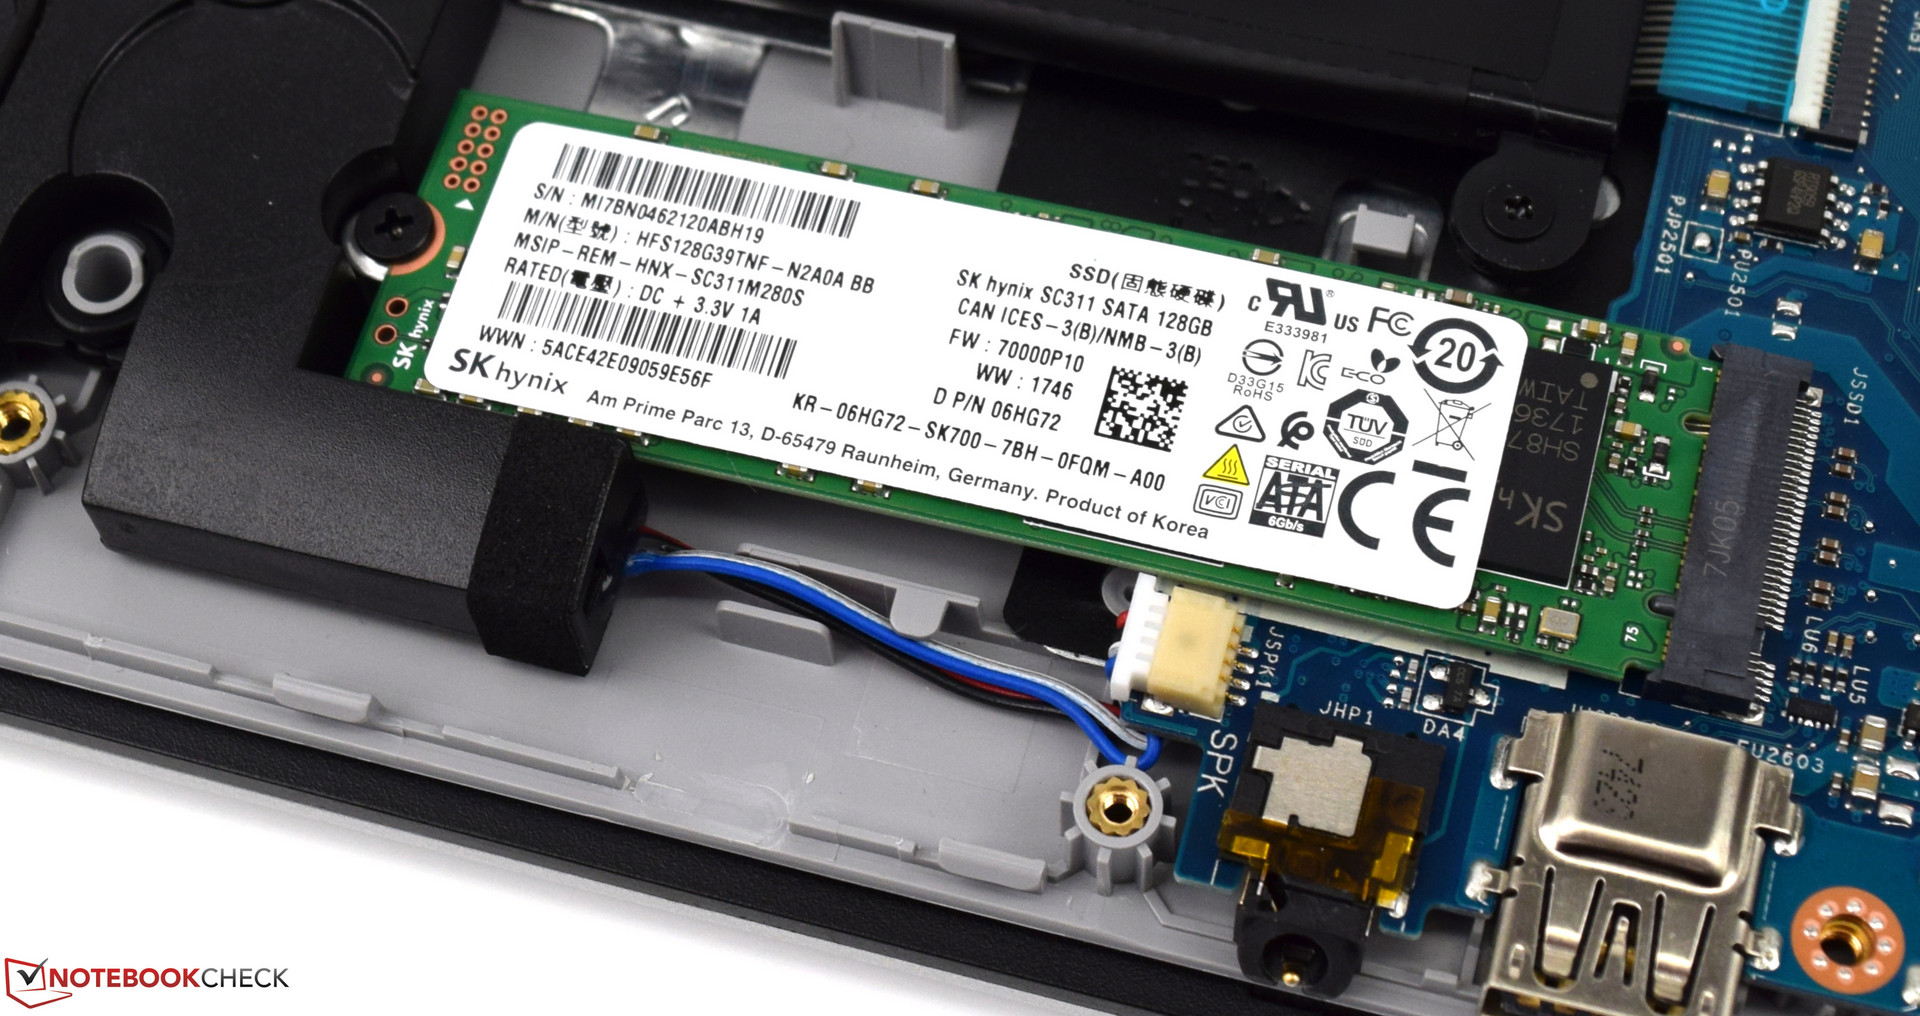
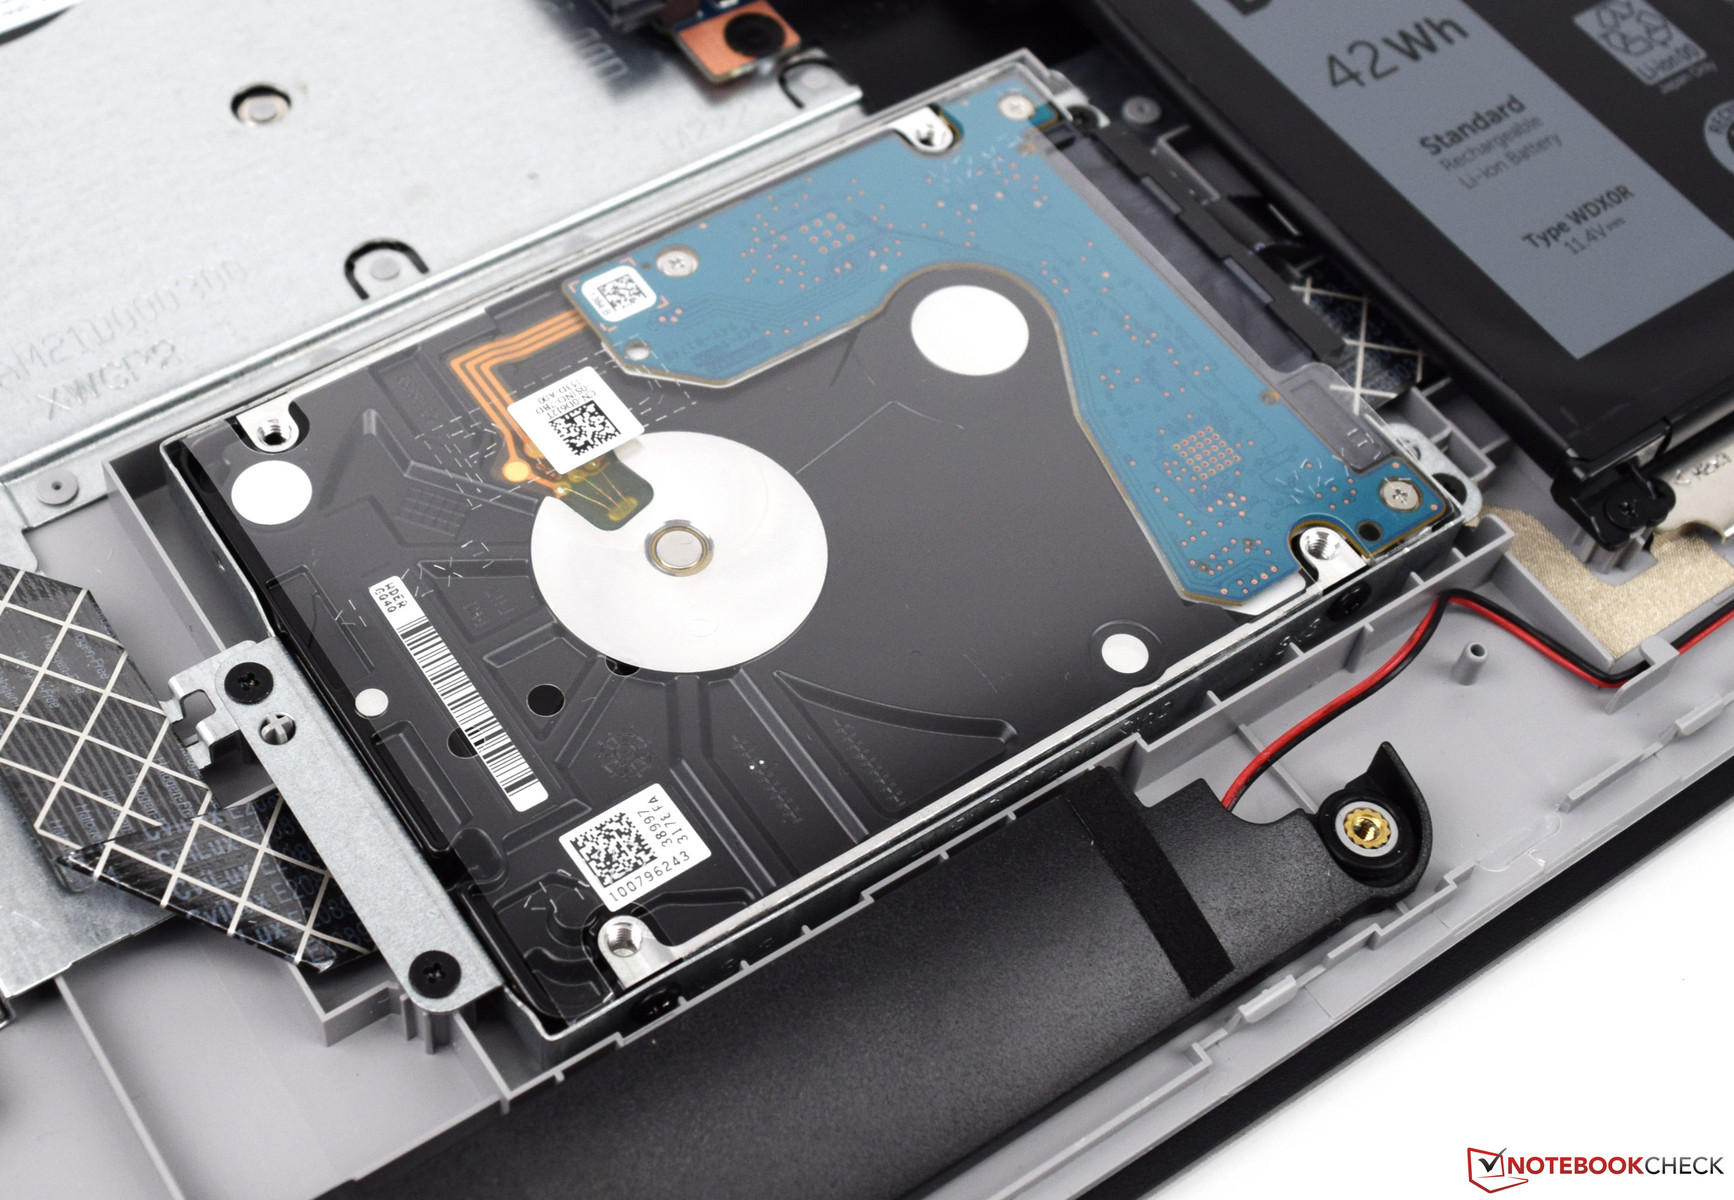
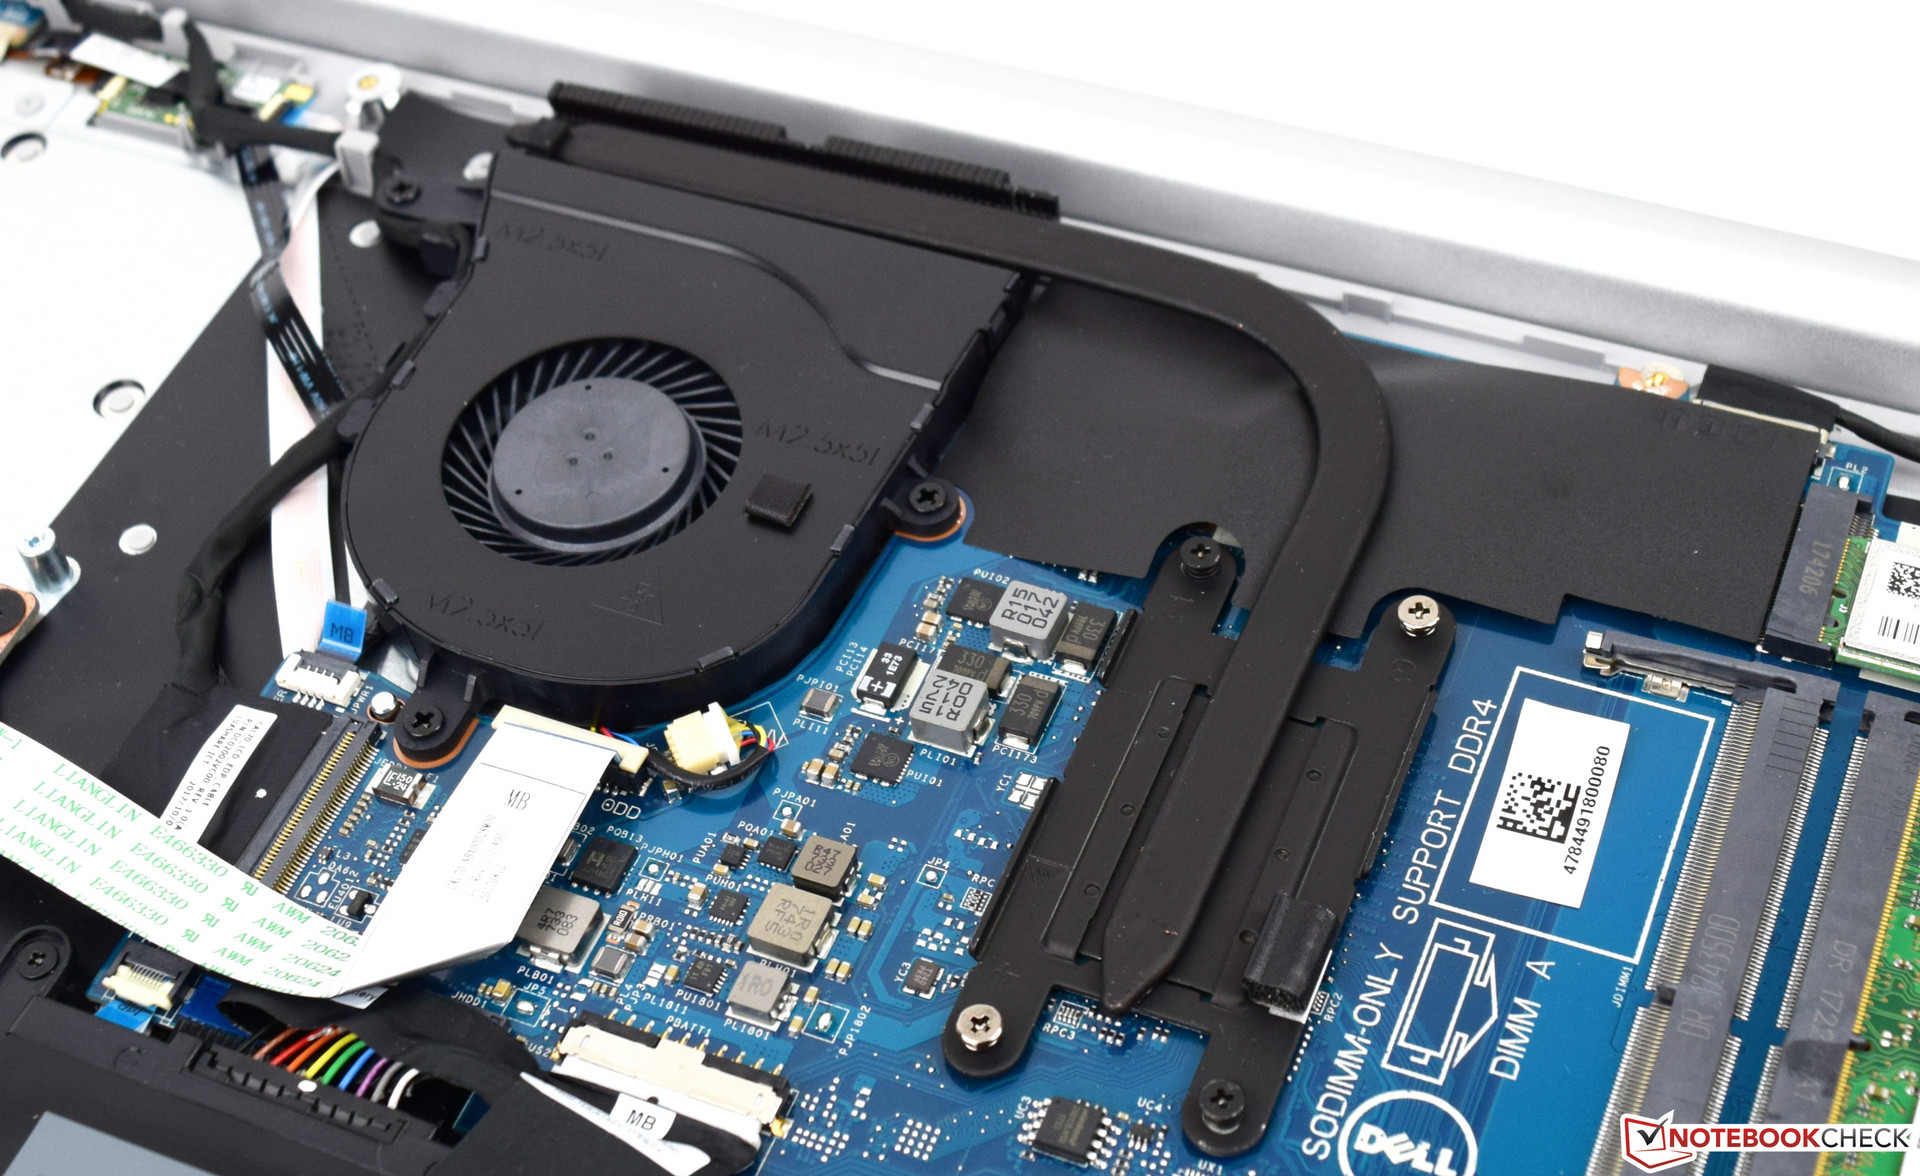
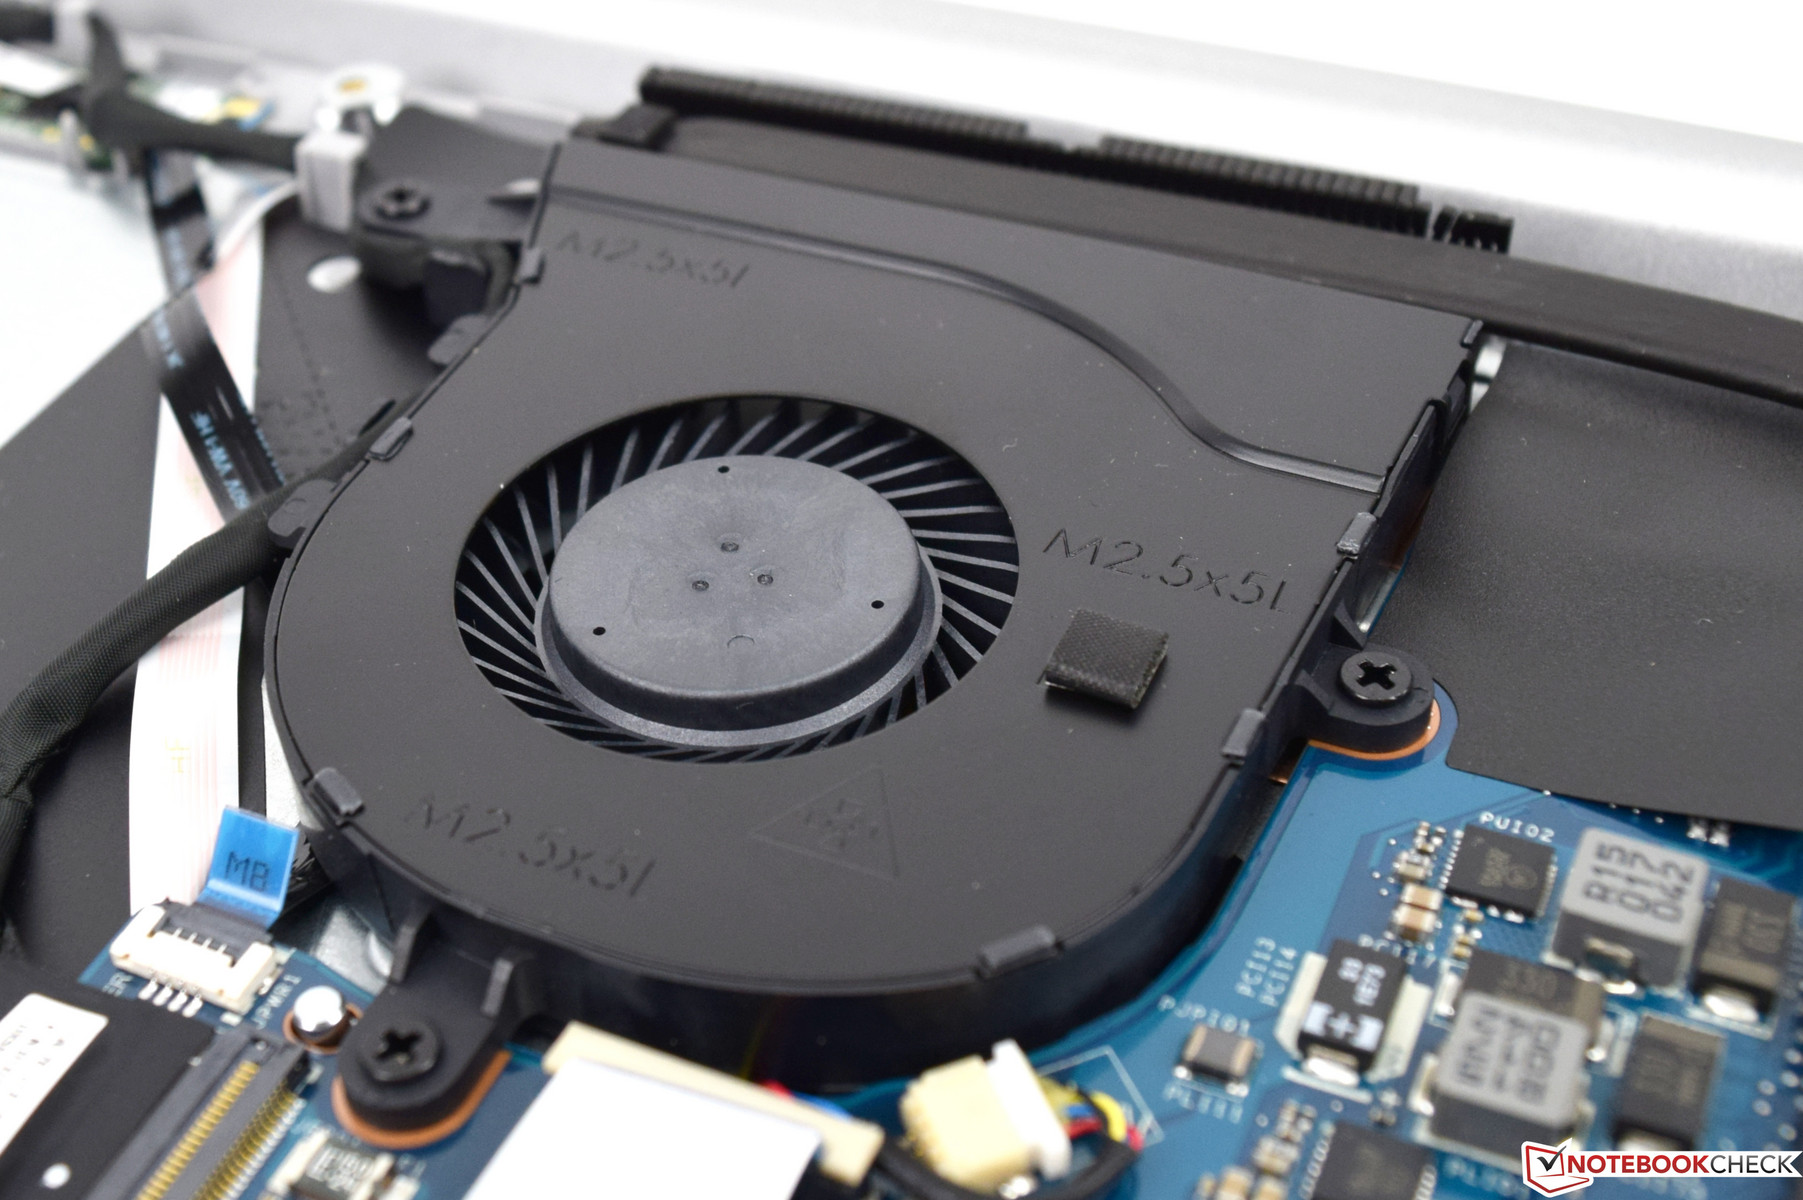
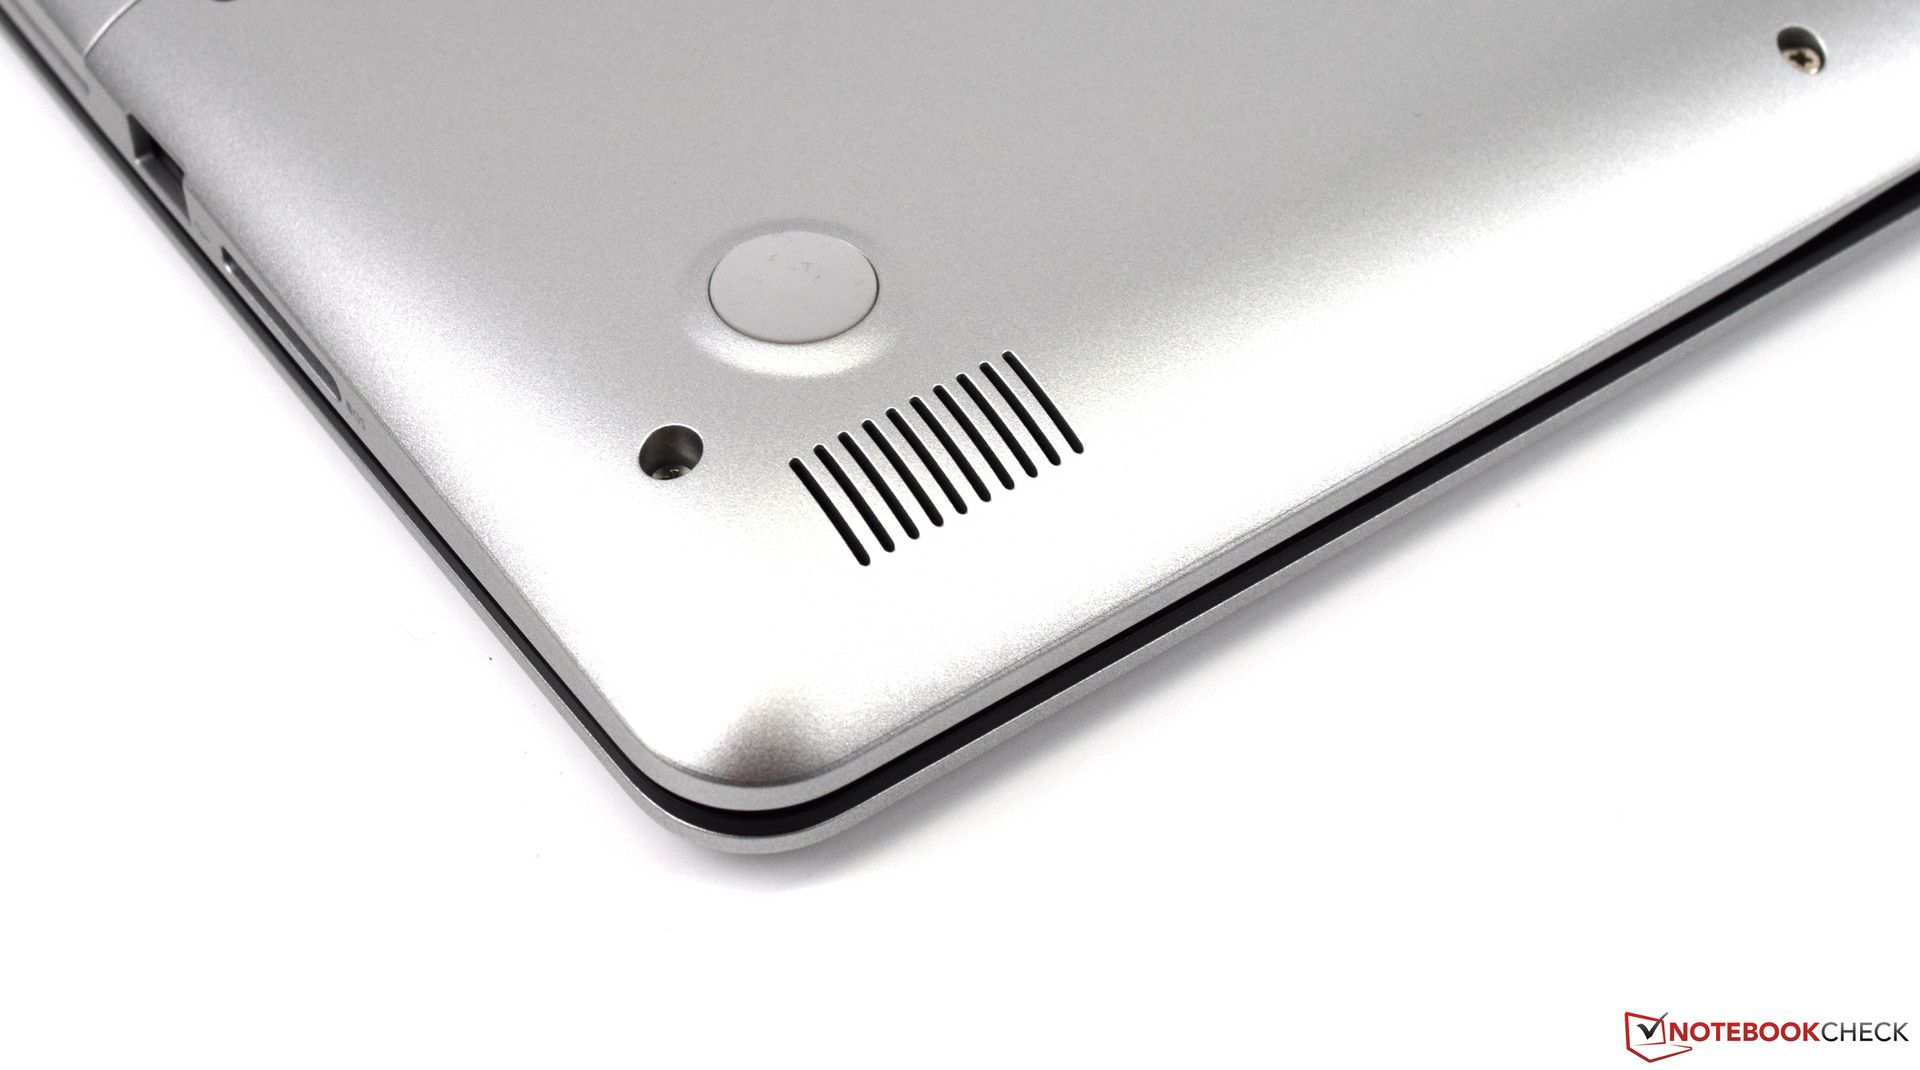
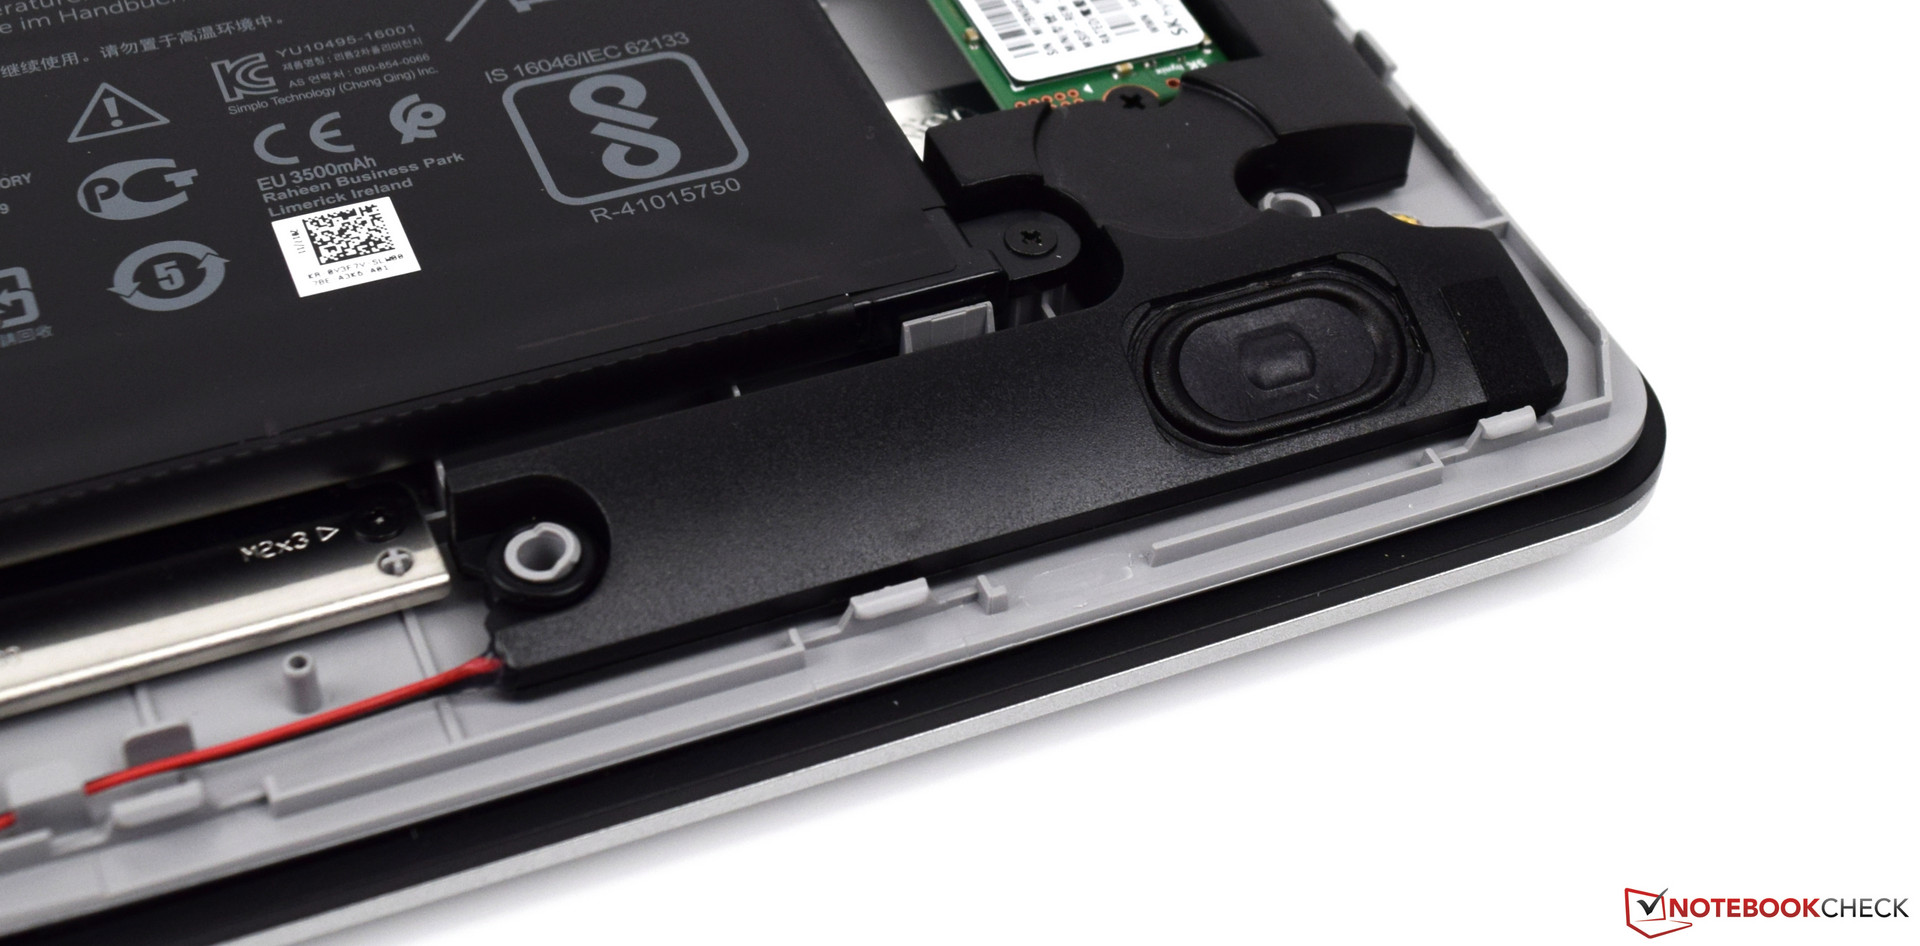
The Inspiron 17-5770 compensates for the lack of a maintenance hatch with a relatively easy to remove base plate, which can be carefully extracted with the right tool after taking out the optical drive and the numerous screws. This makes it possible to exchange the storage or expand the RAM without any problems. The cooler can also be cleaned easily.
Warranty
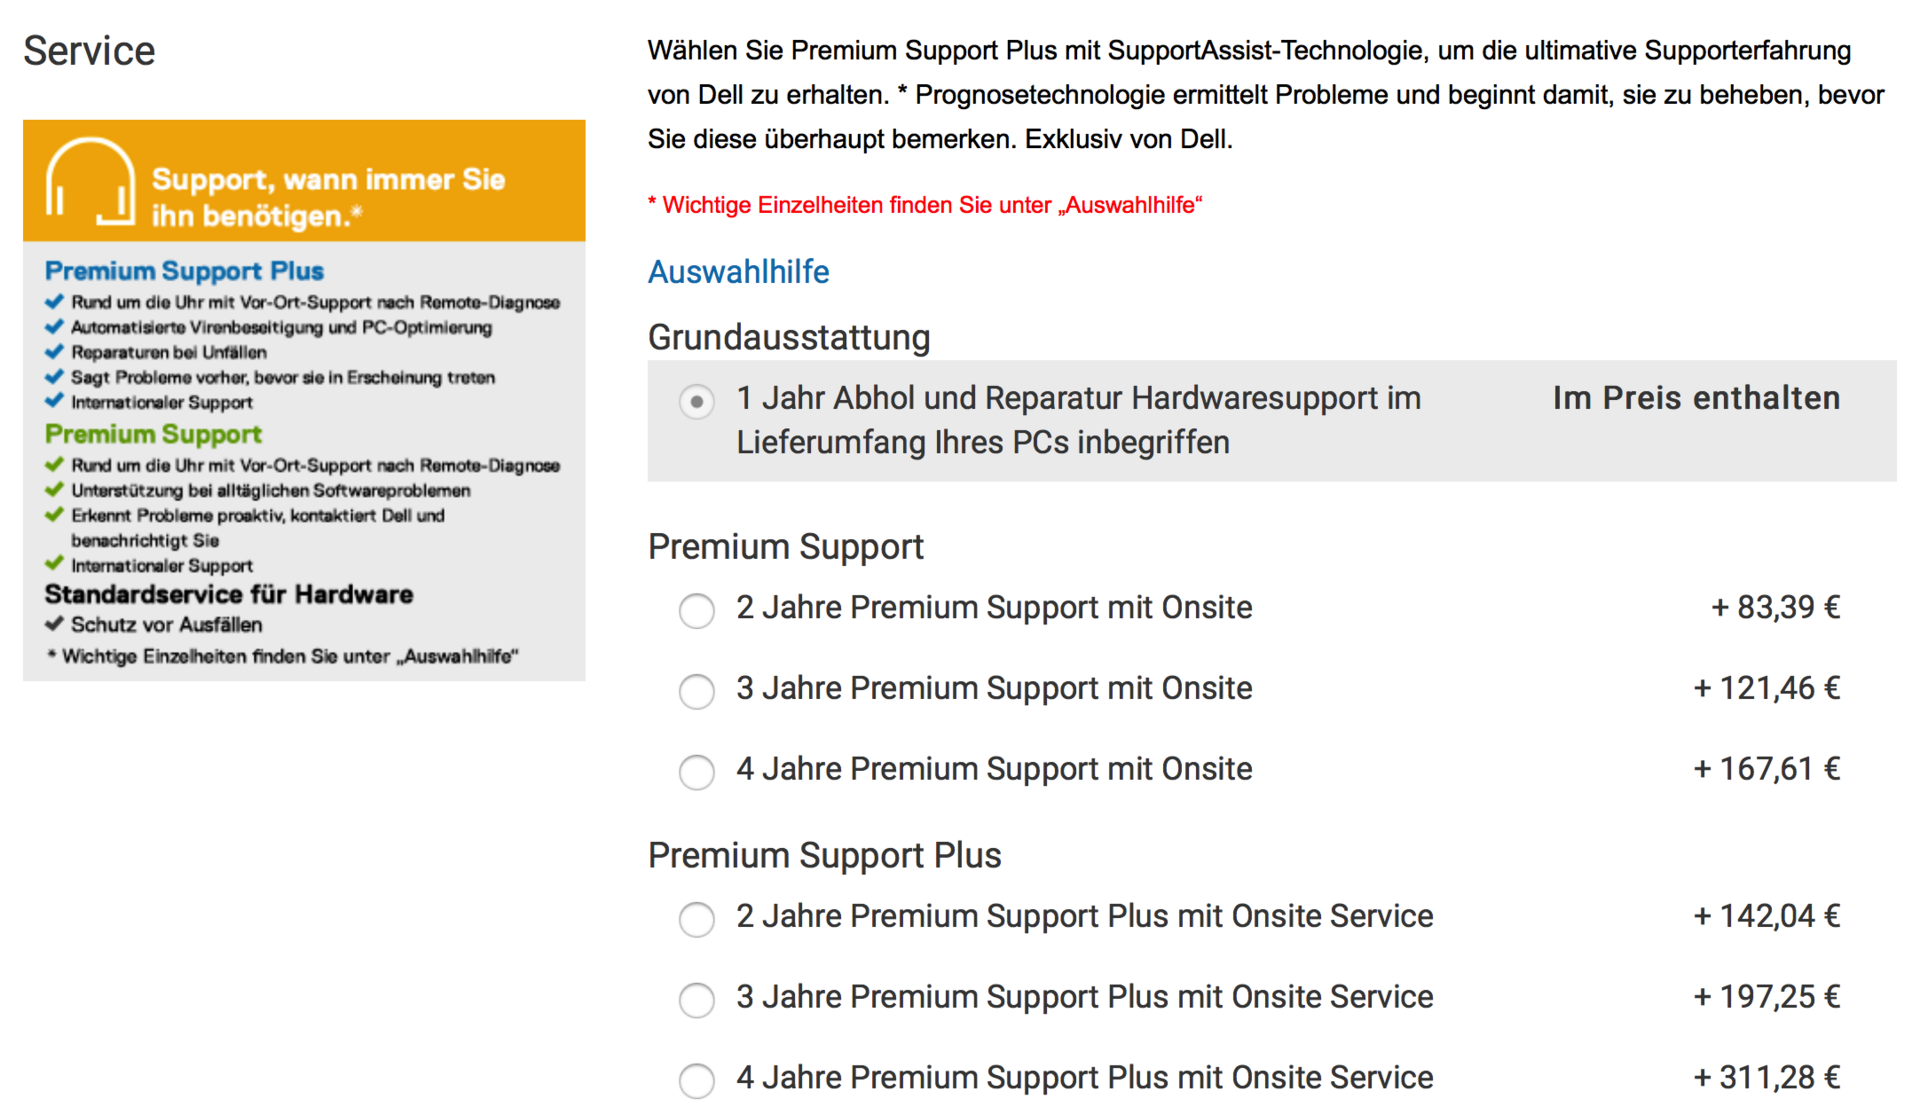
Users who purchase this laptop directly from the manufacturer (Dell Online Shop) receive the so-called Basic Package, which includes a one-year pick-up-and-repair hardware support. Optionally, this warranty can be extended for up to four years. However, the Premium Support Plus warranty would require a one-time surcharge of 311 Euros (~$383; for 48 months).
Please see our Guarantees, Return Policies and Warranties FAQ for country-specific information.
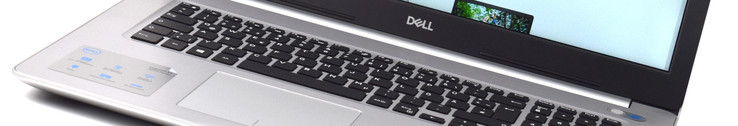
Input Devices
Keyboard
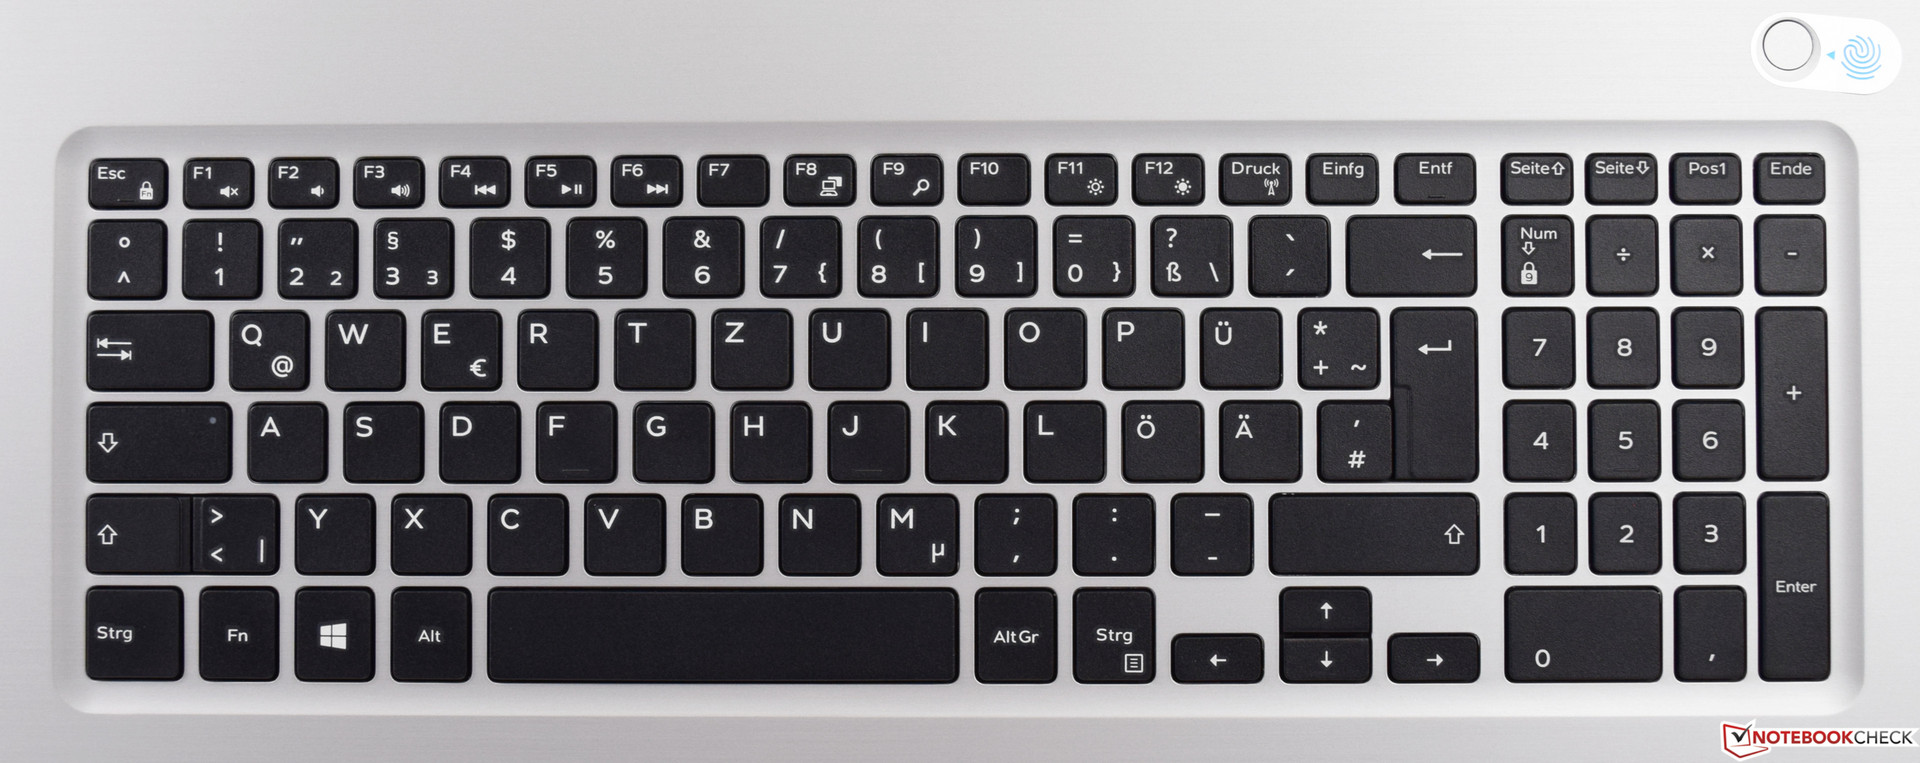
The chiclet keyboard of the Dell Inspiron 17-5770 has been integrated directly into the surface of the base unit so that the wrist rest and keys are at the same height. At 16 x 16 millimeters (~0.63 x 0.63 in), the keys have a sufficient size and a good grip thanks to the roughened surfaces. The layout requires the arrow keys to be smaller, which takes some time to get used to at the beginning. The white labeling makes the keys easy to see, even though Dell has refrained from installing any backlighting for this keyboard. The pressure point is clear and distinct and in combination with the short travel and the crisp keystroke, the keyboard makes for a good typing experience. Even in the long run, the keyboard should keep working reliably, as Dell has performed an endurance test with it and advertizes its durability.
Touchpad
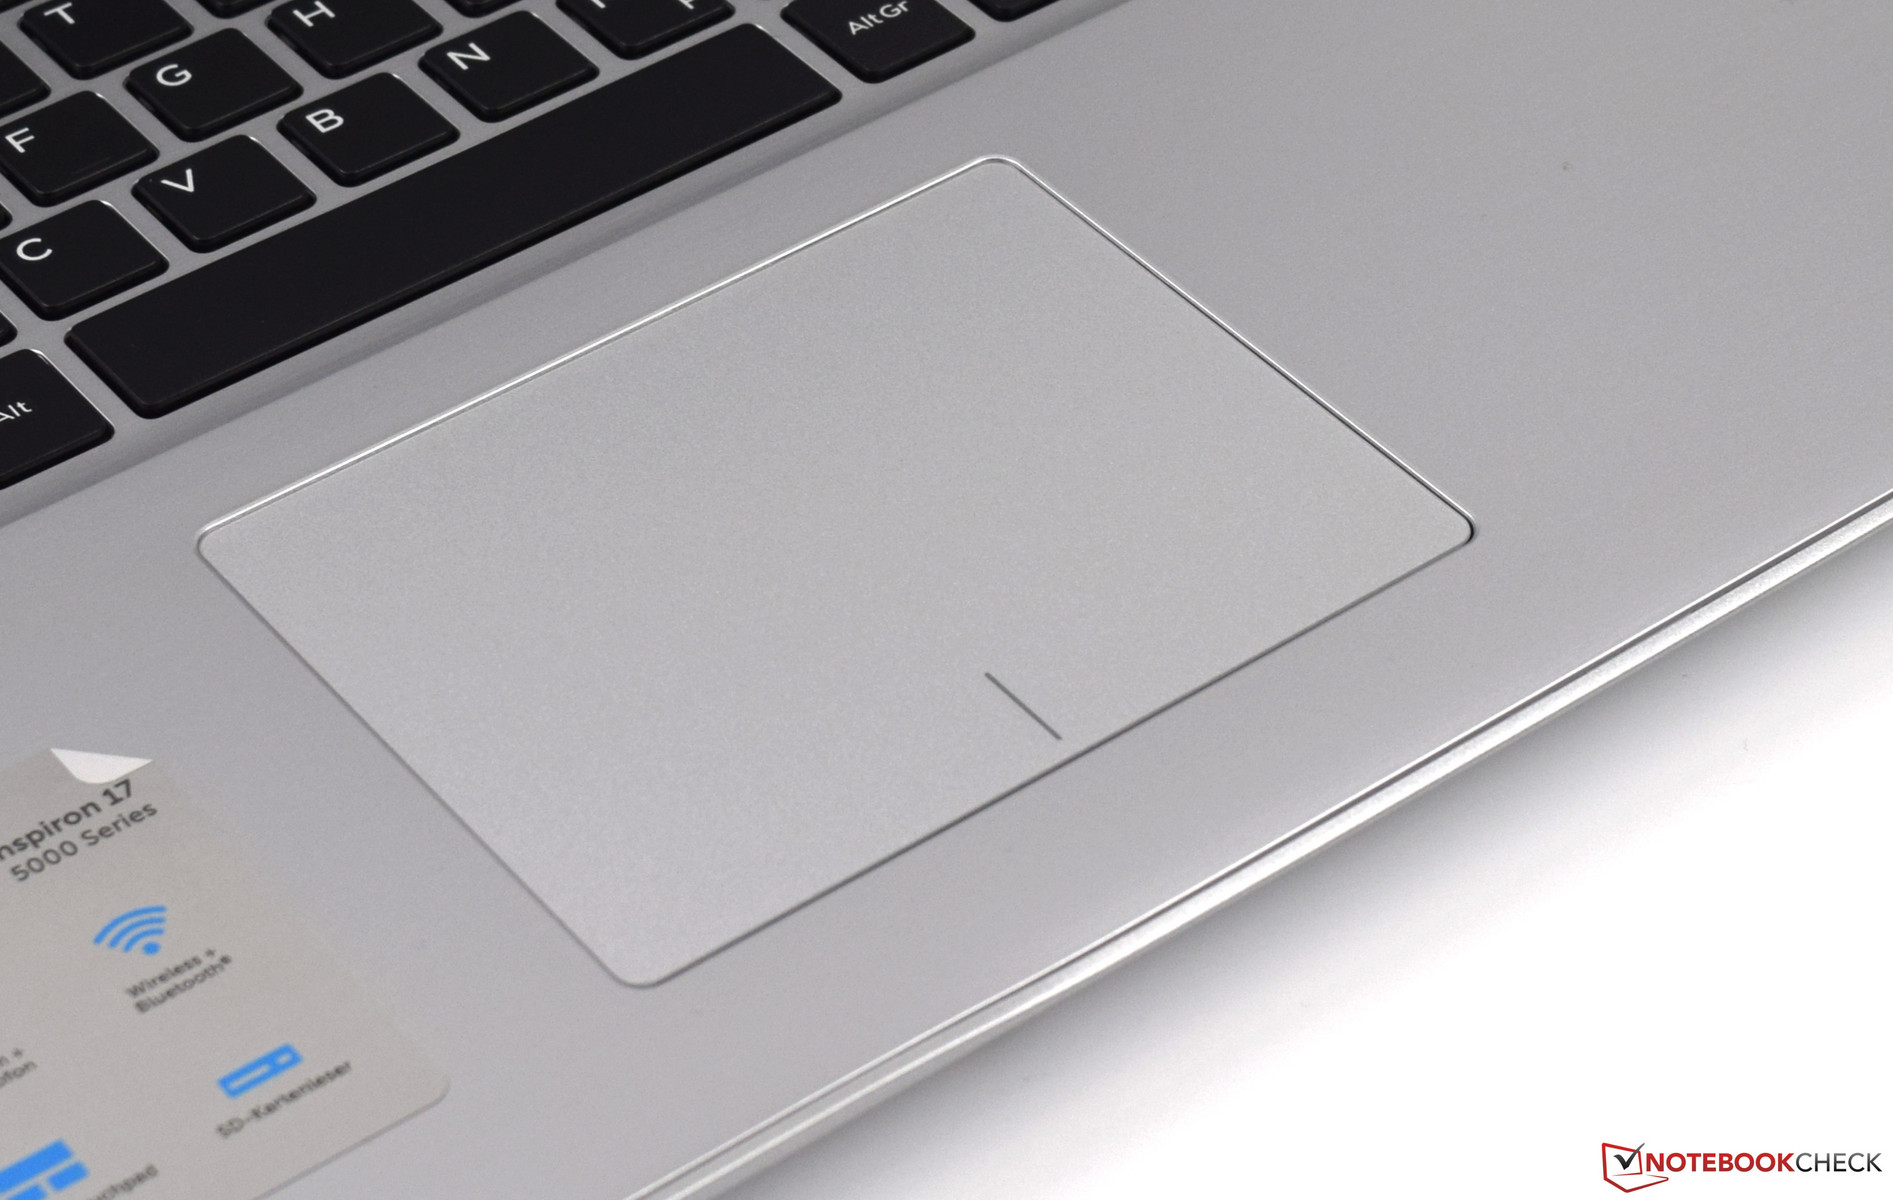
At 10.5 x 8 centimeters (~4.1 x 3.1 in), the ClickPad has exactly the same size as that of the Dell Inspiron 17-7773. Matching the color of its surroundings, the input surface is almost at the same height as the two wrist rests. The roughened input surface lets the mouse cursor glide over the screen fast. However, the input device has small areas at the edges and especially in the corners where it reacts less accurately. This hardly matters in everyday use, though, because of the rather generous input surface. The two integrated buttons at the lower edge feature a short travel and produce a quiet clicking noise when used.
Display
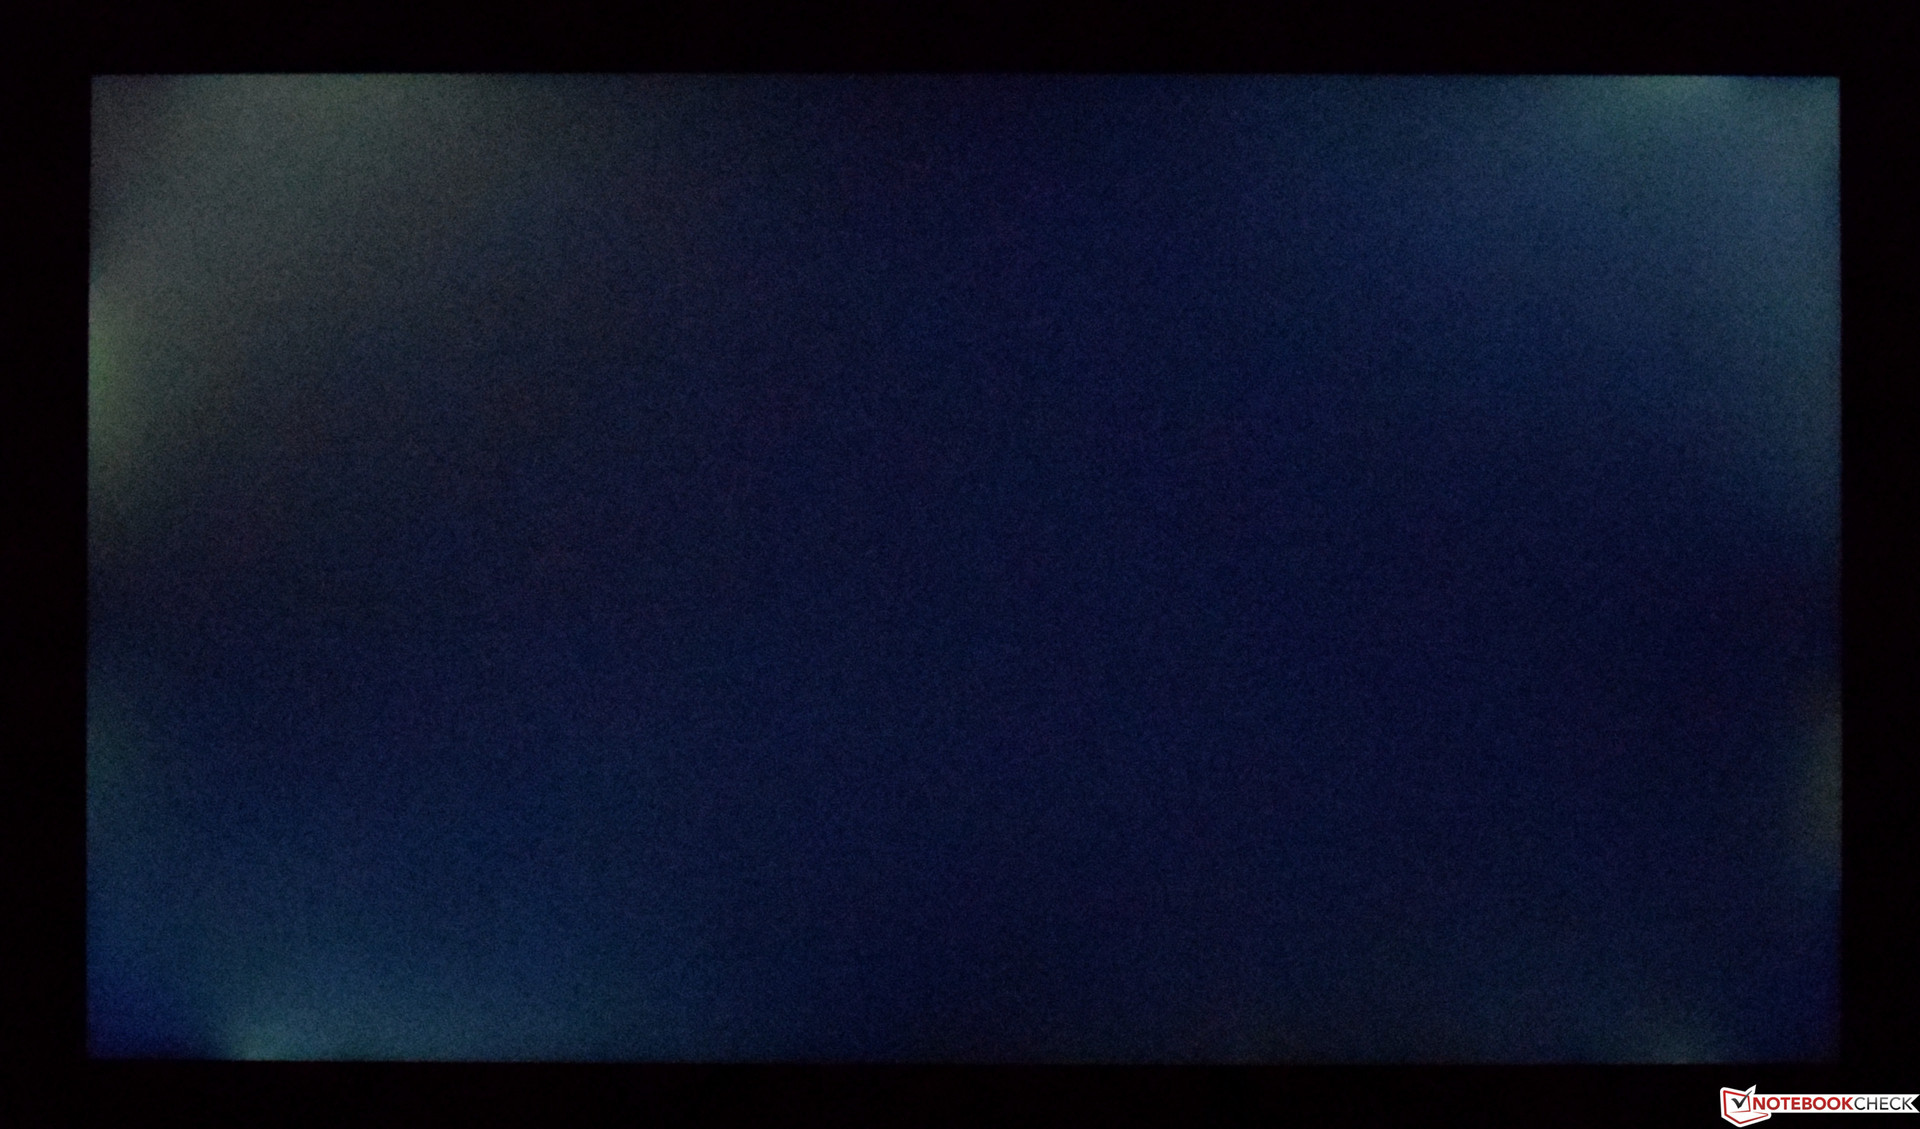
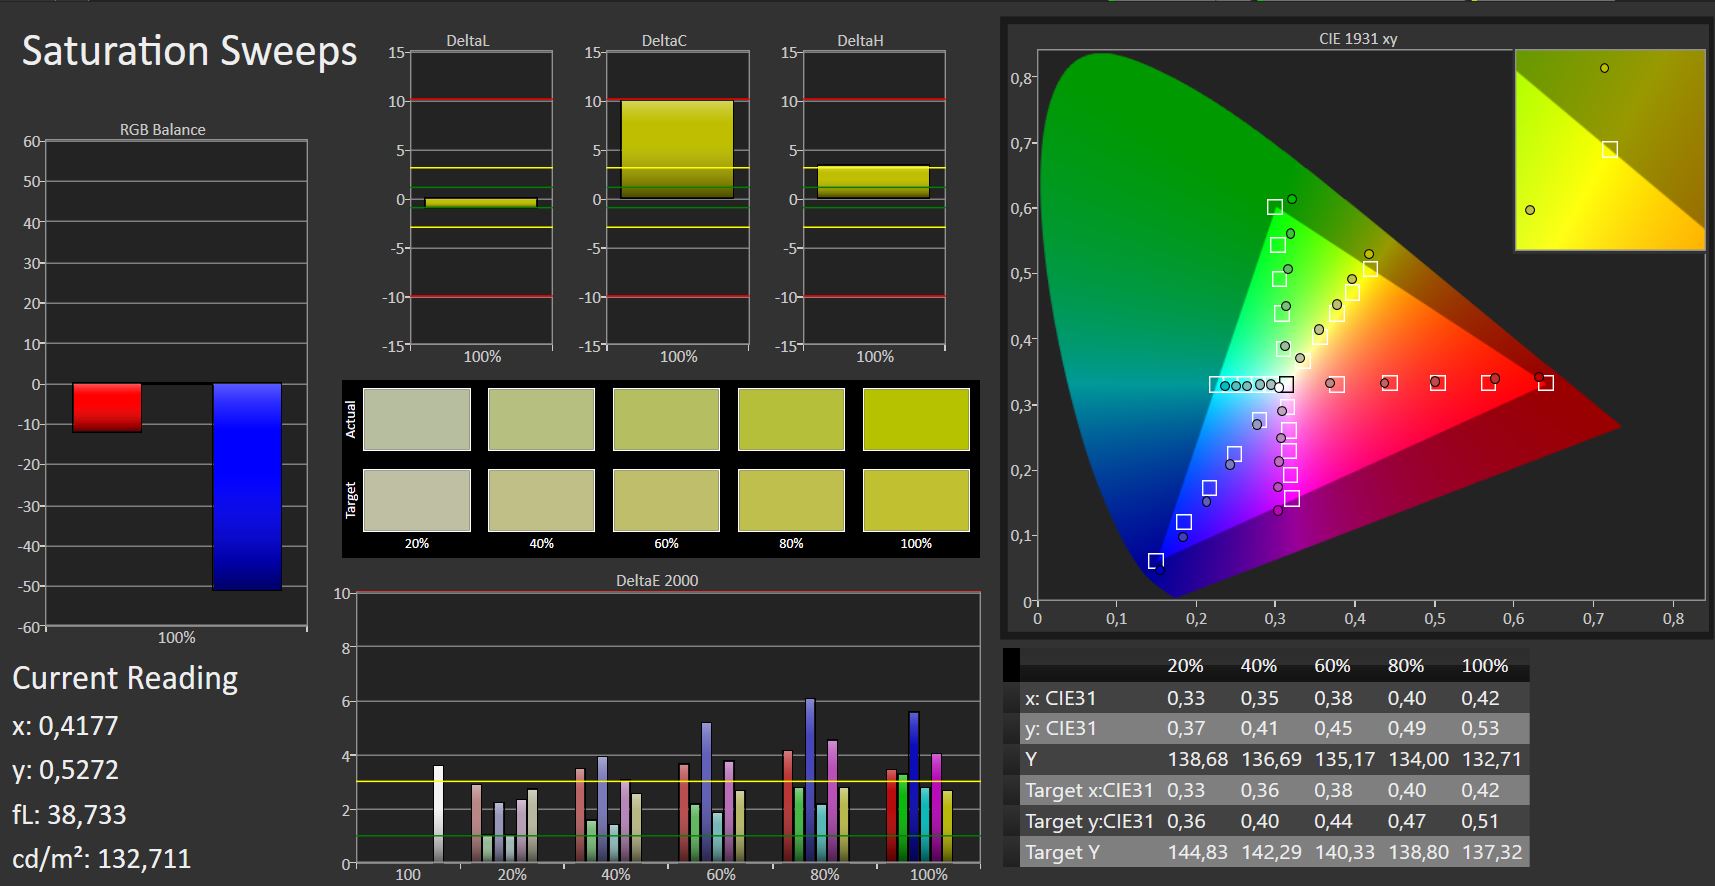
The display installed in our test device is a panel with 1920x1080 pixels by AU Optronics. This means that the 17.3-inch display has a pixel density of 127 PPI. There is no 4K display offered as an alternative. At only 262 cd/m², the Dell Inspiron 17-5770's matte IPS panel has the lowest average brightness of all comparison devices. Despite the average brightness, the very low black value of 0.18 is still able to provide a good contrast (1538:1). The brightness distribution of 85% is still acceptable, even though the HP Pavilion had the best result at 91%. The screen bleeding was quite noticeable and impossible to ignore, especially at the two upper corners. There was clearly visible clouding at the edges and in the corners as well. Our test device did not utilize PWM to regulate the display brightness, which is a clear advantage for the Dell Inspiron 17-5770.
| |||||||||||||||||||||||||
Brightness Distribution: 85 %
Center on Battery: 279 cd/m²
Contrast: 1550:1 (Black: 0.18 cd/m²)
ΔE ColorChecker Calman: 3.58 | ∀{0.5-29.43 Ø4.73}
ΔE Greyscale Calman: 2.75 | ∀{0.09-98 Ø4.97}
88% sRGB (Argyll 1.6.3 3D)
58% AdobeRGB 1998 (Argyll 1.6.3 3D)
64.8% AdobeRGB 1998 (Argyll 3D)
88.7% sRGB (Argyll 3D)
63.9% Display P3 (Argyll 3D)
Gamma: 2.57
CCT: 6836 K
| Dell Inspiron 17-5770-0357 AUO109D (AU Optronics), 1920x1080, 17.3" | Dell Inspiron 17-7773-0043 Chi Mei CMN1738, 1920x1080, 17.3" | Acer Aspire 5 A517-51G-80L LG Display, LP173WF4-SPF5, 1920x1080, 17.3" | HP Pavilion 17z 1EX13AV ID: AUO109D, Name: AU Optronics B173HW01 V0, 1920x1080, 17.3" | HP Omen 17-w206ng Chi Mei CMN1738, 1920x1080, 17.3" | Acer Aspire F5-771G-50RD AU Optronics B173HTN01.1, 1920x1080, 17.3" | |
|---|---|---|---|---|---|---|
| Display | 4% | -2% | 0% | 5% | 5% | |
| Display P3 Coverage (%) | 63.9 | 67.4 5% | 66.3 4% | 64.3 1% | 67.2 5% | 69.7 9% |
| sRGB Coverage (%) | 88.7 | 91.9 4% | 84.2 -5% | 88.5 0% | 93.1 5% | 91.2 3% |
| AdobeRGB 1998 Coverage (%) | 64.8 | 67.2 4% | 61.6 -5% | 64.6 0% | 67.4 4% | 66.8 3% |
| Response Times | -9% | -16% | -7% | -2% | 2% | |
| Response Time Grey 50% / Grey 80% * (ms) | 38 ? | 40 ? -5% | 41 ? -8% | 40.8 ? -7% | 38 ? -0% | 43 ? -13% |
| Response Time Black / White * (ms) | 25 ? | 28 ? -12% | 31 ? -24% | 26.4 ? -6% | 26 ? -4% | 21 ? 16% |
| PWM Frequency (Hz) | 1000 ? | 122000 ? | 200 ? | 1000 ? | ||
| Screen | -20% | -6% | -15% | -19% | -77% | |
| Brightness middle (cd/m²) | 279 | 323 16% | 397 42% | 333.5 20% | 318 14% | 339 22% |
| Brightness (cd/m²) | 262 | 290 11% | 364 39% | 323 23% | 295 13% | 315 20% |
| Brightness Distribution (%) | 85 | 77 -9% | 84 -1% | 91 7% | 79 -7% | 84 -1% |
| Black Level * (cd/m²) | 0.18 | 0.21 -17% | 0.29 -61% | 0.32 -78% | 0.25 -39% | 0.35 -94% |
| Contrast (:1) | 1550 | 1538 -1% | 1369 -12% | 1042 -33% | 1272 -18% | 969 -37% |
| Colorchecker dE 2000 * | 3.58 | 4.88 -36% | 3.88 -8% | 4 -12% | 4.7 -31% | 10.4 -191% |
| Colorchecker dE 2000 max. * | 5.98 | 8.86 -48% | 8.22 -37% | 6.9 -15% | 8.8 -47% | 15.96 -167% |
| Greyscale dE 2000 * | 2.75 | 6.21 -126% | 3.1 -13% | 4.5 -64% | 5 -82% | 11.67 -324% |
| Gamma | 2.57 86% | 2.36 93% | 2.59 85% | 2.19 100% | 2.28 96% | 2.32 95% |
| CCT | 6836 95% | 6620 98% | 6570 99% | 6386 102% | 7374 88% | 13081 50% |
| Color Space (Percent of AdobeRGB 1998) (%) | 58 | 60 3% | 55 -5% | 57.5 -1% | 61 5% | 60 3% |
| Color Space (Percent of sRGB) (%) | 88 | 92 5% | 84 -5% | 88.1 0% | 93 6% | 91 3% |
| Total Average (Program / Settings) | -8% /
-14% | -8% /
-7% | -7% /
-11% | -5% /
-12% | -23% /
-50% |
* ... smaller is better
The image quality is good, but the visible clouding repeatedly had a negative influence on dark scenes. The measured DeltaE deviations are relatively low and not far from the ideal value of 3. Out-of-the-box, we did not notice a blue cast, but we still conducted a calibration to have the ICC profile available for download (see the box above the comparison table). The color-space coverage is decent at 88% (sRGB) and 58% (AdobeRGB), but insufficient for professional use.
The matte display surface should provide the device with a good outdoor usability. However, the low display brightness (262 cd/m²) undermines this. Users who absolutely want to or have to work outdoors will be forced to find a place in the shade.
Display Response Times
| ↔ Response Time Black to White | ||
|---|---|---|
| 25 ms ... rise ↗ and fall ↘ combined | ↗ 14 ms rise | 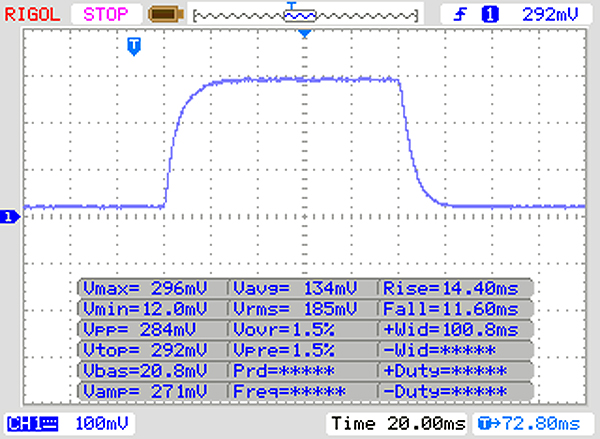 |
| ↘ 11 ms fall | ||
| The screen shows relatively slow response rates in our tests and may be too slow for gamers. In comparison, all tested devices range from 0.1 (minimum) to 240 (maximum) ms. » 59 % of all devices are better. This means that the measured response time is worse than the average of all tested devices (19.9 ms). | ||
| ↔ Response Time 50% Grey to 80% Grey | ||
| 38 ms ... rise ↗ and fall ↘ combined | ↗ 20 ms rise | 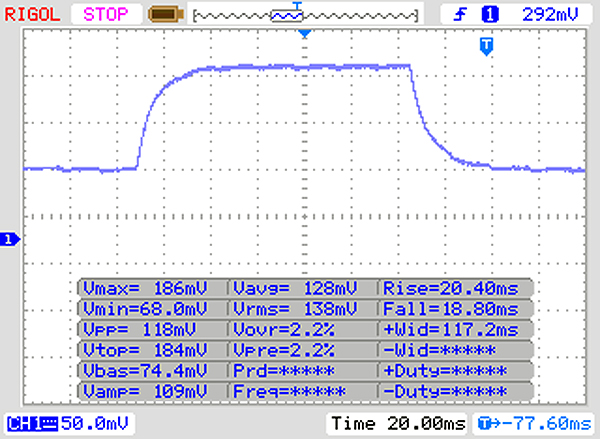 |
| ↘ 18 ms fall | ||
| The screen shows slow response rates in our tests and will be unsatisfactory for gamers. In comparison, all tested devices range from 0.165 (minimum) to 636 (maximum) ms. » 55 % of all devices are better. This means that the measured response time is worse than the average of all tested devices (31.1 ms). | ||
Screen Flickering / PWM (Pulse-Width Modulation)
| Screen flickering / PWM not detected | ||
In comparison: 52 % of all tested devices do not use PWM to dim the display. If PWM was detected, an average of 7798 (minimum: 5 - maximum: 343500) Hz was measured. | ||
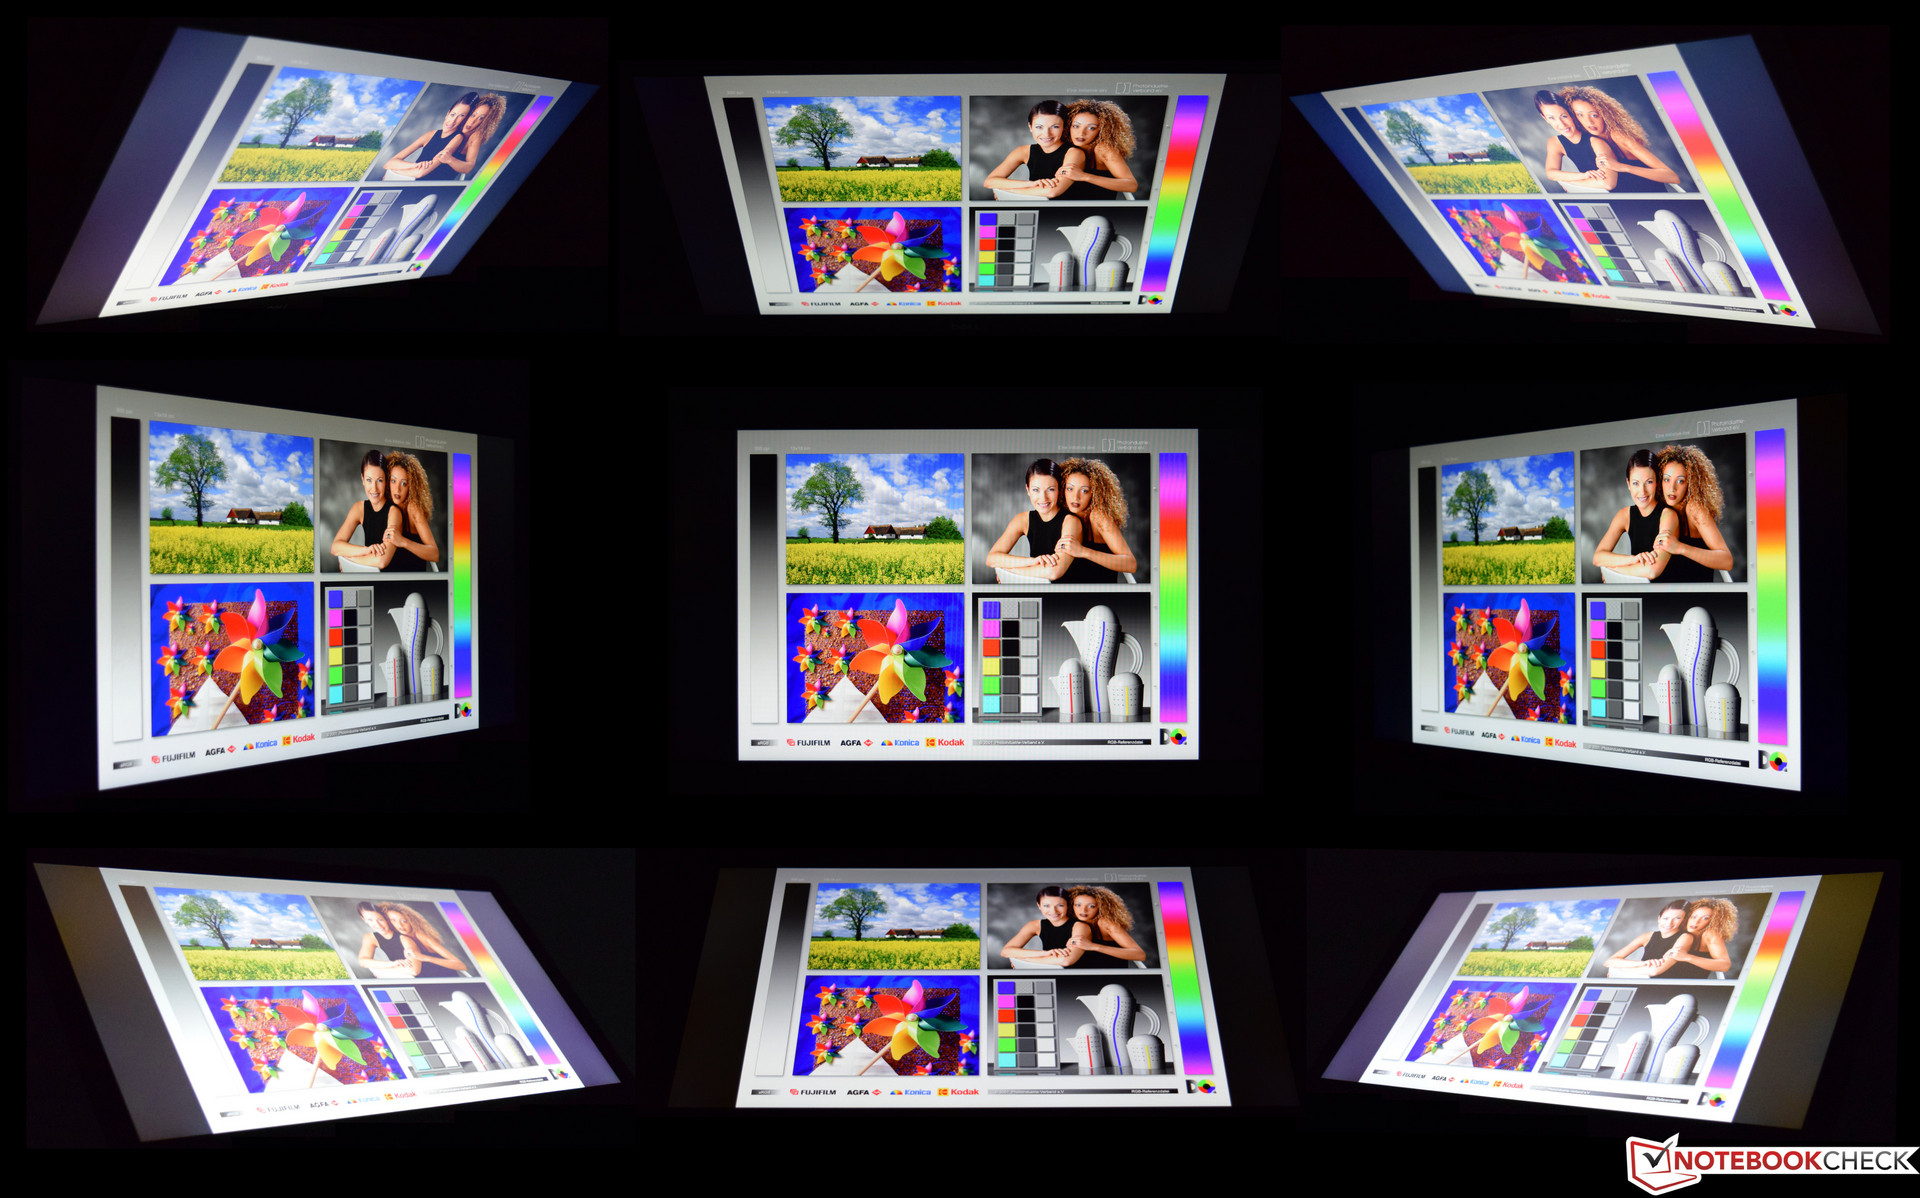
The viewing-angle test shows a typical IPS panel with minimal problems in the corner images. We have seen this effect frequently with other devices. However, this does not limit the everyday use in any way because the phenomenon is only visible at a very flat and slanted angle.
Performance
The performance of our test device is sufficient for most daily tasks since Dell has utilized the most recent generation of Intel processors in the form of an Intel Core i5-8250U. We cannot, however, recommend the entry-level device based on a significantly older Intel Core i3-6006U. Users who do not want to do without a dedicated graphics card will have to choose a device based on an Intel Core i7-8550U. Unfortunately, only users buying the high-end variant will be able to enjoy a dedicated AMD Radeon 530, which comes with a separate 4 GB of VRAM.
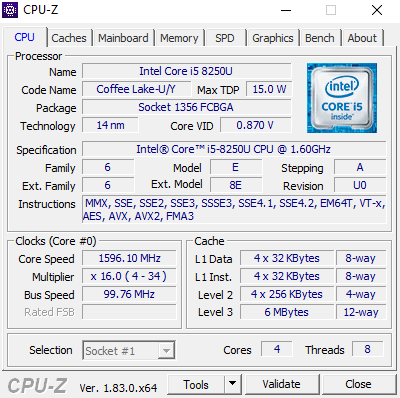
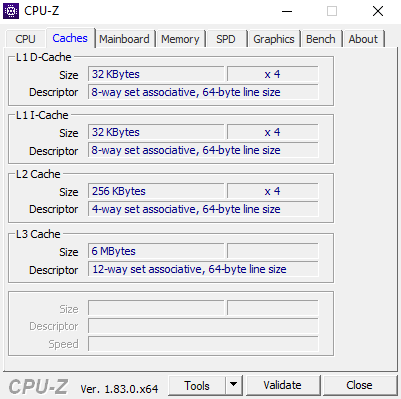
Processor
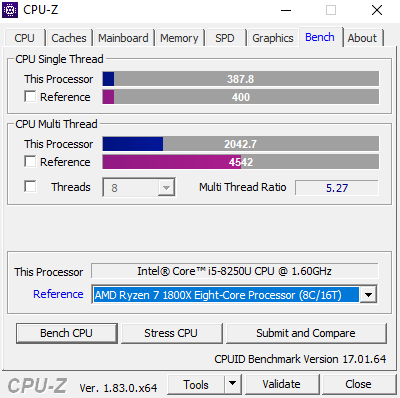
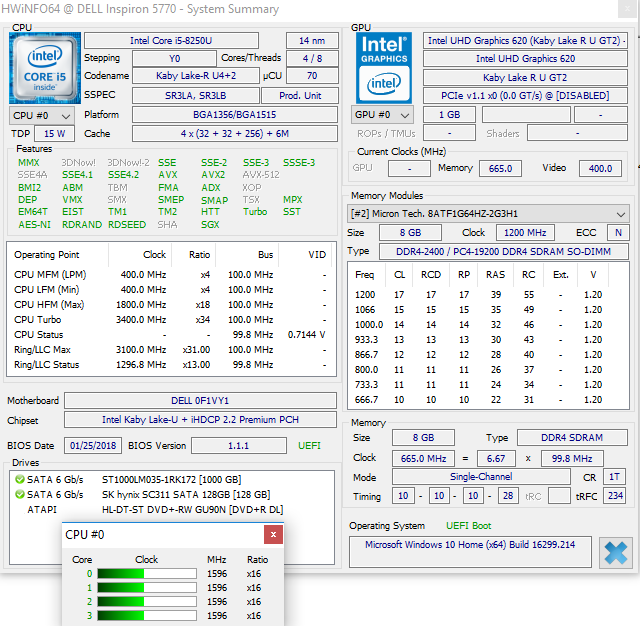
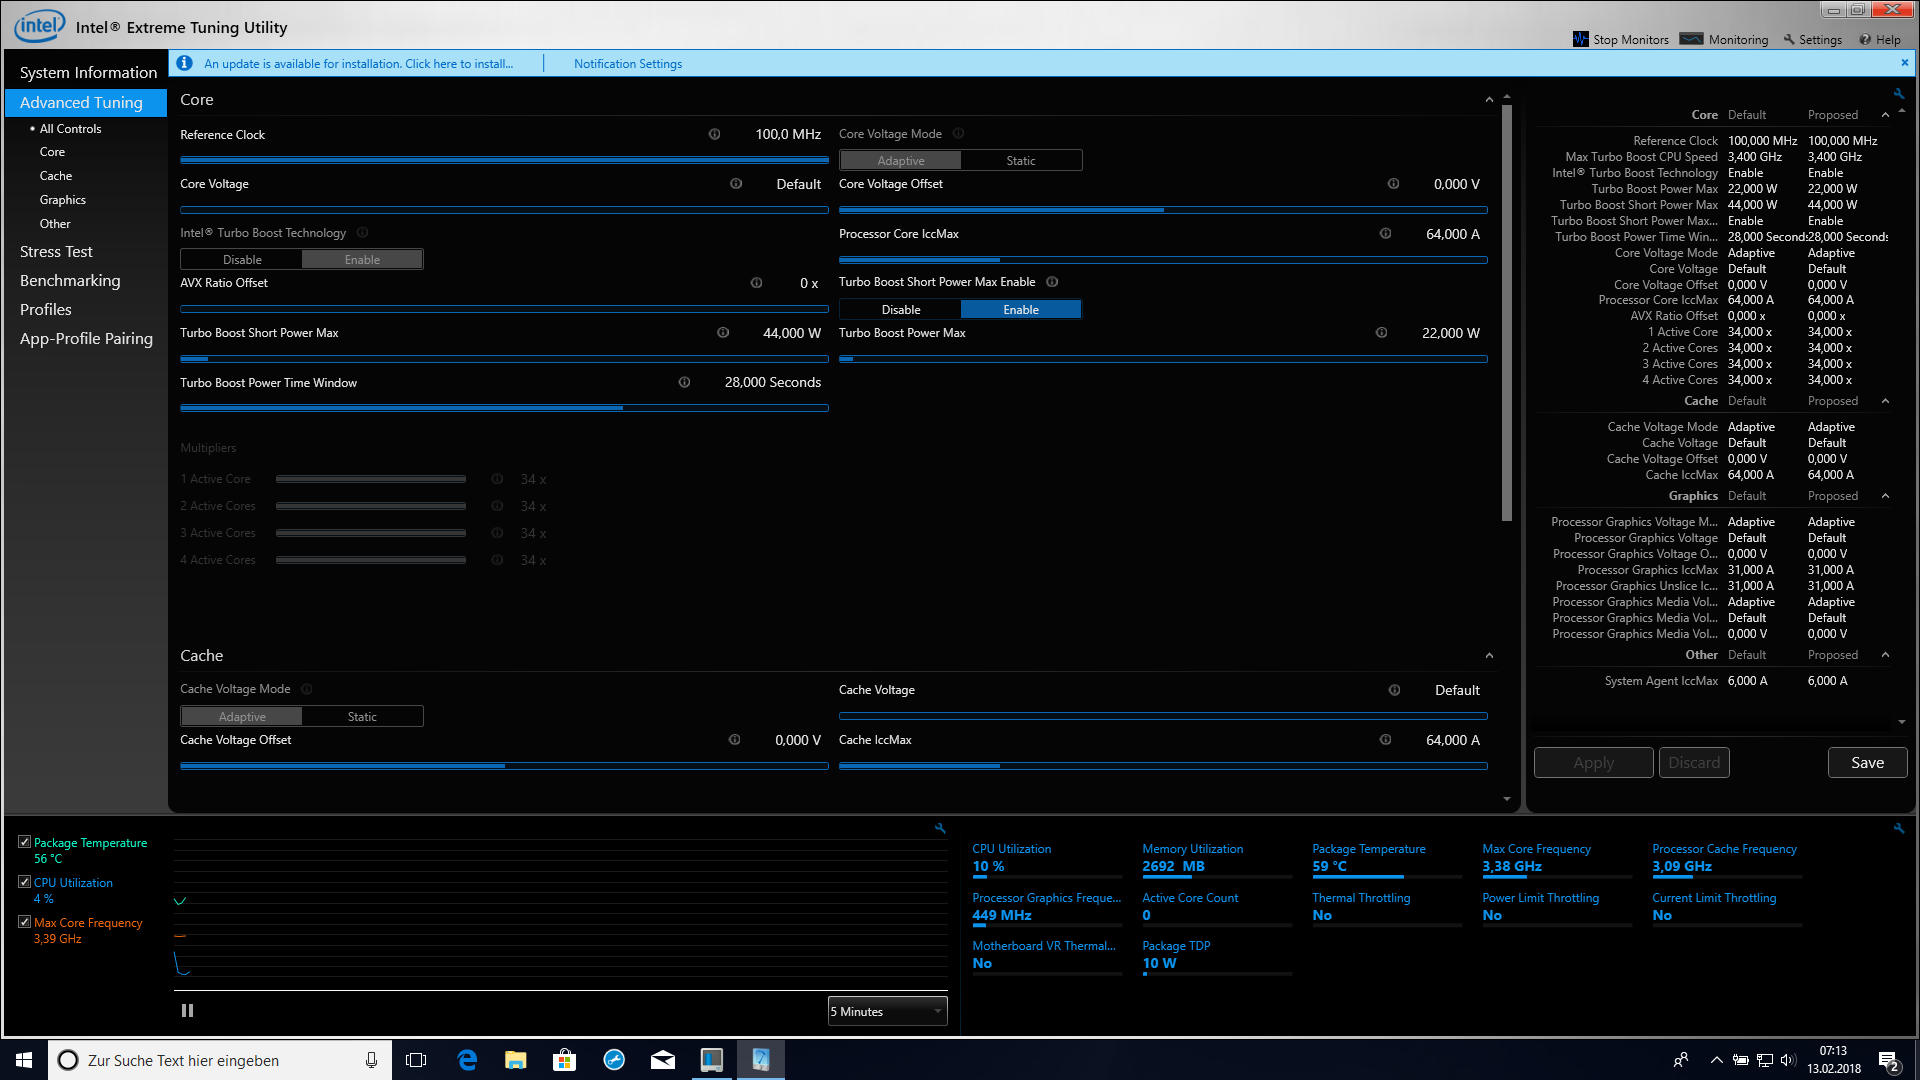
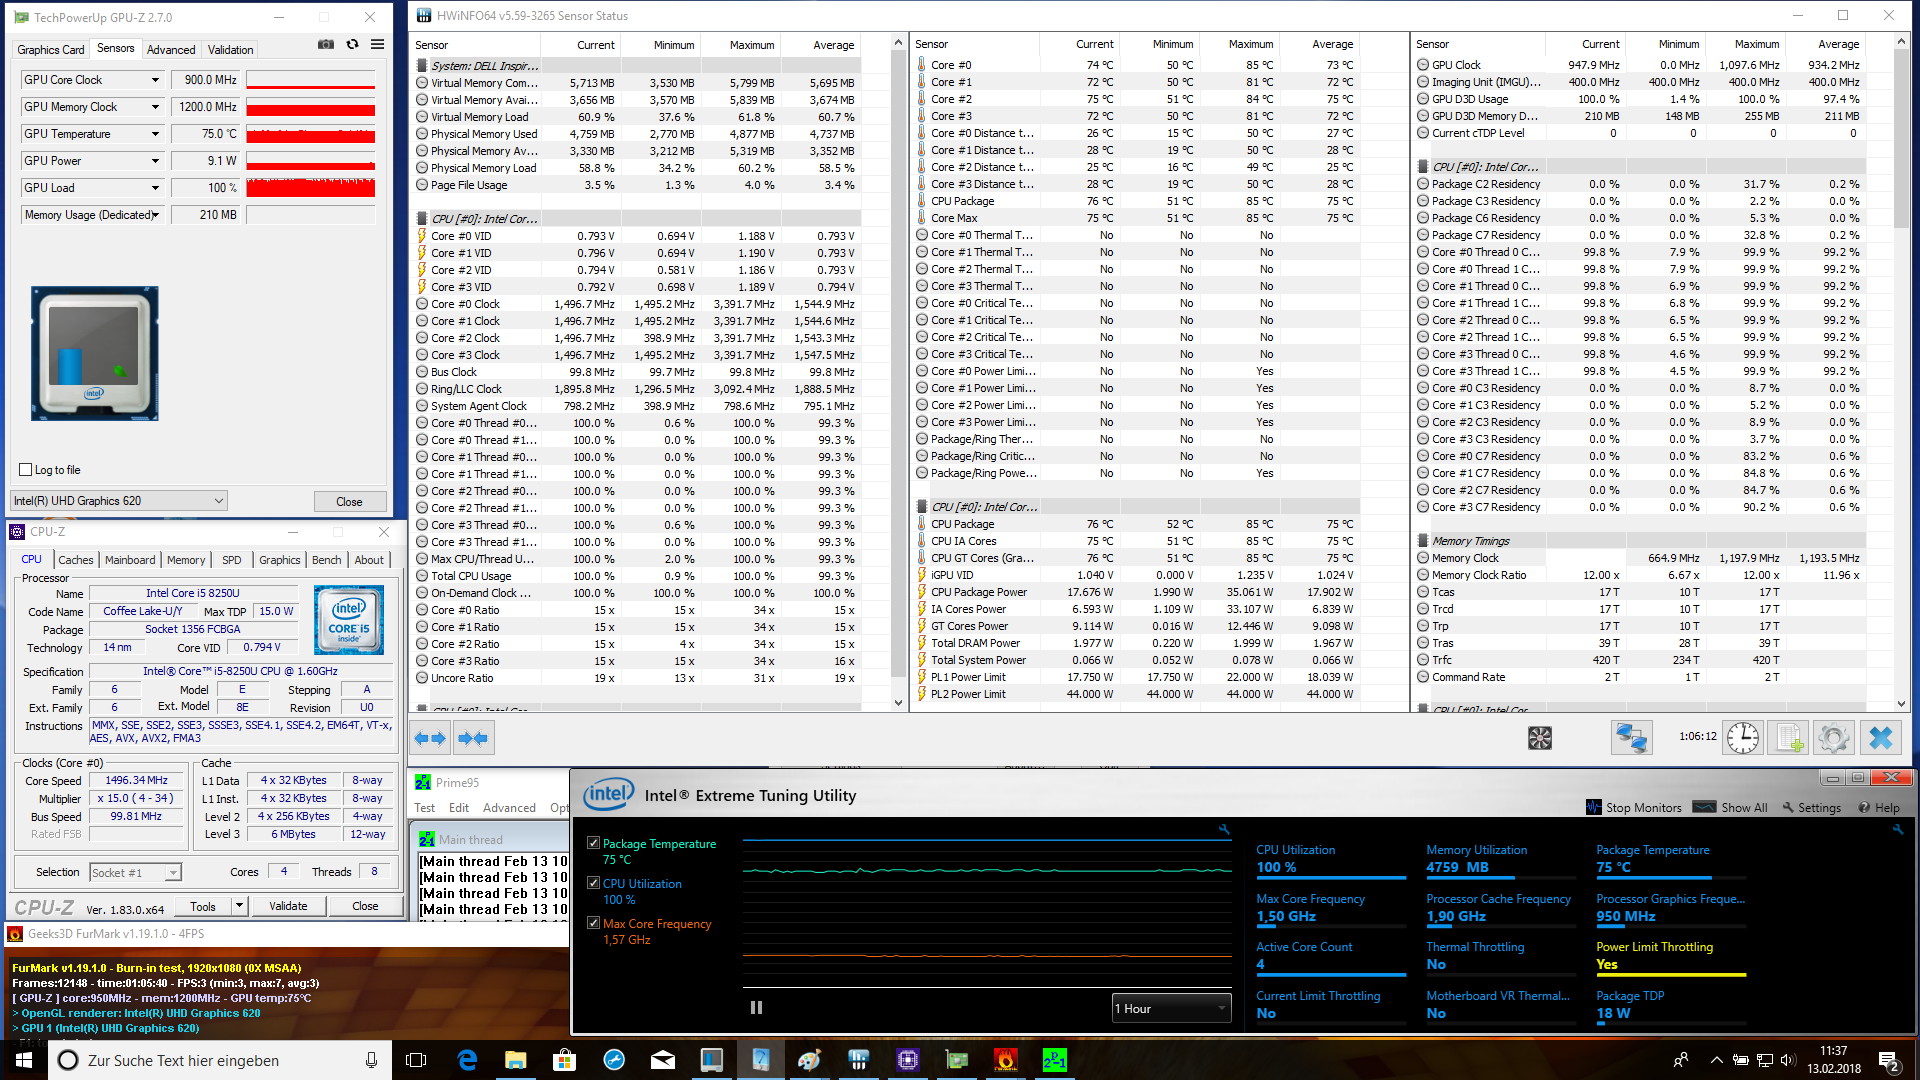
The Intel Core i5-8250U is a very energy-efficient quad-core processor based on the Kaby Lake architecture. The TDP is 15 watts, but the SoC still offers four physical cores which can process up to eight threads at once. The processor clocks at 1.6 GHz (base clock speed) and can reach up to 3.4 GHz dynamically, depending on the load. The benchmark results show that the Intel Core i5-8250U can reach its full potential in our test device. Even the Acer Aspire 5 with a supposedly faster i7 processor was left behind by our test device in the multi-thread benchmark. Power Target and Temperature Target play an important role in combination with a good cooling system. It seems that Dell did their homework here. For comparative purposes, we have also included the most recent AMD model in our test. In direct comparison, the AMD Ryzen 5 2500U and the Intel Core i5-8250U from our test device were nearly equal.
You can find additional benchmarks for the Intel Core i5-8250U here.
We used the Cinebench R15 Multi loop to measure the processor's performance under constant load. The diagram reveals that the high multi-thread performance is achieved only in the first run. The result fell to 597 points during the second iteration and then stabilized with very few exceptions.
| JetStream 1.1 - 1.1 Total | |
| Acer Aspire 5 A517-51G-80L | |
| HP Omen 17-w206ng | |
| Acer Swift 3 SF315-41-R4W1 | |
| Acer Aspire F5-771G-50RD | |
| HP Pavilion 17z 1EX13AV | |
| Octane V2 - Total Score | |
| Acer Aspire 5 A517-51G-80L | |
| Acer Aspire F5-771G-50RD | |
| Acer Swift 3 SF315-41-R4W1 | |
| HP Pavilion 17z 1EX13AV | |
| Mozilla Kraken 1.1 - Total | |
| Acer Aspire F5-771G-50RD | |
| Acer Aspire 5 A517-51G-80L | |
* ... smaller is better
System Performance
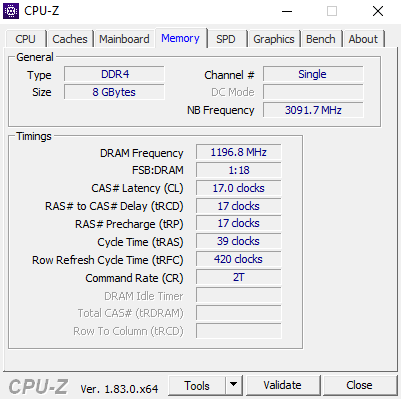
The interaction between the installed components is good, which is reflected in the good benchmark results. The SSD plays an important role in this, contributing to the system running smoothly. There is some potential for an even higher performance after upgrading the system with a second RAM module, as the memory is currently working in single-channel mode. The integrated graphics unit Intel UHD Graphics 620 could benefit from this upgrade as well.
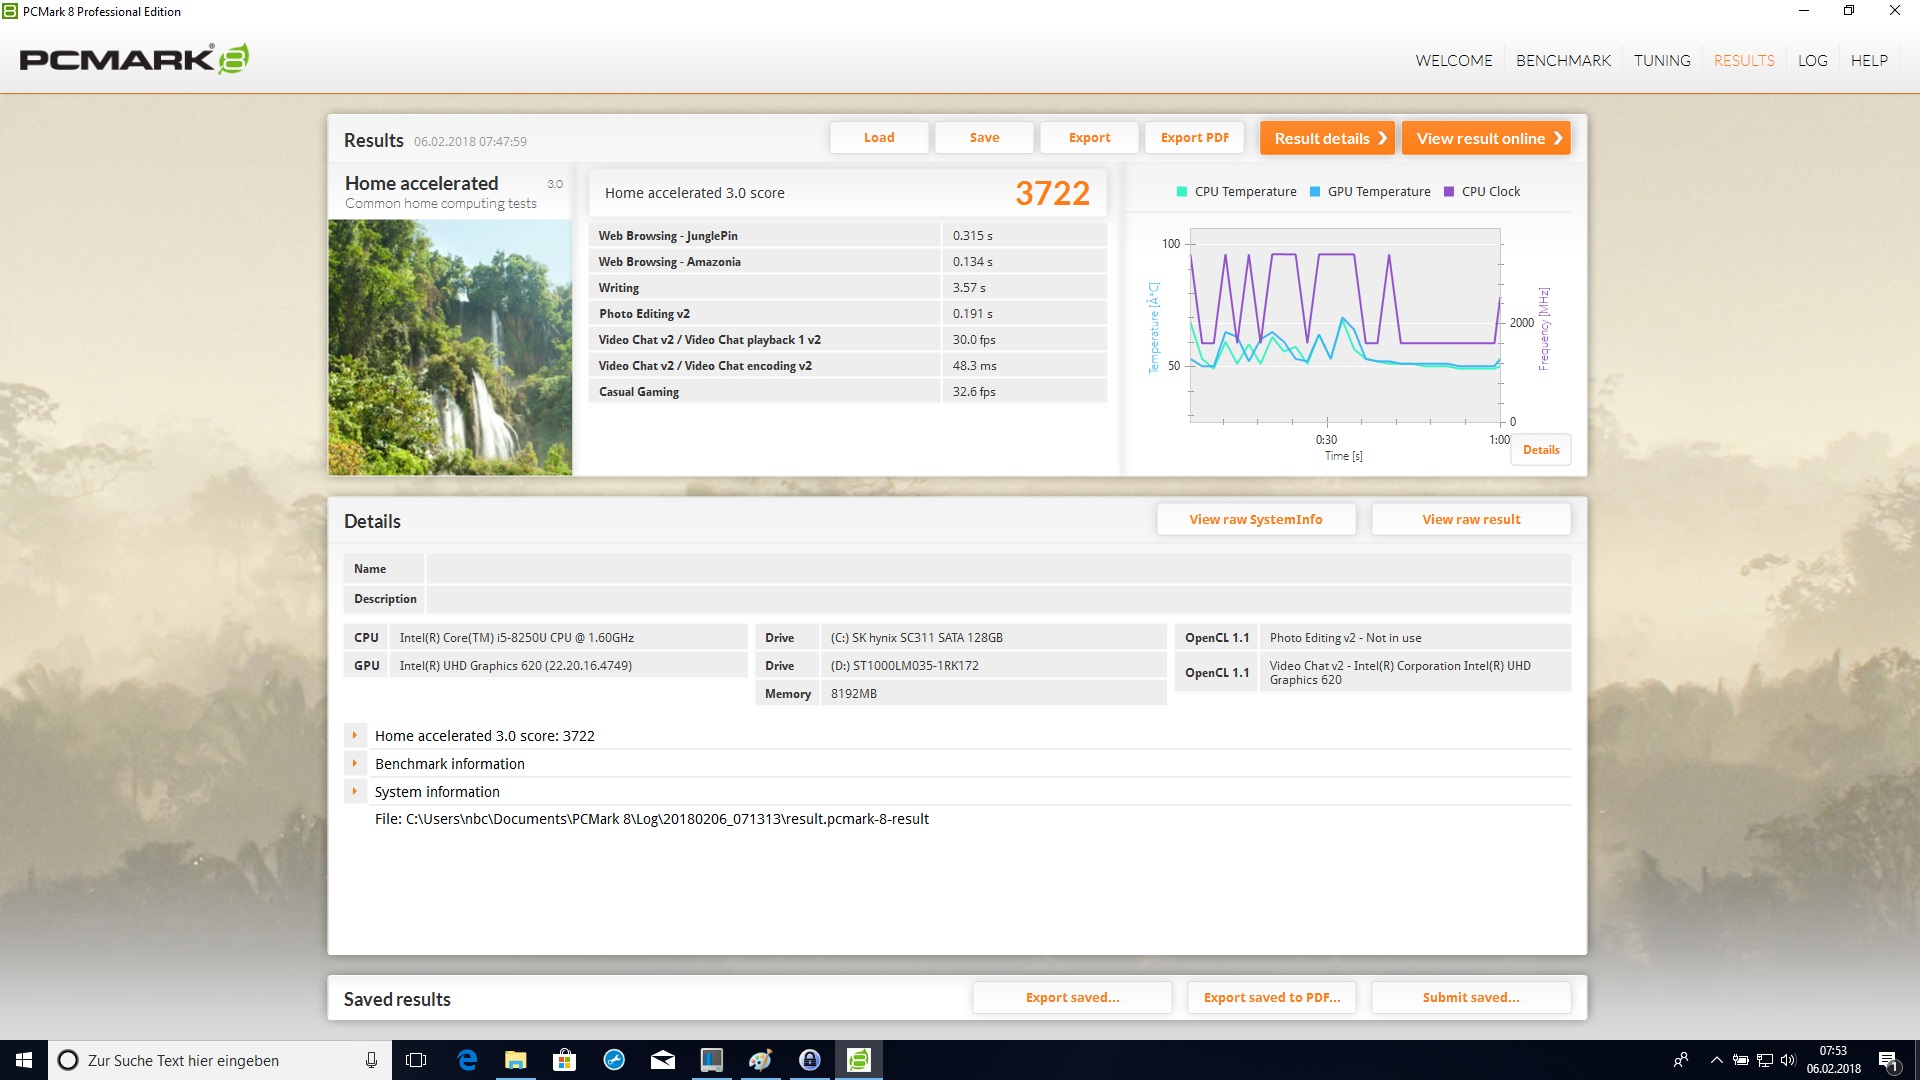
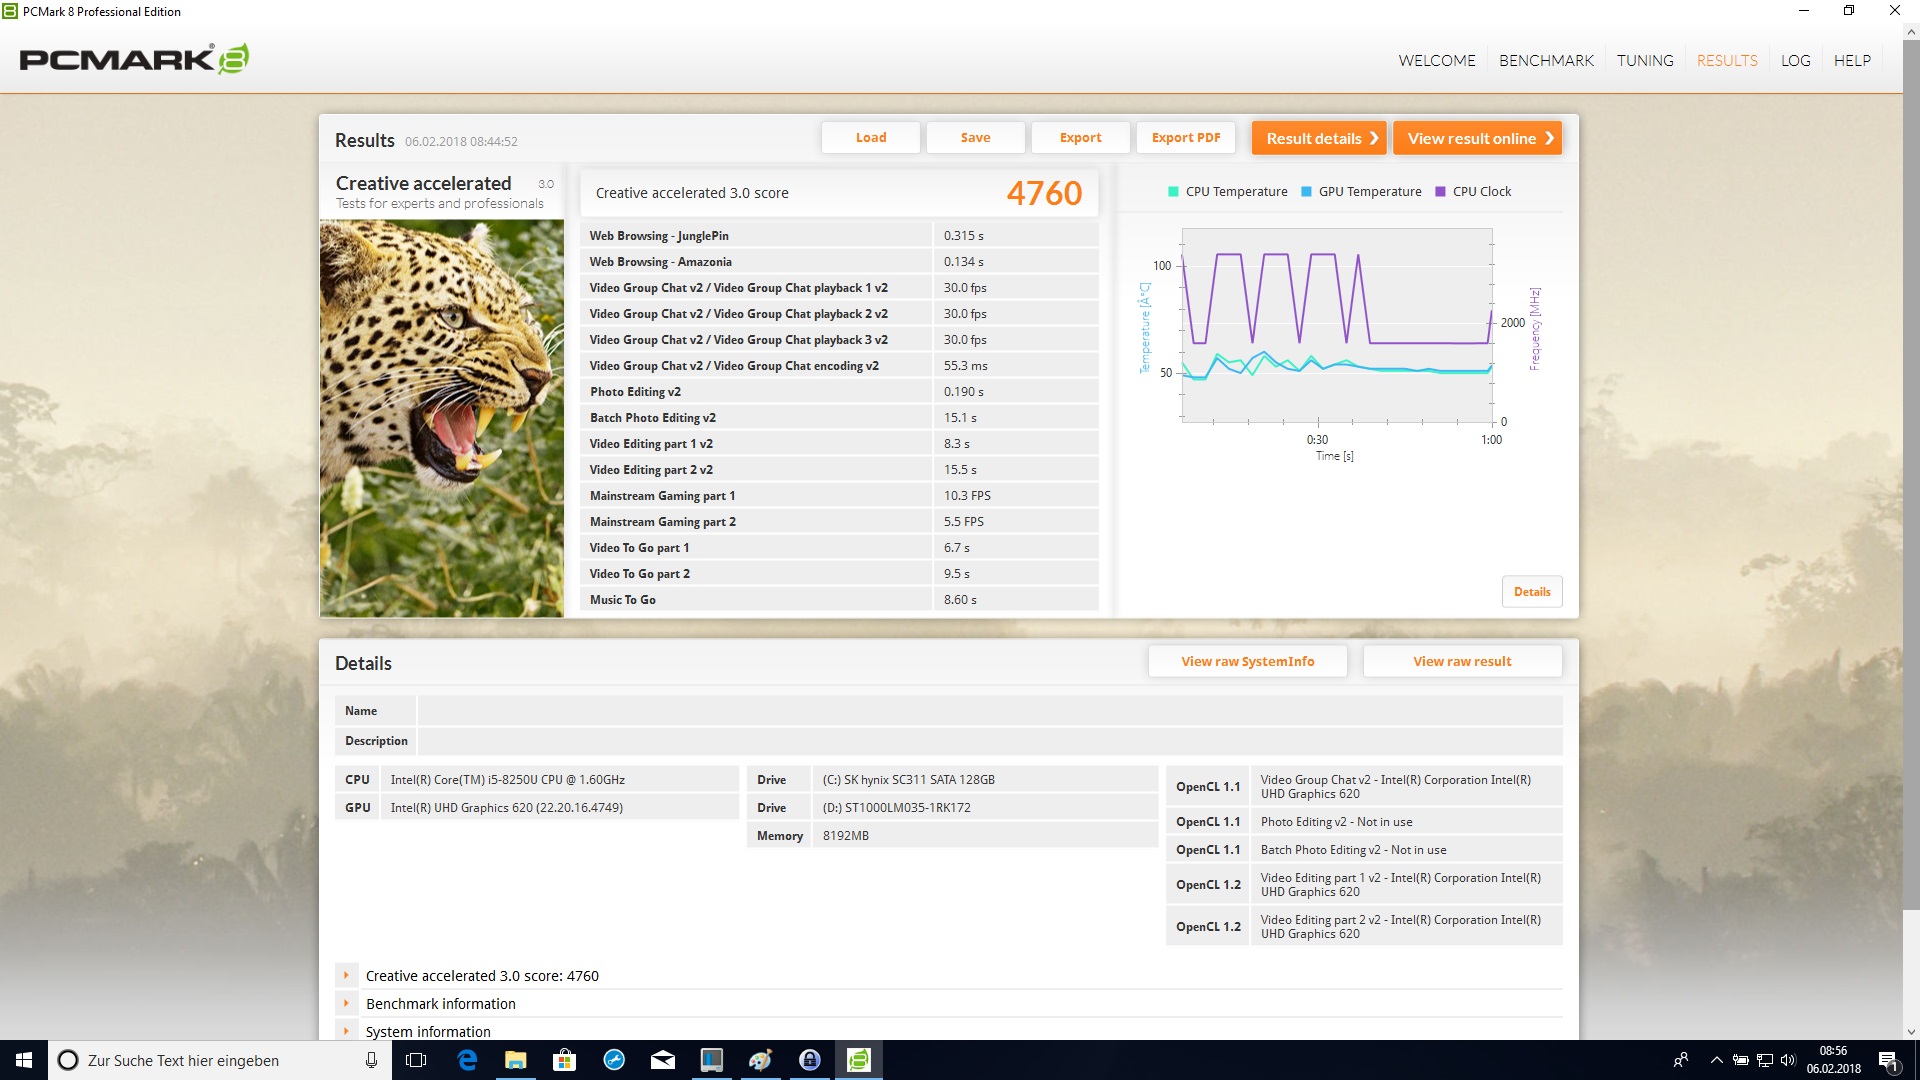
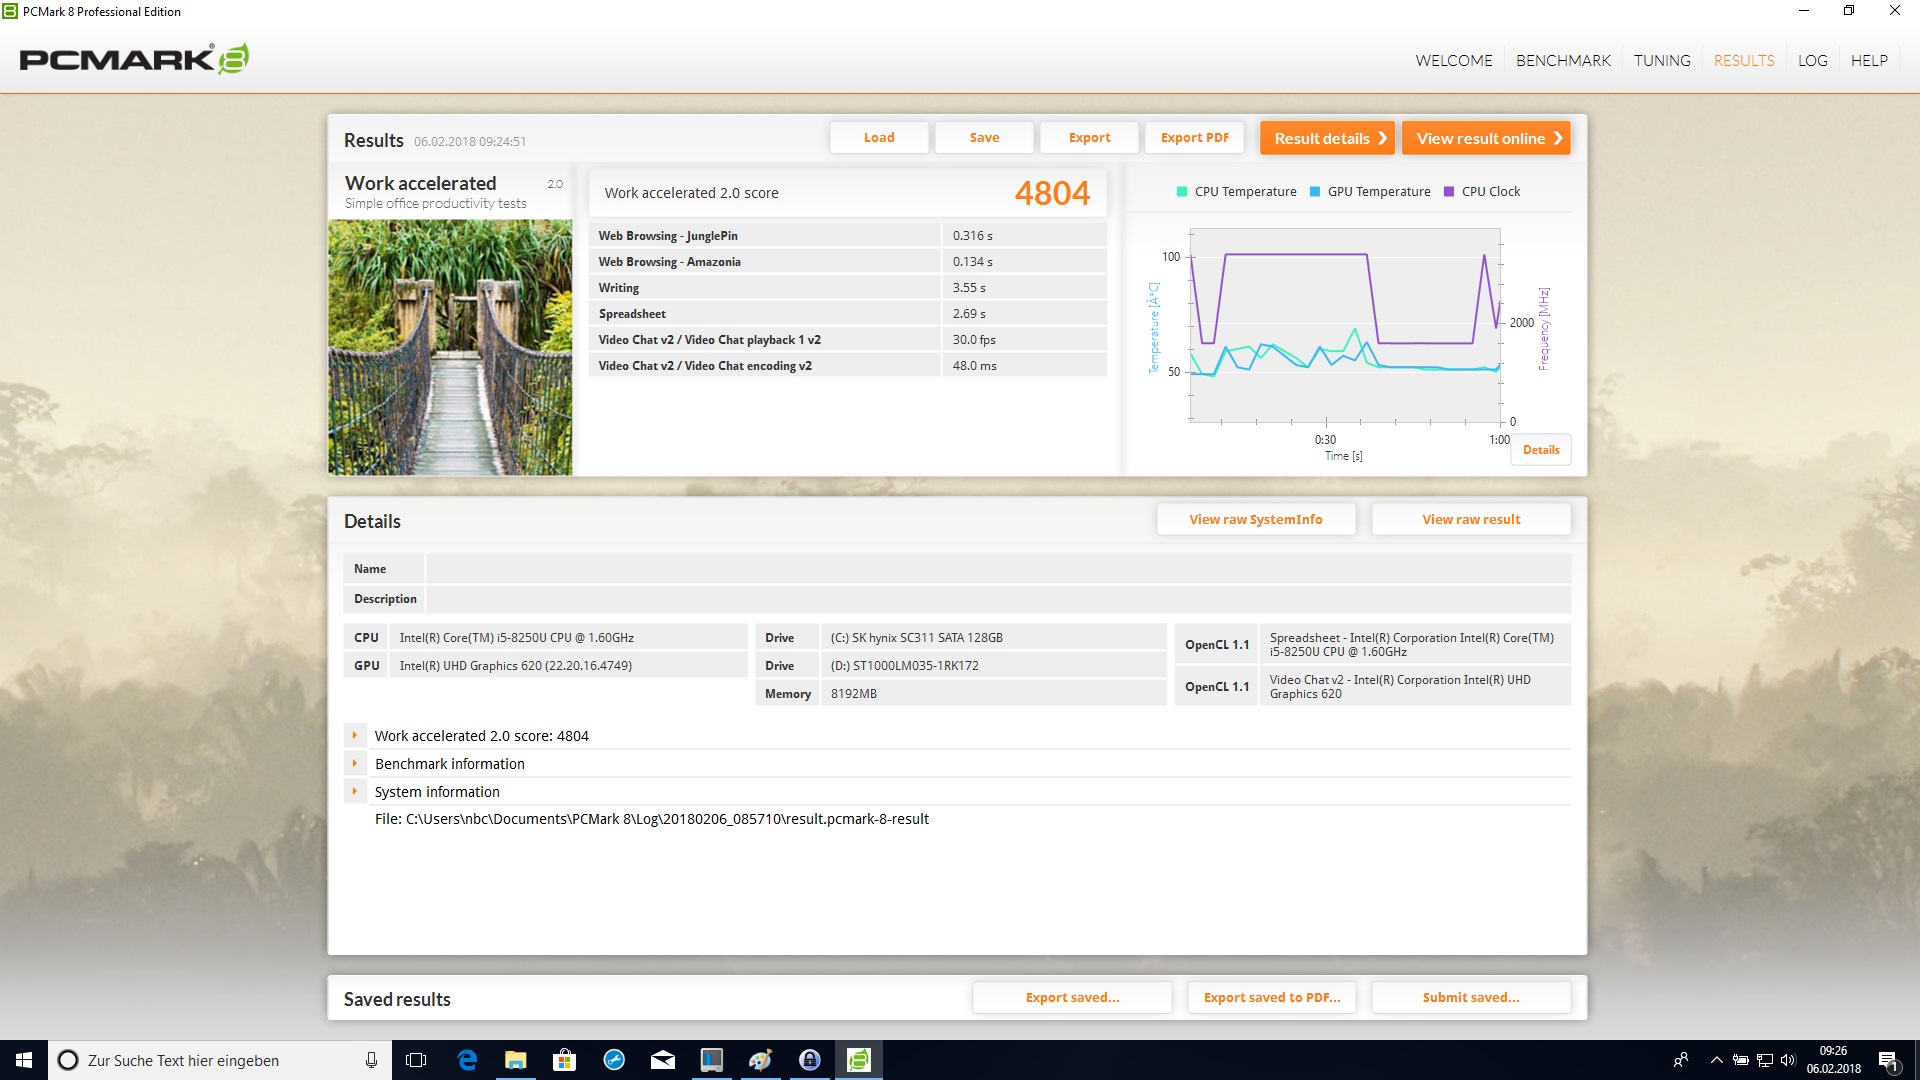
| PCMark 8 Home Score Accelerated v2 | 3722 points | |
| PCMark 8 Creative Score Accelerated v2 | 4760 points | |
| PCMark 8 Work Score Accelerated v2 | 4804 points | |
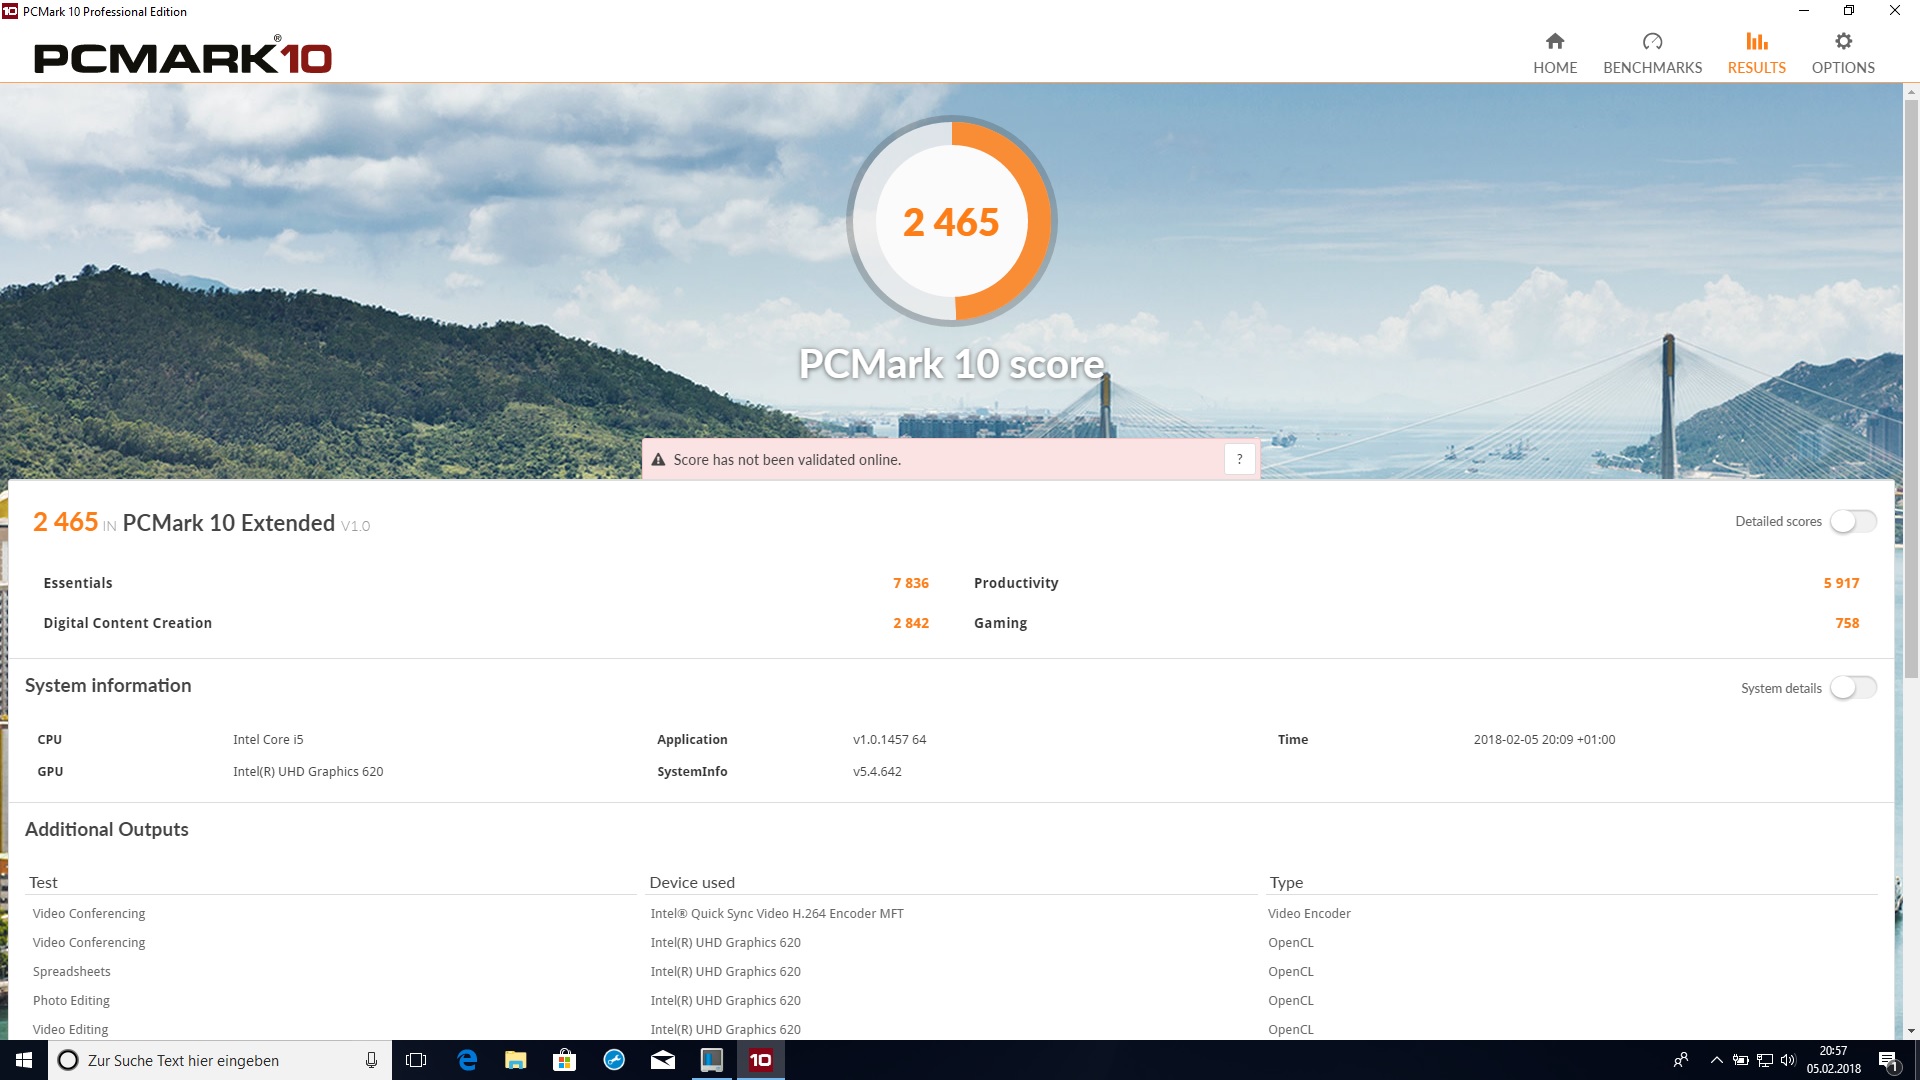
| PCMark 10 Score | 2465 points | |
Help | ||
Storage Devices
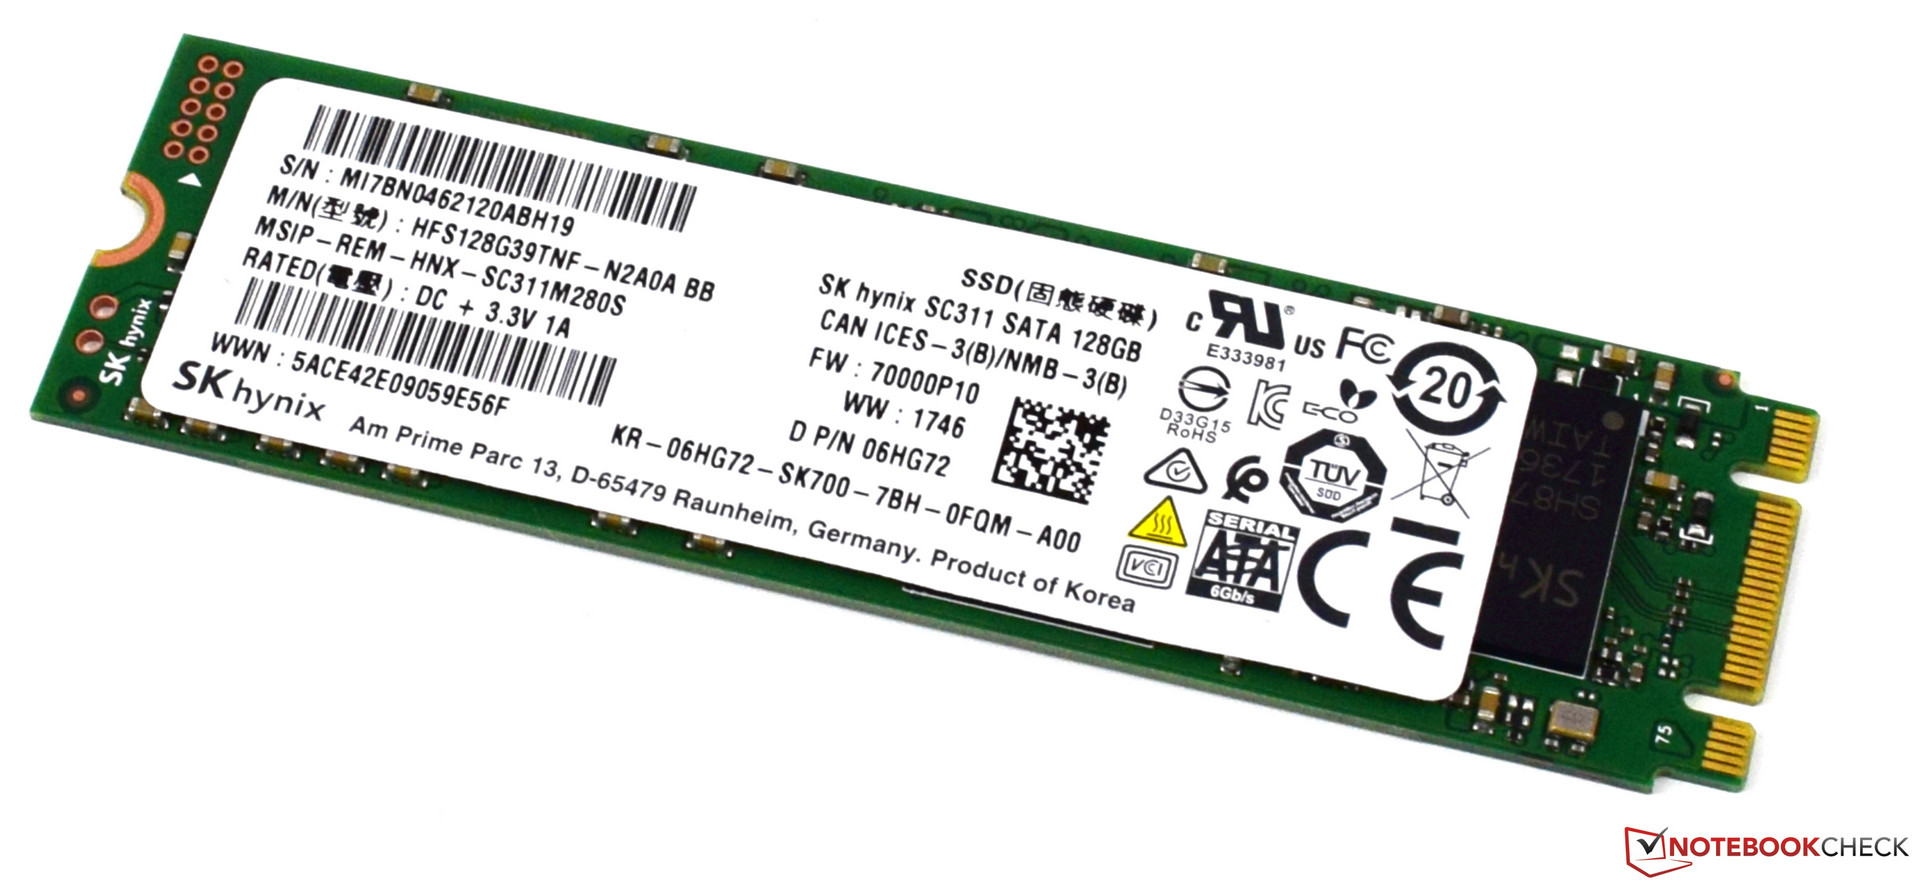
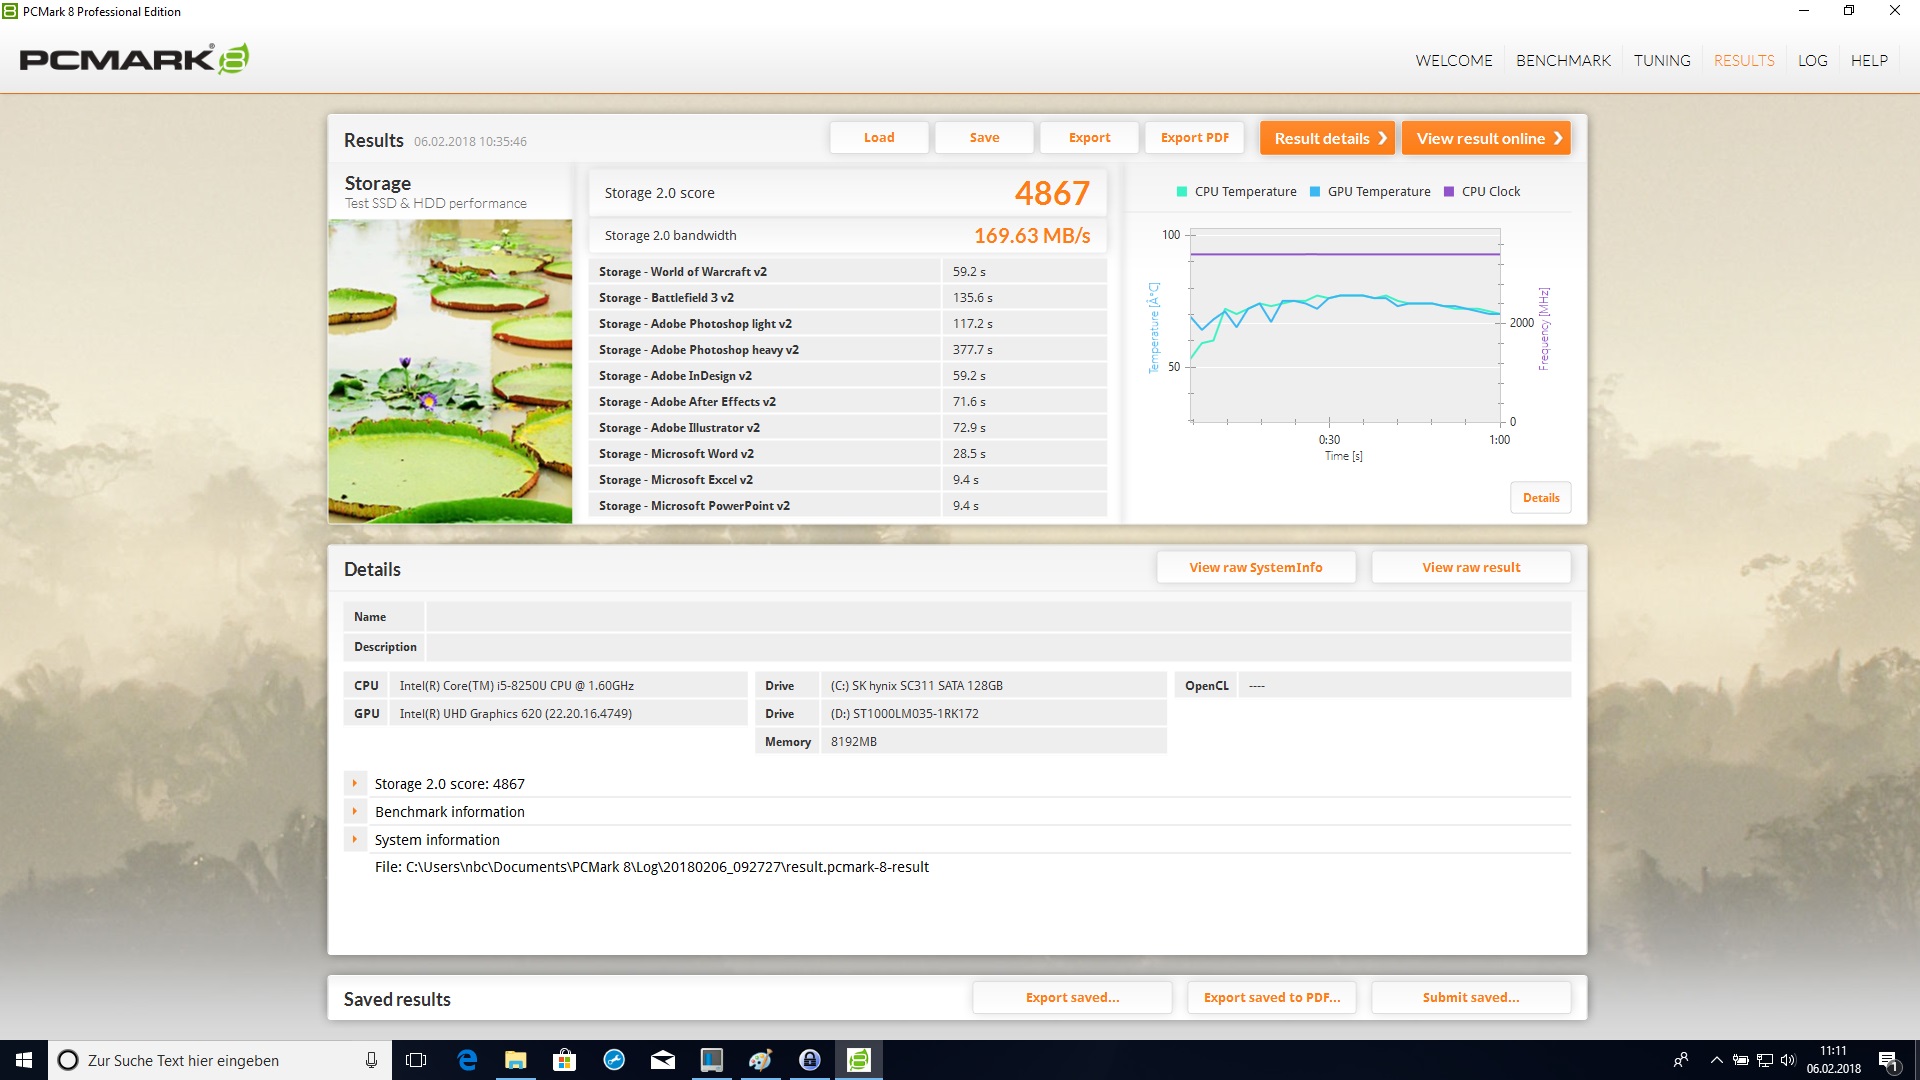
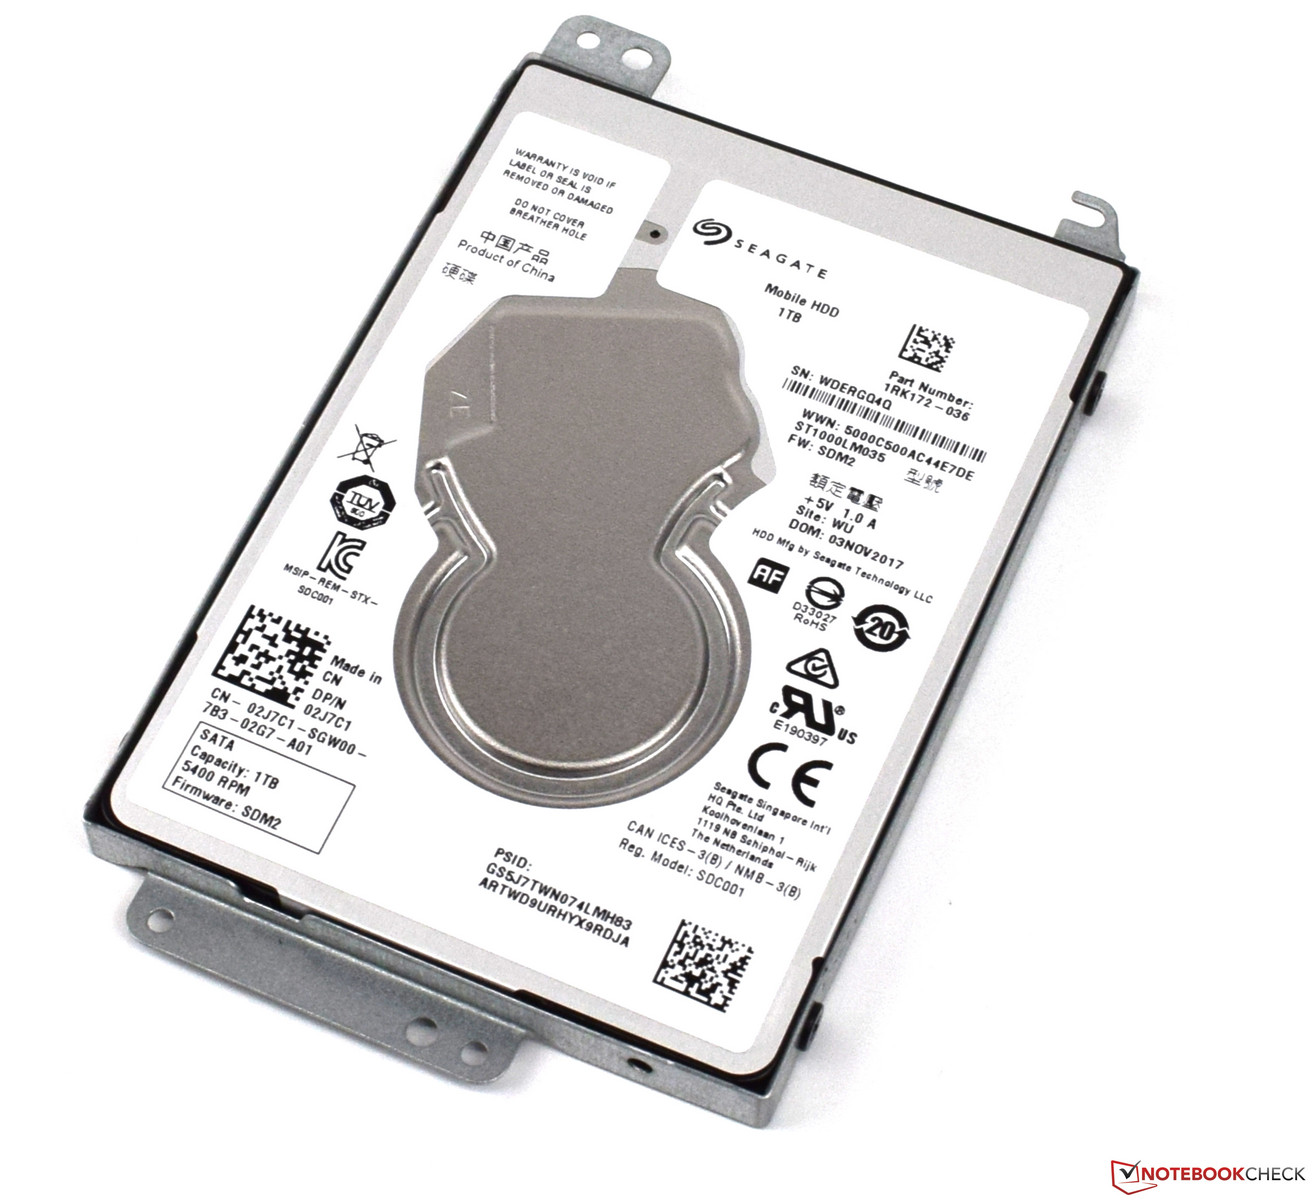
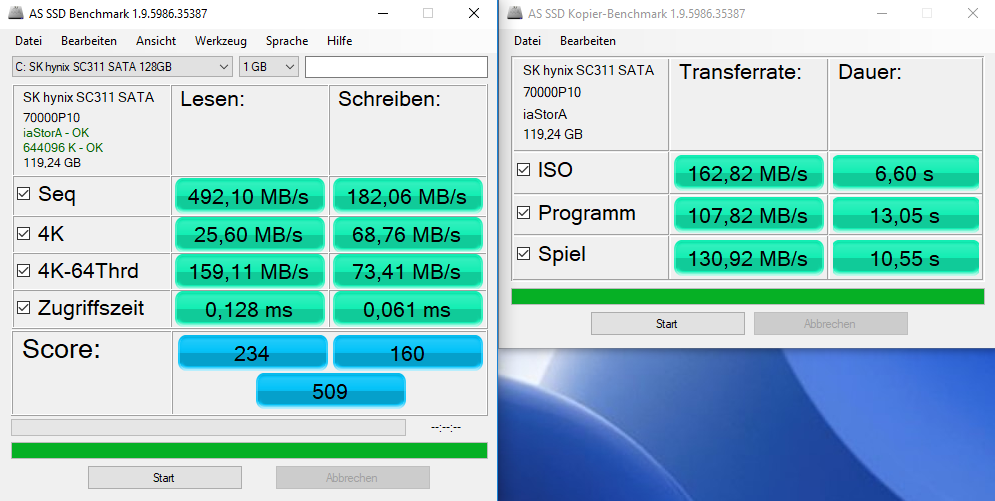
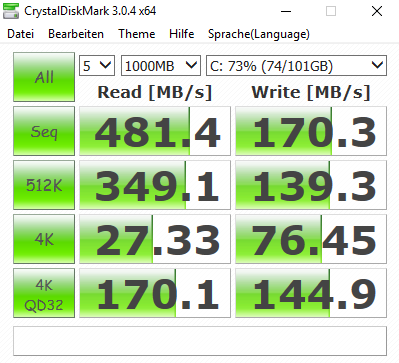
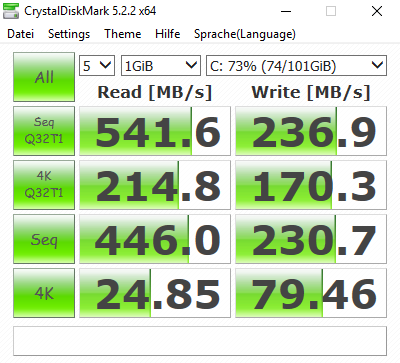
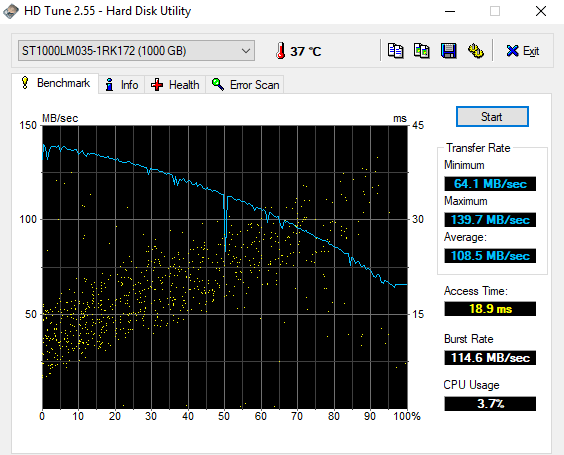
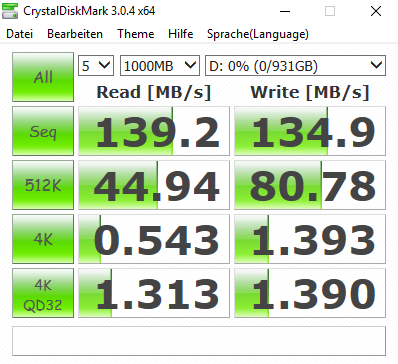
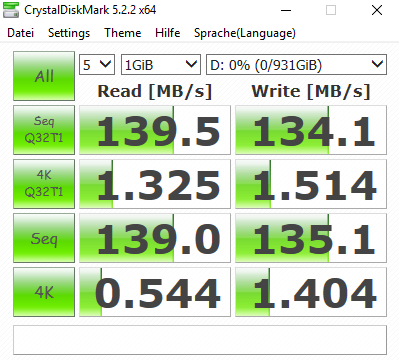
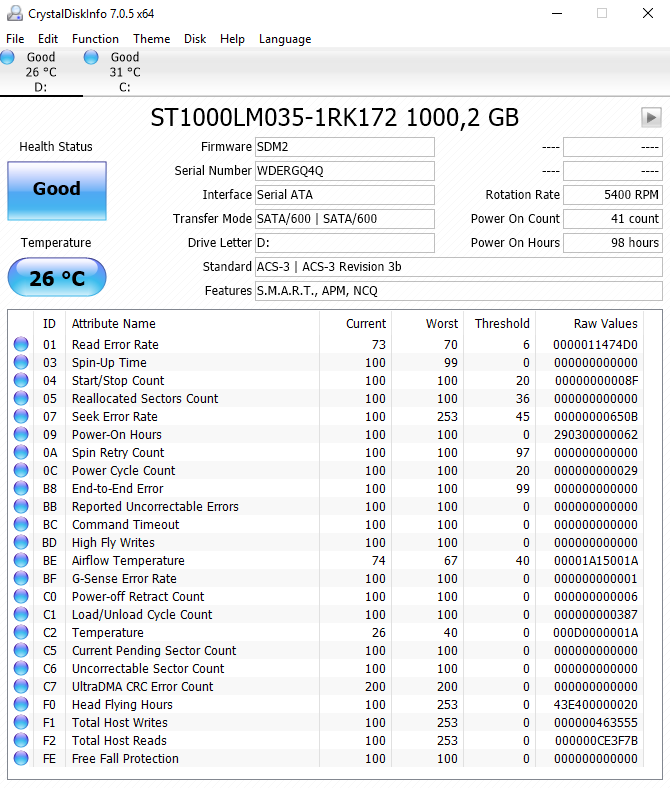
The installed storage solution in our test device is a combination of an SSD, which includes the operating system, and a regular hard drive. The SSD by SK Hynix comes in the M.2 2280 format and is only just sufficient with 128 GB of storage space. In our opinion, it should never be any less than that. However, the SSD is no miracle of performance, as the measurement results of the benchmarks show. In comparison to a regular hard drive, the SSD can take a clear lead, though. We were pleased with the 4K read values which never slipped below the 20 MB/s mark. There is an additional storage device in the form of a Seagate hard drive with 1 TB of storage space. With an average transfer rate of 108.5 MB/s, the HDD can hold its own, especially with the platters spinning at 5400 RPM.
| Dell Inspiron 17-5770-0357 SK hynix SC311 M.2 | Acer Aspire 5 A517-51G-80L Micron 1100 MTFDDAV256TBN | HP Pavilion 17z 1EX13AV WDC Scorpio Blue WD10JPVX-60JC3T1 | HP Omen 17-w206ng Samsung PM961 MZVLW256HEHP | Acer Aspire F5-771G-50RD Toshiba MQ01ABD100 | Acer Swift 3 SF315-41-R4W1 Intel SSD 600p SSDPEKKW256G7 | |
|---|---|---|---|---|---|---|
| CrystalDiskMark 3.0 | 43% | -85% | 270% | -86% | 111% | |
| Read Seq (MB/s) | 481.4 | 480.1 0% | 90 -81% | 1606 234% | 107.1 -78% | 1130 135% |
| Write Seq (MB/s) | 170.3 | 385.6 126% | 90.3 -47% | 1176 591% | 103.1 -39% | 601 253% |
| Read 512 (MB/s) | 349.1 | 295.6 -15% | 28.47 -92% | 846 142% | 28.89 -92% | 837 140% |
| Write 512 (MB/s) | 139.3 | 302.5 117% | 47.07 -66% | 805 478% | 27.34 -80% | 606 335% |
| Read 4k (MB/s) | 27.33 | 27.58 1% | 0.31 -99% | 59.9 119% | 0.331 -99% | 20.46 -25% |
| Write 4k (MB/s) | 76.4 | 81.4 7% | 0.3997 -99% | 155.6 104% | 0.831 -99% | 81.7 7% |
| Read 4k QD32 (MB/s) | 170.1 | 247.4 45% | 1.021 -99% | 588 246% | 0.666 -100% | 235.5 38% |
| Write 4k QD32 (MB/s) | 144.9 | 237.7 64% | 1.076 -99% | 505 249% | 0.828 -99% | 155 7% |

Graphics Performance
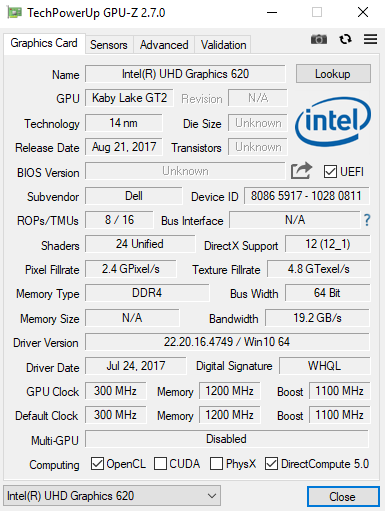
The Intel UHD Graphics 620 takes care of video output. It does not receive any support in the form of a dedicated graphics card in our test device. Hence, the graphics performance does not suffice to beat the competitors, all of which use a dedicated graphics card. A second RAM module could improve the performance of the Intel UHD Graphics 620 slightly. However, users should not expect too much from the dual-channel mode. The AMD Radeon 530, which can be found in the high-end hardware of the Dell Inspiron 17-5770, should be slightly better than the AMD Radeon R7 M340 performance-wise.
Additional benchmarks for the Intel UHD Graphics 620 can be found here.
| 3DMark | |
| 1280x720 Cloud Gate Standard Graphics | |
| Acer Aspire F5-771G-50RD | |
| Acer Aspire 5 A517-51G-80L | |
| Acer Swift 3 SF315-41-R4W1 | |
| HP Pavilion 17z 1EX13AV | |
| Dell Inspiron 17-5770-0357 | |
| 1920x1080 Fire Strike Graphics | |
| Acer Aspire 5 A517-51G-80L | |
| Acer Aspire F5-771G-50RD | |
| Acer Swift 3 SF315-41-R4W1 | |
| HP Pavilion 17z 1EX13AV | |
| Dell Inspiron 17-5770-0357 | |
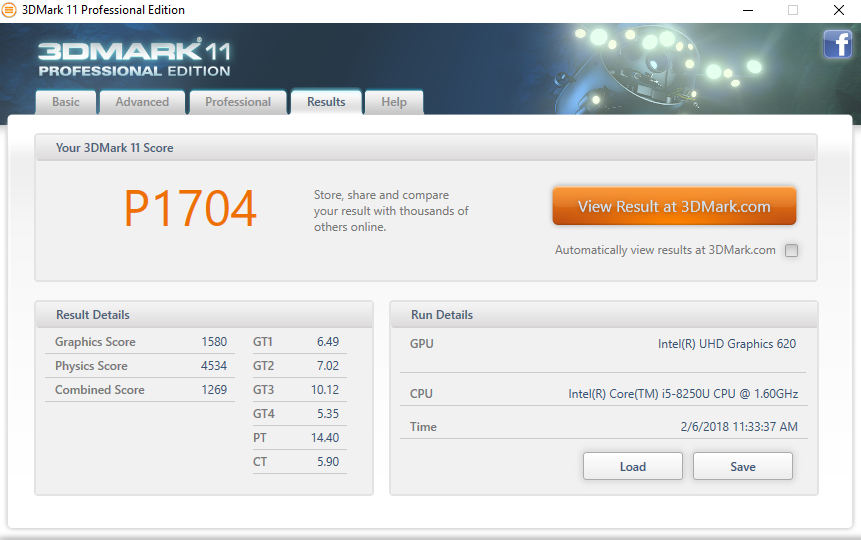
| 3DMark 11 - 1280x720 Performance GPU | |
| HP Omen 17-w206ng | |
| Acer Aspire 5 A517-51G-80L | |
| Acer Aspire F5-771G-50RD | |
| HP Pavilion 17z 1EX13AV | |
| Acer Swift 3 SF315-41-R4W1 | |
| Dell Inspiron 17-5770-0357 | |
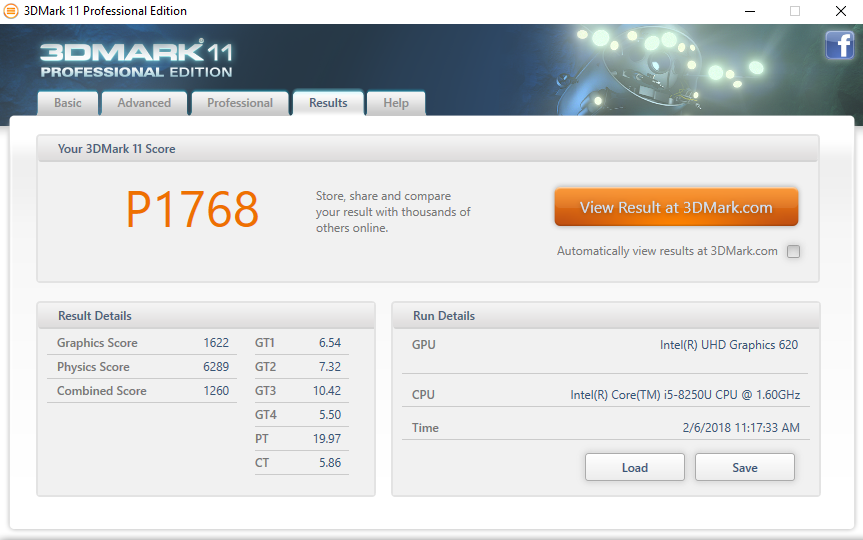
| 3DMark 11 Performance | 1768 points | |
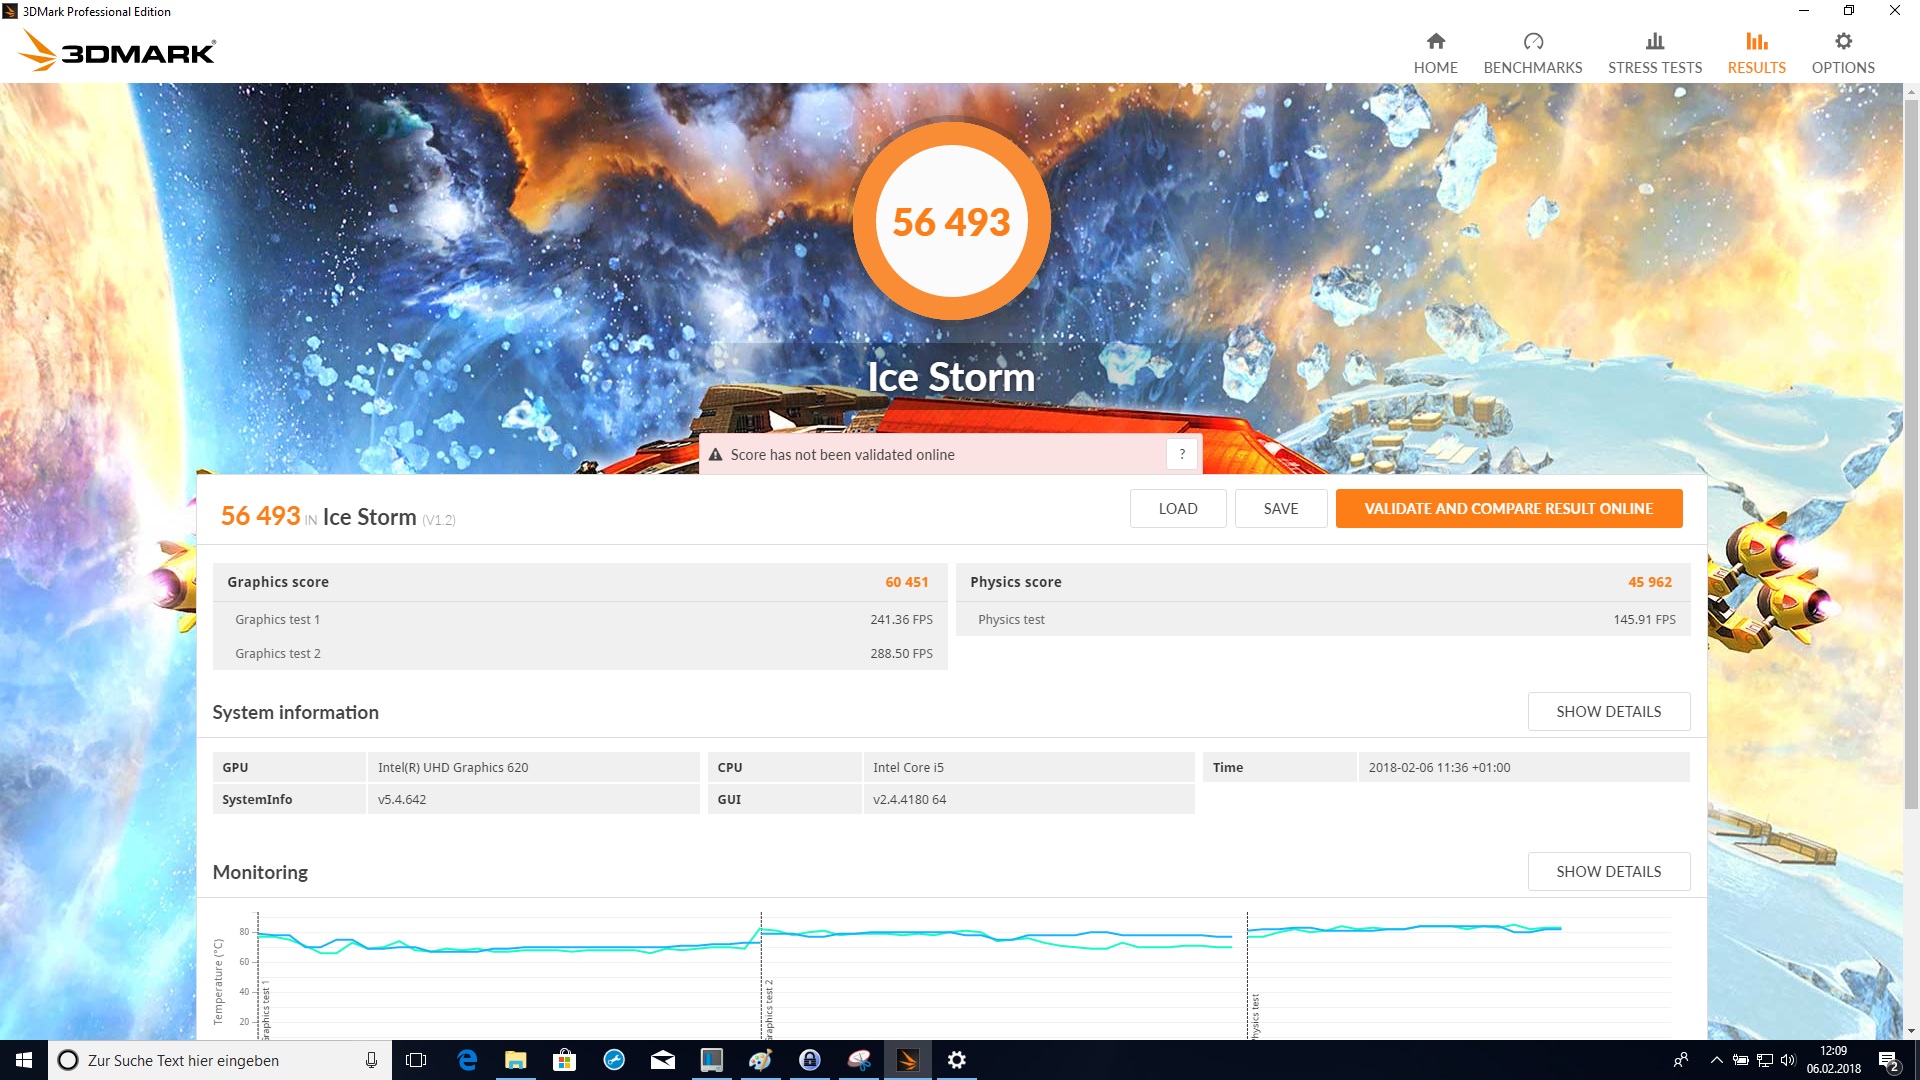
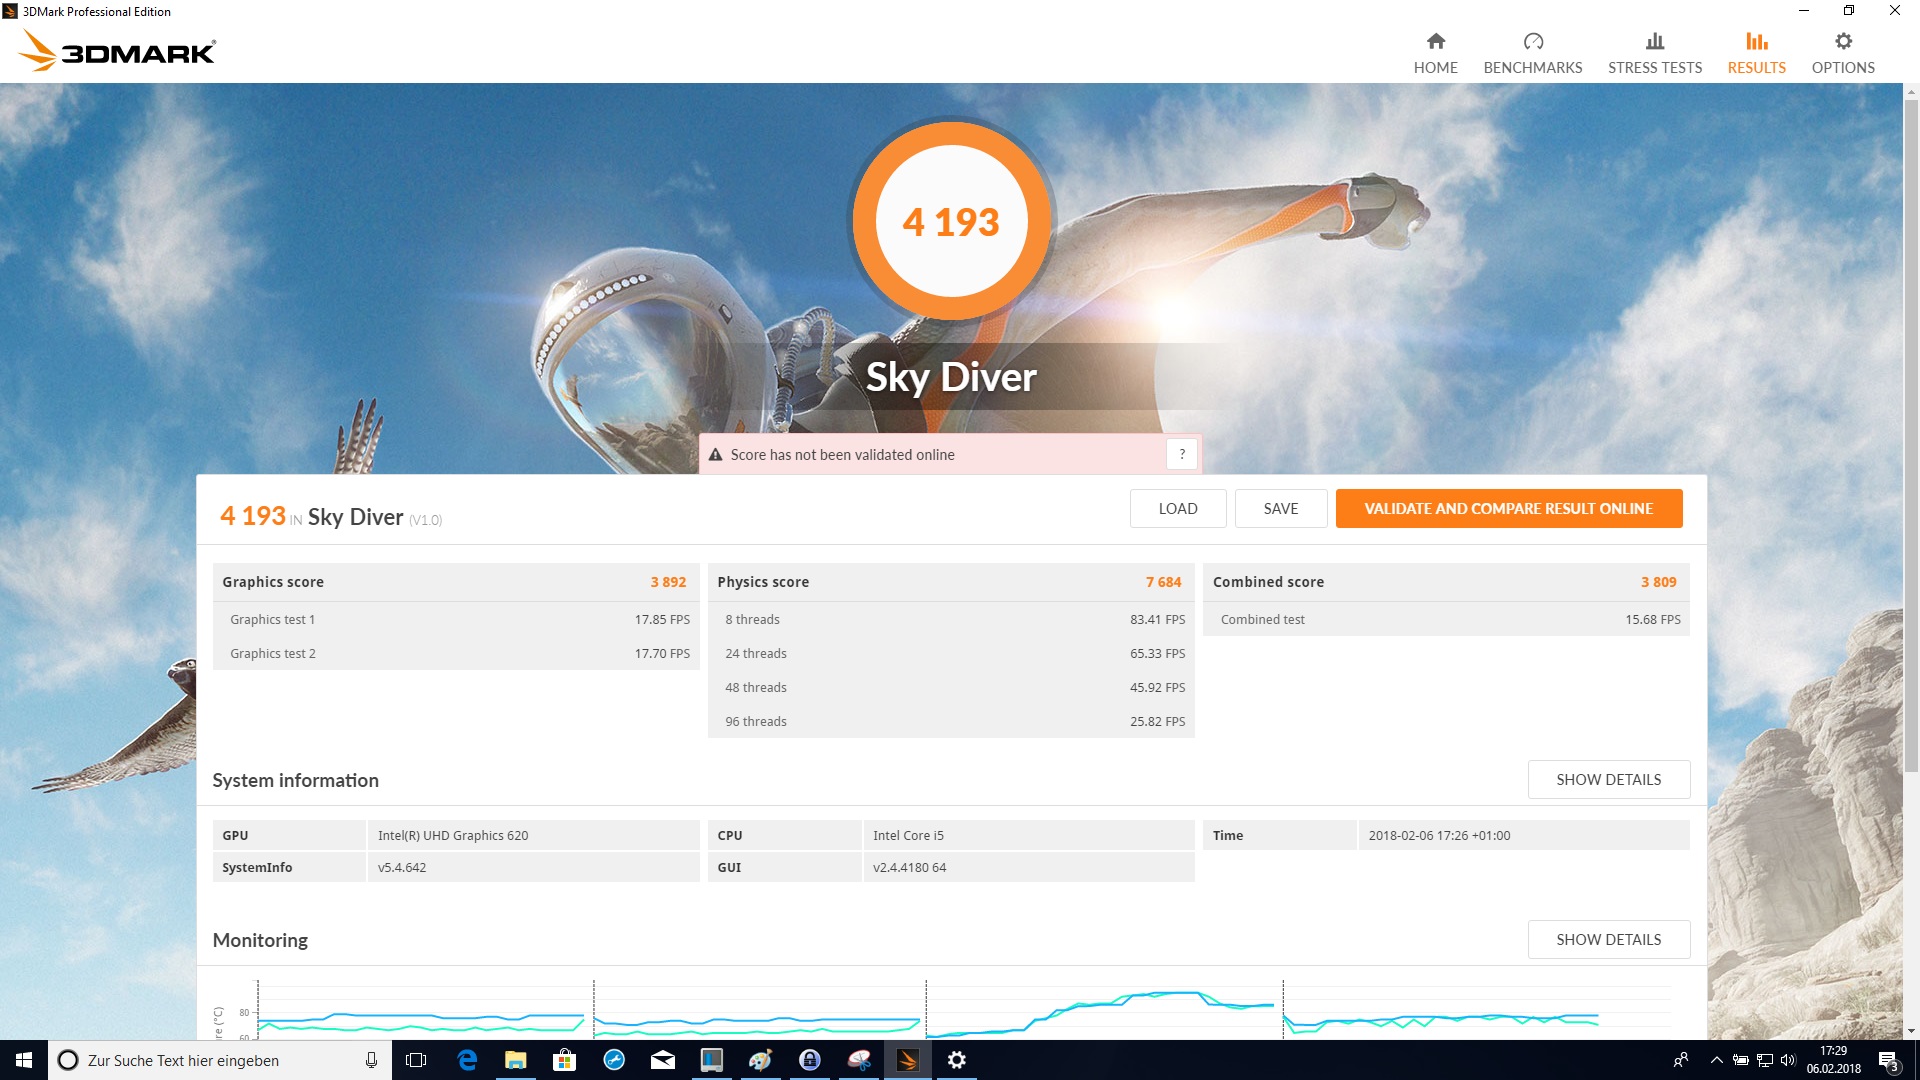
| 3DMark Ice Storm Standard Score | 56493 points | |
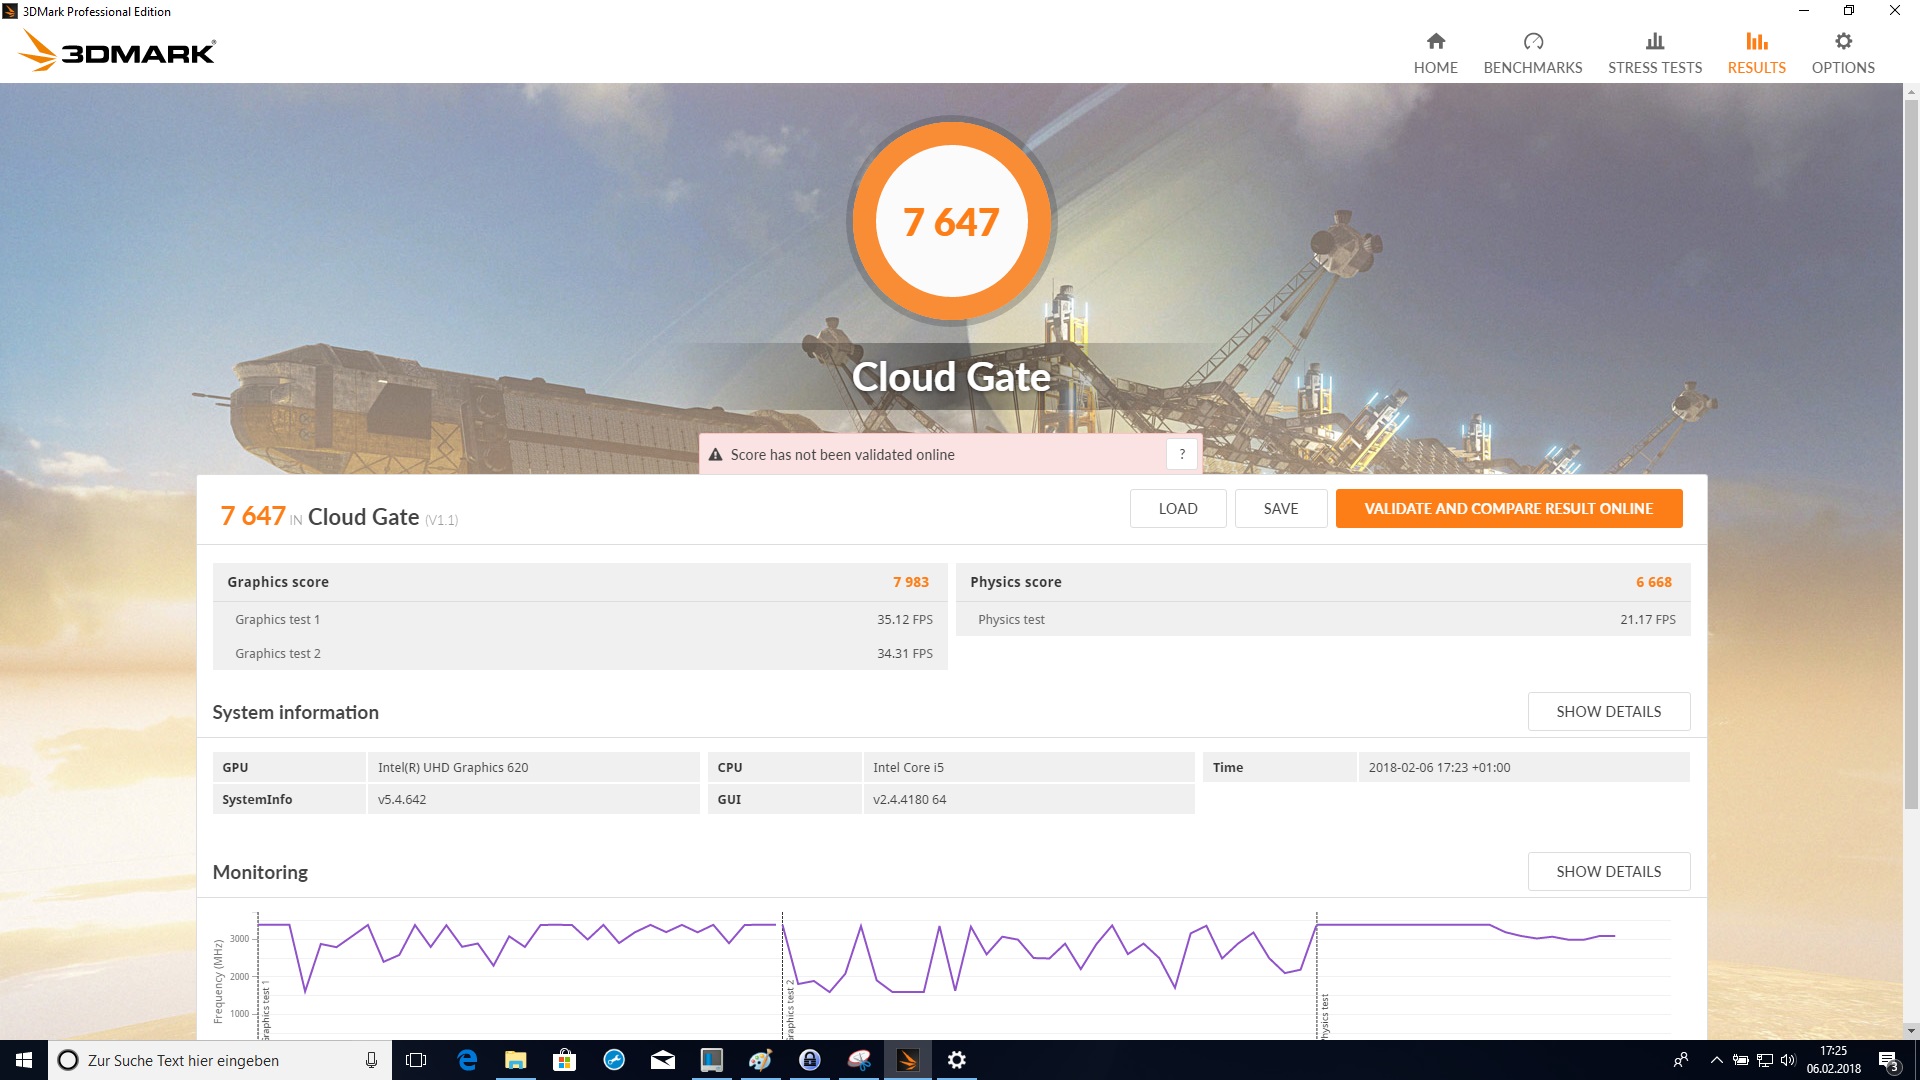
| 3DMark Cloud Gate Standard Score | 7647 points | |
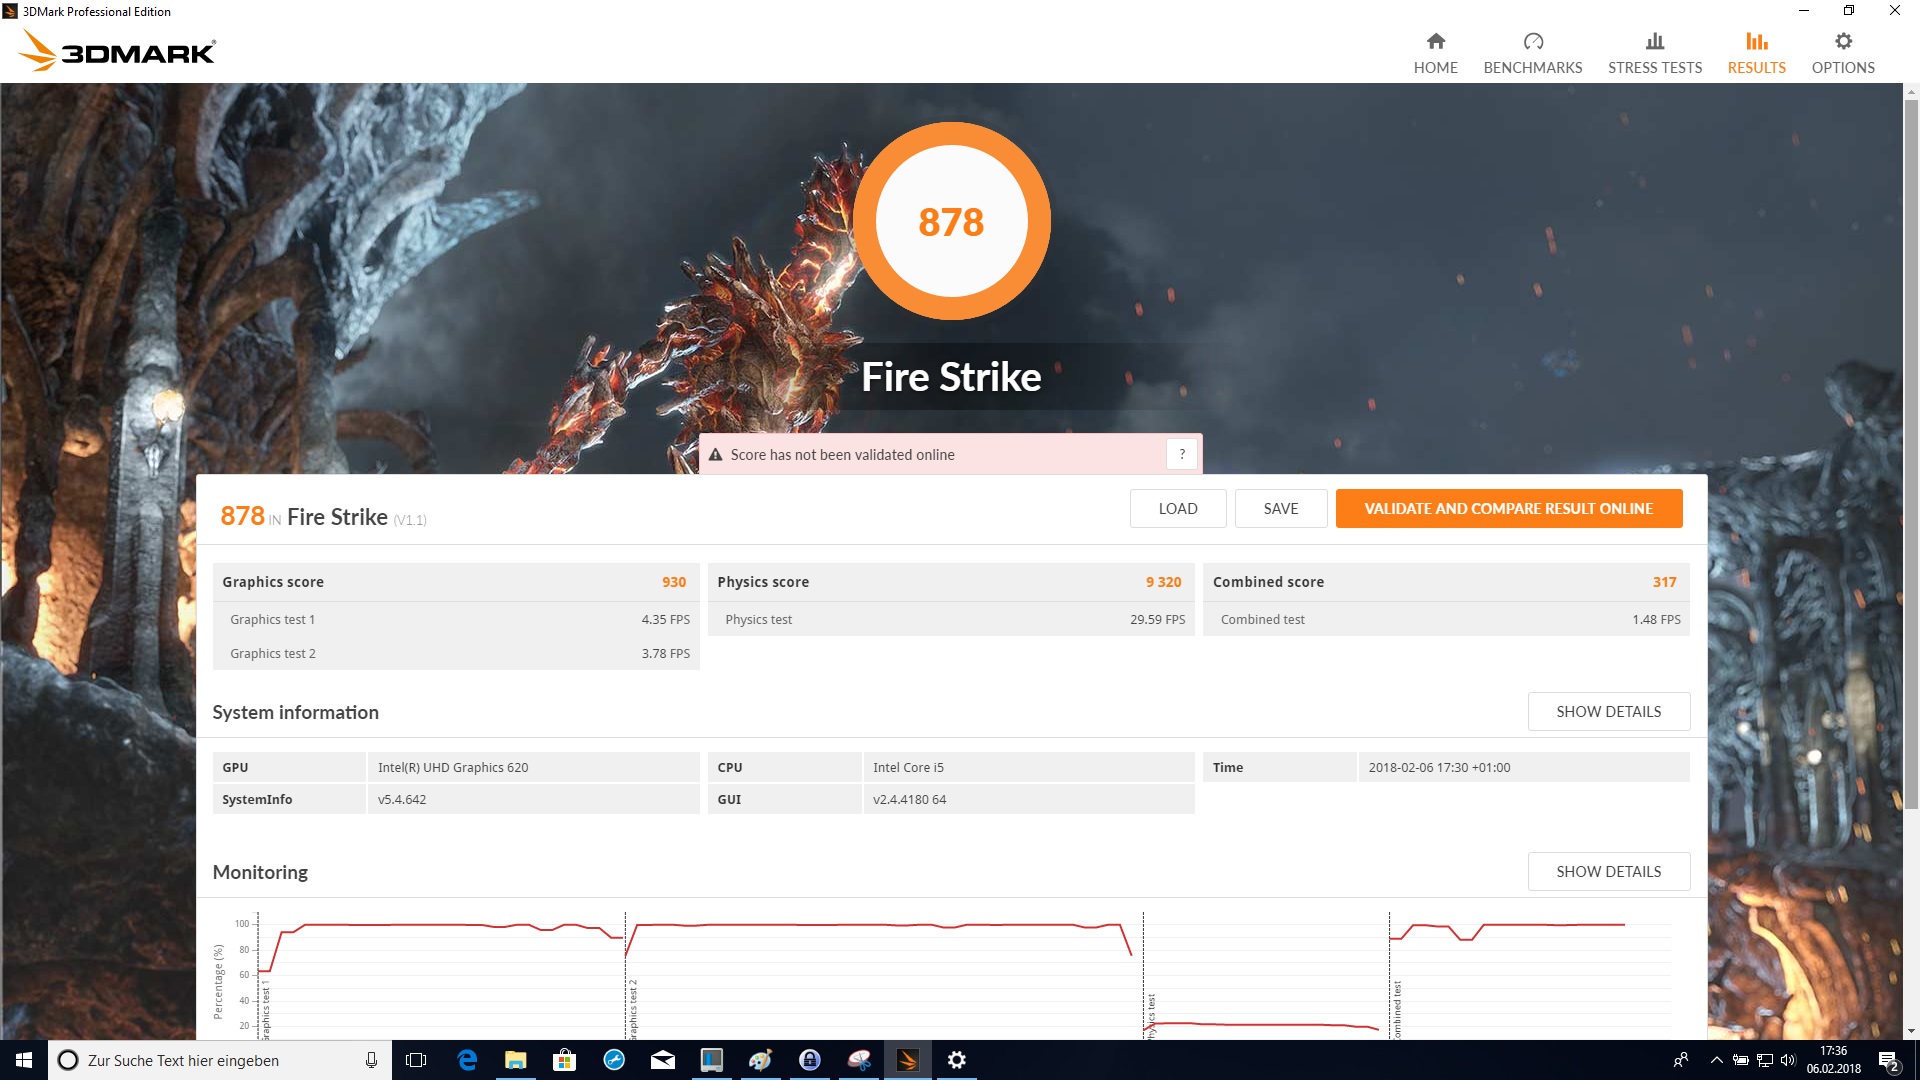
| 3DMark Fire Strike Score | 878 points | |
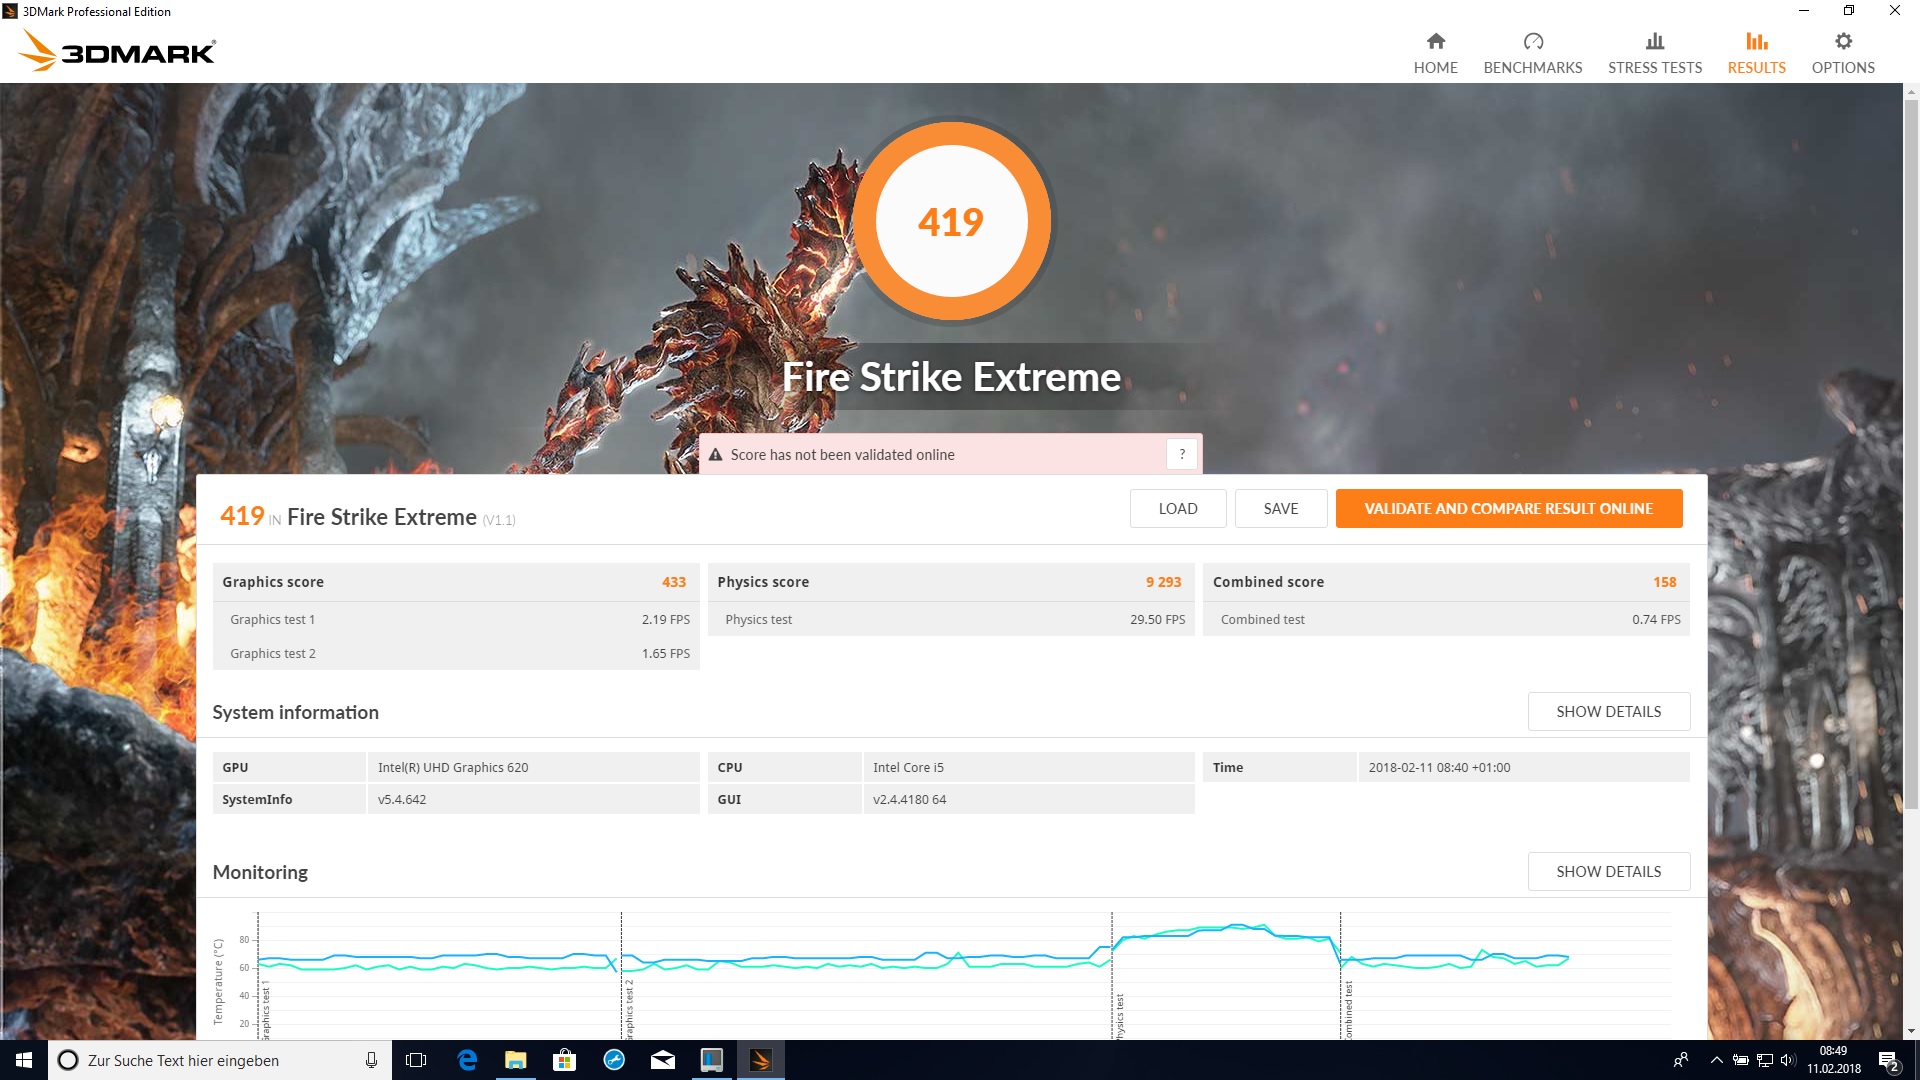
| 3DMark Fire Strike Extreme Score | 419 points | |
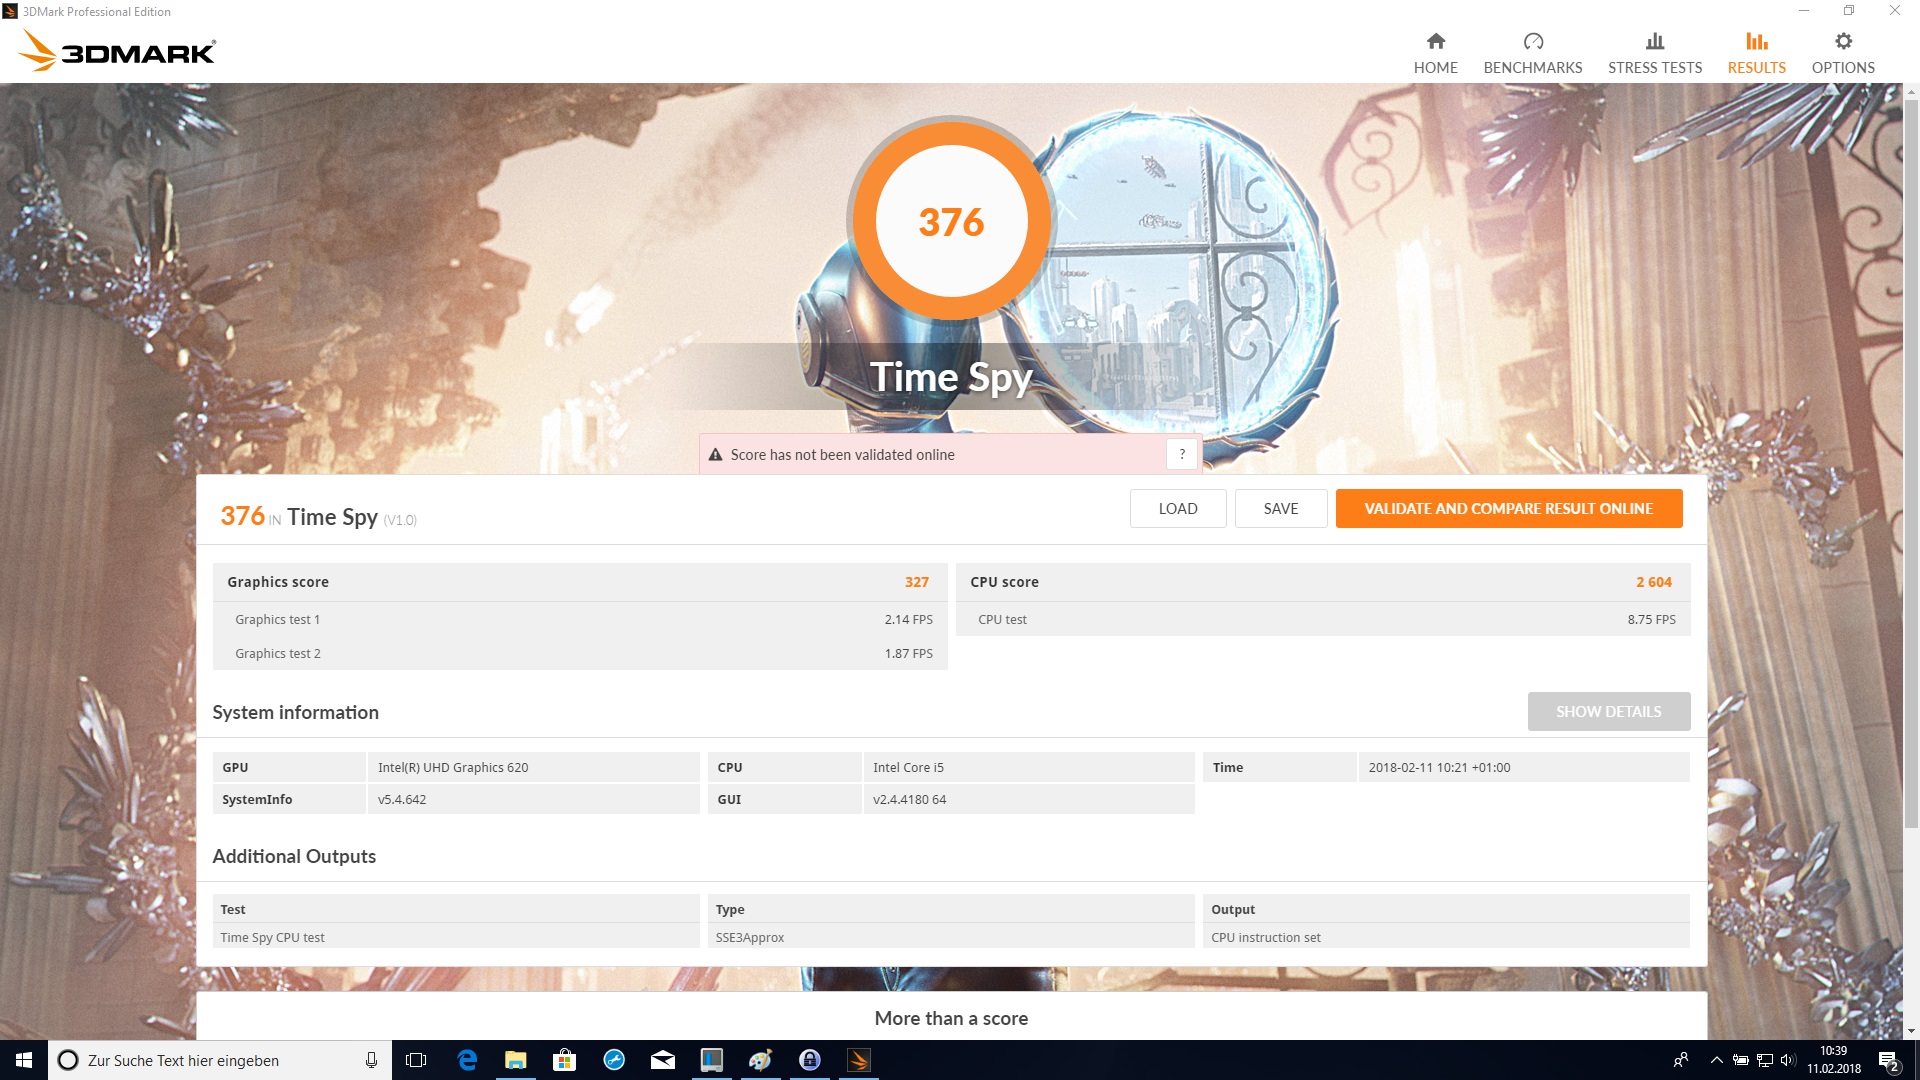
| 3DMark Time Spy Score | 376 points | |
Help | ||
Gaming Performance
Because of the low 3D performance, the Dell Inspiron 17-5770 in our test configuration is not suitable for gaming. However, simple browser games at least should be possible with the Inspiron 17.
| low | med. | high | ultra | |
|---|---|---|---|---|
| BioShock Infinite (2013) | 52.6 | 27.6 | 22.8 | 7.6 |
| The Witcher 3 (2015) | 15.6 | 9.9 | ||
| Rise of the Tomb Raider (2016) | 17.1 | 11.8 | 6.8 |
Emissions
System Noise
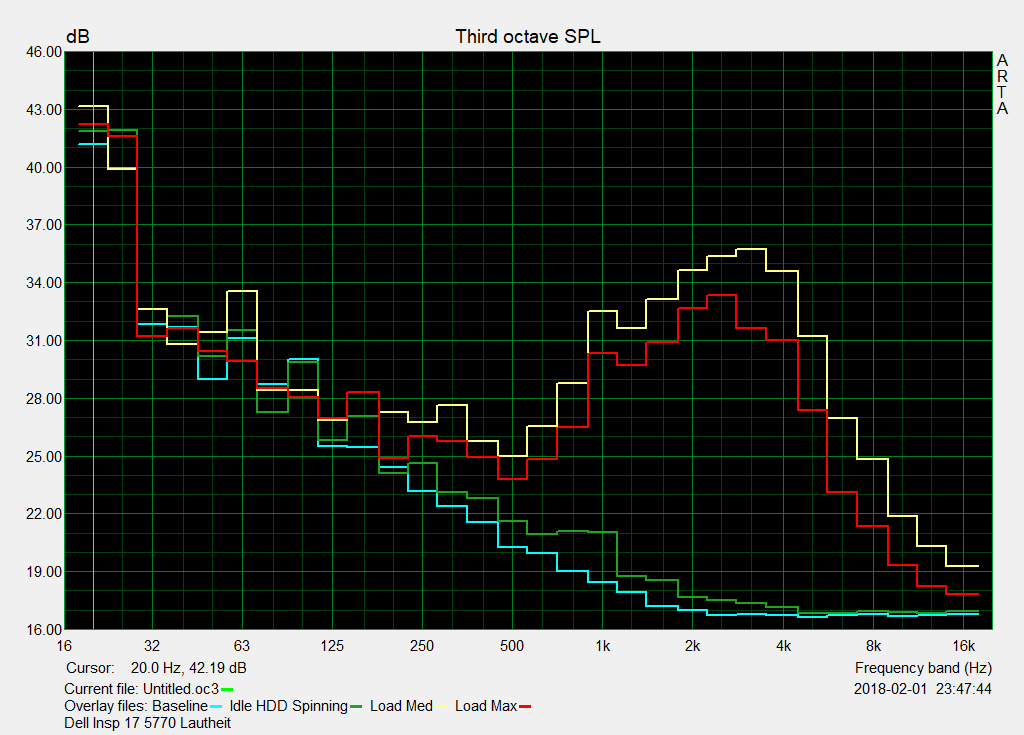
It is not possible for the Dell Inspiron 17-5770 to run the system entirely without noise. Even in idle mode, there is a minimal base noise coming from the case. Furthermore, the hard drive causes some background noise, but it can barely be classified as annoying. There was no excessive clattering noise caused by the hard drive of our test sample. However, the small cooler speeds up under load and calls attention to itself at 44.4 dB(A). In comparison, this puts the Inspiron on the next to last place of our ranking. Only the HP Omen 17 is even louder.
Noise level
| Idle |
| 31.1 / 31.1 / 31.1 dB(A) |
| HDD |
| 31.8 dB(A) |
| DVD |
| 34.7 / dB(A) |
| Load |
| 44.4 / 41.7 dB(A) |
 | ||
30 dB silent 40 dB(A) audible 50 dB(A) loud |
||
min: | ||
| Dell Inspiron 17-5770-0357 UHD Graphics 620, i5-8250U, SK hynix SC311 M.2 | Acer Aspire 5 A517-51G-80L GeForce MX150, i5-8550U, Micron 1100 MTFDDAV256TBN | HP Pavilion 17z 1EX13AV Radeon R7 M340, A12-9720P, WDC Scorpio Blue WD10JPVX-60JC3T1 | HP Omen 17-w206ng GeForce GTX 1050 Ti Mobile, i7-7700HQ, Samsung PM961 MZVLW256HEHP | Acer Aspire F5-771G-50RD GeForce GTX 950M, i5-7200U, Toshiba MQ01ABD100 | Acer Swift 3 SF315-41-R4W1 Vega 8, R5 2500U, Intel SSD 600p SSDPEKKW256G7 | |
|---|---|---|---|---|---|---|
| Noise | 9% | 1% | -12% | 7% | 5% | |
| off / environment * (dB) | 30.1 | 29.4 2% | 28 7% | 30 -0% | 30 -0% | 31.8 -6% |
| Idle Minimum * (dB) | 31.1 | 30.1 3% | 30.4 2% | 34 -9% | 31.5 -1% | 31.8 -2% |
| Idle Average * (dB) | 31.1 | 30.1 3% | 30.5 2% | 35 -13% | 31.5 -1% | 32.1 -3% |
| Idle Maximum * (dB) | 31.1 | 29.7 5% | 30.5 2% | 36 -16% | 31.6 -2% | 32.1 -3% |
| Load Average * (dB) | 44.4 | 34.4 23% | 41.5 7% | 47 -6% | 31.7 29% | 33 26% |
| Load Maximum * (dB) | 41.7 | 34.4 18% | 48.2 -16% | 52 -25% | 34.5 17% | 34.8 17% |
| Witcher 3 ultra * (dB) | 41.8 | 48 | 31.4 |
* ... smaller is better
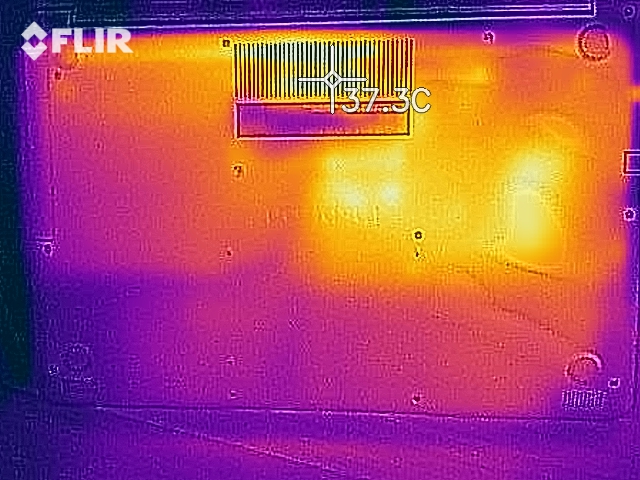
Temperature
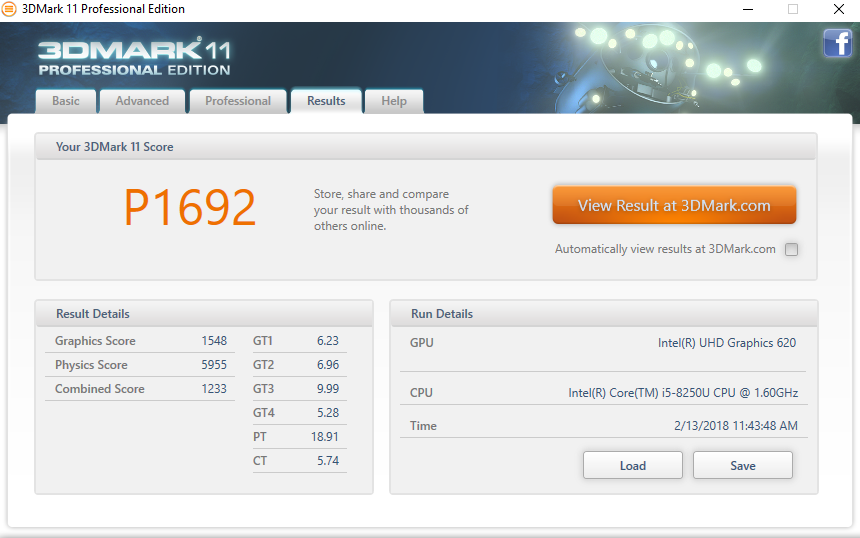
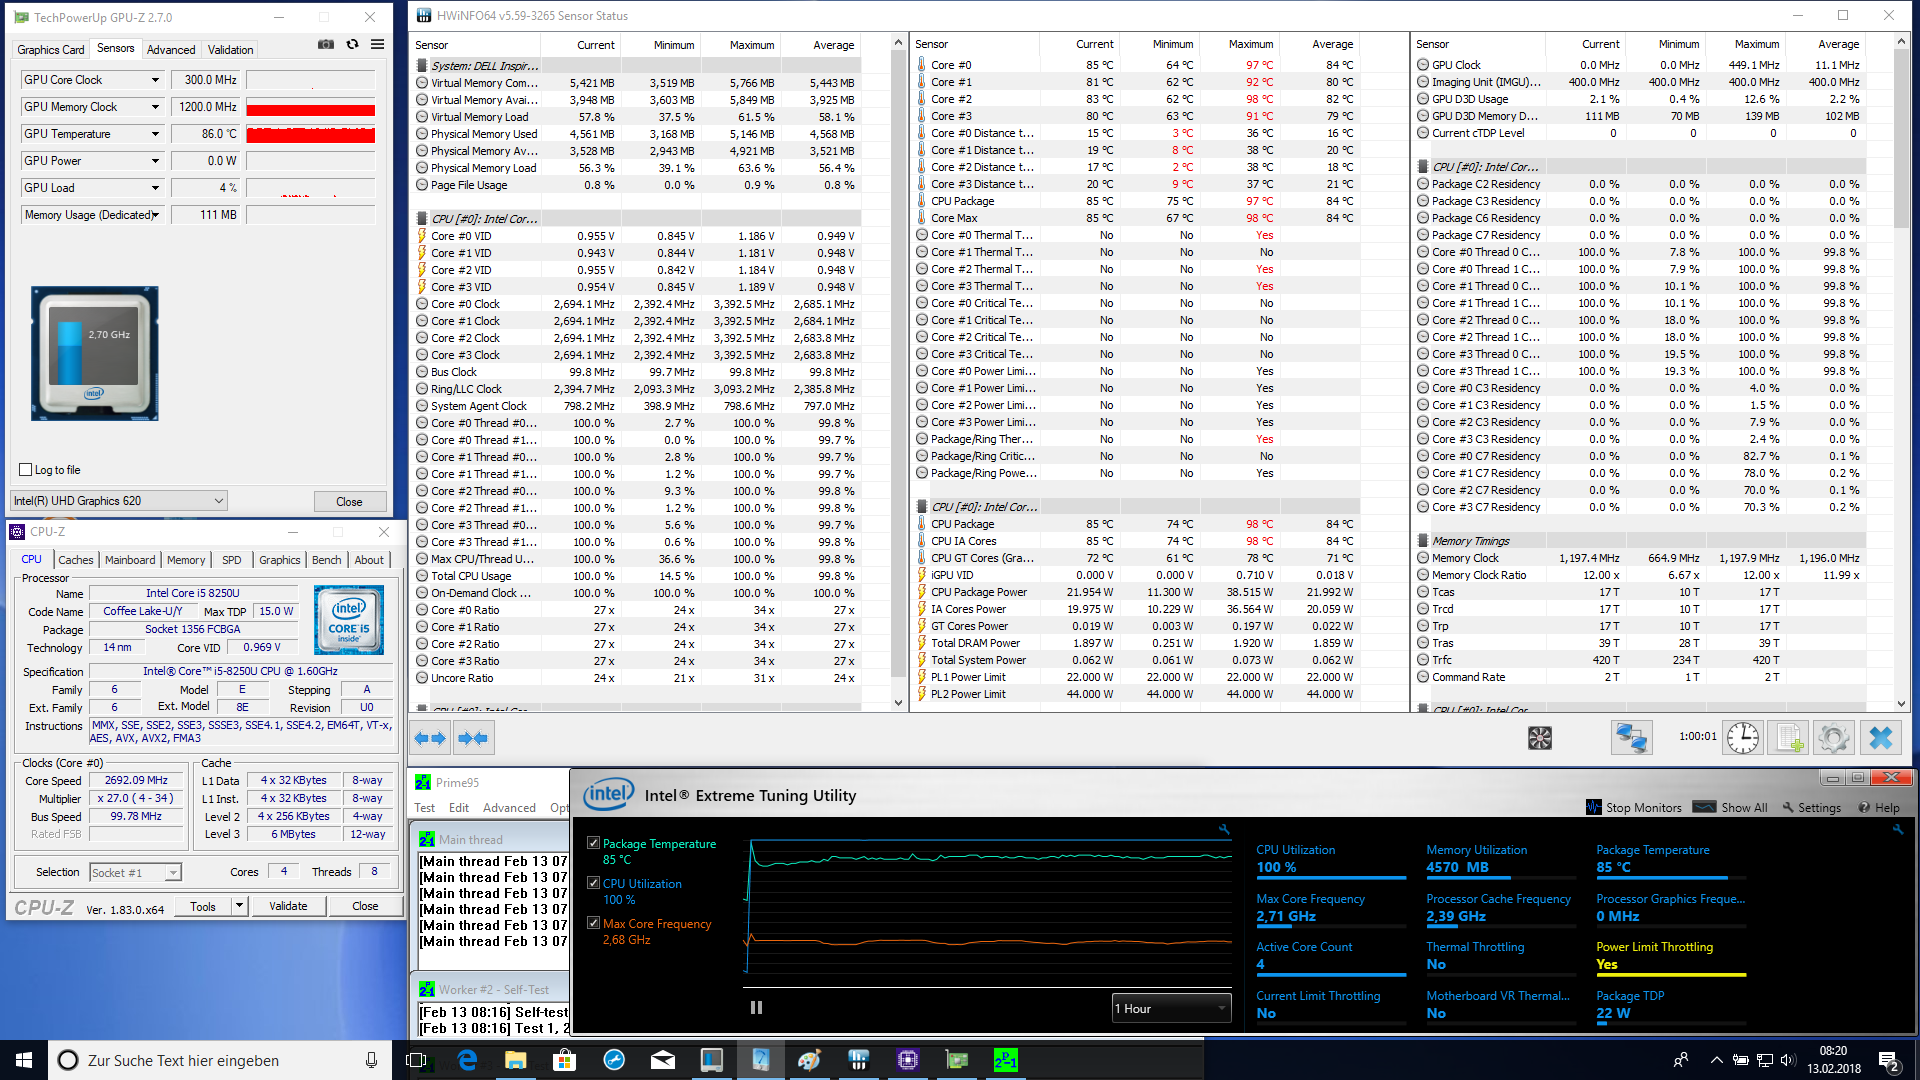
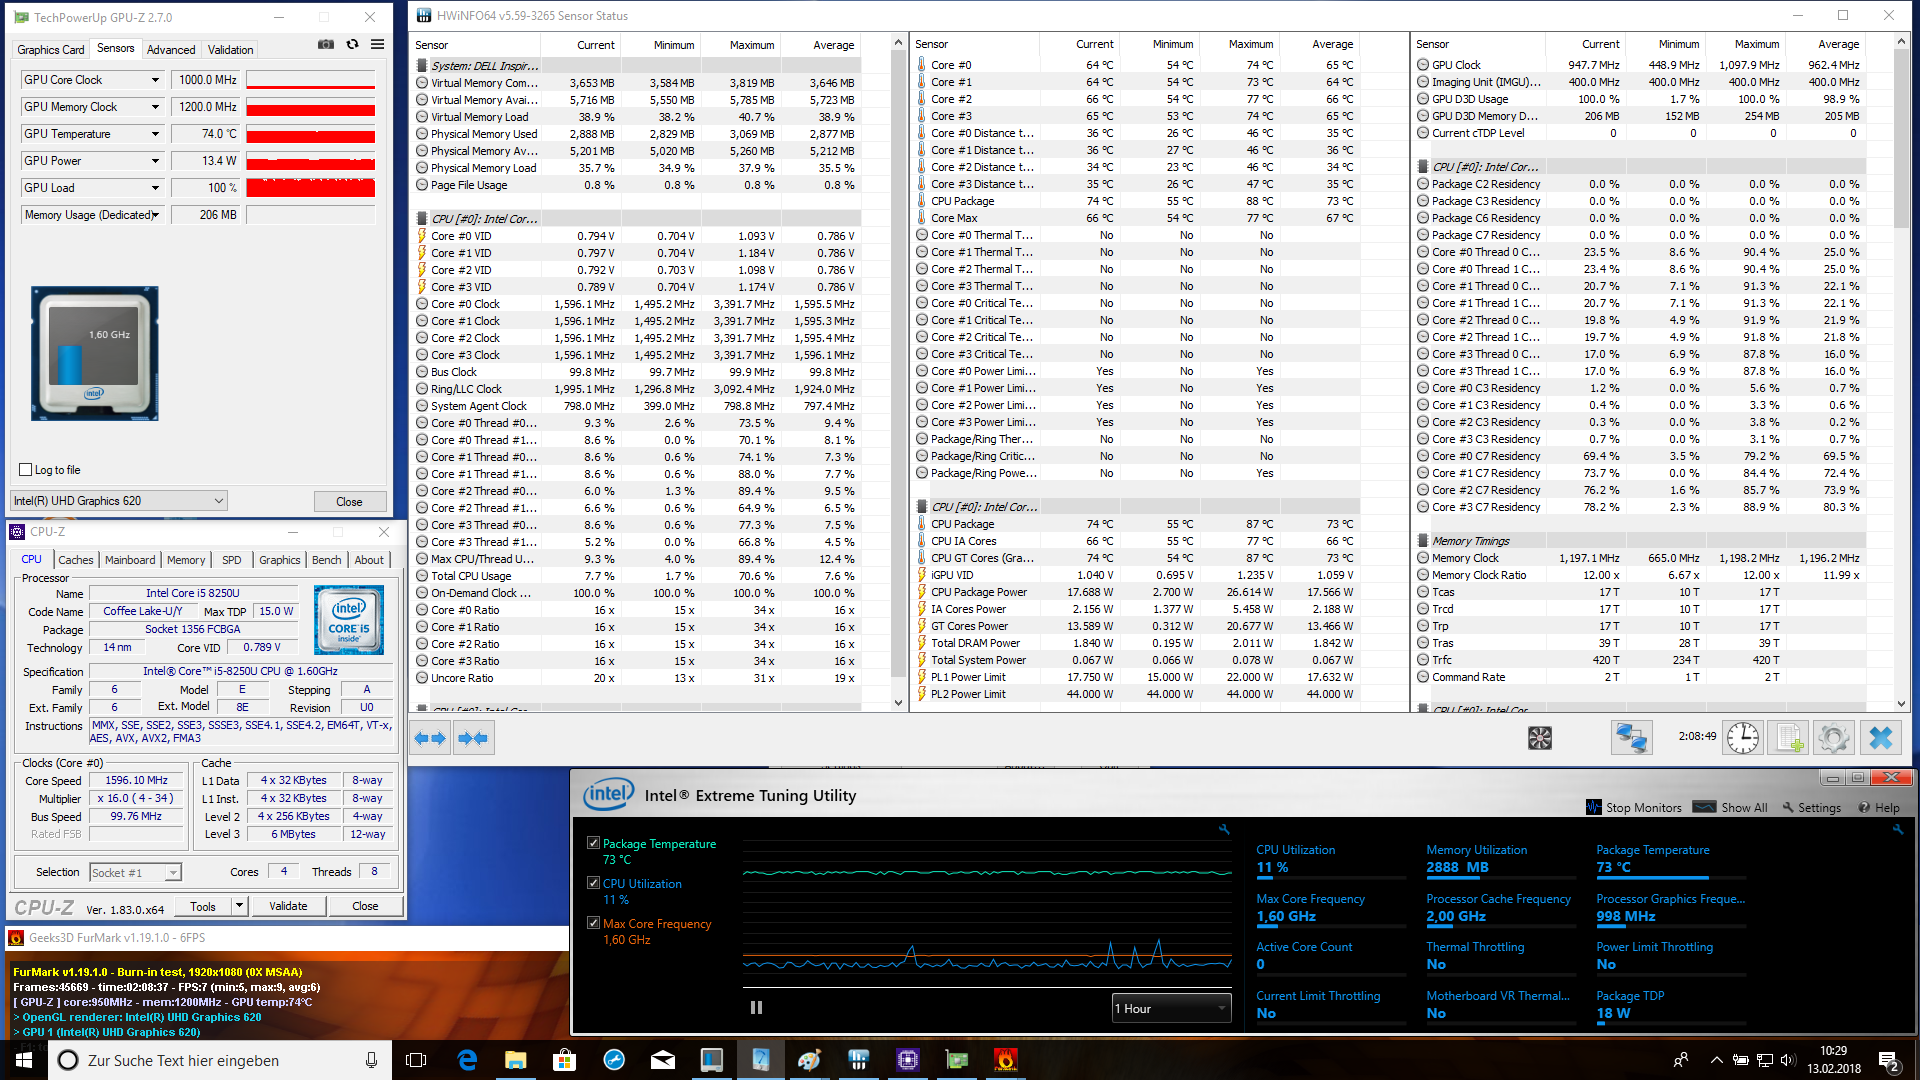
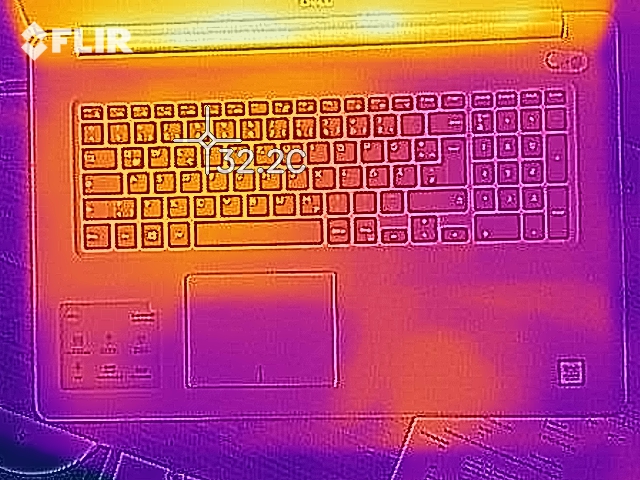
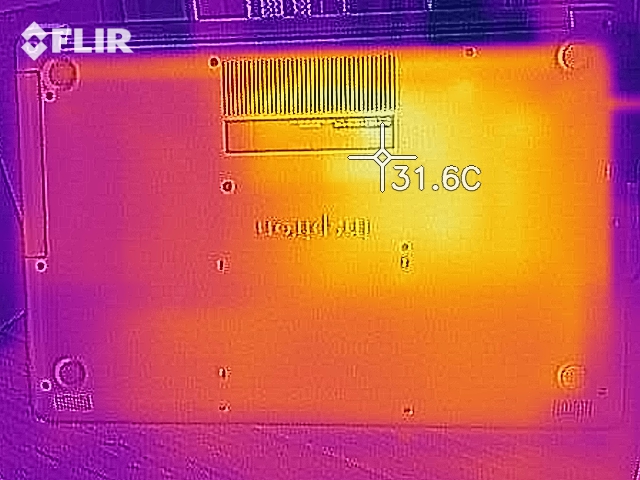
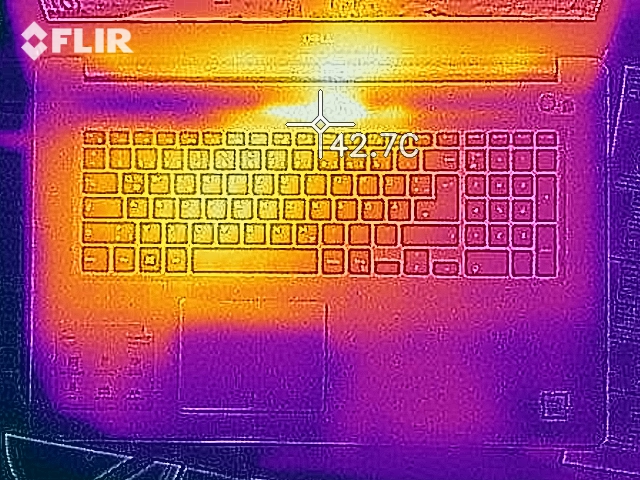
The case of the Dell Inspiron 17-5770 does not heat up particularly under load. The warmest spot we measured was 37 °C (~99 °F) on the bottom of the base unit. A very good result, considering all of the competitors' devices became significantly warmer. To be fair, it should be mentioned that all of those are equipped with a dedicated graphics card, though. This additional source of heat was not present in our test sample. However, the stress test revealed that the cooling unit reaches its limits rather quickly. Even after only one iteration of the Cinebench R15 Multi loop, we measured a clear drop in performance. Only a few seconds after the start of the stress test with Prime95, temperatures shot up into a critical range. During our one-hour stress test, temperatures settled at about 79 to 84 °C (~174 to 183 °F). Despite the high temperatures, the Intel Core i5-8250U was able to keep its clock speed of 2.7 GHz. The 3D performance was not throttled much. The subsequent 3DMark 11 score of 1692 points is only slightly worse than after a cold boot.
(+) The maximum temperature on the upper side is 32.6 °C / 91 F, compared to the average of 36.8 °C / 98 F, ranging from 21 to 71 °C for the class Multimedia.
(+) The bottom heats up to a maximum of 37 °C / 99 F, compared to the average of 39.1 °C / 102 F
(+) In idle usage, the average temperature for the upper side is 26.8 °C / 80 F, compared to the device average of 31.3 °C / 88 F.
(+) The palmrests and touchpad are cooler than skin temperature with a maximum of 26.5 °C / 79.7 F and are therefore cool to the touch.
(+) The average temperature of the palmrest area of similar devices was 28.7 °C / 83.7 F (+2.2 °C / 4 F).
| Dell Inspiron 17-5770-0357 UHD Graphics 620, i5-8250U, SK hynix SC311 M.2 | Acer Aspire 5 A517-51G-80L GeForce MX150, i5-8550U, Micron 1100 MTFDDAV256TBN | HP Pavilion 17z 1EX13AV Radeon R7 M340, A12-9720P, WDC Scorpio Blue WD10JPVX-60JC3T1 | HP Omen 17-w206ng GeForce GTX 1050 Ti Mobile, i7-7700HQ, Samsung PM961 MZVLW256HEHP | Acer Aspire F5-771G-50RD GeForce GTX 950M, i5-7200U, Toshiba MQ01ABD100 | Acer Swift 3 SF315-41-R4W1 Vega 8, R5 2500U, Intel SSD 600p SSDPEKKW256G7 | |
|---|---|---|---|---|---|---|
| Heat | -2% | -17% | -36% | -23% | -15% | |
| Maximum Upper Side * (°C) | 32.6 | 40.4 -24% | 40.8 -25% | 55.6 -71% | 41.9 -29% | 41 -26% |
| Maximum Bottom * (°C) | 37 | 37 -0% | 41.6 -12% | 57.7 -56% | 55.8 -51% | 41.1 -11% |
| Idle Upper Side * (°C) | 28 | 25.3 10% | 26.4 6% | 32.2 -15% | 33.4 -19% | 29.9 -7% |
| Idle Bottom * (°C) | 26.9 | 24.7 8% | 37 -38% | 27.2 -1% | 25.1 7% | 30.9 -15% |
* ... smaller is better
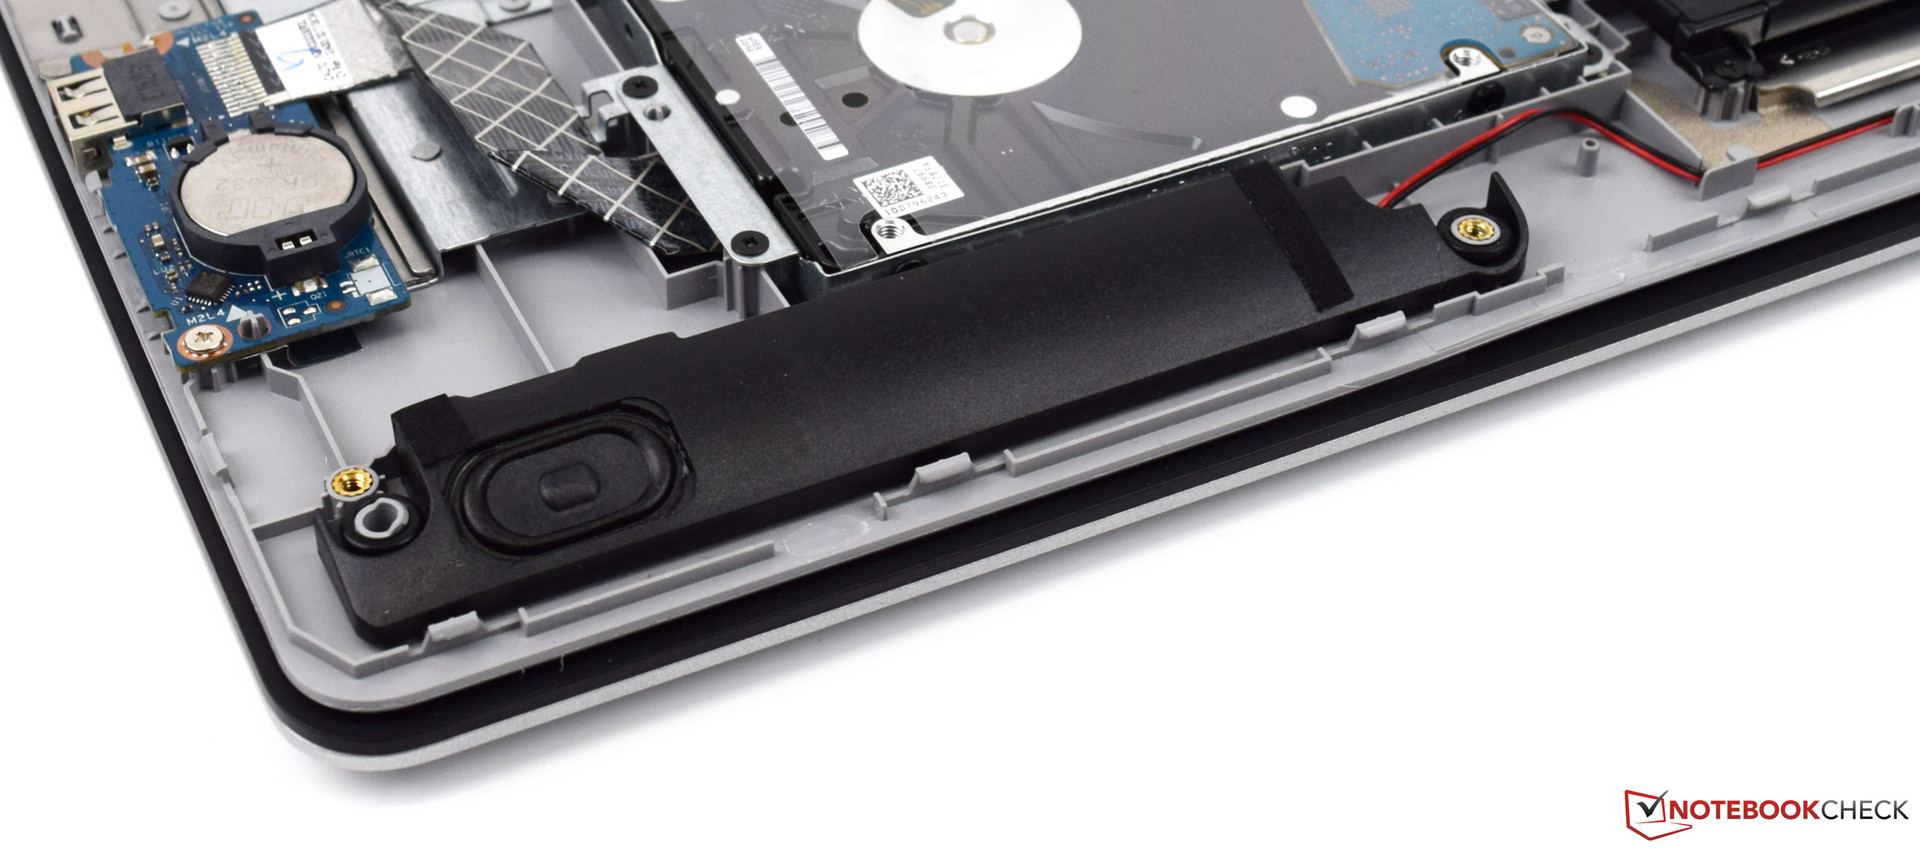
Speakers
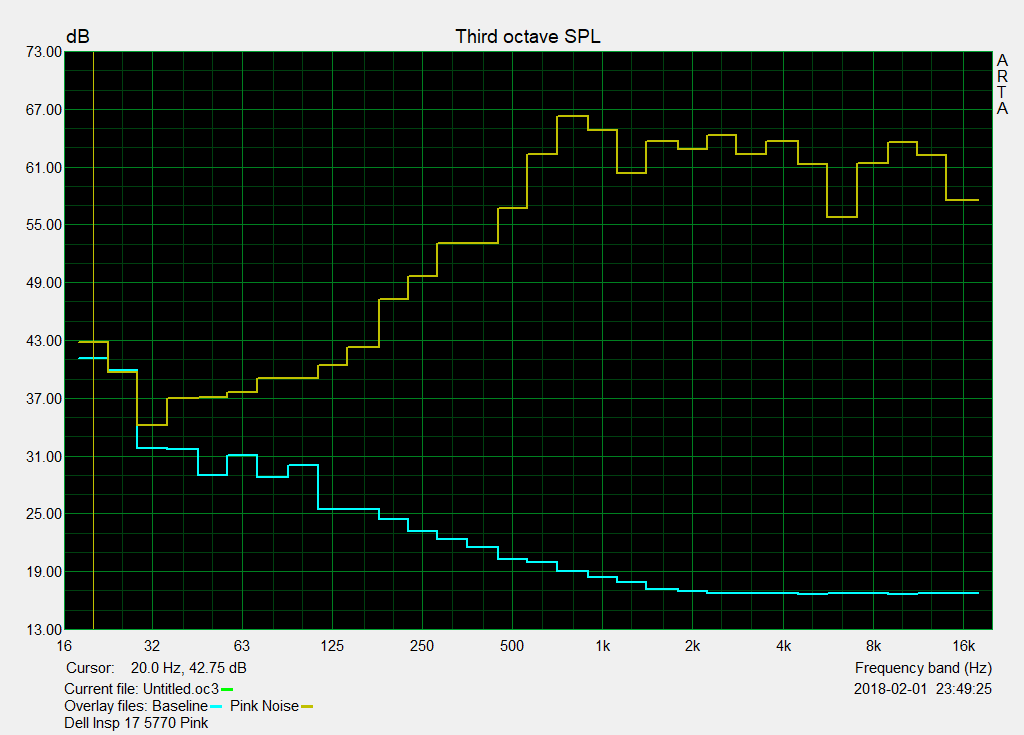
Both speakers are located at the front, below the wrist rest. The openings face downwards so that the sound can get reflected by the table top and then passed on to the user. On soft surfaces in particular, this can cause trouble, muffling the sound. The sound quality is average. The maximum volume of 66 dB(A) is sufficient and the sound is clear even at full volume. The mids and highs are prevalent, basses are vaguely perceptible with some imagination. Voices are clear and easy to understand, allowing for video-chatting without technical restraints. For a considerably better sound experience, we recommend an external sound system, which can be connected via the 3.5-mm audio jack (headphone/mic).
Dell Inspiron 17-5770-0357 audio analysis
(-) | not very loud speakers (66.3 dB)
Bass 100 - 315 Hz
(-) | nearly no bass - on average 15.9% lower than median
(+) | bass is linear (5.4% delta to prev. frequency)
Mids 400 - 2000 Hz
(+) | balanced mids - only 3.4% away from median
(+) | mids are linear (6.8% delta to prev. frequency)
Highs 2 - 16 kHz
(+) | balanced highs - only 2.1% away from median
(+) | highs are linear (6.7% delta to prev. frequency)
Overall 100 - 16.000 Hz
(±) | linearity of overall sound is average (16.8% difference to median)
Compared to same class
» 45% of all tested devices in this class were better, 8% similar, 47% worse
» The best had a delta of 5%, average was 17%, worst was 45%
Compared to all devices tested
» 29% of all tested devices were better, 8% similar, 63% worse
» The best had a delta of 4%, average was 24%, worst was 134%
Acer Aspire 5 A517-51G-80L audio analysis
(-) | not very loud speakers (71.9 dB)
Bass 100 - 315 Hz
(-) | nearly no bass - on average 15.8% lower than median
(+) | bass is linear (5% delta to prev. frequency)
Mids 400 - 2000 Hz
(+) | balanced mids - only 3.5% away from median
(±) | linearity of mids is average (7.6% delta to prev. frequency)
Highs 2 - 16 kHz
(+) | balanced highs - only 3.6% away from median
(+) | highs are linear (6.9% delta to prev. frequency)
Overall 100 - 16.000 Hz
(±) | linearity of overall sound is average (16.3% difference to median)
Compared to same class
» 41% of all tested devices in this class were better, 8% similar, 51% worse
» The best had a delta of 5%, average was 17%, worst was 45%
Compared to all devices tested
» 27% of all tested devices were better, 6% similar, 68% worse
» The best had a delta of 4%, average was 24%, worst was 134%
Frequency diagram in comparison (checkboxes can be turned on/off!)
Energy Management
Power Consumption
Unsurprisingly, our Dell Inspiron 17-5770 was very energy-efficient in comparison to the competitors. It should be noted again here that our test sample was not equipped with a dedicated GPU. The 17-inch device makes do with 4 to 9.6 watts in idle mode. Under load, the power consumption rises to an average of 40.2 watts and we measured peaks of 41.4 watts. Therefore, the included power supply offers enough power at 45 watts. The battery did not discharge under full load.
| Off / Standby | |
| Idle | |
| Load |
|
Key:
min: | |
| Dell Inspiron 17-5770-0357 i5-8250U, UHD Graphics 620, SK hynix SC311 M.2, IPS, 1920x1080, 17.3" | Acer Aspire 5 A517-51G-80L i5-8550U, GeForce MX150, Micron 1100 MTFDDAV256TBN, aSi TFT, IPS, 1920x1080, 17.3" | HP Pavilion 17z 1EX13AV A12-9720P, Radeon R7 M340, WDC Scorpio Blue WD10JPVX-60JC3T1, IPS, 1920x1080, 17.3" | HP Omen 17-w206ng i7-7700HQ, GeForce GTX 1050 Ti Mobile, Samsung PM961 MZVLW256HEHP, IPS, 1920x1080, 17.3" | Acer Aspire F5-771G-50RD i5-7200U, GeForce GTX 950M, Toshiba MQ01ABD100, TN, 1920x1080, 17.3" | Acer Swift 3 SF315-41-R4W1 R5 2500U, Vega 8, Intel SSD 600p SSDPEKKW256G7, IPS, 1920x1080, 15.6" | |
|---|---|---|---|---|---|---|
| Power Consumption | -26% | -57% | -159% | -53% | -26% | |
| Idle Minimum * (Watt) | 4.08 | 4.1 -0% | 7.8 -91% | 11 -170% | 6.9 -69% | 7.3 -79% |
| Idle Average * (Watt) | 8.45 | 9.3 -10% | 11.7 -38% | 18 -113% | 13.6 -61% | 9.7 -15% |
| Idle Maximum * (Watt) | 9.6 | 9.8 -2% | 15.7 -64% | 24 -150% | 14.8 -54% | 13 -35% |
| Load Average * (Watt) | 40.2 | 64 -59% | 57.4 -43% | 84 -109% | 41 -2% | 40.4 -0% |
| Load Maximum * (Watt) | 41.4 | 66.4 -60% | 62.3 -50% | 146 -253% | 75 -81% | 42.2 -2% |
| Witcher 3 ultra * (Watt) | 53.3 | 101 | 33 |
* ... smaller is better
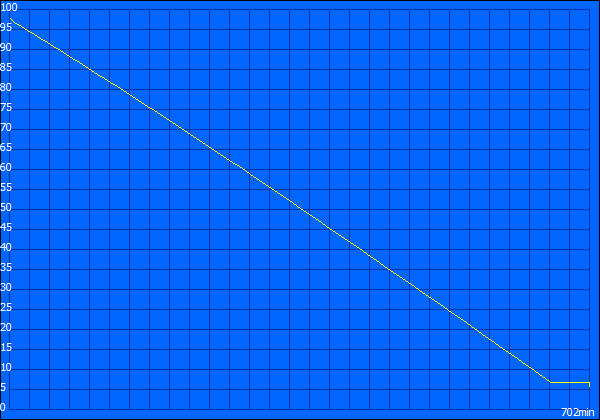
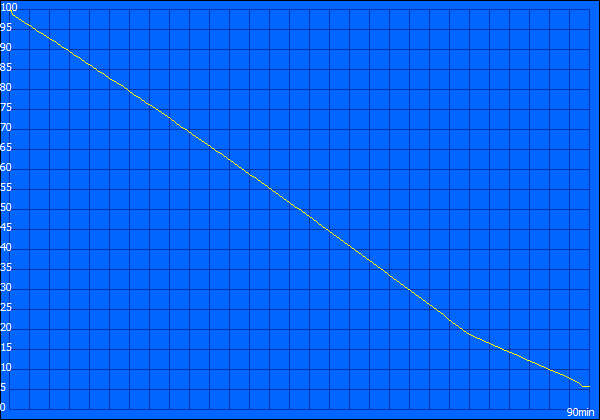
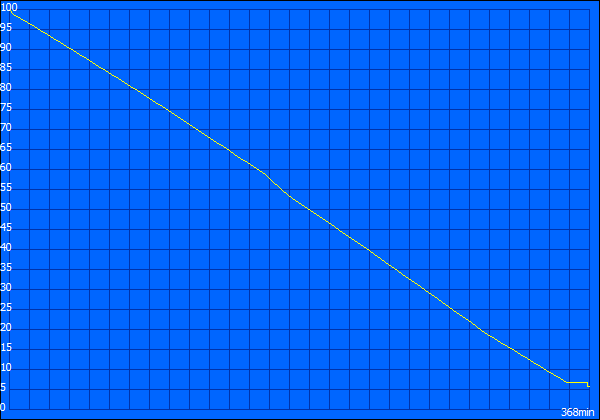
Battery Runtime
Given the low power consumption, it is not surprising that the battery runtimes are quite good as well. At 42 Wh, the battery capacity of our test device is not particularly large. By implication, this means that our test device reached a runtime of about 6 hours in our Wi-Fi test. To meet the required parameters for this test, we had to reduce the display's brightness level by five, which corresponds to a display brightness of 150 cd/m². About 3 hours should be calculated for the subsequent charging process. We did not notice a drop in 3D performance in battery mode.
| Dell Inspiron 17-5770-0357 i5-8250U, UHD Graphics 620, 42 Wh | Acer Aspire 5 A517-51G-80L i5-8550U, GeForce MX150, 48 Wh | HP Pavilion 17z 1EX13AV A12-9720P, Radeon R7 M340, 41.6 Wh | HP Omen 17-w206ng i7-7700HQ, GeForce GTX 1050 Ti Mobile, 62 Wh | Acer Aspire F5-771G-50RD i5-7200U, GeForce GTX 950M, 40 Wh | Acer Swift 3 SF315-41-R4W1 R5 2500U, Vega 8, 48 Wh | |
|---|---|---|---|---|---|---|
| Battery runtime | -4% | -33% | 8% | -21% | -6% | |
| Reader / Idle (h) | 11.7 | 9.3 -21% | 6.8 -42% | 13.3 14% | 7.2 -38% | 12.2 4% |
| H.264 (h) | 5.3 | 5.4 2% | ||||
| WiFi v1.3 (h) | 6.1 | 6.3 3% | 3.9 -36% | 6.3 3% | 4.5 -26% | 5.2 -15% |
| Load (h) | 1.5 | 1.5 0% | 1.2 -20% | 1.6 7% | 1.5 0% | 1.4 -7% |
Verdict
Pros
Cons

The Dell Inspiron 17-5770 is a 17-inch multimedia device with an up-to-date quad-core CPU. The Intel Core i5-8250U offers a solid base for daily tasks. With 8 GB of RAM, the laptop is equipped with a sufficient amount of RAM and the two storage devices work well together. At a purchase price of 749 Euros (~$922), customers get an elegant and stable device. Good input devices and a fingerprint sensor are additional assets.
The Dell Inspiron 17-5770 is a multimedia device with minor flaws in terms of its 3D performance. User who do not place high importance on that fact cannot go wrong much by buying the 17-inch device in our test configuration.
The terrible memory card performance is a clear point of criticism for the Dell Inspiron 17-5770. We were also unable to comprehend how an ethernet port could work at only 100 MBit/s. Devices equipped with an RJ45 connector should offer speeds in the GBit range. Opinions differ on the question of the IPS display, which can score with a high viewing-angle stability and a good contrast. However, the average display brightness does not inspire much enthusiasm and the strong clouding effect is really annoying during video playback. It puzzled us that the USB 3.1 Gen 1 Type-C port has been axed. Only the high-end variants with a dedicated GPU are equipped with this up-to-date port, but the reason as to why this port was withheld from i5 users remains a mystery. It might make sense from a marketing point of view to motivate more customers to choose the more expensive i7 variant, but this approach is certainly not customer-friendly.
Dell Inspiron 17-5770-0357
- 02/19/2018 v6 (old)
Sebastian Bade
Price comparison
