Origin PC EVO16-S (Clevo P960RD) Review: A Rare 16.1-inch Gaming Laptop
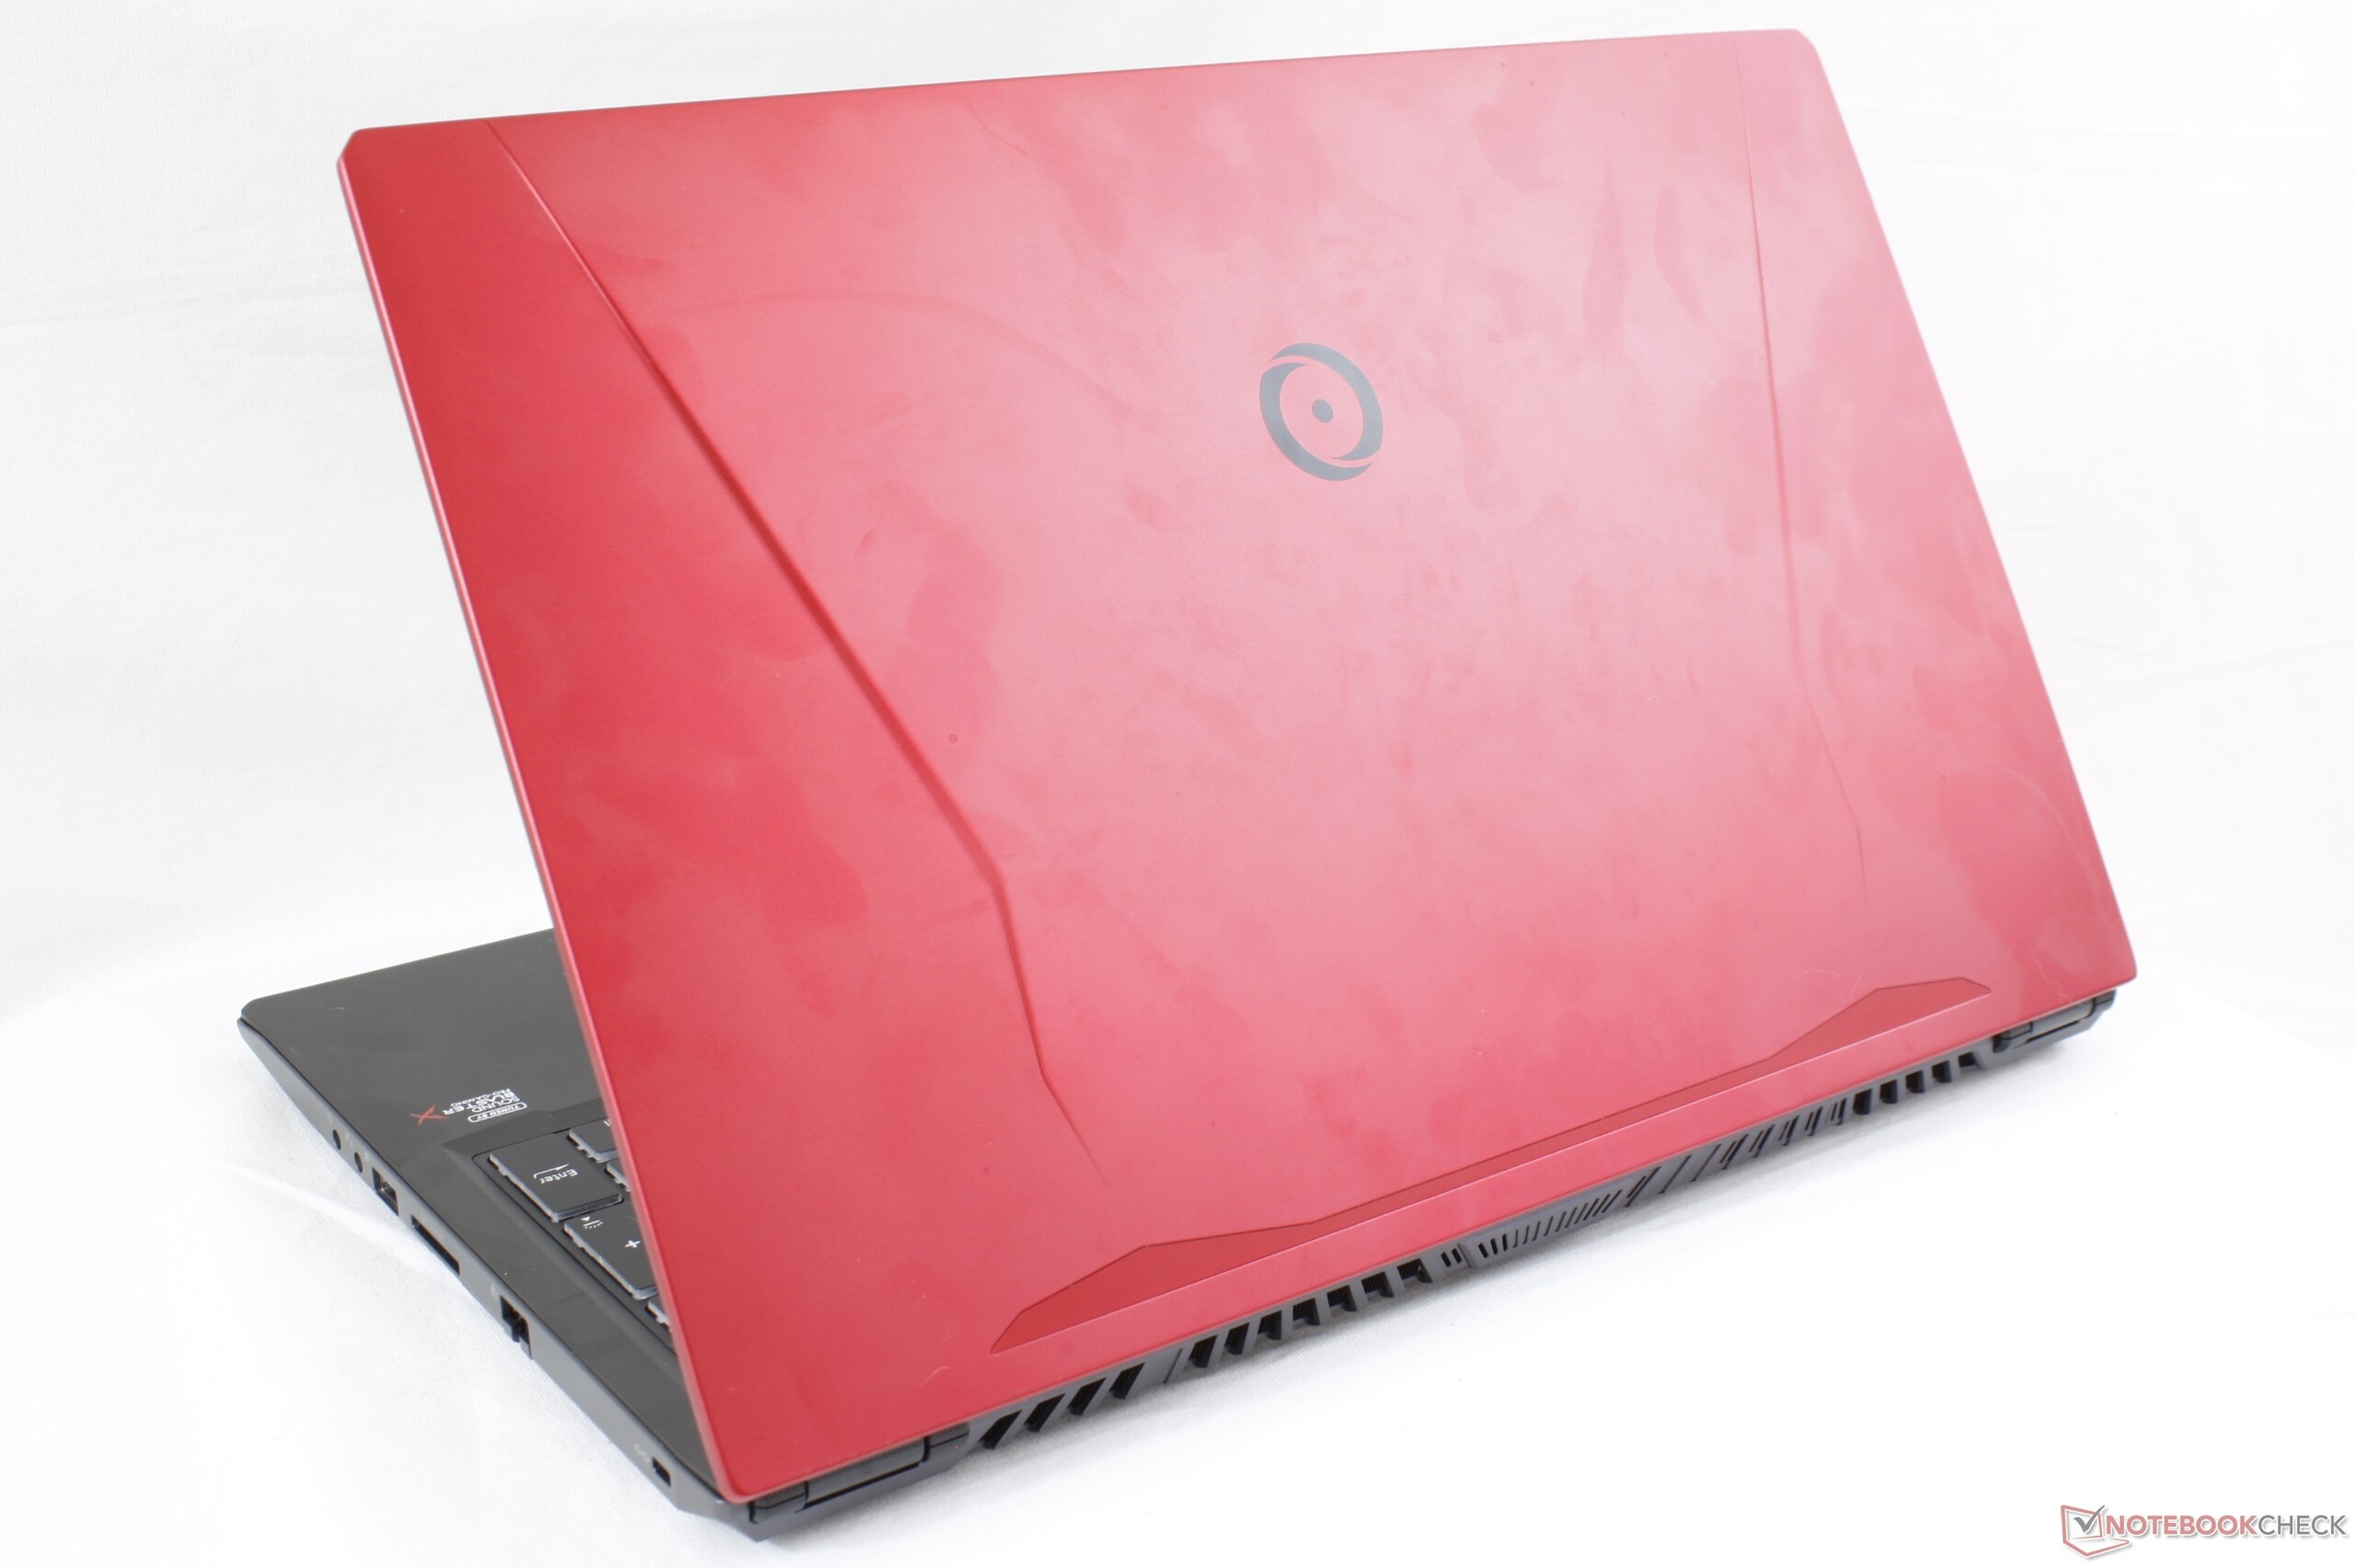
Origin PC is a PC builder and reseller of high-performance desktops and laptops that typically target enthusiasts, professional workstation users, and gamers. The EVO16-S is Origin PC's ultra-thin gaming laptop based on the Clevo P960RD chassis but with additional customization options and paint jobs for a wider variety of possible colors not available on most other gaming laptops.
The most notable feature of the EVO16-S is its uncommon 16.1-inch display size to make the system a middle alternative to the sea of both 15.6-inch and 17.3-inch gaming laptops in the market. The EVO16-S competes directly with other ultra-thin gaming laptops like the MSI GS65/GS75, Asus Zephyrus GX701, Acer Predator Triton, Razer Blade 15 or Pro 17, and the Gigabyte Aero 15 or Aero 17.
SKUs range from Intel Core i7 only (i7-8750H or i7-9750H) with GeForce RTX graphics (2060, 2070 Max-Q, 2080 Max-Q), up to 32 GB of RAM, and up to three storage options. The 144 Hz 1080p FHD remains fixed across all configurations. Prices can be as low as $1800 to as high as $3000 USD depending on features.
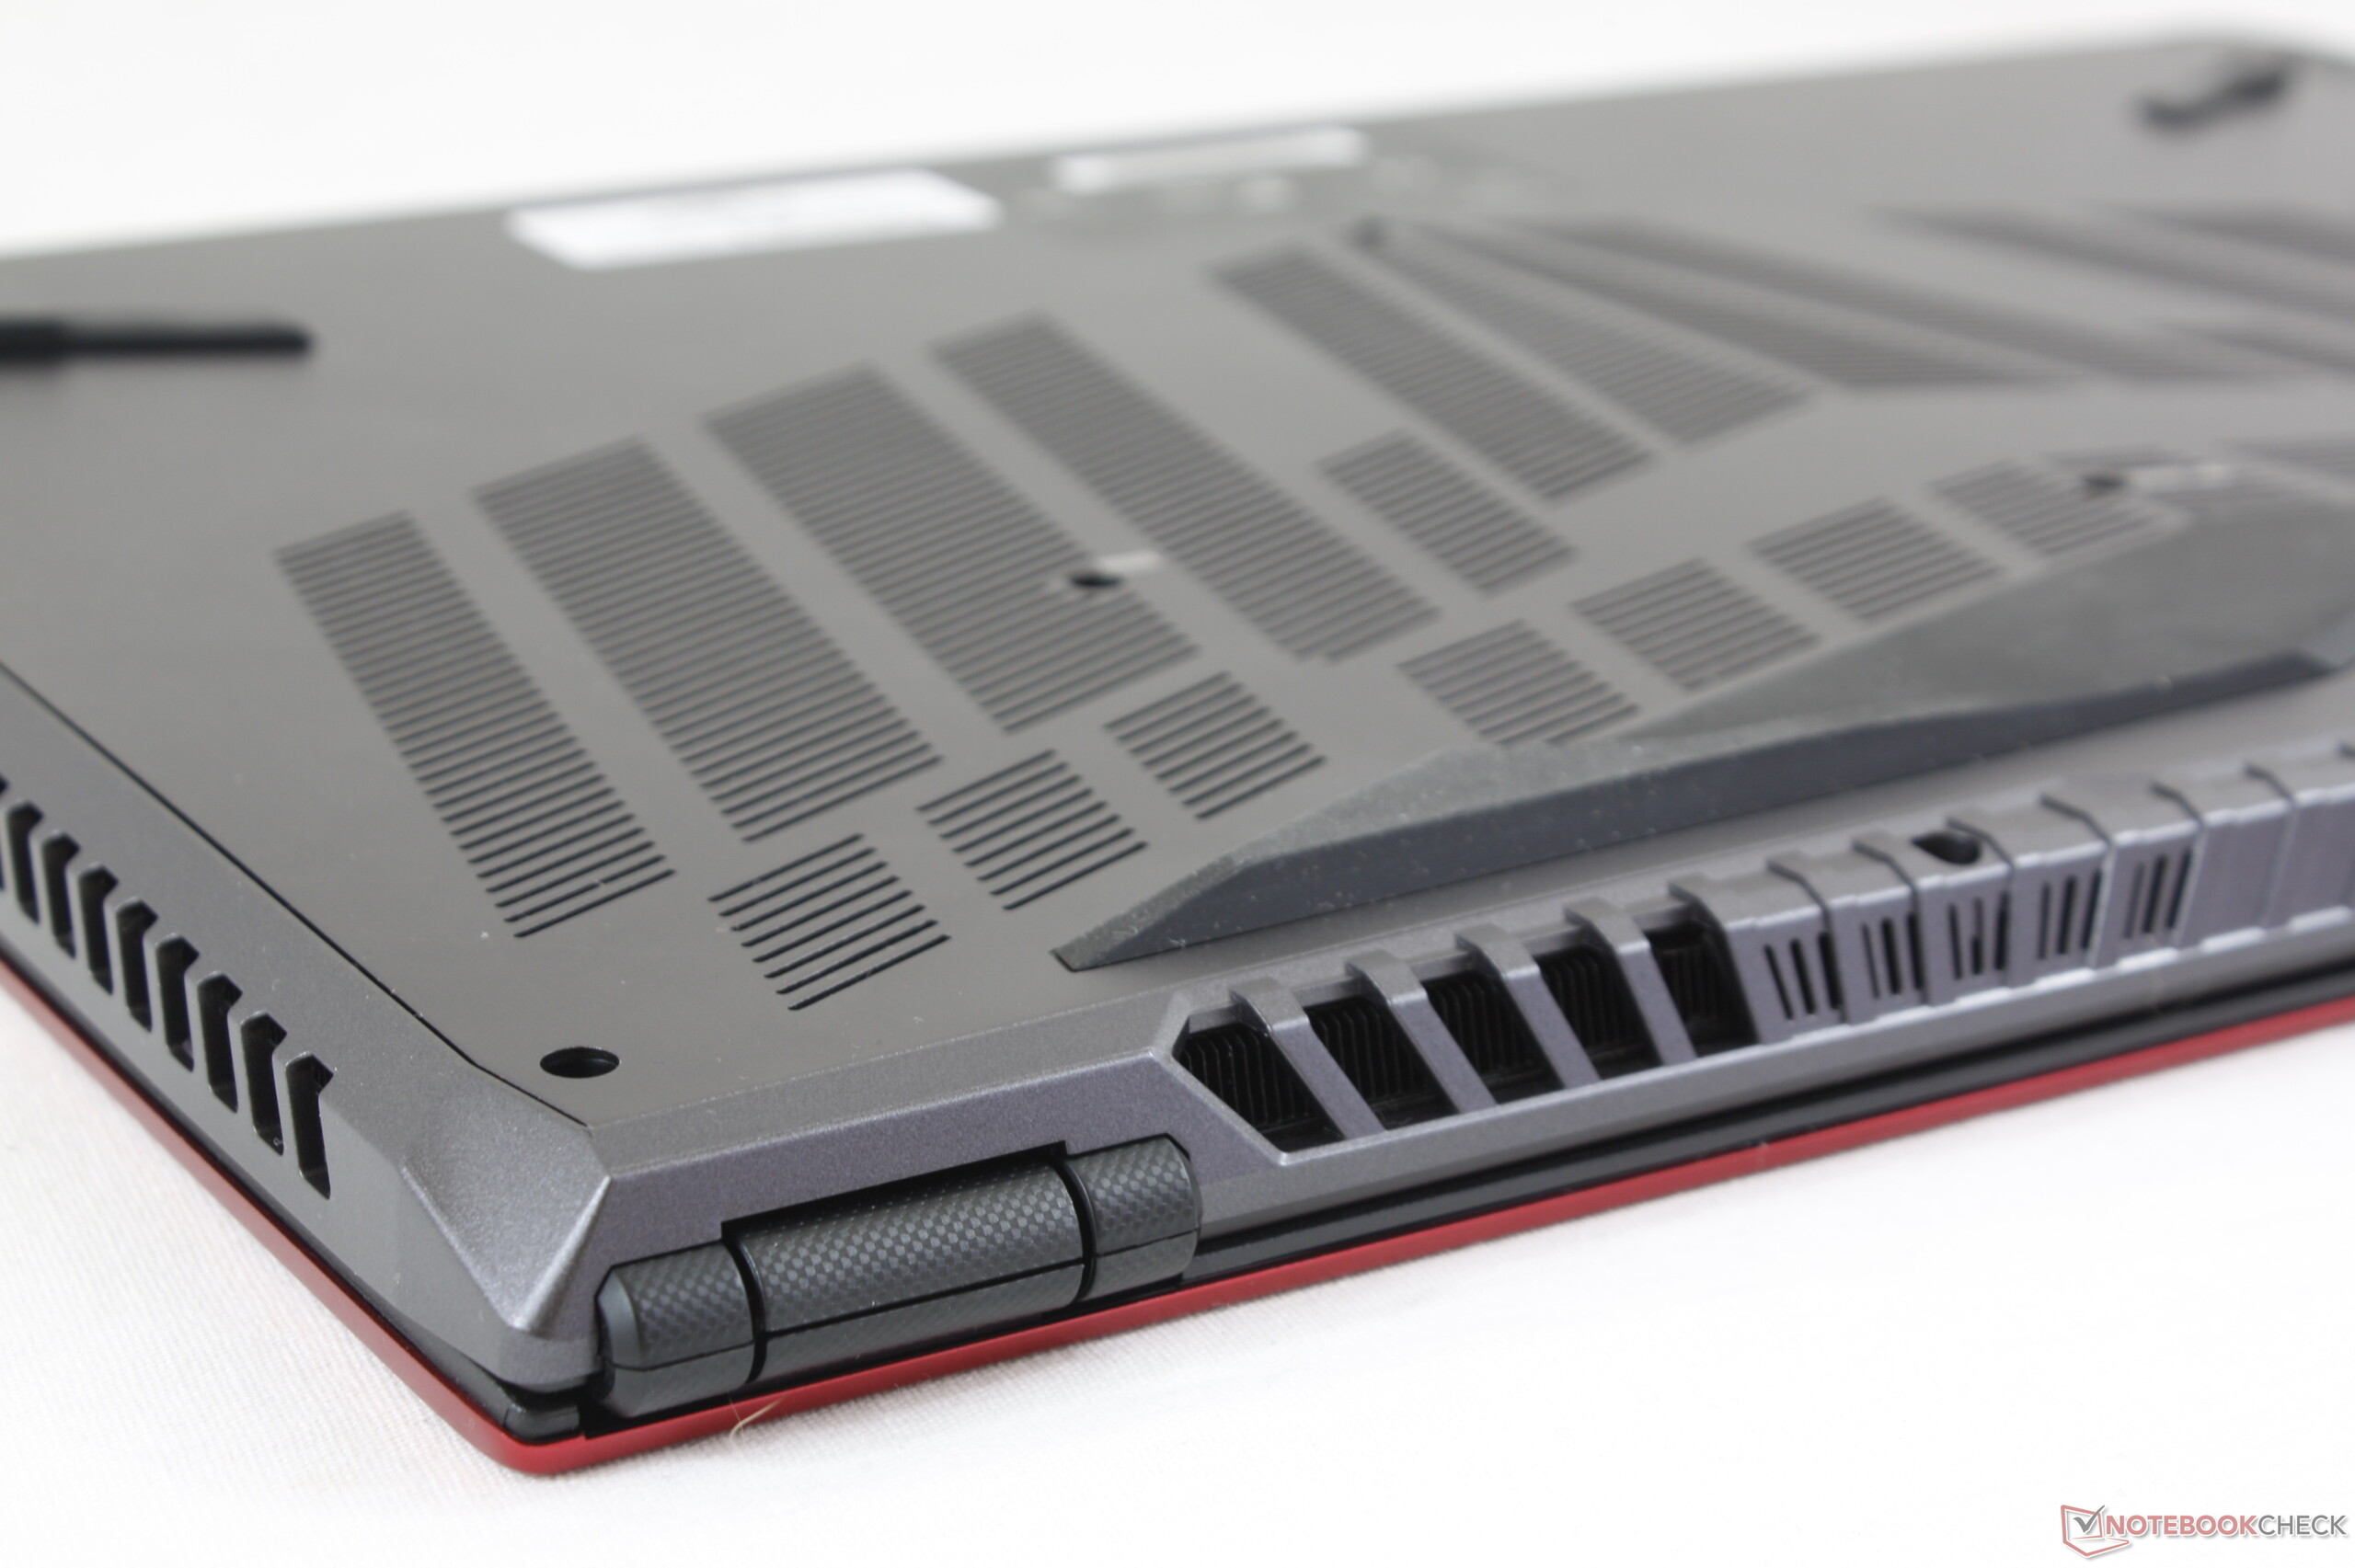
Case
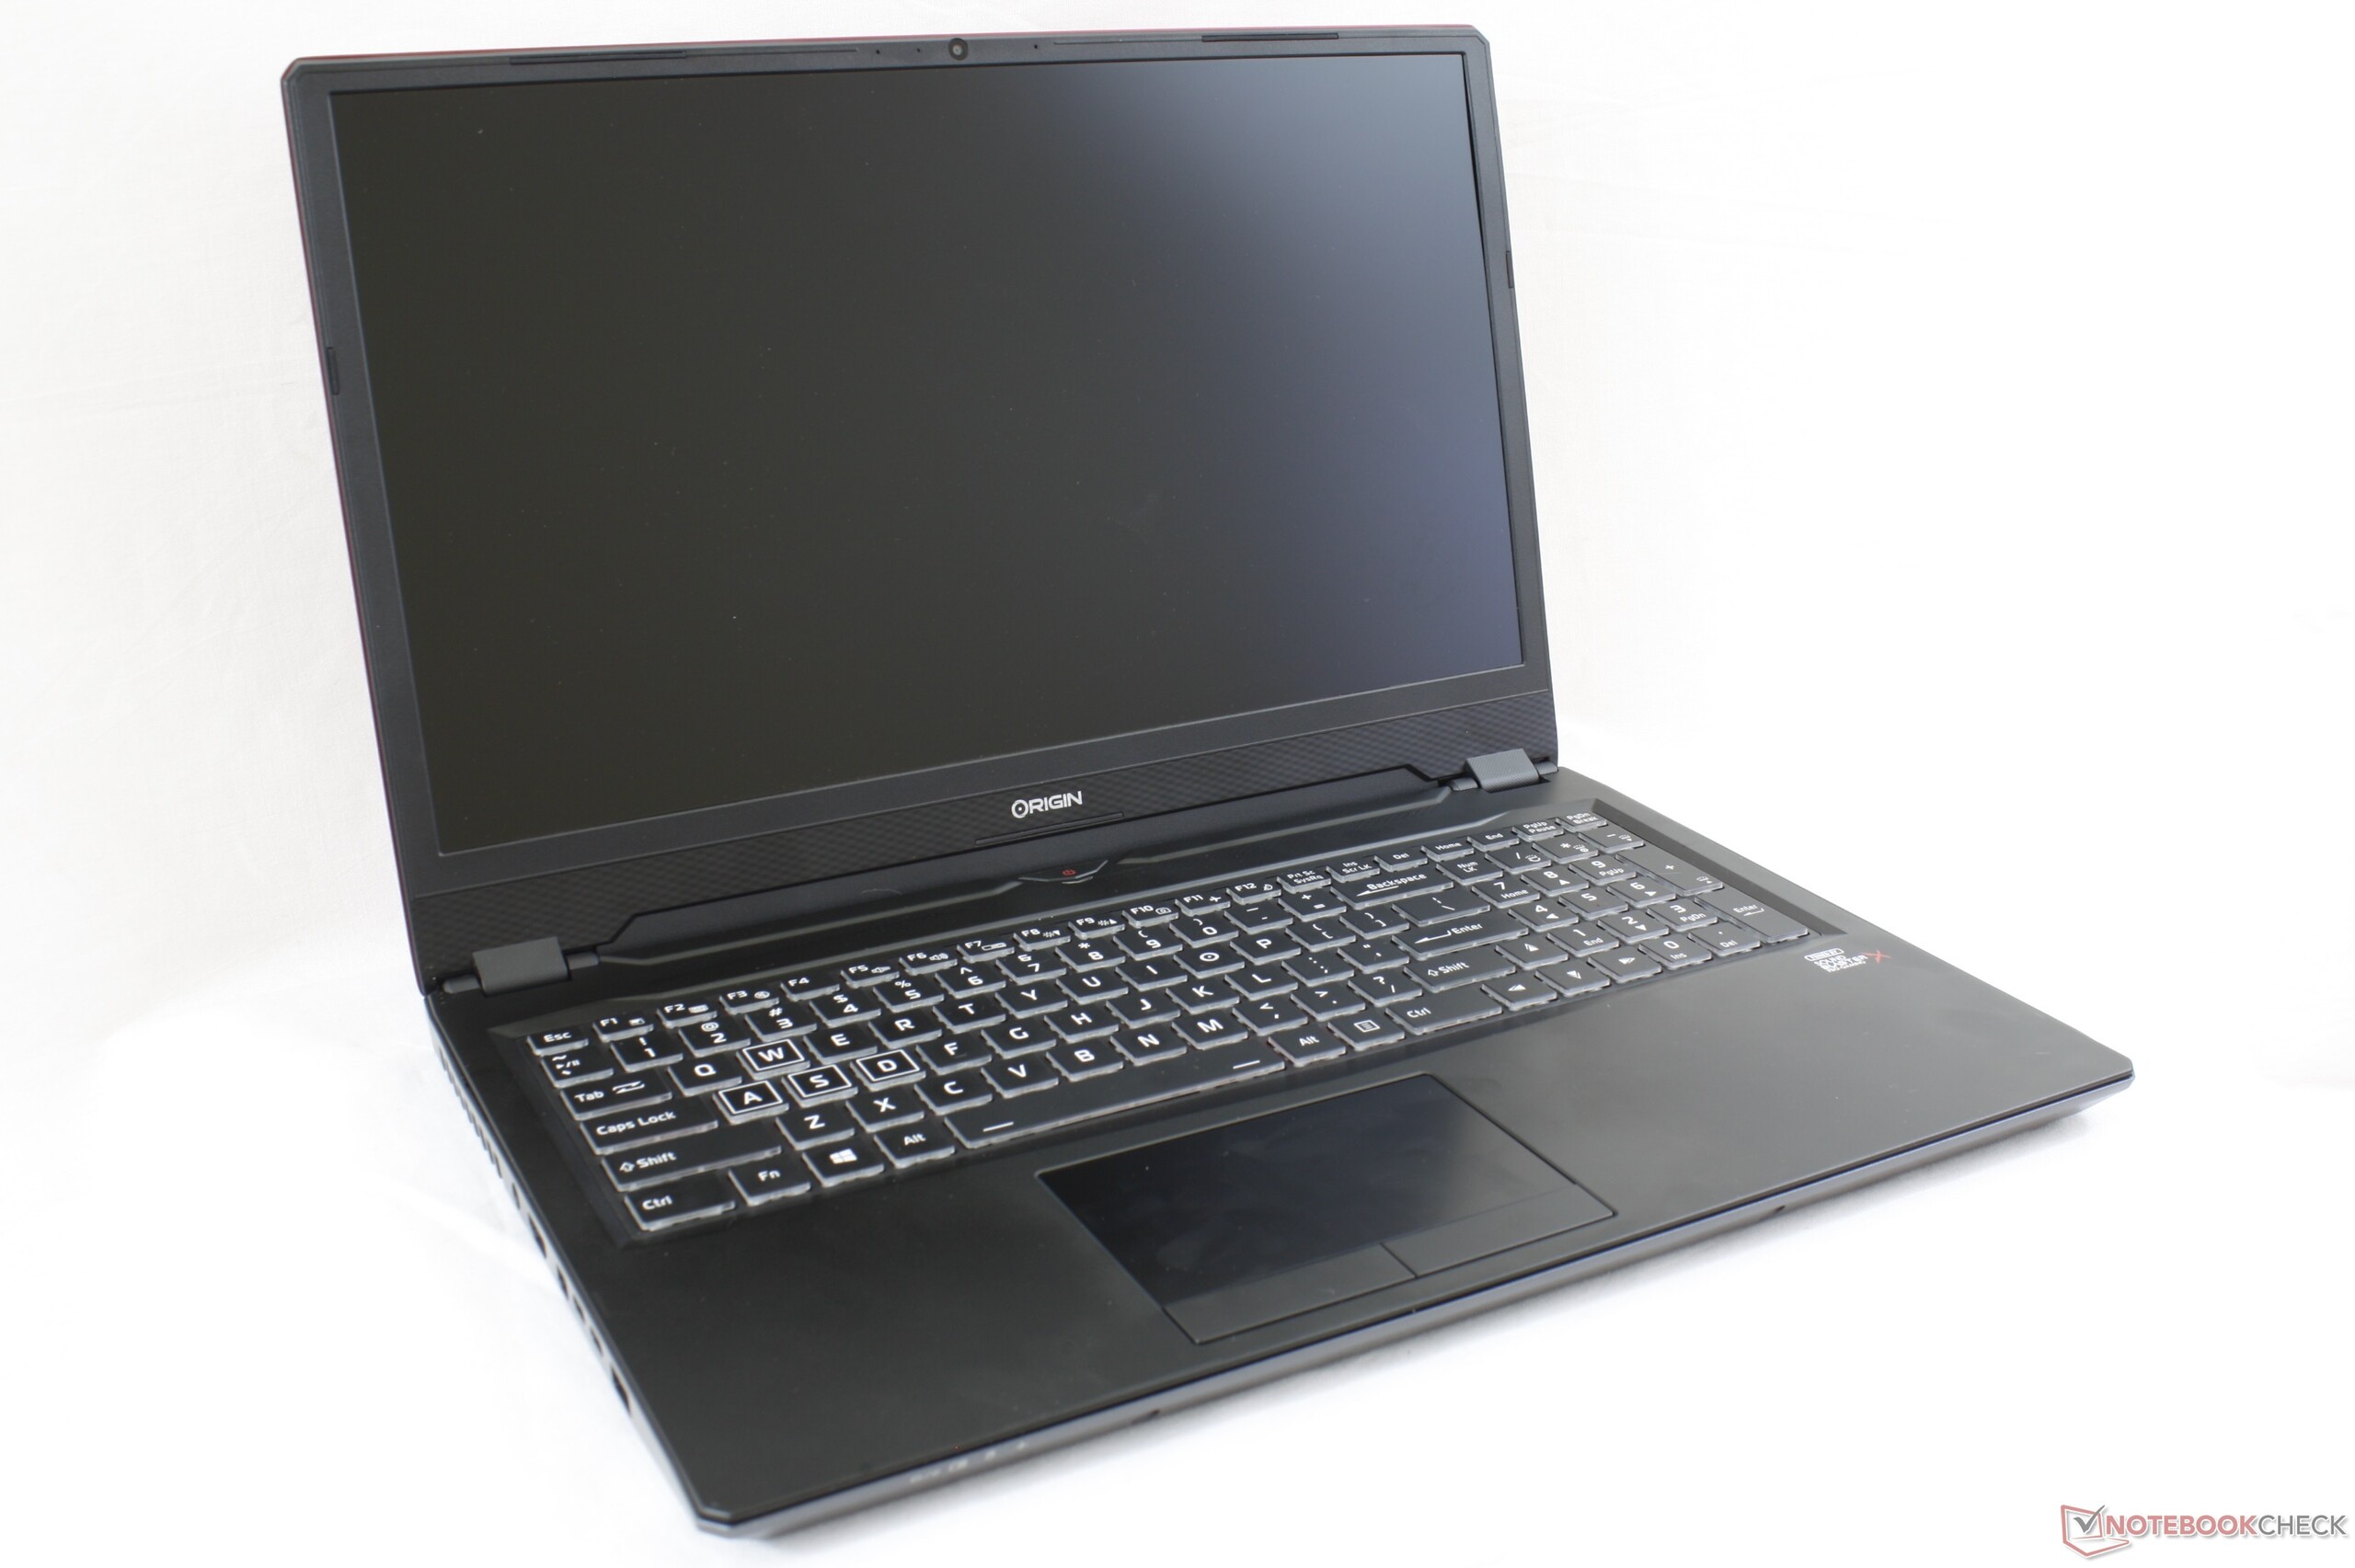
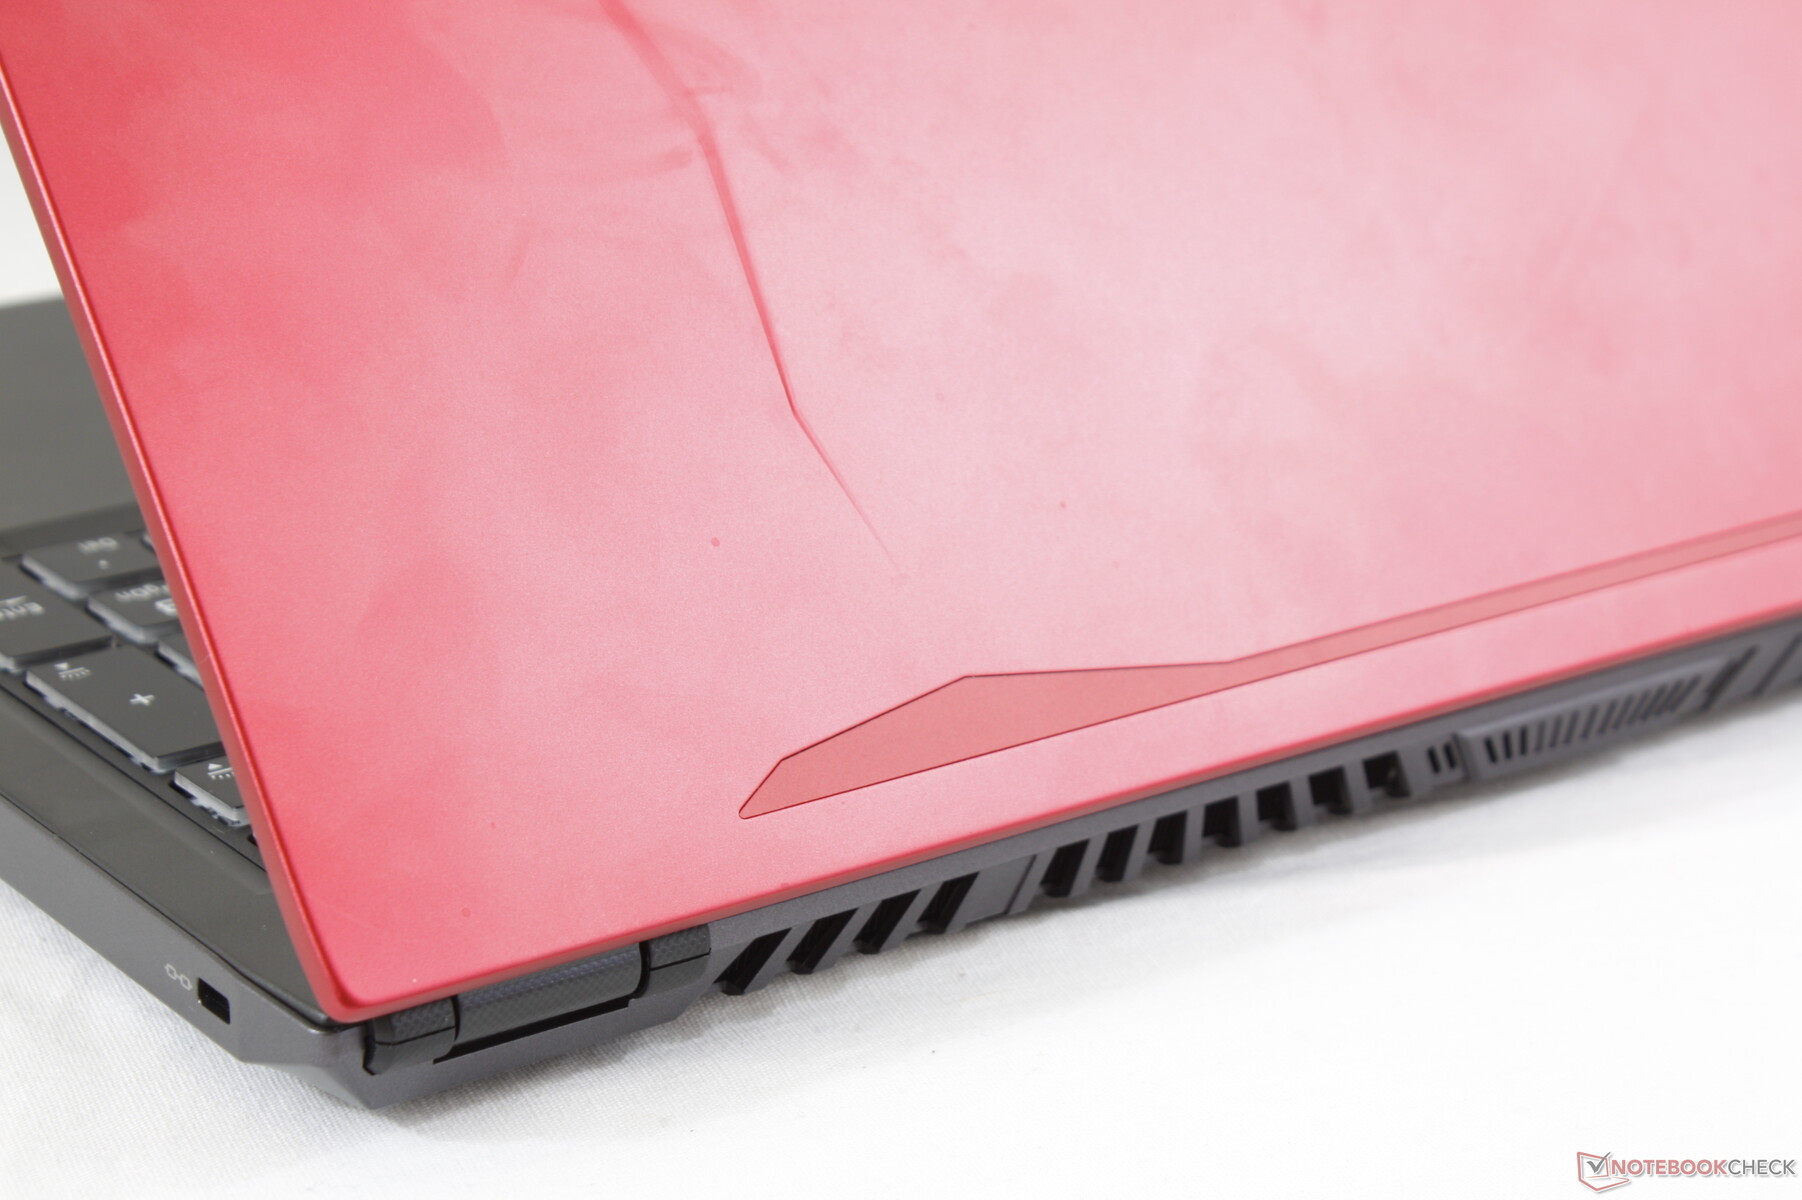
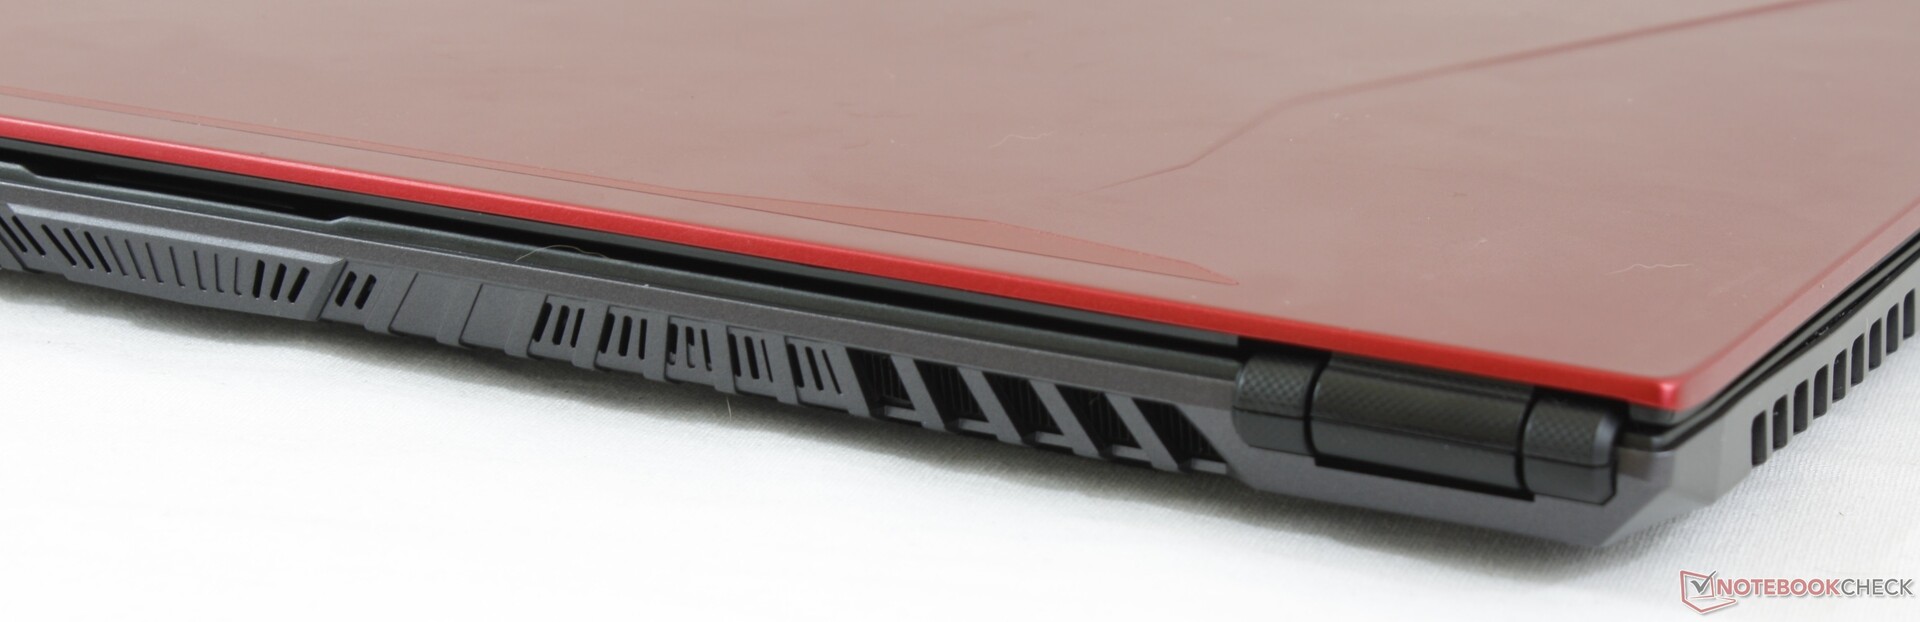
The smooth matte aluminum chassis has a high quality feel with a relatively rigid base. It's stronger and less flexible than the MSI GS75 or GS65, but it's still not nearly as sound as the Razer Blade 15 or Blade Pro 17. Surfaces bend and creak slightly more than on the Razer especially when applying pressure on the outer lid or when twisting the base from its front two corners. The two small hinges also tend to creak when close to their maximum angle.
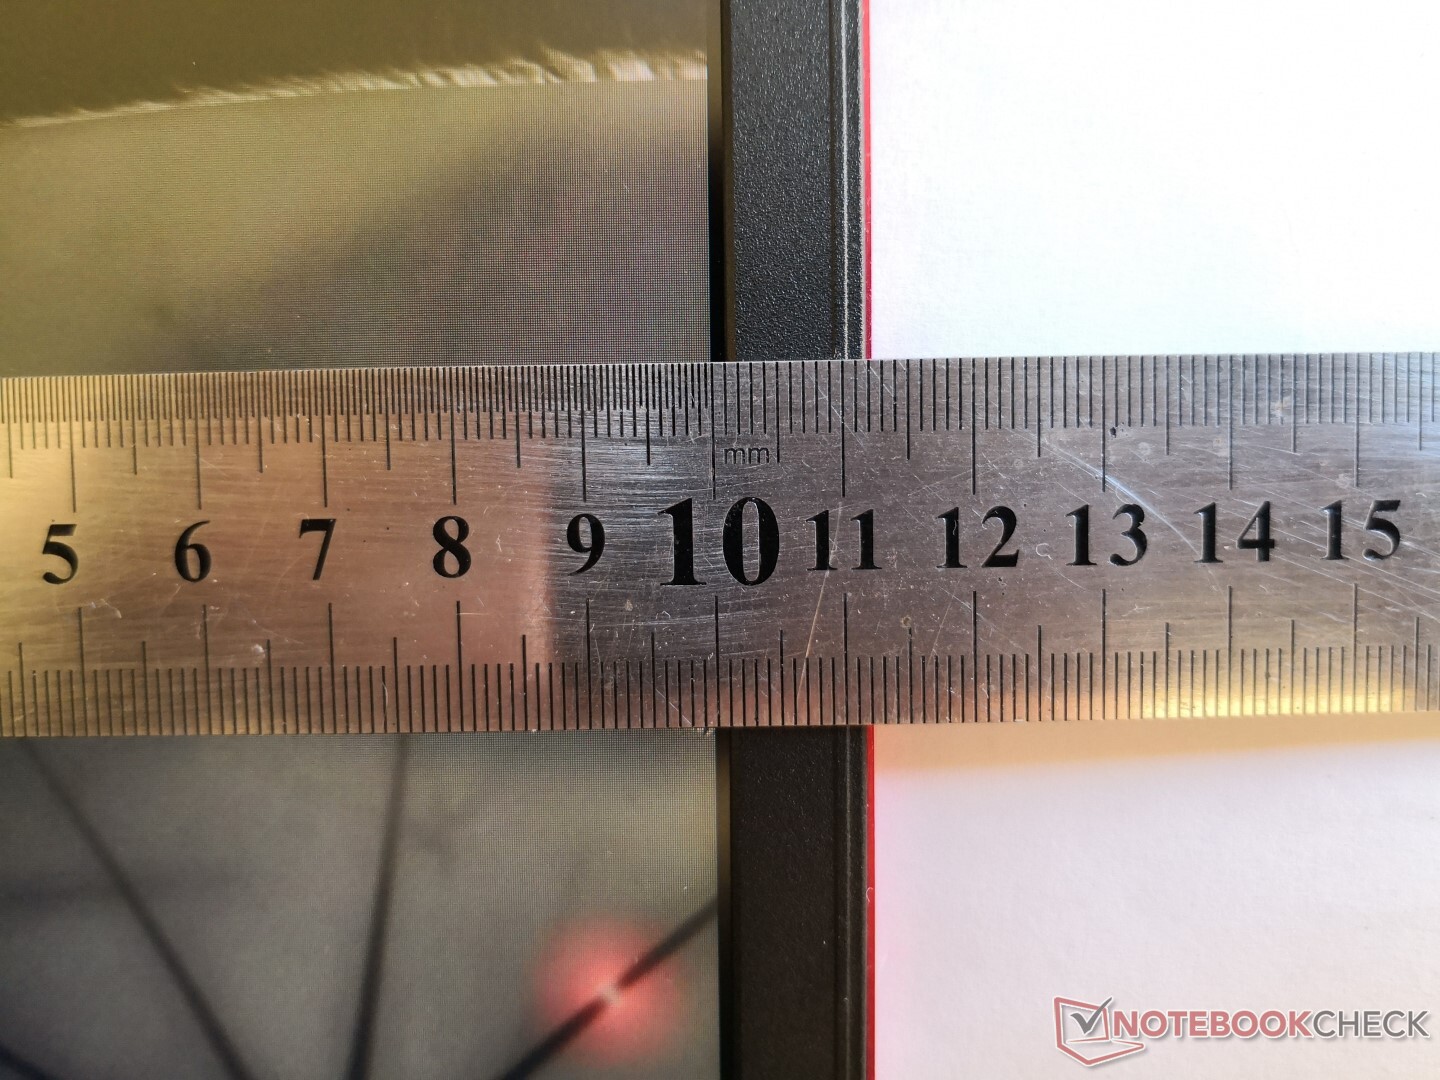
Despite having a larger footprint than most 15.6-inch gaming laptop because of the 16.1-inch screen size, the EVO16-S manages to weigh almost the same as the smaller Gigabyte Aero 15 or Razer Blade 15. It's thicker than these alternatives as well by just 2 mm at most.
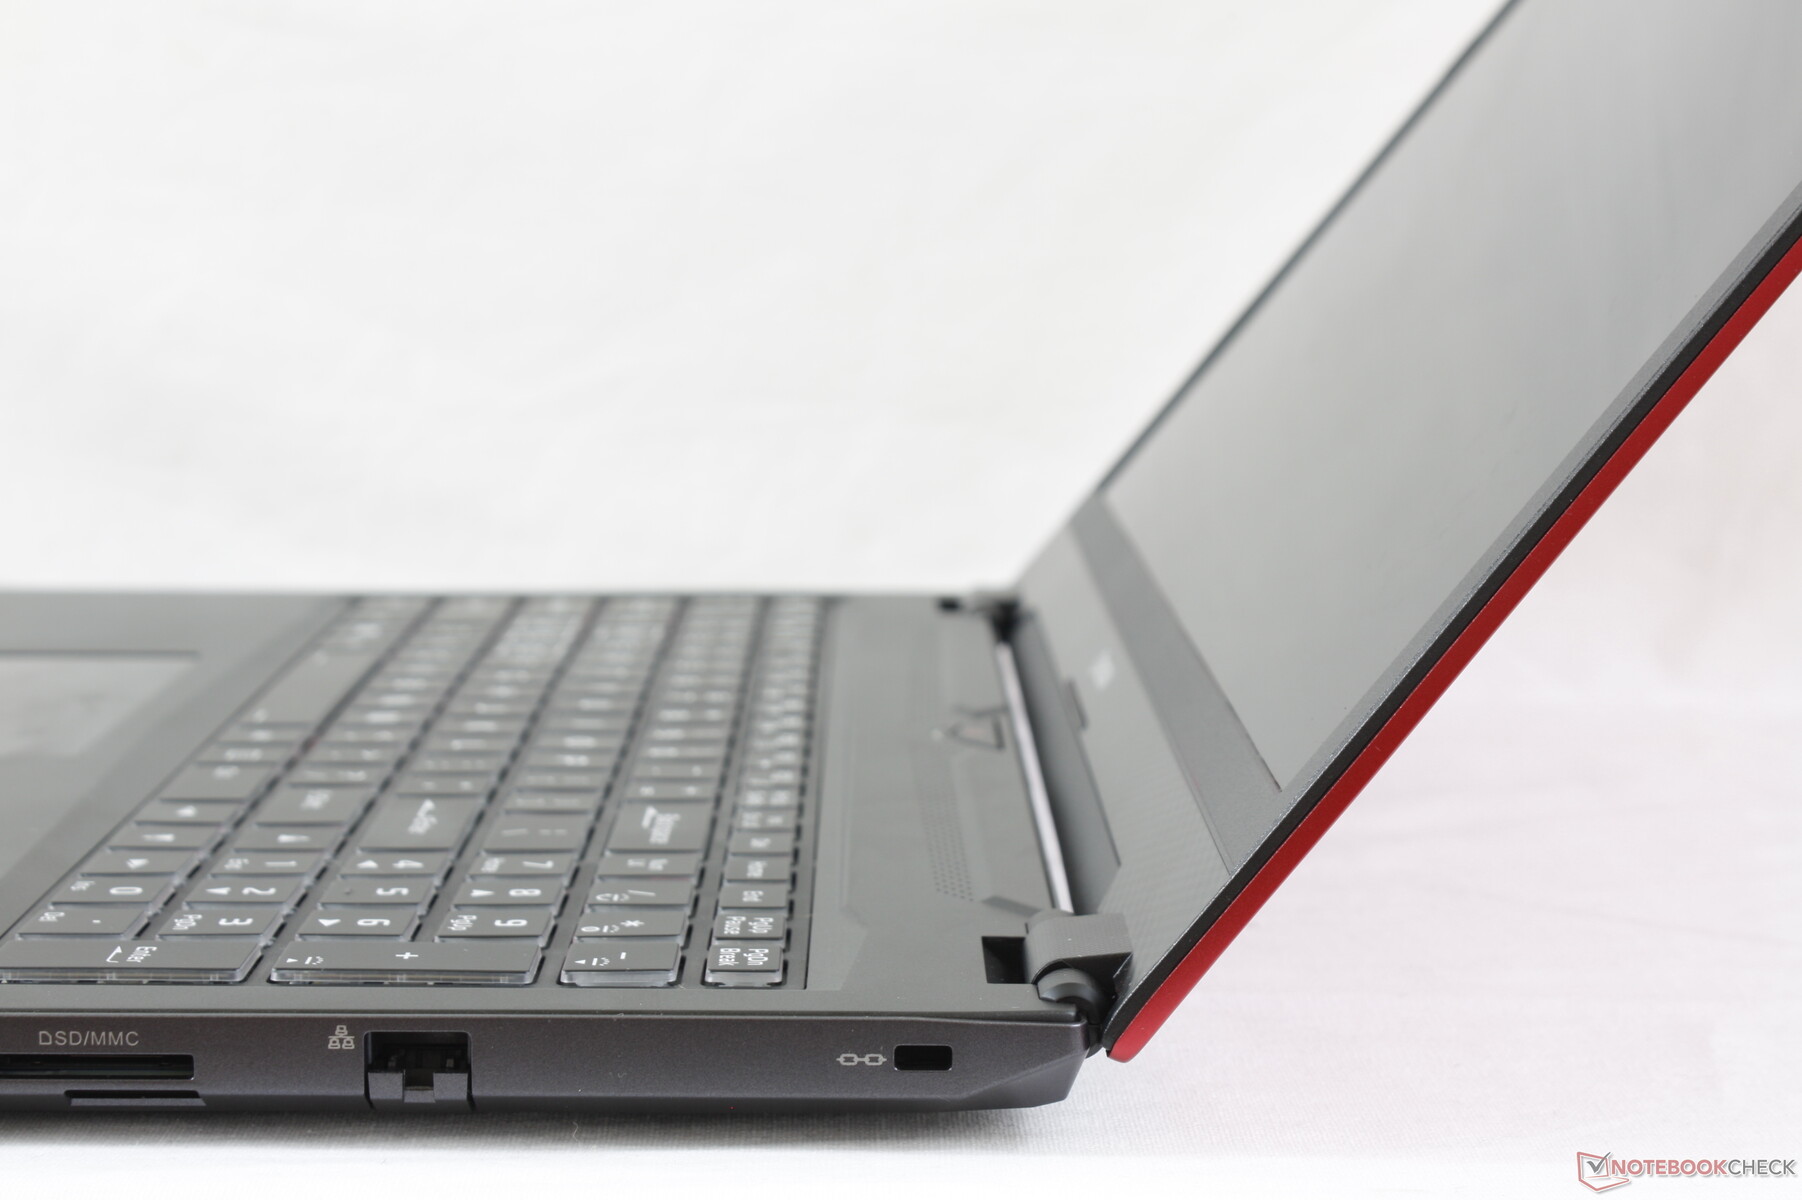
Connectivity
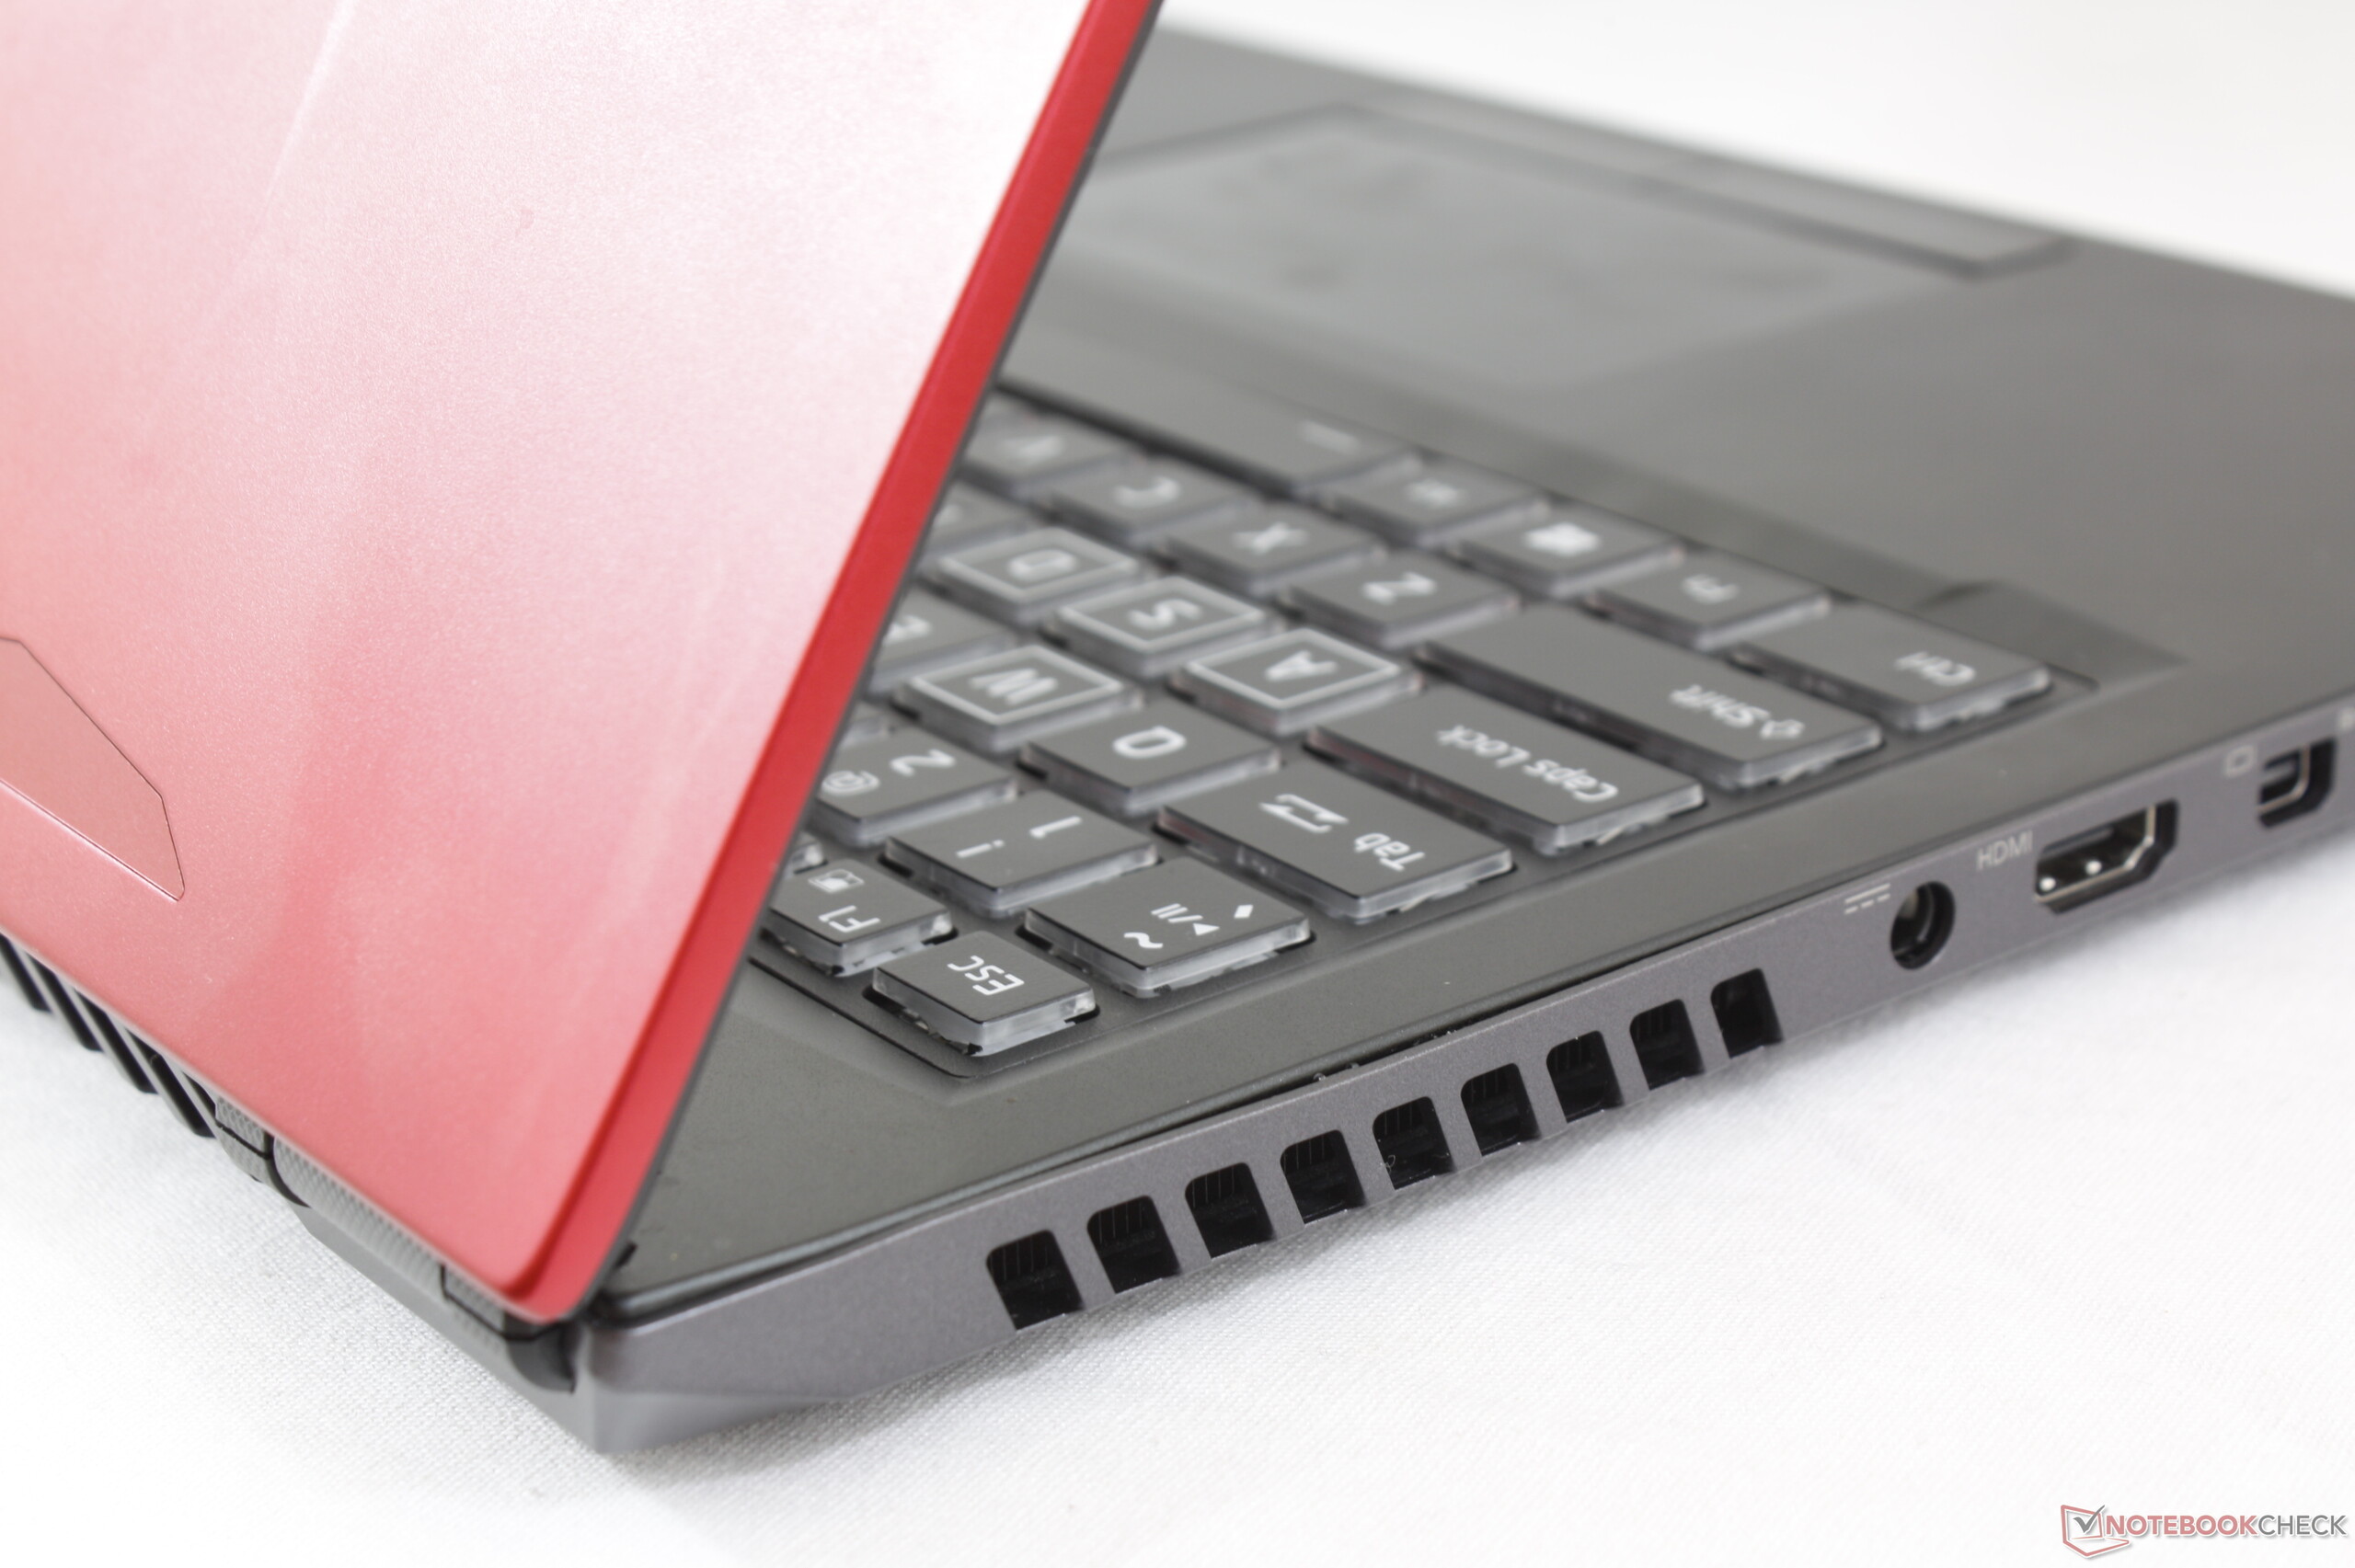
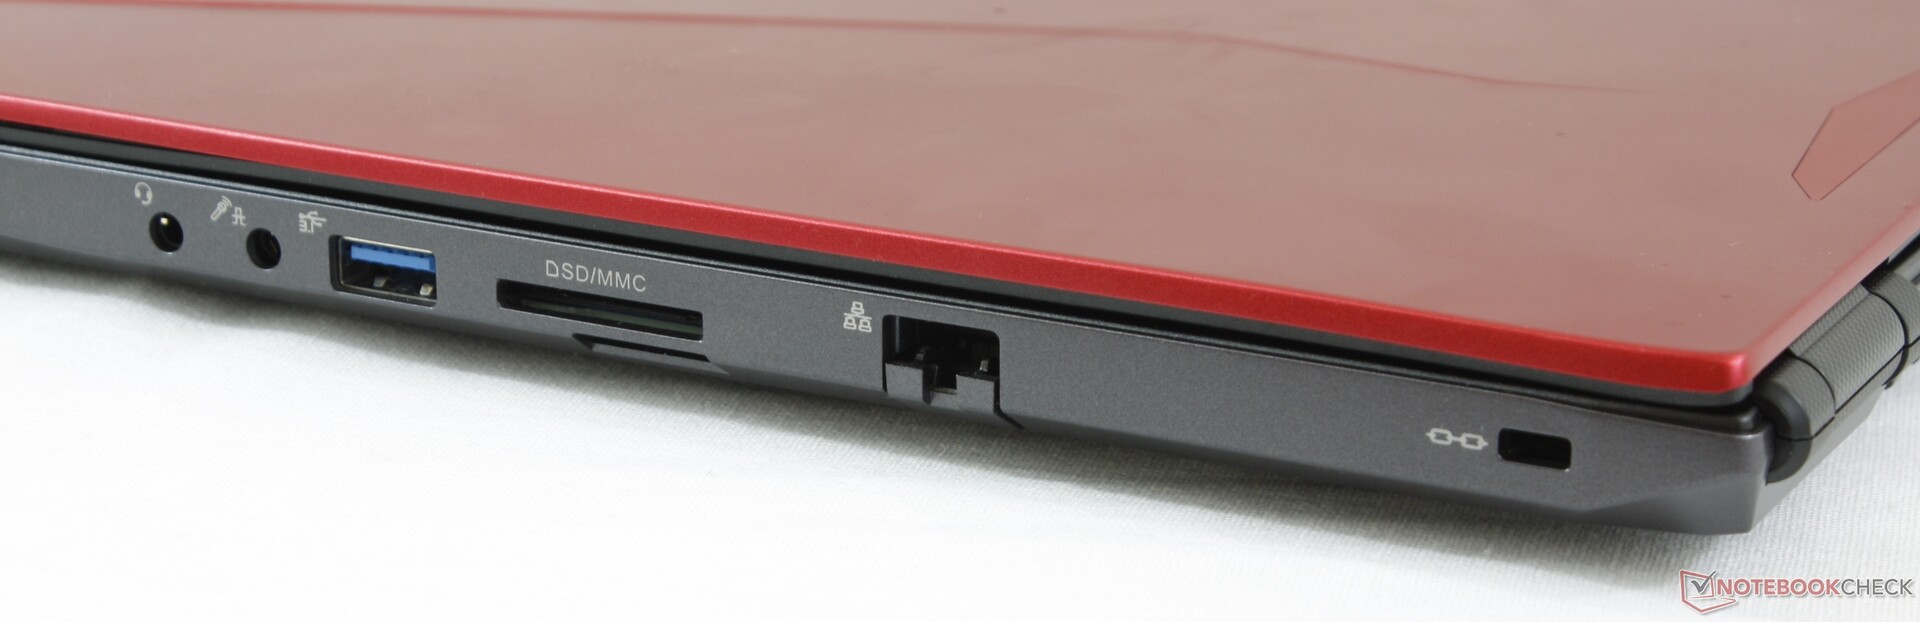
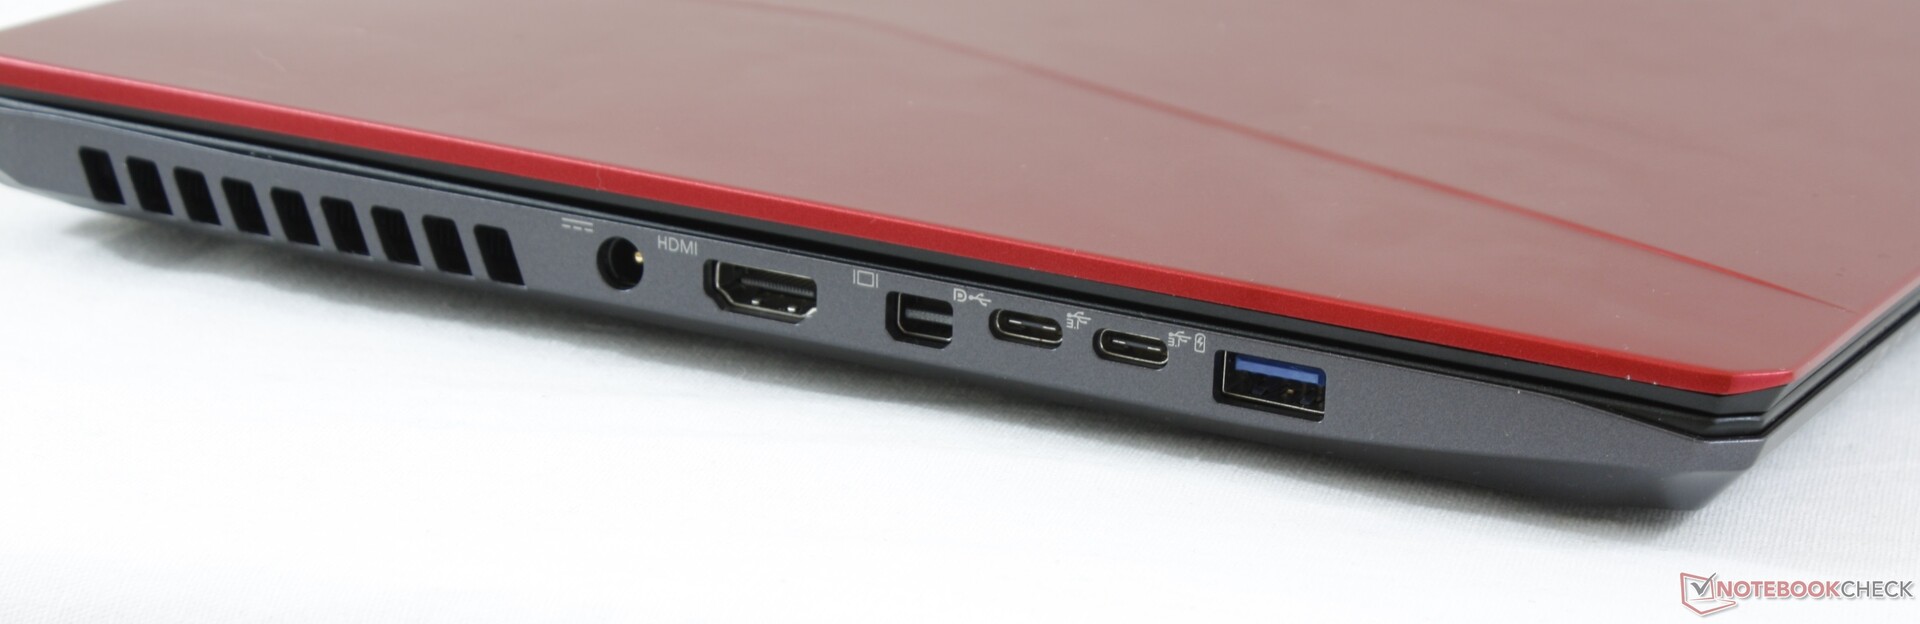
Port options are balanced with 2x USB Type-A ports, 2x USB Type-C ports, and 2x dedicated video-out ports. One USB Type-C port supports DisplayPort for up to three external monitors. Curiously, the chassis also supports a SIM card but this particular SKU does not come equipped with a WAN module.
Port positioning is a mixed bag. While the are easy to reach, all ports are far too close to the front and so any connected cables will occupy valuable desk space.
SD Card Reader
The spring-loaded SD card reader offers average transfer rates of about 87 MB/s. Moving 1 GB worth of pictures from our UHS-II test card to desktop takes about 13 seconds compared to half that on the Dell XPS 15.
A fully inserted card will only protrude by about 1 to 2 mm for safe transporting.
| SD Card Reader | |
| average JPG Copy Test (av. of 3 runs) | |
| Eurocom Nightsky RX17 (Toshiba Exceria Pro SDXC 64 GB UHS-II) | |
| Gigabyte Aero 15 Classic-XA (Toshiba Exceria Pro SDXC 64 GB UHS-II) | |
| Origin PC EVO16-S i7-9750H RTX 2080 Max-Q (Toshiba Exceria Pro SDXC 64 GB UHS-II) | |
| MSI GP75 Leopard 9SD (Toshiba Exceria Pro SDXC 64 GB UHS-II) | |
| maximum AS SSD Seq Read Test (1GB) | |
| Gigabyte Aero 15 Classic-XA (Toshiba Exceria Pro SDXC 64 GB UHS-II) | |
| Eurocom Nightsky RX17 (Toshiba Exceria Pro SDXC 64 GB UHS-II) | |
| Origin PC EVO16-S i7-9750H RTX 2080 Max-Q (Toshiba Exceria Pro SDXC 64 GB UHS-II) | |
| MSI GP75 Leopard 9SD (Toshiba Exceria Pro SDXC 64 GB UHS-II) | |
Communication
The Intel 9560 with integrated Bluetooth 5.0 is a common find on high-end laptops. Performance is similar to the Killer 1550 sans the gaming-centric features that are exclusive to the latter. We didn't experience any connectivity issues during our time with the unit.
Accessories
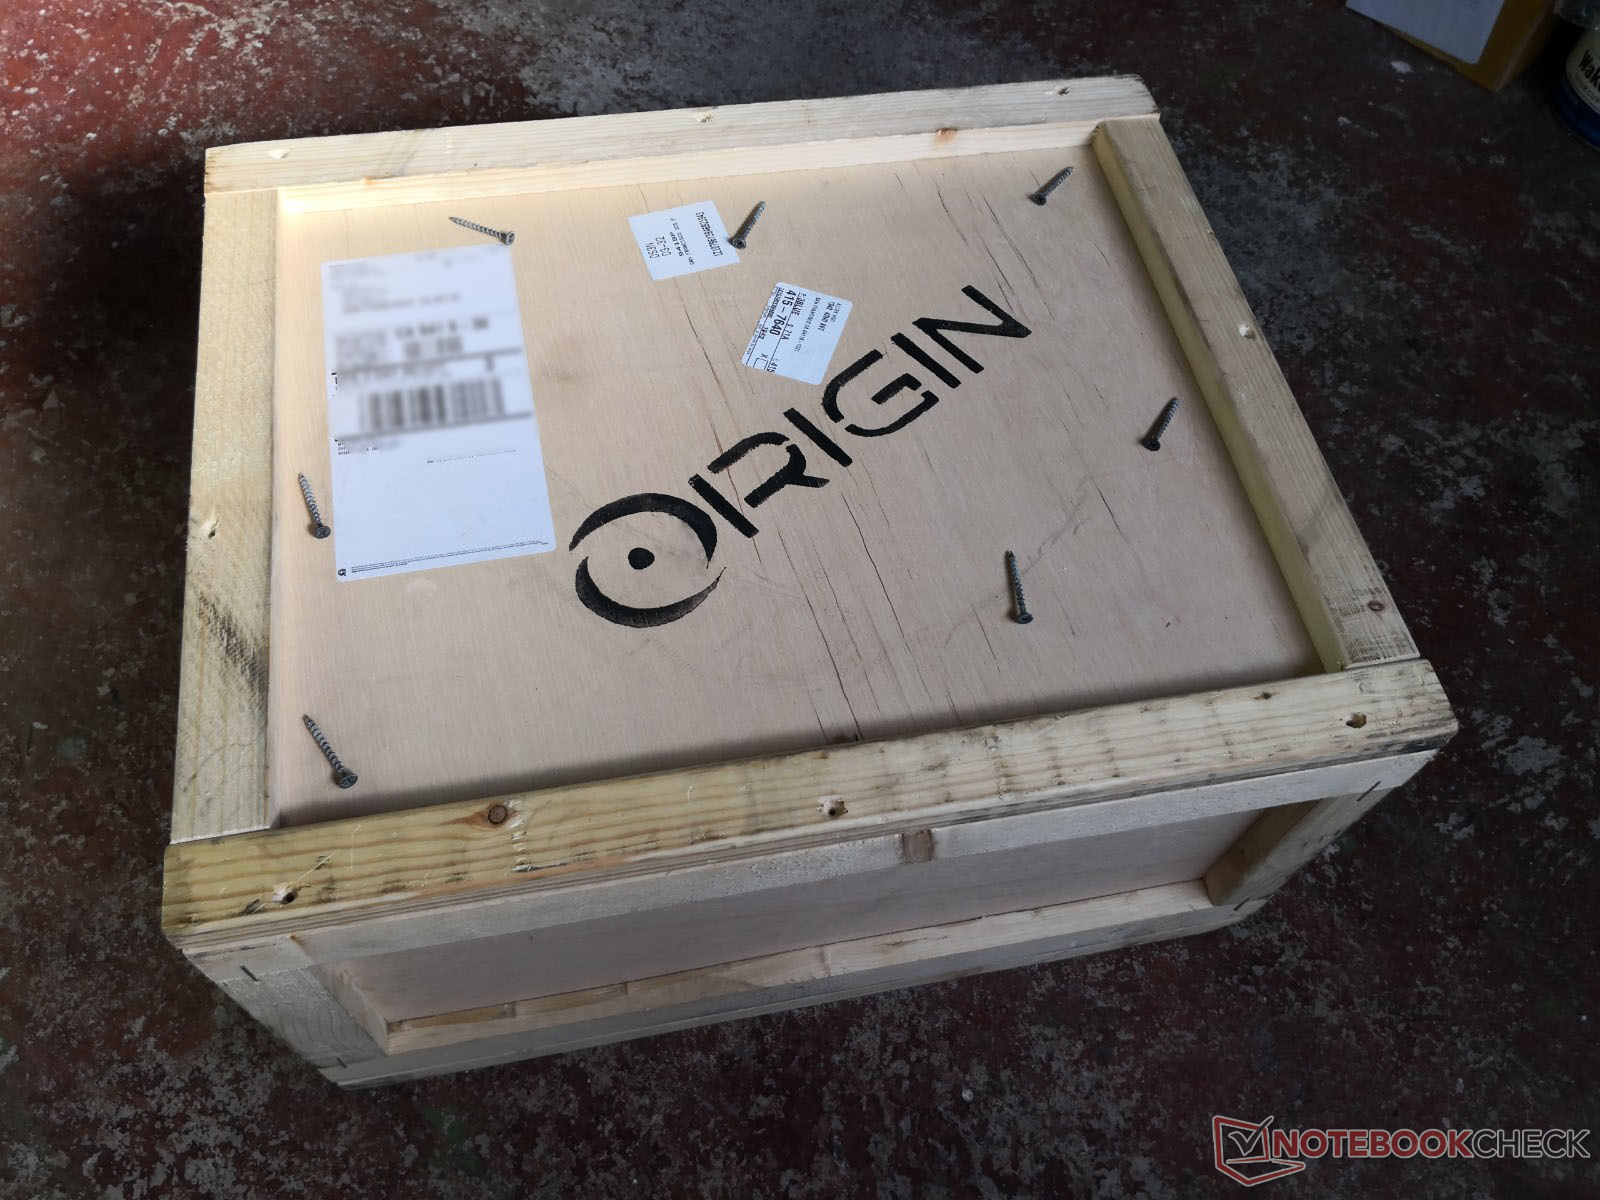
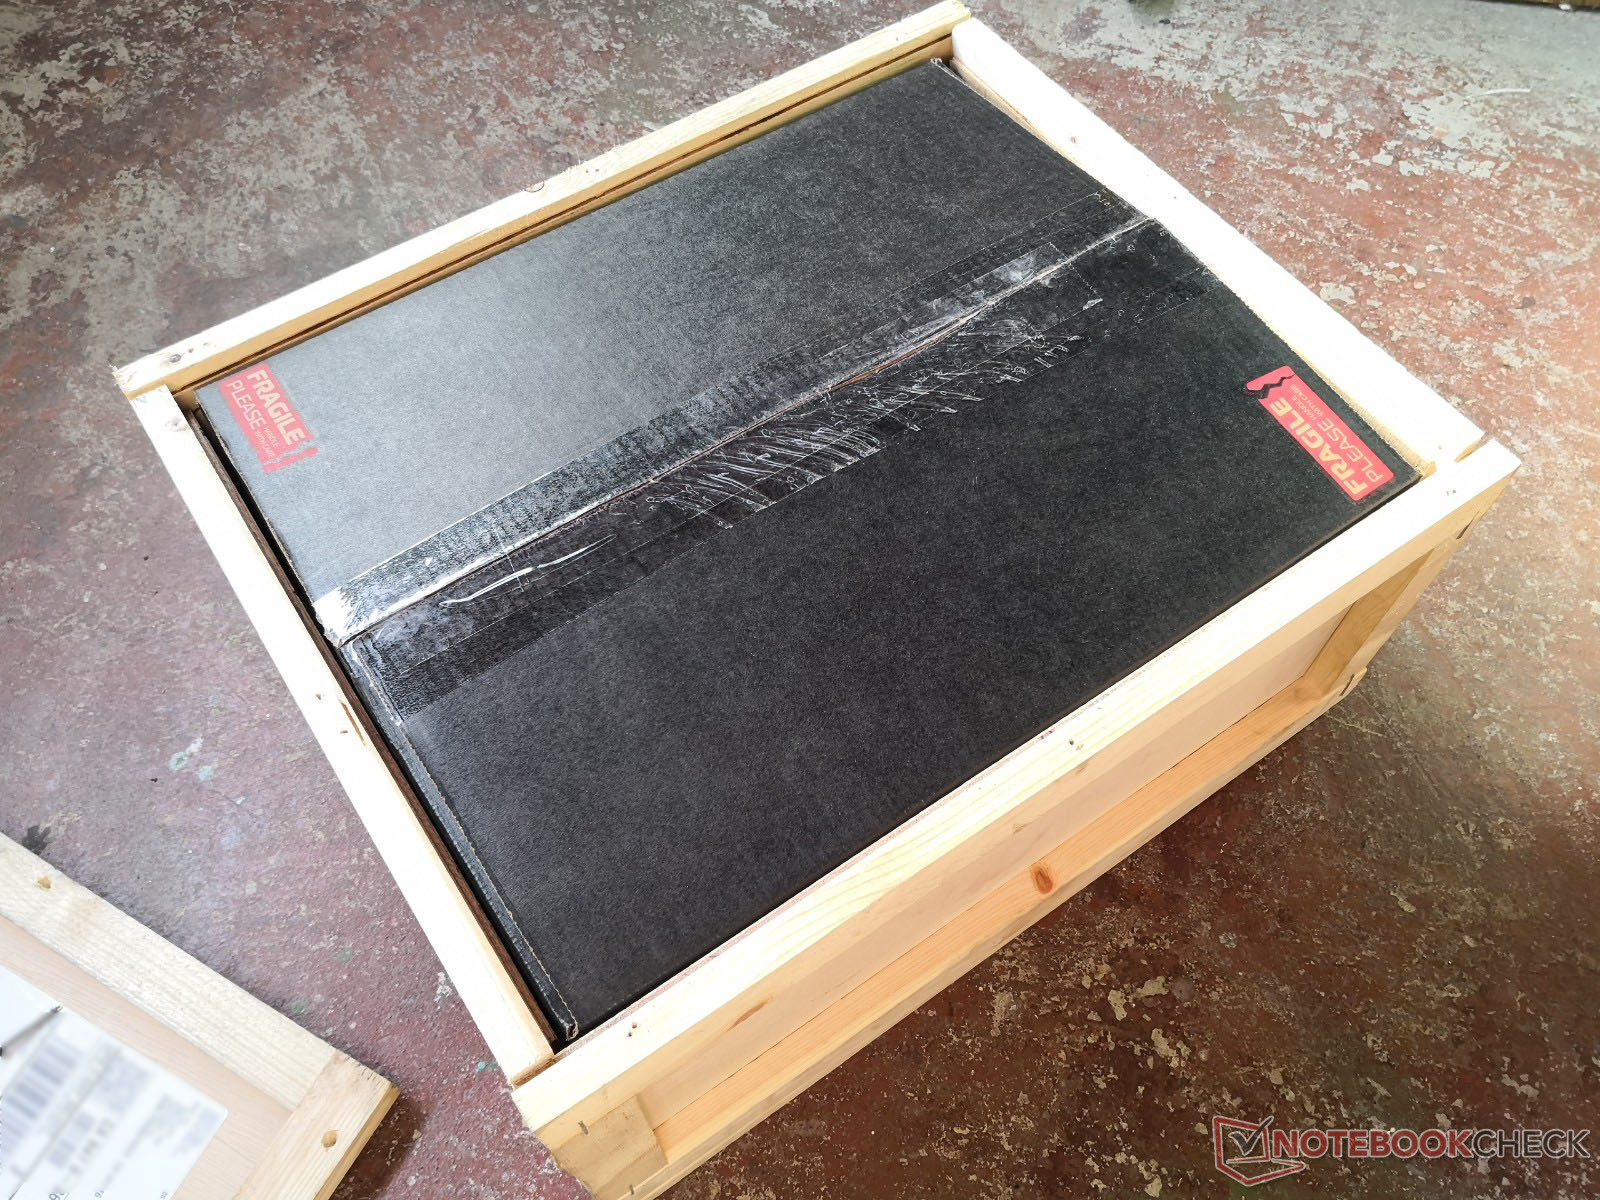
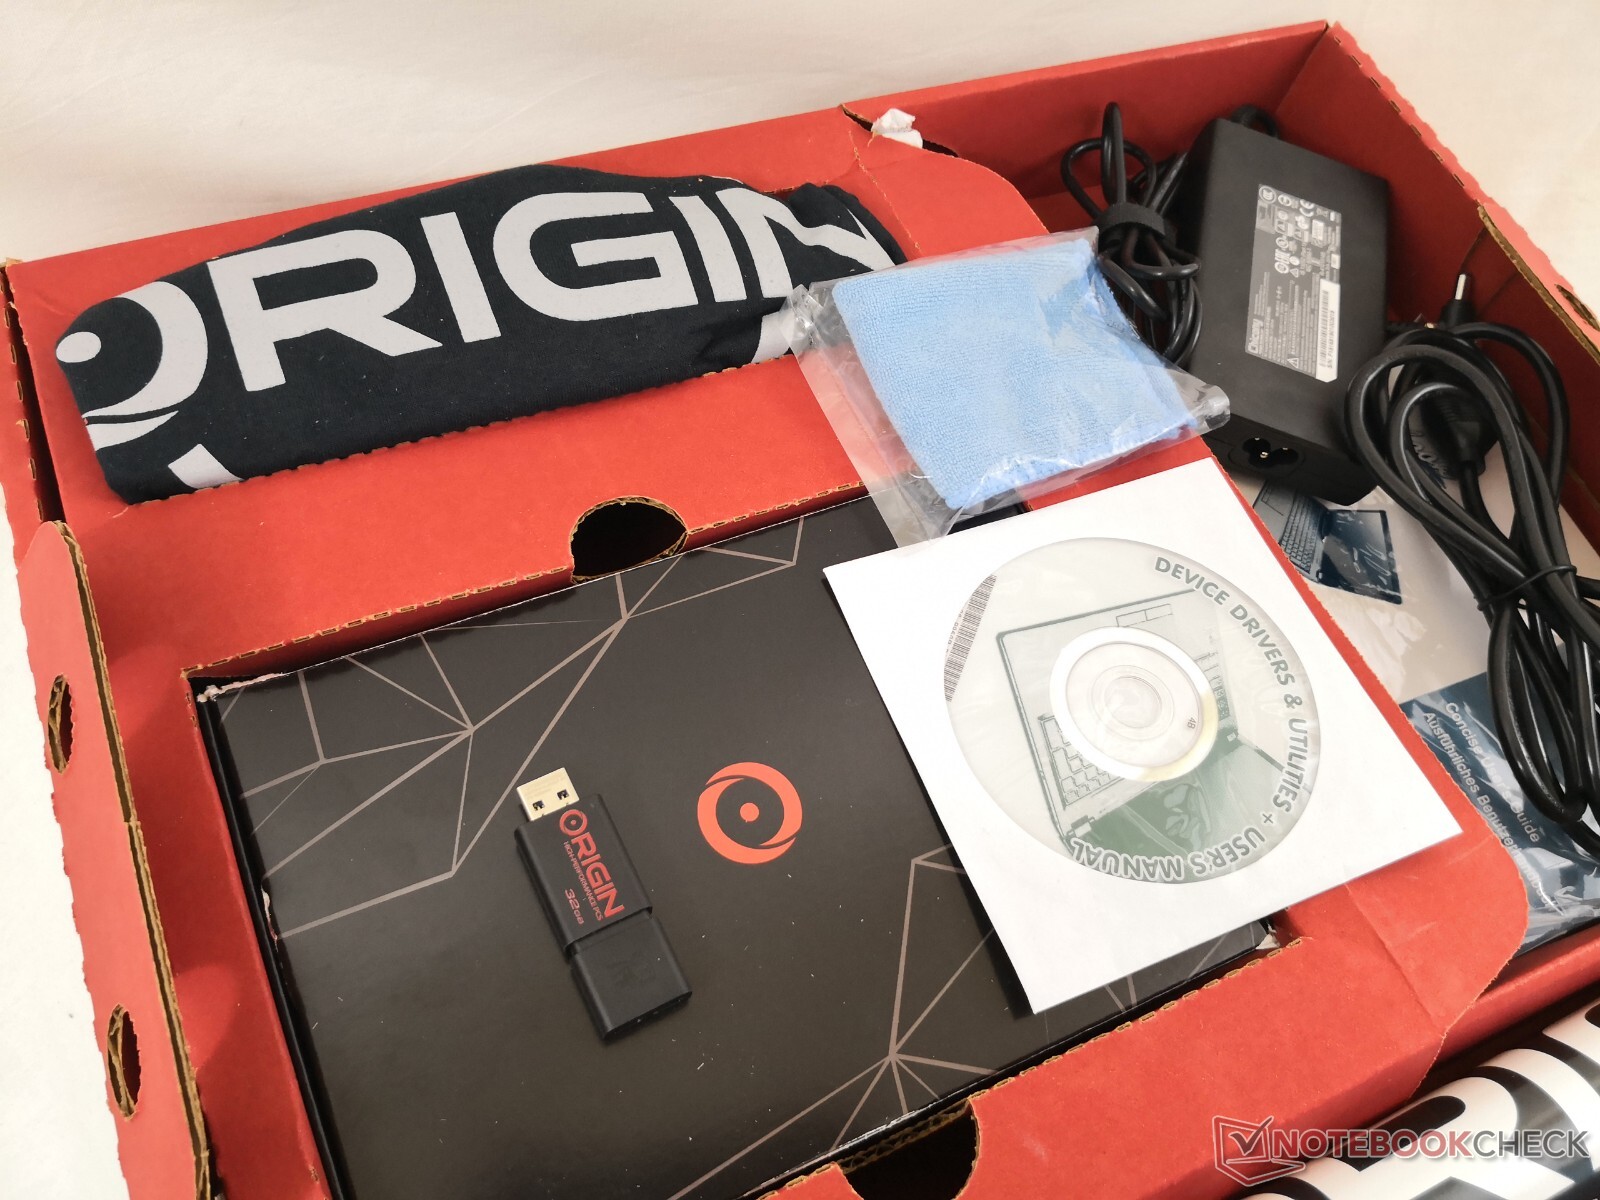
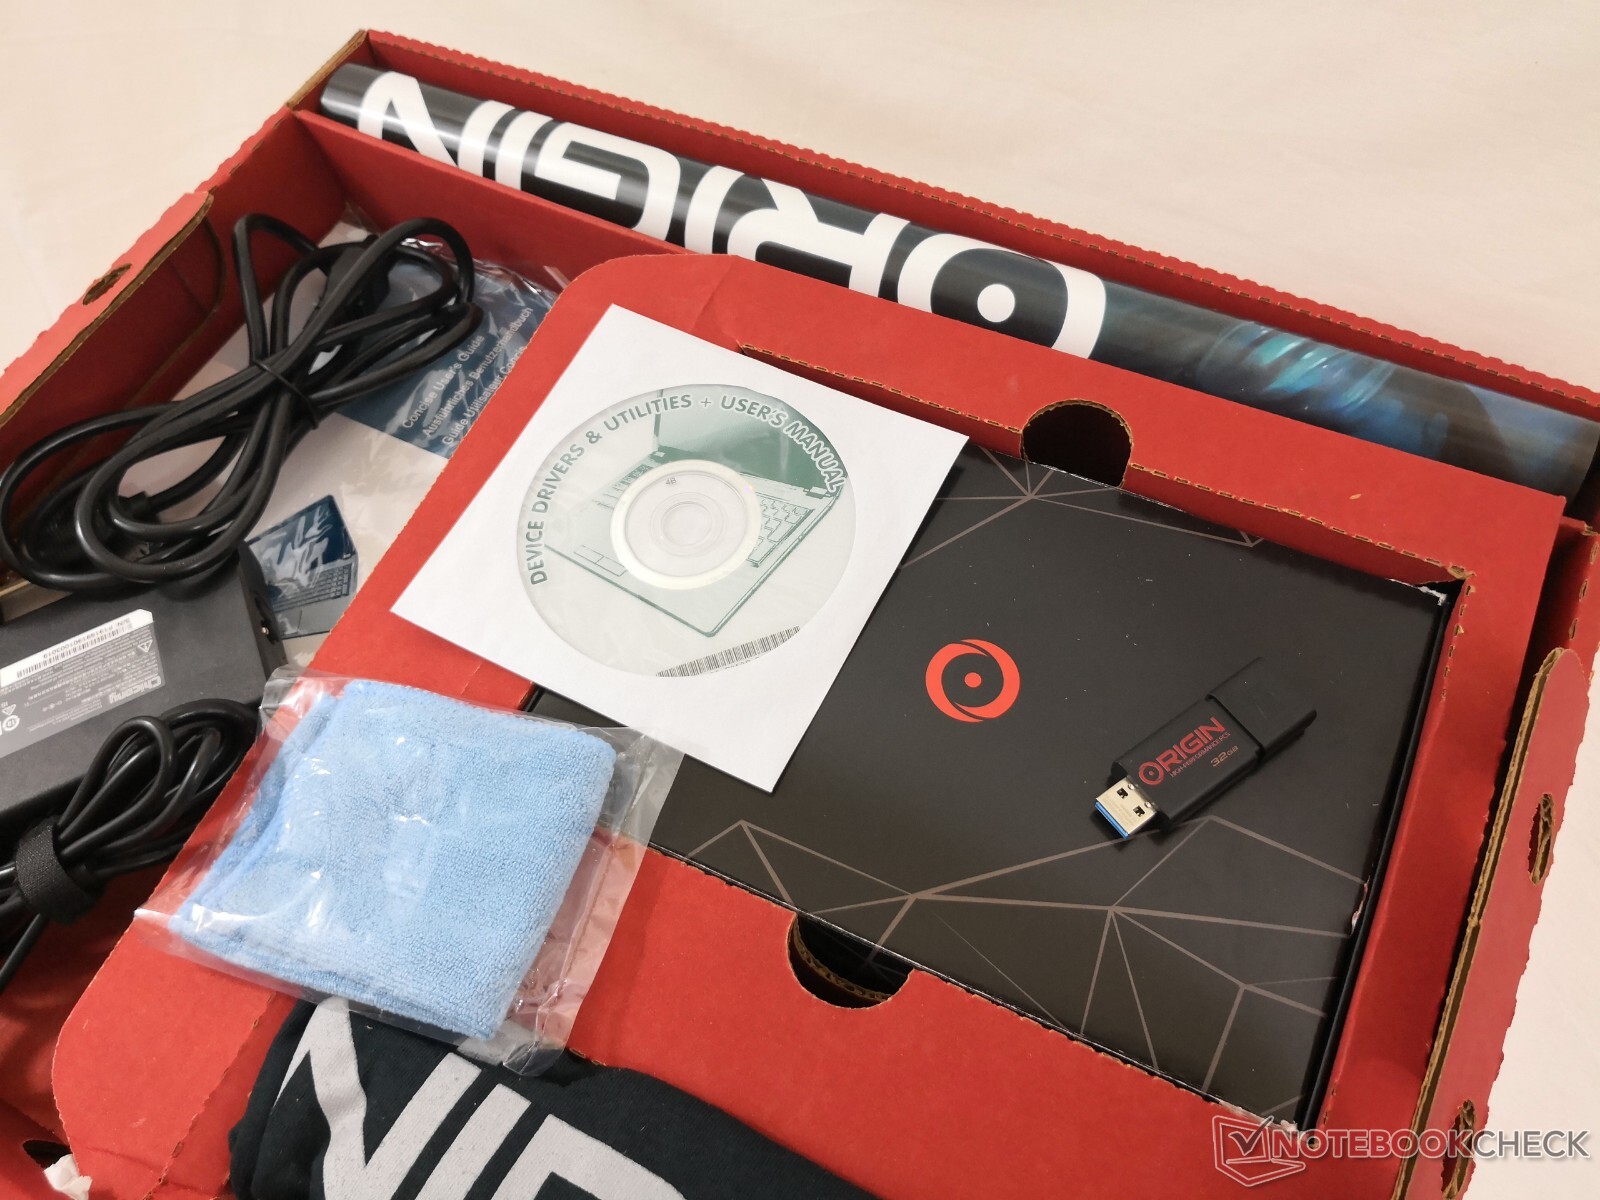
Origin PC goes all the way when it comes to the unboxing experience. Users have the option to receive a wooden crate instead of the usual cardboard box alongside other free extras like a wall poster, notebook sleeve, t-shirt, mouse pad, drivers DVD, and even a 32 GB USB drive pre-loaded with a factory restore image.
While the included accessories are nice, the DVD is a puzzling because the laptop does not integrate an optical drive. Simply including the contents of the DVD onto the USB drive instead would have been much more useful to the end user.
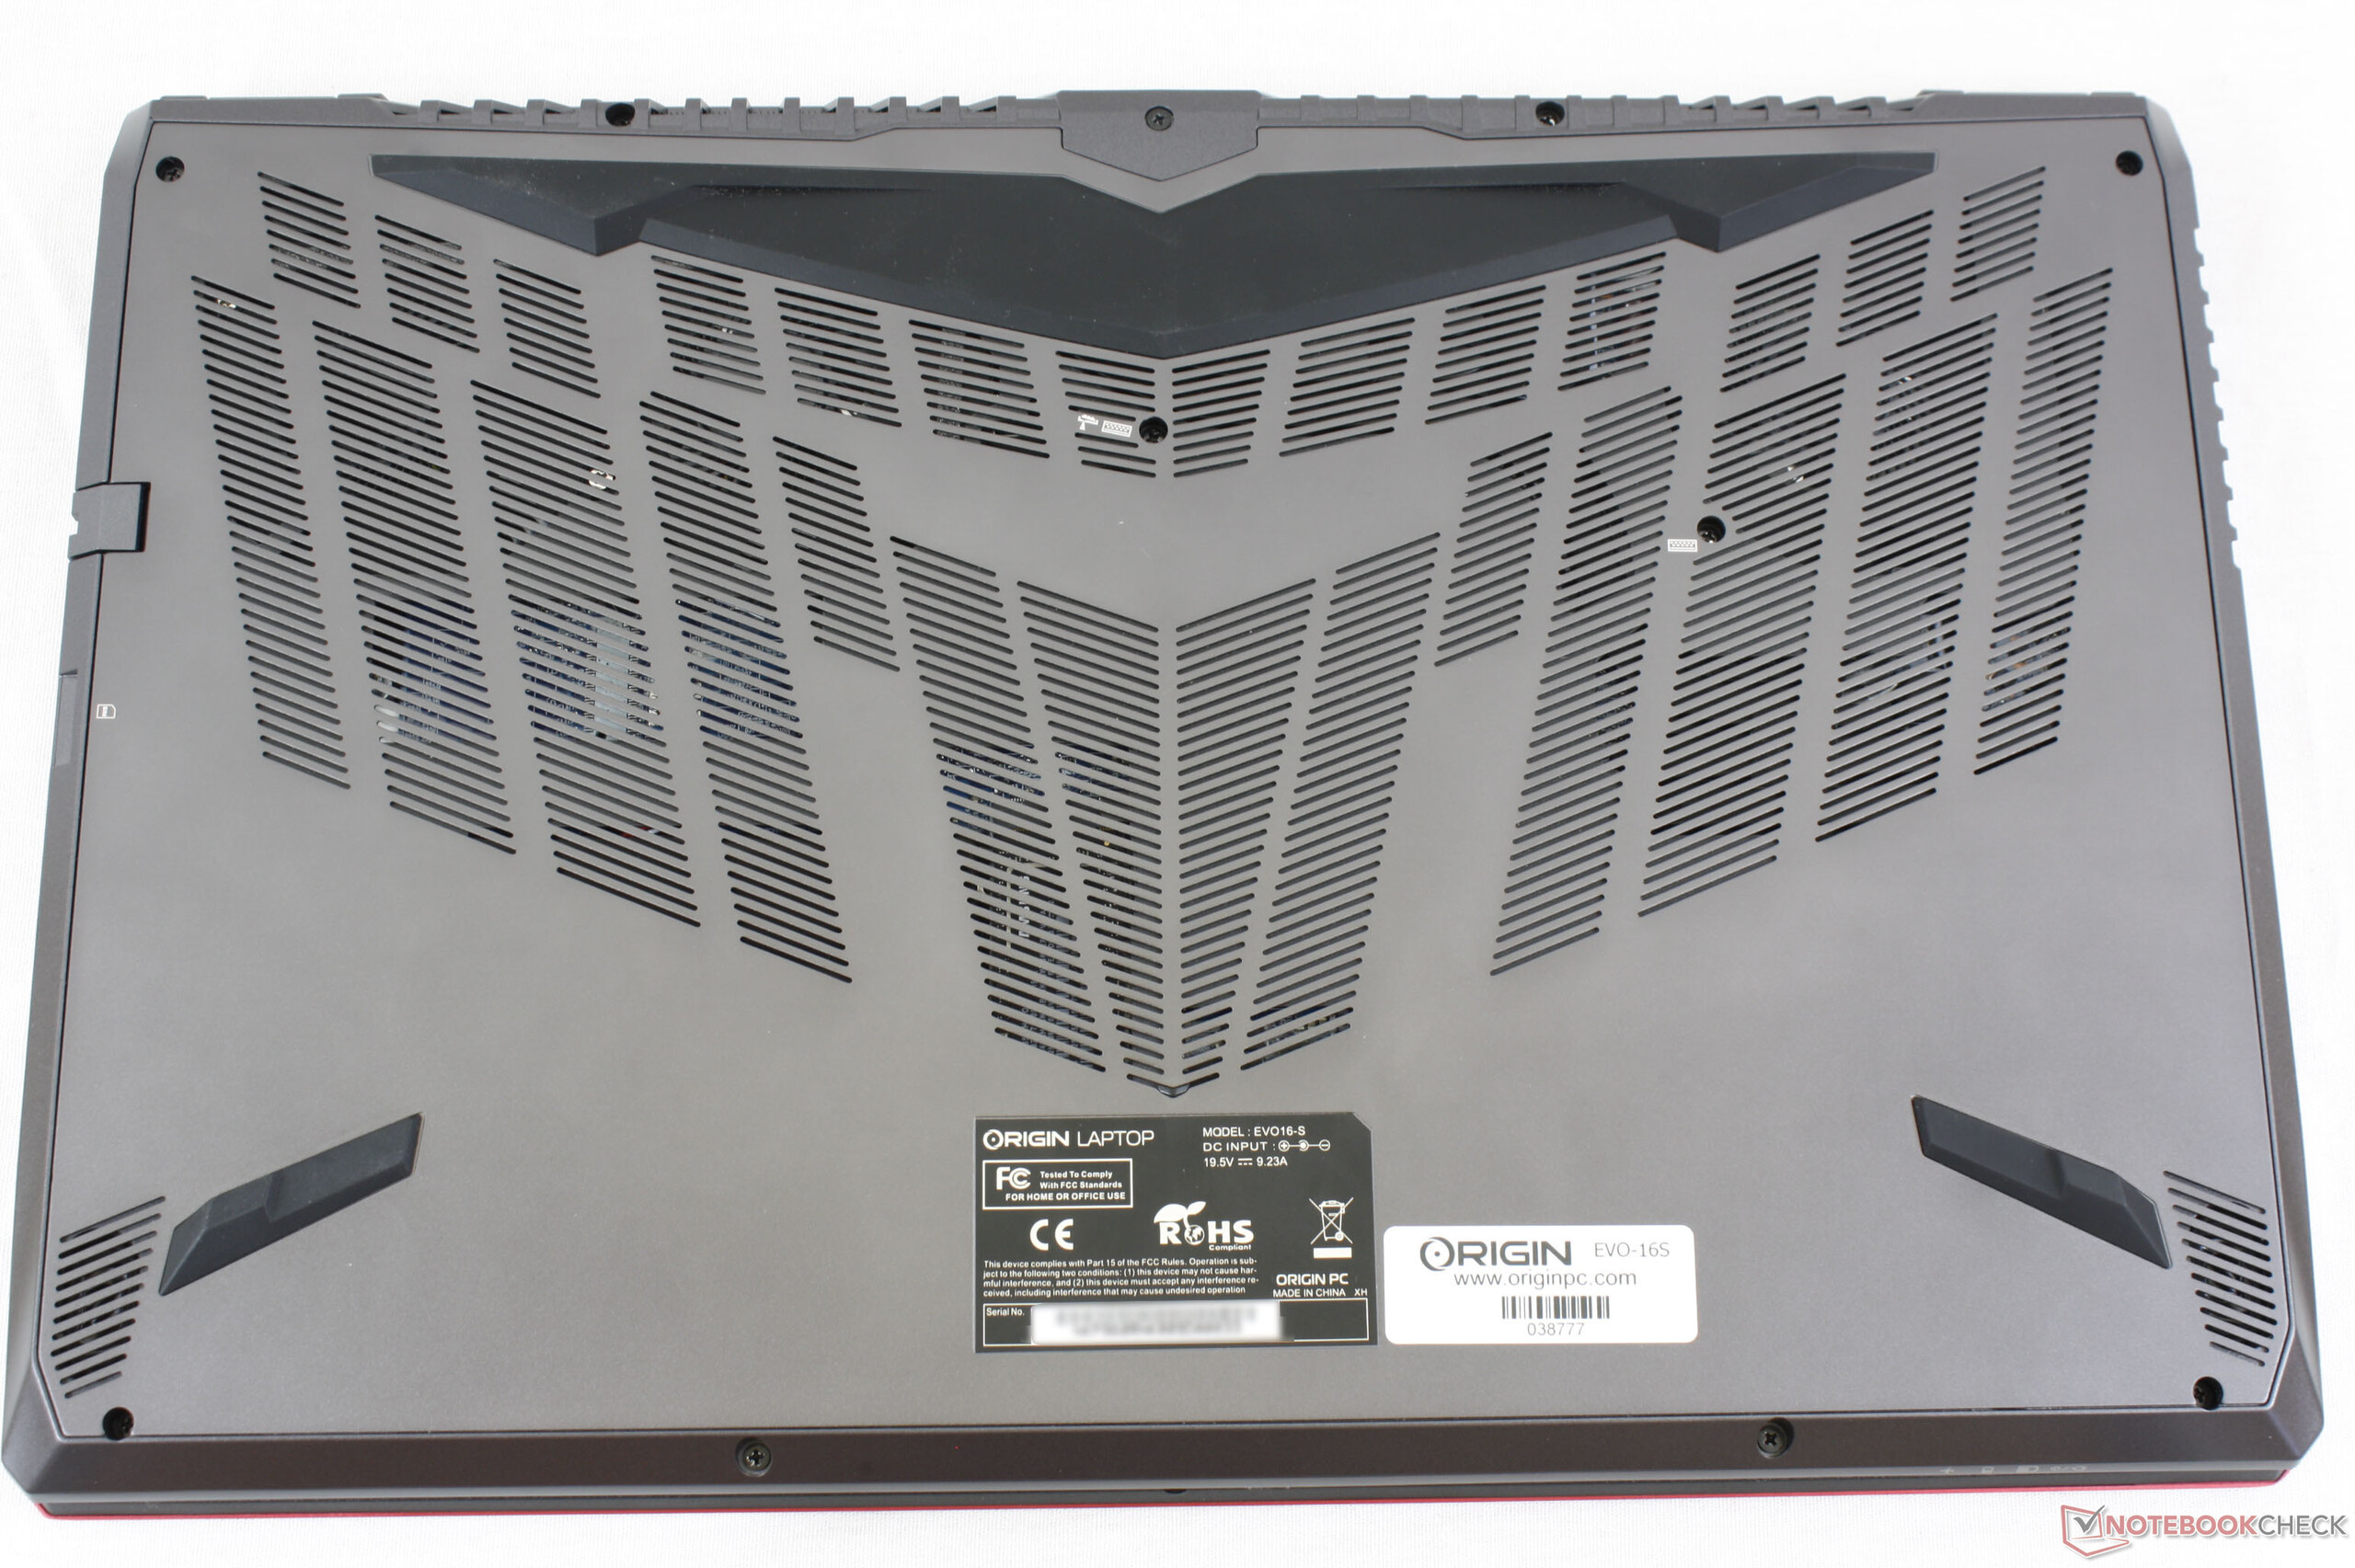
Maintenance
Unfortunately, end-user upgrades are not easy. The bottom panel is secured tightly to the base to make servicing more difficult than it should be.
Warranty
Origin PC offers 1 to 3 years of protection with free shipping and a 45-day "No Dead Pixel Guarantee" for its laptops. They also offer 24/7 technical support in the U.S. for the life of the product.
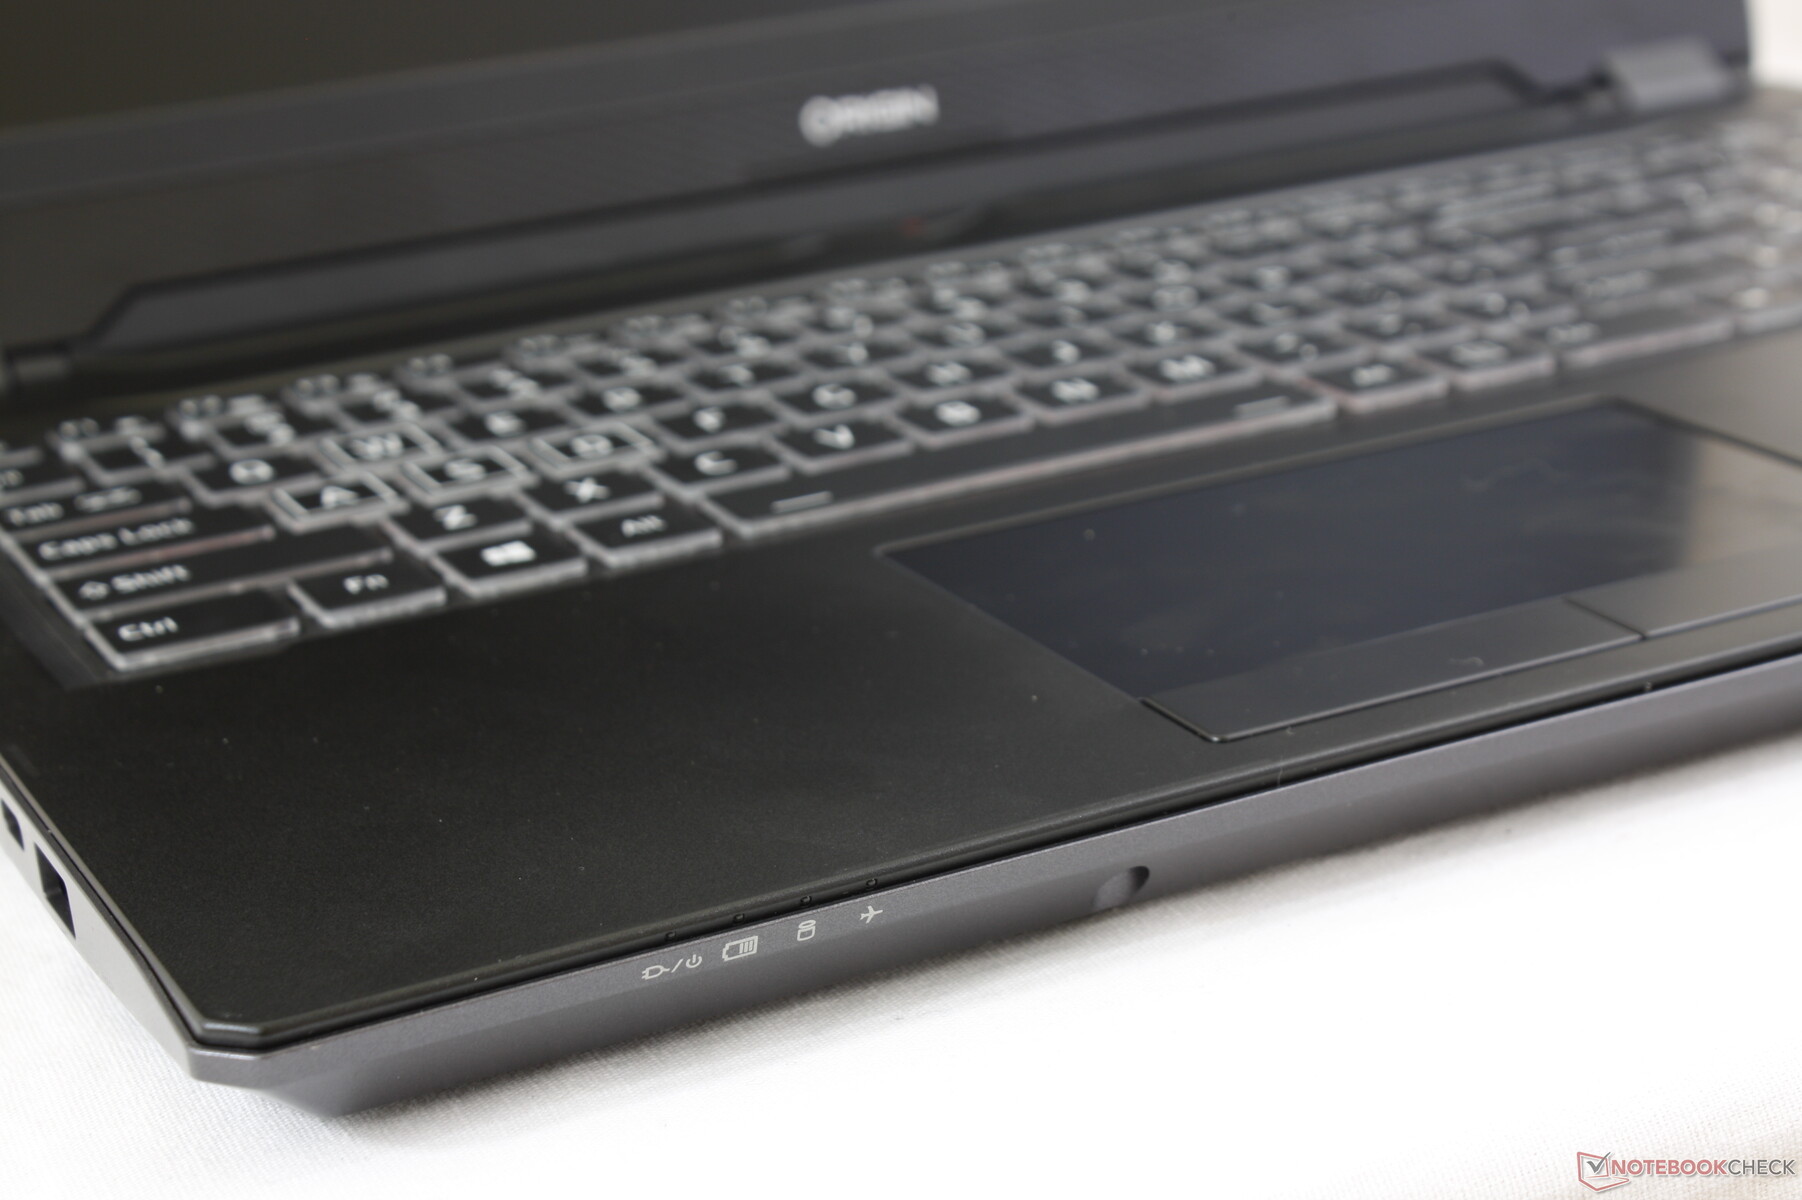
Input Devices
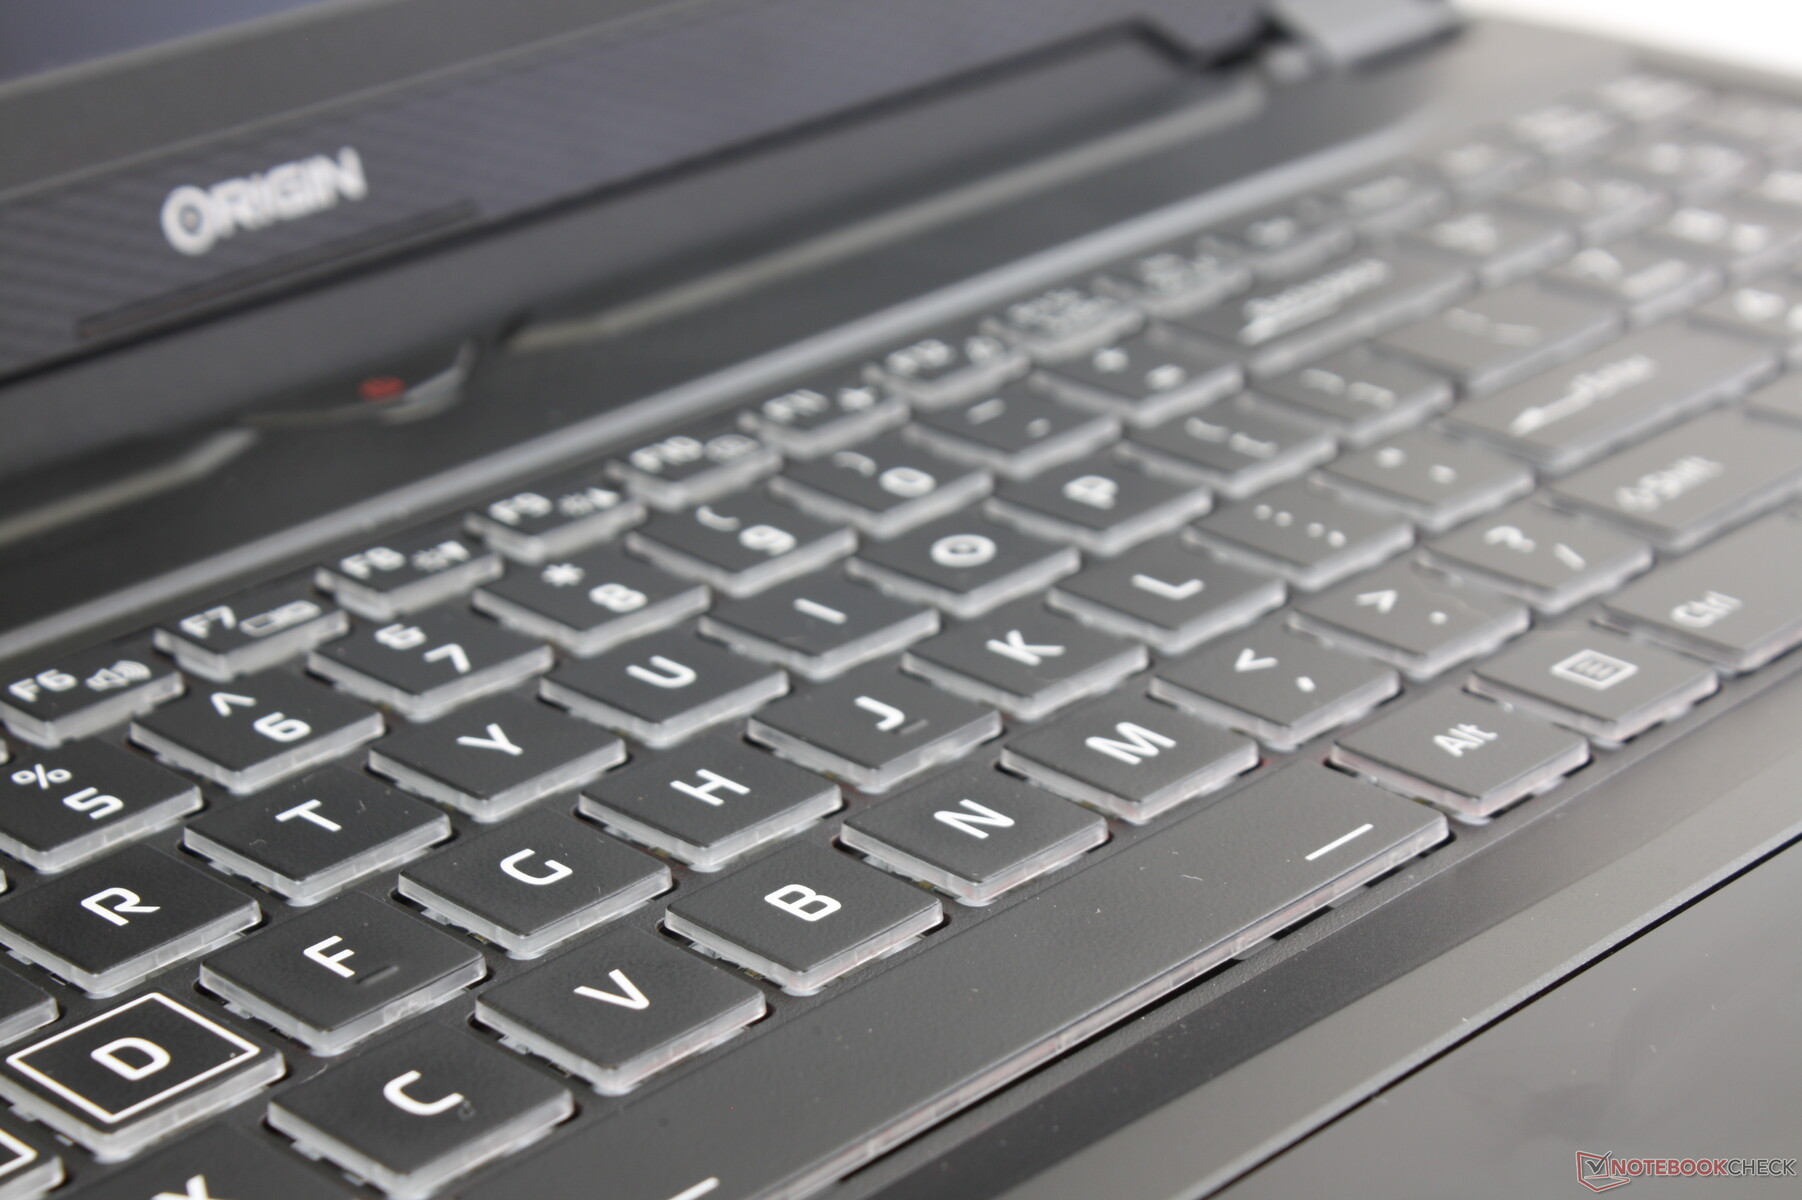
Keyboard
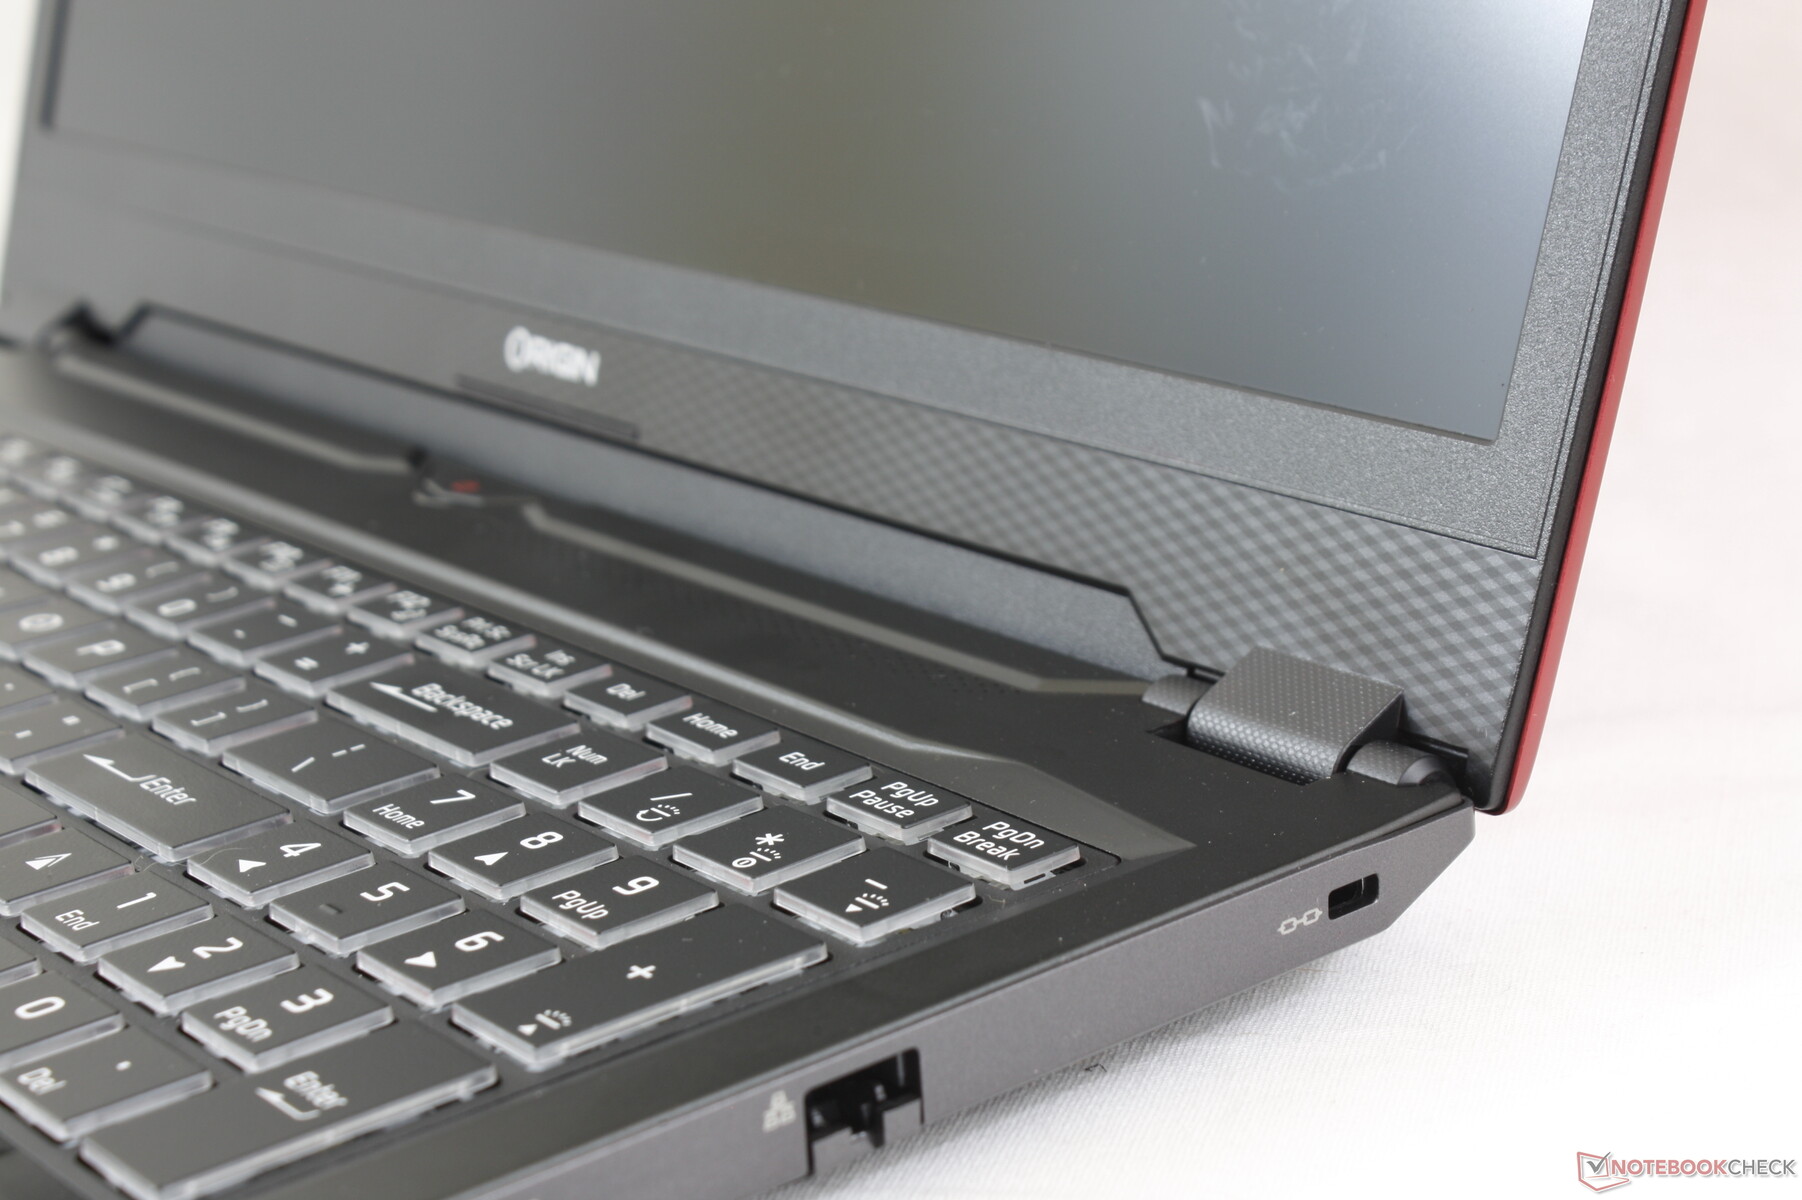
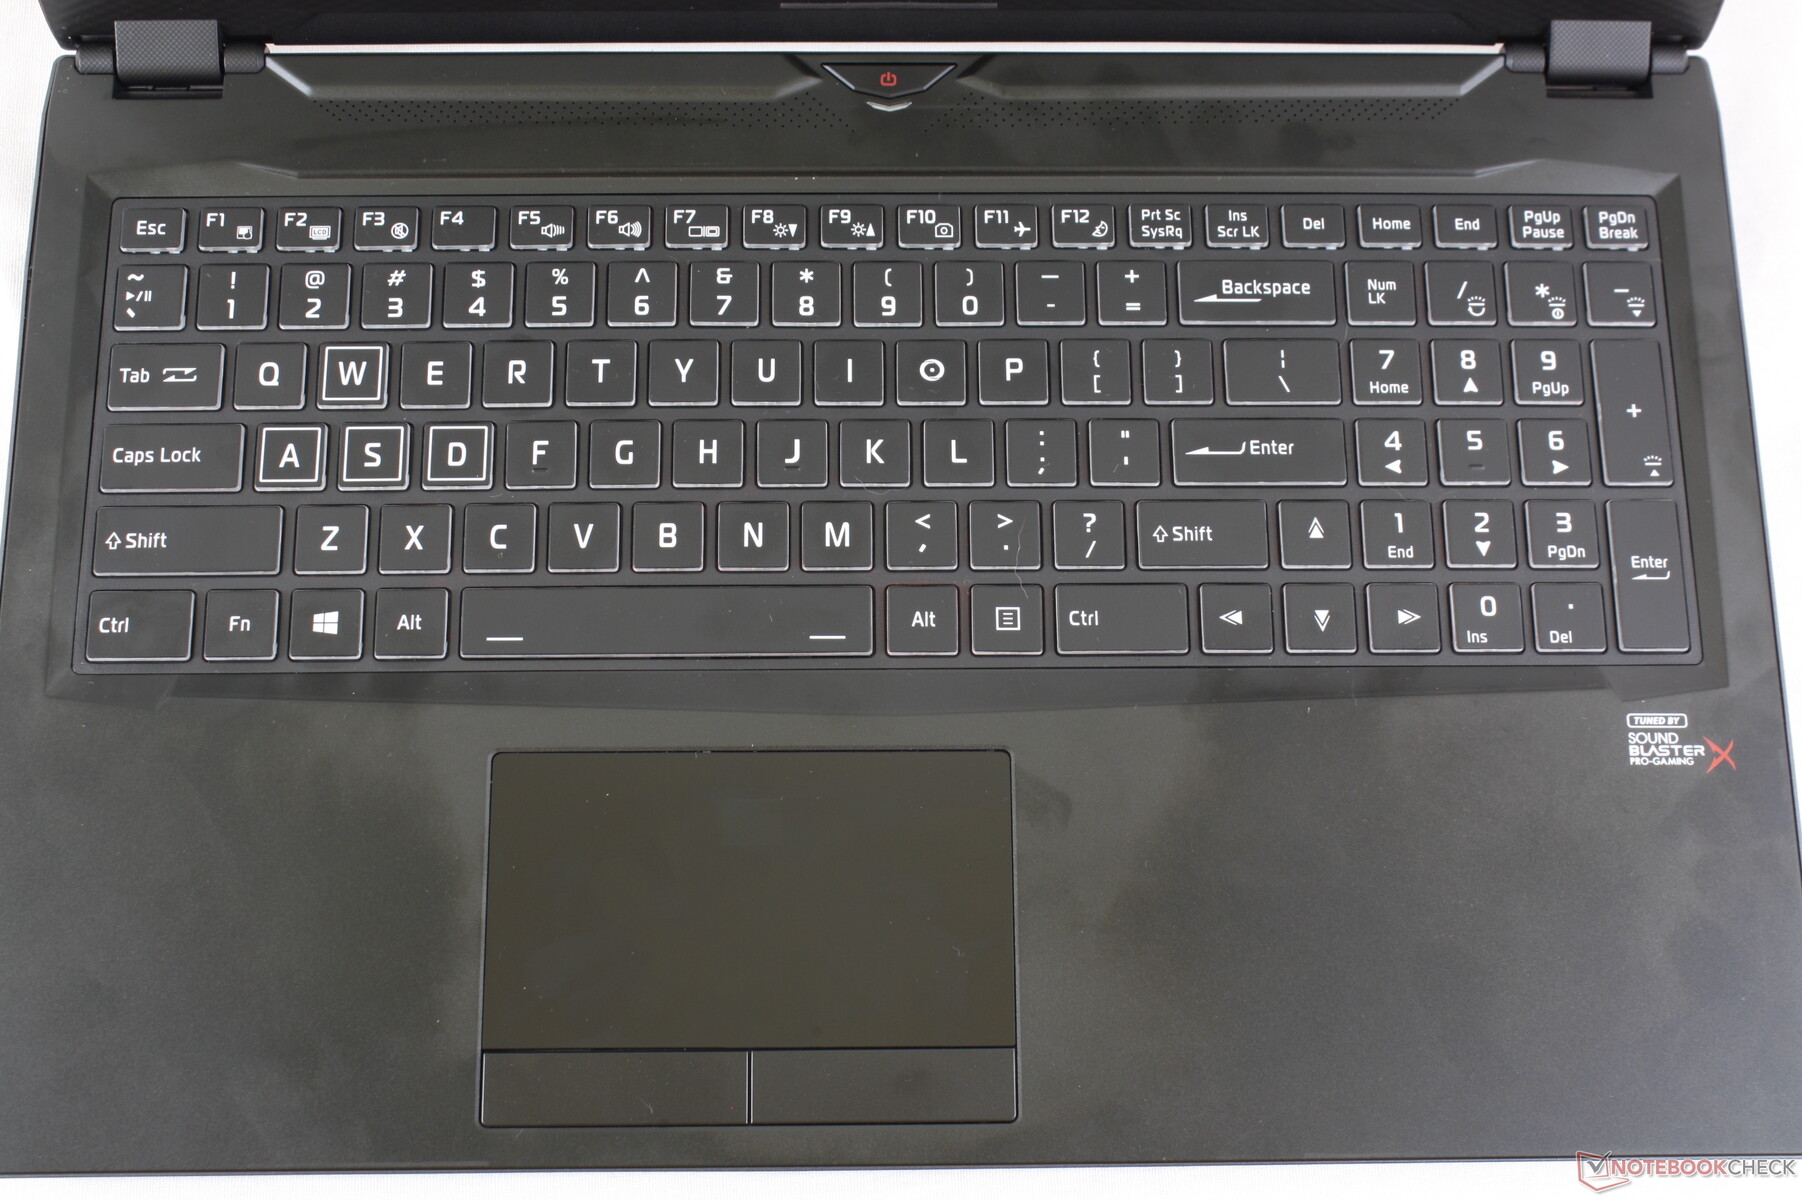
Key feedback and layout are most similar to the Schenker Slim 15 or Schenker XMG A517. Feedback and travel are both firmer and deeper, respectively, than the keys on the XPS 15. In return, clatter is slightly louder.
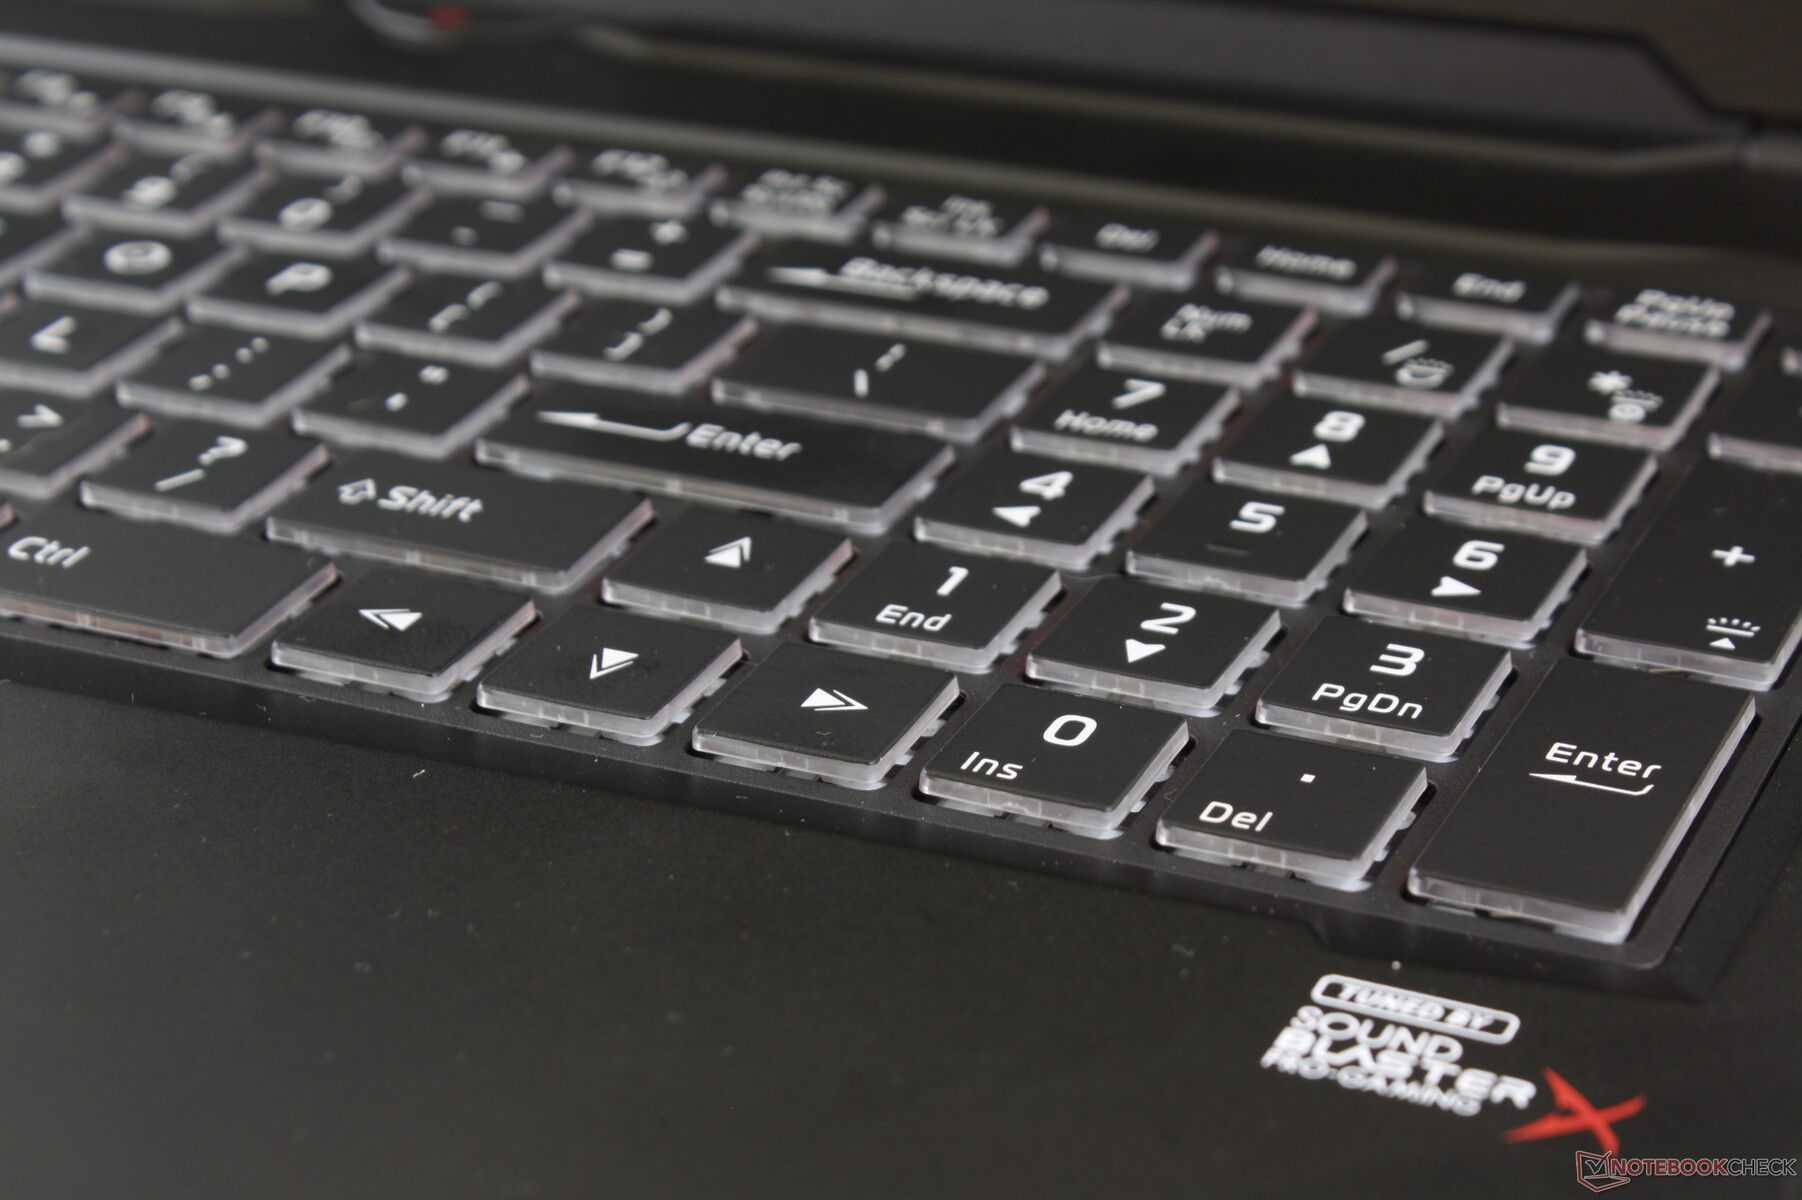
Perhaps the best characteristic of the keyboard is the similar key cap size of the QWERTY keys, Arrow keys, and NumPad keys for uniform feedback between all these keys. On most other laptops, the Arrow and/or NumPad keys would often be smaller than the main QWERTY keys for spongier feedback and a more cramped experience.
Touchpad
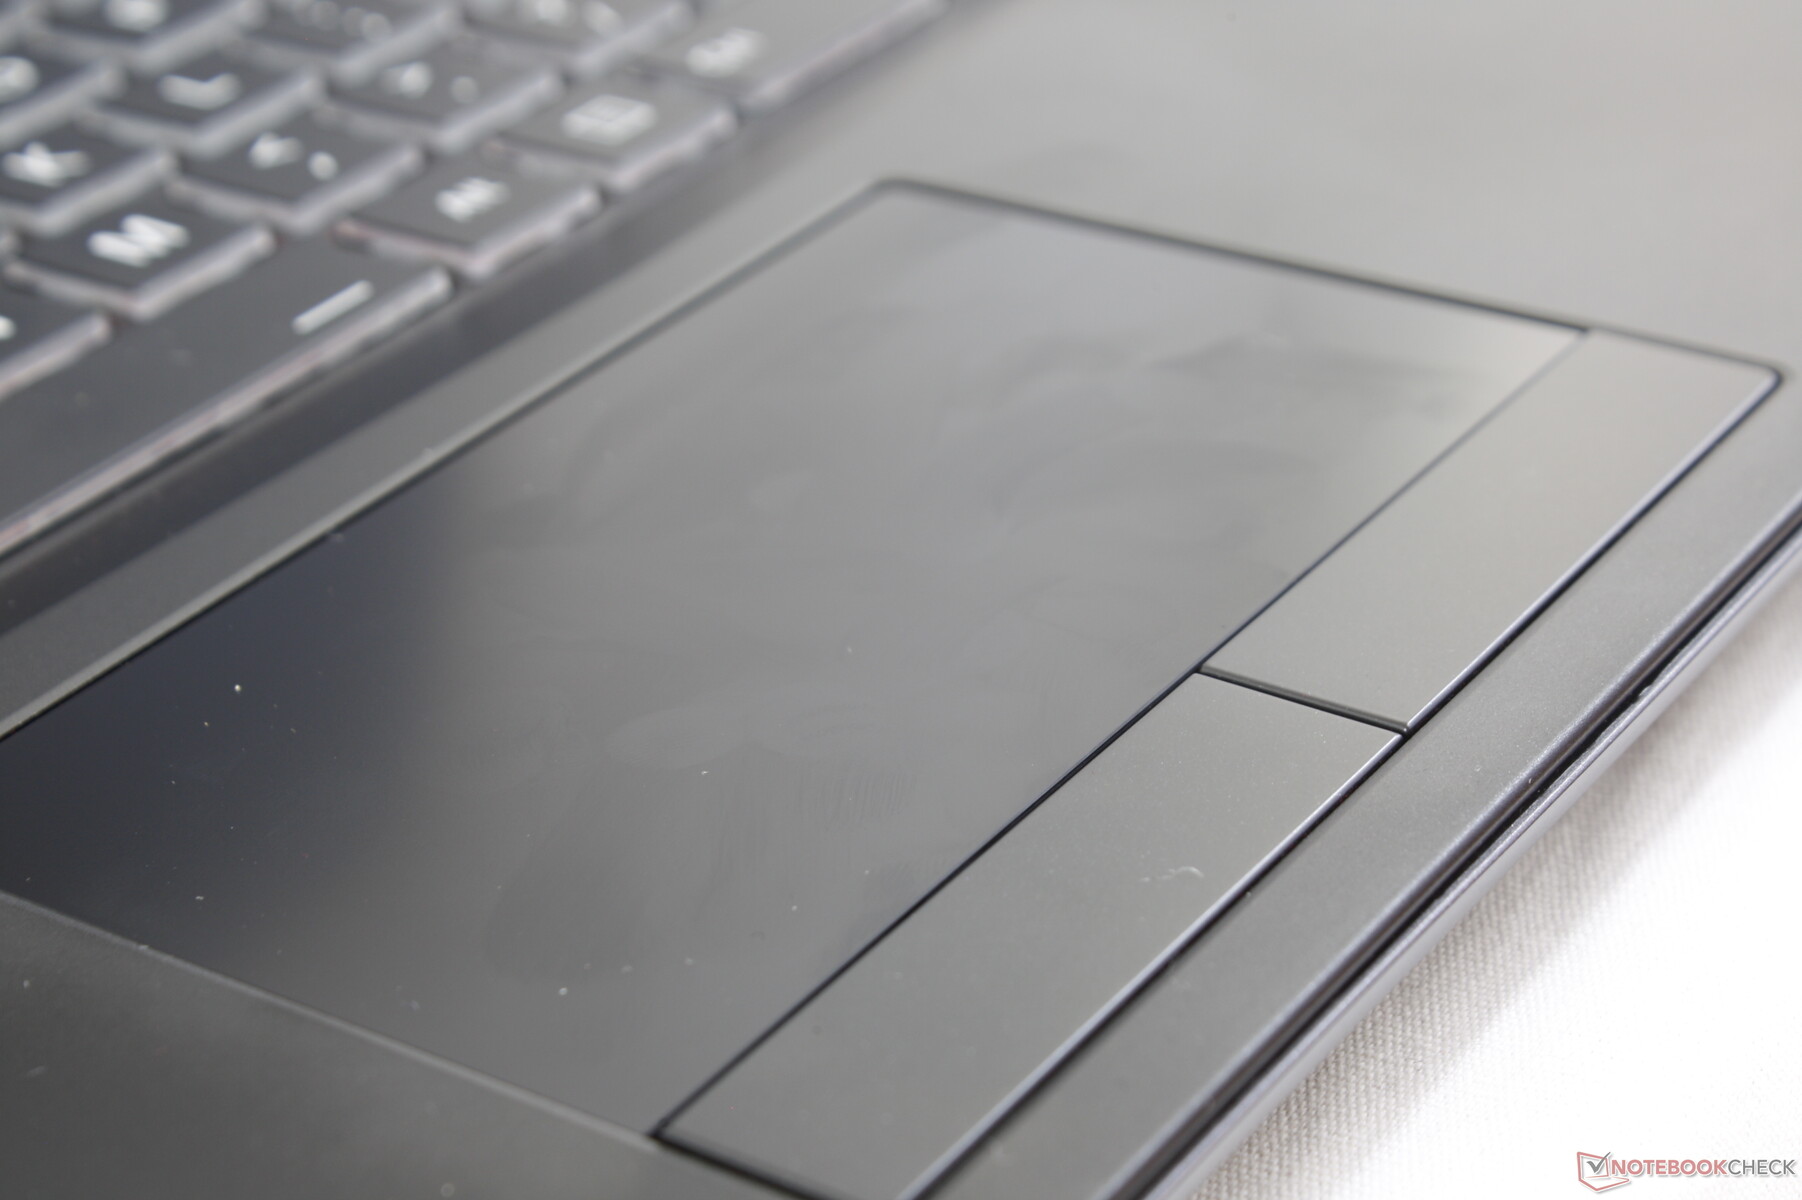
The trackpad is average in size (~10.8 x 6 cm) and similar in texture and glide to the trackpad of the Eurocom Nightsky RX17. Unlike most other laptops, the glass surface is completely smooth much like on a smartphone touchscreen. Glide is therefore uneven depending on movement speed with more resistance than usual. The atypical surface takes some getting used to..
The dedicated mouse keys are quiet when pressed with moderate feedback and travel. We find dragging and dropping to be much easier with mouse keys when compared to clickpads.
Display
As the first 16.1-inch laptop in our database, there are no other models we know of sporting the same Chi Mei N161HCA-GA1 IPS panel. This appears to be a mid-range to high-end panel that matches the color space and fast black-white response times of other 120/144 Hz panels from Chi Mei albeit with a slightly dimmer backlight and lower contrast ratio. The larger MSI GS75, for example, is about 30 percent brighter with almost twice the contrast ratio.
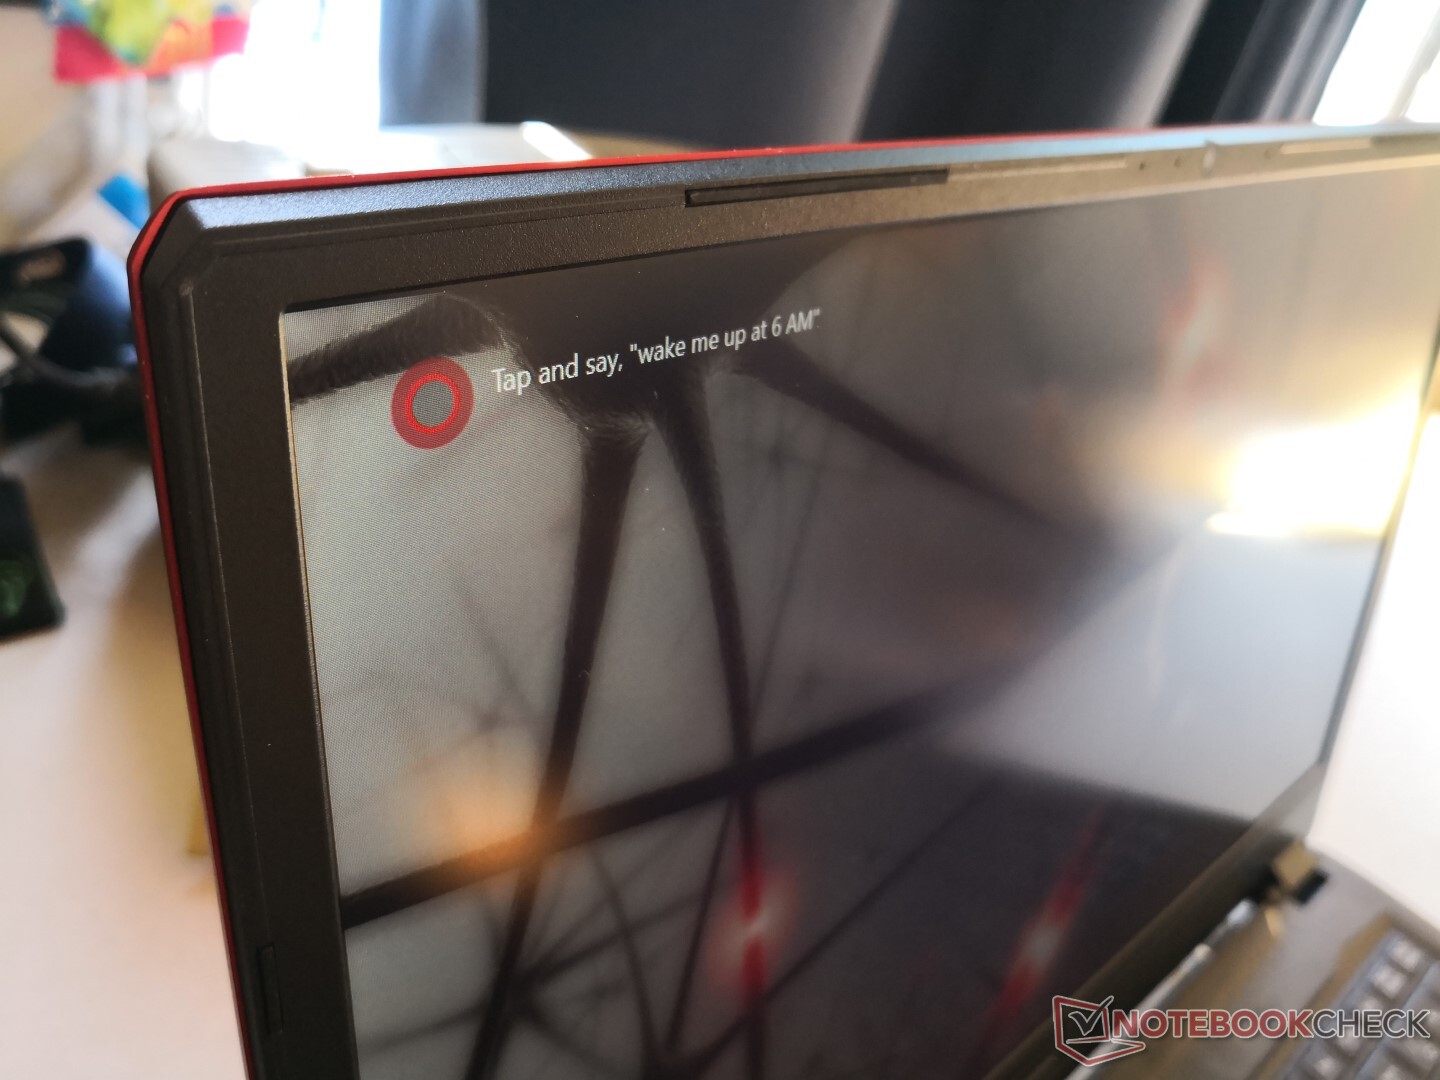
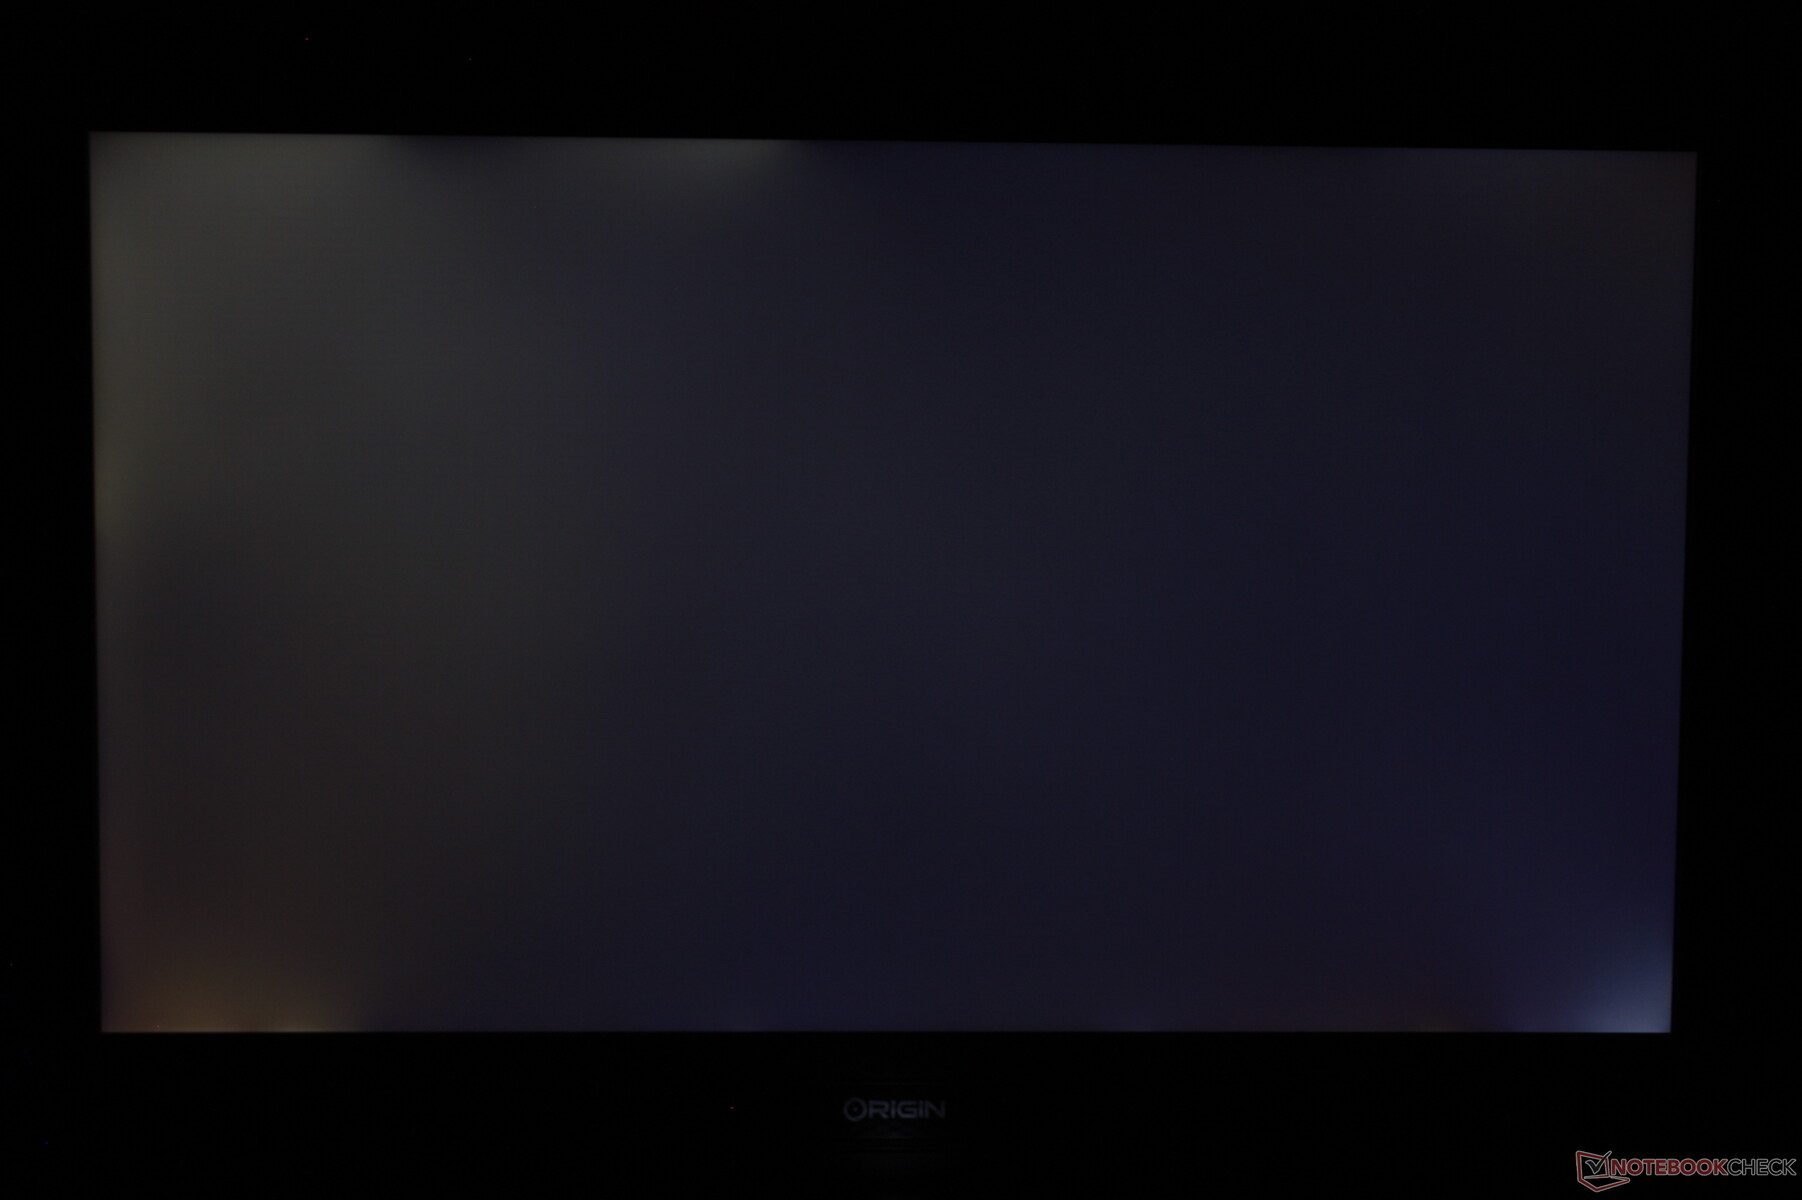
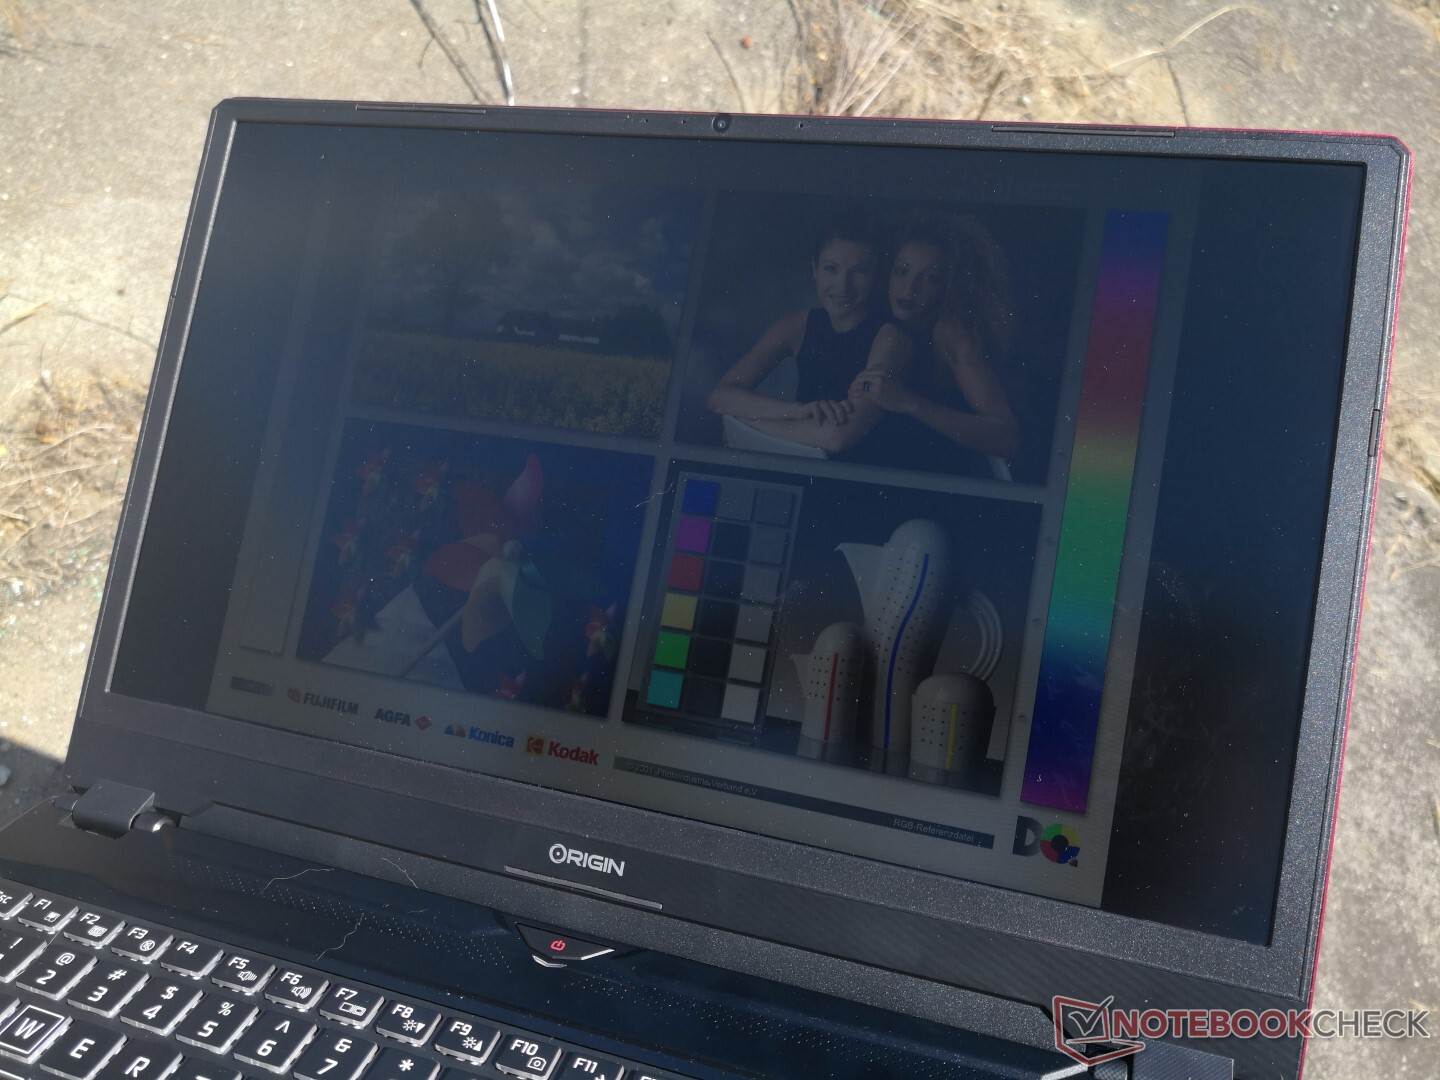
The display is slightly grainy as is common on many matte displays. Thus, glossy displays will still have the notable advantage in terms of sharpness at the cost of glare. Our test unit unfortunately exhibits moderate backlight bleeding along the edges and corners as shown below that will become noticeable during boot up or when watching videos with black borders.

| |||||||||||||||||||||||||
Brightness Distribution: 89 %
Center on Battery: 278 cd/m²
Contrast: 678:1 (Black: 0.41 cd/m²)
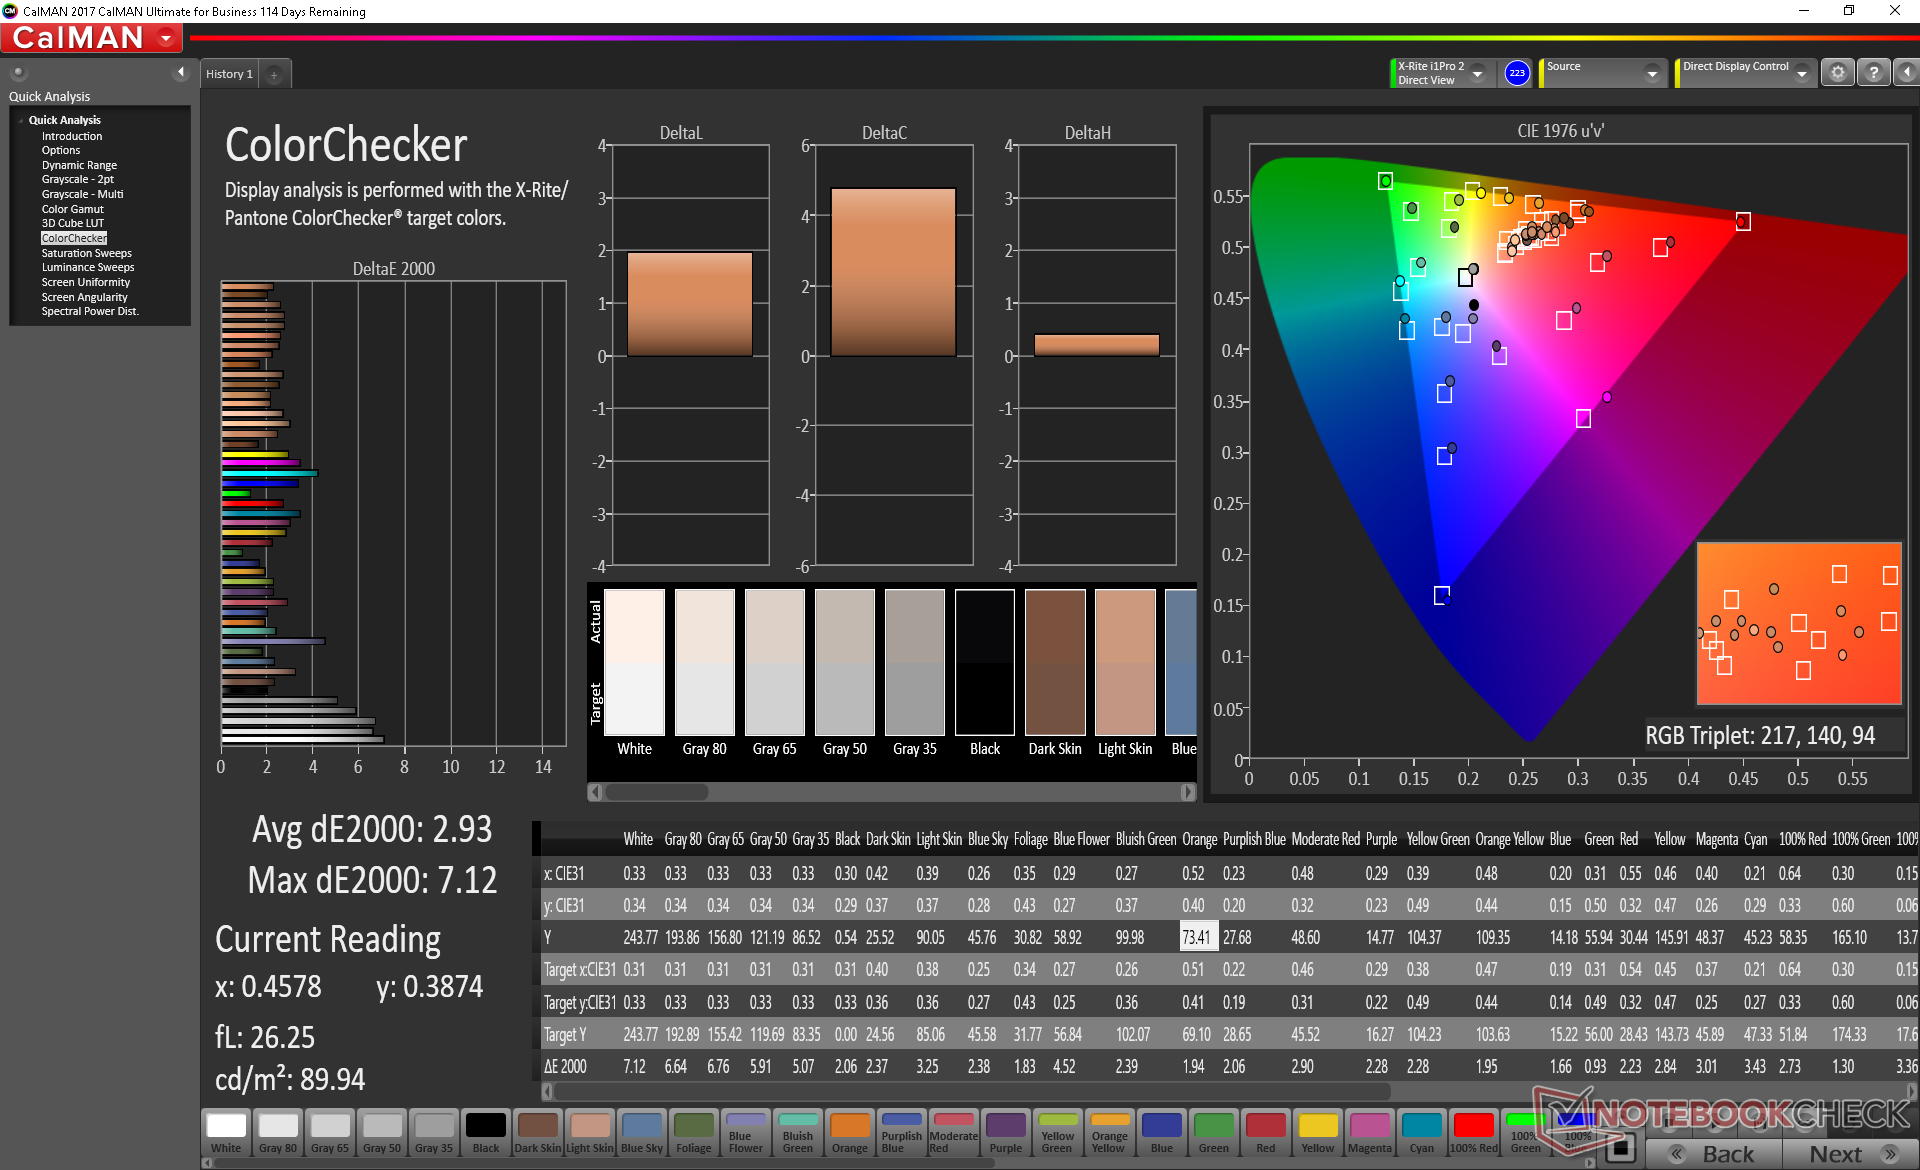
ΔE ColorChecker Calman: 2.93 | ∀{0.5-29.43 Ø4.73}
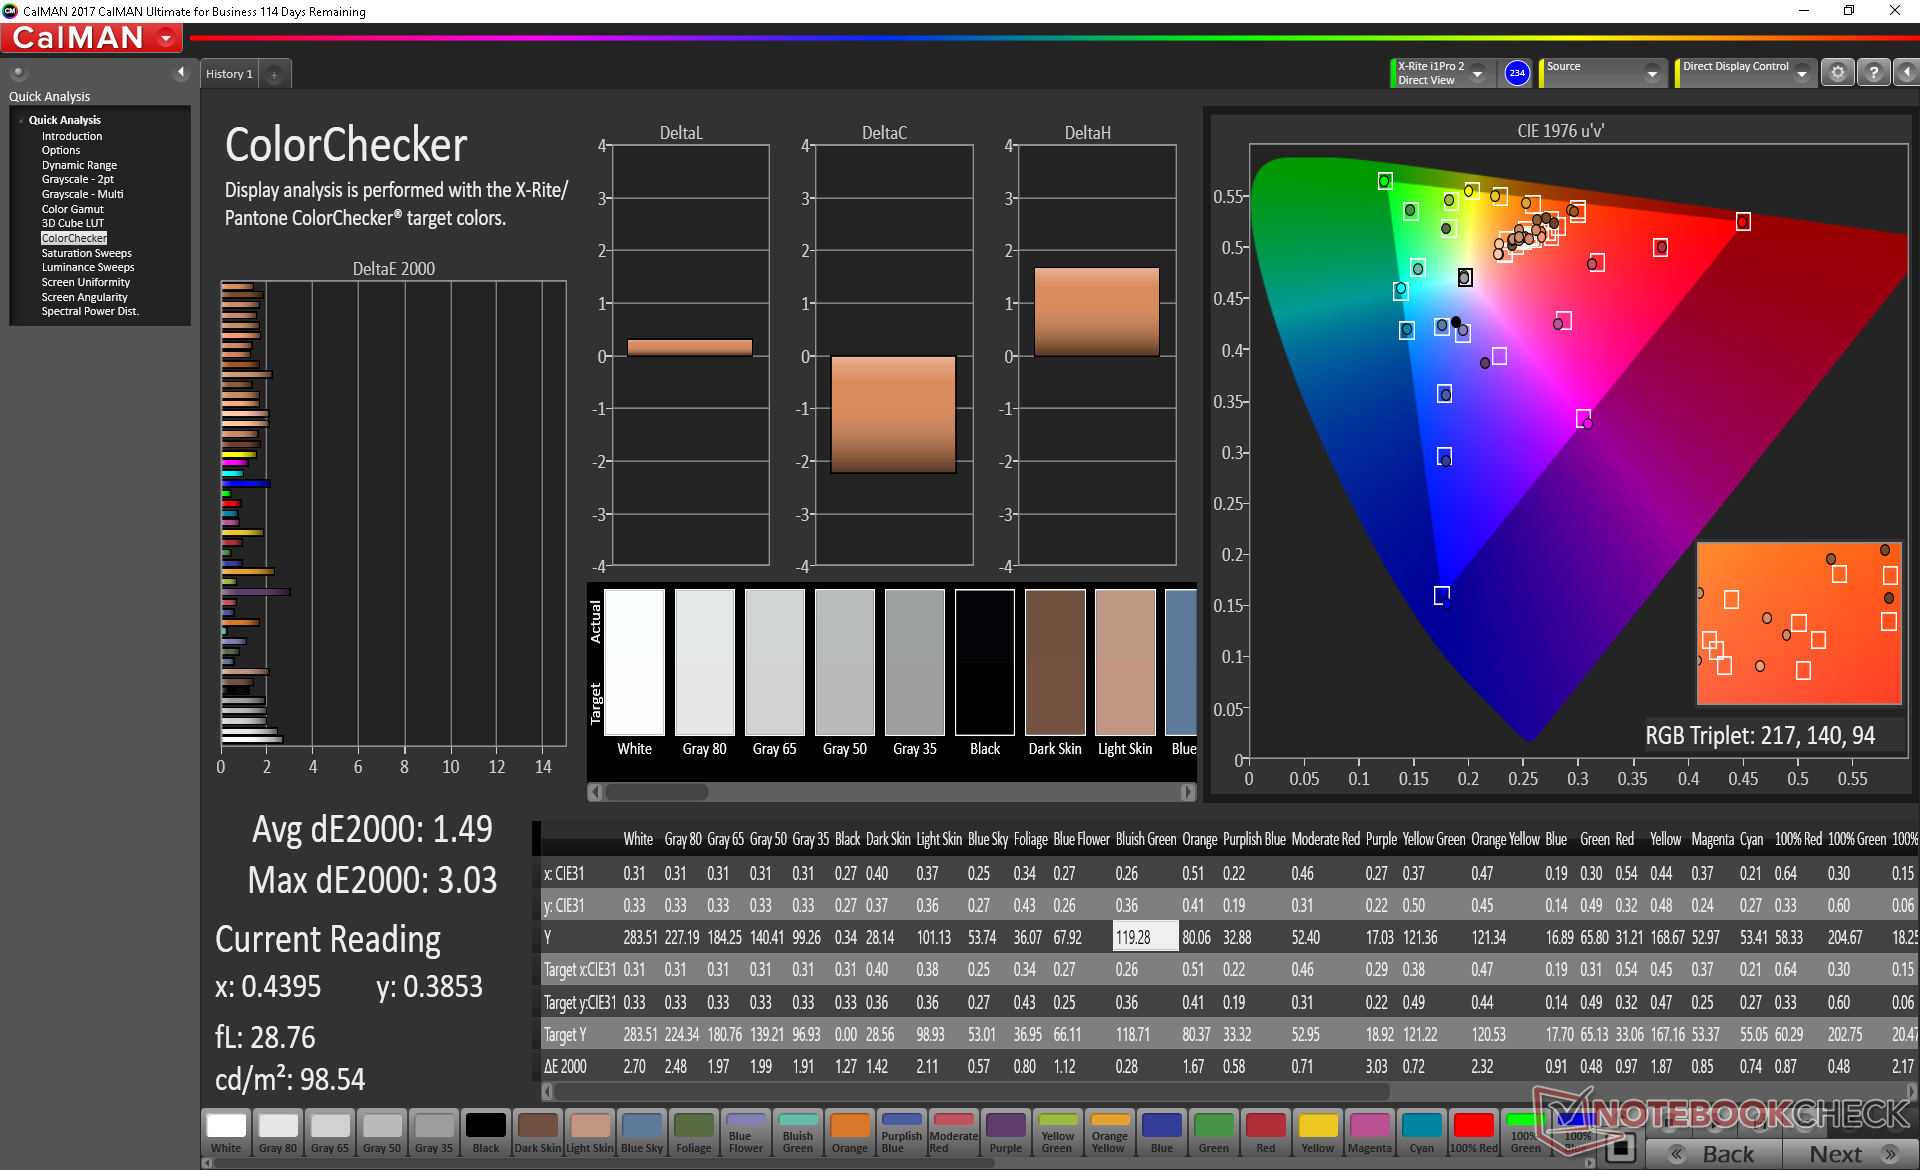
calibrated: 1.49
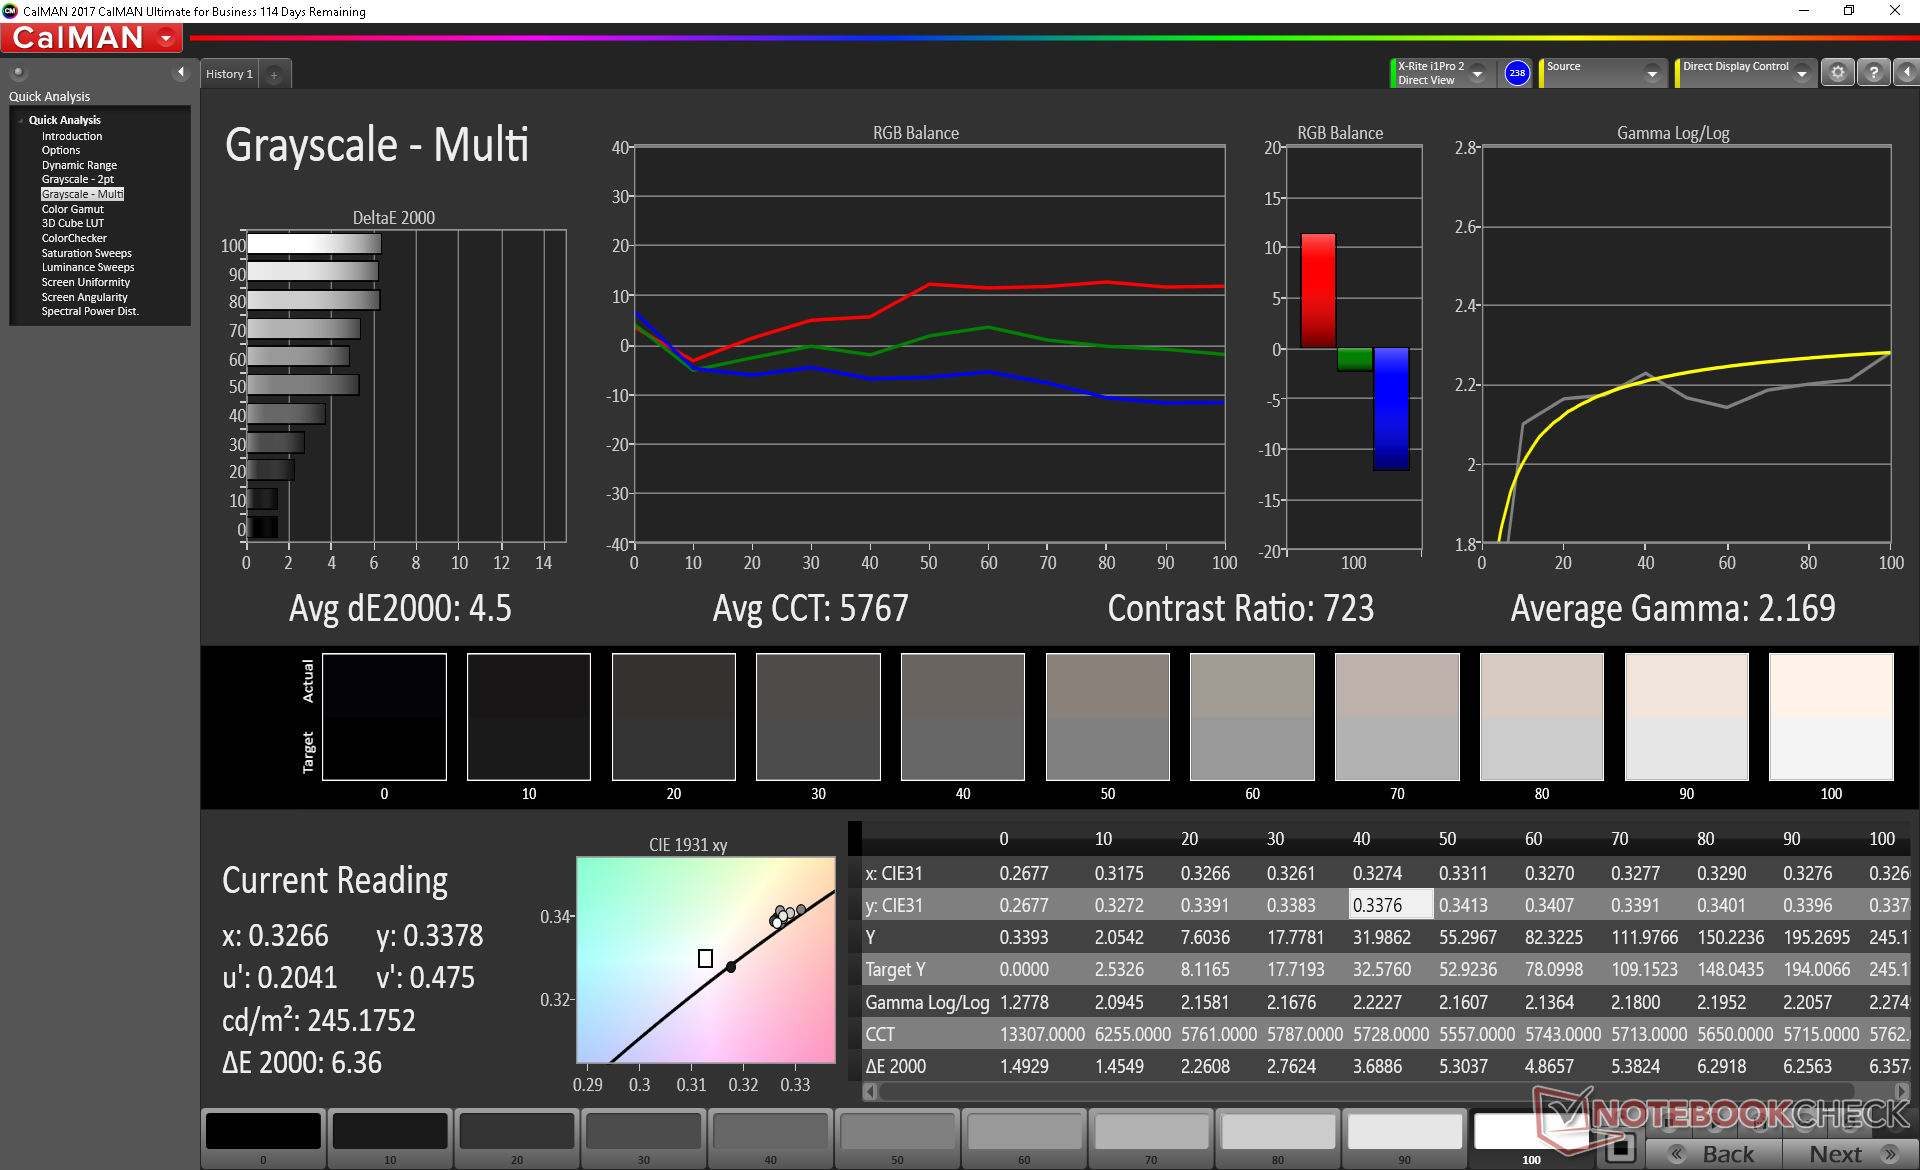
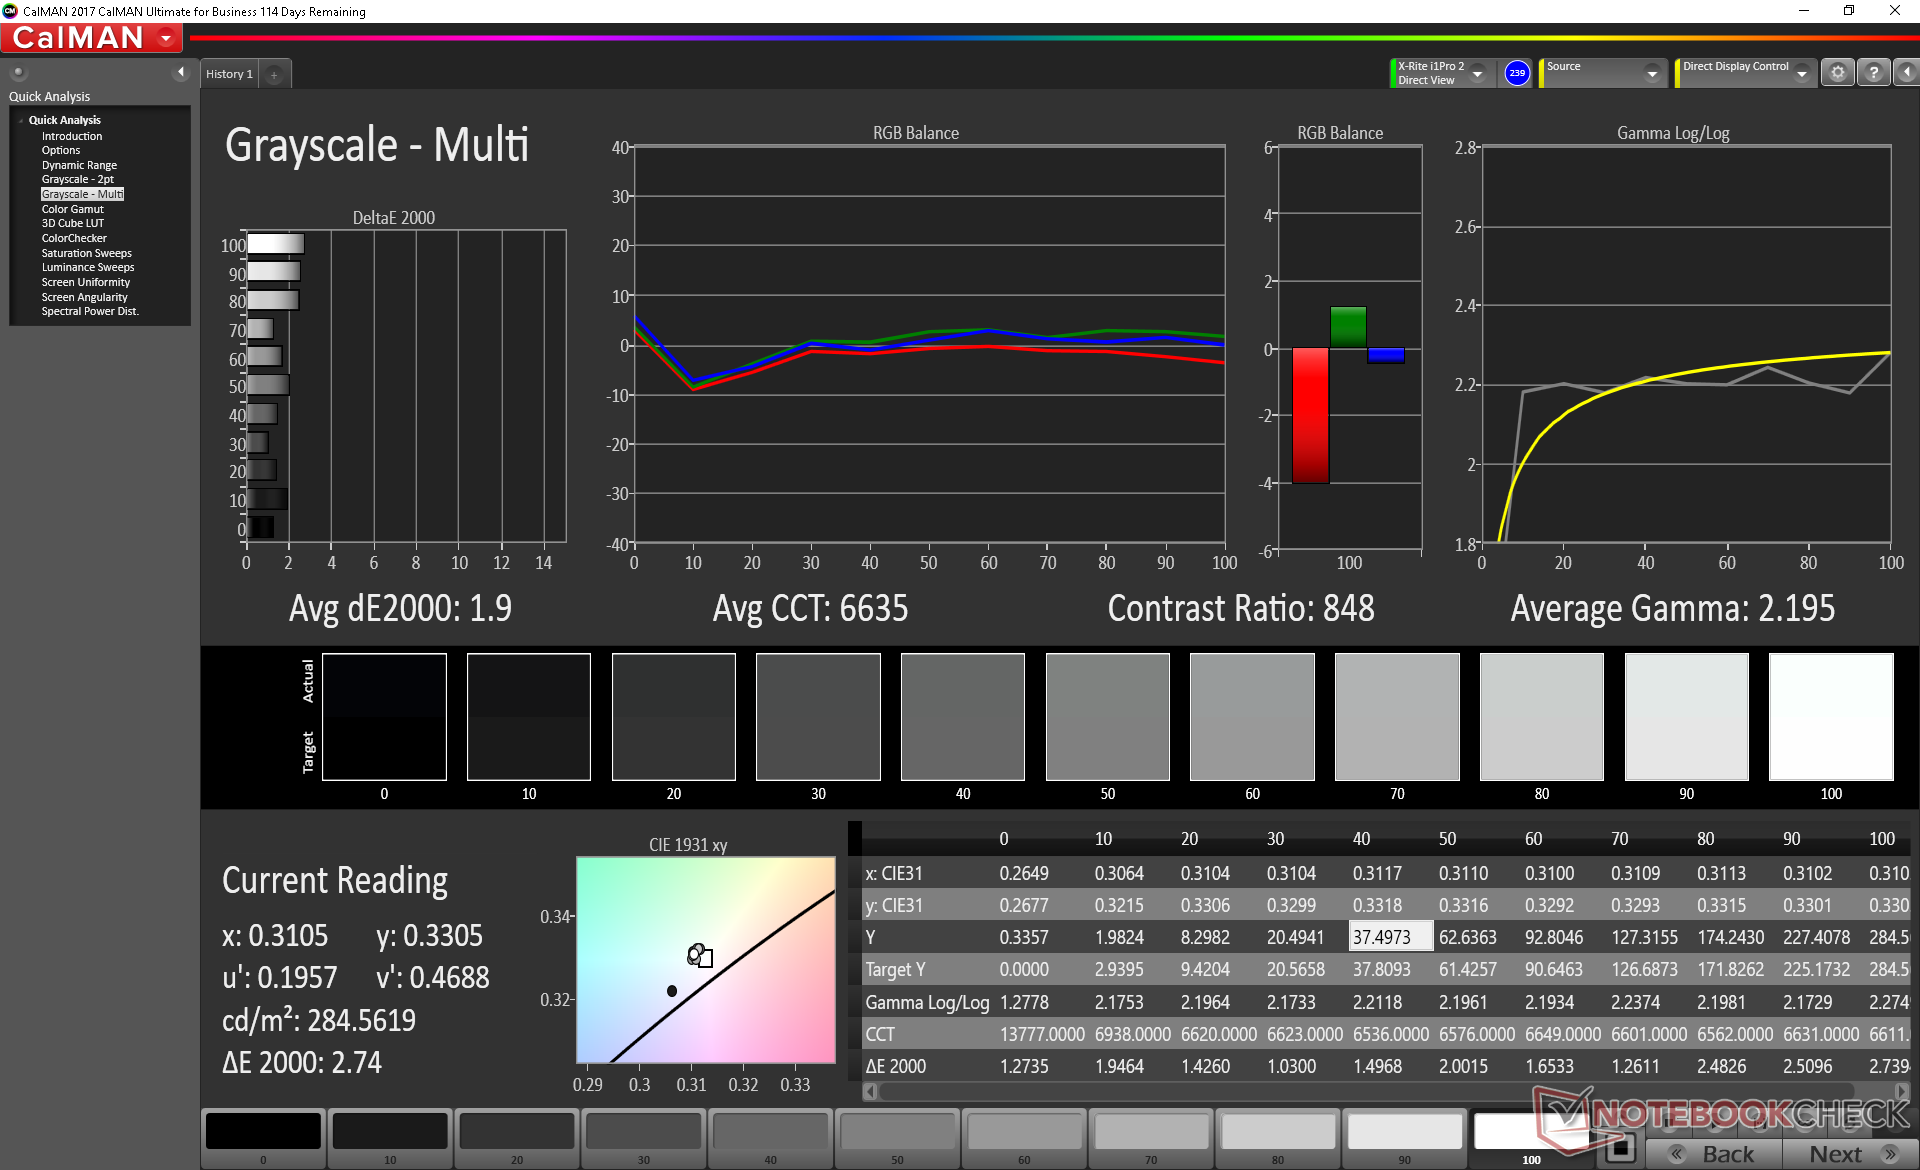
ΔE Greyscale Calman: 4.5 | ∀{0.09-98 Ø4.97}
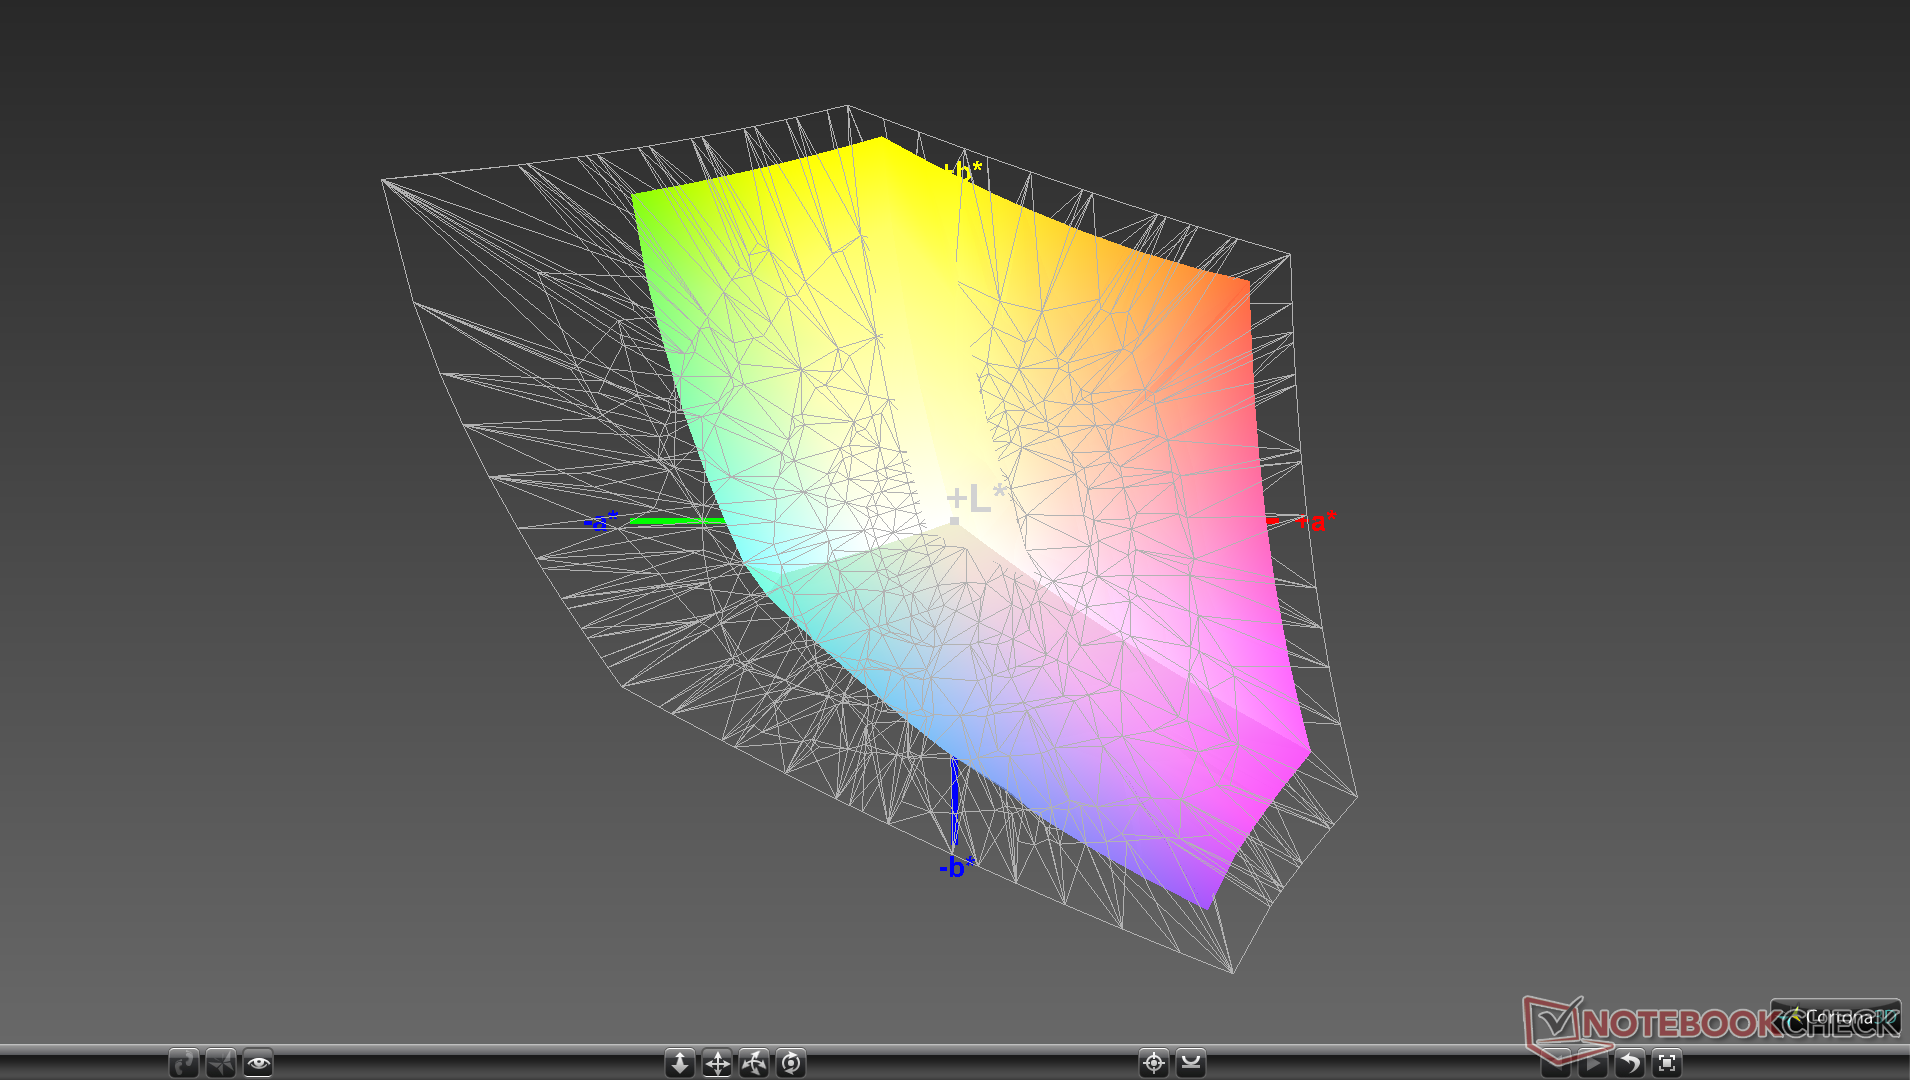
93.2% sRGB (Argyll 1.6.3 3D)
59.2% AdobeRGB 1998 (Argyll 1.6.3 3D)
64% AdobeRGB 1998 (Argyll 3D)
93.3% sRGB (Argyll 3D)
62.3% Display P3 (Argyll 3D)
Gamma: 2.17
CCT: 5767 K
| Origin PC EVO16-S i7-9750H RTX 2080 Max-Q Chi Mei CMN N161HCA-GA1, IPS, 16.1", 1920x1080 | Razer Blade 15 RTX 2080 Max-Q Sharp LQ156M1JW03 (SHP14C5), IPS, 15.6", 1920x1080 | Gigabyte Aero 15 Classic-XA Sharp LQ156M1JW03 (SHP14C5), IGZO, 15.6", 1920x1080 | MSI GS75 Stealth 9SG Chi Mei N173HCE-G33 (CMN175C), IPS, 17.3", 1920x1080 | Asus Zephyrus S GX502GW AU Optronics B156HAN08.2 (AUO82ED), IPS, 15.6", 1920x1080 | Eurocom Nightsky RX17 BOE NV173FHM-N44, IPS, 17.3", 1920x1080 | |
|---|---|---|---|---|---|---|
| Display | 6% | 4% | 0% | 2% | 4% | |
| Display P3 Coverage (%) | 62.3 | 66.9 7% | 65.3 5% | 62.6 0% | 64.9 4% | 66.1 6% |
| sRGB Coverage (%) | 93.3 | 98.1 5% | 95.5 2% | 93.5 0% | 91 -2% | 93.1 0% |
| AdobeRGB 1998 Coverage (%) | 64 | 68.5 7% | 66.5 4% | 64.7 1% | 65.9 3% | 67.2 5% |
| Response Times | 2% | -12% | 23% | 29% | -11% | |
| Response Time Grey 50% / Grey 80% * (ms) | 14.4 ? | 12.8 ? 11% | 15.2 ? -6% | 7.2 ? 50% | 7.2 ? 50% | 16.4 ? -14% |
| Response Time Black / White * (ms) | 9.6 ? | 10.4 ? -8% | 11.2 ? -17% | 10 ? -4% | 8.8 ? 8% | 10.4 ? -8% |
| PWM Frequency (Hz) | 25510 ? | 23810 ? | 23580 ? | 25510 ? | 990 ? | |
| Screen | 23% | 12% | 36% | 9% | 2% | |
| Brightness middle (cd/m²) | 278 | 293 5% | 266 -4% | 366 32% | 286 3% | 298.4 7% |
| Brightness (cd/m²) | 259 | 270 4% | 248 -4% | 343 32% | 275 6% | 287 11% |
| Brightness Distribution (%) | 89 | 87 -2% | 89 0% | 91 2% | 90 1% | 90 1% |
| Black Level * (cd/m²) | 0.41 | 0.29 29% | 0.31 24% | 0.29 29% | 0.37 10% | 0.3 27% |
| Contrast (:1) | 678 | 1010 49% | 858 27% | 1262 86% | 773 14% | 995 47% |
| Colorchecker dE 2000 * | 2.93 | 1.69 42% | 2.78 5% | 1.51 48% | 2.19 25% | 3.58 -22% |
| Colorchecker dE 2000 max. * | 7.12 | 3.37 53% | 5.96 16% | 3.22 55% | 4.4 38% | 6.29 12% |
| Colorchecker dE 2000 calibrated * | 1.49 | 1.24 17% | 0.91 39% | 0.71 52% | 2.27 -52% | 2.82 -89% |
| Greyscale dE 2000 * | 4.5 | 2.3 49% | 3.58 20% | 1.93 57% | 2.2 51% | 3.1 31% |
| Gamma | 2.17 101% | 2.3 96% | 2.46 89% | 2.38 92% | 2.41 91% | 2.24 98% |
| CCT | 5767 113% | 6758 96% | 7186 90% | 6881 94% | 6405 101% | 7064 92% |
| Color Space (Percent of AdobeRGB 1998) (%) | 59.2 | 63 6% | 62 5% | 60 1% | 59 0% | 60.2 2% |
| Color Space (Percent of sRGB) (%) | 93.2 | 98.5 6% | 96 3% | 94 1% | 91 -2% | 92.7 -1% |
| Total Average (Program / Settings) | 10% /
18% | 1% /
7% | 20% /
28% | 13% /
10% | -2% /
1% |
* ... smaller is better
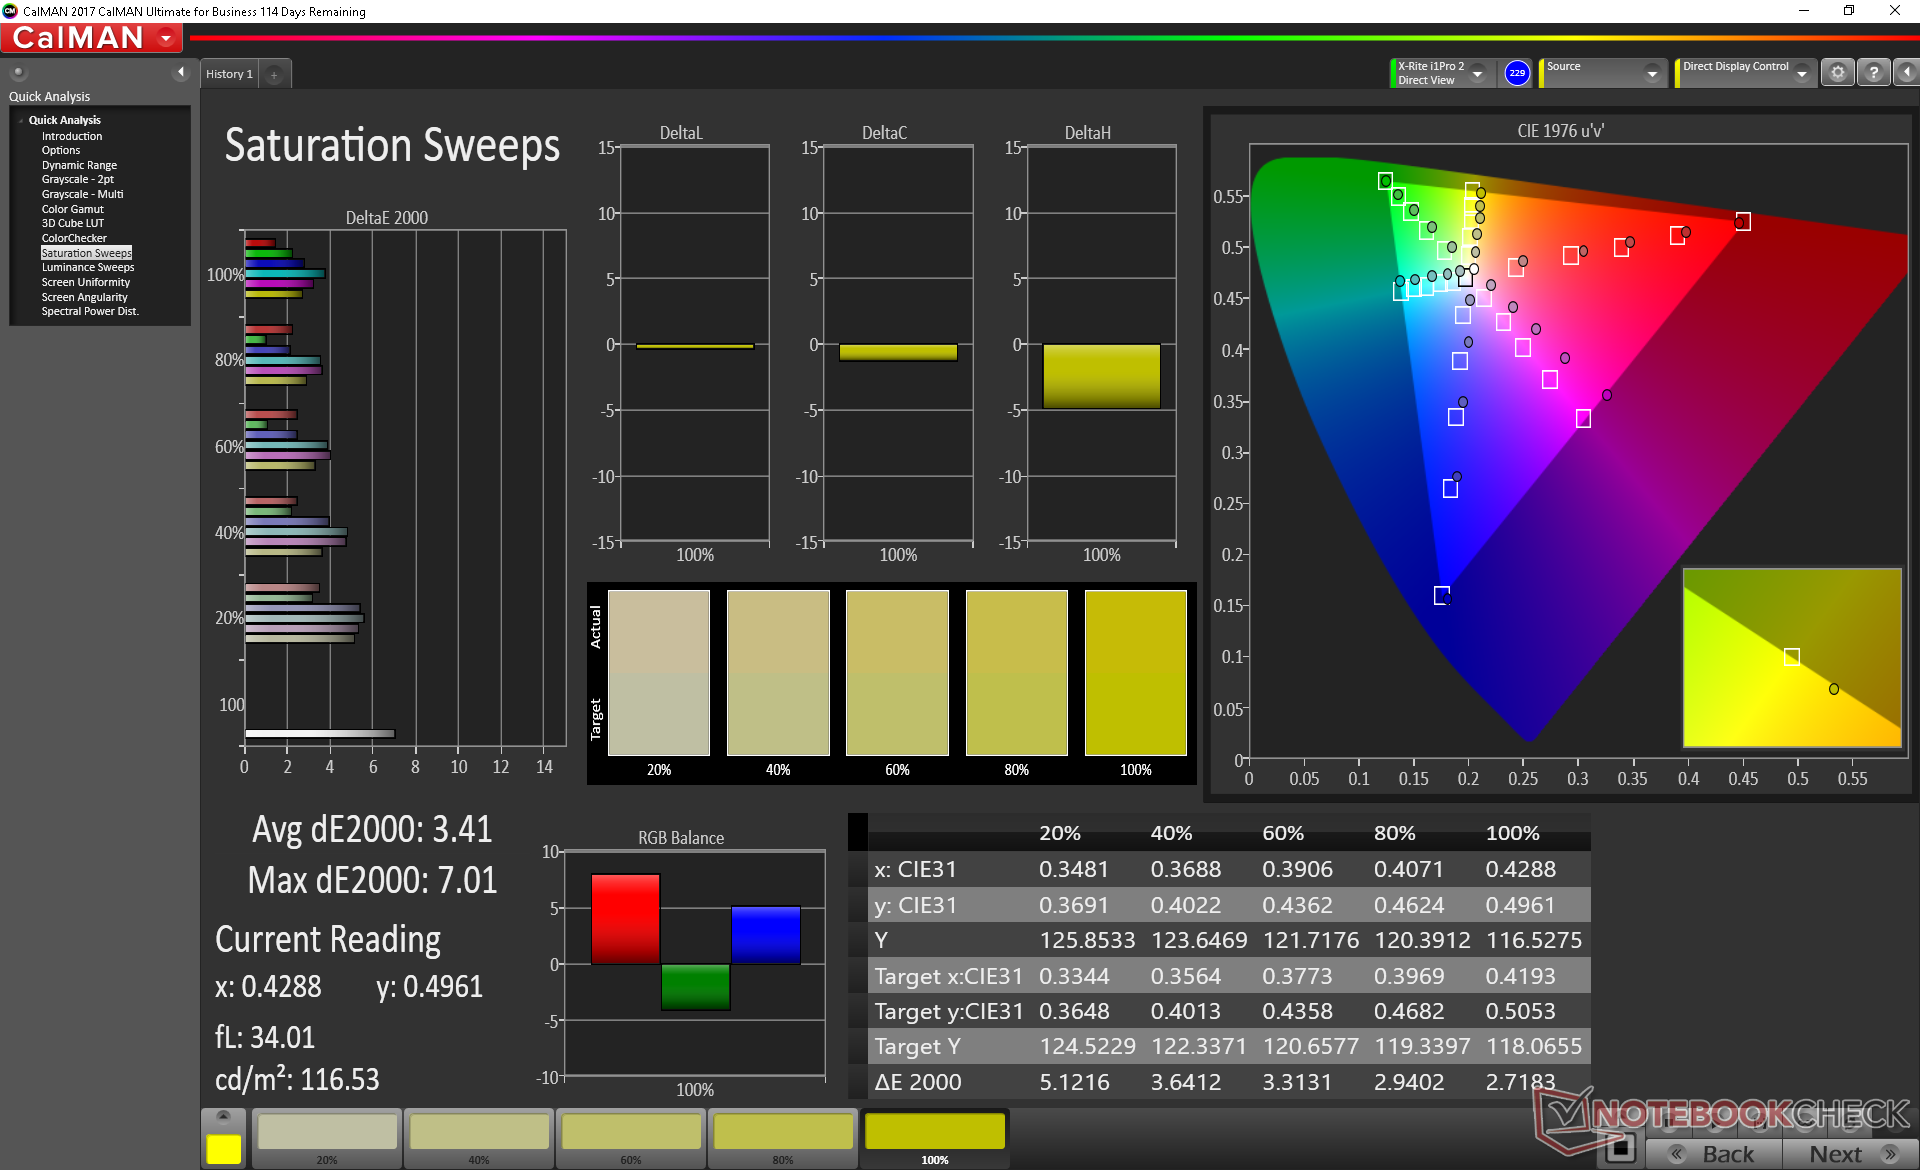
Color space is about the same as most other 144 Hz IPS panels at around 95 percent of sRGB. This is indicative of a high-end panel with both deep colors and a fast native refresh rate unlike the Panda LM156LF-CL03 panel on the cheaper Asus Zephyrus G GA502.

Further measurements with an X-Rite colorimeter reveal just average grayscale and color accuracy out of the box. Color temperature is also too warm, but a calibration addresses this and improves accuracy noticeably. Average grayscale and color DeltaE values sit at just 1.9 and 1.14 after calibration.

Display Response Times
| ↔ Response Time Black to White | ||
|---|---|---|
| 9.6 ms ... rise ↗ and fall ↘ combined | ↗ 5.2 ms rise | 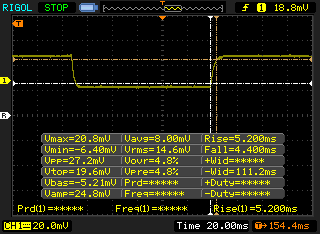 |
| ↘ 4.4 ms fall | ||
| The screen shows fast response rates in our tests and should be suited for gaming. In comparison, all tested devices range from 0.1 (minimum) to 240 (maximum) ms. » 26 % of all devices are better. This means that the measured response time is better than the average of all tested devices (19.9 ms). | ||
| ↔ Response Time 50% Grey to 80% Grey | ||
| 14.4 ms ... rise ↗ and fall ↘ combined | ↗ 7.6 ms rise | 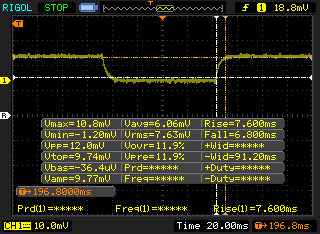 |
| ↘ 6.8 ms fall | ||
| The screen shows good response rates in our tests, but may be too slow for competitive gamers. In comparison, all tested devices range from 0.165 (minimum) to 636 (maximum) ms. » 28 % of all devices are better. This means that the measured response time is better than the average of all tested devices (31.1 ms). | ||
Screen Flickering / PWM (Pulse-Width Modulation)
| Screen flickering / PWM detected | 25510 Hz | ≤ 21 % brightness setting | 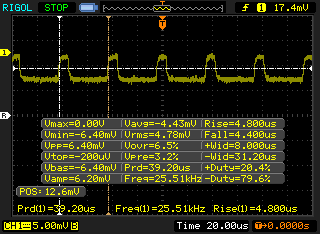 |
The display backlight flickers at 25510 Hz (worst case, e.g., utilizing PWM) Flickering detected at a brightness setting of 21 % and below. There should be no flickering or PWM above this brightness setting. The frequency of 25510 Hz is quite high, so most users sensitive to PWM should not notice any flickering. In comparison: 52 % of all tested devices do not use PWM to dim the display. If PWM was detected, an average of 7794 (minimum: 5 - maximum: 343500) Hz was measured. | |||
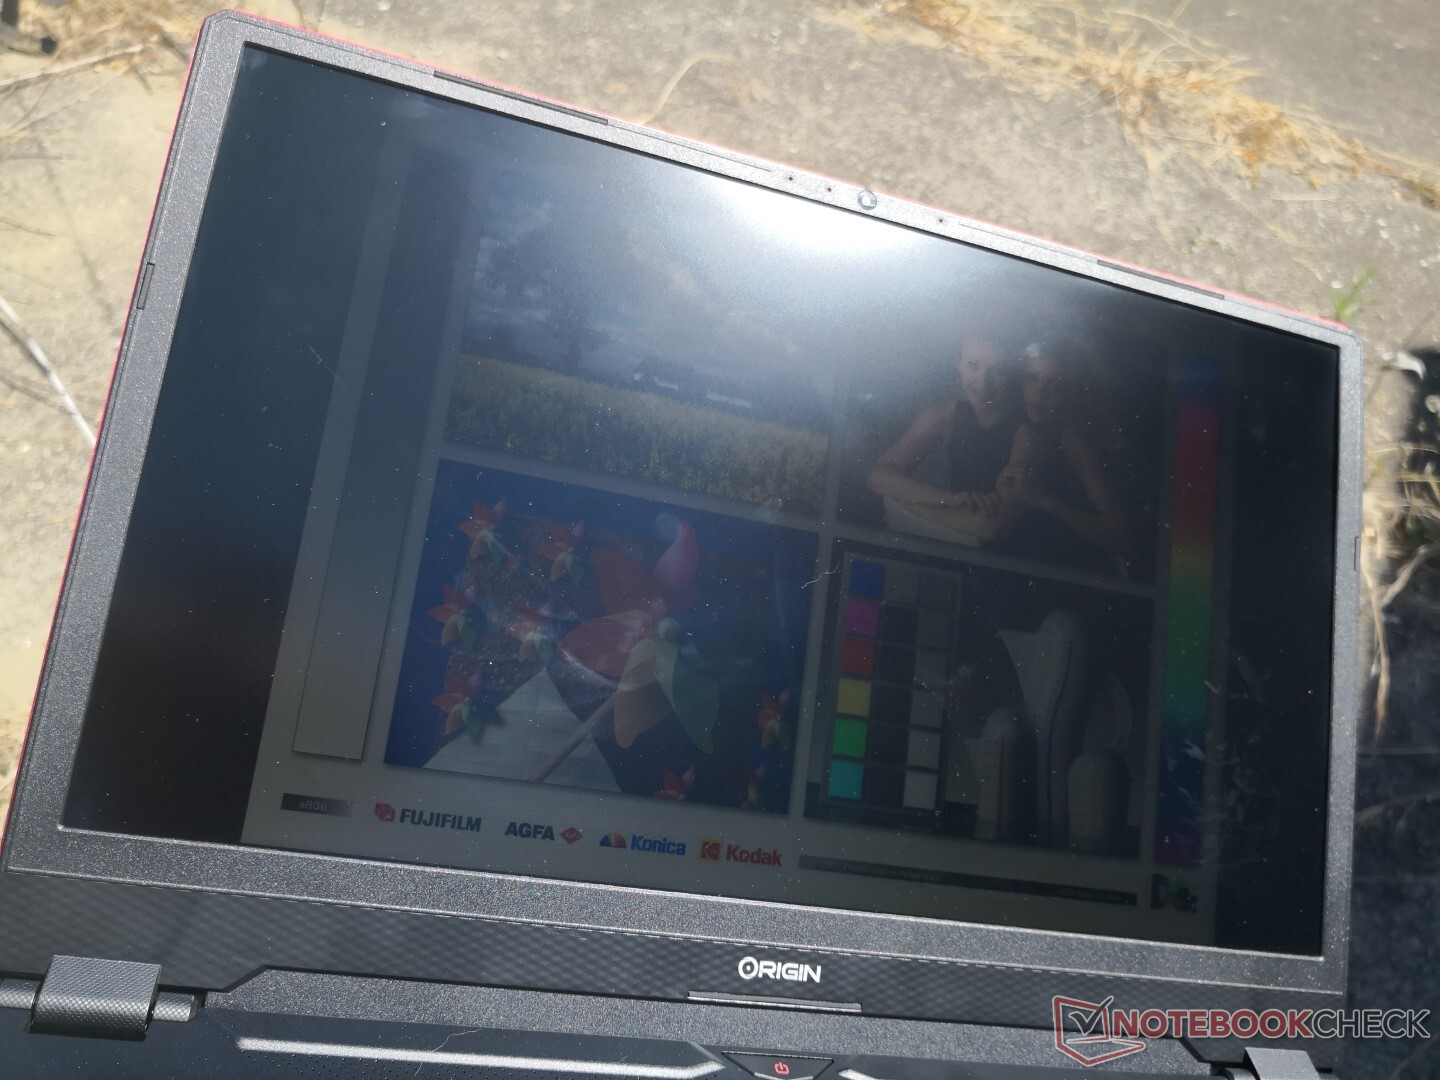
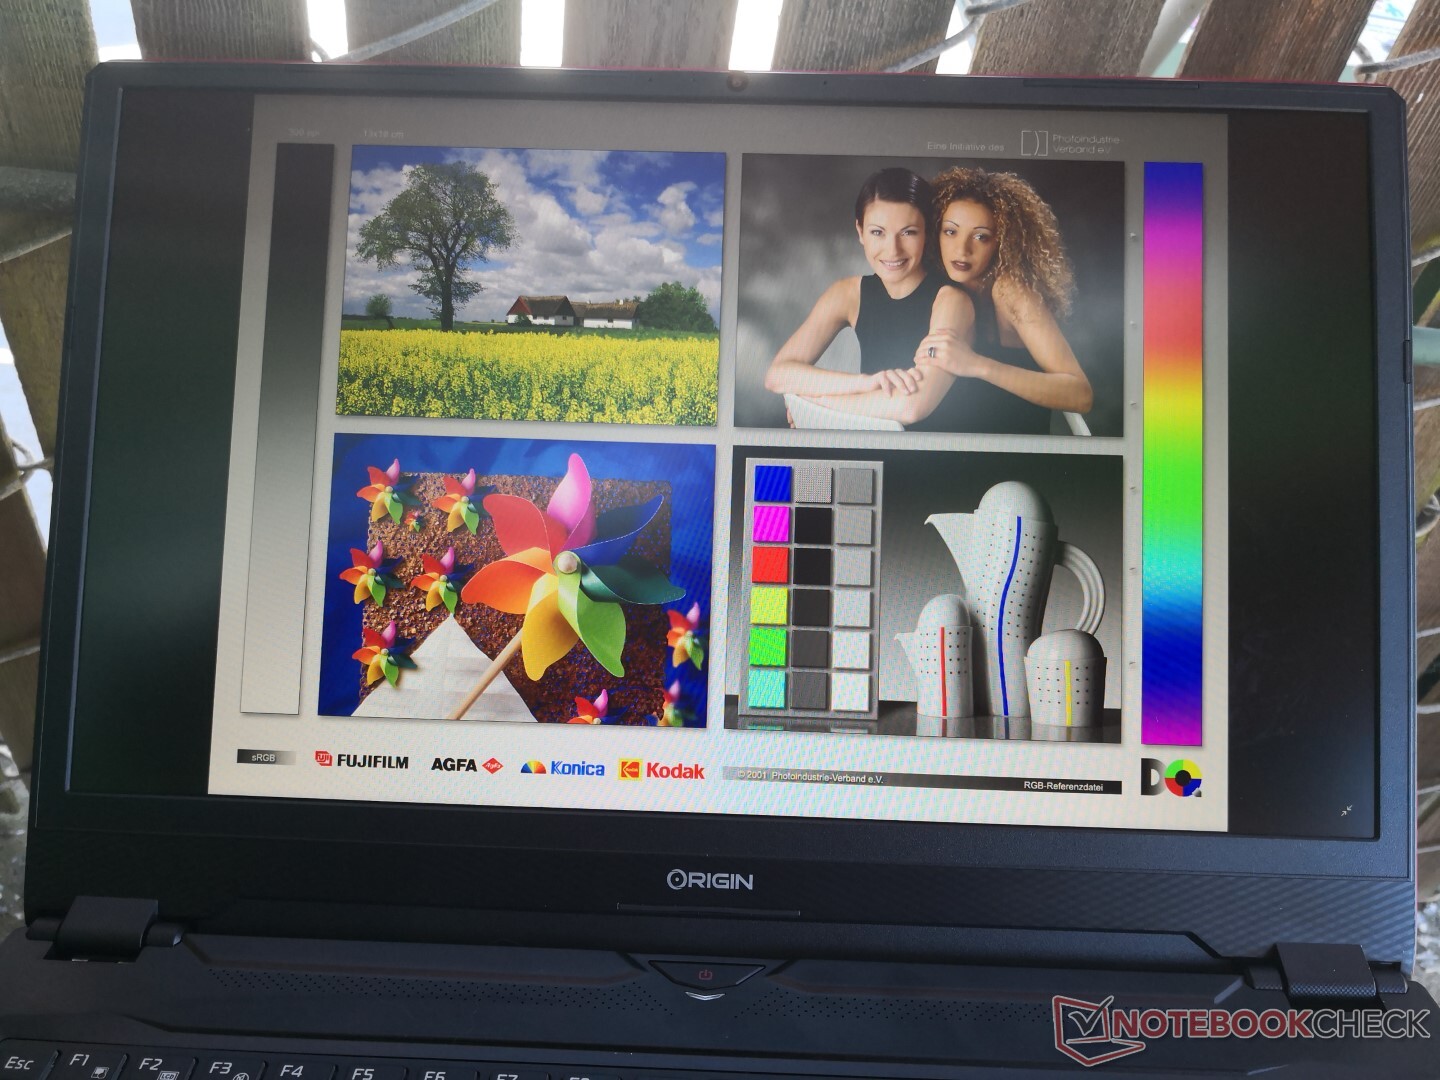
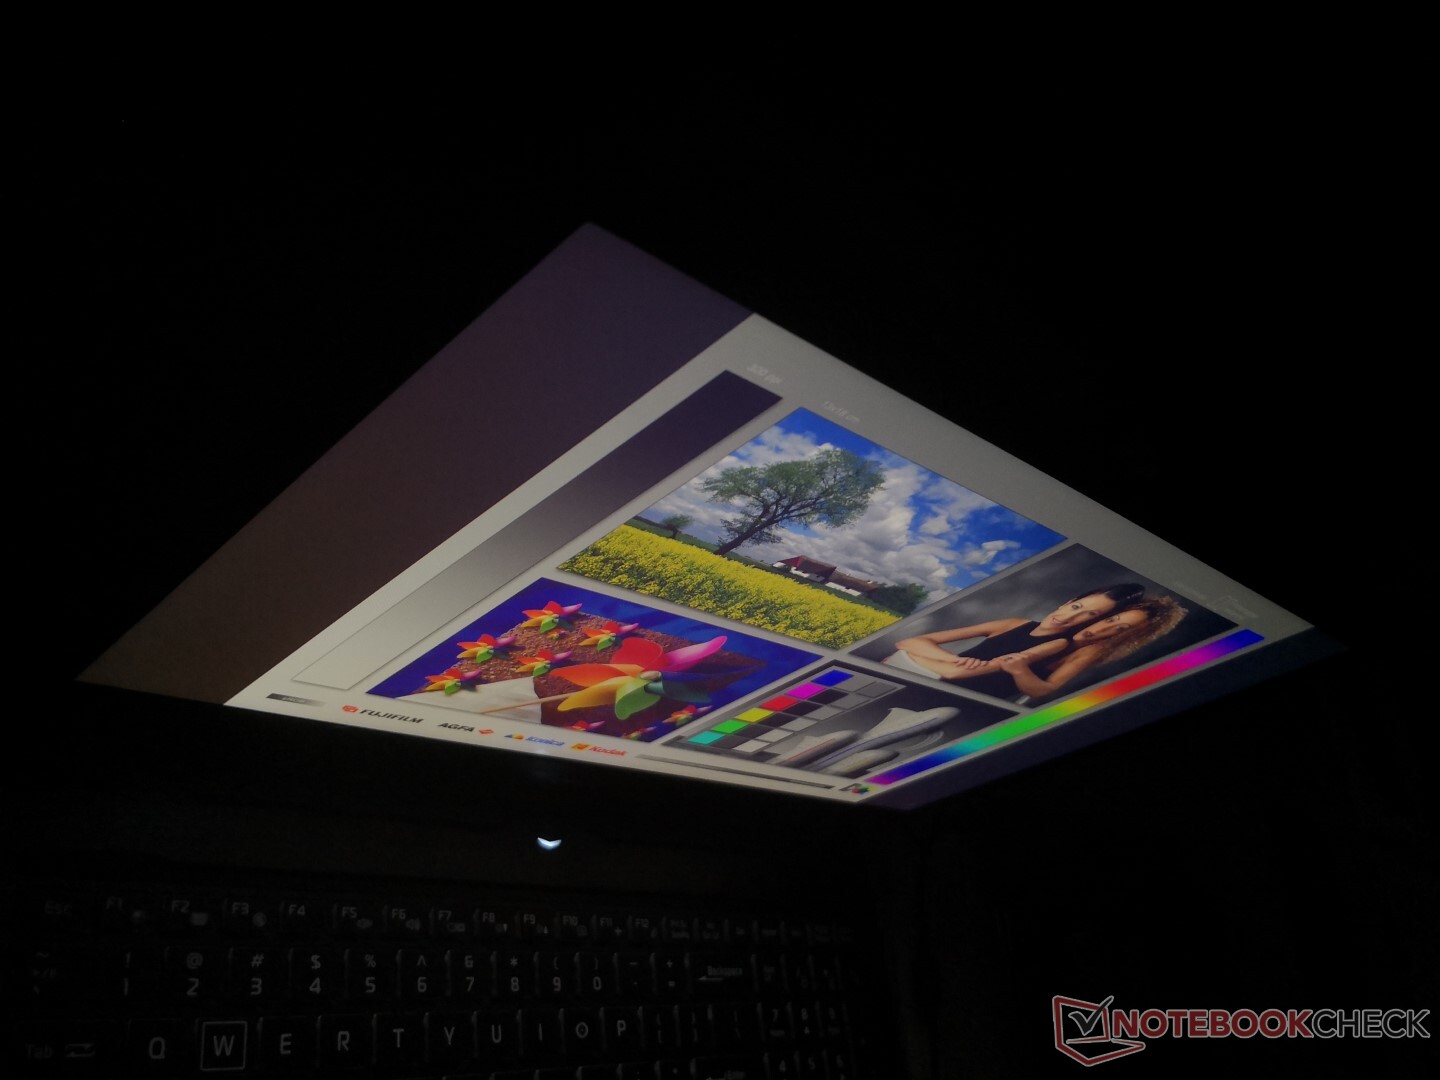
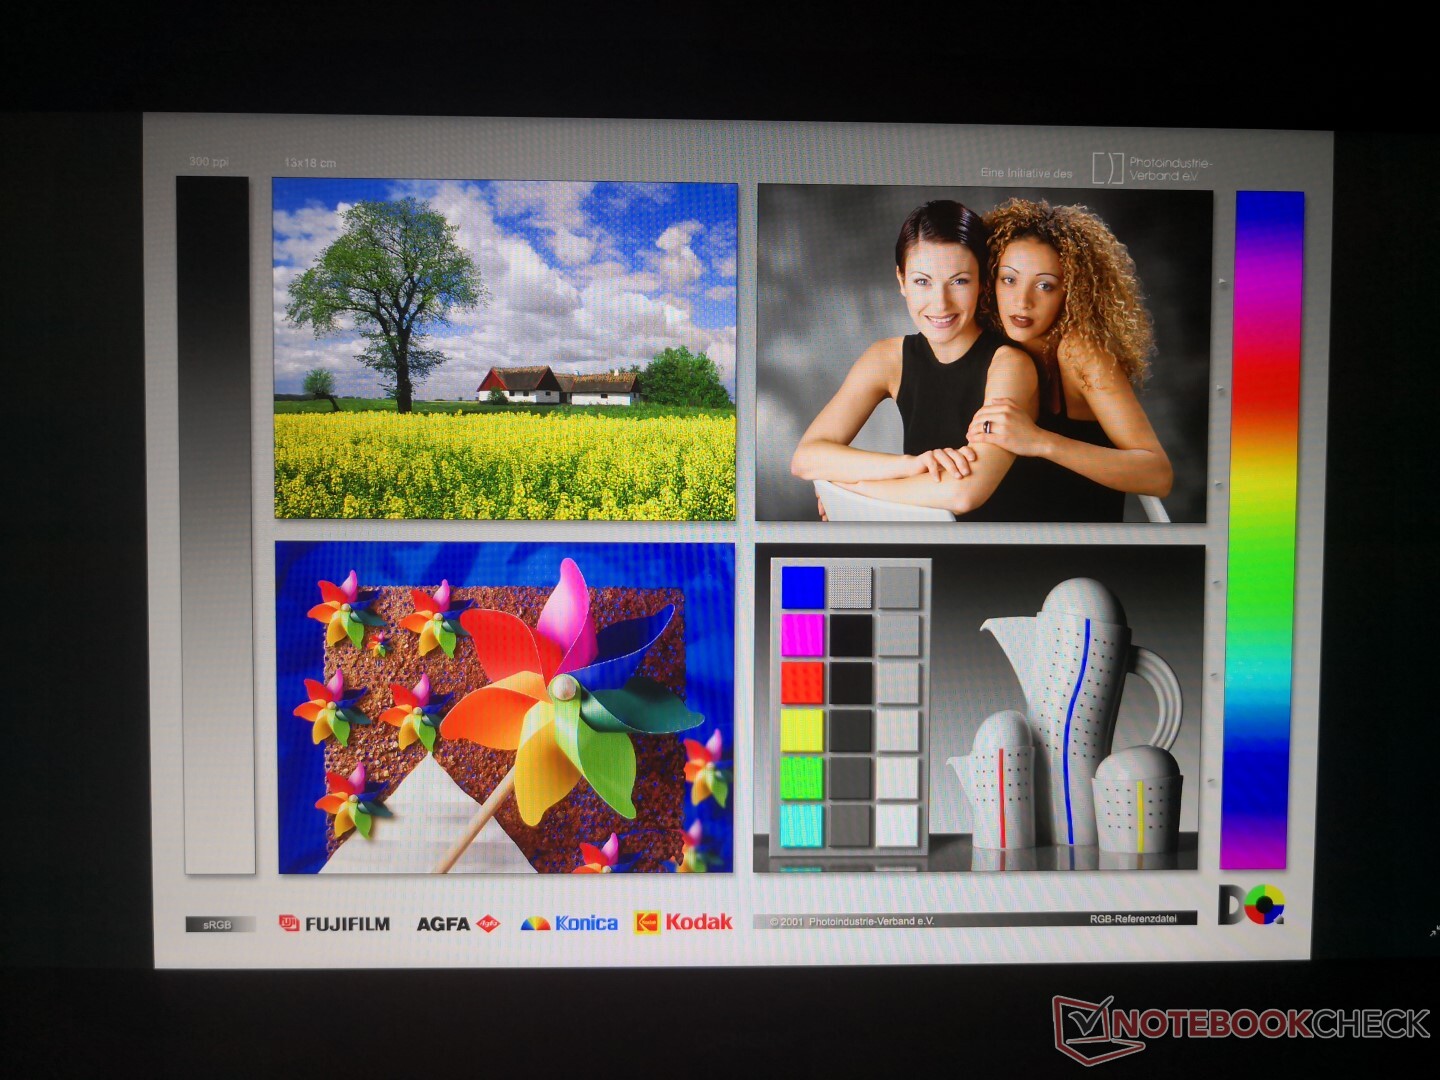
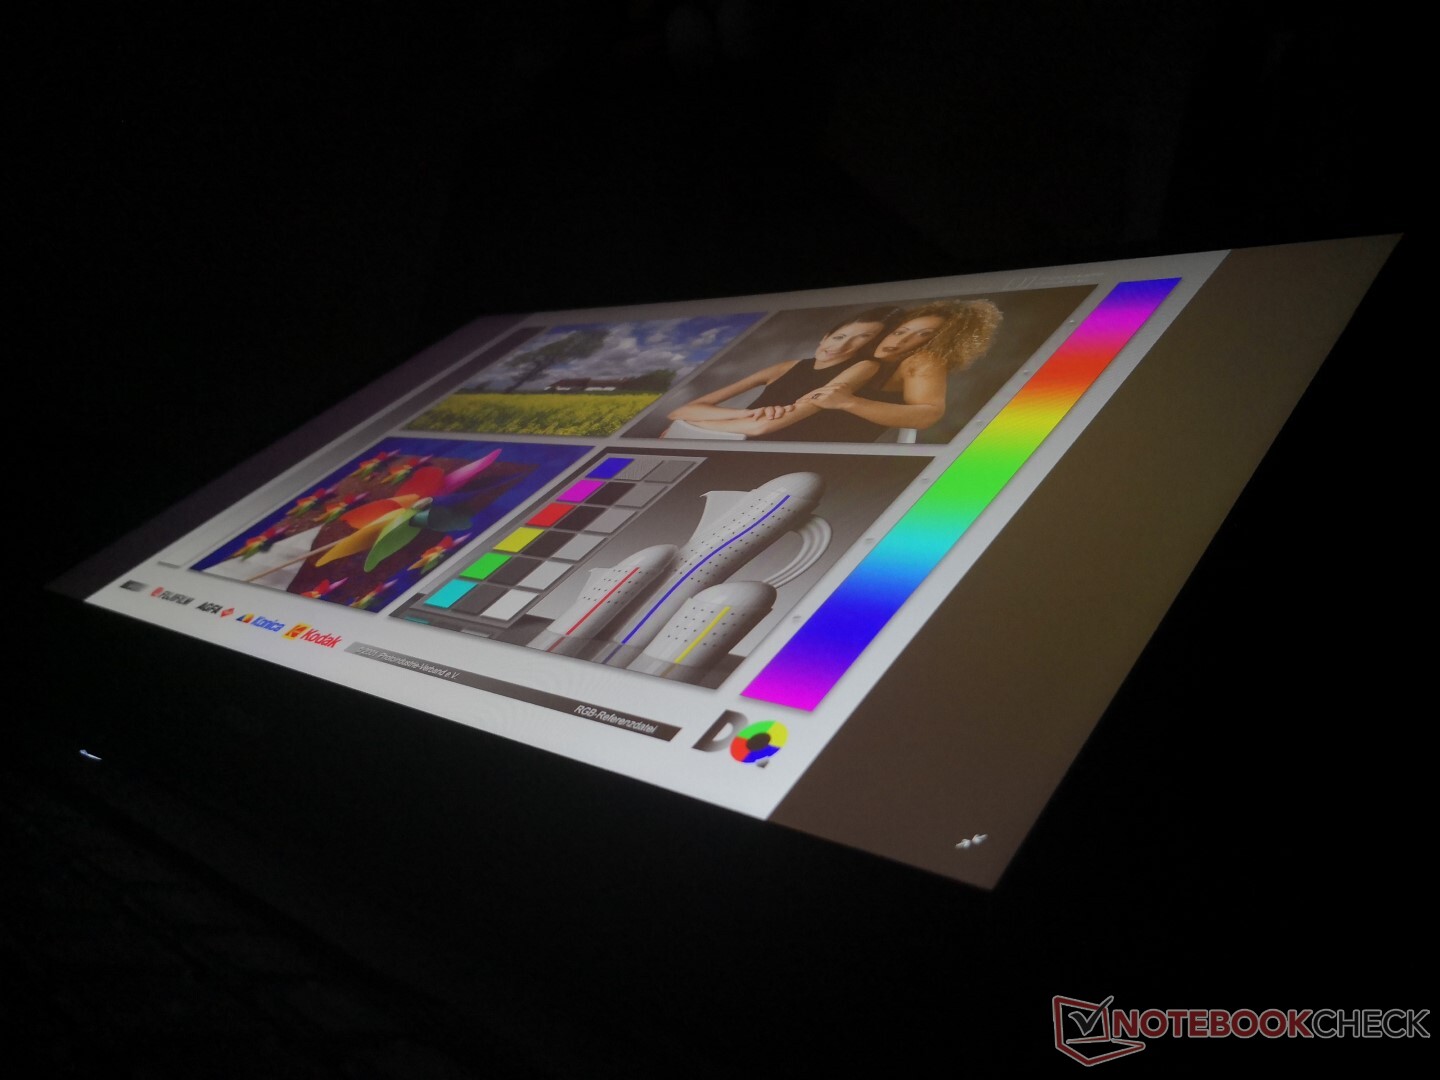
Outdoor visibility is only average at best since the backlight is dimmer than most Ultrabooks. Colors and texts become washed out very easily from the bright ambient lighting. Viewing angles are wide with slight changes to contrast and colors from extreme angles as is typical of IPS displays.
Performance
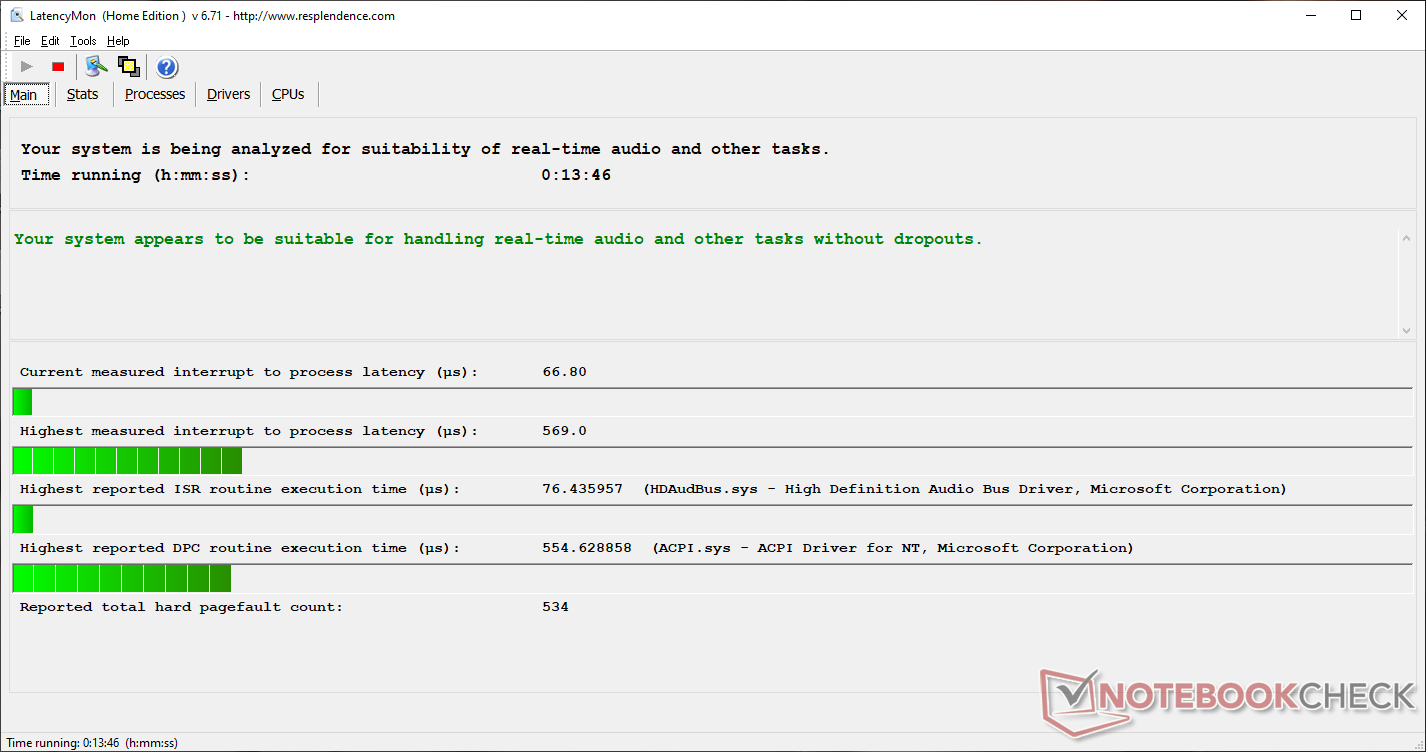
The EVO16-S ships with only Coffee Lake-H Core i7 and GeForce RTX graphics for now to cater directly to enthusiasts. LatencyMon shows no DPC latency issues even when the wireless is enabled.
Nvidia G-Sync is not available since Optimus comes standard.

Processor
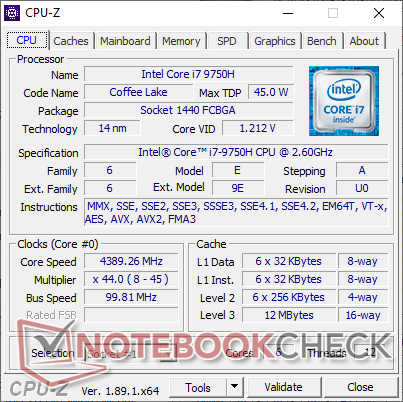
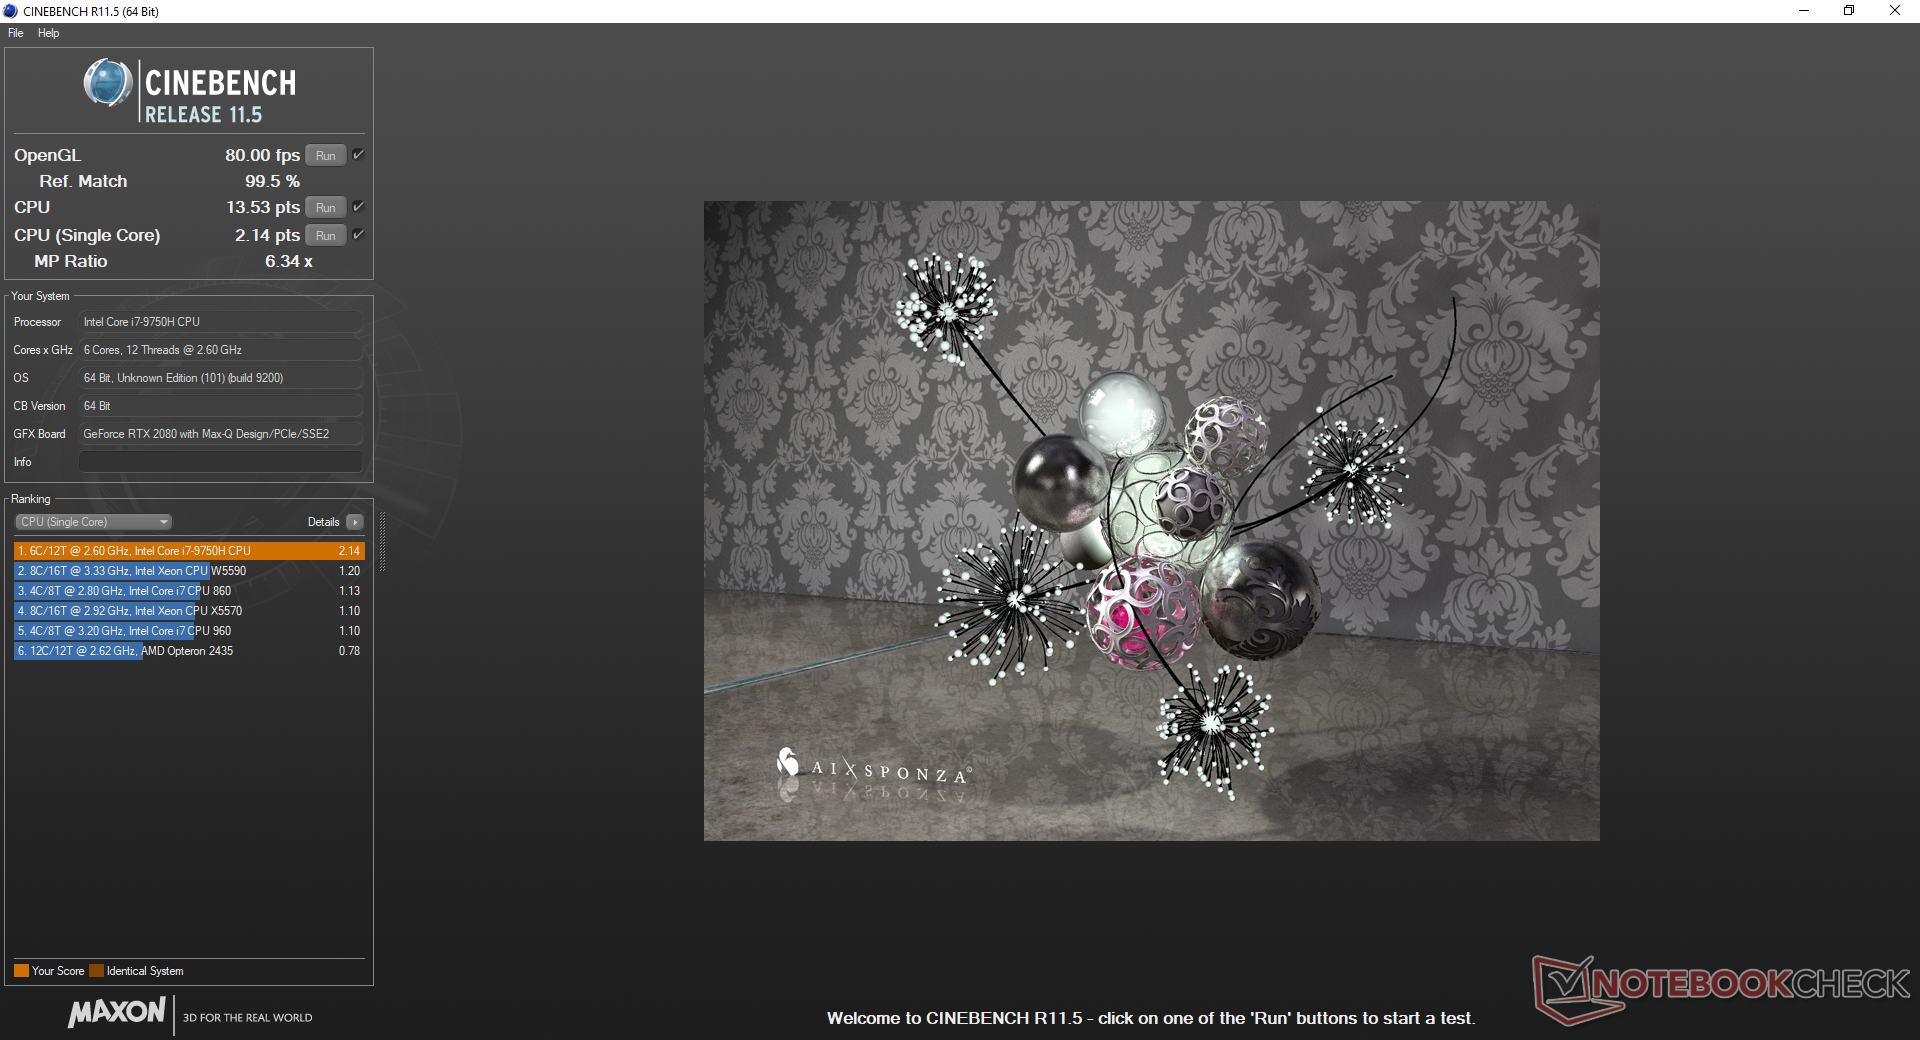
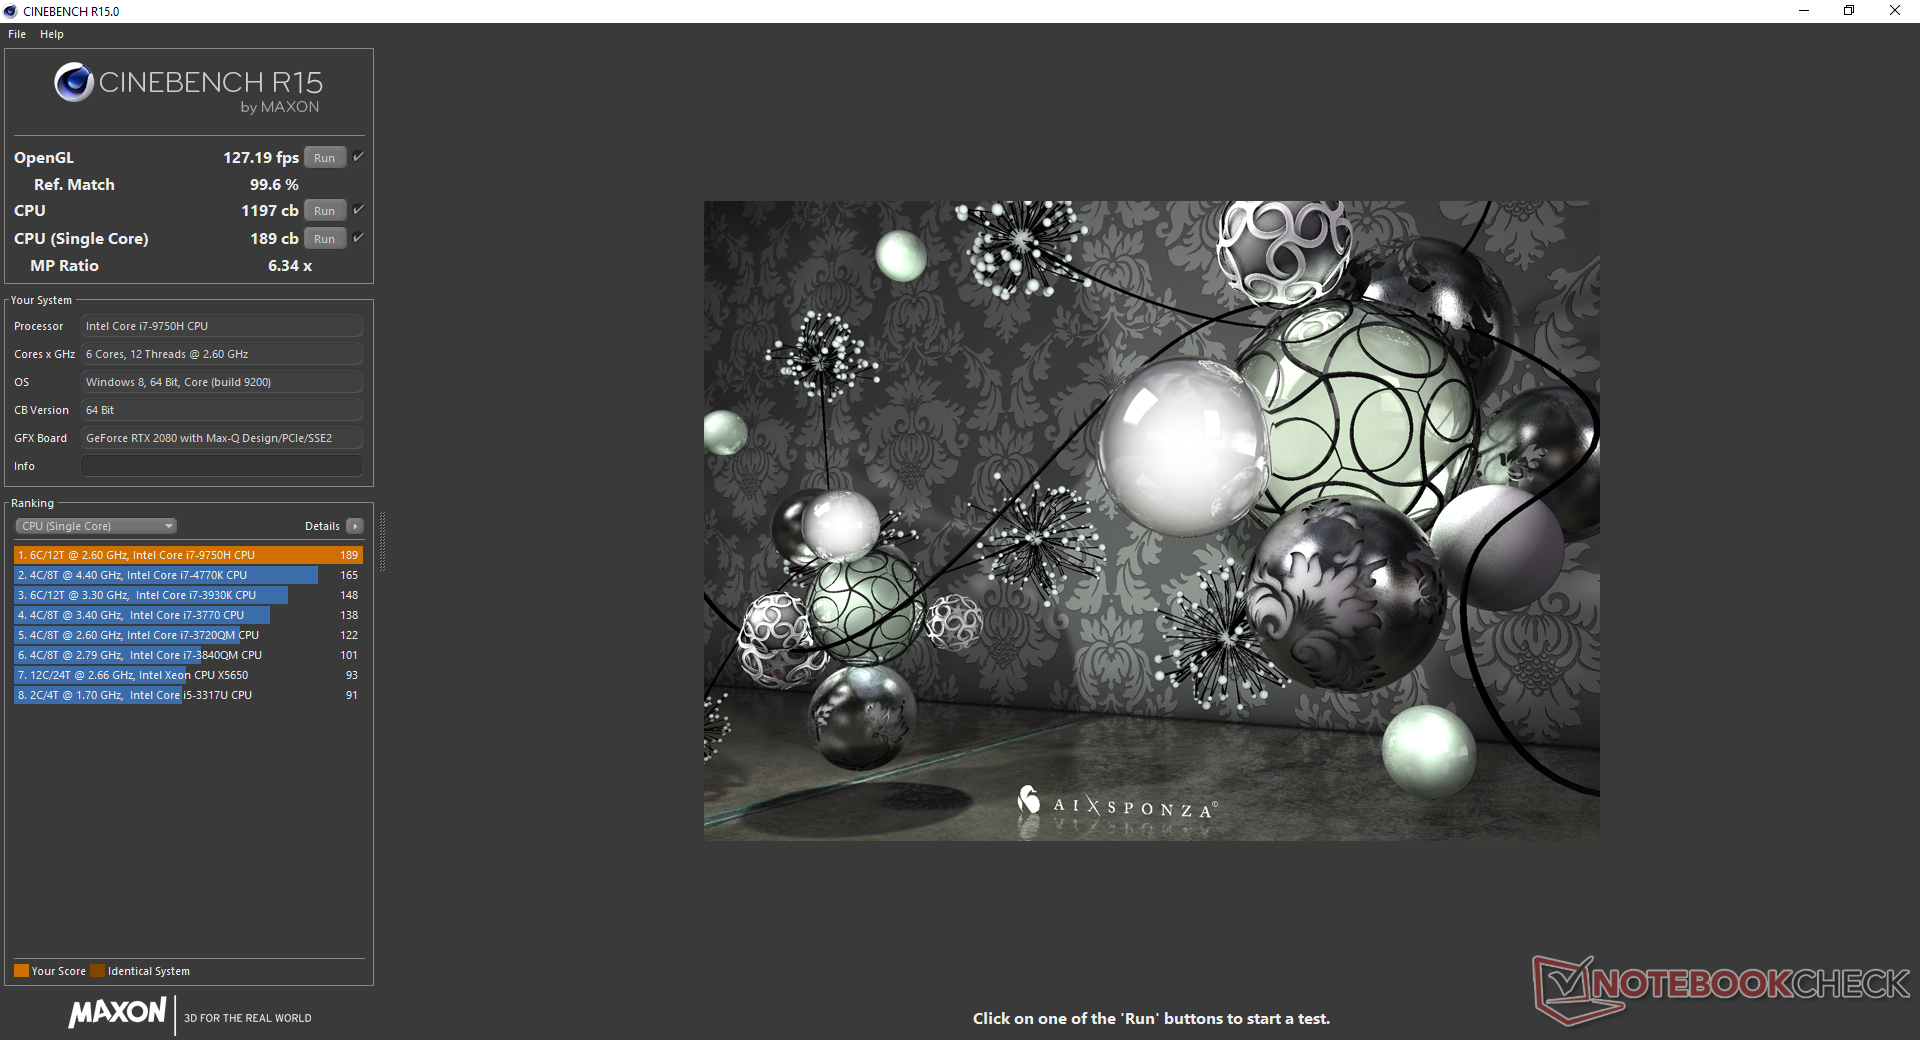
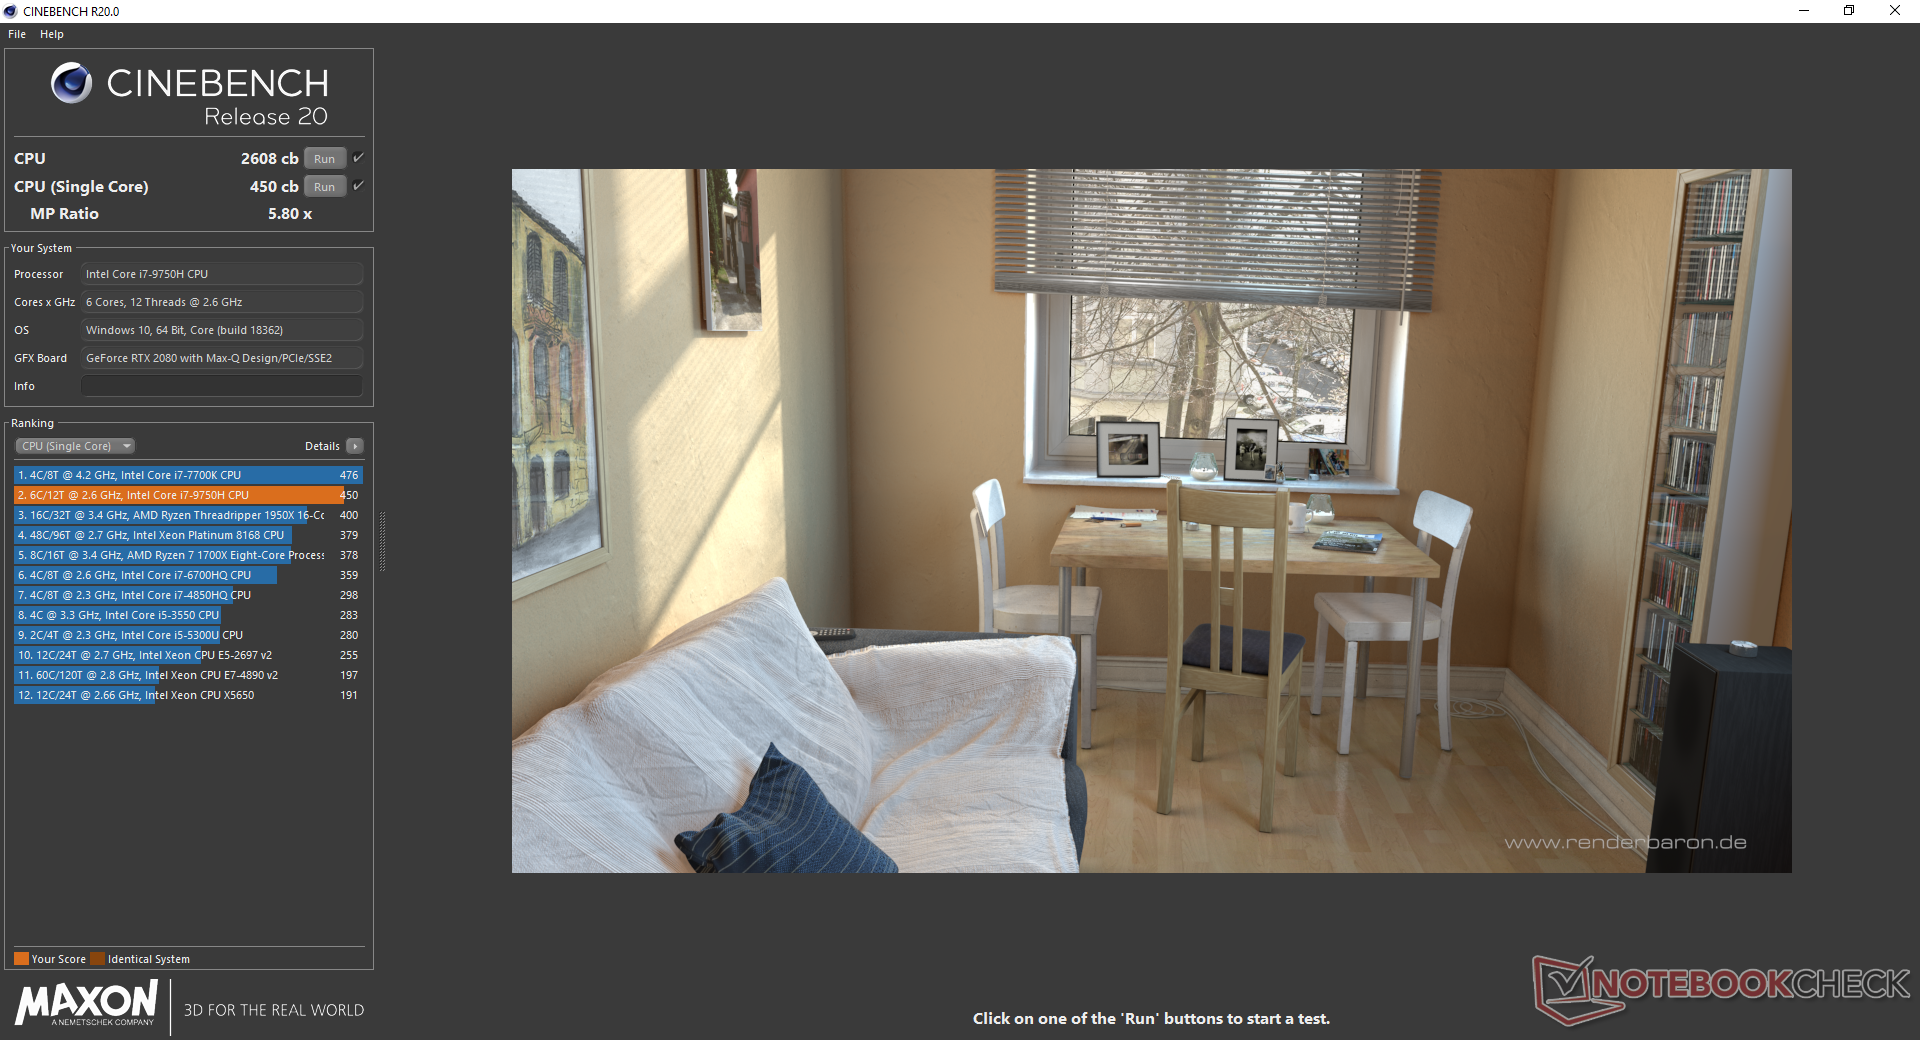
CPU performance is essentially the same as the Core i7-8750H for all intents and purposes as detailed here. Nonetheless, raw performance is still 40 to 60 percent faster than the Core i5-9300H or older Core i7-7700HQ since the i7-9750H offfers a higher core count.
When running CineBench R15 Multi-Thread in a loop, performance dips by about 11 percent after the first loop not unlike many other gaming laptops with Core i7 Coffee Lake-H CPUs. The graph below shows that some older Core i7-8750H laptops can still outperform the Core i7-9750H by the slightest of margins after accounting for throttling.
See our dedicated page on the Core i7-9750H for more technical information and benchmark comparisons.
| Cinebench R10 | |
| Rendering Multiple CPUs 32Bit | |
| MSI GE75 9SG | |
| Eurocom Sky X4C | |
| Average Intel Core i7-9750H (28251 - 36304, n=13) | |
| HP Omen 15-dc1020ng | |
| Asus FX503VM-EH73 | |
| Asus ROG Zephyrus G15 GA502DU | |
| Rendering Single 32Bit | |
| Eurocom Sky X4C | |
| MSI GE75 9SG | |
| Average Intel Core i7-9750H (6659 - 7214, n=13) | |
| HP Omen 15-dc1020ng | |
| Asus FX503VM-EH73 | |
| Asus ROG Zephyrus G15 GA502DU | |
| wPrime 2.10 - 1024m | |
| MSI GF63 8RC-040XPL | |
| Asus FX503VM-EH73 | |
| Asus ROG Zephyrus G15 GA502DU | |
| Average Intel Core i7-9750H (n=1) | |
| Eurocom Sky X4C | |
| MSI GE75 9SG | |
* ... smaller is better
System Performance
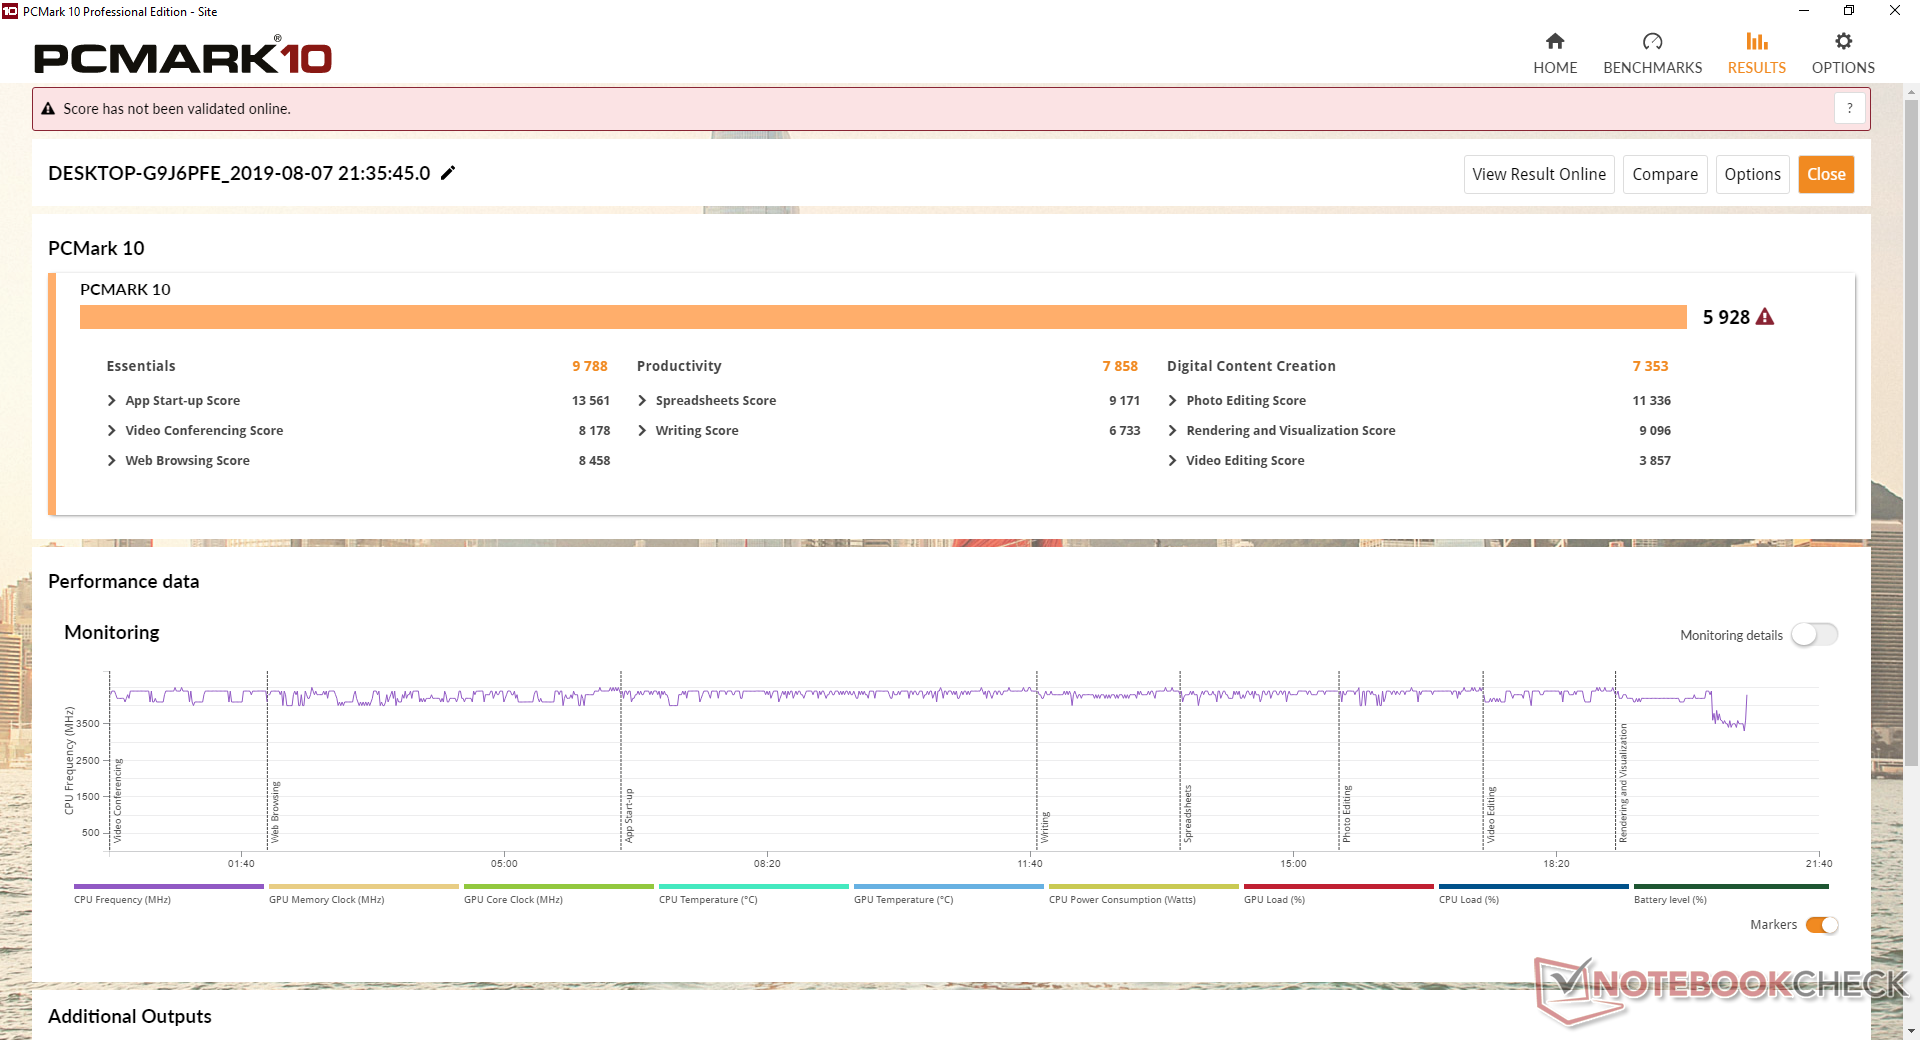
PCMark benchmarks are in the same ballpark as other gaming laptops equipped with GeForce RTX graphics. We didn't experience any software or hardware hitches during our time with the test unit.
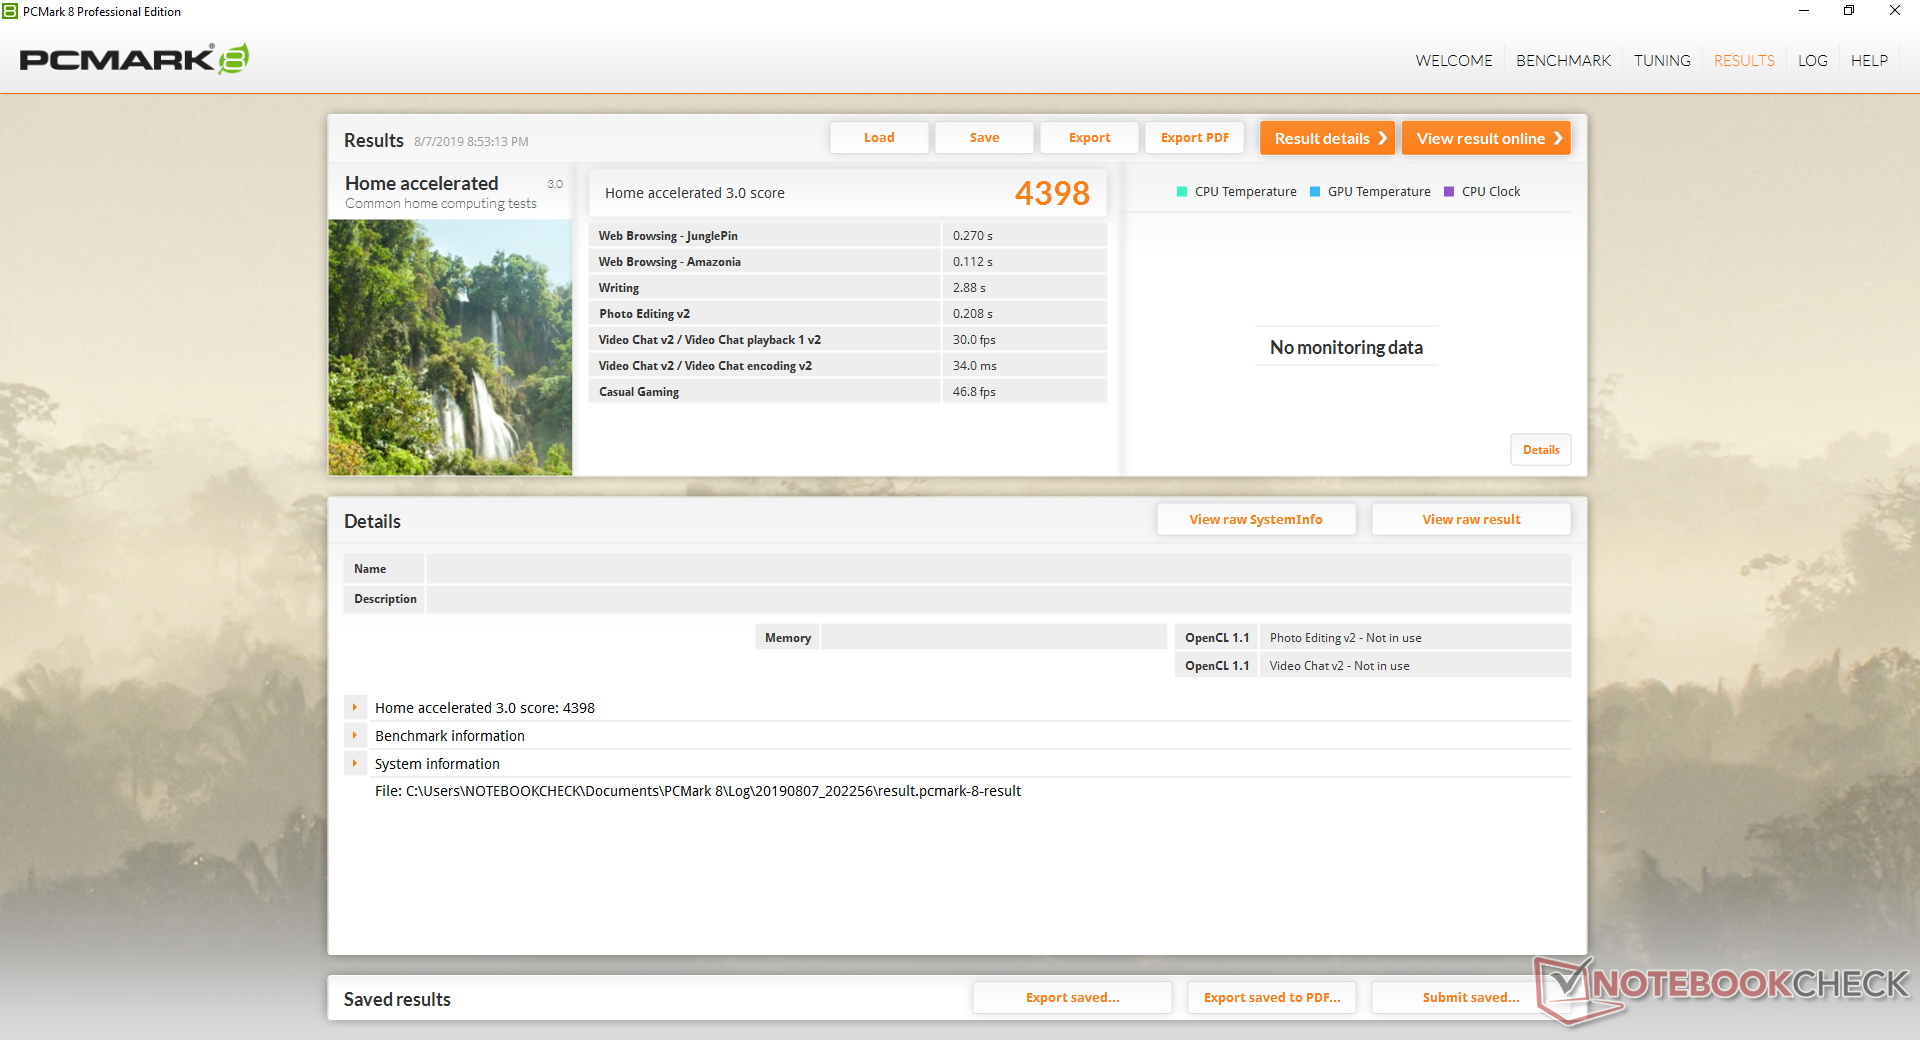
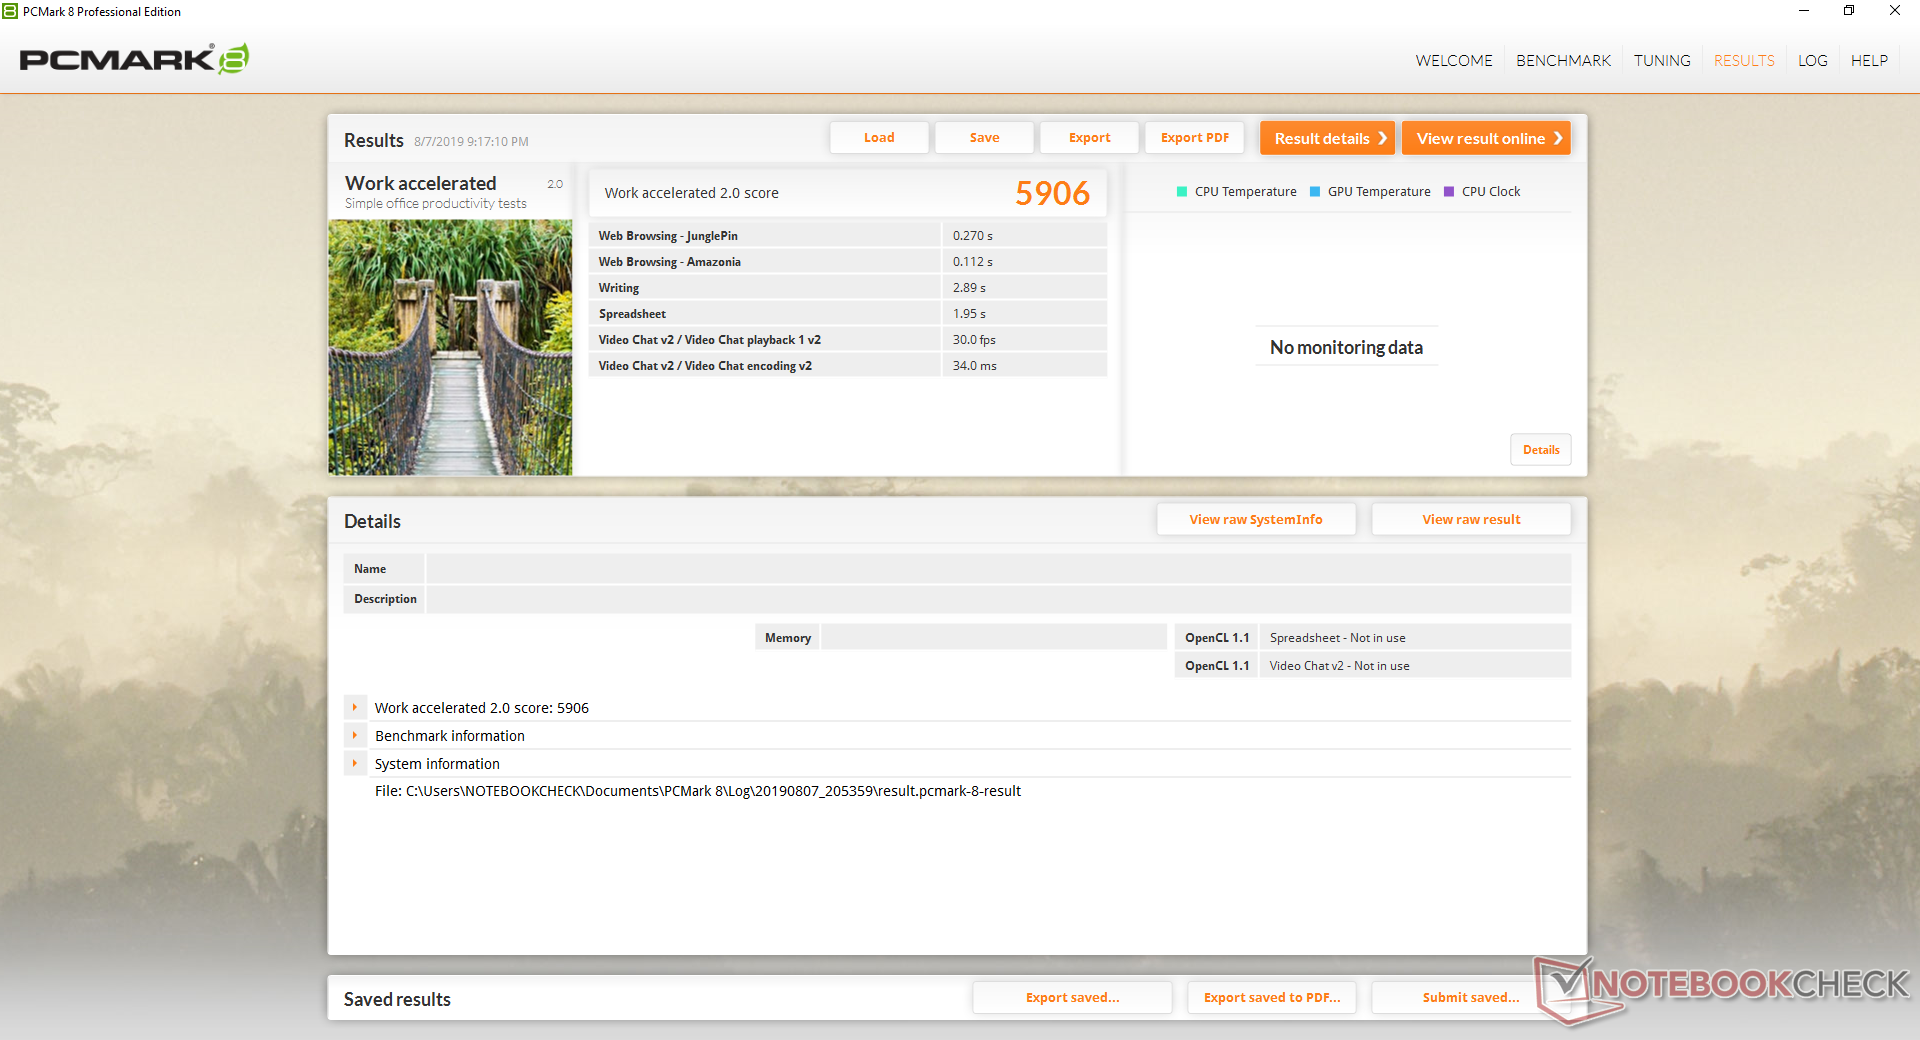
| PCMark 8 Home Score Accelerated v2 | 4398 points | |
| PCMark 8 Work Score Accelerated v2 | 5906 points | |
| PCMark 10 Score | 5928 points | |
Help | ||
Storage Devices
Three internal storage bays are available in the form of 2x M.2 PCIe and 1x 2.5-inch SATA III (7 mm only). Origin PC offers multiple combinations and we recommend choosing carefully since end-user upgrades can be difficult.
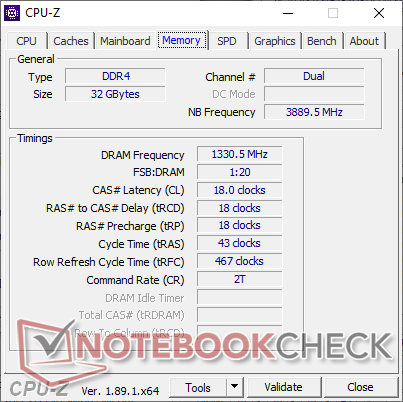
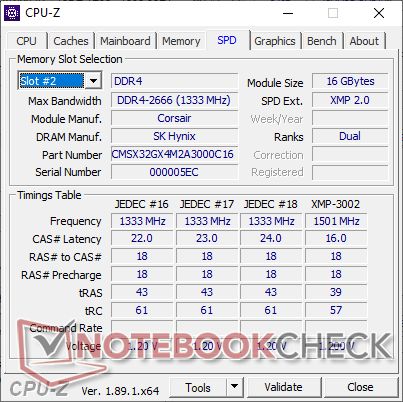
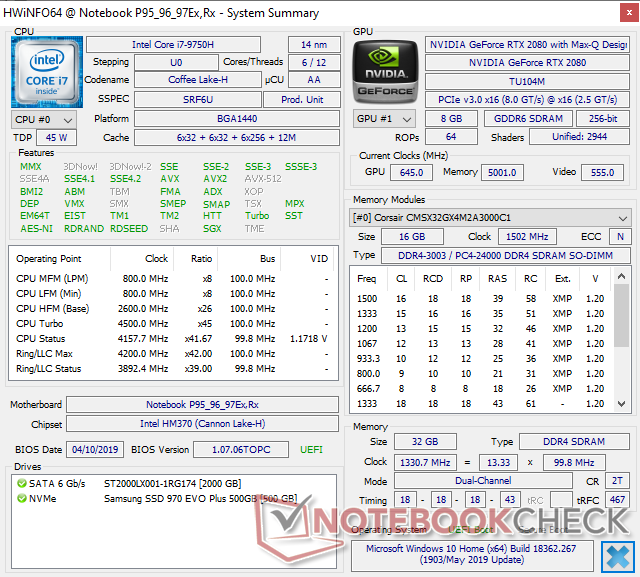
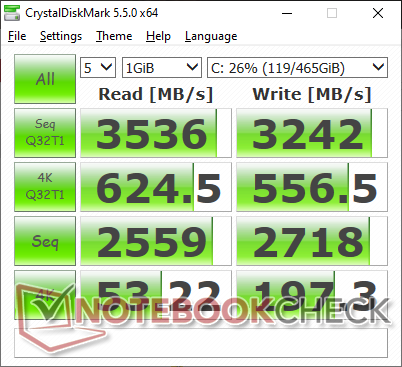
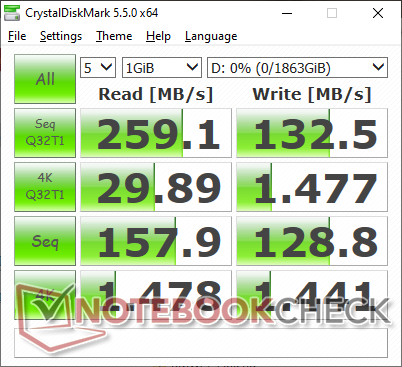
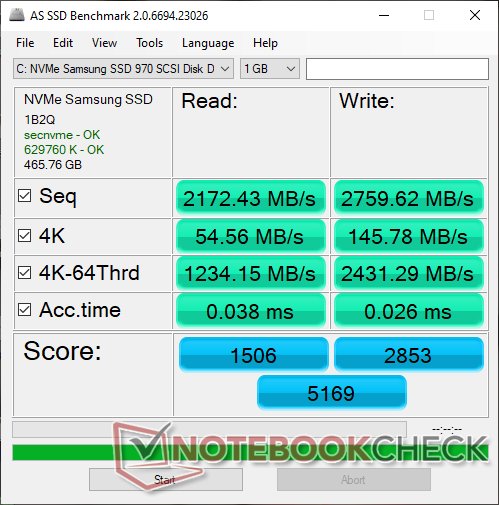
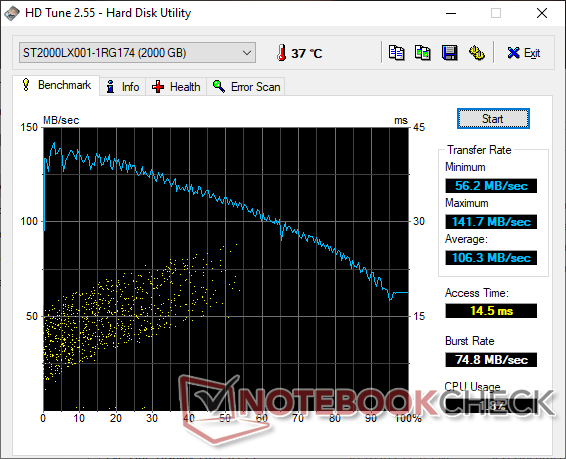
Our specific test unit comes configured with a 500 GB Samsung SSD 970 EVO Plus M.2 NVMe SSD and a secondary 2 TB Seagate ST2000LX001. Samsung offers some of the fastest consumer SSDs and this model is no different with sequential write rates approaching 2800 MB/s according to AS SSD. This particular drive is a common option on Clevo systems as most larger OEMs tend to use slower solutions from Intel or Toshiba instead.
| Origin PC EVO16-S i7-9750H RTX 2080 Max-Q Samsung SSD 970 EVO Plus 500GB | Razer Blade 15 RTX 2080 Max-Q Samsung SSD PM981 MZVLB512HAJQ | Gigabyte Aero 15 Classic-XA Intel SSD 760p SSDPEKKW512G8 | MSI GF63 8RC-040XPL WDC WD Green PC SSD WDS240G2G0B | Asus FX503VM-EH73 SanDisk SD8SN8U128G1002 | |
|---|---|---|---|---|---|
| AS SSD | -21% | -36% | -385% | -119% | |
| Seq Read (MB/s) | 2172 | 1832 -16% | 2517 16% | 507 -77% | 476.3 -78% |
| Seq Write (MB/s) | 2760 | 1864 -32% | 924 -67% | 353 -87% | 328.4 -88% |
| 4K Read (MB/s) | 54.6 | 52.1 -5% | 59.1 8% | 6.81 -88% | 20.44 -63% |
| 4K Write (MB/s) | 145.8 | 108.3 -26% | 126.5 -13% | 15.68 -89% | 46.48 -68% |
| 4K-64 Read (MB/s) | 1234 | 1159 -6% | 876 -29% | 7.25 -99% | 343.4 -72% |
| 4K-64 Write (MB/s) | 2431 | 1807 -26% | 922 -62% | 17.82 -99% | 95.5 -96% |
| Access Time Read * (ms) | 0.038 | 0.05 -32% | 0.042 -11% | 0.52 -1268% | 0.17 -347% |
| Access Time Write * (ms) | 0.026 | 0.034 -31% | 0.065 -150% | 0.582 -2138% | 0.09 -246% |
| Score Read (Points) | 1506 | 1394 -7% | 1186 -21% | 65 -96% | 411 -73% |
| Score Write (Points) | 2853 | 2102 -26% | 1141 -60% | 69 -98% | 178 -94% |
| Score Total (Points) | 5169 | 4221 -18% | 2870 -44% | 162 -97% | 798 -85% |
| Copy ISO MB/s (MB/s) | 2728 | 2083 -24% | 2086 -24% | ||
| Copy Program MB/s (MB/s) | 570 | 496.5 -13% | 454.2 -20% | ||
| Copy Game MB/s (MB/s) | 1434 | 977 -32% | 1141 -20% |
* ... smaller is better

GPU Performance
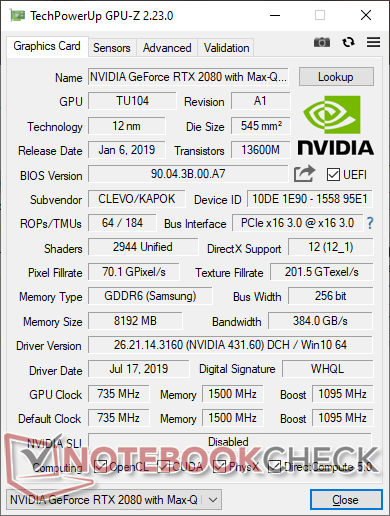
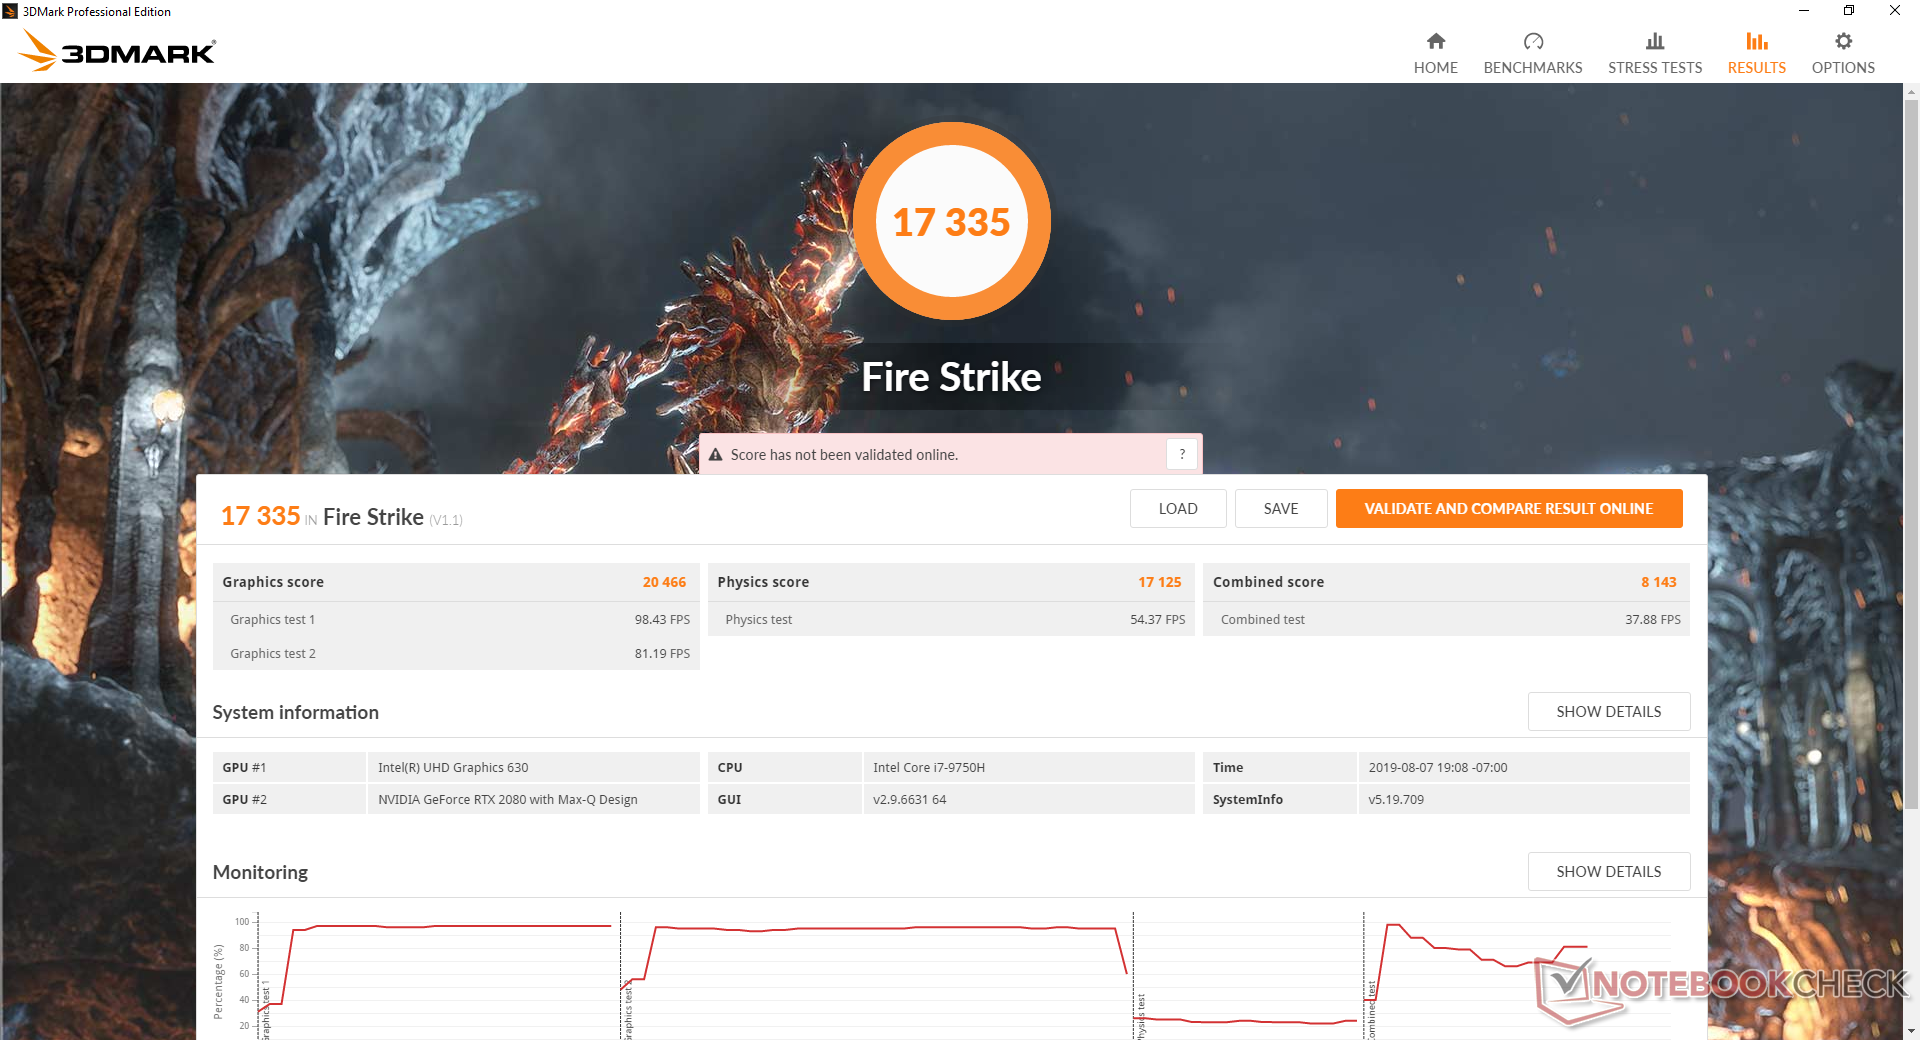
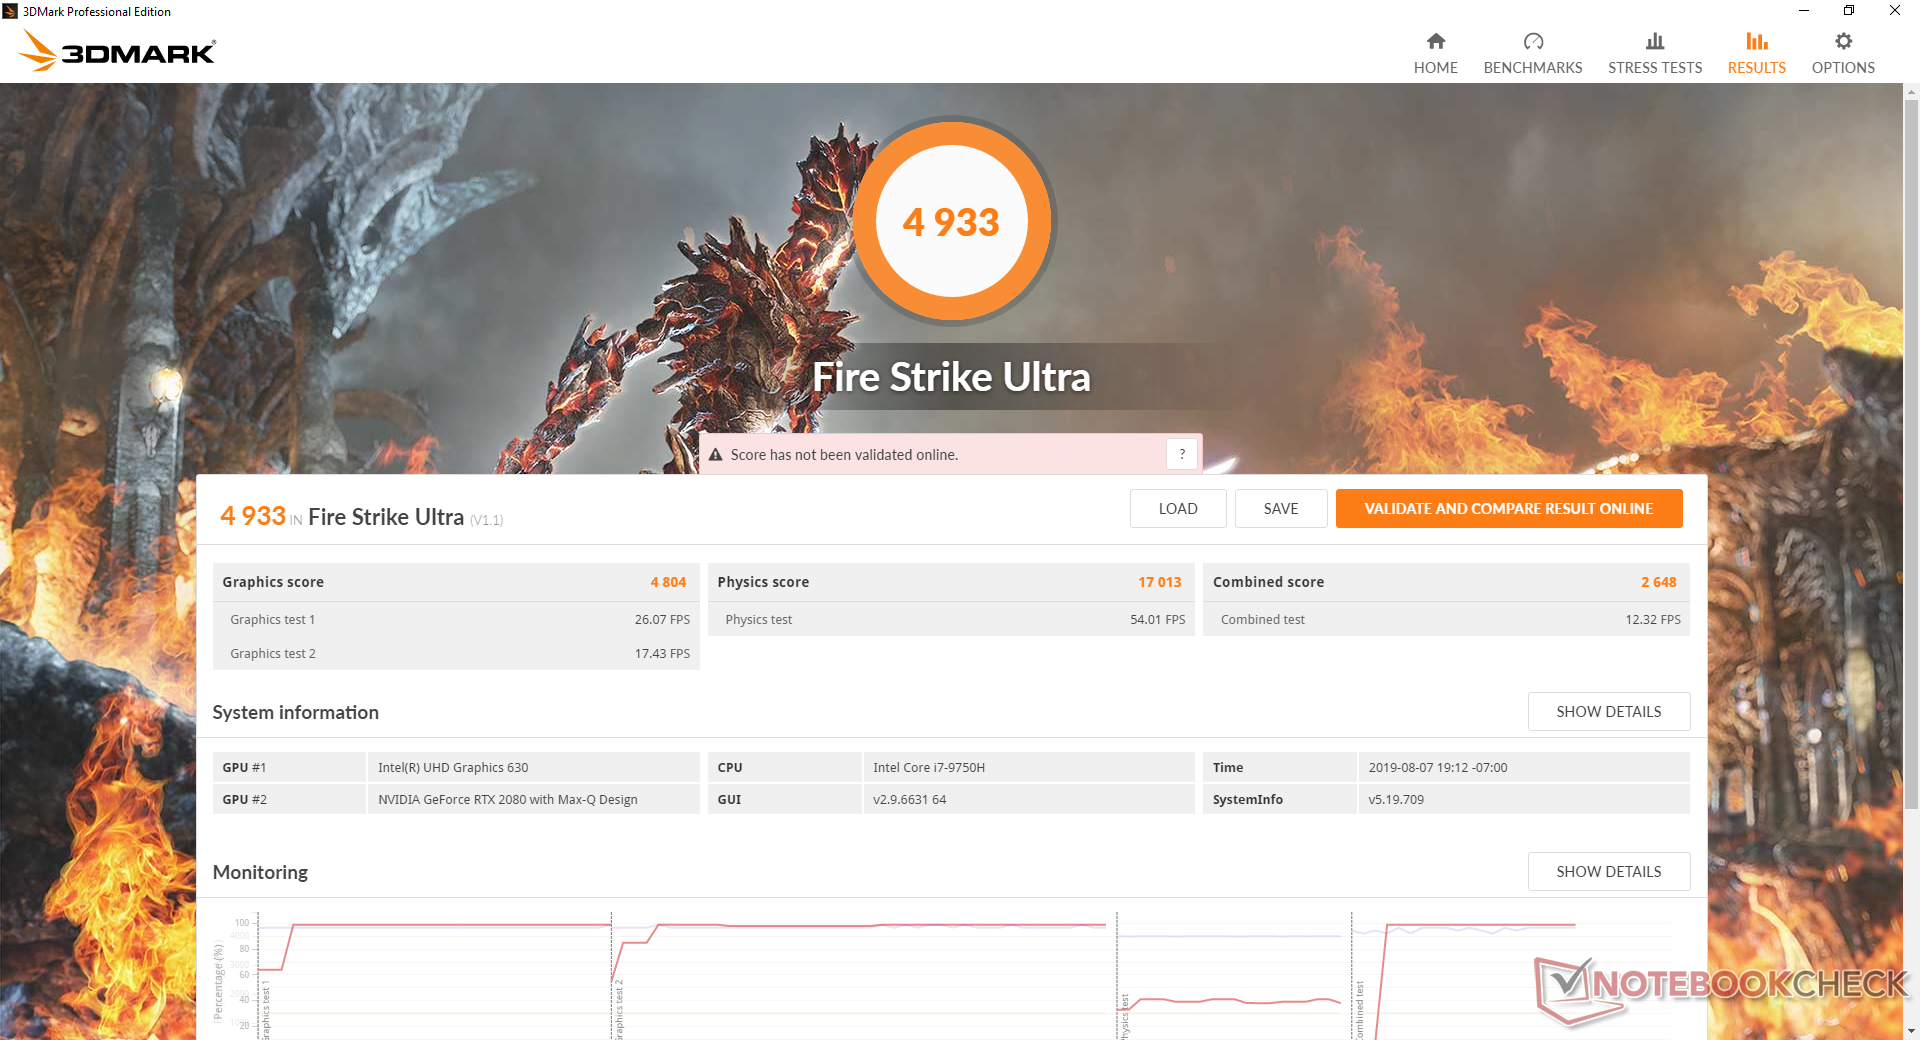
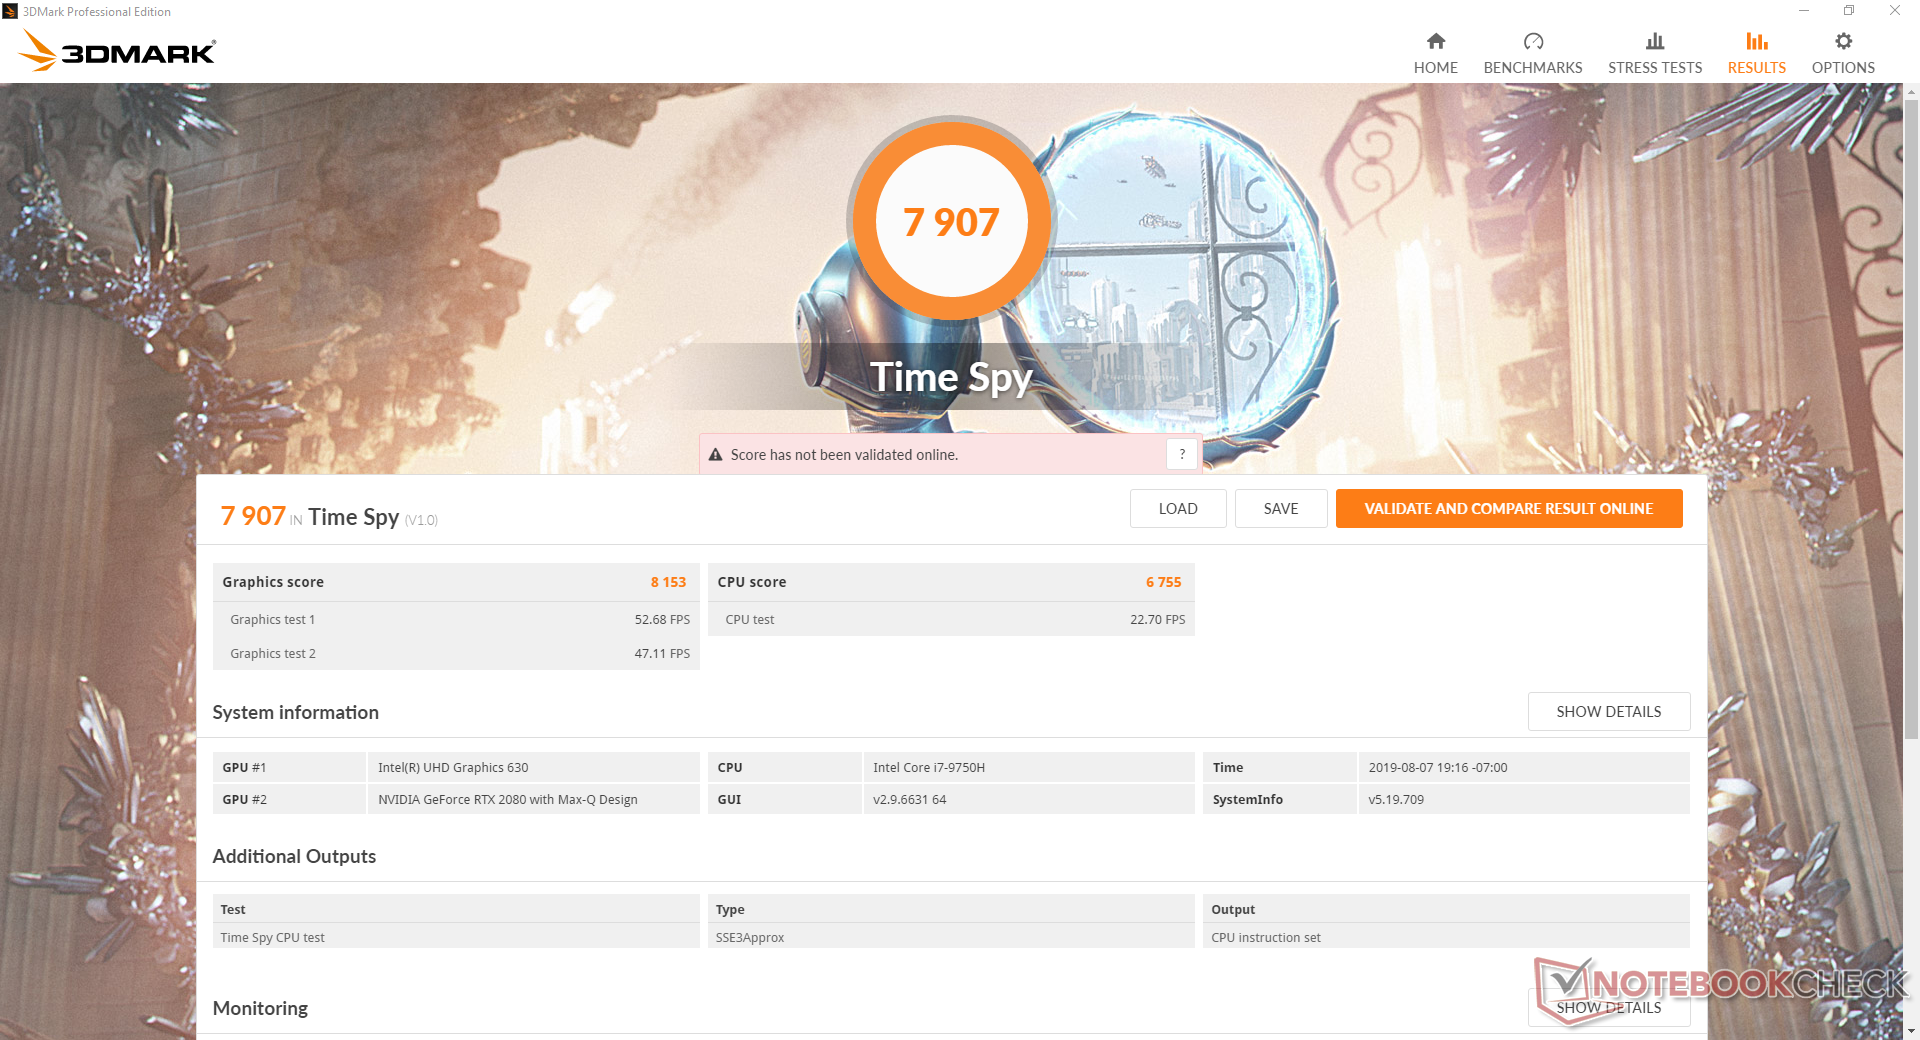
The RTX 2080 Max-Q is performing where we expect it to be when compared to the average RTX 2080 Max-Q in our database. 3DMark results are very similar to the mobile RTX 2070 "Max-P" in the Asus Zephyrus GX502GW despite consuming slightly less power. A desktop RTX 2080 is still about 35 to 40 percent faster than the RTX 2080 Max-Q.
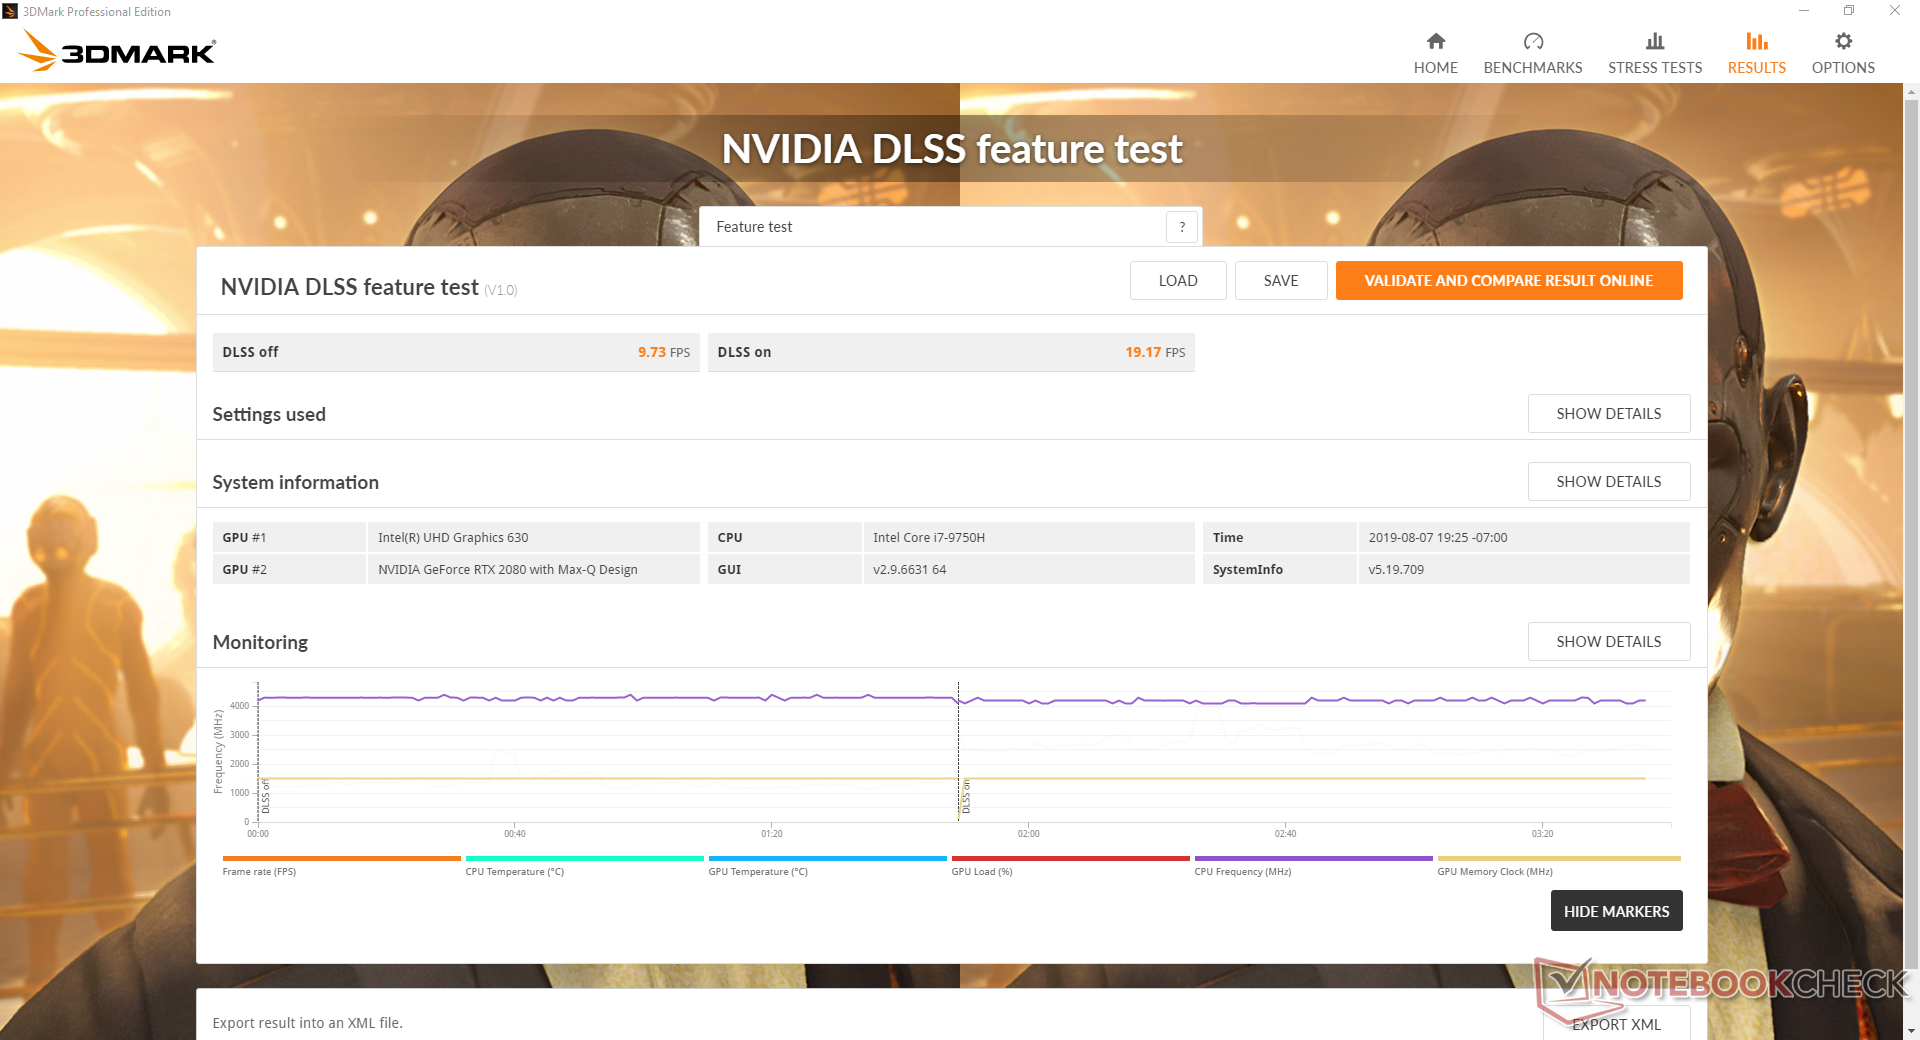
Performance benefits over Pascal GPUs like the GTX 1080 become greater when playing DX12 titles since Turing has been optimized for DX12.
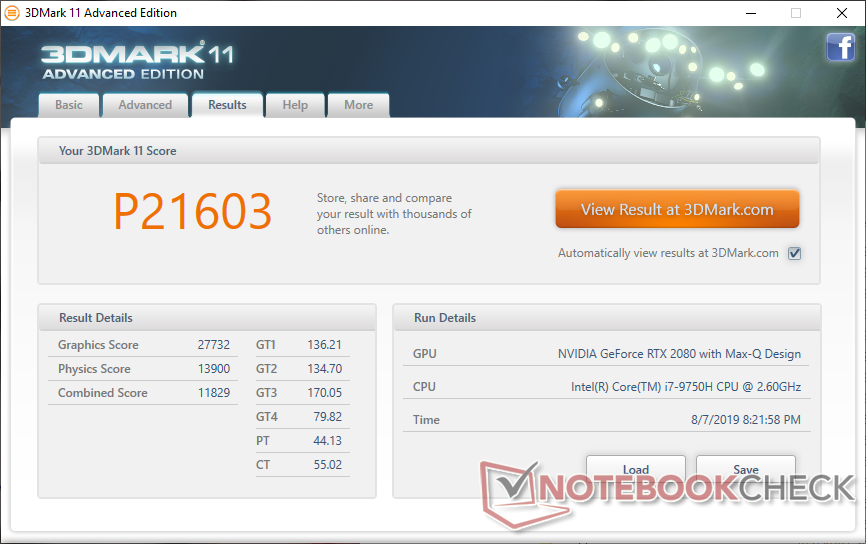
| 3DMark 11 Performance | 21603 points | |
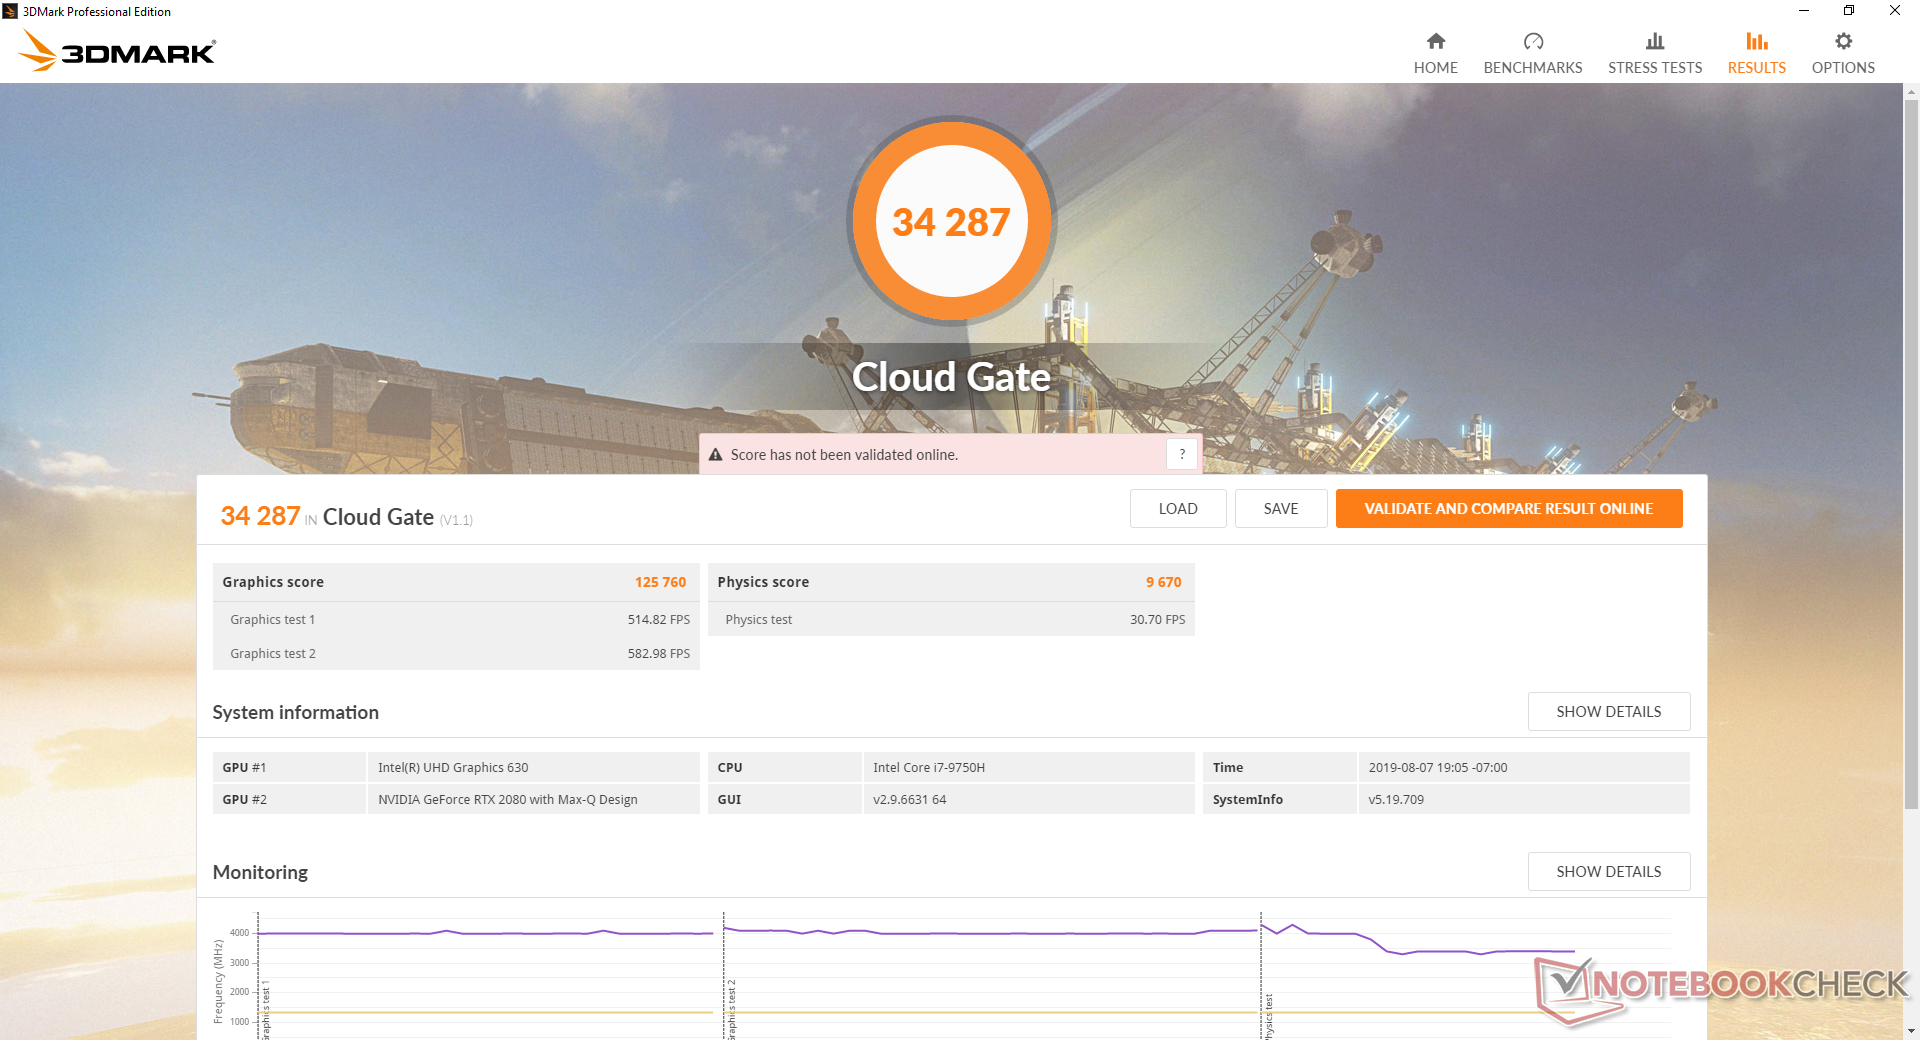
| 3DMark Cloud Gate Standard Score | 34287 points | |
| 3DMark Fire Strike Score | 17335 points | |
| 3DMark Time Spy Score | 7907 points | |
Help | ||
Gaming Performance
All titles will run at 60 FPS since the display is a "low" native resolution of 1080p. To fully exploit the 144 Hz refresh rate, however, you may want to consider dropping the graphics settings to low-medium or medium on most titles. Idling on Witcher 3 shows no recurring frame drops to suggest no interrupting background activity when gaming.
See our dedicated page on the GeForce RTX 2080 Max-Q for more technical information and benchmarks.
| low | med. | high | ultra | |
|---|---|---|---|---|
| BioShock Infinite (2013) | 326.9 | 285.6 | 272 | 165.6 |
| The Witcher 3 (2015) | 292.5 | 225.7 | 145.1 | 77.6 |
| Shadow of the Tomb Raider (2018) | 131 | 103 | 99 | 94 |
Emissions
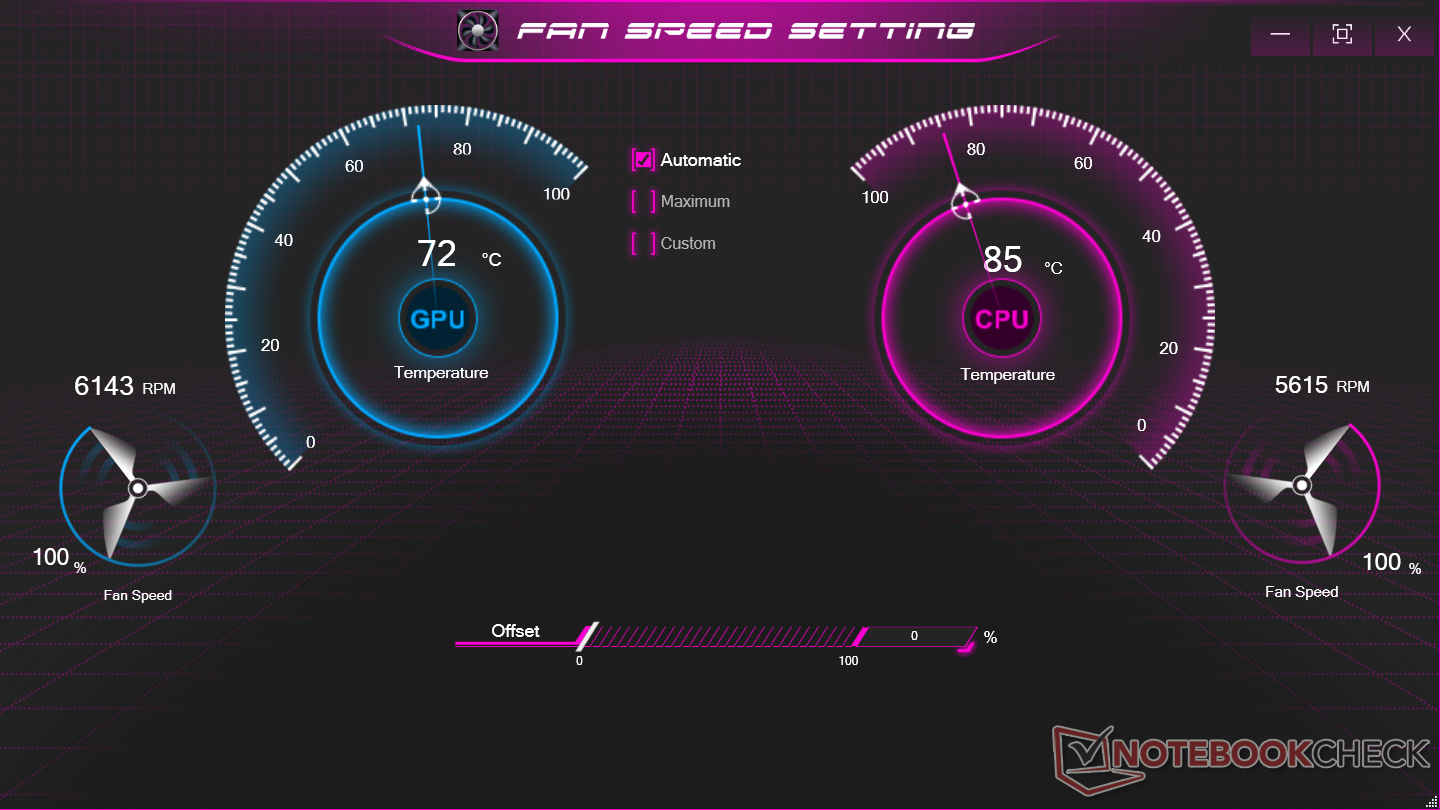
System Noise
There are three internal fans similar to the older MSI GS73. While they are generally quiet in the 31 to 34 dB(A) range when browsing or video streaming for extended periods, they become very loud very quickly when gaming. We're able to record a fan noise of 55.3 dB(A) when running Witcher 3 compared to 45 dB(A) on the Razer Blade Pro 17 with the same CPU and GPU.
We can notice no coil whine or electronic noise from our test unit.
| Origin PC EVO16-S i7-9750H RTX 2080 Max-Q GeForce RTX 2080 Max-Q, i7-9750H, Samsung SSD 970 EVO Plus 500GB | Razer Blade 15 RTX 2080 Max-Q GeForce RTX 2080 Max-Q, i7-9750H, Samsung SSD PM981 MZVLB512HAJQ | Gigabyte Aero 15 Classic-XA GeForce RTX 2070 Max-Q, i7-9750H, Intel SSD 760p SSDPEKKW512G8 | MSI GS75 Stealth 9SG GeForce RTX 2080 Max-Q, i7-9750H, 2x Samsung SSD PM981 MZVLB1T0HALR (RAID 0) | Asus Zephyrus S GX502GW GeForce RTX 2070 Mobile, i7-9750H, 2x Intel SSD 660p SSDPEKNW512G8 (RAID 0) | Eurocom Nightsky RX17 GeForce RTX 2070 Mobile, i7-9750H, 2x Samsung SSD 970 Pro 512GB (RAID 0) | |
|---|---|---|---|---|---|---|
| Noise | 13% | -4% | -0% | -5% | 4% | |
| off / environment * (dB) | 28.5 | 28.3 1% | 30 -5% | 30 -5% | 30 -5% | 28 2% |
| Idle Minimum * (dB) | 30.4 | 28.8 5% | 31 -2% | 31 -2% | 31 -2% | 28 8% |
| Idle Average * (dB) | 30.4 | 28.8 5% | 34 -12% | 32 -5% | 33 -9% | 28.4 7% |
| Idle Maximum * (dB) | 31.5 | 29 8% | 39 -24% | 38 -21% | 38 -21% | 32.9 -4% |
| Load Average * (dB) | 50 | 33.5 33% | 46 8% | 47 6% | 50 -0% | 45 10% |
| Witcher 3 ultra * (dB) | 55.3 | 45 19% | 53 4% | 48 13% | 53 4% | 53.2 4% |
| Load Maximum * (dB) | 55.5 | 45.2 19% | 55 1% | 49 12% | 56 -1% | 53.2 4% |
* ... smaller is better
Noise level
| Idle |
| 30.4 / 30.4 / 31.5 dB(A) |
| Load |
| 50 / 55.5 dB(A) |
 | ||
30 dB silent 40 dB(A) audible 50 dB(A) loud |
||
min: | ||
Temperature

The left half of the chassis will always be warmer than the right half. For gaming laptops, this is not ideal because users will be placing their fingers and palms on the warmer areas of the chassis. The palm rests and WASD keys can become as warm as 33 C and 45 C, respectively, when gaming. In contrast, the right palm rest and NumPad keys remain relatively cool at just 27 C to 31 C. Gaming could have been more comfortable for titles that rely on the WASD keys.
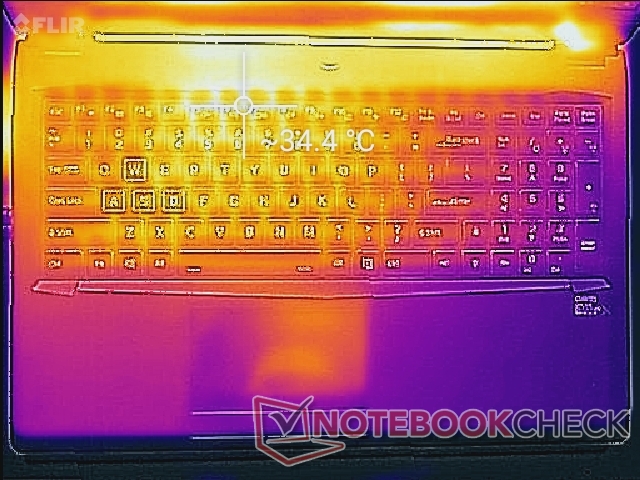
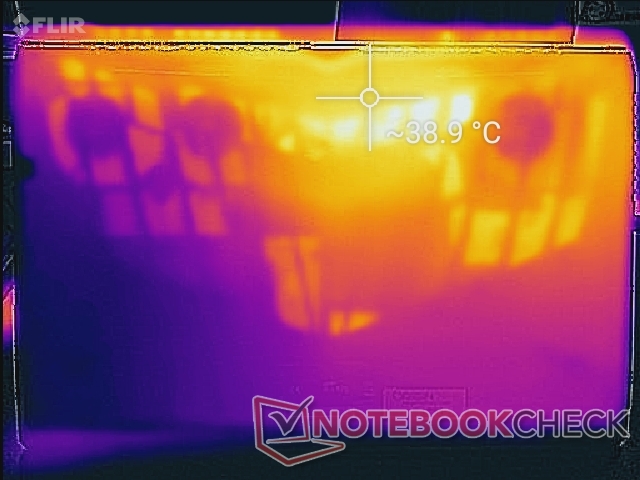
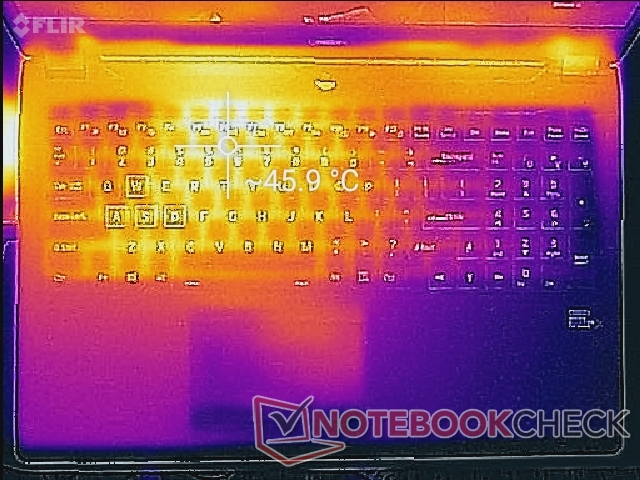
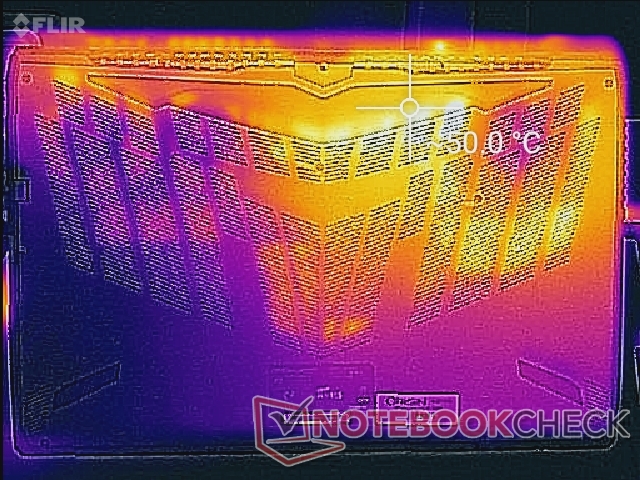
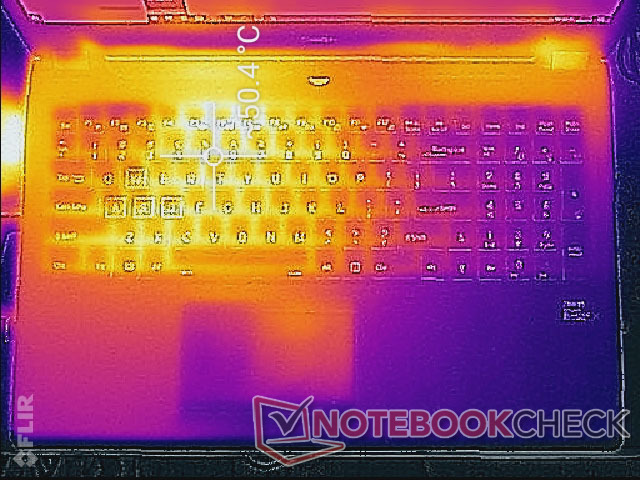
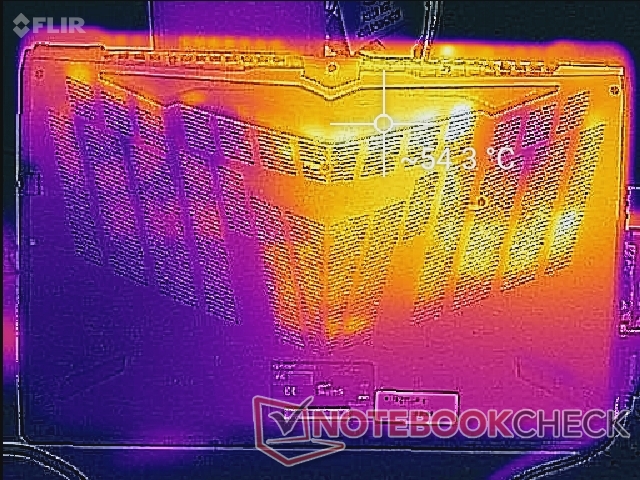
(-) The maximum temperature on the upper side is 51.8 °C / 125 F, compared to the average of 40.4 °C / 105 F, ranging from 21.2 to 68.8 °C for the class Gaming.
(-) The bottom heats up to a maximum of 55 °C / 131 F, compared to the average of 43.2 °C / 110 F
(+) In idle usage, the average temperature for the upper side is 30 °C / 86 F, compared to the device average of 33.9 °C / 93 F.
(±) Playing The Witcher 3, the average temperature for the upper side is 37.1 °C / 99 F, compared to the device average of 33.9 °C / 93 F.
(±) The palmrests and touchpad can get very hot to the touch with a maximum of 39.8 °C / 103.6 F.
(-) The average temperature of the palmrest area of similar devices was 28.8 °C / 83.8 F (-11 °C / -19.8 F).
Stress Test
We stress the system to identify for any potential throttling or stability issues. When running Prime95, the CPU can be observed operating at up to 4 GHz for the first few seconds until hitting a core temperature of 98 C. Thereafter, clock rates drop to the 3.1 to 3.2 GHz range in order to maintain a cooler core temperature of 77 C. Running both Prime95 and FurMark simultaneously will cause CPU and GPU temperatures to stabilize at 85 C and 72 C, respectively.
Running Witcher 3 is more representative of real-world gaming loads. Here, the CPU and GPU stabilize at 83 C and 70 C, respectively, compared to 79 C and 69 C on the Blade 15 with the same RTX 2080 Max-Q GPU. The system exhibits no CPU or GPU throttling behavior when under high processing stress.
Running on batteries will limit performance. A 3DMark Time Spy run on batteries returns Physics and Graphics scores of 4364 and 2425 points, respectively, compared to 6755 and 8153 points when on mains.
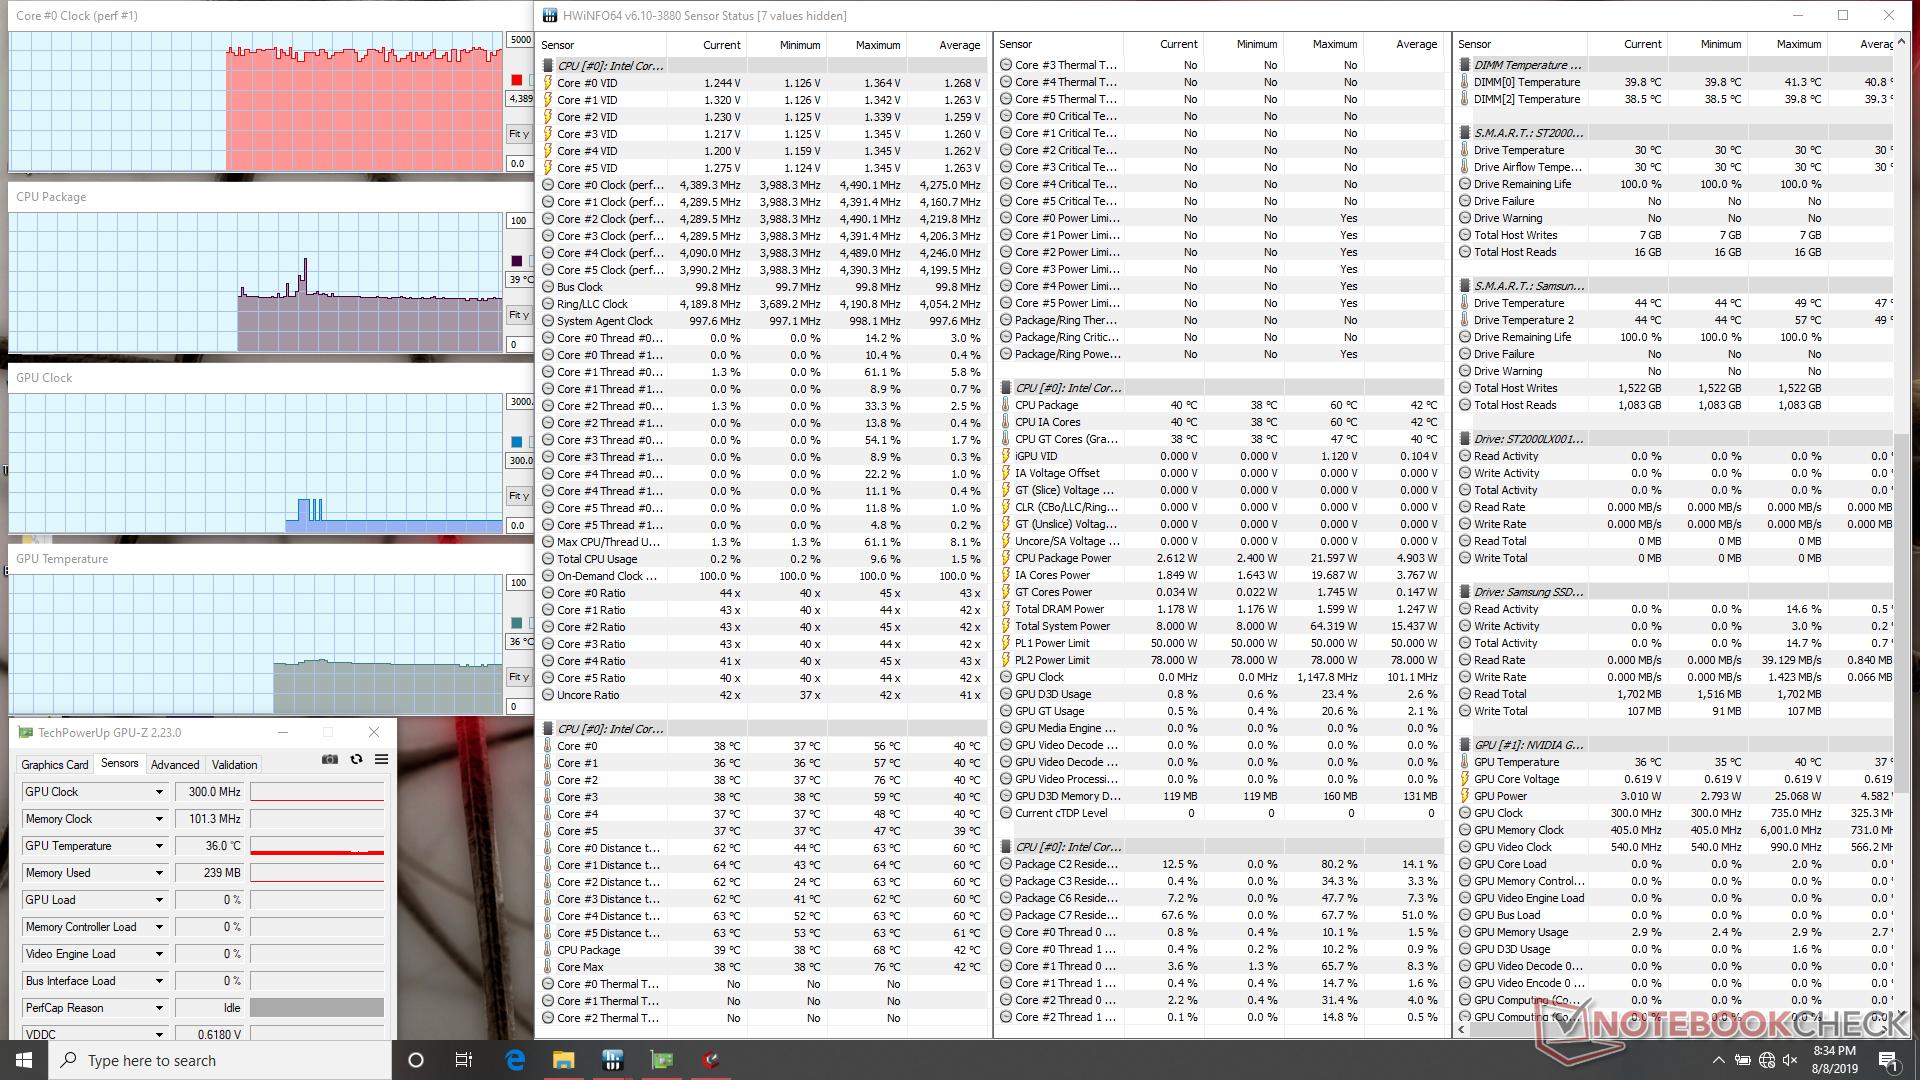
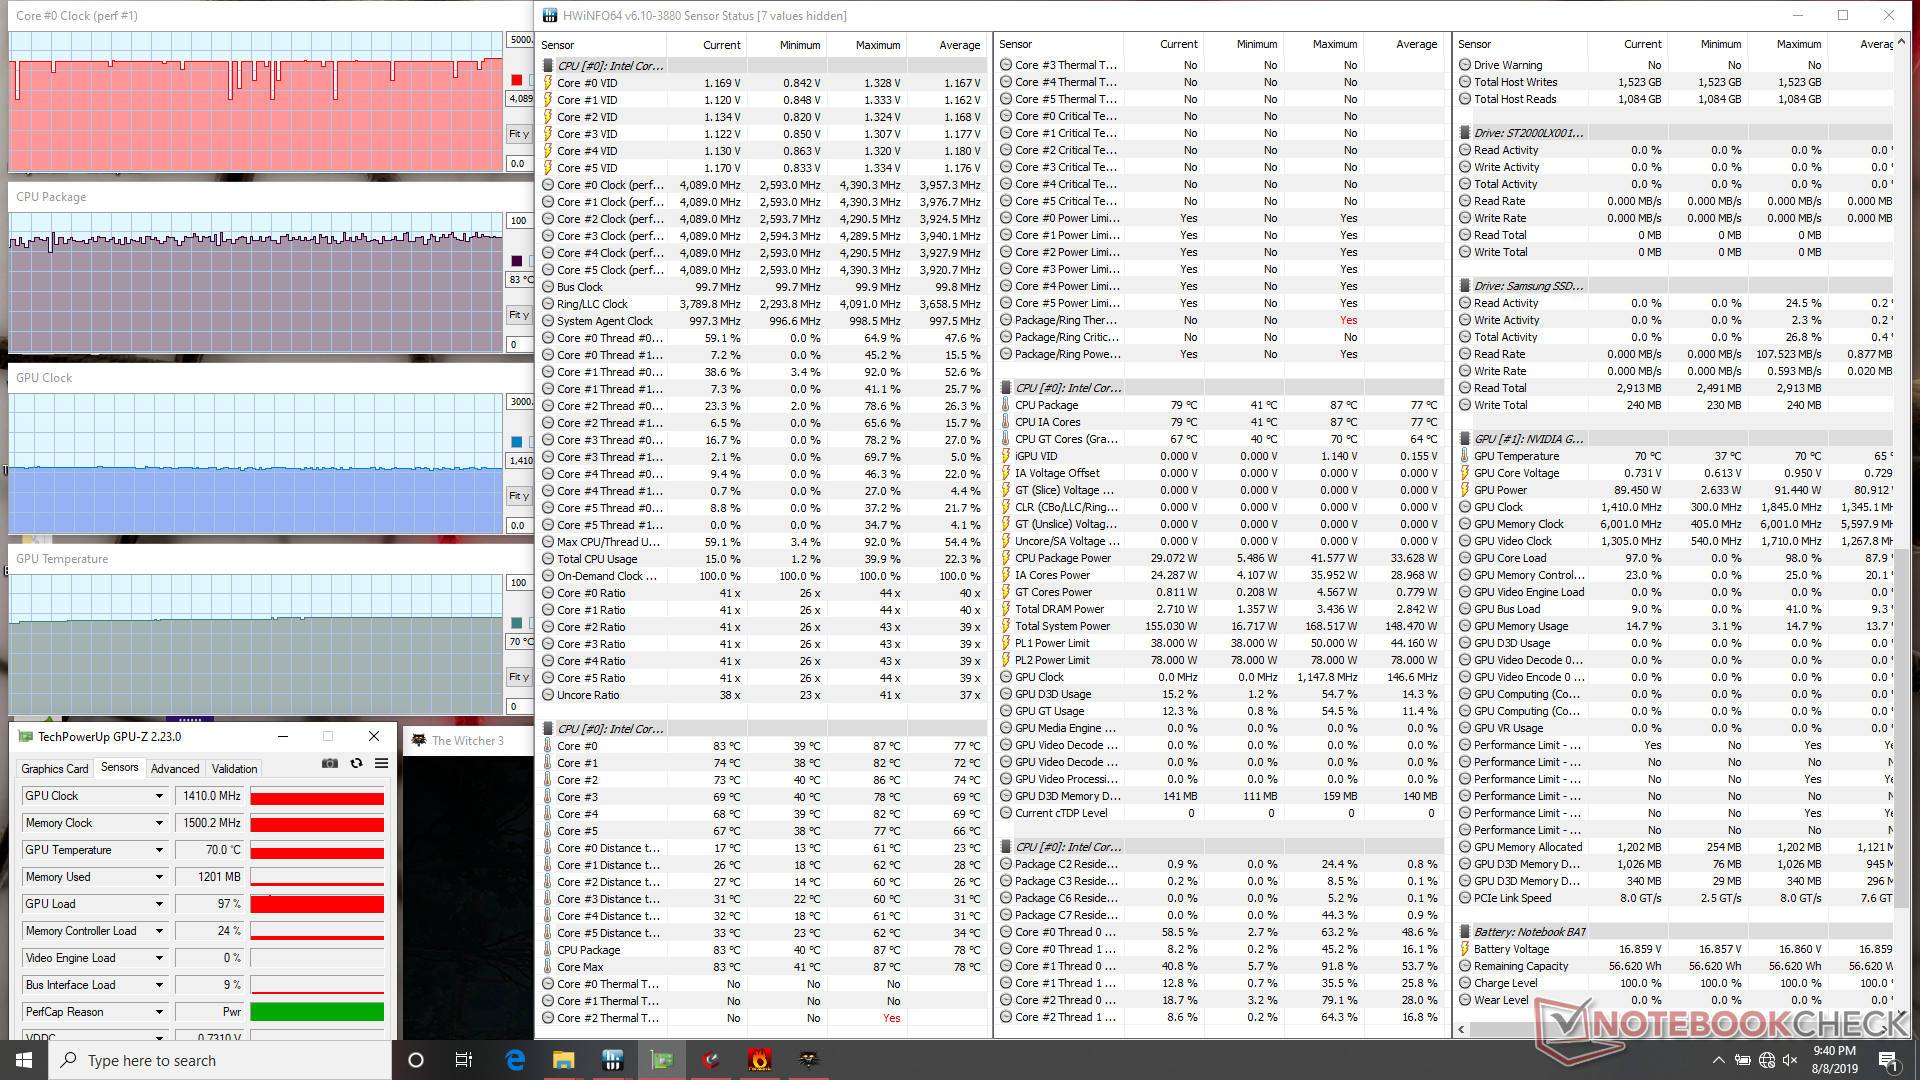
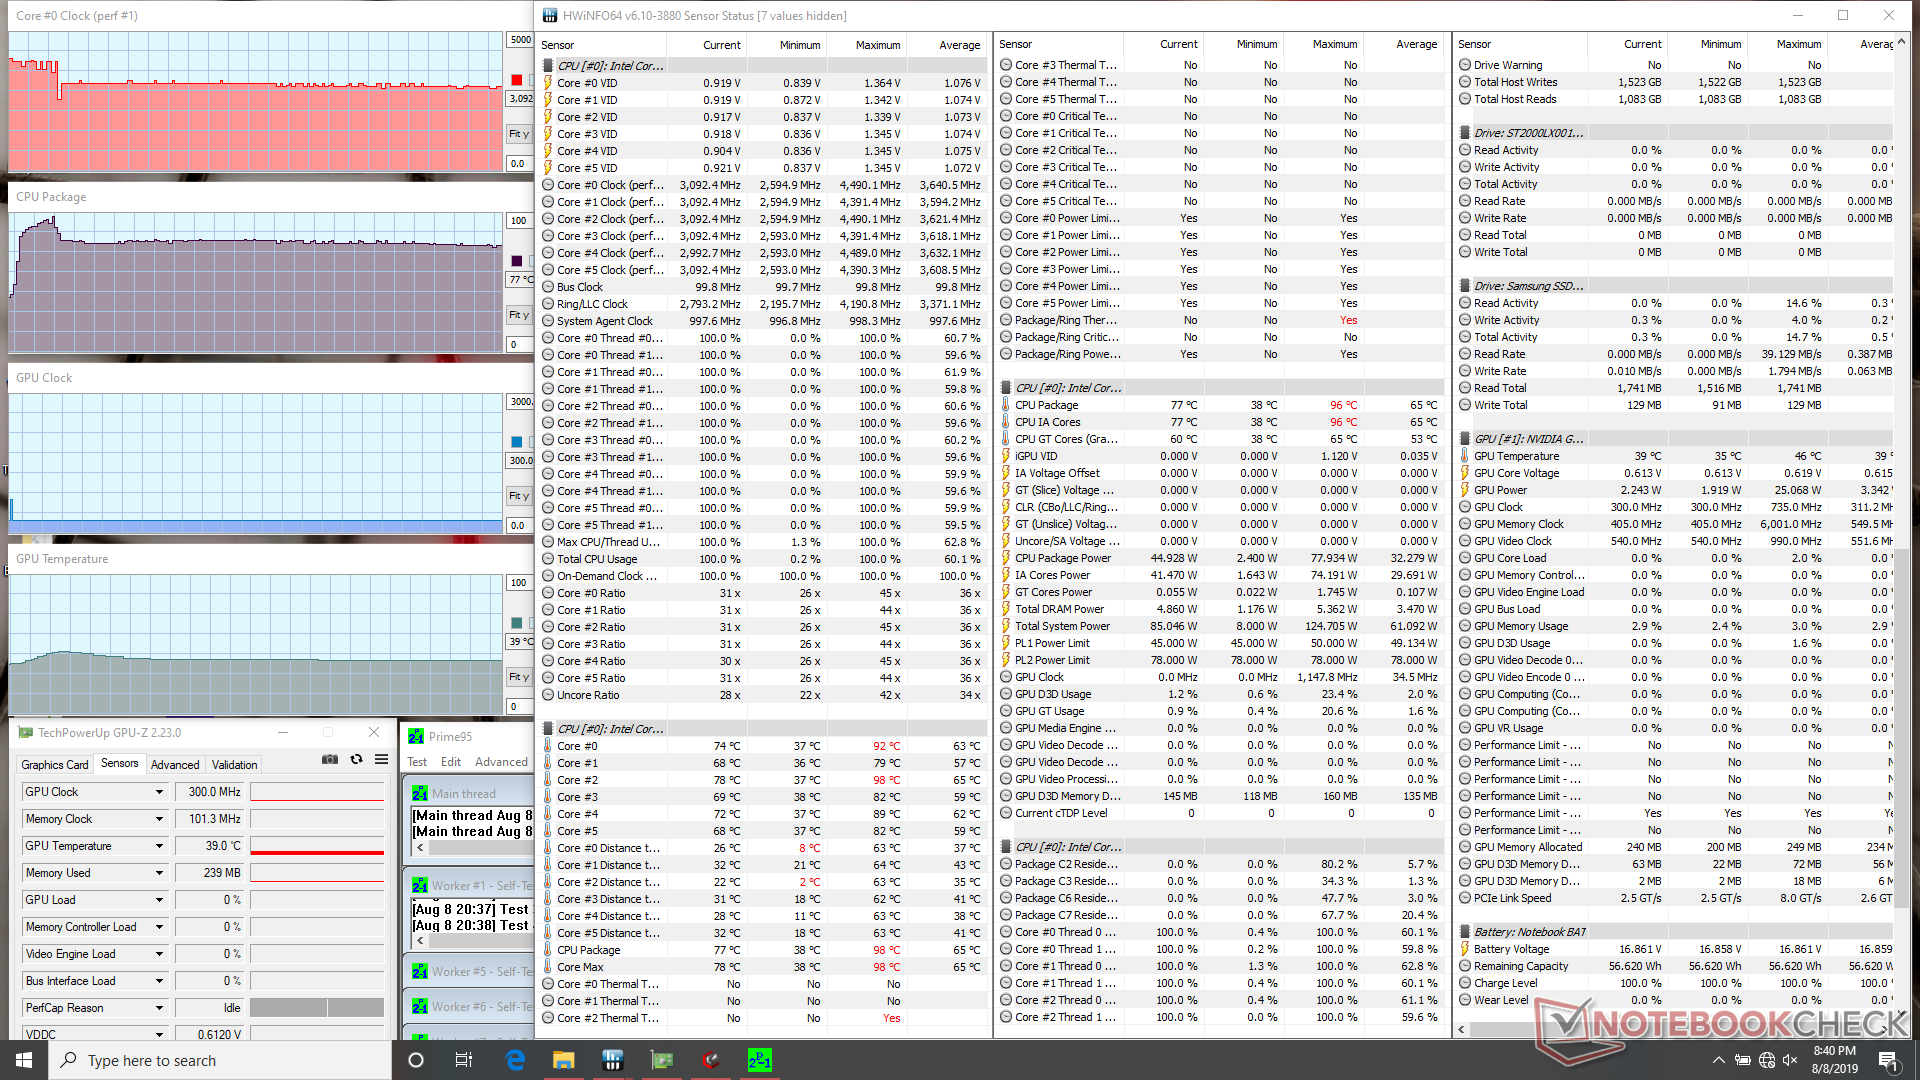
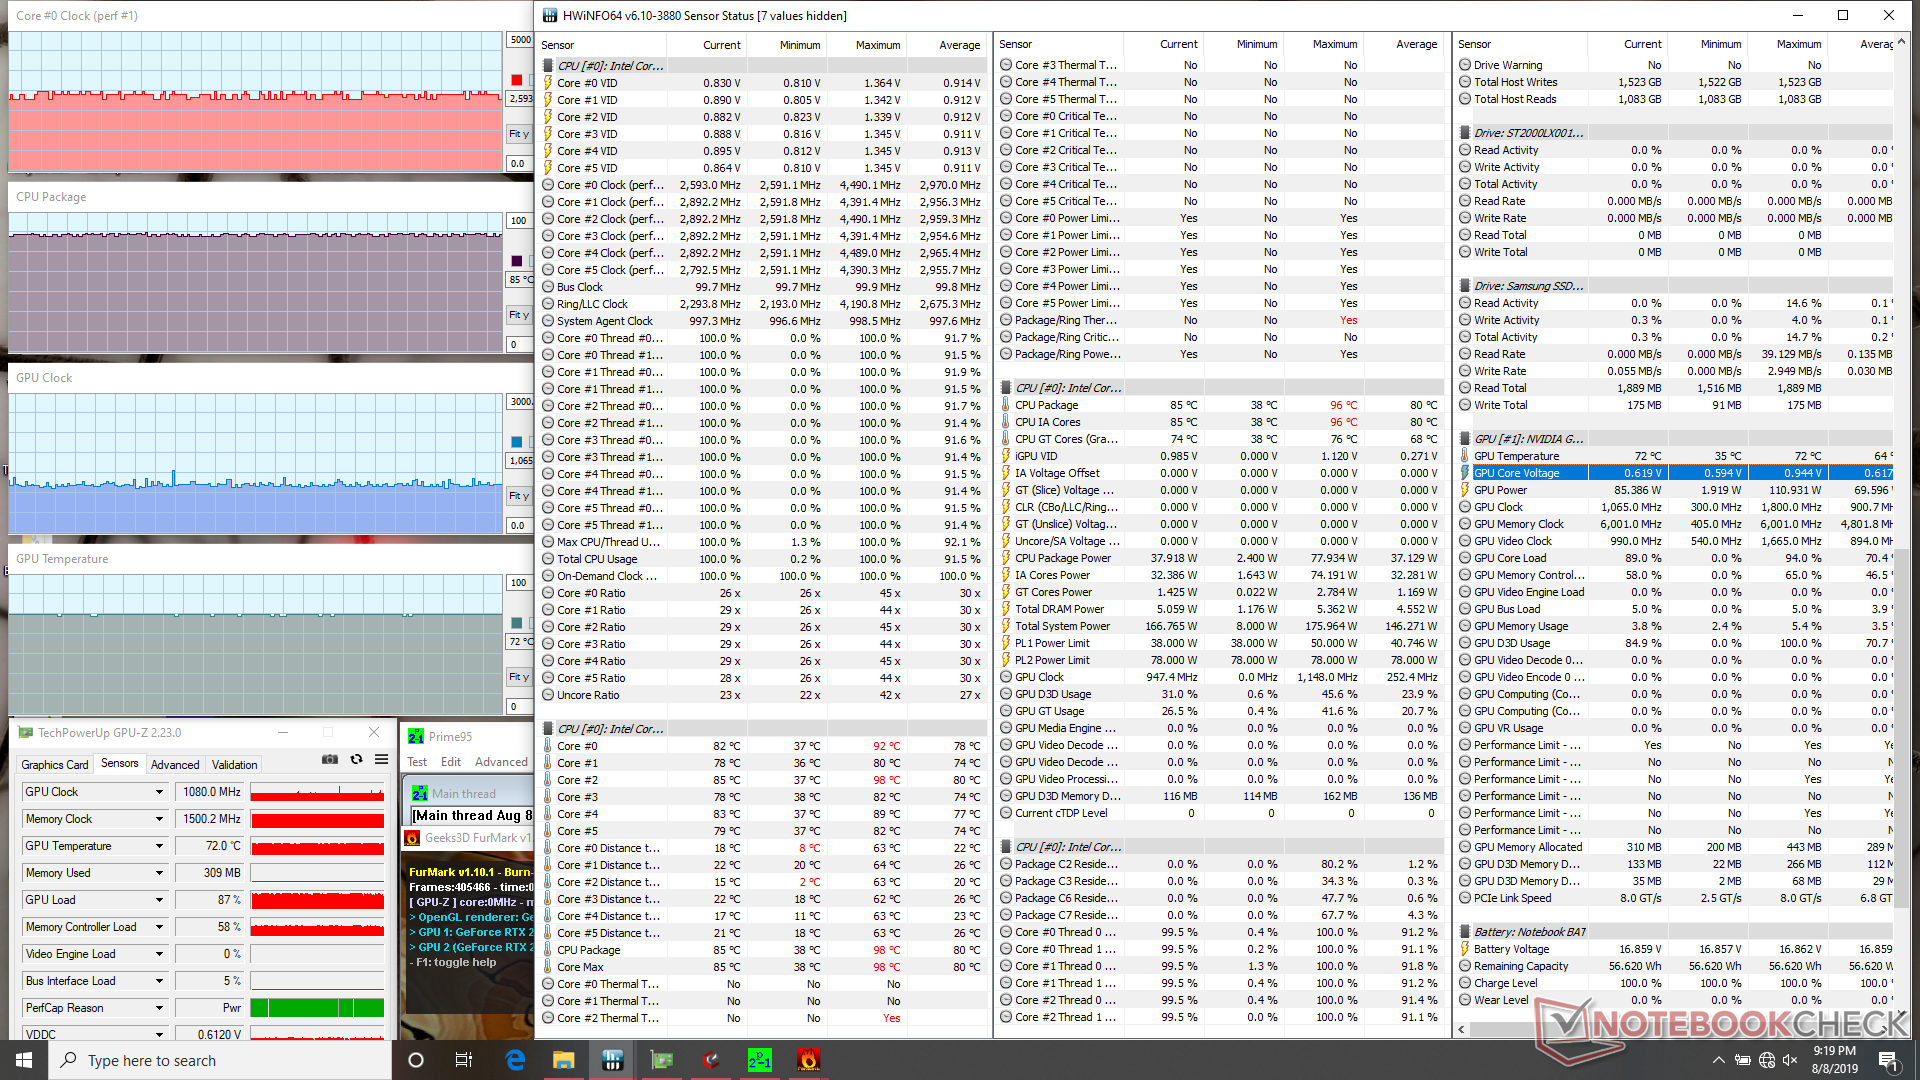
| CPU Clock (GHz) | GPU Clock (MHz) | Average CPU Temperature (°C) | Average GPU Temperature (°C) | |
| System Idle | -- | -- | 39 | 36 |
| Prime95 Stress | 3.0 - 3.1 | -- | 77 | 39 |
| Prime95 + FurMark Stress | ~2.6 | ~1080 | 85 | 72 |
| Witcher 3 Stress | ~4.0 | 1410 | 83 | 70 |
Speakers
The stereo speakers are loud at just under 90 dB. Perhaps unsurprisingly, bass is poor with roll off beginning at 500 Hz. The palm rests do no vibrate at all even when on maximum volume.

Origin PC EVO16-S i7-9750H RTX 2080 Max-Q audio analysis
(+) | speakers can play relatively loud (89.3 dB)
Bass 100 - 315 Hz
(-) | nearly no bass - on average 32.5% lower than median
(±) | linearity of bass is average (8.9% delta to prev. frequency)
Mids 400 - 2000 Hz
(+) | balanced mids - only 3% away from median
(±) | linearity of mids is average (8.6% delta to prev. frequency)
Highs 2 - 16 kHz
(±) | higher highs - on average 5.6% higher than median
(+) | highs are linear (6.8% delta to prev. frequency)
Overall 100 - 16.000 Hz
(±) | linearity of overall sound is average (26.7% difference to median)
Compared to same class
» 93% of all tested devices in this class were better, 1% similar, 6% worse
» The best had a delta of 6%, average was 18%, worst was 132%
Compared to all devices tested
» 82% of all tested devices were better, 4% similar, 14% worse
» The best had a delta of 4%, average was 24%, worst was 134%
Apple MacBook 12 (Early 2016) 1.1 GHz audio analysis
(+) | speakers can play relatively loud (83.6 dB)
Bass 100 - 315 Hz
(±) | reduced bass - on average 11.3% lower than median
(±) | linearity of bass is average (14.2% delta to prev. frequency)
Mids 400 - 2000 Hz
(+) | balanced mids - only 2.4% away from median
(+) | mids are linear (5.5% delta to prev. frequency)
Highs 2 - 16 kHz
(+) | balanced highs - only 2% away from median
(+) | highs are linear (4.5% delta to prev. frequency)
Overall 100 - 16.000 Hz
(+) | overall sound is linear (10.2% difference to median)
Compared to same class
» 7% of all tested devices in this class were better, 2% similar, 91% worse
» The best had a delta of 5%, average was 18%, worst was 53%
Compared to all devices tested
» 5% of all tested devices were better, 1% similar, 94% worse
» The best had a delta of 4%, average was 24%, worst was 134%
Energy Management
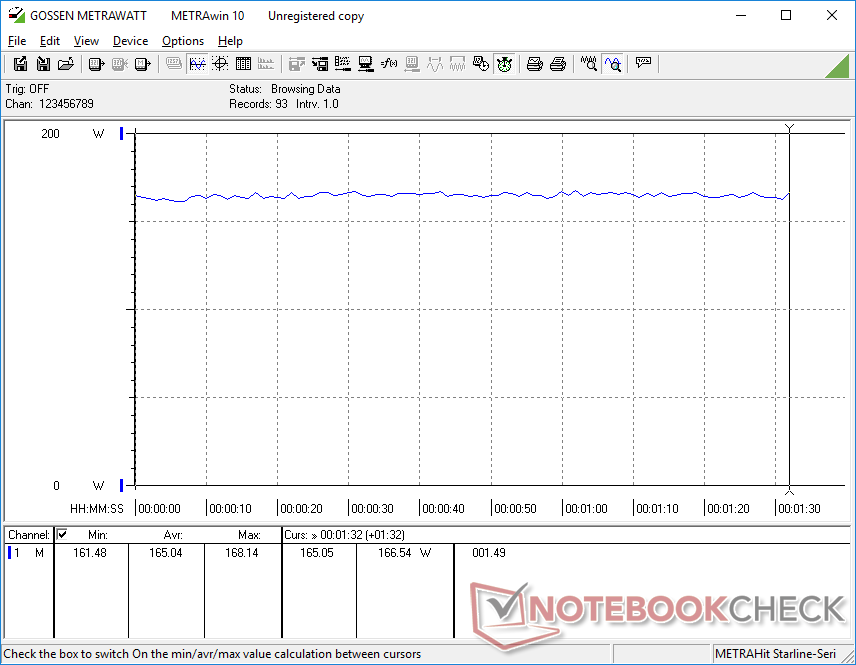
Power Consumption
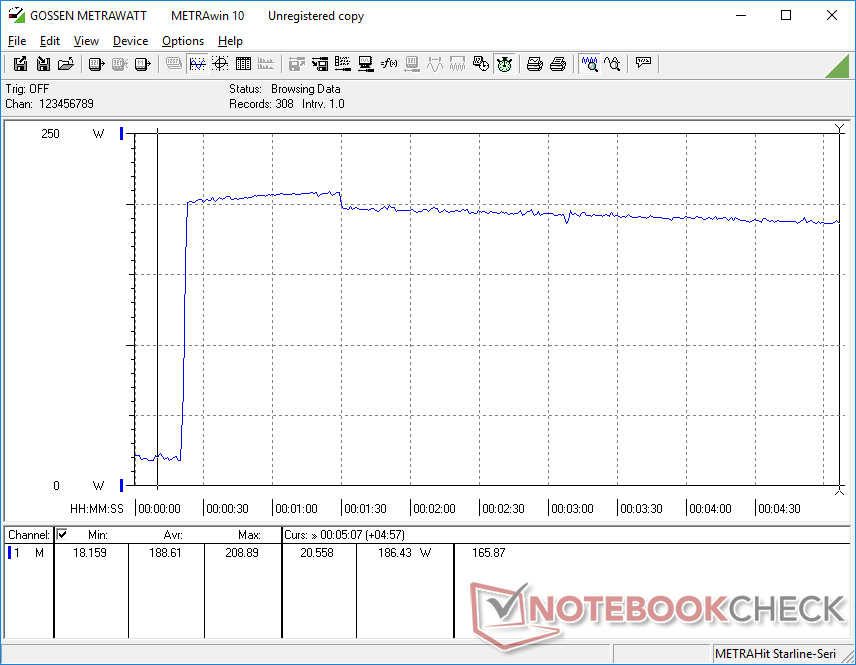
Idling on desktop demands anywhere between 7 W and 21 W depending on the brightness setting and power profile. When running Witcher 3, consumption averages about 165 W to be very close to the Razer Blade 15 and MSI GS75 each equipped with the same RTX 2080 Max-Q GPU. The system consumes about 10 percent more power than an RTX 2070 Max-Q laptop for roughly 15 percent faster graphics performance.
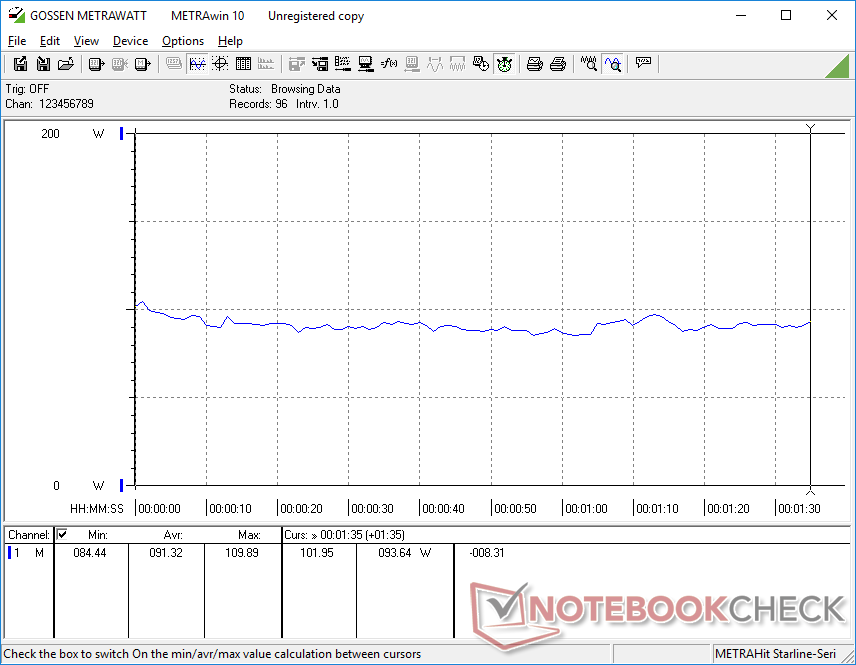
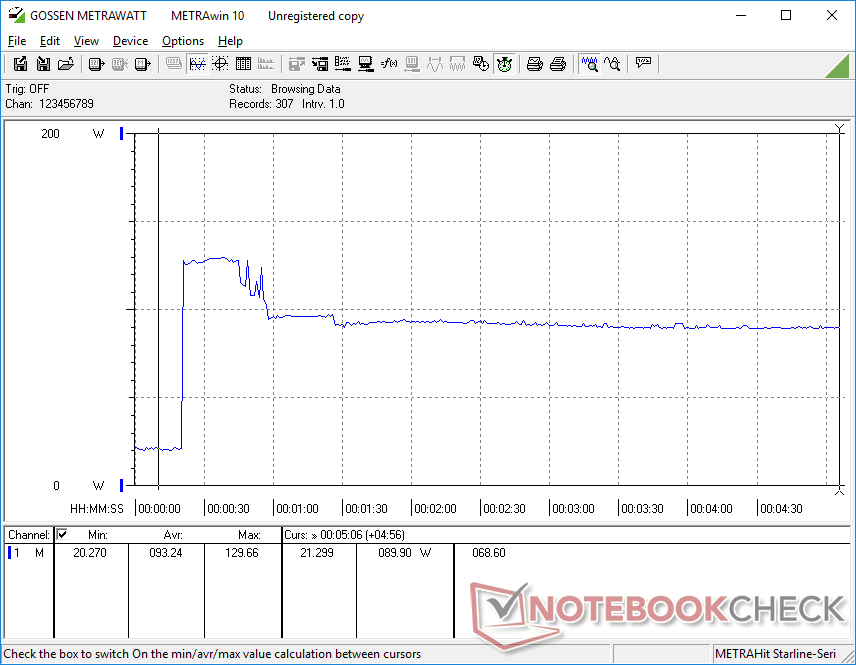
When running Prime95, consumption spikes to 129.7 W for about 30 seconds before falling to 68 W as shown by our graph below. The timing of the spikes and dips in power consumption correlates with our clock rate observations during the stress test above.
We're able to record a maximum consumption of 208.9 W from the small-medium (~14.3 x 7.5 x 2.9 cm) 180 W AC adapter to suggest that the OEM or reseller should have paired this laptop with a more capable AC adapter. The Razer Blade 15 with the same RTX 2080 Max-Q GPU, for example, ships with a higher capacity 230 W AC adapter instead. In practice, this means that the recharge rate will slow to a crawl when gaming or running very high processing loads.
| Off / Standby | |
| Idle | |
| Load |
|
Key:
min: | |
| Origin PC EVO16-S i7-9750H RTX 2080 Max-Q i7-9750H, GeForce RTX 2080 Max-Q, Samsung SSD 970 EVO Plus 500GB, IPS, 1920x1080, 16.1" | Razer Blade 15 RTX 2080 Max-Q i7-9750H, GeForce RTX 2080 Max-Q, Samsung SSD PM981 MZVLB512HAJQ, IPS, 1920x1080, 15.6" | Gigabyte Aero 15 Classic-XA i7-9750H, GeForce RTX 2070 Max-Q, Intel SSD 760p SSDPEKKW512G8, IGZO, 1920x1080, 15.6" | MSI GS75 Stealth 9SG i7-9750H, GeForce RTX 2080 Max-Q, 2x Samsung SSD PM981 MZVLB1T0HALR (RAID 0), IPS, 1920x1080, 17.3" | Asus Zephyrus S GX502GW i7-9750H, GeForce RTX 2070 Mobile, 2x Intel SSD 660p SSDPEKNW512G8 (RAID 0), IPS, 1920x1080, 15.6" | MSI GE75 9SG i9-9880H, GeForce RTX 2080 Mobile, Samsung SSD PM981 MZVLB1T0HALR, AHVA, 1920x1080, 17.3" | |
|---|---|---|---|---|---|---|
| Power Consumption | -16% | -55% | -25% | -77% | -43% | |
| Idle Minimum * (Watt) | 7.5 | 12.5 -67% | 21 -180% | 13 -73% | 24 -220% | 13.9 -85% |
| Idle Average * (Watt) | 11.6 | 15.3 -32% | 23 -98% | 17 -47% | 27 -133% | 18.8 -62% |
| Idle Maximum * (Watt) | 21 | 20.7 1% | 32 -52% | 25 -19% | 33 -57% | 23.1 -10% |
| Load Average * (Watt) | 91.3 | 90.2 1% | 97 -6% | 96 -5% | 129 -41% | 112.3 -23% |
| Witcher 3 ultra * (Watt) | 165.1 | 162 2% | 148 10% | 156 6% | 176 -7% | 231 -40% |
| Load Maximum * (Watt) | 208.9 | 209.3 -0% | 213 -2% | 239 -14% | 216 -3% | 291.5 -40% |
* ... smaller is better
Battery Life
The internal 56 Wh battery is smaller than expected when compared to the 80 Wh and 94 Wh batteries of the Razer Blade 15 and Gigabyte Aero 15, respectively. Runtimes are therefore about two hours shorter than the aforementioned alternatives during real-world WLAN loads. For a gaming laptop, however, results are average at just over 4.5 hours.
Charging from empty to full capacity takes about 1.5 hours.
| Origin PC EVO16-S i7-9750H RTX 2080 Max-Q i7-9750H, GeForce RTX 2080 Max-Q, 62 Wh | Razer Blade 15 RTX 2080 Max-Q i7-9750H, GeForce RTX 2080 Max-Q, 80 Wh | Gigabyte Aero 15 Classic-XA i7-9750H, GeForce RTX 2070 Max-Q, 94.24 Wh | MSI GS75 Stealth 9SG i7-9750H, GeForce RTX 2080 Max-Q, 80.25 Wh | Asus Zephyrus S GX502GW i7-9750H, GeForce RTX 2070 Mobile, 76 Wh | Eurocom Nightsky RX17 i7-9750H, GeForce RTX 2070 Mobile, 62 Wh | |
|---|---|---|---|---|---|---|
| Battery runtime | 40% | 49% | 28% | -21% | -57% | |
| WiFi v1.3 (h) | 4.7 | 6.6 40% | 7 49% | 6 28% | 3.7 -21% | 2 -57% |
| Reader / Idle (h) | 15.9 | 9.1 | 7.7 | 5.9 | 4.2 | |
| Load (h) | 1.7 | 3 | 1.2 | 1 | 1.2 |
Pros
Cons
Verdict
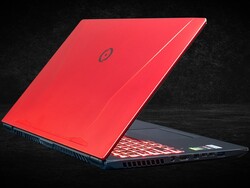

The biggest reasons to own an EVO16-S over other gaming laptops are for its uncommon 16.1-inch display size, highly customizeable outer lid, thin and portable form factor, extended Origin PC support, and perhaps its full-size NumPad and Arrow keys. Most everything else is fairly average for an enthusiast gaming laptop. Chassis rigidity could be better, battery life is unexceptional, and fan noise when gaming is louder than expected.
End-user servicing is disappointingly more difficult than it should be especially for a gaming laptop aimed at enthusiasts. Upgrades that should be relatively simple, like RAM or storage, are easier on some other competing systems like the Gigabyte Aero 15, MSI GS65, or the Razer Blade Pro 17. Quieter fans, cooler WASD keys, and easier upgrading should be on the to-do list for a potential next generation model.
The super-thin 16-inch Origin PC EVO16-S offers a slightly larger display than a 15-inch offering without being all that much heavier or larger. It sacrifices a few features along the way including easy serviceability and lack of additional display options.
Origin PC EVO16-S i7-9750H RTX 2080 Max-Q
- 08/13/2019 v6 (old)
Allen Ngo
Price comparison
