HP EliteBook 865 G10 laptop review - Capable business laptop ruined by Sure View

The EliteBook series is synonymous with premium business notebooks from HP. The slim 865 G10 is equipped with LTE support, a SmartCard reader and plenty of security features. A 16-inch model was also added to the EliteBook lineup last year. The first update has now arrived. So what has HP come up with this time?
At first glance, the G10 hasn’t changed much compared with the previous model G9. But has HP only updated its EliteBook series with Zen 4 processors, or are there other improvements? And how does the Zen 4 CPU stack up against the Zen 3 chip in the previous model? Those who like it smaller can also check out our review of the 14-inch HP Elite 845 G10.
In this review, we're going to not only compare the current model with its predecessor, but also analyse how well it stacks up against other high-end business laptops such as the Lenovo ThinkPad P16s G2, the Acer Swift Edge 16, the Lenovo ThinkPad T16 G2 and the Galaxy Book3 Pro 16.
Comparison with possible competitors
Rating | Date | Model | Weight | Height | Size | Resolution | Price |
|---|---|---|---|---|---|---|---|
| 85.8 % v7 (old) | 03 / 2024 | HP EliteBook 865 G10 R9 PRO 7940HS, Radeon 780M | 1.9 kg | 19.2 mm | 16.00" | 1920x1200 | |
| 87.2 % v7 (old) | 12 / 2022 | HP EliteBook 865 G9 R7 PRO 6850U, Radeon 680M | 1.9 kg | 19 mm | 16.00" | 1920x1200 | |
| 88.6 % v7 (old) | 01 / 2024 | Lenovo ThinkPad P16s G2 21K9000CGE R7 PRO 7840U, Radeon 780M | 1.8 kg | 24.4 mm | 16.00" | 3840x2400 | |
| 88.6 % v7 (old) | 10 / 2023 | Acer Swift Edge SFE16 Ryzen 7 7840U R7 7840U, Radeon 780M | 1.2 kg | 13 mm | 16.00" | 3200x2000 | |
| 90 % v7 (old) | 08 / 2023 | Lenovo ThinkPad T16 G2 21HH003AGE i7-1355U, Iris Xe G7 96EUs | 1.8 kg | 20.5 mm | 16.00" | 1920x1200 | |
| 85.6 % v7 (old) | 05 / 2023 | Samsung Galaxy Book3 Pro 16 i5-1340P, Iris Xe G7 80EUs | 1.6 kg | 12.5 mm | 16.00" | 2880x1800 |
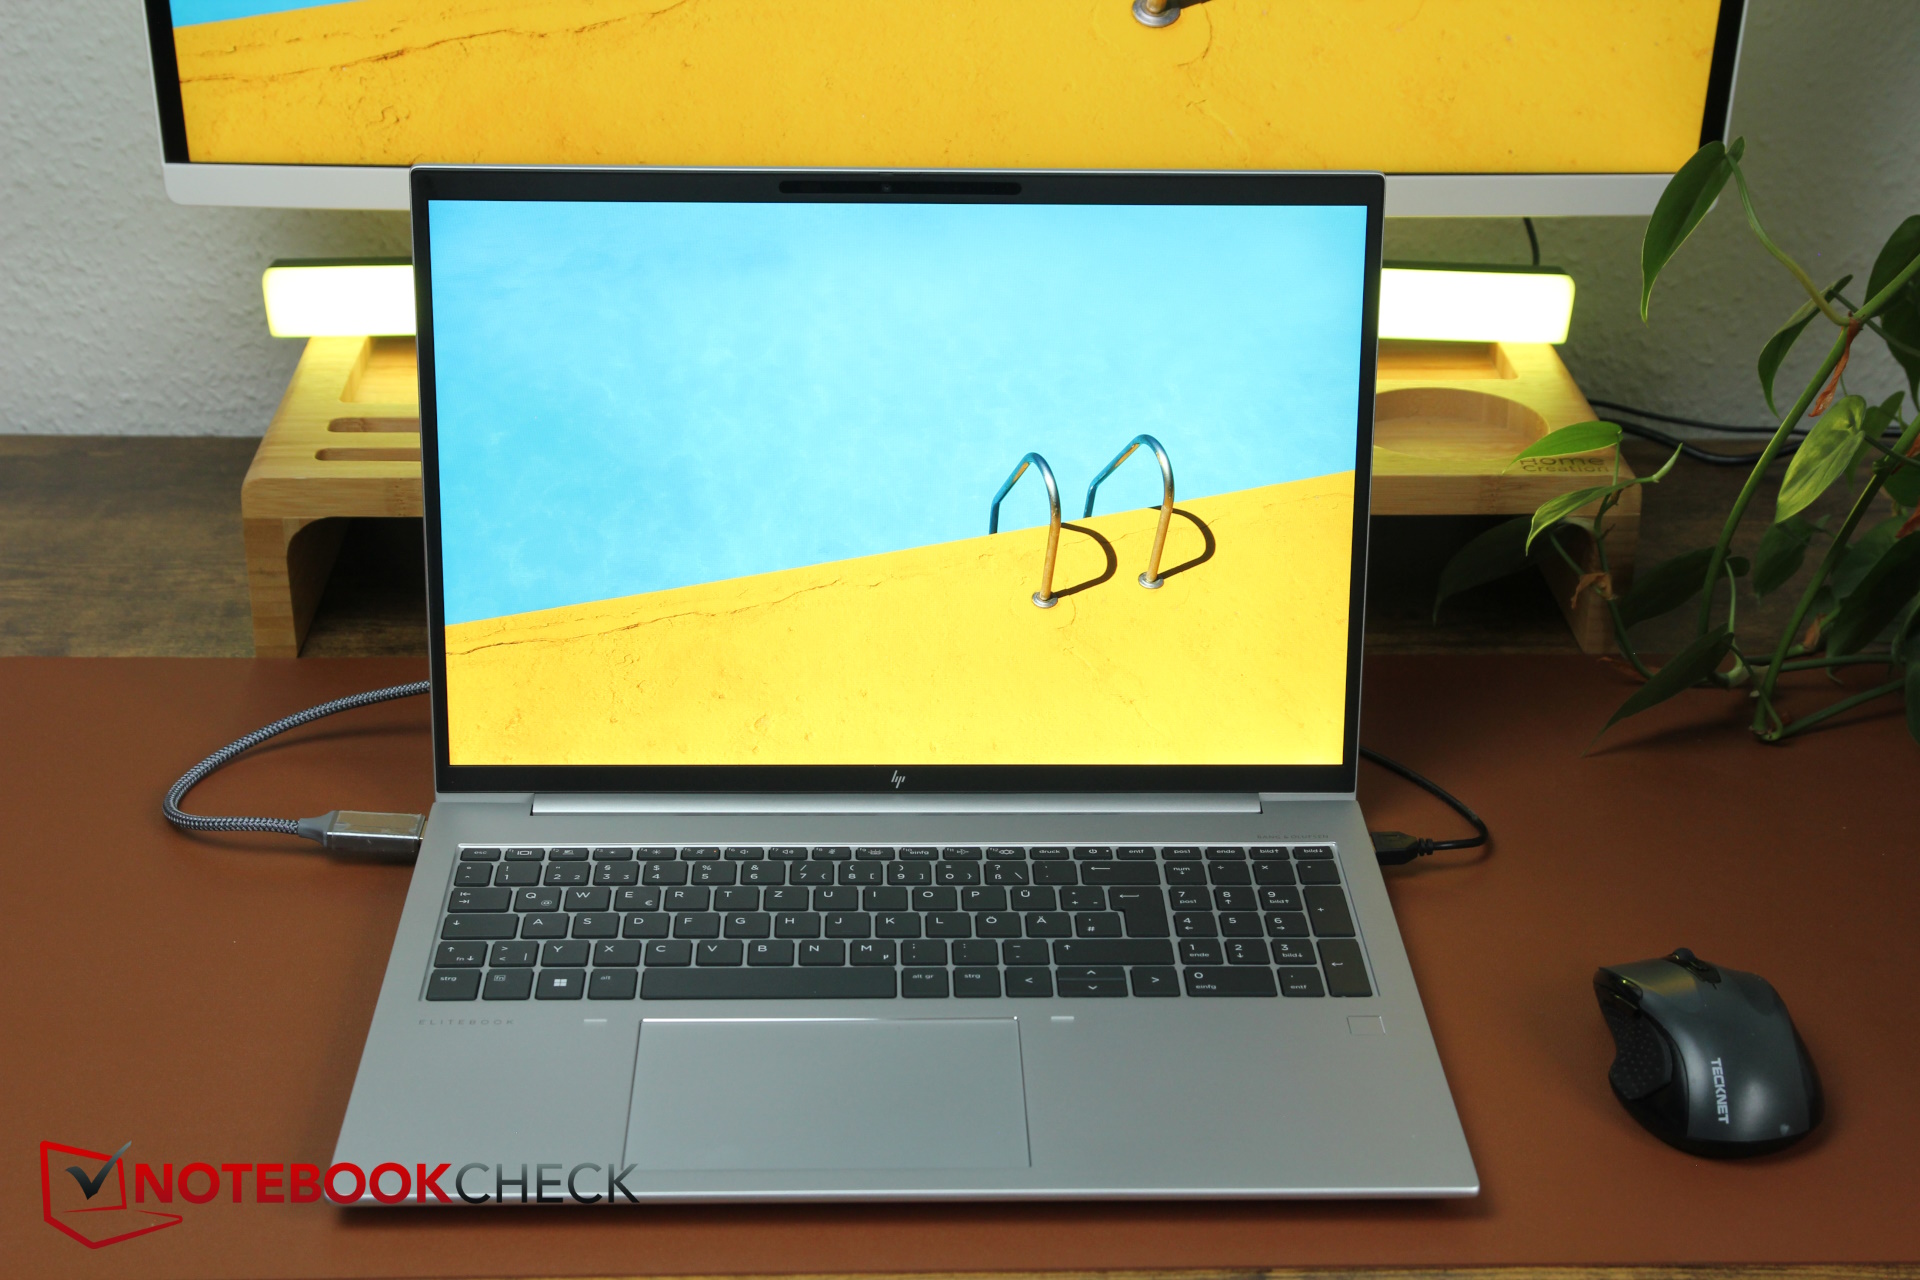
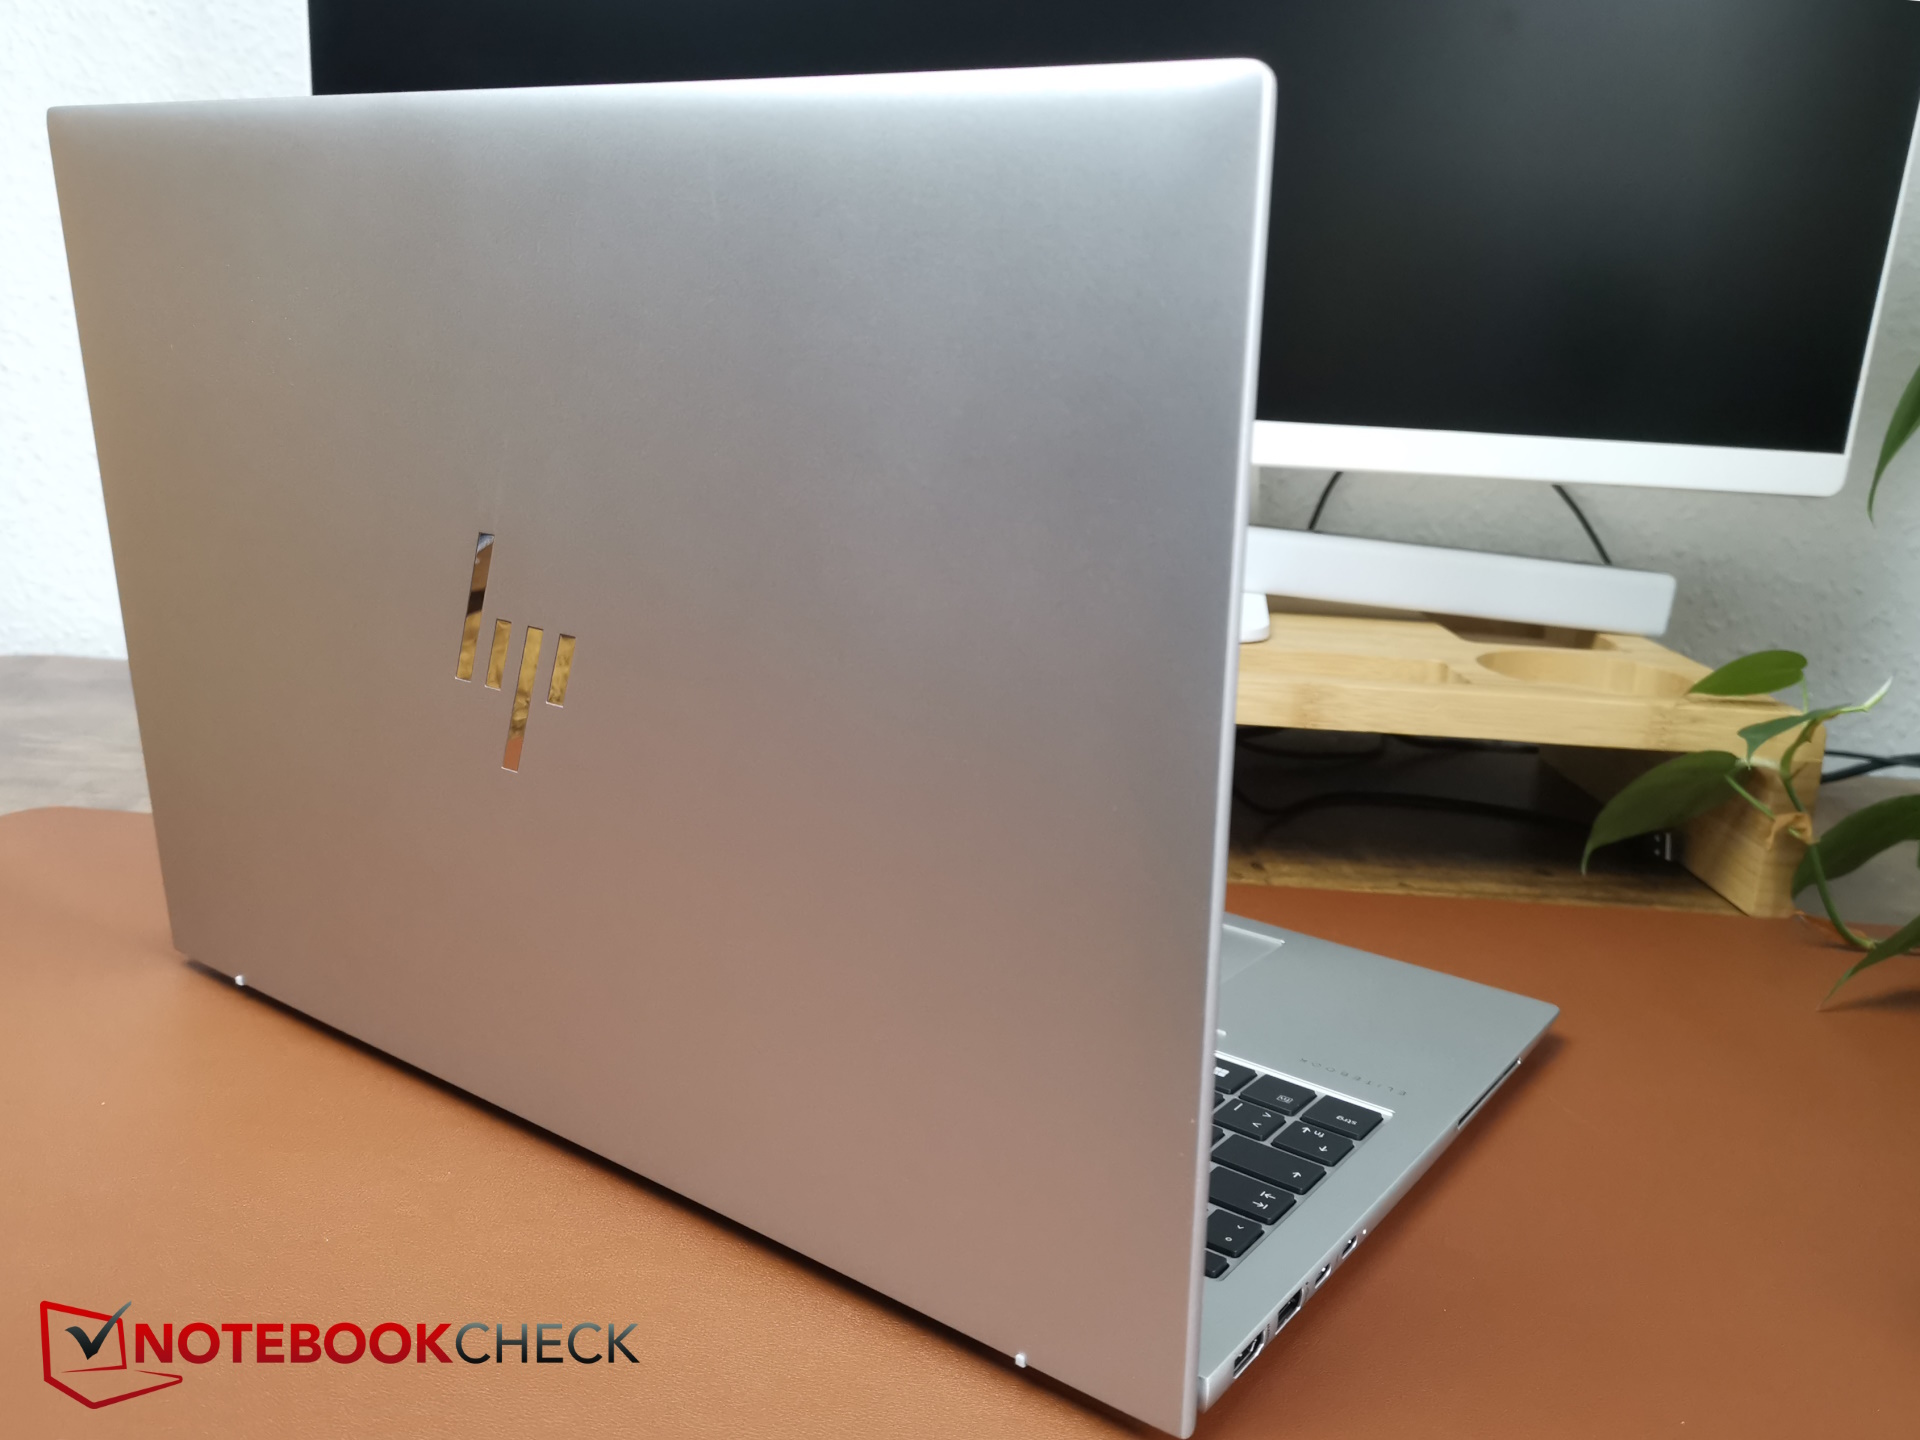
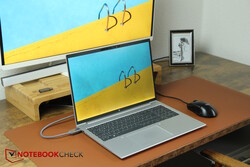
Chassis - EliteBook 16 with silver-coloured metal
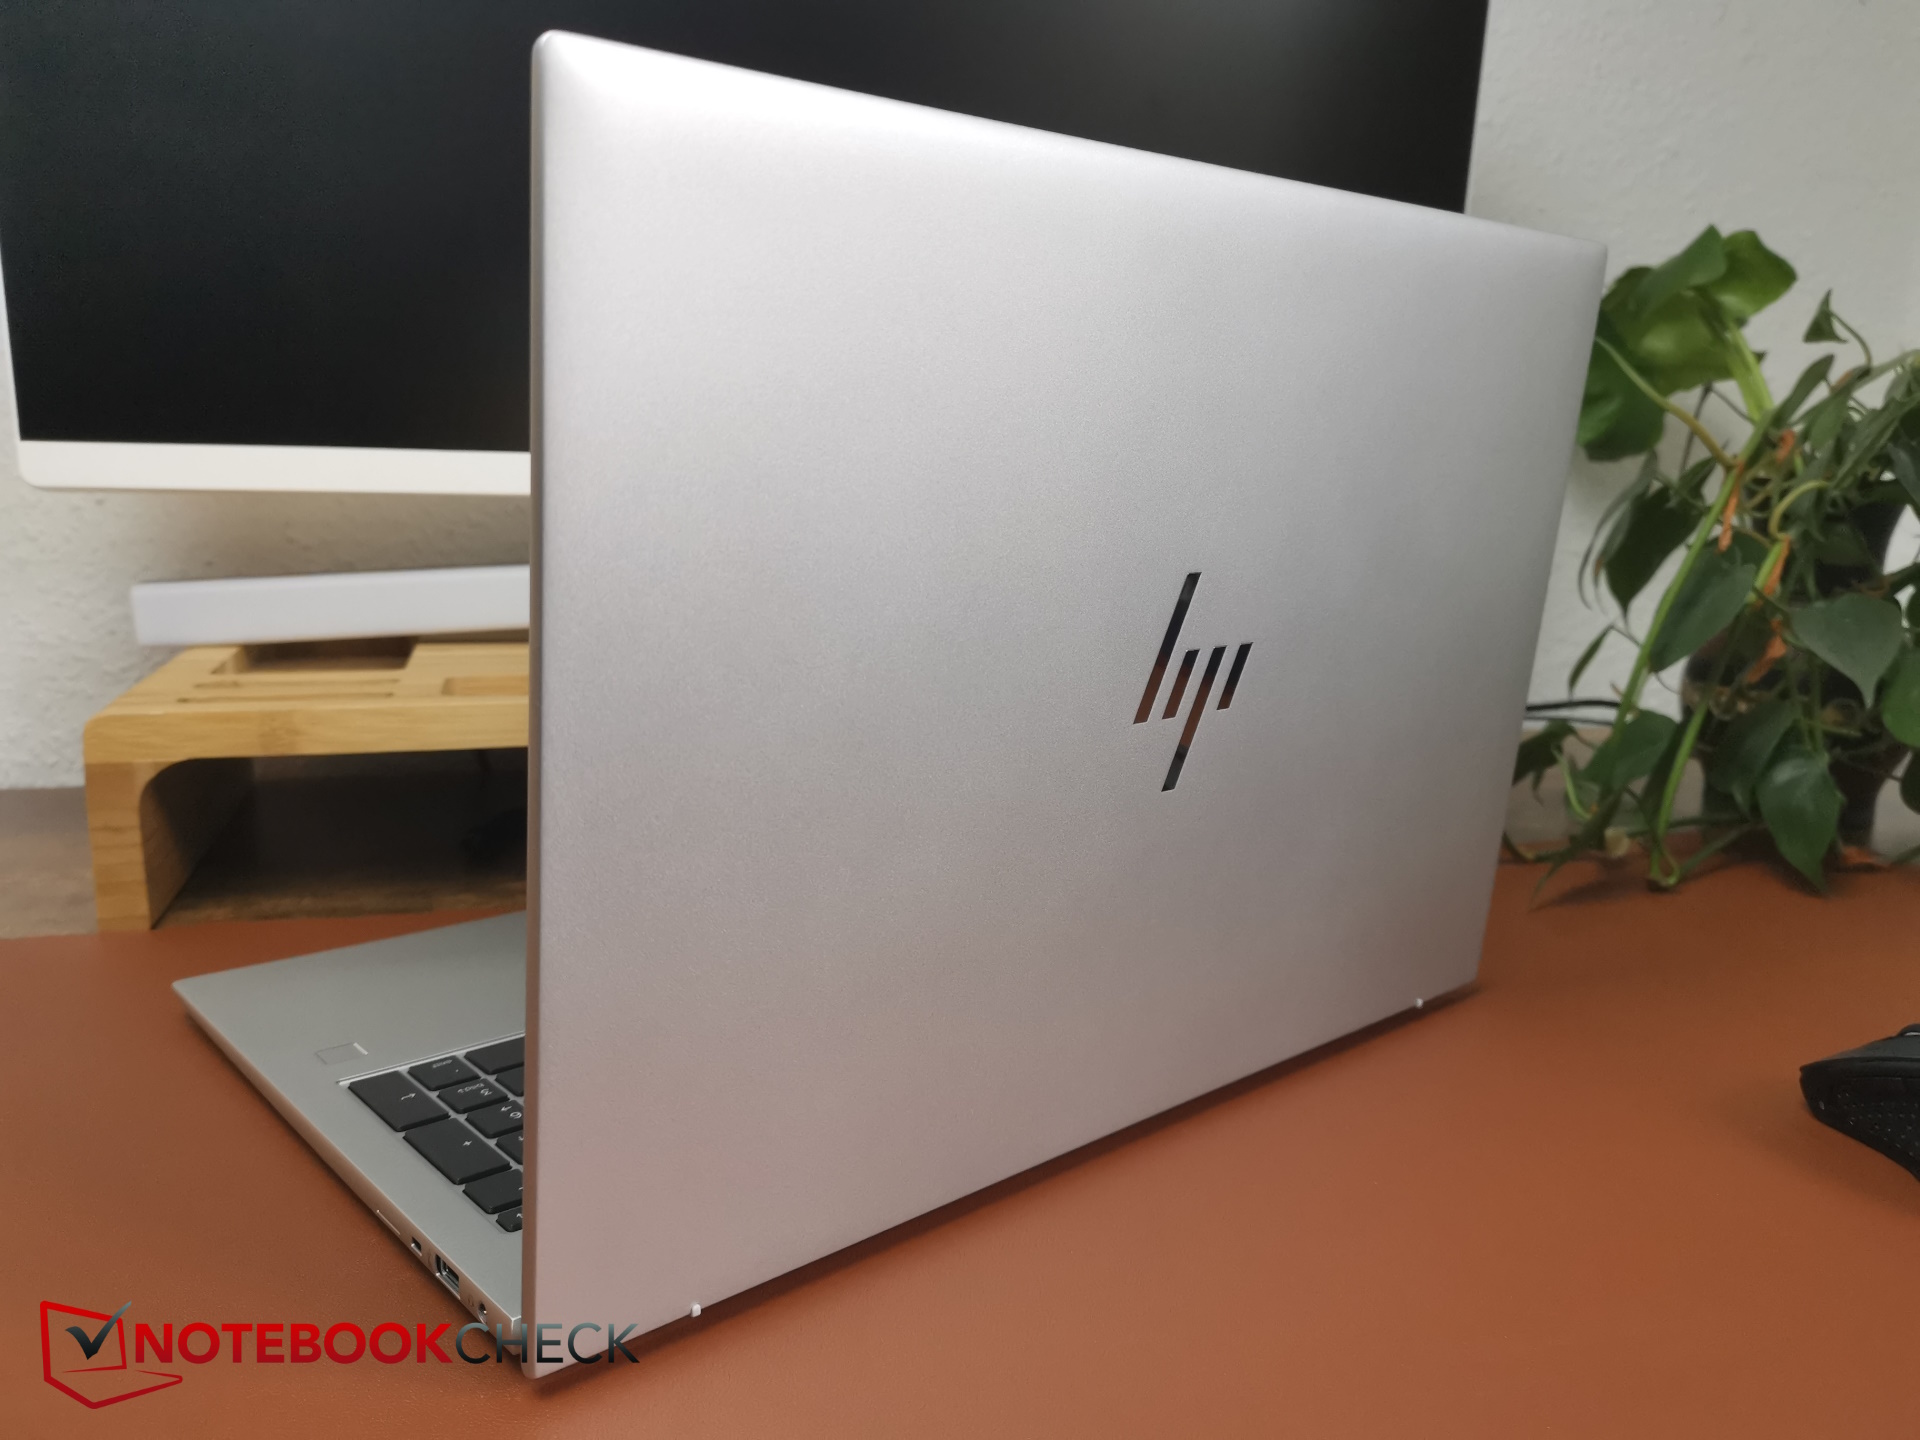
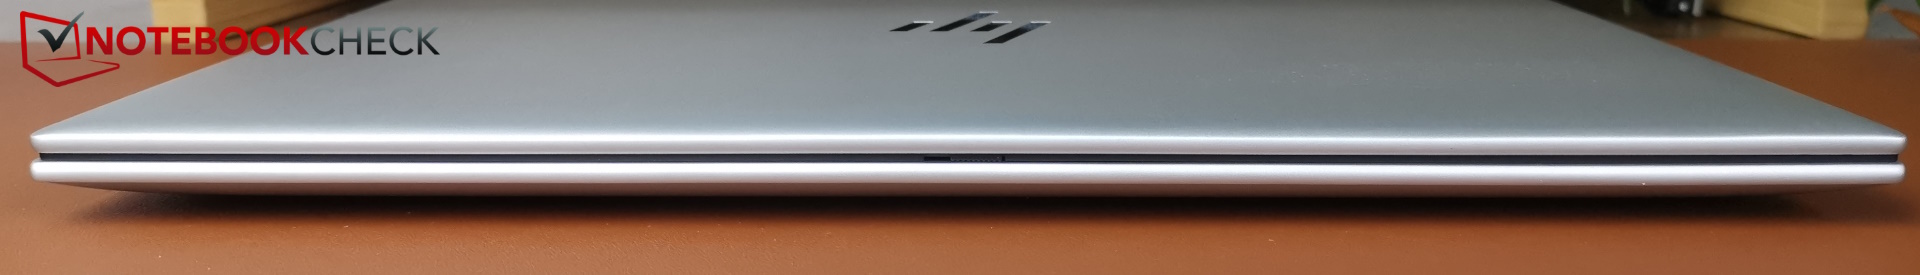
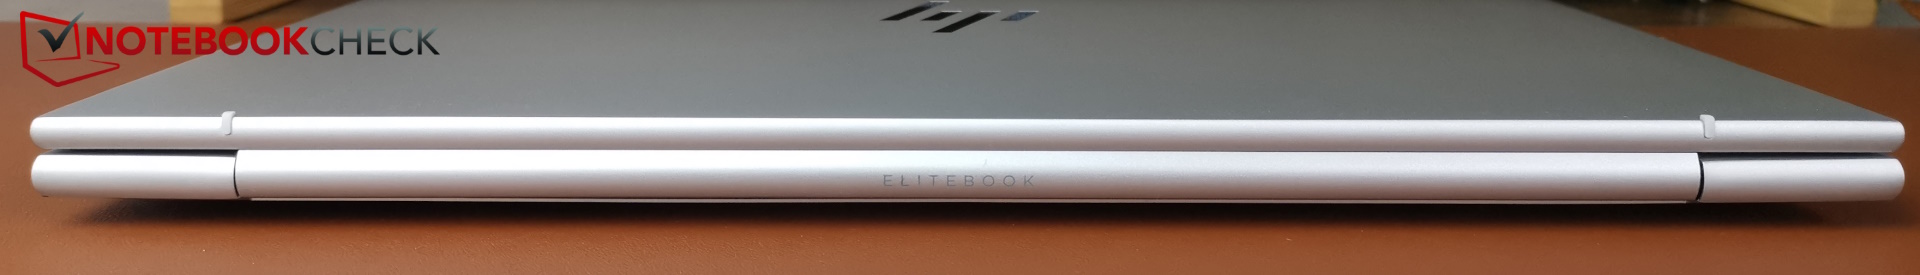
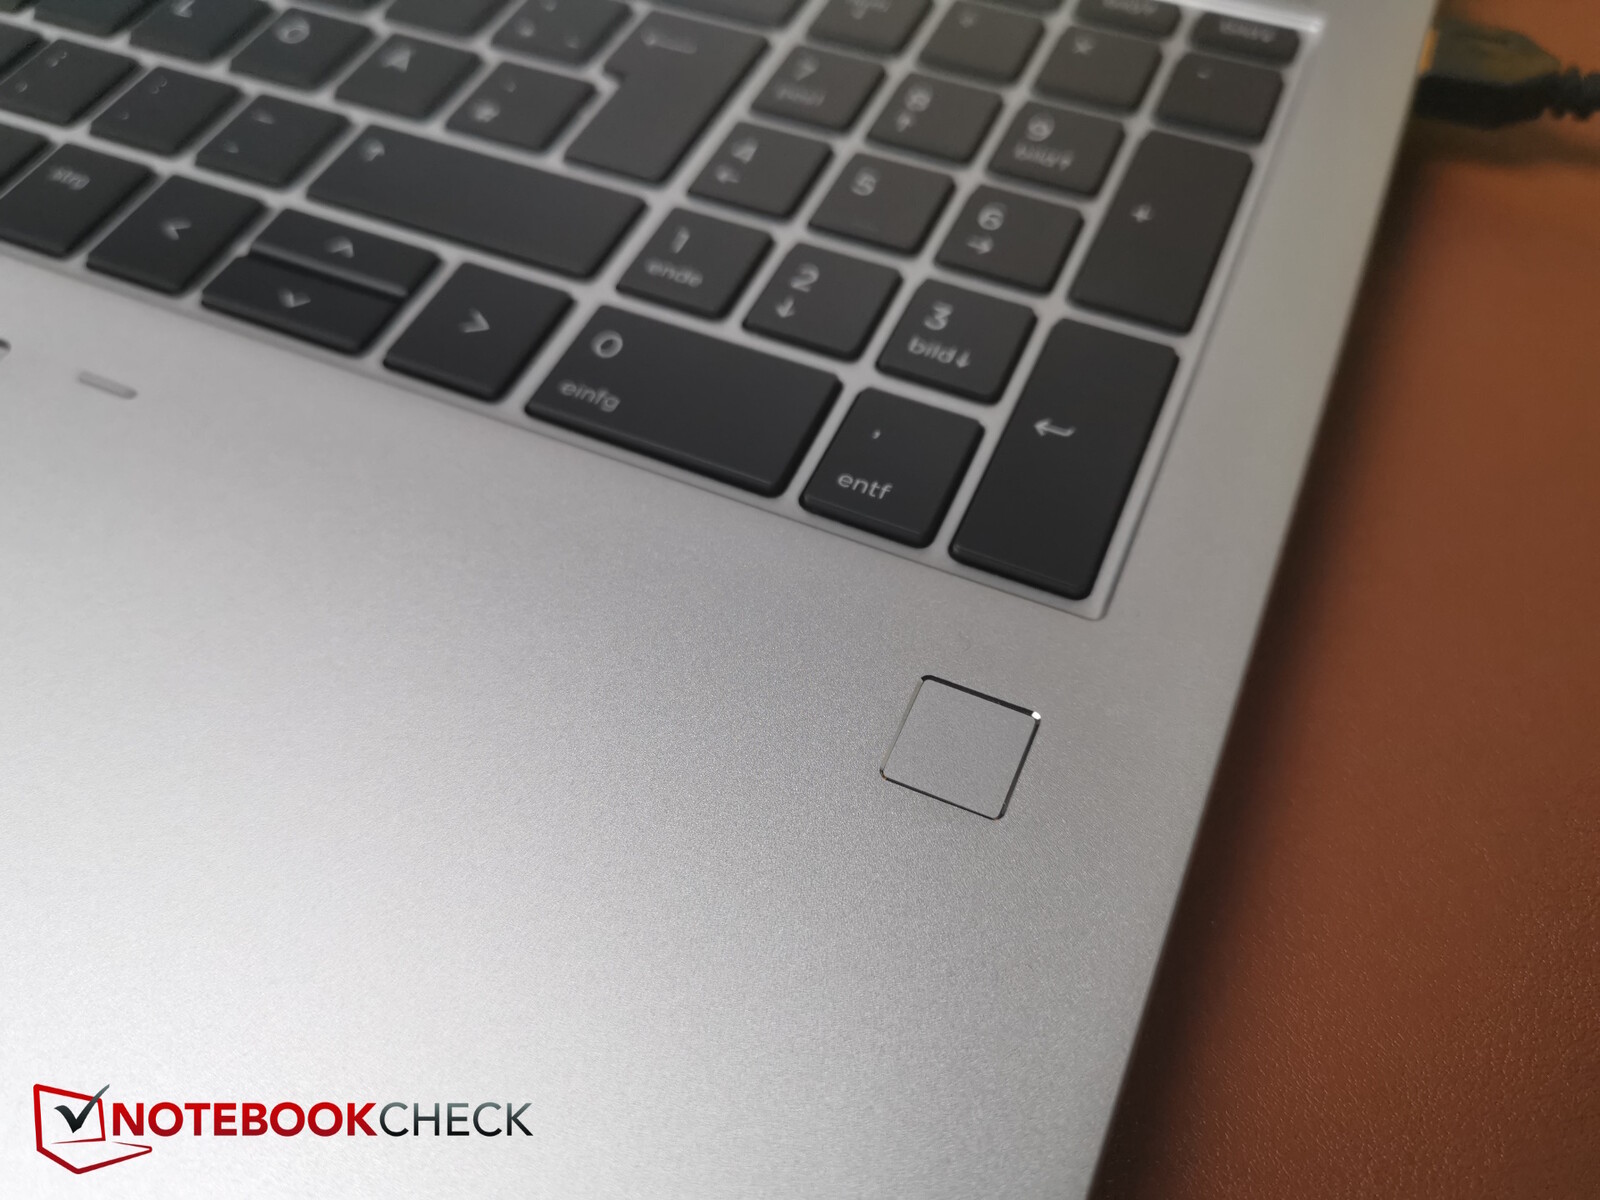
All the edges on the silver-coloured aluminium body are rounded. The metal gives the base great sturdiness; we only heard a minimal amount of creaking during our twist tests. The display lid is fairly robust as well, but is naturally a little easier to bend. Only the bezel around the display is made of smooth, black plastic. A notch on the front of the lid lets you open the laptop with one hand.
The lid can be folded back by almost 180 degrees. The long hinge in the middle is also firm, but the display can still wobble slightly for a short while after being opened or shaken lightly. Two small rubber pads above the top left and right corners of the touchpad ensure that the display doesn’t get scratched by the keyboard deck when the lid is closed.
The EliteBook is on the small side in terms of size. The competitors are often a few millimetres deeper or wider. However, this is not always true for thickness since both the Acer Swift Edge and Samsung Galaxy Book are considerably thinner than our EliteBook. On the other hand, the two ThinkPads are a little thicker, meaning that the 865 G10 is in the middle of the pack as far as thickness goes.
At 1.9 kg (4.2 lb), the EliteBook 865 is on the heavier end in our comparison. Both ThinkPads weigh roughly 100 g (0.2 lb) less, whilst the extra-slim Acer and Samsung laptops are even lighter.
Specifications - SmartCard & LTE, but no LAN or SD card reader
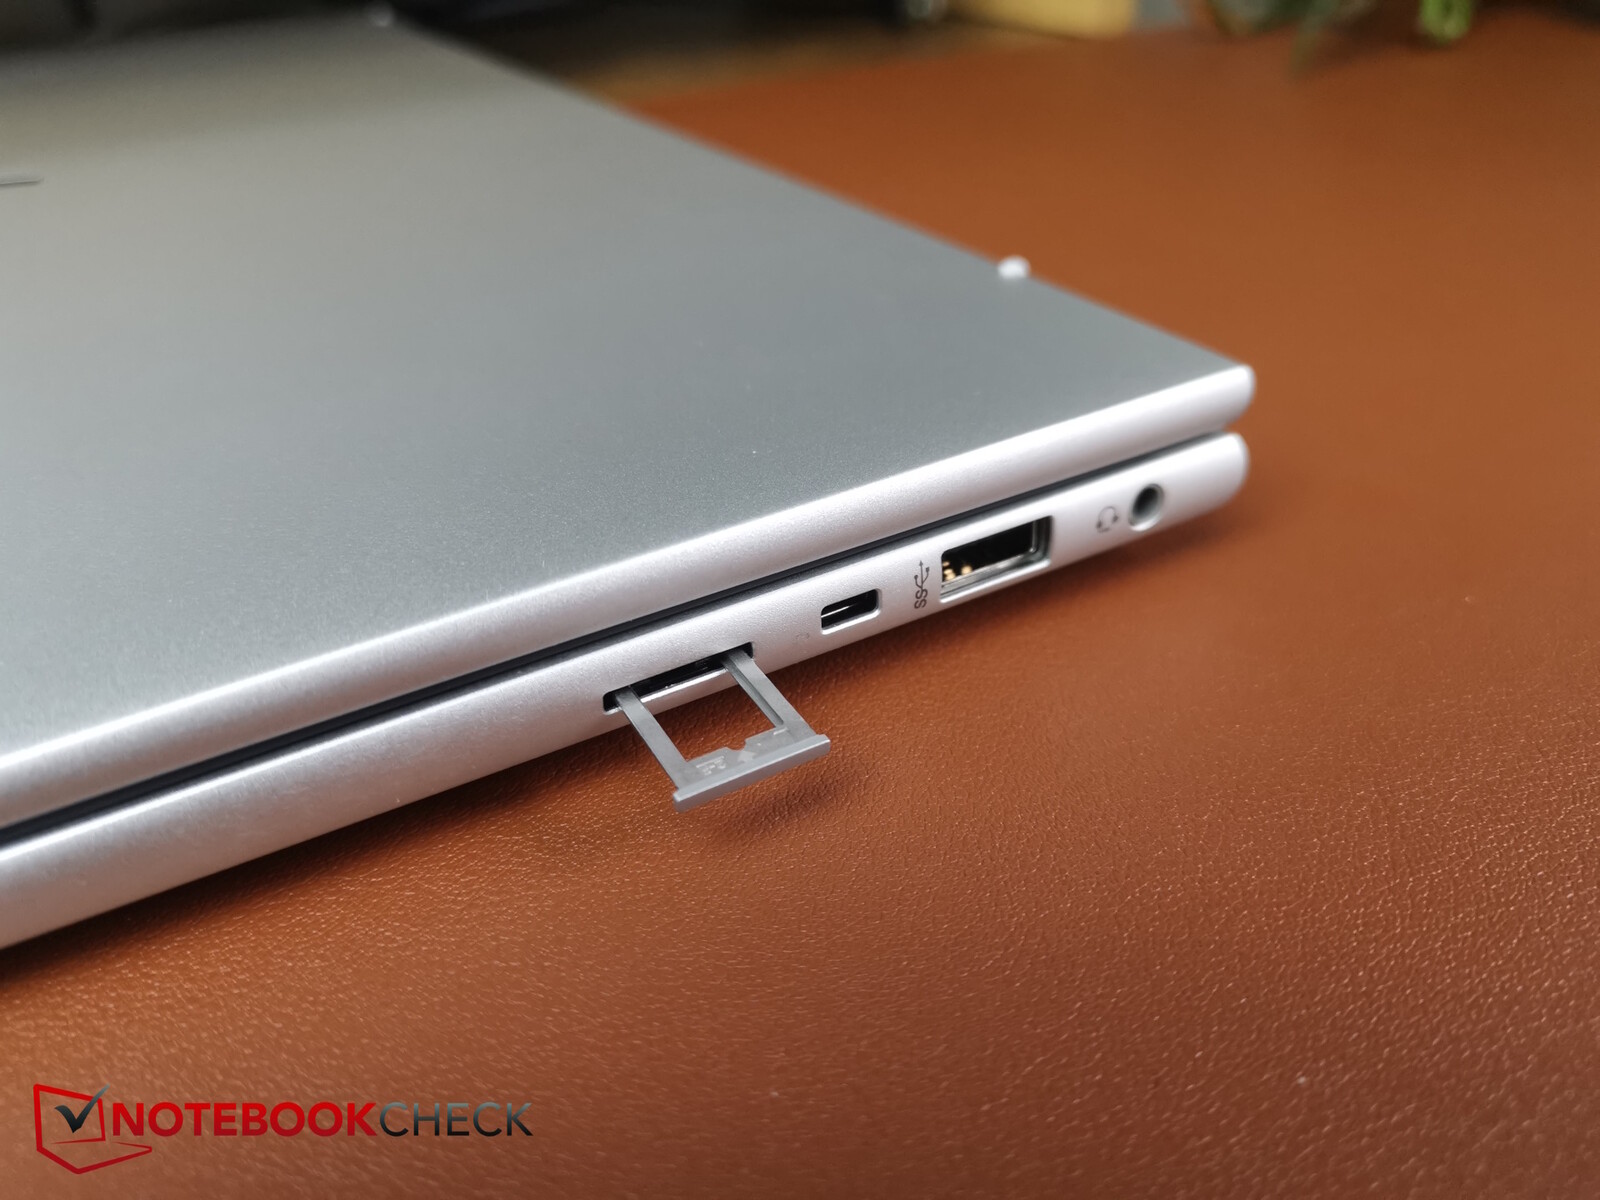
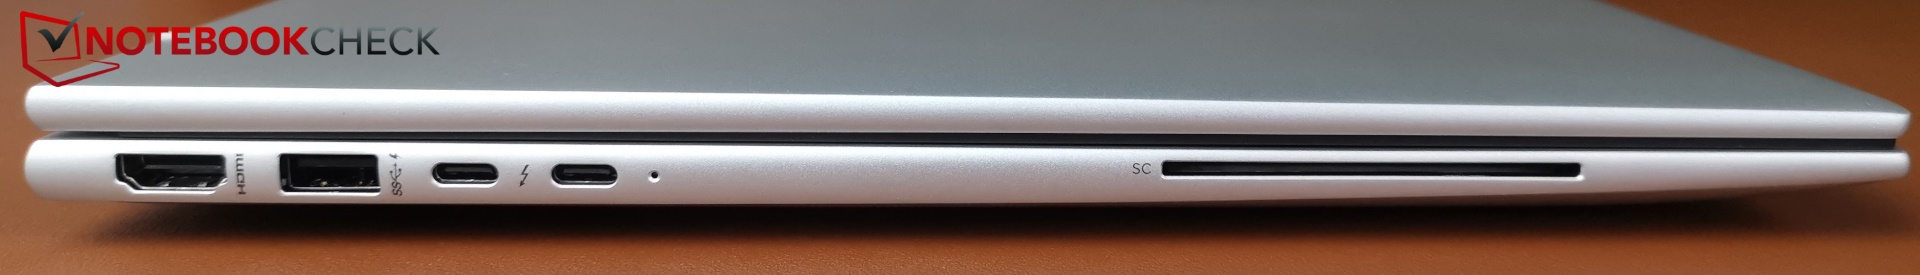
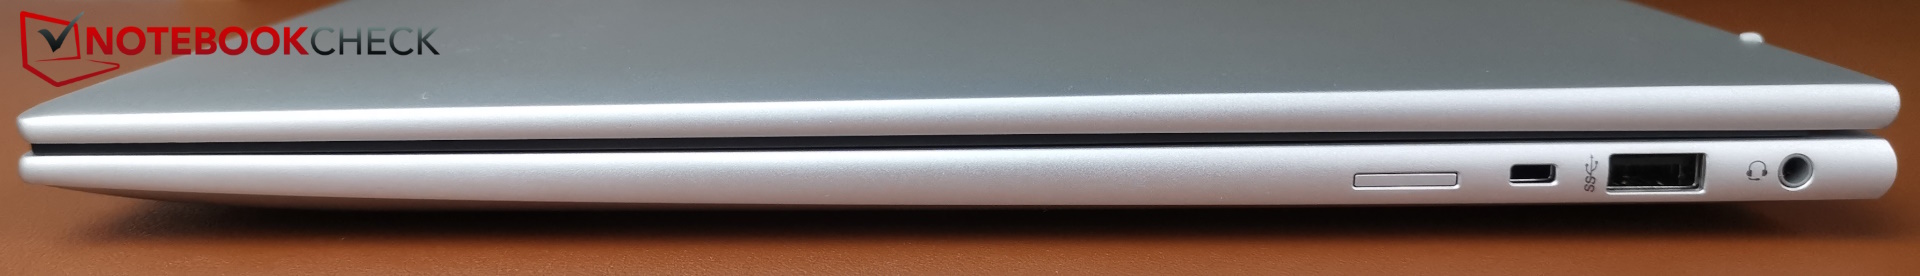
The I/O options are quite decent for an ultrabook. There are a total of four USB ports: two Type-A and two Type-C.
However, the EliteBook lacks an SD card reader and a LAN port. In any case, it isn't really surprising that the latter is missing on a laptop of this class. Interesting features include a SmartCard reader and a SIM card slot with LTE support.
The ports are all located far back on both sides, which gives your hand more space when you’re using a mouse. The HDMI and USB-A ports could be slighter farther apart.
Connectivity
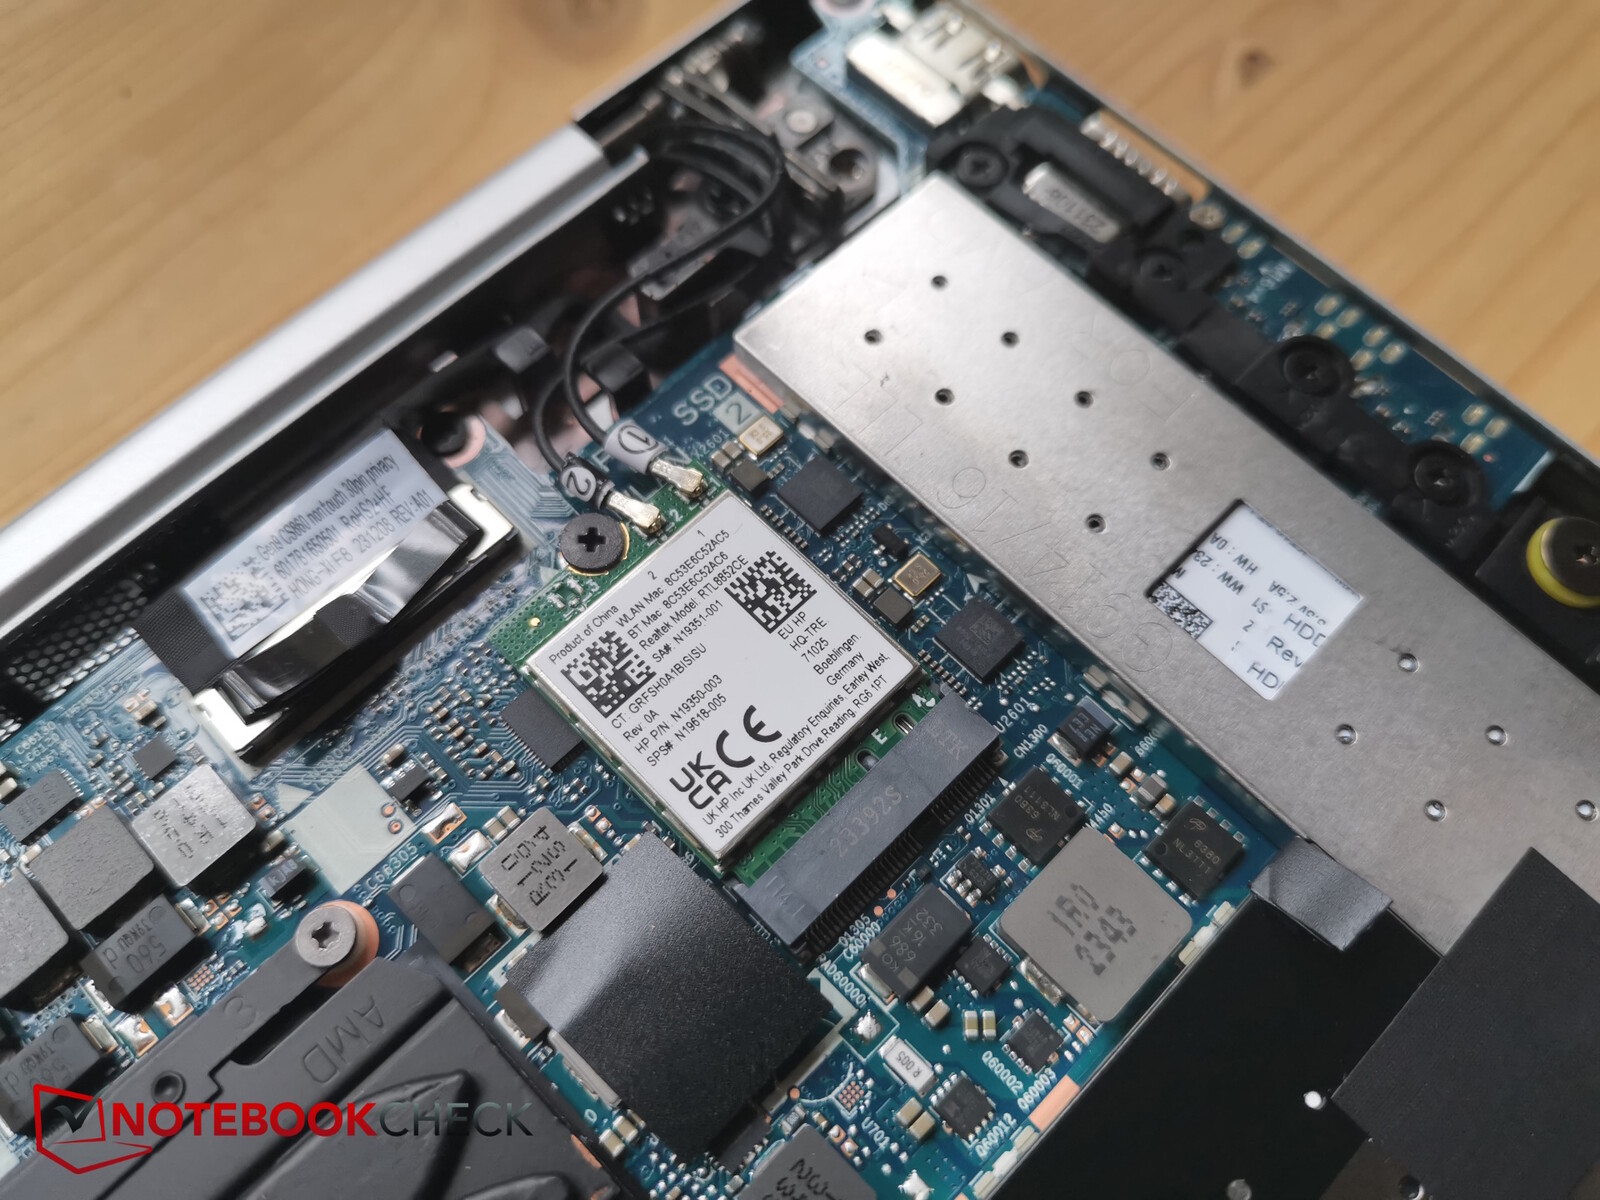
Wi-Fi plays a particularly crucial role because the laptop doesn't have an Ethernet port. Unlike the HP Spectre x360 16 (supports Wi-Fi 7), the HP EliteBook uses a Realtek Wi-Fi 6E card.
Transfer speeds are very good, but the Qualcomm adapter in the previous model produced marginally better results.
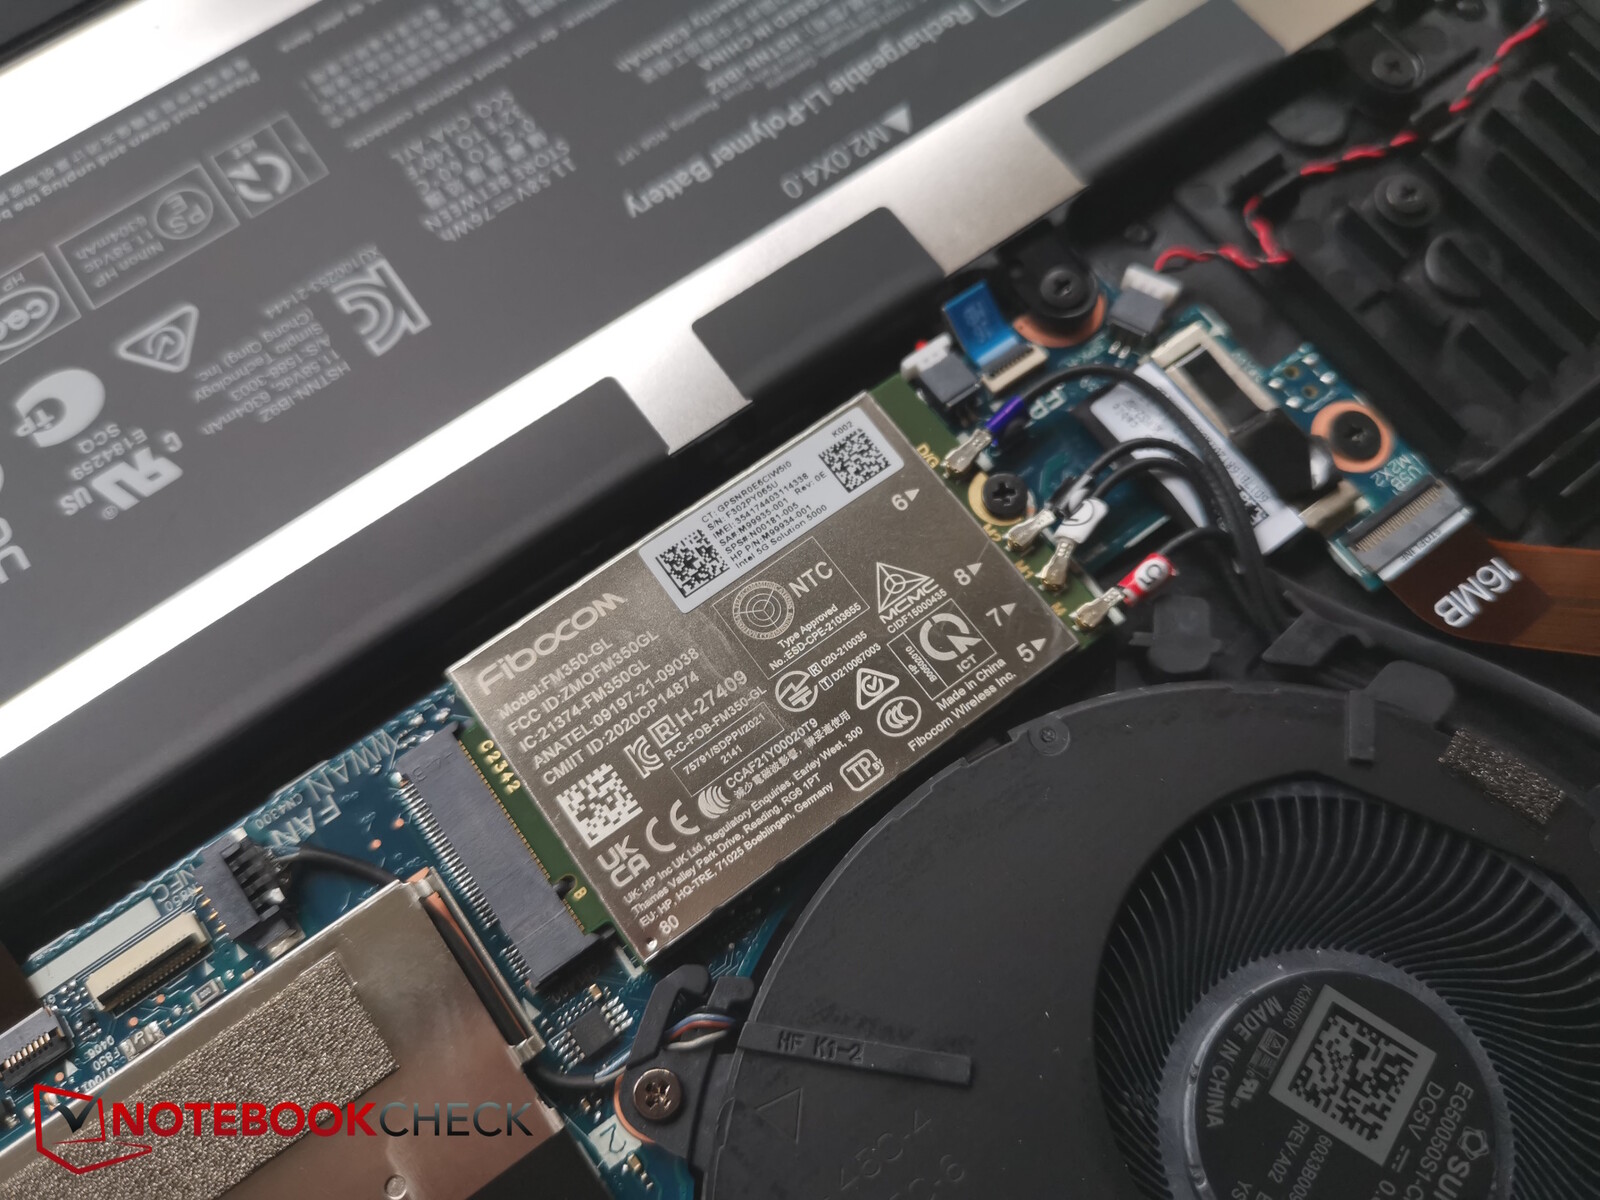
Then there is also the LTE slot that takes Nano SIM cards. LTE connectivity is handled by an Intel XMM 7560 LTE Advanced Pro modem. HP offers a 5G module option, but its availability may vary by region and apparently hasn't been finalised yet.
Webcam
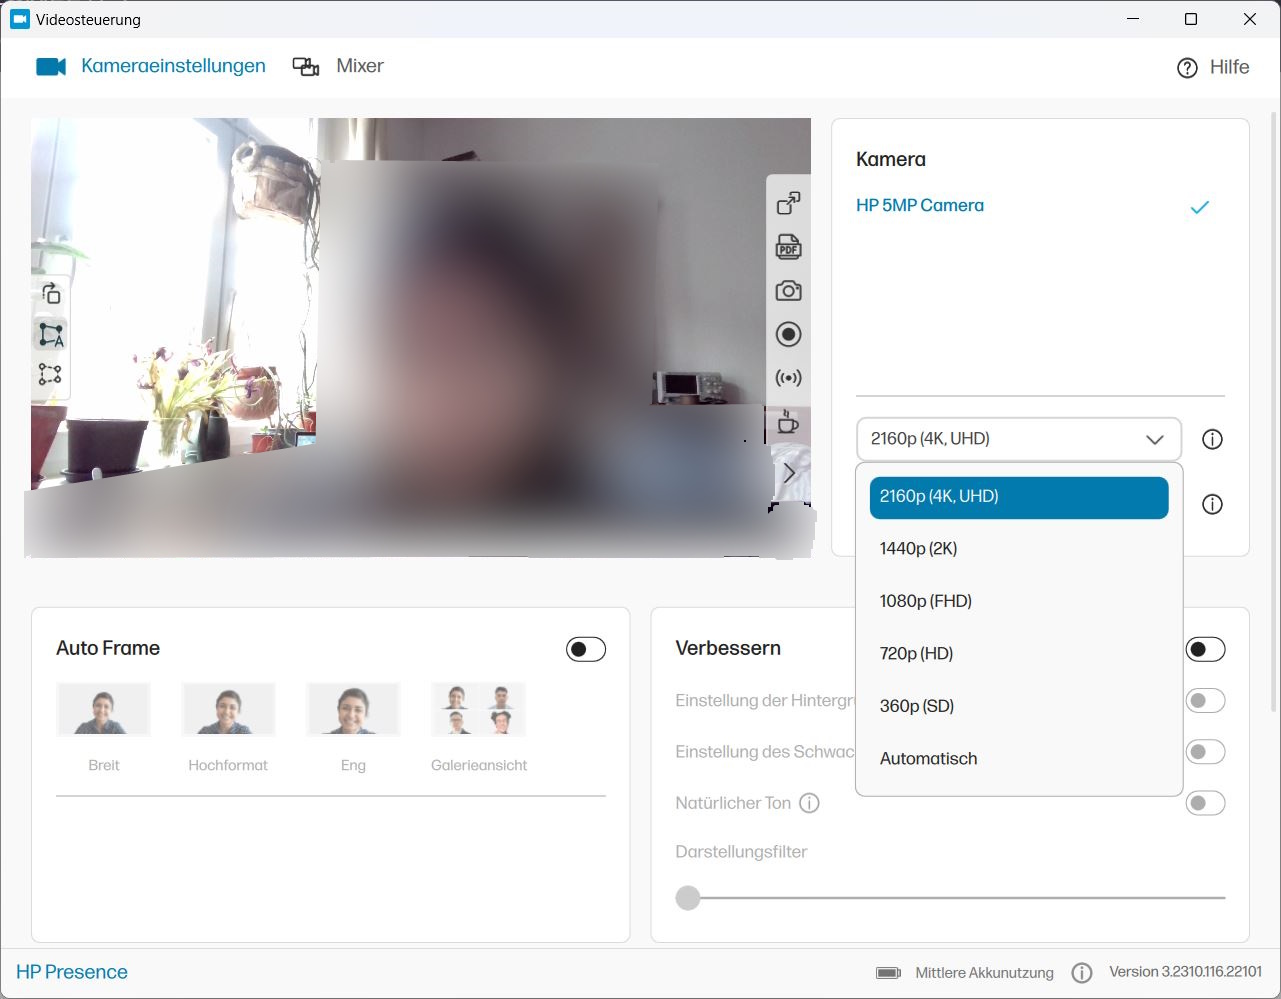
HP has given the G10 a 5MP webcam with infrared that is compatible with Windows Hello. Though the predecessor likewise had a 5MP camera with infrared, it can only take pictures with a resolution of 3.7MP (2,560 x 1,440 pixels). In contrast, the current model can capture images at 3,840 x 2,160.
Resolution aside, colour differences were far too high according to our measurements. This is primarily because the webcam tends to severely overexpose in certain areas so that the main subject doesn't appear too dark.
A few of the webcam’s features can also be controlled using the myHP software, including auto frame, resolution and a handful of image enhancement (or perhaps worsening) options, such as “Natural tone” (boosts skin tone and gives the image a red tinge) and “Appearance filter”. The latter seems to just soften the image, which introduces blurriness.
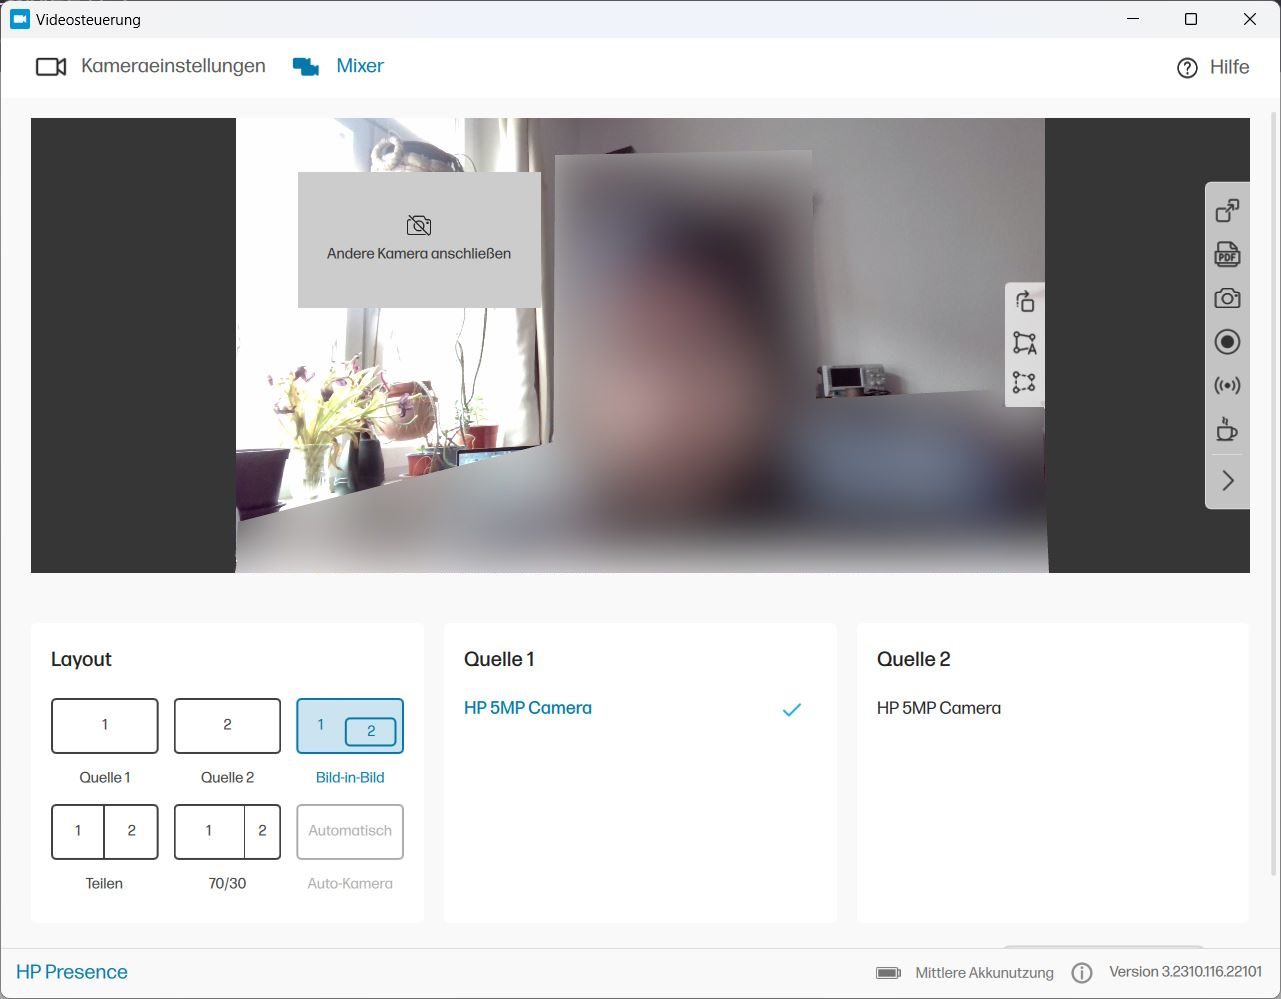
One interesting feature is possibly the Mixer option. When several cameras are connected, you can use this option to arrange the various feeds and even stream, like some sort of OBS-super-lite.


Security
HP tries to woo buyers with a host of security features and software. First off, our review unit comes with a fingerprint scanner. According to HP’s footnotes, though, not all SKUs have this scanner, but rather it is an optional feature that must be selected during the configuration process.
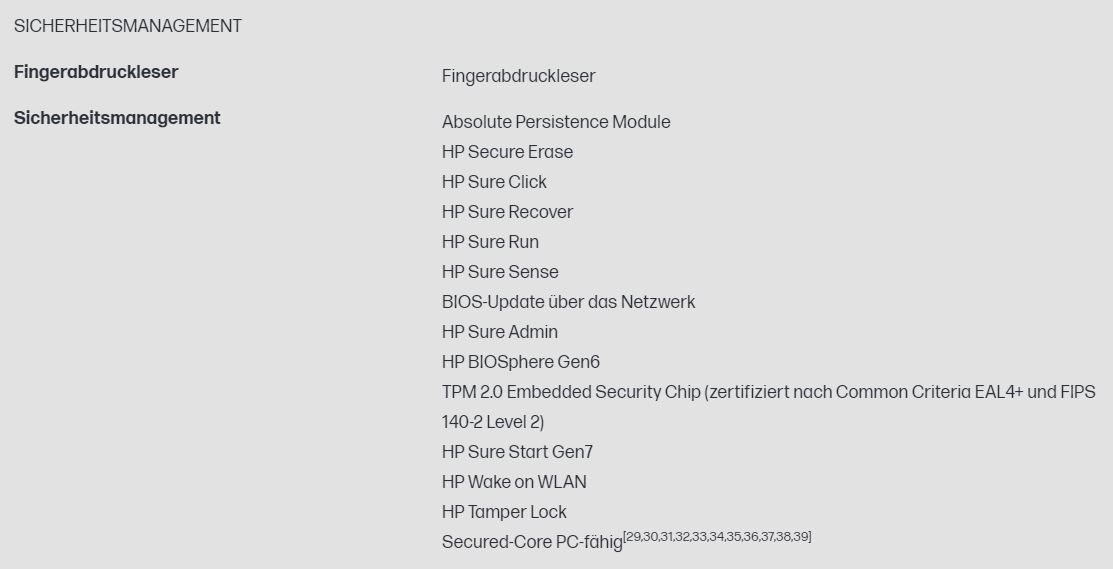
The HP Wolf Security logo appears on the screen once you boot up the laptop. HP says that the security software is designed to strengthen “your company's cyber-resilience”. You can click on this link to go to HP's website for more info. But the software doesn’t run forever. Upon purchasing the laptop, you'll get a licence agreement for a length of time based on the warranty period (see further down). Once the licence expires, you’ll need to renew it to continue using the software. The same goes for the integrated software solutions HP Sure Click Pro and HP Sure Sense Pro.
Here is a screenshot showing the security management features and apps of the manufacturer.
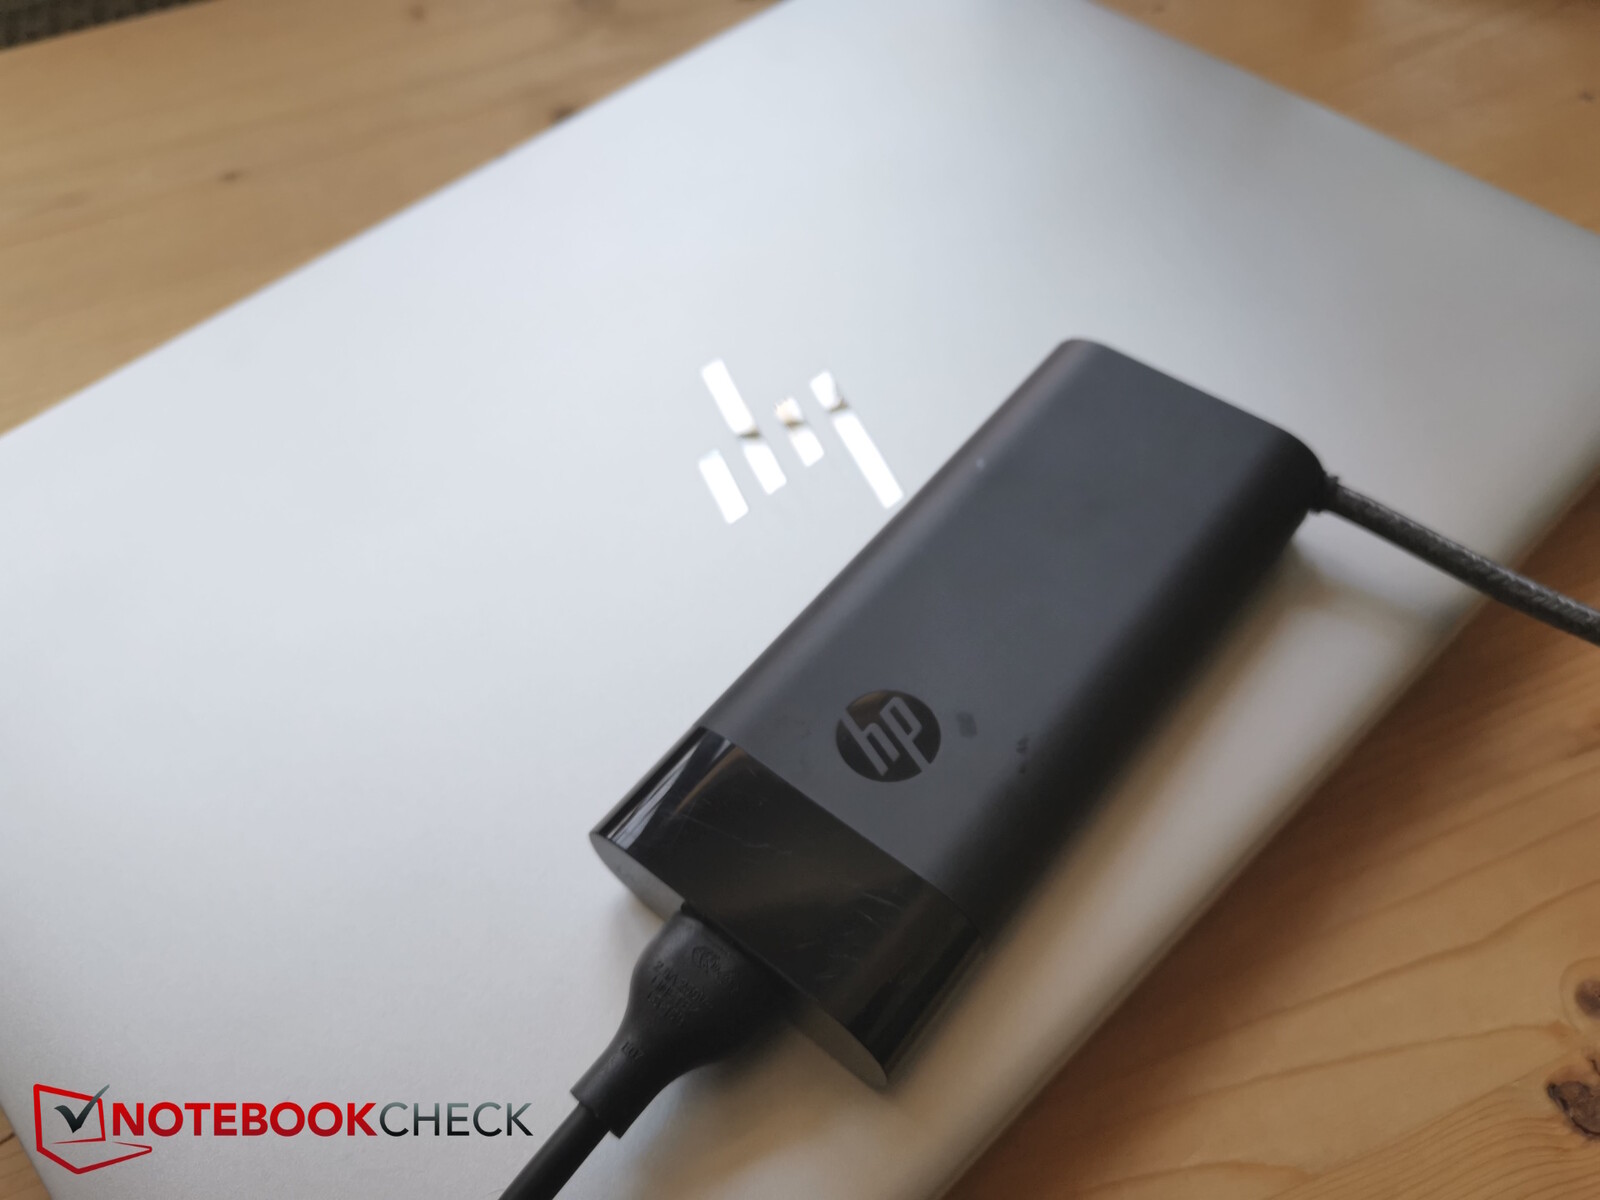
Accessories and warranty

Apart from a USB-C charger and a bit of paperwork, no other extras are included in the packaging.
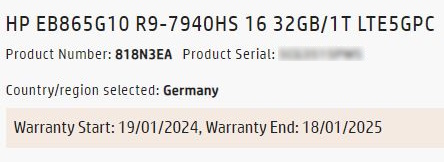
HP is somewhat vague when it comes to warranty. The manufacturer mentions a one-year limited warranty (1/1/0), comprising a one-year warranty on parts and labour, as well as three years of included next-business-day onsite hardware support service with travel coverage.
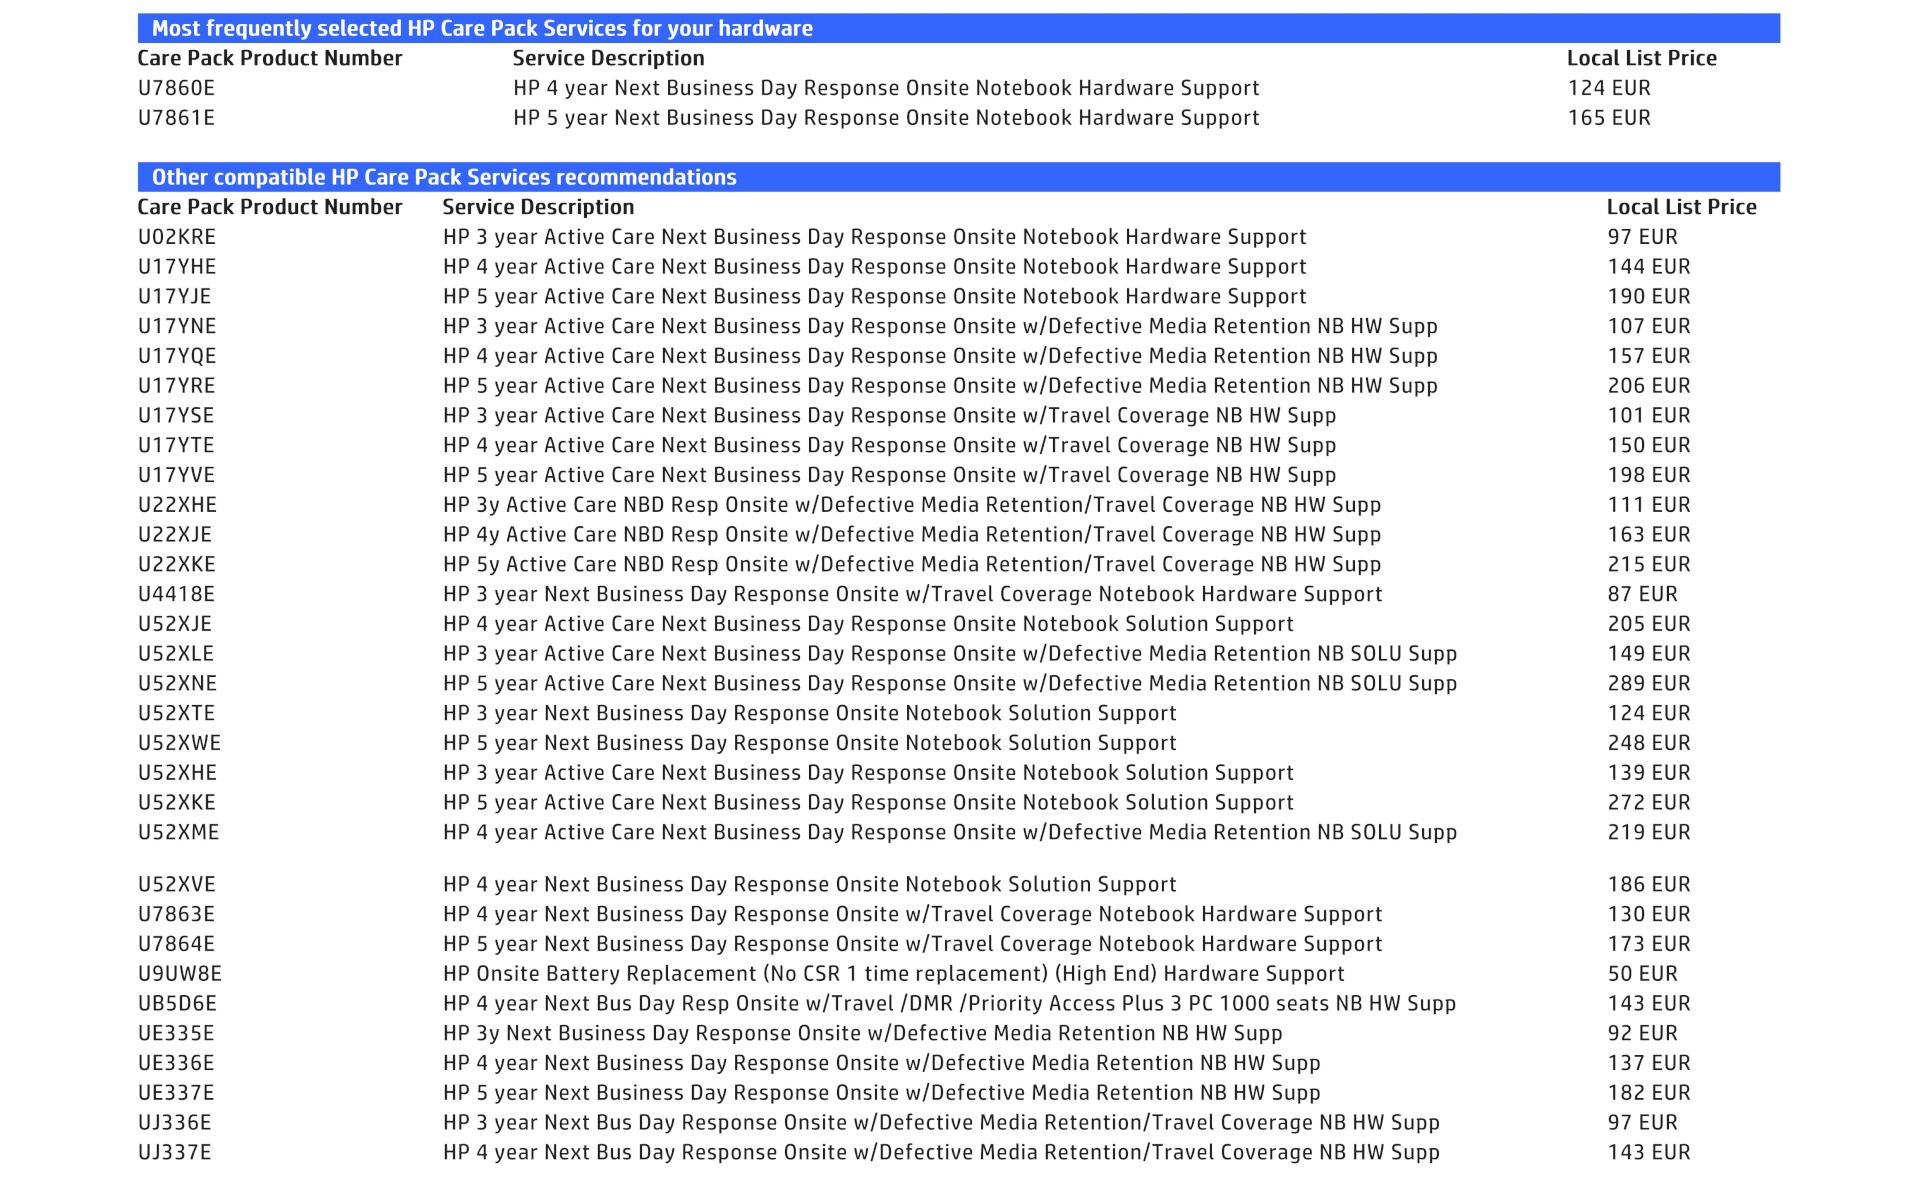
When we entered the serial number on HP’s website, the system only found a one-year warranty. HP offers countless extended warranty options for the laptop that costs extra (see screenshot).
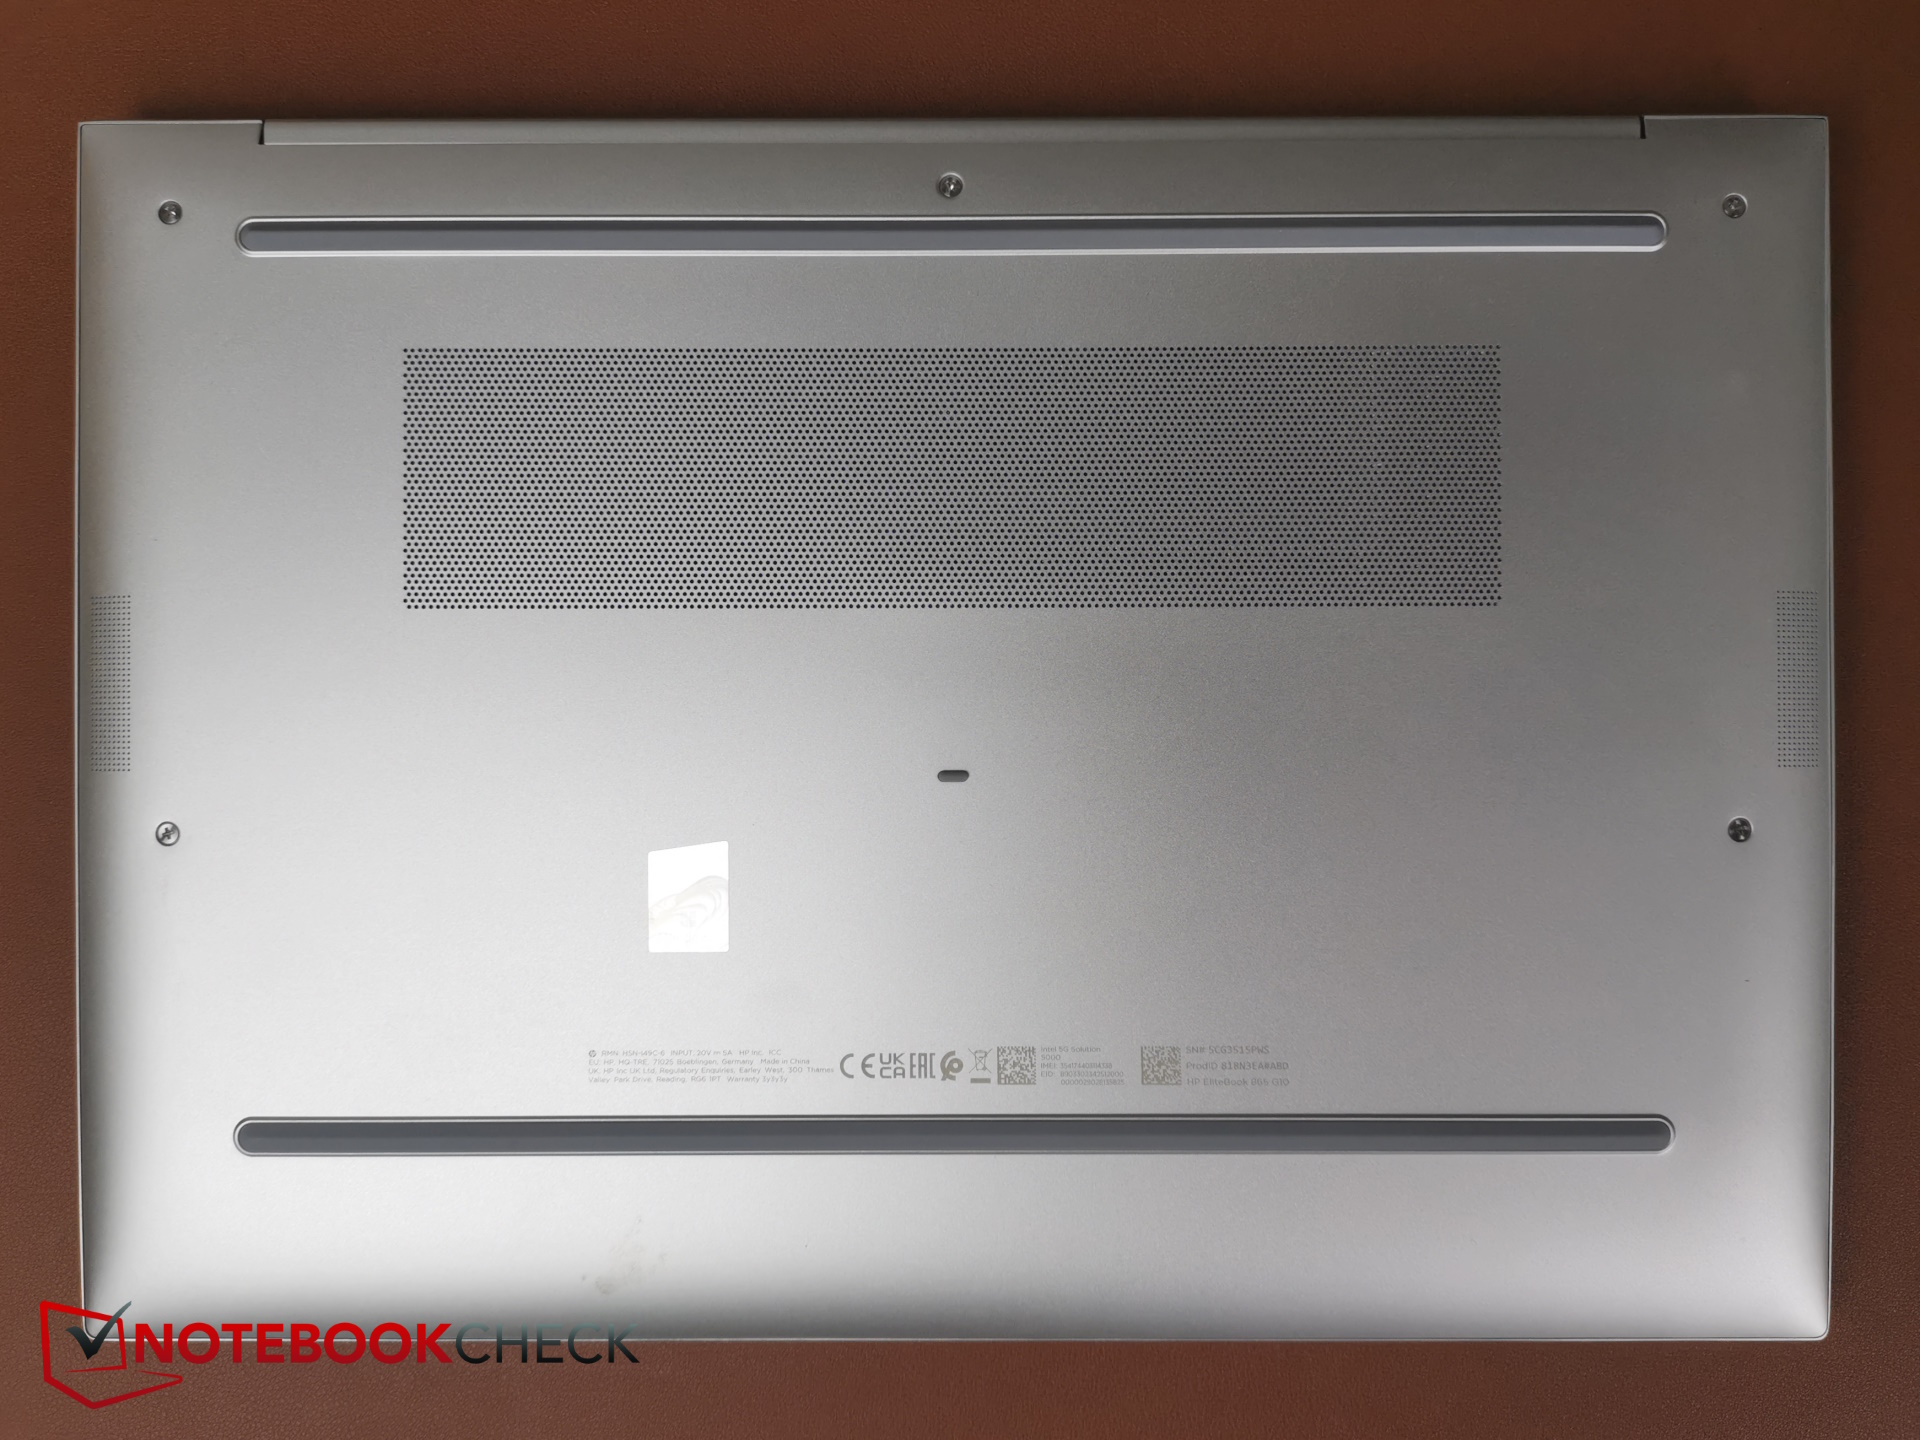
Upgrade and maintenance
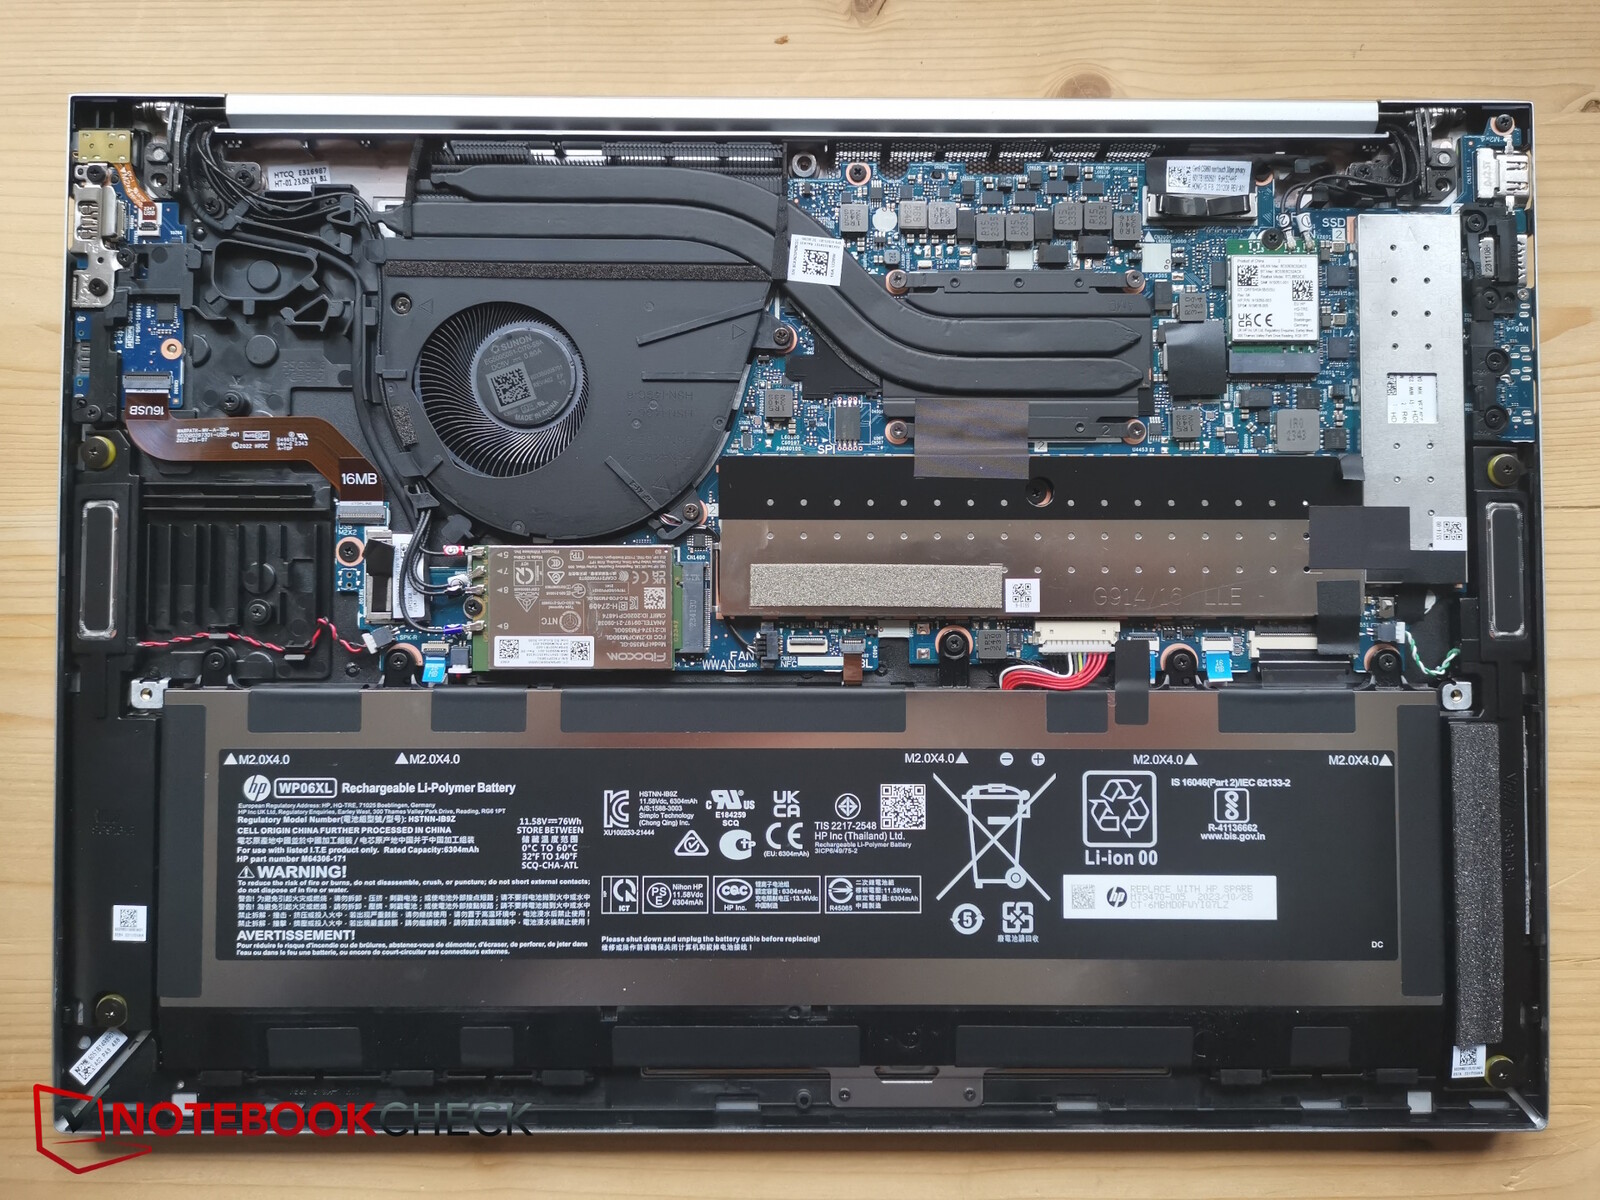
The bottom cover is held in place with five straightforward cross-head captive screws, meaning it is unlikely for users to accidentally mix up or misplace the screws. Once the screws are loosened, the easiest way to remove the bottom cover is to lift it up from behind the display.
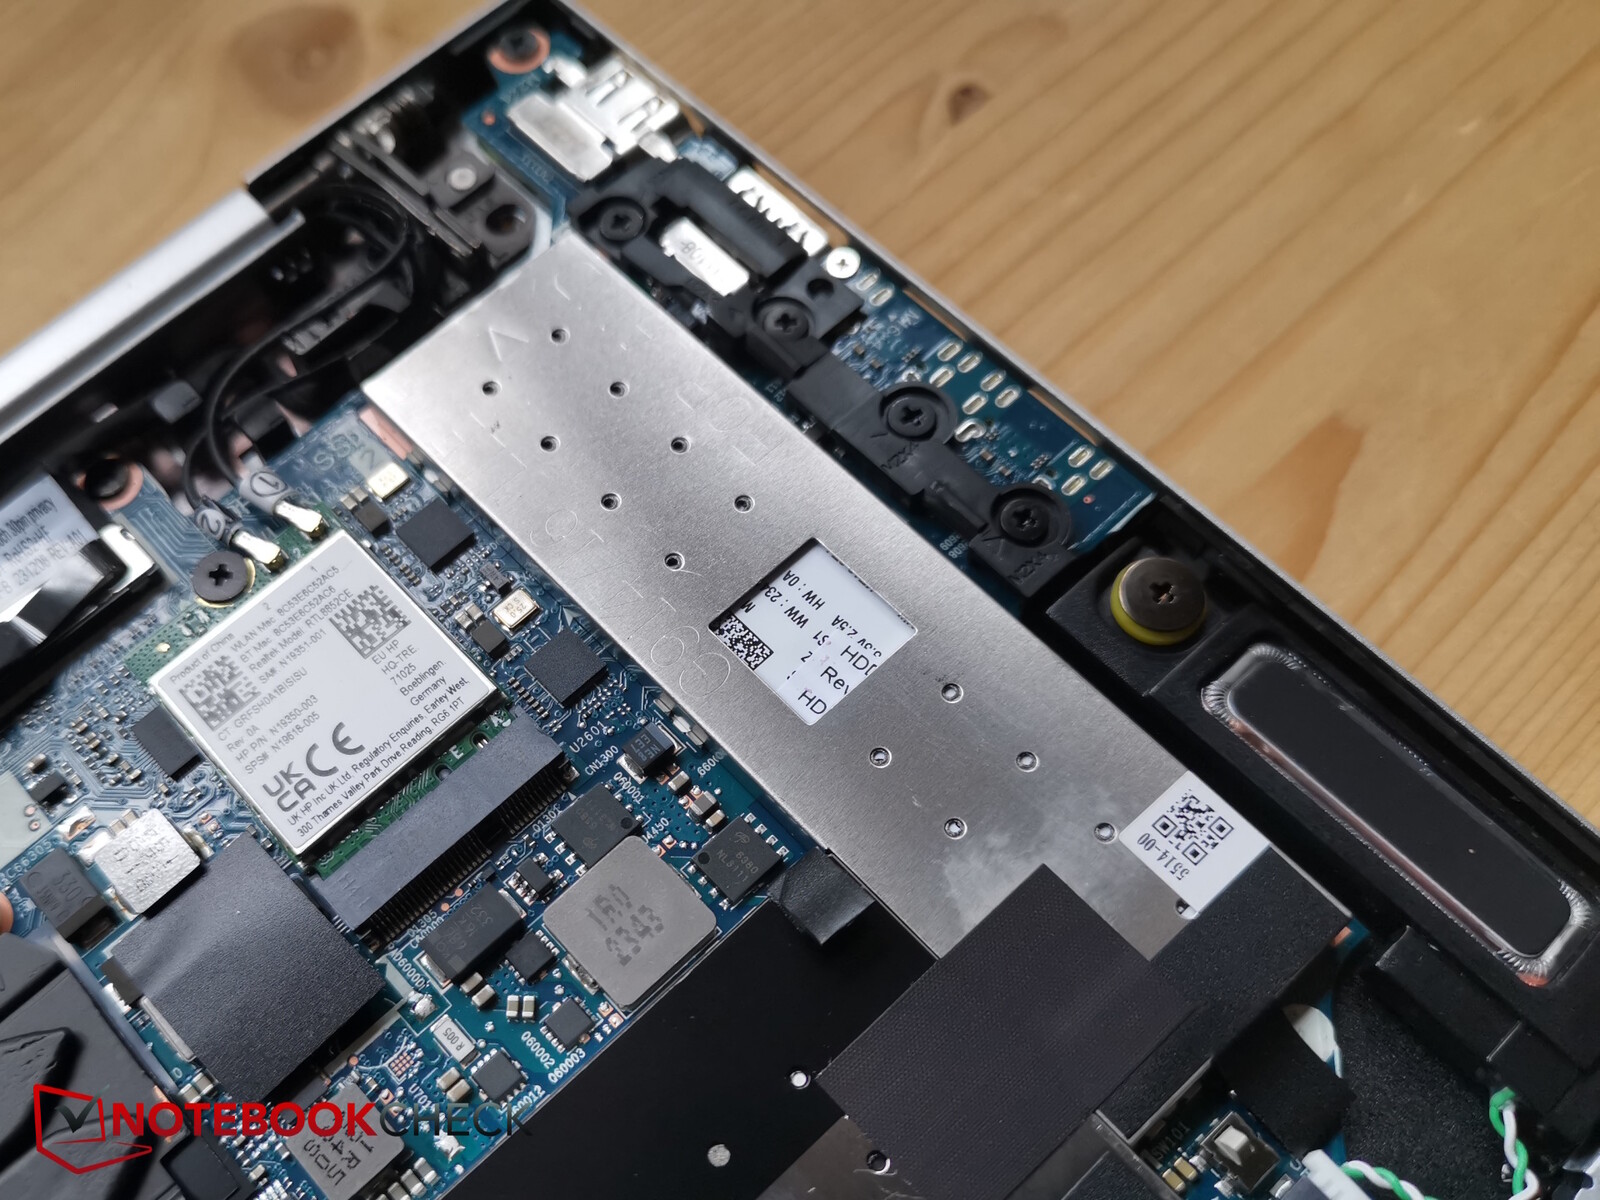
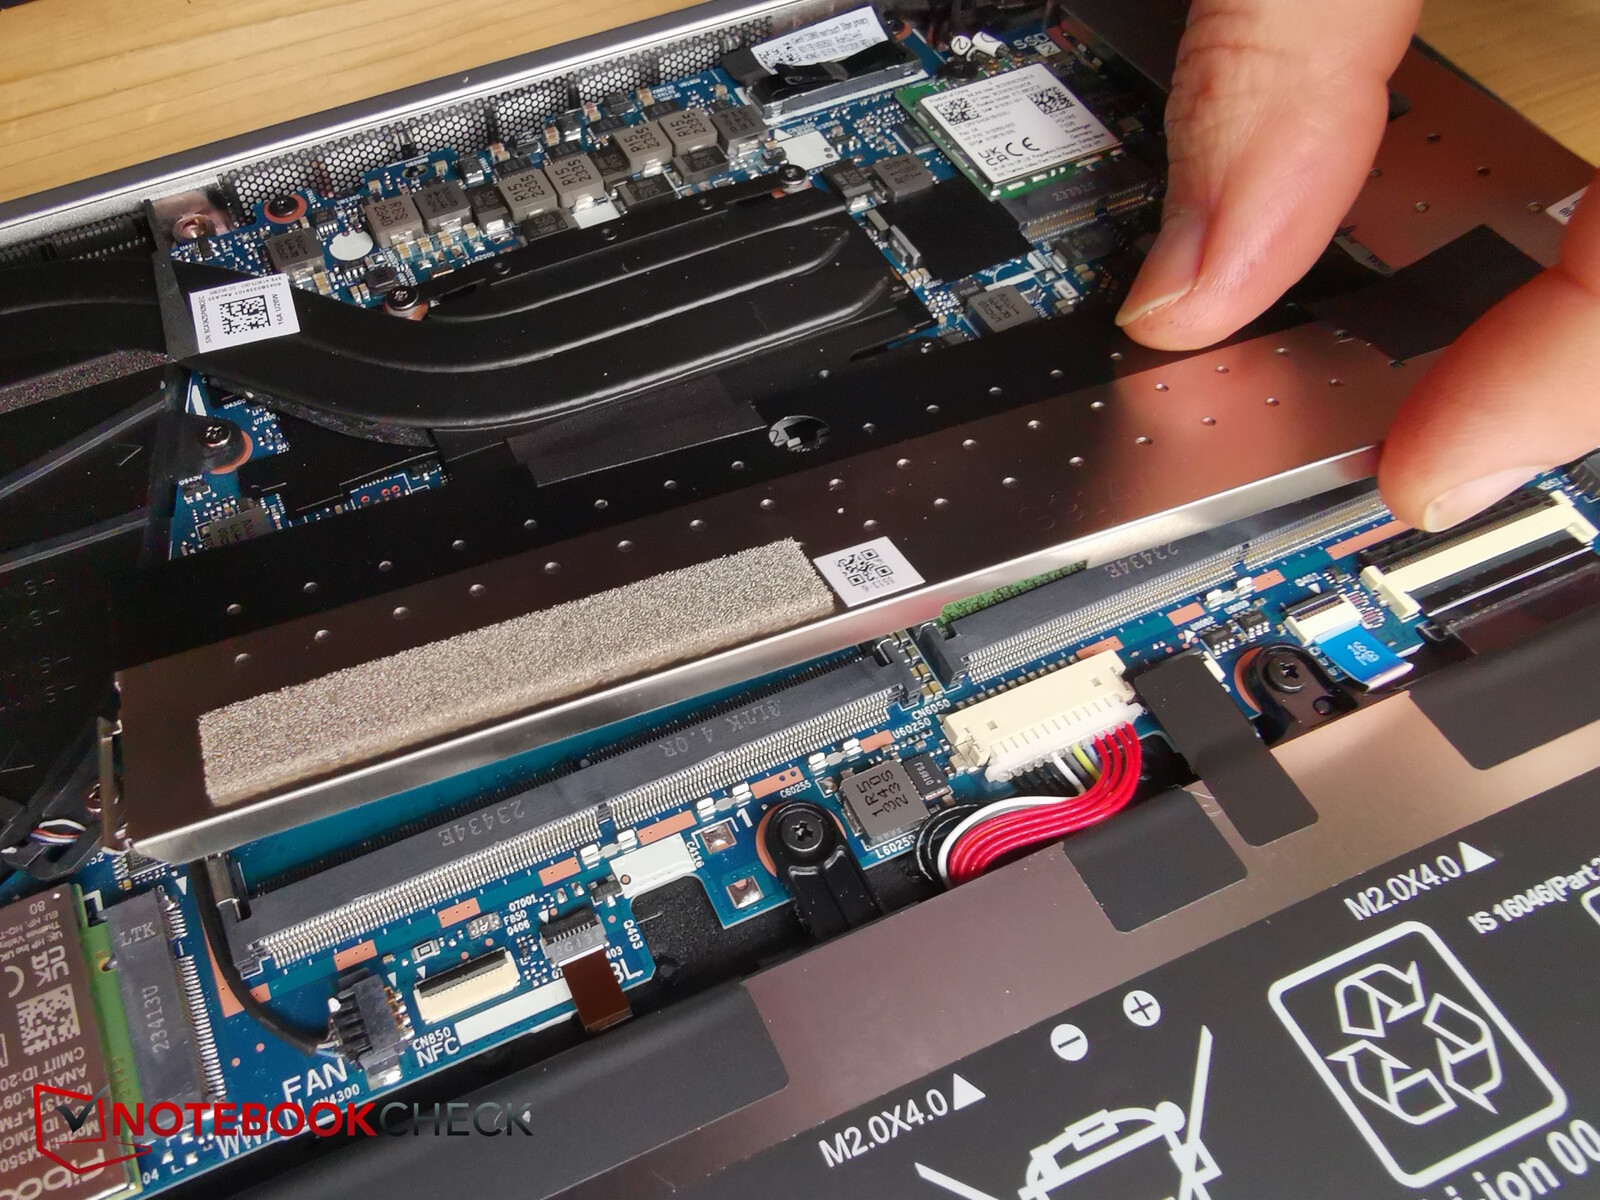
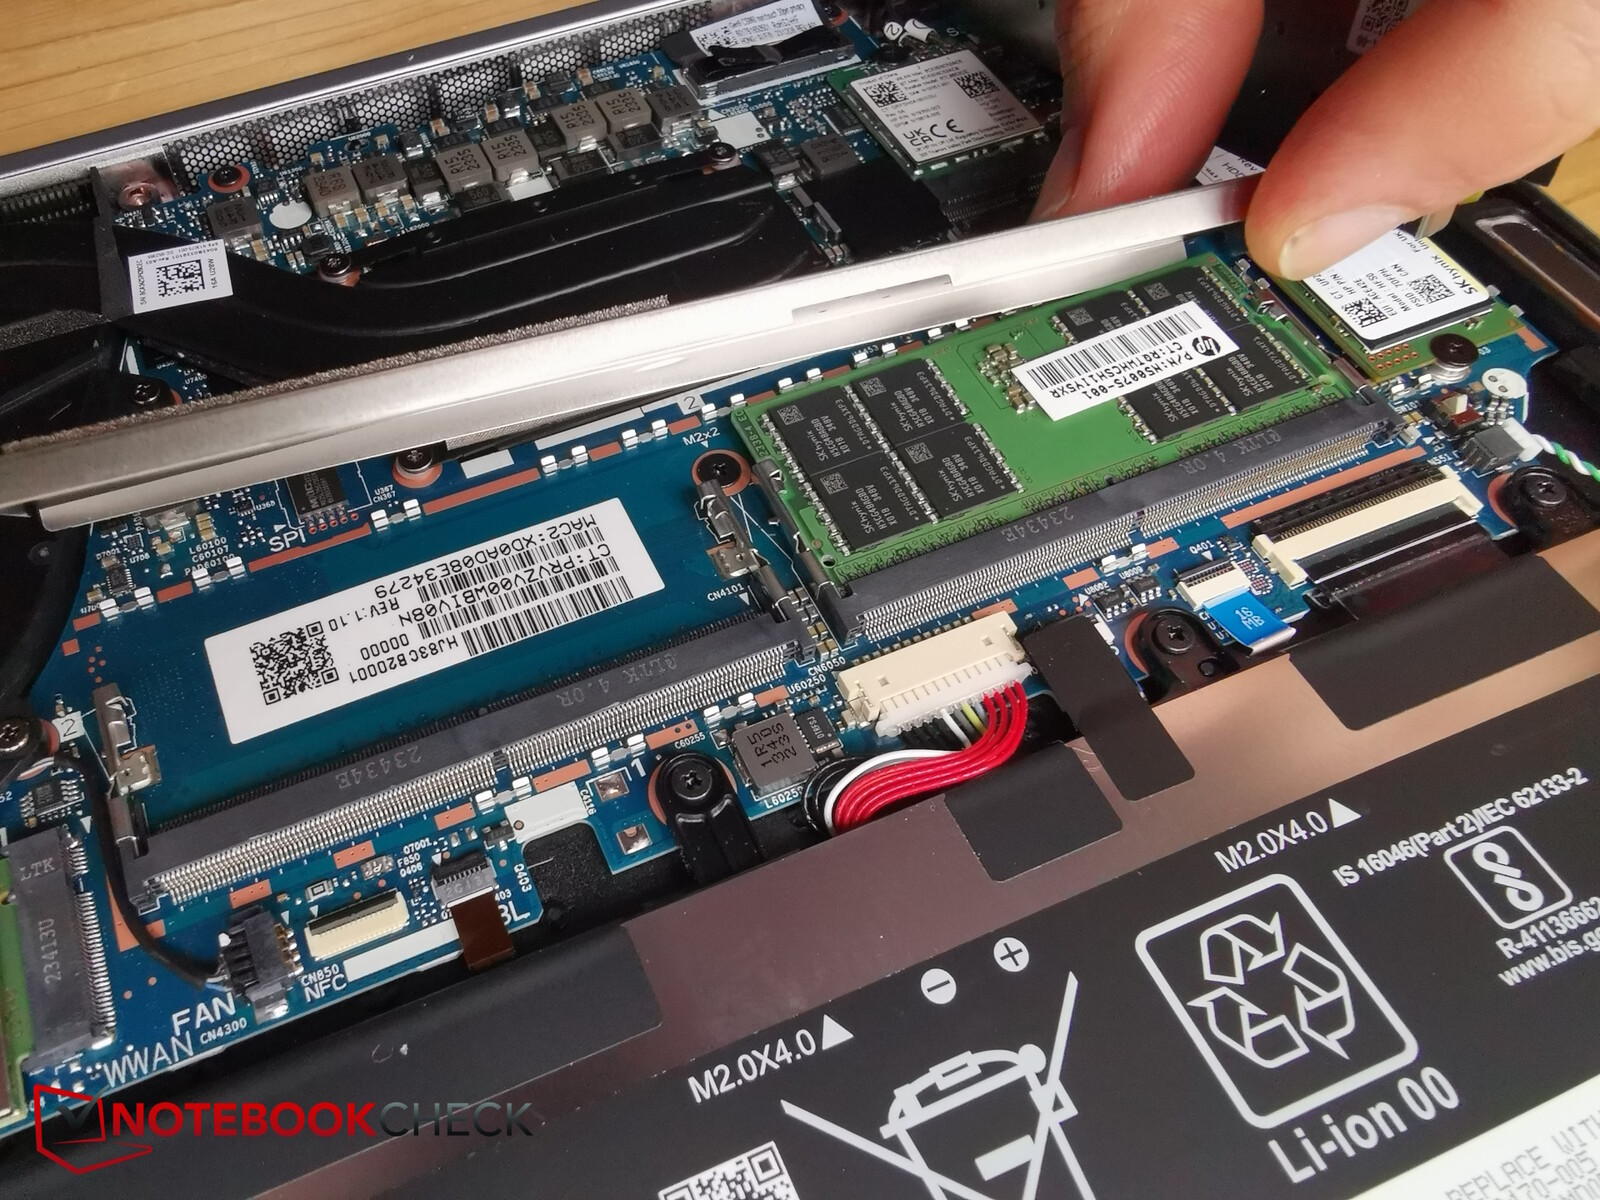
In general, most of the hardware inside can be maintained or replaced, including the fans, battery, SSD, RAM, Wi-Fi adapter and WWAN module. However, several components are located underneath firmly attached metal shields, some of which are further connected and secured to each other with adhesive tape. This makes accessing the components difficult and may discourage some users from performing maintenance.
Input devices - Pleasant and quiet typing and clicking
Keyboard
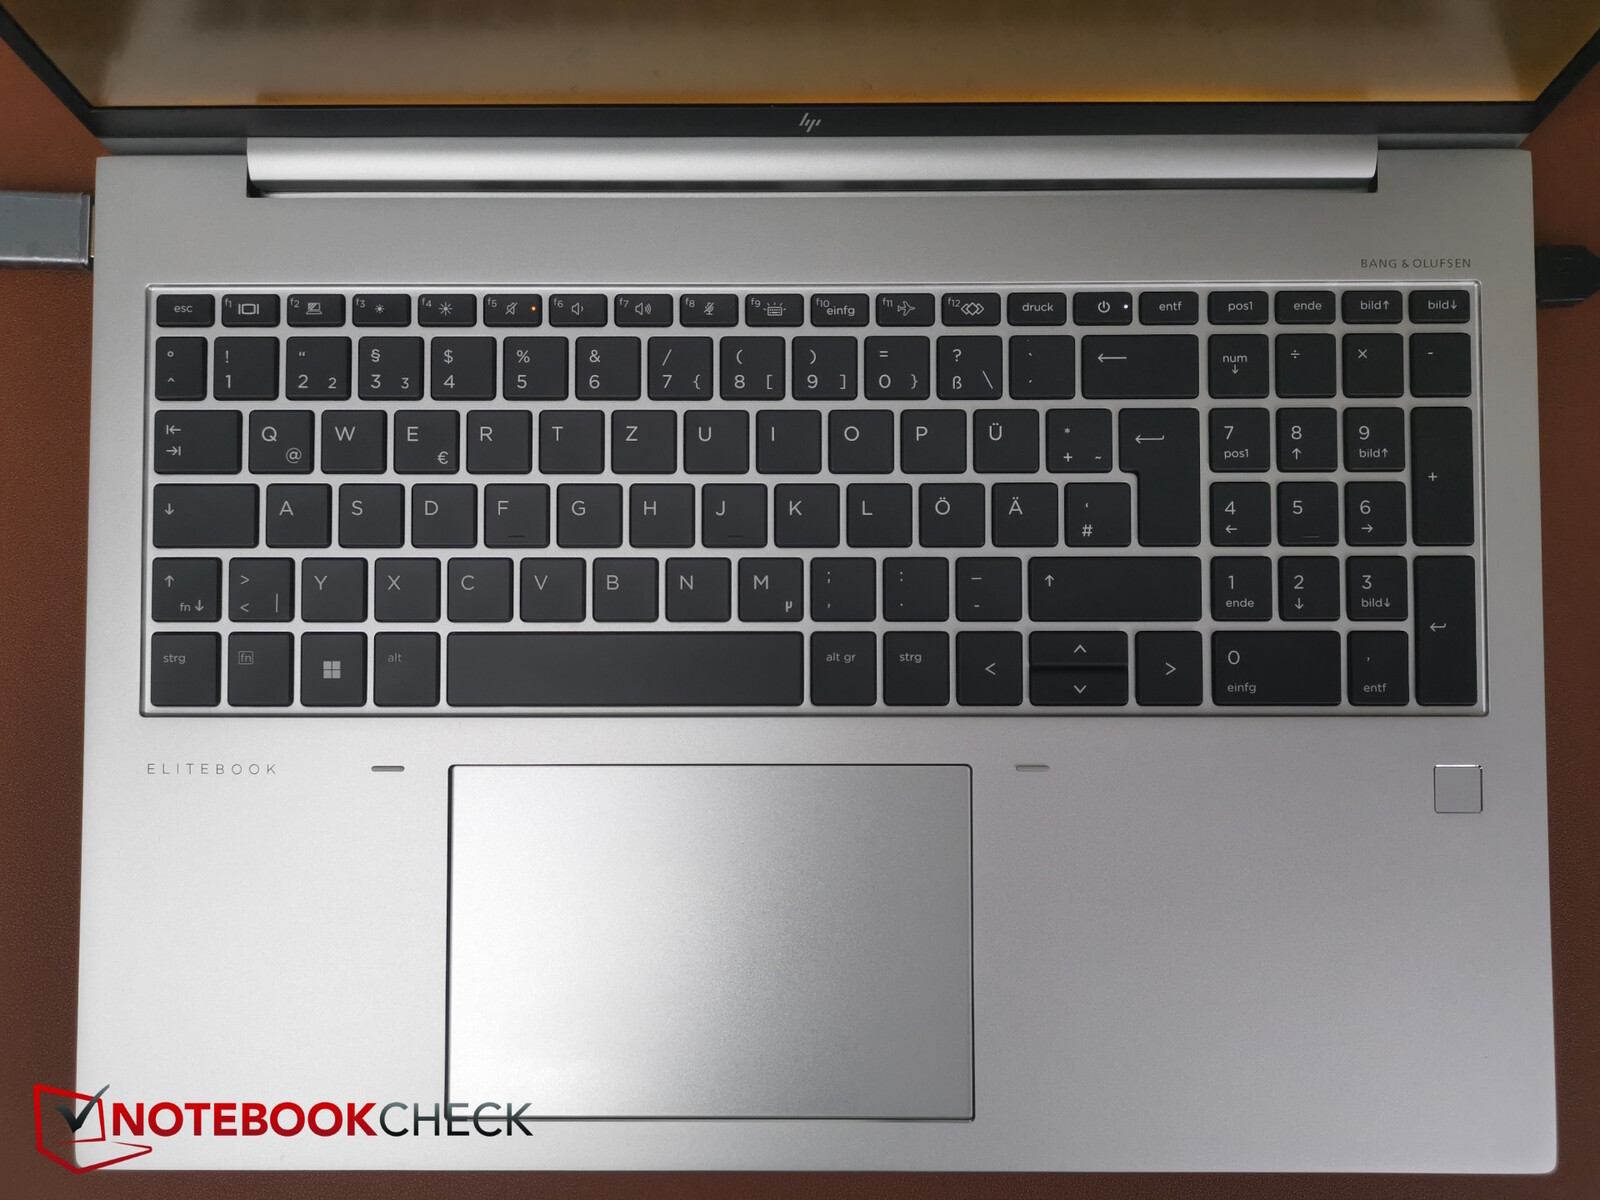
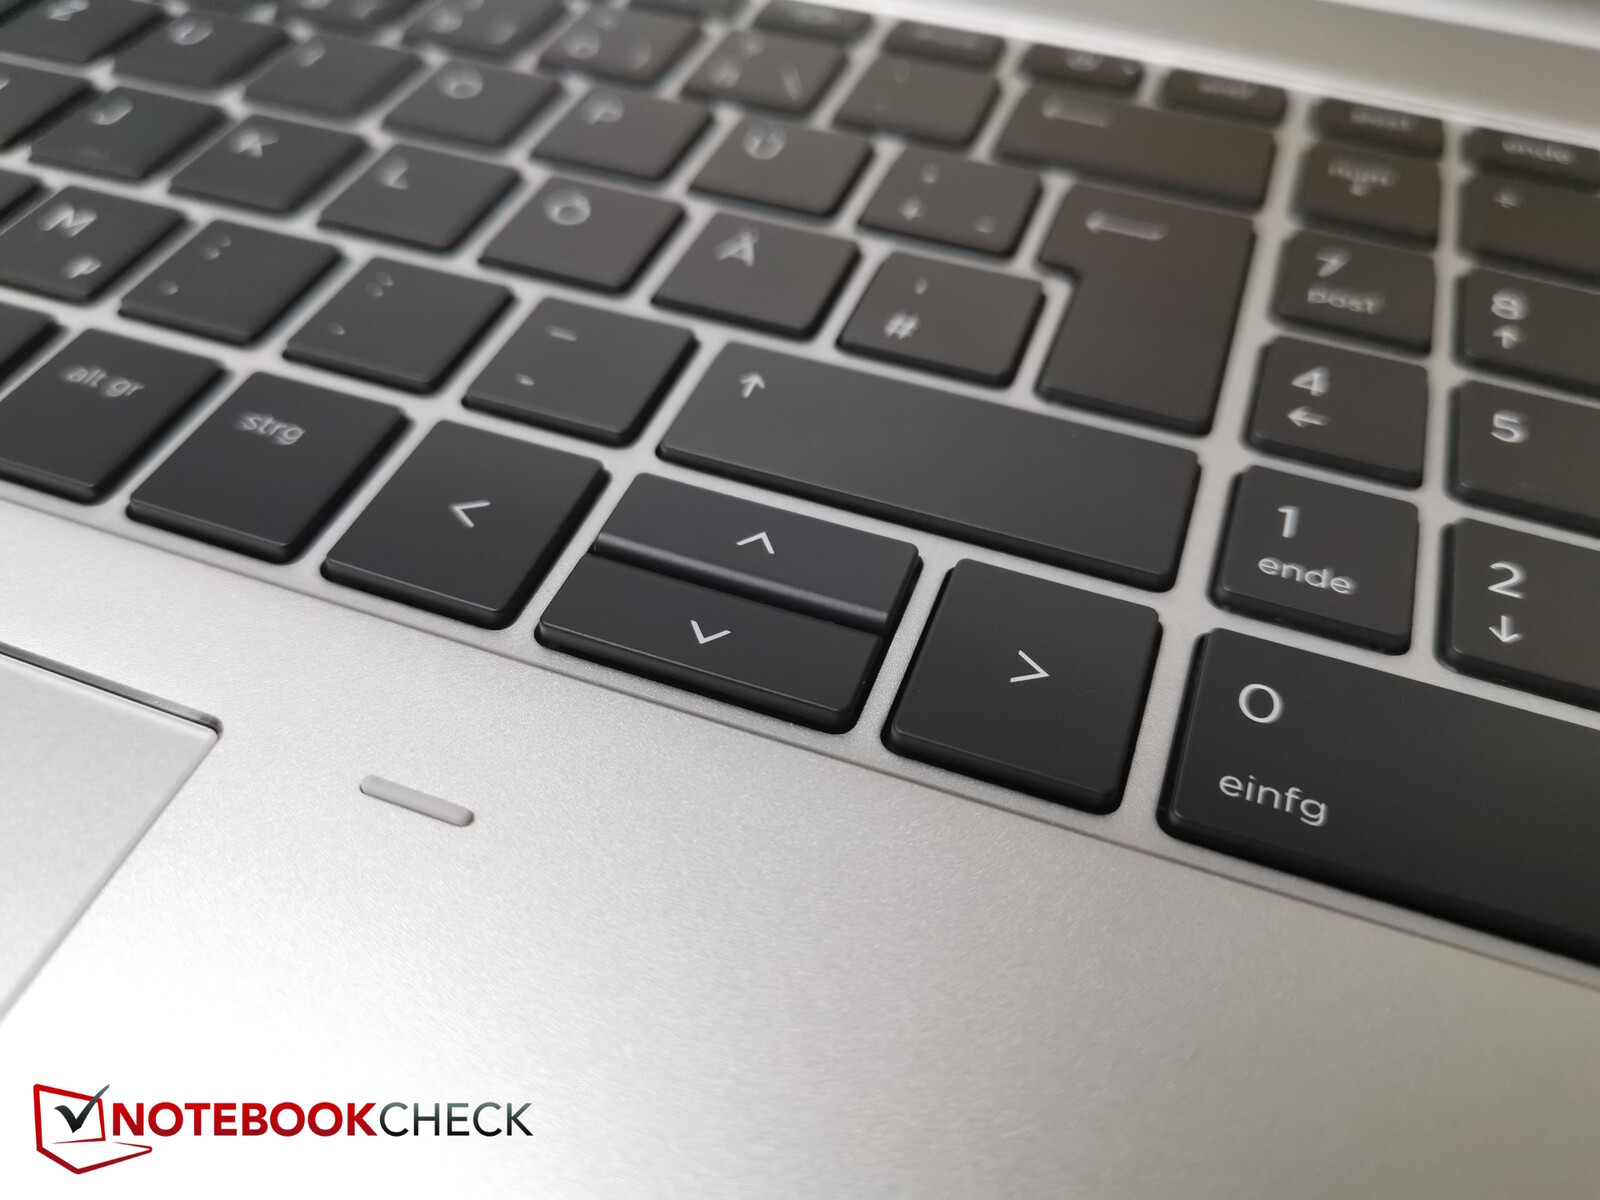
As usual, HP has given the G10 a very neat and tidy keyboard layout that includes a numeric pad. Slightly less optimal are the location of the power button (middle of top row, between print and delete) and the half-height up and down arrow keys.
The keys have a bit of a gap between them, but are rather small in and of themselves (approx. 1.5 cm, or 0.6 in). They only have a short to moderate travel, though their feedback is crisp and very easily felt. Even so, key presses sound very muted. The keyboard thus enables you to type fast and feels highly premium as a whole. Writing on theEliteBook 865 G10’s keyboard is a pleasant experience.
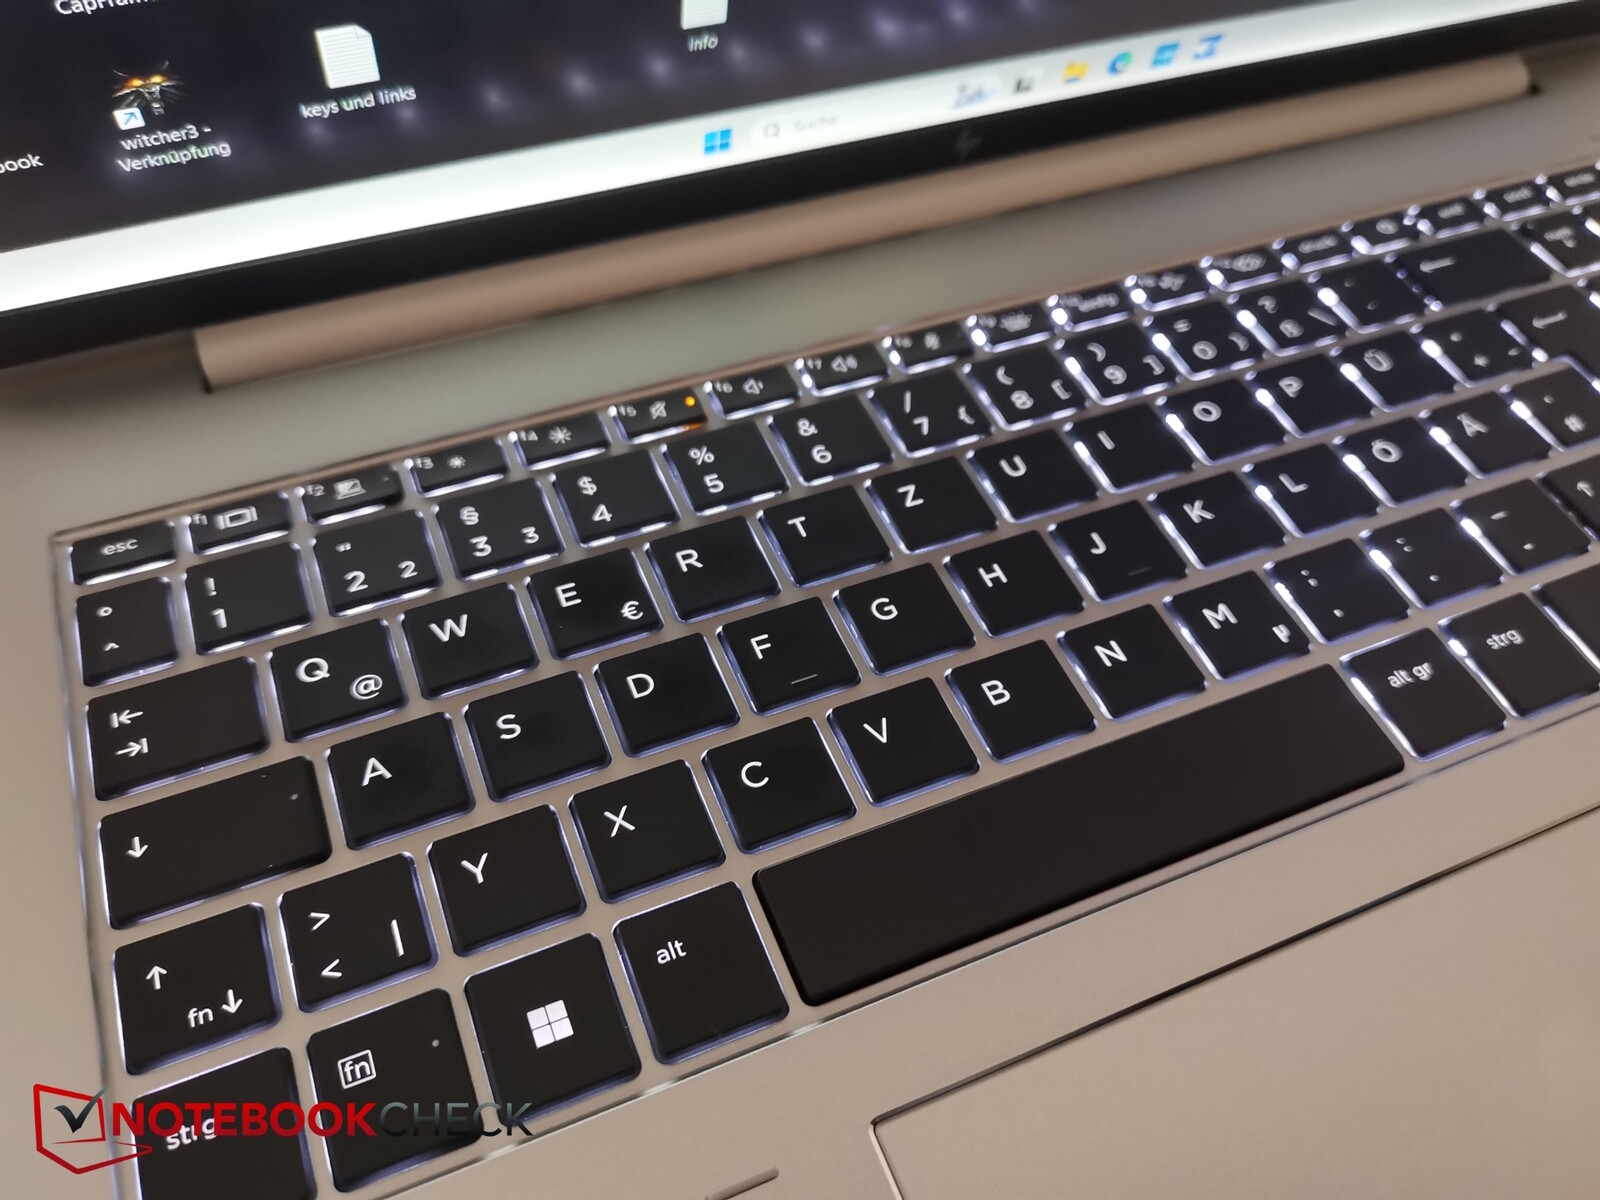
In dark environments, the single-zone white backlight with two brightness levels makes the keycap letters easily readable, including those on the special function keys.
Touchpad
The touchpad shines with its decent dimensions (approx. 12.7 x 8.5 cm, or 5 x 3.3 in) and an immensely smooth surface that hardly has any resistance even when you move your finger slowly. Multi-touch gestures are recognised without any issues. The integrated buttons have a clearly defined click point and work reliably. The clicking sound produced by the buttons is pleasantly soft. However, in extreme applications such as gaming, there may be slight delays between inputs and responses from the touchpad (e.g. in Witcher 3).
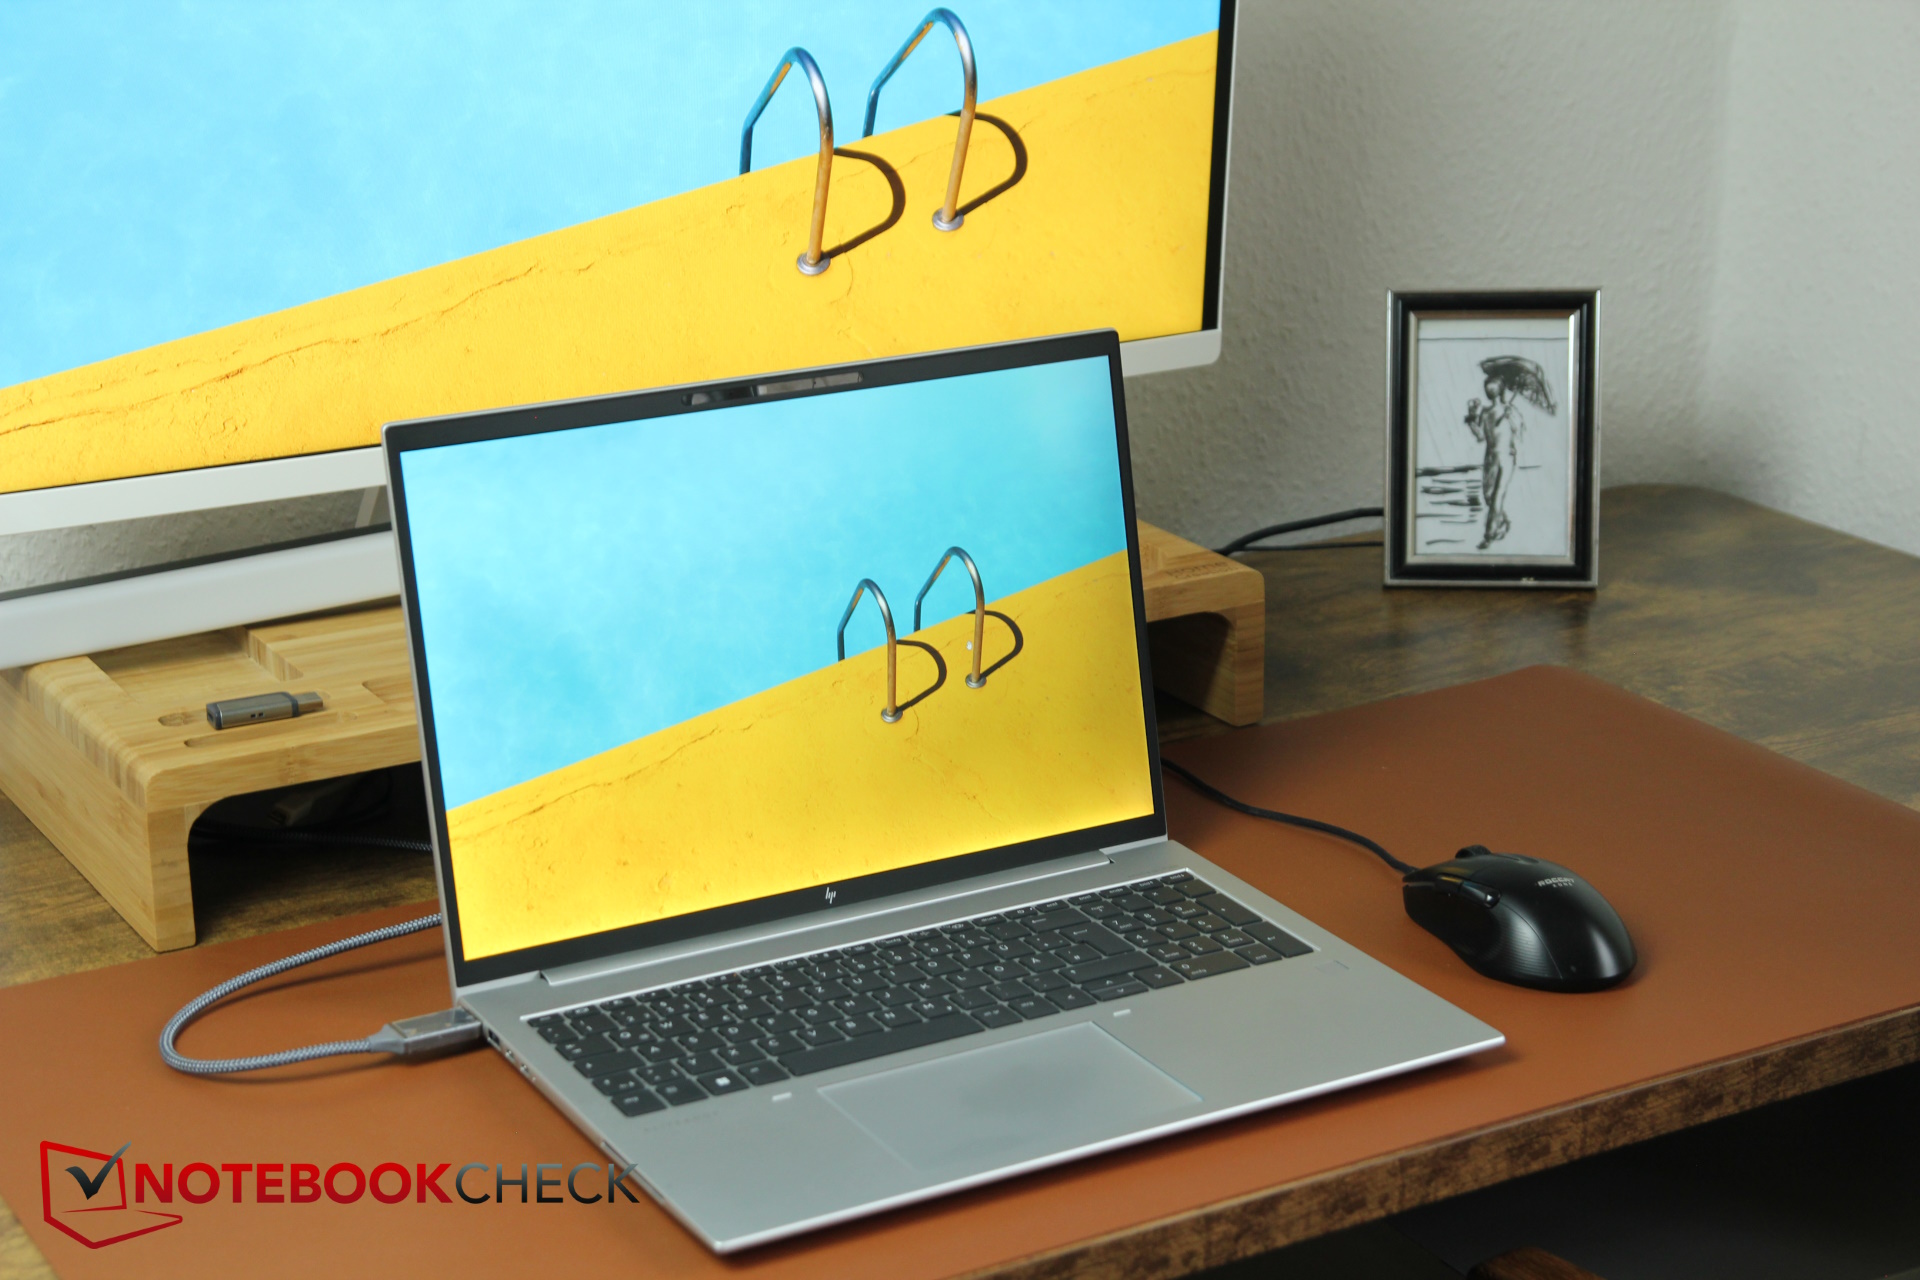
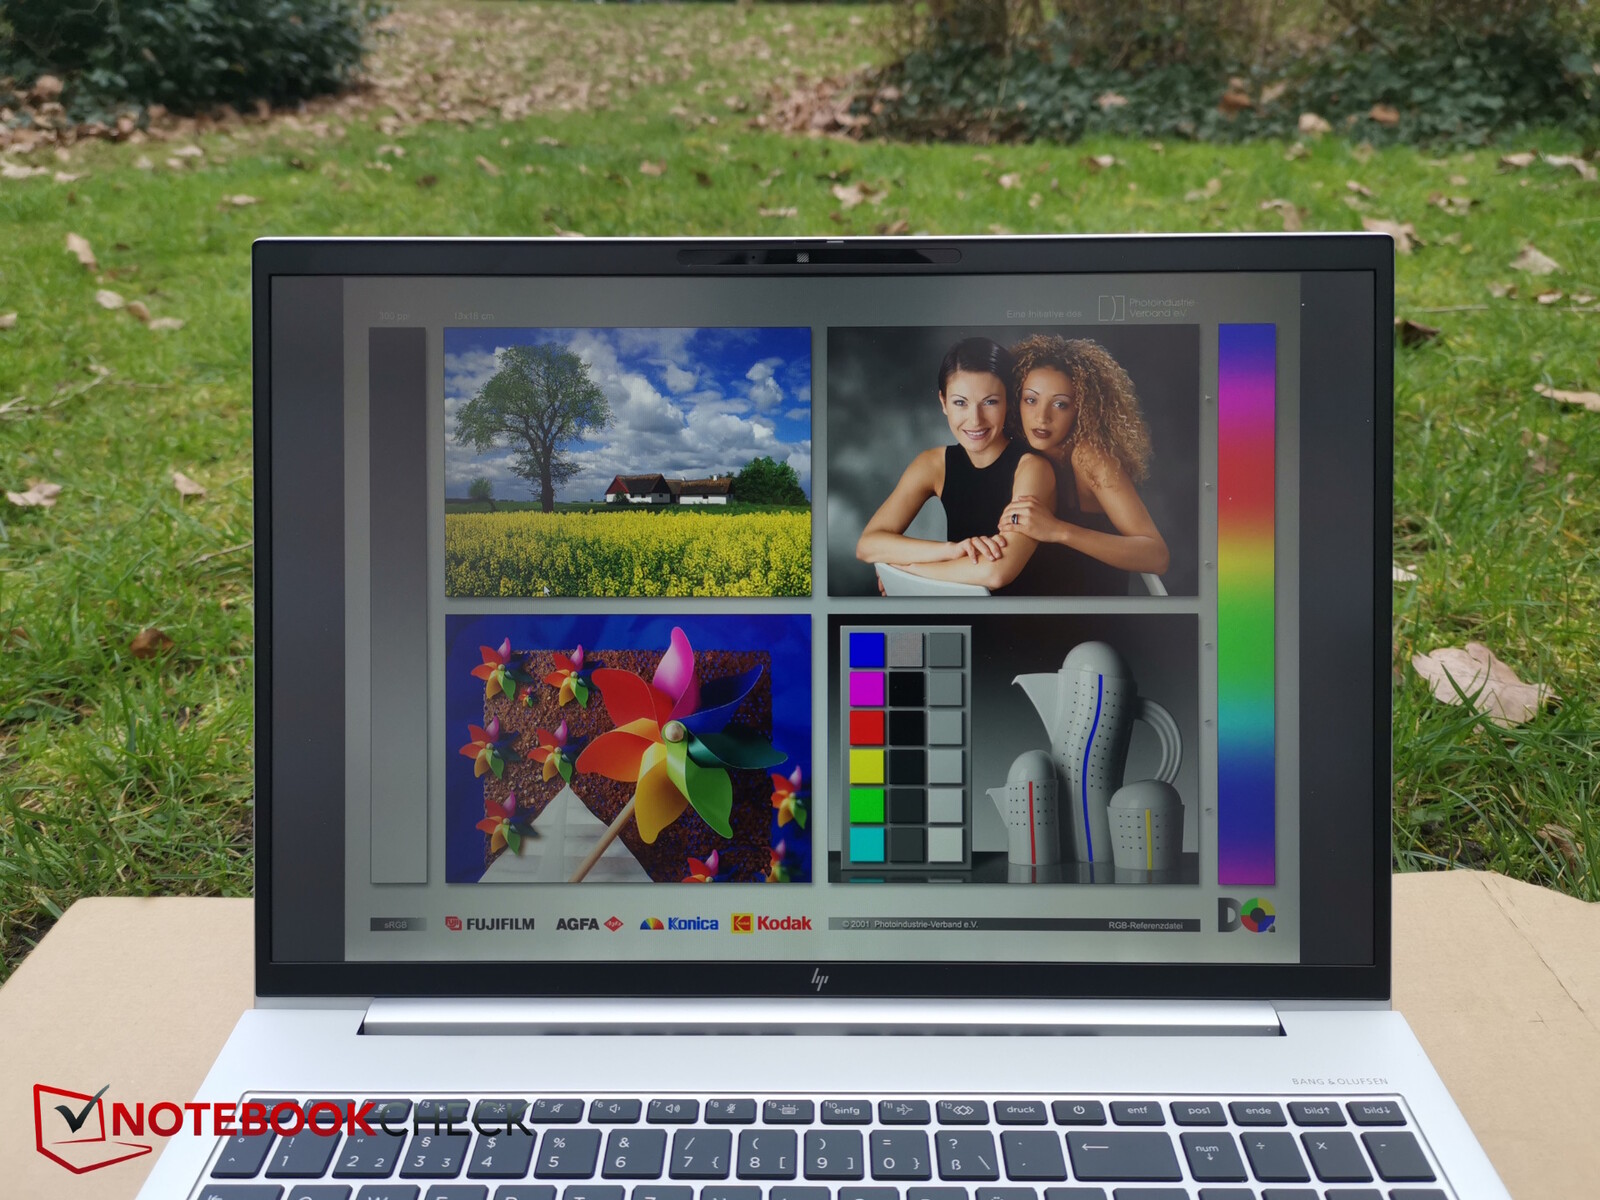
Display - Sure View hasn't been improved

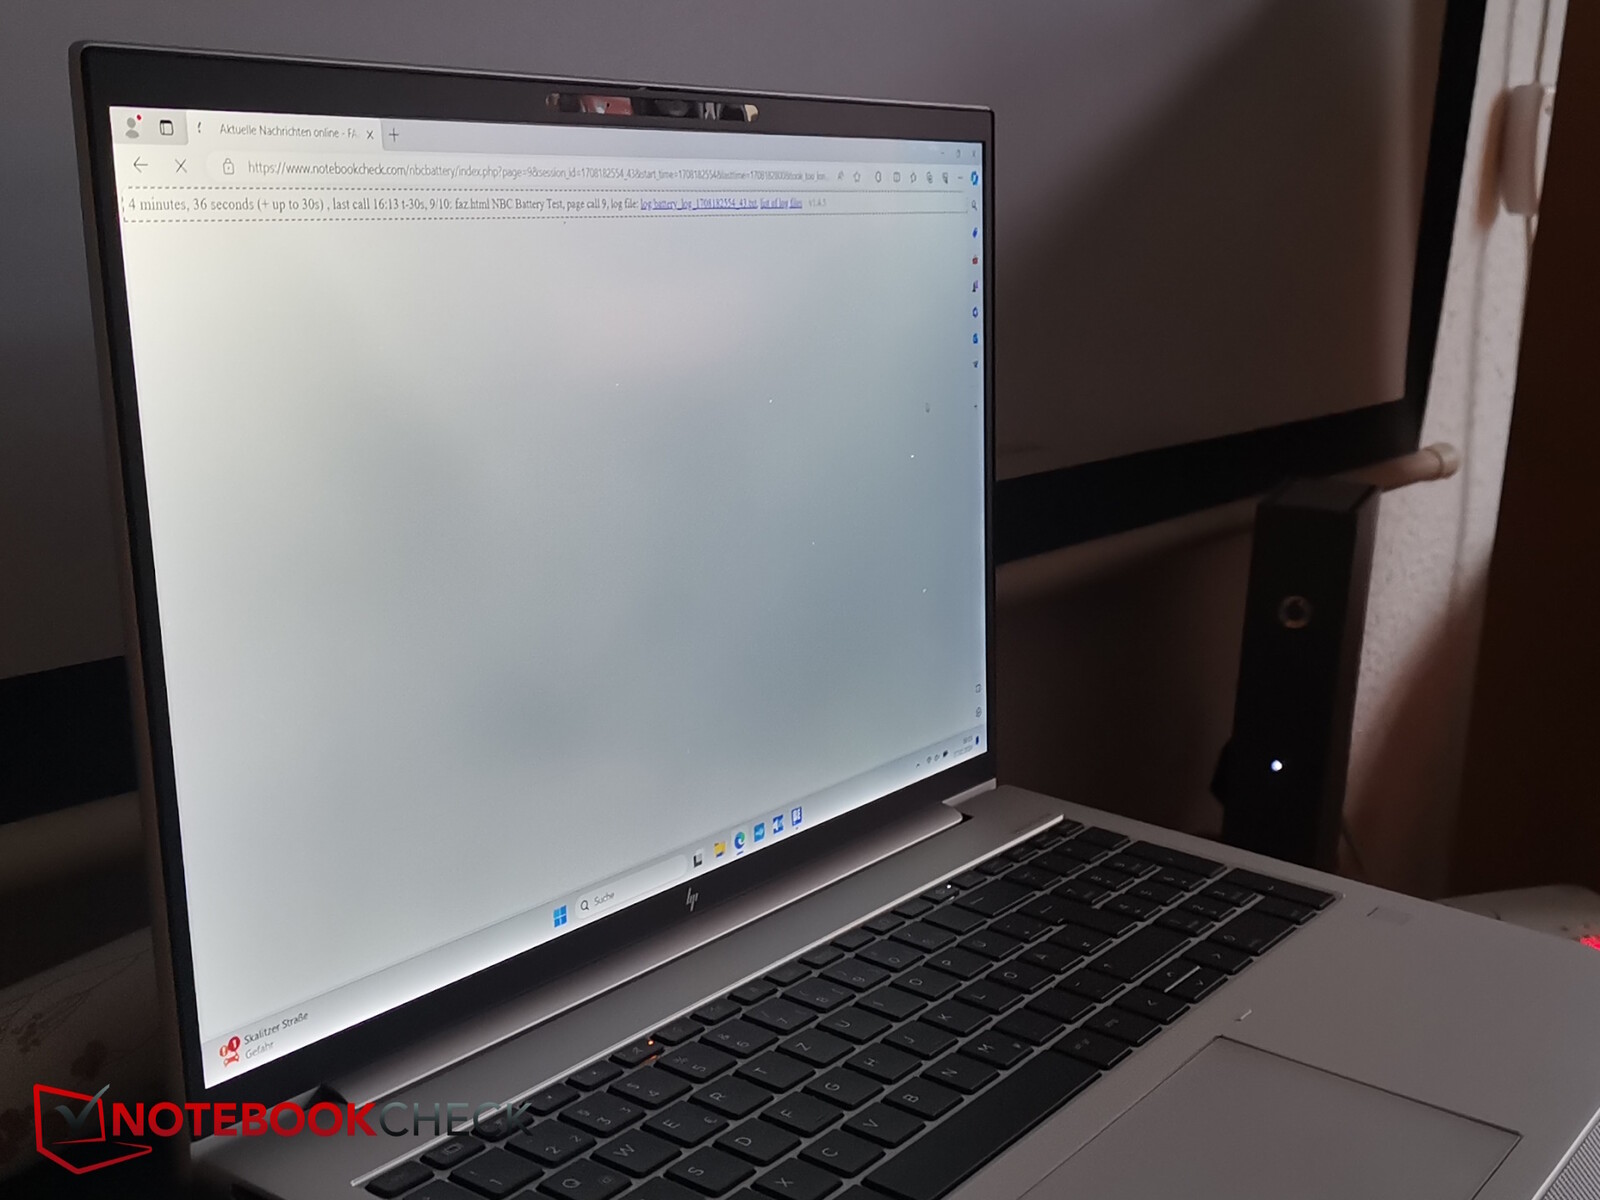
Last year, we already criticised the G9's display, which is actually capable of hitting 1,000 nits, for its Sure View privacy filter. HP has evidently not listened because the privacy filter is still more of a curse than a blessing for the G10. The laptop features a 16-inch IPS panel made by InfoVision. It is a 1200p display with a 16:10 aspect ratio and only a 60Hz refresh rate. It is supposed to be able to go as bright as 1,000 nits. But this is where the problems already start.
We measured a max peak brightness of 865 nits, with an average of “just” 724 nits across the panel – roughly 140 nits less! This is because the three measurement points in the bottom row, in particular, produced markedly lower brightness levels, which understandably doesn’t result in even brightness distribution (a poor 47%). Even the predecessor model did better here. Although the bottom row is still brighter than the displays on some other laptops, the screen is nonetheless extremely dependent on the angle it is viewed from even when Sure View is disabled. If you don’t set up the laptop at an ideal angle, the display will quickly appear much darker and less contrasty. Well at least the black level is fairly low despite the high brightness, which gives the display a rather good contrast.
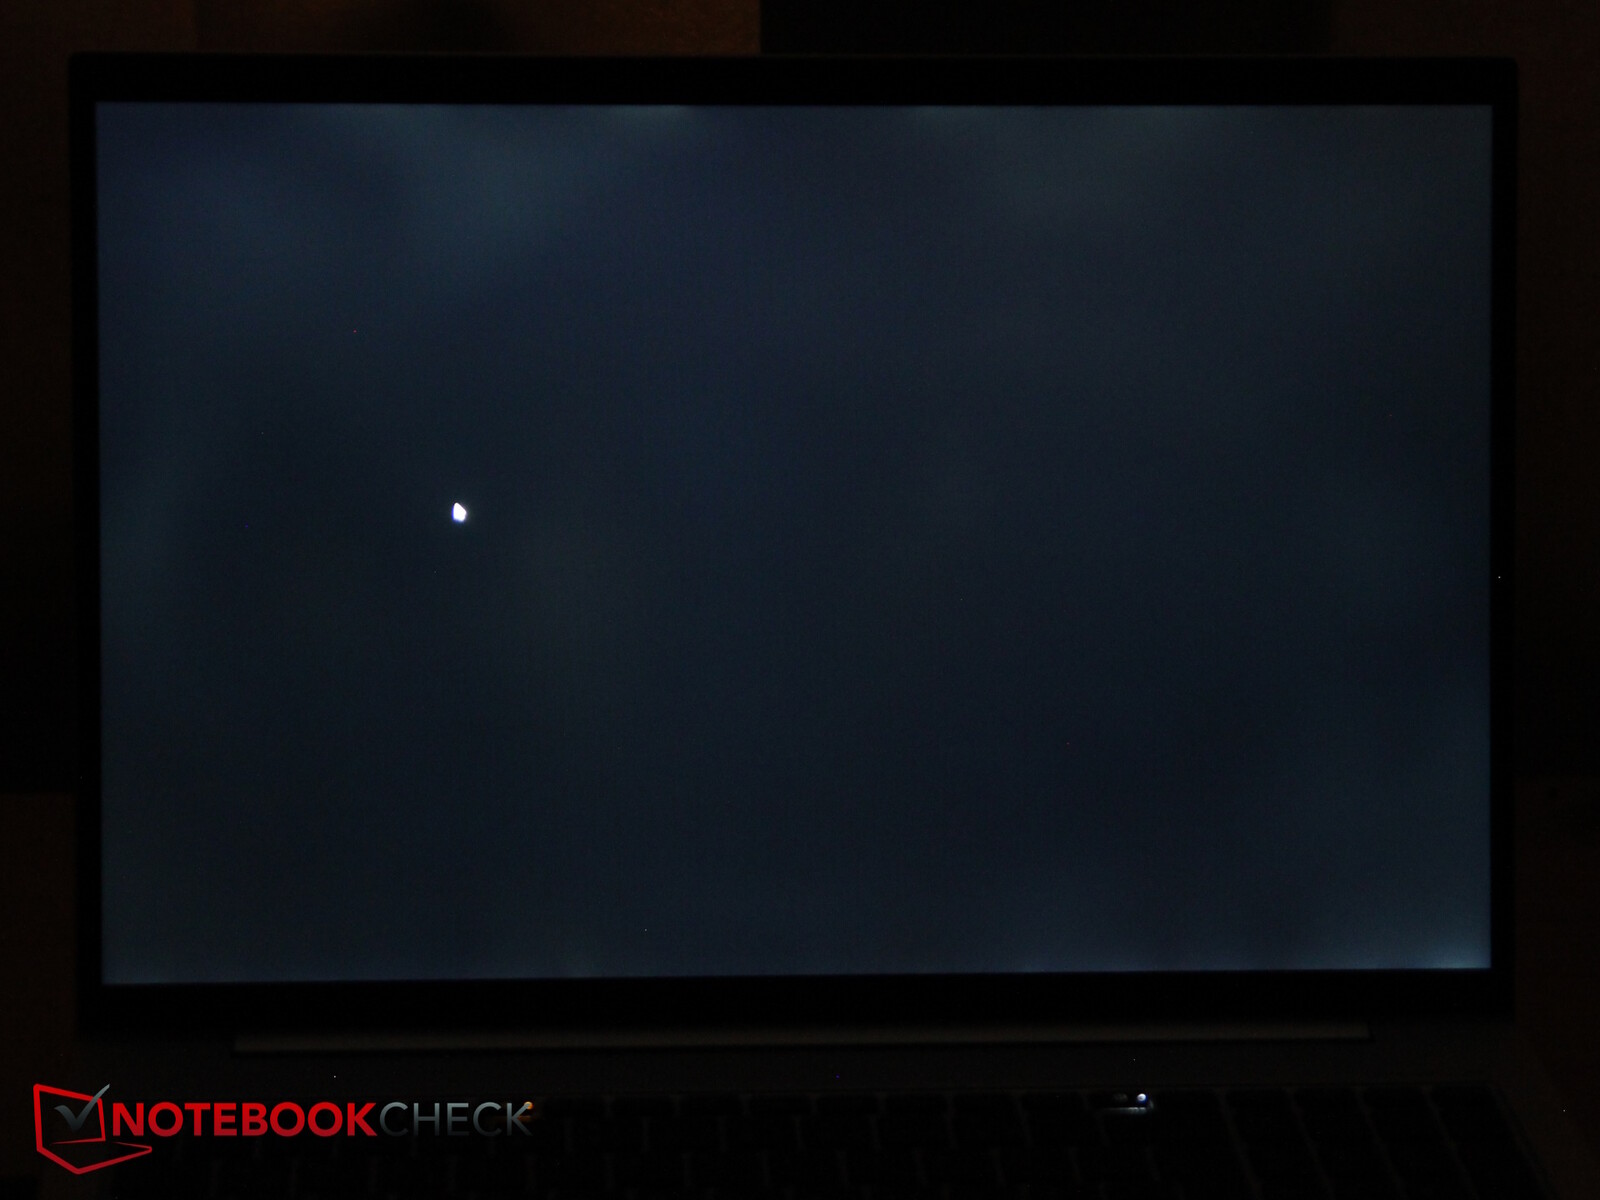
Once the Sure View privacy filter is enabled, brightness in the middle of the screen drops to 120 nits at best. Needless to say, this is much too low to provide a good viewing experience. That’s why we don’t quite understand the reason for this filter. Once it is activated, contents on the screen generally become so dark that you won’t even want to work on the laptop. Furthermore, even when disabled, Sure View still causes image quality to be substantially worse than on laptops without this filter.
The display also suffers from relatively serious backlight bleed and poor response times, much like the one on the G9. This is not to mention that it uses PWM, with the frequency varying based on the chosen brightness level (see below).
But there is a way to get around this. Various display options are available during the configuration process. Whilst there isn’t a 1,000-nit model without Sure View, HP offers an anti-glare WUXGA IPS display (1,920 x 1,200) with 400 nits, lower power usage and likewise 100% sRGB coverage.
| |||||||||||||||||||||||||
Brightness Distribution: 47 %
Center on Battery: 860 cd/m²
Contrast: 2544:1 (Black: 0.34 cd/m²)
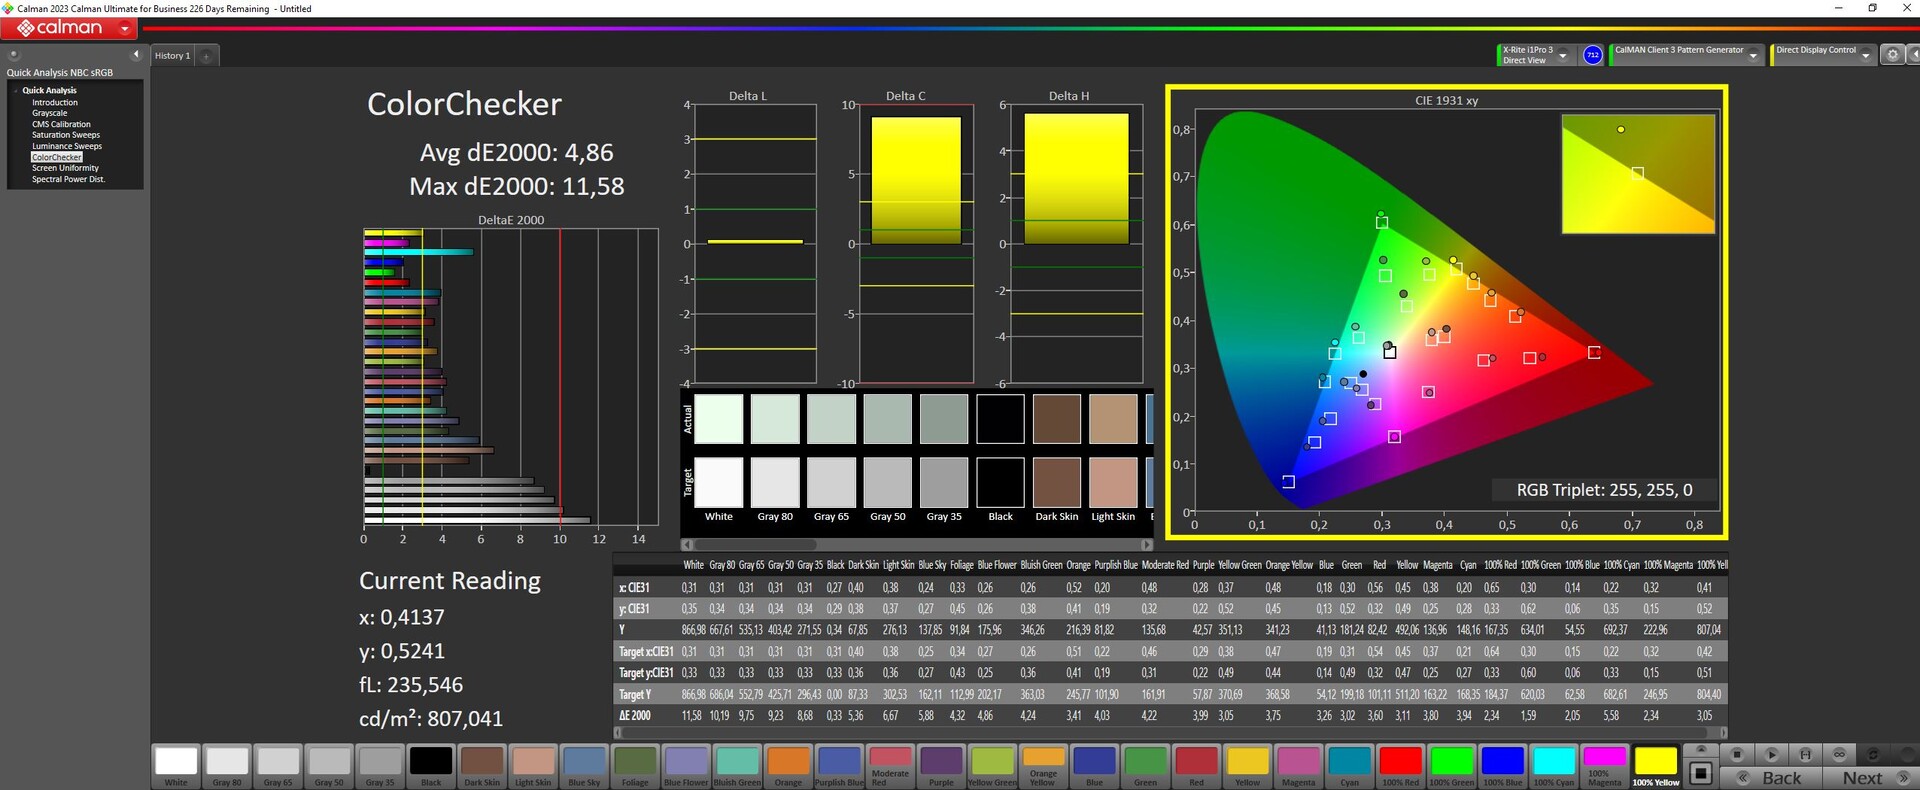
ΔE ColorChecker Calman: 4.86 | ∀{0.5-29.43 Ø4.71}
calibrated: 1.05
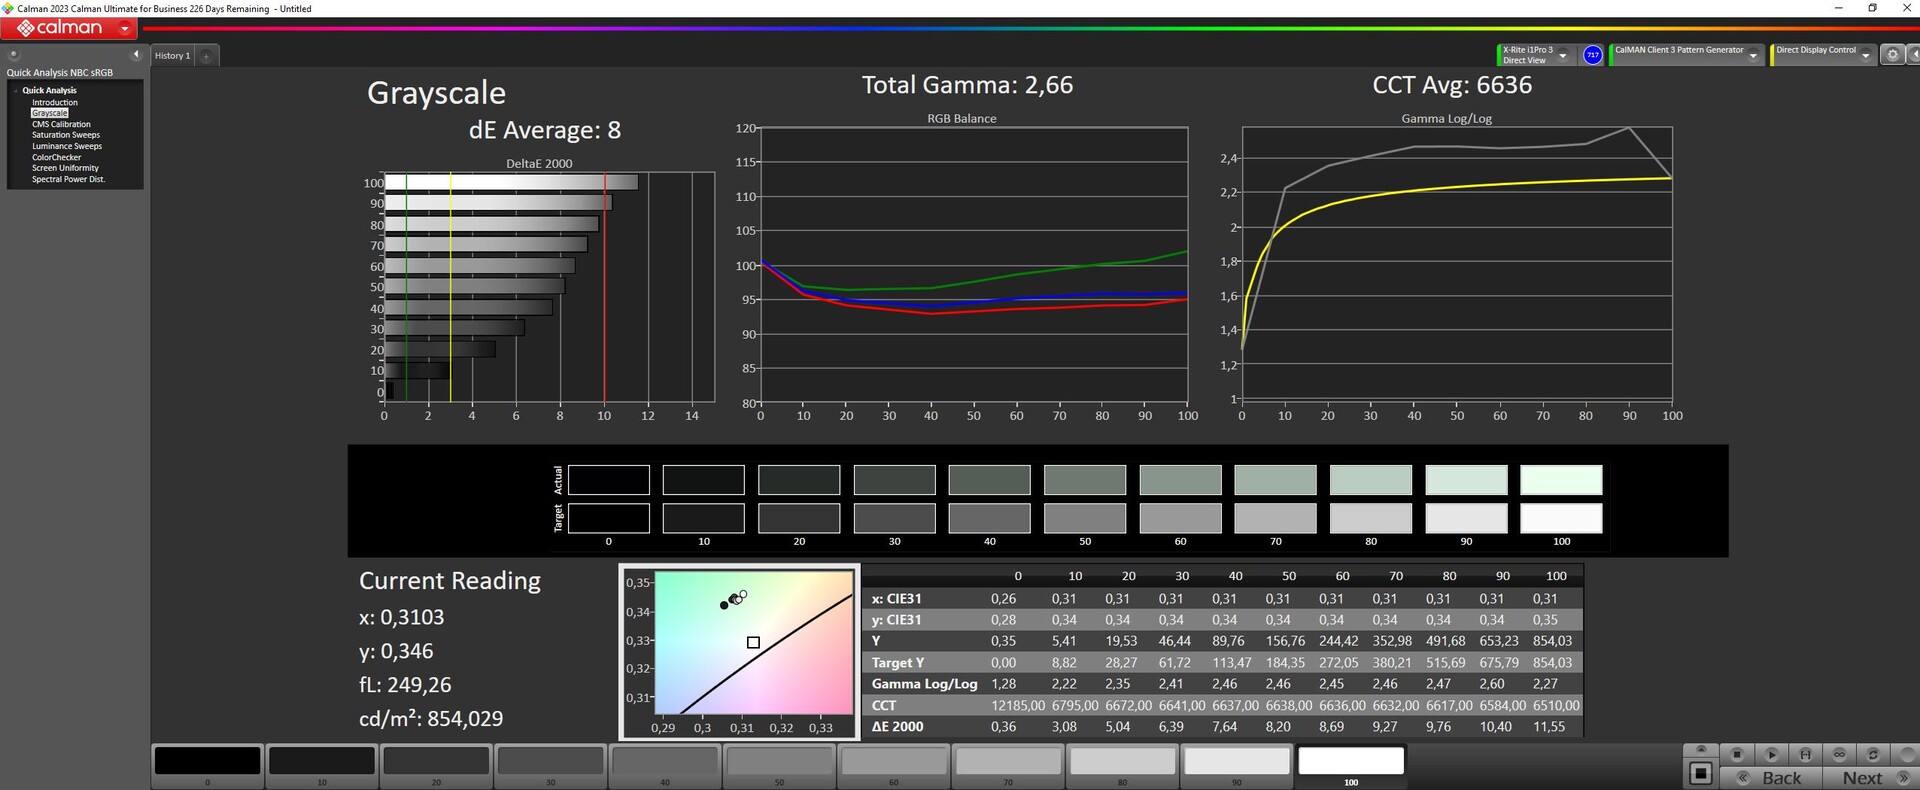
ΔE Greyscale Calman: 8 | ∀{0.09-98 Ø4.96}
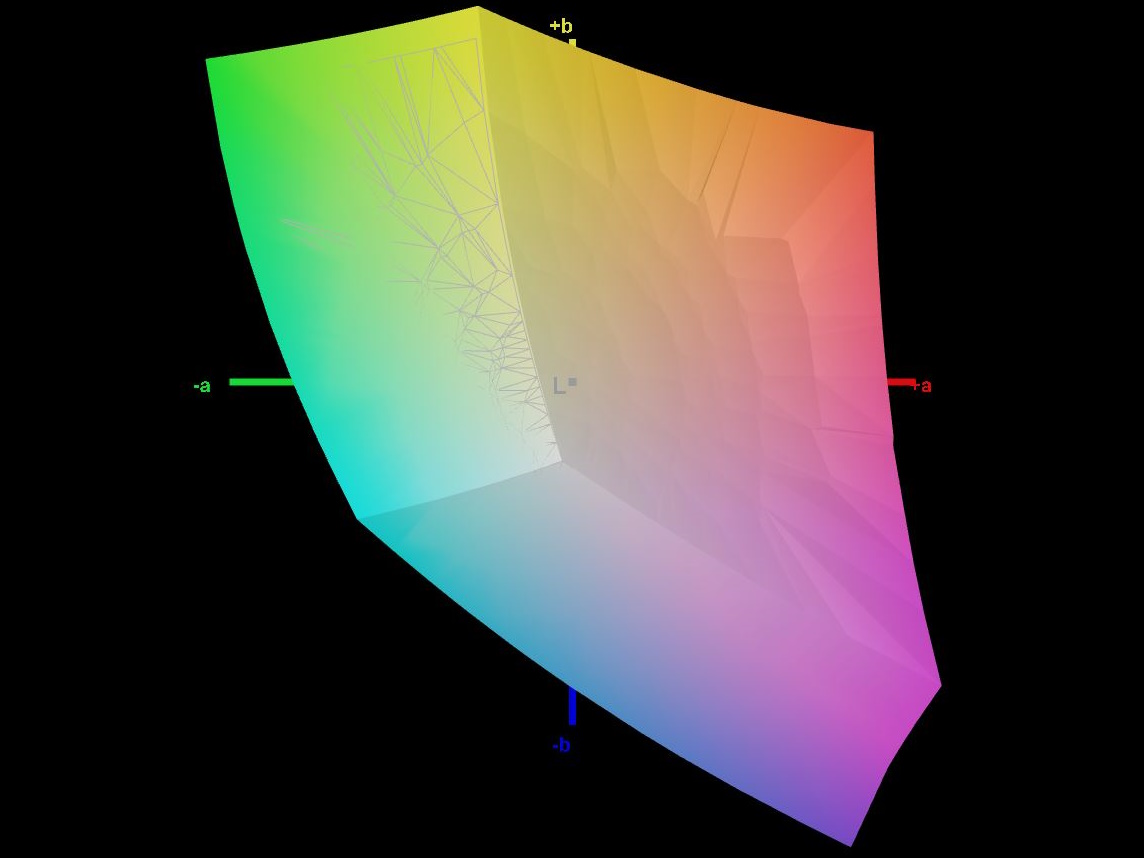
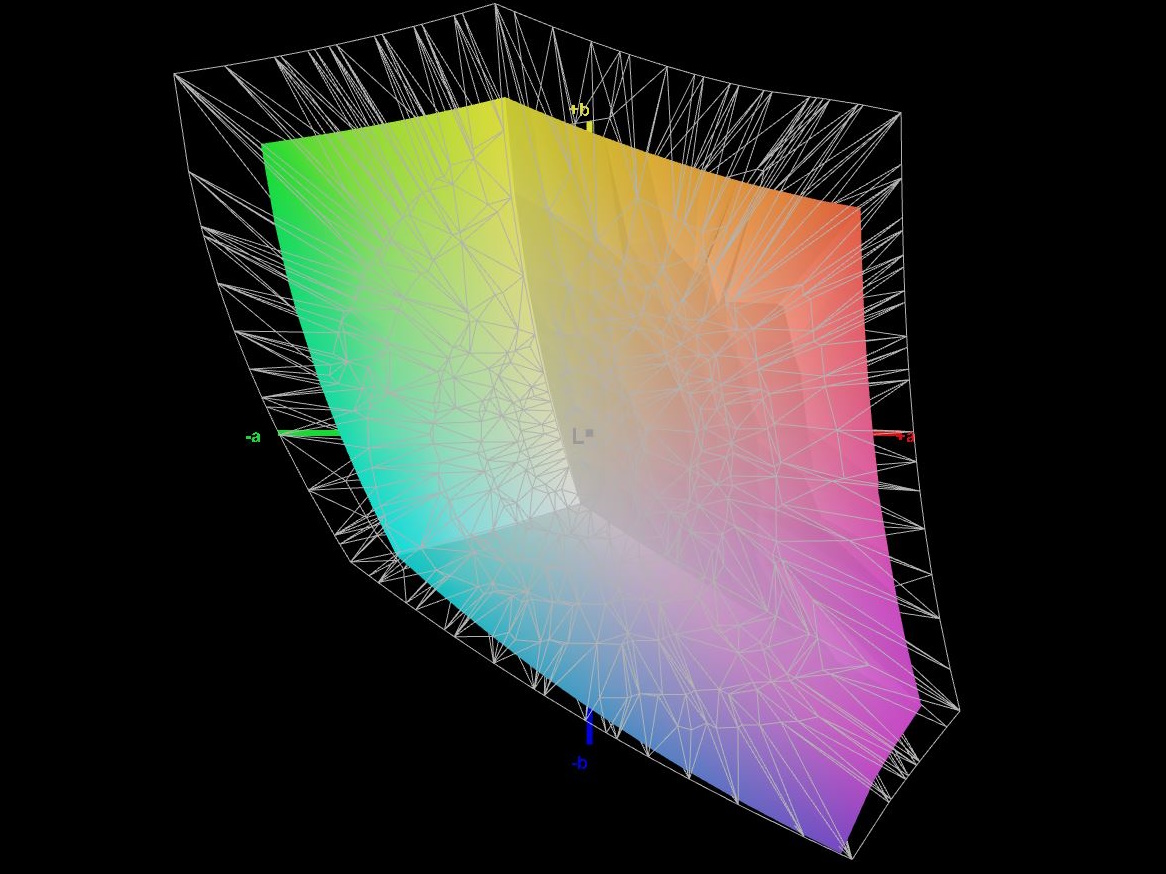
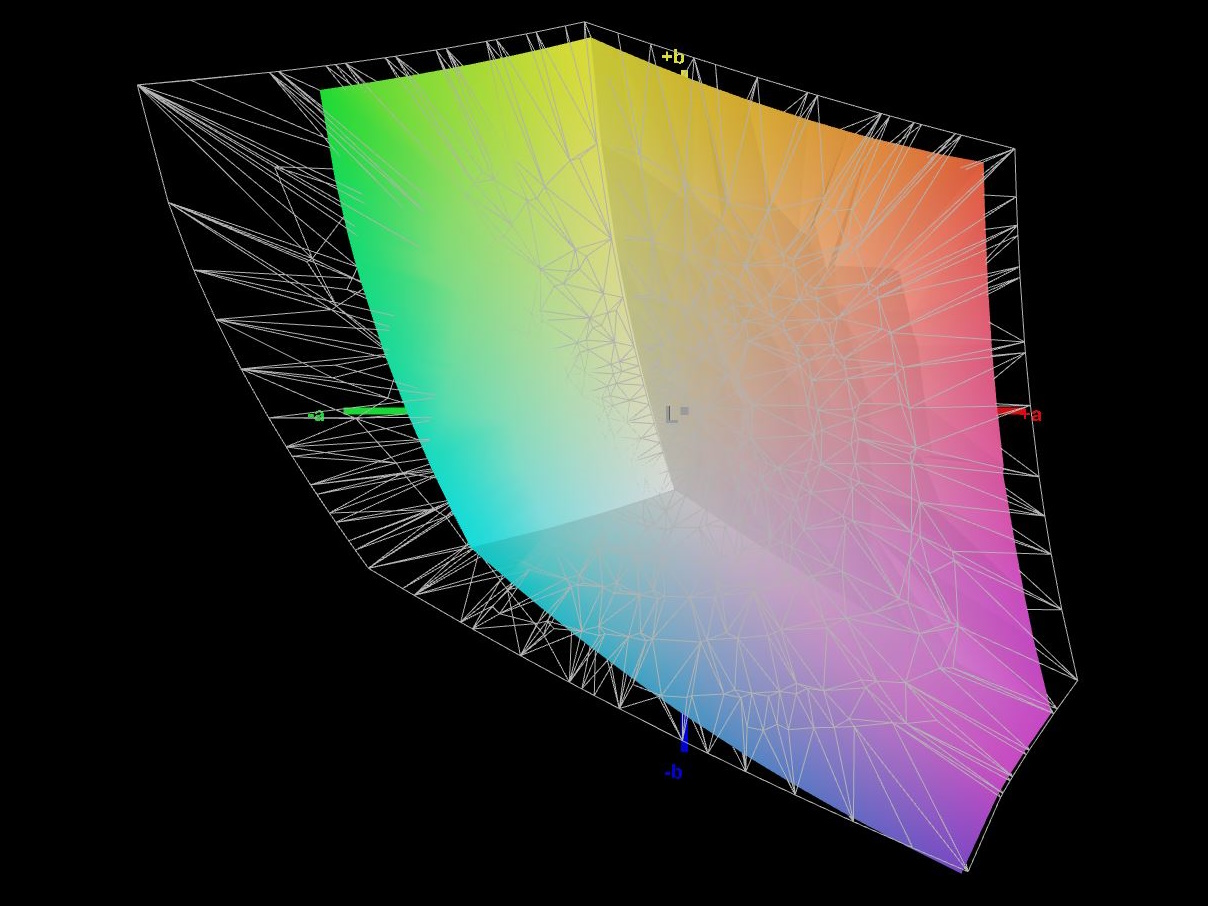
75% AdobeRGB 1998 (Argyll 3D)
99.9% sRGB (Argyll 3D)
72.8% Display P3 (Argyll 3D)
Gamma: 2.66
CCT: 6636 K
| HP EliteBook 865 G10 InfoVision IVO3E94 (X160NV42 R0), IPS, 1920x1200, 16" | HP EliteBook 865 G9 X160NV42, IPS, 1920x1200, 16" | Lenovo ThinkPad P16s G2 21K9000CGE ATNA60YV04-0, OLED, 3840x2400, 16" | Acer Swift Edge SFE16 Ryzen 7 7840U Samsung ATNA60BX03-0, OLED, 3200x2000, 16" | Lenovo ThinkPad T16 G2 21HH003AGE Lenovo MNG007JA1-2, IPS, 1920x1200, 16" | Samsung Galaxy Book3 Pro 16 Samsung ATNA60CL03-0, AMOLED, 2880x1800, 16" | |
|---|---|---|---|---|---|---|
| Display | -2% | 22% | 23% | -6% | 22% | |
| Display P3 Coverage (%) | 72.8 | 71.4 -2% | 99.9 37% | 99.9 37% | 67 -8% | 99.7 37% |
| sRGB Coverage (%) | 99.9 | 99.3 -1% | 100 0% | 100 0% | 96.9 -3% | 100 0% |
| AdobeRGB 1998 Coverage (%) | 75 | 73.2 -2% | 96.9 29% | 100 33% | 69.3 -8% | 97 29% |
| Response Times | 21% | 96% | 98% | 31% | 95% | |
| Response Time Grey 50% / Grey 80% * (ms) | 48 ? | 35.5 ? 26% | 1.5 ? 97% | 0.57 ? 99% | 32 ? 33% | 2 ? 96% |
| Response Time Black / White * (ms) | 27.6 ? | 23.5 ? 15% | 1.3 ? 95% | 1 ? 96% | 20 ? 28% | 2 ? 93% |
| PWM Frequency (Hz) | 550 | 56.7 | 60 | 238.8 | ||
| Screen | 22% | 9% | 26% | 21% | 122% | |
| Brightness middle (cd/m²) | 865 | 865 0% | 416 -52% | 379.8 -56% | 446 -48% | 412 -52% |
| Brightness (cd/m²) | 724 | 771 6% | 421 -42% | 383 -47% | 414 -43% | 412 -43% |
| Brightness Distribution (%) | 47 | 72 53% | 98 109% | 98 109% | 86 83% | 98 109% |
| Black Level * (cd/m²) | 0.34 | 0.3 12% | 0.32 6% | 0.015 96% | ||
| Contrast (:1) | 2544 | 2883 13% | 1394 -45% | 27467 980% | ||
| Colorchecker dE 2000 * | 4.86 | 2.4 51% | 1.3 73% | 4.7 3% | 1.5 69% | 2.34 52% |
| Colorchecker dE 2000 max. * | 11.58 | 5.8 50% | 2.8 76% | 7.51 35% | 2.2 81% | 3.34 71% |
| Colorchecker dE 2000 calibrated * | 1.05 | 1.5 -43% | 2.9 -176% | 0.55 48% | 1 5% | 2.95 -181% |
| Greyscale dE 2000 * | 8 | 3.8 52% | 1.8 77% | 0.8 90% | 1.6 80% | 2.78 65% |
| Gamma | 2.66 83% | 2.36 93% | 2.25 98% | 2.22 99% | 2.24 98% | 2.5 88% |
| CCT | 6636 98% | 6922 94% | 6574 99% | 6381 102% | 6482 100% | 6879 94% |
| Total Average (Program / Settings) | 14% /
16% | 42% /
27% | 49% /
37% | 15% /
16% | 80% /
97% |
* ... smaller is better
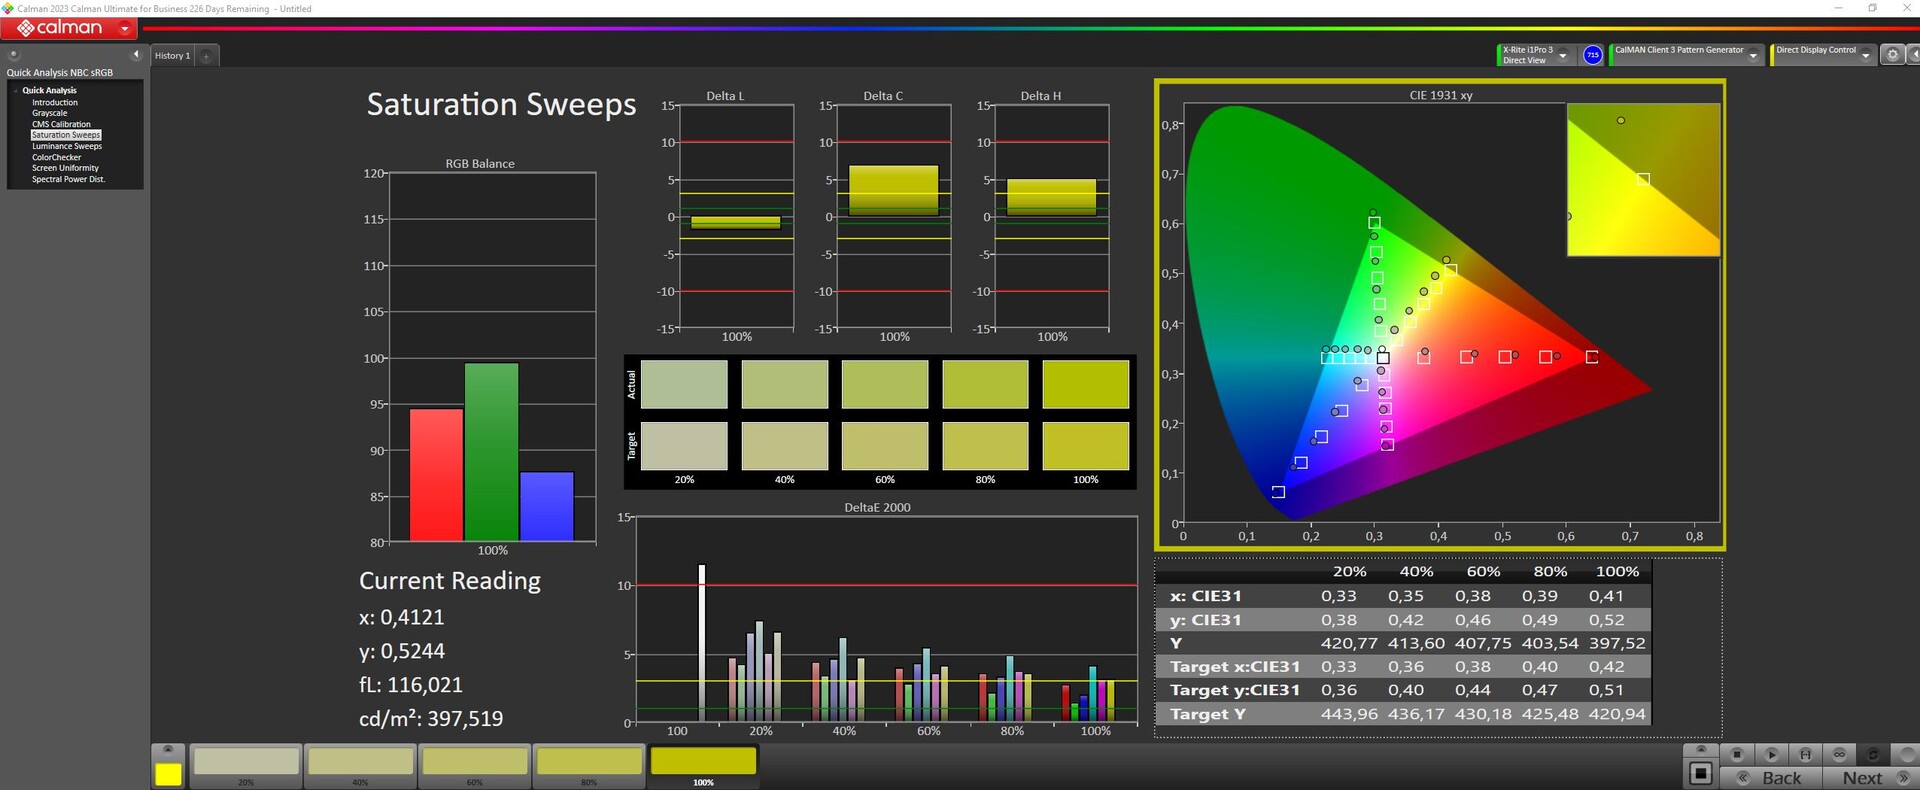
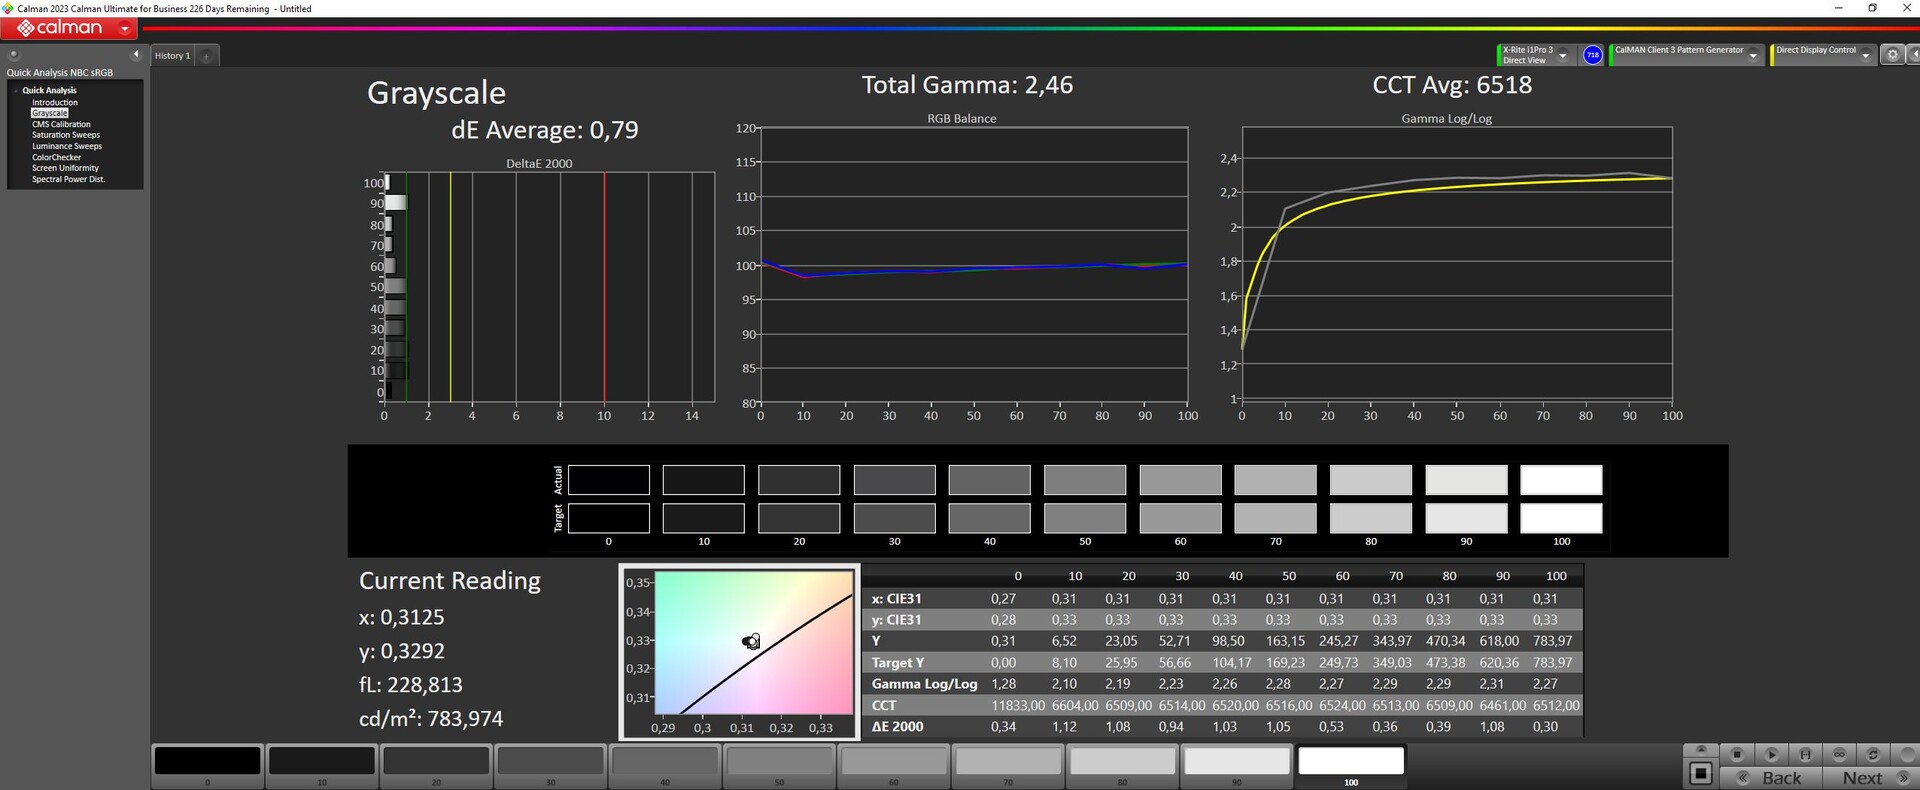
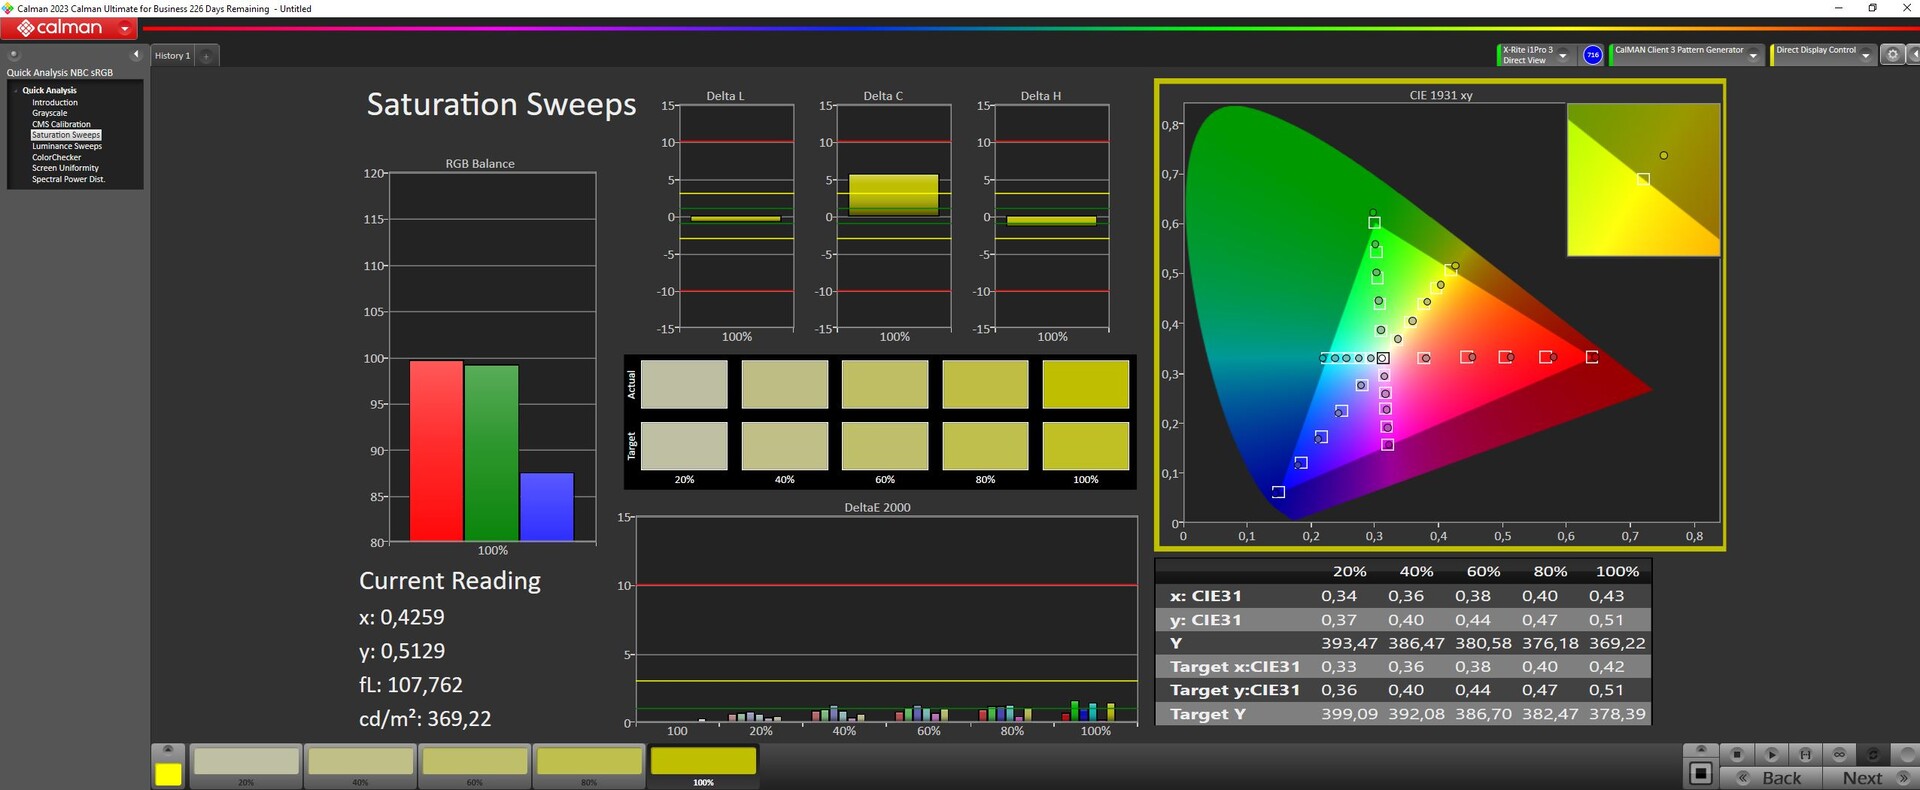
Our measurements confirmed HP’s claim of full sRGB coverage. The display is also able to reproduce 73% and 75% of the DCI-P3 and AdobeRGB gamuts respectively.
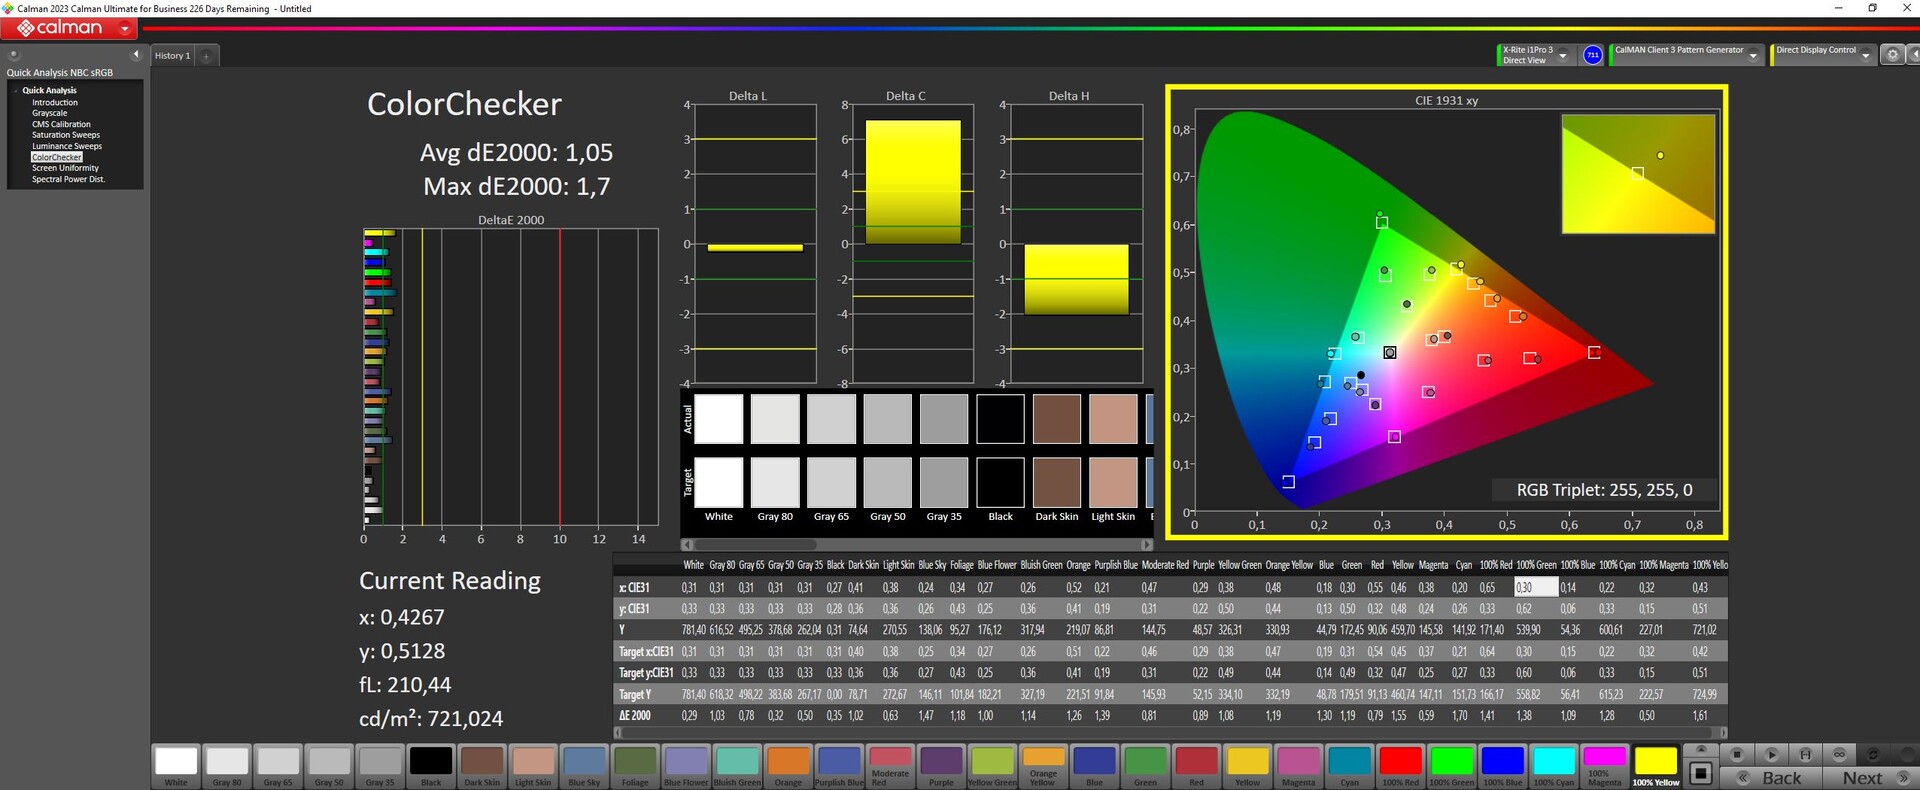
Right out of the box, the display is in a pretty poor state as far as calibration is concerned. In Calman ColorChecker, we measured an average Delta E of 4.68, with the max value hovering around 11. After manually calibrating the screen, we were able to decrease the average Delta E to almost 1 (max value of about 1.7).
The situation is similar with greyscale. The initial difference of 8 is much too high. Our calibration pushed the Delta E down to one tenth of this value! There is a link above for you to download our calibrated ICM profile for free.
Display Response Times
| ↔ Response Time Black to White | ||
|---|---|---|
| 27.6 ms ... rise ↗ and fall ↘ combined | ↗ 14.6 ms rise | 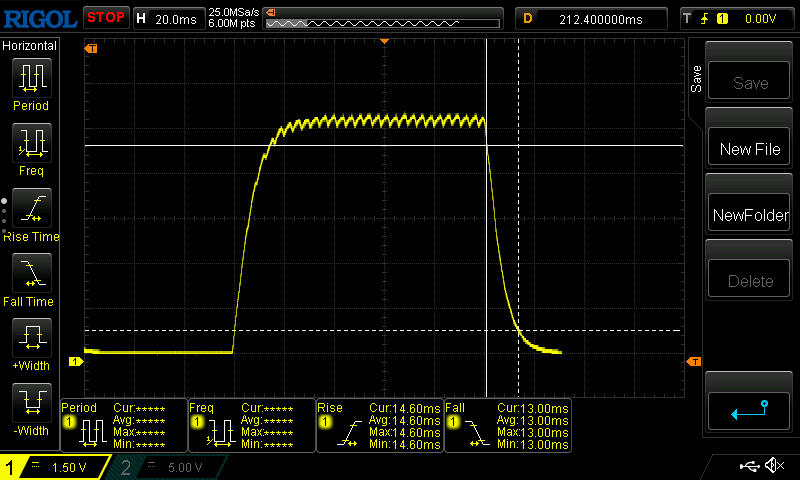 |
| ↘ 13 ms fall | ||
| The screen shows relatively slow response rates in our tests and may be too slow for gamers. In comparison, all tested devices range from 0.1 (minimum) to 240 (maximum) ms. » 70 % of all devices are better. This means that the measured response time is worse than the average of all tested devices (19.8 ms). | ||
| ↔ Response Time 50% Grey to 80% Grey | ||
| 48 ms ... rise ↗ and fall ↘ combined | ↗ 21.8 ms rise | 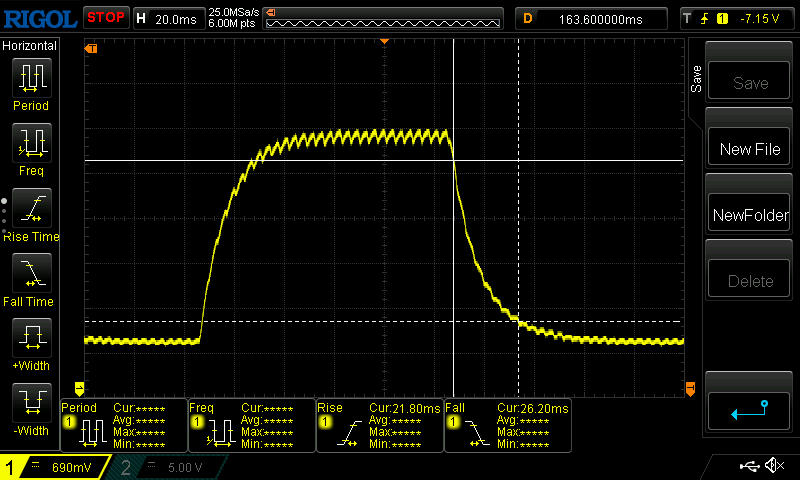 |
| ↘ 26.2 ms fall | ||
| The screen shows slow response rates in our tests and will be unsatisfactory for gamers. In comparison, all tested devices range from 0.165 (minimum) to 636 (maximum) ms. » 82 % of all devices are better. This means that the measured response time is worse than the average of all tested devices (31 ms). | ||
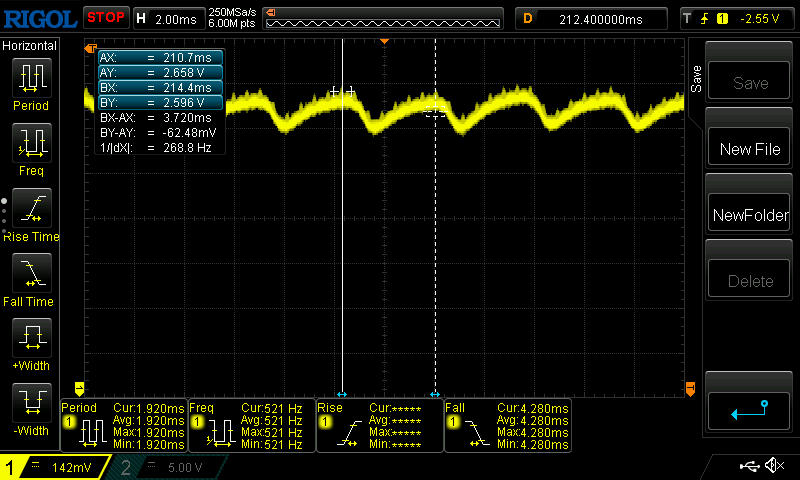
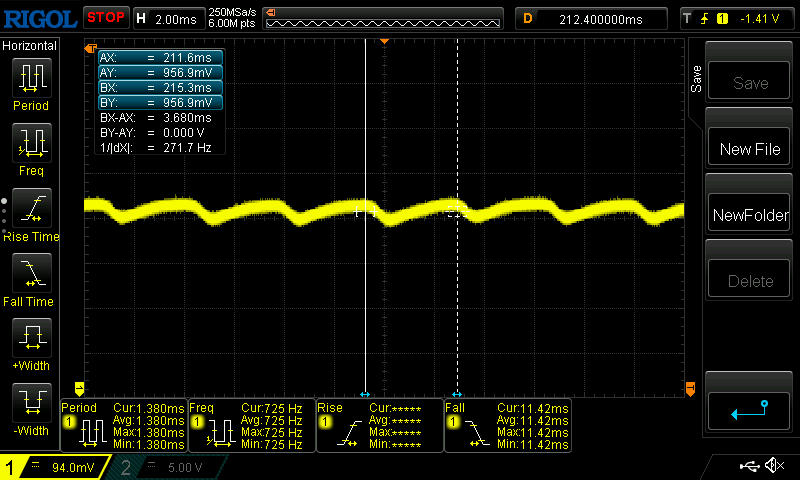
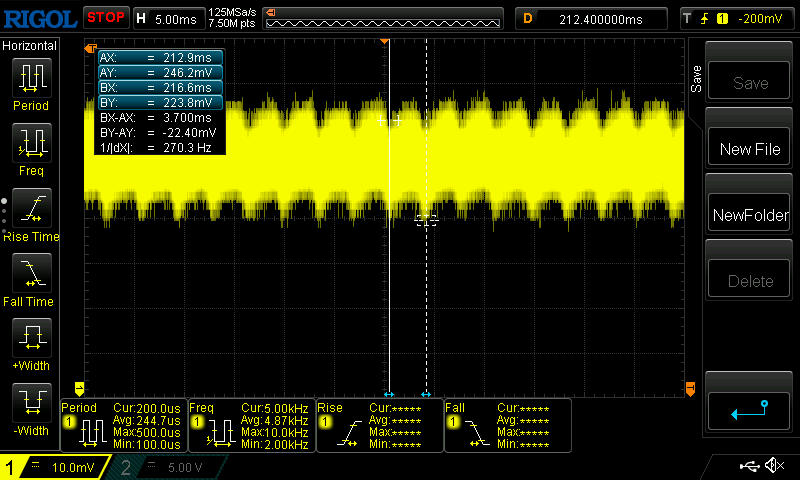
Screen Flickering / PWM (Pulse-Width Modulation)
| Screen flickering / PWM detected | 550 Hz |  | |
The display backlight flickers at 550 Hz (worst case, e.g., utilizing PWM) . The frequency of 550 Hz is quite high, so most users sensitive to PWM should not notice any flickering. In comparison: 52 % of all tested devices do not use PWM to dim the display. If PWM was detected, an average of 7747 (minimum: 5 - maximum: 343500) Hz was measured. | |||
With the privacy filter disabled, the viewing angle issues are the only thing hindering the use of the laptop outdoors. The display is otherwise bright enough, and the matt surface can get rid of most reflections. All you need to do is to ensure the display sits at an optimal angle.
It’s better just to stay indoors when Sure View is enabled. That’s because the display will become so dark that you would hardly be able to read the screen contents outside.
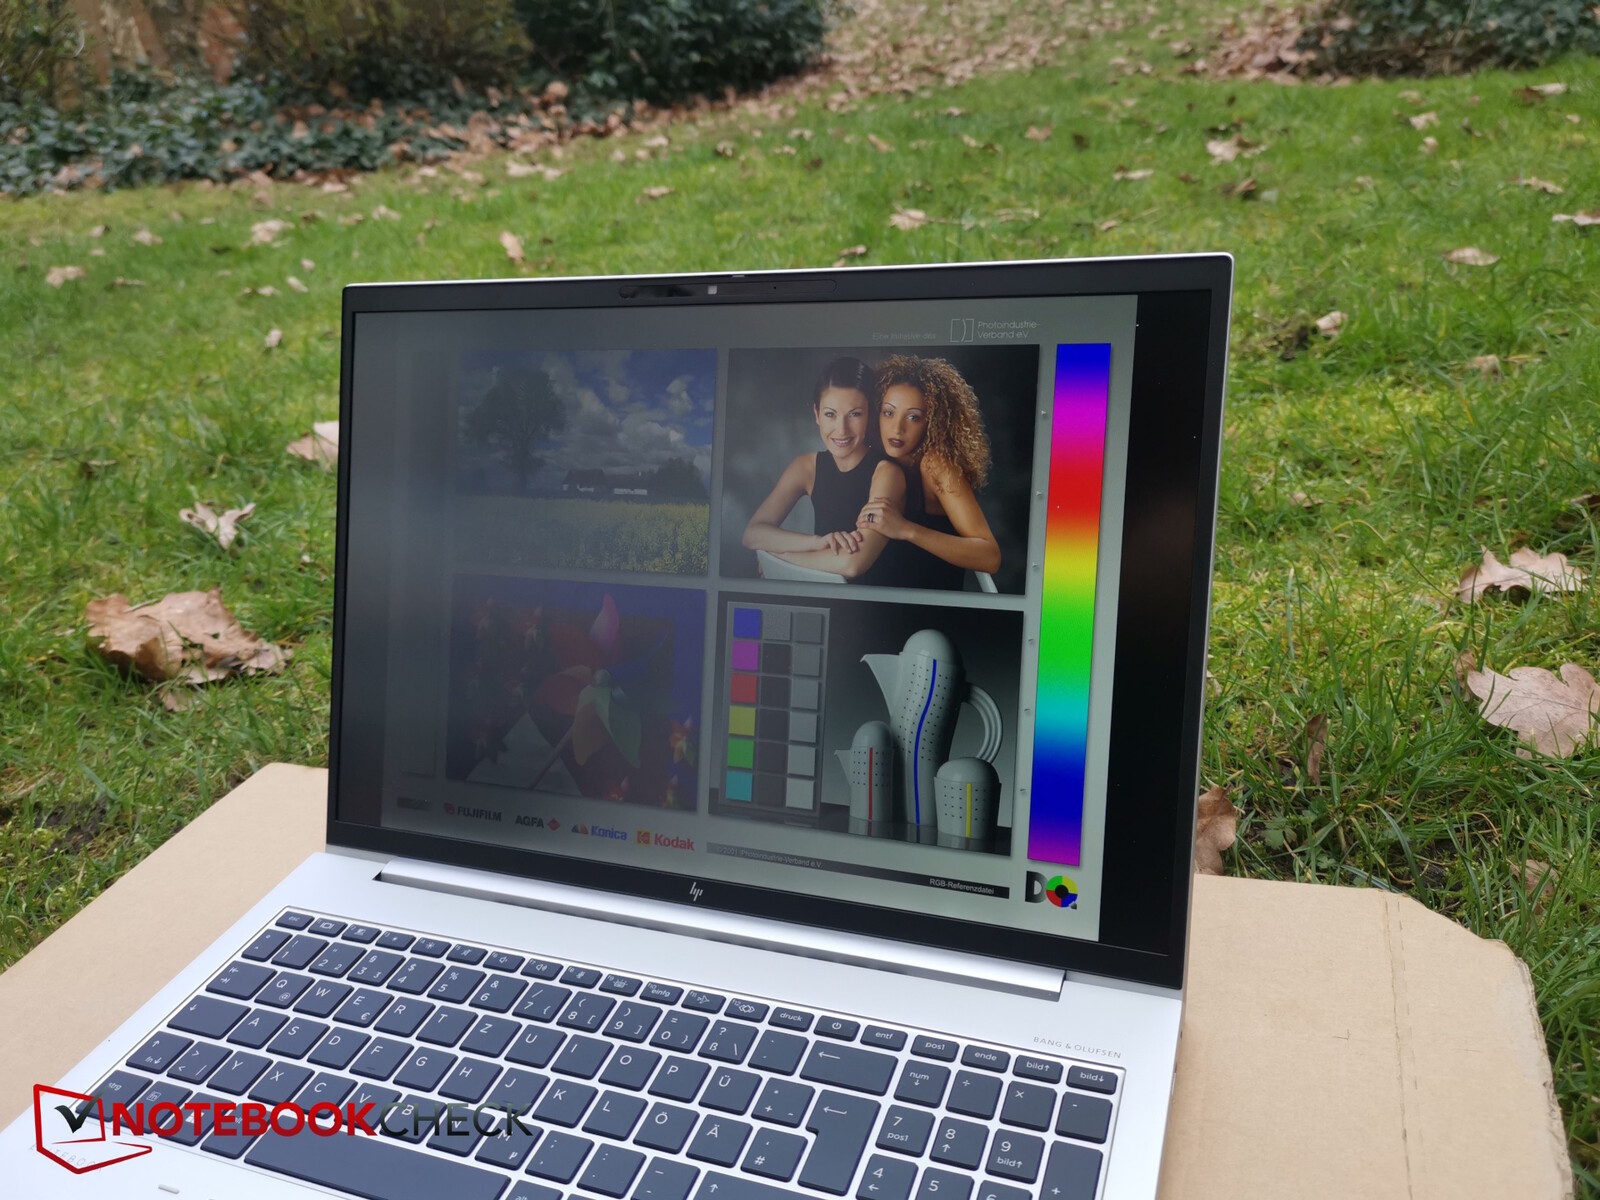
As mentioned earlier, the viewing angle is extremely modest even with the privacy filter disabled. Naturally, it is intentional that turning on the filter drastically restricts the viewing angle. You will hardly be able to read anything on the screen even when viewing it at a slight angle.
However, this feature is really not worth the many drawbacks caused by it or the filter overlay. That said, the pictures below aren’t very accurate and make the display look worse than how it actually appears to the naked eye. It seems like cameras still have major trouble with capturing light through the filter.

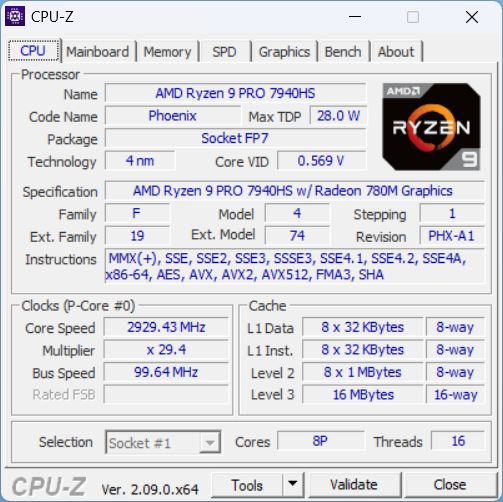
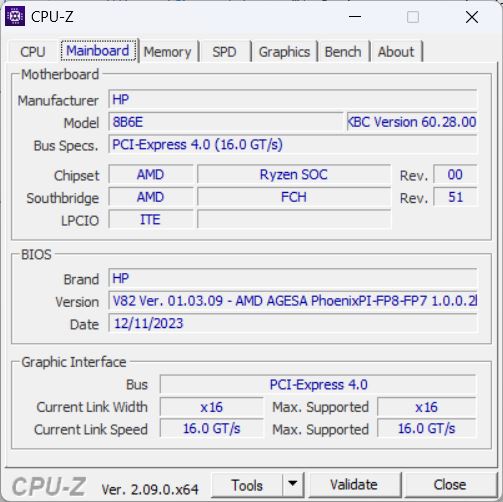
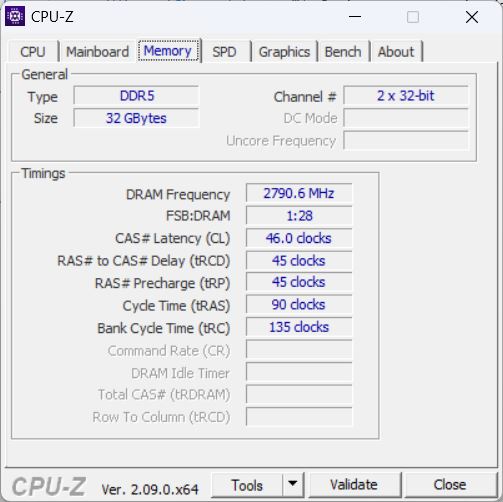
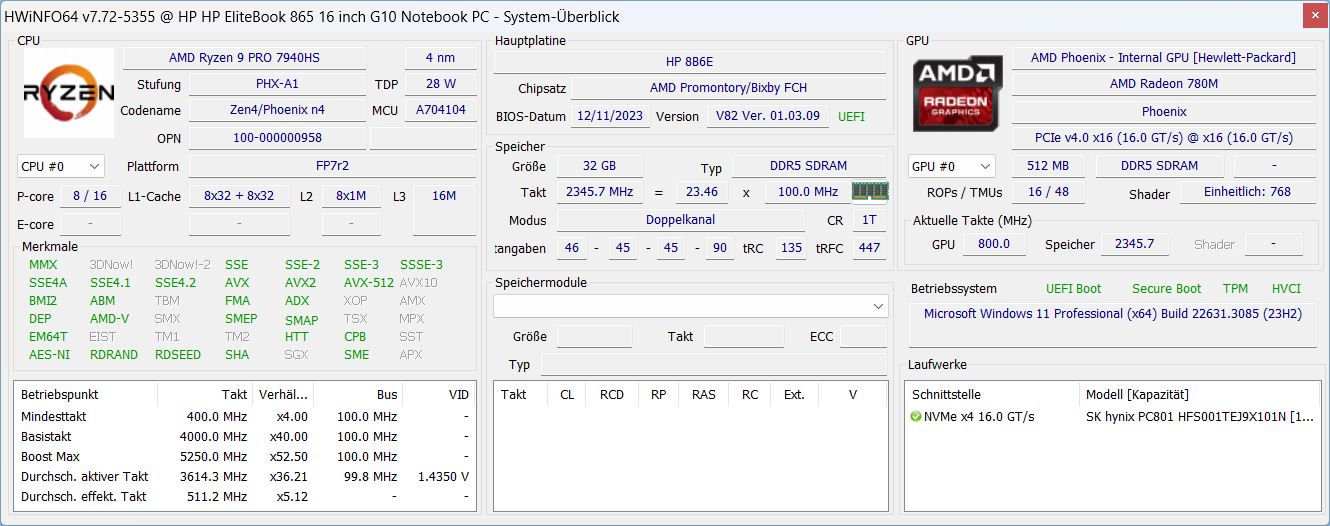
Performance - Once again single-channel memory
HP has equipped its elite business laptop with a Ryzen 9 PRO 7940HS featuring the integrated Radeon 780M. The processor is flanked by 32 GB of RAM and a 1TB SSD. The Sure View privacy filter is designed to protect the screen from prying eyes in professional use. The SmartCard slot and the numerous security features also point to companies being the target audience.
Moreover, there are many configuration options when it comes to things like display, processor, memory and so on.
Test conditions
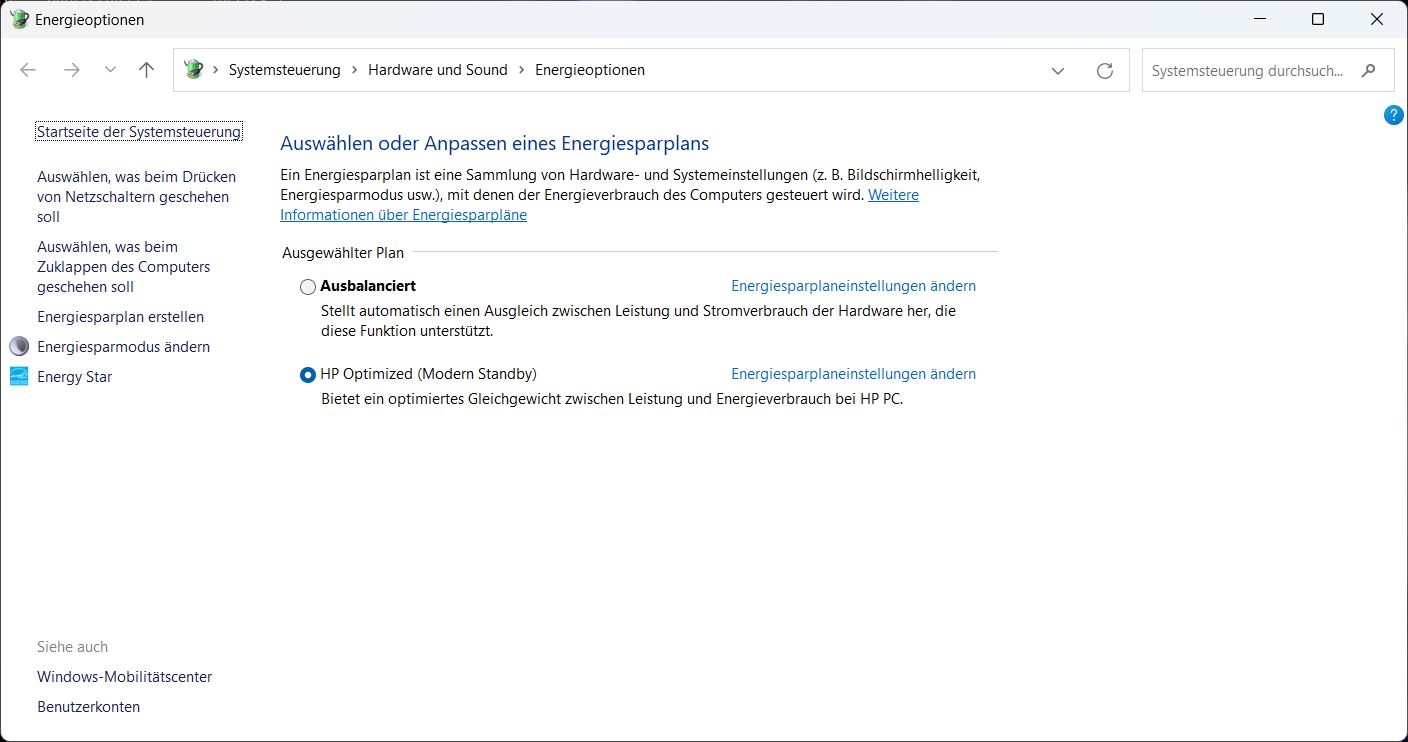
The myHP software doesn’t provide any performance profiles for the 865 G10. But HP has created its own “HP Optimized” plan in Windows power options, which is selected by default. We thus used this power plan during our benchmarks as well.
Processor
The Ryzen 9 PRO 7940HS is one of the top models in AMD’s Phoenix Series of Zen 4 processors. Its 8 cores run at 4 to 5.2 GHz and can handle up to 16 threads at once thanks to virtual core duplication. AMD also offers a non-Pro version of the Ryzen 9 7940HS, but the Pro model has additional management and security features enabled for businesses. In addition, the CPU boasts the Radeon 780M integrated graphics and, for the first time, an AI accelerator.
Alternatively, you can also select a Ryzen 3, 5 or 7 CPU for the EliteBook, which will affect what iGPU is built into the laptop.
In our 30-minute Cinebench R15 loop test, the Ryzen 9 exhibited a very consistent and high level of performance right from the start. The only competitor that could keep up is, of all things, the ThinkPad P16s G2 equipped with “just” a Ryzen 7 PRO 7840U. By contrast, the Swift Edge performed much worse than the ThinkPad despite having the same Ryzen 7 processor.
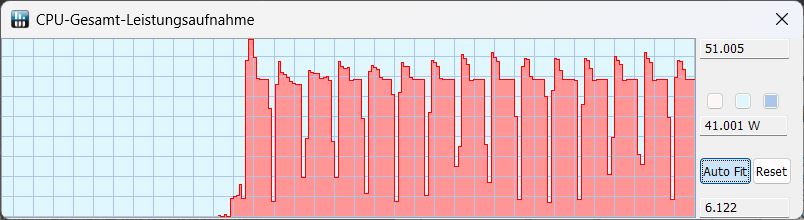
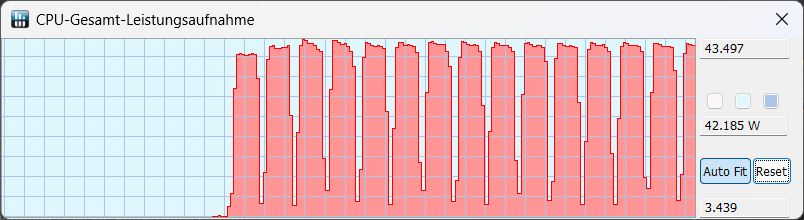
TDP was mostly around 50 watts at the start of a run and then dropped to a hair above 40 watts. On battery power, there wasn’t any initial peak, and the TDP stayed at a fairly consistent 40 to 43 watts. The performance drop was consequently low at just 3% based on our calculation.
In Balanced mode, the device demonstrated the same TDP behaviour and delivered the same results as in HP Optimized mode.
The EliteBook and ThinkPad P16s jointly took the top spot in our CPU performance ranking. The EliteBook’s CPU overall ran roughly 39% faster than the Ryzen 7 PRO 6850U in the predecessor.
Cinebench R15 Multi Sustained load
Cinebench R23: Multi Core | Single Core
Cinebench R20: CPU (Multi Core) | CPU (Single Core)
Cinebench R15: CPU Multi 64Bit | CPU Single 64Bit
Blender: v2.79 BMW27 CPU
7-Zip 18.03: 7z b 4 | 7z b 4 -mmt1
Geekbench 6.7: Multi-Core | Single-Core
Geekbench 5.5: Multi-Core | Single-Core
HWBOT x265 Benchmark v2.2: 4k Preset
LibreOffice : 20 Documents To PDF
R Benchmark 2.5: Overall mean
| CPU Performance rating | |
| Average AMD Ryzen 9 PRO 7940HS | |
| HP EliteBook 865 G10 | |
| Lenovo ThinkPad P16s G2 21K9000CGE | |
| Acer Swift Edge SFE16 Ryzen 7 7840U | |
| Average of class Office | |
| Samsung Galaxy Book3 Pro 16 -2! | |
| Lenovo ThinkPad T16 G2 21HH003AGE | |
| HP EliteBook 865 G9 -2! | |
| Cinebench R23 / Multi Core | |
| Average AMD Ryzen 9 PRO 7940HS (14919 - 16938, n=3) | |
| Lenovo ThinkPad P16s G2 21K9000CGE | |
| HP EliteBook 865 G10 | |
| Acer Swift Edge SFE16 Ryzen 7 7840U | |
| Average of class Office (1673 - 22808, n=75, last 2 years) | |
| Samsung Galaxy Book3 Pro 16 | |
| HP EliteBook 865 G9 | |
| Lenovo ThinkPad T16 G2 21HH003AGE | |
| Cinebench R23 / Single Core | |
| Lenovo ThinkPad T16 G2 21HH003AGE | |
| HP EliteBook 865 G10 | |
| Samsung Galaxy Book3 Pro 16 | |
| Acer Swift Edge SFE16 Ryzen 7 7840U | |
| Lenovo ThinkPad P16s G2 21K9000CGE | |
| Average AMD Ryzen 9 PRO 7940HS (1568 - 1794, n=3) | |
| Average of class Office (708 - 2130, n=75, last 2 years) | |
| HP EliteBook 865 G9 | |
| Cinebench R20 / CPU (Multi Core) | |
| Average AMD Ryzen 9 PRO 7940HS (5790 - 6601, n=3) | |
| Lenovo ThinkPad P16s G2 21K9000CGE | |
| HP EliteBook 865 G10 | |
| Acer Swift Edge SFE16 Ryzen 7 7840U | |
| Average of class Office (648 - 8840, n=74, last 2 years) | |
| Samsung Galaxy Book3 Pro 16 | |
| HP EliteBook 865 G9 | |
| Lenovo ThinkPad T16 G2 21HH003AGE | |
| Cinebench R20 / CPU (Single Core) | |
| Lenovo ThinkPad T16 G2 21HH003AGE | |
| HP EliteBook 865 G10 | |
| Lenovo ThinkPad P16s G2 21K9000CGE | |
| Acer Swift Edge SFE16 Ryzen 7 7840U | |
| Average AMD Ryzen 9 PRO 7940HS (611 - 695, n=3) | |
| Average of class Office (345 - 816, n=74, last 2 years) | |
| Samsung Galaxy Book3 Pro 16 | |
| HP EliteBook 865 G9 | |
| Cinebench R15 / CPU Multi 64Bit | |
| Average AMD Ryzen 9 PRO 7940HS (2356 - 2718, n=3) | |
| Lenovo ThinkPad P16s G2 21K9000CGE | |
| HP EliteBook 865 G10 | |
| Acer Swift Edge SFE16 Ryzen 7 7840U | |
| Average of class Office (250 - 3380, n=76, last 2 years) | |
| Samsung Galaxy Book3 Pro 16 | |
| HP EliteBook 865 G9 | |
| Lenovo ThinkPad T16 G2 21HH003AGE | |
| Cinebench R15 / CPU Single 64Bit | |
| HP EliteBook 865 G10 | |
| Acer Swift Edge SFE16 Ryzen 7 7840U | |
| Average AMD Ryzen 9 PRO 7940HS (247 - 280, n=3) | |
| Lenovo ThinkPad P16s G2 21K9000CGE | |
| Lenovo ThinkPad T16 G2 21HH003AGE | |
| Average of class Office (99.5 - 316, n=76, last 2 years) | |
| Samsung Galaxy Book3 Pro 16 | |
| HP EliteBook 865 G9 | |
| Blender / v2.79 BMW27 CPU | |
| Lenovo ThinkPad T16 G2 21HH003AGE | |
| Average of class Office (158 - 1940, n=75, last 2 years) | |
| HP EliteBook 865 G9 | |
| Samsung Galaxy Book3 Pro 16 | |
| Acer Swift Edge SFE16 Ryzen 7 7840U | |
| Lenovo ThinkPad P16s G2 21K9000CGE | |
| HP EliteBook 865 G10 | |
| Average AMD Ryzen 9 PRO 7940HS (191 - 215, n=3) | |
| 7-Zip 18.03 / 7z b 4 | |
| Average AMD Ryzen 9 PRO 7940HS (61111 - 67813, n=3) | |
| Lenovo ThinkPad P16s G2 21K9000CGE | |
| HP EliteBook 865 G10 | |
| Acer Swift Edge SFE16 Ryzen 7 7840U | |
| Samsung Galaxy Book3 Pro 16 | |
| Average of class Office (7098 - 76886, n=76, last 2 years) | |
| HP EliteBook 865 G9 | |
| Lenovo ThinkPad T16 G2 21HH003AGE | |
| 7-Zip 18.03 / 7z b 4 -mmt1 | |
| HP EliteBook 865 G10 | |
| Average AMD Ryzen 9 PRO 7940HS (5844 - 6497, n=3) | |
| Acer Swift Edge SFE16 Ryzen 7 7840U | |
| Lenovo ThinkPad P16s G2 21K9000CGE | |
| Lenovo ThinkPad T16 G2 21HH003AGE | |
| HP EliteBook 865 G9 | |
| Average of class Office (3387 - 6469, n=76, last 2 years) | |
| Samsung Galaxy Book3 Pro 16 | |
| Geekbench 6.7 / Multi-Core | |
| Lenovo ThinkPad P16s G2 21K9000CGE | |
| Average AMD Ryzen 9 PRO 7940HS (10095 - 13028, n=3) | |
| Acer Swift Edge SFE16 Ryzen 7 7840U | |
| HP EliteBook 865 G10 | |
| Average of class Office (757 - 17846, n=81, last 2 years) | |
| Lenovo ThinkPad T16 G2 21HH003AGE | |
| Geekbench 6.7 / Single-Core | |
| HP EliteBook 865 G10 | |
| Lenovo ThinkPad T16 G2 21HH003AGE | |
| Acer Swift Edge SFE16 Ryzen 7 7840U | |
| Average AMD Ryzen 9 PRO 7940HS (2339 - 2614, n=3) | |
| Lenovo ThinkPad P16s G2 21K9000CGE | |
| Average of class Office (462 - 2988, n=82, last 2 years) | |
| Geekbench 5.5 / Multi-Core | |
| Lenovo ThinkPad P16s G2 21K9000CGE | |
| Average AMD Ryzen 9 PRO 7940HS (9897 - 12038, n=3) | |
| Samsung Galaxy Book3 Pro 16 | |
| HP EliteBook 865 G10 | |
| Acer Swift Edge SFE16 Ryzen 7 7840U | |
| Average of class Office (1483 - 16999, n=72, last 2 years) | |
| Lenovo ThinkPad T16 G2 21HH003AGE | |
| HP EliteBook 865 G9 | |
| Geekbench 5.5 / Single-Core | |
| HP EliteBook 865 G10 | |
| Acer Swift Edge SFE16 Ryzen 7 7840U | |
| Average AMD Ryzen 9 PRO 7940HS (1758 - 1969, n=3) | |
| Lenovo ThinkPad T16 G2 21HH003AGE | |
| Average of class Office (811 - 2175, n=72, last 2 years) | |
| Lenovo ThinkPad P16s G2 21K9000CGE | |
| Samsung Galaxy Book3 Pro 16 | |
| HP EliteBook 865 G9 | |
| HWBOT x265 Benchmark v2.2 / 4k Preset | |
| Average AMD Ryzen 9 PRO 7940HS (17 - 20.4, n=3) | |
| Lenovo ThinkPad P16s G2 21K9000CGE | |
| HP EliteBook 865 G10 | |
| Acer Swift Edge SFE16 Ryzen 7 7840U | |
| Average of class Office (2.21 - 26, n=75, last 2 years) | |
| Samsung Galaxy Book3 Pro 16 | |
| HP EliteBook 865 G9 | |
| Lenovo ThinkPad T16 G2 21HH003AGE | |
| LibreOffice / 20 Documents To PDF | |
| Average of class Office (39.9 - 102.3, n=75, last 2 years) | |
| HP EliteBook 865 G10 | |
| HP EliteBook 865 G9 | |
| Lenovo ThinkPad P16s G2 21K9000CGE | |
| Average AMD Ryzen 9 PRO 7940HS (46.1 - 55, n=3) | |
| Lenovo ThinkPad T16 G2 21HH003AGE | |
| Acer Swift Edge SFE16 Ryzen 7 7840U | |
| Samsung Galaxy Book3 Pro 16 | |
| R Benchmark 2.5 / Overall mean | |
| Average of class Office (0.393 - 0.888, n=75, last 2 years) | |
| HP EliteBook 865 G9 | |
| Samsung Galaxy Book3 Pro 16 | |
| Lenovo ThinkPad T16 G2 21HH003AGE | |
| Lenovo ThinkPad P16s G2 21K9000CGE | |
| Average AMD Ryzen 9 PRO 7940HS (0.4462 - 0.4835, n=3) | |
| Acer Swift Edge SFE16 Ryzen 7 7840U | |
| HP EliteBook 865 G10 | |
* ... smaller is better
AIDA64: FP32 Ray-Trace | FPU Julia | CPU SHA3 | CPU Queen | FPU SinJulia | FPU Mandel | CPU AES | CPU ZLib | FP64 Ray-Trace | CPU PhotoWorxx
| Performance rating | |
| Average AMD Ryzen 9 PRO 7940HS | |
| Lenovo ThinkPad P16s G2 21K9000CGE | |
| HP EliteBook 865 G10 | |
| Acer Swift Edge SFE16 Ryzen 7 7840U | |
| Average of class Office | |
| HP EliteBook 865 G9 | |
| Samsung Galaxy Book3 Pro 16 | |
| Lenovo ThinkPad T16 G2 21HH003AGE | |
| AIDA64 / FP32 Ray-Trace | |
| Average AMD Ryzen 9 PRO 7940HS (24034 - 27411, n=3) | |
| HP EliteBook 865 G10 | |
| Lenovo ThinkPad P16s G2 21K9000CGE | |
| Acer Swift Edge SFE16 Ryzen 7 7840U | |
| Average of class Office (2083 - 31245, n=82, last 2 years) | |
| HP EliteBook 865 G9 | |
| Samsung Galaxy Book3 Pro 16 | |
| Lenovo ThinkPad T16 G2 21HH003AGE | |
| AIDA64 / FPU Julia | |
| Average AMD Ryzen 9 PRO 7940HS (101262 - 116960, n=3) | |
| HP EliteBook 865 G10 | |
| Lenovo ThinkPad P16s G2 21K9000CGE | |
| Acer Swift Edge SFE16 Ryzen 7 7840U | |
| HP EliteBook 865 G9 | |
| Average of class Office (8191 - 125394, n=82, last 2 years) | |
| Samsung Galaxy Book3 Pro 16 | |
| Lenovo ThinkPad T16 G2 21HH003AGE | |
| AIDA64 / CPU SHA3 | |
| Average AMD Ryzen 9 PRO 7940HS (4418 - 4944, n=3) | |
| HP EliteBook 865 G10 | |
| Lenovo ThinkPad P16s G2 21K9000CGE | |
| Acer Swift Edge SFE16 Ryzen 7 7840U | |
| Average of class Office (433 - 5755, n=82, last 2 years) | |
| Samsung Galaxy Book3 Pro 16 | |
| HP EliteBook 865 G9 | |
| Lenovo ThinkPad T16 G2 21HH003AGE | |
| AIDA64 / CPU Queen | |
| Average AMD Ryzen 9 PRO 7940HS (112873 - 124565, n=3) | |
| HP EliteBook 865 G10 | |
| Lenovo ThinkPad P16s G2 21K9000CGE | |
| Acer Swift Edge SFE16 Ryzen 7 7840U | |
| HP EliteBook 865 G9 | |
| Samsung Galaxy Book3 Pro 16 | |
| Average of class Office (22784 - 115197, n=67, last 2 years) | |
| Lenovo ThinkPad T16 G2 21HH003AGE | |
| AIDA64 / FPU SinJulia | |
| Average AMD Ryzen 9 PRO 7940HS (14147 - 15304, n=3) | |
| HP EliteBook 865 G10 | |
| Lenovo ThinkPad P16s G2 21K9000CGE | |
| Acer Swift Edge SFE16 Ryzen 7 7840U | |
| HP EliteBook 865 G9 | |
| Average of class Office (1378 - 18321, n=82, last 2 years) | |
| Samsung Galaxy Book3 Pro 16 | |
| Lenovo ThinkPad T16 G2 21HH003AGE | |
| AIDA64 / FPU Mandel | |
| Average AMD Ryzen 9 PRO 7940HS (54003 - 62357, n=3) | |
| HP EliteBook 865 G10 | |
| Lenovo ThinkPad P16s G2 21K9000CGE | |
| Acer Swift Edge SFE16 Ryzen 7 7840U | |
| HP EliteBook 865 G9 | |
| Average of class Office (4601 - 66922, n=82, last 2 years) | |
| Samsung Galaxy Book3 Pro 16 | |
| Lenovo ThinkPad T16 G2 21HH003AGE | |
| AIDA64 / CPU AES | |
| Samsung Galaxy Book3 Pro 16 | |
| Lenovo ThinkPad P16s G2 21K9000CGE | |
| Average AMD Ryzen 9 PRO 7940HS (76133 - 88705, n=3) | |
| HP EliteBook 865 G10 | |
| Acer Swift Edge SFE16 Ryzen 7 7840U | |
| Average of class Office (4854 - 155900, n=82, last 2 years) | |
| HP EliteBook 865 G9 | |
| Lenovo ThinkPad T16 G2 21HH003AGE | |
| AIDA64 / CPU ZLib | |
| Average AMD Ryzen 9 PRO 7940HS (976 - 1079, n=3) | |
| Lenovo ThinkPad P16s G2 21K9000CGE | |
| HP EliteBook 865 G10 | |
| Acer Swift Edge SFE16 Ryzen 7 7840U | |
| Samsung Galaxy Book3 Pro 16 | |
| Average of class Office (114.6 - 1366, n=82, last 2 years) | |
| HP EliteBook 865 G9 | |
| Lenovo ThinkPad T16 G2 21HH003AGE | |
| AIDA64 / FP64 Ray-Trace | |
| Average AMD Ryzen 9 PRO 7940HS (12715 - 14590, n=3) | |
| HP EliteBook 865 G10 | |
| Lenovo ThinkPad P16s G2 21K9000CGE | |
| Acer Swift Edge SFE16 Ryzen 7 7840U | |
| Average of class Office (1109 - 17834, n=82, last 2 years) | |
| HP EliteBook 865 G9 | |
| Samsung Galaxy Book3 Pro 16 | |
| Lenovo ThinkPad T16 G2 21HH003AGE | |
| AIDA64 / CPU PhotoWorxx | |
| Samsung Galaxy Book3 Pro 16 | |
| Lenovo ThinkPad P16s G2 21K9000CGE | |
| Average of class Office (11090 - 65229, n=82, last 2 years) | |
| Acer Swift Edge SFE16 Ryzen 7 7840U | |
| Average AMD Ryzen 9 PRO 7940HS (24030 - 37800, n=3) | |
| HP EliteBook 865 G10 | |
| Lenovo ThinkPad T16 G2 21HH003AGE | |
| HP EliteBook 865 G9 | |
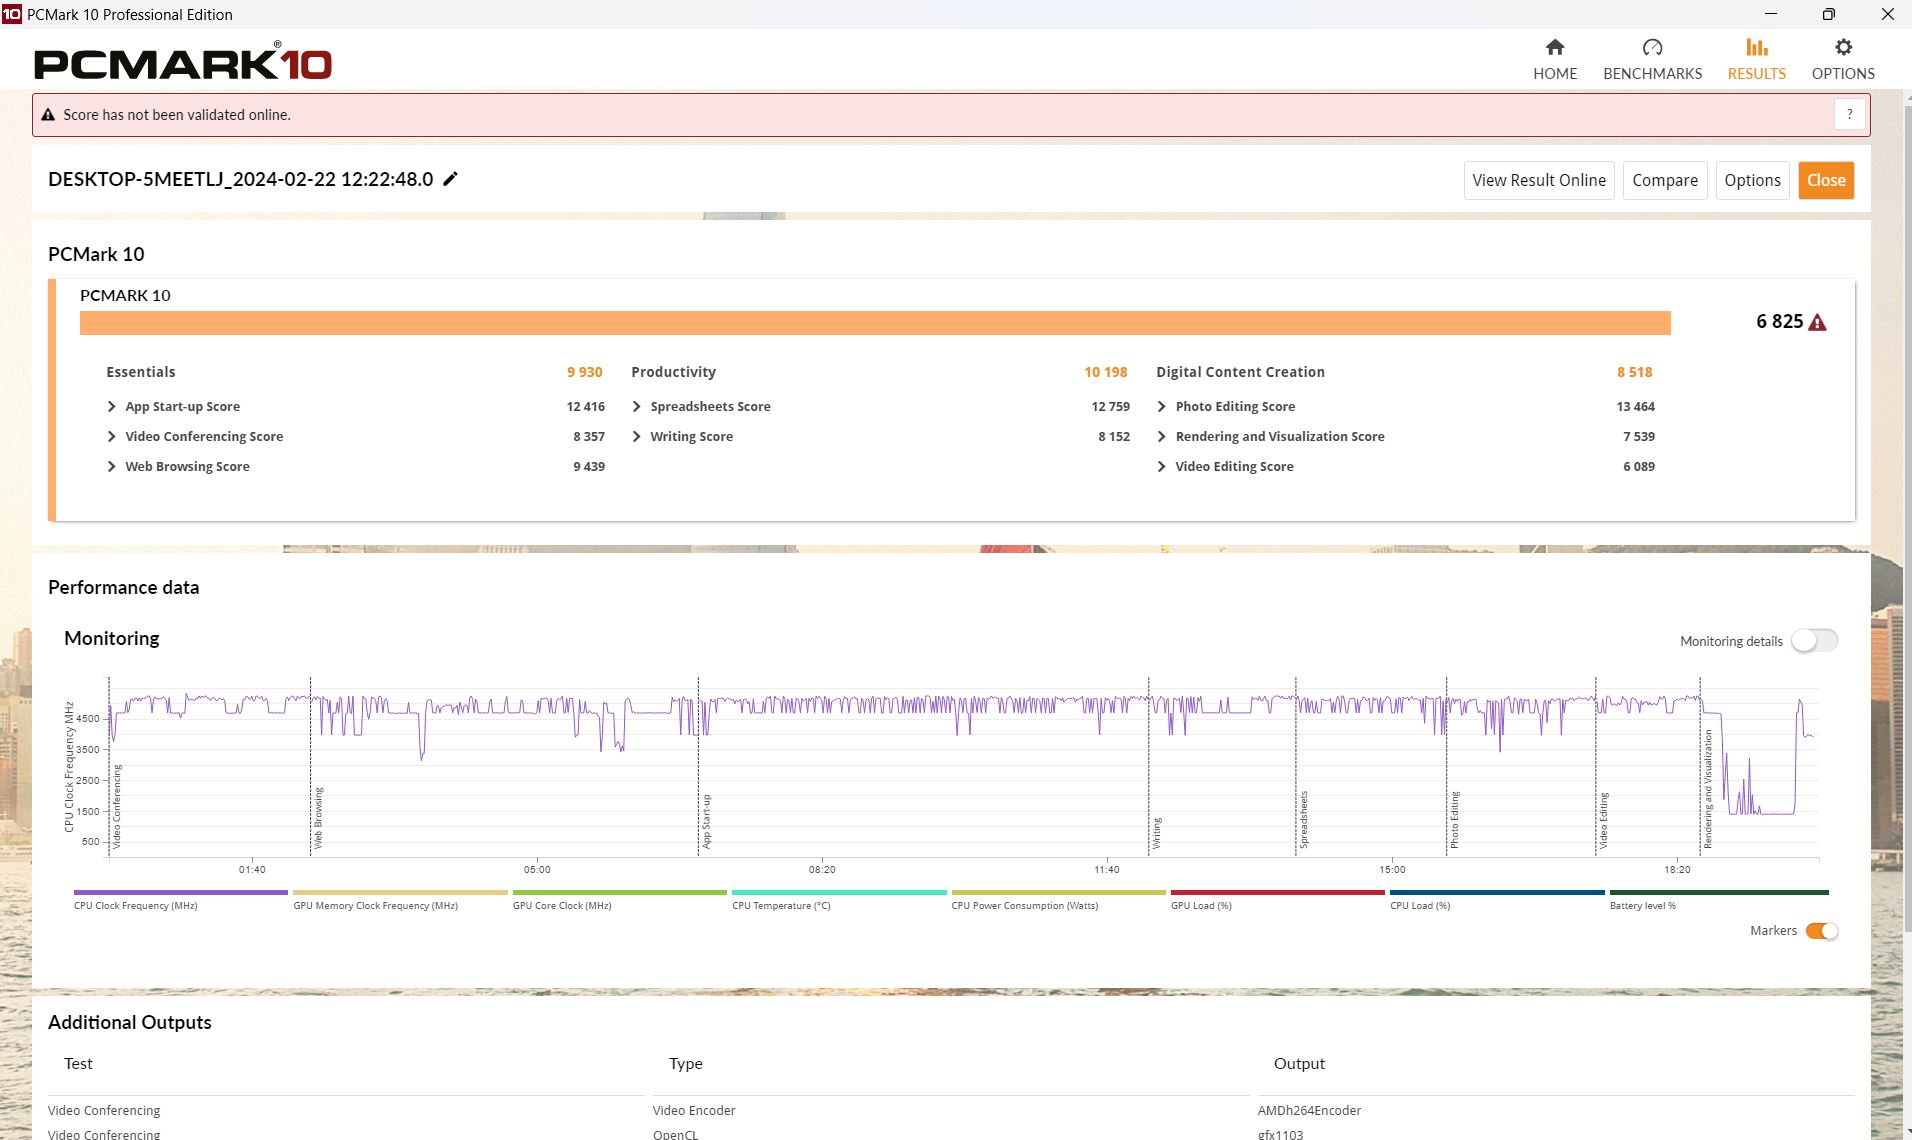
System performance
Our review model only took second place in PCMark 10. This is because the Acer Swift Edge suddenly became 2% faster after trailing the EliteBook by 6% in CPU score. Nevertheless, our system delivered performance above the average of what we’ve seen from all laptops with the same CPU in our database. Most devices with a Ryzen 9 CPU seem to have minor trouble with the Essentials group in PCMark. In CrossMark, the Swift was even able to gain a 10% lead over the EliteBook despite having a nominally weaker Ryzen 7 processor instead of a Ryzen 9.
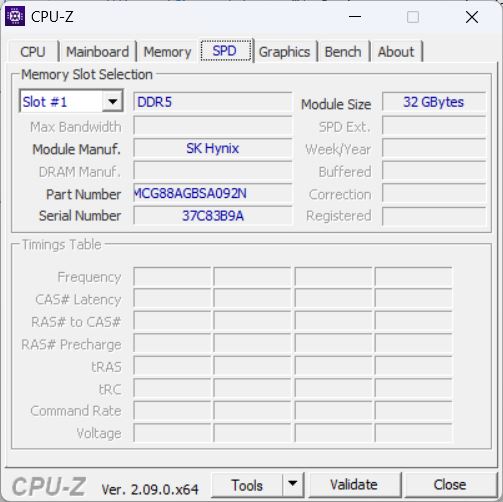
The rather sluggish RAM seems to be the reason why the HP EliteBook failed to secure the top spot. HP has installed only one stick of memory, leaving the other RAM slot free. As a result, the memory runs in the slow single-channel mode, which also made itself felt in the AIDA64 memory test and PCMark.
CrossMark: Overall | Productivity | Creativity | Responsiveness
WebXPRT 3: Overall
WebXPRT 4: Overall
Mozilla Kraken 1.1: Total
| PCMark 10 / Score | |
| Acer Swift Edge SFE16 Ryzen 7 7840U | |
| HP EliteBook 865 G10 | |
| Average AMD Ryzen 9 PRO 7940HS, AMD Radeon 780M (6523 - 6825, n=2) | |
| Lenovo ThinkPad P16s G2 21K9000CGE | |
| Average of class Office (2601 - 9298, n=67, last 2 years) | |
| HP EliteBook 865 G9 | |
| Lenovo ThinkPad T16 G2 21HH003AGE | |
| Samsung Galaxy Book3 Pro 16 | |
| PCMark 10 / Essentials | |
| Lenovo ThinkPad T16 G2 21HH003AGE | |
| Acer Swift Edge SFE16 Ryzen 7 7840U | |
| Samsung Galaxy Book3 Pro 16 | |
| Lenovo ThinkPad P16s G2 21K9000CGE | |
| Average of class Office (3245 - 11594, n=67, last 2 years) | |
| HP EliteBook 865 G10 | |
| Average AMD Ryzen 9 PRO 7940HS, AMD Radeon 780M (9873 - 9930, n=2) | |
| HP EliteBook 865 G9 | |
| PCMark 10 / Productivity | |
| HP EliteBook 865 G10 | |
| Acer Swift Edge SFE16 Ryzen 7 7840U | |
| Average of class Office (5336 - 17243, n=67, last 2 years) | |
| Average AMD Ryzen 9 PRO 7940HS, AMD Radeon 780M (9192 - 10198, n=2) | |
| Lenovo ThinkPad P16s G2 21K9000CGE | |
| HP EliteBook 865 G9 | |
| Lenovo ThinkPad T16 G2 21HH003AGE | |
| Samsung Galaxy Book3 Pro 16 | |
| PCMark 10 / Digital Content Creation | |
| Lenovo ThinkPad P16s G2 21K9000CGE | |
| HP EliteBook 865 G10 | |
| Average AMD Ryzen 9 PRO 7940HS, AMD Radeon 780M (8299 - 8518, n=2) | |
| Acer Swift Edge SFE16 Ryzen 7 7840U | |
| Average of class Office (2049 - 13541, n=67, last 2 years) | |
| HP EliteBook 865 G9 | |
| Samsung Galaxy Book3 Pro 16 | |
| Lenovo ThinkPad T16 G2 21HH003AGE | |
| CrossMark / Overall | |
| Acer Swift Edge SFE16 Ryzen 7 7840U | |
| HP EliteBook 865 G10 | |
| Lenovo ThinkPad P16s G2 21K9000CGE | |
| Lenovo ThinkPad T16 G2 21HH003AGE | |
| Samsung Galaxy Book3 Pro 16 | |
| Average AMD Ryzen 9 PRO 7940HS, AMD Radeon 780M (1423 - 1635, n=2) | |
| Average of class Office (381 - 2010, n=74, last 2 years) | |
| HP EliteBook 865 G9 | |
| CrossMark / Productivity | |
| Acer Swift Edge SFE16 Ryzen 7 7840U | |
| Lenovo ThinkPad T16 G2 21HH003AGE | |
| HP EliteBook 865 G10 | |
| Lenovo ThinkPad P16s G2 21K9000CGE | |
| Samsung Galaxy Book3 Pro 16 | |
| Average AMD Ryzen 9 PRO 7940HS, AMD Radeon 780M (1400 - 1620, n=2) | |
| Average of class Office (464 - 1880, n=74, last 2 years) | |
| HP EliteBook 865 G9 | |
| CrossMark / Creativity | |
| Acer Swift Edge SFE16 Ryzen 7 7840U | |
| HP EliteBook 865 G10 | |
| Lenovo ThinkPad P16s G2 21K9000CGE | |
| Average of class Office (319 - 2361, n=74, last 2 years) | |
| Samsung Galaxy Book3 Pro 16 | |
| Average AMD Ryzen 9 PRO 7940HS, AMD Radeon 780M (1549 - 1754, n=2) | |
| Lenovo ThinkPad T16 G2 21HH003AGE | |
| HP EliteBook 865 G9 | |
| CrossMark / Responsiveness | |
| Acer Swift Edge SFE16 Ryzen 7 7840U | |
| Lenovo ThinkPad T16 G2 21HH003AGE | |
| Samsung Galaxy Book3 Pro 16 | |
| HP EliteBook 865 G10 | |
| Lenovo ThinkPad P16s G2 21K9000CGE | |
| Average AMD Ryzen 9 PRO 7940HS, AMD Radeon 780M (1161 - 1362, n=2) | |
| Average of class Office (360 - 1820, n=74, last 2 years) | |
| HP EliteBook 865 G9 | |
| WebXPRT 3 / Overall | |
| Acer Swift Edge SFE16 Ryzen 7 7840U | |
| HP EliteBook 865 G10 | |
| Average AMD Ryzen 9 PRO 7940HS, AMD Radeon 780M (279 - 296, n=2) | |
| Average of class Office (129.9 - 444, n=76, last 2 years) | |
| Lenovo ThinkPad T16 G2 21HH003AGE | |
| HP EliteBook 865 G9 | |
| Lenovo ThinkPad P16s G2 21K9000CGE | |
| Samsung Galaxy Book3 Pro 16 | |
| WebXPRT 4 / Overall | |
| HP EliteBook 865 G10 | |
| HP EliteBook 865 G10 | |
| Acer Swift Edge SFE16 Ryzen 7 7840U | |
| Average AMD Ryzen 9 PRO 7940HS, AMD Radeon 780M (229 - 252, n=3) | |
| Lenovo ThinkPad T16 G2 21HH003AGE | |
| Average of class Office (104.2 - 313, n=76, last 2 years) | |
| HP EliteBook 865 G9 | |
| Samsung Galaxy Book3 Pro 16 | |
| Mozilla Kraken 1.1 / Total | |
| HP EliteBook 865 G9 | |
| Average of class Office (391 - 1297, n=77, last 2 years) | |
| Lenovo ThinkPad P16s G2 21K9000CGE | |
| Samsung Galaxy Book3 Pro 16 | |
| Average AMD Ryzen 9 PRO 7940HS, AMD Radeon 780M (532 - 564, n=2) | |
| HP EliteBook 865 G10 | |
| Acer Swift Edge SFE16 Ryzen 7 7840U | |
| Lenovo ThinkPad T16 G2 21HH003AGE | |
* ... smaller is better
| PCMark 10 Score | 6825 points | |
Help | ||
| AIDA64 / Memory Copy | |
| Samsung Galaxy Book3 Pro 16 | |
| Acer Swift Edge SFE16 Ryzen 7 7840U | |
| Lenovo ThinkPad P16s G2 21K9000CGE | |
| Average of class Office (20075 - 110930, n=79, last 2 years) | |
| Average AMD Ryzen 9 PRO 7940HS (34339 - 66740, n=3) | |
| Lenovo ThinkPad T16 G2 21HH003AGE | |
| HP EliteBook 865 G10 | |
| HP EliteBook 865 G9 | |
| AIDA64 / Memory Read | |
| Average of class Office (10084 - 128030, n=80, last 2 years) | |
| Samsung Galaxy Book3 Pro 16 | |
| Lenovo ThinkPad P16s G2 21K9000CGE | |
| Acer Swift Edge SFE16 Ryzen 7 7840U | |
| Lenovo ThinkPad T16 G2 21HH003AGE | |
| Average AMD Ryzen 9 PRO 7940HS (30289 - 50398, n=3) | |
| HP EliteBook 865 G9 | |
| HP EliteBook 865 G10 | |
| AIDA64 / Memory Write | |
| Acer Swift Edge SFE16 Ryzen 7 7840U | |
| Lenovo ThinkPad P16s G2 21K9000CGE | |
| Samsung Galaxy Book3 Pro 16 | |
| Average of class Office (20073 - 119858, n=80, last 2 years) | |
| Average AMD Ryzen 9 PRO 7940HS (39877 - 91516, n=3) | |
| HP EliteBook 865 G10 | |
| Lenovo ThinkPad T16 G2 21HH003AGE | |
| HP EliteBook 865 G9 | |
| AIDA64 / Memory Latency | |
| Lenovo ThinkPad P16s G2 21K9000CGE | |
| Acer Swift Edge SFE16 Ryzen 7 7840U | |
| Average AMD Ryzen 9 PRO 7940HS (102.2 - 121.3, n=3) | |
| Average of class Office (7.6 - 162.9, n=75, last 2 years) | |
| HP EliteBook 865 G10 | |
| Samsung Galaxy Book3 Pro 16 | |
| HP EliteBook 865 G9 | |
| Lenovo ThinkPad T16 G2 21HH003AGE | |
* ... smaller is better
DPC latency
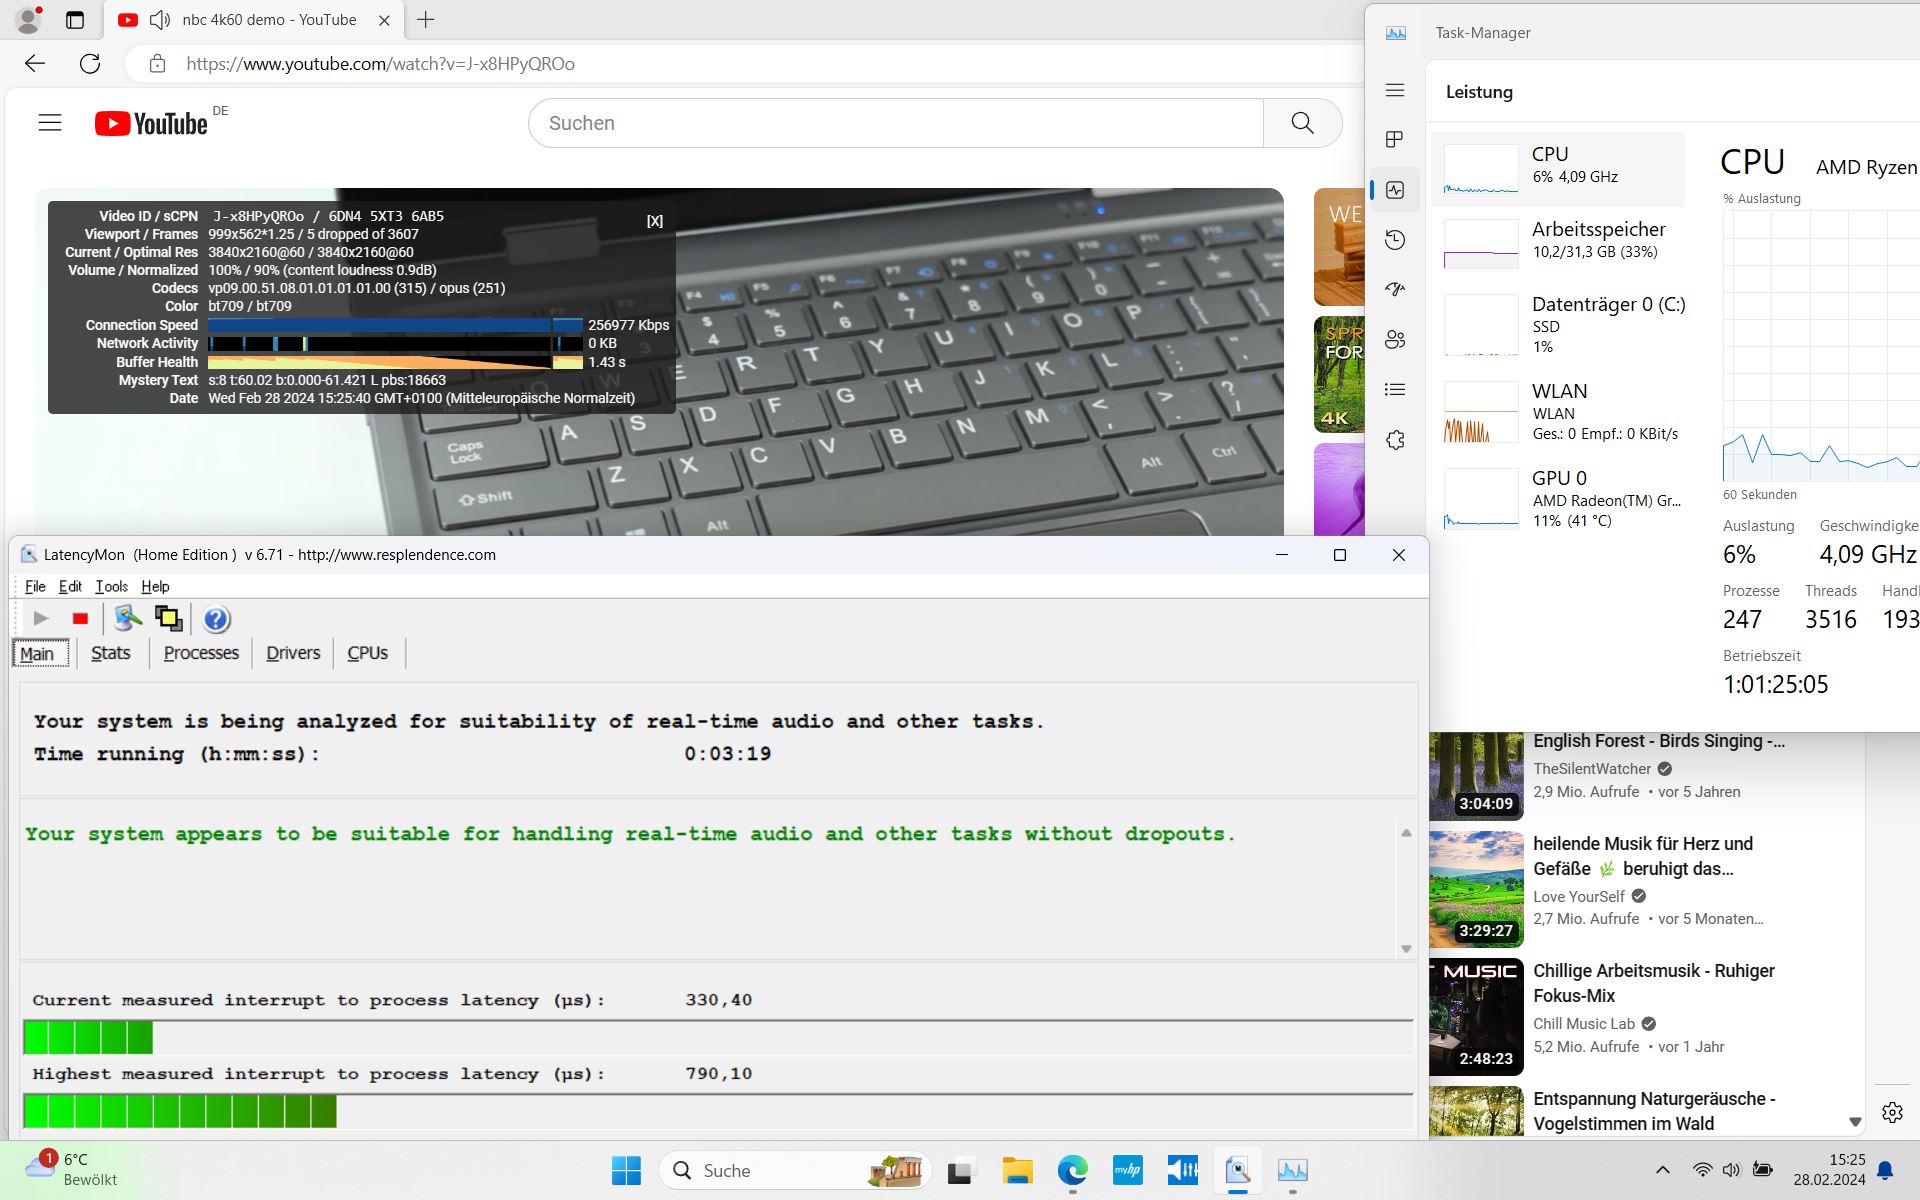
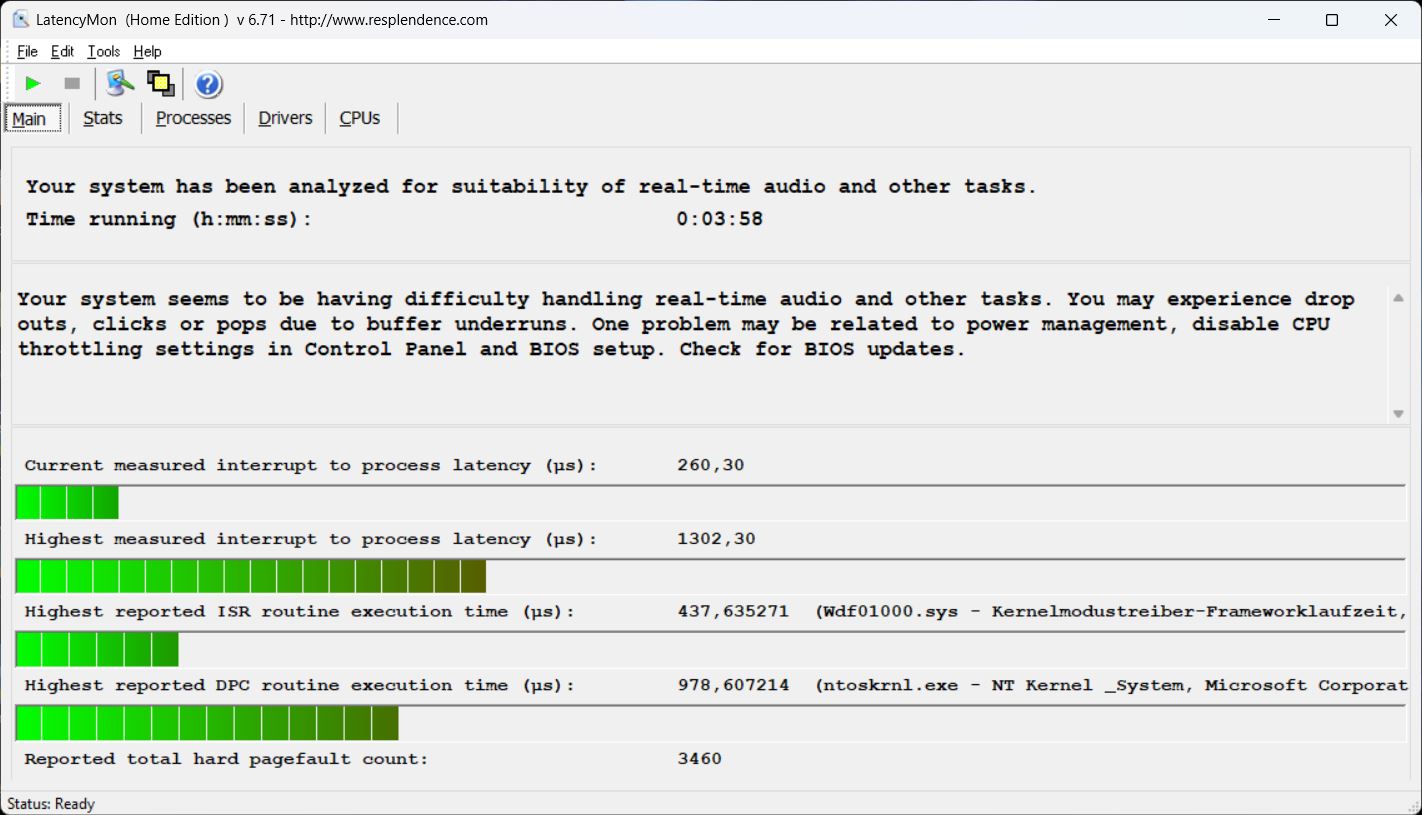
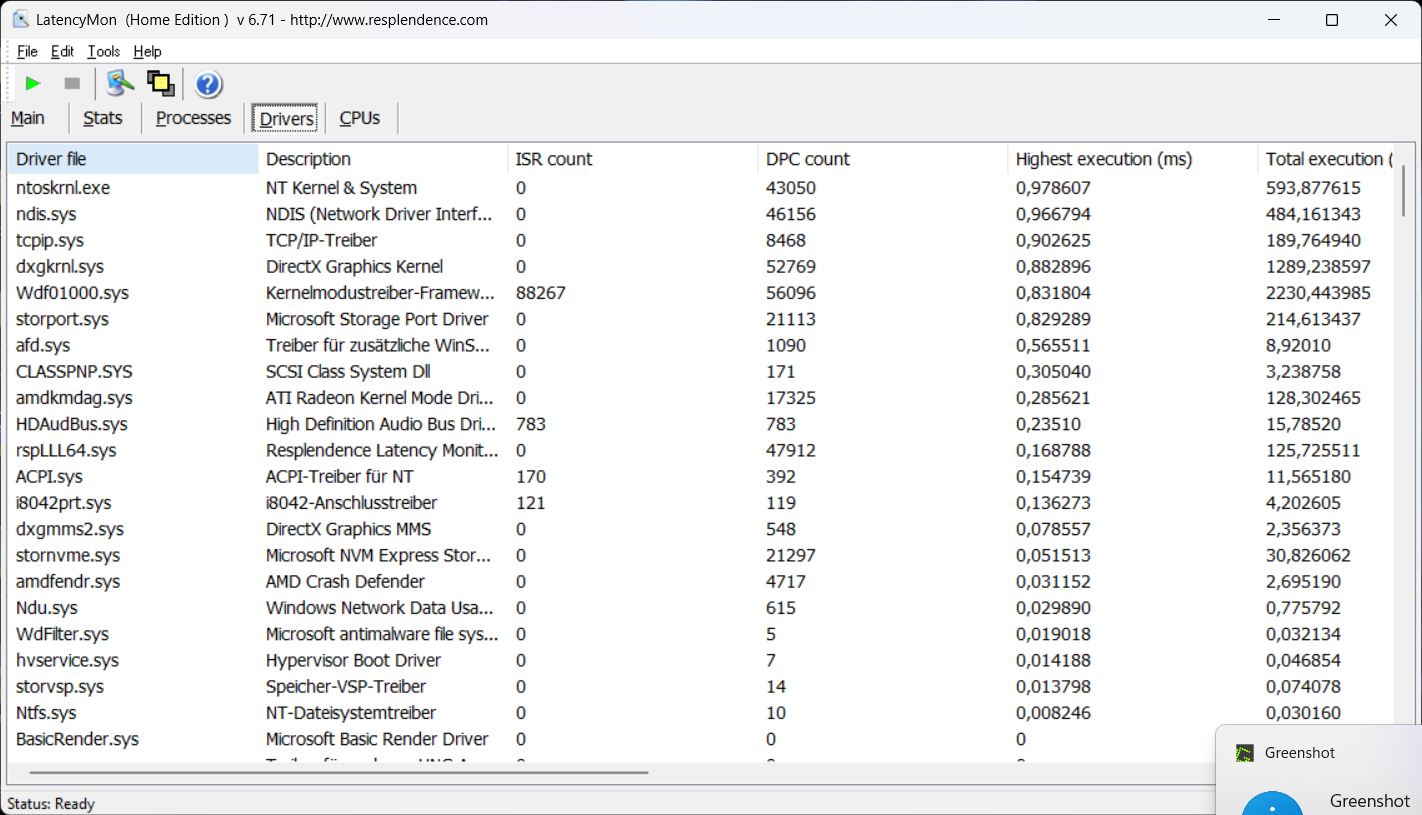
LatencyMon didn’t find any major latency issues when opening either a browser or several tabs on our homepage. However, playing back YouTube videos at 4K/60fps led to five dropped frames, and the latency unfortunately increased to a level considered potentially problematic by LatencyMon during a subsequent 10-second run of Prime95.
The HP laptop is thus ranked in the middle of our comparison group, better than the ThinkPads (with their very high latency values) but worse than the Swift and especially the Galaxy Book (which has barely any issues).
| DPC Latencies / LatencyMon - interrupt to process latency (max), Web, Youtube, Prime95 | |
| Lenovo ThinkPad T16 G2 21HH003AGE | |
| Lenovo ThinkPad P16s G2 21K9000CGE | |
| HP EliteBook 865 G10 | |
| Acer Swift Edge SFE16 Ryzen 7 7840U | |
| HP EliteBook 865 G9 | |
| Samsung Galaxy Book3 Pro 16 | |
* ... smaller is better
Mass storage
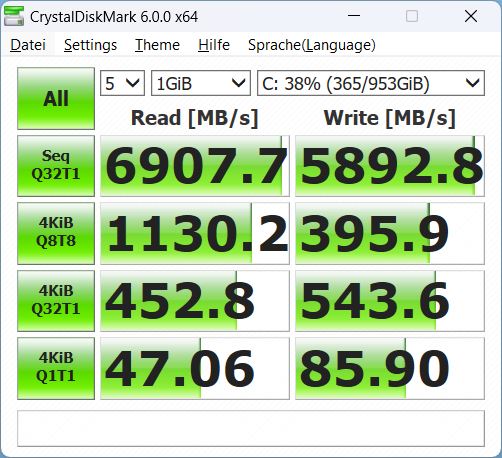
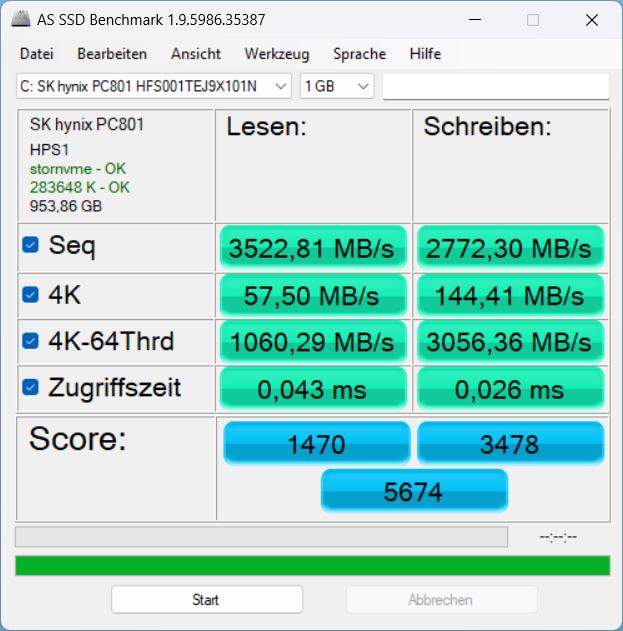
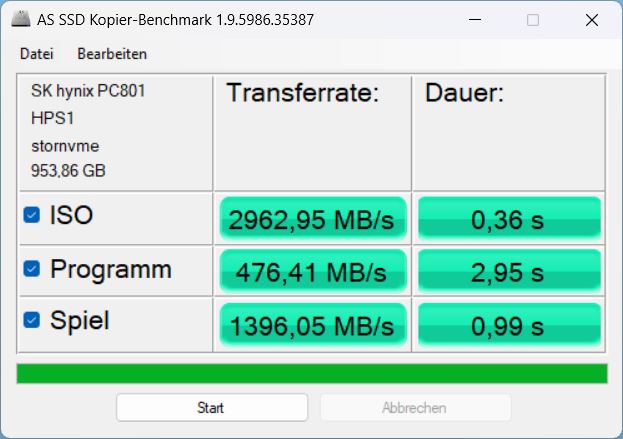
The manufacturer has once again installed a 1TB PCIe 4.0 NVMe SSD made by SK Hynix. The storage drive currently occupies third place in our SSD ranking, meaning it is possibly one of the fastest models on the market.
That said, the SSD isn’t able to bring out elite performance in the EliteBook, but rather operates about 25% below its potential. The overall rating is marred by the comparatively lacklustre 4K transfer speeds.
In contrast, sustained sequential read and write speeds are excellent and stable – we didn’t encounter any throttling. The SK Hynix drive surpassed the competitors in this regard.

* ... smaller is better
Sustained load Read: DiskSpd Read Loop, Queue Depth 8
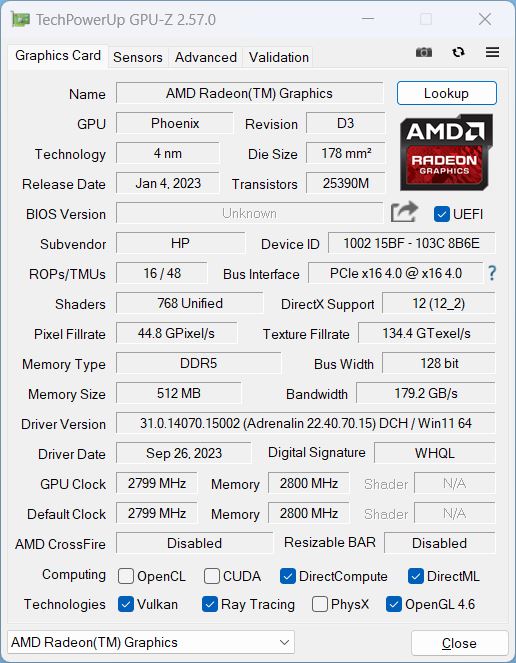
Graphics card
Graphics processing is handled by the integrated AMD Radeon 780M, currently one of the most powerful iGPUs around. Needless to say, its performance is very much dependent on the CPU’s clock speeds.
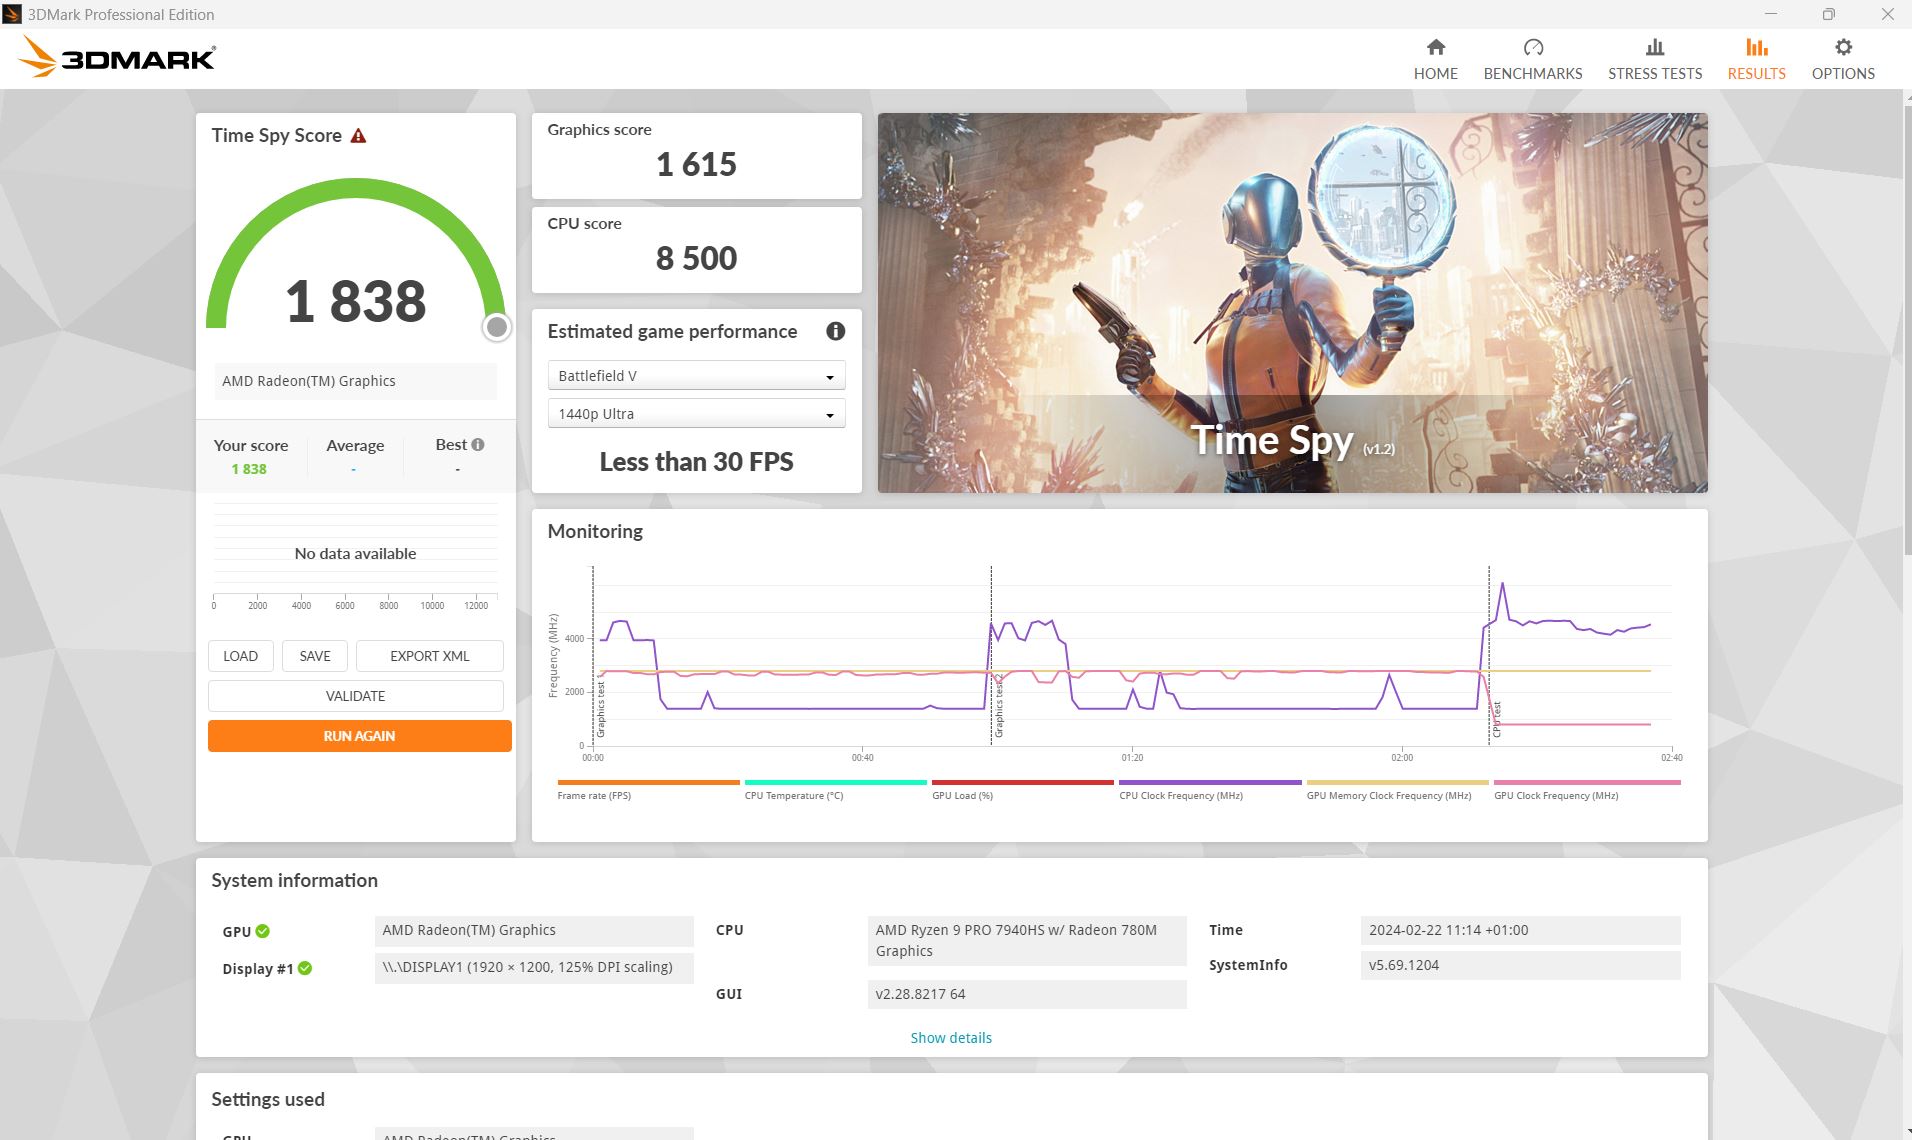
Sadly, the 3D accelerator in the EliteBook performed more than 50% worse than what the same GPU can deliver in other laptops on average, at least in 3DMark tests. The single-channel RAM is likely part of the problem here as well.
The G10 is only 15% better its predecessor, whereas the Swift and ThinkPad P16s are 46% and 67% faster than the G10 respectively! These results are highly disappointing even though the EliteBook probably won’t have to handle 3D tasks very often in a business setting. The Blender Classroom HIP/AMD test constantly refused to run despite the HIP SDK installation.
At any rate, graphics performance doesn’t drop much further when the laptop is on battery power. We measured an approximately 15% decrease in a new Fire Strike run.
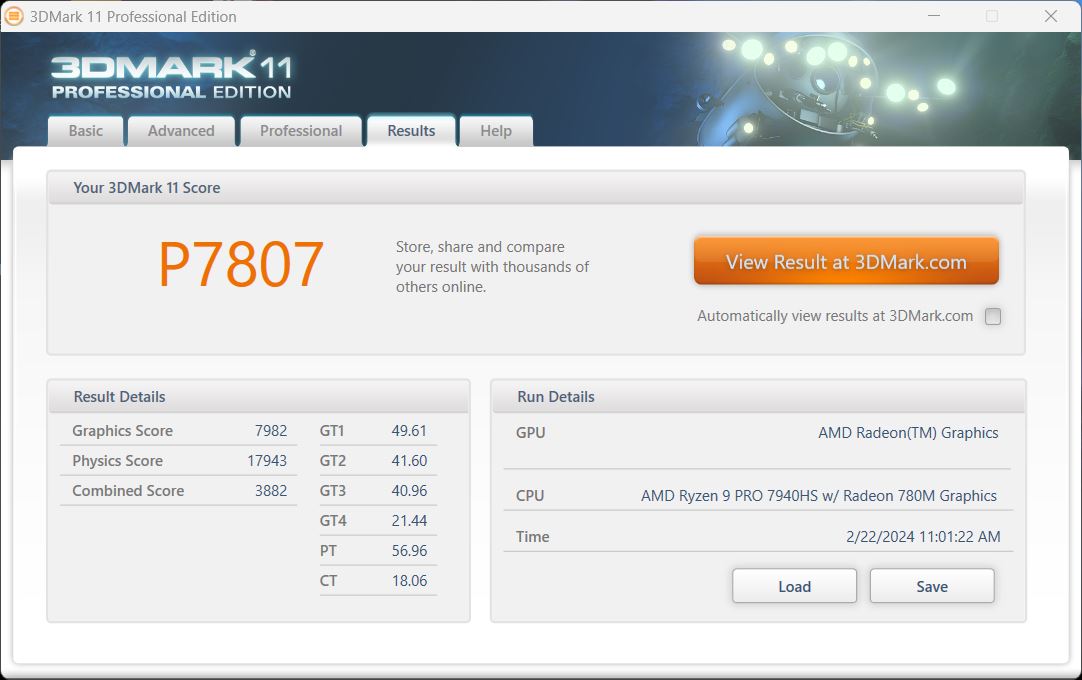
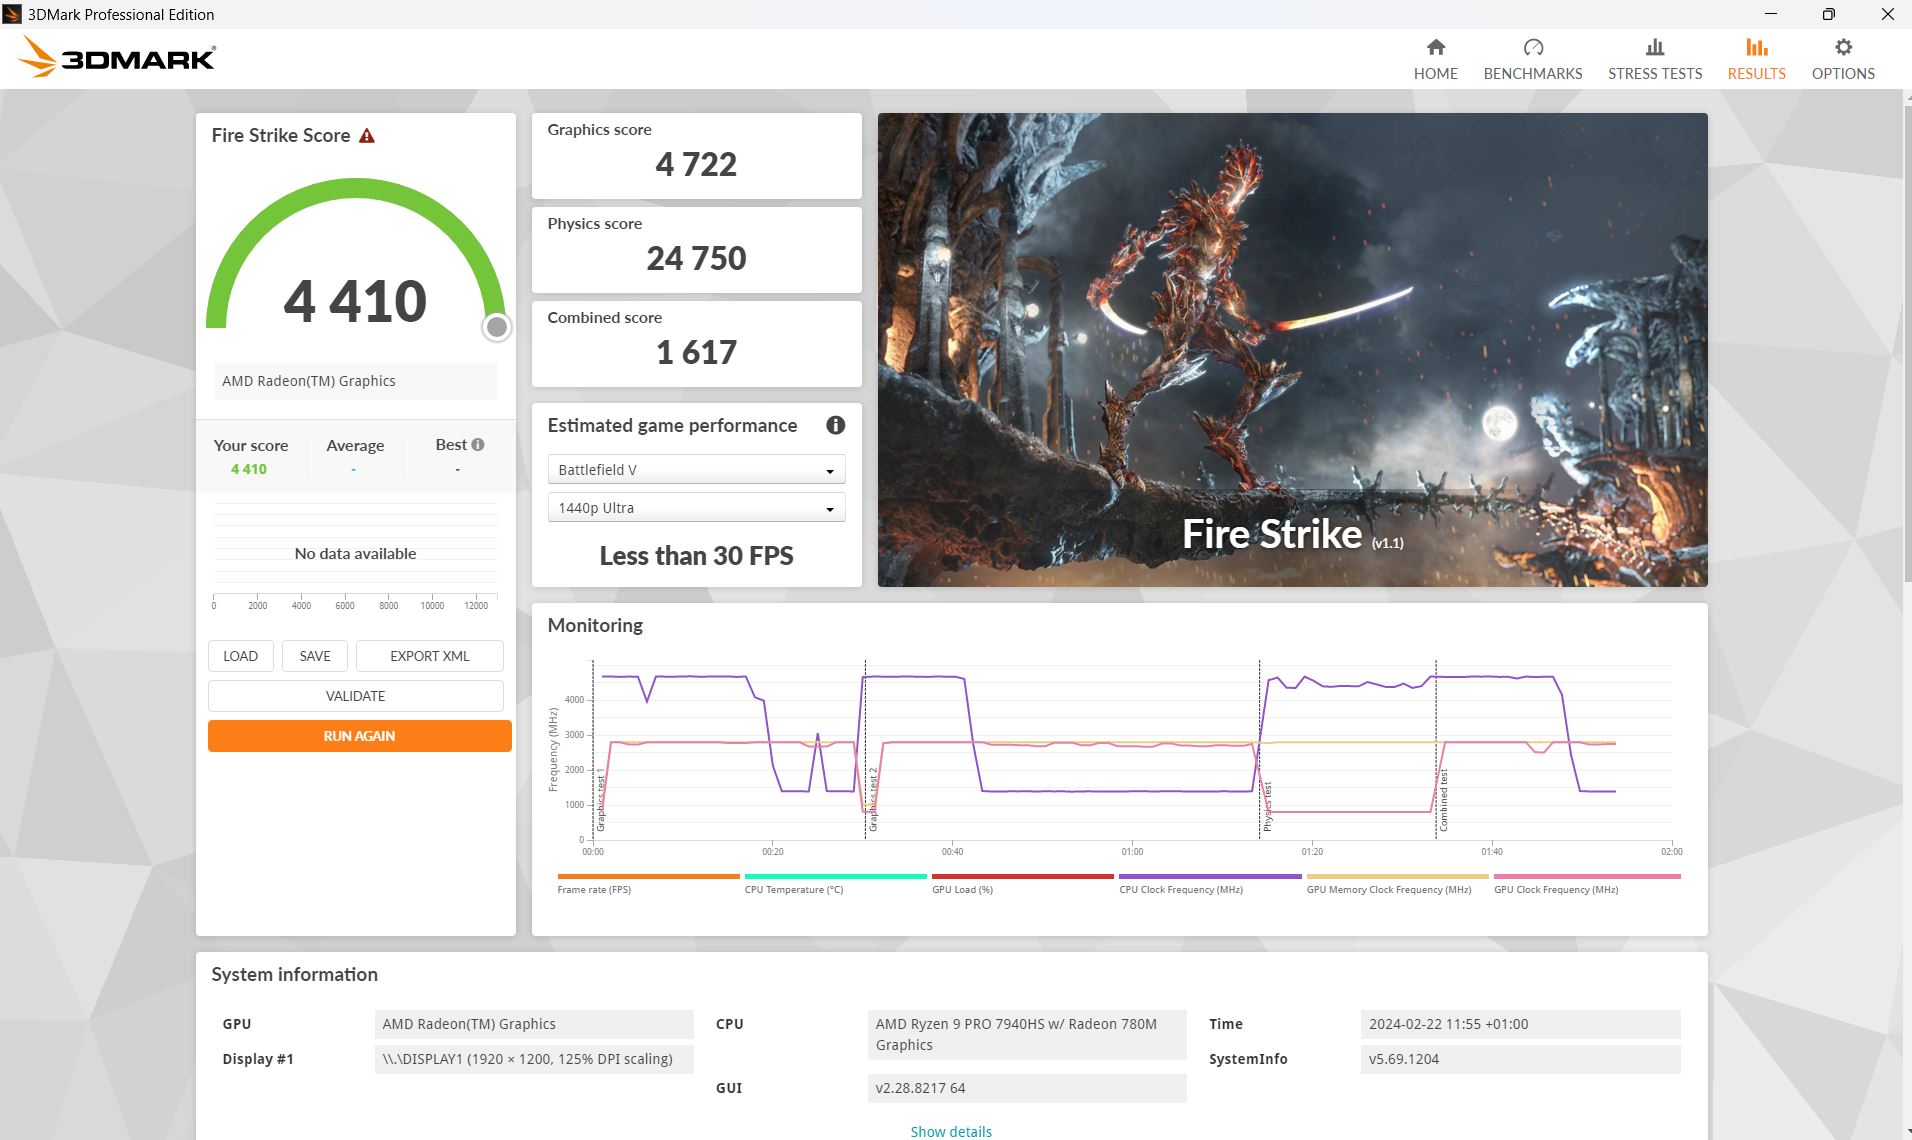
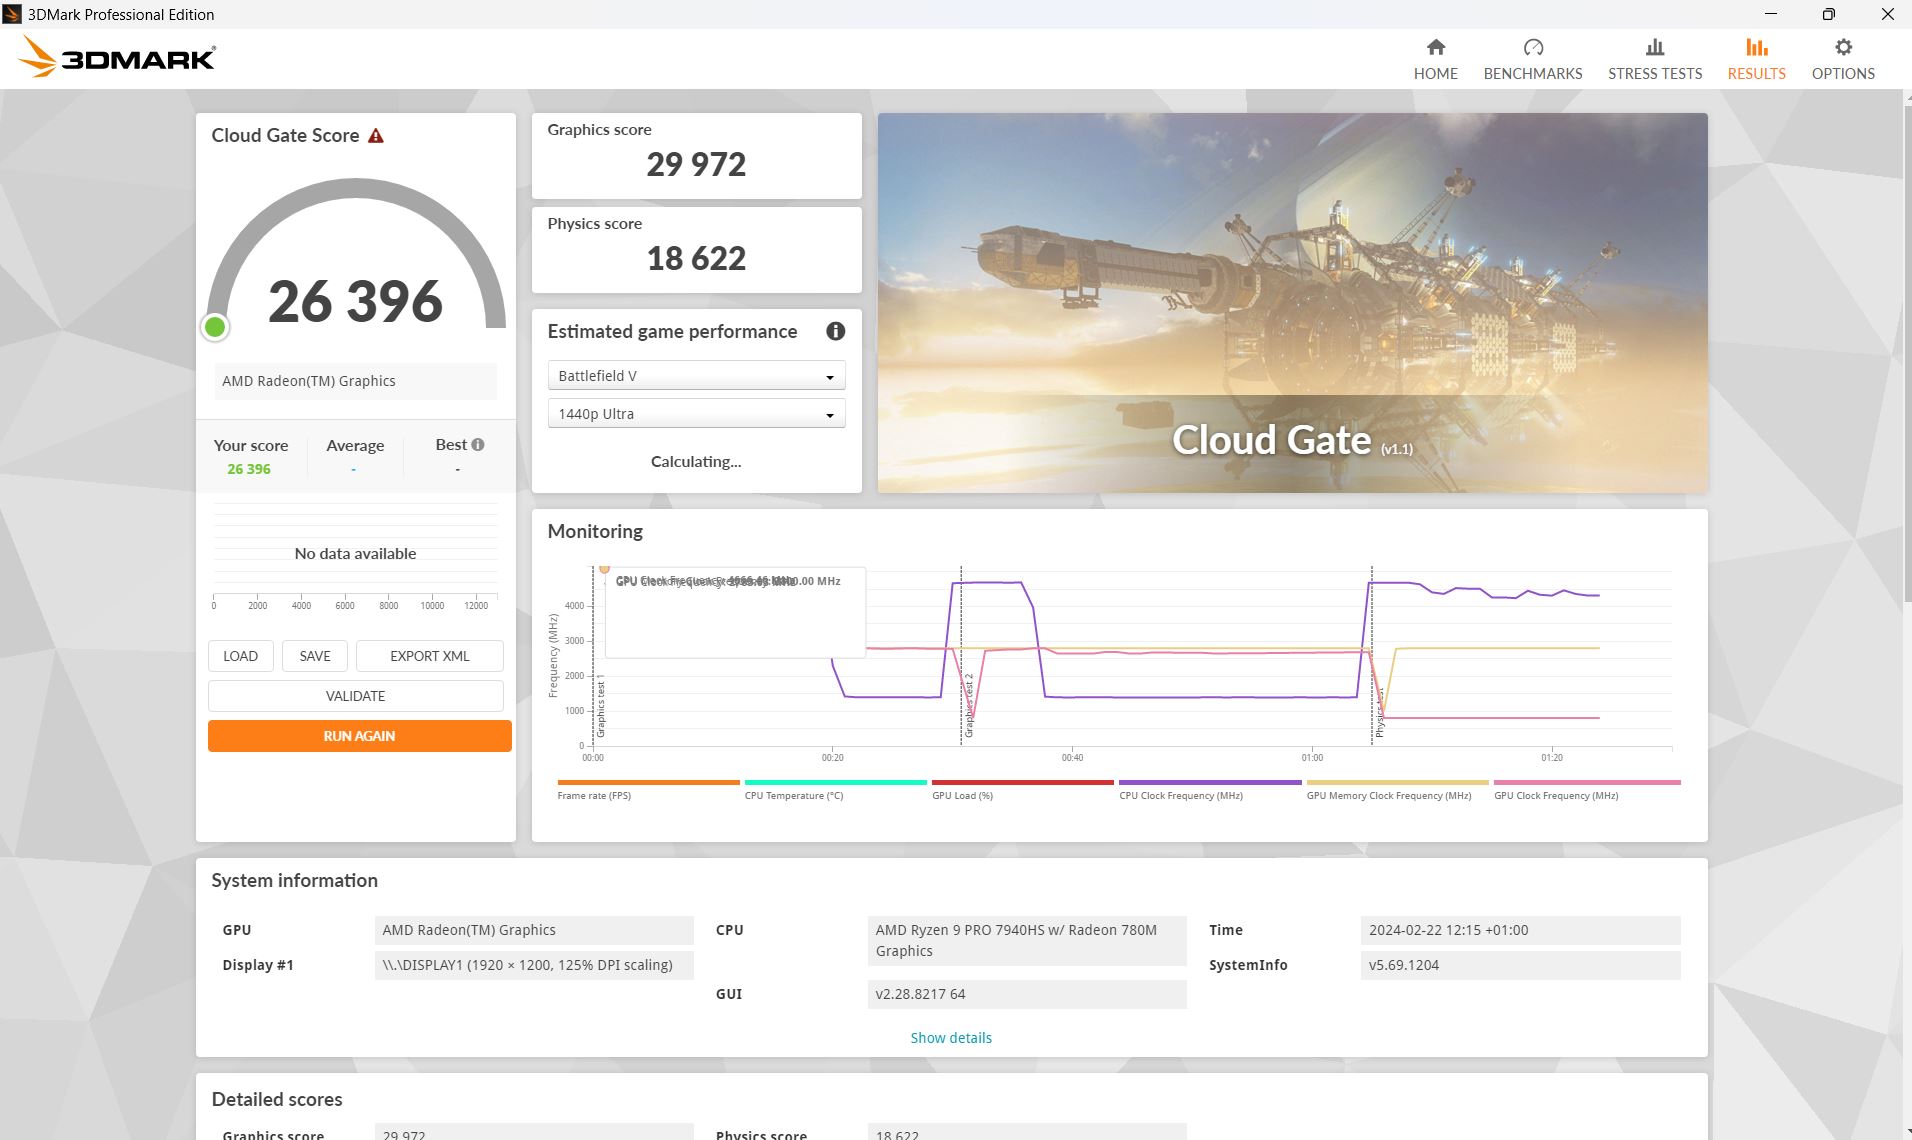
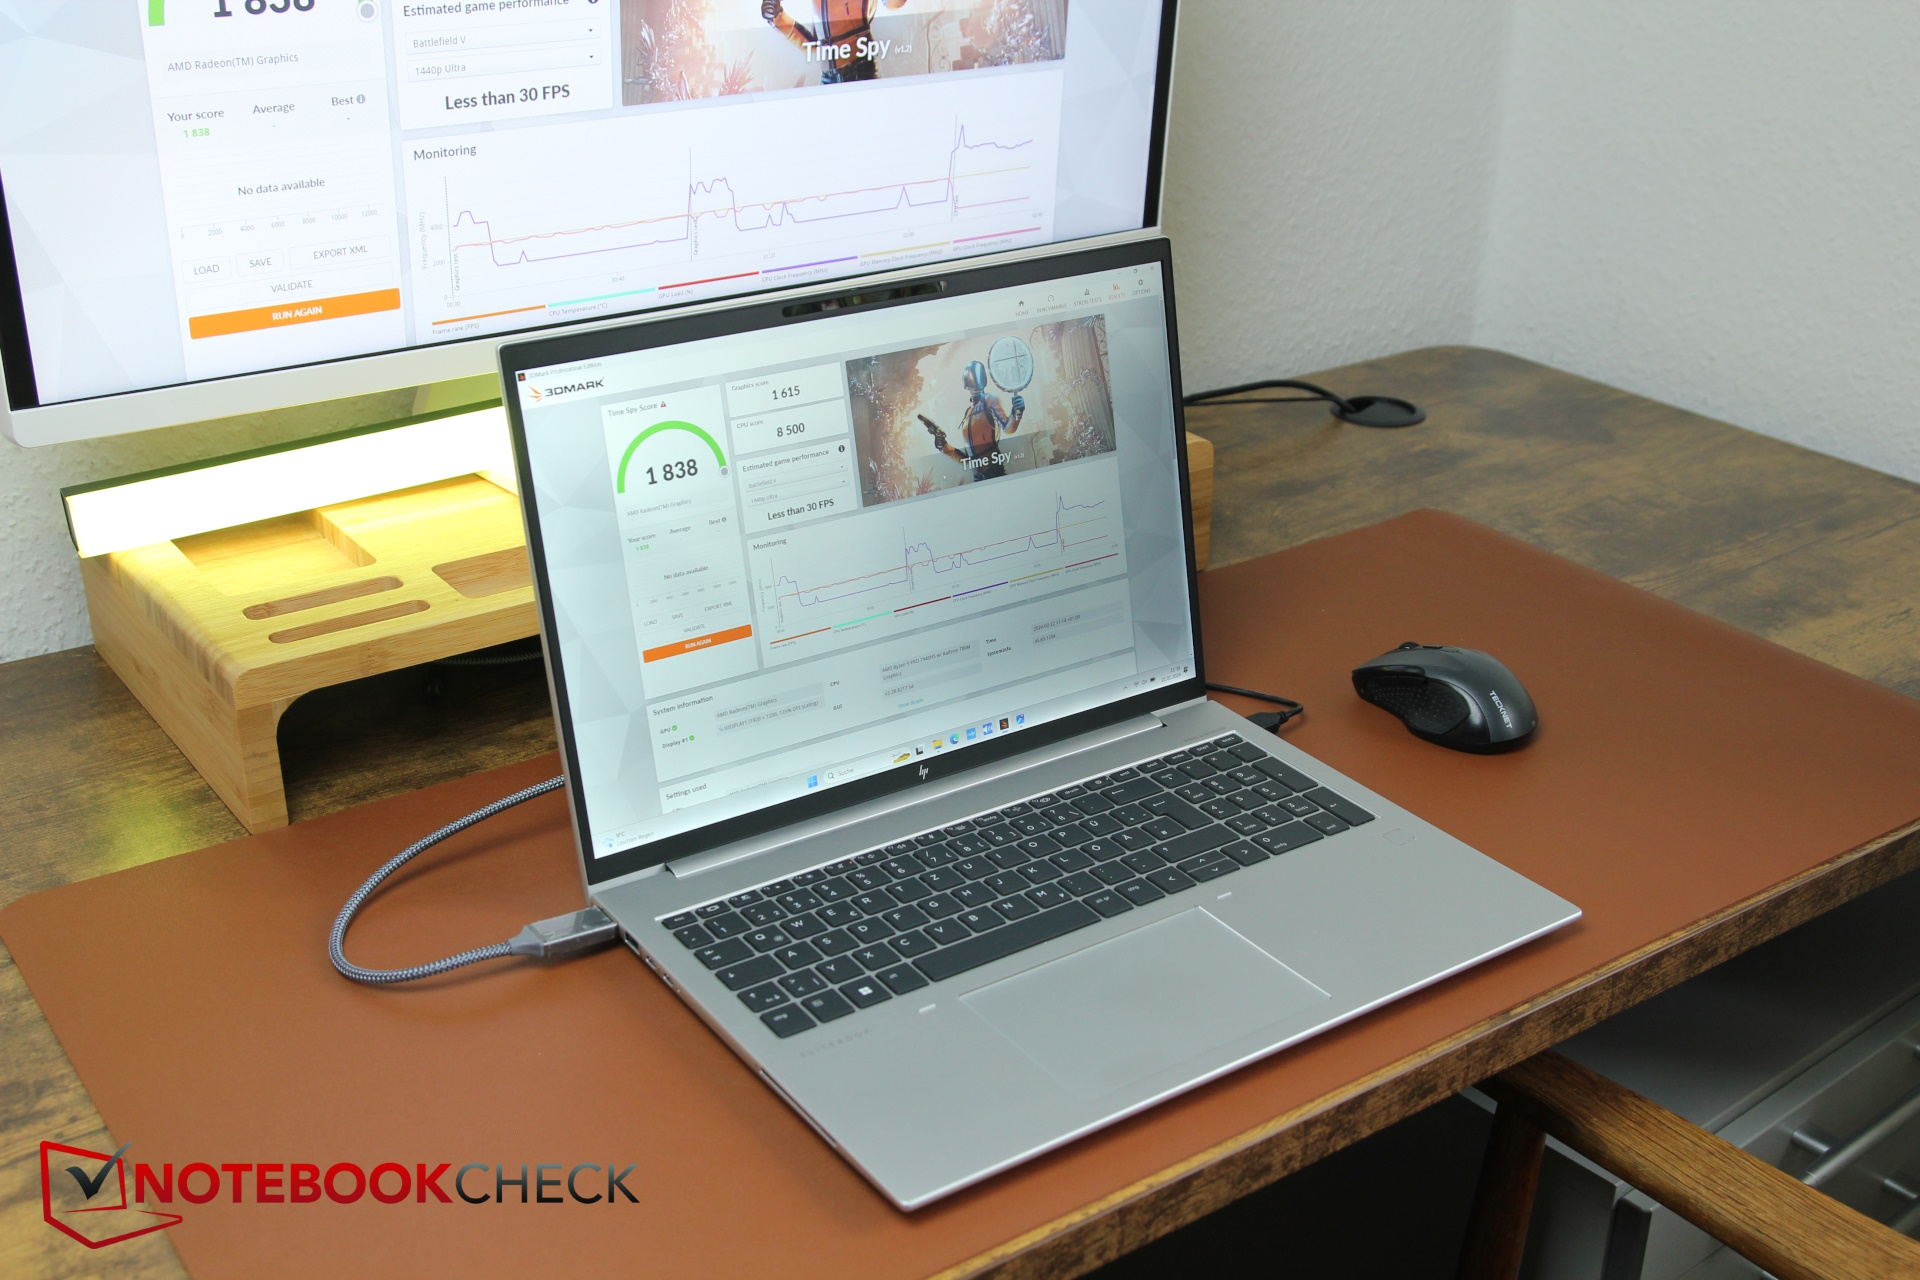
| 3DMark 11 Performance | 7807 points | |
| 3DMark Cloud Gate Standard Score | 26396 points | |
| 3DMark Fire Strike Score | 4410 points | |
| 3DMark Time Spy Score | 1838 points | |
Help | ||
* ... smaller is better
Gaming performance
The trend observed in 3DMark continues into our gaming tests. The powerful and thicker ThinkPad P16s featuring a Ryzen 7 and the same 780M iGPU outperformed the EliteBook by a whopping 60%; the Acer Swift Edge has a lead of 36%. There is only a meagre 9% gain separating the old and the current EliteBook
In practice, the HP EliteBook 865 G10 is at most capable of running older or less demanding games, and even then probably at reduced quality settings. Games that are more CPU-dependent (e.g. DOTA 2 Reborn) play better, whereas all GPU-intensive titles will only run smoothly below FHD and at low to medium settings.
| The Witcher 3 - 1920x1080 Ultra Graphics & Postprocessing (HBAO+) | |
| Lenovo ThinkPad P16s G2 21K9000CGE | |
| Acer Swift Edge SFE16 Ryzen 7 7840U | |
| Average of class Office (14.8 - 28.1, n=3, last 2 years) | |
| HP EliteBook 865 G10 | |
| Samsung Galaxy Book3 Pro 16 | |
| HP EliteBook 865 G9 | |
| Lenovo ThinkPad T16 G2 21HH003AGE | |
| GTA V - 1920x1080 Highest AA:4xMSAA + FX AF:16x | |
| Lenovo ThinkPad P16s G2 21K9000CGE | |
| Acer Swift Edge SFE16 Ryzen 7 7840U | |
| Average of class Office (5.77 - 45.3, n=68, last 2 years) | |
| HP EliteBook 865 G10 | |
| HP EliteBook 865 G9 | |
| Samsung Galaxy Book3 Pro 16 | |
| Strange Brigade - 1920x1080 ultra AA:ultra AF:16 | |
| Lenovo ThinkPad P16s G2 21K9000CGE | |
| Acer Swift Edge SFE16 Ryzen 7 7840U | |
| Average of class Office (12.9 - 142.1, n=52, last 2 years) | |
| HP EliteBook 865 G10 | |
| HP EliteBook 865 G9 | |
| Lenovo ThinkPad T16 G2 21HH003AGE | |
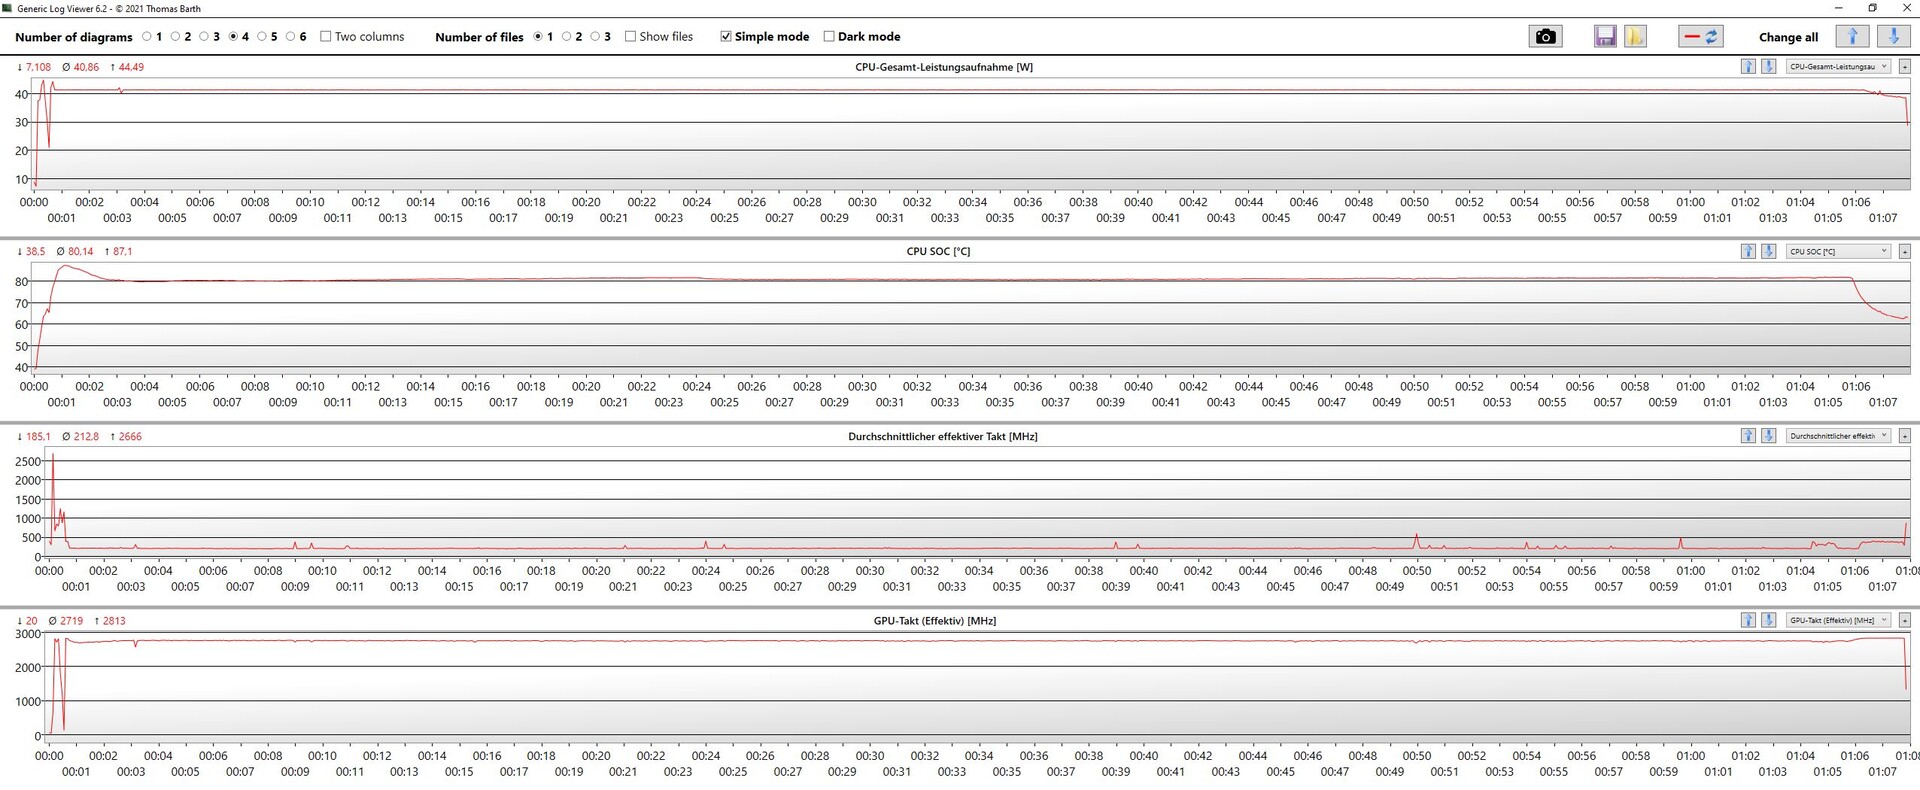
In the one-hour Witcher 3 test at Ultra settings, the frame rate varied according to the usual in-game day/night cycle. Otherwise, it largely remained constant with occasional, very brief dips.
The SoC warmed up to between 80 and 87°C (176 and 188.6°F) during the test, and average power consumption was roughly 41 watts, a large part of which was allocated to the iGPU. The GPU ran at around 2.7 GHz, whilst the CPU cores had significantly lower clock speeds.
Witcher 3 FPS chart
| low | med. | high | ultra | QHD | |
|---|---|---|---|---|---|
| GTA V (2015) | 98.8 | 32.7 | 12.5 | ||
| The Witcher 3 (2015) | 74.4 | 47.7 | 21.3 | 18 | |
| Dota 2 Reborn (2015) | 127.1 | 96.6 | 56 | 51.3 | |
| Final Fantasy XV Benchmark (2018) | 41.1 | 21.1 | 16.1 | ||
| X-Plane 11.11 (2018) | 48 | 35.7 | 29.5 | ||
| Far Cry 5 (2018) | 42 | 22 | 21 | 21 | |
| Strange Brigade (2018) | 77.8 | 31.7 | 27.3 | 23.5 | |
| F1 23 (2023) | 42.4 | 38.1 | 28.4 | 7.63 | 6.91 |
Emissions - Relatively quiet, but warm under load
Noise emissions
At idle, the single fan in the EliteBook is inactive most of the time. In 3DMark06, it started spinning after about 20 seconds but stayed relatively quiet, only the ThinkPad T16 G2 was similarly quiet in this scenario.
The EliteBook too can get louder during gaming or under heavy load. Most of the competitors have somewhat noisier fans, but then again some of them also have better (3D) performance, for example the Swift Edge and the ThinkPad P16s. Only the slim Galaxy Book3 Pro 16 is considerably louder despite having weaker performance.
The fan has a tendency to pulse lightly during gaming, i.e. it doesn’t quite spin at a steady speed.
Noise level
| Idle |
| 23 / 23 / 23 dB(A) |
| Load |
| 29.17 / 39.46 dB(A) |
 | ||
30 dB silent 40 dB(A) audible 50 dB(A) loud |
||
min: | ||
| HP EliteBook 865 G10 Radeon 780M, R9 PRO 7940HS, SK hynix PC801 HFS001TEJ9X101N | HP EliteBook 865 G9 Radeon 680M, R7 PRO 6850U, Samsung PM991 MZVLQ512HBLU | Lenovo ThinkPad P16s G2 21K9000CGE Radeon 780M, R7 PRO 7840U, SK hynix PC801 HFS001TEJ9X162N | Acer Swift Edge SFE16 Ryzen 7 7840U Radeon 780M, R7 7840U, SK hynix HFS512GEJ9X125N | Lenovo ThinkPad T16 G2 21HH003AGE Iris Xe G7 96EUs, i7-1355U, Lenovo UMIS AM6A0 RPETJ512MKP1QDQ | Samsung Galaxy Book3 Pro 16 Iris Xe G7 80EUs, i5-1340P, WD PC SN740 256GB SDDPNQD-256G | |
|---|---|---|---|---|---|---|
| Noise | 6% | -4% | -12% | -3% | -22% | |
| off / environment * (dB) | 23 | 23 -0% | 22.6 2% | 23.4 -2% | 24 -4% | 25.2 -10% |
| Idle Minimum * (dB) | 23 | 23 -0% | 22.6 2% | 24.1 -5% | 24 -4% | 25.2 -10% |
| Idle Average * (dB) | 23 | 23 -0% | 22.6 2% | 24.3 -6% | 24 -4% | 25.2 -10% |
| Idle Maximum * (dB) | 23 | 23 -0% | 22.6 2% | 28 -22% | 26.8 -17% | 29.3 -27% |
| Load Average * (dB) | 29.17 | 29.1 -0% | 37.8 -30% | 41 -41% | 26.8 8% | 46.4 -59% |
| Witcher 3 ultra * (dB) | 38.91 | 29.1 25% | 40.3 -4% | 40.9 -5% | 38.9 -0% | |
| Load Maximum * (dB) | 39.46 | 32.9 17% | 40.5 -3% | 40.9 -4% | 38.6 2% | 46.4 -18% |
* ... smaller is better
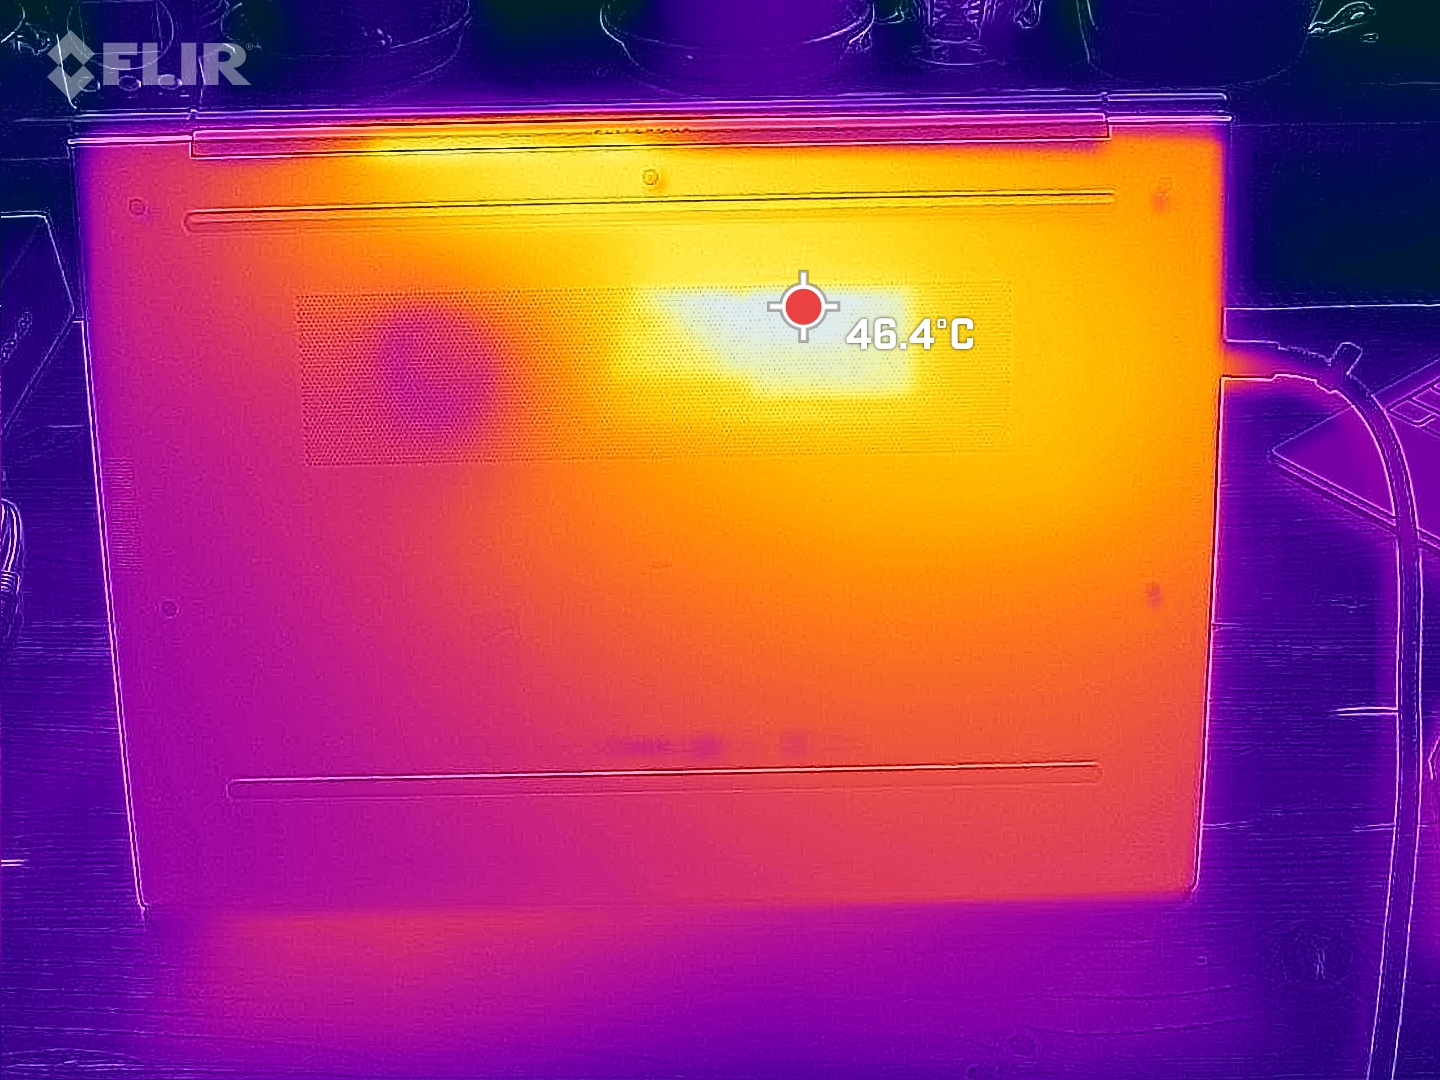
Temperature
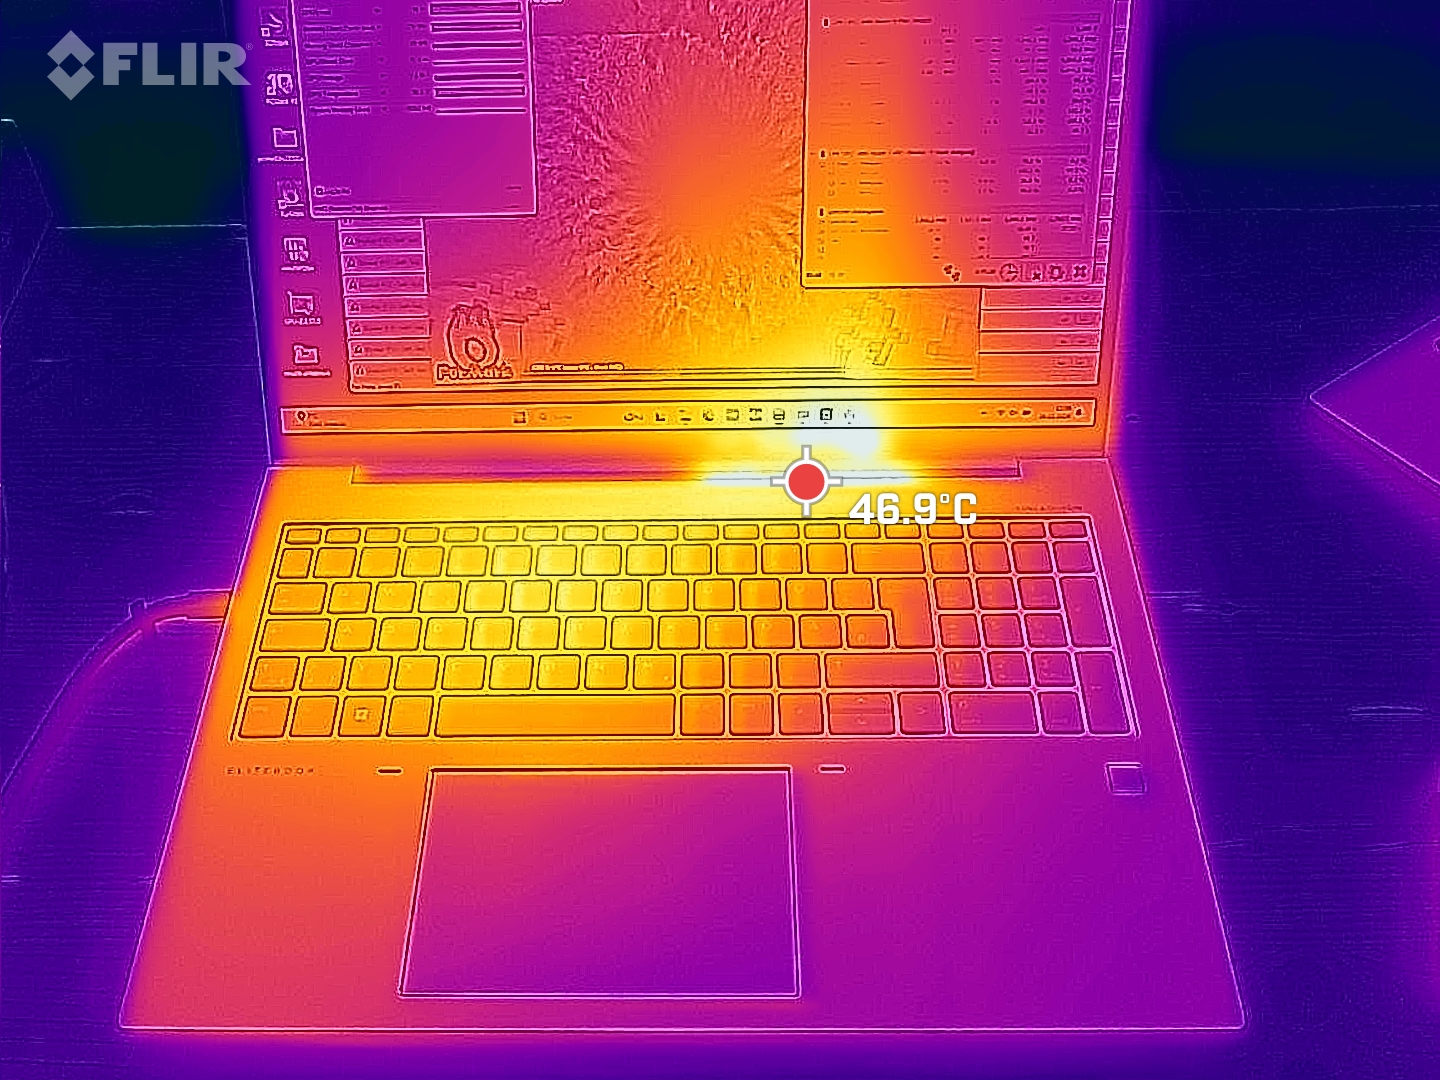
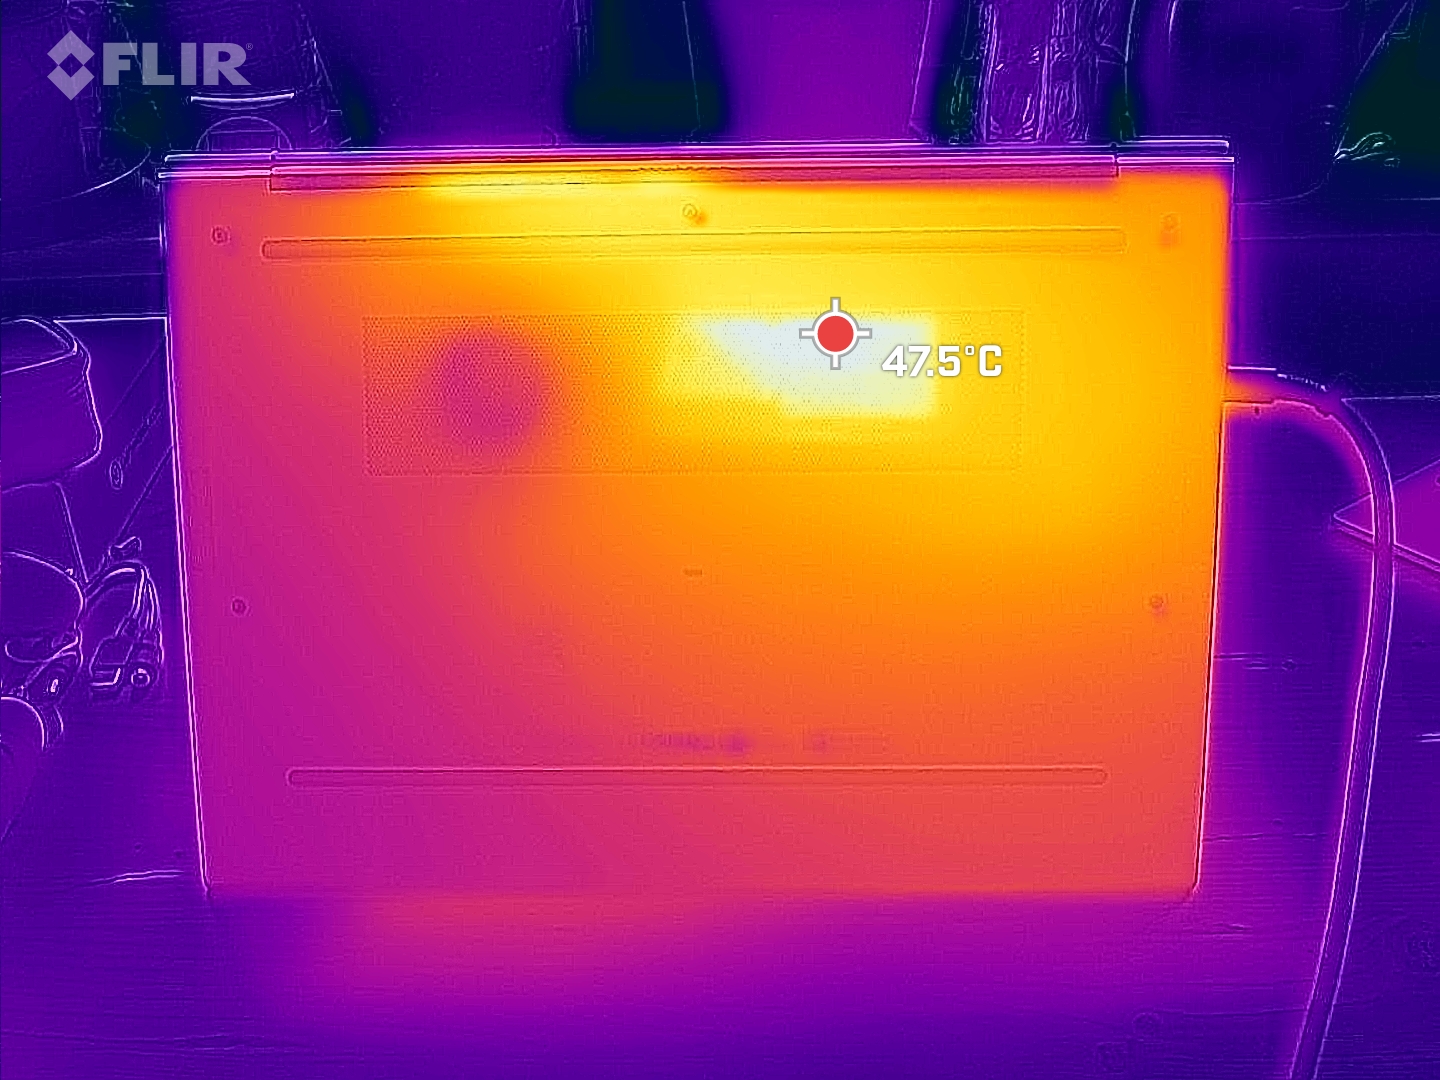
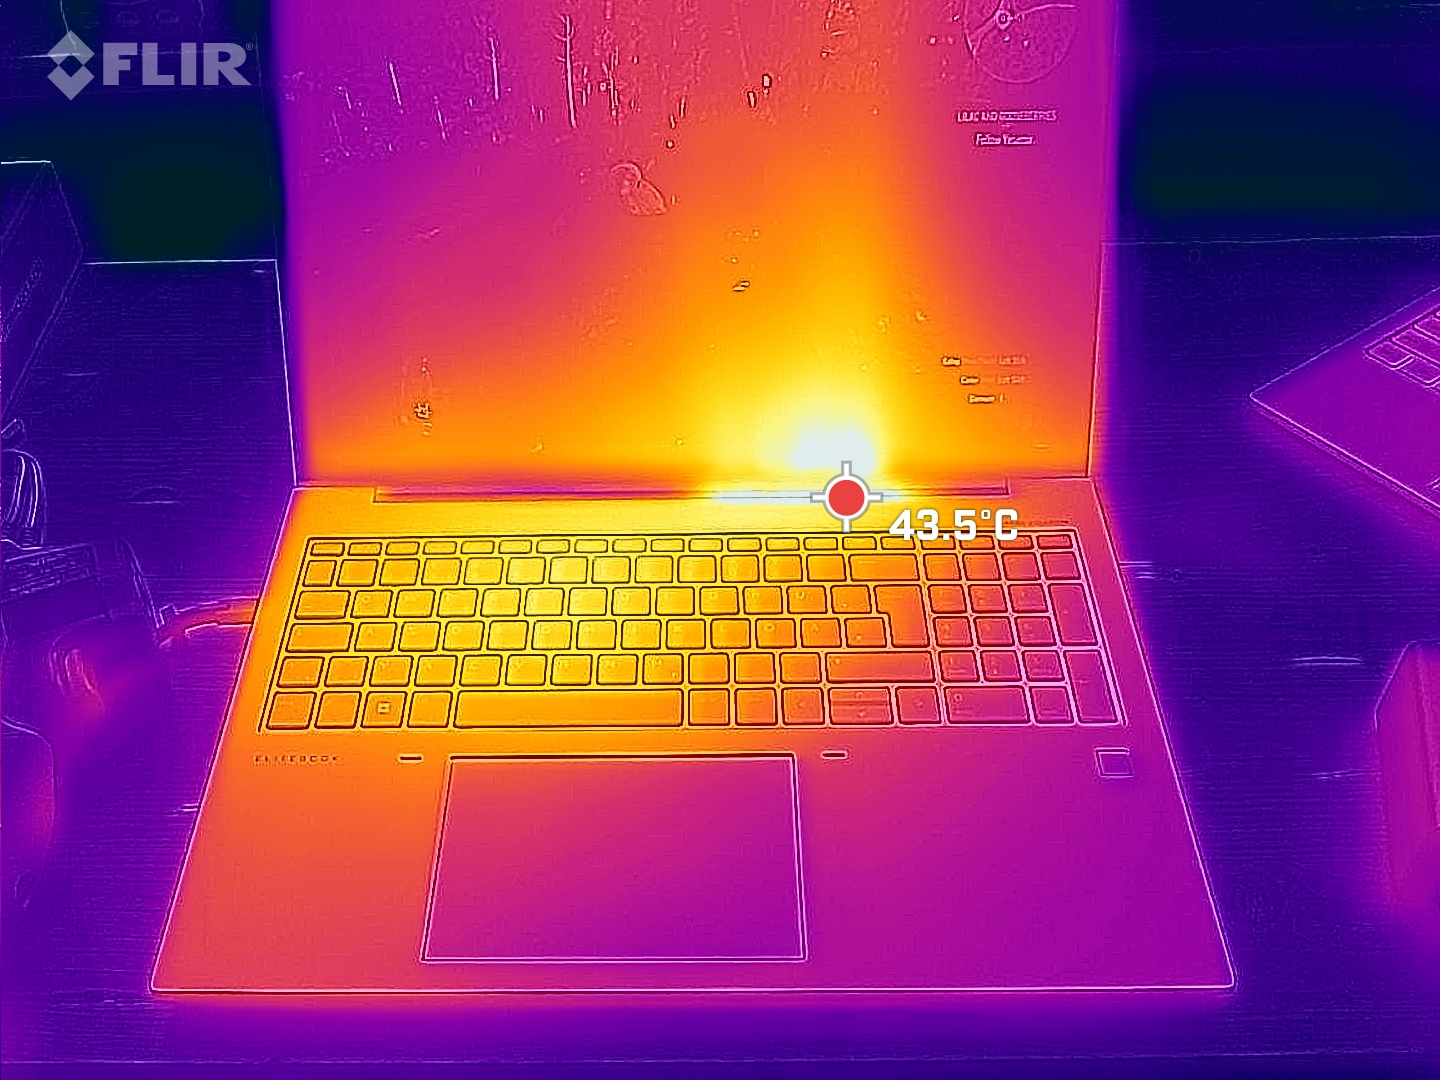
Heat distribution is not very optimal on the HP laptop. The fan is located slightly to the right of the centre, allowing this side in particular to remain cool. The other side and the middle of the chassis gets extra warm under heavy load.
We detected hot spots of 50°C (122°F) on the bottom not only during the stress test but also during gaming. In such load scenarios, which are rather unusual, the EliteBook is no longer suitable for use on the lap. The competitors can often stay cooler under load. That said, temperatures shouldn’t be an issue in normal office use.
(±) The maximum temperature on the upper side is 45 °C / 113 F, compared to the average of 34.3 °C / 94 F, ranging from 21.2 to 62.5 °C for the class Office.
(-) The bottom heats up to a maximum of 50 °C / 122 F, compared to the average of 36.8 °C / 98 F
(+) In idle usage, the average temperature for the upper side is 27 °C / 81 F, compared to the device average of 29.5 °C / 85 F.
(±) Playing The Witcher 3, the average temperature for the upper side is 35.9 °C / 97 F, compared to the device average of 29.5 °C / 85 F.
(+) The palmrests and touchpad are reaching skin temperature as a maximum (32 °C / 89.6 F) and are therefore not hot.
(-) The average temperature of the palmrest area of similar devices was 27.5 °C / 81.5 F (-4.5 °C / -8.1 F).
| HP EliteBook 865 G10 AMD Ryzen 9 PRO 7940HS, AMD Radeon 780M | HP EliteBook 865 G9 AMD Ryzen 7 PRO 6850U, AMD Radeon 680M | Lenovo ThinkPad P16s G2 21K9000CGE AMD Ryzen 7 PRO 7840U, AMD Radeon 780M | Acer Swift Edge SFE16 Ryzen 7 7840U AMD Ryzen 7 7840U, AMD Radeon 780M | Lenovo ThinkPad T16 G2 21HH003AGE Intel Core i7-1355U, Intel Iris Xe Graphics G7 96EUs | Samsung Galaxy Book3 Pro 16 Intel Core i5-1340P, Intel Iris Xe Graphics G7 80EUs | |
|---|---|---|---|---|---|---|
| Heat | 17% | 9% | 6% | 12% | 4% | |
| Maximum Upper Side * (°C) | 45 | 39.4 12% | 42.7 5% | 41.6 8% | 40.5 10% | 41.6 8% |
| Maximum Bottom * (°C) | 50 | 47.6 5% | 47.2 6% | 46.6 7% | 42.7 15% | 45 10% |
| Idle Upper Side * (°C) | 30 | 23.6 21% | 27.8 7% | 30.4 -1% | 28.2 6% | 31 -3% |
| Idle Bottom * (°C) | 34 | 24.1 29% | 28.4 16% | 31 9% | 28 18% | 33.6 1% |
* ... smaller is better
Stress test
Our stress test involved running Prime95 and FurMark simultaneously for one hour. During the test, the CPU cores briefly operated at 4.7 GHz and drew 51 watts. The clock speeds and power usage later dropped and stabilised at around 4.1 GHz and 41 watts respectively. The SoC heated up to about 81°C (177.8°F).
The iGPU ran at 2.5 GHz before settling down at 2.1 GHz a little later.
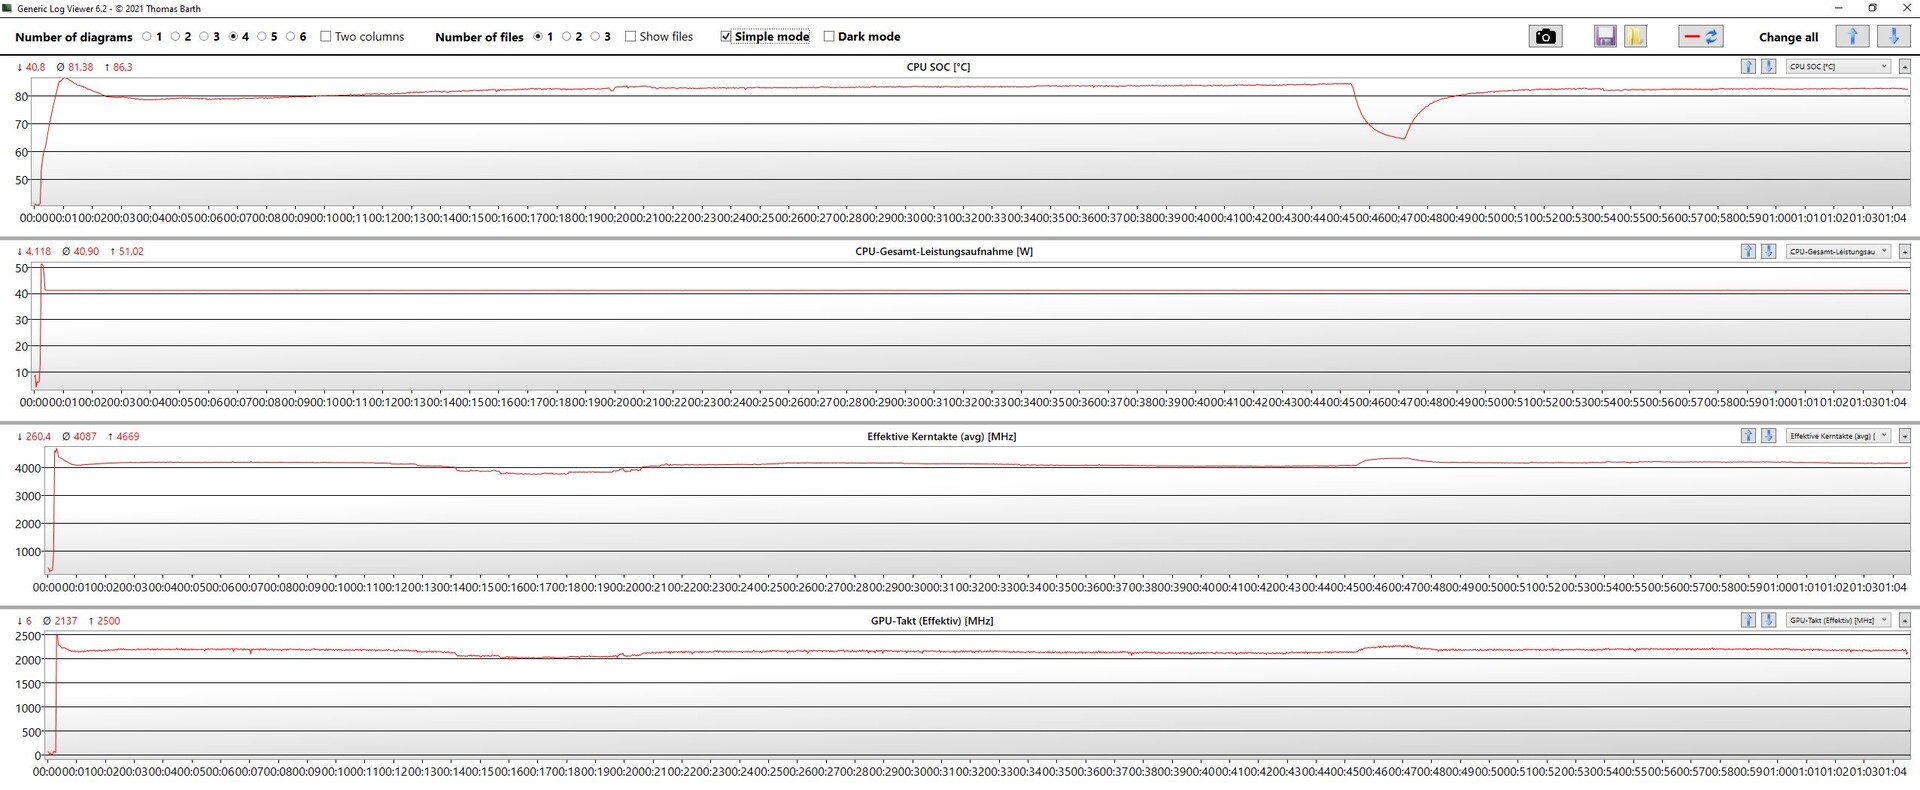
| CPU Clock (GHz) | GPU Clock (MHz) | Average SoC Temperature (°C) | |
| Prime95 + FurMark Stress | 4.1 | 2,100 | 81 |
| Witcher 3 Stress | 0.220 | 2,700 | 80 |
Speakers
The stereo speakers on the EliteBook are downward firing and aren’t located at the front, but rather in the middle of the sides. This is significantly less direct than what we are used to. Consequently, the sound level microphone we placed 15 cm (5.9 in) from the front edge of the laptop measured a low output level. The speakers are too quiet to our ears as well.
At least they produce balanced mids and highs, but clearly lack bass.
There is a 3.5 mm combo audio jack available for connecting analogue playback devices.
HP EliteBook 865 G10 audio analysis
(±) | speaker loudness is average but good (74.09 dB)
Bass 100 - 315 Hz
(-) | nearly no bass - on average 19.3% lower than median
(±) | linearity of bass is average (12% delta to prev. frequency)
Mids 400 - 2000 Hz
(+) | balanced mids - only 2.8% away from median
(+) | mids are linear (4.3% delta to prev. frequency)
Highs 2 - 16 kHz
(+) | balanced highs - only 2.1% away from median
(+) | highs are linear (3.3% delta to prev. frequency)
Overall 100 - 16.000 Hz
(±) | linearity of overall sound is average (16.8% difference to median)
Compared to same class
» 22% of all tested devices in this class were better, 7% similar, 70% worse
» The best had a delta of 7%, average was 21%, worst was 53%
Compared to all devices tested
» 30% of all tested devices were better, 8% similar, 63% worse
» The best had a delta of 4%, average was 23%, worst was 134%
Acer Swift Edge SFE16 Ryzen 7 7840U audio analysis
(±) | speaker loudness is average but good (80.8 dB)
Bass 100 - 315 Hz
(-) | nearly no bass - on average 24.5% lower than median
(±) | linearity of bass is average (14.2% delta to prev. frequency)
Mids 400 - 2000 Hz
(+) | balanced mids - only 2.9% away from median
(+) | mids are linear (3.5% delta to prev. frequency)
Highs 2 - 16 kHz
(+) | balanced highs - only 4.8% away from median
(+) | highs are linear (3.7% delta to prev. frequency)
Overall 100 - 16.000 Hz
(±) | linearity of overall sound is average (19.8% difference to median)
Compared to same class
» 41% of all tested devices in this class were better, 9% similar, 50% worse
» The best had a delta of 7%, average was 21%, worst was 53%
Compared to all devices tested
» 50% of all tested devices were better, 7% similar, 42% worse
» The best had a delta of 4%, average was 23%, worst was 134%
Power management - Good stamina despite excessive power usage
Power consumption
At idle, the new EliteBook consumes almost as much power as its predecessor. And its power usage is still somewhat too high at max brightness and with wireless modules enabled.
Compared with the competition, the laptop’s power draw is likewise too high under load. Even the much more performant Lenovo ThinkPad P16s G2 uses slightly less power than the EliteBook. Quite a bit of power seems to be lost through the theoretically very bright display. On the other hand, the ThinkPad P16s has to drive a 4K OLED screen.
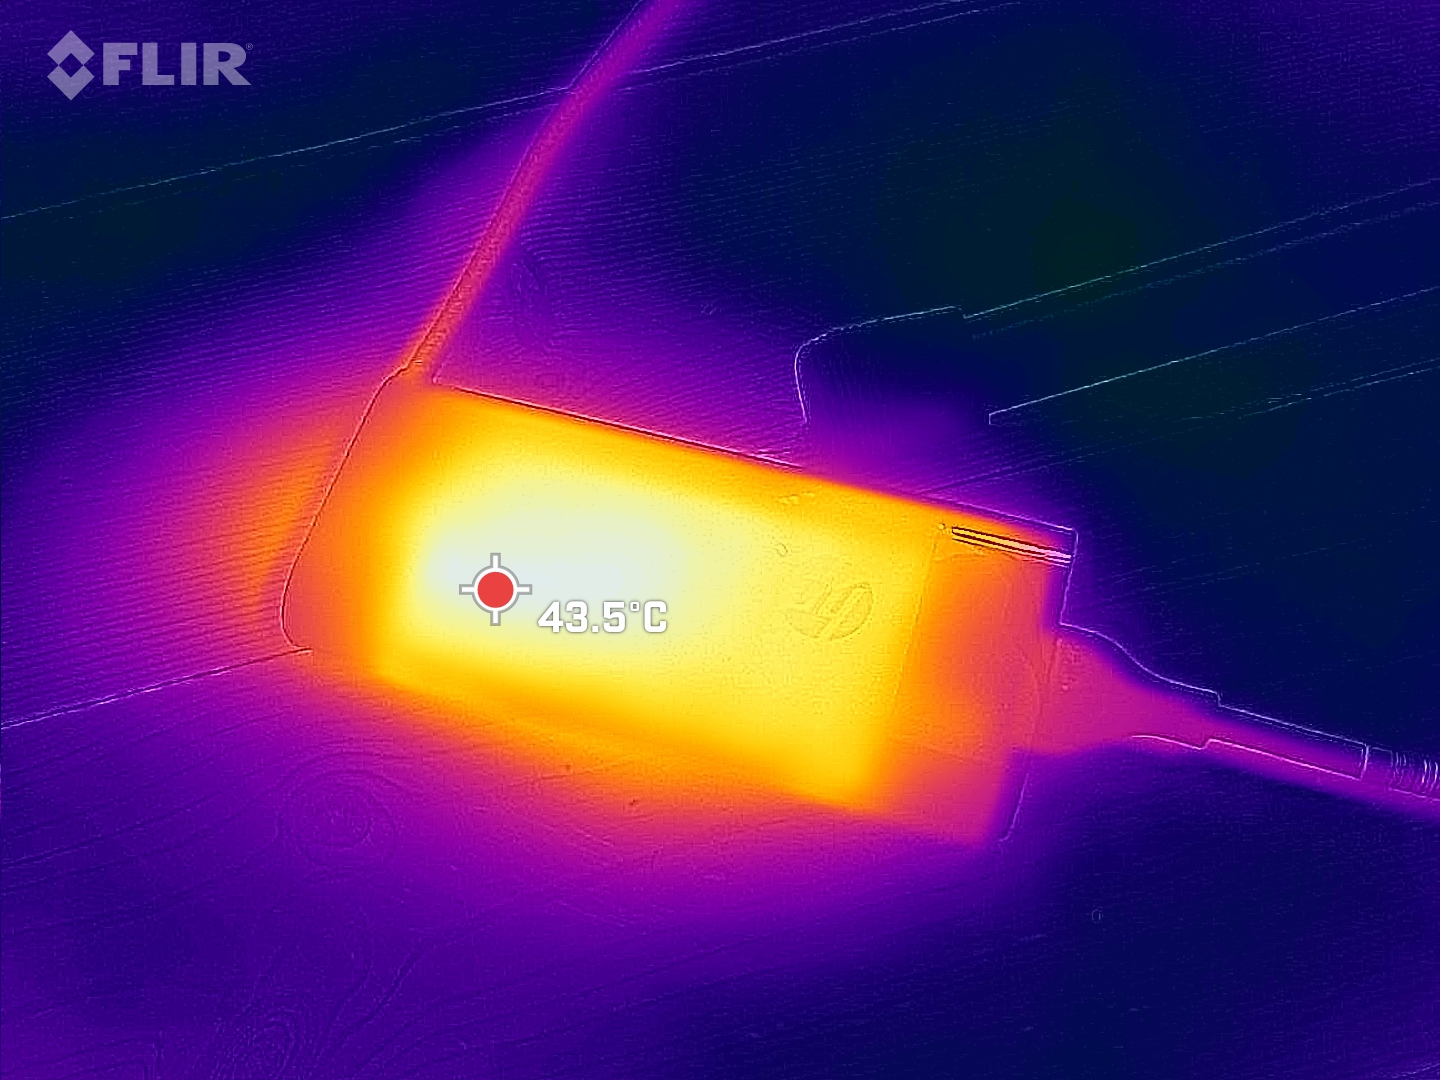
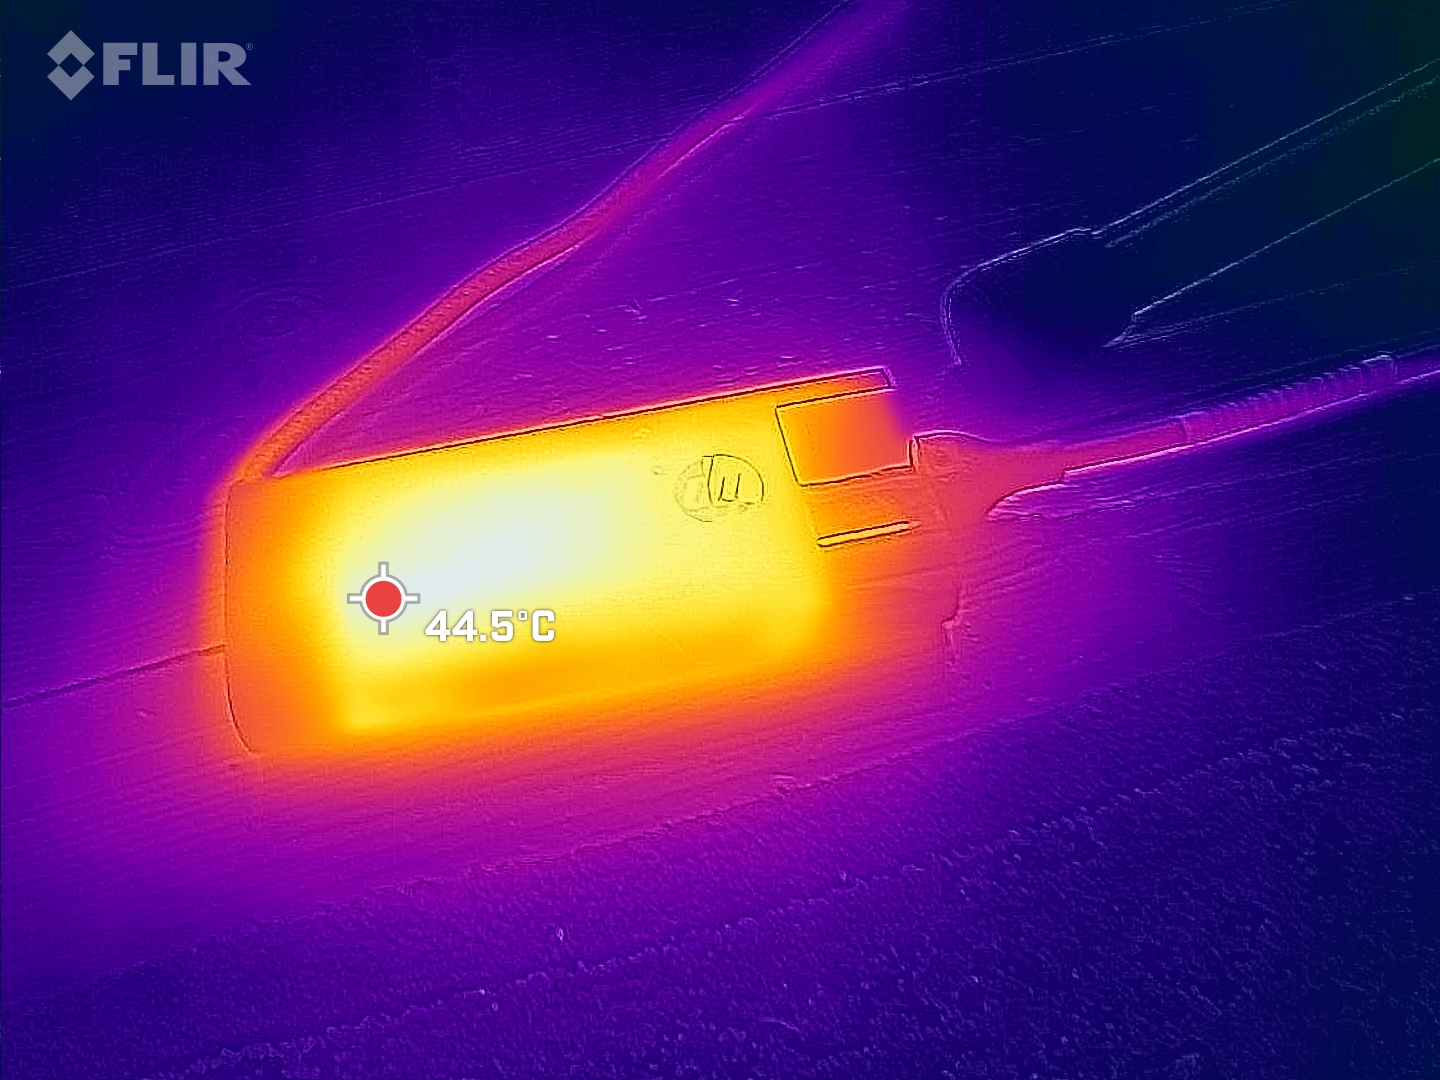
We measured transient power spikes of up to 101 watts. This means the compact 110-watt USB-C charger (approx. 13.5 x 6 cm, or 5.3 x 2.4 in) shouldn’t have any problem powering the laptop.

| Off / Standby | |
| Idle | |
| Load |
|
Key:
min: | |
| HP EliteBook 865 G10 R9 PRO 7940HS, Radeon 780M, SK hynix PC801 HFS001TEJ9X101N, IPS, 1920x1200, 16" | HP EliteBook 865 G9 R7 PRO 6850U, Radeon 680M, Samsung PM991 MZVLQ512HBLU, IPS, 1920x1200, 16" | Lenovo ThinkPad P16s G2 21K9000CGE R7 PRO 7840U, Radeon 780M, SK hynix PC801 HFS001TEJ9X162N, OLED, 3840x2400, 16" | Acer Swift Edge SFE16 Ryzen 7 7840U R7 7840U, Radeon 780M, SK hynix HFS512GEJ9X125N, OLED, 3200x2000, 16" | Lenovo ThinkPad T16 G2 21HH003AGE i7-1355U, Iris Xe G7 96EUs, Lenovo UMIS AM6A0 RPETJ512MKP1QDQ, IPS, 1920x1200, 16" | Samsung Galaxy Book3 Pro 16 i5-1340P, Iris Xe G7 80EUs, WD PC SN740 256GB SDDPNQD-256G, AMOLED, 2880x1800, 16" | Average AMD Radeon 780M | Average of class Office | |
|---|---|---|---|---|---|---|---|---|
| Power Consumption | 16% | 23% | 12% | 45% | 38% | 16% | 33% | |
| Idle Minimum * (Watt) | 5.2 | 5.3 -2% | 6.1 -17% | 7.1 -37% | 3.1 40% | 3.9 25% | 6.01 ? -16% | 4.3 ? 17% |
| Idle Average * (Watt) | 12.8 | 12.8 -0% | 6.5 49% | 10.1 21% | 6.4 50% | 4.8 63% | 8.15 ? 36% | 7.35 ? 43% |
| Idle Maximum * (Watt) | 14.1 | 14.1 -0% | 7 50% | 18.6 -32% | 6.8 52% | 10 29% | 10.3 ? 27% | 8.6 ? 39% |
| Load Average * (Watt) | 65 | 48.5 25% | 56.6 13% | 45.3 30% | 29.3 55% | 44 32% | 57.6 ? 11% | 43.9 ? 32% |
| Witcher 3 ultra * (Watt) | 68.2 | 48.7 29% | 61.2 10% | 39.5 42% | 41.5 39% | 42.3 38% | ||
| Load Maximum * (Watt) | 101.44 | 56.6 44% | 68.3 33% | 52.9 48% | 64.6 36% | 63 38% | 77 ? 24% | 64.5 ? 36% |
* ... smaller is better
Power consumption Witcher 3 / Stress test
Power consumption with external monitor
Battery life
As with the previous model, HP has given the current EliteBook 865 a battery with a 76 Wh capacity. Despite its high power usage under load, the laptop can deliver exceptional battery life in less demanding tasks such as web browsing and video streaming.
At the same time, we observed that the display, in particular, seems to consume an extremely high amount of power. At max brightness, the HP laptop only lasted about half as long as when screen brightness was reduced to 150 nits (7.5 instead of 15.5 hours). But battery life is still very good in general.
| HP EliteBook 865 G10 R9 PRO 7940HS, Radeon 780M, 76 Wh | HP EliteBook 865 G9 R7 PRO 6850U, Radeon 680M, 76 Wh | Lenovo ThinkPad P16s G2 21K9000CGE R7 PRO 7840U, Radeon 780M, 84 Wh | Acer Swift Edge SFE16 Ryzen 7 7840U R7 7840U, Radeon 780M, 54 Wh | Lenovo ThinkPad T16 G2 21HH003AGE i7-1355U, Iris Xe G7 96EUs, 52.5 Wh | Samsung Galaxy Book3 Pro 16 i5-1340P, Iris Xe G7 80EUs, 76 Wh | Average of class Office | |
|---|---|---|---|---|---|---|---|
| Battery runtime | 19% | -10% | -64% | 20% | 4% | 8% | |
| H.264 (h) | 14 | 18.5 32% | 13.3 -5% | 13.7 -2% | 14.4 3% | 15.5 ? 11% | |
| WiFi v1.3 (h) | 15.4 | 15 -3% | 10.6 -31% | 5.6 -64% | 11.5 -25% | 10.2 -34% | 13 ? -16% |
| Load (h) | 1.4 | 1.8 29% | 1.5 7% | 2.6 86% | 2 43% | 1.808 ? 29% | |
| Reader / Idle (h) | 19.5 | 30.4 | 24.5 ? |
Pros
Cons
Verdict - Elite should be polished; there's still much to do, HP!
The HP EliteBook 865 G10 has a few good things going for it, especially with regard to its build quality and specs. Its sturdy metal chassis stands out as much as its excellent input devices. The laptop also comes with an LTE SIM card slot, a SmartCard reader and a whole host of security features. So is it the perfect laptop for business professionals?
Unfortunately, no. We are more disappointed than impressed by the device overall. The predecessor model definitely had its flaws, and sadly, HP hasn’t done anything to optimise and improve the laptop. Sure View continues to be more of a curse than a blessing in our opinion; performance is still hindered by the single-channel RAM configuration, though this is easy to fix. HP needs to be criticised for not actually doing anything other than updating the CPU. Customers should be able to expect more from the manufacturer for the Elite series. In particular, the Sure View privacy filter urgently needs reworking. The laptop has even introduced new issues, such as the excessive power consumption (especially under load).
That said, the EliteBook can be extensively configured. If you go for the 400-nit display and two RAM sticks in dual-channel mode instead, you’ll nonetheless get a highly capable business laptop. However, our job is still to evaluate our review configuration – not easy in this case.
With the right configuration, the HP EliteBook 865 G10 can be an excellent business laptop. But the annoying Sure View filter and the performance-hindering single-channel RAM keep our review model from getting a higher rating.
If you want a capable HP laptop and can do without LTE and SmartCard support, you should consider the highly versatile HP Spectre x360 16 that we recently reviewed. Otherwise, the previous EliteBook G9 is still worth taking a look at, though Sure View should likewise be avoided where possible.
Price and availability
The Ryzen 9 version of the EliteBook 865 G10 is currently not yet available on HP's shop in the US. But you can find various Ryzen 5 and 7 variants with prices starting at US$1,250. A Ryzen 5 model with touchscreen is selling on Amazon right now for around US$1,550.
HP EliteBook 865 G10
- 02/29/2024 v7 (old)
Christian Hintze
Transparency
The selection of devices to be reviewed is made by our editorial team. The test sample was provided to the author as a loan by the manufacturer or retailer for the purpose of this review. The lender had no influence on this review, nor did the manufacturer receive a copy of this review before publication. There was no obligation to publish this review. As an independent media company, Notebookcheck is not subjected to the authority of manufacturers, retailers or publishers.
This is how Notebookcheck is testing
Every year, Notebookcheck independently reviews hundreds of laptops and smartphones using standardized procedures to ensure that all results are comparable. We have continuously developed our test methods for around 20 years and set industry standards in the process. In our test labs, high-quality measuring equipment is utilized by experienced technicians and editors. These tests involve a multi-stage validation process. Our complex rating system is based on hundreds of well-founded measurements and benchmarks, which maintains objectivity. Further information on our test methods can be found here.
Price comparison

