
Verdict - ThinkPad P16v Gen 3 is a good mobile workstation
In the test, the ThinkPad P16v Gen 3 is quite convincing as a mobile workstation and receives a good overall rating. In addition to long battery runtimes, there is good system performance, many connections and very good maintenance options. The TouchPad and TrackPoint keys are of very high quality, but the keyboard is only average and there is definitely room for improvement here (especially compared to the ThinkPad P1 16 Gen 8).
The classification as a relatively affordable workstation can be seen above all in the casing, as only plastic is used here and there are also points of criticism in terms of stability (especially the middle keyboard area) and the hinges (noticeable rocking). Only 60 Hz panels are available for the displays (including OLED), whereby the standard IPS model does a reasonable job with more than 500 cd/m² brightness, accurate colors and full sRGB coverage.
We would have liked a little more performance, especially from the graphics card. The Nvidia RTX PRO 2000 (Blackwell, comparable to GeForce RTX 5060) is only operated with a maximum of 60 watts and is therefore well away from the maximum 115 watts (would provide around 30% more performance). In view of the large 16-inch case, this is relatively weak.
Pros
Cons
Price and availability
The test device is available from our loaner Campuspoint for 2,825 Euros (~$3277)(or 2,529 Euros/~$2933 in the Campus program) and the P16v G3 can be configured at Lenovo from 2,469 Euros (~$2864).
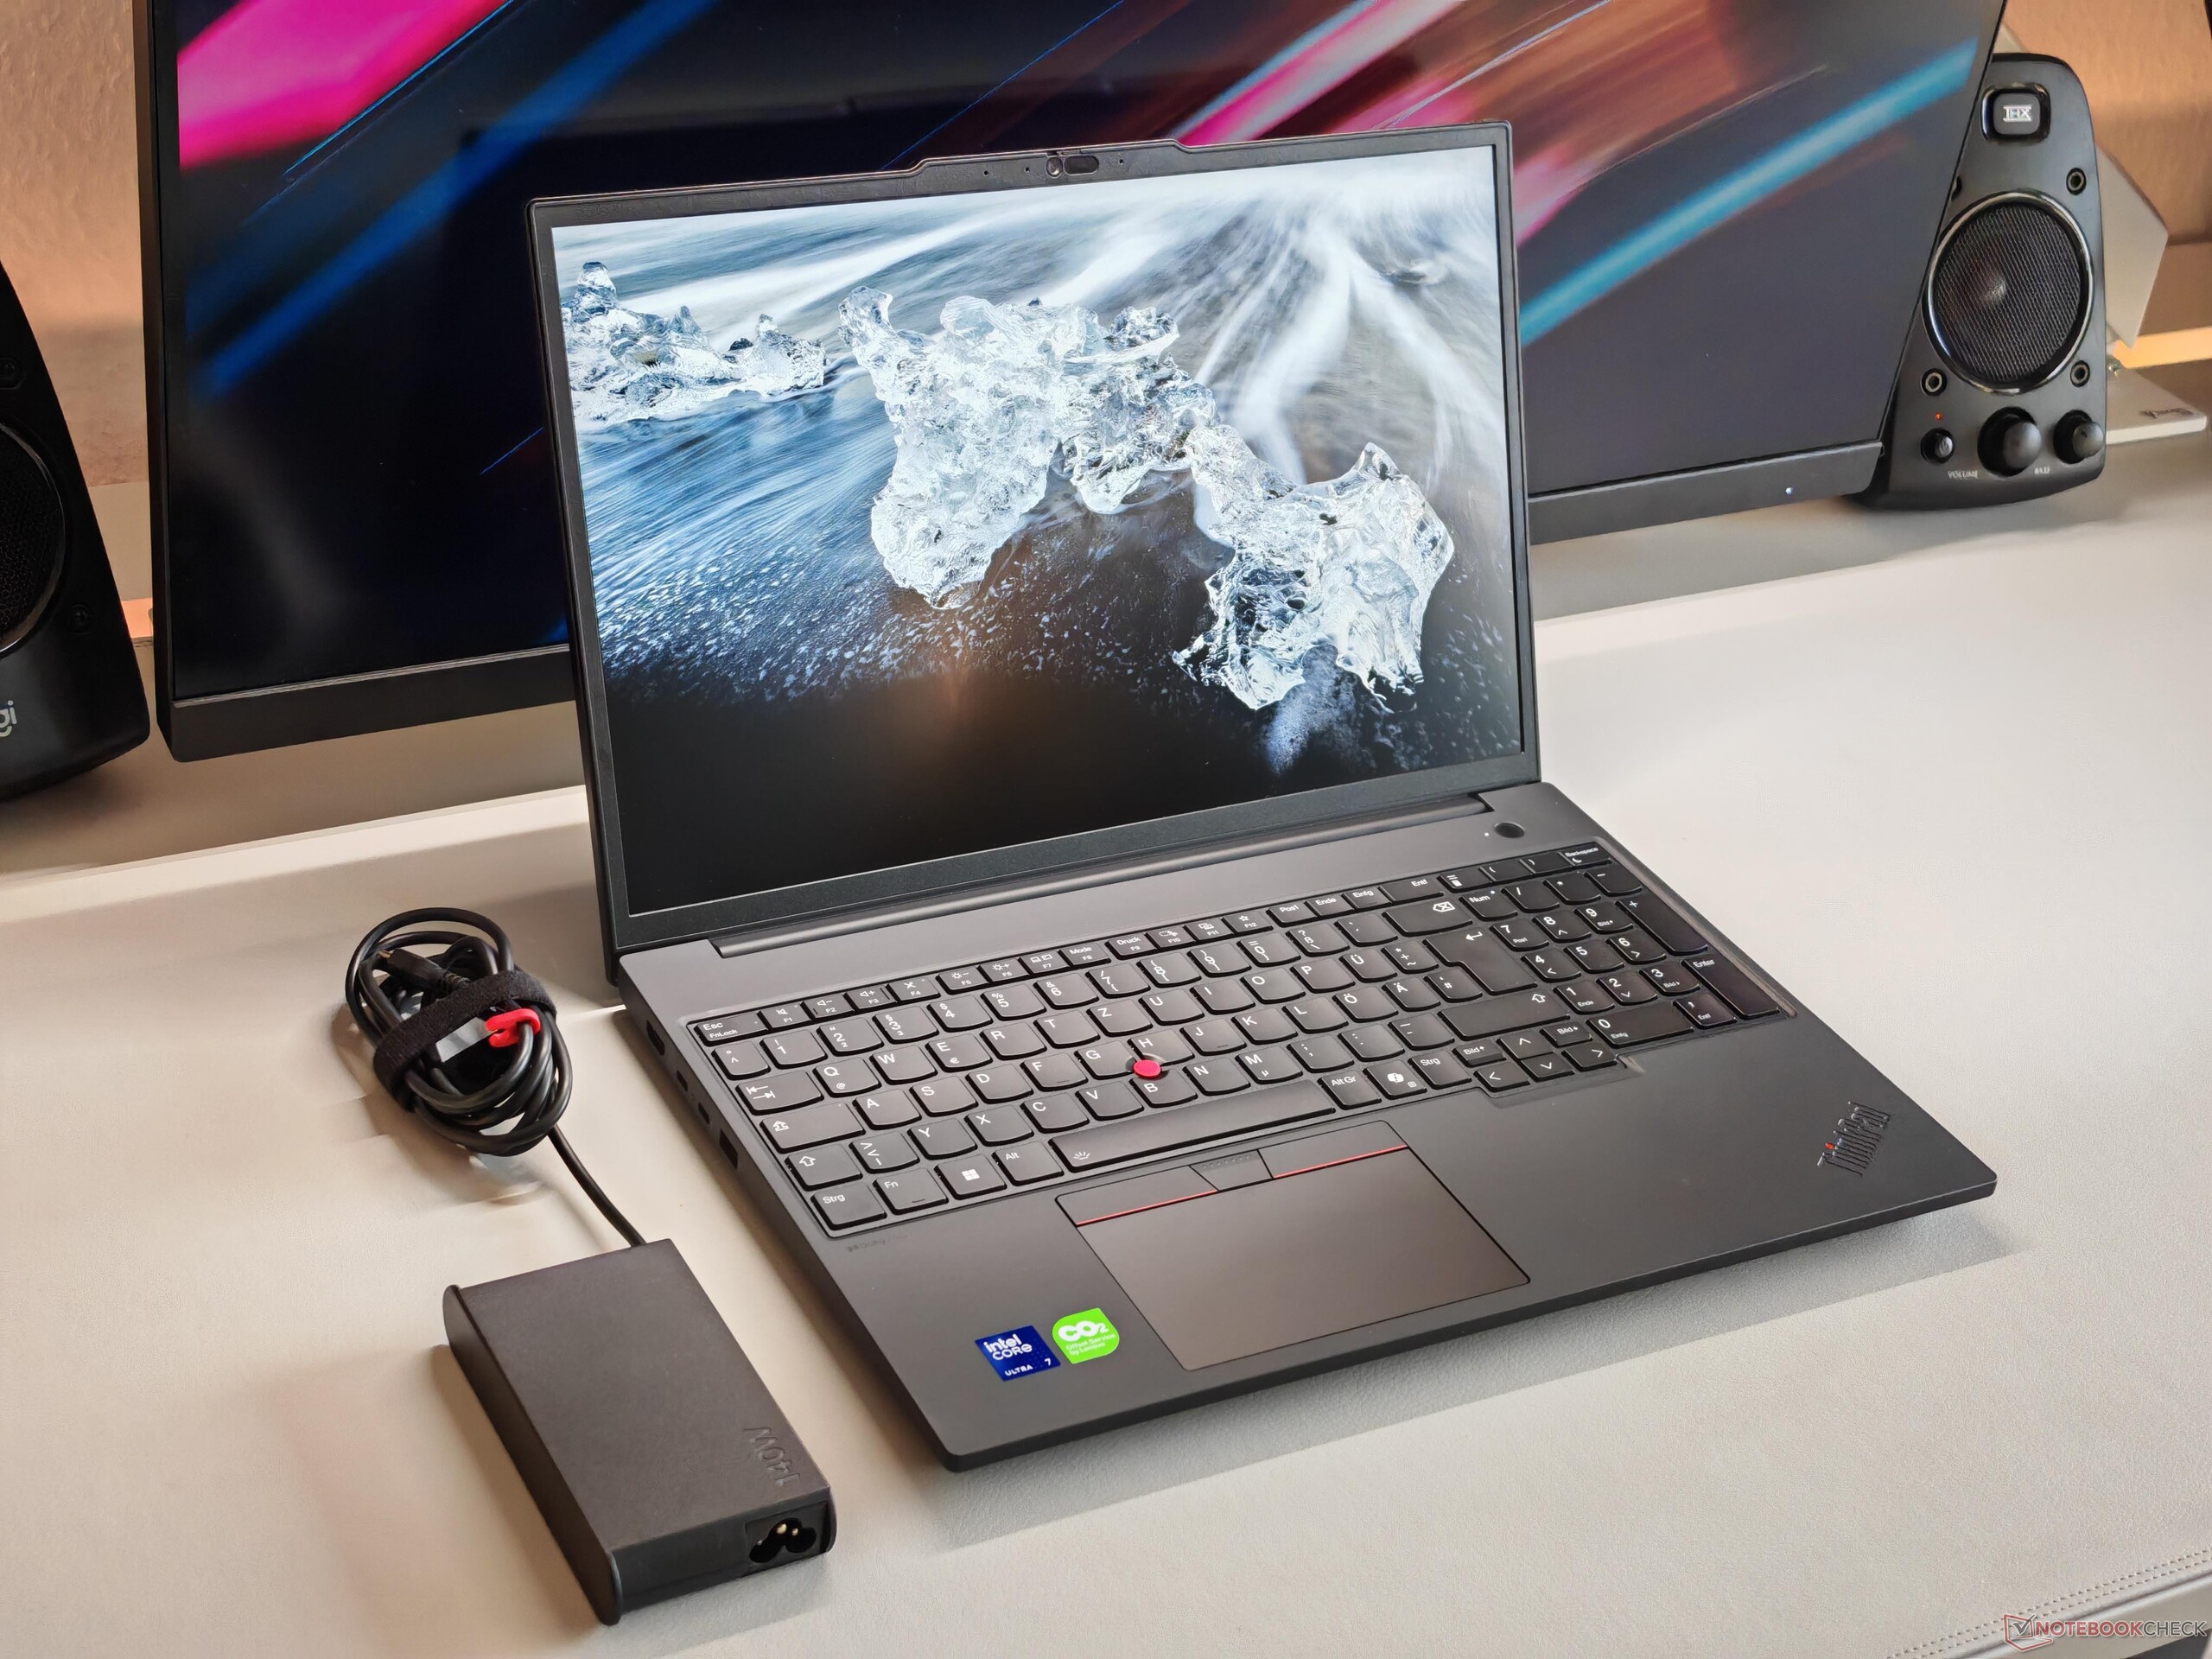
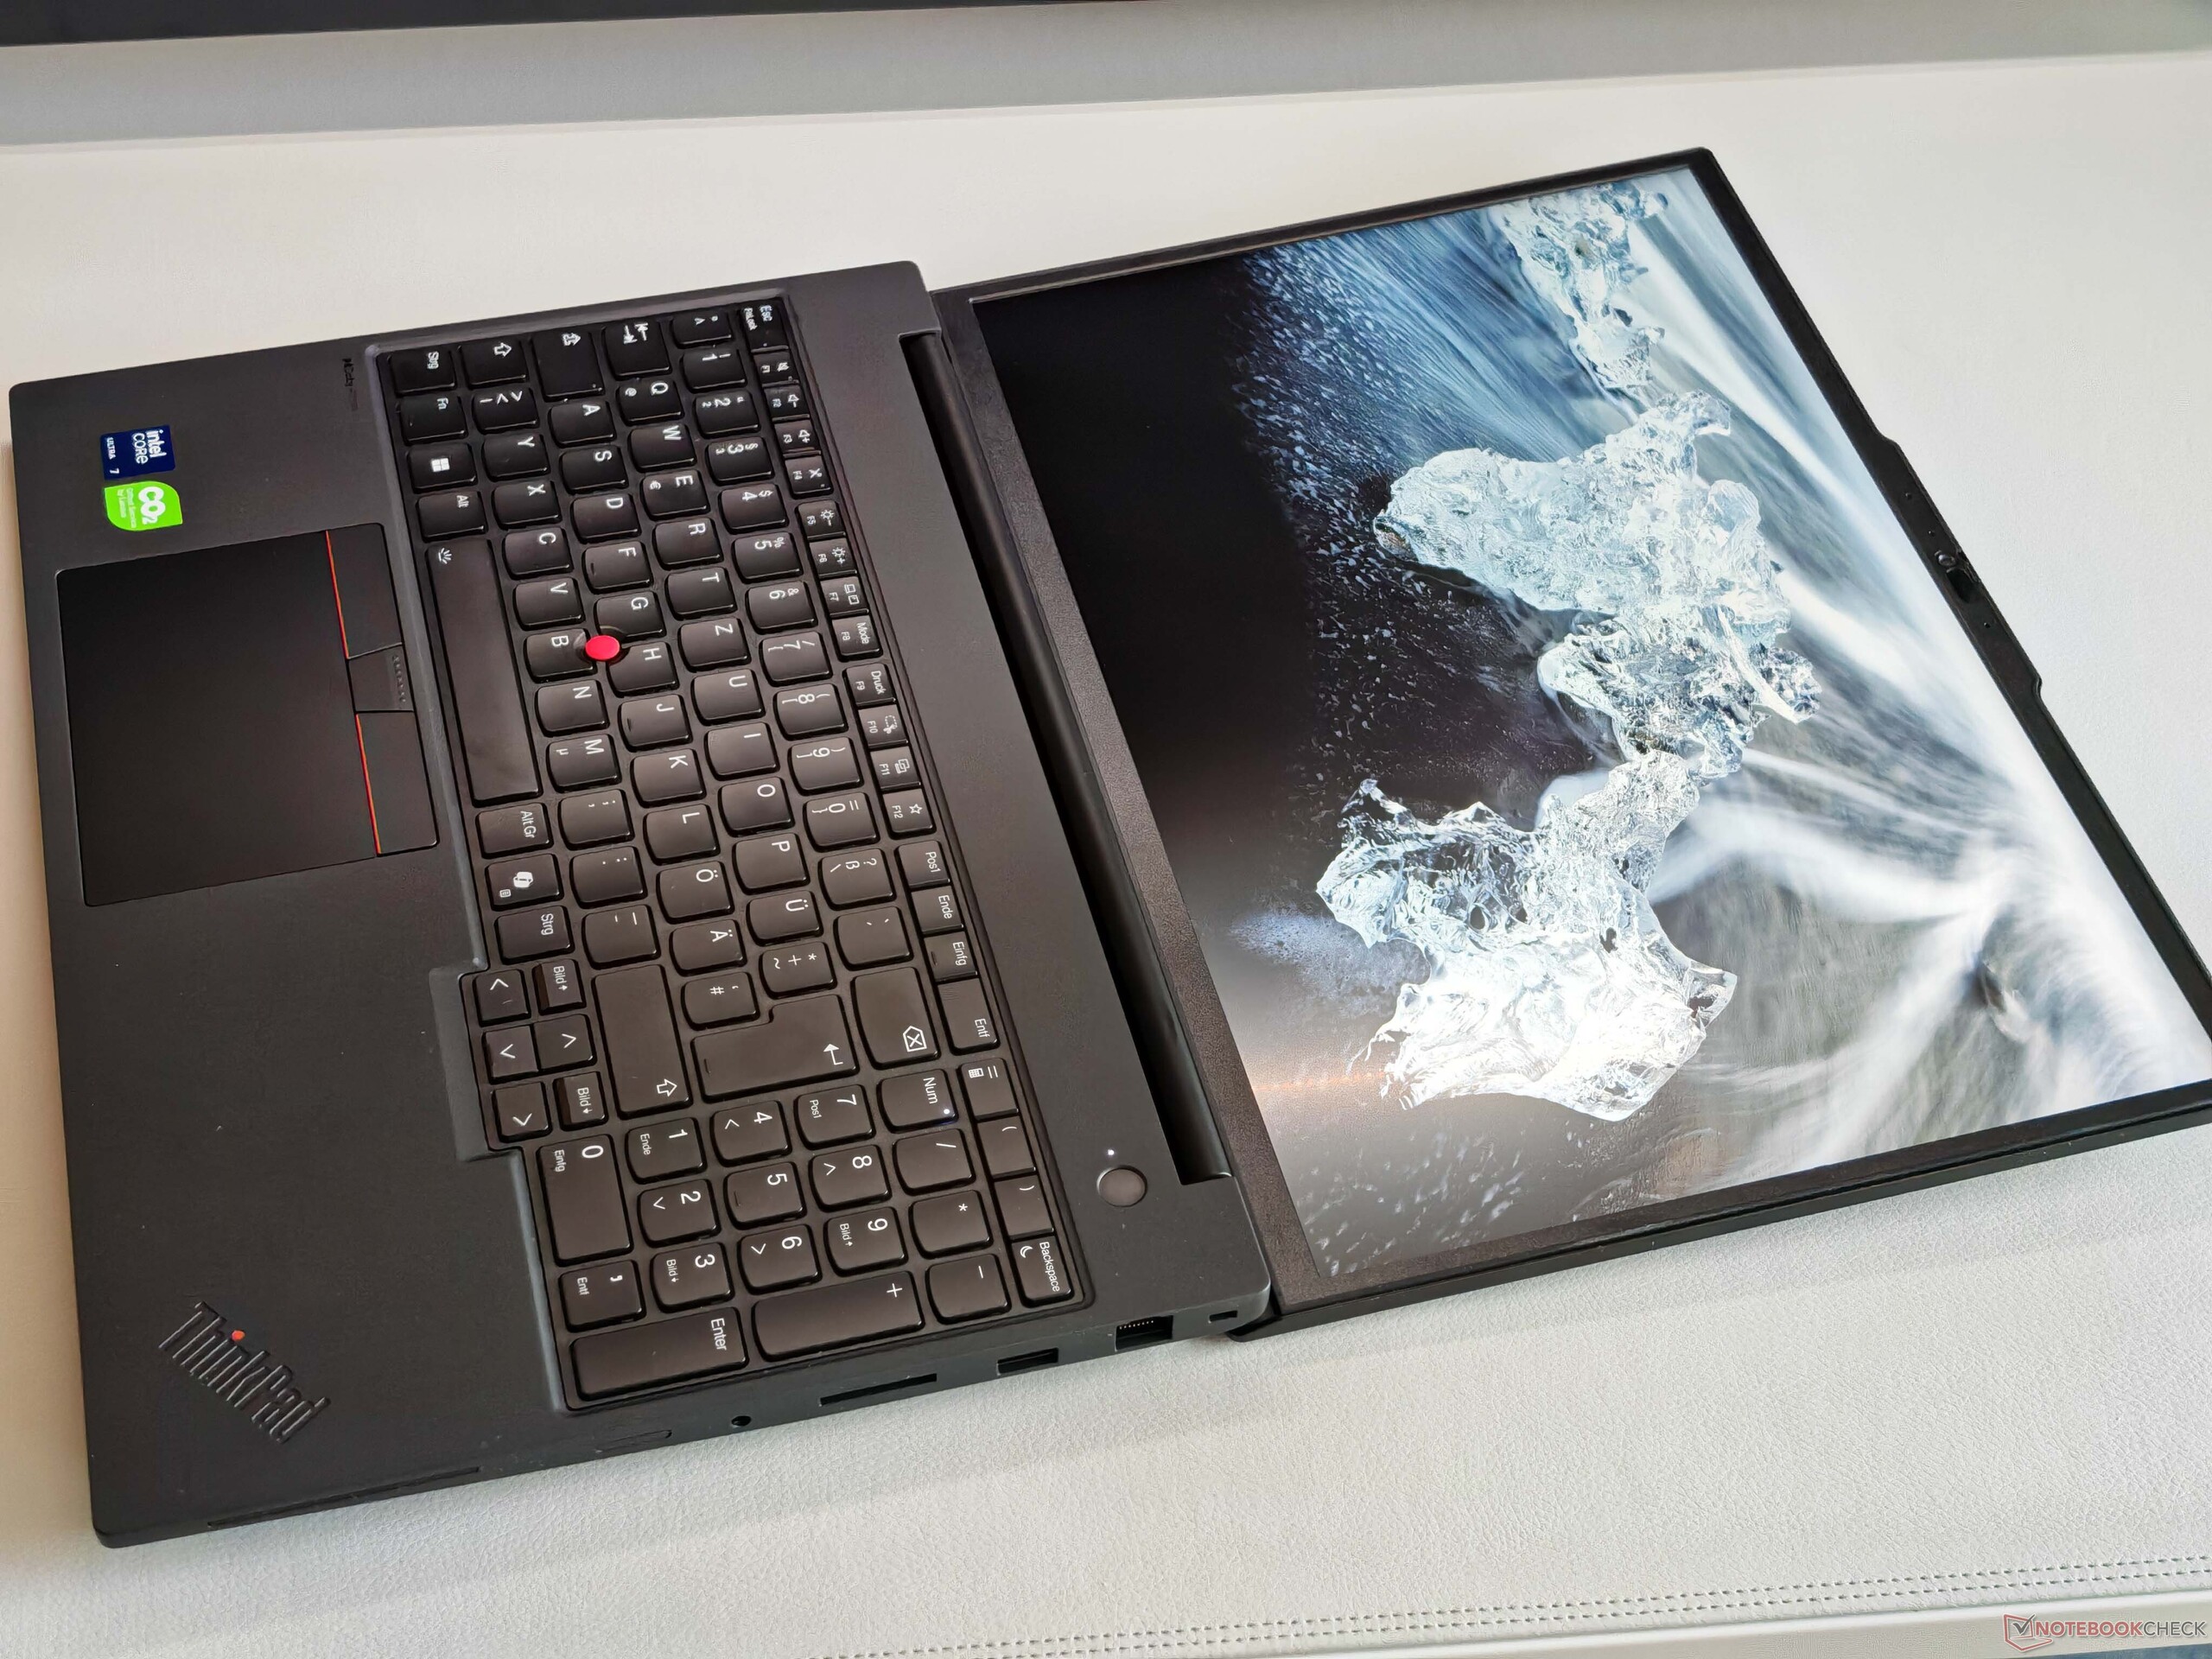
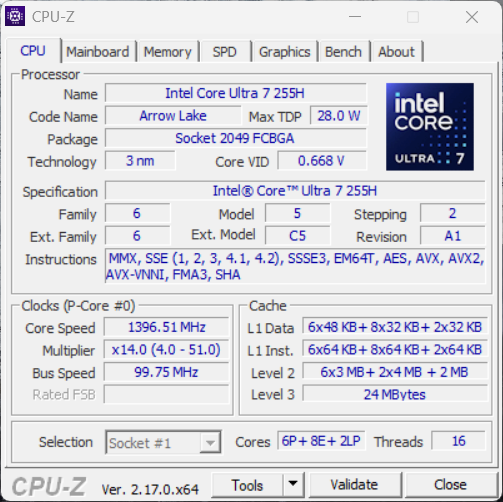
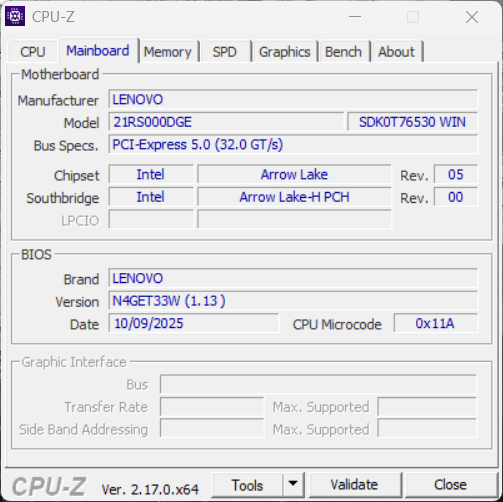
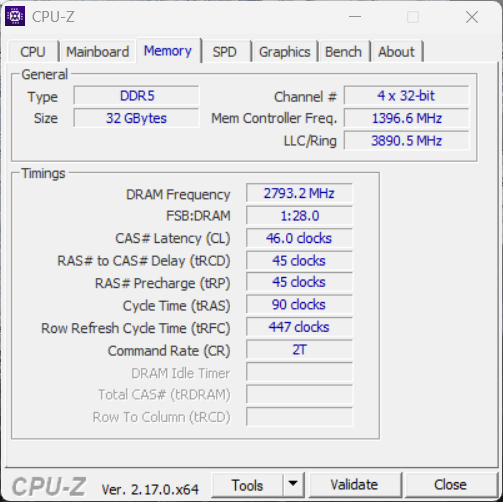
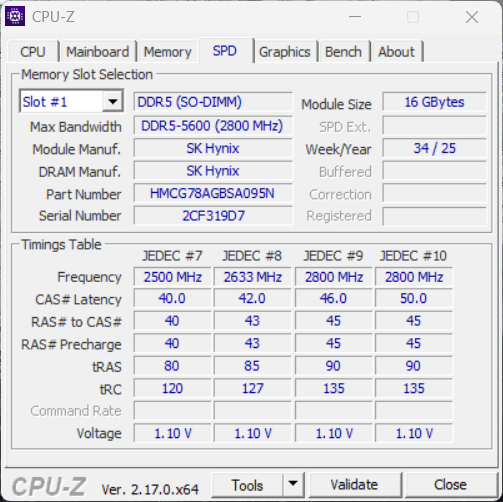
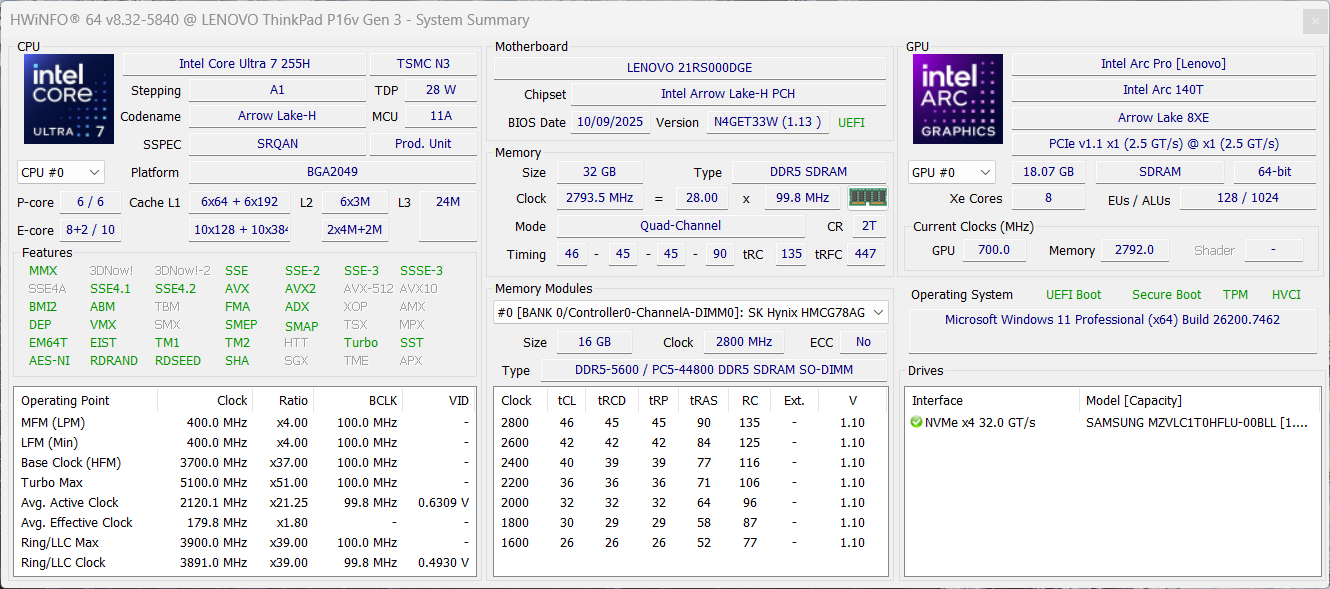
The ThinkPad P16v Gen3 is Lenovo's current entry-level model when it comes to full-blown mobile workstations. We test the 21RS000DGE model with the Core Ultra 7 255H, 32 GB RAM, the Nvidia RTX PRO 2000, a 1 TB SSD and the Full HD screen with a brightness of 500 cd/m² for 2,825 Euros (~$3277).
Specifications
Case & equipment
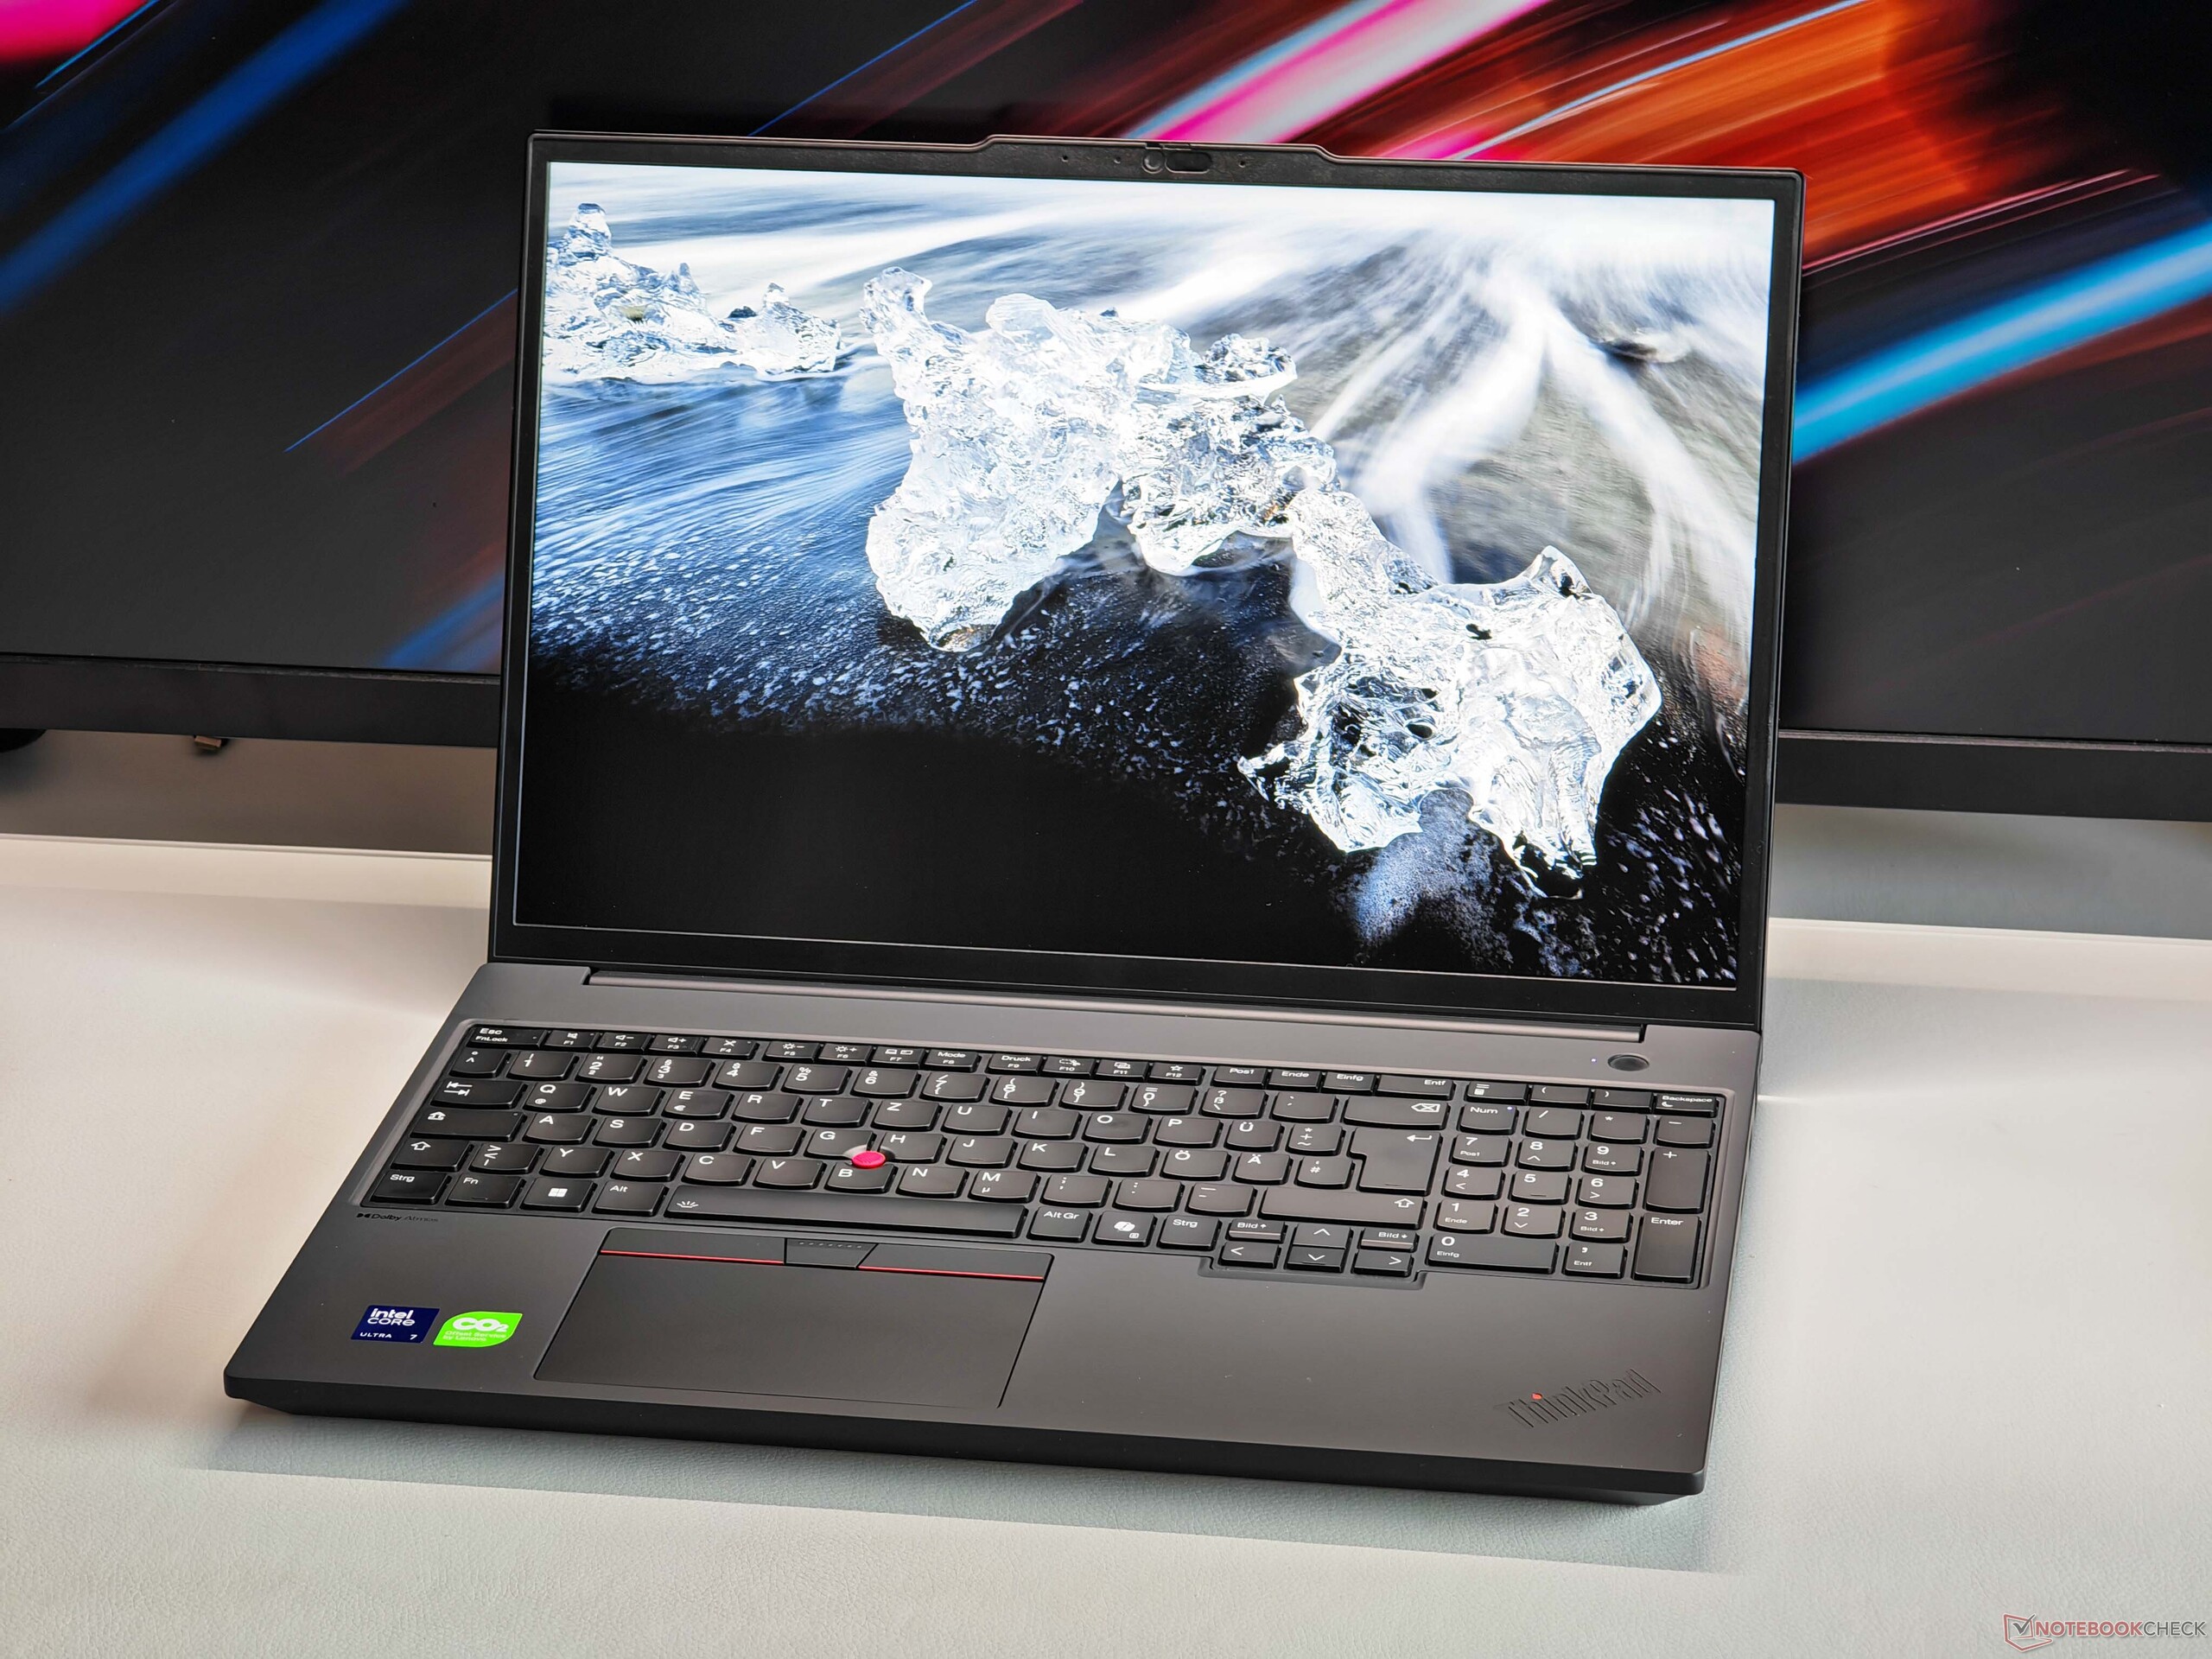
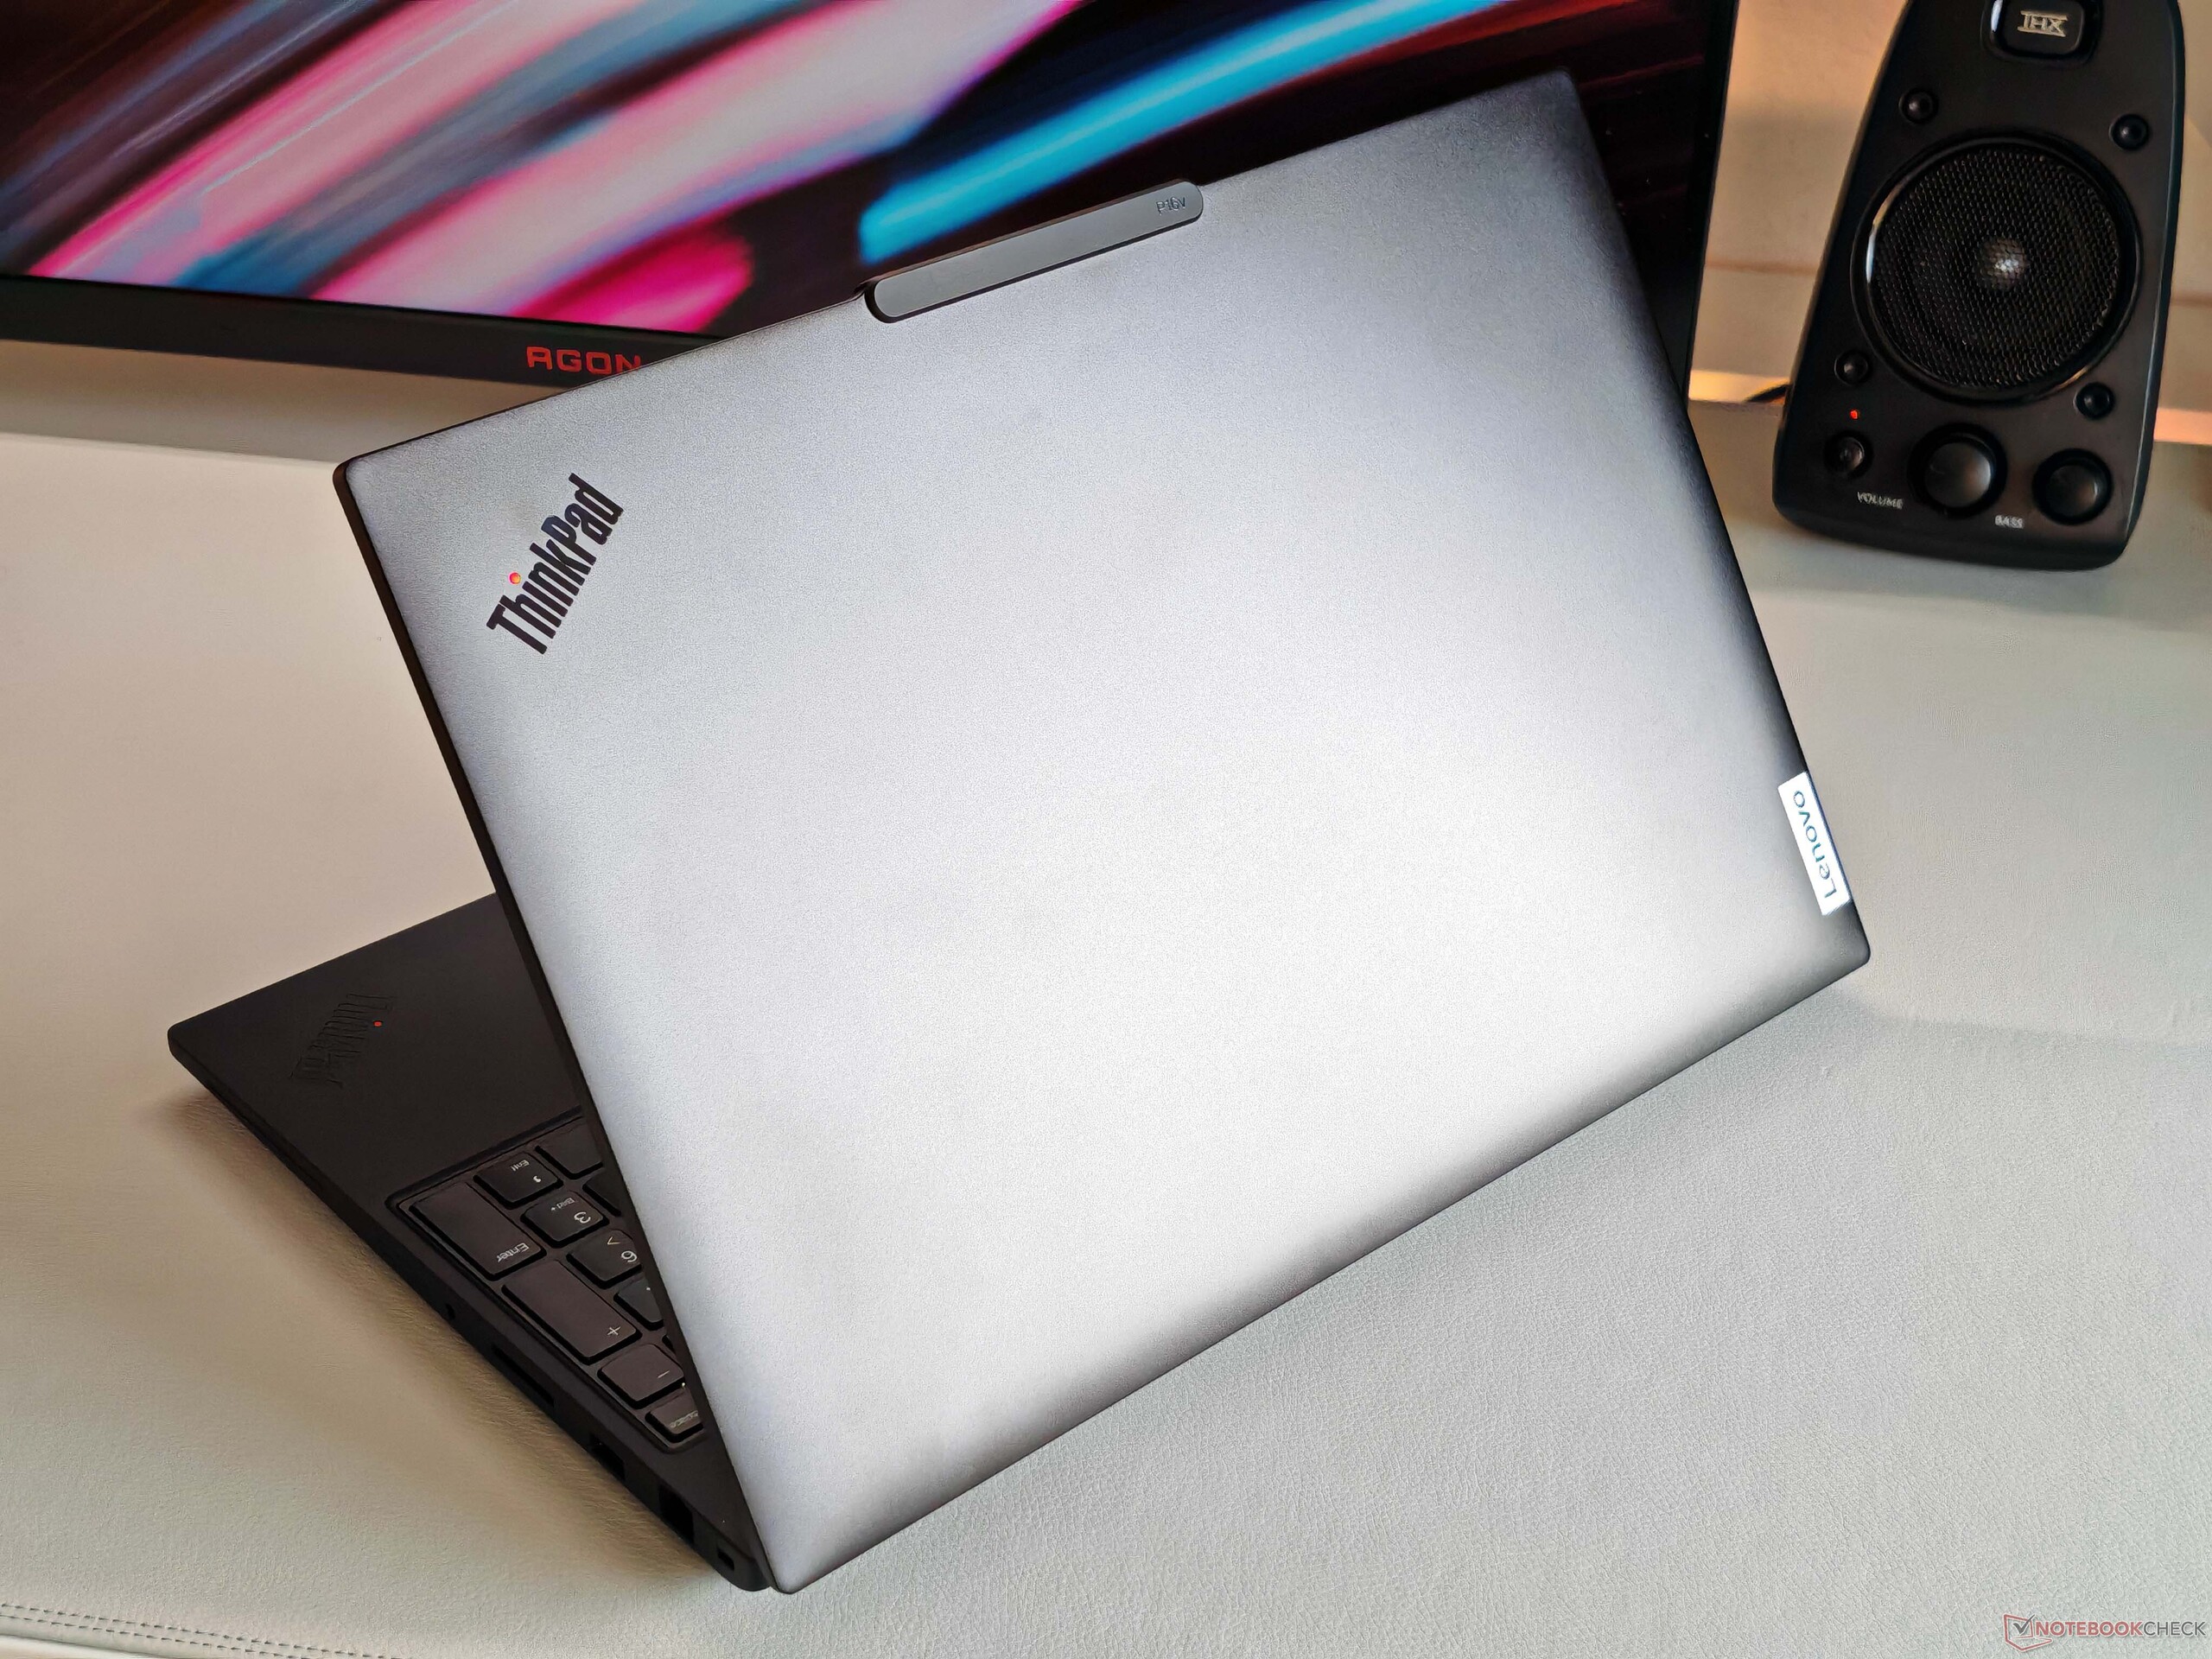
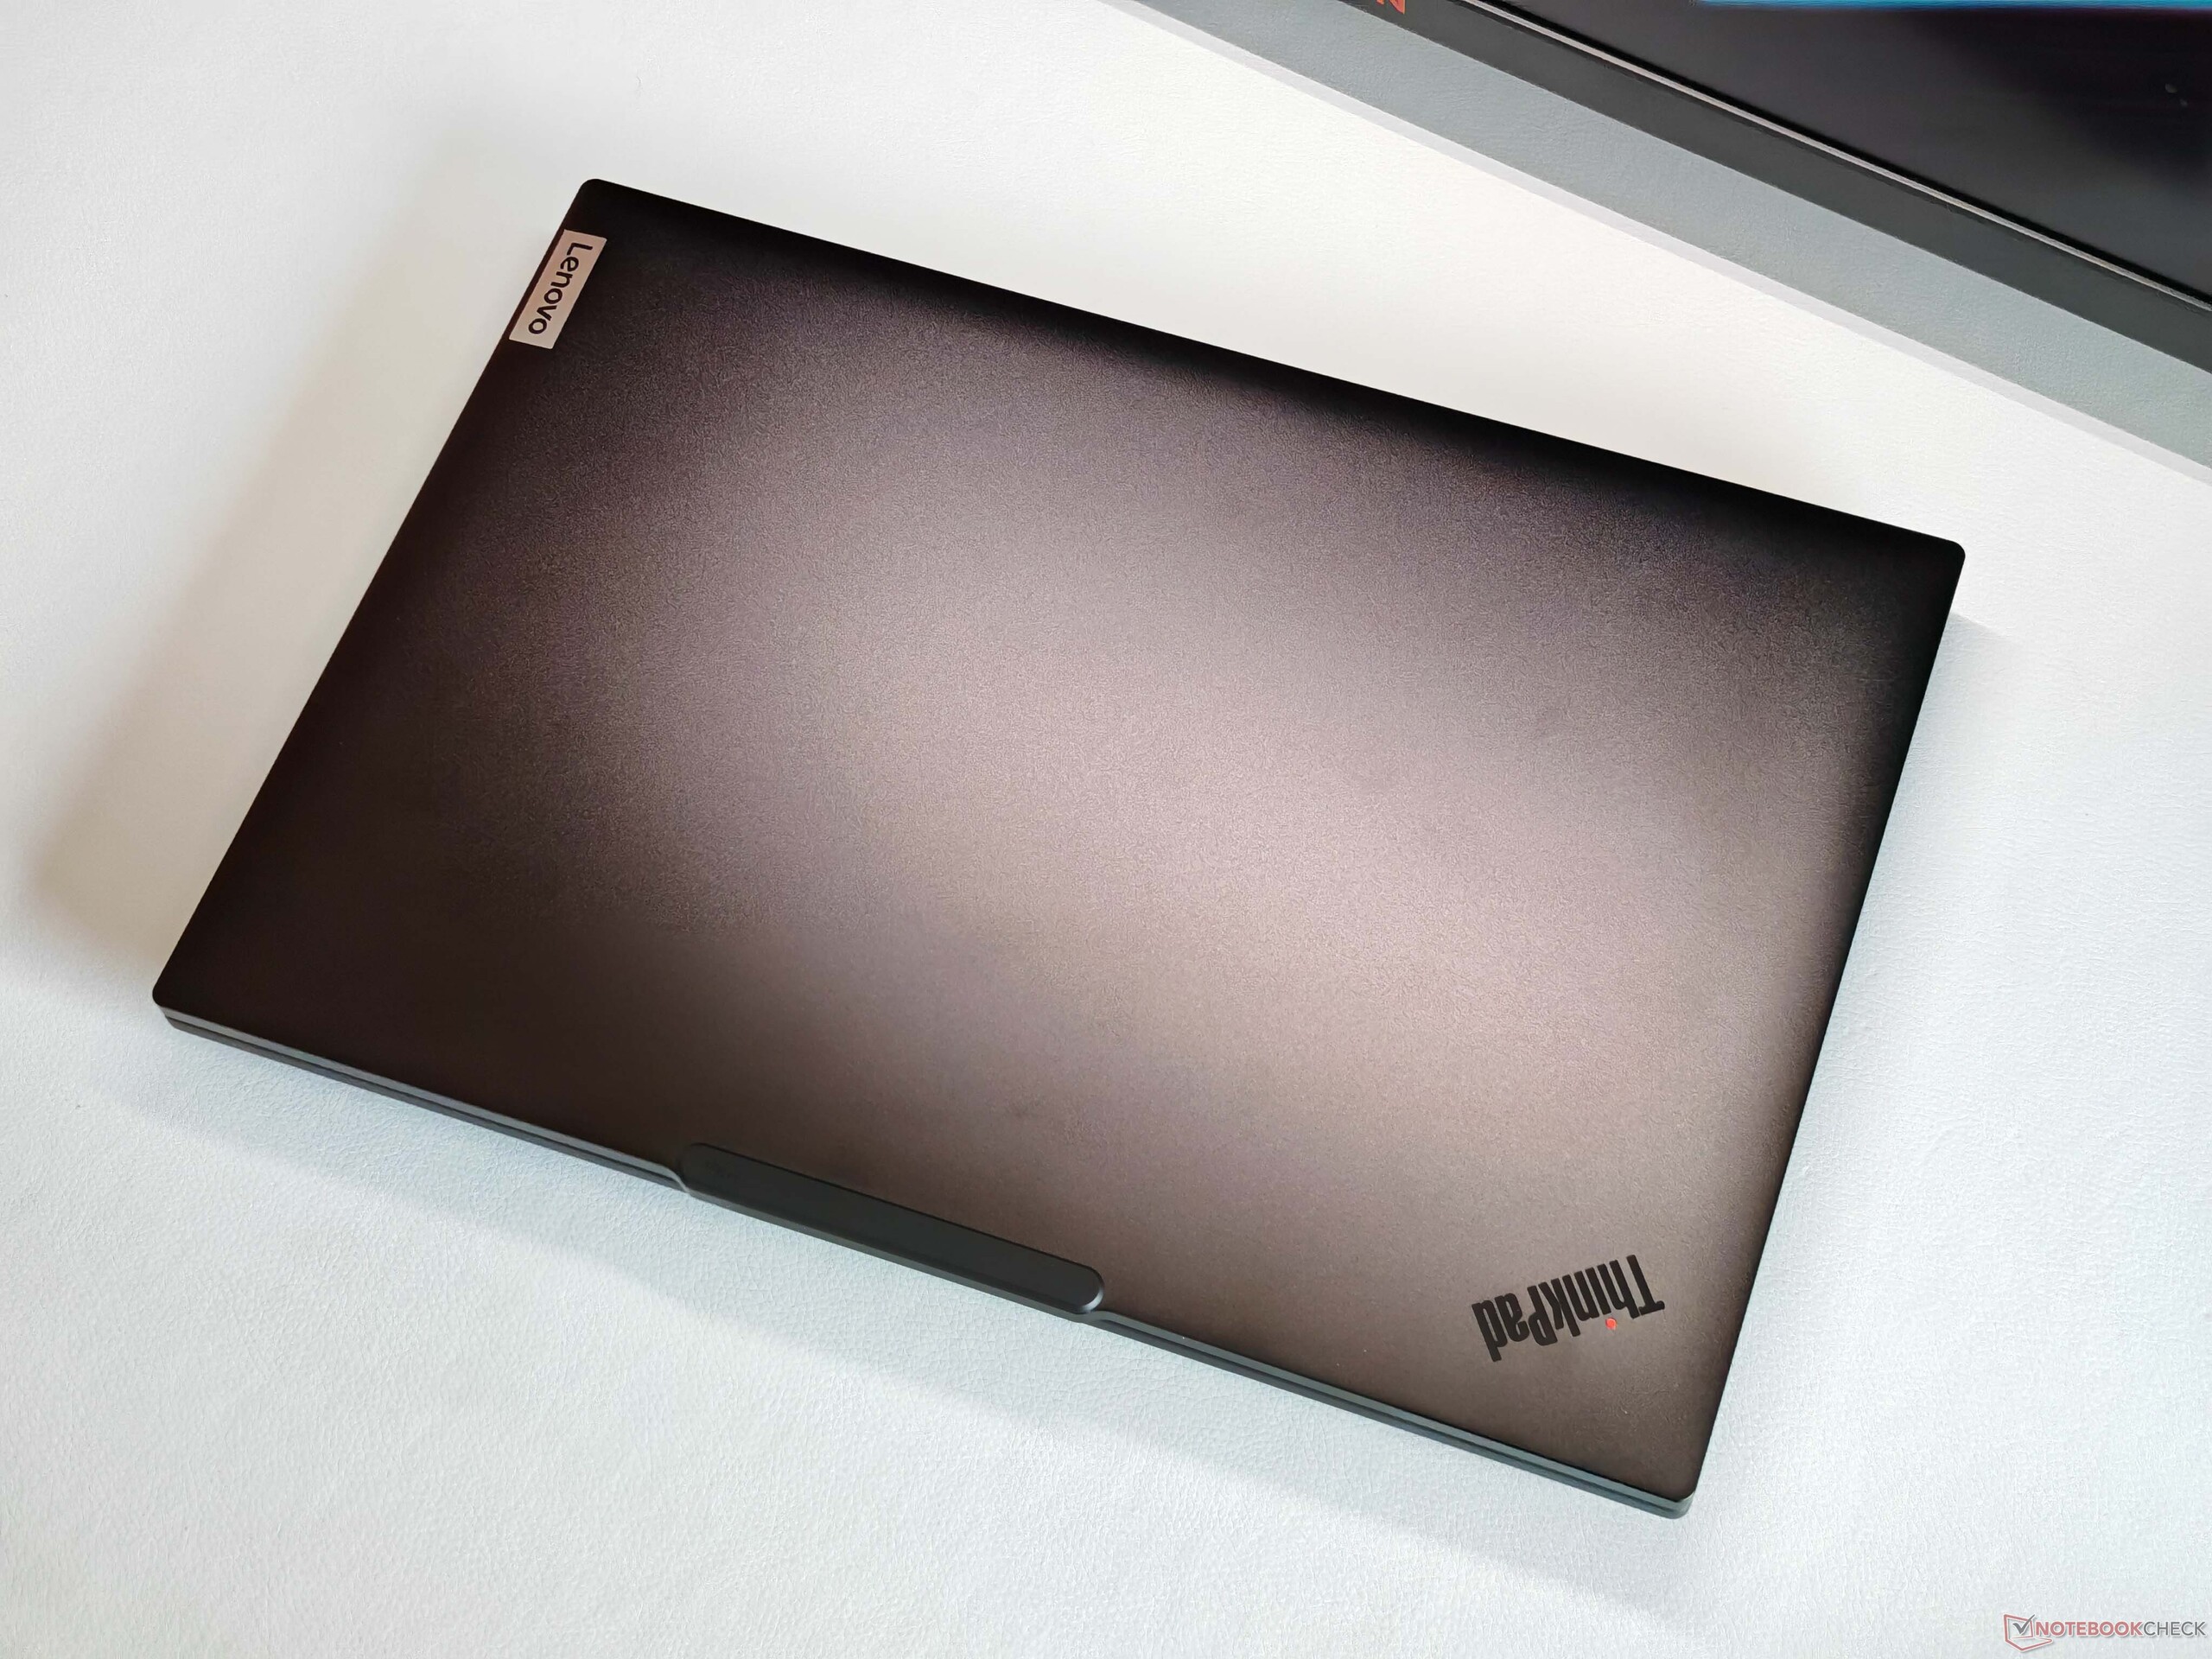
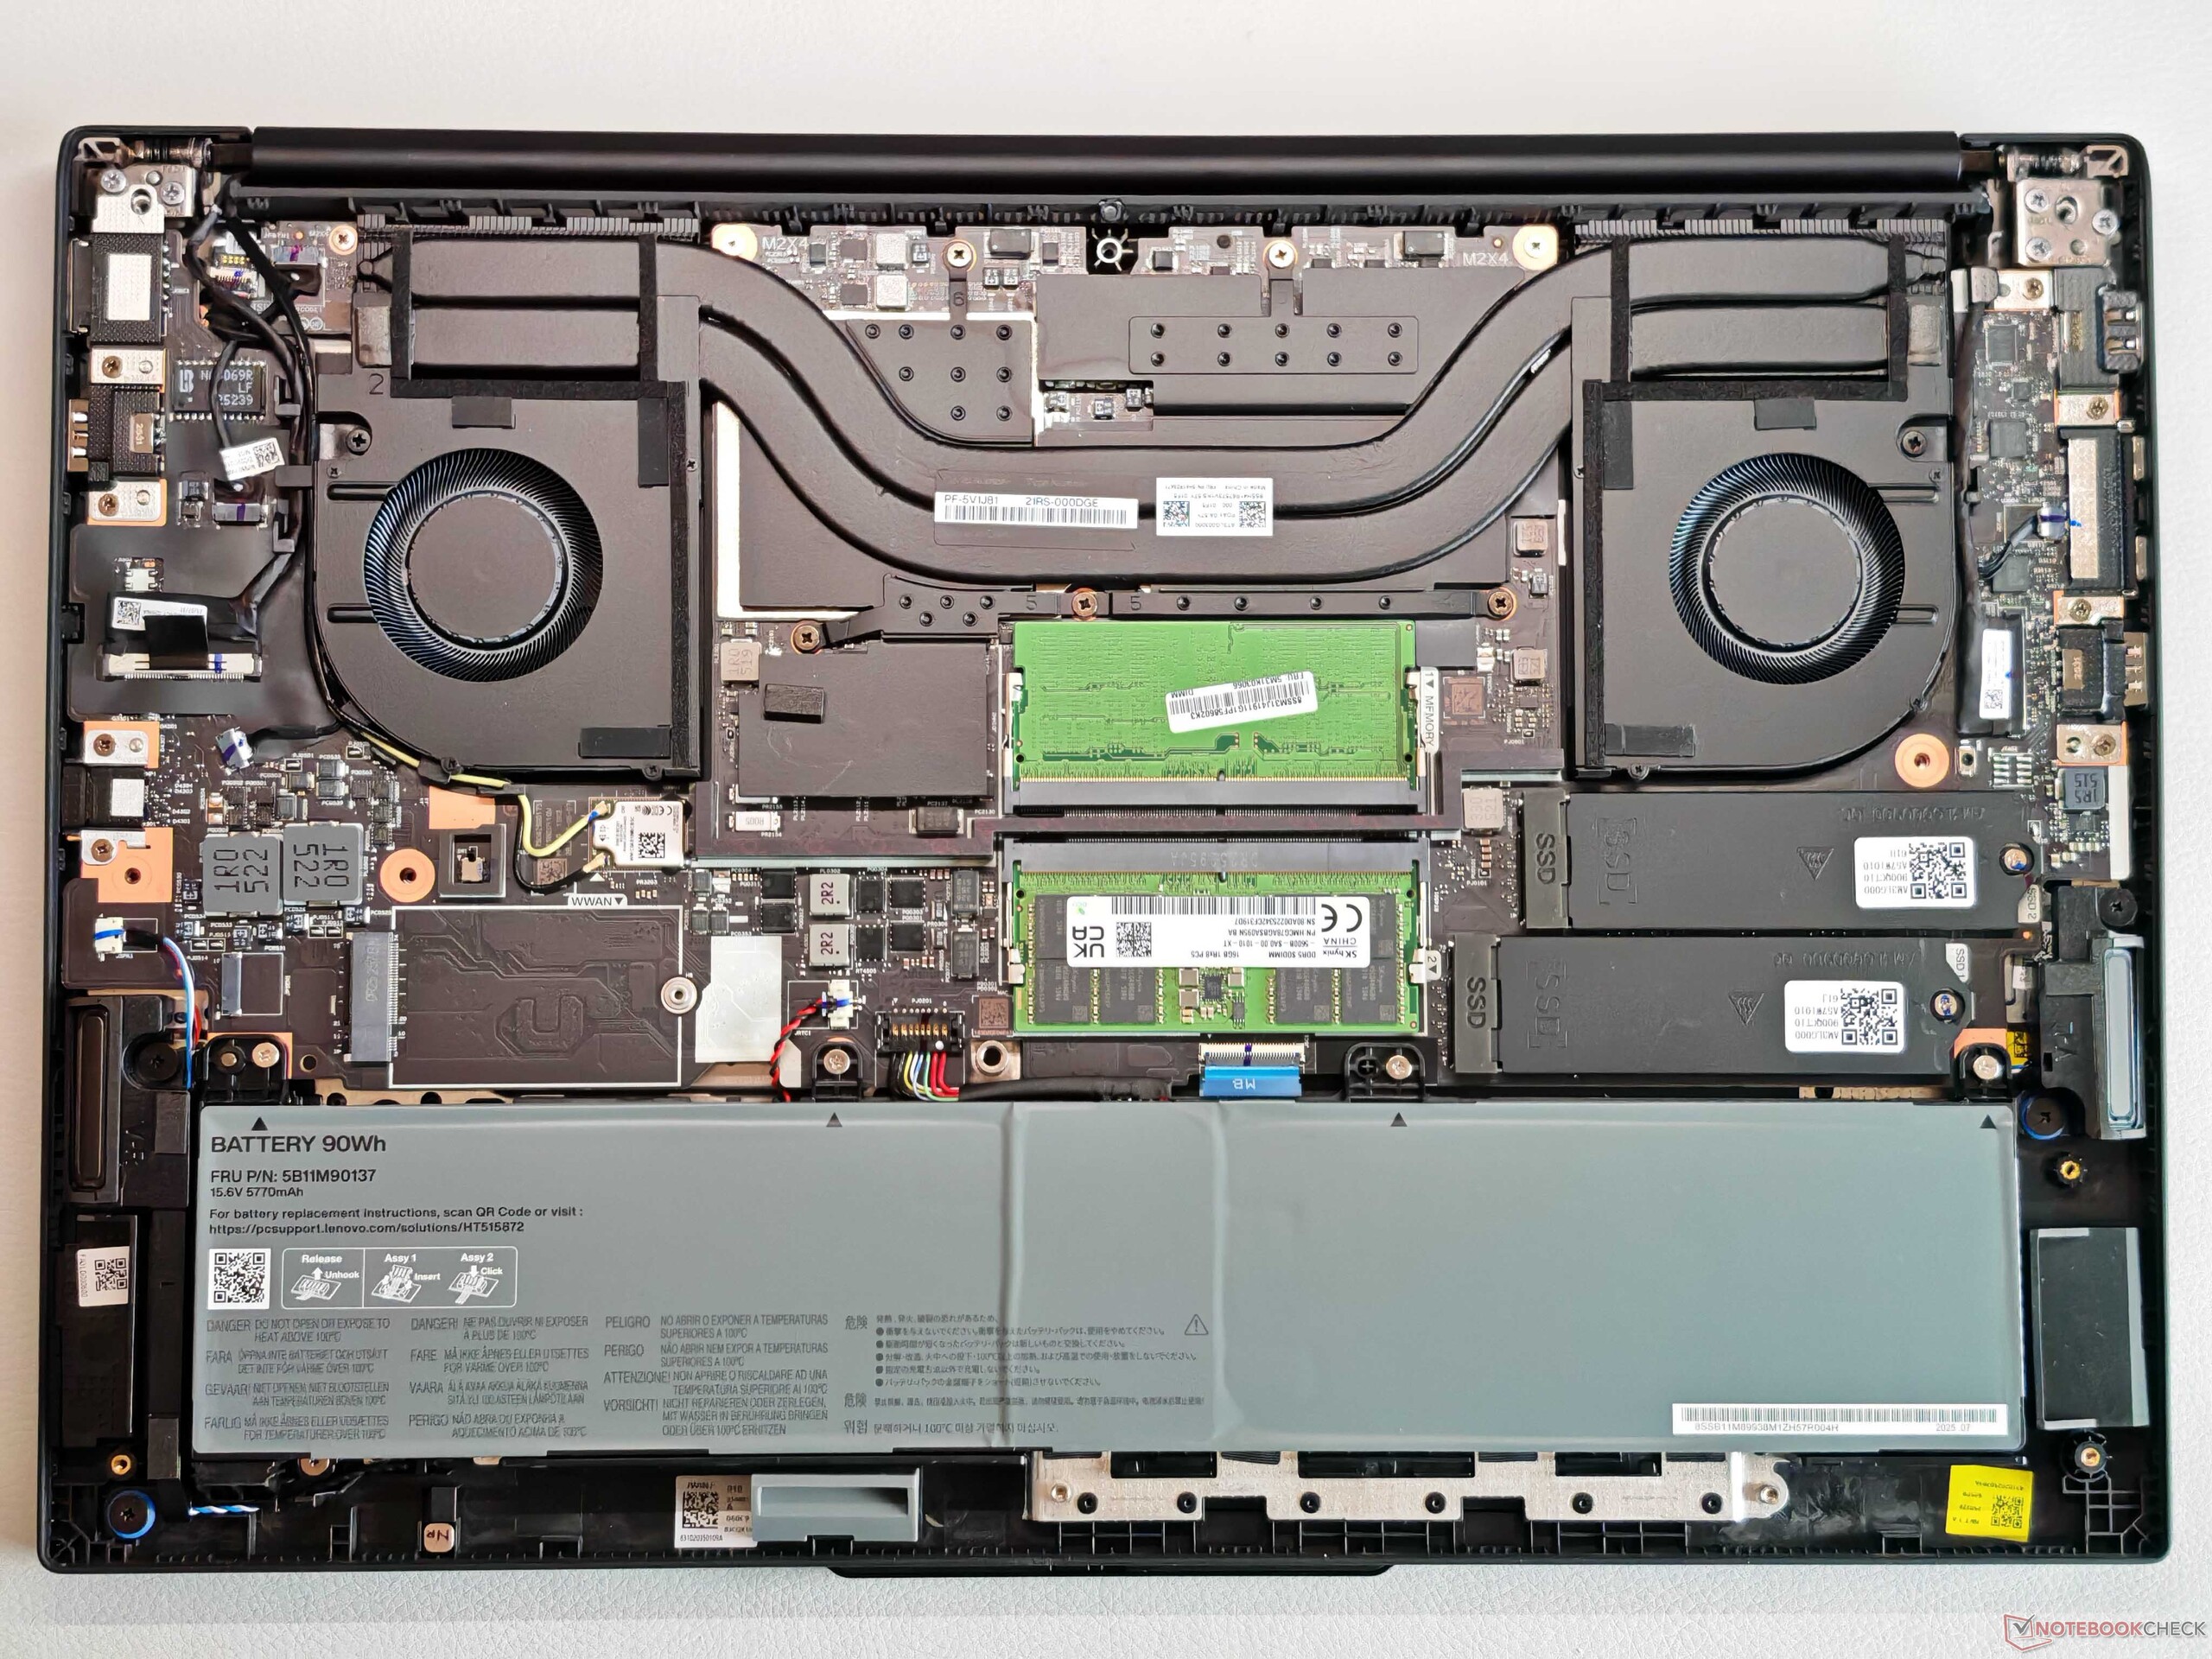
Despite the high price, you can see the classification as an entry-level workstation in the casing, as only plastic is used here. The design is typical of the current ThinkPads, including the unsightly camera hump. The workmanship is basically good, but the stability is disappointing, especially considering the rather thick base unit. The middle area of the keyboard in particular can be visibly dented, but we were unable to provoke any creaking noises. The display lid performs better, but the hinges bounce a little (max. opening angle 180 degrees). The smooth lid in particular is very susceptible to fingerprints and is also difficult to clean. The maintenance options are very good overall (2x RAM, 2x SSD).
There's not much to complain about in terms of connections, but one of the two Thunderbolt 4 ports is always occupied by the power supply unit. The Wi-Fi 7 module achieves good and stable transfer rates, and there is also an Ethernet port available. There is also space for a WWAN module, but the antennas are not pre-routed (not WWAN-ready). The card reader achieves average transfer rates and the 5 MP webcam (with shutter + IR) takes usable pictures.


| SD Card Reader | |
| average JPG Copy Test (av. of 3 runs) | |
| HP ZBook X G1i 16 (Toshiba Exceria Pro SDXC 64 GB UHS-II) | |
| HP ZBook Power 16 G11 A (Toshiba Exceria Pro SDXC 64 GB UHS-II) | |
| Average of class Workstation (49.6 - 681, n=14, last 2 years) | |
| Lenovo ThinkPad P1 Gen 8 (Toshiba Exceria Pro SDXC 64 GB UHS-II) | |
| Lenovo ThinkPad P16v G3 21RS000DGE (Angelbird AV Pro V60) | |
| maximum AS SSD Seq Read Test (1GB) | |
| HP ZBook Power 16 G11 A (Toshiba Exceria Pro SDXC 64 GB UHS-II) | |
| HP ZBook X G1i 16 (Toshiba Exceria Pro SDXC 64 GB UHS-II) | |
| Average of class Workstation (87.6 - 1455, n=14, last 2 years) | |
| Lenovo ThinkPad P16v G3 21RS000DGE (Angelbird AV Pro V60) | |
| Lenovo ThinkPad P1 Gen 8 (Toshiba Exceria Pro SDXC 64 GB UHS-II) | |
| Networking | |
| Lenovo ThinkPad P16v G3 21RS000DGE | |
| iperf3 transmit AXE11000 | |
| iperf3 receive AXE11000 | |
| Lenovo ThinkPad P1 Gen 8 | |
| iperf3 transmit AXE11000 | |
| iperf3 receive AXE11000 | |
| iperf3 transmit AXE11000 6GHz | |
| iperf3 receive AXE11000 6GHz | |
| HP ZBook X G1i 16 | |
| iperf3 transmit AXE11000 | |
| iperf3 receive AXE11000 | |
| iperf3 transmit AXE11000 6GHz | |
| iperf3 receive AXE11000 6GHz | |
| HP ZBook Power 16 G11 A | |
| iperf3 transmit AXE11000 | |
| iperf3 receive AXE11000 | |
| iperf3 transmit AXE11000 6GHz | |
| iperf3 receive AXE11000 6GHz | |
| Lenovo ThinkPad P16s Gen 4 21RX000YGE | |
| iperf3 transmit AXE11000 | |
| iperf3 receive AXE11000 | |
| iperf3 transmit AXE11000 6GHz | |
| iperf3 receive AXE11000 6GHz | |


Sustainability
Lenovo provides extensive information on the CO2 balance and the use of recycled materials.


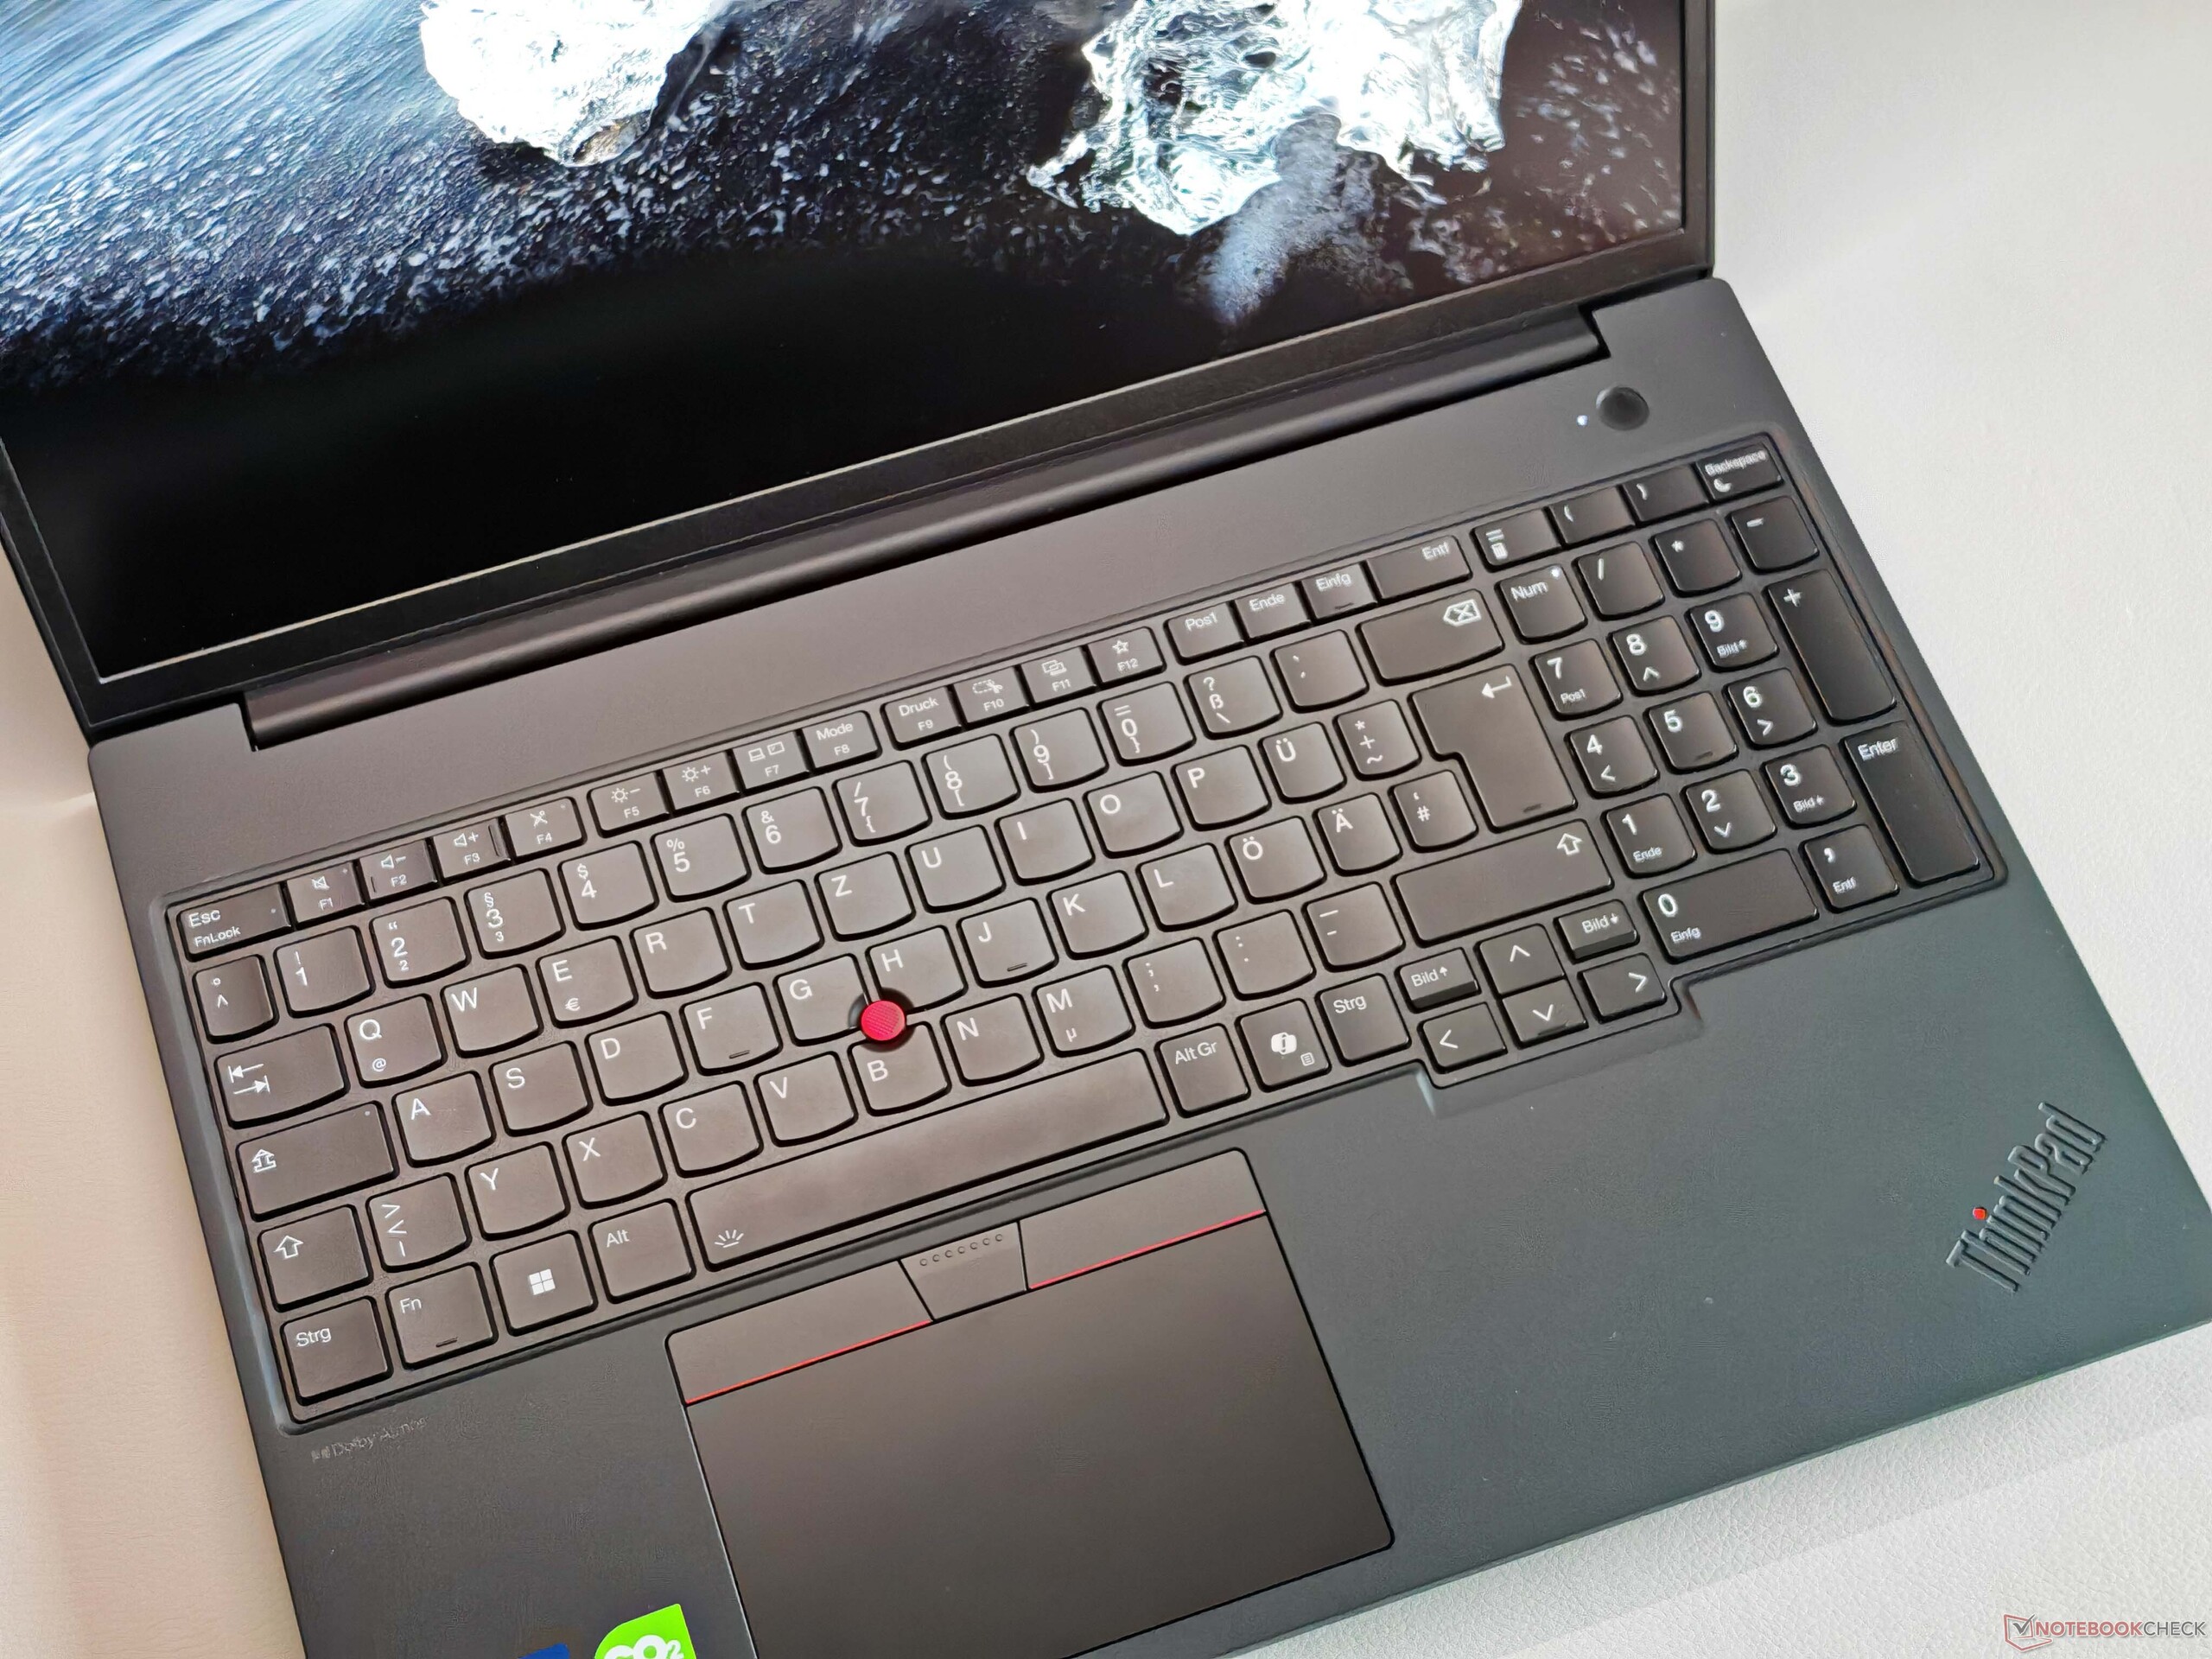
Input devices - Average keyboard
The backlit keyboard including numeric keypad also meets the current ThinkPad standard, although there are significantly better models in the current line-up (e.g ThinkPad P1 16 G8). Overall, we would describe the typing feel as comfortable and precise, but the competition can do this at least as well. The ClickPad (11.5 x 6.7 cm/~4.5 x ~2.6 inches) is quite small by modern standards due to the dedicated TrackPoint buttons, but the operation is excellent and the mechanical clicks in the lower area are also extremely high-quality. This also applies to the TrackPoint buttons.


Display - IPS with 500 cd/m²

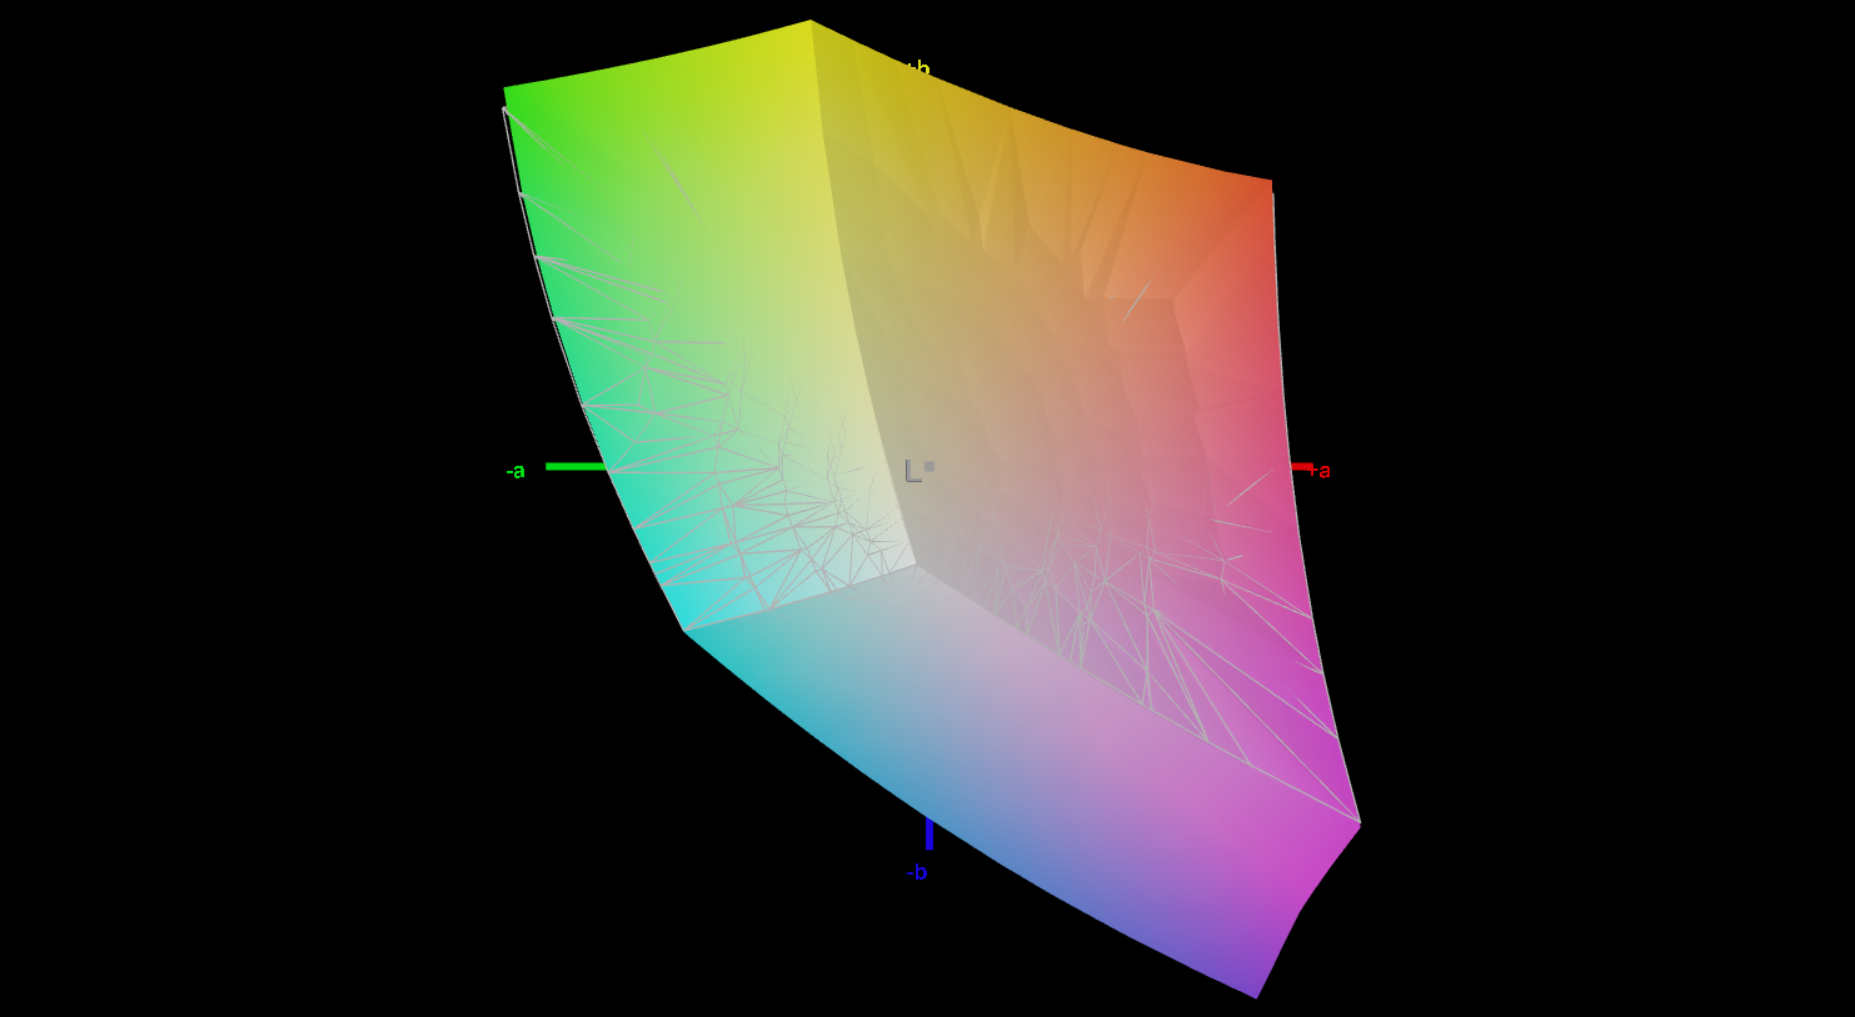
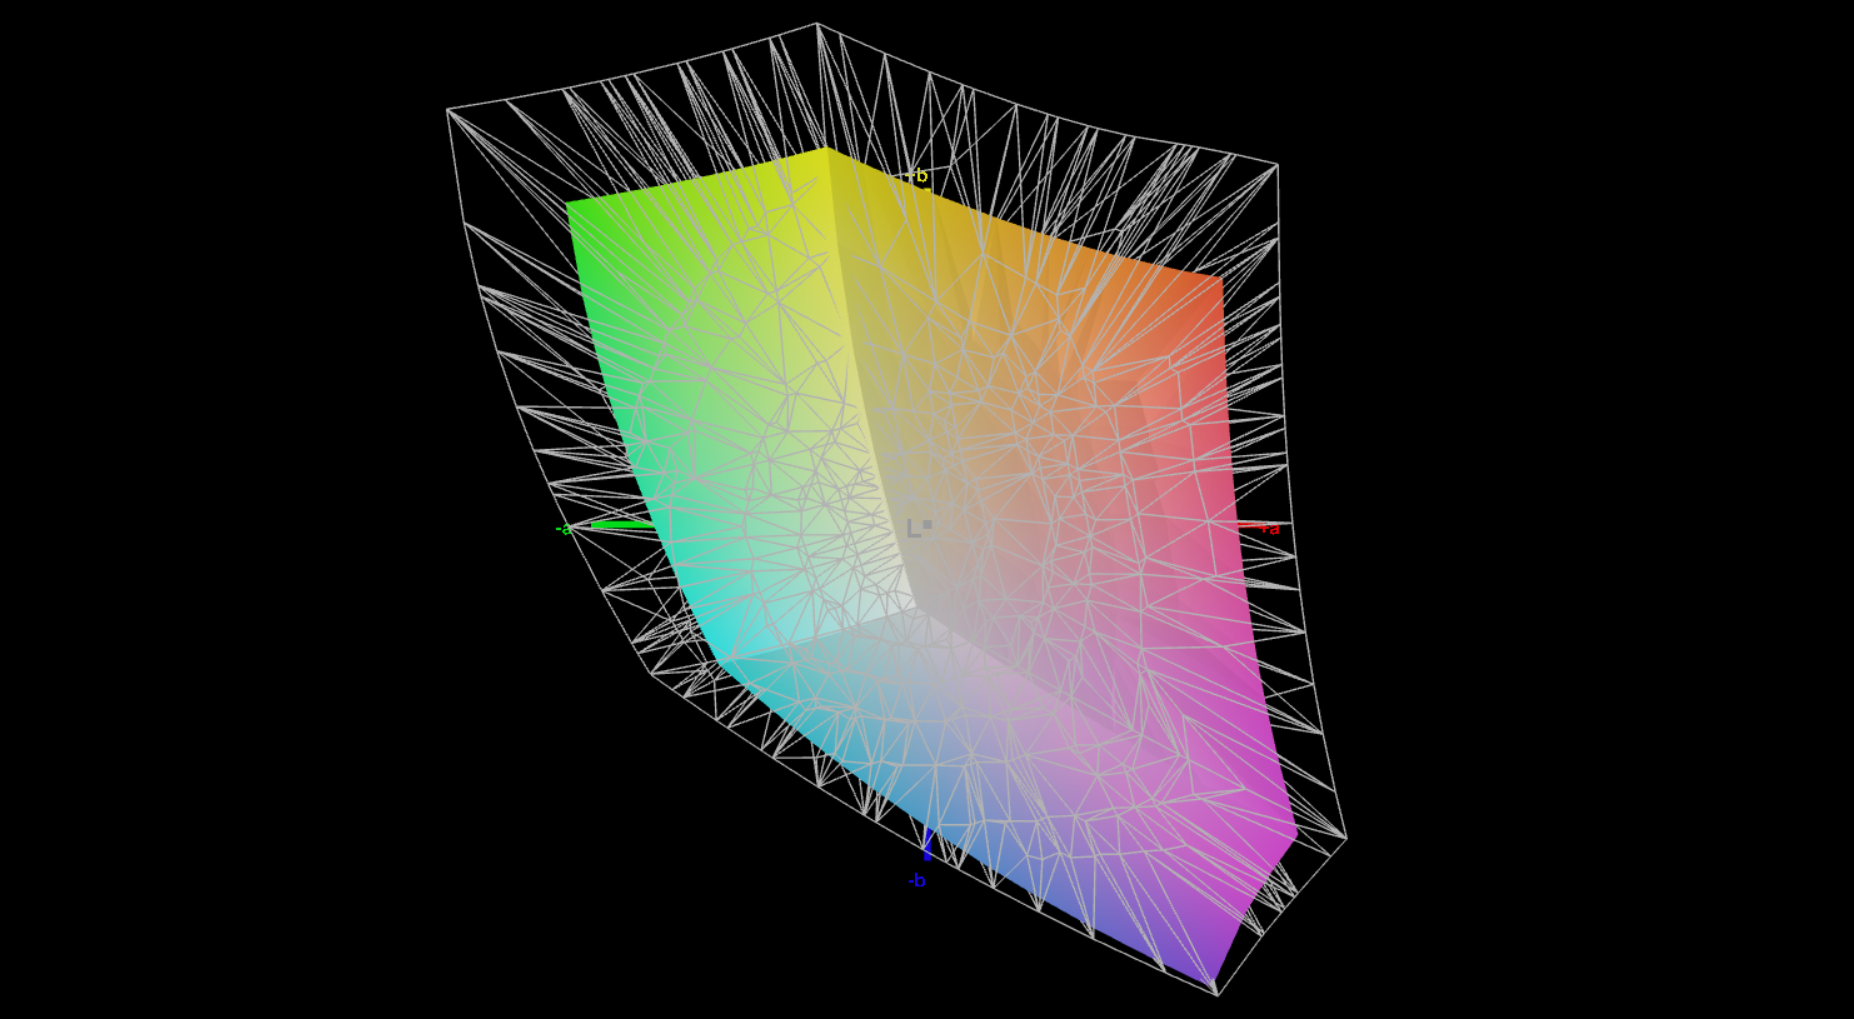
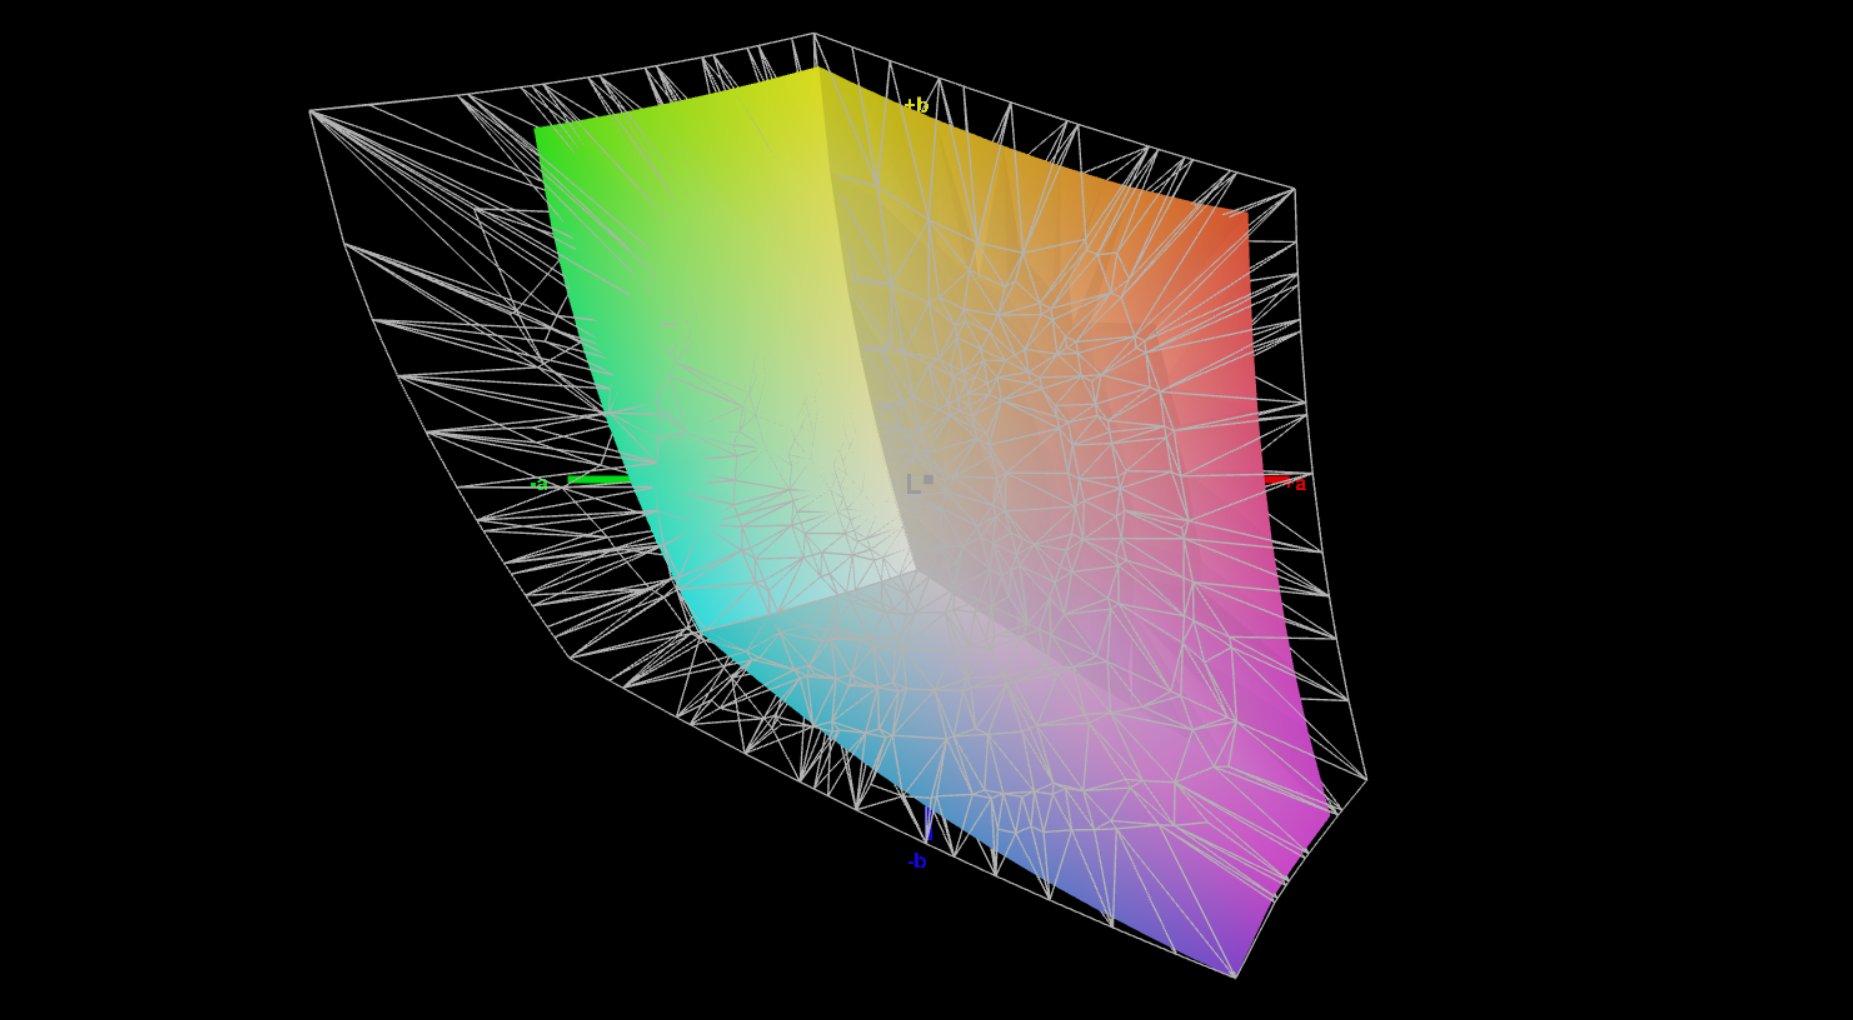
Lenovo only offers 60 Hz screens (IPS & OLED) for the P16v Gen 3, which is somewhat surprising considering the high price. The standard Full HD IPS model (1,920 x 1,200 pixels, 16:10) with a matte surface is installed in our test device. The subjective picture impression is generally good, but bright areas appear slightly grainy on closer inspection. There is no PWM flickering and the response times are generally unremarkable.
The average brightness is a very good ~554 cd/m² and, in conjunction with the black level of 0.33 cd/m², this results in a high contrast ratio (~1,700:1). The factory color profile already shows a good performance in our analysis with the professional CalMAN software, but we were able to improve the display even further with our own calibration.
| |||||||||||||||||||||||||
Brightness Distribution: 90 %
Center on Battery: 565 cd/m²
Contrast: 1712:1 (Black: 0.33 cd/m²)
ΔE ColorChecker Calman: 1.8 | ∀{0.5-29.43 Ø4.72}
calibrated: 0.7
ΔE Greyscale Calman: 2.9 | ∀{0.09-98 Ø4.97}
70.6% AdobeRGB 1998 (Argyll 3D)
99.7% sRGB (Argyll 3D)
68.4% Display P3 (Argyll 3D)
Gamma: 2.23
CCT: 6534 K
| Lenovo ThinkPad P16v G3 21RS000DGE M160NW49 R0, IPS, 1920x1200, 16", 60 Hz | Lenovo ThinkPad P1 Gen 8 Samsung ATNA60KA02-0, Tandem OLED, 3200x2000, 16", 120 Hz | HP ZBook X G1i 16 LG Philips LGD07B3, IPS, 2560x1600, 16", 120 Hz | HP ZBook Power 16 G11 A AUOA0A9, IPS, 2560x1600, 16", 120 Hz | Lenovo ThinkPad P16s Gen 4 21RX000YGE N160JCA-GT1, IPS LED, 1920x1200, 16", 60 Hz | |
|---|---|---|---|---|---|
| Display | 27% | 28% | 0% | -4% | |
| Display P3 Coverage (%) | 68.4 | 98.8 44% | 97.2 42% | 69.1 1% | 65.8 -4% |
| sRGB Coverage (%) | 99.7 | 100 0% | 100 0% | 97.7 -2% | 96.8 -3% |
| AdobeRGB 1998 Coverage (%) | 70.6 | 97.5 38% | 99.9 42% | 71 1% | 67.8 -4% |
| Response Times | 97% | -51% | 53% | -17% | |
| Response Time Grey 50% / Grey 80% * (ms) | 39.2 ? | 0.57 ? 99% | 45.5 ? -16% | 13.6 ? 65% | 29.4 ? 25% |
| Response Time Black / White * (ms) | 14.1 ? | 0.73 ? 95% | 26.1 ? -85% | 8.4 ? 40% | 22.4 ? -59% |
| PWM Frequency (Hz) | 1199 | 26536 ? | |||
| PWM Amplitude * (%) | 18 | 47 | |||
| Screen | 15% | -41% | -35% | -27% | |
| Brightness middle (cd/m²) | 565 | 561.8 -1% | 461.8 -18% | 470.7 -17% | 540 -4% |
| Brightness (cd/m²) | 554 | 566 2% | 427 -23% | 431 -22% | 516 -7% |
| Brightness Distribution (%) | 90 | 99 10% | 88 -2% | 88 -2% | 93 3% |
| Black Level * (cd/m²) | 0.33 | 0.46 -39% | 0.57 -73% | 0.37 -12% | |
| Contrast (:1) | 1712 | 1004 -41% | 826 -52% | 1459 -15% | |
| Colorchecker dE 2000 * | 1.8 | 1.29 28% | 4.08 -127% | 2.16 -20% | 3.4 -89% |
| Colorchecker dE 2000 max. * | 4.2 | 2.96 30% | 8.1 -93% | 4.39 -5% | 5.6 -33% |
| Colorchecker dE 2000 calibrated * | 0.7 | 0.81 -16% | 0.75 -7% | 1.37 -96% | 0.9 -29% |
| Greyscale dE 2000 * | 2.9 | 1.4 52% | 3.5 -21% | 3.7 -28% | 4.5 -55% |
| Gamma | 2.23 99% | 2.23 99% | 2.15 102% | 2.38 92% | 2.51 88% |
| CCT | 6534 99% | 6319 103% | 6715 97% | 6765 96% | 6294 103% |
| Total Average (Program / Settings) | 46% /
32% | -21% /
-28% | 6% /
-15% | -16% /
-20% |
* ... smaller is better


Display Response Times
| ↔ Response Time Black to White | ||
|---|---|---|
| 14.1 ms ... rise ↗ and fall ↘ combined | ↗ 4.6 ms rise | 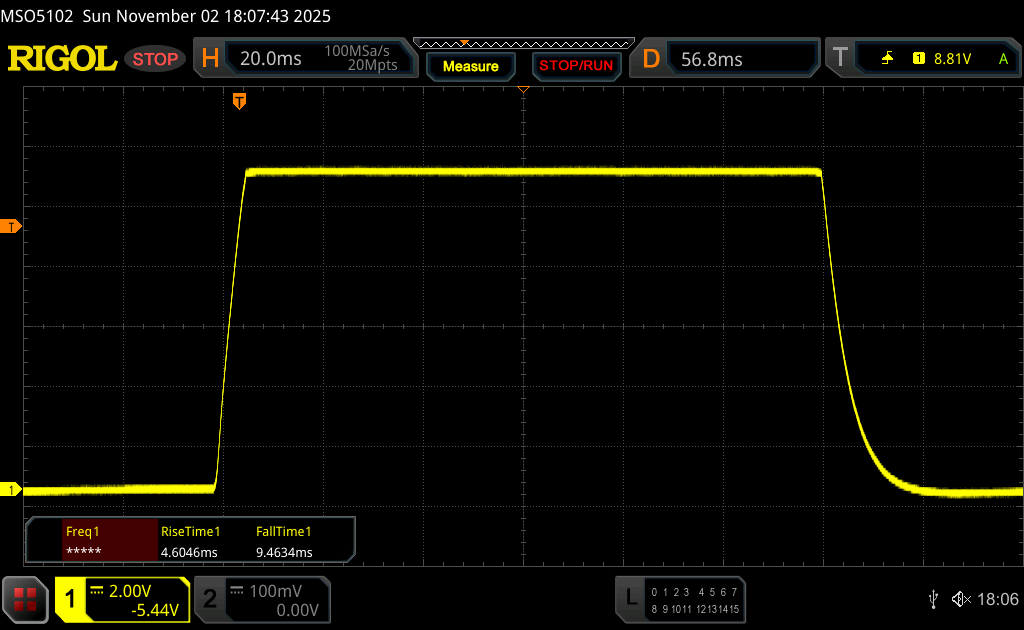 |
| ↘ 9.5 ms fall | ||
| The screen shows good response rates in our tests, but may be too slow for competitive gamers. In comparison, all tested devices range from 0.1 (minimum) to 240 (maximum) ms. » 35 % of all devices are better. This means that the measured response time is better than the average of all tested devices (19.8 ms). | ||
| ↔ Response Time 50% Grey to 80% Grey | ||
| 39.2 ms ... rise ↗ and fall ↘ combined | ↗ 17.5 ms rise | 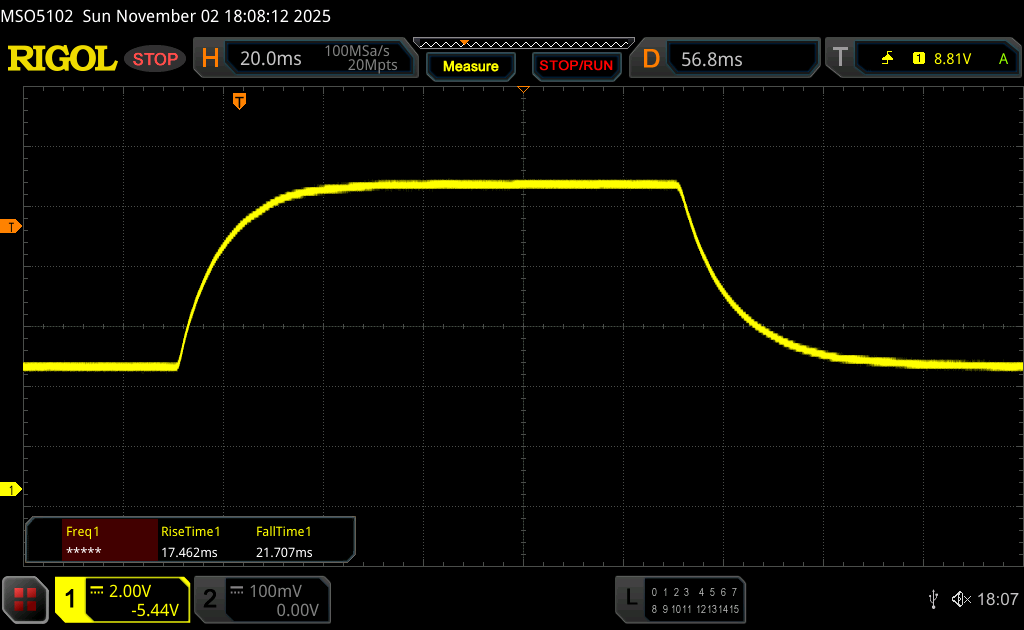 |
| ↘ 21.7 ms fall | ||
| The screen shows slow response rates in our tests and will be unsatisfactory for gamers. In comparison, all tested devices range from 0.165 (minimum) to 636 (maximum) ms. » 60 % of all devices are better. This means that the measured response time is worse than the average of all tested devices (31 ms). | ||
Screen Flickering / PWM (Pulse-Width Modulation)
| Screen flickering / PWM not detected | 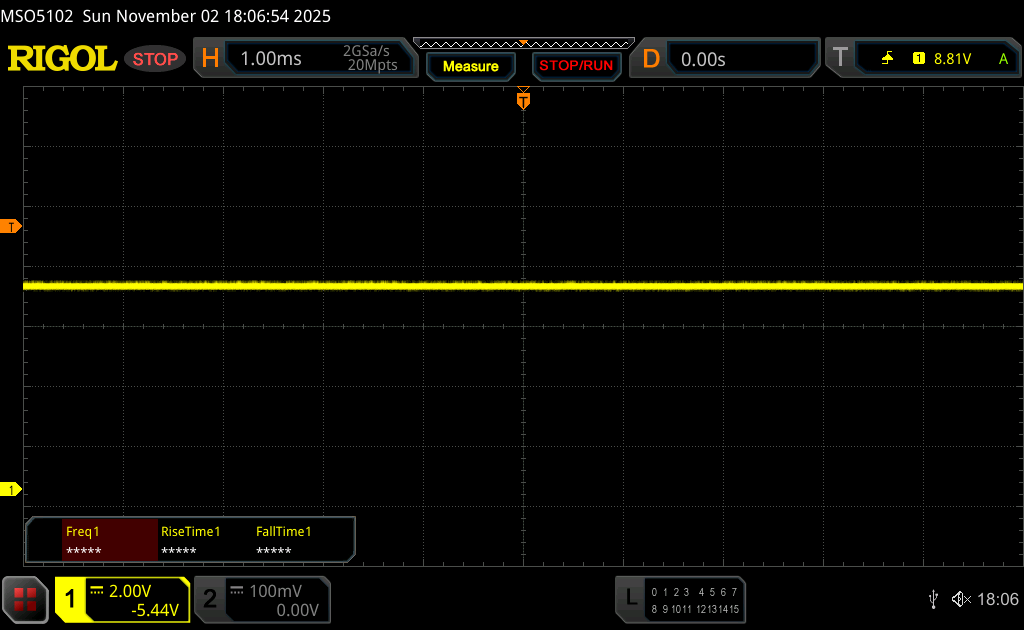 | ||
In comparison: 52 % of all tested devices do not use PWM to dim the display. If PWM was detected, an average of 7750 (minimum: 5 - maximum: 343500) Hz was measured. | |||


Performance - Arrow Lake & RTX PRO 2000
Test conditions
Lenovo's energy profiles are directly linked to the Windows settings on the ThinkPads. We performed the benchmarks and measurements in Best Performance mode.
Processor
The test device contains the Intel Core Ultra 7 255H (Arrow Lake), which can consume up to 115 watts for short periods and 70 watts continuously. The CPU performance is good overall, even if some of the competitors are even slightly faster. In battery mode, the processor can consume a maximum of 40 watts, which is why the multi-core performance is around 14% lower here.
Cinebench R15 Multi endurance test
Cinebench R23: Multi Core | Single Core
Cinebench R20: CPU (Multi Core) | CPU (Single Core)
Cinebench R15: CPU Multi 64Bit | CPU Single 64Bit
Blender: v2.79 BMW27 CPU
7-Zip 18.03: 7z b 4 | 7z b 4 -mmt1
Geekbench 6.7: Multi-Core | Single-Core
Geekbench 5.5: Multi-Core | Single-Core
HWBOT x265 Benchmark v2.2: 4k Preset
LibreOffice : 20 Documents To PDF
R Benchmark 2.5: Overall mean
| CPU Performance rating | |
| Average of class Workstation | |
| HP ZBook X G1i 16 | |
| Lenovo ThinkPad P16v G3 21RS000DGE | |
| Lenovo ThinkPad P1 Gen 8 | |
| Average Intel Core Ultra 7 255H | |
| Lenovo ThinkPad P16s Gen 4 21RX000YGE | |
| HP ZBook Power 16 G11 A | |
| Cinebench R23 / Multi Core | |
| Average of class Workstation (14621 - 38520, n=24, last 2 years) | |
| Lenovo ThinkPad P1 Gen 8 | |
| HP ZBook X G1i 16 | |
| Lenovo ThinkPad P16v G3 21RS000DGE | |
| Average Intel Core Ultra 7 255H (16105 - 22578, n=20) | |
| Lenovo ThinkPad P16s Gen 4 21RX000YGE | |
| HP ZBook Power 16 G11 A | |
| Cinebench R23 / Single Core | |
| Lenovo ThinkPad P16v G3 21RS000DGE | |
| Average Intel Core Ultra 7 255H (1874 - 2152, n=20) | |
| Average of class Workstation (1712 - 2228, n=24, last 2 years) | |
| HP ZBook X G1i 16 | |
| Lenovo ThinkPad P1 Gen 8 | |
| Lenovo ThinkPad P16s Gen 4 21RX000YGE | |
| HP ZBook Power 16 G11 A | |
| Cinebench R20 / CPU (Multi Core) | |
| Average of class Workstation (5760 - 15043, n=24, last 2 years) | |
| Lenovo ThinkPad P1 Gen 8 | |
| HP ZBook X G1i 16 | |
| Lenovo ThinkPad P16v G3 21RS000DGE | |
| Average Intel Core Ultra 7 255H (6356 - 8860, n=19) | |
| Lenovo ThinkPad P16s Gen 4 21RX000YGE | |
| HP ZBook Power 16 G11 A | |
| Cinebench R20 / CPU (Single Core) | |
| Lenovo ThinkPad P16v G3 21RS000DGE | |
| Lenovo ThinkPad P16s Gen 4 21RX000YGE | |
| Average Intel Core Ultra 7 255H (743 - 826, n=19) | |
| Average of class Workstation (671 - 857, n=24, last 2 years) | |
| HP ZBook X G1i 16 | |
| Lenovo ThinkPad P1 Gen 8 | |
| HP ZBook Power 16 G11 A | |
| Cinebench R15 / CPU Multi 64Bit | |
| Average of class Workstation (2489 - 5810, n=24, last 2 years) | |
| HP ZBook X G1i 16 | |
| Lenovo ThinkPad P1 Gen 8 | |
| Lenovo ThinkPad P16v G3 21RS000DGE | |
| Lenovo ThinkPad P16s Gen 4 21RX000YGE | |
| Average Intel Core Ultra 7 255H (2414 - 3444, n=19) | |
| HP ZBook Power 16 G11 A | |
| Cinebench R15 / CPU Single 64Bit | |
| Lenovo ThinkPad P16s Gen 4 21RX000YGE | |
| HP ZBook X G1i 16 | |
| Average Intel Core Ultra 7 255H (258 - 322, n=20) | |
| Lenovo ThinkPad P1 Gen 8 | |
| Lenovo ThinkPad P16v G3 21RS000DGE | |
| Average of class Workstation (191.4 - 328, n=24, last 2 years) | |
| HP ZBook Power 16 G11 A | |
| Blender / v2.79 BMW27 CPU | |
| HP ZBook Power 16 G11 A | |
| Average Intel Core Ultra 7 255H (156 - 293, n=19) | |
| Lenovo ThinkPad P16s Gen 4 21RX000YGE | |
| Lenovo ThinkPad P16v G3 21RS000DGE | |
| Lenovo ThinkPad P1 Gen 8 | |
| HP ZBook X G1i 16 | |
| Average of class Workstation (91 - 222, n=24, last 2 years) | |
| 7-Zip 18.03 / 7z b 4 | |
| Average of class Workstation (60489 - 116969, n=24, last 2 years) | |
| Lenovo ThinkPad P16s Gen 4 21RX000YGE | |
| HP ZBook X G1i 16 | |
| Lenovo ThinkPad P16v G3 21RS000DGE | |
| HP ZBook Power 16 G11 A | |
| Lenovo ThinkPad P1 Gen 8 | |
| Average Intel Core Ultra 7 255H (42155 - 70397, n=20) | |
| 7-Zip 18.03 / 7z b 4 -mmt1 | |
| HP ZBook Power 16 G11 A | |
| Lenovo ThinkPad P16s Gen 4 21RX000YGE | |
| Lenovo ThinkPad P16v G3 21RS000DGE | |
| Average of class Workstation (5126 - 6960, n=24, last 2 years) | |
| HP ZBook X G1i 16 | |
| Average Intel Core Ultra 7 255H (4589 - 6385, n=20) | |
| Lenovo ThinkPad P1 Gen 8 | |
| Geekbench 6.7 / Multi-Core | |
| HP ZBook X G1i 16 | |
| Lenovo ThinkPad P1 Gen 8 | |
| Lenovo ThinkPad P16v G3 21RS000DGE | |
| Average of class Workstation (12721 - 20887, n=24, last 2 years) | |
| Average Intel Core Ultra 7 255H (11979 - 17489, n=20) | |
| Lenovo ThinkPad P16s Gen 4 21RX000YGE | |
| HP ZBook Power 16 G11 A | |
| Geekbench 6.7 / Single-Core | |
| Lenovo ThinkPad P16s Gen 4 21RX000YGE | |
| Lenovo ThinkPad P16v G3 21RS000DGE | |
| HP ZBook X G1i 16 | |
| Average Intel Core Ultra 7 255H (2712 - 2939, n=20) | |
| Lenovo ThinkPad P1 Gen 8 | |
| Average of class Workstation (2389 - 3065, n=24, last 2 years) | |
| HP ZBook Power 16 G11 A | |
| Geekbench 5.5 / Multi-Core | |
| Average of class Workstation (11542 - 25554, n=24, last 2 years) | |
| Lenovo ThinkPad P1 Gen 8 | |
| HP ZBook X G1i 16 | |
| Lenovo ThinkPad P16v G3 21RS000DGE | |
| Lenovo ThinkPad P16s Gen 4 21RX000YGE | |
| Average Intel Core Ultra 7 255H (11348 - 17218, n=19) | |
| HP ZBook Power 16 G11 A | |
| Geekbench 5.5 / Single-Core | |
| Lenovo ThinkPad P16s Gen 4 21RX000YGE | |
| Lenovo ThinkPad P16v G3 21RS000DGE | |
| HP ZBook X G1i 16 | |
| Average Intel Core Ultra 7 255H (1938 - 2121, n=19) | |
| Average of class Workstation (1783 - 2183, n=24, last 2 years) | |
| Lenovo ThinkPad P1 Gen 8 | |
| HP ZBook Power 16 G11 A | |
| HWBOT x265 Benchmark v2.2 / 4k Preset | |
| Average of class Workstation (17.8 - 40.5, n=24, last 2 years) | |
| Lenovo ThinkPad P1 Gen 8 | |
| HP ZBook X G1i 16 | |
| Lenovo ThinkPad P16v G3 21RS000DGE | |
| Lenovo ThinkPad P16s Gen 4 21RX000YGE | |
| Average Intel Core Ultra 7 255H (13.7 - 26.5, n=19) | |
| HP ZBook Power 16 G11 A | |
| LibreOffice / 20 Documents To PDF | |
| Lenovo ThinkPad P16s Gen 4 21RX000YGE | |
| HP ZBook Power 16 G11 A | |
| Average Intel Core Ultra 7 255H (41.1 - 61.6, n=19) | |
| Average of class Workstation (37.1 - 74.7, n=24, last 2 years) | |
| HP ZBook X G1i 16 | |
| Lenovo ThinkPad P1 Gen 8 | |
| Lenovo ThinkPad P16v G3 21RS000DGE | |
| R Benchmark 2.5 / Overall mean | |
| Lenovo ThinkPad P16s Gen 4 21RX000YGE | |
| HP ZBook Power 16 G11 A | |
| Average Intel Core Ultra 7 255H (0.4233 - 0.515, n=19) | |
| Lenovo ThinkPad P16v G3 21RS000DGE | |
| Lenovo ThinkPad P1 Gen 8 | |
| Average of class Workstation (0.3825 - 0.603, n=24, last 2 years) | |
| HP ZBook X G1i 16 | |
* ... smaller is better
AIDA64: FP32 Ray-Trace | FPU Julia | CPU SHA3 | CPU Queen | FPU SinJulia | FPU Mandel | CPU AES | CPU ZLib | FP64 Ray-Trace | CPU PhotoWorxx
| Performance rating | |
| Average of class Workstation | |
| Lenovo ThinkPad P16s Gen 4 21RX000YGE | |
| HP ZBook Power 16 G11 A | |
| Lenovo ThinkPad P1 Gen 8 | |
| Lenovo ThinkPad P16v G3 21RS000DGE | |
| Average Intel Core Ultra 7 255H | |
| AIDA64 / FP32 Ray-Trace | |
| Lenovo ThinkPad P16s Gen 4 21RX000YGE | |
| Average of class Workstation (15143 - 61611, n=24, last 2 years) | |
| HP ZBook Power 16 G11 A | |
| Lenovo ThinkPad P1 Gen 8 | |
| Lenovo ThinkPad P16v G3 21RS000DGE | |
| Average Intel Core Ultra 7 255H (13863 - 24741, n=17) | |
| AIDA64 / FPU Julia | |
| Average of class Workstation (81575 - 186971, n=24, last 2 years) | |
| Lenovo ThinkPad P1 Gen 8 | |
| HP ZBook Power 16 G11 A | |
| Lenovo ThinkPad P16s Gen 4 21RX000YGE | |
| Lenovo ThinkPad P16v G3 21RS000DGE | |
| Average Intel Core Ultra 7 255H (71030 - 119222, n=17) | |
| AIDA64 / CPU SHA3 | |
| Average of class Workstation (3833 - 8975, n=24, last 2 years) | |
| Lenovo ThinkPad P1 Gen 8 | |
| Lenovo ThinkPad P16s Gen 4 21RX000YGE | |
| Lenovo ThinkPad P16v G3 21RS000DGE | |
| HP ZBook Power 16 G11 A | |
| Average Intel Core Ultra 7 255H (3408 - 5548, n=17) | |
| AIDA64 / CPU Queen | |
| HP ZBook Power 16 G11 A | |
| Average of class Workstation (60778 - 144411, n=24, last 2 years) | |
| Lenovo ThinkPad P16s Gen 4 21RX000YGE | |
| Lenovo ThinkPad P1 Gen 8 | |
| Lenovo ThinkPad P16v G3 21RS000DGE | |
| Average Intel Core Ultra 7 255H (59098 - 68460, n=16) | |
| AIDA64 / FPU SinJulia | |
| Lenovo ThinkPad P16s Gen 4 21RX000YGE | |
| HP ZBook Power 16 G11 A | |
| Average of class Workstation (8165 - 29343, n=24, last 2 years) | |
| Lenovo ThinkPad P1 Gen 8 | |
| Lenovo ThinkPad P16v G3 21RS000DGE | |
| Average Intel Core Ultra 7 255H (6716 - 9006, n=17) | |
| AIDA64 / FPU Mandel | |
| Average of class Workstation (40055 - 98153, n=24, last 2 years) | |
| Lenovo ThinkPad P1 Gen 8 | |
| Lenovo ThinkPad P16s Gen 4 21RX000YGE | |
| Lenovo ThinkPad P16v G3 21RS000DGE | |
| HP ZBook Power 16 G11 A | |
| Average Intel Core Ultra 7 255H (37031 - 63347, n=17) | |
| AIDA64 / CPU AES | |
| Average of class Workstation (73133 - 187841, n=24, last 2 years) | |
| Lenovo ThinkPad P16s Gen 4 21RX000YGE | |
| Lenovo ThinkPad P1 Gen 8 | |
| HP ZBook Power 16 G11 A | |
| Lenovo ThinkPad P16v G3 21RS000DGE | |
| Average Intel Core Ultra 7 255H (58402 - 83568, n=17) | |
| AIDA64 / CPU ZLib | |
| Average of class Workstation (929 - 2148, n=24, last 2 years) | |
| Lenovo ThinkPad P1 Gen 8 | |
| Lenovo ThinkPad P16s Gen 4 21RX000YGE | |
| Lenovo ThinkPad P16v G3 21RS000DGE | |
| Average Intel Core Ultra 7 255H (822 - 1316, n=17) | |
| HP ZBook Power 16 G11 A | |
| AIDA64 / FP64 Ray-Trace | |
| Lenovo ThinkPad P16s Gen 4 21RX000YGE | |
| Average of class Workstation (7813 - 32891, n=24, last 2 years) | |
| Lenovo ThinkPad P1 Gen 8 | |
| HP ZBook Power 16 G11 A | |
| Lenovo ThinkPad P16v G3 21RS000DGE | |
| Average Intel Core Ultra 7 255H (7384 - 13231, n=17) | |
| AIDA64 / CPU PhotoWorxx | |
| Lenovo ThinkPad P1 Gen 8 | |
| Average Intel Core Ultra 7 255H (23836 - 65787, n=17) | |
| Average of class Workstation (37151 - 93684, n=24, last 2 years) | |
| Lenovo ThinkPad P16s Gen 4 21RX000YGE | |
| Lenovo ThinkPad P16v G3 21RS000DGE | |
| HP ZBook Power 16 G11 A | |
System performance
In everyday use, the ThinkPad P16v Gen 3 is a very responsive computer and the benchmark results are very good. There were no stability problems during the test.
PCMark 10: Score | Essentials | Productivity | Digital Content Creation
CrossMark: Overall | Productivity | Creativity | Responsiveness
WebXPRT 3: Overall
WebXPRT 4: Overall
Mozilla Kraken 1.1: Total
| Performance rating | |
| Lenovo ThinkPad P16v G3 21RS000DGE | |
| Average Intel Core Ultra 7 255H, NVIDIA RTX PRO 2000 Blackwell Generation Laptop | |
| Lenovo ThinkPad P1 Gen 8 | |
| HP ZBook X G1i 16 -4! | |
| Average of class Workstation | |
| HP ZBook Power 16 G11 A | |
| Lenovo ThinkPad P16s Gen 4 21RX000YGE | |
| PCMark 10 / Score | |
| Lenovo ThinkPad P16v G3 21RS000DGE | |
| Average Intel Core Ultra 7 255H, NVIDIA RTX PRO 2000 Blackwell Generation Laptop (9625 - 9723, n=2) | |
| Lenovo ThinkPad P1 Gen 8 | |
| Average of class Workstation (6563 - 10409, n=20, last 2 years) | |
| Lenovo ThinkPad P16s Gen 4 21RX000YGE | |
| HP ZBook Power 16 G11 A | |
| PCMark 10 / Essentials | |
| Lenovo ThinkPad P16v G3 21RS000DGE | |
| Average Intel Core Ultra 7 255H, NVIDIA RTX PRO 2000 Blackwell Generation Laptop (10650 - 10921, n=2) | |
| Lenovo ThinkPad P16s Gen 4 21RX000YGE | |
| Lenovo ThinkPad P1 Gen 8 | |
| Average of class Workstation (9622 - 11157, n=20, last 2 years) | |
| HP ZBook Power 16 G11 A | |
| PCMark 10 / Productivity | |
| Lenovo ThinkPad P1 Gen 8 | |
| Average Intel Core Ultra 7 255H, NVIDIA RTX PRO 2000 Blackwell Generation Laptop (18083 - 18261, n=2) | |
| Lenovo ThinkPad P16v G3 21RS000DGE | |
| Average of class Workstation (8789 - 20616, n=20, last 2 years) | |
| Lenovo ThinkPad P16s Gen 4 21RX000YGE | |
| HP ZBook Power 16 G11 A | |
| PCMark 10 / Digital Content Creation | |
| Lenovo ThinkPad P16v G3 21RS000DGE | |
| Average Intel Core Ultra 7 255H, NVIDIA RTX PRO 2000 Blackwell Generation Laptop (12443 - 12631, n=2) | |
| Lenovo ThinkPad P1 Gen 8 | |
| Average of class Workstation (8108 - 15631, n=20, last 2 years) | |
| HP ZBook Power 16 G11 A | |
| Lenovo ThinkPad P16s Gen 4 21RX000YGE | |
| CrossMark / Overall | |
| HP ZBook X G1i 16 | |
| Lenovo ThinkPad P1 Gen 8 | |
| Average Intel Core Ultra 7 255H, NVIDIA RTX PRO 2000 Blackwell Generation Laptop (1942 - 1953, n=2) | |
| Lenovo ThinkPad P16v G3 21RS000DGE | |
| Average of class Workstation (1307 - 2267, n=23, last 2 years) | |
| HP ZBook Power 16 G11 A | |
| Lenovo ThinkPad P16s Gen 4 21RX000YGE | |
| CrossMark / Productivity | |
| HP ZBook X G1i 16 | |
| Lenovo ThinkPad P1 Gen 8 | |
| Average Intel Core Ultra 7 255H, NVIDIA RTX PRO 2000 Blackwell Generation Laptop (1834 - 1836, n=2) | |
| Lenovo ThinkPad P16v G3 21RS000DGE | |
| Average of class Workstation (1130 - 2122, n=23, last 2 years) | |
| HP ZBook Power 16 G11 A | |
| Lenovo ThinkPad P16s Gen 4 21RX000YGE | |
| CrossMark / Creativity | |
| HP ZBook X G1i 16 | |
| Lenovo ThinkPad P16v G3 21RS000DGE | |
| Average Intel Core Ultra 7 255H, NVIDIA RTX PRO 2000 Blackwell Generation Laptop (2211 - 2232, n=2) | |
| Lenovo ThinkPad P1 Gen 8 | |
| Average of class Workstation (1657 - 2725, n=23, last 2 years) | |
| HP ZBook Power 16 G11 A | |
| Lenovo ThinkPad P16s Gen 4 21RX000YGE | |
| CrossMark / Responsiveness | |
| Lenovo ThinkPad P1 Gen 8 | |
| Average of class Workstation (993 - 2096, n=23, last 2 years) | |
| Average Intel Core Ultra 7 255H, NVIDIA RTX PRO 2000 Blackwell Generation Laptop (1520 - 1622, n=2) | |
| HP ZBook X G1i 16 | |
| Lenovo ThinkPad P16v G3 21RS000DGE | |
| HP ZBook Power 16 G11 A | |
| Lenovo ThinkPad P16s Gen 4 21RX000YGE | |
| WebXPRT 3 / Overall | |
| Lenovo ThinkPad P1 Gen 8 | |
| Average Intel Core Ultra 7 255H, NVIDIA RTX PRO 2000 Blackwell Generation Laptop (322 - 330, n=2) | |
| Lenovo ThinkPad P16v G3 21RS000DGE | |
| HP ZBook X G1i 16 | |
| Average of class Workstation (260 - 360, n=24, last 2 years) | |
| Lenovo ThinkPad P16s Gen 4 21RX000YGE | |
| HP ZBook Power 16 G11 A | |
| WebXPRT 4 / Overall | |
| Lenovo ThinkPad P16v G3 21RS000DGE | |
| Average Intel Core Ultra 7 255H, NVIDIA RTX PRO 2000 Blackwell Generation Laptop (298 - 307, n=2) | |
| HP ZBook X G1i 16 | |
| Lenovo ThinkPad P1 Gen 8 | |
| Average of class Workstation (189.2 - 326, n=24, last 2 years) | |
| HP ZBook Power 16 G11 A | |
| Lenovo ThinkPad P16s Gen 4 21RX000YGE | |
| Mozilla Kraken 1.1 / Total | |
| HP ZBook Power 16 G11 A | |
| Lenovo ThinkPad P16s Gen 4 21RX000YGE | |
| Lenovo ThinkPad P1 Gen 8 | |
| Average of class Workstation (411 - 538, n=24, last 2 years) | |
| HP ZBook X G1i 16 | |
| Average Intel Core Ultra 7 255H, NVIDIA RTX PRO 2000 Blackwell Generation Laptop (448 - 461, n=2) | |
| Lenovo ThinkPad P16v G3 21RS000DGE | |
* ... smaller is better
| PCMark 10 Score | 9723 points | |
Help | ||
| AIDA64 / Memory Copy | |
| Lenovo ThinkPad P1 Gen 8 | |
| Average Intel Core Ultra 7 255H (39188 - 110930, n=17) | |
| Average of class Workstation (56003 - 164795, n=24, last 2 years) | |
| Lenovo ThinkPad P16v G3 21RS000DGE | |
| Lenovo ThinkPad P16s Gen 4 21RX000YGE | |
| HP ZBook Power 16 G11 A | |
| AIDA64 / Memory Read | |
| Lenovo ThinkPad P16s Gen 4 21RX000YGE | |
| Lenovo ThinkPad P16v G3 21RS000DGE | |
| Average Intel Core Ultra 7 255H (43703 - 90552, n=17) | |
| Average of class Workstation (55795 - 121563, n=24, last 2 years) | |
| Lenovo ThinkPad P1 Gen 8 | |
| HP ZBook Power 16 G11 A | |
| AIDA64 / Memory Write | |
| Average of class Workstation (55663 - 214520, n=24, last 2 years) | |
| HP ZBook Power 16 G11 A | |
| Lenovo ThinkPad P16s Gen 4 21RX000YGE | |
| Lenovo ThinkPad P16v G3 21RS000DGE | |
| Average Intel Core Ultra 7 255H (36438 - 87199, n=17) | |
| Lenovo ThinkPad P1 Gen 8 | |
| AIDA64 / Memory Latency | |
| Lenovo ThinkPad P1 Gen 8 | |
| Average of class Workstation (84.5 - 165.2, n=24, last 2 years) | |
| Average Intel Core Ultra 7 255H (107.6 - 147.2, n=17) | |
| Lenovo ThinkPad P16v G3 21RS000DGE | |
| Lenovo ThinkPad P16s Gen 4 21RX000YGE | |
| HP ZBook Power 16 G11 A | |
* ... smaller is better
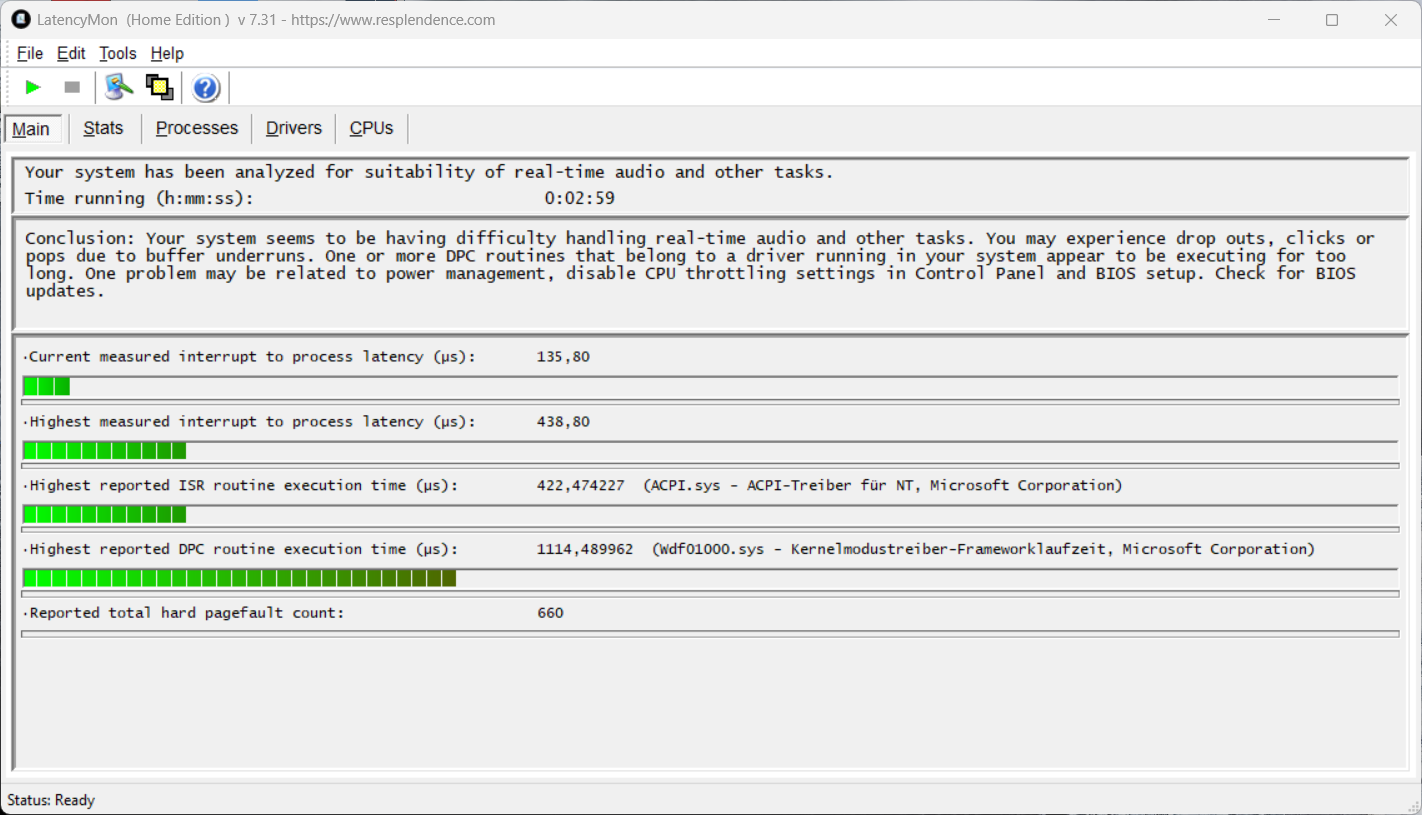
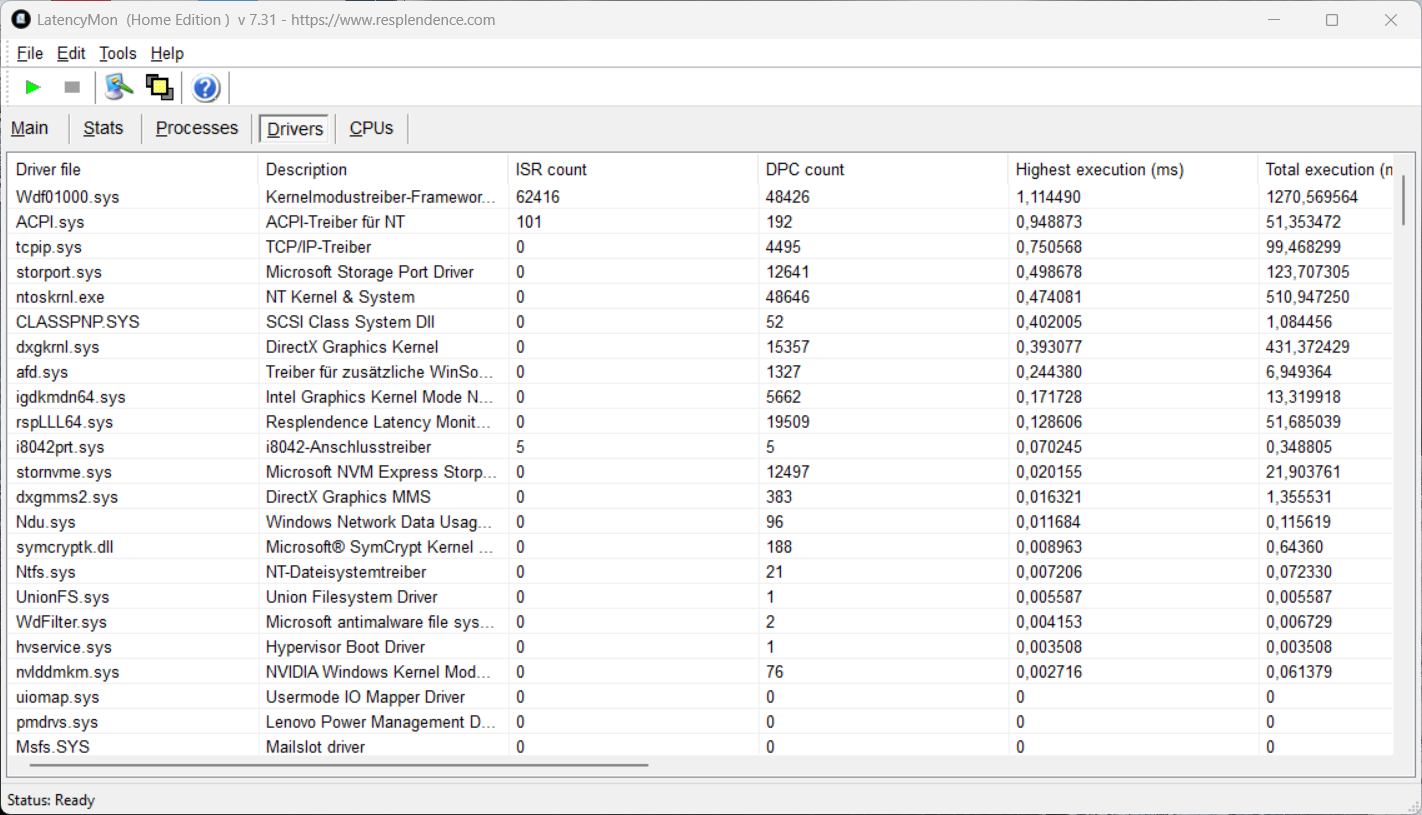
DPC latencies
In our standardized latency test (surfing the Internet, 4K YouTube playback, CPU load), the test device with the current BIOS version shows slight limitations when using real-time audio applications.
| DPC Latencies / LatencyMon - interrupt to process latency (max), Web, Youtube, Prime95 | |
| HP ZBook Power 16 G11 A | |
| Lenovo ThinkPad P1 Gen 8 | |
| Lenovo ThinkPad P16s Gen 4 21RX000YGE | |
| HP ZBook X G1i 16 | |
| Lenovo ThinkPad P16v G3 21RS000DGE | |
* ... smaller is better
Storage devices
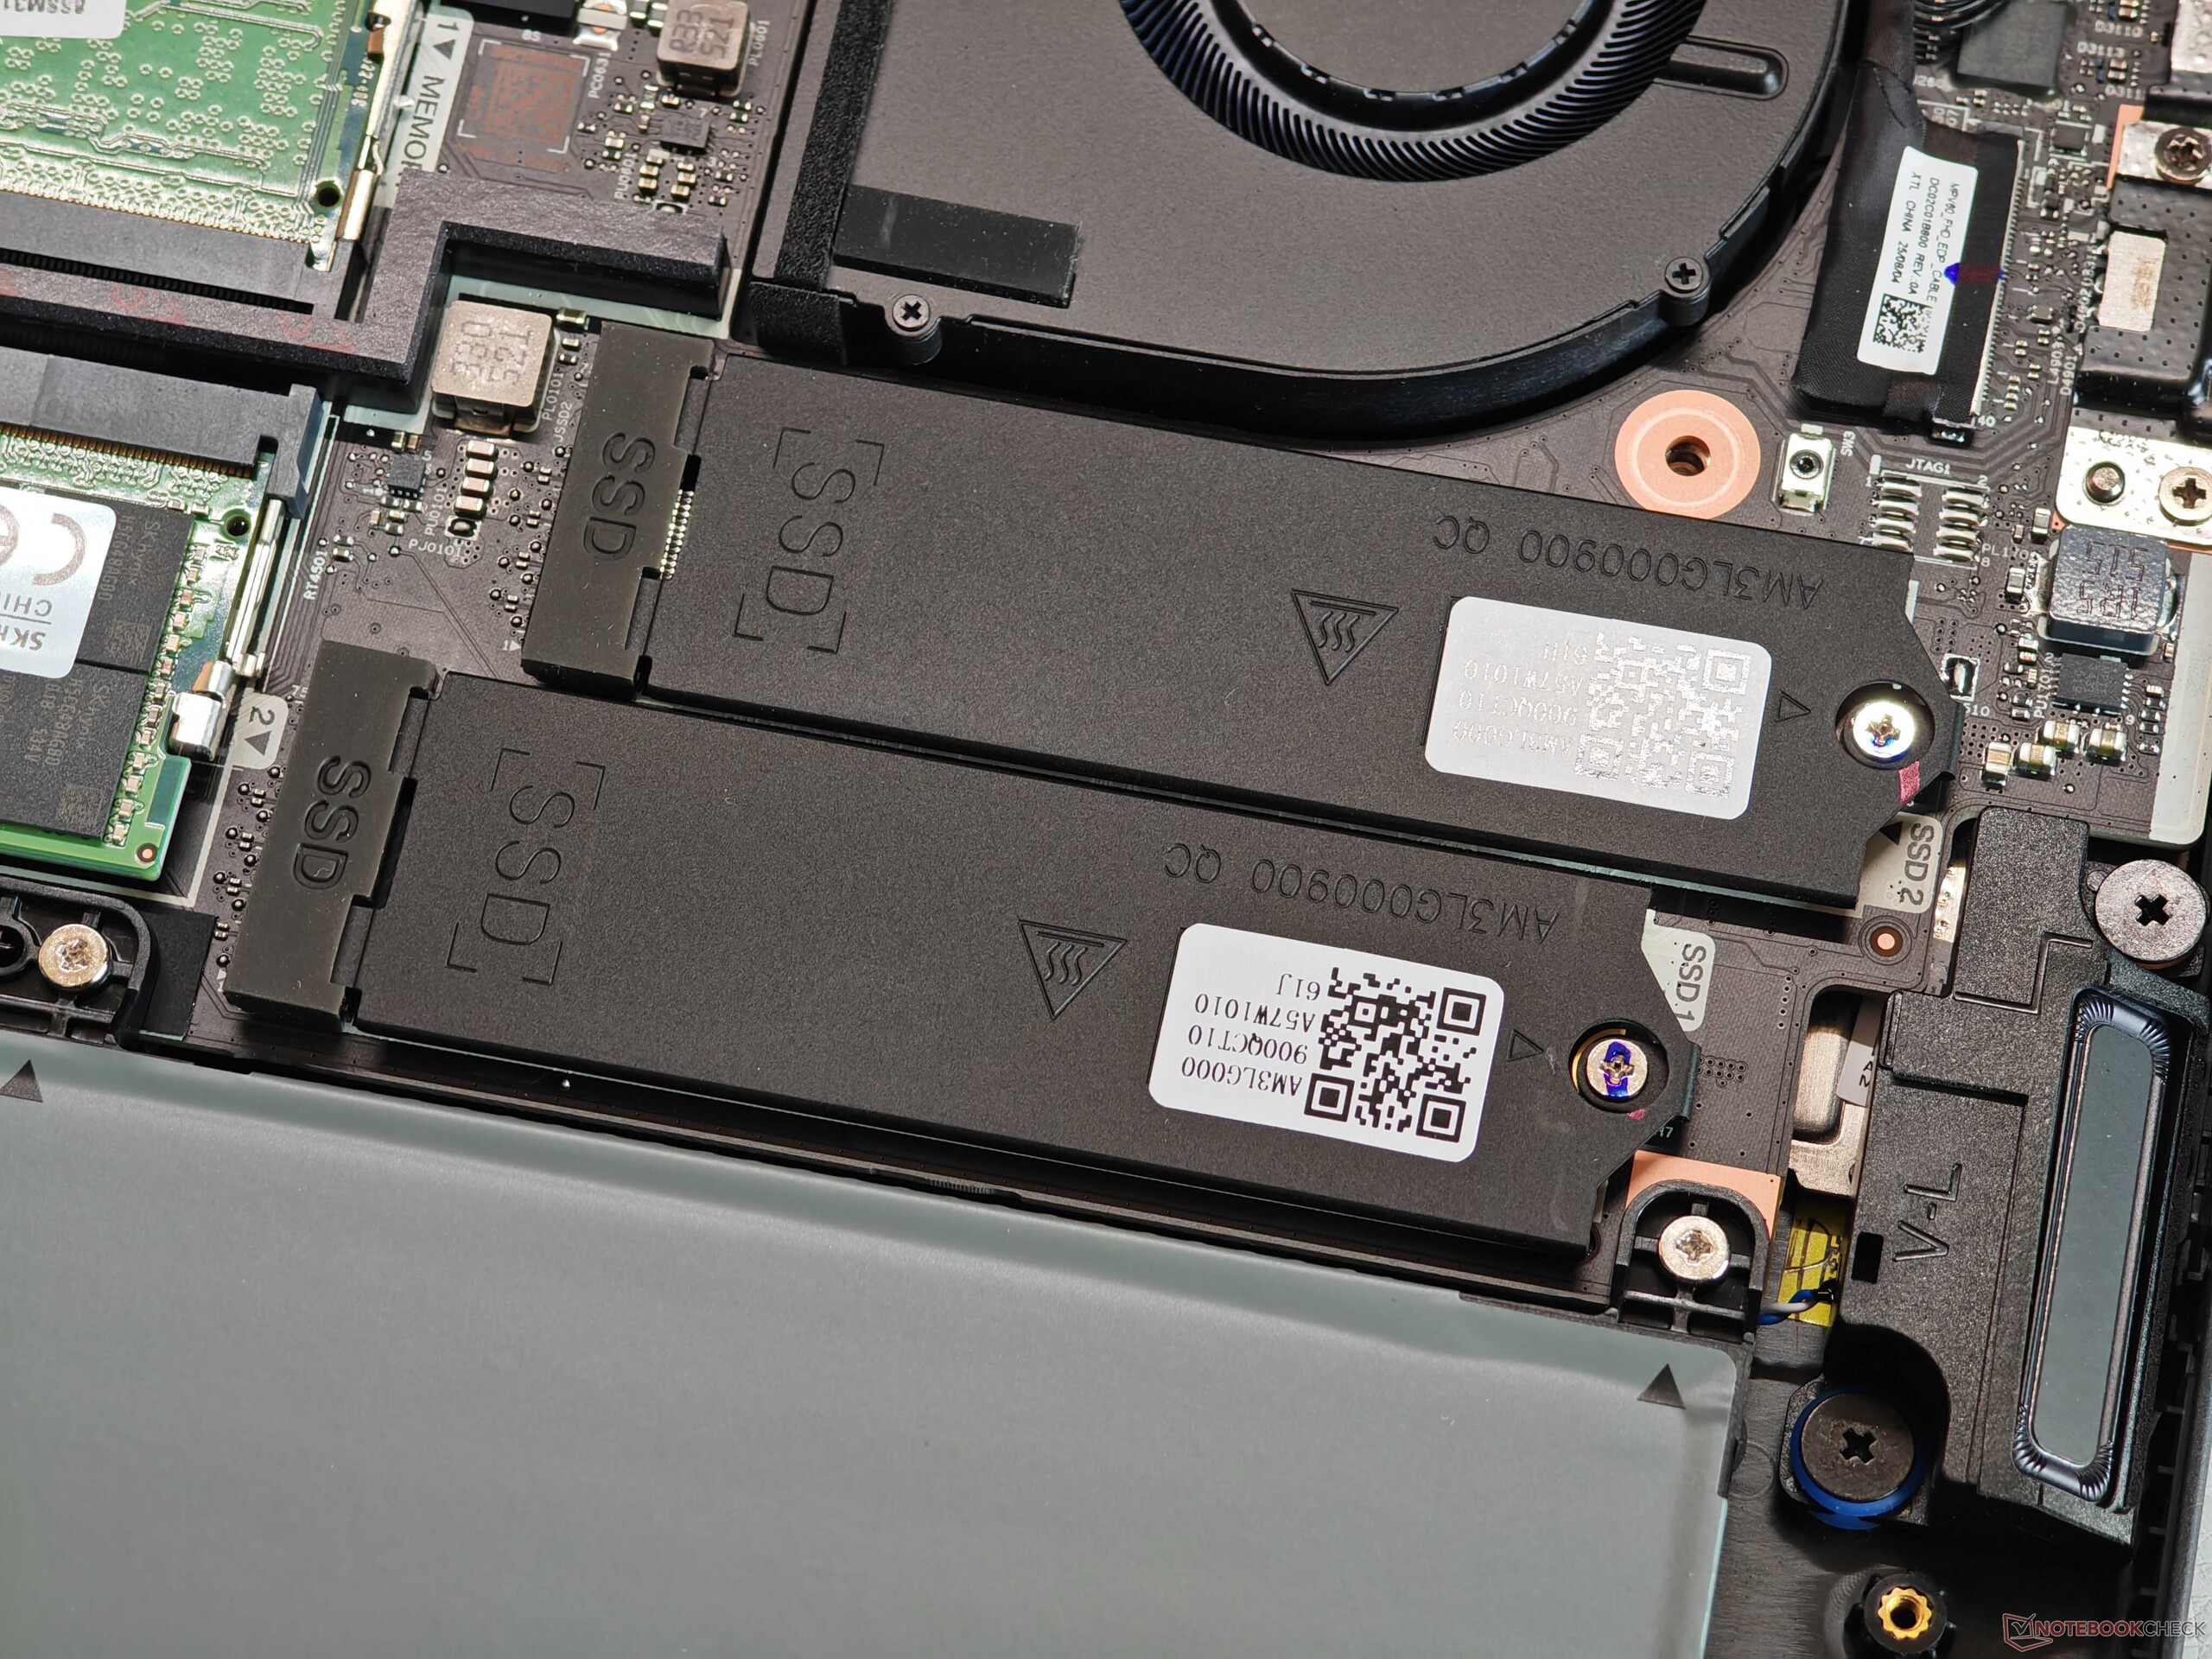
The Samsung PM9E1 (1 TB, 879 GB free), a PCIe 5.0 SSD, is already installed in our test device, but the two M.2-2280 slots are only connected via PCIe 4.0. Accordingly, the transfer rates are also a maximum of around 7 GB/s instead of 13-14 GB/s. However, the performance is still good and remains stable even under prolonged load.

* ... smaller is better
Read continuous performance: DiskSpd Read Loop, Queue Depth 8
GPU performance
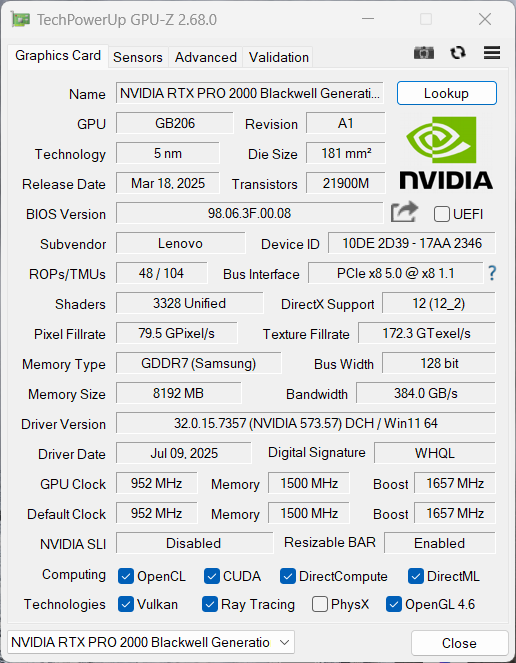
The GPU is the professional Nvidia RTX PRO 2000 (Blackwell, 8 GB VRAM) is used, which is switched on via Optimus technology. The chip itself is identical to the GeForce RTX 5060, but in the case of the P16v Gen 3, only the 60-watt version is implemented (a maximum of 115 watts would be possible), which is somewhat disappointing given the large casing. However, this is similar for the other mobile workstations in this segment (max. 75 watts), which is why the graphics performance here is also comparable. We have also included the 115-watt version of the RTX 5060 laptop in the comparison, which works a full 31% faster. The graphics performance remains completely stable under continuous load, but the GPU may only consume 25 watts in battery mode (-56 % performance).
| 3DMark 11 Performance | 29308 points | |
| 3DMark Fire Strike Score | 23134 points | |
| 3DMark Time Spy Score | 9371 points | |
| 3DMark Steel Nomad Score | 1932 points | |
| 3DMark Steel Nomad Light Score | 9029 points | |
Help | ||
| Blender / v3.3 Classroom OPTIX/RTX | |
| HP ZBook Power 16 G11 A | |
| HP ZBook X G1i 16 | |
| Average NVIDIA RTX PRO 2000 Blackwell Generation Laptop (22 - 25, n=3) | |
| Lenovo ThinkPad P1 Gen 8 | |
| Lenovo ThinkPad P16v G3 21RS000DGE | |
| Average of class Workstation (10 - 43, n=18, last 2 years) | |
| Blender / v3.3 Classroom CUDA | |
| HP ZBook Power 16 G11 A | |
| HP ZBook X G1i 16 | |
| Average NVIDIA RTX PRO 2000 Blackwell Generation Laptop (42 - 45, n=3) | |
| Lenovo ThinkPad P1 Gen 8 | |
| Lenovo ThinkPad P16v G3 21RS000DGE | |
| Average of class Workstation (16 - 74, n=18, last 2 years) | |
| Blender / v3.3 Classroom CPU | |
| HP ZBook Power 16 G11 A | |
| Lenovo ThinkPad P1 Gen 8 | |
| Lenovo ThinkPad P16v G3 21RS000DGE | |
| Average NVIDIA RTX PRO 2000 Blackwell Generation Laptop (266 - 273, n=3) | |
| Lenovo ThinkPad P16s Gen 4 21RX000YGE | |
| HP ZBook X G1i 16 | |
| Average of class Workstation (148 - 364, n=24, last 2 years) | |
* ... smaller is better
| SPECviewperf 15 | |
| 3840x2160 Siemens NX 2406 (snx-05) | |
| Lenovo ThinkPad P16v G3 21RS000DGE | |
| 3840x2160 Unreal Engine 5.4.2 (unreal_engine-01) | |
| Lenovo ThinkPad P1 Gen 8 | |
| Lenovo ThinkPad P16v G3 21RS000DGE | |
| 3840x2160 Solidworks 2024 (solidworks-08) | |
| Lenovo ThinkPad P1 Gen 8 | |
| Lenovo ThinkPad P16v G3 21RS000DGE | |
| 3840x2160 Tuvok (medical-04) | |
| Lenovo ThinkPad P1 Gen 8 | |
| Lenovo ThinkPad P16v G3 21RS000DGE | |
| 3840x2160 Maya 2025 (maya-07) | |
| Lenovo ThinkPad P1 Gen 8 | |
| Lenovo ThinkPad P16v G3 21RS000DGE | |
| 3840x2160 Enscape 4.0 (enscape-01) | |
| Lenovo ThinkPad P1 Gen 8 | |
| Lenovo ThinkPad P16v G3 21RS000DGE | |
| 3840x2160 OpendTect (energy-04) | |
| Lenovo ThinkPad P1 Gen 8 | |
| Lenovo ThinkPad P16v G3 21RS000DGE | |
| 3840x2160 Creo 9 (creo-04) | |
| Lenovo ThinkPad P1 Gen 8 | |
| Lenovo ThinkPad P16v G3 21RS000DGE | |
| 3840x2160 Blender 3.6 (blender-01) | |
| Lenovo ThinkPad P1 Gen 8 | |
| Lenovo ThinkPad P16v G3 21RS000DGE | |
| 3840x2160 3ds Max 2023 (3dsmax-08) | |
| Lenovo ThinkPad P1 Gen 8 | |
| Lenovo ThinkPad P16v G3 21RS000DGE | |
Gaming performance
The RTX PRO 2000 is perfectly able to handle gaming and the professional drivers were no problem at all. In principle, most modern titles can be played in the native resolution and high/maximum details without any problems. We recently wrote about the limitations of 8 GB VRAM in a separate article.
| Performance rating - Percent | |
| Lenovo ThinkPad P1 Gen 8 | |
| Average of class Workstation | |
| HP ZBook X G1i 16 | |
| Lenovo ThinkPad P16v G3 21RS000DGE | |
| HP ZBook Power 16 G11 A | |
| Lenovo ThinkPad P16s Gen 4 21RX000YGE -1! | |
| Cyberpunk 2077 - 1920x1080 Ultra Preset (FSR off) | |
| Lenovo ThinkPad P1 Gen 8 | |
| Average of class Workstation (21.5 - 152.4, n=24, last 2 years) | |
| HP ZBook X G1i 16 | |
| Lenovo ThinkPad P16v G3 21RS000DGE | |
| HP ZBook Power 16 G11 A | |
| Lenovo ThinkPad P16s Gen 4 21RX000YGE | |
| Baldur's Gate 3 - 1920x1080 Ultra Preset AA:T | |
| Lenovo ThinkPad P1 Gen 8 | |
| Average of class Workstation (23.7 - 205, n=25, last 2 years) | |
| HP ZBook X G1i 16 | |
| Lenovo ThinkPad P16v G3 21RS000DGE | |
| HP ZBook Power 16 G11 A | |
| Lenovo ThinkPad P16s Gen 4 21RX000YGE | |
| GTA V - 1920x1080 Highest AA:4xMSAA + FX AF:16x | |
| Lenovo ThinkPad P1 Gen 8 | |
| Lenovo ThinkPad P16v G3 21RS000DGE | |
| HP ZBook X G1i 16 | |
| Average of class Workstation (18.1 - 156.1, n=24, last 2 years) | |
| HP ZBook Power 16 G11 A | |
| Lenovo ThinkPad P16s Gen 4 21RX000YGE | |
| Final Fantasy XV Benchmark - 1920x1080 High Quality | |
| Lenovo ThinkPad P1 Gen 8 | |
| Average of class Workstation (26.4 - 197.6, n=24, last 2 years) | |
| HP ZBook X G1i 16 | |
| Lenovo ThinkPad P16v G3 21RS000DGE | |
| HP ZBook Power 16 G11 A | |
| Lenovo ThinkPad P16s Gen 4 21RX000YGE | |
| Strange Brigade - 1920x1080 ultra AA:ultra AF:16 | |
| Average of class Workstation (91 - 418, n=18, last 2 years) | |
| Lenovo ThinkPad P1 Gen 8 | |
| HP ZBook X G1i 16 | |
| Lenovo ThinkPad P16v G3 21RS000DGE | |
| HP ZBook Power 16 G11 A | |
| Dota 2 Reborn - 1920x1080 ultra (3/3) best looking | |
| Lenovo ThinkPad P16v G3 21RS000DGE | |
| HP ZBook X G1i 16 | |
| Average of class Workstation (50.7 - 178.4, n=24, last 2 years) | |
| Lenovo ThinkPad P1 Gen 8 | |
| HP ZBook Power 16 G11 A | |
| Lenovo ThinkPad P16s Gen 4 21RX000YGE | |
Cyberpunk 2077 ultra FPS chart
| low | med. | high | ultra | |
|---|---|---|---|---|
| GTA V (2015) | 174.7 | 117.7 | ||
| Dota 2 Reborn (2015) | 174.2 | 159.8 | 151.6 | 142.8 |
| Final Fantasy XV Benchmark (2018) | 199.5 | 127.3 | 98.1 | |
| X-Plane 11.11 (2018) | 105.4 | 95.2 | 78.8 | |
| Strange Brigade (2018) | 469 | 241 | 194.1 | 167.8 |
| Baldur's Gate 3 (2023) | 121.3 | 96 | 81.4 | 81.2 |
| Cyberpunk 2077 (2023) | 119.5 | 93.5 | 79.1 | 70.1 |
| F1 24 (2024) | 200 | 194.8 | 165.5 | 53.3 |
Emissions & Energy
Noise emissions

The cooling unit remains very quiet during everyday tasks (max. 29.2 dB(A)), but it becomes noticeably louder when the components are put under greater strain. In Best Performance mode, we measured 47.1 dB(A) during gaming and the stress test(Balanced: 43.2 dB(A), Best Energy Efficiency: 39.9 dB(A), battery: 37 dB(A)). coil whine did not occur on the test device.
Noise level
| Idle |
| 25.9 / 25.9 / 29.2 dB(A) |
| Load |
| 37.5 / 47.1 dB(A) |
 | ||
30 dB silent 40 dB(A) audible 50 dB(A) loud |
||
min: | ||
| Lenovo ThinkPad P16v G3 21RS000DGE Ultra 7 255H, RTX PRO 2000 Blackwell Generation Laptop | Lenovo ThinkPad P1 Gen 8 Ultra 7 255H, RTX PRO 2000 Blackwell Generation Laptop | HP ZBook X G1i 16 Ultra 7 265H, RTX PRO 2000 Blackwell Generation Laptop | HP ZBook Power 16 G11 A R7 8845HS, RTX 2000 Ada Generation Laptop | Lenovo ThinkPad P16s Gen 4 21RX000YGE Ryzen AI 9 HX PRO 370, Radeon 890M | |
|---|---|---|---|---|---|
| Noise | 13% | 7% | 12% | -3% | |
| off / environment * (dB) | 25.9 | 23.1 11% | 23.7 8% | 23.5 9% | 25.9 -0% |
| Idle Minimum * (dB) | 25.9 | 23.1 11% | 23.7 8% | 23.8 8% | 25.9 -0% |
| Idle Average * (dB) | 25.9 | 23.1 11% | 23.7 8% | 24.2 7% | 25.9 -0% |
| Idle Maximum * (dB) | 29.2 | 23.1 21% | 23.7 19% | 24.2 17% | 28.5 2% |
| Load Average * (dB) | 37.5 | 27.3 27% | 32.7 13% | 25.4 32% | 42.9 -14% |
| Cyberpunk 2077 ultra * (dB) | 47.1 | 50.9 -8% | 43 9% | 48.7 -3% | |
| Load Maximum * (dB) | 47.1 | 47.9 -2% | 48 -2% | 45 4% | 48.5 -3% |
* ... smaller is better
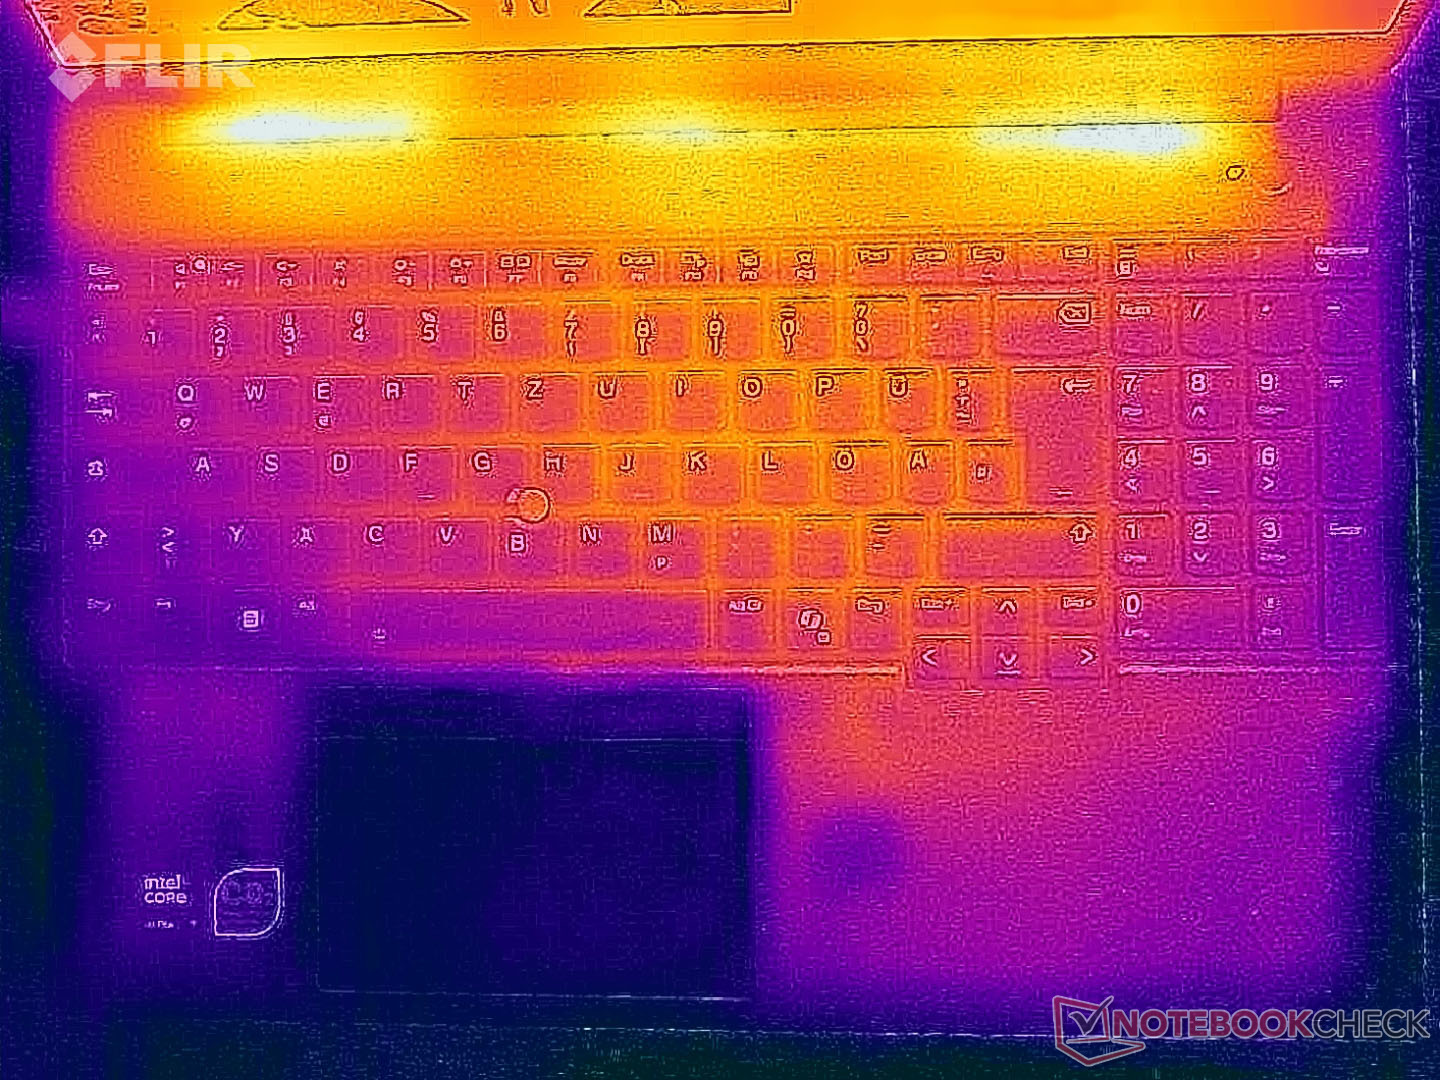
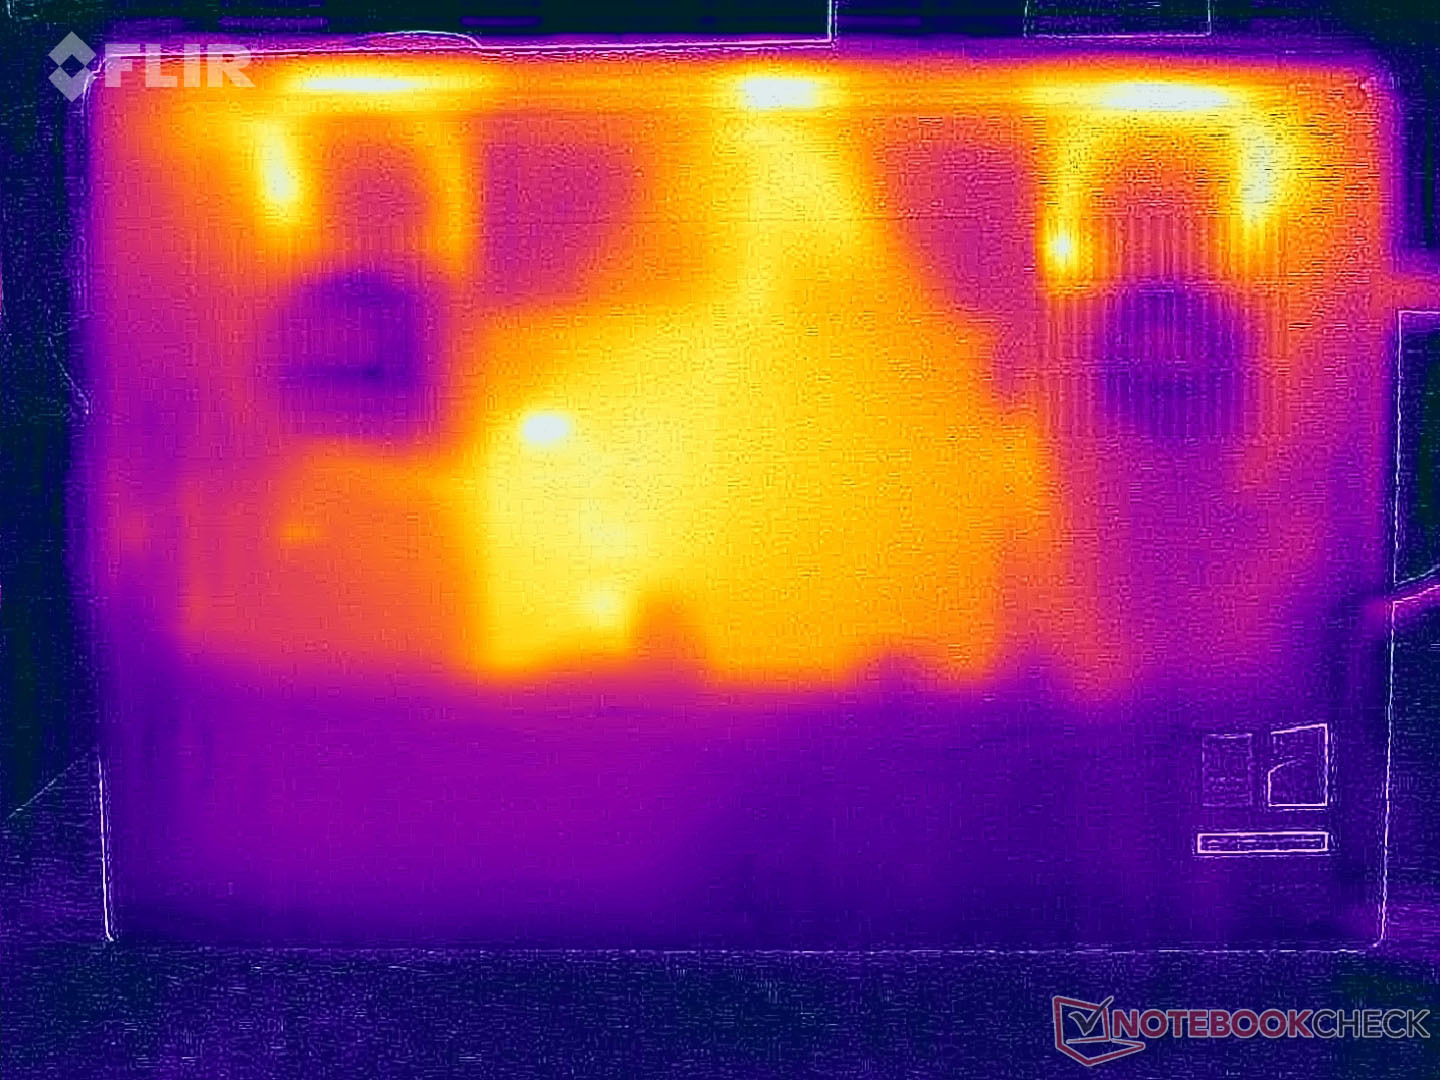
Temperature
The surface temperatures remain completely harmless even in the stress test, as we only measured just under 45 °C (113 °F) at one point on the underside; the other measuring points remain noticeably cooler. In the stress test, the processor stabilized at ~34 watts (81 °C/177.8 °F) and the GPU at ~55 watts (76 °C/168.8 °F). This is not particularly high considering the large casing.

(+) The maximum temperature on the upper side is 39.9 °C / 104 F, compared to the average of 38.2 °C / 101 F, ranging from 22.2 to 69.8 °C for the class Workstation.
(±) The bottom heats up to a maximum of 44.8 °C / 113 F, compared to the average of 41.1 °C / 106 F
(+) In idle usage, the average temperature for the upper side is 23.5 °C / 74 F, compared to the device average of 32 °C / 90 F.
(±) 3: The average temperature for the upper side is 33 °C / 91 F, compared to the average of 32 °C / 90 F for the class Workstation.
(+) The palmrests and touchpad are reaching skin temperature as a maximum (32.1 °C / 89.8 F) and are therefore not hot.
(-) The average temperature of the palmrest area of similar devices was 27.8 °C / 82 F (-4.3 °C / -7.8 F).
| Lenovo ThinkPad P16v G3 21RS000DGE Ultra 7 255H, RTX PRO 2000 Blackwell Generation Laptop | Lenovo ThinkPad P1 Gen 8 Ultra 7 255H, RTX PRO 2000 Blackwell Generation Laptop | HP ZBook X G1i 16 Ultra 7 265H, RTX PRO 2000 Blackwell Generation Laptop | HP ZBook Power 16 G11 A R7 8845HS, RTX 2000 Ada Generation Laptop | Lenovo ThinkPad P16s Gen 4 21RX000YGE Ryzen AI 9 HX PRO 370, Radeon 890M | |
|---|---|---|---|---|---|
| Heat | -10% | -8% | -2% | -37% | |
| Maximum Upper Side * (°C) | 39.9 | 45 -13% | 36 10% | 40.6 -2% | 50.6 -27% |
| Maximum Bottom * (°C) | 44.8 | 33 26% | 39.4 12% | 40.6 9% | 54.3 -21% |
| Idle Upper Side * (°C) | 24 | 30.6 -28% | 30.4 -27% | 26 -8% | 35.3 -47% |
| Idle Bottom * (°C) | 25 | 31.6 -26% | 31.8 -27% | 26.6 -6% | 38.5 -54% |
* ... smaller is better
Speakers
The stereo speakers are hardly convincing; the ThinkPad P1 16 G8 has a clear advantage.
Lenovo ThinkPad P16v G3 21RS000DGE audio analysis
(±) | speaker loudness is average but good (78.2 dB)
Bass 100 - 315 Hz
(±) | reduced bass - on average 10.7% lower than median
(±) | linearity of bass is average (10% delta to prev. frequency)
Mids 400 - 2000 Hz
(±) | higher mids - on average 7.2% higher than median
(+) | mids are linear (5.3% delta to prev. frequency)
Highs 2 - 16 kHz
(+) | balanced highs - only 1.3% away from median
(+) | highs are linear (3.8% delta to prev. frequency)
Overall 100 - 16.000 Hz
(±) | linearity of overall sound is average (15.6% difference to median)
Compared to same class
» 35% of all tested devices in this class were better, 11% similar, 54% worse
» The best had a delta of 7%, average was 17%, worst was 35%
Compared to all devices tested
» 23% of all tested devices were better, 5% similar, 72% worse
» The best had a delta of 4%, average was 23%, worst was 134%
Lenovo ThinkPad P1 Gen 8 audio analysis
(+) | speakers can play relatively loud (87.5 dB)
Bass 100 - 315 Hz
(±) | reduced bass - on average 9.8% lower than median
(±) | linearity of bass is average (11.2% delta to prev. frequency)
Mids 400 - 2000 Hz
(+) | balanced mids - only 2.9% away from median
(+) | mids are linear (2.8% delta to prev. frequency)
Highs 2 - 16 kHz
(+) | balanced highs - only 3% away from median
(+) | highs are linear (4.7% delta to prev. frequency)
Overall 100 - 16.000 Hz
(+) | overall sound is linear (8.3% difference to median)
Compared to same class
» 1% of all tested devices in this class were better, 1% similar, 97% worse
» The best had a delta of 7%, average was 17%, worst was 35%
Compared to all devices tested
» 2% of all tested devices were better, 1% similar, 97% worse
» The best had a delta of 4%, average was 23%, worst was 134%
HP ZBook X G1i 16 audio analysis
(+) | speakers can play relatively loud (84 dB)
Bass 100 - 315 Hz
(-) | nearly no bass - on average 28% lower than median
(±) | linearity of bass is average (8.8% delta to prev. frequency)
Mids 400 - 2000 Hz
(+) | balanced mids - only 1.9% away from median
(+) | mids are linear (6.1% delta to prev. frequency)
Highs 2 - 16 kHz
(+) | balanced highs - only 2.9% away from median
(+) | highs are linear (5.1% delta to prev. frequency)
Overall 100 - 16.000 Hz
(±) | linearity of overall sound is average (15.6% difference to median)
Compared to same class
» 35% of all tested devices in this class were better, 11% similar, 54% worse
» The best had a delta of 7%, average was 17%, worst was 35%
Compared to all devices tested
» 23% of all tested devices were better, 5% similar, 72% worse
» The best had a delta of 4%, average was 23%, worst was 134%
HP ZBook Power 16 G11 A audio analysis
(+) | speakers can play relatively loud (87.9 dB)
Bass 100 - 315 Hz
(-) | nearly no bass - on average 28.1% lower than median
(±) | linearity of bass is average (9% delta to prev. frequency)
Mids 400 - 2000 Hz
(+) | balanced mids - only 1.9% away from median
(+) | mids are linear (4.8% delta to prev. frequency)
Highs 2 - 16 kHz
(+) | balanced highs - only 3.6% away from median
(+) | highs are linear (2.4% delta to prev. frequency)
Overall 100 - 16.000 Hz
(±) | linearity of overall sound is average (15.1% difference to median)
Compared to same class
» 33% of all tested devices in this class were better, 7% similar, 60% worse
» The best had a delta of 7%, average was 17%, worst was 35%
Compared to all devices tested
» 21% of all tested devices were better, 4% similar, 75% worse
» The best had a delta of 4%, average was 23%, worst was 134%
Lenovo ThinkPad P16s Gen 4 21RX000YGE audio analysis
(±) | speaker loudness is average but good (79.6 dB)
Bass 100 - 315 Hz
(-) | nearly no bass - on average 15.7% lower than median
(±) | linearity of bass is average (11.9% delta to prev. frequency)
Mids 400 - 2000 Hz
(±) | higher mids - on average 5.8% higher than median
(+) | mids are linear (5.9% delta to prev. frequency)
Highs 2 - 16 kHz
(+) | balanced highs - only 1.5% away from median
(+) | highs are linear (4.6% delta to prev. frequency)
Overall 100 - 16.000 Hz
(±) | linearity of overall sound is average (16.2% difference to median)
Compared to same class
» 43% of all tested devices in this class were better, 7% similar, 50% worse
» The best had a delta of 7%, average was 17%, worst was 35%
Compared to all devices tested
» 26% of all tested devices were better, 6% similar, 68% worse
» The best had a delta of 4%, average was 23%, worst was 134%
Energy consumption

The maximum consumption in idle mode is 12.7 watts, which is relatively high considering the low display resolution. We briefly measured ~140 watts in the stress test, but this quickly leveled off at ~120 watts. The 140-watt power supply is therefore sufficiently dimensioned.
| Off / Standby | |
| Idle | |
| Load |
|
Key:
min: | |
| Lenovo ThinkPad P16v G3 21RS000DGE Ultra 7 255H, RTX PRO 2000 Blackwell Generation Laptop, Samsung PM9E1 1 TB MZVLC1T0HFLU, IPS, 1920x1200, 16" | Lenovo ThinkPad P1 Gen 8 Ultra 7 255H, RTX PRO 2000 Blackwell Generation Laptop, Samsung PM9E1 1 TB MZVLC1T0HFLU, Tandem OLED, 3200x2000, 16" | HP ZBook X G1i 16 Ultra 7 265H, RTX PRO 2000 Blackwell Generation Laptop, Samsung PM9A1 MZVL22T0HBLB, IPS, 2560x1600, 16" | HP ZBook Power 16 G11 A R7 8845HS, RTX 2000 Ada Generation Laptop, Samsung PM9A1 MZVL22T0HBLB, IPS, 2560x1600, 16" | Lenovo ThinkPad P16s Gen 4 21RX000YGE Ryzen AI 9 HX PRO 370, Radeon 890M, Micron 3500 1TB MTFDKBA1T0TGD, IPS LED, 1920x1200, 16" | Average NVIDIA RTX PRO 2000 Blackwell Generation Laptop | Average of class Workstation | |
|---|---|---|---|---|---|---|---|
| Power Consumption | -50% | 12% | 14% | 41% | -18% | -35% | |
| Idle Minimum * (Watt) | 4.8 | 15.4 -221% | 4.1 15% | 4.6 4% | 3.9 19% | 8.1 ? -69% | 9.04 ? -88% |
| Idle Average * (Watt) | 12.3 | 16.5 -34% | 9 27% | 10 19% | 8.3 33% | 12.6 ? -2% | 13.8 ? -12% |
| Idle Maximum * (Watt) | 12.7 | 23.1 -82% | 9.4 26% | 10.6 17% | 8.7 31% | 15.1 ? -19% | 17.7 ? -39% |
| Load Average * (Watt) | 89.6 | 86.6 3% | 86.7 3% | 60.9 32% | 51.6 42% | 87.6 ? 2% | 96.2 ? -7% |
| Cyberpunk 2077 ultra external monitor * (Watt) | 115.8 | 121.8 -5% | 102 12% | 92.8 20% | 54.6 53% | ||
| Cyberpunk 2077 ultra * (Watt) | 115.1 | 123.1 -7% | 106.1 8% | 96.8 16% | 55.4 52% | ||
| Load Maximum * (Watt) | 139.5 | 143.6 -3% | 152.9 -10% | 154.8 -11% | 63.7 54% | 145.3 ? -4% | 178.5 ? -28% |
* ... smaller is better
Energy consumption Cyberpunk / Stress test
Energy consumption with external monitor
Battery life
With the 90 Whbattery, we measured 14:11 hours (150 cd/m²) and 8:51 hours (full brightness) in the WLAN test, which are good results.

| Lenovo ThinkPad P16v G3 21RS000DGE Ultra 7 255H, RTX PRO 2000 Blackwell Generation Laptop, 90 Wh | Lenovo ThinkPad P1 Gen 8 Ultra 7 255H, RTX PRO 2000 Blackwell Generation Laptop, 90 Wh | HP ZBook X G1i 16 Ultra 7 265H, RTX PRO 2000 Blackwell Generation Laptop, 83 Wh | HP ZBook Power 16 G11 A R7 8845HS, RTX 2000 Ada Generation Laptop, 83 Wh | Lenovo ThinkPad P16s Gen 4 21RX000YGE Ryzen AI 9 HX PRO 370, Radeon 890M, 86 Wh | Average of class Workstation | |
|---|---|---|---|---|---|---|
| Battery Runtime | -61% | -12% | -32% | -2% | -31% | |
| WiFi Websurfing (h) | 14.2 | 5.5 -61% | 12.5 -12% | 9.7 -32% | 13.9 -2% | 8.52 ? -40% |
| WiFi Websurfing max. Brightness (h) | 8.9 | 6.96 ? -22% |
Notebookcheck overall rating
Lenovo ThinkPad P16v G3 21RS000DGE
- 01/14/2026 v8
Andreas Osthoff
 Total Sustainability Score:
 Possible alternatives in comparison
Image | Model / Review | Price | Weight | Height | Display |
|---|---|---|---|---|---|
1. 87.3%  | Lenovo ThinkPad P16v G3 21RS000DGE Intel Core Ultra 7 255H ⎘ NVIDIA RTX PRO 2000 Blackwell Generation Laptop ⎘ 32 GB Memory, 1024 GB SSD | Amazon: List Price: 2825€ | 2.2 kg | 19.6 mm | 16.00" 1920x1200 IPS |
2. 91.6%  | Lenovo ThinkPad P1 Gen 8 Intel Core Ultra 7 255H ⎘ NVIDIA RTX PRO 2000 Blackwell Generation Laptop ⎘ 32 GB Memory, 1024 GB SSD | Amazon: List Price: 2000 USD | 1.9 kg | 20.6 mm | 16.00" 3200x2000 236 PPI Tandem OLED |
3. 87.4%  | HP ZBook X G1i 16 Intel Core Ultra 7 265H ⎘ NVIDIA RTX PRO 2000 Blackwell Generation Laptop ⎘ 64 GB Memory, 2048 GB SSD | Amazon: List Price: 2700 USD | 2.2 kg | 23 mm | 16.00" 2560x1600 189 PPI IPS |
4. 85.4%  | HP ZBook Power 16 G11 A AMD Ryzen 7 8845HS ⎘ NVIDIA RTX 2000 Ada Generation Laptop ⎘ 64 GB Memory, 2048 GB SSD | Amazon: List Price: 2100 USD | 2.2 kg | 22.9 mm | 16.00" 2560x1600 189 PPI IPS |
5. 82%  | Lenovo ThinkPad P16s Gen 4 21RX000YGE AMD Ryzen AI 9 HX PRO 370 ⎘ AMD Radeon 890M ⎘ 64 GB Memory, 1024 GB SSD | Amazon: List Price: 2440 Euro | 2 kg | 23 mm | 16.00" 1920x1200 142 PPI IPS LED |
Transparency
The selection of devices to be reviewed is made by our editorial team. The test sample was provided to the author as a loan by the manufacturer or retailer for the purpose of this review. The lender had no influence on this review, nor did the manufacturer receive a copy of this review before publication. There was no obligation to publish this review. As an independent media company, Notebookcheck is not subjected to the authority of manufacturers, retailers or publishers.
This is how Notebookcheck is testing
Every year, Notebookcheck independently reviews hundreds of laptops and smartphones using standardized procedures to ensure that all results are comparable. We have continuously developed our test methods for around 20 years and set industry standards in the process. In our test labs, high-quality measuring equipment is utilized by experienced technicians and editors. These tests involve a multi-stage validation process. Our complex rating system is based on hundreds of well-founded measurements and benchmarks, which maintains objectivity. Further information on our test methods can be found here.

