Verdict - The ROG Zephyrus G14 gets more expensive, but even better in 2026
The ROG Zephyrus G14 was already the fastest 14-inch gaming/multimedia allrounder and Asus improved some aspects for the new 2026 model. The AMD processor was replaced by a Panther Lake CPU from Intel, which improves single-core performance as well as efficiency resulting in longer battery runtimes. It is still the only 14-inch gamer with the powerful GeForce RTX 5070 Ti and the gaming performance does not disappoint. Combined with the new OLED panel, which is much brighter than before, games simply look stunning. Asus also improved other aspects and now implements a full-size SD-card reader and also improves the access to the internal with magnetic instead of glued screw covers. It is also one of the most comfortable keyboards you will find on a laptop.
All the positive things come at a cost though, and in addition to the price increase ($3199 for the SKU with the 5070 Ti and 32 GB RAM) you also have to live with loud fans when you want to use the full performance of the GPU. This means you should probably wear a headset while gaming. In everyday situations, however, the laptop usually stays very quiet.
All in all, Asus managed to improve the ROG Zephyrus G14 even further and the new OLED panel fixes one of the issues we had with the old model. If you do not really care about HDR gaming, though, we recommend the 2025 model, which is still available and noticeably cheaper ($2599).
Pros
Cons
Price and Availability
You can order the 2026 version of the ROG Zephyrus G14 with the RTX 5070 Ti for $3199 from BestBuy.
- $129.99280W 250W Charger for Asus ROG Zephyrus G14 (2026) GU405 GU405AR GU405AR-XB97 Gaming Laptop Power Supply Adapter Cord
- $89.99240W Charger for Asus ROG Zephyrus G14 GA402R GA402X GA402RJ GA402RK GA402NU GA402XV GA402XI GA402XZ GA402XY 2022 Gaming Laptop Power Supply Adapter Cord
- $1,749.99EXCaliberPC [2025] ASUS ROG Zephyrus G14 GA403UM-G14.R9HX4 (AMD Ryzen 9 270, 16GB LPDDR5X, 1TB NVMe SSD, NVIDIA GeForce RTX 5060, 14" 3K OLED 120Hz, Windows 11) Gaming Laptop
Specifications
Case, Connectivity and Input Devices
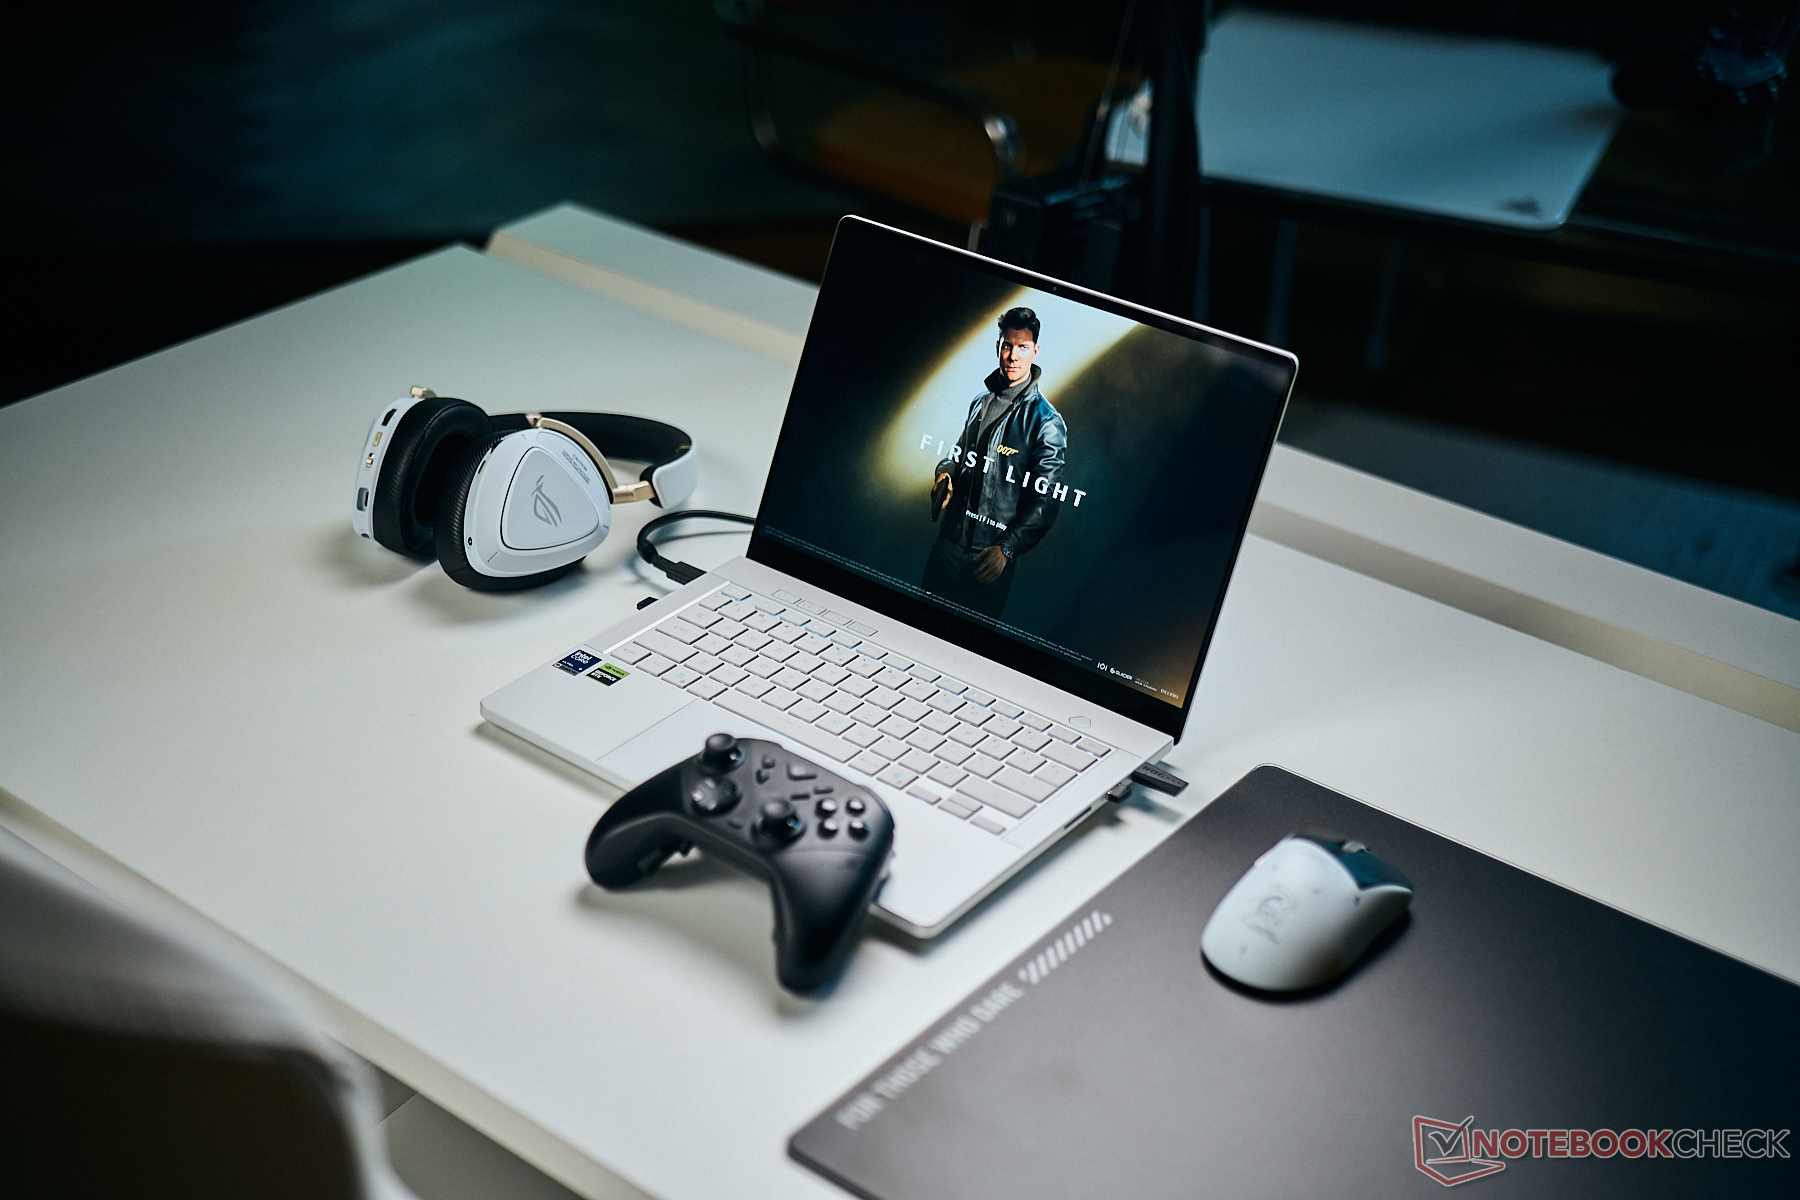
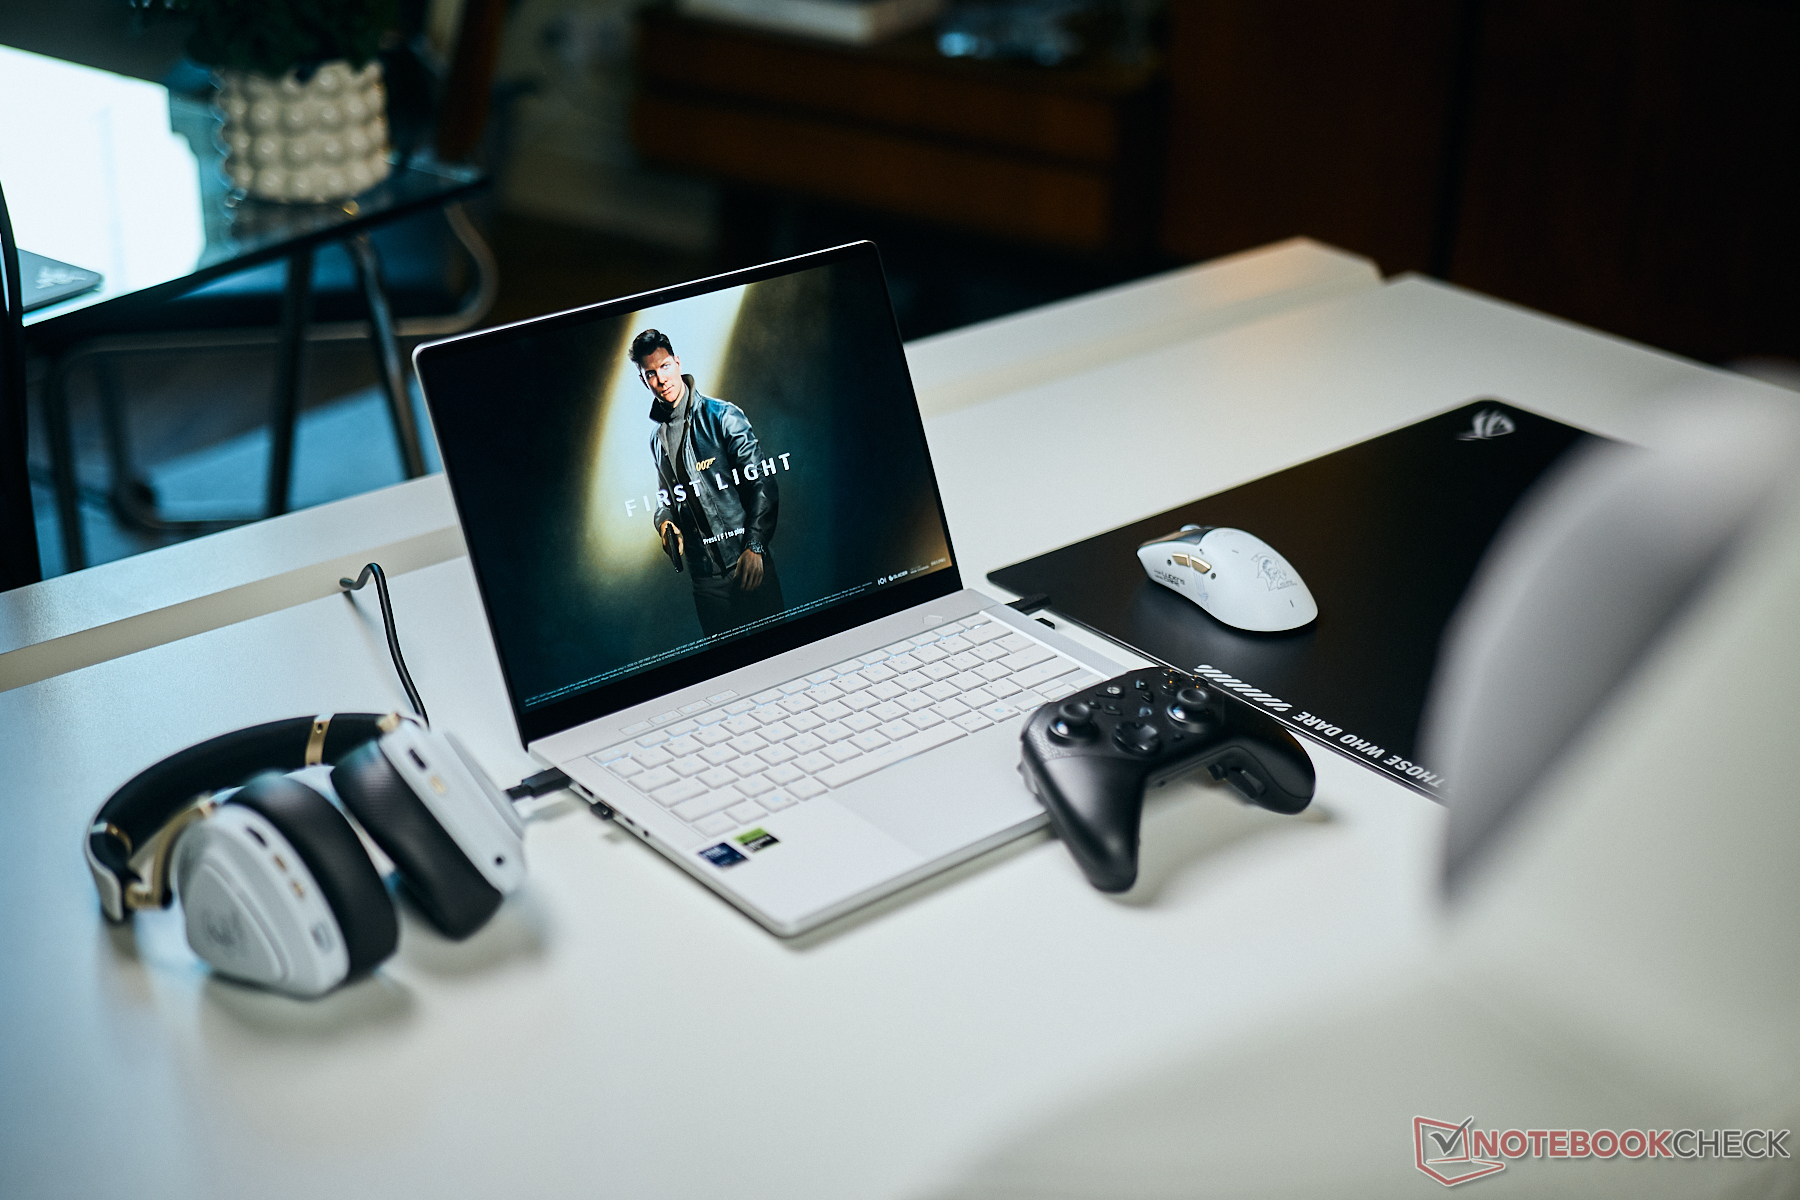
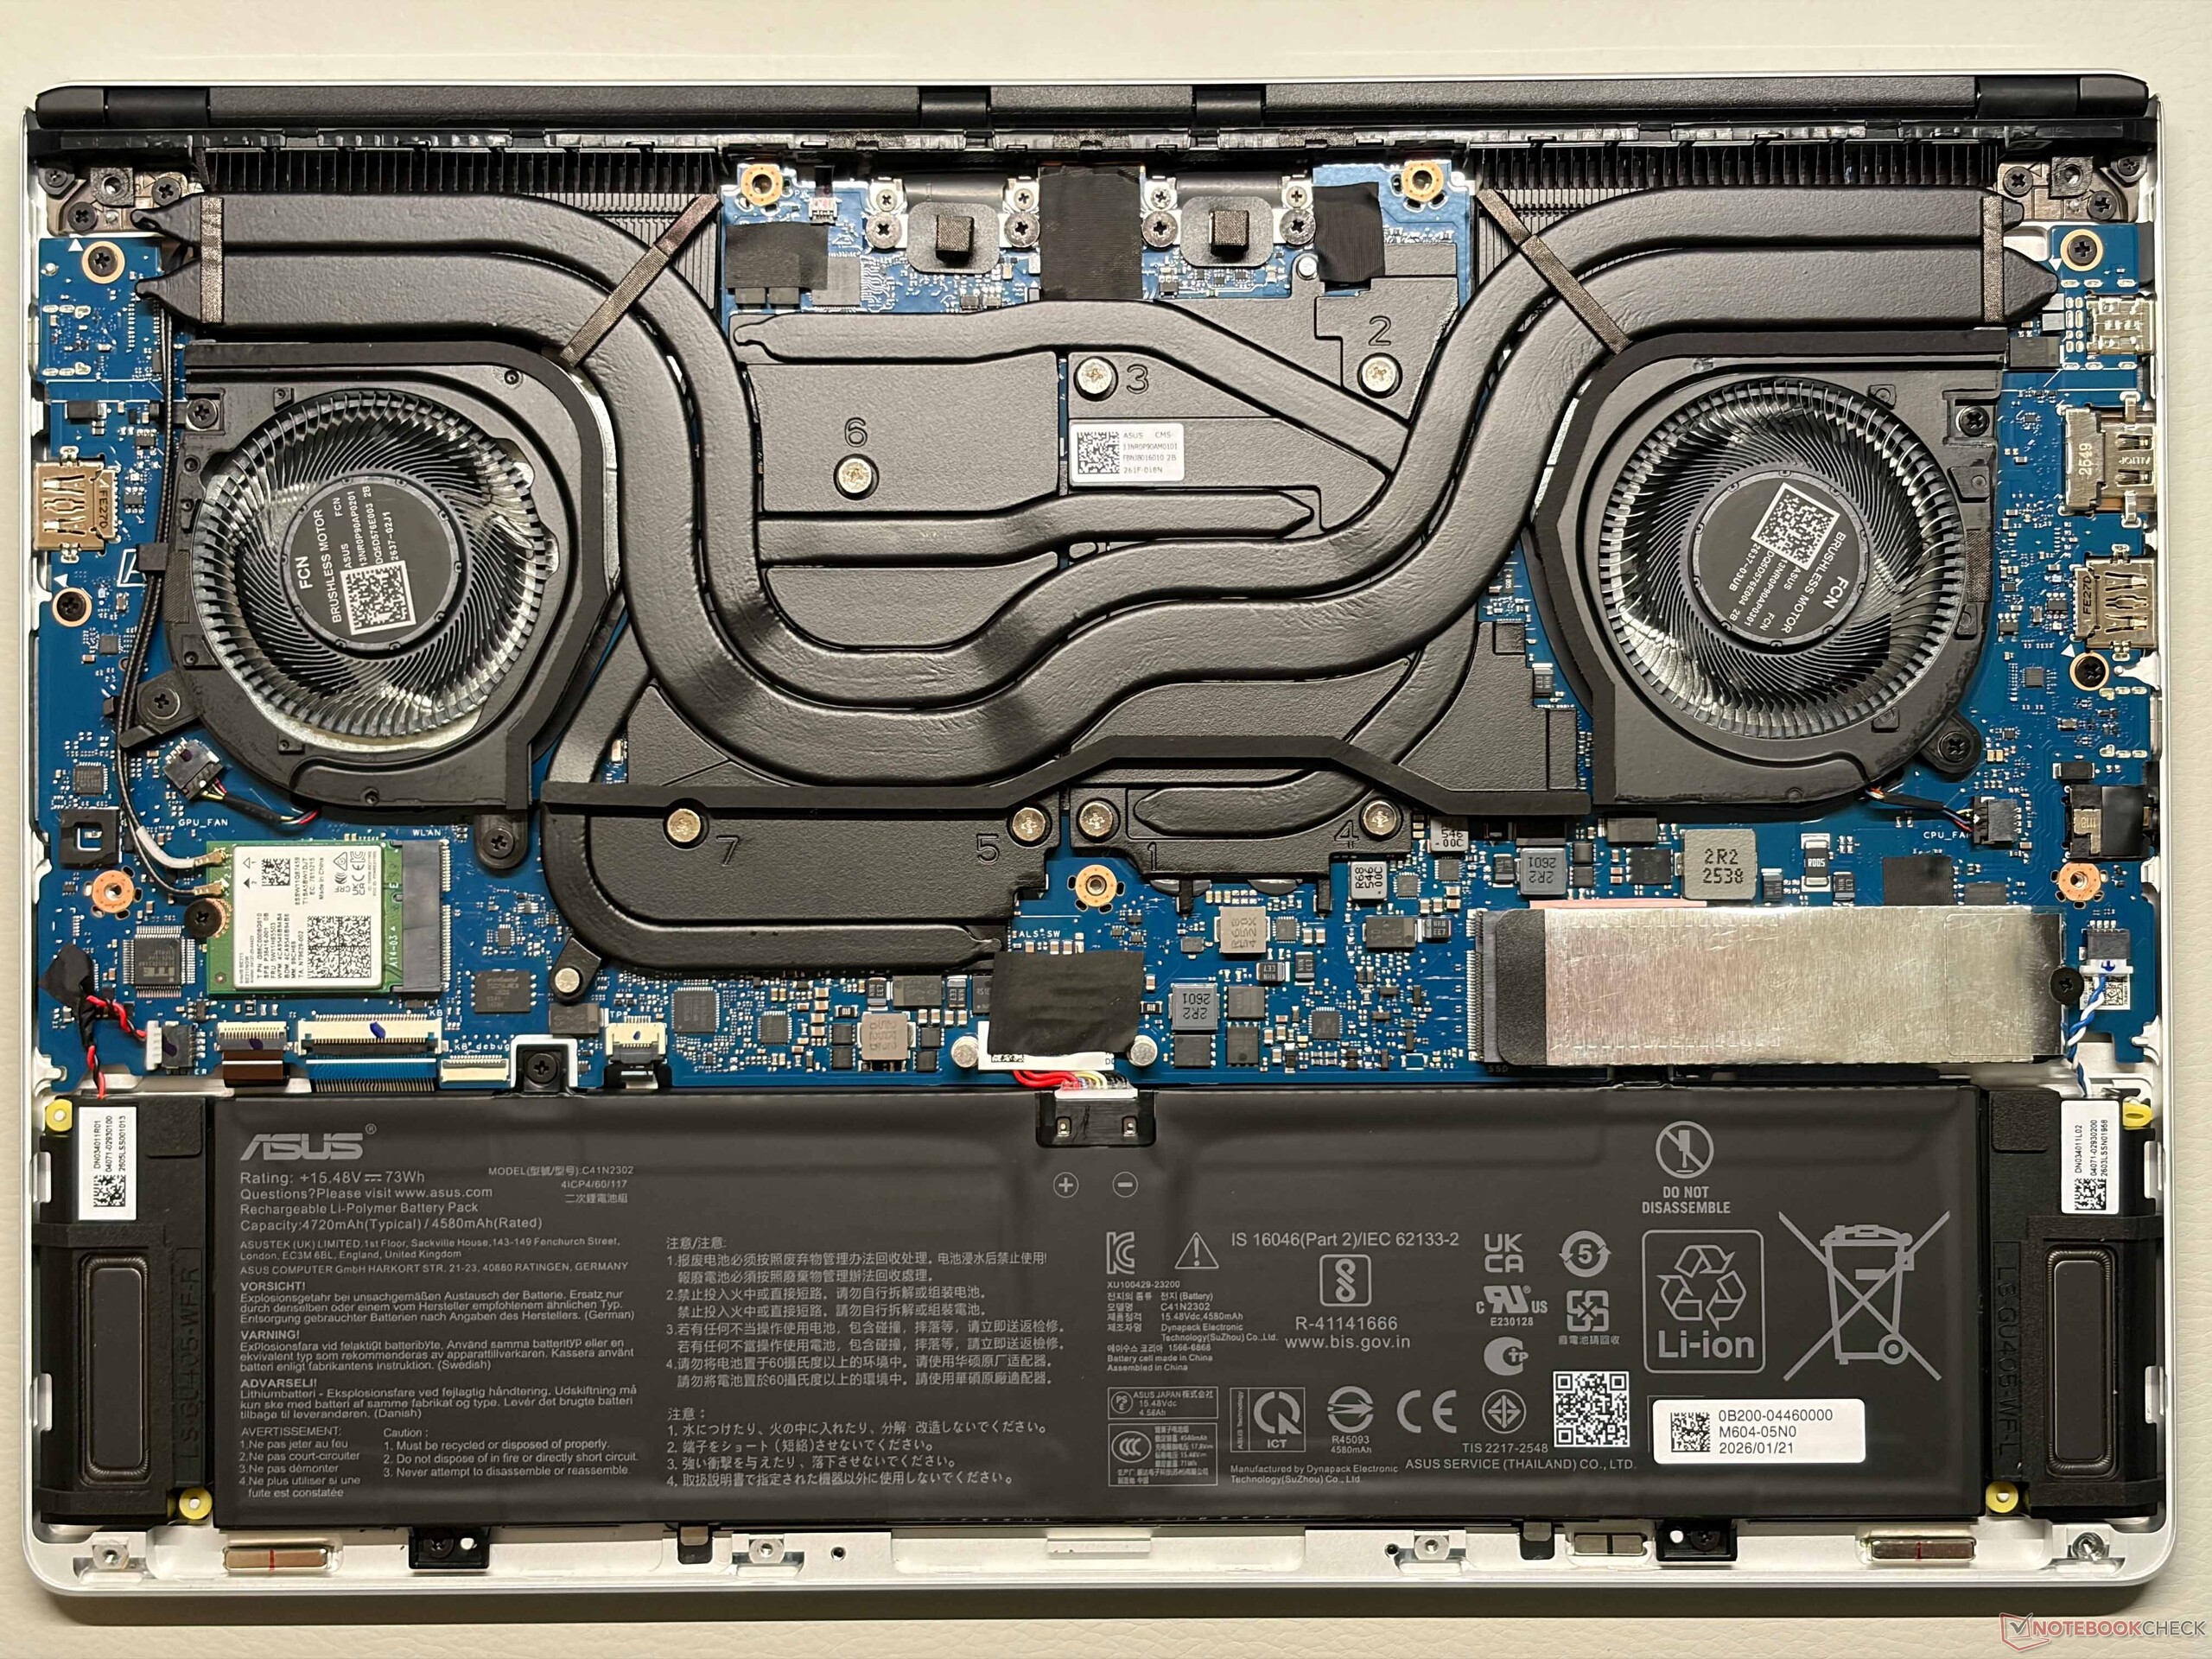
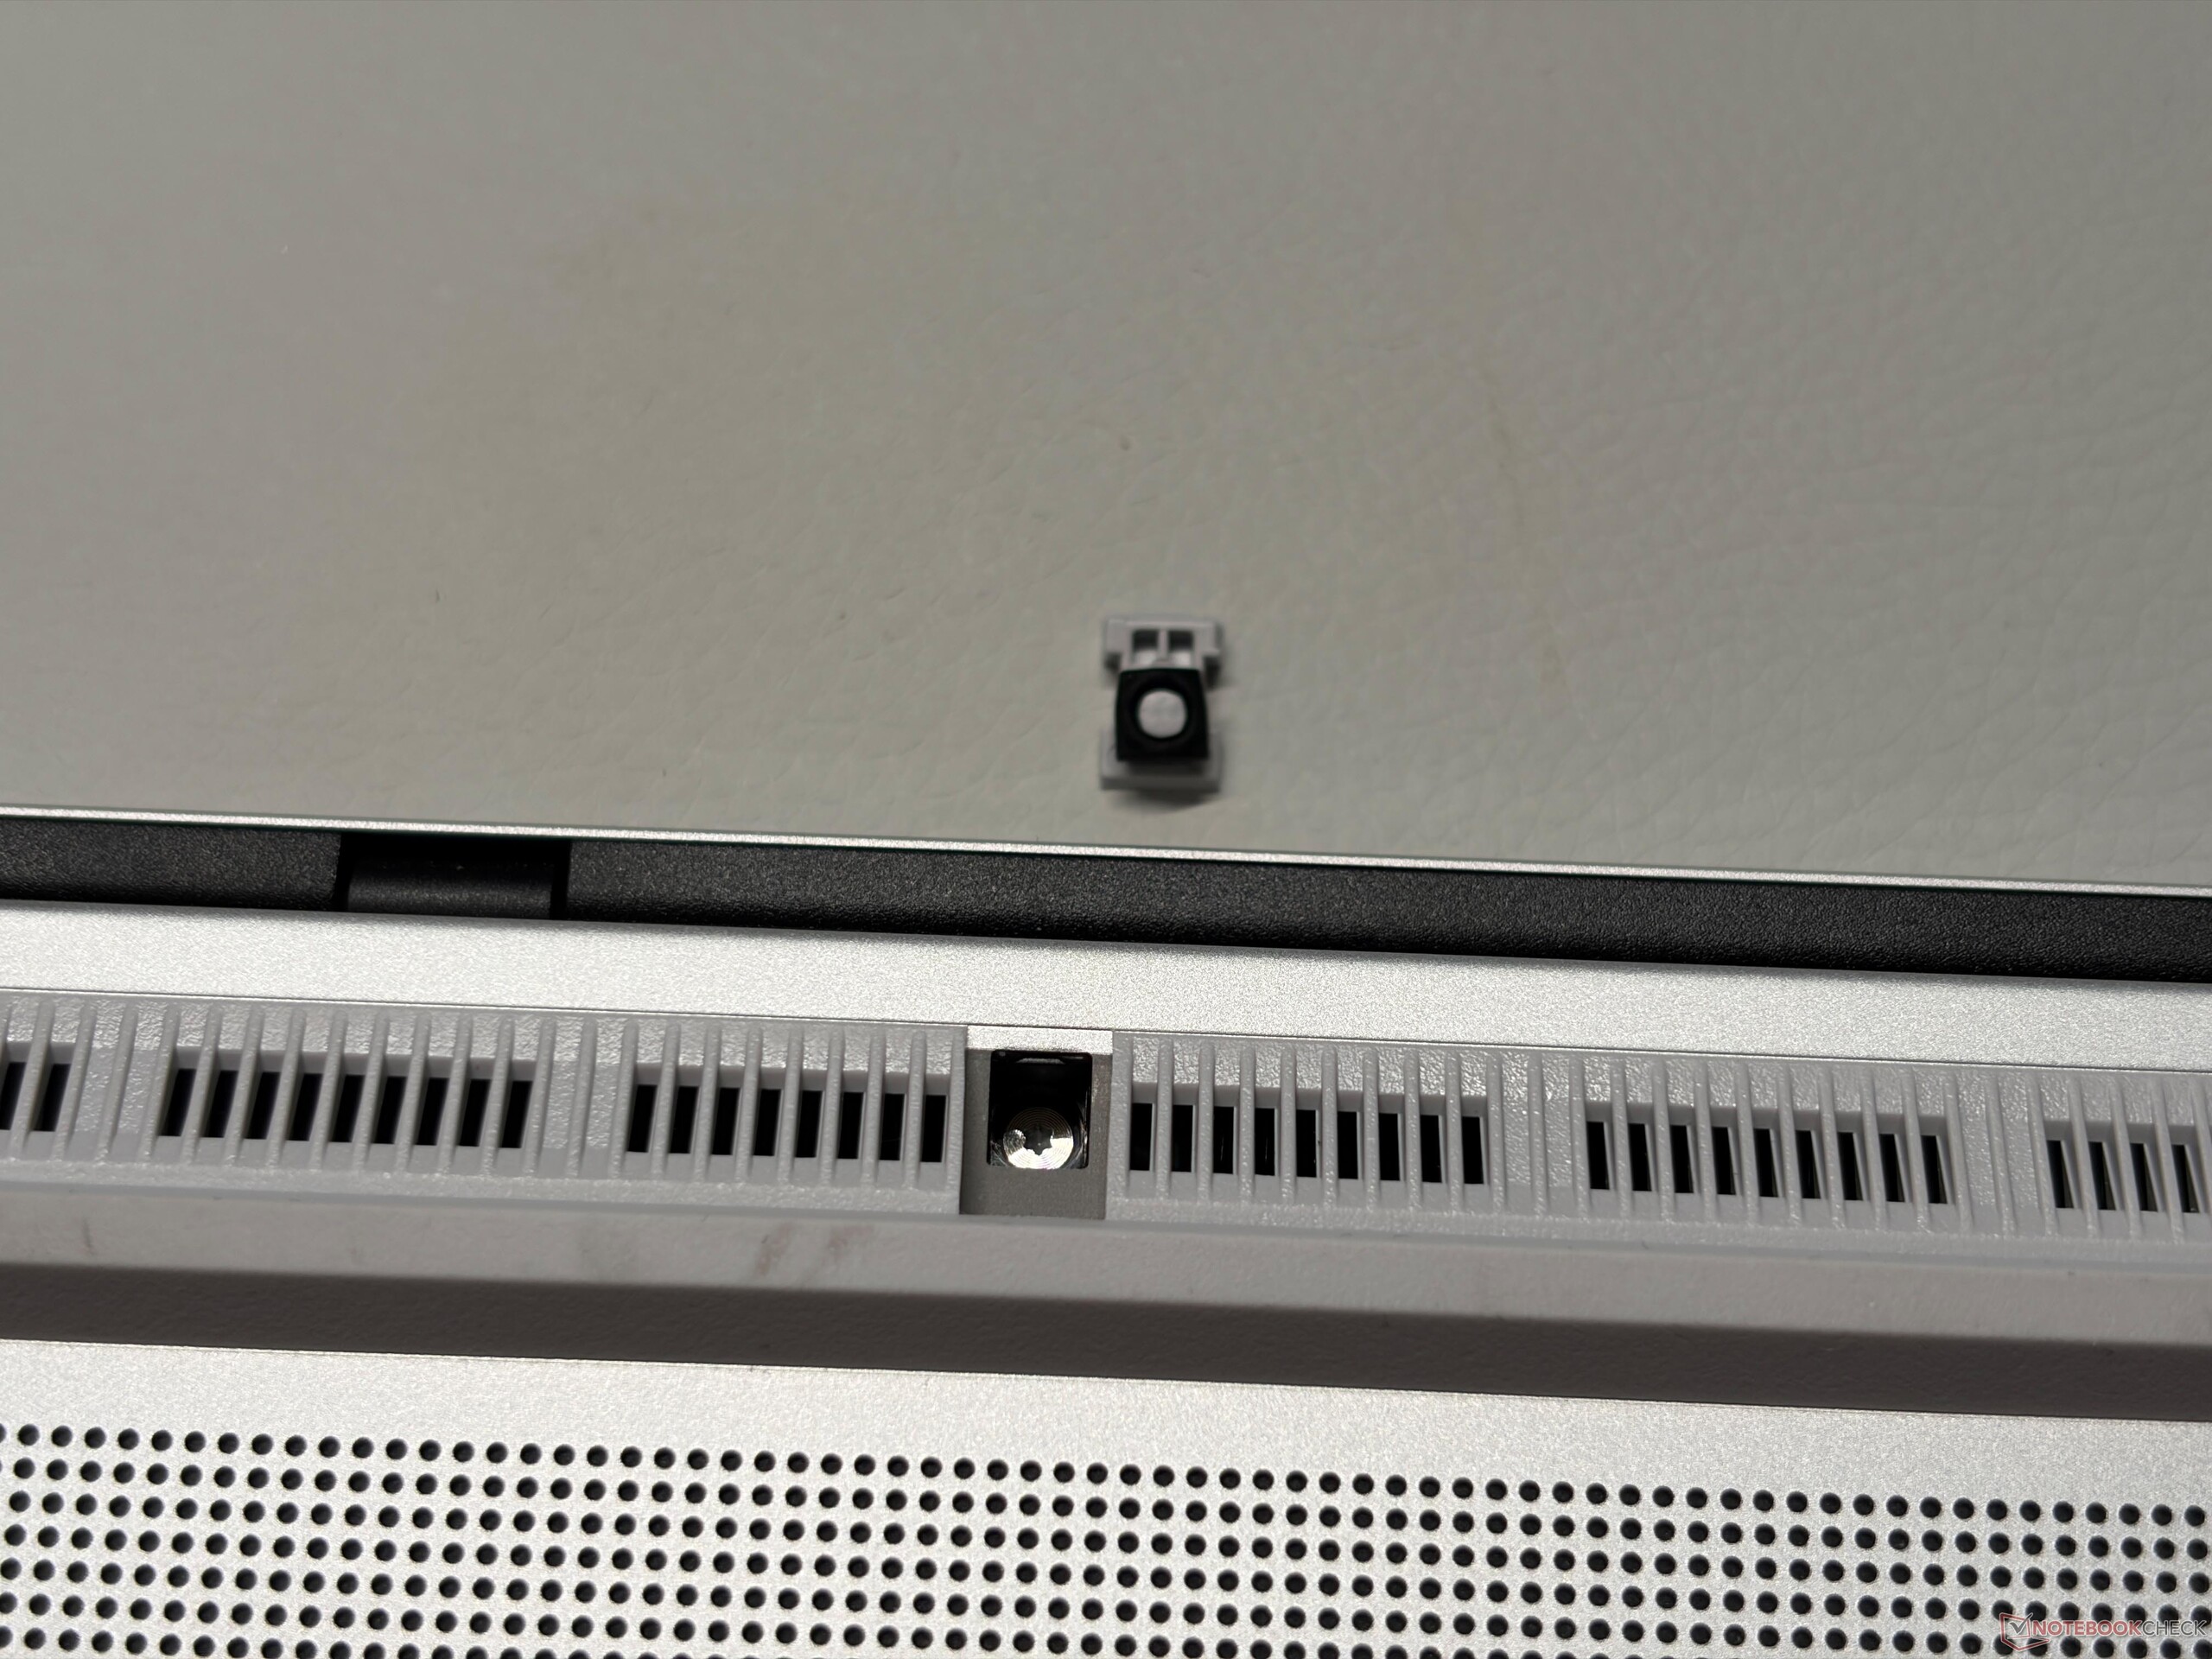
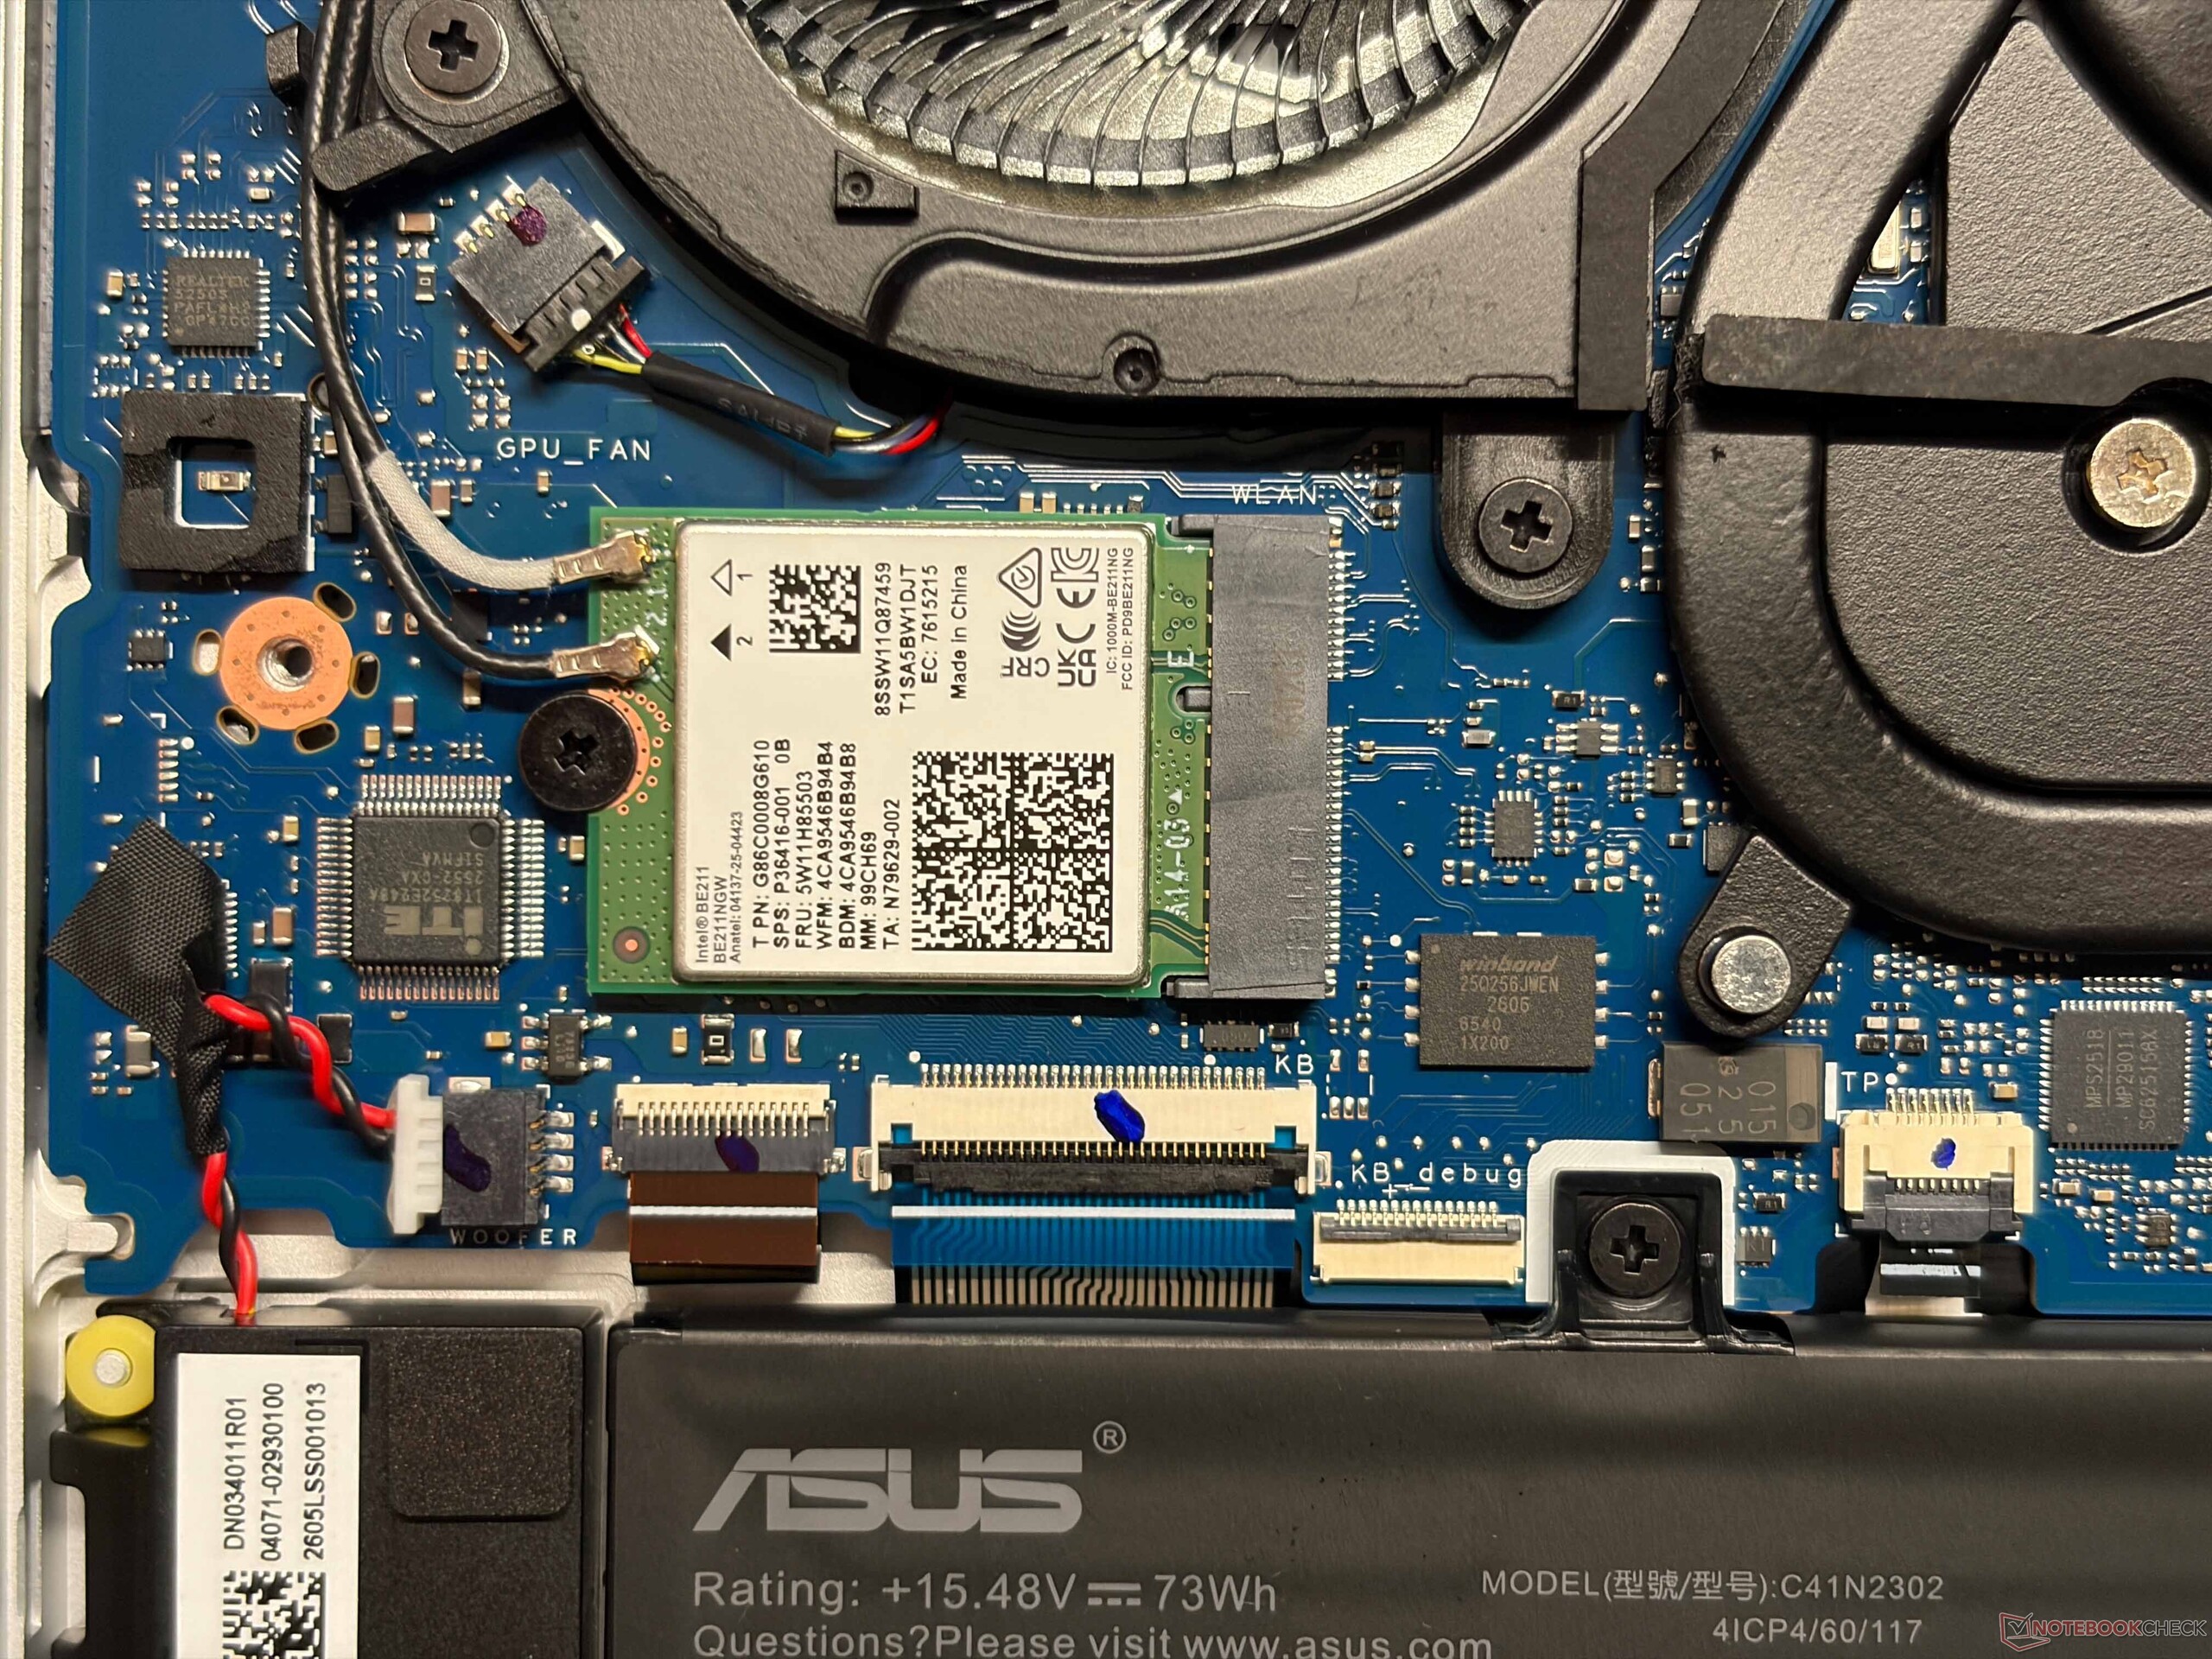
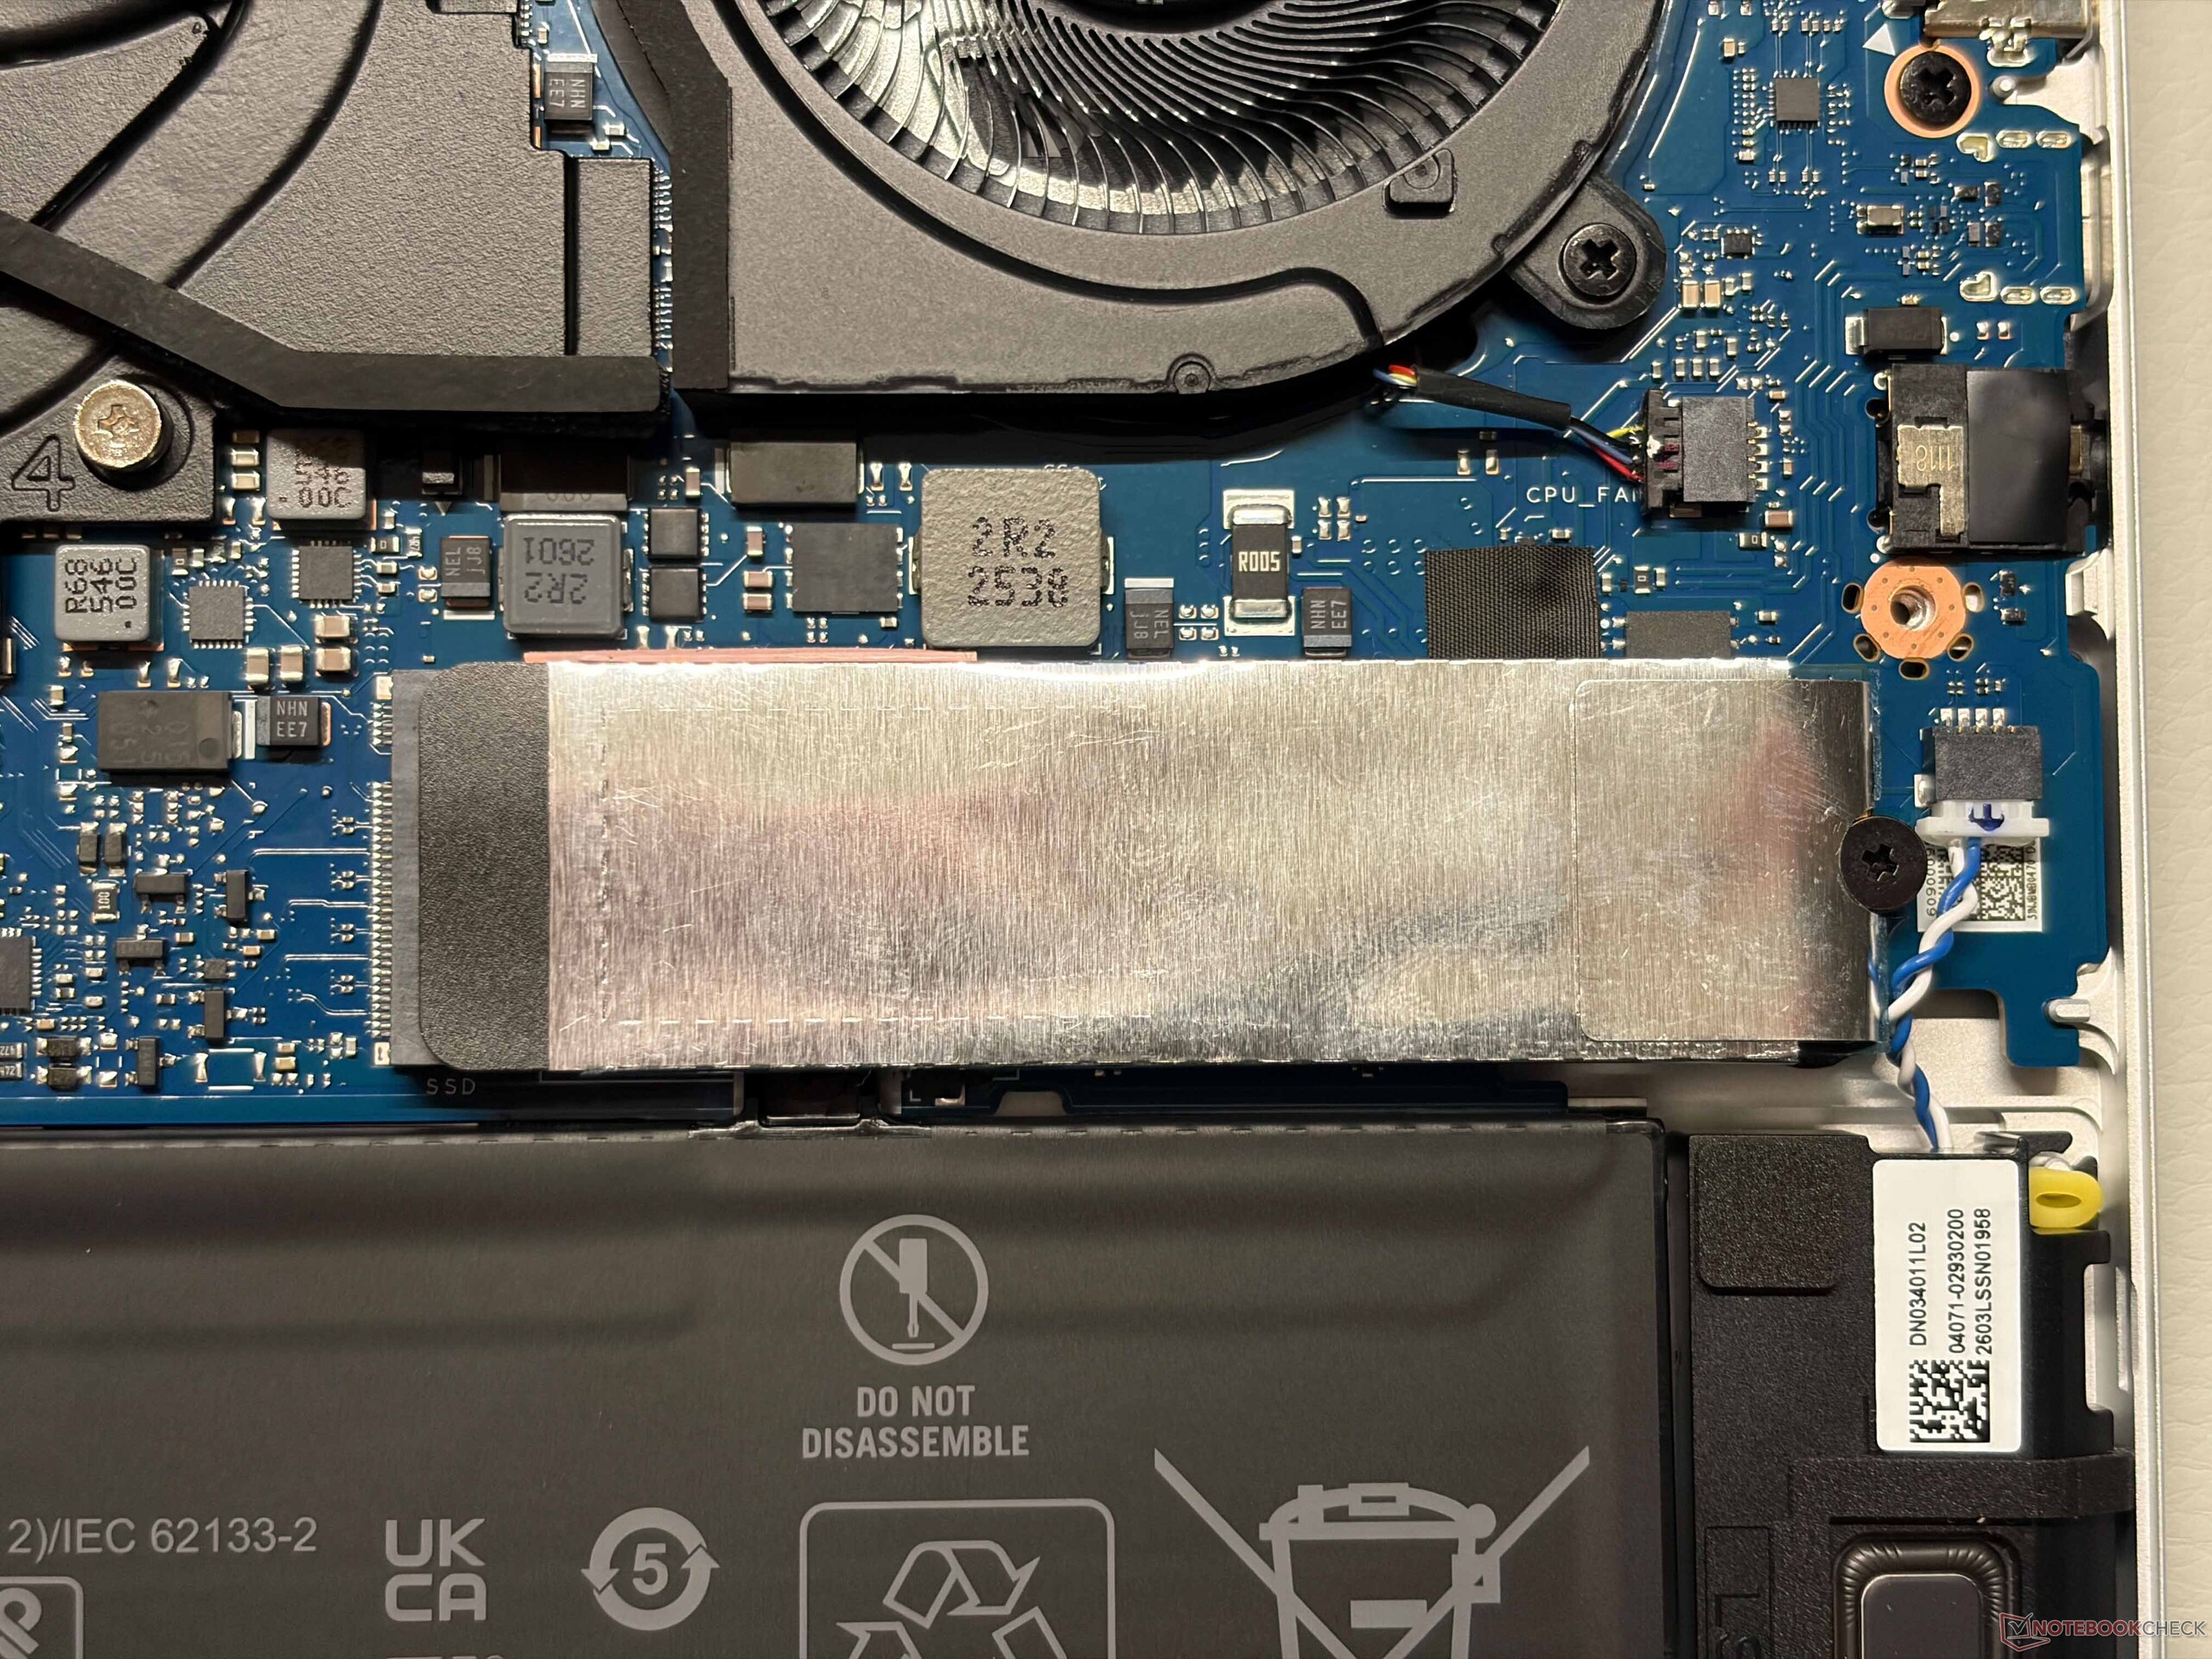
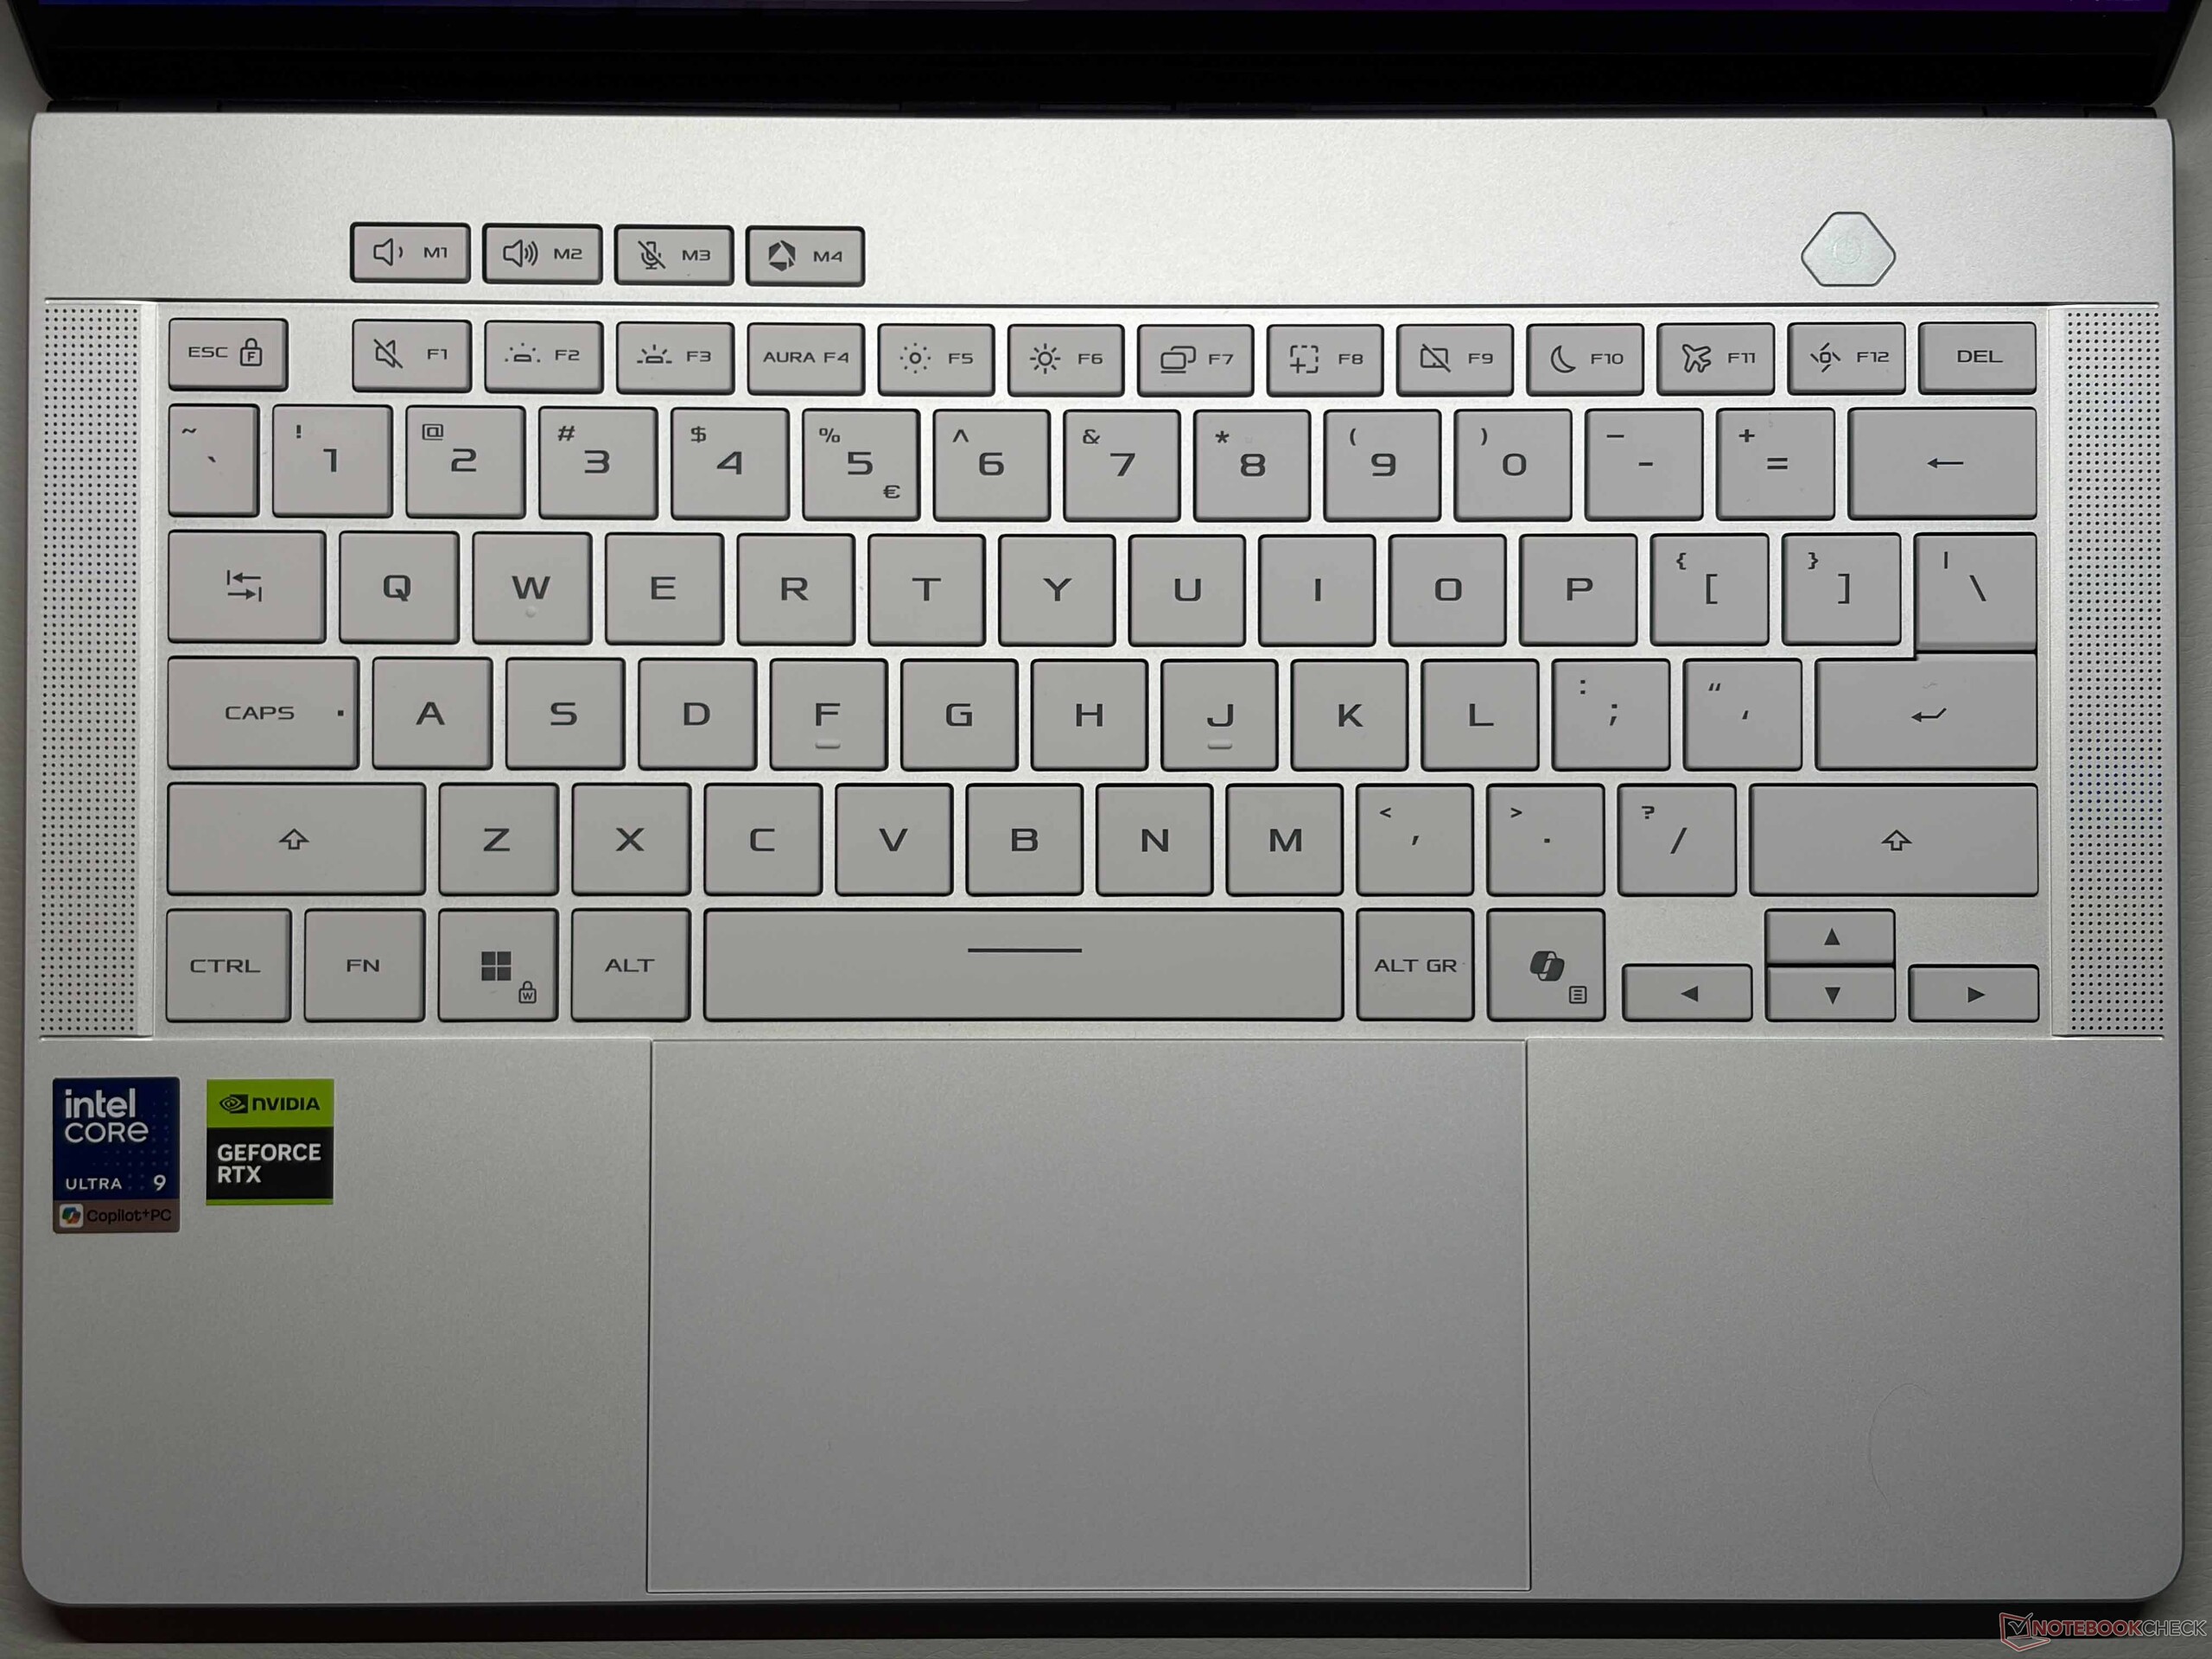
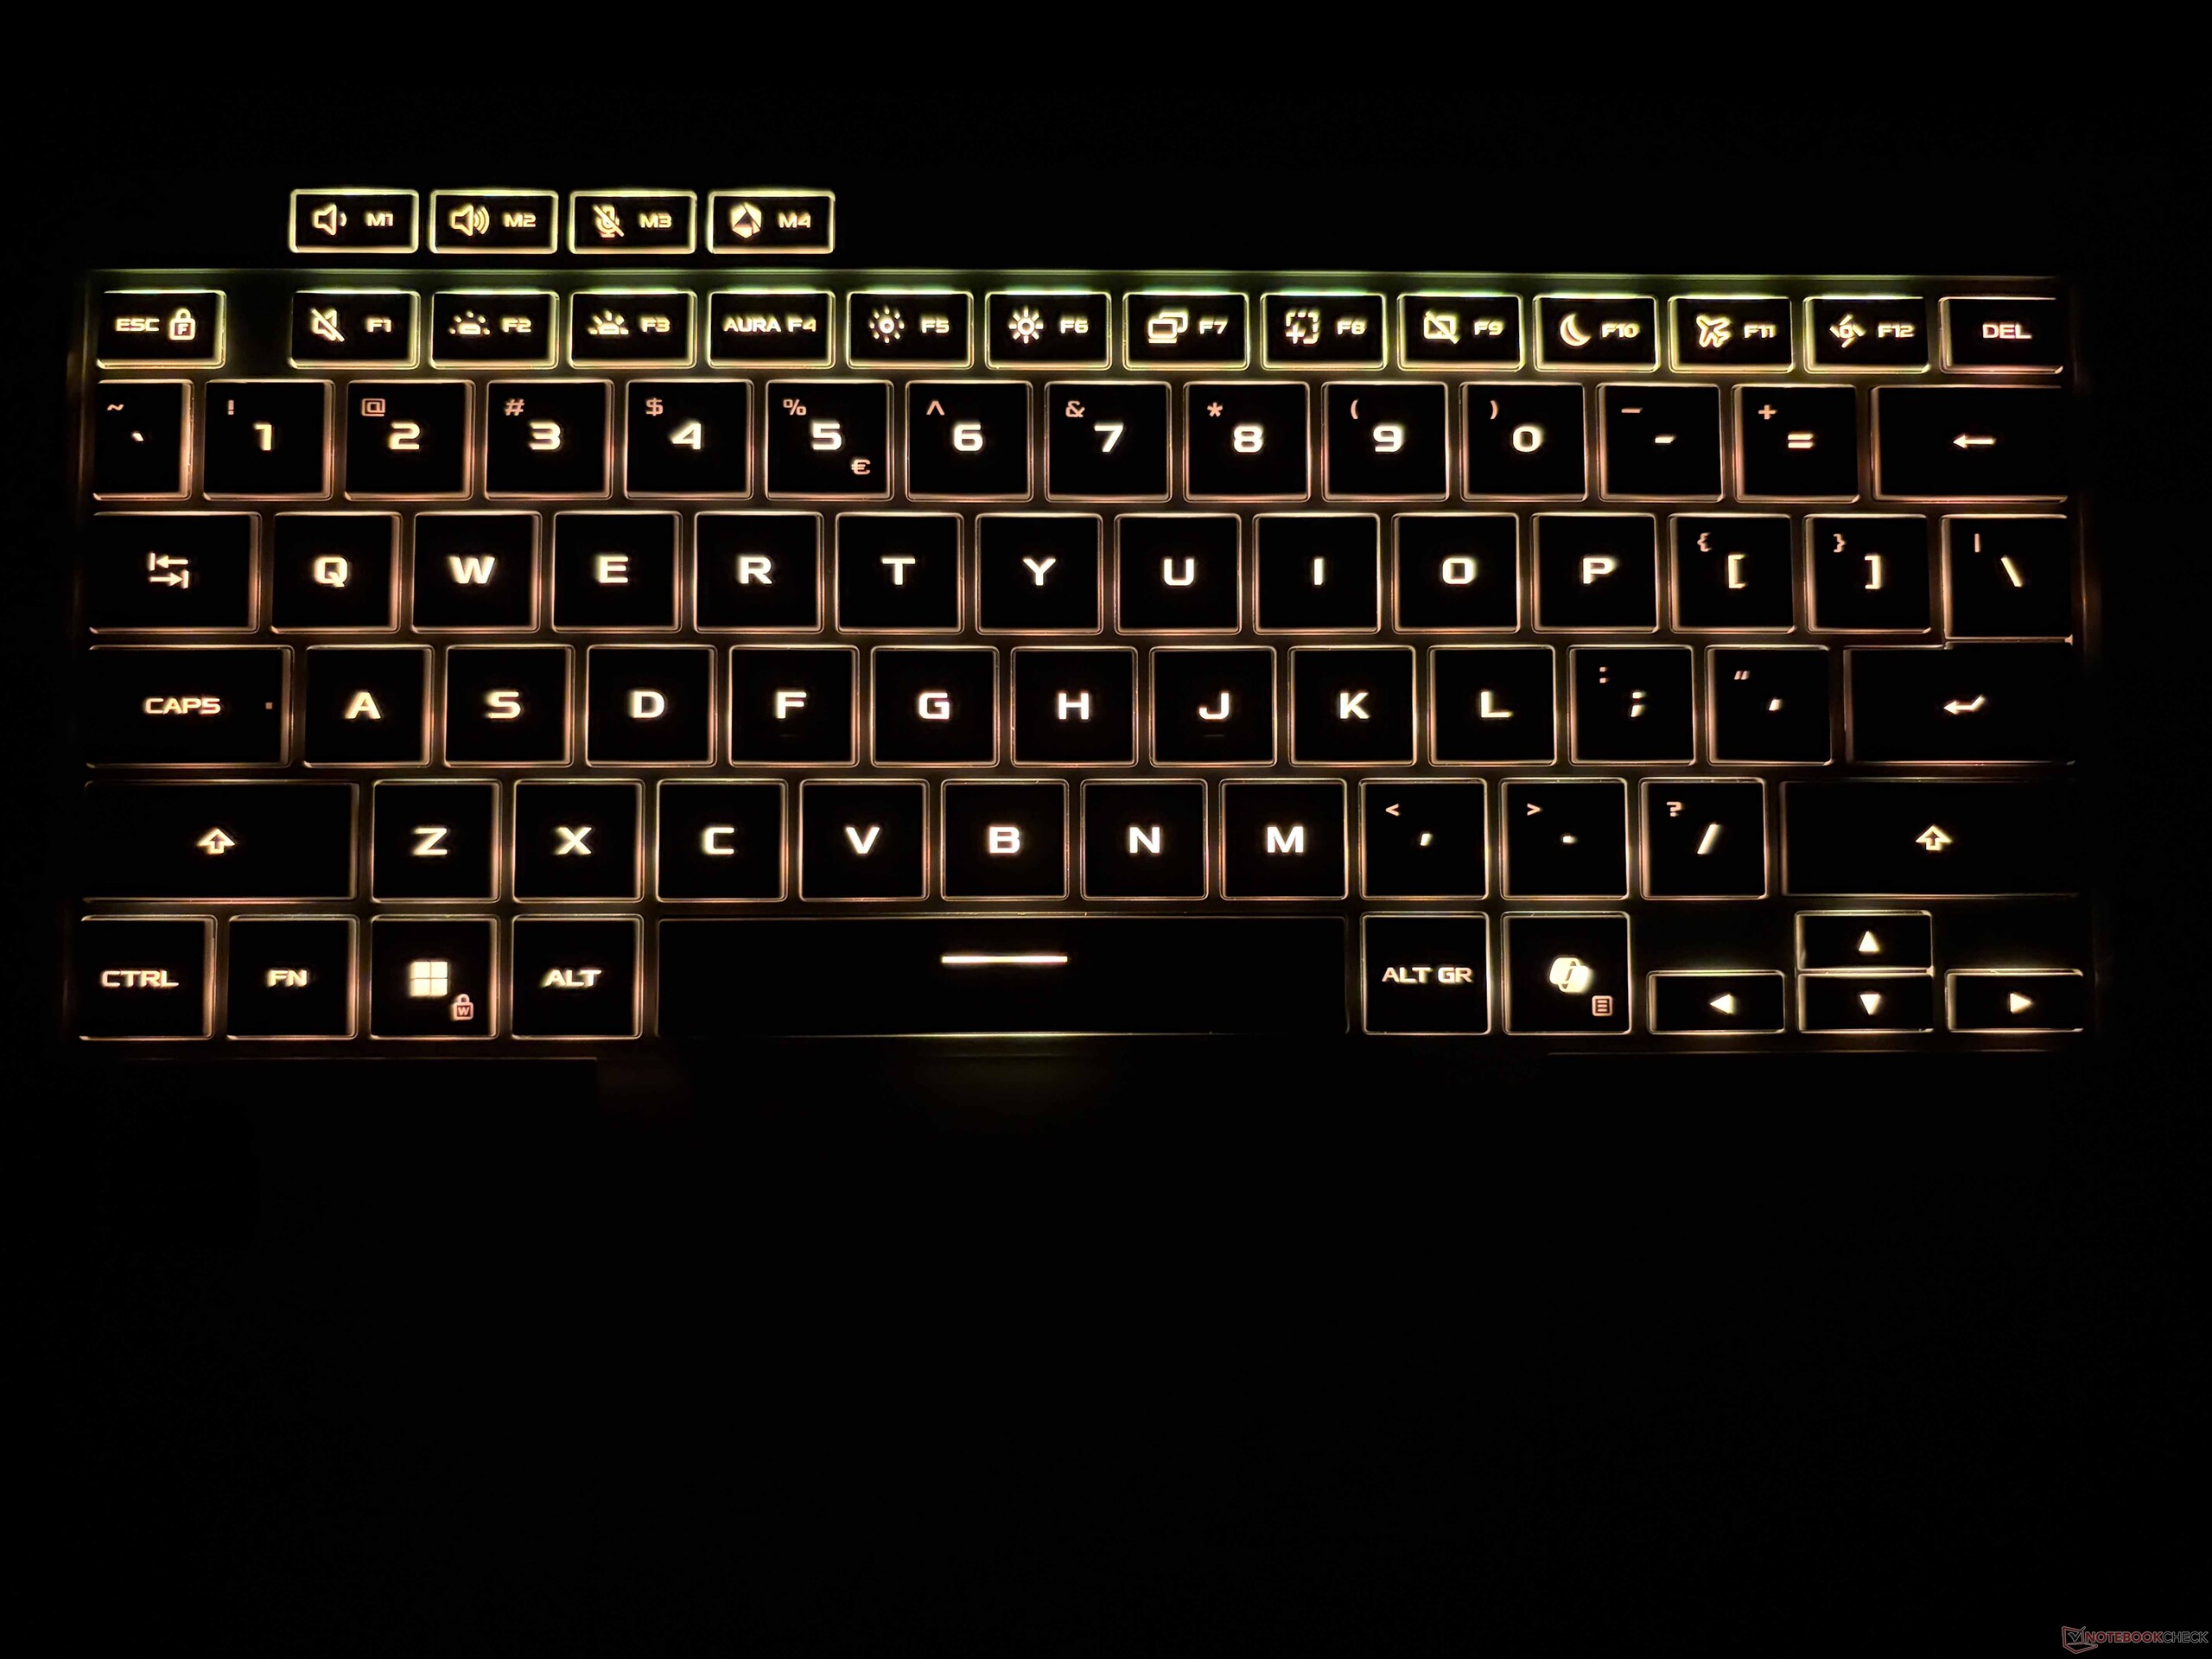
Compared to the previous generation, the case of the 2026 ROG Zephyrus G14 is pretty much unchanged from the outside and the white model still looks great. The overall quality is excellent and this is a premium laptop without any doubt. Asus made it easier to access the internals, because the two screw covers at the rear are now magnetically attached and not glued anymore. The internal layout changed a bit due to the switch to an Intel CPU, but both the M.2-2280 SSD as well as the Wi-Fi module are still replaceable. The keyboard with 1.7 mm travel is still one of the most comfortable units you will find in any laptop and the clickpad convinces with high-quality clicks as well as good gliding capabilities.
The G14 now supports Thunderbolt 4 as well as a full-size SD-card reader. It does not support the SD-Express standard, but the transfer rates are still speedy at more than 200 MB/s. The Wi-Fi 7 module is also very speedy when you have a corresponding router.


| SD Card Reader | |
| average JPG Copy Test (av. of 3 runs) | |
| Razer Blade 14 2025 (Angelbird AV Pro V60) | |
| Asus ROG Zephyrus G14 2025 GA403WW (Angelbird AV Pro V60) | |
| Asus ROG Zephyrus G14 GU405AR (Angelbird AV Pro V60) | |
| Apple MacBook Pro 14 2026 M5 Max (Angelbird AV Pro V60) | |
| Average of class Gaming (20.9 - 210, n=54, last 2 years) | |
| Acer Predator Triton 14 AI PT14-52 (Angelbird AV Pro V60) | |
| maximum AS SSD Seq Read Test (1GB) | |
| Apple MacBook Pro 14 2026 M5 Max (Angelbird AV Pro V60) | |
| Asus ROG Zephyrus G14 GU405AR (Angelbird AV Pro V60) | |
| Razer Blade 14 2025 (Angelbird AV Pro V60) | |
| Asus ROG Zephyrus G14 2025 GA403WW (Angelbird AV Pro V60) | |
| Average of class Gaming (25.5 - 261, n=51, last 2 years) | |
| Acer Predator Triton 14 AI PT14-52 (Angelbird AV Pro V60) | |
| Networking | |
| Asus ROG Zephyrus G14 GU405AR | |
| iperf3 transmit Wi-Fi6/7 RT-BE96U | |
| iperf3 receive Wi-Fi6/7 RT-BE96U | |
| Acer Predator Triton 14 AI PT14-52 | |
| iperf3 receive AXE11000 | |
| iperf3 transmit AXE11000 | |
| Razer Blade 14 2025 | |
| iperf3 receive AXE11000 | |
| iperf3 transmit AXE11000 | |
| Asus ROG Zephyrus G14 2025 GA403WW | |
| iperf3 receive AXE11000 | |
| iperf3 transmit AXE11000 | |
| Apple MacBook Pro 14 2026 M5 Max | |
| iperf3 receive AXE11000 | |
| iperf3 transmit AXE11000 | |


Display - Brighter OLED
The OLED panel of the old G14 was one of the weak spots because the brightness was rather limited with HDR contents. The new panel once again offers the 2.8K resolution with 120 Hz, but the brightness has increased substantially. Our analysis with the professional CalMAN software shows that the new 2026 model fixes this issue and the brightness in SDR mode is slightly above 500 nits, while we measured up to 1140 nits for HDR contents, so there are no more criticisms. The glossy panel does not support touch inputs, but the image quality is superb and bright contents do not look grainy. There is PWM flickering, but the frequency is pretty high at 960 Hz and the amplitude is low at most brightness levels. Asus also offers its flicker-free OLED dimming via software. You once again get accurate multiple color profiles for P3 as well as sRGB, so image editing is no problem here. We did not manage to improve the color accuracy even further with our own calibration.
| |||||||||||||||||||||||||
Brightness Distribution: 98 %
Center on Battery: 508 cd/m²
Contrast: 25400:1 (Black: 0.02 cd/m²)
ΔE ColorChecker Calman: 1.3 | ∀{0.5-29.43 Ø4.71}
ΔE Greyscale Calman: 2 | ∀{0.09-98 Ø4.96}
94.1% AdobeRGB 1998 (Argyll 3D)
100% sRGB (Argyll 3D)
99.8% Display P3 (Argyll 3D)
Gamma: 2.13
CCT: 6588 K
| Asus ROG Zephyrus G14 GU405AR ATNA40HQ06-0, OLED, 2880x1800, 14", 120 Hz | Acer Predator Triton 14 AI PT14-52 ATNA45AF03-0, OLED, 2880x1800, 14.5", 120 Hz | Razer Blade 14 2025 ATNA40CU05-0, OLED, 2880x1800, 14", 120 Hz | Asus ROG Zephyrus G14 2025 GA403WW ATNA40CU05-0, OLED, 2880x1800, 14", 120 Hz | Apple MacBook Pro 14 2025 M5 Mini-LED, 3024x1964, 14.2", 120 Hz | |
|---|---|---|---|---|---|
| Display | 0% | -2% | -1% | -2% | |
| Display P3 Coverage (%) | 99.8 | 99.6 0% | 99.5 0% | 99.6 0% | 99.5 0% |
| sRGB Coverage (%) | 100 | 99.9 0% | 100 0% | 100 0% | 100 0% |
| AdobeRGB 1998 Coverage (%) | 94.1 | 95.1 1% | 89.2 -5% | 89.9 -4% | 88.8 -6% |
| Response Times | 21% | 30% | 11% | -3978% | |
| Response Time Grey 50% / Grey 80% * (ms) | 2 ? | 0.48 ? 76% | 0.59 ? 70% | 0.62 ? 69% | 49.4 ? -2370% |
| Response Time Black / White * (ms) | 0.49 ? | 0.65 ? -33% | 0.63 ? -29% | 0.68 ? -39% | 47 ? -9492% |
| PWM Frequency (Hz) | 960 ? | 240 ? | 960 ? | 960 ? | 14900 |
| PWM Amplitude * (%) | 52 | 41 21% | 26 50% | 50 4% | 90 -73% |
| Screen | -41% | -20% | 30% | 22% | |
| Brightness middle (cd/m²) | 508 | 376 -26% | 361 -29% | 423 -17% | 633 25% |
| Brightness (cd/m²) | 514 | 377 -27% | 363 -29% | 424 -18% | 619 20% |
| Brightness Distribution (%) | 98 | 99 1% | 98 0% | 98 0% | 92 -6% |
| Black Level * (cd/m²) | 0.02 | 0.01 50% | |||
| Contrast (:1) | 25400 | 42300 67% | |||
| Colorchecker dE 2000 * | 1.3 | 2.7 -108% | 1.7 -31% | 0.7 46% | 1 23% |
| Colorchecker dE 2000 max. * | 3.5 | 5.3 -51% | 3.9 -11% | 1.8 49% | 2.2 37% |
| Greyscale dE 2000 * | 2 | 2.7 -35% | 2.4 -20% | 0.8 60% | 1.3 35% |
| Gamma | 2.13 103% | 2.23 99% | 2.14 103% | 2.18 101% | 2.2 100% |
| CCT | 6588 99% | 6138 106% | 6571 99% | 6505 100% | 6549 99% |
| Total Average (Program / Settings) | -7% /
-15% | 3% /
-3% | 13% /
19% | -1319% /
-984% |
* ... smaller is better


Display Response Times
| ↔ Response Time Black to White | ||
|---|---|---|
| 0.49 ms ... rise ↗ and fall ↘ combined | ↗ 0.27 ms rise | 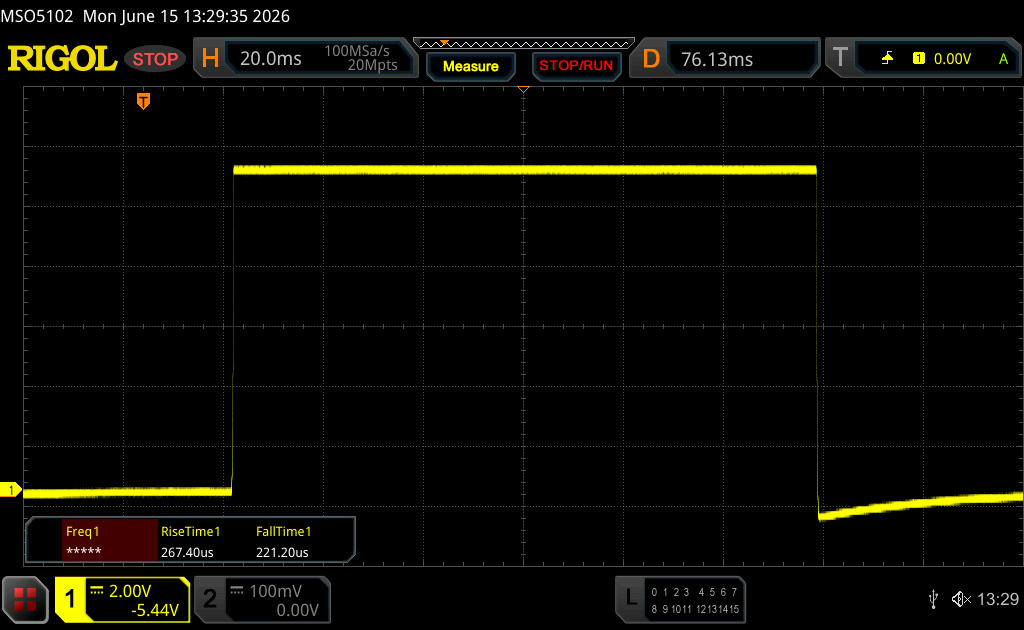 |
| ↘ 0.22 ms fall | ||
| The screen shows very fast response rates in our tests and should be very well suited for fast-paced gaming. In comparison, all tested devices range from 0.1 (minimum) to 240 (maximum) ms. » 1 % of all devices are better. This means that the measured response time is better than the average of all tested devices (19.8 ms). | ||
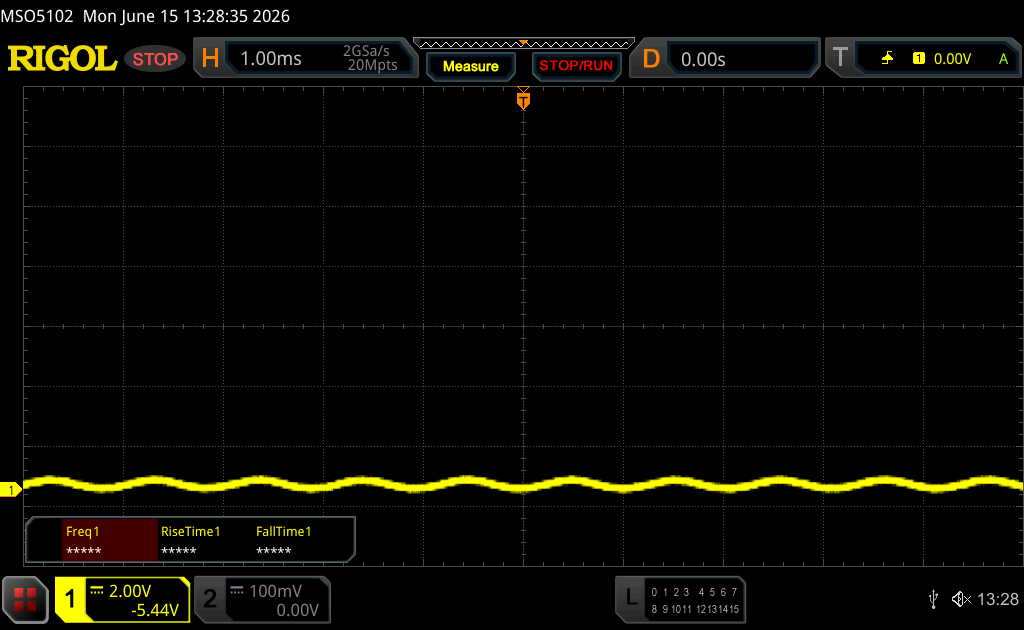
| ↔ Response Time 50% Grey to 80% Grey | ||
| 2 ms ... rise ↗ and fall ↘ combined | ↗ 1 ms rise | 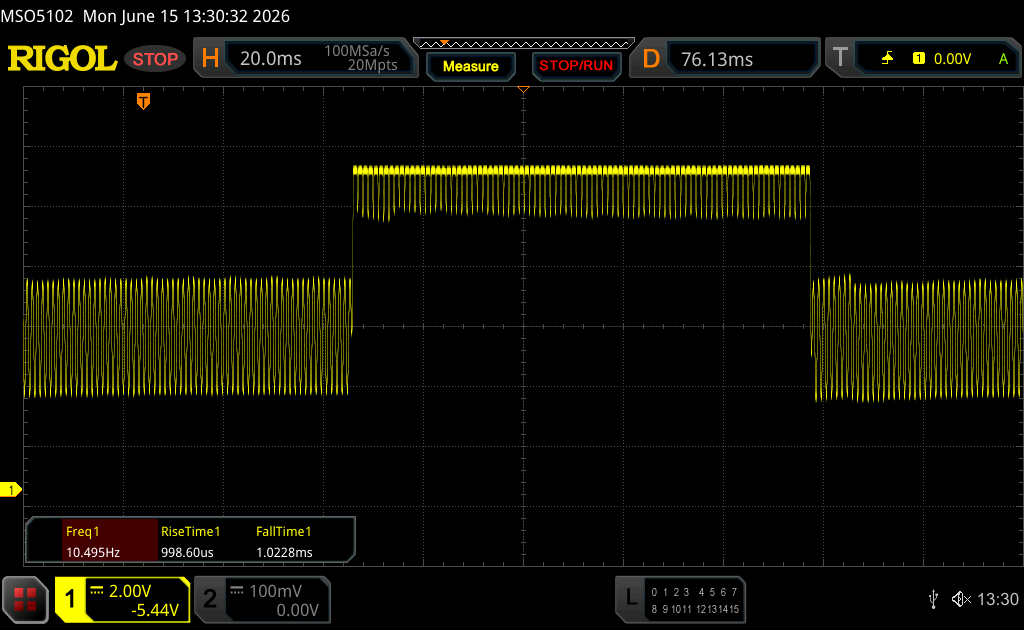 |
| ↘ 1 ms fall | ||
| The screen shows very fast response rates in our tests and should be very well suited for fast-paced gaming. In comparison, all tested devices range from 0.165 (minimum) to 636 (maximum) ms. » 10 % of all devices are better. This means that the measured response time is better than the average of all tested devices (30.9 ms). | ||
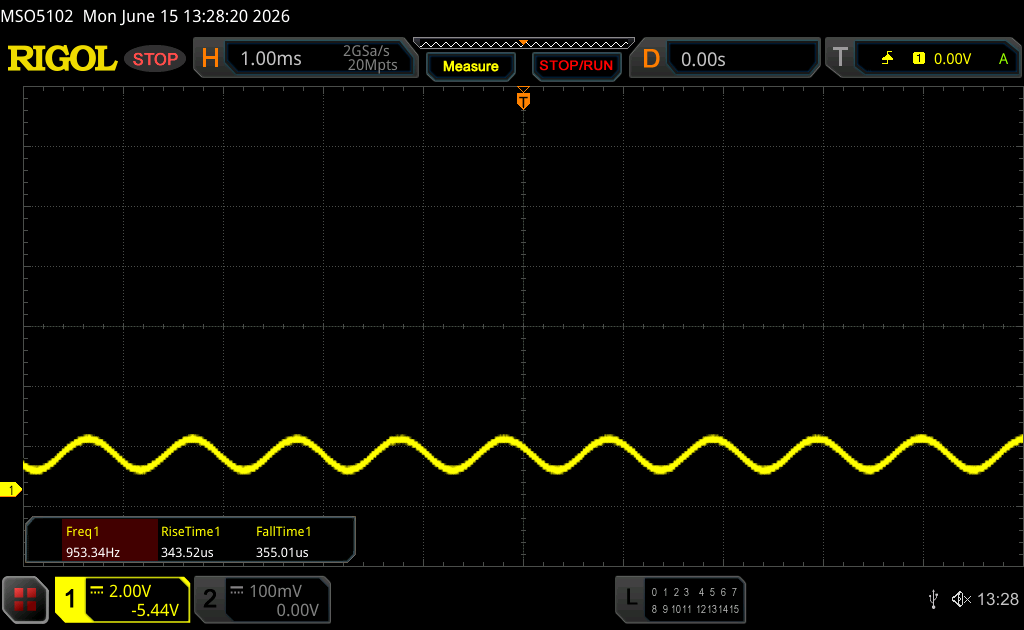
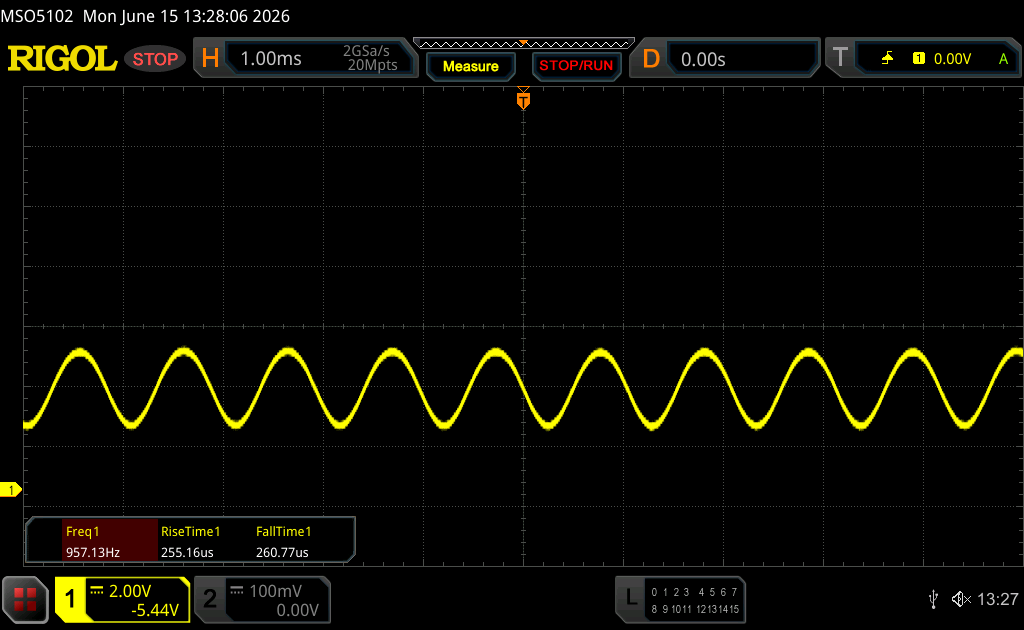
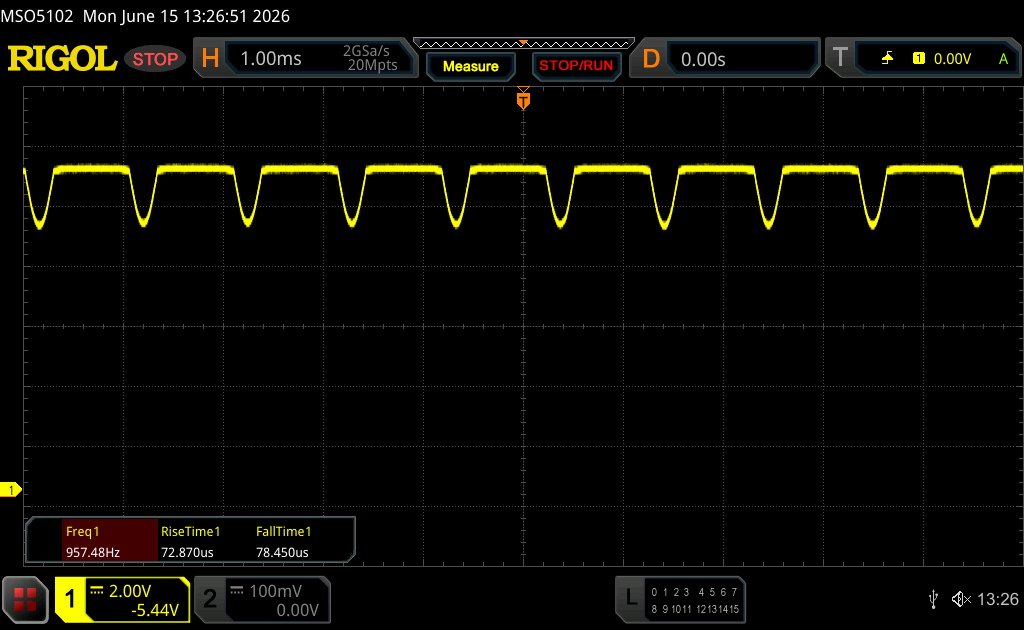
Screen Flickering / PWM (Pulse-Width Modulation)
| Screen flickering / PWM detected | 960 Hz Amplitude: 52 % | ≤ 90 % brightness setting | 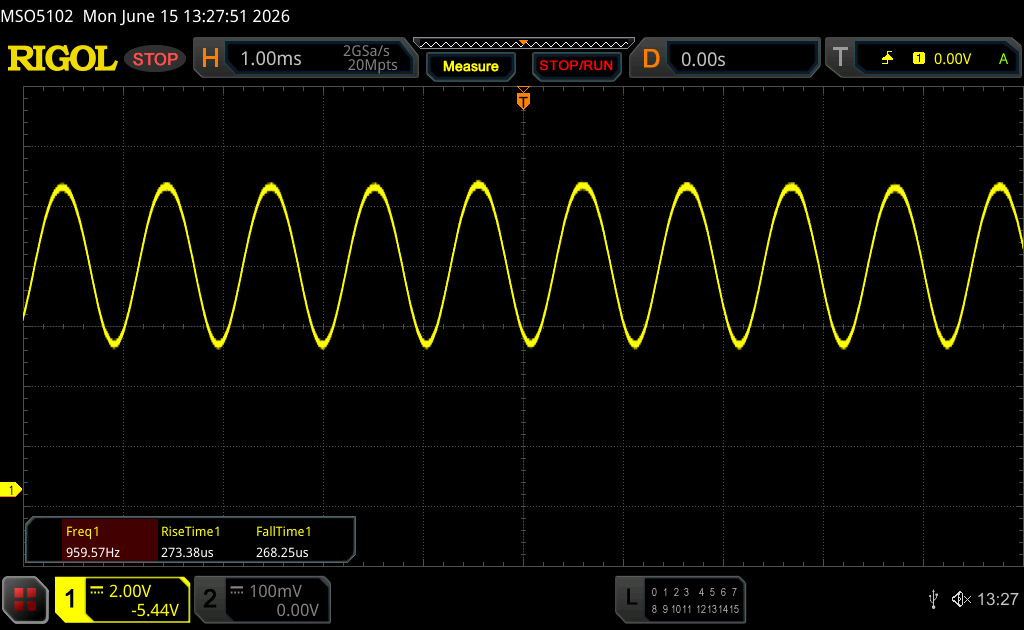 |
The display backlight flickers at 960 Hz (worst case, e.g., utilizing PWM) Flickering detected at a brightness setting of 90 % and below. There should be no flickering or PWM above this brightness setting. The frequency of 960 Hz is quite high, so most users sensitive to PWM should not notice any flickering. In comparison: 52 % of all tested devices do not use PWM to dim the display. If PWM was detected, an average of 7744 (minimum: 5 - maximum: 343500) Hz was measured. | |||


Performance - Panther Lake & Blackwell
Testing Conditions
Asus offers the familiar power modes and you need the Turbo mode to get the highest GPU performance. In daily scenarios, you can easily use the Silent mode, because the CPU performance is pretty much identical and completely sufficient as long as you do not need the dedicated GPU.
| Energy profile | CPU TDP | CB24 Multi | GPU TGP | Time Spy Graphics | Cyberpunk 2077 QHD Ultra | max. fan noise |
|---|---|---|---|---|---|---|
| Silent | 65/50 W | 1169 points | 80/45 W | 9267 points | 43.8 fps | 38.2 dB(A) |
| Performance | 65/50 W | 1173 points | 95 W | 14774 points | 69.5 fps | 49.8 dB(A) |
| Turbo | 70 W | 1262 points | 115 W | 16295 points | 77.4 fps | 55.5 dB(A) |
| Battery (Performance) | 54 W | 1209 points | 45 W | 8115 points | 39.3 fps | 38.2 dB(A) |
Processor Performance
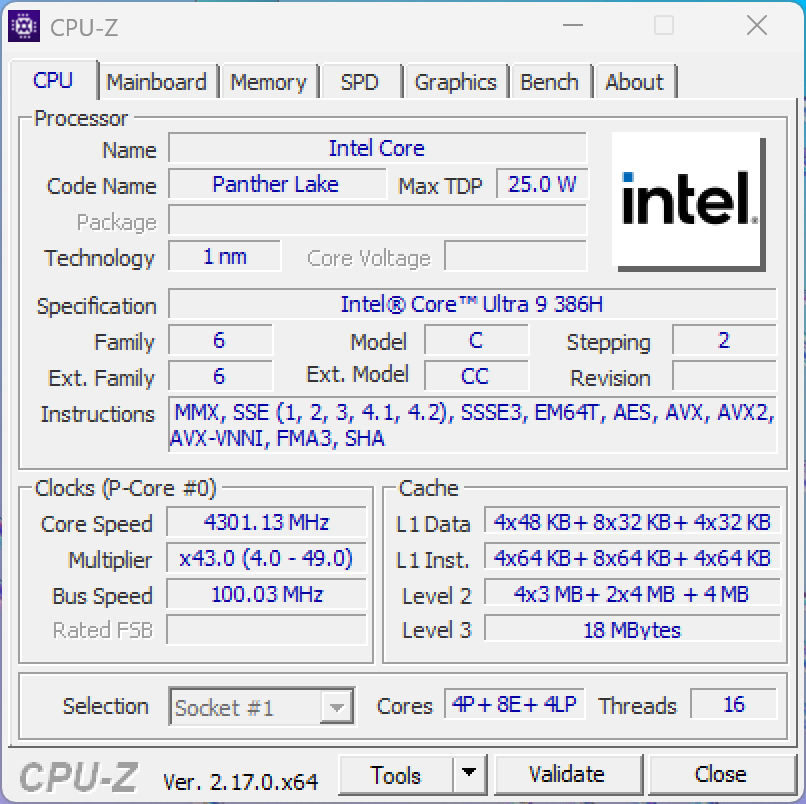
Asus replaced the AMD Ryzen CPU with a new Panther Lake model from Intel. While this improves the single-core CPU performance and the efficiency (as we will see later), the raw multi-core performance is either similar or lower depending on the benchmark. Our table with the power modes also shows that Core Ultra 9 386H does not really benefit from higher power limits and the performance gain is marginal from Silent mode to Turbo mode, for example.
Cinebench R15 Multi Loop
Cinebench 2024: CPU Multi Core | CPU Single Core
Cinebench R23: Multi Core | Single Core
Cinebench R20: CPU (Multi Core) | CPU (Single Core)
Cinebench R15: CPU Multi 64Bit | CPU Single 64Bit
Blender: v2.79 BMW27 CPU
7-Zip 18.03: 7z b 4 | 7z b 4 -mmt1
Geekbench 6.7: Multi-Core | Single-Core
Geekbench 5.5: Multi-Core | Single-Core
HWBOT x265 Benchmark v2.2: 4k Preset
LibreOffice : 20 Documents To PDF
R Benchmark 2.5: Overall mean
| CPU Performance rating | |
| Apple MacBook Pro 14 2026 M5 Max -14! | |
| Average of class Gaming | |
| Asus ROG Zephyrus G14 2025 GA403WW | |
| Asus ROG Zephyrus G14 GU405AR | |
| Average Intel Core Ultra 9 386H | |
| Razer Blade 14 2025 | |
| Acer Predator Triton 14 AI PT14-52 | |
| Cinebench 2024 / CPU Multi Core | |
| Apple MacBook Pro 14 2026 M5 Max | |
| Average of class Gaming (486 - 2327, n=88, last 2 years) | |
| Asus ROG Zephyrus G14 GU405AR | |
| Asus ROG Zephyrus G14 2025 GA403WW | |
| Average Intel Core Ultra 9 386H (873 - 1271, n=8) | |
| Razer Blade 14 2025 | |
| Acer Predator Triton 14 AI PT14-52 | |
| Cinebench 2024 / CPU Single Core | |
| Apple MacBook Pro 14 2026 M5 Max | |
| Acer Predator Triton 14 AI PT14-52 | |
| Average Intel Core Ultra 9 386H (118.1 - 126.8, n=8) | |
| Average of class Gaming (95 - 141, n=88, last 2 years) | |
| Asus ROG Zephyrus G14 GU405AR | |
| Asus ROG Zephyrus G14 2025 GA403WW | |
| Razer Blade 14 2025 | |
| Cinebench R23 / Multi Core | |
| Average of class Gaming (10488 - 42661, n=104, last 2 years) | |
| Asus ROG Zephyrus G14 2025 GA403WW | |
| Asus ROG Zephyrus G14 GU405AR | |
| Razer Blade 14 2025 | |
| Average Intel Core Ultra 9 386H (12144 - 21186, n=8) | |
| Acer Predator Triton 14 AI PT14-52 | |
| Cinebench R23 / Single Core | |
| Average Intel Core Ultra 9 386H (2010 - 2101, n=8) | |
| Average of class Gaming (1601 - 2415, n=104, last 2 years) | |
| Acer Predator Triton 14 AI PT14-52 | |
| Asus ROG Zephyrus G14 GU405AR | |
| Asus ROG Zephyrus G14 2025 GA403WW | |
| Razer Blade 14 2025 | |
| Cinebench R20 / CPU (Multi Core) | |
| Average of class Gaming (4029 - 16433, n=103, last 2 years) | |
| Asus ROG Zephyrus G14 2025 GA403WW | |
| Asus ROG Zephyrus G14 GU405AR | |
| Razer Blade 14 2025 | |
| Average Intel Core Ultra 9 386H (4757 - 8405, n=8) | |
| Acer Predator Triton 14 AI PT14-52 | |
| Cinebench R20 / CPU (Single Core) | |
| Asus ROG Zephyrus G14 2025 GA403WW | |
| Average Intel Core Ultra 9 386H (762 - 796, n=8) | |
| Average of class Gaming (622 - 913, n=103, last 2 years) | |
| Razer Blade 14 2025 | |
| Acer Predator Triton 14 AI PT14-52 | |
| Asus ROG Zephyrus G14 GU405AR | |
| Cinebench R15 / CPU Multi 64Bit | |
| Average of class Gaming (1578 - 6330, n=102, last 2 years) | |
| Asus ROG Zephyrus G14 2025 GA403WW | |
| Asus ROG Zephyrus G14 GU405AR | |
| Average Intel Core Ultra 9 386H (2197 - 3347, n=8) | |
| Razer Blade 14 2025 | |
| Acer Predator Triton 14 AI PT14-52 | |
| Cinebench R15 / CPU Single 64Bit | |
| Acer Predator Triton 14 AI PT14-52 | |
| Asus ROG Zephyrus G14 2025 GA403WW | |
| Asus ROG Zephyrus G14 GU405AR | |
| Average of class Gaming (188.8 - 350, n=103, last 2 years) | |
| Average Intel Core Ultra 9 386H (249 - 314, n=8) | |
| Razer Blade 14 2025 | |
| Blender / v2.79 BMW27 CPU | |
| Acer Predator Triton 14 AI PT14-52 | |
| Average Intel Core Ultra 9 386H (156 - 299, n=8) | |
| Razer Blade 14 2025 | |
| Asus ROG Zephyrus G14 GU405AR | |
| Average of class Gaming (79 - 330, n=101, last 2 years) | |
| Asus ROG Zephyrus G14 2025 GA403WW | |
| 7-Zip 18.03 / 7z b 4 | |
| Average of class Gaming (33491 - 148086, n=102, last 2 years) | |
| Asus ROG Zephyrus G14 2025 GA403WW | |
| Asus ROG Zephyrus G14 GU405AR | |
| Razer Blade 14 2025 | |
| Average Intel Core Ultra 9 386H (44980 - 72882, n=8) | |
| Acer Predator Triton 14 AI PT14-52 | |
| 7-Zip 18.03 / 7z b 4 -mmt1 | |
| Average of class Gaming (4824 - 7436, n=102, last 2 years) | |
| Asus ROG Zephyrus G14 GU405AR | |
| Average Intel Core Ultra 9 386H (5488 - 6493, n=8) | |
| Asus ROG Zephyrus G14 2025 GA403WW | |
| Razer Blade 14 2025 | |
| Acer Predator Triton 14 AI PT14-52 | |
| Geekbench 6.7 / Multi-Core | |
| Apple MacBook Pro 14 2026 M5 Max | |
| Asus ROG Zephyrus G14 GU405AR | |
| Average Intel Core Ultra 9 386H (13776 - 17405, n=10) | |
| Average of class Gaming (6625 - 22850, n=103, last 2 years) | |
| Asus ROG Zephyrus G14 2025 GA403WW | |
| Razer Blade 14 2025 | |
| Acer Predator Triton 14 AI PT14-52 | |
| Geekbench 6.7 / Single-Core | |
| Apple MacBook Pro 14 2026 M5 Max | |
| Asus ROG Zephyrus G14 2025 GA403WW | |
| Razer Blade 14 2025 | |
| Acer Predator Triton 14 AI PT14-52 | |
| Average of class Gaming (1982 - 3259, n=103, last 2 years) | |
| Average Intel Core Ultra 9 386H (2778 - 2919, n=10) | |
| Asus ROG Zephyrus G14 GU405AR | |
| Geekbench 5.5 / Multi-Core | |
| Average of class Gaming (6460 - 28263, n=102, last 2 years) | |
| Asus ROG Zephyrus G14 GU405AR | |
| Average Intel Core Ultra 9 386H (13098 - 17557, n=8) | |
| Asus ROG Zephyrus G14 2025 GA403WW | |
| Razer Blade 14 2025 | |
| Acer Predator Triton 14 AI PT14-52 | |
| Geekbench 5.5 / Single-Core | |
| Asus ROG Zephyrus G14 2025 GA403WW | |
| Razer Blade 14 2025 | |
| Average Intel Core Ultra 9 386H (1992 - 2162, n=8) | |
| Acer Predator Triton 14 AI PT14-52 | |
| Average of class Gaming (1403 - 2474, n=102, last 2 years) | |
| Asus ROG Zephyrus G14 GU405AR | |
| HWBOT x265 Benchmark v2.2 / 4k Preset | |
| Average of class Gaming (11.5 - 44.4, n=102, last 2 years) | |
| Asus ROG Zephyrus G14 2025 GA403WW | |
| Asus ROG Zephyrus G14 GU405AR | |
| Razer Blade 14 2025 | |
| Average Intel Core Ultra 9 386H (13.2 - 25.1, n=8) | |
| Acer Predator Triton 14 AI PT14-52 | |
| LibreOffice / 20 Documents To PDF | |
| Razer Blade 14 2025 | |
| Asus ROG Zephyrus G14 2025 GA403WW | |
| Average of class Gaming (33.2 - 88.8, n=102, last 2 years) | |
| Average Intel Core Ultra 9 386H (38.5 - 56.1, n=8) | |
| Asus ROG Zephyrus G14 GU405AR | |
| Acer Predator Triton 14 AI PT14-52 | |
| R Benchmark 2.5 / Overall mean | |
| Asus ROG Zephyrus G14 GU405AR | |
| Average Intel Core Ultra 9 386H (0.4055 - 0.4384, n=8) | |
| Average of class Gaming (0.3439 - 0.59, n=102, last 2 years) | |
| Acer Predator Triton 14 AI PT14-52 | |
| Razer Blade 14 2025 | |
| Asus ROG Zephyrus G14 2025 GA403WW | |
* ... smaller is better
AIDA64: FP32 Ray-Trace | FPU Julia | CPU SHA3 | CPU Queen | FPU SinJulia | FPU Mandel | CPU AES | CPU ZLib | FP64 Ray-Trace | CPU PhotoWorxx | CPU CheckMate
| Performance rating | |
| Asus ROG Zephyrus G14 2025 GA403WW -1! | |
| Average of class Gaming | |
| Razer Blade 14 2025 -1! | |
| Asus ROG Zephyrus G14 GU405AR -1! | |
| Average Intel Core Ultra 9 386H -1! | |
| Acer Predator Triton 14 AI PT14-52 -1! | |
| AIDA64 / FP32 Ray-Trace | |
| Asus ROG Zephyrus G14 2025 GA403WW (v6.92.6600) | |
| Average of class Gaming (10227 - 85542, n=102, last 2 years) | |
| Razer Blade 14 2025 (v6.92.6600) | |
| Asus ROG Zephyrus G14 GU405AR (v8.20.8100) | |
| Average Intel Core Ultra 9 386H (10001 - 21727, n=8) | |
| Acer Predator Triton 14 AI PT14-52 (v6.92.6600) | |
| AIDA64 / FPU Julia | |
| Average of class Gaming (51376 - 372155, n=102, last 2 years) | |
| Asus ROG Zephyrus G14 2025 GA403WW (v6.92.6600) | |
| Razer Blade 14 2025 (v6.92.6600) | |
| Asus ROG Zephyrus G14 GU405AR (v8.20.8100) | |
| Average Intel Core Ultra 9 386H (53370 - 113595, n=8) | |
| Acer Predator Triton 14 AI PT14-52 (v6.92.6600) | |
| AIDA64 / CPU SHA3 | |
| Average of class Gaming (2180 - 10115, n=102, last 2 years) | |
| Asus ROG Zephyrus G14 2025 GA403WW (v6.92.6600) | |
| Asus ROG Zephyrus G14 GU405AR (v8.20.8100) | |
| Razer Blade 14 2025 (v6.92.6600) | |
| Average Intel Core Ultra 9 386H (2776 - 5604, n=8) | |
| Acer Predator Triton 14 AI PT14-52 (v6.92.6600) | |
| AIDA64 / CPU Queen | |
| Average of class Gaming (49785 - 173351, n=86, last 2 years) | |
| Asus ROG Zephyrus G14 2025 GA403WW (v6.92.6600) | |
| Razer Blade 14 2025 (v6.92.6600) | |
| Acer Predator Triton 14 AI PT14-52 (v6.92.6600) | |
| AIDA64 / FPU SinJulia | |
| Asus ROG Zephyrus G14 2025 GA403WW (v6.92.6600) | |
| Razer Blade 14 2025 (v6.92.6600) | |
| Average of class Gaming (4424 - 33636, n=102, last 2 years) | |
| Asus ROG Zephyrus G14 GU405AR (v8.20.8100) | |
| Average Intel Core Ultra 9 386H (5314 - 7332, n=8) | |
| Acer Predator Triton 14 AI PT14-52 (v6.92.6600) | |
| AIDA64 / FPU Mandel | |
| Asus ROG Zephyrus G14 2025 GA403WW (v6.92.6600) | |
| Average of class Gaming (25115 - 196829, n=102, last 2 years) | |
| Razer Blade 14 2025 (v6.92.6600) | |
| Asus ROG Zephyrus G14 GU405AR (v8.20.8100) | |
| Average Intel Core Ultra 9 386H (28414 - 61578, n=8) | |
| Acer Predator Triton 14 AI PT14-52 (v6.92.6600) | |
| AIDA64 / CPU AES | |
| Asus ROG Zephyrus G14 2025 GA403WW (v6.92.6600) | |
| Average of class Gaming (39258 - 247074, n=102, last 2 years) | |
| Razer Blade 14 2025 (v6.92.6600) | |
| Asus ROG Zephyrus G14 GU405AR (v8.20.8100) | |
| Average Intel Core Ultra 9 386H (46362 - 72112, n=8) | |
| Acer Predator Triton 14 AI PT14-52 (v6.92.6600) | |
| AIDA64 / CPU ZLib | |
| Average of class Gaming (574 - 2531, n=102, last 2 years) | |
| Asus ROG Zephyrus G14 2025 GA403WW (v6.92.6600) | |
| Razer Blade 14 2025 (v6.92.6600) | |
| Asus ROG Zephyrus G14 GU405AR (v8.20.8100) | |
| Average Intel Core Ultra 9 386H (669 - 1271, n=8) | |
| Acer Predator Triton 14 AI PT14-52 (v6.92.6600) | |
| AIDA64 / FP64 Ray-Trace | |
| Asus ROG Zephyrus G14 2025 GA403WW (v6.92.6600) | |
| Average of class Gaming (5509 - 45446, n=102, last 2 years) | |
| Razer Blade 14 2025 (v6.92.6600) | |
| Asus ROG Zephyrus G14 GU405AR (v8.20.8100) | |
| Average Intel Core Ultra 9 386H (5138 - 11627, n=8) | |
| Acer Predator Triton 14 AI PT14-52 (v6.92.6600) | |
| AIDA64 / CPU PhotoWorxx | |
| Asus ROG Zephyrus G14 GU405AR (v8.20.8100) | |
| Average Intel Core Ultra 9 386H (54042 - 89891, n=8) | |
| Acer Predator Triton 14 AI PT14-52 (v6.92.6600) | |
| Razer Blade 14 2025 (v6.92.6600) | |
| Asus ROG Zephyrus G14 2025 GA403WW (v6.92.6600) | |
| Average of class Gaming (12271 - 89891, n=102, last 2 years) | |
| AIDA64 / CPU CheckMate | |
| Average of class Gaming (2930 - 20751, n=15, last 2 years) | |
| Asus ROG Zephyrus G14 GU405AR (v8.20.8100) | |
| Average Intel Core Ultra 9 386H (4051 - 4858, n=7) | |
System and Storage Devices
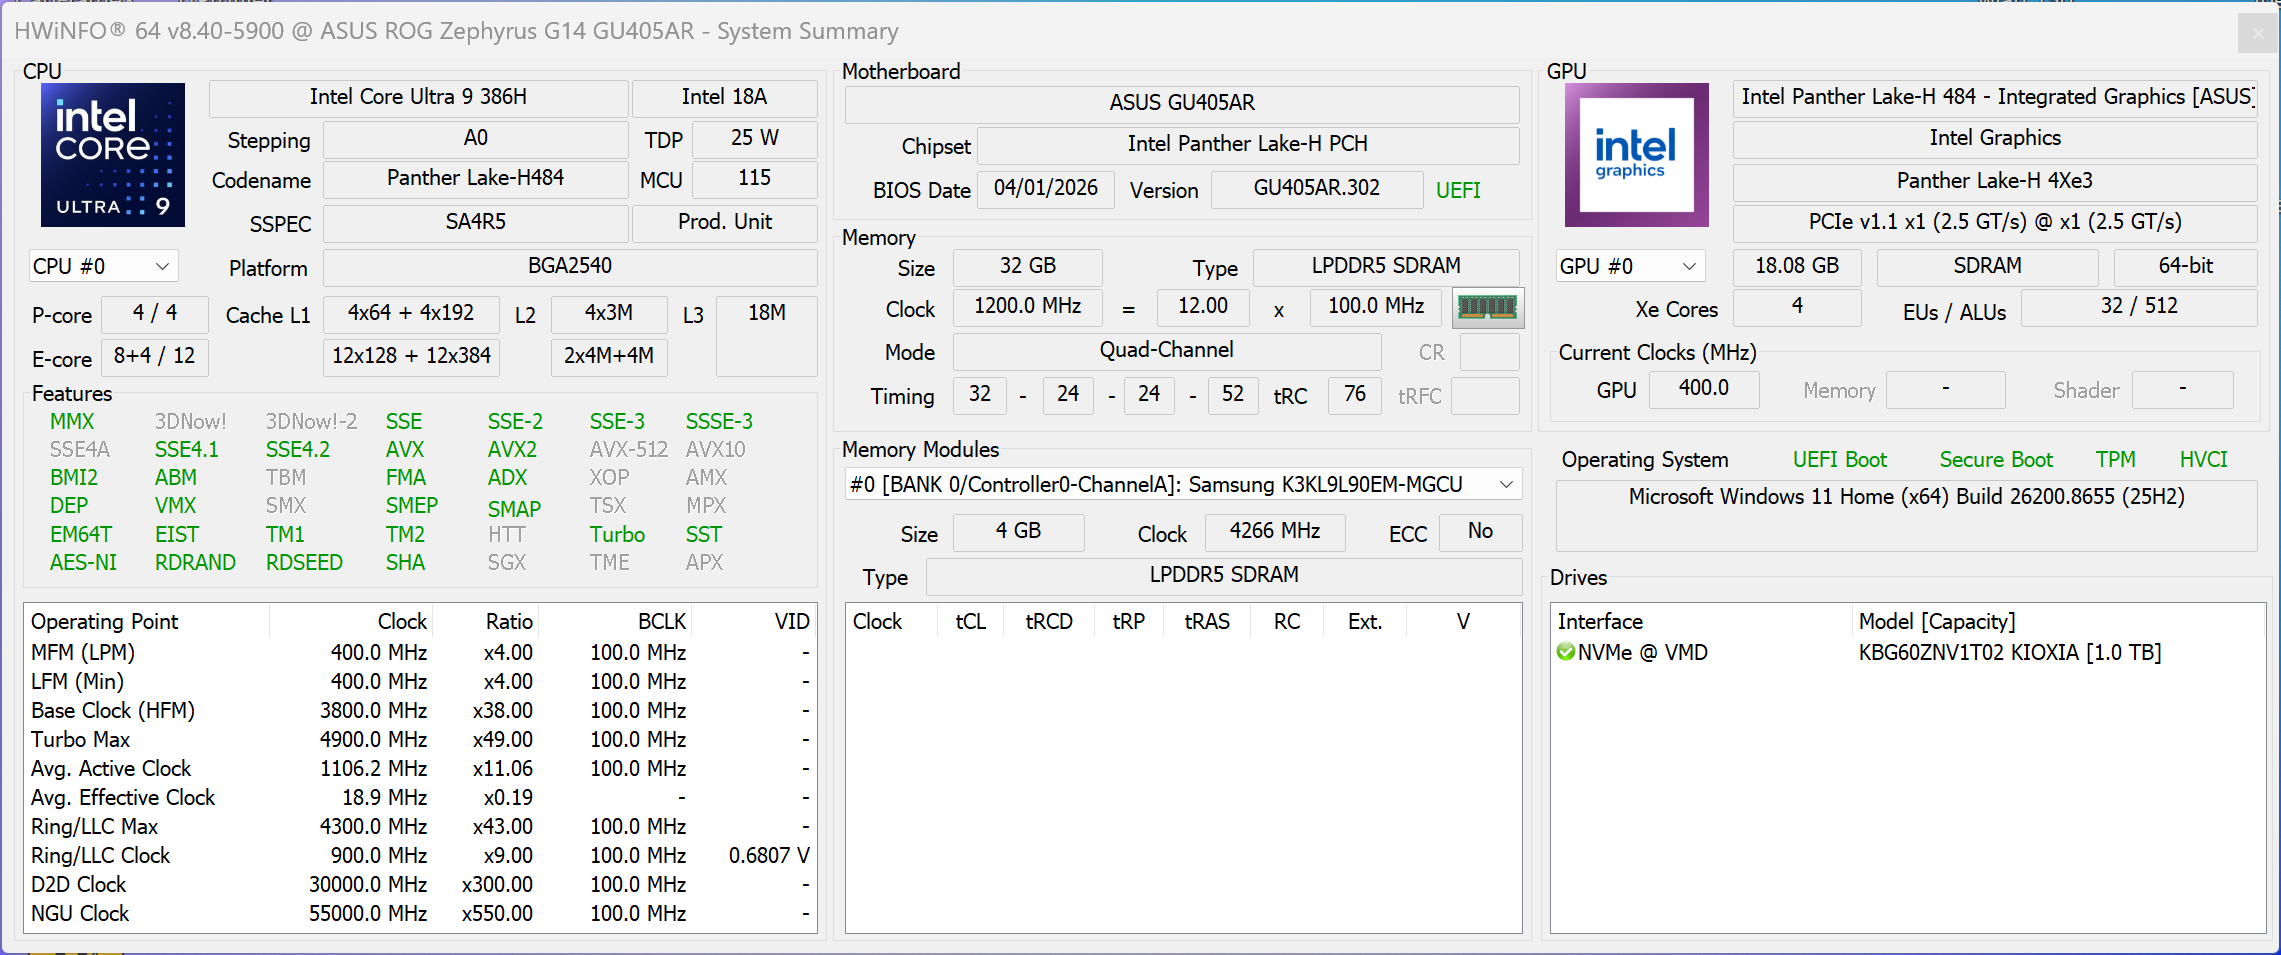
The system performance is excellent and we did not experience any stability issues. Our standardized latency test did not reveal any issues with real-time audio applications, either. Asus uses a PCIe 4.0 SSD from Kioxia with a storage capacity of 1 TB (830 GB free) and the transfer rates are very good and also stable under sustained workloads.
PCMark 10: Score | Essentials | Productivity | Digital Content Creation
CrossMark: Overall | Productivity | Creativity | Responsiveness
WebXPRT 3: Overall
WebXPRT 4: Overall
Mozilla Kraken 1.1: Total
| Performance rating | |
| Apple MacBook Pro 14 2026 M5 Max -4! | |
| Asus ROG Zephyrus G14 GU405AR | |
| Average Intel Core Ultra 9 386H, NVIDIA GeForce RTX 5070 Ti Laptop | |
| Average of class Gaming | |
| Asus ROG Zephyrus G14 2025 GA403WW | |
| Razer Blade 14 2025 | |
| Acer Predator Triton 14 AI PT14-52 | |
| PCMark 10 / Score | |
| Asus ROG Zephyrus G14 GU405AR | |
| Average Intel Core Ultra 9 386H, NVIDIA GeForce RTX 5070 Ti Laptop (n=1) | |
| Average of class Gaming (5828 - 12414, n=93, last 2 years) | |
| Asus ROG Zephyrus G14 2025 GA403WW | |
| Razer Blade 14 2025 | |
| Acer Predator Triton 14 AI PT14-52 | |
| PCMark 10 / Essentials | |
| Average of class Gaming (8810 - 11935, n=97, last 2 years) | |
| Razer Blade 14 2025 | |
| Asus ROG Zephyrus G14 2025 GA403WW | |
| Asus ROG Zephyrus G14 GU405AR | |
| Average Intel Core Ultra 9 386H, NVIDIA GeForce RTX 5070 Ti Laptop (n=1) | |
| Acer Predator Triton 14 AI PT14-52 | |
| PCMark 10 / Productivity | |
| Asus ROG Zephyrus G14 GU405AR | |
| Average Intel Core Ultra 9 386H, NVIDIA GeForce RTX 5070 Ti Laptop (n=1) | |
| Acer Predator Triton 14 AI PT14-52 | |
| Average of class Gaming (6845 - 25323, n=95, last 2 years) | |
| Asus ROG Zephyrus G14 2025 GA403WW | |
| Razer Blade 14 2025 | |
| PCMark 10 / Digital Content Creation | |
| Asus ROG Zephyrus G14 GU405AR | |
| Average Intel Core Ultra 9 386H, NVIDIA GeForce RTX 5070 Ti Laptop (n=1) | |
| Average of class Gaming (7602 - 19954, n=95, last 2 years) | |
| Asus ROG Zephyrus G14 2025 GA403WW | |
| Razer Blade 14 2025 | |
| Acer Predator Triton 14 AI PT14-52 | |
| CrossMark / Overall | |
| Apple MacBook Pro 14 2026 M5 Max | |
| Asus ROG Zephyrus G14 GU405AR | |
| Average Intel Core Ultra 9 386H, NVIDIA GeForce RTX 5070 Ti Laptop (n=1) | |
| Average of class Gaming (1366 - 2409, n=94, last 2 years) | |
| Asus ROG Zephyrus G14 2025 GA403WW | |
| Razer Blade 14 2025 | |
| Acer Predator Triton 14 AI PT14-52 | |
| CrossMark / Productivity | |
| Apple MacBook Pro 14 2026 M5 Max | |
| Average of class Gaming (1386 - 2254, n=94, last 2 years) | |
| Razer Blade 14 2025 | |
| Asus ROG Zephyrus G14 GU405AR | |
| Average Intel Core Ultra 9 386H, NVIDIA GeForce RTX 5070 Ti Laptop (n=1) | |
| Asus ROG Zephyrus G14 2025 GA403WW | |
| Acer Predator Triton 14 AI PT14-52 | |
| CrossMark / Creativity | |
| Apple MacBook Pro 14 2026 M5 Max | |
| Asus ROG Zephyrus G14 GU405AR | |
| Average Intel Core Ultra 9 386H, NVIDIA GeForce RTX 5070 Ti Laptop (n=1) | |
| Asus ROG Zephyrus G14 2025 GA403WW | |
| Razer Blade 14 2025 | |
| Average of class Gaming (1343 - 2786, n=94, last 2 years) | |
| Acer Predator Triton 14 AI PT14-52 | |
| CrossMark / Responsiveness | |
| Apple MacBook Pro 14 2026 M5 Max | |
| Asus ROG Zephyrus G14 GU405AR | |
| Average Intel Core Ultra 9 386H, NVIDIA GeForce RTX 5070 Ti Laptop (n=1) | |
| Average of class Gaming (1226 - 2334, n=94, last 2 years) | |
| Razer Blade 14 2025 | |
| Asus ROG Zephyrus G14 2025 GA403WW | |
| Acer Predator Triton 14 AI PT14-52 | |
| WebXPRT 3 / Overall | |
| Apple MacBook Pro 14 2026 M5 Max | |
| Asus ROG Zephyrus G14 2025 GA403WW | |
| Average of class Gaming (220 - 532, n=98, last 2 years) | |
| Asus ROG Zephyrus G14 GU405AR | |
| Average Intel Core Ultra 9 386H, NVIDIA GeForce RTX 5070 Ti Laptop (n=1) | |
| Acer Predator Triton 14 AI PT14-52 | |
| Razer Blade 14 2025 | |
| WebXPRT 4 / Overall | |
| Apple MacBook Pro 14 2026 M5 Max | |
| Asus ROG Zephyrus G14 GU405AR | |
| Average Intel Core Ultra 9 386H, NVIDIA GeForce RTX 5070 Ti Laptop (n=1) | |
| Average of class Gaming (165 - 354, n=98, last 2 years) | |
| Acer Predator Triton 14 AI PT14-52 | |
| Asus ROG Zephyrus G14 2025 GA403WW | |
| Razer Blade 14 2025 | |
| Mozilla Kraken 1.1 / Total | |
| Acer Predator Triton 14 AI PT14-52 | |
| Asus ROG Zephyrus G14 GU405AR | |
| Average Intel Core Ultra 9 386H, NVIDIA GeForce RTX 5070 Ti Laptop (n=1) | |
| Average of class Gaming (391 - 590, n=100, last 2 years) | |
| Razer Blade 14 2025 | |
| Asus ROG Zephyrus G14 2025 GA403WW | |
| Apple MacBook Pro 14 2026 M5 Max | |
* ... smaller is better
| PCMark 10 Score | 9049 points | |
Help | ||
| AIDA64 / Memory Copy | |
| Asus ROG Zephyrus G14 GU405AR | |
| Average Intel Core Ultra 9 386H (75437 - 129946, n=8) | |
| Acer Predator Triton 14 AI PT14-52 | |
| Razer Blade 14 2025 | |
| Asus ROG Zephyrus G14 2025 GA403WW | |
| Average of class Gaming (21750 - 129946, n=102, last 2 years) | |
| AIDA64 / Memory Read | |
| Asus ROG Zephyrus G14 GU405AR | |
| Average Intel Core Ultra 9 386H (81021 - 118858, n=8) | |
| Razer Blade 14 2025 | |
| Asus ROG Zephyrus G14 2025 GA403WW | |
| Acer Predator Triton 14 AI PT14-52 | |
| Average of class Gaming (22956 - 118858, n=102, last 2 years) | |
| AIDA64 / Memory Write | |
| Asus ROG Zephyrus G14 GU405AR | |
| Acer Predator Triton 14 AI PT14-52 | |
| Average Intel Core Ultra 9 386H (75959 - 135096, n=8) | |
| Asus ROG Zephyrus G14 2025 GA403WW | |
| Razer Blade 14 2025 | |
| Average of class Gaming (22297 - 135096, n=102, last 2 years) | |
| AIDA64 / Memory Latency | |
| Asus ROG Zephyrus G14 2025 GA403WW | |
| Average of class Gaming (75.3 - 165.4, n=102, last 2 years) | |
| Razer Blade 14 2025 | |
| Acer Predator Triton 14 AI PT14-52 | |
| Average Intel Core Ultra 9 386H (87.2 - 116.9, n=8) | |
| Asus ROG Zephyrus G14 GU405AR | |
* ... smaller is better
| DPC Latencies / LatencyMon - interrupt to process latency (max), Web, Youtube, Prime95 | |
| Razer Blade 14 2025 | |
| Average of class Gaming (410 - 11799, n=92, last 2 years) | |
| Acer Predator Triton 14 AI PT14-52 | |
| Asus ROG Zephyrus G14 GU405AR | |
| Asus ROG Zephyrus G14 2025 GA403WW | |
* ... smaller is better

* ... smaller is better
Disk Throttling: DiskSpd Read Loop, Queue Depth 8
GPU and Gaming Performance
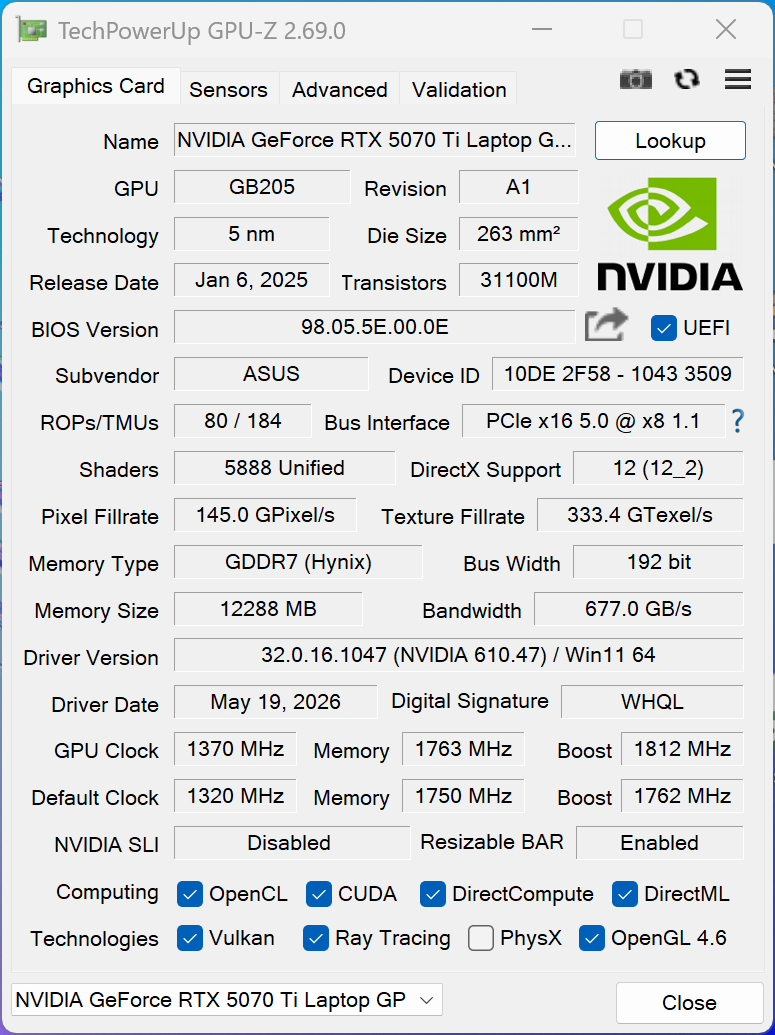
The Nvidia GeForce RTX 5070 Ti with 12 GB VRAM did not change compared to last year's G14, but the GPU can now consume up to 115 Watts in Turbo mode. It can even reach up to 130 Watts in manual mode, but we only saw minor improvements in benchmarks. The GPU performance is still excellent for a 14-inch laptop and there is simply no competition (except for the M5 Max GPU and the 2025 Zephyrus G14 with the RTX 5080). The gaming performance is actually better than before and sometimes on par with the G14 powered by the RTX 5080, but please keep in mind that we got plenty of driver updates since then, so some of the additional performance is probably a result of the drivers. Even demanding games can be played in the QHD resolution, even though some titles might require DLSS and/or frame generation.
| 3DMark 11 Performance | 41208 points | |
| 3DMark Fire Strike Score | 32870 points | |
| 3DMark Time Spy Score | 16242 points | |
| 3DMark Steel Nomad Score | 3694 points | |
| 3DMark Steel Nomad Light Score | 16907 points | |
Help | ||
| Blender / v3.3 Classroom OPTIX/RTX | |
| Acer Predator Triton 14 AI PT14-52 | |
| Razer Blade 14 2025 | |
| Average of class Gaming (9 - 32, n=103, last 2 years) | |
| Asus ROG Zephyrus G14 2025 GA403WW | |
| Asus ROG Zephyrus G14 GU405AR | |
| Asus ROG Zephyrus G14 2025 5070 Ti | |
| Average NVIDIA GeForce RTX 5070 Ti Laptop (13 - 19, n=14) | |
| Blender / v3.3 Classroom CUDA | |
| Acer Predator Triton 14 AI PT14-52 | |
| Average of class Gaming (15 - 228, n=103, last 2 years) | |
| Razer Blade 14 2025 | |
| Average NVIDIA GeForce RTX 5070 Ti Laptop (24 - 33, n=14) | |
| Asus ROG Zephyrus G14 2025 5070 Ti | |
| Asus ROG Zephyrus G14 GU405AR | |
| Asus ROG Zephyrus G14 2025 GA403WW | |
| Blender / v3.3 Classroom CPU | |
| Acer Predator Triton 14 AI PT14-52 | |
| Razer Blade 14 2025 | |
| Asus ROG Zephyrus G14 GU405AR | |
| Average of class Gaming (122 - 565, n=99, last 2 years) | |
| Asus ROG Zephyrus G14 2025 5070 Ti | |
| Asus ROG Zephyrus G14 2025 GA403WW | |
| Average NVIDIA GeForce RTX 5070 Ti Laptop (122 - 361, n=14) | |
| Apple MacBook Pro 14 2026 M5 Max | |
| Blender / v3.3 Classroom METAL | |
| Apple MacBook Pro 14 2026 M5 Max | |
* ... smaller is better
| Final Fantasy XV Benchmark - 1920x1080 High Quality | |
| Average of class Gaming (64.2 - 215, n=91, last 2 years) | |
| Asus ROG Zephyrus G14 GU405AR | |
| Asus ROG Zephyrus G14 2025 GA403WW | |
| Razer Blade 14 2025 | |
| Asus ROG Zephyrus G14 2025 5070 Ti | |
| Acer Predator Triton 14 AI PT14-52 | |
| Strange Brigade - 1920x1080 ultra AA:ultra AF:16 | |
| Asus ROG Zephyrus G14 2025 GA403WW | |
| Asus ROG Zephyrus G14 GU405AR | |
| Average of class Gaming (113.6 - 458, n=83, last 2 years) | |
| Asus ROG Zephyrus G14 2025 5070 Ti | |
| Razer Blade 14 2025 | |
| Acer Predator Triton 14 AI PT14-52 | |
| Dota 2 Reborn - 1920x1080 ultra (3/3) best looking | |
| Average of class Gaming (84.8 - 252, n=104, last 2 years) | |
| Asus ROG Zephyrus G14 GU405AR | |
| Razer Blade 14 2025 | |
| Asus ROG Zephyrus G14 2025 GA403WW | |
| Asus ROG Zephyrus G14 2025 5070 Ti | |
| Acer Predator Triton 14 AI PT14-52 | |
| Forza Horizon 6 | |
| 2560x1440 extreme + RT AA:T | |
| Average of class Gaming (15 - 66, n=6, last 2 years) | |
| Average NVIDIA GeForce RTX 5070 Ti Laptop (42 - 46, n=3) | |
| Asus ROG Zephyrus G14 GU405AR | |
| 2560x1440 extreme + RT + DLSS perf. AA:T | |
| Average NVIDIA GeForce RTX 5070 Ti Laptop (56 - 66, n=3) | |
| Asus ROG Zephyrus G14 GU405AR | |
| Average of class Gaming (18 - 88, n=5, last 2 years) | |
| F1 25 | |
| 2560x1440 Ultra Max Preset AA:T AF:16x | |
| Asus ROG Zephyrus G14 GU405AR | |
| Average NVIDIA GeForce RTX 5070 Ti Laptop (18 - 26, n=7) | |
| Average of class Gaming (5 - 39.1, n=26, last 2 years) | |
| Asus ROG Zephyrus G14 2025 5070 Ti | |
| Razer Blade 14 2025 | |
| 2560x1440 Ultra Max Preset + DLSS Quality AA:DLSS AF:16x | |
| Asus ROG Zephyrus G14 GU405AR | |
| Average NVIDIA GeForce RTX 5070 Ti Laptop (32 - 48.1, n=7) | |
| Average of class Gaming (9 - 67.5, n=23, last 2 years) | |
| Asus ROG Zephyrus G14 2025 5070 Ti | |
| Razer Blade 14 2025 | |
Cyberpunk 2077 ultra FPS Chart
| low | med. | high | ultra | QHD DLSS | QHD | |
|---|---|---|---|---|---|---|
| GTA V (2015) | 148.2 | 133.1 | ||||
| Dota 2 Reborn (2015) | 183.9 | 166.5 | 159.2 | 150.1 | ||
| Final Fantasy XV Benchmark (2018) | 219 | 195.8 | 151 | 119.6 | ||
| X-Plane 11.11 (2018) | 122 | 112.3 | 104.5 | |||
| Strange Brigade (2018) | 514 | 324 | 330 | 295 | 209 | |
| Baldur's Gate 3 (2023) | 196.8 | 166.8 | 145.4 | 141.9 | 120 | |
| Cyberpunk 2077 (2023) | 147.3 | 142.4 | 124.5 | 111.9 | 88.5 | 77.4 |
| F1 24 (2024) | 268 | 261 | 101.4 | 102.5 | 66.5 | |
| Assassin's Creed Shadows (2025) | 86 | 80 | 68 | 52 | 52 | 44 |
| F1 25 (2025) | 220 | 207 | 183.3 | 37.9 | 41.3 | 22.6 |
| Forza Horizon 6 (2026) | 182 | 141 | 104 | 62 | 58 | 42 |
| 007 First Light (2026) | 88 | 82.5 | 73.2 | 70 | 50 |
Emissions & Power Consumption
System Noise

The fan noise depends heavily on the power mode and the fans will spin all the time at ~35 dB(A) in Turbo mode, which is obviously very audible. The advantage is that peak load can be compensated without any fan speed increasements. For everyday tasks, we definitely recommend the Silent mode, as the fans will be deactivated most of the time. Gaming in Turbo mode results in a very loud fan noise of 55 dB(A), so you will need headphones. Gaming in Performance mode is not that much quieter at almost 50 dB(A), so that is the compromise for the high performance. We did not experience any other electronic noises.
Noise level
| Idle |
| 26 / 35.1 / 35.1 dB(A) |
| Load |
| 35.1 / 55.5 dB(A) |
 | ||
30 dB silent 40 dB(A) audible 50 dB(A) loud |
||
min: | ||
| Asus ROG Zephyrus G14 GU405AR Ultra 9 386H, GeForce RTX 5070 Ti Laptop | Acer Predator Triton 14 AI PT14-52 Core Ultra 9 288V, GeForce RTX 5070 Laptop | Razer Blade 14 2025 Ryzen AI 9 365, GeForce RTX 5070 Laptop | Asus ROG Zephyrus G14 2025 GA403WW Ryzen AI 9 HX 370, GeForce RTX 5080 Laptop | Apple MacBook Pro 14 2026 M5 Max M5 Max, M5 Max 40-Core GPU | |
|---|---|---|---|---|---|
| Noise | 6% | 7% | -3% | 15% | |
| off / environment * (dB) | 26 | 24.9 4% | 23.7 9% | 23.3 10% | 23.1 11% |
| Idle Minimum * (dB) | 26 | 24.9 4% | 23.7 9% | 29.1 -12% | 23.1 11% |
| Idle Average * (dB) | 35.1 | 24.9 29% | 23.7 32% | 29.1 17% | 23.1 34% |
| Idle Maximum * (dB) | 35.1 | 30.5 13% | 27 23% | 29.1 17% | 23.1 34% |
| Load Average * (dB) | 35.1 | 36.1 -3% | 44.9 -28% | 54.4 -55% | 36.8 -5% |
| Cyberpunk 2077 ultra * (dB) | 55.5 | 57.9 -4% | 54.6 2% | 54.4 2% | 47.8 14% |
| Load Maximum * (dB) | 55.5 | 57.9 -4% | 54.6 2% | 54.4 2% | 53.2 4% |
* ... smaller is better
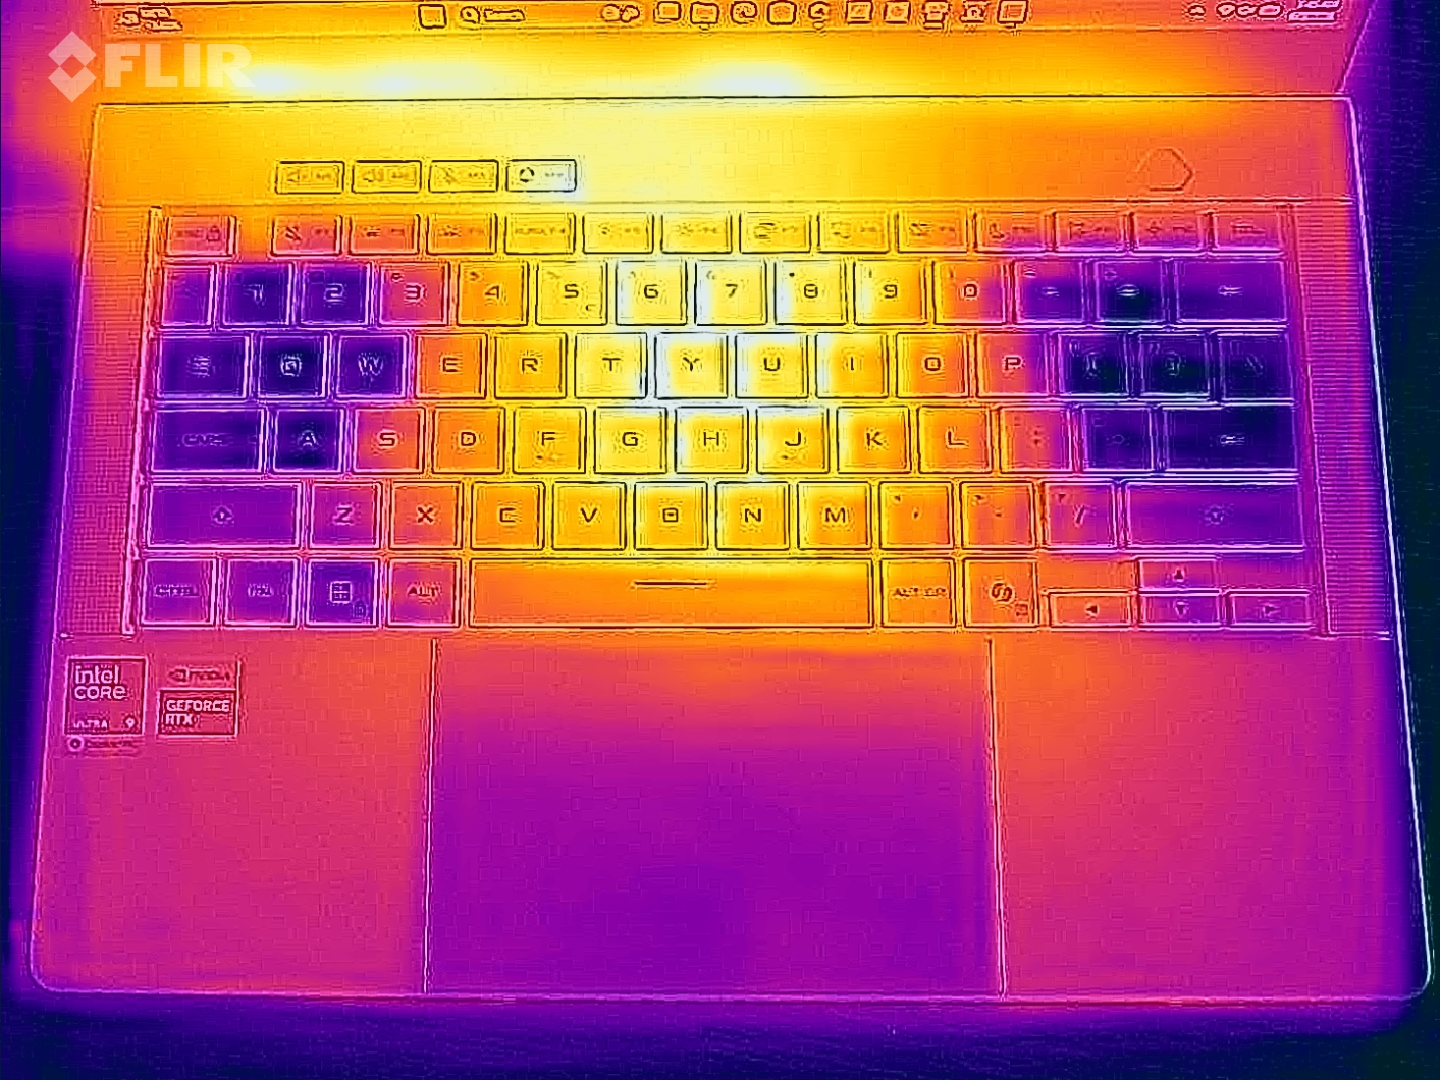
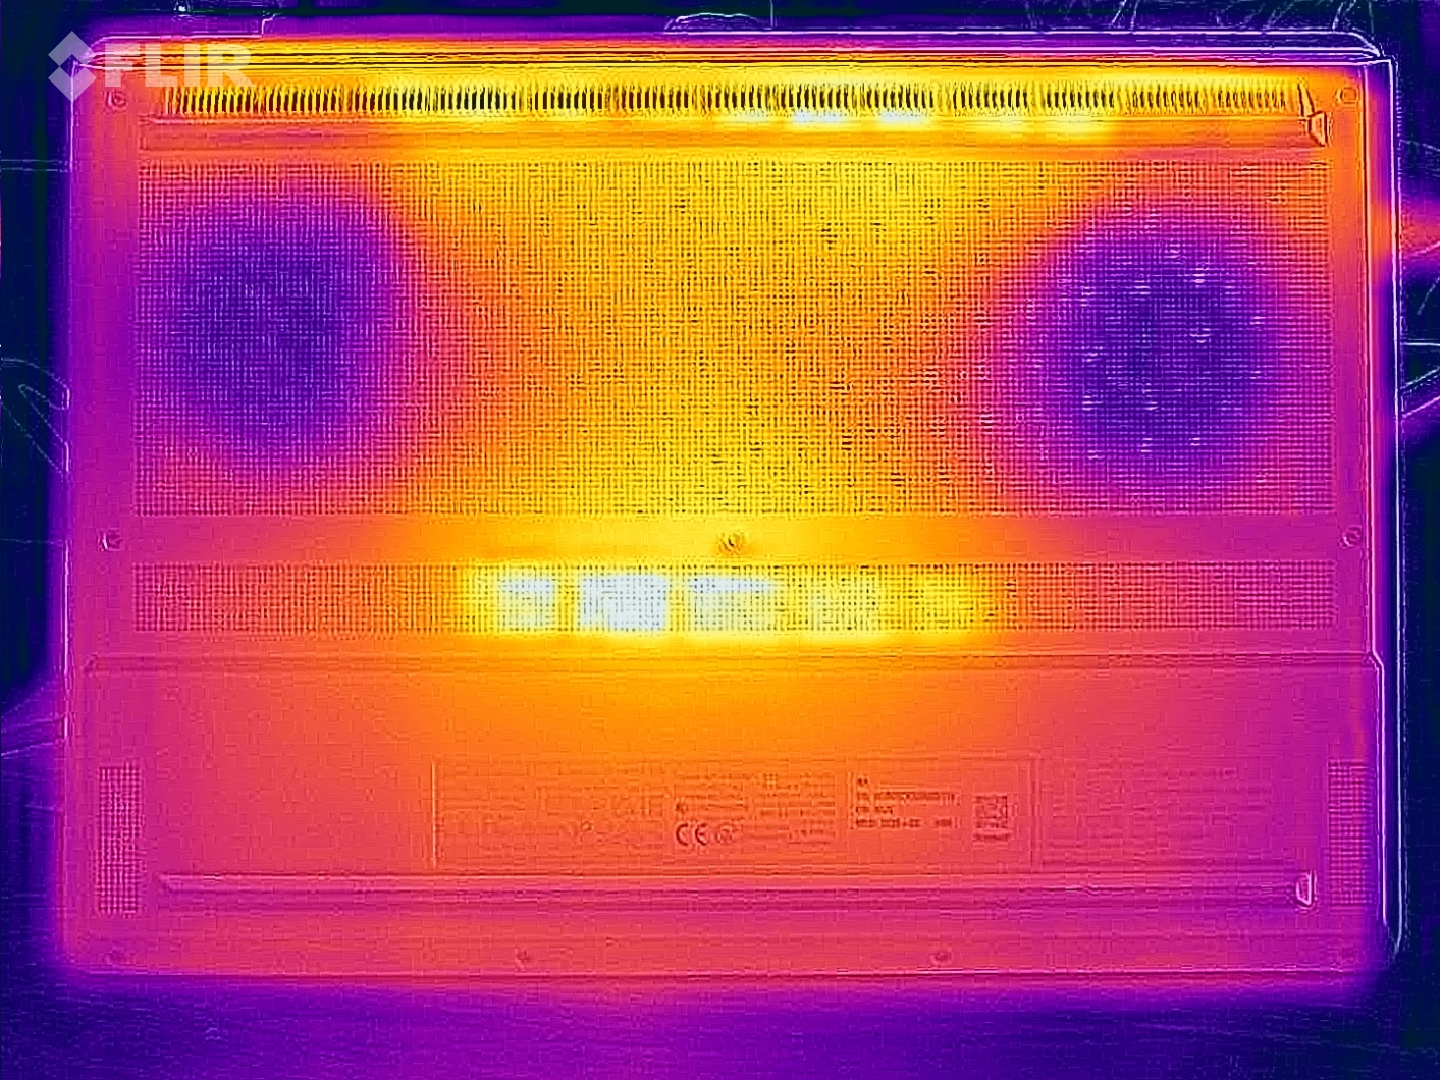
Temperature
The surface temperatures of the Zephyrus G14 are nothing to worry about, even under maximum load. We only measured slightly more than 40 °C at the hot spots on the bottom and the keyboard area stays cooler, so there are no limitations. During the stress test, the GPU maintains 100 Watts (~74 °C) and the CPU 35 Watts (~79 °C).

(±) The maximum temperature on the upper side is 41.7 °C / 107 F, compared to the average of 40.4 °C / 105 F, ranging from 21.2 to 68.8 °C for the class Gaming.
(±) The bottom heats up to a maximum of 41.5 °C / 107 F, compared to the average of 43.2 °C / 110 F
(+) In idle usage, the average temperature for the upper side is 24.5 °C / 76 F, compared to the device average of 33.9 °C / 93 F.
(±) 3: The average temperature for the upper side is 36.3 °C / 97 F, compared to the average of 33.9 °C / 93 F for the class Gaming.
(+) The palmrests and touchpad are cooler than skin temperature with a maximum of 31.5 °C / 88.7 F and are therefore cool to the touch.
(-) The average temperature of the palmrest area of similar devices was 28.8 °C / 83.8 F (-2.7 °C / -4.9 F).
| Asus ROG Zephyrus G14 GU405AR Ultra 9 386H, GeForce RTX 5070 Ti Laptop | Acer Predator Triton 14 AI PT14-52 Core Ultra 9 288V, GeForce RTX 5070 Laptop | Razer Blade 14 2025 Ryzen AI 9 365, GeForce RTX 5070 Laptop | Asus ROG Zephyrus G14 2025 GA403WW Ryzen AI 9 HX 370, GeForce RTX 5080 Laptop | Apple MacBook Pro 14 2026 M5 Max M5 Max, M5 Max 40-Core GPU | |
|---|---|---|---|---|---|
| Heat | -10% | -19% | -23% | 1% | |
| Maximum Upper Side * (°C) | 41.7 | 42.9 -3% | 47 -13% | 51.2 -23% | 47 -13% |
| Maximum Bottom * (°C) | 41.5 | 47.4 -14% | 49.6 -20% | 50.3 -21% | 40.5 2% |
| Idle Upper Side * (°C) | 25 | 27.3 -9% | 29.8 -19% | 30.2 -21% | 23.3 7% |
| Idle Bottom * (°C) | 24.8 | 28.1 -13% | 30.7 -24% | 30.9 -25% | 23.4 6% |
* ... smaller is better
Speakers
The speaker performance is excellent and the G14 offers one of the best sound systems you can get on any laptop.
Asus ROG Zephyrus G14 GU405AR audio analysis
(+) | speakers can play relatively loud (85.9 dB)
Bass 100 - 315 Hz
(+) | good bass - only 4.3% away from median
(±) | linearity of bass is average (7.1% delta to prev. frequency)
Mids 400 - 2000 Hz
(+) | balanced mids - only 2.8% away from median
(+) | mids are linear (2.8% delta to prev. frequency)
Highs 2 - 16 kHz
(+) | balanced highs - only 3% away from median
(+) | highs are linear (3.6% delta to prev. frequency)
Overall 100 - 16.000 Hz
(+) | overall sound is linear (6.7% difference to median)
Compared to same class
» 0% of all tested devices in this class were better, 1% similar, 99% worse
» The best had a delta of 6%, average was 18%, worst was 132%
Compared to all devices tested
» 1% of all tested devices were better, 0% similar, 99% worse
» The best had a delta of 4%, average was 23%, worst was 134%
Acer Predator Triton 14 AI PT14-52 audio analysis
(+) | speakers can play relatively loud (90.7 dB)
Bass 100 - 315 Hz
(±) | reduced bass - on average 11.9% lower than median
(±) | linearity of bass is average (10.3% delta to prev. frequency)
Mids 400 - 2000 Hz
(±) | higher mids - on average 10.1% higher than median
(+) | mids are linear (6.9% delta to prev. frequency)
Highs 2 - 16 kHz
(±) | reduced highs - on average 5.2% lower than median
(+) | highs are linear (4.4% delta to prev. frequency)
Overall 100 - 16.000 Hz
(±) | linearity of overall sound is average (17.9% difference to median)
Compared to same class
» 55% of all tested devices in this class were better, 9% similar, 36% worse
» The best had a delta of 6%, average was 18%, worst was 132%
Compared to all devices tested
» 37% of all tested devices were better, 8% similar, 55% worse
» The best had a delta of 4%, average was 23%, worst was 134%
Razer Blade 14 2025 audio analysis
(±) | speaker loudness is average but good (79.6 dB)
Bass 100 - 315 Hz
(±) | reduced bass - on average 9% lower than median
(±) | linearity of bass is average (7.4% delta to prev. frequency)
Mids 400 - 2000 Hz
(±) | higher mids - on average 9% higher than median
(+) | mids are linear (5.4% delta to prev. frequency)
Highs 2 - 16 kHz
(+) | balanced highs - only 3.2% away from median
(+) | highs are linear (5% delta to prev. frequency)
Overall 100 - 16.000 Hz
(±) | linearity of overall sound is average (15.1% difference to median)
Compared to same class
» 32% of all tested devices in this class were better, 6% similar, 61% worse
» The best had a delta of 6%, average was 18%, worst was 132%
Compared to all devices tested
» 21% of all tested devices were better, 4% similar, 75% worse
» The best had a delta of 4%, average was 23%, worst was 134%
Asus ROG Zephyrus G14 2025 GA403WW audio analysis
(±) | speaker loudness is average but good (81.2 dB)
Bass 100 - 315 Hz
(+) | good bass - only 2.8% away from median
(±) | linearity of bass is average (8.1% delta to prev. frequency)
Mids 400 - 2000 Hz
(+) | balanced mids - only 3.9% away from median
(+) | mids are linear (5.6% delta to prev. frequency)
Highs 2 - 16 kHz
(±) | reduced highs - on average 5.9% lower than median
(+) | highs are linear (4.3% delta to prev. frequency)
Overall 100 - 16.000 Hz
(+) | overall sound is linear (10.4% difference to median)
Compared to same class
» 6% of all tested devices in this class were better, 2% similar, 92% worse
» The best had a delta of 6%, average was 18%, worst was 132%
Compared to all devices tested
» 5% of all tested devices were better, 1% similar, 93% worse
» The best had a delta of 4%, average was 23%, worst was 134%
Apple MacBook Pro 14 2026 M5 Max audio analysis
(+) | speakers can play relatively loud (83.1 dB)
Bass 100 - 315 Hz
(+) | good bass - only 4.5% away from median
(±) | linearity of bass is average (7.1% delta to prev. frequency)
Mids 400 - 2000 Hz
(+) | balanced mids - only 1.3% away from median
(+) | mids are linear (2.5% delta to prev. frequency)
Highs 2 - 16 kHz
(+) | balanced highs - only 3.3% away from median
(+) | highs are linear (3.7% delta to prev. frequency)
Overall 100 - 16.000 Hz
(+) | overall sound is linear (6.5% difference to median)
Compared to same class
» 4% of all tested devices in this class were better, 1% similar, 95% worse
» The best had a delta of 5%, average was 17%, worst was 45%
Compared to all devices tested
» 1% of all tested devices were better, 0% similar, 99% worse
» The best had a delta of 4%, average was 23%, worst was 134%
Power Consumption and Battery Life
Our consumption measurements show a small improvements over the previous model in the idle tests, but slightly higher values under load due to the higher TGP of the GeForce GPU. The provided 250W power adapter is completely sufficient as the maximum consumption of 230 Watts during the stress test quickly levels off at around 170/180 Watts.
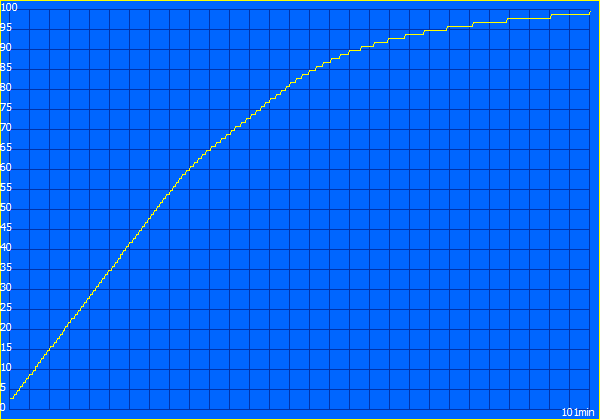
The battery capacity remains at 73 Wh, but the switch to the Intel CPU provides significantly longer battery runtimes in our Wi-Fi test. At 150 nits, the new 2026 model manages almost 14.5 hours and therefore four hours more. If you use the maximum SDR brightness (which is now higher than before), the difference is smaller, but the new model still lasts longer.

| Off / Standby | |
| Idle | |
| Load |
|
Key:
min: | |
| Asus ROG Zephyrus G14 GU405AR Ultra 9 386H, GeForce RTX 5070 Ti Laptop, Kioxia BG6 KBG60ZNV1T02, OLED, 2880x1800, 14" | Acer Predator Triton 14 AI PT14-52 Core Ultra 9 288V, GeForce RTX 5070 Laptop, Micron 3400 1TB MTFDKBA1T0TFH, OLED, 2880x1800, 14.5" | Razer Blade 14 2025 Ryzen AI 9 365, GeForce RTX 5070 Laptop, Samsung PM9A1 MZVL21T0HCLR, OLED, 2880x1800, 14" | Asus ROG Zephyrus G14 2025 GA403WW Ryzen AI 9 HX 370, GeForce RTX 5080 Laptop, WD PC SN740 SDDPNQE-2T00, OLED, 2880x1800, 14" | Apple MacBook Pro 14 2026 M5 Max M5 Max, M5 Max 40-Core GPU, Apple SSD AP8192Z, Mini-LED, 3024x1964, 14.2" | Average NVIDIA GeForce RTX 5070 Ti Laptop | Average of class Gaming | |
|---|---|---|---|---|---|---|---|
| Power Consumption | -23% | -32% | -19% | 11% | -129% | -126% | |
| Idle Minimum * (Watt) | 3.9 | 9.3 -138% | 9.3 -138% | 6.7 -72% | 2.5 36% | 12.4 ? -218% | 13.1 ? -236% |
| Idle Average * (Watt) | 7.8 | 12.2 -56% | 11.1 -42% | 8.8 -13% | 11.6 -49% | 19.7 ? -153% | 19 ? -144% |
| Idle Maximum * (Watt) | 8.1 | 12.5 -54% | 11.2 -38% | 9.3 -15% | 11.8 -46% | 24.9 ? -207% | 24.6 ? -204% |
| Load Average * (Watt) | 82.2 | 68.4 17% | 91.9 -12% | 121.5 -48% | 95.6 -16% | 123.6 ? -50% | 111.3 ? -35% |
| Cyberpunk 2077 ultra * (Watt) | 162.9 | 134 18% | 171.5 -5% | 157.4 3% | 89.4 45% | ||
| Cyberpunk 2077 ultra external monitor * (Watt) | 161.6 | 132.2 18% | 168.6 -4% | 155.5 4% | 86.4 47% | ||
| Load Maximum * (Watt) | 230.7 | 145.4 37% | 195 15% | 218.1 5% | 98.8 57% | 272 ? -18% | 260 ? -13% |
* ... smaller is better
Notebookcheck Rating
Asus ROG Zephyrus G14 GU405AR
- 06/19/2026 v8
Andreas Osthoff
 Total Sustainability Score:
 Potential Competitors in Comparison
Image | Model / Review | Price | Weight | Height | Display |
|---|---|---|---|---|---|
1. 89.9%  | Asus ROG Zephyrus G14 GU405AR Intel Core Ultra 9 386H ⎘ NVIDIA GeForce RTX 5070 Ti Laptop ⎘ 32 GB Memory, 1024 GB SSD | Amazon: 1. $129.99 280W 250W Charger for Asus R... 2. $89.99 240W Charger for Asus ROG Ze... 3. $1,749.99 EXCaliberPC [2025] ASUS ROG ... List Price: 3299€ | 1.6 kg | 16.3 mm | 14.00" 2880x1800 243 PPI OLED |
2. 82.6%  | Acer Predator Triton 14 AI PT14-52 Intel Core Ultra 9 288V ⎘ NVIDIA GeForce RTX 5070 Laptop ⎘ 32 GB Memory, 1024 GB SSD | Amazon: List Price: 2999€ | 1.6 kg | 17.31 mm | 14.50" 2880x1800 234 PPI OLED |
3. 87.2% 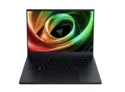 | Razer Blade 14 2025 AMD Ryzen AI 9 365 ⎘ NVIDIA GeForce RTX 5070 Laptop ⎘ 32 GB Memory, 1024 GB SSD | Amazon: List Price: 2399€ | 1.6 kg | 16.2 mm | 14.00" 2880x1800 243 PPI OLED |
4. 88.9%  | Asus ROG Zephyrus G14 2025 GA403WW AMD Ryzen AI 9 HX 370 ⎘ NVIDIA GeForce RTX 5080 Laptop ⎘ 64 GB Memory, 2048 GB SSD | Amazon: List Price: 3899€ | 1.6 kg | 18.3 mm | 14.00" 2880x1800 243 PPI OLED |
5. 90.2%  | Apple MacBook Pro 14 2026 M5 Max Apple M5 Max ⎘ Apple M5 Max 40-Core GPU ⎘ 128 GB Memory, 8192 GB SSD | Amazon: List Price: 8589€ | 1.6 kg | 15.5 mm | 14.20" 3024x1964 254 PPI Mini-LED |
6. 88.5%  | Asus ROG Zephyrus G14 2025 5070 Ti AMD Ryzen AI 9 HX 370 ⎘ NVIDIA GeForce RTX 5070 Ti Laptop ⎘ 32 GB Memory, 2048 GB SSD | Amazon: List Price: 3399€ | 1.6 kg | 18.3 mm | 14.00" 2880x1800 243 PPI OLED |
Transparency
The selection of devices to be reviewed is made by our editorial team. The test sample was provided to the author as a loan by the manufacturer or retailer for the purpose of this review. The lender had no influence on this review, nor did the manufacturer receive a copy of this review before publication. There was no obligation to publish this review. As an independent media company, Notebookcheck is not subjected to the authority of manufacturers, retailers or publishers.
This is how Notebookcheck is testing
Every year, Notebookcheck independently reviews hundreds of laptops and smartphones using standardized procedures to ensure that all results are comparable. We have continuously developed our test methods for around 20 years and set industry standards in the process. In our test labs, high-quality measuring equipment is utilized by experienced technicians and editors. These tests involve a multi-stage validation process. Our complex rating system is based on hundreds of well-founded measurements and benchmarks, which maintains objectivity. Further information on our test methods can be found here.
