Lenovo IdeaPad 320-17AST (E2-9000, HD+) Laptop Review

For the original German review, click here.
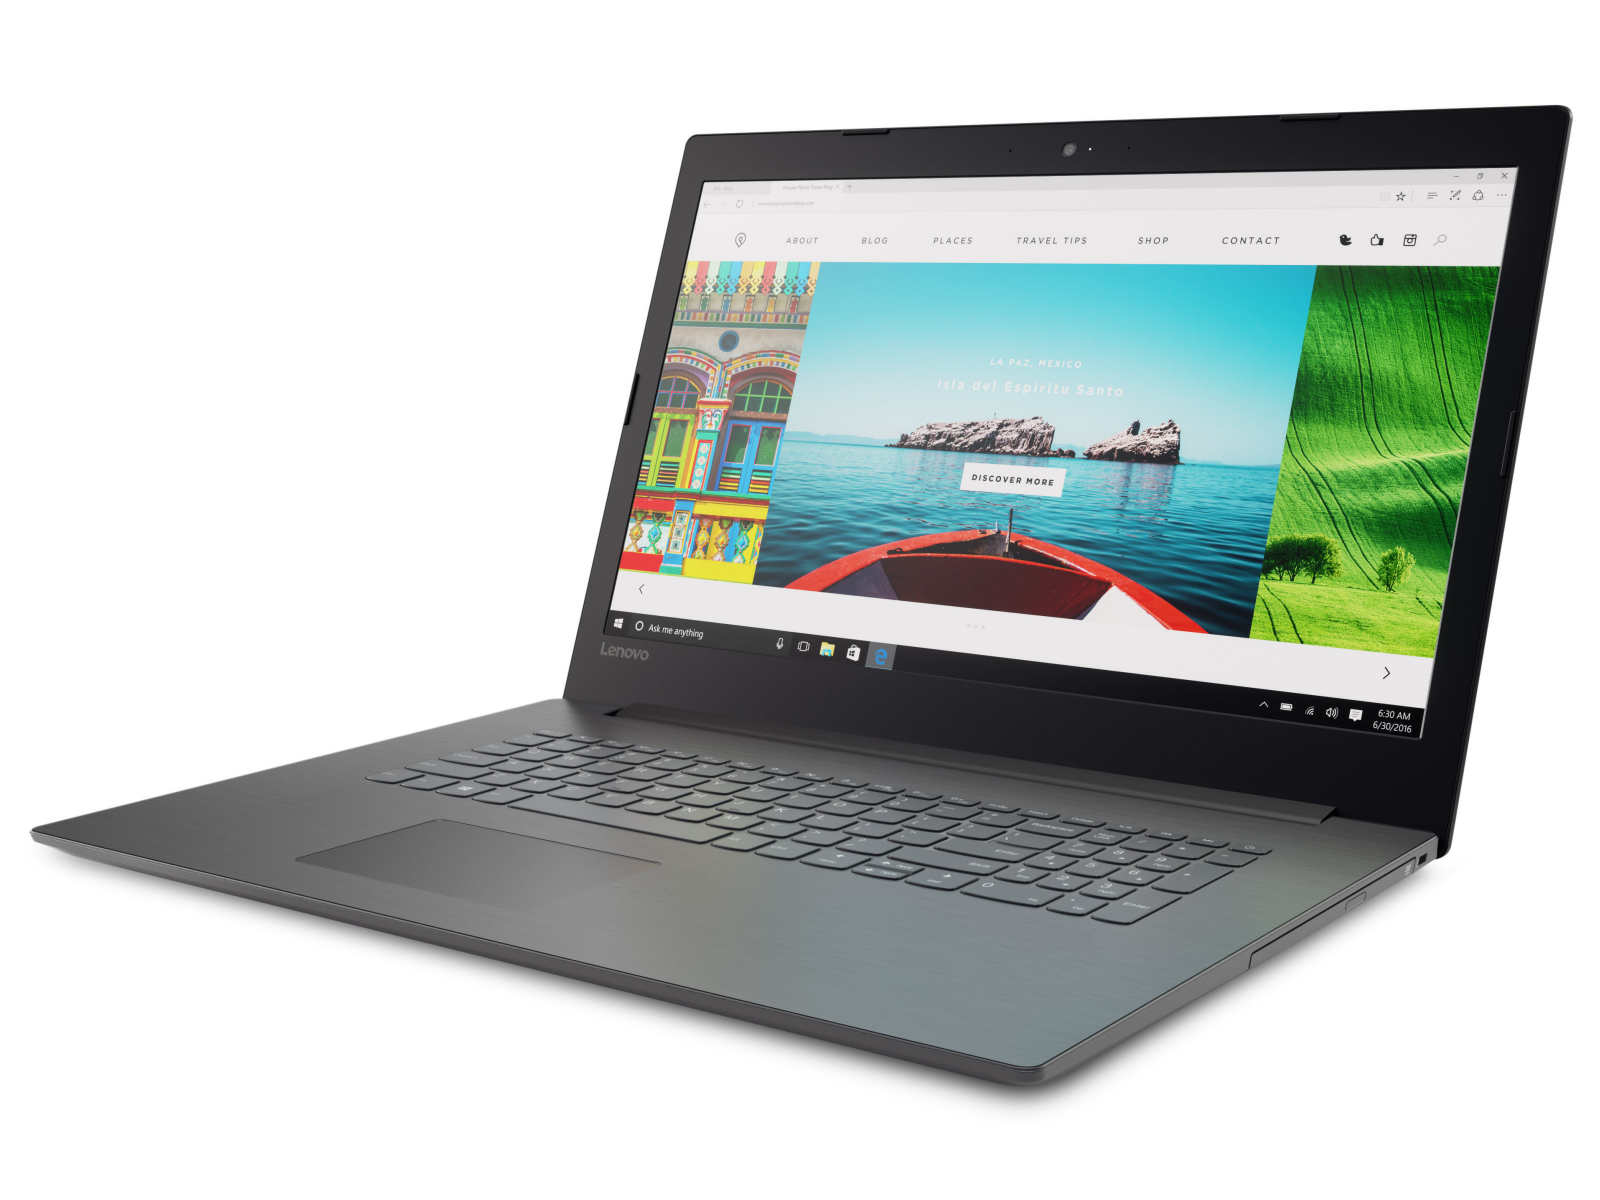
Lenovo has presented a series of 17.3-inch notebooks powered by AMD's Stoney Ridge APUs: the IdeaPad 320-17AST. It is based on the same build as the V320-12IKB series. Not so long ago, we tested a representative of this series - the Lenovo V320-17IKB 81AH0002GE. Two of the IdeaPad's competitors are the Acer Aspire ES1-731G and the HP 17.
As the IdeaPad and the V320-17IKB have the same build, we will not go into detail about the case, connectivity, input devices and speakers in this review, but we will only highlight any differences. For more detailed information on these aspects, please consult the review of the V320-17IKB.
Please note: This device is not currently for sale in the US but will become available later this year.
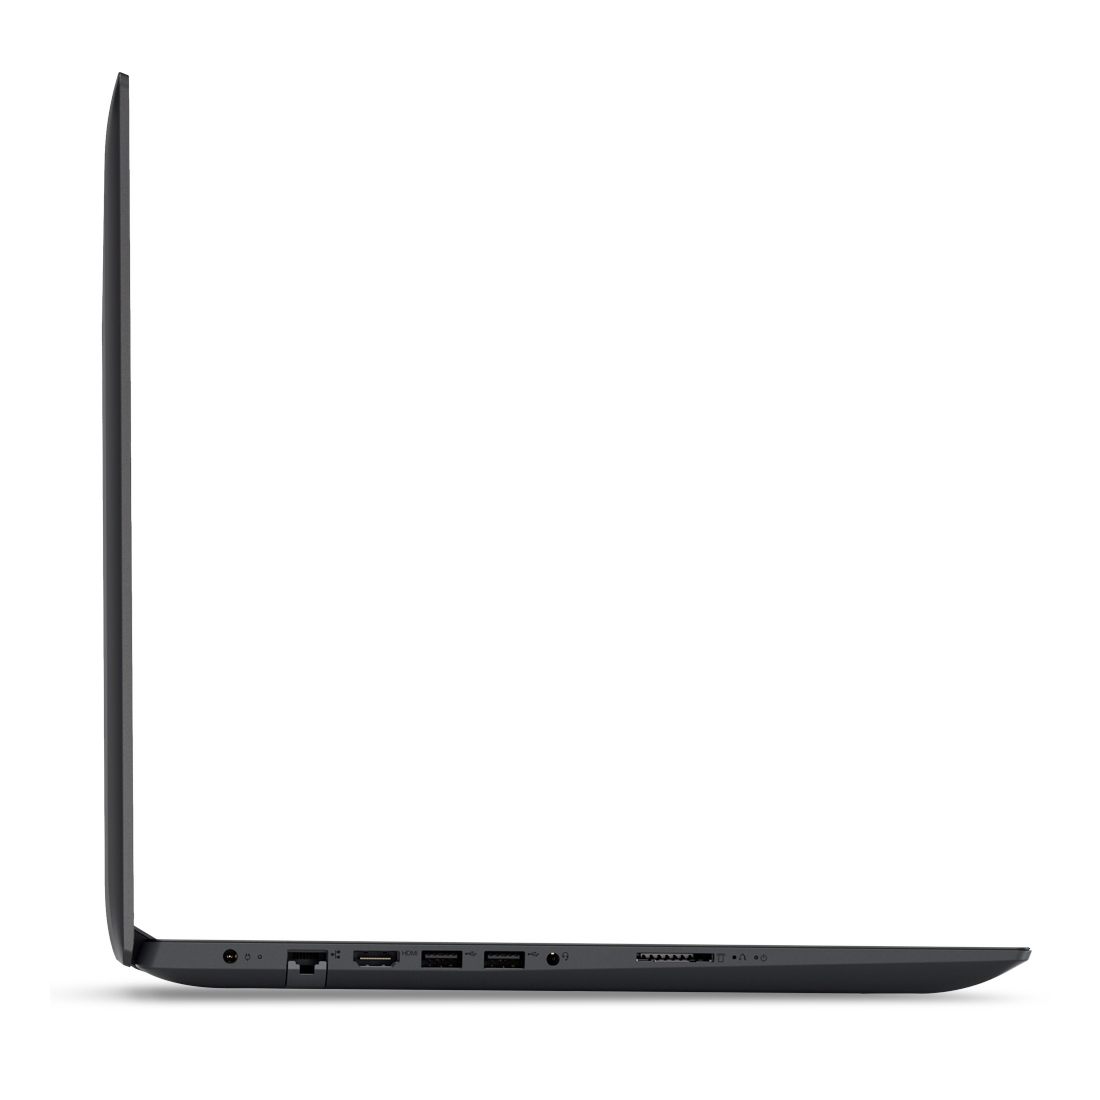
Case & Connectivity
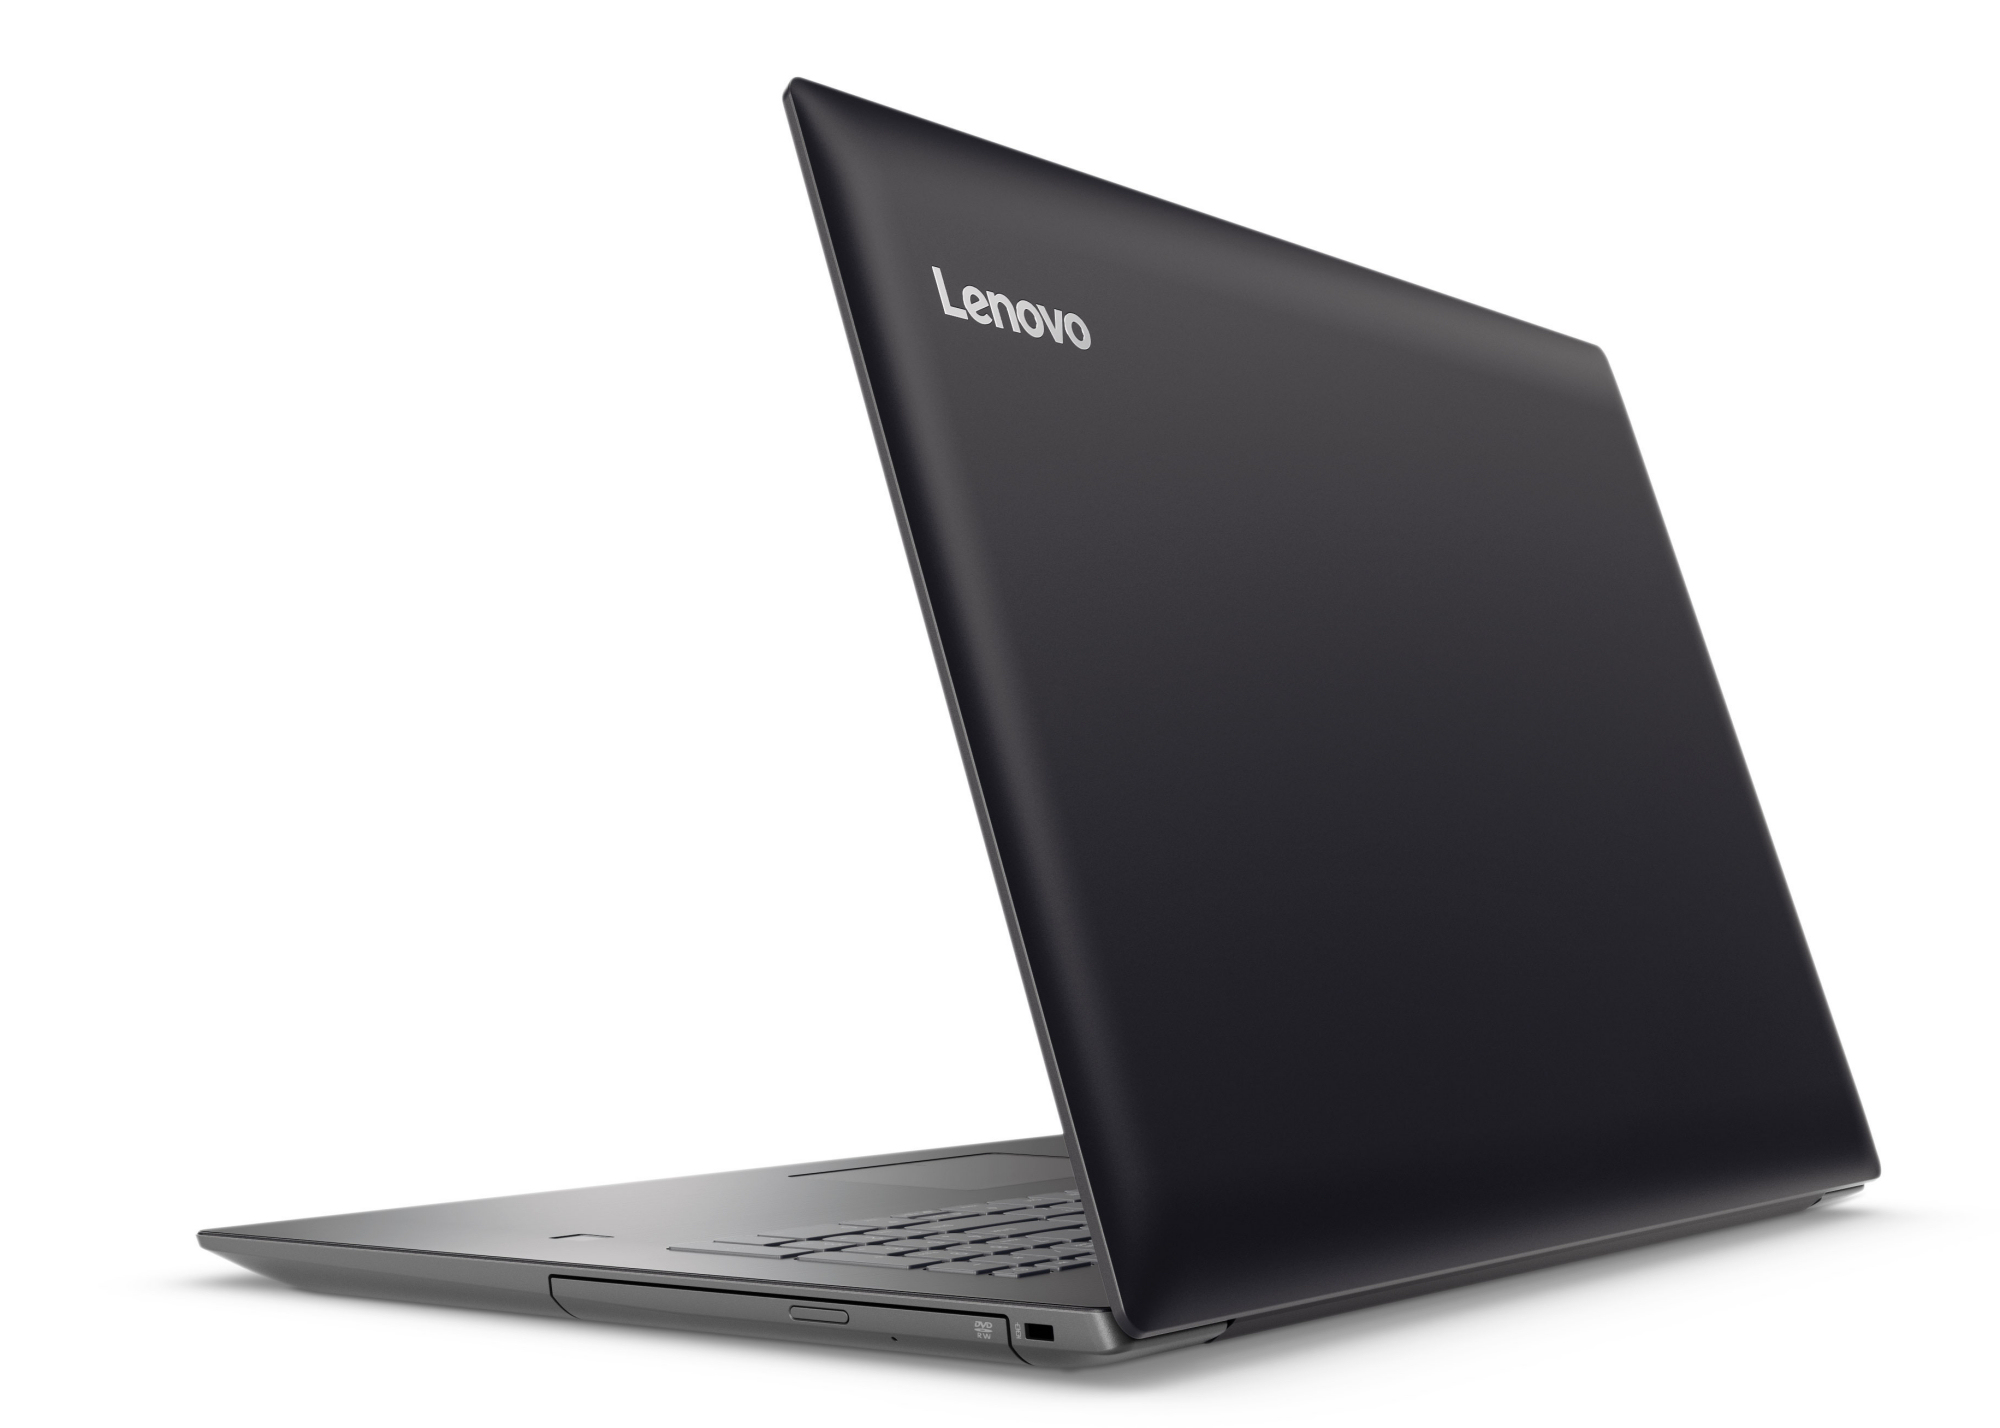
There are some differences between the IdeaPad 320-17IKB's connectivity and that of its sister model, the V320-17IKB. The IdeaPad is not equipped with the Type-C USB port or fingerprint-scanner and only has a Fast Ethernet port.
| SD Card Reader | |
| average JPG Copy Test (av. of 3 runs) | |
| Lenovo Ideapad 320-17AST-80XW0013GE (Toshiba Exceria Pro SDXC 64 GB UHS-II) | |
| HP 17-y044ng (Toshiba Exceria Pro SDXC 64 GB UHS-II) | |
| HP 17-x066ng (Toshiba Exceria Pro SDXC 64 GB UHS-II) | |
| maximum AS SSD Seq Read Test (1GB) | |
| HP 17-y044ng (Toshiba Exceria Pro SDXC 64 GB UHS-II) | |
| Lenovo Ideapad 320-17AST-80XW0013GE (Toshiba Exceria Pro SDXC 64 GB UHS-II) | |
| HP 17-x066ng (Toshiba Exceria Pro SDXC 64 GB UHS-II) | |
| Networking | |
| iperf3 transmit AX12 | |
| Lenovo Ideapad 320-17AST-80XW0013GE | |
| HP 17-x066ng | |
| HP 17-y044ng (jseb) | |
| iperf3 receive AX12 | |
| Lenovo Ideapad 320-17AST-80XW0013GE | |
| HP 17-x066ng | |
| HP 17-y044ng (jseb) | |
Display
The matte 17.3-inch display of the IdeaPad has a native resolution of 1600x900 p. Its brightness (209.1 cd/m2) and contrast ratio (373:1) are not convincing, but at least the device does not have PWM-flickering.
| |||||||||||||||||||||||||
Brightness Distribution: 81 %
Center on Battery: 232 cd/m²
Contrast: 373:1 (Black: 0.55 cd/m²)
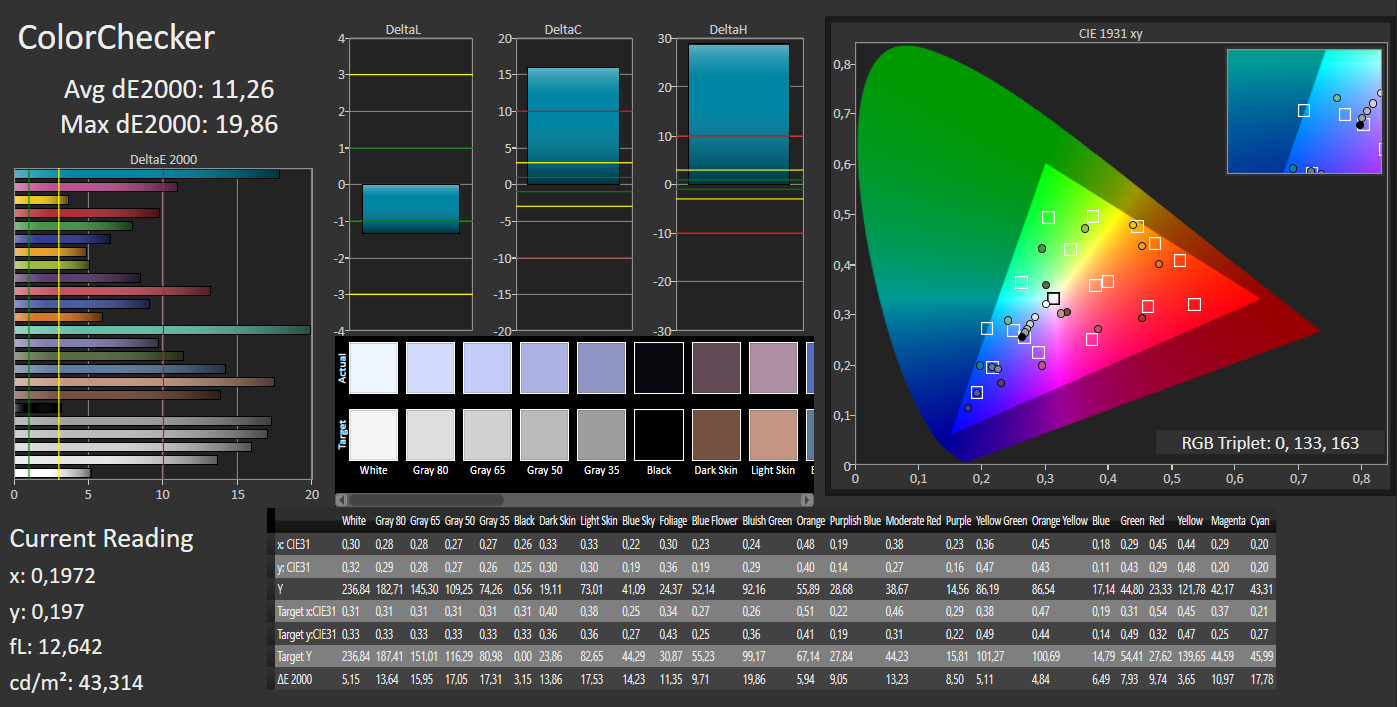
ΔE ColorChecker Calman: 11.26 | ∀{0.5-29.43 Ø4.72}
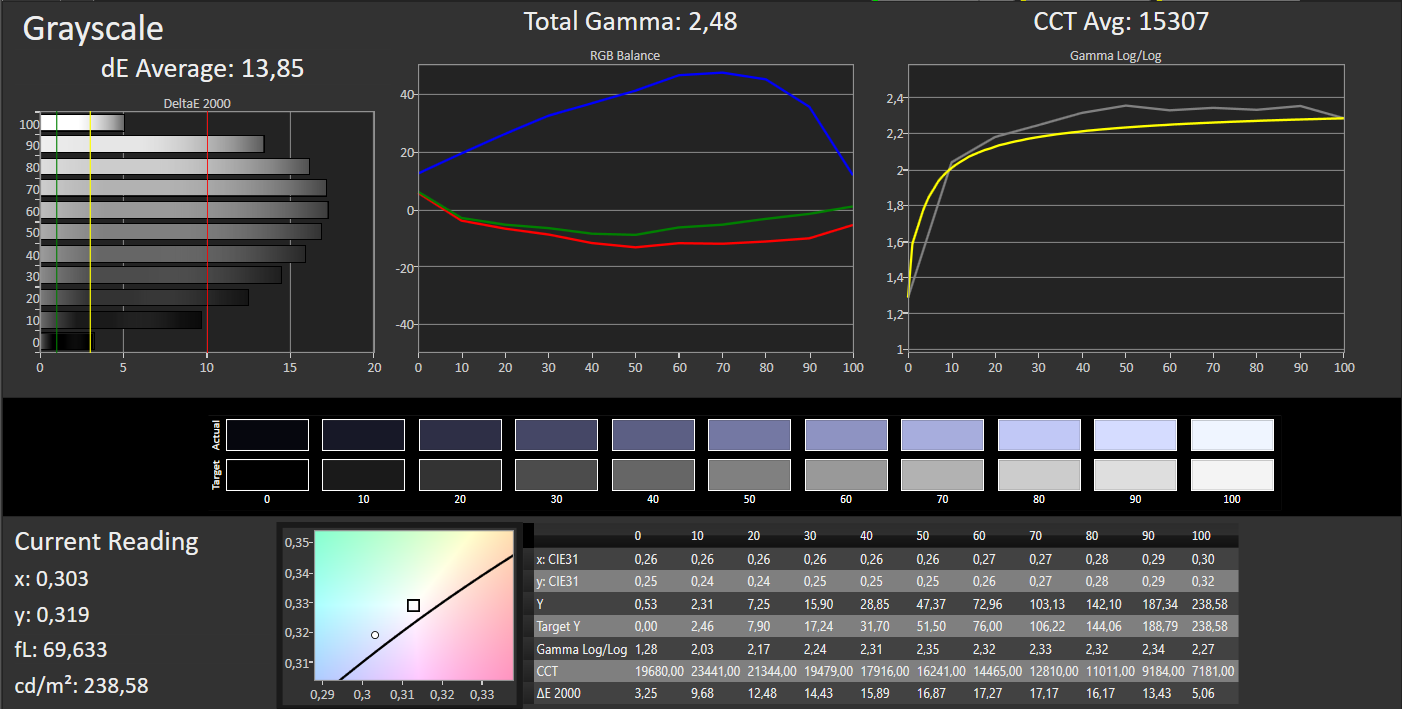
ΔE Greyscale Calman: 13.85 | ∀{0.09-98 Ø4.97}
73% sRGB (Argyll 1.6.3 3D)
47% AdobeRGB 1998 (Argyll 1.6.3 3D)
52.1% AdobeRGB 1998 (Argyll 3D)
73.3% sRGB (Argyll 3D)
50.5% Display P3 (Argyll 3D)
Gamma: 2.48
CCT: 15307 K
| Lenovo Ideapad 320-17AST-80XW0013GE TN LED, 1600x900, 17.3" | HP 17-x066ng IPS, 1920x1080, 17.3" | HP 17-y044ng TN LED, 1600x900, 17.3" | Acer Aspire ES1-731-P4A6 TN LED, 1600x900, 17.3" | |
|---|---|---|---|---|
| Display | 22% | 1% | 10% | |
| Display P3 Coverage (%) | 50.5 | 63.6 26% | 50.9 1% | 55.4 10% |
| sRGB Coverage (%) | 73.3 | 86.5 18% | 73.8 1% | 80.1 9% |
| AdobeRGB 1998 Coverage (%) | 52.1 | 63.3 21% | 52.6 1% | 57.3 10% |
| Response Times | -13% | -12% | -21% | |
| Response Time Grey 50% / Grey 80% * (ms) | 40 ? | 38 ? 5% | 43 ? -8% | 41 ? -2% |
| Response Time Black / White * (ms) | 20 ? | 26 ? -30% | 23 ? -15% | 28 ? -40% |
| PWM Frequency (Hz) | 199 ? | |||
| Screen | 54% | 7% | 25% | |
| Brightness middle (cd/m²) | 205 | 331 61% | 264 29% | 219 7% |
| Brightness (cd/m²) | 209 | 310 48% | 232 11% | 224 7% |
| Brightness Distribution (%) | 81 | 87 7% | 80 -1% | 91 12% |
| Black Level * (cd/m²) | 0.55 | 0.33 40% | 0.59 -7% | 0.31 44% |
| Contrast (:1) | 373 | 1003 169% | 447 20% | 706 89% |
| Colorchecker dE 2000 * | 11.26 | 4.58 59% | 10.58 6% | 9.31 17% |
| Colorchecker dE 2000 max. * | 19.86 | 7.83 61% | 18.96 5% | 13.74 31% |
| Greyscale dE 2000 * | 13.85 | 6.18 55% | 13.13 5% | 10.87 22% |
| Gamma | 2.48 89% | 2.34 94% | 2.49 88% | 2.9 76% |
| CCT | 15307 42% | 6076 107% | 14044 46% | 11513 56% |
| Color Space (Percent of AdobeRGB 1998) (%) | 47 | 56 19% | 48 2% | 52 11% |
| Color Space (Percent of sRGB) (%) | 73 | 86 18% | 74 1% | 80 10% |
| Total Average (Program / Settings) | 21% /
38% | -1% /
3% | 5% /
16% |
* ... smaller is better
Screen Flickering / PWM (Pulse-Width Modulation)
| Screen flickering / PWM not detected | ||
In comparison: 52 % of all tested devices do not use PWM to dim the display. If PWM was detected, an average of 7781 (minimum: 5 - maximum: 343500) Hz was measured. | ||
Color display is not the screen's forte either. It has a Delta E-2000 deviation of 11.26, which is very far away from the ideal value of below 3. On top of that, it has a significant blue cast.
Display Response Times
| ↔ Response Time Black to White | ||
|---|---|---|
| 20 ms ... rise ↗ and fall ↘ combined | ↗ 16 ms rise | 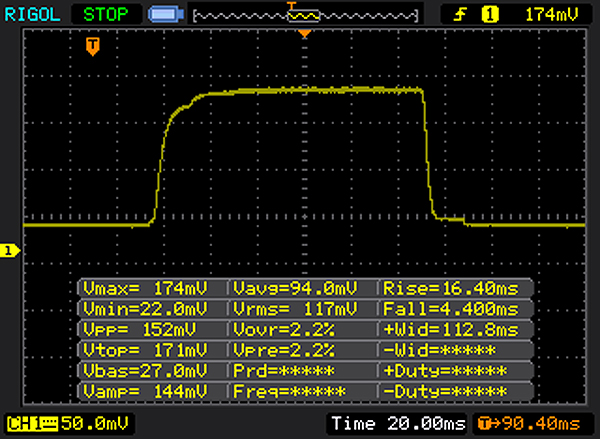 |
| ↘ 4 ms fall | ||
| The screen shows good response rates in our tests, but may be too slow for competitive gamers. In comparison, all tested devices range from 0.1 (minimum) to 240 (maximum) ms. » 44 % of all devices are better. This means that the measured response time is similar to the average of all tested devices (19.8 ms). | ||
| ↔ Response Time 50% Grey to 80% Grey | ||
| 40 ms ... rise ↗ and fall ↘ combined | ↗ 22 ms rise | 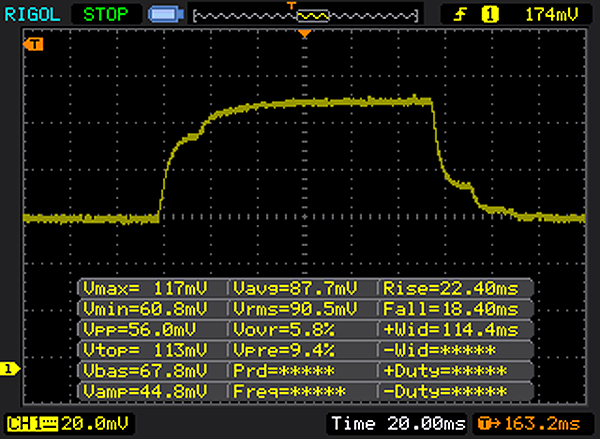 |
| ↘ 18 ms fall | ||
| The screen shows slow response rates in our tests and will be unsatisfactory for gamers. In comparison, all tested devices range from 0.165 (minimum) to 636 (maximum) ms. » 61 % of all devices are better. This means that the measured response time is worse than the average of all tested devices (31 ms). | ||
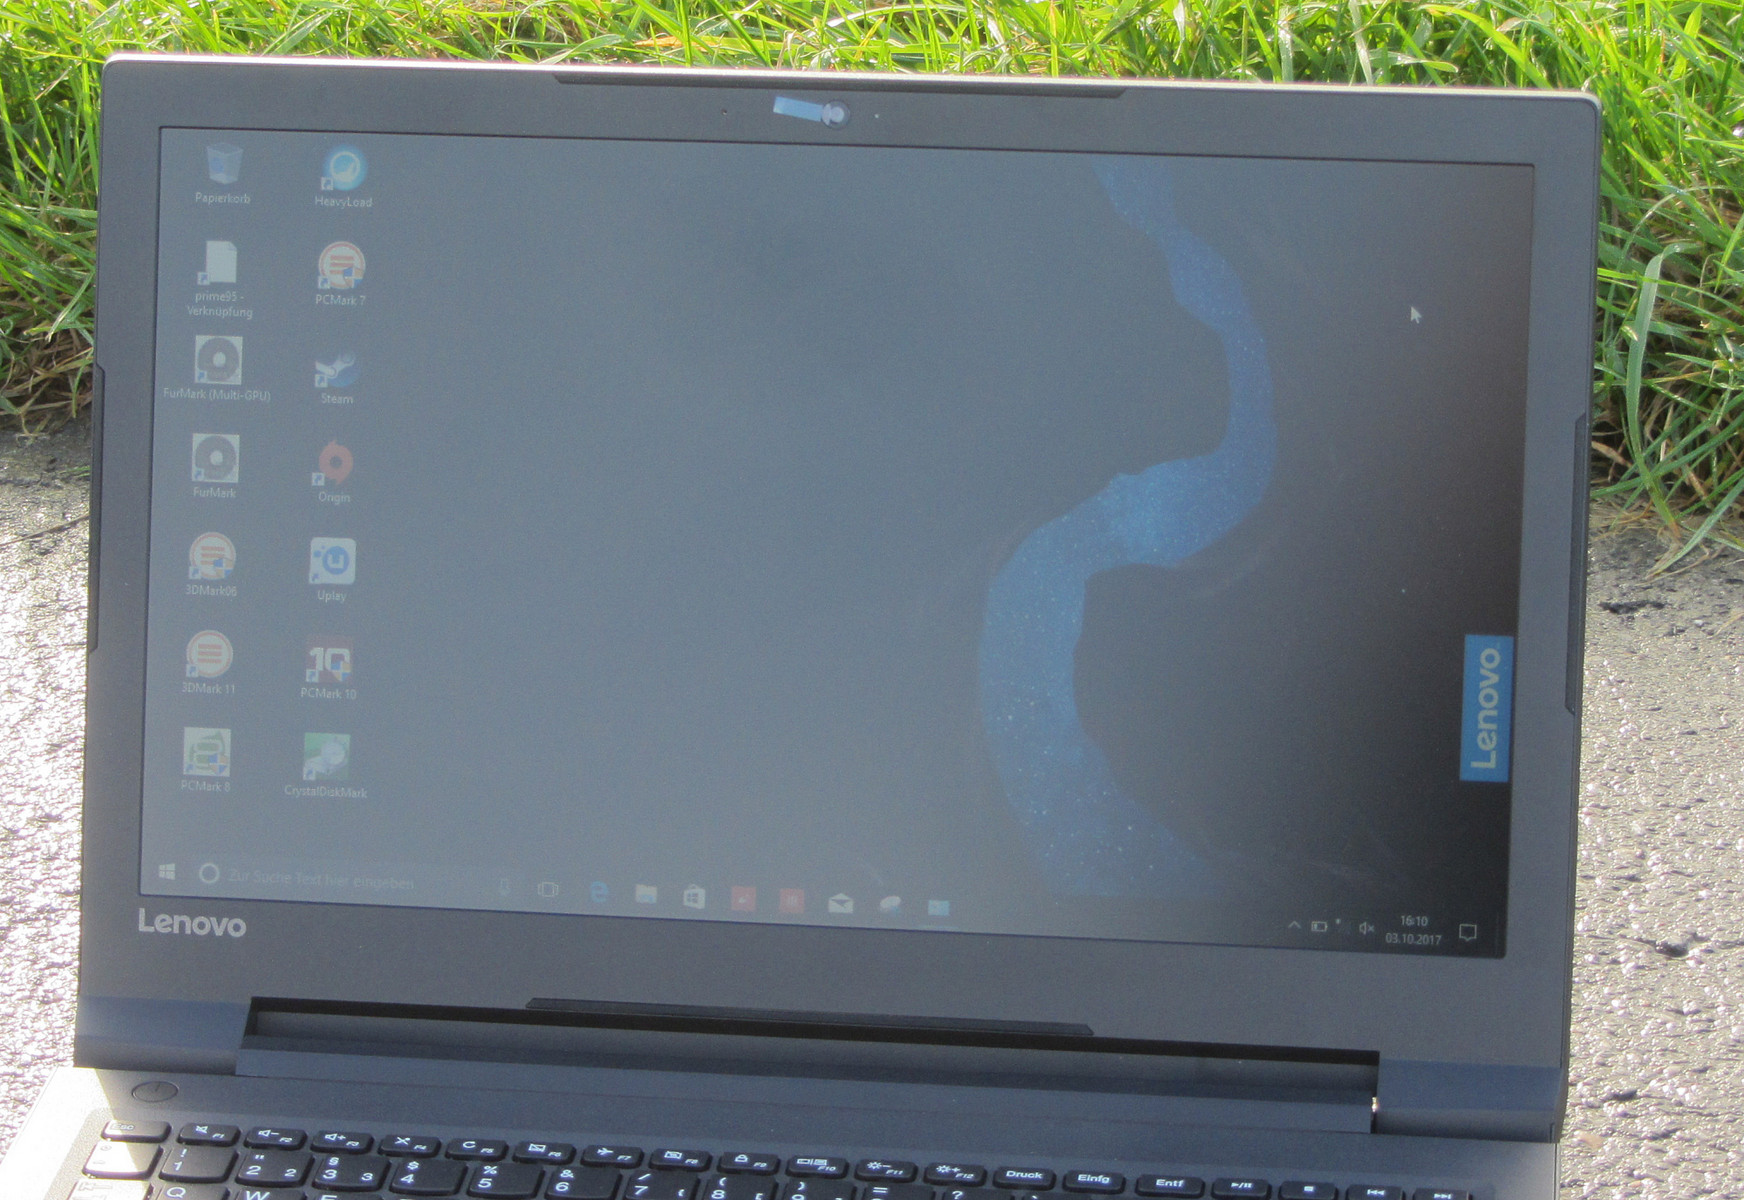
Lenovo has equipped the IdeaPad with a TN panel that does not have stable viewing angles. This means that the screen cannot be read from a wider viewing angle. The notebook cannot be used very well outdoors, either.
Performance
Lenovo's IdeaPad 320-17AST is a simple 17.3-inch office notebook. Its performance is made for simple applications such as office and Internet use. In Europe, our test unit is available for about 460 Euros (~$543). As mentioned above, this device will become available in the US later this year. Other configurations are available as well, as are the models of the IdeaPad-320-17IKB and V320-IKB series with the same build.
Processor
Lenovo has equipped the IdeaPad with an E2-9000 (Stoney Ridge) APU from the manufacturer AMD. The CPU part of the APU consists of a dual-core processor and is one of the least powerful models that AMD has available at the moment. It is made for simple applications in the areas of office and Internet use. The CPU works at a base clock rate of 1.8 GHz. This can be increased to up to 2.2 GHz with the turbo. The processor could not keep up its maximum speed for long during our CPU tests, and its working speed soon dropped to 1.9-2.1 GHz.
We test whether the turbo can be used over a longer period of time by running the Cinebench R15 multithread test in a loop for 30 minutes. The results drop a little at first and then remain on the level of 80 points. This means that the CPU does not fall below its base clock rate of 1.8 GHz.
The CPU's single-thread performance is similar to that of Intel's Pentium N4200. The AMD CPU cannot keep up with the Intel processor's multithread performance, as the latter has four cores.
| Geekbench 4.4 | |
| 64 Bit Multi-Core Score | |
| Asus VivoBook Flip 12 TP203NAH-BP049T | |
| Dell Latitude 3180 | |
| Lenovo Ideapad 320-17AST-80XW0013GE | |
| 64 Bit Single-Core Score | |
| Asus VivoBook Flip 12 TP203NAH-BP049T | |
| Lenovo Ideapad 320-17AST-80XW0013GE | |
| Dell Latitude 3180 | |
System Performance
You cannot expect top performances from this system. After all, it is only equipped with a low-performance APU which is made for simple applications in the areas of office and Internet. The results of the PCMark benchmarks are accordingly low. It would be possible to improve the general system performance by replacing the HDD with an SSD. This would make the system run quicker and shorten loading times.
| PCMark 7 Score | 2185 points | |
| PCMark 8 Home Score Accelerated v2 | 1844 points | |
| PCMark 8 Creative Score Accelerated v2 | 2119 points | |
| PCMark 8 Work Score Accelerated v2 | 3225 points | |
| PCMark 10 Score | 1385 points | |
Help | ||
| PCMark 8 - Home Score Accelerated v2 | |
| HP 17-x066ng | |
| HP 17-y044ng | |
| Lenovo Ideapad 320-17AST-80XW0013GE | |
| Acer Aspire ES1-731G-P5UR | |
Storage Devices
The system drive is a conventional 2.5-inch hard drive from Seagate. It runs at 5400 rpm and has a capacity of 1 TB. The HDD's transfer rates are normal for 5400-rpm models.

| Lenovo Ideapad 320-17AST-80XW0013GE Seagate Mobile HDD 1TB ST1000LM035 | HP 17-x066ng WDC WD10JPVX-08JC3T5 | HP 17-y044ng WDC Scorpio Blue WD10JPVX-75JC3T0 | Acer Aspire ES1-731G-P5UR Toshiba MQ01ABD100 | |
|---|---|---|---|---|
| CrystalDiskMark 3.0 | 86% | 83% | 74% | |
| Read Seq (MB/s) | 98.6 | 98.6 0% | 105.5 7% | 105 6% |
| Write Seq (MB/s) | 87 | 98.2 13% | 102 17% | 96 10% |
| Read 512 (MB/s) | 30.3 | 33.8 12% | 19.17 -37% | 32.89 9% |
| Write 512 (MB/s) | 92.2 | 45.98 -50% | 28.27 -69% | 25.77 -72% |
| Read 4k (MB/s) | 0.448 | 0.395 -12% | 0.328 -27% | 0.324 -28% |
| Write 4k (MB/s) | 0.316 | 0.96 204% | 1.013 221% | 0.755 139% |
| Read 4k QD32 (MB/s) | 1.088 | 1.039 -5% | 0.891 -18% | 0.892 -18% |
| Write 4k QD32 (MB/s) | 0.154 | 0.959 523% | 1.03 569% | 1 549% |
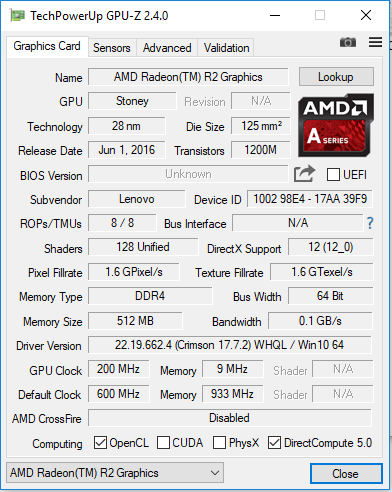
Graphics
The device's graphics are taken care of by AMD's Radeon R2 (Stoney Ridge) GPU. This supports DirectX 12 and reaches a speed of up to 600 MHz. The results of the 3DMark benchmarks are similar to those of Intel's HD Graphics 505. This is only when Intel's GPU can work with the RAM in dual-channel mode. Otherwise, AMD's GPU is ahead. AMD's graphics core cannot be accelerated by activating dual-channel mode, as this is not available. The IdeaPad also only has one memory slot.
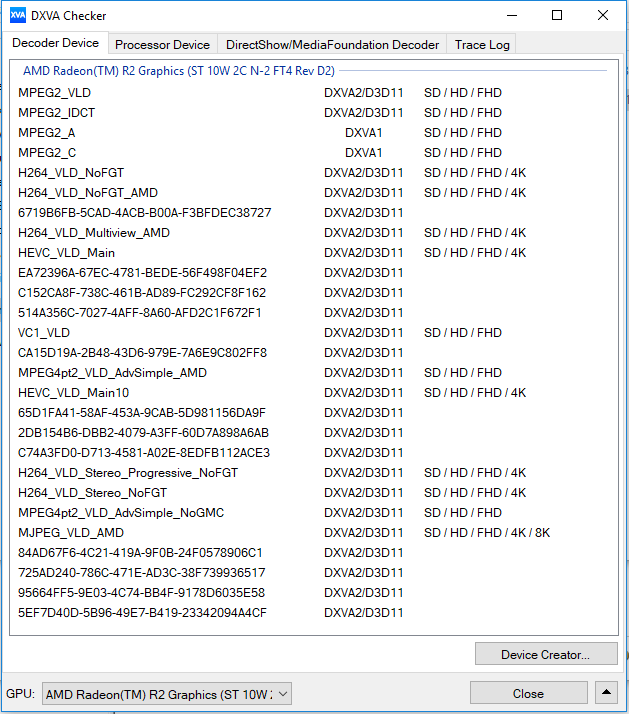
The performance of the integrated decoder is more interesting than the device's graphics performance. This can render both H.264 and HEVC/H.265 material at 4K resolution.
| 3DMark 05 Standard | 6853 points | |
| 3DMark 06 Standard Score | 3809 points | |
| 3DMark Vantage P Result | 2136 points | |
| 3DMark 11 Performance | 788 points | |
| 3DMark Ice Storm Standard Score | 26099 points | |
| 3DMark Cloud Gate Standard Score | 2187 points | |
| 3DMark Fire Strike Score | 477 points | |
Help | ||
| 3DMark 11 - 1280x720 Performance GPU | |
| Lenovo Ideapad 110-17IKB 80VK0001GE | |
| Lenovo V320-17IKB 81AH0002GE | |
| HP 17-y044ng | |
| Acer Aspire ES1-731G-P5UR | |
| HP 17-x066ng | |
| Dell Latitude 3180 | |
| Acer Aspire E5-722-662J | |
| Lenovo Ideapad 320-17AST-80XW0013GE | |
| Acer Aspire ES1-533-P7WA | |
| Acer Aspire E5-722-2611 | |
| Asus VivoBook Flip 12 TP203NAH-BP049T | |
| Lenovo G70-35 80Q5000BGE | |
Gaming Performance
The IdeaPad can display some games smoothly, but only games that have low hardware requirements. You will still have to limit yourself to low resolution and quality settings.
| low | med. | high | ultra | |
|---|---|---|---|---|
| World of Warcraft (2005) | 65.2 | 33.2 | ||
| Dirt 3 (2011) | 55.7 | 28.1 | 22.1 | |
| Deus Ex Human Revolution (2011) | 41 | 20.3 | ||
| The Elder Scrolls V: Skyrim (2011) | 24.7 | 16.3 | 10.8 | |
| Anno 2070 (2011) | 48.8 | 22.3 | 13.9 | |
| Diablo III (2012) | 28.5 | 17.8 | 15.9 | |
| Counter-Strike: GO (2012) | 26.9 | 21.7 | 20 | |
| Dead Space 3 (2013) | 43.5 | 20.8 | 16.5 | |
| Tomb Raider (2013) | 35.7 | 15.7 | 11.1 | |
| BioShock Infinite (2013) | 36.8 | 18.1 | 14.2 | |
| GRID 2 (2013) | 39.5 | 20.7 | 12.6 | |
| GRID: Autosport (2014) | 46 | 16.9 | ||
| Sims 4 (2014) | 82.1 | 20.7 | ||
| F1 2014 (2014) | 28 | 18 | ||
| Metal Gear Solid V (2015) | 23.6 | 18.5 | ||
| Dota 2 Reborn (2015) | 28.7 | 18.4 | ||
| World of Warships (2015) | 25.5 | 20.3 | ||
| Overwatch (2016) | 17.5 | 15 | ||
| Farming Simulator 17 (2016) | 43.5 | 26.4 | ||
| Prey (2017) | 9.4 | |||
| Rocket League (2017) | 30.8 | |||
| Team Fortress 2 (2017) | 19.7 | 18.5 |
Emissions & Energy Management
System Noise
As was to be expected, the device produces very little noise over the entire load spectrum. After all, it only has a low-performance APU inside. The cooling fan is often turned off while idling and you can only hear the quiet humming of the 2.5-inch hard drive. But even under load, the cooling fan hardly speeds up. We measured a noise level of 32.2 dB(A) during our stress test. The device was loudest when Prime95 was running on its own. In that case we measured 33 dB(A).
Noise level
| Idle |
| 31 / 31 / 31 dB(A) |
| HDD |
| 32.1 dB(A) |
| DVD |
| 34.8 / dB(A) |
| Load |
| 22.6 / 32.2 dB(A) |
 | ||
30 dB silent 40 dB(A) audible 50 dB(A) loud |
||
min: | ||
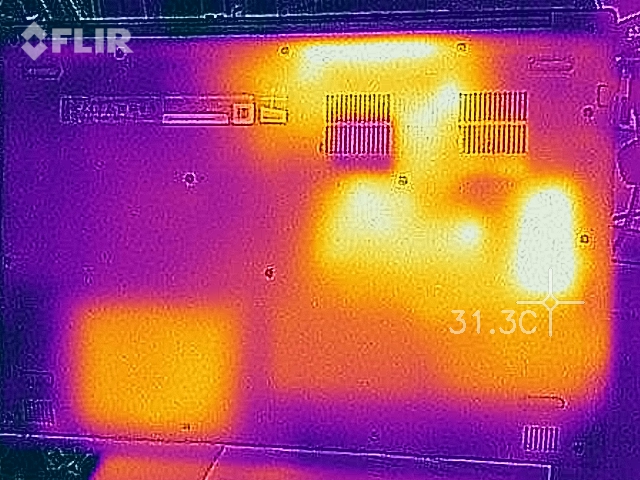
Temperature
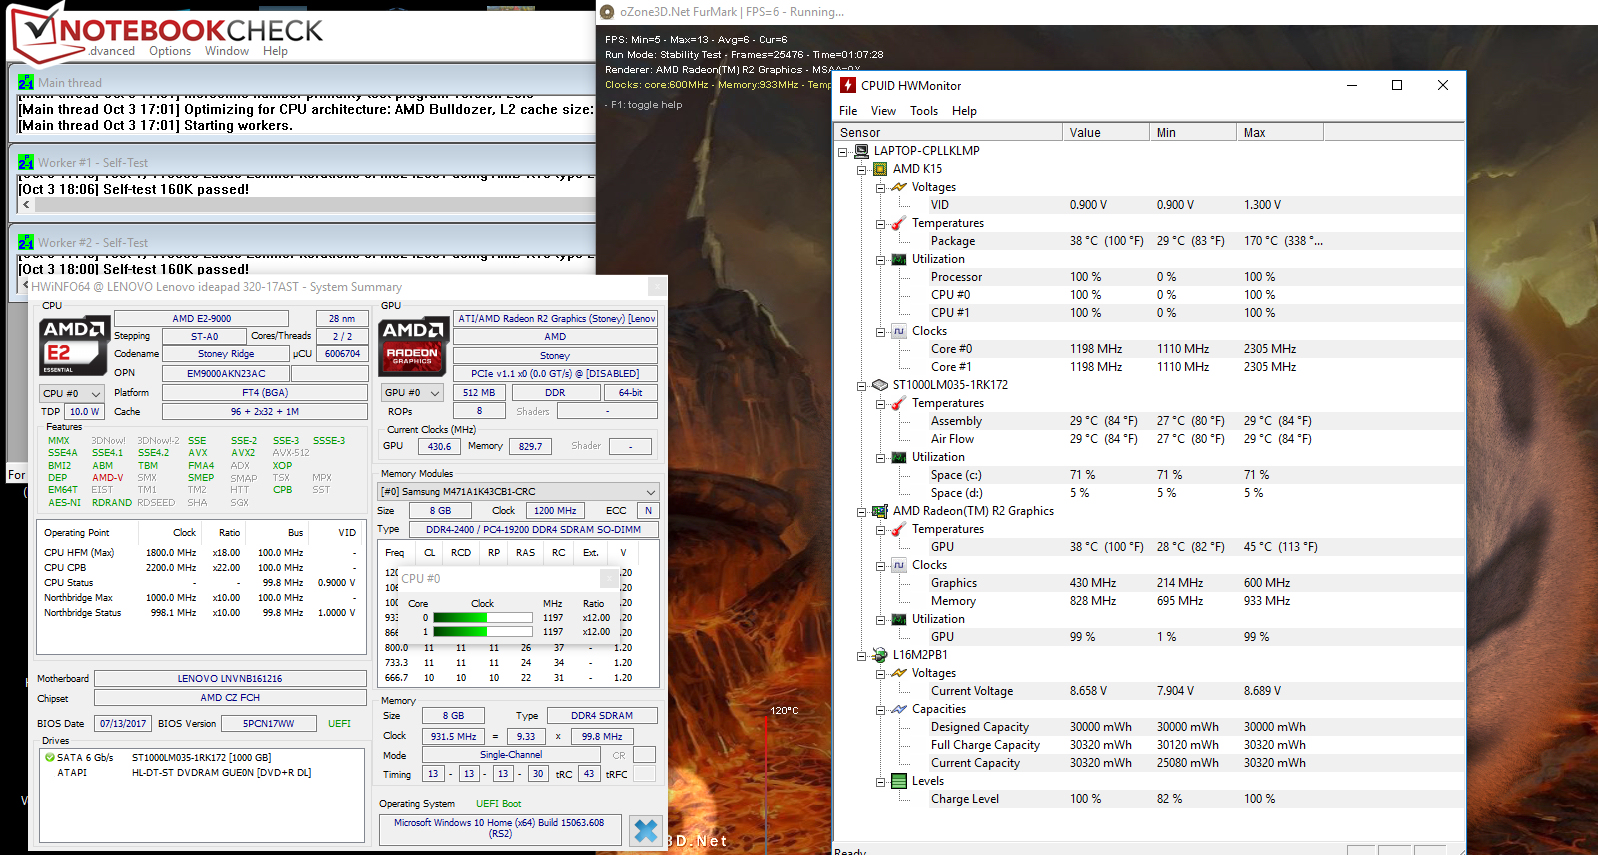
The IdeaPad did a similar job in our stress test (Prime95 and FurMark running for at least an hour) on power supply and on battery. The processor and graphics core worked at full power for a short time only and then dropped to 1.2 GHz (CPU) and 430 MHz (GPU), where they remained.
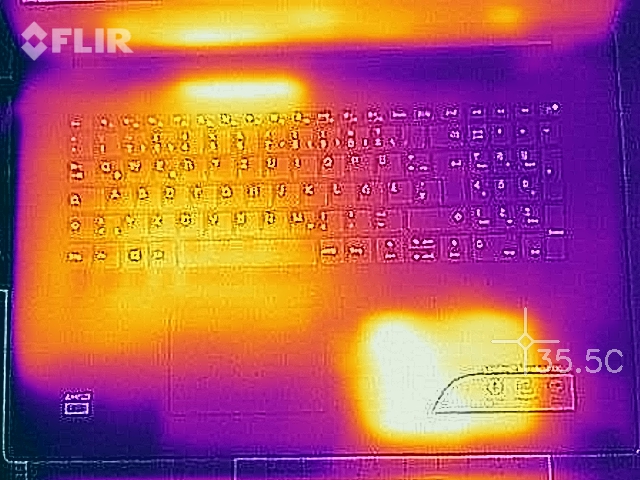
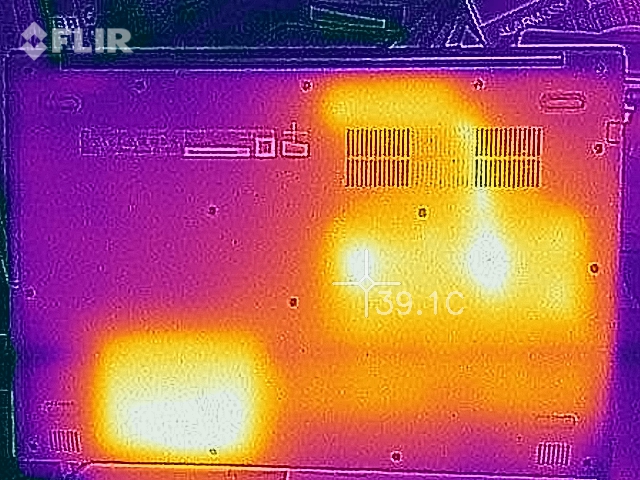
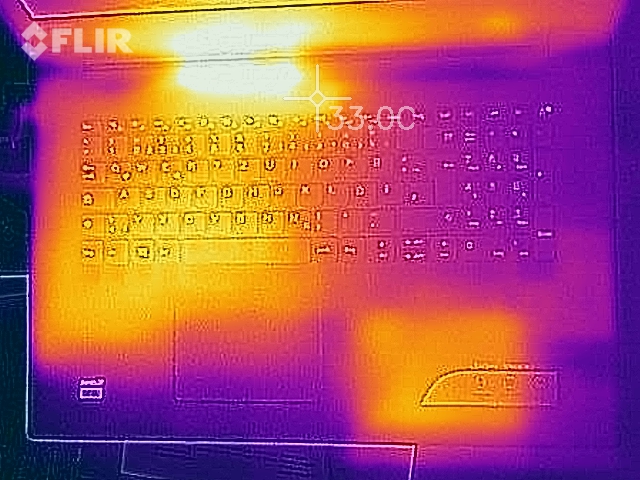
You can hardly say the IdeaPad heats up - only on one spot did it exceed 30 °C (~86 °F) during the stress test.
(+) The maximum temperature on the upper side is 29.6 °C / 85 F, compared to the average of 34.3 °C / 94 F, ranging from 21.2 to 62.5 °C for the class Office.
(+) The bottom heats up to a maximum of 33.4 °C / 92 F, compared to the average of 36.8 °C / 98 F
(+) In idle usage, the average temperature for the upper side is 25.4 °C / 78 F, compared to the device average of 29.5 °C / 85 F.
(+) The palmrests and touchpad are cooler than skin temperature with a maximum of 27.9 °C / 82.2 F and are therefore cool to the touch.
(±) The average temperature of the palmrest area of similar devices was 27.5 °C / 81.5 F (-0.4 °C / -0.7 F).
Speakers
Lenovo Ideapad 320-17AST-80XW0013GE audio analysis
(-) | not very loud speakers (68.9 dB)
Bass 100 - 315 Hz
(-) | nearly no bass - on average 21.4% lower than median
(±) | linearity of bass is average (14.7% delta to prev. frequency)
Mids 400 - 2000 Hz
(+) | balanced mids - only 2.1% away from median
(±) | linearity of mids is average (8.6% delta to prev. frequency)
Highs 2 - 16 kHz
(+) | balanced highs - only 4.8% away from median
(±) | linearity of highs is average (8% delta to prev. frequency)
Overall 100 - 16.000 Hz
(±) | linearity of overall sound is average (20.8% difference to median)
Compared to same class
» 48% of all tested devices in this class were better, 9% similar, 42% worse
» The best had a delta of 7%, average was 21%, worst was 53%
Compared to all devices tested
» 56% of all tested devices were better, 8% similar, 36% worse
» The best had a delta of 4%, average was 24%, worst was 134%
Apple MacBook 12 (Early 2016) 1.1 GHz audio analysis
(+) | speakers can play relatively loud (83.6 dB)
Bass 100 - 315 Hz
(±) | reduced bass - on average 11.3% lower than median
(±) | linearity of bass is average (14.2% delta to prev. frequency)
Mids 400 - 2000 Hz
(+) | balanced mids - only 2.4% away from median
(+) | mids are linear (5.5% delta to prev. frequency)
Highs 2 - 16 kHz
(+) | balanced highs - only 2% away from median
(+) | highs are linear (4.5% delta to prev. frequency)
Overall 100 - 16.000 Hz
(+) | overall sound is linear (10.2% difference to median)
Compared to same class
» 7% of all tested devices in this class were better, 2% similar, 91% worse
» The best had a delta of 5%, average was 18%, worst was 53%
Compared to all devices tested
» 5% of all tested devices were better, 1% similar, 94% worse
» The best had a delta of 4%, average was 24%, worst was 134%
Frequency diagram in comparison (checkboxes can be turned on/off!)
Power Consumption
As our device is only equipped with a low-performance APU, it consumes very little power over the entire load spectrum. We measured a maximum consumption of 8 watts while idling. During the stress test, this value increased to 22 watts for a short time, but then it dropped to 19.6 watts as the CPU and GPU were throttled. The 45-watt power supply will not be pushed to its limits.
| Off / Standby | |
| Idle | |
| Load |
|
Key:
min: | |
Battery Runtime
Our practical Wi-Fi test simulates the load of regularly accessing websites. We set the power profile to "balanced" and display brightness to about 150 cd/m² with power-saving functions turned off. With these settings, the IdeaPad reaches a runtime of 3:44h. This is not particularly exciting, even for a 17.3-inch device. You can see that the battery has a low capacity (30 Wh). The sister model with the same build, V320-17IKB, is a little better here (35 Wh).
| Battery Runtime - WiFi Websurfing | |
| HP 17-x066ng | |
| Lenovo V320-17IKB 81AH0002GE | |
| Acer Aspire ES1-731G-P5UR | |
| HP 17-y044ng | |
| Lenovo Ideapad 320-17AST-80XW0013GE | |
Pros
Cons
Verdict
Lenovo's IdeaPad 320-17AST is a 17.3-inch office notebook for your desk at home. The APU it contains is suitable for simple applications in the areas of office and Internet. Potential buyers should be aware that the APU quickly reaches its limits. For example, when several websites are open simultaneously in the browser.
The notebook hardly heats up and is very quiet even under load. You will not lack storage space thanks to the 1-TB hard drive, which could also be exchanged for an SSD. To do this, however, the device would have to be opened - and it offers no maintenance hatch. The keyboard gave us a decent impression and is suitable for regular typing. The matte 17.3-inch display could not convince us: it is dark, has low contrast and it has bad viewing angles.
The main problem of the IdeaPad 320-17AST is its price.
In Europe, our device is available for about 460 Euros (~$543) - this is quite a price for such a low-powered device. If you are interested in an IdeaPad, we would recommend thinking about another model.
The model 80XW0018GE might be a good option, for example, as it is equipped with the stronger A9-9420 APU. The device is also available for about 460 Euros (~$543), but it is not equipped with a Windows operating system. However, a used Windows 7 or Windows 8.1 license can be bought for between $5 and $10, with the help of which you can easily install Windows 10.
Lenovo Ideapad 320-17AST-80XW0013GE
- 10/10/2017 v6 (old)
Sascha Mölck
Price comparison
