Asus ROG Strix Scar 15 G533zm review: Modern RTX 3060 gaming laptop with many strengths
We currently have two models of the Asus ROG Strix Scar 15 available for testing. This article will focus on the RTX 3060 version, whilst a review of the RTX 3070 Ti model will be published in parallel. Besides the RTX 3060, our SKU is equipped with a powerful Alder Lake i9-12900H CPU, 16 GB of RAM and a 240Hz QHD display.
Last year, we reviewed the previous Scar 15 with an RTX 3080, so it makes more sense to compare our review unit with its RTX 3070 Ti sibling instead. Additionally, we have opted to include other 15-inch gaming laptops with the same GPU in our comparison, such as the Asus TUF Gaming F15, the MSI Pulse GL66 and the Alienware m15 R5. Although the comparison also features the Lenovo Legion 5 with a Radeon RX6600M, this laptop isn’t in the same price bracket as the Strix Scar, given that our review configuration is priced at around €2,000 (US$2,170) whilst the Legion costs just slightly over €1,000 (US$1,085).
For sections on the chassis, maintenance, input devices and more, please refer to our main review of the Asus ROG Strix Scar with RTX 3070 Ti.
Comparison with possible competitors
Rating | Date | Model | Weight | Height | Size | Resolution | Price |
|---|---|---|---|---|---|---|---|
| 89.2 % v7 (old) | 11 / 2024 | Asus ROG Strix Scar 15 G533zm i9-12900H, GeForce RTX 3060 Laptop GPU | 2.3 kg | 27.2 mm | 15.60" | 2560x1440 | |
| 86.3 % v7 (old) | 05 / 2022 | Asus ROG Strix Scar 15 G533ZW-LN106WS i9-12900H, GeForce RTX 3070 Ti Laptop GPU | 2.3 kg | 27.2 mm | 15.60" | 2560x1440 | |
| 87.2 % v7 (old) | 03 / 2022 | Asus TUF Gaming F15 FX507ZM i7-12700H, GeForce RTX 3060 Laptop GPU | 2.1 kg | 24.95 mm | 15.60" | 1920x1080 | |
| 80.7 % v7 (old) | 04 / 2022 | MSI Pulse GL66 12UEK i9-12900H, GeForce RTX 3060 Laptop GPU | 2.3 kg | 25 mm | 15.60" | 1920x1080 | |
| 84.7 % v7 (old) | 06 / 2021 | Alienware m15 R5 Ryzen Edition R7 5800H, GeForce RTX 3060 Laptop GPU | 2.5 kg | 22.85 mm | 15.60" | 1920x1080 | |
| 82.6 % v7 (old) | 05 / 2022 | Lenovo Legion 5 15ACH6A-82NW0010GE R5 5600H, Radeon RX 6600M | 2.5 kg | 25.75 mm | 15.60" | 1920x1080 |
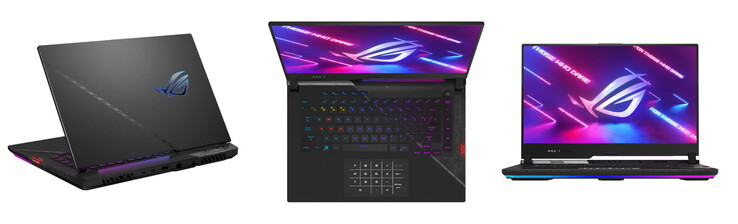
Case - Appealing gaming laptop design
A fairly unique design philosophy permeates the entire ROG Scar, making it an attractive laptop for gamers. With diagonal lines, a replaceable plate on the back cover, subtle colour accents and RGB elements, the manufacturer has created a distinct gaming style without overly garish lighting that flashes and glows.

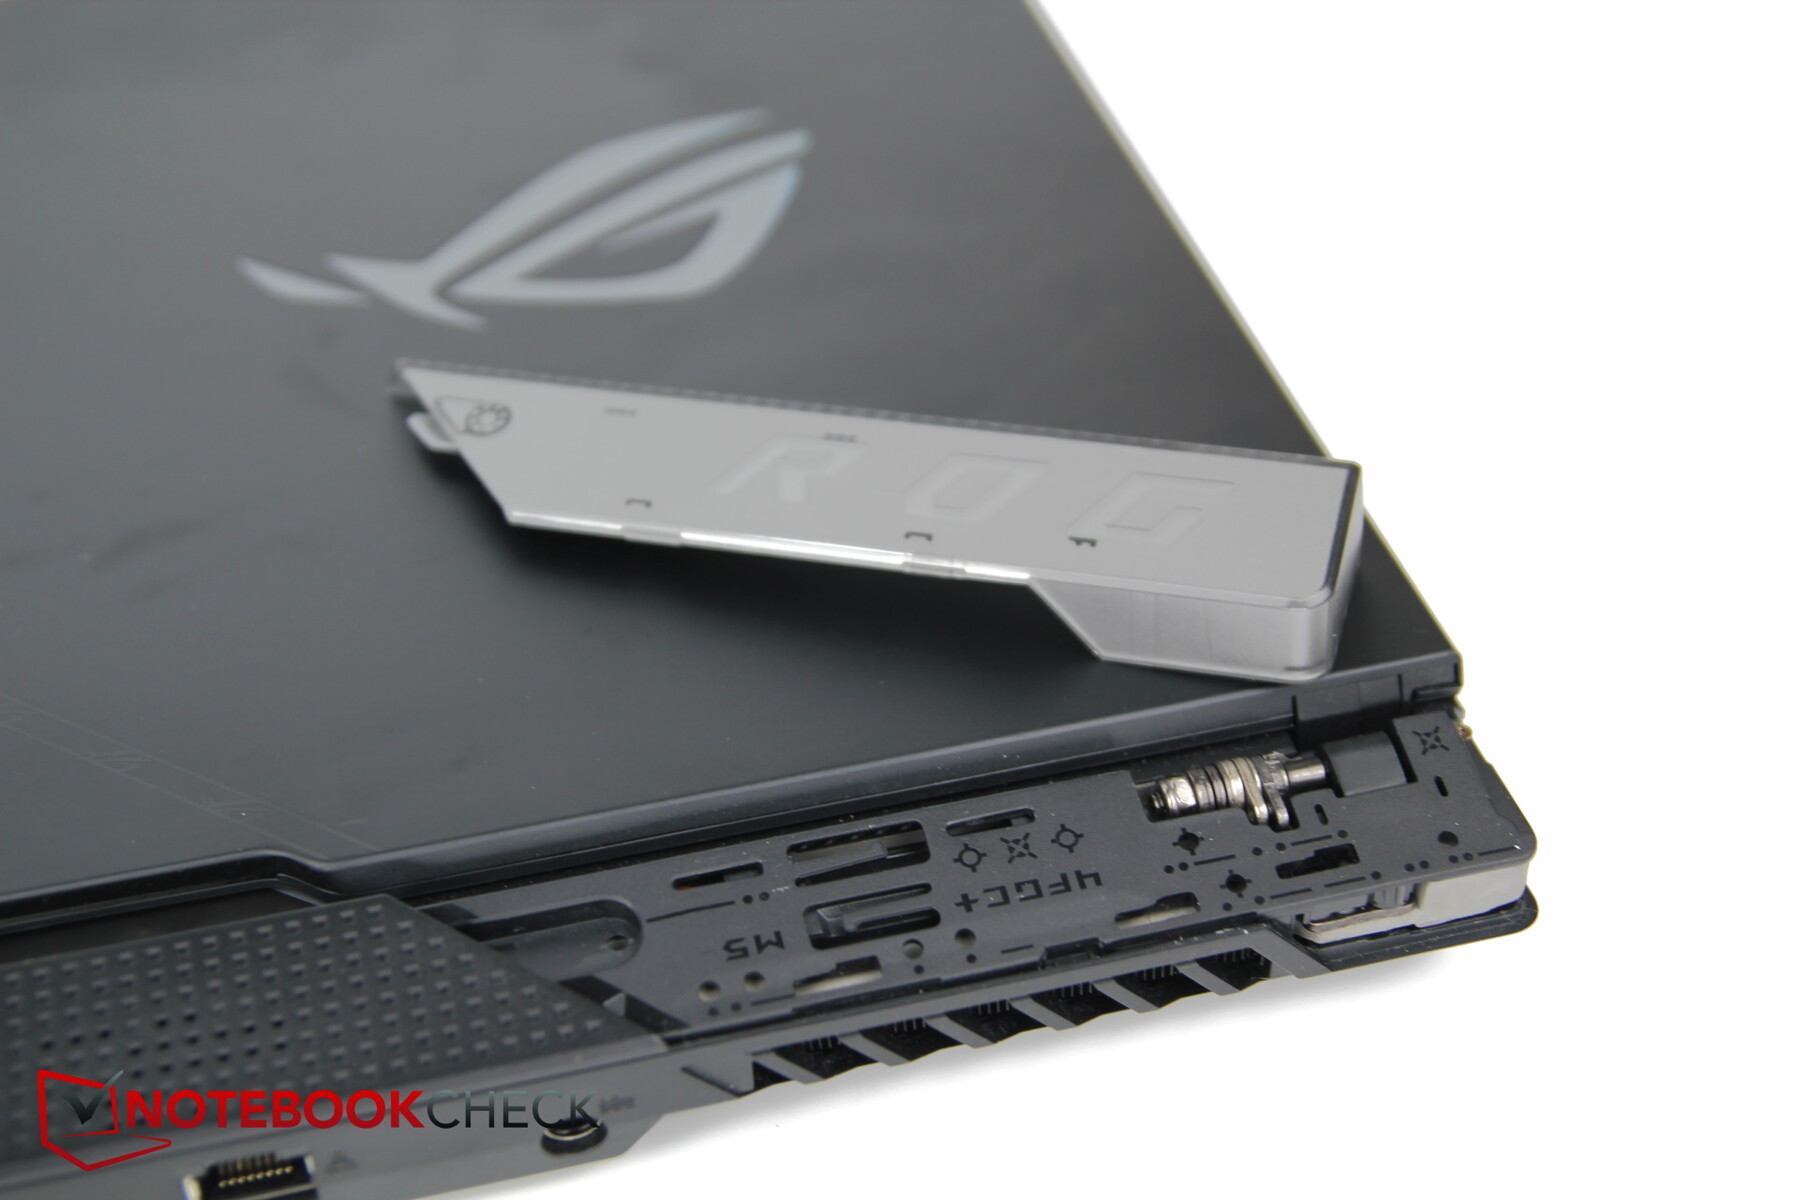
For instance, there is a light strip running across the entire front, but it is slightly recessed, making it feel less prominent. This light strip can also be synchronised with the keyboard and the ROG logo on the top side.
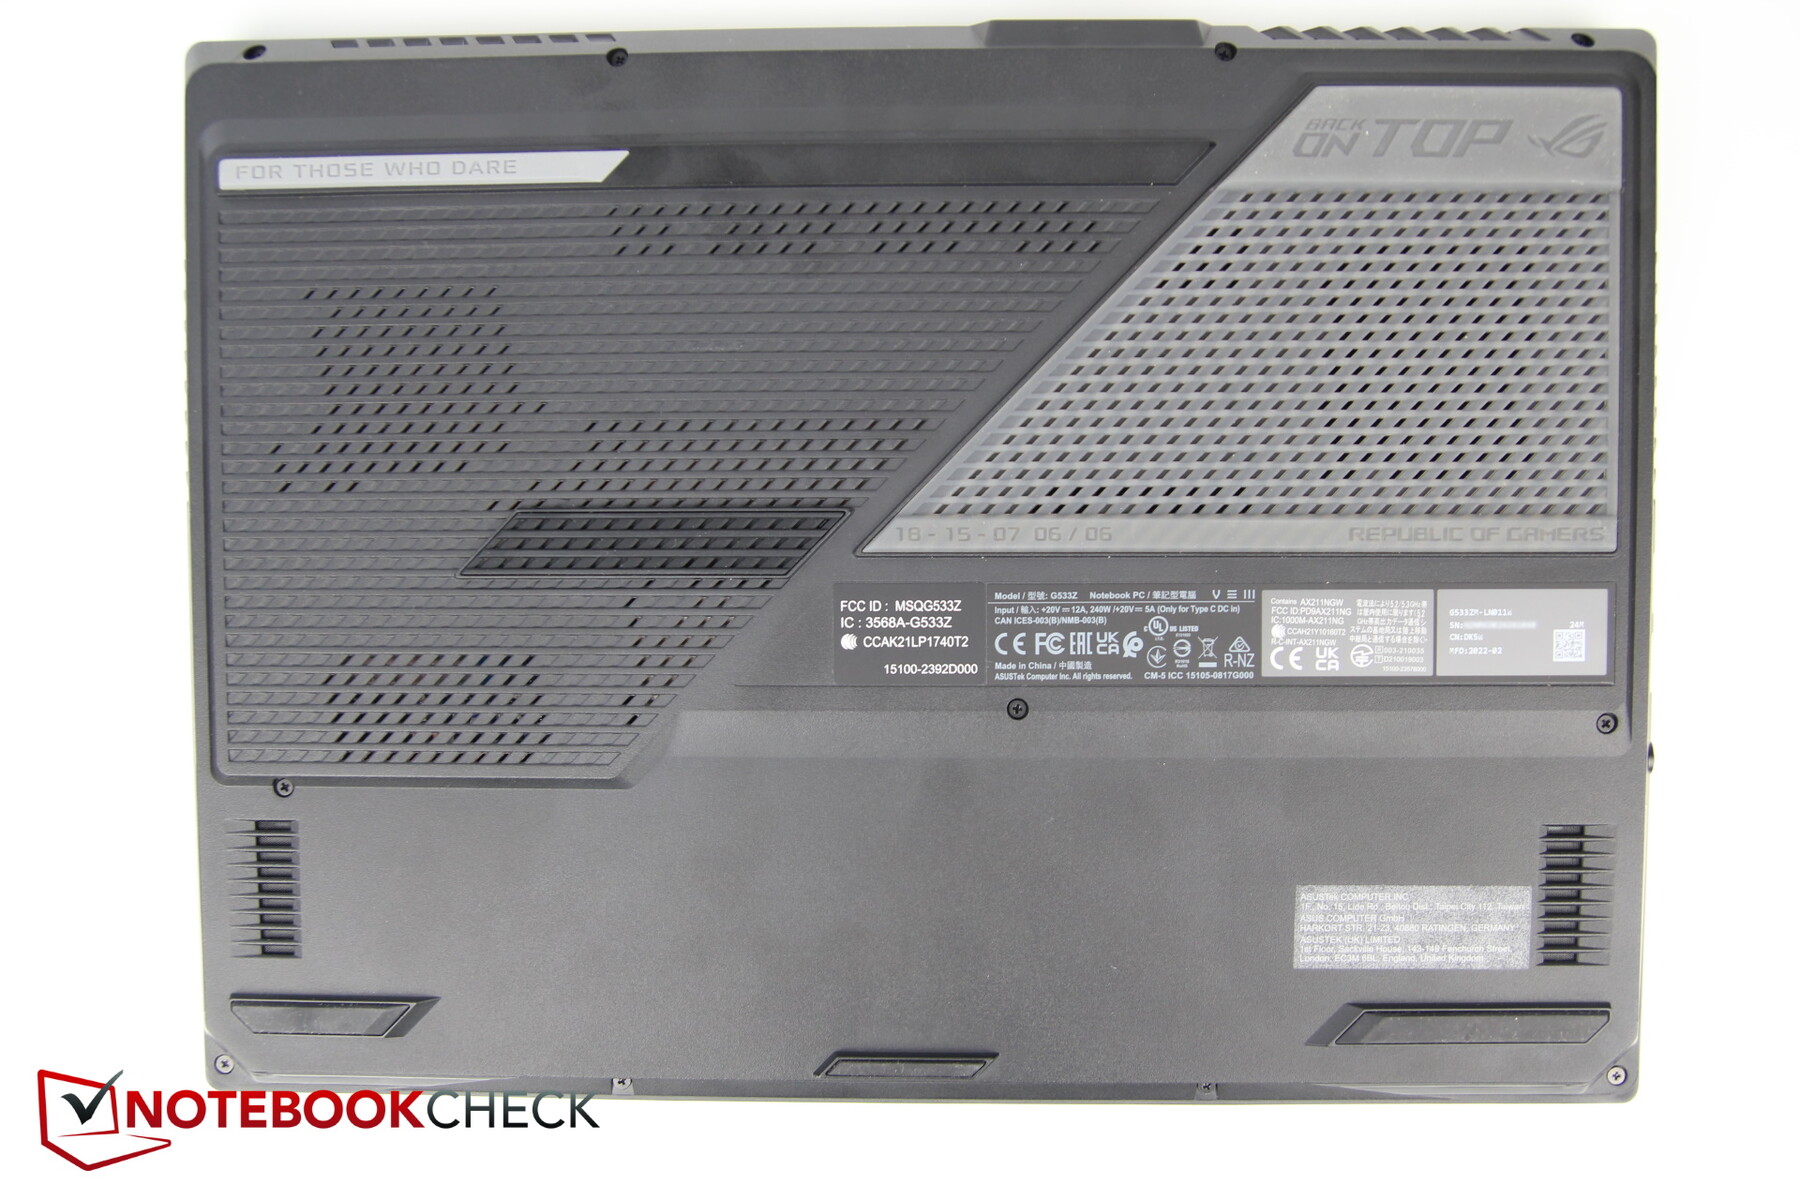
On the bottom are wide, brightly coloured rubber feet, adding contrast to the predominantly black chassis.
Despite its almost all-plastic construction, the Strix Scar 15 feels rather sturdy. The display doesn’t make any noise when twisted, whilst the base section only creaks slightly.
The display is held securely in place by two hinges, exhibiting barely any wobble when moved.


Size comparison
Overall, the Scar 15 is marginally thicker but a fraction smaller than some of its competitors. It is also relatively lightweight; for example, the Alienware and Legion models are heavier, and only the TUF Gaming F15 is slightly lighter.
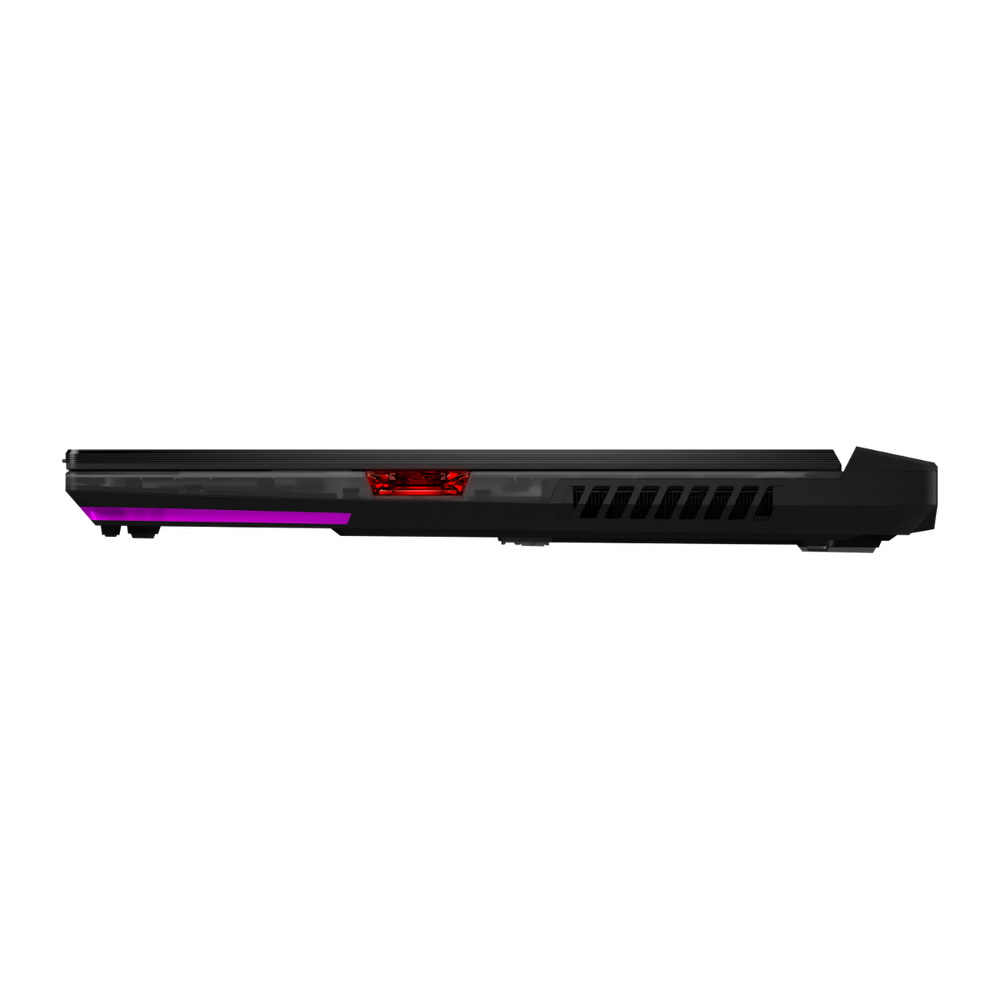
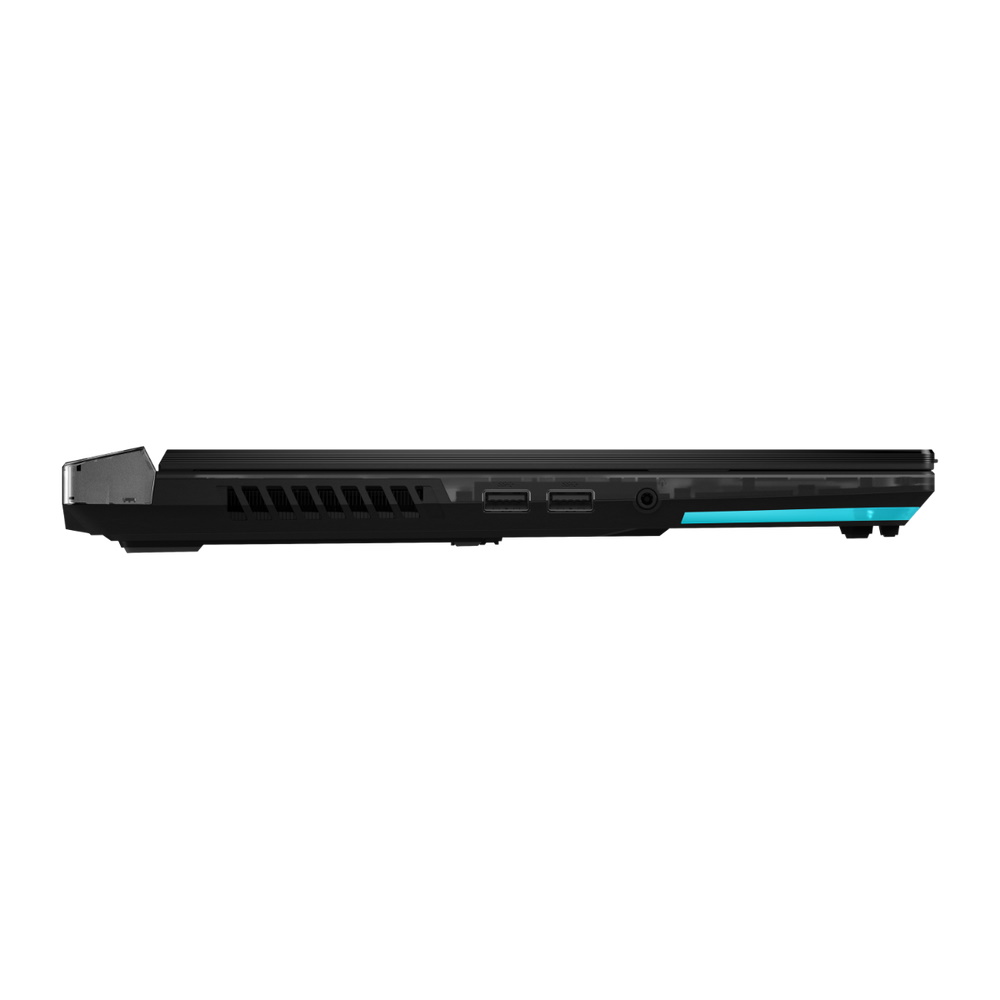
Specifications - Thunderbolt 4, Keystone, but no Webcam
The Strix is equipped with two USB-C ports, one of which supports Thunderbolt 4 and the other is capable of USB 3.2 Gen 2 speeds; both offer DisplayPort functionality. This shows that the laptop has fairly modern features. The I/Os are well distributed across the left side and rear of the device.
The right side only features a Keystone slot. The Keystone is sort of like a small storage device and switch in one. For instance, it can be used to store settings and transfer them to laptops that support this feature (a list of compatible models is provided by Asus). It can also function as a security key on the Strix Scar: once configured, the laptop will only turn on with the Keystone inserted. Another application is enabling quick access to programs. Users can instruct the laptop to automatically open a certain program, such as a game, when the Keystone is plugged in. The laptop can also be programmed to perform a combination of actions, such as switching to high-performance fan mode and launching Cyberpunk simultaneously. The choice is in the user’s hands.
However, one thing is missing on the Asus device – a webcam. This makes the Scar Strix one of the few (gaming) laptops without a webcam.


Connectivity
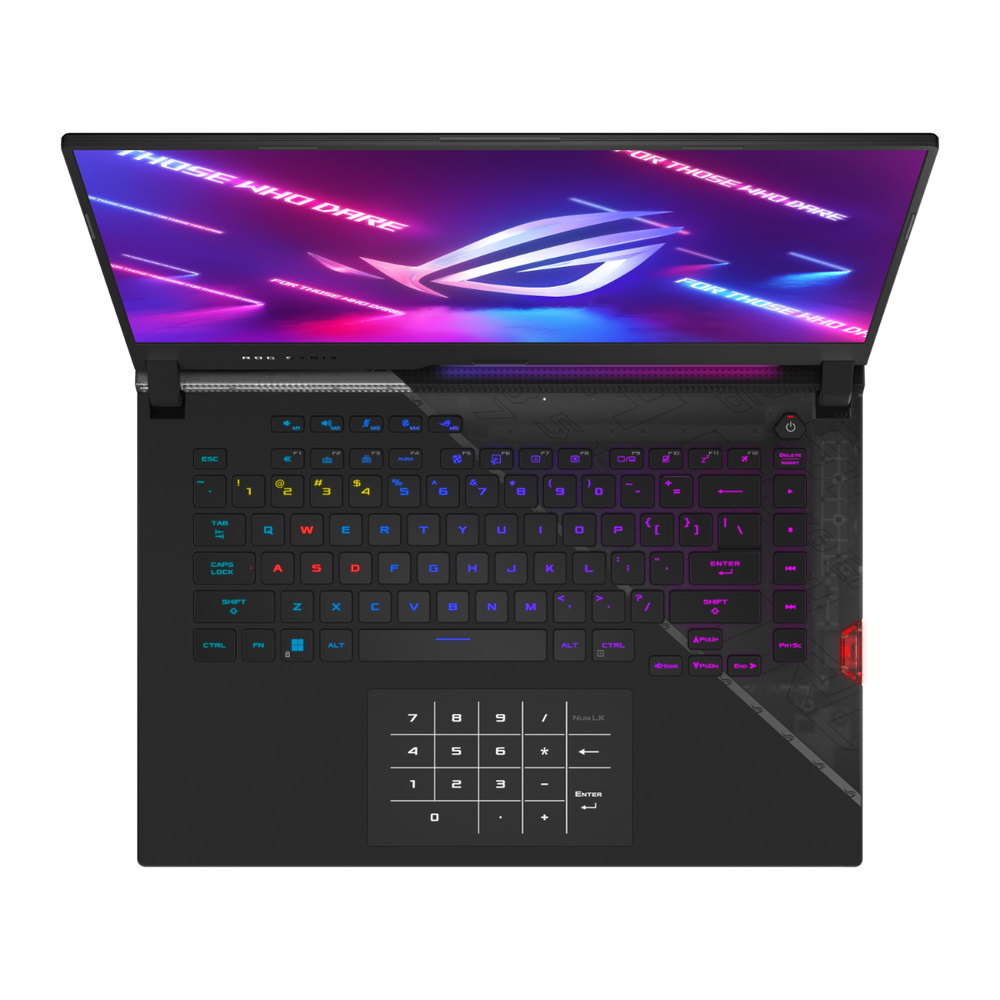
Input devices - Touchpad button can get slightly stuck
Touchpad
The huge touchpad has a neat trick up its sleeve: it can display a numeric keypad. That said, the integrated buttons on our review unit can sometimes get slightly stuck especially the left button, which we found highly annoying.

Display - QHD with 240Hz and Dolby Vision Atmos


The QHD IPS display (2,560 x 1,440 pixels) made by BOE boasts fairly fast response times, a high refresh rate of 240Hz and excellent colour coverage, capable of reproducing almost the entire sRGB and AdobeRGB gamuts.
The panel has an average peak brightness of 300 nits and a pretty good brightness distribution of 89%. However, its black level and contrast are rather average.
The laptop doesn’t use PWM for adjusting brightness, and there is only a miniscule amount of screen bleeding.
| |||||||||||||||||||||||||
Brightness Distribution: 89 %
Center on Battery: 357 cd/m²
Contrast: 1026:1 (Black: 0.34 cd/m²)
ΔE ColorChecker Calman: 3.44 | ∀{0.5-29.43 Ø4.73}
calibrated: 2.43
ΔE Greyscale Calman: 3.34 | ∀{0.09-98 Ø4.97}
84.1% AdobeRGB 1998 (Argyll 3D)
99.6% sRGB (Argyll 3D)
95% Display P3 (Argyll 3D)
Gamma: 2.5
CCT: 6641 K
| Asus ROG Strix Scar 15 G533zm BOE CQ NE156QHM-NZ2 (BOE0A55), IPS, 2560x1440, 15.6" | Asus ROG Strix Scar 15 G533ZW-LN106WS BOE CQ NE156QHM-NZ2, IPS-level, 2560x1440, 15.6" | Asus TUF Gaming F15 FX507ZM TL156VDXP0101, IPS, 1920x1080, 15.6" | MSI Pulse GL66 12UEK AU Optronics B156HAN08.4 (AUOAF90), IPS, 1920x1080, 15.6" | Alienware m15 R5 Ryzen Edition B156HAN, IPS, 1920x1080, 15.6" | Lenovo Legion 5 15ACH6A-82NW0010GE LGD06A5, IPS, 1920x1080, 15.6" | |
|---|---|---|---|---|---|---|
| Display | 0% | -17% | -51% | -13% | ||
| Display P3 Coverage (%) | 95 | 96.2 1% | 66.4 -30% | 39 -59% | 71.1 -25% | |
| sRGB Coverage (%) | 99.6 | 99.9 0% | 97 -3% | 58.4 -41% | 99.1 -1% | |
| AdobeRGB 1998 Coverage (%) | 84.1 | 84.5 0% | 68.5 -19% | 40.3 -52% | 72.3 -14% | |
| Response Times | 14% | -3% | -333% | 30% | -45% | |
| Response Time Grey 50% / Grey 80% * (ms) | 6.4 ? | 7.86 ? -23% 4.21 ? 34% | 5.6 ? 13% | 38.8 ? -506% | 4 ? 37% | 15 ? -134% |
| Response Time Black / White * (ms) | 10.8 ? | 7.5 ? 31% | 12.8 ? -19% | 28 ? -159% | 8.4 ? 22% | 6 ? 44% |
| PWM Frequency (Hz) | ||||||
| Screen | -14% | 23% | 15% | 14% | 2% | |
| Brightness middle (cd/m²) | 349 | 346 -1% | 353.7 1% | 248 -29% | 329 -6% | 371 6% |
| Brightness (cd/m²) | 333 | 329 -1% | 340 2% | 245 -26% | 321 -4% | 328 -2% |
| Brightness Distribution (%) | 89 | 91 2% | 89 0% | 86 -3% | 92 3% | 85 -4% |
| Black Level * (cd/m²) | 0.34 | 0.59 -74% | 0.34 -0% | 0.13 62% | 0.27 21% | 0.32 6% |
| Contrast (:1) | 1026 | 586 -43% | 1040 1% | 1908 86% | 1219 19% | 1159 13% |
| Colorchecker dE 2000 * | 3.44 | 3.06 11% | 1.74 49% | 3.14 9% | 2.78 19% | 3.25 6% |
| Colorchecker dE 2000 max. * | 5.78 | 5.81 -1% | 3.63 37% | 5.82 -1% | 4.88 16% | 6.33 -10% |
| Colorchecker dE 2000 calibrated * | 2.43 | 2.57 -6% | 0.5 79% | 3.14 -29% | 1.63 33% | 1.11 54% |
| Greyscale dE 2000 * | 3.34 | 2.1 37% | 1.2 64% | 2.5 25% | 4.94 -48% | |
| Gamma | 2.5 88% | 2.12 104% | 2.3 96% | 2.49 88% | 2.106 104% | 2.45 90% |
| CCT | 6641 98% | 7021 93% | 6257 104% | 6468 100% | 6201 105% | 6064 107% |
| Color Space (Percent of AdobeRGB 1998) (%) | 76 | |||||
| Color Space (Percent of sRGB) (%) | 99 | |||||
| Total Average (Program / Settings) | 0% /
-5% | 1% /
11% | -123% /
-49% | 22% /
17% | -19% /
-8% |
* ... smaller is better
Using Portrait Displays’ Calman color calibration tool, we measured normal to moderate colour differences right out of the box, with the display having a more orangey tint. Through our calibration, we managed to reduce the colour differences substantially.


Display Response Times
| ↔ Response Time Black to White | ||
|---|---|---|
| 10.8 ms ... rise ↗ and fall ↘ combined | ↗ 5.7 ms rise | 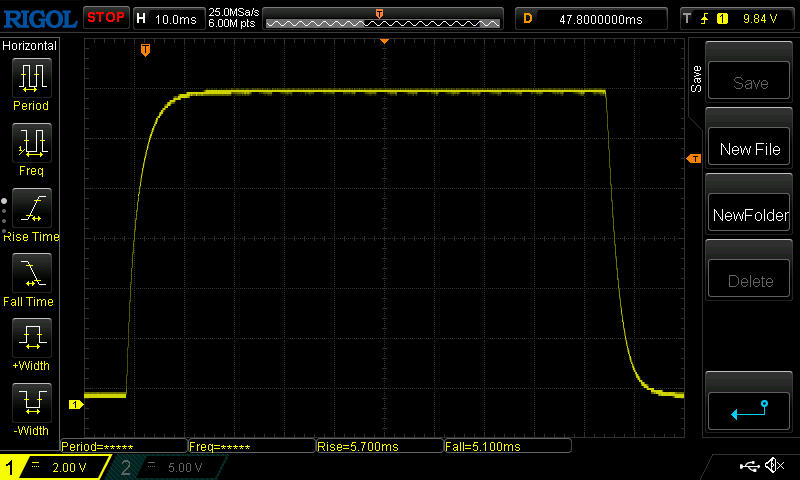 |
| ↘ 5.1 ms fall | ||
| The screen shows good response rates in our tests, but may be too slow for competitive gamers. In comparison, all tested devices range from 0.1 (minimum) to 240 (maximum) ms. » 29 % of all devices are better. This means that the measured response time is better than the average of all tested devices (19.9 ms). | ||
| ↔ Response Time 50% Grey to 80% Grey | ||
| 6.4 ms ... rise ↗ and fall ↘ combined | ↗ 3 ms rise |  |
| ↘ 3.4 ms fall | ||
| The screen shows very fast response rates in our tests and should be very well suited for fast-paced gaming. In comparison, all tested devices range from 0.165 (minimum) to 636 (maximum) ms. » 19 % of all devices are better. This means that the measured response time is better than the average of all tested devices (31.1 ms). | ||
Screen Flickering / PWM (Pulse-Width Modulation)
| Screen flickering / PWM not detected |  | ||
In comparison: 52 % of all tested devices do not use PWM to dim the display. If PWM was detected, an average of 7791 (minimum: 5 - maximum: 343500) Hz was measured. | |||
Thanks to the display’s matt surface and solid brightness levels, screen contents remain readable in the shade outdoors. However, you should ideally avoid direct sunlight and try to view the display head-on.


The viewing angle is pretty good, which is typical for an IPS panel. Colour distortion and brightness roll-off only become noticeable when the display is viewed from an extreme angle.

Performance - Good gaming performance with a 140W RTX 3060
The Core i9-12900H is amongst the best in its hardware class. Although the RTX 3060 should be capable of handling all games at FHD, it may struggle with highly demanding games at the display’s native QHD resolution. Asus has also included high-speed DDR5 RAM. Overall, the Strix Scar is an upper mid-range gaming laptop that some photo and video editors may find appealing as well.


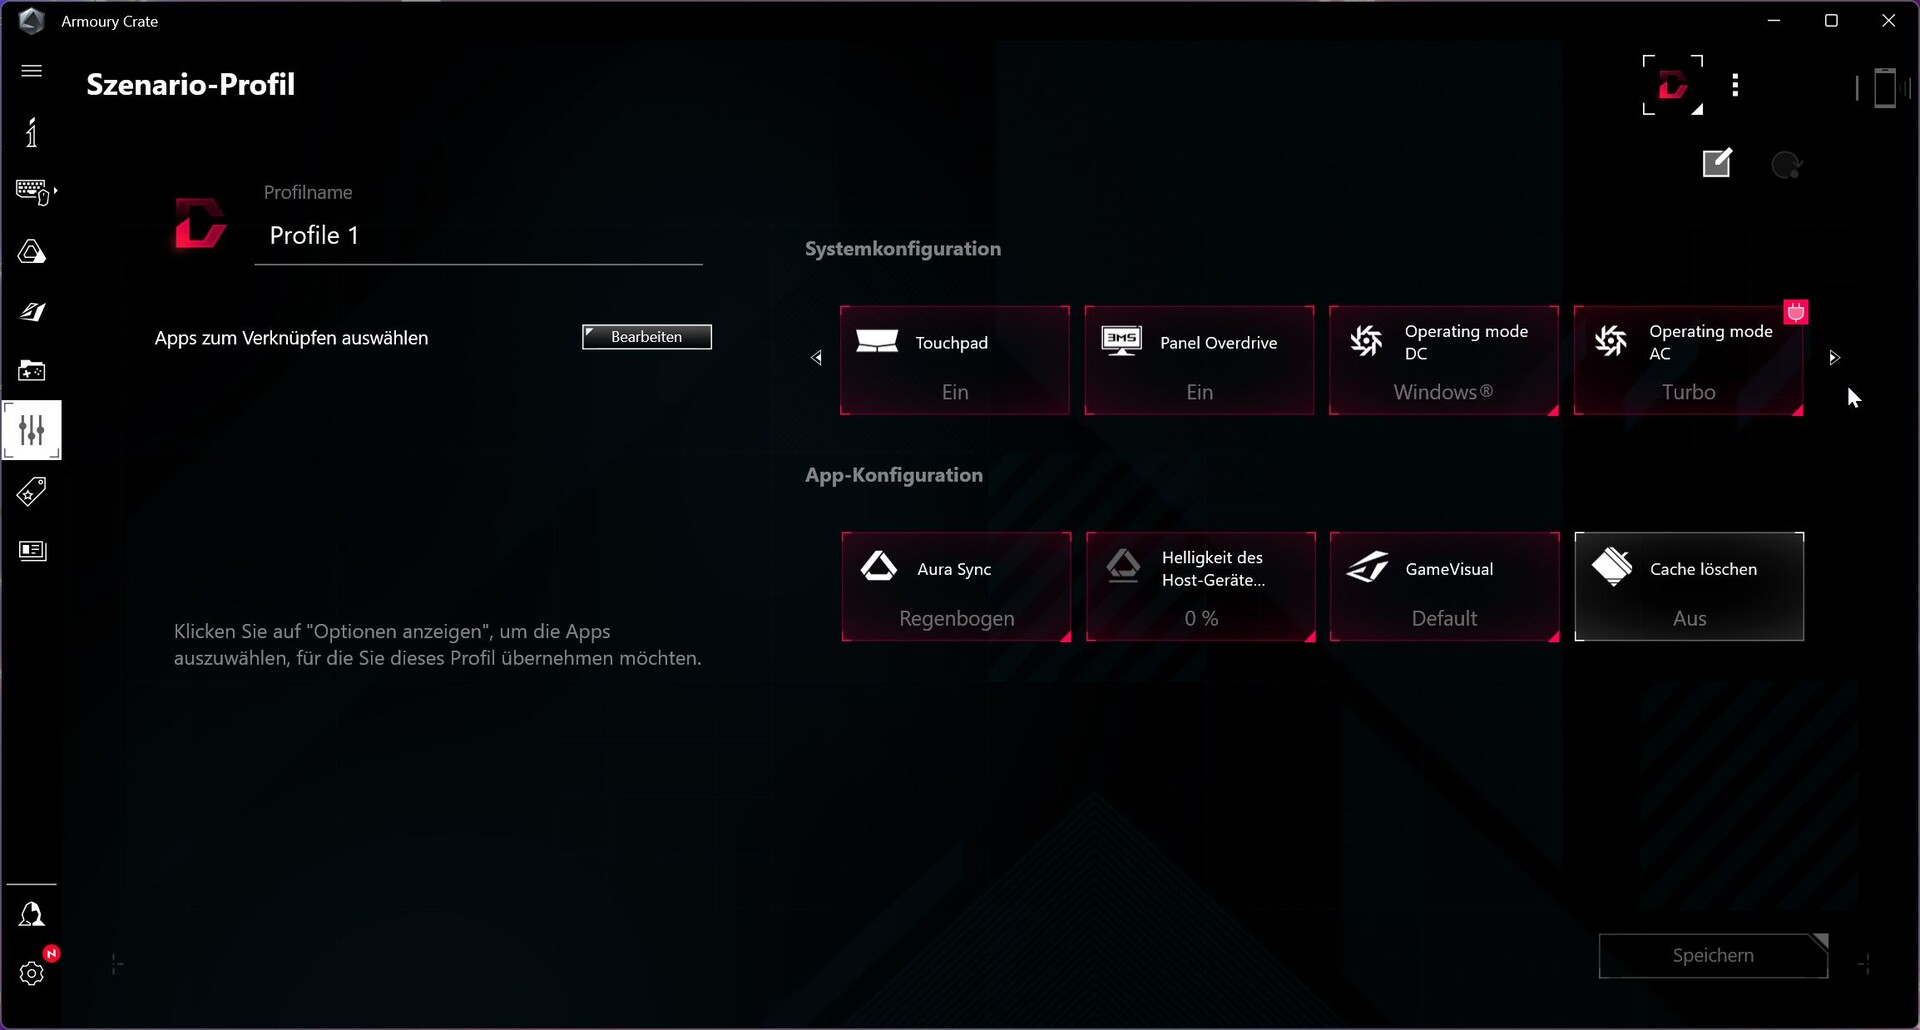
Test conditions
In our opinion, Asus has gone overboard with their software. Asus gaming notebooks ship with the Armoury Crate software on top of the MyASUS program, which is also preinstalled on their regular laptops. Armoury Crate allows you to adjust fan and performance profiles, and we used Turbo mode to achieve the best possible benchmark results in our testing. On the other hand, MyASUS includes settings for the battery’s charging behaviour, Wi-Fi options, and ways to contact customer support. It might be beneficial for Asus to consider combining the two programs to avoid unnecessarily software bloat for their customers.


Processor
Asus has opted to equip most of the models with the high-end Intel Core i9-12900H, which features 6 Performance (P) and 8 Efficiency (E) cores, capable of handling 20 threads simultaneously. Each P-core can run at up to 5 GHz. Both the Strix G533zm and G533zw are available with the slightly less powerful i7-12700H.
In our Cinebench R15 loop test, the CPU delivered great performance as expected, surpassing both the i7-12700H in the Asus TUF Gaming F15 and previous-gen Ryzen chips. It only fell behind reproducibly in Cinebench R20.
Switching to battery power caused the Cinebench R15 score to drop to 1,752.
Cinebench R15 Multi sustained load
Cinebench R23: Multi Core | Single Core
Cinebench R20: CPU (Multi Core) | CPU (Single Core)
Cinebench R15: CPU Multi 64Bit | CPU Single 64Bit
Blender: v2.79 BMW27 CPU
7-Zip 18.03: 7z b 4 | 7z b 4 -mmt1
Geekbench 5.5: Multi-Core | Single-Core
HWBOT x265 Benchmark v2.2: 4k Preset
LibreOffice : 20 Documents To PDF
R Benchmark 2.5: Overall mean
| CPU Performance rating | |
| Average of class Gaming | |
| Asus ROG Strix Scar 15 G533ZW-LN106WS | |
| Asus ROG Strix Scar 15 G533zm | |
| MSI Pulse GL66 12UEK | |
| Asus TUF Gaming F15 FX507ZM | |
| Average Intel Core i9-12900H | |
| Alienware m15 R5 Ryzen Edition | |
| Lenovo Legion 5 15ACH6A-82NW0010GE | |
| Cinebench R23 / Multi Core | |
| Average of class Gaming (10488 - 40970, n=110, last 2 years) | |
| Asus ROG Strix Scar 15 G533ZW-LN106WS | |
| Asus TUF Gaming F15 FX507ZM | |
| MSI Pulse GL66 12UEK | |
| Asus ROG Strix Scar 15 G533zm | |
| Average Intel Core i9-12900H (7359 - 19648, n=28) | |
| Alienware m15 R5 Ryzen Edition | |
| Lenovo Legion 5 15ACH6A-82NW0010GE | |
| Cinebench R23 / Single Core | |
| Average of class Gaming (1166 - 2356, n=110, last 2 years) | |
| Asus ROG Strix Scar 15 G533ZW-LN106WS | |
| MSI Pulse GL66 12UEK | |
| Average Intel Core i9-12900H (1634 - 1930, n=28) | |
| Asus ROG Strix Scar 15 G533zm | |
| Asus TUF Gaming F15 FX507ZM | |
| Alienware m15 R5 Ryzen Edition | |
| Lenovo Legion 5 15ACH6A-82NW0010GE | |
| Cinebench R20 / CPU (Multi Core) | |
| Average of class Gaming (4029 - 16108, n=109, last 2 years) | |
| Asus ROG Strix Scar 15 G533ZW-LN106WS | |
| Asus TUF Gaming F15 FX507ZM | |
| MSI Pulse GL66 12UEK | |
| Average Intel Core i9-12900H (2681 - 7471, n=28) | |
| Asus ROG Strix Scar 15 G533zm | |
| Alienware m15 R5 Ryzen Edition | |
| Lenovo Legion 5 15ACH6A-82NW0010GE | |
| Cinebench R20 / CPU (Single Core) | |
| Average of class Gaming (442 - 895, n=109, last 2 years) | |
| MSI Pulse GL66 12UEK | |
| Asus ROG Strix Scar 15 G533zm | |
| Asus ROG Strix Scar 15 G533ZW-LN106WS | |
| Average Intel Core i9-12900H (624 - 738, n=28) | |
| Asus TUF Gaming F15 FX507ZM | |
| Alienware m15 R5 Ryzen Edition | |
| Lenovo Legion 5 15ACH6A-82NW0010GE | |
| Cinebench R15 / CPU Multi 64Bit | |
| Average of class Gaming (1578 - 6271, n=109, last 2 years) | |
| Asus ROG Strix Scar 15 G533zm | |
| Asus ROG Strix Scar 15 G533ZW-LN106WS | |
| Asus TUF Gaming F15 FX507ZM | |
| MSI Pulse GL66 12UEK | |
| Average Intel Core i9-12900H (1395 - 3077, n=28) | |
| Alienware m15 R5 Ryzen Edition | |
| Lenovo Legion 5 15ACH6A-82NW0010GE | |
| Cinebench R15 / CPU Single 64Bit | |
| Average of class Gaming (188.8 - 343, n=109, last 2 years) | |
| MSI Pulse GL66 12UEK | |
| Asus ROG Strix Scar 15 G533zm | |
| Asus ROG Strix Scar 15 G533ZW-LN106WS | |
| Average Intel Core i9-12900H (235 - 277, n=29) | |
| Asus TUF Gaming F15 FX507ZM | |
| Alienware m15 R5 Ryzen Edition | |
| Lenovo Legion 5 15ACH6A-82NW0010GE | |
| Blender / v2.79 BMW27 CPU | |
| Lenovo Legion 5 15ACH6A-82NW0010GE | |
| Alienware m15 R5 Ryzen Edition | |
| Average Intel Core i9-12900H (160 - 451, n=28) | |
| MSI Pulse GL66 12UEK | |
| Asus TUF Gaming F15 FX507ZM | |
| Asus ROG Strix Scar 15 G533ZW-LN106WS | |
| Asus ROG Strix Scar 15 G533zm | |
| Average of class Gaming (80 - 330, n=107, last 2 years) | |
| 7-Zip 18.03 / 7z b 4 | |
| Average of class Gaming (33491 - 148086, n=108, last 2 years) | |
| Asus ROG Strix Scar 15 G533zm | |
| Asus ROG Strix Scar 15 G533ZW-LN106WS | |
| Asus TUF Gaming F15 FX507ZM | |
| MSI Pulse GL66 12UEK | |
| Average Intel Core i9-12900H (34684 - 76677, n=28) | |
| Alienware m15 R5 Ryzen Edition | |
| Lenovo Legion 5 15ACH6A-82NW0010GE | |
| 7-Zip 18.03 / 7z b 4 -mmt1 | |
| Average of class Gaming (4199 - 7436, n=108, last 2 years) | |
| MSI Pulse GL66 12UEK | |
| Asus ROG Strix Scar 15 G533zm | |
| Asus ROG Strix Scar 15 G533ZW-LN106WS | |
| Average Intel Core i9-12900H (5302 - 6289, n=28) | |
| Alienware m15 R5 Ryzen Edition | |
| Asus TUF Gaming F15 FX507ZM | |
| Lenovo Legion 5 15ACH6A-82NW0010GE | |
| Geekbench 5.5 / Multi-Core | |
| Average of class Gaming (6460 - 27010, n=108, last 2 years) | |
| Asus ROG Strix Scar 15 G533ZW-LN106WS | |
| Asus ROG Strix Scar 15 G533zm | |
| Asus TUF Gaming F15 FX507ZM | |
| Average Intel Core i9-12900H (8519 - 14376, n=31) | |
| MSI Pulse GL66 12UEK | |
| Alienware m15 R5 Ryzen Edition | |
| Lenovo Legion 5 15ACH6A-82NW0010GE | |
| Geekbench 5.5 / Single-Core | |
| Average of class Gaming (986 - 2474, n=108, last 2 years) | |
| Asus ROG Strix Scar 15 G533ZW-LN106WS | |
| MSI Pulse GL66 12UEK | |
| Asus ROG Strix Scar 15 G533zm | |
| Average Intel Core i9-12900H (1631 - 1897, n=31) | |
| Asus TUF Gaming F15 FX507ZM | |
| Alienware m15 R5 Ryzen Edition | |
| Lenovo Legion 5 15ACH6A-82NW0010GE | |
| HWBOT x265 Benchmark v2.2 / 4k Preset | |
| Average of class Gaming (11.5 - 44.3, n=108, last 2 years) | |
| Asus ROG Strix Scar 15 G533zm | |
| Asus ROG Strix Scar 15 G533ZW-LN106WS | |
| Asus TUF Gaming F15 FX507ZM | |
| MSI Pulse GL66 12UEK | |
| Average Intel Core i9-12900H (8.05 - 22.5, n=28) | |
| Alienware m15 R5 Ryzen Edition | |
| Lenovo Legion 5 15ACH6A-82NW0010GE | |
| LibreOffice / 20 Documents To PDF | |
| Alienware m15 R5 Ryzen Edition | |
| Lenovo Legion 5 15ACH6A-82NW0010GE | |
| Asus TUF Gaming F15 FX507ZM | |
| Average of class Gaming (19 - 88.8, n=108, last 2 years) | |
| Average Intel Core i9-12900H (36.8 - 59.8, n=28) | |
| MSI Pulse GL66 12UEK | |
| Asus ROG Strix Scar 15 G533zm | |
| Asus ROG Strix Scar 15 G533ZW-LN106WS | |
| R Benchmark 2.5 / Overall mean | |
| Lenovo Legion 5 15ACH6A-82NW0010GE | |
| Alienware m15 R5 Ryzen Edition | |
| Asus TUF Gaming F15 FX507ZM | |
| Average Intel Core i9-12900H (0.4218 - 0.506, n=28) | |
| Asus ROG Strix Scar 15 G533zm | |
| Asus ROG Strix Scar 15 G533ZW-LN106WS | |
| Average of class Gaming (0.3439 - 0.759, n=109, last 2 years) | |
| MSI Pulse GL66 12UEK | |
* ... smaller is better
AIDA64: FP32 Ray-Trace | FPU Julia | CPU SHA3 | CPU Queen | FPU SinJulia | FPU Mandel | CPU AES | CPU ZLib | FP64 Ray-Trace | CPU PhotoWorxx
| Performance rating | |
| Average of class Gaming | |
| Alienware m15 R5 Ryzen Edition | |
| Asus ROG Strix Scar 15 G533zm | |
| Asus ROG Strix Scar 15 G533ZW-LN106WS | |
| Average Intel Core i9-12900H | |
| MSI Pulse GL66 12UEK | |
| Asus TUF Gaming F15 FX507ZM | |
| Lenovo Legion 5 15ACH6A-82NW0010GE | |
| AIDA64 / FP32 Ray-Trace | |
| Average of class Gaming (10227 - 85542, n=107, last 2 years) | |
| Alienware m15 R5 Ryzen Edition | |
| Lenovo Legion 5 15ACH6A-82NW0010GE | |
| Average Intel Core i9-12900H (4074 - 18289, n=29) | |
| Asus ROG Strix Scar 15 G533zm | |
| Asus ROG Strix Scar 15 G533ZW-LN106WS | |
| Asus TUF Gaming F15 FX507ZM | |
| MSI Pulse GL66 12UEK | |
| AIDA64 / FPU Julia | |
| Average of class Gaming (51376 - 238426, n=107, last 2 years) | |
| Alienware m15 R5 Ryzen Edition | |
| Lenovo Legion 5 15ACH6A-82NW0010GE | |
| Average Intel Core i9-12900H (22307 - 93236, n=29) | |
| Asus ROG Strix Scar 15 G533zm | |
| Asus ROG Strix Scar 15 G533ZW-LN106WS | |
| Asus TUF Gaming F15 FX507ZM | |
| MSI Pulse GL66 12UEK | |
| AIDA64 / CPU SHA3 | |
| Average of class Gaming (2180 - 9817, n=107, last 2 years) | |
| Asus ROG Strix Scar 15 G533zm | |
| Asus ROG Strix Scar 15 G533ZW-LN106WS | |
| Asus TUF Gaming F15 FX507ZM | |
| MSI Pulse GL66 12UEK | |
| Alienware m15 R5 Ryzen Edition | |
| Average Intel Core i9-12900H (1378 - 4215, n=29) | |
| Lenovo Legion 5 15ACH6A-82NW0010GE | |
| AIDA64 / CPU Queen | |
| Average of class Gaming (49785 - 173351, n=98, last 2 years) | |
| Asus ROG Strix Scar 15 G533zm | |
| MSI Pulse GL66 12UEK | |
| Asus ROG Strix Scar 15 G533ZW-LN106WS | |
| Average Intel Core i9-12900H (78172 - 111241, n=28) | |
| Asus TUF Gaming F15 FX507ZM | |
| Alienware m15 R5 Ryzen Edition | |
| Lenovo Legion 5 15ACH6A-82NW0010GE | |
| AIDA64 / FPU SinJulia | |
| Average of class Gaming (4424 - 33636, n=107, last 2 years) | |
| Alienware m15 R5 Ryzen Edition | |
| Asus ROG Strix Scar 15 G533zm | |
| Asus ROG Strix Scar 15 G533ZW-LN106WS | |
| MSI Pulse GL66 12UEK | |
| Asus TUF Gaming F15 FX507ZM | |
| Average Intel Core i9-12900H (5709 - 10410, n=29) | |
| Lenovo Legion 5 15ACH6A-82NW0010GE | |
| AIDA64 / FPU Mandel | |
| Average of class Gaming (25115 - 128721, n=107, last 2 years) | |
| Alienware m15 R5 Ryzen Edition | |
| Lenovo Legion 5 15ACH6A-82NW0010GE | |
| Average Intel Core i9-12900H (11257 - 45581, n=29) | |
| Asus ROG Strix Scar 15 G533zm | |
| Asus TUF Gaming F15 FX507ZM | |
| Asus ROG Strix Scar 15 G533ZW-LN106WS | |
| MSI Pulse GL66 12UEK | |
| AIDA64 / CPU AES | |
| Alienware m15 R5 Ryzen Edition | |
| Asus ROG Strix Scar 15 G533zm | |
| Average of class Gaming (39258 - 247074, n=107, last 2 years) | |
| Asus ROG Strix Scar 15 G533ZW-LN106WS | |
| MSI Pulse GL66 12UEK | |
| Lenovo Legion 5 15ACH6A-82NW0010GE | |
| Average Intel Core i9-12900H (31935 - 151546, n=29) | |
| Asus TUF Gaming F15 FX507ZM | |
| AIDA64 / CPU ZLib | |
| Average of class Gaming (574 - 2531, n=107, last 2 years) | |
| Asus ROG Strix Scar 15 G533ZW-LN106WS | |
| Asus ROG Strix Scar 15 G533zm | |
| Asus TUF Gaming F15 FX507ZM | |
| MSI Pulse GL66 12UEK | |
| Average Intel Core i9-12900H (449 - 1193, n=29) | |
| Alienware m15 R5 Ryzen Edition | |
| Lenovo Legion 5 15ACH6A-82NW0010GE | |
| AIDA64 / FP64 Ray-Trace | |
| Average of class Gaming (5509 - 45446, n=107, last 2 years) | |
| Alienware m15 R5 Ryzen Edition | |
| Lenovo Legion 5 15ACH6A-82NW0010GE | |
| Average Intel Core i9-12900H (2235 - 10511, n=29) | |
| Asus ROG Strix Scar 15 G533zm | |
| Asus ROG Strix Scar 15 G533ZW-LN106WS | |
| Asus TUF Gaming F15 FX507ZM | |
| MSI Pulse GL66 12UEK | |
| AIDA64 / CPU PhotoWorxx | |
| Average of class Gaming (12271 - 89891, n=107, last 2 years) | |
| Asus ROG Strix Scar 15 G533ZW-LN106WS | |
| Average Intel Core i9-12900H (20960 - 48269, n=30) | |
| Asus ROG Strix Scar 15 G533zm | |
| Asus TUF Gaming F15 FX507ZM | |
| MSI Pulse GL66 12UEK | |
| Lenovo Legion 5 15ACH6A-82NW0010GE | |
| Alienware m15 R5 Ryzen Edition | |
System performance
The Asus Strix mostly took the top spot in PCMark 10 and delivered slightly better performance than what the same CPU/GPU combination offers on average, based on our database.

CrossMark: Overall | Productivity | Creativity | Responsiveness
| PCMark 10 / Score | |
| Average of class Gaming (5828 - 11574, n=94, last 2 years) | |
| Asus ROG Strix Scar 15 G533ZW-LN106WS | |
| Asus ROG Strix Scar 15 G533zm | |
| Average Intel Core i9-12900H, NVIDIA GeForce RTX 3060 Laptop GPU (7135 - 7861, n=4) | |
| Asus TUF Gaming F15 FX507ZM | |
| MSI Pulse GL66 12UEK | |
| Lenovo Legion 5 15ACH6A-82NW0010GE | |
| Alienware m15 R5 Ryzen Edition | |
| PCMark 10 / Essentials | |
| Asus ROG Strix Scar 15 G533zm | |
| Average Intel Core i9-12900H, NVIDIA GeForce RTX 3060 Laptop GPU (10380 - 11198, n=4) | |
| Asus ROG Strix Scar 15 G533ZW-LN106WS | |
| Average of class Gaming (8810 - 12600, n=98, last 2 years) | |
| Lenovo Legion 5 15ACH6A-82NW0010GE | |
| Asus TUF Gaming F15 FX507ZM | |
| MSI Pulse GL66 12UEK | |
| Alienware m15 R5 Ryzen Edition | |
| PCMark 10 / Productivity | |
| Average of class Gaming (6845 - 18766, n=96, last 2 years) | |
| Asus ROG Strix Scar 15 G533zm | |
| Asus ROG Strix Scar 15 G533ZW-LN106WS | |
| Average Intel Core i9-12900H, NVIDIA GeForce RTX 3060 Laptop GPU (9751 - 10486, n=4) | |
| MSI Pulse GL66 12UEK | |
| Lenovo Legion 5 15ACH6A-82NW0010GE | |
| Asus TUF Gaming F15 FX507ZM | |
| Alienware m15 R5 Ryzen Edition | |
| PCMark 10 / Digital Content Creation | |
| Average of class Gaming (7602 - 19657, n=96, last 2 years) | |
| Asus ROG Strix Scar 15 G533ZW-LN106WS | |
| Asus TUF Gaming F15 FX507ZM | |
| Asus ROG Strix Scar 15 G533zm | |
| Average Intel Core i9-12900H, NVIDIA GeForce RTX 3060 Laptop GPU (9741 - 11226, n=4) | |
| Lenovo Legion 5 15ACH6A-82NW0010GE | |
| MSI Pulse GL66 12UEK | |
| Alienware m15 R5 Ryzen Edition | |
| CrossMark / Overall | |
| MSI Pulse GL66 12UEK | |
| Asus ROG Strix Scar 15 G533ZW-LN106WS | |
| Asus ROG Strix Scar 15 G533zm | |
| Average of class Gaming (1366 - 2409, n=96, last 2 years) | |
| Average Intel Core i9-12900H, NVIDIA GeForce RTX 3060 Laptop GPU (1789 - 2096, n=4) | |
| CrossMark / Productivity | |
| MSI Pulse GL66 12UEK | |
| Asus ROG Strix Scar 15 G533ZW-LN106WS | |
| Asus ROG Strix Scar 15 G533zm | |
| Average Intel Core i9-12900H, NVIDIA GeForce RTX 3060 Laptop GPU (1677 - 2062, n=4) | |
| Average of class Gaming (1386 - 2254, n=96, last 2 years) | |
| CrossMark / Creativity | |
| Average of class Gaming (1343 - 2729, n=96, last 2 years) | |
| Asus ROG Strix Scar 15 G533zm | |
| Asus ROG Strix Scar 15 G533ZW-LN106WS | |
| Average Intel Core i9-12900H, NVIDIA GeForce RTX 3060 Laptop GPU (2032 - 2125, n=4) | |
| MSI Pulse GL66 12UEK | |
| CrossMark / Responsiveness | |
| MSI Pulse GL66 12UEK | |
| Asus ROG Strix Scar 15 G533ZW-LN106WS | |
| Asus ROG Strix Scar 15 G533zm | |
| Average Intel Core i9-12900H, NVIDIA GeForce RTX 3060 Laptop GPU (1486 - 2230, n=4) | |
| Average of class Gaming (1226 - 2334, n=96, last 2 years) | |
| PCMark 10 Score | 7861 points | |
Help | ||
| AIDA64 / Memory Copy | |
| Average of class Gaming (21750 - 129946, n=107, last 2 years) | |
| Asus ROG Strix Scar 15 G533ZW-LN106WS | |
| Average Intel Core i9-12900H (34438 - 74264, n=29) | |
| Asus TUF Gaming F15 FX507ZM | |
| Asus ROG Strix Scar 15 G533zm | |
| MSI Pulse GL66 12UEK | |
| Alienware m15 R5 Ryzen Edition | |
| Lenovo Legion 5 15ACH6A-82NW0010GE | |
| AIDA64 / Memory Read | |
| Average of class Gaming (22956 - 118858, n=107, last 2 years) | |
| Asus ROG Strix Scar 15 G533ZW-LN106WS | |
| Average Intel Core i9-12900H (36365 - 74642, n=29) | |
| Asus TUF Gaming F15 FX507ZM | |
| Asus ROG Strix Scar 15 G533zm | |
| MSI Pulse GL66 12UEK | |
| Alienware m15 R5 Ryzen Edition | |
| Lenovo Legion 5 15ACH6A-82NW0010GE | |
| AIDA64 / Memory Write | |
| Average of class Gaming (22297 - 135096, n=107, last 2 years) | |
| Asus ROG Strix Scar 15 G533ZW-LN106WS | |
| Average Intel Core i9-12900H (32276 - 67858, n=29) | |
| Asus ROG Strix Scar 15 G533zm | |
| Asus TUF Gaming F15 FX507ZM | |
| MSI Pulse GL66 12UEK | |
| Alienware m15 R5 Ryzen Edition | |
| Lenovo Legion 5 15ACH6A-82NW0010GE | |
| AIDA64 / Memory Latency | |
| Average of class Gaming (75.3 - 259, n=107, last 2 years) | |
| Asus ROG Strix Scar 15 G533zm | |
| Asus ROG Strix Scar 15 G533ZW-LN106WS | |
| MSI Pulse GL66 12UEK | |
| Lenovo Legion 5 15ACH6A-82NW0010GE | |
| Average Intel Core i9-12900H (74.7 - 118.1, n=28) | |
| Alienware m15 R5 Ryzen Edition | |
| Asus TUF Gaming F15 FX507ZM | |
* ... smaller is better
DPC latency
LatencyMon immediately reported issues once a browser was launched. Opening several tabs worsened the problems. Latency values increased further during playback of our YouTube test video at 4K and 60 fps. However, the video ran without any dropped frames.
| DPC Latencies / LatencyMon - interrupt to process latency (max), Web, Youtube, Prime95 | |
| Asus ROG Strix Scar 15 G533zm | |
| MSI Pulse GL66 12UEK | |
| Asus ROG Strix Scar 15 G533ZW-LN106WS | |
| Lenovo Legion 5 15ACH6A-82NW0010GE | |
| Asus TUF Gaming F15 FX507ZM | |
| Alienware m15 R5 Ryzen Edition | |
* ... smaller is better
Mass storage

Asus has fitted a fairly new 1TB PCIe 4.0 NVMe SSD made by Micron. Despite providing excellent transfer rates, the drive didn’t fully exploit the speeds offered by the relatively new standard. That said, it mostly delivered the best performance compared with the storage drives in competing laptops. Its performance is also superb under sustained load.

* ... smaller is better
Sustained load Read: DiskSpd Read Loop, Queue Depth 8
Graphics card
The Nividia GeForce RTX 3060 occupies the space between the mid-range and the high-end. Its TGP can range from 60 to 115 watts, and the power configuration has a lasting impact on the card’s 3D performance. The RTX 3060 in the Strix Scar has access to the full 115 watts and can go up to 140 watts with a 25-watt Dynamic Boost.
In synthetic 3D benchmarks, the GPU’s performed slightly better than an average RTX 3060 from our database, but the Lenovo Legion 5 and the Asus TUF Gaming F15 are marginally faster than the Strix Scar. The RTX 3070 Ti in the Scar 15 G533zw is roughly 35% more powerful.
On battery power, the laptop’s 3D performance plummeted by around 67% in a new Fire Strike test run, resulting in a graphics score of just 7,168 rather than the usual 21,671.


| 3DMark 11 Performance | 27156 points | |
| 3DMark Fire Strike Score | 19296 points | |
| 3DMark Time Spy Score | 8606 points | |
Help | ||
Gaming performance
Unfortunately, Optimus limits the Strix to running DirectX 11 games at just 60 fps. This is a general problem affecting some laptops with Optimus. Other than playing these games on an external monitor, the only workaround is to enable the MUX switch and use the dGPU directly.
The Strix 15 mostly offers the best performance amongst the devices in our comparison. Only the TUF Gaming F15 is marginally faster in some games.
Unplugging the Strix caused frame rates to stabilised at 30 fps in Witcher 3 running at Ultra, and the fans remained pleasantly quiet the entire time.
Witcher 3 ran quite stably throughout the one-hour test period, with only a slight decrease in frame rate.
Witcher 3 FPS chart
| low | med. | high | ultra | QHD | |
|---|---|---|---|---|---|
| GTA V (2015) | 186.2 | 181.6 | 166.9 | 105 | 80.5 |
| The Witcher 3 (2015) | 400 | 290 | 165 | 88.7 | |
| Dota 2 Reborn (2015) | 182.6 | 167.7 | 159.1 | 151.4 | |
| Final Fantasy XV Benchmark (2018) | 178.9 | 117.2 | 87.5 | 65.1 | |
| X-Plane 11.11 (2018) | 145.8 | 123.9 | 99.8 | ||
| Far Cry 5 (2018) | 160 | 129 | 123 | 117 | 92 |
| Strange Brigade (2018) | 398 | 216 | 176.4 | 153 | |
| Cyberpunk 2077 1.6 (2022) | 120 | 118 | 63 | 63 |
Emissions - Cool, but no necessarily quiet
Noise emissions
In Turbo mode, the fans inside regularly spin up quite loudly for a few seconds before returning to idle. Asus may want to consider making the cooling system less aggressive in a future update. That said, the fans are usually not spinning in Silent mode.
The Asus Strix Scar isn’t necessarily quiet under load. During gaming and the stress test, the Asus TUF and MSI Pulse were similarly loud, whilst the Lenovo Legion and Alienware remained quieter.
When starting certain loads (e.g. Witcher 3), we also noticed soft electronic beeping noises beeping coming from the device, but they were only present temporarily.
Noise level
| Idle |
| 23 / 23 / 37.75 dB(A) |
| Load |
| 45.35 / 56.22 dB(A) |
 | ||
30 dB silent 40 dB(A) audible 50 dB(A) loud |
||
min: | ||
| Asus ROG Strix Scar 15 G533zm GeForce RTX 3060 Laptop GPU, i9-12900H | Asus ROG Strix Scar 15 G533ZW-LN106WS GeForce RTX 3070 Ti Laptop GPU, i9-12900H, Samsung PM9A1 MZVL22T0HBLB | Asus TUF Gaming F15 FX507ZM GeForce RTX 3060 Laptop GPU, i7-12700H, SK Hynix HFM001TD3JX013N | MSI Pulse GL66 12UEK GeForce RTX 3060 Laptop GPU, i9-12900H, Micron 2450 512GB MTFDKBA512TFK | Alienware m15 R5 Ryzen Edition GeForce RTX 3060 Laptop GPU, R7 5800H, Toshiba KBG40ZNS512G NVMe | Lenovo Legion 5 15ACH6A-82NW0010GE Radeon RX 6600M, R5 5600H, Micron 2210 MTFDHBA512QFD | |
|---|---|---|---|---|---|---|
| Noise | -26% | 6% | 0% | 2% | -4% | |
| off / environment * (dB) | 23 | 26.86 -17% | 23.2 -1% | 23 -0% | 24 -4% | 25 -9% |
| Idle Minimum * (dB) | 23 | 39.07 -70% | 23.6 -3% | 23 -0% | 24 -4% | 25 -9% |
| Idle Average * (dB) | 23 | 39.07 -70% | 23.6 -3% | 27 -17% | 25 -9% | 25 -9% |
| Idle Maximum * (dB) | 37.75 | 39.07 -3% | 25.4 33% | 27 28% | 35 7% | 34.5 9% |
| Load Average * (dB) | 45.35 | 53.34 -18% | 38 16% | 48.2 -6% | 44 3% | 51.1 -13% |
| Witcher 3 ultra * (dB) | 55.48 | 56.6 -2% | 54.1 2% | 56.9 -3% | 48 13% | |
| Load Maximum * (dB) | 56.22 | 56.6 -1% | 57.2 -2% | 56.94 -1% | 50 11% | 51.3 9% |
* ... smaller is better
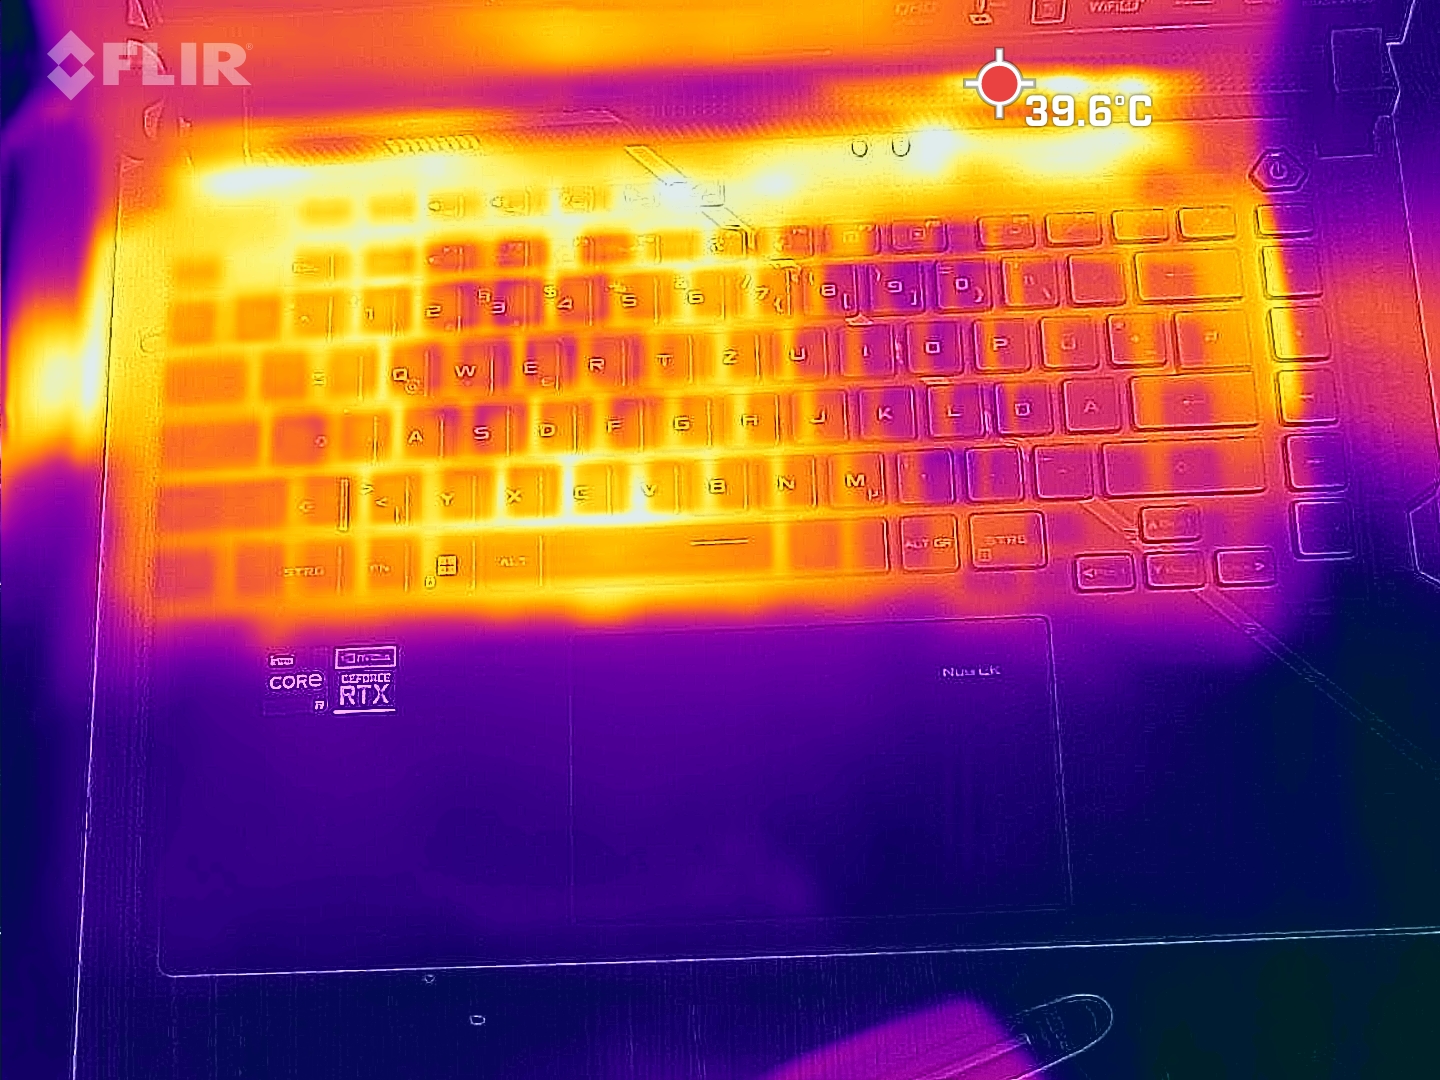
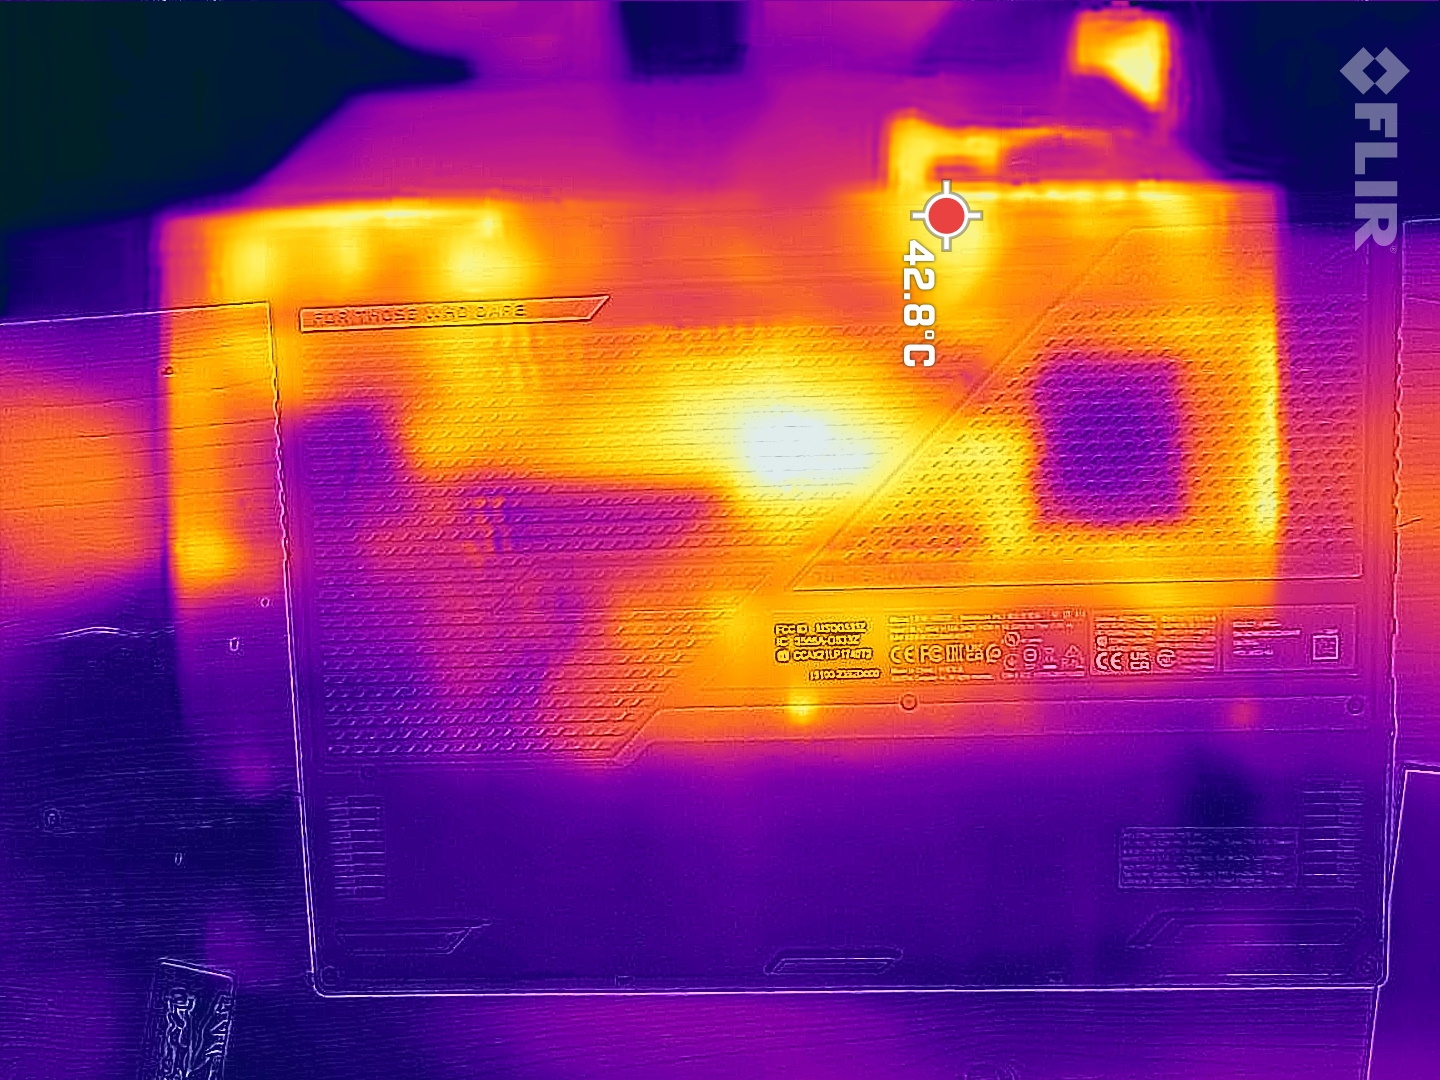
Temperature
The Asus gaming laptop is able to stay relatively cool both at idle and under load. For instance, the Alienware runs much hotter despite its protruding cooling system. The Strix Scar has an audibly more aggressive fan curve, helping surface temperatures to remain at a reasonable level.
(±) The maximum temperature on the upper side is 43 °C / 109 F, compared to the average of 40.4 °C / 105 F, ranging from 21.2 to 68.8 °C for the class Gaming.
(-) The bottom heats up to a maximum of 47 °C / 117 F, compared to the average of 43.2 °C / 110 F
(+) In idle usage, the average temperature for the upper side is 29.2 °C / 85 F, compared to the device average of 33.9 °C / 93 F.
(±) Playing The Witcher 3, the average temperature for the upper side is 32.9 °C / 91 F, compared to the device average of 33.9 °C / 93 F.
(+) The palmrests and touchpad are cooler than skin temperature with a maximum of 25 °C / 77 F and are therefore cool to the touch.
(+) The average temperature of the palmrest area of similar devices was 28.8 °C / 83.8 F (+3.8 °C / 6.8 F).

| Asus ROG Strix Scar 15 G533zm Intel Core i9-12900H, NVIDIA GeForce RTX 3060 Laptop GPU | Asus ROG Strix Scar 15 G533ZW-LN106WS Intel Core i9-12900H, NVIDIA GeForce RTX 3070 Ti Laptop GPU | Asus TUF Gaming F15 FX507ZM Intel Core i7-12700H, NVIDIA GeForce RTX 3060 Laptop GPU | MSI Pulse GL66 12UEK Intel Core i9-12900H, NVIDIA GeForce RTX 3060 Laptop GPU | Alienware m15 R5 Ryzen Edition AMD Ryzen 7 5800H, NVIDIA GeForce RTX 3060 Laptop GPU | Lenovo Legion 5 15ACH6A-82NW0010GE AMD Ryzen 5 5600H, AMD Radeon RX 6600M | |
|---|---|---|---|---|---|---|
| Heat | -10% | -11% | -11% | -22% | 3% | |
| Maximum Upper Side * (°C) | 43 | 42.6 1% | 44.4 -3% | 50 -16% | 62 -44% | 39.9 7% |
| Maximum Bottom * (°C) | 47 | 50.2 -7% | 48.8 -4% | 47 -0% | 61 -30% | 43.8 7% |
| Idle Upper Side * (°C) | 32 | 36.2 -13% | 37.8 -18% | 36 -13% | 36 -13% | 34.1 -7% |
| Idle Bottom * (°C) | 33 | 40.2 -22% | 39.6 -20% | 38 -15% | 33 -0% | 31.7 4% |
* ... smaller is better
Stress test
During the stress test, TDP reached around 95 watts for a few seconds before falling to the nominal 45 watts. At the same time, the CPU’s clock speed dropped to roughly 2.3 GHz on average, with core temperatures hovering around 76°C (168.8°F).
The GPU’s clock ran at around 1.6 GHz with only minor fluctuations. Its memory clock ran at an absolutely steady 1,750 MHz. However, GPU temperatures were relatively high at about 81°C (177.8°F), which nevertheless still falls within a safe range and indicates the headroom was well utilised. The entire card drew an average of 109 watts.


| CPU Clock (GHz) | GPU Clock (MHz) | Average CPU Temperature (°C) | Average GPU Temperature (°C) | |
| Prime95 + FurMark Stress | 2.3 | 1.600 | 76 | 81 |
Speakers
The speakers don’t get quite loud enough even at maximum volume. That said, they are at least capable of producing decent bass for laptop speakers. On the other hand, the highs aren’t quite as impressive as on competing devices.
There is a combo audio jack for users to plug in external analogue audio devices.
Asus ROG Strix Scar 15 G533zm audio analysis
(±) | speaker loudness is average but good (79.48 dB)
Bass 100 - 315 Hz
(+) | good bass - only 3.5% away from median
(+) | bass is linear (4.6% delta to prev. frequency)
Mids 400 - 2000 Hz
(±) | higher mids - on average 5.6% higher than median
(+) | mids are linear (4.8% delta to prev. frequency)
Highs 2 - 16 kHz
(±) | reduced highs - on average 6.8% lower than median
(±) | linearity of highs is average (8.2% delta to prev. frequency)
Overall 100 - 16.000 Hz
(+) | overall sound is linear (14.7% difference to median)
Compared to same class
» 28% of all tested devices in this class were better, 7% similar, 64% worse
» The best had a delta of 6%, average was 18%, worst was 132%
Compared to all devices tested
» 19% of all tested devices were better, 4% similar, 77% worse
» The best had a delta of 4%, average was 24%, worst was 134%
Asus TUF Gaming F15 FX507ZM audio analysis
(±) | speaker loudness is average but good (76.7 dB)
Bass 100 - 315 Hz
(±) | reduced bass - on average 13.7% lower than median
(±) | linearity of bass is average (10.1% delta to prev. frequency)
Mids 400 - 2000 Hz
(±) | higher mids - on average 5.2% higher than median
(+) | mids are linear (4.9% delta to prev. frequency)
Highs 2 - 16 kHz
(+) | balanced highs - only 4.1% away from median
(±) | linearity of highs is average (8.6% delta to prev. frequency)
Overall 100 - 16.000 Hz
(±) | linearity of overall sound is average (15.9% difference to median)
Compared to same class
» 38% of all tested devices in this class were better, 7% similar, 56% worse
» The best had a delta of 6%, average was 18%, worst was 132%
Compared to all devices tested
» 25% of all tested devices were better, 5% similar, 70% worse
» The best had a delta of 4%, average was 24%, worst was 134%
Power management - Decent battery life
Power consumption
Overall, despite not being particularly power-efficient, the Asus Strix Scar 15 also isn’t too problematic in this regard. It consumes slightly more power than its competitors in the energy-saving idle mode as well as during gaming. Nonetheless, its transient peak usage of 221 watts is not higher than that of its rivals and is well within the means of the 240-watt charger.
| Idle | |
| Load |
|
Key:
min: | |
| Asus ROG Strix Scar 15 G533zm i9-12900H, GeForce RTX 3060 Laptop GPU, , IPS, 2560x1440, 15.6" | Asus ROG Strix Scar 15 G533ZW-LN106WS i9-12900H, GeForce RTX 3070 Ti Laptop GPU, Samsung PM9A1 MZVL22T0HBLB, IPS-level, 2560x1440, 15.6" | Asus TUF Gaming F15 FX507ZM i7-12700H, GeForce RTX 3060 Laptop GPU, SK Hynix HFM001TD3JX013N, IPS, 1920x1080, 15.6" | MSI Pulse GL66 12UEK i9-12900H, GeForce RTX 3060 Laptop GPU, Micron 2450 512GB MTFDKBA512TFK, IPS, 1920x1080, 15.6" | Alienware m15 R5 Ryzen Edition R7 5800H, GeForce RTX 3060 Laptop GPU, Toshiba KBG40ZNS512G NVMe, IPS, 1920x1080, 15.6" | Lenovo Legion 5 15ACH6A-82NW0010GE R5 5600H, Radeon RX 6600M, Micron 2210 MTFDHBA512QFD, IPS, 1920x1080, 15.6" | Average NVIDIA GeForce RTX 3060 Laptop GPU | Average of class Gaming | |
|---|---|---|---|---|---|---|---|---|
| Power Consumption | 7% | 9% | 28% | 1% | 8% | 7% | -10% | |
| Idle Minimum * (Watt) | 13 | 7.56 42% | 6.3 52% | 7 46% | 11 15% | 10 23% | 10.4 ? 20% | 13.2 ? -2% |
| Idle Average * (Watt) | 17 | 13.5 21% | 9.8 42% | 13 24% | 14 18% | 13.2 22% | 14.5 ? 15% | 18.9 ? -11% |
| Idle Maximum * (Watt) | 17 | 16.87 1% | 26.5 -56% | 13.7 19% | 25 -47% | 15.6 8% | 21.4 ? -26% | 24.3 ? -43% |
| Load Average * (Watt) | 135 | 128.9 5% | 103.8 23% | 48.4 64% | 123 9% | 178 -32% | 109.3 ? 19% | 108.3 ? 20% |
| Witcher 3 ultra * (Watt) | 195 | 196.2 -1% | 189 3% | 148 24% | 176 10% | 181 7% | ||
| Load Maximum * (Watt) | 221 | 274.86 -24% | 241.9 -9% | 244 -10% | 226 -2% | 180 19% | 206 ? 7% | 254 ? -15% |
* ... smaller is better
Power consumption Witcher 3 / stress test
Power consumption with external monitor
Battery life
Asus has equipped the laptop with a large 90Wh battery capable of offering an outstanding 8.5 hours of video playback and 9 hours of Internet browsing in our testing, which was performed with reduced screen brightness.
| Asus ROG Strix Scar 15 G533zm i9-12900H, GeForce RTX 3060 Laptop GPU, 90 Wh | Asus ROG Strix Scar 15 G533ZW-LN106WS i9-12900H, GeForce RTX 3070 Ti Laptop GPU, 90 Wh | Asus TUF Gaming F15 FX507ZM i7-12700H, GeForce RTX 3060 Laptop GPU, 90 Wh | MSI Pulse GL66 12UEK i9-12900H, GeForce RTX 3060 Laptop GPU, 53.5 Wh | Alienware m15 R5 Ryzen Edition R7 5800H, GeForce RTX 3060 Laptop GPU, 86 Wh | Lenovo Legion 5 15ACH6A-82NW0010GE R5 5600H, Radeon RX 6600M, 80 Wh | Average of class Gaming | |
|---|---|---|---|---|---|---|---|
| Battery runtime | -16% | -40% | -17% | -16% | 13% | -12% | |
| H.264 (h) | 8.6 | 8.5 -1% | 4 -53% | 8.8 2% | 8.26 ? -4% | ||
| WiFi v1.3 (h) | 9.2 | 8.4 -9% | 4.8 -48% | 5.1 -45% | 9.2 0% | 7.04 ? -23% | |
| Witcher 3 ultra (h) | 1.3 | 1.2 -8% | 1.6 23% | ||||
| Load (h) | 1.6 | 0.9 -44% | 1.1 -31% | 1.9 19% | 0.9 -44% | 2 25% | 1.47 ? -8% |
| Reader / Idle (h) | 15.8 | 14.7 | 12.8 | 8.71 ? |
Pros
Cons
Verdict - Impressive gaming laptop for €1,999
Featuring an RTX 3060, the G533zm model of the Asus ROG Strix Scar 15 is likewise a highly competent and great gaming laptop with superb build quality. It offers modern I/Os, a fantastic typing experience, powerful hardware and customisation options. Furthermore, its display stands out with great response time, excellent colour coverage, and solid contrast and brightness. Compared with the RTX 3070 Ti model (G533zw) and direct competitors, the G533zm runs relatively cool.
We don’t have any real complaints about the laptop. Its noise level could use some optimisation but is otherwise quite reasonable. On that note, you may ask yourself whether it's necessary to pair an RTX 3060 with the speedy but hot i9-12900H, when an i7-12700H would probably do the job just fine. On our review unit, the left touchpad button occasionally got a little stuck, though the other Scar model didn’t have this issue.
For around €2,000 (US$2,170), gamers are getting an excellent laptop with great performance, plenty of strengths and few downsides.
Though it may not be a steal for an RTX 3060 gaming laptop, the €2,000 (US$2,170) price tag is rather reasonable given the many positive aspects and almost non-existent drawbacks. Those who want to invest less money can also consider the Asus TUF Gaming F15. This laptop has fewer features but offers excellent performance whilst costing about €400 (U
Price and availability
The review configuration is current available from Cyberport for €1,999 (US$2,166). You can also find a lower-spec model with less memory and an FHD display on Amazon for around US$1,600.
Asus ROG Strix Scar 15 G533zm
- 04/30/2024 v7 (old)
Christian Hintze
Price comparison

