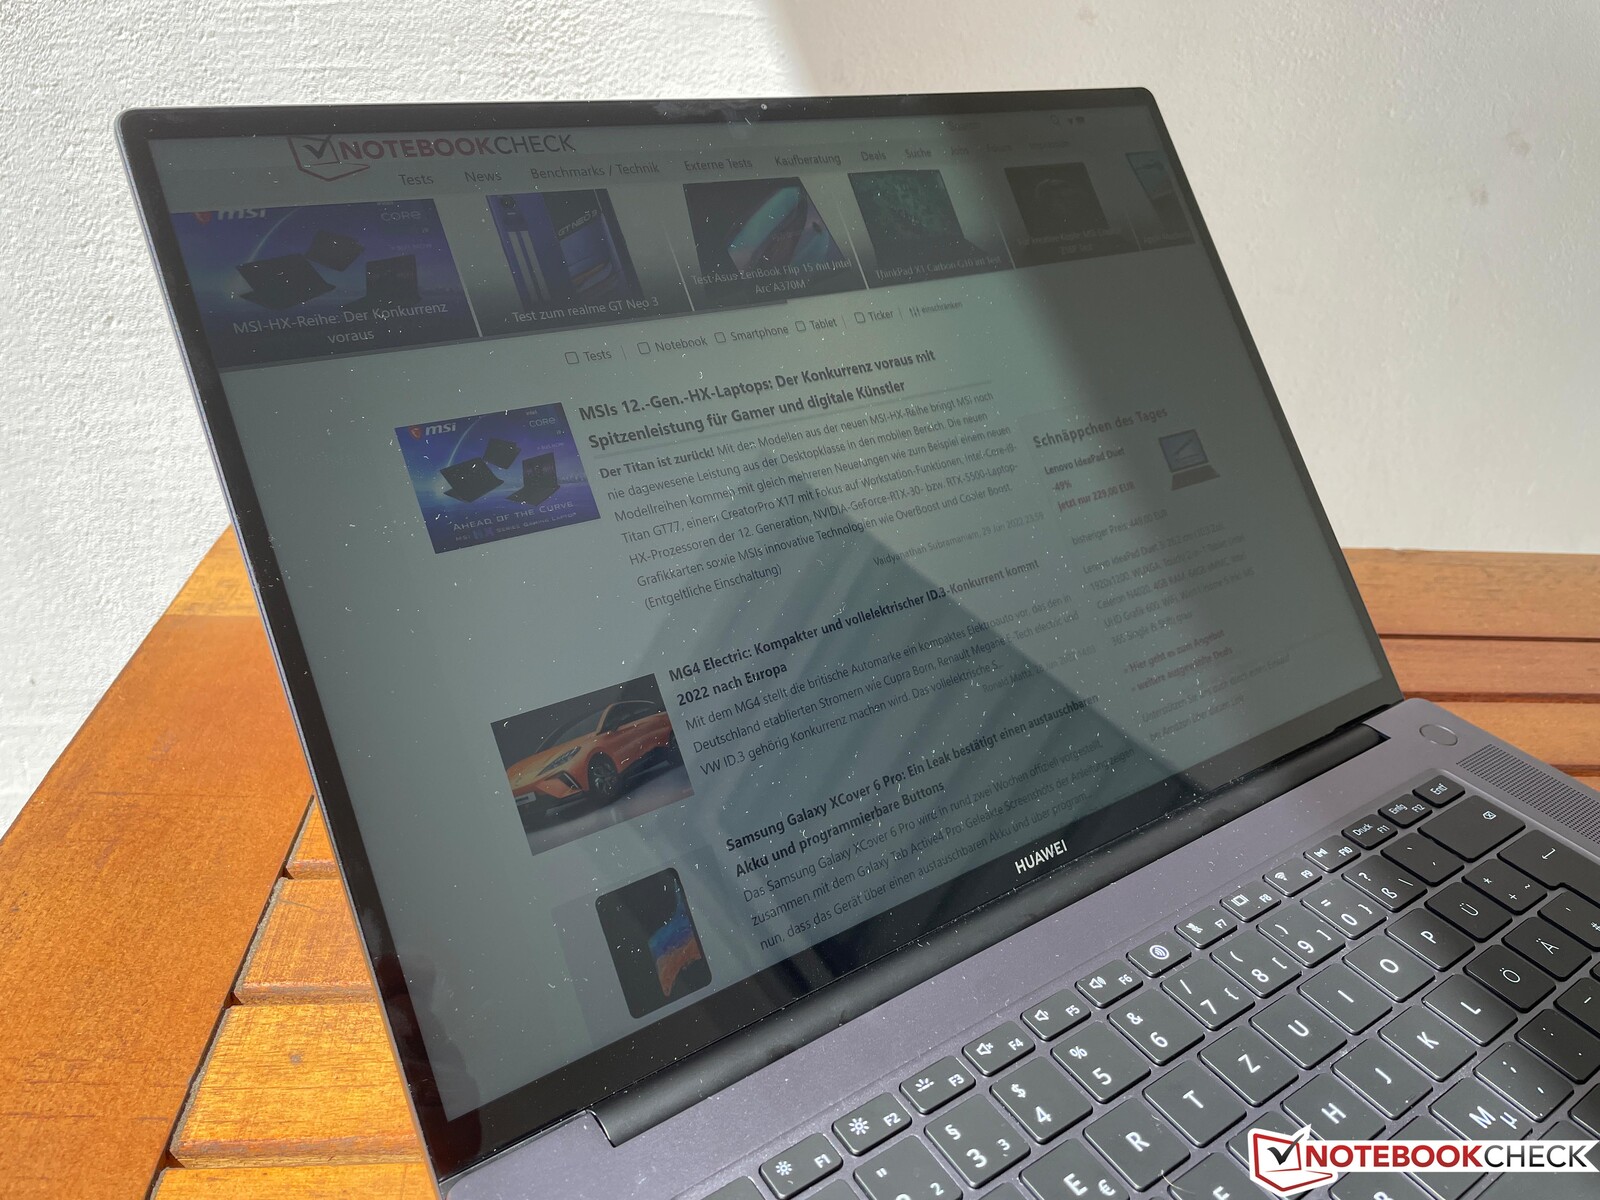
Huawei MateBook 16s Review - Large multimedia laptop with an Alder Lake i7
With the MateBook 16, Huawei has a large multimedia notebook in its product range. To date, its AMD Ryzen processor has convincingly delivered a good price-performance ratio. However, the manufacturer has now switched to Intel Alder Lake processors (either Core i7 or Core i9) for the new MateBook 16s. There are some minor tweaks and the new processor also offers slightly improved performance, but what is immediately noticeable is the significantly higher price. Our test device with a Core i7-12700H, 16 GB RAM and a 1 TB PCIe SSD costs 1,699 euros (US$1,730). That’s a whopping 500 euros (US$510) more than the almost identical predecessor with its Ryzen 7 5800H. The model with the Core i9-12900H is also optionally available for 1,899 euros (US$1,940). The latter comes with 16 GB of RAM and a 1 TB SSD.
There are really not many direct competitors in this price category, at least none without a dedicated graphics card. The only exception in the premium range, where the MateBook 16s is now also placed given its price increase, is the Dell XPS 15 which can also be configured without a dedicated graphics card.
Potential Competitors in Comparison
Rating | Date | Model | Weight | Height | Size | Resolution | Price |
|---|---|---|---|---|---|---|---|
| 86.4 % v7 (old) | 07 / 2022 | Huawei MateBook 16s i7 i7-12700H, Iris Xe G7 96EUs | 2 kg | 17.8 mm | 16.00" | 2520x1680 | |
| 86.5 % v7 (old) | 10 / 2021 | Huawei MateBook 16 R7 5800H R7 5800H, Vega 8 | 2 kg | 17.8 mm | 16.00" | 2520x1680 | |
| 85.7 % v7 (old) | 06 / 2022 | Dell Inspiron 16 7620 2-in-1 i7-1260P, Iris Xe G7 96EUs | 2.1 kg | 18.41 mm | 16.00" | 1920x1200 | |
| 84.2 % v7 (old) | 10 / 2021 | Dell XPS 15 9510 i5 11400H FHD i5-11400H, UHD Graphics Xe 16EUs | 1.8 kg | 18 mm | 15.60" | 1920x1200 | |
| 86.3 % v7 (old) | 06 / 2021 | LG Gram 16 (2021) i7-1165G7, Iris Xe G7 96EUs | 1.2 kg | 16.8 mm | 16.00" | 2560x1600 |
Case - Metal case with slight modifications
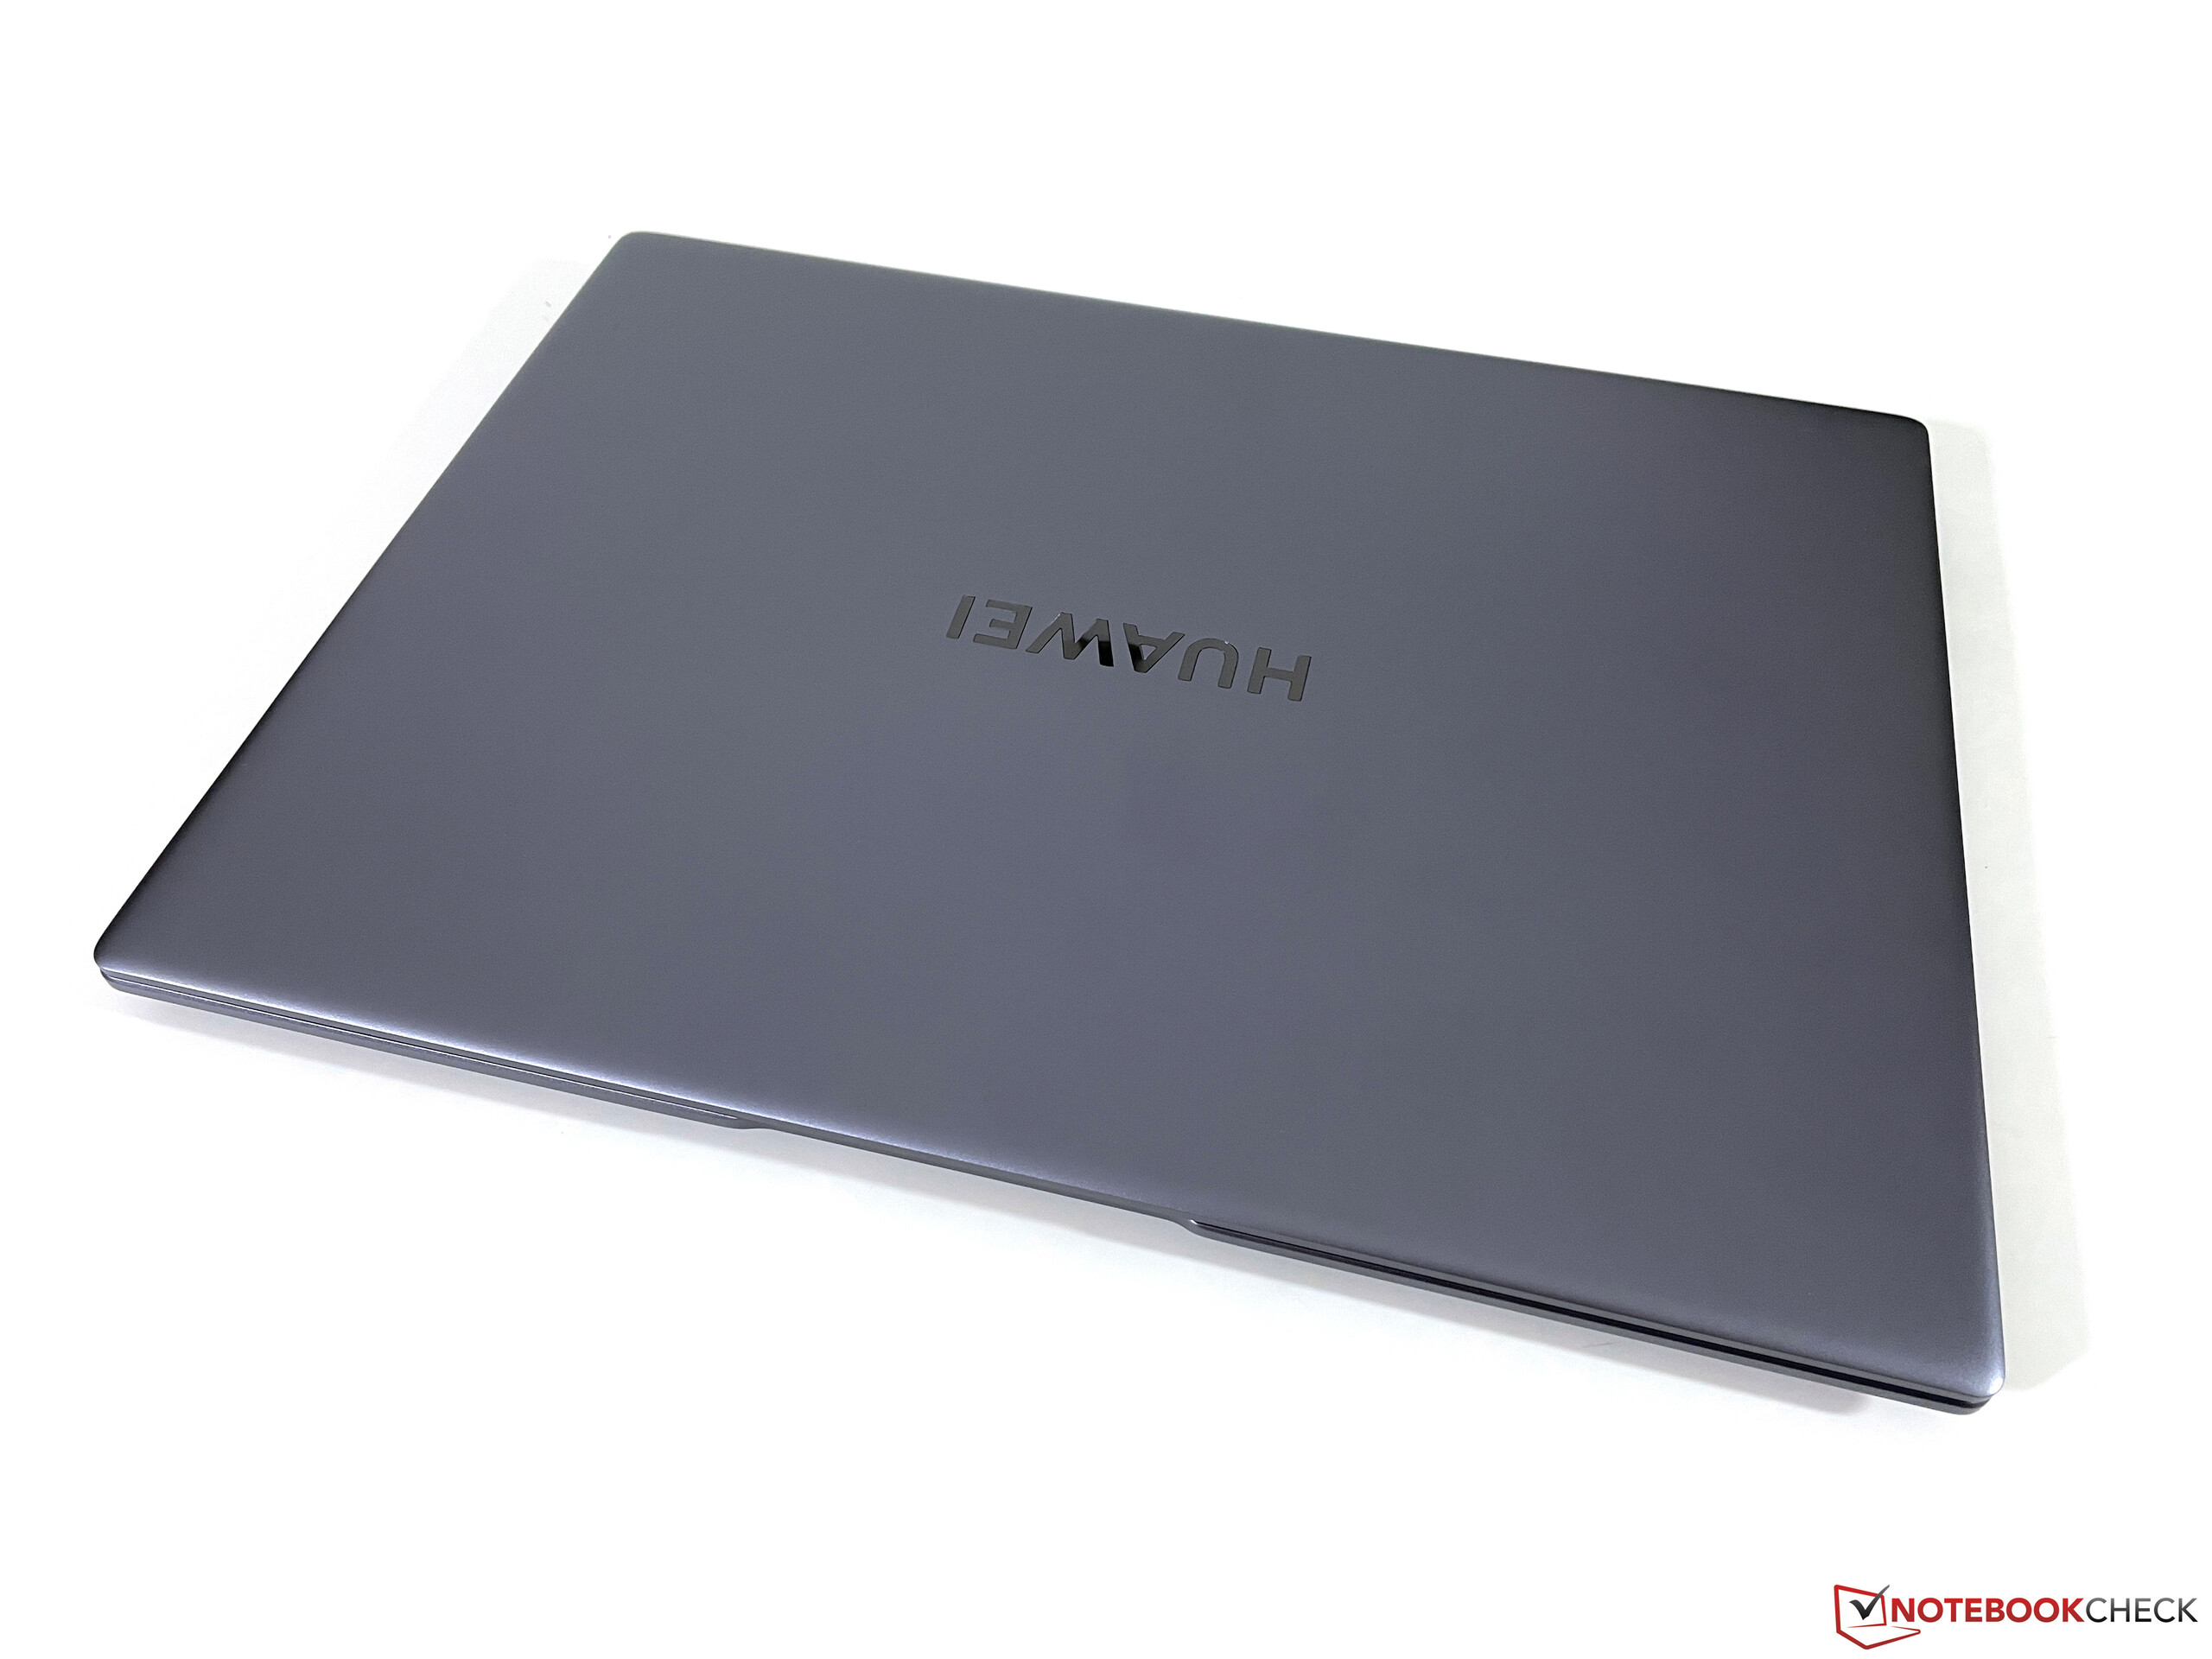
The basic case design of the MateBook 16s has remained essentially unchanged. There are just very minor modifications. The metal housing in space gray (which does, however, have the familiar blue/purple sheen) is still of very high quality and sturdy. The MateBook looks very modest and blends well into a professional environment. The only two color accents are the keyboard and the screen frame in black. The matt surfaces are not particularly susceptible to collecting dirt.
As soon as you open the lid, a small change to the previous model becomes apparent. The upper edge of the screen is slightly thicker to accommodate the improved 1080p webcam. Both the base unit and the lid have a firm feel to them, but the hinge doesn’t completely prevent the large lid from wobbling slightly. The maximum opening angle is still around 145 degrees.
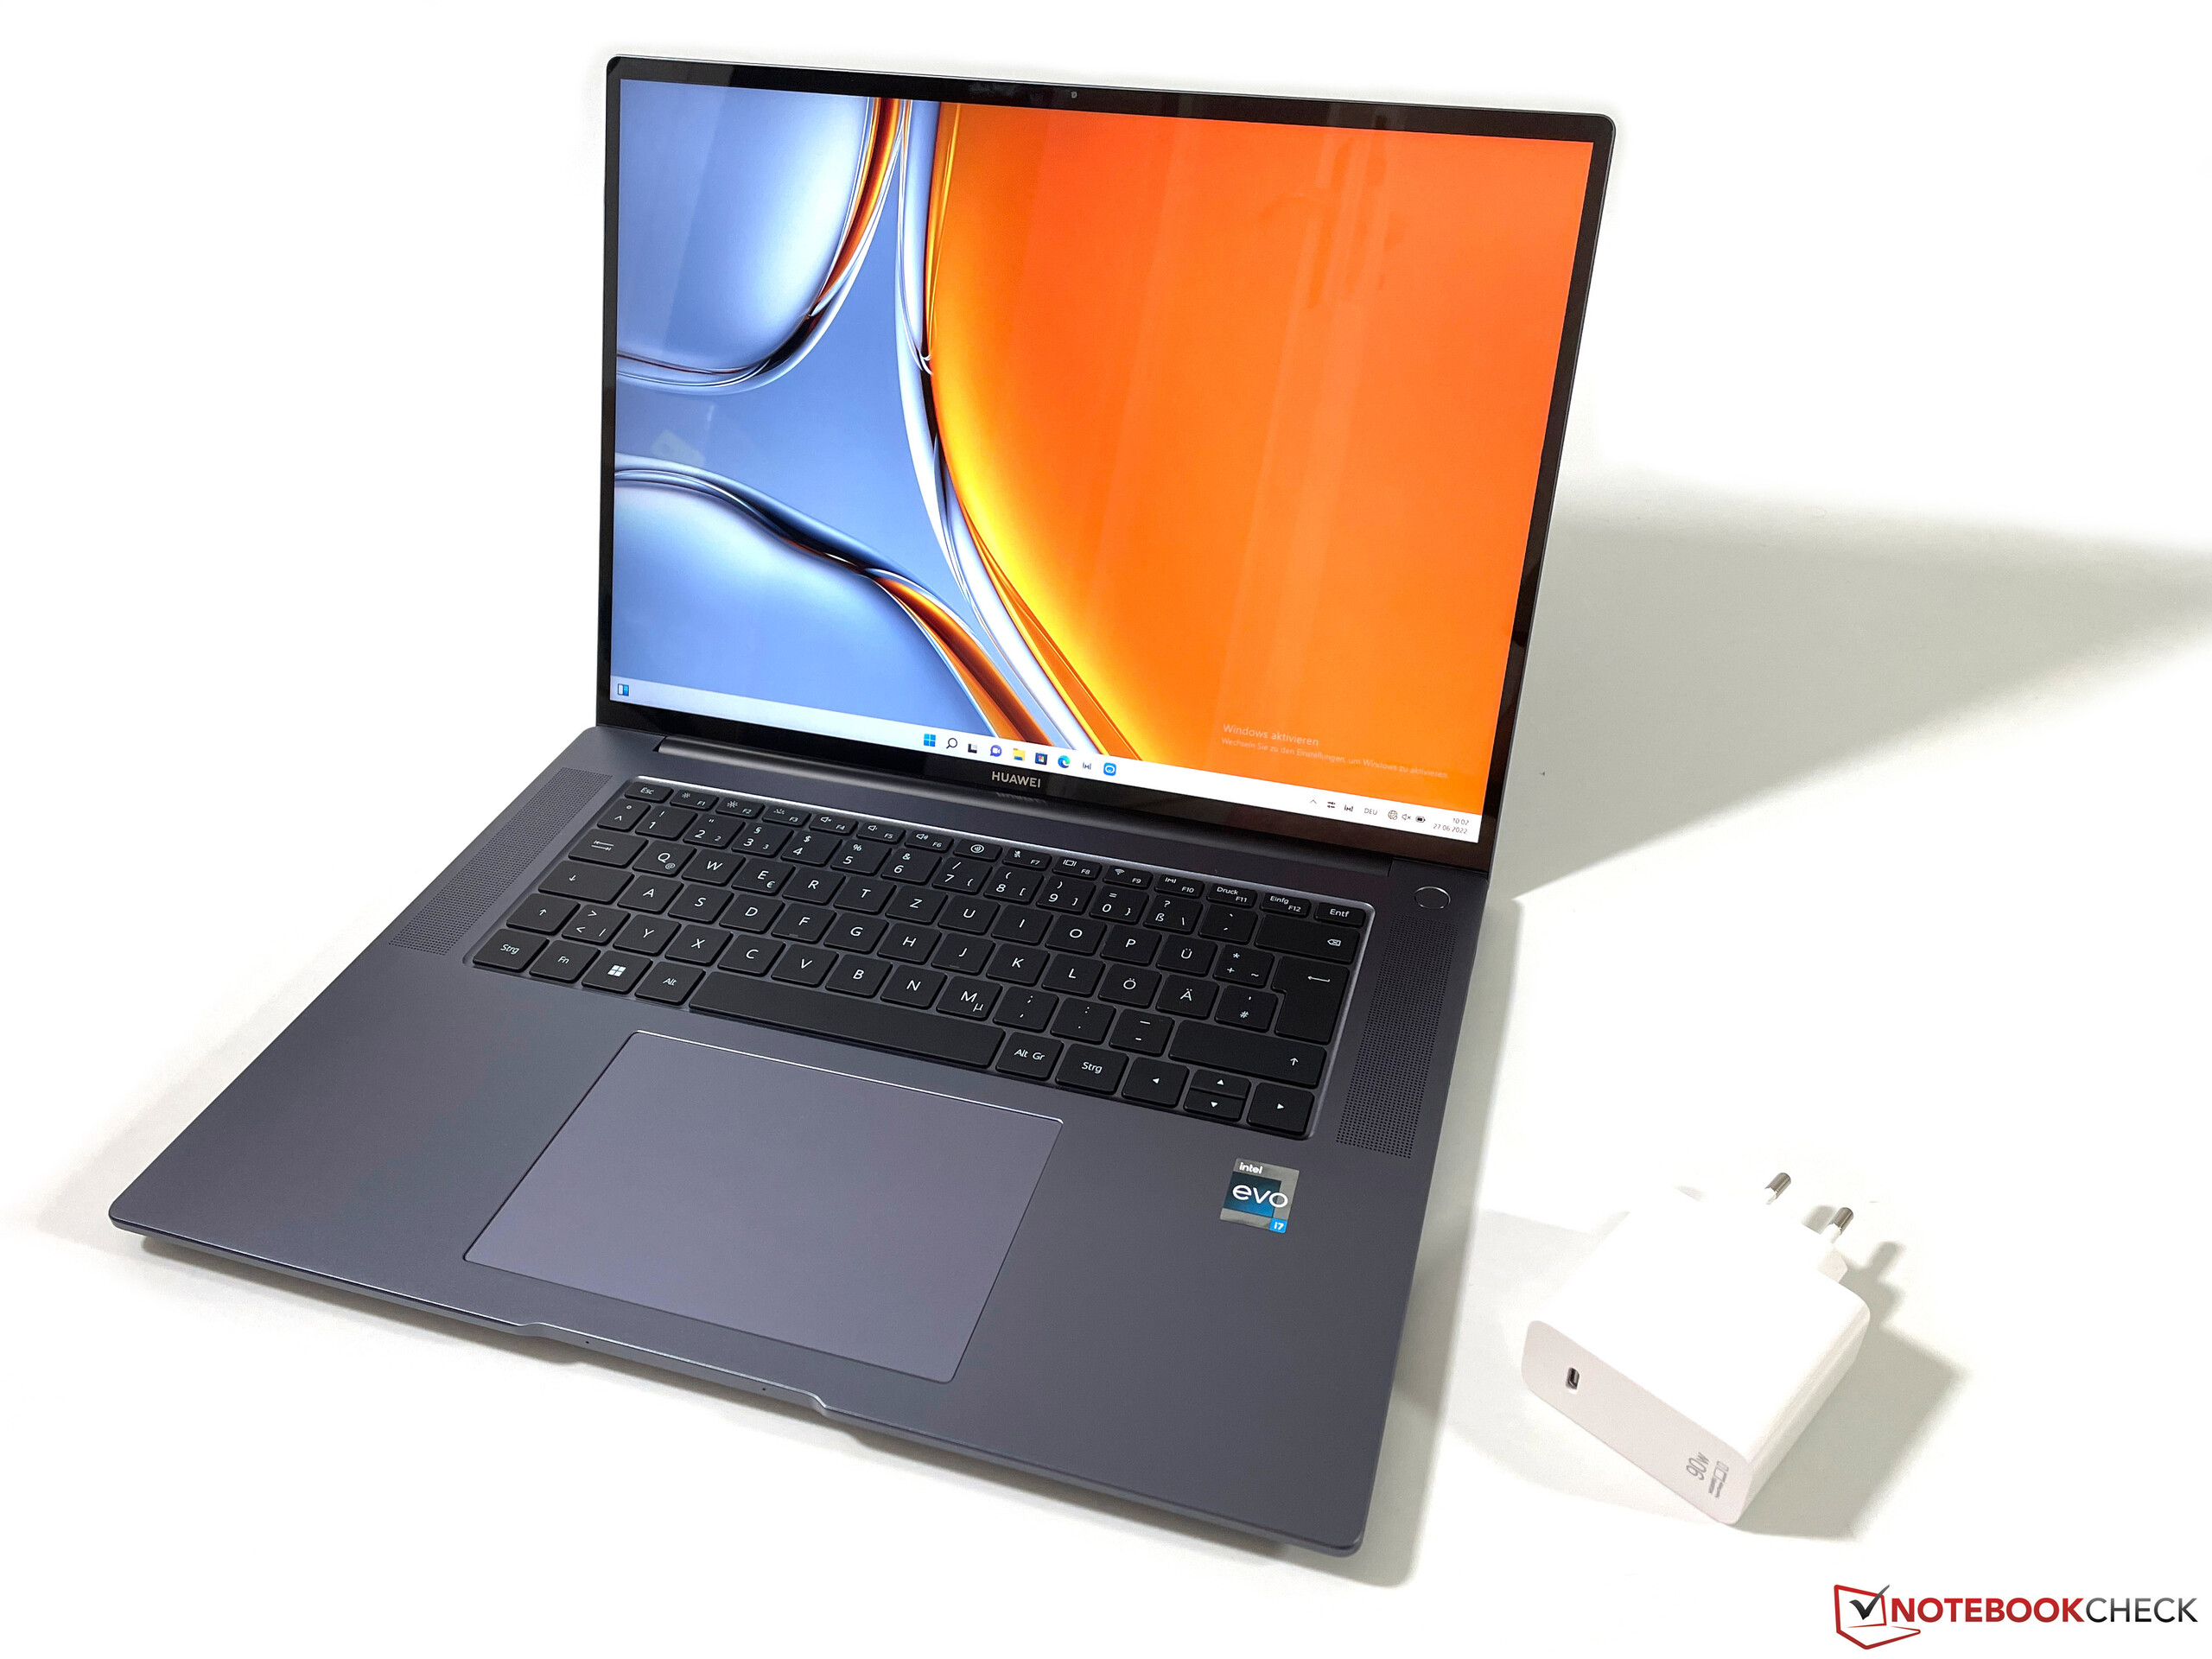
The old MateBook 16 had 1.9 mm more depth, but the footprint itself hasn’t changed. Due to the screen’s 3:2 aspect ratio, the MateBook 16s is reasonably thick, but other 16-inch comparison devices are not any more compact. It weighs about 2 kg and you can add another 240 grams for the 90-watt power adapter and the USB-C cable.
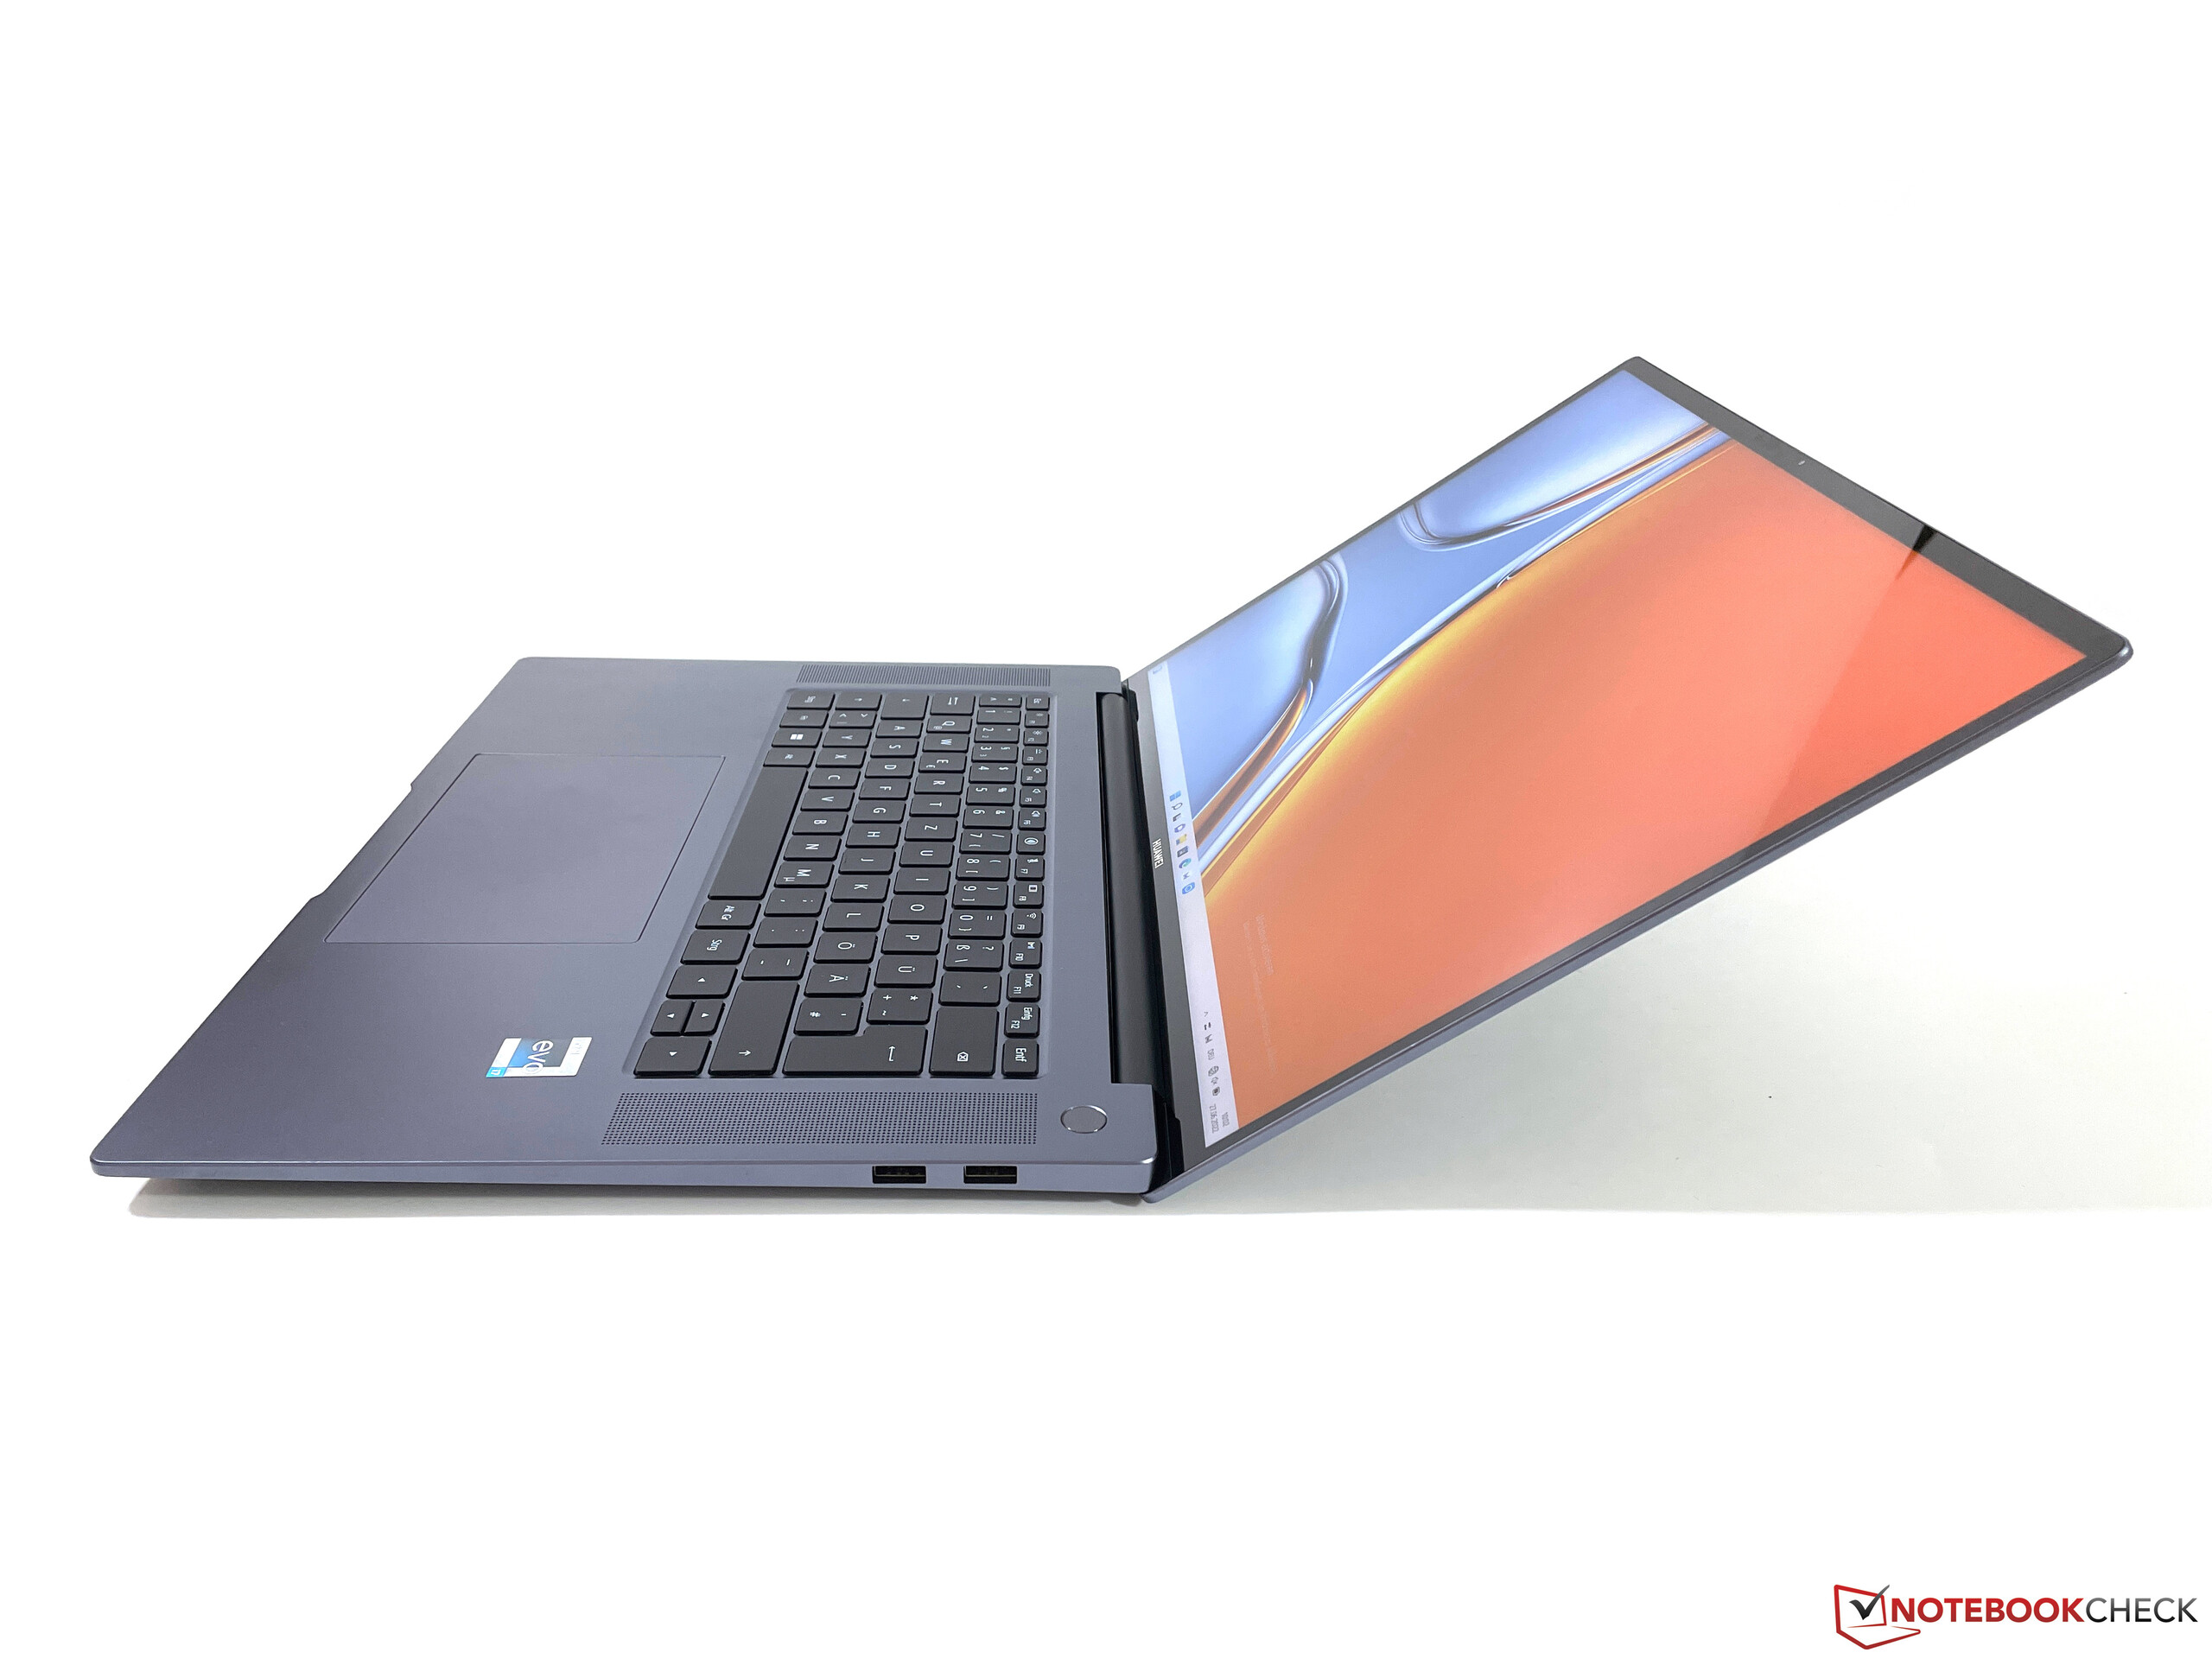
Connectivity - Thunderbolt support
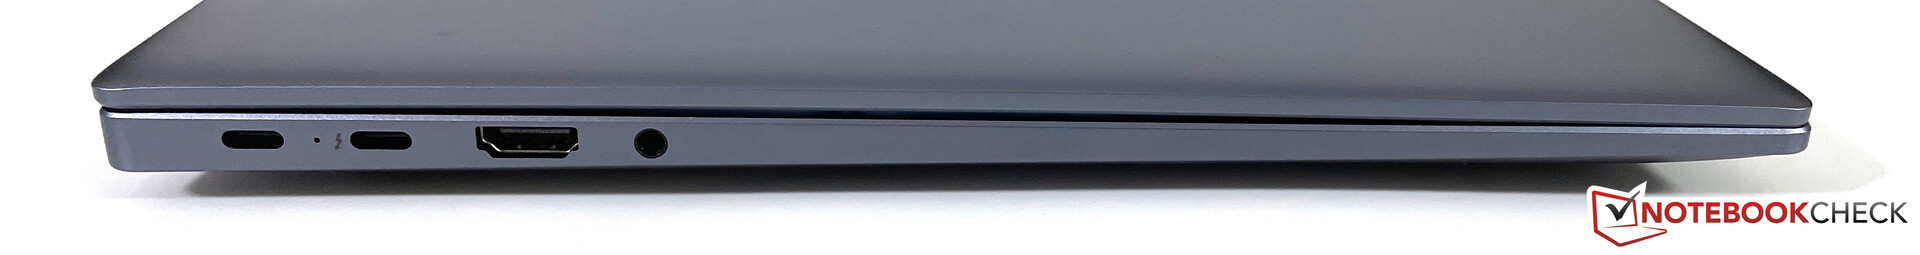
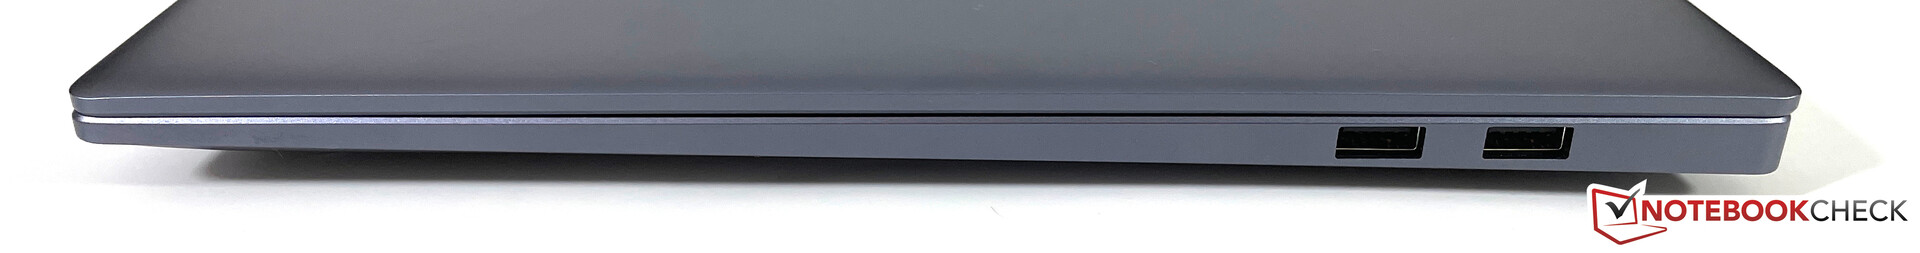
In terms of port layout, there are basically no changes compared to the MateBook 16 AMD. There are still two USB-C ports and two normal USB-A sockets. One of the USB-C ports now also supports the state-of-the-art Thunderbolt 4 protocol (40 GBit/s). We actually just miss a card reader, for which a lot of space would be available.
Communication
For the WLAN module, Huawei also uses an Intel component that already supports the current Wi-Fi 6E standard and Bluetooth 5.2. In our test, the AX211E connected easily to the 6 GHz network of our Asus reference router and achieved very high and, above all, stable transmission rates. Unlike its predecessor, the WLAN module can no longer be replaced.
Webcam
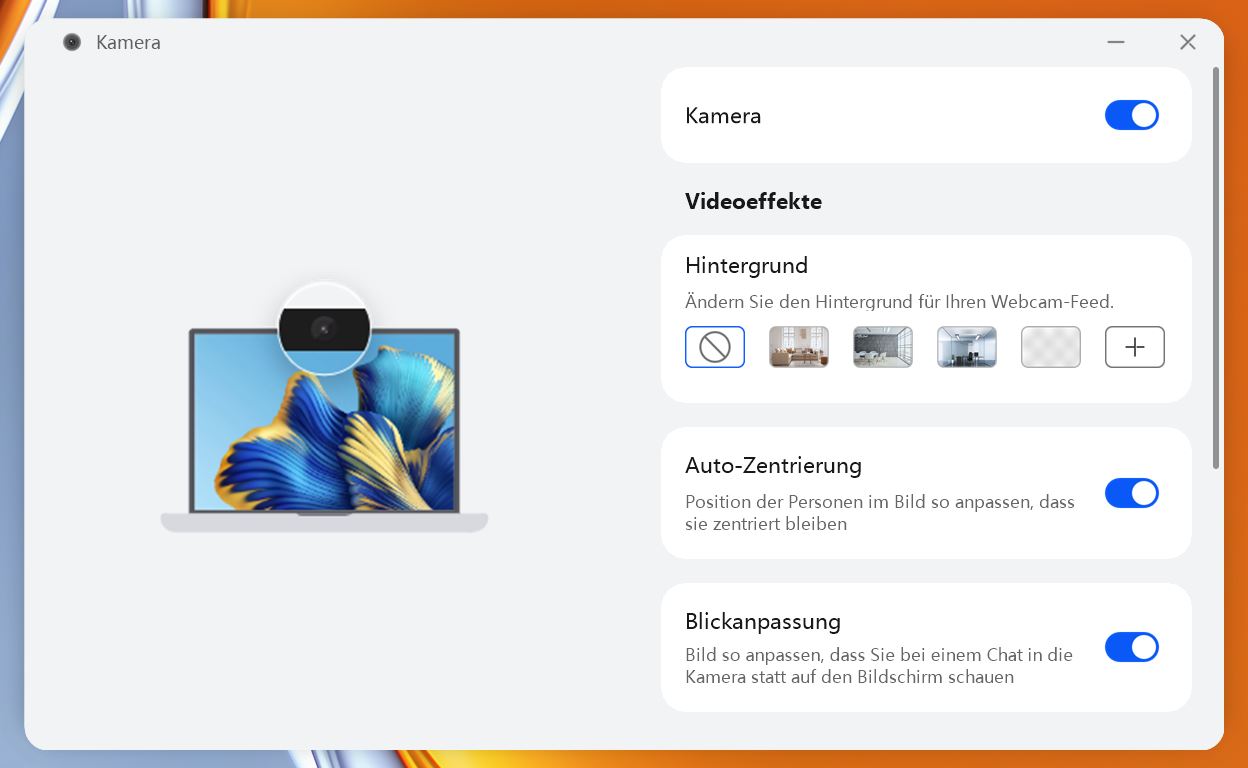
The webcam has also had an upgrade. The 1080p sensor replaces the 720p module and offers slightly better image quality. The AI function that Huawei has introduced is also interesting. As with Apple devices, and this works well in practice, the camera can follow the user and make it look like the user’s eyes are staring directly at the camera. A background filter is also available (independent of the application used), but not in combination with user tracking. When using the webcam’s advanced functionality, we noticed that video recording is noticeably jerkier. There is obviously some more work to do here.


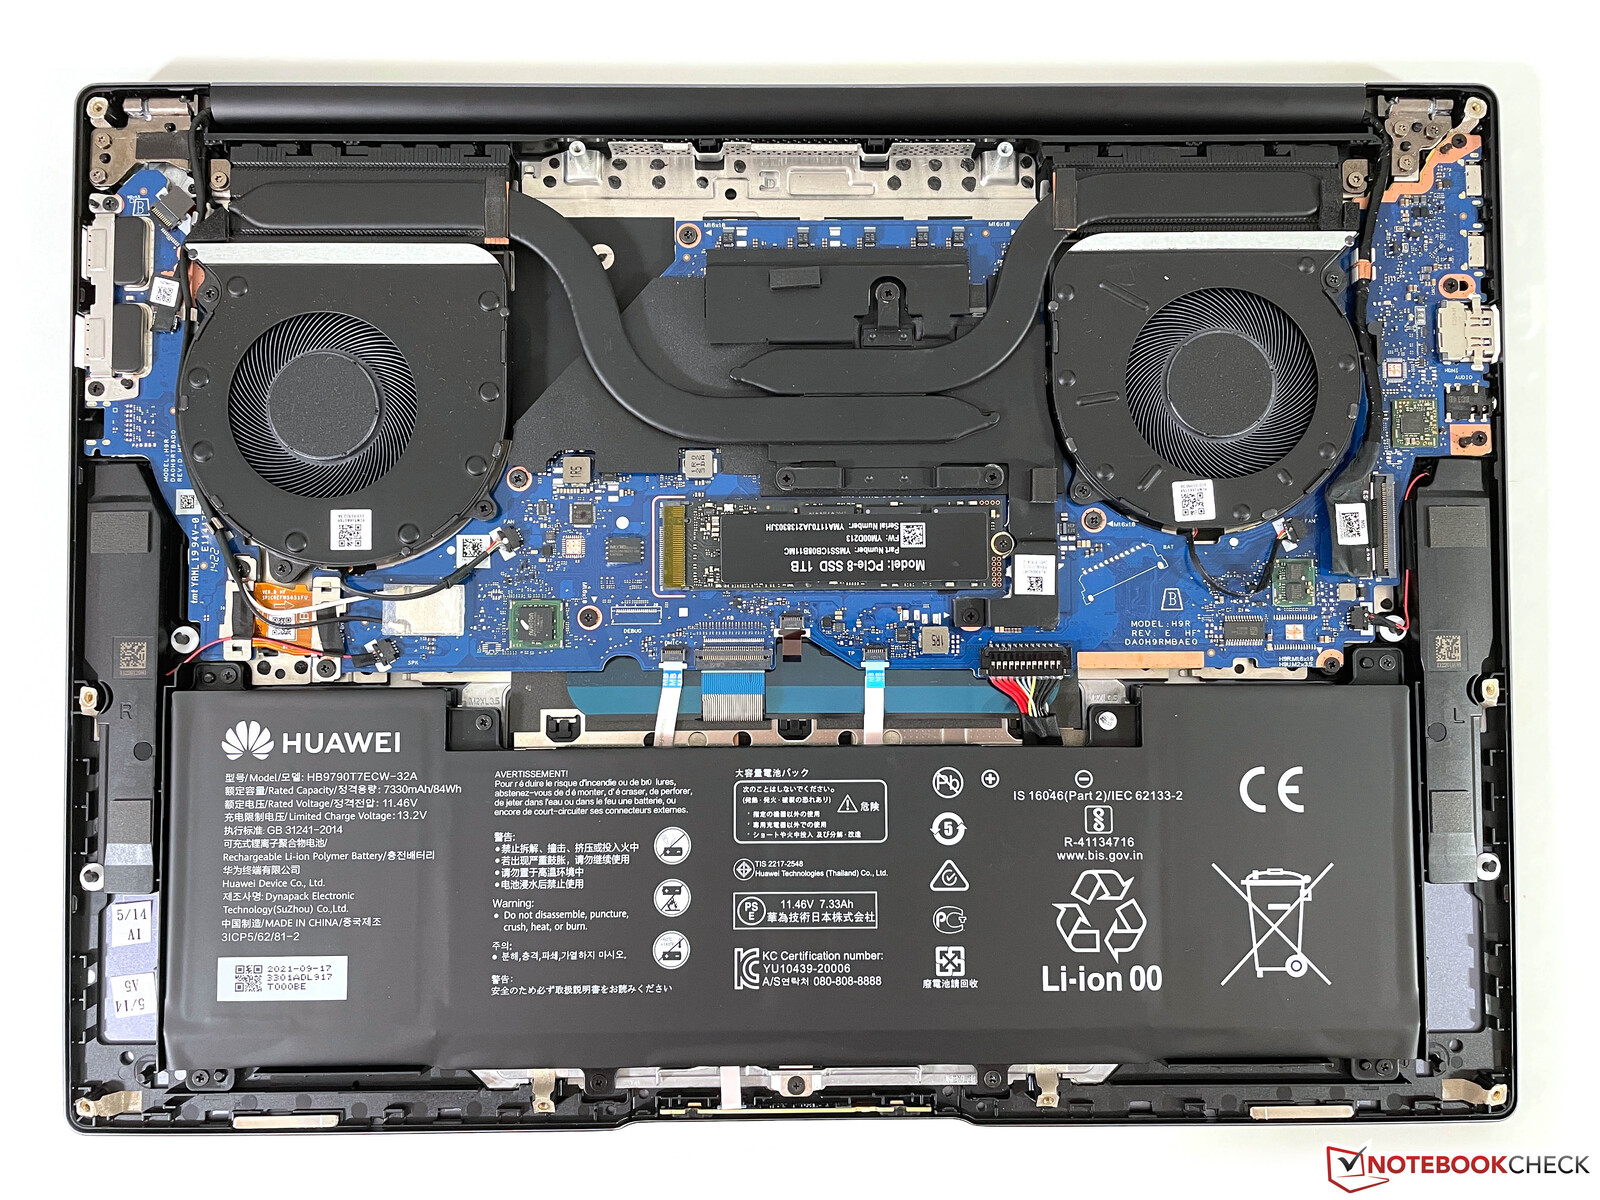
Maintenance
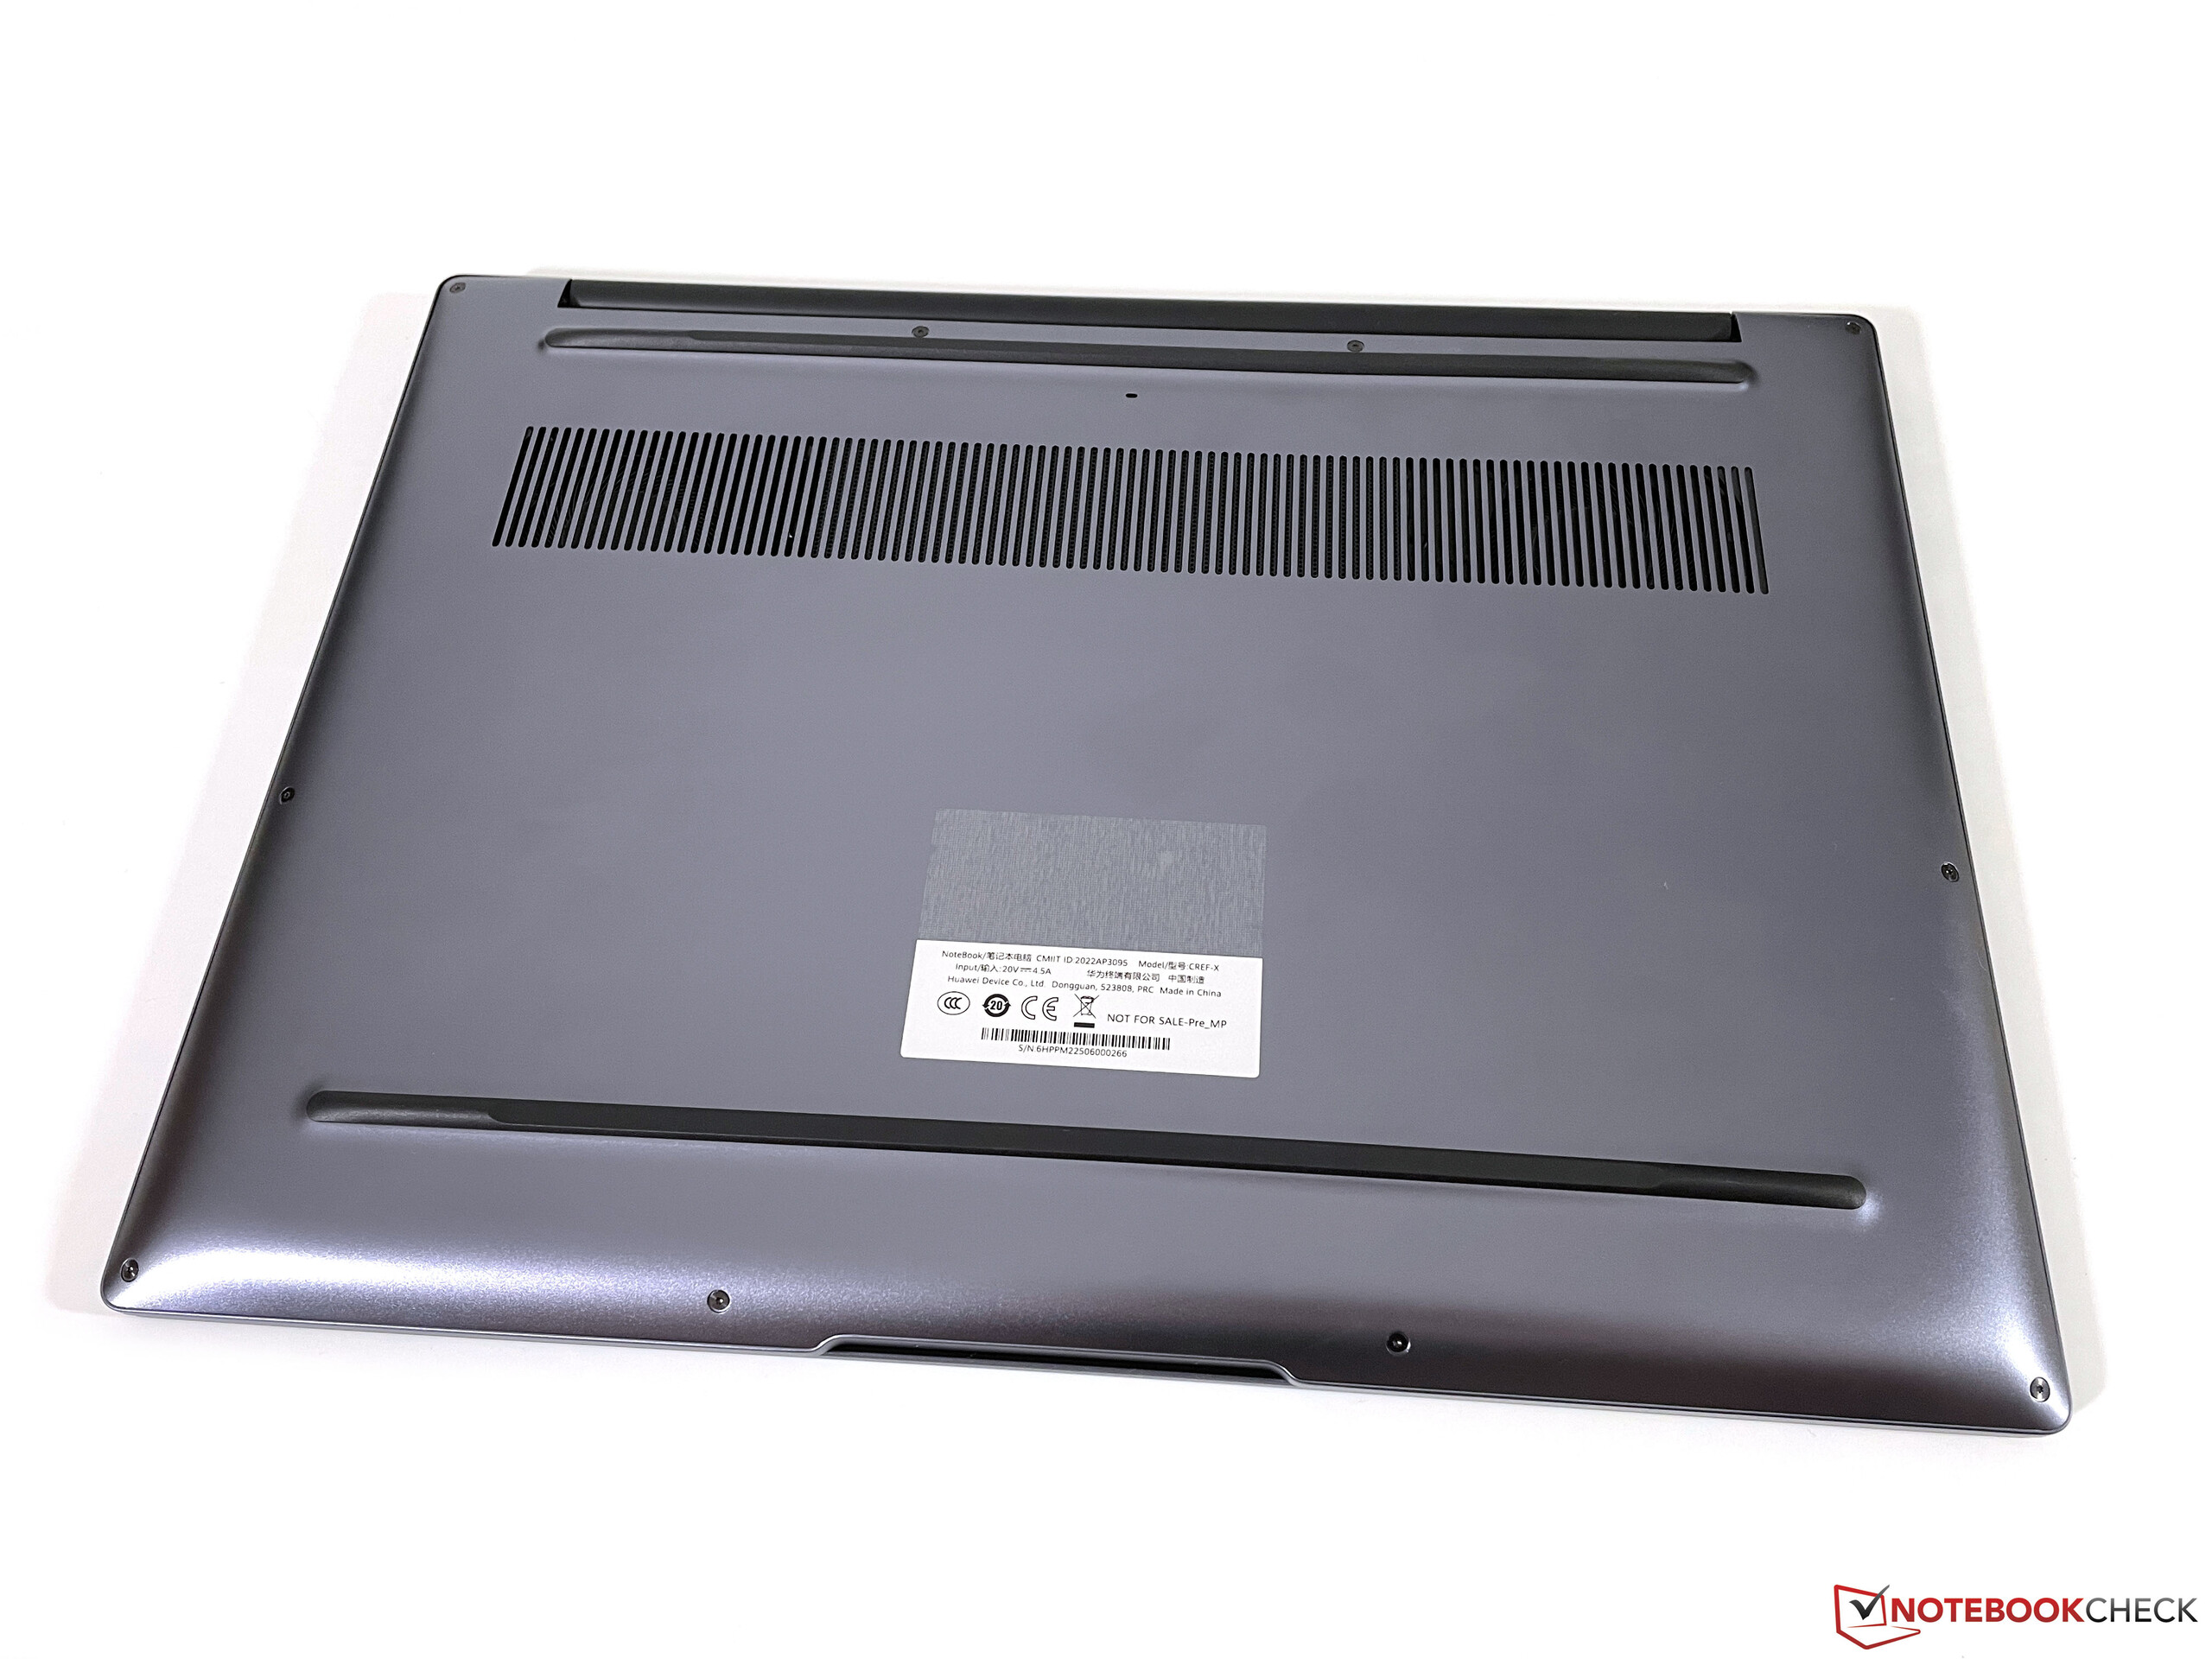
The bottom panel is secured with Torx screws (T5) and is easy to remove. The WLAN module is now soldered to the motherboard, so the maintenance options are limited to the M.2-2280 SSD and the fan cleaning.
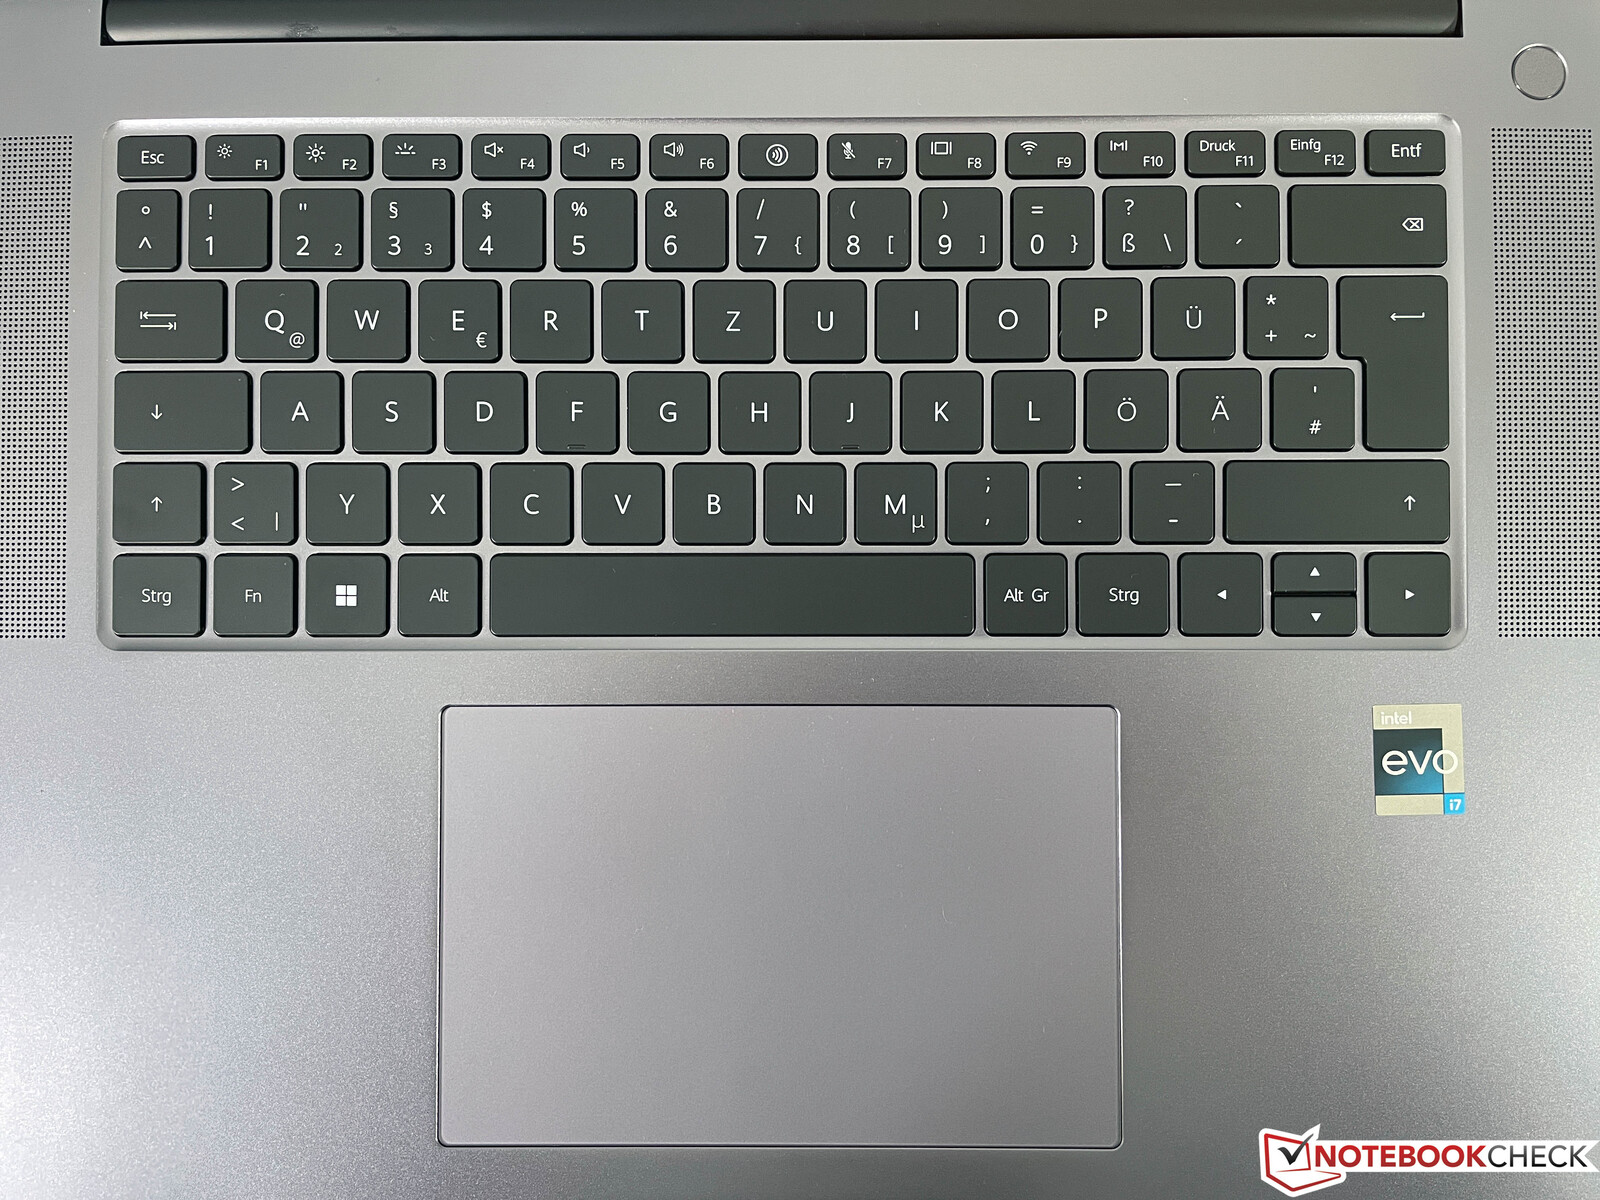
Input Devices - Huawei now has 1.5 mm key travel
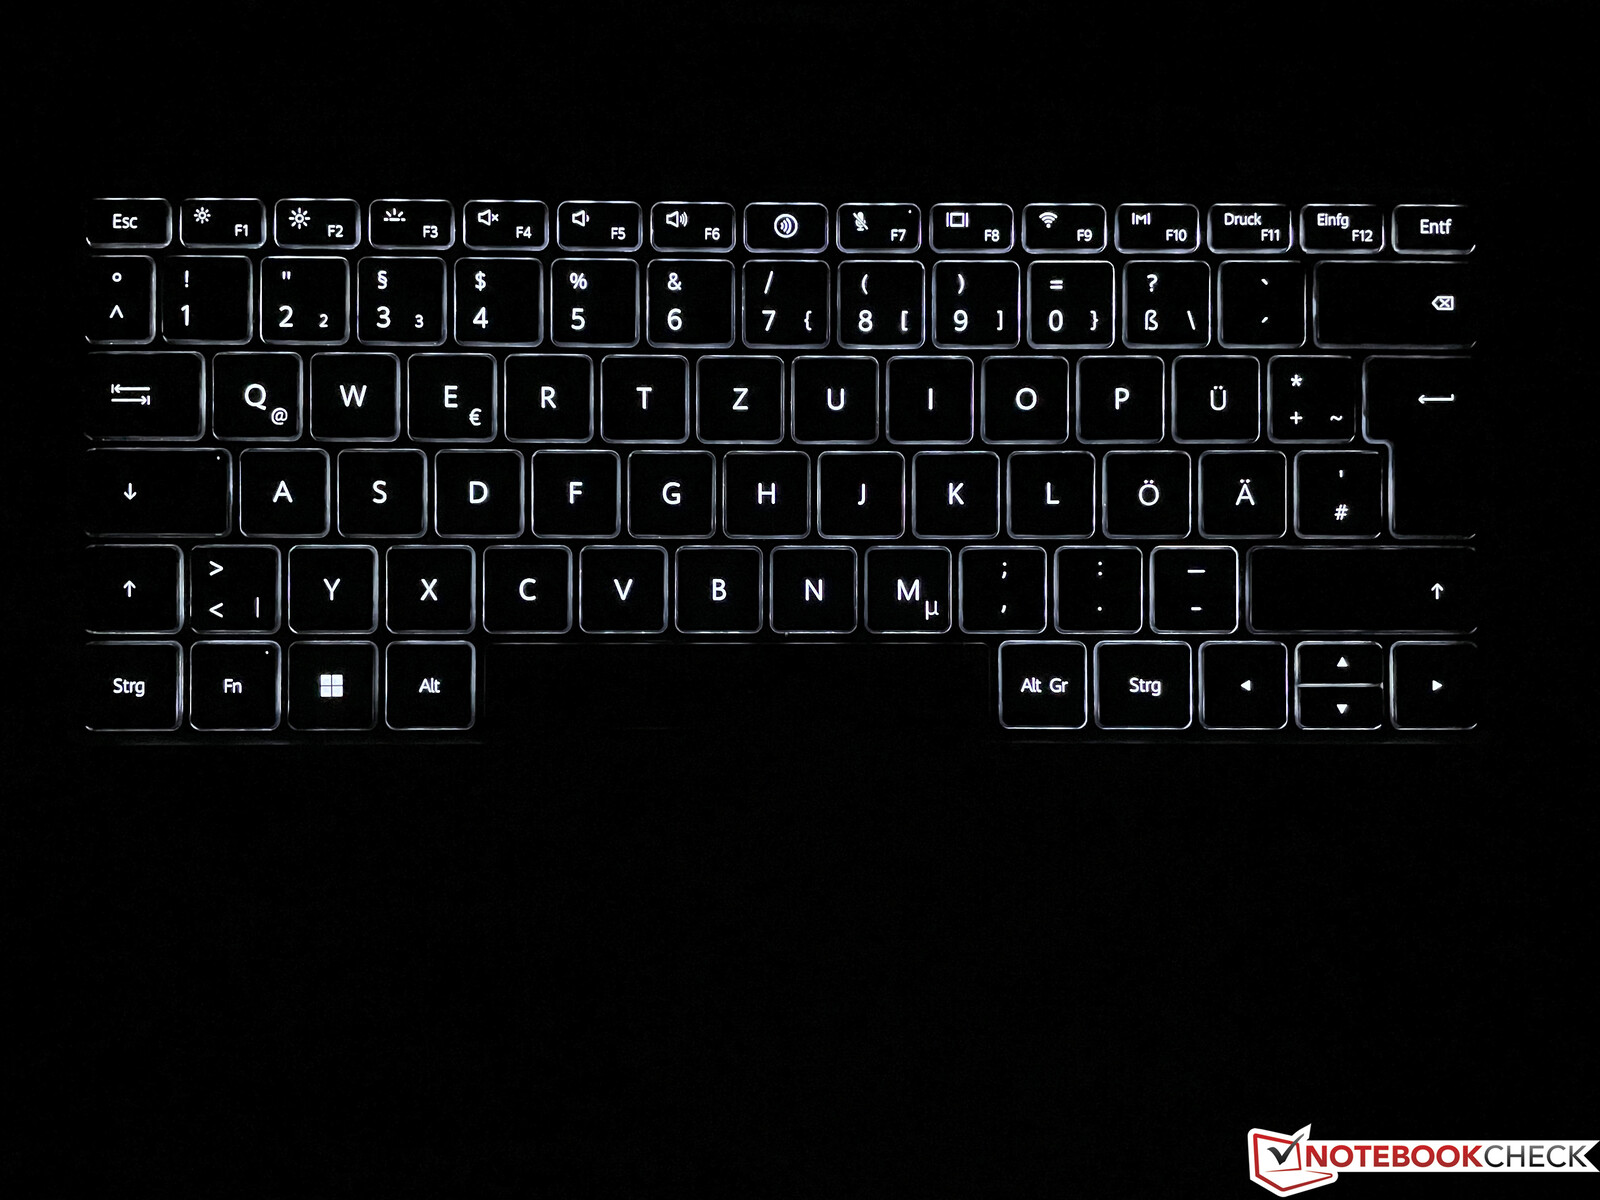
While the cheaper MateBook D16 has a full-fledged numeric keypad, Huawei remains true to the familiar layout of the MateBook 16 and perseveres with the placement of the speakers beside the keyboard. There is, however, one welcome change with key travel increased from 1.3 to 1.5 mm. Measured subjectively, tactility is also very good. But as with its predecessor, some of the keys tend to rattle somewhat and that reduces perceived quality to a certain extent. The two-level white keyboard backlight doesn’t turn on automatically. The power button is placed right above the keyboard and also serves as a fingerprint scanner, which works well.
The large ClickPad still works without a hitch, but the clicking noises are still quite loud. Our recommendation is therefore to apply just light touches to the pad for input. The capacitive touchscreen presents no issues either.
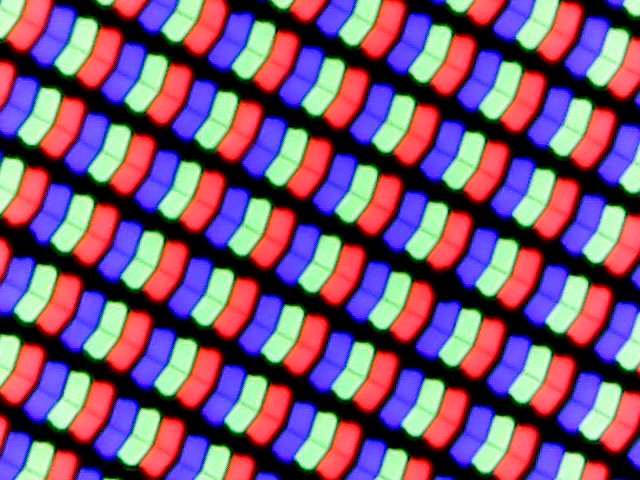
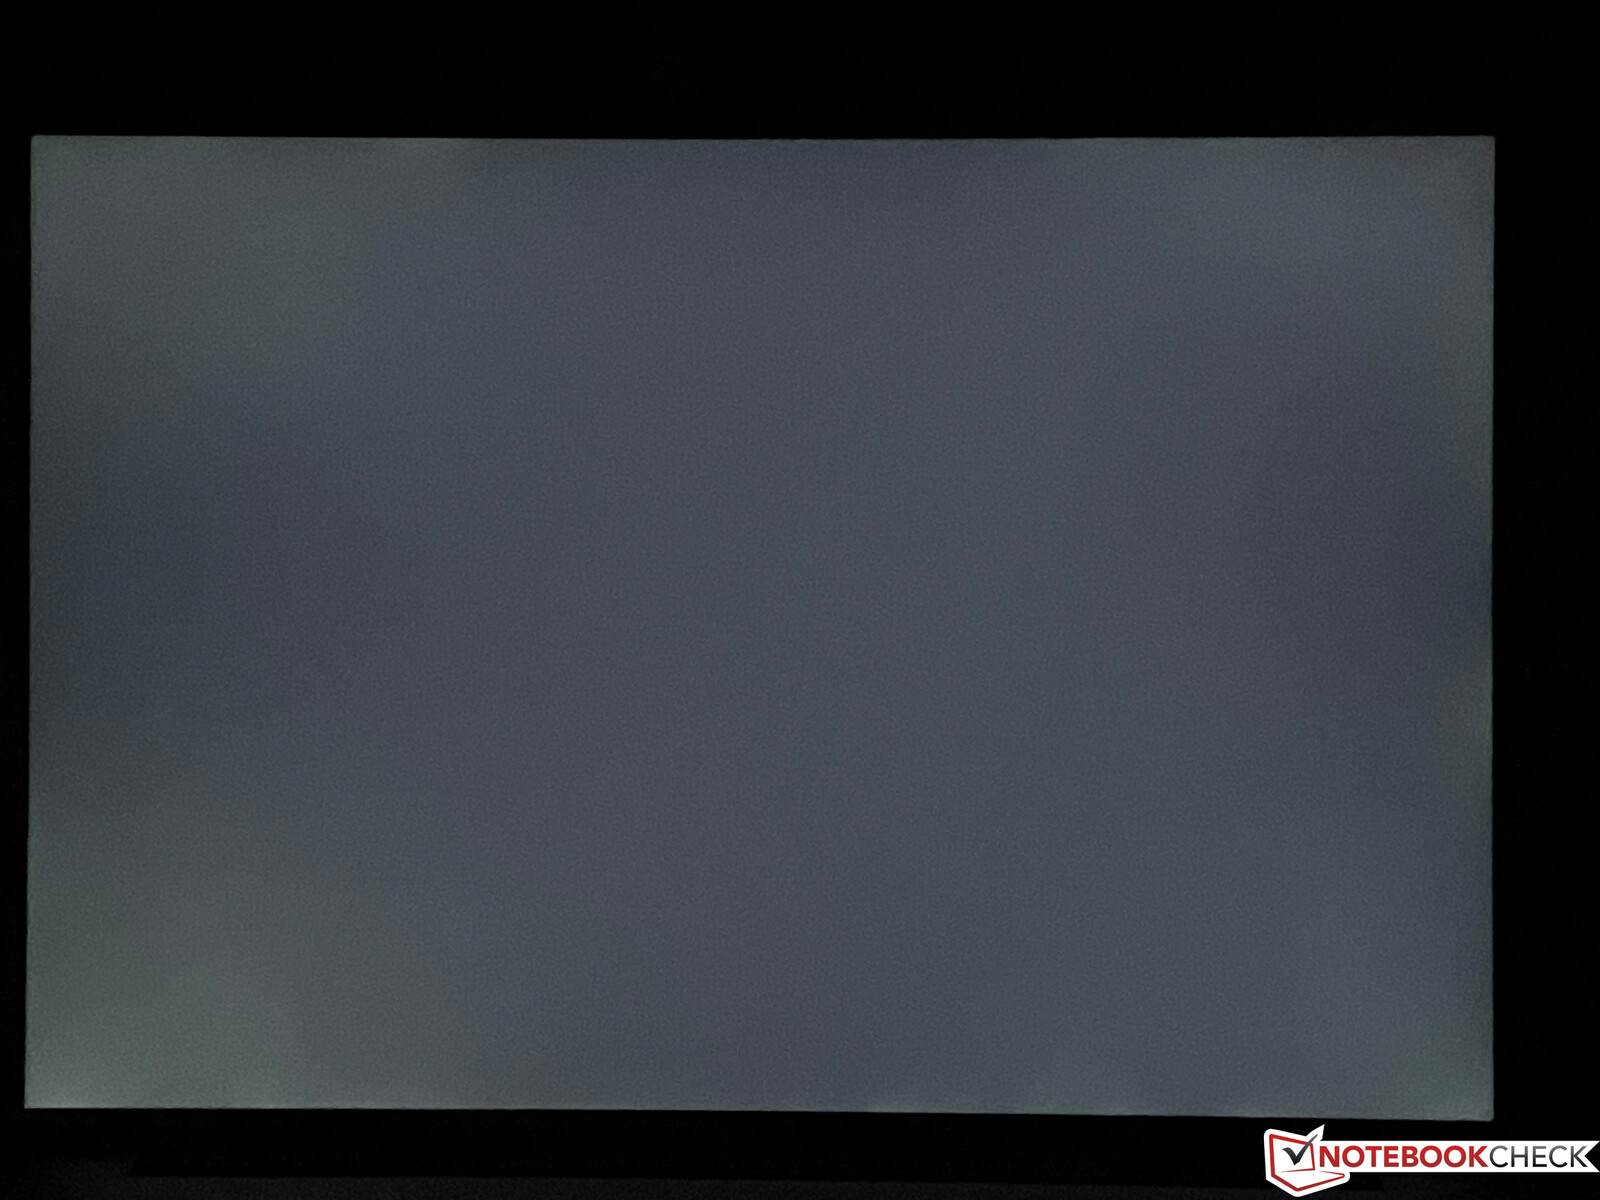
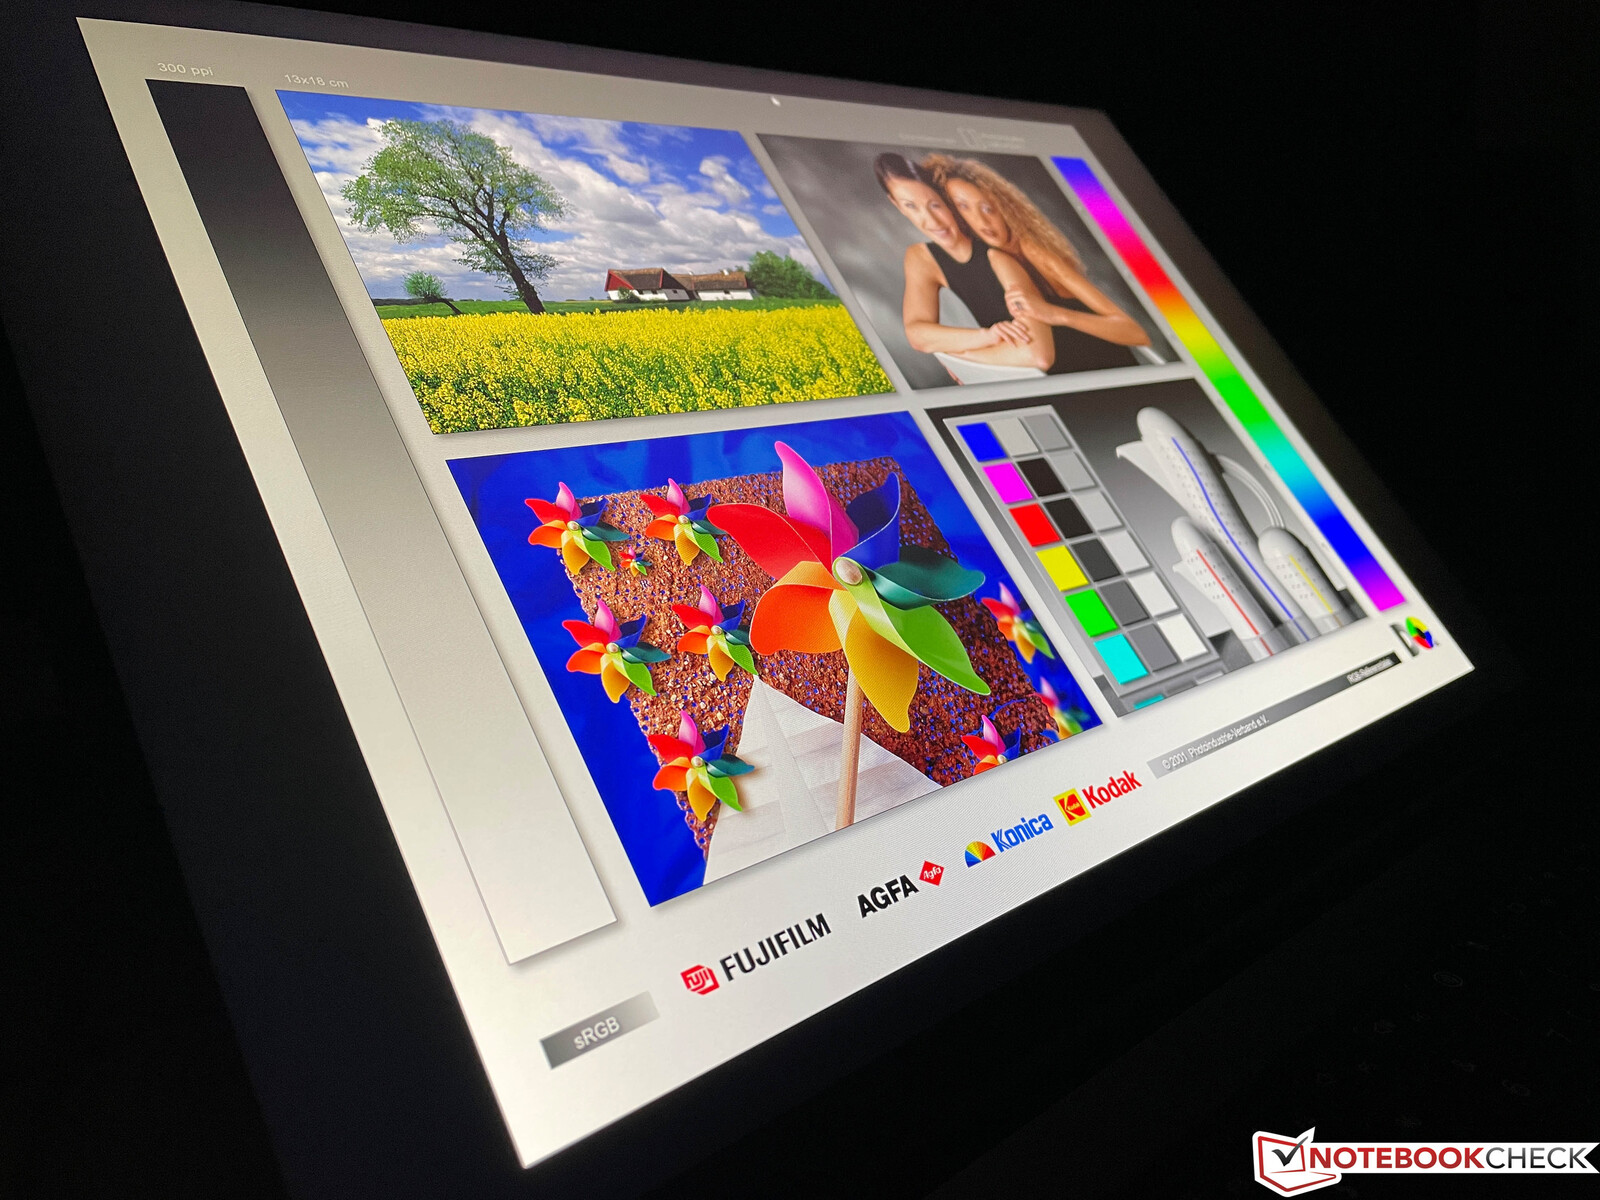
Display - 3:2 IPS panel remains unchanged
We can keep our analysis short when it comes to the display. We are already familiar with the 3:2 16-inch IPS panel from the MateBook 16. In fact, the self-same display screen is used. Subjectively, the image impression is again very good, but our test device is not quite as bright this time (but is still above the advertised 300 cd/m²). The black level is also pleasantly low and ensures a high contrast ratio. The response times are fine, backlight bleeding is not an issue, and we can’t detect any PWM. The viewing angle stability of the IPS panel is also very good.
Given the now higher price, however, we still have a beef with the display panel. Especially given the highly reflective surface, its brightness level should be higher. What’s more, there is no brightness sensor for automatic brightness control and there are no higher 90 or 120 Hz refresh rates.
| |||||||||||||||||||||||||
Brightness Distribution: 91 %
Center on Battery: 309 cd/m²
Contrast: 1829:1 (Black: 0.17 cd/m²)
ΔE ColorChecker Calman: 1 | ∀{0.5-29.43 Ø4.73}
calibrated: 0.8
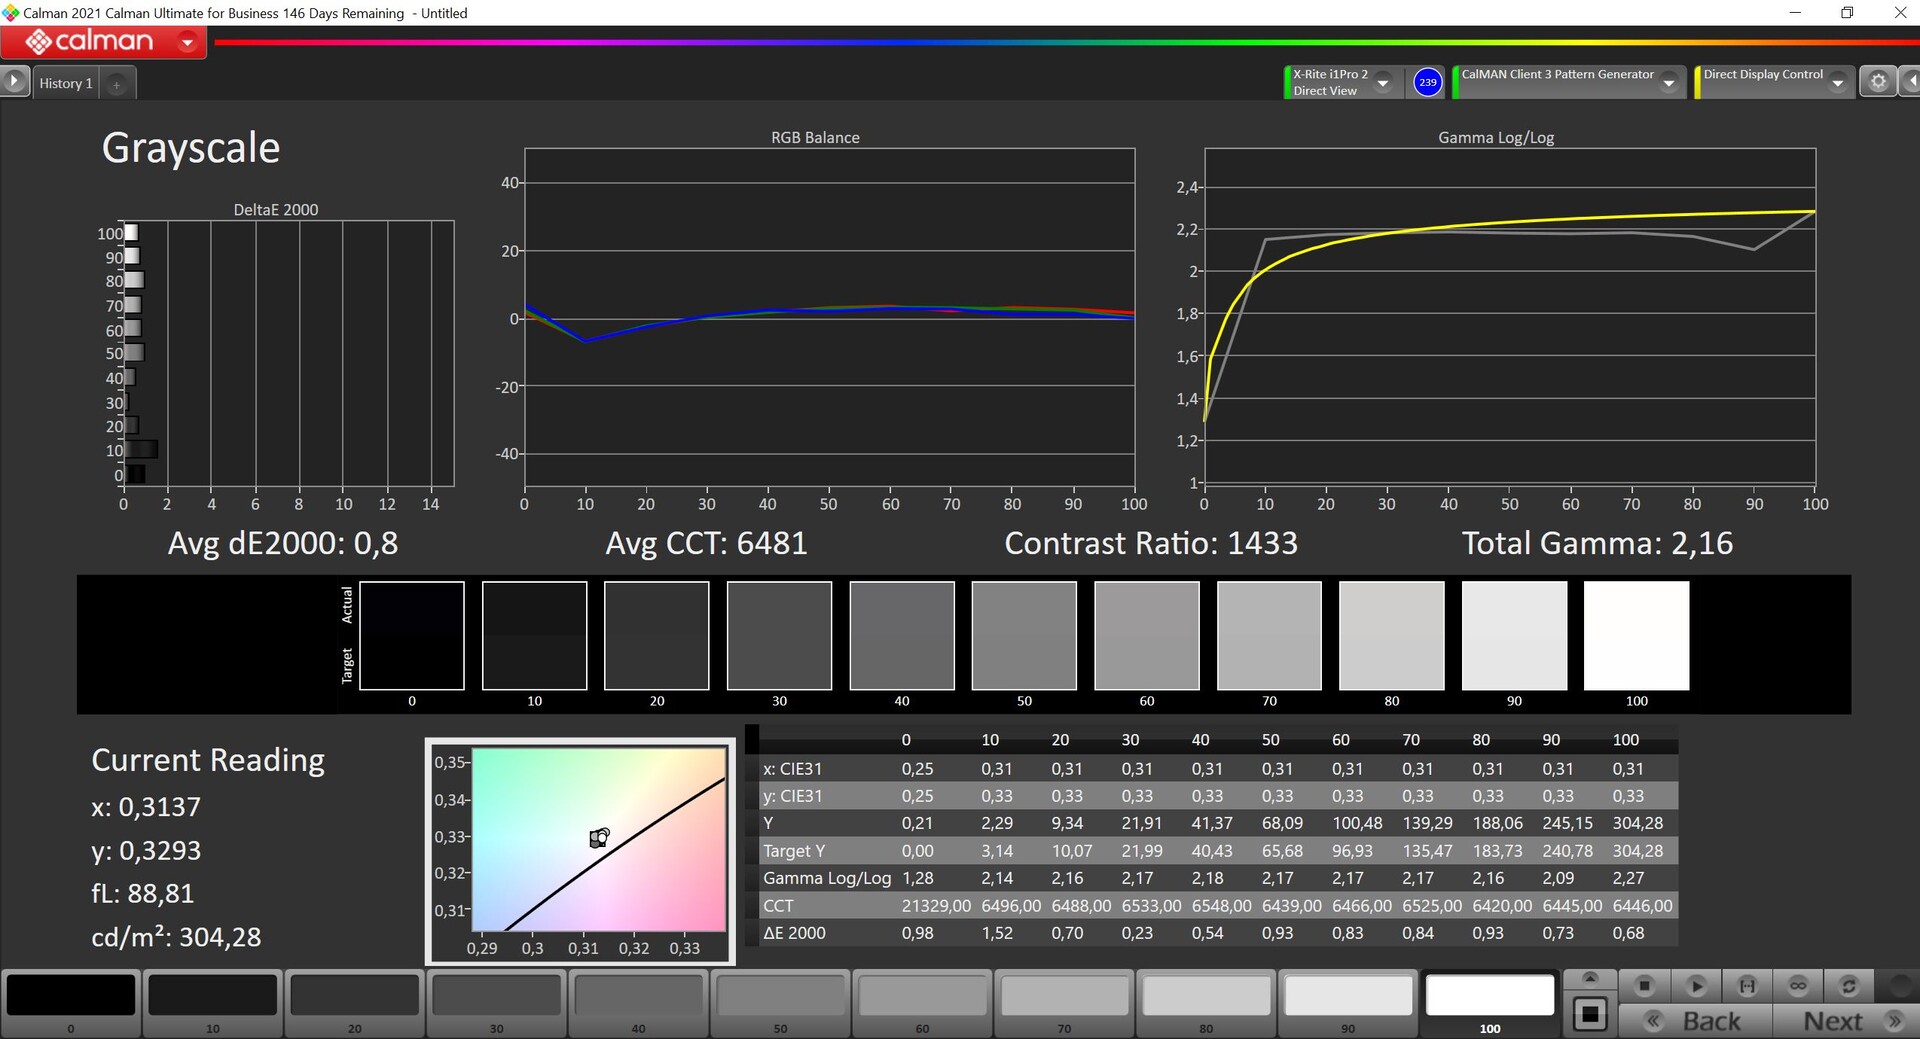
ΔE Greyscale Calman: 1.5 | ∀{0.09-98 Ø4.97}
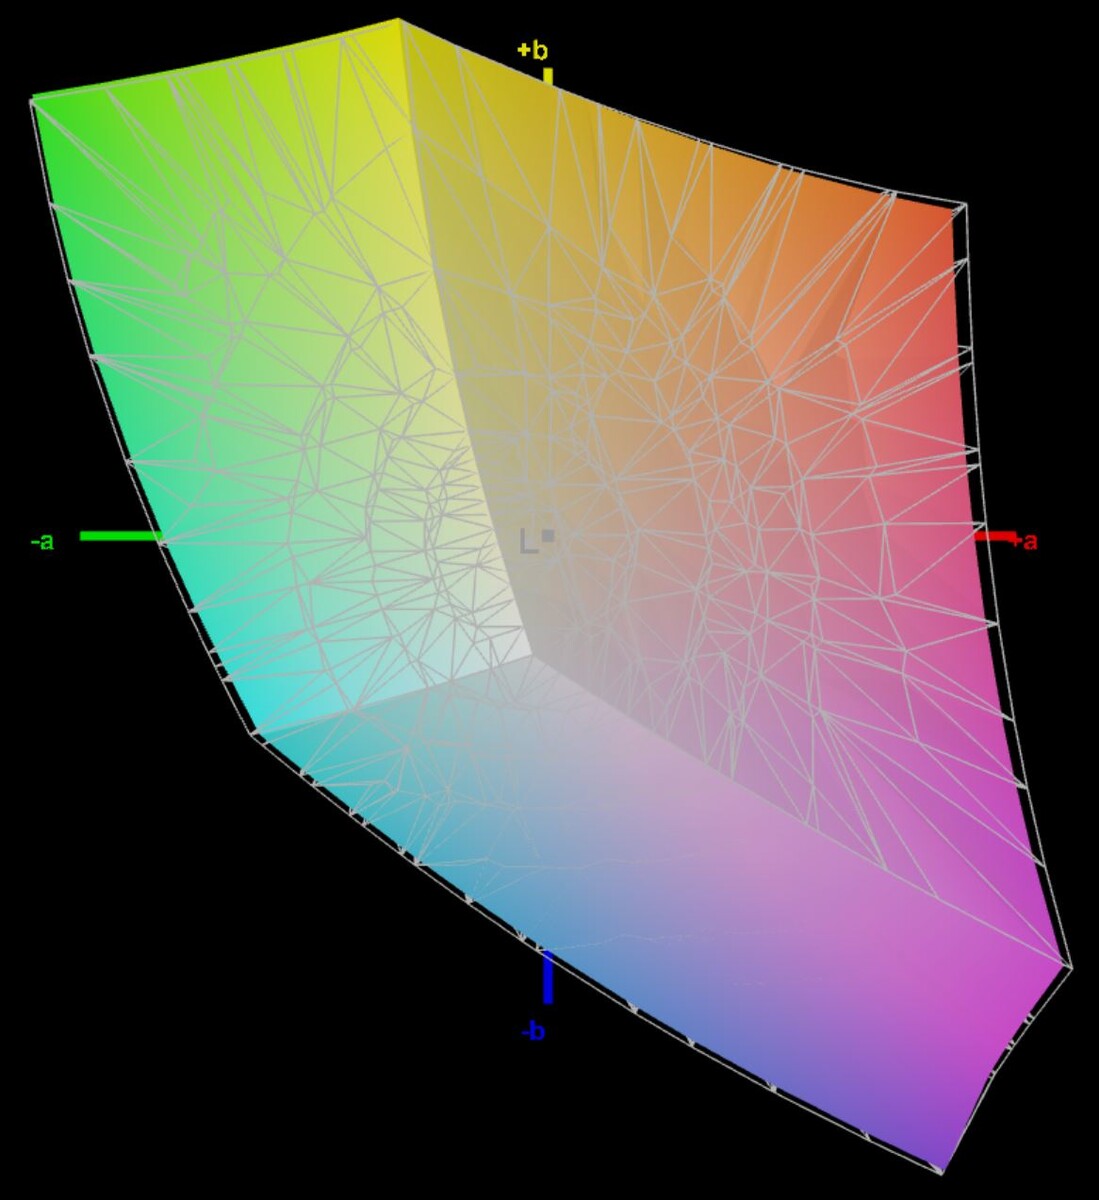
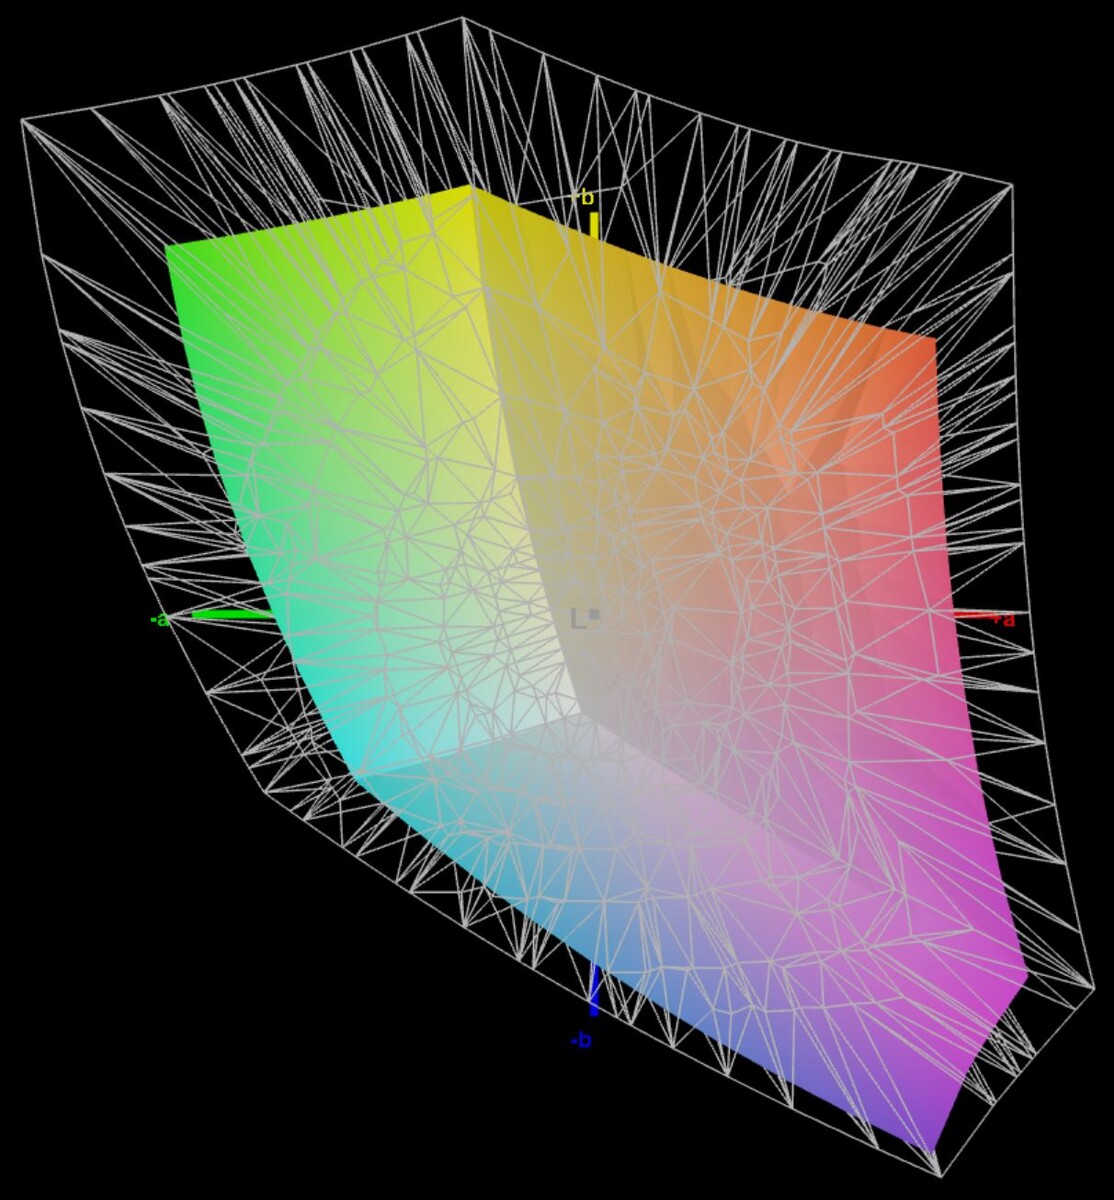
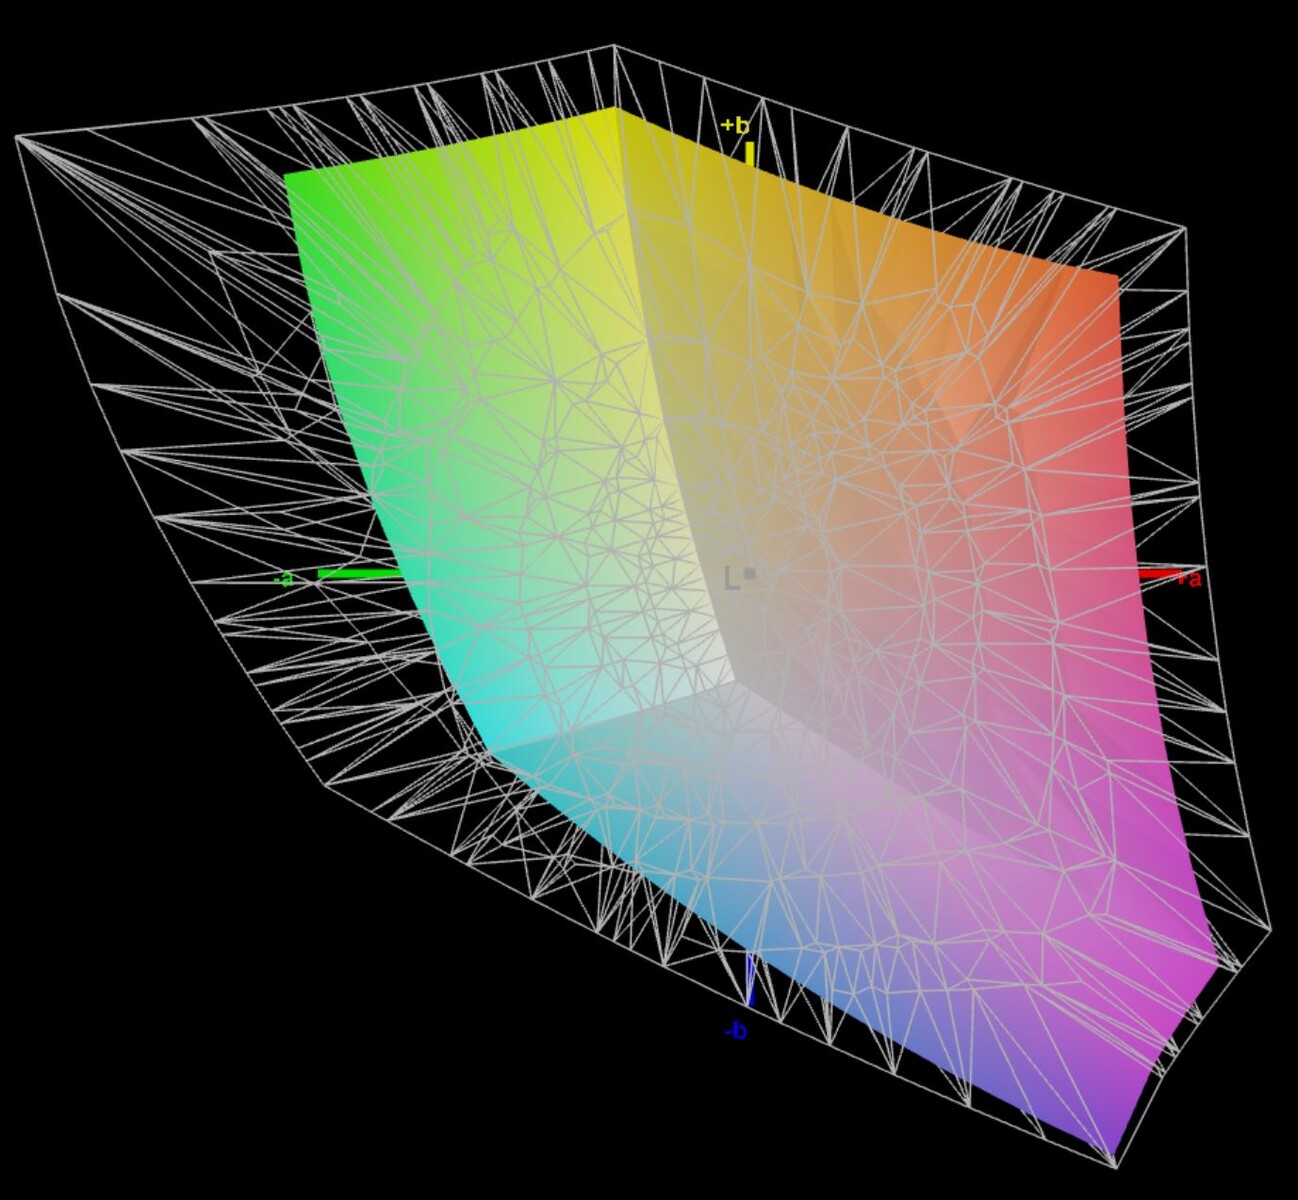
66.6% AdobeRGB 1998 (Argyll 3D)
96.7% sRGB (Argyll 3D)
64.5% Display P3 (Argyll 3D)
Gamma: 2.15
CCT: 6432 K
| Huawei MateBook 16s i7 BOE XS TV160DKT-NH0, IPS, 2520x1680, 16" | Huawei MateBook 16 R7 5800H BOE TV160DKT-NH0, , 2520x1680, 16" | Dell Inspiron 16 7620 2-in-1 BOE NV16N45, IPS, 1920x1200, 16" | Dell XPS 15 9510 i5 11400H FHD Sharp LQ156N1, IPS, 1920x1200, 15.6" | LG Gram 16 (2021) LG Philips LP160WQ1-SPA1, IPS, 2560x1600, 16" | |
|---|---|---|---|---|---|
| Display | -2% | 2% | 16% | 26% | |
| Display P3 Coverage (%) | 64.5 | 63.1 -2% | 67 4% | 80.9 25% | 95.8 49% |
| sRGB Coverage (%) | 96.7 | 94.9 -2% | 95.9 -1% | 100 3% | 99.8 3% |
| AdobeRGB 1998 Coverage (%) | 66.6 | 65.1 -2% | 69.3 4% | 79.1 19% | 83.8 26% |
| Response Times | -15% | 10% | -71% | -5% | |
| Response Time Grey 50% / Grey 80% * (ms) | 35.7 ? | 41.2 ? -15% | 32 ? 10% | 62.4 ? -75% | 44 ? -23% |
| Response Time Black / White * (ms) | 23.2 ? | 26.4 ? -14% | 20.8 ? 10% | 38.8 ? -67% | 20 ? 14% |
| PWM Frequency (Hz) | |||||
| Screen | -25% | -133% | -85% | -172% | |
| Brightness middle (cd/m²) | 311 | 357 15% | 320.7 3% | 632 103% | 331 6% |
| Brightness (cd/m²) | 319 | 349 9% | 309 -3% | 606 90% | 309 -3% |
| Brightness Distribution (%) | 91 | 93 2% | 90 -1% | 91 0% | 88 -3% |
| Black Level * (cd/m²) | 0.17 | 0.21 -24% | 0.36 -112% | 0.29 -71% | 0.22 -29% |
| Contrast (:1) | 1829 | 1700 -7% | 891 -51% | 2179 19% | 1505 -18% |
| Colorchecker dE 2000 * | 1 | 1.6 -60% | 4.18 -318% | 3.5 -250% | 4.64 -364% |
| Colorchecker dE 2000 max. * | 1.7 | 3.9 -129% | 8.48 -399% | 6.4 -276% | 9.82 -478% |
| Colorchecker dE 2000 calibrated * | 0.8 | 0.6 25% | 0.77 4% | 2 -150% | 3.16 -295% |
| Greyscale dE 2000 * | 1.5 | 2.4 -60% | 6.3 -320% | 5 -233% | 6.9 -360% |
| Gamma | 2.15 102% | 2.14 103% | 2.21 100% | 2.26 97% | 2.34 94% |
| CCT | 6432 101% | 6728 97% | 6258 104% | 7033 92% | 7904 82% |
| Color Space (Percent of AdobeRGB 1998) (%) | 75.1 | ||||
| Color Space (Percent of sRGB) (%) | 100 | ||||
| Total Average (Program / Settings) | -14% /
-19% | -40% /
-84% | -47% /
-62% | -50% /
-105% |
* ... smaller is better
According to Huawei, all display panels are factory calibrated and we can confirm that. Our analysis using professional CalMAN software (X-Rite i1 Pro 2) shows just very minor deviations as delivered ex-factory; both for the colors and the grayscale. There are also no issues with color temperature or color cast.
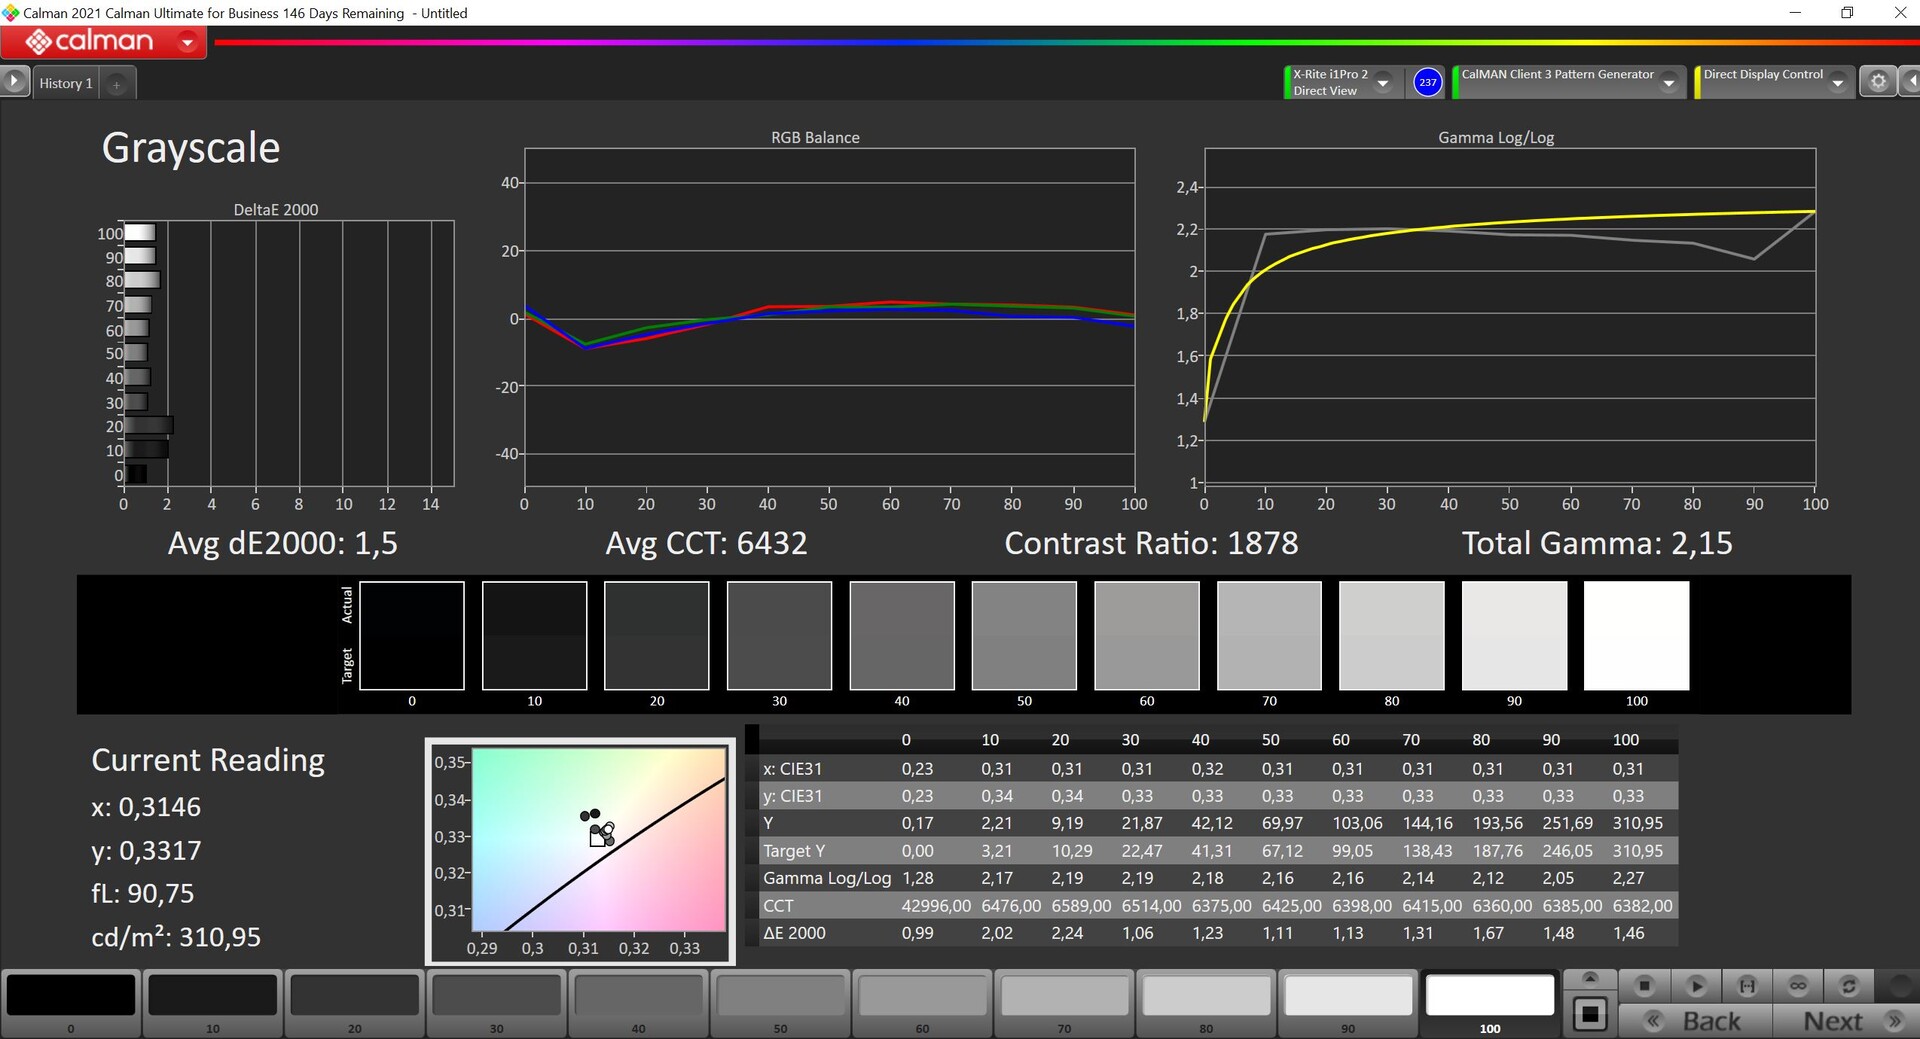
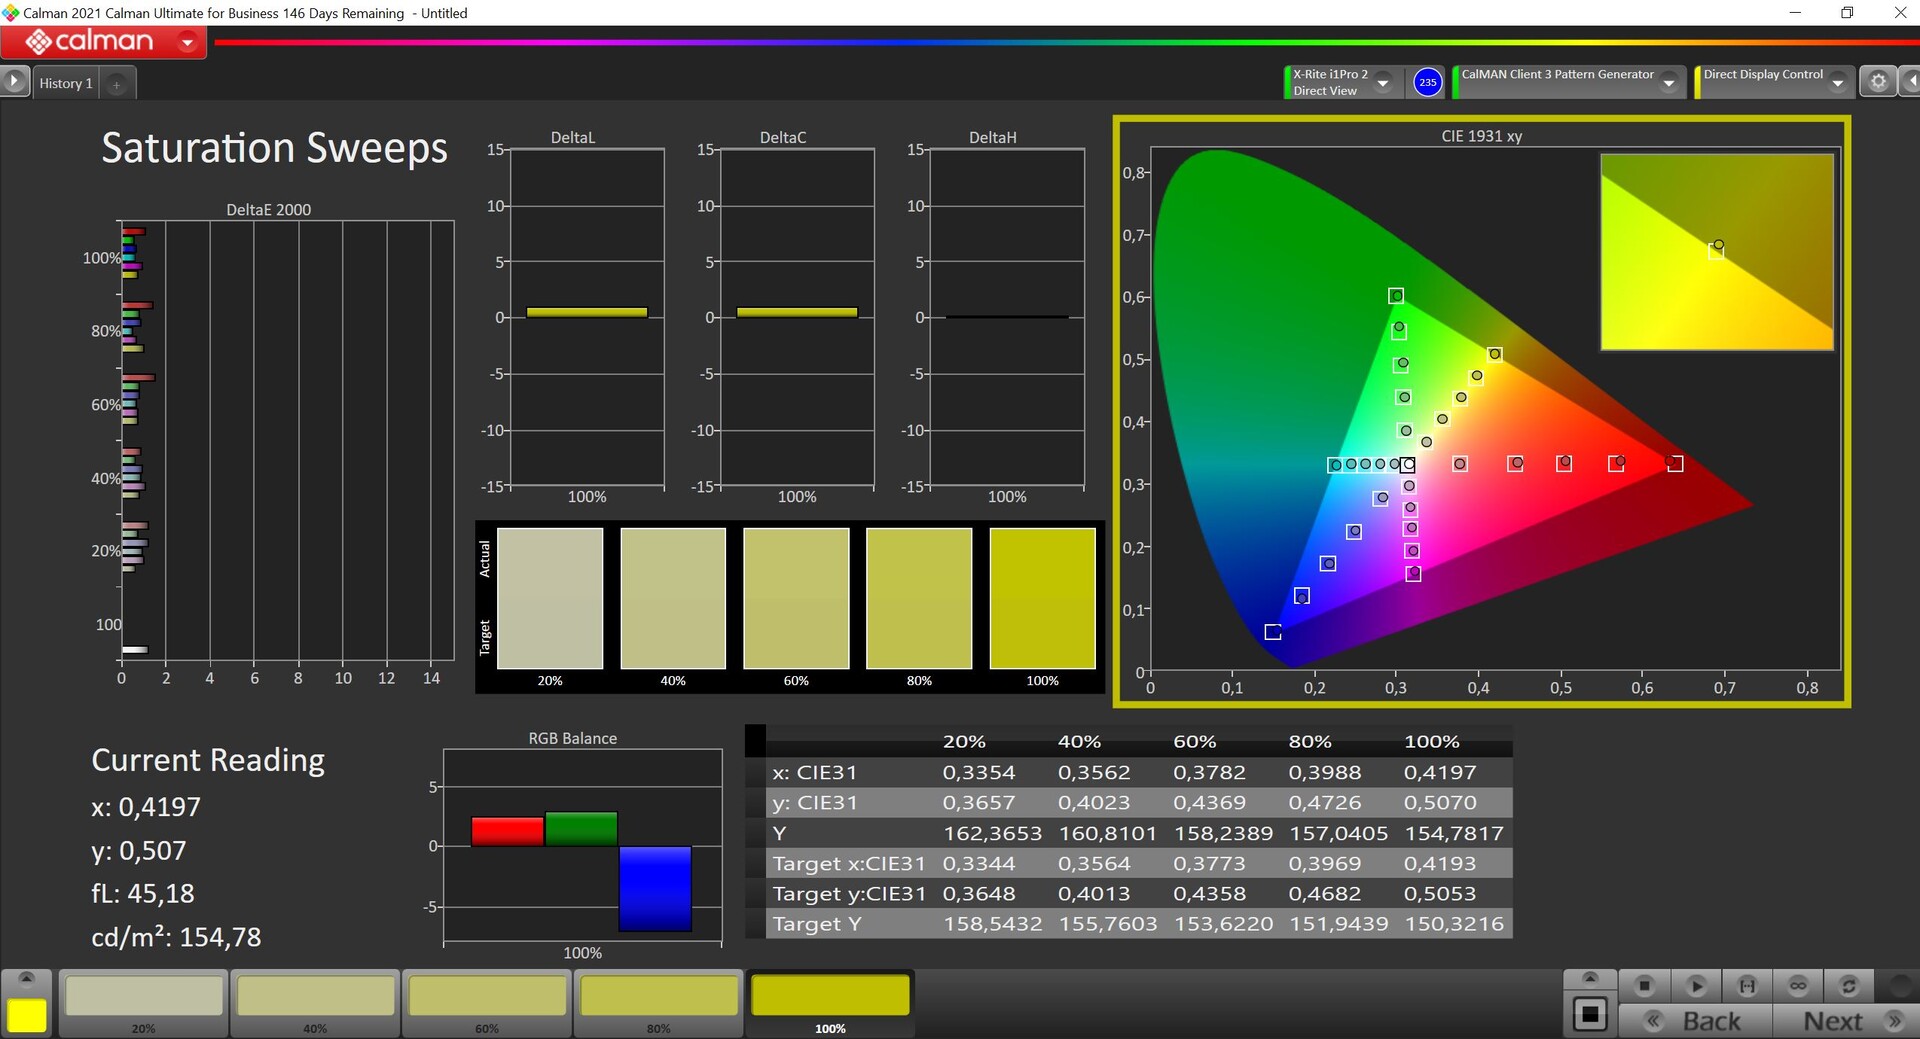
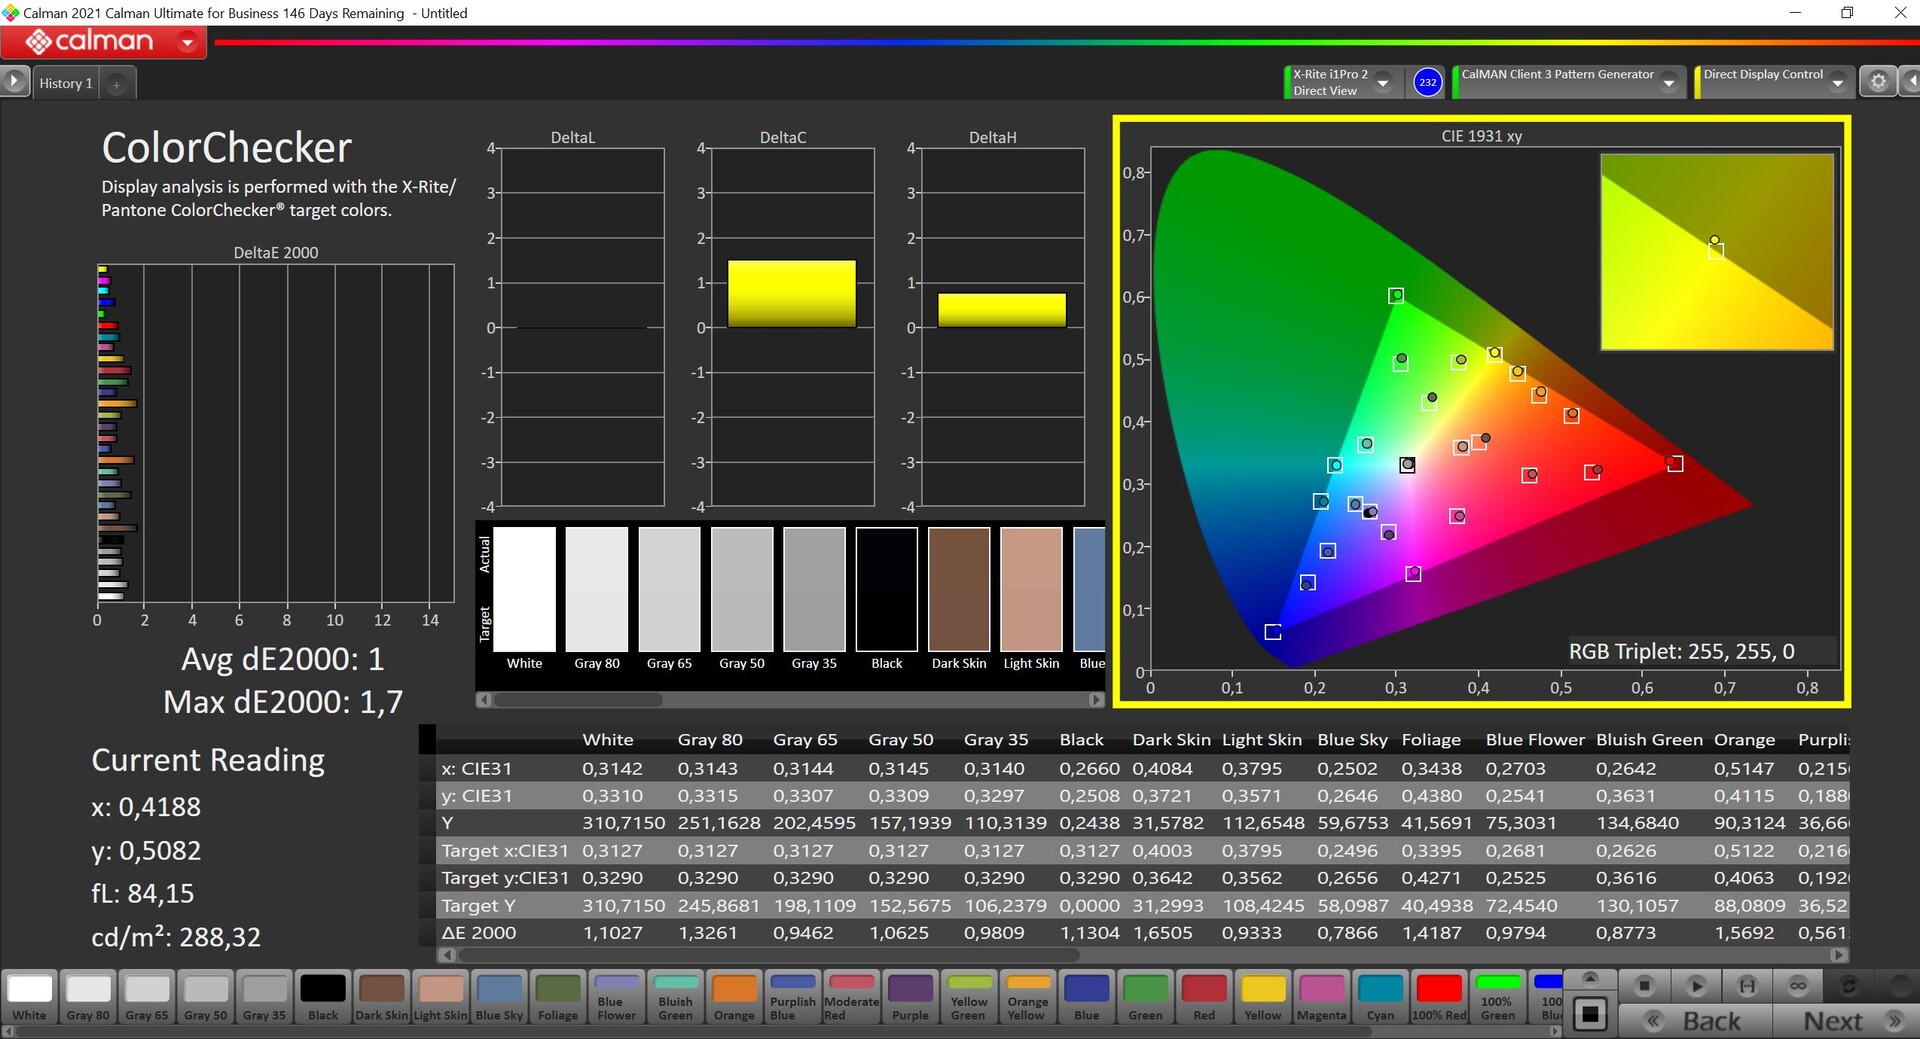
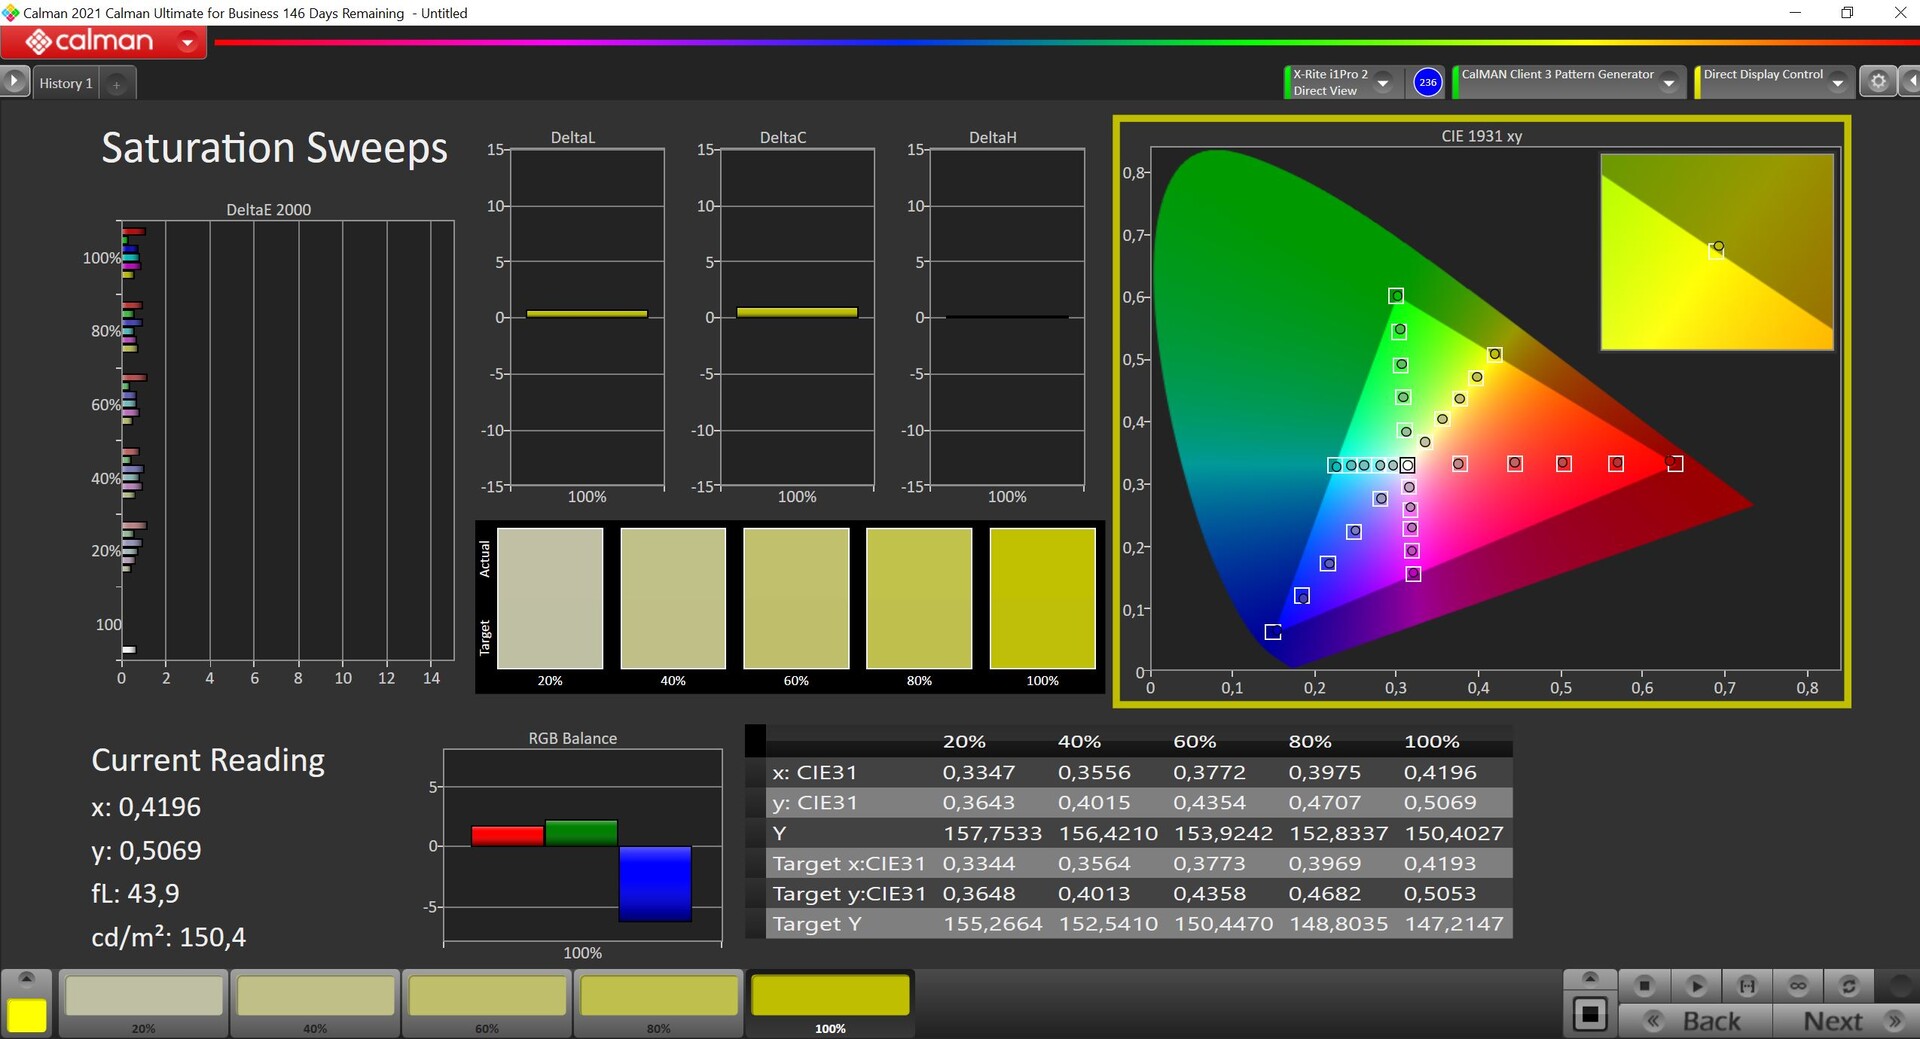
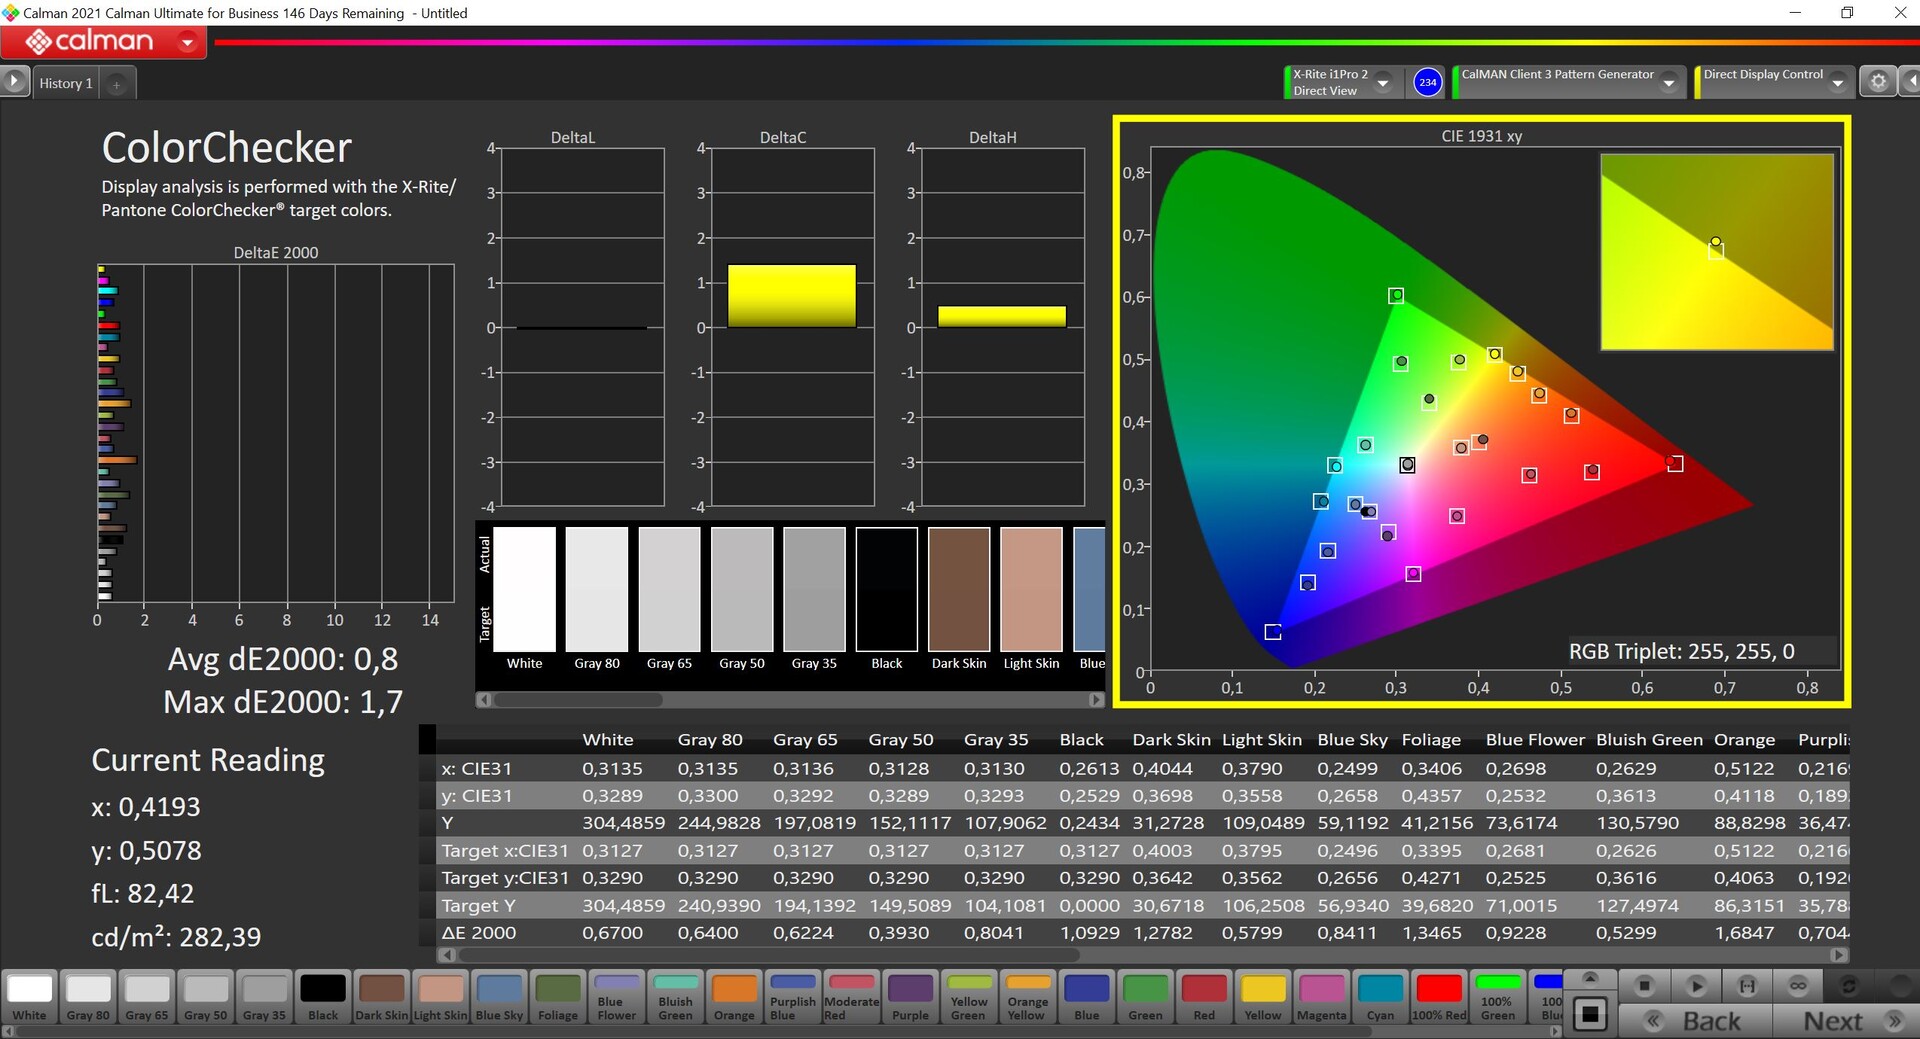
With our own calibration software (our profile is available for free download above) we could only improve rendition very slightly. Any difference is indiscernible to the naked eye. However, this display panel once again only delivers the smaller sRGB color space.
Display Response Times
| ↔ Response Time Black to White | ||
|---|---|---|
| 23.2 ms ... rise ↗ and fall ↘ combined | ↗ 12.6 ms rise | 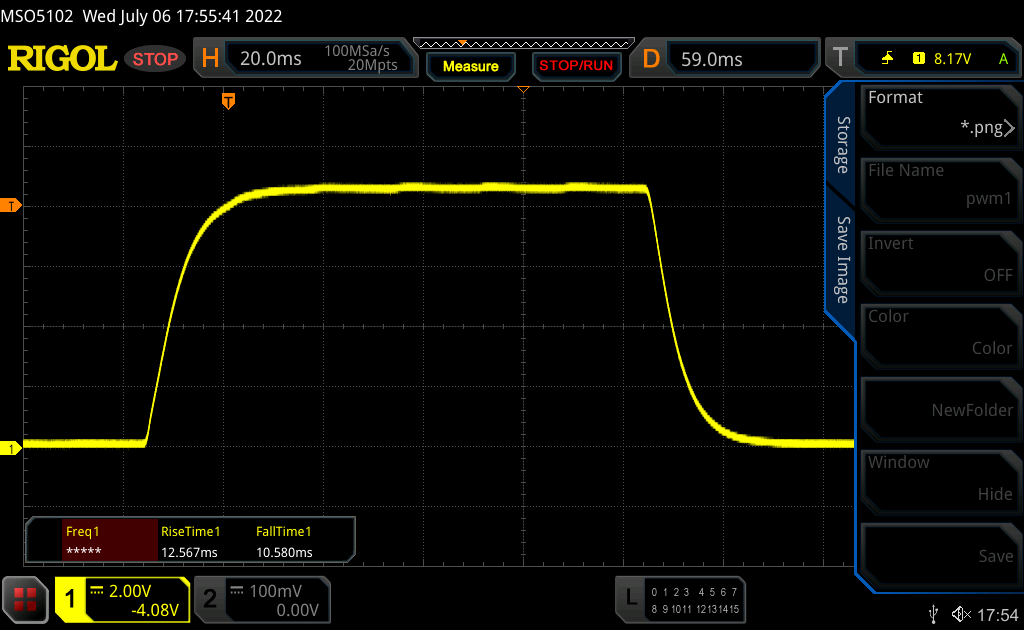 |
| ↘ 10.6 ms fall | ||
| The screen shows good response rates in our tests, but may be too slow for competitive gamers. In comparison, all tested devices range from 0.1 (minimum) to 240 (maximum) ms. » 53 % of all devices are better. This means that the measured response time is worse than the average of all tested devices (19.9 ms). | ||
| ↔ Response Time 50% Grey to 80% Grey | ||
| 35.7 ms ... rise ↗ and fall ↘ combined | ↗ 16.8 ms rise |  |
| ↘ 18.9 ms fall | ||
| The screen shows slow response rates in our tests and will be unsatisfactory for gamers. In comparison, all tested devices range from 0.165 (minimum) to 636 (maximum) ms. » 50 % of all devices are better. This means that the measured response time is worse than the average of all tested devices (31.1 ms). | ||
Screen Flickering / PWM (Pulse-Width Modulation)
| Screen flickering / PWM not detected |  | ||
In comparison: 52 % of all tested devices do not use PWM to dim the display. If PWM was detected, an average of 7798 (minimum: 5 - maximum: 343500) Hz was measured. | |||
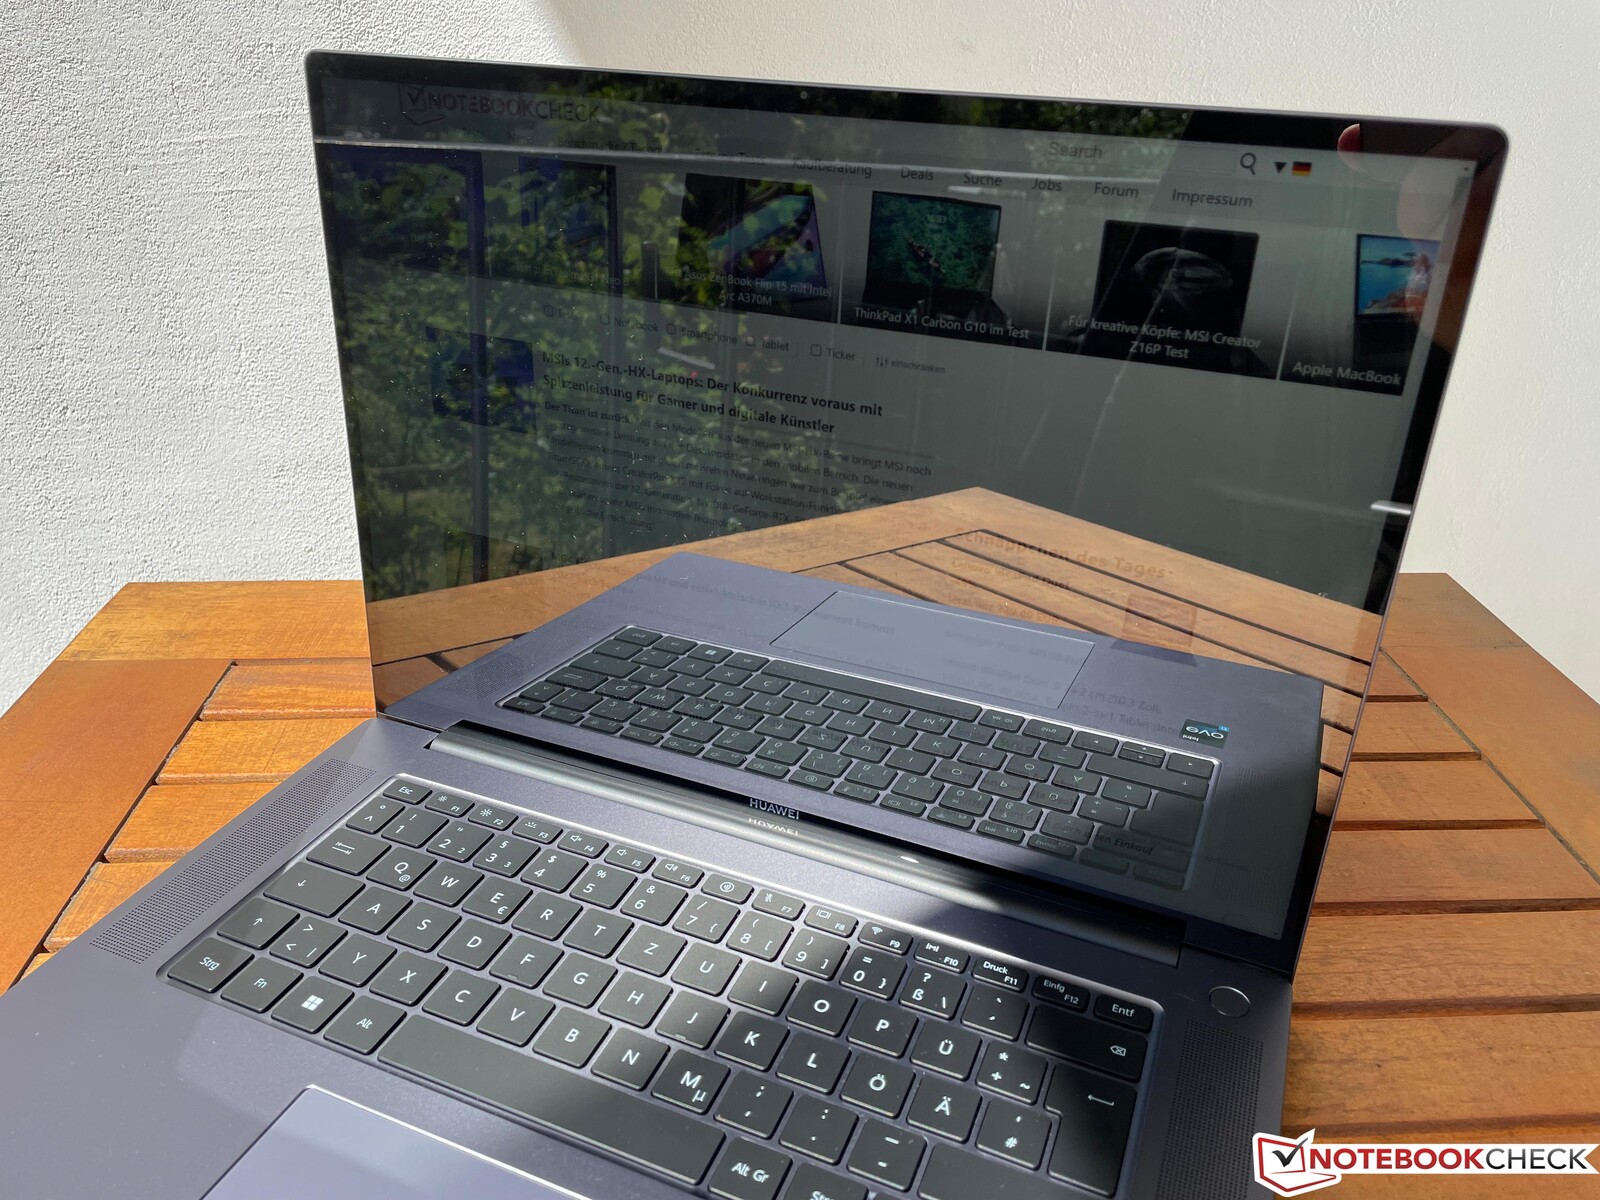
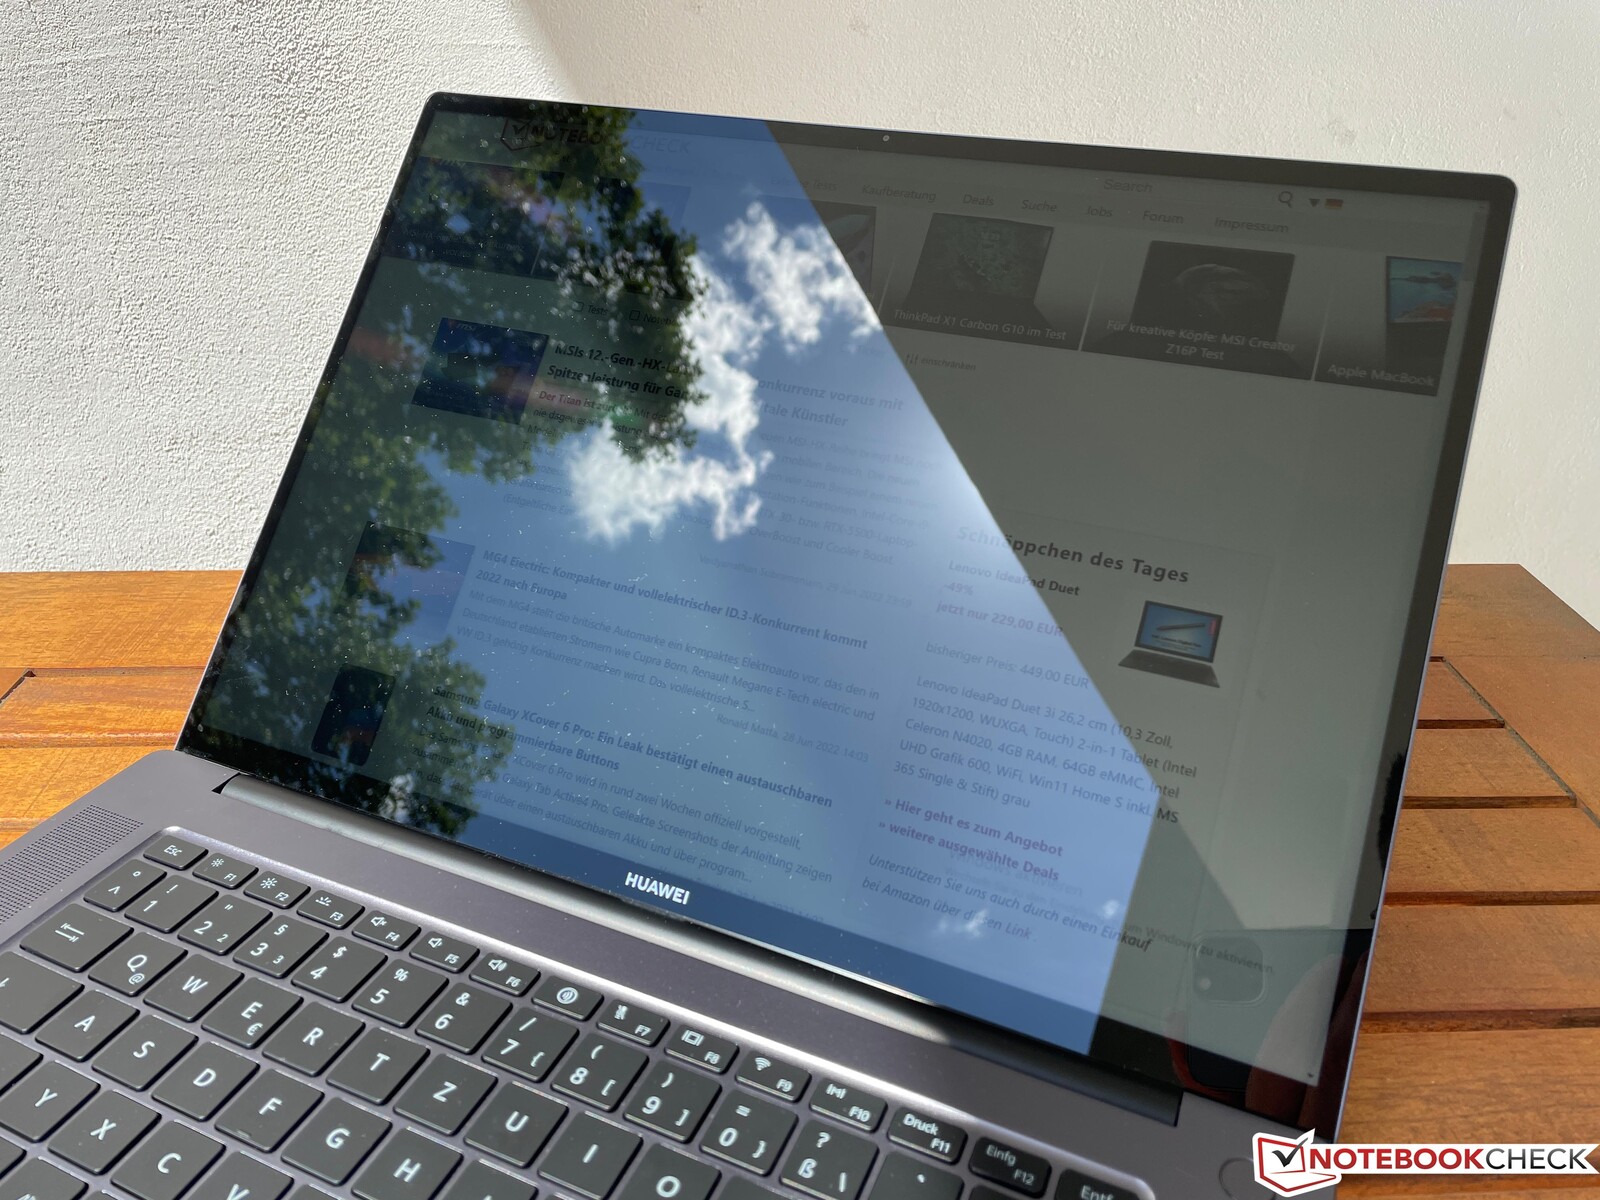
The MateBook 16s doesn’t feel very confident outdoors. The screen is highly reflective and with just over 300 cd/m² its brightness is just not high enough. Even in the absence of direct light sources, it can be difficult to avoid reflections and still recognize the content to any reasonable degree.
Performance - MateBook with Intel Alder Lake
Testing Conditions
The pre-installed PC Manager has an optional power mode, which can also be activated by keyboard shortcut Fn+P. In power mode, the PL1 value (stands for permanent load) is increased from 45 to 54 watts. However, since the processor can also consume up to 96 watts in normal mode, the difference in everyday use is not particularly noticeable. Little (if any) advantage is to be expected even if you're stressing CPU cores exclusively, something we will demonstrate below. In principle, we performed the following benchmarks and measurements in normal mode.
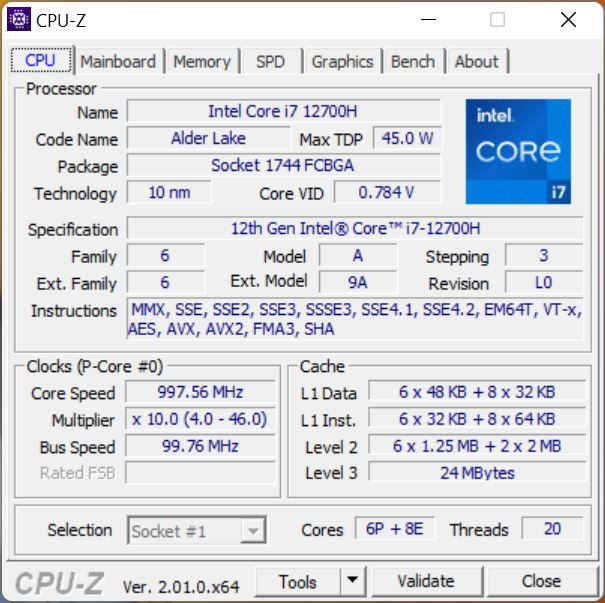
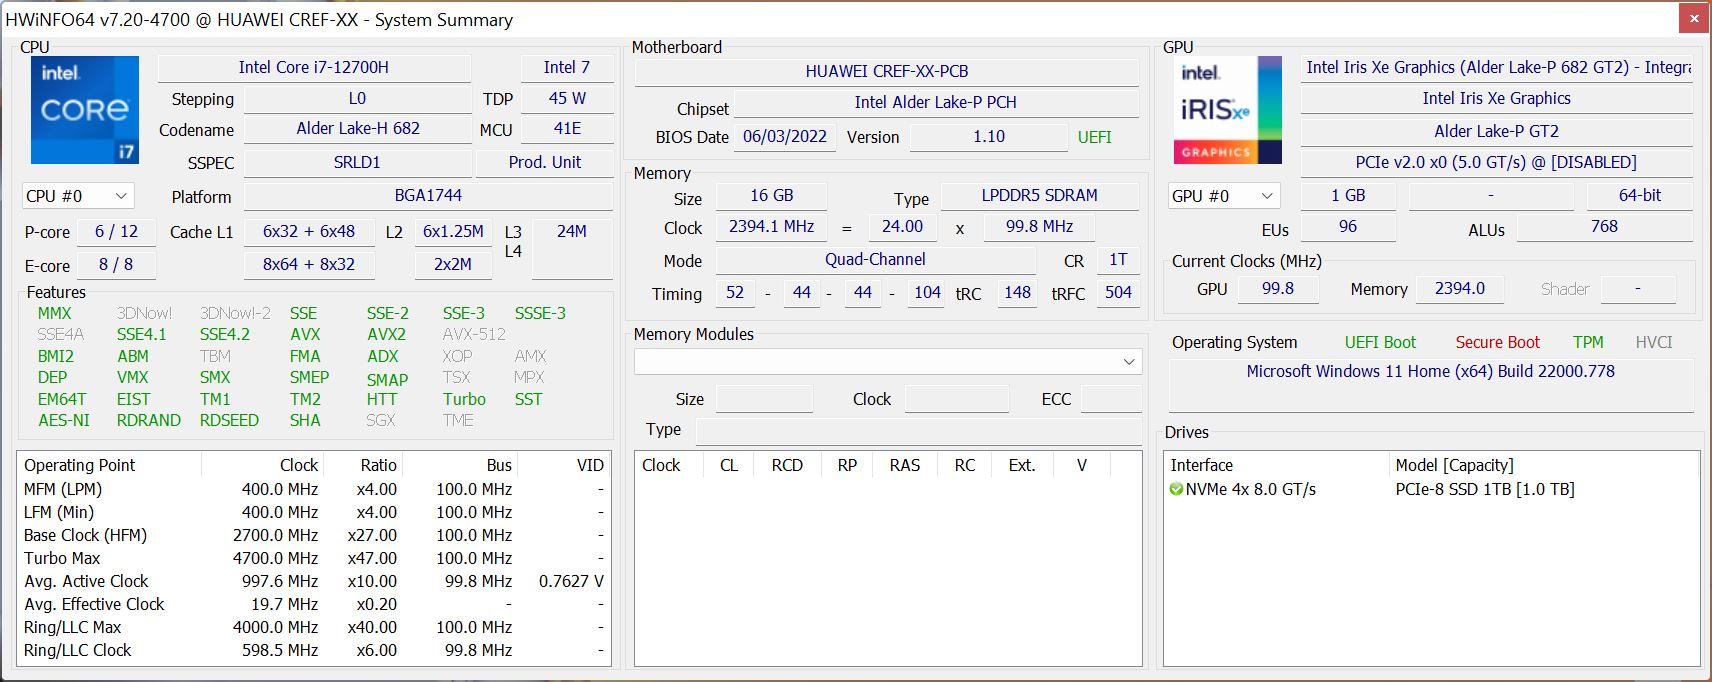
Processor - Core i7 12700H
The Intel Core i7-12700H belongs to the current 12th generation (Alder Lake) and offers a hybrid architecture using both performance and efficiency cores. We have already tested this processor several times, all further technical information is available here. The Core i7 is set to consume a maximum of 96 watts and then settles down to 54 watts.
In the Cinebench loop, it’s quite evident that performance drops noticeably after a few runs and that there is hardly any performance difference to the old MateBook 16 with the Ryzen 7 5800H. What’s more, the difference with performance mode enabled is very small and, in our opinion, does not justify the higher fan noise.
Cinebench R15 score
In the benchmarks, the MateBook 16s naturally benefits from the high power limits and can achieve good results. The single-core performance of the new performance cores is also very good, but this is at the expense of higher power consumption of almost 30 watts (single-core).
In battery mode, the power consumption of the processor is reduced to 40 watts, which only affects the multi-core performance (-25%). More CPU benchmarks are available in our Tech section.
Cinebench R23: Multi Core | Single Core
Cinebench R20: CPU (Multi Core) | CPU (Single Core)
Cinebench R15: CPU Multi 64Bit | CPU Single 64Bit
Blender: v2.79 BMW27 CPU
7-Zip 18.03: 7z b 4 | 7z b 4 -mmt1
Geekbench 5.5: Multi-Core | Single-Core
HWBOT x265 Benchmark v2.2: 4k Preset
LibreOffice : 20 Documents To PDF
R Benchmark 2.5: Overall mean
| CPU Performance rating | |
| Average of class Multimedia | |
| Huawei MateBook 16s i7 | |
| Average Intel Core i7-12700H | |
| Huawei MateBook 16 R7 5800H | |
| Dell Inspiron 16 7620 2-in-1 | |
| Dell XPS 15 9510 i5 11400H FHD | |
| LG Gram 16 (2021) | |
| Cinebench R23 / Multi Core | |
| Average of class Multimedia (4861 - 33362, n=81, last 2 years) | |
| Average Intel Core i7-12700H (4032 - 19330, n=64) | |
| Huawei MateBook 16s i7 | |
| Huawei MateBook 16 R7 5800H | |
| Dell Inspiron 16 7620 2-in-1 | |
| Dell XPS 15 9510 i5 11400H FHD | |
| LG Gram 16 (2021) | |
| Cinebench R23 / Single Core | |
| Average of class Multimedia (1128 - 2459, n=73, last 2 years) | |
| Huawei MateBook 16s i7 | |
| Average Intel Core i7-12700H (778 - 1826, n=63) | |
| Dell Inspiron 16 7620 2-in-1 | |
| Dell XPS 15 9510 i5 11400H FHD | |
| Huawei MateBook 16 R7 5800H | |
| LG Gram 16 (2021) | |
| Cinebench R20 / CPU (Multi Core) | |
| Average of class Multimedia (1887 - 12912, n=64, last 2 years) | |
| Average Intel Core i7-12700H (1576 - 7407, n=64) | |
| Huawei MateBook 16s i7 | |
| Huawei MateBook 16 R7 5800H | |
| Dell Inspiron 16 7620 2-in-1 | |
| Dell XPS 15 9510 i5 11400H FHD | |
| LG Gram 16 (2021) | |
| Cinebench R20 / CPU (Single Core) | |
| Average of class Multimedia (425 - 853, n=64, last 2 years) | |
| Huawei MateBook 16s i7 | |
| Average Intel Core i7-12700H (300 - 704, n=64) | |
| Dell Inspiron 16 7620 2-in-1 | |
| Dell XPS 15 9510 i5 11400H FHD | |
| LG Gram 16 (2021) | |
| Huawei MateBook 16 R7 5800H | |
| Cinebench R15 / CPU Multi 64Bit | |
| Average of class Multimedia (856 - 5224, n=68, last 2 years) | |
| Huawei MateBook 16s i7 | |
| Huawei MateBook 16s i7 | |
| Average Intel Core i7-12700H (1379 - 2916, n=70) | |
| Huawei MateBook 16 R7 5800H | |
| Dell Inspiron 16 7620 2-in-1 | |
| Dell XPS 15 9510 i5 11400H FHD | |
| Dell XPS 15 9510 i5 11400H FHD | |
| LG Gram 16 (2021) | |
| Cinebench R15 / CPU Single 64Bit | |
| Average of class Multimedia (184.8 - 326, n=66, last 2 years) | |
| Huawei MateBook 16s i7 | |
| Average Intel Core i7-12700H (113 - 263, n=65) | |
| Dell Inspiron 16 7620 2-in-1 | |
| Huawei MateBook 16 R7 5800H | |
| Dell XPS 15 9510 i5 11400H FHD | |
| LG Gram 16 (2021) | |
| Blender / v2.79 BMW27 CPU | |
| LG Gram 16 (2021) | |
| Dell XPS 15 9510 i5 11400H FHD | |
| Dell Inspiron 16 7620 2-in-1 | |
| Huawei MateBook 16 R7 5800H | |
| Average of class Multimedia (100 - 557, n=65, last 2 years) | |
| Huawei MateBook 16s i7 | |
| Average Intel Core i7-12700H (168 - 732, n=63) | |
| 7-Zip 18.03 / 7z b 4 | |
| Average Intel Core i7-12700H (22844 - 73067, n=63) | |
| Average of class Multimedia (29095 - 130368, n=62, last 2 years) | |
| Huawei MateBook 16s i7 | |
| Huawei MateBook 16 R7 5800H | |
| Dell Inspiron 16 7620 2-in-1 | |
| Dell XPS 15 9510 i5 11400H FHD | |
| LG Gram 16 (2021) | |
| 7-Zip 18.03 / 7z b 4 -mmt1 | |
| Average of class Multimedia (3666 - 7545, n=63, last 2 years) | |
| Huawei MateBook 16s i7 | |
| Average Intel Core i7-12700H (2743 - 5972, n=63) | |
| Huawei MateBook 16 R7 5800H | |
| Dell Inspiron 16 7620 2-in-1 | |
| LG Gram 16 (2021) | |
| Dell XPS 15 9510 i5 11400H FHD | |
| Geekbench 5.5 / Multi-Core | |
| Huawei MateBook 16s i7 | |
| Average of class Multimedia (4652 - 20422, n=62, last 2 years) | |
| Average Intel Core i7-12700H (5144 - 13745, n=64) | |
| Huawei MateBook 16 R7 5800H | |
| Dell Inspiron 16 7620 2-in-1 | |
| Dell XPS 15 9510 i5 11400H FHD | |
| LG Gram 16 (2021) | |
| Geekbench 5.5 / Single-Core | |
| Average of class Multimedia (805 - 2974, n=62, last 2 years) | |
| Huawei MateBook 16s i7 | |
| Average Intel Core i7-12700H (803 - 1851, n=64) | |
| Dell Inspiron 16 7620 2-in-1 | |
| LG Gram 16 (2021) | |
| Dell XPS 15 9510 i5 11400H FHD | |
| Huawei MateBook 16 R7 5800H | |
| HWBOT x265 Benchmark v2.2 / 4k Preset | |
| Average of class Multimedia (5.26 - 36.1, n=63, last 2 years) | |
| Average Intel Core i7-12700H (4.67 - 21.8, n=64) | |
| Huawei MateBook 16s i7 | |
| Huawei MateBook 16 R7 5800H | |
| Dell Inspiron 16 7620 2-in-1 | |
| Dell XPS 15 9510 i5 11400H FHD | |
| LG Gram 16 (2021) | |
| LibreOffice / 20 Documents To PDF | |
| Average of class Multimedia (23.9 - 146.7, n=64, last 2 years) | |
| Huawei MateBook 16 R7 5800H | |
| Dell Inspiron 16 7620 2-in-1 | |
| Dell XPS 15 9510 i5 11400H FHD | |
| Average Intel Core i7-12700H (34.2 - 95.3, n=63) | |
| LG Gram 16 (2021) | |
| Huawei MateBook 16s i7 | |
| R Benchmark 2.5 / Overall mean | |
| LG Gram 16 (2021) | |
| Dell XPS 15 9510 i5 11400H FHD | |
| Huawei MateBook 16 R7 5800H | |
| Dell Inspiron 16 7620 2-in-1 | |
| Average Intel Core i7-12700H (0.4441 - 1.052, n=63) | |
| Average of class Multimedia (0.3604 - 0.947, n=63, last 2 years) | |
| Huawei MateBook 16s i7 | |
* ... smaller is better
AIDA64: FP32 Ray-Trace | FPU Julia | CPU SHA3 | CPU Queen | FPU SinJulia | FPU Mandel | CPU AES | CPU ZLib | FP64 Ray-Trace | CPU PhotoWorxx
| Performance rating | |
| Average of class Multimedia | |
| Huawei MateBook 16 R7 5800H | |
| Average Intel Core i7-12700H | |
| Huawei MateBook 16s i7 | |
| Dell Inspiron 16 7620 2-in-1 | |
| LG Gram 16 (2021) | |
| Dell XPS 15 9510 i5 11400H FHD -9! | |
| AIDA64 / FP32 Ray-Trace | |
| Average of class Multimedia (2214 - 50388, n=60, last 2 years) | |
| Huawei MateBook 16 R7 5800H | |
| Average Intel Core i7-12700H (2585 - 17957, n=64) | |
| Huawei MateBook 16s i7 | |
| Dell Inspiron 16 7620 2-in-1 | |
| LG Gram 16 (2021) | |
| AIDA64 / FPU Julia | |
| Huawei MateBook 16 R7 5800H | |
| Average of class Multimedia (12867 - 201874, n=61, last 2 years) | |
| Average Intel Core i7-12700H (12439 - 90760, n=64) | |
| Huawei MateBook 16s i7 | |
| Dell Inspiron 16 7620 2-in-1 | |
| LG Gram 16 (2021) | |
| AIDA64 / CPU SHA3 | |
| Average of class Multimedia (653 - 8623, n=61, last 2 years) | |
| Average Intel Core i7-12700H (833 - 4242, n=64) | |
| Huawei MateBook 16 R7 5800H | |
| Huawei MateBook 16s i7 | |
| Dell Inspiron 16 7620 2-in-1 | |
| LG Gram 16 (2021) | |
| AIDA64 / CPU Queen | |
| Average Intel Core i7-12700H (57923 - 103202, n=63) | |
| Huawei MateBook 16 R7 5800H | |
| Huawei MateBook 16s i7 | |
| Average of class Multimedia (13483 - 181505, n=49, last 2 years) | |
| Dell Inspiron 16 7620 2-in-1 | |
| LG Gram 16 (2021) | |
| AIDA64 / FPU SinJulia | |
| Huawei MateBook 16 R7 5800H | |
| Average of class Multimedia (1240 - 28794, n=61, last 2 years) | |
| Average Intel Core i7-12700H (3249 - 9939, n=64) | |
| Huawei MateBook 16s i7 | |
| Dell Inspiron 16 7620 2-in-1 | |
| LG Gram 16 (2021) | |
| AIDA64 / FPU Mandel | |
| Huawei MateBook 16 R7 5800H | |
| Average of class Multimedia (6395 - 105740, n=60, last 2 years) | |
| Average Intel Core i7-12700H (7135 - 44760, n=64) | |
| Huawei MateBook 16s i7 | |
| Dell Inspiron 16 7620 2-in-1 | |
| LG Gram 16 (2021) | |
| AIDA64 / CPU AES | |
| Huawei MateBook 16 R7 5800H | |
| Average Intel Core i7-12700H (31839 - 144360, n=64) | |
| Huawei MateBook 16s i7 | |
| Average of class Multimedia (13243 - 126790, n=61, last 2 years) | |
| LG Gram 16 (2021) | |
| Dell Inspiron 16 7620 2-in-1 | |
| AIDA64 / CPU ZLib | |
| Average of class Multimedia (167.2 - 2022, n=61, last 2 years) | |
| Average Intel Core i7-12700H (305 - 1171, n=64) | |
| Huawei MateBook 16 R7 5800H | |
| Huawei MateBook 16s i7 | |
| Dell Inspiron 16 7620 2-in-1 | |
| LG Gram 16 (2021) | |
| Dell XPS 15 9510 i5 11400H FHD | |
| AIDA64 / FP64 Ray-Trace | |
| Average of class Multimedia (1014 - 26875, n=61, last 2 years) | |
| Huawei MateBook 16 R7 5800H | |
| Average Intel Core i7-12700H (1437 - 9692, n=64) | |
| Huawei MateBook 16s i7 | |
| Dell Inspiron 16 7620 2-in-1 | |
| LG Gram 16 (2021) | |
| AIDA64 / CPU PhotoWorxx | |
| Average of class Multimedia (12860 - 88154, n=61, last 2 years) | |
| LG Gram 16 (2021) | |
| Huawei MateBook 16s i7 | |
| Average Intel Core i7-12700H (12863 - 52207, n=64) | |
| Dell Inspiron 16 7620 2-in-1 | |
| Huawei MateBook 16 R7 5800H | |
System Performance
The MateBook 16s is a responsive system in everyday use, but subjectively there is no difference to the old MateBook 16 and in the synthetic PCMark 10, the new MateBook 16s is outperformed by its AMD predecessor (even if the difference is very small).
In the same way, as Apple facilitates connectivity within its product range, the MateBook 16s connects different Huawei devices. For example, it is very easy to move files between a laptop and a tablet or smartphone from this brand. Huawei also provides the option to use mobile apps from the Huawei Gallery on the MateBook.
CrossMark: Overall | Productivity | Creativity | Responsiveness
| PCMark 10 / Score | |
| Average of class Multimedia (4325 - 10386, n=58, last 2 years) | |
| Huawei MateBook 16 R7 5800H | |
| Huawei MateBook 16s i7 | |
| Average Intel Core i7-12700H, Intel Iris Xe Graphics G7 96EUs (5541 - 6281, n=8) | |
| Dell Inspiron 16 7620 2-in-1 | |
| LG Gram 16 (2021) | |
| Dell XPS 15 9510 i5 11400H FHD | |
| PCMark 10 / Essentials | |
| Huawei MateBook 16s i7 | |
| Average Intel Core i7-12700H, Intel Iris Xe Graphics G7 96EUs (9991 - 11699, n=8) | |
| Huawei MateBook 16 R7 5800H | |
| Average of class Multimedia (8025 - 11664, n=57, last 2 years) | |
| LG Gram 16 (2021) | |
| Dell XPS 15 9510 i5 11400H FHD | |
| Dell Inspiron 16 7620 2-in-1 | |
| PCMark 10 / Productivity | |
| Average of class Multimedia (7323 - 18233, n=57, last 2 years) | |
| Huawei MateBook 16 R7 5800H | |
| Huawei MateBook 16s i7 | |
| Average Intel Core i7-12700H, Intel Iris Xe Graphics G7 96EUs (6690 - 8038, n=8) | |
| LG Gram 16 (2021) | |
| Dell XPS 15 9510 i5 11400H FHD | |
| Dell Inspiron 16 7620 2-in-1 | |
| PCMark 10 / Digital Content Creation | |
| Average of class Multimedia (3651 - 16240, n=57, last 2 years) | |
| Huawei MateBook 16s i7 | |
| Average Intel Core i7-12700H, Intel Iris Xe Graphics G7 96EUs (6207 - 7401, n=8) | |
| Huawei MateBook 16 R7 5800H | |
| Dell Inspiron 16 7620 2-in-1 | |
| LG Gram 16 (2021) | |
| Dell XPS 15 9510 i5 11400H FHD | |
| CrossMark / Overall | |
| Huawei MateBook 16s i7 | |
| Average of class Multimedia (866 - 2728, n=67, last 2 years) | |
| Average Intel Core i7-12700H, Intel Iris Xe Graphics G7 96EUs (1492 - 1907, n=8) | |
| Dell Inspiron 16 7620 2-in-1 | |
| CrossMark / Productivity | |
| Huawei MateBook 16s i7 | |
| Average of class Multimedia (931 - 2489, n=67, last 2 years) | |
| Average Intel Core i7-12700H, Intel Iris Xe Graphics G7 96EUs (1499 - 1832, n=8) | |
| Dell Inspiron 16 7620 2-in-1 | |
| CrossMark / Creativity | |
| Average of class Multimedia (907 - 3465, n=67, last 2 years) | |
| Huawei MateBook 16s i7 | |
| Average Intel Core i7-12700H, Intel Iris Xe Graphics G7 96EUs (1507 - 2016, n=8) | |
| Dell Inspiron 16 7620 2-in-1 | |
| CrossMark / Responsiveness | |
| Huawei MateBook 16s i7 | |
| Average Intel Core i7-12700H, Intel Iris Xe Graphics G7 96EUs (1384 - 1831, n=8) | |
| Average of class Multimedia (605 - 2024, n=67, last 2 years) | |
| Dell Inspiron 16 7620 2-in-1 | |
| PCMark 10 Score | 6281 points | |
Help | ||
| AIDA64 / Memory Copy | |
| Average of class Multimedia (21158 - 132135, n=61, last 2 years) | |
| Huawei MateBook 16s i7 | |
| LG Gram 16 (2021) | |
| Average Intel Core i7-12700H (25615 - 80511, n=64) | |
| Dell Inspiron 16 7620 2-in-1 | |
| Huawei MateBook 16 R7 5800H | |
| AIDA64 / Memory Read | |
| Average of class Multimedia (19699 - 174586, n=61, last 2 years) | |
| Huawei MateBook 16s i7 | |
| LG Gram 16 (2021) | |
| Average Intel Core i7-12700H (25586 - 79442, n=64) | |
| Huawei MateBook 16 R7 5800H | |
| Dell Inspiron 16 7620 2-in-1 | |
| AIDA64 / Memory Write | |
| Average of class Multimedia (17733 - 134998, n=61, last 2 years) | |
| LG Gram 16 (2021) | |
| Huawei MateBook 16s i7 | |
| Average Intel Core i7-12700H (23679 - 88660, n=64) | |
| Dell Inspiron 16 7620 2-in-1 | |
| Huawei MateBook 16 R7 5800H | |
| AIDA64 / Memory Latency | |
| Average of class Multimedia (7 - 535, n=60, last 2 years) | |
| Huawei MateBook 16s i7 | |
| LG Gram 16 (2021) | |
| Huawei MateBook 16 R7 5800H | |
| Average Intel Core i7-12700H (76.2 - 133.9, n=62) | |
| Dell XPS 15 9510 i5 11400H FHD | |
* ... smaller is better
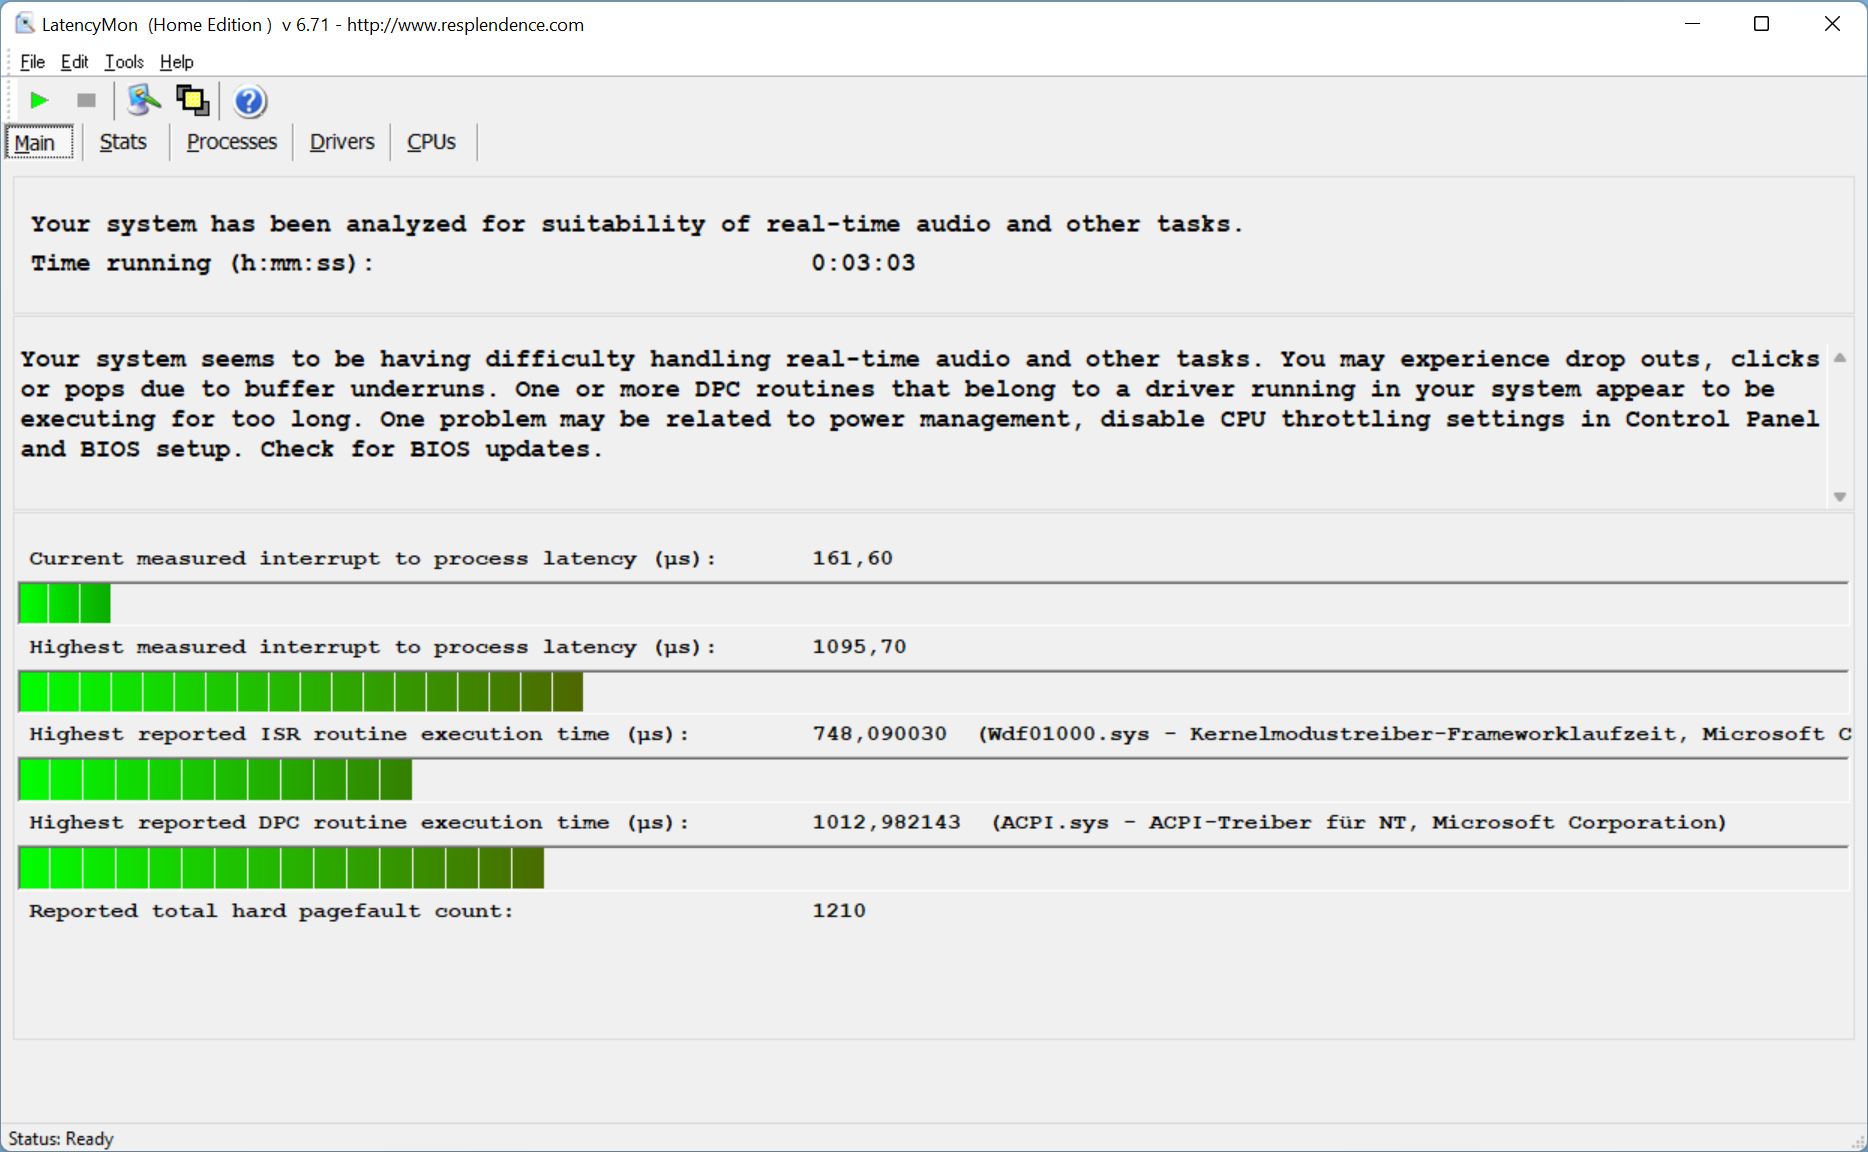
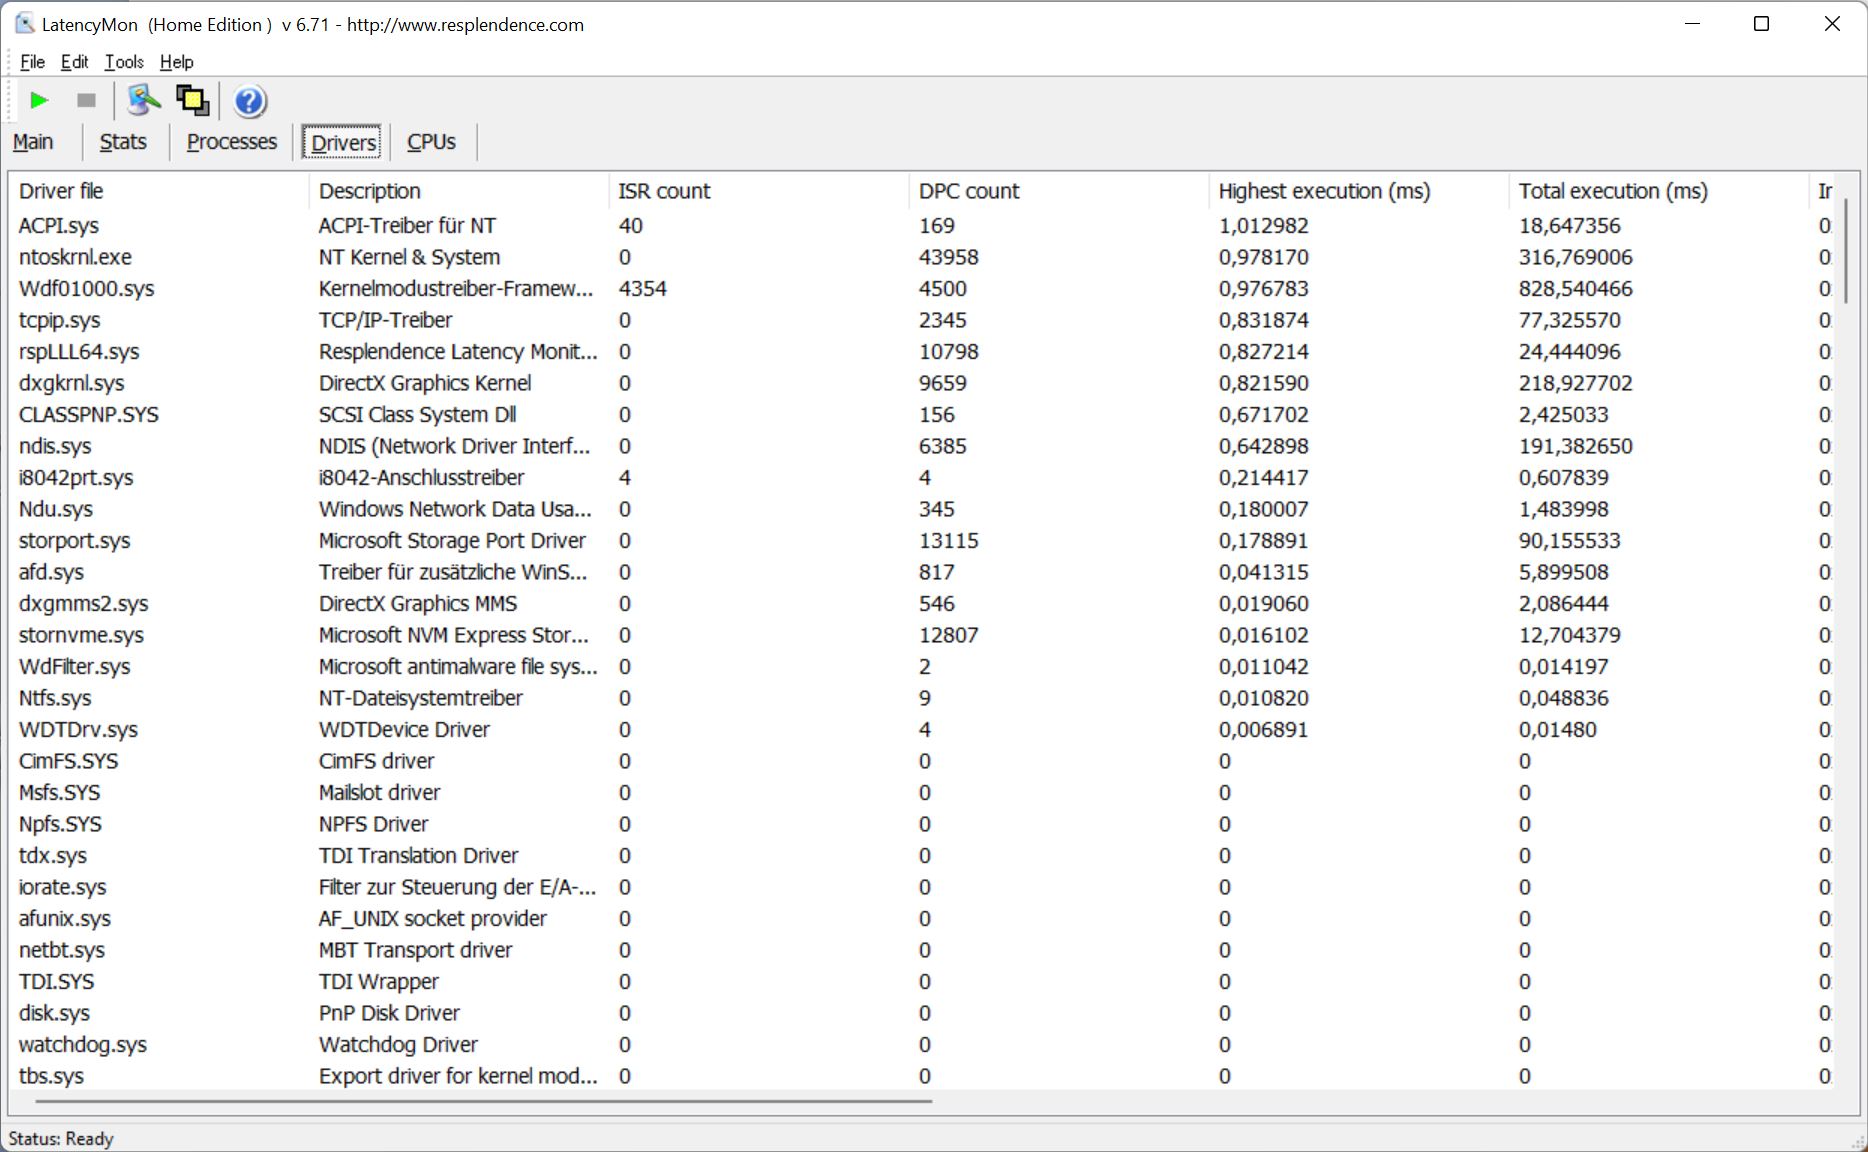
DPC Latencies
In our standardized latency test (surfing the Internet, 4K YouTube playback, CPU load), the MateBook 16s shows some minor limitations using the present BIOS version. It is therefore not well suited for the use of real-time audio software.
| DPC Latencies / LatencyMon - interrupt to process latency (max), Web, Youtube, Prime95 | |
| Dell XPS 15 9510 i5 11400H FHD | |
| Dell Inspiron 16 7620 2-in-1 | |
| Huawei MateBook 16 R7 5800H | |
| LG Gram 16 (2021) | |
* ... smaller is better
Storage
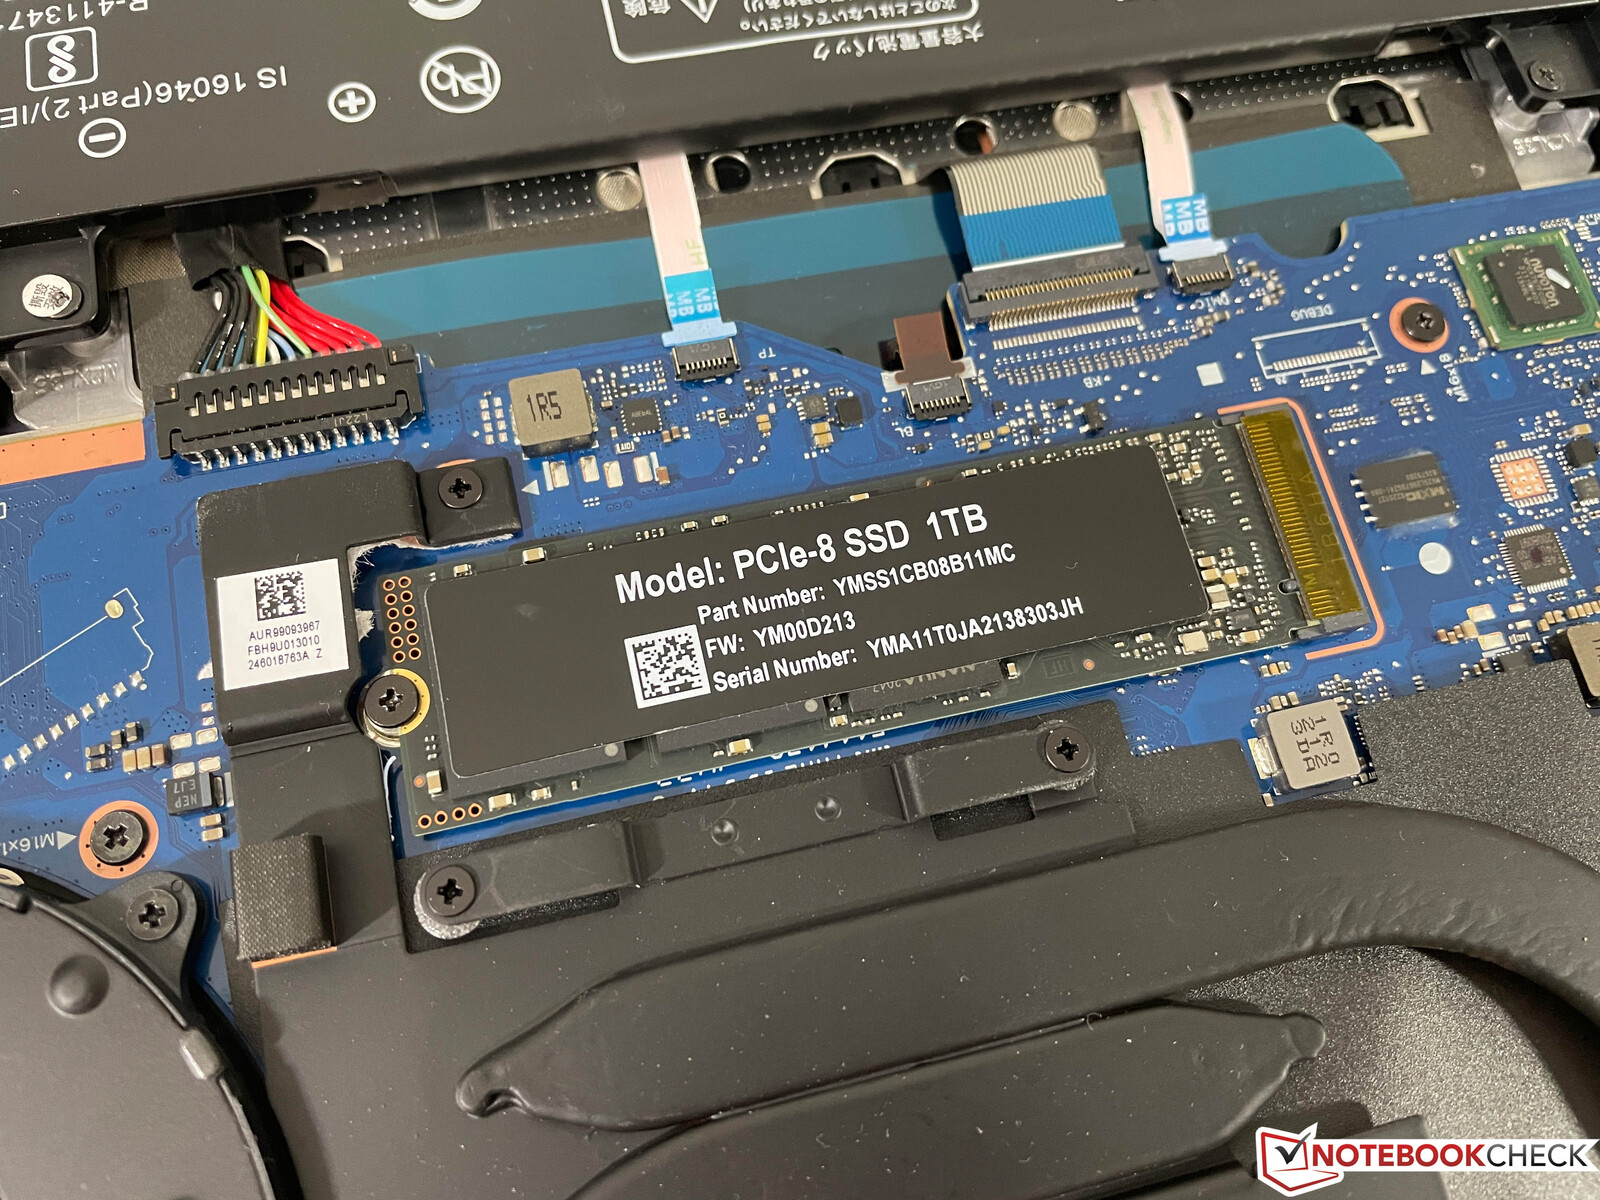
Our test device is equipped with an M.2 SSD with a storage capacity of 1 TB, but as with previous laptops from Huawei, the SSD is once again partitioned. It is particularly disturbing here that the partition of the system drive is extremely small and provides the user with around just 70 GB. If you are not careful with installations and downloads, you will quickly end up with capacity problems.
In terms of speed, there is also much room for improvement. Huawei only uses a PCIe 3.0 x4 SSD and the manufacturer was unable to tell us whether the port supports the faster PCIe 4.0 standard. Transfer rates of more than 3 GB/s are by no means bad, but in view of the price, higher speeds would have been possible here. Further SSD benchmarks are available here.

* ... smaller is better
Disk Throttling: DiskSpd Read Loop, Queue Depth 8
Graphics Card
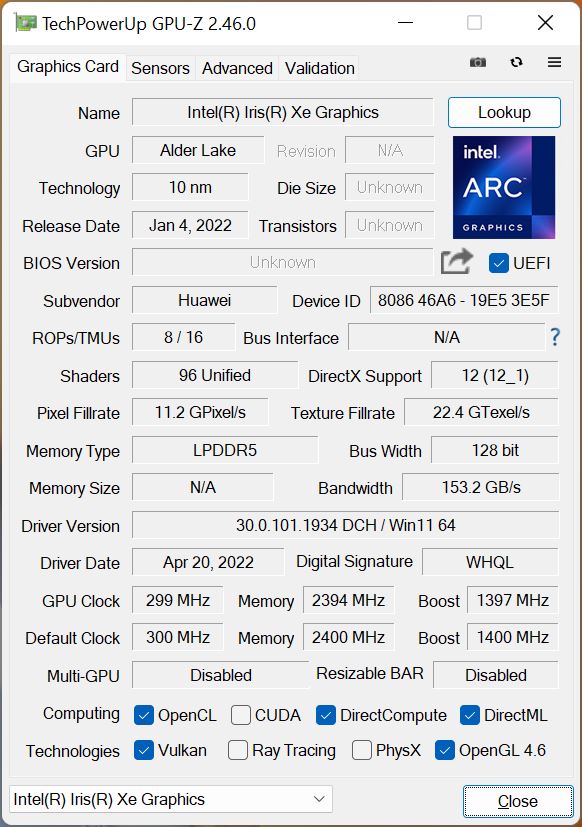
Huawei does without a dedicated graphics card and all graphics computation is managed by the integrated Xe Graphics G7 (96 EUs), which we already know from the old Tiger Lake mobile processors. The iGPU is completely sufficient for everyday use, including the playback of high-resolution videos, but the new Radeon 680M of the Ryzen 6000 CPUs offers significantly more power and also a more efficient video decoder. At least the graphics performance has been improved by about 40-50% when compared to the RX Vega 8 in the old MateBook 16.
Gaming ambitions should therefore not be too far-reaching, as one will have to restrict oneself to older or less demanding titles such as Dota 2. Popular titles such as F1 2021, for example, still run smoothly on medium/high resolution. Graphics performance remains stable under continuous load as well as on battery power, and further GPU benchmarks are to be found here.
| 3DMark 11 Performance | 7527 points | |
| 3DMark Cloud Gate Standard Score | 23270 points | |
| 3DMark Fire Strike Score | 5320 points | |
| 3DMark Time Spy Score | 1928 points | |
Help | ||
Witcher 3 FPS Chart
| low | med. | high | ultra | |
|---|---|---|---|---|
| GTA V (2015) | 105.3 | 94.5 | 27.6 | 11.5 |
| The Witcher 3 (2015) | 102 | 66 | 33 | 14.2 |
| Dota 2 Reborn (2015) | 133.9 | 95.1 | 74.7 | 67.8 |
| Final Fantasy XV Benchmark (2018) | 48.9 | 26.8 | 18.9 | |
| X-Plane 11.11 (2018) | 57.9 | 38.4 | 36.1 | |
| Far Cry 5 (2018) | 63 | 34 | 31 | 29 |
| Strange Brigade (2018) | 95.7 | 47.2 | 36.9 | 30 |
| F1 2021 (2021) | 119.4 | 56 | 44.7 | 30.1 |
| Farming Simulator 22 (2021) | 110 | 51 | 37 | 33 |
Emissions - Huawei continues to rely on two fans
System Noise

The MateBook 16s is generally a very quiet companion in everyday use, but it would seem that the two fans often run at a slower speed because the noise is often hardly noticeable. As long as you stay in normal mode, the volume at full load is still okay at 39 dB(A) (or ~35 when gaming). Only in performance mode does it get very loud with up to 48.4 dB(A). Relatively speaking that’s too loud.
Basic system noise characteristics have also changed slightly compared to the MateBook 16. The fans seem to start up a little earlier in everyday use. Other electronic noises, such as coil whistling, were not detected.
Noise level
| Idle |
| 24 / 25.2 / 27.2 dB(A) |
| Load |
| 34.8 / 39 dB(A) |
 | ||
30 dB silent 40 dB(A) audible 50 dB(A) loud |
||
min: | ||
| Huawei MateBook 16s i7 Iris Xe G7 96EUs, i7-12700H, Silicon Motion PCIe-8 SSD | Huawei MateBook 16 R7 5800H Vega 8, R7 5800H, Lite-On CA5-8D512 | Dell Inspiron 16 7620 2-in-1 Iris Xe G7 96EUs, i7-1260P, Toshiba KBG40ZNS512G NVMe | Dell XPS 15 9510 i5 11400H FHD UHD Graphics Xe 16EUs, i5-11400H, Micron 2300 512GB MTFDHBA512TDV | LG Gram 16 (2021) Iris Xe G7 96EUs, i7-1165G7, SK Hynix PC601 1TB HFS001TD9TNG | |
|---|---|---|---|---|---|
| Noise | 1% | 5% | 6% | 3% | |
| off / environment * (dB) | 24 | 24.8 -3% | 23.2 3% | 24.4 -2% | 26 -8% |
| Idle Minimum * (dB) | 24 | 24.8 -3% | 23.5 2% | 24.4 -2% | 26 -8% |
| Idle Average * (dB) | 25.2 | 24.8 2% | 23.5 7% | 24.4 3% | 26 -3% |
| Idle Maximum * (dB) | 27.2 | 26.7 2% | 23.5 14% | 24.4 10% | 26 4% |
| Load Average * (dB) | 34.8 | 32 8% | 29.4 16% | 26.1 25% | 30.8 11% |
| Witcher 3 ultra * (dB) | 34.8 | 32 8% | 35.6 -2% | 33.2 5% | |
| Load Maximum * (dB) | 39 | 42.4 -9% | 39.7 -2% | 37.7 3% | 31.1 20% |
* ... smaller is better
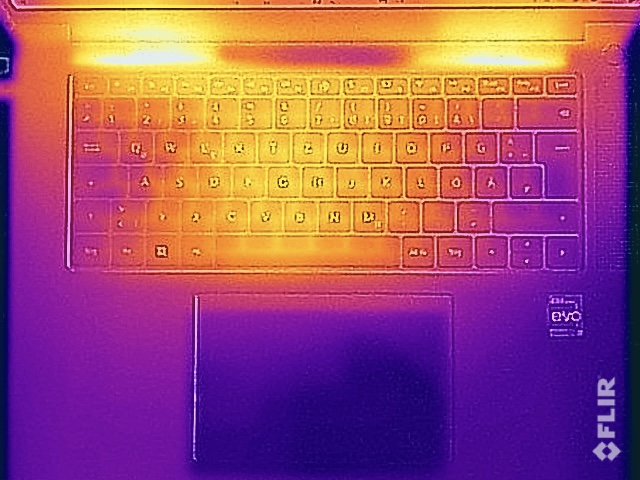
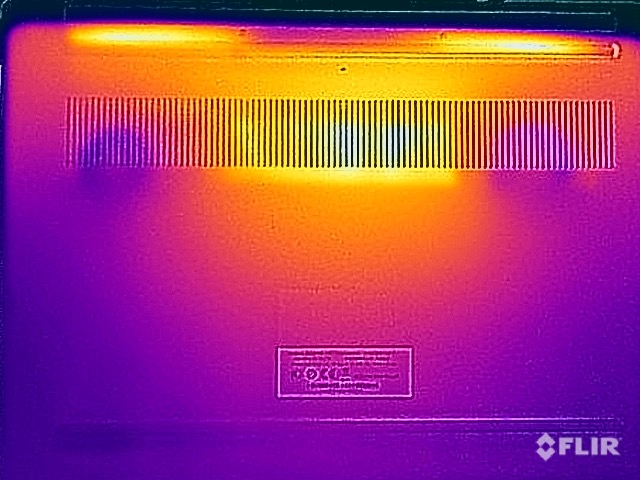
Temperature
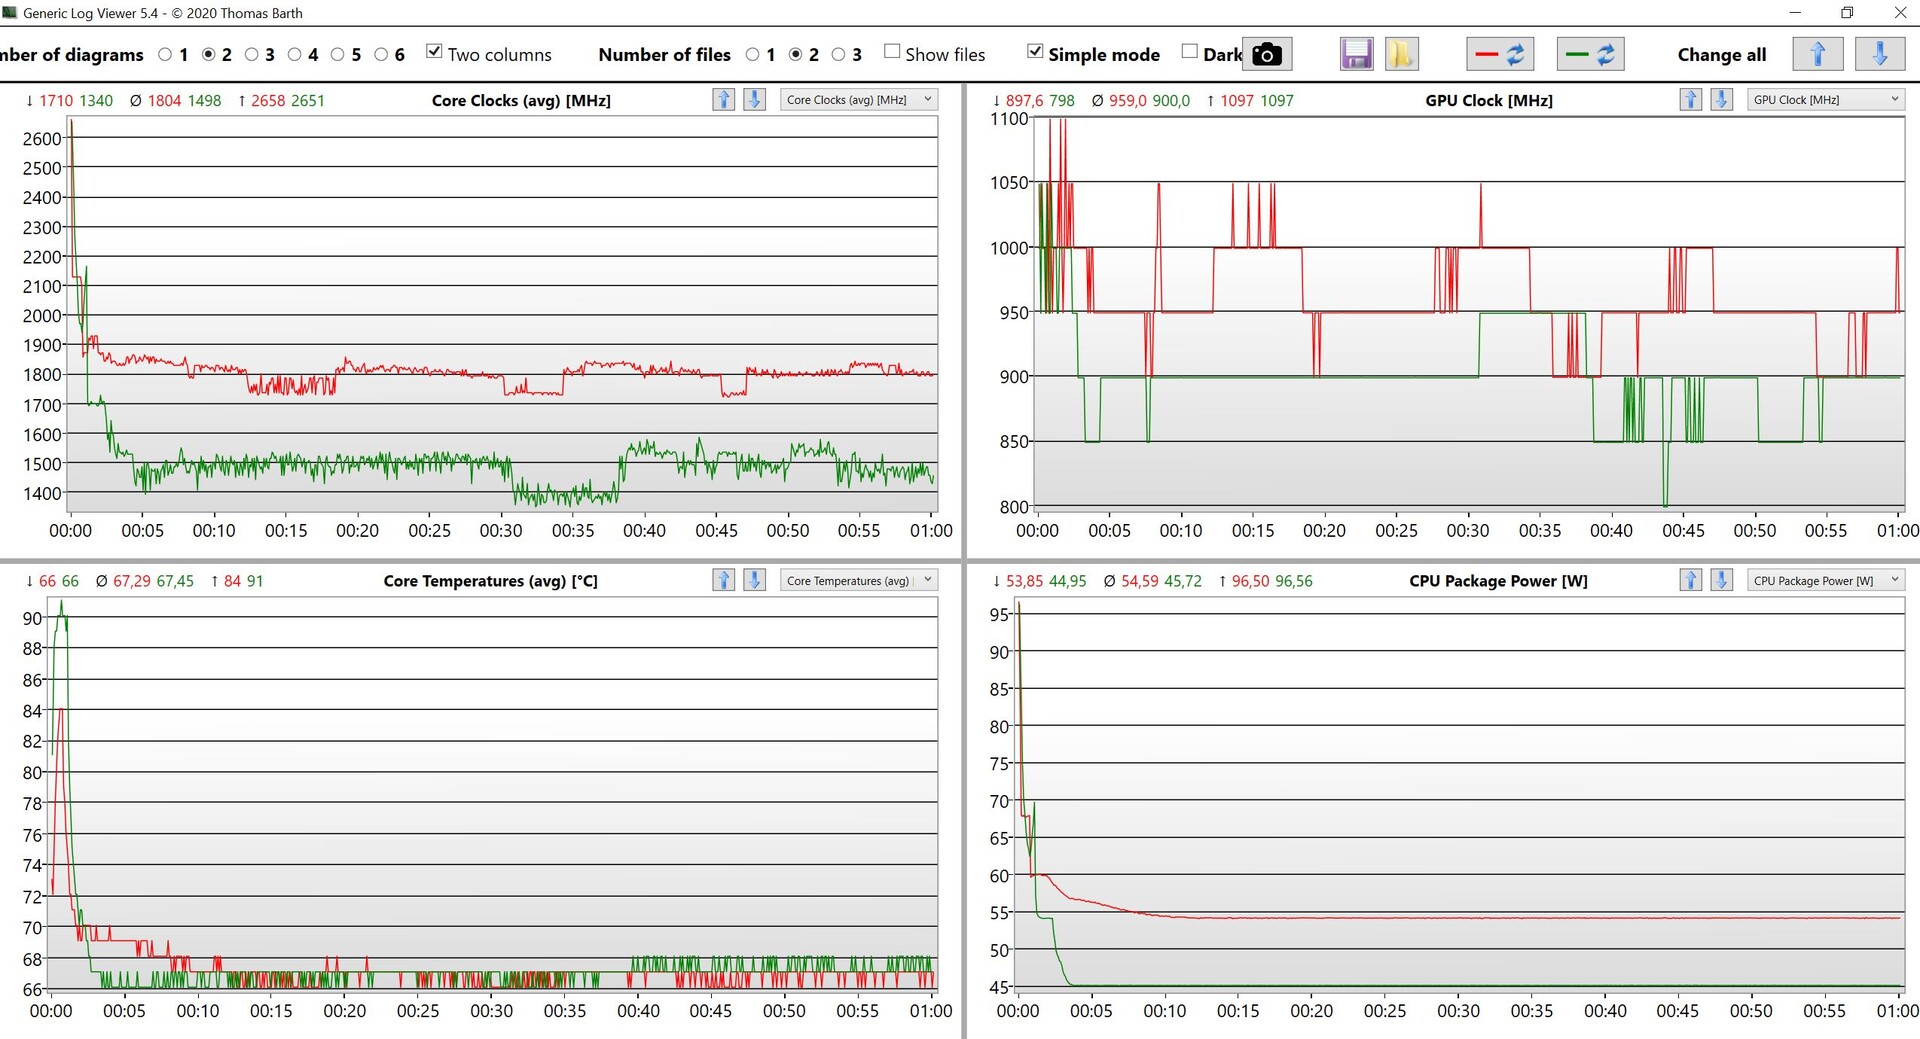
Overall, the surface temperatures are of no concern whatsoever. There are no issues apparent in everyday use and even under extreme load, there is only a small hotspot on the bottom panel. We measured 48°C following the one-hour stress test. The problem in this regard lies rather more with the power supply. Huawei was able to make the 90-watt power supply more compact, but it gets very hot (~65°C).
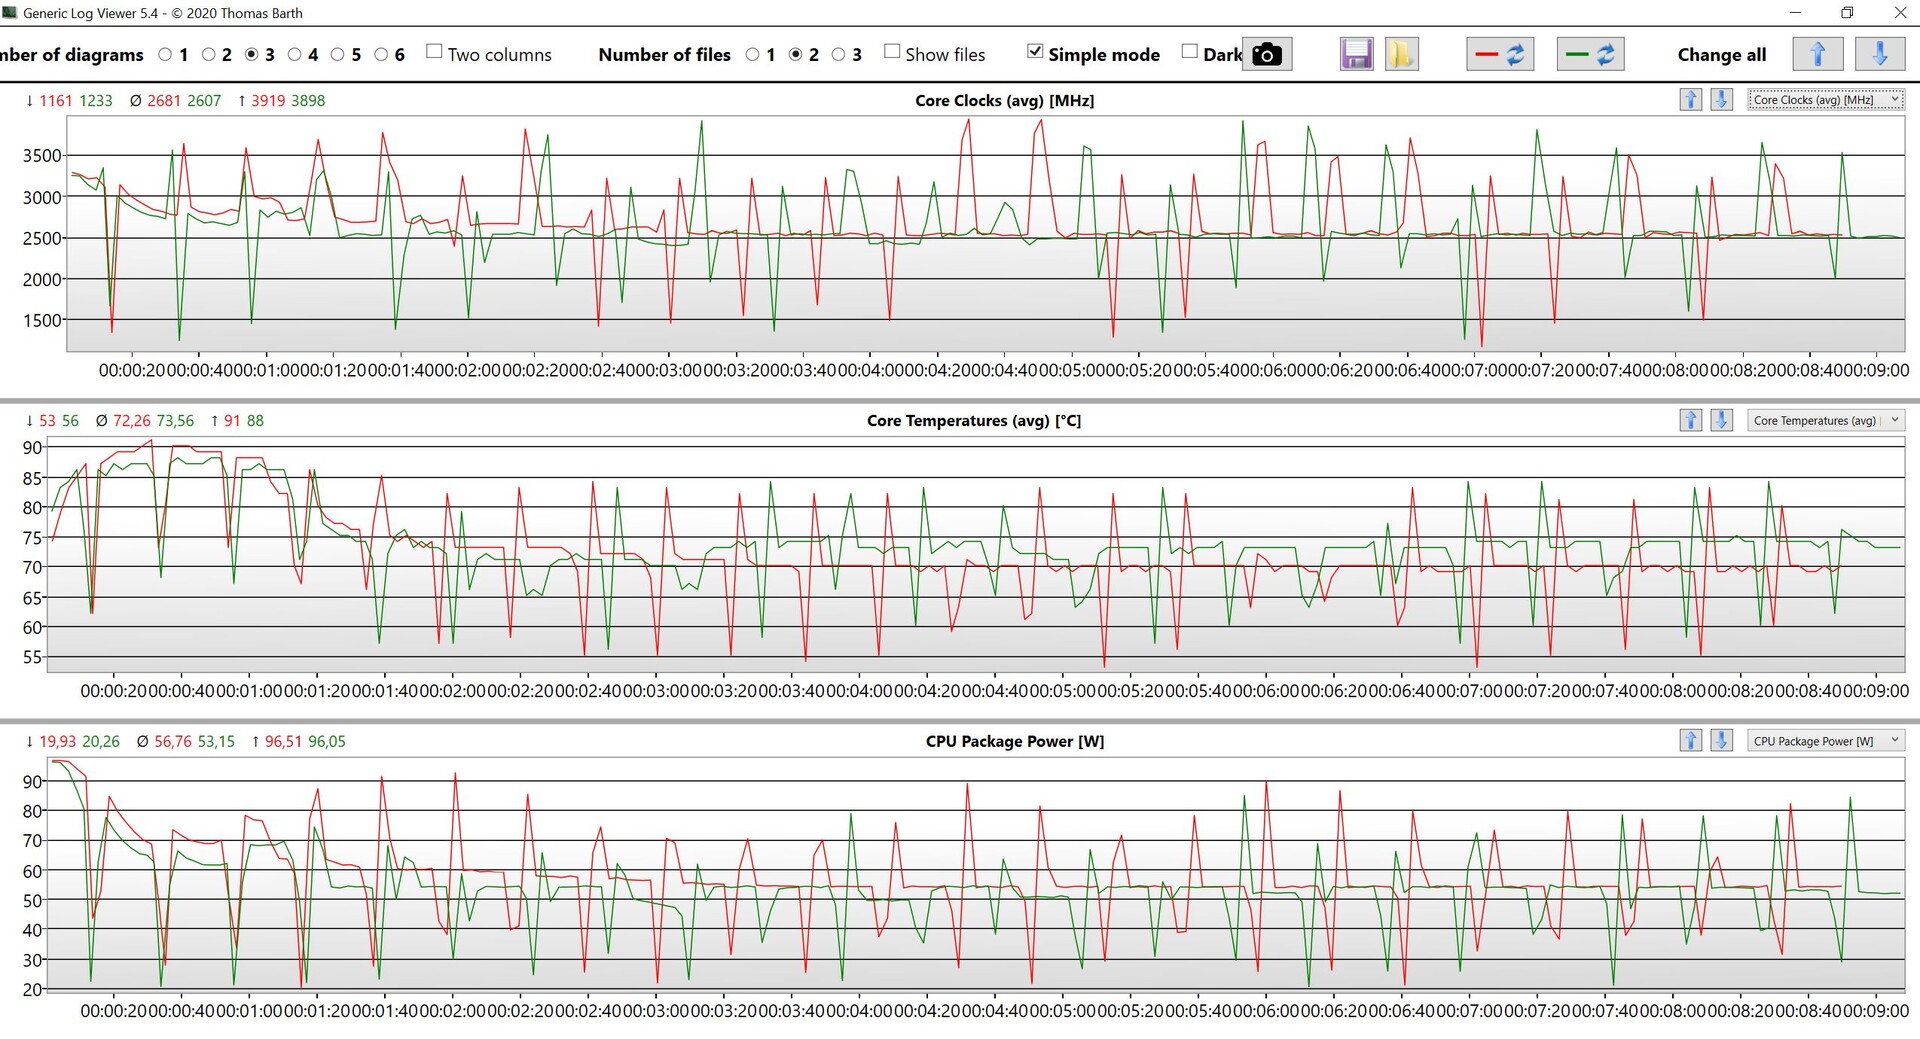
In the stress test, it’s quite evident that the processor’s power consumption quickly reaches 45 watts, 54 watts in power mode, and then settles to those values.
(±) The maximum temperature on the upper side is 40.9 °C / 106 F, compared to the average of 36.8 °C / 98 F, ranging from 21 to 71 °C for the class Multimedia.
(-) The bottom heats up to a maximum of 48.3 °C / 119 F, compared to the average of 39.1 °C / 102 F
(+) In idle usage, the average temperature for the upper side is 27.4 °C / 81 F, compared to the device average of 31.3 °C / 88 F.
(±) Playing The Witcher 3, the average temperature for the upper side is 34.6 °C / 94 F, compared to the device average of 31.3 °C / 88 F.
(+) The palmrests and touchpad are cooler than skin temperature with a maximum of 27.9 °C / 82.2 F and are therefore cool to the touch.
(±) The average temperature of the palmrest area of similar devices was 28.7 °C / 83.7 F (+0.8 °C / 1.5 F).
| Huawei MateBook 16s i7 Intel Core i7-12700H, Intel Iris Xe Graphics G7 96EUs | Huawei MateBook 16 R7 5800H AMD Ryzen 7 5800H, AMD Radeon RX Vega 8 (Ryzen 4000/5000) | Dell Inspiron 16 7620 2-in-1 Intel Core i7-1260P, Intel Iris Xe Graphics G7 96EUs | Dell XPS 15 9510 i5 11400H FHD Intel Core i5-11400H, Intel UHD Graphics Xe 16EUs | LG Gram 16 (2021) Intel Core i7-1165G7, Intel Iris Xe Graphics G7 96EUs | |
|---|---|---|---|---|---|
| Heat | 6% | -6% | 9% | 6% | |
| Maximum Upper Side * (°C) | 40.9 | 40.2 2% | 42.2 -3% | 42.8 -5% | 46.9 -15% |
| Maximum Bottom * (°C) | 48.3 | 49.7 -3% | 47.4 2% | 41.2 15% | 45.1 7% |
| Idle Upper Side * (°C) | 29.2 | 26.4 10% | 32.2 -10% | 25.8 12% | 26.4 10% |
| Idle Bottom * (°C) | 30.4 | 26.4 13% | 33.6 -11% | 26.2 14% | 24.1 21% |
* ... smaller is better
Speakers
There are no changes to the two stereo speakers next to the keyboard and our measurements are almost identical. There may have been minor software adjustments by Huawei. They can get very loud, take up a lot of space, and a slight stereo effect is quite noticeable. A little more bass would be nice, but for normal background music playback or occasional videos, the built-in sound system is definitely adequate.
Huawei MateBook 16s i7 audio analysis
(+) | speakers can play relatively loud (87.3 dB)
Bass 100 - 315 Hz
(±) | reduced bass - on average 8% lower than median
(+) | bass is linear (6.2% delta to prev. frequency)
Mids 400 - 2000 Hz
(±) | higher mids - on average 6.3% higher than median
(+) | mids are linear (4.2% delta to prev. frequency)
Highs 2 - 16 kHz
(+) | balanced highs - only 3.7% away from median
(+) | highs are linear (3.3% delta to prev. frequency)
Overall 100 - 16.000 Hz
(+) | overall sound is linear (11.1% difference to median)
Compared to same class
» 16% of all tested devices in this class were better, 3% similar, 81% worse
» The best had a delta of 5%, average was 17%, worst was 45%
Compared to all devices tested
» 7% of all tested devices were better, 2% similar, 92% worse
» The best had a delta of 4%, average was 24%, worst was 134%
Dell XPS 15 9510 i5 11400H FHD audio analysis
(+) | speakers can play relatively loud (88.8 dB)
Bass 100 - 315 Hz
(±) | reduced bass - on average 5.6% lower than median
(+) | bass is linear (4.3% delta to prev. frequency)
Mids 400 - 2000 Hz
(+) | balanced mids - only 3.9% away from median
(+) | mids are linear (4.1% delta to prev. frequency)
Highs 2 - 16 kHz
(+) | balanced highs - only 2.4% away from median
(+) | highs are linear (4.9% delta to prev. frequency)
Overall 100 - 16.000 Hz
(+) | overall sound is linear (8.4% difference to median)
Compared to same class
» 9% of all tested devices in this class were better, 2% similar, 89% worse
» The best had a delta of 5%, average was 17%, worst was 45%
Compared to all devices tested
» 2% of all tested devices were better, 1% similar, 97% worse
» The best had a delta of 4%, average was 24%, worst was 134%
Energy Management - Intel MateBook requires more power
Power Consumption
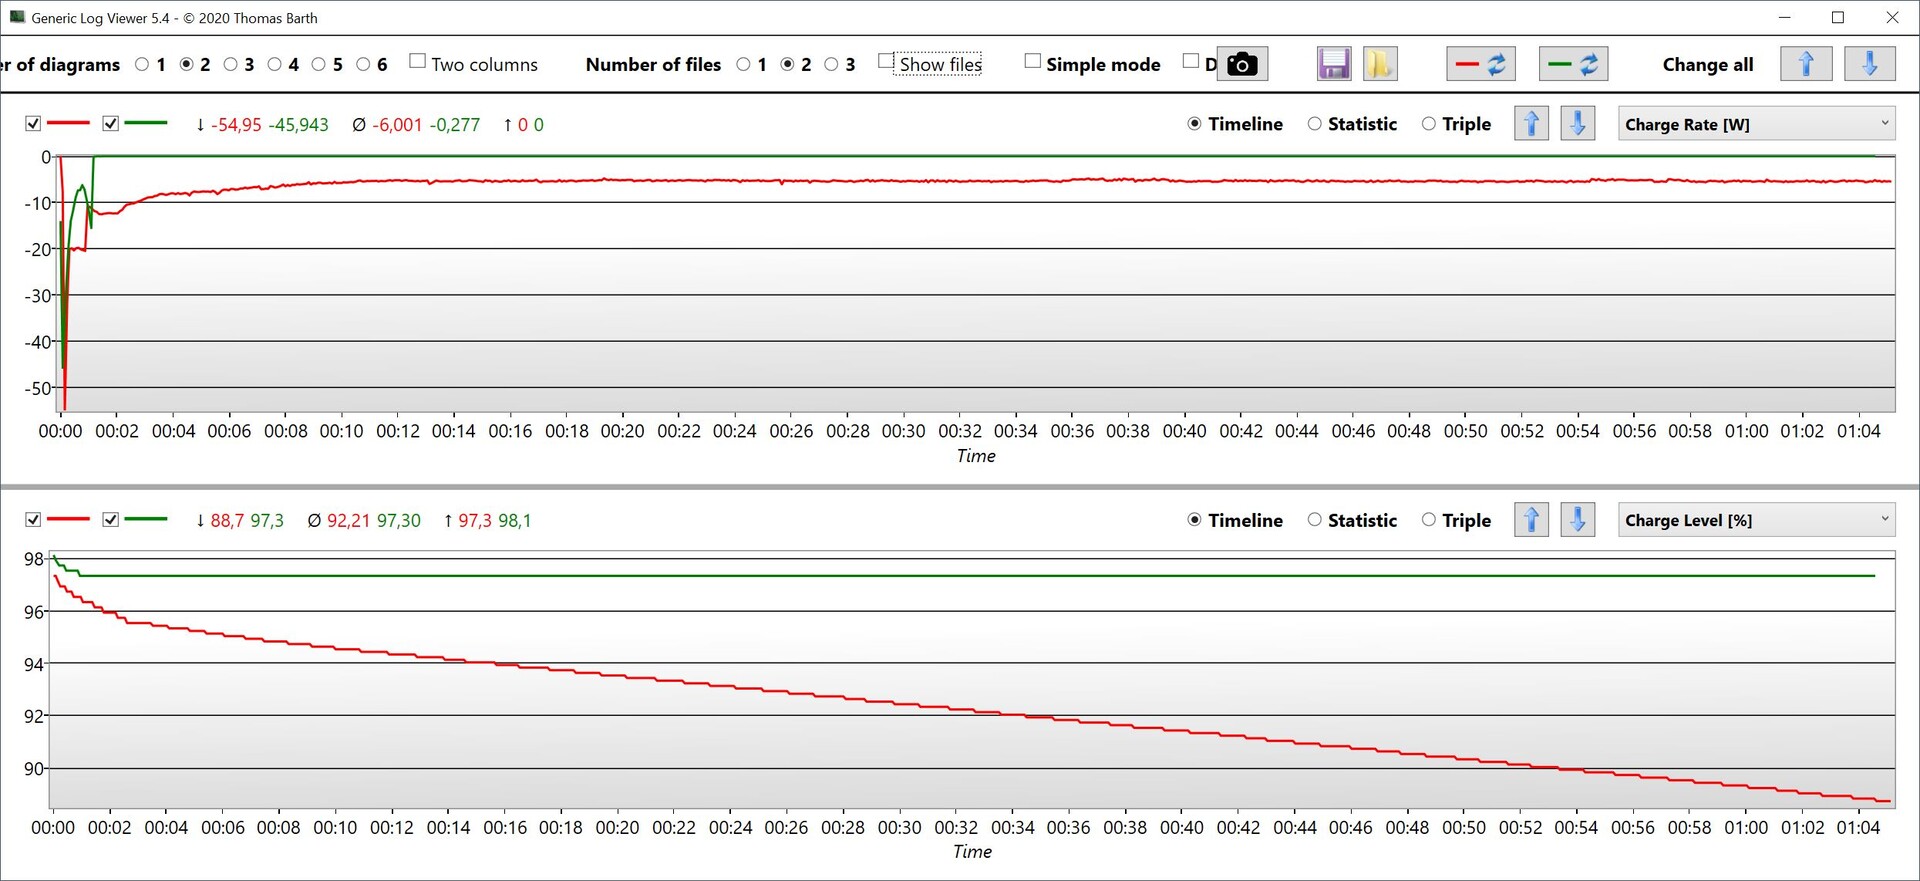
Although this was by no means inevitable, power consumption is one of the MateBook 16s’ biggest issues. Its predecessor had the Ryzen 7 5800H and came with a 135-watt power supply as standard. That is now only the case with the Core i9 version. In comparison, the Core i7 model of the MateBook 16s only gets a 90-watt adapter, even though its power limits have been raised. If the processor alone consumes almost 100 watts, one could ask oneself just how a 90-watt power supply could possibly suffice. The maximum power consumption of the entire system reaches almost 135 watts, which consequently means that 45 watts may have to be drawn from the battery at the start of a CPU load process (see Charge Rate in the following diagram). This can‘t be healthy for the battery.
However, this is not only the case under stress test conditions but also with any CPU load in which all cores are used. We cannot understand why savings have been made on the power supply despite the significant price increase. The idle power consumption rates have also increased slightly despite the slightly darker display. This can only be attributed to the Intel processor given an otherwise similar configuration.
| Off / Standby | |
| Idle | |
| Load |
|
Key:
min: | |
| Huawei MateBook 16s i7 i7-12700H, Iris Xe G7 96EUs, Silicon Motion PCIe-8 SSD, IPS, 2520x1680, 16" | Huawei MateBook 16 R7 5800H R7 5800H, Vega 8, Lite-On CA5-8D512, , 2520x1680, 16" | Dell Inspiron 16 7620 2-in-1 i7-1260P, Iris Xe G7 96EUs, Toshiba KBG40ZNS512G NVMe, IPS, 1920x1200, 16" | Dell XPS 15 9510 i5 11400H FHD i5-11400H, UHD Graphics Xe 16EUs, Micron 2300 512GB MTFDHBA512TDV, IPS, 1920x1200, 15.6" | LG Gram 16 (2021) i7-1165G7, Iris Xe G7 96EUs, SK Hynix PC601 1TB HFS001TD9TNG, IPS, 2560x1600, 16" | Average Intel Iris Xe Graphics G7 96EUs | Average of class Multimedia | |
|---|---|---|---|---|---|---|---|
| Power Consumption | 13% | 27% | 34% | 40% | 28% | 8% | |
| Idle Minimum * (Watt) | 6.8 | 4.6 32% | 5.3 22% | 5.3 22% | 3.8 44% | 5.51 ? 19% | 5.71 ? 16% |
| Idle Average * (Watt) | 13.2 | 10.5 20% | 8.3 37% | 9 32% | 9 32% | 8.66 ? 34% | 10.1 ? 23% |
| Idle Maximum * (Watt) | 13.8 | 11.2 19% | 9.6 30% | 9.7 30% | 11.3 18% | 10.9 ? 21% | 12.4 ? 10% |
| Load Average * (Watt) | 75.2 | 59.1 21% | 54.3 28% | 30.3 60% | 35.2 53% | 45.6 ? 39% | 65 ? 14% |
| Witcher 3 ultra * (Watt) | 56.1 | 58.6 -4% | 43.9 22% | 30.6 45% | |||
| Load Maximum * (Watt) | 90.6 | 98.3 -8% | 70 23% | 76.2 16% | 43.5 52% | 67.8 ? 25% | 112.2 ? -24% |
* ... smaller is better
Power Consumption Witcher 3 / Stresstest
Power Consumption external Monitor
Battery Life
Increased energy consumption and the same battery capacity mean that the battery life of the new MateBook 16s is worse than that of the MateBook 16 with an AMD processor. In the WLAN test at 150 cd/m² (51% of the maximum brightness) we now only reach 8 hours of run time. That is certainly also due to the higher power consumption of the new performance cores. At full brightness, it is just under 6 hours, and on video playback, it’s just over 9 hours. The old MateBook 16 easily managed 2 hours more in every category. The complete charging process with the device switched on takes about two hours.
| Huawei MateBook 16s i7 i7-12700H, Iris Xe G7 96EUs, 84 Wh | Huawei MateBook 16 R7 5800H R7 5800H, Vega 8, 84 Wh | Dell Inspiron 16 7620 2-in-1 i7-1260P, Iris Xe G7 96EUs, 87 Wh | Dell XPS 15 9510 i5 11400H FHD i5-11400H, UHD Graphics Xe 16EUs, 56 Wh | LG Gram 16 (2021) i7-1165G7, Iris Xe G7 96EUs, 80 Wh | Average of class Multimedia | |
|---|---|---|---|---|---|---|
| Battery runtime | 16% | 74% | -9% | 112% | 37% | |
| H.264 (h) | 9.3 | 10.9 17% | 20.1 116% | 16.4 ? 76% | ||
| WiFi v1.3 (h) | 8.1 | 12.8 58% | 14.6 80% | 7.4 -9% | 15.7 94% | 12 ? 48% |
| Load (h) | 1.9 | 1.4 -26% | 3.2 68% | 4.3 126% | 1.675 ? -12% |
Pros
Cons
Verdict - The switch to Intel comes with some disadvantages

The new MateBook 16s succeeds the MateBook 16 and has many similarities, but there isn’t much left of the former good price-performance ratio after switching to the Intel processor. The new Intel Core i7 of the Alder Lake generation offers only slightly better performance than the old AMD chip and improvements such as Wi-Fi 6E or additional keystroke travel would of course also be possible with an AMD processor. Really convincing arguments for an Intel processor are absent, and on top of all that, battery life is also shorter. Despite this, the price has risen by 500 Euros (US$510).
This raises more issues, as one would expect quite a lot more from the display given the high price of the unit. The image quality is very good, but the brightness is only slightly over 300 cd/m². What's more, sRGB coverage, the absence of a brightness sensor, and just 60 Hz do not meet expectations at this price. The Intel processor’s iGPU also just cannot compete against small, dedicated graphics cards. If you were to dispense with a dedicated graphics card, an AMD processor with the new Radeon 680M would have been a significantly better choice.
With the new Intel processor, performance increases only marginally compared to the old MateBook 16 AMD, but battery life is also shorter. All in all, the new MateBook 16s is somewhat disappointing, especially in view of its price-performance ratio. The overall package would probably be much more attractive with a current spec AMD processor.
The power supply also presents a significant issue because while the old MateBook 16 came with a 135-watt adapter as standard, buyers will now have to make do with the 90-watt power supply that comes with the i7 version of the MateBook 16s. That is simply insufficient power under high load, and the device also gets very hot. In this instance, the fact that the new power supply is more compact and lighter is of little benefit and it’s rather obvious that this was an attempt to make savings in the wrong place.
All in all, the MateBook 16s is not a bad multimedia notebook, but we can hardly recommend it at this price. If you can do without the new features such as a 1080p webcam or slightly longer keystroke travel, you would be better off looking at the old MateBook 16, which is still available, comes with a Ryzen 7 5800H and at a price that has already dropped to under 1,000 Euros (US$1,020).
Price and Availability
At market launch, Huawei is pricing the MateBook 16s at 1,699 Euros (US$1,730). That price includes the external monitor MateView GT 27 and a backpack. The MateBook 16s Core i9-12900H with the monitor and backpack will be available July 14 for 1,899 euros (US$1,940).
Huawei MateBook 16s i7
- 07/08/2022 v7 (old)
Andreas Osthoff
Price comparison

