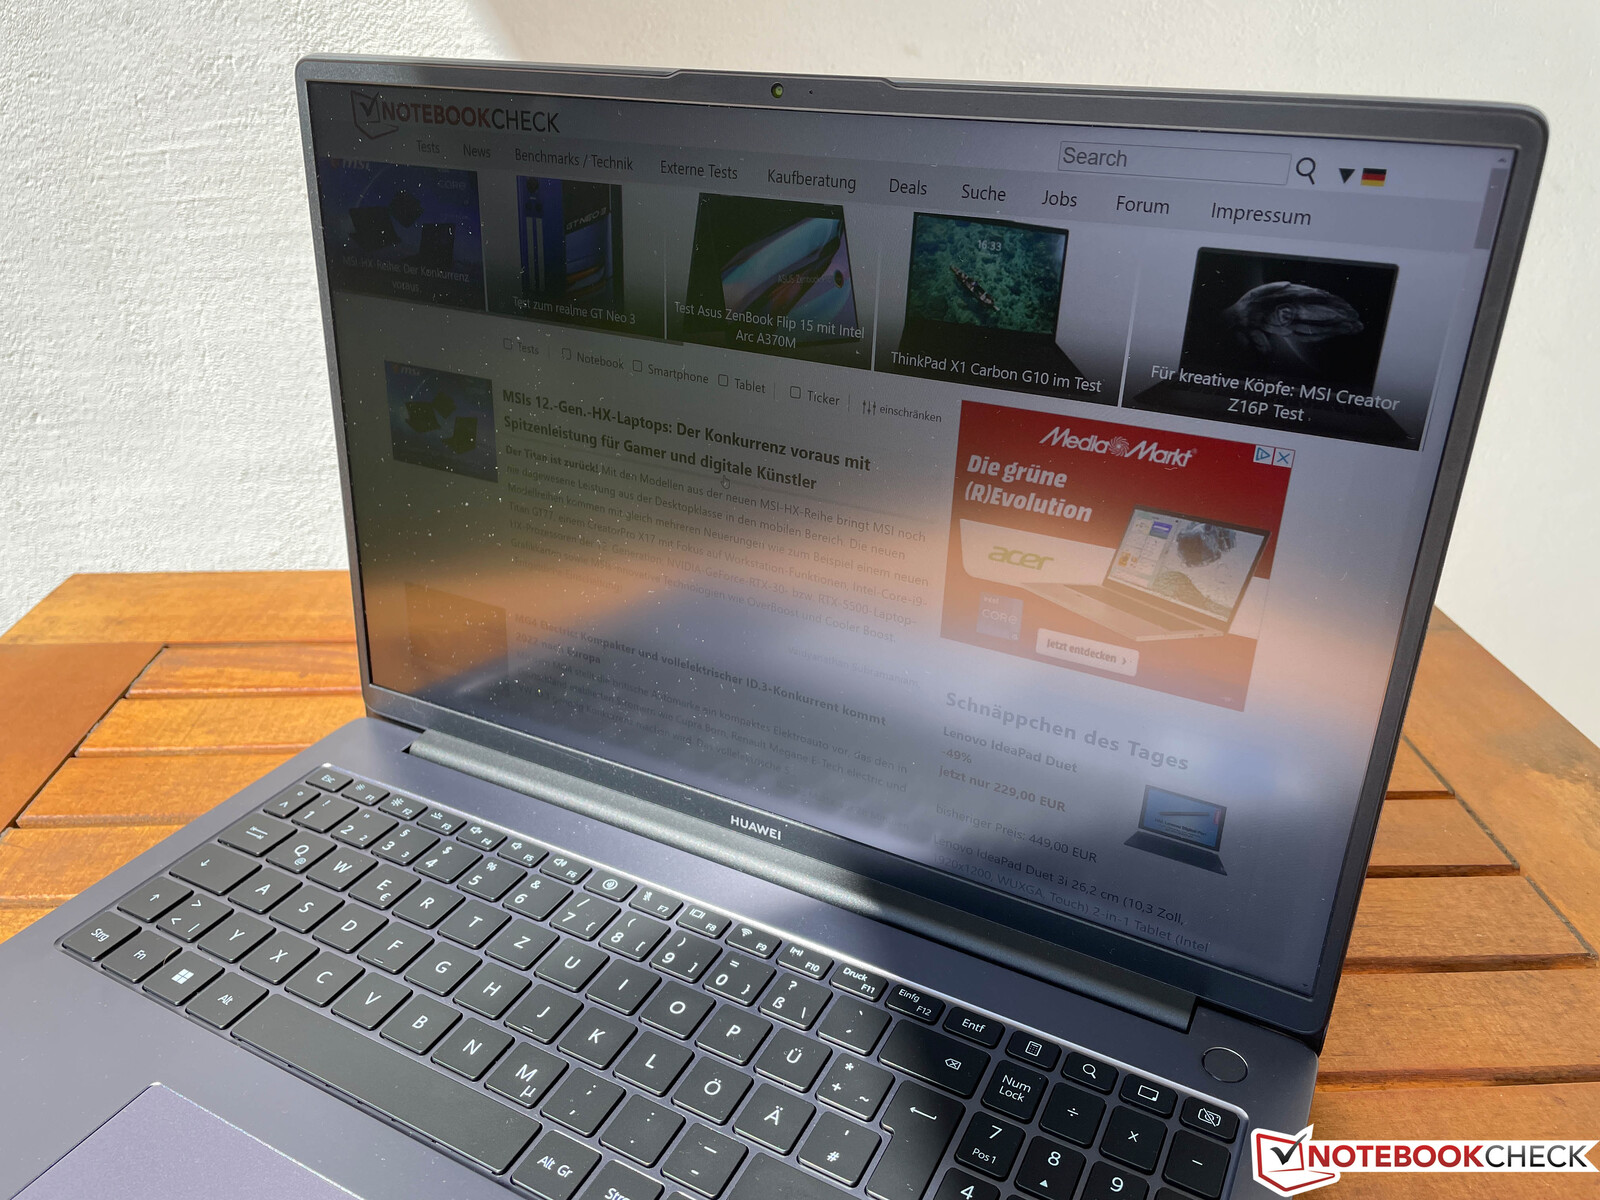
Huawei MateBook D 16 2022 review - Multimedia laptop now in 16:10 format and with number pad

The new MateBook D 16 2022 gets a large update with a completely new metal case, 16:10 display, and for the first time also a keyboard with a full numeric keypad. As already in the MateBook 16s, Huawei changes from an AMD to an Intel processor of the new Alder Lake generation. In terms of the price, the new MateBook D 16 starts from 949 Euros (~$958) with a Core i5-12450H, 16 GB of RAM, and a large 512-GB SSD. However, our test unit with a Core i7-12700H and identical rest of the equipment already costs 1299 Euros (~$1311), so Huawei charges a hefty 350-Euro (~$353) premium for the upgrade from the Core i5 to the Core i7.
Possible Competitors in Comparison
Rating | Date | Model | Weight | Height | Size | Resolution | Price |
|---|---|---|---|---|---|---|---|
| 83.6 % v7 (old) | 07 / 2022 | Huawei MateBook D 16 2022 i7-12700H, Iris Xe G7 96EUs | 1.7 kg | 18.4 mm | 16.00" | 1920x1200 | |
| 80.6 % v7 (old) | 11 / 2021 | Asus Vivobook 15 K513EQ i7-1165G7, GeForce MX350 | 1.6 kg | 17.9 mm | 15.60" | 1920x1080 | |
| 86 % v7 (old) | 08 / 2021 | Lenovo IdeaPad 5 Pro 16IHU6 i5-11300H, GeForce MX450 | 1.9 kg | 18.4 mm | 16.00" | 2560x1600 | |
| 86.7 % v7 (old) | 08 / 2021 | Dell Inspiron 16 Plus 7610 i7-11800H, GeForce RTX 3050 4GB Laptop GPU | 2 kg | 18.99 mm | 16.00" | 3072x1920 | |
| 86 % v7 (old) | 04 / 2021 | Huawei MateBook D 16-53011VFJ R5 4600H, Vega 6 | 1.7 kg | 18.4 mm | 16.10" | 1920x1080 |
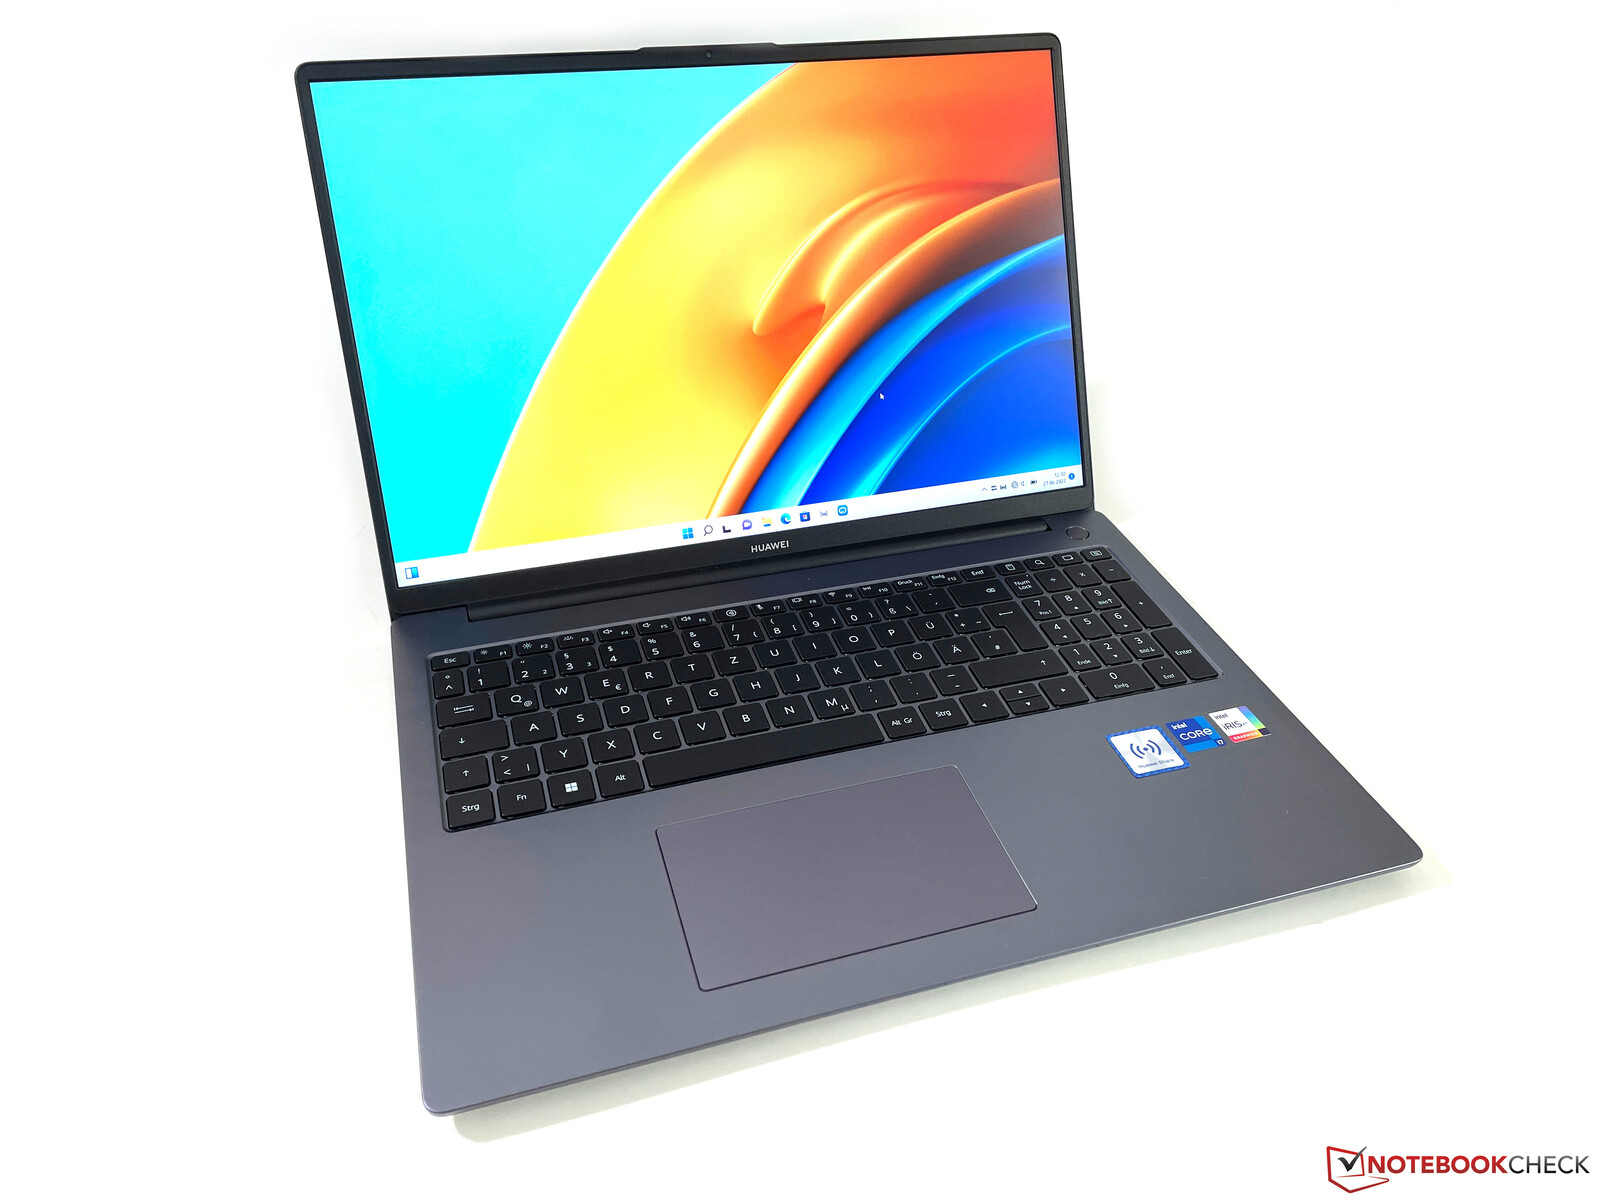
Case and Equipment
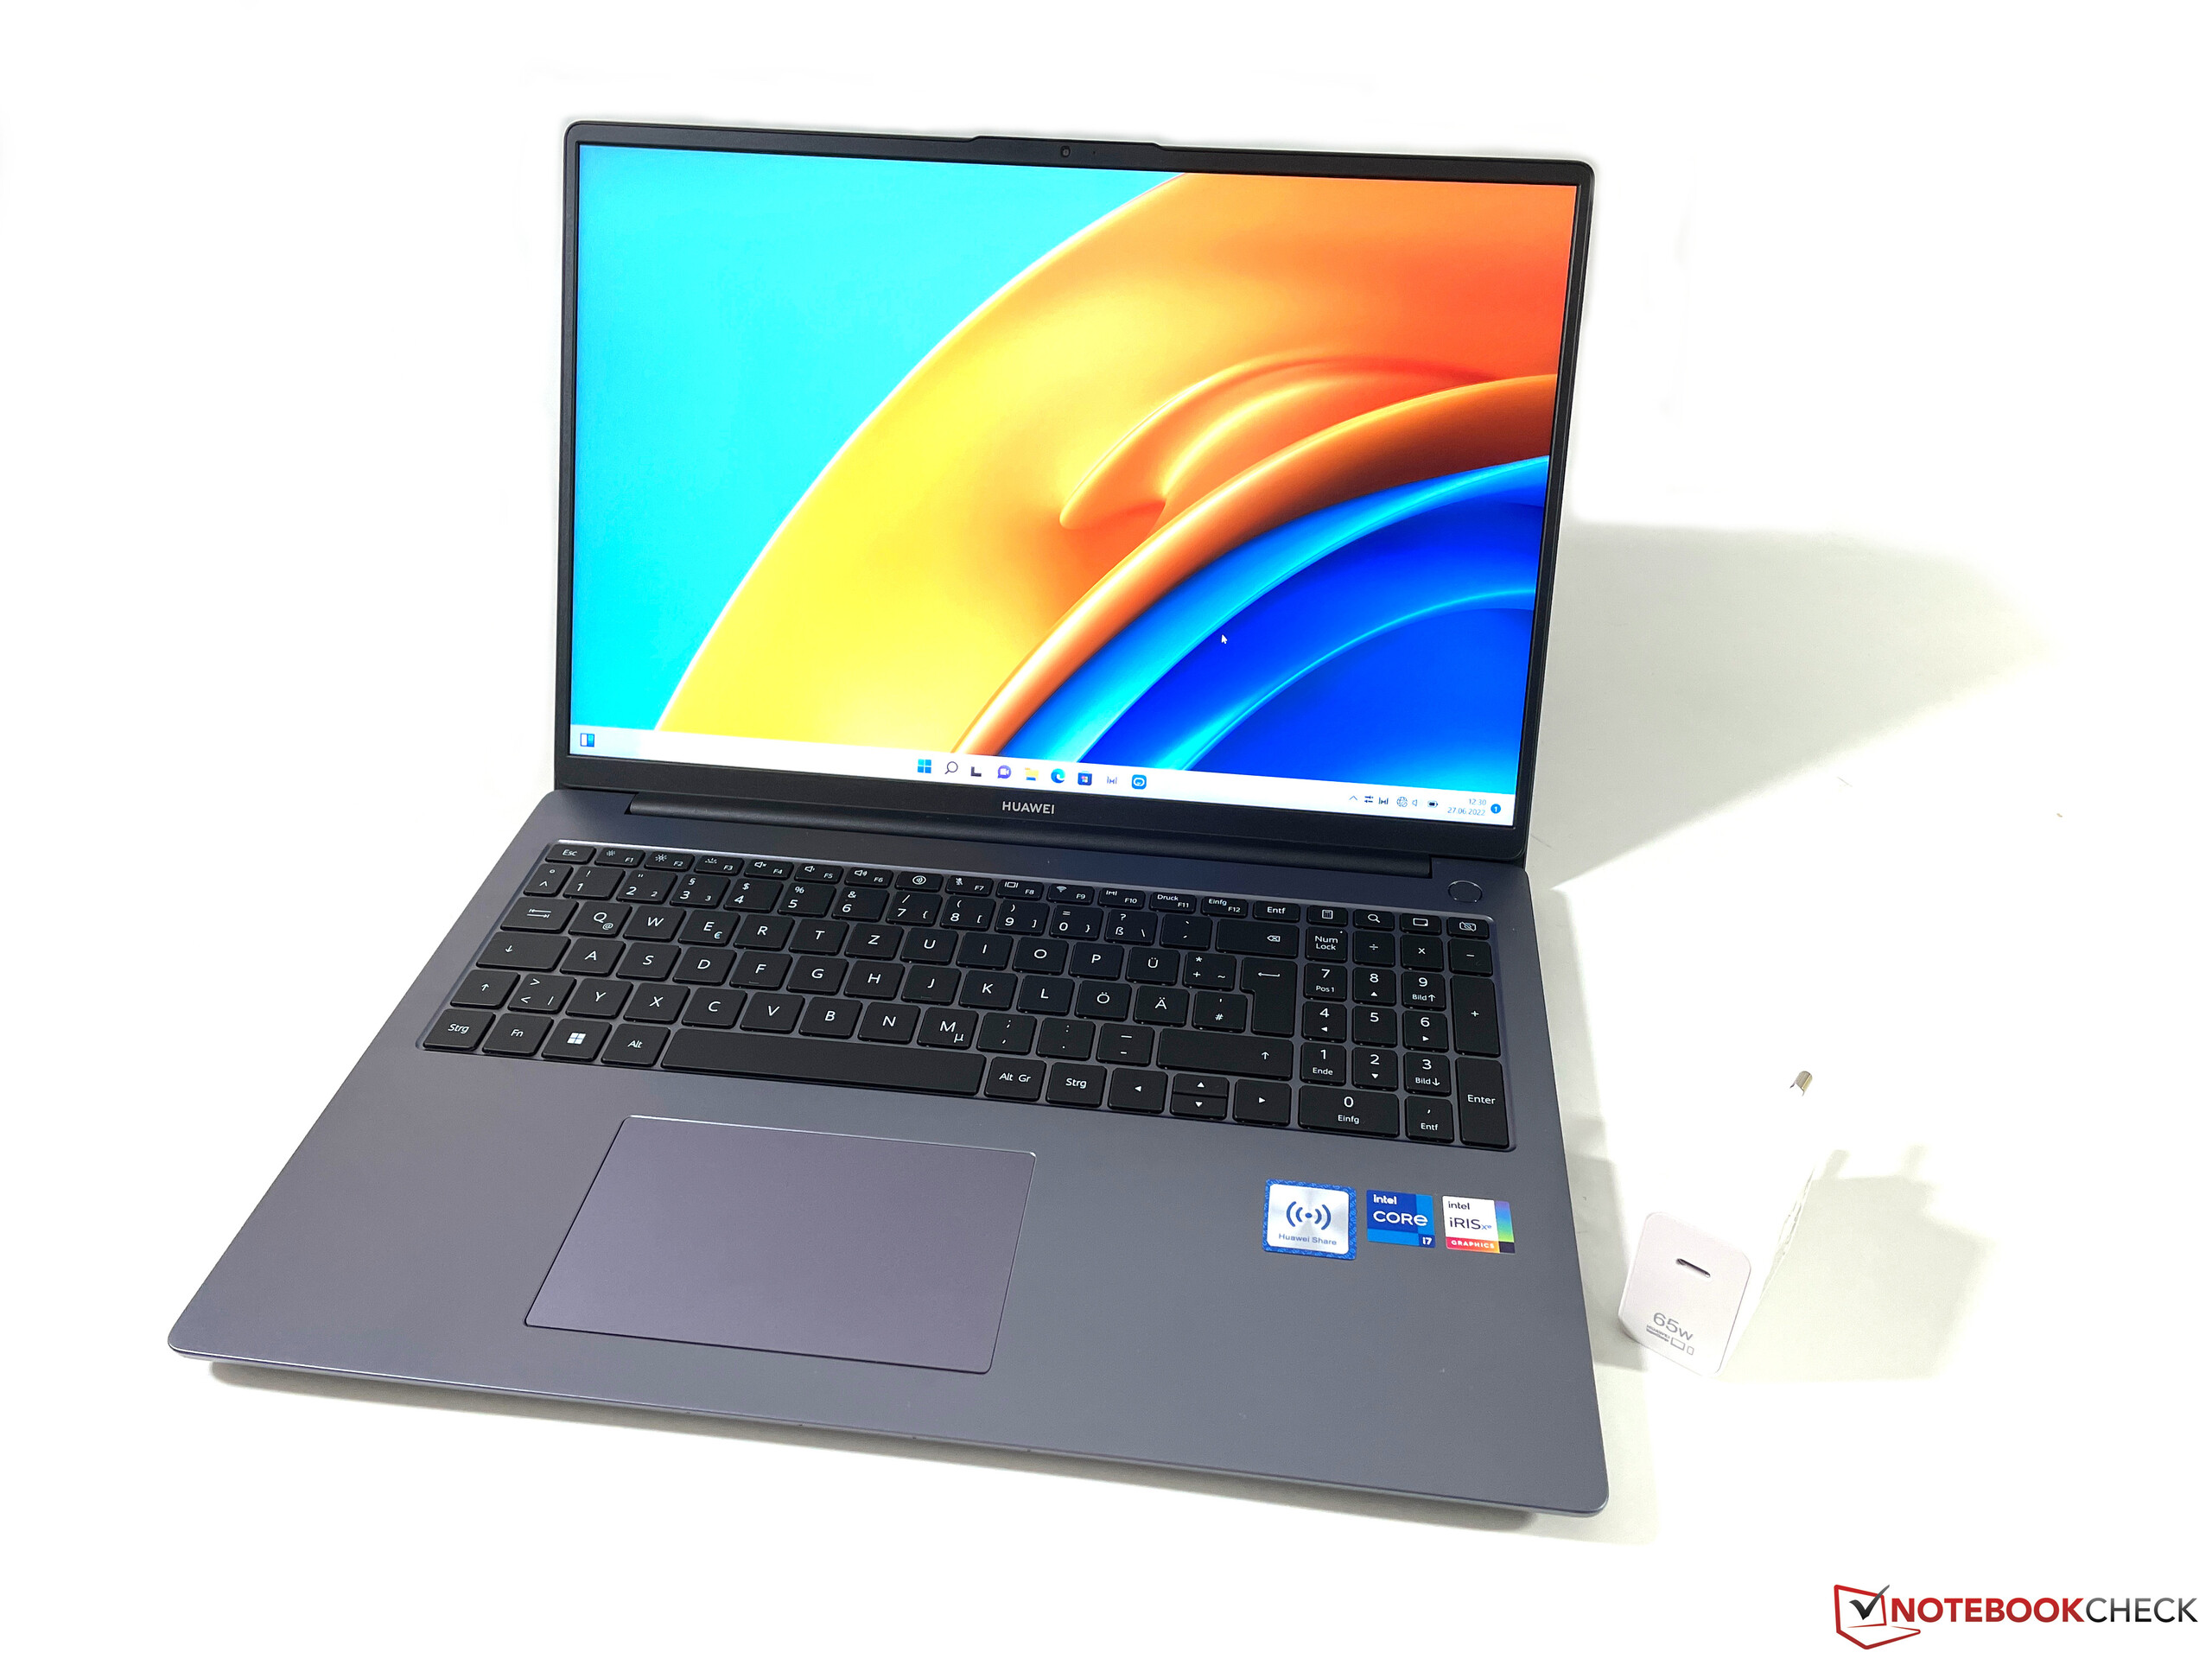
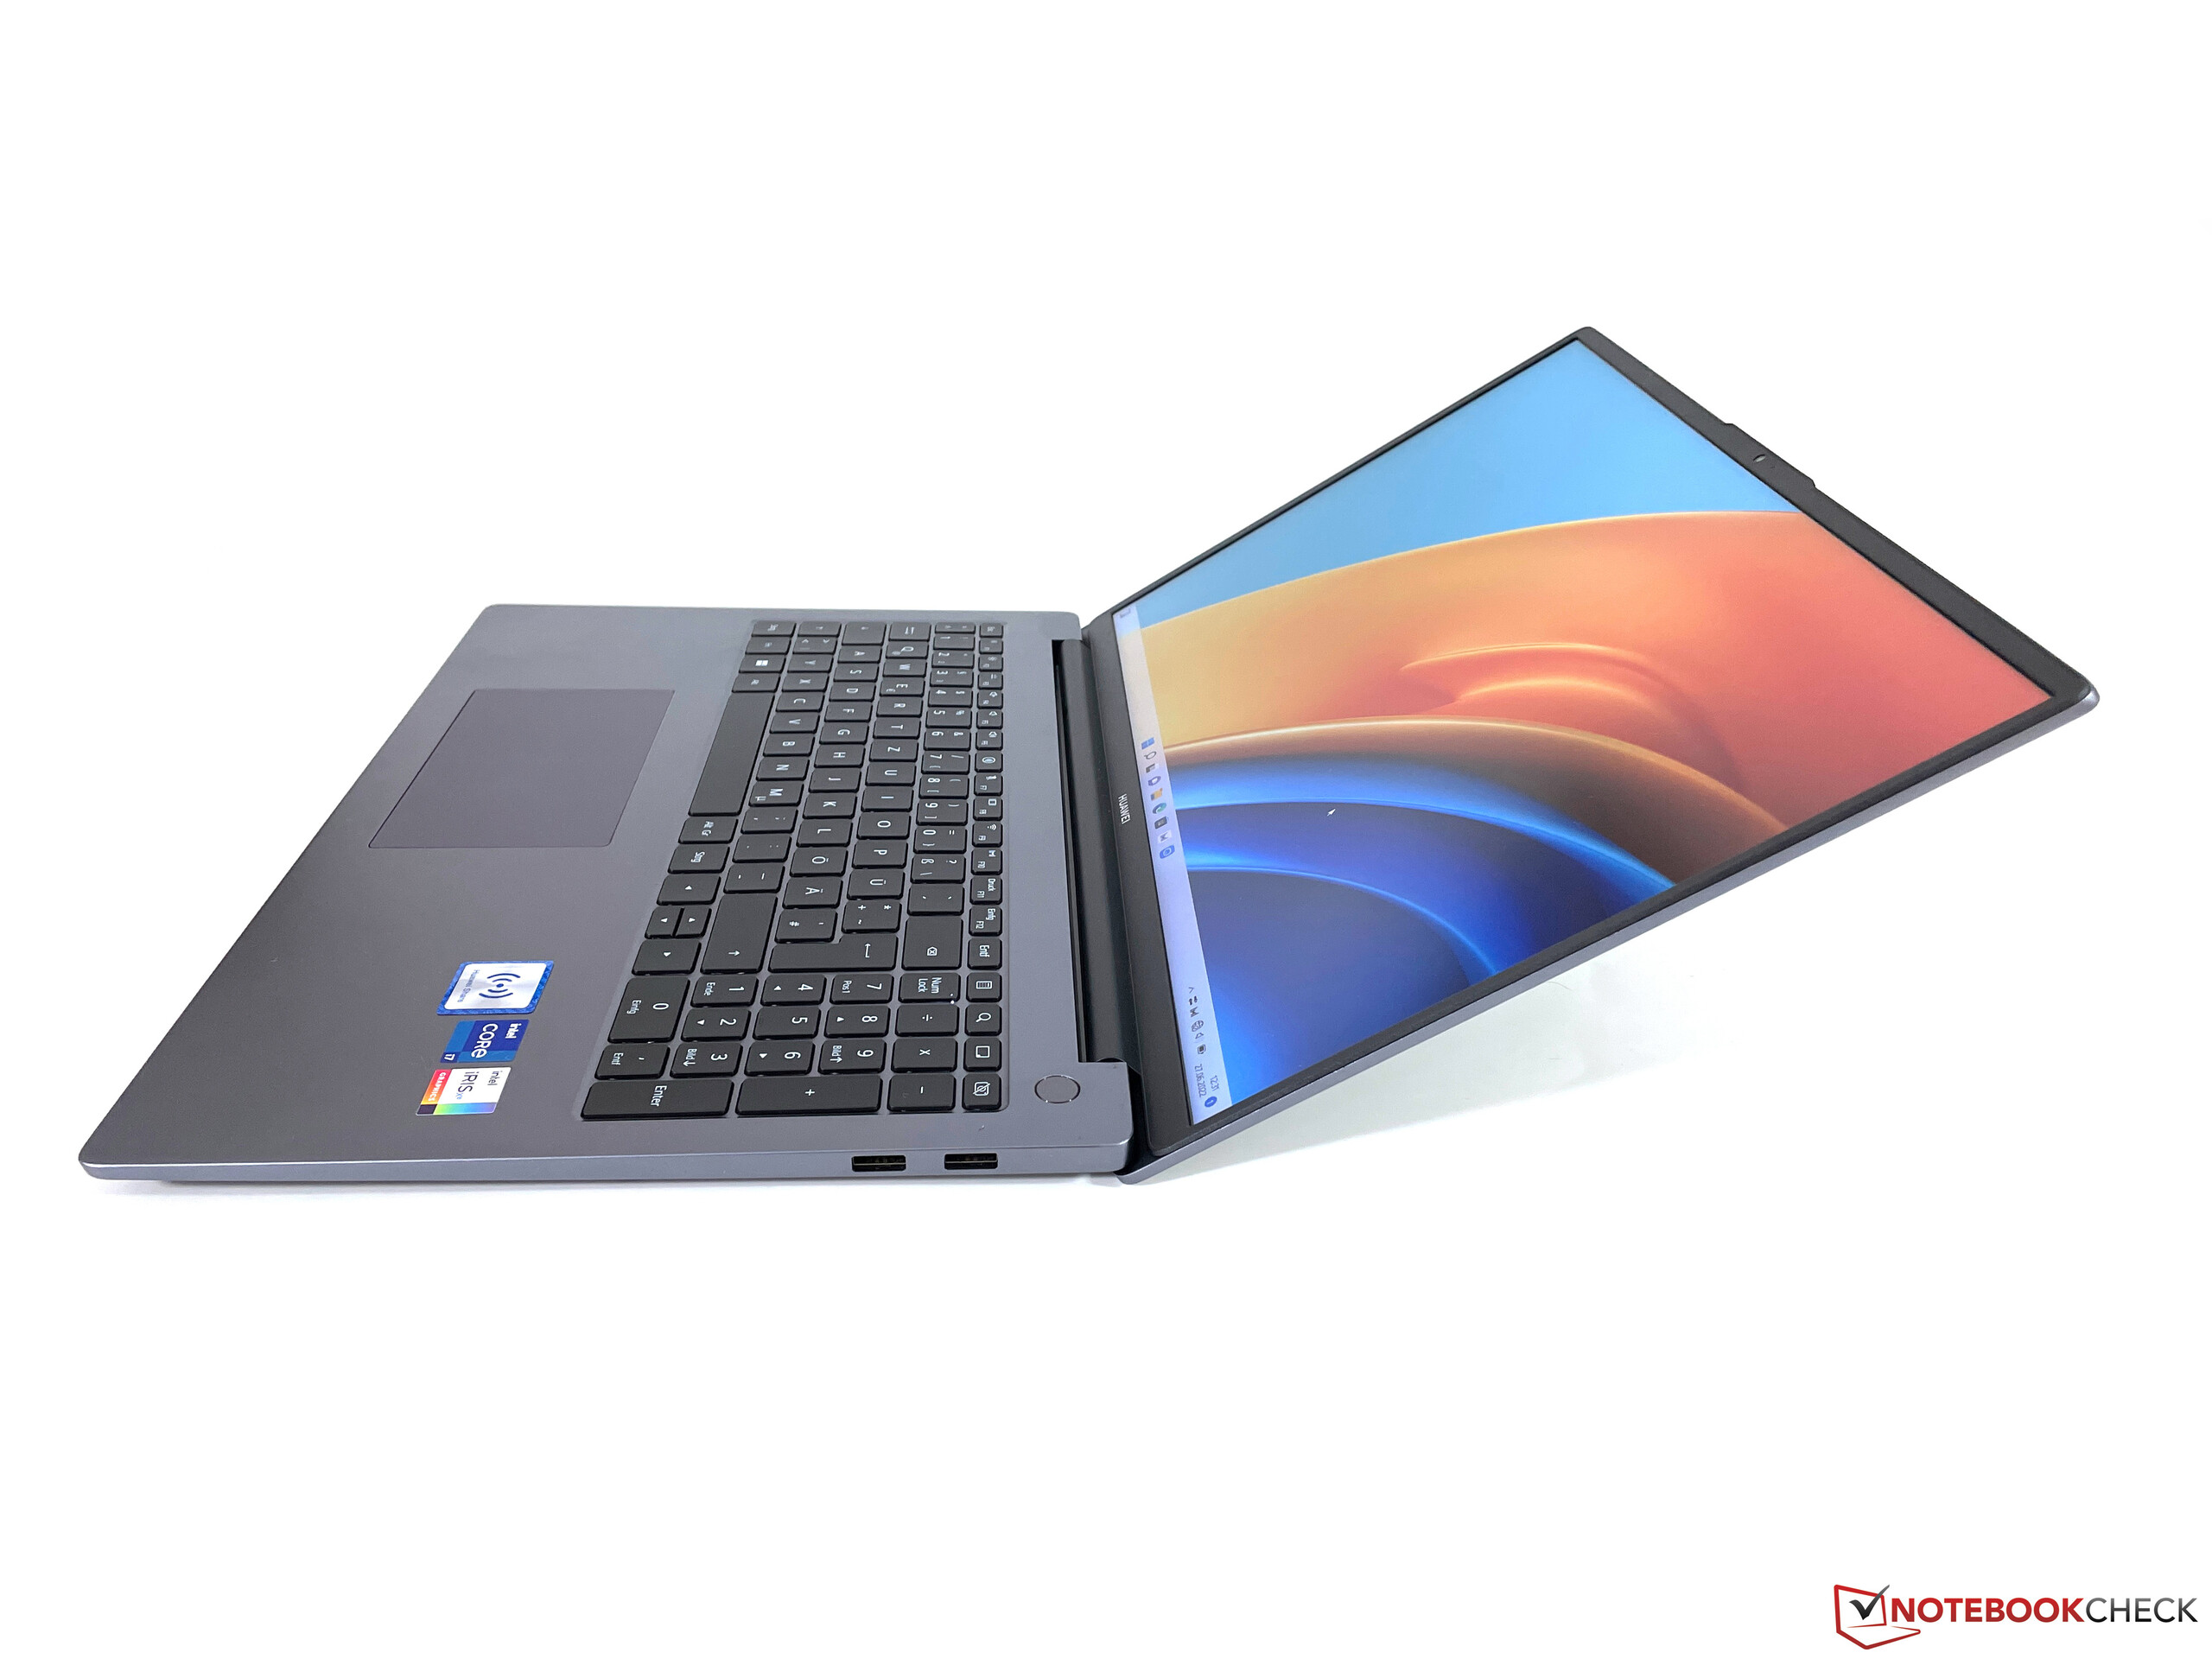
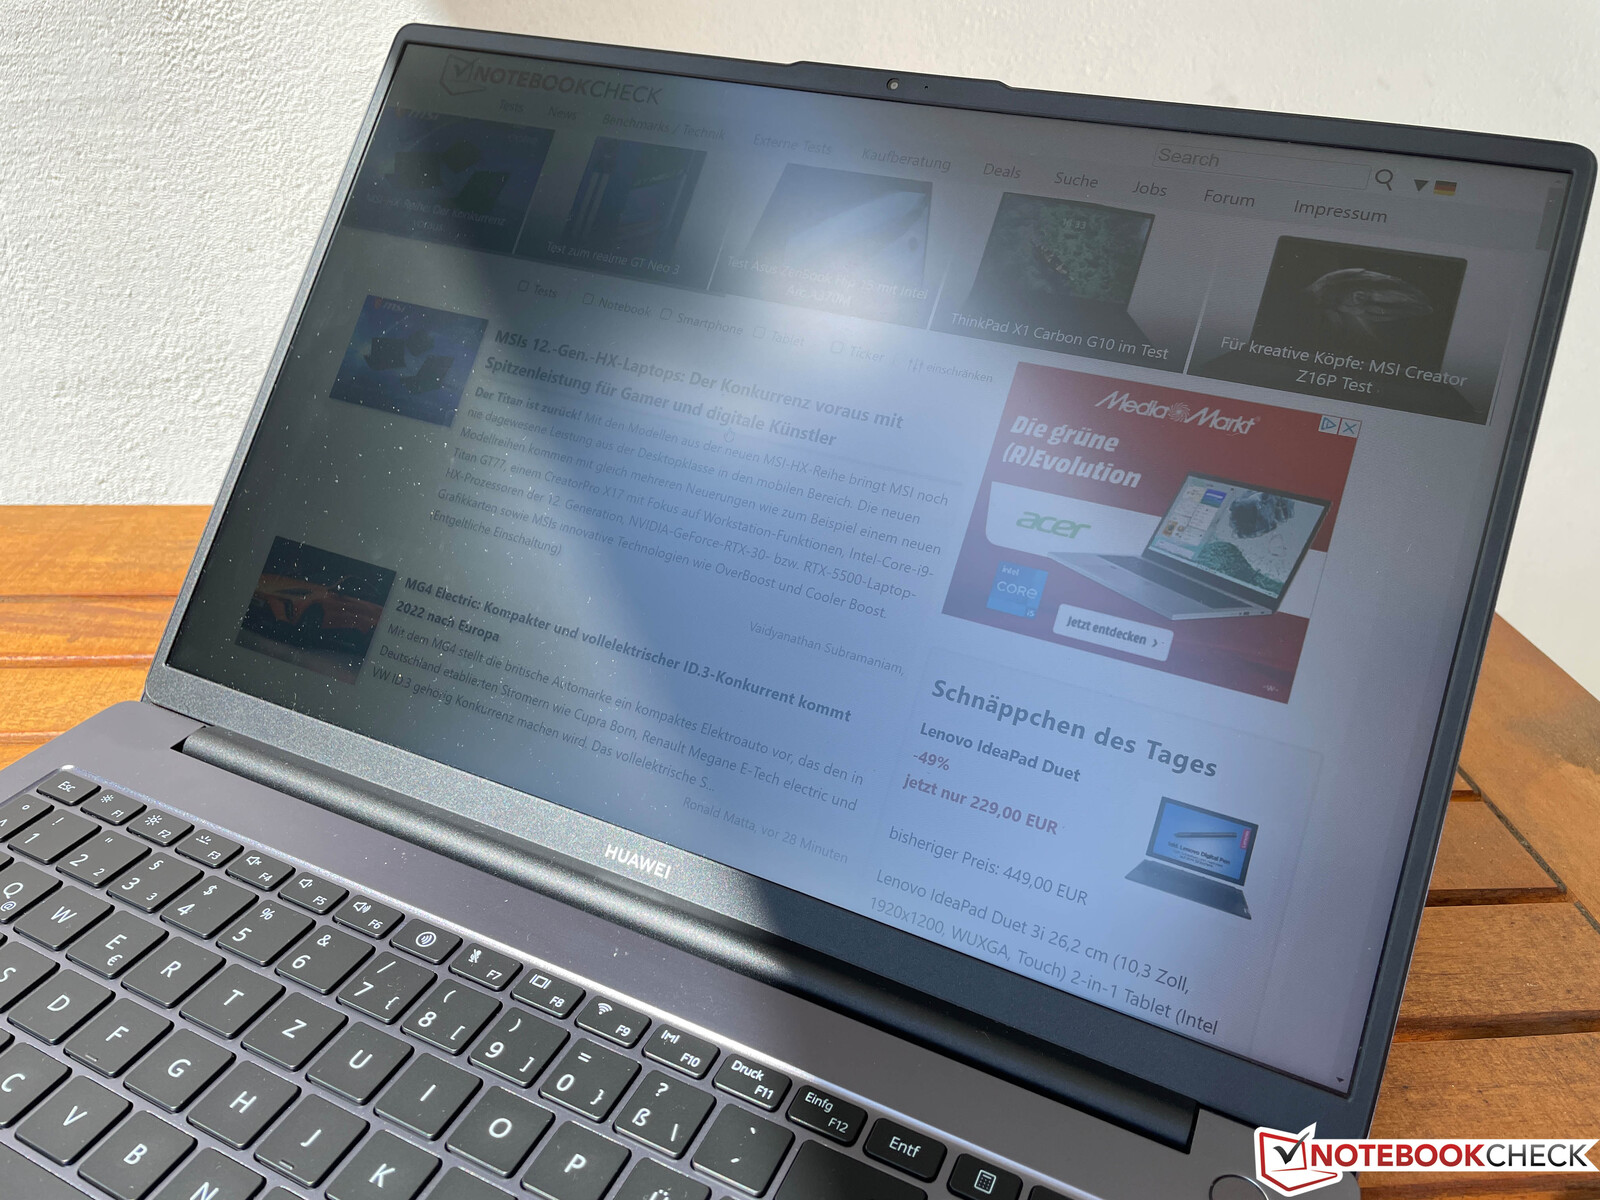
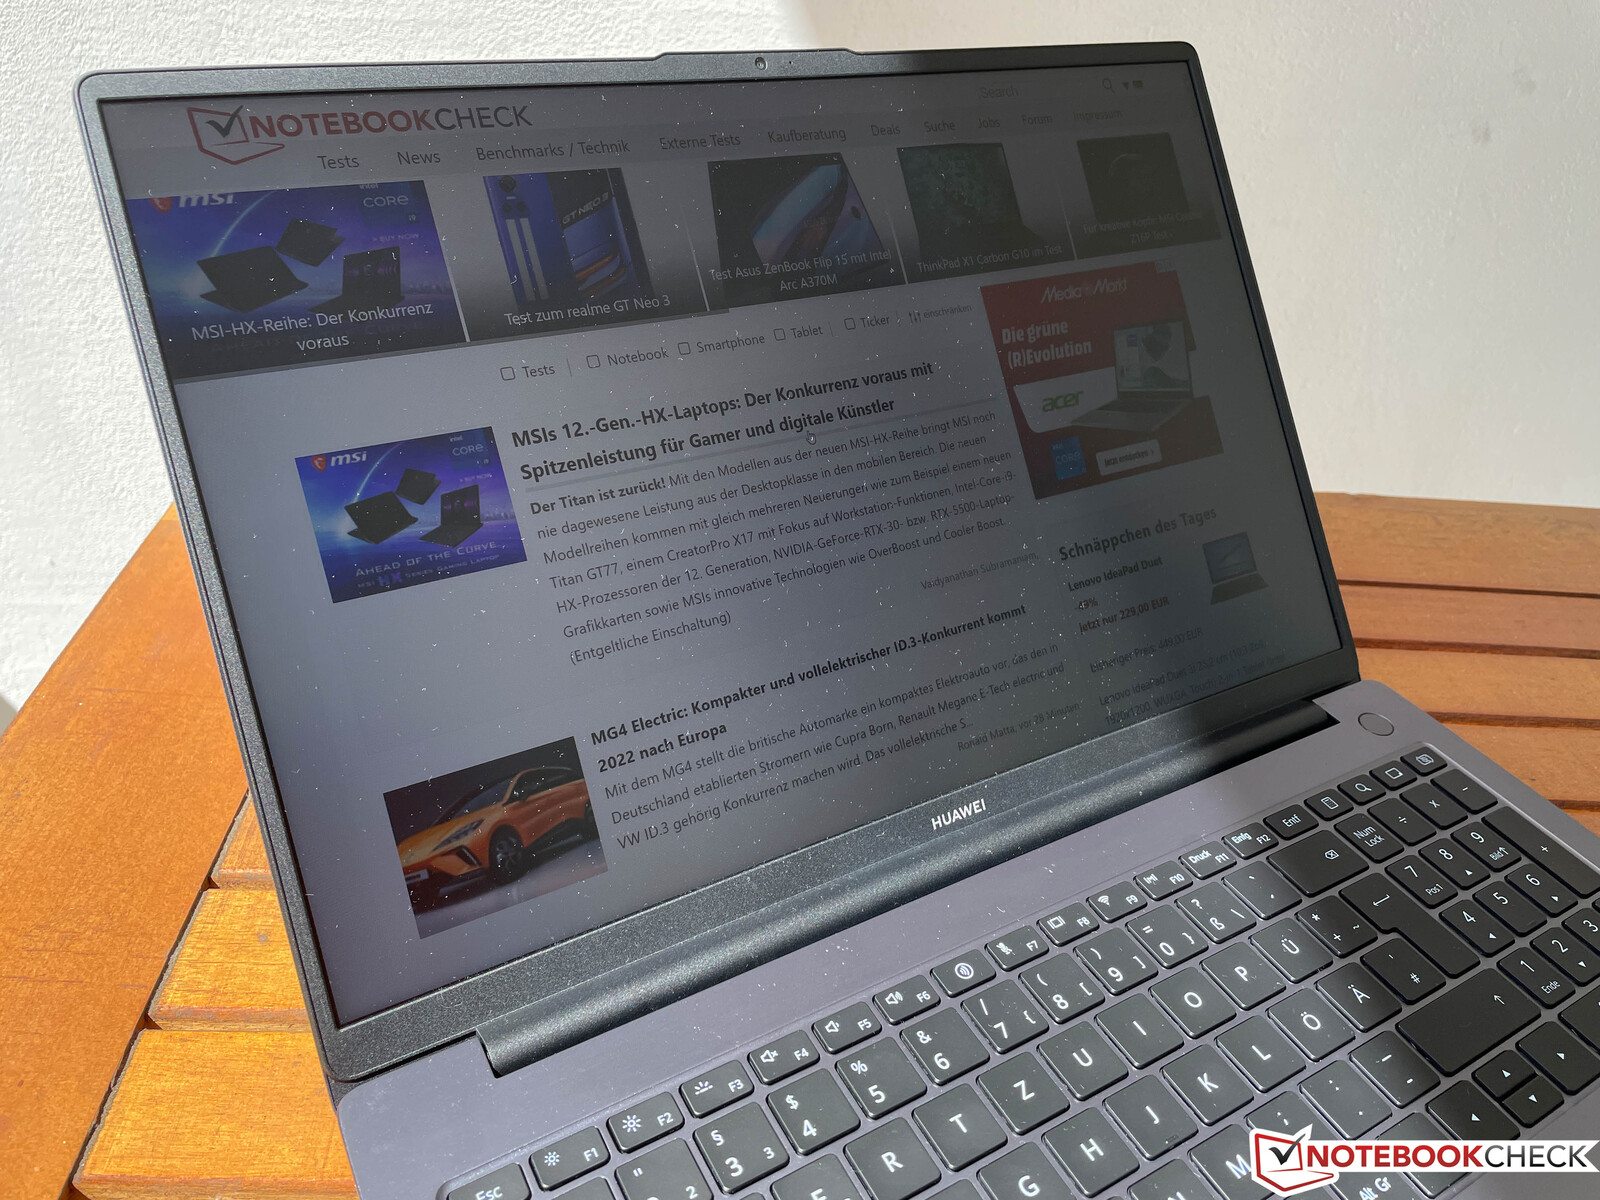
Huawei has completely reworked the case of the new MateBook D 16, now mostly following the design of the MateBook 16s. In term of the exterior, the two laptops can hardly be distinguished, besides having slightly different sizes due to their different screen formats (3:2 for the MateBook 16s and 16:10 for the MateBook D 16). This is definitely an upgrade for the MateBook D 16, and we don't find many reasons for complaint, neither in the workmanship, nor in terms of the case stability.
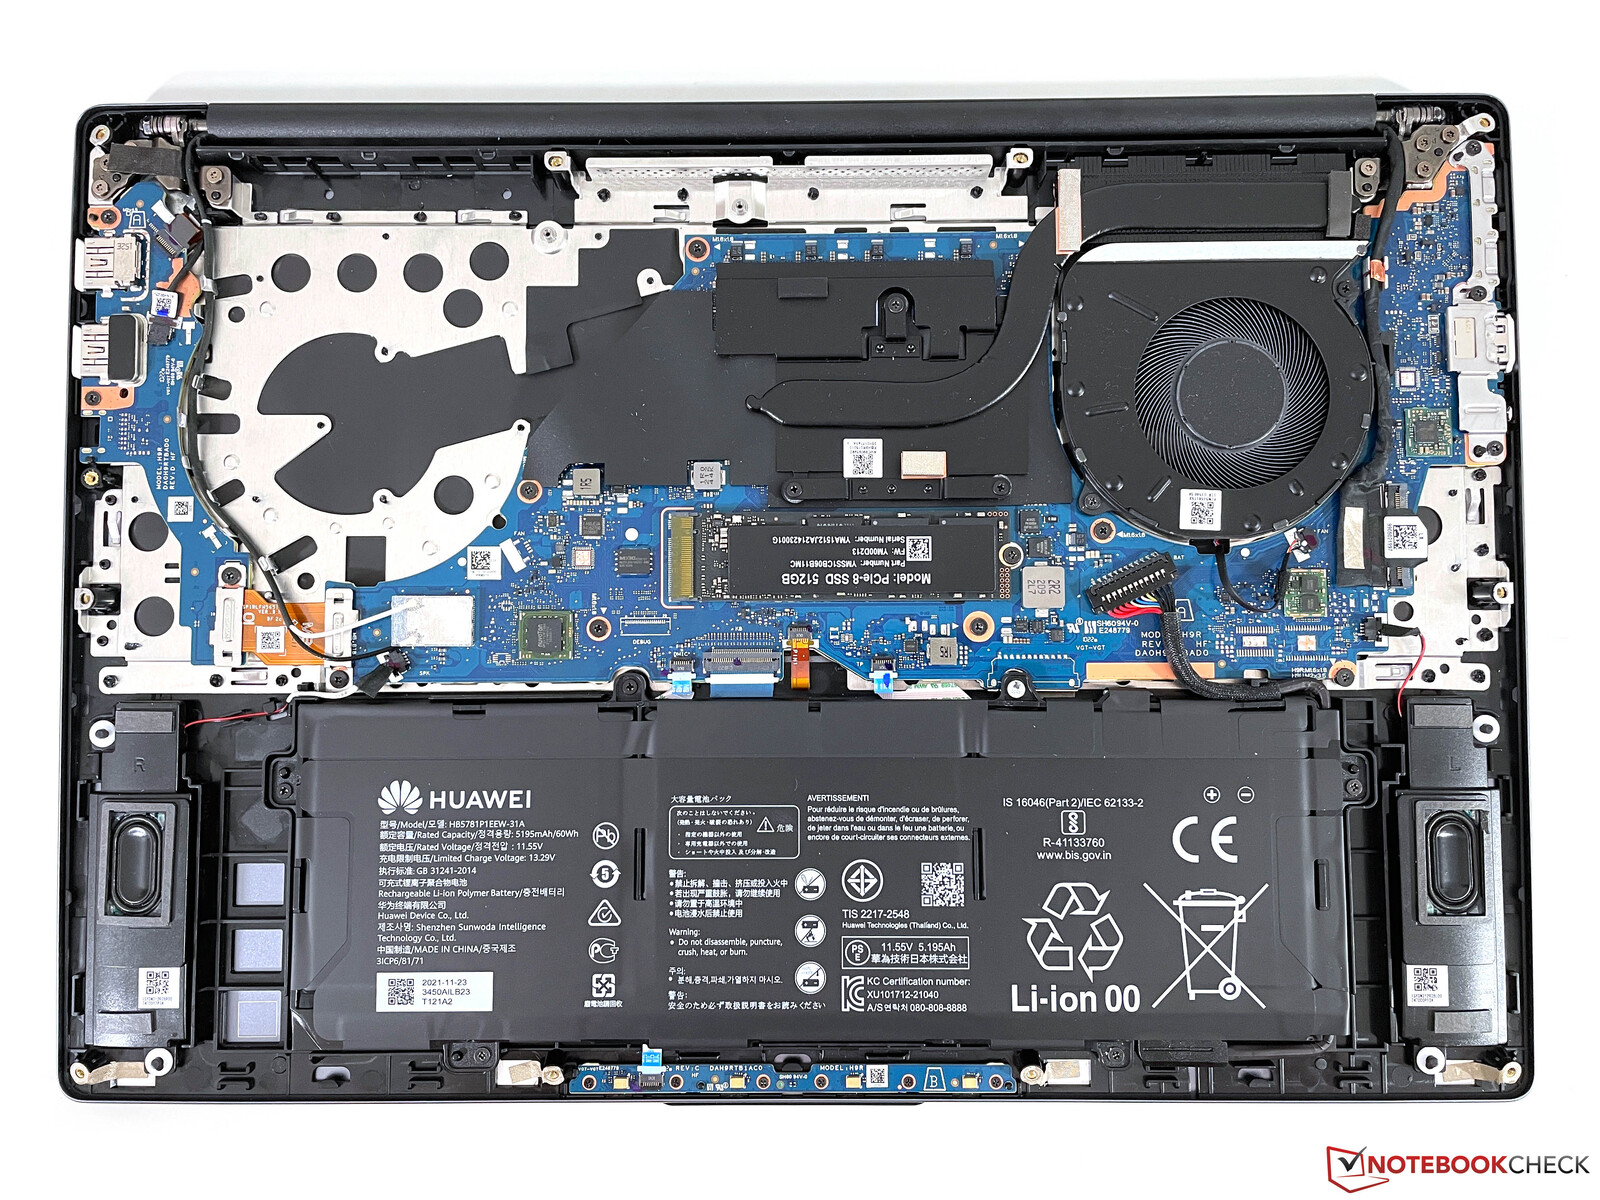
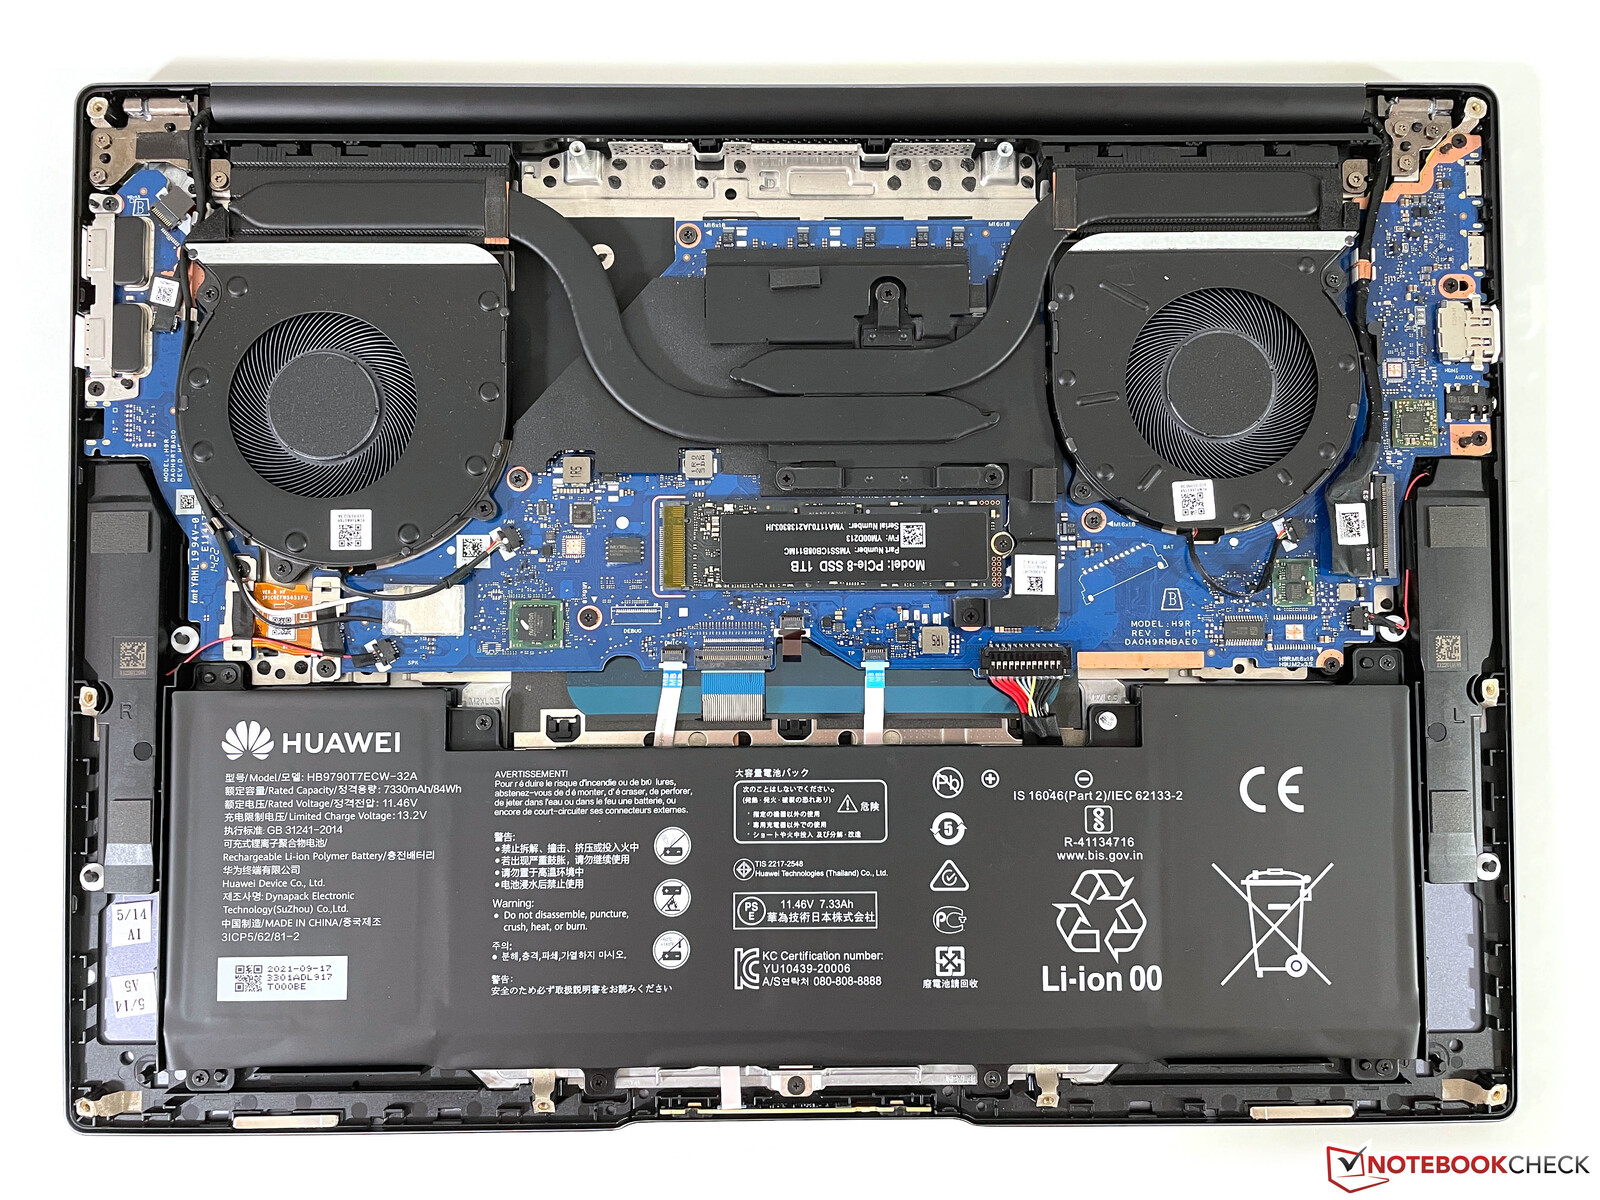
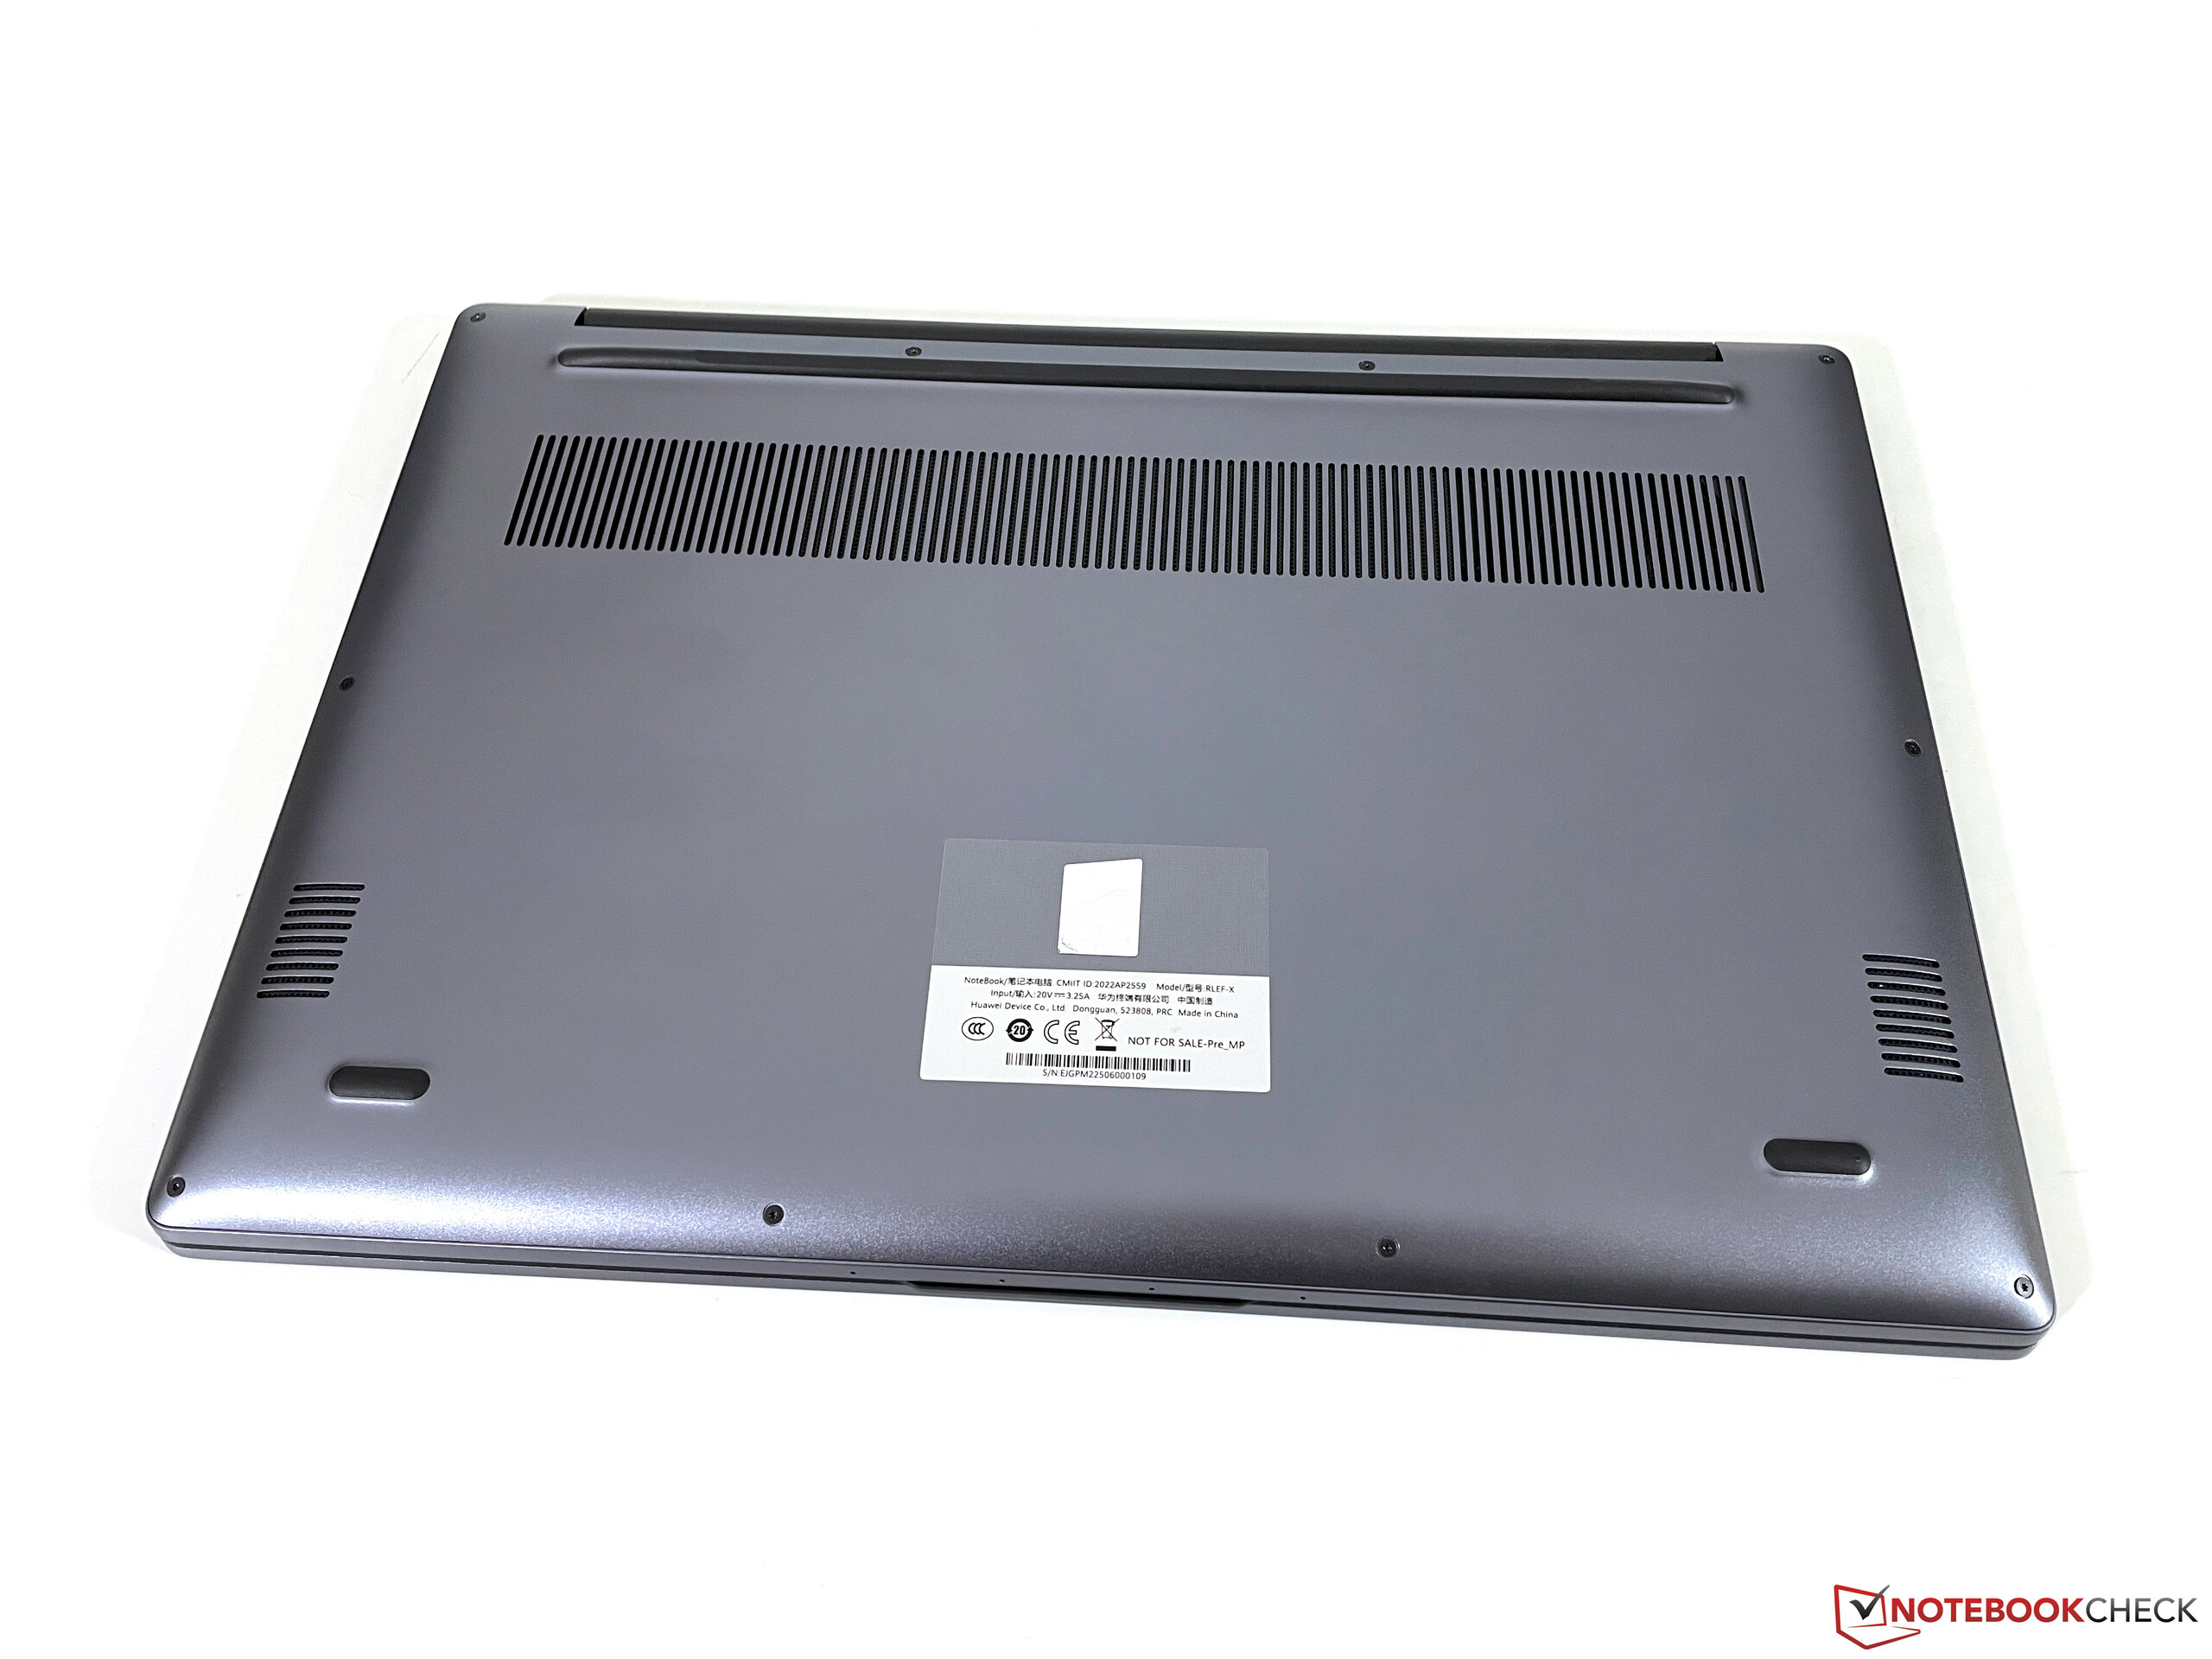
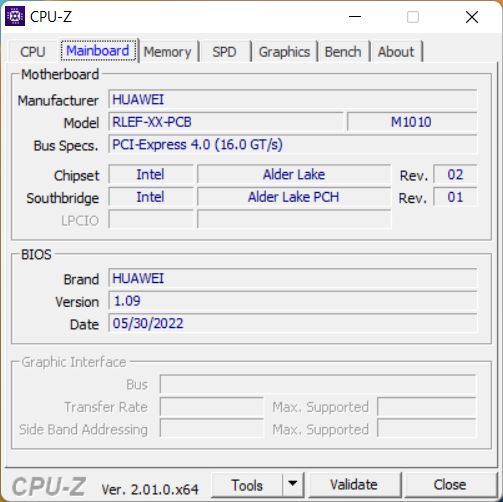
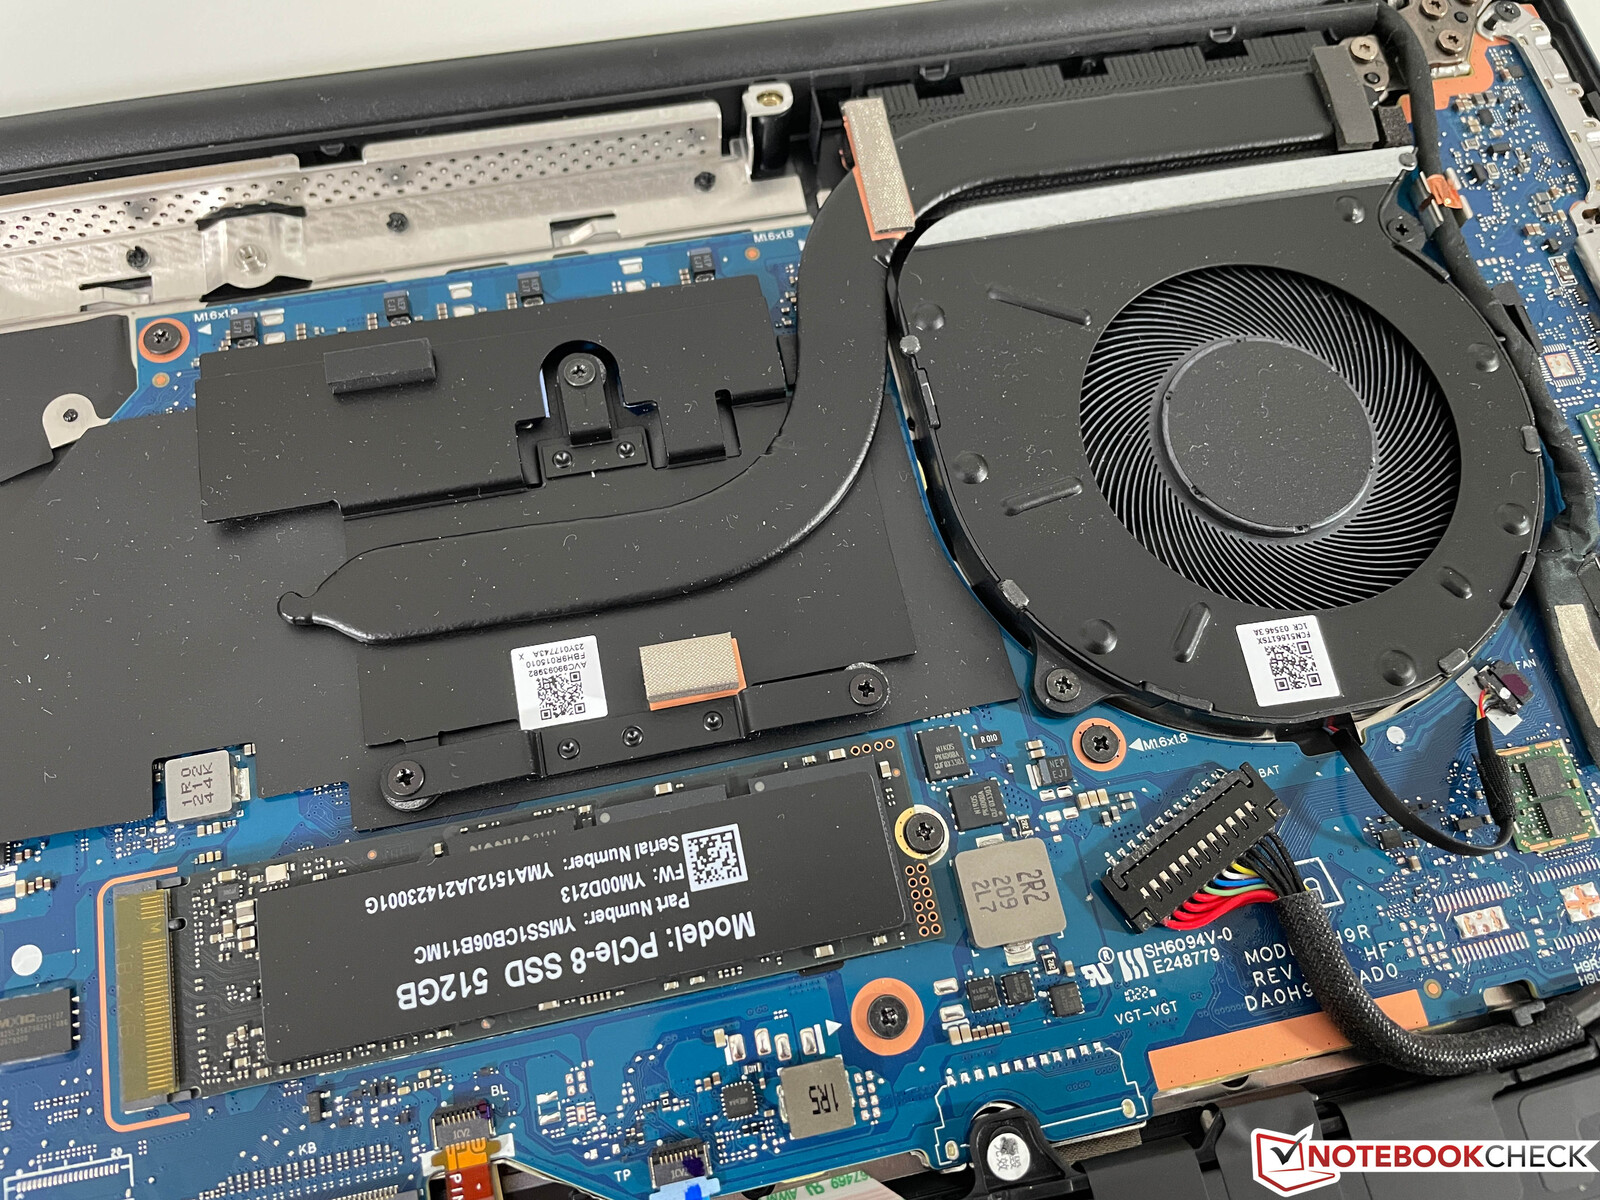
A glance inside the case also shows that Huawei uses an identical mainboard for both devices. However, despite using the same processor, the MateBook D 16 only receives a single fan and single heat pipe. The user can only replace the M.2 SSD, since the WLAN module is soldered in. Compared to the predecessor, the new MateBook D 16 is less wide and deeper instead, but the overall size of both devices is fairly similar.
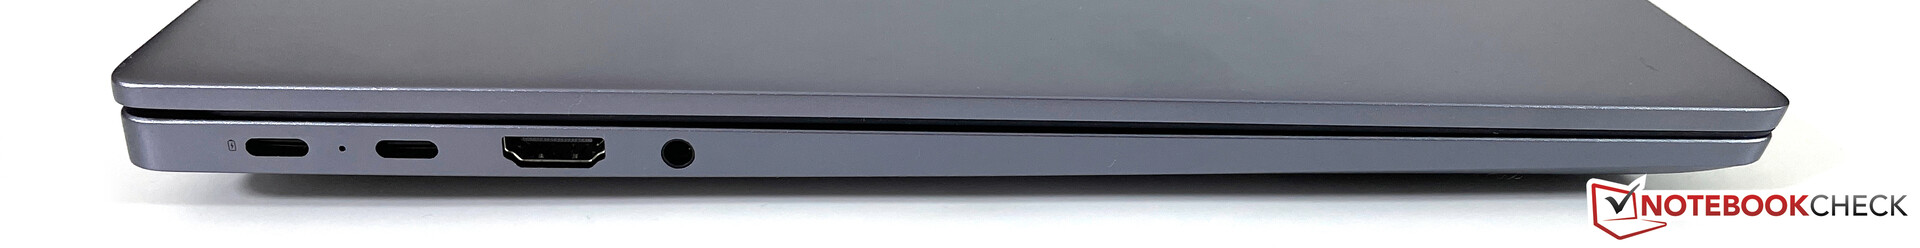
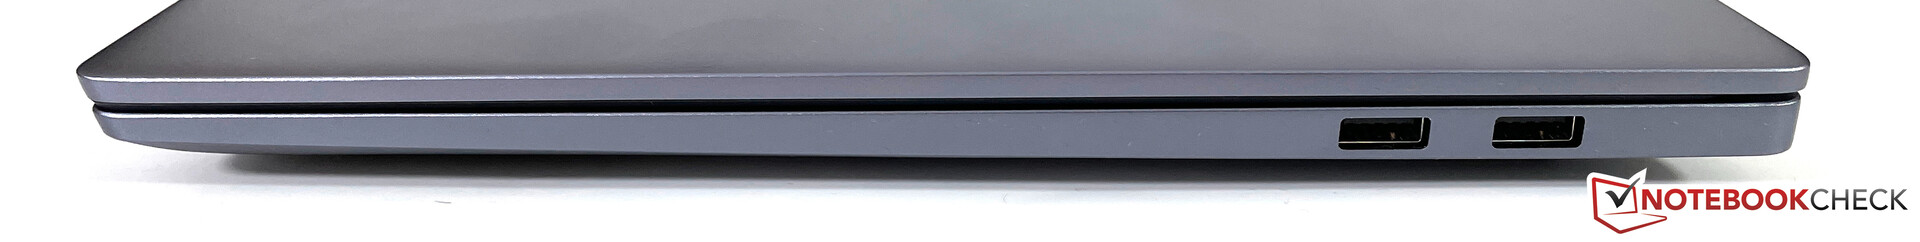
In terms of the connections and their amounts, there is again parity with the larger MateBook 16s, but Huawei saves on the licensing fees for a Thunderbolt 4 connection, and one of the two USB-A ports on the right side only supports the old 2.0 standard. The Wi-Fi module also lacks support for the newest 6-GHz networks, but the AX201 card from Intel (Wi-Fi 6) still does a very good job and you shouldn't encounter any limitations in practice.
The new 1080p webcam takes decent pictures and offers several interesting AI functions (background filter, object tracking, adjustment of the viewpoint, etc.). In practice, this works well in principle, but the image impression is slightly more jerky when the AI camera is activated.


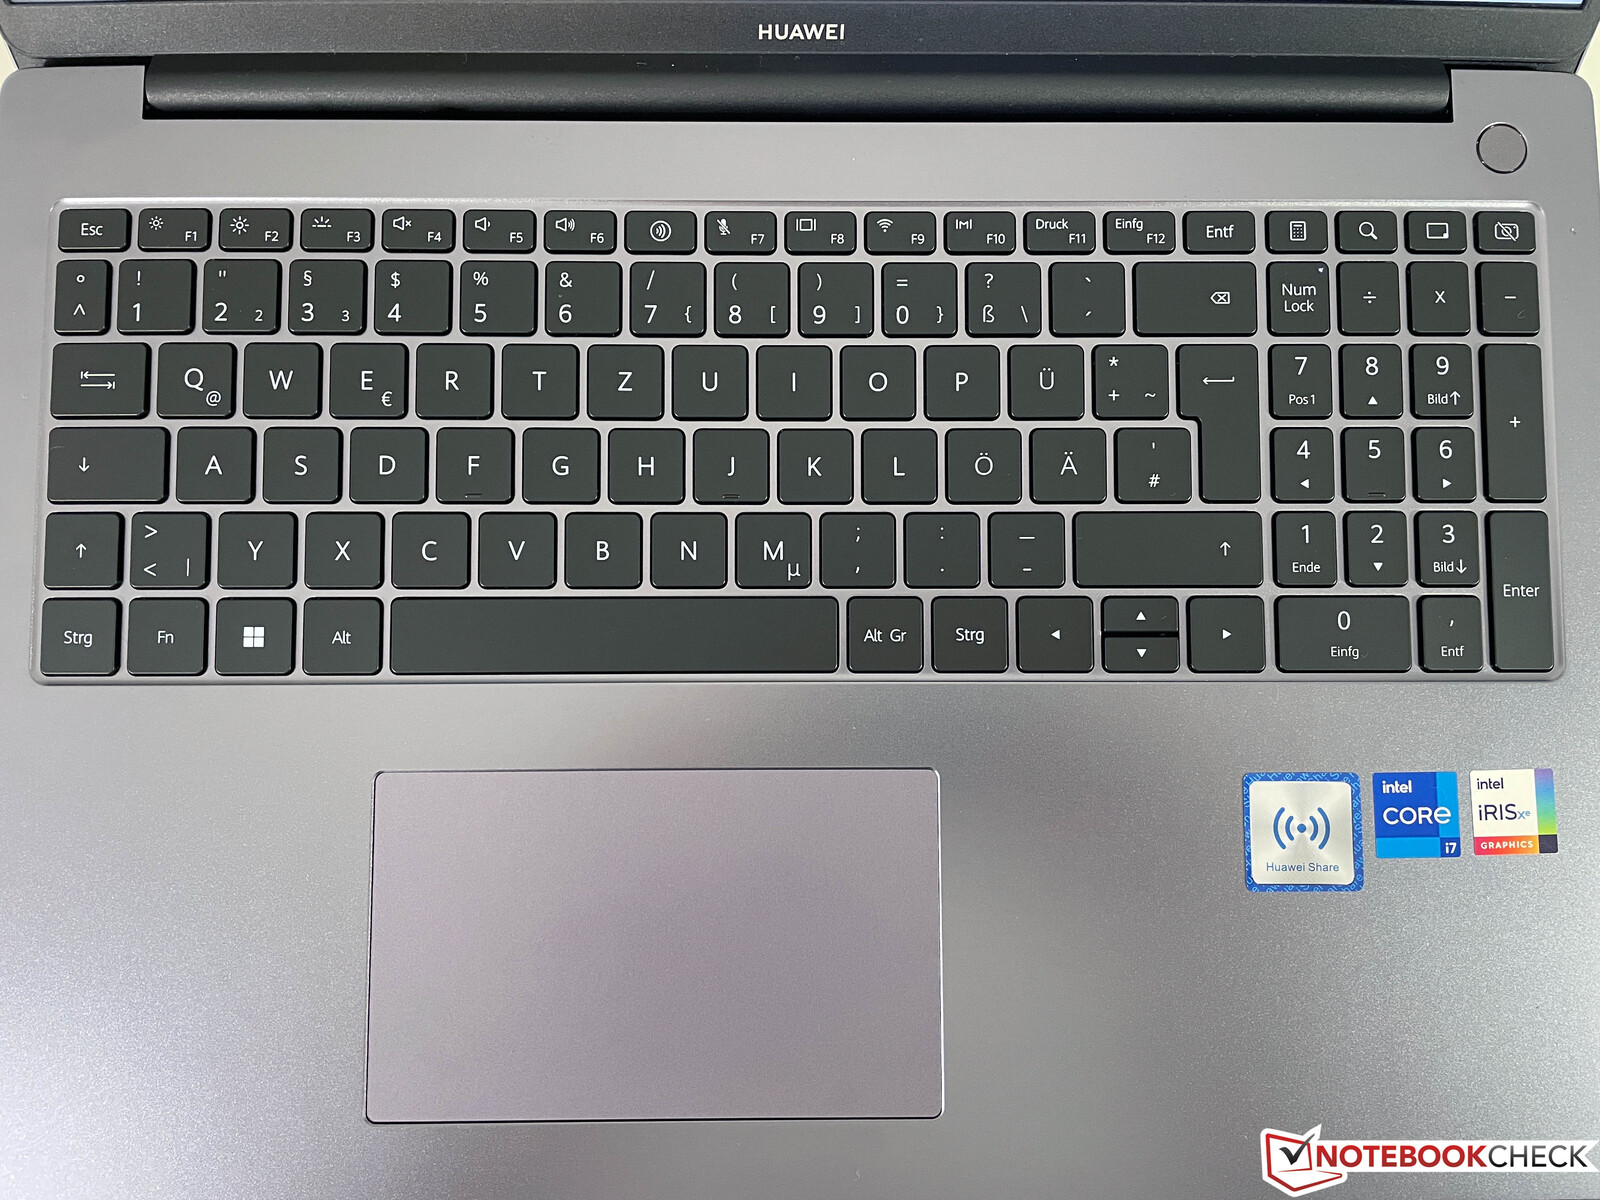
Input Devices - MateBook now with number pad
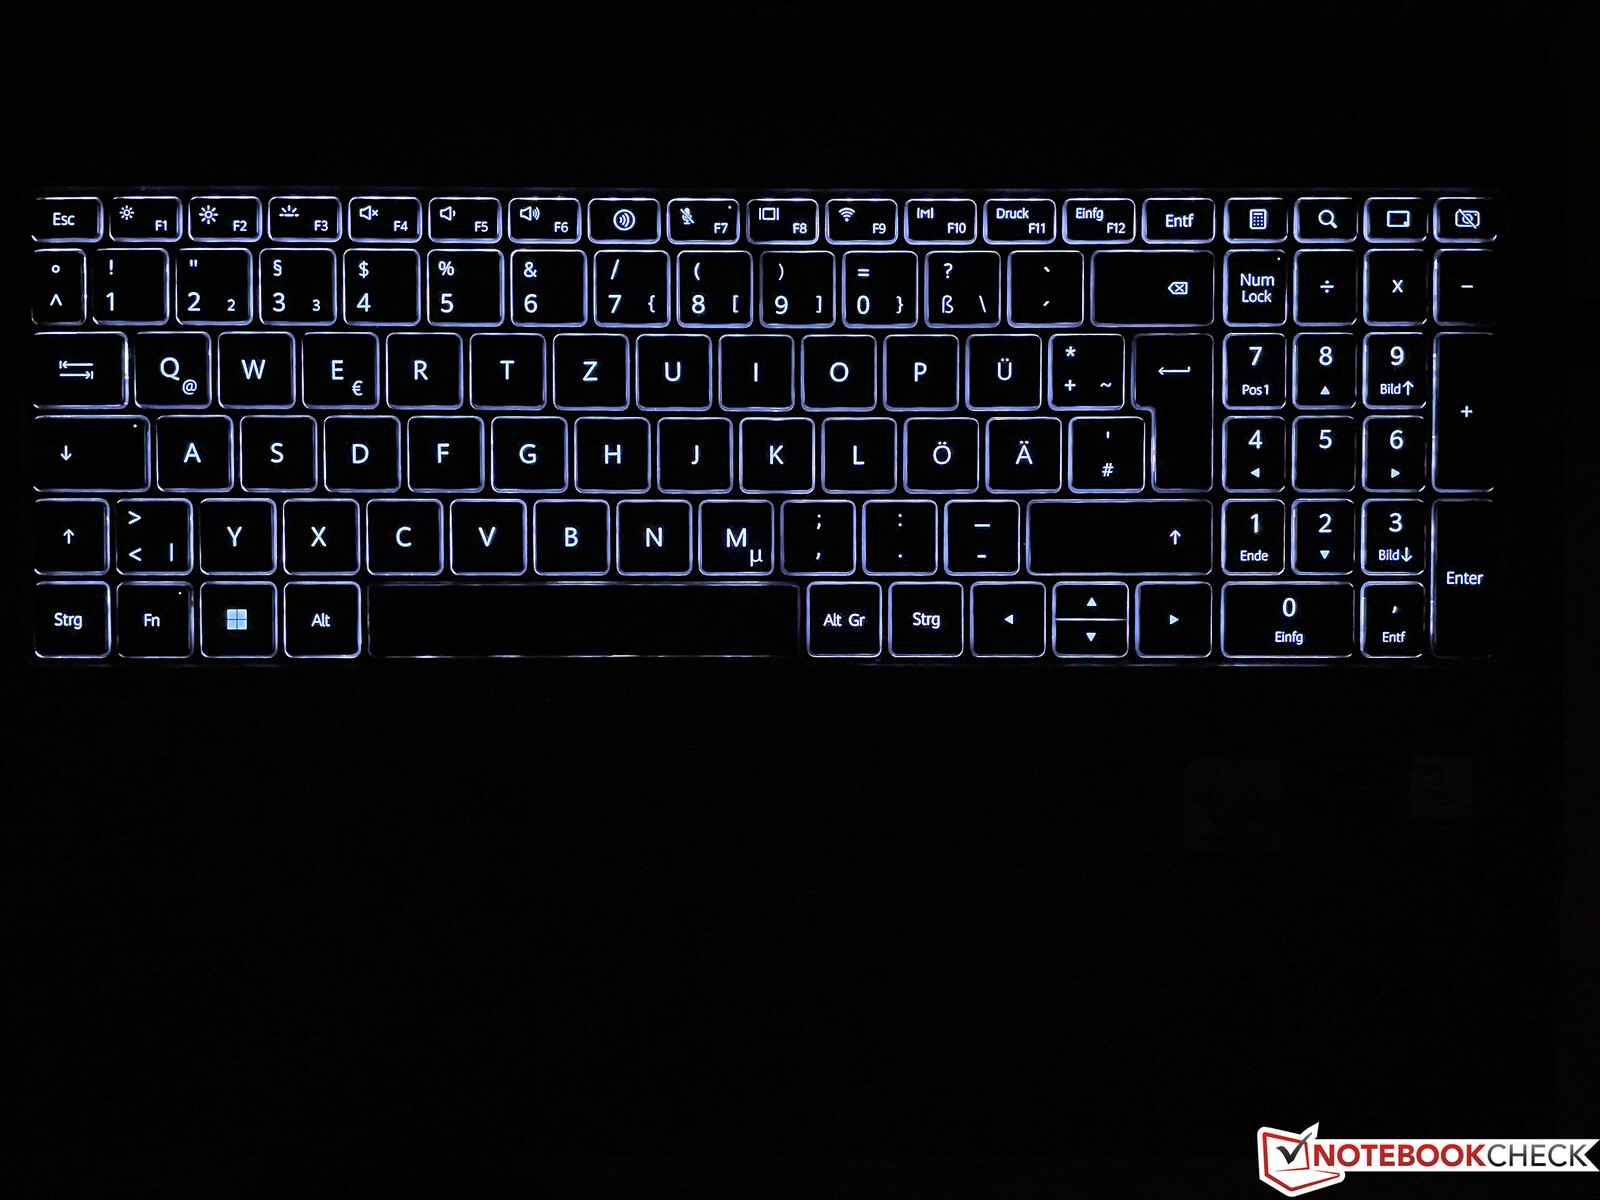
The new MateBook D 16 is the first laptop from Huawei with a dedicated numeric keypad. As already in the MateBook 16s, the key stroke has increased from 1.3 to 1.5 mm, and the typing experience is very good overall. We even like it a little better than that of the 16s, since the key stroke is slightly quieter. The feedback is precise, and even longer texts can be typed up without any problems. As before, the vertical arrow keys are still smaller. There is a white, two-step keyboard illumination, but it cannot be activated automatically via sensor. The Power button is now placed at the top right and contains a fingerprint sensor.
The ClickPad is shifted slightly to the left, which might take some time to get used to in some circumstances. The pad works very well, and we did not encounter any problems in practice, but the clicking sounds continue to be very loud.
Display - Huawei now uses a 16:10 panel
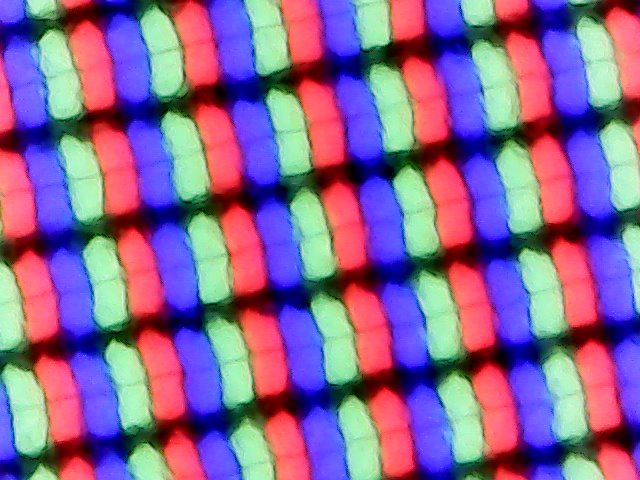
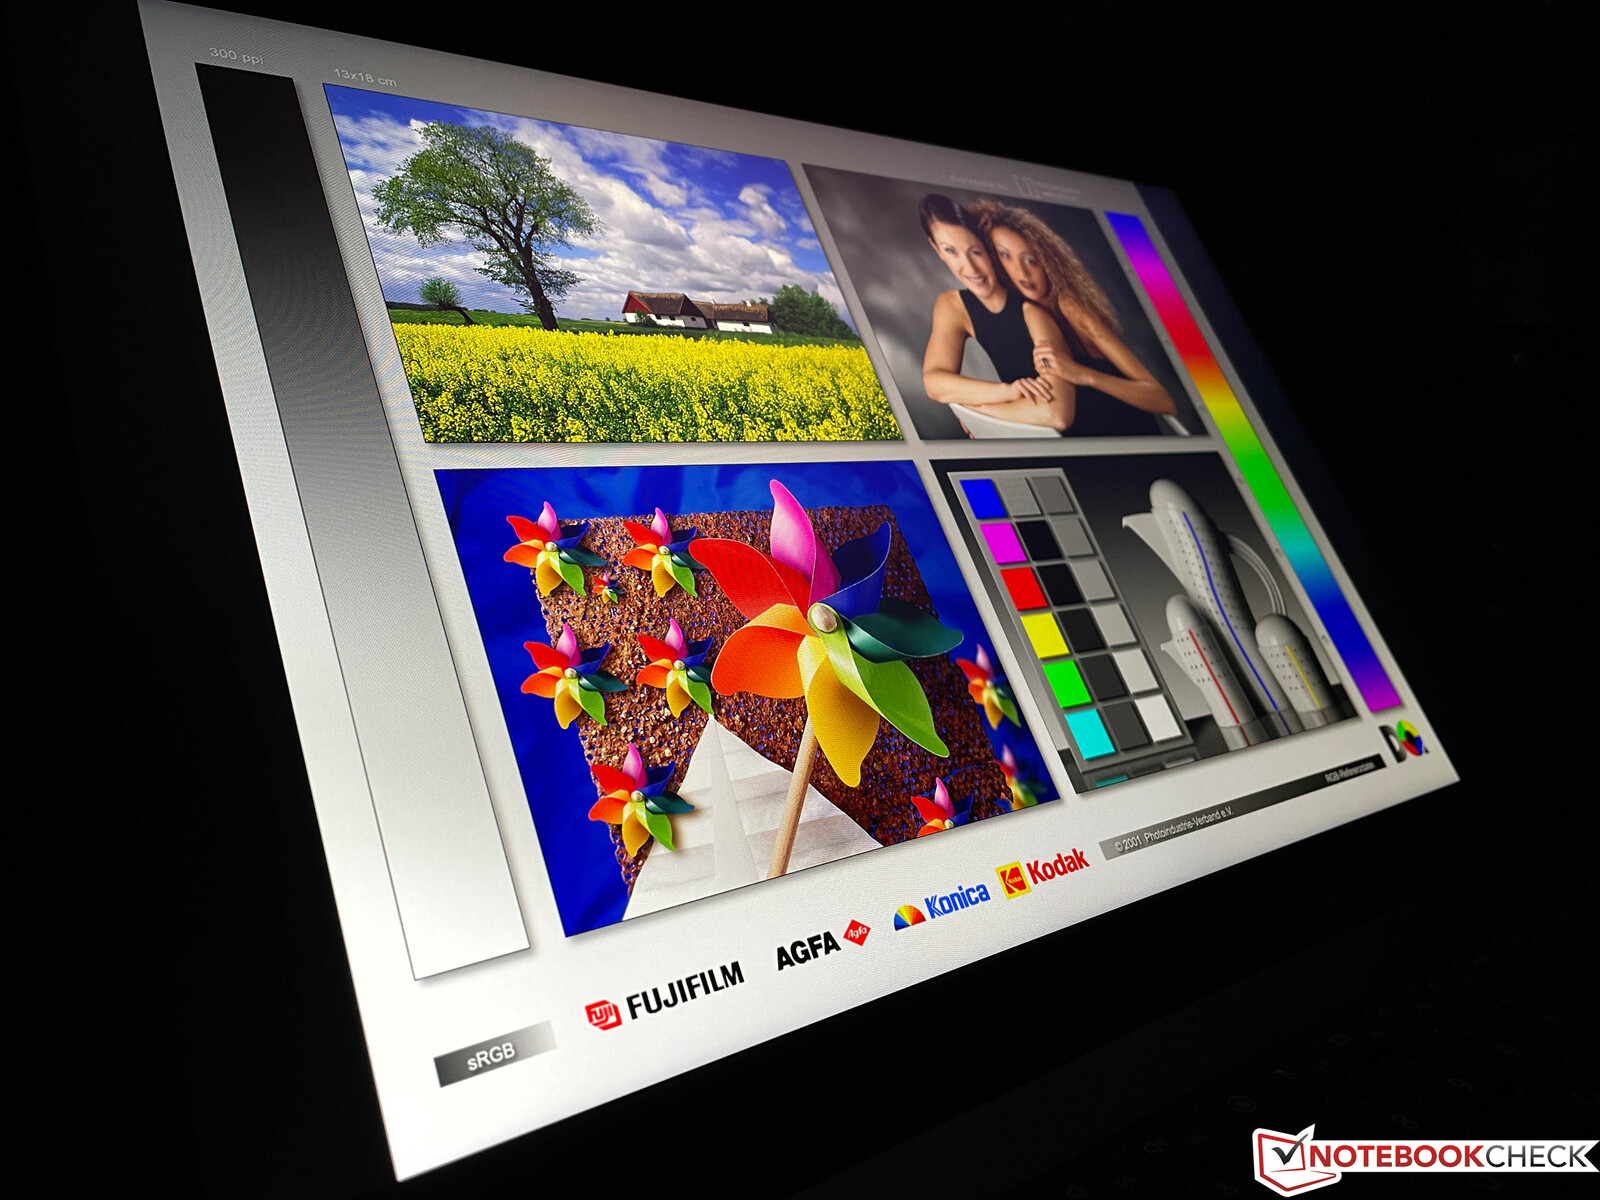
Huawei basically continues to use a matte IPS panel, but now it has a 16:10 format with 1920 x 1200 pixels. The image quality is very good and even bright areas don't look grainy. However, you have to live without any special features, since there is only a 60-Hz refresh rate, no HDR, and also no brightness sensor.
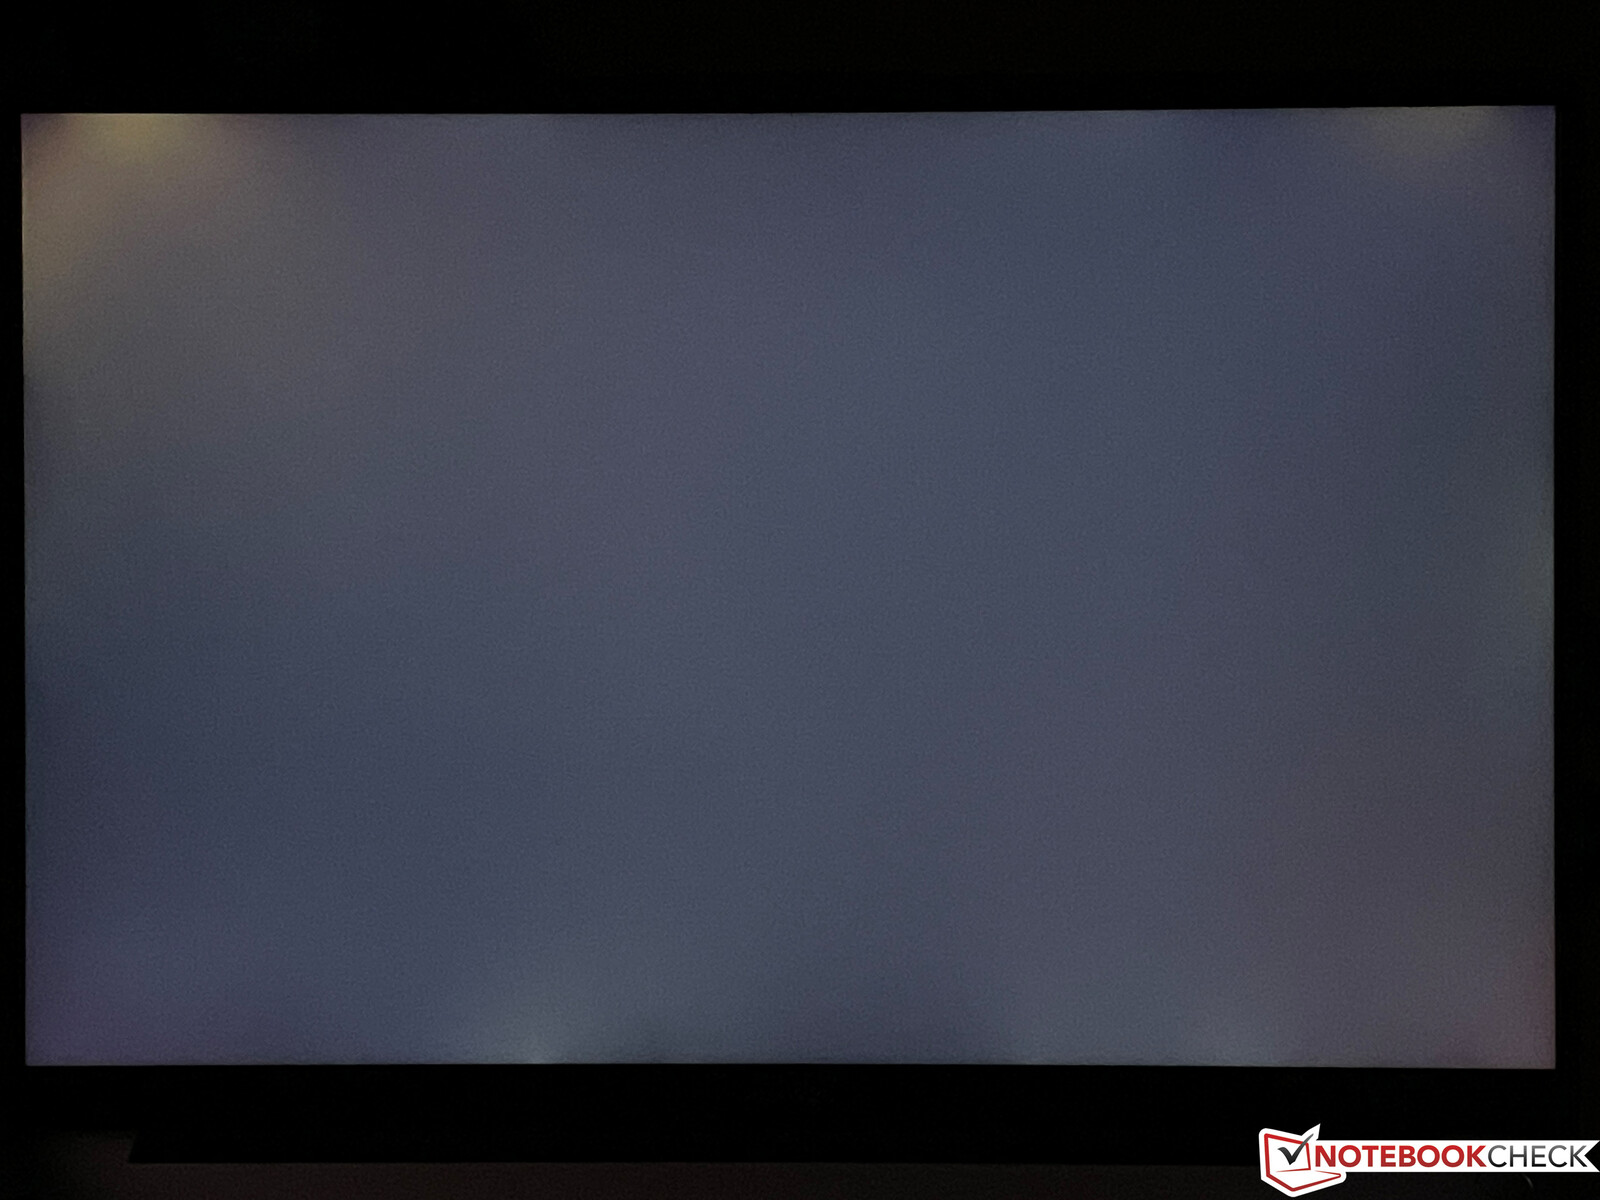
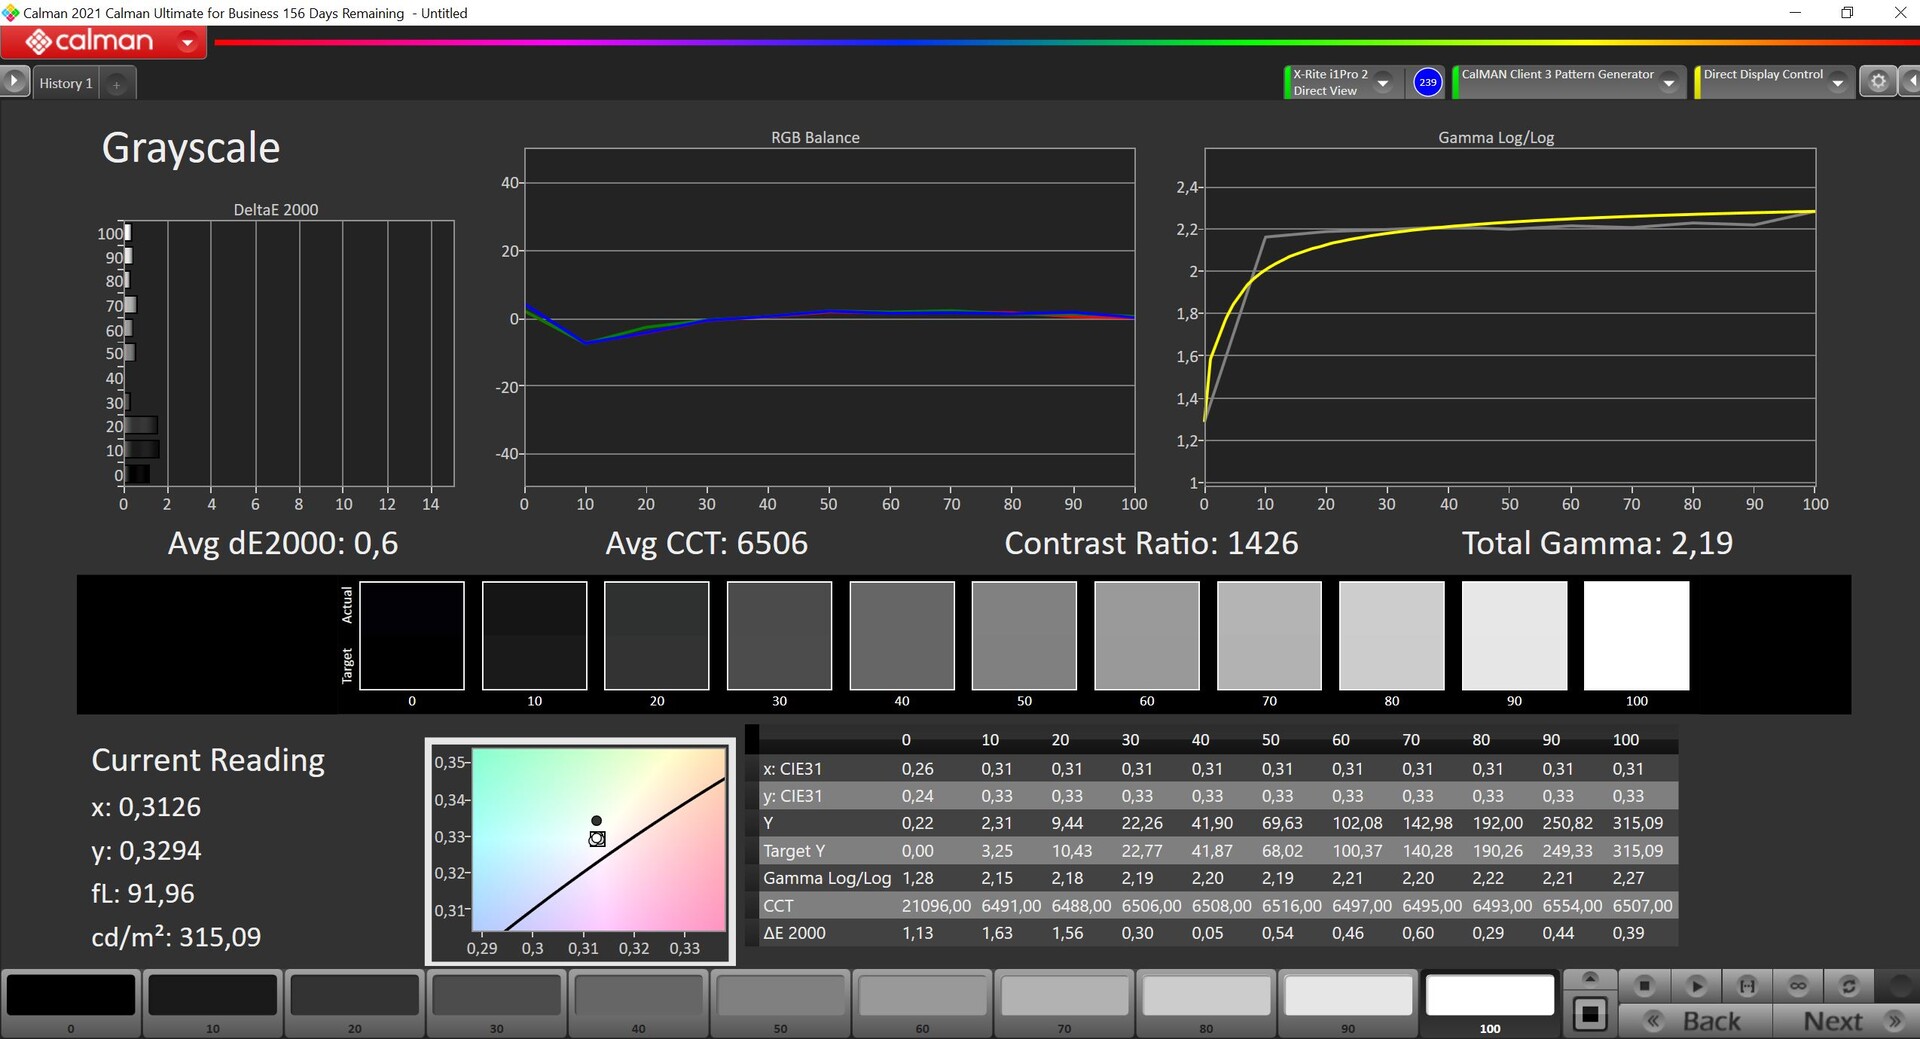
The maximum brightness is slightly higher than 300 cd/m², which in combination with the good black value results in a very good contrast ratio of almost 1400:1. We did not measure any PWM, and the response times are decent. There are some visible light halos particularly at the top edge, but the viewing angle stability of the IPS panel shows no weaknesses.
| |||||||||||||||||||||||||
Brightness Distribution: 90 %
Center on Battery: 318 cd/m²
Contrast: 1387:1 (Black: 0.23 cd/m²)
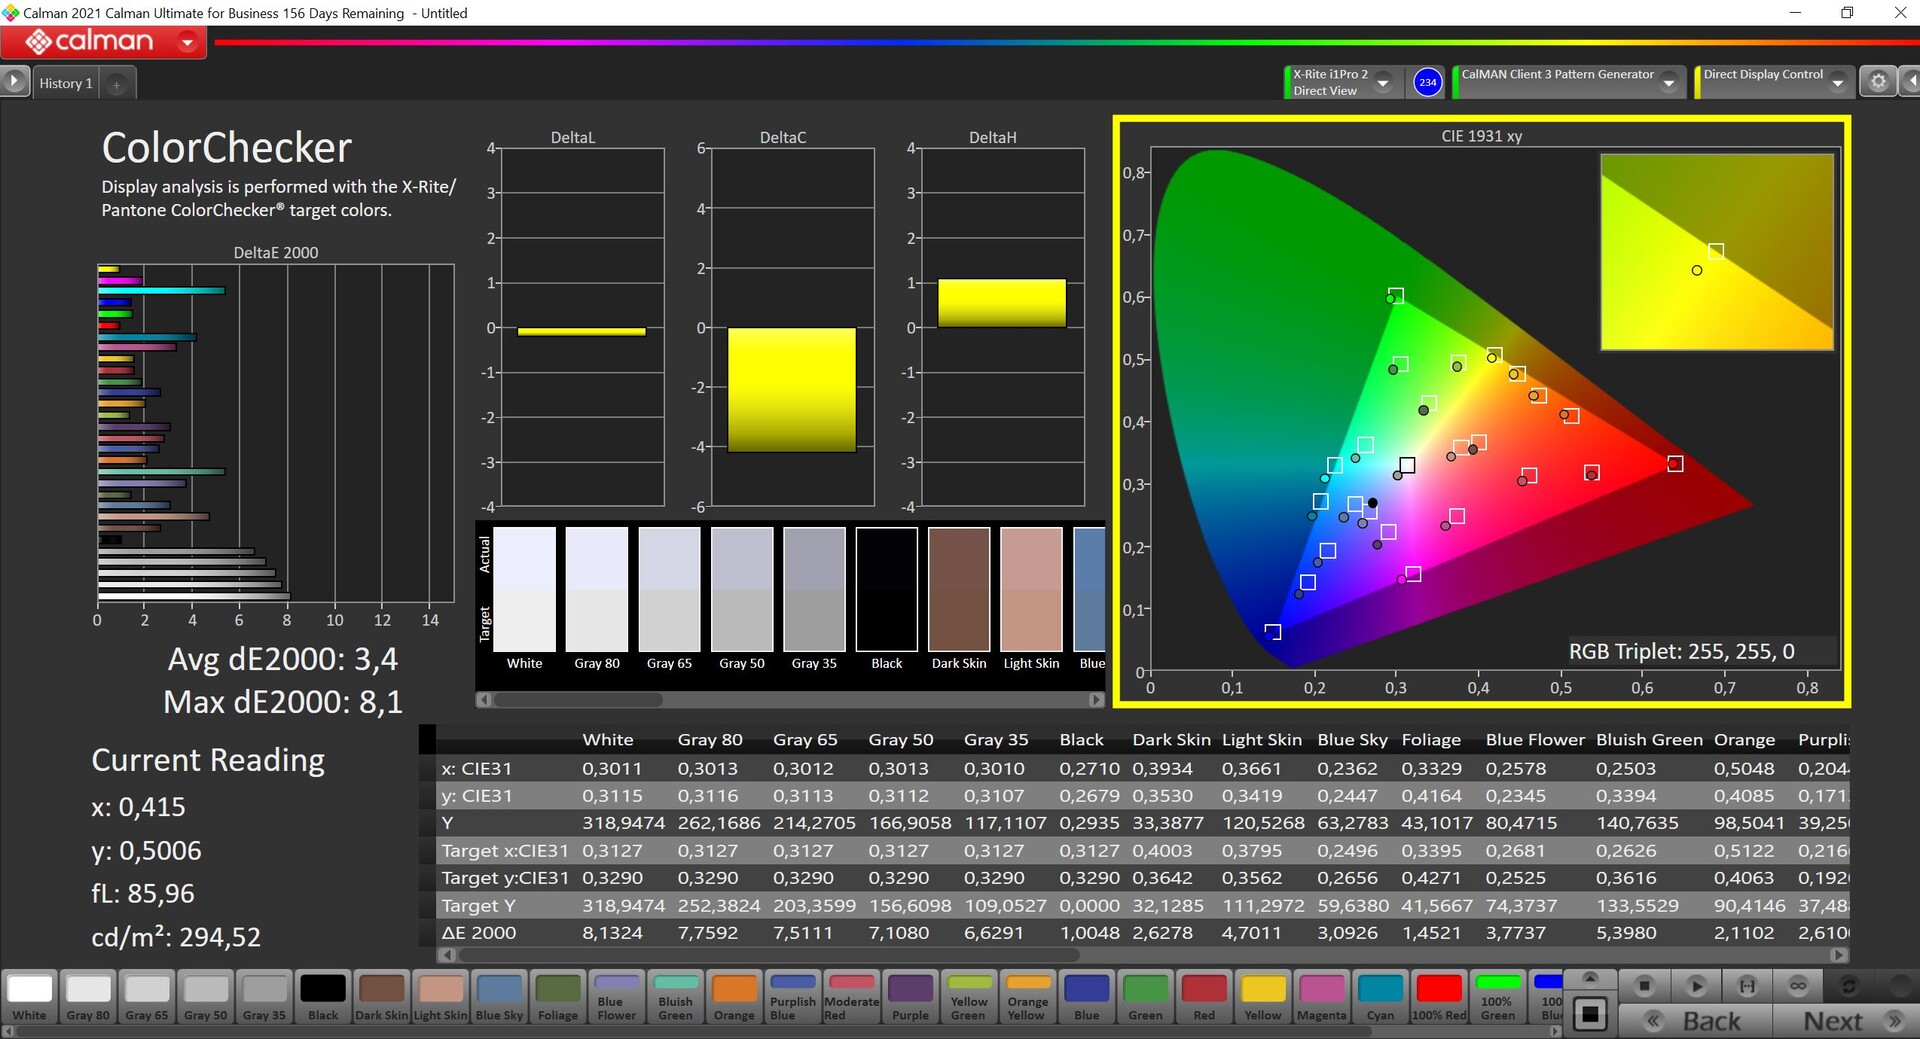
ΔE ColorChecker Calman: 3.4 | ∀{0.5-29.43 Ø4.72}
calibrated: 0.8
ΔE Greyscale Calman: 5.7 | ∀{0.09-98 Ø4.97}
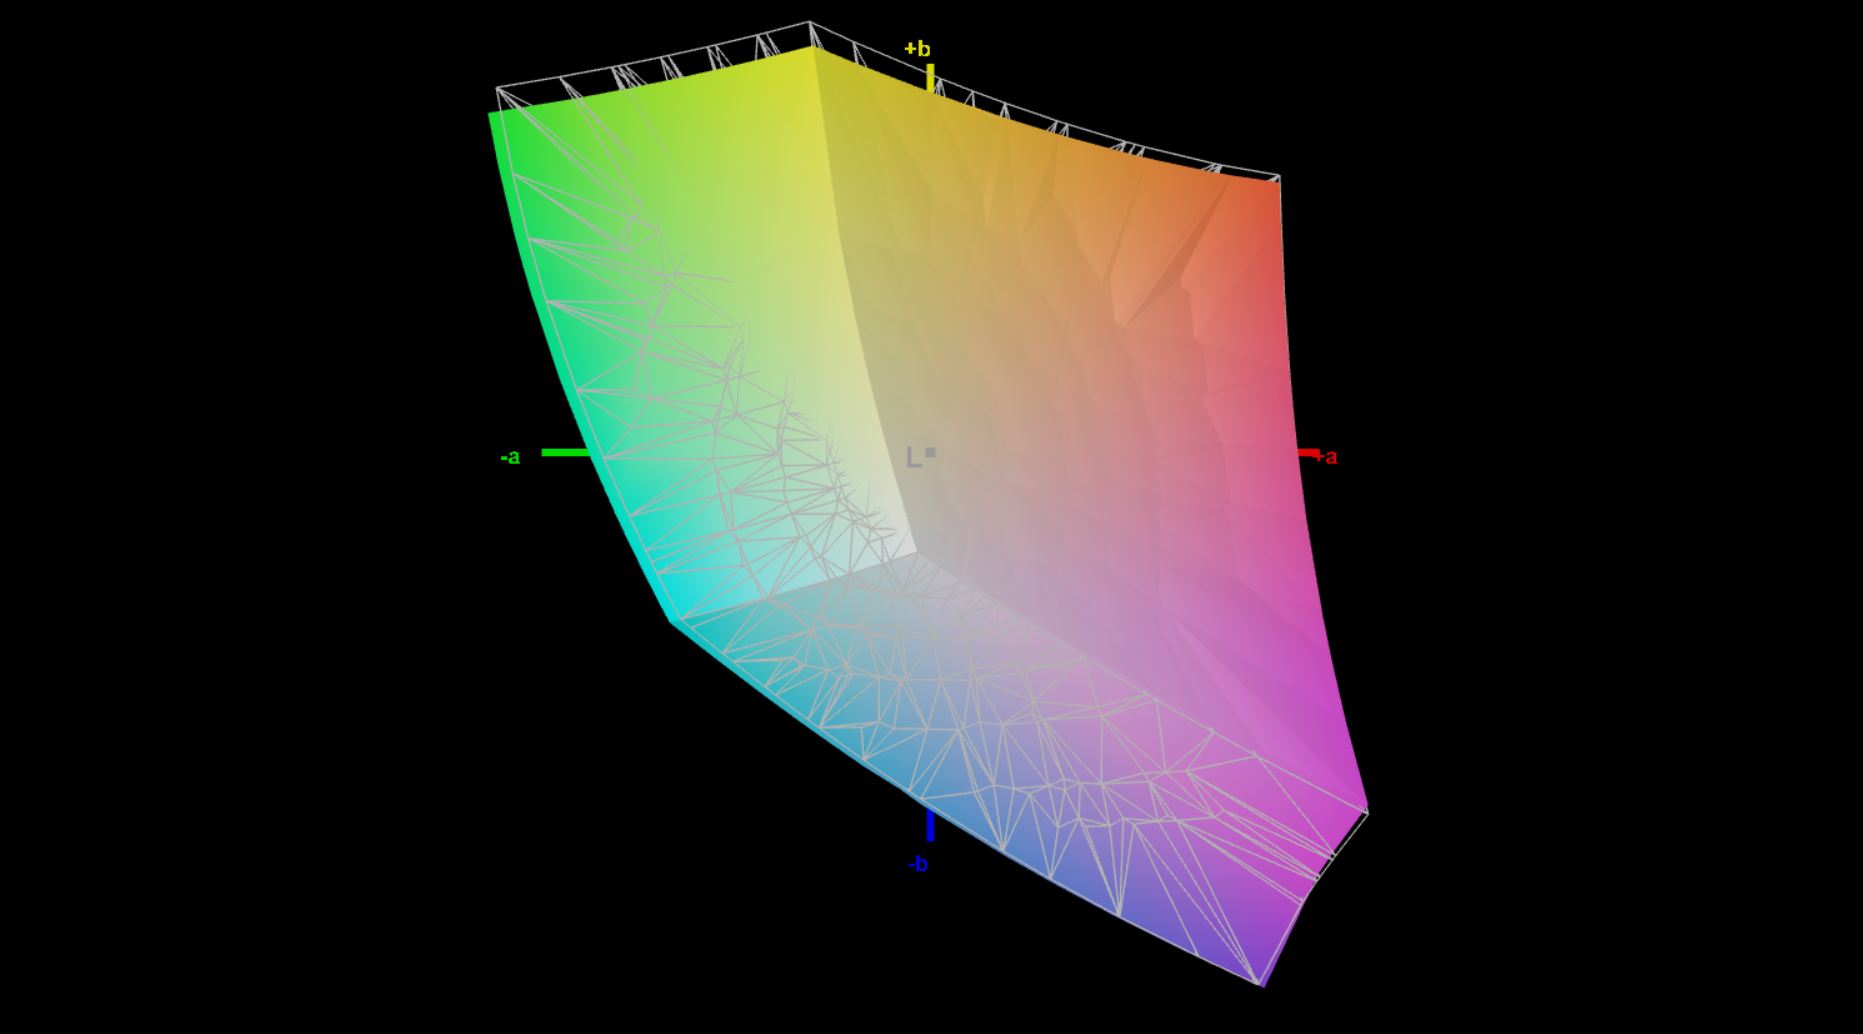
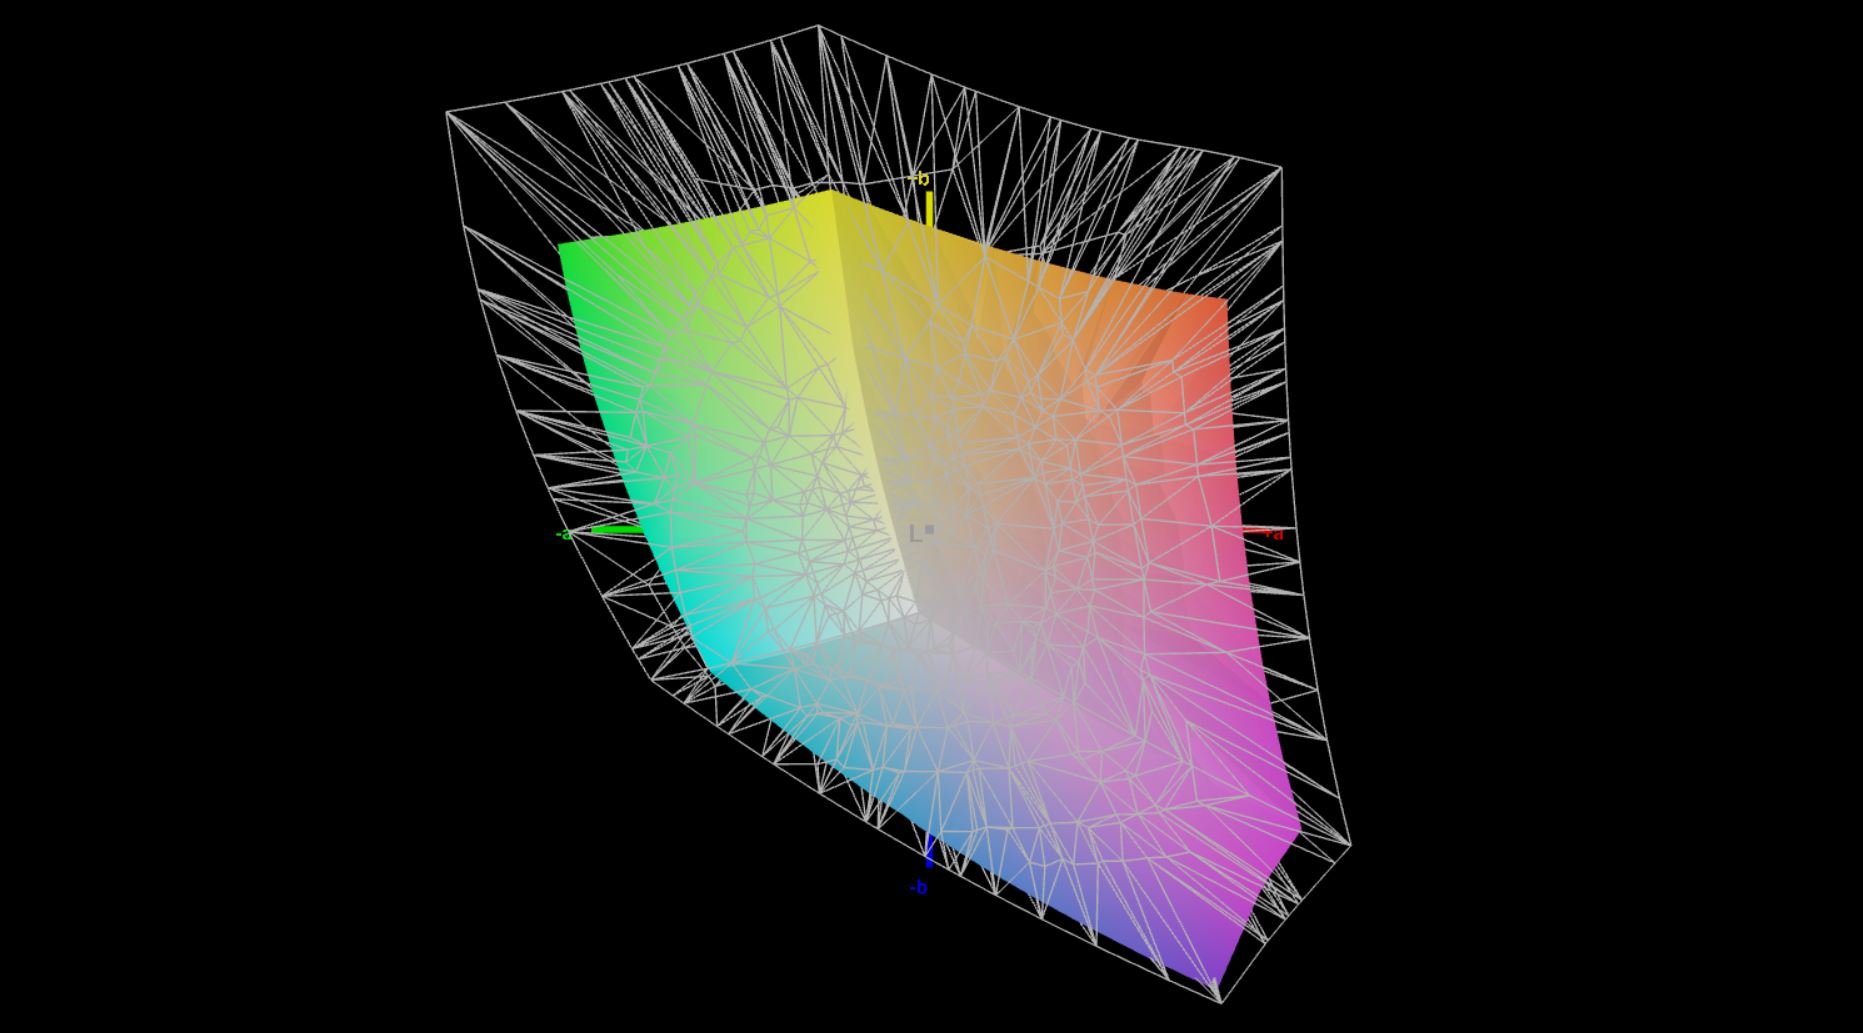
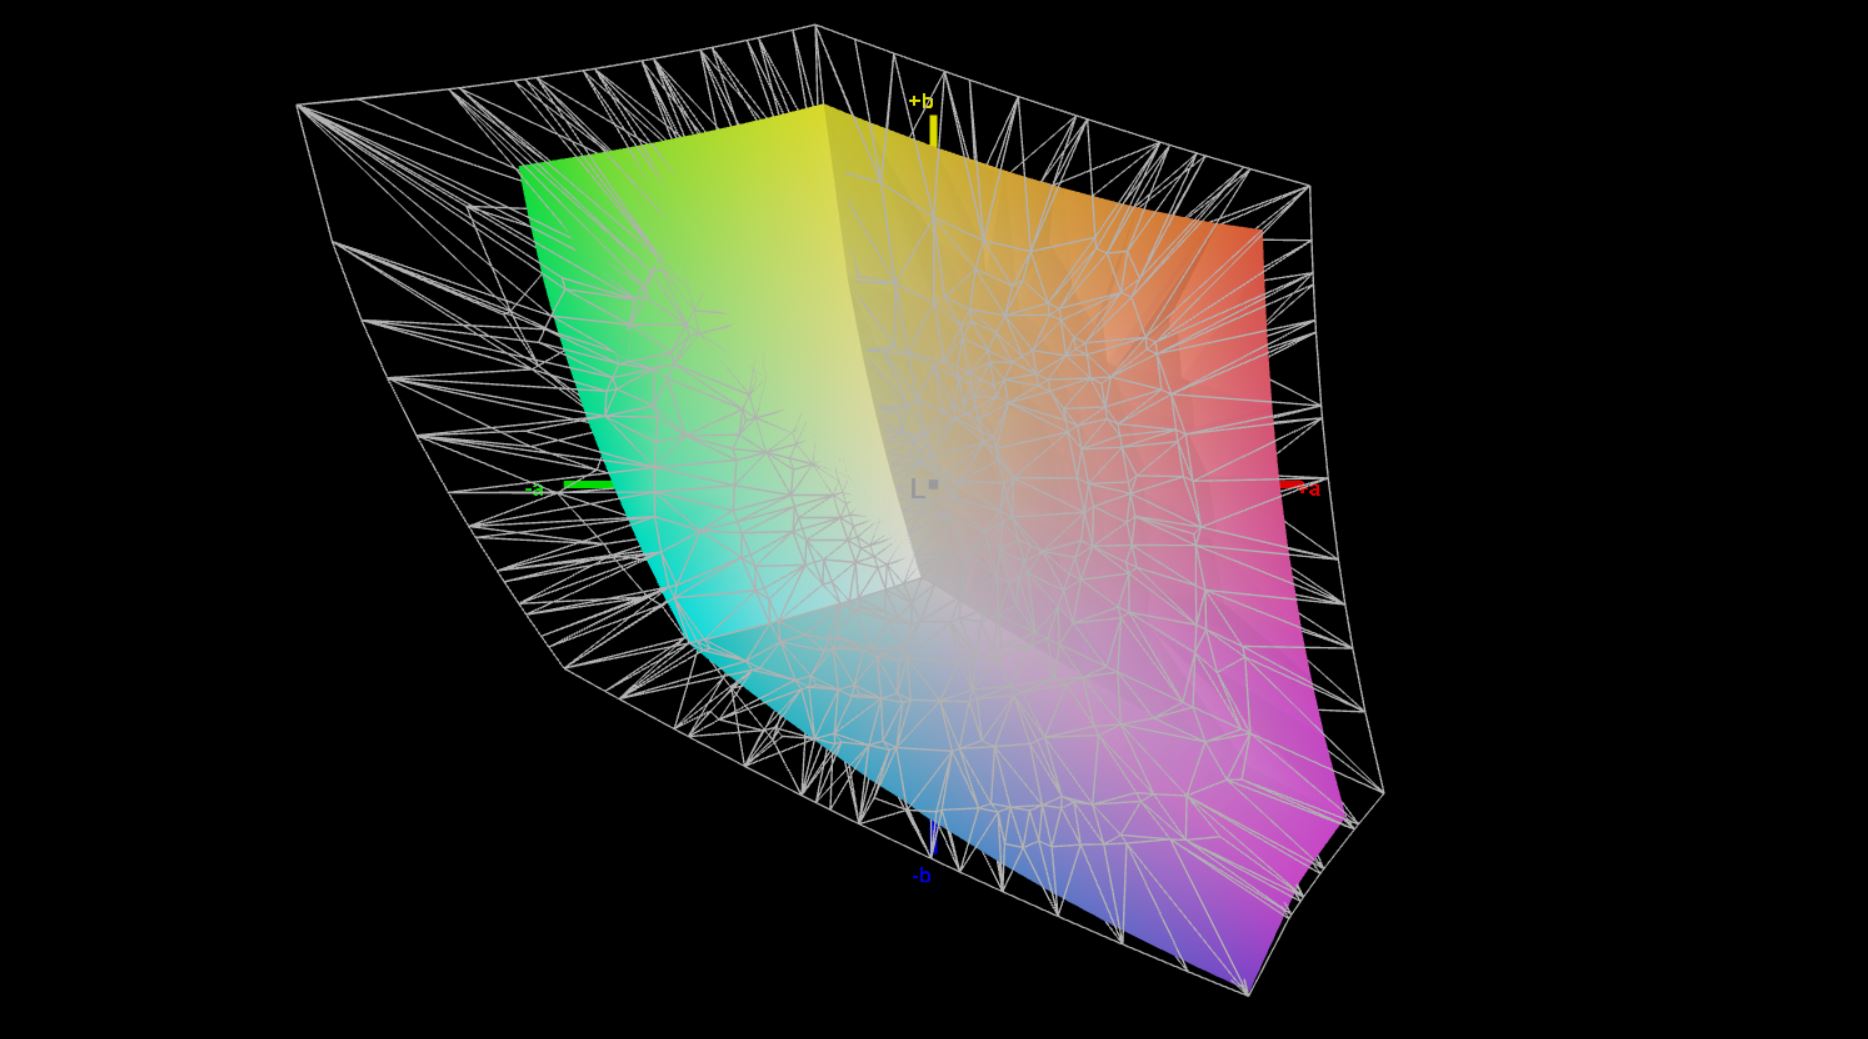
68.3% AdobeRGB 1998 (Argyll 3D)
96.4% sRGB (Argyll 3D)
66.2% Display P3 (Argyll 3D)
Gamma: 2.1
CCT: 7433 K
| Huawei MateBook D 16 2022 BOE NV160WUM-NH0, IPS, 1920x1200, 16" | Asus Vivobook 15 K513EQ Samsung ATNA56YX03-0, OLED, 1920x1080, 15.6" | Lenovo IdeaPad 5 Pro 16IHU6 Lenovo LEN160WQXGA, IPS, 2560x1600, 16" | Dell Inspiron 16 Plus 7610 AU Optronics B160QAN, IPS, 3072x1920, 16" | Huawei MateBook D 16-53011VFJ N161HCA-EA3, IPS, 1920x1080, 16.1" | |
|---|---|---|---|---|---|
| Display | 34% | 8% | 9% | 2% | |
| Display P3 Coverage (%) | 66.2 | 99.9 51% | 74 12% | 74.1 12% | 66.8 1% |
| sRGB Coverage (%) | 96.4 | 100 4% | 98.7 2% | 99.4 3% | 99 3% |
| AdobeRGB 1998 Coverage (%) | 68.3 | 99.9 46% | 74.5 9% | 75.8 11% | 69 1% |
| Response Times | 89% | 57% | -79% | 0% | |
| Response Time Grey 50% / Grey 80% * (ms) | 30.5 ? | 2.2 ? 93% | 13 ? 57% | 49.2 ? -61% | 25 ? 18% |
| Response Time Black / White * (ms) | 18.7 ? | 2.9 ? 84% | 8 ? 57% | 36.8 ? -97% | 22 ? -18% |
| PWM Frequency (Hz) | 59.5 ? | 2500 ? | |||
| Screen | 29% | 13% | -2% | 22% | |
| Brightness middle (cd/m²) | 319 | 384.5 21% | 356 12% | 296.8 -7% | 352 10% |
| Brightness (cd/m²) | 317 | 388 22% | 322 2% | 292 -8% | 330 4% |
| Brightness Distribution (%) | 90 | 98 9% | 80 -11% | 87 -3% | 89 -1% |
| Black Level * (cd/m²) | 0.23 | 0.27 -17% | 0.21 9% | 0.28 -22% | |
| Contrast (:1) | 1387 | 1319 -5% | 1413 2% | 1257 -9% | |
| Colorchecker dE 2000 * | 3.4 | 2.53 26% | 2.4 29% | 2.56 25% | 1.35 60% |
| Colorchecker dE 2000 max. * | 8.1 | 6.16 24% | 4.42 45% | 4.76 41% | 2.58 68% |
| Colorchecker dE 2000 calibrated * | 0.8 | 1.86 -133% | |||
| Greyscale dE 2000 * | 5.7 | 1.6 72% | 2.81 51% | 2.6 54% | 2.02 65% |
| Gamma | 2.1 105% | 2.24 98% | 2.4 92% | 2.07 106% | 2.49 88% |
| CCT | 7433 87% | 6464 101% | 6294 103% | 6628 98% | 6445 101% |
| Color Space (Percent of AdobeRGB 1998) (%) | 63 | ||||
| Color Space (Percent of sRGB) (%) | 99 | ||||
| Total Average (Program / Settings) | 51% /
41% | 26% /
19% | -24% /
-11% | 8% /
14% |
* ... smaller is better
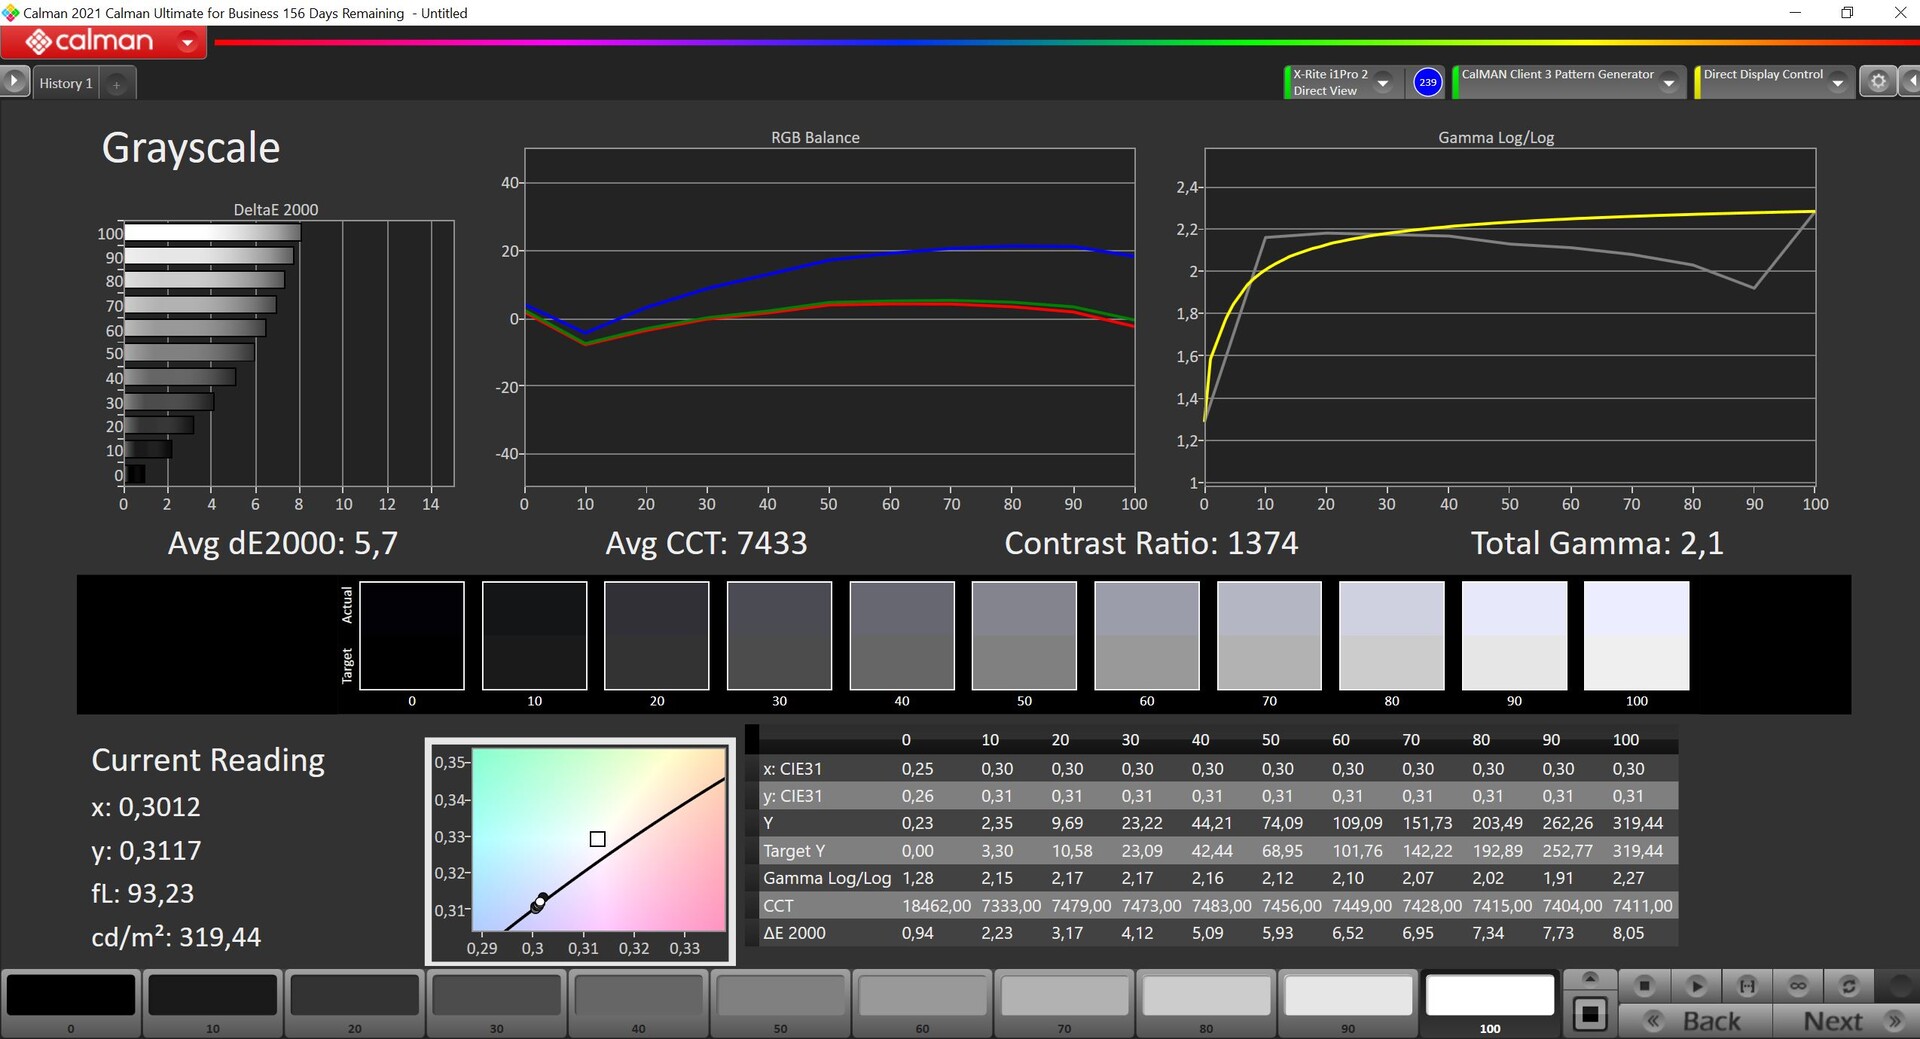
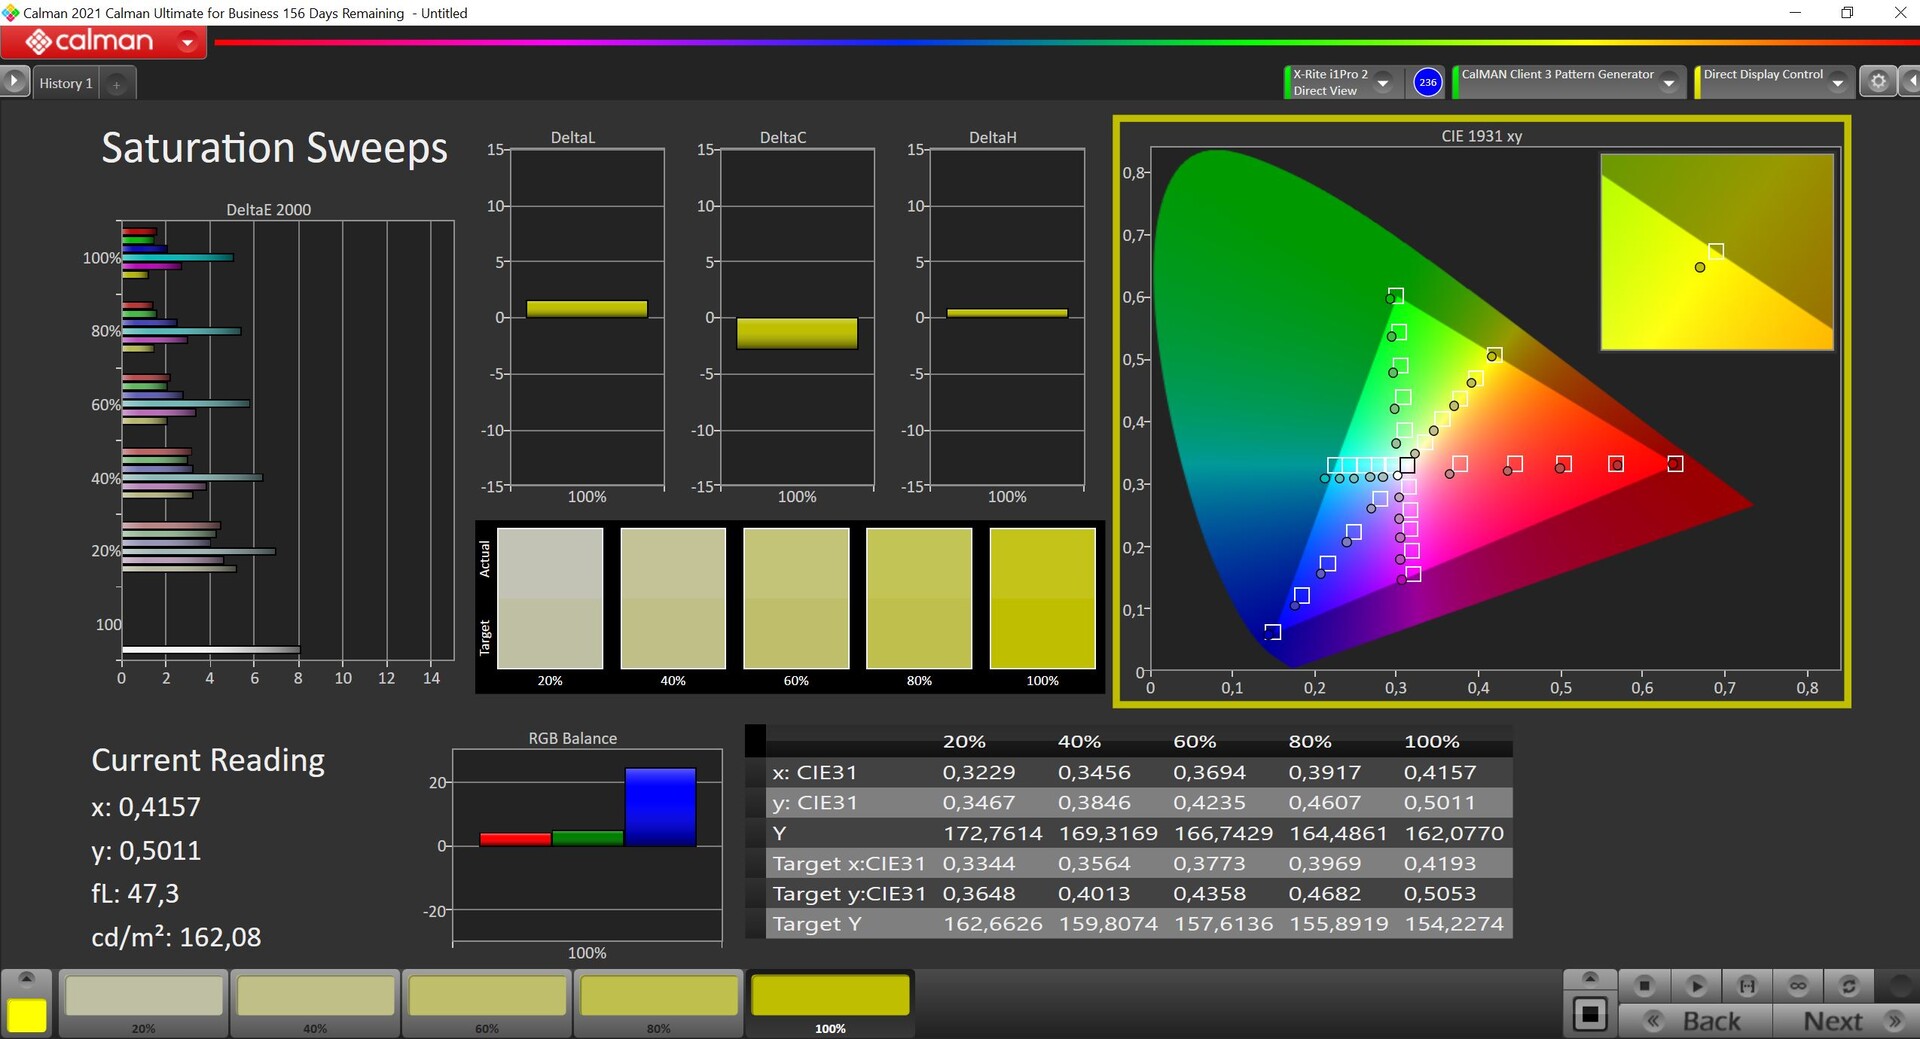
Our analysis with the professional CalMAN software (X-Rite i1 Pro 2) shows a clear blue tint in combination with a color temperature that is too cool in the state of delivery. However, our calibration (profile available for free download above) is able to remedy this problem and also lowers the color deviations. The calibrated values are even excellent, and image/video processing is definitely possible in the sRGB color space.


Display Response Times
| ↔ Response Time Black to White | ||
|---|---|---|
| 18.7 ms ... rise ↗ and fall ↘ combined | ↗ 9.7 ms rise | 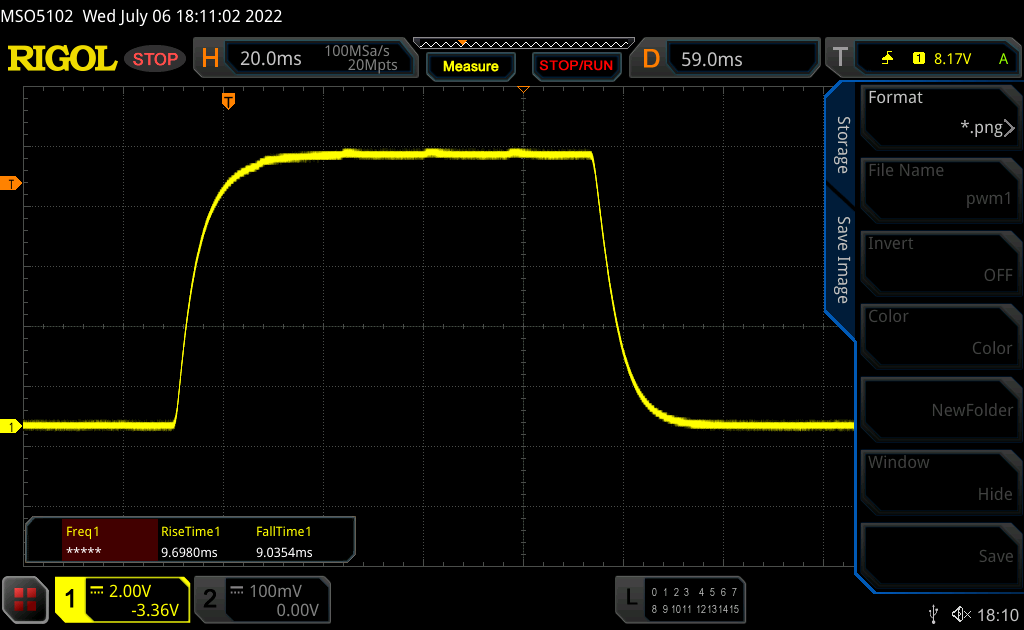 |
| ↘ 9 ms fall | ||
| The screen shows good response rates in our tests, but may be too slow for competitive gamers. In comparison, all tested devices range from 0.1 (minimum) to 240 (maximum) ms. » 42 % of all devices are better. This means that the measured response time is similar to the average of all tested devices (19.8 ms). | ||
| ↔ Response Time 50% Grey to 80% Grey | ||
| 30.5 ms ... rise ↗ and fall ↘ combined | ↗ 14.2 ms rise | 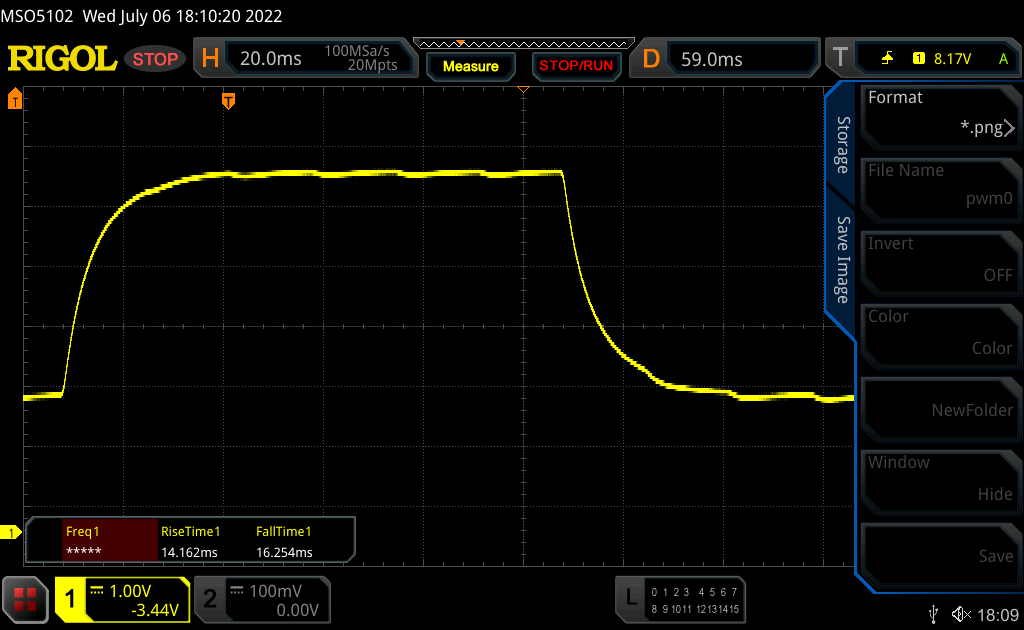 |
| ↘ 16.3 ms fall | ||
| The screen shows slow response rates in our tests and will be unsatisfactory for gamers. In comparison, all tested devices range from 0.165 (minimum) to 636 (maximum) ms. » 41 % of all devices are better. This means that the measured response time is similar to the average of all tested devices (31 ms). | ||
Screen Flickering / PWM (Pulse-Width Modulation)
| Screen flickering / PWM not detected | 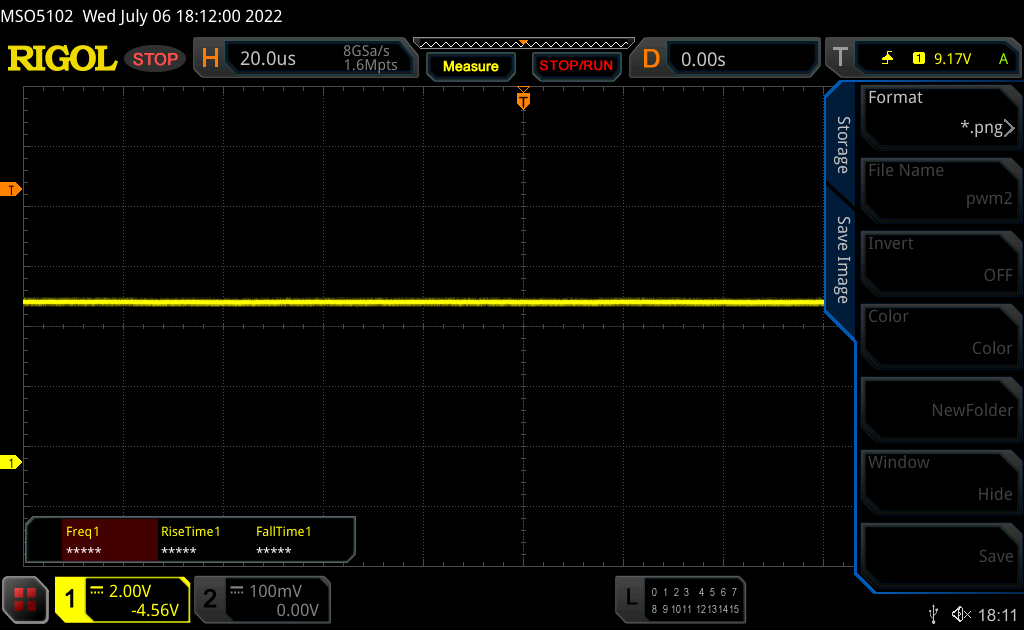 | ||
In comparison: 52 % of all tested devices do not use PWM to dim the display. If PWM was detected, an average of 7750 (minimum: 5 - maximum: 343500) Hz was measured. | |||
Thanks to the matte panel, you can also easily work outdoors, if you avoid direct sunlight.
Performance - Huawei uses Alder Lake
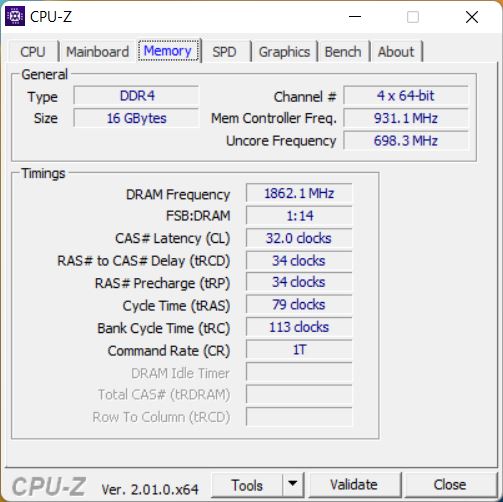
In addition to our test unit with the Core i7-12700H, Huawei also offers the entry-level model with the Core i5-12450H. However, this Core i5 brings a few disadvantages such as less efficiency cores and also a significantly slower iGPU. We were unable to test this CPU until now, but there probably won't be any performance advantage compared to the Ryzen 5 5600H of the old MateBook D 16. The MateBook D 16 only offers LPDDR4X-3733 RAM and no LPDDR5 modules yet.
Test Conditions
The preinstalled PC Manager offers two performance modes. The processor is allowed to consume up to 64 watts for a short time, after which it levels out quickly at 35 watts (Balanced mode) or 40 watts (Performance mode, only in mains operation). This means that even in Performance mode, the processor still remains below its nominal TDP of 45 watts. Because the fan then becomes significantly louder, we cannot recommend the Performance mode and used the Balanced mode for all the following measurements and benchmarks.
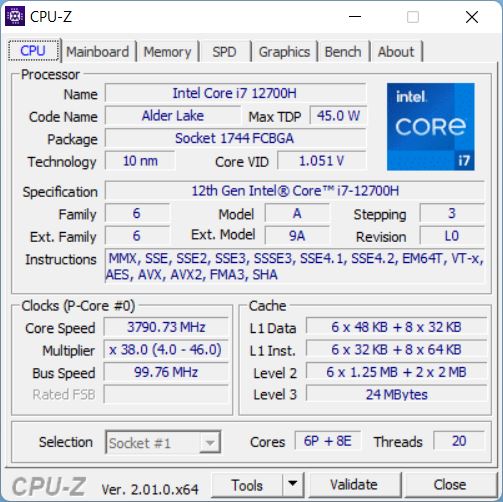
Prozessor - Core i7-12700H
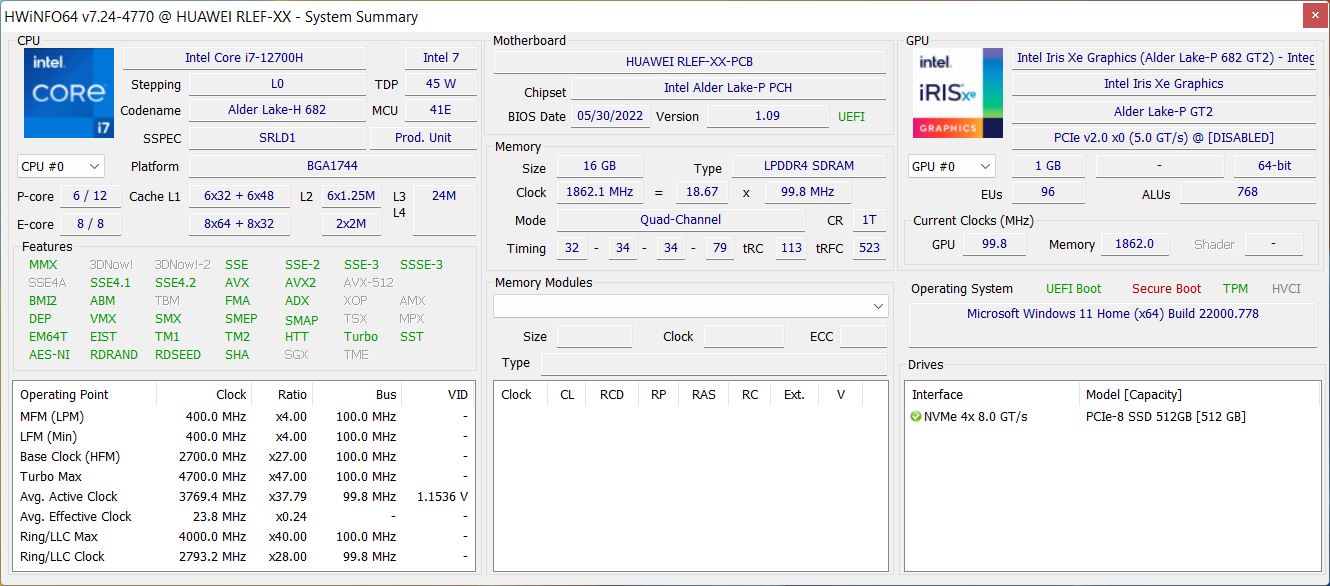
We already tested the Core i7-12700H several times and refer you to our CPU page for additional technical details. Compared to the MateBook 16s that has two fans, the MateBook D 16 only uses a single fan, resulting in a lower performance. At 64 watts for a short time and a constant 35 watts, the performance of our test unit remains clearly below the capabilities of the Core i7-12700H.
Cinebench R15 Multi Constant Load Test
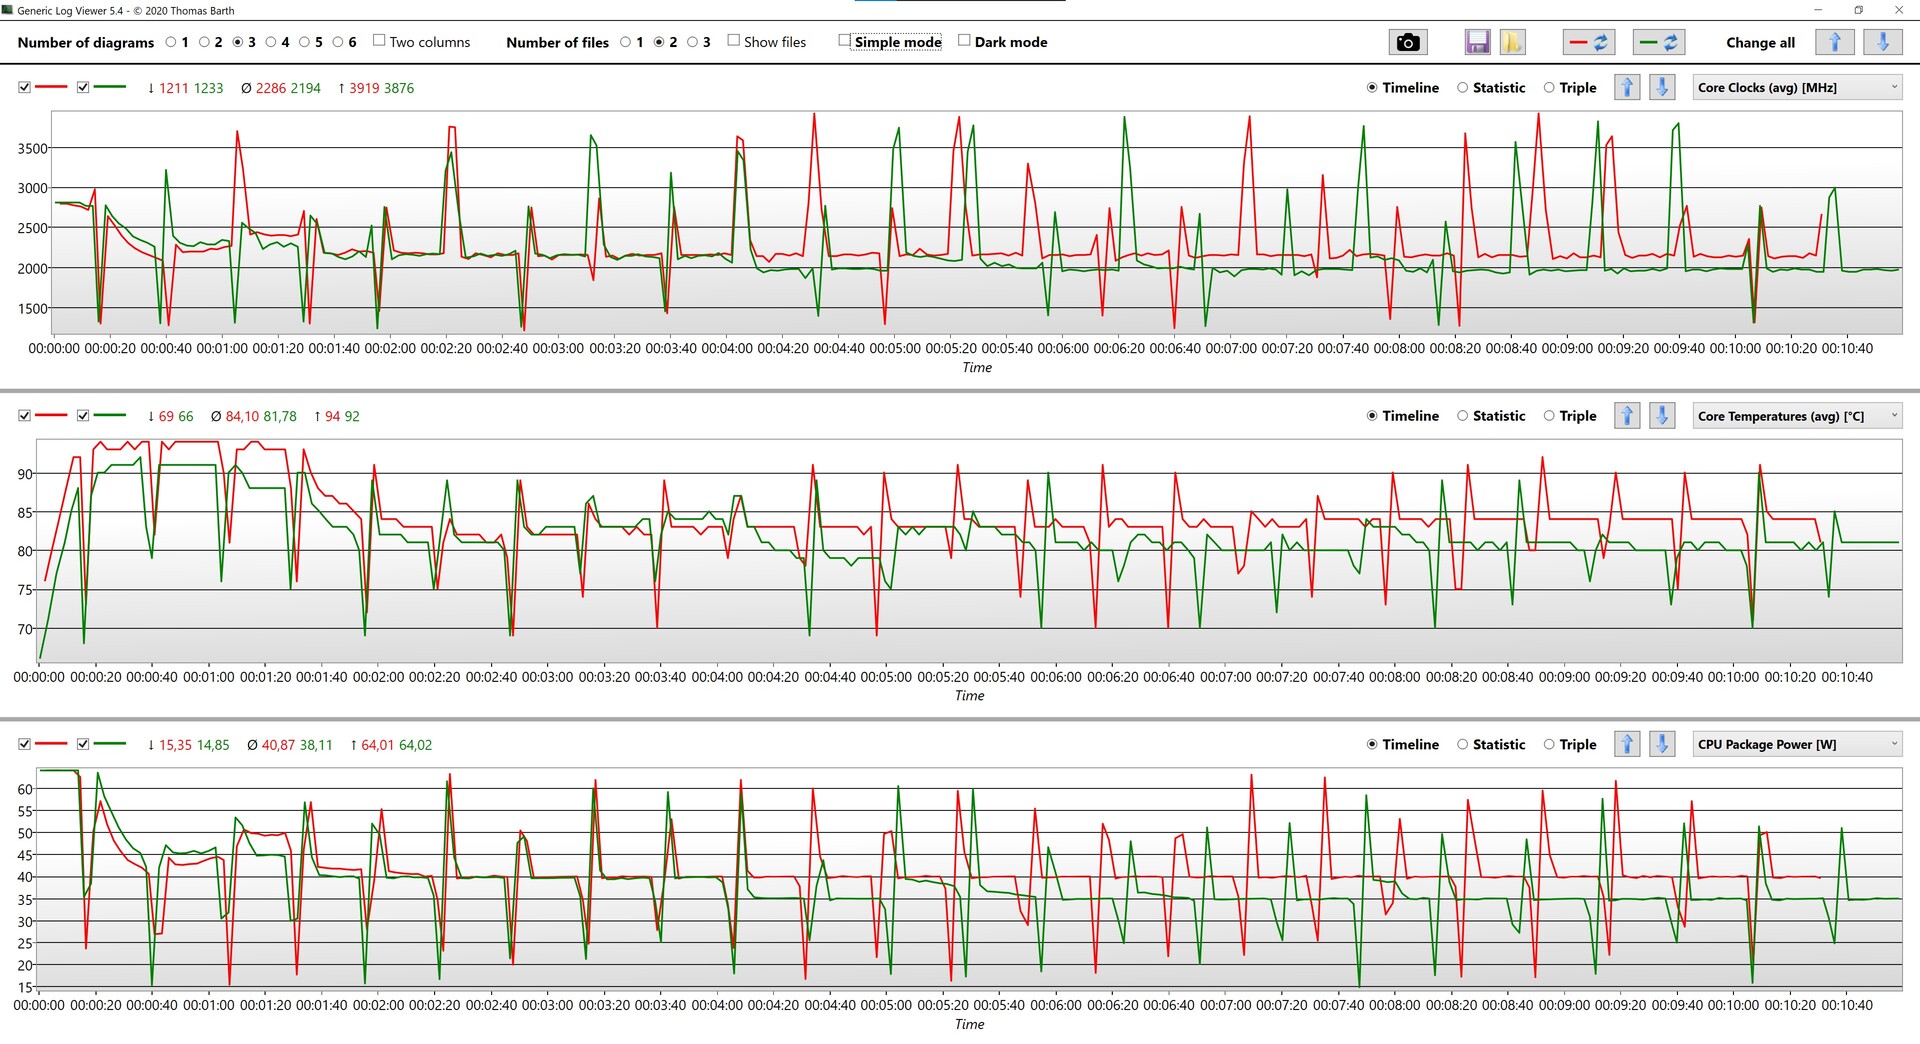
However, the results are often still good in the benchmarks, since the processor is able to benefit from the high power limits here - but the maximum of 64 watts is also only reached briefly at the beginning of the tests. Under constant load, the i7-12700H is quickly forced to throttle its performance. In single-core operation, the high performance of the Performance cores is also paid dearly with a high power consumption. In battery operation, the power consumption of the processor is limited to 40 watts (later 35 watts), but interestingly, this has hardly any effect on the performance. Since the CPU temperature doesn't increase that much at 40 watts, the CPU is able to maintain this value for longer, only dropping to 35 watts later. For example, there is only a difference of 2% in the CBR23 Multi test, which is negligeable. You can find additional CPU benchmarks here.
Cinebench R23: Multi Core | Single Core
Cinebench R20: CPU (Multi Core) | CPU (Single Core)
Cinebench R15: CPU Multi 64Bit | CPU Single 64Bit
Blender: v2.79 BMW27 CPU
7-Zip 18.03: 7z b 4 | 7z b 4 -mmt1
Geekbench 5.5: Multi-Core | Single-Core
HWBOT x265 Benchmark v2.2: 4k Preset
LibreOffice : 20 Documents To PDF
R Benchmark 2.5: Overall mean
| CPU Performance rating | |
| Average of class Multimedia | |
| Huawei MateBook 16s i7 | |
| Average Intel Core i7-12700H | |
| Huawei MateBook D 16 2022 | |
| Huawei MateBook 16 R7 5800H | |
| Dell Inspiron 16 Plus 7610 -2! | |
| Huawei MateBook D 16-53011VFJ | |
| Asus Vivobook 15 K513EQ -2! | |
| Lenovo IdeaPad 5 Pro 16IHU6 | |
| Cinebench R23 / Multi Core | |
| Average of class Multimedia (4861 - 33362, n=79, last 2 years) | |
| Average Intel Core i7-12700H (4032 - 19330, n=64) | |
| Huawei MateBook 16s i7 | |
| Huawei MateBook D 16 2022 | |
| Dell Inspiron 16 Plus 7610 | |
| Huawei MateBook 16 R7 5800H | |
| Huawei MateBook D 16-53011VFJ | |
| Lenovo IdeaPad 5 Pro 16IHU6 | |
| Asus Vivobook 15 K513EQ | |
| Cinebench R23 / Single Core | |
| Average of class Multimedia (1128 - 2459, n=71, last 2 years) | |
| Huawei MateBook 16s i7 | |
| Huawei MateBook D 16 2022 | |
| Average Intel Core i7-12700H (778 - 1826, n=63) | |
| Dell Inspiron 16 Plus 7610 | |
| Asus Vivobook 15 K513EQ | |
| Lenovo IdeaPad 5 Pro 16IHU6 | |
| Huawei MateBook 16 R7 5800H | |
| Huawei MateBook D 16-53011VFJ | |
| Cinebench R20 / CPU (Multi Core) | |
| Average of class Multimedia (1887 - 12912, n=62, last 2 years) | |
| Average Intel Core i7-12700H (1576 - 7407, n=64) | |
| Huawei MateBook 16s i7 | |
| Huawei MateBook D 16 2022 | |
| Dell Inspiron 16 Plus 7610 | |
| Huawei MateBook 16 R7 5800H | |
| Huawei MateBook D 16-53011VFJ | |
| Lenovo IdeaPad 5 Pro 16IHU6 | |
| Asus Vivobook 15 K513EQ | |
| Cinebench R20 / CPU (Single Core) | |
| Average of class Multimedia (425 - 853, n=62, last 2 years) | |
| Huawei MateBook 16s i7 | |
| Average Intel Core i7-12700H (300 - 704, n=64) | |
| Huawei MateBook D 16 2022 | |
| Dell Inspiron 16 Plus 7610 | |
| Asus Vivobook 15 K513EQ | |
| Lenovo IdeaPad 5 Pro 16IHU6 | |
| Huawei MateBook 16 R7 5800H | |
| Huawei MateBook D 16-53011VFJ | |
| Cinebench R15 / CPU Multi 64Bit | |
| Huawei MateBook 16s i7 | |
| Huawei MateBook 16s i7 | |
| Average of class Multimedia (856 - 5224, n=66, last 2 years) | |
| Average Intel Core i7-12700H (1379 - 2916, n=70) | |
| Huawei MateBook D 16 2022 | |
| Huawei MateBook D 16 2022 | |
| Huawei MateBook 16 R7 5800H | |
| Dell Inspiron 16 Plus 7610 | |
| Huawei MateBook D 16-53011VFJ | |
| Lenovo IdeaPad 5 Pro 16IHU6 | |
| Asus Vivobook 15 K513EQ | |
| Cinebench R15 / CPU Single 64Bit | |
| Average of class Multimedia (184.8 - 326, n=64, last 2 years) | |
| Huawei MateBook D 16 2022 | |
| Huawei MateBook 16s i7 | |
| Average Intel Core i7-12700H (113 - 263, n=65) | |
| Huawei MateBook 16 R7 5800H | |
| Dell Inspiron 16 Plus 7610 | |
| Asus Vivobook 15 K513EQ | |
| Huawei MateBook D 16-53011VFJ | |
| Lenovo IdeaPad 5 Pro 16IHU6 | |
| Blender / v2.79 BMW27 CPU | |
| Lenovo IdeaPad 5 Pro 16IHU6 | |
| Asus Vivobook 15 K513EQ | |
| Huawei MateBook D 16-53011VFJ | |
| Huawei MateBook D 16 2022 | |
| Dell Inspiron 16 Plus 7610 | |
| Huawei MateBook 16 R7 5800H | |
| Average of class Multimedia (100 - 557, n=63, last 2 years) | |
| Huawei MateBook 16s i7 | |
| Average Intel Core i7-12700H (168 - 732, n=63) | |
| 7-Zip 18.03 / 7z b 4 | |
| Average Intel Core i7-12700H (22844 - 73067, n=63) | |
| Average of class Multimedia (26062 - 130368, n=60, last 2 years) | |
| Huawei MateBook 16s i7 | |
| Huawei MateBook 16 R7 5800H | |
| Huawei MateBook D 16 2022 | |
| Dell Inspiron 16 Plus 7610 | |
| Huawei MateBook D 16-53011VFJ | |
| Lenovo IdeaPad 5 Pro 16IHU6 | |
| Asus Vivobook 15 K513EQ | |
| 7-Zip 18.03 / 7z b 4 -mmt1 | |
| Average of class Multimedia (3666 - 7545, n=61, last 2 years) | |
| Huawei MateBook 16s i7 | |
| Huawei MateBook D 16 2022 | |
| Average Intel Core i7-12700H (2743 - 5972, n=63) | |
| Huawei MateBook 16 R7 5800H | |
| Dell Inspiron 16 Plus 7610 | |
| Asus Vivobook 15 K513EQ | |
| Lenovo IdeaPad 5 Pro 16IHU6 | |
| Huawei MateBook D 16-53011VFJ | |
| Geekbench 5.5 / Multi-Core | |
| Huawei MateBook 16s i7 | |
| Average of class Multimedia (4652 - 20422, n=60, last 2 years) | |
| Average Intel Core i7-12700H (5144 - 13745, n=64) | |
| Huawei MateBook D 16 2022 | |
| Huawei MateBook 16 R7 5800H | |
| Huawei MateBook D 16-53011VFJ | |
| Lenovo IdeaPad 5 Pro 16IHU6 | |
| Geekbench 5.5 / Single-Core | |
| Average of class Multimedia (805 - 2974, n=60, last 2 years) | |
| Huawei MateBook 16s i7 | |
| Huawei MateBook D 16 2022 | |
| Average Intel Core i7-12700H (803 - 1851, n=64) | |
| Huawei MateBook 16 R7 5800H | |
| Lenovo IdeaPad 5 Pro 16IHU6 | |
| Huawei MateBook D 16-53011VFJ | |
| HWBOT x265 Benchmark v2.2 / 4k Preset | |
| Average of class Multimedia (5.26 - 36.1, n=61, last 2 years) | |
| Average Intel Core i7-12700H (4.67 - 21.8, n=64) | |
| Huawei MateBook 16s i7 | |
| Huawei MateBook 16 R7 5800H | |
| Huawei MateBook D 16 2022 | |
| Dell Inspiron 16 Plus 7610 | |
| Huawei MateBook D 16-53011VFJ | |
| Asus Vivobook 15 K513EQ | |
| Lenovo IdeaPad 5 Pro 16IHU6 | |
| LibreOffice / 20 Documents To PDF | |
| Huawei MateBook D 16-53011VFJ | |
| Lenovo IdeaPad 5 Pro 16IHU6 | |
| Average of class Multimedia (23.9 - 146.7, n=62, last 2 years) | |
| Huawei MateBook 16 R7 5800H | |
| Asus Vivobook 15 K513EQ | |
| Dell Inspiron 16 Plus 7610 | |
| Average Intel Core i7-12700H (34.2 - 95.3, n=63) | |
| Huawei MateBook 16s i7 | |
| Huawei MateBook D 16 2022 | |
| R Benchmark 2.5 / Overall mean | |
| Huawei MateBook D 16-53011VFJ | |
| Lenovo IdeaPad 5 Pro 16IHU6 | |
| Asus Vivobook 15 K513EQ | |
| Dell Inspiron 16 Plus 7610 | |
| Huawei MateBook 16 R7 5800H | |
| Average Intel Core i7-12700H (0.4441 - 1.052, n=63) | |
| Average of class Multimedia (0.3604 - 0.947, n=61, last 2 years) | |
| Huawei MateBook D 16 2022 | |
| Huawei MateBook 16s i7 | |
* ... smaller is better
AIDA64: FP32 Ray-Trace | FPU Julia | CPU SHA3 | CPU Queen | FPU SinJulia | FPU Mandel | CPU AES | CPU ZLib | FP64 Ray-Trace | CPU PhotoWorxx
| Performance rating | |
| Average of class Multimedia | |
| Average Intel Core i7-12700H | |
| Huawei MateBook D 16 2022 | |
| Huawei MateBook D 16-53011VFJ | |
| Lenovo IdeaPad 5 Pro 16IHU6 | |
| Asus Vivobook 15 K513EQ | |
| Dell Inspiron 16 Plus 7610 -9! | |
| AIDA64 / FP32 Ray-Trace | |
| Average of class Multimedia (2214 - 50388, n=58, last 2 years) | |
| Huawei MateBook D 16 2022 | |
| Average Intel Core i7-12700H (2585 - 17957, n=64) | |
| Huawei MateBook D 16-53011VFJ | |
| Lenovo IdeaPad 5 Pro 16IHU6 | |
| Asus Vivobook 15 K513EQ | |
| AIDA64 / FPU Julia | |
| Average of class Multimedia (12867 - 201874, n=59, last 2 years) | |
| Huawei MateBook D 16 2022 | |
| Huawei MateBook D 16-53011VFJ | |
| Average Intel Core i7-12700H (12439 - 90760, n=64) | |
| Lenovo IdeaPad 5 Pro 16IHU6 | |
| Asus Vivobook 15 K513EQ | |
| AIDA64 / CPU SHA3 | |
| Average of class Multimedia (626 - 8623, n=59, last 2 years) | |
| Average Intel Core i7-12700H (833 - 4242, n=64) | |
| Huawei MateBook D 16 2022 | |
| Lenovo IdeaPad 5 Pro 16IHU6 | |
| Asus Vivobook 15 K513EQ | |
| Huawei MateBook D 16-53011VFJ | |
| AIDA64 / CPU Queen | |
| Average Intel Core i7-12700H (57923 - 103202, n=63) | |
| Huawei MateBook D 16 2022 | |
| Average of class Multimedia (13483 - 181505, n=46, last 2 years) | |
| Huawei MateBook D 16-53011VFJ | |
| Asus Vivobook 15 K513EQ | |
| Lenovo IdeaPad 5 Pro 16IHU6 | |
| AIDA64 / FPU SinJulia | |
| Huawei MateBook D 16-53011VFJ | |
| Average Intel Core i7-12700H (3249 - 9939, n=64) | |
| Average of class Multimedia (886 - 28794, n=59, last 2 years) | |
| Huawei MateBook D 16 2022 | |
| Asus Vivobook 15 K513EQ | |
| Lenovo IdeaPad 5 Pro 16IHU6 | |
| AIDA64 / FPU Mandel | |
| Average of class Multimedia (6395 - 105740, n=58, last 2 years) | |
| Huawei MateBook D 16-53011VFJ | |
| Average Intel Core i7-12700H (7135 - 44760, n=64) | |
| Huawei MateBook D 16 2022 | |
| Lenovo IdeaPad 5 Pro 16IHU6 | |
| Asus Vivobook 15 K513EQ | |
| AIDA64 / CPU AES | |
| Huawei MateBook D 16 2022 | |
| Average Intel Core i7-12700H (31839 - 144360, n=64) | |
| Asus Vivobook 15 K513EQ | |
| Lenovo IdeaPad 5 Pro 16IHU6 | |
| Average of class Multimedia (8171 - 126790, n=59, last 2 years) | |
| Huawei MateBook D 16-53011VFJ | |
| AIDA64 / CPU ZLib | |
| Average of class Multimedia (143.8 - 2022, n=59, last 2 years) | |
| Average Intel Core i7-12700H (305 - 1171, n=64) | |
| Huawei MateBook D 16 2022 | |
| Huawei MateBook D 16-53011VFJ | |
| Asus Vivobook 15 K513EQ | |
| Lenovo IdeaPad 5 Pro 16IHU6 | |
| Dell Inspiron 16 Plus 7610 | |
| AIDA64 / FP64 Ray-Trace | |
| Average of class Multimedia (1014 - 26875, n=59, last 2 years) | |
| Average Intel Core i7-12700H (1437 - 9692, n=64) | |
| Huawei MateBook D 16 2022 | |
| Huawei MateBook D 16-53011VFJ | |
| Lenovo IdeaPad 5 Pro 16IHU6 | |
| Asus Vivobook 15 K513EQ | |
| AIDA64 / CPU PhotoWorxx | |
| Average of class Multimedia (8187 - 88154, n=59, last 2 years) | |
| Huawei MateBook D 16 2022 | |
| Average Intel Core i7-12700H (12863 - 52207, n=64) | |
| Huawei MateBook D 16-53011VFJ | |
| Asus Vivobook 15 K513EQ | |
| Lenovo IdeaPad 5 Pro 16IHU6 | |
System Performance
The subjective performance impression of the new MateBook D 16 is very good, and we did not encounter any problems during our testing. This impression is also confirmed by the good benchmark results.
CrossMark: Overall | Productivity | Creativity | Responsiveness
| PCMark 10 / Score | |
| Average of class Multimedia (4325 - 10386, n=56, last 2 years) | |
| Dell Inspiron 16 Plus 7610 | |
| Huawei MateBook D 16 2022 | |
| Average Intel Core i7-12700H, Intel Iris Xe Graphics G7 96EUs (5541 - 6281, n=8) | |
| Lenovo IdeaPad 5 Pro 16IHU6 | |
| Asus Vivobook 15 K513EQ | |
| Huawei MateBook D 16-53011VFJ | |
| PCMark 10 / Essentials | |
| Huawei MateBook D 16 2022 | |
| Average Intel Core i7-12700H, Intel Iris Xe Graphics G7 96EUs (9991 - 11699, n=8) | |
| Average of class Multimedia (8025 - 11664, n=55, last 2 years) | |
| Dell Inspiron 16 Plus 7610 | |
| Asus Vivobook 15 K513EQ | |
| Huawei MateBook D 16-53011VFJ | |
| Lenovo IdeaPad 5 Pro 16IHU6 | |
| PCMark 10 / Productivity | |
| Average of class Multimedia (7323 - 18233, n=55, last 2 years) | |
| Asus Vivobook 15 K513EQ | |
| Lenovo IdeaPad 5 Pro 16IHU6 | |
| Dell Inspiron 16 Plus 7610 | |
| Huawei MateBook D 16 2022 | |
| Huawei MateBook D 16-53011VFJ | |
| Average Intel Core i7-12700H, Intel Iris Xe Graphics G7 96EUs (6690 - 8038, n=8) | |
| PCMark 10 / Digital Content Creation | |
| Average of class Multimedia (3651 - 16240, n=55, last 2 years) | |
| Dell Inspiron 16 Plus 7610 | |
| Average Intel Core i7-12700H, Intel Iris Xe Graphics G7 96EUs (6207 - 7401, n=8) | |
| Huawei MateBook D 16 2022 | |
| Lenovo IdeaPad 5 Pro 16IHU6 | |
| Huawei MateBook D 16-53011VFJ | |
| Asus Vivobook 15 K513EQ | |
| CrossMark / Overall | |
| Huawei MateBook D 16 2022 | |
| Average of class Multimedia (866 - 2728, n=65, last 2 years) | |
| Average Intel Core i7-12700H, Intel Iris Xe Graphics G7 96EUs (1492 - 1907, n=8) | |
| CrossMark / Productivity | |
| Huawei MateBook D 16 2022 | |
| Average of class Multimedia (931 - 2489, n=65, last 2 years) | |
| Average Intel Core i7-12700H, Intel Iris Xe Graphics G7 96EUs (1499 - 1832, n=8) | |
| CrossMark / Creativity | |
| Average of class Multimedia (907 - 3465, n=65, last 2 years) | |
| Huawei MateBook D 16 2022 | |
| Average Intel Core i7-12700H, Intel Iris Xe Graphics G7 96EUs (1507 - 2016, n=8) | |
| CrossMark / Responsiveness | |
| Huawei MateBook D 16 2022 | |
| Average Intel Core i7-12700H, Intel Iris Xe Graphics G7 96EUs (1384 - 1831, n=8) | |
| Average of class Multimedia (605 - 2024, n=65, last 2 years) | |
| PCMark 10 Score | 6041 points | |
Help | ||
| AIDA64 / Memory Copy | |
| Average of class Multimedia (11299 - 132135, n=59, last 2 years) | |
| Huawei MateBook D 16 2022 | |
| Average Intel Core i7-12700H (25615 - 80511, n=64) | |
| Lenovo IdeaPad 5 Pro 16IHU6 | |
| Asus Vivobook 15 K513EQ | |
| Huawei MateBook D 16-53011VFJ | |
| AIDA64 / Memory Read | |
| Average of class Multimedia (11624 - 174586, n=59, last 2 years) | |
| Average Intel Core i7-12700H (25586 - 79442, n=64) | |
| Huawei MateBook D 16 2022 | |
| Asus Vivobook 15 K513EQ | |
| Lenovo IdeaPad 5 Pro 16IHU6 | |
| Huawei MateBook D 16-53011VFJ | |
| AIDA64 / Memory Write | |
| Average of class Multimedia (11755 - 134998, n=59, last 2 years) | |
| Huawei MateBook D 16 2022 | |
| Average Intel Core i7-12700H (23679 - 88660, n=64) | |
| Asus Vivobook 15 K513EQ | |
| Lenovo IdeaPad 5 Pro 16IHU6 | |
| Huawei MateBook D 16-53011VFJ | |
| AIDA64 / Memory Latency | |
| Average of class Multimedia (7 - 535, n=58, last 2 years) | |
| Huawei MateBook D 16 2022 | |
| Asus Vivobook 15 K513EQ | |
| Huawei MateBook D 16-53011VFJ | |
| Lenovo IdeaPad 5 Pro 16IHU6 | |
| Average Intel Core i7-12700H (76.2 - 133.9, n=62) | |
| Dell Inspiron 16 Plus 7610 | |
* ... smaller is better
DPC Latencies
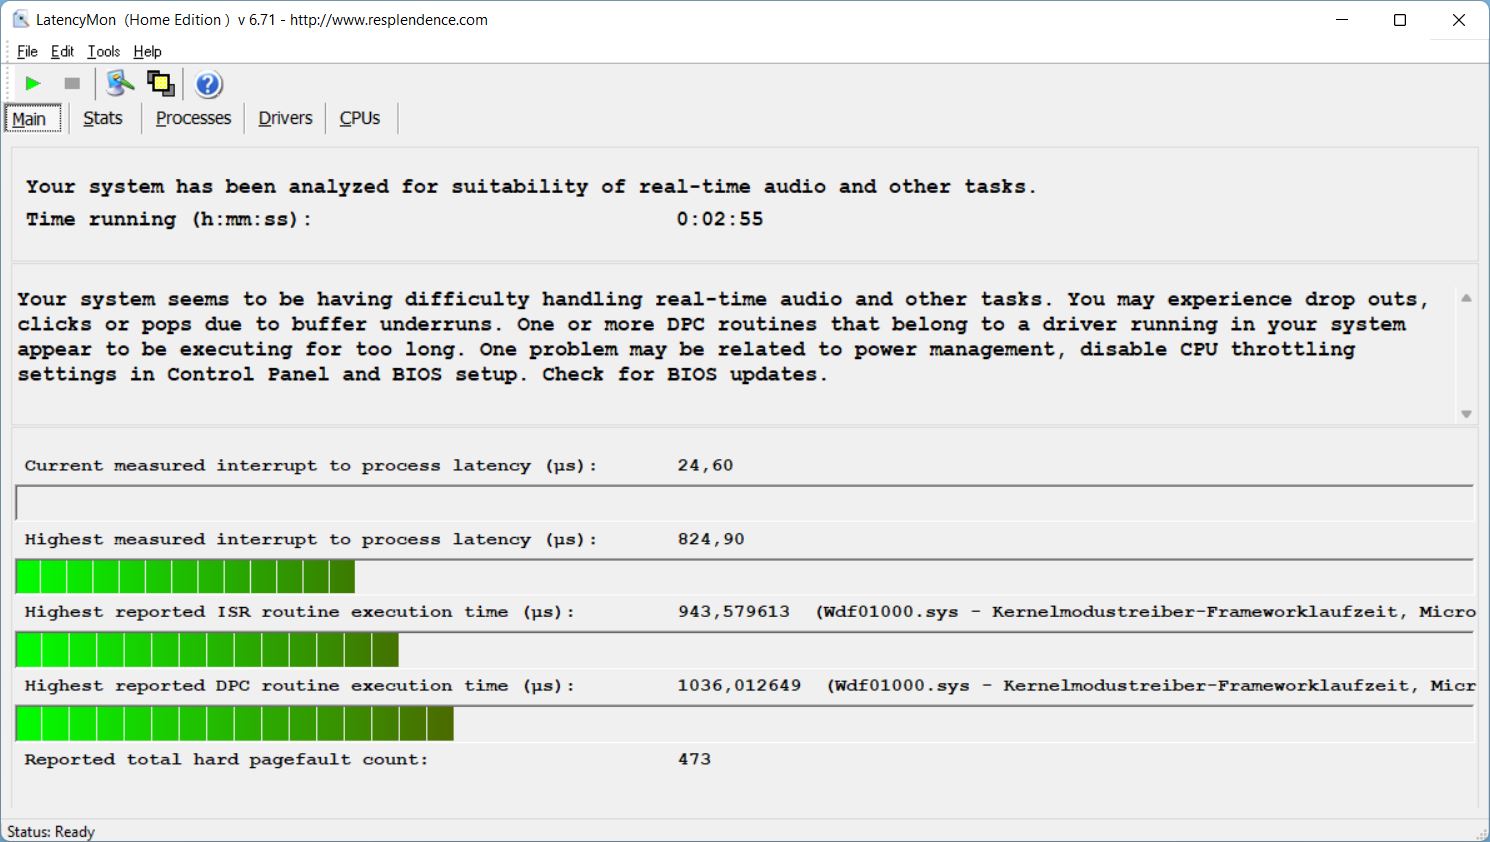
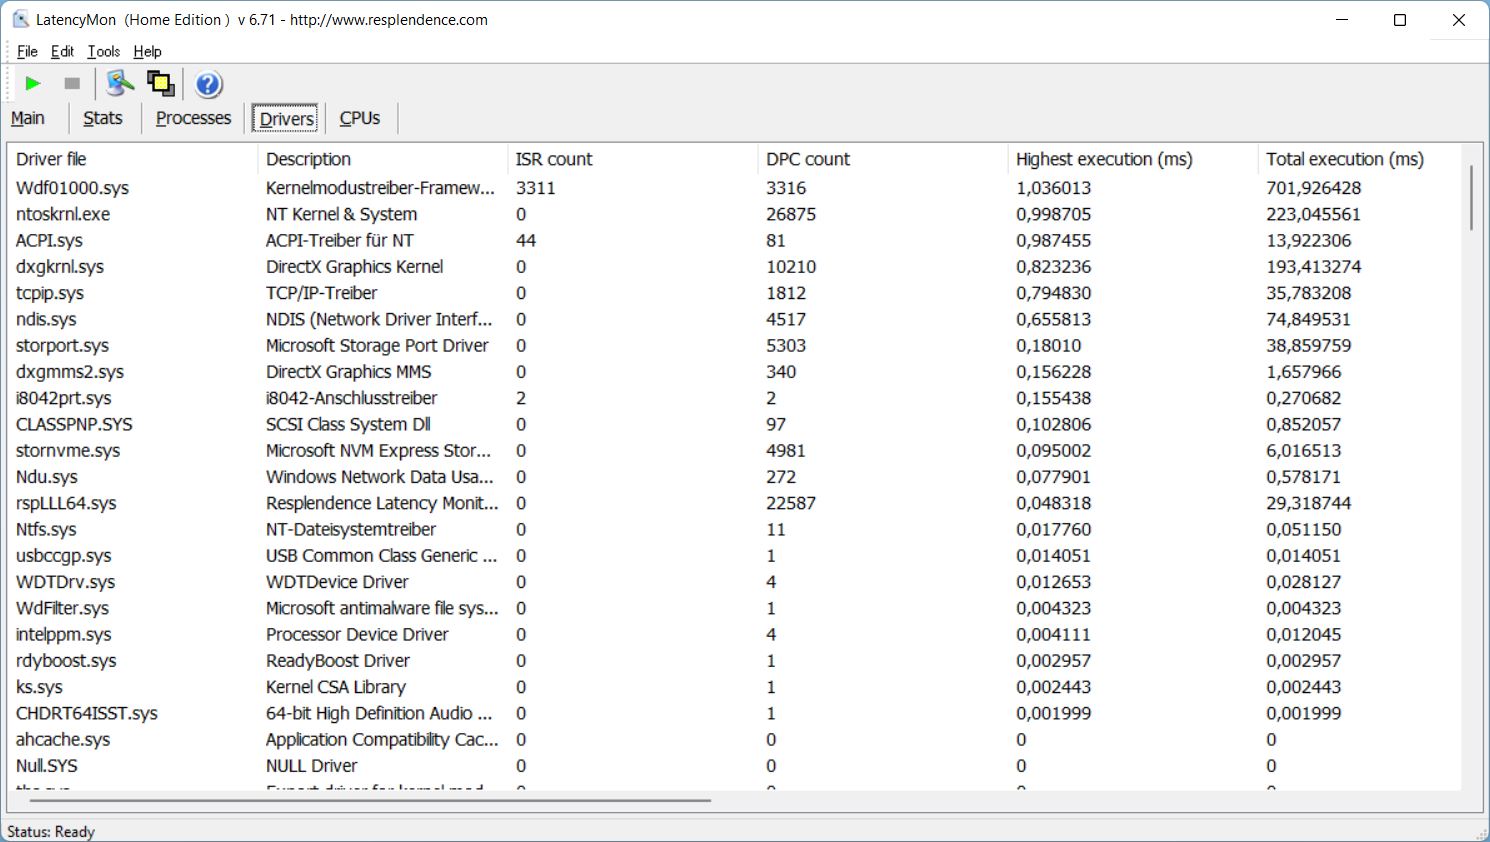
| DPC Latencies / LatencyMon - interrupt to process latency (max), Web, Youtube, Prime95 | |
| Asus Vivobook 15 K513EQ | |
| Dell Inspiron 16 Plus 7610 | |
| Huawei MateBook D 16 2022 | |
| Huawei MateBook D 16-53011VFJ | |
| Lenovo IdeaPad 5 Pro 16IHU6 | |
* ... smaller is better
Storage Solution
The M.2-2280 SSD in our test unit offers a storage capacity of 512 GB. Unfortunately, it is partitioned unnecessarily in the state of delivery, and there are only slightly more than 70 GB of space available on the system drive. The transfer rates of the PCIe 3.0-x4 SSD are okay, but users have to live without a modern PCIe 4.0 connection. You can find additional SSD benchmarks here.

* ... smaller is better
Constant Performance Reading: DiskSpd Read Loop, Queue Depth 8
Graphics Card
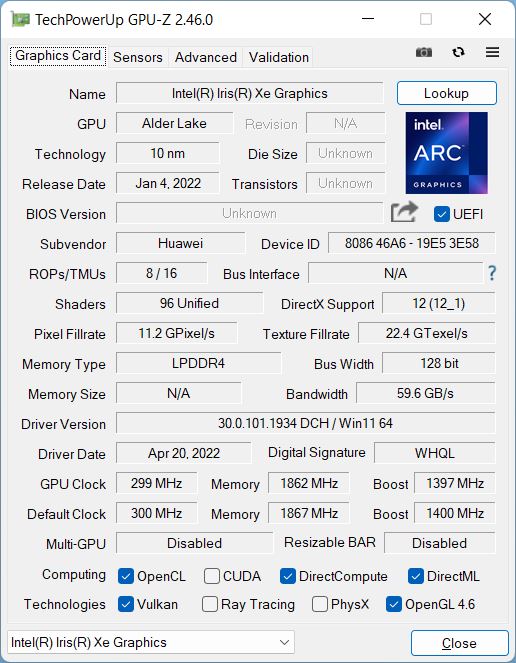
Huawei doesn't offer a dedicated GPU, so there is only the Iris Xe Graphics G7 (96 EUs) of the processor. This offers sufficient performance for everyday tasks, including the reproduction of high-resolution videos, but the iGPU quickly loses steam when gaming. This means that you are limited to less demanding games and often reduced detail settings. At least, the graphics performance also remains stable under constant load and in battery operation. You can find additional GPU benchmarks here.
| 3DMark 11 Performance | 7649 points | |
| 3DMark Cloud Gate Standard Score | 24596 points | |
| 3DMark Fire Strike Score | 5391 points | |
| 3DMark Time Spy Score | 1982 points | |
Help | ||
The Witcher 3 FPS Chart
| low | med. | high | ultra | |
|---|---|---|---|---|
| GTA V (2015) | 123.3 | 107.8 | 24.9 | 10.8 |
| The Witcher 3 (2015) | 102 | 66 | 35 | 14 |
| Dota 2 Reborn (2015) | 139.2 | 98.3 | 69.5 | 63.5 |
| Final Fantasy XV Benchmark (2018) | 47.9 | 26.8 | 26.8 | |
| X-Plane 11.11 (2018) | 50.1 | 36.3 | 41.8 | |
| Strange Brigade (2018) | 98.7 | 45.9 | 36.4 | 29.3 |
| F1 2021 (2021) | 108.4 | 54.8 | 43 | 30 |
Emissions and Power Management
Noise Emissions
The single fan often runs at low speed even under low load, but this is often hardly audible. Particular after the end of some load phases, the fan still keeps running for several minutes at slightly more than 30 dB(A), even during completely idle operation, which can be really annoying in everyday work. The AMD predecessor was significantly quieter, particularly during idle operation and also under low load.
Under load, the fan quickly reaches its maximum volume of 39.8 dB(A), regardless of whether you are gaming or only put some load on the processor. In the optional Performance mode, it even reaches almost 48 dB(A), which is simply too loud considering the TDP of 40 watts and the large case. Just for this reason, we would not recommend the Performance mode. We did not notice any additional electronic noises.
Noise level
| Idle |
| 24.2 / 25.8 / 30.5 dB(A) |
| Load |
| 39.8 / 39.8 dB(A) |
 | ||
30 dB silent 40 dB(A) audible 50 dB(A) loud |
||
min: | ||
| Huawei MateBook D 16 2022 Iris Xe G7 96EUs, i7-12700H, Silicon Motion PCIe-8 SSD | Asus Vivobook 15 K513EQ GeForce MX350, i7-1165G7, Intel SSD 660p SSDPEKNW512G8 | Lenovo IdeaPad 5 Pro 16IHU6 GeForce MX450, i5-11300H, Samsung SSD PM981a MZVLB512HBJQ | Dell Inspiron 16 Plus 7610 GeForce RTX 3050 4GB Laptop GPU, i7-11800H, Kingston OM3PDP3512B | Huawei MateBook D 16-53011VFJ Vega 6, R5 4600H, Samsung SSD PM981a MZVLB512HBJQ | |
|---|---|---|---|---|---|
| Noise | 1% | 2% | -6% | 3% | |
| off / environment * (dB) | 24.2 | 23.4 3% | 25 -3% | 24.4 -1% | 25.5 -5% |
| Idle Minimum * (dB) | 24.2 | 23.6 2% | 25 -3% | 24.4 -1% | 25.5 -5% |
| Idle Average * (dB) | 25.8 | 23.6 9% | 25 3% | 24.4 5% | 25.5 1% |
| Idle Maximum * (dB) | 30.5 | 23.6 23% | 25 18% | 24.4 20% | 25.5 16% |
| Load Average * (dB) | 39.8 | 41 -3% | 44.5 -12% | 48.3 -21% | 33 17% |
| Witcher 3 ultra * (dB) | 39.8 | 42.9 -8% | 48.9 -23% | ||
| Load Maximum * (dB) | 39.8 | 47 -18% | 36.5 8% | 48.9 -23% | 42.1 -6% |
* ... smaller is better
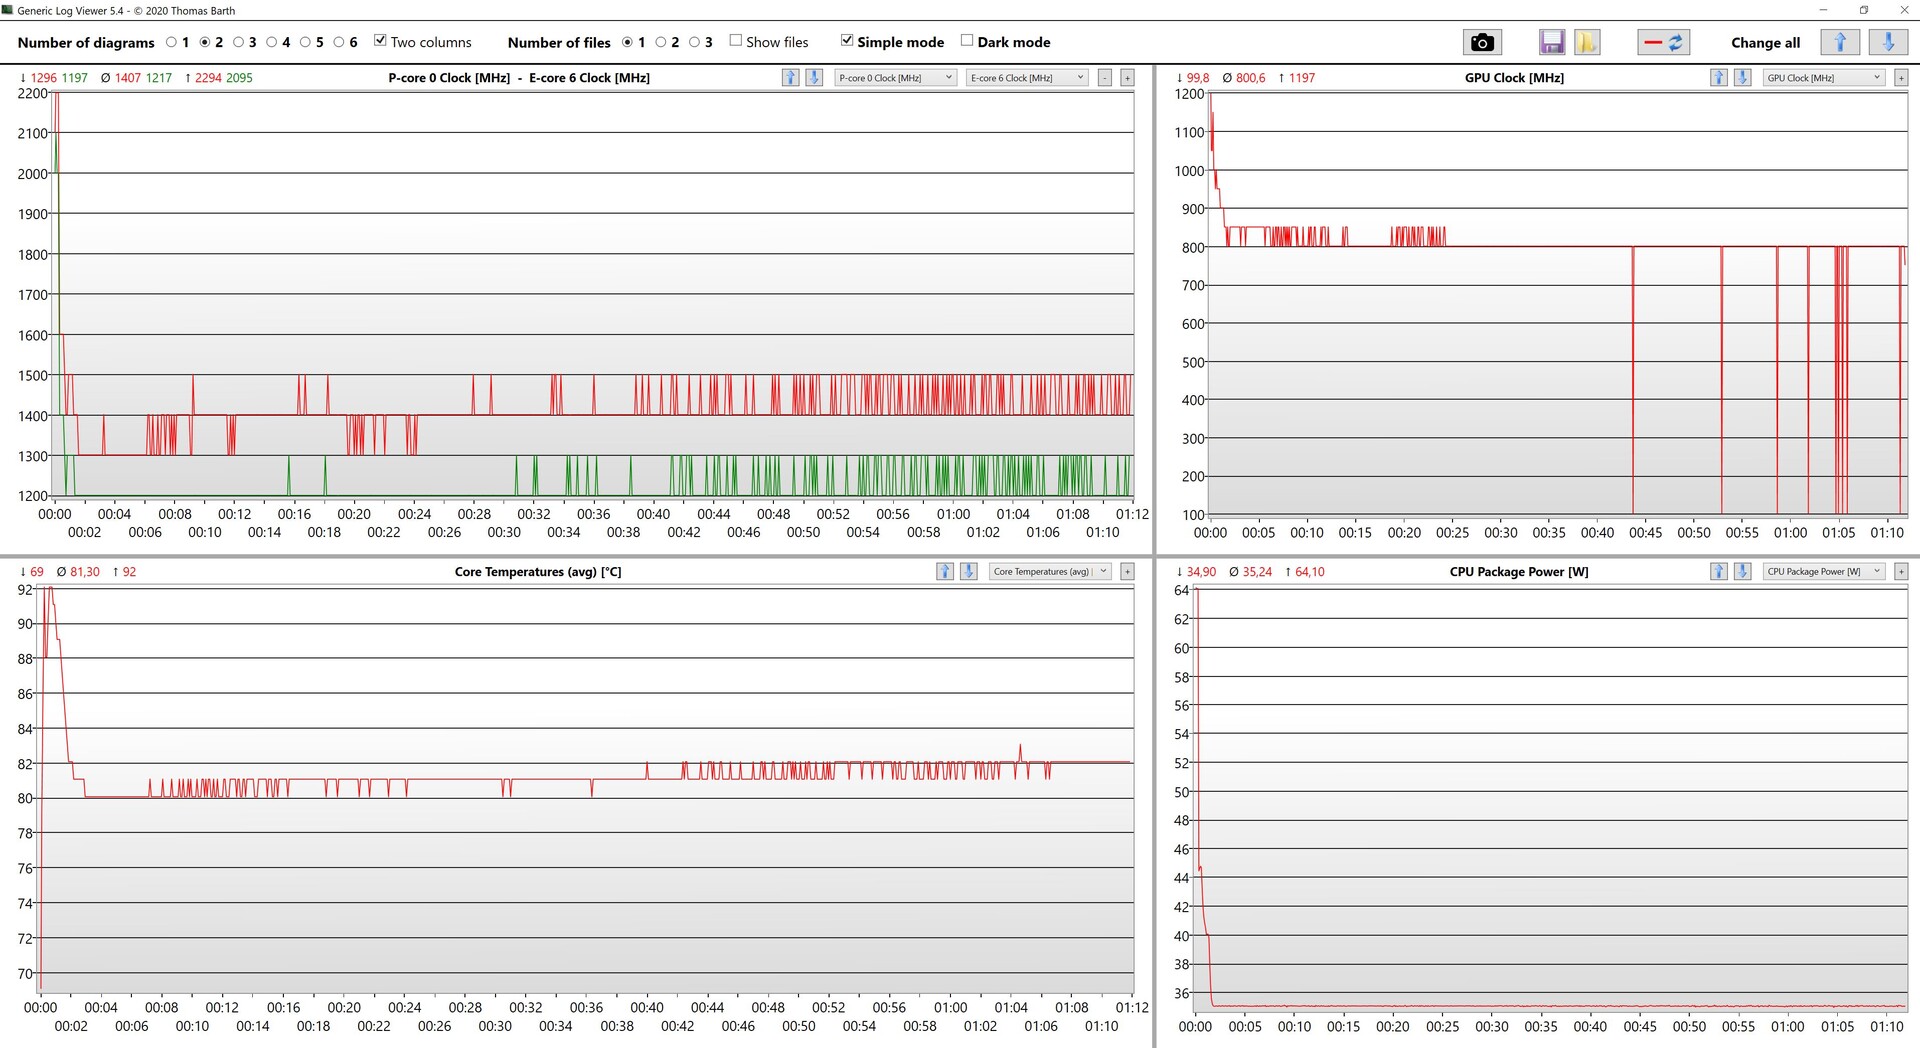
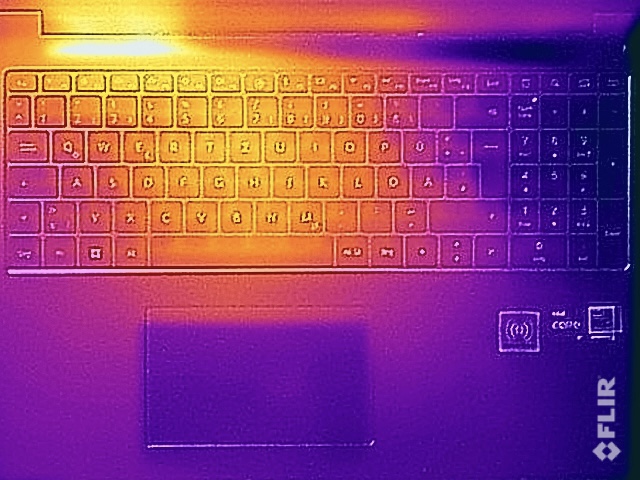
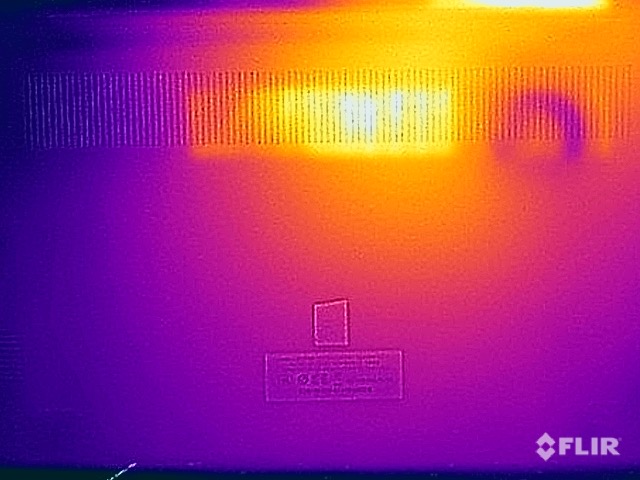
Temperature
The heat development is concentrated at the left side on top, which is the position of the single fan. During the stress test, the bottom gets noticeably warm, but this doesn't result in any limitations here, and there won't be any problems during everyday operation anyways. In the stress test, the TDP of the processor quickly drops to 35 watts but then remains stable afterwards.
(±) The maximum temperature on the upper side is 41.8 °C / 107 F, compared to the average of 36.8 °C / 98 F, ranging from 21 to 71 °C for the class Multimedia.
(-) The bottom heats up to a maximum of 47.3 °C / 117 F, compared to the average of 39.1 °C / 102 F
(+) In idle usage, the average temperature for the upper side is 26.9 °C / 80 F, compared to the device average of 31.3 °C / 88 F.
(±) Playing The Witcher 3, the average temperature for the upper side is 32.6 °C / 91 F, compared to the device average of 31.3 °C / 88 F.
(+) The palmrests and touchpad are cooler than skin temperature with a maximum of 28.4 °C / 83.1 F and are therefore cool to the touch.
(±) The average temperature of the palmrest area of similar devices was 28.7 °C / 83.7 F (+0.3 °C / 0.6 F).
| Huawei MateBook D 16 2022 Intel Core i7-12700H, Intel Iris Xe Graphics G7 96EUs | Asus Vivobook 15 K513EQ Intel Core i7-1165G7, NVIDIA GeForce MX350 | Lenovo IdeaPad 5 Pro 16IHU6 Intel Core i5-11300H, NVIDIA GeForce MX450 | Dell Inspiron 16 Plus 7610 Intel Core i7-11800H, NVIDIA GeForce RTX 3050 4GB Laptop GPU | Huawei MateBook D 16-53011VFJ AMD Ryzen 5 4600H, AMD Radeon RX Vega 6 (Ryzen 4000/5000) | |
|---|---|---|---|---|---|
| Heat | -7% | -13% | -15% | 5% | |
| Maximum Upper Side * (°C) | 41.8 | 48.8 -17% | 65.3 -56% | 46.4 -11% | 42.6 -2% |
| Maximum Bottom * (°C) | 47.3 | 42 11% | 55.4 -17% | 54.8 -16% | 41.7 12% |
| Idle Upper Side * (°C) | 28.3 | 30 -6% | 25.4 10% | 31.4 -11% | 27.8 2% |
| Idle Bottom * (°C) | 30.2 | 35 -16% | 26.8 11% | 36.6 -21% | 27.6 9% |
* ... smaller is better
Speakers
The two speakers are not positioned next to the keyboard anymore, but they output sound toward the bottom now. So depending on the surface, they may sound muffled. The speakers are slightly louder than those of the predecessor, but they also lack the pressure. However, the performance is good particularly in the mids and highs, benefiting the voice reproduction.
Huawei MateBook D 16 2022 audio analysis
(±) | speaker loudness is average but good (76 dB)
Bass 100 - 315 Hz
(-) | nearly no bass - on average 17.7% lower than median
(±) | linearity of bass is average (9.8% delta to prev. frequency)
Mids 400 - 2000 Hz
(+) | balanced mids - only 1.9% away from median
(+) | mids are linear (5.6% delta to prev. frequency)
Highs 2 - 16 kHz
(+) | balanced highs - only 4.4% away from median
(+) | highs are linear (3.1% delta to prev. frequency)
Overall 100 - 16.000 Hz
(±) | linearity of overall sound is average (16.2% difference to median)
Compared to same class
» 41% of all tested devices in this class were better, 7% similar, 51% worse
» The best had a delta of 5%, average was 17%, worst was 45%
Compared to all devices tested
» 26% of all tested devices were better, 6% similar, 68% worse
» The best had a delta of 4%, average was 23%, worst was 134%
Asus Vivobook 15 K513EQ audio analysis
(±) | speaker loudness is average but good (80.8 dB)
Bass 100 - 315 Hz
(-) | nearly no bass - on average 15.3% lower than median
(±) | linearity of bass is average (13% delta to prev. frequency)
Mids 400 - 2000 Hz
(+) | balanced mids - only 4.2% away from median
(+) | mids are linear (3.8% delta to prev. frequency)
Highs 2 - 16 kHz
(+) | balanced highs - only 0.8% away from median
(+) | highs are linear (2.3% delta to prev. frequency)
Overall 100 - 16.000 Hz
(+) | overall sound is linear (12.5% difference to median)
Compared to same class
» 24% of all tested devices in this class were better, 3% similar, 73% worse
» The best had a delta of 5%, average was 17%, worst was 45%
Compared to all devices tested
» 11% of all tested devices were better, 2% similar, 87% worse
» The best had a delta of 4%, average was 23%, worst was 134%
Power Consumption
If the processor alone can consume 64 watts, it is not surprising that the compact 65-Watt charger is unable to provide enough for the full power consumption under high CPU load. The system will draw a maximum of an additional 24 watts from battery, and only at a TDP of about 38 watts, the battery is not used anymore. As already in the MateBook 16s before, Huawei cuts corners in the wrong place here, and the device should include a 90-Watt charger instead. Under high load or while gaming, this also results in high temperatures of the charger. But the new model also consumes more power than its AMD predecessor during idle operation.
| Off / Standby | |
| Idle | |
| Load |
|
Key:
min: | |
Power Consumption The Witcher 3 / Stress Test
Power Consumption With External Monitor
Battery Life
Even though the battery capacity has increased slightly from 56 to 60 Wh, due to the increased power consumption, the battery life has worsened. In our WLAN test at a brightness of 150 cd/m² (corresponding to 51% of the maximum brightness in our test unit), the device only lasts slightly longer than 7 hours, and at maximum brightness, only 5.5 hours. The predecessor lasted noticeably longer here at 9 or 6.5 hours respectively.
| Huawei MateBook D 16 2022 i7-12700H, Iris Xe G7 96EUs, 60 Wh | Asus Vivobook 15 K513EQ i7-1165G7, GeForce MX350, 42 Wh | Lenovo IdeaPad 5 Pro 16IHU6 i5-11300H, GeForce MX450, 75 Wh | Dell Inspiron 16 Plus 7610 i7-11800H, GeForce RTX 3050 4GB Laptop GPU, 86 Wh | Huawei MateBook D 16-53011VFJ R5 4600H, Vega 6, 56 Wh | Average of class Multimedia | |
|---|---|---|---|---|---|---|
| Battery runtime | -15% | 28% | 39% | 27% | 69% | |
| WiFi v1.3 (h) | 7.1 | 6 -15% | 9.1 28% | 9.9 39% | 9 27% | 12 ? 69% |
| Witcher 3 ultra (h) | 1 |
Pros
Cons
Verdict - The expensive Intel CPU is throttled
In principle, the verdict on the new MateBook D 16 is comparable to that of the MateBook 16s, since the change to the Intel processor also brings several problems. These include primarily also the increased price, particularly if you consider that the Core i7 brings significantly less performance with the drop of one of the fans. In addition, Huawei foregoes Thunderbolt 4, and one of the USB-A connections on the right side only supports the aged USB 2.0 standard.
Although the CPU performance (particularly single-core) is better than that of the predecessor, we had tested that with the Ryzen 5 5600H. So to be fair, we should have used the new MateBook D 16 with the Core i5-12450H in our comparison, which is also equipped with the slower GPU. That version might lose the performance comparison with the old model, which would also mean that we can hardly recommend the basic version for 949 Euros (~$958). In addition, the higher power consumption of the Intel processor also leads to a shorter battery life, and the 65-Watt charger is too weak.
The old MateBook D 16 was mainly convincing with its good price-performance ratio. But this is not the case anymore with the new model with the Intel Core i7, and at the same time the manufacturer also cut some corners in several places (no Thunderbolt 4, an aged USB-2.0 port, and a charger that is too weak), which is simply not appropriate for the increased price of 1299 Euros (~$1331).
On the other hand, we should of course also mention that Huawei improved the case quality, and the full-size keyboard with the numeric keypad and longer key stroke also leaves a good impression. So some slight price increase would therefore probably be justified, but not by 400 Euros (~$404). While the change to an Intel processor might look good on paper, the MateBook D 16 would be a significantly more attractive and (with a high probability) also faster overall package, if it had been equipped with an AMD processor.
Price and Availability
The new MateBook D 16 has been launched in Europe. At its market introduction, Huawei includes MateView GT 27 and a free backpack. The entry level model with the weaker Core i5-12450H costs 949 Euros (~$958) and our test unit with the Core i7-12700H is available for 1299 Euros (~$1311).
Huawei MateBook D 16 2022
- 07/15/2022 v7 (old)
Andreas Osthoff
Price comparison

